UNITED STATES
SECURITIES AND EXCHANGE COMMISSION
Washington, D.C. 20549
FORM N-CSR
CERTIFIED SHAREHOLDER REPORT
OF
REGISTERED MANAGEMENT INVESTMENT COMPANIES
Investment Company Act file number: 811-07239
Name of Registrant: Vanguard Horizon Funds
Address of Registrant:
P.O. Box 2600
Valley Forge, PA 19482
Name and address of agent for service:
Heidi Stam, Esquire
P.O. Box 876
Valley Forge, PA 19482
Registrant’s telephone number, including area code: (610) 669-1000
Date of fiscal year end: September 30
Date of reporting period: October 1, 2014 – September 30, 2015
Item 1: Reports to Shareholders

Annual Report | September 30, 2015
Vanguard Strategic Equity Fund
Vanguard’s Principles for Investing Success
We want to give you the best chance of investment success. These principles,
grounded in Vanguard’s research and experience, can put you on the right path.
Goals. Create clear, appropriate investment goals.
Balance. Develop a suitable asset allocation using broadly diversified funds.
Cost. Minimize cost.
Discipline. Maintain perspective and long-term discipline.
A single theme unites these principles: Focus on the things you can control.
We believe there is no wiser course for any investor.
| |
| Contents | |
| Your Fund’s Total Returns. | 1 |
| Chairman’s Letter. | 2 |
| Advisor’s Report. | 8 |
| Fund Profile. | 10 |
| Performance Summary. | 11 |
| Financial Statements. | 13 |
| Your Fund’s After-Tax Returns. | 28 |
| About Your Fund’s Expenses. | 29 |
| Glossary. | 31 |
Please note: The opinions expressed in this report are just that—informed opinions. They should not be considered promises or advice.
Also, please keep in mind that the information and opinions cover the period through the date on the front of this report. Of course, the risks of investing in your fund are spelled out in the prospectus.
See the Glossary for definitions of investment terms used in this report.
About the cover: Pictured is a sailing block on the Brilliant, a 1932 schooner docked in Mystic, Connecticut. A type of pulley, the sailing block helps coordinate the setting of the sails. At Vanguard, the intricate coordination of technology and people allows us to help millions of clients around the world reach their financial goals.
| | | | |
| Your Fund’s Total Returns | | | | |
| |
| |
| |
| |
| Fiscal Year Ended September 30, 2015 | | | | |
| | | | | Total |
| | | | | Returns |
| Vanguard Strategic Equity Fund | | | | 2.01% |
| MSCI US Small + Mid Cap 2200 Index | | | | 0.65 |
| Mid-Cap Core Funds Average | | | | -1.58 |
| Mid-Cap Core Funds Average: Derived from data provided by Lipper, a Thomson Reuters Company. | | |
| |
| |
| Your Fund’s Performance at a Glance | | | | |
| September 30, 2014, Through September 30, 2015 | | | | |
| | | | Distributions Per Share |
| | Starting | Ending | | |
| | Share | Share | Income | Capital |
| | Price | Price | Dividends | Gains |
| Vanguard Strategic Equity Fund | $32.02 | $30.82 | $0.354 | $1.519 |
1

Chairman’s Letter
Dear Shareholder,
The fiscal year ended September 30, 2015, was a volatile one for financial markets. Initially, stock prices headed higher amid largely positive developments regarding the domestic economy. As the period progressed, however, the ride got bumpier. A number of concerns affected investor sentiment, including the pace of growth at home and abroad and the fall in the price of oil and other commodities. The prospect of a Federal Reserve rate hike, the impact of a strong U.S. dollar on corporate profits, and seemingly lofty stock market valuations also weighed on returns.
The outcome for U.S. stocks as a whole was a slightly negative performance. But domestic mid- and small-capitalization stocks, which tend to be more insulated from developments abroad, managed to stay above water, and Vanguard Strategic Equity Fund returned 2.01% for the period. This put it ahead of its benchmark, the MSCI US Small + Mid Cap 2200 Index, which returned 0.65%, and well out in front of its peers’ average return of –1.58%.
Returns varied widely by sector. For the fund, three sectors posted double-digit gains and three produced double-digit declines. Relative to the benchmark, strong stock selection in information technology and consumer discretionary made the biggest contributions to its outperformance. This helped to offset subpar selection results from other sectors including materials and financials.
2
If you own shares of your fund in a taxable account, you may wish to review the funds’ after-tax returns that appear later in this report.
Please note that as of September 30, 2015, the Strategic Equity Fund had realized capital gains equal to about 9% of fund assets. Gains will be distributed in December.
China’s economic woes weighed on global stocks
The broad U.S. stock market returned –0.49% for the 12 months. The final two months were especially rocky as investors worried in particular about the global ripple effects of slower economic growth in China.
For much of the fiscal year, investors were preoccupied with the possibility of an increase in short-term interest rates. On September 17, the Fed announced that it would hold rates steady for the time being, a decision that to some investors indicated the Fed’s concern about the fragility of global markets.
International stocks returned about –11% as the dollar’s strength against many foreign currencies weighed on results. Returns for emerging markets, which were especially hard hit by concerns about China, trailed those of the developed markets of the Pacific region and Europe.
| | | |
| Market Barometer | | | |
| |
| | | Average Annual Total Returns |
| | Periods Ended September 30, 2015 |
| | One | Three | Five |
| | Year | Years | Years |
| Stocks | | | |
| Russell 1000 Index (Large-caps) | -0.61% | 12.66% | 13.42% |
| Russell 2000 Index (Small-caps) | 1.25 | 11.02 | 11.73 |
| Russell 3000 Index (Broad U.S. market) | -0.49 | 12.53 | 13.28 |
| FTSE All-World ex US Index (International) | -11.34 | 2.87 | 2.19 |
| |
| Bonds | | | |
| Barclays U.S. Aggregate Bond Index (Broad taxable market) | 2.94% | 1.71% | 3.10% |
| Barclays Municipal Bond Index (Broad tax-exempt market) | 3.16 | 2.88 | 4.14 |
| Citigroup Three-Month U.S. Treasury Bill Index | 0.02 | 0.02 | 0.04 |
| |
| CPI | | | |
| Consumer Price Index | -0.04% | 0.93% | 1.73% |
3
Taxable bonds recorded gains as investors searched for safety
The broad U.S. taxable bond market returned 2.94% as investors gravitated toward safe-haven assets amid global stock market turmoil. Stimulative monetary policies from the world’s central banks, declining inflation expectations, and global investors’ search for higher yields also helped lift U.S. bonds.
The yield of the 10-year Treasury note ended September at 2.05%, down from 2.48% a year earlier. (Bond prices and yields move in opposite directions.)
International bond markets (as measured by the Barclays Global Aggregate Index ex USD) returned –7.67%; the dollar’s strength was again a significant factor. Without this currency effect, international bonds advanced modestly.
The Fed’s 0%–0.25% target for short-term interest rates continued to limit returns for money market funds and savings accounts.
The fund’s quantitative screening produced benchmark-beating results
The fund’s advisor, Vanguard Quantitative
that consider criteria such as valuations, earnings growth potential, and market sentiment.
This screening process met with success in seven of the ten market sectors. Relative outperformance was especially strong for information technology holdings in software, IT services, and semiconductors.
Consumer discretionary was another top-performing sector. The advisor’s company-by-company analysis resulted in benchmark-beating returns for its selections among cable TV, footwear, internet retailing, and automotive parts companies.
Energy stocks continued to suffer from the sharp drop in the price of oil, returning roughly –45% for the benchmark index. Although the fund’s holdings in equipment and services disappointed, they produced an above-benchmark return in this sector. The fund succeeded primarily by avoiding coal stocks and limiting its exposure to oil and gas exploration and production companies.
In financials, consumer finance and regional banks underperformed for the fund. Materials was an even bigger detractor from relative results, mainly because of stakes in the metals and mining segment.
For more information about the advisor’s management of the fund, please see the Advisor’s Report that follows this letter.
| |
| Total Returns | |
| Ten Years Ended September 30, 2015 | |
| | Average |
| | Annual Return |
| Strategic Equity Fund | 6.95% |
| MSCI US Small + Mid Cap 2200 Index | 7.79 |
| Mid-Cap Core Funds Average | 6.59 |
| Mid-Cap Core Funds Average: Derived from data provided by Lipper, a Thomson Reuters Company. | |
The figures shown represent past performance, which is not a guarantee of future results. (Current performance may be lower or higher than the performance data cited. For performance data current to the most recent month-end, visit our website at vanguard.com/performance.) Note, too, that both investment returns and principal value can fluctuate widely, so an investor’s shares, when sold, could be worth more or less than their original cost.
5
| |
|
| Staying the course can help you stay closer to your fund’s return |
| |
| When stock markets are highly volatile, as in recent months, it’s tempting to run for cover. |
| But the price of panic can be high. |
| |
| A rough measure of what can be lost from attempts to time the market is the difference |
| between the returns produced by a fund and the returns earned by the fund’s investors. |
| |
| The results shown in the Performance Summary later in this report are your fund’s time- |
| weighted returns—the average annual returns investors would have earned if they invested |
| a lump sum in the fund at the start of the period and reinvested any distributions they had |
| received. Their actual returns, however, depend on whether they subsequently bought or |
| sold any shares. There’s often a gap between this dollar-weighted return for investors and |
| the fund’s time-weighted return, as shown below. |
| |
| Many sensible investment behaviors can contribute to the difference in returns, but industry |
| cash flow data suggest that one important factor is the generally counterproductive effort to |
| buy and sell at the “right” time. Keeping your emotions in check can help narrow the gap. |
| |
| Mutual fund returns and investor returns over the last decade |

|
| Average fund return |
| Average investor return |
| |
| Notes: Data are as of December 31, 2014. The average fund returns and average investor returns are from Morningstar. The average |
| fund returns are the average of the funds’ time-weighted returns in each category. The average investor returns assume that the growth |
| of a fund’s total net assets for a given period is driven by market returns and investor cash ow. To calculate investor return, a fund’s |
| change in assets for the period is discounted by the return of the fund to isolate how much of the asset growth was driven by cash ow. |
| A model, similar to an internal rate-of-return calculation, is then used to calculate a constant growth rate that links the beginning total |
| net assets and periodic cash ows to the ending total net assets. |
| Sources: Vanguard and Morningstar, Inc. |
6
Fund added another positive year to its long-term track record
Vanguard Strategic Equity Fund produced an average annual return of 6.95% over the past decade, lagging the 7.79% return of its benchmark index. The advisor struggled to keep up with its benchmark going into and coming out of the 2008–2009 financial crisis. This period, when investors were focused more on macroeconomic concerns than on individual company fundamentals, accounts for much of the fund’s shortfall. The advisor has had more success of late, and this fiscal year marks the fund’s fifth consecutive year of outperformance.
The fund’s average annual return over the last ten years has outpaced that of its peers.
A dose of discipline is crucial when markets become volatile
Although the broad U.S. stock market has posted gains for six straight calendar years—from 2009 to 2014—that streak may not last a seventh. Stocks tumbled in August and swung up and down in September.
Nobody can control the direction of the markets or reliably predict where they’ll go in the short term. However, investors can control how they react to volatility.
During periods of market adversity, it’s more important than ever to keep sight of one of Vanguard’s key principles: Maintain perspective and long-term discipline. Whether you’re investing for yourself or on behalf of clients, your success is affected greatly by how you respond—or don’t respond—during turbulent markets. (You can read Vanguard’s Principles for Investing Success at vanguard.com/research.)
As I’ve written in the past, the best course for long-term investors is generally to ignore daily market moves and not make decisions based on emotion. (See the box on page 6 for more discussion on the benefit of staying the course.) This is also a good time to evaluate your portfolio and make sure your asset allocation is aligned with your time horizon, goals, and risk tolerance.
The markets are unpredictable and often confounding. Keeping our long-term plans clearly in focus can be essential as we weather these periodic storms.
As always, thank you for investing with Vanguard.
Sincerely,

F. William McNabb III
Chairman and Chief Executive Officer
October 15, 2015
7
Advisor’s Report
For the fiscal year ended September 30, 2015, the Strategic Equity Fund had a total return of 2.01%, outpacing its benchmark index by 1.36 percentage points. Overall, stocks struggled—the broad U.S. equity market (as measured by the MSCI US Investable Market Index) returned –0.39%. Large-capitalization stocks lagged smaller-caps, and growth-oriented stocks outpaced value. Equities outside the United States returned roughly –9%. Emerging markets were a large contributor to that result as they returned about –19%.
Sector performance in the benchmark index was mixed, although a majority produced positive results. Health care, consumer staples, and information technology did best, but energy, materials, and telecommunication services lagged.
After six straight years of positive returns, the U.S. stock market declined slightly for the period. The Federal Reserve held off on raising interest rates to facilitate further progress toward its employment and inflation targets. Second-quarter real GDP increased at an annual rate of 3.9% compared with an increase of 0.6% in the first quarter. This growth reflected contributions from exports, an acceleration in personal consumption expenditures, and an increase in state and local government spending.
The unemployment rate continued to fall. The U.S. nonfarm payroll rose by 142,000 in September, and the unemployment rate declined to 5.1% from 5.9% a year ago.
The economic slowdown overseas, especially in emerging markets, added to recent market volatility. Emerging-market currencies have lost value against the U.S. dollar. The possibility that the Fed might raise interest rates by the end of 2015 pushed the dollar up and spurred capital outflows from these countries. Many emerging economies were also affected by weak commodity prices that contributed to lower export growth. China’s continuing slowdown still represents significant downside risk to overall emerging-market performance.
Although we seek to understand the impact of macro factors on fund performance, our investment process is focused on specific stock fundamentals. We compare stocks within the same industry groups to identify those with characteristics that we believe will help them outperform over the long run.
We use a strict quantitative model to analyze valuation and other factors centered on fundamental growth. We then use the results to construct our portfolio. Our goal is to maximize expected return and minimize exposure to risks that our research indicates do not improve returns, such as deviations from market-capitalization and sector weightings relative to the benchmark.
For the fiscal year, the growth, management decisions, and sentiment components of our model boosted the fund’s results. However, the quality and valuation components did not perform
8
as expected. The model’s effectiveness was mixed. Stock selection was positive in five sectors, virtually flat in two, and negative in three. The strongest results were in information technology, consumer discretionary, and industrials. We underper-formed primarily in materials, financials, and consumer staples.
At the individual stock level, the largest contributions came from overweighted positions in Electronic Arts, Manhattan Associates, and Qorvo. Compared with the benchmark, we benefited from underweighting or avoiding stocks including NetApp and Trimble Navigation.
Unfortunately, we were not able to avoid all disappointments. Overweighted positions in Century Aluminum, Alcoa, and United States Steel directly lowered results. And underweighted positions in Vulcan Materials and Martin Marietta Materials, which our model did not select, hurt the fund’s relative performance.
We continue to believe that constructing a portfolio that focuses on the fundamentals described above will benefit investors over the long term, although we recognize that risk can reward or punish us in the near term. We feel that the fund offers a strong mix of stocks with attractive valuation and growth characteristics relative to its benchmark index.
We thank you for your investment and look forward to the coming year.
Portfolio Managers:
James D. Troyer, CFA, Principal
James P. Stetler, Principal
Michael R. Roach, CFA
Vanguard Quantitative Equity Group
October 16, 2015
9
Strategic Equity Fund
Fund Profile
As of September 30, 2015
| | | |
| Portfolio Characteristics | | |
| | | | DJ |
| | | | U.S. |
| | | MSCI US | Total |
| | | Small + | Market |
| | | Mid Cap | FA |
| | Fund | 2200 Index | Index |
| Number of Stocks | 426 | 2,188 | 4,000 |
| Median Market Cap | $3.9B | $5.9B | $46.5B |
| Price/Earnings Ratio | 17.5x | 25.0x | 20.2x |
| Price/Book Ratio | 2.6x | 2.3x | 2.5x |
| Return on Equity | 13.9% | 13.5% | 17.2% |
| Earnings Growth | | | |
| Rate | 14.1% | 11.5% | 10.1% |
| Dividend Yield | 1.8% | 1.7% | 2.1% |
| Foreign Holdings | 1.0% | 0.0% | 0.0% |
| Turnover Rate | 70% | — | — |
| Ticker Symbol | VSEQX | — | — |
| Expense Ratio1 | 0.27% | — | — |
| 30-Day SEC Yield | 1.55% | — | — |
| Short-Term Reserves | 0.1% | — | — |
| | | |
| Sector Diversification (% of equity exposure) |
| | | | DJ |
| | | | U.S. |
| | | MSCI US | Total |
| | | Small + | Market |
| | | Mid Cap | FA |
| | Fund | 2200 Index | Index |
| Consumer Discretionary | 17.1% | 16.7% | 13.7% |
| Consumer Staples | 5.3 | 4.5 | 8.7 |
| Energy | 4.9 | 4.4 | 6.3 |
| Financials | 21.6 | 22.5 | 18.3 |
| Health Care | 10.7 | 10.8 | 14.4 |
| Industrials | 13.6 | 13.5 | 10.6 |
| Information Technology | 15.9 | 16.3 | 19.6 |
| Materials | 5.1 | 5.4 | 3.1 |
| Telecommunication | | | |
| Services | 0.4 | 0.9 | 2.1 |
| Utilities | 5.4 | 5.0 | 3.2 |
| | |
| Volatility Measures | | |
| | MSCI US | DJ |
| | Small + | U.S. Total |
| | Mid Cap | Market |
| | 2200 Index | FA Index |
| R-Squared | 0.97 | 0.91 |
| Beta | 0.98 | 1.07 |
These measures show the degree and timing of the fund’s fluctuations compared with the indexes over 36 months.
| | |
| Ten Largest Holdings (% of total net assets) |
| Electronic Arts Inc. | Home Entertainment | |
| | Software | 1.2% |
| Tesoro Corp. | Oil & Gas Refining & | |
| | Marketing | 1.0 |
| Best Buy Co. Inc. | Computer & | |
| | Electronics Retail | 1.0 |
| FirstEnergy Corp. | Electric Utilities | 1.0 |
| Cintas Corp. | Diversified Support | |
| | Services | 0.9 |
| Everest Re Group Ltd. | Reinsurance | 0.9 |
| CDW Corp. | Technology | |
| | Distributors | 0.9 |
| Bunge Ltd. | Agricultural Products | 0.9 |
| Computer Sciences | Data Processing & | |
| Corp. | Outsourced Services | 0.9 |
| Voya Financial Inc. | Diversified Financial | |
| | Services | 0.9 |
| Top Ten | | 9.6% |
The holdings listed exclude any temporary cash investments and equity index products.
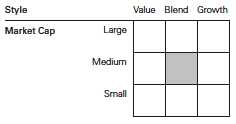
Investment Focus
1 The expense ratio shown is from the prospectus dated January 27, 2015, and represents estimated costs for the current fiscal year. For the fiscal year ended September 30, 2015, the expense ratio was 0.21%.
10
Strategic Equity Fund
Performance Summary
All of the returns in this report represent past performance, which is not a guarantee of future results that may be achieved by the fund. (Current performance may be lower or higher than the performance data cited. For performance data current to the most recent month-end, visit our website at vanguard.com/performance.) Note, too, that both investment returns and principal value can fluctuate widely, so an investor’s shares, when sold, could be worth more or less than their original cost. The returns shown do not reflect taxes that a shareholder would pay on fund distributions or on the sale of fund shares.
Cumulative Performance: September 30, 2005, Through September 30, 2015
Initial Investment of $10,000

| | | | |
| | | Average Annual Total Returns | |
| | Periods Ended September 30, 2015 | |
| |
| | | | | Final Value |
| | One | Five | Ten | of a $10,000 |
| | Year | Years | Years | Investment |
| |
| Strategic Equity Fund* | 2.01% | 16.10% | 6.95% | $19,588 |
| MSCI US Small + Mid Cap 2200 | | | | |
| Index | 0.65 | 13.38 | 7.79 | 21,181 |
| |
| Mid-Cap Core Funds Average | -1.58 | 11.41 | 6.59 | 18,928 |
| Dow Jones U.S. Total Stock Market | | | | |
| Float Adjusted Index | -0.55 | 13.26 | 7.06 | 19,778 |
Mid-Cap Core Funds Average: Derived from data provided by Lipper, a Thomson Reuters Company.
See Financial Highlights for dividend and capital gains information.
11
Strategic Equity Fund
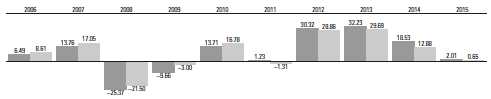
Fiscal-Year Total Returns (%): September 30, 2005, Through September 30, 2015
| |
| Strategic Equity Fund |
| MSCI US Small + Mid Cap 2200 Index |
12
Strategic Equity Fund
Financial Statements
Statement of Net Assets
As of September 30, 2015
The fund reports a complete list of its holdings in regulatory filings four times in each fiscal year, at the quarter-ends. For the second and fourth fiscal quarters, the lists appear in the fund’s semiannual and annual reports to shareholders. For the first and third fiscal quarters, the fund files the lists with the Securities and Exchange Commission on Form N-Q. Shareholders can look up the fund’s Forms N-Q on the SEC’s website at sec.gov. Forms N-Q may also be reviewed and copied at the SEC’s Public Reference Room (see the back cover of this report for further information).
| | | |
| | | | Market |
| | | | Value• |
| | | Shares | ($000) |
| Common Stocks (99.6%)1 | | |
| Consumer Discretionary (17.1%) | |
| | Best Buy Co. Inc. | 1,526,300 | 56,656 |
| * | Skechers U.S.A. Inc. | | |
| | Class A | 366,400 | 49,127 |
| | Big Lots Inc. | 1,002,900 | 48,059 |
| | American Eagle | | |
| | Outfitters Inc. | 2,797,300 | 43,722 |
| | Expedia Inc. | 364,800 | 42,930 |
| | Leggett & Platt Inc. | 1,034,600 | 42,677 |
| * | American Axle & | | |
| | Manufacturing | | |
| | Holdings Inc. | 1,953,200 | 38,947 |
| | Cooper Tire & Rubber Co. | 968,800 | 38,277 |
| | Darden Restaurants Inc. | 553,250 | 37,920 |
| * | O’Reilly Automotive Inc. | 149,100 | 37,275 |
| ^ | Outerwall Inc. | 635,590 | 36,184 |
| | Brinker International Inc. | 684,950 | 36,076 |
| | Domino’s Pizza Inc. | 291,820 | 31,490 |
| | Hasbro Inc. | 423,500 | 30,551 |
| * | Murphy USA Inc. | 445,000 | 24,453 |
| | Nutrisystem Inc. | 865,000 | 22,940 |
| | Jack in the Box Inc. | 275,000 | 21,186 |
| * | NVR Inc. | 12,200 | 18,608 |
| | DR Horton Inc. | 632,300 | 18,564 |
| | Carter’s Inc. | 184,500 | 16,723 |
| * | Pinnacle Entertainment Inc. | 485,848 | 16,441 |
| * | Madison Square Garden Co. | |
| | Class A | 225,800 | 16,289 |
| | Marriott Vacations | | |
| | Worldwide Corp. | 212,300 | 14,466 |
| * | Strayer Education Inc. | 262,400 | 14,424 |
| | Wyndham Worldwide Corp. | 200,100 | 14,387 |
| | Foot Locker Inc. | 177,013 | 12,740 |
| | Lear Corp. | 116,400 | 12,662 |
| * | Helen of Troy Ltd. | 138,800 | 12,395 |
| | Caleres Inc. | 358,800 | 10,954 |
| * | BJ’s Restaurants Inc. | 248,400 | 10,689 |
| | World Wrestling | | |
| | Entertainment Inc. Class A | 617,300 | 10,432 |
| | | |
| | | | Market |
| | | | Value• |
| | | Shares | ($000) |
| * | Grand Canyon | | |
| | Education Inc. | 256,000 | 9,725 |
| * | Tower International Inc. | 368,200 | 8,748 |
| * | Burlington Stores Inc. | 149,600 | 7,636 |
| * | Starz | 202,700 | 7,569 |
| | Interpublic Group of | | |
| | Cos. Inc. | 378,300 | 7,237 |
| | Harman International | | |
| | Industries Inc. | 74,400 | 7,142 |
| * | Denny’s Corp. | 572,700 | 6,317 |
| | Cablevision Systems Corp. | | |
| | Class A | 189,800 | 6,163 |
| | News Corp. Class A | 464,000 | 5,856 |
| | Cato Corp. Class A | 167,600 | 5,703 |
| * | Boyd Gaming Corp. | 321,800 | 5,245 |
| * | Iconix Brand Group Inc. | 384,800 | 5,203 |
| | Gannett Co. Inc. | 327,800 | 4,829 |
| * | Fossil Group Inc. | 85,100 | 4,755 |
| | Whirlpool Corp. | 30,900 | 4,550 |
| * | G-III Apparel Group Ltd. | 67,300 | 4,150 |
| | News Corp. Class B | 323,500 | 4,147 |
| * | Live Nation | | |
| | Entertainment Inc. | 166,900 | 4,012 |
| | Columbia Sportswear Co. | 67,200 | 3,951 |
| * | Universal Electronics Inc. | 82,800 | 3,480 |
| | AMC Entertainment | | |
| | Holdings Inc. | 105,900 | 2,668 |
| | Barnes & Noble Inc. | 216,400 | 2,621 |
| * | Select Comfort Corp. | 118,700 | 2,597 |
| * | Penn National Gaming Inc. | 150,900 | 2,532 |
| * | lululemon athletica Inc. | 46,200 | 2,340 |
| * | Barnes & Noble | | |
| | Education Inc. | 156,945 | 1,995 |
| * | Deckers Outdoor Corp. | 34,000 | 1,974 |
| * | Michaels Cos. Inc. | 84,200 | 1,945 |
| * | Liberty Interactive Corp. | | |
| | QVC Group Class A | 66,424 | 1,742 |
| | Oxford Industries Inc. | 21,200 | 1,566 |
| * | Unifi Inc. | 44,600 | 1,330 |
13
| | | |
| Strategic Equity Fund | | |
| |
| |
| |
| | | | Market |
| | | | Value• |
| | | Shares | ($000) |
| * | ServiceMaster Global | | |
| | Holdings Inc. | 26,200 | 879 |
| | Libbey Inc. | 23,900 | 779 |
| * | Gray Television Inc. | 53,100 | 678 |
| | | | 980,308 |
| Consumer Staples (5.3%) | | |
| | Bunge Ltd. | 700,600 | 51,354 |
| ^ | Pilgrim’s Pride Corp. | 2,120,700 | 44,068 |
| | Clorox Co. | 316,600 | 36,577 |
| ^ | Cal-Maine Foods Inc. | 668,100 | 36,485 |
| * | SUPERVALU Inc. | 4,851,200 | 34,832 |
| ^ | Sanderson Farms Inc. | 492,000 | 33,736 |
| * | USANA Health | | |
| | Sciences Inc. | 131,000 | 17,558 |
| | Ingles Markets Inc. | | |
| | Class A | 235,600 | 11,269 |
| | Dr Pepper Snapple | | |
| | Group Inc. | 109,690 | 8,671 |
| | ConAgra Foods Inc. | 181,000 | 7,332 |
| | Lancaster Colony Corp. | 55,619 | 5,422 |
| | Dean Foods Co. | 292,000 | 4,824 |
| | Pinnacle Foods Inc. | 107,500 | 4,502 |
| | Fresh Del Monte | | |
| | Produce Inc. | 84,600 | 3,343 |
| | Campbell Soup Co. | 44,900 | 2,275 |
| | Coty Inc. Class A | 67,900 | 1,837 |
| | | | 304,085 |
| Energy (4.9%) | | |
| | Tesoro Corp. | 584,100 | 56,798 |
| | Noble Corp. plc | 3,096,700 | 33,785 |
| | Western Refining Inc. | 726,100 | 32,035 |
| | PBF Energy Inc. Class A | 1,090,212 | 30,777 |
| | Alon USA Energy Inc. | 1,589,700 | 28,726 |
| | Core Laboratories NV | 280,400 | 27,984 |
| | Plains GP Holdings LP | | |
| | Class A | 1,026,700 | 17,967 |
| * | Oil States International Inc. | 615,122 | 16,073 |
| | HollyFrontier Corp. | 208,300 | 10,173 |
| * | WPX Energy Inc. | 1,131,700 | 7,492 |
| | Atwood Oceanics Inc. | 415,600 | 6,155 |
| * | FMC Technologies Inc. | 164,990 | 5,115 |
| | Delek US Holdings Inc. | 127,700 | 3,537 |
| * | Cameron International Corp. | 54,526 | 3,344 |
| | Green Plains Inc. | 133,600 | 2,600 |
| * | Matrix Service Co. | 25,700 | 577 |
| | | | 283,138 |
| Financials (21.5%) | | |
| | Everest Re Group Ltd. | 307,500 | 53,302 |
| | Voya Financial Inc. | 1,295,100 | 50,211 |
| | Huntington | | |
| | Bancshares Inc. | 4,577,100 | 48,517 |
| | AmTrust Financial | | |
| | Services Inc. | 751,800 | 47,348 |
| * | MGIC Investment Corp. | 4,705,900 | 43,577 |
| | Radian Group Inc. | 2,620,400 | 41,691 |
| | | |
| | | | Market |
| | | | Value• |
| | | Shares | ($000) |
| | Assured Guaranty Ltd. | 1,623,160 | 40,579 |
| | KeyCorp | 2,564,830 | 33,368 |
| | Aspen Insurance | | |
| | Holdings Ltd. | 533,500 | 24,792 |
| | Extra Space Storage Inc. | 320,540 | 24,733 |
| | Navient Corp. | 2,056,400 | 23,114 |
| | Apartment Investment & | | |
| | Management Co. | 519,000 | 19,213 |
| | Lamar Advertising Co. | | |
| | Class A | 364,800 | 19,035 |
| | Kimco Realty Corp. | 759,500 | 18,555 |
| | Hospitality Properties Trust | 723,200 | 18,499 |
| *,^ | Credit Acceptance Corp. | 92,361 | 18,183 |
| * | Walker & Dunlop Inc. | 685,800 | 17,886 |
| | Axis Capital Holdings Ltd. | 328,400 | 17,642 |
| | Weingarten Realty Investors | 528,900 | 17,512 |
| | CoreSite Realty Corp. | 338,300 | 17,402 |
| | CyrusOne Inc. | 523,800 | 17,107 |
| | Ryman Hospitality | | |
| | Properties Inc. | 338,700 | 16,674 |
| * | Santander Consumer USA | | |
| | Holdings Inc. | 808,900 | 16,518 |
| | EPR Properties | 317,400 | 16,368 |
| | Sovran Self Storage Inc. | 173,500 | 16,361 |
| | Universal Insurance | | |
| | Holdings Inc. | 548,400 | 16,200 |
| | Omega Healthcare | | |
| | Investors Inc. | 460,000 | 16,169 |
| * | LendingTree Inc. | 169,400 | 15,759 |
| | Associated Banc-Corp | 854,300 | 15,352 |
| | GEO Group Inc. | 502,900 | 14,956 |
| | DuPont Fabros | | |
| | Technology Inc. | 577,400 | 14,943 |
| | Jones Lang LaSalle Inc. | 101,600 | 14,607 |
| | Corrections Corp. of | | |
| | America | 478,732 | 14,142 |
| | Popular Inc. | 466,700 | 14,108 |
| | First American Financial | | |
| | Corp. | 361,100 | 14,108 |
| | Reinsurance Group of | | |
| | America Inc. Class A | 143,920 | 13,038 |
| | Regency Centers Corp. | 202,700 | 12,598 |
| * | PRA Group Inc. | 237,000 | 12,542 |
| | CBL & Associates | | |
| | Properties Inc. | 905,800 | 12,455 |
| | Summit Hotel | | |
| | Properties Inc. | 1,066,400 | 12,445 |
| | PacWest Bancorp | 288,065 | 12,332 |
| | Host Hotels & Resorts Inc. | 764,300 | 12,084 |
| | RLJ Lodging Trust | 472,700 | 11,945 |
| | Cathay General Bancorp | 393,800 | 11,798 |
| *,^ | World Acceptance Corp. | 425,619 | 11,424 |
| | Pennsylvania REIT | 560,800 | 11,121 |
| | Equity LifeStyle | | |
| | Properties Inc. | 189,300 | 11,087 |
14
| | | |
| Strategic Equity Fund | | |
| |
| |
| |
| | | | Market |
| | | | Value• |
| | | Shares | ($000) |
| | BioMed Realty Trust Inc. | 534,600 | 10,681 |
| | PrivateBancorp Inc. | 275,800 | 10,571 |
| ^ | Lexington Realty Trust | 1,222,900 | 9,906 |
| | UDR Inc. | 283,620 | 9,779 |
| | Allied World Assurance | | |
| | Co. Holdings AG | 255,300 | 9,745 |
| * | Cowen Group Inc. | | |
| | Class A | 2,102,500 | 9,587 |
| | Validus Holdings Ltd. | 210,600 | 9,492 |
| | Hersha Hospitality Trust | | |
| | Class A | 408,775 | 9,263 |
| | Ashford Hospitality | | |
| | Trust Inc. | 1,402,700 | 8,557 |
| * | Heritage Insurance | | |
| | Holdings Inc. | 432,700 | 8,537 |
| * | E*TRADE Financial Corp. | 315,400 | 8,305 |
| * | Realogy Holdings Corp. | 209,916 | 7,899 |
| | Washington Federal Inc. | 334,700 | 7,614 |
| | Digital Realty Trust Inc. | 115,050 | 7,515 |
| | Chambers Street Properties | 989,400 | 6,421 |
| | National Retail | | |
| | Properties Inc. | 171,500 | 6,220 |
| | HCI Group Inc. | 151,100 | 5,858 |
| | Camden Property Trust | 78,000 | 5,764 |
| | Inland Real Estate Corp. | 638,500 | 5,172 |
| | First Industrial Realty | | |
| | Trust Inc. | 236,500 | 4,955 |
| | RAIT Financial Trust | 965,300 | 4,788 |
| * | Marcus & Millichap Inc. | 101,800 | 4,682 |
| | Alexandria Real Estate | | |
| | Equities Inc. | 53,900 | 4,564 |
| | Government Properties | | |
| | Income Trust | 282,300 | 4,517 |
| | CIT Group Inc. | 109,900 | 4,399 |
| | CubeSmart | 161,500 | 4,394 |
| | Home Properties Inc. | 55,500 | 4,149 |
| * | Piper Jaffray Cos. | 102,200 | 3,697 |
| * | Strategic Hotels & | | |
| | Resorts Inc. | 259,500 | 3,579 |
| | Post Properties Inc. | 58,400 | 3,404 |
| | Highwoods Properties Inc. | 87,100 | 3,375 |
| | Nelnet Inc. Class A | 96,512 | 3,340 |
| | Columbia Property Trust Inc. | 137,800 | 3,197 |
| | LaSalle Hotel Properties | 108,700 | 3,086 |
| | Monogram Residential | | |
| | Trust Inc. | 314,700 | 2,930 |
| | National Health Investors Inc. | 47,300 | 2,719 |
| | Chesapeake Lodging Trust | 89,400 | 2,330 |
| | HCC Insurance Holdings Inc. | 29,000 | 2,247 |
| | Investment Technology | | |
| | Group Inc. | 167,900 | 2,240 |
| | Ramco-Gershenson | | |
| | Properties Trust | 148,300 | 2,226 |
| * | INTL. FCStone Inc. | 86,200 | 2,128 |
| | Progressive Corp. | 65,000 | 1,992 |
| | | |
| | | | Market |
| | | | Value• |
| | | Shares | ($000) |
| | Brixmor Property Group Inc. | 83,600 | 1,963 |
| | Apollo Residential | | |
| | Mortgage Inc. | 153,400 | 1,942 |
| | Central Pacific Financial | | |
| | Corp. | 87,400 | 1,833 |
| | Mid-America Apartment | | |
| | Communities Inc. | 21,400 | 1,752 |
| | International Bancshares | | |
| | Corp. | 63,900 | 1,599 |
| | Brandywine Realty Trust | 123,032 | 1,516 |
| | CareTrust REIT Inc. | 132,227 | 1,501 |
| | Cardinal Financial Corp. | 56,200 | 1,293 |
| | Ashford Hospitality | | |
| | Prime Inc. | 92,014 | 1,291 |
| | Universal Health Realty | | |
| | Income Trust | 26,700 | 1,253 |
| | Pinnacle Financial | | |
| | Partners Inc. | 24,900 | 1,230 |
| * | First NBC Bank Holding Co. | 34,900 | 1,223 |
| | Great Southern Bancorp Inc. | 28,000 | 1,212 |
| * | First BanCorp | 321,600 | 1,145 |
| | Medical Properties Trust Inc. 103,200 | 1,141 |
| * | Capital Bank Financial Corp. | 28,100 | 849 |
| | Northfield Bancorp Inc. | 52,400 | 797 |
| | Chatham Lodging Trust | 34,100 | 733 |
| | Maiden Holdings Ltd. | 43,300 | 601 |
| | Agree Realty Corp. | 12,000 | 358 |
| | Getty Realty Corp. | 20,300 | 321 |
| | RE/MAX Holdings Inc. | 5,300 | 191 |
| | One Liberty Properties Inc. | 3,300 | 70 |
| | | | 1,235,038 |
| Health Care (10.6%) | | |
| * | Quintiles Transnational | | |
| | Holdings Inc. | 709,900 | 49,388 |
| * | Centene Corp. | 836,550 | 45,366 |
| * | Charles River Laboratories | | |
| | International Inc. | 684,900 | 43,505 |
| * | Hologic Inc. | 910,200 | 35,616 |
| * | PAREXEL International | | |
| | Corp. | 573,100 | 35,486 |
| * | ABIOMED Inc. | 353,000 | 32,744 |
| * | Isis Pharmaceuticals Inc. | 545,500 | 22,049 |
| * | Edwards Lifesciences Corp. | 152,100 | 21,624 |
| | CR Bard Inc. | 104,000 | 19,376 |
| *,^ | Merrimack | | |
| | Pharmaceuticals Inc. | 1,899,400 | 16,164 |
| | ResMed Inc. | 311,583 | 15,878 |
| | Chemed Corp. | 116,300 | 15,523 |
| * | Affymetrix Inc. | 1,802,700 | 15,395 |
| * | VCA Inc. | 278,700 | 14,673 |
| * | Community Health | | |
| | Systems Inc. | 313,100 | 13,391 |
| * | INC Research Holdings Inc. | | |
| | Class A | 326,000 | 13,040 |
| * | Natus Medical Inc. | 329,900 | 13,015 |
15
| | | |
| Strategic Equity Fund | | |
| |
| |
| |
| | | | Market |
| | | | Value• |
| | | Shares | ($000) |
| * | Infinity | | |
| | Pharmaceuticals Inc. | 1,302,600 | 11,007 |
| * | Eagle Pharmaceuticals Inc. | 137,500 | 10,179 |
| * | NewLink Genetics Corp. | 262,900 | 9,422 |
| * | Depomed Inc. | 466,085 | 8,786 |
| | PDL BioPharma Inc. | 1,739,100 | 8,748 |
| | Universal Health Services | | |
| | Inc. Class B | 69,416 | 8,664 |
| * | Mettler-Toledo | | |
| | International Inc. | 29,764 | 8,475 |
| * | Lannett Co. Inc. | 196,800 | 8,171 |
| * | ICU Medical Inc. | 73,900 | 8,092 |
| | Ensign Group Inc. | 182,600 | 7,784 |
| * | Sucampo Pharmaceuticals | | |
| | Inc. Class A | 378,300 | 7,517 |
| * | United Therapeutics Corp. | 53,800 | 7,061 |
| * | AMN Healthcare | | |
| | Services Inc. | 229,800 | 6,896 |
| * | Molina Healthcare Inc. | 96,900 | 6,672 |
| *,^ | Sequenom Inc. | 3,459,000 | 6,053 |
| * | Bruker Corp. | 323,400 | 5,313 |
| * | Alere Inc. | 102,300 | 4,926 |
| * | Health Net Inc. | 76,000 | 4,577 |
| * | Henry Schein Inc. | 34,000 | 4,512 |
| * | Merit Medical Systems Inc. | 171,300 | 4,096 |
| * | Amedisys Inc. | 102,900 | 3,907 |
| * | Array BioPharma Inc. | 796,900 | 3,634 |
| * | Integra LifeSciences | | |
| | Holdings Corp. | 55,900 | 3,329 |
| | Phibro Animal Health Corp. | | |
| | Class A | 100,600 | 3,182 |
| | West Pharmaceutical | | |
| | Services Inc. | 56,500 | 3,058 |
| * | LifePoint Health Inc. | 43,000 | 3,049 |
| * | PRA Health Sciences Inc. | 74,500 | 2,893 |
| * | Veeva Systems Inc. Class A | 119,000 | 2,786 |
| * | Incyte Corp. | 24,000 | 2,648 |
| * | LHC Group Inc. | 49,900 | 2,234 |
| * | Waters Corp. | 18,500 | 2,187 |
| * | Masimo Corp. | 56,100 | 2,163 |
| * | MacroGenics Inc. | 70,900 | 1,519 |
| | Quality Systems Inc. | 118,200 | 1,475 |
| *,^ | Orexigen Therapeutics Inc. | 653,500 | 1,379 |
| * | Cambrex Corp. | 30,300 | 1,202 |
| * | Triple-S Management Corp. | |
| | Class B | 57,600 | 1,026 |
| | | | 610,855 |
| Industrials (13.5%) | | |
| | Cintas Corp. | 623,400 | 53,457 |
| * | Spirit AeroSystems | | |
| | Holdings Inc. Class A | 1,018,500 | 49,234 |
| | Huntington Ingalls | | |
| | Industries Inc. | 436,400 | 46,760 |
| * | JetBlue Airways Corp. | 1,804,600 | 46,505 |
| | Alaska Air Group Inc. | 558,180 | 44,347 |
| | | |
| | | | Market |
| | | | Value• |
| | | Shares | ($000) |
| * | Hawaiian Holdings Inc. | 1,788,500 | 44,140 |
| | Pitney Bowes Inc. | 1,893,000 | 37,576 |
| | AO Smith Corp. | 568,200 | 37,041 |
| | Trinity Industries Inc. | 1,481,500 | 33,586 |
| * | United Rentals Inc. | 454,200 | 27,275 |
| ^ | Greenbrier Cos. Inc. | 832,100 | 26,719 |
| *,^ | TASER International Inc. | 1,211,100 | 26,674 |
| * | Meritor Inc. | 2,010,500 | 21,372 |
| | Masco Corp. | 626,900 | 15,785 |
| | Deluxe Corp. | 281,613 | 15,697 |
| * | Wabash National Corp. | 1,456,500 | 15,424 |
| * | Dycom Industries Inc. | 197,100 | 14,262 |
| * | American Woodmark Corp. | 219,000 | 14,207 |
| * | Virgin America Inc. | 375,400 | 12,850 |
| | Rockwell Collins Inc. | 152,700 | 12,497 |
| | Stanley Black & Decker Inc. | 125,233 | 12,145 |
| | L-3 Communications | | |
| | Holdings Inc. | 108,100 | 11,299 |
| | CEB Inc. | 156,400 | 10,688 |
| | Aircastle Ltd. | 503,200 | 10,371 |
| | GATX Corp. | 228,500 | 10,088 |
| | Acuity Brands Inc. | 55,500 | 9,745 |
| | Comfort Systems USA Inc. | 282,500 | 7,701 |
| | Allison Transmission | | |
| | Holdings Inc. | 270,000 | 7,206 |
| | Korn/Ferry International | 206,700 | 6,836 |
| | General Cable Corp. | 494,300 | 5,882 |
| | Standex International Corp. | 78,050 | 5,881 |
| | Owens Corning | 136,900 | 5,737 |
| | Interface Inc. Class A | 237,700 | 5,334 |
| | Hyster-Yale Materials | | |
| | Handling Inc. | 89,500 | 5,176 |
| | Douglas Dynamics Inc. | 232,600 | 4,619 |
| | RR Donnelley & Sons Co. | 314,200 | 4,575 |
| | Robert Half International Inc. | 84,000 | 4,297 |
| | SkyWest Inc. | 240,500 | 4,012 |
| | ManpowerGroup Inc. | 48,400 | 3,963 |
| | Steelcase Inc. Class A | 202,600 | 3,730 |
| | Allegion plc | 56,400 | 3,252 |
| | ITT Corp. | 85,800 | 2,868 |
| | Global Brass & Copper | | |
| | Holdings Inc. | 128,500 | 2,636 |
| | KBR Inc. | 130,000 | 2,166 |
| | Graco Inc. | 32,000 | 2,145 |
| | Textron Inc. | 55,000 | 2,070 |
| | Equifax Inc. | 20,000 | 1,944 |
| | Griffon Corp. | 120,400 | 1,899 |
| | Lincoln Electric Holdings Inc. | 35,000 | 1,835 |
| | Insperity Inc. | 38,400 | 1,687 |
| | Quanex Building Products | | |
| | Corp. | 91,900 | 1,670 |
| | Cubic Corp. | 38,800 | 1,627 |
| * | Aerojet Rocketdyne | | |
| | Holdings Inc. | 99,300 | 1,607 |
| | Briggs & Stratton Corp. | 66,500 | 1,284 |
16
| | | |
| Strategic Equity Fund | | |
| |
| |
| |
| | | | Market |
| | | | Value• |
| | | Shares | ($000) |
| | Federal Signal Corp. | 89,200 | 1,223 |
| | HNI Corp. | 27,700 | 1,188 |
| | ESCO Technologies Inc. | 31,500 | 1,131 |
| | Carlisle Cos. Inc. | 12,800 | 1,118 |
| | Heidrick & Struggles | | |
| | International Inc. | 56,200 | 1,093 |
| * | Blount International Inc. | 194,900 | 1,086 |
| | Ennis Inc. | 57,600 | 1,000 |
| | G&K Services Inc. Class A | 15,000 | 999 |
| *,^ | Enphase Energy Inc. | 247,976 | 917 |
| * | Moog Inc. Class A | 15,500 | 838 |
| | John Bean Technologies | | |
| | Corp. | 17,200 | 658 |
| * | Babcock & Wilcox | | |
| | Enterprises Inc. | 38,500 | 647 |
| | Knoll Inc. | 28,200 | 620 |
| | | | 775,901 |
| Information Technology (15.9%) | |
| * | Electronic Arts Inc. | 975,500 | 66,090 |
| | CDW Corp. | 1,284,500 | 52,485 |
| | Computer Sciences Corp. | 827,800 | 50,810 |
| * | Manhattan Associates Inc. | 799,841 | 49,830 |
| * | Gartner Inc. | 575,491 | 48,301 |
| | Booz Allen Hamilton | | |
| | Holding Corp. Class A | 1,735,300 | 45,482 |
| * | Aspen Technology Inc. | 1,186,400 | 44,976 |
| * | ARRIS Group Inc. | 1,494,000 | 38,799 |
| | Heartland Payment | | |
| | Systems Inc. | 578,800 | 36,470 |
| | MAXIMUS Inc. | 515,180 | 30,684 |
| | Lexmark International Inc. | | |
| | Class A | 1,048,400 | 30,383 |
| * | Cirrus Logic Inc. | 935,418 | 29,475 |
| *,^ | Ambarella Inc. | 503,924 | 29,122 |
| | DST Systems Inc. | 276,270 | 29,047 |
| * | Synaptics Inc. | 319,900 | 26,379 |
| | Skyworks Solutions Inc. | 279,100 | 23,503 |
| *,^ | Advanced Micro | | |
| | Devices Inc. | 13,658,835 | 23,493 |
| | Broadridge Financial | | |
| | Solutions Inc. | 414,100 | 22,920 |
| | EarthLink Holdings Corp. | 2,549,800 | 19,838 |
| * | MicroStrategy Inc. Class A | 91,600 | 17,997 |
| * | Tech Data Corp. | 260,600 | 17,851 |
| * | Blackhawk Network | | |
| | Holdings Inc. | 368,936 | 15,639 |
| | NVIDIA Corp. | 578,500 | 14,260 |
| * | Ciena Corp. | 626,100 | 12,973 |
| | SYNNEX Corp. | 146,074 | 12,425 |
| * | Super Micro Computer Inc. | 432,400 | 11,787 |
| | Avnet Inc. | 269,100 | 11,485 |
| | Science Applications | | |
| | International Corp. | 271,500 | 10,917 |
| *,^ | VASCO Data Security | | |
| | International Inc. | 577,900 | 9,847 |
| | | |
| | | | Market |
| | | | Value• |
| | | Shares | ($000) |
| *,^ | Cimpress NV | 124,200 | 9,453 |
| | Lam Research Corp. | 127,900 | 8,356 |
| | Jabil Circuit Inc. | 362,500 | 8,109 |
| * | Fiserv Inc. | 89,300 | 7,734 |
| * | Gigamon Inc. | 235,900 | 4,720 |
| * | Flextronics International Ltd. | 422,952 | 4,458 |
| *,^ | Angie’s List Inc. | 877,000 | 4,420 |
| * | Freescale | | |
| | Semiconductor Ltd. | 105,200 | 3,848 |
| | Jack Henry & | | |
| | Associates Inc. | 47,900 | 3,334 |
| | Blackbaud Inc. | 57,200 | 3,210 |
| * | ePlus Inc. | 39,800 | 3,147 |
| | CSG Systems | | |
| | International Inc. | 92,200 | 2,840 |
| * | Sanmina Corp. | 122,200 | 2,611 |
| * | Sykes Enterprises Inc. | 98,100 | 2,502 |
| | Western Union Co. | 130,363 | 2,394 |
| * | Mellanox Technologies Ltd. | 42,700 | 1,614 |
| | Diebold Inc. | 48,300 | 1,438 |
| * | Advanced Energy | | |
| | Industries Inc. | 50,300 | 1,323 |
| * | CACI International Inc. | | |
| | Class A | 16,800 | 1,243 |
| * | ON Semiconductor Corp. | 62,100 | 584 |
| | | | 910,606 |
| Materials (5.0%) | | |
| | Sealed Air Corp. | 1,057,409 | 49,571 |
| | Avery Dennison Corp. | 840,900 | 47,570 |
| * | Berry Plastics Group Inc. | 1,135,889 | 34,156 |
| | Ashland Inc. | 217,800 | 21,915 |
| | Ball Corp. | 316,000 | 19,655 |
| | Bemis Co. Inc. | 489,700 | 19,378 |
| * | Chemtura Corp. | 509,900 | 14,593 |
| * | Century Aluminum Co. | 2,900,894 | 13,344 |
| *,^ | Trinseo SA | 383,917 | 9,694 |
| | Graphic Packaging | | |
| | Holding Co. | 636,819 | 8,145 |
| | Neenah Paper Inc. | 117,200 | 6,831 |
| | AptarGroup Inc. | 93,300 | 6,154 |
| | Domtar Corp. | 165,700 | 5,924 |
| * | Ferro Corp. | 537,200 | 5,882 |
| * | Stillwater Mining Co. | 516,300 | 5,333 |
| | Mercer International Inc. | 434,800 | 4,361 |
| | International Flavors & | | |
| | Fragrances Inc. | 36,600 | 3,779 |
| | Valspar Corp. | 52,100 | 3,745 |
| | NewMarket Corp. | 8,922 | 3,185 |
| | Newmont Mining Corp. | 115,000 | 1,848 |
| | Sonoco Products Co. | 46,700 | 1,763 |
| | Calgon Carbon Corp. | 54,700 | 852 |
| * | US Concrete Inc. | 17,100 | 817 |
| * | Kraton Performance | | |
| | Polymers Inc. | 34,000 | 609 |
| | | | 289,104 |
17
| | | |
| Strategic Equity Fund | | |
| |
| |
| |
| | | | Market |
| | | | Value• |
| | | Shares | ($000) |
| Telecommunication Services (0.4%) | |
| | Inteliquent Inc. | 306,700 | 6,849 |
| * | Level 3 | | |
| | Communications Inc. | 110,800 | 4,841 |
| | Telephone & Data | | |
| | Systems Inc. | 141,600 | 3,534 |
| * | Cincinnati Bell Inc. | 977,500 | 3,050 |
| * | General Communication Inc. | |
| | Class A | 66,500 | 1,148 |
| * | Vonage Holdings Corp. | 140,400 | 825 |
| | | | 20,247 |
| Utilities (5.4%) | | |
| | FirstEnergy Corp. | 1,754,400 | 54,930 |
| | Entergy Corp. | 698,300 | 45,459 |
| | WGL Holdings Inc. | 605,600 | 34,925 |
| | Vectren Corp. | 823,900 | 34,612 |
| | UGI Corp. | 929,650 | 32,370 |
| | AES Corp. | 2,198,800 | 21,526 |
| | New Jersey Resources | | |
| | Corp. | 702,200 | 21,087 |
| | PNM Resources Inc. | 431,435 | 12,102 |
| | American States Water Co. | 262,600 | 10,872 |
| | Ameren Corp. | 256,900 | 10,859 |
| | Portland General Electric Co. 273,100 | 10,097 |
| | Atmos Energy Corp. | 121,200 | 7,051 |
| | DTE Energy Co. | 67,000 | 5,385 |
| * | Talen Energy Corp. | 324,800 | 3,281 |
| | IDACORP Inc. | 25,400 | 1,644 |
| | Unitil Corp. | 37,500 | 1,383 |
| | Chesapeake Utilities Corp. | 12,300 | 653 |
| | | | 308,236 |
| Total Common Stocks | | |
| (Cost $5,343,177) | | 5,717,518 |
| Temporary Cash Investments (2.1%)1 | |
| Money Market Fund (2.1%) | | |
| 2,3 | Vanguard Market | | |
| | Liquidity Fund, | | |
| | 0.189% | 120,165,621 | 120,166 |
| |
| | | Face | |
| | | Amount | |
| | | ($000) | |
| U.S. Government and Agency Obligations (0.0%) |
| 4,5 | Federal Home Loan | | |
| | Bank Discount Notes, | | |
| | 0.208%, 12/9/15 | 2,000 | 1,999 |
| Total Temporary Cash Investments | |
| (Cost $122,165) | | 122,165 |
| Total Investments (101.7%) | | |
| (Cost $5,465,342) | | 5,839,683 |
| |
| | Amount |
| | ($000) |
| Other Assets and Liabilities (-1.7%) | |
| Other Assets | |
| Investment in Vanguard | 536 |
| Receivables for Investment Securities Sold 19,153 |
| Receivables for Accrued Income | 6,837 |
| Receivables for Capital Shares Issued | 1,706 |
| Total Other Assets | 28,232 |
| Liabilities | |
| Payables for Investment Securities | |
| Purchased | (17,741) |
| Collateral for Securities on Loan | (98,637) |
| Payables for Capital Shares Redeemed | (5,126) |
| Payables to Vanguard | (6,829) |
| Other Liabilities | (132) |
| Total Liabilities | (128,465) |
| Net Assets (100%) | |
| Applicable to 186,255,040 outstanding | |
| $.001 par value shares of beneficial | |
| interest (unlimited authorization) | 5,739,450 |
| Net Asset Value Per Share | $30.82 |
18
| |
| Strategic Equity Fund | |
| |
| |
| |
| At September 30, 2015, net assets consisted of: |
| | Amount |
| | ($000) |
| Paid-in Capital | 4,790,584 |
| Undistributed Net Investment Income | 53,032 |
| Accumulated Net Realized Gains | 521,691 |
| Unrealized Appreciation (Depreciation) | |
| Investment Securities | 374,341 |
| Futures Contracts | (198) |
| Net Assets | 5,739,450 |
• See Note A in Notes to Financial Statements.
* Non-income-producing security.
^ Includes partial security positions on loan to broker-dealers. The total value of securities on loan is $96,216,000.
1 The fund invests a portion of its cash reserves in equity markets through the use of index futures contracts. After giving effect to futures investments, the fund’s effective common stock and temporary cash investment positions represent 100.0% and 1.7%, respectively, of net assets.
2 Affiliated money market fund available only to Vanguard funds and certain trusts and accounts managed by Vanguard. Rate shown is the 7-day yield.
3 Includes $98,637,000 of collateral received for securities on loan.
4 The issuer operates under a congressional charter; its securities are generally neither guaranteed by the U.S. Treasury nor backed by the full faith and credit of the U.S. government.
5 Securities with a value of $1,300,000 have been segregated as initial margin for open futures contracts.
REIT—Real Estate Investment Trust.
See accompanying Notes, which are an integral part of the Financial Statements.
19
| |
| Strategic Equity Fund | |
| |
| |
| Statement of Operations | |
| |
| | Year Ended |
| | September 30, 2015 |
| | ($000) |
| Investment Income | |
| Income | |
| Dividends | 92,881 |
| Interest1 | 57 |
| Securities Lending | 4,031 |
| Total Income | 96,969 |
| Expenses | |
| The Vanguard Group—Note B | |
| Investment Advisory Services | 1,082 |
| Management and Administrative | 10,334 |
| Marketing and Distribution | 961 |
| Custodian Fees | 74 |
| Auditing Fees | 33 |
| Shareholders’ Reports | 58 |
| Trustees’ Fees and Expenses | 6 |
| Total Expenses | 12,548 |
| Net Investment Income | 84,421 |
| Realized Net Gain (Loss) | |
| Investment Securities Sold | 613,339 |
| Futures Contracts | 124 |
| Realized Net Gain (Loss) | 613,463 |
| Change in Unrealized Appreciation (Depreciation) | |
| Investment Securities | (609,530) |
| Futures Contracts | 531 |
| Change in Unrealized Appreciation (Depreciation) | (608,999) |
| Net Increase (Decrease) in Net Assets Resulting from Operations | 88,885 |
| 1 Interest income from an affiliated company of the fund was $54,000. | |
See accompanying Notes, which are an integral part of the Financial Statements.
20
| | |
| Strategic Equity Fund | | |
| |
| |
| Statement of Changes in Net Assets | | |
| |
| | Year Ended September 30, |
| | 2015 | 2014 |
| | ($000) | ($000) |
| Increase (Decrease) in Net Assets | | |
| Operations | | |
| Net Investment Income | 84,421 | 59,506 |
| Realized Net Gain (Loss) | 613,463 | 731,563 |
| Change in Unrealized Appreciation (Depreciation) | (608,999) | 6,972 |
| Net Increase (Decrease) in Net Assets Resulting from Operations | 88,885 | 798,041 |
| Distributions | | |
| Net Investment Income | (60,071) | (56,549) |
| Realized Capital Gain | (257,765) | — |
| Total Distributions | (317,836) | (56,549) |
| Capital Share Transactions | | |
| Issued | 1,082,468 | 895,563 |
| Issued in Lieu of Cash Distributions | 301,093 | 52,365 |
| Redeemed | (807,310) | (536,280) |
| Net Increase (Decrease) from Capital Share Transactions | 576,251 | 411,648 |
| Total Increase (Decrease) | 347,300 | 1,153,140 |
| Net Assets | | |
| Beginning of Period | 5,392,150 | 4,239,010 |
| End of Period1 | 5,739,450 | 5,392,150 |
1 Net Assets—End of Period includes undistributed (overdistributed) net investment income of $53,032,000 and $34,092,000.
See accompanying Notes, which are an integral part of the Financial Statements.
21
| | | | | |
| Strategic Equity Fund | | | | | |
| |
| |
| Financial Highlights | | | | | |
| |
| |
| For a Share Outstanding | | | Year Ended September 30, |
| Throughout Each Period | 2015 | 2014 | 2013 | 2012 | 2011 |
| Net Asset Value, Beginning of Period | $32.02 | $27.34 | $21.02 | $16.30 | $16.30 |
| Investment Operations | | | | | |
| Net Investment Income | . 466 | .361 | .4261 | .249 | .210 |
| Net Realized and Unrealized Gain (Loss) | | | | | |
| on Investments | .207 | 4.679 | 6.244 | 4.667 | .017 |
| Total from Investment Operations | .673 | 5.040 | 6.670 | 4.916 | . 227 |
| Distributions | | | | | |
| Dividends from Net Investment Income | (.354) | (. 360) | (. 350) | (.196) | (. 227) |
| Distributions from Realized Capital Gains | (1.519) | — | — | — | — |
| Total Distributions | (1.873) | (. 360) | (. 350) | (.196) | (. 227) |
| Net Asset Value, End of Period | $30.82 | $32.02 | $27.34 | $21.02 | $16.30 |
| |
| Total Return2 | 2.01% | 18.53% | 32.23% | 30.32% | 1.23% |
| |
| Ratios/Supplemental Data | | | | | |
| Net Assets, End of Period (Millions) | $5,739 | $5,392 | $4,239 | $3,254 | $2,756 |
| Ratio of Total Expenses to Average Net Assets | 0.21% | 0.27% | 0.28% | 0.29% | 0.30% |
| Ratio of Net Investment Income to | | | | | |
| Average Net Assets | 1.41% | 1.19% | 1.75%1 | 1.25% | 1.09% |
| Portfolio Turnover Rate | 70% | 60% | 64% | 67% | 73% |
1 Net investment income per share and the ratio of net investment income to average net assets include $.043 and 0.18%, respectively, resulting from a special dividend received in connection with a merger between T-Mobile US Inc. and Metro PCS Communications Inc. in May 2013.
2 Total returns do not include account service fees that may have applied in the periods shown. Fund prospectuses provide information about any applicable account service fees.
See accompanying Notes, which are an integral part of the Financial Statements.
22
Strategic Equity Fund
Notes to Financial Statements
Vanguard Strategic Equity Fund is registered under the Investment Company Act of 1940 as an open-end investment company, or mutual fund.
A. The following significant accounting policies conform to generally accepted accounting principles for U.S. investment companies. The fund consistently follows such policies in preparing its financial statements.
1. Security Valuation: Securities are valued as of the close of trading on the New York Stock Exchange (generally 4 p.m., Eastern time) on the valuation date. Equity securities are valued at the latest quoted sales prices or official closing prices taken from the primary market in which each security trades; such securities not traded on the valuation date are valued at the mean of the latest quoted bid and asked prices. Securities for which market quotations are not readily available, or whose values have been materially affected by events occurring before the fund’s pricing time but after the close of the securities’ primary markets, are valued by methods deemed by the board of trustees to represent fair value. Investments in Vanguard Market Liquidity Fund are valued at that fund’s net asset value. Temporary cash investments acquired over 60 days to maturity are valued using the latest bid prices or using valuations based on a matrix system (which considers such factors as security prices, yields, maturities, and ratings), both as furnished by independent pricing services. Other temporary cash investments are valued at amortized cost, which approximates market value.
2. Futures Contracts: The fund uses index futures contracts to a limited extent, with the objective of maintaining full exposure to the stock market while maintaining liquidity. The fund may purchase or sell futures contracts to achieve a desired level of investment, whether to accommodate portfolio turnover or cash flows from capital share transactions. The primary risks associated with the use of futures contracts are imperfect correlation between changes in market values of stocks held by the fund and the prices of futures contracts, and the possibility of an illiquid market. Counterparty risk involving futures is mitigated because a regulated clearinghouse is the counterparty instead of the clearing broker. To further mitigate counterparty risk, the fund trades futures contracts on an exchange, monitors the financial strength of its clearing brokers and clearinghouse, and has entered into clearing agreements with its clearing brokers. The clearinghouse imposes initial margin requirements to secure the fund’s performance and requires daily settlement of variation margin representing changes in the market value of each contract.
Futures contracts are valued at their quoted daily settlement prices. The aggregate settlement values of the contracts are not recorded in the Statement of Net Assets. Fluctuations in the value of the contracts are recorded in the Statement of Net Assets as an asset (liability) and in the Statement of Operations as unrealized appreciation (depreciation) until the contracts are closed, when they are recorded as realized futures gains (losses).
During the year ended September 30, 2015, the fund’s average investments in long and short futures contracts represented less than 1% and 0% of net assets, respectively, based on the average of aggregate settlement values at each quarter-end during the period.
3. Federal Income Taxes: The fund intends to continue to qualify as a regulated investment company and distribute all of its taxable income. Management has analyzed the fund’s tax positions taken for all open federal income tax years (September 30, 2012–2015), and has concluded that no provision for federal income tax is required in the fund’s financial statements.
4. Distributions: Distributions to shareholders are recorded on the ex-dividend date.
23
Strategic Equity Fund
5. Securities Lending: To earn additional income, the fund lends its securities to qualified institutional borrowers. Security loans are required to be secured at all times by collateral in an amount at least equal to the market value of securities loaned. Daily market fluctuations could cause the value of loaned securities to be more or less than the value of the collateral received. When this occurs, the collateral is adjusted and settled on the next business day. The fund further mitigates its counterparty risk by entering into securities lending transactions only with a diverse group of prequalified counter-parties, monitoring their financial strength, and entering into master securities lending agreements with its counterparties. The master securities lending agreements provide that, in the event of a counterparty’s default (including bankruptcy), the fund may terminate any loans with that borrower, determine the net amount owed, and sell or retain the collateral up to the net amount owed to the fund; however, such actions may be subject to legal proceedings. While collateral mitigates counter-party risk, in the absence of a default the fund may experience delays and costs in recovering the securities loaned. The fund invests cash collateral received in Vanguard Market Liquidity Fund, and records a liability in the Statement of Net Assets for the return of the collateral, during the period the securities are on loan. Securities lending income represents fees charged to borrowers plus income earned on invested cash collateral, less expenses associated with the loan.
6. Credit Facility: The fund and certain other funds managed by The Vanguard Group (“Vanguard”) participate in a $3 billion committed credit facility provided by a syndicate of lenders pursuant to a credit agreement that may be renewed annually; each fund is individually liable for its borrowings, if any, under the credit facility. Borrowings may be utilized for temporary and emergency purposes, and are subject to the fund’s regulatory and contractual borrowing restrictions. The participating funds are charged administrative fees and an annual commitment fee of 0.06% of the undrawn amount of the facility; these fees are allocated to the funds based on a method approved by the fund’s board of trustees and included in Management and Administrative expenses on the fund’s Statement of Operations. Any borrowings under this facility bear interest at a rate equal to the higher of the federal funds rate or LIBOR reference rate plus an agreed-upon spread.
The fund had no borrowings outstanding at September 30, 2015, or at any time during the period then ended.
7. Other: Dividend income is recorded on the ex-dividend date. Interest income includes income distributions received from Vanguard Market Liquidity Fund and is accrued daily. Premiums and discounts on debt securities purchased are amortized and accreted, respectively, to interest income over the lives of the respective securities. Security transactions are accounted for on the date securities are bought or sold. Costs used to determine realized gains (losses) on the sale of investment securities are those of the specific securities sold.
B. In accordance with the terms of a Funds’ Service Agreement (the “FSA”) between Vanguard and the fund, Vanguard furnishes to the fund investment advisory, corporate management, administrative, marketing, and distribution services at Vanguard’s cost of operations (as defined by the FSA). These costs of operations are allocated to the fund based on methods and guidelines approved by the board of trustees. Vanguard does not require reimbursement in the current period for certain costs of operations (such as deferred compensation/benefits and risk/insurance costs); the fund’s liability for these costs of operations is included in Payables to Vanguard on the Statement of Net Assets.
Upon the request of Vanguard, the fund may invest up to 0.40% of its net assets as capital in Vanguard. At September 30, 2015, the fund had contributed to Vanguard capital in the amount of $536,000, representing 0.01% of the fund’s net assets and 0.21% of Vanguard’s capitalization. The fund’s trustees and officers are also directors and employees, respectively, of Vanguard.
24
Strategic Equity Fund
C. Various inputs may be used to determine the value of the fund’s investments. These inputs are summarized in three broad levels for financial statement purposes. The inputs or methodologies used to value securities are not necessarily an indication of the risk associated with investing in those securities.
Level 1—Quoted prices in active markets for identical securities.
Level 2—Other significant observable inputs (including quoted prices for similar securities, interest rates, prepayment speeds, credit risk, etc.).
Level 3—Significant unobservable inputs (including the fund’s own assumptions used to determine the fair value of investments).
The following table summarizes the market value of the fund’s investments as of September 30, 2015, based on the inputs used to value them:
| | | |
| | Level 1 | Level 2 | Level 3 |
| Investments | ($000) | ($000) | ($000) |
| Common Stocks | 5,717,518 | — | — |
| Temporary Cash Investments | 120,166 | 1,999 | — |
| Futures Contracts—Assets1 | 433 | — | — |
| Futures Contracts—Liabilities1 | (44) | — | — |
| Total | 5,838,073 | 1,999 | — |
| 1 Represents variation margin on the last day of the reporting period. | | | |
D. At September 30, 2015, the aggregate settlement value of open futures contracts and the related unrealized appreciation (depreciation) were:
| | | | |
| | | | | ($000) |
| | | | Aggregate | |
| | | Number of | Settlement | Unrealized |
| | | Long (Short) | Value | Appreciation |
| Futures Contracts | Expiration | Contracts | Long (Short) | (Depreciation) |
| E-mini S&P MidCap 400 Index | December 2015 | 85 | 11,585 | (308) |
| E-mini Russell 2000 Index | December 2015 | 104 | 11,397 | 110 |
| | | | | (198) |
Unrealized appreciation (depreciation) on open futures contracts is required to be treated as realized gain (loss) for tax purposes.
E. Distributions are determined on a tax basis and may differ from net investment income and realized capital gains for financial reporting purposes. Differences may be permanent or temporary. Permanent differences are reclassified among capital accounts in the financial statements to reflect their tax character. Temporary differences arise when certain items of income, expense, gain, or loss are recognized in different periods for financial statement and tax purposes. These differences will reverse at some time in the future. Differences in classification may also result from the treatment of short-term gains as ordinary income for tax purposes.
The fund used a tax accounting practice to treat a portion of the price of capital shares redeemed during the year as distributions from net investment income and realized capital gains. Accordingly, the fund has reclassified $5,410,000 from undistributed net investment income, and $39,604,000 from accumulated net realized gains, to paid-in capital.
25
Strategic Equity Fund
For tax purposes, at September 30, 2015, the fund had $59,640,000 of ordinary income and $521,719,000 of long-term capital gains available for distribution.
At September 30, 2015, the cost of investment securities for tax purposes was $5,465,602,000. Net unrealized appreciation of investment securities for tax purposes was $374,081,000, consisting of unrealized gains of $913,198,000 on securities that had risen in value since their purchase and $539,117,000 in unrealized losses on securities that had fallen in value since their purchase.
F. During the year ended September 30, 2015, the fund purchased $4,527,153,000 of investment securities and sold $4,176,983,000 of investment securities, other than temporary cash investments.
G. Capital shares issued and redeemed were:
| | |
| | Year Ended September 30, |
| | 2015 | 2014 |
| | Shares | Shares |
| | (000) | (000) |
| Issued | 32,774 | 29,053 |
| Issued in Lieu of Cash Distributions | 9,610 | 1,751 |
| Redeemed | (24,537) | (17,464) |
| Net Increase (Decrease) in Shares Outstanding | 17,847 | 13,340 |
H. Management has determined that no material events or transactions occurred subsequent to September 30, 2015, that would require recognition or disclosure in these financial statements.
26
Report of Independent Registered Public Accounting Firm
To the Board of Trustees of Vanguard Horizon Funds and the Shareholders of Vanguard Strategic Equity Fund:
In our opinion, the accompanying statement of net assets and the related statements of operations and of changes in net assets and the financial highlights present fairly, in all material respects, the financial position of Vanguard Strategic Equity Fund (constituting a separate portfolio of Vanguard Horizon Funds, hereafter referred to as the “Fund”) at September 30, 2015, the results of its operations for the year then ended, the changes in its net assets for each of the two years in the period then ended, and the financial highlights for each of the five years in the period then ended, in conformity with accounting principles generally accepted in the United States of America. These financial statements and financial highlights (hereafter referred to as “financial statements”) are the responsibility of the Fund’s management. Our responsibility is to express an opinion on these financial statements based on our audits. We conducted our audits of these financial statements in accordance with the standards of the Public Company Accounting Oversight Board (United States). Those standards require that we plan and perform the audit to obtain reasonable assurance about whether the financial statements are free of material misstatement. An audit includes examining, on a test basis, evidence supporting the amounts and disclosures in the financial statements, assessing the accounting principles used and significant estimates made by management, and evaluating the overall financial statement presentation. We believe that our audits, which included confirmation of securities at September 30, 2015 by correspondence with the custodian and brokers, by agreement to the underlying ownership records of the transfer agent and the application of alternative auditing procedures where securities purchased had not been received, provide a reasonable basis for our opinion.
/s/PricewaterhouseCoopers LLP
Philadelphia, Pennsylvania
November 10, 2015
|
| |
| Special 2015 tax information (unaudited) for Vanguard Strategic Equity Fund |
| |
| This information for the fiscal year ended September 30, 2015, is included pursuant to provisions of |
| the Internal Revenue Code. |
| |
| The fund distributed $297,370,000 as capital gain dividends (20% rate gain distributions) to |
| shareholders during the fiscal year. |
| |
| The fund distributed $55,806,000 of qualified dividend income to shareholders during the fiscal year. |
| |
| For corporate shareholders, 79.0% of investment income (dividend income plus short-term gains, |
| if any) qualifies for the dividends-received deduction. |
27
Your Fund’s After-Tax Returns
This table presents returns for your fund both before and after taxes. The after-tax returns are shown in two ways: (1) assuming that an investor owned the fund during the entire period and paid taxes on the fund’s distributions, and (2) assuming that an investor paid taxes on the fund’s distributions and sold all shares at the end of each period.
Calculations are based on the highest individual federal income tax and capital gains tax rates in effect at the times of the distributions and the hypothetical sales. State and local taxes were not considered. After-tax returns reflect any qualified dividend income, using actual prior-year figures and estimates for 2015. (In the example, returns after the sale of fund shares may be higher than those assuming no sale. This occurs when the sale would have produced a capital loss. The calculation assumes that the investor received a tax deduction for the loss.)
Please note that your actual after-tax returns will depend on your tax situation and may differ from those shown. Also note that if you own the fund in a tax-deferred account, such as an individual retirement account or a 401(k) plan, this information does not apply to you. Such accounts are not subject to current taxes.
Finally, keep in mind that a fund’s performance—whether before or after taxes—does not guarantee future results.
| | | |
| Average Annual Total Returns: Strategic Equity Fund | | | |
| Periods Ended September 30, 2015 | | | |
| | One | Five | Ten |
| | Year | Years | Years |
| Returns Before Taxes | 2.01% | 16.10% | 6.95% |
| Returns After Taxes on Distributions | 0.62 | 15.58 | 6.20 |
| Returns After Taxes on Distributions and Sale of Fund Shares | 2.28 | 13.03 | 5.54 |
28
About Your Fund’s Expenses
As a shareholder of the fund, you incur ongoing costs, which include costs for portfolio management, administrative services, and shareholder reports (like this one), among others. Operating expenses, which are deducted from a fund’s gross income, directly reduce the investment return of the fund.
A fund’s expenses are expressed as a percentage of its average net assets. This figure is known as the expense ratio. The following examples are intended to help you understand the ongoing costs (in dollars) of investing in your fund and to compare these costs with those of other mutual funds. The examples are based on an investment of $1,000 made at the beginning of the period shown and held for the entire period.
The accompanying table illustrates your fund’s costs in two ways:
• Based on actual fund return. This section helps you to estimate the actual expenses that you paid over the period. The ”Ending Account Value“ shown is derived from the fund‘s actual return, and the third column shows the dollar amount that would have been paid by an investor who started with $1,000 in the fund. You may use the information here, together with the amount you invested, to estimate the expenses that you paid over the period.
To do so, simply divide your account value by $1,000 (for example, an $8,600 account value divided by $1,000 = 8.6), then multiply the result by the number given for your fund under the heading ”Expenses Paid During Period.“
• Based on hypothetical 5% yearly return. This section is intended to help you compare your fund‘s costs with those of other mutual funds. It assumes that the fund had a yearly return of 5% before expenses, but that the expense ratio is unchanged. In this case—because the return used is not the fund’s actual return—the results do not apply to your investment. The example is useful in making comparisons because the Securities and Exchange Commission requires all mutual funds to calculate expenses based on a 5% return. You can assess your fund’s costs by comparing this hypothetical example with the hypothetical examples that appear in shareholder reports of other funds.
Note that the expenses shown in the table are meant to highlight and help you compare ongoing costs only and do not reflect transaction costs incurred by the fund for buying and selling securities. Further, the expenses do not include any purchase, redemption, or account service fees described in the fund prospectus. If such fees were applied to your account, your costs would be higher. Your fund does not carry a “sales load.”
The calculations assume no shares were bought or sold during the period. Your actual costs may have been higher or lower, depending on the amount of your investment and the timing of any purchases or redemptions.
You can find more information about the fund’s expenses, including annual expense ratios, in the Financial Statements section of this report. For additional information on operating expenses and other shareholder costs, please refer to your fund’s current prospectus.
29
| | | |
| Six Months Ended September 30, 2015 | | | |
| | Beginning | Ending | Expenses |
| | Account Value | Account Value | Paid During |
| Strategic Equity Fund | 3/31/2015 | 9/30/2015 | Period |
| Based on Actual Fund Return | $1,000.00 | $910.76 | $0.81 |
| Based on Hypothetical 5% Yearly Return | 1,000.00 | 1,024.22 | 0.86 |
The calculations are based on expenses incurred in the most recent six-month period. The fund’s annualized six-month expense ratio for that period is 0.17%. The dollar amounts shown as “Expenses Paid” are equal to the annualized expense ratio multiplied by the average account value over the period, multiplied by the number of days in the most recent six-month period, then divided by the number of days in the most recent 12-month period (183/365).
30
Glossary
30-Day SEC Yield. A fund’s 30-day SEC yield is derived using a formula specified by the U.S. Securities and Exchange Commission. Under the formula, data related to the fund’s security holdings in the previous 30 days are used to calculate the fund’s hypothetical net income for that period, which is then annualized and divided by the fund’s estimated average net assets over the calculation period. For the purposes of this calculation, a security’s income is based on its current market yield to maturity (for bonds), its actual income (for asset-backed securities), or its projected dividend yield (for stocks). Because the SEC yield represents hypothetical annualized income, it will differ—at times significantly—from the fund’s actual experience. As a result, the fund’s income distributions may be higher or lower than implied by the SEC yield.
Beta. A measure of the magnitude of a fund’s past share-price fluctuations in relation to the ups and downs of a given market index. The index is assigned a beta of 1.00. Compared with a given index, a fund with a beta of 1.20 typically would have seen its share price rise or fall by 12% when the index rose or fell by 10%. For this report, beta is based on returns over the past 36 months for both the fund and the index. Note that a fund’s beta should be reviewed in conjunction with its R-squared (see definition). The lower the R-squared, the less correlation there is between the fund and the index, and the less reliable beta is as an indicator of volatility.
Dividend Yield. Dividend income earned by stocks, expressed as a percentage of the aggregate market value (or of net asset value, for a fund). The yield is determined by dividing the amount of the annual dividends by the aggregate value (or net asset value) at the end of the period. For a fund, the dividend yield is based solely on stock holdings and does not include any income produced by other investments.
Earnings Growth Rate. The average annual rate of growth in earnings over the past five years for the stocks now in a fund.
Equity Exposure. A measure that reflects a fund’s investments in stocks and stock futures. Any holdings in short-term reserves are excluded.
Expense Ratio. A fund’s total annual operating expenses expressed as a percentage of the fund’s average net assets. The expense ratio includes management and administrative expenses, but does not include the transaction costs of buying and selling portfolio securities.
Foreign Holdings. The percentage of a fund represented by securities or depositary receipts of companies based outside the United States.
Inception Date. The date on which the assets of a fund (or one of its share classes) are first invested in accordance with the fund’s investment objective. For funds with a subscription period, the inception date is the day after that period ends. Investment performance is measured from the inception date.
Median Market Cap. An indicator of the size of companies in which a fund invests; the midpoint of market capitalization (market price x shares outstanding) of a fund’s stocks, weighted by the proportion of the fund’s assets invested in each stock. Stocks representing half of the fund’s assets have market capitalizations above the median, and the rest are below it.
Price/Book Ratio. The share price of a stock divided by its net worth, or book value, per share. For a fund, the weighted average price/book ratio of the stocks it holds.
31
Price/Earnings Ratio. The ratio of a stock’s current price to its per-share earnings over the past year. For a fund, the weighted average P/E of the stocks it holds. P/E is an indicator of market expectations about corporate prospects; the higher the P/E, the greater the expectations for a company’s future growth.
R-Squared. A measure of how much of a fund’s past returns can be explained by the returns from the market in general, as measured by a given index. If a fund’s total returns were precisely synchronized with an index’s returns, its R-squared would be 1.00. If the fund’s returns bore no relationship to the index’s returns, its R-squared would be 0. For this report, R-squared is based on returns over the past 36 months for both the fund and the index.
Return on Equity. The annual average rate of return generated by a company during the past five years for each dollar of shareholder’s equity (net income divided by shareholder’s equity). For a fund, the weighted average return on equity for the companies whose stocks it holds.
Short-Term Reserves. The percentage of a fund invested in highly liquid, short-term securities that can be readily converted to cash.
Turnover Rate. An indication of the fund’s trading activity. Funds with high turnover rates incur higher transaction costs and may be more likely to distribute capital gains (which may be taxable to investors). The turnover rate excludes in-kind transactions, which have minimal impact on costs.
32
This page intentionally left blank.
This page intentionally left blank.
This page intentionally left blank.
The People Who Govern Your Fund
The trustees of your mutual fund are there to see that the fund is operated and managed in your best interests since, as a shareholder, you are a part owner of the fund. Your fund’s trustees also serve on the board of directors of The Vanguard Group, Inc., which is owned by the Vanguard funds and provides services to them on an at-cost basis.
A majority of Vanguard’s board members are independent, meaning that they have no affiliation with Vanguard or the funds they oversee, apart from the sizable personal investments they have made as private individuals. The independent board members have distinguished backgrounds in business, academia, and public service. Each of the trustees and executive officers oversees 194 Vanguard funds.
The following table provides information for each trustee and executive officer of the fund. More information about the trustees is in the Statement of Additional Information, which can be obtained, without charge, by contacting Vanguard at 800-662-7447, or online at vanguard.com.
| |
| InterestedTrustee1 | Rajiv L. Gupta |
| | Born 1945. Trustee Since December 2001.2 Principal |
| F. William McNabb III | Occupation(s) During the Past Five Years and Other |
| Born 1957. Trustee Since July 2009. Chairman of | Experience: Chairman and Chief Executive Officer |
| the Board. Principal Occupation(s) During the Past | (retired 2009) and President (2006–2008) of |
| Five Years and Other Experience: Chairman of the | Rohm and Haas Co. (chemicals); Director of Tyco |
| Board of The Vanguard Group, Inc., and of each of | International PLC (diversified manufacturing and |
| the investment companies served by The Vanguard | services), Hewlett-Packard Co. (electronic computer |
| Group, since January 2010; Director of The Vanguard | manufacturing), and Delphi Automotive PLC |
| Group since 2008; Chief Executive Officer and | (automotive components); Senior Advisor at New |
| President of The Vanguard Group, and of each of | Mountain Capital. |
| the investment companies served by The Vanguard | |
| Group, since 2008; Director of Vanguard Marketing | Amy Gutmann |
| Corporation; Managing Director of The Vanguard | Born 1949. Trustee Since June 2006. Principal |
| Group (1995–2008). | Occupation(s) During the Past Five Years and |
| | Other Experience: President of the University of |
| IndependentTrustees | Pennsylvania; Christopher H. Browne Distinguished |
| | Professor of Political Science, School of Arts and |
| Emerson U. Fullwood | Sciences, and Professor of Communication, Annenberg |
| Born 1948. Trustee Since January 2008. Principal | School for Communication, with secondary faculty |
| Occupation(s) During the Past Five Years and | appointments in the Department of Philosophy, School |
| Other Experience: Executive Chief Staff and | of Arts and Sciences, and at the Graduate School of |
| Marketing Officer for North America and Corporate | Education, University of Pennsylvania; Trustee of the |
| Vice President (retired 2008) of Xerox Corporation | National Constitution Center; Chair of the Presidential |
| (document management products and services); | Commission for the Study of Bioethical Issues. |
| Executive in Residence and 2009–2010 Distinguished | |
| Minett Professor at the Rochester Institute of | JoAnn Heffernan Heisen |
| Technology; Director of SPX Corporation (multi-industry | Born 1950. Trustee Since July 1998. Principal |
| manufacturing), the United Way of Rochester, | Occupation(s) During the Past Five Years and Other |
| Amerigroup Corporation (managed health care), the | Experience: Corporate Vice President and Chief |
| University of Rochester Medical Center, Monroe | Global Diversity Officer (retired 2008) and Member |
| Community College Foundation, and North Carolina | of the Executive Committee (1997–2008) of Johnson |
| A&T University. | & Johnson (pharmaceuticals/medical devices/ |
| | consumer products); Director of Skytop Lodge |
| | Corporation (hotels), the University Medical Center |
| | at Princeton, the Robert Wood Johnson Foundation, |
| | and the Center for Talent Innovation; Member of |
| | the Advisory Board of the Institute for Women’s |
| | Leadership at Rutgers University. |
| | |
| F. Joseph Loughrey | Executive Officers | |
| Born 1949. Trustee Since October 2009. Principal | | |
| Occupation(s) During the Past Five Years and Other | Glenn Booraem | |
| Experience: President and Chief Operating Officer | Born 1967. Treasurer Since May 2015. Principal |
| (retired 2009) of Cummins Inc. (industrial machinery); | Occupation(s) During the Past Five Years and |
| Chairman of the Board of Hillenbrand, Inc. (specialized | Other Experience: Principal of The Vanguard Group, |
| consumer services), and of Oxfam America; Director | Inc.; Treasurer of each of the investment companies |
| of SKF AB (industrial machinery), Hyster-Yale Materials | served by The Vanguard Group; Controller of each of |
| Handling, Inc. (forklift trucks), the Lumina Foundation | the investment companies served by The Vanguard |
| for Education, and the V Foundation for Cancer | Group (2010–2015); Assistant Controller of each of |
| Research; Member of the Advisory Council for the | the investment companies served by The Vanguard |
| College of Arts and Letters and of the Advisory Board | Group (2001–2010). | |
| to the Kellogg Institute for International Studies, both | | |
| at the University of Notre Dame. | Thomas J. Higgins | |
| Born 1957. Chief Financial Officer Since September |
| Mark Loughridge | 2008. Principal Occupation(s) During the Past Five |
| Born 1953. Trustee Since March 2012. Principal | Years and Other Experience: Principal of The Vanguard |
| Occupation(s) During the Past Five Years and Other | Group, Inc.; Chief Financial Officer of each of the |
| Experience: Senior Vice President and Chief Financial | investment companies served by The Vanguard Group; |
| Officer (retired 2013) at IBM (information technology | Treasurer of each of the investment companies served |
| services); Fiduciary Member of IBM’s Retirement Plan | by The Vanguard Group (1998–2008). |
| Committee (2004–2013); Director of the Dow Chemical | |
| Company; Member of the Council on Chicago Booth. | Peter Mahoney | |
| Born 1974. Controller Since May 2015. Principal |
| Scott C. Malpass | Occupation(s) During the Past Five Years and |
| Born 1962. Trustee Since March 2012. Principal | Other Experience: Head of Global Fund Accounting |
| Occupation(s) During the Past Five Years and Other | at The Vanguard Group, Inc.; Controller of each of the |
| Experience: Chief Investment Officer and Vice | investment companies served by The Vanguard Group; |
| President at the University of Notre Dame; Assistant | Head of International Fund Services at The Vanguard |
| Professor of Finance at the Mendoza College of | Group (2008–2014). | |
| Business at Notre Dame; Member of the Notre Dame | | |
| 403(b) Investment Committee; Board Member of | Heidi Stam | |
| TIFF Advisory Services, Inc., and Catholic Investment | Born 1956. Secretary Since July 2005. Principal |
| Services, Inc. (investment advisors); Member of | Occupation(s) During the Past Five Years and Other |
| the Investment Advisory Committee of Major | Experience: Managing Director of The Vanguard |
| League Baseball. | Group, Inc.; General Counsel of The Vanguard Group; |
| Secretary of The Vanguard Group and of each of the |
| André F. Perold | investment companies served by The Vanguard Group; |
| Born 1952. Trustee Since December 2004. Principal | Director and Senior Vice President of Vanguard |
| Occupation(s) During the Past Five Years and Other | Marketing Corporation. | |
| Experience: George Gund Professor of Finance and | | |
| Banking, Emeritus at the Harvard Business School | Vanguard Senior Management Team |
| (retired 2011); Chief Investment Officer and Managing | |
| Partner of HighVista Strategies LLC (private investment | Mortimer J. Buckley | Chris D. McIsaac |
| firm); Director of Rand Merchant Bank; Overseer of | Kathleen C. Gubanich | James M. Norris |
| the Museum of Fine Arts Boston. | Paul A. Heller | Thomas M. Rampulla |
| Martha G. King | Glenn W. Reed |
| Peter F. Volanakis | John T. Marcante | Karin A. Risi |
| | |
| Born 1955. Trustee Since July 2009. Principal | Chairman Emeritus and Senior Advisor | |
| Occupation(s) During the Past Five Years and Other | |
| Experience: President and Chief Operating Officer | John J. Brennan | |
| (retired 2010) of Corning Incorporated (communications | Chairman, 1996–2009 | |
| equipment); Trustee of Colby-Sawyer College; | Chief Executive Officer and President, 1996–2008 | |
| Member of the Advisory Board of the Norris Cotton | | |
| Cancer Center and of the Advisory Board of the | Founder | |
| Parthenon Group (strategy consulting). | |
| John C. Bogle | |
| Chairman and Chief Executive Officer, 1974–1996 | |
| | |
| | | |
| | |
1 Mr. McNabb is considered an “interested person,” as defined in the Investment Company Act of 1940, because he is an officer of the Vanguard funds.
2 December 2002 for Vanguard Equity Income Fund, the Vanguard Municipal Bond Funds, and the Vanguard State Tax-Exempt Funds.
|  |
| P.O. Box 2600 |
| Valley Forge, PA 19482-2600 |
Connect with Vanguard® > vanguard.com
| |
| Fund Information > 800-662-7447 | CFA® is a registered trademark owned by CFA Institute. |
| Direct Investor Account Services > 800-662-2739 | |
| Institutional Investor Services > 800-523-1036 | |
| Text Telephone for People | |
| Who Are Deaf or Hard of Hearing> 800-749-7273 | |
| |
| This material may be used in conjunction | |
| with the offering of shares of any Vanguard | |
| fund only if preceded or accompanied by | |
| the fund’s current prospectus. | |
| |
| All comparative mutual fund data are from Lipper, a | |
| Thomson Reuters Company, or Morningstar, Inc., unless | |
| otherwise noted. | |
| |
| You can obtain a free copy of Vanguard’s proxy voting | |
| guidelines by visiting vanguard.com/proxyreporting or by | |
| calling Vanguard at 800-662-2739. The guidelines are | |
| also available from the SEC’s website, sec.gov. In | |
| addition, you may obtain a free report on how your fund | |
| voted the proxies for securities it owned during the 12 | |
| months ended June 30. To get the report, visit either | |
| vanguard.com/proxyreporting or sec.gov. | |
| |
| You can review and copy information about your fund at | |
| the SEC’s Public Reference Room in Washington, D.C. To | |
| find out more about this public service, call the SEC at | |
| 202-551-8090. Information about your fund is also | |
| available on the SEC’s website, and you can receive | |
| copies of this information, for a fee, by sending a | |
| request in either of two ways: via email addressed to | |
| publicinfo@sec.gov or via regular mail addressed to the | |
| Public Reference Section, Securities and Exchange | |
| Commission, Washington, DC 20549-1520. | |
| |
| | © 2015 The Vanguard Group, Inc. |
| | All rights reserved. |
| | Vanguard Marketing Corporation, Distributor. |
| |
| | Q1140 112015 |

Annual Report | September 30, 2015
Vanguard Capital Opportunity Fund
Vanguard’s Principles for Investing Success
We want to give you the best chance of investment success. These principles, grounded in Vanguard’s research and experience, can put you on the right path.
Goals. Create clear, appropriate investment goals.
Balance. Develop a suitable asset allocation using broadly diversified funds.
Cost. Minimize cost.
Discipline. Maintain perspective and long-term discipline.
A single theme unites these principles: Focus on the things you can control.
We believe there is no wiser course for any investor.
| |
| Contents | |
| Your Fund’s Total Returns. | 1 |
| Chairman’s Letter. | 2 |
| Advisor’s Report. | 9 |
| Fund Profile. | 12 |
| Performance Summary. | 14 |
| Financial Statements. | 16 |
| Your Fund’s After-Tax Returns. | 28 |
| About Your Fund’s Expenses. | 29 |
| Glossary. | 31 |
Please note: The opinions expressed in this report are just that—informed opinions. They should not be considered promises or advice.
Also, please keep in mind that the information and opinions cover the period through the date on the front of this report. Of course, the risks of investing in your fund are spelled out in the prospectus.
See the Glossary for definitions of investment terms used in this report.
About the cover: Pictured is a sailing block on the Brilliant, a 1932 schooner docked in Mystic, Connecticut. A type of pulley, the sailing block helps coordinate the setting of the sails. At Vanguard, the intricate coordination of technology and people allows us to help millions of clients around the world reach their financial goals.
| | | | |
| Your Fund’s Total Returns | | | | |
| |
| |
| |
| |
| Fiscal Year Ended September 30, 2015 | | | | |
| | | | | Total |
| | | | | Returns |
| Vanguard Capital Opportunity Fund | | | | |
| Investor Shares | | | | 1.72% |
| Admiral™ Shares | | | | 1.78 |
| Russell Midcap Growth Index | | | | 1.45 |
| Multi-Cap Growth Funds Average | | | | 1.40 |
| Multi-Cap Growth Funds Average: Derived from data provided by Lipper, a Thomson Reuters Company. | | |
| Admiral Shares carry lower expenses and are available to investors who meet certain account-balance requirements. | |
| |
| |
| Your Fund’s Performance at a Glance | | | | |
| September 30, 2014, Through September 30, 2015 | | | | |
| | | | Distributions Per Share |
| | Starting | Ending | | |
| | Share | Share | Income | Capital |
| | Price | Price | Dividends | Gains |
| Vanguard Capital Opportunity Fund | | | | |
| Investor Shares | $51.42 | $50.25 | $0.308 | $1.877 |
| Admiral Shares | 118.79 | 116.06 | 0.816 | 4.334 |
1

Chairman’s Letter
Dear Shareholder,
Vanguard Capital Opportunity Fund’s portfolio of stocks has traditionally differed significantly from that of its benchmark, the Russell Midcap Growth Index. But for the 12 months ended September 30, 2015, returns for the fund and the benchmark were fairly similar.
The Capital Opportunity Fund returned a little under 2%, slightly better than its benchmark and the average return of its multi-capitalization growth fund peers. In the overall market environment, growth stocks topped their value brethren, and mid-cap and small-cap stocks eclipsed large-caps.
The health care and information technology sectors, which have driven the fund’s strong results over the long term, met with different degrees of success this time. Health care stocks contributed significantly to the fund’s return, although the advisor’s holdings didn’t compare favorably with those in the benchmark. Technology stocks hurt performance. Instead, the advisor’s consumer discretionary and industrial holdings provided support.
If you hold fund shares in a taxable account, you may wish to review the table of after-tax returns, based on the highest federal income tax bracket, that appears later in this report.
China’s economic woes weighed on U.S. stocks
The broad U.S. stock market returned –0.49% for the 12 months. The final two months were especially rocky as

investors worried in particular about the global ripple effects of slower economic growth in China.
For much of the fiscal year, investors were preoccupied with the possibility of an increase in short-term interest rates. On September 17, the Federal Reserve announced that it would hold rates steady for the time being, a decision that to some investors indicated the Fed’s concern about the fragility of global markets.
International stocks returned about –11% as the dollar’s strength against many foreign currencies weighed on results. Returns for emerging markets, which were especially hard hit by concerns about China, trailed those of the developed markets of the Pacific region and Europe.
Taxable bonds recorded gains as investors searched for safety
The broad U.S. taxable bond market returned 2.94% as investors gravitated toward safe-haven assets amid global stock market turmoil. Stimulative monetary policies from the world’s central banks, declining inflation expectations, and global investors’ search for higher yields also helped lift U.S. bonds.
The yield of the 10-year Treasury note ended September at 2.05%, down from 2.48% a year earlier. (Bond prices and yields move in opposite directions.)
International bond markets (as measured by the Barclays Global Aggregate Index ex USD) returned –7.67%, hurt by the dollar’s
| | | |
| Market Barometer | | | |
| |
| | | Average Annual Total Returns |
| | Periods Ended September 30, 2015 |
| | One | Three | Five |
| | Year | Years | Years |
| Stocks | | | |
| Russell 1000 Index (Large-caps) | -0.61% | 12.66% | 13.42% |
| Russell 2000 Index (Small-caps) | 1.25 | 11.02 | 11.73 |
| Russell 3000 Index (Broad U.S. market) | -0.49 | 12.53 | 13.28 |
| FTSE All-World ex US Index (International) | -11.34 | 2.87 | 2.19 |
| |
| Bonds | | | |
| Barclays U.S. Aggregate Bond Index (Broad taxable market) | 2.94% | 1.71% | 3.10% |
| Barclays Municipal Bond Index (Broad tax-exempt market) | 3.16 | 2.88 | 4.14 |
| Citigroup Three-Month U.S. Treasury Bill Index | 0.02 | 0.02 | 0.04 |
| |
| CPI | | | |
| Consumer Price Index | -0.04% | 0.93% | 1.73% |
3
strength against many foreign currencies. Without this currency effect, international bonds advanced modestly.
The Fed’s 0%–0.25% target for short-term interest rates continued to limit returns for money market funds and savings accounts.
Industrial stocks offered a lift as information technology fell
Vanguard Capital Opportunity Fund has generally delivered superior results since its inception in 1995. However, the route to robust returns occasionally involves some backtracking or sideways moves. Because the fund’s holdings have historically not aligned with the benchmark, it is possible for the fund to trail or trump its comparative standards. As an investor in the fund, you have to have patience through short-term periods of disappointment in order to reap the potential benefits of long-term outperformance.
When PRIMECAP Management, the fund’s advisor, identifies the stocks of companies that meet its rigorous standards, it displays conviction and patience through good times and bad. It typically holds those stocks unless and until they no longer fundamentally fit the portfolio and their valuations or business models have changed.
Capital Opportunity continued to be dominated by health care and information technology stocks, which together accounted for nearly 70% of the portfolio’s
| | | |
| Expense Ratios | | | |
| Your Fund Compared With Its Peer Group | | | |
| |
| | Investor | Admiral | Peer Group |
| | Shares | Shares | Average |
| Capital Opportunity Fund | 0.47% | 0.40% | 1.28% |
The fund expense ratios shown are from the prospectus dated January 27, 2015, and represent estimated costs for the current fiscal year. For the fiscal year ended September 30, 2015, the fund’s expense ratios were 0.45% for Investor Shares and 0.38% for Admiral Shares. The peer-group expense ratio is derived from data provided by Lipper, a Thomson Reuters Company, and captures information through year-end 2014.
Peer group: Multi-Cap Growth Funds.
4
holdings, on average, over the period. But these industries didn’t deliver as they have in the past.
On the surface, health care appeared to hold up fairly well. The fund’s health care holdings returned about 8%. However, the benchmark’s health care stocks returned almost 14%. Capital Opportunity’s pharmaceutical stocks outperformed, but its biotechnology stocks lagged as a group and it had no exposure to thriving distributors, services, and managed-care companies.
Information technology results were more disappointing. Capital Opportunity’s IT stocks declined about 6% compared with a rise of about 3% for those held by the benchmark. Weakness in hardware, semiconductors, IT consulting and other services, communications equipment, and electronic equipment far offset the positives from software and internet stocks.
On a brighter note, the fund’s industrial holdings offered a considerable boost to performance, climbing about 8% as those in the benchmark declined about 2%. Airlines accounted for most of the strength. Lower fuel prices have translated into greater profits overall, and some companies have benefited from capacity improvements and favorable pricing.
In the consumer discretionary sector, the advisor’s outlook on vacation trends was perceptive. The fund owned shares in cruise lines, which surged, and avoided casinos, which slumped. Capital Opportunity’s limited energy holdings
| |
| Total Returns | |
| Ten Years Ended September 30, 2015 | |
| | Average |
| | Annual Return |
| Capital Opportunity Fund Investor Shares | 9.31% |
| Russell Midcap Growth Index | 8.09 |
| Multi-Cap Growth Funds Average | 6.40 |
| Multi-Cap Growth Funds Average: Derived from data provided by Lipper, a Thomson Reuters Company. | |
The figures shown represent past performance, which is not a guarantee of future results. (Current performance may be lower or higher than the performance data cited. For performance data current to the most recent month-end, visit our website at vanguard.com/performance.) Note, too, that both investment returns and principal value can fluctuate widely, so an investor’s shares, when sold, could be worth more or less than their original cost.
5
| |
| |
| Staying the course can help you stay closer to your fund’s return |
| |
| When stock markets are highly volatile, as in recent months, it’s tempting to run for cover. |
| But the price of panic can be high. |
| |
| A rough measure of what can be lost from attempts to time the market is the difference |
| between the returns produced by a fund and the returns earned by the fund’s investors. |
| |
| The results shown in the Performance Summary later in this report are your fund’s time- |
| weighted returns—the average annual returns investors would have earned if they had invested |
| a lump sum in the fund at the start of the period and reinvested any distributions they received. |
| Their actual returns, however, depend on whether they subsequently bought or sold any shares. |
| There’s often a gap between this dollar-weighted return for investors and the fund’s time- |
| weighted return, as shown below. |
| |
| Many sensible investment behaviors can contribute to the difference in returns, but industry |
| cash flow data suggest that one important factor is the generally counterproductive effort to |
| buy and sell at the “right” time. Keeping your emotions in check can help narrow the gap. |
| |
| Mutual fund returns and investor returns over the last decade |

|
| Average fund return |
| Average investor return |
| |
| Notes: Data are as of December 31, 2014. The average fund returns and average investor returns are from Morningstar. The average |
| fund returns are the average of the funds’ time-weighted returns in each category. The average investor returns assume that the growth |
| of a fund’s total net assets for a given period is driven by market returns and investor cash ow. To calculate investor return, a fund’s |
| change in assets for the period is discounted by the return of the fund to isolate how much of the asset growth was driven by cash ow. |
| A model, similar to an internal rate-of-return calculation, is then used to calculate a constant growth rate that links the beginning total |
| net assets and periodic cash ows to the ending total net assets. |
| Sources: Vanguard and Morningstar, Inc. |
6
declined sharply as low oil prices continued to weigh on the sector. The fund’s minimal allocation to the sector, however, greatly limited the damage.
For more about the advisor’s strategy and the fund’s positioning during the 12 months, please see the Advisor’s Report that follows this letter.
The advisor’s patience and focus helped lift results over a decade
Both the Capital Opportunity Fund’s performance over the past decade and its path to that performance can be traced to the advisor’s strategy of investing with conviction and a long-term lens.
For the ten years ended September 30, 2015, the fund’s Investor Shares registered an average annual return of 9.31%, more than 1 percentage point ahead of its benchmark index and nearly 3 percentage points higher than its peer-fund average. During one long stretch—in each fiscal year from 2010 through 2012––the fund lagged both its comparative standards.
At times, some of the fund’s stock holdings and sector allocations appeared out of sync with market trends and investor sentiment. PRIMECAP Management stayed true to its plan and process, and some of the stocks Capital Opportunity held rebounded strongly in the final years of the decade.
Along with the advisor’s experience and skill, the fund’s shareholders benefited from relatively low investment expenses. Lower costs allow shareholders to pocket more of the fund’s returns.
A dose of discipline is crucial when markets become volatile
While the broad U.S. stock market has posted gains for six straight calendar years—from 2009 to 2014—that streak may not last a seventh. Stocks tumbled in August, and swung up and down in September.
Nobody can control the direction of the markets or reliably predict where they’ll go in the short term. However, investors can control how they react to unstable and turbulent markets.
During periods of market adversity, it’s more important than ever to keep sight of one of Vanguard’s key principles: Maintain perspective and long-term discipline. Whether you’re investing for yourself or on behalf of clients, your
7
success is affected greatly by how you respond—or don’t respond—during turbulent markets. (You can read Vanguard’s Principles for Investing Success at vanguard.com/research.)
As I’ve written in the past, the best course for long-term investors is generally to ignore daily market moves and not make decisions based on emotion. (See the box on page 6 for more discussion on the benefit of staying the course.) This is also a good time to evaluate your portfolio and make sure your asset allocation is aligned with your time horizon, goals, and risk tolerance.
The markets are unpredictable and often confounding. Keeping your long-term plans clearly in focus can help you weather these periodic storms.
As always, thank you for investing with Vanguard.
Sincerely,

F. William McNabb III
Chairman and Chief Executive Officer
October 15, 2015
8
Advisor’s Report
For the fiscal year ended September 30, 2015, Vanguard Capital Opportunity Fund returned 1.72% for Investor Shares and 1.78% for Admiral Shares. These results exceeded the 1.45% return of its benchmark, the Russell Midcap Growth Index, the –0.61% return of the Standard & Poor’s 500 Index, and the 1.40% average return of its multi-capitalization growth fund competitors.
Relative to the S&P 500 Index, favorable sector allocations, including an underweight position in energy and an overweight position in information technology, drove the fund’s outperformance.
The investment environment
Despite a record close on May 21, 2015, the S&P 500 Index delivered a slightly negative total return over the 12 months ended September 30 as global growth concerns weighed on equity values late in the fiscal year.
The U.S. economy expanded at a modest pace; real gross domestic product growth averaged about 2% over the three quarters ended June 30. The labor market continued to improve—the unemployment rate declined to 5.1% at the end of September. Monetary policy remained highly accommodative. The dollar appreciated significantly, driven by the relative strength of the U.S. economy. Over the 12 months ended September 30, the price of West Texas Intermediate crude oil declined by approximately 50%.
Concerns about China’s economic health intensified as the year progressed. The Shanghai Stock Exchange Composite Index experienced significant volatility, which reverberated across the global financial markets. U.S. investors tried to assess the impact that a slowing Chinese economy may have on the domestic economic recovery.
Outlook for U.S. equities
We find U.S. equities to be fairly valued. As of September 30, the S&P 500 Index was trading at approximately 16 times the next 12 months’ earnings, a reasonable valuation by historical standards—though the index appears more expensive on a price/sales ratio basis since profit margins are near all-time highs. We continue to believe that many individual stocks are attractively valued, and that stocks represent a more attractive investment than bonds at current prices.
Portfolio update and outlook
For the 12 months ended September 30, the portfolio was overweighted in health care, information technology, and industrial stocks. These sectors made up 83% of the fund’s average holdings (compared with a combined average weighting of about 45% in the S&P 500 Index).
Favorable sector allocations, notably in energy (underweight), health care (overweight), and information technology (overweight), were slightly offset by unfavorable allocation in consumer staples
9
(underweight). Positive stock selection, primarily in industrials, was offset by negative stock selection, primarily in information technology and energy.
In industrials, positive selection was reflected in the fund’s airline holdings (JetBlue Airways was up 143%, Southwest Airlines 13%, United Continental 13%, and Delta Air Lines 25%). Unfavorable stock selection in information technology was reflected by Micron (–56%), SanDisk (–44%), Trimble (–46%), Cree (–41%), NetApp (–30%), and the fund’s underweight position in Apple (+11%). In the energy sector, unfavorable selection was led by Transocean (–56%).
Energy
The fund remains significantly under-weighted in energy, the worst-performing sector in the S&P 500 Index over the last 12 months. We cannot predict the direction of oil prices with any certainty; we believe, however, that technological innovation may push down the price of oil long term. Advancements such as hydraulic fracturing may continue to lower the cost of production, while new technologies such as vehicle electrification may reduce future oil demand.
We have found few compelling investments within the sector. For many companies, a rebound in oil prices would be needed to make their valuations attractive. Although such a rebound is possible, we do not want to make investments predicated on higher oil prices. Oil prices also affect our investments outside the energy sector. We believe that certain holdings, such as airlines (overweight) and cruise lines (overweight), may continue to benefit from lower input costs if current oil prices persist. Other holdings, such as some industrial companies, may continue to face weaker demand from energy-related customers at current oil prices.
Industrials
Within industrials, we continue to find our investments in the airline segment attractive. The industry has consolidated significantly, and the four largest airlines now control over 80% of total capacity. Management teams are increasingly focused on generating adequate returns on capital, rather than chasing unprofitable market share. Domestic capacity has been reduced since 2007 and utilization is high. In light of these industry dynamics, strong free cash flow, and low valuation multiples, we remain overweighted in airlines.
Information technology
We believe that our holdings within information technology represent compelling investments. A major technological shift is under way as software, storage, and computing power continue to move to the cloud, where clients can rent these services over the internet. This shift is helping to enable new big data and
10
mobility applications, while increasing demand for certain types of storage and processing infrastructure. Although the trends have mixed implications for some holdings with legacy technology, the companies’ strong competitive positions, cash-rich balance sheets, and healthy cash flow generation allow them to invest ample resources in cloud-based offerings. In addition, we believe the low valuation multiples assigned to many of these stocks more than adequately reflect the risks associated with this transition.
Health care
We continue to believe that the health care industry’s long-term outlook remains favorable. Increasing demand for health care products will be driven by demographic trends as well as the industry’s ability to develop more effective therapies. The industry’s pipeline includes promising new treatments for cancer, Alzheimer’s, and autoimmune diseases. In addition, the reduced cost of genetic sequencing may result in breakthroughs in drug development. With the recent pullback in health care stocks, valuations of large-cap biotechnology and pharmaceutical companies are reasonable; some are trading at a discount to the S&P 500 Index price/earnings multiple in spite of their superior growth profiles.
Tempering our positive outlook is the nearer-term uncertainty over reimbursement and pricing. Earlier this year, pharmacy benefit managers extracted higher-than-expected pricing concessions from AbbVie and Gilead as the two firms competed for market share with their new hepatitis C drugs. Proposals in the U.S. presidential campaign to reduce pharmaceutical spending have again raised the specter of government-negotiated or -mandated pricing. Although we are mindful of these potential negatives, we believe that companies with novel drug treatments that provide significant benefits over older therapies will continue to receive favorable reimbursement from payers.
Conclusion
We remain committed to our investment philosophy, which is to invest in attractively priced stocks for the long term. This “bottom-up” approach often results in portfolios that bear little resemblance to market indexes; therefore, our results often deviate substantially from such indexes. Furthermore, our long-term investment horizon results in low portfolio turnover, which creates the possibility for extended periods of underperformance when the stocks in our portfolio fall out of favor. We nonetheless believe that this approach can generate superior results for shareholders over the long term.
PRIMECAP Management Company
October 14, 2015
11
Capital Opportunity Fund
Fund Profile
As of September 30, 2015
| | | |
| Share-Class Characteristics | | |
| | Investor | | Admiral |
| | Shares | | Shares |
| Ticker Symbol | VHCOX | | VHCAX |
| Expense Ratio1 | 0.47% | | 0.40% |
| 30-Day SEC Yield | 0.70% | | 0.77% |
| |
| |
| Portfolio Characteristics | | |
| | | | DJ |
| | | | U.S. |
| | | Russell | Total |
| | | Midcap | Market |
| | | Growth | FA |
| | Fund | Index | Index |
| Number of Stocks | 137 | 502 | 4,000 |
| Median Market Cap | $36.6B | $11.1B | $46.5B |
| Price/Earnings Ratio | 23.4x | 26.6x | 20.2x |
| Price/Book Ratio | 3.3x | 5.1x | 2.5x |
| Return on Equity | 15.7% | 20.1% | 17.2% |
| Earnings Growth | | | |
| Rate | 8.9% | 14.8% | 10.1% |
| Dividend Yield | 1.2% | 1.2% | 2.1% |
| Foreign Holdings | 11.8% | 0.0% | 0.0% |
| Turnover Rate | 7% | — | — |
| Short-Term | | | |
| Reserves | 5.9% | — | — |
| | |
| Volatility Measures | | |
| | Russell | DJ |
| | Midcap | U.S. Total |
| | Growth | Market |
| | Index | FA Index |
| R-Squared | 0.90 | 0.79 |
| Beta | 0.97 | 1.01 |
These measures show the degree and timing of the fund’s fluctuations compared with the indexes over 36 months.
| | |
| Ten Largest Holdings (% of total net assets) |
| Biogen Inc. | Biotechnology | 6.1% |
| Amgen Inc. | Biotechnology | 4.9 |
| Eli Lilly & Co. | Pharmaceuticals | 4.8 |
| BioMarin Pharmaceutical | | |
| Inc. | Biotechnology | 3.8 |
| Southwest Airlines Co. | Airlines | 3.2 |
| Roche Holding AG | Pharmaceuticals | 3.1 |
| Google Inc. | Internet Software & | |
| | Services | 2.9 |
| Adobe Systems Inc. | Application Software | 2.6 |
| FedEx Corp. | Air Freight & | |
| | Logistics | 2.6 |
| Novartis AG | Pharmaceuticals | 2.2 |
| Top Ten | | 36.2% |
The holdings listed exclude any temporary cash investments and equity index products.
Investment Focus
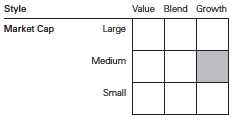
1 The expense ratios shown are from the prospectus dated January 27, 2015, and represent estimated costs for the current fiscal year. For the fiscal year ended September 30, 2015, the expense ratios were 0.45% for Investor Shares and 0.38% for Admiral Shares.
12
Capital Opportunity Fund
| | | |
| Sector Diversification (% of equity exposure) |
| | | Russell | DJ |
| | | Midcap | U.S. Total |
| | | Growth | Market |
| | Fund | Index | FA Index |
| Consumer | | | |
| Discretionary | 10.7% | 25.4% | 13.7% |
| Consumer Staples | 0.0 | 8.0 | 8.7 |
| Energy | 0.6 | 0.8 | 6.3 |
| Financials | 3.0 | 11.5 | 18.3 |
| Health Care | 35.1 | 13.1 | 14.4 |
| Industrials | 16.9 | 15.7 | 10.6 |
| Information | | | |
| Technology | 31.2 | 20.0 | 19.6 |
| Materials | 1.7 | 5.0 | 3.1 |
| Telecommunication | | | |
| Services | 0.8 | 0.4 | 2.1 |
| Utilities | 0.0 | 0.1 | 3.2 |
13
Capital Opportunity Fund
Performance Summary
All of the returns in this report represent past performance, which is not a guarantee of future results that may be achieved by the fund. (Current performance may be lower or higher than the performance data cited. For performance data current to the most recent month-end, visit our website at vanguard.com/performance.) Note, too, that both investment returns and principal value can fluctuate widely, so an investor’s shares, when sold, could be worth more or less than their original cost. The returns shown do not reflect taxes that a shareholder would pay on fund distributions or on the sale of fund shares.
Cumulative Performance: September 30, 2005, Through September 30, 2015
Initial Investment of $10,000
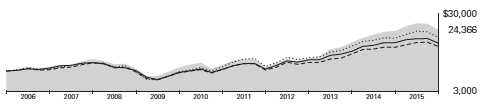
| | | | |
| | Average Annual Total Returns | |
| | Periods Ended September 30, 2015 | |
| |
| | | | | Final Value |
| | One | Five | Ten | of a $10,000 |
| | Year | Years | Years | Investment |
| Capital Opportunity Fund*Investor | | | | |
| Shares | 1.72% | 15.14% | 9.31% | $24,366 |
| Russell Midcap Growth Index | 1.45 | 13.58 | 8.09 | 21,772 |
| Multi-Cap Growth Funds Average | 1.40 | 12.02 | 6.40 | 18,592 |
| Dow Jones U.S. Total Stock Market | | | | |
| Float Adjusted Index | -0.55 | 13.26 | 7.06 | 19,778 |
Multi-Cap Growth Funds Average: Derived from data provided by Lipper, a Thomson Reuters Company.
| | | | |
| | | | | Final Value |
| | One | Five | Ten | of a $50,000 |
| | Year | Years | Years | Investment |
| Capital Opportunity Fund Admiral Shares | 1.78% | 15.21% | 9.40% | $122,773 |
| Russell Midcap Growth Index | 1.45 | 13.58 | 8.09 | 108,862 |
| Dow Jones U.S. Total Stock Market Float | | | | |
| Adjusted Index | -0.55 | 13.26 | 7.06 | 98,892 |
See Financial Highlights for dividend and capital gains information.
14
Capital Opportunity Fund
Fiscal-Year Total Returns (%): September 30, 2005, Through September 30, 2015
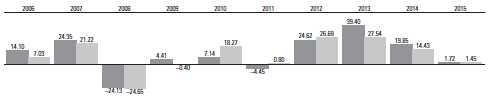
| |
| Capital Opportunity Fund Investor Shares |
| Russell Midcap Growth Index |
15
Capital Opportunity Fund
Financial Statements
Statement of Net Assets
As of September 30, 2015
The fund reports a complete list of its holdings in regulatory filings four times in each fiscal year, at the quarter-ends. For the second and fourth fiscal quarters, the lists appear in the fund’s semiannual and annual reports to shareholders. For the first and third fiscal quarters, the fund files the lists with the Securities and Exchange Commission on Form N-Q. Shareholders can look up the fund’s Forms N-Q on the SEC’s website at sec.gov. Forms N-Q may also be reviewed and copied at the SEC’s Public Reference Room (see the back cover of this report for further information).
| | | |
| | | | Market |
| | | | Value• |
| | | Shares | ($000) |
| Common Stocks (94.3%) | | |
| Consumer Discretionary (10.1%) | |
| * | CarMax Inc. | 4,191,397 | 248,634 |
| | TJX Cos. Inc. | 2,580,000 | 184,264 |
| | Carnival Corp. | 3,522,600 | 175,073 |
| *,^ | Tesla Motors Inc. | 657,566 | 163,339 |
| | Royal Caribbean | | |
| | Cruises Ltd. | 1,327,000 | 118,222 |
| | L Brands Inc. | 572,100 | 51,563 |
| | Gildan Activewear Inc. | | |
| | Class A | 1,546,300 | 46,636 |
| *,^ | DreamWorks Animation | | |
| | SKG Inc. Class A | 2,510,000 | 43,800 |
| * | Norwegian Cruise Line | | |
| | Holdings Ltd. | 724,000 | 41,485 |
| * | Bed Bath & Beyond Inc. | 703,700 | 40,125 |
| * | Sony Corp. ADR | 1,525,800 | 37,382 |
| * | Amazon.com Inc. | 63,510 | 32,510 |
| | Ross Stores Inc. | 506,400 | 24,545 |
| * | Ascena Retail Group Inc. | 1,675,200 | 23,302 |
| * | Shutterfly Inc. | 573,500 | 20,503 |
| | Tribune Media Co. Class A | 495,000 | 17,622 |
| | Las Vegas Sands Corp. | 340,000 | 12,910 |
| | Carter’s Inc. | 81,220 | 7,362 |
| | Newell Rubbermaid Inc. | 86,200 | 3,423 |
| * | Cabela’s Inc. | 47,600 | 2,171 |
| * | Urban Outfitters Inc. | 41,700 | 1,225 |
| | Tribune Publishing Co. | 120,000 | 941 |
| | Hilton Worldwide | | |
| | Holdings Inc. | 14,000 | 321 |
| | | | 1,297,358 |
| Energy (0.6%) | | |
| | Cabot Oil & Gas Corp. | 1,290,000 | 28,199 |
| * | Southwestern Energy Co. 1,591,334 | 20,194 |
| | National Oilwell Varco Inc. | 275,000 | 10,354 |
| ^ | Transocean Ltd. | 568,000 | 7,339 |
| * | Cameron International Corp. 79,700 | 4,887 |
| | Frank’s International NV | 250,000 | 3,833 |
| | Ensco plc Class A | 143,340 | 2,018 |
| | | | 76,824 |
| | | |
| | | | Market |
| | | | Value• |
| | | Shares | ($000) |
| Financials (2.8%) | | |
| | Charles Schwab Corp. | 7,586,500 | 216,670 |
| | JPMorgan Chase & Co. | 570,600 | 34,789 |
| * | E*TRADE Financial Corp. | 1,215,300 | 31,999 |
| | Discover Financial | | |
| | Services | 496,100 | 25,792 |
| | Chubb Corp. | 204,000 | 25,021 |
| | CME Group Inc. | 161,150 | 14,945 |
| | Progressive Corp. | 380,600 | 11,662 |
| | | | 360,878 |
| Health Care (33.1%) | | |
| * | Biogen Inc. | 2,690,438 | 785,097 |
| | Amgen Inc. | 4,512,400 | 624,155 |
| | Eli Lilly & Co. | 7,444,500 | 623,030 |
| * | BioMarin | | |
| | Pharmaceutical Inc. | 4,634,100 | 488,063 |
| | Roche Holding AG | 1,524,800 | 404,791 |
| | Novartis AG ADR | 3,015,400 | 277,175 |
| * | QIAGEN NV | 8,390,000 | 216,462 |
| * | Illumina Inc. | 1,220,100 | 214,518 |
| | Medtronic plc | 2,083,100 | 139,443 |
| * | Boston Scientific Corp. | 6,758,800 | 110,912 |
| * | Seattle Genetics Inc. | 1,830,500 | 70,584 |
| | Thermo Fisher | | |
| | Scientific Inc. | 533,600 | 65,249 |
| | Abbott Laboratories | 1,299,600 | 52,270 |
| * | Charles River | | |
| | Laboratories | | |
| | International Inc. | 661,000 | 41,987 |
| | PerkinElmer Inc. | 912,700 | 41,948 |
| * | Edwards Lifesciences | | |
| | Corp. | 280,000 | 39,807 |
| * | Affymetrix Inc. | 2,700,600 | 23,063 |
| * | Waters Corp. | 152,000 | 17,968 |
| * | ImmunoGen Inc. | 1,280,000 | 12,288 |
| | Agilent Technologies Inc. | 233,000 | 7,999 |
| | Zimmer Biomet | | |
| | Holdings Inc. | 50,000 | 4,696 |
| * | Cerner Corp. | 10,000 | 600 |
| | AstraZeneca plc ADR | 15,300 | 487 |
| | | | 4,262,592 |
16
| | | |
| Capital Opportunity Fund | | |
| |
| |
| |
| | | | Market |
| | | | Value• |
| | | Shares | ($000) |
| Industrials (16.0%) | | |
| | Southwest Airlines Co. | 10,935,100 | 415,971 |
| | FedEx Corp. | 2,293,974 | 330,286 |
| * | United Continental | | |
| | Holdings Inc. | 4,331,200 | 229,770 |
| * | JetBlue Airways Corp. | 6,940,150 | 178,848 |
| | Delta Air Lines Inc. | 3,917,000 | 175,756 |
| | Airbus Group SE | 2,893,040 | 171,327 |
| | American Airlines | | |
| | Group Inc. | 2,723,000 | 105,734 |
| * | Jacobs Engineering | | |
| | Group Inc. | 2,158,419 | 80,790 |
| ^ | Ritchie Bros | | |
| | Auctioneers Inc. | 2,937,000 | 76,010 |
| | Rockwell Automation Inc. | 742,000 | 75,291 |
| | Union Pacific Corp. | 672,000 | 59,412 |
| * | AECOM | 1,625,000 | 44,704 |
| | IDEX Corp. | 615,000 | 43,849 |
| | Curtiss-Wright Corp. | 500,000 | 31,210 |
| | CH Robinson | | |
| | Worldwide Inc. | 200,000 | 13,556 |
| | Alaska Air Group Inc. | 110,000 | 8,739 |
| * | Spirit Airlines Inc. | 158,235 | 7,484 |
| ^ | Chicago Bridge | | |
| | & Iron Co. NV | 100,000 | 3,966 |
| * | Esterline | | |
| | Technologies Corp. | 30,631 | 2,202 |
| | | | 2,054,905 |
| Information Technology (29.4%) | |
| * | Adobe Systems Inc. | 4,074,500 | 335,005 |
| | Texas Instruments Inc. | 4,896,400 | 242,470 |
| | Altera Corp. | 4,585,000 | 229,617 |
| | NetApp Inc. | 7,154,400 | 211,770 |
| | Microsoft Corp. | 4,750,000 | 210,235 |
| * | Google Inc. Class A | 298,630 | 190,636 |
| * | Google Inc. Class C | 300,874 | 183,058 |
| | SanDisk Corp. | 2,784,377 | 151,275 |
| | NVIDIA Corp. | 5,959,400 | 146,899 |
| * | Flextronics | | |
| | International Ltd. | 13,147,000 | 138,569 |
| | Corning Inc. | 8,080,000 | 138,330 |
| | ASML Holding NV | 1,340,000 | 117,893 |
| * | Trimble Navigation Ltd. | 6,400,400 | 105,095 |
| * | Micron Technology Inc. | 6,605,000 | 98,943 |
| *,^ | Cree Inc. | 3,944,900 | 95,585 |
| | QUALCOMM Inc. | 1,623,700 | 87,241 |
| | EMC Corp. | 3,513,800 | 84,893 |
| *,1 | Descartes Systems | | |
| | Group Inc. | 4,645,000 | 82,170 |
| | Visa Inc. Class A | 1,125,000 | 78,367 |
| | Hewlett-Packard Co. | 2,390,000 | 61,208 |
| | Plantronics Inc. | 1,150,000 | 58,477 |
| * | Rambus Inc. | 4,905,000 | 57,879 |
| *,^ | BlackBerry Ltd. | 9,408,200 | 57,672 |
| | KLA-Tencor Corp. | 943,900 | 47,195 |
| | | |
| | | | Market |
| | | | Value• |
| | | Shares | ($000) |
| *,^ | NeuStar Inc. Class A | 1,653,416 | 44,989 |
| * | Electronic Arts Inc. | 625,000 | 42,344 |
| * | Nuance | | |
| | Communications Inc. | 2,495,000 | 40,843 |
| *,1 | FormFactor Inc. | 5,809,700 | 39,390 |
| * | VMware Inc. Class A | 471,700 | 37,165 |
| | Intuit Inc. | 370,000 | 32,838 |
| | Apple Inc. | 261,000 | 28,788 |
| | Symantec Corp. | 1,467,700 | 28,576 |
| * | F5 Networks Inc. | 242,500 | 28,082 |
| * | Entegris Inc. | 2,019,231 | 26,634 |
| | Jabil Circuit Inc. | 1,175,000 | 26,285 |
| * | PayPal Holdings Inc. | 730,100 | 22,662 |
| * | Alibaba Group | | |
| | Holding Ltd. ADR | 322,200 | 19,000 |
| | Broadcom Corp. Class A | 365,000 | 18,772 |
| | FEI Co. | 248,000 | 18,114 |
| * | eBay Inc. | 732,100 | 17,893 |
| * | Keysight Technologies Inc. | 570,000 | 17,579 |
| * | Yahoo! Inc. | 444,300 | 12,845 |
| | Analog Devices Inc. | 225,000 | 12,692 |
| * | Ciena Corp. | 500,000 | 10,360 |
| *,^ | Mobileye NV | 223,831 | 10,180 |
| | Brocade Communications | | |
| | Systems Inc. | 900,000 | 9,342 |
| | Teradyne Inc. | 360,000 | 6,484 |
| | Applied Materials Inc. | 385,000 | 5,656 |
| *,^ | SMART Technologies Inc. 3,824,304 | 2,451 |
| | Telefonaktiebolaget | | |
| | LM Ericsson ADR | 230,000 | 2,249 |
| * | salesforce.com inc | 23,500 | 1,632 |
| | MasterCard Inc. Class A | 15,000 | 1,352 |
| * | Arista Networks Inc. | 15,500 | 948 |
| * | Workday Inc. Class A | 10,000 | 689 |
| * | Twitter Inc. | 12,680 | 342 |
| | | | 3,777,658 |
| Materials (1.6%) | | |
| | Monsanto Co. | 2,368,786 | 202,152 |
| |
| Telecommunication Services (0.7%) | |
| | AT&T Inc. | 2,906,266 | 94,686 |
| * | Sprint Corp. | 230,000 | 884 |
| | | | 95,570 |
| Total Common Stocks | | |
| (Cost $6,339,784) | | 12,127,937 |
| Temporary Cash Investment (6.8%) | |
| Money Market Fund (6.8%) | | |
| 2,3 | Vanguard Market | | |
| | Liquidity Fund, 0.189% | | |
| | (Cost $877,225) | 877,224,759 | 877,225 |
| Total Investments (101.1%) | | |
| (Cost $7,217,009) | | 13,005,162 |
17
| |
| Capital Opportunity Fund | |
| |
| |
| |
| |
| | Amount |
| | ($000) |
| Other Assets and Liabilities (-1.1%) | |
| Other Assets | |
| Investment in VGI | 1,210 |
| Receivables for Investment Securities Sold 2,404 |
| Receivables for Accrued Income | 8,225 |
| Receivables for Capital Shares Issued | 4,439 |
| Total Other Assets | 16,278 |
| Liabilities | |
| Payables for Investment Securities | |
| Purchased | (4,523) |
| Collateral for Securities on Loan | (121,498) |
| Payables for Investment Advisor | (8,338) |
| Payables for Capital Shares Redeemed | (8,545) |
| Payables to Vanguard | (16,592) |
| Other Liabilities | (5) |
| Total Liabilities | (159,501) |
| Net Assets (100%) | 12,861,939 |
| |
| At September 30, 2015, net assets consisted of: |
| | Amount |
| | ($000) |
| Paid-in Capital | 6,444,002 |
| Undistributed Net Investment Income | 51,816 |
| Accumulated Net Realized Gains | 578,180 |
| Unrealized Appreciation (Depreciation) | |
| Investment Securities | 5,788,153 |
| Foreign Currencies | (212) |
| Net Assets | 12,861,939 |
| |
| |
| Investor Shares—Net Assets | |
| Applicable to 45,428,823 outstanding | |
| $.001 par value shares of beneficial | |
| interest (unlimited authorization) | 2,282,703 |
| Net Asset Value Per Share— | |
| Investor Shares | $50.25 |
| |
| |
| Admiral Shares—Net Assets | |
| Applicable to 91,150,560 outstanding | |
| $.001 par value shares of beneficial | |
| interest (unlimited authorization) | 10,579,236 |
| Net Asset Value Per Share— | |
| Admiral Shares | $116.06 |
• See Note A in Notes to Financial Statements.
* Non-income-producing security.
^ Includes partial security positions on loan to broker-dealers. The total value of securities on loan is $117,661,000.
1 Considered an affiliated company of the fund as the fund owns more than 5% of the outstanding voting securities of such company.
2 Affiliated money market fund available only to Vanguard funds and certain trusts and accounts managed by Vanguard. Rate shown is the
7-day yield.
3 Includes $121,498,000 of collateral received for securities on loan.
ADR—American Depositary Receipt.
See accompanying Notes, which are an integral part of the Financial Statements.
18
| |
| Capital Opportunity Fund | |
| |
| |
| Statement of Operations | |
| |
| | Year Ended |
| | September 30, 2015 |
| | ($000) |
| Investment Income | |
| Income | |
| Dividends1 | 149,665 |
| Interest | 1,025 |
| Securities Lending | 2,512 |
| Total Income | 153,202 |
| Expenses | |
| Investment Advisory Fees—Note B | 33,586 |
| The Vanguard Group—Note C | |
| Management and Administrative—Investor Shares | 5,244 |
| Management and Administrative—Admiral Shares | 13,944 |
| Marketing and Distribution—Investor Shares | 438 |
| Marketing and Distribution—Admiral Shares | 1,161 |
| Custodian Fees | 202 |
| Auditing Fees | 31 |
| Shareholders’ Reports—Investor Shares | 2 |
| Shareholders’ Reports—Admiral Shares | 31 |
| Trustees’ Fees and Expenses | 21 |
| Total Expenses | 54,660 |
| Net Investment Income | 98,542 |
| Realized Net Gain (Loss) | |
| Investment Securities Sold | 706,826 |
| Foreign Currencies | (110) |
| Realized Net Gain (Loss) | 706,716 |
| Change in Unrealized Appreciation (Depreciation) | |
| Investment Securities | (559,513) |
| Foreign Currencies | 14 |
| Change in Unrealized Appreciation (Depreciation) | (559,499) |
| Net Increase (Decrease) in Net Assets Resulting from Operations | 245,759 |
| 1 Dividends are net of foreign withholding taxes of $4,329,000. | |
See accompanying Notes, which are an integral part of the Financial Statements.
19
| | |
| Capital Opportunity Fund | | |
| |
| |
| Statement of Changes in Net Assets | | |
| |
| | Year Ended September 30, |
| | 2015 | 2014 |
| | ($000) | ($000) |
| Increase (Decrease) in Net Assets | | |
| Operations | | |
| Net Investment Income | 98,542 | 75,621 |
| Realized Net Gain (Loss) | 706,716 | 435,273 |
| Change in Unrealized Appreciation (Depreciation) | (559,499) | 1,638,778 |
| Net Increase (Decrease) in Net Assets Resulting from Operations | 245,759 | 2,149,672 |
| Distributions | | |
| Net Investment Income | | |
| Investor Shares | (16,335) | (4,359)1 |
| Admiral Shares | (69,765) | (19,984)1 |
| Realized Capital Gain 2 | | |
| Investor Shares | (99,546) | (100,744) |
| Admiral Shares | (370,543) | (305,893) |
| Total Distributions | (556,189) | (430,980) |
| Capital Share Transactions | | |
| Investor Shares | (487,925) | (341,836) |
| Admiral Shares | 816,562 | 820,230 |
| Net Increase (Decrease) from Capital Share Transactions | 328,637 | 478,394 |
| Total Increase (Decrease) | 18,207 | 2,197,086 |
| Net Assets | | |
| Beginning of Period | 12,843,732 | 10,646,646 |
| End of Period3 | 12,861,939 | 12,843,732 |
1 Fiscal 2013 distributions from net investment income include $34,400,000 from a dividend received from ASML Holding NV. Subsequent to the fund’s distribution from net investment income made in December 2012, the ASML dividend was reallocated to return of capital. The reallocation reduced the fund’s net investment income distribution in December 2013.
2 Includes fiscal 2015 and 2014 short-term gain distributions totaling $10,268,000 and $28,347,000, respectively. Short-term gain distributions are treated as ordinary income dividends for tax purposes.
3 Net Assets—End of Period includes undistributed (overdistributed) net investment income of $51,816,000 and $43,631,000.
See accompanying Notes, which are an integral part of the Financial Statements.
20
| | | | | |
| Capital Opportunity Fund | | | | | |
| |
| |
| Financial Highlights | | | | | |
| |
| |
| Investor Shares | | | | | |
| |
| For a Share Outstanding | | | Year Ended September 30, |
| Throughout Each Period | 2015 | 2014 | 2013 | 2012 | 2011 |
| Net Asset Value, Beginning of Period | $51.42 | $44.57 | $33.22 | $28.17 | $29.59 |
| Investment Operations | | | | | |
| Net Investment Income | . 349 | .272 | .270 | .216 | .151 |
| Net Realized and Unrealized Gain (Loss) | | | | | |
| on Investments | . 666 | 8.314 | 12.395 | 6.464 | (1.450) |
| Total from Investment Operations | 1.015 | 8.586 | 12.665 | 6.680 | (1.299) |
| Distributions | | | | | |
| Dividends from Net Investment Income | (.308) | (.072)1 | (. 385)1 | (.161) | (.121) |
| Distributions from Realized Capital Gains | (1.877) | (1.664) | (.930) | (1.469) | — |
| Total Distributions | (2.185) | (1.736) | (1.315) | (1.630) | (.121) |
| Net Asset Value, End of Period | $50.25 | $51.42 | $44.57 | $33.22 | $28.17 |
| |
| Total Return2 | 1.72% | 19.85% | 39.40% | 24.62% | -4.45% |
| |
| Ratios/Supplemental Data | | | | | |
| Net Assets, End of Period (Millions) | $2,283 | $2,793 | $2,720 | $2,432 | $2,412 |
| Ratio of Total Expenses to | | | | | |
| Average Net Assets | 0.45% | 0.47% | 0.48% | 0.48% | 0.48% |
| Ratio of Net Investment Income to | | | | | |
| Average Net Assets | 0.65% | 0.57% | 0.68% | 0.67% | 0.45% |
| Portfolio Turnover Rate | 7% | 7% | 9% | 9% | 9% |
1 Fiscal 2013 dividends from net investment income include $.157 per share from a dividend received from ASML Holding NV. Subsequent to the payment of the fund’s dividend from net investment income in December 2012, the ASML dividend was reallocated to return of capital. The reallocation reduced the fund’s dividend from net investment income in December 2013. The reallocation had no impact on net assets, net asset values per share, or total returns.
2 Total returns do not include transaction or account service fees that may have applied in the periods shown. Fund prospectuses provide information about any applicable transaction and account service fees.
See accompanying Notes, which are an integral part of the Financial Statements.
21
| | | | | |
| Capital Opportunity Fund | | | | | |
| |
| |
| Financial Highlights | | | | | |
| |
| |
| Admiral Shares | | | | | |
| |
| For a Share Outstanding | | | Year Ended September 30, |
| Throughout Each Period | 2015 | 2014 | 2013 | 2012 | 2011 |
| Net Asset Value, Beginning of Period | $118.79 | $102.97 | $76.75 | $65.10 | $68.38 |
| Investment Operations | | | | | |
| Net Investment Income | . 916 | .728 | .707 | .559 | .400 |
| Net Realized and Unrealized Gain (Loss) | | | | | |
| on Investments | 1.504 | 19.185 | 28.613 | 14.917 | (3.358) |
| Total from Investment Operations | 2.420 | 19.913 | 29.320 | 15.476 | (2.958) |
| Distributions | | | | | |
| Dividends from Net Investment Income | (.816) | (.251)1 | (. 953)1 | (. 434) | (.322) |
| Distributions from Realized Capital Gains | (4.334) | (3.842) | (2.147) | (3.392) | — |
| Total Distributions | (5.150) | (4.093) | (3.100) | (3.826) | (. 322) |
| Net Asset Value, End of Period | $116.06 | $118.79 | $102.97 | $76.75 | $65.10 |
| |
| Total Return2 | 1.78% | 19.94% | 39.50% | 24.69% | -4.39% |
| |
| Ratios/Supplemental Data | | | | | |
| Net Assets, End of Period (Millions) | $10,579 | $10,051 | $7,927 | $5,045 | $4,342 |
| Ratio of Total Expenses to | | | | | |
| Average Net Assets | 0.38% | 0.40% | 0.41% | 0.41% | 0.41% |
| Ratio of Net Investment Income to | | | | | |
| Average Net Assets | 0.72% | 0.64% | 0.75% | 0.74% | 0.52% |
| Portfolio Turnover Rate | 7% | 7% | 9% | 9% | 9% |
1 Fiscal 2013 dividends from net investment income include $.363 per share from a dividend received from ASML Holding NV. Subsequent to the payment of the fund’s dividend from net investment income in December 2012, the ASML dividend was reallocated to return of capital. The reallocation reduced the fund’s dividend from net investment income in December 2013. The reallocation had no impact on net assets, net asset values per share, or total returns.
2 Total returns do not include transaction or account service fees that may have applied in the periods shown. Fund prospectuses provide information about any applicable transaction and account service fees.
See accompanying Notes, which are an integral part of the Financial Statements.
22
Capital Opportunity Fund
Notes to Financial Statements
Vanguard Capital Opportunity Fund is registered under the Investment Company Act of 1940 as an open-end investment company, or mutual fund. The fund offers two classes of shares: Investor Shares and Admiral Shares. Investor Shares are available to any investor who meets the fund’s minimum purchase requirements. Admiral Shares are designed for investors who meet certain administrative, service, and account-size criteria.
A. The following significant accounting policies conform to generally accepted accounting principles for U.S. investment companies. The fund consistently follows such policies in preparing its financial statements.
1. Security Valuation: Securities are valued as of the close of trading on the New York Stock Exchange (generally 4 p.m., Eastern time) on the valuation date. Equity securities are valued at the latest quoted sales prices or official closing prices taken from the primary market in which each security trades; such securities not traded on the valuation date are valued at the mean of the latest quoted bid and asked prices. Securities for which market quotations are not readily available, or whose values have been affected by events occurring before the fund’s pricing time but after the close of the securities’ primary markets, are valued at their fair values calculated according to procedures adopted by the board of trustees. These procedures include obtaining quotations from an independent pricing service, monitoring news to identify significant market- or security-specific events, and evaluating changes in the values of foreign market proxies (for example, ADRs, futures contracts, or exchange-traded funds), between the time the foreign markets close and the fund’s pricing time. When fair-value pricing is employed, the prices of securities used by a fund to calculate its net asset value may differ from quoted or published prices for the same securities. Investments in Vanguard Market Liquidity Fund are valued at that fund’s net asset value.
2. Foreign Currency: Securities and other assets and liabilities denominated in foreign currencies are translated into U.S. dollars using exchange rates obtained from an independent third party as of the fund’s pricing time on the valuation date. Realized gains (losses) and unrealized appreciation (depreciation) on investment securities include the effects of changes in exchange rates since the securities were purchased, combined with the effects of changes in security prices. Fluctuations in the value of other assets and liabilities resulting from changes in exchange rates are recorded as unrealized foreign currency gains (losses) until the assets or liabilities are settled in cash, at which time they are recorded as realized foreign currency gains (losses).
3. Federal Income Taxes: The fund intends to continue to qualify as a regulated investment company and distribute all of its taxable income. Management has analyzed the fund’s tax positions taken for all open federal income tax years (September 30, 2012–2015), and has concluded that no provision for federal income tax is required in the fund’s financial statements.
4. Distributions: Distributions to shareholders are recorded on the ex-dividend date.
5. Securities Lending: To earn additional income, the fund lends its securities to qualified institutional borrowers. Security loans are required to be secured at all times by collateral in an amount at least equal to the market value of securities loaned. Daily market fluctuations could cause the value of loaned securities to be more or less than the value of the collateral received. When this occurs, the collateral is adjusted and settled on the next business day. The fund further mitigates its counterparty risk by entering into securities lending transactions only with a diverse group of prequalified counter-parties, monitoring their financial strength, and entering into master securities lending agreements
23
Capital Opportunity Fund
with its counterparties. The master securities lending agreements provide that, in the event of a counterparty’s default (including bankruptcy), the fund may terminate any loans with that borrower, determine the net amount owed, and sell or retain the collateral up to the net amount owed to the fund; however, such actions may be subject to legal proceedings. While collateral mitigates counter-party risk, in the absence of a default the fund may experience delays and costs in recovering the securities loaned. The fund invests cash collateral received in Vanguard Market Liquidity Fund, and records a liability in the Statement of Net Assets for the return of the collateral, during the period the securities are on loan. Securities lending income represents fees charged to borrowers plus income earned on invested cash collateral, less expenses associated with the loan.
6. Credit Facility: The fund and certain other funds managed by The Vanguard Group (“Vanguard”) participate in a $3 billion committed credit facility provided by a syndicate of lenders pursuant to a credit agreement that may be renewed annually; each fund is individually liable for its borrowings, if any, under the credit facility. Borrowings may be utilized for temporary and emergency purposes, and are subject to the fund’s regulatory and contractual borrowing restrictions. The participating funds are charged administrative fees and an annual commitment fee of 0.06% of the undrawn amount of the facility; these fees are allocated to the funds based on a method approved by the fund’s board of trustees and included in Management and Administrative expenses on the fund’s Statement of Operations. Any borrowings under this facility bear interest at a rate equal to the higher of the federal funds rate or LIBOR reference rate plus an agreed-upon spread.
The fund had no borrowings outstanding at September 30, 2015, or at any time during the period then ended.
7. Other: Dividend income is recorded on the ex-dividend date. Interest income includes income distributions received from Vanguard Market Liquidity Fund and is accrued daily. Security transactions are accounted for on the date securities are bought or sold. Costs used to determine realized gains (losses) on the sale of investment securities are those of the specific securities sold.
Each class of shares has equal rights as to assets and earnings, except that each class separately bears certain class-specific expenses related to maintenance of shareholder accounts (included in Management and Administrative expenses) and shareholder reporting. Marketing and distribution expenses are allocated to each class of shares based on a method approved by the board of trustees. Income, other non-class-specific expenses, and gains and losses on investments are allocated to each class of shares based on its relative net assets.
B. PRIMECAP Management Company provides investment advisory services to the fund for a fee calculated at an annual percentage rate of average net assets. For the year ended September 30, 2015, the investment advisory fee represented an effective annual rate of 0.24% of the fund’s average net assets.
C. In accordance with the terms of a Funds’ Service Agreement (the “FSA”) between Vanguard and the fund, Vanguard furnishes to the fund corporate management, administrative, marketing, and distribution services at Vanguard’s cost of operations (as defined by the FSA). These costs of operations are allocated to the fund based on methods and guidelines approved by the board of trustees. Vanguard does not require reimbursement in the current period for certain costs of operations (such as deferred compensation/benefits and risk/insurance costs); the fund’s liability for these costs of operations is included in Payables to Vanguard on the Statement of Net Assets.
24
Capital Opportunity Fund
Upon the request of Vanguard, the fund may invest up to 0.40% of its net assets as capital in Vanguard. At September 30, 2015, the fund had contributed to Vanguard capital in the amount of $1,210,000, representing 0.01% of the fund’s net assets and 0.48% of Vanguard’s capitalization. The fund’s trustees and officers are also directors and employees, respectively, of Vanguard.
D. Various inputs may be used to determine the value of the fund’s investments. These inputs are summarized in three broad levels for financial statement purposes. The inputs or methodologies used to value securities are not necessarily an indication of the risk associated with investing in those securities.
Level 1—Quoted prices in active markets for identical securities.
Level 2—Other significant observable inputs (including quoted prices for similar securities, interest rates, prepayment speeds, credit risk, etc.).
Level 3—Significant unobservable inputs (including the fund’s own assumptions used to determine the fair value of investments).
The following table summarizes the market value of the fund’s investments as of September 30, 2015, based on the inputs used to value them:
| | | |
| | Level 1 | Level 2 | Level 3 |
| Investments | ($000) | ($000) | ($000) |
| Common Stocks | 11,551,819 | 576,118 | — |
| Temporary Cash Investments | 877,225 | — | — |
| Total | 12,429,044 | 576,118 | — |
E. Distributions are determined on a tax basis and may differ from net investment income and realized capital gains for financial reporting purposes. Differences may be permanent or temporary. Permanent differences are reclassified among capital accounts in the financial statements to reflect their tax character. Temporary differences arise when certain items of income, expense, gain, or loss are recognized in different periods for financial statement and tax purposes. These differences will reverse at some time in the future. Differences in classification may also result from the treatment of short-term gains as ordinary income for tax purposes.
During the year ended September 30, 2015, the fund realized net foreign currency losses of $110,000, which decreased distributable net income for tax purposes; accordingly, such losses have been reclassified from accumulated net realized gains to undistributed net investment income.
The fund used a tax accounting practice to treat a portion of the price of capital shares redeemed during the year as distributions from net investment income and realized capital gains. Accordingly, the fund has reclassified $4,147,000 from undistributed net investment income, and $29,744,000 from accumulated net realized gains, to paid-in capital.
For tax purposes, at September 30, 2015, the fund had $65,635,000 of ordinary income and $580,376,000 of long-term capital gains available for distribution.
At September 30, 2015, the cost of investment securities for tax purposes was $7,217,009,000.
Net unrealized appreciation of investment securities for tax purposes was $5,788,153,000, consisting of unrealized gains of $6,305,005,000 on securities that had risen in value since their purchase and $516,852,000 in unrealized losses on securities that had fallen in value since their purchase.
25
Capital Opportunity Fund
F. During the year ended September 30, 2015, the fund purchased $956,371,000 of investment securities and sold $1,205,884,000 of investment securities, other than temporary cash investments.
G. Capital share transactions for each class of shares were:
| | | | |
| | | | Year Ended September 30, |
| | | 2015 | | 2014 |
| | Amount | Shares | Amount | Shares |
| | ($000) | (000) | ($000) | (000) |
| Investor Shares | | | | |
| Issued | 365,789 | 6,845 | 486,523 | 10,295 |
| Issued in Lieu of Cash Distributions | 111,603 | 2,090 | 101,413 | 2,267 |
| Redeemed | (965,317) | (17,816) | (929,772) | (19,277) |
| Net Increase (Decrease)—Investor Shares | (487,925) | (8,881) | (341,836) | (6,715) |
| Admiral Shares | | | | |
| Issued | 1,187,443 | 9,514 | 1,283,265 | 11,628 |
| Issued in Lieu of Cash Distributions | 403,938 | 3,277 | 299,123 | 2,896 |
| Redeemed | (774,819) | (6,256) | (762,158) | (6,891) |
| Net Increase (Decrease) —Admiral Shares | 816,562 | 6,535 | 820,230 | 7,633 |
H. Certain of the fund’s investments are in companies that are considered to be affiliated companies of the fund because the fund owns more than 5% of the outstanding voting securities of the company or the issuer is another member of The Vanguard Group. Transactions during the period in securities of these companies were as follows:
| | | | | | |
| | | | Current Period Transactions | |
| | Sept. 30, | | Proceeds | | | Sept. 30, |
| | 2014 | | from | | Capital Gain | 2015 |
| | Market | Purchases | Securities | | Distributions | Market |
| | Value | at Cost | Sold | Income | Received | Value |
| | ($000) | ($000) | ($000) | ($000) | ($000) | ($000) |
| Descartes Systems Group Inc. | 64,147 | — | — | — | — | 82,170 |
| FormFactor Inc. | 41,656 | — | — | — | — | 39,390 |
| Vanguard Market Liquidity Fund | 728,974 | NA1 | NA1 | 1,025 | — | 877,225 |
| Total | 834,777 | | | 1,025 | — | 998,785 |
| 1 Not applicable—purchases and sales are for temporary cash investment purposes. |
I. Management has determined that no material events or transactions occurred subsequent to September 30, 2015, that would require recognition or disclosure in these financial statements.
26
Report of Independent Registered Public Accounting Firm
To the Board of Trustees of Vanguard Horizon Funds and the Shareholders of Vanguard Capital Opportunity Fund: In our opinion, the accompanying statement of net assets and the related statements of operations and of changes in net assets and the financial highlights present fairly, in all material respects, the financial position of Vanguard Capital Opportunity Fund (constituting a separate portfolio of Vanguard Horizon Funds, hereafter referred to as the “Fund”) at September 30, 2015, the results of its operations for the year then ended, the changes in its net assets for each of the two years in the period then ended, and the financial highlights for each of the five years in the period then ended, in conformity with accounting principles generally accepted in the United States of America. These financial statements and financial highlights (hereafter referred to as “financial statements”) are the responsibility of the Fund’s management. Our responsibility is to express an opinion on these financial statements based on our audits. We conducted our audits of these financial statements in accordance with the standards of the Public Company Accounting Oversight Board (United States). Those standards require that we plan and perform the audit to obtain reasonable assurance about whether the financial statements are free of material misstatement. An audit includes examining, on a test basis, evidence supporting the amounts and disclosures in the financial statements, assessing the accounting principles used and significant estimates made by management, and evaluating the overall financial statement presentation. We believe that our audits, which included confirmation of securities at September 30, 2015 by correspondence with the custodian and brokers, by agreement to the underlying ownership records of the transfer agent and the application of alternative auditing procedures where securities purchased had not been received, provide a reasonable basis for our opinion.
/s/PricewaterhouseCoopers LLP
Philadelphia, Pennsylvania
November 10, 2015
| |
| |
| Special 2015 tax information (unaudited) for Vanguard Capital Opportunity Fund |
| |
| This information for the fiscal year ended September 30, 2015, is included pursuant to provisions |
| of the Internal Revenue Code. |
| |
| The fund distributed $489,565,000 as capital gain dividends (20% rate gain distributions) to |
| shareholders during the fiscal year. |
| |
| For nonresident alien shareholders, 100% of short-term capital gain dividends distributed by the fund |
| are qualified short-term capital gains. |
| |
| The fund distributed $96,368,000 of qualified dividend income to shareholders during the fiscal year. |
| |
| For corporate shareholders, 100% of investment income (dividend income plus short-term gains, |
| if any) qualifies for the dividends-received deduction. |
27
Your Fund’s After-Tax Returns
This table presents returns for your fund both before and after taxes. The after-tax returns are shown in two ways: (1) assuming that an investor owned the fund during the entire period and paid taxes on the fund’s distributions, and (2) assuming that an investor paid taxes on the fund’s distributions and sold all shares at the end of each period.
Calculations are based on the highest individual federal income tax and capital gains tax rates in effect at the times of the distributions and the hypothetical sales. State and local taxes were not considered. After-tax returns reflect any qualified dividend income, using actual prior-year figures and estimates for 2015. (In the example, returns after the sale of fund shares may be higher than those assuming no sale. This occurs when the sale would have produced a capital loss. The calculation assumes that the investor received a tax deduction for the loss.) The table shows returns for Investor Shares only; returns for other share classes will differ. Please note that your actual after-tax returns will depend on your tax situation and may differ from those shown. Also note that if you own the fund in a tax-deferred account, such as an individual retirement account or a 401(k) plan, this information does not apply to you. Such accounts are not subject to current taxes.
Finally, keep in mind that a fund’s performance—whether before or after taxes—does not guarantee future results.
Average Annual Total Returns: Capital Opportunity Fund Investor Shares
Periods Ended September 30, 2015
| | | |
| | One | Five | Ten |
| | Year | Years | Years |
| Returns Before Taxes | 1.72% | 15.14% | 9.31% |
| Returns After Taxes on Distributions | 0.77 | 14.39 | 8.54 |
| Returns After Taxes on Distributions and Sale of Fund Shares | 1.84 | 12.20 | 7.59 |
28
About Your Fund’s Expenses
As a shareholder of the fund, you incur ongoing costs, which include costs for portfolio management, administrative services, and shareholder reports (like this one), among others. Operating expenses, which are deducted from a fund’s gross income, directly reduce the investment return of the fund.
A fund’s expenses are expressed as a percentage of its average net assets. This figure is known as the expense ratio. The following examples are intended to help you understand the ongoing costs (in dollars) of investing in your fund and to compare these costs with those of other mutual funds. The examples are based on an investment of $1,000 made at the beginning of the period shown and held for the entire period.
The accompanying table illustrates your fund’s costs in two ways:
• Based on actual fund return. This section helps you to estimate the actual expenses that you paid over the period. The ”Ending Account Value“ shown is derived from the fund‘s actual return, and the third column shows the dollar amount that would have been paid by an investor who started with $1,000 in the fund. You may use the information here, together with the amount you invested, to estimate the expenses that you paid over the period.
To do so, simply divide your account value by $1,000 (for example, an $8,600 account value divided by $1,000 = 8.6), then multiply the result by the number given for your fund under the heading ”Expenses Paid During Period.“
• Based on hypothetical 5% yearly return. This section is intended to help you compare your fund‘s costs with those of other mutual funds. It assumes that the fund had a yearly return of 5% before expenses, but that the expense ratio is unchanged. In this case—because the return used is not the fund’s actual return—the results do not apply to your investment. The example is useful in making comparisons because the Securities and Exchange Commission requires all mutual funds to calculate expenses based on a 5% return. You can assess your fund’s costs by comparing this hypothetical example with the hypothetical examples that appear in shareholder reports of other funds.
Note that the expenses shown in the table are meant to highlight and help you compare ongoing costs only and do not reflect transaction costs incurred by the fund for buying and selling securities. Further, the expenses do not include any purchase, redemption, or account service fees described in the fund prospectus. If such fees were applied to your account, your costs would be higher. Your fund does not carry a “sales load.”
The calculations assume no shares were bought or sold during the period. Your actual costs may have been higher or lower, depending on the amount of your investment and the timing of any purchases or redemptions.
You can find more information about the fund’s expenses, including annual expense ratios, in the Financial Statements section of this report. For additional information on operating expenses and other shareholder costs, please refer to your fund’s current prospectus.
29
| | | |
| Six Months Ended September 30, 2015 | | | |
| | Beginning | Ending | Expenses |
| | Account Value | Account Value | Paid During |
| Capital Opportunity Fund | 3/31/2015 | 9/30/2015 | Period |
| Based on Actual Fund Return | | | |
| Investor Shares | $1,000.00 | $914.13 | $2.11 |
| Admiral Shares | 1,000.00 | 914.43 | 1.78 |
| Based on Hypothetical 5% Yearly Return | | | |
| Investor Shares | $1,000.00 | $1,022.86 | $2.23 |
| Admiral Shares | 1,000.00 | 1,023.21 | 1.88 |
The calculations are based on expenses incurred in the most recent six-month period. The fund’s annualized six-month expense ratios for that period are 0.44% for Investor Shares and 0.37% for Admiral Shares. The dollar amounts shown as “Expenses Paid” are equal to the annualized expense ratio multiplied by the average account value over the period, multiplied by the number of days in the most recent six-month period, then divided by the number of days in the most recent 12-month period (183/365).
30
Glossary
30-Day SEC Yield. A fund’s 30-day SEC yield is derived using a formula specified by the U.S. Securities and Exchange Commission. Under the formula, data related to the fund’s security holdings in the previous 30 days are used to calculate the fund’s hypothetical net income for that period, which is then annualized and divided by the fund’s estimated average net assets over the calculation period. For the purposes of this calculation, a security’s income is based on its current market yield to maturity (for bonds), its actual income (for asset-backed securities), or its projected dividend yield (for stocks). Because the SEC yield represents hypothetical annualized income, it will differ—at times significantly—from the fund’s actual experience. As a result, the fund’s income distributions may be higher or lower than implied by the SEC yield.
Beta. A measure of the magnitude of a fund’s past share-price fluctuations in relation to the ups and downs of a given market index. The index is assigned a beta of 1.00. Compared with a given index, a fund with a beta of 1.20 typically would have seen its share price rise or fall by 12% when the index rose or fell by 10%. For this report, beta is based on returns over the past 36 months for both the fund and the index. Note that a fund’s beta should be reviewed in conjunction with its R-squared (see definition). The lower the R-squared, the less correlation there is between the fund and the index, and the less reliable beta is as an indicator of volatility.
Dividend Yield. Dividend income earned by stocks, expressed as a percentage of the aggregate market value (or of net asset value, for a fund). The yield is determined by dividing the amount of the annual dividends by the aggregate value (or net asset value) at the end of the period. For a fund, the dividend yield is based solely on stock holdings and does not include any income produced by other investments.
Earnings Growth Rate. The average annual rate of growth in earnings over the past five years for the stocks now in a fund.
Equity Exposure. A measure that reflects a fund’s investments in stocks and stock futures. Any holdings in short-term reserves are excluded.
Expense Ratio. A fund’s total annual operating expenses expressed as a percentage of the fund’s average net assets. The expense ratio includes management and administrative expenses, but does not include the transaction costs of buying and selling portfolio securities.
Foreign Holdings. The percentage of a fund represented by securities or depositary receipts of companies based outside the United States.
Inception Date. The date on which the assets of a fund (or one of its share classes) are first invested in accordance with the fund’s investment objective. For funds with a subscription period, the inception date is the day after that period ends. Investment performance is measured from the inception date.
Median Market Cap. An indicator of the size of companies in which a fund invests; the midpoint of market capitalization (market price x shares outstanding) of a fund’s stocks, weighted by the proportion of the fund’s assets invested in each stock. Stocks representing half of the fund’s assets have market capitalizations above the median, and the rest are below it.
Price/Book Ratio. The share price of a stock divided by its net worth, or book value, per share. For a fund, the weighted average price/book ratio of the stocks it holds.
31
Price/Earnings Ratio. The ratio of a stock’s current price to its per-share earnings over the past year. For a fund, the weighted average P/E of the stocks it holds. P/E is an indicator of market expectations about corporate prospects; the higher the P/E, the greater the expectations for a company’s future growth.
R-Squared. A measure of how much of a fund’s past returns can be explained by the returns from the market in general, as measured by a given index. If a fund’s total returns were precisely synchronized with an index’s returns, its R-squared would be 1.00. If the fund’s returns bore no relationship to the index’s returns, its R-squared would be 0. For this report, R-squared is based on returns over the past 36 months for both the fund and the index.
Return on Equity. The annual average rate of return generated by a company during the past five years for each dollar of shareholder’s equity (net income divided by shareholder’s equity). For a fund, the weighted average return on equity for the companies whose stocks it holds.
Short-Term Reserves. The percentage of a fund invested in highly liquid, short-term securities that can be readily converted to cash.
Turnover Rate. An indication of the fund’s trading activity. Funds with high turnover rates incur higher transaction costs and may be more likely to distribute capital gains (which may be taxable to investors). The turnover rate excludes in-kind transactions, which have minimal impact on costs.
32
This page intentionally left blank.
This page intentionally left blank.
This page intentionally left blank.
The People Who Govern Your Fund
The trustees of your mutual fund are there to see that the fund is operated and managed in your best interests since, as a shareholder, you are a part owner of the fund. Your fund’s trustees also serve on the board of directors of The Vanguard Group, Inc., which is owned by the Vanguard funds and provides services to them on an at-cost basis.
A majority of Vanguard’s board members are independent, meaning that they have no affiliation with Vanguard or the funds they oversee, apart from the sizable personal investments they have made as private individuals. The independent board members have distinguished backgrounds in business, academia, and public service. Each of the trustees and executive officers oversees 194 Vanguard funds.
The following table provides information for each trustee and executive officer of the fund. More information about the trustees is in the Statement of Additional Information, which can be obtained, without charge, by contacting Vanguard at 800-662-7447, or online at vanguard.com.
| |
| InterestedTrustee1 | Rajiv L. Gupta |
| | Born 1945. Trustee Since December 2001.2 Principal |
| F. William McNabb III | Occupation(s) During the Past Five Years and Other |
| Born 1957. Trustee Since July 2009. Chairman of | Experience: Chairman and Chief Executive Officer |
| the Board. Principal Occupation(s) During the Past | (retired 2009) and President (2006–2008) of |
| Five Years and Other Experience: Chairman of the | Rohm and Haas Co. (chemicals); Director of Tyco |
| Board of The Vanguard Group, Inc., and of each of | International PLC (diversified manufacturing and |
| the investment companies served by The Vanguard | services), Hewlett-Packard Co. (electronic computer |
| Group, since January 2010; Director of The Vanguard | manufacturing), and Delphi Automotive PLC |
| Group since 2008; Chief Executive Officer and | (automotive components); Senior Advisor at New |
| President of The Vanguard Group, and of each of | Mountain Capital. |
| the investment companies served by The Vanguard | |
| Group, since 2008; Director of Vanguard Marketing | Amy Gutmann |
| Corporation; Managing Director of The Vanguard | Born 1949. Trustee Since June 2006. Principal |
| Group (1995–2008). | Occupation(s) During the Past Five Years and |
| | Other Experience: President of the University of |
| IndependentTrustees | Pennsylvania; Christopher H. Browne Distinguished |
| | Professor of Political Science, School of Arts and |
| Emerson U. Fullwood | Sciences, and Professor of Communication, Annenberg |
| Born 1948. Trustee Since January 2008. Principal | School for Communication, with secondary faculty |
| Occupation(s) During the Past Five Years and | appointments in the Department of Philosophy, School |
| Other Experience: Executive Chief Staff and | of Arts and Sciences, and at the Graduate School of |
| Marketing Officer for North America and Corporate | Education, University of Pennsylvania; Trustee of the |
| Vice President (retired 2008) of Xerox Corporation | National Constitution Center; Chair of the Presidential |
| (document management products and services); | Commission for the Study of Bioethical Issues. |
| Executive in Residence and 2009–2010 Distinguished | |
| Minett Professor at the Rochester Institute of | JoAnn Heffernan Heisen |
| Technology; Director of SPX Corporation (multi-industry | Born 1950. Trustee Since July 1998. Principal |
| manufacturing), the United Way of Rochester, | Occupation(s) During the Past Five Years and Other |
| Amerigroup Corporation (managed health care), the | Experience: Corporate Vice President and Chief |
| University of Rochester Medical Center, Monroe | Global Diversity Officer (retired 2008) and Member |
| Community College Foundation, and North Carolina | of the Executive Committee (1997–2008) of Johnson |
| A&T University. | & Johnson (pharmaceuticals/medical devices/ |
| | consumer products); Director of Skytop Lodge |
| | Corporation (hotels), the University Medical Center |
| | at Princeton, the Robert Wood Johnson Foundation, |
| | and the Center for Talent Innovation; Member of |
| | the Advisory Board of the Institute for Women’s |
| | Leadership at Rutgers University. |
| | |
| F. Joseph Loughrey | Executive Officers | |
| Born 1949. Trustee Since October 2009. Principal | | |
| Occupation(s) During the Past Five Years and Other | Glenn Booraem | |
| Experience: President and Chief Operating Officer | Born 1967. Treasurer Since May 2015. Principal |
| (retired 2009) of Cummins Inc. (industrial machinery); | Occupation(s) During the Past Five Years and |
| Chairman of the Board of Hillenbrand, Inc. (specialized | Other Experience: Principal of The Vanguard Group, |
| consumer services), and of Oxfam America; Director | Inc.; Treasurer of each of the investment companies |
| of SKF AB (industrial machinery), Hyster-Yale Materials | served by The Vanguard Group; Controller of each of |
| Handling, Inc. (forklift trucks), the Lumina Foundation | the investment companies served by The Vanguard |
| for Education, and the V Foundation for Cancer | Group (2010–2015); Assistant Controller of each of |
| Research; Member of the Advisory Council for the | the investment companies served by The Vanguard |
| College of Arts and Letters and of the Advisory Board | Group (2001–2010). | |
| to the Kellogg Institute for International Studies, both | | |
| at the University of Notre Dame. | Thomas J. Higgins | |
| Born 1957. Chief Financial Officer Since September |
| Mark Loughridge | 2008. Principal Occupation(s) During the Past Five |
| Born 1953. Trustee Since March 2012. Principal | Years and Other Experience: Principal of The Vanguard |
| Occupation(s) During the Past Five Years and Other | Group, Inc.; Chief Financial Officer of each of the |
| Experience: Senior Vice President and Chief Financial | investment companies served by The Vanguard Group; |
| Officer (retired 2013) at IBM (information technology | Treasurer of each of the investment companies served |
| services); Fiduciary Member of IBM’s Retirement Plan | by The Vanguard Group (1998–2008). |
| Committee (2004–2013); Director of the Dow Chemical | |
| Company; Member of the Council on Chicago Booth. | Peter Mahoney | |
| Born 1974. Controller Since May 2015. Principal |
| Scott C. Malpass | Occupation(s) During the Past Five Years and |
| Born 1962. Trustee Since March 2012. Principal | Other Experience: Head of Global Fund Accounting |
| Occupation(s) During the Past Five Years and Other | at The Vanguard Group, Inc.; Controller of each of the |
| Experience: Chief Investment Officer and Vice | investment companies served by The Vanguard Group; |
| President at the University of Notre Dame; Assistant | Head of International Fund Services at The Vanguard |
| Professor of Finance at the Mendoza College of | Group (2008–2014). | |
| Business at Notre Dame; Member of the Notre Dame | | |
| 403(b) Investment Committee; Board Member of | Heidi Stam | |
| TIFF Advisory Services, Inc., and Catholic Investment | Born 1956. Secretary Since July 2005. Principal |
| Services, Inc. (investment advisors); Member of | Occupation(s) During the Past Five Years and Other |
| the Investment Advisory Committee of Major | Experience: Managing Director of The Vanguard |
| League Baseball. | Group, Inc.; General Counsel of The Vanguard Group; |
| Secretary of The Vanguard Group and of each of the |
| André F. Perold | investment companies served by The Vanguard Group; |
| Born 1952. Trustee Since December 2004. Principal | Director and Senior Vice President of Vanguard |
| Occupation(s) During the Past Five Years and Other | Marketing Corporation. | |
| Experience: George Gund Professor of Finance and | | |
| Banking, Emeritus at the Harvard Business School | Vanguard Senior ManagementTeam |
| (retired 2011); Chief Investment Officer and Managing | |
| Partner of HighVista Strategies LLC (private investment | Mortimer J. Buckley | Chris D. McIsaac |
| firm); Director of Rand Merchant Bank; Overseer of | Kathleen C. Gubanich | James M. Norris |
| the Museum of Fine Arts Boston. | Paul A. Heller | Thomas M. Rampulla |
| Martha G. King | Glenn W. Reed |
| Peter F. Volanakis | John T. Marcante | Karin A. Risi |
| Born 1955. Trustee Since July 2009. Principal | | |
| Occupation(s) During the Past Five Years and Other | Chairman Emeritus and Senior Advisor |
| Experience: President and Chief Operating Officer | |
| (retired 2010) of Corning Incorporated (communications | John J. Brennan | |
| equipment); Trustee of Colby-Sawyer College; | Chairman, 1996–2009 | |
| Member of the Advisory Board of the Norris Cotton | Chief Executive Officer and President, 1996–2008 |
| Cancer Center and of the Advisory Board of the | | |
| Parthenon Group (strategy consulting). | Founder | |
| | |
| | John C. Bogle | |
| | Chairman and Chief Executive Officer, 1974–1996 |
1 Mr. McNabb is considered an “interested person,” as defined in the Investment Company Act of 1940, because he is an officer of the Vanguard funds.
2 December 2002 for Vanguard Equity Income Fund, the Vanguard Municipal Bond Funds, and the Vanguard State Tax-Exempt Funds.
|  |
| P.O. Box 2600 |
| Valley Forge, PA 19482-2600 |
Connect with Vanguard® > vanguard.com
| |
| Fund Information > 800-662-7447 | |
| Direct Investor Account Services > 800-662-2739 | |
| Institutional Investor Services > 800-523-1036 | |
| Text Telephone for People | |
| Who Are Deaf or Hard of Hearing> 800-749-7273 | |
| |
| This material may be used in conjunction | |
| with the offering of shares of any Vanguard | |
| fund only if preceded or accompanied by | |
| the fund’s current prospectus. | |
| |
| All comparative mutual fund data are from Lipper, a | |
| Thomson Reuters Company, or Morningstar, Inc., unless | |
| otherwise noted. | |
| |
| You can obtain a free copy of Vanguard’s proxy voting | |
| guidelines by visiting vanguard.com/proxyreporting or by | |
| calling Vanguard at 800-662-2739. The guidelines are | |
| also available from the SEC’s website, sec.gov. In | |
| addition, you may obtain a free report on how your fund | |
| voted the proxies for securities it owned during the 12 | |
| months ended June 30. To get the report, visit either | |
| vanguard.com/proxyreporting or sec.gov. | |
| |
| You can review and copy information about your fund at | |
| the SEC’s Public Reference Room in Washington, D.C. To | |
| find out more about this public service, call the SEC at | |
| 202-551-8090. Information about your fund is also | |
| available on the SEC’s website, and you can receive | |
| copies of this information, for a fee, by sending a | |
| request in either of two ways: via email addressed to | |
| publicinfo@sec.gov or via regular mail addressed to the | |
| Public Reference Section, Securities and Exchange | |
| Commission, Washington, DC 20549-1520. | |
| |
| | © 2015 The Vanguard Group, Inc. |
| | All rights reserved. |
| | Vanguard Marketing Corporation, Distributor. |
| |
| | Q1110 112015 |

Annual Report | September 30, 2015
Vanguard Global Equity Fund
Vanguard’s Principles for Investing Success
We want to give you the best chance of investment success. These principles, grounded in Vanguard’s research and experience, can put you on the right path.
Goals. Create clear, appropriate investment goals.
Balance. Develop a suitable asset allocation using broadly diversified funds.
Cost. Minimize cost.
Discipline. Maintain perspective and long-term discipline.
A single theme unites these principles: Focus on the things you can control.
We believe there is no wiser course for any investor.
| |
| Contents | |
| Your Fund’s Total Returns. | 1 |
| Chairman’s Letter. | 2 |
| Advisors’ Report. | 9 |
| Fund Profile. | 13 |
| Performance Summary. | 15 |
| Financial Statements. | 17 |
| Your Fund’s After-Tax Returns. | 34 |
| About Your Fund’s Expenses. | 35 |
| Glossary. | 37 |
Please note: The opinions expressed in this report are just that—informed opinions. They should not be considered promises or advice.
Also, please keep in mind that the information and opinions cover the period through the date on the front of this report. Of course, the risks of investing in your fund are spelled out in the prospectus.
See the Glossary for definitions of investment terms used in this report.
About the cover: Pictured is a sailing block on the Brilliant, a 1932 schooner docked in Mystic, Connecticut. A type of pulley, the
sailing block helps coordinate the setting of the sails. At Vanguard, the intricate coordination of technology and people allows us to help millions of clients around the world reach their financial goals.
| | | | |
| Your Fund’s Total Returns | | | | |
| |
| |
| |
| |
| Fiscal Year Ended September 30, 2015 | | | | |
| | | | | Total |
| | | | | Returns |
| Vanguard Global Equity Fund | | | | -4.09% |
| MSCI All Country World Index | | | | -6.66 |
| Global Funds Average | | | | -5.44 |
| Global Funds Average: Derived from data provided by Lipper, a Thomson Reuters Company. | | | |
| |
| |
| Your Fund’s Performance at a Glance | | | | |
| September 30, 2014, Through September 30, 2015 | | | | |
| | | | Distributions Per Share |
| | Starting | Ending | | |
| | Share | Share | Income | Capital |
| | Price | Price | Dividends | Gains |
| Vanguard Global Equity Fund | $24.19 | $22.85 | $0.375 | $0.000 |
1

Chairman’s Letter
Dear Shareholder,
The global stock market’s modest gains in the first half of the fiscal year ended September 30, 2015, were more than offset by its second-half slide. For U.S. dollar-based investors, the already weak returns of many international markets were further eroded by the dollar’s strength against many foreign currencies.
Vanguard Global Equity Fund returned –4.09% for the 12 months—its first fiscal year in the red since 2011—but still ahead of its comparative standards. Your advisors’ positioning in Europe and North America helped.
If you hold the Global Equity Fund in a taxable account, you may wish to review the discussion of after-tax returns later in this report.
China’s economic woes weighed on global stocks
The broad U.S. stock market returned –0.49% for the fiscal year, ahead of international markets. The final two months were especially rocky as investors worried in particular about the global ripple effects of slower economic growth in China.
For much of the period, investors were preoccupied with the possibility of an increase in short-term interest rates. On September 17, the Federal Reserve announced that it would hold rates steady for the time being, a decision that to some investors indicated the Fed’s concern about the fragility of global markets.
2
For dollar-based investors, international stocks returned about –11%. Concerns about China, the world’s second-largest economy, cast doubt on the investment outlook for emerging markets in particular.
Taxable bonds recorded gains as investors searched for safety
The broad U.S. taxable bond market returned 2.94% as investors gravitated toward safe-haven assets amid global stock market turmoil. Stimulative monetary policies from many of the world’s central banks, declining inflation expectations, and global investors’ search for higher yields also helped lift U.S. bonds.
The yield of the 10-year Treasury note ended September at 2.05%, down from 2.48% a year earlier. (Bond prices and yields move in opposite directions.)
The Fed’s 0%–0.25% target for short-term interest rates continued to limit returns for money market funds and savings accounts.
International bond markets (as measured by the Barclays Global Aggregate Index ex USD) returned –7.67%, hurt by the dollar’s strength. Without this currency effect, international bonds advanced modestly.
| | | |
| Market Barometer | | | |
| |
| | | Average Annual Total Returns |
| | Periods Ended September 30, 2015 |
| | One | Three | Five |
| | Year | Years | Years |
| Stocks | | | |
| Russell 1000 Index (Large-caps) | -0.61% | 12.66% | 13.42% |
| Russell 2000 Index (Small-caps) | 1.25 | 11.02 | 11.73 |
| Russell 3000 Index (Broad U.S. market) | -0.49 | 12.53 | 13.28 |
| FTSE All-World ex US Index (International) | -11.34 | 2.87 | 2.19 |
| |
| Bonds | | | |
| Barclays U.S. Aggregate Bond Index (Broad taxable market) | 2.94% | 1.71% | 3.10% |
| Barclays Municipal Bond Index (Broad tax-exempt market) | 3.16 | 2.88 | 4.14 |
| Citigroup Three-Month U.S. Treasury Bill Index | 0.02 | 0.02 | 0.04 |
| |
| CPI | | | |
| Consumer Price Index | -0.04% | 0.93% | 1.73% |
3
Emerging markets struggled more than developed countries
Stocks of companies based in North America, which made up more than half of your fund’s assets, on average, were a source of strength. As I mentioned, U.S. stocks generally outperformed non-U.S. stocks. Your fund’s U.S. holdings did a bit better; their modest advance helped lift the fund’s total return above that of its benchmark. In Canada, whose economy is oriented toward natural resources, the fund’s holdings declined less than those in the benchmark as oil and other resource prices sank.
Beyond North America, the dampening effect of the stronger U.S. dollar was evident. When measured in local currencies, the fund’s overall holdings in both developed Europe and the Pacific posted gains. But returns for both regions were negative for U.S. dollar-based investors after foreign currency translation effects. Of course, when the tide turns and foreign currencies strengthen, U.S. investor returns are lifted. Either way, it’s important to keep in mind the role of currency effects and the diversification benefit of owning both U.S. and international stocks, as the Global Equity Fund does.
| | |
| Expense Ratios | | |
| Your Fund Compared With Its Peer Group | | |
| |
| | | Peer Group |
| | Fund | Average |
| Global Equity Fund | 0.61% | 1.33% |
The fund expense ratio shown is from the prospectus dated January 27, 2015, and represents estimated costs for the current fiscal year. For the fiscal year ended September 30, 2015, the fund’s expense ratio was 0.57%. The peer-group expense ratio is derived from data provided by Lipper, a Thomson Reuters Company, and captures information through year-end 2014.
Peer group: Global Funds.
4
Exchange rates reflect differences in interest rates and other factors across countries, and the fiscal year brought several significant developments. Notably, the European Central Bank embarked on a stimulative bond-buying program that led to negative rates on some European sovereign bonds and a weaker euro. This program, along with a generally improving economic outlook, was welcomed by many European stock markets. In some, including Ireland, your fund notched double-digit gains that helped lift it above the benchmark. (The fund’s sliver of holdings in beleaguered Greece, which dominated headlines for many months, declined less than their counterparts in the benchmark.)
The more upbeat tone in Europe was counterbalanced by the less sanguine outlook for growth in China. This had a domino effect on emerging markets whose economies depend on exporting commodities to China and other countries. As a group, emerging markets declined in double digits in both local currencies and dollars. The fund’s holdings included some small pockets of strength, but its above-benchmark stake in Chinese companies weighed on results.
Among industry sectors, energy was the worst performer in both your fund and its index amid the steep drop in oil prices. Financials and information technology, two larger sectors, also finished in the red. Consumer-oriented stocks gained some
| |
| Total Returns | |
| Ten Years Ended September 30, 2015 | |
| | Average |
| | Annual Return |
| Global Equity Fund | 4.80% |
| Spliced Global Equity Index | 4.65 |
| Global Funds Average | 4.24 |
For a benchmark description, see the Glossary.
Global Funds Average: Derived from data provided by Lipper, a Thomson Reuters Company.
The figures shown represent past performance, which is not a guarantee of future results. (Current performance may be lower or higher than the performance data cited. For performance data current to the most recent month-end, visit our website at vanguard.com/performance.) Note, too, that both investment returns and principal value can fluctuate widely, so an investor’s shares, when sold, could be worth more or less than their original cost.
5
| |
| |
| Staying the course can help you stay closer to your fund’s return |
| |
| When stock markets are highly volatile, as in recent months, it’s tempting to run for cover. |
| But the price of panic can be high. |
| |
| A rough measure of what can be lost from attempts to time the market is the difference |
| between the returns produced by a fund and the returns earned by the fund’s investors. |
| |
| The results shown in the Performance Summary later in this report are your fund’s time- |
| weighted returns—the average annual returns investors would have earned if they had invested |
| a lump sum in the fund at the start of the period and reinvested any distributions they received. |
| Their actual returns, however, depend on whether they subsequently bought or sold any shares. |
| There’s often a gap between this dollar-weighted return for investors and the fund’s time- |
| weighted return, as shown below. |
| |
| Many sensible investment behaviors can contribute to the difference in returns, but industry |
| cash flow data suggest that one important factor is the generally counterproductive effort to |
| buy and sell at the “right” time. Keeping your emotions in check can help narrow the gap. |
| |
| Mutual fund returns and investor returns over the last decade |
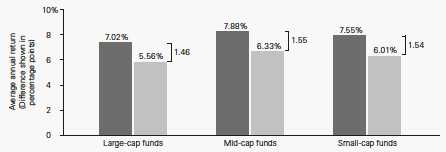
|
| Average fund return |
| Average investor return |
| |
| Notes: Data are as of December 31, 2014. The average fund returns and average investor returns are from Morningstar. The average |
| fund returns are the average of the funds’ time-weighted returns in each category. The average investor returns assume that the growth |
| of a fund’s total net assets for a given period is driven by market returns and investor cash ow. To calculate investor return, a fund’s |
| change in assets for the period is discounted by the return of the fund to isolate how much of the asset growth was driven by cash ow. |
| A model, similar to an internal rate-of-return calculation, is then used to calculate a constant growth rate that links the beginning total |
| net assets and periodic cash ows to the ending total net assets. |
| Sources: Vanguard and Morningstar, Inc. |
6
ground. Compared with the benchmark, the fund outperformed notably in industrials, which advanced modestly.
The Advisors’ Report that follows this letter provides additional details about the management of the fund during the fiscal year.
On a separate note, Vanguard Global Equity Fund marked its 20th anniversary in August. Marathon Asset Management and portfolio managers Neil Ostrer and William Arah have managed a portion of the fund since its inception, and I would like to thank them for their stewardship throughout our productive 20-year relationship.
Global Equity Fund showed resilience in the last ten years
For the ten years ended September 30, 2015, your fund recorded an average annual return of 4.80%, a step ahead of its comparative standards.
The period was marked by the 2008–2009 financial crisis, which thrust global markets into turmoil, and the global economic slowdown. Steered by its multimanager advisory team, your fund navigated those choppy waters well. And Vanguard’s low investment costs helped you keep more of its return.
A dose of discipline is crucial when markets become volatile
Although the broad U.S. stock market has posted gains for six straight calendar years—from 2009 to 2014—that streak may not last a seventh. Stocks tumbled in August and swung up and down in September.
Nobody can control the direction of the markets or reliably predict where they’ll go in the short term. However, investors can control how they react to volatility.
During periods of market adversity, it’s more important than ever to keep sight of one of Vanguard’s key principles: Maintain perspective and long-term discipline. Whether you’re investing for yourself or on behalf of clients, your success is affected greatly by how you respond—or don’t respond—during turbulent markets. (You can read Vanguard’s Principles for Investing Success at vanguard.com/research.)
As I’ve written in the past, the best course for long-term investors is generally to ignore daily market moves and not make decisions based on emotion. (See the box on page 6 for more discussion on the benefit of staying the course.) This is also a good time to evaluate your portfolio and
7
make sure your asset allocation is aligned with your time horizon, goals, and risk tolerance.
The markets are unpredictable and often confounding. Keeping your long-term plans clearly in focus can help you weather these periodic storms.
As always, thank you for investing with Vanguard.
Sincerely,

F. William McNabb III
Chairman and Chief Executive Officer
October 16, 2015
8
Advisors’ Report
For the fiscal year ended September 30, 2015, Vanguard Global Equity Fund returned –4.09%, outpacing its benchmark index and the average return of its peers. Your fund is managed by three independent advisors, a strategy that enhances the fund’s diversification by providing exposure to distinct yet complementary investment approaches. It’s not uncommon for different advisors to have different views about individual securities or the broader investment environment.
The advisors, the amount and percentage of fund assets each manages, and brief descriptions of their investment strategies are presented in the table below. Each advisor has also prepared a discussion of the investment environment that existed during the half year and its effect on portfolio positioning. These comments were prepared on October 12, 2015.
| | | |
| Vanguard Global Equity Fund Investment Advisors | |
| |
| | Fund Assets Managed | |
| Investment Advisor | % | $ Million | Investment Strategy |
| Baillie Gifford Overseas Ltd. | 33 | 1,367 | A long-term, active, bottom-up investment approach is |
| | | | used to identify companies that can generate |
| | | | above-average growth in earnings and cash flow. |
| Marathon Asset Management | 33 | 1,354 | A long-term and contrarian investment philosophy and |
| LLP | | | process with a focus on industry capital cycle analysis |
| | | | and in-depth management assessment. |
| Acadian Asset Management LLC | 32 | 1,329 | A quantitative, active, bottom-up investment process |
| | | | that combines stock and peer-group valuation to arrive |
| | | | at a return forecast for each of more than 35,000 |
| | | | securities in the global universe. |
| Cash Investments | 2 | 94 | These short-term reserves are invested by Vanguard in |
| | | | equity index products to simulate investment in stocks. |
| | | | Each advisor may also maintain a modest cash |
| | | | position. |
9
Baillie Gifford Overseas Ltd.
Portfolio Managers:
Charles Plowden, Joint Senior Partner and Lead Portfolio Manager
Spencer Adair, CFA, Partner and Investment Manager, Global Alpha Strategy
Malcolm MacColl, Partner and Investment Manager, Global Alpha Strategy
The recovering U.S. economy continues to help drive global equity markets, while at the same time a number of international economies are stagnating. Commodity-producing nations such as Brazil, heavily indebted countries (notably, Greece), and, most recently and obviously, China, have dominated headlines and depressed global equity markets, which fell sharply in the last few months.
Stock selection, rather than country or sector allocation, has driven our returns. We are optimistic about the ongoing U.S. recovery. The most notable contributor to our portfolio was Royal Caribbean Cruises, whose ships host around 3.5 million vacationers annually. A combination of better demand and lower costs (mainly due to the weaker oil price) has buoyed this significant holding.
Perhaps surprisingly given the gloomy stories, many of our best-performing stocks are in continental Europe. A highlight has been Ryanair, Europe’s
low-cost airline. The company has benefited from cheaper energy and its judicious investment in new aircraft, which leaves it well-placed to continue to take market share from national carriers. Other notable European performers include Schibsted (online classified advertising), CRH (construction materials, mainly for the U.S. market), and Fiat Chrysler Automobiles, which is restructuring to boost its premium auto sales.
We have generally shunned commodity producers. The few energy companies we do own have struggled, including Ultra Petroleum, NOW Inc., and Inpex. Other weak performers included Baidu and Alibaba, two of the three Chinese online giants that we hold. These have prospered operationally but have had weak share prices as top-line growth rates have moderated, investment has accelerated, and short-term earnings expectations have deteriorated.
We judge the success of Baidu and Alibaba over the five-year horizon we look toward for all our investments. We admire management teams that invest today to build sustainable businesses that will dominate their markets in the future. Such long-term thinking is out of step with the stock market’s current appetite for safety. We retain the view that our approach is the right one to generate strong returns. And we remain optimistic that the good fundamentals underpinning the portfolio will ultimately drive share prices and reward patient owners.
10
Marathon Asset Management LLP
Portfolio Managers:
Neil M. Ostrer, Co-Head of Global Equity
William J. Arah, Co-Head of Global Equity
Global markets experienced a volatile summer amid concerns about a China hard landing and whether the Federal Reserve would raise interest rates. Commodity prices fell sharply in response to China and emerging-market growth fears. Strong stock selection and regional allocation helped our performance. Selection in Europe was a strong contributor. An overweight to the outperforming Japanese market and stock picks within the region also helped.
At the stock level, insurer Chubb was a leader as its shares rallied on news of its acquisition by ACE Group. Solid organic sales and a significant contract win with Apple drove shares in Analog Devices. Insurers Alleghany and Travelers were again strong performers. In Europe, another large contributor was online real estate company Rightmove, which fended off a challenge from new market entrant Agents’ Mutual. Exposure to large European defensive businesses Reckitt Benckiser and Nestlé was helpful. Conversely, not owning outperforming Apple hurt, and Canadian Natural Resources and Superior Energy Services fell broadly, in line with oil prices.
The U.S. equity market has been a tale of two cities. Production-related sectors (energy, materials, industrials, transports,
technology) have significantly underper-formed their consumption-related brethren (health care, staples, discretionary). The former group has been hurt by a stronger dollar, overcapacity, and plunging commodity prices. The latter has benefited as investors sought businesses exposed purely to domestic U.S. growth and consumption. The correction in equities during the third calendar quarter of 2015 reflected this bifurcation. Other factors included the market’s already high valuations and relatively high levels of corporate profitability—which make earnings growth more difficult in the absence of revenue growth.
Meanwhile, the Fed appears to be in a data-driven state of confusion over monetary policy, which is adding to the uncertainty. For North American equities to regain their footing and move significantly higher, some combination of a weaker dollar, higher commodity prices signaling improving global growth, and higher interest rates is probably required.
Because U.S. earnings growth has been weak, a continuation of the “deflationary” scenario that has helped domestic consumption and growth stocks is probably not sustainable. This environment is precisely the type in which valuations are most extended. In Europe, the recent decline in the markets has opened up some value while the stimula-tory European quantitative easing program continues apace. And the fall in oil and commodity prices is, on balance, positive for economies that are net importers of these raw materials.
11
Acadian Asset Management LLC
Portfolio Managers:
John R. Chisholm, CFA, Executive Vice President and Chief Investment Officer
Brian K. Wolahan, CFA, Senior Vice President, Senior Portfolio Manager
Global equities finished the period in firmly negative territory. The end of 2014 was marked by heavy pressure on small-capitalization stocks and mounting risk aversion before the oil sell-off. Moving into 2015, equity markets generally stabilized from those sharp swings. The relative leveling of oil prices, the expected benefits of those lower prices to consumers, the announcement of quantitative easing in Europe, and central bank easing elsewhere all helped. On the negative side, concerns grew about a looming Fed rate hike and increasing evidence of economic troubles in the BRIC countries (Brazil, Russia, India, and China).
In the second calendar quarter, markets continued to be driven by macro themes. Investors remained heavily influenced by interest rate expectations, changes in oil prices, and foreign exchange trends, and central banks strategically injected more liquidity into capital markets.
In the third quarter, volatility surged to levels not seen in years, and global equity markets ended the period sharply lower. The rout extended to emerging-market currencies, oil, and commodities. Turmoil was driven by a combination of forces.
China’s surprise devaluation of the yuan sparked broader-based concerns about the pace and magnitude of slowing in the Chinese economy. Increased uncertainty about the expected timing of the Fed’s impending rate hike and more generalized worries about global growth added to the instability. These and other forces drove investors away from riskier emerging-market assets, leading to deeply negative returns.
We focused on attractively valued stocks that appeared likely to rise in price based on earnings data, price characteristics, and quality. Based on bottom-up stock selection, the portfolio was overweighted relative to the benchmark in markets including the United States, Canada, Taiwan, South Korea, and Australia.
We were underweighted in the United Kingdom, France, Switzerland, and Japan. Our sector allocations focused on information technology and, to a lesser extent, financials, and were light in materials, consumer discretionary, and consumer staples.
Successful stock selection in the United States helped offset the value lost to country allocations. Our picks among industrials, particularly airlines, and in health care were positive contributors. At the country level, overweighting the emerging markets and Australia was costly, as was an underweight to Japan.
12
Global Equity Fund
Fund Profile
As of September 30, 2015
| | |
| Portfolio Characteristics | | |
| | | MSCI All |
| | | Country |
| | Fund | World Index |
| Number of Stocks | 794 | 2,472 |
| Median Market Cap | $19.6B | $42.4B |
| Price/Earnings Ratio | 17.1x | 17.8x |
| Price/Book Ratio | 2.1x | 2.0x |
| Return on Equity | 16.0% | 16.6% |
| Earnings Growth | | |
| Rate | 12.2% | 10.4% |
| Dividend Yield | 2.1% | 2.7% |
| Turnover Rate | 36% | — |
| Ticker Symbol | VHGEX | — |
| Expense Ratio1 | 0.61% | — |
| Short-Term Reserves | 1.6% | — |
| | |
| Sector Diversification (% of equity exposure) |
| | | MSCI All |
| | | Country |
| | Fund | World Index |
| Consumer Discretionary | 12.9% | 12.9% |
| Consumer Staples | 9.4 | 10.3 |
| Energy | 5.2 | 6.6 |
| Financials | 24.0 | 21.6 |
| Health Care | 10.7 | 12.3 |
| Industrials | 11.8 | 10.3 |
| Information Technology | 18.5 | 14.2 |
| Materials | 3.5 | 4.7 |
| Telecommunication Services | 3.0 | 3.8 |
| Utilities | 1.0 | 3.3 |
| |
| Volatility Measures | |
| | MSCI All |
| | Country |
| | World Index |
| R-Squared | 0.95 |
| Beta | 0.96 |
These measures show the degree and timing of the fund’s fluctuations compared with the index over 36 months.
| | |
| Ten Largest Holdings (% of total net assets) |
| Royal Caribbean Cruises | Hotels, Resorts & | |
| Ltd. | Cruise Lines | 1.4% |
| Nestle SA | Packaged Foods & | |
| | Meats | 1.4 |
| Anthem Inc. | Managed Health | |
| | Care | 1.3 |
| Taiwan Semiconductor | | |
| Manufacturing Co. Ltd. | Semiconductors | 1.3 |
| Prudential plc | Life & Health | |
| | Insurance | 1.2 |
| Wells Fargo & Co. | Diversified Banks | 1.1 |
| Samsung Electronics Co. Technology | |
| Ltd. | Hardware, Storage & | |
| | Peripherals | 1.1 |
| Amazon.com Inc. | Internet Retail | 1.0 |
| Naspers Ltd. | Cable & Satellite | 0.9 |
| Google Inc. | Internet Software & | |
| | Services | 0.9 |
| Top Ten | | 11.6% |
The holdings listed exclude any temporary cash investments and equity index products.
Allocation by Region (% of equity exposure)
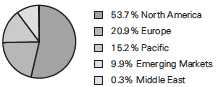
1 The expense ratio shown is from the prospectus dated January 27, 2015, and represents estimated costs for the current fiscal year. For the fiscal year ended September 30, 2015, the expense ratio was 0.57%.
13
Global Equity Fund
| | |
| Market Diversification (% of equity exposure) |
| | | MSCI All |
| | | Country |
| | | World |
| | Fund | Index |
| Europe | | |
| United Kingdom | 7.0% | 7.0% |
| Switzerland | 2.8 | 3.3 |
| Germany | 2.1 | 3.1 |
| Ireland | 2.0 | 0.1 |
| Sweden | 1.5 | 1.0 |
| Netherlands | 1.0 | 1.0 |
| Other | 4.5 | 7.4 |
| Subtotal | 20.9% | 22.9% |
| Pacific | | |
| Japan | 10.0% | 7.7% |
| South Korea | 2.3 | 1.5 |
| Hong Kong | 1.3 | 1.0 |
| Australia | 1.1 | 2.2 |
| Other | 0.5 | 0.5 |
| Subtotal | 15.2% | 12.9% |
| Emerging Markets | | |
| Taiwan | 3.0% | 1.2% |
| China | 2.2 | 2.3 |
| South Africa | 1.4 | 0.8 |
| Other | 3.3 | 3.8 |
| Subtotal | 9.9% | 8.1% |
| North America | | |
| United States | 50.2% | 52.8% |
| Canada | 3.5 | 3.0 |
| Subtotal | 53.7% | 55.8% |
| Middle East | 0.3% | 0.2% |
| Other | 0.0% | 0.1% |
14
Global Equity Fund
Performance Summary
All of the returns in this report represent past performance, which is not a guarantee of future results that may be achieved by the fund. (Current performance may be lower or higher than the performance data cited. For performance data current to the most recent month-end, visit our website at vanguard.com/performance.) Note, too, that both investment returns and principal value can fluctuate widely, so an investor’s shares, when sold, could be worth more or less than their original cost. The returns shown do not reflect taxes that a shareholder would pay on fund distributions or on the sale of fund shares.
Cumulative Performance: September 30, 2005, Through September 30, 2015
Initial Investment of $10,000

| | | | |
| | Average Annual Total Returns | |
| | Periods Ended September 30, 2015 | |
| | | | | Final Value |
| | One | Five | Ten | of a $10,000 |
| | Year | Years | Years | Investment |
| Global Equity Fund* | -4.09% | 8.34% | 4.80% | $15,977 |
| Spliced Global Equity Index | -6.66 | 6.82 | 4.65 | 15,761 |
| Global Funds Average | -5.44 | 6.59 | 4.24 | 15,149 |
For a benchmark description, see the Glossary.
Global Funds Average: Derived from data provided by Lipper, a Thomson Reuters Company.
See Financial Highlights for dividend and capital gains information.
15
Global Equity Fund
Fiscal-Year Total Returns (%): September 30, 2005, Through September 30, 2015

|
| Global Equity Fund |
| Spliced Global Equity Index |
For a benchmark description, see the Glossary.
16
Global Equity Fund
Financial Statements
Statement of Net Assets—Investments Summary
As of September 30, 2015
This Statement summarizes the fund’s holdings by asset type. Details are reported for each of the fund’s 50 largest individual holdings and for investments that, in total for any issuer, represent more than 1% of the fund’s net assets. The total value of smaller holdings is reported as a single amount within each category.
The fund reports a complete list of its holdings in regulatory filings four times in each fiscal year, at the quarter-ends. For the second and fourth fiscal quarters, the complete listing of the fund’s holdings is available electronically on vanguard.com and on the Securities and Exchange Commission’s website (sec.gov), or you can have it mailed to you without charge by calling 800-662-7447. For the first and third fiscal quarters, the fund files the lists with the SEC on Form N-Q. Shareholders can look up the fund’s Forms N-Q on the SEC’s website. Forms N-Q may also be reviewed and copied at the SEC’s Public Reference Room (see the back cover of this report for further information).
| | | |
| | | Market | Percentage |
| | | Value• | of Net |
| | Shares | ($000) | Assets |
| Common Stocks | | | |
| Australia † | | 40,005 | 1.0% |
| Austria † | | 2,421 | 0.1% |
| Belgium † | | 3,427 | 0.1% |
| Brazil † | | 18,605 | 0.4% |
| Canada | | | |
| Royal Bank of Canada | 428,800 | 23,710 | 0.6% |
| ^ Toronto-Dominion Bank | 582,600 | 22,964 | 0.6% |
| Magna International Inc. | 446,100 | 21,397 | 0.5% |
| Canada—Other † | | 74,872 | 1.8% |
| | | 142,943 | 3.5% |
| |
| Chile † | | 8,985 | 0.2% |
| China | | | |
| China Mobile Ltd. | 1,780,500 | 21,312 | 0.5% |
| China—Other † | | 66,518 | 1.6% |
| | | 87,830 | 2.1% |
| |
| Colombia † | | 1,137 | 0.0% |
| Cyprus † | | 1,325 | 0.0% |
| Czech Republic † | | 632 | 0.0% |
| Denmark † | | 33,879 | 0.8% |
| Finland † | | 18,407 | 0.4% |
17
| | | |
| Global Equity Fund | | | |
| |
| |
| | | Market | Percentage |
| | | Value• | of Net |
| | Shares | ($000) | Assets |
| France † | | 32,299 | 0.8% |
| Germany | | | |
| SAP SE | 292,603 | 18,956 | 0.5% |
| Germany—Other † | | 63,725 | 1.5% |
| | | 82,681 | 2.0% |
| |
| Greece † | | 443 | 0.0% |
| Hong Kong | | | |
| AIA Group Ltd. | 4,109,200 | 21,371 | 0.5% |
| Hong Kong—Other † | | 31,735 | 0.8% |
| | | 53,106 | 1.3% |
| |
| India † | | 35,607 | 0.9% |
| Indonesia † | | 3,467 | 0.1% |
| Ireland | | | |
| Ryanair Holdings plc ADR | 458,230 | 35,879 | 0.9% |
| CRH plc | 862,718 | 22,773 | 0.5% |
| Ireland—Other † | | 21,899 | 0.5% |
| | | 80,551 | 1.9% |
| |
| Israel † | | 13,275 | 0.3% |
| Italy † | | 25,275 | 0.6% |
| Japan | | | |
| MS&AD Insurance Group Holdings Inc. | 1,232,800 | 33,076 | 0.8% |
| Nippon Telegraph & Telephone Corp. | 719,200 | 25,333 | 0.6% |
| Mizuho Financial Group Inc. | 12,554,700 | 23,485 | 0.6% |
| Japan—Other † | | 316,171 | 7.6% |
| | | 398,065 | 9.6% |
| |
| Luxembourg † | | 446 | 0.0% |
| Malaysia † | | 6,201 | 0.2% |
| Mexico † | | 23,115 | 0.6% |
| Netherlands | | | |
| Unilever NV | 640,695 | 25,682 | 0.6% |
| Netherlands—Other † | | 13,885 | 0.4% |
| | | 39,567 | 1.0% |
| |
| New Zealand † | | 1,333 | 0.0% |
| Norway † | | 36,955 | 0.9% |
| Other | | | |
| 1 Vanguard FTSE Emerging Markets ETF | 333,683 | 11,042 | 0.3% |
18
| | | |
| Global Equity Fund | | | |
| |
| |
| |
| | | Market | Percentage |
| | | Value• | of Net |
| | Shares | ($000) | Assets |
| Peru † | | 3,489 | 0.1% |
| |
| Philippines † | | 1,597 | 0.0% |
| |
| Poland † | | 4,791 | 0.1% |
| |
| Qatar † | | 1,529 | 0.0% |
| |
| Russia † | | 15,415 | 0.4% |
| |
| Singapore † | | 21,949 | 0.5% |
| |
| South Africa | | | |
| Naspers Ltd. | 308,167 | 38,622 | 0.9% |
| South Africa—Other † | | 17,265 | 0.4% |
| | | 55,887 | 1.3% |
| South Korea | | | |
| Samsung Electronics Co. Ltd. | 32,226 | 30,919 | 0.7% |
| Samsung Electronics Co. Ltd. GDR | 35,004 | 16,554 | 0.4% |
| South Korea—Other † | | 47,945 | 1.2% |
| | | 95,418 | 2.3% |
| |
| Spain † | | 21,165 | 0.5% |
| |
| Sweden | | | |
| * Svenska Handelsbanken AB Class A | 1,870,215 | 26,828 | 0.6% |
| Sweden—Other † | | 32,592 | 0.8% |
| | | 59,420 | 1.4% |
| Switzerland | | | |
| Nestle SA | 752,918 | 56,624 | 1.4% |
| Switzerland—Other † | | 58,712 | 1.4% |
| | | 115,336 | 2.8% |
| Taiwan | | | |
| Taiwan Semiconductor Manufacturing Co. Ltd. ADR | 2,202,258 | 45,697 | 1.1% |
| Hon Hai Precision Industry Co. Ltd. | 10,135,198 | 26,478 | 0.6% |
| Fubon Financial Holding Co. Ltd. | 13,176,279 | 20,627 | 0.5% |
| Taiwan Semiconductor Manufacturing Co. Ltd. | 1,641,577 | 6,579 | 0.2% |
| Taiwan—Other † | | 22,946 | 0.6% |
| | | 122,327 | 3.0% |
| |
| Thailand † | | 3,658 | 0.1% |
| |
| Turkey † | | 2,444 | 0.1% |
| |
| United Kingdom | | | |
| Prudential plc | 2,315,346 | 48,846 | 1.2% |
| Reckitt Benckiser Group plc | 283,207 | 25,683 | 0.6% |
| Royal Dutch Shell plc Class A | 876,601 | 20,793 | 0.5% |
| Wolseley plc | 338,620 | 19,807 | 0.5% |
| 2 United Kingdom—Other † | | 159,567 | 3.8% |
| | | 274,696 | 6.6% |
19
| | | |
| Global Equity Fund | | | |
| |
| |
| |
| | | Market | Percentage |
| | | Value• | of Net |
| | Shares | ($000) | Assets |
| United States | | | |
| Consumer Discretionary | | | |
| Royal Caribbean Cruises Ltd. | 658,826 | 58,695 | 1.4% |
| * Amazon.com Inc. | 84,840 | 43,429 | 1.0% |
| Harley-Davidson Inc. | 417,058 | 22,896 | 0.6% |
| Cablevision Systems Corp. Class A | 632,390 | 20,534 | 0.5% |
| * CarMax Inc. | 336,884 | 19,984 | 0.5% |
| Consumer Discretionary—Other † | | 112,902 | 2.7% |
| | | 278,440 | 6.7% |
| Consumer Staples | | | |
| Colgate-Palmolive Co. | 590,484 | 37,472 | 0.9% |
| Procter & Gamble Co. | 322,939 | 23,232 | 0.6% |
| Consumer Staples—Other † | | 104,250 | 2.5% |
| | | 164,954 | 4.0% |
| Energy | | | |
| Valero Energy Corp. | 343,312 | 20,633 | 0.5% |
| Energy—Other † | | 102,081 | 2.5% |
| | | 122,714 | 3.0% |
| Financials | | | |
| Wells Fargo & Co. | 924,646 | 47,481 | 1.2% |
| Travelers Cos. Inc. | 351,387 | 34,974 | 0.8% |
| * Berkshire Hathaway Inc. Class B | 264,865 | 34,538 | 0.8% |
| M&T Bank Corp. | 232,922 | 28,405 | 0.7% |
| * Markel Corp. | 34,295 | 27,500 | 0.7% |
| First Republic Bank | 432,147 | 27,126 | 0.7% |
| TD Ameritrade Holding Corp. | 806,950 | 25,693 | 0.6% |
| Voya Financial Inc. | 563,534 | 21,848 | 0.5% |
| Moody’s Corp. | 214,299 | 21,044 | 0.5% |
| US Bancorp | 504,176 | 20,676 | 0.5% |
| Financials—Other † | | 141,382 | 3.4% |
| | | 430,667 | 10.4% |
| Health Care | | | |
| Anthem Inc. | 376,549 | 52,717 | 1.3% |
| Johnson & Johnson | 305,500 | 28,519 | 0.7% |
| * Waters Corp. | 233,889 | 27,648 | 0.6% |
| Health Care—Other † | | 201,691 | 4.9% |
| | | 310,575 | 7.5% |
| Industrials | | | |
| Alaska Air Group Inc. | 311,258 | 24,729 | 0.6% |
| * JetBlue Airways Corp. | 855,128 | 22,037 | 0.5% |
| Industrials—Other † | | 97,053 | 2.4% |
| | | 143,819 | 3.5% |
| Information Technology | | | |
| * Google Inc. Class C | 52,388 | 31,874 | 0.8% |
| Computer Sciences Corp. | 421,523 | 25,873 | 0.6% |
| Visa Inc. Class A | 279,016 | 19,436 | 0.4% |
| Information Technology—Other † | | 384,469 | 9.3% |
| | | 461,652 | 11.1% |
| Materials | | | |
| Praxair Inc. | 278,616 | 28,380 | 0.7% |
| Materials—Other † | | 39,522 | 0.9% |
| | | 67,902 | 1.6% |
20
| | | | |
| Global Equity Fund | | | | |
| |
| |
| | | | Market | Percentage |
| | | | Value• | of Net |
| | | | ($000) | Assets |
| Other † | | | — | 0.0% |
| |
| Telecommunication Services † | | | 3,106 | 0.1% |
| |
| Utilities † | | | 3,622 | 0.1% |
| | | | 1,987,451 | 48.0% |
| Total Common Stocks (Cost $3,774,793) | | | 3,989,596 | 96.3%3 |
| |
| | Coupon | Shares | | |
| Temporary Cash Investments | | | | |
| Money Market Fund | | | | |
| 4,5 Vanguard Market Liquidity Fund | 0.189% | 170,221,907 | 170,222 | 4.1% |
| |
| 6U.S. Government and Agency Obligations † | | | 10,199 | 0.2% |
| Total Temporary Cash Investments (Cost $180,420) | | | 180,421 | 4.3%3 |
| Total Investments (Cost $3,955,213) | | | 4,170,017 | 100.6% |
| |
| | | | Amount | |
| | | | ($000) | |
| Other Assets and Liabilities | | | | |
| Other Assets | | | | |
| Investment in Vanguard | | | 386 | |
| Receivables for Investment Securities Sold | | | 44,628 | |
| Receivables for Accrued Income | | | 15,426 | |
| Receivables for Capital Shares Issued | | | 3,284 | |
| Other Assets | | | 17,827 | |
| Total Other Assets | | | 81,551 | 2.0% |
| Liabilities | | | | |
| Payables for Investment Securities Purchased | | | (47,362) | |
| Collateral for Securities on Loan | | | (44,824) | |
| Payables to Investment Advisor | | | (3,611) | |
| Payables for Capital Shares Redeemed | | | (1,805) | |
| Payables to Vanguard | | | (8,089) | |
| Other Liabilities | | | (2,376) | |
| Total Liabilities | | | (108,067) | (2.6%) |
| Net Assets | | | 4,143,501 | 100.0% |
| |
| Net Assets | | | | |
| Applicable to 181,342,998 outstanding $.001 par value shares of | | | |
| beneficial interest (unlimited authorization) | | | | 4,143,501 |
| Net Asset Value Per Share | | | | $22.85 |
21
| |
| Global Equity Fund | |
| |
| |
| |
| At September 30, 2015, net assets consisted of: | |
| | Amount |
| | ($000) |
| Paid-in Capital | 4,256,530 |
| Undistributed Net Investment Income | 42,018 |
| Accumulated Net Realized Losses | (367,595) |
| Unrealized Appreciation (Depreciation) | |
| Investment Securities | 214,804 |
| Futures Contracts | (1,502) |
| Forward Currency Contracts | (370) |
| Foreign Currencies | (384) |
| Net Assets | 4,143,501 |
• See Note A in Notes to Financial Statements.
^ Includes partial security positions on loan to broker-dealers. The total value of securities on loan is $42,484,000.
* Non-income-producing security.
† Represents the aggregate value, by category, of securities that are not among the 50 largest holdings and, in total for any issuer, represent 1% or less of net assets.
1 Considered an affiliated company of the fund as the issuer is another member of The Vanguard Group.
2 Certain of the fund’s securities are exempt from registration under Rule 144A of the Securities Act of 1933. Such securities may be sold in transactions exempt from registration, normally to qualified institutional buyers. At September 30, 2015, the aggregate value of these securities was $2,712,000, representing 0.1% of net assets.
3 The fund invests a portion of its cash reserves in equity markets through the use of index futures contracts. After giving effect to futures investments, the fund’s effective common stock and temporary cash investment positions represent 98.3% and 2.3%, respectively, of net assets.
4 Affiliated money market fund available only to Vanguard funds and certain trusts and accounts managed by Vanguard. Rate shown is the 7-day yield.
5 Includes $44,824,000 of collateral received for securities on loan.
6 Securities with a value of $5,599,000 have been segregated as initial margin for open futures contracts.
ADR—American Depositary Receipt.
GDR—Global Depositary Receipt.
See accompanying Notes, which are an integral part of the Financial Statements.
22
| |
| Global Equity Fund | |
| |
| |
| Statement of Operations | |
| |
| | Year Ended |
| | September 30, 2015 |
| | ($000) |
| Investment Income | |
| Income | |
| Dividends1,2 | 90,400 |
| Interest2 | 200 |
| Securities Lending | 2,613 |
| Total Income | 93,213 |
| Expenses | |
| Investment Advisory Fees—Note B | |
| Basic Fee | 10,929 |
| Performance Adjustment | 3,612 |
| The Vanguard Group—Note C | |
| Management and Administrative | 9,963 |
| Marketing and Distribution | 723 |
| Custodian Fees | 498 |
| Auditing Fees | 45 |
| Shareholders’ Reports | 61 |
| Trustees’ Fees and Expenses | 9 |
| Total Expenses | 25,840 |
| Net Investment Income | 67,373 |
| Realized Net Gain (Loss) | |
| Investment Securities Sold2 | 244,020 |
| Futures Contracts | 159 |
| Foreign Currencies and Forward Currency Contracts | (6,951) |
| Realized Net Gain (Loss) | 237,228 |
| Change in Unrealized Appreciation (Depreciation) | |
| Investment Securities | (475,107) |
| Futures Contracts | (1,106) |
| Foreign Currencies and Forward Currency Contracts | 842 |
| Change in Unrealized Appreciation (Depreciation) | (475,371) |
| Net Increase (Decrease) in Net Assets Resulting from Operations | (170,770) |
1 Dividends are net of foreign withholding taxes of $3,467,000.
2 Dividend income, interest income, and realized net gain (loss) from affiliated companies of the fund were $183,000, $194,000, and ($278,000), respectively.
See accompanying Notes, which are an integral part of the Financial Statements.
23
| | |
| Global Equity Fund | | |
| |
| |
| Statement of Changes in Net Assets | | |
| |
| | Year Ended September 30, |
| | 2015 | 2014 |
| | ($000) | ($000) |
| Increase (Decrease) in Net Assets | | |
| Operations | | |
| Net Investment Income | 67,373 | 67,559 |
| Realized Net Gain (Loss) | 237,228 | 482,349 |
| Change in Unrealized Appreciation (Depreciation) | (475,371) | (26,154) |
| Net Increase (Decrease) in Net Assets Resulting from Operations | (170,770) | 523,754 |
| Distributions | | |
| Net Investment Income | (69,095) | (72,177) |
| Realized Capital Gain | — | — |
| Total Distributions | (69,095) | (72,177) |
| Capital Share Transactions | | |
| Issued | 435,287 | 464,225 |
| Issued in Lieu of Cash Distributions | 65,332 | 68,763 |
| Redeemed | (648,717) | (951,643) |
| Net Increase (Decrease) from Capital Share Transactions | (148,098) | (418,655) |
| Total Increase (Decrease) | (387,963) | 32,922 |
| Net Assets | | |
| Beginning of Period | 4,531,464 | 4,498,542 |
| End of Period1 | 4,143,501 | 4,531,464 |
1 Net Assets—End of Period includes undistributed (overdistributed) net investment income of $42,018,000 and $43,277,000.
See accompanying Notes, which are an integral part of the Financial Statements.
24
| | | | | |
| Global Equity Fund | | | | | |
| |
| |
| Financial Highlights | | | | | |
| |
| |
| For a Share Outstanding | | | Year Ended September 30, |
| Throughout Each Period | 2015 | 2014 | 2013 | 2012 | 2011 |
| Net Asset Value, Beginning of Period | $24.19 | $21.94 | $18.21 | $15.24 | $16.74 |
| Investment Operations | | | | | |
| Net Investment Income | . 373 | .353 | .342 | .320 | .3451 |
| Net Realized and Unrealized Gain (Loss) | | | | | |
| on Investments | (1.338) | 2.255 | 3.730 | 3.012 | (1.525) |
| Total from Investment Operations | (.965) | 2.608 | 4.072 | 3.332 | (1.180) |
| Distributions | | | | | |
| Dividends from Net Investment Income | (.375) | (. 358) | (.342) | (. 362) | (. 320) |
| Distributions from Realized Capital Gains | — | — | — | — | — |
| Total Distributions | (.375) | (. 358) | (.342) | (. 362) | (. 320) |
| Net Asset Value, End of Period | $22.85 | $24.19 | $21.94 | $18.21 | $15.24 |
| |
| Total Return2 | -4.09% | 11.95% | 22.72% | 22.20% | -7.31% |
| |
| Ratios/Supplemental Data | | | | | |
| Net Assets, End of Period (Millions) | $4,144 | $4,531 | $4,499 | $3,853 | $3,330 |
| Ratio of Total Expenses to Average Net Assets3 | 0.57% | 0.61% | 0.61% | 0.57% | 0.54% |
| Ratio of Net Investment Income to | | | | | |
| Average Net Assets | 1.49% | 1.45% | 1.69% | 1.82% | 1.92% |
| Portfolio Turnover Rate | 36% | 45% | 70% | 67% | 44% |
1 Calculated based on average shares outstanding.
2 Total returns do not include account service fees that may have applied in the periods shown. Fund prospectuses provide information about any applicable account service fees.
3 Includes performance-based investment advisory fee increases (decreases) of 0.08%, 0.08%, 0.07%, 0.02%, and (0.02%).
See accompanying Notes, which are an integral part of the Financial Statements.
25
Global Equity Fund
Notes to Financial Statements
Vanguard Global Equity Fund is registered under the Investment Company Act of 1940 as an open-end investment company, or mutual fund. The fund invests in securities of foreign issuers, which may subject it to investment risks not normally associated with investing in securities of U.S. corporations.
A. The following significant accounting policies conform to generally accepted accounting principles for U.S. investment companies. The fund consistently follows such policies in preparing its financial statements.
1. Security Valuation: Securities are valued as of the close of trading on the New York Stock Exchange (generally 4 p.m., Eastern time) on the valuation date. Equity securities are valued at the latest quoted sales prices or official closing prices taken from the primary market in which each security trades; such securities not traded on the valuation date are valued at the mean of the latest quoted bid and asked prices. Bonds, and temporary cash investments acquired over 60 days to maturity, are valued using the latest bid prices or using valuations based on a matrix system (which considers such factors as security prices, yields, maturities, and ratings), both as furnished by independent pricing services. Investments in Vanguard Market Liquidity Fund are valued at that fund’s net asset value. Other temporary cash investments are valued at amortized cost, which approximates market value. Securities for which market quotations are not readily available, or whose values have been affected by events occurring before the fund’s pricing time but after the close of the securities’ primary markets, are valued at their fair values calculated according to procedures adopted by the board of trustees. These procedures include obtaining quotations from an independent pricing service, monitoring news to identify significant market- or security-specific events, and evaluating changes in the values of foreign market proxies (for example, ADRs, futures contracts, or exchange-traded funds), between the time the foreign markets close and the fund’s pricing time. When fair-value pricing is employed, the prices of securities used by a fund to calculate its net asset value may differ from quoted or published prices for the same securities.
2. Foreign Currency: Securities and other assets and liabilities denominated in foreign currencies are translated into U.S. dollars using exchange rates obtained from an independent third party as of the fund’s pricing time on the valuation date. Realized gains (losses) and unrealized appreciation (depreciation) on investment securities include the effects of changes in exchange rates since the securities were purchased, combined with the effects of changes in security prices. Fluctuations in the value of other assets and liabilities resulting from changes in exchange rates are recorded as unrealized foreign currency gains (losses) until the assets or liabilities are settled in cash, at which time they are recorded as realized foreign currency gains (losses).
3. Futures and Forward Currency Contracts: The fund uses index futures contracts to a limited extent, with the objective of maintaining full exposure to the stock market while maintaining liquidity. The fund may purchase or sell futures contracts to achieve a desired level of investment, whether to accommodate portfolio turnover or cash flows from capital share transactions. The primary risks associated with the use of futures contracts are imperfect correlation between changes in market values of stocks held by the fund and the prices of futures contracts, and the possibility of an illiquid market. Counterparty risk involving futures is mitigated because a regulated clearinghouse is the counterparty instead of the clearing broker. To further mitigate counterparty risk, the fund trades futures contracts on an exchange, monitors the financial strength of its clearing brokers and clearing-house, and has entered into clearing agreements with its clearing brokers. The clearinghouse imposes initial margin requirements to secure the fund’s performance and requires daily settlement of variation margin representing changes in the market value of each contract.
26
Global Equity Fund
The fund enters into forward currency contracts to provide the appropriate currency exposure related to any open futures contracts or to protect the value of securities and related receivables and payables against changes in foreign exchange rates. The fund’s risks in using these contracts include movement in the values of the foreign currencies relative to the U.S. dollar and the ability of the counterparties to fulfill their obligations under the contracts. The fund mitigates its counterparty risk by entering into forward currency contracts only with a diverse group of prequalified counter-parties, monitoring their financial strength, entering into master netting arrangements with its counterparties, and requiring its counterparties to transfer collateral as security for their performance. The master netting arrangements provide that, in the event of a counterparty’s default (including bankruptcy), the fund may terminate the forward currency contracts, determine the net amount owed by either party in accordance with its master netting arrangements, and sell or retain any collateral held up to the net amount owed to the fund under the master netting arrangements. The forward currency contracts contain provisions whereby a counterparty may terminate open contracts if the fund’s net assets decline below a certain level, triggering a payment by the fund if the fund is in a net liability position at the time of the termination. The payment amount would be reduced by any collateral the fund has pledged. Any assets pledged as collateral for open contracts are noted in the Statement of Net Assets. The value of collateral received or pledged is compared daily to the value of the forward currency contracts exposure with each counterparty, and any difference, if in excess of a specified minimum transfer amount, is adjusted and settled within two business days.
Futures contracts are valued at their quoted daily settlement prices. Forward currency contracts are valued at their quoted daily prices obtained from an independent third party, adjusted for currency risk based on the expiration date of each contract. The aggregate settlement values and notional amounts of the contracts are not recorded in the Statement of Net Assets. Fluctuations in the value of the contracts are recorded in the Statement of Net Assets as an asset (liability) and in the Statement of Operations as unrealized appreciation (depreciation) until the contracts are closed, when they are recorded as realized gains (losses) on futures or forward currency contracts.
During the year ended September 30, 2015, the fund’s average investments in long and short futures contracts represented 2% and 0% of net assets, respectively, based on the average of aggregate settlement values at each quarter-end during the period. The fund’s average investment in forward currency contracts represented less than 1% of net assets, based on the average of notional amounts at each quarter-end during the period.
4. Federal Income Taxes: The fund intends to continue to qualify as a regulated investment company and distribute all of its taxable income. Management has analyzed the fund’s tax positions taken for all open federal income tax years (September 30, 2012–2015), and has concluded that no provision for federal income tax is required in the fund’s financial statements.
5. Distributions: Distributions to shareholders are recorded on the ex-dividend date.
6. Securities Lending: To earn additional income, the fund lends its securities to qualified institutional borrowers. Security loans are required to be secured at all times by collateral in an amount at least equal to the market value of securities loaned. Daily market fluctuations could cause the value of loaned securities to be more or less than the value of the collateral received. When this occurs, the collateral is adjusted and settled on the next business day. The fund further mitigates its counterparty risk by entering into securities lending transactions only with a diverse group of prequalified counter-parties, monitoring their financial strength, and entering into master securities lending agreements
27
Global Equity Fund
with its counterparties. The master securities lending agreements provide that, in the event of a counterparty’s default (including bankruptcy), the fund may terminate any loans with that borrower, determine the net amount owed, and sell or retain the collateral up to the net amount owed to the fund; however, such actions may be subject to legal proceedings. While collateral mitigates counterparty risk, in the absence of a default the fund may experience delays and costs in recovering the securities loaned. The fund invests cash collateral received in Vanguard Market Liquidity Fund, and records a liability in the Statement of Net Assets for the return of the collateral, during the period the securities are on loan. Securities lending income represents fees charged to borrowers plus income earned on invested cash collateral, less expenses associated with the loan.
7. Credit Facility: The fund and certain other funds managed by The Vanguard Group (“Vanguard”) participate in a $3 billion committed credit facility provided by a syndicate of lenders pursuant to a credit agreement that may be renewed annually; each fund is individually liable for its borrowings, if any, under the credit facility. Borrowings may be utilized for temporary and emergency purposes, and are subject to the fund’s regulatory and contractual borrowing restrictions. The participating funds are charged administrative fees and an annual commitment fee of 0.06% of the undrawn amount of the facility; these fees are allocated to the funds based on a method approved by the fund’s board of trustees and included in Management and Administrative expenses on the fund’s Statement of Operations. Any borrowings under this facility bear interest at a rate equal to the higher of the federal funds rate or LIBOR reference rate plus an agreed-upon spread.
The fund had no borrowings outstanding at September 30, 2015, or at any time during the period then ended.
8. Other: Dividend income is recorded on the ex-dividend date. Interest income includes income distributions received from Vanguard Market Liquidity Fund and is accrued daily. Premiums and discounts on debt securities purchased are amortized and accreted, respectively, to interest income over the lives of the respective securities. Security transactions are accounted for on the date securities are bought or sold. Costs used to determine realized gains (losses) on the sale of investment securities are those of the specific securities sold.
B. The investment advisory firms Baillie Gifford Overseas Ltd., Marathon Asset Management LLP, and Acadian Asset Management LLC each provide investment advisory services to a portion of the fund for a fee calculated at an annual percentage rate of average net assets managed by the advisor. The basic fees of Baillie Gifford Overseas Ltd., Marathon Asset Management LLP, and Acadian Asset Management LLC are subject to quarterly adjustments based on performance relative to the MSCI All Country World Index for the preceding three years.
Vanguard manages the cash reserves of the fund as described below.
For the year ended September 30, 2015, the aggregate investment advisory fee represented an effective annual basic rate of 0.24% of the fund’s average net assets, before an increase of $3,612,000 (0.08%) based on performance.
C. In accordance with the terms of a Funds’ Service Agreement (the “FSA”) between Vanguard and the fund, Vanguard furnishes to the fund corporate management, administrative, marketing, distribution and cash management services at Vanguard’s cost of operations (as defined by the FSA). These costs of operations are allocated to the fund based on methods and guidelines approved by the board of trustees. Vanguard does not require reimbursement in the current period for certain costs of operations (such as deferred compensation/benefits and risk/insurance costs); the fund’s liability for these costs of operations is included in Payables to Vanguard on the Statement of Net Assets.
28
Global Equity Fund
Upon the request of Vanguard, the fund may invest up to 0.40% of its net assets as capital in Vanguard. At September 30, 2015, the fund had contributed to Vanguard capital in the amount of $386,000, representing 0.01% of the fund’s net assets and 0.15% of Vanguard’s capitalization. The fund’s trustees and officers are also directors and employees, respectively, of Vanguard.
D. Various inputs may be used to determine the value of the fund’s investments. These inputs are summarized in three broad levels for financial statement purposes. The inputs or methodologies used to value securities are not necessarily an indication of the risk associated with investing in those securities.
Level 1—Quoted prices in active markets for identical securities.
Level 2—Other significant observable inputs (including quoted prices for similar securities, interest rates, prepayment speeds, credit risk, etc.).
Level 3—Significant unobservable inputs (including the fund’s own assumptions used to determine the fair value of investments).
The following table summarizes the market value of the fund’s investments as of September 30, 2015, based on the inputs used to value them:
| | | |
| | Level 1 | Level 2 | Level 3 |
| Investments | ($000) | ($000) | ($000) |
| Common Stocks—International | 370,810 | 1,631,335 | — |
| Common Stocks—United States | 1,987,451 | — | — |
| Temporary Cash Investments | 170,222 | 10,199 | — |
| Futures Contracts—Assets1 | 1,626 | — | — |
| Forward Currency Contracts—Liabilities | — | (370) | — |
| Total | 2,530,109 | 1,641,164 | — |
| 1 Represents variation margin on the last day of the reporting period. |
E. At September 30, 2015, the fair values of derivatives were reflected in the Statement of Net Assets as follows:
| | | |
| | | Foreign | |
| | Equity | Exchange | |
| | Contracts | Contracts | Total |
| Statement of Net Assets Caption | ($000) | ($000) | ($000) |
| Other Assets | 1,626 | — | 1,626 |
| Liabilities | — | (370) | (370) |
29
Global Equity Fund
Realized net gain (loss) and the change in unrealized appreciation (depreciation) on derivatives for the year ended September 30, 2015, were:
| | | |
| | | Foreign | |
| | Equity | Exchange | |
| | Contracts | Contracts | Total |
| Realized Net Gain (Loss) on Derivatives | ($000) | ($000) | ($000) |
| Futures Contracts | 159 | — | 159 |
| Forward Currency Contracts | — | (3,943) | (3,943) |
| Realized Net Gain (Loss) on Derivatives | 159 | (3,943) | (3,784) |
| |
| Change in Unrealized Appreciation (Depreciation) on Derivatives | | | |
| Futures Contracts | (1,106) | — | (1,106) |
| Forward Currency Contracts | — | 322 | 322 |
| Change in Unrealized Appreciation (Depreciation) on Derivatives | (1,106) | 322 | (784) |
At September 30, 2015, the aggregate settlement value of open futures contracts and the related unrealized appreciation (depreciation) were:
| | | | |
| | | | | ($000) |
| | | | Aggregate | |
| | | Number of | Settlement | Unrealized |
| | | Long (Short) | Value | Appreciation |
| Futures Contracts | Expiration | Contracts | Long (Short) | (Depreciation) |
| S&P 500 Index | December 2015 | 70 | 33,402 | (620) |
| E-mini S&P MidCap 400 Index | December 2015 | 118 | 16,082 | (428) |
| Dow Jones EURO STOXX 50 Index | December 2015 | 363 | 12,525 | (348) |
| FTSE 100 Index | December 2015 | 108 | 9,846 | (5) |
| Topix Index | December 2015 | 78 | 9,193 | (101) |
| S&P ASX 200 Index | December 2015 | 49 | 4,307 | — |
| | | | | (1,502) |
Unrealized appreciation (depreciation) on open S&P 500 Index, E-mini S&P MidCap 400 Index, Dow Jones EURO STOXX 50 Index, and FTSE 100 Index futures contracts is required to be treated as realized gain (loss) for tax purposes.
30
Global Equity Fund
At September 30, 2015, the fund had open forward currency contracts to receive and deliver currencies as follows. Unrealized appreciation (depreciation) on open forward currency contracts is treated as realized gain (loss) for tax purposes.
| | | | | | |
| | | | | | | Unrealized |
| | Contract | | | | | Appreciation |
| | Settlement | | Contract Amount (000) | (Depreciation) |
| Counterparty | Date | | Receive | | Deliver | ($000) |
| BNP Paribas | 12/23/15 | EUR | 11,545 | USD | 13,049 | (129) |
| BNP Paribas | 12/23/15 | GBP | 6,506 | USD | 10,004 | (165) |
| Bank of America, N.A. | 12/15/15 | JPY | 1,113,457 | USD | 9,311 | (16) |
| BNP Paribas | 12/22/15 | AUD | 6,137 | USD | 4,348 | (60) |
| | | | | | | (370) |
| AUD—Australian dollar. | | | | | | |
| EUR—Euro. | | | | | | |
| GBP—British pound. | | | | | | |
| JPY—Japanese yen. | | | | | | |
| USD—U.S. dollar. | | | | | | |
F. Distributions are determined on a tax basis and may differ from net investment income and realized capital gains for financial reporting purposes. Differences may be permanent or temporary. Permanent differences are reclassified among capital accounts in the financial statements to reflect their tax character. Temporary differences arise when certain items of income, expense, gain, or loss are recognized in different periods for financial statement and tax purposes. These differences will reverse at some time in the future. Differences in classification may also result from the treatment of short-term gains as ordinary income for tax purposes.
During the year ended September 30, 2015, the fund realized net foreign currency losses of $3,008,000, which decreased distributable net income for tax purposes; accordingly, such losses have been reclassified from accumulated net realized losses to undistributed net investment income. Certain of the fund’s investments are in securities considered to be passive foreign investment companies, for which any unrealized appreciation and/or realized gains are required to be included in distributable net income for tax purposes. During the year ended September 30, 2015, the fund realized gains on the sale of passive foreign investment companies of $3,547,000, which have been included in current and prior periods’ taxable income; accordingly, such gains have been reclassified from accumulated net realized losses to undistributed net investment income. Passive foreign investment companies held at September 30, 2015, had unrealized appreciation of $7,270,000, all of which has been distributed and is reflected in the balance of undistributed net investment income.
The fund realized gains on the sale of securities that were subject to capital gains tax in certain foreign countries. Capital gains taxes reduce realized gains for financial statement purposes but are treated as an expense for tax purposes. Accordingly, $76,000 of capital gains tax has been reclassified from accumulated net realized losses to undistributed net investment income.
31
Global Equity Fund
For tax purposes, at September 30, 2015, the fund had $58,070,000 of ordinary income available for distribution. The fund used capital loss carryforwards of $262,668,000 to offset taxable capital gains realized during the year ended September 30, 2015. At September 30, 2015, the fund had available capital losses totaling $369,785,000 to offset future net capital gains. Of this amount, $343,681,000 is subject to expiration on September 30, 2018. Capital losses of $26,104,000 realized beginning in fiscal 2012 may be carried forward indefinitely under the Regulated Investment Company Modernization Act of 2010, but must be used before any expiring loss carryforwards.
At September 30, 2015, the cost of investment securities for tax purposes was $3,963,021,000. Net unrealized appreciation of investment securities for tax purposes was $206,996,000, consisting of unrealized gains of $608,618,000 on securities that had risen in value since their purchase and $401,622,000 in unrealized losses on securities that had fallen in value since their purchase.
G. During the year ended September 30, 2015, the fund purchased $1,562,987,000 of investment securities and sold $1,742,957,000 of investment securities, other than temporary cash investments.
H. Capital shares issued and redeemed were:
| | |
| | Year Ended September 30, |
| | 2015 | 2014 |
| | Shares | Shares |
| | (000) | (000) |
| Issued | 17,696 | 19,482 |
| Issued in Lieu of Cash Distributions | 2,678 | 2,958 |
| Redeemed | (26,391) | (40,101) |
| Net Increase (Decrease) in Shares Outstanding | (6,017) | (17,661) |
I. Management has determined that no material events or transactions occurred subsequent to September 30, 2015, that would require recognition or disclosure in these financial statements.
32
Report of Independent Registered Public Accounting Firm
To the Board of Trustees of Vanguard Horizon Funds and the Shareholders of Vanguard Global Equity Fund: In our opinion, the accompanying statement of net assets—investment summary and the related statements of operations and of changes in net assets and the financial highlights present fairly, in all material respects, the financial position of Vanguard Global Equity Fund (constituting a separate portfolio of Vanguard Horizon Funds, hereafter referred to as the “Fund”) at September 30, 2015, the results of its operations for the year then ended, the changes in its net assets for each of the two years in the period then ended, and the financial highlights for each of the five years in the period then ended, in conformity with accounting principles generally accepted in the United States of America. These financial statements and financial highlights (hereafter referred to as “financial statements”) are the responsibility of the Fund’s management. Our responsibility is to express an opinion on these financial statements based on our audits. We conducted our audits of these financial statements in accordance with the standards of the Public Company Accounting Oversight Board (United States). Those standards require that we plan and perform the audit to obtain reasonable assurance about whether the financial statements are free of material misstatement. An audit includes examining, on a test basis, evidence supporting the amounts and disclosures in the financial statements, assessing the accounting principles used and significant estimates made by management, and evaluating the overall financial statement presentation. We believe that our audits, which included confirmation of securities at September 30, 2015 by correspondence with the custodian and brokers, by agreement to the underlying ownership records of the transfer agent and the application of alternative auditing procedures where securities purchased had not been received, provide a reasonable basis for our opinion.
/s/PricewaterhouseCoopers LLP
Philadelphia, Pennsylvania
November 16, 2015
| |
| |
| Special 2015 tax information (unaudited) for Vanguard Global Equity Fund |
| |
| This information for the fiscal year ended September 30, 2015, is included pursuant to provisions |
| of the Internal Revenue Code. |
| |
| The fund distributed $63,374,000 of qualified dividend income to shareholders during the fiscal year. |
| |
| For corporate shareholders, 52.4% of investment income (dividend income plus short-term gains, |
| if any) qualifies for the dividends-received deduction. |
| |
| The fund designates to shareholders foreign source income of $48,703,000 and foreign taxes paid |
| of $3,474,000. Shareholders will receive more detailed information with their Form 1099-DIV in |
| January 2016 to determine the calendar-year amounts to be included on their 2015 tax returns. |
33
Your Fund’s After-Tax Returns
This table presents returns for your fund both before and after taxes. The after-tax returns are shown in two ways: (1) assuming that an investor owned the fund during the entire period and paid taxes on the fund’s distributions, and (2) assuming that an investor paid taxes on the fund’s distributions and sold all shares at the end of each period.
Calculations are based on the highest individual federal income tax and capital gains tax rates in effect at the times of the distributions and the hypothetical sales. State and local taxes were not considered. After-tax returns reflect any qualified dividend income, using actual prior-year figures and estimates for 2015. (In the example, returns after the sale of fund shares may be higher than those assuming no sale. This occurs when the sale would have produced a capital loss. The calculation assumes that the investor received a tax deduction for the loss.)
Please note that your actual after-tax returns will depend on your tax situation and may differ from those shown. Also note that if you own the fund in a tax-deferred account, such as an individual retirement account or a 401(k) plan, this information does not apply to you. Such accounts are not subject to current taxes.
Finally, keep in mind that a fund’s performance—whether before or after taxes—does not guarantee future results.
| | | |
| Average Annual Total Returns: Global Equity Fund | | | |
| Periods Ended September 30, 2015 | | | |
| | One | Five | Ten |
| | Year | Years | Years |
| Returns Before Taxes | -4.09% | 8.34% | 4.80% |
| Returns After Taxes on Distributions | -4.42 | 8.00 | 4.18 |
| Returns After Taxes on Distributions and Sale of Fund Shares | -1.98 | 6.64 | 3.82 |
34
About Your Fund’s Expenses
As a shareholder of the fund, you incur ongoing costs, which include costs for portfolio management, administrative services, and shareholder reports (like this one), among others. Operating expenses, which are deducted from a fund’s gross income, directly reduce the investment return of the fund.
A fund’s expenses are expressed as a percentage of its average net assets. This figure is known as the expense ratio. The following examples are intended to help you understand the ongoing costs (in dollars) of investing in your fund and to compare these costs with those of other mutual funds. The examples are based on an investment of $1,000 made at the beginning of the period shown and held for the entire period.
The accompanying table illustrates your fund’s costs in two ways:
• Based on actual fund return. This section helps you to estimate the actual expenses that you paid over the period. The ”Ending Account Value“ shown is derived from the fund‘s actual return, and the third column shows the dollar amount that would have been paid by an investor who started with $1,000 in the fund. You may use the information here, together with the amount you invested, to estimate the expenses that you paid over the period.
To do so, simply divide your account value by $1,000 (for example, an $8,600 account value divided by $1,000 = 8.6), then multiply the result by the number given for your fund under the heading ”Expenses Paid During Period.“
• Based on hypothetical 5% yearly return. This section is intended to help you compare your fund‘s costs with those of other mutual funds. It assumes that the fund had a yearly return of 5% before expenses, but that the expense ratio is unchanged. In this case—because the return used is not the fund’s actual return—the results do not apply to your investment. The example is useful in making comparisons because the Securities and Exchange Commission requires all mutual funds to calculate expenses based on a 5% return. You can assess your fund’s costs by comparing this hypothetical example with the hypothetical examples that appear in shareholder reports of other funds.
Note that the expenses shown in the table are meant to highlight and help you compare ongoing costs only and do not reflect transaction costs incurred by the fund for buying and selling securities. Further, the expenses do not include any purchase, redemption, or account service fees described in the fund prospectus. If such fees were applied to your account, your costs would be higher. Your fund does not carry a “sales load.”
The calculations assume no shares were bought or sold during the period. Your actual costs may have been higher or lower, depending on the amount of your investment and the timing of any purchases or redemptions.
You can find more information about the fund’s expenses, including annual expense ratios, in the Financial Statements section of this report. For additional information on operating expenses and other shareholder costs, please refer to your fund’s current prospectus.
35
| | | |
| Six Months Ended September 30, 2015 | | | |
| | Beginning | Ending | Expenses |
| | Account Value | Account Value | Paid During |
| Global Equity Fund | 3/31/2015 | 9/30/2015 | Period |
| Based on Actual Fund Return | $1,000.00 | $913.63 | $2.59 |
| Based on Hypothetical 5% Yearly Return | 1,000.00 | 1,022.36 | 2.74 |
The calculations are based on expenses incurred in the most recent six-month period. The fund’s annualized six-month expense ratio for that period is 0.54%. The dollar amounts shown as “Expenses Paid” are equal to the annualized expense ratio multiplied by the average account value over the period, multiplied by the number of days in the most recent six-month period, then divided by the number of days in the most recent 12-month period (183/365).
36
Glossary
Beta. A measure of the magnitude of a fund’s past share-price fluctuations in relation to the ups and downs of a given market index. The index is assigned a beta of 1.00. Compared with a given index, a fund with a beta of 1.20 typically would have seen its share price rise or fall by 12% when the index rose or fell by 10%. For this report, beta is based on returns over the past 36 months for both the fund and the index. Note that a fund’s beta should be reviewed in conjunction with its R-squared (see definition). The lower the R-squared, the less correlation there is between the fund and the index, and the less reliable beta is as an indicator of volatility.
Dividend Yield. Dividend income earned by stocks, expressed as a percentage of the aggregate market value (or of net asset value, for a fund). The yield is determined by dividing the amount of the annual dividends by the aggregate value (or net asset value) at the end of the period. For a fund, the dividend yield is based solely on stock holdings and does not include any income produced by other investments.
Earnings Growth Rate. The average annual rate of growth in earnings over the past five years for the stocks now in a fund.
Equity Exposure. A measure that reflects a fund’s investments in stocks and stock futures. Any holdings in short-term reserves are excluded.
Expense Ratio. A fund’s total annual operating expenses expressed as a percentage of the fund’s average net assets. The expense ratio includes management and administrative expenses, but does not include the transaction costs of buying and selling portfolio securities.
Inception Date. The date on which the assets of a fund (or one of its share classes) are first invested in accordance with the fund’s investment objective. For funds with a subscription period, the inception date is the day after that period ends. Investment performance is measured from the inception date.
Median Market Cap. An indicator of the size of companies in which a fund invests; the midpoint of market capitalization (market price x shares outstanding) of a fund’s stocks, weighted by the proportion of the fund’s assets invested in each stock. Stocks representing half of the fund’s assets have market capitalizations above the median, and the rest are below it.
Price/Book Ratio. The share price of a stock divided by its net worth, or book value, per share. For a fund, the weighted average price/book ratio of the stocks it holds.
Price/Earnings Ratio. The ratio of a stock’s current price to its per-share earnings over the past year. For a fund, the weighted average P/E of the stocks it holds. P/E is an indicator of market expectations about corporate prospects; the higher the P/E, the greater the expectations for a company’s future growth.
R-Squared. A measure of how much of a fund’s past returns can be explained by the returns from the market in general, as measured by a given index. If a fund’s total returns were precisely synchronized with an index’s returns, its R-squared would be 1.00. If the fund’s returns bore no relationship to the index’s returns, its R-squared would be 0. For this report, R-squared is based on returns over the past 36 months for both the fund and the index.
37
Return on Equity. The annual average rate of return generated by a company during the past five years for each dollar of shareholder’s equity (net income divided by shareholder’s equity). For a fund, the weighted average return on equity for the companies whose stocks it holds.
Short-Term Reserves. The percentage of a fund invested in highly liquid, short-term securities that can be readily converted to cash.
Turnover Rate. An indication of the fund’s trading activity. Funds with high turnover rates incur higher transaction costs and may be more likely to distribute capital gains (which may be taxable to investors). The turnover rate excludes in-kind transactions, which have minimal impact on costs.
Benchmark Information
Spliced Global Equity Index: MSCI All Country World Index returns gross of taxes through March 31, 2007; MSCI All Country World Index returns net of withholding taxes thereafter.
38
This page intentionally left blank.
The People Who Govern Your Fund
The trustees of your mutual fund are there to see that the fund is operated and managed in your best interests since, as a shareholder, you are a part owner of the fund. Your fund’s trustees also serve on the board of directors of The Vanguard Group, Inc., which is owned by the Vanguard funds and provides services to them on an at-cost basis.
A majority of Vanguard’s board members are independent, meaning that they have no affiliation with Vanguard or the funds they oversee, apart from the sizable personal investments they have made as private individuals. The independent board members have distinguished backgrounds in business, academia, and public service. Each of the trustees and executive officers oversees 194 Vanguard funds.
The following table provides information for each trustee and executive officer of the fund. More information about the trustees is in the Statement of Additional Information, which can be obtained, without charge, by contacting Vanguard at 800-662-7447, or online at vanguard.com.
| |
| InterestedTrustee1 | Rajiv L. Gupta |
| | Born 1945. Trustee Since December 2001.2 Principal |
| F. William McNabb III | Occupation(s) During the Past Five Years and Other |
| Born 1957. Trustee Since July 2009. Chairman of | Experience: Chairman and Chief Executive Officer |
| the Board. Principal Occupation(s) During the Past | (retired 2009) and President (2006–2008) of |
| Five Years and Other Experience: Chairman of the | Rohm and Haas Co. (chemicals); Director of Tyco |
| Board of The Vanguard Group, Inc., and of each of | International PLC (diversified manufacturing and |
| the investment companies served by The Vanguard | services), Hewlett-Packard Co. (electronic computer |
| Group, since January 2010; Director of The Vanguard | manufacturing), and Delphi Automotive PLC |
| Group since 2008; Chief Executive Officer and | (automotive components); Senior Advisor at New |
| President of The Vanguard Group, and of each of | Mountain Capital. |
| the investment companies served by The Vanguard | |
| Group, since 2008; Director of Vanguard Marketing | Amy Gutmann |
| Corporation; Managing Director of The Vanguard | Born 1949. Trustee Since June 2006. Principal |
| Group (1995–2008). | Occupation(s) During the Past Five Years and |
| | Other Experience: President of the University of |
| IndependentTrustees | Pennsylvania; Christopher H. Browne Distinguished |
| | Professor of Political Science, School of Arts and |
| Emerson U. Fullwood | Sciences, and Professor of Communication, Annenberg |
| Born 1948. Trustee Since January 2008. Principal | School for Communication, with secondary faculty |
| Occupation(s) During the Past Five Years and | appointments in the Department of Philosophy, School |
| Other Experience: Executive Chief Staff and | of Arts and Sciences, and at the Graduate School of |
| Marketing Officer for North America and Corporate | Education, University of Pennsylvania; Trustee of the |
| Vice President (retired 2008) of Xerox Corporation | National Constitution Center; Chair of the Presidential |
| (document management products and services); | Commission for the Study of Bioethical Issues. |
| Executive in Residence and 2009–2010 Distinguished | |
| Minett Professor at the Rochester Institute of | JoAnn Heffernan Heisen |
| Technology; Director of SPX Corporation (multi-industry | Born 1950. Trustee Since July 1998. Principal |
| manufacturing), the United Way of Rochester, | Occupation(s) During the Past Five Years and Other |
| Amerigroup Corporation (managed health care), the | Experience: Corporate Vice President and Chief |
| University of Rochester Medical Center, Monroe | Global Diversity Officer (retired 2008) and Member |
| Community College Foundation, and North Carolina | of the Executive Committee (1997–2008) of Johnson |
| A&T University. | & Johnson (pharmaceuticals/medical devices/ |
| | consumer products); Director of Skytop Lodge |
| | Corporation (hotels), the University Medical Center |
| | at Princeton, the Robert Wood Johnson Foundation, |
| | and the Center for Talent Innovation; Member of |
| | the Advisory Board of the Institute for Women’s |
| | Leadership at Rutgers University. |
| | |
| F. Joseph Loughrey | Executive Officers | |
| Born 1949. Trustee Since October 2009. Principal | | |
| Occupation(s) During the Past Five Years and Other | Glenn Booraem | |
| Experience: President and Chief Operating Officer | Born 1967. Treasurer Since May 2015. Principal |
| (retired 2009) of Cummins Inc. (industrial machinery); | Occupation(s) During the Past Five Years and |
| Chairman of the Board of Hillenbrand, Inc. (specialized | Other Experience: Principal of The Vanguard Group, |
| consumer services), and of Oxfam America; Director | Inc.; Treasurer of each of the investment companies |
| of SKF AB (industrial machinery), Hyster-Yale Materials | served by The Vanguard Group; Controller of each of |
| Handling, Inc. (forklift trucks), the Lumina Foundation | the investment companies served by The Vanguard |
| for Education, and the V Foundation for Cancer | Group (2010–2015); Assistant Controller of each of |
| Research; Member of the Advisory Council for the | the investment companies served by The Vanguard |
| College of Arts and Letters and of the Advisory Board | Group (2001–2010). | |
| to the Kellogg Institute for International Studies, both | | |
| at the University of Notre Dame. | Thomas J. Higgins | |
| Born 1957. Chief Financial Officer Since September |
| Mark Loughridge | 2008. Principal Occupation(s) During the Past Five |
| Born 1953. Trustee Since March 2012. Principal | Years and Other Experience: Principal of The Vanguard |
| Occupation(s) During the Past Five Years and Other | Group, Inc.; Chief Financial Officer of each of the |
| Experience: Senior Vice President and Chief Financial | investment companies served by The Vanguard Group; |
| Officer (retired 2013) at IBM (information technology | Treasurer of each of the investment companies served |
| services); Fiduciary Member of IBM’s Retirement Plan | by The Vanguard Group (1998–2008). |
| Committee (2004–2013); Director of the Dow Chemical | |
| Company; Member of the Council on Chicago Booth. | Peter Mahoney | |
| Born 1974. Controller Since May 2015. Principal |
| Scott C. Malpass | Occupation(s) During the Past Five Years and |
| Born 1962. Trustee Since March 2012. Principal | Other Experience: Head of Global Fund Accounting |
| Occupation(s) During the Past Five Years and Other | at The Vanguard Group, Inc.; Controller of each of the |
| Experience: Chief Investment Officer and Vice | investment companies served by The Vanguard Group; |
| President at the University of Notre Dame; Assistant | Head of International Fund Services at The Vanguard |
| Professor of Finance at the Mendoza College of | Group (2008–2014). | |
| Business at Notre Dame; Member of the Notre Dame | | |
| 403(b) Investment Committee; Board Member of | Heidi Stam | |
| TIFF Advisory Services, Inc., and Catholic Investment | Born 1956. Secretary Since July 2005. Principal |
| Services, Inc. (investment advisors); Member of | Occupation(s) During the Past Five Years and Other |
| the Investment Advisory Committee of Major | Experience: Managing Director of The Vanguard |
| League Baseball. | Group, Inc.; General Counsel of The Vanguard Group; |
| Secretary of The Vanguard Group and of each of the |
| André F. Perold | investment companies served by The Vanguard Group; |
| Born 1952. Trustee Since December 2004. Principal | Director and Senior Vice President of Vanguard |
| Occupation(s) During the Past Five Years and Other | Marketing Corporation. | |
| Experience: George Gund Professor of Finance and | | |
| Banking, Emeritus at the Harvard Business School | Vanguard Senior ManagementTeam |
| (retired 2011); Chief Investment Officer and Managing | Mortimer J. Buckley | Chris D. McIsaac |
| Partner of HighVista Strategies LLC (private investment | Kathleen C. Gubanich | James M. Norris |
| firm); Director of Rand Merchant Bank; Overseer of | Paul A. Heller | Thomas M. Rampulla |
| the Museum of Fine Arts Boston. | Martha G. King | Glenn W. Reed |
| John T. Marcante | Karin A. Risi |
| Peter F. Volanakis | | |
| Born 1955. Trustee Since July 2009. Principal | Chairman Emeritus and Senior Advisor | |
| Occupation(s) During the Past Five Years and Other | |
| Experience: President and Chief Operating Officer | John J. Brennan | |
| (retired 2010) of Corning Incorporated (communications | Chairman, 1996–2009 | |
| equipment); Trustee of Colby-Sawyer College; | Chief Executive Officer and President, 1996–2008 | |
| Member of the Advisory Board of the Norris Cotton | | |
| Cancer Center and of the Advisory Board of the | Founder | |
| Parthenon Group (strategy consulting). | |
| John C. Bogle | |
| Chairman and Chief Executive Officer, 1974–1996 | |
| | |
1 Mr. McNabb is considered an “interested person,” as defined in the Investment Company Act of 1940, because he is an officer of the Vanguard funds.
2 December 2002 for Vanguard Equity Income Fund, the Vanguard Municipal Bond Funds, and the Vanguard State Tax-Exempt Funds.
|  |
| P.O. Box 2600 | |
| Valley Forge, PA 19482-2600 | |
Connect with Vanguard® > vanguard.com
| |
| Fund Information > 800-662-7447 | CFA® is a registered trademark owned by CFA Institute. |
| Direct Investor Account Services > 800-662-2739 | |
| Institutional Investor Services > 800-523-1036 | |
| Text Telephone for People | |
| Who Are Deaf or Hard of Hearing> 800-749-7273 | |
| |
| This material may be used in conjunction | |
| with the offering of shares of any Vanguard | |
| fund only if preceded or accompanied by | |
| the fund’s current prospectus. | |
| |
| All comparative mutual fund data are from Lipper, a | |
| Thomson Reuters Company, or Morningstar, Inc., unless | |
| otherwise noted. | |
| |
| You can obtain a free copy of Vanguard’s proxy voting | |
| guidelines by visiting vanguard.com/proxyreporting or by | |
| calling Vanguard at 800-662-2739. The guidelines are | |
| also available from the SEC’s website, sec.gov. In | |
| addition, you may obtain a free report on how your fund | |
| voted the proxies for securities it owned during the 12 | |
| months ended June 30. To get the report, visit either | |
| vanguard.com/proxyreporting or sec.gov. | |
| |
| You can review and copy information about your fund at | |
| the SEC’s Public Reference Room in Washington, D.C. To | |
| find out more about this public service, call the SEC at | |
| 202-551-8090. Information about your fund is also | |
| available on the SEC’s website, and you can receive | |
| copies of this information, for a fee, by sending a | |
| request in either of two ways: via email addressed to | |
| publicinfo@sec.gov or via regular mail addressed to the | |
| Public Reference Section, Securities and Exchange | |
| Commission, Washington, DC 20549-1520. | |
| |
| | © 2015 The Vanguard Group, Inc. |
| | All rights reserved. |
| | Vanguard Marketing Corporation, Distributor. |
| |
| | Q1290 112015 |

Annual Report | September 30, 2015
Vanguard Strategic Small-Cap Equity Fund
Vanguard’s Principles for Investing Success
We want to give you the best chance of investment success. These principles, grounded in Vanguard’s research and experience, can put you on the right path.
Goals. Create clear, appropriate investment goals.
Balance. Develop a suitable asset allocation using broadly diversified funds.
Cost. Minimize cost.
Discipline. Maintain perspective and long-term discipline.
A single theme unites these principles: Focus on the things you can control.
We believe there is no wiser course for any investor.
| |
| Contents | |
| Your Fund’s Total Returns. | 1 |
| Chairman’s Letter. | 2 |
| Advisor’s Report. | 8 |
| Fund Profile. | 10 |
| Performance Summary. | 11 |
| Financial Statements. | 13 |
| Your Fund’s After-Tax Returns. | 27 |
| About Your Fund’s Expenses. | 28 |
| Glossary. | 30 |
Please note: The opinions expressed in this report are just that—informed opinions. They should not be considered promises or advice.
Also, please keep in mind that the information and opinions cover the period through the date on the front of this report. Of course, the risks of investing in your fund are spelled out in the prospectus.
See the Glossary for definitions of investment terms used in this report.
About the cover: Pictured is a sailing block on the Brilliant, a 1932 schooner docked in Mystic, Connecticut. A type of pulley, the sailing block helps coordinate the setting of the sails. At Vanguard, the intricate coordination of technology and people allows us to help millions of clients around the world reach their financial goals.
| | | | |
| Your Fund’s Total Returns | | | | |
| |
| |
| |
| |
| Fiscal Year Ended September 30, 2015 | | | | |
| | | | | Total |
| | | | | Returns |
| Vanguard Strategic Small-Cap Equity Fund | | | | 2.10% |
| MSCI US Small Cap 1750 Index | | | | -0.51 |
| Small-Cap Core Funds Average | | | | -0.89 |
| Small-Cap Core Funds Average: Derived from data provided by Lipper, a Thomson Reuters Company. | | |
| |
| |
| Your Fund’s Performance at a Glance | | | | |
| September 30, 2014, Through September 30, 2015 | | | | |
| | | | Distributions Per Share |
| | Starting | Ending | | |
| | Share | Share | Income | Capital |
| | Price | Price | Dividends | Gains |
| Vanguard Strategic Small-Cap Equity Fund | $30.91 | $28.95 | $0.246 | $2.431 |
1

Chairman’s Letter
Dear Shareholder,
The fiscal year ended September 30, 2015, was a volatile one for U.S. financial markets. Initially, stock prices headed higher amid largely positive developments regarding the domestic economy. As the period progressed, however, the ride got bumpier. A number of concerns weighed on investor sentiment at different times, including the pace of growth at home and abroad, the fall in the price of oil and other commodities, the prospect of a Federal Reserve rate hike, the impact of a strong U.S. dollar on corporate profits, and stock market valuations that seemed inflated to some investors.
U.S. stocks as a whole posted slightly negative results for the period, and small-capitalization stocks produced a similar return. Vanguard Strategic Small-Cap Equity Fund returned 2.10%, putting it ahead of its benchmark, the MSCI US Small Cap 1750 Index, which returned –0.51%. The fund also outpaced the –0.89% average return of its peers.
Returns varied widely by sector. For the fund, four sectors posted double-digit gains and two produced double-digit declines. Strong stock selection within information technology and consumer discretionary contributed the most to the fund’s outperformance relative to its benchmark. This helped offset subpar selection in other sectors, including materials and financials.
2
If you own shares of your fund in a taxable account, you may wish to review the fund’s after-tax returns that appear later in this report.
China’s economic woes weighed on U.S. stocks
The broad U.S. stock market returned –0.49% for the 12 months. The final two months were especially rocky as investors worried in particular about the global ripple effects of slower economic growth in China.
For much of the fiscal year, investors were preoccupied with the possibility of an increase in short-term interest rates. On September 17, the Federal Reserve announced that it would hold rates steady for the time being, a decision that to some investors indicated the Fed’s concern about the fragility of global markets.
International stocks returned about –11%, held back in part by the dollar’s strength against many foreign currencies. Returns for emerging markets, which were especially hard hit by concerns about China, trailed those of the developed markets of the Pacific region and Europe.
Taxable bonds recorded gains as investors searched for safety
The broad U.S. taxable bond market returned 2.94%, as investors gravitated toward safe-haven assets amid global stock market turmoil. Stimulative monetary policies from many of the world’s central
| | | |
| Market Barometer | | | |
| |
| | | Average Annual Total Returns |
| | Periods Ended September 30, 2015 |
| | One | Three | Five |
| | Year | Years | Years |
| Stocks | | | |
| Russell 1000 Index (Large-caps) | -0.61% | 12.66% | 13.42% |
| Russell 2000 Index (Small-caps) | 1.25 | 11.02 | 11.73 |
| Russell 3000 Index (Broad U.S. market) | -0.49 | 12.53 | 13.28 |
| FTSE All-World ex US Index (International) | -11.34 | 2.87 | 2.19 |
| |
| Bonds | | | |
| Barclays U.S. Aggregate Bond Index (Broad taxable market) | 2.94% | 1.71% | 3.10% |
| Barclays Municipal Bond Index (Broad tax-exempt market) | 3.16 | 2.88 | 4.14 |
| Citigroup Three-Month U.S. Treasury Bill Index | 0.02 | 0.02 | 0.04 |
| |
| CPI | | | |
| Consumer Price Index | -0.04% | 0.93% | 1.73% |
3
banks, declining inflation expectations, and global investors’ search for higher yields also helped lift U.S. bonds.
The yield of the 10-year Treasury note ended September at 2.05%, down from 2.48% a year earlier. (Bond prices and yields move in opposite directions.)
International bond markets (as measured by the Barclays Global Aggregate Index ex USD) returned –7.67%, hurt by the dollar’s strength. Without this currency effect, international bonds advanced modestly.
The Fed’s 0%–0.25% target for short-term interest rates continued to limit returns for money market funds and savings accounts.
The fund’s quantitative screening produced benchmarkbeating results
The fund’s advisor, Vanguard Quantitative Equity Group, seeks to construct a portfolio whose characteristics—stock market capitalization, sector allocation, and risk profile—closely match those of its benchmark. The portfolio, however, contains only a subset of small-cap stocks in the fund’s benchmark. The advisor selects these stocks using computer-driven quantitative models that take into consideration criteria such as valuations, earnings growth potential, and market sentiment.
This screening process met with success in six of the ten market sectors. Within the industrial sector, relative performance was especially strong among airline stocks, although the fund’s holdings in both the
| | |
| Expense Ratios | | |
| Your Fund Compared With Its Peer Group | | |
| |
| | | Peer Group |
| | Fund | Average |
| Strategic Small-Cap Equity Fund | 0.38% | 1.29% |
The fund expense ratio shown is from the prospectus dated January 27, 2015, and represents estimated costs for the current fiscal year. For the fiscal year ended September 30, 2015, the fund’s expense ratio was 0.34%. The peer-group expense ratio is derived from data provided by Lipper, a Thomson Reuters Company, and captures information through year-end 2014.
Peer group: Small-Cap Core Funds.
4
construction and engineering and the building products segments were also bright spots.
Information technology was another top-performing sector. The advisor’s company-by-company analysis resulted in a narrow selection of software stocks that boosted the fund’s return compared with that of its benchmark. An outsized allocation to the IT services segment, which posted a double-digit return, also helped results.
The energy sector continued to suffer from the sharp drop in the price of oil. It returned about –55% for the benchmark. Although the fund’s holdings in the energy equipment and services segment disappointed, its return for the sector as a whole was solidly ahead of the benchmark, thanks to a lack of coal stocks and more limited exposure to oil and gas exploration and production companies.
In some sectors, the fund underper-formed its benchmark. Health care was the biggest detractor. Although the relative returns of the fund’s holdings in the health care providers and services segment were strong, these gains were more than offset by missed opportunities among biotechnology stocks.
For more information about the advisor’s management of the fund, please see the Advisor’s Report that follows this letter.
| |
| Total Returns | |
| Inception Through September 30, 2015 | |
| | Average |
| | Annual Return |
| Strategic Small-Cap Equity Fund (Returns since inception: 4/24/2006) | 6.10% |
| MSCI US Small Cap 1750 Index | 6.59 |
| Small-Cap Core Funds Average | 4.54 |
| Small-Cap Core Funds Average: Derived from data provided by Lipper, a Thomson Reuters Company. | |
The figures shown represent past performance, which is not a guarantee of future results. (Current performance may be lower or higher than the performance data cited. For performance data current to the most recent month-end, visit our website at vanguard.com/performance.) Note, too, that both investment returns and principal value can fluctuate widely, so an investor’s shares, when sold, could be worth more or less than their original cost.
5
| |
| |
| Staying the course can help you stay closer to your fund’s return |
| |
| When stock markets are highly volatile, as in recent months, it’s tempting to run for cover. |
| But the price of panic can be high. |
| |
| A rough measure of what can be lost from attempts to time the market is the difference |
| between the returns produced by a fund and the returns earned by the fund’s investors. |
| |
| The results shown in the Performance Summary later in this report are your fund’s time- |
| weighted returns—the average annual returns investors would have earned if they had invested |
| a lump sum in the fund at the start of the period and reinvested any distributions they received. |
| Their actual returns, however, depend on whether they subsequently bought or sold any shares. |
| There’s often a gap between this dollar-weighted return for investors and the fund’s time- |
| weighted return, as shown below. |
| |
| Many sensible investment behaviors can contribute to the difference in returns, but industry |
| cash flow data suggest that one important factor is the generally counterproductive effort to |
| buy and sell at the “right” time. Keeping your emotions in check can help narrow the gap. |
| |
| Mutual fund returns and investor returns over the last decade |
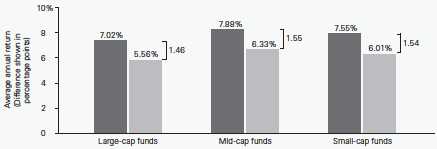
|
| Average fund return |
| Average investor return |
| |
| Notes: Data are as of December 31, 2014. The average fund returns and average investor returns are from Morningstar. The average |
| fund returns are the average of the funds’ time-weighted returns in each category. The average investor returns assume that the growth |
| of a fund’s total net assets for a given period is driven by market returns and investor cash ow. To calculate investor return, a fund’s |
| change in assets for the period is discounted by the return of the fund to isolate how much of the asset growth was driven by cash ow. |
| A model, similar to an internal rate-of-return calculation, is then used to calculate a constant growth rate that links the beginning total |
| net assets and periodic cash ows to the ending total net assets. |
| Sources: Vanguard and Morningstar, Inc. |
6
The fund added another year of positive results to its record
Since its inception in April 2006, Vanguard Strategic Small-Cap Equity Fund has produced an average annual return of 6.10%, a bit behind its index (+6.59%) but ahead of its peers. The advisor struggled to keep up with the fund’s benchmark going into and coming out of the 2008–2009 financial crisis. Much of the fund’s shortfall dates from this period, a time when investors were more focused on macroeconomic concerns than company fundamentals. Since then, however, the advisor has had more success; this year marks the fund’s fifth fiscal year of outperformance in the last six years.
A dose of discipline is crucial when markets become volatile
While the broad U.S. stock market has posted gains for six straight calendar years—from 2009 to 2014—that streak may not last a seventh. Stocks tumbled in August, and swung up and down in September.
Nobody can control the direction of the markets or reliably predict where they’ll go in the short term. However, investors can control how they react to unstable and turbulent markets.
During periods of market adversity, it’s more important than ever to keep sight of one of Vanguard’s key principles: Maintain perspective and long-term discipline. Whether you’re investing for yourself or on behalf of clients, your success is affected greatly by how you respond—or don’t respond—during turbulent markets. (You can read Vanguard’s Principles for Investing Success at vanguard.com/research.)
As I’ve written in the past, the best course for long-term investors is generally to ignore daily market moves and not make decisions based on emotion. (See the box on page 6 for more discussion on the benefit of staying the course.) This is also a good time to evaluate your portfolio and make sure your asset allocation is aligned with your time horizon, goals, and risk tolerance.
The markets are unpredictable and often confounding. Keeping our long-term plans clearly in focus can be key as we weather these periodic storms.
As always, thank you for investing with Vanguard.
Sincerely,

F. William McNabb III
Chairman and Chief Executive Officer
October 15, 2015
7
Advisor’s Report
For the fiscal year ended September 30, 2015, the Strategic Small-Cap Equity Fund returned 2.10%, outpacing its benchmark index by 2.61 percentage points. Overall, stocks struggled during the period—the broad U.S. equity market (as measured by the MSCI US Investable Market Index) returned –0.39%, its first decline after six years of positive returns. Large-capitalization stocks lagged smaller-caps, and growth-oriented equities outpaced value. Equities outside the United States returned roughly –9%. Emerging markets played a large role in that result, as they returned about –19%.
Within the small-cap benchmark, seven sectors generated positive returns and three generated negative returns. Health care, utilities, and consumer staples did best. Energy, materials, and industrials performed poorly; the drop in energy prices and the drag in emerging-market economies had a knock-on effect on all three of these sectors.
In the United States, the Federal Reserve held off on raising interest rates to facilitate further progress toward its employment and inflation targets. Second-quarter real GDP increased at an annual rate of 3.9%, compared with an increase of 0.6% in the first quarter. This growth reflected positive contributions from exports, an acceleration in personal consumption expenditures, and an increase in state and local government spending. The unemployment rate continued to fall. The U.S. nonfarm payrolls rose by 142,000 in September, and the unemployment rate declined to 5.1% from 5.9% a year ago.
The economic slowdown overseas, especially in emerging markets, added to recent market volatility. The possibility that the Fed might raise interest rates by the end of 2015 pushed the dollar up and spurred capital outflows from emerging markets, whose currency has lost value against the U.S. dollar. Many of these economies were also affected by weak commodity prices that contributed to lower export growth. China’s continuing slowdown still represents significant downside risk to overall emerging-market performance.
Although we seek to understand the impact of macroeconomic factors on fund performance, our investment process is centered on specific stock fundamentals. We use a quantitative approach to systematically identify stocks in our investment universe that are more likely to exhibit long-term outperformance. Our process focuses on valuation as well as other factors that we believe affect fundamental growth. Using the results of our model, we then construct our portfolio with the goal of maximizing expected return while minimizing exposure to risks that our research indicates do not improve returns, such as deviations from market-capitalization and sector weightings relative to our benchmark.
For the fiscal year, our stock selection models were effective in identifying outperforming companies. The growth, management decision, and sentiment components of our model boosted performance, but the quality and valuation components disappointed.
8
Our portfolio generated positive stock selection results in six of the ten sectors. Industrials, information technology, and financials yielded strong relative returns. Unfortunately, we were not able to avoid all poor performers. Our selection results in health care, consumer discretionary, and consumer staples were disappointing.
At the individual stock level, overweight positions relative to the benchmark in Skechers, JetBlue Airways, and Manhattan Associates were the top positive contributors. We also held some overweight positions in stocks that disappointed, including Strayer Education, Sanderson Farms, and PAREXEL International.
We continue to believe that constructing a portfolio that focuses on the key fundamentals described above will benefit investors over the long term, while recognizing that risk can reward or punish us in the near term. We believe that the fund offers a strong mix of stocks with attractive valuation and growth characteristics relative to its benchmark index.
We thank you for your investment and look forward to the coming year.
Portfolio Managers:
James P. Stetler, Principal
James D. Troyer, CFA, Principal
Michael R. Roach, CFA
Vanguard Quantitative Equity Group
October 16, 2015
9
Strategic Small-Cap Equity Fund
Fund Profile
As of September 30, 2015
| | | |
| Portfolio Characteristics | | |
| | | MSCI US | DJ |
| | | Small Cap | U.S. Total |
| | | 1750 | Market |
| | Fund | Index | FA Index |
| Number of Stocks | 333 | 1,742 | 4,000 |
| Median Market Cap | $2.0B | $2.5B | $46.5B |
| Price/Earnings Ratio | 19.4x | 27.2x | 20.2x |
| Price/Book Ratio | 2.4x | 2.1x | 2.5x |
| Return on Equity | 12.5% | 11.6% | 17.2% |
| Earnings Growth Rate | 13.9% | 11.3% | 10.1% |
| Dividend Yield | 1.6% | 1.7% | 2.1% |
| Foreign Holdings | 0.2% | 0.0% | 0.0% |
| Turnover Rate | 62% | — | — |
| Ticker Symbol | VSTCX | — | — |
| Expense Ratio1 | 0.38% | — | — |
| 30-Day SEC Yield | 1.27% | — | — |
| Short-Term Reserves | 0.1% | — | — |
| | | |
| Sector Diversification (% of equity exposure) |
| | | | DJ |
| | | | U.S. |
| | | MSCI US | Total |
| | | Small Cap | Market |
| | | 1750 | FA |
| | Fund | Index | Index |
| Consumer | | | |
| Discretionary | 15.1% | 15.0% | 13.7% |
| Consumer Staples | 3.7 | 2.9 | 8.7 |
| Energy | 3.2 | 3.5 | 6.3 |
| Financials | 25.7 | 26.3 | 18.3 |
| Health Care | 13.5 | 13.5 | 14.4 |
| Industrials | 14.0 | 13.3 | 10.6 |
| Information | | | |
| Technology | 15.8 | 16.6 | 19.6 |
| Materials | 4.2 | 4.5 | 3.1 |
| Telecommunication | | | |
| Services | 0.9 | 0.6 | 2.1 |
| Utilities | 3.9 | 3.8 | 3.2 |
| | |
| Volatility Measures | | |
| | MSCI US | DJ |
| | Small Cap | U.S. Total |
| | 1750 | Market |
| | Index | FA Index |
| R-Squared | 0.96 | 0.81 |
| Beta | 0.97 | 1.12 |
These measures show the degree and timing of the fund’s fluctuations compared with the indexes over 36 months.
| | |
| Ten Largest Holdings (% of total net assets) |
| JetBlue Airways Corp. | Airlines | 0.8% |
| Manhattan Associates | | |
| Inc. | Application Software | 0.7 |
| Skechers U.S.A. Inc. | Footwear | 0.7 |
| Vectren Corp. | Multi-Utilities | 0.7 |
| Cirrus Logic Inc. | Semiconductors | 0.7 |
| First American Financial | Property & Casualty | |
| Corp. | Insurance | 0.7 |
| WGL Holdings Inc. | Gas Utilities | 0.7 |
| AO Smith Corp. | Building Products | 0.7 |
| ABIOMED Inc. | Health Care | |
| | Equipment | 0.7 |
| Western Refining Inc. | Oil & Gas Refining & | |
| | Marketing | 0.6 |
| Top Ten | | 7.0% |
The holdings listed exclude any temporary cash investments and equity index products.
Investment Focus
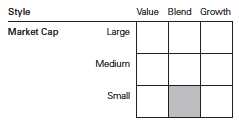
1 The expense ratio shown is from the prospectus dated January 27, 2015, and represents estimated costs for the current fiscal year. For the fiscal year ended September 30, 2015, the expense ratio was 0.34%.
10
Strategic Small-Cap Equity Fund
Performance Summary
All of the returns in this report represent past performance, which is not a guarantee of future results that may be achieved by the fund. (Current performance may be lower or higher than the performance data cited. For performance data current to the most recent month-end, visit our website at vanguard.com/performance.) Note, too, that both investment returns and principal value can fluctuate widely, so an investor’s shares, when sold, could be worth more or less than their original cost. The returns shown do not reflect taxes that a shareholder would pay on fund distributions or on the sale of fund shares.
Cumulative Performance: April 24, 2006, Through September 30, 2015
Initial Investment of $10,000

| | | | |
| | Average Annual Total Returns | |
| | Periods Ended September 30, 2015 | |
| | | | Since | Final Value |
| | One | Five | Inception | of a $10,000 |
| | Year | Years | (4/24/2006) | Investment |
| Strategic Small-Cap Equity Fund* | 2.10% | 14.98% | 6.10% | $17,480 |
| MSCI US Small Cap 1750 Index | -0.51 | 12.77 | 6.59 | 18,258 |
| Small-Cap Core Funds Average | -0.89 | 10.88 | 4.54 | 15,204 |
| Dow Jones U.S. Total Stock Market | | | | |
| Float Adjusted Index | -0.55 | 13.26 | 6.54 | 18,177 |
Small-Cap Core Funds Average: Derived from data provided by Lipper, a Thomson Reuters Company.
"Since Inception" performance is calculated from the inception date for both the fund and its comparative standards.
See Financial Highlights for dividend and capital gains information.
11
Strategic Small-Cap Equity Fund
Fiscal-Year Total Returns (%): April 24, 2006, Through September 30, 2015
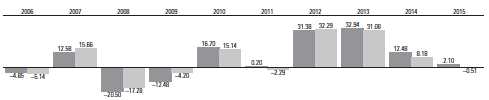
|
| Strategic Small-Cap Equity Fund |
| MSCI US Small Cap 1750 Index |
12
Strategic Small-Cap Equity Fund
Financial Statements
Statement of Net Assets
As of September 30, 2015
The fund reports a complete list of its holdings in regulatory filings four times in each fiscal year, at the quarter-ends. For the second and fourth fiscal quarters, the lists appear in the fund’s semiannual and annual reports to shareholders. For the first and third fiscal quarters, the fund files the lists with the Securities and Exchange Commission on Form N-Q. Shareholders can look up the fund’s Forms N-Q on the SEC’s website at sec.gov. Forms N-Q may also be reviewed and copied at the SEC’s Public Reference Room (see the back cover of this report for further information).
| | | |
| | | | Market |
| | | | Value |
| | | Shares | ($000) |
| Common Stocks (99.4%)1 | | |
| Consumer Discretionary (15.0%) | |
| * | Skechers U.S.A. Inc. | | |
| | Class A | 50,300 | 6,744 |
| | American Eagle Outfitters | | |
| | Inc. | 377,300 | 5,897 |
| | Cooper Tire & Rubber Co. | 144,600 | 5,713 |
| | Carter’s Inc. | 62,500 | 5,665 |
| * | Madison Square Garden Co. | | |
| | Class A | 76,900 | 5,548 |
| | Cracker Barrel Old Country | | |
| | Store Inc. | 35,600 | 5,243 |
| * | American Axle & | | |
| | Manufacturing Holdings | | |
| | Inc. | 254,000 | 5,065 |
| | Children’s Place Inc. | 87,600 | 5,052 |
| | Nutrisystem Inc. | 188,200 | 4,991 |
| * | Pinnacle Entertainment Inc. | 147,100 | 4,978 |
| | Big Lots Inc. | 103,300 | 4,950 |
| * | Strayer Education Inc. | 86,200 | 4,738 |
| | Jack in the Box Inc. | 61,400 | 4,730 |
| | Brinker International Inc. | 89,400 | 4,709 |
| * | Denny’s Corp. | 423,900 | 4,676 |
| ^ | World Wrestling | | |
| | Entertainment Inc. | | |
| | Class A | 260,300 | 4,399 |
| * | Express Inc. | 239,500 | 4,280 |
| | Cato Corp. Class A | 123,600 | 4,206 |
| | Marriott Vacations | | |
| | Worldwide Corp. | 59,600 | 4,061 |
| ^ | Outerwall Inc. | 71,000 | 4,042 |
| * | Boyd Gaming Corp. | 209,300 | 3,412 |
| | AMC Entertainment | | |
| | Holdings Inc. | 130,900 | 3,297 |
| * | Burlington Stores Inc. | 62,500 | 3,190 |
| * | Universal Electronics Inc. | 74,900 | 3,148 |
| | Kirkland’s Inc. | 139,700 | 3,009 |
| | Dillard’s Inc. Class A | 28,550 | 2,495 |
| | | |
| | | | Market |
| | | | Value |
| | | Shares | ($000) |
| * | ServiceMaster Global | | |
| | Holdings Inc. | 69,100 | 2,318 |
| * | Gray Television Inc. | 165,000 | 2,105 |
| | Wolverine World Wide Inc. | 94,500 | 2,045 |
| * | Penn National Gaming Inc. | 102,000 | 1,712 |
| | Time Inc. | 85,800 | 1,635 |
| | Caleres Inc. | 50,600 | 1,545 |
| | Sonic Corp. | 65,400 | 1,501 |
| | Libbey Inc. | 40,600 | 1,324 |
| | Scholastic Corp. | 31,600 | 1,231 |
| * | Tower International Inc. | 46,600 | 1,107 |
| | Aaron’s Inc. | 30,000 | 1,083 |
| | Cinemark Holdings Inc. | 31,900 | 1,036 |
| * | Unifi Inc. | 28,700 | 856 |
| * | BJ’s Restaurants Inc. | 17,600 | 757 |
| * | Deckers Outdoor Corp. | 11,300 | 656 |
| * | Grand Canyon Education | | |
| | Inc. | 12,600 | 479 |
| | Oxford Industries Inc. | 6,400 | 473 |
| * | Vince Holding Corp. | 123,600 | 424 |
| | New York Times Co. | | |
| | Class A | 28,600 | 338 |
| | Citi Trends Inc. | 11,000 | 257 |
| | Domino’s Pizza Inc. | 2,200 | 237 |
| * | Diamond Resorts | | |
| | International Inc. | 7,800 | 183 |
| | Shoe Carnival Inc. | 7,100 | 169 |
| | | | 141,709 |
| Consumer Staples (3.7%) | | |
| ^ | Cal-Maine Foods Inc. | 100,100 | 5,467 |
| | Dean Foods Co. | 323,800 | 5,349 |
| | Ingles Markets Inc. | | |
| | Class A | 103,800 | 4,965 |
| * | USANA Health Sciences | | |
| | Inc. | 32,300 | 4,329 |
| * | SUPERVALU Inc. | 545,700 | 3,918 |
| | Pinnacle Foods Inc. | 69,900 | 2,927 |
| ^ | Pilgrim’s Pride Corp. | 108,250 | 2,249 |
| ^ | Sanderson Farms Inc. | 23,700 | 1,625 |
13
| | | |
| Strategic Small-Cap Equity Fund | |
| |
| |
| |
| | | | Market |
| | | | Value |
| | | Shares | ($000) |
| | Fresh Del Monte Produce | | |
| | Inc. | 39,605 | 1,565 |
| | Casey’s General Stores Inc. | 6,900 | 710 |
| | Lancaster Colony Corp. | 4,900 | 478 |
| * | Central Garden & Pet Co. | | |
| | Class A | 29,300 | 472 |
| * | Post Holdings Inc. | 5,000 | 296 |
| * | Central Garden & Pet Co. | 17,400 | 269 |
| | Vector Group Ltd. | 11,550 | 261 |
| | | | 34,880 |
| Energy (3.2%) | | |
| | Western Refining Inc. | 139,100 | 6,137 |
| | PBF Energy Inc. Class A | 206,500 | 5,830 |
| | Alon USA Energy Inc. | 278,100 | 5,025 |
| | SemGroup Corp. Class A | 106,900 | 4,622 |
| | Delek US Holdings Inc. | 118,400 | 3,280 |
| | World Fuel Services Corp. | 60,300 | 2,159 |
| * | Oil States International Inc. | 79,500 | 2,077 |
| | Atwood Oceanics Inc. | 68,400 | 1,013 |
| | | | 30,143 |
| Financials (25.5%) | | |
| | First American Financial | | |
| | Corp. | 162,900 | 6,364 |
| | Assured Guaranty Ltd. | 244,100 | 6,102 |
| * | MGIC Investment Corp. | 631,000 | 5,843 |
| * | Walker & Dunlop Inc. | 214,900 | 5,605 |
| | PrivateBancorp Inc. | 145,700 | 5,585 |
| | Validus Holdings Ltd. | 123,600 | 5,571 |
| | Cathay General Bancorp | 180,600 | 5,411 |
| | Popular Inc. | 176,700 | 5,342 |
| * | Heritage Insurance | | |
| | Holdings Inc. | 265,000 | 5,228 |
| | AmTrust Financial Services | | |
| | Inc. | 82,300 | 5,183 |
| | Radian Group Inc. | 319,400 | 5,082 |
| | HCI Group Inc. | 121,700 | 4,718 |
| | Central Pacific Financial | | |
| | Corp. | 224,500 | 4,708 |
| | PacWest Bancorp | 102,500 | 4,388 |
| * | Cowen Group Inc. Class A | 958,506 | 4,371 |
| | International Bancshares | | |
| | Corp. | 172,300 | 4,313 |
| | Associated Banc-Corp | 236,700 | 4,253 |
| *,^ | Credit Acceptance Corp. | 21,322 | 4,198 |
| | CubeSmart | 154,100 | 4,193 |
| * | LendingTree Inc. | 42,100 | 3,917 |
| | Hospitality Properties Trust | 150,100 | 3,839 |
| | Aspen Insurance Holdings | | |
| | Ltd. | 82,000 | 3,810 |
| | Washington Federal Inc. | 148,000 | 3,367 |
| * | Essent Group Ltd. | 135,400 | 3,365 |
| | Sovran Self Storage Inc. | 34,800 | 3,282 |
| | BioMed Realty Trust Inc. | 164,200 | 3,281 |
| * | Capital Bank Financial Corp. | 105,400 | 3,186 |
| | | |
| | | | Market |
| | | | Value |
| | | Shares | ($000) |
| | CyrusOne Inc. | 96,400 | 3,148 |
| | Ryman Hospitality | | |
| | Properties Inc. | 63,200 | 3,111 |
| * | INTL. FCStone Inc. | 125,700 | 3,103 |
| | CoreSite Realty Corp. | 58,000 | 2,983 |
| | Janus Capital Group Inc. | 218,300 | 2,969 |
| | Monogram Residential | | |
| | Trust Inc. | 318,200 | 2,962 |
| | Chambers Street Properties | 446,800 | 2,900 |
| | Weingarten Realty Investors | 84,900 | 2,811 |
| | EPR Properties | 53,000 | 2,733 |
| | Summit Hotel Properties | | |
| | Inc. | 229,400 | 2,677 |
| | LaSalle Hotel Properties | 93,900 | 2,666 |
| | DuPont Fabros Technology | | |
| | Inc. | 101,800 | 2,635 |
| | Universal Insurance | | |
| | Holdings Inc. | 87,200 | 2,576 |
| | Hersha Hospitality Trust | | |
| | Class A | 113,550 | 2,573 |
| | Great Western Bancorp Inc. | 101,400 | 2,572 |
| | Piedmont Office Realty | | |
| | Trust Inc. Class A | 141,500 | 2,531 |
| | Post Properties Inc. | 43,100 | 2,512 |
| | Sunstone Hotel Investors | | |
| | Inc. | 181,200 | 2,397 |
| | DiamondRock Hospitality | | |
| | Co. | 214,300 | 2,368 |
| | American Assets Trust Inc. | 56,200 | 2,296 |
| * | Marcus & Millichap Inc. | 48,800 | 2,244 |
| | CBL & Associates | | |
| | Properties Inc. | 158,700 | 2,182 |
| | CareTrust REIT Inc. | 187,100 | 2,124 |
| * | First NBC Bank Holding Co. | 60,000 | 2,102 |
| | GEO Group Inc. | 70,500 | 2,097 |
| | Medical Properties Trust | | |
| | Inc. | 186,600 | 2,064 |
| | Nelnet Inc. Class A | 58,848 | 2,037 |
| | Corrections Corp. of America | 68,212 | 2,015 |
| | Omega Healthcare Investors | | |
| | Inc. | 54,500 | 1,916 |
| | Pennsylvania REIT | 95,300 | 1,890 |
| | Healthcare Trust of America | | |
| | Inc. Class A | 76,650 | 1,879 |
| | Ramco-Gershenson | | |
| | Properties Trust | 124,300 | 1,866 |
| | Chatham Lodging Trust | 81,600 | 1,753 |
| | RLJ Lodging Trust | 69,200 | 1,749 |
| | Inland Real Estate Corp. | 209,600 | 1,698 |
| | HFF Inc. Class A | 48,200 | 1,627 |
| | FelCor Lodging Trust Inc. | 224,400 | 1,586 |
| | Universal Health Realty | | |
| | Income Trust | 33,000 | 1,549 |
| | First Industrial Realty Trust | | |
| | Inc. | 73,600 | 1,542 |
14
| | | |
| Strategic Small-Cap Equity Fund | |
| |
| |
| |
| | | | Market |
| | | | Value |
| | | Shares | ($000) |
| | Pebblebrook Hotel Trust | 42,100 | 1,492 |
| | Home Properties Inc. | 19,800 | 1,480 |
| | MarketAxess Holdings Inc. | 15,100 | 1,402 |
| | CenterState Banks Inc. | 94,200 | 1,385 |
| | Lexington Realty Trust | 169,000 | 1,369 |
| * | Strategic Hotels & Resorts | | |
| | Inc. | 97,800 | 1,349 |
| | Ashford Hospitality Trust | | |
| | Inc. | 208,900 | 1,274 |
| | Chesapeake Lodging Trust | 46,600 | 1,214 |
| | Cardinal Financial Corp. | 51,700 | 1,190 |
| | Government Properties | | |
| | Income Trust | 72,200 | 1,155 |
| *,^ | World Acceptance Corp. | 33,900 | 910 |
| | City Holding Co. | 18,300 | 902 |
| | Rouse Properties Inc. | 55,000 | 857 |
| | One Liberty Properties Inc. | 39,600 | 845 |
| | Highwoods Properties Inc. | 21,300 | 825 |
| | Synovus Financial Corp. | 27,700 | 820 |
| | Flushing Financial Corp. | 36,300 | 727 |
| | Franklin Street Properties | | |
| | Corp. | 62,400 | 671 |
| | Heartland Financial USA | | |
| | Inc. | 17,100 | 621 |
| | Silver Bay Realty Trust | | |
| | Corp. | 38,200 | 612 |
| | National Penn Bancshares | | |
| | Inc. | 50,300 | 591 |
| | Fulton Financial Corp. | 46,300 | 560 |
| * | Enova International Inc. | 53,300 | 545 |
| | Oritani Financial Corp. | 32,100 | 501 |
| | Winthrop Realty Trust | 34,200 | 491 |
| * | First BanCorp | 133,800 | 476 |
| | NorthStar Realty Finance | | |
| | Corp. | 34,500 | 426 |
| | RE/MAX Holdings Inc. | 10,700 | 385 |
| | EastGroup Properties Inc. | 6,400 | 347 |
| | Getty Realty Corp. | 17,700 | 280 |
| | Brookline Bancorp Inc. | 27,200 | 276 |
| | 1st Source Corp. | 7,920 | 244 |
| | Altisource Residential Corp. | 14,600 | 203 |
| | BancFirst Corp. | 3,100 | 196 |
| | Ashford Hospitality Prime | | |
| | Inc. | 194 | 3 |
| | | | 241,572 |
| Health Care (13.4%) | | |
| * | ABIOMED Inc. | 66,300 | 6,150 |
| * | ICU Medical Inc. | 48,000 | 5,256 |
| * | VCA Inc. | 99,600 | 5,244 |
| * | PAREXEL International | | |
| | Corp. | 83,300 | 5,158 |
| * | Merit Medical Systems Inc. | 214,200 | 5,122 |
| * | Molina Healthcare Inc. | 73,500 | 5,060 |
| | | |
| | | | Market |
| | | | Value |
| | | Shares | ($000) |
| * | Charles River Laboratories | | |
| | International Inc. | 79,400 | 5,043 |
| * | Natus Medical Inc. | 126,238 | 4,980 |
| * | INC Research Holdings Inc. | | |
| | Class A | 120,900 | 4,836 |
| * | Amedisys Inc. | 125,400 | 4,761 |
| | Ensign Group Inc. | 110,100 | 4,694 |
| * | AMN Healthcare Services | | |
| | Inc. | 143,900 | 4,318 |
| * | Affymetrix Inc. | 486,100 | 4,151 |
| * | Sucampo Pharmaceuticals | | |
| | Inc. Class A | 208,300 | 4,139 |
| * | Array BioPharma Inc. | 842,900 | 3,844 |
| | Chemed Corp. | 28,400 | 3,791 |
| | Quality Systems Inc. | 301,000 | 3,756 |
| *,^ | NewLink Genetics Corp. | 104,500 | 3,745 |
| * | Cambrex Corp. | 93,400 | 3,706 |
| * | Community Health Systems | |
| | Inc. | 84,300 | 3,606 |
| * | Centene Corp. | 65,800 | 3,568 |
| * | Infinity Pharmaceuticals Inc. 415,400 | 3,510 |
| *,^ | Merrimack Pharmaceuticals | |
| | Inc. | 411,200 | 3,499 |
| * | LHC Group Inc. | 66,300 | 2,968 |
| * | Lannett Co. Inc. | 68,800 | 2,857 |
| | Phibro Animal Health Corp. | | |
| | Class A | 90,300 | 2,856 |
| * | Veeva Systems Inc. | | |
| | Class A | 99,800 | 2,336 |
| *,^ | Sequenom Inc. | 1,062,000 | 1,859 |
| * | Eagle Pharmaceuticals Inc. | 24,500 | 1,814 |
| * | Bruker Corp. | 104,400 | 1,715 |
| * | Health Net Inc. | 27,300 | 1,644 |
| * | Prestige Brands Holdings | | |
| | Inc. | 32,900 | 1,486 |
| * | PRA Health Sciences Inc. | 33,600 | 1,305 |
| | Abaxis Inc. | 24,700 | 1,087 |
| * | Nektar Therapeutics | 85,300 | 935 |
| * | Triple-S Management Corp. | |
| | Class B | 49,600 | 883 |
| * | SurModics Inc. | 40,231 | 879 |
| * | Greatbatch Inc. | 11,100 | 626 |
| | | | 127,187 |
| Industrials (13.9%) | | |
| * | JetBlue Airways Corp. | 300,600 | 7,746 |
| | AO Smith Corp. | 95,100 | 6,200 |
| * | Dycom Industries Inc. | 81,100 | 5,868 |
| * | Hawaiian Holdings Inc. | 217,900 | 5,378 |
| * | American Woodmark Corp. | 81,500 | 5,287 |
| | CEB Inc. | 76,200 | 5,208 |
| | Comfort Systems USA Inc. | 180,900 | 4,931 |
| | Interface Inc. Class A | 219,700 | 4,930 |
| * | Spirit AeroSystems | | |
| | Holdings Inc. Class A | 101,300 | 4,897 |
15
| | | |
| Strategic Small-Cap Equity Fund | |
| |
| |
| |
| | | | Market |
| | | | Value |
| | | Shares | ($000) |
| | Aircastle Ltd. | 233,000 | 4,802 |
| * | Wabash National Corp. | 446,000 | 4,723 |
| | Alaska Air Group Inc. | 56,200 | 4,465 |
| | Huntington Ingalls | | |
| | Industries Inc. | 40,600 | 4,350 |
| | GATX Corp. | 93,300 | 4,119 |
| | Insperity Inc. | 89,800 | 3,945 |
| | Pitney Bowes Inc. | 191,900 | 3,809 |
| * | Aerojet Rocketdyne | | |
| | Holdings Inc. | 223,900 | 3,623 |
| | Douglas Dynamics Inc. | 174,300 | 3,462 |
| | Korn/Ferry International | 102,900 | 3,403 |
| | Deluxe Corp. | 58,700 | 3,272 |
| | ESCO Technologies Inc. | 82,400 | 2,958 |
| * | Meritor Inc. | 274,600 | 2,919 |
| | Matson Inc. | 75,800 | 2,918 |
| | John Bean Technologies | | |
| | Corp. | 73,000 | 2,792 |
| | General Cable Corp. | 228,700 | 2,722 |
| *,^ | Virgin America Inc. | 73,200 | 2,506 |
| * | ACCO Brands Corp. | 304,000 | 2,149 |
| | G&K Services Inc. Class A | 31,900 | 2,125 |
| * | MYR Group Inc. | 80,000 | 2,096 |
| | SkyWest Inc. | 118,700 | 1,980 |
| | Griffon Corp. | 109,600 | 1,728 |
| | Federal Signal Corp. | 121,600 | 1,667 |
| | Heidrick & Struggles | | |
| | International Inc. | 81,400 | 1,583 |
| | Quanex Building Products | | |
| | Corp. | 81,500 | 1,481 |
| | Global Brass & Copper | | |
| | Holdings Inc. | 65,300 | 1,339 |
| | Ennis Inc. | 68,600 | 1,191 |
| | HNI Corp. | 15,900 | 682 |
| * | Lydall Inc. | 23,400 | 667 |
| | Multi-Color Corp. | 7,900 | 604 |
| | HEICO Corp. Class A | 13,200 | 599 |
| | National Presto Industries | | |
| | Inc. | 3,000 | 253 |
| | Kadant Inc. | 4,400 | 172 |
| | | | 131,549 |
| Information Technology (15.7%) | |
| * | Manhattan Associates Inc. | 108,300 | 6,747 |
| * | Cirrus Logic Inc. | 204,600 | 6,447 |
| * | Blackhawk Network | | |
| | Holdings Inc. | 140,957 | 5,975 |
| * | Tech Data Corp. | 84,300 | 5,775 |
| | MAXIMUS Inc. | 95,832 | 5,708 |
| * | Ciena Corp. | 264,200 | 5,474 |
| * | Aspen Technology Inc. | 137,900 | 5,228 |
| * | Sykes Enterprises Inc. | 204,500 | 5,215 |
| | Booz Allen Hamilton | | |
| | Holding Corp. Class A | 197,000 | 5,163 |
| * | Infinera Corp. | 262,700 | 5,138 |
| | | |
| | | | Market |
| | | | Value |
| | | Shares | ($000) |
| *,^ | Cimpress NV | 67,000 | 5,099 |
| * | MicroStrategy Inc. Class A | 25,300 | 4,971 |
| | Broadridge Financial | | |
| | Solutions Inc. | 89,800 | 4,970 |
| | DST Systems Inc. | 47,058 | 4,948 |
| | EarthLink Holdings Corp. | 618,300 | 4,810 |
| | SYNNEX Corp. | 54,400 | 4,627 |
| * | ARRIS Group Inc. | 172,035 | 4,468 |
| * | Super Micro Computer Inc. | 134,600 | 3,669 |
| | Blackbaud Inc. | 64,400 | 3,614 |
| * | Sanmina Corp. | 164,900 | 3,524 |
| | Science Applications | | |
| | International Corp. | 85,400 | 3,434 |
| *,^ | Ambarella Inc. | 58,595 | 3,386 |
| | Tessera Technologies Inc. | 99,700 | 3,231 |
| * | ePlus Inc. | 40,000 | 3,163 |
| * | Synaptics Inc. | 36,500 | 3,010 |
| *,^ | Angie’s List Inc. | 544,600 | 2,745 |
| * | Mellanox Technologies Ltd. | 69,200 | 2,615 |
| | TeleTech Holdings Inc. | 94,000 | 2,518 |
| | Lexmark International Inc. | | |
| | Class A | 84,900 | 2,460 |
| * | Gigamon Inc. | 112,200 | 2,245 |
| | CSG Systems International | | |
| | Inc. | 62,100 | 1,913 |
| * | Avid Technology Inc. | 236,400 | 1,882 |
| | Leidos Holdings Inc. | 45,300 | 1,871 |
| * | Constant Contact Inc. | 59,500 | 1,442 |
| * | Plexus Corp. | 33,100 | 1,277 |
| * | ShoreTel Inc. | 142,300 | 1,063 |
| * | Sigma Designs Inc. | 144,500 | 996 |
| * | WebMD Health Corp. | 23,600 | 940 |
| | Pegasystems Inc. | 34,400 | 847 |
| * | Benchmark Electronics Inc. | 38,100 | 829 |
| * | PMC-Sierra Inc. | 110,900 | 751 |
| | InterDigital Inc. | 14,700 | 744 |
| * | Quantum Corp. | 871,200 | 608 |
| * | Advanced Micro Devices | | |
| | Inc. | 320,900 | 552 |
| * | Magnachip Semiconductor | | |
| | Corp. | 74,900 | 494 |
| * | FormFactor Inc. | 69,200 | 469 |
| * | OmniVision Technologies | | |
| | Inc. | 16,700 | 439 |
| * | Jive Software Inc. | 66,000 | 308 |
| * | Carbonite Inc. | 20,200 | 225 |
| | Marchex Inc. Class B | 54,900 | 221 |
| | | | 148,248 |
| Materials (4.2%) | | |
| * | Chemtura Corp. | 199,400 | 5,707 |
| *,^ | Trinseo SA | 203,700 | 5,143 |
| | Graphic Packaging Holding | | |
| | Co. | 288,800 | 3,694 |
| | Bemis Co. Inc. | 90,000 | 3,561 |
16
| | | |
| Strategic Small-Cap Equity Fund | |
| |
| |
| |
| | | | Market |
| | | | Value |
| | | Shares | ($000) |
| | Mercer International Inc. | 350,400 | 3,514 |
| * | Ferro Corp. | 295,300 | 3,234 |
| | Neenah Paper Inc. | 49,644 | 2,893 |
| | Domtar Corp. | 72,200 | 2,581 |
| | Innospec Inc. | 50,500 | 2,349 |
| | Schweitzer-Mauduit | | |
| | International Inc. | 65,000 | 2,235 |
| | Sensient Technologies Corp. | 32,100 | 1,968 |
| | Scotts Miracle-Gro Co. | | |
| | Class A | 13,400 | 815 |
| | Sonoco Products Co. | 17,000 | 642 |
| | Materion Corp. | 19,700 | 591 |
| | A Schulman Inc. | 12,000 | 390 |
| | | | 39,317 |
| Telecommunication Services (0.9%) | |
| | Inteliquent Inc. | 179,500 | 4,008 |
| | Telephone & Data Systems | | |
| | Inc. | 98,100 | 2,449 |
| * | Cincinnati Bell Inc. | 562,800 | 1,756 |
| * | FairPoint Communications | | |
| �� | Inc. | 12,200 | 188 |
| | | | 8,401 |
| Utilities (3.9%) | | |
| | Vectren Corp. | 154,500 | 6,491 |
| | WGL Holdings Inc. | 109,500 | 6,315 |
| | American States Water Co. | 135,800 | 5,622 |
| | New Jersey Resources | | |
| | Corp. | 175,700 | 5,276 |
| | IDACORP Inc. | 70,800 | 4,581 |
| | Chesapeake Utilities Corp. | 52,900 | 2,808 |
| | ONE Gas Inc. | 43,100 | 1,954 |
| | Great Plains Energy Inc. | 52,800 | 1,427 |
| | Unitil Corp. | 28,900 | 1,066 |
| | Ormat Technologies Inc. | 22,700 | 772 |
| | Otter Tail Corp. | 9,200 | 240 |
| | | | 36,552 |
| Total Common Stocks | | |
| (Cost $912,146) | | 939,558 |
| | | |
| | | | Market |
| | | | Value |
| | | Shares | ($000) |
| Temporary Cash Investments (3.2%)1 | |
| Money Market Fund (3.2%) | | |
| 2,3 | Vanguard Market | | |
| | Liquidity Fund, | | |
| | 0.189% | 29,756,000 | 29,756 |
| |
| | | Face | |
| | | Amount | |
| | | ($000) | |
| U.S. Government and Agency Obligations (0.0%) |
| 4,5 | Federal Home Loan | | |
| | Bank Discount Notes, | | |
| | 0.100%, 10/23/15 | 200 | 200 |
| 4,5 | Federal Home Loan | | |
| | Bank Discount Notes, | | |
| | 0.150%, 11/13/15 | 200 | 200 |
| | | | 400 |
| Total Temporary Cash Investments | |
| (Cost $30,156) | | 30,156 |
| Total Investments (102.6%) | | |
| (Cost $942,302) | | 969,714 |
| |
| | | | Amount |
| | | | ($000) |
| Other Assets and Liabilities (-2.6%) | |
| Other Assets | | |
| Investment in Vanguard | | 86 |
| Receivables for Accrued Income | 1,334 |
| Receivables for Capital Shares Issued | 1,246 |
| Other Assets | | 200 |
| Total Other Assets | | 2,866 |
| Liabilities | | |
| Payables for Investment Securities | |
| Purchased | | (6,640) |
| Collateral for Securities on Loan | (19,692) |
| Payables for Capital Shares Redeemed | (502) |
| Payables to Vanguard | | (560) |
| Total Liabilities | | (27,394) |
| Net Assets (100%) | | |
| Applicable to 32,654,328 outstanding | |
| $.001 par value shares of beneficial | |
| interest (unlimited authorization) | 945,186 |
| Net Asset Value Per Share | | $28.95 |
17
Strategic Small-Cap Equity Fund
| |
| At September 30, 2015, net assets consisted of: |
| | Amount |
| | ($000) |
| Paid-in Capital | 899,645 |
| Undistributed Net Investment Income | 7,198 |
| Accumulated Net Realized Gains | 11,058 |
| Unrealized Appreciation (Depreciation) | |
| Investment Securities | 27,412 |
| Futures Contracts | (127) |
| Net Assets | 945,186 |
See Note A in Notes to Financial Statements.
* Non-income-producing security.
^ Includes partial security positions on loan to broker-dealers. The total value of securities on loan is $19,427,000.
1 The fund invests a portion of its cash reserves in equity markets through the use of index futures contracts. After giving effect to futures investments, the fund’s effective common stock and temporary cash investment positions represent 99.9% and 2.7%, respectively, of net assets.
2 Affiliated money market fund available only to Vanguard funds and certain trusts and accounts managed by Vanguard. Rate shown is the 7-day yield.
3 Includes $19,692,000 of collateral received for securities on loan.
4 The issuer operates under a congressional charter; its securities are generally neither guaranteed by the U.S. Treasury nor backed by the full faith and credit of the U.S. government.
5 Securities with a value of $400,000 have been segregated as initial margin for open futures contracts.
REIT—Real Estate Investment Trust.
See accompanying Notes, which are an integral part of the Financial Statements.
18
| |
| Strategic Small-Cap Equity Fund | |
| |
| |
| Statement of Operations | |
| |
| | Year Ended |
| | September 30, 2015 |
| | ($000) |
| Investment Income | |
| Income | |
| Dividends | 12,852 |
| Interest1 | 14 |
| Securities Lending | 425 |
| Total Income | 13,291 |
| Expenses | |
| The Vanguard Group—Note B | |
| Investment Advisory Services | 478 |
| Management and Administrative | 1,981 |
| Marketing and Distribution | 162 |
| Custodian Fees | 19 |
| Auditing Fees | 33 |
| Shareholders’ Reports | 15 |
| Trustees’ Fees and Expenses | 1 |
| Total Expenses | 2,689 |
| Net Investment Income | 10,602 |
| Realized Net Gain (Loss) | |
| Investment Securities Sold | 14,956 |
| Futures Contracts | 35 |
| Realized Net Gain (Loss) | 14,991 |
| Change in Unrealized Appreciation (Depreciation) | |
| Investment Securities | (43,013) |
| Futures Contracts | (36) |
| Change in Unrealized Appreciation (Depreciation) | (43,049) |
| Net Increase (Decrease) in Net Assets Resulting from Operations | (17,456) |
| 1 Interest income from an affiliated company of the fund was $13,000. | |
See accompanying Notes, which are an integral part of the Financial Statements.
19
| | |
| Strategic Small-Cap Equity Fund | | |
| |
| |
| Statement of Changes in Net Assets | | |
| |
| | Year Ended September 30, |
| | 2015 | 2014 |
| | ($000) | ($000) |
| Increase (Decrease) in Net Assets | | |
| Operations | | |
| Net Investment Income | 10,602 | 4,634 |
| Realized Net Gain (Loss) | 14,991 | 54,256 |
| Change in Unrealized Appreciation (Depreciation) | (43,049) | (10,336) |
| Net Increase (Decrease) in Net Assets Resulting from Operations | (17,456) | 48,554 |
| Distributions | | |
| Net Investment Income | (4,646) | (3,377) |
| Realized Capital Gain1 | (45,915) | (4,018) |
| Total Distributions | (50,561) | (7,395) |
| Capital Share Transactions | | |
| Issued | 586,229 | 229,407 |
| Issued in Lieu of Cash Distributions | 47,237 | 6,904 |
| Redeemed | (165,424) | (109,249) |
| Net Increase (Decrease) from Capital Share Transactions | 468,042 | 127,062 |
| Total Increase (Decrease) | 400,025 | 168,221 |
| Net Assets | | |
| Beginning of Period | 545,161 | 376,940 |
| End of Period2 | 945,186 | 545,161 |
1 Includes fiscal 2015 and 2014 short-term gain distributions totaling $6,762,000 and $451,000, respectively. Short-term gain distributions are treated as ordinary income dividends for tax purposes.
2 Net Assets—End of Period includes undistributed (overdistributed) net investment income of $7,198,000 and $2,308,000.
See accompanying Notes, which are an integral part of the Financial Statements.
20
| | | | | |
| Strategic Small-Cap Equity Fund | | | | | |
| |
| |
| Financial Highlights | | | | | |
| |
| |
| For a Share Outstanding | | | Year Ended September 30, |
| Throughout Each Period | 2015 | 2014 | 2013 | 2012 | 2011 |
| Net Asset Value, Beginning of Period | $30.91 | $27.94 | $21.37 | $16.44 | $16.53 |
| Investment Operations | | | | | |
| Net Investment Income | . 368 | .277 | .345 | .238 | .176 |
| Net Realized and Unrealized Gain (Loss) | | | | | |
| on Investments | . 349 | 3.201 | 6.585 | 4.888 | (.126) |
| Total from Investment Operations | .717 | 3.478 | 6.930 | 5.126 | .050 |
| Distributions | | | | | |
| Dividends from Net Investment Income | (.246) | (. 232) | (. 360) | (.196) | (.140) |
| Distributions from Realized Capital Gains | (2.431) | (.276) | — | — | — |
| Total Distributions | (2.677) | (.508) | (. 360) | (.196) | (.140) |
| Net Asset Value, End of Period | $28.95 | $30.91 | $27.94 | $21.37 | $16.44 |
| |
| Total Return1 | 2.10% | 12.48% | 32.94% | 31.38% | 0.20% |
| |
| Ratios/Supplemental Data | | | | | |
| Net Assets, End of Period (Millions) | $945 | $545 | $377 | $259 | $223 |
| Ratio of Total Expenses to Average Net Assets | 0.34% | 0.38% | 0.38% | 0.38% | 0.38% |
| Ratio of Net Investment Income to | | | | | |
| Average Net Assets | 1.34% | 0.96% | 1.40% | 1.16% | 0.89% |
| Portfolio Turnover Rate | 62% | 64% | 64% | 66% | 64% |
1 Total returns do not include account service fees that may have applied in the periods shown. Fund prospectuses provide information about any applicable account service fees.
See accompanying Notes, which are an integral part of the Financial Statements.
21
Strategic Small-Cap Equity Fund
Notes to Financial Statements
Vanguard Strategic Small-Cap Equity Fund is registered under the Investment Company Act of 1940 as an open-end investment company, or mutual fund.
A. The following significant accounting policies conform to generally accepted accounting principles for U.S. investment companies. The fund consistently follows such policies in preparing its financial statements.
1. Security Valuation: Securities are valued as of the close of trading on the New York Stock Exchange (generally 4 p.m., Eastern time) on the valuation date. Equity securities are valued at the latest quoted sales prices or official closing prices taken from the primary market in which each security trades; such securities not traded on the valuation date are valued at the mean of the latest quoted bid and asked prices. Securities for which market quotations are not readily available, or whose values have been materially affected by events occurring before the fund’s pricing time but after the close of the securities’ primary markets, are valued by methods deemed by the board of trustees to represent fair value. Investments in Vanguard Market Liquidity Fund are valued at that fund’s net asset value. Temporary cash investments acquired over 60 days to maturity are valued using the latest bid prices or using valuations based on a matrix system (which considers such factors as security prices, yields, maturities, and ratings), both as furnished by independent pricing services. Other temporary cash investments are valued at amortized cost, which approximates market value.
2. Futures Contracts: The fund uses index futures contracts to a limited extent, with the objective of maintaining full exposure to the stock market while maintaining liquidity. The fund may purchase or sell futures contracts to achieve a desired level of investment, whether to accommodate portfolio turnover or cash flows from capital share transactions. The primary risks associated with the use of futures contracts are imperfect correlation between changes in market values of stocks held by the fund and the prices of futures contracts, and the possibility of an illiquid market. Counterparty risk involving futures is mitigated because a regulated clearinghouse is the counterparty instead of the clearing broker. To further mitigate counterparty risk, the fund trades futures contracts on an exchange, monitors the financial strength of its clearing brokers and clearinghouse, and has entered into clearing agreements with its clearing brokers. The clearinghouse imposes initial margin requirements to secure the fund’s performance and requires daily settlement of variation margin representing changes in the market value of each contract.
Futures contracts are valued at their quoted daily settlement prices. The aggregate settlement values of the contracts are not recorded in the Statement of Net Assets. Fluctuations in the value of the contracts are recorded in the Statement of Net Assets as an asset (liability) and in the Statement of Operations as unrealized appreciation (depreciation) until the contracts are closed, when they are recorded as realized futures gains (losses).
During the year ended September 30, 2015, the fund’s average investments in long and short futures contracts represented less than 1% and 0% of net assets, respectively, based on the average of aggregate settlement values at each quarter-end during the period.
3. Federal Income Taxes: The fund intends to continue to qualify as a regulated investment company and distribute all of its taxable income. Management has analyzed the fund’s tax positions taken for all open federal income tax years (September 30, 2012–2015), and has concluded that no provision for federal income tax is required in the fund’s financial statements.
4. Distributions: Distributions to shareholders are recorded on the ex-dividend date.
22
Strategic Small-Cap Equity Fund
5. Securities Lending: To earn additional income, the fund lends its securities to qualified institutional borrowers. Security loans are required to be secured at all times by collateral in an amount at least equal to the market value of securities loaned. Daily market fluctuations could cause the value of loaned securities to be more or less than the value of the collateral received. When this occurs, the collateral is adjusted and settled on the next business day. The fund further mitigates its counterparty risk by entering into securities lending transactions only with a diverse group of prequalified counterparties, monitoring their financial strength, and entering into master securities lending agreements with its counterparties. The master securities lending agreements provide that, in the event of a counterparty’s default (including bankruptcy), the fund may terminate any loans with that borrower, determine the net amount owed, and sell or retain the collateral up to the net amount owed to the fund; however, such actions may be subject to legal proceedings. While collateral mitigates counterparty risk, in the absence of a default the fund may experience delays and costs in recovering the securities loaned. The fund invests cash collateral received in Vanguard Market Liquidity Fund, and records a liability in the Statement of Net Assets for the return of the collateral, during the period the securities are on loan. Securities lending income represents fees charged to borrowers plus income earned on invested cash collateral, less expenses associated with the loan.
6. Credit Facility: The fund and certain other funds managed by The Vanguard Group (“Vanguard”) participate in a $3 billion committed credit facility provided by a syndicate of lenders pursuant to a credit agreement that may be renewed annually; each fund is individually liable for its borrowings, if any, under the credit facility. Borrowings may be utilized for temporary and emergency purposes, and are subject to the fund’s regulatory and contractual borrowing restrictions. The participating funds are charged administrative fees and an annual commitment fee of 0.06% of the undrawn amount of the facility; these fees are allocated to the funds based on a method approved by the fund’s board of trustees and included in Management and Administrative expenses on the fund’s Statement of Operations. Any borrowings under this facility bear interest at a rate equal to the higher of the federal funds rate or LIBOR reference rate plus an agreed-upon spread.
The fund had no borrowings outstanding at September 30, 2015, or at any time during the period then ended.
7. Other: Dividend income is recorded on the ex-dividend date. Interest income includes income distributions received from Vanguard Market Liquidity Fund and is accrued daily. Premiums and discounts on debt securities purchased are amortized and accreted, respectively, to interest income over the lives of the respective securities. Security transactions are accounted for on the date securities are bought or sold. Costs used to determine realized gains (losses) on the sale of investment securities are those of the specific securities sold.
B. In accordance with the terms of a Funds’ Service Agreement (the “FSA”) between Vanguard and the fund, Vanguard furnishes to the fund investment advisory, corporate management, administrative, marketing, and distribution services at Vanguard’s cost of operations (as defined by the FSA). These costs of operations are allocated to the fund based on methods and guidelines approved by the board of trustees. Vanguard does not require reimbursement in the current period for certain costs of operations (such as deferred compensation/benefits and risk/insurance costs); the fund’s liability for these costs of operations is included in Payables to Vanguard on the Statement of Net Assets.
Upon the request of Vanguard, the fund may invest up to 0.40% of its net assets as capital in Vanguard. At September 30, 2015, the fund had contributed to Vanguard capital in the amount of $86,000, representing 0.01% of the fund’s net assets and 0.03% of Vanguard’s capitalization. The fund’s trustees and officers are also directors and employees, respectively, of Vanguard.
23
Strategic Small-Cap Equity Fund
C. Various inputs may be used to determine the value of the fund’s investments. These inputs are summarized in three broad levels for financial statement purposes. The inputs or methodologies used to value securities are not necessarily an indication of the risk associated with investing in those securities.
Level 1—Quoted prices in active markets for identical securities.
Level 2—Other significant observable inputs (including quoted prices for similar securities, interest rates, prepayment speeds, credit risk, etc.).
Level 3—Significant unobservable inputs (including the fund’s own assumptions used to determine the fair value of investments).
The following table summarizes the market value of the fund’s investments as of September 30, 2015, based on the inputs used to value them:
| | | |
| | Level 1 | Level 2 | Level 3 |
| Investments | ($000) | ($000) | ($000) |
| Common Stocks | 939,558 | — | — |
| Temporary Cash Investments | 29,756 | 400 | — |
| Futures Contracts—Assets1 | 77 | — | — |
| Total | 969,391 | 400 | — |
| 1 Represents variation margin on the last day of the reporting period. |
D. At September 30, 2015, the aggregate settlement value of open futures contracts and the related unrealized appreciation (depreciation) were:
| | | | |
| | | | | ($000) |
| | | | Aggregate | |
| | | Number of | Settlement | Unrealized |
| | | Long (Short) | Value | Appreciation |
| Futures Contracts | Expiration | Contracts | Long (Short) | (Depreciation) |
| E-mini Russell 2000 Index | December 2015 | 44 | 4,822 | (127) |
Unrealized appreciation (depreciation) on open futures contracts is required to be treated as realized gain (loss) for tax purposes.
E. Distributions are determined on a tax basis and may differ from net investment income and realized capital gains for financial reporting purposes. Differences may be permanent or temporary. Permanent differences are reclassified among capital accounts in the financial statements to reflect their tax character. Temporary differences arise when certain items of income, expense, gain, or loss are recognized in different periods for financial statement and tax purposes. These differences will reverse at some time in the future. Differences in classification may also result from the treatment of short-term gains as ordinary income for tax purposes.
The fund used a tax accounting practice to treat a portion of the price of capital shares redeemed during the year as distributions from net investment income and realized capital gains. Accordingly, the fund has reclassified $1,066,000 from undistributed net investment income, and $3,948,000 from accumulated net realized gains, to paid-in capital.
For tax purposes, at September 30, 2015, the fund had $7,684,000 of ordinary income and $10,942,000 of long-term capital gains available for distribution.
24
Strategic Small-Cap Equity Fund
At September 30, 2015, the cost of investment securities for tax purposes was $942,322,000. Net unrealized appreciation of investment securities for tax purposes was $27,392,000, consisting of unrealized gains of $106,243,000 on securities that had risen in value since their purchase and $78,851,000 in unrealized losses on securities that had fallen in value since their purchase.
F. During the year ended September 30, 2015, the fund purchased $916,596,000 of investment securities and sold $490,355,000 of investment securities, other than temporary cash investments.
G. Capital shares issued and redeemed were:
| | |
| | Year Ended September 30, |
| | 2015 | 2014 |
| | Shares | Shares |
| | (000) | (000) |
| Issued | 18,723 | 7,470 |
| Issued in Lieu of Cash Distributions | 1,590 | 228 |
| Redeemed | (5,297) | (3,550) |
| Net Increase (Decrease) in Shares Outstanding | 15,016 | 4,148 |
H. Management has determined that no material events or transactions occurred subsequent to September 30, 2015, that would require recognition or disclosure in these financial statements.
25
Report of Independent Registered Public Accounting Firm
To the Board of Trustees of Vanguard Horizon Funds and the Shareholders of Vanguard Strategic Small-Cap Equity Fund:
In our opinion, the accompanying statement of net assets and the related statements of operations and of changes in net assets and the financial highlights present fairly, in all material respects, the financial position of Vanguard Strategic Small-Cap Equity Fund (constituting a separate portfolio of Vanguard Horizon Funds, hereafter referred to as the “Fund”) at September 30, 2015, the results of its operations for the year then ended, the changes in its net assets for each of the two years in the period then ended, and the financial highlights for each of the five years in the period then ended, in conformity with accounting principles generally accepted in the United States of America. These financial statements and financial highlights (hereafter referred to as “financial statements”) are the responsibility of the Fund’s management. Our responsibility is to express an opinion on these financial statements based on our audits. We conducted our audits of these financial statements in accordance with the standards of the Public Company Accounting Oversight Board (United States). Those standards require that we plan and perform the audit to obtain reasonable assurance about whether the financial statements are free of material misstatement. An audit includes examining, on a test basis, evidence supporting the amounts and disclosures in the financial statements, assessing the accounting principles used and significant estimates made by management, and evaluating the overall financial statement presentation. We believe that our audits, which included confirmation of securities at September 30, 2015 by correspondence with the custodian and brokers, by agreement to the underlying ownership records of the transfer agent and the application of alternative auditing procedures where securities purchased had not been received, provide a reasonable basis for our opinion.
/s/PricewaterhouseCoopers LLP
Philadelphia, Pennsylvania
November 10, 2015
| |
|
| Special 2015 tax information (unaudited) for Vanguard Strategic Small-Cap Equity Fund |
| |
| This information for the fiscal year ended September 30, 2015, is included pursuant to provisions |
| of the Internal Revenue Code. |
| |
| The fund distributed $43,101,000 as capital gain dividends (20% rate gain distributions) to |
| shareholders during the fiscal year. |
| |
| For nonresident alien shareholders, 100% of short-term capital gain dividends distributed by the |
| fund are qualified short-term capital gains. |
| |
| The fund distributed $4,690,000 of qualified dividend income to shareholders during the fiscal year. |
| |
| For corporate shareholders, 80.4% of investment income (dividend income plus short-term gains, |
| if any) qualifies for the dividends-received deduction. |
26
Your Fund’s After-Tax Returns
This table presents returns for your fund both before and after taxes. The after-tax returns are shown in two ways: (1) assuming that an investor owned the fund during the entire period and paid taxes on the fund’s distributions, and (2) assuming that an investor paid taxes on the fund’s distributions and sold all shares at the end of each period.
Calculations are based on the highest individual federal income tax and capital gains tax rates in effect at the times of the distributions and the hypothetical sales. State and local taxes were not considered. After-tax returns reflect any qualified dividend income, using actual prior-year figures and estimates for 2015. (In the example, returns after the sale of fund shares may be higher than those assuming no sale. This occurs when the sale would have produced a capital loss. The calculation assumes that the investor received a tax deduction for the loss.)
Please note that your actual after-tax returns will depend on your tax situation and may differ from those shown. Also note that if you own the fund in a tax-deferred account, such as an individual retirement account or a 401(k) plan, this information does not apply to you. Such accounts are not subject to current taxes.
Finally, keep in mind that a fund’s performance—whether before or after taxes—does not guarantee future results.
| | | |
| Average Annual Total Returns: Strategic Small-Cap Equity Fund | | |
| Periods Ended September 30, 2015 | | | |
| | | | Since |
| | One | Five | Inception |
| | Year | Years | (4/24/2006) |
| Returns Before Taxes | 2.10% | 14.98% | 6.10% |
| Returns After Taxes on Distributions | -0.13 | 14.26 | 5.64 |
| Returns After Taxes on Distributions and Sale of Fund Shares | 2.69 | 12.04 | 4.85 |
27
About Your Fund’s Expenses
As a shareholder of the fund, you incur ongoing costs, which include costs for portfolio management, administrative services, and shareholder reports (like this one), among others. Operating expenses, which are deducted from a fund’s gross income, directly reduce the investment return of the fund.
A fund’s expenses are expressed as a percentage of its average net assets. This figure is known as the expense ratio. The following examples are intended to help you understand the ongoing costs (in dollars) of investing in your fund and to compare these costs with those of other mutual funds. The examples are based on an investment of $1,000 made at the beginning of the period shown and held for the entire period.
The accompanying table illustrates your fund’s costs in two ways:
• Based on actual fund return. This section helps you to estimate the actual expenses that you paid over the period. The ”Ending Account Value“ shown is derived from the fund‘s actual return, and the third column shows the dollar amount that would have been paid by an investor who started with $1,000 in the fund. You may use the information here, together with the amount you invested, to estimate the expenses that you paid over the period.
To do so, simply divide your account value by $1,000 (for example, an $8,600 account value divided by $1,000 = 8.6), then multiply the result by the number given for your fund under the heading ”Expenses Paid During Period.“
• Based on hypothetical 5% yearly return. This section is intended to help you compare your fund‘s costs with those of other mutual funds. It assumes that the fund had a yearly return of 5% before expenses, but that the expense ratio is unchanged. In this case—because the return used is not the fund’s actual return—the results do not apply to your investment. The example is useful in making comparisons because the Securities and Exchange Commission requires all mutual funds to calculate expenses based on a 5% return. You can assess your fund’s costs by comparing this hypothetical example with the hypothetical examples that appear in shareholder reports of other funds.
Note that the expenses shown in the table are meant to highlight and help you compare ongoing costs only and do not reflect transaction costs incurred by the fund for buying and selling securities. Further, the expenses do not include any purchase, redemption, or account service fees described in the fund prospectus. If such fees were applied to your account, your costs would be higher. Your fund does not carry a “sales load.”
The calculations assume no shares were bought or sold during the period. Your actual costs may have been higher or lower, depending on the amount of your investment and the timing of any purchases or redemptions.
You can find more information about the fund’s expenses, including annual expense ratios, in the Financial Statements section of this report. For additional information on operating expenses and other shareholder costs, please refer to your fund’s current prospectus.
28
| | | |
| Six Months Ended September 30, 2015 | | | |
| | Beginning | Ending | Expenses |
| | Account Value | Account Value | Paid During |
| Strategic Small-Cap Equity Fund | 3/31/2015 | 9/30/2015 | Period |
| Based on Actual Fund Return | $1,000.00 | $902.71 | $1.53 |
| Based on Hypothetical 5% Yearly Return | 1,000.00 | 1,023.46 | 1.62 |
The calculations are based on expenses incurred in the most recent six-month period. The fund’s annualized six-month expense ratio for that period is 0.32%. The dollar amounts shown as “Expenses Paid” are equal to the annualized expense ratio multiplied by the average account value over the period, multiplied by the number of days in the most recent six-month period, then divided by the number of days in the most recent 12-month period (183/365).
29
Glossary
30-Day SEC Yield. A fund’s 30-day SEC yield is derived using a formula specified by the U.S. Securities and Exchange Commission. Under the formula, data related to the fund’s security holdings in the previous 30 days are used to calculate the fund’s hypothetical net income for that period, which is then annualized and divided by the fund’s estimated average net assets over the calculation period. For the purposes of this calculation, a security’s income is based on its current market yield to maturity (for bonds), its actual income (for asset-backed securities), or its projected dividend yield (for stocks). Because the SEC yield represents hypothetical annualized income, it will differ—at times significantly—from the fund’s actual experience. As a result, the fund’s income distributions may be higher or lower than implied by the SEC yield.
Beta. A measure of the magnitude of a fund’s past share-price fluctuations in relation to the ups and downs of a given market index. The index is assigned a beta of 1.00. Compared with a given index, a fund with a beta of 1.20 typically would have seen its share price rise or fall by 12% when the index rose or fell by 10%. For this report, beta is based on returns over the past 36 months for both the fund and the index. Note that a fund’s beta should be reviewed in conjunction with its R-squared (see definition). The lower the R-squared, the less correlation there is between the fund and the index, and the less reliable beta is as an indicator of volatility.
Dividend Yield. Dividend income earned by stocks, expressed as a percentage of the aggregate market value (or of net asset value, for a fund). The yield is determined by dividing the amount of the annual dividends by the aggregate value (or net asset value) at the end of the period. For a fund, the dividend yield is based solely on stock holdings and does not include any income produced by other investments.
Earnings Growth Rate. The average annual rate of growth in earnings over the past five years for the stocks now in a fund.
Equity Exposure. A measure that reflects a fund’s investments in stocks and stock futures. Any holdings in short-term reserves are excluded.
Expense Ratio. A fund’s total annual operating expenses expressed as a percentage of the fund’s average net assets. The expense ratio includes management and administrative expenses, but does not include the transaction costs of buying and selling portfolio securities.
Foreign Holdings. The percentage of a fund represented by securities or depositary receipts of companies based outside the United States.
Inception Date. The date on which the assets of a fund (or one of its share classes) are first invested in accordance with the fund’s investment objective. For funds with a subscription period, the inception date is the day after that period ends. Investment performance is measured from the inception date.
Median Market Cap. An indicator of the size of companies in which a fund invests; the midpoint of market capitalization (market price x shares outstanding) of a fund’s stocks, weighted by the proportion of the fund’s assets invested in each stock. Stocks representing half of the fund’s assets have market capitalizations above the median, and the rest are below it.
Price/Book Ratio. The share price of a stock divided by its net worth, or book value, per share. For a fund, the weighted average price/book ratio of the stocks it holds.
30
Price/Earnings Ratio. The ratio of a stock’s current price to its per-share earnings over the past year. For a fund, the weighted average P/E of the stocks it holds. P/E is an indicator of market expectations about corporate prospects; the higher the P/E, the greater the expectations for a company’s future growth.
R-Squared. A measure of how much of a fund’s past returns can be explained by the returns from the market in general, as measured by a given index. If a fund’s total returns were precisely synchronized with an index’s returns, its R-squared would be 1.00. If the fund’s returns bore no relationship to the index’s returns, its R-squared would be 0. For this report, R-squared is based on returns over the past 36 months for both the fund and the index.
Return on Equity. The annual average rate of return generated by a company during the past five years for each dollar of shareholder’s equity (net income divided by shareholder’s equity). For a fund, the weighted average return on equity for the companies whose stocks it holds.
Short-Term Reserves. The percentage of a fund invested in highly liquid, short-term securities that can be readily converted to cash.
Turnover Rate. An indication of the fund’s trading activity. Funds with high turnover rates incur higher transaction costs and may be more likely to distribute capital gains (which may be taxable to investors). The turnover rate excludes in-kind transactions, which have minimal impact on costs.
31
The People Who Govern Your Fund
The trustees of your mutual fund are there to see that the fund is operated and managed in your best interests since, as a shareholder, you are a part owner of the fund. Your fund’s trustees also serve on the board of directors of The Vanguard Group, Inc., which is owned by the Vanguard funds and provides services to them on an at-cost basis.
A majority of Vanguard’s board members are independent, meaning that they have no affiliation with Vanguard or the funds they oversee, apart from the sizable personal investments they have made as private individuals. The independent board members have distinguished backgrounds in business, academia, and public service. Each of the trustees and executive officers oversees 194 Vanguard funds.
The following table provides information for each trustee and executive officer of the fund. More information about the trustees is in the Statement of Additional Information, which can be obtained, without charge, by contacting Vanguard at 800-662-7447, or online at vanguard.com.
| |
| InterestedTrustee1 | Rajiv L. Gupta |
| | Born 1945. Trustee Since December 2001.2 Principal |
| F. William McNabb III | Occupation(s) During the Past Five Years and Other |
| Born 1957. Trustee Since July 2009. Chairman of | Experience: Chairman and Chief Executive Officer |
| the Board. Principal Occupation(s) During the Past | (retired 2009) and President (2006–2008) of |
| Five Years and Other Experience: Chairman of the | Rohm and Haas Co. (chemicals); Director of Tyco |
| Board of The Vanguard Group, Inc., and of each of | International PLC (diversified manufacturing and |
| the investment companies served by The Vanguard | services), Hewlett-Packard Co. (electronic computer |
| Group, since January 2010; Director of The Vanguard | manufacturing), and Delphi Automotive PLC |
| Group since 2008; Chief Executive Officer and | (automotive components); Senior Advisor at New |
| President of The Vanguard Group, and of each of | Mountain Capital. |
| the investment companies served by The Vanguard | |
| Group, since 2008; Director of Vanguard Marketing | Amy Gutmann |
| Corporation; Managing Director of The Vanguard | Born 1949. Trustee Since June 2006. Principal |
| Group (1995–2008). | Occupation(s) During the Past Five Years and |
| | Other Experience: President of the University of |
| IndependentTrustees | Pennsylvania; Christopher H. Browne Distinguished |
| | Professor of Political Science, School of Arts and |
| Emerson U. Fullwood | Sciences, and Professor of Communication, Annenberg |
| Born 1948. Trustee Since January 2008. Principal | School for Communication, with secondary faculty |
| Occupation(s) During the Past Five Years and | appointments in the Department of Philosophy, School |
| Other Experience: Executive Chief Staff and | of Arts and Sciences, and at the Graduate School of |
| Marketing Officer for North America and Corporate | Education, University of Pennsylvania; Trustee of the |
| Vice President (retired 2008) of Xerox Corporation | National Constitution Center; Chair of the Presidential |
| (document management products and services); | Commission for the Study of Bioethical Issues. |
| Executive in Residence and 2009–2010 Distinguished | |
| Minett Professor at the Rochester Institute of | JoAnn Heffernan Heisen |
| Technology; Director of SPX Corporation (multi-industry | Born 1950. Trustee Since July 1998. Principal |
| manufacturing), the United Way of Rochester, | Occupation(s) During the Past Five Years and Other |
| Amerigroup Corporation (managed health care), the | Experience: Corporate Vice President and Chief |
| University of Rochester Medical Center, Monroe | Global Diversity Officer (retired 2008) and Member |
| Community College Foundation, and North Carolina | of the Executive Committee (1997–2008) of Johnson |
| A&T University. | & Johnson (pharmaceuticals/medical devices/ |
| | consumer products); Director of Skytop Lodge |
| | Corporation (hotels), the University Medical Center |
| | at Princeton, the Robert Wood Johnson Foundation, |
| | and the Center for Talent Innovation; Member of |
| | the Advisory Board of the Institute for Women’s |
| | Leadership at Rutgers University. |
| | |
| F. Joseph Loughrey | Executive Officers | |
| Born 1949. Trustee Since October 2009. Principal | | |
| Occupation(s) During the Past Five Years and Other | Glenn Booraem | |
| Experience: President and Chief Operating Officer | Born 1967. Treasurer Since May 2015. Principal |
| (retired 2009) of Cummins Inc. (industrial machinery); | Occupation(s) During the Past Five Years and |
| Chairman of the Board of Hillenbrand, Inc. (specialized | Other Experience: Principal of The Vanguard Group, |
| consumer services), and of Oxfam America; Director | Inc.; Treasurer of each of the investment companies |
| of SKF AB (industrial machinery), Hyster-Yale Materials | served by The Vanguard Group; Controller of each of |
| Handling, Inc. (forklift trucks), the Lumina Foundation | the investment companies served by The Vanguard |
| for Education, and the V Foundation for Cancer | Group (2010–2015); Assistant Controller of each of |
| Research; Member of the Advisory Council for the | the investment companies served by The Vanguard |
| College of Arts and Letters and of the Advisory Board | Group (2001–2010). | |
| to the Kellogg Institute for International Studies, both | | |
| at the University of Notre Dame. | Thomas J. Higgins | |
| Born 1957. Chief Financial Officer Since September |
| Mark Loughridge | 2008. Principal Occupation(s) During the Past Five |
| Born 1953. Trustee Since March 2012. Principal | Years and Other Experience: Principal of The Vanguard |
| Occupation(s) During the Past Five Years and Other | Group, Inc.; Chief Financial Officer of each of the |
| Experience: Senior Vice President and Chief Financial | investment companies served by The Vanguard Group; |
| Officer (retired 2013) at IBM (information technology | Treasurer of each of the investment companies served |
| services); Fiduciary Member of IBM’s Retirement Plan | by The Vanguard Group (1998–2008). |
| Committee (2004–2013); Director of the Dow Chemical | |
| Company; Member of the Council on Chicago Booth. | Peter Mahoney | |
| Born 1974. Controller Since May 2015. Principal |
| Scott C. Malpass | Occupation(s) During the Past Five Years and |
| Born 1962. Trustee Since March 2012. Principal | Other Experience: Head of Global Fund Accounting |
| Occupation(s) During the Past Five Years and Other | at The Vanguard Group, Inc.; Controller of each of the |
| Experience: Chief Investment Officer and Vice | investment companies served by The Vanguard Group; |
| President at the University of Notre Dame; Assistant | Head of International Fund Services at The Vanguard |
| Professor of Finance at the Mendoza College of | Group (2008–2014). | |
| Business at Notre Dame; Member of the Notre Dame | | |
| 403(b) Investment Committee; Board Member of | Heidi Stam | |
| TIFF Advisory Services, Inc., and Catholic Investment | Born 1956. Secretary Since July 2005. Principal |
| Services, Inc. (investment advisors); Member of | Occupation(s) During the Past Five Years and Other |
| the Investment Advisory Committee of Major | Experience: Managing Director of The Vanguard |
| League Baseball. | Group, Inc.; General Counsel of The Vanguard Group; |
| Secretary of The Vanguard Group and of each of the |
| André F. Perold | investment companies served by The Vanguard Group; |
| Born 1952. Trustee Since December 2004. Principal | Director and Senior Vice President of Vanguard |
| Occupation(s) During the Past Five Years and Other | Marketing Corporation. | |
| Experience: George Gund Professor of Finance and | | |
| Banking, Emeritus at the Harvard Business School | Vanguard Senior Management Team |
| (retired 2011); Chief Investment Officer and Managing | |
| Partner of HighVista Strategies LLC (private investment | Mortimer J. Buckley | Chris D. McIsaac |
| firm); Director of Rand Merchant Bank; Overseer of | Kathleen C. Gubanich | James M. Norris |
| the Museum of Fine Arts Boston. | Paul A. Heller | Thomas M. Rampulla |
| Martha G. King | Glenn W. Reed |
| Peter F. Volanakis | John T. Marcante | Karin A. Risi |
| Born 1955. Trustee Since July 2009. Principal | | |
| Occupation(s) During the Past Five Years and Other | | |
| Experience: President and Chief Operating Officer | Chairman Emeritus and Senior Advisor |
| (retired 2010) of Corning Incorporated (communications | | |
| equipment); Trustee of Colby-Sawyer College; | John J. Brennan | |
| Member of the Advisory Board of the Norris Cotton | Chairman, 1996–2009 | |
| Cancer Center and of the Advisory Board of the | Chief Executive Officer and President, 1996–2008 |
| Parthenon Group (strategy consulting). | | |
| Founder | |
| | |
| | John C. Bogle | |
| | Chairman and Chief Executive Officer, 1974–1996 |
1 Mr. McNabb is considered an “interested person,” as defined in the Investment Company Act of 1940, because he is an officer of the Vanguard funds.
2 December 2002 for Vanguard Equity Income Fund, the Vanguard Municipal Bond Funds, and the Vanguard State Tax-Exempt Funds.
|  |
| P.O. Box 2600 |
| Valley Forge, PA 19482-2600 |
Connect with Vanguard® > vanguard.com
| |
| Fund Information > 800-662-7447 | CFA® is a registered trademark owned by CFA Institute. |
| Direct Investor Account Services > 800-662-2739 | |
| Institutional Investor Services > 800-523-1036 | |
| Text Telephone for People | |
| Who Are Deaf or Hard of Hearing> 800-749-7273 | |
| |
| This material may be used in conjunction | |
| with the offering of shares of any Vanguard | |
| fund only if preceded or accompanied by | |
| the fund’s current prospectus. | |
| |
| All comparative mutual fund data are from Lipper, a | |
| Thomson Reuters Company, or Morningstar, Inc., unless | |
| otherwise noted. | |
| |
| You can obtain a free copy of Vanguard’s proxy voting | |
| guidelines by visiting vanguard.com/proxyreporting or by | |
| calling Vanguard at 800-662-2739. The guidelines are | |
| also available from the SEC’s website, sec.gov. In | |
| addition, you may obtain a free report on how your fund | |
| voted the proxies for securities it owned during the 12 | |
| months ended June 30. To get the report, visit either | |
| vanguard.com/proxyreporting or sec.gov. | |
| |
| You can review and copy information about your fund at | |
| the SEC’s Public Reference Room in Washington, D.C. To | |
| find out more about this public service, call the SEC at | |
| 202-551-8090. Information about your fund is also | |
| available on the SEC’s website, and you can receive | |
| copies of this information, for a fee, by sending a | |
| request in either of two ways: via email addressed to | |
| publicinfo@sec.gov or via regular mail addressed to the | |
| Public Reference Section, Securities and Exchange | |
| Commission, Washington, DC 20549-1520. | |
| |
| | © 2015 The Vanguard Group, Inc. |
| | All rights reserved. |
| | Vanguard Marketing Corporation, Distributor. |
| |
| | Q6150 112015 |
Item 2: Code of Ethics. The Registrant has adopted a code of ethics that applies to the Registrant’s principal executive officer, principal financial officer, principal accounting officer or controller or persons performing similar functions. The Code of Ethics was amended during the reporting period covered by this report to make certain technical, non-material changes.
Item 3: Audit Committee Financial Expert. The following members of the Audit Committee have been determined by the Registrant’s Board of Trustees to be Audit Committee Financial Experts serving on its Audit Committee, and to be independent: Rajiv L. Gupta, Amy Gutmann, JoAnn Heffernan Heisen, F. Joseph Loughrey, Mark Loughridge, Scott C. Malpass, and André F. Perold.
Item 4: Principal Accountant Fees and Services.
(a) Audit Fees.
Audit Fees of the Registrant
Fiscal Year Ended September 30, 2015: $142,000
Fiscal Year Ended September 30, 2014: $138,000
Aggregate Audit Fees of Registered Investment Companies in the Vanguard Group.
Fiscal Year Ended September 30, 2015: $7,000,200
Fiscal Year Ended September 30, 2014: $6,605,127
Includes fees billed in connection with audits of the Registrant, other registered investment companies in the Vanguard complex, The Vanguard Group, Inc. and Vanguard Marketing Corporation.
(b) Audit-Related Fees.
Fiscal Year Ended September 30, 2015: $2,899,096
Fiscal Year Ended September 30, 2014: $2,176,479
Includes fees billed in connection with assurance and related services provided to the Registrant, other registered investment companies in the Vanguard complex, The Vanguard Group, Inc., and Vanguard Marketing Corporation.
(c) Tax Fees.
Fiscal Year Ended September 30, 2015: $353,389
Fiscal Year Ended September 30, 2014: $316,869
Includes fees billed in connection with tax compliance, planning, and advice services provided to the Registrant, other registered investment companies in the Vanguard complex, The Vanguard Group, Inc., and Vanguard Marketing Corporation.
(d) All Other Fees.
Fiscal Year Ended September 30, 2015: $202,313
Fiscal Year Ended September 30, 2014: $198,163
Includes fees billed for services related to tax reported information provided to the Registrant, other registered investment companies in the Vanguard complex, The Vanguard Group, Inc., and Vanguard Marketing Corporation.
(e) (1) Pre-Approval Policies. The policy of the Registrant’s Audit Committee is to consider and, if appropriate, approve before the principal accountant is engaged for such services, all specific audit and non-audit services provided to: the Registrant, other registered investment companies in the Vanguard complex, The Vanguard Group, Inc., and entities controlled by The Vanguard Group, Inc. that provide ongoing services to the Registrant. In making a determination, the Audit Committee considers whether the services are consistent with maintaining the principal accountant’s independence.
In the event of a contingency situation in which the principal accountant is needed to provide services in between scheduled Audit Committee meetings, the Chairman of the Audit Committee would be called on to consider and, if appropriate, pre-approve audit or permitted non-audit services in an amount sufficient to complete services through the next Audit Committee meeting, and to determine if such services would be consistent with maintaining the accountant’s independence. At the next scheduled Audit Committee meeting, services and fees would be presented to the Audit Committee for formal consideration, and, if appropriate, approval by the entire Audit Committee. The Audit Committee would again consider whether such services and fees are consistent with maintaining the principal accountant’s independence.
The Registrant’s Audit Committee is informed at least annually of all audit and non-audit services provided by the principal accountant to the Vanguard complex, whether such services are provided to: the Registrant, other registered investment companies in the Vanguard complex, The Vanguard Group, Inc., or other entities controlled by The Vanguard Group, Inc. that provide ongoing services to the Registrant.
(2) No percentage of the principal accountant’s fees or services were approved pursuant to the waiver provision of paragraph (c)(7)(i)(C) of Rule 2-01 of Regulation S-X.
(f) For the most recent fiscal year, over 50% of the hours worked under the principal accountant’s engagement were not performed by persons other than full-time, permanent employees of the principal accountant.
(g) Aggregate Non-Audit Fees.
Fiscal Year Ended September 30, 2015: $555,702
Fiscal Year Ended September 30, 2014: $515,032
Includes fees billed for non-audit services provided to the Registrant, other registered investment companies in the Vanguard complex, The Vanguard Group, Inc., and Vanguard Marketing Corporation.
(h) For the most recent fiscal year, the Audit Committee has determined that the provision of all non-audit services was consistent with maintaining the principal accountant’s independence.
Item 5: Audit Committee of Listed Registrants.
Not Applicable.
Item 6: Investments.
| | |
| Vanguard® Global Equity Fund | | |
| Schedule of Investments | | |
| September 30, 2015 | | |
| |
| | | Market |
| | | Value |
| | Shares | ($000) |
| Common Stocks (96.3%)1 | | |
| Australia (1.0%) | | |
| Brambles Ltd. | 1,526,550 | 10,487 |
| Caltex Australia Ltd. | 388,620 | 8,579 |
| * Qantas Airways Ltd. | 1,859,160 | 4,881 |
| Amcor Ltd. | 244,254 | 2,272 |
| Coca-Cola Amatil Ltd. | 304,297 | 1,929 |
| Alumina Ltd. | 1,780,460 | 1,416 |
| BlueScope Steel Ltd. | 448,417 | 1,142 |
| Fairfax Media Ltd. | 1,737,450 | 1,086 |
| Orica Ltd. | 99,579 | 1,057 |
| Transpacific Industries Group Ltd. | 1,894,421 | 910 |
| BHP Billiton Ltd. | 54,774 | 865 |
| Iluka Resources Ltd. | 176,581 | 776 |
| ALS Ltd. | 218,448 | 710 |
| Australia & New Zealand Banking Group Ltd. | 35,016 | 669 |
| * Newcrest Mining Ltd. | 71,630 | 645 |
| SAI Global Ltd. | 165,132 | 529 |
| DuluxGroup Ltd. | 129,254 | 488 |
| GUD Holdings Ltd. | 65,328 | 397 |
| Metcash Ltd. | 524,973 | 390 |
| Sigma Pharmaceuticals Ltd. | 592,440 | 312 |
| Santos Ltd. | 68,002 | 192 |
| Orora Ltd. | 107,206 | 175 |
| Premier Investments Ltd. | 10,829 | 98 |
| | | 40,005 |
| Austria (0.1%) | | |
| Wienerberger AG | 64,888 | 1,143 |
| Oesterreichische Post AG | 20,229 | 695 |
| ANDRITZ AG | 12,943 | 583 |
| | | 2,421 |
| Belgium (0.1%) | | |
| Anheuser-Busch InBev SA/NV | 32,227 | 3,427 |
| |
| Brazil (0.4%) | | |
| BM&FBovespa SA - Bolsa de Valores Mercadorias e Futuros | 1,834,600 | 5,127 |
| Banco do Brasil SA | 875,700 | 3,358 |
| EDP - Energias do Brasil SA | 485,000 | 1,404 |
| Ambev SA | 250,700 | 1,228 |
| Alpargatas SA Preference Shares | 673,982 | 1,143 |
| TOTVS SA | 149,200 | 1,134 |
| MRV Engenharia e Participacoes SA | 734,200 | 1,128 |
| BTG Pactual Group | 132,800 | 883 |
| Ultrapar Participacoes SA | 39,000 | 657 |
| * B2W Cia Digital | 148,781 | 558 |
| Cia Energetica de Minas Gerais ADR | 307,244 | 547 |
| Vale SA Preference Shares | 148,800 | 500 |
| Tim Participacoes SA | 214,235 | 406 |
| LPS Brasil Consultoria de Imoveis SA | 291,100 | 209 |
| Banco Bradesco SA Preference Shares | 30,760 | 166 |
| Natura Cosmeticos SA | 31,926 | 157 |
| | | 18,605 |
| Canada (3.5%) | | |
| Royal Bank of Canada | 428,800 | 23,710 |
| ^ Toronto-Dominion Bank | 582,600 | 22,964 |
| Magna International Inc. | 446,100 | 21,397 |
| Canadian Imperial Bank of Commerce | 242,000 | 17,387 |
| Bank of Montreal | 299,500 | 16,334 |
| Fairfax Financial Holdings Ltd. | 29,785 | 13,569 |
| Ritchie Bros Auctioneers Inc. | 343,596 | 8,892 |
| Canadian Natural Resources Ltd. | 298,305 | 5,810 |
| Rogers Communications Inc. Class B | 163,060 | 5,618 |
| Brookfield Asset Management Inc. Class A | 120,059 | 3,778 |
1
| | |
| Vanguard® Global Equity Fund | | |
| Schedule of Investments | | |
| September 30, 2015 | | |
| |
| | | Market |
| | | Value |
| | Shares | ($000) |
| Sun Life Financial Inc. | 44,200 | 1,426 |
| * CGI Group Inc. Class A | 15,800 | 572 |
| Constellation Software Inc. | 1,300 | 545 |
| George Weston Ltd. | 6,600 | 534 |
| CCL Industries Inc. Class B | 2,900 | 407 |
| | | 142,943 |
| Chile (0.2%) | | |
| Enersis SA ADR | 350,783 | 4,434 |
| Cia Cervecerias Unidas SA | 214,064 | 2,360 |
| Quinenco SA | 694,166 | 1,396 |
| * Banco de Chile ADR | 5,875 | 369 |
| * Cia Sud Americana de Vapores SA | 11,759,616 | 348 |
| Sociedad Quimica y Minera de Chile SA ADR | 5,329 | 78 |
| | | 8,985 |
| China (2.1%) | | |
| China Mobile Ltd. | 1,780,500 | 21,312 |
| * Alibaba Group Holding Ltd. ADR | 281,118 | 16,578 |
| * Baidu Inc. ADR | 117,387 | 16,130 |
| Mindray Medical International Ltd. ADR | 425,690 | 9,310 |
| Tsingtao Brewery Co. Ltd. | 1,188,000 | 5,225 |
| * Autohome Inc. ADR | 153,602 | 4,997 |
| China Telecom Corp. Ltd. | 5,360,000 | 2,597 |
| China Resources Enterprise Ltd. | 1,232,994 | 2,294 |
| * Li Ning Co. Ltd. | 4,122,833 | 1,796 |
| China Mengniu Dairy Co. Ltd. | 441,000 | 1,555 |
| Want Want China Holdings Ltd. | 1,228,557 | 1,012 |
| Ajisen China Holdings Ltd. | 1,722,000 | 777 |
| CNOOC Ltd. | 716,913 | 738 |
| China Merchants Holdings International Co. Ltd. | 218,000 | 644 |
| * Goodbaby International Holdings Ltd. | 1,043,000 | 466 |
| * Daphne International Holdings Ltd. | 2,016,000 | 459 |
| * Wumart Stores Inc. | 1,093,000 | 443 |
| TravelSky Technology Ltd. | 348,000 | 440 |
| CITIC Ltd. | 225,000 | 411 |
| Shenzhou International Group Holdings Ltd. | 76,456 | 396 |
| Yingde Gases Group Co. Ltd. | 603,500 | 250 |
| | | 87,830 |
| Colombia (0.0%) | | |
| Bancolombia SA ADR | 35,300 | 1,137 |
| |
| Cyprus (0.0%) | | |
| * Global Ports Investments plc GDR | 269,523 | 1,123 |
| * Globaltrans Investment plc GDR | 50,250 | 202 |
| | | 1,325 |
| Czech Republic (0.0%) | | |
| Komercni banka as | 2,914 | 632 |
| |
| Denmark (0.8%) | | |
| Carlsberg A/S Class B | 164,728 | 12,658 |
| Vestas Wind Systems A/S | 108,822 | 5,657 |
| Coloplast A/S Class B | 73,945 | 5,243 |
| Novo Nordisk A/S Class B | 63,501 | 3,427 |
| GN Store Nord A/S | 103,481 | 1,859 |
| Novo Nordisk A/S ADR | 32,732 | 1,775 |
| * William Demant Holding A/S | 21,150 | 1,757 |
| * Topdanmark A/S | 23,442 | 666 |
| Danske Bank A/S | 18,927 | 572 |
| ISS A/S | 7,977 | 265 |
| | | 33,879 |
| Finland (0.4%) | | |
| Sampo Oyj Class A | 116,603 | 5,643 |
| Neste Oyj | 185,198 | 4,262 |
| Tikkurila Oyj | 252,175 | 4,191 |
| Nokian Renkaat Oyj | 39,148 | 1,267 |
2
| | | |
| Vanguard® Global Equity Fund | | |
| Schedule of Investments | | |
| September 30, 2015 | | |
| |
| | | | Market |
| | | | Value |
| | | Shares | ($000) |
| | UPM-Kymmene Oyj | 72,571 | 1,089 |
| | Metso Oyj | 39,726 | 827 |
| | Wartsila Oyj Abp | 16,705 | 663 |
| | Tieto Oyj | 18,385 | 465 |
| | | | 18,407 |
| France (0.8%) | | |
| | Air Liquide SA | 48,777 | 5,783 |
| | Legrand SA | 102,285 | 5,442 |
| | L'Oreal SA | 31,036 | 5,394 |
| | BNP Paribas SA | 47,937 | 2,822 |
| | Groupe Eurotunnel SE | 145,891 | 1,988 |
| | Airbus Group SE | 26,393 | 1,563 |
| | AXA SA | 63,180 | 1,534 |
| | Eurofins Scientific SE | 4,854 | 1,493 |
| *,^ | Air France-KLM | 150,012 | 1,049 |
| | Sanofi | 10,822 | 1,030 |
| | Thales SA | 11,804 | 823 |
| | Edenred | 39,050 | 639 |
| | TOTAL SA | 13,980 | 629 |
| | ArcelorMittal | 85,865 | 445 |
| | Vicat | 6,967 | 435 |
| | Neopost SA | 12,434 | 324 |
| | Imerys SA | 4,772 | 307 |
| | Technip SA | 5,067 | 240 |
| | Elis SA | 12,658 | 198 |
| | Vallourec SA | 18,126 | 161 |
| | | | 32,299 |
| Germany (2.0%) | | |
| | SAP SE | 292,603 | 18,956 |
| | Deutsche Boerse AG | 200,647 | 17,305 |
| | Merck KGaA | 168,324 | 14,903 |
| * | QIAGEN NV | 315,500 | 8,140 |
| | Fresenius Medical Care AG & Co. KGaA | 55,444 | 4,333 |
| | BASF SE | 37,502 | 2,868 |
| * | Deutsche Telekom AG | 160,499 | 2,857 |
| | Bayerische Motoren Werke AG | 27,489 | 2,398 |
| | Axel Springer SE | 26,948 | 1,507 |
| | Volkswagen AG Preference Shares | 13,297 | 1,461 |
| | CTS Eventim AG & Co. KGaA | 27,720 | 1,028 |
| | Symrise AG | 14,916 | 899 |
| ^ | RHOEN-KLINIKUM AG | 27,111 | 768 |
| | TUI AG | 40,083 | 735 |
| | Brenntag AG | 12,329 | 665 |
| | Rheinmetall AG | 10,161 | 625 |
| | Hannover Rueck SE | 5,774 | 591 |
| | GEA Group AG | 12,710 | 485 |
| | E.ON SE | 56,105 | 481 |
| | Fielmann AG | 7,015 | 481 |
| | Gerresheimer AG | 6,309 | 461 |
| | adidas AG | 5,672 | 457 |
| | HOCHTIEF AG | 3,318 | 277 |
| | | | 82,681 |
| Greece (0.0%) | | |
| | OPAP SA | 43,682 | 396 |
| * | Alpha Bank AE | 394,381 | 47 |
| | | | 443 |
| Hong Kong (1.3%) | | |
| | AIA Group Ltd. | 4,109,200 | 21,371 |
| | Jardine Matheson Holdings Ltd. | 242,800 | 11,497 |
| | Sands China Ltd. | 1,676,400 | 5,092 |
| | CK Hutchison Holdings Ltd. | 287,800 | 3,744 |
| | HSBC Holdings plc | 382,800 | 2,874 |
| | Esprit Holdings Ltd. | 3,284,714 | 2,446 |
3
| | | |
| Vanguard® Global Equity Fund | | |
| Schedule of Investments | | |
| September 30, 2015 | | |
| |
| | | | Market |
| | | | Value |
| | | Shares | ($000) |
| | Cheung Kong Property Holdings Ltd. | 299,800 | 2,196 |
| | First Pacific Co. Ltd. | 1,879,250 | 1,148 |
| | Television Broadcasts Ltd. | 259,300 | 865 |
| | Hongkong & Shanghai Hotels Ltd. | 754,700 | 852 |
| | SmarTone Telecommunications Holdings Ltd. | 231,694 | 438 |
| | Stella International Holdings Ltd. | 151,173 | 372 |
| | Texwinca Holdings Ltd. | 144,823 | 131 |
| | New World Development Co. Ltd. | 82,000 | 80 |
| | | | 53,106 |
| India (0.9%) | | |
| | ICICI Bank Ltd. | 2,919,326 | 12,065 |
| | HCL Technologies Ltd. | 539,544 | 8,092 |
| | Housing Development Finance Corp. Ltd. | 357,800 | 6,629 |
| | Tata Consultancy Services Ltd. | 79,522 | 3,143 |
| | CESC Ltd. | 205,534 | 1,624 |
| | Bharti Airtel Ltd. | 251,975 | 1,300 |
| | Bank of Baroda | 353,979 | 997 |
| | Axis Bank Ltd. | 103,798 | 787 |
| | Maruti Suzuki India Ltd. | 9,561 | 685 |
| | Britannia Industries Ltd. | 6,049 | 285 |
| | | | 35,607 |
| Indonesia (0.1%) | | |
| | Telekomunikasi Indonesia Persero Tbk PT | 14,485,300 | 2,616 |
| | Telekomunikasi Indonesia Persero Tbk PT ADR | 17,078 | 609 |
| * | XL Axiata Tbk PT | 1,352,000 | 242 |
| | | | 3,467 |
| Ireland (1.9%) | | |
| | Ryanair Holdings plc ADR | 458,230 | 35,879 |
| | CRH plc | 862,718 | 22,773 |
| * | Bank of Ireland | 47,042,094 | 18,393 |
| | Paddy Power plc | 20,872 | 2,415 |
| | Irish Continental Group plc | 168,021 | 823 |
| | Ardmore Shipping Corp. | 22,199 | 268 |
| * | Irish Bank Resolution Corp. Ltd. | 122,273 | — |
| | | | 80,551 |
| Israel (0.3%) | | |
| | Teva Pharmaceutical Industries Ltd. ADR | 235,116 | 13,275 |
| |
| Italy (0.6%) | | |
| * | Fiat Chrysler Automobiles NV | 769,451 | 10,001 |
| | Luxottica Group SPA ADR | 53,744 | 3,723 |
| ^ | Piaggio & C SPA | 1,101,213 | 2,648 |
| | UniCredit SPA | 370,406 | 2,309 |
| | CNH Industrial NV | 234,412 | 1,528 |
| | EXOR SPA | 35,006 | 1,526 |
| | Luxottica Group SPA | 16,888 | 1,170 |
| *,^ | Saipem SPA | 108,160 | 867 |
| | Intesa Sanpaolo SPA (Registered) | 234,350 | 828 |
| | Davide Campari-Milano SPA | 56,834 | 453 |
| * | Saras SPA | 104,270 | 222 |
| | | | 25,275 |
| Japan (9.6%) | | |
| | MS&AD Insurance Group Holdings Inc. | 1,232,800 | 33,076 |
| | Nippon Telegraph & Telephone Corp. | 719,200 | 25,333 |
| | Mizuho Financial Group Inc. | 12,554,700 | 23,485 |
| | Daito Trust Construction Co. Ltd. | 155,200 | 15,769 |
| | SMC Corp. | 52,700 | 11,539 |
| | Inpex Corp. | 1,286,400 | 11,501 |
| | Daiwa House Industry Co. Ltd. | 431,900 | 10,707 |
| | Olympus Corp. | 328,400 | 10,246 |
| | Secom Co. Ltd. | 170,200 | 10,236 |
| * | Tokyo Electric Power Co. Inc. | 1,496,000 | 9,993 |
| | FUJIFILM Holdings Corp. | 232,000 | 8,673 |
4
| | |
| Vanguard® Global Equity Fund | | |
| Schedule of Investments | | |
| September 30, 2015 | | |
| |
| | | Market |
| | | Value |
| | Shares | ($000) |
| Japan Exchange Group Inc. | 573,000 | 8,376 |
| THK Co. Ltd. | 524,300 | 8,351 |
| Toyota Motor Corp. | 129,100 | 7,559 |
| CyberAgent Inc. | 186,400 | 7,292 |
| Sumitomo Mitsui Financial Group Inc. | 191,900 | 7,277 |
| Rohm Co. Ltd. | 160,900 | 7,155 |
| Seven & i Holdings Co. Ltd. | 156,100 | 7,123 |
| Sumitomo Chemical Co. Ltd. | 1,302,000 | 6,584 |
| NTT Data Corp. | 130,200 | 6,564 |
| Japan Airlines Co. Ltd. | 185,400 | 6,560 |
| Dai-ichi Life Insurance Co. Ltd. | 397,000 | 6,320 |
| Obayashi Corp. | 649,000 | 5,537 |
| East Japan Railway Co. | 63,900 | 5,385 |
| West Japan Railway Co. | 81,800 | 5,127 |
| Resona Holdings Inc. | 966,600 | 4,925 |
| Sompo Japan Nipponkoa Holdings Inc. | 168,900 | 4,906 |
| Hitachi Ltd. | 966,000 | 4,875 |
| Kirin Holdings Co. Ltd. | 360,000 | 4,722 |
| Shiseido Co. Ltd. | 204,400 | 4,457 |
| Kao Corp. | 91,200 | 4,134 |
| USS Co. Ltd. | 236,700 | 3,937 |
| Tokio Marine Holdings Inc. | 102,600 | 3,833 |
| Alfresa Holdings Corp. | 221,500 | 3,783 |
| Otsuka Holdings Co. Ltd. | 115,000 | 3,672 |
| Mitsubishi Estate Co. Ltd. | 173,000 | 3,534 |
| Fujitsu Ltd. | 733,000 | 3,188 |
| Mitsubishi UFJ Financial Group Inc. | 513,500 | 3,103 |
| Nintendo Co. Ltd. | 18,300 | 3,085 |
| Tohoku Electric Power Co. Inc. | 222,700 | 3,018 |
| Toyo Seikan Group Holdings Ltd. | 185,800 | 2,957 |
| Yamato Holdings Co. Ltd. | 152,100 | 2,912 |
| JFE Holdings Inc. | 216,300 | 2,841 |
| Marui Group Co. Ltd. | 232,300 | 2,802 |
| Daiichi Sankyo Co. Ltd. | 160,600 | 2,787 |
| ITOCHU Corp. | 254,700 | 2,693 |
| Mitsubishi Heavy Industries Ltd. | 561,000 | 2,509 |
| Japan Tobacco Inc. | 80,700 | 2,503 |
| Bandai Namco Holdings Inc. | 107,150 | 2,487 |
| Central Japan Railway Co. | 14,800 | 2,386 |
| Toyo Suisan Kaisha Ltd. | 62,600 | 2,373 |
| Isetan Mitsukoshi Holdings Ltd. | 144,300 | 2,165 |
| Sumitomo Electric Industries Ltd. | 159,700 | 2,043 |
| Mitsubishi Corp. | 119,800 | 1,964 |
| ANA Holdings Inc. | 695,000 | 1,947 |
| LIXIL Group Corp. | 95,000 | 1,933 |
| Sumitomo Dainippon Pharma Co. Ltd. | 187,500 | 1,874 |
| Shimizu Corp. | 214,000 | 1,837 |
| Dentsu Inc. | 34,800 | 1,786 |
| NTT DOCOMO Inc. | 105,700 | 1,783 |
| Tokyo Electron Ltd. | 36,700 | 1,733 |
| Nomura Holdings Inc. | 281,900 | 1,636 |
| Fuji Media Holdings Inc. | 131,000 | 1,527 |
| Mitsubishi Logistics Corp. | 131,000 | 1,519 |
| NH Foods Ltd. | 74,000 | 1,510 |
| Chiba Bank Ltd. | 208,000 | 1,477 |
| Azbil Corp. | 48,600 | 1,230 |
| Toyota Industries Corp. | 25,200 | 1,199 |
| Bank of Yokohama Ltd. | 195,000 | 1,185 |
| Astellas Pharma Inc. | 86,300 | 1,117 |
| Onward Holdings Co. Ltd. | 174,000 | 1,029 |
| Yamada Denki Co. Ltd. | 254,200 | 1,025 |
| Sekisui House Ltd. | 57,900 | 907 |
| Sumitomo Forestry Co. Ltd. | 78,600 | 880 |
| Nippon Suisan Kaisha Ltd. | 289,600 | 865 |
5
| | |
| Vanguard® Global Equity Fund | | |
| Schedule of Investments | | |
| September 30, 2015 | | |
| |
| | | Market |
| | | Value |
| | Shares | ($000) |
| Daiwa Securities Group Inc. | 132,000 | 854 |
| Taisei Corp. | 93,000 | 606 |
| NTT Urban Development Corp. | 65,000 | 599 |
| Asahi Glass Co. Ltd. | 92,000 | 538 |
| Adastria Co. Ltd. | 7,200 | 431 |
| Rohto Pharmaceutical Co. Ltd. | 26,400 | 405 |
| MediPal Holdings Corp. | 24,800 | 394 |
| Sega Sammy Holdings Inc. | 39,700 | 387 |
| Suzuken Co. Ltd. | 11,100 | 370 |
| KDDI Corp. | 15,900 | 356 |
| Sojitz Corp. | 170,900 | 318 |
| Kinden Corp. | 24,400 | 310 |
| Kyudenko Corp. | 17,000 | 284 |
| Kaken Pharmaceutical Co. Ltd. | 3,000 | 278 |
| Coca-Cola West Co. Ltd. | 14,200 | 277 |
| Nippo Corp. | 16,000 | 273 |
| Saizeriya Co. Ltd. | 12,000 | 272 |
| Izumi Co. Ltd. | 6,600 | 267 |
| Shionogi & Co. Ltd. | 7,200 | 258 |
| Fujikura Ltd. | 55,000 | 227 |
| | | 398,065 |
| Luxembourg (0.0%) | | |
| O'Key Group SA GDR | 278,566 | 446 |
| |
| Malaysia (0.2%) | | |
| Tenaga Nasional Bhd. | 1,789,400 | 4,894 |
| AirAsia Bhd. | 1,770,100 | 516 |
| Top Glove Corp. Bhd. | 225,600 | 414 |
| IHH Healthcare Bhd. | 277,700 | 377 |
| | | 6,201 |
| Mexico (0.6%) | | |
| America Movil SAB de CV ADR | 1,025,499 | 16,972 |
| America Movil SAB de CV | 5,852,249 | 4,854 |
| Grupo Comercial Chedraui SA de CV | 378,745 | 987 |
| Grupo Aeroportuario del Pacifico SAB de CV ADR | 3,482 | 302 |
| | | 23,115 |
| Netherlands (1.0%) | | |
| Unilever NV | 640,695 | 25,682 |
| Heineken NV | 45,965 | 3,722 |
| Boskalis Westminster | 48,454 | 2,121 |
| Koninklijke Ahold NV | 98,853 | 1,928 |
| Akzo Nobel NV | 26,794 | 1,743 |
| Koninklijke KPN NV | 460,268 | 1,726 |
| Koninklijke Philips NV | 60,272 | 1,418 |
| ASML Holding NV | 7,663 | 674 |
| Randstad Holding NV | 9,246 | 553 |
| | | 39,567 |
| New Zealand (0.0%) | | |
| Spark New Zealand Ltd. | 690,601 | 1,320 |
| PGG Wrightson Ltd. | 51,996 | 13 |
| | | 1,333 |
| Norway (0.9%) | | |
| Statoil ASA | 1,111,709 | 16,208 |
| Schibsted ASA Class A | 299,697 | 10,162 |
| * Schibsted ASA Class B | 299,697 | 9,495 |
| DNB ASA | 64,120 | 834 |
| Telenor ASA | 13,723 | 256 |
| | | 36,955 |
| Other (0.3%) | | |
| 2 Vanguard FTSE Emerging Markets ETF | 333,683 | 11,042 |
| |
| Peru (0.1%) | | |
| Credicorp Ltd. | 27,902 | 2,968 |
6
| | |
| Vanguard® Global Equity Fund | | |
| Schedule of Investments | | |
| September 30, 2015 | | |
| |
| | | Market |
| | | Value |
| | Shares | ($000) |
| Cia de Minas Buenaventura SAA ADR | 87,417 | 521 |
| | | 3,489 |
| Philippines (0.0%) | | |
| Energy Development Corp. | 10,020,300 | 1,181 |
| Lopez Holdings Corp. | 3,310,349 | 416 |
| | | 1,597 |
| Poland (0.1%) | | |
| ^ PGE Polska Grupa Energetyczna SA | 787,654 | 2,799 |
| Polski Koncern Naftowy Orlen SA | 52,760 | 921 |
| Polskie Gornictwo Naftowe i Gazownictwo SA | 347,186 | 597 |
| Bank Pekao SA | 7,100 | 288 |
| Tauron Polska Energia SA | 215,055 | 186 |
| | | 4,791 |
| Qatar (0.0%) | | |
| Barwa Real Estate Co. | 129,964 | 1,529 |
| |
| Russia (0.4%) | | |
| * Yandex NV Class A | 778,846 | 8,357 |
| Sberbank of Russia ADR | 1,225,855 | 6,070 |
| Lukoil PJSC ADR | 29,016 | 988 |
| | | 15,415 |
| Singapore (0.5%) | | |
| DBS Group Holdings Ltd. | 1,539,500 | 17,572 |
| Great Eastern Holdings Ltd. | 162,500 | 2,435 |
| United Overseas Bank Ltd. | 45,000 | 588 |
| GuocoLeisure Ltd. | 817,100 | 457 |
| Singapore Airlines Ltd. | 51,800 | 390 |
| Haw Par Corp. Ltd. | 46,000 | 263 |
| United Industrial Corp. Ltd. | 113,300 | 244 |
| | | 21,949 |
| South Africa (1.3%) | | |
| Naspers Ltd. | 308,167 | 38,622 |
| MTN Group Ltd. | 502,734 | 6,465 |
| FirstRand Ltd. | 968,319 | 3,441 |
| Standard Bank Group Ltd. | 301,191 | 2,941 |
| Old Mutual plc | 413,712 | 1,185 |
| Anglo American plc Ordinary Shares | 89,761 | 751 |
| Telkom SA SOC Ltd. | 133,641 | 642 |
| Sasol Ltd. | 22,402 | 628 |
| Grindrod Ltd. | 468,118 | 499 |
| Brait SE | 34,470 | 350 |
| Liberty Holdings Ltd. | 26,883 | 246 |
| * Anglo American Platinum Ltd. | 7,044 | 117 |
| * African Bank Investments Ltd. | 2,597,627 | — |
| | | 55,887 |
| South Korea (2.3%) | | |
| Samsung Electronics Co. Ltd. | 32,226 | 30,919 |
| SK Hynix Inc. | 617,413 | 17,609 |
| Samsung Electronics Co. Ltd. GDR | 35,004 | 16,554 |
| SK Holdings Co. Ltd. | 34,521 | 7,126 |
| LG Display Co. Ltd. | 199,021 | 3,800 |
| Shinhan Financial Group Co. Ltd. | 106,230 | 3,715 |
| Hyundai Motor Co. | 21,112 | 2,934 |
| Lotte Shopping Co. Ltd. | 11,666 | 2,819 |
| Hana Financial Group Inc. | 85,298 | 1,906 |
| * KT Corp. | 64,396 | 1,673 |
| LG Uplus Corp. | 154,930 | 1,586 |
| KB Financial Group Inc. | 49,345 | 1,467 |
| S-1 Corp. | 13,755 | 1,084 |
| Korea Electric Power Corp. | 14,273 | 588 |
| Hite Jinro Co. Ltd. | 30,360 | 585 |
| LG Corp. | 9,043 | 466 |
| GS Home Shopping Inc. | 1,909 | 306 |
7
| | |
| Vanguard® Global Equity Fund | | |
| Schedule of Investments | | |
| September 30, 2015 | | |
| |
| | | Market |
| | | Value |
| | Shares | ($000) |
| CJ O Shopping Co. Ltd. | 1,794 | 281 |
| | | 95,418 |
| Spain (0.5%) | | |
| Distribuidora Internacional de Alimentacion SA | 1,526,419 | 9,240 |
| Banco Popular Espanol SA | 1,482,327 | 5,415 |
| Viscofan SA | 28,378 | 1,712 |
| Banco Santander SA | 292,120 | 1,553 |
| Mediaset Espana Comunicacion SA | 87,231 | 954 |
| * Acerinox SA | 94,631 | 846 |
| Telefonica SA | 35,128 | 426 |
| Grifols SA | 9,314 | 385 |
| * ACS Actividades de Construccion y Servicios SA | 12,464 | 359 |
| Gamesa Corp. Tecnologica SA | 19,831 | 275 |
| | | 21,165 |
| Sweden (1.4%) | | |
| * Svenska Handelsbanken AB Class A | 1,870,215 | 26,828 |
| * Atlas Copco AB Class B | 643,517 | 14,394 |
| Volvo AB Class B | 773,375 | 7,408 |
| * Assa Abloy AB Class B | 247,819 | 4,445 |
| Telefonaktiebolaget LM Ericsson Class B | 150,670 | 1,478 |
| Nordea Bank AB | 94,575 | 1,055 |
| Millicom International Cellular SA | 13,739 | 859 |
| Modern Times Group MTG AB Class B | 29,509 | 760 |
| Swedish Match AB | 20,668 | 625 |
| BillerudKorsnas AB | 22,507 | 324 |
| L E Lundbergforetagen AB Class B | 6,634 | 320 |
| * Swedish Orphan Biovitrum AB | 22,239 | 294 |
| Skanska AB Class B | 14,676 | 288 |
| Peab AB | 37,897 | 264 |
| * Oriflame Holding AG | 6,251 | 78 |
| | | 59,420 |
| Switzerland (2.8%) | | |
| Nestle SA | 752,918 | 56,624 |
| Schindler Holding AG | 112,312 | 16,133 |
| Novartis AG | 142,941 | 13,138 |
| Cie Financiere Richemont SA | 167,105 | 13,003 |
| Geberit AG | 17,840 | 5,458 |
| Roche Holding AG | 16,237 | 4,310 |
| Adecco SA | 30,702 | 2,248 |
| UBS Group AG | 97,584 | 1,804 |
| Logitech International SA | 74,786 | 976 |
| Sonova Holding AG | 7,053 | 908 |
| Helvetia Holding AG | 903 | 443 |
| ABB Ltd. | 16,441 | 291 |
| | | 115,336 |
| Taiwan (3.0%) | | |
| Taiwan Semiconductor Manufacturing Co. Ltd. ADR | 2,202,258 | 45,697 |
| Hon Hai Precision Industry Co. Ltd. | 10,135,198 | 26,478 |
| Fubon Financial Holding Co. Ltd. | 13,176,279 | 20,627 |
| Chunghwa Telecom Co. Ltd. | 3,827,000 | 11,500 |
| Taiwan Semiconductor Manufacturing Co. Ltd. | 1,641,577 | 6,579 |
| United Microelectronics Corp. | 18,021,000 | 5,920 |
| Yungtay Engineering Co. Ltd. | 1,304,000 | 2,071 |
| Delta Electronics Inc. | 314,000 | 1,481 |
| Teco Electric and Machinery Co. Ltd. | 1,607,190 | 1,267 |
| Chroma ATE Inc. | 249,000 | 426 |
| Pegatron Corp. | 115,000 | 281 |
| | | 122,327 |
| Thailand (0.1%) | | |
| Bangkok Bank PCL (Foreign) | 447,500 | 1,977 |
| Thanachart Capital PCL | 794,000 | 695 |
| Kasikornbank PCL (Foreign) | 91,200 | 431 |
| Krung Thai Bank PCL (Foreign) | 638,800 | 301 |
8
| | |
| Vanguard® Global Equity Fund | | |
| Schedule of Investments | | |
| September 30, 2015 | | |
| |
| | | Market |
| | | Value |
| | Shares | ($000) |
| Siam Cement PCL NVDR | 19,850 | 254 |
| | | 3,658 |
| Turkey (0.1%) | | |
| Turkiye Garanti Bankasi AS | 837,412 | 1,949 |
| * Tupras Turkiye Petrol Rafinerileri AS | 20,218 | 495 |
| | | 2,444 |
| United Kingdom (6.6%) | | |
| Prudential plc | 2,315,346 | 48,846 |
| Reckitt Benckiser Group plc | 283,207 | 25,683 |
| Royal Dutch Shell plc Class A | 876,601 | 20,793 |
| Wolseley plc | 338,620 | 19,807 |
| Rolls-Royce Holdings plc | 1,236,654 | 12,686 |
| Hays plc | 4,331,737 | 10,069 |
| WPP plc | 477,446 | 9,940 |
| Coca-Cola HBC AG | 334,654 | 7,084 |
| Rightmove plc | 100,959 | 5,584 |
| Compass Group plc | 271,757 | 4,341 |
| Capita plc | 238,086 | 4,324 |
| Jupiter Fund Management plc | 633,214 | 4,160 |
| Intertek Group plc | 103,323 | 3,813 |
| ITV plc | 1,010,736 | 3,766 |
| Bunzl plc | 137,543 | 3,691 |
| Provident Financial plc | 76,806 | 3,654 |
| Unilever plc | 88,724 | 3,614 |
| BP plc | 711,453 | 3,609 |
| Lloyds Banking Group plc | 3,055,439 | 3,479 |
| Diageo plc | 109,143 | 2,932 |
| Barclays plc | 791,119 | 2,928 |
| RELX plc | 162,186 | 2,782 |
| Aggreko plc | 190,176 | 2,742 |
| 3 Merlin Entertainments plc | 449,976 | 2,535 |
| DCC plc | 33,043 | 2,497 |
| Betfair Group plc | 49,008 | 2,470 |
| BAE Systems plc | 341,249 | 2,313 |
| Carnival plc | 44,167 | 2,285 |
| 3i Group plc | 302,490 | 2,137 |
| TUI AG | 112,834 | 2,085 |
| G4S plc | 595,580 | 2,082 |
| Experian plc | 123,666 | 1,985 |
| Daily Mail & General Trust plc | 155,667 | 1,776 |
| SSP Group plc | 382,346 | 1,770 |
| * HomeServe plc | 283,440 | 1,740 |
| ICAP plc | 248,534 | 1,721 |
| Admiral Group plc | 75,303 | 1,713 |
| Moneysupermarket.com Group plc | 308,692 | 1,581 |
| International Personal Finance plc | 266,352 | 1,565 |
| Stagecoach Group plc | 290,374 | 1,483 |
| Royal Dutch Shell plc Class B | 61,660 | 1,458 |
| WH Smith plc | 61,359 | 1,454 |
| IG Group Holdings plc | 122,702 | 1,430 |
| Rexam plc | 179,274 | 1,423 |
| * Thomas Cook Group plc | 782,186 | 1,372 |
| Rio Tinto plc | 38,472 | 1,291 |
| Standard Chartered plc | 127,212 | 1,235 |
| Vodafone Group plc | 385,554 | 1,216 |
| BHP Billiton plc | 76,917 | 1,171 |
| Informa plc | 134,921 | 1,149 |
| Spectris plc | 44,432 | 1,137 |
| Cable & Wireless Communications plc | 1,259,045 | 1,057 |
| * Serco Group plc | 674,162 | 1,042 |
| Pets at Home Group plc | 240,099 | 1,002 |
| Tesco plc | 357,922 | 994 |
| * Just Eat plc | 143,859 | 895 |
| Inchcape plc | 81,255 | 885 |
9
| | | |
| Vanguard® Global Equity Fund | | |
| Schedule of Investments | | |
| September 30, 2015 | | |
| |
| | | | Market |
| | | | Value |
| | | Shares | ($000) |
| | Barratt Developments plc | 90,238 | 881 |
| | BP plc ADR | 28,127 | 860 |
| | Sky plc | 53,302 | 843 |
| | Berendsen plc | 50,951 | 775 |
| | Devro plc | 150,697 | 673 |
| | Smith & Nephew plc | 35,190 | 615 |
| | Bank of Georgia Holdings plc | 20,872 | 571 |
| | Michael Page International plc | 69,750 | 501 |
| | Glencore plc | 341,550 | 474 |
| | Close Brothers Group plc | 20,861 | 472 |
| | Amec Foster Wheeler plc | 41,168 | 447 |
| | Millennium & Copthorne Hotels plc | 52,467 | 383 |
| | National Express Group plc | 88,797 | 383 |
| | GlaxoSmithKline plc | 18,261 | 350 |
| | British American Tobacco plc | 6,251 | 345 |
| | IMI plc | 20,097 | 289 |
| | Abcam plc | 30,390 | 267 |
| | Northgate plc | 37,787 | 260 |
| | Centrica plc | 71,680 | 249 |
| | GVC Holdings plc | 37,269 | 230 |
| | Petrofac Ltd. | 17,691 | 206 |
| *,3 | Non-Standard Finance plc | 115,857 | 177 |
| | Antofagasta plc | 22,336 | 169 |
| | | | 274,696 |
| United States (48.0%) | | |
| Consumer Discretionary (6.7%) | | |
| | Royal Caribbean Cruises Ltd. | 658,826 | 58,695 |
| * | Amazon.com Inc. | 84,840 | 43,429 |
| | Harley-Davidson Inc. | 417,058 | 22,896 |
| | Cablevision Systems Corp. Class A | 632,390 | 20,534 |
| * | CarMax Inc. | 336,884 | 19,984 |
| | McDonald's Corp. | 166,935 | 16,448 |
| *,^ | Tesla Motors Inc. | 54,373 | 13,506 |
| | Omnicom Group Inc. | 196,911 | 12,976 |
| | Comcast Corp. Class A | 204,887 | 11,654 |
| * | Skechers U.S.A. Inc. Class A | 83,094 | 11,141 |
| | Time Warner Inc. | 146,903 | 10,100 |
| * | TripAdvisor Inc. | 137,243 | 8,649 |
| | Cooper Tire & Rubber Co. | 145,621 | 5,754 |
| * | AutoZone Inc. | 6,990 | 5,060 |
| | Cracker Barrel Old Country Store Inc. | 22,221 | 3,273 |
| | Gannett Co. Inc. | 221,262 | 3,259 |
| | Nutrisystem Inc. | 88,564 | 2,349 |
| * | Murphy USA Inc. | 27,336 | 1,502 |
| | AMC Entertainment Holdings Inc. | 45,269 | 1,140 |
| | Best Buy Co. Inc. | 26,965 | 1,001 |
| * | TravelCenters of America LLC | 76,819 | 794 |
| * | American Axle & Manufacturing Holdings Inc. | 33,499 | 668 |
| | Outerwall Inc. | 10,892 | 620 |
| * | Chuy's Holdings Inc. | 20,378 | 579 |
| | PetMed Express Inc. | 29,777 | 479 |
| * | NVR Inc. | 233 | 355 |
| | Citi Trends Inc. | 13,254 | 310 |
| * | Unifi Inc. | 10,209 | 304 |
| * | Ruby Tuesday Inc. | 42,835 | 266 |
| * | JAKKS Pacific Inc. | 30,406 | 259 |
| | Speedway Motorsports Inc. | 14,086 | 254 |
| | Rocky Brands Inc. | 14,203 | 202 |
| * | Sun-Times Media Group Inc. Class A | 130,959 | — |
| | | | 278,440 |
| Consumer Staples (4.0%) | | |
| | Colgate-Palmolive Co. | 590,484 | 37,472 |
| | Procter & Gamble Co. | 322,939 | 23,232 |
| | Coca-Cola Co. | 457,170 | 18,342 |
10
| | | |
| Vanguard® Global Equity Fund | | |
| Schedule of Investments | | |
| September 30, 2015 | | |
| |
| | | | Market |
| | | | Value |
| | | Shares | ($000) |
| | Bunge Ltd. | 240,992 | 17,665 |
| | Hershey Co. | 185,457 | 17,040 |
| ^ | Pilgrim's Pride Corp. | 577,852 | 12,008 |
| | Cal-Maine Foods Inc. | 144,112 | 7,870 |
| | Wal-Mart Stores Inc. | 99,600 | 6,458 |
| | Costco Wholesale Corp. | 42,807 | 6,189 |
| | Estee Lauder Cos. Inc. Class A | 72,404 | 5,841 |
| | Dean Foods Co. | 217,949 | 3,600 |
| ^ | Sanderson Farms Inc. | 43,996 | 3,017 |
| * | SUPERVALU Inc. | 413,906 | 2,972 |
| | Archer-Daniels-Midland Co. | 50,472 | 2,092 |
| | Energizer Holdings Inc. | 27,278 | 1,056 |
| | Ingles Markets Inc. Class A | 2,100 | 100 |
| | | | 164,954 |
| Energy (3.0%) | | |
| | Valero Energy Corp. | 343,312 | 20,633 |
| | Tesoro Corp. | 169,188 | 16,452 |
| | EOG Resources Inc. | 213,558 | 15,547 |
| | PBF Energy Inc. Class A | 494,608 | 13,963 |
| | Marathon Petroleum Corp. | 237,010 | 10,981 |
| | Delek US Holdings Inc. | 310,888 | 8,612 |
| | Western Refining Inc. | 137,839 | 6,081 |
| | HollyFrontier Corp. | 98,159 | 4,794 |
| *,^ | Ultra Petroleum Corp. | 722,895 | 4,619 |
| | Superior Energy Services Inc. | 335,038 | 4,231 |
| | Alon USA Energy Inc. | 146,862 | 2,654 |
| | National Oilwell Varco Inc. | 68,553 | 2,581 |
| * | WPX Energy Inc. | 298,870 | 1,978 |
| | QEP Resources Inc. | 143,956 | 1,804 |
| | Noble Corp. plc | 127,843 | 1,395 |
| | World Fuel Services Corp. | 37,338 | 1,337 |
| | Green Plains Inc. | 67,424 | 1,312 |
| | Atwood Oceanics Inc. | 75,562 | 1,119 |
| * | REX American Resources Corp. | 20,076 | 1,016 |
| * | Renewable Energy Group Inc. | 88,038 | 729 |
| * | Pioneer Energy Services Corp. | 162,234 | 341 |
| | CVR Energy Inc. | 6,747 | 277 |
| * | Hornbeck Offshore Services Inc. | 19,044 | 258 |
| | | | 122,714 |
| Financials (10.4%) | | |
| | Wells Fargo & Co. | 924,646 | 47,481 |
| | Travelers Cos. Inc. | 351,387 | 34,974 |
| * | Berkshire Hathaway Inc. Class B | 264,865 | 34,538 |
| | M&T Bank Corp. | 232,922 | 28,405 |
| * | Markel Corp. | 34,295 | 27,500 |
| | First Republic Bank | 432,147 | 27,126 |
| | TD Ameritrade Holding Corp. | 806,950 | 25,693 |
| | Voya Financial Inc. | 563,534 | 21,848 |
| | Moody's Corp. | 214,299 | 21,044 |
| | US Bancorp | 504,176 | 20,676 |
| | American Express Co. | 239,216 | 17,733 |
| | Chubb Corp. | 132,393 | 16,238 |
| * | Alleghany Corp. | 26,686 | 12,492 |
| | Loews Corp. | 345,407 | 12,483 |
| | Aflac Inc. | 186,989 | 10,870 |
| | Rayonier Inc. | 333,072 | 7,351 |
| | Hartford Financial Services Group Inc. | 148,144 | 6,782 |
| | Leucadia National Corp. | 301,500 | 6,108 |
| * | Howard Hughes Corp. | 53,000 | 6,081 |
| | CYS Investments Inc. | 837,289 | 6,079 |
| | Financial Engines Inc. | 190,870 | 5,625 |
| | Franklin Resources Inc. | 135,407 | 5,045 |
| | American Equity Investment Life Holding Co. | 213,951 | 4,987 |
| | JPMorgan Chase & Co. | 72,570 | 4,425 |
11
| | | |
| Vanguard® Global Equity Fund | | |
| Schedule of Investments | | |
| September 30, 2015 | | |
| |
| | | | Market |
| | | | Value |
| | | Shares | ($000) |
| | RenaissanceRe Holdings Ltd. | 39,249 | 4,173 |
| | Aspen Insurance Holdings Ltd. | 83,119 | 3,863 |
| | Endurance Specialty Holdings Ltd. | 50,004 | 3,052 |
| | Everest Re Group Ltd. | 8,939 | 1,549 |
| | Assured Guaranty Ltd. | 48,400 | 1,210 |
| * | INTL. FCStone Inc. | 39,866 | 984 |
| * | Cowen Group Inc. Class A | 198,287 | 904 |
| | Cincinnati Financial Corp. | 14,792 | 796 |
| | Hanover Insurance Group Inc. | 7,597 | 590 |
| * | Ally Financial Inc. | 23,449 | 478 |
| | RE/MAX Holdings Inc. | 9,987 | 359 |
| | Employers Holdings Inc. | 12,406 | 277 |
| | GAIN Capital Holdings Inc. | 34,802 | 253 |
| * | World Acceptance Corp. | 9,312 | 250 |
| * | Ambac Financial Group Inc. | 12,212 | 177 |
| | Calamos Asset Management Inc. Class A | 17,710 | 168 |
| | | | 430,667 |
| Health Care (7.5%) | | |
| | Anthem Inc. | 376,549 | 52,717 |
| | Johnson & Johnson | 305,500 | 28,519 |
| * | Waters Corp. | 233,889 | 27,648 |
| * | United Therapeutics Corp. | 130,952 | 17,186 |
| *,^ | Myriad Genetics Inc. | 447,318 | 16,766 |
| * | Centene Corp. | 301,056 | 16,326 |
| * | Charles River Laboratories International Inc. | 236,357 | 15,013 |
| * | Health Net Inc. | 248,673 | 14,975 |
| * | Seattle Genetics Inc. | 302,572 | 11,667 |
| * | PAREXEL International Corp. | 180,355 | 11,168 |
| | Pfizer Inc. | 321,119 | 10,086 |
| * | Bio-Rad Laboratories Inc. Class A | 65,888 | 8,850 |
| | Abbott Laboratories | 183,987 | 7,400 |
| | Merck & Co. Inc. | 112,744 | 5,569 |
| | Baxter International Inc. | 166,112 | 5,457 |
| * | Quintiles Transnational Holdings Inc. | 78,327 | 5,449 |
| | Baxalta Inc. | 166,112 | 5,234 |
| | Aetna Inc. | 43,109 | 4,717 |
| | PDL BioPharma Inc. | 920,398 | 4,630 |
| * | Varian Medical Systems Inc. | 60,285 | 4,448 |
| * | Intuitive Surgical Inc. | 8,519 | 3,915 |
| * | INC Research Holdings Inc. Class A | 90,610 | 3,624 |
| * | Magellan Health Inc. | 61,505 | 3,409 |
| * | LifePoint Health Inc. | 36,300 | 2,574 |
| * | Sucampo Pharmaceuticals Inc. Class A | 121,534 | 2,415 |
| | ResMed Inc. | 45,318 | 2,309 |
| * | Emergent BioSolutions Inc. | 73,935 | 2,106 |
| * | Molina Healthcare Inc. | 30,330 | 2,088 |
| * | Enanta Pharmaceuticals Inc. | 54,840 | 1,982 |
| * | VWR Corp. | 73,188 | 1,880 |
| * | HCA Holdings Inc. | 17,540 | 1,357 |
| * | Cambrex Corp. | 32,835 | 1,303 |
| * | Affymetrix Inc. | 91,726 | 783 |
| * | Mettler-Toledo International Inc. | 2,512 | 715 |
| * | NewLink Genetics Corp. | 19,732 | 707 |
| | Cigna Corp. | 4,870 | 658 |
| * | Luminex Corp. | 37,026 | 626 |
| * | Amsurg Corp. | 7,079 | 550 |
| * | Triple-S Management Corp. Class B | 28,538 | 508 |
| * | Amedisys Inc. | 12,084 | 459 |
| * | Merit Medical Systems Inc. | 18,475 | 442 |
| * | BioSpecifics Technologies Corp. | 9,084 | 396 |
| * | Supernus Pharmaceuticals Inc. | 22,352 | 314 |
| * | LHC Group Inc. | 5,897 | 264 |
| * | SurModics Inc. | 11,690 | 255 |
| * | Spectrum Pharmaceuticals Inc. | 41,515 | 248 |
12
| | | |
| Vanguard® Global Equity Fund | | |
| Schedule of Investments | | |
| September 30, 2015 | | |
| |
| | | | Market |
| | | | Value |
| | | Shares | ($000) |
| * | Inotek Pharmaceuticals Corp. | 24,252 | 228 |
| * | Lannett Co. Inc. | 4,795 | 199 |
| * | Infinity Pharmaceuticals Inc. | 20,461 | 173 |
| * | Five Star Quality Care Inc. | 40,229 | 124 |
| * | Symmetry Surgical Inc. | 8,121 | 72 |
| * | Alliance HealthCare Services Inc. | 6,889 | 67 |
| | | | 310,575 |
| Industrials (3.5%) | | |
| | Alaska Air Group Inc. | 311,258 | 24,729 |
| * | JetBlue Airways Corp. | 855,128 | 22,037 |
| | CH Robinson Worldwide Inc. | 207,904 | 14,092 |
| | Lincoln Electric Holdings Inc. | 213,507 | 11,194 |
| | 3M Co. | 55,984 | 7,937 |
| | Emerson Electric Co. | 179,092 | 7,910 |
| *,^ | NOW Inc. | 430,793 | 6,376 |
| | Northrop Grumman Corp. | 35,741 | 5,931 |
| | United Technologies Corp. | 63,730 | 5,671 |
| * | Clean Harbors Inc. | 125,594 | 5,522 |
| * | Hawaiian Holdings Inc. | 216,332 | 5,339 |
| | MSC Industrial Direct Co. Inc. Class A | 65,960 | 4,026 |
| | Expeditors International of Washington Inc. | 65,485 | 3,081 |
| * | Atlas Air Worldwide Holdings Inc. | 75,470 | 2,608 |
| | Towers Watson & Co. Class A | 19,805 | 2,325 |
| | Insperity Inc. | 45,569 | 2,002 |
| | Werner Enterprises Inc. | 78,463 | 1,969 |
| | Comfort Systems USA Inc. | 45,796 | 1,248 |
| * | Spirit AeroSystems Holdings Inc. Class A | 25,382 | 1,227 |
| | Argan Inc. | 34,880 | 1,210 |
| * | RPX Corp. | 53,302 | 731 |
| | SkyWest Inc. | 42,694 | 712 |
| * | American Woodmark Corp. | 10,504 | 681 |
| | Universal Forest Products Inc. | 10,811 | 624 |
| * | Wabash National Corp. | 53,282 | 564 |
| | AGCO Corp. | 11,766 | 549 |
| | Kimball International Inc. Class B | 48,535 | 459 |
| * | Vectrus Inc. | 20,431 | 450 |
| | Global Brass & Copper Holdings Inc. | 16,817 | 345 |
| | Douglas Dynamics Inc. | 17,198 | 342 |
| | Kforce Inc. | 12,732 | 335 |
| * | MYR Group Inc. | 11,954 | 313 |
| | Huntington Ingalls Industries Inc. | 2,507 | 269 |
| * | CRA International Inc. | 12,066 | 260 |
| | Heidrick & Struggles International Inc. | 13,045 | 254 |
| * | Ducommun Inc. | 12,486 | 251 |
| * | Air Transport Services Group Inc. | 28,770 | 246 |
| | | | 143,819 |
| Information Technology (11.1%) | | |
| * | Google Inc. Class C | 52,388 | 31,874 |
| | Computer Sciences Corp. | 421,523 | 25,873 |
| | Visa Inc. Class A | 279,016 | 19,436 |
| | MasterCard Inc. Class A | 209,303 | 18,862 |
| | Xilinx Inc. | 429,012 | 18,190 |
| | Oracle Corp. | 468,146 | 16,909 |
| | Linear Technology Corp. | 418,621 | 16,891 |
| | FLIR Systems Inc. | 578,671 | 16,197 |
| | Jabil Circuit Inc. | 714,281 | 15,979 |
| * | PayPal Holdings Inc. | 507,132 | 15,741 |
| * | Facebook Inc. Class A | 168,169 | 15,118 |
| | Xerox Corp. | 1,451,534 | 14,123 |
| | Intel Corp. | 433,139 | 13,055 |
| * | eBay Inc. | 507,132 | 12,394 |
| | Teradyne Inc. | 681,072 | 12,266 |
| | Texas Instruments Inc. | 230,790 | 11,429 |
| | Amdocs Ltd. | 187,896 | 10,688 |
13
| | | |
| Vanguard® Global Equity Fund | | |
| Schedule of Investments | | |
| September 30, 2015 | | |
| |
| | | | Market |
| | | | Value |
| | | Shares | ($000) |
| | QUALCOMM Inc. | 192,100 | 10,322 |
| | Microsoft Corp. | 196,016 | 8,676 |
| | Convergys Corp. | 374,533 | 8,656 |
| | MAXIMUS Inc. | 137,917 | 8,214 |
| | Accenture plc Class A | 78,564 | 7,720 |
| | DST Systems Inc. | 70,903 | 7,455 |
| | Analog Devices Inc. | 131,825 | 7,436 |
| * | Tech Data Corp. | 107,624 | 7,372 |
| | Dolby Laboratories Inc. Class A | 216,472 | 7,057 |
| | Science Applications International Corp. | 170,811 | 6,868 |
| | Broadridge Financial Solutions Inc. | 116,367 | 6,441 |
| * | Google Inc. Class A | 9,524 | 6,080 |
| | FactSet Research Systems Inc. | 33,169 | 5,301 |
| | Booz Allen Hamilton Holding Corp. Class A | 180,496 | 4,731 |
| | Paychex Inc. | 87,266 | 4,157 |
| * | Fiserv Inc. | 45,023 | 3,899 |
| * | Manhattan Associates Inc. | 61,168 | 3,811 |
| *,^ | Zillow Group Inc. | 135,812 | 3,667 |
| * | LogMeIn Inc. | 53,626 | 3,655 |
| * | MicroStrategy Inc. Class A | 17,912 | 3,519 |
| | Lexmark International Inc. Class A | 115,084 | 3,335 |
| | Automatic Data Processing Inc. | 40,069 | 3,220 |
| * | Sanmina Corp. | 146,218 | 3,125 |
| * | Euronet Worldwide Inc. | 40,493 | 3,000 |
| * | Twitter Inc. | 104,690 | 2,820 |
| | CSG Systems International Inc. | 88,150 | 2,715 |
| | Western Union Co. | 146,683 | 2,693 |
| * | Aspen Technology Inc. | 67,799 | 2,570 |
| * | Amkor Technology Inc. | 558,320 | 2,507 |
| *,^ | Zillow Group Inc. Class A | 67,906 | 1,951 |
| | Jack Henry & Associates Inc. | 27,468 | 1,912 |
| * | Benchmark Electronics Inc. | 81,831 | 1,781 |
| | ManTech International Corp. Class A | 67,194 | 1,727 |
| * | Sykes Enterprises Inc. | 54,007 | 1,377 |
| * | Arrow Electronics Inc. | 21,133 | 1,168 |
| | EarthLink Holdings Corp. | 149,361 | 1,162 |
| * | Insight Enterprises Inc. | 43,008 | 1,112 |
| | IAC/InterActiveCorp | 16,987 | 1,109 |
| | Activision Blizzard Inc. | 35,432 | 1,095 |
| * | Net 1 UEPS Technologies Inc. | 60,242 | 1,009 |
| | Ingram Micro Inc. | 36,237 | 987 |
| | SYNNEX Corp. | 10,755 | 915 |
| * | Web.com Group Inc. | 39,816 | 839 |
| * | NeuStar Inc. Class A | 29,203 | 795 |
| * | CoreLogic Inc. | 18,247 | 679 |
| * | EnerNOC Inc. | 83,187 | 657 |
| * | Genpact Ltd. | 27,448 | 648 |
| | Leidos Holdings Inc. | 13,833 | 571 |
| * | ePlus Inc. | 6,096 | 482 |
| * | DHI Group Inc. | 65,894 | 482 |
| * | Kimball Electronics Inc. | 36,401 | 434 |
| * | Citrix Systems Inc. | 6,239 | 432 |
| | Pegasystems Inc. | 14,067 | 346 |
| * | Ixia | 22,836 | 331 |
| | TeleTech Holdings Inc. | 12,295 | 329 |
| | Methode Electronics Inc. | 8,315 | 265 |
| * | Anixter International Inc. | 4,526 | 262 |
| | Total System Services Inc. | 5,750 | 261 |
| * | United Online Inc. | 25,472 | 255 |
| * | Tucows Inc. Class A | 10,021 | 232 |
| | | | 461,652 |
| Materials (1.6%) | | |
| | Praxair Inc. | 278,616 | 28,380 |
| | Martin Marietta Materials Inc. | 116,115 | 17,644 |
14
| | | | | |
| Vanguard® Global Equity Fund | | | | |
| Schedule of Investments | | | | |
| September 30, 2015 | | | | |
| |
| | | | | | Market |
| | | | | | Value |
| | | | | Shares | ($000) |
| | Monsanto Co. | | | 123,899 | 10,573 |
| | Sigma-Aldrich Corp. | | | 45,122 | 6,268 |
| * | Chemtura Corp. | | | 119,669 | 3,425 |
| | Stepan Co. | | | 20,180 | 840 |
| | Mercer International Inc. | | | 57,584 | 577 |
| | KMG Chemicals Inc. | | | 10,096 | 195 |
| | | | | | 67,902 |
| Other (0.0%) | | | | |
| * | Washington Mutual Inc. Escrow | | | 166,300 | — |
| |
| Telecommunication Services (0.1%) | | | | |
| | AT&T Inc. | | | 89,294 | 2,909 |
| | IDT Corp. Class B | | | 13,786 | 197 |
| | | | | | 3,106 |
| Utilities (0.1%) | | | | |
| * | Talen Energy Corp. | | | 358,623 | 3,622 |
| |
| | | | | | 1,987,451 |
| Total Common Stocks (Cost $3,774,793) | | | | 3,989,596 |
| |
| |
| | | Coupon | | | |
| Temporary Cash Investments (4.3%)1 | | | | |
| Money Market Fund (4.1%) | | | | |
| 4,5 | Vanguard Market Liquidity Fund | 0.189% | | 170,221,907 | 170,222 |
| |
| |
| | | | | Face | |
| | | | Maturity | Amount | |
| | | | Date | ($000) | |
| U.S. Government and Agency Obligations (0.2%) | | | | |
| 6,7 | Federal Home Loan Bank Discount Notes | 0.095% | 10/21/15 | 4,200 | 4,200 |
| 6,7 | Federal Home Loan Bank Discount Notes | 0.170% | 11/12/15 | 1,000 | 1,000 |
| 6,7 | Federal Home Loan Bank Discount Notes | 0.192% | 11/27/15 | 1,000 | 1,000 |
| 7,8 | Freddie Mac Discount Notes | 0.160% | 11/13/15 | 4,000 | 3,999 |
| |
| | | | | | 10,199 |
| Total Temporary Cash Investments (Cost $180,420) | | | | 180,421 |
| Total Investments (100.6%) (Cost $3,955,213) | | | | 4,170,017 |
| Other Assets and Liabilities—Net (-0.6%)5 | | | | (26,516) |
| Net Assets (100%) | | | | 4,143,501 |
* Non-income-producing security.
^ Includes partial security positions on loan to broker-dealers. The total value of securities on loan is $42,484,000.
1 The fund invests a portion of its cash reserves in equity markets through the use of index futures contracts. After giving effect to futures investments, the fund's effective common stock and temporary cash investment positions represent 98.3% and 2.3%, respectively, of net assets.
2 Considered an affiliated company of the fund as the issuer is another member of The Vanguard Group.
3 Security exempt from registration under Rule 144A of the Securities Act of 1933. Such securities may be sold in transactions exempt from registration, normally to qualified institutional buyers. At September 30, 2015, the aggregate value of these securities was $2,712,000, representing 0.1% of net assets.
4 Affiliated money market fund available only to Vanguard funds and certain trusts and accounts managed by Vanguard. Rate shown is the 7-day yield.
5 Includes $44,824,000 of collateral received for securities on loan.
6 The issuer operates under a congressional charter; its securities are generally neither guaranteed by the U.S. Treasury nor backed by the full faith and credit of the U.S. government.
7 Securities with a value of $5,599,000 have been segregated as initial margin for open futures contracts.
15
Vanguard® Global Equity Fund
Schedule of Investments
September 30, 2015
8 The issuer was placed under federal conservatorship in September 2008; since that time, its daily operations have been managed by the Federal Housing Finance Agency and it receives capital from the U.S. Treasury, as needed to maintain a positive net worth, in exchange for senior preferred stock.
ADR—American Depositary Receipt.
GDR—Global Depositary Receipt.
NVDR—Non-Voting Depository Receipt.
16
This page intentionally left blank.
© 2015 The Vanguard Group, Inc.
All rights reserved.
Vanguard Marketing Corporation, Distributor.
SNA1290 112015

Report of Independent Registered Public Accounting Firm
To the Board of Trustees of Vanguard Horizon Funds and the Shareholders of Vanguard Global Equity Fund:
In our opinion, the accompanying statement of net assets – investments summary and the related statements of operations and of changes in net assets and the financial highlights (included in Item 1 of this Form N-CSR) and the schedule of investments (included in Item 6 of this Form N-CSR) present fairly, in all material respects, the financial position of the Vanguard Global Equity Fund (constituting a separate portfolio of Vanguard Horizon Funds, hereafter referred to as the "Fund") at September 30, 2015, the results of its operations for the year then ended, the changes in its net assets for each of the two years in the period then ended, and the financial highlights for each of the five years in the period then ended, in conformity with accounting principles generally accepted in the United States of America. These financial statements, financial highlights, and schedule of investments (hereafter referred to as "financial statements") are the responsibility of the Fund's management. Our responsibility is to express an opinion on these financial statements based on our audits. We conducted our audits of these financial statements in accordance with the standards of the Public Company Accounting Oversight Board (United States). Those standards require that we plan and perform the audit to obtain reasonable assurance about whether the financial statements are free of material misstatement. An audit includes examining, on a test basis, evidence supporting the amounts and disclosures in the financial statements, assessing the accounting principles used and significant estimates made by management, and evaluating the overall financial statement presentation. We believe that our audits, which included confirmation of securities at September 30, 2015 by correspondence with the custodian and brokers, by agreement to the underlying ownership records of the transfer agent and the application of alternative auditing procedures where securities purchased had not been received, provide a reasonable basis for our opinion.

November 16, 2015
PricewaterhouseCoopers LLP, Two Commerce Square, 2001 Market Street, Suite 1800, Philadelphia, PA 19103-7042
T: (267) 330-3000, F: (267) 330-3300, www.pwc.com/us
Item 7: Disclosure of Proxy Voting Policies and Procedures for Closed-End Management Investment Companies.
Not Applicable.
Item 8: Portfolio Managers of Closed-End Management Investment Companies.
Not Applicable.
Item 9: Purchase of Equity Securities by Closed-End Management Investment Company and Affiliated Purchasers.
Not Applicable.
Item 10: Submission of Matters to a Vote of Security Holders.
Not Applicable.
Item 11: Controls and Procedures.
(a) Disclosure Controls and Procedures. The Principal Executive and Financial Officers concluded that the Registrant’s Disclosure Controls and Procedures are effective based on their evaluation of the Disclosure Controls and Procedures as of a date within 90 days of the filing date of this report.
(b) Internal Control Over Financial Reporting. There were no significant changes in Registrant’s Internal Control Over Financial Reporting or in other factors that could significantly affect this control subsequent to the date of the evaluation, including any corrective actions with regard to significant deficiencies and material weaknesses.
Item 12: Exhibits.
(a) Code of Ethics. (b) Certifications.
Pursuant to the requirements of the Securities Exchange Act of 1934 and the Investment Company Act of 1940, the registrant has duly caused this report to be signed on its behalf by the undersigned, thereunto duly authorized.
| |
| | VANGUARD HORIZON FUNDS |
| |
| By: | /s/ F. WILLIAM MCNABB III* |
| | F. WILLIAM MCNABB III |
| | CHIEF EXECUTIVE OFFICER |
| |
| Date: November 18, 2015 |
Pursuant to the requirements of the Securities Exchange Act of 1934 and the Investment Company Act of 1940, this report has been signed below by the following persons on behalf of the registrant and in the capacities and on the dates indicated.
| |
| | VANGUARD HORIZON FUNDS |
| |
| By: | /s/ F. WILLIAM MCNABB III* |
| | F. WILLIAM MCNABB III |
| | CHIEF EXECUTIVE OFFICER |
| |
| Date: November 18, 2015 |
| |
| | VANGUARD HORIZON FUNDS |
| |
| By: | /s/ THOMAS J. HIGGINS* |
| | THOMAS J. HIGGINS |
| | CHIEF FINANCIAL OFFICER |
| |
| Date: November 18, 2015 |
* By: /s/ Heidi Stam
Heidi Stam, pursuant to a Power of Attorney filed on April 22, 2014 see file Number 2-17620, Incorporated by Reference.