UNITED STATES
SECURITIES AND EXCHANGE COMMISSION
Washington, D.C. 20549
FORM N-CSR
CERTIFIED SHAREHOLDER REPORT
OF
REGISTERED MANAGEMENT INVESTMENT COMPANIES
| | |
Investment Company Act file number: 811-07239 |
Name of Registrant: | Vanguard Horizon Funds |
| Address of Registrant: | P.O. Box 2600 |
| | Valley Forge, PA 19482 |
| Name and address of agent for service: | Heidi Stam, Esquire |
| | P.O. Box 876 |
| | Valley Forge, PA 19482 |
Registrant’s telephone number, including area code: (610) 669-1000 |
Date of fiscal year end: September 30 |
Date of reporting period: October 1, 2011 – September 30, 2012 |
| Item 1: Reports to Shareholders |

Annual Report | September 30, 2012
Vanguard Strategic Equity Fund

> Vanguard Strategic Equity Fund returned 30.32% for the fiscal year ended
September 30, 2012.
> The fund’s return outpaced the 28.86% return posted by its benchmark index
and the 25.91% average return of peer-group funds.
> Bright spots in the portfolio included stock selections in the energy, materials,
and information technology sectors.
| |
| Contents | |
| Your Fund’s Total Returns. | 1 |
| Chairman’s Letter. | 2 |
| Advisor’s Report. | 8 |
| Fund Profile. | 10 |
| Performance Summary. | 11 |
| Financial Statements. | 13 |
| Your Fund’s After-Tax Returns. | 26 |
| About Your Fund’s Expenses. | 27 |
| Glossary. | 29 |
Please note: The opinions expressed in this report are just that—informed opinions. They should not be considered promises or advice.
Also, please keep in mind that the information and opinions cover the period through the date on the front of this report. Of course, the
risks of investing in your fund are spelled out in the prospectus.
See the Glossary for definitions of investment terms used in this report.
About the cover: Our cover photograph shows rigging on the HMSSurprise, a replica of an 18th-century Royal Navy frigate. It
was featured in the 2003 movie Master and Commander: The Far Side of the World, which was based on Patrick O’Brian’s sea
novels, set amid the Napoleonic Wars. Vanguard was named for another ship of that era, the HMSVanguard, which was the
flagship of British Admiral Horatio Nelson at the Battle of the Nile.
Your Fund’s Total Returns
| |
| Fiscal Year Ended September 30, 2012 | |
| |
| | Total |
| | Returns |
| Vanguard Strategic Equity Fund | 30.32% |
| MSCI US Small + Mid Cap 2200 Index | 28.86 |
| Mid-Cap Core Funds Average | 25.91 |
| Mid-Cap Core Funds Average: Derived from data provided by Lipper Inc. |
| | | | |
| Your Fund’s Performance at a Glance | | | |
| September 30, 2011, Through September 30, 2012 | | | |
| | | | Distributions Per Share |
| | Starting | Ending | Income | Capital |
| | Share Price | Share Price | Dividends | Gains |
| Vanguard Strategic Equity Fund | $16.30 | $21.02 | $0.196 | $0.000 |
1

Chairman’s Letter
Dear Shareholder,
Vanguard Strategic Equity Fund fully participated in the stock market rally that took place during the 12 months ended September 30, 2012. The fund returned 30.32%, its highest annual return in nine years. That exceeded the 28.86% return of its benchmark, the MSCI US Small + Mid Cap 2200 Index, and the 25.91% average return of its peer group.
Whether the stock market is rising or falling, the fund’s advisor has a twofold task in selecting stocks for the portfolio: to outpace the returns of the fund’s benchmark sectors and to maintain, for each sector, a risk profile similar to the benchmark’s. To do so, the advisor,
Vanguard Equity Investment Group, relies on computer models that focus on key characteristics that influence a stock’s long-term performance, such as valuation levels, the sustainability of earnings, and balance-sheet strength. The advisor was particularly successful in energy, materials, and information technology but less so in the health care, industrial, and consumer discretionary sectors.
Note: If you hold shares in a taxable account, you may wish to review the table and discussion of after-tax returns for the fiscal year, based on the highest tax bracket, later in this report.
Stocks notched a powerful rally, with help from central bankers
U.S. stocks surged 30% in the 12 months ended September 30, 2012, outpacing the gains of their international counterparts. The rally came amid moves by U.S. and
2
European central bankers to quiet—at least temporarily—investors’ concerns about the U.S. economy and the finances of Euro-pean governments and banks.
U.S. stocks were the standouts, but European and emerging markets stocks also posted double-digit results. The developed markets of the Pacific region were the weakest performers but still recorded a modest advance.
In July, the president of the European Central Bank declared that policymakers would do whatever was needed to preserve the euro common currency.
That pronouncement was encouraging to investors, but Europe’s financial troubles
are by no means resolved. Vanguard economists believe the most likely scenario is that the Eurozone will “muddle through” for several years, with occasional spikes in market volatility, as fiscal tightening continues in the face of weak economic growth.
Bonds produced solid returns; future results may be more muted
Bonds once again advanced; the broad
U.S. taxable market returned about 5% for the 12 months. Among U.S. Treasuries, long-term bonds were particularly strong as they benefited from the Federal Reserve’s bond-buying program.
| | | |
| Market Barometer | | | |
| |
| | Average Annual Total Returns |
| | Periods Ended September 30, 2012 |
| | One | Three | Five |
| | Year | Years | Years |
| Stocks | | | |
| Russell 1000 Index (Large-caps) | 30.06% | 13.27% | 1.22% |
| Russell 2000 Index (Small-caps) | 31.91 | 12.99 | 2.21 |
| Dow Jones U.S. Total Stock Market Index | 30.00 | 13.29 | 1.53 |
| MSCI All Country World Index ex USA (International) | 14.48 | 3.17 | -4.12 |
| |
| Bonds | | | |
| Barclays U.S. Aggregate Bond Index (Broad taxable market) | 5.16% | 6.19% | 6.53% |
| Barclays Municipal Bond Index (Broad tax-exempt market) | 8.32 | 5.99 | 6.06 |
| Citigroup Three-Month U.S. Treasury Bill Index | 0.05 | 0.08 | 0.63 |
| |
| CPI | | | |
| Consumer Price Index | 1.99% | 2.33% | 2.11% |
3
As bond prices rose, the yield of the 10-year U.S. Treasury note fell to a record low in July, closing below 1.5%. (Bond yields and prices move in opposite directions.) By the end of the period, the yield had climbed, but it still remained low by historical standards.
Bondholders have enjoyed years of strong returns. But as Tim Buckley, our incoming chief investment officer, has noted, investors shouldn’t be surprised if future results are much more modest. As yields tumble, the scope for further declines—and price increases—diminishes.
The Federal Reserve announced on September 13 that it would continue to hold its target for short-term interest rates
between 0% and 0.25% at least through mid-2015. The exceptionally low rates, in place since late 2008, kept a tight lid on returns from money market funds and savings accounts.
Energy stocks stood out in contributing to results
The advisor’s computer models (described in the Advisor’s Report that follows this letter) serve as a filter for stocks with the strong financial characteristics that can produce outstanding results over time.
Unlike with mutual funds that pay less attention to risk control, the approach aims to produce a lot of “singles,” rather than “home runs.”
| | |
| Expense Ratios | | |
| Your Fund Compared With Its Peer Group | | |
| | | Peer Group |
| | Fund | Average |
| Strategic Equity Fund | 0.33% | 1.28% |
The fund expense ratio shown is from the prospectus dated January 26, 2012, and represents estimated costs for the current fiscal year. For
the fiscal year ended September 30, 2012, the fund’s expense ratio was 0.29%. The peer-group expense ratio is derived from data provided
by Lipper Inc. and captures information through year-end 2011.
Peer group: Mid-Cap Core Funds.
4
In trying to outperform the fund’s benchmark, Vanguard Equity Investment Group made particularly effective stock selections among companies in the entire energy-supply chain, from exploration to marketing. Selections in materials, especially among chemical manufacturers, also paid off. Information technology stocks were another major contributor to relative results; these included semi-conductor firms and companies that provide computer storage and peripheral equipment. Declines among computer hardware manufacturers somewhat offset these gains. Despite double-digit results in many cases, the fund’s holdings in the
health care, industrial, and consumer discretionary sectors underperformed their benchmark counterparts.
Some of these less successful holdings included biotechnology companies and providers of health care equipment, supplies, and services. Machinery and electric equipment makers dampened industrial sector returns, as did service firms, such as providers of office services and human resources consultants. In consumer discretionary, good selections among retail, restaurant, and leisure-industry stocks could not offset disap-pointing results from home-furnishing and home-building companies.
| |
| Total Returns | |
| Ten Years Ended September 30, 2012 | |
| | Average |
| | Annual Return |
| Strategic Equity Fund | 9.27% |
| Spliced Small and Mid Cap Index | 11.14 |
| Mid-Cap Core Funds Average | 9.18 |
| For a benchmark description, see the Glossary. | |
| Mid-Cap Core Funds Average: Derived from data provided by Lipper Inc. | |
The figures shown represent past performance, which is not a guarantee of future results. (Current performance may be
lower or higher than the performance data cited. For performance data current to the most recent month-end, visit our
website at vanguard.com/performance.) Note, too, that both investment returns and principal value can fluctuate widely, so
an investor’s shares, when sold, could be worth more or less than their original cost.
5
Over a decade, results have been mixed for the fund
The Strategic Equity Fund’s subpar performance during the 2008–2009 financial crisis and, to a lesser extent, the subsequent recovery is reflected in its mixed results over the past ten years.
The fund’s average annual return over that time is a solid 9.27%; that’s higher than the 8.77% return of the broad stock market, as measured by the Dow Jones U.S. Total Stock Market Index, and the 9.18% average return of peer funds.
But the Strategic Equity Fund lagged its benchmark, which returned 11.14% over the decade.
The fund’s strategies, and indeed those of many active stock pickers, were not especially effective in the years surrounding the crisis. Investing styles and strategies occasionally move in and out of favor, and the ten-year period includes a lengthy stretch when your fund’s approach was out of step with the market. With any actively managed fund, occasional periods of weakness can be thought of as the price we pay for the potential to outperform. We remain confident that the methodology used by Vanguard Equity Investment Group will, over time, accomplish the goal of maintaining the risk profile of the fund’s benchmark while providing competitive returns.
The lessons of the financial crisis remain relevant four years later
In September, the end of your fund’s fiscal year, we marked the fourth anniversary of Lehman Brothers’ collapse, the start of the 2008–2009 financial crisis. When the Lehman news broke, I was speaking to institutional clients at an event in Washington, D.C., all of three weeks into my new role as Vanguard’s CEO.
In the ensuing months, I was struck both by how fortunate I was to work with a great team of Vanguard “crew” and by the remarkable steadiness demonstrated by our clients. Many clients experienced significant losses, but signs of panic were few. On balance, they remained committed to their long-term investment programs and managed to benefit from the financial markets’ subsequent recovery.
As the crisis recedes further in time, it’s important not to lose sight of the lessons that it illuminated about investing and sound financial practices generally. First among those lessons is that diversification does work. Diversification didn’t immunize investors from the market’s decline, but it certainly helped to insulate them from the worst of it.
Second, saving money and living within your means are critical. Investors are acting on this lesson as they pay off debt, which
6
is a form of saving, and increase their savings rates from the dangerously low levels that prevailed before the crisis.
Third, having the courage to stick with a sound investment plan—as so many of our clients did—is important during volatile, uncertain times. Investors who resisted the urge to bail out of stocks at the depths of the crisis have largely been rewarded in the succeeding years.
I am very optimistic that, if investors embrace these lessons, they can give themselves a better chance of reaching their long-term goals. As always, thank you for investing with Vanguard.
Sincerely,

F. William McNabb III
Chairman and Chief Executive Officer
October 17, 2012
7
Advisor’s Report
For the 12-month period that ended September 30, 2012, the Strategic Equity Fund returned 30.32%, outperforming the 28.86% return of its benchmark MSCI US Small + Mid Cap 2200 Index during a fiscal year that presented very different halves.
In the first six months, mid- and small-capitalization stocks rose more than 28%. By the second half, the market’s momentum had slowed dramatically, and mid-and small-cap stocks moved ahead by less than 1%. Mid- and small-cap stocks, the focus of your investment in the fund, underperformed the broad market MSCI US Investable Market 2500 Index for the full year by more than 1 percentage point. All ten sector groups generated positive returns within the benchmark, but the index’s results were best among health care, materials, and consumer discretionary companies. Telecommunications and consumer staples were the laggards within the small- and mid-cap universe.
Equity markets have staged quite a rally since last fall, but investor unease and economic worries are still prominent.
A “fiscal cliff” scenario could send the United States into recession if not resolved, and investors are concerned anew about the Eurozone crisis and slowing growth in China. Add to that stagnant employment, election-year uncertainty, and a lack of clarity on corporate profits, and it’s easy to see why investors’ appetite for riskier assets may be put on hold for a while. Market volatility declined substantially during this period, but it is likely to
persist amid our unresolved budget, deficit, and employment problems and anemic world economic growth.
These macro factors affect overall portfolio performance, but our approach to investing focuses on specific stock fundamentals and employs five components:
• Valuation, which measures the price we pay for earnings and cash flows.
• Growth, which considers the growth of earnings as a factor in how much we pay for them.
• Management decisions, which assesses the actions taken by company management that signal its informed opinions of a firm’s prospects and earnings.
• Market sentiment, which captures how investors reflect their opinions of a company through their activity in the market.
• Quality, which measures balance-sheet strength and the sustainability of earnings.
Using these components, we control risk by neutralizing our exposure to market capitalization, volatility, and industry risks relative to our benchmark. In our view, the rewards available do not justify such risk exposures. The effect of these risk controls can be seen by analyzing the fund’s tracking error—a measure of relative performance volatility. The trailing three-year tracking error of 2.44% is well within an acceptable range given this fund’s risk tolerance.
8
The results from our stock-selection model continued a trend from the first six months of the fiscal year. Our quality and management decisions signals remained effective in distinguishing outperformers from underperformers, but our valuation and market sentiment indicators detracted from results. The portfolio experienced modest gains from our growth signal.
The model’s effectiveness over the period across sectors was strong, as we produced positive stock-selection results in seven of the ten sectors in the benchmark. The sectors with the best absolute returns in the portfolio were materials (+54%), energy (+51%), and financials (+35%). Those with the weakest were utilities (+20%), telecommunications (+19%), and consumer staples (+19%).
Among individual stocks, the largest contributors came from overweight positions in Tesoro, United Rentals, and Western Refining. Comparing the portfolio’s performance with that of its benchmark, we benefited from underweighting or avoiding poor performers such as Green Mountain Coffee Roasters, Alpha Natural Resources, and Rovi.
Unfortunately, we could not avoid all bad performers. Overweights in Goodyear Tire & Rubber, Tempur-Pedic International, and Regeneron Pharmaceuticals directly lowered performance. Also, underweighting companies such as Equinix, Pharmasset, and Roper Industries that our model’s fundamentals did not positively identify hurt our overall relative outperformance.
Although we cannot predict with certainty the impact of broader political or economic events, we are confident that the stock market will provide worthwhile returns for long-term investors. With that in mind, we believe that equity exposure will continue to play an important part in a diversified investment plan.
We thank you for your investment and look forward to the new fiscal year.
James D. Troyer, CFA
Principal and Portfolio Manager
James P. Stetler
Principal and Portfolio Manager
Michael R. Roach, CFA
Portfolio Manager
Vanguard Equity Investment Group
October 22, 2012
9
Strategic Equity Fund
Fund Profile
As of September 30, 2012
| | | |
| Portfolio Characteristics | | |
| | | MSCI US | |
| | | Small + | DJ |
| | | Mid Cap | U.S. Total |
| | | 2200 | Market |
| | Fund | Index | Index |
| Number of Stocks | 390 | 2,174 | 3,638 |
| Median Market Cap | $3.6B | $4.2B | $35.6B |
| Price/Earnings Ratio | 14.6x | 20.8x | 17.0x |
| Price/Book Ratio | 2.1x | 2.0x | 2.2x |
| Return on Equity | 10.9% | 11.8% | 18.0% |
| Earnings Growth Rate | 9.4% | 7.9% | 10.4% |
| Dividend Yield | 1.5% | 1.5% | 2.0% |
| Foreign Holdings | 0.0% | 0.0% | 0.0% |
| Turnover Rate | 67% | — | — |
| Ticker Symbol | VSEQX | — | — |
| Expense Ratio1 | 0.33% | — | — |
| 30-Day SEC Yield | 1.19% | — | — |
| Short-Term Reserves | 0.3% | — | — |
| | | |
| Sector Diversification (% of equity exposure) |
| | | MSCI US | |
| | | Small + | DJ |
| | | Mid Cap | U.S. Total |
| | | 2200 | Market |
| | Fund | Index | Index |
| Consumer Discretionary 17.2% | 16.5% | 12.0% |
| Consumer Staples | 3.3 | 4.1 | 9.5 |
| Energy | 6.7 | 7.1 | 10.4 |
| Financials | 19.9 | 19.8 | 16.0 |
| Health Care | 11.1 | 11.2 | 11.9 |
| Industrials | 13.3 | 13.7 | 10.6 |
| Information Technology | 15.9 | 15.3 | 19.2 |
| Materials | 7.0 | 6.5 | 3.9 |
| Telecommunication | | | |
| Services | 0.6 | 1.0 | 2.9 |
| Utilities | 5.0 | 4.8 | 3.6 |
| | |
| Volatility Measures | | |
| | MSCI US | |
| | Small + | DJ |
| | Mid Cap | U.S. Total |
| | 2200 | Market |
| | Index | Index |
| R-Squared | 0.99 | 0.94 |
| Beta | 1.02 | 1.18 |
| These measures show the degree and timing of the fund’s fluctuations compared with the indexes over 36 months. |
| |
| Ten Largest Holdings (% of total net assets) |
| CF Industries Holdings | Fertilizers & |
| Inc. | Agricultural |
| | Chemicals |
| Watson Pharmaceuticals | |
| Inc. | Pharmaceuticals |
| Seagate Technology plc | Computer Storage & |
| | Peripherals |
| Eastman Chemical Co. | Diversified Chemicals |
| AmerisourceBergen | Health Care |
| Corp. Class A | Distributors |
| Tesoro Corp. | Oil & Gas Refining & |
| | Marketing |
| O'Reilly Automotive Inc. | Automotive Retail |
| KLA-Tencor Corp. | Semiconductor |
| | Equipment |
| Polaris Industries Inc. | Leisure Products |
| Torchmark Corp. | Life & Health |
| | Insurance |
| Top Ten | |
| The holdings listed exclude any temporary cash investments and equity index products. |
Investment Focus

1 The expense ratio shown is from the prospectus dated January 26, 2012, and represents estimated costs for the current fiscal year. For the
fiscal year ended September 30, 2012, the expense ratio was 0.29%.
10
Strategic Equity Fund
Performance Summary
All of the returns in this report represent past performance, which is not a guarantee of future results that may be achieved by the fund. (Current performance may be lower or higher than the performance data cited. For performance data current to the most recent month-end, visit our website at vanguard.com/performance.) Note, too, that both investment returns and principal value can fluctuate widely, so an investor’s shares, when sold, could be worth more or less than their original cost. The returns shown do not reflect taxes that a shareholder would pay on fund distributions or on the sale of fund shares.
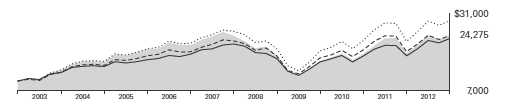
Cumulative Performance: September 30, 2002, Through September 30, 2012
Initial Investment of $10,000
| | | | | |
| | | | Average Annual Total Returns | |
| | | Periods Ended September 30, 2012 | |
| | | | | | Final Value |
| | | One | Five | Ten | of a $10,000 |
| | | Year | Years | Years | Investment |
| | Strategic Equity Fund | 30.32% | 0.23% | 9.27% | $24,275 |
| •••••••• | Spliced Small and Mid Cap Index | 28.86 | 2.49 | 11.14 | 28,742 |
| – – – – | Mid-Cap Core Funds Average | 25.91 | 1.41 | 9.18 | 24,077 |
| | Dow Jones U.S. Total Stock Market | | | | |
| | Index | 30.00 | 1.53 | 8.77 | 23,184 |
| For a benchmark description, see the Glossary. | | | | |
| Mid-Cap Core Funds Average: Derived from data provided by Lipper Inc. |
See Financial Highlights for dividend and capital gains information.
11
Strategic Equity Fund
Fiscal-Year Total Returns (%): September 30, 2002, Through September 30, 2012
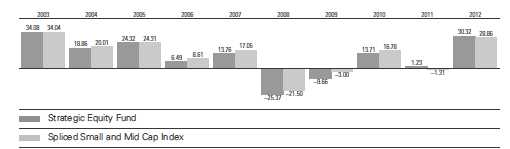
For a benchmark description, see the Glossary.
12
Strategic Equity Fund
Financial Statements
Statement of Net Assets
As of September 30, 2012
The fund reports a complete list of its holdings in regulatory filings four times in each fiscal year, at the quarter-ends. For the second and fourth fiscal quarters, the lists appear in the fund’s semiannual and annual reports to shareholders. For the first and third fiscal quarters, the fund files the lists with the Securities and Exchange Commission on Form N-Q. Shareholders can look up the fund’s Forms N-Q on the SEC’s website at sec.gov. Forms N-Q may also be reviewed and copied at the SEC’s Public Reference Room (see the back cover of this report for further information).
| | | |
| | | | Market |
| | | | Value |
| | | Shares | ($000) |
| Common Stocks (99.4%)1 | | |
| Consumer Discretionary (17.2%) | |
| * | O’ReillyAutomotive Inc. | 380,300 | 31,801 |
| | Polaris Industries Inc. | 372,782 | 30,147 |
| | Virgin Media Inc. | 987,500 | 29,072 |
| | Harley-Davidson Inc. | 670,600 | 28,413 |
| | Dillard’s Inc. Class A | 365,570 | 26,438 |
| | Wyndham Worldwide Corp. | 490,100 | 25,720 |
| | Advance Auto Parts Inc. | 367,800 | 25,172 |
| * | PulteGroup Inc. | 1,521,500 | 23,583 |
| | ExpediaInc. | 396,150 | 22,913 |
| ^ | Garmin Ltd. | 435,200 | 18,165 |
| * | Fifth & Pacific Cos. Inc. | 1,332,600 | 17,031 |
| | Gannett Co. Inc. | 951,600 | 16,891 |
| | Brinker International Inc. | 476,650 | 16,826 |
| ^ | Buckle Inc. | 361,100 | 16,405 |
| | Domino’s Pizza Inc. | 375,720 | 14,165 |
| | Dana Holding Corp. | 1,129,300 | 13,890 |
| * | Coinstar Inc. | 302,190 | 13,593 |
| | Foot Locker Inc. | 361,800 | 12,844 |
| ^ | Regal Entertainment Group | | |
| | Class A | 887,800 | 12,491 |
| | Jarden Corp. | 231,300 | 12,222 |
| | Thor Industries Inc. | 251,500 | 9,135 |
| | Bob Evans Farms Inc. | 206,751 | 8,090 |
| * | Conn’s Inc. | 358,900 | 7,914 |
| ^ | Sturm Ruger & Co. Inc. | 159,800 | 7,909 |
| * | Tenneco Inc. | 277,995 | 7,784 |
| | PVH Corp. | 75,000 | 7,029 |
| | Ross Stores Inc. | 108,024 | 6,978 |
| | Starwood Hotels & Resorts | | |
| | Worldwide Inc. | 117,300 | 6,799 |
| | CheesecakeFactory Inc. | 185,500 | 6,632 |
| | Ameristar Casinos Inc. | 367,800 | 6,547 |
| | PetSmart Inc. | 93,700 | 6,463 |
| | Sinclair Broadcast Group | | |
| | Inc. Class A | 502,640 | 5,635 |
| | Newell Rubbermaid Inc. | 261,600 | 4,994 |
| * | Francesca’s Holdings Corp. | 151,200 | 4,646 |
| | | |
| | American Eagle | | |
| | Outfitters Inc. | 199,000 | 4,195 |
| * | ExpressInc. | 251,500 | 3,727 |
| | Rent-A-Center Inc. | 103,400 | 3,627 |
| * | Vitamin Shoppe Inc. | 54,800 | 3,196 |
| | Aaron’s Inc. | 106,200 | 2,953 |
| * | Smith & Wesson | | |
| | Holding Corp. | 264,300 | 2,910 |
| | Scholastic Corp. | 78,000 | 2,479 |
| | Pier 1 Imports Inc. | 125,900 | 2,359 |
| * | Goodyear Tire & Rubber Co. | 184,600 | 2,250 |
| * | Arctic Cat Inc. | 49,700 | 2,061 |
| * | Dollar Tree Inc. | 41,000 | 1,979 |
| * | Lamar Advertising Co. | | |
| | Class A | 53,300 | 1,975 |
| | Blyth Inc. | 74,600 | 1,939 |
| * | Liberty Interactive Corp. | | |
| | Class A | 104,300 | 1,930 |
| | Brunswick Corp. | 81,700 | 1,849 |
| | Service Corp. International | 128,200 | 1,726 |
| | Cinemark Holdings Inc. | 68,200 | 1,530 |
| * | LeapFrog Enterprises Inc. | 167,900 | 1,514 |
| | Hot Topic Inc. | 172,600 | 1,502 |
| * | AFC Enterprises Inc. | 60,045 | 1,477 |
| | Brown Shoe Co. Inc. | 91,600 | 1,468 |
| * | Red Robin Gourmet | | |
| | Burgers Inc. | 43,300 | 1,410 |
| | Regis Corp. | 63,400 | 1,165 |
| * | Journal Communications | | |
| | Inc. Class A | 215,261 | 1,119 |
| | Cato Corp. Class A | 36,294 | 1,078 |
| | | | 557,755 |
| Consumer Staples (3.3%) | | |
| * | Dean Foods Co. | 1,599,704 | 26,155 |
| | Beam Inc. | 280,100 | 16,117 |
| | Herbalife Ltd. | 315,978 | 14,977 |
| | B&G Foods Inc. Class A | 471,620 | 14,295 |
| * | Monster Beverage Corp. | 204,254 | 11,062 |
| | Lancaster Colony Corp. | 108,519 | 7,949 |
13
Strategic Equity Fund
| | | |
| | | | Market |
| | | | Value |
| | | Shares | ($000) |
| | Safeway Inc. | 276,000 | 4,441 |
| | Universal Corp. | 75,400 | 3,839 |
| | Nu Skin Enterprises Inc. | | |
| | Class A | 69,900 | 2,714 |
| | Ingredion Inc. | 40,600 | 2,240 |
| | Cal-Maine Foods Inc. | 26,000 | 1,169 |
| * | Boston Beer Co. Inc. | | |
| | Class A | 9,800 | 1,097 |
| * | Pilgrim’s Pride Corp. | 189,900 | 970 |
| * | Central Garden and | | |
| | Pet Co. Class A | 60,800 | 735 |
| | | | 107,760 |
| Energy (6.7%) | | |
| | Tesoro Corp. | 762,400 | 31,945 |
| | Western Refining Inc. | 1,042,300 | 27,287 |
| | Core Laboratories NV | 192,000 | 23,324 |
| | Helmerich & Payne Inc. | 482,092 | 22,952 |
| | Energy XXI Bermuda Ltd. | 471,000 | 16,461 |
| * | Rosetta Resources Inc. | 311,645 | 14,928 |
| * | Helix Energy Solutions | | |
| | Group Inc. | 676,100 | 12,352 |
| * | Denbury Resources Inc. | 616,800 | 9,968 |
| | HollyFrontier Corp. | 219,200 | 9,046 |
| * | Stone Energy Corp. | 323,212 | 8,119 |
| | Delek US Holdings Inc. | 202,400 | 5,159 |
| * | Plains Exploration & | | |
| | Production Co. | 114,300 | 4,283 |
| * | Vaalco Energy Inc. | 460,100 | 3,934 |
| | Energen Corp. | 65,600 | 3,438 |
| * | Oil States International Inc. | 41,500 | 3,298 |
| | Crosstex Energy Inc. | 212,475 | 2,981 |
| * | EPLOil & Gas Inc. | 145,100 | 2,944 |
| * | Rentech Inc. | 1,113,900 | 2,740 |
| * | Hornbeck Offshore | | |
| | Services Inc. | 70,000 | 2,566 |
| * | OYO Geospace Corp. | 17,250 | 2,112 |
| * | Nabors Industries Ltd. | 148,100 | 2,078 |
| * | ION Geophysical Corp. | 280,100 | 1,944 |
| * | Contango Oil & Gas Co. | 33,800 | 1,661 |
| | Alon USA Energy Inc. | 118,200 | 1,619 |
| | Berry Petroleum Co. Class A | 18,800 | 764 |
| | | | 217,903 |
| Financials (19.7%) | | |
| | Torchmark Corp. | 583,995 | 29,988 |
| * | Arch Capital Group Ltd. | 653,726 | 27,247 |
| | Discover Financial Services | 670,025 | 26,620 |
| * | World Acceptance Corp. | 338,783 | 22,851 |
| | KeyCorp | 2,599,930 | 22,723 |
| | American Financial | | |
| | Group Inc. | 539,689 | 20,454 |
| | Host Hotels & | | |
| | Resorts Inc. | 1,097,100 | 17,608 |
| | NASDAQ OMX Group Inc. | 729,200 | 16,987 |
| | Commerce Bancshares Inc. | 388,530 | 15,669 |
| | | |
| | Kimco Realty Corp. | 759,500 | 15,395 |
| | Assurant Inc. | 409,700 | 15,282 |
| | Macerich Co. | 246,600 | 14,113 |
| | Digital Realty Trust Inc. | 189,200 | 13,216 |
| | Moody’s Corp. | 290,900 | 12,849 |
| | Huntington Bancshares | | |
| | Inc. | 1,841,000 | 12,703 |
| | Liberty Property Trust | 310,000 | 11,234 |
| | ExtraSpace Storage Inc. | 335,740 | 11,163 |
| | CBL& Associates | | |
| | Properties Inc. | 519,774 | 11,092 |
| | Douglas Emmett Inc. | 476,200 | 10,986 |
| | Weingarten Realty | | |
| | Investors | 386,500 | 10,865 |
| | Allied World Assurance | | |
| | Co. Holdings AG | 133,700 | 10,328 |
| | Post Properties Inc. | 215,300 | 10,326 |
| | Hospitality Properties Trust | 432,700 | 10,290 |
| * | Altisource Portfolio | | |
| | Solutions SA | 114,709 | 9,894 |
| | Brandywine Realty Trust | 806,832 | 9,835 |
| ^ | Lexington Realty Trust | 1,014,900 | 9,804 |
| * | Sunstone Hotel | | |
| | Investors Inc. | 881,000 | 9,691 |
| | Entertainment Properties | | |
| | Trust | 215,200 | 9,561 |
| | DCT Industrial Trust Inc. | 1,460,300 | 9,448 |
| | Protective Life Corp. | 349,800 | 9,168 |
| | Sun Communities Inc. | 205,143 | 9,051 |
| * | First Industrial Realty | | |
| | Trust Inc. | 687,825 | 9,038 |
| | ProAssurance Corp. | 99,800 | 9,026 |
| | Duke Realty Corp. | 578,100 | 8,498 |
| | East West Bancorp Inc. | 383,600 | 8,102 |
| | Cash America | | |
| | International Inc. | 207,300 | 7,996 |
| | Omega Healthcare | | |
| | Investors Inc. | 340,500 | 7,740 |
| * | American Capital Ltd. | 598,089 | 6,782 |
| | Bank of Hawaii Corp. | 141,900 | 6,474 |
| | CVB Financial Corp. | 532,900 | 6,363 |
| | BOK Financial Corp. | 101,021 | 5,970 |
| * | Texas Capital | | |
| | Bancshares Inc. | 110,600 | 5,498 |
| * | Credit Acceptance Corp. | 62,622 | 5,355 |
| | EverestRe Group Ltd. | 47,400 | 5,070 |
| | Apartment Investment & | | |
| | Management Co. Class A | 190,200 | 4,943 |
| | Nelnet Inc. Class A | 204,212 | 4,848 |
| | Regions Financial Corp. | 660,500 | 4,762 |
| | Provident Financial | | |
| | Services Inc. | 293,425 | 4,633 |
| | Umpqua Holdings Corp. | 338,000 | 4,357 |
| * | Forest City Enterprises | | |
| | Inc. Class A | 266,405 | 4,223 |
14
Strategic Equity Fund
| | | |
| | | | Market |
| | | | Value |
| | | Shares | ($000) |
| | Prospect Capital Corp. | 349,300 | 4,024 |
| | International Bancshares | | |
| | Corp. | 204,325 | 3,892 |
| | Amtrust Financial | | |
| | Services Inc. | 143,440 | 3,675 |
| | Pennsylvania REIT | 221,500 | 3,513 |
| | City Holding Co. | 95,105 | 3,409 |
| | Apollo Residential | | |
| | Mortgage Inc. | 153,400 | 3,381 |
| | UMB Financial Corp. | 68,888 | 3,354 |
| | Bank of the Ozarks Inc. | 93,420 | 3,220 |
| | Cathay General Bancorp | 185,510 | 3,202 |
| | AvalonBay Communities Inc. | 20,800 | 2,829 |
| | OldNational Bancorp | 200,000 | 2,722 |
| | CNOFinancial Group Inc. | 277,200 | 2,675 |
| * | First Cash Financial | | |
| | Services Inc. | 53,200 | 2,448 |
| | PrivateBancorp Inc. | | |
| | Class A | 152,500 | 2,439 |
| * | iStar Financial Inc. | 279,055 | 2,311 |
| | Webster Financial Corp. | 90,500 | 2,145 |
| * | St. Joe Co. | 109,100 | 2,127 |
| | Health Care REIT Inc. | 36,800 | 2,125 |
| | National Penn | | |
| | Bancshares Inc. | 210,800 | 1,920 |
| | Ramco-Gershenson | | |
| | Properties Trust | 148,300 | 1,858 |
| | Montpelier Re Holdings Ltd. | 83,000 | 1,837 |
| | CapitalSource Inc. | 226,000 | 1,713 |
| | Synovus Financial Corp. | 706,400 | 1,674 |
| | Bancfirst Corp. | 38,783 | 1,666 |
| | Susquehanna Bancshares | | |
| | Inc. | 157,400 | 1,646 |
| | Republic Bancorp Inc. | | |
| | Class A | 73,911 | 1,622 |
| | Oritani Financial Corp. | 94,900 | 1,428 |
| | HCC Insurance Holdings Inc. | 35,300 | 1,196 |
| | Primerica Inc. | 39,400 | 1,128 |
| | Validus Holdings Ltd. | 32,500 | 1,102 |
| | Camden National Corp. | 25,345 | 939 |
| | MFA Financial Inc. | 92,300 | 785 |
| | Southside Bancshares Inc. | 34,664 | 756 |
| | American Capital | | |
| | Agency Corp. | 21,300 | 737 |
| * | Citizens Republic | | |
| | Bancorp Inc. | 36,300 | 702 |
| | | | 642,319 |
| Health Care (11.0%) | | |
| * | Watson Pharmaceuticals | | |
| | Inc. | 421,800 | 35,920 |
| | AmerisourceBergen Corp. | | |
| | Class A | 841,604 | 32,578 |
| | Omnicare Inc. | 816,600 | 27,740 |
| * | Mylan Inc. | 986,300 | 24,066 |
| * | WellCare Health Plans Inc. | 417,100 | 23,587 |
| | | |
| * | Health Net Inc. | 910,000 | 20,484 |
| * | Regeneron | | |
| | Pharmaceuticals Inc. | 120,200 | 18,350 |
| | Cooper Cos. Inc. | 180,315 | 17,033 |
| | Perrigo Co. | 137,250 | 15,944 |
| * | Salix Pharmaceuticals Ltd. | 373,205 | 15,801 |
| | ResMed Inc. | 362,083 | 14,653 |
| * | Cubist Pharmaceuticals Inc. | 290,900 | 13,870 |
| * | LifePoint Hospitals Inc. | 274,035 | 11,723 |
| * | Pharmacyclics Inc. | 177,000 | 11,417 |
| * | Magellan Health | | |
| | Services Inc. | 188,600 | 9,734 |
| * | CharlesRiver Laboratories | | |
| | International Inc. | 234,900 | 9,302 |
| *,^ | Arena Pharmaceuticals Inc. | 844,000 | 7,022 |
| * | Medicines Co. | 267,875 | 6,914 |
| * | Cyberonics Inc. | 121,800 | 6,385 |
| * | Affymax Inc. | 248,400 | 5,231 |
| * | Thoratec Corp. | 141,100 | 4,882 |
| | PDL BioPharma Inc. | 482,100 | 3,707 |
| * | Wright Medical Group Inc. | 119,700 | 2,647 |
| * | Auxilium Pharmaceuticals | | |
| | Inc. | 92,500 | 2,263 |
| | West Pharmaceutical | | |
| | Services Inc. | 41,800 | 2,218 |
| *,^ | Questcor Pharmaceuticals | | |
| | Inc. | 112,400 | 2,079 |
| | Ensign Group Inc. | 67,000 | 2,051 |
| * | Molina Healthcare Inc. | 72,600 | 1,826 |
| *,^ | Spectrum Pharmaceuticals | | |
| | Inc. | 133,900 | 1,567 |
| * | HealthSouth Corp. | 61,600 | 1,482 |
| * | Genomic Health Inc. | 38,408 | 1,332 |
| | ChemedCorp. | 18,200 | 1,261 |
| * | Universal American Corp. | 130,700 | 1,208 |
| * | Akorn Inc. | 71,067 | 940 |
| * | Bio-Rad Laboratories Inc. | | |
| | Class A | 8,200 | 875 |
| | | | 358,092 |
| Industrials (13.2%) | | |
| | Textron Inc. | 1,139,900 | 29,831 |
| | Triumph Group Inc. | 445,366 | 27,849 |
| * | Delta Air Lines Inc. | 2,829,100 | 25,915 |
| ^ | Pitney Bowes Inc. | 1,228,650 | 16,980 |
| | Equifax Inc. | 339,200 | 15,800 |
| *,^ | USG Corp. | 679,300 | 14,911 |
| | Cintas Corp. | 343,600 | 14,242 |
| * | WESCO International Inc. | 235,500 | 13,471 |
| | Trinity Industries Inc. | 426,800 | 12,791 |
| | Dun & Bradstreet Corp. | 157,500 | 12,540 |
| * | EnerSys Inc. | 346,257 | 12,219 |
| * | US Airways Group Inc. | 1,146,200 | 11,989 |
| | Toro Co. | 296,400 | 11,791 |
| | Towers Watson & Co. | | |
| | Class A | 209,400 | 11,109 |
15
Strategic Equity Fund
| | | | |
| | | | | Market |
| | | | | Value |
| | | | Shares | ($000) |
| | AO Smith Corp. | | 175,900 | 10,121 |
| * | Alaska Air Group Inc. | | 279,790 | 9,809 |
| * | United Rentals Inc. | | 253,147 | 8,280 |
| | Sauer-Danfoss Inc. | | 205,323 | 8,256 |
| | Barnes Group Inc. | | 318,400 | 7,963 |
| * | Huntington Ingalls | | | |
| | Industries Inc. | | 185,000 | 7,779 |
| | NACCO Industries Inc. | | |
| | Class A | | 60,000 | 7,525 |
| | Applied Industrial | | | |
| | Technologies Inc. | | 179,200 | 7,424 |
| * | JetBlue Airways Corp. | 1,334,900 | 6,394 |
| | Manitowoc Co. Inc. | | 475,050 | 6,337 |
| | Hubbell Inc. Class B | | 74,900 | 6,047 |
| * | Trimas Corp. | | 239,700 | 5,779 |
| * | B/E Aerospace Inc. | | 133,750 | 5,631 |
| | Macquarie Infrastructure | | |
| | Co. LLC | | 129,900 | 5,388 |
| | Belden Inc. | | 143,000 | 5,274 |
| | Amerco Inc. | | 45,740 | 4,865 |
| * | Spirit Airlines Inc. | | 282,700 | 4,829 |
| * | Moog Inc. Class A | | 126,500 | 4,791 |
| | Aircastle Ltd. | | 386,600 | 4,380 |
| | Lincoln Electric | | | |
| | Holdings Inc. | | 111,400 | 4,350 |
| | Timken Co. | | 109,000 | 4,050 |
| | JB Hunt Transport | | | |
| | Services Inc. | | 73,800 | 3,841 |
| | ExelisInc. | | 330,500 | 3,417 |
| | Standex International Corp. | 76,450 | 3,398 |
| * | Hexcel Corp. | | 125,400 | 3,012 |
| * | Terex Corp. | | 121,000 | 2,732 |
| | Armstrong World | | | |
| | Industries Inc. | | 58,800 | 2,727 |
| | Lennox International Inc. | 55,000 | 2,660 |
| * | WABCO Holdings Inc. | | 46,100 | 2,659 |
| | Generac Holdings Inc. | | 115,100 | 2,635 |
| | Deluxe Corp. | | 86,113 | 2,632 |
| | GATXCorp. | | 61,400 | 2,606 |
| | Steelcase Inc. Class A | | 255,700 | 2,519 |
| * | General Cable Corp. | | 83,500 | 2,453 |
| | Mueller Industries Inc. | 48,800 | 2,219 |
| * | Teledyne Technologies Inc. | 32,100 | 2,035 |
| | Cooper Industries plc | | 27,000 | 2,027 |
| | RR Donnelley & Sons Co. | 188,900 | 2,002 |
| | Brink’s Co. | | 70,800 | 1,819 |
| * | GenCorp Inc. | | 178,200 | 1,691 |
| | Robbins & Myers Inc. | | 27,900 | 1,663 |
| | Mine Safety Appliances Co. | 40,500 | 1,509 |
| | Actuant Corp. Class A | | 49,100 | 1,405 |
| | Southwest Airlines Co. | 150,000 | 1,315 |
| | Franklin Electric Co. Inc. | 17,600 | 1,065 |
| * | Dycom Industries Inc. | | 74,000 | 1,064 |
| | United Stationers Inc. | | 39,922 | 1,039 |
| | | |
| * | Trex Co. Inc. | 30,200 | 1,030 |
| | G&KServices Inc. Class A | 31,100 | 974 |
| | Mueller Water Products Inc. | |
| | Class A | 165,600 | 811 |
| | Primoris Services Corp. | 59,700 | 779 |
| | FreightCar America Inc. | 28,764 | 512 |
| | | | 428,960 |
| Information Technology (15.8%) | |
| | Seagate Technology plc | 1,076,050 | 33,358 |
| | KLA-TencorCorp. | 632,475 | 30,172 |
| | Western Digital Corp. | 771,900 | 29,896 |
| * | Alliance Data Systems Corp. | 208,900 | 29,653 |
| | IAC/InterActiveCorp | 545,000 | 28,373 |
| * | Gartner Inc. | 608,991 | 28,068 |
| * | LSI Corp. | 3,500,400 | 24,188 |
| * | Cadence Design | | |
| | Systems Inc. | 1,827,400 | 23,510 |
| | Anixter International Inc. | 407,408 | 23,410 |
| * | Fiserv Inc. | 282,900 | 20,943 |
| * | CACIInternational Inc. | | |
| | Class A | 349,000 | 18,075 |
| * | CoreLogic Inc. | 572,700 | 15,194 |
| * | Avnet Inc. | 456,000 | 13,265 |
| | Lender Processing | | |
| | Services Inc. | 386,600 | 10,782 |
| * | CommVault Systems Inc. | 180,500 | 10,595 |
| | Fair Isaac Corp. | 233,000 | 10,313 |
| | Avago Technologies Ltd. | 285,600 | 9,957 |
| * | Teradata Corp. | 121,600 | 9,170 |
| * | Cardtronics Inc. | 283,896 | 8,454 |
| * | Tech Data Corp. | 182,700 | 8,276 |
| * | AOL Inc. | 225,900 | 7,958 |
| * | Kulicke & Soffa | | |
| | Industries Inc. | 748,600 | 7,785 |
| | FEI Co. | 141,300 | 7,560 |
| | MAXIMUS Inc. | 113,540 | 6,781 |
| | Jabil Circuit Inc. | 332,900 | 6,232 |
| | DST Systems Inc. | 103,230 | 5,839 |
| * | Aspen Technology Inc. | 192,800 | 4,984 |
| * | Advanced Micro | | |
| | Devices Inc. | 1,456,735 | 4,909 |
| * | Ingram Micro Inc. | 299,500 | 4,561 |
| * | Manhattan Associates Inc. | 79,200 | 4,536 |
| * | Unisys Corp. | 205,900 | 4,287 |
| | Total System Services Inc. | 180,600 | 4,280 |
| | Plantronics Inc. | 110,900 | 3,918 |
| * | SYNNEX Corp. | 113,274 | 3,690 |
| * | Ultratech Inc. | 115,400 | 3,621 |
| | Diebold Inc. | 105,800 | 3,567 |
| * | Insight Enterprises Inc. | 198,800 | 3,475 |
| * | NVIDIA Corp. | 260,200 | 3,471 |
| * | NETGEAR Inc. | 81,106 | 3,093 |
| | Heartland Payment | | |
| | Systems Inc. | 91,400 | 2,896 |
16
Strategic Equity Fund
| | | |
| | | | Market |
| | | | Value |
| | | Shares | ($000) |
| * | Teradyne Inc. | 186,917 | 2,658 |
| * | Mentor Graphics Corp. | 150,000 | 2,322 |
| * | Acxiom Corp. | 118,700 | 2,169 |
| * | Electronicsfor Imaging Inc. | 122,300 | 2,031 |
| | Maxim Integrated | | |
| | Products Inc. | 75,250 | 2,003 |
| * | Advanced Energy | | |
| | Industries Inc. | 156,700 | 1,931 |
| * | Plexus Corp. | 58,900 | 1,784 |
| | NIC Inc. | 115,750 | 1,713 |
| * | FormFactor Inc. | 267,200 | 1,494 |
| * | Monolithic Power | | |
| | Systems Inc. | 75,600 | 1,493 |
| * | Integrated Device | | |
| | Technology Inc. | 249,800 | 1,469 |
| * | Silicon Graphics | | |
| | International Corp. | 156,788 | 1,427 |
| * | Itron Inc. | 31,500 | 1,359 |
| * | Freescale Semiconductor | | |
| | Ltd. | 142,200 | 1,352 |
| * | Volterra Semiconductor | | |
| | Corp. | 60,800 | 1,330 |
| * | Brocade Communications | | |
| | Systems Inc. | 201,700 | 1,193 |
| | Fidelity National Information | | |
| | Services Inc. | 38,000 | 1,186 |
| | Computer Sciences Corp. | 28,400 | 915 |
| * | Quantum Corp. | 537,800 | 866 |
| * | FlextronicsInternational Ltd. | 134,670 | 808 |
| | | | 514,598 |
| Materials (7.0%) | | |
| | CF Industries Holdings Inc. | 176,000 | 39,114 |
| | Eastman Chemical Co. | 582,536 | 33,210 |
| | Rockwood Holdings Inc. | 546,010 | 25,444 |
| * | Coeur d’Alene Mines Corp. | 579,300 | 16,701 |
| | Sherwin-WilliamsCo. | 85,000 | 12,657 |
| | Domtar Corp. | 147,275 | 11,530 |
| | Valspar Corp. | 190,400 | 10,682 |
| | Westlake Chemical Corp. | 127,386 | 9,307 |
| | Buckeye Technologies Inc. | 279,608 | 8,964 |
| * | WR Grace & Co. | 144,800 | 8,555 |
| | American Vanguard Corp. | 244,500 | 8,509 |
| | NewMarket Corp. | 32,822 | 8,090 |
| * | Graphic Packaging | | |
| | Holding Co. | 999,019 | 5,804 |
| | Georgia Gulf Corp. | 134,900 | 4,886 |
| | Cytec Industries Inc. | 56,800 | 3,722 |
| | Neenah Paper Inc. | 93,600 | 2,681 |
| | | |
| | Huntsman Corp. | 152,800 | 2,281 |
| | Haynes International Inc. | 43,100 | 2,248 |
| | FMCCorp. | 40,000 | 2,215 |
| * | ChemturaCorp. | 125,500 | 2,161 |
| * | KapStone Paper and | | |
| | Packaging Corp. | 88,600 | 1,984 |
| | Minerals Technologies Inc. | 26,300 | 1,866 |
| | Schweitzer-Mauduit | | |
| | International Inc. | 55,178 | 1,820 |
| * | Headwaters Inc. | 148,500 | 977 |
| | Albemarle Corp. | 14,600 | 769 |
| * | Innospec Inc. | 20,700 | 702 |
| | | | 226,879 |
| Telecommunication Services (0.6%) | |
| * | MetroPCS | | |
| | Communications Inc. | 1,650,287 | 19,325 |
| * | United States Cellular Corp. | 20,700 | 810 |
| | | | 20,135 |
| Utilities (4.9%) | | |
| | Ameren Corp. | 774,500 | 25,303 |
| | CMSEnergy Corp. | 1,012,662 | 23,848 |
| | Portland General | | |
| | Electric Co. | 687,500 | 18,590 |
| | PNM Resources Inc. | 662,335 | 13,929 |
| | DTEEnergy Co. | 223,350 | 13,388 |
| | Southwest Gas Corp. | 271,640 | 12,006 |
| | Pinnacle West Capital Corp. | 195,300 | 10,312 |
| | TECO Energy Inc. | 485,500 | 8,613 |
| | American Water Works | | |
| | Co. Inc. | 190,400 | 7,056 |
| | Wisconsin Energy Corp. | 151,700 | 5,714 |
| | NV Energy Inc. | 309,300 | 5,570 |
| | NorthWestern Corp. | 144,997 | 5,253 |
| | Avista Corp. | 150,100 | 3,864 |
| | WGL Holdings Inc. | 44,671 | 1,798 |
| | ClecoCorp. | 42,200 | 1,772 |
| | MGE Energy Inc. | 25,000 | 1,325 |
| | Laclede Group Inc. | 27,600 | 1,187 |
| | Vectren Corp. | 39,700 | 1,135 |
| | | | 160,663 |
| Total Common Stocks | | |
| (Cost $2,757,262) | | 3,235,064 |
| Temporary Cash Investments (2.0%)1 | |
| Money Market Fund (1.9%) | | |
| 2,3 | Vanguard Market | | |
| | Liquidity Fund, | | |
| | 0.163% | 61,776,773 | 61,777 |
17
Strategic Equity Fund
| | | |
| | | Face | Market |
| | | Amount | Valuet |
| | | ($000) | ($000) |
| U.S. Government and Agency Obligations (0.1%) |
| 4,5 | Fannie Mae | | |
| | Discount Notes, | | |
| | 0.135%, 12/12/12 | 500 | 500 |
| 4,5 | Freddie Mac | | |
| | Discount Notes, | | |
| | 0.140%, 11/13/12 | 1,500 | 1,500 |
| | | | 2,000 |
| Total Temporary Cash Investments | |
| (Cost $63,777) | | 63,777 |
| Total Investments (101.4%) | | |
| (Cost $2,821,039) | | 3,298,841 |
| Other Assets and Liabilities (-1.4%) | |
| Other Assets | | 8,784 |
| Liabilities3 | | (54,029) |
| | | | (45,245) |
| Net Assets (100%) | | |
| Applicable to 154,772,975 outstanding | |
| $.001 par value shares of beneficial | |
| interest (unlimited authorization) | 3,253,596 |
| Net Asset Value Per Share | | $21.02 |
| |
| At September 30, 2012, net assets consisted of: |
| | Amount |
| | ($000) |
| Paid-in Capital | 3,742,697 |
| Undistributed Net Investment Income | 20,089 |
| Accumulated Net Realized Losses | (986,552) |
| Unrealized Appreciation (Depreciation) | |
| InvestmentSecurities | 477,802 |
| Futures Contracts | (440) |
| Net Assets | 3,253,596 |
t See Note A in Notes to Financial Statements.
* Non-income-producing security.
^ Part of security position is on loan to broker-dealers. The total value of securities on loan is $34,523,000.
1 The fund invests a portion of its cash reserves in equity markets through the use of index futures contracts. After giving effect to
futures investments, the fund’s effective common stock and temporary cash investment positions represent 100.0% and 1.4%, respectively,
of net assets.
2 Affiliated money market fund available only to Vanguard funds and certain trusts and accounts managed by Vanguard. Rate shown is the
7-day yield.
3 Includes $36,285,000 of collateral received for securities on loan.
4 The issuer was placed under federal conservatorship in September 2008; since that time, its daily operations have been managed by the
Federal Housing Finance Agency and it receives capital from the U.S. Treasury, as needed to maintain a positive net worth, in exchange for
senior preferred stock.
5 Securities with a value of $1,600,000 have been segregated as initial margin for open futures contracts.
REIT—Real Estate Investment Trust.
See accompanying Notes, which are an integral part of the Financial Statements.
18
Strategic Equity Fund
Statement of Operations
| |
| | Year Ended |
| | September 30, 2012 |
| | ($000) |
| Investment Income | |
| Income | |
| Dividends | 47,968 |
| Interest1 | 37 |
| Security Lending | 890 |
| Total Income | 48,895 |
| Expenses | |
| The Vanguard Group—Note B | |
| Investment Advisory Services | 949 |
| Management and Administrative | 7,560 |
| Marketing and Distribution | 591 |
| Custodian Fees | 56 |
| Auditing Fees | 28 |
| Shareholders’ Reports | 22 |
| Trustees’ Fees and Expenses | 4 |
| Total Expenses | 9,210 |
| Net Investment Income | 39,685 |
| Realized Net Gain (Loss) | |
| Investment Securities Sold | 289,002 |
| Futures Contracts | 4,304 |
| Realized Net Gain (Loss) | 293,306 |
| Change in Unrealized Appreciation (Depreciation) | |
| Investment Securities | 476,387 |
| Futures Contracts | 1,032 |
| Change in Unrealized Appreciation (Depreciation) | 477,419 |
| Net Increase (Decrease) in Net Assets Resulting from Operations | 810,410 |
| 1 Interest income from an affiliated company of the fund was $35,000. |
See accompanying Notes, which are an integral part of the Financial Statements.
19
Strategic Equity Fund
Statement of Changes in Net Assets
| | |
| | Year Ended September 30, |
| | 2012 | 2011 |
| | ($000) | ($000) |
| Increase (Decrease) in Net Assets | | |
| Operations | | |
| Net Investment Income | 39,685 | 36,888 |
| Realized Net Gain (Loss) | 293,306 | 521,680 |
| Change in Unrealized Appreciation (Depreciation) | 477,419 | (474,353) |
| Net Increase (Decrease) in Net Assets Resulting from Operations | 810,410 | 84,215 |
| Distributions | | |
| Net Investment Income | (32,559) | (41,795) |
| Realized Capital Gain | — | — |
| Total Distributions | (32,559) | (41,795) |
| Capital Share Transactions | | |
| Issued | 237,519 | 421,286 |
| Issued in Lieu of Cash Distributions | 30,266 | 39,080 |
| Redeemed | (548,498) | (849,470) |
| Net Increase (Decrease) from Capital Share Transactions | (280,713) | (389,104) |
| Total Increase (Decrease) | 497,138 | (346,684) |
| Net Assets | | |
| Beginning of Period | 2,756,458 | 3,103,142 |
| End of Period1 | 3,253,596 | 2,756,458 |
| 1 Net Assets—End of Period includes undistributed (overdistributed) net investment income of $20,089,000 and $12,963,000. |
See accompanying Notes, which are an integral part of the Financial Statements.
20
Strategic Equity Fund
Financial Highlights
| | | | | |
| For a Share Outstanding | Year Ended September 30, |
| Throughout Each Period | 2012 | 2011 | 2010 | 2009 | 2008 |
| Net Asset Value, Beginning of Period | $16.30 | $16.30 | $14.52 | $16.42 | $24.94 |
| Investment Operations | | | | | |
| Net Investment Income | 0.249 | .210 | .221 | .184 | .240 |
| Net Realized and Unrealized Gain (Loss) | | | | | |
| on Investments | 4.667 | .017 | 1.759 | (1.843) | (6.090) |
| Total from Investment Operations | 4.916 | .227 | 1.980 | (1.659) | (5.850) |
| Distributions | | | | | |
| Dividends from Net Investment Income | (.196) | (.227) | (.200) | (.241) | (.240) |
| Distributions from Realized Capital Gains | — | — | — | — | (2.430) |
| Total Distributions | (.196) | (.227) | (.200) | (.241) | (2.670) |
| Net Asset Value, End of Period | $21.02 | $16.30 | $16.30 | $14.52 | $16.42 |
| |
| Total Return1 | 30.32% | 1.23% | 13.71% | -9.66% | -25.37% |
| |
| Ratios/Supplemental Data | | | | | |
| Net Assets, End of Period (Millions) | $3,254 | $2,756 | $3,103 | $3,549 | $4,822 |
| Ratio of Total Expenses to Average Net Assets | 0.29% | 0.30% | 0.30% | 0.30% | 0.25% |
| Ratio of Net Investment Income to | | | | | |
| Average Net Assets | 1.25% | 1.09% | 1.37% | 1.47% | 1.09% |
| Portfolio Turnover Rate | 67% | 73% | 60% | 60% | 79% |
| 1 Total returns do not include account service fees that may have applied in the periods shown. Fund prospectuses provide information about |
| any applicable account service fees. |
See accompanying Notes, which are an integral part of the Financial Statements.
21
Strategic Equity Fund
Notes to Financial Statements
Vanguard Strategic Equity Fund is registered under the Investment Company Act of 1940 as an open-end investment company, or mutual fund.
A. The following significant accounting policies conform to generally accepted accounting principles for U.S. mutual funds. The fund consistently follows such policies in preparing its financial statements.
1. Security Valuation: Securities are valued as of the close of trading on the New York Stock Exchange (generally 4 p.m., Eastern time) on the valuation date. Equity securities are valued at the latest quoted sales prices or official closing prices taken from the primary market in which each security trades; such securities not traded on the valuation date are valued at the mean of the latest quoted bid and asked prices. Securities for which market quotations are not readily available, or whose values have been materially affected by events occurring before the fund’s pricing time but after the close of the securities’ primary markets, are valued by methods deemed by the board of trustees to represent fair value. Investments in Vanguard Market Liquidity Fund are valued at that fund’s net asset value.
Temporary cash investments acquired over 60 days to maturity are valued using the latest bid prices or using valuations based on a matrix system (which considers such factors as security prices, yields, maturities, and ratings), both as furnished by independent pricing services. Other temporary cash investments are valued at amortized cost, which approximates market value.
2. Futures Contracts: The fund uses index futures contracts to a limited extent, with the objective of maintaining full exposure to the stock market while maintaining liquidity. The fund may purchase or sell futures contracts to achieve a desired level of investment, whether to accommodate portfolio turnover or cash flows from capital share transactions. The primary risks associated with the use of futures contracts are imperfect correlation between changes in market values of stocks held by the fund and the prices of futures contracts, and the possibility of an illiquid market.
Futures contracts are valued at their quoted daily settlement prices. The aggregate principal amounts of the contracts are not recorded in the Statement of Net Assets. Fluctuations in the value of the contracts are recorded in the Statement of Net Assets as an asset (liability) and in the Statement of Operations as unrealized appreciation (depreciation) until the contracts are closed, when they are recorded as realized futures gains (losses).
During the year ended September 30, 2012, the fund’s average investment in futures contracts represented less than 1% of net assets, based on quarterly average aggregate settlement values.
3. Federal Income Taxes: The fund intends to continue to qualify as a regulated investment company and distribute all of its taxable income. Management has analyzed the fund’s tax positions taken for all open federal income tax years (September 30, 2009–2012), and has concluded that no provision for federal income tax is required in the fund’s financial statements.
4. Distributions: Distributions to shareholders are recorded on the ex-dividend date.
5. Security Lending: The fund may lend its securities to qualified institutional borrowers to earn additional income. Security loans are required to be secured at all times by collateral at least equal to the market value of securities loaned. The fund invests cash collateral received in Vanguard Market Liquidity Fund, and records a liability for the return of the collateral, during the period the securities are on loan. Security lending income represents fees charged to borrowers plus income earned on investing cash collateral, less expenses associated with the loan.
6. Other: Dividend income is recorded on the ex-dividend date. Interest income includes income distributions received from Vanguard Market Liquidity Fund and is accrued daily. Security transactions are accounted for on the date securities are bought or sold. Costs used to determine realized gains (losses) on the sale of investment securities are those of the specific securities sold.
22
Strategic Equity Fund
B. The Vanguard Group furnishes at cost investment advisory, corporate management, administrative, marketing, and distribution services. The costs of such services are allocated to the fund under methods approved by the board of trustees. The fund has committed to provide up to 0.40% of its net assets in capital contributions to Vanguard. At September 30, 2012, the fund had contributed capital of $458,000 to Vanguard (included in Other Assets), representing 0.01% of the fund’s net assets and 0.18% of Vanguard’s capitalization. The fund’s trustees and officers are also directors and officers of Vanguard.
C. Various inputs may be used to determine the value of the fund’s investments. These inputs are summarized in three broad levels for financial statement purposes. The inputs or methodologies used to value securities are not necessarily an indication of the risk associated with investing in those securities.
Level 1—Quoted prices in active markets for identical securities.
Level 2—Other significant observable inputs (including quoted prices for similar securities, interest
rates, prepayment speeds, credit risk, etc.).
Level 3—Significant unobservable inputs (including the fund’s own assumptions used to determine
the fair value of investments).
The following table summarizes the market value of the fund’s investments as of September 30,
2012, based on the inputs used to value them:
| | | |
| | Level 1 | Level 2 | Level 3 |
| Investments | ($000) | ($000) | ($000) |
| Common Stocks | 3,235,064 | — | — |
| Temporary Cash Investments | 61,777 | 2,000 | — |
| Futures Contracts—Assets1 | 7 | — | — |
| Futures Contracts—Liabilities1 | (125) | — | — |
| Total | 3,296,723 | 2,000 | — |
| 1 Represents variation margin on the last day of the reporting period. |
D. At September 30, 2012, the aggregate settlement value of open futures contracts and the related unrealized appreciation (depreciation) were:
| | | | |
| | | | ($000) |
| | | | Aggregate | |
| | | Number of | Settlement | Unrealized |
| | | Long (Short) | Value | Appreciation |
| Futures Contracts | Expiration | Contracts | Long (Short) | (Depreciation) |
| E-mini Russell 2000 Index | December 2012 | 158 | 13,184 | (318) |
| E-mini S&P MidCap 400 Index | December 2012 | 57 | 5,623 | (122) |
Unrealized appreciation (depreciation) on open futures contracts is required to be treated as realized gain (loss) for tax purposes.
E. Distributions are determined on a tax basis and may differ from net investment income and realized capital gains for financial reporting purposes. Differences may be permanent or temporary. Permanent differences are reclassified among capital accounts in the financial statements to reflect their tax character. Temporary differences arise when certain items of income, expense, gain, or loss
23
Strategic Equity Fund
are recognized in different periods for financial statement and tax purposes; these differences will reverse at some time in the future. Differences in classification may also result from the treatment of short-term gains as ordinary income for tax purposes.
For tax purposes, at September 30, 2012, the fund had $27,929,000 of ordinary income available for distribution. The fund used capital loss carryforwards of $327,088,000 to offset taxable capital gains realized during the year ended September 30, 2012. At September 30, 2012, the fund had available capital losses totaling $986,991,000 to offset future net capital gains. Of this amount, $954,229,000 is subject to expiration on September 30, 2018. Capital losses of $32,762,000 realized beginning in fiscal 2012 may be carried forward indefinitely under the Regulated Investment Company Modernization Act of 2010, but must be used before any expiring loss carryforwards.
At September 30, 2012, the cost of investment securities for tax purposes was $2,821,039,000. Net unrealized appreciation of investment securities for tax purposes was $477,802,000, consisting of unrealized gains of $553,441,000 on securities that had risen in value since their purchase and $75,639,000 in unrealized losses on securities that had fallen in value since their purchase.
F. During the year ended September 30, 2012, the fund purchased $2,109,866,000 of investment securities and sold $2,368,368,000 of investment securities, other than temporary cash investments.
G. Capital shares issued and redeemed were:
| | |
| | Year Ended September 30, |
| | 2012 | 2011 |
| | Shares | Shares |
| | (000) | (000) |
| Issued | 12,157 | 21,858 |
| Issued in Lieu of Cash Distributions | 1,630 | 2,125 |
| Redeemed | (28,154) | (45,260) |
| Net Increase (Decrease) in Shares Outstanding | (14,367) | (21,277) |
H. In preparing the financial statements as of September 30, 2012, management considered the impact of subsequent events for potential recognition or disclosure in these financial statements.
24
Report of Independent Registered
Public Accounting Firm
To the Trustees of Vanguard Horizon Funds and the Shareholders of Vanguard Strategic Equity Fund:
In our opinion, the accompanying statement of net assets and the related statements of operations and of changes in net assets and the financial highlights present fairly, in all material respects, the financial position of Vanguard Strategic Equity Fund (constituting a separate portfolio of Vanguard Horizon Funds, hereafter referred to as the “Fund”) at September 30, 2012, the results of its operations for the year then ended, the changes in its net assets for each of the two years in the period then ended and the financial highlights for each of the five years in the period then ended, in conformity with accounting principles generally accepted in the United States of America. These financial statements and financial highlights (hereafter referred to as “financial statements”) are the responsibility of the Fund’s management; our responsibility is to express an opinion on these financial statements based on our audits. We conducted our audits of these financial statements in accordance with the standards of the Public Company Accounting Oversight Board (United States). Those standards require that we plan and perform the audit to obtain reasonable assurance about whether the financial statements are free of material misstatement. An audit includes examining, on a test basis, evidence supporting the amounts and disclosures in the financial statements, assessing the accounting principles used and significant estimates made by management, and evaluating the overall financial statement presentation. We believe that our audits, which included confirmation of securities at September 30, 2012 by correspondence with the custodian and broker and by agreement to the underlying ownership records of the transfer agent, provide a reasonable basis for our opinion.
PricewaterhouseCoopers LLP
Philadelphia, Pennsylvania
November 12, 2012

Special 2012 tax information (unaudited) for Vanguard Strategic Equity Fund
This information for the fiscal year ended September 30, 2012, is included pursuant to provisions of
the Internal Revenue Code.
The fund distributed $32,559,000 of qualified dividend income to shareholders during the fiscal year.
For corporate shareholders, 99.8% of investment income (dividend income plus short-term gains, if
any) qualifies for the dividends-received deduction.
25
Your Fund’s After-Tax Returns
This table presents returns for your fund both before and after taxes. The after-tax returns are shown in two ways: (1) assuming that an investor owned the fund during the entire period and paid taxes on the fund’s distributions, and (2) assuming that an investor paid taxes on the fund’s distributions and sold all shares at the end of each period.
Calculations are based on the highest individual federal income tax and capital gains tax rates in effect at the times of the distributions and the hypothetical sales. State and local taxes were not considered. After-tax returns reflect any qualified dividend income, using actual prior-year figures and estimates for 2012. (In the example, returns after the sale of fund shares may be higher than those assuming no sale. This occurs when the sale would have produced a capital loss. The calculation assumes that the investor received a tax deduction for the loss.)
Please note that your actual after-tax returns will depend on your tax situation and may differ from those shown. Also note that if you own the fund in a tax-deferred account, such as an individual retirement account or a 401(k) plan, this information does not apply to you. Such accounts are not subject to current taxes.
Finally, keep in mind that a fund’s performance—whether before or after taxes—does not guarantee future results.
| | | |
| Average Annual Total Returns: Strategic Equity Fund | | | |
| Periods Ended September 30, 2012 | | | |
| | One | Five | Ten |
| | Year | Years | Years |
| Returns Before Taxes | 30.32% | 0.23% | 9.27% |
| Returns After Taxes on Distributions | 30.11 | -0.37 | 8.55 |
| Returns After Taxes on Distributions and Sale of Fund Shares | 19.93 | 0.06 | 8.04 |
26
About Your Fund’s Expenses
As a shareholder of the fund, you incur ongoing costs, which include costs for portfolio management, administrative services, and shareholder reports (like this one), among others. Operating expenses, which are deducted from a fund’s gross income, directly reduce the investment return of the fund.
A fund’s expenses are expressed as a percentage of its average net assets. This figure is known as the expense ratio. The following examples are intended to help you understand the ongoing costs (in dollars) of investing in your fund and to compare these costs with those of other mutual funds. The examples are based on an investment of $1,000 made at the beginning of the period shown and held for the entire period.
The accompanying table illustrates your fund’s costs in two ways:
• Based on actual fund return. This section helps you to estimate the actual expenses that you paid over the period. The ”Ending Account Value“ shown is derived from the fund‘s actual return, and the third column shows the dollar amount that would have been paid by an investor who started with $1,000 in the fund. You may use the information here, together with the amount you invested, to estimate the expenses that you paid over the period.
To do so, simply divide your account value by $1,000 (for example, an $8,600 account value divided by $1,000 = 8.6), then multiply the result by the number given for your fund under the heading ”Expenses Paid During Period.“
• Based on hypothetical 5% yearly return. This section is intended to help you compare your fund‘s costs with those of other mutual funds. It assumes that the fund had a yearly return of 5% before expenses, but that the expense ratio is unchanged. In this case—because the return used is not the fund’s actual return—the results do not apply to your investment. The example is useful in making comparisons because the Securities and Exchange Commission requires all mutual funds to calculate expenses based on a 5% return. You can assess your fund’s costs by comparing this hypothetical example with the hypothetical examples that appear in shareholder reports of other funds.
Note that the expenses shown in the table are meant to highlight and help you compare ongoing costs only and do not reflect transaction costs incurred by the fund for buying and selling securities. Further, the expenses do not include any purchase, redemption, or account service fees described in the fund prospectus. If such fees were applied to your account, your costs would be higher. Your fund does not carry a “sales load.”
The calculations assume no shares were bought or sold during the period. Your actual costs may have been higher or lower, depending on the amount of your investment and the timing of any purchases or redemptions.
You can find more information about the fund’s expenses, including annual expense ratios, in the Financial Statements section of this report. For additional information on operating expenses and other shareholder costs, please refer to your fund’s current prospectus.
27
| | | |
| Six Months Ended September 30, 2012 | | | |
| | Beginning | Ending | Expenses |
| | Account Value | Account Value | Paid During |
| Strategic Equity Fund | 3/31/2012 | 9/30/2012 | Period |
| Based on Actual Fund Return | $1,000.00 | $1,003.82 | $1.41 |
| Based on Hypothetical 5% Yearly Return | 1,000.00 | 1,023.66 | 1.42 |
The calculations are based on expenses incurred in the most recent six-month period. The fund’s annualized six-month expense ratio for that
period is 0.28%. The dollar amounts shown as “Expenses Paid” are equal to the annualized expense ratio multiplied by the average account
value over the period, multiplied by the number of days in the most recent six-month period, then divided by the number of days in the most
recent 12-month period.
28
Glossary
30-Day SEC Yield. A fund’s 30-day SEC yield is derived using a formula specified by the U.S. Securities and Exchange Commission. Under the formula, data related to the fund’s security holdings in the previous 30 days are used to calculate the fund’s hypothetical net income for that period, which is then annualized and divided by the fund’s estimated average net assets over the calculation period. For the purposes of this calculation, a security’s income is based on its current market yield to maturity (for bonds), its actual income (for asset-backed securities), or its projected dividend yield (for stocks). Because the SEC yield represents hypothetical annualized income, it will differ—at times significantly—from the fund’s actual experience. As a result, the fund’s income distributions may be higher or lower than implied by the SEC yield.
Beta. A measure of the magnitude of a fund’s past share-price fluctuations in relation to the ups and downs of a given market index. The index is assigned a beta of 1.00. Compared with a given index, a fund with a beta of 1.20 typically would have seen its share price rise or fall by 12% when the index rose or fell by 10%. For this report, beta is based on returns over the past 36 months for both the fund and the index. Note that a fund’s beta should be reviewed in conjunction with its R-squared (see definition). The lower the R-squared, the less correlation there is between the fund and the index, and the less reliable beta is as an indicator of volatility.
Dividend Yield. Dividend income earned by stocks, expressed as a percentage of the aggregate market value (or of net asset value, for a fund). The yield is determined by dividing the amount of the annual dividends by the aggregate value (or net asset value) at the end of the period. For a fund, the dividend yield is based solely on stock holdings and does not include any income produced by other investments.
Earnings Growth Rate. The average annual rate of growth in earnings over the past five years for the stocks now in a fund.
Equity Exposure. A measure that reflects a fund’s investments in stocks and stock futures. Any holdings in short-term reserves are excluded.
Expense Ratio. A fund’s total annual operating expenses expressed as a percentage of the fund’s average net assets. The expense ratio includes management and administrative expenses, but does not include the transaction costs of buying and selling portfolio securities.
Foreign Holdings. The percentage of a fund represented by securities or depositary receipts of companies based outside the United States.
Inception Date. The date on which the assets of a fund (or one of its share classes) are first invested in accordance with the fund’s investment objective. For funds with a subscription period, the inception date is the day after that period ends. Investment performance is measured from the inception date.
Median Market Cap. An indicator of the size of companies in which a fund invests; the midpoint of market capitalization (market price x shares outstanding) of a fund’s stocks, weighted by the proportion of the fund’s assets invested in each stock. Stocks representing half of the fund’s assets have market capitalizations above the median, and the rest are below it.
Price/Book Ratio. The share price of a stock divided by its net worth, or book value, per share. For a fund, the weighted average price/book ratio of the stocks it holds.
29
Price/Earnings Ratio. The ratio of a stock’s current price to its per-share earnings over the past year. For a fund, the weighted average P/E of the stocks it holds. P/E is an indicator of market expectations about corporate prospects; the higher the P/E, the greater the expectations for a company’s future growth.
R-Squared. A measure of how much of a fund’s past returns can be explained by the returns from the market in general, as measured by a given index. If a fund’s total returns were precisely synchronized with an index’s returns, its R-squared would be 1.00. If the fund’s returns bore no relationship to the index’s returns, its R-squared would be 0. For this report, R-squared is based on returns over the past 36 months for both the fund and the index.
Return on Equity. The annual average rate of return generated by a company during the past five years for each dollar of shareholder’s equity (net income divided by shareholder’s equity). For a fund, the weighted average return on equity for the companies whose stocks it holds.
Short-Term Reserves. The percentage of a fund invested in highly liquid, short-term securities that can be readily converted to cash.
Turnover Rate. An indication of the fund’s trading activity. Funds with high turnover rates incur higher transaction costs and may be more likely to distribute capital gains (which may be taxable to investors). The turnover rate excludes in-kind transactions, which have minimal impact on costs.
Benchmark Information
Spliced Small and Mid Cap Index: Russell 2800 Index through May 31, 2003; MSCI US Small +
Mid Cap 2200 Index thereafter.
30
This page intentionally left blank.
The People Who Govern Your Fund
The trustees of your mutual fund are there to see that the fund is operated and managed in your best interests since, as a shareholder, you are a part owner of the fund. Your fund’s trustees also serve on the board of directors of The Vanguard Group, Inc., which is owned by the Vanguard funds and provides services to them on an at-cost basis.
A majority of Vanguard’s board members are independent, meaning that they have no affiliation with Vanguard or the funds they oversee, apart from the sizable personal investments they have made as private individuals. The independent board members have distinguished backgrounds in business, academia, and public service. Each of the trustees and executive officers oversees 179 Vanguard funds.
The following table provides information for each trustee and executive officer of the fund. More information about the trustees is in the Statement of Additional Information, which can be obtained, without charge, by contacting Vanguard at 800-662-7447, or online at vanguard.com.
| |
| InterestedTrustee1 | and Delphi Automotive LLP (automotive components); |
| | Senior Advisor at New Mountain Capital; Trustee of |
| F. William McNabb III | The Conference Board. |
| Born 1957. Trustee Since July 2009. Chairman of the | |
| Board. Principal Occupation(s) During the Past Five | Amy Gutmann |
| Years: Chairman of the Board of The Vanguard Group, | Born 1949. Trustee Since June 2006. Principal |
| Inc., and of each of the investment companies served | Occupation(s) During the Past Five Years: President |
| by The Vanguard Group, since January 2010; Director | of the University of Pennsylvania; Christopher H. |
| of The Vanguard Group since 2008; Chief Executive | Browne Distinguished Professor of Political Science |
| Officer and President of The Vanguard Group and of | in the School of Arts and Sciences with secondary |
| each of the investment companies served by The | appointments at the Annenberg School for |
| Vanguard Group since 2008; Director of Vanguard | Communication and the Graduate School of Education |
| Marketing Corporation; Managing Director of The | of the University of Pennsylvania; Member of the |
| Vanguard Group (1995–2008). | National Commission on the Humanities and Social |
| | Sciences; Trustee of Carnegie Corporation of New |
| IndependentTrustees | York and of the National Constitution Center; Chair |
| of the U.S. Presidential Commission for the Study |
| Emerson U. Fullwood | of Bioethical Issues. |
| Born 1948. Trustee Since January 2008. Principal | |
| Occupation(s) During the Past Five Years: Executive | JoAnn Heffernan Heisen |
| Chief Staff and Marketing Officer for North America | Born 1950. Trustee Since July 1998. Principal |
| and Corporate Vice President (retired 2008) of Xerox | Occupation(s) During the Past Five Years: Corporate |
| Corporation (document management products and | Vice President and Chief Global Diversity Officer |
| services); Executive in Residence and 2010 | (retired 2008) and Member of the Executive |
| Distinguished Minett Professor at the Rochester | Committee (1997–2008) of Johnson & Johnson |
| Institute of Technology; Director of SPX Corporation | (pharmaceuticals/medical devices/consumer |
| (multi-industry manufacturing), the United Way of | products); Director of Skytop Lodge Corporation |
| Rochester, Amerigroup Corporation (managed health | (hotels), the University Medical Center at Princeton, |
| care), the University of Rochester Medical Center, | the Robert Wood Johnson Foundation, and the Center |
| Monroe Community College Foundation, and North | for Talent Innovation; Member of the Advisory Board |
| Carolina A&T University. | of the Maxwell School of Citizenship and Public Affairs |
| | at Syracuse University. |
| Rajiv L. Gupta | |
| Born 1945. Trustee Since December 2001. 2 | F. Joseph Loughrey |
| Principal Occupation(s) During the Past Five Years: | Born 1949. Trustee Since October 2009. Principal |
| Chairman and Chief Executive Officer (retired 2009) | Occupation(s) During the Past Five Years: President |
| and President (2006–2008) of Rohm and Haas Co. | and Chief Operating Officer (retired 2009) of Cummins |
| (chemicals); Director of Tyco International, Ltd. | Inc. (industrial machinery); Director of SKF AB |
| (diversified manufacturing and services), Hewlett- | (industrial machinery), Hillenbrand, Inc. (specialized |
| Packard Co. (electronic computer manufacturing), | consumer services), the Lumina Foundation for |
| | |
| Education, and Oxfam America; Chairman of the | Executive Officers | |
| Advisory Council for the College of Arts and Letters | | |
| and Member of the Advisory Board to the Kellogg | Glenn Booraem | |
| Institute for International Studies at the University | Born 1967. Controller Since July 2010. Principal |
| of Notre Dame. | Occupation(s) During the Past Five Years: Principal |
| | of The Vanguard Group, Inc.; Controller of each of |
| Mark Loughridge | the investment companies served by The Vanguard |
| Born 1953. Trustee Since March 2012. Principal | Group; Assistant Controller of each of the investment |
| Occupation(s) During the Past Five Years: Senior Vice | companies served by The Vanguard Group (2001–2010). |
| President and Chief Financial Officer at IBM (information | | |
| technology services); Fiduciary Member of IBM’s | Thomas J. Higgins | |
| Retirement Plan Committee. | Born 1957. Chief Financial Officer Since September |
| | 2008. Principal Occupation(s) During the Past Five |
| Scott C. Malpass | Years: Principal of The Vanguard Group, Inc.; Chief |
| Born 1962. Trustee Since March 2012. Principal | Financial Officer of each of the investment companies |
| Occupation(s) During the Past Five Years: Chief | served by The Vanguard Group; Treasurer of each of |
| Investment Officer and Vice President at the University | the investment companies served by The Vanguard |
| of Notre Dame; Assistant Professor of Finance at the | Group (1998–2008). | |
| Mendoza College of Business at Notre Dame; Member | | |
| of the Notre Dame 403(b) Investment Committee; | Kathryn J. Hyatt | |
| Director of TIFF Advisory Services, Inc. (investment | Born 1955. Treasurer Since November 2008. Principal |
| advisor); Member of the Investment Advisory | Occupation(s) During the Past Five Years: Principal of |
| Committees of the Financial Industry Regulatory | The Vanguard Group, Inc.; Treasurer of each of the |
| Authority (FINRA) and of Major League Baseball. | investment companies served by The Vanguard |
| | Group; Assistant Treasurer of each of the investment |
| André F. Perold | companies served by The Vanguard Group (1988–2008). |
| Born 1952. Trustee Since December 2004. Principal | | |
| Occupation(s) During the Past Five Years: George | Heidi Stam | |
| Gund Professor of Finance and Banking at the Harvard | Born 1956. Secretary Since July 2005. Principal |
| Business School (retired 2011); Chief Investment | Occupation(s) During the Past Five Years: Managing |
| Officer and Managing Partner of HighVista Strategies | Director of The Vanguard Group, Inc.; General Counsel |
| LLC (private investment firm); Director of Rand | of The Vanguard Group; Secretary of The Vanguard |
| Merchant Bank; Overseer of the Museum of Fine | Group and of each of the investment companies |
| Arts Boston. | served by The Vanguard Group; Director and Senior |
| | Vice President of Vanguard Marketing Corporation. |
| | |
| Alfred M. Rankin, Jr. | | |
| Born 1941. Trustee Since January 1993. Principal | Vanguard Senior Management Team |
| Occupation(s) During the Past Five Years: Chairman, | | |
| President, and Chief Executive Officer of NACCO | Mortimer J. Buckley | Michael S. Miller |
| Industries, Inc. (forklift trucks/housewares/lignite); | Kathleen C. Gubanich | James M. Norris |
| Director of Goodrich Corporation (industrial products/ | Paul A. Heller | Glenn W. Reed |
| aircraft systems and services) and the National | Martha G. King | George U. Sauter |
| Association of Manufacturers; Chairman of the Board | Chris D. McIsaac | |
| of the Federal Reserve Bank of Cleveland and of | | |
| University Hospitals of Cleveland; Advisory Chairman | | |
| of the Board of The Cleveland Museum of Art. | Chairman Emeritus and Senior Advisor |
| | |
| | John J. Brennan | |
| Chairman, 1996–2009 | |
| Peter F. Volanakis | Chief Executive Officer and President, 1996–2008 |
| Born 1955. Trustee Since July 2009. Principal | | |
| Occupation(s) During the Past Five Years: President | Founder | |
| and Chief Operating Officer (retired 2010) of Corning | | |
| Incorporated (communications equipment); Director | John C. Bogle | |
| of SPX Corporation (multi-industry manufacturing); | Chairman and Chief Executive Officer, 1974–1996 |
| Overseer of the Amos Tuck School of Business | | |
| Administration at Dartmouth College; Advisor to the | | |
| Norris Cotton Cancer Center. | |
1 Mr. McNabb is considered an “interested person,” as defined in the Investment Company Act of 1940, because he is an officer of the
Vanguard funds.
2 December 2002 for Vanguard Equity Income Fund, Vanguard Growth Equity Fund, the Vanguard Municipal Bond Funds, and the Vanguard
State Tax-Exempt Funds.

| |
| | P.O. Box 2600 |
| | Valley Forge, PA 19482-2600 |
| |
| |
| |
| Connect with Vanguard® > vanguard.com | |
| |
| |
| |
| Fund Information > 800-662-7447 | CFA® is a trademark owned by CFA Institute. |
| Direct Investor Account Services > 800-662-2739 | |
| Institutional Investor Services > 800-523-1036 | |
| Text Telephone for People | |
| With Hearing Impairment > 800-749-7273 | |
| |
| This material may be used in conjunction | |
| with the offering of shares of any Vanguard | |
| fund only if preceded or accompanied by | |
| the fund’s current prospectus. | |
| |
| All comparative mutual fund data are from Lipper Inc. or | |
| Morningstar, Inc., unless otherwise noted. | |
| |
| You can obtain a free copy of Vanguard’s proxy voting | |
| guidelines by visiting vanguard.com/proxyreporting or by | |
| calling Vanguard at 800-662-2739. The guidelines are | |
| also available from the SEC’s website, sec.gov. In | |
| addition, you may obtain a free report on how your fund | |
| voted the proxies for securities it owned during the 12 | |
| months ended June 30. To get the report, visit either | |
| vanguard.com/proxyreporting or sec.gov. | |
| |
| You can review and copy information about your fund at | |
| the SEC’s Public Reference Room in Washington, D.C. To | |
| find out more about this public service, call the SEC at | |
| 202-551-8090. Information about your fund is also | |
| available on the SEC’s website, and you can receive | |
| copies of this information, for a fee, by sending a | |
| request in either of two ways: via e-mail addressed to | |
| publicinfo@sec.gov or via regular mail addressed to the | |
| Public Reference Section, Securities and Exchange | |
| Commission, Washington, DC 20549-1520. | |
| |
| |
| | © 2012 The Vanguard Group, Inc. |
| | All rights reserved. |
| | Vanguard Marketing Corporation, Distributor. |
| |
| | Q1140 112012 |

Annual Report | September 30, 2012
Vanguard Capital Opportunity Fund

> For the 2012 fiscal year, Vanguard Capital Opportunity Fund returned more than
24%, trailing both its benchmark and the average return of peer funds.
> The fund’s holdings in information technology, its largest sector, didn’t measure
up to those of its benchmark, but its commitment to health care boosted
performance.
> For the decade ended September 30, 2012, the fund’s average annual return of
more than 11% surpassed the returns of its benchmark and peer funds.
| |
| Contents | |
| Your Fund’s Total Returns. | 1 |
| Chairman’s Letter. | 2 |
| Advisor’s Report. | 9 |
| Fund Profile. | 13 |
| Performance Summary. | 14 |
| Financial Statements. | 16 |
| Your Fund’s After-Tax Returns. | 28 |
| About Your Fund’s Expenses. | 29 |
| Glossary. | 31 |
Please note: The opinions expressed in this report are just that—informed opinions. They should not be considered promises or advice.
Also, please keep in mind that the information and opinions cover the period through the date on the front of this report. Of course, the
risks of investing in your fund are spelled out in the prospectus.
See the Glossary for definitions of investment terms used in this report.
About the cover: Our cover photograph shows rigging on the HMSSurprise, a replica of an 18th-century Royal Navy frigate. It
was featured in the 2003 movie Master and Commander: The Far Side of the World, which was based on Patrick O’Brian’s sea
novels, set amid the Napoleonic Wars. Vanguard was named for another ship of that era, the HMSVanguard, which was the
flagship of British Admiral Horatio Nelson at the Battle of the Nile.
Your Fund’s Total Returns
| |
| Fiscal Year Ended September 30, 2012 | |
| |
| | Total |
| | Returns |
| Vanguard Capital Opportunity Fund | |
| Investor Shares | 24.62% |
| Admiral™ Shares | 24.69 |
| Russell Midcap Growth Index | 26.69 |
| Multi-Cap Growth Funds Average | 25.46 |
| Multi-Cap Growth Funds Average: Derived from data provided by Lipper Inc. |
| Admiral Shares carry lower expenses and are available to investors who meet certain account-balance requirements. |
| | | | |
| Your Fund’s Performance at a Glance | | | |
| September 30, 2011, Through September 30, 2012 | | | |
| | | | Distributions Per Share |
| | Starting | Ending | Income | Capital |
| | Share Price | Share Price | Dividends | Gains |
| Vanguard Capital Opportunity Fund | | | | |
| Investor Shares | $28.17 | $33.22 | $0.161 | $1.469 |
| Admiral Shares | 65.10 | 76.75 | 0.434 | 3.392 |
1

Chairman’s Letter
Dear Shareholder,
Global stock markets began the fiscal year strongly and––after weathering some springtime disruption––also finished on a high note with four straight months of gains. Although Vanguard Capital Opportunity Fund’s performance was strong for the 12 months ended September 30, 2012, it trailed its comparative standards.
The fund returned more than 24% for the period, compared with more than 26% for its benchmark, the Russell Midcap Growth Index, and about 25% on average for peer multi-capitalization growth funds.
The Capital Opportunity Fund’s returns often diverge from those of its benchmark and peers because of the advisor’s willingness to establish outsized stakes in what it considers the market’s most promising long-term investment opportunities. In many years, the advisor has found those opportunities in information technology and health care companies. Over the past 12 months, however, the fund’s tech stocks weighed on relative performance, while its health care stocks gave it a boost.
On a separate note, I want to inform you that Vanguard has eliminated the redemption fee for your fund, effective May 23. The fund’s trustees determined that the fee, one of several measures
2
in place to discourage frequent trading and protect the interests of long-term investors, was no longer needed. If you hold fund shares in a taxable account, you may wish to review the table of after-tax returns, that appears later in this report.
Stocks notched a powerful rally, with help from central bankers
U.S. stocks surged 30% in the 12 months ended September 30, outpacing the gains of their international counterparts. The rally came amid moves by U.S. and European central bankers to quiet—at least temporarily—investors’ concerns about the U.S. economy and the finances of European governments and banks.
While U.S. stocks were the standouts, European and emerging markets stocks also posted double-digit results. The developed markets of the Pacific region were the weakest performers but still recorded a modest advance.
In July, the president of the European Central Bank declared that policymakers would do whatever was needed to preserve the euro common currency. That pronouncement was encouraging to investors, but Europe’s financial troubles are by no means resolved.
Vanguard economists believe the most likely scenario is that the Eurozone will “muddle through” for several years, with occasional spikes in market volatility, as fiscal tightening continues in the face of weak economic growth.
| | | |
| Market Barometer | | | |
| |
| | Average Annual Total Returns |
| | Periods Ended September 30, 2012 |
| | One | Three | Five |
| | Year | Years | Years |
| Stocks | | | |
| Russell 1000 Index (Large-caps) | 30.06% | 13.27% | 1.22% |
| Russell 2000 Index (Small-caps) | 31.91 | 12.99 | 2.21 |
| Dow Jones U.S. Total Stock Market Index | 30.00 | 13.29 | 1.53 |
| MSCI All Country World Index ex USA (International) | 14.48 | 3.17 | -4.12 |
| |
| Bonds | | | |
| Barclays U.S. Aggregate Bond Index (Broad taxable market) | 5.16% | 6.19% | 6.53% |
| Barclays Municipal Bond Index (Broad tax-exempt market) | 8.32 | 5.99 | 6.06 |
| Citigroup Three-Month U.S. Treasury Bill Index | 0.05 | 0.08 | 0.63 |
| |
| CPI | | | |
| Consumer Price Index | 1.99% | 2.33% | 2.11% |
3
Bonds produced solid returns; future results may be more muted Bonds once again advanced; the broad U.S. taxable market returned about 5% for the 12 months. Among U.S. Treasuries, long-term bonds were particularly strong as they benefited from the Federal Reserve’s bond-buying program.
As bond prices rose, the yield of the 10-year U.S. Treasury note fell to a record low in July, closing below 1.5%. (Bond yields and prices move in opposite directions.) By the end of the period, the yield had climbed, but it still remained low by historical standards.
Bondholders have enjoyed years of strong returns. But as Tim Buckley, our incoming chief investment officer, has noted, investors shouldn’t be surprised if future results are more modest. As yields tumble, the scope for further declines—and price increases—diminishes.
The Federal Reserve announced on September 13 that it would continue to hold its target for short-term interest rates between 0% and 0.25% at least through mid-2015. The exceptionally low rates, in place since late 2008, kept a tight lid on returns from money market funds and savings accounts.
| | | |
| Expense Ratios | | | |
| Your Fund Compared With Its Peer Group | | | |
| | Investor | Admiral | Peer Group |
| | Shares | Shares | Average |
| Capital Opportunity Fund | 0.48% | 0.41% | 1.34% |
The fund expense ratios shown are from the prospectus dated January 26, 2012, and represent estimated costs for the current fiscal year. For
the fiscal year ended September 30, 2012, the fund’s expense ratios were 0.48% for Investor Shares and 0.41% for Admiral Shares. The
peer-group expense ratio is derived from data provided by Lipper Inc. and captures information through year-end 2011.
Peer group: Multi-Cap Growth Funds.
4
The fund’s technology holdings weighed on relative results
The Capital Opportunity Fund seeks to invest in companies with underappreciated long-term growth prospects, a strategy that has served it well over the years. The advisor has built a solid track record on a willingness to assemble a portfolio that can look very different from the market.
The flip side of this distinctive approach is that there are times when the fund’s performance trails the benchmark results. Such was the case over the recent period, when the fund’s return relative to the index was hurt both by some stocks it held and by some it didn’t.
The shortfalls relative to the index were most evident in the technology sector, where the fund’s exposure was about double that of the benchmark. Capital Opportunity’s technology stocks climbed almost 10%, but that was less than half of the sector’s advance in the index. The advisor’s tech holdings include some formerly high-flying companies that have fallen (temporarily, in the advisor’s judgment) from consumers’ and investors’ favor. In particular, the stocks of home entertainment software firms suffered from investors’ perception that consumers’ tastes and spending have shifted somewhat from gaming toward mobile technology.
| |
| Total Returns | |
| Ten Years Ended September 30, 2012 | |
| | Average |
| | Annual Return |
| Capital Opportunity Fund Investor Shares | 11.82% |
| Russell Midcap Growth Index | 11.11 |
| Multi-Cap Growth Funds Average | 7.96 |
| Multi-Cap Growth Funds Average: Derived from data provided by Lipper Inc. |
The figures shown represent past performance, which is not a guarantee of future results. (Current performance may be
lower or higher than the performance data cited. For performance data current to the most recent month-end, visit our
website at vanguard.com/performance.) Note, too, that both investment returns and principal value can fluctuate widely, so
an investor’s shares, when sold, could be worth more or less than their original cost.
5
Industrial stocks were a further disappointment for Capital Opportunity. The fund’s airline companies––which are susceptible to swings both large and small––struggled during the period in part because of the toll being exacted on profits by higher fuel prices and weaker global trade.
Against these sore spots for the fund, health care stocks provided a measure of balm. Capital Opportunity’s health care allocation was more than double the index weighting and accounted for 11 percentage points of the fund’s overall return. Most of the strength came from
| Investment insight |
| Patience and perspective with active management |
| Vanguard Capital Opportunity Fund’s |
| portfolio looks very different from that |
| of its benchmark index. Ideally, these |
| differences would lead to benchmark- |
| beating long-term returns. At times, |
| however, different can mean subpar. A |
| key to success with Capital Opportunity’s |
| bold, relatively concentrated approach is |
| patience during these patches of |
| weakness. |
| |
| The fund’s historical returns show |
| that short-term weakness has often |
| marked the path to superior long-term |
| returns. The fund’s Investor Shares |
| have outperformed the Russell Midcap |
| Growth Index in 63% of the 164 rolling |
| 12-month periods since PRIMECAP |
| Management Company assumed |
| operation of the fund in February |
| 1998. That figure is impressive, but |
| look at it from the other side: The |
| fund has trailed the index 37% of the |
| time—60 occasions when an impatient |
| investor could have grown frustrated. |
| |
| Over the 56 rolling 10-year periods |
| since its inception, however, the fund |
| has outperformed the Russell Midcap |
| Growth Index 91% of the time— |
| a powerful case for patience |
| and perspective with a strategy |
| designed not to mirror the market, |
| but to follow its own path toward |
| potentially superior results. |
| |
| Percentage of periods in which Vanguard |
| Capital Opportunity Fund outperformed |
| the Russell Midcap Growth Index: |
| February 1998–September 2012 |
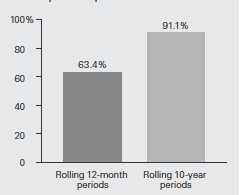
| Note: In the 164 rolling 12-month periods since February 28, |
| 1998, the fund’s Investor Shares outperformed the Russell |
| Midcap Growth Index 104 times. In the 56 rolling 10-year |
| periods since February 28, 1998, the Investor Shares |
| outperformed the index 51 times, based on average |
| annual returns. |
| Sources: Vanguard and S&P. |
6
the biotechnology industry, where the fund’s stocks benefited from developing drug pipelines and their strong financial position. For more on the advisor’s strategy and outlook, please see the Advisor’s Report following this letter.
The long-term record testifies to the merit of a patient approach
PRIMECAP Management Company, the fund’s advisor, maintains an investment philosophy rooted in a conviction that deep fundamental research can uncover investment opportunities that will yield outsized rewards over the next three to five years. The fund’s long-term record is a ringing validation of this belief.
But the key word there is long-term. I hope you’ll read the Investment Insight on page 6 for some additional thoughts regarding the kind of patience and tempered expectations that a distinctively managed fund such as this one can require from its investors.
For the ten years ended September 30, 2012, the Capital Opportunity Fund generated an average annual return of 11.82%, slightly ahead of its benchmark’s return and more than 3 percentage points ahead of the average return of peer funds. An initial investment of $10,000 in the fund would have grown to $30,568 in that time.
These results are a credit to PRIMECAP Management’s expertise, focus, and discipline. Vanguard’s historically low costs helped the advisor’s cause and allowed shareholders to keep more of the fund’s returns.
The lessons of the financial crisis remain relevant four years later
In September, the end of your fund’s fiscal year, we marked the fourth anniversary of Lehman Brothers’ collapse, the start of the 2008–2009 financial crisis. When the Lehman news broke, I was speaking to institutional clients at an event in Washington, D.C., all of three weeks into my new role as Vanguard’s CEO.
In the ensuing months, I was struck both by how fortunate I was to work with a great team of Vanguard “crew” and by the remarkable steadiness demonstrated by our clients. Many clients experienced significant losses, but signs of panic were few. On balance, they remained committed to their long-term investment programs and managed to benefit from the financial markets’ subsequent recovery.
As the crisis recedes further in time, it’s important not to lose sight of the lessons that it illuminated about investing and sound financial practices generally. First among those lessons is that diversification does work. Diversification didn’t immunize investors from the market’s decline, but it certainly helped to insulate them from the worst of it.
Second, saving money and living within your means are critical. Investors are acting on this lesson as they pay off debt, which is a form of saving, and increase their savings rates from the dangerously low levels that prevailed before the crisis.
7
Third, having the courage to stick with a sound investment plan—as so many of our clients did—is important during volatile, uncertain times. Investors who resisted the urge to bail out of stocks at the depths of the crisis have largely been rewarded in the succeeding years.
I am very optimistic that, if investors embrace these lessons, they can give themselves a better chance of reaching their long-term goals.
As always, thank you for entrusting your assets to Vanguard.
Sincerely,

F. William McNabb III
Chairman and Chief Executive Officer
October 16, 2012
8
Advisor’s Report
For the fiscal year ended September 30, 2012, Vanguard Capital Opportunity Fund returned 24.62% for Investor Shares and 24.69% for Admiral Shares, trailing both the 26.69% average return of its benchmark, the unmanaged Russell
Midcap Growth Index, and the 25.46% average return of multi-capitalization growth fund competitors.
Investment environment
The stock market showed strong gains over the past 12 months despite a more challenging global economic outlook.
Growth in U.S. gross domestic product (GDP) for the second quarter of 2012 was just 1.3%, suggesting a slowdown in the midst of an already tepid recovery. Consumer spending trends have been mixed, with signs of acceleration followed by periods of sluggishness as households struggle in the face of high unemployment, little growth in personal income, and a difficult housing market.
Despite news that the unemployment rate dropped below 8% in September for the first time since January 2009, job growth remains weak. The official unemployment rate likely understates the difficult job environment, since it does not reflect workers who are no longer seeking employment or those who are underemployed. Outside the United
States, economic and geopolitical developments were largely negative. The sovereign-debt crisis continued to weigh on European economies, China showed signs of slowing economic growth, and tensions flared in the Middle East.
Management of the fund
Despite the subpar results this past fiscal year, our investment approach remains consistent. We rely on fundamental research to identify companies whose revenues and earnings will, in our opinion, grow more rapidly over a three-to-five-year time frame than current valuations might suggest. We seek to capitalize on situations in which the fundamental value of a company significantly exceeds its current market value.
This investment strategy has led us to build and maintain significant investments in health care and information technology companies that we believe offer the potential for higher returns than the overall market will produce. These two sectors make up more than 70% of the fund’s holdings (versus about 31% for the Russell Midcap Growth Index). Eight of the ten largest holdings in the fund are health care or information technology stocks.
Technology
The fund’s overweight position in the information technology sector, along with poor stock selection, was a major reason for its disappointing relative returns. The IT stocks in the Russell Midcap Growth Index returned 21.8% for the fiscal year, lagging the index’s overall return of 26.7%. In comparison, the fund’s holdings in the sector returned only 9.8%. Research In Motion (–63%), Rambus (–60%), and Electronic Arts (–38%) were notable detractors from the fund’s results.
Several of the largest holdings in information technology, including Cree (–2%), Altera (+9%), Symantec (+10%),
9
and Texas Instruments (+6%), had lower returns than the benchmark index. This drag on relative performance was partially offset by ASML (+57%) and Google (+47%).
Despite the disappointing results over the past 12 months, we remain enthusiastic about the fund’s information technology holdings for several reasons. Many of these companies have good growth prospects, possess large cash balances, and are currently trading at attractive valuations. The adoption of mobile computing devices, such as smartphones and tablet computers, and the continued expansion of the internet through social networking and e-commerce applications are helping to drive growth in demand for semiconductors, computer hardware, software, storage, and technology-driven services such as consulting and data analytics. Some of the largest holdings in the portfolio, including Google, Qualcomm, Texas Instruments, and Microsoft, are well-positioned to capitalize on these trends.
Health care
The fund’s significant commitment to the health care sector contributed favorably to overall results. This sector had the second-highest return among the ten sectors in the Russell Midcap Growth Index, trailing only the materials group.
Two of the fund’s largest holdings, Biogen Idec (+60%) and Amgen (+56%), were among the biggest gainers. Biogen Idec reported favorable results from studies of its new oral drug to treat multiple sclerosis, while Amgen’s stock price increased following the company’s announcement in November 2011 of a share repurchase program that included a $5 billion Dutch tender offer. Pharmacyclics (+445.2%) reported promising results from clinical trials for its lymphoma treatment. This gain was partially offset by the drop in
Dendreon (–47%), which has experienced disappointing sales of its prostate cancer drug, Provenge.
We continue to believe that large pharmaceutical, biotechnology, and medical device companies will experience growth in revenues and earnings from new products, an aging global population, and growing demand in emerging markets.
In the wake of a period of considerable political and regulatory challenges as well as an unusually high number of patent expirations, we are encouraged by an increase in new drug approvals by the U.S. Food and Drug Administration in the past two years. For the longer term, we believe that the aging of populations in the United States, Europe, and Japan, along with rising standards of living in developing markets such as China and India, should lead to greater demand for health care products.
The health care industry spends tens of billions of dollars annually on research and development, which we believe will lead to the discovery of more effective treatments for many diseases, such as cancer, diabetes, and Alzheimer’s. For example, because of the rapid decline in the cost of sequencing human genomes, it is expected that millions of individuals
10
globally will have their genome sequenced in the near future. Further, cancer cell genome are being sequenced to gain an understanding of the specific genetic mutations responsible for their proliferation.
The availability of this increasingly rich and broad set of genetic information is helping researchers better understand how patients with certain genetic traits develop diseases and respond to pathogens, chemicals, and drugs. That growing knowledge base is enabling the development of new, highly effective targeted drug therapies and associated diagnostic tests, bringing the possibility of personalized medicine closer to reality.
Other sectors
The fund has significantly underweighted positions in the consumer staples, energy, and financial sectors relative to the Russell Midcap Growth Index. In consumer staples, the fund’s minimal exposure was a plus because this sector, along with utilities, had the lowest returns in the index by a considerable margin.
The underweight position in energy also helped the fund’s results. In contrast, the underweighting in financials hurt relative performance.
Several stocks in the consumer discretionary and materials sectors boosted the fund’s performance versus the benchmark. TJX (+63%) and Ascena Retail Group (+59%) were significant
contributors in the consumer discretionary group. The help in materials came from Monsanto (+54%), the fund’s sole holding in the sector.
Outlook
As we enter fiscal year 2013, we are more tempered in our optimism for U.S. equities than we were a year ago.
Valuations generally seem attractive relative to historical standards, especially given the low interest rate environment. Although the S&P 500 Index, which is generally representative of the overall stock market, is considerably higher than it was a year ago, equities remain attractive relative to most other asset classes. As we write, the average dividend of the S&P 500 is almost 2%, which is still above the current yield on the 10-year U.S. Treasury note.
In the sectors where the fund has the greatest weightings, we find current valuations compelling. We believe that investors may be underestimating the growth potential of many companies.
Although we expect the economic growth rate in the United States to be modest in the near future, we believe that, because of globalization and innovation, many U.S. companies can grow revenues and earnings at a faster rate than the GDP will grow. U.S. corporations generate an increasing portion of their revenues and earnings from abroad; last year, 46% of the revenues for S&P 500 companies came from outside the United States.
11
Prospects for international growth are particularly attractive for companies in the information technology, health care, and industrial sectors.
We also believe that innovation by U.S. companies, particularly those in the information technology and health care sectors, should result in revenue and earnings growth opportunities that are not reflected in current expectations. Those two sectors represent areas in which we believe the United States has a strong competitive advantage relative to the rest of the world. We expect that the substantial investment in research and development will lead to new products and services that improve productivity for businesses and quality of life for consumers.
Furthermore, the stock market may be undervaluing the cash on the balance sheets of many companies. As U.S. corporations have recovered from the recession, many have improved their balance sheets by paying down debt and growing their cash balances, which in the current low interest rate environment represent an under utilized asset. That asset could be a source of higher returns in the future. Companies
with strong cash flows have seen considerable appreciation in their stock price as they returned cash to shareholders by raising dividends or by buying back shares of their stock.
In closing, we note that the fund’s returns have generally lagged those of the Russell Midcap Growth Index for the past two years. We are certainly disappointed with these results, but we accept that our low-turnover approach will not produce returns that exceed the index every year. Our disciplined approach of continuing to add to high-conviction, out-of-favor positions as they decline ensures that if our view of the fundamentals ultimately proves correct, the fund will hold larger positions on the way up than it did on the way down. In our view, this approach is instrumental to delivering superior relative returns over the long run.
PRIMECAP Management Company October 12, 2012
12
Capital Opportunity Fund
Fund Profile
As of September 30, 2012
| | |
| Share-Class Characteristics | |
| | Investor | Admiral |
| | Shares | Shares |
| Ticker Symbol | VHCOX | VHCAX |
| Expense Ratio1 | 0.48% | 0.41% |
| 30-Day SEC Yield | 0.67% | 0.74% |
| | | |
| Portfolio Characteristics | | |
| | | Russell | DJ |
| | | Midcap | U.S. Total |
| | | Growth | Market |
| | Fund | Index | Index |
| Number of Stocks | 123 | 454 | 3,638 |
| Median Market Cap $22.2B | $8.8B | $35.6B |
| Price/Earnings Ratio | 20.0x | 23.0x | 17.0x |
| Price/Book Ratio | 2.7x | 4.5x | 2.2x |
| Return on Equity | 18.5% | 18.3% | 18.0% |
| Earnings Growth Rate | 12.5% | 12.8% | 10.4% |
| Dividend Yield | 1.2% | 1.1% | 2.0% |
| Foreign Holdings | 13.2% | 0.0% | 0.0% |
| Turnover Rate | 9% | — | — |
| Short-Term Reserves | 2.0% | — | — |
| | | |
| Sector Diversification (% of equity exposure) |
| | | Russell | DJ |
| | | Midcap | U.S. Total |
| | | Growth | Market |
| | Fund | Index | Index |
| Consumer Discretionary | 9.5% | 25.2% | 12.0% |
| Consumer Staples | 0.0 | 7.8 | 9.5 |
| Energy | 2.3 | 5.5 | 10.4 |
| Financials | 1.6 | 7.3 | 16.0 |
| Health Care | 37.4 | 13.4 | 11.9 |
| Industrials | 11.3 | 14.3 | 10.6 |
| Information Technology | 34.0 | 17.6 | 19.2 |
| Materials | 2.9 | 6.3 | 3.9 |
| Telecommunication Services | 0.3 | 1.8 | 2.9 |
| Utilities | 0.7 | 0.8 | 3.6 |
| | |
| Volatility Measures | | |
| | Russell | DJ |
| | Midcap | U.S. Total |
| | Growth | Market |
| | Index | Index |
| R-Squared | 0.94 | 0.95 |
| Beta | 0.99 | 1.14 |
| These measures show the degree and timing of the fund’s fluctuations compared with the indexes over 36 months. |
| | |
| Ten Largest Holdings (% of total net assets) |
| Biogen Idec Inc. | Biotechnology | 6.5% |
| Amgen Inc. | Biotechnology | 6.4 |
| Eli Lilly & Co. | Pharmaceuticals | 4.5 |
| Roche Holding AG | Pharmaceuticals | 3.9 |
| Google Inc. Class A | Internet Software & | |
| | Services | 3.1 |
| FedEx Corp. | Air Freight & | |
| | Logistics | 3.1 |
| Monsanto Co. | Fertilizers & | |
| | Agricultural | |
| | Chemicals | 2.8 |
| Medtronic Inc. | Health Care | |
| | Equipment | 2.8 |
| Altera Corp. | Semiconductor | |
| | Equipment | 2.8 |
| BioMarin Pharmaceutical | | |
| Inc. | Biotechnology | 2.7 |
| Top Ten | | 38.6% |
| The holdings listed exclude any temporary cash investments and equity index products. |
Investment Focus
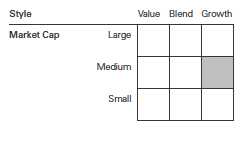
1 The expense ratios shown are from the prospectus dated January 26, 2012, and represent estimated costs for the current fiscal year. For
the fiscal year ended September 30, 2012, the expense ratios were 0.48% for Investor Shares and 0.41% for Admiral Shares.
13
Capital Opportunity Fund
Performance Summary
All of the returns in this report represent past performance, which is not a guarantee of future results that may be achieved by the fund. (Current performance may be lower or higher than the performance data cited. For performance data current to the most recent month-end, visit our website at vanguard.com/performance.) Note, too, that both investment returns and principal value can fluctuate widely, so an investor’s shares, when sold, could be worth more or less than their original cost. The returns shown do not reflect taxes that a shareholder would pay on fund distributions or on the sale of fund shares.
Cumulative Performance: September 30, 2002, Through September 30, 2012
Initial Investment of $10,000
| | | | | |
| | | Average Annual Total Returns | |
| | | Periods Ended September 30, 2012 | |
| | | | | | Final Value |
| | | One | Five | Ten | of a $10,000 |
| | | Year | Years | Years | Investment |
| | Capital Opportunity Fund Investor | | | | |
| | Shares | 24.62% | 0.21% | 11.82% | $30,568 |
| •••••••• | Russell Midcap Growth Index | 26.69 | 2.54 | 11.11 | 28,668 |
| – – – – | Multi-Cap Growth Funds Average | 25.46 | 0.31 | 7.96 | 21,516 |
| | Dow Jones U.S. Total Stock Market | | | | |
| | Index | 30.00 | 1.53 | 8.77 | 23,184 |
| Multi-Cap Growth Funds Average: Derived from data provided by Lipper Inc. |
| | | | |
| | | | | Final Value |
| | One | Five | Ten | of a $50,000 |
| | Year | Years | Years | Investment |
| Capital Opportunity Fund Admiral Shares | 24.69% | 0.29% | 11.91% | $154,081 |
| Russell Midcap Growth Index | 26.69 | 2.54 | 11.11 | 143,340 |
| Dow Jones U.S. Total Stock Market Index | 30.00 | 1.53 | 8.77 | 115,920 |
See Financial Highlights for dividend and capital gains information.
14
Capital Opportunity Fund
Fiscal-Year Total Returns (%): September 30, 2002, Through September 30, 2012
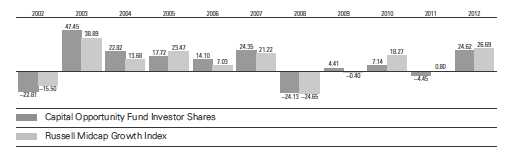
15
Capital Opportunity Fund
Financial Statements
Statement of Net Assets
As of September 30, 2012
The fund reports a complete list of its holdings in regulatory filings four times in each fiscal year, at the quarter-ends. For the second and fourth fiscal quarters, the lists appear in the fund’s semiannual and annual reports to shareholders. For the first and third fiscal quarters, the fund files the lists with the Securities and Exchange Commission on Form N-Q. Shareholders can look up the fund’s Forms N-Q on the SEC’s website at sec.gov. Forms N-Q may also be reviewed and copied at the SEC’s Public Reference Room (see the back cover of this report for further information).
| | | |
| | | | Market |
| | | | Value |
| | | Shares | ($000) |
| Common Stocks (98.6%) | | |
| Consumer Discretionary (9.3%) | |
| * | DIRECTV | 2,946,576 | 154,577 |
| * | CarMax Inc. | 4,436,797 | 125,561 |
| | TJX Cos. Inc. | 2,630,000 | 117,798 |
| | Carnival Corp. | 2,038,900 | 74,298 |
| * | Ascena Retail Group Inc. | 2,935,200 | 62,960 |
| * | Bed Bath & Beyond Inc. | 853,700 | 53,783 |
| | Royal Caribbean Cruises | | |
| | Ltd. | 1,215,000 | 36,705 |
| *,^ | Tesla Motors Inc. | 913,700 | 26,753 |
| * | Amazon.com Inc. | 54,700 | 13,911 |
| | Lowe’s Cos. Inc. | 375,000 | 11,340 |
| | Nordstrom Inc. | 160,000 | 8,829 |
| | Limited Brands Inc. | 82,400 | 4,059 |
| | Gentex Corp. | 180,000 | 3,062 |
| * | DreamWorks Animation | | |
| | SKG Inc. Class A | 89,700 | 1,725 |
| | Strattec Security Corp. | 61,186 | 1,303 |
| | Ross Stores Inc. | 4,600 | 297 |
| * | Deckers Outdoor Corp. | 1,000 | 37 |
| | | | 696,998 |
| Energy (2.3%) | | |
| | Cabot Oil & Gas Corp. | 840,000 | 37,716 |
| | Noble Energy Inc. | 383,000 | 35,508 |
| | Oceaneering International | | |
| | Inc. | 500,000 | 27,625 |
| | National Oilwell Varco Inc. | 286,000 | 22,911 |
| | ConocoPhillips | 250,000 | 14,295 |
| | Ensco plc Class A | 193,340 | 10,549 |
| | Phillips 66 | 125,000 | 5,796 |
| * | Southwestern Energy Co. | 160,000 | 5,565 |
| | Transocean Ltd. | 100,000 | 4,489 |
| | Range Resources Corp. | 58,700 | 4,101 |
| | | | 168,555 |
| Financials (1.6%) | | |
| | CharlesSchwab Corp. | 6,965,000 | 89,083 |
| | ChubbCorp. | 350,000 | 26,698 |
| | | |
| * | MSCI Inc. Class A | 127,000 | 4,545 |
| | | | 120,326 |
| Health Care (36.9%) | | |
| * | Biogen Idec Inc. | 3,249,600 | 484,938 |
| | Amgen Inc. | 5,711,500 | 481,594 |
| | Eli Lilly & Co. | 7,019,600 | 332,799 |
| | Roche Holding AG | 1,566,100 | 292,934 |
| | Medtronic Inc. | 4,909,200 | 211,685 |
| * | BioMarin Pharmaceutical | | |
| | Inc. | 4,941,700 | 199,002 |
| | Novartis AG ADR | 3,131,000 | 191,805 |
| * | Life Technologies Corp. | 2,875,945 | 140,576 |
| * | QIAGEN NV | 7,100,000 | 131,421 |
| * | Pharmacyclics Inc. | 937,100 | 60,443 |
| * | Boston Scientific Corp. | 7,566,300 | 43,431 |
| * | Illumina Inc. | 673,600 | 32,468 |
| * | Edwards Lifesciences | | |
| | Corp. | 300,000 | 32,211 |
| * | Seattle Genetics Inc. | 1,019,000 | 27,462 |
| * | Immunogen Inc. | 1,280,000 | 18,688 |
| * | CharlesRiver | | |
| | Laboratories | | |
| | International Inc. | 378,000 | 14,969 |
| * | Waters Corp. | 169,500 | 14,124 |
| * | Dendreon Corp. | 2,628,900 | 12,698 |
| * | Affymetrix Inc. | 2,700,600 | 11,694 |
| | PerkinElmer Inc. | 335,000 | 9,872 |
| * | InterMune Inc. | 790,000 | 7,086 |
| | Zimmer Holdings Inc. | 54,000 | 3,651 |
| * | Cerner Corp. | 5,000 | 387 |
| | | | 2,755,938 |
| Industrials (11.2%) | | |
| | FedEx Corp. | 2,754,430 | 233,080 |
| | Rockwell Automation Inc. | 1,534,100 | 106,697 |
| | Southwest Airlines Co. | 11,235,100 | 98,532 |
| | Pall Corp. | 1,106,600 | 70,258 |
| ^ | Ritchie Bros Auctioneers | | |
| | Inc. | 2,945,000 | 56,632 |
| | Union Pacific Corp. | 325,000 | 38,577 |
16
Capital Opportunity Fund
| | | |
| | | | Market |
| | | | Value |
| | | Shares | ($000) |
| | C.H. Robinson | | |
| | Worldwide Inc. | 564,100 | 33,028 |
| * | JetBlue Airways Corp. | 6,740,150 | 32,285 |
| * | AECOM Technology Corp. | 1,100,000 | 23,276 |
| * | United Continental | | |
| | Holdings Inc. | 1,155,000 | 22,522 |
| * | Delta Air Lines Inc. | 2,150,000 | 19,694 |
| | European Aeronautic | | |
| | Defence and Space | | |
| | Co. NV | 596,440 | 18,904 |
| * | Jacobs Engineering | | |
| | Group Inc. | 455,500 | 18,416 |
| * | Babcock & Wilcox Co. | 700,000 | 17,829 |
| | ExpeditorsInternational | | |
| | of Washington Inc. | 420,700 | 15,297 |
| | IDEX Corp. | 300,000 | 12,531 |
| | ChicagoBridge & Iron | | |
| | Co. NV | 250,000 | 9,523 |
| | SPXCorp. | 80,000 | 5,233 |
| * | US Airways Group Inc. | 57,000 | 596 |
| * | Colfax Corp. | 4,200 | 154 |
| | | | 833,064 |
| Information Technology (33.5%) | |
| * | Google Inc. Class A | 309,605 | 233,597 |
| | Altera Corp. | 6,189,200 | 210,340 |
| | ASML Holding NV | 3,489,900 | 187,338 |
| * | Symantec Corp. | 9,206,100 | 165,710 |
| * | Adobe Systems Inc. | 4,104,500 | 133,232 |
| | Texas Instruments Inc. | 4,552,200 | 125,413 |
| | Microsoft Corp. | 4,000,000 | 119,120 |
| * | Trimble Navigation Ltd. | 2,466,100 | 117,534 |
| | Corning Inc. | 8,080,000 | 106,252 |
| * | Cree Inc. | 3,944,900 | 100,713 |
| * | Electronic Arts Inc. | 7,030,000 | 89,211 |
| * | Flextronics International | | |
| | Ltd. | 12,183,400 | 73,100 |
| * | NVIDIA Corp. | 5,426,600 | 72,391 |
| * | SanDisk Corp. | 1,582,248 | 68,717 |
| * | NeuStar Inc. Class A | 1,623,416 | 64,985 |
| * | EMCCorp. | 2,375,000 | 64,766 |
| *,^ | Research In Motion Ltd. | 7,108,700 | 53,315 |
| | Visa Inc. Class A | 326,930 | 43,900 |
| *,1 | Descartes Systems | | |
| | Group Inc. | 4,645,000 | 40,644 |
| | Plantronics Inc. | 1,150,000 | 40,630 |
| | QUALCOMM Inc. | 576,915 | 36,052 |
| * | Micron Technology Inc. | 5,550,000 | 33,217 |
| *,1 | FormFactor Inc. | 5,769,300 | 32,250 |
| * | NetApp Inc. | 810,000 | 26,633 |
| * | Rambus Inc. | 4,400,000 | 24,376 |
| | Hewlett-Packard Co. | 1,350,000 | 23,031 |
| * | Nuance Communications | | |
| | Inc. | 850,000 | 21,157 |
| | Intuit Inc. | 350,000 | 20,608 |
| | | |
| | Motorola Solutions Inc. | 375,000 | 18,956 |
| | FEI Co. | 345,000 | 18,458 |
| | KLA-TencorCorp. | 350,000 | 16,697 |
| * | Entegris Inc. | 2,019,231 | 16,416 |
| | Jabil Circuit Inc. | 875,000 | 16,380 |
| | Apple Inc. | 24,000 | 16,014 |
| * | Cymer Inc. | 250,000 | 12,765 |
| | Xilinx Inc. | 300,000 | 10,023 |
| | Mastercard Inc. Class A | 22,100 | 9,978 |
| * | Ciena Corp. | 607,142 | 8,257 |
| | Analog Devices Inc. | 200,000 | 7,838 |
| * | Smart Technologies Inc. | | |
| | Class A | 4,672,304 | 7,616 |
| * | Brocade Communications | |
| | Systems Inc. | 1,200,000 | 7,098 |
| | Accenture plc Class A | 95,700 | 6,702 |
| * | Citrix Systems Inc. | 30,000 | 2,297 |
| | Applied Materials Inc. | 200,000 | 2,233 |
| * | Zynga Inc. Class A | 67,350 | 191 |
| * | Facebook Inc. Class A | 100 | 2 |
| | | | 2,506,153 |
| Materials (2.8%) | | |
| | Monsanto Co. | 2,328,786 | 211,966 |
| |
| Telecommunication Services (0.3%) | |
| * | Sprint Nextel Corp. | 4,200,000 | 23,184 |
| |
| Utilities (0.7%) | | |
| | Public Service Enterprise | | |
| | Group Inc. | 830,800 | 26,735 |
| * | AES Corp. | 2,338,825 | 25,657 |
| | | | 52,392 |
| Total Common Stocks | | |
| (Cost $5,068,604) | | 7,368,576 |
| Temporary Cash Investment (2.6%) | |
| Money Market Fund (2.6%) | | |
| 2,3 | Vanguard Market | | |
| | Liquidity Fund, 0.163% | | |
| | (Cost $194,525) | 194,525,321 | 194,525 |
| Total Investments (101.2%) | | |
| (Cost $5,263,129) | | 7,563,101 |
| Other Assets and Liabilities (-1.2%) | |
| Other Assets | | 12,904 |
| Liabilities3 | | (99,472) |
| | | | (86,568) |
| Net Assets (100%) | | 7,476,533 |
17
Capital Opportunity Fund
| |
| At September 30, 2012, net assets consisted of: |
| | Amount |
| | ($000) |
| Paid-in Capital | 4,947,559 |
| Undistributed Net Investment Income | 25,047 |
| Accumulated Net Realized Gains | 203,845 |
| Unrealized Appreciation (Depreciation) | |
| Investment Securities | 2,299,972 |
| Foreign Currencies | 110 |
| Net Assets | 7,476,533 |
| |
| |
| Investor Shares—Net Assets | |
| Applicable to 73,212,058 outstanding | |
| $.001 par value shares of beneficial | |
| interest (unlimited authorization) | 2,431,803 |
| Net Asset Value Per Share— | |
| Investor Shares | $33.22 |
| |
| |
| Admiral Shares—Net Assets | |
| Applicable to 65,732,986 outstanding | |
| $.001 par value shares of beneficial | |
| interest (unlimited authorization) | 5,044,730 |
| Net Asset Value Per Share— | |
| Admiral Shares | $76.75 |
See Note A in Notes to Financial Statements.
* Non-income-producing security.
^ Part of security position is on loan to broker-dealers. The total value of securities on loan is $41,363,000.
1 Considered an affiliated company of the fund as the fund owns more than 5% of the outstanding voting
securities of such company.
2 Affiliated money market fund available only to Vanguard funds and certain trusts and accounts managed
by Vanguard. Rate shown is the 7-day yield.
3 Includes $44,950,000 of collateral received for securities on loan.
ADR—American Depositary Receipt.
See accompanying Notes, which are an integral part of the Financial Statements.
18
Capital Opportunity Fund
Statement of Operations
| |
| | Year Ended |
| | September 30, 2012 |
| | ($000) |
| Investment Income | |
| Income | |
| Dividends1,2 | 84,805 |
| Interest2 | 274 |
| Security Lending | 356 |
| Total Income | 85,435 |
| Expenses | |
| Investment Advisory Fees—Note B | 19,490 |
| The Vanguard Group—Note C | |
| Management and Administrative—Investor Shares | 4,958 |
| Management and Administrative—Admiral Shares | 6,375 |
| Marketing and Distribution—Investor Shares | 505 |
| Marketing and Distribution—Admiral Shares | 849 |
| Custodian Fees | 133 |
| Auditing Fees | 26 |
| Shareholders’ Reports—Investor Shares | 38 |
| Shareholders’ Reports—Admiral Shares | 30 |
| Trustees’ Fees and Expenses | 15 |
| Total Expenses | 32,419 |
| Net Investment Income | 53,016 |
| Realized Net Gain (Loss) | |
| Investment Securities Sold2 | 221,296 |
| Foreign Currencies | 36 |
| Realized Net Gain (Loss) | 221,332 |
| Change in Unrealized Appreciation (Depreciation) | |
| Investment Securities | 1,331,407 |
| Foreign Currencies | (108) |
| Change in Unrealized Appreciation (Depreciation) | 1,331,299 |
| Net Increase (Decrease) in Net Assets Resulting from Operations | 1,605,647 |
| 1 Dividends are net of foreign withholding taxes of $3,511,000. |
| 2 Dividend income, interest income, and realized net gain (loss) from affiliated companies of the fund were $67,000, $274,000, |
| and $249,108,000, respectively. |
See accompanying Notes, which are an integral part of the Financial Statements.
19
Capital Opportunity Fund
Statement of Changes in Net Assets
| | |
| | Year Ended September 30, |
| | 2012 | 2011 |
| | ($000) | ($000) |
| Increase (Decrease) in Net Assets | | |
| Operations | | |
| Net Investment Income | 53,016 | 41,306 |
| Realized Net Gain (Loss) | 221,332 | 507,469 |
| Change in Unrealized Appreciation (Depreciation) | 1,331,299 | (779,207) |
| Net Increase (Decrease) in Net Assets Resulting from Operations | 1,605,647 | (230,432) |
| Distributions | | |
| Net Investment Income | | |
| Investor Shares | (13,132) | (11,536) |
| Admiral Shares | (28,694) | (22,920) |
| Realized Capital Gain1 | | |
| Investor Shares | (119,830) | — |
| Admiral Shares | (224,279) | — |
| Total Distributions | (385,935) | (34,456) |
| Capital Share Transactions | | |
| Investor Shares | (401,140) | (1,228,183) |
| Admiral Shares | (96,730) | 349,482 |
| Net Increase (Decrease) from Capital Share Transactions | (497,870) | (878,701) |
| Total Increase (Decrease) | 721,842 | (1,143,589) |
| Net Assets | | |
| Beginning of Period | 6,754,691 | 7,898,280 |
| End of Period2 | 7,476,533 | 6,754,691 |
| 1 Includes fiscal 2012 short-term gain distributions totaling $1,640,000. Short-term gain distributions are treated as ordinary income dividends |
| for tax purposes. |
| 2 Net Assets—End of Period includes undistributed net investment income of $25,047,000 and $18,113,000. |
See accompanying Notes, which are an integral part of the Financial Statements.
20
Capital Opportunity Fund
Financial Highlights
| | | | | |
| Investor Shares | | | | | |
| |
| |
| For a Share Outstanding | Year Ended September 30, |
| Throughout Each Period | 2012 | 2011 | 2010 | 2009 | 2008 |
| Net Asset Value, Beginning of Period | $28.17 | $29.59 | $27.71 | $29.41 | $42.70 |
| Investment Operations | | | | | |
| Net Investment Income | .216 | .151 | .106 | .121 | .2541 |
| Net Realized and Unrealized Gain | | | | | |
| (Loss) on Investments | 6.464 | (1.450) | 1.871 | .355 | (9.884) |
| Total from Investment Operations | 6.680 | (1.299) | 1.977 | .476 | (9.630) |
| Distributions | | | | | |
| Dividends from Net Investment Income | (.161) | (.121) | (.097) | (.114) | (.218) |
| Distributions from Realized Capital Gains | (1.469) | — | — | (2.062) | (3.442) |
| Total Distributions | (1.630) | (.121) | (.097) | (2.176) | (3.660) |
| Net Asset Value, End of Period | $33.22 | $28.17 | $29.59 | $27.71 | $29.41 |
| |
| Total Return2 | 24.62% | -4.45% | 7.14% | 4.41% | -24.13% |
| |
| Ratios/Supplemental Data | | | | | |
| Net Assets, End of Period (Millions) | $2,432 | $2,412 | $3,675 | $3,903 | $3,851 |
| Ratio of Total Expenses to | | | | | |
| Average Net Assets | 0.48% | 0.48% | 0.48% | 0.50% | 0.45% |
| Ratio of Net Investment Income to | | | | | |
| Average Net Assets | 0.67% | 0.45% | 0.36% | 0.50% | 0.67%1 |
| Portfolio Turnover Rate | 9% | 9% | 8% | 12% | 13% |
1 Net investment income per share and the ratio of net investment income to average net assets include $.125 and 0.33%, respectively,
resulting from a special dividend from ASML Holding NV in October 2007.
2 Total returns do not include transaction or account service fees that may have applied in the periods shown. Fund prospectuses provide
information about any applicable transaction and account service fees.
See accompanying Notes, which are an integral part of the Financial Statements.
21
Capital Opportunity Fund
Financial Highlights
| | | | | |
| Admiral Shares | | | | | |
| |
| |
| For a Share Outstanding | Year Ended September 30, |
| Throughout Each Period | 2012 | 2011 | 2010 | 2009 | 2008 |
| Net Asset Value, Beginning of Period | $65.10 | $68.38 | $64.04 | $68.00 | $98.71 |
| Investment Operations | | | | | |
| Net Investment Income | .559 | .400 | .298 | .329 | .6641 |
| Net Realized and Unrealized Gain (Loss) | | | | | |
| on Investments | 14.917 | (3.358) | 4.315 | .811 | (22.845) |
| Total from Investment Operations | 15.476 | (2.958) | 4.613 | 1.140 | (22.181) |
| Distributions | | | | | |
| Dividends from Net Investment Income | (.434) | (.322) | (.273) | (.339) | (.577) |
| Distributions from Realized Capital Gains | (3.392) | — | — | (4.761) | (7.952) |
| Total Distributions | (3.826) | (.322) | (.273) | (5.100) | (8.529) |
| Net Asset Value, End of Period | $76.75 | $65.10 | $68.38 | $64.04 | $68.00 |
| |
| Total Return2 | 24.69% | -4.39% | 7.21% | 4.52% | -24.05% |
| |
| Ratios/Supplemental Data | | | | | |
| Net Assets, End of Period (Millions) | $5,045 | $4,342 | $4,223 | $3,938 | $3,787 |
| Ratio of Total Expenses to | | | | | |
| Average Net Assets | 0.41% | 0.41% | 0.41% | 0.41% | 0.36% |
| Ratio of Net Investment Income to | | | | | |
| Average Net Assets | 0.74% | 0.52% | 0.43% | 0.59% | 0.76%1 |
| Portfolio Turnover Rate | 9% | 9% | 8% | 12% | 13% |
1 Net investment income per share and the ratio of net investment income to average net assets include $.289 and 0.33%, respectively,
resulting from a special dividend from ASML Holding NV in October 2007.
2 Total returns do not include transaction or account service fees that may have applied in the periods shown. Fund prospectuses provide
information about any applicable transaction and account service fees.
See accompanying Notes, which are an integral part of the Financial Statements.
22
Capital Opportunity Fund
Notes to Financial Statements
Vanguard Capital Opportunity Fund is registered under the Investment Company Act of 1940 as an open-end investment company, or mutual fund. The fund offers two classes of shares: Investor Shares and Admiral Shares. Investor Shares are available to any investor who meets the fund’s minimum purchase requirements. Admiral Shares are designed for investors who meet certain administrative, service, and account-size criteria.
A. The following significant accounting policies conform to generally accepted accounting principles for U.S. mutual funds. The fund consistently follows such policies in preparing its financial statements.
1. Security Valuation: Securities are valued as of the close of trading on the New York Stock Exchange (generally 4 p.m., Eastern time) on the valuation date. Equity securities are valued at the latest quoted sales prices or official closing prices taken from the primary market in which each security trades; such securities not traded on the valuation date are valued at the mean of the latest quoted bid and asked prices. Securities for which market quotations are not readily available, or whose values have been affected by events occurring before the fund’s pricing time but after the close of the securities’ primary markets, are valued at their fair values calculated according to procedures adopted by the board of trustees. These procedures include obtaining quotations from an independent pricing service, monitoring news to identify significant market- or security-specific events, and evaluating changes in the values of foreign market proxies (for example, ADRs, futures contracts, or exchange-traded funds), between the time the foreign markets close and the fund’s pricing time. When fair-value pricing is employed, the prices of securities used by a fund to calculate its net asset value may differ from quoted or published prices for the same securities. Investments in Vanguard Market Liquidity Fund are valued at that fund’s net asset value.
2. Foreign Currency: Securities and other assets and liabilities denominated in foreign currencies are translated into U.S. dollars using exchange rates obtained from an independent third party as of the fund’s pricing time on the valuation date. Realized gains (losses) and unrealized appreciation (depreciation) on investment securities include the effects of changes in exchange rates since the securities were purchased, combined with the effects of changes in security prices. Fluctuations in the value of other assets and liabilities resulting from changes in exchange rates are recorded as unrealized foreign currency gains (losses) until the assets or liabilities are settled in cash, at which time they are recorded as realized foreign currency gains (losses).
3. Federal Income Taxes: The fund intends to continue to qualify as a regulated investment company and distribute all of its taxable income. Management has analyzed the fund’s tax positions taken for all open federal income tax years (September 30, 2009–2012), and has concluded that no provision for federal income tax is required in the fund’s financial statements.
4. Distributions: Distributions to shareholders are recorded on the ex-dividend date.
5. Security Lending: The fund may lend its securities to qualified institutional borrowers to earn additional income. Security loans are required to be secured at all times by collateral at least equal to the market value of securities loaned. The fund invests cash collateral received in Vanguard Market Liquidity Fund, and records a liability for the return of the collateral, during the period the securities are on loan. Security lending income represents fees charged to borrowers plus income earned on investing cash collateral, less expenses associated with the loan.
6. Other: Dividend income is recorded on the ex-dividend date. Interest income includes income distributions received from Vanguard Market Liquidity Fund and is accrued daily. Security transactions are accounted for on the date securities are bought or sold. Costs used to determine realized gains (losses) on the sale of investment securities are those of the specific securities sold. Fees assessed on redemptions of capital shares prior to May 23, 2012, were credited to paid-in capital.
23
Capital Opportunity Fund
Each class of shares has equal rights as to assets and earnings, except that each class separately bears certain class-specific expenses related to maintenance of shareholder accounts (included in Management and Administrative expenses) and shareholder reporting. Marketing and distribution expenses are allocated to each class of shares based on a method approved by the board of trustees Income, other non-class-specific expenses, and gains and losses on investments are allocated to each class of shares based on its relative net assets.
B. PRIMECAP Management Company, provides investment advisory services to the fund for a fee calculated at an annual percentage rate of average net assets. For the year ended September 30, 2012, the investment advisory fee represented an effective annual rate of 0.26% of the fund’s average net assets.
C. The Vanguard Group furnishes at cost corporate management, administrative, marketing, and distribution services. The costs of such services are allocated to the fund under methods approved by the board of trustees. The fund has committed to provide up to 0.40% of its net assets in capital contributions to Vanguard. At September 30, 2012, the fund had contributed capital of $1,057,000 to Vanguard (included in Other Assets), representing 0.01% of the fund’s net assets and 0.42% of Vanguard’s capitalization. The fund’s trustees and officers are also directors and officers of Vanguard.
D. Various inputs may be used to determine the value of the fund’s investments. These inputs are summarized in three broad levels for financial statement purposes. The inputs or methodologies used to value securities are not necessarily an indication of the risk associated with investing in those securities.
Level 1—Quoted prices in active markets for identical securities.
Level 2—Other significant observable inputs (including quoted prices for similar securities, interest rates, prepayment speeds, credit risk, etc.).
Level 3—Significant unobservable inputs (including the fund’s own assumptions used to determine the fair value of investments).
The following table summarizes the market value of the fund’s investments as of September 30, 2012, based on the inputs used to value them:
| | | |
| | Level 1 | Level 2 | Level 3 |
| Investments | ($000) | ($000) | ($000) |
| Common Stocks | 7,056,738 | 311,838 | — |
| Temporary Cash Investments | 194,525 | — | — |
| Total | 7,251,263 | 311,838 | — |
E. Distributions are determined on a tax basis and may differ from net investment income and realized capital gains for financial reporting purposes. Differences may be permanent or temporary. Permanent differences are reclassified among capital accounts in the financial statements to reflect their tax character. Temporary differences arise when certain items of income, expense, gain, or loss are recognized in different periods for financial statement and tax purposes; these differences will reverse at some time in the future. Differences in classification may also result from the treatment of short-term gains as ordinary income for tax purposes.
24
Capital Opportunity Fund
During the year ended September 30, 2012, the fund realized net foreign currency gains of $36,000, which increased distributable net income for tax purposes; accordingly, such gains have been reclassified from accumulated net realized gains to undistributed net investment income.
The fund used a tax accounting practice to treat a portion of the price of capital shares redeemed during the year as distributions from net investment income and realized capital gains. Accordingly, the fund has reclassified $4,292,000 from undistributed net investment income, and $17,754,000 from accumulated net realized gains, to paid-in capital.
For tax purposes, at September 30, 2012, the fund had $40,209,000 of ordinary income and $203,541,000 of long-term capital gains available for distribution.
At September 30, 2012, the cost of investment securities for tax purposes was $5,263,129,000. Net unrealized appreciation of investment securities for tax purposes was $2,299,972,000, consisting of unrealized gains of $2,971,420,000 on securities that had risen in value since their purchase and $671,448,000 in unrealized losses on securities that had fallen in value since their purchase.
F. During the year ended September 30, 2012, the fund purchased $624,962,000 of investment securities and sold $1,379,710,000 of investment securities, other than temporary cash investments.
G. Capital share transactions for each class of shares were:
| | | | |
| | Year Ended September 30, |
| | 2012 | 2011 |
| | Amount | Shares | Amount | Shares |
| | ($000) | (000) | ($000) | (000) |
| Investor Shares | | | | |
| Issued | 169,576 | 5,405 | 223,210 | 6,730 |
| Issued in Lieu of Cash Distributions | 127,508 | 4,438 | 11,042 | 334 |
| Redeemed1 | (698,224) | (22,264) | (1,462,435) | (45,617) |
| Net Increase (Decrease)—Investor Shares | (401,140) | (12,421) | (1,228,183) | (38,553) |
| Admiral Shares | | | | |
| Issued | 459,825 | 6,387 | 1,053,781 | 14,293 |
| Issued in Lieu of Cash Distributions | 231,561 | 3,491 | 20,865 | 274 |
| Redeemed1 | (788,116) | (10,843) | (725,164) | (9,629) |
| Net Increase (Decrease)—Admiral Shares | (96,730) | (965) | 349,482 | 4,938 |
1 Net of redemption fees for fiscal 2012 and 2011 of $131,000 and $356,000, respectively (fund totals). Effective May, 23, 2012, the
redemption fee was eliminated.
25
Capital Opportunity Fund
H. Certain of the fund’s investments are in companies that are considered to be affiliated companies of the fund because the fund owns more than 5% of the outstanding voting securities of the company. Transactions during the period in securities of these companies were as follows:
| | | | | |
| | | Current Period Transactions | |
| | Sept. 30, 2011 | | Proceeds from | | Sept. 30, 2012 |
| | Market | Purchases | Securities | Dividend | Market |
| | Value | at Cost | Sold | Income | Value |
| | ($000) | ($000) | ($000) | ($000) | ($000) |
| Ascena Retail Group Inc. | 112,246 | — | 113,729 | — | NA1 |
| Descartes Systems Group Inc. | 28,892 | — | — | — | 40,644 |
| FormFactor Inc. | 35,864 | 303 | 223 | — | 32,250 |
| Strattec Security Corp. | 5,088 | — | 3,431 | 67 | NA1 |
| Thomas & Betts Corp. | 115,739 | — | 202,246 | — | — |
| | 297,829 | | | 67 | 72,894 |
| 1 Not applicable — At September 30, 2012, the security was still held, but the issuer was no longer an affiliated company of the fund. |
I. In preparing the financial statements as of September 30, 2012, management considered the impact of subsequent events for potential recognition or disclosure in these financial statements.
26
Report of Independent Registered
Public Accounting Firm
To the Trustees of Vanguard Horizon Funds and the Shareholders of Vanguard Capital Opportunity Fund:
In our opinion, the accompanying statement of net assets and the related statements of operations and of changes in net assets and the financial highlights present fairly, in all material respects, the financial position of Vanguard Capital Opportunity Fund (constituting a separate portfolio of Vanguard Horizon Funds, hereafter referred to as the “Fund”) at September 30, 2012, the results of its operations for the year then ended, the changes in its net assets for each of the two years in the period then ended and the financial highlights for each of the five years in the period then ended, in conformity with accounting principles generally accepted in the United States of America. These financial statements and financial highlights (hereafter referred to as “financial statements”) are the responsibility of the Fund’s management; our responsibility is to express an opinion on these financial statements based on our audits. We conducted our audits of these financial statements in accordance with the standards of the Public Company Accounting Oversight Board (United States). Those standards require that we plan and perform the audit to obtain reasonable assurance about whether the financial statements are free of material misstatement. An audit includes examining, on a test basis, evidence supporting the amounts and disclosures in the financial statements, assessing the accounting principles used and significant estimates made by management, and evaluating the overall financial statement presentation. We believe that our audits, which included confirmation of securities at September 30, 2012 by correspondence with the custodian and by agreement to the underlying ownership records of the transfer agent, provide a reasonable basis for our opinion.
PricewaterhouseCoopers LLP
Philadelphia, Pennsylvania
November 12, 2012

Special 2012 tax information (unaudited) for Vanguard Capital Opportunity Fund
This information for the fiscal year ended September 30, 2012, is included pursuant to provisions of
the Internal Revenue Code.
The fund distributed $41,826,000 of qualified dividend income to shareholders during the fiscal year.
The fund distributed $360,576,000 as capital gain dividends (from net long-term capital gains) to
shareholders during the fiscal year.
For corporate shareholders, 100% of investment income (dividend income plus short-term gains,
if any) qualifies for the dividends-received deduction.
27
Your Fund’s After-Tax Returns
This table presents returns for your fund both before and after taxes. The after-tax returns are shown in two ways: (1) assuming that an investor owned the fund during the entire period and paid taxes on the fund’s distributions, and (2) assuming that an investor paid taxes on the fund’s distributions and sold all shares at the end of each period.
Calculations are based on the highest individual federal income tax and capital gains tax rates in effect at the times of the distributions and the hypothetical sales. State and local taxes were not considered. After-tax returns reflect any qualified dividend income , using actual prior-year figures and estimates for 2012. (In the example, returns after the sale of fund shares may be higher than those assuming no sale. This occurs when the sale would have produced a capital loss. The calculation assumes that the investor received a tax deduction for the loss.)
The table shows returns for Investor Shares only; returns for other share classes will differ. Please note that your actual after-tax returns will depend on your tax situation and may differ from those shown. Also note that if you own the fund in a tax-deferred account, such as an individual retirement account or a 401(k) plan, this information does not apply to you. Such accounts are not subject to current taxes.
Finally, keep in mind that a fund’s performance—whether before or after taxes—does not guarantee future results.
| | | |
| Average Annual Total Returns: Capital Opportunity Fund Investor Shares | | |
| Periods Ended September 30, 2012 | | | |
| | One | Five | Ten |
| | Year | Years | Years |
| Returns Before Taxes | 24.62% | 0.21% | 11.82% |
| Returns After Taxes on Distributions | 23.61 | -0.55 | 11.29 |
| Returns After Taxes on Distributions and Sale of Fund Shares | 17.07 | 0.03 | 10.51 |
28
About Your Fund’s Expenses
As a shareholder of the fund, you incur ongoing costs, which include costs for portfolio management, administrative services, and shareholder reports (like this one), among others. Operating expenses, which are deducted from a fund’s gross income, directly reduce the investment return of the fund.
A fund’s expenses are expressed as a percentage of its average net assets. This figure is known as the expense ratio. The following examples are intended to help you understand the ongoing costs (in dollars) of investing in your fund and to compare these costs with those of other mutual funds. The examples are based on an investment of $1,000 made at the beginning of the period shown and held for the entire period.
The accompanying table illustrates your fund’s costs in two ways:
• Based on actual fund return. This section helps you to estimate the actual expenses that you paid over the period. The ”Ending Account Value“ shown is derived from the fund‘s actual return, and the third column shows the dollar amount that would have been paid by an investor who started with $1,000 in the fund. You may use the information here, together with the amount you invested, to estimate the expenses that you paid over the period.
To do so, simply divide your account value by $1,000 (for example, an $8,600 account value divided by $1,000 = 8.6), then multiply the result by the number given for your fund under the heading ”Expenses Paid During Period.“
• Based on hypothetical 5% yearly return. This section is intended to help you compare your fund‘s costs with those of other mutual funds. It assumes that the fund had a yearly return of 5% before expenses, but that the expense ratio is unchanged. In this case—because the return used is not the fund’s actual return—the results do not apply to your investment. The example is useful in making comparisons because the Securities and Exchange Commission requires all mutual funds to calculate expenses based on a 5% return. You can assess your fund’s costs by comparing this hypothetical example with the hypothetical examples that appear in shareholder reports of other funds.
Note that the expenses shown in the table are meant to highlight and help you compare ongoing costs only and do not reflect transaction costs incurred by the fund for buying and selling securities. Further, the expenses do not include any purchase, redemption, or account service fees described in the fund prospectus. If such fees were applied to your account, your costs would be higher. Your fund does not carry a “sales load.”
The calculations assume no shares were bought or sold during the period. Your actual costs may have been higher or lower, depending on the amount of your investment and the timing of any purchases or redemptions.
You can find more information about the fund’s expenses, including annual expense ratios, in the Financial Statements section of this report. For additional information on operating expenses and other shareholder costs, please refer to your fund’s current prospectus.
29
| | | |
| Six Months Ended September 30, 2012 | | | |
| | Beginning | Ending | Expenses |
| | Account Value | Account Value | Paid During |
| Capital Opportunity Fund | 3/31/2012 | 9/30/2012 | Period |
| Based on Actual Fund Return | | | |
| Investor Shares | $1,000.00 | $1,010.96 | $2.42 |
| Admiral Shares | 1,000.00 | 1,011.20 | 2.07 |
| Based on Hypothetical 5% Yearly Return | | | |
| Investor Shares | $1,000.00 | $1,022.66 | $2.43 |
| Admiral Shares | 1,000.00 | 1,023.01 | 2.08 |
The calculations are based on expenses incurred in the most recent six-month period. The fund’s annualized six-month expense ratios for that
period are 0.48% for Investor Shares and 0.41% for Admiral Shares. The dollar amounts shown as “Expenses Paid” are equal to the
annualized expense ratio multiplied by the average account value over the period, multiplied by the number of days in the most recent
six-month period, then divided by the number of days in the most recent 12-month period.
30
Glossary
30-Day SEC Yield. A fund’s 30-day SEC yield is derived using a formula specified by the U.S. Securities and Exchange Commission. Under the formula, data related to the fund’s security holdings in the previous 30 days are used to calculate the fund’s hypothetical net income for that period, which is then annualized and divided by the fund’s estimated average net assets over the calculation period. For the purposes of this calculation, a security’s income is based on its current market yield to maturity (for bonds), its actual income (for asset-backed securities), or its projected dividend yield (for stocks). Because the SEC yield represents hypothetical annualized income, it will differ—at times significantly—from the fund’s actual experience. As a result, the fund’s income distributions may be higher or lower than implied by the SEC yield.
Beta. A measure of the magnitude of a fund’s past share-price fluctuations in relation to the ups and downs of a given market index. The index is assigned a beta of 1.00. Compared with a given index, a fund with a beta of 1.20 typically would have seen its share price rise or fall by 12% when the index rose or fell by 10%. For this report, beta is based on returns over the past 36 months for both the fund and the index. Note that a fund’s beta should be reviewed in conjunction with its R-squared (see definition). The lower the R-squared, the less correlation there is between the fund and the index, and the less reliable beta is as an indicator of volatility.
Dividend Yield. Dividend income earned by stocks, expressed as a percentage of the aggregate market value (or of net asset value, for a fund). The yield is determined by dividing the amount of the annual dividends by the aggregate value (or net asset value) at the end of the period. For a fund, the dividend yield is based solely on stock holdings and does not include any income produced by other investments.
Earnings Growth Rate. The average annual rate of growth in earnings over the past five years for the stocks now in a fund.
Equity Exposure. A measure that reflects a fund’s investments in stocks and stock futures. Any holdings in short-term reserves are excluded.
Expense Ratio. A fund’s total annual operating expenses expressed as a percentage of the fund’s average net assets. The expense ratio includes management and administrative expenses, but does not include the transaction costs of buying and selling portfolio securities.
Foreign Holdings. The percentage of a fund represented by securities or depositary receipts of companies based outside the United States.
Inception Date. The date on which the assets of a fund (or one of its share classes) are first invested in accordance with the fund’s investment objective. For funds with a subscription period, the inception date is the day after that period ends. Investment performance is measured from the inception date.
Median Market Cap. An indicator of the size of companies in which a fund invests; the midpoint of market capitalization (market price x shares outstanding) of a fund’s stocks, weighted by the proportion of the fund’s assets invested in each stock. Stocks representing half of the fund’s assets have market capitalizations above the median, and the rest are below it.
Price/Book Ratio. The share price of a stock divided by its net worth, or book value, per share. For a fund, the weighted average price/book ratio of the stocks it holds.
31
Price/Earnings Ratio. The ratio of a stock’s current price to its per-share earnings over the past year. For a fund, the weighted average P/E of the stocks it holds. P/E is an indicator of market expectations about corporate prospects; the higher the P/E, the greater the expectations for a company’s future growth.
R-Squared. A measure of how much of a fund’s past returns can be explained by the returns from the market in general, as measured by a given index. If a fund’s total returns were precisely synchronized with an index’s returns, its R-squared would be 1.00. If the fund’s returns bore no relationship to the index’s returns, its R-squared would be 0. For this report, R-squared is based on returns over the past 36 months for both the fund and the index.
Return on Equity. The annual average rate of return generated by a company during the past five years for each dollar of shareholder’s equity (net income divided by shareholder’s equity). For a fund, the weighted average return on equity for the companies whose stocks it holds.
Short-Term Reserves. The percentage of a fund invested in highly liquid, short-term securities that can be readily converted to cash.
Turnover Rate. An indication of the fund’s trading activity. Funds with high turnover rates incur higher transaction costs and may be more likely to distribute capital gains (which may be taxable to investors). The turnover rate excludes in-kind transactions, which have minimal impact on costs.
32
This page intentionally left blank.
This page intentionally left blank.
This page intentionally left blank.
The People Who Govern Your Fund
The trustees of your mutual fund are there to see that the fund is operated and managed in your best interests since, as a shareholder, you are a part owner of the fund. Your fund’s trustees also serve on the board of directors of The Vanguard Group, Inc., which is owned by the Vanguard funds and provides services to them on an at-cost basis.
A majority of Vanguard’s board members are independent, meaning that they have no affiliation with Vanguard or the funds they oversee, apart from the sizable personal investments they have made as private individuals. The independent board members have distinguished backgrounds in business, academia, and public service. Each of the trustees and executive officers oversees 179 Vanguard funds.
The following table provides information for each trustee and executive officer of the fund. More information about the trustees is in the Statement of Additional Information, which can be obtained, without charge, by contacting Vanguard at 800-662-7447, or online at vanguard.com.
| |
| InterestedTrustee1 | and Delphi Automotive LLP (automotive components); |
| | Senior Advisor at New Mountain Capital; Trustee of |
| F. William McNabb III | The Conference Board. |
| Born 1957. Trustee Since July 2009. Chairman of the | |
| Board. Principal Occupation(s) During the Past Five | Amy Gutmann |
| Years: Chairman of the Board of The Vanguard Group, | Born 1949. Trustee Since June 2006. Principal |
| Inc., and of each of the investment companies served | Occupation(s) During the Past Five Years: President |
| by The Vanguard Group, since January 2010; Director | of the University of Pennsylvania; Christopher H. |
| of The Vanguard Group since 2008; Chief Executive | Browne Distinguished Professor of Political Science |
| Officer and President of The Vanguard Group and of | in the School of Arts and Sciences with secondary |
| each of the investment companies served by The | appointments at the Annenberg School for |
| Vanguard Group since 2008; Director of Vanguard | Communication and the Graduate School of Education |
| Marketing Corporation; Managing Director of The | of the University of Pennsylvania; Member of the |
| Vanguard Group (1995–2008). | National Commission on the Humanities and Social |
| | Sciences; Trustee of Carnegie Corporation of New |
| | York and of the National Constitution Center; Chair |
| IndependentTrustees | of the U.S. Presidential Commission for the Study |
| | of Bioethical Issues. |
| Emerson U. Fullwood | |
| Born 1948. Trustee Since January 2008. Principal | JoAnn Heffernan Heisen |
| Occupation(s) During the Past Five Years: Executive | Born 1950. Trustee Since July 1998. Principal |
| Chief Staff and Marketing Officer for North America | Occupation(s) During the Past Five Years: Corporate |
| and Corporate Vice President (retired 2008) of Xerox | Vice President and Chief Global Diversity Officer |
| Corporation (document management products and | (retired 2008) and Member of the Executive |
| services); Executive in Residence and 2010 | Committee (1997–2008) of Johnson & Johnson |
| Distinguished Minett Professor at the Rochester | (pharmaceuticals/medical devices/consumer |
| Institute of Technology; Director of SPX Corporation | products); Director of Skytop Lodge Corporation |
| (multi-industry manufacturing), the United Way of | (hotels), the University Medical Center at Princeton, |
| Rochester, Amerigroup Corporation (managed health | the Robert Wood Johnson Foundation, and the Center |
| care), the University of Rochester Medical Center, | for Talent Innovation; Member of the Advisory Board |
| Monroe Community College Foundation, and North | of the Maxwell School of Citizenship and Public Affairs |
| Carolina A&T University. | at Syracuse University. |
| | |
| Rajiv L. Gupta | F. Joseph Loughrey |
| Born 1945. Trustee Since December 2001. 2 | Born 1949. Trustee Since October 2009. Principal |
| Principal Occupation(s) During the Past Five Years: | Occupation(s) During the Past Five Years: President |
| Chairman and Chief Executive Officer (retired 2009) | and Chief Operating Officer (retired 2009) of Cummins |
| and President (2006–2008) of Rohm and Haas Co. | Inc. (industrial machinery); Director of SKF AB |
| (chemicals); Director of Tyco International, Ltd. | (industrial machinery), Hillenbrand, Inc. (specialized |
| (diversified manufacturing and services), Hewlett- | consumer services), the Lumina Foundation for |
| Packard Co. (electronic computer manufacturing), | |
| | |
| Education, and Oxfam America; Chairman of the | Executive Officers | |
| Advisory Council for the College of Arts and Letters | | |
| and Member of the Advisory Board to the Kellogg | Glenn Booraem | |
| Institute for International Studies at the University | Born 1967. Controller Since July 2010. Principal |
| of Notre Dame. | Occupation(s) During the Past Five Years: Principal |
| | of The Vanguard Group, Inc.; Controller of each of |
| Mark Loughridge | the investment companies served by The Vanguard |
| Born 1953. Trustee Since March 2012. Principal | Group; Assistant Controller of each of the investment |
| Occupation(s) During the Past Five Years: Senior Vice | companies served by The Vanguard Group (2001–2010). |
| President and Chief Financial Officer at IBM (information | | |
| technology services); Fiduciary Member of IBM’s | Thomas J. Higgins | |
| Retirement Plan Committee. | Born 1957. Chief Financial Officer Since September |
| | 2008. Principal Occupation(s) During the Past Five |
| Scott C. Malpass | Years: Principal of The Vanguard Group, Inc.; Chief |
| Born 1962. Trustee Since March 2012. Principal | Financial Officer of each of the investment companies |
| Occupation(s) During the Past Five Years: Chief | served by The Vanguard Group; Treasurer of each of |
| Investment Officer and Vice President at the University | the investment companies served by The Vanguard |
| of Notre Dame; Assistant Professor of Finance at the | Group (1998–2008). | |
| Mendoza College of Business at Notre Dame; Member | | |
| of the Notre Dame 403(b) Investment Committee; | Kathryn J. Hyatt | |
| Director of TIFF Advisory Services, Inc. (investment | Born 1955. Treasurer Since November 2008. Principal |
| advisor); Member of the Investment Advisory | Occupation(s) During the Past Five Years: Principal of |
| Committees of the Financial Industry Regulatory | The Vanguard Group, Inc.; Treasurer of each of the |
| Authority (FINRA) and of Major League Baseball. | investment companies served by The Vanguard |
| | Group; Assistant Treasurer of each of the investment |
| André F. Perold | companies served by The Vanguard Group (1988–2008). |
| Born 1952. Trustee Since December 2004. Principal | | |
| Occupation(s) During the Past Five Years: George | Heidi Stam | |
| Gund Professor of Finance and Banking at the Harvard | Born 1956. Secretary Since July 2005. Principal |
| Business School (retired 2011); Chief Investment | Occupation(s) During the Past Five Years: Managing |
| Officer and Managing Partner of HighVista Strategies | Director of The Vanguard Group, Inc.; General Counsel |
| LLC (private investment firm); Director of Rand | of The Vanguard Group; Secretary of The Vanguard |
| Merchant Bank; Overseer of the Museum of Fine | Group and of each of the investment companies |
| Arts Boston. | served by The Vanguard Group; Director and Senior |
| | Vice President of Vanguard Marketing Corporation. |
| Alfred M. Rankin, Jr. | | |
| Born 1941. Trustee Since January 1993. Principal | Vanguard Senior ManagementTeam |
| Occupation(s) During the Past Five Years: Chairman, | | |
| President, and Chief Executive Officer of NACCO | Mortimer J. Buckley | Michael S. Miller |
| Industries, Inc. (forklift trucks/housewares/lignite); | Kathleen C. Gubanich | James M. Norris |
| Director of Goodrich Corporation (industrial products/ | Paul A. Heller | Glenn W. Reed |
| aircraft systems and services) and the National | Martha G. King | George U. Sauter |
| Association of Manufacturers; Chairman of the Board | Chris D. McIsaac | |
| of the Federal Reserve Bank of Cleveland and of | | |
| University Hospitals of Cleveland; Advisory Chairman | | |
| of the Board of The Cleveland Museum of Art. | Chairman Emeritus and Senior Advisor |
| | |
| | John J. Brennan | |
| Peter F. Volanakis | Chairman, 1996–2009 | |
| Born 1955. Trustee Since July 2009. Principal | Chief Executive Officer and President, 1996–2008 |
| Occupation(s) During the Past Five Years: President | | |
| and Chief Operating Officer (retired 2010) of Corning | | |
| Incorporated (communications equipment); Director | Founder | |
| of SPX Corporation (multi-industry manufacturing); | John C. Bogle | |
| Overseer of the Amos Tuck School of Business | Chairman and Chief Executive Officer, 1974–1996 |
| Administration at Dartmouth College; Advisor to the | | |
| Norris Cotton Cancer Center. | | |
1 Mr. McNabb is considered an “interested person,” as defined in the Investment Company Act of 1940, because he is an officer of the
Vanguard funds.
2 December 2002 for Vanguard Equity Income Fund, Vanguard Growth Equity Fund, the Vanguard Municipal Bond Funds, and the Vanguard
State Tax-Exempt Funds.

| |
| | P.O. Box 2600 |
| | Valley Forge, PA 19482-2600 |
| |
| |
| |
| Connect with Vanguard® > vanguard.com | |
| |
| |
| |
| Fund Information > 800-662-7447 | |
| Direct Investor Account Services > 800-662-2739 | |
| Institutional Investor Services > 800-523-1036 | |
| Text Telephone for People | |
| With Hearing Impairment > 800-749-7273 | |
| |
| This material may be used in conjunction | |
| with the offering of shares of any Vanguard | |
| fund only if preceded or accompanied by | |
| the fund’s current prospectus. | |
| |
| All comparative mutual fund data are from Lipper Inc. or | |
| Morningstar, Inc., unless otherwise noted. | |
| |
| You can obtain a free copy of Vanguard’s proxy voting | |
| guidelines by visiting vanguard.com/proxyreporting or by | |
| calling Vanguard at 800-662-2739. The guidelines are | |
| also available from the SEC’s website, sec.gov. In | |
| addition, you may obtain a free report on how your fund | |
| voted the proxies for securities it owned during the 12 | |
| months ended June 30. To get the report, visit either | |
| vanguard.com/proxyreporting or sec.gov. | |
| |
| You can review and copy information about your fund at | |
| the SEC’s Public Reference Room in Washington, D.C. To | |
| find out more about this public service, call the SEC at | |
| 202-551-8090. Information about your fund is also | |
| available on the SEC’s website, and you can receive | |
| copies of this information, for a fee, by sending a | |
| request in either of two ways: via e-mail addressed to | |
| publicinfo@sec.gov or via regular mail addressed to the | |
| Public Reference Section, Securities and Exchange | |
| Commission, Washington, DC 20549-1520. | |
| |
| |
| | © 2012 The Vanguard Group, Inc. |
| | All rights reserved. |
| | Vanguard Marketing Corporation, Distributor. |
| |
| | Q1110 112012 |

Annual Report | September 30, 2012
Vanguard Global Equity Fund

> Vanguard Global Equity Fund returned 22.20% for the 12 months ended September 30, 2012, outperforming both its benchmark index and the average return of peer funds.
> The fund’s long-standing decision to moderate its exposure to North American, principally U.S., stocks created the portfolio’s only notable shortfall.
> Across almost every region, the fund held some of the better-performing stocks.
| |
| Contents | |
| Your Fund’s Total Returns. | 1 |
| Chairman’s Letter. | 2 |
| Advisors’ Report. | 7 |
| Fund Profile. | 11 |
| Performance Summary. | 13 |
| Financial Statements. | 15 |
| Your Fund’s After-Tax Returns. | 31 |
| About Your Fund’s Expenses. | 32 |
| Glossary. | 34 |
Please note: The opinions expressed in this report are just that—informed opinions. They should not be considered promises or advice.
Also, please keep in mind that the information and opinions cover the period through the date on the front of this report. Of course, the
risks of investing in your fund are spelled out in the prospectus.
See the Glossary for definitions of investment terms used in this report.
About the cover: Our cover photograph shows rigging on the HMSSurprise, a replica of an 18th-century Royal Navy frigate. It
was featured in the 2003 movie Master and Commander: The Far Side of the World, which was based on Patrick O’Brian’s sea
novels, set amid the Napoleonic Wars. Vanguard was named for another ship of that era, the HMSVanguard, which was the
flagship of British Admiral Horatio Nelson at the Battle of the Nile.
Your Fund’s Total Returns
| |
| Fiscal Year Ended September 30, 2012 | |
| |
| | Total |
| | Returns |
| Vanguard Global Equity Fund | 22.20% |
| MSCI All Country World Index | 20.98 |
| Global Funds Average | 19.05 |
| Global Funds Average: Derived from data provided by Lipper Inc. |
| | | | |
| Your Fund’s Performance at a Glance | | | |
| September 30, 2011, Through September 30, 2012 | | | |
| | | | Distributions Per Share |
| | Starting | Ending | Income | Capital |
| | Share Price | Share Price | Dividends | Gains |
| Vanguard Global Equity Fund | $15.24 | $18.21 | $0.362 | $0.000 |
1

Chairman’s Letter
Dear Shareholder,
Even as the economic headlines painted a generally dispiriting picture, global stock markets delivered strong returns for the 12 months ended September 30. Vanguard Global Equity Fund returned 22.20%, outpacing the 20.98% return of its benchmark index and the average return of peer funds.
During the past 12 months, the sources of the fund’s strength were almost as wide-ranging as its mandate. It held a preponderance of benchmark-beating stocks in both the developed and emerging markets. The fund’s lone setback came from its long-standing decision to moderate its exposure to North American (principally U.S.) stock markets, which outperformed most other markets during the period.
In August, the fund’s trustees restructured its advisory arrangement, removing AllianceBernstein. Baillie Gifford Overseas, which has advised the fund since 2008, assumed responsibility for the assets previously managed by AllianceBernstein.
If you hold Vanguard Global Equity Fund in a taxable account, you may wish to review the discussion of after-tax returns later in this report.
2
Stocks notched a powerful rally, with help from central bankers
U.S. stocks surged 30% in the 12 months ended September 30, outpacing the gains of their international counterparts. The rally came amid moves by U.S. and European central bankers to quiet—at least temporarily—investors’ concerns about the U.S. economy and the finances of European governments and banks.
While U.S. stocks were the standouts, European and emerging markets stocks also posted double-digit results. The developed markets of the Pacific region were the weakest performers but still recorded a modest advance.
In July, the president of the European
Central Bank declared that policymakers would do whatever was needed to preserve the euro common currency.
That pronouncement was encouraging to investors, but Europe’s financial troubles are by no means resolved. Vanguard economists believe the most likely scenario is that the Eurozone will “muddle through” for several years, with occasional spikes in market volatility, as fiscal tightening continues in the face of weak economic growth.
Bonds produced solid returns, future results may be more muted
Bonds once again advanced; the broad U.S. taxable market returned about 5% for the 12 months. Among U.S. Treasuries,
| | | |
| Market Barometer | | | |
| |
| | Average Annual Total Returns |
| | Periods Ended September 30, 2012 |
| | One | Three | Five |
| | Year | Years | Years |
| Stocks | | | |
| Russell 1000 Index (Large-caps) | 30.06% | 13.27% | 1.22% |
| Russell 2000 Index (Small-caps) | 31.91 | 12.99 | 2.21 |
| Dow Jones U.S. Total Stock Market Index | 30.00 | 13.29 | 1.53 |
| MSCI All Country World Index ex USA (International) | 14.48 | 3.17 | -4.12 |
| |
| Bonds | | | |
| Barclays U.S. Aggregate Bond Index (Broad taxable market) | 5.16% | 6.19% | 6.53% |
| Barclays Municipal Bond Index (Broad tax-exempt market) | 8.32 | 5.99 | 6.06 |
| Citigroup Three-Month U.S. Treasury Bill Index | 0.05 | 0.08 | 0.63 |
| |
| CPI | | | |
| Consumer Price Index | 1.99% | 2.33% | 2.11% |
3
long-term bonds were particularly strong as they benefited from the Federal
Reserve’s bond-buying program.
As bond prices rose, the yield of the 10-year U.S. Treasury note fell to a record low in July, closing below 1.5%. (Bond yields and prices move in opposite directions.) By the end of the period, the yield had climbed, but it still remained low by historical standards.
Bondholders have enjoyed years of strong returns. But as Tim Buckley, our incoming chief investment officer, has noted, investors shouldn’t be surprised if future results are much more modest. As yields tumble, the scope for further declines—and price increases—diminishes.
The Federal Reserve announced on September 13 that it would continue to hold its target for short-term interest rates between 0% and 0.25% at least through mid-2015. The exceptionally low rates, in place since late 2008, kept a tight lid on returns from money market funds and savings accounts.
Wrong markets, right stocks added up to strong 12-month return
Vanguard Global Equity Fund is broadly diversified across developed and emerging stock markets. Compared with its global benchmark index, however, the fund tilts more toward emerging markets and the Pacific region’s developed stock markets. During the past 12 months, these regional
| | |
| Expense Ratios | | |
| Your Fund Compared With Its Peer Group | | |
| | | Peer Group |
| | Fund | Average |
| Global Equity Fund | 0.59% | 1.44% |
The fund expense ratio shown is from the prospectus dated October 12, 2012, and represents estimated costs for the current fiscal year. For the fiscal year ended September 30, 2012, the fund’s expense ratio was 0.57%. The peer-group expense ratio is derived from data provided by Lipper Inc. and captures information through year-end 2011.
Peer group: Global Funds.
4
preferences could have worked against the fund, as the best-performing stock markets were in Europe and the United States.
The fund managed to compensate for this potential disadvantage by holding the better-performing stocks in most markets. In every region except North America, the fund’s stock holdings produced returns superior to those in the index. In North America (primarily the United States), returns for the fund’s holdings and the benchmark’s stocks were more or less equal, and the fund paid a modest price for dialing back its exposure to this generally strong market.
In most markets, the fund’s materials and industrial stocks were sources of strength. In Europe and North America, energy stocks were a highlight. In North America and Europe, the fund earned strong returns from its holdings in consumer discretionary companies, whose fortunes rise and fall with changes in shoppers’ confidence and paychecks. In the Pacific region’s developed markets and emerging markets, by contrast, these stocks were relative laggards. The fund’s choices among consumer staples stocks, which are relatively insensitive to the rhythms of the business cycle, were less successful across the board.
| |
| Total Returns | |
| Ten Years Ended September 30, 2012 | |
| | Average |
| | Annual Return |
| Global Equity Fund | 9.65% |
| Spliced Global Equity Index | 8.83 |
| Global Funds Average | 7.60 |
For a benchmark description, see the Glossary.
Global Funds Average: Derived from data provided by Lipper Inc.
The figures shown represent past performance, which is not a guarantee of future results. (Current performance may be
lower or higher than the performance data cited. For performance data current to the most recent month-end, visit our
website at vanguard.com/performance.) Note, too, that both investment returns and principal value can fluctuate widely, so
an investor’s shares, when sold, could be worth more or less than their original cost.
5
The fund’s long-term return yields timeless lessons
For the ten years ended September 30, Vanguard Global Equity Fund returned an average of 9.65% per year, 2 percentage points better than the average return of its peer group and 0.82 percentage point more than the benchmark index. In light of the past decade’s challenges, which include the worst financial crisis since the Great Depression and questions about the euro’s fate, the fund’s performance has been surprisingly robust.
This disconnect between the headlines and the fund’s return illustrates two important lessons. First, talented advisors such as Marathon Asset Management, Acadian Asset Management, and Baillie Gifford Overseas can deliver market-beating returns, especially when they aren’t burdened by high expense ratios. The second lesson is more generally about the benefits of sticking with a long-term investment program.
You need to balance your willingness to take risk with your need to earn rewards. One of the best ways to modulate this balance is through your allocations to higher-risk assets such as stocks and lower-risk assets such as bonds and cash. Once the balance is struck, however, be prepared to sit tight through the occasional—and inevitable—periods
of turbulence in higher-risk assets. These frightening setbacks are the price you pay for the potential for longer-term reward.
We thank Jeremy Hosking for his years of distinguished service
When we launched Vanguard Global Equity Fund in 1995, our shareholders were privileged to have advisory firm Marathon Asset Management and portfolio manager Jeremy Hosking at the helm. Marathon and Jeremy brought best-in-class advisory capabilities, superior insight, and a global perspective to our new fund just as non-U.S. stocks were assuming more importance in our clients’ portfolios. At the end of the year, Jeremy will retire from Marathon. We thank him for his years of distinguished service to Vanguard clients. Marathon continues to advise the fund, working with fellow advisory firms Acadian and Baillie Gifford to build on the fund’s record of long-term excellence.
Thank you for entrusting your assets to Vanguard.
Sincerely,

F. William McNabb III
Chairman and Chief Executive Officer
October 16, 2012
6
Advisors’ Report
For the fiscal year ended September 30, 2012, the Global Equity Fund returned
22.20%. Your fund is managed by three independent advisors, a strategy that enhances the fund’s diversification by providing exposure to distinct, yet complementary, investment approaches. It’s not uncommon for different advisors to have different views about individual securities or the broader investment environment.
The advisors, the percentage of fund assets each manages, and brief descriptions of their investment strategies are presented in the table below. Each advisor has also prepared a discussion of the investment environment that existed during the fiscal period and of how portfolio positioning reflects this assessment. These comments were prepared on October 17, 2012.
| | | |
| Vanguard Global Equity Fund Investment Advisors | |
| |
| | Fund Assets Managed | |
| Investment Advisor | % | $ Million | Investment Strategy |
| Marathon Asset Management | 46 | 1,754 | A long-term and contrarian investment philosophy and |
| LLP | | | process with a focus on industry capital cycle analysis |
| | | | and in-depth management assessment. |
| Acadian Asset Management LLC | 33 | 1,289 | A quantitative, active, bottom-up investment process |
| | | | that combines stock and peer-group valuation to arrive |
| | | | at a return forecast for each of more than 40,000 |
| | | | securities in the global universe. |
| Baillie Gifford Overseas Ltd. | 20 | 759 | The advisor seeks stocks that can generate |
| | | | above-average growth in earnings and cash flow, |
| | | | producing a bottom-up, stock-driven approach to |
| | | | country and asset allocation. An in-depth view on each |
| | | | company is measured against the consensus view, |
| | | | leading to discrepancies and potential opportunities to |
| | | | add value. |
| Cash Investments | 1 | 51 | These short-term reserves are invested by Vanguard in |
| | | | equity index products to simulate investment in stocks. |
| | | | Each advisor may also maintain a modest cash |
| | | | position. |
7
Marathon Asset Management LLP
Portfolio Managers:
Jeremy J. Hosking, Investment Director
Neil M. Ostrer, Investment Director
William J. Arah, Investment Director
Following the global financial crisis the dilemma confronting equity investors remains much the same: Should one bet that the unorthodox monetary policies being pursued in the United States, the United Kingdom, the Eurozone, and even
Japan will be successful in restoring growth? To the extent that recent problems have been caused by excessive financial sector balance sheet expansion from 2002 to 2007, is it rational to expect central bank balance sheet expansion to be part of a solution?
Attempts to reframe the question don’t help much either. Corporate cash flows are at record levels, but economic activity, in developed countries at least, is depressed. There is also a valuation paradox: The U.S. stock market, for example, is believed to be about 50% higher than its long-term
“cyclically adjusted” level when calculated using metrics such as “The Q ratio” (a company’s market value divided by the replacement value of its assets) or “CAPE,” the cyclically adjusted price/ earnings ratio, which is based on corporate earnings over the past ten years. In previous episodes of cyclically depressed economic activity it has always paid to bet that the central banks will prevail and, even with the misgivings outlined above, we
believe that this is the way to bet today. Consistent with this conviction is a portfolio that, in the jargon of the day, is “risk on” rather than “risk off.”
It is interesting to note that over the last 12 months the portfolio has outperformed the MSCI All Country World Index despite the long list of concerns that worry investors. The outperformance is largely attributable to stock selection. Geographical allocation was a negative contributor: An underweighting to the United States and an overweighting to Asia ex Japan both had a negative effect on relative performance. However, Asia ex Japan produced the strongest stock selection results, particularly Thailand. AIS, the Thai telecommunication company, made a notable contribution amid growing optimism that the cost of 3G licenses would not be as onerous as feared.
Equity market strength is likely to gather momentum rather than be reversed in the final quarter of 2012 and into 2013, as investors reflect on the latest round of monetary stimulus. The main risks would appear to be unintended consequences. The two most obvious possibilities here are that the monetary accommodation will “leak” into emerging markets, fuelling their rise, and/or that such accommodation will leak directly into consumer price and commodity inflation without any intervening expansion of output. Both of these scenarios are likely to unfold to a degree but not to the extent of completely invalidating the case for a fully invested global equity portfolio.
8
Acadian Asset Management LLC
Portfolio Managers:
John R. Chisholm, CFA,
Chief Investment Officer
Ronald D. Frashure, CFA,
Chairman, President, and CEO
Brian K. Wolahan, CFA,
Senior Vice President, Director of
Portfolio Management
World markets realized double-digit returns for the 12 months despite volatility throughout the period. The final months of 2011 saw moderation of the year’s generally downward trajectory as investors perceived some hopeful signals from the U.S. economy and from European officials on the region’s debt crises. Early 2012 saw a strong bounce for global equities, as investors were encouraged by a number of positive developments in the United States and European markets were buoyed by better-than-expected economic news and a possible resolution to the Greek debt crisis.
Market momentum soon decelerated, however, with intensifying concerns about the Eurozone’s most indebted members reigniting worries. Despite signs of progress in Europe, economic indicators for most of the region were gloomy.
A contraction in Japanese industrial production and continued slowing in China further eroded sentiment. U.S. indicators told a mixed story, with unease about the strength of the employ-ment recovery somewhat mitigated by positive signs from the long-beleaguered housing market.
Late in the period, a renewed optimism was driven in part by perceived progress on stabilizing Europe and measures by key central banks to prop up economic growth, including the Fed’s passage of QE3, the European Central Bank’s commitment to backstop troubled bond markets, and the Bank of Japan’s expansion of its monetary-easing program.
The portfolio was focused on attractively valued stocks that appeared likely to rise in price based on quality, earnings signals, and price characteristics. Key over-weighted markets, based on bottom-up stock selection, included South Korea, Japan, the United States, and China. The United Kingdom, Switzerland, Canada, and
Brazil were underweighted. The sector focus was on energy, health care, and telecommunication services.
Relative performance was driven by successful stock selection, particularly in Japan. Country allocations were also positive, specifically underweightings in Brazil and Canada and a lack of exposure to Spain.
9
Baillie Gifford Overseas Ltd.
Portfolio Managers:
Charles Plowden, Joint Senior Partner
and Lead Portfolio Manager
Spencer Adair, CFA, Investment Manager
Malcolm MacColl, Investment Manager
Global markets have rallied strongly over the past year. Much of the good news can be attributed to the United States, where steady, if slow, progress has helped lift sentiment and stock markets. In recent weeks, action by the European Central
Bank and further Quantitative Easing announcements in the United States have reminded us that the authorities still have firepower to deploy to help the world on its path to recovery. Such activity should help to create an atmosphere of confidence more conducive to economic growth.
We remain optimistic and this has been reflected in the portfolio. We continued to reduce exposure to some steady growth companies whose reliable earnings streams have now become richly valued, such as Altria and Japan Tobacco. We also sought to increase the longer-term growth profile of the portfolio by seeking out more rapidly growing companies or those whose growth will benefit from more stringent industrywide capital discipline.
Semiconductors are a natural area of interest for a growth investor. Every year, electronic gadgetry becomes more prevalent, more complex, and demands more processing power, and this presents a number of interesting opportunities. Two recent purchases, Altera and Xilinx, are longstanding superior operators and dominate the market for programmable semiconductors. We envisage program-mable devices taking market share from bespoke ones because of the flexibility their products afford to customers.
Increasing capital discipline, which in turn has been aided by industry consolidation, is apparent in both the cruise holiday and truck industries. We have purchased Royal Caribbean and Volvo (whose auto business was divested many years ago). Both should benefit from a recovery in end demand, self-help, and much-improved industry dynamics, which will lift margins and returns.
In the short term, we cannot discount the possibility that market volatility will reappear. Global growth forecasts have been revised downward amid the Euro-zone’s economic slowdown and China’s realignment toward domestic consumption. However, we see no shortage of opportunity and our companies are making good progress toward long-term goals, which bodes well for the portfolio.
10
Global Equity Fund
Fund Profile
As of September 30, 2012
| | |
| Portfolio Characteristics | | |
| | | MSCI All |
| | | Country |
| | Fund | World Index |
| Number of Stocks | 905 | 2,433 |
| Median Market Cap | $16.5B | $36.3B |
| Price/Earnings Ratio | 14.7x | 15.2x |
| Price/Book Ratio | 1.7x | 1.7x |
| Return on Equity | 16.0% | 17.9% |
| Earnings Growth Rate | 10.9% | 7.8% |
| Dividend Yield | 2.1% | 2.8% |
| Turnover Rate | 67% | — |
| Ticker Symbol | VHGEX | — |
| Expense Ratio1 | 0.59% | — |
| Short-Term Reserves | 1.8% | — |
| | |
| Sector Diversification (% of equity exposure) |
| | | MSCI All |
| | | Country |
| | Fund | World Index |
| Consumer Discretionary | 18.0% | 10.4% |
| Consumer Staples | 8.9 | 10.6 |
| Energy | 7.7 | 11.1 |
| Financials | 21.4 | 19.8 |
| Health Care | 8.8 | 9.5 |
| Industrials | 13.1 | 10.2 |
| Information Technology | 10.1 | 12.7 |
| Materials | 5.3 | 7.5 |
| Telecommunication Services | 5.9 | 4.6 |
| Utilities | 0.8 | 3.6 |
| |
| Volatility Measures | |
| | MSCI All |
| | Country |
| | World Index |
| R-Squared | 0.98 |
| Beta | 1.03 |
| These measures show the degree and timing of the fund’s fluctuations compared with the index over 36 months. |
| | |
| Ten Largest Holdings (% of total net assets) |
| Amazon.com Inc. | Internet Retail | 1.5% |
| Philip Morris | | |
| International Inc. | Tobacco | 1.4 |
| Liberty Global Inc. | Cable & Satellite | 1.3 |
| Apple Inc. | Computer Hardware | 1.2 |
| American International | | |
| Group Inc. | Multi-line Insurance | 1.0 |
| Samsung Electronics Co. | | |
| Ltd. | Semiconductors | 1.0 |
| Jardine Matheson | Industrial | |
| Holdings Ltd. | Conglomerates | 1.0 |
| Royal Dutch Shell plc | Integrated Oil & Gas | 1.0 |
| Jardine Strategic | Industrial | |
| Holdings Ltd. | Conglomerates | 1.0 |
| Costco Wholesale Corp. | Hypermarkets & | |
| | Super Centers | 0.9 |
| Top Ten | | 11.3% |
| The holdings listed exclude any temporary cash investments and equity index products. |
Allocation by Region (% of equity exposure)
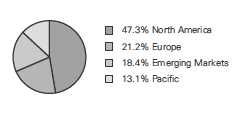
1 The expense ratio shown is from the prospectus dated October 12, 2012, and represents estimated costs for the current fiscal year. For the
fiscal year ended September 30, 2012, the expense ratio was 0.57%.
11
Global Equity Fund
| | |
| Market Diversification (% of equity exposure) |
| | | MSCI All |
| | | Country |
| | | World |
| | Fund | Index |
| Europe | | |
| United Kingdom | 8.6% | 8.3% |
| Switzerland | 2.4 | 3.1 |
| France | 2.0 | 3.3 |
| Germany | 2.0 | 3.1 |
| Sweden | 1.7 | 1.2 |
| Other | 4.5 | 4.5 |
| Subtotal | 21.2% | 23.5% |
| Pacific | | |
| Japan | 6.9% | 7.2% |
| Hong Kong | 4.0 | 1.1 |
| Singapore | 1.2 | 0.7 |
| Australia | 1.0 | 3.2 |
| Subtotal | 13.1% | 12.2% |
| Emerging Markets | | |
| South Korea | 2.7% | 2.0% |
| China | 2.3 | 2.2 |
| South Africa | 2.3 | 1.0 |
| Thailand | 1.9 | 0.3 |
| Philippines | 1.8 | 0.1 |
| Malaysia | 1.5 | 0.5 |
| Taiwan | 1.4 | 1.4 |
| Brazil | 1.1 | 1.6 |
| Mexico | 1.0 | 0.6 |
| Other | 2.4 | 2.9 |
| Subtotal | 18.4% | 12.6% |
| North America | | |
| United States | 43.5% | 47.1% |
| Canada | 3.8 | 4.4 |
| Subtotal | 47.3% | 51.5% |
| Middle East | | |
| Israel | 0.0% | 0.2% |
12
Global Equity Fund
Performance Summary
All of the returns in this report represent past performance, which is not a guarantee of future results that may be achieved by the fund. (Current performance may be lower or higher than the performance data cited. For performance data current to the most recent month-end, visit our website at vanguard.com/performance.) Note, too, that both investment returns and principal value can fluctuate widely, so an investor’s shares, when sold, could be worth more or less than their original cost. The returns shown do not reflect taxes that a shareholder would pay on fund distributions or on the sale of fund shares.
Cumulative Performance: September 30, 2002, Through September 30, 2012
Initial Investment of $10,000
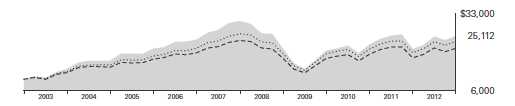
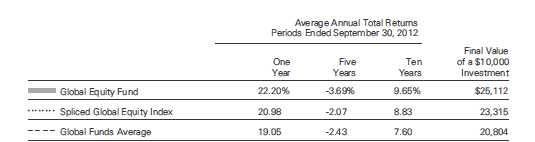
For a benchmark description, see the Glossary.
Global Funds Average: Derived from data provided by Lipper Inc.
See Financial Highlights for dividend and capital gains information.
13
Global Equity Fund
Fiscal-Year Total Returns (%): September 30, 2002, Through September 30, 2012

For a benchmark description, see the Glossary.
14
Global Equity Fund
Financial Statements
Statement of Net Assets—Investments Summary
As of September 30, 2012
This Statement summarizes the fund’s holdings by asset type. Details are reported for each of the fund’s 50 largest individual holdings and for investments that, in total for any issuer, represent more than 1% of the fund’s net assets. The total value of smaller holdings is reported as a single amount within each category.
The fund reports a complete list of its holdings in regulatory filings four times in each fiscal year, at the quarter-ends. For the second and fourth fiscal quarters, the complete listing of the fund’s holdings is available electronically on vanguard.com and on the Securities and Exchange Commission’s website (sec.gov), or you can have it mailed to you without charge by calling 800-662-7447. For the first and third fiscal quarters, the fund files the lists with the SEC on Form N-Q. Shareholders can look up the fund’s Forms N-Q on the SEC’s website. Forms N-Q may also be reviewed and copied at the SEC’s Public Reference Room (see the back cover of this report for further information).
| | | |
| | | Market | Percentage |
| | | Value | of Net |
| | Shares | ($000) | Assets |
| Common Stocks | | | |
| Argentina † | | 3,883 | 0.1% |
| |
| Australia † | | 35,961 | 0.9% |
| |
| Austria † | | 2,597 | 0.1% |
| |
| Belgium † | | 11,107 | 0.3% |
| |
| Brazil † | | 42,717 | 1.1% |
| |
| Canada | | | |
| Rogers Communications Inc. Class B | 703,255 | 28,471 | 0.7% |
| Agrium Inc. | 221,500 | 22,981 | 0.6% |
| Canada—Other † | | 90,539 | 2.4% |
| | | 141,991 | 3.7% |
| |
| Chile † | | 4,799 | 0.1% |
| |
| China | | | |
| China Mobile Ltd. | 2,791,000 | 30,941 | 0.8% |
| PetroChina Co. Ltd. | 6,928,000 | 8,957 | 0.2% |
| China Petroleum & Chemical Corp. | 6,726,000 | 6,239 | 0.2% |
| China Telecom Corp. Ltd. | 4,736,000 | 2,737 | 0.1% |
| China Resources Enterprise Ltd. | 336,067 | 1,118 | 0.0% |
| China—Other † | | 35,872 | 0.9% |
| | | 85,864 | 2.2% |
| |
| Colombia † | | 498 | 0.0% |
| |
| Denmark † | | 33,831 | 0.9% |
| |
| Egypt † | | 2,776 | 0.1% |
15
Global Equity Fund
| | | |
| | | Market | Percentage |
| | | Value• | of Net |
| | Shares | ($000) | Assets |
| Finland † | | 10,374 | 0.3% |
| |
| France | | | |
| Sanofi | 240,712 | 20,600 | 0.5% |
| European Aeronautic Defence and Space Co. NV | 558,271 | 17,695 | 0.5% |
| France—Other † | | 35,142 | 0.9% |
| | | 73,437 | 1.9% |
| |
| Germany † | | 73,195 | 1.9% |
| |
| Greece † | | 11,327 | 0.3% |
| |
| Hong Kong | | | |
| Jardine Matheson Holdings Ltd. | 699,902 | 39,732 | 1.0% |
| Jardine Strategic Holdings Ltd. | 1,089,900 | 36,896 | 1.0% |
| Mandarin Oriental International Ltd. | 806,690 | 1,163 | 0.0% |
| Hong Kong—Other † | | 72,839 | 1.9% |
| | | 150,630 | 3.9% |
| |
| Hungary † | | 312 | 0.0% |
| |
| India † | | 9,994 | 0.3% |
| |
| Indonesia † | | 19,021 | 0.5% |
| |
| Ireland † | | 21,222 | 0.6% |
| |
| Israel † | | 716 | 0.0% |
| |
| Italy † | | 19,248 | 0.5% |
| |
| Japan | | | |
| Nippon Telegraph & Telephone Corp. | 557,700 | 26,535 | 0.7% |
| Daito Trust Construction Co. Ltd. | 217,200 | 21,803 | 0.6% |
| Hitachi Ltd. | 3,105,000 | 17,242 | 0.4% |
| Japan—Other † | | 193,133 | 5.0% |
| | | 258,713 | 6.7% |
| |
| Malaysia † | | 57,575 | 1.5% |
| |
| Mexico | | | |
| America Movil SAB de CV ADR | 1,104,928 | 28,109 | 0.7% |
| Mexico—Other † | | 10,878 | 0.3% |
| | | 38,987 | 1.0% |
| |
| Netherlands † | | 17,231 | 0.5% |
| |
| New Zealand † | | 724 | 0.0% |
| |
| Norway † | | 25,639 | 0.7% |
| |
| Philippines | | | |
| Ayala Corp. | 2,399,833 | 24,454 | 0.6% |
| Philippines—Other † | | 44,500 | 1.2% |
| | | 68,954 | 1.8% |
16
Global Equity Fund
| | | |
| | | Market | Percentage |
| | | Value | of Net |
| | Shares | ($000) | Assets |
| Poland † | | 13,884 | 0.4% |
| |
| Russia † | | 13,484 | 0.3% |
| |
| Singapore | | | |
| DBS Group Holdings Ltd. | 2,232,000 | 26,070 | 0.7% |
| Singapore—Other † | | 19,174 | 0.5% |
| | | 45,244 | 1.2% |
| |
| South Africa | | | |
| Naspers Ltd. | 265,496 | 16,467 | 0.4% |
| South Africa—Other † | | 69,172 | 1.8% |
| | | 85,639 | 2.2% |
| |
| South Korea | | | |
| Samsung Electronics Co. Ltd. | 22,886 | 27,580 | 0.7% |
| Hyundai Motor Co. | 97,255 | 21,936 | 0.6% |
| Samsung Electronics Co. Ltd. GDR | 20,200 | 12,184 | 0.3% |
| South Korea—Other † | | 42,078 | 1.1% |
| | | 103,778 | 2.7% |
| |
| Spain † | | 12,050 | 0.3% |
| |
| Sweden | | | |
| Svenska Handelsbanken AB Class A | 693,730 | 26,035 | 0.7% |
| Sweden—Other † | | 36,788 | 0.9% |
| | | 62,823 | 1.6% |
| |
| Switzerland | | | |
| Roche Holding AG | 107,431 | 20,095 | 0.5% |
| Nestle SA | 274,930 | 17,347 | 0.5% |
| Cie Financiere Richemont SA | 285,737 | 17,157 | 0.5% |
| Switzerland—Other † | | 36,050 | 0.9% |
| | | 90,649 | 2.4% |
| |
| Taiwan † | | 53,278 | 1.4% |
| |
| Thailand † | | 70,850 | 1.8% |
| |
| Turkey † | | 20,125 | 0.5% |
| |
| United Kingdom | | | |
| Royal Dutch Shell plc Class A | 984,195 | 34,078 | 0.9% |
| Wolseley plc | 544,681 | 23,299 | 0.6% |
| Rolls-Royce Holdings plc | 1,646,285 | 22,458 | 0.6% |
| Prudential plc | 1,496,828 | 19,437 | 0.5% |
| Vodafone Group plc | 5,845,864 | 16,612 | 0.4% |
| Royal Dutch Shell plc Class B | 146,694 | 5,220 | 0.1% |
| United Kingdom—Other † | | 199,353 | 5.2% |
| | | 320,457 | 8.3% |
17
Global Equity Fund
| | | |
| | | Market | Percentage |
| | | Value | of Net |
| | Shares | ($000) | Assets |
| United States | | | |
| Consumer Discretionary | | | |
| * Amazon.com Inc. | 223,014 | 56,717 | 1.5% |
| * Liberty Global Inc. Class A | 512,678 | 31,145 | 0.8% |
| Cablevision Systems Corp. Class A | 1,410,186 | 22,351 | 0.6% |
| * Liberty Global Inc. | 349,117 | 19,697 | 0.5% |
| Brinker International Inc. | 480,344 | 16,956 | 0.4% |
| Consumer Discretionary—Other † | | 251,805 | 6.5% |
| | | 398,671 | 10.3% |
| |
| Consumer Staples | | | |
| Philip Morris International Inc. | 611,772 | 55,023 | 1.4% |
| Costco Wholesale Corp. | 355,015 | 35,546 | 0.9% |
| Tyson Foods Inc. Class A | 1,110,798 | 17,795 | 0.5% |
| Estee Lauder Cos. Inc. Class A | 259,144 | 15,955 | 0.4% |
| Consumer Staples—Other † | | 49,845 | 1.3% |
| | | 174,164 | 4.5% |
| |
| Energy | | | |
| ConocoPhillips | 397,108 | 22,707 | 0.6% |
| Phillips 66 | 347,377 | 16,108 | 0.4% |
| Energy—Other † | | 92,654 | 2.4% |
| | | 131,469 | 3.4% |
| |
| Exchange-Traded Fund | | | |
| 1 Vanguard MSCI Emerging Markets ETF | 317,402 | 13,251 | 0.3% |
| |
| Financials | | | |
| * American International Group Inc. | 1,214,892 | 39,836 | 1.0% |
| * Berkshire Hathaway Inc. Class B | 244,855 | 21,596 | 0.6% |
| Discover Financial Services | 504,825 | 20,057 | 0.5% |
| SL Green Realty Corp. | 236,114 | 18,906 | 0.5% |
| Bank of America Corp. | 1,894,205 | 16,726 | 0.5% |
| Financials—Other † | | 185,408 | 4.8% |
| | | 302,529 | 7.9% |
| |
| Health Care | | | |
| Merck & Co. Inc. | 604,305 | 27,254 | 0.7% |
| Eli Lilly & Co. | 565,033 | 26,788 | 0.7% |
| Abbott Laboratories | 355,360 | 24,363 | 0.6% |
| UnitedHealth Group Inc. | 365,055 | 20,228 | 0.5% |
| WellPoint Inc. | 296,003 | 17,171 | 0.5% |
| Health Care—Other † | | 69,626 | 1.8% |
| | | 185,430 | 4.8% |
| Industrials | | | |
| Northrop Grumman Corp. | 329,148 | 21,865 | 0.6% |
| Kansas City Southern | 243,615 | 18,461 | 0.5% |
| Industrials—Other † | | 62,410 | 1.6% |
| | | 102,736 | 2.7% |
18
Global Equity Fund
| | | | |
| | | | Market | Percentage |
| | | | Value• | of Net |
| | | Shares | ($000) | Assets |
| Information Technology | | | | |
| Apple Inc. | | 69,653 | 46,477 | 1.2% |
| * eBay Inc. | | 610,843 | 29,571 | 0.8% |
| Information Technology—Other † | | | 154,016 | 4.0% |
| | | | 230,064 | 6.0% |
| |
| Materials † | | | 78,299 | 2.0% |
| |
| Telecommunication Services † | | | 18,377 | 0.5% |
| |
| Utilities † | | | 252 | 0.0% |
| | | | 1,635,242 | 42.4% |
| Total Common Stocks (Cost $3,048,441) | | | 3,750,826 | 97.4%2 |
| Preferred Stocks (Cost $75) † | | | 60 | 0.0% |
| Convertible Bonds | | | | |
| |
| Consumer Discretionary † | | | — | 0.0% |
| |
| 3Financials † | | | 1,119 | 0.0% |
| |
| Industrials † | | | 1,517 | 0.1% |
| Total Convertible Bonds (Cost $1,608) | | | 2,636 | 0.1% |
| |
| |
| | Coupon | | | |
| Temporary Cash Investments | | | | |
| Money Market Fund | | | | |
| 4,5 Vanguard Market Liquidity Fund | 0.163% | 172,201,054 | 172,201 | 4.4% |
| |
| 6U.S. Government and Agency Obligations † | | | 10,498 | 0.3% |
| Total Temporary Cash Investments (Cost $182,700) | | | 182,699 | 4.7%2 |
| 7Total Investments (Cost $3,232,824) | | | 3,936,221 | 102.2% |
| Other Assets and Liabilities | | | | |
| Other Assets | | | 18,669 | 0.5% |
| Liabilities5 | | | (101,642) | (2.7%) |
| | | | (82,973) | (2.2%) |
| Net Assets | | | 3,853,248 | 100.0% |
19
Global Equity Fund
| |
| At September 30, 2012, net assets consisted of: | |
| | Amount |
| | ($000) |
| Paid-in Capital | 4,967,510 |
| Undistributed Net Investment Income | 30,043 |
| Accumulated Net Realized Losses | (1,847,193) |
| Unrealized Appreciation (Depreciation) | |
| Investment Securities | 703,397 |
| Futures Contracts | (522) |
| Forward Currency Contracts | (85) |
| Foreign Currencies | 98 |
| Net Assets | 3,853,248 |
| |
| |
| |
| Net Assets | |
| Applicable to 211,634,614 outstanding $.001 par value shares | |
| of beneficial interest (unlimited authorization) | 3,853,248 |
| Net Asset Value Per Share | $18.21 |
See Note A in Notes to Financial Statements.
* Non-income-producing security.
† Represents the aggregate value, by category, of securities that are not among the 50 largest holdings and, in total for any issuer, represent
1% or less of net assets.
1 Considered an affiliated company of the fund as the issuer is another member of The Vanguard Group.
2 The fund invests a portion of its cash reserves in equity markets through the use of index futures contracts. After giving effect to futures
investments, the fund’s effective common stock and temporary cash investment positions represent 98.2% and 3.9%, respectively, of net
assets.
3 Certain of the fund’s securities are exempt from registration under Rule 144A of the Securities Act of 1933. Such securities may be sold in
transactions exempt from registration, normally to qualified institutional buyers. At September 30, 2012, the aggregate value of these
securities was $1,119,000, representing 0.0% of net assets.
4 Affiliated money market fund available only to Vanguard funds and certain trusts and accounts managed by Vanguard. Rate shown is the
7-day yield.
5 Includes $79,729,000 of collateral received for securities on loan.
6 Securities with a value of $4,599,000 have been segregated as initial margin for open futures contracts.
7 The total value of securities on loan is $73,493,000.
ADR—American Depositary Receipt.
GDR—Global Depositary Receipt.
See accompanying Notes, which are an integral part of the Financial Statements.
20
Global Equity Fund
Statement of Operations
| |
| | Year Ended |
| | September 30, 2012 |
| | ($000) |
| Investment Income | |
| Income | |
| Dividends1,2 | 84,507 |
| Interest2 | 719 |
| Security Lending | 2,516 |
| Total Income | 87,742 |
| Expenses | |
| Investment Advisory Fees—Note B | |
| Basic Fee | 9,101 |
| Performance Adjustment | 793 |
| The Vanguard Group—Note C | |
| Management and Administrative | 9,532 |
| Marketing and Distribution | 774 |
| Custodian Fees | 604 |
| Auditing Fees | 40 |
| Shareholders’ Reports | 69 |
| Trustees’ Fees and Expenses | 9 |
| Total Expenses | 20,922 |
| Net Investment Income | 66,820 |
| Realized Net Gain (Loss) | |
| Investment Securities Sold2 | (29,528) |
| Futures Contracts | 11,044 |
| Foreign Currencies and Forward Currency Contracts | (2,986) |
| Realized Net Gain (Loss) | (21,470) |
| Change in Unrealized Appreciation (Depreciation) | |
| Investment Securities | 664,502 |
| Futures Contracts | 270 |
| Foreign Currencies and Forward Currency Contracts | 945 |
| Change in Unrealized Appreciation (Depreciation) | 665,717 |
| Net Increase (Decrease) in Net Assets Resulting from Operations | 711,067 |
| 1 Dividends are net of foreign withholding taxes of $3,556,000. | |
| 2 Dividend income, interest income, and realized net gain (loss) from affiliated companies of the fund were $167,000, $194,000, |
| and $105,000, respectively. |
See accompanying Notes, which are an integral part of the Financial Statements.
21
Global Equity Fund
Statement of Changes in Net Assets
| | |
| | Year Ended September 30, |
| | 2012 | 2011 |
| | ($000) | ($000) |
| Increase (Decrease) in Net Assets | | |
| Operations | | |
| Net Investment Income | 66,820 | 78,752 |
| Realized Net Gain (Loss) | (21,470) | 254,579 |
| Change in Unrealized Appreciation (Depreciation) | 665,717 | (568,777) |
| Net Increase (Decrease) in Net Assets Resulting from Operations | 711,067 | (235,446) |
| Distributions | | |
| Net Investment Income | (76,902) | (73,523) |
| Realized Capital Gain | — | — |
| Total Distributions | (76,902) | (73,523) |
| Capital Share Transactions | | |
| Issued | 452,881 | 446,848 |
| Issued in Lieu of Cash Distributions | 72,488 | 69,613 |
| Redeemed | (636,233) | (783,383) |
| Net Increase (Decrease) from Capital Share Transactions | (110,864) | (266,922) |
| Total Increase (Decrease) | 523,301 | (575,891) |
| Net Assets | | |
| Beginning of Period | 3,329,947 | 3,905,838 |
| End of Period1 | 3,853,248 | 3,329,947 |
| 1 Net Assets—End of Period includes undistributed net investment income of $30,043,000 and $38,960,000. |
See accompanying Notes, which are an integral part of the Financial Statements.
22
Global Equity Fund
Financial Highlights
| | | | | |
| For a Share Outstanding | Year Ended September 30, |
| Throughout Each Period | 2012 | 2011 | 2010 | 2009 | 2008 |
| Net Asset Value, Beginning of Period | $15.24 | $16.74 | $15.49 | $16.64 | $26.51 |
| Investment Operations | | | | | |
| Net Investment Income | .320 | .3451 | .314 | .371 | .529 |
| Net Realized and Unrealized Gain (Loss) | | | | | |
| on Investments | 3.012 | (1.525) | 1.292 | (.948) | (8.569) |
| Total from Investment Operations | 3.332 | (1.180) | 1.606 | (.577) | (8.040) |
| Distributions | | | | | |
| Dividends from Net Investment Income | (.362) | (.320) | (.356) | (.573) | (.430) |
| Distributions from Realized Capital Gains | — | — | — | — | (1.400) |
| Total Distributions | (.362) | (.320) | (.356) | (.573) | (1.830) |
| Net Asset Value, End of Period | $18.21 | $15.24 | $16.74 | $15.49 | $16.64 |
| |
| Total Return2 | 22.20% | -7.31% | 10.51% | -2.30% | -32.24% |
| |
| Ratios/Supplemental Data | | | | | |
| Net Assets, End of Period (Millions) | $3,853 | $3,330 | $3,906 | $3,813 | $5,160 |
| Ratio of Total Expenses to Average | | | | | |
| Net Assets3 | 0.57% | 0.54% | 0.44% | 0.47% | 0.51% |
| Ratio of Net Investment Income | | | | | |
| to Average Net Assets | 1.82% | 1.92% | 1.94% | 2.55% | 2.35% |
| Portfolio Turnover Rate | 67% | 44% | 64% | 71% | 73% |
1 Calculated based on average shares outstanding.
2 Total returns do not include account service fees that may have applied in the periods shown. Fund prospectuses provide information about
any applicable account service fees.
3 Includes performance-based investment advisory fee increases (decreases) of 0.02%, (0.02%), (0.11%), (0.13%), and (0.02%).
See accompanying Notes, which are an integral part of the Financial Statements.
23
Global Equity Fund
Notes to Financial Statements
Vanguard Global Equity Fund is registered under the Investment Company Act of 1940 as an open-end investment company, or mutual fund. The fund invests in securities of foreign issuers, which may subject it to investment risks not normally associated with investing in securities of United States corporations.
A. The following significant accounting policies conform to generally accepted accounting principles for U.S. mutual funds. The fund consistently follows such policies in preparing its financial statements.
1. Security Valuation: Securities are valued as of the close of trading on the New York Stock Exchange (generally 4 p.m., Eastern time) on the valuation date. Equity securities are valued at the latest quoted sales prices or official closing prices taken from the primary market in which each security trades; such securities not traded on the valuation date are valued at the mean of the latest quoted bid and asked prices. Bonds, and temporary cash investments acquired over 60 days to maturity, are valued using the latest bid prices or using valuations based on a matrix system (which considers such factors as security prices, yields, maturities, and ratings), both as furnished by independent pricing services. Other temporary cash investments are valued at amortized cost, which approximates market value. Securities for which market quotations are not readily available, or whose values have been affected by events occurring before the fund’s pricing time but after the close of the securities’ primary markets, are valued at their fair values calculated according to procedures adopted by the board of trustees. These procedures include obtaining quotations from an independent pricing service, monitoring news to identify significant market- or security-specific events, and evaluating changes in the values of foreign market proxies (for example, ADRs, futures contracts, or exchange-traded funds), between the time the foreign markets close and the fund’s pricing time. When fair-value pricing is employed, the prices of securities used by a fund to calculate its net asset value may differ from quoted or published prices for the same securities.
2. Foreign Currency: Securities and other assets and liabilities denominated in foreign currencies are translated into U.S. dollars using exchange rates obtained from an independent third party as of the fund’s pricing time on the valuation date. Realized gains (losses) and unrealized appreciation (depreciation) on investment securities include the effects of changes in exchange rates since the securities were purchased, combined with the effects of changes in security prices. Fluctuations in the value of other assets and liabilities resulting from changes in exchange rates are recorded as unrealized foreign currency gains (losses) until the assets or liabilities are settled in cash, at which time they are recorded as realized foreign currency gains (losses).
3. Futures and Forward Currency Contracts: The fund uses index futures contracts to a limited extent, with the objective of maintaining full exposure to the stock market while maintaining liquidity. The fund may purchase or sell futures contracts to achieve a desired level of investment, whether to accommodate portfolio turnover or cash flows from capital share transactions. The primary risks associated with the use of futures contracts are imperfect correlation between changes in market values of stocks held by the fund and the prices of futures contracts, and the possibility of an illiquid market.
The fund also enters into forward currency contracts to provide the appropriate currency exposure related to any open futures contracts or to protect the value of securities and related receivables and payables against changes in foreign exchange rates. The primary risk associated with the fund’s use of these contracts is that a counterparty will fail to fulfill its obligation to pay gains due to the fund under the contracts. Counterparty risk is mitigated by entering into forward currency contracts only
24
Global Equity Fund
with highly rated counterparties, by a master netting arrangement between the fund and the counterparty, and by the posting of collateral by the counterparty. The forward currency contracts contain provisions whereby a counterparty may terminate open contracts if the fund’s net assets decline below a certain level, triggering a payment by the fund if the fund is in a net liability position at the time of the termination. The payment amount would be reduced by any collateral the fund has posted. Any securities posted as collateral for open contracts are noted in the Statement of Net Assets.
Futures contracts are valued at their quoted daily settlement prices. Forward currency contracts are valued at their quoted daily prices obtained from an independent third party, adjusted for currency risk based on the expiration date of each contract. The aggregate principal amounts of the contracts are not recorded in the Statement of Net Assets. Fluctuations in the value of the contracts are recorded in the Statement of Net Assets as an asset (liability) and in the Statement of Operations as unrealized appreciation (depreciation) until the contracts are closed, when they are recorded as realized gains (losses) on futures or forward currency contracts.
During the year ended September 30, 2012, the fund’s average investment in futures contracts represented 3% of net assets, based on quarterly average aggregate settlement values. The fund’s average investment in forward currency contracts represented 2% of net assets, based on quarterly average notional amounts.
4. Federal Income Taxes: The fund intends to continue to qualify as a regulated investment company and distribute all of its taxable income. Management has analyzed the fund’s tax positions taken for all open federal income tax years (September 30, 2009–2012), and has concluded that no provision for federal income tax is required in the fund’s financial statements.
5. Distributions: Distributions to shareholders are recorded on the ex-dividend date.
6. Security Lending: The fund may lend its securities to qualified institutional borrowers to earn additional income. Security loans are required to be secured at all times by collateral at least equal to the market value of securities loaned. The fund invests cash collateral received in Vanguard Market Liquidity Fund, and records a liability for the return of the collateral, during the period the securities are on loan. Security lending income represents fees charged to borrowers plus income earned on investing cash collateral, less expenses associated with the loan.
7. Other: Dividend income is recorded on the ex-dividend date. Interest income includes income distributions received from Vanguard Market Liquidity Fund and is accrued daily. Security transactions are accounted for on the date securities are bought or sold. Costs used to determine realized gains (losses) on the sale of investment securities are those of the specific securities sold.
B. Marathon Asset Management LLP, Acadian Asset Management LLC, and Baillie Gifford Overseas Ltd. each provide investment advisory services to a portion of the fund for a fee calculated at an annual percentage rate of average net assets managed by the advisor. The basic fees of Marathon Asset Management LLP, Acadian Asset Management LLC, and Baillie Gifford Overseas Ltd. are subject to quarterly adjustments based on performance for the preceding three years relative to the MSCI All Country World Index. Until August 2012, a portion of the fund was managed by AllianceBernstein L.P. The basic fee paid to AllianceBernstein L.P. was subject to quarterly adjustments based on performance for the preceding five years relative to the MSCI All Country World Index.
25
Global Equity Fund
The Vanguard Group manages the cash reserves of the fund on an at-cost basis.
For the year ended September 30, 2012, the aggregate investment advisory fee represented an effective annual basic rate of 0.25% of the fund’s average net assets, before an increase of $793,000 (0.02%) based on performance.
C. The Vanguard Group furnishes at cost corporate management, administrative, marketing, and distribution services. The costs of such services are allocated to the fund under methods approved by the board of trustees. The fund has committed to provide up to 0.40% of its net assets in capital contributions to Vanguard. At September 30, 2012, the fund had contributed capital of $535,000 to Vanguard (included in Other Assets), representing 0.01% of the fund’s net assets and 0.21% of Vanguard’s capitalization. The fund’s trustees and officers are also directors and officers of Vanguard.
D. Various inputs may be used to determine the value of the fund’s investments. These inputs are summarized in three broad levels for financial statement purposes. The inputs or methodologies used to value securities are not necessarily an indication of the risk associated with investing in those securities.
Level 1—Quoted prices in active markets for identical securities.
Level 2—Other significant observable inputs (including quoted prices for similar securities, interest rates, prepayment speeds, credit risk, etc.).
Level 3—Significant unobservable inputs (including the fund’s own assumptions used to determine the fair value of investments).
The following table summarizes the market value of the fund’s investments as of September 30, 2012, based on the inputs used to value them:
| | | |
| | Level 1 | Level 2 | Level 3 |
| Investments | ($000) | ($000) | ($000) |
| Common Stocks—International | 296,084 | 1,819,502 | — |
| Common Stocks—United States | 1,635,240 | — | — |
| Preferred Stocks | — | 60 | — |
| Convertible Bonds | — | 2,636 | — |
| Temporary Cash Investments | 172,201 | 10,498 | — |
| Futures Contracts—Liabilities1 | (247) | — | — |
| Forward Currency Contracts—Liabilities | — | (85) | — |
| Total | 2,103,278 | 1,832,611 | — |
| 1 Represents variation margin on the last day of the reporting period. |
E. At September 30, 2012, the fair values of derivatives were reflected in the Statement of
Net Assets as follows:
| | | |
| | | Foreign | |
| | Equity | Exchange | |
| | Contracts | Contracts | Total |
| Statement of Net Assets Caption | ($000) | ($000) | ($000) |
| Liabilities | (247) | (85) | (332) |
26
Global Equity Fund
Realized net gain (loss) and the change in unrealized appreciation (depreciation) on derivatives for the year ended September 30, 2012, were:
| | | |
| | | Foreign | |
| | Equity | Exchange | |
| | Contracts | Contracts | Total |
| Realized Net Gain (Loss) on Derivatives | ($000) | ($000) | ($000) |
| Futures Contracts | 11,044 | — | 11,044 |
| Forward Currency Contracts | — | (2,639) | (2,639) |
| Realized Net Gain (Loss) on Derivatives | 11,044 | (2,639) | 8,405 |
| |
| Change in Unrealized Appreciation (Depreciation) on Derivatives | | | |
| Futures Contracts | 270 | — | 270 |
| Forward Currency Contracts | — | 548 | 548 |
| Change in Unrealized Appreciation (Depreciation) on Derivatives | 270 | 548 | 818 |
At September 30, 2012, the aggregate settlement value of open futures contracts and the related unrealized appreciation (depreciation) were:
| | | | |
| | | | ($000) |
| | | | Aggregate | |
| | | Number of | Settlement | Unrealized |
| | | Long (Short) | Value | Appreciation |
| Futures Contracts | Expiration | Contracts | Long (Short) | (Depreciation) |
| S&P 500 Index | December 2012 | 53 | 19,003 | (250) |
| FTSE 100 Index | December 2012 | 46 | 4,244 | (108) |
| Dow Jones EURO STOXX 50 Index | December 2012 | 119 | 3,758 | (183) |
| Topix Index | December 2012 | 33 | 3,118 | 35 |
| S&P ASX 200 Index | December 2012 | 17 | 1,938 | (16) |
Unrealized appreciation (depreciation) on open S&P 500 Index and FTSE 100 Index futures is required to be treated as realized gain (loss) for tax purposes.
At September 30, 2012, the fund had open forward currency contracts to receive and deliver currencies as follows. Unrealized appreciation (depreciation) on open forward currency contracts is treated as realized gain (loss) for tax purposes.
27
Global Equity Fund
| | | | | | |
| | | | | | | Unrealized |
| | Contract | | | | | Appreciation |
| | Settlement | Contract Amount (000) | (Depreciation) |
| Counterparty | Date | Receive | Deliver | ($000) |
| UBS AG | 12/21/12 | GBP | 2,749 | USD | 4,437 | (20) |
| UBS AG | 12/21/12 | EUR | 3,079 | USD | 3,965 | (59) |
| UBS AG | 12/18/12 | JPY | 233,327 | USD | 3,001 | — |
| UBS AG | 12/21/12 | AUD | 1,899 | USD | 1,960 | (6) |
| AUD—Australian dollar. | | | | | | |
| EUR—Euro. | | | | | | |
| GBP—British pound. | | | | | | |
| JPY—Japanese yen. | | | | | | |
| USD—U.S. dollar. | | | | | | |
F. Distributions are determined on a tax basis and may differ from net investment income and realized capital gains for financial reporting purposes. Differences may be permanent or temporary. Permanent differences are reclassified among capital accounts in the financial statements to reflect their tax character. Temporary differences arise when certain items of income, expense, gain, or loss are recognized in different periods for financial statement and tax purposes; these differences will reverse at some time in the future. Differences in classification may also result from the treatment of short-term gains as ordinary income for tax purposes.
During the year ended September 30, 2012, the fund realized net foreign currency losses of $347,000, which decreased distributable net income for tax purposes; accordingly, such losses have been reclassified from accumulated net realized losses to undistributed net investment income.
Certain of the fund’s investments are in securities considered to be “passive foreign investment companies,” for which any unrealized appreciation and/or realized gains are required to be included in distributable net income for tax purposes. During the year ended September 30, 2012, the fund realized gains on the sale of passive foreign investment companies of $1,512,000, which have been included in current and prior periods’ taxable income; accordingly, such gains have been reclassified from accumulated net realized losses to undistributed net investment income. Passive foreign investment companies held at September 30, 2012, had unrealized appreciation of $17,200,000, of which, $16,817,000 has been distributed and is reflected in the balance of undistributed net investment income.
For tax purposes, at September 30, 2012, the fund had $55,604,000 of ordinary income available for distribution. At September 30, 2012, the fund had available capital losses totaling $1,848,782,000 to offset future net capital gains. Of this amount, $1,796,173,000 is subject to expiration dates; $565,891,000 may be used to offset future net capital gains through September 30, 2017, and $1,230,282,000 through September 30, 2018. Capital losses of $52,609,000 realized beginning in fiscal 2012 may be carried forward indefinitely under the Regulated Investment Company
Modernization Act of 2010, but must be used before any expiring loss carryforwards.
At September 30, 2012, the cost of investment securities for tax purposes was $3,250,024,000. Net unrealized appreciation of investment securities for tax purposes was $686,197,000, consisting of unrealized gains of $917,651,000 on securities that had risen in value since their purchase and $231,454,000 in unrealized losses on securities that had fallen in value since their purchase.
28
Global Equity Fund
G. During the year ended September 30, 2012, the fund purchased $2,347,365,000 of investment securities and sold $2,451,266,000 of investment securities, other than temporary cash investments.
H. Capital shares issued and redeemed were:
| | |
| | Year Ended September 30, |
| | 2012 | 2011 |
| | Shares | Shares |
| | (000) | (000) |
| Issued | 26,113 | 24,878 |
| Issued in Lieu of Cash Distributions | 4,542 | 3,933 |
| Redeemed | (37,464) | (43,692) |
| Net Increase (Decrease) in Shares Outstanding | (6,809) | (14,881) |
I. In preparing the financial statements as of September 30, 2012, management considered the impact of subsequent events for potential recognition or disclosure in these financial statements.
29
Report of Independent Registered
Public Accounting Firm
To the Trustees of Vanguard Horizon Funds and the Shareholders of Vanguard Global Equity Fund:
In our opinion, the accompanying statement of net assets—investment summary and the related statements of operations and of changes in net assets and the financial highlights present fairly, in all material respects, the financial position of Vanguard Global Equity Fund (constituting a separate portfolio of Vanguard Horizon Funds, hereafter referred to as the “Fund”) at September 30, 2012, the results of its operations for the year then ended, the changes in its net assets for each of the two years in the period then ended and the financial highlights for each of the five years in the period then ended, in conformity with accounting principles generally accepted in the United States of America. These financial statements and financial highlights (hereafter referred to as “financial statements”) are the responsibility of the Fund’s management; our responsibility is to express an opinion on these financial statements based on our audits. We conducted our audits of these financial statements in accordance with the standards of the Public Company Accounting Oversight Board (United States). Those standards require that we plan and perform the audit to obtain reasonable assurance about whether the financial statements are free of material misstatement. An audit includes examining, on a test basis, evidence supporting the amounts and disclosures in the financial statements, assessing the accounting principles used and significant estimates made by management, and evaluating the overall financial statement presentation. We believe that our audits, which included confirmation of securities at September 30, 2012 by correspondence with the custodian and brokers and by agreement to the underlying ownership records of the transfer agent, provide a reasonable basis for our opinion.
PricewaterhouseCoopers LLP
Philadelphia, Pennsylvania
November 12, 2012

Special 2012 tax information (unaudited) for Vanguard Global Equity Fund
This information for the fiscal year ended September 30, 2012, is included pursuant to provisions of
the Internal Revenue Code.
The fund distributed $62,606,000 of qualified dividend income to shareholders during the fiscal year.
For corporate shareholders, 34.4% of investment income (dividend income plus short-term gains, if
any) qualifies for the dividends-received deduction.
The fund designates to shareholders foreign source income of $48,080,000 and foreign taxes paid
of $3,340,000. Shareholders will receive more detailed information with their Form 1099-DIV in
January 2013 to determine the calendar-year amounts to be included on their 2012 tax returns.
30
Your Fund’s After-Tax Returns
This table presents returns for your fund both before and after taxes. The after-tax returns are shown in two ways: (1) assuming that an investor owned the fund during the entire period and paid taxes on the fund’s distributions, and (2) assuming that an investor paid taxes on the fund’s distributions and sold all shares at the end of each period.
Calculations are based on the highest individual federal income tax and capital gains tax rates in effect at the times of the distributions and the hypothetical sales. State and local taxes were not considered. After-tax returns reflect any qualified dividend income , using actual prior-year figures and estimates for 2012. (In the example, returns after the sale of fund shares may be higher than those assuming no sale. This occurs when the sale would have produced a capital loss. The calculation assumes that the investor received a tax deduction for the loss.)
Please note that your actual after-tax returns will depend on your tax situation and may differ from those shown. Also note that if you own the fund in a tax-deferred account, such as an individual retirement account or a 401(k) plan, this information does not apply to you. Such accounts are not subject to current taxes.
Finally, keep in mind that a fund’s performance—whether before or after taxes—does not guarantee future results.
Average Annual Total Returns: Global Equity Fund
Periods Ended September 30, 2012
| | | |
| | One | Five | Ten |
| | Year | Years | Years |
| Returns Before Taxes | 22.20% | -3.69% | 9.65% |
| Returns After Taxes on Distributions | 21.78 | -4.32 | 8.99 |
| Returns After Taxes on Distributions and Sale of Fund Shares | 14.86 | -3.24 | 8.40 |
31
About Your Fund’s Expenses
As a shareholder of the fund, you incur ongoing costs, which include costs for portfolio management, administrative services, and shareholder reports (like this one), among others. Operating expenses, which are deducted from a fund’s gross income, directly reduce the investment return of the fund.
A fund’s expenses are expressed as a percentage of its average net assets. This figure is known as the expense ratio. The following examples are intended to help you understand the ongoing costs (in dollars) of investing in your fund and to compare these costs with those of other mutual funds. The examples are based on an investment of $1,000 made at the beginning of the period shown and held for the entire period.
The accompanying table illustrates your fund’s costs in two ways:
• Based on actual fund return. This section helps you to estimate the actual expenses that you paid over the period. The ”Ending Account Value“ shown is derived from the fund‘s actual return, and the third column shows the dollar amount that would have been paid by an investor who started with $1,000 in the fund. You may use the information here, together with the amount you invested, to estimate the expenses that you paid over the period.
To do so, simply divide your account value by $1,000 (for example, an $8,600 account value divided by $1,000 = 8.6), then multiply the result by the number given for your fund under the heading ”Expenses Paid During Period.“
• Based on hypothetical 5% yearly return. This section is intended to help you compare your fund‘s costs with those of other mutual funds. It assumes that the fund had a yearly return of 5% before expenses, but that the expense ratio is unchanged. In this case—because the return used is not the fund’s actual return—the results do not apply to your investment. The example is useful in making comparisons because the Securities and Exchange Commission requires all mutual funds to calculate expenses based on a 5% return. You can assess your fund’s costs by comparing this hypothetical example with the hypothetical examples that appear in shareholder reports of other funds.
Note that the expenses shown in the table are meant to highlight and help you compare ongoing costs only and do not reflect transaction costs incurred by the fund for buying and selling securities. Further, the expenses do not include any purchase, redemption, or account service fees described in the fund prospectus. If such fees were applied to your account, your costs would be higher. Your fund does not carry a “sales load.”
The calculations assume no shares were bought or sold during the period. Your actual costs may have been higher or lower, depending on the amount of your investment and the timing of any purchases or redemptions.
You can find more information about the fund’s expenses, including annual expense ratios, in the Financial Statements section of this report. For additional information on operating expenses and other shareholder costs, please refer to your fund’s current prospectus.
32
| | | |
| Six Months Ended September 30, 2012 | | | |
| | Beginning | Ending | Expenses |
| | Account Value | Account Value | Paid During |
| Global Equity Fund | 3/31/2012 | 9/30/2012 | Period |
| Based on Actual Fund Return | $1,000.00 | $1,007.75 | $2.87 |
| Based on Hypothetical 5% Yearly Return | 1,000.00 | 1,022.21 | 2.89 |
The calculations are based on expenses incurred in the most recent six-month period. The fund’s annualized six-month expense ratio for that
period is 0.57%. The dollar amounts shown as “Expenses Paid” are equal to the annualized expense ratio multiplied by the average account
value over the period, multiplied by the number of days in the most recent six-month period, then divided by the number of days in the most
recent 12-month period.
33
Glossary
Beta. A measure of the magnitude of a fund’s past share-price fluctuations in relation to the ups and downs of a given market index. The index is assigned a beta of 1.00. Compared with a given index, a fund with a beta of 1.20 typically would have seen its share price rise or fall by 12% when the index rose or fell by 10%. For this report, beta is based on returns over the past 36 months for both the fund and the index. Note that a fund’s beta should be reviewed in conjunction with its R-squared (see definition). The lower the R-squared, the less correlation there is between the fund and the index, and the less reliable beta is as an indicator of volatility.
Dividend Yield. Dividend income earned by stocks, expressed as a percentage of the aggregate market value (or of net asset value, for a fund). The yield is determined by dividing the amount of the annual dividends by the aggregate value (or net asset value) at the end of the period. For a fund, the dividend yield is based solely on stock holdings and does not include any income produced by other investments.
Earnings Growth Rate. The average annual rate of growth in earnings over the past five years for the stocks now in a fund.
Equity Exposure. A measure that reflects a fund’s investments in stocks and stock futures. Any holdings in short-term reserves are excluded.
Expense Ratio. A fund’s total annual operating expenses expressed as a percentage of the fund’s average net assets. The expense ratio includes management and administrative expenses, but does not include the transaction costs of buying and selling portfolio securities.
Inception Date. The date on which the assets of a fund (or one of its share classes) are first invested in accordance with the fund’s investment objective. For funds with a subscription period, the inception date is the day after that period ends. Investment performance is measured from the inception date.
Median Market Cap. An indicator of the size of companies in which a fund invests; the midpoint of market capitalization (market price x shares outstanding) of a fund’s stocks, weighted by the proportion of the fund’s assets invested in each stock. Stocks representing half of the fund’s assets have market capitalizations above the median, and the rest are below it.
Price/Book Ratio. The share price of a stock divided by its net worth, or book value, per share. For a fund, the weighted average price/book ratio of the stocks it holds.
Price/Earnings Ratio. The ratio of a stock’s current price to its per-share earnings over the past year. For a fund, the weighted average P/E of the stocks it holds. P/E is an indicator of market expectations about corporate prospects; the higher the P/E, the greater the expectations for a company’s future growth.
R-Squared. A measure of how much of a fund’s past returns can be explained by the returns from the market in general, as measured by a given index. If a fund’s total returns were precisely synchronized with an index’s returns, its R-squared would be 1.00. If the fund’s returns bore no relationship to the index’s returns, its R-squared would be 0. For this report, R-squared is based on returns over the past 36 months for both the fund and the index.
34
Return on Equity. The annual average rate of return generated by a company during the past five years for each dollar of shareholder’s equity (net income divided by shareholder’s equity). For a fund, the weighted average return on equity for the companies whose stocks it holds.
Short-Term Reserves. The percentage of a fund invested in highly liquid, short-term securities that can be readily converted to cash.
Turnover Rate. An indication of the fund’s trading activity. Funds with high turnover rates incur higher transaction costs and may be more likely to distribute capital gains (which may be taxable to investors). The turnover rate excludes in-kind transactions, which have minimal impact on costs.
Benchmark Information
Spliced Global Equity Index: MSCI All Country World Index returns gross of taxes through
March 31, 2007; MSCI All Country World Index returns net of withholding taxes thereafter.
35
The People Who Govern Your Fund
The trustees of your mutual fund are there to see that the fund is operated and managed in your best interests since, as a shareholder, you are a part owner of the fund. Your fund’s trustees also serve on the board of directors of The Vanguard Group, Inc., which is owned by the Vanguard funds and provides services to them on an at-cost basis.
A majority of Vanguard’s board members are independent, meaning that they have no affiliation with Vanguard or the funds they oversee, apart from the sizable personal investments they have made as private individuals. The independent board members have distinguished backgrounds in business, academia, and public service. Each of the trustees and executive officers oversees 179 Vanguard funds.
The following table provides information for each trustee and executive officer of the fund. More information about the trustees is in the Statement of Additional Information, which can be obtained, without charge, by contacting Vanguard at 800-662-7447, or online at vanguard.com.
| |
| InterestedTrustee1 | and Delphi Automotive LLP (automotive components); |
| | Senior Advisor at New Mountain Capital; Trustee of |
| F. William McNabb III | The Conference Board. |
| Born 1957. Trustee Since July 2009. Chairman of the | |
| Board. Principal Occupation(s) During the Past Five | Amy Gutmann |
| Years: Chairman of the Board of The Vanguard Group, | Born 1949. Trustee Since June 2006. Principal |
| Inc., and of each of the investment companies served | Occupation(s) During the Past Five Years: President |
| by The Vanguard Group, since January 2010; Director | of the University of Pennsylvania; Christopher H. |
| of The Vanguard Group since 2008; Chief Executive | Browne Distinguished Professor of Political Science |
| Officer and President of The Vanguard Group and of | in the School of Arts and Sciences with secondary |
| each of the investment companies served by The | appointments at the Annenberg School for |
| Vanguard Group since 2008; Director of Vanguard | Communication and the Graduate School of Education |
| Marketing Corporation; Managing Director of The | of the University of Pennsylvania; Member of the |
| Vanguard Group (1995–2008). | National Commission on the Humanities and Social |
| | Sciences; Trustee of Carnegie Corporation of New |
| IndependentTrustees | York and of the National Constitution Center; Chair |
| of the U.S. Presidential Commission for the Study |
| Emerson U. Fullwood | of Bioethical Issues. |
| Born 1948. Trustee Since January 2008. Principal | |
| Occupation(s) During the Past Five Years: Executive | JoAnn Heffernan Heisen |
| Chief Staff and Marketing Officer for North America | Born 1950. Trustee Since July 1998. Principal |
| and Corporate Vice President (retired 2008) of Xerox | Occupation(s) During the Past Five Years: Corporate |
| Corporation (document management products and | Vice President and Chief Global Diversity Officer |
| services); Executive in Residence and 2010 | (retired 2008) and Member of the Executive |
| Distinguished Minett Professor at the Rochester | Committee (1997–2008) of Johnson & Johnson |
| Institute of Technology; Director of SPX Corporation | (pharmaceuticals/medical devices/consumer |
| (multi-industry manufacturing), the United Way of | products); Director of Skytop Lodge Corporation |
| Rochester, Amerigroup Corporation (managed health | (hotels), the University Medical Center at Princeton, |
| care), the University of Rochester Medical Center, | the Robert Wood Johnson Foundation, and the Center |
| Monroe Community College Foundation, and North | for Talent Innovation; Member of the Advisory Board |
| Carolina A&T University. | of the Maxwell School of Citizenship and Public Affairs |
| | at Syracuse University. |
| |
| Rajiv L. Gupta | F. Joseph Loughrey |
| Born 1945. Trustee Since December 2001. 2 | Born 1949. Trustee Since October 2009. Principal |
| Principal Occupation(s) During the Past Five Years: | Occupation(s) During the Past Five Years: President |
| Chairman and Chief Executive Officer (retired 2009) | and Chief Operating Officer (retired 2009) of Cummins |
| and President (2006–2008) of Rohm and Haas Co. | Inc. (industrial machinery); Director of SKF AB |
| (chemicals); Director of Tyco International, Ltd. | (industrial machinery), Hillenbrand, Inc. (specialized |
| (diversified manufacturing and services), Hewlett- | consumer services), the Lumina Foundation for |
| Packard Co. (electronic computer manufacturing), | |
| | |
| Education, and Oxfam America; Chairman of the | Executive Officers | |
| Advisory Council for the College of Arts and Letters | | |
| and Member of the Advisory Board to the Kellogg | Glenn Booraem | |
| Institute for International Studies at the University | Born 1967. Controller Since July 2010. Principal |
| of Notre Dame. | Occupation(s) During the Past Five Years: Principal |
| | of The Vanguard Group, Inc.; Controller of each of |
| Mark Loughridge | the investment companies served by The Vanguard |
| Born 1953. Trustee Since March 2012. Principal | Group; Assistant Controller of each of the investment |
| Occupation(s) During the Past Five Years: Senior Vice | companies served by The Vanguard Group (2001–2010). |
| President and Chief Financial Officer at IBM (information | | |
| technology services); Fiduciary Member of IBM’s | Thomas J. Higgins | |
| Retirement Plan Committee. | Born 1957. Chief Financial Officer Since September |
| | 2008. Principal Occupation(s) During the Past Five |
| Scott C. Malpass | Years: Principal of The Vanguard Group, Inc.; Chief |
| Born 1962. Trustee Since March 2012. Principal | Financial Officer of each of the investment companies |
| Occupation(s) During the Past Five Years: Chief | served by The Vanguard Group; Treasurer of each of |
| Investment Officer and Vice President at the University | the investment companies served by The Vanguard |
| of Notre Dame; Assistant Professor of Finance at the | Group (1998–2008). | |
| Mendoza College of Business at Notre Dame; Member | | |
| of the Notre Dame 403(b) Investment Committee; | Kathryn J. Hyatt | |
| Director of TIFF Advisory Services, Inc. (investment | Born 1955. Treasurer Since November 2008. Principal |
| advisor); Member of the Investment Advisory | Occupation(s) During the Past Five Years: Principal of |
| Committees of the Financial Industry Regulatory | The Vanguard Group, Inc.; Treasurer of each of the |
| Authority (FINRA) and of Major League Baseball. | investment companies served by The Vanguard |
| | Group; Assistant Treasurer of each of the investment |
| André F. Perold | companies served by The Vanguard Group (1988–2008). |
| Born 1952. Trustee Since December 2004. Principal | | |
| Occupation(s) During the Past Five Years: George | Heidi Stam | |
| Gund Professor of Finance and Banking at the Harvard | Born 1956. Secretary Since July 2005. Principal |
| Business School (retired 2011); Chief Investment | Occupation(s) During the Past Five Years: Managing |
| Officer and Managing Partner of HighVista Strategies | Director of The Vanguard Group, Inc.; General Counsel |
| LLC (private investment firm); Director of Rand | of The Vanguard Group; Secretary of The Vanguard |
| Merchant Bank; Overseer of the Museum of Fine | Group and of each of the investment companies |
| Arts Boston. | served by The Vanguard Group; Director and Senior |
| | Vice President of Vanguard Marketing Corporation. |
| Alfred M. Rankin, Jr. | | |
| Born 1941. Trustee Since January 1993. Principal | Vanguard Senior ManagementTeam |
| Occupation(s) During the Past Five Years: Chairman, | | |
| President, and Chief Executive Officer of NACCO | Mortimer J. Buckley | Michael S. Miller |
| Industries, Inc. (forklift trucks/housewares/lignite); | Kathleen C. Gubanich | James M. Norris |
| Director of Goodrich Corporation (industrial products/ | Paul A. Heller | Glenn W. Reed |
| aircraft systems and services) and the National | Martha G. King | George U. Sauter |
| Association of Manufacturers; Chairman of the Board | Chris D. McIsaac | |
| of the Federal Reserve Bank of Cleveland and of | | |
| University Hospitals of Cleveland; Advisory Chairman | | |
| of the Board of The Cleveland Museum of Art. | Chairman Emeritus and Senior Advisor |
| | John J. Brennan | |
| Peter F. Volanakis | Chairman, 1996–2009 | |
| Born 1955. Trustee Since July 2009. Principal | Chief Executive Officer and President, 1996–2008 |
| Occupation(s) During the Past Five Years: President | | |
| and Chief Operating Officer (retired 2010) of Corning | Founder | |
| Incorporated (communications equipment); Director | John C. Bogle | |
| of SPX Corporation (multi-industry manufacturing); | Chairman and Chief Executive Officer, 1974–1996 |
| Overseer of the Amos Tuck School of Business | | |
| Administration at Dartmouth College; Advisor to the | | |
| Norris Cotton Cancer Center. | | |
1 Mr. McNabb is considered an “interested person,” as defined in the Investment Company Act of 1940, because he is an officer of the
Vanguard funds.
2 December 2002 for Vanguard Equity Income Fund, Vanguard Growth Equity Fund, the Vanguard Municipal Bond Funds, and the Vanguard
State Tax-Exempt Funds.

| |
| | P.O. Box 2600 |
| | Valley Forge, PA 19482-2600 |
| |
| |
| |
| Connect with Vanguard® > vanguard.com | |
| |
| |
| |
| Fund Information > 800-662-7447 | CFA® is a trademark owned by CFA Institute. |
| Direct Investor Account Services > 800-662-2739 | |
| Institutional Investor Services > 800-523-1036 | |
| Text Telephone for People | |
| With Hearing Impairment > 800-749-7273 | |
| |
| This material may be used in conjunction | |
| with the offering of shares of any Vanguard | |
| fund only if preceded or accompanied by | |
| the fund’s current prospectus. | |
| |
| All comparative mutual fund data are from Lipper Inc. or | |
| Morningstar, Inc., unless otherwise noted. | |
| |
| You can obtain a free copy of Vanguard’s proxy voting | |
| guidelines by visiting vanguard.com/proxyreporting or by | |
| calling Vanguard at 800-662-2739. The guidelines are | |
| also available from the SEC’s website, sec.gov. In | |
| addition, you may obtain a free report on how your fund | |
| voted the proxies for securities it owned during the 12 | |
| months ended June 30. To get the report, visit either | |
| vanguard.com/proxyreporting or sec.gov. | |
| |
| You can review and copy information about your fund at | |
| the SEC’s Public Reference Room in Washington, D.C. To | |
| find out more about this public service, call the SEC at | |
| 202-551-8090. Information about your fund is also | |
| available on the SEC’s website, and you can receive | |
| copies of this information, for a fee, by sending a | |
| request in either of two ways: via e-mail addressed to | |
| publicinfo@sec.gov or via regular mail addressed to the | |
| Public Reference Section, Securities and Exchange | |
| Commission, Washington, DC 20549-1520. | |
| |
| |
| | © 2012 The Vanguard Group, Inc. |
| | All rights reserved. |
| | Vanguard Marketing Corporation, Distributor. |
| |
| | Q1290 112012 |
Vanguard® Global Equity Fund
Schedule of Investments
September 30, 2012
| | |
| | | Market |
| | | Value |
| | Shares | ($000) |
| |
| Common Stocks (97.4%)1 | | |
| Argentina (0.1%) | | |
| Arcos Dorados Holdings Inc. Class A | 251,662 | 3,883 |
| |
| Australia (0.9%) | | |
| Australia & New Zealand Banking Group Ltd. | 364,662 | 9,319 |
| Brambles Ltd. | 1,105,032 | 8,007 |
| Amcor Ltd. | 556,530 | 4,466 |
| Wesfarmers Ltd. | 92,007 | 3,256 |
| Cochlear Ltd. | 42,720 | 2,964 |
| BHP Billiton Ltd. | 80,233 | 2,742 |
| Santos Ltd. | 130,325 | 1,529 |
| Orica Ltd. | 59,242 | 1,523 |
| Iluka Resources Ltd. | 117,143 | 1,197 |
| Alumina Ltd. | 455,071 | 396 |
| CSL Ltd. | 7,542 | 359 |
| DuluxGroup Ltd. | 59,322 | 203 |
| | | 35,961 |
| Austria (0.1%) | | |
| Andritz AG | 21,806 | 1,237 |
| Oesterreichische Post AG | 27,351 | 979 |
| Raiffeisen Bank International AG | 5,662 | 205 |
| * Erste Group Bank AG | 7,881 | 176 |
| | | 2,597 |
| Belgium (0.3%) | | |
| Anheuser-Busch InBev NV | 129,831 | 11,107 |
| |
| Brazil (1.1%) | | |
| Vale SA Class B ADR | 477,600 | 8,291 |
| BM&FBovespa SA | 1,288,600 | 7,761 |
| Petroleo Brasileiro SA ADR Type A | 263,600 | 5,818 |
| Odontoprev SA | 983,953 | 5,485 |
| Cia de Saneamento Basico do Estado de Sao Paulo ADR | 65,414 | 5,312 |
| * OGX Petroleo e Gas Participacoes SA | 1,058,403 | 3,232 |
| Embraer SA ADR | 49,231 | 1,311 |
| Banco do Brasil SA | 89,700 | 1,097 |
| Multiplan Empreendimentos Imobiliarios SA | 34,500 | 1,014 |
| Petroleo Brasileiro SA ADR | 34,900 | 801 |
| MRV Engenharia e Participacoes SA | 94,400 | 559 |
| Cia de Saneamento Basico do Estado de Sao Paulo | 13,600 | 553 |
| Duratex SA | 83,800 | 547 |
| Diagnosticos da America SA | 60,700 | 363 |
| Localiza Rent a Car SA | 18,147 | 314 |
| WEG SA | 22,100 | 259 |
| | | 42,717 |
| Canada (3.7%) | | |
| Rogers Communications Inc. Class B | 703,255 | 28,471 |
| Agrium Inc. | 221,500 | 22,981 |
| Bombardier Inc. Class B | 3,931,616 | 14,757 |
| Imperial Oil Ltd. | 245,092 | 11,281 |
| Magna International Inc. | 258,000 | 11,156 |
| Fairfax Financial Holdings Ltd. | 27,179 | 10,460 |
| ^ Toronto-Dominion Bank | 118,500 | 9,883 |
| BCE Inc. | 132,531 | 5,830 |
| Onex Corp. | 147,253 | 5,812 |
| Bank of Montreal | 90,600 | 5,354 |
| Ritchie Bros Auctioneers Inc. | 267,891 | 5,152 |
| Bank of Montreal | 73,484 | 4,338 |
| Suncor Energy Inc. | 99,800 | 3,283 |
| Aimia Inc. | 86,213 | 1,293 |
| * CGI Group Inc. Class A | 44,000 | 1,182 |
| Saputo Inc. | 11,200 | 481 |
| Empire Co. Ltd. Class A | 4,500 | 271 |
| * Yellow Media Inc. | 83,441 | 6 |
1
Vanguard® Global Equity Fund
Schedule of Investments
September 30, 2012
| | | |
| | | | Market |
| | | | Value |
| | | Shares | ($000) |
| * | Yellow Media Inc. | 83,441 | 6 |
| | | | 141,991 |
| Chile (0.1%) | | |
| | Enersis SA ADR | 229,729 | 3,765 |
| | Vina Concha y Toro SA | 299,789 | 626 |
| | Quinenco SA | 146,924 | 408 |
| | | | 4,799 |
| China (2.2%) | | |
| | China Mobile Ltd. | 2,791,000 | 30,941 |
| | Mindray Medical International Ltd. ADR | 364,984 | 12,267 |
| | PetroChina Co. Ltd. | 6,928,000 | 8,957 |
| | Tsingtao Brewery Co. Ltd. | 1,524,000 | 8,377 |
| | China Petroleum & Chemical Corp. | 6,726,000 | 6,239 |
| | Shandong Weigao Group Medical Polymer Co. Ltd. | 4,312,000 | 5,541 |
| * | Baidu Inc. ADR | 34,800 | 4,065 |
| | China Telecom Corp. Ltd. | 4,736,000 | 2,737 |
| * | SINA Corp. | 31,300 | 2,025 |
| * | NetEase Inc. ADR | 20,400 | 1,145 |
| | China Resources Enterprise Ltd. | 336,067 | 1,118 |
| | Want Want China Holdings Ltd. | 695,994 | 886 |
| | Tingyi Cayman Islands Holding Corp. | 186,373 | 559 |
| * | Giant Interactive Group Inc. ADR | 87,822 | 456 |
| | Weiqiao Textile Co. | 778,185 | 284 |
| | Silver Grant International | 1,692,000 | 267 |
| | | | 85,864 |
| Colombia (0.0%) | | |
| | Cementos Argos SA | 64,150 | 279 |
| | Grupo Argos SA Prior Pfd. | 19,886 | 219 |
| | | | 498 |
| Denmark (0.9%) | | |
| | Carlsberg A/S Class B | 129,574 | 11,479 |
| | Novo Nordisk A/S Class B | 37,514 | 5,904 |
| | Coloplast A/S Class B | 24,145 | 5,031 |
| * | Jyske Bank A/S | 118,803 | 3,516 |
| | GN Store Nord A/S | 186,511 | 2,866 |
| * | William Demant Holding A/S | 26,776 | 2,399 |
| * | Danske Bank A/S | 62,838 | 1,133 |
| * | Topdanmark A/S | 3,899 | 762 |
| * | Bang & Olufsen A/S | 33,672 | 462 |
| *,^ | Vestas Wind Systems A/S | 39,297 | 279 |
| | | | 33,831 |
| Egypt (0.1%) | | |
| | Ezz Steel | 1,397,944 | 2,776 |
| |
| Finland (0.3%) | | |
| | Sampo Oyj | 164,626 | 5,130 |
| | Metso Oyj | 78,220 | 2,802 |
| | Tieto Oyj | 56,943 | 985 |
| | Wartsila OYJ Abp | 19,854 | 689 |
| | Cargotec Oyj Class B | 15,037 | 355 |
| * | Outokumpu Oyj | 214,800 | 230 |
| | Nokia Oyj | 70,491 | 183 |
| | | | 10,374 |
| France (1.9%) | | |
| | Sanofi | 240,712 | 20,600 |
| | European Aeronautic Defence and Space Co. NV | 558,271 | 17,695 |
| | BNP Paribas SA | 279,995 | 13,275 |
| | Total SA | 80,453 | 4,003 |
| | Legrand SA | 91,749 | 3,458 |
| | AXA SA | 110,826 | 1,650 |
| | Societe BIC SA | 12,362 | 1,493 |
2
Vanguard® Global Equity Fund
Schedule of Investments
September 30, 2012
| | | |
| | | | Market |
| | | | Value |
| | | Shares | ($000) |
| | ArcelorMittal | 101,392 | 1,460 |
| | Eurofins Scientific | 9,450 | 1,340 |
| | Thales SA | 36,712 | 1,260 |
| | Carrefour SA | 56,773 | 1,178 |
| | Neopost SA | 21,174 | 1,171 |
| | Groupe Eurotunnel SA | 161,478 | 1,137 |
| | Technip SA | 8,255 | 917 |
| * | Societe Generale SA | 27,467 | 778 |
| | Edenred | 26,202 | 736 |
| | Imerys SA | 7,677 | 450 |
| | SA des Ciments Vicat | 7,459 | 400 |
| | Nexity SA | 9,290 | 268 |
| * | Alcatel-Lucent ADR | 131,498 | 145 |
| | APERAM | 722 | 12 |
| *,^ | Eurofins Scientific Warrants Exp. 6/29/2017 | 249 | 11 |
| | | | 73,437 |
| Germany (1.9%) | | |
| | Deutsche Post AG | 565,549 | 11,049 |
| | Bayer AG | 99,756 | 8,578 |
| | Muenchener Rueckversicherungs AG | 39,081 | 6,111 |
| | BASF SE | 68,437 | 5,783 |
| | Deutsche Boerse AG | 101,544 | 5,619 |
| | Fresenius Medical Care AG & Co. KGaA | 71,944 | 5,277 |
| | Deutsche Lufthansa AG | 321,891 | 4,369 |
| | Daimler AG | 77,968 | 3,784 |
| | SAP AG | 47,553 | 3,384 |
| | Bayerische Motoren Werke AG | 37,224 | 2,730 |
| | Henkel AG & Co. KGaA Prior Pfd. | 30,708 | 2,446 |
| | E.ON AG | 100,626 | 2,391 |
| | Merck KGaA | 13,595 | 1,678 |
| | Deutsche Telekom AG | 127,476 | 1,568 |
| | Suedzucker AG | 44,182 | 1,565 |
| | Siemens AG | 11,664 | 1,167 |
| | Hannover Rueckversicherung AG | 13,240 | 847 |
| | Adidas AG | 9,352 | 767 |
| | GEA Group AG | 21,137 | 641 |
| | Deutsche Bank AG | 15,904 | 630 |
| | Duerr AG | 8,554 | 570 |
| | Axel Springer AG | 11,289 | 490 |
| | Freenet AG | 26,631 | 435 |
| | Aurubis AG | 6,953 | 406 |
| | Fresenius SE & Co. KGaA | 3,277 | 381 |
| | Celesio AG | 15,140 | 270 |
| | Gildemeister AG | 14,555 | 259 |
| | | | 73,195 |
| Greece (0.3%) | | |
| | Coca Cola Hellenic Bottling Co. SA | 549,422 | 10,258 |
| | Motor Oil Hellas Corinth Refineries SA | 118,599 | 923 |
| | OPAP SA | 28,458 | 146 |
| | | | 11,327 |
| Hong Kong (3.9%) | | |
| | Jardine Matheson Holdings Ltd. | 699,902 | 39,732 |
| | Jardine Strategic Holdings Ltd. | 1,089,900 | 36,896 |
| | New World Development Co. Ltd. | 10,271,097 | 15,828 |
| | Esprit Holdings Ltd. | 5,174,743 | 7,931 |
| | Television Broadcasts Ltd. | 1,064,000 | 7,855 |
| | Wheelock & Co. Ltd. | 1,788,000 | 7,682 |
| | First Pacific Co. Ltd. | 6,438,400 | 6,962 |
| | SmarTone Telecommunications Holdings Ltd. | 3,360,474 | 6,672 |
| | CLP Holdings Ltd. | 538,000 | 4,567 |
| | Midland Holdings Ltd. | 7,120,000 | 4,217 |
| | Hongkong & Shanghai Hotels | 2,953,281 | 3,491 |
| | Henderson Land Development Co. Ltd. | 458,466 | 3,283 |
3
Vanguard® Global Equity Fund
Schedule of Investments
September 30, 2012
| | | |
| | | | Market |
| | | | Value |
| | | Shares | ($000) |
| | Hong Kong Aircraft Engineering Co. Ltd. | 170,400 | 2,265 |
| | Mandarin Oriental International Ltd. | 806,690 | 1,163 |
| * | Next Media Ltd. | 6,072,000 | 594 |
| | Goodbaby International Holdings Ltd. | 1,690,000 | 546 |
| | Texwinca Holdings Ltd. | 487,139 | 313 |
| * | I-CABLE Communications Ltd. | 6,402,000 | 304 |
| | SJM Holdings Ltd. | 115,000 | 248 |
| | City Telecom HK Ltd. ADR | 17,300 | 81 |
| | | | 150,630 |
| Hungary (0.0%) | | |
| | OTP Bank plc | 17,667 | 312 |
| |
| India (0.3%) | | |
| | Hindustan Unilever Ltd. | 391,511 | 4,044 |
| | Zee Entertainment Enterprises Ltd. | 423,471 | 1,565 |
| | United Breweries Ltd. | 56,578 | 700 |
| * | Dish TV India Ltd. | 445,283 | 696 |
| | Havells India Ltd. | 56,327 | 666 |
| | Tata Consultancy Services Ltd. | 20,910 | 513 |
| | Indian Bank | 116,661 | 427 |
| | Grasim Industries Ltd. | 6,497 | 408 |
| | Sun TV Network Ltd. | 61,060 | 403 |
| | Infosys Ltd. ADR | 7,900 | 383 |
| * | Idea Cellular Ltd. | 116,891 | 189 |
| | | | 9,994 |
| Indonesia (0.5%) | | |
| * | Bank Pan Indonesia Tbk PT | 78,480,843 | 5,641 |
| | Matahari Putra Prima Tbk PT | 22,549,275 | 3,530 |
| | Indofood Sukses Makmur Tbk PT | 5,656,000 | 3,330 |
| | Bank Negara Indonesia Persero Tbk PT | 7,436,611 | 3,037 |
| | Telekomunikasi Indonesia Persero Tbk PT ADR | 22,978 | 895 |
| | Gajah Tunggal Tbk PT | 2,642,500 | 625 |
| | Semen Gresik Persero Tbk PT | 327,000 | 492 |
| | Bank Rakyat Indonesia Persero Tbk PT | 588,768 | 456 |
| | Citra Marga Nusaphala Persada Tbk PT | 2,020,500 | 447 |
| | Gudang Garam Tbk PT | 42,000 | 203 |
| | Ace Hardware Indonesia Tbk PT | 264,000 | 169 |
| | Mayora Indah Tbk PT | 70,000 | 163 |
| * | Mulia Industrindo Tbk PT | 921,000 | 23 |
| | Sumber Alfaria Trijaya Tbk PT | 17,180 | 10 |
| | | | 19,021 |
| Ireland (0.6%) | | |
| * | Ryanair Holdings plc ADR | 224,371 | 7,236 |
| | Dragon Oil plc | 455,435 | 4,460 |
| | Paddy Power plc | 35,818 | 2,653 |
| | CRH plc (London Shares) | 132,814 | 2,557 |
| * | Governor & Co. of the Bank of Ireland | 9,959,141 | 1,235 |
| | CRH plc | 48,801 | 937 |
| | DCC plc (London Shares) | 28,986 | 837 |
| | Irish Continental Group plc | 36,081 | 827 |
| | DCC plc | 14,768 | 424 |
| * | Independent News & Media plc | 318,558 | 56 |
| * | Irish Bank Resolution Corp. Ltd. | 122,273 | — |
| | | | 21,222 |
| Israel (0.0%) | | |
| | Teva Pharmaceutical Industries Ltd. ADR | 17,300 | 716 |
| |
| Italy (0.5%) | | |
| | Saipem SPA | 107,207 | 5,166 |
| | Luxottica Group SPA ADR | 94,994 | 3,349 |
| | Enel SPA | 764,733 | 2,709 |
| | Luxottica Group SPA | 61,709 | 2,177 |
| | Fiat Industrial SPA | 219,090 | 2,146 |
| * | Fiat SPA | 218,604 | 1,169 |
4
Vanguard® Global Equity Fund
Schedule of Investments
September 30, 2012
| | |
| | | Market |
| | | Value |
| | Shares | ($000) |
| * UniCredit SPA | 190,215 | 792 |
| Davide Campari-Milano SPA | 92,610 | 729 |
| Exor SPA | 19,437 | 490 |
| Intesa Sanpaolo SPA (Registered) | 218,567 | 333 |
| * Finmeccanica SPA | 39,468 | 188 |
| | | 19,248 |
| Japan (6.7%) | | |
| ^ Nippon Telegraph & Telephone Corp. | 557,700 | 26,535 |
| ^ Daito Trust Construction Co. Ltd. | 217,200 | 21,803 |
| Hitachi Ltd. | 3,105,000 | 17,242 |
| Namco Bandai Holdings Inc. | 874,650 | 14,818 |
| Otsuka Holdings Co. Ltd. | 372,400 | 11,541 |
| Inpex Corp. | 1,717 | 10,207 |
| Fujitsu Ltd. | 2,541,000 | 9,539 |
| ^ Marubeni Corp. | 1,255,000 | 7,979 |
| NTT Data Corp. | 2,214 | 6,951 |
| Yamaha Motor Co. Ltd. | 747,500 | 6,523 |
| Daiwa House Industry Co. Ltd. | 346,000 | 5,013 |
| Toyota Motor Corp. | 125,200 | 4,909 |
| * Olympus Corp. | 222,800 | 4,350 |
| Rohm Co. Ltd. | 114,500 | 3,856 |
| Toyota Tsusho Corp. | 178,000 | 3,802 |
| Tokyo Electron Ltd. | 88,400 | 3,766 |
| ^ Sumitomo Mitsui Financial Group Inc. | 113,700 | 3,543 |
| Kao Corp. | 120,300 | 3,537 |
| Dainippon Sumitomo Pharma Co. Ltd. | 320,700 | 3,524 |
| East Japan Railway Co. | 52,900 | 3,500 |
| Tokyo Gas Co. Ltd. | 570,000 | 3,134 |
| Seven & I Holdings Co. Ltd. | 100,200 | 3,070 |
| Mitsubishi UFJ Financial Group Inc. | 613,100 | 2,869 |
| Central Japan Railway Co. | 31,800 | 2,791 |
| LIXIL Group Corp. | 107,800 | 2,569 |
| Sumitomo Electric Industries Ltd. | 237,500 | 2,512 |
| Astellas Pharma Inc. | 48,300 | 2,448 |
| Alfresa Holdings Corp. | 46,500 | 2,291 |
| Secom Co. Ltd. | 41,600 | 2,168 |
| Ship Healthcare Holdings Inc. | 66,500 | 2,116 |
| Isetan Mitsukoshi Holdings Ltd. | 199,400 | 2,078 |
| Yamato Holdings Co. Ltd. | 128,200 | 2,028 |
| Dai-ichi Life Insurance Co. Ltd. | 1,712 | 1,936 |
| Kirin Holdings Co. Ltd. | 134,000 | 1,792 |
| ^ ITOCHU Corp. | 177,100 | 1,788 |
| ^ MS&AD Insurance Group Holdings | 97,700 | 1,687 |
| Mitsubishi Estate Co. Ltd. | 87,000 | 1,663 |
| Aisin Seiki Co. Ltd. | 57,300 | 1,632 |
| Konica Minolta Holdings Inc. | 202,000 | 1,554 |
| Obayashi Corp. | 335,000 | 1,527 |
| Sekisui House Ltd. | 143,000 | 1,420 |
| West Japan Railway Co. | 32,600 | 1,392 |
| NET One Systems Co. Ltd. | 109,400 | 1,379 |
| Dentsu Inc. | 50,500 | 1,279 |
| Nippon Meat Packers Inc. | 98,000 | 1,257 |
| Daihatsu Motor Co. Ltd. | 75,000 | 1,250 |
| Nichii Gakkan Co. | 118,000 | 1,133 |
| SKY Perfect JSAT Holdings Inc. | 2,509 | 1,130 |
| ^ JX Holdings Inc. | 204,250 | 1,116 |
| Fukuoka Financial Group Inc. | 266,000 | 1,080 |
| Sumitomo Forestry Co. Ltd. | 112,400 | 998 |
| Calsonic Kansei Corp. | 259,000 | 998 |
| Toyo Seikan Kaisha Ltd. | 92,600 | 989 |
| Toyo Suisan Kaisha Ltd. | 38,000 | 951 |
| NKSJ Holdings Inc. | 48,200 | 940 |
| Marui Group Co. Ltd. | 128,600 | 909 |
| Onward Holdings Co. Ltd. | 109,000 | 868 |
5
Vanguard® Global Equity Fund
Schedule of Investments
September 30, 2012
| | |
| | | Market |
| | | Value |
| | Shares | ($000) |
| Sega Sammy Holdings Inc. | 39,600 | 747 |
| Chiba Bank Ltd. | 128,000 | 744 |
| Shimizu Corp. | 220,000 | 740 |
| Kinden Corp. | 112,000 | 705 |
| Yamada Denki Co. Ltd. | 15,700 | 689 |
| Kyowa Hakko Kirin Co. Ltd. | 57,000 | 688 |
| NSK Ltd. | 116,000 | 674 |
| ^ Shiseido Co. Ltd. | 49,000 | 672 |
| Azbil Corp. | 29,300 | 588 |
| Bank of Yokohama Ltd. | 122,000 | 580 |
| Hitachi Metals Ltd. | 64,000 | 570 |
| Oriental Land Co. Ltd. | 3,800 | 500 |
| IT Holdings Corp. | 34,900 | 454 |
| Misawa Homes Co. Ltd. | 28,000 | 425 |
| HIS Co. Ltd. | 13,500 | 423 |
| Taiyo Nippon Sanso Corp. | 80,000 | 421 |
| Avex Group Holdings Inc. | 20,200 | 415 |
| Hitachi Chemical Co. Ltd. | 30,300 | 409 |
| Arnest One Corp. | 26,400 | 407 |
| ^ Ryosan Co. Ltd. | 22,500 | 403 |
| Toho Holdings Co. Ltd. | 19,400 | 396 |
| United Arrows Ltd. | 14,800 | 395 |
| Nippo Corp. | 34,000 | 394 |
| Unipres Corp. | 17,600 | 390 |
| Maeda Road Construction Co. Ltd. | 27,000 | 352 |
| Nippon Suisan Kaisha Ltd. | 163,200 | 351 |
| Fuji Soft Inc. | 16,300 | 342 |
| Omron Corp. | 17,500 | 336 |
| MediPal Holdings Corp. | 23,500 | 323 |
| Sekisui Chemical Co. Ltd. | 40,000 | 322 |
| Otsuka Corp. | 3,500 | 313 |
| Shimachu Co. Ltd. | 14,500 | 302 |
| Futaba Corp. | 23,100 | 299 |
| Resorttrust Inc. | 15,600 | 290 |
| Seino Holdings Co. Ltd. | 45,000 | 285 |
| Aoyama Trading Co. Ltd. | 14,900 | 285 |
| Nihon Unisys Ltd. | 39,100 | 281 |
| Geo Holdings Corp. | 244 | 280 |
| Nagase & Co. Ltd. | 25,000 | 278 |
| Suzuken Co. Ltd. | 8,300 | 275 |
| COMSYS Holdings Corp. | 19,600 | 273 |
| Izumi Co. Ltd. | 12,600 | 272 |
| Kuroda Electric Co. Ltd. | 21,700 | 264 |
| Universal Entertainment Corp. | 13,000 | 263 |
| IHI Corp. | 115,000 | 256 |
| Osaka Gas Co. Ltd. | 58,000 | 255 |
| ^ Konaka Co. Ltd. | 27,400 | 251 |
| ^ Autobacs Seven Co. Ltd. | 5,400 | 244 |
| DCM Holdings Co. Ltd. | 35,800 | 238 |
| ^ Mitsubishi Corp. | 13,100 | 237 |
| Iwatani Corp. | 65,000 | 236 |
| Kawai Musical Instruments Manufacturing Co. Ltd. | 103,000 | 235 |
| Tokyo Ohka Kogyo Co. Ltd. | 10,700 | 229 |
| Daicel Corp. | 36,000 | 216 |
| Alpine Electronics Inc. | 23,000 | 214 |
| TS Tech Co. Ltd. | 13,100 | 211 |
| Yellow Hat Ltd. | 14,700 | 203 |
| Press Kogyo Co. Ltd. | 49,000 | 196 |
| Gulliver International Co. Ltd. | 6,790 | 194 |
| ^ Round One Corp. | 38,700 | 186 |
| Mitsubishi Heavy Industries Ltd. | 41,000 | 177 |
| Tokyo Seimitsu Co. Ltd. | 12,100 | 168 |
| Fujitsu Frontech Ltd. | 25,500 | 141 |
6
Vanguard® Global Equity Fund
Schedule of Investments
September 30, 2012
| | | |
| | | | Market |
| | | | Value |
| | | Shares | ($000) |
| | EDION Corp. | 29,600 | 131 |
| | | | 258,713 |
| Malaysia (1.5%) | | |
| | CIMB Group Holdings Bhd. | 6,363,238 | 15,586 |
| | Genting Malaysia Bhd. | 10,098,500 | 11,545 |
| | AMMB Holdings Bhd. | 4,214,287 | 8,755 |
| | Telekom Malaysia Bhd. | 3,043,375 | 6,154 |
| | Sime Darby Bhd. | 1,705,757 | 5,465 |
| | British American Tobacco Malaysia Bhd. | 160,400 | 3,165 |
| | Multi-Purpose Holdings Bhd. | 1,744,190 | 1,994 |
| | Malayan Banking Bhd. | 624,300 | 1,838 |
| | Carlsberg Brewery Malaysia Bhd. | 400,300 | 1,504 |
| * | Malaysian Airline System Bhd. | 3,065,566 | 1,010 |
| | Genting Bhd. | 135,800 | 386 |
| * | UEM Land Holdings Bhd. | 315,900 | 173 |
| | | | 57,575 |
| Mexico (1.0%) | | |
| | America Movil SAB de CV ADR | 1,104,928 | 28,109 |
| * | Cemex SAB de CV ADR | 586,117 | 4,882 |
| | Grupo Financiero Banorte SAB de CV | 513,400 | 2,902 |
| | Fomento Economico Mexicano SAB de CV ADR | 10,300 | 948 |
| | Bolsa Mexicana de Valores SAB de CV | 373,700 | 771 |
| * | Genomma Lab Internacional SAB de CV Class B | 360,531 | 697 |
| | Grupo Carso SAB de CV | 197,600 | 678 |
| | | | 38,987 |
| Netherlands (0.5%) | | |
| | Heineken NV | 91,243 | 5,439 |
| * | QIAGEN NV | 223,800 | 4,143 |
| | Koninklijke Boskalis Westminster NV | 62,410 | 2,255 |
| | Koninklijke KPN NV | 254,981 | 1,941 |
| | ASML Holding NV | 16,662 | 891 |
| | Akzo Nobel NV | 15,434 | 871 |
| | Koninklijke Philips Electronics NV | 27,074 | 632 |
| | Randstad Holding NV | 13,740 | 457 |
| | Wolters Kluwer NV | 22,352 | 420 |
| | TNT Express NV | 12,503 | 130 |
| | PostNL NV | 14,021 | 49 |
| *,^ | Eurocastle Investment Ltd. | 35,695 | 3 |
| | | | 17,231 |
| New Zealand (0.0%) | | |
| | Telecom Corp. of New Zealand Ltd. | 282,806 | 557 |
| | Chorus Ltd. | 56,561 | 152 |
| * | PGG Wrightson Ltd. | 51,996 | 15 |
| | | | 724 |
| Norway (0.7%) | | |
| | Statoil ASA | 559,257 | 14,432 |
| | Schibsted ASA | 124,423 | 4,762 |
| | Norsk Hydro ASA | 891,365 | 4,189 |
| | DNB ASA | 160,452 | 1,965 |
| * | Storebrand ASA | 63,234 | 291 |
| | | | 25,639 |
| Philippines (1.8%) | | |
| | Ayala Corp. | 2,399,833 | 24,454 |
| | ABS-CBN Holdings Corp. | 13,224,538 | 10,487 |
| | Globe Telecom Inc. | 368,370 | 10,215 |
| | DMCI Holdings Inc. | 5,365,760 | 7,450 |
| | Jollibee Foods Corp. | 2,802,990 | 6,791 |
| | Lopez Holdings Corp. | 33,935,874 | 4,513 |
| * | BDO Unibank Inc. | 1,423,982 | 2,212 |
| | SM Investments Corp. | 105,900 | 1,852 |
| | Bank of the Philippine Islands | 268,300 | 512 |
7
Vanguard® Global Equity Fund
Schedule of Investments
September 30, 2012
| | |
| | | Market |
| | | Value |
| | Shares | ($000) |
| Universal Robina Corp. | 280,300 | 468 |
| | | 68,954 |
| Poland (0.4%) | | |
| KGHM Polska Miedz SA | 264,377 | 12,613 |
| Bank Pekao SA | 15,911 | 785 |
| Tauron Polska Energia SA | 318,383 | 486 |
| | | 13,884 |
| Russia (0.3%) | | |
| Lukoil OAO ADR | 146,902 | 9,080 |
| Sberbank of Russia ADR | 107,007 | 1,261 |
| Globaltrans Investment plc GDR | 53,384 | 1,111 |
| Sistema JSFC GDR | 30,421 | 621 |
| Eurasia Drilling Co. Ltd. GDR | 13,254 | 438 |
| * VimpelCom Ltd. ADR | 33,389 | 397 |
| Gazprom OAO ADR | 30,334 | 306 |
| LSR Group GDR | 57,897 | 270 |
| | | 13,484 |
| Singapore (1.2%) | | |
| DBS Group Holdings Ltd. | 2,232,000 | 26,070 |
| Great Eastern Holdings Ltd. | 711,000 | 8,813 |
| GuocoLeisure Ltd. | 6,677,000 | 3,312 |
| * STATS ChipPAC Ltd. | 8,243,000 | 2,544 |
| Genting Singapore plc | 1,066,244 | 1,185 |
| Golden Agri-Resources Ltd. | 1,660,000 | 887 |
| United Industrial Corp. Ltd. | 368,000 | 863 |
| Oversea-Chinese Banking Corp. Ltd. | 109,000 | 827 |
| United Overseas Bank Ltd. | 25,000 | 399 |
| Global Yellow Pages Ltd. | 2,403,000 | 185 |
| Yoma Strategic Holdings Ltd. | 380,000 | 152 |
| * Global Yellow Pages Ltd. Warrants Exp. 08/13/2014 | 704,000 | 7 |
| | | 45,244 |
| South Africa (2.2%) | | |
| Naspers Ltd. | 265,496 | 16,467 |
| Hosken Consolidated Investments Ltd. | 1,398,780 | 14,647 |
| Clicks Group Ltd. | 1,621,423 | 11,241 |
| RMB Holdings Ltd. | 1,483,238 | 6,595 |
| Nedbank Group Ltd. | 256,991 | 5,669 |
| FirstRand Ltd. | 1,357,077 | 4,549 |
| RMI Holdings | 1,668,812 | 4,314 |
| Sun International Ltd. | 368,158 | 3,776 |
| Anglo American plc Ordinary Shares | 120,722 | 3,549 |
| MTN Group Ltd. | 109,757 | 2,119 |
| Remgro Ltd. | 96,537 | 1,688 |
| JD Group Ltd. | 296,836 | 1,666 |
| * Old Mutual plc | 573,014 | 1,575 |
| Anglo American Platinum Ltd. | 25,290 | 1,299 |
| Gold Fields Ltd. | 66,432 | 840 |
| Foschini Group Ltd. | 45,988 | 699 |
| AngloGold Ashanti Ltd. | 20,027 | 698 |
| City Lodge Hotels Ltd. | 56,350 | 623 |
| * Niveus Investments Ltd. | 529,505 | 588 |
| MMI Holdings Ltd. | 226,203 | 575 |
| Steinhoff International Holdings Ltd. | 165,153 | 518 |
| * Murray & Roberts Holdings Ltd. | 183,008 | 487 |
| Imperial Holdings Ltd. | 19,096 | 430 |
| JSE Ltd. | 51,278 | 424 |
| Discovery Holdings Ltd. | 53,846 | 360 |
| Mondi Ltd. | 12,320 | 125 |
| Impala Platinum Holdings Ltd. | 4,987 | 83 |
| Mpact Ltd. | 15,297 | 35 |
| | | 85,639 |
8
Vanguard® Global Equity Fund
Schedule of Investments
September 30, 2012
| | |
| | | Market |
| | | Value |
| | Shares | ($000) |
| South Korea (2.7%) | | |
| Samsung Electronics Co. Ltd. | 22,886 | 27,580 |
| Hyundai Motor Co. | 97,255 | 21,936 |
| Kia Motors Corp. | 247,268 | 15,364 |
| Samsung Electronics Co. Ltd. GDR | 20,200 | 12,184 |
| SK Holdings Co. Ltd. | 60,007 | 8,317 |
| Woori Finance Holdings Co. Ltd. | 596,130 | 5,867 |
| KB Financial Group Inc. | 117,240 | 4,156 |
| Hana Financial Group Inc. | 98,651 | 3,009 |
| Hyundai Mobis | 6,554 | 1,822 |
| SK Telecom Co. Ltd. | 12,396 | 1,628 |
| Hankook Tire Co. Ltd. | 35,606 | 1,333 |
| Nexen Tire Corp. | 18,710 | 326 |
| KT Corp. | 8,120 | 256 |
| | | 103,778 |
| Spain (0.3%) | | |
| Inditex SA | 23,879 | 2,967 |
| * Banco Santander SA | 331,892 | 2,477 |
| Viscofan SA | 34,273 | 1,570 |
| Acerinox SA | 112,159 | 1,260 |
| Acciona SA | 18,381 | 1,047 |
| Telefonica SA | 62,231 | 832 |
| Mediaset Espana Comunicacion SA | 150,750 | 819 |
| Amadeus IT Holding SA | 16,708 | 390 |
| Distribuidora Internacional de Alimentacion SA | 55,629 | 307 |
| Banco Bilbao Vizcaya Argentaria SA | 31,471 | 248 |
| Banco Santander SA ADR | 17,899 | 133 |
| | | 12,050 |
| Sweden (1.6%) | | |
| Svenska Handelsbanken AB Class A | 693,730 | 26,035 |
| Atlas Copco AB Class B | 482,340 | 10,111 |
| Investor AB Class B | 367,400 | 8,096 |
| Assa Abloy AB Class B | 145,340 | 4,719 |
| Volvo AB Class B | 277,479 | 3,898 |
| Telefonaktiebolaget LM Ericsson Class B | 276,076 | 2,518 |
| Swedish Match AB | 56,037 | 2,268 |
| Nordea Bank AB | 115,648 | 1,145 |
| Oriflame Cosmetics SA | 32,321 | 1,108 |
| Hoganas AB Class B | 26,417 | 920 |
| Skandinaviska Enskilda Banken AB Class A | 101,513 | 851 |
| Modern Times Group AB Class B | 12,334 | 546 |
| Millicom International Cellular SA | 5,491 | 509 |
| * CDON Group AB | 15,780 | 99 |
| | | 62,823 |
| Switzerland (2.4%) | | |
| Roche Holding AG | 107,431 | 20,095 |
| Nestle SA | 274,930 | 17,347 |
| Cie Financiere Richemont SA | 285,737 | 17,157 |
| Schindler Holding AG | 84,212 | 10,368 |
| Novartis AG | 95,419 | 5,840 |
| Julius Baer Group Ltd. | 162,352 | 5,663 |
| UBS AG | 412,467 | 5,022 |
| Geberit AG | 13,661 | 2,975 |
| Adecco SA | 47,134 | 2,250 |
| Clariant AG | 114,473 | 1,364 |
| Sonova Holding AG | 9,584 | 970 |
| Helvetia Holding AG | 1,492 | 521 |
| ^ Logitech International SA | 49,852 | 458 |
| ABB Ltd. | 18,548 | 348 |
| OC Oerlikon Corp. AG | 28,172 | 271 |
| | | 90,649 |
| Taiwan (1.4%) | | |
| Fubon Financial Holding Co. Ltd. | 13,957,279 | 15,075 |
9
Vanguard® Global Equity Fund
Schedule of Investments
September 30, 2012
| | |
| | | Market |
| | | Value |
| | Shares | ($000) |
| Taiwan Semiconductor Manufacturing Co. Ltd. ADR | 842,146 | 13,323 |
| United Microelectronics Corp. | 21,180,000 | 8,764 |
| Taiwan Semiconductor Manufacturing Co. Ltd. | 2,303,431 | 7,086 |
| Uni-President Enterprises Corp. | 1,511,595 | 2,671 |
| Hon Hai Precision Industry Co. Ltd. | 548,900 | 1,718 |
| Taishin Financial Holding Co. Ltd. | 3,987,981 | 1,532 |
| Chunghwa Telecom Co. Ltd. | 353,000 | 1,128 |
| Far EasTone Telecommunications Co. Ltd. | 423,000 | 1,044 |
| Giant Manufacturing Co. Ltd. | 81,000 | 429 |
| Lite-On Technology Corp. | 308,641 | 397 |
| King Yuan Electronics Co. Ltd. | 203,000 | 111 |
| | | 53,278 |
| Thailand (1.8%) | | |
| Kasikornbank PCL (Foreign) | 1,863,000 | 11,012 |
| Bangkok Bank PCL (Foreign) | 1,459,400 | 9,506 |
| * Advanced Info Service PCL (Local) | 917,300 | 6,370 |
| Siam Cement PCL (Foreign) | 477,400 | 6,152 |
| Advanced Info Service PCL (Foreign) | 860,400 | 5,975 |
| Thanachart Capital PCL | 4,655,100 | 5,709 |
| MBK PCL (Foreign) | 1,495,900 | 5,688 |
| Advanced Info Service PCL | 613,000 | 4,257 |
| Land and Houses PCL (Foreign) | 9,411,400 | 2,744 |
| Total Access Communication PCL | 901,000 | 2,703 |
| * Total Access Communication PCL (Local) | 896,616 | 2,690 |
| * GMM Grammy PCL NVDR | 2,917,000 | 1,934 |
| * Siam Commercial Bank PCL (Local) | 294,700 | 1,609 |
| * Big C Supercenter PCL | 242,600 | 1,471 |
| * GMM Grammy PCL (Foreign) | 1,829,500 | 1,213 |
| * BEC World PCL | 282,256 | 698 |
| Major Cineplex Group PCL | 534,400 | 327 |
| BEC World PCL (Foreign) | 85,285 | 211 |
| Post Publishing PCL (Foreign) | 1,188,500 | 209 |
| Matichon PCL (Foreign) | 833,800 | 203 |
| Siam Commercial Bank PCL (Foreign) | 30,900 | 169 |
| | | 70,850 |
| Turkey (0.5%) | | |
| BIM Birlesik Magazalar AS | 146,467 | 6,111 |
| Turkiye Garanti Bankasi AS | 1,050,873 | 4,390 |
| Turkiye Garanti Bankasi AS ADR | 495,900 | 2,142 |
| KOC Holding AS | 512,638 | 2,052 |
| Turkiye Is Bankasi | 598,948 | 1,882 |
| * Turkcell Iletisim Hizmetleri AS | 201,903 | 1,231 |
| Turkiye Halk Bankasi AS | 121,992 | 951 |
| Haci Omer Sabanci Holding AS (Bearer) | 149,304 | 655 |
| Ulker Biskuvi Sanayi AS | 102,586 | 436 |
| Bizim Toptan Satis Magazalari AS | 11,518 | 147 |
| Tupras Turkiye Petrol Rafinerileri AS | 5,594 | 128 |
| | | 20,125 |
| United Kingdom (8.3%) | | |
| Royal Dutch Shell plc Class A | 984,195 | 34,078 |
| Wolseley plc | 544,681 | 23,299 |
| Rolls-Royce Holdings plc | 1,646,285 | 22,458 |
| Prudential plc | 1,496,828 | 19,437 |
| Vodafone Group plc | 5,845,864 | 16,612 |
| BP plc | 1,807,162 | 12,740 |
| Bunzl plc | 672,324 | 12,057 |
| BP plc ADR | 225,117 | 9,536 |
| * Lloyds Banking Group plc | 14,770,461 | 9,300 |
| British American Tobacco plc | 171,078 | 8,791 |
| Rio Tinto plc | 174,267 | 8,149 |
| HSBC Holdings plc | 792,853 | 7,365 |
| Intertek Group plc | 152,092 | 6,743 |
| BHP Billiton plc | 187,952 | 5,869 |
10
Vanguard® Global Equity Fund
Schedule of Investments
September 30, 2012
| | |
| | | Market |
| | | Value |
| | Shares | ($000) |
| Diageo plc | 203,297 | 5,724 |
| Aggreko plc | 149,823 | 5,609 |
| Royal Dutch Shell plc Class B | 146,694 | 5,220 |
| Reckitt Benckiser Group plc | 77,908 | 4,489 |
| Invensys plc | 1,163,539 | 4,411 |
| Compass Group plc | 379,871 | 4,199 |
| Hays plc | 3,325,056 | 4,151 |
| Howden Joinery Group plc | 1,615,039 | 3,882 |
| Capita plc | 308,296 | 3,861 |
| Unilever plc | 102,049 | 3,726 |
| TESCO plc | 692,356 | 3,718 |
| Michael Page International plc | 613,159 | 3,534 |
| Rightmove plc | 116,953 | 2,964 |
| Sage Group plc | 584,097 | 2,960 |
| APR Energy plc | 215,059 | 2,903 |
| Carnival plc | 74,985 | 2,762 |
| Informa plc | 400,127 | 2,607 |
| Provident Financial plc | 110,686 | 2,457 |
| BAE Systems plc | 439,829 | 2,313 |
| Barclays plc | 603,276 | 2,095 |
| GlaxoSmithKline plc | 85,203 | 1,967 |
| G4S plc | 427,950 | 1,838 |
| WPP plc | 131,408 | 1,790 |
| Reed Elsevier plc | 185,743 | 1,778 |
| Stagecoach Group plc | 389,906 | 1,770 |
| ITV plc | 1,235,916 | 1,767 |
| Experian plc | 105,558 | 1,758 |
| Rexam plc | 247,791 | 1,744 |
| Spectris plc | 59,017 | 1,649 |
| International Personal Finance plc | 334,803 | 1,624 |
| Paragon Group of Cos. plc | 464,431 | 1,550 |
| ICAP plc | 292,757 | 1,522 |
| Smiths Group plc | 89,603 | 1,505 |
| Next plc | 24,563 | 1,370 |
| Admiral Group plc | 78,614 | 1,340 |
| TUI Travel plc | 343,910 | 1,302 |
| Glencore International plc | 226,171 | 1,256 |
| Homeserve plc | 306,876 | 1,042 |
| 3i Group plc | 279,496 | 1,007 |
| * Berkeley Group Holdings plc | 43,010 | 978 |
| WH Smith plc | 89,551 | 936 |
| TalkTalk Telecom Group plc | 311,659 | 934 |
| AMEC plc | 45,722 | 849 |
| Devro plc | 159,231 | 844 |
| * Cairn Energy plc | 189,278 | 843 |
| Cable & Wireless Communications plc | 1,393,728 | 813 |
| Aviva plc | 152,079 | 786 |
| Xyratex Ltd. | 83,632 | 769 |
| Sportingbet plc | 906,197 | 756 |
| Petrofac Ltd. | 28,459 | 735 |
| IG Group Holdings plc | 100,548 | 725 |
| Millennium & Copthorne Hotels plc | 86,358 | 678 |
| Sthree plc | 143,910 | 663 |
| Smith & Nephew plc | 58,521 | 646 |
| Centrica plc | 115,309 | 610 |
| Bwin.Party Digital Entertainment plc | 359,387 | 605 |
| British Sky Broadcasting Group plc | 49,898 | 599 |
| Jupiter Fund Management plc | 140,892 | 555 |
| Ladbrokes plc | 193,711 | 541 |
| Mondi plc | 52,859 | 539 |
| IMI plc | 36,949 | 538 |
| * Royal Bank of Scotland Group plc | 125,468 | 521 |
| Standard Chartered plc | 21,933 | 497 |
| National Express Group plc | 144,692 | 490 |
11
Vanguard® Global Equity Fund
Schedule of Investments
September 30, 2012
| | | |
| | | | Market |
| | | | Value |
| | | Shares | ($000) |
| * | Barratt Developments plc | 172,408 | 473 |
| | Close Brothers Group plc | 34,692 | 468 |
| * | Thomas Cook Group plc | 1,421,073 | 402 |
| | Mondi plc | 38,261 | 388 |
| | Daily Mail & General Trust plc | 43,118 | 336 |
| | N Brown Group plc | 75,106 | 333 |
| | Anglo American plc London Shares | 10,073 | 297 |
| | Carphone Warehouse Group plc | 104,186 | 275 |
| | Marshalls plc | 155,051 | 216 |
| | Northgate plc | 41,164 | 160 |
| * | Perform Group plc | 9,640 | 61 |
| * | Connaught plc | 103,081 | — |
| | | | 320,457 |
| United States (42.4%) | | |
| Consumer Discretionary (10.3%) | | |
| * | Amazon.com Inc. | 223,014 | 56,717 |
| * | Liberty Global Inc. Class A | 512,678 | 31,145 |
| | Cablevision Systems Corp. Class A | 1,410,186 | 22,351 |
| * | Liberty Global Inc. | 349,117 | 19,697 |
| | Brinker International Inc. | 480,344 | 16,956 |
| * | priceline.com Inc. | 25,386 | 15,707 |
| | Dillard's Inc. Class A | 183,661 | 13,282 |
| * | PulteGroup Inc. | 850,478 | 13,182 |
| | Omnicom Group Inc. | 209,341 | 10,794 |
| | Walt Disney Co. | 182,075 | 9,519 |
| | CBS Corp. Class B | 261,143 | 9,487 |
| * | Mohawk Industries Inc. | 112,250 | 8,982 |
| | Ford Motor Co. | 897,900 | 8,853 |
| | TJX Cos. Inc. | 197,032 | 8,825 |
| | Royal Caribbean Cruises Ltd. | 272,590 | 8,235 |
| * | Coinstar Inc. | 173,450 | 7,802 |
| ^ | American Greetings Corp. Class A | 455,975 | 7,660 |
| *,^ | Blue Nile Inc. | 202,858 | 7,524 |
| | Harley-Davidson Inc. | 173,570 | 7,354 |
| * | Liberty Media Corp. - Liberty Capital Class A | 68,849 | 7,172 |
| * | CarMax Inc. | 246,277 | 6,970 |
| * | MGM Resorts International | 631,021 | 6,783 |
| * | AMC Networks Inc. Class A | 155,026 | 6,747 |
| | Time Warner Inc. | 146,644 | 6,647 |
| | Sotheby's | 199,219 | 6,275 |
| * | Bed Bath & Beyond Inc. | 85,490 | 5,386 |
| | Cooper Tire & Rubber Co. | 273,087 | 5,238 |
| * | Liberty Interactive Corp. Class A | 260,839 | 4,826 |
| * | DIRECTV | 88,320 | 4,633 |
| * | Hanesbrands Inc. | 140,912 | 4,492 |
| * | ANN Inc. | 111,001 | 4,188 |
| | American Eagle Outfitters Inc. | 193,110 | 4,071 |
| | Gap Inc. | 104,472 | 3,738 |
| | CBS Corp. Class A | 85,395 | 3,109 |
| | Bob Evans Farms Inc. | 79,326 | 3,104 |
| * | K12 Inc. | 134,336 | 2,714 |
| | Interpublic Group of Cos. Inc. | 206,795 | 2,300 |
| | Foot Locker Inc. | 51,730 | 1,836 |
| | KB Home | 123,345 | 1,770 |
| | Ross Stores Inc. | 26,883 | 1,737 |
| | Yum! Brands Inc. | 20,948 | 1,390 |
| | Scholastic Corp. | 43,334 | 1,377 |
| * | TripAdvisor Inc. | 41,200 | 1,357 |
| * | LeapFrog Enterprises Inc. | 145,001 | 1,308 |
| * | Arctic Cat Inc. | 29,033 | 1,204 |
| * | Red Robin Gourmet Burgers Inc. | 36,818 | 1,199 |
| * | Skechers U.S.A. Inc. Class A | 58,149 | 1,186 |
| | Jarden Corp. | 20,889 | 1,104 |
| | Movado Group Inc. | 32,052 | 1,081 |
12
Vanguard® Global Equity Fund
Schedule of Investments
September 30, 2012
| | |
| | | Market |
| | | Value |
| | Shares | ($000) |
| * Standard Pacific Corp. | 151,172 | 1,022 |
| Hot Topic Inc. | 112,620 | 980 |
| * Smith & Wesson Holding Corp. | 81,693 | 899 |
| * Liberty Ventures Class A | 17,389 | 863 |
| * Discovery Communications Inc. Class A | 12,827 | 765 |
| * Cavco Industries Inc. | 14,618 | 671 |
| * CC Media Holdings Inc. Class A | 292,110 | 666 |
| * Papa John's International Inc. | 9,571 | 511 |
| * Live Nation Entertainment Inc. | 52,419 | 451 |
| * Sonic Corp. | 40,846 | 419 |
| * Discovery Communications Inc. | 7,303 | 409 |
| JAKKS Pacific Inc. | 27,282 | 398 |
| * Multimedia Games Holding Co. Inc. | 24,709 | 389 |
| CTC Media Inc. | 33,336 | 304 |
| Destination Maternity Corp. | 11,763 | 220 |
| * Carmike Cinemas Inc. | 18,803 | 212 |
| Blyth Inc. | 6,774 | 176 |
| * Office Depot Inc. | 68,658 | 176 |
| * Ascent Capital Group Inc. Class A | 2,330 | 126 |
| * Sun-Times Media Group Inc. Class A | 130,959 | — |
| | | 398,671 |
| Consumer Staples (4.5%) | | |
| Philip Morris International Inc. | 611,772 | 55,023 |
| Costco Wholesale Corp. | 355,015 | 35,546 |
| Tyson Foods Inc. Class A | 1,110,798 | 17,795 |
| Estee Lauder Cos. Inc. Class A | 259,144 | 15,955 |
| * Smithfield Foods Inc. | 648,854 | 12,750 |
| PepsiCo Inc. | 147,680 | 10,451 |
| Kroger Co. | 352,895 | 8,307 |
| Herbalife Ltd. | 115,962 | 5,497 |
| Universal Corp. | 78,879 | 4,016 |
| Altria Group Inc. | 118,836 | 3,968 |
| * Susser Holdings Corp. | 22,300 | 807 |
| * Medifast Inc. | 30,042 | 786 |
| Nu Skin Enterprises Inc. Class A | 17,770 | 690 |
| PriceSmart Inc. | 8,582 | 650 |
| Kimberly-Clark Corp. | 5,384 | 462 |
| Cal-Maine Foods Inc. | 8,504 | 382 |
| * USANA Health Sciences Inc. | 7,763 | 361 |
| * Omega Protein Corp. | 52,359 | 359 |
| * Central Garden and Pet Co. Class A | 26,454 | 319 |
| SUPERVALU Inc. | 16,485 | 40 |
| | | 174,164 |
| Energy (3.4%) | | |
| ConocoPhillips | 397,108 | 22,707 |
| Phillips 66 | 347,377 | 16,108 |
| Exxon Mobil Corp. | 174,066 | 15,918 |
| Marathon Petroleum Corp. | 283,603 | 15,482 |
| Valero Energy Corp. | 439,552 | 13,925 |
| Tesoro Corp. | 289,324 | 12,123 |
| EOG Resources Inc. | 82,633 | 9,259 |
| * Ultra Petroleum Corp. | 329,663 | 7,246 |
| National Oilwell Varco Inc. | 80,180 | 6,423 |
| Western Refining Inc. | 237,234 | 6,211 |
| Delek US Holdings Inc. | 157,254 | 4,008 |
| * Helix Energy Solutions Group Inc. | 38,397 | 701 |
| Baker Hughes Inc. | 11,500 | 520 |
| Alon USA Energy Inc. | 29,024 | 398 |
| EXCO Resources Inc. | 32,300 | 259 |
| Devon Energy Corp. | 2,990 | 181 |
| | | 131,469 |
13
Vanguard® Global Equity Fund
Schedule of Investments
September 30, 2012
| | |
| | | Market |
| | | Value |
| | Shares | ($000) |
| Exchange-Traded Fund (0.3%) | | |
| 2 Vanguard MSCI Emerging Markets ETF | 317,402 | 13,251 |
| |
| Financials (7.9%) | | |
| * American International Group Inc. | 1,214,892 | 39,836 |
| * Berkshire Hathaway Inc. Class B | 244,855 | 21,596 |
| Discover Financial Services | 504,825 | 20,057 |
| SL Green Realty Corp. | 236,114 | 18,906 |
| Bank of America Corp. | 1,894,205 | 16,726 |
| * CBRE Group Inc. Class A | 699,356 | 12,875 |
| Citigroup Inc. | 381,516 | 12,483 |
| * Markel Corp. | 26,512 | 12,156 |
| Lazard Ltd. Class A | 409,154 | 11,960 |
| Moody's Corp. | 264,252 | 11,672 |
| American Express Co. | 182,540 | 10,379 |
| Legg Mason Inc. | 417,094 | 10,294 |
| New York Community Bancorp Inc. | 685,680 | 9,709 |
| * MBIA Inc. | 940,330 | 9,526 |
| Huntington Bancshares Inc. | 1,217,077 | 8,398 |
| First Republic Bank | 217,647 | 7,500 |
| * CIT Group Inc. | 156,119 | 6,150 |
| Regions Financial Corp. | 795,900 | 5,738 |
| * PHH Corp. | 260,851 | 5,308 |
| KeyCorp | 522,258 | 4,565 |
| M&T Bank Corp. | 47,816 | 4,550 |
| Progressive Corp. | 197,093 | 4,088 |
| * World Acceptance Corp. | 59,705 | 4,027 |
| Cash America International Inc. | 94,736 | 3,654 |
| * Altisource Portfolio Solutions SA | 39,633 | 3,418 |
| Mercury General Corp. | 81,370 | 3,145 |
| Brandywine Realty Trust | 242,884 | 2,961 |
| CNO Financial Group Inc. | 303,005 | 2,924 |
| Assurant Inc. | 77,832 | 2,903 |
| Synovus Financial Corp. | 1,166,300 | 2,764 |
| JPMorgan Chase & Co. | 55,595 | 2,250 |
| Federated Investors Inc. Class B | 91,705 | 1,897 |
| * MGIC Investment Corp. | 688,379 | 1,053 |
| Piedmont Office Realty Trust Inc. Class A | 58,642 | 1,017 |
| Symetra Financial Corp. | 69,674 | 857 |
| PartnerRe Ltd. | 10,856 | 806 |
| Zions Bancorporation | 32,047 | 662 |
| Reinsurance Group of America Inc. Class A | 10,796 | 625 |
| Republic Bancorp Inc. Class A | 27,308 | 599 |
| Principal Financial Group Inc. | 20,500 | 552 |
| * First Cash Financial Services Inc. | 9,500 | 437 |
| Vornado Realty Trust | 4,235 | 343 |
| Ameriprise Financial Inc. | 5,932 | 336 |
| TD Ameritrade Holding Corp. | 21,308 | 328 |
| Maiden Holdings Ltd. | 32,585 | 290 |
| Calamos Asset Management Inc. Class A | 17,710 | 206 |
| * WMI Holdings Corp. | 5,570 | 3 |
| | | 302,529 |
| Health Care (4.8%) | | |
| Merck & Co. Inc. | 604,305 | 27,254 |
| Eli Lilly & Co. | 565,033 | 26,788 |
| Abbott Laboratories | 355,360 | 24,363 |
| UnitedHealth Group Inc. | 365,055 | 20,228 |
| WellPoint Inc. | 296,003 | 17,171 |
| Humana Inc. | 177,020 | 12,418 |
| * Waters Corp. | 100,653 | 8,387 |
| * Life Technologies Corp. | 161,430 | 7,891 |
| Pfizer Inc. | 218,096 | 5,420 |
| * Express Scripts Holding Co. | 73,378 | 4,599 |
14
Vanguard® Global Equity Fund
Schedule of Investments
September 30, 2012
| | | |
| | | | Market |
| | | | Value |
| | | Shares | ($000) |
| | PDL BioPharma Inc. | 582,763 | 4,481 |
| * | Seattle Genetics Inc. | 160,100 | 4,315 |
| * | Illumina Inc. | 74,334 | 3,583 |
| * | Intuitive Surgical Inc. | 6,480 | 3,212 |
| * | Biogen Idec Inc. | 18,495 | 2,760 |
| | Bristol-Myers Squibb Co. | 64,062 | 2,162 |
| * | Momenta Pharmaceuticals Inc. | 141,139 | 2,056 |
| * | Magellan Health Services Inc. | 33,785 | 1,744 |
| | Warner Chilcott plc Class A | 116,559 | 1,574 |
| * | Health Management Associates Inc. Class A | 174,837 | 1,467 |
| * | Acorda Therapeutics Inc. | 30,743 | 787 |
| * | United Therapeutics Corp. | 10,926 | 611 |
| * | Cambrex Corp. | 32,835 | 385 |
| * | Pozen Inc. | 55,485 | 368 |
| | Chemed Corp. | 4,998 | 346 |
| * | Triple-S Management Corp. Class B | 13,306 | 278 |
| * | Hi-Tech Pharmacal Co. Inc. | 7,983 | 264 |
| * | Orthofix International NV | 5,892 | 264 |
| * | PharMerica Corp. | 20,090 | 254 |
| | | | 185,430 |
| Industrials (2.7%) | | |
| | Northrop Grumman Corp. | 329,148 | 21,865 |
| | Kansas City Southern | 243,615 | 18,461 |
| * | Delta Air Lines Inc. | 1,161,528 | 10,640 |
| | Towers Watson & Co. Class A | 147,549 | 7,828 |
| | Viad Corp. | 317,934 | 6,632 |
| | Raytheon Co. | 114,107 | 6,522 |
| | Deere & Co. | 75,224 | 6,205 |
| | General Electric Co. | 256,300 | 5,821 |
| * | US Airways Group Inc. | 529,881 | 5,543 |
| * | Alaska Air Group Inc. | 97,922 | 3,433 |
| | Expeditors International of Washington Inc. | 55,500 | 2,018 |
| | JB Hunt Transport Services Inc. | 20,464 | 1,065 |
| | Aircastle Ltd. | 66,569 | 754 |
| * | Huntington Ingalls Industries Inc. | 17,180 | 722 |
| * | Hawaiian Holdings Inc. | 121,528 | 679 |
| | Kimball International Inc. Class B | 48,535 | 593 |
| *,^ | Ultrapetrol Bahamas Ltd. | 416,979 | 592 |
| * | GenCorp Inc. | 52,040 | 494 |
| | Pitney Bowes Inc. | 26,200 | 362 |
| | Heidrick & Struggles International Inc. | 28,147 | 359 |
| * | Saia Inc. | 16,197 | 326 |
| * | Taser International Inc. | 50,896 | 307 |
| | Apogee Enterprises Inc. | 15,152 | 297 |
| | Norfolk Southern Corp. | 4,652 | 296 |
| | Alliant Techsystems Inc. | 4,967 | 249 |
| | Standex International Corp. | 5,537 | 246 |
| | Sauer-Danfoss Inc. | 5,544 | 223 |
| * | Consolidated Graphics Inc. | 7,804 | 204 |
| | | | 102,736 |
| Information Technology (6.0%) | | |
| | Apple Inc. | 69,653 | 46,477 |
| * | eBay Inc. | 610,843 | 29,571 |
| * | Gartner Inc. | 340,213 | 15,680 |
| * | Google Inc. Class A | 18,820 | 14,200 |
| | Mastercard Inc. Class A | 28,483 | 12,860 |
| * | Alliance Data Systems Corp. | 69,040 | 9,800 |
| * | Flextronics International Ltd. | 1,575,979 | 9,456 |
| * | LSI Corp. | 1,088,340 | 7,520 |
| | FLIR Systems Inc. | 369,701 | 7,385 |
| | Microsoft Corp. | 234,403 | 6,981 |
| | Xilinx Inc. | 207,948 | 6,948 |
| * | CACI International Inc. Class A | 126,306 | 6,541 |
| | DST Systems Inc. | 108,062 | 6,112 |
15
Vanguard® Global Equity Fund
Schedule of Investments
September 30, 2012
| | | |
| | | | Market |
| | | | Value |
| | | Shares | ($000) |
| | Altera Corp. | 153,403 | 5,213 |
| *,^ | VistaPrint NV | 151,791 | 5,184 |
| * | CoreLogic Inc. | 166,694 | 4,422 |
| * | Sapient Corp. | 406,377 | 4,332 |
| * | AOL Inc. | 111,970 | 3,945 |
| * | Teradata Corp. | 48,221 | 3,636 |
| | Western Digital Corp. | 84,700 | 3,280 |
| | Forrester Research Inc. | 107,818 | 3,102 |
| * | Dolby Laboratories Inc. Class A | 88,720 | 2,906 |
| | Xerox Corp. | 324,264 | 2,380 |
| * | Kulicke & Soffa Industries Inc. | 174,695 | 1,817 |
| * | Unisys Corp. | 80,796 | 1,682 |
| * | CSG Systems International Inc. | 72,359 | 1,627 |
| | Convergys Corp. | 92,487 | 1,449 |
| * | Tech Data Corp. | 27,163 | 1,230 |
| | Hewlett-Packard Co. | 48,379 | 825 |
| * | Magnachip Semiconductor Corp. | 57,252 | 676 |
| * | Hackett Group Inc. | 129,156 | 540 |
| | Seagate Technology plc | 16,182 | 502 |
| * | Cognizant Technology Solutions Corp. Class A | 5,576 | 390 |
| | Heartland Payment Systems Inc. | 9,645 | 306 |
| * | Photronics Inc. | 54,881 | 295 |
| | United Online Inc. | 53,261 | 294 |
| | Dell Inc. | 25,900 | 255 |
| * | Power-One Inc. | 43,472 | 243 |
| * | Nortel Networks Corp. | 241,295 | 2 |
| | | | 230,064 |
| Materials (2.0%) | | |
| | CF Industries Holdings Inc. | 69,719 | 15,494 |
| | Domtar Corp. | 136,001 | 10,648 |
| | Monsanto Co. | 96,542 | 8,787 |
| | Praxair Inc. | 63,553 | 6,602 |
| | Scotts Miracle-Gro Co. Class A | 126,269 | 5,489 |
| | Huntsman Corp. | 366,518 | 5,472 |
| | Georgia Gulf Corp. | 131,770 | 4,773 |
| | Boise Inc. | 415,368 | 3,639 |
| * | Chemtura Corp. | 199,220 | 3,431 |
| * | Coeur d'Alene Mines Corp. | 93,137 | 2,685 |
| | Minerals Technologies Inc. | 29,401 | 2,085 |
| | American Vanguard Corp. | 33,605 | 1,170 |
| * | Resolute Forest Products | 78,674 | 1,023 |
| | Buckeye Technologies Inc. | 31,125 | 998 |
| | Myers Industries Inc. | 56,409 | 881 |
| | Sherwin-Williams Co. | 5,502 | 819 |
| | PH Glatfelter Co. | 42,530 | 758 |
| | Schweitzer-Mauduit International Inc. | 17,170 | 566 |
| | Neenah Paper Inc. | 19,183 | 549 |
| * | KapStone Paper and Packaging Corp. | 17,899 | 401 |
| * | Kraton Performance Polymers Inc. | 14,445 | 377 |
| | LyondellBasell Industries NV Class A | 7,222 | 373 |
| * | TPC Group Inc. | 7,751 | 316 |
| | United States Steel Corp. | 14,325 | 273 |
| | Bemis Co. Inc. | 8,381 | 264 |
| | Cabot Corp. | 6,815 | 249 |
| * | Mercer International Inc. | 23,757 | 177 |
| | | | 78,299 |
| Telecommunication Services (0.5%) | | |
| | Verizon Communications Inc. | 211,674 | 9,646 |
| * | Level 3 Communications Inc. | 191,696 | 4,403 |
| | Telephone & Data Systems Inc. | 67,508 | 1,729 |
| * | NII Holdings Inc. | 212,981 | 1,672 |
| * | Cincinnati Bell Inc. | 118,179 | 674 |
16
Vanguard® Global Equity Fund
Schedule of Investments
September 30, 2012
| | | | | |
| | | | | | Market |
| | | | | | Value |
| | | | | Shares | ($000) |
| * | United States Cellular Corp. | | | 6,463 | 253 |
| | | | | | 18,377 |
| Utilities (0.0%) | | | | |
| | American States Water Co. | | | 5,670 | 252 |
| |
| | | | | | 1,635,242 |
| Total Common Stocks (Cost $3,048,441) | | | | 3,750,826 |
| |
| | | Coupon | | | |
| Preferred Stocks (0.0%) | | | | |
| * | Malaysian Airline System Bhd. Pfd. (Cost $75) | 30.000% | | 183,333 | 60 |
| |
| | | | | Face | |
| | | | Maturity | Amount | |
| | | | Date | ($000) | |
| |
| Convertible Bonds (0.1%) | | | | |
| Consumer Discretionary (0.0%) | | | | |
| | Sotheby's Cvt. | 3.125% | 6/15/13 | — | — |
| Financials (0.0%) | | | | |
| 3 | SL Green Operating Partnership LP Cvt. | 3.000% | 3/30/27 | 1,032 | 1,031 |
| 3 | MGIC Investment Corp. Cvt. | 9.000% | 4/1/63 | 323 | 88 |
| | | | | | 1,119 |
| Industrials (0.1%) | | | | |
| | AMR Corp. Cvt. | 6.250% | 10/15/14 | 1,635 | 1,079 |
| | US Airways Group Inc. Cvt. | 7.250% | 5/15/14 | 184 | 438 |
| | | | | | 1,517 |
| Total Convertible Bonds (Cost $1,608) | | | | 2,636 |
| |
| | | | | Shares | |
| Temporary Cash Investments (4.7%)1 | | | | |
| Money Market Fund (4.4%) | | | | |
| 4,5 | Vanguard Market Liquidity Fund | 0.163% | | 172,201,054 | 172,201 |
| |
| | | | | Face | |
| | | | | Amount | |
| | | | | ($000) | |
| U.S. Government and Agency Obligations (0.3%) | | | | |
| 6,7 | Fannie Mae Discount Notes | 0.135% | 12/12/12 | 10,000 | 9,997 |
| | United States Treasury Note/Bond | 1.375% | 11/15/12 | 500 | 501 |
| | | | | | 10,498 |
| Total Temporary Cash Investments (Cost $182,700) | | | | 182,699 |
| Total Investments (102.2%) (Cost $3,232,824) | | | | 3,936,221 |
| Other Assets and Liabilities—Net (-2.2%)5 | | | | (82,973) |
| Net Assets (100%) | | | | 3,853,248 |
* Non-income-producing security.
^ Part of security position is on loan to broker-dealers. The total value of securities on loan is $73,493,000.
1 The fund invests a portion of its cash reserves in equity markets through the use of index futures contracts. After giving effect to futures
investments, the fund's effective common stock and temporary cash investment positions represent 98.2% and 3.9%, respectively, of net
assets.
2 Considered an affiliated company of the fund as the issuer is another member of The Vanguard Group.
17
Vanguard® Global Equity Fund
Schedule of Investments
September 30, 2012
3 Security exempt from registration under Rule 144A of the Securities Act of 1933. Such securities may be sold in transactions exempt from
registration, normally to qualified institutional buyers. At September 30, 2012, the aggregate value of these securities was $1,119,000,
representing 0.0% of net assets.
4 Affiliated money market fund available only to Vanguard funds and certain trusts and accounts managed by Vanguard. Rate shown is the 7-day
yield.
5 Includes $79,729,000 of collateral received for securities on loan.
6 The issuer was placed under federal conservatorship in September 2008; since that time, its daily operations have been managed by the Federal
Housing Finance Agency and it receives capital from the U.S. Treasury, as needed to maintain a positive net worth, in exchange for senior
preferred stock.
7 Securities with a value of $4,599,000 have been segregated as initial margin for open futures contracts.
ADR—American Depositary Receipt.
GDR—Global Depositary Receipt.
NVDR—Non-Voting Depositary Receipt.
18
Report of Independent Registered Public Accounting Firm
To the Trustees of Vanguard Horizon Funds and the Shareholders of Vanguard Global Equity Fund:
We have audited, in accordance with the standards of the Public Company Accounting Oversight Board (United States), the financial statements (not presented herein) of Vanguard Global Equity Fund (the “Fund”) as of September 30, 2012 and for the year then ended and have issued our unqualified report thereon dated November 12, 2012. Our audit included an audit of the Fund’s schedule of investments as of September 30, 2012. This schedule of investments is the responsibility of the Fund’s management. Our responsibility is to express an opinion on this schedule of investments based on our audit.
In our opinion, the accompanying schedule of investments referred to above, when read in conjunction with the financial statements of the Fund referred to above, presents fairly, in all material respects, the information set forth therein.
PricewaterhouseCoopers LLP
Philadelphia, Pennsylvania
November 12, 2012
19
© 2012 The Vanguard Group. Inc.
All rights reserved.
Vanguard Marketing Corporation, Distributor.
SNA 1290 112012

Annual Report | September 30, 2012
Vanguard Strategic Small-Cap Equity Fund

> Vanguard Strategic Small-Cap Equity Fund returned 31.38% for the fiscal year
ended September 30, 2012, benefiting from the powerful rally in
small-capitalization stocks.
> The fund’s return was a step behind the 32.29% posted by its benchmark index
but ahead of the 28.66% average return of peer-group funds.
> Bright spots in the portfolio included stock selections in the energy, industrial,
and consumer staples sectors.
| |
| Contents | |
| Your Fund’s Total Returns. | 1 |
| Chairman’s Letter. | 2 |
| Advisor’s Report. | 8 |
| Fund Profile. | 10 |
| Performance Summary. | 11 |
| Financial Statements. | 13 |
| Your Fund’s After-Tax Returns. | 25 |
| About Your Fund’s Expenses. | 26 |
| Glossary. | 28 |
Please note: The opinions expressed in this report are just that—informed opinions. They should not be considered promises or advice.
Also, please keep in mind that the information and opinions cover the period through the date on the front of this report. Of course, the
risks of investing in your fund are spelled out in the prospectus.
See the Glossary for definitions of investment terms used in this report.
About the cover: Our cover photograph shows rigging on the HMSSurprise, a replica of an 18th-century Royal Navy frigate. It
was featured in the 2003 movie Master and Commander: The Far Side of the World, which was based on Patrick O’Brian’s sea
novels, set amid the Napoleonic Wars. Vanguard was named for another ship of that era, the HMSVanguard, which was the
flagship of British Admiral Horatio Nelson at the Battle of the Nile.
Your Fund’s Total Returns
| |
| Fiscal Year Ended September 30, 2012 | |
| |
| | Total |
| | Returns |
| Vanguard Strategic Small-Cap Equity Fund | 31.38% |
| MSCI US Small Cap 1750 Index | 32.29 |
| Small-Cap Core Funds Average | 28.66 |
| Small-Cap Core Funds Average: Derived from data provided by Lipper Inc. | |
| | | | |
| Your Fund’s Performance at a Glance | | | | |
| September 30, 2011, Through September 30, 2012 | | | | |
| | | | Distributions Per Share |
| | Starting | Ending | Income | Capital |
| | Share Price | Share Price | Dividends | Gains |
| Vanguard Strategic Small-Cap Equity Fund | $16.44 | $21.37 | $0.196 | $0.000 |
1

Chairman’s Letter
Dear Shareholder,
Vanguard Strategic Small-Cap Equity Fund fully participated in the stock market rally that took place during the 12 months ended September 30, 2012. The fund posted its highest fiscal-year return—31.38%—since operations began about six years ago. As impressive as this absolute return was, it’s important to remember that we evaluate success with this fund by relative standards. Here, the record was mixed. The fund fell a step behind the 32.29% return of its benchmark, the MSCI US Small Cap 1750 Index, but exceeded the 28.66% return of its peer group.
Irrespective of the broad economic and market environment, the advisor has a twofold task in selecting stocks for the portfolio: to outpace the returns of the fund’s benchmark sectors while keeping, for each sector, a risk profile similar to the benchmark’s. To do so, the advisor, Vanguard Equity Investment Group, relies on sophisticated computer models. While maintaining sector-by-sector risk control, the advisor was particularly successful with stock selections in energy, industrials, and consumer staples but less so in information technology and health care.
Note: If you hold shares in a taxable account, you may wish to review the table and discussion of after-tax returns for the fiscal year, based on the highest tax bracket, later in this report.
2
Stocks notched a powerful rally, with help from central bankers
U.S. stocks surged 30% in the 12 months ended September 30, outpacing the gains of their international counterparts. The rally came amid moves by U.S. and European central bankers to quiet—at least temporarily—investors’ concerns about the U.S. economy and the finances of European governments and banks. Although all capitalization sectors benefited from the upswing, small-cap stocks outpaced large-cap ones.
U.S. stocks were the standouts, but European and emerging markets stocks also posted double-digit results. The developed markets of the Pacific region were the weakest performers but still recorded a modest advance.
In July, the president of the European Central Bank declared that policymakers would do whatever was needed to preserve the euro common currency. That pronouncement was encouraging to investors, but Europe’s financial troubles are by no means resolved. Vanguard economists believe the most likely scenario is that the Eurozone will “muddle through” for several years, with occasional spikes in market volatility, as fiscal tightening continues in the face of weak economic growth.
Bonds produced solid returns; future results may be more muted
Bonds once again advanced; the broad U.S. taxable market returned about 5% for the 12 months. Among U.S. Treasuries,
| | | |
| Market Barometer | | | |
| |
| | | Average Annual Total Returns |
| | Periods Ended September 30, 2012 |
| | One | Three | Five |
| | Year | Years | Years |
| Stocks | | | |
| Russell 1000 Index (Large-caps) | 30.06% | 13.27% | 1.22% |
| Russell 2000 Index (Small-caps) | 31.91 | 12.99 | 2.21 |
| Dow Jones U.S. Total Stock Market Index | 30.00 | 13.29 | 1.53 |
| MSCI All Country World Index ex USA (International) | 14.48 | 3.17 | -4.12 |
| |
| Bonds | | | |
| Barclays U.S. Aggregate Bond Index (Broad taxable market) | 5.16% | 6.19% | 6.53% |
| Barclays Municipal Bond Index (Broad tax-exempt market) | 8.32 | 5.99 | 6.06 |
| Citigroup Three-Month U.S. Treasury Bill Index | 0.05 | 0.08 | 0.63 |
| |
| CPI | | | |
| Consumer Price Index | 1.99% | 2.33% | 2.11% |
3
long-term bonds were particularly strong as they benefited from the Federal Reserve’s bond-buying program.
As bond prices rose, the yield of the 10-year U.S. Treasury note fell to a record low in July, closing below 1.5%. (Bond yields and prices move in opposite directions.) By the end of the period, the yield had climbed, but it still remained low by historical standards.
Bondholders have enjoyed years of strong returns. But as Tim Buckley, our incoming chief investment officer, has noted, investors shouldn’t be surprised if future results are much more modest. As yields tumble, the scope for further declines—and price increases—diminishes.
The Federal Reserve announced on September 13 that it would continue to hold its target for short-term interest rates between 0% and 0.25% at least through mid-2015. The exceptionally low rates, in place since late 2008, kept a tight lid on returns from money market funds and savings accounts.
Energy stock selections contributed to results
The advisor’s computer models (described in the Advisor’s Report that follows this letter) seek stocks with the strong financial characteristics that can produce outstanding results over time. Unlike mutual funds that pay less attention to risk control, the approach aims to produce a lot of “singles,” rather than “home runs.”
| | |
| Expense Ratios | | |
| Your Fund Compared With Its Peer Group | | |
| | | Peer Group |
| | Fund | Average |
| Strategic Small-Cap Equity Fund | 0.43% | 1.37% |
The fund expense ratio shown is from the prospectus dated January 26, 2012, and represents estimated costs for the current fiscal year. For
the fiscal year ended September 30, 2012, the fund’s expense ratio was 0.38%. The peer-group expense ratio is derived from data provided
by Lipper Inc. and captures information through year-end 2011.
Peer group: Small-Cap Core Funds.
The advisor made particularly effective selections in the energy sector, which gained ground on the strength of holdings in oil and gas refinery and marketing companies. Selections were also strong in industrials—especially among industrial distributors, electrical equipment makers, and commercial printers—and in consumer staples—particularly among packaged food and food-market companies.
Despite double-digit returns, other sectors held back fund results relative to their counterparts in the benchmark. In health care, results were dampened by pharmaceutical companies and providers of health care equipment and facilities. Computer software and hardware firms trimmed returns among the fund’s information technology selections.
The fund’s challenging start is still affecting long-term returns
The Strategic Small-Cap Equity Fund’s performance during its initial years of operation continues to weigh on longer-term results. Those years included the financial crisis, a severe bear market, and a market environment that blunted the effectiveness of the stock-selection models used by this fund and many competing quantitative portfolios.
As a result, the fund’s average return since inception is about half that of its benchmark index, though about on a par with peer-group funds.
The returns for the fund and its benchmarks are far lower than investors expect from stock funds—a gauge of how unusual the recent market has been.
| |
| Total Returns | |
| Inception Through September 30, 2012 | |
| | Average |
| | Annual Return |
| Strategic Small-Cap Equity Fund (Returns since inception: 4/24/2006) | 2.12% |
| MSCI US Small Cap 1750 Index | 4.09 |
| Small-Cap Core Funds Average | 1.90 |
| Small-Cap Core Funds Average: Derived from data provided by Lipper Inc. | |
The figures shown represent past performance, which is not a guarantee of future results. (Current performance may be
lower or higher than the performance data cited. For performance data current to the most recent month-end, visit our
website at vanguard.com/performance.) Note, too, that both investment returns and principal value can fluctuate widely, so
an investor’s shares, when sold, could be worth more or less than their original cost.
5
Another measure of how heavily the fund’s rough start has weighed on long-term performance is a comparison of its first three years of returns with those of the past three. For the three years ended September 30, 2009, the fund’s annualized return was –7.82%, compared with –2.86% for its benchmark index and –5.22% for its peer group. For the three years ended September 30, 2012, the fund’s annualized return was 15.38%, compared with 14.17% for its index and 12.12% for peers.
We’re aware that market characteristics can change and favor, or disfavor, an investing style. We are confident that the methodology used by Vanguard Equity Investment Group will, over time, accomplish the goal of maintaining the risk profile of the fund’s benchmark while providing competitive returns.
The lessons of the financial crisis remain relevant four years later
In September, the end of your fund’s fiscal year, we marked the fourth anniversary of Lehman Brothers’ collapse, the start of the 2008–2009 financial crisis. When the Lehman news broke, I was speaking to institutional clients at an event in Washington, D.C., all of three weeks into my new role as Vanguard’s CEO.
In the ensuing months, I was struck both by how fortunate I was to work with a great team of Vanguard “crew” and by the remarkable steadiness demonstrated by our clients. Many clients experienced significant losses, but signs of panic were few. On balance, they remained committed to their long-term investment programs and managed to benefit from the financial markets’ subsequent recovery.
A note on expense ratios
The Expense Ratios table in each report’s Chairman’s Letter displays fund expense ratios from the most recent prospectus. These figures include the funds’ actual operating expenses. For some funds, the figures also include “acquired fund fees and expenses,” which result from the funds’ holdings in business development companies (BDCs).
Although the Securities and Exchange Commission requires that BDC costs be included in a fund’s expense ratio, these fees are not incurred by the fund. They have no impact on a fund’s total return or on its tracking error relative to an index. A footnote to the Expense Ratios table reports an annualized calculation of the fund’s actual expenses for the period, a more relevant tally of the operating costs incurred by shareholders.
6
As the crisis recedes further in time, it’s important not to lose sight of the lessons that it illuminated about investing and sound financial practices generally. First among those lessons is that diversification does work. Diversification didn’t immunize investors from the market’s decline, but it certainly helped to insulate them from the worst of it.
Second, saving money and living within your means are critical. Investors are acting on this lesson as they pay off debt, which is a form of saving, and increase their savings rates from the dangerously low levels that prevailed before the crisis.
Third, having the courage to stick with a sound investment plan—as so many of our clients did—is important during volatile, uncertain times. Investors who resisted the urge to bail out of stocks at the depths of the crisis have largely been rewarded in the succeeding years.
I am very optimistic that, if investors embrace these lessons, they can give themselves a better chance of reaching their long-term goals. As always, thank you for investing with Vanguard.
Sincerely,
F. William McNabb III
Chairman and Chief Executive Officer October 16, 2012
7
Advisor’s Report
For the fiscal year ended September 30, 2012, the Strategic Small-Cap Equity Fund returned 31.38%, falling short of the 32.29% gain of the benchmark MSCI US Small Cap 1750 Index. The year presented very different halves. In the first six months, small-capitalization stocks rose sharply—almost 30%. In the second half, they slowed dramatically, moving ahead by less than 2%.
Small-cap stocks, the focus of your investment in the fund, outpaced their large-cap counterparts, as reflected in the MSCI US Prime Market 750 Index, by about 2 percentage points. Although all ten sector groups generated positive returns within the fund’s benchmark, the best performers were health care, materials, and consumer discretionary companies. Utility and energy companies were the laggards among the benchmark’s sectors.
Equity markets have staged quite a rally since last fall, but investor unease and economic worries are still prominent.
A “fiscal cliff” scenario could send the United States into recession if not resolved, and investors are concerned anew about the Eurozone crisis and slowing growth in China. Add to that stagnant employment, election-year uncertainty, and a lack of clarity on corporate profits, and it’s easy to see why investors’ appetite for riskier assets may be put on hold for a while. Market volatility has declined substantially during this period, but it is likely to persist amid
our unresolved budget, deficit, and employment problems and anemic world economic growth.
Although these macro factors affect overall portfolio performance, our approach to investing focuses on specific stock fundamentals and employs five components: • Valuation, which measures the price we pay for earnings and cash flows.
• Growth, which considers the growth of earnings as a factor in how much we pay for them.
• Management decisions, which assesses the actions taken by company management that signal its informed opinions regarding a firm’s prospects and earnings.
• Market sentiment, which captures how investors reflect their opinions of a company through their activity in the market.
• Quality, which measures balance-sheet strength and the sustainability of earnings.
Using these components, we assess stocks by comparing companies within an industry group.
For the 12-month period, our stock selection results were mixed. Our management decisions and quality indicators were effective in distinguishing outperformers from underperformers, but our valuation and market sentiment indicators detracted from results.
8
Our selection results were positive in seven of ten sectors and negative in three. Selections in energy, industrials, and consumer staples added the most to our relative returns. In energy, Delek US Holdings, HollyFrontier, and CVR Energy were the standouts. In industrials, United Rentals, Amerco, and Deluxe were the largest contributors, as were B&G Foods, Susser Holdings, and Boston Beer in consumer staples. Selection results were most disappointing in health care and technology. Among health care companies, Invacare, Health Net, and AVEO Pharmaceuticals did not perform as expected and detracted from results. In information technology, the same was true for MercadoLibre, GT Technologies, and Powerwave Technologies.
Although we cannot predict with certainty the impact of broader political or economic events, we are confident that the stock market will provide worthwhile returns for long-term investors. With that in mind, we believe that equity exposure will continue to be an important part of a diversified investment plan.
We thank you for your investment and look forward to the new fiscal year.
Portfolio Managers:
James D. Troyer, CFA, Principal
James P. Stetler, Principal
Michael R. Roach, CFA
Vanguard Equity Investment Group
October 19, 2012
9
Strategic Small-Cap Equity Fund
Fund Profile
As of September 30, 2012
| | | |
| Portfolio Characteristics | | |
| | | | DJ |
| | | MSCI US | U.S. Total |
| | | Small Cap | Market |
| | Fund 1750 Index | Index |
| Number of Stocks | 314 | 1,730 | 3,638 |
| Median Market Cap | $1.6B | $1.7B | $35.6B |
| Price/Earnings Ratio | 15.4x | 23.3x | 17.0x |
| Price/Book Ratio | 1.9x | 1.9x | 2.2x |
| Return on Equity | 9.4% | 9.0% | 18.0% |
| Earnings Growth Rate | 8.4% | 5.6% | 10.4% |
| Dividend Yield | 1.3% | 1.4% | 2.0% |
| Foreign Holdings | 0.0% | 0.0% | 0.0% |
| Turnover Rate | 66% | — | — |
| Ticker Symbol | VSTCX | — | — |
| Expense Ratio1 | 0.43% | — | — |
| 30-Day SEC Yield | 0.92% | — | — |
| Short-Term Reserves | 0.1% | — | — |
| | | |
| Sector Diversification (% of equity exposure) |
| | | | DJ |
| | | MSCI US | U.S. Total |
| | | Small Cap | Market |
| | Fund 1750 Index | Index |
| Consumer Discretionary 14.0% | 13.4% | 12.0% |
| Consumer Staples | 3.6 | 3.1 | 9.5 |
| Energy | 5.9 | 5.5 | 10.4 |
| Financials | 21.9 | 22.3 | 16.0 |
| Health Care | 12.6 | 12.9 | 11.9 |
| Industrials | 16.0 | 16.1 | 10.6 |
| Information Technology 16.7 | 16.5 | 19.2 |
| Materials | 5.3 | 5.8 | 3.9 |
| Telecommunication | | | |
| Services | 0.4 | 0.8 | 2.9 |
| Utilities | 3.6 | 3.6 | 3.6 |
| | |
| Volatility Measures | | |
| | | DJ |
| | MSCI US | U.S. Total |
| | Small Cap | Market |
| | 1750 Index | Index |
| R-Squared | 0.99 | 0.92 |
| Beta | 1.01 | 1.25 |
These measures show the degree and timing of the fund’s
fluctuations compared with the indexes over 36 months.
| | |
| Ten Largest Holdings (% of total net assets) |
| Cadence Design | | |
| Systems Inc. | Application Software | 0.8% |
| Cubist Pharmaceuticals | | |
| Inc. | Biotechnology | 0.8 |
| Pharmacyclics Inc. | Biotechnology | 0.7 |
| Brinker International Inc. Restaurants | 0.7 |
| American Capital Ltd. | Asset Management | |
| | & Custody Banks | 0.7 |
| CoreLogic Inc. | Data Processing & | |
| | Outsourced Services | 0.7 |
| MAXIMUS Inc. | IT Consulting & | |
| | Other Services | 0.7 |
| Lender Processing | Data Processing & | |
| Services Inc. | Outsourced Services | 0.7 |
| Charles River | | |
| Laboratories | Life Sciences Tools & | |
| International Inc. | Services | 0.7 |
| ProAssurance Corp. | Property & Casualty | |
| | Insurance | 0.7 |
| Top Ten | | 7.2% |
| The holdings listed exclude any temporary cash investments and |
| equity index products. | | |
Investment Focus
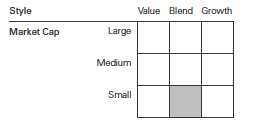
1 The expense ratio shown is from the prospectus dated January 26, 2012, and represents estimated costs for the current fiscal year. For the
fiscal year ended September 30, 2012, the expense ratio was 0.38%.
Strategic Small-Cap Equity Fund
Performance Summary
All of the returns in this report represent past performance, which is not a guarantee of future results that may be achieved by the fund. (Current performance may be lower or higher than the performance data cited. For performance data current to the most recent month-end, visit our website at vanguard.com/performance.) Note, too, that both investment returns and principal value can fluctuate widely, so an investor’s shares, when sold, could be worth more or less than their original cost. The returns shown do not reflect taxes that a shareholder would pay on fund distributions or on the sale of fund shares.
Cumulative Performance: April 24, 2006, Through September 30, 2012
Initial Investment of $10,000
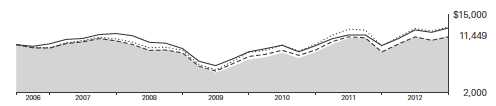
| | | | | |
| | | | Average Annual Total Returns | |
| | | Periods Ended September 30, 2012 | |
| | | | | Since | Final Value |
| | | One | Five | Inception | of a $10,000 |
| | | Year | Years | (4/24/2006) | Investment |
| | Strategic Small-Cap Equity Fund | 31.38% | 1.34% | 2.12% | $11,449 |
| •••••••• | MSCI US Small Cap 1750 Index | 32.29 | 3.36 | 4.09 | 12,942 |
| – – – – | Small-Cap Core Funds Average | 28.66 | 1.19 | 1.90 | 11,290 |
| | Dow Jones U.S. Total Stock Market | | | | |
| | Index | 30.00 | 1.53 | 3.91 | 12,803 |
Small-Cap Core Funds Average: Derived from data provided by Lipper Inc.
"Since Inception" performance is calculated from the inception date for both the fund and its comparative standards.
See Financial Highlights for dividend and capital gains information.
11
Strategic Small-Cap Equity Fund
Fiscal-Year Total Returns (%): April 24, 2006, Through September 30, 2012
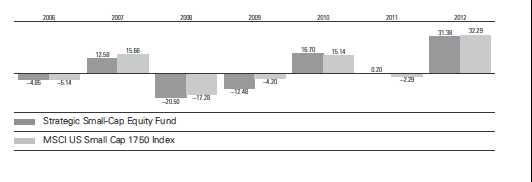
12
Strategic Small-Cap Equity Fund
Financial Statements
Statement of Net Assets
As of September 30, 2012
The fund reports a complete list of its holdings in regulatory filings four times in each fiscal year, at the quarter-ends. For the second and fourth fiscal quarters, the lists appear in the fund’s semiannual and annual reports to shareholders. For the first and third fiscal quarters, the fund files the lists with the Securities and Exchange Commission on Form N-Q. Shareholders can look up the fund’s Forms N-Q on the SEC’s website at sec.gov. Forms N-Q may also be reviewed and copied at the SEC’s Public Reference Room (see the back cover of this report for further information).
| | | |
| | | | Market |
| | | | Value |
| | | Shares | ($000) |
| Common Stocks (99.6%)1 | | |
| Consumer Discretionary (13.9%) | |
| | Brinker International Inc. | 54,200 | 1,913 |
| * | ANN Inc. | 46,500 | 1,754 |
| | Dillard’s Inc. Class A | 23,950 | 1,732 |
| | Domino’s Pizza Inc. | 45,300 | 1,708 |
| | Thor Industries Inc. | 46,400 | 1,685 |
| * | Smith & Wesson Holding | | |
| | Corp. | 147,700 | 1,626 |
| | Jarden Corp. | 30,600 | 1,617 |
| * | Fifth & Pacific Cos. Inc. | 118,700 | 1,517 |
| | Movado Group Inc. | 43,800 | 1,477 |
| | Brown Shoe Co. Inc. | 89,000 | 1,427 |
| | Foot Locker Inc. | 40,100 | 1,424 |
| * | Papa John’s International | | |
| | Inc. | 25,115 | 1,341 |
| | Sinclair Broadcast Group | | |
| | Inc. Class A | 119,604 | 1,341 |
| | Regal Entertainment Group | | |
| | Class A | 90,900 | 1,279 |
| * | Asbury Automotive Group | | |
| | Inc. | 43,900 | 1,227 |
| * | Coinstar Inc. | 25,400 | 1,143 |
| * | Journal Communications | | |
| | Inc. Class A | 209,375 | 1,089 |
| | Buckle Inc. | 23,100 | 1,049 |
| | Dana Holding Corp. | 79,600 | 979 |
| | Cheesecake Factory Inc. | 27,100 | 969 |
| | Pier 1 Imports Inc. | 44,400 | 832 |
| * | LeapFrog Enterprises Inc. | 88,900 | 802 |
| * | Corinthian Colleges Inc. | 319,100 | 759 |
| * | Conn’s Inc. | 32,300 | 712 |
| * | Crocs Inc. | 42,900 | 695 |
| | Cinemark Holdings Inc. | 29,700 | 666 |
| * | Tenneco Inc. | 22,000 | 616 |
| | Ameristar Casinos Inc. | 31,900 | 568 |
| * | Express Inc. | 25,200 | 373 |
| * | Vitamin Shoppe Inc. | 5,500 | 321 |
| | | |
| | Cracker Barrel Old Country | | |
| | Store Inc. | 3,200 | 215 |
| | Churchill Downs Inc. | 3,000 | 188 |
| * | McClatchy Co. Class A | 78,700 | 176 |
| | Cato Corp. Class A | 3,800 | 113 |
| | Cooper Tire & Rubber Co. | 5,600 | 107 |
| * | Sonic Corp. | 8,200 | 84 |
| | Core-Mark Holding Co. Inc. | 1,700 | 82 |
| | Aaron’s Inc. | 2,800 | 78 |
| | Stage Stores Inc. | 3,600 | 76 |
| | Brunswick Corp. | 3,300 | 75 |
| | Speedway Motorsports Inc. | 4,300 | 66 |
| * | Zumiez Inc. | 2,100 | 58 |
| | Blyth Inc. | 1,800 | 47 |
| | | | 36,006 |
| Consumer Staples (3.6%) | | |
| * | Dean Foods Co. | 107,900 | 1,764 |
| | B&G Foods Inc. Class A | 52,400 | 1,588 |
| | Nu Skin Enterprises Inc. | | |
| | Class A | 38,500 | 1,495 |
| * | Susser Holdings Corp. | 38,800 | 1,403 |
| * | Pilgrim’s Pride Corp. | 214,700 | 1,097 |
| * | Rite Aid Corp. | 653,400 | 765 |
| | Universal Corp. | 12,900 | 657 |
| | Herbalife Ltd. | 2,800 | 133 |
| * | Central Garden and Pet Co. | | |
| | Class A | 10,500 | 127 |
| * | USANA Health Sciences | | |
| | Inc. | 2,600 | 121 |
| | Sanderson Farms Inc. | 2,500 | 111 |
| | | | 9,261 |
| Energy (5.9%) | | |
| * | Rosetta Resources Inc. | 35,600 | 1,705 |
| | Western Refining Inc. | 61,000 | 1,597 |
| * | Helix Energy Solutions | | |
| | Group Inc. | 86,500 | 1,580 |
| | Delek US Holdings Inc. | 57,100 | 1,456 |
| | HollyFrontier Corp. | 33,634 | 1,388 |
| * | Vaalco Energy Inc. | 158,300 | 1,354 |
13
Strategic Small-Cap Equity Fund
| | | |
| | | | Market |
| | | | Value |
| | | Shares | ($000) |
| * | Stone Energy Corp. | 52,300 | 1,314 |
| * | EPL Oil & Gas Inc. | 62,300 | 1,264 |
| | Energy XXI Bermuda Ltd. | 30,900 | 1,080 |
| * | Oil States International Inc. | 12,160 | 966 |
| | Crosstex Energy Inc. | 63,600 | 892 |
| * | Parker Drilling Co. | 77,100 | 326 |
| * | Hornbeck Offshore | | |
| | Services Inc. | 4,400 | 161 |
| * | Rentech Inc. | 34,000 | 84 |
| * | Cloud Peak Energy Inc. | 4,200 | 76 |
| | | | 15,243 |
| Financials (21.9%) | | |
| * | American Capital Ltd. | 164,300 | 1,863 |
| | ProAssurance Corp. | 19,980 | 1,807 |
| | Allied World Assurance | | |
| | Co. Holdings AG | 21,400 | 1,653 |
| | CVB Financial Corp. | 130,100 | 1,553 |
| | Protective Life Corp. | 58,900 | 1,544 |
| | CNO Financial Group Inc. | 157,700 | 1,522 |
| | Cathay General Bancorp | 87,700 | 1,514 |
| | Umpqua Holdings Corp. | 112,900 | 1,455 |
| | Nelnet Inc. Class A | 60,048 | 1,426 |
| | Heartland Financial USA Inc. | 51,500 | 1,404 |
| * | World Acceptance Corp. | 20,800 | 1,403 |
| | Chemical Financial Corp. | 57,900 | 1,401 |
| | Webster Financial Corp. | 54,830 | 1,299 |
| * | Credit Acceptance Corp. | 15,112 | 1,292 |
| | Cash America International | | |
| | Inc. | 31,613 | 1,219 |
| | Extra Space Storage Inc. | 34,100 | 1,134 |
| | Apartment Investment & | | |
| | Management Co. Class A | 42,100 | 1,094 |
| | CBL & Associates | | |
| | Properties Inc. | 50,900 | 1,086 |
| | Douglas Emmett Inc. | 46,700 | 1,077 |
| | Republic Bancorp Inc. | | |
| | Class A | 46,854 | 1,028 |
| | WesBanco Inc. | 49,411 | 1,023 |
| | Post Properties Inc. | 20,400 | 978 |
| | Omega Healthcare | | |
| | Investors Inc. | 42,500 | 966 |
| | Entertainment Properties | | |
| | Trust | 20,900 | 929 |
| | Brandywine Realty Trust | 72,400 | 883 |
| * | Forest City Enterprises Inc. | | |
| | Class A | 54,700 | 867 |
| | DCT Industrial Trust Inc. | 132,700 | 859 |
| | Oritani Financial Corp. | 55,800 | 840 |
| | Lexington Realty Trust | 86,300 | 834 |
| | Provident Financial Services | | |
| | Inc. | 52,500 | 829 |
| | RLJ Lodging Trust | 43,600 | 825 |
| * | First Industrial Realty Trust | | |
| | Inc. | 61,800 | 812 |
| | Highwoods Properties Inc. | 23,700 | 773 |
| | | |
| | DiamondRock Hospitality | | |
| | Co. | 80,000 | 770 |
| | PacWest Bancorp | 32,900 | 769 |
| | MarketAxess Holdings Inc. | 24,300 | 768 |
| | National Retail Properties | | |
| | Inc. | 24,900 | 759 |
| | Sun Communities Inc. | 17,200 | 759 |
| * | Sunstone Hotel Investors | | |
| | Inc. | 68,800 | 757 |
| * | St. Joe Co. | 37,800 | 737 |
| | PrivateBancorp Inc. Class A | 46,000 | 736 |
| * | Strategic Hotels & Resorts | | |
| | Inc. | 119,700 | 719 |
| | Mack-Cali Realty Corp. | 26,900 | 716 |
| * | Alexander & Baldwin Inc. | 23,800 | 703 |
| | Pennsylvania REIT | 44,100 | 699 |
| | Ramco-Gershenson | | |
| | Properties Trust | 53,800 | 674 |
| | Inland Real Estate Corp. | 80,400 | 663 |
| | CapitalSource Inc. | 86,200 | 653 |
| | Washington Federal Inc. | 38,000 | 634 |
| | Cedar Realty Trust Inc. | 112,700 | 595 |
| | CapLease Inc. | 113,100 | 585 |
| | Old National Bancorp | 41,100 | 559 |
| | Camden Property Trust | 7,700 | 497 |
| | DDR Corp. | 30,500 | 469 |
| | FBL Financial Group Inc. | | |
| | Class A | 8,000 | 266 |
| | Associated Banc-Corp | 19,300 | 254 |
| | Cardinal Financial Corp. | 17,700 | 253 |
| | Community Trust Bancorp | | |
| | Inc. | 6,600 | 235 |
| | Sterling Financial Corp. | 9,600 | 214 |
| | Bancfirst Corp. | 4,500 | 193 |
| | Montpelier Re Holdings Ltd. | 8,000 | 177 |
| | Equity One Inc. | 7,600 | 160 |
| * | Citizens Republic Bancorp | | |
| | Inc. | 8,200 | 159 |
| | Primerica Inc. | 5,500 | 158 |
| | Medical Properties Trust | | |
| | Inc. | 14,700 | 154 |
| | MainSource Financial Group | | |
| | Inc. | 11,200 | 144 |
| | GAMCO Investors Inc. | 2,200 | 109 |
| * | Netspend Holdings Inc. | 10,200 | 100 |
| | United Fire Group Inc. | 3,600 | 90 |
| | Horace Mann Educators | | |
| | Corp. | 4,400 | 80 |
| | Washington Trust Bancorp | | |
| | Inc. | 3,000 | 79 |
| | Great Southern Bancorp Inc. | 2,500 | 77 |
| * | National Financial Partners | | |
| | Corp. | 4,200 | 71 |
| | BRE Properties Inc. | 1,500 | 70 |
| | MB Financial Inc. | 3,400 | 67 |
14
Strategic Small-Cap Equity Fund
| | | |
| | | | Market |
| | | | Value |
| | | Shares | ($000) |
| * | NewStar Financial Inc. | 5,600 | 67 |
| | Synovus Financial Corp. | 26,900 | 64 |
| | Kansas City Life Insurance | | |
| | Co. | 1,600 | 62 |
| | American Campus | | |
| | Communities Inc. | 1,100 | 48 |
| | | | 56,764 |
| Health Care (12.6%) | | |
| * | Cubist Pharmaceuticals Inc. | 41,200 | 1,964 |
| * | Pharmacyclics Inc. | 29,800 | 1,922 |
| * | Charles River Laboratories | | |
| | International Inc. | 45,700 | 1,810 |
| | PDL BioPharma Inc. | 204,100 | 1,570 |
| * | WellCare Health Plans Inc. | 27,100 | 1,532 |
| * | Auxilium Pharmaceuticals | | |
| | Inc. | 60,900 | 1,490 |
| * | Community Health Systems | | |
| | Inc. | 49,800 | 1,451 |
| * | Team Health Holdings Inc. | 53,400 | 1,449 |
| * | Magellan Health Services | | |
| | Inc. | 26,700 | 1,378 |
| * | Health Net Inc. | 60,200 | 1,355 |
| * | Cyberonics Inc. | 25,400 | 1,331 |
| | Chemed Corp. | 19,000 | 1,317 |
| * | LifePoint Hospitals Inc. | 30,700 | 1,313 |
| * | PAREXEL International | | |
| | Corp. | 39,600 | 1,218 |
| * | Medicines Co. | 42,200 | 1,089 |
| * | Molina Healthcare Inc. | 39,709 | 999 |
| | Analogic Corp. | 12,700 | 993 |
| * | Pozen Inc. | 132,200 | 876 |
| * | Affymax Inc. | 39,800 | 838 |
| ^,* | Questcor Pharmaceuticals | | |
| | Inc. | 35,200 | 651 |
| * | Acorda Therapeutics Inc. | 25,400 | 650 |
| * | Thoratec Corp. | 16,400 | 567 |
| | West Pharmaceutical | | |
| | Services Inc. | 10,600 | 563 |
| * | Genomic Health Inc. | 16,200 | 562 |
| * | SurModics Inc. | 24,631 | 498 |
| * | Salix Pharmaceuticals Ltd. | 11,100 | 470 |
| * | ICU Medical Inc. | 5,000 | 302 |
| * | Gentiva Health Services Inc. | 25,800 | 292 |
| * | Par Pharmaceutical Cos. Inc. | 5,300 | 265 |
| * | Abaxis Inc. | 6,600 | 237 |
| * | Wright Medical Group Inc. | 10,200 | 226 |
| * | ABIOMED Inc. | 10,500 | 220 |
| * | Bio-Reference Labs Inc. | 6,700 | 191 |
| * | Select Medical Holdings | | |
| | Corp. | 15,900 | 179 |
| * | Orthofix International NV | 3,900 | 175 |
| * | Affymetrix Inc. | 33,000 | 143 |
| * | RTI Biologics Inc. | 27,400 | 114 |
| * | HealthSouth Corp. | 4,200 | 101 |
| | STERIS Corp. | 2,500 | 89 |
| | | |
| * | Isis Pharmaceuticals Inc. | 5,600 | 79 |
| * | Universal American Corp. | 8,200 | 76 |
| | Young Innovations Inc. | 1,600 | 63 |
| | | | 32,608 |
| Industrials (15.9%) | | |
| | Deluxe Corp. | 56,300 | 1,721 |
| | Toro Co. | 43,200 | 1,719 |
| * | Alaska Air Group Inc. | 48,800 | 1,711 |
| | Triumph Group Inc. | 26,500 | 1,657 |
| * | WESCO International Inc. | 28,300 | 1,619 |
| | Actuant Corp. Class A | 54,100 | 1,548 |
| | Amerco Inc. | 14,500 | 1,542 |
| | Applied Industrial | | |
| | Technologies Inc. | 37,200 | 1,541 |
| | AZZ Inc. | 39,600 | 1,504 |
| * | US Airways Group Inc. | 138,300 | 1,447 |
| | Mine Safety Appliances Co. | 38,100 | 1,420 |
| | Barnes Group Inc. | 56,700 | 1,418 |
| * | JetBlue Airways Corp. | 286,500 | 1,372 |
| * | EnerSys Inc. | 38,676 | 1,365 |
| | Cascade Corp. | 24,691 | 1,352 |
| | Aircastle Ltd. | 117,500 | 1,331 |
| | Trinity Industries Inc. | 43,500 | 1,304 |
| | NACCO Industries Inc. | | |
| | Class A | 10,342 | 1,297 |
| | Sauer-Danfoss Inc. | 30,400 | 1,222 |
| * | Moog Inc. Class A | 31,299 | 1,185 |
| * | Navigant Consulting Inc. | 104,500 | 1,155 |
| | Belden Inc. | 31,100 | 1,147 |
| * | Kadant Inc. | 46,585 | 1,080 |
| | Armstrong World Industries | | |
| | Inc. | 23,200 | 1,076 |
| | Steelcase Inc. Class A | 103,300 | 1,018 |
| * | USG Corp. | 43,500 | 955 |
| | Lincoln Electric Holdings | | |
| | Inc. | 20,000 | 781 |
| * | Exponent Inc. | 12,000 | 685 |
| | Standex International Corp. | 15,100 | 671 |
| | G&K Services Inc. Class A | 17,900 | 561 |
| | Robbins & Myers Inc. | 6,300 | 376 |
| | US Ecology Inc. | 15,031 | 324 |
| | FreightCar America Inc. | 16,400 | 292 |
| | Apogee Enterprises Inc. | 13,000 | 255 |
| | United Stationers Inc. | 8,200 | 213 |
| | SkyWest Inc. | 19,900 | 206 |
| * | Swift Transportation Co. | 21,300 | 184 |
| | AO Smith Corp. | 3,100 | 178 |
| * | Taser International Inc. | 23,800 | 144 |
| | Kimball International Inc. | | |
| | Class B | 9,600 | 117 |
| * | Northwest Pipe Co. | 4,600 | 113 |
| * | Pacer International Inc. | 24,700 | 98 |
| | GATX Corp. | 2,200 | 93 |
| * | Spirit Airlines Inc. | 3,800 | 65 |
15
Strategic Small-Cap Equity Fund
| | | |
| | | | Market |
| | | | Value |
| | | Shares | ($000) |
| | Universal Forest Products | | |
| | Inc. | 1,500 | 62 |
| * | Saia Inc. | 2,800 | 56 |
| | | | 41,180 |
| Information Technology (16.6%) | |
| * | Cadence Design Systems | | |
| | Inc. | 154,800 | 1,991 |
| * | CoreLogic Inc. | 70,000 | 1,857 |
| | MAXIMUS Inc. | 30,866 | 1,843 |
| | Lender Processing Services | | |
| | Inc. | 65,400 | 1,824 |
| * | Brocade Communications | | |
| | Systems Inc. | 300,000 | 1,774 |
| | Fair Isaac Corp. | 36,400 | 1,611 |
| | Diebold Inc. | 46,800 | 1,578 |
| * | Tech Data Corp. | 31,400 | 1,422 |
| * | Cardtronics Inc. | 47,600 | 1,417 |
| * | CACI International Inc. | | |
| | Class A | 27,250 | 1,411 |
| * | Global Cash Access | | |
| | Holdings Inc. | 173,400 | 1,396 |
| * | Gartner Inc. | 29,600 | 1,364 |
| * | Unisys Corp. | 64,712 | 1,347 |
| * | Kulicke & Soffa Industries | | |
| | Inc. | 128,900 | 1,341 |
| | Anixter International Inc. | 23,200 | 1,333 |
| * | Liquidity Services Inc. | 25,154 | 1,263 |
| * | AOL Inc. | 35,300 | 1,244 |
| * | Manhattan Associates Inc. | 21,200 | 1,214 |
| * | Advanced Energy Industries | | |
| | Inc. | 96,800 | 1,193 |
| * | Insight Enterprises Inc. | 67,348 | 1,177 |
| * | OSI Systems Inc. | 15,100 | 1,175 |
| * | Spansion Inc. Class A | 97,100 | 1,157 |
| * | Entegris Inc. | 140,300 | 1,141 |
| * | SYNNEX Corp. | 32,500 | 1,059 |
| * | CommVault Systems Inc. | 18,000 | 1,057 |
| * | Teradyne Inc. | 61,531 | 875 |
| * | Ciena Corp. | 54,500 | 741 |
| * | Synaptics Inc. | 30,000 | 721 |
| * | Itron Inc. | 14,800 | 639 |
| | Heartland Payment Systems | | |
| | Inc. | 19,400 | 615 |
| * | Plexus Corp. | 17,700 | 536 |
| | Plantronics Inc. | 13,800 | 488 |
| * | Quantum Corp. | 266,700 | 429 |
| * | Entropic Communications | | |
| | Inc. | 70,900 | 413 |
| | NIC Inc. | 27,100 | 401 |
| * | Silicon Graphics International | | |
| | Corp. | 41,500 | 378 |
| * | MicroStrategy Inc. Class A | 1,900 | 255 |
| * | NCR Corp. | 8,700 | 203 |
| * | Volterra Semiconductor Corp. 9,200 | 201 |
| | | |
| | | Shares | ($000) |
| * | Magnachip Semiconductor | | |
| | Corp. | 14,800 | 175 |
| * | DSP Group Inc. | 23,700 | 141 |
| | Jack Henry & Associates Inc. | 3,000 | 114 |
| * | Parametric Technology Corp. | 4,900 | 107 |
| * | MaxLinear Inc. | 15,000 | 100 |
| * | Ancestry.com Inc. | 3,000 | 90 |
| | Pulse Electronics Corp. | 89,800 | 74 |
| * | TNS Inc. | 4,900 | 73 |
| * | Acxiom Corp. | 4,000 | 73 |
| * | CSG Systems International | | |
| | Inc. | 3,000 | 67 |
| | | | 43,098 |
| Materials (5.3%) | | |
| | NewMarket Corp. | 7,300 | 1,799 |
| | Rockwood Holdings Inc. | 36,200 | 1,687 |
| | Buckeye Technologies Inc. | 45,100 | 1,446 |
| | Georgia Gulf Corp. | 35,900 | 1,300 |
| | Myers Industries Inc. | 80,500 | 1,258 |
| | Neenah Paper Inc. | 38,444 | 1,101 |
| * | Coeur d’Alene Mines Corp. | 30,900 | 891 |
| | Cytec Industries Inc. | 13,100 | 858 |
| | PH Glatfelter Co. | 45,700 | 814 |
| | Westlake Chemical Corp. | 10,300 | 753 |
| | Koppers Holdings Inc. | 16,200 | 566 |
| | Haynes International Inc. | 9,400 | 490 |
| * | Graphic Packaging Holding | | |
| | Co. | 57,700 | 335 |
| * | Chemtura Corp. | 15,700 | 270 |
| * | WR Grace & Co. | 2,300 | 136 |
| | Wausau Paper Corp. | 10,700 | 99 |
| | | | 13,803 |
| Telecommunication Services (0.4%) | |
| * | Premiere Global Services | | |
| | Inc. | 85,300 | 797 |
| | Atlantic Tele-Network Inc. | 3,600 | 155 |
| | | | 952 |
| Utilities (3.5%) | | |
| | PNM Resources Inc. | 79,100 | 1,664 |
| | Portland General Electric | | |
| | Co. | 58,700 | 1,587 |
| | Laclede Group Inc. | 26,000 | 1,118 |
| | Avista Corp. | 42,600 | 1,097 |
| | NorthWestern Corp. | 28,900 | 1,047 |
| | Atmos Energy Corp. | 24,400 | 873 |
| | Vectren Corp. | 21,700 | 621 |
| | Cleco Corp. | 11,200 | 470 |
| | MGE Energy Inc. | 8,500 | 450 |
| | American States Water Co. | 3,400 | 151 |
| | CH Energy Group Inc. | 1,500 | 98 |
| | | | 9,176 |
| Total Common Stocks | | |
| (Cost $221,859) | | 258,091 |
16
Strategic Small-Cap Equity Fund
| | |
| | | Market |
| | | Value |
| | Shares | ($000) |
| Temporary Cash Investments (0.6%)1 | |
| Money Market Fund (0.5%) | | |
| 2,3 Vanguard Market | | |
| Liquidity Fund, 0.163% 1,293,000 | 1,293 |
| |
| | Face | |
| | Amount | |
| | ($000) | |
| U.S. Government and Agency Obligations (0.1%) |
| 4,5 Federal Home Loan Bank | | |
| Discount Notes, 0.130%, | | |
| 10/19/12 | 200 | 200 |
| Total Temporary Cash Investments | |
| (Cost $1,494) | | 1,493 |
| Total Investments (100.2%) | | |
| (Cost $223,353) | | 259,584 |
| Other Assets and Liabilities (-0.2%) | |
| Other Assets | | 740 |
| Liabilities3 | | (1,149) |
| | | (409) |
| Net Assets (100%) | | |
| Applicable to 12,126,999 outstanding | |
| $.001 par value shares of beneficial | |
| interest (unlimited authorization) | 259,175 |
| Net Asset Value Per Share | | $21.37 |
| |
| At September 30, 2012, net assets consisted of: |
| | Amount |
| | ($000) |
| Paid-in Capital | 258,296 |
| Undistributed Net Investment Income | 1,519 |
| Accumulated Net Realized Losses | (36,842) |
| Unrealized Appreciation (Depreciation) | |
| Investment Securities | 36,231 |
| Futures Contracts | (29) |
| Net Assets | 259,175 |
See Note A in Notes to Financial Statements.
* Non-income-producing security.
^ Part of security position is on loan to broker-dealers. The total value of securities on loan is $96,000.
1 The fund invests a portion of its cash reserves in equity markets through the use of index futures contracts. After giving effect to futures
investments, the fund’s effective common stock and temporary cash investment positions represent 100.0% and 0.2%, respectively,
of net assets.
2 Affiliated money market fund available only to Vanguard funds and certain trusts and accounts managed by Vanguard. Rate shown is the
7-day yield.
3 Includes $99,000 of collateral received for securities on loan.
4 Securities with a value of $100,000 have been segregated as initial margin for open futures contracts.
5 The issuer operates under a congressional charter; its securities are generally neither guaranteed by the U.S. Treasury nor backed by the full
faith and credit of the U.S. government.
See accompanying Notes, which are an integral part of the Financial Statements.
17
Strategic Small-Cap Equity Fund
Statement of Operations
| |
| | Year Ended |
| | September 30, 2012 |
| | ($000) |
| Investment Income | |
| Income | |
| Dividends | 3,764 |
| Interest1 | 3 |
| Security Lending | 94 |
| Total Income | 3,861 |
| Expenses | |
| The Vanguard Group—Note B | |
| Investment Advisory Services | 236 |
| Management and Administrative | 609 |
| Marketing and Distribution | 60 |
| Custodian Fees | 14 |
| Auditing Fees | 28 |
| Shareholders’ Reports | 8 |
| Total Expenses | 955 |
| Net Investment Income | 2,906 |
| Realized Net Gain (Loss) | |
| Investment Securities Sold | 15,363 |
| Futures Contracts | 221 |
| Realized Net Gain (Loss) | 15,584 |
| Change in Unrealized Appreciation (Depreciation) | |
| Investment Securities | 47,996 |
| Futures Contracts | 54 |
| Change in Unrealized Appreciation (Depreciation) | 48,050 |
| Net Increase (Decrease) in Net Assets Resulting from Operations | 66,540 |
| 1 Interest income from an affiliated company of the fund was $1,000. | |
See accompanying Notes, which are an integral part of the Financial Statements.
18
Strategic Small-Cap Equity Fund
Statement of Changes in Net Assets
| | |
| | Year Ended September 30, |
| | 2012 | 2011 |
| | ($000) | ($000) |
| Increase (Decrease) in Net Assets | | |
| Operations | | |
| Net Investment Income | 2,906 | 2,186 |
| Realized Net Gain (Loss) | 15,584 | 27,197 |
| Change in Unrealized Appreciation (Depreciation) | 48,050 | (41,074) |
| Net Increase (Decrease) in Net Assets Resulting from Operations | 66,540 | (11,691) |
| Distributions | | |
| Net Investment Income | (2,511) | (1,572) |
| Realized Capital Gain | — | — |
| Total Distributions | (2,511) | (1,572) |
| Capital Share Transactions | | |
| Issued | 45,193 | 142,411 |
| Issued in Lieu of Cash Distributions | 2,343 | 1,479 |
| Redeemed | (75,381) | (85,734) |
| Net Increase (Decrease) from Capital Share Transactions | (27,845) | 58,156 |
| Total Increase (Decrease) | 36,184 | 44,893 |
| Net Assets | | |
| Beginning of Period | 222,991 | 178,098 |
| End of Period1 | 259,175 | 222,991 |
| 1 Net Assets—End of Period includes undistributed net investment income of $1,519,000 and $1,124,000. | | |
See accompanying Notes, which are an integral part of the Financial Statements.
19
Strategic Small-Cap Equity Fund
Financial Highlights
| | | | | |
| For a Share Outstanding | | | Year Ended September 30, |
| Throughout Each Period | 2012 | 2011 | 2010 | 2009 | 2008 |
| Net Asset Value, Beginning of Period | $16.44 | $16.53 | $14.32 | $16.60 | $21.28 |
| Investment Operations | | | | | |
| Net Investment Income | .238 | .176 | .154 | .145 | .160 |
| Net Realized and Unrealized Gain (Loss) | | | | | |
| on Investments | 4.888 | (.126) | 2.216 | (2.257) | (4.479) |
| Total from Investment Operations | 5.126 | .050 | 2.370 | (2.112) | (4.319) |
| Distributions | | | | | |
| Dividends from Net Investment Income | (.196) | (.140) | (.160) | (.168) | (.210) |
| Distributions from Realized Capital Gains | — | — | — | — | (.151) |
| Total Distributions | (.196) | (.140) | (.160) | (.168) | (.361) |
| Net Asset Value, End of Period | $21.37 | $16.44 | $16.53 | $14.32 | $16.60 |
| |
| Total Return1 | 31.38% | 0.20% | 16.70% | -12.48% | -20.50% |
| |
| Ratios/Supplemental Data | | | | | |
| Net Assets, End of Period (Millions) | $259 | $223 | $178 | $165 | $200 |
| Ratio of Total Expenses to Average Net Assets | 0.38% | 0.38% | 0.43% | 0.43% | 0.38% |
| Ratio of Net Investment Income to | | | | | |
| Average Net Assets | 1.16% | 0.89% | 0.98% | 1.18% | 0.83% |
| Portfolio Turnover Rate | 66% | 64% | 66% | 76% | 99% |
| 1 Total returns do not include account service fees that may have applied in the periods shown. Fund prospectuses provide information about |
| any applicable account service fees. | | | | | |
See accompanying Notes, which are an integral part of the Financial Statements.

Strategic Small-Cap Equity Fund
Notes to Financial Statements
Vanguard Strategic Small-Cap Equity Fund is registered under the Investment Company Act of 1940 as an open-end investment company, or mutual fund.
A. The following significant accounting policies conform to generally accepted accounting principles for U.S. mutual funds. The fund consistently follows such policies in preparing its financial statements.
1. Security Valuation: Securities are valued as of the close of trading on the New York Stock Exchange (generally 4 p.m., Eastern time) on the valuation date. Equity securities are valued at the latest quoted sales prices or official closing prices taken from the primary market in which each security trades; such securities not traded on the valuation date are valued at the mean of the latest quoted bid and asked prices. Securities for which market quotations are not readily available, or whose values have been materially affected by events occurring before the fund’s pricing time but after the close of the securities’ primary markets, are valued by methods deemed by the board of trustees to represent fair value. Investments in Vanguard Market Liquidity Fund are valued at that fund’s net asset value. Temporary cash investments acquired over 60 days to maturity are valued using the latest bid prices or using valuations based on a matrix system (which considers such factors as security prices, yields, maturities, and ratings), both as furnished by independent pricing services. Other temporary cash investments are valued at amortized cost, which approximates market value.
2. Futures Contracts: The fund uses index futures contracts to a limited extent, with the objective of maintaining full exposure to the stock market while maintaining liquidity. The fund may purchase or sell futures contracts to achieve a desired level of investment, whether to accommodate portfolio turnover or cash flows from capital share transactions. The primary risks associated with the use of futures contracts are imperfect correlation between changes in market values of stocks held by the fund and the prices of futures contracts, and the possibility of an illiquid market.
Futures contracts are valued at their quoted daily settlement prices. The aggregate principal amounts of the contracts are not recorded in the Statement of Net Assets. Fluctuations in the value of the contracts are recorded in the Statement of Net Assets as an asset (liability) and in the Statement of Operations as unrealized appreciation (depreciation) until the contracts are closed, when they are recorded as realized futures gains (losses).
During the year ended September 30, 2012, the fund’s average investment in futures contracts represented less than 1% of net assets, based on quarterly average aggregate settlement values.
3. Federal Income Taxes: The fund intends to continue to qualify as a regulated investment company and distribute all of its taxable income. Management has analyzed the fund’s tax positions taken for all open federal income tax years (September 30, 2009–2012), and has concluded that no provision for federal income tax is required in the fund’s financial statements.
4. Distributions: Distributions to shareholders are recorded on the ex-dividend date.
5. Security Lending: The fund may lend its securities to qualified institutional borrowers to earn additional income. Security loans are required to be secured at all times by collateral at least equal to the market value of securities loaned. The fund invests cash collateral received in Vanguard Market Liquidity Fund, and records a liability for the return of the collateral, during the period the securities are on loan. Security lending income represents fees charged to borrowers plus income earned on investing cash collateral, less expenses associated with the loan.
21
Strategic Small-Cap Equity Fund
6. Other: Dividend income is recorded on the ex-dividend date. Interest income includes income distributions received from Vanguard Market Liquidity Fund and is accrued daily. Security transactions are accounted for on the date securities are bought or sold. Costs used to determine realized gains (losses) on the sale of investment securities are those of the specific securities sold.
B. The Vanguard Group furnishes at cost investment advisory, corporate management, administrative, marketing, and distribution services. The costs of such services are allocated to the fund under methods approved by the board of trustees. The fund has committed to provide up to 0.40% of its net assets in capital contributions to Vanguard. At September 30, 2012, the fund had contributed capital of $36,000 to Vanguard (included in Other Assets), representing 0.01% of the fund’s net assets and 0.01% of Vanguard’s capitalization. The fund’s trustees and officers are also directors and officers of Vanguard.
C. Various inputs may be used to determine the value of the fund’s investments. These inputs are summarized in three broad levels for financial statement purposes. The inputs or methodologies used to value securities are not necessarily an indication of the risk associated with investing in those securities.
Level 1—Quoted prices in active markets for identical securities.
Level 2—Other significant observable inputs (including quoted prices for similar securities, interest
rates, prepayment speeds, credit risk, etc.).
Level 3—Significant unobservable inputs (including the fund’s own assumptions used to determine
the fair value of investments).
The following table summarizes the market value of the fund’s investments as of September 30, 2012, based on the inputs used to value them:
| | | |
| | Level 1 | Level 2 | Level 3 |
| Investments | ($000) | ($000) | ($000) |
| Common Stocks | 258,091 | — | — |
| Temporary Cash Investments | 1,293 | 200 | — |
| Futures Contracts—Liabilities1 | (8) | — | — |
| Total | 259,376 | 200 | — |
| 1 Represents variation margin on the last day of the reporting period. | | | |
D. At September 30, 2012, the aggregate settlement value of open futures contracts and the related unrealized appreciation (depreciation) were:
| | | | |
| | | | | ($000) |
| | | | Aggregate | |
| | | Number of | Settlement | Unrealized |
| | | Long (Short) | Value | Appreciation |
| Futures Contracts | Expiration | Contracts | Long (Short) | (Depreciation) |
| E-mini Russell 2000 Index | December 2012 | 13 | 1,085 | (29) |
Unrealized appreciation (depreciation) on open futures contracts is required to be treated as realized gain (loss) for tax purposes.
22
Strategic Small-Cap Equity Fund
E. Distributions are determined on a tax basis and may differ from net investment income and realized capital gains for financial reporting purposes. Differences may be permanent or temporary. Permanent differences are reclassified among capital accounts in the financial statements to reflect their tax character. Temporary differences arise when certain items of income, expense, gain, or loss are recognized in different periods for financial statement and tax purposes; these differences will reverse at some time in the future. Differences in classification may also result from the treatment of short-term gains as ordinary income for tax purposes.
For tax purposes, at September 30, 2012, the fund had $1,945,000 of ordinary income available for distribution. The fund used capital loss carryforwards of $19,202,000 to offset taxable capital gains realized during the year ended September 30, 2012. At September 30, 2012, the fund had available capital losses totaling $36,878,000 to offset future net capital gains. Of this amount, $33,186,000 is subject to expiration on September 30, 2018. Capital losses of $3,692,000 realized beginning in fiscal 2012 may be carried forward indefinitely under the Regulated Investment Company Modernization Act of 2010, but must be used before any expiring loss carryforwards.
At September 30, 2012, the cost of investment securities for tax purposes was $223,353,000. Net unrealized appreciation of investment securities for tax purposes was $36,231,000, consisting of unrealized gains of $43,501,000 on securities that had risen in value since their purchase and $7,270,000 in unrealized losses on securities that had fallen in value since their purchase.
F. During the year ended September 30, 2012, the fund purchased $165,693,000 of investment securities and sold $191,952,000 of investment securities, other than temporary cash investments.
G. Capital shares issued and redeemed were:
| | |
| | Year Ended September 30, |
| | 2012 | 2011 |
| | Shares | Shares |
| | (000) | (000) |
| Issued | 2,260 | 7,150 |
| Issued in Lieu of Cash Distributions | 128 | 79 |
| Redeemed | (3,827) | (4,435) |
| Net Increase (Decrease) in Shares Outstanding | (1,439) | 2,794 |
H. In preparing the financial statements as of September 30, 2012, management considered the impact of subsequent events for potential recognition or disclosure in these financial statements.
Report of Independent Registered
Public Accounting Firm
To the Trustees of Vanguard Horizon Funds and the Shareholders of Vanguard Strategic Small-Cap Equity Fund:
In our opinion, the accompanying statement of net assets and the related statements of operations and of changes in net assets and the financial highlights present fairly, in all material respects, the financial position of Vanguard Strategic Small-Cap Equity Fund (constituting a separate portfolio of Vanguard Horizon Funds, hereafter referred to as the “Fund”) at September 30, 2012, the results of its operations for the year then ended, the changes in its net assets for each of the two years in the period then ended and the financial highlights for each of the five years in the period then ended, in conformity with accounting principles generally accepted in the United States of America. These financial statements and financial highlights (hereafter referred to as “financial statements”) are the responsibility of the Fund’s management; our responsibility is to express an opinion on these financial statements based on our audits. We conducted our audits of these financial statements in accordance with the standards of the Public Company Accounting Oversight Board (United States). Those standards require that we plan and perform the audit to obtain reasonable assurance about whether the financial statements are free of material misstatement. An audit includes examining, on a test basis, evidence supporting the amounts and disclosures in the financial statements, assessing the accounting principles used and significant estimates made by management, and evaluating the overall financial statement presentation. We believe that our audits, which included confirmation of securities at September 30, 2012 by correspondence with the custodian and broker and by agreement to the underlying ownership records of the transfer agent, provide a reasonable basis for our opinion.
PricewaterhouseCoopers LLP
Philadelphia, Pennsylvania
November 12, 2012

Special 2012 tax information (unaudited) for Vanguard Strategic Small-Cap Equity Fund
This information for the fiscal year ended September 30, 2012, is included pursuant to provisions of
the Internal Revenue Code.
The fund distributed $2,511,000 of qualified dividend income to shareholders during the fiscal year.
For corporate shareholders, 100% of investment income (dividend income plus short-term gains,
if any) qualifies for the dividends-received deduction.
24
Your Fund’s After-Tax Returns
This table presents returns for your fund both before and after taxes. The after-tax returns are shown in two ways: (1) assuming that an investor owned the fund during the entire period and paid taxes on the fund’s distributions, and (2) assuming that an investor paid taxes on the fund’s distributions and sold all shares at the end of each period.
Calculations are based on the highest individual federal income tax and capital gains tax rates in effect at the times of the distributions and the hypothetical sales. State and local taxes were not considered. After-tax returns reflect any qualified dividend income , using actual prior-year figures and estimates for 2012. (In the example, returns after the sale of fund shares may be higher than those assuming no sale. This occurs when the sale would have produced a capital loss. The calculation assumes that the investor received a tax deduction for the loss.)
Please note that your actual after-tax returns will depend on your tax situation and may differ from those shown. Also note that if you own the fund in a tax-deferred account, such as an individual retirement account or a 401(k) plan, this information does not apply to you. Such accounts are not subject to current taxes.
Finally, keep in mind that a fund’s performance—whether before or after taxes—does not guarantee future results.
Average Annual Total Returns: Strategic Small-Cap Equity Fund
Periods Ended September 30, 2012
| | | |
| | | | Since |
| | One | Five | Inception |
| | Year | Years | (4/24/2006) |
| Returns Before Taxes | 31.38% | 1.34% | 2.12% |
| Returns After Taxes on Distributions | 31.17 | 1.13 | 1.94 |
| Returns After Taxes on Distributions and Sale of Fund Shares | 20.61 | 1.08 | 1.77 |
25
About Your Fund’s Expenses
As a shareholder of the fund, you incur ongoing costs, which include costs for portfolio management, administrative services, and shareholder reports (like this one), among others. Operating expenses, which are deducted from a fund’s gross income, directly reduce the investment return of the fund.
A fund’s expenses are expressed as a percentage of its average net assets. This figure is known as the expense ratio. The following examples are intended to help you understand the ongoing costs (in dollars) of investing in your fund and to compare these costs with those of other mutual funds. The examples are based on an investment of $1,000 made at the beginning of the period shown and held for the entire period.
The accompanying table illustrates your fund’s costs in two ways:
• Based on actual fund return. This section helps you to estimate the actual expenses that you paid over the period. The ”Ending Account Value“ shown is derived from the fund‘s actual return, and the third column shows the dollar amount that would have been paid by an investor who started with $1,000 in the fund. You may use the information here, together with the amount you invested, to estimate the expenses that you paid over the period.
To do so, simply divide your account value by $1,000 (for example, an $8,600 account value divided by $1,000 = 8.6), then multiply the result by the number given for your fund under the heading ”Expenses Paid During Period.“
• Based on hypothetical 5% yearly return. This section is intended to help you compare your fund‘s costs with those of other mutual funds. It assumes that the fund had a yearly return of 5% before expenses, but that the expense ratio is unchanged. In this case—because the return used is not the fund’s actual return—the results do not apply to your investment. The example is useful in making comparisons because the Securities and Exchange Commission requires all mutual funds to calculate expenses based on a 5% return. You can assess your fund’s costs by comparing this hypothetical example with the hypothetical examples that appear in shareholder reports of other funds.
Note that the expenses shown in the table are meant to highlight and help you compare ongoing costs only and do not reflect transaction costs incurred by the fund for buying and selling securities. Further, the expenses do not include any purchase, redemption, or account service fees described in the fund prospectus. If such fees were applied to your account, your costs would be higher. Your fund does not carry a “sales load.”
The calculations assume no shares were bought or sold during the period. Your actual costs may have been higher or lower, depending on the amount of your investment and the timing of any purchases or redemptions.
You can find more information about the fund’s expenses, including annual expense ratios, in the Financial Statements section of this report. For additional information on operating expenses and other shareholder costs, please refer to your fund’s current prospectus.
26
| | | |
| Six Months Ended September 30, 2012 | | | |
| | Beginning | Ending | Expenses |
| | Account Value | Account Value | Paid During |
| Strategic Small-Cap Equity Fund | 3/31/2012 | 9/30/2012 | Period |
| Based on Actual Fund Return | $1,000.00 | $1,011.36 | $1.92 |
| Based on Hypothetical 5% Yearly Return | 1,000.00 | 1,023.16 | 1.93 |
The calculations are based on expenses incurred in the most recent six-month period. The fund’s annualized six-month expense ratio for that
period is 0.38%. The dollar amounts shown as “Expenses Paid” are equal to the expense ratio multiplied by the average account value over
the period, multiplied by the number of days in the most recent six-month period, then divided by the number of days in the most recent
12-month period.
27
Glossary
30-Day SEC Yield. A fund’s 30-day SEC yield is derived using a formula specified by the U.S. Securities and Exchange Commission. Under the formula, data related to the fund’s security holdings in the previous 30 days are used to calculate the fund’s hypothetical net income for that period, which is then annualized and divided by the fund’s estimated average net assets over the calculation period. For the purposes of this calculation, a security’s income is based on its current market yield to maturity (for bonds), its actual income (for asset-backed securities), or its projected dividend yield (for stocks). Because the SEC yield represents hypothetical annualized income, it will differ—at times significantly—from the fund’s actual experience. As a result, the fund’s income distributions may be higher or lower than implied by the SEC yield.
Beta. A measure of the magnitude of a fund’s past share-price fluctuations in relation to the ups and downs of a given market index. The index is assigned a beta of 1.00. Compared with a given index, a fund with a beta of 1.20 typically would have seen its share price rise or fall by 12% when the index rose or fell by 10%. For this report, beta is based on returns over the past 36 months for both the fund and the index. Note that a fund’s beta should be reviewed in conjunction with its R-squared (see definition). The lower the R-squared, the less correlation there is between the fund and the index, and the less reliable beta is as an indicator of volatility.
Dividend Yield. Dividend income earned by stocks, expressed as a percentage of the aggregate market value (or of net asset value, for a fund). The yield is determined by dividing the amount of the annual dividends by the aggregate value (or net asset value) at the end of the period. For a fund, the dividend yield is based solely on stock holdings and does not include any income produced by other investments.
Earnings Growth Rate. The average annual rate of growth in earnings over the past five years for the stocks now in a fund.
Equity Exposure. A measure that reflects a fund’s investments in stocks and stock futures. Any holdings in short-term reserves are excluded.
Expense Ratio. A fund’s total annual operating expenses expressed as a percentage of the fund’s average net assets. The expense ratio includes management and administrative expenses, but does not include the transaction costs of buying and selling portfolio securities.
Foreign Holdings. The percentage of a fund represented by securities or depositary receipts of companies based outside the United States.
Inception Date. The date on which the assets of a fund (or one of its share classes) are first invested in accordance with the fund’s investment objective. For funds with a subscription period, the inception date is the day after that period ends. Investment performance is measured from the inception date.
Median Market Cap. An indicator of the size of companies in which a fund invests; the midpoint of market capitalization (market price x shares outstanding) of a fund’s stocks, weighted by the proportion of the fund’s assets invested in each stock. Stocks representing half of the fund’s assets have market capitalizations above the median, and the rest are below it.
Price/Book Ratio. The share price of a stock divided by its net worth, or book value, per share. For a fund, the weighted average price/book ratio of the stocks it holds.
28
Price/Earnings Ratio. The ratio of a stock’s current price to its per-share earnings over the past year. For a fund, the weighted average P/E of the stocks it holds. P/E is an indicator of market expectations about corporate prospects; the higher the P/E, the greater the expectations for a company’s future growth.
R-Squared. A measure of how much of a fund’s past returns can be explained by the returns from the market in general, as measured by a given index. If a fund’s total returns were precisely synchronized with an index’s returns, its R-squared would be 1.00. If the fund’s returns bore no relationship to the index’s returns, its R-squared would be 0. For this report, R-squared is based on returns over the past 36 months for both the fund and the index.
Return on Equity. The annual average rate of return generated by a company during the past five years for each dollar of shareholder’s equity (net income divided by shareholder’s equity). For a fund, the weighted average return on equity for the companies whose stocks it holds.
Short-Term Reserves. The percentage of a fund invested in highly liquid, short-term securities that can be readily converted to cash.
Turnover Rate. An indication of the fund’s trading activity. Funds with high turnover rates incur higher transaction costs and may be more likely to distribute capital gains (which may be taxable to investors). The turnover rate excludes in-kind transactions, which have minimal impact on costs.
29
This page intentionally left blank.
This page intentionally left blank.
The People Who Govern Your Fund
The trustees of your mutual fund are there to see that the fund is operated and managed in your best interests since, as a shareholder, you are a part owner of the fund. Your fund’s trustees also serve on the board of directors of The Vanguard Group, Inc., which is owned by the Vanguard funds and provides services to them on an at-cost basis.
A majority of Vanguard’s board members are independent, meaning that they have no affiliation with Vanguard or the funds they oversee, apart from the sizable personal investments they have made as private individuals. The independent board members have distinguished backgrounds in business, academia, and public service. Each of the trustees and executive officers oversees 179 Vanguard funds.
The following table provides information for each trustee and executive officer of the fund. More information about the trustees is in the Statement of Additional Information, which can be obtained, without charge, by contacting Vanguard at 800-662-7447, or online at vanguard.com.
| |
| InterestedTrustee1 | and Delphi Automotive LLP (automotive components); |
| | Senior Advisor at New Mountain Capital; Trustee of |
| F. William McNabb III | The Conference Board. |
| Born 1957. Trustee Since July 2009. Chairman of the | |
| Board. Principal Occupation(s) During the Past Five | Amy Gutmann |
| Years: Chairman of the Board of The Vanguard Group, | Born 1949. Trustee Since June 2006. Principal |
| Inc., and of each of the investment companies served | Occupation(s) During the Past Five Years: President |
| by The Vanguard Group, since January 2010; Director | of the University of Pennsylvania; Christopher H. |
| of The Vanguard Group since 2008; Chief Executive | Browne Distinguished Professor of Political Science |
| Officer and President of The Vanguard Group and of | in the School of Arts and Sciences with secondary |
| each of the investment companies served by The | appointments at the Annenberg School for |
| Vanguard Group since 2008; Director of Vanguard | Communication and the Graduate School of Education |
| Marketing Corporation; Managing Director of The | of the University of Pennsylvania; Member of the |
| Vanguard Group (1995–2008). | National Commission on the Humanities and Social |
| | Sciences; Trustee of Carnegie Corporation of New |
| | York and of the National Constitution Center; Chair |
| IndependentTrustees | of the U. S. Presidential Commission for the Study |
| of Bioethical Issues. |
| Emerson U. Fullwood |
| Born 1948. Trustee Since January 2008. Principal | JoAnn Heffernan Heisen |
| Occupation(s) During the Past Five Years: Executive | Born 1950. Trustee Since July 1998. Principal |
| Chief Staff and Marketing Officer for North America | Occupation(s) During the Past Five Years: Corporate |
| and Corporate Vice President (retired 2008) of Xerox | Vice President and Chief Global Diversity Officer |
| Corporation (document management products and | (retired 2008) and Member of the Executive |
| services); Executive in Residence and 2010 | Committee (1997–2008) of Johnson & Johnson |
| Distinguished Minett Professor at the Rochester | (pharmaceuticals/medical devices/consumer |
| Institute of Technology; Director of SPX Corporation | products); Director of Skytop Lodge Corporation |
| (multi-industry manufacturing), the United Way of | (hotels), the University Medical Center at Princeton, |
| Rochester, Amerigroup Corporation (managed health | the Robert Wood Johnson Foundation, and the Center |
| care), the University of Rochester Medical Center, | for Talent Innovation; Member of the Advisory Board |
| Monroe Community College Foundation, and North | of the Maxwell School of Citizenship and Public Affairs |
| Carolina A&T University. | at Syracuse University. |
| |
| Rajiv L. Gupta | F. Joseph Loughrey |
| Born 1945. Trustee Since December 2001.2 | Born 1949. Trustee Since October 2009. Principal |
| Principal Occupation(s) During the Past Five Years: | Occupation(s) During the Past Five Years: President |
| Chairman and Chief Executive Officer (retired 2009) | and Chief Operating Officer (retired 2009) of Cummins |
| and President (2006–2008) of Rohm and Haas Co. | Inc. (industrial machinery); Director of SKF AB |
| (chemicals); Director of Tyco International, Ltd. | (industrial machinery), Hillenbrand, Inc. (specialized |
| (diversified manufacturing and services), Hewlett- | consumer services), the Lumina Foundation for |
| Packard Co. (electronic computer manufacturing), | |
| | |
| Education, and Oxfam America; Chairman of the | Executive Officers | |
| Advisory Council for the College of Arts and Letters | | |
| and Member of the Advisory Board to the Kellogg | Glenn Booraem | |
| Institute for International Studies at the University | Born 1967. Controller Since July 2010. Principal |
| of Notre Dame. | Occupation(s) During the Past Five Years: Principal |
| | of The Vanguard Group, Inc.; Controller of each of |
| Mark Loughridge | the investment companies served by The Vanguard |
| Born 1953. Trustee Since March 2012. Principal | Group; Assistant Controller of each of the investment |
| Occupation(s) During the Past Five Years: Senior Vice | companies served by The Vanguard Group (2001–2010). |
| President and Chief Financial Officer at IBM (information | | |
| technology services); Fiduciary Member of IBM’s | Thomas J. Higgins | |
| Retirement Plan Committee. | Born 1957. Chief Financial Officer Since September |
| | 2008. Principal Occupation(s) During the Past Five |
| Scott C. Malpass | Years: Principal of The Vanguard Group, Inc.; Chief |
| Born 1962. Trustee Since March 2012. Principal | Financial Officer of each of the investment companies |
| Occupation(s) During the Past Five Years: Chief | served by The Vanguard Group; Treasurer of each of |
| Investment Officer and Vice President at the University | the investment companies served by The Vanguard |
| of Notre Dame; Assistant Professor of Finance at the | Group (1998–2008). | |
| Mendoza College of Business at Notre Dame; Member | | |
| of the Notre Dame 403(b) Investment Committee; | Kathryn J. Hyatt | |
| Director of TIFF Advisory Services, Inc. (investment | Born 1955. Treasurer Since November 2008. Principal |
| advisor); Member of the Investment Advisory | Occupation(s) During the Past Five Years: Principal of |
| Committees of the Financial Industry Regulatory | The Vanguard Group, Inc.; Treasurer of each of the |
| Authority (FINRA) and of Major League Baseball. | investment companies served by The Vanguard |
| | Group; Assistant Treasurer of each of the investment |
| André F. Perold | companies served by The Vanguard Group (1988–2008). |
| Born 1952. Trustee Since December 2004. Principal | | |
| Occupation(s) During the Past Five Years: George | Heidi Stam | |
| Gund Professor of Finance and Banking at the Harvard | Born 1956. Secretary Since July 2005. Principal |
| Business School (retired 2011); Chief Investment | Occupation(s) During the Past Five Years: Managing |
| Officer and Managing Partner of HighVista Strategies | Director of The Vanguard Group, Inc.; General Counsel |
| LLC (private investment firm); Director of Rand | of The Vanguard Group; Secretary of The Vanguard |
| Merchant Bank; Overseer of the Museum of Fine | Group and of each of the investment companies |
| Arts Boston. | served by The Vanguard Group; Director and Senior |
| | Vice President of Vanguard Marketing Corporation. |
| Alfred M. Rankin, Jr. | | |
| Born 1941. Trustee Since January 1993. Principal | | |
| | Vanguard Senior ManagementTeam |
| Occupation(s) During the Past Five Years: Chairman, | | |
| President, and Chief Executive Officer of NACCO | Mortimer J. Buckley | Michael S. Miller |
| Industries, Inc. (forklift trucks/housewares/lignite); | Kathleen C. Gubanich | James M. Norris |
| Director of Goodrich Corporation (industrial products/ | Paul A. Heller | Glenn W. Reed |
| aircraft systems and services) and the National | Martha G. King | George U. Sauter |
| Association of Manufacturers; Chairman of the Board | Chris D. McIsaac | |
| of the Federal Reserve Bank of Cleveland and of | | |
| University Hospitals of Cleveland; Advisory Chairman | | |
| | Chairman Emeritus and Senior Advisor |
| of the Board of The Cleveland Museum of Art. | | |
| | John J. Brennan | |
| Peter F. Volanakis | | |
| | Chairman, 1996–2009 | |
| Born 1955. Trustee Since July 2009. Principal | | |
| | Chief Executive Officer and President, 1996–2008 |
| Occupation(s) During the Past Five Years: President | | |
| and Chief Operating Officer (retired 2010) of Corning | | |
| Incorporated (communications equipment); Director | Founder | |
| of SPX Corporation (multi-industry manufacturing); | | |
| | John C. Bogle | |
| Overseer of the Amos Tuck School of Business | | |
| | Chairman and Chief Executive Officer, 1974–1996 |
| Administration at Dartmouth College; Advisor to the | | |
| Norris Cotton Cancer Center. | | |
1 Mr. McNabb is considered an “interested person,” as defined in the Investment Company Act of 1940, because he is an officer of the
Vanguard funds.
2 December 2002 for Vanguard Equity Income Fund, Vanguard Growth Equity Fund, the Vanguard Municipal Bond Funds, and the Vanguard
State Tax-Exempt Funds.

| |
| | P.O. Box 2600 |
| | Valley Forge, PA 19482-2600 |
| |
| |
| |
| Connect with Vanguard® > vanguard.com | |
| |
| |
| |
| Fund Information > 800-662-7447 | CFA® is a trademark owned by CFA Institute. |
| Direct Investor Account Services > 800-662-2739 | |
| Institutional Investor Services > 800-523-1036 | |
| Text Telephone for People | |
| With Hearing Impairment > 800-749-7273 | |
| |
| This material may be used in conjunction | |
| with the offering of shares of any Vanguard | |
| fund only if preceded or accompanied by | |
| the fund’s current prospectus. | |
| |
| All comparative mutual fund data are from Lipper Inc. or | |
| Morningstar, Inc., unless otherwise noted. | |
| |
| You can obtain a free copy of Vanguard’s proxy voting | |
| guidelines by visiting vanguard.com/proxyreporting or by | |
| calling Vanguard at 800-662-2739. The guidelines are | |
| also available from the SEC’s website, sec.gov. In | |
| addition, you may obtain a free report on how your fund | |
| voted the proxies for securities it owned during the 12 | |
| months ended June 30. To get the report, visit either | |
| vanguard.com/proxyreporting or sec.gov. | |
| |
| You can review and copy information about your fund at | |
| the SEC’s Public Reference Room in Washington, D.C. To | |
| find out more about this public service, call the SEC at | |
| 202-551-8090. Information about your fund is also | |
| available on the SEC’s website, and you can receive | |
| copies of this information, for a fee, by sending a | |
| request in either of two ways: via e-mail addressed to | |
| publicinfo@sec.gov or via regular mail addressed to the | |
| Public Reference Section, Securities and Exchange | |
| Commission, Washington, DC 20549-1520. | |
| |
| |
| | © 2012 The Vanguard Group, Inc. |
| | All rights reserved. |
| | Vanguard Marketing Corporation, Distributor. |
| |
| | Q6150 112012 |
Item 2: Code of Ethics. The Registrant has adopted a code of ethics that applies to the Registrant’s principal executive officer, principal financial officer, principal accounting officer or controller or persons performing similar functions. The Code of Ethics was amended during the reporting period covered by this report to make certain technical, non-material changes.
Item 3: Audit Committee Financial Expert. The following members of the Audit Committee have been determined by the Registrant’s Board of Trustees to be Audit Committee Financial Experts serving on its Audit Committee, and to be independent: Rajiv L. Gupta, Amy Gutmann, JoAnn Heffernan Heisen, F. Joseph Loughrey, Mark Loughridge, Scott C. Malpass, André F. Perold, and Alfred M. Rankin, Jr.
Item 4: Principal Accountant Fees and Services.
(a) Audit Fees.
Audit Fees of the Registrant
Fiscal Year Ended September 30, 2012: $122,000
Fiscal Year Ended September 30, 2011: $122,000
Aggregate Audit Fees of Registered Investment Companies in the Vanguard Group.
Fiscal Year Ended September 30, 2012: $4,809,780
Fiscal Year Ended September 30, 2011: $3,978,540
(b) Audit-Related Fees.
Fiscal Year Ended September 30, 2012: $1,812,565
Fiscal Year Ended September 30, 2011: $1,341,750
Includes fees billed in connection with assurance and related services provided to the Registrant, The Vanguard Group, Inc., Vanguard Marketing Corporation, and other registered investment companies in the Vanguard Group.
(c) Tax Fees.
Fiscal Year Ended September 30, 2012: $490,518
Fiscal Year Ended September 30, 2011: $373,830
Includes fees billed in connection with tax compliance, planning and advice services provided to the Registrant, The Vanguard Group, Inc., Vanguard Marketing Corporation, and other registered investment companies in the Vanguard Group and related to income and excise taxes.
(d) All Other Fees.
Fiscal Year Ended September 30, 2012: $16,000
Fiscal Year Ended September 30, 2011: $16,000
Includes fees billed for services related to risk management and privacy matters. Services were provided to the Registrant, The Vanguard Group, Inc., Vanguard Marketing Corporation, and other registered investment companies in the Vanguard Group.
(e) (1) Pre-Approval Policies. The policy of the Registrant’s Audit Committee is to consider and, if appropriate, approve before the principal accountant is engaged for such services, all specific audit and non-audit services provided to: (1) the Registrant; (2) The Vanguard Group, Inc.; (3) other entities controlled by The Vanguard Group, Inc. that provide ongoing services to the Registrant; and (4) other registered investment companies in the Vanguard Group. In making a determination, the Audit Committee considers whether the services are consistent with maintaining the principal accountant’s independence.
In the event of a contingency situation in which the principal accountant is needed to provide services in between scheduled Audit Committee meetings, the Chairman of the Audit Committee would be called on to consider and, if appropriate, pre-approve audit or permitted non-audit services in an amount sufficient to complete services through the next Audit Committee meeting, and to determine if such services would be consistent with maintaining the accountant’s independence. At the next scheduled Audit Committee meeting, services and fees would be presented to the Audit Committee for formal consideration, and, if appropriate, approval by the entire Audit Committee. The Audit Committee would again consider whether such services and fees are consistent with maintaining the principal accountant’s independence.
The Registrant’s Audit Committee is informed at least annually of all audit and non-audit services provided by the principal accountant to the Vanguard complex, whether such services are provided to: (1) the Registrant; (2) The Vanguard Group, Inc.; (3) other entities controlled by The Vanguard Group, Inc. that provide ongoing services to the Registrant; or (4) other registered investment companies in the Vanguard Group.
(2) No percentage of the principal accountant’s fees or services were approved pursuant to the waiver provision of paragraph (c)(7)(i)(C) of Rule 2-01 of Regulation S-X.
(f) For the most recent fiscal year, over 50% of the hours worked under the principal accountant’s engagement were not performed by persons other than full-time, permanent employees of the principal accountant.
(g) Aggregate Non-Audit Fees.
Fiscal Year Ended September 30, 2012: $506,518
Fiscal Year Ended September 30, 2011: $389,830
Includes fees billed for non-audit services provided to the Registrant, The Vanguard Group, Inc., Vanguard Marketing Corporation, and other registered investment companies in the Vanguard Group.
(h) For the most recent fiscal year, the Audit Committee has determined that the provision of all non-audit services was consistent with maintaining the principal accountant’s independence.
Item 5: Audit Committee of Listed Registrants.
Not Applicable.
Item 6: Investments.
Not Applicable.
Item 7: Disclosure of Proxy Voting Policies and Procedures for Closed-End Management
Investment Companies.
Not Applicable.
Item 8: Portfolio Managers of Closed-End Management Investment Companies.
Not Applicable.
Item 9: Purchase of Equity Securities by Closed-End Management Investment Company and
Affiliated Purchasers.
Not Applicable.
Item 10: Submission of Matters to a Vote of Security Holders.
Not Applicable.
Item 11: Controls and Procedures.
(a) Disclosure Controls and Procedures. The Principal Executive and Financial Officers concluded that the Registrant's Disclosure Controls and Procedures are effective based on their evaluation of the Disclosure Controls and Procedures as of a date within 90 days of the filing date of this report.
(b) Internal Control Over Financial Reporting. There were no significant changes in Registrant’s Internal Control Over Financial Reporting or in other factors that could significantly affect this control subsequent to the date of the evaluation, including any corrective actions with regard to significant deficiencies and material weaknesses.
Item 12: Exhibits.
(a) Code of Ethics.
(b) Certifications.
Pursuant to the requirements of the Securities Exchange Act of 1934 and the Investment Company Act of 1940, the registrant has duly caused this report to be signed on its behalf by the undersigned, thereunto duly authorized.
| |
| | VANGUARD HORIZON FUNDS |
| |
| |
| BY: | /s/ F. WILLIAM MCNABB III* |
| | F. WILLIAM MCNABB III |
| | CHIEF EXECUTIVE OFFICER |
| |
| Date: November 16, 2012 |
Pursuant to the requirements of the Securities Exchange Act of 1934 and the Investment Company Act of 1940, this report has been signed below by the following persons on behalf of the registrant and in the capacities and on the dates indicated.
| |
| | VANGUARD HORIZON FUNDS |
| BY: | /s/ F. WILLIAM MCNABB III* |
| | F. WILLIAM MCNABB III |
| | CHIEF EXECUTIVE OFFICER |
Date: November 16, 2012 |
| | VANGUARD HORIZON FUNDS |
| BY: | /s/ THOMAS J. HIGGINS* |
| | THOMAS J. HIGGINS |
| | CHIEF FINANCIAL OFFICER |
| Date: November 16, 2012 |
* By: /s/ Heidi Stam
Heidi Stam, pursuant to a Power of Attorney filed on March 27, 2012 see file Number
2-11444, Incorporated by Reference.