UNITED STATES
SECURITIES AND EXCHANGE COMMISSION
Washington, D.C. 20549
FORM N-CSR
CERTIFIED SHAREHOLDER REPORT
OF
REGISTERED MANAGEMENT INVESTMENT COMPANIES
Investment Company Act file number: 811-07239
Name of Registrant: Vanguard Horizon Funds
Address of Registrant:
P.O. Box 2600
Valley Forge, PA 19482
Name and address of agent for service:
Heidi Stam, Esquire
P.O. Box 876
Valley Forge, PA 19482
Registrant’s telephone number, including area code: (610) 669-1000
Date of fiscal year end: September 30
Date of reporting period: October 1, 2009 – September 30, 2010
Item 1: Reports to Shareholders
 |
| Vanguard Strategic Equity Fund |
| Annual Report |
|
|
| September 30, 2010 |
|
 |
|
> Vanguard Strategic Equity Fund returned almost 14% for the fiscal year ended September 30, 2010, lagging both its benchmark and its peers.
> The broad U.S. stock market returned about 11%, with mid- and small-capitalization companies slightly outpacing their large-cap counterparts.
> Information technology and industrials stocks weighed most heavily on the fund’s performance against the benchmark.
| |
| Contents | |
| Your Fund’s Total Returns. | 1 |
| Chairman’s Letter. | 2 |
| Advisor’s Report. | 7 |
| Fund Profile. | 9 |
| Performance Summary. | 10 |
| Financial Statements. | 12 |
| Your Fund’s After-Tax Returns. | 27 |
| About Your Fund’s Expenses. | 28 |
| Glossary. | 30 |
Please note: The opinions expressed in this report are just that—informed opinions. They should not be considered promises or advice. Also, please keep in mind that the information and opinions cover the period through the date on the front of this report. Of course, the risks of investing in your fund are spelled out in the prospectus.
See the Glossary for definitions of investment terms used in this report.
Cover photograph: Jean Maher.
Your Fund’s Total Returns
| |
| Fiscal Year Ended September 30, 2010 | |
| | Total |
| | Returns |
| Vanguard Strategic Equity Fund | 13.71% |
| MSCI US Small + Mid Cap 2200 Index | 16.78 |
| Mid-Cap Core Funds Average | 14.36 |
| Mid-Cap Core Funds Average: Derived from data provided by Lipper Inc. | |
| | | | |
| Your Fund’s Performance at a Glance | | | | |
| September 30, 2009, Through September 30, 2010 | | | | |
| | | | Distributions Per Share |
| | Starting | Ending | Income | Capital |
| | Share Price | Share Price | Dividends | Gains |
| Vanguard Strategic Equity Fund | $14.52 | $16.30 | $0.200 | $0.000 |
1

Chairman’s Letter
Dear Shareholder,
Vanguard Strategic Equity Fund returned almost 14% for the fiscal year ended September 30, 2010. The fund’s return trailed that of its benchmark, the MSCI US Small + Mid Cap 2200 Index, and the average return of its peers.
Most of the fund’s underperformance against the benchmark can be attributed to the subpar performance of its information technology and industrials stocks. Overall, seven of the fund’s ten sectors came up short.
If you hold shares in a taxable account, you may wish to review the table and discussion on after-tax returns for the fiscal year, based on the highest tax bracket, later in this report.
An upbeat end to a worrisome 12 months
Although global stock markets traced a ragged trajectory, they ultimately gained ground for the 12 months ended September 30. Europe’s sovereign debt crisis and a dispiriting lack of vigor in the U.S. economy weighed on stock prices through the spring and summer. In September, however, investor sentiment perked up, buoyed by continued signs of strength in corporate financial statements. The broad U.S. stock market rallied to close the period with a return of more than 11%. Small-capitalization stocks finished a few steps ahead of their large-cap counterparts.
2
International stock markets were a mixed bag: middling returns in Europe, stagnation in the Pacific region’s developed markets, and a return of more than 20% from emerging markets. The combined result, as measured by the MSCI All Country World Index ex USA, was a 12-month return of 8%.
Bond prices rallied, driving yields to surprising lows
Bonds produced strong 12-month returns, a gratifying performance that nevertheless raised questions about the prospects for total returns in a fixed income market where yields hovered near all-time lows. At the start of the period, the 10-year U.S. Treasury note yielded 3.31%; at the end, the figure was 2.51% as investors bid up bond prices. As yields move lower, of course, the scope for continued declines—and the attendant rise in prices—diminishes. Corporate bonds performed best for the 12 months. Municipal bonds delivered solid, but more modest, returns.
As has been the case for almost two years now, the yields of money market securities remained near 0%, a consequence of the Federal Reserve Board’s efforts to stimulate the economy by keeping a tight lid on borrowing costs.
Information technology, industrials weighed most on fund’s performance
Vanguard Strategic Equity Fund experienced more setbacks than successes for the fiscal year as it trailed its benchmark and competing funds. The fund’s manager, Vanguard Quantitative Equity Group, uses
| | | |
| Market Barometer | | | |
| |
| | | Average Annual Total Returns |
| | | Periods Ended September 30, 2010 |
| | One | Three | Five |
| | Year | Years | Years |
| Stocks | | | |
| Russell 1000 Index (Large-caps) | 10.75% | -6.79% | 0.86% |
| Russell 2000 Index (Small-caps) | 13.35 | -4.29 | 1.60 |
| Dow Jones U.S. Total Stock Market Index | 11.51 | -6.12 | 1.37 |
| MSCI All Country World Index ex USA (International) | 8.00 | -6.98 | 4.72 |
| |
| Bonds | | | |
| Barclays Capital U.S. Aggregate Bond Index (Broad | | | |
| taxable market) | 8.16% | 7.42% | 6.20% |
| Barclays Capital Municipal Bond Index (Broad | | | |
| tax-exempt market) | 5.81 | 6.04 | 5.13 |
| Citigroup Three-Month U.S. Treasury Bill Index | 0.12 | 1.01 | 2.47 |
| |
| CPI | | | |
| Consumer Price Index | 1.14% | 1.57% | 1.90% |
3
computer models that seek to match the sector allocations and risk characteristics of the fund’s benchmark while identifying individual stocks that can help it outperform the benchmark. While this quantitative approach is careful and disciplined, there will be times––as with any investment strategy––when the fund does not surpass its benchmark.
Over the course of the year, the fund’s performance, like that of the broad stock market, was uneven. The fund rose about 14% for the first six months of the period as the stock market continued the rally that began in March 2009. However, as concerns spread about the health of the U.S. economy and Europe’s debt crisis worsened, it struggled to a return of about –0.4% in the second half of the fiscal year despite a surge of about 11% in September.
Information technology and industrials stocks were the biggest restraint on the fund’s relative performance. Within the information technology sector, computer storage companies accounted for much of the shortfall. Elsewhere in the sector, advances in the fund’s software stocks weren’t enough to offset declines among internet, semiconductor, and electronic equipment companies.
Within the fund’s industrial holdings, weakness was evident in airlines, trucking, machinery, construction, and office services. While the fund owned a
| | |
| Expense Ratios | | |
| Your Fund Compared With Its Peer Group | | |
| | | Peer Group |
| | Fund | Average |
| Strategic Equity Fund | 0.30% | 1.32% |
The fund expense ratio shown is from the prospectus dated January 26, 2010, and represents estimated costs for the current fiscal year. For the fiscal year ended September 30, 2010, the fund’s expense ratio was 0.30%. The peer-group expense ratio is derived from data provided by Lipper Inc. and captures information through year-end 2009.
Peer group: Mid-Cap Core Funds.
4
substantial stake in a prominent airline at the beginning of the fiscal period, it sold much of the holding before the stock began to rise and ended up missing eventual gains.
Although energy is one of the fund’s smaller sectors, these stocks also weighed on relative performance. The fund experienced its biggest shortfall among coal mining companies. Although the performance of these stocks was so-so in general, the fund’s holdings struggled.
The financial sector provided the greatest lift against the benchmark. Real estate management and mortgage companies suffered severe declines during the financial crisis, and those areas are still well off their highs of several years ago. But the fund’s computer model identified a few resilient firms that made steady gains over the past year as the economy slowly improved.
Strength relative to the benchmark also came from the health care sector, where a few pharmaceutical companies and a health care distributor made a difference. Although the consumer discretionary sector didn’t provide an advantage against the benchmark, its 24% return was the fund’s highest and contributed the most to overall return.
Ten-year performance offers more meaningful view
Although Vanguard Strategic Equity Fund did not keep pace with its comparative
| |
| Total Returns | |
| Ten Years Ended September 30, 2010 | |
| | Average |
| | Annual Return |
| Strategic Equity Fund | 4.84% |
| Spliced Small and Mid Cap Index | 4.83 |
| Mid-Cap Core Funds Average | 2.71 |
Spliced Small and Mid Cap Index: Russell 2800 Index through May 31, 2003; MSCI US Small + Mid Cap 2200 Index thereafter.
Mid-Cap Core Funds Average: Derived from data provided by Lipper Inc.
The figures shown represent past performance, which is not a guarantee of future results. (Current performance may be lower or higher than the performance data cited. For performance data current to the most recent month-end, visit our website at vanguard.com/performance.) Note, too, that both investment returns and principal value can fluctuate widely, so an investor’s shares, when sold, could be worth more or less than their original cost.
5
standards during fiscal-year 2010, its long-term performance is more revealing. For the ten years ended September 30, the fund’s average annual return of 4.84% is nearly identical to the benchmark’s return of 4.83% and more than 2 percentage points higher than the mid-cap core funds’ average return of 2.71%.
The fund’s ten-year returns are not exceptional, but they were achieved during a decade that was defined by two major bear markets. In comparison, the broad U.S. stock market, as measured by the Dow Jones U.S. Total Stock Market Index, returned 0.41%.
Like many active quantitative managers, Vanguard Quantitative Equity Group has struggled with unusual volatility and rallies in which the seemingly stronger and more attractively valued companies favored by its models have trailed the market’s more speculative stocks. Like any stock market dynamic, this one will eventually change course. We remain confident that when it does, the advisor’s disciplined, quantitative stock selection techniques can put it in a position to deliver highly competitive long-term returns. Its efforts are aided by the fund’s low costs, which help shareholders keep more of the return, an advantage that can compound over time.
Lessons to be learned through market’s bounces
It’s common for stock market returns to proceed unevenly in any given year, but the Strategic Equity Fund’s journey in 2010 was especially jagged. If not for September’s sharp increase, most of the gains achieved in the period’s first half would have been wiped out.
The past year’s market turbulence offered a lesson in the benefits of balance, diversification, and a long-term investment plan. Instead of trying to predict the market’s next move, we counsel investors to hold a portfolio that is diversified across and within the major asset classes of stocks, bonds, and money market instruments and consistent with your goals, risk tolerance, and time horizon.
The Strategic Equity Fund is expected to go through up and down periods. But we continue to have confidence in Vanguard Quantitative Equity Group’s underlying stock selection methodology and the fund’s long-term strategy. We believe the fund can play a useful part as a mid-and small-cap component of a low-cost, well-balanced investment plan.
Thank you for entrusting your assets to Vanguard.
Sincerely,

F. William McNabb III
Chairman and Chief Executive Officer
October 14, 2010
6
Advisor’s Report
For the fiscal year ended September 30, the Strategic Equity Fund returned 13.71% and the MSCI US Small + Mid Cap 2200 Index gained 16.78%. The period started with two strong quarters. The market then declined by more than 10%, weighed down by investors’ concerns over sovereign debt and doubts about economic recovery, before returning almost to its March levels during September’s rally. The growth rate of the U.S. economy has declined steadily since the fourth quarter of 2009, when GDP grew at a 5.0% annual rate; that was followed by a 3.7% rate in the first quarter of 2010 and a 1.6% rate in the second. Although corporate earnings have been strong and may remain so, nearly 10% unemployment, lingering sovereign debt concerns, and doubts about the strength of economic growth have left investors cautious about the outlook for equities.
These sudden changes in the market’s direction reinforce our conviction that attempting to time our investments is not profitable. Our aim, instead, is to identify individual stocks that may outperform over the long run. To select these stocks, we use a model with five components: valuation, growth, management decisions, market sentiment, and quality. Each component is itself a model, with several underlying parts. Each of the five models can yield superior stock selections, but combining them creates a stronger indicator than any individual signal. Each individual model goes through periods of over- or underperformance; combining them dampens the cyclicality and improves the overall results, although our overall model also experiences periods when it does not match the benchmark return.
Our process displays a preference for stocks that have a low multiple on earnings or cash flow, with growth and other fundamental characteristics that are similar to or better than those of their peers. Our valuation model assesses the price we pay for earnings and cash flows relative to other stocks of the same size in an industry. Because buying cheap earnings that are shrinking is not a compelling strategy, we use our growth model to evaluate each company’s earnings growth prospects, again relative to its peers. We measure a firm’s ability to sustain earnings growth with our quality model, which analyzes balance sheet strength and returns on invested capital. We consider management’s opinions through our management decisions model, which evaluates capital spending and debt and stock issuance. Finally, we use our market sentiment model to capture investors’ opinions of a company as reflected in market activity.
We then use the results of our overall model to construct our portfolio, with the goal of minimizing exposure to risks that our research indicates do not improve returns. Thus, we are always fully invested and do not try to add value by over- or underweighting sectors. Our portfolio’s
7
major risk factors, such as market capitalization and beta, will closely match the benchmark’s. Finally, we want to hold many small stakes, so we own a portfolio with several hundred holdings. This means that our return will be determined by how our model performs, not by one or two stocks.
For the past year, our portfolios have lagged their benchmarks, hurt primarily by investors’ rapidly changing views of the economic future. At times like these, investors tend to trade securities as quickly as possible. This puts a premium on liquidity, and means that more finely grained distinctions among stocks are not as important as overall market exposure. As investors become less uncertain, we believe they will once again focus on the fundamental differences among stocks and prefer companies with strong fundamentals and low multiples.
Over the last year, the best-performing industries were automobiles, household products, and media. Among the laggards were diversified financial firms, commercial services companies, and banks.
At the individual stock level, Valassis Communications, Dana Holdings, and Wyndham Worldwide were among our best performers. On the other hand, Western Digital, Micron Technology, and NRG Energy pulled down returns.
We cannot predict the strength or timing of economic recovery, but we continue to believe that stocks are an important part of a diversified investment plan, as is a portfolio of companies with lower relative price/earnings and price/cash flow ratios, growth rates near the market’s overall rate, a higher return on equity, quality balance sheets, and positive market sentiment.
We thank you for your investment and look forward to the coming year.
James D. Troyer, CFA Principal and Portfolio Manager
Joel M. Dickson, Ph.D.
Prinicipal and Head Vanguard Active Quantitative Equity Management
Vanguard Quantitative Equity Group
October 20, 2010
8
Strategic Equity Fund
Fund Profile
As of September 30, 2010
| | | |
| Portfolio Characteristics | | |
| | | MSCI US | |
| | | Small + | DJ |
| | | Mid Cap | U.S. Total |
| | | 2200 | Market |
| | Fund | Index | Index |
| Number of Stocks | 561 | 2,176 | 3,920 |
| Median Market Cap | $3.4B | $3.5B | $27.3B |
| Price/Earnings Ratio | 15.4x | 22.2x | 17.1x |
| Price/Book Ratio | 2.2x | 1.9x | 2.1x |
| Return on Equity | 13.3% | 13.0% | 19.1% |
| Earnings Growth Rate 10.5% | 6.3% | 6.4% |
| Dividend Yield | 1.4% | 1.3% | 1.8% |
| Foreign Holdings | 0.1% | 0.0% | 0.0% |
| Turnover Rate | 60% | — | — |
| Ticker Symbol | VSEQX | — | — |
| Expense Ratio1 | 0.30% | — | — |
| 30-Day SEC Yield | 0.44% | — | — |
| Short-Term Reserves | 0.1% | — | — |
| | | |
| Sector Diversification (% of equity exposure) |
| | | MSCI US | |
| | | Small + | DJ |
| | | Mid Cap | U.S. Total |
| | | 2200 | Market |
| | Fund | Index | Index |
| Consumer | | | |
| Discretionary | 16.1% | 15.9% | 11.7% |
| Consumer Staples | 4.0 | 3.8 | 10.1 |
| Energy | 7.6 | 7.2 | 9.7 |
| Financials | 18.3 | 19.1 | 16.6 |
| Health Care | 11.4 | 10.6 | 11.2 |
| Industrials | 12.9 | 13.6 | 11.1 |
| Information | | | |
| Technology | 16.8 | 16.9 | 19.0 |
| Materials | 6.4 | 6.4 | 4.2 |
| Telecommunication | | | |
| Services | 0.9 | 1.4 | 2.9 |
| Utilities | 5.6 | 5.1 | 3.5 |
| | |
| Volatility Measures | | |
| | MSCI US | |
| | Small + | DJ |
| | Mid Cap | U.S. Total |
| | 2200 | Market |
| | Index | Index |
| R-Squared | 0.99 | 0.95 |
| Beta | 1.00 | 1.18 |
These measures show the degree and timing of the fund’s fluctuations compared with the indexes over 36 months.
| | |
| Ten Largest Holdings (% of total net assets) |
| Cooper Industries PLC | Electrical | |
| | Components & | |
| | Equipment | 1.0% |
| Altera Corp. | Semiconductors | 1.0 |
| Joy Global Inc. | Construction & | |
| | Farm Machinery & | |
| | Heavy Trucks | 1.0 |
| Unum Group | Life & Health | |
| | Insurance | 1.0 |
| Dr Pepper Snapple | Soft Drinks | |
| Group Inc. | | 1.0 |
| Eastman Chemical Co. | Diversified | |
| | Chemicals | 1.0 |
| AmerisourceBergen | Health Care | |
| Corp. Class A | Distributors | 1.0 |
| Wyndham Worldwide | Hotels, Resorts & | |
| Corp. | Cruise Lines | 1.0 |
| CenterPoint Energy Inc. | Multi-Utilities | 0.9 |
| Rovi Corp. | Systems Software | 0.9 |
| Top Ten | | 9.8% |
The holdings listed exclude any temporary cash investments and equity index products.
Investment Focus
1 The expense ratio shown is from the prospectus dated January 26, 2010, and represents estimated costs for the current fiscal year. For the fiscal year ended September 30, 2010, the expense ratio was 0.30%.
9
Strategic Equity Fund
Performance Summary
All of the returns in this report represent past performance, which is not a guarantee of future results that may be achieved by the fund. (Current performance may be lower or higher than the performance data cited. For performance data current to the most recent month-end, visit our website at vanguard.com/performance.) Note, too, that both investment returns and principal value can fluctuate widely, so an investor’s shares, when sold, could be worth more or less than their original cost. The returns shown do not reflect taxes that a shareholder would pay on fund distributions or on the sale of fund shares.
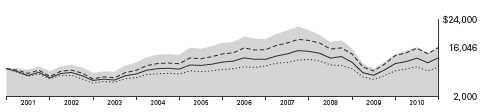
Cumulative Performance: September 30, 2000, Through September 30, 2010
Initial Investment of $10,000
| | | | |
| | Average Annual Total Returns | |
| | Periods Ended September 30, 2010 | |
| | | | | Final Value |
| | One | Five | Ten | of a $10,000 |
| | Year | Years | Years | Investment |
| Strategic Equity Fund | 13.71% | -1.47% | 4.84% | $16,046 |
| Dow Jones U.S. Total Stock Market | | | | |
| Index | 11.51 | 1.37 | 0.41 | 10,421 |
| Spliced Small and Mid Cap Index | 16.78 | 2.48 | 4.83 | 16,020 |
| Mid-Cap Core Funds Average | 14.36 | 1.98 | 2.71 | 13,065 |
Spliced Small and Mid Cap Index: Russell 2800 Index through May 31, 2003; MSCI US Small + Mid Cap 2200 Index thereafter.
Mid-Cap Core Funds Average: Derived from data provided by Lipper Inc.
See Financial Highlights for dividend and capital gains information.
10
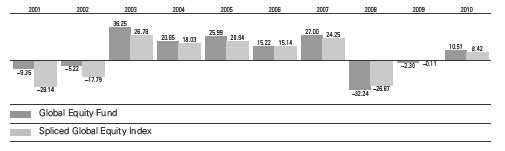
Strategic Equity Fund
Fiscal-Year Total Returns (%): September 30, 2000, Through September 30, 2010
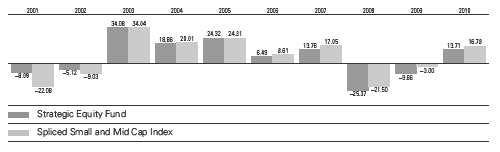
11
Strategic Equity Fund
Financial Statements
Statement of Net Assets
As of September 30, 2010
The fund reports a complete list of its holdings in regulatory filings four times in each fiscal year, at the quarter-ends. For the second and fourth fiscal quarters, the lists appear in the fund’s semiannual and annual reports to shareholders. For the first and third fiscal quarters, the fund files the lists with the Securities and Exchange Commission on Form N-Q. Shareholders can look up the fund’s Forms N-Q on the SEC’s website at sec.gov. Forms N-Q may also be reviewed and copied at the SEC’s Public Reference Room (see the back cover of this report for further information).
| | | |
| | | | Market |
| | | | Value |
| | | Shares | ($000) |
| Common Stocks (99.3%)1 | | |
| Consumer Discretionary (16.0%) | |
| | Wyndham | | |
| | Worldwide Corp. | 1,074,083 | 29,505 |
| | Ross Stores Inc. | 527,762 | 28,826 |
| * | Dollar Tree Inc. | 587,720 | 28,657 |
| | Whirlpool Corp. | 311,311 | 25,204 |
| | Williams-Sonoma Inc. | 766,500 | 24,298 |
| * | Valassis | | |
| | Communications Inc. | 696,230 | 23,595 |
| | Limited Brands, Inc. | 767,800 | 20,562 |
| | DR Horton Inc. | 1,701,802 | 18,924 |
| * | TRW Automotive | | |
| | Holdings Corp. | 453,648 | 18,854 |
| | Darden Restaurants Inc. | 433,532 | 18,546 |
| * | Tempur-Pedic | | |
| | International Inc. | 569,999 | 17,670 |
| * | Liberty Media Corp. - | | |
| | Interactive | 1,169,500 | 16,034 |
| * | Big Lots Inc. | 482,185 | 16,033 |
| * | Aeropostale Inc. | 606,425 | 14,099 |
| | Gannett Co. Inc. | 1,151,350 | 14,081 |
| | Cablevision | | |
| | Systems Corp. Class A | 476,700 | 12,485 |
| | Autoliv Inc. | 170,514 | 11,140 |
| * | Liberty Media Corp. - | | |
| | Capital | 195,900 | 10,199 |
| * | Talbots Inc. | 769,300 | 10,078 |
| * | Warnaco Group Inc. | 181,859 | 9,298 |
| * | Panera Bread Co. Class A | 98,062 | 8,689 |
| * | Jo-Ann Stores Inc. | 166,538 | 7,419 |
| | Bob Evans Farms Inc. | 254,951 | 7,156 |
| | Sotheby’s | 188,800 | 6,952 |
| * | Tenneco Inc. | 239,895 | 6,950 |
| | Cracker Barrel Old | | |
| | Country Store Inc. | 134,823 | 6,844 |
| | Meredith Corp. | 175,920 | 5,860 |
| * | Denny’s Corp. | 1,838,665 | 5,718 |
| | | |
| | | | Market |
| | | | Value |
| | | Shares | ($000) |
| * | Ulta Salon Cosmetics & | | |
| | Fragrance Inc. | 172,700 | 5,043 |
| * | Dana Holding Corp. | 407,025 | 5,015 |
| * | Domino’s Pizza Inc. | 379,200 | 5,013 |
| | Scholastic Corp. | 160,174 | 4,456 |
| * | Fossil Inc. | 77,600 | 4,174 |
| | PF Chang’s China Bistro Inc. | 89,802 | 4,149 |
| * | Helen of Troy Ltd. | 152,500 | 3,857 |
| *,^ | Beazer Homes USA Inc. | 714,040 | 2,949 |
| | Wynn Resorts Ltd. | 33,900 | 2,942 |
| * | Chipotle Mexican Grill Inc. | | |
| | Class A | 16,600 | 2,855 |
| | Advance Auto Parts Inc. | 45,600 | 2,676 |
| | Brinker International Inc. | 117,500 | 2,216 |
| | DeVry Inc. | 40,000 | 1,968 |
| * | Lincoln Educational | | |
| | Services Corp. | 126,871 | 1,828 |
| * | AFC Enterprises Inc. | 136,445 | 1,692 |
| * | Career Education Corp. | 73,200 | 1,572 |
| * | New York Times Co. | | |
| | Class A | 173,900 | 1,346 |
| | Hillenbrand Inc. | 61,800 | 1,329 |
| * | Papa John’s International Inc. | 50,000 | 1,319 |
| * | HSN Inc. | 38,600 | 1,154 |
| * | Pier 1 Imports Inc. | 125,900 | 1,031 |
| | Cato Corp. Class A | 36,294 | 971 |
| | Finish Line Inc. Class A | 59,300 | 825 |
| * | Journal Communications Inc. | | |
| | Class A | 171,561 | 774 |
| * | Steven Madden Ltd. | 15,167 | 623 |
| * | Lear Corp. | 7,800 | 616 |
| * | DSW Inc. Class A | 21,100 | 606 |
| | Dillard’s Inc. Class A | 25,400 | 600 |
| | Service Corp. International | 67,007 | 578 |
| * | Liberty Media Corp. - Starz | 8,900 | 577 |
| * | Cheesecake Factory Inc. | 21,800 | 577 |
| * | Belo Corp. Class A | 92,500 | 573 |
| * | Shutterfly Inc. | 21,800 | 567 |
| * | EW Scripps Co. Class A | 67,900 | 535 |
| * | Winnebago Industries Inc. | 51,100 | 532 |
12
Strategic Equity Fund
| | | |
| | | | Market |
| | | | Value |
| | | Shares | ($000) |
| | Jones Apparel Group Inc. | 23,000 | 452 |
| *,^ | Hovnanian Enterprises Inc. | | |
| | Class A | 112,900 | 444 |
| * | J Crew Group Inc. | 12,300 | 414 |
| * | Ruby Tuesday Inc. | 33,100 | 393 |
| * | Biglari Holdings Inc. | 1,160 | 381 |
| * | Standard Pacific Corp. | 94,800 | 376 |
| | Blyth Inc. | 9,000 | 371 |
| * | Jakks Pacific Inc. | 21,000 | 370 |
| | Leggett & Platt Inc. | 13,500 | 307 |
| * | Skechers U.S.A. Inc. Class A | 13,000 | 305 |
| * | Kenneth Cole | | |
| | Productions Inc. | | |
| | Class A | 17,900 | 298 |
| | Mattel Inc. | 10,900 | 256 |
| * | Deckers Outdoor Corp. | 3,900 | 195 |
| | American Greetings Corp. | | |
| | Class A | 10,200 | 190 |
| * | Brookfield Homes Corp. | 20,200 | 165 |
| | | | 496,131 |
| Consumer Staples (4.0%) | | |
| | Dr Pepper Snapple | | |
| | Group Inc. | 855,308 | 30,381 |
| | Del Monte Foods Co. | 1,786,045 | 23,415 |
| | Mead Johnson | | |
| | Nutrition Co. | 240,760 | 13,702 |
| * | Revlon Inc. Class A | 561,426 | 7,085 |
| | Ruddick Corp. | 182,300 | 6,322 |
| | Lancaster Colony Corp. | 121,619 | 5,777 |
| | Tyson Foods Inc. Class A | 342,500 | 5,487 |
| | Andersons Inc. | 128,445 | 4,868 |
| * | Central Garden and Pet Co. | | |
| | Class A | 449,679 | 4,659 |
| | Herbalife Ltd. | 73,029 | 4,407 |
| * | Boston Beer Co. Inc. | | |
| | Class A | 63,800 | 4,266 |
| | Sanderson Farms Inc. | 94,700 | 4,100 |
| * | Whole Foods Market Inc. | 66,500 | 2,468 |
| | Universal Corp. | 55,336 | 2,218 |
| | Casey’s General Stores Inc. | 29,735 | 1,241 |
| | Vector Group Ltd. | 63,315 | 1,184 |
| * | United Natural Foods Inc. | 29,200 | 968 |
| * | Central Garden and Pet Co. | 73,251 | 757 |
| | National Beverage Corp. | 31,100 | 435 |
| | Cal-Maine Foods Inc. | 13,700 | 397 |
| | | | 124,137 |
| Energy (7.5%) | | |
| * | FMC Technologies Inc. | 427,800 | 29,215 |
| | Helmerich & Payne Inc. | 692,542 | 28,020 |
| | El Paso Corp. | 2,070,854 | 25,637 |
| | Pioneer Natural | | |
| | Resources Co. | 305,100 | 19,841 |
| | Core Laboratories NV | 204,000 | 17,960 |
| * | Newfield Exploration Co. | 311,151 | 17,873 |
| | | |
| | | | Market |
| | | | Value |
| | | Shares | ($000) |
| * | Whiting Petroleum Corp. | 131,100 | 12,521 |
| * | Oil States International Inc. | 264,428 | 12,309 |
| | SM Energy Co. | 292,300 | 10,950 |
| | Cimarex Energy Co. | 151,225 | 10,008 |
| | World Fuel Services Corp. | 384,324 | 9,996 |
| * | Stone Energy Corp. | 394,512 | 5,811 |
| * | International Coal | | |
| | Group Inc. | 824,283 | 4,385 |
| * | Rosetta Resources Inc. | 145,745 | 3,424 |
| | Southern Union Co. | 133,442 | 3,211 |
| * | Concho Resources Inc. | 48,500 | 3,209 |
| * | Rowan Cos. Inc. | 104,900 | 3,185 |
| * | Brigham Exploration Co. | 118,566 | 2,223 |
| | QEP Resources Inc. | 49,500 | 1,492 |
| * | Gulfport Energy Corp. | 95,696 | 1,324 |
| * | Warren Resources Inc. | 325,000 | 1,290 |
| * | Tetra Technologies Inc. | 94,990 | 969 |
| * | McMoRan Exploration Co. | 46,500 | 800 |
| * | Forest Oil Corp. | 25,900 | 769 |
| * | Complete Production | | |
| | Services Inc. | 37,400 | 765 |
| * | Venoco Inc. | 35,600 | 699 |
| * | Gastar Exploration Ltd. | 135,324 | 544 |
| * | ION Geophysical Corp. | 104,200 | 536 |
| | Sunoco Inc. | 14,300 | 522 |
| * | Cloud Peak Energy Inc. | 26,200 | 478 |
| * | Swift Energy Co. | 16,600 | 466 |
| * | Petroquest Energy Inc. | 76,400 | 465 |
| * | Gran Tierra Energy Inc. | 59,500 | 459 |
| * | Energy XXI Bermuda Ltd. | 19,000 | 439 |
| | Berry Petroleum Co. Class A | 13,800 | 438 |
| * | Unit Corp. | 11,500 | 429 |
| | W&T Offshore Inc. | 40,300 | 427 |
| * | Crosstex Energy Inc. | 48,575 | 384 |
| * | OYO Geospace Corp. | 4,100 | 237 |
| | | | 233,710 |
| Financials (18.1%) | | |
| | Unum Group | 1,387,835 | 30,741 |
| | Platinum Underwriters | | |
| | Holdings Ltd. | 588,700 | 25,620 |
| | Torchmark Corp. | 455,647 | 24,213 |
| | Bank of Hawaii Corp. | 536,164 | 24,084 |
| * | Arch Capital Group Ltd. | 248,892 | 20,857 |
| | New York Community | | |
| | Bancorp Inc. | 1,109,870 | 18,035 |
| | Ventas Inc. | 329,528 | 16,994 |
| | American Financial | | |
| | Group Inc. | 539,689 | 16,504 |
| | Macerich Co. | 354,328 | 15,218 |
| | SL Green Realty Corp. | 234,300 | 14,838 |
| | Plum Creek Timber Co. Inc. | 397,400 | 14,028 |
| | Cullen/Frost Bankers Inc. | 222,256 | 11,973 |
| * | CB Richard Ellis Group Inc. | | |
| | Class A | 638,700 | 11,675 |
| | Nelnet Inc. Class A | 503,512 | 11,520 |
13
Strategic Equity Fund
| | | |
| | | | Market |
| | | | Value |
| | | Shares | ($000) |
| | Rayonier Inc. | 212,850 | 10,668 |
| | RenaissanceRe | | |
| | Holdings Ltd. | 177,700 | 10,655 |
| | CBL & Associates | | |
| | Properties Inc. | 812,624 | 10,613 |
| | Highwoods Properties Inc. | 270,246 | 8,775 |
| | Jefferies Group Inc. | 379,800 | 8,618 |
| | Hospitality Properties Trust | 362,400 | 8,092 |
| | BOK Financial Corp. | 174,621 | 7,881 |
| | Sun Communities Inc. | 255,843 | 7,854 |
| *,^ | World Acceptance Corp. | 177,268 | 7,828 |
| | AvalonBay Communities Inc. | 74,500 | 7,743 |
| * | Credit Acceptance Corp. | 126,279 | 7,647 |
| | UMB Financial Corp. | 212,788 | 7,556 |
| | Cash America | | |
| | International Inc. | 213,500 | 7,473 |
| | NBT Bancorp Inc. | 338,230 | 7,465 |
| | Jones Lang LaSalle Inc. | 82,700 | 7,135 |
| * | Ezcorp Inc. Class A | 350,217 | 7,018 |
| | Brandywine Realty Trust | 559,032 | 6,848 |
| | Bank of the Ozarks Inc. | 183,987 | 6,824 |
| | Federated Investors Inc. | | |
| | Class B | 281,330 | 6,403 |
| | Equity Lifestyle | | |
| | Properties Inc. | 108,383 | 5,905 |
| | City Holding Co. | 192,455 | 5,903 |
| | Colonial Properties Trust | 313,160 | 5,070 |
| | Unitrin Inc. | 199,162 | 4,858 |
| | Duke Realty Corp. | 392,800 | 4,553 |
| * | Ashford Hospitality | | |
| | Trust Inc. | 501,690 | 4,540 |
| | Pennsylvania Real Estate | | |
| | Investment Trust | 378,182 | 4,485 |
| | Parkway Properties Inc. | 290,075 | 4,293 |
| | International | | |
| | Bancshares Corp. | 238,425 | 4,027 |
| | American Campus | | |
| | Communities Inc. | 127,400 | 3,878 |
| * | CIT Group Inc. | 95,000 | 3,878 |
| * | SLM Corp. | 333,300 | 3,850 |
| * | Cardtronics Inc. | 242,676 | 3,745 |
| | Provident Financial | | |
| | Services Inc. | 293,425 | 3,627 |
| | Republic Bancorp Inc. | | |
| | Class A | 153,611 | 3,246 |
| | Reinsurance Group of | | |
| | America Inc. Class A | 63,307 | 3,057 |
| | Montpelier Re Holdings Ltd. | 176,200 | 3,052 |
| | Community Bank | | |
| | System Inc. | 132,561 | 3,050 |
| * | AmeriCredit Corp. | 123,300 | 3,016 |
| | Apartment Investment & | | |
| | Management Co. | 140,400 | 3,002 |
| | Mid-America Apartment | | |
| | Communities Inc. | 48,808 | 2,845 |
| | | |
| | | | Market |
| | | | Value |
| | | Shares | ($000) |
| | Ares Capital Corp. | 181,412 | 2,839 |
| | Westamerica Bancorporation | 51,819 | 2,824 |
| | Bancfirst Corp. | 65,783 | 2,662 |
| | Post Properties Inc. | 94,500 | 2,638 |
| | Extra Space Storage Inc. | 164,400 | 2,637 |
| * | Strategic Hotels & | | |
| | Resorts Inc. | 620,700 | 2,632 |
| | Advance America Cash | | |
| | Advance Centers Inc. | 648,588 | 2,614 |
| * | FPIC Insurance Group Inc. | 72,140 | 2,531 |
| * | First Cash Financial | | |
| | Services Inc. | 84,501 | 2,345 |
| | First Financial | | |
| | Bankshares Inc. | 48,210 | 2,265 |
| * | iStar Financial Inc. | 729,905 | 2,234 |
| * | Altisource Portfolio | | |
| | Solutions SA | 70,447 | 2,194 |
| | Lexington Realty Trust | 306,000 | 2,191 |
| | Prosperity Bancshares Inc. | 62,200 | 2,020 |
| * | Alleghany Corp. | 6,400 | 1,939 |
| | Provident New York | | |
| | Bancorp | 209,469 | 1,757 |
| | Arrow Financial Corp. | 67,678 | 1,697 |
| | Tompkins Financial Corp. | 39,520 | 1,567 |
| | FBL Financial Group Inc. | | |
| | Class A | 51,500 | 1,338 |
| | First Citizens BancShares Inc. | |
| | Class A | 6,500 | 1,204 |
| | Flagstone Reinsurance | | |
| | Holdings SA | 107,400 | 1,140 |
| | NewAlliance Bancshares Inc. | 88,204 | 1,113 |
| * | ProAssurance Corp. | 19,017 | 1,095 |
| | Winthrop Realty Trust | 82,600 | 1,021 |
| | Infinity Property & | | |
| | Casualty Corp. | 20,071 | 979 |
| | CapLease Inc. | 173,700 | 971 |
| | Southside Bancshares Inc. | 51,395 | 971 |
| * | First Industrial | | |
| | Realty Trust Inc. | 189,925 | 963 |
| | U-Store-It Trust | 106,477 | 889 |
| | Camden National Corp. | 25,345 | 878 |
| | GAMCO Investors Inc. | 22,300 | 859 |
| | Boston Private Financial | | |
| | Holdings Inc. | 126,000 | 824 |
| | Park National Corp. | 11,500 | 736 |
| * | Meridian Interstate | | |
| | Bancorp Inc. | 69,866 | 736 |
| | Medical Properties Trust Inc. | 60,000 | 608 |
| | SCBT Financial Corp. | 18,900 | 590 |
| | Douglas Emmett Inc. | 33,600 | 588 |
| | United Bankshares Inc. | 23,285 | 580 |
| | Erie Indemnity Co. Class A | 10,300 | 577 |
| | Weingarten Realty Investors | 26,300 | 574 |
| | Amtrust Financial | | |
| | Services Inc. | 35,500 | 515 |
14
Strategic Equity Fund
| | | | |
| | | | | Market |
| | | | | Value |
| | | | Shares | ($000) |
| | Fulton Financial Corp. | | 52,900 | 479 |
| | MFA Financial Inc. | | 61,600 | 470 |
| | Wintrust Financial Corp. | 14,400 | 467 |
| | Clifton Savings Bancorp Inc. | 53,514 | 460 |
| | Hersha Hospitality Trust | 82,500 | 427 |
| | Abington Bancorp Inc. | | 40,000 | 422 |
| | American Physicians | | | |
| | Capital Inc. | | 9,357 | 388 |
| | Great Southern Bancorp Inc. | 15,615 | 340 |
| * | Sunstone Hotel Investors Inc. 35,400 | 321 |
| | Iberiabank Corp. | | 6,400 | 320 |
| | Dime Community | | | |
| | Bancshares Inc. | | 22,198 | 307 |
| | MarketAxess Holdings Inc. | 18,000 | 306 |
| | Protective Life Corp. | | 13,730 | 299 |
| | Regency Centers Corp. | 6,600 | 261 |
| | Axis Capital Holdings Ltd. | 7,800 | 257 |
| | First Financial Bancorp | 15,400 | 257 |
| | Horace Mann | | | |
| | Educators Corp. | | 14,200 | 252 |
| * | Beneficial Mutual | | | |
| | Bancorp Inc. | | 27,800 | 249 |
| * | St. Joe Co. | | 9,700 | 241 |
| * | FelCor Lodging Trust Inc. | 50,419 | 232 |
| * | Signature Bank | | 5,900 | 229 |
| | Alterra Capital Holdings Ltd. | 11,500 | 229 |
| | Baldwin & Lyons Inc. | | 8,868 | 226 |
| | 1st Source Corp. | | 9,707 | 169 |
| * | Avatar Holdings Inc. | | 2,330 | 44 |
| | Cousins Properties Inc. | 209 | 2 |
| | | | | 562,265 |
| Health Care (11.4%) | | | |
| | AmerisourceBergen Corp. | | |
| | Class A | | 972,104 | 29,805 |
| * | Cephalon Inc. | | 439,600 | 27,449 |
| | Perrigo Co. | | 423,800 | 27,216 |
| | STERIS Corp. | | 813,743 | 27,032 |
| | Lincare Holdings Inc. | | 822,756 | 20,643 |
| * | Incyte Corp. Ltd. | 1,272,400 | 20,346 |
| * | Emergency Medical | | | |
| | Services Corp. Class A | 358,217 | 19,075 |
| | Warner Chilcott PLC | | | |
| | Class A | | 752,650 | 16,889 |
| * | Humana Inc. | | 315,100 | 15,831 |
| * | Mylan Inc. | | 587,438 | 11,050 |
| | Cooper Cos. Inc. | | 236,615 | 10,936 |
| | Invacare Corp. | | 410,354 | 10,878 |
| * | Waters Corp. | | 133,300 | 9,435 |
| * | Endo Pharmaceuticals | | | |
| | Holdings Inc. | | 256,925 | 8,540 |
| * | Hospira Inc. | | 146,390 | 8,346 |
| * | Targacept Inc. | | 355,200 | 7,935 |
| * | AMERIGROUP Corp. | | 158,200 | 6,719 |
| * | Sirona Dental Systems Inc. | 177,600 | 6,401 |
| | | | |
| | | | | Market |
| | | | | Value |
| | | | Shares | ($000) |
| * | American Medical | | | |
| | Systems Holdings Inc. | 297,789 | 5,831 |
| * | Gentiva Health Services Inc. 229,913 | 5,024 |
| * | LifePoint Hospitals Inc. | 143,135 | 5,018 |
| * | Magellan Health | | | |
| | Services Inc. | | 85,400 | 4,034 |
| * | Kensey Nash Corp. | | 120,471 | 3,480 |
| | Valeant Pharmaceuticals | | |
| | International Inc. | | 130,782 | 3,276 |
| * | Bruker Corp. | | 210,087 | 2,947 |
| * | Health Management | | | |
| | Associates Inc. Class A | 361,348 | 2,768 |
| * | Par Pharmaceutical Cos. Inc. | 88,904 | 2,585 |
| | Medicis | | | |
| | Pharmaceutical Corp. | | |
| | Class A | | 77,900 | 2,310 |
| * | Bio-Rad Laboratories Inc. | | |
| | Class A | | 25,000 | 2,263 |
| * | DaVita Inc. | | 32,691 | 2,257 |
| | Chemed Corp. | | 39,400 | 2,245 |
| * | Nabi Biopharmaceuticals | 419,767 | 2,015 |
| * | Cepheid Inc. | | 103,620 | 1,939 |
| * | Nektar Therapeutics | | 123,672 | 1,827 |
| * | Community Health | | | |
| | Systems Inc. | | 56,800 | 1,759 |
| * | Psychiatric Solutions Inc. | 49,800 | 1,671 |
| * | Akorn Inc. | | 373,442 | 1,509 |
| * | Corvel Corp. | | 35,369 | 1,501 |
| * | NxStage Medical Inc. | | 65,100 | 1,243 |
| * | Mettler-Toledo | | | |
| | International Inc. | | 9,251 | 1,151 |
| * | Life Technologies Corp. | 24,200 | 1,130 |
| * | Impax Laboratories Inc. | 56,100 | 1,111 |
| * | Greatbatch Inc. | | 47,400 | 1,099 |
| * | Micromet Inc. | | 115,342 | 775 |
| * | Clarient Inc. | | 171,800 | 581 |
| * | Catalyst Health | | | |
| | Solutions Inc. | | 16,200 | 570 |
| * | Zymogenetics Inc. | | 55,000 | 536 |
| * | PSS World Medical Inc. | 23,295 | 498 |
| * | Enzon Pharmaceuticals Inc. | 42,300 | 476 |
| | Owens & Minor Inc. | | 16,650 | 474 |
| * | Salix Pharmaceuticals Ltd. | 11,205 | 445 |
| * | Insulet Corp. | | 30,100 | 426 |
| | Universal American Corp. | 28,800 | 425 |
| * | Triple-S Management Corp. | | |
| | Class B | | 22,869 | 385 |
| * | Genomic Health Inc. | | 21,308 | 285 |
| | | | | 352,395 |
| Industrials (12.8%) | | | |
| | Cooper Industries PLC | 662,950 | 32,438 |
| | Joy Global Inc. | | 445,337 | 31,316 |
| * | EMCOR Group Inc. | 1,018,867 | 25,054 |
| * | Owens Corning | | 883,751 | 22,651 |
| | Rockwell Automation Inc. | 366,450 | 22,621 |
15
Strategic Equity Fund
| | | | |
| | | | | Market |
| | | | | Value |
| | | | Shares | ($000) |
| | Timken Co. | | 499,380 | 19,156 |
| * | Delta Air Lines Inc. | 1,537,200 | 17,893 |
| | Pitney Bowes Inc. | | 732,000 | 15,650 |
| * | Oshkosh Corp. | | 505,000 | 13,888 |
| * | United Stationers Inc. | | 254,961 | 13,643 |
| * | UAL Corp. | | 513,100 | 12,125 |
| * | Stericycle Inc. | | 171,900 | 11,944 |
| | Manitowoc Co. Inc. | | 973,800 | 11,793 |
| * | Avis Budget Group Inc. | 871,900 | 10,158 |
| | Donaldson Co. Inc. | | 142,400 | 6,711 |
| | Cubic Corp. | | 145,033 | 5,917 |
| | Triumph Group Inc. | | 75,583 | 5,638 |
| | Briggs & Stratton Corp. | 274,543 | 5,219 |
| * | Waste Connections Inc. | 121,700 | 4,827 |
| * | ArvinMeritor Inc. | | 284,887 | 4,427 |
| * | EnerSys | | 172,657 | 4,311 |
| | AO Smith Corp. | | 74,300 | 4,301 |
| | Avery Dennison Corp. | | 107,900 | 4,005 |
| | Allegiant Travel Co. Class A | 86,273 | 3,651 |
| * | Consolidated Graphics Inc. | 84,973 | 3,522 |
| | Werner Enterprises Inc. | 154,737 | 3,171 |
| | TAL International Group Inc. | 125,905 | 3,049 |
| | RR Donnelley & Sons Co. | 162,600 | 2,758 |
| | AAON Inc. | | 113,965 | 2,680 |
| * | Armstrong World | | | |
| | Industries Inc. | | 63,500 | 2,636 |
| | Textron Inc. | | 126,500 | 2,601 |
| * | Powell Industries Inc. | | 82,031 | 2,553 |
| | Cintas Corp. | | 87,300 | 2,405 |
| | NACCO Industries Inc. | | |
| | Class A | | 26,400 | 2,307 |
| | Toro Co. | | 40,200 | 2,260 |
| * | Ladish Co. Inc. | | 72,400 | 2,254 |
| * | Macquarie Infrastructure Co. | | |
| | LLC | | 141,900 | 2,199 |
| * | M&F Worldwide Corp. | 88,000 | 2,143 |
| | Crane Co. | | 55,400 | 2,102 |
| | Schawk Inc. Class A | | 112,800 | 2,082 |
| | Dover Corp. | | 39,100 | 2,041 |
| * | GenCorp Inc. | | 413,200 | 2,033 |
| * | Sauer-Danfoss Inc. | | 94,043 | 2,002 |
| * | WABCO Holdings Inc. | | 45,415 | 1,905 |
| * | Pacer International Inc. | 296,100 | 1,788 |
| * | Blount International Inc. | 135,182 | 1,721 |
| * | Alaska Air Group Inc. | | 28,165 | 1,437 |
| | Standex International Corp. | 57,750 | 1,397 |
| | Ennis Inc. | | 76,525 | 1,369 |
| * | Thomas & Betts Corp. | 32,800 | 1,345 |
| * | Amerco Inc. | | 16,800 | 1,335 |
| * | Terex Corp. | | 55,500 | 1,272 |
| * | Hawaiian Holdings Inc. | 211,025 | 1,264 |
| * | Dollar Thrifty | | | |
| | Automotive Group Inc. | 23,940 | 1,200 |
| | AZZ Inc. | | 27,100 | 1,161 |
| | Regal-Beloit Corp. | | 19,700 | 1,156 |
| | | |
| | | | Market |
| | | | Value |
| | | Shares | ($000) |
| | Nordson Corp. | 15,400 | 1,135 |
| * | Advisory Board Co. | 25,300 | 1,117 |
| | Seaboard Corp. | 604 | 1,070 |
| | Carlisle Cos. Inc. | 34,760 | 1,041 |
| * | URS Corp. | 25,000 | 950 |
| | Tredegar Corp. | 48,720 | 925 |
| | Vicor Corp. | 56,790 | 830 |
| | HNI Corp. | 27,466 | 790 |
| * | Polypore International Inc. | 25,500 | 769 |
| | Corporate Executive | | |
| | Board Co. | 24,212 | 764 |
| * | ACCO Brands Corp. | 107,615 | 619 |
| | Deluxe Corp. | 31,713 | 607 |
| * | WESCO International Inc. | 15,200 | 597 |
| | Rollins Inc. | 25,100 | 587 |
| | Lennox International Inc. | 13,800 | 575 |
| * | GrafTech International Ltd. | 36,164 | 565 |
| * | Layne Christensen Co. | 21,725 | 562 |
| | Watts Water | | |
| | Technologies Inc. Class A | 16,200 | 552 |
| | Lindsay Corp. | 12,700 | 550 |
| * | Atlas Air Worldwide | | |
| | Holdings Inc. | 10,200 | 513 |
| * | ATC Technology Corp. | 20,714 | 512 |
| | Universal Forest | | |
| | Products Inc. | 17,300 | 506 |
| | Tennant Co. | 16,316 | 504 |
| * | School Specialty Inc. | 38,317 | 499 |
| | Great Lakes Dredge & | | |
| | Dock Corp. | 85,000 | 494 |
| * | APAC Customer | | |
| | Services Inc. | 85,458 | 484 |
| | Interface Inc. Class A | 33,645 | 479 |
| * | SFN Group Inc. | 79,000 | 475 |
| * | Corrections Corp. of America | 18,800 | 464 |
| * | Fushi Copperweld Inc. | 51,300 | 446 |
| | Kimball International Inc. | | |
| | Class B | 75,333 | 439 |
| | Bowne & Co. Inc. | 37,800 | 428 |
| | Quanex Building | | |
| | Products Corp. | 23,780 | 411 |
| * | EnPro Industries Inc. | 11,900 | 372 |
| | Lawson Products Inc. | 23,370 | 357 |
| | Standard Register Co. | 42,798 | 125 |
| * | Trimas Corp. | 5,900 | 88 |
| | | | 396,686 |
| Information Technology (16.7%) | |
| | Altera Corp. | 1,056,400 | 31,861 |
| * | Rovi Corp. | 582,008 | 29,339 |
| * | Red Hat Inc. | 705,700 | 28,934 |
| | Xilinx Inc. | 1,087,212 | 28,931 |
| * | Micron Technology Inc. | 3,415,850 | 24,628 |
| | Earthlink Inc. | 2,570,905 | 23,370 |
| | Computer Sciences Corp. | 464,292 | 21,357 |
| * | Avnet Inc. | 774,900 | 20,930 |
16
Strategic Equity Fund
| | | |
| | | | Market |
| | | | Value |
| | | Shares | ($000) |
| * | SanDisk Corp. | 544,600 | 19,960 |
| *,^ | Power-One Inc. | 2,023,100 | 18,390 |
| * | CSG Systems | | |
| | International Inc. | 989,381 | 18,036 |
| * | Anixter International Inc. | 304,868 | 16,460 |
| * | Plexus Corp. | 554,466 | 16,274 |
| * | Lexmark International Inc. | | |
| | Class A | 357,900 | 15,969 |
| * | VeriFone Systems Inc. | 450,950 | 14,011 |
| | Solera Holdings Inc. | 296,380 | 13,088 |
| * | Isilon Systems Inc. | 577,978 | 12,877 |
| * | Advanced Micro | | |
| | Devices Inc. | 1,596,100 | 11,348 |
| * | Teradata Corp. | 255,002 | 9,833 |
| * | RF Micro Devices Inc. | 1,568,806 | 9,632 |
| * | ANSYS Inc. | 193,300 | 8,167 |
| * | Mantech International Corp. | |
| | Class A | 200,969 | 7,958 |
| * | TIBCO Software Inc. | 424,069 | 7,523 |
| *,^ | OpenTable Inc. | 101,200 | 6,890 |
| | iGate Corp. | 353,714 | 6,416 |
| * | Acxiom Corp. | 378,996 | 6,011 |
| * | SuccessFactors Inc. | 231,700 | 5,818 |
| * | Aruba Networks Inc. | 257,500 | 5,495 |
| | Factset Research | | |
| | Systems Inc. | 53,100 | 4,308 |
| * | QLogic Corp. | 242,993 | 4,286 |
| * | Hewitt Associates Inc. | | |
| | Class A | 82,522 | 4,162 |
| * | Gartner Inc. | 136,059 | 4,006 |
| * | SYNNEX Corp. | 113,274 | 3,188 |
| * | Tech Data Corp. | 78,300 | 3,155 |
| * | Netscout Systems Inc. | 141,605 | 2,904 |
| * | Unisys Corp. | 88,506 | 2,469 |
| | MAXIMUS Inc. | 35,470 | 2,184 |
| * | Atmel Corp. | 273,200 | 2,175 |
| * | Manhattan Associates Inc. | 72,200 | 2,119 |
| * | AOL Inc. | 85,000 | 2,104 |
| * | Teradyne Inc. | 186,917 | 2,082 |
| | DST Systems Inc. | 42,900 | 1,924 |
| | Opnet Technologies Inc. | 101,324 | 1,839 |
| | Plantronics Inc. | 54,200 | 1,831 |
| * | Sanmina-SCI Corp. | 142,981 | 1,727 |
| | CTS Corp. | 177,152 | 1,704 |
| * | MercadoLibre Inc. | 23,200 | 1,675 |
| * | Insight Enterprises Inc. | 101,600 | 1,589 |
| * | Avago Technologies Ltd. | 67,600 | 1,522 |
| * | VeriSign Inc. | 44,700 | 1,419 |
| * | Vishay Intertechnology Inc. | 125,500 | 1,215 |
| * | Internap Network | | |
| | Services Corp. | 231,400 | 1,136 |
| * | TriQuint Semiconductor Inc. 117,395 | 1,127 |
| * | InterDigital Inc. | 35,800 | 1,060 |
| * | Ariba Inc. | 53,900 | 1,019 |
| * | Lattice Semiconductor Corp. 195,800 | 930 |
| | | |
| | | | Market |
| | | | Value |
| | | Shares | ($000) |
| * | Veeco Instruments Inc. | 25,000 | 872 |
| * | NeuStar Inc. Class A | 34,900 | 868 |
| * | Interactive Intelligence Inc. | 48,069 | 846 |
| * | Kulicke & Soffa | | |
| | Industries Inc. | 114,500 | 709 |
| * | Diodes Inc. | 41,100 | 702 |
| | Jabil Circuit Inc. | 47,900 | 690 |
| * | IAC/InterActiveCorp | 24,900 | 654 |
| | Methode Electronics Inc. | 69,900 | 635 |
| * | Quantum Corp. | 283,730 | 602 |
| * | Ultratech Inc. | 34,600 | 592 |
| * | Hittite Microwave Corp. | 11,900 | 567 |
| * | MICROS Systems Inc. | 12,800 | 542 |
| * | Fairchild Semiconductor | | |
| | International Inc. Class A | 57,400 | 540 |
| * | MicroStrategy Inc. Class A | 6,100 | 528 |
| * | Entegris Inc. | 112,000 | 523 |
| * | Omnivision | | |
| | Technologies Inc. | 22,500 | 518 |
| | Blackbaud Inc. | 21,400 | 514 |
| * | Silicon Image Inc. | 107,600 | 514 |
| * | Knot Inc. | 56,300 | 514 |
| * | Netgear Inc. | 18,800 | 508 |
| * | SMART Modular | | |
| | Technologies WWH Inc. | 83,000 | 500 |
| * | Novell Inc. | 83,100 | 496 |
| * | JDS Uniphase Corp. | 37,900 | 470 |
| * | Liquidity Services Inc. | 28,700 | 459 |
| * | Progress Software Corp. | 13,600 | 450 |
| * | MKS Instruments Inc. | 24,700 | 444 |
| * | Volterra Semiconductor Corp. | 20,452 | 440 |
| * | Magma Design | | |
| | Automation Inc. | 81,800 | 303 |
| * | IXYS Corp. | 20,200 | 193 |
| | Renaissance Learning Inc. | 11,200 | 114 |
| | | | 516,672 |
| Materials (6.3%) | | |
| | Eastman Chemical Co. | 407,188 | 30,132 |
| | Lubrizol Corp. | 271,700 | 28,792 |
| | Celanese Corp. Class A | 896,290 | 28,771 |
| | Walter Energy Inc. | 346,450 | 28,163 |
| | Greif Inc. Class A | 286,675 | 16,868 |
| | Silgan Holdings Inc. | 254,372 | 8,064 |
| | Domtar Corp. | 111,200 | 7,181 |
| | Rock-Tenn Co. Class A | 132,958 | 6,623 |
| * | Century Aluminum Co. | 415,186 | 5,468 |
| | Innophos Holdings Inc. | 157,285 | 5,206 |
| | Schweitzer-Mauduit | | |
| | International Inc. | 78,039 | 4,550 |
| | Ashland Inc. | 92,300 | 4,501 |
| | Valspar Corp. | 96,500 | 3,074 |
| * | Clearwater Paper Corp. | 30,271 | 2,303 |
| | Stepan Co. | 38,226 | 2,260 |
| | Buckeye Technologies Inc. | 147,758 | 2,173 |
| | A Schulman Inc. | 78,810 | 1,588 |
17
Strategic Equity Fund
| | | |
| | | | Market |
| | | | Value |
| | | Shares | ($000) |
| * | Solutia Inc. | 96,600 | 1,548 |
| * | PolyOne Corp. | 119,150 | 1,440 |
| * | Graphic Packaging | | |
| | Holding Co. | 383,629 | 1,281 |
| | Sonoco Products Co. | 30,203 | 1,010 |
| | Cytec Industries Inc. | 15,400 | 868 |
| | Carpenter Technology Corp. | 18,000 | 607 |
| | NewMarket Corp. | 5,222 | 594 |
| * | Titanium Metals Corp. | 26,500 | 529 |
| * | Innospec Inc. | 34,400 | 524 |
| * | KapStone Paper and | | |
| | Packaging Corp. | 41,100 | 499 |
| | Haynes International Inc. | 13,200 | 461 |
| * | Kraton Performance | | |
| | Polymers Inc. | 15,414 | 418 |
| * | WR Grace & Co. | 13,200 | 369 |
| | Neenah Paper Inc. | 19,200 | 292 |
| | American Vanguard Corp. | 21,600 | 133 |
| | | | 196,290 |
| Telecommunication Services (0.9%) | |
| * | Cincinnati Bell Inc. | 3,829,800 | 10,225 |
| * | tw telecom inc Class A | 284,700 | 5,287 |
| | Frontier | | |
| | Communications Corp. | 563,800 | 4,606 |
| | USA Mobility Inc. | 184,515 | 2,958 |
| * | United States Cellular Corp. | 59,316 | 2,727 |
| | Consolidated | | |
| | Communications | | |
| | Holdings Inc. | 68,874 | 1,286 |
| | Telephone & | | |
| | Data Systems Inc. | 35,400 | 1,161 |
| * | Vonage Holdings Corp. | 272,000 | 694 |
| | | | 28,944 |
| Utilities (5.6%) | | |
| | CenterPoint Energy Inc. | 1,869,208 | 29,384 |
| | CMS Energy Corp. | 1,480,262 | 26,674 |
| | Oneok Inc. | 477,145 | 21,491 |
| | Atmos Energy Corp. | 459,911 | 13,452 |
| | AGL Resources Inc. | 304,910 | 11,696 |
| | DTE Energy Co. | 209,500 | 9,622 |
| | Integrys Energy Group Inc. | 122,000 | 6,351 |
| | IDACORP Inc. | 162,944 | 5,853 |
| | DPL Inc. | 221,100 | 5,777 |
| | Southwest Gas Corp. | 171,000 | 5,744 |
| | NiSource Inc. | 294,400 | 5,123 |
| * | El Paso Electric Co. | 189,200 | 4,499 |
| | NSTAR | 102,655 | 4,040 |
| | ITC Holdings Corp. | 59,600 | 3,710 |
| | Avista Corp. | 161,629 | 3,375 |
| | Hawaiian Electric | | |
| | Industries Inc. | 141,780 | 3,196 |
| | | | |
| | | | | Market |
| | | | | Value |
| | | | Shares | ($000) |
| | NorthWestern Corp. | | 88,397 | 2,519 |
| | Nicor Inc. | | 46,100 | 2,112 |
| | Pinnacle West Capital Corp. | 42,000 | 1,733 |
| | WGL Holdings Inc. | | 36,971 | 1,397 |
| | OGE Energy Corp. | | 32,900 | 1,312 |
| | Unisource Energy Corp. | 37,700 | 1,260 |
| | Cleco Corp. | | 36,700 | 1,087 |
| | Questar Corp. | | 50,900 | 892 |
| | UIL Holdings Corp. | | 18,400 | 518 |
| | PNM Resources Inc. | | 36,835 | 420 |
| | CH Energy Group Inc. | 8,300 | 367 |
| | Piedmont Natural Gas Co. Inc. | 8,700 | 252 |
| | Laclede Group Inc. | | 6,900 | 238 |
| | | | | 174,094 |
| Total Common Stocks | | | |
| (Cost $2,607,586) | | | 3,081,324 |
| Temporary Cash Investments (1.2%)1 | |
| Money Market Fund (1.1%) | | |
| 2,3 | Vanguard Market | | | |
| | Liquidity Fund, | | | |
| | 0.261% | 36,602,985 | 36,603 |
| |
| | | | Face | |
| | | Amount | |
| | | | ($000) | |
| U.S. Government and Agency Obligations (0.1%) |
| 4,5 | Freddie Mac | | | |
| | Discount Notes, | | | |
| | 0.296%, 3/31/11 | | 2,000 | 1,997 |
| 4,5 | Freddie Mac | | | |
| | Discount Notes, | | | |
| | 0.281%, 6/21/11 | | 200 | 200 |
| | | | | 2,197 |
| Total Temporary Cash Investments | |
| (Cost $38,800) | | | 38,800 |
| Total Investments (100.5%) | | |
| (Cost $2,646,386) | | | 3,120,124 |
| Other Assets and Liabilities (-0.5%) | |
| Other Assets | | | 12,162 |
| Liabilities3 | | | (29,144) |
| | | | | (16,982) |
| Net Assets (100%) | | | |
| Applicable to 190,416,447 outstanding | |
| $.001 par value shares of beneficial | |
| interest (unlimited authorization) | 3,103,142 |
| Net Asset Value Per Share | | $16.30 |
18
Strategic Equity Fund
| |
| At September 30, 2010, net assets consisted of: |
| | Amount |
| | ($000) |
| Paid-in Capital | 4,412,514 |
| Undistributed Net Investment Income | 17,870 |
| Accumulated Net Realized Losses | (1,801,538) |
| Unrealized Appreciation (Depreciation) | |
| Investment Securities | 473,738 |
| Futures Contracts | 558 |
| Net Assets | 3,103,142 |
See Note A in Notes to Financial Statements.
* Non-income-producing security.
^ Part of security position is on loan to broker-dealers. The total value of securities on loan is $11,217,000.
1 The fund invests a portion of its cash reserves in equity markets through the use of index futures contracts. After giving effect to futures investments, the fund’s effective common stock and temporary cash investment positions represent 100.0% and 0.5%, respectively, of net assets.
2 Affiliated money market fund available only to Vanguard funds and certain trusts and accounts managed by Vanguard. Rate shown is the 7-day yield.
3 Includes $12,405,000 of collateral received for securities on loan.
4 The issuer operates under a congressional charter; its securities are not backed by the full faith and credit of the U.S. government.
5 Securities with a value of $2,197,000 have been segregated as initial margin for open futures contracts.
See accompanying Notes, which are an integral part of the Financial Statements.
19
Strategic Equity Fund
| |
| Statement of Operations | |
| |
| | Year Ended |
| | September 30, 2010 |
| | ($000) |
| Investment Income | |
| Income | |
| Dividends | 52,820 |
| Interest1 | 66 |
| Security Lending | 1,232 |
| Total Income | 54,118 |
| Expenses | |
| The Vanguard Group—Note B | |
| Investment Advisory Services | 1,317 |
| Management and Administrative | 7,414 |
| Marketing and Distribution | 747 |
| Custodian Fees | 98 |
| Auditing Fees | 26 |
| Shareholders’ Reports | 105 |
| Trustees’ Fees and Expenses | 7 |
| Total Expenses | 9,714 |
| Net Investment Income | 44,404 |
| Realized Net Gain (Loss) | |
| Investment Securities Sold | 137,737 |
| Futures Contracts | 1,113 |
| Realized Net Gain (Loss) | 138,850 |
| Change in Unrealized Appreciation (Depreciation) | |
| Investment Securities | 235,612 |
| Futures Contracts | 633 |
| Change in Unrealized Appreciation (Depreciation) | 236,245 |
| Net Increase (Decrease) in Net Assets Resulting from Operations | 419,499 |
| 1 Interest income from an affiliated company of the fund was $57,000. | |
See accompanying Notes, which are an integral part of the Financial Statements.
20
Strategic Equity Fund
| | |
| Statement of Changes in Net Assets | | |
| |
| | Year Ended September 30, |
| | 2010 | 2009 |
| | ($000) | ($000) |
| Increase (Decrease) in Net Assets | | |
| Operations | | |
| Net Investment Income | 44,404 | 47,590 |
| Realized Net Gain (Loss) | 138,850 | (1,569,418) |
| Change in Unrealized Appreciation (Depreciation) | 236,245 | 922,539 |
| Net Increase (Decrease) in Net Assets Resulting from Operations | 419,499 | (599,289) |
| Distributions | | |
| Net Investment Income | (44,385) | (67,840) |
| Realized Capital Gain | — | — |
| Total Distributions | (44,385) | (67,840) |
| Capital Share Transactions | | |
| Issued | 265,701 | 436,608 |
| Issued in Lieu of Cash Distributions | 41,702 | 63,748 |
| Redeemed | (1,128,109) | (1,106,155) |
| Net Increase (Decrease) from Capital Share Transactions | (820,706) | (605,799) |
| Total Increase (Decrease) | (445,592) | (1,272,928) |
| Net Assets | | |
| Beginning of Period | 3,548,734 | 4,821,662 |
| End of Period1 | 3,103,142 | 3,548,734 |
| 1 Net Assets—End of Period includes undistributed (overdistributed) net investment income of $17,870,000 and $17,851,000. | |
See accompanying Notes, which are an integral part of the Financial Statements.
21
Strategic Equity Fund
| | | | | |
| Financial Highlights | | | | | |
| |
| |
| For a Share Outstanding | | | Year Ended September 30, |
| Throughout Each Period | 2010 | 2009 | 2008 | 2007 | 2006 |
| Net Asset Value, Beginning of Period | $14.52 | $16.42 | $24.94 | $23.07 | $23.28 |
| Investment Operations | | | | | |
| Net Investment Income | .221 | .184 | .240 | .270 | .270 |
| Net Realized and Unrealized Gain (Loss) | | | | | |
| on Investments | 1.759 | (1.843) | (6.090) | 2.840 | 1.170 |
| Total from Investment Operations | 1.980 | (1.659) | (5.850) | 3.110 | 1.440 |
| Distributions | | | | | |
| Dividends from Net Investment Income | (.200) | (.241) | (.240) | (.260) | (.210) |
| Distributions from Realized Capital Gains | — | — | (2.430) | (.980) | (1.440) |
| Total Distributions | (.200) | (.241) | (2.670) | (1.240) | (1.650) |
| Net Asset Value, End of Period | $16.30 | $14.52 | $16.42 | $24.94 | $23.07 |
| |
| Total Return1 | 13.71% | -9.66% | -25.37% | 13.76% | 6.49% |
| |
| Ratios/Supplemental Data | | | | | |
| Net Assets, End of Period (Millions) | $3,103 | $3,549 | $4,822 | $7,699 | $6,755 |
| Ratio of Total Expenses to | | | | | |
| Average Net Assets | 0.30% | 0.30% | 0.25% | 0.30% | 0.35% |
| Ratio of Net Investment Income to | | | | | |
| Average Net Assets | 1.37% | 1.47% | 1.09% | 1.03% | 1.18% |
| Portfolio Turnover Rate | 60% | 60% | 79% | 75% | 80% |
1 Total returns do not include account service fees that may have applied in the periods shown. Fund prospectuses provide information about any applicable account service fees.
See accompanying Notes, which are an integral part of the Financial Statements.
22
Strategic Equity Fund
Notes to Financial Statements
Vanguard Strategic Equity Fund is registered under the Investment Company Act of 1940 as an open-end investment company, or mutual fund.
A. The following significant accounting policies conform to generally accepted accounting principles for U.S. mutual funds. The fund consistently follows such policies in preparing its financial statements.
1. Security Valuation: Securities are valued as of the close of trading on the New York Stock Exchange (generally 4 p.m., Eastern time) on the valuation date. Equity securities are valued at the latest quoted sales prices or official closing prices taken from the primary market in which each security trades; such securities not traded on the valuation date are valued at the mean of the latest quoted bid and asked prices. Securities for which market quotations are not readily available, or whose values have been materially affected by events occurring before the fund’s pricing time but after the close of the securities’ primary markets, are valued by methods deemed by the board of trustees to represent fair value. Investments in Vanguard Market Liquidity Fund are valued at that fund’s net asset value. Temporary cash investments acquired over 60 days to maturity are valued using the latest bid prices or using valuations based on a matrix system (which considers such factors as security prices, yields, maturities, and ratings), both as furnished by independent pricing services. Other temporary cash investments are valued at amortized cost, which approximates market value.
2. Futures Contracts: The fund uses index futures contracts to a limited extent, with the objective of maintaining full exposure to the stock market while maintaining liquidity. The fund may purchase or sell futures contracts to achieve a desired level of investment, whether to accommodate portfolio turnover or cash flows from capital share transactions. The primary risks associated with the use of futures contracts are imperfect correlation between changes in market values of stocks held by the fund and the prices of futures contracts, and the possibility of an illiquid market.
Futures contracts are valued at their quoted daily settlement prices. The aggregate principal amounts of the contracts are not recorded in the Statement of Net Assets. Fluctuations in the value of the contracts are recorded in the Statement of Net Assets as an asset (liability) and in the Statement of Operations as unrealized appreciation (depreciation) until the contracts are closed, when they are recorded as realized futures gains (losses).
3. Federal Income Taxes: The fund intends to continue to qualify as a regulated investment company and distribute all of its taxable income. Management has analyzed the fund’s tax positions taken for all open federal income tax years (September 30, 2007–2010), and has concluded that no provision for federal income tax is required in the fund’s financial statements.
4. Distributions: Distributions to shareholders are recorded on the ex-dividend date.
5. Security Lending: The fund may lend its securities to qualified institutional borrowers to earn additional income. Security loans are required to be secured at all times by collateral at least equal to the market value of securities loaned. The fund invests cash collateral received in Vanguard Market Liquidity Fund, and records a liability for the return of the collateral, during the period the securities are on loan. Security lending income represents fees charged to borrowers plus income earned on investing cash collateral, less expenses associated with the loan.
6. Other: Dividend income is recorded on the ex-dividend date. Interest income includes income distributions received from Vanguard Market Liquidity Fund and is accrued daily. Security transactions are accounted for on the date securities are bought or sold. Costs used to determine realized gains (losses) on the sale of investment securities are those of the specific securities sold.
23
Strategic Equity Fund
B. The Vanguard Group furnishes at cost investment advisory, corporate management, administrative, marketing, and distribution services. The costs of such services are allocated to the fund under methods approved by the board of trustees. The fund has committed to provide up to 0.40% of its net assets in capital contributions to Vanguard. At September 30, 2010, the fund had contributed capital of $536,000 to Vanguard (included in Other Assets), representing 0.02% of the fund’s net assets and 0.21% of Vanguard’s capitalization. The fund’s trustees and officers are also directors and officers of Vanguard.
C. Various inputs may be used to determine the value of the fund’s investments. These inputs are summarized in three broad levels for financial statement purposes. The inputs or methodologies used to value securities are not necessarily an indication of the risk associated with investing in those securities.
Level 1—Quoted prices in active markets for identical securities.
Level 2—Other significant observable inputs (including quoted prices for similar securities, interest rates, prepayment speeds, credit risk, etc.).
Level 3—Significant unobservable inputs (including the fund’s own assumptions used to determine the fair value of investments).
The following table summarizes the fund’s investments as of September 30, 2010, based on the inputs
used to value them:
| | | |
| | Level 1 | Level 2 | Level 3 |
| Investments | ($000) | ($000) | ($000) |
| Common Stocks | 3,081,324 | — | — |
| Temporary Cash Investments | 36,603 | 2,197 | — |
| Futures Contracts—Assets1 | 3 | — | — |
| Futures Contracts—Liabilities1 | (16) | — | — |
| Total | 3,117,914 | 2,197 | — |
| 1 Represents variation margin on the last day of the reporting period. | | | |
D. At September 30, 2010, the aggregate settlement value of open futures contracts and the related unrealized appreciation (depreciation) were:
| | | | |
| | | | | ($000) |
| | | | Aggregate | |
| | | Number of | Settlement | Unrealized |
| | | Long (Short) | Value | Appreciation |
| Futures Contracts | Expiration | Contracts | Long (Short) | (Depreciation) |
| E-mini Russell 2000 Index | December 2010 | 145 | 9,780 | 144 |
| S&P MidCap 400 Index | December 2010 | 20 | 8,001 | 262 |
| E-mini S&P MidCap 400 Index | December 2010 | 71 | 5,681 | 152 |
Unrealized appreciation (depreciation) on open futures contracts is required to be treated as realized gain (loss) for tax purposes.
24
Strategic Equity Fund
E. Distributions are determined on a tax basis and may differ from net investment income and realized capital gains for financial reporting purposes. Differences may be permanent or temporary. Permanent differences are reclassified among capital accounts in the financial statements to reflect their tax character. Temporary differences arise when certain items of income, expense, gain, or loss are recognized in different periods for financial statement and tax purposes; these differences will reverse at some time in the future. Differences in classification may also result from the treatment of short-term gains as ordinary income for tax purposes.
For tax purposes, at September 30, 2010, the fund had $27,566,000 of ordinary income available for distribution. The fund had available capital loss carryforwards totaling $1,800,489,000 to offset future net capital gains of $755,793,000 through September 30, 2017, and $1,044,696,000 through September 30, 2018.
At September 30, 2010, the cost of investment securities for tax purposes was $2,646,878,000. Net unrealized appreciation of investment securities for tax purposes was $473,246,000, consisting of unrealized gains of $557,879,000 on securities that had risen in value since their purchase and $84,633,000 in unrealized losses on securities that had fallen in value since their purchase.
F. During the year ended September 30, 2010, the fund purchased $1,919,628,000 of investment securities and sold $2,736,108,000 of investment securities, other than temporary cash investments.
G. Capital shares issued and redeemed were:
| | |
| | Year Ended September 30, |
| | 2010 | 2009 |
| | Shares | Shares |
| | (000) | (000) |
| Issued | 16,900 | 37,584 |
| Issued in Lieu of Cash Distributions | 2,690 | 5,712 |
| Redeemed | (73,654) | (92,503) |
| Net Increase (Decrease) in Shares Outstanding | (54,064) | (49,207) |
H. In preparing the financial statements as of September 30, 2010, management considered the impact of subsequent events for potential recognition or disclosure in these financial statements.
25
Report of Independent Registered Public Accounting Firm
To the Trustees of Vanguard Horizon Funds and the Shareholders of Vanguard Strategic Equity Fund:
In our opinion, the accompanying statement of net assets and the related statements of operations and of changes in net assets and the financial highlights present fairly, in all material respects, the financial position of Vanguard Strategic Equity Fund (constituting a separate portfolio of Vanguard Horizon Funds, hereafter referred to as the “Fund”) at September 30, 2010, the results of its operations for the year then ended, the changes in its net assets for each of the two years in the period then ended and the financial highlights for each of the five years in the period then ended, in conformity with accounting principles generally accepted in the United States of America. These financial statements and financial highlights (hereafter referred to as “financial statements”) are the responsibility of the Fund’s management; our responsibility is to express an opinion on these financial stateme nts based on our audits. We conducted our audits of these financial statements in accordance with the standards of the Public Company Accounting Oversight Board (United States). Those standards require that we plan and perform the audit to obtain reasonable assurance about whether the financial statements are free of material misstatement. An audit includes examining, on a test basis, evidence supporting the amounts and disclosures in the financial statements, assessing the accounting principles used and significant estimates made by management, and evaluating the overall financial statement presentation. We believe that our audits, which included confirmation of securities at September 30, 2010 by correspondence with the custodian and brokers and by agreement to the underlying ownership records of Vanguard Market Liquidity Fund, provide a reasonable basis for our opinion.
| PricewaterhouseCoopers LLP |
|
| Philadelphia, Pennsylvania |
| November 17, 2010 |
| Special 2010 tax information (unaudited) for Vanguard Strategic Equity Fund |
This information for the fiscal year ended September 30, 2010, is included pursuant to provisions of the Internal Revenue Code.
The fund distributed $44,385,000 of qualified dividend income to shareholders during the fiscal year.
For corporate shareholders, 100% of investment income (dividend income plus short-term gains, if any) qualifies for the dividends-received deduction.
26
Your Fund’s After-Tax Returns
This table presents returns for your fund both before and after taxes. The after-tax returns are shown in two ways: (1) assuming that an investor owned the fund during the entire period and paid taxes on the fund’s distributions, and (2) assuming that an investor paid taxes on the fund’s distributions and sold all shares at the end of each period.
Calculations are based on the highest individual federal income tax and capital gains tax rates in effect at the times of the distributions and the hypothetical sales. State and local taxes were not considered. After-tax returns reflect any qualified dividend income , using actual prior-year figures and estimates for 2010. (In the example, returns after the sale of fund shares may be higher than those assuming no sale. This occurs when the sale would have produced a capital loss. The calculation assumes that the investor received a tax deduction for the loss.) Please note that your actual after-tax returns will depend on your tax situation and may differ from those shown. Also note that if you own the fund in a tax-deferred account, such as an individual retirement account or a 401(k) plan, this information does not apply to you. Such accounts are not subject to current taxes.
Finally, keep in mind that a fund’s performance—whether before or after taxes—does not guarantee future results.
| | | |
| Average Annual Total Returns: Strategic Equity Fund | | | |
| Periods Ended September 30, 2010 | | | |
| | One | Five | Ten |
| | Year | Years | Years |
| Returns Before Taxes | 13.71% | -1.47% | 4.84% |
| Returns After Taxes on Distributions | 13.49 | -2.42 | 3.55 |
| Returns After Taxes on Distributions and Sale of Fund Shares | 9.18 | -1.31 | 3.72 |
27
About Your Fund’s Expenses
As a shareholder of the fund, you incur ongoing costs, which include costs for portfolio management, administrative services, and shareholder reports (like this one), among others. Operating expenses, which are deducted from a fund’s gross income, directly reduce the investment return of the fund.
A fund’s expenses are expressed as a percentage of its average net assets. This figure is known as the expense ratio. The following examples are intended to help you understand the ongoing costs (in dollars) of investing in your fund and to compare these costs with those of other mutual funds. The examples are based on an investment of $1,000 made at the beginning of the period shown and held for the entire period.
The accompanying table illustrates your fund’s costs in two ways:
• Based on actual fund return. This section helps you to estimate the actual expenses that you paid over the period. The ”Ending Account Value“ shown is derived from the fund‘s actual return, and the third column shows the dollar amount that would have been paid by an investor who started with $1,000 in the fund. You may use the information here, together with the amount you invested, to estimate the expenses that you paid over the period.
To do so, simply divide your account value by $1,000 (for example, an $8,600 account value divided by $1,000 = 8.6), then multiply the result by the number given for your fund under the heading ”Expenses Paid During Period.“
• Based on hypothetical 5% yearly return. This section is intended to help you compare your fund‘s costs with those of other mutual funds. It assumes that the fund had a yearly return of 5% before expenses, but that the expense ratio is unchanged. In this case—because the return used is not the fund’s actual return—the results do not apply to your investment. The example is useful in making comparisons because the Securities and Exchange Commission requires all mutual funds to calculate expenses based on a 5% return. You can assess your fund’s costs by comparing this hypothetical example with the hypothetical examples that appear in shareholder reports of other funds.
Note that the expenses shown in the table are meant to highlight and help you compare ongoing costs only and do not reflect transaction costs incurred by the fund for buying and selling securities. Further, the expenses do not include the account service fee described in the prospectus. If such a fee were applied to your account, your costs would be higher. Your fund does not charge transaction fees, such as purchase or redemption fees, nor does it carry a “sales load.” The calculations assume no shares were bought or sold during the period. Your actual costs may have been higher or lower, depending on the amount of your investment and the timing of any purchases or redemptions.
You can find more information about the fund’s expenses, including annual expense ratios, in the Financial Statements section of this report. For additional information on operating expenses and other shareholder costs, please refer to your fund’s current prospectus.
28
| | | |
| Six Months Ended September 30, 2010 | | | |
| | Beginning | Ending | Expenses |
| | Account Value | Account Value | Paid During |
| Strategic Equity Fund | 3/31/2010 | 9/30/2010 | Period |
| Based on Actual Fund Return | $1,000.00 | $995.72 | $1.50 |
| Based on Hypothetical 5% Yearly Return | 1,000.00 | 1,023.56 | 1.52 |
The calculations are based on expenses incurred in the most recent six-month period. The fund’s annualized six-month expense ratio for that period is 0.30%. The dollar amounts shown as “Expenses Paid” are equal to the annualized expense ratio multiplied by the average account value over the period, multiplied by the number of days in the most recent six-month period, then divided by the number of days in the most recent 12-month period.
29
Glossary
30-Day SEC Yield. A fund’s 30-day SEC yield is derived using a formula specified by the U.S. Securities and Exchange Commission. Under the formula, data related to the fund’s security holdings in the previous 30 days are used to calculate the fund’s hypothetical net income for that period, which is then annualized and divided by the fund’s estimated average net assets over the calculation period. For the purposes of this calculation, a security’s income is based on its current market yield to maturity (in the case of bonds) or its projected dividend yield (for stocks). Because the SEC yield represents hypothetical annualized income, it will differ—at times significantly—from the fund’s actual experience. As a result, the fund’s income distributions may be higher or lower than implied by the SEC yield.
Beta. A measure of the magnitude of a fund’s past share-price fluctuations in relation to the ups and downs of a given market index. The index is assigned a beta of 1.00. Compared with a given index, a fund with a beta of 1.20 typically would have seen its share price rise or fall by 12% when the index rose or fell by 10%. For this report, beta is based on returns over the past 36 months for both the fund and the index. Note that a fund’s beta should be reviewed in conjunction with its R-squared (see definition). The lower the R-squared, the less correlation there is between the fund and the index, and the less reliable beta is as an indicator of volatility.
Dividend Yield. Dividend income earned by stocks, expressed as a percentage of the aggregate market value (or of net asset value, for a fund). The yield is determined by dividing the amount of the annual dividends by the aggregate value (or net asset value) at the end of the period. For a fund, the dividend yield is based solely on stock holdings and does not include any income produced by other investments.
Earnings Growth Rate. The average annual rate of growth in earnings over the past five years for the stocks now in a fund.
Equity Exposure. A measure that reflects a fund’s investments in stocks and stock futures. Any holdings in short-term reserves are excluded.
Expense Ratio. The percentage of a fund’s average net assets used to pay its annual administrative and advisory expenses. These expenses directly reduce returns to investors.
Foreign Holdings. The percentage of a fund represented by stocks or depositary receipts of companies based outside the United States.
Inception Date. The date on which the assets of a fund (or one of its share classes) are first invested in accordance with the fund’s investment objective. For funds with a subscription period, the inception date is the day after that period ends. Investment performance is measured from the inception date.
Median Market Cap. An indicator of the size of companies in which a fund invests; the midpoint of market capitalization (market price x shares outstanding) of a fund’s stocks, weighted by the proportion of the fund’s assets invested in each stock. Stocks representing half of the fund’s assets have market capitalizations above the median, and the rest are below it.
Price/Book Ratio. The share price of a stock divided by its net worth, or book value, per share. For a fund, the weighted average price/book ratio of the stocks it holds.
30
Price/Earnings Ratio. The ratio of a stock’s current price to its per-share earnings over the past year. For a fund, the weighted average P/E of the stocks it holds. P/E is an indicator of market expectations about corporate prospects; the higher the P/E, the greater the expectations for a company’s future growth.
R-Squared. A measure of how much of a fund’s past returns can be explained by the returns from the market in general, as measured by a given index. If a fund’s total returns were precisely synchronized with an index’s returns, its R-squared would be 1.00. If the fund’s returns bore no relationship to the index’s returns, its R-squared would be 0. For this report, R-squared is based on returns over the past 36 months for both the fund and the index.
Return on Equity. The annual average rate of return generated by a company during the past five years for each dollar of shareholder’s equity (net income divided by shareholder’s equity). For a fund, the weighted average return on equity for the companies whose stocks it holds.
Short-Term Reserves. The percentage of a fund invested in highly liquid, short-term securities that can be readily converted to cash.
Turnover Rate. An indication of the fund’s trading activity. Funds with high turnover rates incur higher transaction costs and may be more likely to distribute capital gains (which may be taxable to investors). The turnover rate excludes in-kind transactions, which have minimal impact on costs.
31
The People Who Govern Your Fund
The trustees of your mutual fund are there to see that the fund is operated and managed in your best interests since, as a shareholder, you are a part owner of the fund. Your fund’s trustees also serve on the board of directors of The Vanguard Group, Inc., which is owned by the Vanguard funds and provides services to them on an at-cost basis.
A majority of Vanguard’s board members are independent, meaning that they have no affiliation with Vanguard or the funds they oversee, apart from the sizable personal investments they have made as private individuals. The independent board members have distinguished backgrounds in business, academia, and public service. Each of the trustees and executive officers oversees 178 Vanguard funds.
The following table provides information for each trustee and executive officer of the fund. More information about the trustees is in the Statement of Additional Information, which can be obtained, without charge, by contacting Vanguard at 800-662-7447, or online at Vanguard.com.
| |
| Interested Trustee1 | Amy Gutmann |
| | Born 1949. Trustee Since June 2006. Principal |
| F. William McNabb III | Occupation(s) During the Past Five Years: President |
| Born 1957. Trustee Since July 2009. Chairman of the | of the University of Pennsylvania; Christopher H. |
| Board. Principal Occupation(s) During the Past Five | Browne Distinguished Professor of Political Science |
| Years: Chairman of the Board of The Vanguard Group, | in the School of Arts and Sciences with secondary |
| Inc., and of each of the investment companies served | appointments at the Annenberg School for Commu- |
| by The Vanguard Group, since January 2010; Director | nication and the Graduate School of Education |
| of The Vanguard Group since 2008; Chief Executive | of the University of Pennsylvania; Director of |
| Officer and President of The Vanguard Group and of | Carnegie Corporation of New York, Schuylkill River |
| each of the investment companies served by The | Development Corporation, and Greater Philadelphia |
| Vanguard Group since 2008; Director of Vanguard | Chamber of Commerce; Trustee of the National |
| Marketing Corporation; Managing Director of The | Constitution Center; Chair of the Presidential |
| Vanguard Group (1995–2008) . | Commission for the Study of Bioethical Issues. |
| |
| | JoAnn Heffernan Heisen |
| Independent Trustees | Born 1950. Trustee Since July 1998. Principal |
| | Occupation(s) During the Past Five Years: Corporate |
| Emerson U. Fullwood | Vice President and Chief Global Diversity Officer |
| Born 1948. Trustee Since January 2008. Principal | since 2006 (retired 2008) and Member of the |
| Occupation(s) During the Past Five Years: Executive | Executive Committee (retired 2008) of Johnson & |
| Chief Staff and Marketing Officer for North America | Johnson (pharmaceuticals/consumer products); Vice |
| and Corporate Vice President (retired 2008) of Xerox | President and Chief Information Officer of Johnson & |
| Corporation (document management products and | Johnson (1997–2005); Director of the University |
| services); Director of SPX Corporation (multi-industry | Medical Center at Princeton and Women’s Research |
| manufacturing), the United Way of Rochester, | and Education Institute; Member of the Advisory |
| Amerigroup Corporation (managed health care), | Board of the Maxwell School of Citizenship and Public |
| the University of Rochester Medical Center, and | Affairs at Syracuse University. |
| Monroe Community College Foundation. | |
| | F. Joseph Loughrey |
| Rajiv L. Gupta | Born 1949. Trustee Since October 2009. Principal |
| Born 1945. Trustee Since December 2001.2 | Occupation(s) During the Past Five Years: President |
| Principal Occupation(s) During the Past Five Years: | and Chief Operating Officer since 2005 (retired 2009) |
| Chairman and Chief Executive Officer (retired 2009) | and Vice Chairman of the Board (2008–2009) of |
| and President (2006–2008) of Rohm and Haas Co. | Cummins Inc. (industrial machinery); Director of |
| (chemicals); Director of Tyco International, Ltd. | SKF AB (industrial machinery), Hillenbrand, Inc. |
| (diversified manufacturing and services) and Hewlett- | (specialized consumer services), Sauer-Danfoss Inc. |
| Packard Co. (electronic computer manufacturing); | (machinery), the Lumina Foundation for Education, |
| Trustee of The Conference Board; Member of the | and Oxfam America; Chairman of the Advisory |
| Board of Managers of Delphi Automotive LLP | Council for the College of Arts and Letters at the |
| (automotive components) . | University of Notre Dame. |
| | |
| André F. Perold | Kathryn J. Hyatt | |
| Born 1952. Trustee Since December 2004. Principal | Born 1955. Treasurer Since November 2008. Principal |
| Occupation(s) During the Past Five Years: George | Occupation(s) During the Past Five Years: Principal |
| Gund Professor of Finance and Banking at the Harvard | of The Vanguard Group, Inc.; Treasurer of each of |
| Business School; Chair of the Investment Committee | the investment companies served by The Vanguard |
| of HighVista Strategies LLC (private investment firm) . | Group since 2008; Assistant Treasurer of each of the |
| | investment companies served by The Vanguard Group |
| Alfred M. Rankin, Jr. | (1988–2008) . | |
| Born 1941. Trustee Since January 1993. Principal | | |
| Occupation(s) During the Past Five Years: Chairman, | Heidi Stam | |
| President, and Chief Executive Officer of NACCO | Born 1956. Secretary Since July 2005. Principal |
| Industries, Inc. (forklift trucks/housewares/lignite); | Occupation(s) During the Past Five Years: Managing |
| Director of Goodrich Corporation (industrial products/ | Director of The Vanguard Group, Inc., since 2006; |
| aircraft systems and services); Chairman of the | General Counsel of The Vanguard Group since 2005; |
| Federal Reserve Bank of Cleveland; Trustee of The | Secretary of The Vanguard Group and of each of the |
| Cleveland Museum of Art. | investment companies served by The Vanguard Group |
| | since 2005; Director and Senior Vice President of |
| Peter F. Volanakis | Vanguard Marketing Corporation since 2005; |
| Born 1955. Trustee Since July 2009. Principal | Principal of The Vanguard Group (1997–2006). |
| Occupation(s) During the Past Five Years: President | | |
| since 2007 and Chief Operating Officer since 2005 | | |
| of Corning Incorporated (communications equipment); | Vanguard Senior Management Team |
| President of Corning Technologies (2001–2005); | | |
| Director of Corning Incorporated and Dow Corning; | R. Gregory Barton | Michael S. Miller |
| Trustee of the Corning Incorporated Foundation and | Mortimer J. Buckley | James M. Norris |
| the Corning Museum of Glass; Overseer of the | Kathleen C. Gubanich | Glenn W. Reed |
| Amos Tuck School of Business Administration at | Paul A. Heller | George U. Sauter |
| Dartmouth College. | | |
| |
| | Chairman Emeritus and Senior Advisor |
| Executive Officers | | |
| | John J. Brennan | |
| Glenn Booraem | Chairman, 1996–2009 | |
| Born 1967. Controller Since July 2010. Principal | Chief Executive Officer and President, 1996–2008 |
| Occupation(s) During the Past Five Years: Principal | | |
| of The Vanguard Group, Inc.; Controller of each of | | |
| the investment companies served by The Vanguard | Founder | |
| Group since 2010; Assistant Controller of each of | | |
| the investment companies served by The Vanguard | John C. Bogle | |
| Group (2001–2010) . | Chairman and Chief Executive Officer, 1974–1996 |
| |
| Thomas J. Higgins | | |
| Born 1957. Chief Financial Officer Since September | | |
| 2008. Principal Occupation(s) During the Past Five | | |
| Years: Principal of The Vanguard Group, Inc.; Chief | | |
| Financial Officer of each of the investment companies | | |
| served by The Vanguard Group since 2008; Treasurer | | |
| of each of the investment companies served by The | | |
| Vanguard Group (1998–2008) . | | |
1 Mr. McNabb is considered an “interested person,” as defined in the Investment Company Act of 1940, because he is an officer of the Vanguard funds.
2 December 2002 for Vanguard Equity Income Fund, Vanguard Growth Equity Fund, the Vanguard Municipal Bond Funds, and the Vanguard State Tax-Exempt Funds.
|  |
| P.O. Box 2600 |
| Valley Forge, PA 19482-2600 |
Connect with Vanguard® > Vanguard.com
| |
| Fund Information > 800-662-7447 | CFA® is a trademark owned by CFA Institute. |
| Direct Investor Account Services > 800-662-2739 | |
| Institutional Investor Services > 800-523-1036 | |
| Text Telephone for People | |
| With Hearing Impairment > 800-749-7273 | |
| |
| This material may be used in conjunction | |
| with the offering of shares of any Vanguard | |
| fund only if preceded or accompanied by | |
| the fund’s current prospectus. | |
| |
| All comparative mutual fund data are from Lipper Inc. or | |
| Morningstar, Inc., unless otherwise noted. | |
| |
| You can obtain a free copy of Vanguard’s proxy voting | |
| guidelines by visiting vanguard.com/proxyreporting or by | |
| calling Vanguard at 800-662-2739. The guidelines are | |
| also available from the SEC’s website, sec.gov. In | |
| addition, you may obtain a free report on how your fund | |
| voted the proxies for securities it owned during the 12 | |
| months ended June 30. To get the report, visit either | |
| vanguard.com/proxyreporting or sec.gov. | |
| |
| You can review and copy information about your fund at | |
| the SEC’s Public Reference Room in Washington, D.C. To | |
| find out more about this public service, call the SEC at | |
| 202-551-8090. Information about your fund is also | |
| available on the SEC’s website, and you can receive | |
| copies of this information, for a fee, by sending a | |
| request in either of two ways: via e-mail addressed to | |
| publicinfo@sec.gov or via regular mail addressed to the | |
| Public Reference Section, Securities and Exchange | |
| Commission, Washington, DC 20549-1520. | |
| |
| |
| | © 2010 The Vanguard Group, Inc. |
| | All rights reserved. |
| | Vanguard Marketing Corporation, Distributor. |
| |
| | Q1140 112010 |
 |
| Vanguard Capital Opportunity Fund |
| Annual Report |
|
|
| September 30, 2010 |
|
 |
|
> Vanguard Capital Opportunity Fund had a disappointing return of about 7% for the 2010 fiscal year, trailing the results of its comparative standards.
> The fund’s information technology and health care stocks, representing nearly two-thirds of the fund’s market value, pulled down results.
> For the decade ended September 30, 2010, the fund retained its significant lead over its comparative standards with an average annual return of almost 3%.
| |
| Contents | |
| Your Fund’s Total Returns. | 1 |
| Chairman’s Letter. | 2 |
| Advisor’s Report. | 8 |
| Fund Profile. | 13 |
| Performance Summary. | 14 |
| Financial Statements. | 16 |
| Your Fund’s After-Tax Returns. | 28 |
| About Your Fund’s Expenses. | 29 |
| Glossary. | 31 |
The figures shown represent past performance, which is not a guarantee of future results. (Current performance may be lower or higher than the performance data cited. For performance data current to the most recent month-end, visit our website at vanguard.com/performance.)
Please note: The opinions expressed in this report are just that—informed opinions. They should not be considered promises or advice. Also, please keep in mind that the information and opinions cover the period through the date on the front of this report. Of course, the risks of investing in your fund are spelled out in the prospectus.
See the Glossary for definitions of investment terms used in this report.
Cover photograph: Jean Maher.
Your Fund’s Total Returns
| |
| Fiscal Year Ended September 30, 2010 | |
| | Total |
| | Returns |
| Vanguard Capital Opportunity Fund | |
| Investor Shares | 7.14% |
| Admiral™ Shares | 7.21 |
| Russell Midcap Growth Index | 18.27 |
| Multi-Cap Growth Funds Average | 12.25 |
Multi-Cap Growth Funds Average: Derived from data provided by Lipper Inc.
Admiral Shares carry lower expenses and are available to investors who meet certain account-balance requirements.
| | | | |
| Your Fund’s Performance at a Glance | | | | |
| September 30, 2009, Through September 30, 2010 | | | | |
| | | | Distributions Per Share |
| | Starting | Ending | Income | Capital |
| | Share Price | Share Price | Dividends | Gains |
| Vanguard Capital Opportunity Fund | | | | |
| Investor Shares | $27.71 | $29.59 | $0.097 | $0.000 |
| Admiral Shares | 64.04 | 68.38 | 0.273 | 0.000 |
1

Chairman’s Letter
Dear Shareholder,
Although Vanguard Capital Opportunity Fund got off to a good start with a return of more than 14% in the first six months of the 2010 fiscal year, losses in the second half clipped the fund’s total return for the year to about 7%. In contrast, the benchmark Russell Midcap Growth Index—which represented one of the market’s best-performing segments—added to its first-half result and returned more than 18% for the year. The average return of the fund’s multi-capitalization growth fund peers was about 12%.
Unlike its benchmark index, your fund has sizable investments in large- and small-cap companies. As a result, the fund’s portfolio characteristics can differ significantly from those of the benchmark. For example, the median market capitalization of the fund as of September 30 was almost $13 billion, roughly twice that of the benchmark index. There have been times when such differences have worked to shareholders’ advantage, but not this year, when mid-cap growth stocks were several paces ahead of their large- and small-cap counterparts.
Several other distinctive aspects of the investment strategy of the fund’s advisor, PRIMECAP Management Company, can also cause the fund’s results to be out of step with those of its benchmark or peers. Perhaps most notable are outsized investments in information technology and health care and a patient, low-turnover style—
2
features that also have rewarded the fund’s shareholders over time. In the 2010 fiscal year, however, some disappointing stocks in both of these two key sectors held back results. Astute choices among consumer discretionary and industrial stocks couldn’t close the gap.
If you hold shares in a taxable account, you may wish to review the table and discussion on after-tax returns for the fiscal year, based on the highest tax bracket, later in this report.
Also, please note that on October 6, after the close of the period, Vanguard broadened the availability of our lower-cost Admiral Shares. We reduced the Admiral minimums on most of our actively managed funds to $50,000 from $100,000, as part of our ongoing efforts to lower the cost of investing for our clients.
An upbeat end to a worrisome 12 months
Although global stock markets traced a ragged trajectory, they ultimately gained ground for the 12 months ended September 30. Europe’s sovereign debt crisis and a dispiriting lack of vigor in the U.S. economy weighed on stock prices through the spring and summer. In September, however, investor sentiment perked up, buoyed by continued signs of strength in corporate financial statements. The broad U.S. stock market rallied to
| | | |
| Market Barometer | | | |
| |
| | | Average Annual Total Returns |
| | | Periods Ended September 30, 2010 |
| | One | Three | Five |
| | Year | Years | Years |
| Stocks | | | |
| Russell 1000 Index (Large-caps) | 10.75% | -6.79% | 0.86% |
| Russell 2000 Index (Small-caps) | 13.35 | -4.29 | 1.60 |
| Dow Jones U.S. Total Stock Market Index | 11.51 | -6.12 | 1.37 |
| MSCI All Country World Index ex USA (International) | 8.00 | -6.98 | 4.72 |
| |
| Bonds | | | |
| Barclays Capital U.S. Aggregate Bond Index (Broad | | | |
| taxable market) | 8.16% | 7.42% | 6.20% |
| Barclays Capital Municipal Bond Index (Broad | | | |
| tax-exempt market) | 5.81 | 6.04 | 5.13 |
| Citigroup Three-Month U.S. Treasury Bill Index | 0.12 | 1.01 | 2.47 |
| |
| CPI | | | |
| Consumer Price Index | 1.14% | 1.57% | 1.90% |
3
close the 12-month period with a return of more than 11%. Small-capitalization stocks finished a few steps ahead of their large-cap counterparts.
International stock markets were a mixed bag: middling returns in Europe, stagnation in the Pacific region’s developed markets, and a return of more than 20% from emerging markets. The combined result, as measured by the MSCI All Country World Index ex USA, was a 12-month return of 8%.
Bond prices rallied, driving yields to surprising lows
Bonds produced strong 12-month returns, a gratifying performance that nevertheless raises questions about the prospects for total returns in a fixed income market where yields hover near all-time lows. At the start of the period, the 10-year U.S. Treasury note yielded 3.31%; at the end of the period, the figure was 2.51% as investors bid up bond prices. As yields move lower, of course, the scope for continued declines—and the attendant rise in prices—diminishes. Corporate bonds performed best for the 12 months. Municipal bonds delivered solid, but more modest, returns.
As has been the case for almost two years now, the yields of money market securities remained near 0%, a consequence of the Federal Reserve Board’s efforts to stimulate the economy by keeping a tight lid on borrowing costs.
| | | |
| Expense Ratios | | | |
| Your Fund Compared With Its Peer Group | | | |
| | Investor | Admiral | Peer Group |
| | Shares | Shares | Average |
| Capital Opportunity Fund | 0.50% | 0.41% | 1.40% |
The fund expense ratios shown are from the prospectus dated January 26, 2010, and represent estimated costs for the current fiscal year. For the fiscal year ended September 30, 2010, the fund’s expense ratios were 0.48% for Investor Shares and 0.41% for Admiral Shares. The peer-group expense ratio is derived from data provided by Lipper Inc. and captures information through year-end 2009.
Peer group: Multi-Cap Growth Funds.
4
Disappointing stock selection, especially in key sectors
Your fund typically holds roughly 110 to 115 stocks, while there are nearly 500 stocks in the Russell Midcap Growth Index. In a more concentrated portfolio, the impact of a few large holdings on the fund’s total return can be magnified—sometimes for better, sometimes for worse. In the 2009 fiscal year, for example, the advisor’s technology stock selections were rewarding and helped the fund outperform its benchmark, even though health care lagged. But in 2010, some weak performers caused both sectors to fall behind, trimming about 9 percentage points from the fund’s return relative to the benchmark.
Despite several bright spots, the fund’s IT holdings netted only a low single-digit return for the fiscal year, compared with about 22% in the benchmark. Top-ten holdings Altera (a semiconductor manufacturer) and Cree (a specialist in LED chip technology) were some of the best performers; each returned almost 50% and added almost a full percentage point to the fund’s return.
This benefit was more than offset by declines in Research In Motion (a top-ten holding and maker of the BlackBerry smartphone) and FormFactor (a maker of semiconductor products). Together, these companies—which are not included in the
| |
| Total Returns | |
| Ten Years Ended September 30, 2010 | |
| | Average |
| | Annual Return |
| Capital Opportunity Fund Investor Shares | 2.90% |
| Russell Midcap Growth Index | -0.88 |
| Multi-Cap Growth Funds Average | -3.76 |
| Multi-Cap Growth Funds Average: Derived from data provided by Lipper Inc. | |
The figures shown represent past performance, which is not a guarantee of future results. (Current performance may be lower or higher than the performance data cited. For performance data current to the most recent month-end, visit our website at vanguard.com/performance.) Note, too, that both investment returns and principal value can fluctuate widely, so an investor’s shares, when sold, could be worth more or less than their original cost.
5
benchmark index—accounted for about half of the fund’s shortfall against the tech sector’s return in the index.
In health care, the fund’s mid-single-digit return was anemic compared with the sector’s more than 18% return in the benchmark. The fund’s large holdings generated mixed results for company-specific reasons that seemed to have little to do with the eventual passage of health care reform. In biotechnology, for example, Biogen Idec and Dendreon advanced while Amgen lost ground. A similar dichotomy existed among pharmaceutical giants.
With the U.S. economy on the mend, the fund’s consumer discretionary and industrial holdings posted gains well above 20% for the year. In materials, though, Monsanto continued to struggle after being a standout performer in fiscal years 2007 and 2008.
For more on the advisor’s strategy and outlook, please see the Advisor’s Report following this letter.
Ten-year performance remained out in front
Although the fund produced a return of about 7%, its relative performance didn’t measure up to the high standards we have come to expect of PRIMECAP. Over the years, shareholders have been well served by the advisor’s research-intensive, bottom-up approach to seeking reasonably priced companies that appear to have superior growth prospects. When PRIMECAP identifies such companies, it often invests wholeheartedly. For example, as of September 30, the fund’s ten largest holdings made up about one-third of the portfolio’s capitalization, a level consistent with recent years but one that can amplify the impact of ups and downs in such holdings.
The decade ended September 30, 2010, was a challenging one that included two bear markets—the first characterized by the bursting of the technology bubble, and the second associated with the “Great Recession.” In this environment, the fund’s modest average annual return of about 3% placed it squarely ahead of the losses sustained by its comparative standards. And relatively low costs have helped shareholders keep more of the fund’s returns.
A patient approach can reap rewards
The up-and-down path of the U.S. stock market over the past 12 months was not unlike historical patterns of market returns from year to year. Also, over time, growth and value stocks have often traded places in the performance rankings, as have large-, mid-, and small-cap stocks. Because of the unpredictability of such twists and turns, it helps to diversify your holdings
6
among and within stocks, bonds, and money market funds, in proportions that are consistent with your risk tolerance and time horizon.
Vanguard Capital Opportunity Fund can play an important role in such a balanced portfolio. The advisor’s patient and disciplined approach—more like the proverbial tortoise than the hare—can help you stay the course and reach your investment goals.
Thank you for entrusting your assets to Vanguard.
Sincerely,

F. William McNabb III
Chairman and Chief Executive Officer
October 13, 2010
7
Advisor’s Report
For the fiscal year ended September 30, 2010, Vanguard Capital Opportunity Fund returned 7.14% for Investor Shares and 7.21% for Admiral Shares, well below the 12.25% average return of multi-capitalization growth fund competitors and the 18.27% return of the Russell Midcap Growth Index benchmark. These disappointing results were due mainly to poor stock selection in information technology, the fund’s largest sector. The fund’s holdings in the health care and materials sectors also detracted from results.
Investment environment
In a year characterized by considerable volatility in equity markets, the major indexes managed to post gains. For example, the S&P 500 Index advanced slightly more than 10%, largely on the strength of a rally in September 2010. Taking a longer perspective, the S&P 500 ended the fiscal year approximately 70% higher than its March 2009 low, but remained more than 25% below the peak levels reached in October 2007.
The National Bureau of Economic Research recently determined that the recession, which began in late 2007, officially ended in June 2009. However, growth in the U.S. economy continues to be modest, unemployment hovers near 10%, and housing markets remain weak. Uncertainty regarding the future course of tax rates, regulatory reforms, monetary and fiscal policies, and the overall fragility of the economic recovery cloud the investment outlook.
Although stock prices have risen dramatically over the past 18 months, valuations appear attractive, especially given the low interest rate environment. Corporate earnings have also improved as business activity has rebounded, allowing many companies to improve their balance sheets during this period. We have found compelling purchase opportunities over the past year in companies with strong growth prospects, solid balance sheets, and attractive valuations.
Management of the fund
Our investment philosophy and process have not changed. We rely on fundamental, in-depth research to find companies whose revenue and earnings will, in our opinion, grow more rapidly over a three-to-five-year horizon than current valuations might suggest. In doing so, we focus on assessing the fundamental value of a company relative to the market price of its stock.
This bottom-up, stock-by-stock investment strategy has led us to build and maintain significant investments in technology and health care companies that we believe offer superior appreciation potential. The following discussion focuses on these two sectors, which on average represented more than 60% of the fund’s market value (but less than 40% of the benchmark’s) during the fiscal year.
8
Technology
Our information technology holdings, which represent more than one-third of the fund’s market value, returned slightly less than 3% in the fiscal year, well below the almost 22% return of the technology sector in the Russell Midcap Growth Index. While the past 12 months have been a challenging period for some of our holdings, we believe that technology remains an attractive investment area for several reasons. First, internet usage continues to grow, driven by social networking, e-commerce, and the emergence of new devices such as smartphones and tablet computers. Second, demand for semiconductors, computer hardware, and storage remains robust as consumers and enterprises generate ever greater amounts of data, photos, and videos. Third, emerging middle-class consumers in developing economies represent a vast new audience for technology products and services. Finally, technology companies have strong balance sheets with cash at record levels and reas onable stock valuations.
Research In Motion and FormFactor were two notable detractors from the fund’s performance. Despite very strong revenue and earnings growth this year, concerns mounted that Research In Motion’s BlackBerry smartphones will lose market share to Android devices and Apple’s iPhone. We believe that the BlackBerry franchise remains a vibrant ecosystem with outstanding growth prospects that offers customers distinct advantages
in security, reliability, and messaging. FormFactor, a leading provider of wafer probe cards used by semiconductor manufacturers in the testing of integrated circuits, suffered from several operational miscues and failed to execute on its product road map. New management with considerable industry expertise has recently been installed, and a significant restructuring of the company has occurred. We expect the company to recapture technological leadership and gain market share in the probe card market.
On a positive note, Altera and Cree, two of the fund’s top-ten holdings, each gained almost 50%, and both were significant contributors to the fund’s results. Altera, which designs and sells programmable semiconductor chips, enjoyed strong growth from increasing penetration for a variety of electronic products, particularly communications products. Cree, a leader in energy-efficient LED-lighting technology, experienced rapid growth as LED lights began to displace traditional incandescent lighting. LED lights consume a fraction of the electricity of incandescent bulbs and can last as long as 20 years.
Overall, we remain optimistic about the fund’s overweight position in the technology sector. These well-capitalized companies are highly profitable and continue to invest in innovation that should drive future growth and profitability as they expand into new markets for their products and services.
9
Health care
The fund’s health care stocks returned about 6%, lagging the more than 18% return of the benchmark index’s health care sector. The sector has been challenged with unfavorable news this year. The Patient Protection and Affordable Care Act passed in March will lead to various forms of pricing pressure for health care products. The weak economy and high unemployment have emboldened employers to require more of their employees in terms of co-pays and sharing premiums for health care plans, thereby reducing demand for some health care products. European austerity measures have also hurt health care companies selling products in that region.
Despite these negatives, we remain optimistic about our health care holdings, which are concentrated in the biotechnology, pharmaceutical, and medical device industries. One of the fund’s largest holdings is Amgen. This biotechnology company recently received Food and Drug Administration (FDA) approval to market Prolia for the treatment of osteoporosis in postmenopausal women. Prolia is also awaiting an FDA decision on its use in treating skeletal-related events and may be considered for a third indication—to prevent bone metastases in cases of prostate cancer. We don’t believe Amgen’s below-market valuation reflects the potential of Prolia and other Amgen pipeline drugs to meet the tremendous demand from patients.
Pharmaceuticals makers Eli Lilly and Novartis, two of the fund’s largest holdings, showed double-digit gains for the year. Novartis has one of the most productive research and development platforms in the industry, with more products approved by the FDA than any other pharmaceutical company over the last decade. Novartis has also broadened its portfolio into areas with strong growth prospects, such as personal care products, vaccines, and eye care—the last of these through its purchase of Alcon. Eli Lilly has not been as successful as Novartis in developing and launching new drugs. Its recent launch of the blood thinner Effient has been disappointing. Concerns over patent expirations, especially for block-busters Zyprexa and Cymbalta, weigh on the stock. Our thesis for Eli Lilly remains pinned on its low valuation and commitment to research and development; it has 30 products in late-stage clinical trials (phase two or three) or under regulatory r eview. Both Novartis and Eli Lilly are increasingly investing in biologic therapies, which should provide longer exclusivity periods than easy-to-copy small-molecule therapies.
We remain optimistic that the fund’s overweight position in this sector will help results going forward. The pricing concerns raised by the recently passed health care legislation should be offset, in part, by the 30 million currently uninsured who will gain coverage as a result. We believe that pharmaceutical and medical device
10
products currently in development will represent a far more efficient way, both in terms of cost and efficacy, to treat diseases like Alzheimer’s, diabetes, and cancer than the alternatives available today. Within the United States, baby boomers, the first of whom turn 65 next year, will provide two decades of increased demand for health care products. Outside the United States, there is an even larger opportunity in the emerging markets, where people want better health care products as a critical component of a higher standard of living.
Other sector highlights
As a group, industrial and consumer discretionary stocks were among the year’s best performers in both the fund and the benchmark index. Strong contributors included Rockwell Automation and Thomas & Betts, as well as FedEx and Southwest Airlines. Among consumer discretionary companies, top-ten holding DIRECTV added more than a full percentage point to the fund’s return.
The company continues to distinguish itself as the premier provider of digital television entertainment and is rapidly increasing its Latin American subscriber base. Retailers CarMax, Dress Barn, and TJX Cos. also bolstered results.
Given our long-standing concerns about leverage and lack of transparency in the banking sector, we generally remain negatively disposed toward financial stocks. However, our one holding in the sector, Chubb, a property and casualty insurer, helped the fund’s results. Monsanto, the fund’s only holding in the materials sector, was the single largest detractor from the fund’s results. Early crop reports indicate disappointing yields from Monsanto’s latest generation of seeds. We believe this is a short-term setback and have added to the fund’s position as the stock has declined. In our opinion, Monsanto is the clear technology leader in genetically modified seeds, producing crops resistant to insects, herbicides, and ultimately drought. Monsanto’s products are farmers’ most potent tool to increase their yields and profits.
Outlook
Looking ahead to the 2011 fiscal year and beyond, we view the prospects for equity returns relative to most other asset classes as encouraging. With the earnings yield (a measure of valuation) on stocks approaching 8% versus less than 3% for a 10-year Treasury bond and less than 1% for a money market fund, we believe that stocks have significant potential for appreciation and that valuations are attractive. However, while we are on balance optimistic, our outlook is tempered by several macro-level concerns.
We are concerned that the current fiscal and monetary policies in the United States may ultimately lead to a rise in inflation and a weaker U.S. dollar—which recently touched a 15-year low against the Japanese
11
yen and has weakened against the euro. Increased regulations and other government intervention into the private sector are even more troubling, as they distort economic incentives. We believe that market forces result in a more efficient allocation of resources than government programs.
Longer-term, the recent problems in Greece and other European countries demonstrate the challenge of sustaining fiscal policies that increase government spending more rapidly than the growth rate of the broader economy. The United States faces a similar challenge not only at the federal but also at the state and local government levels—where spending needs and future obligations are increasing faster than tax revenues.
Despite these concerns, we hold a generally positive outlook for U.S. equities. In addition to attractive valuations, we would highlight three factors. First, many U.S. corporations today generate a meaningful and increasing portion of their revenues and earnings from outside the United States. The opportunities for growth globally, particularly in developing economies, will result in many corporations increasing earnings more rapidly than the rate of economic growth in the U.S. Second, we believe the pace of innovation in U.S. companies continues to accelerate. We expect that the substantial investments in research and development, particularly by health care and technology companies, will lead to unforeseen growth opportunities that are not reflected in current expectations. Finally, the balance sheets of corporate America are as strong and liquid as they have ever been. This will afford companies great financial flexibility during challenging economic ti mes.
PRIMECAP Management Company
October 20, 2010
12
Capital Opportunity Fund
Fund Profile
As of September 30, 2010
| | |
| Share-Class Characteristics | |
| | Investor | Admiral |
| | Shares | Shares |
| Ticker Symbol | VHCOX | VHCAX |
| Expense Ratio1 | 0.50% | 0.41% |
| 30-Day SEC Yield | 0.34% | 0.35% |
| | | |
| Portfolio Characteristics | | |
| | | Russell | DJ |
| | | Midcap | U.S. Total |
| | | Growth | Market |
| | Fund | Index | Index |
| Number of Stocks | 114 | 493 | 3,920 |
| Median Market Cap $12.9B | $6.4B | $27.3B |
| Price/Earnings Ratio | 17.7x | 23.6x | 17.1x |
| Price/Book Ratio | 2.6x | 3.6x | 2.1x |
| Return on Equity | 16.5% | 19.1% | 19.1% |
| Earnings Growth Rate 12.0% | 9.3% | 6.4% |
| Dividend Yield | 0.9% | 0.9% | 1.8% |
| Foreign Holdings | 12.1% | 0.0% | 0.0% |
| Turnover Rate | 8% | — | — |
| Short-Term Reserves | 2.6% | — | — |
| | | |
| Sector Diversification (% of equity exposure) |
| | | Russell | DJ |
| | | Midcap | U.S. Total |
| | | Growth | Market |
| | Fund | Index | Index |
| Consumer | | | |
| Discretionary | 15.7% | 20.1% | 11.7% |
| Consumer Staples | 0.0 | 5.4 | 10.1 |
| Energy | 5.4 | 5.5 | 9.7 |
| Financials | 0.3 | 6.9 | 16.6 |
| Health Care | 24.8 | 12.7 | 11.2 |
| Industrials | 13.0 | 15.5 | 11.1 |
| Information | | | |
| Technology | 37.0 | 24.5 | 19.0 |
| Materials | 3.1 | 7.0 | 4.2 |
| Telecommunication | | | |
| Services | 0.5 | 2.1 | 2.9 |
| Utilities | 0.2 | 0.3 | 3.5 |
| | |
| Volatility Measures | | |
| | Russell | DJ |
| | Midcap | U.S. Total |
| | Growth | Market |
| | Index | Index |
| R-Squared | 0.95 | 0.92 |
| Beta | 0.95 | 1.10 |
These measures show the degree and timing of the fund’s fluctuations compared with the indexes over 36 months.
| | |
| Ten Largest Holdings (% of total net assets) |
| Eli Lilly & Co. | Pharmaceuticals | 3.6% |
| FedEx Corp. | Air Freight & | |
| | Logistics | 3.5 |
| Biogen Idec Inc. | Biotechnology | 3.4 |
| Amgen Inc. | Biotechnology | 3.4 |
| DIRECTV Class A | Cable & Satellite | 3.3 |
| Research In Motion Ltd. | Communications | |
| | Equipment | 3.3 |
| Monsanto Co. | Fertilizers & | |
| | Agricultural | |
| | Chemicals | 3.0 |
| Altera Corp. | Semiconductors | 2.9 |
| Cree Inc. | Semiconductors | 2.8 |
| Roche Holding AG | Pharmaceuticals | 2.7 |
| Top Ten | | 31.9% |
The holdings listed exclude any temporary cash investments and equity index products.
Investment Focus
1 The expense ratios shown are from the prospectus dated January 26, 2010, and represent estimated costs for the current fiscal year. For the fiscal year ended September 30, 2010, the expense ratios were 0.48% for Investor Shares and 0.41% for Admiral Shares.
13
Capital Opportunity Fund
Performance Summary
All of the returns in this report represent past performance, which is not a guarantee of future results that may be achieved by the fund. (Current performance may be lower or higher than the performance data cited. For performance data current to the most recent month-end, visit our website at vanguard.com/performance.) Note, too, that both investment returns and principal value can fluctuate widely, so an investor’s shares, when sold, could be worth more or less than their original cost. The returns shown do not reflect taxes that a shareholder would pay on fund distributions or on the sale of fund shares.
Cumulative Performance: September 30, 2000, Through September 30, 2010
Initial Investment of $25,000
| | | | |
| | Average Annual Total Returns | |
| | Periods Ended September 30, 2010 | |
| | | | | Final Value |
| | One | Five | Ten | of a $25,000 |
| | Year | Years | Years | Investment |
| Capital Opportunity Fund Investor | | | | |
| Shares | 7.14% | 3.79% | 2.90% | $33,260 |
| Dow Jones U.S. Total Stock Market | | | | |
| Index | 11.51 | 1.37 | 0.41 | 26,053 |
| Russell Midcap Growth Index | 18.27 | 2.86 | -0.88 | 22,875 |
| Multi-Cap Growth Funds Average | 12.25 | 1.06 | -3.76 | 17,046 |
Multi-Cap Growth Funds Average: Derived from data provided by Lipper Inc.
Vanguard fund returns do not reflect the 1% fee on redemptions of shares held for less than one year.
See Financial Highlights for dividend and capital gains information.
14
Capital Opportunity Fund
| | | | |
| | | Average Annual Total Returns | |
| | | Periods Ended September 30, 2010 | |
| | | | Since | Final Value |
| | One | Five | Inception | of a $50,000 |
| | Year | Years | (11/12/2001) | Investment |
| Capital Opportunity Fund Admiral | | | | |
| Shares | 7.21% | 3.88% | 6.88% | $90,269 |
| Dow Jones U.S. Total Stock Market | | | | |
| Index | 11.51 | 1.37 | 3.53 | 68,032 |
| Russell Midcap Growth Index | 18.27 | 2.86 | 5.52 | 80,594 |
| "Since Inception" performance is calculated from the Admiral Shares’ inception date for both the fund and its comparative standards. |
Fiscal-Year Total Returns (%): September 30, 2000, Through September 30, 2010
Vanguard fund returns do not reflect the 1% fee on redemptions of shares held for less than one year.
15
Capital Opportunity Fund
Financial Statements
Statement of Net Assets
As of September 30, 2010
The fund reports a complete list of its holdings in regulatory filings four times in each fiscal year, at the quarter-ends. For the second and fourth fiscal quarters, the lists appear in the fund’s semiannual and annual reports to shareholders. For the first and third fiscal quarters, the fund files the lists with the Securities and Exchange Commission on Form N-Q. Shareholders can look up the fund’s Forms N-Q on the SEC’s website at sec.gov. Forms N-Q may also be reviewed and copied at the SEC’s Public Reference Room (see the back cover of this report for further information).
| | | |
| | | | Market |
| | | | Value |
| | | Shares | ($000) |
| Common Stocks (97.7%) | | |
| Consumer Discretionary (15.4%) | |
| * | DIRECTV Class A | 6,346,376 | 264,200 |
| * | Bed Bath & Beyond Inc. | 3,272,600 | 142,064 |
| * | CarMax Inc. | 4,812,800 | 134,085 |
| *,1 | Dress Barn Inc. | 4,794,500 | 113,869 |
| | TJX Cos. Inc. | 2,210,000 | 98,632 |
| | Whirlpool Corp. | 1,191,100 | 96,431 |
| * | O’Reilly Automotive Inc. | 940,000 | 50,008 |
| | Nordstrom Inc. | 1,275,000 | 47,430 |
| | Men’s Wearhouse Inc. | 1,800,000 | 42,822 |
| * | 99 Cents Only Stores | 2,200,000 | 41,536 |
| | Lowe’s Cos. Inc. | 1,550,000 | 34,550 |
| | Best Buy Co. Inc. | 750,000 | 30,623 |
| | Gentex Corp. | 1,484,800 | 28,968 |
| * | Amazon.com Inc. | 173,300 | 27,218 |
| * | Quiksilver Inc. | 5,796,500 | 22,664 |
| | Chico’s FAS Inc. | 2,000,000 | 21,040 |
| | Carnival Corp. | 314,800 | 12,029 |
| *,1 | Strattec Security Corp. | 214,000 | 5,337 |
| * | DreamWorks Animation | | |
| | SKG Inc. Class A | 45,000 | 1,436 |
| | | | 1,214,942 |
| Energy (5.3%) | | |
| | Murphy Oil Corp. | 1,800,000 | 111,456 |
| | Noble Energy Inc. | 958,200 | 71,951 |
| * | Oceaneering | | |
| | International Inc. | 986,000 | 53,106 |
| | National Oilwell Varco Inc. | 1,036,000 | 46,071 |
| * | McDermott | | |
| | International Inc. | 3,000,000 | 44,340 |
| * | Plains Exploration & | | |
| | Production Co. | 1,150,200 | 30,676 |
| | ConocoPhillips | 300,000 | 17,229 |
| * | Exterran Holdings Inc. | 631,700 | 14,346 |
| * | Pride International Inc. | 415,000 | 12,213 |
| | Cabot Oil & Gas Corp. | 320,000 | 9,635 |
| * | Transocean Ltd. | 100,000 | 6,429 |
| * | Seahawk Drilling Inc. | 165,000 | 1,396 |
| | | | 418,848 |
| | | |
| | | | Market |
| | | | Value |
| | | Shares | ($000) |
| Financials (0.3%) | | |
| | Chubb Corp. | 390,000 | 22,226 |
| |
| Health Care (24.2%) | | |
| | Eli Lilly & Co. | 7,814,700 | 285,471 |
| * | Biogen Idec Inc. | 4,750,100 | 266,576 |
| * | Amgen Inc. | 4,817,700 | 265,504 |
| | Roche Holding AG | 1,539,000 | 210,277 |
| | Novartis AG ADR | 3,485,000 | 200,980 |
| | Medtronic Inc. | 5,241,800 | 176,020 |
| * | Dendreon Corp. | 3,634,100 | 149,652 |
| * | BioMarin | | |
| | Pharmaceutical Inc. | 5,023,400 | 112,273 |
| * | Life Technologies Corp. | 2,056,445 | 96,015 |
| * | Boston Scientific Corp. | 8,770,300 | 53,762 |
| * | Cerner Corp. | 378,800 | 31,815 |
| * | Illumina Inc. | 463,400 | 22,799 |
| * | Edwards | | |
| | Lifesciences Corp. | 300,000 | 20,115 |
| *,^ | Pharmacyclics Inc. | 1,045,062 | 8,423 |
| * | Waters Corp. | 89,000 | 6,299 |
| * | Affymetrix Inc. | 1,150,000 | 5,244 |
| * | Charles | | |
| | River Laboratories | | |
| | International Inc. | 70,000 | 2,321 |
| * | InterMune Inc. | 22,000 | 300 |
| | | | 1,913,846 |
| Industrials (12.7%) | | |
| | FedEx Corp. | 3,268,650 | 279,470 |
| | Southwest Airlines Co. | 9,919,100 | 129,643 |
| *,1 | Thomas & Betts Corp. | 3,100,000 | 127,162 |
| | Rockwell Automation Inc. | 1,960,000 | 120,991 |
| | Pall Corp. | 1,400,000 | 58,296 |
| | CH Robinson | | |
| | Worldwide Inc. | 820,000 | 57,334 |
| * | AMR Corp. | 8,907,100 | 55,848 |
| ^ | Ritchie Bros | | |
| | Auctioneers Inc. | 1,732,500 | 35,984 |
| * | Babcock & Wilcox Co. | 1,500,000 | 31,920 |
| * | JetBlue Airways Corp. | 4,641,050 | 31,049 |
16
Capital Opportunity Fund
| | | |
| | | | Market |
| | | | Value |
| | | Shares | ($000) |
| | Expeditors International of | | |
| | Washington Inc. | 550,000 | 25,426 |
| | Union Pacific Corp. | 250,000 | 20,450 |
| | SPX Corp. | 228,000 | 14,428 |
| * | Chicago Bridge & | | |
| | Iron Co. NV | 368,930 | 9,020 |
| * | Jacobs Engineering | | |
| | Group Inc. | 65,000 | 2,515 |
| * | US Airways Group Inc. | 57,000 | 527 |
| | | | 1,000,063 |
| Information Technology (36.2%) | |
| * | Research In Motion Ltd. | 5,272,900 | 256,738 |
| | Altera Corp. | 7,514,400 | 226,634 |
| * | Cree Inc. | 4,124,900 | 223,941 |
| * | Google Inc. Class A | 391,400 | 205,794 |
| | ASML Holding NV ADR | 6,592,944 | 196,008 |
| | Corning Inc. | 9,355,000 | 171,009 |
| * | Symantec Corp. | 10,325,300 | 156,635 |
| * | Electronic Arts Inc. | 7,878,700 | 129,447 |
| * | NVIDIA Corp. | 10,799,050 | 126,133 |
| * | Rambus Inc. | 5,235,000 | 109,097 |
| * | Trimble Navigation Ltd. | 2,778,800 | 97,369 |
| | Microsoft Corp. | 3,865,000 | 94,654 |
| | Texas Instruments Inc. | 2,816,600 | 76,443 |
| * | NeuStar Inc. Class A | 2,631,000 | 65,407 |
| * | Flextronics | | |
| | International Ltd. | 10,046,700 | 60,682 |
| * | Adobe Systems Inc. | 2,290,000 | 59,883 |
| * | EMC Corp. | 2,825,000 | 57,376 |
| | Hewlett-Packard Co. | 1,350,000 | 56,795 |
| * | SanDisk Corp. | 1,399,948 | 51,308 |
| *,1 | FormFactor Inc. | 5,756,700 | 49,508 |
| * | Motorola Inc. | 4,800,000 | 40,944 |
| * | Micron Technology Inc. | 5,550,000 | 40,016 |
| | Intersil Corp. Class A | 3,364,200 | 39,327 |
| | Plantronics Inc. | 1,150,000 | 38,847 |
| *,1 | Descartes Systems | | |
| | Group Inc. | 4,645,000 | 29,774 |
| * | eBay Inc. | 1,150,000 | 28,060 |
| * | Intuit Inc. | 470,000 | 20,591 |
| * | Rovi Corp. | 350,000 | 17,644 |
| | QUALCOMM Inc. | 390,000 | 17,597 |
| * | Yahoo! Inc. | 1,043,000 | 14,779 |
| | | | |
| | | | | Market |
| | | | | Value |
| | | | Shares | ($000) |
| * | Smart Technologies Inc. | | |
| | Class A | | 1,051,900 | 14,253 |
| | Xilinx Inc. | | 430,000 | 11,442 |
| * | Ciena Corp. | | 607,142 | 9,453 |
| * | Entegris Inc. | | 2,019,231 | 9,430 |
| * | Cymer Inc. | | 250,000 | 9,270 |
| * | Nuance | | | |
| | Communications Inc. | 575,000 | 8,993 |
| * | Brocade Communications | | |
| | Systems Inc. | | 1,350,000 | 7,884 |
| * | FEI Co. | | 320,000 | 6,262 |
| * | Monster Worldwide Inc. | 375,000 | 4,860 |
| * | Akamai Technologies Inc. | 94,000 | 4,717 |
| * | Citrix Systems Inc. | | 68,000 | 4,640 |
| * | Apple Inc. | | 14,000 | 3,973 |
| | Jabil Circuit Inc. | | 240,000 | 3,458 |
| * | Verigy Ltd. | | 300,000 | 2,439 |
| * | Avid Technology Inc. | 10,000 | 131 |
| | | | | 2,859,645 |
| Materials (3.0%) | | | |
| | Monsanto Co. | | 4,946,986 | 237,109 |
| |
| Telecommunication Services (0.4%) | |
| * | Sprint Nextel Corp. | | 7,814,700 | 36,182 |
| |
| Utilities (0.2%) | | | |
| * | AES Corp. | | 1,352,000 | 15,345 |
| Total Common Stocks | | | |
| (Cost $5,970,325) | | | 7,718,206 |
| Temporary Cash Investment (2.9%) | |
| Money Market Fund (2.9%) | | |
| 2,3 | Vanguard Market | | | |
| | Liquidity Fund, 0.261% | | |
| | (Cost $225,953) | 225,952,951 | 225,953 |
| Total Investments (100.6%) | | |
| (Cost $6,196,278) | | | 7,944,159 |
| Other Assets and Liabilities (-0.6%) | |
| Other Assets | | | 6,530 |
| Liabilities3 | | | (52,409) |
| | | | | (45,879) |
| Net Assets (100%) | | | 7,898,280 |
17
Capital Opportunity Fund
| |
| At September 30, 2010, net assets consisted of: |
| | Amount |
| | ($000) |
| Paid-in Capital | 6,281,253 |
| Undistributed Net Investment Income | 13,589 |
| Accumulated Net Realized Losses | (144,552) |
| Unrealized Appreciation (Depreciation) | |
| Investment Securities | 1,747,881 |
| Foreign Currencies | 109 |
| Net Assets | 7,898,280 |
| |
| Investor Shares—Net Assets | |
| Applicable to 124,185,951 outstanding | |
| $.001 par value shares of beneficial | |
| interest (unlimited authorization) | 3,675,157 |
| Net Asset Value Per Share— | |
| Investor Shares | $29.59 |
| |
| Admiral Shares—Net Assets | |
| Applicable to 61,759,679 outstanding | |
| $.001 par value shares of beneficial | |
| interest (unlimited authorization) | 4,223,123 |
| Net Asset Value Per Share— | |
| Admiral Shares | $68.38 |
See Note A in Notes to Financial Statements.
* Non-income-producing security.
^ Part of security position is on loan to broker-dealers. The total value of securities on loan is $23,336,000.
1 Considered an affiliated company of the fund as the fund owns more than 5% of the outstanding voting securities of such company.
2 Affiliated money market fund available only to Vanguard funds and certain trusts and accounts managed by Vanguard. Rate shown is the 7-day yield.
3 Includes $23,626,000 of collateral received for securities on loan.
ADR—American Depositary Receipt.
See accompanying Notes, which are an integral part of the Financial Statements.
18
Capital Opportunity Fund
| |
| Statement of Operations | |
| |
| | Year Ended |
| | September 30, 2010 |
| | ($000) |
| Investment Income | |
| Income | |
| Dividends1,2 | 67,076 |
| Interest2 | 654 |
| Security Lending | 765 |
| Total Income | 68,495 |
| Expenses | |
| Investment Advisory Fees—Note B | 21,225 |
| The Vanguard Group—Note C | |
| Management and Administrative—Investor Shares | 7,707 |
| Management and Administrative—Admiral Shares | 5,410 |
| Marketing and Distribution—Investor Shares | 751 |
| Marketing and Distribution—Admiral Shares | 768 |
| Custodian Fees | 136 |
| Auditing Fees | 24 |
| Shareholders’ Reports—Investor Shares | 70 |
| Shareholders’ Reports—Admiral Shares | 26 |
| Trustees’ Fees and Expenses | 14 |
| Total Expenses | 36,131 |
| Net Investment Income | 32,364 |
| Realized Net Gain (Loss) | |
| Investment Securities Sold2 | 221,786 |
| Foreign Currencies | 63 |
| Realized Net Gain (Loss) | 221,849 |
| Change in Unrealized Appreciation (Depreciation) | |
| Investment Securities | 287,629 |
| Foreign Currencies | 115 |
| Change in Unrealized Appreciation (Depreciation) | 287,744 |
| Net Increase (Decrease) in Net Assets Resulting from Operations | 541,957 |
1 Dividends are net of foreign withholding taxes of $2,311,000.
2 Dividend income, interest income, and realized net gain (loss) from affiliated companies of the fund were $0, $654,000, and ($2,878,000), respectively.
See accompanying Notes, which are an integral part of the Financial Statements.
19
Capital Opportunity Fund
| | |
| Statement of Changes in Net Assets | | |
| |
| | Year Ended September 30, |
| | 2010 | 2009 |
| | ($000) | ($000) |
| Increase (Decrease) in Net Assets | | |
| Operations | | |
| Net Investment Income | 32,364 | 33,779 |
| Realized Net Gain (Loss) | 221,849 | (367,970) |
| Change in Unrealized Appreciation (Depreciation) | 287,744 | 584,482 |
| Net Increase (Decrease) in Net Assets Resulting from Operations | 541,957 | 250,291 |
| Distributions | | |
| Net Investment Income | | |
| Investor Shares | (13,472) | (14,339) |
| Admiral Shares | (16,758) | (18,037) |
| Realized Capital Gain | | |
| Investor Shares | — | (259,376) |
| Admiral Shares | — | (253,317) |
| Total Distributions | (30,230) | (545,069) |
| Capital Share Transactions | | |
| Investor Shares | (485,711) | 207,062 |
| Admiral Shares | 31,018 | 291,065 |
| Net Increase (Decrease) from Capital Share Transactions | (454,693) | 498,127 |
| Total Increase (Decrease) | 57,034 | 203,349 |
| Net Assets | | |
| Beginning of Period | 7,841,246 | 7,637,897 |
| End of Period1 | 7,898,280 | 7,841,246 |
| 1 Net Assets—End of Period includes undistributed net investment income of $13,589,000 and $11,392,000. | |
See accompanying Notes, which are an integral part of the Financial Statements.
20
Capital Opportunity Fund
Financial Highlights
| | | | | |
| Investor Shares | | | | | |
| |
| For a Share Outstanding | | | Year Ended September 30, |
| Throughout Each Period | 2010 | 2009 | 2008 | 2007 | 2006 |
| Net Asset Value, Beginning of Period | $27.71 | $29.41 | $42.70 | $36.11 | $31.92 |
| Investment Operations | | | | | |
| Net Investment Income | .106 | .121 | .2541 | .070 | .053 |
| Net Realized and Unrealized Gain (Loss) | | | | | |
| on Investments | 1.871 | .355 | (9.884) | 8.447 | 4.421 |
| Total from Investment Operations | 1.977 | .476 | (9.630) | 8.517 | 4.474 |
| Distributions | | | | | |
| Dividends from Net Investment Income | (.097) | (.114) | (.218) | (.070) | (.055) |
| Distributions from Realized Capital Gains | — | (2.062) | (3.442) | (1.857) | (.229) |
| Total Distributions | (.097) | (2.176) | (3.660) | (1.927) | (.284) |
| Net Asset Value, End of Period | $29.59 | $27.71 | $29.41 | $42.70 | $36.11 |
| |
| Total Return2 | 7.14% | 4.41% | -24.13% | 24.35% | 14.10% |
| |
| Ratios/Supplemental Data | | | | | |
| Net Assets, End of Period (Millions) | $3,675 | $3,903 | $3,851 | $5,415 | $5,051 |
| Ratio of Total Expenses to | | | | | |
| Average Net Assets | 0.48% | 0.50% | 0.45% | 0.45% | 0.49% |
| Ratio of Net Investment Income to | | | | | |
| Average Net Assets | 0.36% | 0.50% | 0.67%1 | 0.18% | 0.15% |
| Portfolio Turnover Rate | 8% | 12% | 13% | 14% | 11% |
1 Net investment income per share and the ratio of net investment income to average net assets include $.125 and 0.33%, respectively, resulting from a special dividend from ASML Holding NV in October 2007.
2 Total returns do not include transaction and account service fees that may have applied in the periods shown. Fund prospectuses provide information about any applicable transaction and account service fees.
See accompanying Notes, which are an integral part of the Financial Statements.
21
Capital Opportunity Fund
Financial Highlights
| | | | | |
| Admiral Shares | | | | | |
| |
| For a Share Outstanding | | | Year Ended September 30, |
| Throughout Each Period | 2010 | 2009 | 2008 | 2007 | 2006 |
| Net Asset Value, Beginning of Period | $64.04 | $68.00 | $98.71 | $83.49 | $73.77 |
| Investment Operations | | | | | |
| Net Investment Income | .298 | .329 | .6641 | .240 | .198 |
| Net Realized and Unrealized Gain (Loss) | | | | | |
| on Investments | 4.315 | .811 | (22.845) | 19.508 | 10.229 |
| Total from Investment Operations | 4.613 | 1.140 | (22.181) | 19.748 | 10.427 |
| Distributions | | | | | |
| Dividends from Net Investment Income | (.273) | (.339) | (.577) | (.238) | (.178) |
| Distributions from Realized Capital Gains | — | (4.761) | (7.952) | (4.290) | (.529) |
| Total Distributions | (.273) | (5.100) | (8.529) | (4.528) | (.707) |
| Net Asset Value, End of Period | $68.38 | $64.04 | $68.00 | $98.71 | $83.49 |
| |
| Total Return2 | 7.21% | 4.52% | -24.05% | 24.43% | 14.23% |
| |
| Ratios/Supplemental Data | | | | | |
| Net Assets, End of Period (Millions) | $4,223 | $3,938 | $3,787 | $4,760 | $3,750 |
| Ratio of Total Expenses to | | | | | |
| Average Net Assets | 0.41% | 0.41% | 0.36% | 0.37% | 0.40% |
| Ratio of Net Investment Income to | | | | | |
| Average Net Assets | 0.43% | 0.59% | 0.76%1 | 0.26% | 0.24% |
| Portfolio Turnover Rate | 8% | 12% | 13% | 14% | 11% |
1 Net investment income per share and the ratio of net investment income to average net assets include $.289 and 0.33%, respectively, resulting from a special dividend from ASML Holding NV in October 2007.
2 Total returns do not include transaction fees that may have applied in the periods shown. Fund prospectuses provide information about any applicable transaction fees.
See accompanying Notes, which are an integral part of the Financial Statements.
22
Capital Opportunity Fund
Notes to Financial Statements
Vanguard Capital Opportunity Fund is registered under the Investment Company Act of 1940 as an open-end investment company, or mutual fund. The fund offers two classes of shares: Investor Shares and Admiral Shares. Investor Shares are available to any investor who meets the fund’s minimum purchase requirements. Admiral Shares are designed for investors who meet certain administrative, service, and account-size criteria.
A. The following significant accounting policies conform to generally accepted accounting principles for U.S. mutual funds. The fund consistently follows such policies in preparing its financial statements.
1. Security Valuation: Securities are valued as of the close of trading on the New York Stock Exchange (generally 4 p.m., Eastern time) on the valuation date. Equity securities are valued at the latest quoted sales prices or official closing prices taken from the primary market in which each security trades; such securities not traded on the valuation date are valued at the mean of the latest quoted bid and asked prices. Securities for which market quotations are not readily available, or whose values have been affected by events occurring before the fund’s pricing time but after the close of the securities’ primary markets, are valued at their fair values calculated according to procedures adopted by the board of trustees. These procedures include obtaining quotations from an independent pricing service, monitoring news to identify significant market- or security-specific events, and evaluating changes in the values of foreign market proxies (for example, ADRs, futures contracts, or exchange-traded funds), between the time the foreign markets close and the fund’s pricing time. When fair-value pricing is employed, the prices of securities used by a fund to calculate its net asset value may differ from quoted or published prices for the same securities. Investments in Vanguard Market Liquidity Fund are valued at that fund’s net asset value.
2. Foreign Currency: Securities and other assets and liabilities denominated in foreign currencies are translated into U.S. dollars using exchange rates obtained from an independent third party as of the fund’s pricing time on the valuation date. Realized gains (losses) and unrealized appreciation (depreciation) on investment securities include the effects of changes in exchange rates since the securities were purchased, combined with the effects of changes in security prices. Fluctuations in the value of other assets and liabilities resulting from changes in exchange rates are recorded as unrealized foreign currency gains (losses) until the assets or liabilities are settled in cash, at which time they are recorded as realized foreign currency gains (losses).
3. Federal Income Taxes: The fund intends to continue to qualify as a regulated investment company and distribute all of its taxable income. Management has analyzed the fund’s tax positions taken for all open federal income tax years (September 30, 2007–2010), and has concluded that no provision for federal income tax is required in the fund’s financial statements.
4. Distributions: Distributions to shareholders are recorded on the ex-dividend date.
5. Security Lending: The fund may lend its securities to qualified institutional borrowers to earn additional income. Security loans are required to be secured at all times by collateral at least equal to the market value of securities loaned. The fund invests cash collateral received in Vanguard Market Liquidity Fund, and records a liability for the return of the collateral, during the period the securities are on loan. Security lending income represents fees charged to borrowers plus income earned on investing cash collateral, less expenses associated with the loan.
23
Capital Opportunity Fund
6. Other: Dividend income is recorded on the ex-dividend date. Interest income includes income distributions received from Vanguard Market Liquidity Fund and is accrued daily. Security transactions are accounted for on the date securities are bought or sold. Costs used to determine realized gains (losses) on the sale of investment securities are those of the specific securities sold. Fees assessed on redemptions of capital shares are credited to paid-in capital.
Each class of shares has equal rights as to assets and earnings, except that each class separately bears certain class-specific expenses related to maintenance of shareholder accounts (included in Management and Administrative expenses) and shareholder reporting. Marketing and distribution expenses are allocated to each class of shares based on a method approved by the board of trustees. Income, other non-class-specific expenses, and gains and losses on investments are allocated to each class of shares based on its relative net assets.
B. PRIMECAP Management Company provides investment advisory services to the fund for a fee calculated at an annual percentage rate of average net assets. For the year ended September 30, 2010, the investment advisory fee represented an effective annual rate of 0.26% of the fund’s average net assets.
C. The Vanguard Group furnishes at cost corporate management, administrative, marketing, and distribution services. The costs of such services are allocated to the fund under methods approved by the board of trustees. The fund has committed to provide up to 0.40% of its net assets in capital contributions to Vanguard. At September 30, 2010, the fund had contributed capital of $1,366,000 to Vanguard (included in Other Assets), representing 0.02% of the fund’s net assets and 0.55% of Vanguard’s capitalization. The fund’s trustees and officers are also directors and officers of Vanguard.
D. Various inputs may be used to determine the value of the fund’s investments. These inputs are summarized in three broad levels for financial statement purposes. The inputs or methodologies used to value securities are not necessarily an indication of the risk associated with investing in those securities.
Level 1—Quoted prices in active markets for identical securities.
Level 2—Other significant observable inputs (including quoted prices for similar securities, interest rates, prepayment speeds, credit risk, etc.).
Level 3—Significant unobservable inputs (including the fund’s own assumptions used to determine the fair value of investments).
The following table summarizes the fund’s investments as of September 30, 2010, based on the inputs used to value them:
| | | |
| | Level 1 | Level 2 | Level 3 |
| Investments | ($000) | ($000) | ($000) |
| Common Stocks | 7,507,929 | 210,277 | — |
| Temporary Cash Investments | 225,953 | — | — |
| Total | 7,733,882 | 210,277 | — |
24
Capital Opportunity Fund
E. Distributions are determined on a tax basis and may differ from net investment income and realized capital gains for financial reporting purposes. Differences may be permanent or temporary. Permanent differences are reclassified among capital accounts in the financial statements to reflect their tax character. Temporary differences arise when certain items of income, expense, gain, or loss are recognized in different periods for financial statement and tax purposes; these differences will reverse at some time in the future. Differences in classification may also result from the treatment of short-term gains as ordinary income for tax purposes.
During the year ended September 30, 2010, the fund realized net foreign currency gains of $63,000, which increased distributable net income for tax purposes; accordingly, such gains have been reclassified from accumulated net realized losses to undistributed net investment income.
For tax purposes, at September 30, 2010, the fund had $28,839,000 of ordinary income available for distribution. The fund had available capital loss carryforwards totaling $146,093,000 to offset future net capital gains of $42,246,000 through September 30, 2017, and $103,847,000 through September 30, 2018.
At September 30, 2010, the cost of investment securities for tax purposes was $6,196,327,000. Net unrealized appreciation of investment securities for tax purposes was $1,747,832,000, consisting of unrealized gains of $2,687,196,000 on securities that had risen in value since their purchase and $939,364,000 in unrealized losses on securities that had fallen in value since their purchase.
F. During the year ended September 30, 2010, the fund purchased $641,946,000 of investment securities and sold $907,762,000 of investment securities, other than temporary cash investments.
G. Certain of the fund’s investments are in companies that are considered to be affiliated companies of the fund because the fund owns more than 5% of the outstanding voting securities of the company. Transactions during the period in securities of these companies were as follows:
| | | | | |
| | | | Current Period Transactions | |
| | Sept. 30, 2009 | | Proceeds from | | Sept. 30, 2010 |
| | Market | Purchases | Securities | Dividend | Market |
| | Value | at Cost | Sold | Income | Value |
| | ($000) | ($000) | ($000) | ($000) | ($000) |
| BioMarin Pharmaceutical Inc. | NA1 | 1,522 | 638 | — | NA1 |
| FormFactor Inc. | 143,121 | — | 3,060 | — | 49,508 |
| Strattec Security Corp. | 3,094 | — | 63 | — | 5,337 |
| Descartes Systems Group Inc. | 24,851 | — | — | — | 29,774 |
| Dress Barn Inc. | 86,987 | — | 1,336 | — | 113,869 |
| Thomas & Betts Corp. | 99,595 | — | 8,474 | — | 127,162 |
| | 357,648 | — | | — | 325,650 |
1 Not applicable—At September 30, 2009, and September 30, 2010, the issuer was not an affiliated company of the fund, but it was affiliated during the period.
25
Capital Opportunity Fund
H. Capital share transactions for each class of shares were:
| | | | |
| | | | Year Ended September 30, |
| | | 2010 | | 2009 |
| | Amount | Shares | Amount | Shares |
| | ($000) | (000) | ($000) | (000) |
| Investor Shares | | | | |
| Issued | 322,612 | 10,951 | 483,233 | 21,004 |
| Issued in Lieu of Cash Distributions | 12,722 | 435 | 260,191 | 12,932 |
| Redeemed1 | (821,045) | (28,030) | (536,362) | (24,037) |
| Net Increase (Decrease)—Investor Shares | (485,711) | (16,644) | 207,062 | 9,899 |
| Admiral Shares | | | | |
| Issued | 516,424 | 7,530 | 549,289 | 10,483 |
| Issued in Lieu of Cash Distributions | 15,104 | 224 | 245,987 | 5,296 |
| Redeemed1 | (500,510) | (7,493) | (504,211) | (9,971) |
| Net Increase (Decrease)—Admiral Shares | 31,018 | 261 | 291,065 | 5,808 |
| 1 Net of redemption fees for fiscal 2010 and 2009 of $653,000 and $841,000, respectively (fund totals). | | |
I. In preparing the financial statements as of September 30, 2010, management considered the impact of subsequent events for potential recognition or disclosure in these financial statements.
26
Report of Independent Registered Public Accounting Firm
To the Trustees of Vanguard Horizon Funds and the Shareholders of Vanguard Capital Opportunity Fund:
In our opinion, the accompanying statement of net assets and the related statements of operations and of changes in net assets and the financial highlights present fairly, in all material respects, the financial position of Vanguard Capital Opportunity Fund (constituting a separate portfolio of Vanguard Horizon Funds, hereafter referred to as the “Fund”) at September 30, 2010, the results of its operations for the year then ended, the changes in its net assets for each of the two years in the period then ended and the financial highlights for each of the five years in the period then ended, in conformity with accounting principles generally accepted in the United States of America. These financial statements and financial highlights (hereafter referred to as “financial statements”) are the responsibility of the Fund’s management; our responsibility is to express an opinion on these financial statements based on our audits. We conduc ted our audits of these financial statements in accordance with the standards of the Public Company Accounting Oversight Board (United States). Those standards require that we plan and perform the audit to obtain reasonable assurance about whether the financial statements are free of material misstatement. An audit includes examining, on a test basis, evidence supporting the amounts and disclosures in the financial statements, assessing the accounting principles used and significant estimates made by management, and evaluating the overall financial statement presentation.
We believe that our audits, which included confirmation of securities at September 30, 2010 by correspondence with the custodian and by agreement to the underlying ownership records of Vanguard Market Liquidity Fund, provide a reasonable basis for our opinion.
PricewaterhouseCoopers LLP
Philadelphia, Pennsylvania
November 8, 2010
| Special 2010 tax information (unaudited) for Vanguard Capital Opportunity Fund |
This information for the fiscal year ended September 30, 2010, is included pursuant to provisions of the Internal Revenue Code.
The fund distributed $30,230,000 of qualified dividend income to shareholders during the fiscal year.
For corporate shareholders, 100% of investment income (dividend income plus short-term gains, if any) qualifies for the dividends-received deduction.
27
Your Fund’s After-Tax Returns
This table presents returns for your fund both before and after taxes. The after-tax returns are shown in two ways: (1) assuming that an investor owned the fund during the entire period and paid taxes on the fund’s distributions, and (2) assuming that an investor paid taxes on the fund’s distributions and sold all shares at the end of each period.
Calculations are based on the highest individual federal income tax and capital gains tax rates in effect at the times of the distributions and the hypothetical sales. State and local taxes were not considered. After-tax returns reflect any qualified dividend income , using actual prior-year figures and estimates for 2010. (In the example, returns after the sale of fund shares may be higher than those assuming no sale. This occurs when the sale would have produced a capital loss. The calculation assumes that the investor received a tax deduction for the loss.) The table shows returns for Investor Shares only; returns for other share classes will differ. Please note that your actual after-tax returns will depend on your tax situation and may differ from those shown. Also note that if you own the fund in a tax-deferred account, such as an individual retirement account or a 401(k) plan, this information does not apply to you. Such accounts are not subject to c urrent taxes.
Finally, keep in mind that a fund’s performance—whether before or after taxes—does not guarantee future results.
| | | |
| Average Annual Total Returns: Capital Opportunity Fund Investor Shares | | |
| Periods Ended September 30, 2010 | | | |
| | One | Five | Ten |
| | Year | Years | Years |
| Returns Before Taxes | 7.14% | 3.79% | 2.90% |
| Returns After Taxes on Distributions | 7.09 | 2.99 | 2.23 |
| Returns After Taxes on Distributions and Sale of Fund Shares | 4.71 | 3.18 | 2.29 |
Returns do not reflect the 1% fee on redemptions of shares held for less than one year.
28
About Your Fund’s Expenses
As a shareholder of the fund, you incur ongoing costs, which include costs for portfolio management, administrative services, and shareholder reports (like this one), among others. Operating expenses, which are deducted from a fund’s gross income, directly reduce the investment return of the fund.
A fund’s expenses are expressed as a percentage of its average net assets. This figure is known as the expense ratio. The following examples are intended to help you understand the ongoing costs (in dollars) of investing in your fund and to compare these costs with those of other mutual funds. The examples are based on an investment of $1,000 made at the beginning of the period shown and held for the entire period.
The accompanying table illustrates your fund’s costs in two ways:
• Based on actual fund return. This section helps you to estimate the actual expenses that you paid over the period. The ”Ending Account Value“ shown is derived from the fund‘s actual return, and the third column shows the dollar amount that would have been paid by an investor who started with $1,000 in the fund. You may use the information here, together with the amount you invested, to estimate the expenses that you paid over the period.
To do so, simply divide your account value by $1,000 (for example, an $8,600 account value divided by $1,000 = 8.6), then multiply the result by the number given for your fund under the heading ”Expenses Paid During Period.“
• Based on hypothetical 5% yearly return. This section is intended to help you compare your fund‘s costs with those of other mutual funds. It assumes that the fund had a yearly return of 5% before expenses, but that the expense ratio is unchanged. In this case—because the return used is not the fund’s actual return—the results do not apply to your investment. The example is useful in making comparisons because the Securities and Exchange Commission requires all mutual funds to calculate expenses based on a 5% return. You can assess your fund’s costs by comparing this hypothetical example with the hypothetical examples that appear in shareholder reports of other funds.
Note that the expenses shown in the table are meant to highlight and help you compare ongoing costs only and do not reflect transaction costs incurred by the fund for buying and selling securities. Further, the expenses do not include the 1% fee on redemptions of shares held for less than one year, nor do they include the account service fee described in the prospectus. If such fees were applied to your account, your costs would be higher. Your fund does not carry a “sales load.” The calculations assume no shares were bought or sold during the period. Your actual costs may have been higher or lower, depending on the amount of your investment and the timing of any purchases or redemptions.
You can find more information about the fund’s expenses, including annual expense ratios, in the Financial Statements section of this report. For additional information on operating expenses and other shareholder costs, please refer to your fund’s current prospectus.
29
| | | |
| Six Months Ended September 30, 2010 | | | |
| | Beginning | Ending | Expenses |
| | Account Value | Account Value | Paid During |
| Capital Opportunity Fund | 3/31/2010 | 9/30/2010 | Period |
| Based on Actual Fund Return | | | |
| Investor Shares | $1,000.00 | $936.99 | $2.33 |
| Admiral Shares | 1,000.00 | 937.35 | 2.09 |
| Based on Hypothetical 5% Yearly Return | | | |
| Investor Shares | $1,000.00 | $1,022.66 | $2.43 |
| Admiral Shares | 1,000.00 | 1,022.91 | 2.18 |
The calculations are based on expenses incurred in the most recent six-month period. The fund’s annualized six-month expense ratios for that period are 0.48% for Investor Shares and 0.43% for Admiral Shares. The dollar amounts shown as “Expenses Paid” are equal to the annualized expense ratio multiplied by the average account value over the period, multiplied by the number of days in the most recent six-month period, then divided by the number of days in the most recent 12-month period.
30
Glossary
30-Day SEC Yield. A fund’s 30-day SEC yield is derived using a formula specified by the U.S. Securities and Exchange Commission. Under the formula, data related to the fund’s security holdings in the previous 30 days are used to calculate the fund’s hypothetical net income for that period, which is then annualized and divided by the fund’s estimated average net assets over the calculation period. For the purposes of this calculation, a security’s income is based on its current market yield to maturity (in the case of bonds) or its projected dividend yield (for stocks). Because the SEC yield represents hypothetical annualized income, it will differ—at times significantly—from the fund’s actual experience. As a result, the fund’s income distributions may be higher or lower than implied by the SEC yield.
Beta. A measure of the magnitude of a fund’s past share-price fluctuations in relation to the ups and downs of a given market index. The index is assigned a beta of 1.00. Compared with a given index, a fund with a beta of 1.20 typically would have seen its share price rise or fall by 12% when the index rose or fell by 10%. For this report, beta is based on returns over the past 36 months for both the fund and the index. Note that a fund’s beta should be reviewed in conjunction with its R-squared (see definition). The lower the R-squared, the less correlation there is between the fund and the index, and the less reliable beta is as an indicator of volatility.
Dividend Yield. Dividend income earned by stocks, expressed as a percentage of the aggregate market value (or of net asset value, for a fund). The yield is determined by dividing the amount of the annual dividends by the aggregate value (or net asset value) at the end of the period. For a fund, the dividend yield is based solely on stock holdings and does not include any income produced by other investments.
Earnings Growth Rate. The average annual rate of growth in earnings over the past five years for the stocks now in a fund.
Equity Exposure. A measure that reflects a fund’s investments in stocks and stock futures. Any holdings in short-term reserves are excluded.
Expense Ratio. The percentage of a fund’s average net assets used to pay its annual administrative and advisory expenses. These expenses directly reduce returns to investors.
Foreign Holdings. The percentage of a fund represented by stocks or depositary receipts of companies based outside the United States.
Inception Date. The date on which the assets of a fund (or one of its share classes) are first invested in accordance with the fund’s investment objective. For funds with a subscription period, the inception date is the day after that period ends. Investment performance is measured from the inception date.
Median Market Cap. An indicator of the size of companies in which a fund invests; the midpoint of market capitalization (market price x shares outstanding) of a fund’s stocks, weighted by the proportion of the fund’s assets invested in each stock. Stocks representing half of the fund’s assets have market capitalizations above the median, and the rest are below it.
Price/Book Ratio. The share price of a stock divided by its net worth, or book value, per share. For a fund, the weighted average price/book ratio of the stocks it holds.
31
Price/Earnings Ratio. The ratio of a stock’s current price to its per-share earnings over the past year. For a fund, the weighted average P/E of the stocks it holds. P/E is an indicator of market expectations about corporate prospects; the higher the P/E, the greater the expectations for a company’s future growth.
R-Squared. A measure of how much of a fund’s past returns can be explained by the returns from the market in general, as measured by a given index. If a fund’s total returns were precisely synchronized with an index’s returns, its R-squared would be 1.00. If the fund’s returns bore no relationship to the index’s returns, its R-squared would be 0. For this report, R-squared is based on returns over the past 36 months for both the fund and the index.
Return on Equity. The annual average rate of return generated by a company during the past five years for each dollar of shareholder’s equity (net income divided by shareholder’s equity). For a fund, the weighted average return on equity for the companies whose stocks it holds.
Short-Term Reserves. The percentage of a fund invested in highly liquid, short-term securities that can be readily converted to cash.
Turnover Rate. An indication of the fund’s trading activity. Funds with high turnover rates incur higher transaction costs and may be more likely to distribute capital gains (which may be taxable to investors). The turnover rate excludes in-kind transactions, which have minimal impact on costs.
32
This page intentionally left blank.
This page intentionally left blank.
This page intentionally left blank.
The People Who Govern Your Fund
The trustees of your mutual fund are there to see that the fund is operated and managed in your best interests since, as a shareholder, you are a part owner of the fund. Your fund’s trustees also serve on the board of directors of The Vanguard Group, Inc., which is owned by the Vanguard funds and provides services to them on an at-cost basis.
A majority of Vanguard’s board members are independent, meaning that they have no affiliation with Vanguard or the funds they oversee, apart from the sizable personal investments they have made as private individuals. The independent board members have distinguished backgrounds in business, academia, and public service. Each of the trustees and executive officers oversees 178 Vanguard funds.
The following table provides information for each trustee and executive officer of the fund. More information about the trustees is in the Statement of Additional Information, which can be obtained, without charge, by contacting Vanguard at 800-662-7447, or online at Vanguard.com.
| |
| Interested Trustee1 | Amy Gutmann |
| | Born 1949. Trustee Since June 2006. Principal |
| F. William McNabb III | Occupation(s) During the Past Five Years: President |
| Born 1957. Trustee Since July 2009. Chairman of the | of the University of Pennsylvania; Christopher H. |
| Board. Principal Occupation(s) During the Past Five | Browne Distinguished Professor of Political Science |
| Years: Chairman of the Board of The Vanguard Group, | in the School of Arts and Sciences with secondary |
| Inc., and of each of the investment companies served | appointments at the Annenberg School for Commu- |
| by The Vanguard Group, since January 2010; Director | nication and the Graduate School of Education |
| of The Vanguard Group since 2008; Chief Executive | of the University of Pennsylvania; Director of |
| Officer and President of The Vanguard Group and of | Carnegie Corporation of New York, Schuylkill River |
| each of the investment companies served by The | Development Corporation, and Greater Philadelphia |
| Vanguard Group since 2008; Director of Vanguard | Chamber of Commerce; Trustee of the National |
| Marketing Corporation; Managing Director of The | Constitution Center; Chair of the Presidential |
| Vanguard Group (1995–2008) . | Commission for the Study of Bioethical Issues. |
| |
| | JoAnn Heffernan Heisen |
| Independent Trustees | Born 1950. Trustee Since July 1998. Principal |
| | Occupation(s) During the Past Five Years: Corporate |
| Emerson U. Fullwood | Vice President and Chief Global Diversity Officer |
| Born 1948. Trustee Since January 2008. Principal | since 2006 (retired 2008) and Member of the |
| Occupation(s) During the Past Five Years: Executive | Executive Committee (retired 2008) of Johnson & |
| Chief Staff and Marketing Officer for North America | Johnson (pharmaceuticals/consumer products); Vice |
| and Corporate Vice President (retired 2008) of Xerox | President and Chief Information Officer of Johnson & |
| Corporation (document management products and | Johnson (1997–2005); Director of the University |
| services); Director of SPX Corporation (multi-industry | Medical Center at Princeton and Women’s Research |
| manufacturing), the United Way of Rochester, | and Education Institute; Member of the Advisory |
| Amerigroup Corporation (managed health care), | Board of the Maxwell School of Citizenship and Public |
| the University of Rochester Medical Center, and | Affairs at Syracuse University. |
| Monroe Community College Foundation. | |
| | F. Joseph Loughrey |
| Rajiv L. Gupta | Born 1949. Trustee Since October 2009. Principal |
| Born 1945. Trustee Since December 2001.2 | Occupation(s) During the Past Five Years: President |
| Principal Occupation(s) During the Past Five Years: | and Chief Operating Officer since 2005 (retired 2009) |
| Chairman and Chief Executive Officer (retired 2009) | and Vice Chairman of the Board (2008–2009) of |
| and President (2006–2008) of Rohm and Haas Co. | Cummins Inc. (industrial machinery); Director of |
| (chemicals); Director of Tyco International, Ltd. | SKF AB (industrial machinery), Hillenbrand, Inc. |
| (diversified manufacturing and services) and Hewlett- | (specialized consumer services), Sauer-Danfoss Inc. |
| Packard Co. (electronic computer manufacturing); | (machinery), the Lumina Foundation for Education, |
| Trustee of The Conference Board; Member of the | and Oxfam America; Chairman of the Advisory |
| Board of Managers of Delphi Automotive LLP | Council for the College of Arts and Letters at the |
| (automotive components) . | University of Notre Dame. |
| | |
| André F. Perold | Kathryn J. Hyatt | |
| Born 1952. Trustee Since December 2004. Principal | Born 1955. Treasurer Since November 2008. Principal |
| Occupation(s) During the Past Five Years: George | Occupation(s) During the Past Five Years: Principal |
| Gund Professor of Finance and Banking at the Harvard | of The Vanguard Group, Inc.; Treasurer of each of |
| Business School; Chair of the Investment Committee | the investment companies served by The Vanguard |
| of HighVista Strategies LLC (private investment firm). | Group since 2008; Assistant Treasurer of each of the |
| | investment companies served by The Vanguard Group |
| Alfred M. Rankin, Jr. | (1988–2008). | |
| Born 1941. Trustee Since January 1993. Principal | | |
| Occupation(s) During the Past Five Years: Chairman, | Heidi Stam | |
| President, and Chief Executive Officer of NACCO | Born 1956. Secretary Since July 2005. Principal |
| Industries, Inc. (forklift trucks/housewares/lignite); | Occupation(s) During the Past Five Years: Managing |
| Director of Goodrich Corporation (industrial products/ | Director of The Vanguard Group, Inc., since 2006; |
| aircraft systems and services); Chairman of the | General Counsel of The Vanguard Group since 2005; |
| Federal Reserve Bank of Cleveland; Trustee of The | Secretary of The Vanguard Group and of each of the |
| Cleveland Museum of Art. | investment companies served by The Vanguard Group |
| | since 2005; Director and Senior Vice President of |
| Peter F. Volanakis | Vanguard Marketing Corporation since 2005; |
| Born 1955. Trustee Since July 2009. Principal | Principal of The Vanguard Group (1997–2006). |
| Occupation(s) During the Past Five Years: President | | |
| since 2007 and Chief Operating Officer since 2005 | | |
| of Corning Incorporated (communications equipment); | Vanguard Senior Management Team |
| President of Corning Technologies (2001–2005); | | |
| Director of Corning Incorporated and Dow Corning; | R. Gregory Barton | Michael S. Miller |
| Trustee of the Corning Incorporated Foundation and | Mortimer J. Buckley | James M. Norris |
| the Corning Museum of Glass; Overseer of the | Kathleen C. Gubanich | Glenn W. Reed |
| Amos Tuck School of Business Administration at | Paul A. Heller | George U. Sauter |
| Dartmouth College. | | |
| |
| | Chairman Emeritus and Senior Advisor |
| Executive Officers | | |
| | John J. Brennan | |
| Glenn Booraem | Chairman, 1996–2009 | |
| Born 1967. Controller Since July 2010. Principal | Chief Executive Officer and President, 1996–2008 |
| Occupation(s) During the Past Five Years: Principal | | |
| of The Vanguard Group, Inc.; Controller of each of | | |
| the investment companies served by The Vanguard | Founder | |
| Group since 2010; Assistant Controller of each of | | |
| the investment companies served by The Vanguard | John C. Bogle | |
| Group (2001–2010). | Chairman and Chief Executive Officer, 1974–1996 |
| |
| Thomas J. Higgins | | |
| Born 1957. Chief Financial Officer Since September | | |
| 2008. Principal Occupation(s) During the Past Five | | |
| Years: Principal of The Vanguard Group, Inc.; Chief | | |
| Financial Officer of each of the investment companies | | |
| served by The Vanguard Group since 2008; Treasurer | | |
| of each of the investment companies served by The | | |
| Vanguard Group (1998–2008). | | |
1 Mr. McNabb is considered an “interested person,” as defined in the Investment Company Act of 1940, because he is an officer of the Vanguard funds.
2 December 2002 for Vanguard Equity Income Fund, Vanguard Growth Equity Fund, the Vanguard Municipal Bond Funds, and the Vanguard State Tax-Exempt Funds.
|  |
| P.O Box 2600 |
| Valley Forge, PA 19482-2600 |
| |
| Connect with Vanguard ® > Vanguard.com | |
| |
| Fund Information > 800-662-7447 | |
| Direct Investor Account Services > 800-662-2739 | |
| Institutional Investor Services > 800-523-1036 | |
| Text Telephone for People | |
| With Hearing Impairment > 800-749-7273 | |
| |
| This material may be used in conjunction | |
| with the offering of shares of any Vanguard | |
| fund only if preceded or accompanied by | |
| the fund’s current prospectus. | |
| |
| All comparative mutual fund data are from Lipper Inc. or | |
| Morningstar, Inc., unless otherwise noted. | |
| |
| You can obtain a free copy of Vanguard’s proxy voting | |
| guidelines by visiting vanguard.com/proxyreporting or by | |
| calling Vanguard at 800-662-2739. The guidelines are | |
| also available from the SEC’s website, sec.gov. In | |
| addition, you may obtain a free report on how your fund | |
| voted the proxies for securities it owned during the 12 | |
| months ended June 30. To get the report, visit either | |
| vanguard.com/proxyreporting or sec.gov. | |
| |
| You can review and copy information about your fund at | |
| the SEC’s Public Reference Room in Washington, D.C. To | |
| find out more about this public service, call the SEC at | |
| 202-551-8090. Information about your fund is also | |
| available on the SEC’s website, and you can receive | |
| copies of this information, for a fee, by sending a | |
| request in either of two ways: via e-mail addressed to | |
| publicinfo@sec.gov or via regular mail addressed to the | |
| Public Reference Section, Securities and Exchange | |
| Commission, Washington, DC 20549-1520. | |
| |
| |
| | © 2010 The Vanguard Group, Inc. |
| | All rights reserved. |
| | Vanguard Marketing Corporation, Distributor. |
| |
| | Q1110 112010 |
 |
| Vanguard Global Equity Fund |
| Annual Report |
|
|
| September 30, 2010 |
|
 |
|
|
> Vanguard Global Equity Fund returned 10.51%, outpacing its benchmark index and peer group by about 2 percentage points.
> The fund benefited from the advisors’ enthusiasm for emerging market stocks and astute stock selection in the Pacific region’s developed markets.
> European stocks were a weak spot, beset by concerns about government debt levels in the Continent’s weaker economies.
| |
| Contents | |
| Your Fund’s Total Returns. | 1 |
| Chairman’s Letter. | 2 |
| Advisors’ Report. | 7 |
| Fund Profile. | 13 |
| Performance Summary. | 15 |
| Financial Statements. | 16 |
| Your Fund’s After-Tax Returns. | 38 |
| About Your Fund’s Expenses. | 39 |
| Glossary. | 41 |
Please note: The opinions expressed in this report are just that—informed opinions. They should not be considered promises or advice. Also, please keep in mind that the information and opinions cover the period through the date on the front of this report. Of course, the risks of investing in your fund are spelled out in the prospectus.
See the Glossary for definitions of investment terms used in this report.
Cover photograph: Jean Maher.
Your Fund’s Total Returns
| |
| Fiscal Year Ended September 30, 2010 | |
| | Total |
| | Returns |
| Vanguard Global Equity Fund | 10.51% |
| MSCI All Country World Index | 8.42 |
| Global Funds Average | 8.33 |
| Global Funds Average: Derived from data provided by Lipper Inc. | |
| | | | |
| Your Fund’s Performance at a Glance | | | | |
| September 30, 2009, Through September 30, 2010 | | | | |
| | | | Distributions Per Share |
| | Starting | Ending | Income | Capital |
| | Share Price | Share Price | Dividends | Gains |
| Vanguard Global Equity Fund | $15.49 | $16.74 | $0.356 | $0.000 |
1

Chairman’s Letter
Dear Shareholder,
Vanguard Global Equity Fund returned 10.51% for the year ended September 30, 2010, outpacing its benchmark index and the average return of peer mutual funds by about two percentage points. The fund benefited, in particular, from its sizable commitment to strongly performing emerging markets. It also distinguished itself in the Pacific region’s developed markets.
If you invest in the fund through a taxable account, you may wish to review the after-tax returns for investors in the highest tax bracket, which appear later in this report.
An upbeat end to a worrisome 12 months
Although global stock markets traced a ragged trajectory, they ultimately gained ground for the 12 months ended September 30. Europe’s sovereign debt crisis and a dispiriting lack of vigor in the U.S. economy weighed on stock prices through the spring and summer. In September, however, investor sentiment perked up, buoyed by continued signs of strength in corporate financial statements. The broad U.S. stock market rallied to close the 12-month period with a return of more than 11%. Small-capitalization stocks finished a few steps ahead of their large-cap counterparts.
2
International stock markets were a mixed bag: middling returns in Europe, stagnation in the Pacific region’s developed markets, and a return of more than 20% from emerging markets. The combined result, as measured by the MSCI All Country World Index ex USA, was a 12-month return of 8%.
Bond prices rallied, driving yields to surprising lows
Bonds produced strong 12-month returns, a gratifying performance that nevertheless raises questions about the prospects for total returns in a fixed income market where yields hover near all-time lows.
At the start of the period, the 10-year U.S. Treasury note yielded 3.31%; at the end of the period, the figure was 2.51%
as investors bid up bond prices. As yields move lower, of course, the scope for continued declines—and the attendant rise in prices—diminishes. Corporate bonds performed best for the 12 months. Municipal bonds delivered solid, but more modest, returns.
Strength in emerging markets powered returns
Global stock markets faced a number of challenges over the last 12 months, including the sovereign debt crisis in Europe and uncertainty over the strength of the global economic recovery. Despite those headwinds, global stocks generated solid returns. Global Equity Fund did even better, finishing about 2 percentage points ahead of its comparative standards.
| | | |
| Market Barometer | | | |
| |
| | | Average Annual Total Returns |
| | | Periods Ended September 30, 2010 |
| | One | Three | Five |
| | Year | Years | Years |
| Stocks | | | |
| Russell 1000 Index (Large-caps) | 10.75% | -6.79% | 0.86% |
| Russell 2000 Index (Small-caps) | 13.35 | -4.29 | 1.60 |
| Dow Jones U.S. Total Stock Market Index | 11.51 | -6.12 | 1.37 |
| MSCI All Country World Index ex USA (International) | 8.00 | -6.98 | 4.72 |
| |
| Bonds | | | |
| Barclays Capital U.S. Aggregate Bond Index (Broad | | | |
| taxable market) | 8.16% | 7.42% | 6.20% |
| Barclays Capital Municipal Bond Index (Broad | | | |
| tax-exempt market) | 5.81 | 6.04 | 5.13 |
| Citigroup Three-Month U.S. Treasury Bill Index | 0.12 | 1.01 | 2.47 |
| |
| CPI | | | |
| Consumer Price Index | 1.14% | 1.57% | 1.90% |
3
The single biggest source of this success was the strong performance of emerging markets. Global Equity Fund’s advisors invested nearly 17% of assets, on average, in emerging market stocks, which helped power the fund past its global benchmark. The fund got a boost from investments in India—including a couple of banks that generated high double-digit returns—as well as from stocks in the Philippines and Thailand. Among the few weak spots in developing markets were a handful of poor performers from South Korea. The fund also enjoyed success in the Pacific region. In Hong Kong, returns were boosted by astute selections among companies that have significant exposure to the more robust Chinese economy. Good stock selection in Japan also contributed to the strong performance.
The fund’s U.S. stocks, the single biggest country investment at nearly 39% of total assets, also performed well, if somewhat more modestly than emerging markets stocks. The fund earned notably strong returns in the U.S. health care and materials sectors.
The fund’s weak spot was its European holdings, which produced low single-digit returns. That poor performance stemmed in large part from concerns over how problems in debt-plagued nations such as Greece might affect other members of the European Union. The fund’s relatively heavy weighting in German financial stocks such as Deutsche Bank, for example, restrained returns as investors worried about big banks’ exposure to debt from financially troubled governments. The fund
| | |
| Expense Ratios | | |
| Your Fund Compared With Its Peer Group | | |
| | | Peer Group |
| | Fund | Average |
| Global Equity Fund | 0.47% | 1.49% |
The fund expense ratio shown is from the prospectus dated January 26, 2010, and represents estimated costs for the current fiscal year. For the fiscal year ended September 30, 2010, the fund’s expense ratio was 0.44%. The peer-group expense ratio is derived from data provided by Lipper Inc. and captures information through year-end 2009.
Peer group: Global Funds.
4
also paid a price for its investment in oil company BP, which tumbled as a result of the massive oil spill in the Gulf of Mexico.
Among sectors, the fund’s largest concentrations were financial and consumer discretionary stocks. In both sectors fund managers selected stocks that outperformed the corresponding holdings in the benchmark. The fund’s materials stocks were another bright spot, generating benchmark-beating gains, with notable strength among stocks of construction materials companies outside the United States. But subpar selections in information technology, in particular in the computer hardware subsector, dampened returns. The fund also missed some opportunities in the consumer staples sector.
For more information about the strategies of the fund’s advisors, see the Advisors’ Report that follows this letter.
Ten-year performance exceeds benchmark and peers
In a decade of remarkable stock market volatility, Vanguard Global Equity Fund has outperformed both its unmanaged benchmark index and its peer group. Generating an average annual return of more than 6% over the last ten years, the fund topped the performances of both its benchmark and its peer group by more than 4 percentage points.
That performance reflects the experience and expertise of the four advisory firms that manage the fund’s portfolio. Marathon Asset Management LLP has managed the
| |
| Total Returns | |
| Ten Years Ended September 30, 2010 | |
| | Average |
| | Annual Return |
| Global Equity Fund | 6.66% |
| Spliced Global Equity Index | 1.94 |
| Global Funds Average | 0.74 |
Spliced Global Equity Index: MSCI All Country World Index returns gross of taxes through March 31, 2007; MSCI All Country World Index returns net of withholding taxes applicable to Luxembourg holding companies thereafter.
Global Funds Average: Derived from data provided by Lipper Inc.
The figures shown represent past performance, which is not a guarantee of future results. (Current performance may be lower or higher than the performance data cited. For performance data current to the most recent month-end, visit our website at vanguard.com/performance.) Note, too, that both investment returns and principal value can fluctuate widely, so an investor’s shares, when sold, could be worth more or less than their original cost.
5
fund since its 1995 inception while Acadian Asset Management LLC has been an advisor since 2004. AllianceBernstein L.P. and Baillie Gifford Overseas Ltd. became managers in 2006 and 2008, respectively. And with costs well below that of the average global fund, investors in the Global Equity Fund retain more of the returns produced by those managers.
Global equities aid in diversification
After a rough period during the global financial crisis, international markets have rebounded, particularly emerging markets. Their strength has helped make up for patches of weakness in Europe’s developed markets.
The variation in performance from region to region highlights again the value of a diversified portfolio. Markets around the globe may be affected by similar events but their response to those shifts often differs. Our research suggests that, over time, those differences can become more pronounced. As the impact of a global shock such as the recent financial crisis recedes, stock markets once again take their cues from developments in local economies, enhancing the risk-return properties of a globally diversified portfolio.
That’s why we encourage you to build a portfolio that holds a mix of stocks, including international equities, and bonds that is tailored to match your risk profile and time horizon. How future economic developments will play out around the globe is difficult to predict. But a time-tested way to meet those challenges is to hold a well-diversified portfolio while keeping costs low. Vanguard Global Equity Fund can play a role in that investing strategy.
Thank you for entrusting your assets to Vanguard.
Sincerely,

F. William McNabb III
Chairman and Chief Executive Officer
October 12, 2010
6
Advisors’ Report
For the fiscal year ended September 30, 2010, the Global Equity Fund returned 10.51%. Your fund is managed by four independent advisors, a strategy that enhances the fund’s diversification by providing exposure to distinct, yet complementary, investment approaches. It’s not uncommon for different advisors to have different views about individual securities or the broader investment
The advisors, the percentage of fund assets each manages, and brief descriptions of their investment strategies are presented in the table below. Each advisor has also prepared a discussion of the investment environment that existed during the fiscal year and of how portfolio positioning reflects this assessment. These comments were prepared on October 19, 2010.
| | | |
| Vanguard Global Equity Fund Investment Advisors | |
| |
| | Fund Assets Managed | |
| Investment Advisor | % | $ Million | Investment Strategy |
| Marathon Asset Management | 39 | 1,528 | A long-term and contrarian investment philosophy and |
| LLP | | | process with a focus on industry capital cycle analysis |
| | | | and in-depth management assessment. |
| Acadian Asset Management LLC | 34 | 1,337 | A quantitative, active, bottom-up investment process |
| | | | that combines stock and peer-group valuation to arrive |
| | | | at a return forecast for each of more than 40,000 |
| | | | securities in the global universe. |
| AllianceBernstein L.P. | 19 | 756 | A fundamentally based, research-driven approach, |
| | | | focused on finding companies whose long-term |
| | | | earnings power exceeds the level implied by their |
| | | | current stock price. Proprietary quantitative tools aid |
| | | | risk control and portfolio construction. |
| Baillie Gifford Overseas Ltd. | 5 | 184 | The advisor seeks stocks that can generate |
| | | | above-average growth in earnings and cash flow, |
| | | | producing a bottom-up, stock-driven approach to |
| | | | country and asset allocation. An in-depth view on each |
| | | | company is measured against the consensus view, |
| | | | leading to discrepancies and potential opportunities to |
| | | | add value. |
| Cash Investments | 3 | 101 | These short-term reserves are invested by Vanguard in |
| | | | equity index products to simulate investment in stocks. |
| | | | Each advisor may also maintain a modest cash |
| | | | position. |
7
Marathon Asset Management LLP
Portfolio Managers:
Jeremy J. Hosking, Investment Director
Neil M. Ostrer, Investment Director William J. Arah, Investment Director The long-term investment outlook and corresponding long holding period for our portion of the portfolio were unchanged during the fiscal year. The long-standing cyclical bias of the portfolio remained consistent, and performance was driven by strong stock selection across industries and regions. Among sectors, consumer discretionary and financials stood out. The former included internet retailers priceline.com and Amazon.com plus North American cable and media names such as Cablevision, Liberty Media, and Rogers; the latter included real estate companies SL Green and CB Richard Ellis. Developed and emerging markets in Asia were also strong contributors, including Hong Kong-based Jardine Holdings’ diverse underlying businesses, which benefited from the recovery.
Based on developments so far in 2010, there seems little reason to change our cautiously optimistic stance for global equities, particularly relative to government bonds. A slow economic recovery is unlikely to impede improvements in corporate profits, balance sheets, or
investor expectations. A double-dip recession would be a significant negative but would presumably be met with another bout of countermeasures. Whether emerging markets will continue their leadership role in the equity upswing is another question. Bear in mind that the portfolio is focused in Asia but not in the large, popular markets of China and India. In other markets, valuations are lower, and countries such as Malaysia and the Philippines exhibit few signs of late-cycle excess. Meanwhile, in the developed world, the better companies for investors will be those that shine in an environment of low growth, or that are deleveraging or otherwise rationalizing following the “near death” experience of the last couple of years.
Acadian Asset Management LLC
Portfolio Managers:
John R. Chisholm, CFA, Executive Vice President and Chief Investment Officer
Ronald D. Frashure, CFA, President and Chief Executive Officer
Brian K. Wolahan, CFA, Senior Vice President and Director of Alternative Strategies
During a volatile year for global equities, the portfolio was focused on attractively valued stocks that appear likely to rise in
8
price based on earnings data, price characteristics, and quality. Key markets in which the portfolio held oversized positions, based on bottom-up stock selection, included India, the United Kingdom, Japan, South Korea, and Taiwan. The United States, Switzerland, Canada, Brazil, and Spain were underweighted. The portfolio’s sector focus was on health care, information technology, and telecommunication services.
Given our quantitative investment process and the bottom-up nature of our portfolio construction methods, the portfolio changes gradually based on the attractiveness or unattractiveness of individual holdings. We do not make changes based on a view of the overall investment environment. The overall valuation, size, and alpha positioning of the portfolio remained consistent, and shifts in country and sector positioning were moderate.
Among the largest shifts during the trailing 12 months was our reduction in exposure to France, where the portfolio moved from an overweighted stance to a market underweighting. We also reduced the size of the portfolio’s position in Taiwan, though the portfolio remained overweighted relative to the benchmark. In Germany and Australia, the portfolio increased its active weights and moved from an underweighting to an overweighting during the period.
We also increased its exposure to India and China, though the portfolio remained underweighted in the latter throughout the period. From a sector standpoint, the largest shift was in materials, where an underweighted position evolved into a notable overweighting during the year. We also pared the portfolio’s consumer staples position, notably, deepening the magnitude of its sector underweighting.
We believe it is likely that financial markets will continue to alternate between risk-averse and risk-seeking regimes over the near term as the outlook for economic growth in key markets remains uncertain. A notable risk to global equity markets is the potential for economic stalling in the United States. The U.S. corporate earnings outlook also remains unclear as it remains to be seen whether the domestic slump can be mitigated by stronger foreign demand for exports and a boost from the weaker U.S. dollar.
Behaviorally, we could see continued selling of domestic stocks, pushing returns below the more neutral range that has persisted over the past year and ultimately affecting global markets as well. A scenario featuring positive catalysts also exists, however, including the potential for a pro-growth policy shift after the November elections, higher confidence levels, and more attractive equity valuations.
9
Outside the United States, concerns persist about slowing growth in China and India, as well as a possible backslide of Europe’s (thus far) more resilient markets. However, overall we see better macroeconomic and capital market conditions in non-U.S. markets relative to the United States, and we expect these markets to present more attractive asset allocation opportunities over the near to medium term. We see the emerging markets in particular as a key source of economic growth and strengthening fundamentals.
AllianceBernstein L.P.
Portfolio Managers:
Sharon E. Fay, CFA, Head of Bernstein Value Equities and Chief Investment Officer–Global Value Equities
Kevin F. Simms, Co-Chief Investment Officer–International Value Equities and Director of Research–Global and International Value Equities
Henry S. D’Auria, CFA, Co-Chief Investment Officer–International Value Equities and Chief Investment Officer–Emerging Markets Value Equities
Despite concerns about the sustainability of the economic recovery and investor worries about sovereign debt problems in Europe, global equities rose during the fiscal year ended September 30. Returns on individual stocks were highly correlated, as broad macroeconomic trends—rather than company-specific fundamentals—drove performance.
Our financial holdings were the largest detractors. Euro-denominated holdings were also negative. Strong performers came from a variety of sectors—including capital equipment, consumer staples, and technology—confirming our conviction that opportunity remains widespread across industries and regions.
With global stocks below their long-term average valuation, our portfolio is well positioned to benefit from a rising market and narrowing spreads between the cheapest and most expensive stocks.
We are positioned in attractively valued, strong cash flow-generating companies across a number of industries, including cyclicals such as information technology and industrial commodities, as well as in more defensive sectors such as telecommunication services and consumer staples. Since so many stocks with strong fundamentals trade at depressed valuations, we don’t need to take large sector overweightings to capture the diverse opportunity.
The corporate environment is more encouraging than perceived, as companies report strong earnings growth, expanding
10
sales, and improving profitability. As the market begins to pay closer attention to fundamentals, we expect a big payoff in returns because our portfolio is full of underappreciated stocks with strong fundamentals.
Baillie Gifford Overseas Ltd.
Portfolio Managers:
Charles Plowden, Joint Senior Partner and Lead Portfolio Manager
Spencer Adair, CFA, Investment Manager
Malcolm MacColl, Investment Manager
We continue to hold a broadly optimistic view of the world, and we are finding many longer-term growth opportunities for profitable investment. We are pleased that, despite some disappointing macroeconomic data from developed economies, the majority of our investments have published results that have tended to exceed market expectations; this is at odds with the downbeat tone of much recent commentary and the market volatility we have seen in the past 12 months.
Stock picking has remained the key driver of the portfolio’s performance, and it is pleasing to see that a company whose exposure is broadly to the Western consumer (Amazon.com) can contribute alongside a Chinese search engine (Baidu). The best-performing stocks also include companies benefiting from emerging market industrial and commercial growth (Schindler in elevators, Aggreko in temporary power supply) and oil companies with rapidly growing reserves or production (OGX in Brazil, Cairn in India, and EOG in North America).
Many of our holdings are actually enjoying underlying sales that are in line with and often better than our expectations. The strong fundamentals that we are seeing from a range of holdings demonstrate that the long process of government and consumer deleveraging and corporate balance sheet repair is now firmly under way in much of the Western world. Thanks to government support and action, the banking sector is rapidly returning to a healthier capital position, which bodes well for future credit creation.
That the major developed economies are able to produce even modest aggregate growth while this repair process is under way should be seen as a positive development. It is illuminating that so much attention has been paid to the small number of relatively insignificant economies, particularly on the fringes of Europe, where the problems are most intractable while the progress of larger economies continues to be widely unremarked upon and underreported. Those who expect a return to rapid growth based on further borrowing have failed to learn the lessons of the bust, and this perhaps
11
explains why we are less concerned than others by the slow progress of the U.S. housing market in particular.
In the meantime, demand in emerging economies continues to be robust and monetary policy is steadily reverting to normal, which is a sign of long-term optimism. In many cases, government finances are showing healthy surpluses. This is not only helping to support global growth at a healthy level and giving the West time to repair its own balance sheet and spending patterns, but it also offers attractive markets for companies to exploit, wherever they are based. While our portfolio has substantial direct exposure to emerging markets, we also have significant positions in established Western companies, especially in the consumer and industrial areas, which are successfully growing their businesses globally.
Global equities are attractive on a range of measures, and quality companies offer excellent prospects for long-term growth. Put simply, we believe that the strong and the fortunate will continue to prosper even while the weak and the structurally challenged struggle and shrink.
12
Global Equity Fund
Fund Profile
As of September 30, 2010
| | |
| Portfolio Characteristics | | |
| | | MSCI All |
| | | Country |
| | | World |
| | Fund | Index |
| Number of Stocks | 864 | 2,404 |
| Median Market Cap | $15.4B | $32.8B |
| Price/Earnings Ratio | 15.1x | 15.9x |
| Price/Book Ratio | 1.7x | 1.8x |
| Return on Equity | 16.7% | 19.1% |
| Earnings Growth Rate | 5.5% | 5.4% |
| Dividend Yield | 2.1% | 2.5% |
| Turnover Rate | 64% | — |
| Ticker Symbol | VHGEX | — |
| Expense Ratio1 | 0.47% | — |
| Short-Term Reserves | 0.6% | — |
| | |
| Sector Diversification (% of equity exposure) |
| | | MSCI All |
| | | Country |
| | | World |
| | Fund | Index |
| Consumer Discretionary | 14.8% | 9.7% |
| Consumer Staples | 6.9 | 9.8 |
| Energy | 7.8 | 10.7 |
| Financials | 20.5 | 21.2 |
| Health Care | 9.3 | 8.6 |
| Industrials | 13.0 | 10.6 |
| Information Technology | 10.9 | 11.7 |
| Materials | 8.9 | 8.6 |
| Telecommunication | | |
| Services | 6.1 | 5.0 |
| Utilities | 1.8 | 4.1 |
| |
| Volatility Measures | |
| | MSCI All |
| | Country |
| | World |
| | Index |
| R-Squared | 0.99 |
| Beta | 1.11 |
These measures show the degree and timing of the fund’s fluctuations compared with the index over 36 months.
| | |
| Ten Largest Holdings (% of total net assets) |
| Jardine Holdings Ltd. | Industrial | |
| | Conglomerates | 1.9% |
| Royal Dutch Shell PLC | Integrated Oil & | |
| | Gas | 1.4 |
| Rio Tinto | Diversified Metals | |
| | & Mining | 1.1 |
| Cablevision Systems | Cable & Satellite | |
| Corp. Class A | | 1.0 |
| Johnson & Johnson | Pharmaceuticals | 1.0 |
| ConocoPhillips | Integrated Oil & | |
| | Gas | 0.9 |
| International Business | IT Consulting & | |
| Machines Corp. | Other Services | 0.8 |
| Nippon Telegraph & | Integrated | |
| Telephone Corp. | Telecommunication | |
| | Services | 0.8 |
| Costco Wholesale Corp. | Hypermarkets & | |
| | Super Centers | 0.8 |
| JPMorgan Chase & Co. | Diversified Financial | |
| | Services | 0.7 |
| Top Ten | | 10.4% |
The holdings listed exclude any temporary cash investments and equity index products.
Allocation by Region (% of equity exposure)

1 The expense ratio shown is from the prospectus dated January 26, 2010, and represents estimated costs for the current fiscal year. For the fiscal year ended September 30, 2010, the expense ratio was 0.44%.
13
Global Equity Fund
| | |
| Market Diversification (% of equity exposure) |
| | | MSCI All |
| | | Country |
| | | World |
| | Fund | Index |
| Europe | | |
| United Kingdom | 10.3% | 8.6% |
| Germany | 3.7 | 3.2 |
| France | 3.0 | 4.1 |
| Switzerland | 1.6 | 3.1 |
| Italy | 1.3 | 1.1 |
| Sweden | 1.2 | 1.3 |
| Other | 3.0 | 4.6 |
| Subtotal | 24.1% | 26.0% |
| Pacific | | |
| Japan | 8.8% | 8.5% |
| Hong Kong | 4.2 | 1.1 |
| Australia | 2.1 | 3.4 |
| Singapore | 1.0 | 0.7 |
| Subtotal | 16.1% | 13.7% |
| Emerging Markets | | |
| South Korea | 2.8% | 1.8% |
| India | 2.3 | 1.1 |
| Taiwan | 1.8 | 1.5 |
| China | 1.6 | 2.5 |
| South Africa | 1.5 | 1.0 |
| Philippines | 1.5 | 0.1 |
| Thailand | 1.4 | 0.2 |
| Malaysia | 1.3 | 0.4 |
| Other | 3.6 | 5.2 |
| Subtotal | 17.8% | 13.8% |
| North America | | |
| United States | 38.9% | 41.8% |
| Canada | 3.0 | 4.4 |
| Subtotal | 41.9% | 46.2% |
| Middle East | 0.1% | 0.3% |
14
Global Equity Fund
Performance Summary
All of the returns in this report represent past performance, which is not a guarantee of future results that may be achieved by the fund. (Current performance may be lower or higher than the performance data cited. For performance data current to the most recent month-end, visit our website at vanguard.com/performance.) Note, too, that both investment returns and principal value can fluctuate widely, so an investor’s shares, when sold, could be worth more or less than their original cost. The returns shown do not reflect taxes that a shareholder would pay on fund distributions or on the sale of fund shares.
Cumulative Performance: September 30, 2000, Through September 30, 2010
Initial Investment of $10,000
| | | | |
| | Average Annual Total Returns | |
| | Periods Ended September 30, 2010 | |
| | | | | Final Value |
| | One | Five | Ten | of a $10,000 |
| | Year | Years | Years | Investment |
| Global Equity Fund | 10.51% | 1.37% | 6.66% | $19,050 |
| Spliced Global Equity Index | 8.42 | 2.53 | 1.94 | 12,113 |
| Global Funds Average | 8.33 | 1.94 | 0.74 | 10,770 |
Spliced Global Equity Index: MSCI All Country World Index returns gross of taxes through March 31, 2007; MSCI All Country World Index returns net of withholding taxes applicable to Luxembourg holding companies thereafter.
Global Funds Average: Derived from data provided by Lipper Inc.
Fiscal-Year Total Returns (%): September 30, 2000, Through September 30, 2010
See Financial Highlights for dividend and capital gains information.
15
Global Equity Fund
Financial Statements
Statement of Net Assets
As of September 30, 2010
The fund reports a complete list of its holdings in regulatory filings four times in each fiscal year, at the quarter-ends. For the second and fourth fiscal quarters, the lists appear in the fund’s semiannual and annual reports to shareholders. For the first and third fiscal quarters, the fund files the lists with the Securities and Exchange Commission on Form N-Q. Shareholders can look up the fund’s Forms N-Q on the SEC’s website at sec.gov. Forms N-Q may also be reviewed and copied at the SEC’s Public Reference Room (see the back cover of this report for further information).
| | | |
| | | | Market |
| | | | Value |
| | | Shares | ($000) |
| Common Stocks (96.3%)1 | | |
| Australia (1.8%) | | |
| | Rio Tinto Ltd. | 268,946 | 19,986 |
| | Santos Ltd. | 1,441,319 | 17,862 |
| | Origin Energy Ltd. | 784,355 | 12,040 |
| | National Australia Bank Ltd. | 186,400 | 4,567 |
| | Australia & New Zealand | | |
| | Banking Group Ltd. | 174,900 | 4,006 |
| | BHP Billiton Ltd. | 86,638 | 3,303 |
| | Brambles Ltd. | 480,876 | 2,921 |
| | Amcor Ltd./Australia | 431,936 | 2,722 |
| | Orica Ltd. | 68,424 | 1,707 |
| * | Iluka Resources Ltd. | 190,044 | 1,105 |
| | Alumina Ltd. | 544,419 | 956 |
| | Caltex Australia Ltd. | 49,291 | 574 |
| | Beach Energy Ltd. | 500,099 | 329 |
| * | DuluxGroup Ltd. | 68,424 | 181 |
| | | | 72,259 |
| Austria (0.1%) | | |
| | bwin Interactive | | |
| | Entertainment AG | 19,007 | 985 |
| | Oesterreichische Post AG | 29,996 | 899 |
| | Andritz AG | 10,903 | 766 |
| | OMV AG | 7,330 | 275 |
| | | | 2,925 |
| Belgium (0.2%) | | |
| | Anheuser-Busch InBev NV | 90,678 | 5,338 |
| | Groupe Bruxelles | | |
| | Lambert SA | 30,257 | 2,523 |
| | | | 7,861 |
| Brazil (0.9%) | | |
| | Vale SA Class B Pfd. ADR | 526,200 | 14,602 |
| | Banco do Brasil SA | 491,500 | 9,264 |
| * | OGX Petroleo e Gas | | |
| | Participacoes SA | 267,300 | 3,479 |
| | Petroleo Brasileiro SA | | |
| | ADR Type A | 71,700 | 2,353 |
| | Itau Unibanco Holding | | |
| | SA ADR | 93,525 | 2,261 |
| | BM&FBovespa SA | 243,200 | 2,035 |
| | | | |
| | | | | Market |
| | | | | Value |
| | | | Shares | ($000) |
| | Odontoprev SA | | 75,851 | 878 |
| | Ferbasa-Ferro Ligas da | | |
| | Bahia Prior Pfd. | | 75,400 | 558 |
| | | | | 35,430 |
| Canada (3.0%) | | | |
| ^ | Rogers Communications Inc. | | |
| | Class B | | 753,748 | 28,212 |
| | Bombardier Inc. | 4,132,369 | 20,282 |
| * | Research In Motion Ltd. | 263,608 | 12,835 |
| | Imperial Oil Ltd. | | 218,542 | 8,282 |
| | Nexen Inc. | | 356,089 | 7,164 |
| ^ | BCE Inc. | | 142,465 | 4,636 |
| *,^ | ACE Aviation Holdings Inc. | | |
| | Class A | | 404,559 | 4,423 |
| ^ | National Bank of Canada | 59,600 | 3,761 |
| ^ | Penn West Energy Trust | 185,798 | 3,724 |
| | Onex Corp. | | 110,631 | 3,109 |
| * | CGI Group Inc. Class A | 191,600 | 2,885 |
| | Fairfax Financial Holdings Ltd. | 6,500 | 2,644 |
| | Agrium Inc. | | 28,900 | 2,168 |
| | Suncor Energy Inc. | | 62,568 | 2,037 |
| | Magna International Inc. | 22,700 | 1,863 |
| * | Lundin Mining Corp. | | 345,200 | 1,725 |
| ^ | Ritchie Bros Auctioneers Inc. | 76,607 | 1,591 |
| | Kinross Gold Corp. | | 81,200 | 1,523 |
| | Encana Corp. | | 41,804 | 1,263 |
| * | Gildan Activewear Inc. | 25,600 | 720 |
| | Groupe Aeroplan Inc. | | 55,316 | 680 |
| | Centerra Gold Inc. | | 28,900 | 466 |
| | Canadian Natural | | | |
| | Resources Ltd. | | 12,300 | 426 |
| | Fairfax Financial | | | |
| | Holdings Ltd. | | 1,000 | 407 |
| | Saputo Inc. | | 11,700 | 399 |
| * | Catalyst Paper Corp. | 1,158,844 | 124 |
| * | Fraser Papers Inc. | | 337,960 | 21 |
| * | AbitibiBowater Inc. | | 218,435 | 7 |
| * | Nortel Networks Corp. | 241,295 | 5 |
| * | Transat AT Inc. Class A | 200 | 3 |
| | | | | 117,385 |
16
Global Equity Fund
| | | |
| | | | Market |
| | | | Value• |
| | | Shares | ($000) |
| Chile (0.2%) | | |
| | Enersis SA ADR | 283,479 | 6,665 |
| |
| China (1.6%) | | |
| | China Mobile Ltd. | 2,384,500 | 24,393 |
| ^ | Tsingtao Brewery Co. Ltd. | 2,286,000 | 13,173 |
| | Dongfeng Motor | | |
| | Group Co. Ltd. | 2,654,000 | 5,401 |
| | Bank of China Ltd. | 9,869,000 | 5,156 |
| | China Petroleum & | | |
| | Chemical Corp. | 5,684,000 | 5,015 |
| | China Construction | | |
| | Bank Corp. | 2,982,000 | 2,606 |
| * | Baidu Inc. ADR | 19,000 | 1,950 |
| | China National Building | | |
| | Material Co. Ltd. | 738,000 | 1,724 |
| * | Sina Corp. | 27,000 | 1,366 |
| *,^ | Shanda Interactive | | |
| | Entertainment Ltd. ADR | 33,600 | 1,315 |
| | Silver Grant International | 1,734,000 | 546 |
| | | | 62,645 |
| Czech Republic (0.1%) | | |
| | Komercni Banka AS | 11,181 | 2,425 |
| |
| Denmark (0.7%) | | |
| * | Danske Bank A/S | 238,629 | 5,729 |
| *,^ | William Demant Holding A/S 56,777 | 4,182 |
| | Coloplast A/S Class B | 31,613 | 3,775 |
| | Carlsberg A/S Class B | 34,300 | 3,569 |
| | Novo Nordisk A/S Class B | 29,057 | 2,876 |
| * | GN Store Nord A/S | 364,058 | 2,793 |
| * | Vestas Wind Systems A/S | 56,451 | 2,127 |
| | AP Moller– | | |
| | Maersk A/S Class B | 200 | 1,665 |
| * | Jyske Bank A/S | 23,304 | 906 |
| * | Topdanmark A/S | 3,899 | 490 |
| *,^ | Bang & Olufsen A/S | 33,672 | 356 |
| | | | 28,468 |
| Egypt (0.1%) | | |
| * | Ezz Steel | 1,397,944 | 4,727 |
| | Egyptian Financial | | |
| | Group-Hermes Holding | 223,300 | 1,141 |
| | | | 5,868 |
| Finland (0.4%) | | |
| | Sampo Oyj | 229,018 | 6,188 |
| | Metso Oyj | 120,845 | 5,548 |
| | Tieto Oyj | 53,415 | 1,065 |
| | Wartsila Oyj | 12,083 | 790 |
| | Stora Enso Oyj | 75,824 | 752 |
| | Nokia Oyj | 70,491 | 708 |
| | Cargotec Oyj Class B | 15,037 | 651 |
| | Outokumpu Oyj | 26,850 | 534 |
| | Kone Oyj Class B | 5,113 | 264 |
| | | | 16,500 |
| | | |
| | | | Market |
| | | | Value• |
| | | Shares | ($000) |
| France (2.9%) | | |
| | Sanofi-Aventis SA | 408,074 | 27,164 |
| * | European Aeronautic | | |
| | Defence and | | |
| | Space Co. NV | 527,374 | 13,160 |
| | BNP Paribas | 119,183 | 8,506 |
| | Bouygues SA | 187,800 | 8,091 |
| | Vivendi SA | 282,780 | 7,751 |
| | EDF SA | 141,200 | 6,095 |
| | Cap Gemini SA | 118,600 | 5,954 |
| | ArcelorMittal | 143,230 | 4,725 |
| | Carrefour SA | 79,013 | 4,259 |
| | Legrand SA | 117,822 | 3,987 |
| | Lagardere SCA | 89,523 | 3,505 |
| * | Peugeot SA | 79,186 | 2,671 |
| | AXA SA | 142,215 | 2,493 |
| | Total SA | 44,592 | 2,304 |
| | Neopost SA | 28,936 | 2,155 |
| | Groupe Eurotunnel SA | 239,488 | 2,037 |
| | Thales SA | 50,328 | 1,839 |
| | Societe BIC SA | 15,210 | 1,220 |
| | Societe Generale | 17,670 | 1,022 |
| * | Valeo SA | 21,064 | 978 |
| | Technip SA | 8,255 | 665 |
| | SA des Ciments Vicat | 9,138 | 646 |
| ^ | Eurofins Scientific | 11,975 | 615 |
| | Imerys SA | 7,677 | 460 |
| * | Alcatel-Lucent ADR | 131,498 | 444 |
| | Alstom SA | 8,304 | 424 |
| | Cie de St-Gobain | 8,447 | 378 |
| | Arkema SA | 6,983 | 357 |
| * | Atos Origin SA | 5,280 | 239 |
| *,^ | Eurofins Scientific Warrants | |
| | Exp. 6/29/17 | 249 | — |
| | | | 114,144 |
| Germany (3.6%) | | |
| | Deutsche Telekom AG | 1,497,018 | 20,483 |
| | Allianz SE | 152,365 | 17,214 |
| | BASF SE | 211,234 | 13,320 |
| | Deutsche Post AG | 732,682 | 13,286 |
| | Deutsche Bank AG | 240,418 | 13,162 |
| | E.ON AG | 394,673 | 11,640 |
| | Bayerische Motoren | | |
| | Werke AG | 163,281 | 11,453 |
| | Bayer AG | 141,161 | 9,839 |
| * | Daimler AG | 105,116 | 6,652 |
| | Henkel AG & Co. | | |
| | KGaA Prior Pfd. | 122,199 | 6,563 |
| | Fresenius Medical | | |
| | Care AG & Co. KGaA | 92,662 | 5,723 |
| * | Deutsche Lufthansa AG | 175,706 | 3,227 |
| | Celesio AG | 65,082 | 1,416 |
| * | Infineon Technologies AG | 190,360 | 1,318 |
| | Siemens AG | 11,664 | 1,230 |
| | Deutsche Boerse AG | 17,900 | 1,194 |
| | Suedzucker AG | 33,188 | 742 |
17
Global Equity Fund
| | | |
| | | | Market |
| | | | Value• |
| | | Shares | ($000) |
| | Adidas AG | 11,034 | 683 |
| | Fresenius Medical Care | | |
| | AG & Co. KGaA ADR | 10,741 | 663 |
| | Hannover | | |
| | Rueckversicherung AG | 13,240 | 609 |
| | GEA Group AG | 21,137 | 528 |
| | Axel Springer AG | 3,763 | 497 |
| * | Deutsche Bank AG Rights | 64,200 | 311 |
| | MLP AG | 18,763 | 191 |
| | | | 141,944 |
| Greece (0.0%) | | |
| *,^ | Excel Maritime | | |
| | Carriers Ltd. Class A | 55,265 | 311 |
| |
| Hong Kong (4.2%) | | |
| | Jardine Matheson | | |
| | Holdings Ltd. | 863,102 | 38,944 |
| | Jardine Strategic | | |
| | Holdings Ltd. | 1,267,900 | 34,030 |
| | New World | | |
| | Development Ltd. | 8,160,947 | 16,394 |
| | First Pacific Co. Ltd. | 13,903,600 | 12,615 |
| | Hutchison Whampoa Ltd. | 915,000 | 8,513 |
| | Henderson Land | | |
| | Development Co. Ltd. | 1,044,289 | 7,420 |
| | Television Broadcasts Ltd. | 1,122,000 | 6,394 |
| | Hongkong & | | |
| | Shanghai Hotels | 3,589,805 | 6,299 |
| | Wheelock & Co. Ltd. | 1,826,000 | 6,091 |
| | Esprit Holdings Ltd. | 1,104,500 | 5,982 |
| | SmarTone | | |
| | Telecommunications | | |
| | Holding Ltd. | 3,606,290 | 4,711 |
| | Midland Holdings Ltd. | 4,712,000 | 4,346 |
| | CLP Holdings Ltd. | 463,000 | 3,691 |
| | Hong Kong Aircraft | | |
| | Engineering Co. Ltd. | 182,800 | 3,338 |
| | Mandarin Oriental | | |
| | International Ltd. | 824,690 | 1,414 |
| | Hong Kong Exchanges | | |
| | and Clearing Ltd. | 54,000 | 1,062 |
| * | Next Media Ltd. | 6,210,000 | 894 |
| * | I-CABLE | | |
| | Communications Ltd. | 6,561,000 | 879 |
| | Cathay Pacific Airways Ltd. | 312,000 | 845 |
| * | Henderson Land | | |
| | Development Co. Ltd. | | |
| | Warrants Exp. 6/1/2011 | 205,800 | 60 |
| | | | 163,922 |
| India (2.2%) | | |
| | Punjab National Bank Ltd. | 540,514 | 15,532 |
| | State Bank of India | 204,963 | 14,774 |
| | Bank of Baroda | 606,970 | 11,772 |
| | Bank of India | 782,957 | 9,010 |
| | Hindalco Industries Ltd. | 1,624,931 | 7,109 |
| | | | |
| | | | | Market |
| | | | | Value• |
| | | | Shares | ($000) |
| *,2 | Tata Steel Ltd. Warrants | | | |
| | Exp. 12/23/14 | | 412,400 | 6,042 |
| | IDBI Bank Ltd. | 1,641,220 | 5,556 |
| | Canara Bank | | 370,088 | 4,800 |
| | Allahabad Bank | | 623,815 | 3,224 |
| | Dena Bank | 1,146,752 | 2,703 |
| | Union Bank of India | | 252,033 | 2,184 |
| | Oriental Bank | | | |
| | of Commerce | | 157,171 | 1,613 |
| | Indian Bank | | 223,019 | 1,384 |
| | Vijaya Bank | | 622,993 | 1,130 |
| | Andhra Bank | | 122,011 | 436 |
| | Apollo Tyres Ltd. | | 159,922 | 290 |
| | | | | 87,559 |
| Indonesia (0.7%) | | | |
| * | Bank Pan | | | |
| | Indonesia Tbk PT | 82,959,343 | 10,607 |
| | Indofood Sukses | | | |
| | Makmur Tbk PT | 10,543,000 | 6,435 |
| | Semen Gresik | | | |
| | Persero Tbk PT | 3,047,500 | 3,379 |
| | Matahari Putra | | | |
| | Prima Tbk PT | 24,541,775 | 2,620 |
| | Gudang Garam Tbk PT | | 451,400 | 2,610 |
| | Bank Negara Indonesia | | | |
| | Persero Tbk PT | 1,915,000 | 787 |
| | Gajah Tunggal Tbk PT | 2,642,500 | 586 |
| | Citra Marga Nusaphala | | | |
| | Persada Tbk PT | 1,618,000 | 189 |
| * | Mulia Industrindo Tbk PT | | 921,000 | 40 |
| | | | | 27,253 |
| Ireland (0.2%) | | | |
| | Paddy Power PLC | | 42,500 | 1,492 |
| | CRH PLC | | 87,415 | 1,441 |
| * | Dragon Oil PLC | | 137,335 | 948 |
| | Ryanair Holdings PLC ADR | 28,878 | 890 |
| | DCC PLC | | 28,986 | 831 |
| | Fyffes PLC | 1,219,961 | 532 |
| * | Independent News & | | | |
| | Media PLC | | 441,239 | 384 |
| * | Irish Continental Group PLC | 10,926 | 216 |
| | Total Produce PLC | | 389,036 | 191 |
| * | Anglo Irish Bank Corp. Ltd. | 122,273 | 36 |
| | | | | 6,961 |
| Israel (0.1%) | | | |
| | Teva Pharmaceutical | | | |
| | Industries Ltd. ADR | | 27,200 | 1,435 |
| * | Israel Discount Bank Ltd. | | | |
| | Class A | | 526,190 | 1,041 |
| | | | | 2,476 |
| Italy (1.3%) | | | |
| | Enel SPA | 2,077,878 | 11,108 |
| | UniCredit SPA | 4,165,382 | 10,667 |
| | Saipem SPA | | 161,468 | 6,490 |
18
Global Equity Fund
| | | |
| | | | Market |
| | | | Value |
| | | Shares | ($000) |
| | Telecom Italia SPA | | |
| | (Registered) | 3,703,100 | 5,188 |
| | Fiat SPA | 322,884 | 4,999 |
| | Luxottica Group SPA ADR | 155,327 | 4,237 |
| | Telecom Italia SPA | | |
| | (Bearer) | 2,707,300 | 3,055 |
| | Luxottica Group SPA | 61,709 | 1,688 |
| | Davide Campari-Milano SPA | 92,610 | 555 |
| | Intesa Sanpaolo SPA | | |
| | (Registered) | 169,997 | 554 |
| | Banco Popolare SC | 82,039 | 493 |
| | Finmeccanica SPA | 39,845 | 474 |
| | Mediaset SPA | 44,016 | 313 |
| * | Natuzzi SPA ADR | 42,314 | 157 |
| | | | 49,978 |
| Japan (8.4%) | | |
| | Nippon Telegraph & | | |
| | Telephone Corp. | 729,000 | 31,932 |
| | Nissan Motor Co. Ltd. | 2,013,600 | 17,634 |
| | Astellas Pharma Inc. | 485,500 | 17,568 |
| | Hitachi Ltd. | 3,850,000 | 16,852 |
| | Sony Corp. | 516,400 | 15,942 |
| | Marubeni Corp. | 2,804,000 | 15,855 |
| | Fujitsu Ltd. | 1,905,000 | 13,403 |
| | Daito Trust | | |
| | Construction Co. Ltd. | 219,200 | 13,096 |
| | Mitsui & Co. Ltd. | 721,700 | 10,731 |
| | Mitsubishi Corp. | 437,000 | 10,383 |
| | Mitsui Fudosan Co. Ltd. | 535,000 | 9,027 |
| | ORIX Corp. | 101,400 | 7,761 |
| | JX Holdings Inc. | 1,167,370 | 6,774 |
| | Sharp Corp. | 666,000 | 6,639 |
| | Tokyo Gas Co. Ltd. | 1,377,000 | 6,263 |
| | Japan Tobacco Inc. | 1,773 | 5,908 |
| | NTT Data Corp. | 1,627 | 5,143 |
| | FUJIFILM Holdings Corp. | 110,700 | 3,676 |
| | Toshiba Corp. | 700,000 | 3,385 |
| | Kao Corp. | 133,000 | 3,244 |
| | Panasonic Electric | | |
| | Works Co. Ltd. | 230,000 | 3,050 |
| * | Mitsubishi Materials Corp. | 1,050,000 | 3,019 |
| | Toyo Seikan Kaisha Ltd. | 165,300 | 2,973 |
| | Mitsubishi UFJ | | |
| | Financial Group Inc. | 624,700 | 2,900 |
| | Sumitomo Mitsui | | |
| | Financial Group Inc. | 95,900 | 2,795 |
| | Toyota Tsusho Corp. | 187,200 | 2,758 |
| | Sumitomo Electric | | |
| | Industries Ltd. | 224,900 | 2,743 |
| | Secom Co. Ltd. | 58,400 | 2,638 |
| | West Japan Railway Co. | 722 | 2,593 |
| | Toyota Motor Corp. | 70,800 | 2,537 |
| | Namco Bandai Holdings Inc. | 269,550 | 2,498 |
| | JS Group Corp. | 125,100 | 2,452 |
| | Chubu Electric | | |
| | Power Co. Inc. | 92,500 | 2,288 |
| | | | |
| | | | | Market |
| | | | | Value |
| | | | Shares | ($000) |
| | Yamato Holdings Co. Ltd. | 186,200 | 2,258 |
| | MS&AD Insurance | | | |
| | Group Holdings | | 91,200 | 2,099 |
| | Sumitomo Corp. | | 157,700 | 2,034 |
| | Hitachi Chemical Co. Ltd. | 103,000 | 1,925 |
| | Nippon Meat Packers Inc. | 146,000 | 1,797 |
| | Kawasaki Heavy | | | |
| | Industries Ltd. | | 627,000 | 1,782 |
| | Inpex Corp. | | 376 | 1,769 |
| | Mitsubishi Heavy | | | |
| | Industries Ltd. | | 475,000 | 1,754 |
| | Seven & I Holdings Co. Ltd. | 73,200 | 1,717 |
| | Olympus Corp. | | 64,800 | 1,699 |
| | Isetan Mitsukoshi | | | |
| | Holdings Ltd. | | 163,300 | 1,695 |
| | Tokyo Electric Power Co. Inc. | 68,900 | 1,683 |
| | Panasonic Corp. | | 117,900 | 1,601 |
| | Shiseido Co. Ltd. | | 71,000 | 1,595 |
| | Kyowa Hakko Kirin Co. Ltd. | 155,000 | 1,538 |
| | Obayashi Corp. | | 366,000 | 1,461 |
| * | Yamaha Motor Co. Ltd. | 96,700 | 1,455 |
| | Yamada Denki Co. Ltd. | 23,410 | 1,454 |
| | Fukuoka Financial Group Inc. | 354,000 | 1,418 |
| | Nippon Paper Group Inc. | 56,100 | 1,406 |
| | East Japan Railway Co. | 23,100 | 1,396 |
| | Omron Corp. | | 60,500 | 1,383 |
| | Sekisui House Ltd. | | 146,000 | 1,314 |
| * | NKSJ Holdings Inc. | | 206,000 | 1,291 |
| ^ | Shinsei Bank Ltd. | 1,697,000 | 1,201 |
| | Alfresa Holdings Corp. | 27,200 | 1,159 |
| | Kinden Corp. | | 125,000 | 1,133 |
| *,^ | Elpida Memory Inc. | | 97,000 | 1,116 |
| | Bank of Yokohama Ltd. | 236,000 | 1,103 |
| | Aeon Co. Ltd. | | 102,600 | 1,100 |
| | Yaskawa Electric Corp. | 136,000 | 1,098 |
| | NTT DoCoMo Inc. | | 656 | 1,096 |
| | NSK Ltd. | | 157,000 | 1,065 |
| | Dai Nippon Printing Co. Ltd. | 82,000 | 1,002 |
| | Mitsubishi Tanabe | | | |
| | Pharma Corp. | | 61,000 | 995 |
| | Marui Group Co. Ltd. | | 130,200 | 974 |
| | Shimizu Corp. | | 243,000 | 902 |
| | Sumitomo Forestry Co. Ltd. | 128,000 | 902 |
| | Mitsubishi Estate Co. Ltd. | 55,000 | 895 |
| | Idemitsu Kosan Co. Ltd. | 9,300 | 798 |
| | Yamatake Corp. | | 31,800 | 797 |
| | Dena Co. Ltd. | | 25,200 | 794 |
| | Taiyo Nippon Sanso Corp. | 90,000 | 766 |
| | Asahi Glass Co. Ltd. | | 75,000 | 765 |
| | Rohm Co. Ltd. | | 12,200 | 755 |
| | Toppan Forms Co. Ltd. | 80,200 | 747 |
| | Ryosan Co. Ltd. | | 29,800 | 745 |
| | Chiba Bank Ltd. | | 124,000 | 724 |
| | Nippon Suisan Kaisha Ltd. | 206,800 | 681 |
| | Onward Holdings Co. Ltd. | 86,000 | 674 |
| | Mizuho Financial Group Inc. | 451,500 | 655 |
19
Global Equity Fund
| | | |
| | | | Market |
| | | | Value |
| | | Shares | ($000) |
| | Ajinomoto Co. Inc. | 59,000 | 579 |
| | Hitachi Metals Ltd. | 47,000 | 554 |
| | K’s Holdings Corp. | 21,900 | 504 |
| | KDDI Corp. | 105 | 502 |
| | Tokyo Ohka Kogyo Co. Ltd. | 25,800 | 460 |
| | IT Holdings Corp. | 34,900 | 377 |
| | Arnest One Corp. | 30,300 | 334 |
| | Oriental Land Co. Ltd. | 3,200 | 298 |
| | Nagase & Co. Ltd. | 25,000 | 284 |
| | IHI Corp. | 144,000 | 276 |
| | Seino Holdings Corp. | 45,000 | 273 |
| | KYORIN Holdings Inc. | 17,000 | 264 |
| | Nihon Unisys Ltd. | 39,100 | 258 |
| | Fuji Soft Inc. | 16,300 | 251 |
| | Toho Gas Co. Ltd. | 50,000 | 248 |
| | Daicel Chemical | | |
| | Industries Ltd. | 36,000 | 243 |
| | Fujitsu Frontech Ltd. | 32,100 | 239 |
| | Trend Micro Inc. | 7,800 | 234 |
| | EDION Corp. | 29,600 | 218 |
| | Takasago Thermal | | |
| | Engineering Co. Ltd. | 26,000 | 204 |
| | Noritake Co. Ltd. | 58,000 | 203 |
| | Dainippon Sumitomo | | |
| | Pharma Co. Ltd. | 17,100 | 143 |
| | Inabata & Co. Ltd. | 22,700 | 115 |
| | Ricoh Co. Ltd. | 8,000 | 113 |
| | | | 327,800 |
| Malaysia (1.3%) | | |
| | CIMB Group | | |
| | Holdings Bhd. | 6,020,638 | 15,923 |
| | Genting Malaysia Bhd. | 10,752,400 | 11,806 |
| | AMMB Holdings Bhd. | 3,921,887 | 7,532 |
| | Sime Darby Bhd. | 1,870,457 | 5,141 |
| | British American | | |
| | Tobacco Malaysia Bhd. | 165,000 | 2,590 |
| * | Malaysian Airline | | |
| | System Bhd. | 3,182,866 | 2,401 |
| | Multi-Purpose | | |
| | Holdings Bhd. | 2,007,390 | 1,444 |
| | Telekom Malaysia Bhd. | 1,218,275 | 1,350 |
| | Malayan Banking Bhd. | 203,200 | 579 |
| | Carlsberg Brewery- | | |
| | Malay Bhd. | 109,600 | 184 |
| | Malaysian Airline | | |
| | System Bhd. Pfd. | 183,333 | 50 |
| | | | 49,000 |
| Mexico (0.2%) | | |
| | America Movil SAB | | |
| | de CV ADR | 100,440 | 5,356 |
| | Wal-Mart de Mexico | | |
| | SAB de CV | 596,200 | 1,494 |
| | Telefonos de Mexico | | |
| | SAB de CV ADR | 33,943 | 507 |
| | Alfa SAB de CV Class A | 46,400 | 358 |
| | | | 7,715 |
| | | |
| | | | Market |
| | | | Value |
| | | Shares | ($000) |
| Morocco (0.0%) | | |
| | Maroc Telecom | 22,195 | 403 |
| |
| Netherlands (0.8%) | | |
| * | Randstad Holding NV | 159,631 | 7,253 |
| | Koninklijke KPN NV | 320,736 | 4,969 |
| | Heineken NV | 89,157 | 4,625 |
| | Koninklijke Boskalis | | |
| | Westminster NV | 85,758 | 3,605 |
| | Wolters Kluwer NV | 142,891 | 3,003 |
| | Reed Elsevier NV | 167,800 | 2,120 |
| | Koninklijke DSM NV | 19,974 | 1,025 |
| | Akzo Nobel NV | 15,434 | 952 |
| | Koninklijke Philips | | |
| | Electronics NV | 27,074 | 852 |
| | ASML Holding NV | 19,463 | 579 |
| | Nutreco NV | 7,888 | 577 |
| | TNT NV | 12,503 | 336 |
| *,^ | Eurocastle Investment Ltd. | 275,977 | 98 |
| | | | 29,994 |
| New Zealand (0.0%) | | |
| | Telecom Corp. of | | |
| | New Zealand Ltd. | 338,300 | 504 |
| * | PGG Wrightson Ltd. | 51,996 | 21 |
| | | | 525 |
| Norway (0.1%) | | |
| | DnB NOR ASA | 218,112 | 2,977 |
| | Statoil ASA | 112,237 | 2,349 |
| * | Storebrand ASA | 63,234 | 388 |
| | | | 5,714 |
| Philippines (1.5%) | | |
| | Ayala Corp. | 2,108,913 | 19,577 |
| | ABS-CBN Holdings Corp. | 13,521,188 | 17,191 |
| | Globe Telecom Inc. | 425,190 | 8,608 |
| | Jollibee Foods Corp. | 2,055,100 | 4,305 |
| | DMCI Holdings Inc. | 5,230,000 | 3,269 |
| * | Lopez Holdings Corp. | 15,742,000 | 2,249 |
| | Banco de Oro | | |
| | Unibank Inc. | 1,248,200 | 1,710 |
| | | | 56,909 |
| Poland (0.3%) | | |
| | KGHM Polska Miedz SA | 311,533 | 12,532 |
| * | Polski Koncern | | |
| | Naftowy Orlen | 28,400 | 390 |
| | | | 12,922 |
| Russia (0.5%) | | |
| | Gazprom OAO ADR | 584,050 | 12,304 |
| | Lukoil OAO ADR | 101,800 | 5,802 |
| | Gazprom OAO ADR, | | |
| | (U.S. Shares) | 15,167 | 319 |
| | | | 18,425 |
| Singapore (1.0%) | | |
| | DBS Group Holdings Ltd. | 1,226,000 | 13,116 |
| * | STATS ChipPAC Ltd. | 8,521,000 | 9,149 |
20
Global Equity Fund
| | | |
| | | | Market |
| | | | Value |
| | | Shares | ($000) |
| | Great Eastern | | |
| | Holdings Ltd. | 727,000 | 8,641 |
| | Noble Group Ltd. | 2,013,727 | 2,894 |
| | GuocoLeisure Ltd. | 4,656,000 | 2,369 |
| * | Genting Singapore PLC | 1,049,244 | 1,484 |
| | United Industrial Corp. Ltd. | 377,000 | 672 |
| | Global Yellow Pages Ltd. | 2,464,000 | 329 |
| * | Global Yellow Pages Ltd. | | |
| | Warrants Exp. 8/13/2014 | 704,000 | 27 |
| | | | 38,681 |
| South Africa (1.5%) | | |
| | Hosken Consolidated | | |
| | Investments Ltd. | 1,449,794 | 15,203 |
| | RMB Holdings Ltd. | 1,612,338 | 8,767 |
| | Sun International Ltd. | 461,836 | 6,458 |
| | Nedbank Group Ltd. | 295,899 | 6,250 |
| | Naspers Ltd. | 107,900 | 5,265 |
| | FirstRand Ltd. | 1,559,377 | 4,788 |
| | Clicks Group Ltd. | 373,513 | 2,363 |
| * | Anglo Platinum Ltd. | 21,049 | 1,991 |
| | Standard Bank Group Ltd. | 86,631 | 1,375 |
| | Gold Fields Ltd. | 69,285 | 1,054 |
| | JD Group Ltd. | 144,427 | 988 |
| | AngloGold Ashanti Ltd. | 20,395 | 944 |
| | City Lodge Hotels Ltd. | 70,616 | 799 |
| | Imperial Holdings Ltd. | 44,305 | 719 |
| | Discovery Holdings Ltd. | 74,638 | 418 |
| | Mondi Ltd. | 14,936 | 121 |
| | | | 57,503 |
| South Korea (2.8%) | | |
| | Samsung | | |
| | Electronics Co. Ltd. | 40,071 | 27,289 |
| | LG Corp. | 193,241 | 13,984 |
| | LG Display Co. Ltd. | 335,020 | 11,624 |
| | KB Financial Group Inc. | 262,662 | 11,274 |
| | KT Corp. | 258,614 | 10,353 |
| | Woori Finance | | |
| | Holdings Co. Ltd. | 782,620 | 9,741 |
| | Hana Financial Group Inc. | 261,650 | 7,759 |
| | Hyundai Motor Co. | 47,911 | 6,431 |
| | Kia Motors Corp. | 107,980 | 3,485 |
| | SK Holdings Co. Ltd. | 28,553 | 2,966 |
| 2 | Samsung | | |
| | Electronics Co. Ltd. GDR | 5,600 | 1,925 |
| | Mirae Asset | | |
| | Securities Co. Ltd. | 16,766 | 880 |
| | POSCO | 1,000 | 455 |
| | SK Telecom Co. Ltd. | 2,930 | 440 |
| | Korea Electric Power Corp. | 5,000 | 129 |
| | | | 108,735 |
| Spain (0.5%) | | |
| | Banco Santander SA | 337,800 | 4,287 |
| ^ | Acerinox SA | 219,793 | 3,917 |
| | Inditex SA | 34,291 | 2,726 |
| | Telefonica SA | 83,321 | 2,068 |
| | | |
| | | | Market |
| | | | Value |
| | | Shares | ($000) |
| | Acciona SA | 23,903 | 2,022 |
| | Gestevision Telecinco SA | 143,097 | 1,576 |
| | Viscofan SA | 46,874 | 1,547 |
| | Banco Santander SA ADR | 17,405 | 220 |
| | | | 18,363 |
| Sweden (1.2%) | | |
| | Electrolux AB Class B | 605,413 | 14,926 |
| | Svenska Handelsbanken | | |
| | AB Class A | 278,337 | 9,146 |
| | Assa Abloy AB Class B | 194,875 | 4,925 |
| | Telefonaktiebolaget LM | | |
| | Ericsson Class B | 360,408 | 3,953 |
| | Atlas Copco AB Class B | 187,334 | 3,306 |
| | Swedish Match AB | 78,892 | 2,108 |
| | Investor AB Class B | 78,468 | 1,598 |
| | Hoganas AB Class B | 45,699 | 1,487 |
| * | Volvo AB Class B | 85,260 | 1,256 |
| | Svenska Cellulosa | | |
| | AB Class B | 78,849 | 1,202 |
| | Modern Times Group | | |
| | AB Class B | 15,780 | 1,179 |
| | Nordea Bank AB | 57,088 | 596 |
| | Oriflame Cosmetics SA | 8,844 | 569 |
| | Scania AB Class B | 17,983 | 398 |
| | | | 46,649 |
| Switzerland (1.5%) | | |
| | Novartis AG | 239,637 | 13,793 |
| | Roche Holding AG | 50,939 | 6,960 |
| | Cie Financiere | | |
| | Richemont SA | 142,626 | 6,882 |
| * | UBS AG | 402,423 | 6,852 |
| | Nestle SA | 102,948 | 5,488 |
| | Schindler Holding AG | | |
| | (Bearer) | 37,561 | 4,032 |
| | Geberit AG | 18,989 | 3,384 |
| | Adecco SA | 62,740 | 3,280 |
| | ABB Ltd. | 95,048 | 2,007 |
| | Julius Baer Group Ltd. | 44,759 | 1,630 |
| * | Clariant AG | 104,066 | 1,523 |
| *,^ | Logitech International SA | 74,502 | 1,301 |
| | Sonova Holding AG | 7,070 | 864 |
| | Swiss Reinsurance Co. Ltd. | 12,355 | 542 |
| | Helvetia Holding AG | 1,492 | 518 |
| * | PubliGroupe AG | 4,579 | 451 |
| | | | 59,507 |
| Taiwan (1.7%) | | |
| | Fubon Financial | | |
| | Holding Co. Ltd. | 15,401,663 | 18,927 |
| | United | | |
| | Microelectronics Corp. | 27,782,000 | 12,344 |
| * | AU Optronics Corp. | 11,010,700 | 11,449 |
| | Taiwan Semiconductor | | |
| | Manufacturing Co. Ltd. | 2,363,306 | 4,677 |
| | Compal Electronics Inc. | 3,011,928 | 3,602 |
21
Global Equity Fund
| | | |
| | | | Market |
| | | | Value |
| | | Shares | ($000) |
| | Unimicron | | |
| | Technology Corp. | 1,642,000 | 2,877 |
| | Powertech Technology Inc. | 714,000 | 2,298 |
| | Chunghwa | | |
| | Telecom Co. Ltd. | 911,000 | 2,045 |
| | Taiwan Semiconductor | | |
| | Manufacturing Co. | | |
| | Ltd. ADR | 197,978 | 2,008 |
| * | Taishin Financial | | |
| | Holding Co. Ltd. | 3,420,761 | 1,530 |
| | Uni-President | | |
| | Enterprises Corp. | 1,112,799 | 1,444 |
| | Lite-On Technology Corp. | 719,579 | 908 |
| | Coretronic Corp. | 433,000 | 665 |
| * | Yageo Corp. | 1,392,000 | 599 |
| | Inventec Co. Ltd. | 677,985 | 352 |
| | Gigabyte | | |
| | Technology Co. Ltd. | 314,000 | 305 |
| | Chin-Poon Industrial Co. | 337,000 | 276 |
| | Yosun Industrial Corp. | 100,774 | 181 |
| | Radiant Opto- | | |
| | Electronics Corp. | 65,000 | 97 |
| * | King Yuan | | |
| | Electronics Co. Ltd. | 203,000 | 92 |
| | | | 66,676 |
| Thailand (1.4%) | | |
| | Siam Cement PCL (Foreign) | 664,300 | 8,058 |
| | Advanced Info | | |
| | Service PCL (Foreign) | 2,392,700 | 7,504 |
| | Kasikornbank PCL | | |
| | (Foreign) | 1,832,600 | 7,473 |
| | Siam Cement PCL NVDR | 645,600 | 7,086 |
| | Thanachart Capital PCL | 5,163,500 | 7,013 |
| | MBK PCL (Foreign) | 1,429,100 | 4,673 |
| | PTT PCL | 461,900 | 4,525 |
| | Banpu PCL | 178,200 | 4,204 |
| | Land and Houses | | |
| | PCL (Foreign) | 6,141,000 | 1,537 |
| | GMM Grammy | | |
| | PCL NVDR | 2,917,000 | 1,442 |
| | GMM Grammy | | |
| | PCL (Foreign) | 1,688,200 | 834 |
| * | Bangkok Bank | | |
| | PCL (Local) | 150,700 | 774 |
| * | Big C Supercenter PCL | 84,200 | 182 |
| * | Post Publishing | | |
| | PCL (Foreign) | 1,300,000 | 178 |
| | Matichon PCL (Foreign) | 625,000 | 140 |
| | | | 55,623 |
| Turkey (0.5%) | | |
| | Turkiye Vakiflar | | |
| | Bankasi Tao | 2,057,800 | 6,243 |
| | Haci Omer Sabanci | | |
| | Holding AS (Bearer) | 1,007,799 | 5,209 |
| | Turkiye Garanti | | |
| | Bankasi AS | 681,800 | 3,951 |
| | | |
| | | | Market |
| | | | Value |
| | | Shares | ($000) |
| | Turkiye Garanti | | |
| | Bankasi AS ADR | 503,100 | 2,898 |
| | Anadolu Efes Biracilik | | |
| | Ve Malt Sanayii AS | 80,800 | 1,262 |
| | BIM Birlesik Magazalar AS | 37,594 | 1,085 |
| | | | 20,648 |
| United Kingdom (9.7%) | | |
| | Royal Dutch Shell | | |
| | PLC Class A | 1,687,307 | 51,071 |
| | BP PLC | 3,797,398 | 25,982 |
| | Vodafone Group PLC | 9,851,322 | 24,307 |
| | Rio Tinto PLC | 388,950 | 22,786 |
| | Xstrata PLC | 697,660 | 13,364 |
| * | Lloyds Banking | | |
| | Group PLC | 11,459,183 | 13,294 |
| | AstraZeneca PLC | 241,654 | 12,266 |
| | Barclays PLC | 2,447,531 | 11,504 |
| | BAE Systems PLC | 1,995,853 | 10,748 |
| | Rolls-Royce Group PLC | 1,010,160 | 9,594 |
| | BHP Billiton PLC | 269,602 | 8,598 |
| | Old Mutual PLC | 3,160,000 | 6,897 |
| | Invensys PLC | 1,416,372 | 6,650 |
| | Intertek Group PLC | 211,479 | 6,092 |
| | Reckitt Benckiser | | |
| | Group PLC | 109,081 | 6,008 |
| | Anglo American PLC | 137,037 | 5,552 |
| | Capita Group PLC | 428,653 | 5,297 |
| | Kazakhmys PLC | 231,100 | 5,272 |
| | Tesco PLC | 781,384 | 5,212 |
| | Royal Dutch Shell | | |
| | PLC Class B | 175,938 | 5,140 |
| | Diageo PLC | 287,297 | 4,945 |
| * | Wolseley PLC | 178,124 | 4,478 |
| | Compass Group PLC | 520,623 | 4,344 |
| | Prudential PLC | 413,000 | 4,127 |
| | Thomas Cook Group PLC | 1,522,937 | 4,117 |
| | Sage Group PLC | 859,330 | 3,733 |
| | Ensco PLC ADR | 83,400 | 3,731 |
| | Carnival PLC | 92,456 | 3,646 |
| | Michael Page | | |
| | International PLC | 500,660 | 3,626 |
| | Bunzl PLC | 292,401 | 3,487 |
| | Informa PLC | 509,734 | 3,358 |
| * | Horizon | | |
| | Acquisition Co. PLC | 211,184 | 3,129 |
| | Centrica PLC | 573,965 | 2,918 |
| | Unilever PLC | 93,769 | 2,714 |
| | British American | | |
| | Tobacco PLC | 71,434 | 2,668 |
| | ICAP PLC | 392,992 | 2,665 |
| | Imperial Tobacco | | |
| | Group PLC | 87,565 | 2,612 |
| * | Royal Bank of | | |
| | Scotland Group PLC | 3,260,814 | 2,419 |
| | Rightmove PLC | 209,164 | 2,413 |
| | WPP PLC | 209,017 | 2,317 |
22
Global Equity Fund
| | | |
| | | | Market |
| | | | Value |
| | | Shares | ($000) |
| | Reed Elsevier PLC | 268,647 | 2,272 |
| | TUI Travel PLC | 663,990 | 2,237 |
| * | Inchcape PLC | 447,940 | 2,197 |
| | G4S PLC | 540,728 | 2,167 |
| | HSBC Holdings PLC | 213,269 | 2,157 |
| | Marks & Spencer | | |
| | Group PLC | 336,300 | 2,054 |
| | Smiths Group PLC | 101,757 | 1,952 |
| | International Personal | | |
| | Finance PLC | 454,709 | 1,929 |
| | Provident Financial PLC | 145,765 | 1,891 |
| * | Cairn Energy PLC | 257,190 | 1,835 |
| | Stagecoach Group PLC | 633,202 | 1,816 |
| | Cable & Wireless | | |
| | Communications PLC | 1,992,764 | 1,780 |
| | Rexam PLC | 356,558 | 1,722 |
| * | ITV PLC | 1,765,450 | 1,657 |
| | Cable & Wireless | | |
| | Worldwide PLC | 1,399,089 | 1,609 |
| * | Howden Joinery | | |
| | Group PLC | 1,285,986 | 1,551 |
| | Homeserve PLC | 211,305 | 1,462 |
| | Next PLC | 40,467 | 1,411 |
| | Experian PLC | 116,005 | 1,264 |
| | Man Group PLC | 345,750 | 1,191 |
| | Sportingbet PLC | 912,747 | 1,139 |
| | Devro PLC | 266,692 | 1,047 |
| * | Premier Foods PLC | 3,973,700 | 1,018 |
| | Ladbrokes PLC | 469,194 | 989 |
| | WH Smith PLC | 138,420 | 985 |
| | Aggreko PLC | 38,698 | 956 |
| | Admiral Group PLC | 35,360 | 927 |
| | AMEC PLC | 58,557 | 908 |
| | Hays PLC | 502,744 | 893 |
| | British Sky Broadcasting | | |
| | Group PLC | 72,267 | 803 |
| | Millennium & Copthorne | | |
| | Hotels PLC | 86,358 | 706 |
| | Sthree PLC | 143,910 | 661 |
| | RSA Insurance Group PLC | 320,989 | 660 |
| * | Berkeley Group | | |
| | Holdings PLC | 48,842 | 635 |
| | SSL International PLC | 32,758 | 596 |
| | GlaxoSmithKline PLC | 30,102 | 594 |
| | Smith & Nephew PLC | 58,521 | 534 |
| * | Jupiter Fund | | |
| | Management PLC | 130,781 | 533 |
| * | TalkTalk Telecom | | |
| | Group PLC | 208,373 | 479 |
| | Daily Mail & General | | |
| | Trust PLC | 57,575 | 476 |
| | Aviva PLC | 74,193 | 465 |
| * | Carphone Warehouse | | |
| | Group PLC | 104,186 | 447 |
| * | National Express Group PLC | 112,685 | 429 |
| | Close Brothers Group PLC | 34,692 | 402 |
| | | | |
| | | | | Market |
| | | | | Value |
| | | | Shares | ($000) |
| * | PartyGaming PLC | | 82,853 | 358 |
| * | Enterprise Inns PLC | | 195,094 | 330 |
| | Mondi PLC | | 37,385 | 304 |
| * | Barratt Developments PLC | 172,408 | 268 |
| * | Northgate PLC | | 50,062 | 171 |
| ^ | HMV Group PLC | | 215,229 | 162 |
| | Connaught PLC | | 103,081 | 27 |
| *,^ | Bradford & Bingley PLC | 642,595 | — |
| | | | | 378,137 |
| United States (37.1%) | | | |
| | Consumer Discretionary (7.2%) | |
| | Cablevision Systems Corp. | | |
| | Class A | 1,528,959 | 40,043 |
| * | Amazon.com Inc. | | 164,803 | 25,884 |
| * | priceline.com Inc. | | 56,358 | 19,632 |
| * | Liberty Global Inc. Class A | 511,788 | 15,768 |
| * | Liberty Global Inc. | | 406,125 | 12,411 |
| | Time Warner Cable Inc. | 218,858 | 11,816 |
| | CBS Corp. Class B | | 672,135 | 10,660 |
| | Time Warner Inc. | | 289,938 | 8,887 |
| | Comcast Corp. Class A | 448,500 | 8,109 |
| *,^ | Blue Nile Inc. | | 178,329 | 7,934 |
| | Sotheby’s | | 207,988 | 7,658 |
| * | Royal Caribbean Cruises Ltd. | 227,000 | 7,157 |
| | American Greetings Corp. | | |
| | Class A | | 338,840 | 6,299 |
| | News Corp. Class A | | 472,100 | 6,166 |
| | Gannett Co. Inc. | | 488,441 | 5,974 |
| ^ | Garmin Ltd. | | 195,331 | 5,928 |
| * | Pulte Group Inc. | | 634,536 | 5,559 |
| * | Ford Motor Co. | | 438,700 | 5,370 |
| * | MGM Resorts International | 428,738 | 4,836 |
| * | DIRECTV Class A | | 111,260 | 4,632 |
| * | ITT Educational Services Inc. | 61,432 | 4,317 |
| | Ross Stores Inc. | | 71,911 | 3,928 |
| * | Hanesbrands Inc. | | 140,387 | 3,630 |
| | Gap Inc. | | 181,700 | 3,387 |
| * | Liberty Media Corp.– | | | |
| | Interactive | | 225,941 | 3,098 |
| * | K12 Inc. | | 104,520 | 3,034 |
| | Cooper Tire & Rubber Co. | 135,145 | 2,653 |
| | KB Home | | 227,133 | 2,573 |
| * | Liberty Media Corp.–Capital | 44,434 | 2,313 |
| | International Game | | | |
| | Technology | | 157,171 | 2,271 |
| | Omnicom Group Inc. | | 56,224 | 2,220 |
| * | CC Media Holdings Inc. | | |
| | Class A | | 292,110 | 2,154 |
| | PRIMEDIA Inc. | | 540,783 | 2,055 |
| | News Corp. Class B | | 122,200 | 1,840 |
| * | Aeropostale Inc. | | 72,963 | 1,696 |
| * | Madison Square | | | |
| | Garden Inc. Class A | | 78,832 | 1,662 |
| * | Discovery | | | |
| | Communications Inc. | | |
| | Class A | | 34,831 | 1,517 |
23
Global Equity Fund
| | | | |
| | | | | Market |
| | | | | Value |
| | | | Shares | ($000) |
| * | Mohawk Industries Inc. | 25,590 | 1,364 |
| | CBS Corp. Class A | | 85,148 | 1,354 |
| * | Interpublic Group | | | |
| | of Cos. Inc. | | 118,031 | 1,184 |
| | Finish Line Inc. Class A | 84,872 | 1,181 |
| * | Liberty Media Corp.–Starz | 17,561 | 1,139 |
| * | Discovery | | | |
| | Communications Inc. | 26,743 | 1,021 |
| * | Bed Bath & Beyond Inc. | 23,300 | 1,012 |
| | Scholastic Corp. | | 32,700 | 910 |
| * | Cheesecake Factory Inc. | 31,408 | 831 |
| | Walt Disney Co. | | 24,700 | 818 |
| | Dillard’s Inc. Class A | | 33,546 | 793 |
| | Bob Evans Farms Inc. | | 14,892 | 418 |
| * | Pre-Paid Legal Services Inc. | 6,053 | 378 |
| * | Biglari Holdings Inc. | | 1,130 | 371 |
| * | TRW Automotive | | | |
| | Holdings Corp. | | 7,894 | 328 |
| * | Warnaco Group Inc. | | 6,047 | 309 |
| * | Select Comfort Corp. | | 43,684 | 296 |
| * | Cavco Industries Inc. | | 8,044 | 289 |
| * | DSW Inc. Class A | | 9,809 | 282 |
| | Sturm Ruger & Co. Inc. | 20,139 | 275 |
| * | Domino’s Pizza Inc. | | 20,338 | 269 |
| | DR Horton Inc. | | 13,561 | 151 |
| * | Ascent Media Corp. | | | |
| | Class A | | 2,330 | 62 |
| * | Fleetwood | | | |
| | Enterprises Inc. | 2,250,448 | 2 |
| * | Sun-Times Media | | | |
| | Group Inc. Class A | | 130,959 | — |
| |
| | Consumer Staples (3.7%) | | |
| | Costco Wholesale Corp. | 462,260 | 29,811 |
| | Tyson Foods Inc. Class A | 962,975 | 15,427 |
| | Altria Group Inc. | | 586,637 | 14,091 |
| | Estee Lauder Cos. Inc. | | |
| | Class A | | 138,943 | 8,785 |
| | Philip Morris | | | |
| | International Inc. | | 147,544 | 8,265 |
| | Bunge Ltd. | | 134,400 | 7,951 |
| | Procter & Gamble Co. | | 127,325 | 7,636 |
| | Safeway Inc. | | 314,500 | 6,655 |
| | Del Monte Foods Co. | | 440,709 | 5,778 |
| | Kroger Co. | | 262,635 | 5,689 |
| | Walgreen Co. | | 129,879 | 4,351 |
| | Archer-Daniels-Midland Co. | 133,951 | 4,276 |
| | Sanderson Farms Inc. | | 91,466 | 3,959 |
| * | Constellation Brands Inc. | | |
| | Class A | | 221,400 | 3,917 |
| | PepsiCo Inc. | | 56,849 | 3,777 |
| | Sara Lee Corp. | | 266,700 | 3,582 |
| * | Smithfield Foods Inc. | | 178,200 | 2,999 |
| | Wal-Mart Stores Inc. | | 30,999 | 1,659 |
| | SUPERVALU Inc. | | 136,078 | 1,569 |
| * | Whole Foods Market Inc. | 31,200 | 1,158 |
| | | |
| | | | Market |
| | | | Value |
| | | Shares | ($000) |
| | Nu Skin Enterprises Inc. | | |
| | Class A | 36,841 | 1,061 |
| | Corn Products | | |
| | International Inc. | 20,935 | 785 |
| * | Medifast Inc. | 22,344 | 606 |
| * | Central Garden and | | |
| | Pet Co. Class A | 27,301 | 283 |
| * | Spectrum Brands | | |
| | Holdings Inc. | 9,500 | 258 |
| * | Alliance One | | |
| | International Inc. | 57,800 | 240 |
| | Cal-Maine Foods Inc. | 8,187 | 237 |
| |
| | Energy (2.3%) | | |
| | ConocoPhillips | 587,673 | 33,750 |
| | Chevron Corp. | 348,985 | 28,285 |
| | Devon Energy Corp. | 123,990 | 8,027 |
| | Marathon Oil Corp. | 213,400 | 7,064 |
| * | Rowan Cos. Inc. | 90,335 | 2,743 |
| * | Newfield Exploration Co. | 40,300 | 2,315 |
| | EOG Resources Inc. | 23,282 | 2,164 |
| * | Cloud Peak Energy Inc. | 53,817 | 982 |
| * | Stone Energy Corp. | 57,648 | 849 |
| | National Oilwell Varco Inc. | 18,814 | 837 |
| | Baker Hughes Inc. | 11,500 | 490 |
| |
| | Financials (5.3%) | | |
| | JPMorgan Chase & Co. | 768,416 | 29,254 |
| * | Berkshire Hathaway Inc. | | |
| | Class B | 230,250 | 19,037 |
| | Bank of America Corp. | 1,170,278 | 15,342 |
| | Capital One Financial Corp. | 365,460 | 14,454 |
| * | Citigroup Inc. | 3,329,877 | 12,987 |
| | Legg Mason Inc. | 403,172 | 12,220 |
| | SL Green Realty Corp. | 188,461 | 11,935 |
| * | CB Richard Ellis Group Inc. | | |
| | Class A | 541,822 | 9,905 |
| | Travelers Cos. Inc. | 179,200 | 9,336 |
| | Wells Fargo & Co. | 361,900 | 9,095 |
| | Lazard Ltd. Class A | 203,573 | 7,141 |
| * | MBIA Inc. | 704,792 | 7,083 |
| * | AmeriCredit Corp. | 202,500 | 4,953 |
| | American Express Co. | 105,380 | 4,429 |
| | BB&T Corp. | 178,700 | 4,303 |
| * | PHH Corp. | 189,370 | 3,988 |
| | Annaly Capital | | |
| | Management Inc. | 214,641 | 3,778 |
| | Moody’s Corp. | 148,129 | 3,700 |
| | Mercury General Corp. | 87,648 | 3,582 |
| * | MGIC Investment Corp. | 315,122 | 2,909 |
| * | Markel Corp. | 6,638 | 2,287 |
| | Morgan Stanley | 88,550 | 2,185 |
| | Prosperity Bancshares Inc. | 66,622 | 2,163 |
| | Fifth Third Bancorp | 176,100 | 2,119 |
| | Cash America | | |
| | International Inc. | 34,831 | 1,219 |
24
Global Equity Fund
| | | |
| | | | Market |
| | | | Value |
| | | Shares | ($000) |
| | Progressive Corp. | 55,570 | 1,160 |
| | New York Community | | |
| | Bancorp Inc. | 62,410 | 1,014 |
| | Montpelier Re Holdings Ltd. | 57,268 | 992 |
| | PS Business Parks Inc. | 11,655 | 659 |
| | Republic Bancorp Inc. | | |
| | Class A | 27,308 | 577 |
| * | CIT Group Inc. | 13,702 | 559 |
| * | RAIT Financial Trust | 277,024 | 457 |
| | Ameriprise Financial Inc. | 9,332 | 442 |
| * | World Acceptance Corp. | 9,748 | 431 |
| * | First Cash Financial | | |
| | Services Inc. | 12,766 | 354 |
| | Allied World Assurance Co. | | |
| | Holdings Ltd. | 5,409 | 306 |
| | BGC Partners Inc. Class A | 48,052 | 287 |
| | American Equity Investment | | |
| | Life Holding Co. | 26,726 | 274 |
| | Advance America Cash | | |
| | Advance Centers Inc. | 45,200 | 182 |
| | Horace Mann | | |
| | Educators Corp. | 3,655 | 65 |
| *,^ | Washington Mutual Inc. | 166,300 | 32 |
| *,3 | JG Wentworth Inc. | 1 | — |
| |
| | Health Care (5.8%) | | |
| | Johnson & Johnson | 615,954 | 38,165 |
| | Bristol-Myers Squibb Co. | 949,697 | 25,746 |
| | Eli Lilly & Co. | 640,345 | 23,392 |
| | UnitedHealth Group Inc. | 646,627 | 22,703 |
| | Cardinal Health Inc. | 548,513 | 18,123 |
| * | WellPoint Inc. | 286,396 | 16,222 |
| * | Forest Laboratories Inc. | 483,846 | 14,965 |
| | Pfizer Inc. | 714,700 | 12,271 |
| * | Humana Inc. | 228,877 | 11,499 |
| * | Gilead Sciences Inc. | 206,200 | 7,343 |
| | Hill-Rom Holdings Inc. | 113,909 | 4,088 |
| * | Healthspring Inc. | 148,465 | 3,836 |
| * | Biogen Idec Inc. | 65,228 | 3,661 |
| * | Par Pharmaceutical Cos. Inc. | 108,843 | 3,165 |
| * | Health Net Inc. | 107,917 | 2,934 |
| * | Endo Pharmaceuticals | | |
| | Holdings Inc. | 84,899 | 2,822 |
| * | Magellan Health | | |
| | Services Inc. | 47,946 | 2,265 |
| * | Waters Corp. | 26,521 | 1,877 |
| | Aetna Inc. | 59,134 | 1,869 |
| * | Health Management | | |
| | Associates Inc. Class A | 209,900 | 1,608 |
| | Medicis Pharmaceutical | | |
| | Corp. Class A | 51,951 | 1,540 |
| * | Varian Medical Systems Inc. | 19,000 | 1,150 |
| | Patterson Cos. Inc. | 34,392 | 985 |
| | Merck & Co. Inc. | 25,259 | 930 |
| * | Kindred Healthcare Inc. | 59,522 | 775 |
| * | Medco Health Solutions Inc. | 13,800 | 719 |
| | | |
| | | | Market |
| | | | Value |
| | | Shares | ($000) |
| * | LifePoint Hospitals Inc. | 17,271 | 606 |
| | Universal American Corp. | 28,000 | 413 |
| * | AMERIGROUP Corp. | 9,191 | 390 |
| * | Impax Laboratories Inc. | 15,163 | 300 |
| | Invacare Corp. | 10,493 | 278 |
| * | Insmed Inc. | 353,900 | 255 |
| * | Community Health | | |
| | Systems Inc. | 7,177 | 222 |
| |
| | Industrials (2.5%) | | |
| * | Kansas City Southern | 339,750 | 12,710 |
| * | Delta Air Lines Inc. | 1,081,218 | 12,585 |
| | Towers Watson & Co. | | |
| | Class A | 189,563 | 9,323 |
| * | Oshkosh Corp. | 292,953 | 8,056 |
| | Ingersoll-Rand PLC | 218,300 | 7,795 |
| | Parker Hannifin Corp. | 96,400 | 6,754 |
| | Northrop Grumman Corp. | 104,501 | 6,336 |
| | Viad Corp. | 305,697 | 5,912 |
| | Raytheon Co. | 127,479 | 5,827 |
| * | AMR Corp. | 925,604 | 5,803 |
| * | US Airways Group Inc. | 488,743 | 4,521 |
| * | Ultrapetrol Bahamas Ltd. | 363,983 | 2,337 |
| | Expeditors International | | |
| | of Washington Inc. | 46,439 | 2,147 |
| | Deere & Co. | 22,424 | 1,565 |
| | Brink’s Co. | 64,339 | 1,480 |
| * | Stericycle Inc. | 12,676 | 881 |
| | Unifirst Corp. | 19,852 | 876 |
| * | Hawaiian Holdings Inc. | 122,800 | 736 |
| * | AGCO Corp. | 15,400 | 601 |
| | Pitney Bowes Inc. | 26,200 | 560 |
| | Heidrick & Struggles | | |
| | International Inc. | 28,147 | 548 |
| | Deluxe Corp. | 28,243 | 540 |
| | Standex International Corp. | 19,500 | 472 |
| * | Consolidated Graphics Inc. | 7,804 | 323 |
| * | United Rentals Inc. | 19,617 | 291 |
| | JB Hunt Transport | | |
| | Services Inc. | 5,521 | 192 |
| |
| | Information Technology (5.8%) | |
| | International Business | | |
| | Machines Corp. | 238,990 | 32,058 |
| | Microsoft Corp. | 837,772 | 20,517 |
| | Hewlett-Packard Co. | 432,721 | 18,205 |
| | Computer Sciences Corp. | 388,652 | 17,878 |
| * | Gartner Inc. | 600,014 | 17,664 |
| * | Lexmark International Inc. | | |
| | Class A | 283,086 | 12,631 |
| * | Western Digital Corp. | 378,700 | 10,751 |
| * | Seagate Technology PLC | 801,479 | 9,441 |
| | Tyco Electronics Ltd. | 258,110 | 7,542 |
| * | eBay Inc. | 308,853 | 7,536 |
| * | Motorola Inc. | 858,700 | 7,325 |
| * | Tech Data Corp. | 171,800 | 6,924 |
25
Global Equity Fund
| | | |
| | | | Market |
| | | | Value |
| | | Shares | ($000) |
| * | Dell Inc. | 457,700 | 5,932 |
| | Corning Inc. | 300,444 | 5,492 |
| * | Advanced Micro | | |
| | Devices Inc. | 745,574 | 5,301 |
| | Earthlink Inc. | 570,357 | 5,185 |
| | DST Systems Inc. | 104,406 | 4,682 |
| * | Vishay Intertechnology Inc. | 467,877 | 4,529 |
| * | LSI Corp. | 958,780 | 4,372 |
| * | Alliance Data Systems Corp. | 53,210 | 3,473 |
| | Xerox Corp. | 316,371 | 3,274 |
| * | Google Inc. Class A | 4,949 | 2,602 |
| * | InterDigital Inc. | 81,775 | 2,421 |
| | Accenture PLC Class A | 49,900 | 2,120 |
| * | Cisco Systems Inc. | 67,600 | 1,480 |
| * | Forrester Research Inc. | 43,700 | 1,446 |
| * | CSG Systems | | |
| | International Inc. | 47,796 | 871 |
| * | Net 1 UEPS | | |
| | Technologies Inc. | 64,457 | 745 |
| * | FLIR Systems Inc. | 28,628 | 736 |
| * | Synaptics Inc. | 18,672 | 525 |
| * | ValueClick Inc. | 35,134 | 460 |
| * | Photronics Inc. | 83,300 | 441 |
| * | Insight Enterprises Inc. | 24,200 | 379 |
| * | Flextronics International Ltd. | 60,510 | 365 |
| * | Vishay Precision Group Inc. | 22,504 | 351 |
| * | Integral Systems Inc. | 38,962 | 288 |
| * | Lattice Semiconductor Corp. | 51,304 | 244 |
| * | AOL Inc. | 5,380 | 133 |
| |
| | Materials (3.3%) | | |
| | Freeport-McMoRan | | |
| | Copper & Gold Inc. | 277,915 | 23,731 |
| | Eastman Chemical Co. | 222,203 | 16,443 |
| | Lubrizol Corp. | 147,363 | 15,616 |
| | MeadWestvaco Corp. | 477,393 | 11,639 |
| | International Paper Co. | 464,567 | 10,104 |
| | Domtar Corp. | 130,879 | 8,452 |
| | Scotts Miracle-Gro Co. | | |
| | Class A | 122,405 | 6,332 |
| | Temple-Inland Inc. | 332,840 | 6,211 |
| | Monsanto Co. | 94,297 | 4,520 |
| | CF Industries Holdings Inc. | 47,267 | 4,514 |
| | PPG Industries Inc. | 47,708 | 3,473 |
| | Cabot Corp. | 94,857 | 3,089 |
| | Innophos Holdings Inc. | 58,673 | 1,942 |
| | A Schulman Inc. | 94,589 | 1,906 |
| | Praxair Inc. | 17,943 | 1,620 |
| | Minerals Technologies Inc. | 22,108 | 1,303 |
| | NewMarket Corp. | 10,710 | 1,217 |
| * | Boise Inc. | 182,723 | 1,186 |
| * | Clearwater Paper Corp. | 14,700 | 1,118 |
| | Greif Inc. Class A | 9,597 | 565 |
| * | Ferro Corp. | 32,996 | 425 |
| * | Omnova Solutions Inc. | 58,800 | 423 |
| | Sherwin-Williams Co. | 5,502 | 413 |
| | | |
| | | | Market |
| | | | Value |
| | | Shares | ($000) |
| | Buckeye Technologies Inc. | 24,400 | 359 |
| | PH Glatfelter Co. | 27,000 | 328 |
| * | KapStone Paper and | | |
| | Packaging Corp. | 24,859 | 302 |
| | Rock-Tenn Co. Class A | 5,998 | 299 |
| | Stepan Co. | 5,024 | 297 |
| | Cytec Industries Inc. | 5,209 | 294 |
| * | Wausau Paper Corp. | 26,200 | 217 |
| |
| | Telecommunication Services (0.9%) | | |
| | AT&T Inc. | 579,808 | 16,583 |
| * | NII Holdings Inc. | 210,534 | 8,653 |
| * | Cincinnati Bell Inc. | 1,183,284 | 3,159 |
| * | Sprint Nextel Corp. | 543,921 | 2,518 |
| * | Level 3 | | |
| | Communications Inc. | 2,159,498 | 2,024 |
| | Telephone & Data | | |
| | Systems Inc. | 42,111 | 1,381 |
| | USA Mobility Inc. | 21,200 | 340 |
| |
| | Utilities (0.3%) | | |
| | Constellation Energy | | |
| | Group Inc. | 247,178 | 7,969 |
| | Pepco Holdings Inc. | 230,800 | 4,293 |
| | | | 1,447,479 |
| Total Common Stocks | | |
| (Cost $3,157,607) | | 3,760,387 |
| |
| | | Face | |
| | | Amount | |
| | | ($000) | |
| Convertible Bonds (0.2%) | | |
| Consumer Discretionary (0.0%) | |
| | Sotheby’s, | | |
| | 3.125%, 6/15/13 | 787 | 989 |
| |
| Financials (0.1%) | | |
| 2 | SL Green Realty Corp., | | |
| | 3.000%, 3/30/27 | 1,032 | 1,001 |
| |
| Industrials (0.0%) | | |
| | AMR Corp., | | |
| | 6.250%, 10/15/14 | 452 | 440 |
| | US Airways Group Inc., | | |
| | 7.250%, 5/15/14 | 184 | 408 |
| | | | 848 |
| Telecommunication Services (0.1%) | |
| | NII Holdings Inc., | | |
| | 3.125%, 6/15/12 | 2,998 | 2,908 |
| Total Convertible Bonds | | |
| (Cost $4,116) | | 5,746 |
26
Global Equity Fund
| | | | |
| | | | | Market |
| | | | | Value |
| | | | Shares | ($000) |
| Temporary Cash Investments (4.5%)1 | |
| Money Market Fund (4.3%) | | |
| 4,5 | Vanguard Market | | | |
| | Liquidity Fund, | | | |
| | 0.261% | 166,894,496 | 166,894 |
| |
| | | | Face | |
| | | | Amount | |
| | | | ($000) | |
| U.S. Government and Agency Obligations (0.2%) |
| 6,7 | Fannie Mae Discount | | |
| | Notes, 0.341%, 10/20/10 | 2,000 | 2,000 |
| 6,7 | Fannie Mae Discount | | |
| | Notes, 0.300%, 11/3/10 | 5,000 | 4,999 |
| 6,7 | Federal Home Loan Bank | | |
| | Discount Notes, | | | |
| | 0.300%, 11/19/10 | | 2,000 | 1,999 |
| 6,7 | Freddie Mac Discount | | |
| | Notes, 0.361%, 12/16/10 | 1,000 | 1,000 |
| | | | | 9,998 |
| Total Temporary Cash Investments | |
| (Cost $176,891) | | | 176,892 |
| Total Investments (101.0%) | | |
| (Cost $3,338,614) | | | 3,943,025 |
| |
| | Market |
| | Value |
| | ($000) |
| Other Assets and Liabilities (-1.0%) | |
| Other Assets7 | 47,902 |
| Liabilities5 | (85,089) |
| | (37,187) |
| Net Assets (100%) | |
| Applicable to 233,324,189 outstanding | |
| $.001 par value shares of beneficial | |
| interest (unlimited authorization) | 3,905,838 |
| Net Asset Value Per Share | $16.74 |
| |
| At September 30, 2010, net assets consisted of: |
| | Amount |
| | ($000) |
| Paid-in Capital | 5,345,296 |
| Undistributed Net Investment Income | 32,787 |
| Accumulated Net Realized Losses | (2,078,193) |
| Unrealized Appreciation (Depreciation) | |
| Investment Securities | 604,411 |
| Futures Contracts | (150) |
| Foreign Currencies and | |
| Forward Currency Contracts | 1,687 |
| Net Assets | 3,905,838 |
See Note A in Notes to Financial Statements.
* Non-income-producing security.
^ Part of security position is on loan to broker-dealers. The total value of securities on loan is $46,849,000.
1 The fund invests a portion of its cash reserves in equity markets through the use of index futures contracts. After giving effect to futures investments, the fund’s effective common stock and temporary cash investment positions represent 99.0% and 1.8%, respectively, of net assets.
2 Security exempt from registration under Rule 144A of the Securities Act of 1933. Such securities may be sold in transactions exempt from registration, normally to qualified institutional buyers. At September 30, 2010, the aggregate value of these securities was $8,968,000, representing 0.2% of net assets.
3 Restricted security represents 0.0% of net assets.
4 Affiliated money market fund available only to Vanguard funds and certain trusts and accounts managed by Vanguard. Rate shown is the 7-day yield.
5 Includes $49,433,000 of collateral received for securities on loan.
6 The issuer operates under a congressional charter; its securities are not backed by the full faith and credit of the U.S. government.
7 Securities with a value of $7,198,000 and cash of $500,000 have been segregated as initial margin for open futures contracts.
ADR—American Depositary Receipt.
GDR—Global Depositary Receipt.
NVDR—Non-Voting Depositary Receipt.
See accompanying Notes, which are an integral part of the Financial Statements.
27
Global Equity Fund
| |
| Statement of Operations | |
| |
| | Year Ended |
| | September 30, 2010 |
| | ($000) |
| Investment Income | |
| Income | |
| Dividends1 | 86,876 |
| Interest2 | 937 |
| Security Lending | 2,081 |
| Total Income | 89,894 |
| Expenses | |
| Investment Advisory Fees—Note B | |
| Basic Fee | 9,257 |
| Performance Adjustment | (4,237) |
| The Vanguard Group—Note C | |
| Management and Administrative | 9,783 |
| Marketing and Distribution | 937 |
| Custodian Fees | 668 |
| Auditing Fees | 38 |
| Shareholders’ Reports | 85 |
| Trustees’ Fees and Expenses | 8 |
| Total Expenses | 16,539 |
| Net Investment Income | 73,355 |
| Realized Net Gain (Loss) | |
| Investment Securities Sold | 89 |
| Futures Contracts | 4,374 |
| Foreign Currencies and Forward Currency Contracts | (2,017) |
| Realized Net Gain (Loss) | 2,446 |
| Change in Unrealized Appreciation (Depreciation) | |
| Investment Securities | 295,470 |
| Futures Contracts | (1,637) |
| Foreign Currencies and Forward Currency Contracts | 1,503 |
| Change in Unrealized Appreciation (Depreciation) | 295,336 |
| Net Increase (Decrease) in Net Assets Resulting from Operations | 371,137 |
| 1 Dividends are net of foreign withholding taxes of $4,437,000. | |
| 2 Interest income from an affiliated company of the fund was $295,000. | |
See accompanying Notes, which are an integral part of the Financial Statements.
28
Global Equity Fund
| | |
| Statement of Changes in Net Assets | | |
| |
| | Year Ended September 30, |
| | 2010 | 2009 |
| | ($000) | ($000) |
| Increase (Decrease) in Net Assets | | |
| Operations | | |
| Net Investment Income | 73,355 | 88,227 |
| Realized Net Gain (Loss) | 2,446 | (1,781,355) |
| Change in Unrealized Appreciation (Depreciation) | 295,336 | 1,329,131 |
| Net Increase (Decrease) in Net Assets Resulting from Operations | 371,137 | (363,997) |
| Distributions | | |
| Net Investment Income | (85,415) | (163,433) |
| Realized Capital Gain | — | — |
| Total Distributions | (85,415) | (163,433) |
| Capital Share Transactions | | |
| Issued | 548,911 | 490,456 |
| Issued in Lieu of Cash Distributions | 80,356 | 150,795 |
| Redeemed | (822,546) | (1,460,902) |
| Net Increase (Decrease) from Capital Share Transactions | (193,279) | (819,651) |
| Total Increase (Decrease) | 92,443 | (1,347,081) |
| Net Assets | | |
| Beginning of Period | 3,813,395 | 5,160,476 |
| End of Period1 | 3,905,838 | 3,813,395 |
| 1 Net Assets—End of Period includes undistributed net investment income of $32,787,000 and $46,693,000. | |
See accompanying Notes, which are an integral part of the Financial Statements.
29
Global Equity Fund
| | | | | |
| Financial Highlights | | | | | |
| |
| |
| For a Share Outstanding | | | Year Ended September 30, |
| Throughout Each Period | 2010 | 2009 | 2008 | 2007 | 2006 |
| Net Asset Value, Beginning of Period | $15.49 | $16.64 | $26.51 | $21.96 | $19.72 |
| Investment Operations | | | | | |
| Net Investment Income | .314 | .371 | .529 | .4901 | .320 |
| Net Realized and Unrealized Gain (Loss) | | | | | |
| on Investments | 1.292 | (.948) | (8.569) | 5.250 | 2.595 |
| Total from Investment Operations | 1.606 | (.577) | (8.040) | 5.740 | 2.915 |
| Distributions | | | | | |
| Dividends from Net Investment Income | (.356) | (.573) | (.430) | (.310) | (.240) |
| Distributions from Realized Capital Gains | — | — | (1.400) | (.880) | (.435) |
| Total Distributions | (.356) | (.573) | (1.830) | (1.190) | (.675) |
| Net Asset Value, End of Period | $16.74 | $15.49 | $16.64 | $26.51 | $21.96 |
| |
| Total Return2 | 10.51% | -2.30% | -32.24% | 27.00% | 15.22% |
| |
| Ratios/Supplemental Data | | | | | |
| Net Assets, End of Period (Millions) | $3,906 | $3,813 | $5,160 | $7,552 | $4,191 |
| Ratio of Total Expenses to | | | | | |
| Average Net Assets3 | 0.44% | 0.47% | 0.51% | 0.64% | 0.72% |
| Ratio of Net Investment Income to | | | | | |
| Average Net Assets | 1.94% | 2.55% | 2.35% | 1.98% | 1.76% |
| Portfolio Turnover Rate | 64% | 71% | 73% | 64% | 88% |
1 Calculated based on average shares outstanding.
2 Total returns do not include account service fees that may have applied in the periods shown. Fund prospectuses provide information about any applicable account service fees.
3 Includes performance-based investment advisory fee increases (decreases) of (0.11%), (0.13%), (0.02%), 0.05%, and 0.05%.
See accompanying Notes, which are an integral part of the Financial Statements.
30
Global Equity Fund
Notes to Financial Statements
Vanguard Global Equity Fund is registered under the Investment Company Act of 1940 as an open-end investment company, or mutual fund. The fund invests in securities of foreign issuers, which may subject it to investment risks not normally associated with investing in securities of United States corporations.
A. The following significant accounting policies conform to generally accepted accounting principles for U.S. mutual funds. The fund consistently follows such policies in preparing its financial statements.
1. Security Valuation: Securities are valued as of the close of trading on the New York Stock Exchange (generally 4 p.m., Eastern time) on the valuation date. Equity securities are valued at the latest quoted sales prices or official closing prices taken from the primary market in which each security trades; such securities not traded on the valuation date are valued at the mean of the latest quoted bid and asked prices. Bonds, and temporary cash investments acquired over 60 days to maturity, are valued using the latest bid prices or using valuations based on a matrix system (which considers such factors as security prices, yields, maturities, and ratings), both as furnished by independent pricing services. Investments in Vanguard Market Liquidity Fund are valued at that fund’s net asset value. Other temporary cash investments are valued at amortized cost, which approximates market value. Securities for which market quotations are not readily available , or whose values have been affected by events occurring before the fund’s pricing time but after the close of the securities’ primary markets, are valued at their fair values calculated according to procedures adopted by the board of trustees. These procedures include obtaining quotations from an independent pricing service, monitoring news to identify significant market- or security-specific events, and evaluating changes in the values of foreign market proxies (for example, ADRs, futures contracts or exchange-traded funds), between the time the foreign markets close and the fund’s pricing time. When fair-value pricing is employed, the prices of securities used by a fund to calculate its net asset value may differ from quoted or published prices for the same securities.
2. Foreign Currency: Securities and other assets and liabilities denominated in foreign currencies are translated into U.S. dollars using exchange rates obtained from an independent third party as of the fund’s pricing time on the valuation date. Realized gains (losses) and unrealized appreciation (depreciation) on investment securities include the effects of changes in exchange rates since the securities were purchased, combined with the effects of changes in security prices. Fluctuations in the value of other assets and liabilities resulting from changes in exchange rates are recorded as unrealized foreign currency gains (losses) until the assets or liabilities are settled in cash, at which time they are recorded as realized foreign currency gains (losses).
3. Futures and Forward Currency Contracts: The fund uses index futures contracts to a limited extent, with the objective of maintaining full exposure to the stock market while maintaining liquidity. The fund may purchase or sell futures contracts to achieve a desired level of investment, whether to accommodate portfolio turnover or cash flows from capital share transactions. The primary risks associated with the use of futures contracts are imperfect correlation between changes in market values of stocks held by the fund and the prices of futures contracts, and the possibility of an illiquid market.
The fund may also enter into forward currency contracts to provide the appropriate currency exposure related to any open futures contracts or to protect the value of securities and related receivables and payables against changes in foreign exchange rates. The primary risk associated with the fund’s use of these contracts is that a counterparty will fail to fulfill its obligation to pay gains due to the fund under
31
Global Equity Fund
the contracts. Counterparty risk is mitigated by entering into forward currency contracts only with highly rated counterparties, by a master netting arrangement between the fund and the counterparty, and by the posting of collateral by the counterparty. The forward currency contracts contain provisions whereby a counterparty may terminate open contracts if the fund’s net assets decline below a certain level, triggering a payment by the fund if the fund is in a net liability position at the time of the termination. The payment amount would be reduced by any collateral the fund has posted.
Any securities posted as collateral for open contracts are noted in the Statement of Net Assets.
Futures contracts are valued at their quoted daily settlement prices. Forward currency contracts are valued at their quoted daily prices obtained from an independent third party, adjusted for currency risk based on the expiration date of each contract. The aggregate principal amounts of the contracts are not recorded in the Statement of Net Assets. Fluctuations in the value of the contracts are recorded in the Statement of Net Assets as an asset (liability) and in the Statement of Operations as unrealized appreciation (depreciation) until the contracts are closed, when they are recorded as realized gains (losses) on futures or forward currency contracts.
4. Federal Income Taxes: The fund intends to continue to qualify as a regulated investment company and distribute all of its taxable income. Management has analyzed the fund’s tax positions taken for all open federal income tax years (September 30, 2007–2010), and has concluded that no provision for federal income tax is required in the fund’s financial statements.
5. Distributions: Distributions to shareholders are recorded on the ex-dividend date.
6. Security Lending: The fund may lend its securities to qualified institutional borrowers to earn additional income. Security loans are required to be secured at all times by collateral at least equal to the market value of securities loaned. The fund invests cash collateral received in Vanguard Market Liquidity Fund, and records a liability for the return of the collateral, during the period the securities are on loan. Security lending income represents fees charged to borrowers plus income earned on investing cash collateral, less expenses associated with the loan.
7. Other: Dividend income is recorded on the ex-dividend date. Interest income includes income distributions received from Vanguard Market Liquidity Fund and is accrued daily. Security transactions are accounted for on the date securities are bought or sold. Costs used to determine realized gains (losses) on the sale of investment securities are those of the specific securities sold.
B. Marathon Asset Management LLP, Acadian Asset Management LLC, AllianceBernstein L.P., and Baillie Gifford Overseas Ltd. each provide investment advisory services to a portion of the fund for a fee calculated at an annual percentage rate of average net assets managed by the advisor. The basic fees of Marathon Asset Management LLP and Acadian Asset Management LLC are subject to quarterly adjustments based on performance for the preceding three years relative to the MSCI All Country World Index. The basic fee of AllianceBernstein L.P. is subject to quarterly adjustments based on performance since June 30, 2006, relative to the MSCI All Country World Index. The basic fee of Baillie Gifford Overseas Ltd. is subject to quarterly adjustments based on performance since June 30, 2008, relative to the MSCI All Country World Index.
The Vanguard Group manages the cash reserves of the fund on an at-cost basis.
For the year ended September 30, 2010, the aggregate investment advisory fee represented an effective annual basic rate of 0.24% of the fund’s average net assets, before a decrease of $4,237,000 (0.11%) based on performance.
32
Global Equity Fund
C. The Vanguard Group furnishes at cost corporate management, administrative, marketing, and distribution services. The costs of such services are allocated to the fund under methods approved by the board of trustees. The fund has committed to provide up to 0.40% of its net assets in capital contributions to Vanguard. At September 30, 2010, the fund had contributed capital of $673,000 to Vanguard (included in Other Assets), representing 0.02% of the fund’s net assets and 0.27% of Vanguard’s capitalization. The fund’s trustees and officers are also directors and officers of Vanguard.
D. Various inputs may be used to determine the value of the fund’s investments. These inputs are summarized in three broad levels for financial statement purposes. The inputs or methodologies used to value securities are not necessarily an indication of the risk associated with investing in those securities.
Level 1—Quoted prices in active markets for identical securities.
Level 2—Other significant observable inputs (including quoted prices for similar securities, interest rates, prepayment speeds, credit risk, etc.).
Level 3—Significant unobservable inputs (including the fund’s own assumptions used to determine the fair value of investments).
The following table summarizes the fund’s investments as of September 30, 2010, based on the inputs used to value them:
| | | |
| | Level 1 | Level 2 | Level 3 |
| Investments | ($000) | ($000) | ($000) |
| Common Stocks—International | 188,790 | 2,124,061 | 57 |
| Common Stocks—Domestic | 1,447,479 | — | — |
| Convertible Bonds | — | 5,746 | — |
| Temporary Cash Investments | 166,894 | 9,998 | — |
| Futures Contracts—Liabilities1 | (723) | — | — |
| Forward Currency Contracts—Assets | — | 1,570 | — |
| Forward Currency Contracts—Liabilities | — | (68) | — |
| Total | 1,802,440 | 2,141,307 | 57 |
| 1 Represents variation margin on the last day of the reporting period. | | | |
The following table summarizes changes in investments valued based on Level 3 inputs during the year ended September 30, 2010:
| |
| | Investments in |
| | Common Stocks— |
| | International |
| Amount valued based on Level 3 Inputs | ($000) |
| Balance as of September 30, 2009 | 59 |
| Change in Unrealized Appreciation (Depreciation) | (2) |
| Balance as of September 30, 2010 | 57 |
33
Global Equity Fund
E. At September 30, 2010, the fair values of derivatives were reflected in the Statement of Net Assets as follows:
| | | |
| | | Foreign | |
| | Equity | Exchange | |
| | Contracts1 | Contracts | Total |
| Statement of Net Assets Caption | ($000) | ($000) | ($000) |
| Other Assets | — | 1,570 | 1,570 |
| Liabilities | (723) | (68) | (791) |
| 1 Represents variation margin on the last day of the reporting period. | | | |
Realized net gain (loss) and the change in unrealized appreciation (depreciation) on derivatives for the year ended September 30, 2010, were:
| | | |
| | | Foreign | |
| | Equity | Exchange | |
| | Contracts | Contracts | Total |
| Realized Net Gain (Loss) on Derivatives | ($000) | ($000) | ($000) |
| Futures Contracts | 4,374 | — | 4,374 |
| Forward Currency Contracts | — | 270 | 270 |
| Realized Net Gain (Loss) on Derivatives | 4,374 | 270 | 4,644 |
| |
| Change in Unrealized Appreciation (Depreciation) on Derivatives | | | |
| Futures Contracts | (1,637) | — | (1,637) |
| Forward Currency Contracts | — | 1,410 | 1,410 |
| Change in Unrealized Appreciation (Depreciation) on Derivatives | (1,637) | 1,410 | (227) |
At September 30, 2010, the aggregate settlement value of open futures contracts and the related unrealized appreciation (depreciation) were:
| | | | |
| | | | | ($000) |
| | | | Aggregate | |
| | | Number of | Settlement | Unrealized |
| | | Long (Short) | Value | Appreciation |
| Futures Contracts | Expiration | Contracts | Long (Short) | (Depreciation) |
| S&P 500 Index | December 2010 | 100 | 28,418 | 513 |
| E-mini S&P 500 Index | December 2010 | 399 | 22,677 | (42) |
| Dow Jones EURO STOXX 50 Index | December 2010 | 493 | 18,428 | (350) |
| FTSE 100 Index | December 2010 | 146 | 12,722 | (60) |
| Topix Index | December 2010 | 109 | 10,784 | (51) |
| S&P ASX 200 Index | December 2010 | 96 | 10,689 | (169) |
| MSCI Taiwan Index | October 2010 | 42 | 1,222 | 9 |
Unrealized appreciation (depreciation) on open S&P 500 Index, E-mini S&P 500 Index, and FTSE 100 Index futures is required to be treated as realized gain (loss) for tax purposes.
34
Global Equity Fund
At September 30, 2010, the fund had open forward currency contracts to receive and deliver currencies as follows. Unrealized appreciation (depreciation) on open forward currency contracts is treated as realized gain (loss) for tax purposes.
| | | | | | |
| | | | | | | Unrealized |
| | Contract | | | | | Appreciation |
| | Settlement | | | Contract Amount (000) | (Depreciation) |
| Counterparty | Date | | Receive | | Deliver | ($000) |
| UBS AG | 12/22/10 | EUR | 13,755 | USD | 18,767 | 922 |
| UBS AG | 12/22/10 | GBP | 8,111 | USD | 12,774 | 237 |
| UBS AG | 12/15/10 | JPY | 905,121 | USD | 10,844 | 120 |
| UBS AG | 12/22/10 | AUD | 11,214 | USD | 10,744 | 291 |
| Goldman Sachs Bank USA | 10/15/10 | USD | 4,779 | CAD | 4,912 | (68) |
| AUD—Australian dollar. | | | | | | |
| CAD—Canadian dollar. | | | | | | |
| EUR—Euro. | | | | | | |
| GBP—British pound. | | | | | | |
| JPY—Japanese yen. | | | | | | |
| USD—U.S. dollar. | | | | | | |
At September 30, 2010, the counterparty had deposited in a segregated account securities with a value sufficient to cover substantially all amounts due to the fund in connection with open forward currency contracts.
The fund had net unrealized foreign currency gains of $185,000 resulting from the translation of other assets and liabilities at September 30, 2010.
F. Distributions are determined on a tax basis and may differ from net investment income and realized capital gains for financial reporting purposes. Differences may be permanent or temporary. Permanent differences are reclassified among capital accounts in the financial statements to reflect their tax character. Temporary differences arise when certain items of income, expense, gain, or loss are recognized in different periods for financial statement and tax purposes; these differences will reverse at some time in the future. Differences in classification may also result from the treatment of short-term gains as ordinary income for tax purposes.
During the year ended September 30, 2010, the fund realized net foreign currency losses of $2,287,000, which decreased distributable net income for tax purposes; accordingly, such losses have been reclassified from accumulated net realized losses to undistributed net investment income. Certain of the fund’s investments are in securities considered to be “passive foreign investment companies,” for which any unrealized appreciation and/or realized gains are required to be included in distributable net income for tax purposes. During the year ended September 30, 2010, the fund realized gains on the sale of passive foreign investment companies of $441,000, which have been included in current and prior periods’ taxable income; accordingly, such gains have been reclassified from accumulated net realized losses to undistributed net investment income. Unrealized appreciation on the fund’s passive foreign investment company holdings at Septe mber 30, 2010, was $17,666,000, of which $15,102,000 has been distributed and is reflected in the balance of undistributed net investment income.
35
Global Equity Fund
For tax purposes, at September 30, 2010, the fund had $57,366,000 of ordinary income available for distribution. The fund had available capital loss carryforwards totaling $2,062,156,000 to offset future net capital gains of $831,873,000 through September 30, 2017, and $1,230,283,000 through September 30, 2018. In addition, the fund realized losses of $14,361,000 during the period from November 1, 2009, through September 30, 2010, which are deferred and will be treated as realized for tax purposes in fiscal 2011.
At September 30, 2010, the cost of investment securities for tax purposes was $3,357,003,000. Net unrealized appreciation of investment securities for tax purposes was $586,022,000, consisting of unrealized gains of $873,648,000 on securities that had risen in value since their purchase and $287,626,000 in unrealized losses on securities that had fallen in value since their purchase.
G. During the year ended September 30, 2010, the fund purchased $2,302,854,000 of investment securities and sold $2,484,020,000 of investment securities, other than temporary cash investments.
H. Capital shares issued and redeemed were:
| | |
| | Year Ended September 30, |
| | 2010 | 2009 |
| | Shares | Shares |
| | (000) | (000) |
| Issued | 34,742 | 39,924 |
| Issued in Lieu of Cash Distributions | 5,099 | 13,022 |
| Redeemed | (52,655) | (116,845) |
| Net Increase (Decrease) in Shares Outstanding | (12,814) | (63,899) |
I. In preparing the financial statements as of September 30, 2010, management considered the impact of subsequent events for potential recognition or disclosure in these financial statements.
36
Report of Independent Registered Public Accounting Firm
To the Trustees of Vanguard Horizon Funds and the Shareholders of Vanguard Global Equity Fund:
In our opinion, the accompanying statement of net assets and the related statements of operations and of changes in net assets and the financial highlights present fairly, in all material respects, the financial position of Vanguard Global Equity Fund (constituting a separate portfolio of Vanguard Horizon Funds, hereafter referred to as the “Fund”) at September 30, 2010, the results of its operations for the year then ended, the changes in its net assets for each of the two years in the period then ended and the financial highlights for each of the five years in the period then ended, in conformity with accounting principles generally accepted in the United States of America. These financial statements and financial highlights (hereafter referred to as “financial statements”) are the responsibility of the Fund’s management; our responsibility is to express an opinion on these financial statements based on our audits. We conducted ou r audits of these financial statements in accordance with the standards of the Public Company Accounting Oversight Board (United States). Those standards require that we plan and perform the audit to obtain reasonable assurance about whether the financial statements are free of material misstatement. An audit includes examining, on a test basis, evidence supporting the amounts and disclosures in the financial statements, assessing the accounting principles used and significant estimates made by management, and evaluating the overall financial statement presentation. We believe that our audits, which included confirmation of securities at September 30, 2010 by correspondence with the custodian and brokers and by agreement to the underlying ownership records of Vanguard Market Liquidity Fund, provide a reasonable basis for our opinion.
PricewaterhouseCoopers LLP
Philadelphia, Pennsylvania
November 17, 2010
| Special 2010 tax information (unaudited) for Vanguard Global Equity Fund |
This information for the fiscal year ended September 30, 2010, is included pursuant to provisions of the Internal Revenue Code.
The fund distributed $73,150,000 of qualified dividend income to shareholders during the fiscal year.
For corporate shareholders, 36.6% of investment income (dividend income plus short-term gains, if any) qualifies for the dividends-received deduction.
The fund designates to shareholders foreign source income of $54,568,000 and foreign taxes paid of $4,544,000. Shareholders will receive more detailed information with their Form 1099-DIV in January 2011 to determine the calendar year amounts to be included on their 2010 tax returns.
37
Your Fund’s After-Tax Returns
This table presents returns for your fund both before and after taxes. The after-tax returns are shown in two ways: (1) assuming that an investor owned the fund during the entire period and paid taxes on the fund’s distributions, and (2) assuming that an investor paid taxes on the fund’s distributions and sold all shares at the end of each period.
Calculations are based on the highest individual federal income tax and capital gains tax rates in effect at the times of the distributions and the hypothetical sales. State and local taxes were not considered. After-tax returns reflect any qualified dividend income , using actual prior-year figures and estimates for 2010. (In the example, returns after the sale of fund shares may be higher than those assuming no sale. This occurs when the sale would have produced a capital loss. The calculation assumes that the investor received a tax deduction for the loss.) Please note that your actual after-tax returns will depend on your tax situation and may differ from those shown. Also note that if you own the fund in a tax-deferred account, such as an individual retirement account or a 401(k) plan, this information does not apply to you. Such accounts are not subject to current taxes.
Finally, keep in mind that a fund’s performance—whether before or after taxes—does not guarantee future results.
| | | |
| Average Annual Total Returns: Global Equity Fund | | | |
| Periods Ended September 30, 2010 | | | |
| | One | Five | Ten |
| | Year | Years | Years |
| Returns Before Taxes | 10.51% | 1.37% | 6.66% |
| Returns After Taxes on Distributions | 10.18 | 0.49 | 5.69 |
| Returns After Taxes on Distributions and Sale of Fund Shares | 7.31 | 1.00 | 5.47 |
38
About Your Fund’s Expenses
As a shareholder of the fund, you incur ongoing costs, which include costs for portfolio management, administrative services, and shareholder reports (like this one), among others. Operating expenses, which are deducted from a fund’s gross income, directly reduce the investment return of the fund.
A fund’s expenses are expressed as a percentage of its average net assets. This figure is known as the expense ratio. The following examples are intended to help you understand the ongoing costs (in dollars) of investing in your fund and to compare these costs with those of other mutual funds. The examples are based on an investment of $1,000 made at the beginning of the period shown and held for the entire period.
The accompanying table illustrates your fund’s costs in two ways:
• Based on actual fund return. This section helps you to estimate the actual expenses that you paid over the period. The ”Ending Account Value“ shown is derived from the fund‘s actual return, and the third column shows the dollar amount that would have been paid by an investor who started with $1,000 in the fund. You may use the information here, together with the amount you invested, to estimate the expenses that you paid over the period.
To do so, simply divide your account value by $1,000 (for example, an $8,600 account value divided by $1,000 = 8.6), then multiply the result by the number given for your fund under the heading ”Expenses Paid During Period.“
• Based on hypothetical 5% yearly return. This section is intended to help you compare your fund‘s costs with those of other mutual funds. It assumes that the fund had a yearly return of 5% before expenses, but that the expense ratio is unchanged. In this case—because the return used is not the fund’s actual return—the results do not apply to your investment. The example is useful in making comparisons because the Securities and Exchange Commission requires all mutual funds to calculate expenses based on a 5% return. You can assess your fund’s costs by comparing this hypothetical example with the hypothetical examples that appear in shareholder reports of other funds.
Note that the expenses shown in the table are meant to highlight and help you compare ongoing costs only and do not reflect transaction costs incurred by the fund for buying and selling securities. Further, the expenses do not include the account service fee described in the prospectus. If such a fee were applied to your account, your costs would be higher. Your fund does not charge transaction fees, such as purchase or redemption fees, nor does it carry a “sales load.” The calculations assume no shares were bought or sold during the period. Your actual costs may have been higher or lower, depending on the amount of your investment and the timing of any purchases or redemptions.
You can find more information about the fund’s expenses, including annual expense ratios, in the Financial Statements section of this report. For additional information on operating expenses and other shareholder costs, please refer to your fund’s current prospectus.
39
| | | |
| Six Months Ended September 30, 2010 | | | |
| | Beginning | Ending | Expenses |
| | Account Value | Account Value | Paid During |
| Global Equity Fund | 3/31/2010 | 9/30/2010 | Period |
| Based on Actual Fund Return | $1,000.00 | $1,021.98 | $2.08 |
| Based on Hypothetical 5% Yearly Return | 1,000.00 | 1,023.01 | 2.08 |
The calculations are based on expenses incurred in the most recent six-month period. The fund’s annualized six-month expense ratio for that period is 0.41%. The dollar amounts shown as “Expenses Paid” are equal to the annualized expense ratio multiplied by the average account value over the period, multiplied by the number of days in the most recent six-month period, then divided by the number of days in the most recent 12-month period.
40
Glossary
Beta. A measure of the magnitude of a fund’s past share-price fluctuations in relation to the ups and downs of a given market index. The index is assigned a beta of 1.00. Compared with a given index, a fund with a beta of 1.20 typically would have seen its share price rise or fall by 12% when the index rose or fell by 10%. For this report, beta is based on returns over the past 36 months for both the fund and the index. Note that a fund’s beta should be reviewed in conjunction with its R-squared (see definition). The lower the R-squared, the less correlation there is between the fund and the index, and the less reliable beta is as an indicator of volatility.
Dividend Yield. Dividend income earned by stocks, expressed as a percentage of the aggregate market value (or of net asset value, for a fund). The yield is determined by dividing the amount of the annual dividends by the aggregate value (or net asset value) at the end of the period. For a fund, the dividend yield is based solely on stock holdings and does not include any income produced by other investments.
Earnings Growth Rate. The average annual rate of growth in earnings over the past five years for the stocks now in a fund.
Equity Exposure. A measure that reflects a fund’s investments in stocks and stock futures. Any holdings in short-term reserves are excluded.
Expense Ratio. The percentage of a fund’s average net assets used to pay its annual administrative and advisory expenses. These expenses directly reduce returns to investors.
Inception Date. The date on which the assets of a fund (or one of its share classes) are first invested in accordance with the fund’s investment objective. For funds with a subscription period, the inception date is the day after that period ends. Investment performance is measured from the inception date.
Median Market Cap. An indicator of the size of companies in which a fund invests; the midpoint of market capitalization (market price x shares outstanding) of a fund’s stocks, weighted by the proportion of the fund’s assets invested in each stock. Stocks representing half of the fund’s assets have market capitalizations above the median, and the rest are below it.
Price/Book Ratio. The share price of a stock divided by its net worth, or book value, per share. For a fund, the weighted average price/book ratio of the stocks it holds.
Price/Earnings Ratio. The ratio of a stock’s current price to its per-share earnings over the past year. For a fund, the weighted average P/E of the stocks it holds. P/E is an indicator of market expectations about corporate prospects; the higher the P/E, the greater the expectations for a company’s future growth.
R-Squared. A measure of how much of a fund’s past returns can be explained by the returns from the market in general, as measured by a given index. If a fund’s total returns were precisely synchronized with an index’s returns, its R-squared would be 1.00. If the fund’s returns bore no relationship to the index’s returns, its R-squared would be 0. For this report, R-squared is based on returns over the past 36 months for both the fund and the index.
Return on Equity. The annual average rate of return generated by a company during the past five years for each dollar of shareholder’s equity (net income divided by shareholder’s equity). For a fund, the weighted average return on equity for the companies whose stocks it holds.
41
Short-Term Reserves. The percentage of a fund invested in highly liquid, short-term securities that can be readily converted to cash.
Turnover Rate. An indication of the fund’s trading activity. Funds with high turnover rates incur higher transaction costs and may be more likely to distribute capital gains (which may be taxable to investors). The turnover rate excludes in-kind transactions, which have minimal impact on costs.
42
This page intentionally left blank.
The People Who Govern Your Fund
The trustees of your mutual fund are there to see that the fund is operated and managed in your best interests since, as a shareholder, you are a part owner of the fund. Your fund’s trustees also serve on the board of directors of The Vanguard Group, Inc., which is owned by the Vanguard funds and provides services to them on an at-cost basis.
A majority of Vanguard’s board members are independent, meaning that they have no affiliation with Vanguard or the funds they oversee, apart from the sizable personal investments they have made as private individuals. The independent board members have distinguished backgrounds in business, academia, and public service. Each of the trustees and executive officers oversees 178 Vanguard funds.
The following table provides information for each trustee and executive officer of the fund. More information about the trustees is in the Statement of Additional Information, which can be obtained, without charge, by contacting Vanguard at 800-662-7447, or online at Vanguard.com.
| |
| Interested Trustee1 | Amy Gutmann |
| | Born 1949. Trustee Since June 2006. Principal |
| F. William McNabb III | Occupation(s) During the Past Five Years: President |
| Born 1957. Trustee Since July 2009. Chairman of the | of the University of Pennsylvania; Christopher H. |
| Board. Principal Occupation(s) During the Past Five | Browne Distinguished Professor of Political Science |
| Years: Chairman of the Board of The Vanguard Group, | in the School of Arts and Sciences with secondary |
| Inc., and of each of the investment companies served | appointments at the Annenberg School for Commu- |
| by The Vanguard Group, since January 2010; Director | nication and the Graduate School of Education |
| of The Vanguard Group since 2008; Chief Executive | of the University of Pennsylvania; Director of |
| Officer and President of The Vanguard Group and of | Carnegie Corporation of New York, Schuylkill River |
| each of the investment companies served by The | Development Corporation, and Greater Philadelphia |
| Vanguard Group since 2008; Director of Vanguard | Chamber of Commerce; Trustee of the National |
| Marketing Corporation; Managing Director of The | Constitution Center; Chair of the Presidential |
| Vanguard Group (1995–2008) . | Commission for the Study of Bioethical Issues. |
| |
| | JoAnn Heffernan Heisen |
| Independent Trustees | Born 1950. Trustee Since July 1998. Principal |
| | Occupation(s) During the Past Five Years: Corporate |
| Emerson U. Fullwood | Vice President and Chief Global Diversity Officer |
| Born 1948. Trustee Since January 2008. Principal | since 2006 (retired 2008) and Member of the |
| Occupation(s) During the Past Five Years: Executive | Executive Committee (retired 2008) of Johnson & |
| Chief Staff and Marketing Officer for North America | Johnson (pharmaceuticals/consumer products); Vice |
| and Corporate Vice President (retired 2008) of Xerox | President and Chief Information Officer of Johnson & |
| Corporation (document management products and | Johnson (1997–2005); Director of the University |
| services); Director of SPX Corporation (multi-industry | Medical Center at Princeton and Women’s Research |
| manufacturing), the United Way of Rochester, | and Education Institute; Member of the Advisory |
| Amerigroup Corporation (managed health care), | Board of the Maxwell School of Citizenship and Public |
| the University of Rochester Medical Center, and | Affairs at Syracuse University. |
| Monroe Community College Foundation. | |
| | F. Joseph Loughrey |
| Rajiv L. Gupta | Born 1949. Trustee Since October 2009. Principal |
| Born 1945. Trustee Since December 2001.2 | Occupation(s) During the Past Five Years: President |
| Principal Occupation(s) During the Past Five Years: | and Chief Operating Officer since 2005 (retired 2009) |
| Chairman and Chief Executive Officer (retired 2009) | and Vice Chairman of the Board (2008–2009) of |
| and President (2006–2008) of Rohm and Haas Co. | Cummins Inc. (industrial machinery); Director of |
| (chemicals); Director of Tyco International, Ltd. | SKF AB (industrial machinery), Hillenbrand, Inc. |
| (diversified manufacturing and services) and Hewlett- | (specialized consumer services), Sauer-Danfoss Inc. |
| Packard Co. (electronic computer manufacturing); | (machinery), the Lumina Foundation for Education, |
| Trustee of The Conference Board; Member of the | and Oxfam America; Chairman of the Advisory |
| Board of Managers of Delphi Automotive LLP | Council for the College of Arts and Letters at the |
| (automotive components) . | University of Notre Dame. |
| | |
| André F. Perold | Kathryn J. Hyatt | |
| Born 1952. Trustee Since December 2004. Principal | Born 1955. Treasurer Since November 2008. Principal |
| Occupation(s) During the Past Five Years: George | Occupation(s) During the Past Five Years: Principal |
| Gund Professor of Finance and Banking at the Harvard | of The Vanguard Group, Inc.; Treasurer of each of |
| Business School; Chair of the Investment Committee | the investment companies served by The Vanguard |
| of HighVista Strategies LLC (private investment firm) . | Group since 2008; Assistant Treasurer of each of the |
| | investment companies served by The Vanguard Group |
| Alfred M. Rankin, Jr. | (1988–2008) . | |
| Born 1941. Trustee Since January 1993. Principal | | |
| Occupation(s) During the Past Five Years: Chairman, | Heidi Stam | |
| President, and Chief Executive Officer of NACCO | Born 1956. Secretary Since July 2005. Principal |
| Industries, Inc. (forklift trucks/housewares/lignite); | Occupation(s) During the Past Five Years: Managing |
| Director of Goodrich Corporation (industrial products/ | Director of The Vanguard Group, Inc., since 2006; |
| aircraft systems and services); Chairman of the | General Counsel of The Vanguard Group since 2005; |
| Federal Reserve Bank of Cleveland; Trustee of The | Secretary of The Vanguard Group and of each of the |
| Cleveland Museum of Art. | investment companies served by The Vanguard Group |
| | since 2005; Director and Senior Vice President of |
| Peter F. Volanakis | Vanguard Marketing Corporation since 2005; |
| Born 1955. Trustee Since July 2009. Principal | Principal of The Vanguard Group (1997–2006). |
| Occupation(s) During the Past Five Years: President | | |
| since 2007 and Chief Operating Officer since 2005 | | |
| of Corning Incorporated (communications equipment); | Vanguard Senior Management Team |
| President of Corning Technologies (2001–2005); | | |
| Director of Corning Incorporated and Dow Corning; | R. Gregory Barton | Michael S. Miller |
| Trustee of the Corning Incorporated Foundation and | Mortimer J. Buckley | James M. Norris |
| the Corning Museum of Glass; Overseer of the | Kathleen C. Gubanich | Glenn W. Reed |
| Amos Tuck School of Business Administration at | Paul A. Heller | George U. Sauter |
| Dartmouth College. | | |
| |
| | Chairman Emeritus and Senior Advisor |
| Executive Officers | | |
| | John J. Brennan | |
| Glenn Booraem | Chairman, 1996–2009 | |
| Born 1967. Controller Since July 2010. Principal | Chief Executive Officer and President, 1996–2008 |
| Occupation(s) During the Past Five Years: Principal | | |
| of The Vanguard Group, Inc.; Controller of each of | | |
| the investment companies served by The Vanguard | Founder | |
| Group since 2010; Assistant Controller of each of | | |
| the investment companies served by The Vanguard | John C. Bogle | |
| Group (2001–2010) . | Chairman and Chief Executive Officer, 1974–1996 |
| |
| Thomas J. Higgins | | |
| Born 1957. Chief Financial Officer Since September | | |
| 2008. Principal Occupation(s) During the Past Five | | |
| Years: Principal of The Vanguard Group, Inc.; Chief | | |
| Financial Officer of each of the investment companies | | |
| served by The Vanguard Group since 2008; Treasurer | | |
| of each of the investment companies served by The | | |
| Vanguard Group (1998–2008) . | | |
1 Mr. McNabb is considered an “interested person,” as defined in the Investment Company Act of 1940, because he is an officer of the Vanguard funds.
2 December 2002 for Vanguard Equity Income Fund, Vanguard Growth Equity Fund, the Vanguard Municipal Bond Funds, and the Vanguard State Tax-Exempt Funds.
| 
|
| P.O. Box 2600 |
| Valley Forge, PA 19482-2600 |
Connect with Vanguard® > Vanguard.com
| Fund Information > 800-662-7447 | |
| CFA® is a trademark owned by CFA Institute. |
| Direct Investor Account Services > 800-662-2739 | |
| |
| Institutional Investor Services > 800-523-1036 | |
| |
| Text Telephone for People | |
| With Hearing Impairment > 800-749-7273 | |
| |
| This material may be used in conjunction | |
| with the offering of shares of any Vanguard | |
| fund only if preceded or accompanied by | |
| the fund’s current prospectus. | |
| |
| All comparative mutual fund data are from Lipper Inc. or | |
| Morningstar, Inc., unless otherwise noted. | |
| |
| You can obtain a free copy of Vanguard’s proxy voting | |
| guidelines by visiting vanguard.com/proxyreporting or by | |
| calling Vanguard at 800-662-2739. The guidelines are | |
| also available from the SEC’s website, sec.gov. In | |
| addition, you may obtain a free report on how your fund | |
| voted the proxies for securities it owned during the 12 | |
| months ended June 30. To get the report, visit either | |
| vanguard.com/proxyreporting or sec.gov. | |
| |
| You can review and copy information about your fund at | |
| the SEC’s Public Reference Room in Washington, D.C. To | |
| find out more about this public service, call the SEC at | |
| 202-551-8090. Information about your fund is also | |
| available on the SEC’s website, and you can receive | |
| copies of this information, for a fee, by sending a | |
| request in either of two ways: via e-mail addressed to | |
| publicinfo@sec.gov or via regular mail addressed to the | |
| Public Reference Section, Securities and Exchange | |
| Commission, Washington, DC 20549-1520. | |
| |
| |
| | © 2010 The Vanguard Group, Inc. |
| | All rights reserved. |
| | Vanguard Marketing Corporation, Distributor. |
| |
| | Q1290 112010 |
 |
| Vanguard Strategic Small-Cap |
| Equity Fund Annual Report |
|
|
| September 30, 2010 |
|
 |
|
|
> For the fiscal year ended September 30, 2010, Vanguard Strategic Small-Cap Equity Fund returned about 17%, ahead of the return of its benchmark index and the average return of its peer group.
> The broad U.S. market returned about 11%, and small-capitalization stocks slightly outpaced their large-cap counterparts.
> Financials, information technology, and consumer discretionary stocks were the fund’s leading contributors.
| |
| Contents | |
| Your Fund’s Total Returns. | 1 |
| Chairman’s Letter. | 2 |
| Advisor’s Report. | 7 |
| Fund Profile. | 9 |
| Performance Summary. | 10 |
| Financial Statements. | 12 |
| Your Fund’s After-Tax Returns. | 26 |
| About Your Fund’s Expenses. | 27 |
| Glossary. | 29 |
Please note: The opinions expressed in this report are just that—informed opinions. They should not be considered promises or advice. Also, please keep in mind that the information and opinions cover the period through the date on the front of this report. Of course, the risks of investing in your fund are spelled out in the prospectus.
See the Glossary for definitions of investment terms used in this report.
Cover photograph: Jean Maher.
Your Fund’s Total Returns
| |
| Fiscal Year Ended September 30, 2010 | |
| | Total |
| | Returns |
| Vanguard Strategic Small-Cap Equity Fund | 16.70% |
| MSCI US Small Cap 1750 Index | 15.14 |
| Small-Cap Core Funds Average | 13.24 |
| Small-Cap Core Funds Average: Derived from data provided by Lipper Inc. | |
| | | | |
| Your Fund’s Performance at a Glance | | | | |
| September 30, 2009, Through September 30, 2010 | | | | |
| | | | Distributions Per Share |
| | Starting | Ending | Income | Capital |
| | Share Price | Share Price | Dividends | Gains |
| Vanguard Strategic Small-Cap Equity Fund | $14.32 | $16.53 | $0.160 | $0.000 |
1

Chairman’s Letter
Dear Shareholder,
In a year in which stocks changed course more than once, Vanguard Strategic Small-Cap Equity Fund returned about 17% for the 12 months ended September 30, 2010. The fund advanced about 15% during the first six months of the year but gained only about 1% in the second half, despite a surge of nearly 12% in September.
The fund outpaced its benchmark, the MSCI US Small Cap 1750 Index, which returned about 15%, and exceeded the approximately 13% average return of its peers. Only the energy sector finished the period in negative territory, although telecommunications stocks, a sliver of the fund’s holdings, returned less than 1%. Financials, information technology, and consumer discretionary stocks were the top performers.
If you hold shares in a taxable account, you may wish to review the table and discussion on after-tax returns for the fiscal year, based on the highest tax bracket, later in this report.
An upbeat end to a worrisome 12 months
Although global stock markets traced a ragged trajectory, they ultimately gained ground for the 12 months ended September 30. Europe’s sovereign debt crisis and a dispiriting lack of vigor in the U.S. economy weighed on stock prices through the spring and summer. In September, however, investor sentiment perked up, buoyed by continued signs of
2
strength in corporate financial statements. The broad U.S. stock market rallied to close the period with a return of more than 11%. Small-capitalization stocks finished a few steps ahead of their large-cap counterparts.
International stock markets were a mixed bag: middling returns in Europe, stagnation in the Pacific region’s developed markets, and a return of more than 20% from emerging markets. The combined result, as measured by the MSCI All Country World Index ex USA, was a 12-month return of 8%.
Bond prices rallied, driving yields to surprising lows
Bonds produced strong 12-month returns, a gratifying performance that nevertheless raised questions about the prospects for total returns in a fixed income market where yields hovered near all-time lows. At the start of the period, the 10-year U.S. Treasury note yielded 3.31%; at the end, the figure was 2.51% as investors bid up bond prices. As yields move lower, of course, the scope for continued declines—and the attendant rise in prices—diminishes. Corporate bonds performed best for the 12 months. Municipal bonds delivered solid, but more modest, returns.
| | | |
| Market Barometer | | | |
| |
| | | Average Annual Total Returns |
| | | Periods Ended September 30, 2010 |
| | One | Three | Five |
| | Year | Years | Years |
| Stocks | | | |
| Russell 1000 Index (Large-caps) | 10.75% | -6.79% | 0.86% |
| Russell 2000 Index (Small-caps) | 13.35 | -4.29 | 1.60 |
| Dow Jones U.S. Total Stock Market Index | 11.51 | -6.12 | 1.37 |
| MSCI All Country World Index ex USA (International) | 8.00 | -6.98 | 4.72 |
| |
| Bonds | | | |
| Barclays Capital U.S. Aggregate Bond Index (Broad | | | |
| taxable market) | 8.16% | 7.42% | 6.20% |
| Barclays Capital Municipal Bond Index (Broad | | | |
| tax-exempt market) | 5.81 | 6.04 | 5.13 |
| Citigroup Three-Month U.S. Treasury Bill Index | 0.12 | 1.01 | 2.47 |
| |
| CPI | | | |
| Consumer Price Index | 1.14% | 1.57% | 1.90% |
3
As has been the case for almost two years now, the yields of money market securities remained near 0%, a consequence of the Federal Reserve Board’s efforts to stimulate the economy by keeping a tight lid on borrowing costs.
Financial holdings buoyed fund’s results
Vanguard Strategic Small-Cap Equity Fund’s advisor, Vanguard Quantitative Equity Group, maintains sector allocations and a fund risk profile similar to those of the benchmark index while overweighting or underweighting individual stocks as it seeks outperformance. There were more hits than misses for the fiscal year as the fund surpassed the return of its benchmark and the average return of its peers.
The fund’s fiscal year can be looked at as two distinct halves. As the stock market continued the rally that began in March 2009, the fund returned about 15% for the first six months. The second half was far choppier and less productive as concerns spread about the health of the U.S. economy and Europe’s debt crisis. Despite September’s double-digit gain, the fund returned about 1% for the six-month period.
Financial stocks, the largest sector in both the benchmark and the fund, significantly boosted the fund’s performance. Superior stock selection was evident especially among mortgage finance companies, many of which suffered as weakness
| | |
| Expense Ratios | | |
| Your Fund Compared With Its Peer Group | | |
| | | Peer Group |
| | Fund | Average |
| Strategic Small-Cap Equity Fund | 0.43% | 1.50% |
The fund expense ratio shown is from the prospectus dated January 26, 2010, and represents estimated costs for the current fiscal year. For the fiscal year ended September 30, 2010, the fund’s expense ratio was 0.43%. The peer-group expense ratio is derived from data provided by Lipper Inc. and captures information through year-end 2009.
Peer group: Small-Cap Core Funds.
4
in the real estate market continued. Insurance company holdings provided an additional edge against the benchmark.
Strong stock choices again drove the fund’s superior performance in the information technology sector, where communication equipment manufacturers led the way.
A rebound in advertising spending lifted some media companies in the consumer discretionary sector. Several restaurant companies also did well.
The only sector that posted a negative result for the period was energy. Although one of the fund’s smaller sector weightings, it weighed heavily on performance. Poor stock selection in industrials further limited returns as the fund missed opportunities in several airlines that posted strong results and was overweighted in a few that struggled.
Prior-year results weigh on performance record
Since its launch in April 2006, Vanguard Strategic Small-Cap Equity Fund has had an average annual return of about –3%. Its benchmark index has been nearly flat for the same period, while the average return for peers has been about –2%.
While the fund’s returns over the past 12 months are commendable, they haven’t been enough to offset prior-year losses. Of course, at 4½ years old, the fund is still
| |
| Total Returns | |
| Inception Through September 30, 2010 | |
| | Average |
| | Annual Return |
| Strategic Small-Cap Equity Fund (Returns since inception: 4/24/2006) | -3.10% |
| MSCI US Small Cap 1750 Index | 0.03 |
| Small-Cap Core Funds Average | -2.18 |
| Small-Cap Core Funds Average: Derived from data provided by Lipper Inc. | |
The figures shown represent past performance, which is not a guarantee of future results. (Current performance may be lower or higher than the performance data cited. For performance data current to the most recent month-end, visit our website at vanguard.com/performance.) Note, too, that both investment returns and principal value can fluctuate widely, so an investor’s shares, when sold, could be worth more or less than their original cost.
5
in its infancy, and it’s not yet possible to make a fair judgment about its longer-term performance.
Like many active quantitative managers, Vanguard Quantitative Equity Group has struggled with unusual volatility and rallies in which the seemingly stronger and more attractively valued companies favored by its models have trailed the market’s more speculative stocks. Like any stock market dynamic, this one will eventually change course. We remain confident that when it does, the advisor’s disciplined, quantitative stock selection techniques can put it in a position to deliver highly competitive long-term returns. Its efforts are aided by the fund’s low costs, which help shareholders keep more of the return, an advantage that can compound over time.
Market predictions aren’t a winning recipe
The financial markets have a tendency to move in mysterious ways. Even the most astute market watchers don’t know what will happen next or which segment will be the next big leader or laggard. It’s tempting for investors to try to pick tomorrow’s winner before the masses and then shift tactics when the moment’s right.
Over any length of time, however, such a strategy likely will result in frustration and lower returns. Instead of trying to predict the next popular trend, we counsel investors to hold a portfolio that is diversified across and within the major asset classes of stocks, bonds, and money market instruments.
The Strategic Small-Cap Equity Fund is expected to go through up and down periods. But we continue to have confidence in Vanguard Quantitative Equity Group’s underlying stock-selection methodology and long-term strategy. We believe the fund can play a useful part as a small-cap component of a low-cost, well-balanced investment plan.
Thank you for entrusting your assets to Vanguard.
Sincerely,

F. William McNabb III
Chairman and Chief Executive Officer
October 13, 2010
6
Advisor’s Report
After starting the fiscal year with two strong quarters, the U.S. equity market headed south during the third quarter, declining over 10%, before finishing the fiscal fourth quarter and year with a strong rally. The September recovery came despite continued weakness and uncertainty in economic data. The growth rate of the U.S. economy has declined steadily since the fourth quarter of 2009, when GDP grew at a 5.0% annual pace; that was followed by a 3.7% rate in the first quarter of 2010 and a 1.6% rate in the second quarter. Although corporate earnings have continued to surprise on the upside and may continue to do so for this third quarter, an uncertain recovery, nearly 10% unemployment, sovereign debt concerns, and recent Federal Reserve statements about the possibility of additional stimulus measures have left investors cautious about where equity markets are headed next.
Small-capitalization stocks, the focus of your investment in the Strategic Small-Cap Equity Fund, returned 15.14% for the period as measured by the MSCI Small Cap 1750 Index. We are pleased to report that we were able to deliver a return in excess of the benchmark, as the Strategic Small-Cap Equity Fund gained 16.70%. Small-caps again outpaced larger-cap companies, as they have since 2007. For the 12 months, small-cap returns were led by materials, consumer discretionary, and consumer staples companies. Telecommunication services companies were the laggards.
Our company evaluation process added value during this period, as our valuation, management decisions, growth, and quality indicators accurately identified the outperformers. Our valuation model measures the price we will pay for a stock’s earnings or cash flow. The management decisions model evaluates the decisions corporate managers make to enhance shareholder value, and the growth indicator differentiates between companies with low valuations resulting from poor growth prospects and those with more attractive outlooks. The quality model measures balance sheet strength and the sustainability of earnings.
Our market sentiment model, which assesses investors’ actions regarding a company in the marketplace, was negative for the period and detracted from overall results.
Stock selection results were strongest in the financial, consumer discretionary, and technology sectors. In financials, selections including PMI Group, Nelnet Inc., and Ares Capital Corp. led the way. In the consumer category, Valassis Communications, Dana Holding Corp., and Tempur-Pedic International were the largest contributors to our relative results. Sybase and VeriFone were successful holdings in the technology group.
7
On the other hand, our selections in the industrial and energy sectors held back our overall return, as General Cable, Oshkosh, Helix Energy Solutions, and Cal Dive International did not perform as expected.
Although proof of a stable economic recovery has not yet materialized and market uncertainty and volatility may be with us for the near term, we remain committed to a portfolio of companies with lower relative price/earnings and price/cash flow ratios, growth rates near the market’s overall rate, a higher return on equity, quality balance sheets, and positive market sentiment. We believe this “growth at a reasonable price” approach to building a portfolio combined with a disciplined risk control framework offers an attractive profile that the market will reward over the long term. We thank you for your investment and look forward to the coming year.
James P. Stetler,
Principal and Portfolio Manager
Joel M. Dickson, Ph.D.
Prinicipal and Head, Vanguard Active Quantitative Equity Management
Vanguard Quantitative Equity Group
October 19, 2010
8
Strategic Small-Cap Equity Fund
Fund Profile
As of September 30, 2010
| | | |
| Portfolio Characteristics | | |
| | | | DJ |
| | | MSCI US | U.S. Total |
| | | Small Cap | Market |
| | Fund | 1750 Index | Index |
| Number of Stocks | 475 | 1,724 | 3,920 |
| Median Market Cap | $1.5B | $1.5B | $27.3B |
| Price/Earnings Ratio | 15.5x | 24.9x | 17.1x |
| Price/Book Ratio | 2.0x | 1.8x | 2.1x |
| Return on Equity | 10.1% | 10.4% | 19.1% |
| Earnings Growth Rate 11.2% | 4.3% | 6.4% |
| Dividend Yield | 1.2% | 1.3% | 1.8% |
| Foreign Holdings | 0.2% | 0.0% | 0.0% |
| Turnover Rate | 66% | — | — |
| Ticker Symbol | VSTCX | — | — |
| Expense Ratio1 | 0.43% | — | — |
| 30-Day SEC Yield | 0.80% | — | — |
| Short-Term Reserves | 0.2% | — | — |
| | | |
| Sector Diversification (% of equity exposure) |
| | | | DJ |
| | | MSCI US | U.S. Total |
| | | Small Cap | Market |
| | Fund 1750 Index | Index |
| Consumer | | | |
| Discretionary | 15.0% | 14.5% | 11.7% |
| Consumer Staples | 3.9 | 3.0 | 10.1 |
| Energy | 5.5 | 5.7 | 9.7 |
| Financials | 20.7 | 21.0 | 16.6 |
| Health Care | 11.2 | 10.8 | 11.2 |
| Industrials | 15.2 | 16.1 | 11.1 |
| Information | | | |
| Technology | 17.8 | 18.4 | 19.0 |
| Materials | 5.7 | 5.8 | 4.2 |
| Telecommunication | | | |
| Services | 1.0 | 0.9 | 2.9 |
| Utilities | 4.0 | 3.8 | 3.5 |
| | |
| Volatility Measures | | |
| | | DJ |
| | MSCI US | U.S. Total |
| | Small Cap | Market |
| | 1750 Index | Index |
| R-Squared | 0.99 | 0.94 |
| Beta | 0.95 | 1.18 |
These measures show the degree and timing of the fund’s fluctuations compared with the indexes over 36 months.
| | |
| Ten Largest Holdings (% of total net assets) |
| Core Laboratories NV | Oil & Gas | |
| | Equipment & | |
| | Services | 0.8% |
| VeriFone Systems Inc. | Data Processing & | |
| | Outsourced | |
| | Services | 0.8 |
| Timken Co. | Industrial | |
| | Machinery | 0.8 |
| Solera Holdings Inc. | Application | |
| | Software | 0.7 |
| Warnaco Group Inc. | Apparel, | |
| | Accessories & | |
| | Luxury Goods | 0.7 |
| Panera Bread Co. | Restaurants | 0.7 |
| Oil States International | Oil & Gas | |
| Inc. | Equipment & | |
| | Services | 0.7 |
| Atmos Energy Corp. | Gas Utilities | 0.7 |
| Endurance Specialty | Reinsurance | |
| Holdings Ltd. | | 0.7 |
| Ares Capital Corp. | Asset Management | |
| | & Custody Banks | 0.7 |
| Top Ten | | 7.3% |
The holdings listed exclude any temporary cash investments and equity index products.
Investment Focus
1 The expense ratio shown is from the prospectus dated January 26, 2010, and represents estimated costs for the current fiscal year. For the fiscal year ended September 30, 2010, the expense ratio was 0.43%.
9
Strategic Small-Cap Equity Fund
Performance Summary
All of the returns in this report represent past performance, which is not a guarantee of future results that may be achieved by the fund. (Current performance may be lower or higher than the performance data cited. For performance data current to the most recent month-end, visit our website at vanguard.com/performance.) Note, too, that both investment returns and principal value can fluctuate widely, so an investor’s shares, when sold, could be worth more or less than their original cost. The returns shown do not reflect taxes that a shareholder would pay on fund distributions or on the sale of fund shares.
Cumulative Performance: April 24, 2006, Through September 30, 2010
Initial Investment of $10,000
| | | |
| | Average Annual Total Returns | |
| | Periods Ended September 30, 2010 | |
| | | Since | Final Value |
| | One | Inception | of a $10,000 |
| | Year | (4/24/2006) | Investment |
| Strategic Small-Cap Equity Fund | 16.70% | -3.10% | $8,698 |
| Dow Jones U.S. Total Stock Market | | | |
| Index | 11.51 | -0.41 | 9,818 |
| MSCI US Small Cap 1750 Index | 15.14 | 0.03 | 10,013 |
| Small-Cap Core Funds Average | 13.24 | -2.18 | 9,071 |
Small-Cap Core Funds Average: Derived from data provided by Lipper Inc.
"Since Inception" performance is calculated from the inception date for both the fund and its comparative standards.
See Financial Highlights for dividend and capital gains information.
10
Strategic Small-Cap Equity Fund
Fiscal-Year Total Returns (%): April 24, 2006, Through September 30, 2010
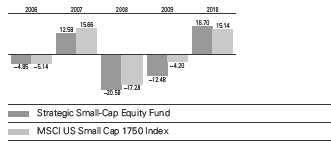
11
Strategic Small-Cap Equity Fund
Financial Statements
Statement of Net Assets
As of September 30, 2010
The fund reports a complete list of its holdings in regulatory filings four times in each fiscal year, at the quarter-ends. For the second and fourth fiscal quarters, the lists appear in the fund’s semiannual and annual reports to shareholders. For the first and third fiscal quarters, the fund files the lists with the Securities and Exchange Commission on Form N-Q. Shareholders can look up the fund’s Forms N-Q on the SEC’s website at sec.gov. Forms N-Q may also be reviewed and copied at the SEC’s Public Reference Room (see the back cover of this report for further information).
| | | |
| | | | Market |
| | | | Value |
| | | Shares | ($000) |
| Common Stocks (99.5%)1 | | |
| Consumer Discretionary (15.0%) | | |
| * | Warnaco Group Inc. | 25,800 | 1,319 |
| * | Panera Bread Co. Class A | 14,500 | 1,285 |
| * | Tempur-Pedic | | |
| | International Inc. | 36,900 | 1,144 |
| * | Big Lots Inc. | 33,800 | 1,124 |
| * | Valassis | | |
| | Communications Inc. | 31,700 | 1,074 |
| | Cracker Barrel Old Country | | |
| | Store Inc. | 20,024 | 1,016 |
| * | Aeropostale Inc. | 42,150 | 980 |
| | Finish Line Inc. Class A | 62,800 | 874 |
| * | TRW Automotive | | |
| | Holdings Corp. | 20,460 | 850 |
| | Rent-A-Center Inc. | 37,700 | 844 |
| | Cooper Tire & Rubber Co. | 41,500 | 815 |
| * | Liberty Media Corp. - Capital | 15,300 | 797 |
| * | CEC Entertainment Inc. | 23,200 | 796 |
| * | Dana Holding Corp. | 61,200 | 754 |
| | PF Chang’s China Bistro Inc. | 15,900 | 735 |
| * | Career Education Corp. | 33,700 | 724 |
| * | Jo-Ann Stores Inc. | 15,900 | 708 |
| * | Sinclair Broadcast Group Inc. | | |
| | Class A | 99,100 | 696 |
| * | Sally Beauty Holdings Inc. | 58,100 | 651 |
| * | La-Z-Boy Inc. | 70,500 | 595 |
| * | Papa John’s International Inc. | 21,815 | 575 |
| | Jones Apparel Group Inc. | 24,600 | 483 |
| | Scholastic Corp. | 15,500 | 431 |
| | Williams-Sonoma Inc. | 13,200 | 418 |
| * | JOS A Bank Clothiers Inc. | 9,450 | 403 |
| * | Timberland Co. Class A | 19,800 | 392 |
| * | HSN Inc. | 13,100 | 392 |
| * | Skechers U.S.A. Inc. | | |
| | Class A | 14,000 | 329 |
| * | Standard Pacific Corp. | 80,500 | 320 |
| * | Fossil Inc. | 5,800 | 312 |
| | Oxford Industries Inc. | 12,500 | 297 |
| | | |
| | | | Market |
| | | | Value |
| | | Shares | ($000) |
| * | Deckers Outdoor Corp. | 5,783 | 289 |
| * | Steven Madden Ltd. | 6,900 | 283 |
| * | Denny’s Corp. | 89,572 | 279 |
| * | New York Times Co. | | |
| | Class A | 31,700 | 245 |
| * | Biglari Holdings Inc. | 717 | 236 |
| * | DSW Inc. Class A | 7,500 | 215 |
| * | Carter’s Inc. | 7,900 | 208 |
| | Dillard’s Inc. Class A | 8,500 | 201 |
| * | Stein Mart Inc. | 22,700 | 200 |
| * | Journal Communications Inc. | | |
| | Class A | 43,475 | 196 |
| * | Domino’s Pizza Inc. | 14,800 | 196 |
| * | AFC Enterprises Inc. | 14,800 | 184 |
| * | AnnTaylor Stores Corp. | 8,000 | 162 |
| | Thor Industries Inc. | 4,400 | 147 |
| * | Ruby Tuesday Inc. | 12,000 | 142 |
| * | Cheesecake Factory Inc. | 5,100 | 135 |
| | Tupperware Brands Corp. | 2,600 | 119 |
| * | Talbots Inc. | 9,000 | 118 |
| | Gannett Co. Inc. | 9,500 | 116 |
| * | Lincoln Educational | | |
| | Services Corp. | 6,738 | 97 |
| * | Ulta Salon Cosmetics & | | |
| | Fragrance Inc. | 2,600 | 76 |
| * | Pre-Paid Legal Services Inc. | 1,200 | 75 |
| | Sotheby’s | 1,800 | 66 |
| | Chico’s FAS Inc. | 6,065 | 64 |
| * | Pier 1 Imports Inc. | 7,500 | 61 |
| * | J Crew Group Inc. | 1,700 | 57 |
| | Cinemark Holdings Inc. | 3,200 | 52 |
| | American Greetings Corp. | | |
| | Class A | 2,600 | 48 |
| * | Jakks Pacific Inc. | 2,700 | 48 |
| * | Office Depot Inc. | 9,636 | 44 |
| * | iRobot Corp. | 2,300 | 43 |
| | Polaris Industries Inc. | 600 | 39 |
12
Strategic Small-Cap Equity Fund
| | | |
| | | | Market |
| | | | Value |
| | | Shares | ($000) |
| | Universal Technical | | |
| | Institute Inc. | 1,900 | 37 |
| | Sturm Ruger & Co. Inc. | 2,200 | 30 |
| * | Brookfield Homes Corp. | 3,200 | 26 |
| | | | 26,667 |
| Consumer Staples (3.8%) | | |
| | Del Monte Foods Co. | 85,800 | 1,125 |
| | Ruddick Corp. | 25,700 | 891 |
| | Andersons Inc. | 17,100 | 648 |
| | Nu Skin Enterprises Inc. | | |
| | Class A | 20,500 | 590 |
| | Lancaster Colony Corp. | 11,500 | 546 |
| * | Central Garden and Pet Co. | | |
| | Class A | 46,506 | 482 |
| | Casey’s General Stores Inc. | 10,792 | 451 |
| * | Boston Beer Co. Inc. Class A | 6,300 | 421 |
| * | TreeHouse Foods Inc. | 7,800 | 360 |
| * | Revlon Inc. Class A | 24,300 | 307 |
| | Sanderson Farms Inc. | 6,400 | 277 |
| | National Beverage Corp. | 18,100 | 253 |
| | Coca-Cola Bottling Co. | | |
| | Consolidated | 3,000 | 159 |
| | J&J Snack Foods Corp. | 2,900 | 122 |
| | Herbalife Ltd. | 1,400 | 84 |
| | Corn Products | | |
| | International Inc. | 2,000 | 75 |
| * | Pantry Inc. | 2,100 | 51 |
| | | | 6,842 |
| Energy (5.4%) | | |
| | Core Laboratories NV | 16,000 | 1,409 |
| * | Oil States International Inc. | 27,197 | 1,266 |
| | Southern Union Co. | 43,000 | 1,034 |
| | World Fuel Services Corp. | 34,100 | 887 |
| * | Stone Energy Corp. | 48,800 | 719 |
| | SM Energy Co. | 11,100 | 416 |
| * | Matrix Service Co. | 37,942 | 332 |
| * | McMoRan Exploration Co. | 18,100 | 311 |
| * | Gran Tierra Energy Inc. | 40,300 | 311 |
| * | Energy Partners Ltd. | 20,800 | 250 |
| | Berry Petroleum Co. Class A | 6,700 | 213 |
| * | Energy XXI Bermuda Ltd. | 9,130 | 211 |
| * | OYO Geospace Corp. | 3,600 | 208 |
| * | Swift Energy Co. | 6,700 | 188 |
| * | PHI Inc. | 11,600 | 188 |
| * | James River Coal Co. | 10,600 | 186 |
| * | Gulfport Energy Corp. | 12,400 | 172 |
| * | Complete Production | | |
| | Services Inc. | 8,300 | 170 |
| * | Tetra Technologies Inc. | 16,300 | 166 |
| | Frontier Oil Corp. | 12,200 | 163 |
| * | International Coal Group Inc. | 30,517 | 162 |
| * | Brigham Exploration Co. | 7,054 | 132 |
| | CARBO Ceramics Inc. | 1,500 | 121 |
| * | Venoco Inc. | 5,229 | 103 |
| | | |
| | | | Market |
| | | | Value |
| | | Shares | ($000) |
| * | Crosstex Energy Inc. | 12,000 | 95 |
| * | Cloud Peak Energy Inc. | 4,200 | 77 |
| * | Petroquest Energy Inc. | 8,714 | 53 |
| | RPC Inc. | 1,700 | 36 |
| * | Clayton Williams Energy Inc. | 700 | 35 |
| * | Newpark Resources Inc. | 4,000 | 34 |
| * | Warren Resources Inc. | 8,300 | 33 |
| | | | 9,681 |
| Financials (20.5%) | | |
| | Endurance Specialty | | |
| | Holdings Ltd. | 29,600 | 1,178 |
| | Ares Capital Corp. | 74,600 | 1,168 |
| | Platinum Underwriters | | |
| | Holdings Ltd. | 25,100 | 1,092 |
| | Bank of Hawaii Corp. | 23,600 | 1,060 |
| | First Citizens | | |
| | BancShares Inc. Class A | 5,214 | 966 |
| | Horace Mann | | |
| | Educators Corp. | 54,300 | 965 |
| | Nelnet Inc. Class A | 42,000 | 961 |
| * | World Acceptance Corp. | 20,600 | 910 |
| | Bank of the Ozarks Inc. | 21,500 | 797 |
| | International | | |
| | Bancshares Corp. | 45,100 | 762 |
| * | Credit Acceptance Corp. | 12,510 | 758 |
| | Cash America | | |
| | International Inc. | 21,213 | 742 |
| | Camden Property Trust | 14,900 | 715 |
| * | ProAssurance Corp. | 11,500 | 662 |
| | Taubman Centers Inc. | 14,200 | 633 |
| | Highwoods Properties Inc. | 19,410 | 630 |
| | Apartment Investment & | | |
| | Management Co. | 29,100 | 622 |
| | Brandywine Realty Trust | 47,600 | 583 |
| | United Bankshares Inc. | 22,600 | 563 |
| | CBL & Associates | | |
| | Properties Inc. | 42,700 | 558 |
| * | Forest City | | |
| | Enterprises Inc. Class A | 43,300 | 556 |
| | Prosperity Bancshares Inc. | 16,300 | 529 |
| * | Altisource Portfolio | | |
| | Solutions SA | 16,800 | 523 |
| | Douglas Emmett Inc. | 29,600 | 518 |
| | Extra Space Storage Inc. | 31,600 | 507 |
| | Trustmark Corp. | 23,222 | 505 |
| | Community Bank | | |
| | System Inc. | 21,700 | 499 |
| | Dime Community | | |
| | Bancshares Inc. | 35,700 | 494 |
| | UMB Financial Corp. | 13,800 | 490 |
| | City Holding Co. | 15,762 | 483 |
| * | Ashford Hospitality Trust Inc. | 52,500 | 475 |
| | Sun Communities Inc. | 14,800 | 454 |
| | Lexington Realty Trust | 62,600 | 448 |
13
Strategic Small-Cap Equity Fund
| | | |
| | | | Market |
| | | | Value |
| | | Shares | ($000) |
| | Amtrust Financial | | |
| | Services Inc. | 30,500 | 443 |
| | U-Store-It Trust | 52,300 | 437 |
| | First Potomac Realty Trust | 28,700 | 431 |
| | Unitrin Inc. | 17,400 | 424 |
| * | Strategic Hotels & | | |
| | Resorts Inc. | 97,400 | 413 |
| * | Sunstone | | |
| | Hotel Investors Inc. | 45,526 | 413 |
| * | AmeriCredit Corp. | 16,600 | 406 |
| | Pennsylvania Real Estate | | |
| | Investment Trust | 33,326 | 395 |
| | Aspen Insurance | | |
| | Holdings Ltd. | 13,000 | 394 |
| | Infinity Property & | | |
| | Casualty Corp. | 8,000 | 390 |
| | Colonial Properties Trust | 23,670 | 383 |
| * | FPIC Insurance Group Inc. | 10,800 | 379 |
| | Parkway Properties Inc. | 25,100 | 371 |
| | SCBT Financial Corp. | 11,800 | 368 |
| | Equity Lifestyle | | |
| | Properties Inc. | 6,700 | 365 |
| | Winthrop Realty Trust | 29,300 | 362 |
| | PS Business Parks Inc. | 6,036 | 341 |
| | Mack-Cali Realty Corp. | 9,920 | 324 |
| | Montpelier Re Holdings Ltd. | 16,200 | 281 |
| | Advance America | | |
| | Cash Advance Centers Inc. | 67,800 | 273 |
| | Medical Properties Trust Inc. | 26,300 | 267 |
| | Acadia Realty Trust | 13,300 | 253 |
| | Hersha Hospitality Trust | 45,900 | 238 |
| | S&T Bancorp Inc. | 13,300 | 232 |
| | SL Green Realty Corp. | 3,600 | 228 |
| * | First Industrial | | |
| | Realty Trust Inc. | 44,200 | 224 |
| * | Cardtronics Inc. | 14,100 | 218 |
| | CapLease Inc. | 38,700 | 216 |
| | MVC Capital Inc. | 14,961 | 194 |
| | First Financial Bankshares Inc. | 4,100 | 193 |
| * | Signature Bank | 4,900 | 190 |
| | NBT Bancorp Inc. | 8,600 | 190 |
| | Provident New York Bancorp | 22,443 | 188 |
| | First Financial Corp. | 6,200 | 183 |
| | Bancfirst Corp. | 4,326 | 175 |
| | Abington Bancorp Inc. | 16,000 | 169 |
| | NewAlliance Bancshares Inc. | 12,000 | 151 |
| | Republic | | |
| | Bancorp Inc. Class A | 6,500 | 137 |
| | Glimcher Realty Trust | 21,700 | 133 |
| | Fulton Financial Corp. | 14,700 | 133 |
| | Westamerica Bancorporation | 2,300 | 125 |
| | Chimera Investment Corp. | 30,400 | 120 |
| | Camden National Corp. | 2,900 | 101 |
| | Provident | | |
| | Financial Services Inc. | 7,400 | 91 |
| | | |
| | | | Market |
| | | | Value |
| | | Shares | ($000) |
| | MFA Financial Inc. | 11,200 | 85 |
| | Jones Lang LaSalle Inc. | 970 | 84 |
| | Great Southern Bancorp Inc. | 3,700 | 81 |
| | FBL Financial | | |
| | Group Inc. Class A | 3,000 | 78 |
| | BlackRock Kelso Capital Corp. | 6,400 | 74 |
| | Kearny Financial Corp. | 7,900 | 70 |
| | 1st Source Corp. | 3,800 | 66 |
| * | Alleghany Corp. | 200 | 61 |
| | Park National Corp. | 900 | 58 |
| * | Greenlight Capital | | |
| | Re Ltd. Class A | 2,300 | 58 |
| | Tompkins Financial Corp. | 1,430 | 57 |
| * | Grubb & Ellis Co. | 47,230 | 57 |
| | Alterra Capital Holdings Ltd. | 2,800 | 56 |
| | Arrow Financial Corp. | 2,198 | 55 |
| | DiamondRock Hospitality Co. | 5,768 | 55 |
| | First Financial Bancorp | 3,200 | 53 |
| | Flagstone | | |
| | Reinsurance Holdings SA | 5,000 | 53 |
| | American | | |
| | Physicians Capital Inc. | 1,272 | 53 |
| | NGP Capital Resources Co. | 5,800 | 53 |
| * | First Cash Financial | | |
| | Services Inc. | 1,800 | 50 |
| | Potlatch Corp. | 1,300 | 44 |
| * | Ezcorp Inc. Class A | 2,100 | 42 |
| | Cardinal Financial Corp. | 4,300 | 41 |
| | Southside Bancshares Inc. | 2,100 | 40 |
| | Meadowbrook | | |
| | Insurance Group Inc. | 4,400 | 39 |
| | Lakeland Bancorp Inc. | 4,600 | 39 |
| | Protective Life Corp. | 1,600 | 35 |
| * | Beneficial Mutual | | |
| | Bancorp Inc. | 3,800 | 34 |
| | CapitalSource Inc. | 6,300 | 34 |
| | Capital Southwest Corp. | 339 | 31 |
| * | Meridian | | |
| | Interstate Bancorp Inc. | 2,869 | 30 |
| | Alexandria | | |
| | Real Estate Equities Inc. | 400 | 28 |
| | Northfield Bancorp Inc. | 2,500 | 27 |
| | Rockville Financial Inc. | 1,800 | 21 |
| | | | 36,490 |
| Health Care (11.2%) | | |
| * | Par Pharmaceutical Cos. Inc. | 33,900 | 986 |
| * | Bruker Corp. | 70,000 | 982 |
| * | Emergency Medical | | |
| | Services Corp. Class A | 18,180 | 968 |
| | STERIS Corp. | 28,500 | 947 |
| * | American Medical | | |
| | Systems Holdings Inc. | 47,800 | 936 |
14
Strategic Small-Cap Equity Fund
| | | |
| | | | Market |
| | | | Value |
| | | Shares | ($000) |
| | Cooper Cos. Inc. | 19,600 | 906 |
| * | Cepheid Inc. | 47,100 | 881 |
| * | LifePoint Hospitals Inc. | 23,100 | 810 |
| | Medicis Pharmaceutical | | |
| | Corp. Class A | 26,100 | 774 |
| * | Bio-Rad Laboratories Inc. | | |
| | Class A | 7,606 | 688 |
| * | Tenet Healthcare Corp. | 144,300 | 681 |
| * | Health Management | | |
| | Associates Inc. Class A | 88,300 | 676 |
| | Chemed Corp. | 11,500 | 655 |
| | Invacare Corp. | 23,400 | 620 |
| * | Healthsouth Corp. | 31,600 | 607 |
| * | Impax Laboratories Inc. | 27,800 | 550 |
| * | Dionex Corp. | 5,500 | 475 |
| * | Kensey Nash Corp. | 16,100 | 465 |
| * | Healthspring Inc. | 16,800 | 434 |
| | Valeant Pharmaceuticals | | |
| | International Inc. | 16,918 | 424 |
| * | Sirona Dental Systems Inc. | 11,700 | 422 |
| * | Molina Healthcare Inc. | 15,406 | 416 |
| | PDL BioPharma Inc. | 77,800 | 409 |
| * | Cyberonics Inc. | 15,191 | 405 |
| * | Gentiva Health Services Inc. | 16,900 | 369 |
| * | Triple-S Management Corp. | | |
| | Class B | 20,100 | 339 |
| * | Magellan Health | | |
| | Services Inc. | 6,500 | 307 |
| * | Affymetrix Inc. | 61,500 | 280 |
| * | Amedisys Inc. | 11,300 | 269 |
| * | Corvel Corp. | 6,100 | 259 |
| * | Targacept Inc. | 8,300 | 185 |
| * | Nabi Biopharmaceuticals | 36,600 | 176 |
| * | Nektar Therapeutics | 11,300 | 167 |
| * | Medicines Co. | 11,600 | 165 |
| * | Catalyst Health Solutions Inc. | 4,400 | 155 |
| * | Enzon Pharmaceuticals Inc. | 13,600 | 153 |
| | Universal American Corp. | 7,200 | 106 |
| | Hill-Rom Holdings Inc. | 2,600 | 93 |
| * | Akorn Inc. | 19,000 | 77 |
| * | Osiris Therapeutics Inc. | 10,000 | 73 |
| *^ | China Biologic Products Inc. | 7,200 | 71 |
| * | Zymogenetics Inc. | 7,000 | 68 |
| * | Genomic Health Inc. | 4,500 | 60 |
| * | Assisted Living Concepts Inc. | |
| | Class A | 1,800 | 55 |
| * | Kindred Healthcare Inc. | 3,600 | 47 |
| | National Healthcare Corp. | 1,200 | 45 |
| | Owens & Minor Inc. | 1,500 | 43 |
| * | Medivation Inc. | 3,200 | 42 |
| * | Durect Corp. | 15,900 | 40 |
| * | AMERIGROUP Corp. | 900 | 38 |
| * | Clarient Inc. | 11,100 | 38 |
| * | Rigel Pharmaceuticals Inc. | 4,200 | 35 |
| * | Arqule Inc. | 6,500 | 34 |
| | | | 19,906 |
| | | |
| | | | Market |
| | | | Value |
| | | Shares | ($000) |
| Industrials (15.2%) | | |
| | Timken Co. | 36,200 | 1,389 |
| | Toro Co. | 20,500 | 1,153 |
| * | EnerSys | 43,576 | 1,088 |
| * | Oshkosh Corp. | 38,900 | 1,070 |
| | AO Smith Corp. | 18,100 | 1,048 |
| * | EMCOR Group Inc. | 40,800 | 1,003 |
| * | Alaska Air Group Inc. | 19,200 | 980 |
| * | Armstrong World | | |
| | Industries Inc. | 23,200 | 963 |
| * | Avis Budget Group Inc. | 81,000 | 944 |
| * | WESCO International Inc. | 23,900 | 939 |
| * | Sauer-Danfoss Inc. | 44,100 | 939 |
| | Regal-Beloit Corp. | 15,900 | 933 |
| * | Consolidated Graphics Inc. | 21,400 | 887 |
| | Briggs & Stratton Corp. | 41,500 | 789 |
| * | Hawaiian Holdings Inc. | 116,700 | 699 |
| | Deluxe Corp. | 34,400 | 658 |
| * | ArvinMeritor Inc. | 37,142 | 577 |
| | Applied Industrial | | |
| | Technologies Inc. | 17,100 | 523 |
| | Cubic Corp. | 12,300 | 502 |
| * | Esterline Technologies Corp. | 8,400 | 481 |
| * | Amerco Inc. | 5,900 | 469 |
| | Allegiant Travel Co. Class A | 11,000 | 466 |
| | Crane Co. | 11,600 | 440 |
| * | M&F Worldwide Corp. | 17,700 | 431 |
| | Ennis Inc. | 23,700 | 424 |
| | Schawk Inc. Class A | 22,500 | 415 |
| * | Dollar Thrifty Automotive | | |
| | Group Inc. | 8,145 | 408 |
| * | Blount International Inc. | 30,500 | 388 |
| | Werner Enterprises Inc. | 18,900 | 387 |
| * | ACCO Brands Corp. | 66,400 | 382 |
| * | Thomas & Betts Corp. | 9,000 | 369 |
| * | UAL Corp. | 15,000 | 354 |
| * | Corrections Corp. of America | 13,400 | 331 |
| | Nordson Corp. | 3,900 | 287 |
| | Tennant Co. | 8,500 | 263 |
| | G&K Services Inc. Class A | 9,700 | 222 |
| * | United Stationers Inc. | 4,100 | 219 |
| | Ampco-Pittsburgh Corp. | 8,130 | 202 |
| | AAON Inc. | 8,200 | 193 |
| | Watts Water | | |
| | Technologies Inc. Class A | 5,400 | 184 |
| | Vicor Corp. | 11,200 | 164 |
| * | Atlas Air | | |
| | Worldwide Holdings Inc. | 3,100 | 156 |
| | Seaboard Corp. | 86 | 152 |
| | Healthcare | | |
| | Services Group Inc. | 6,400 | 146 |
| | Albany International Corp. | 7,500 | 142 |
| | Great Lakes Dredge & | | |
| | Dock Corp. | 23,400 | 136 |
| | Raven Industries Inc. | 3,500 | 133 |
| * | Powell Industries Inc. | 3,793 | 118 |
15
Strategic Small-Cap Equity Fund
| | | |
| | | | Market |
| | | | Value |
| | | Shares | ($000) |
| * | Ladish Co. Inc. | 3,548 | 110 |
| * | Kadant Inc. | 5,400 | 102 |
| * | Macquarie | | |
| | Infrastructure Co. LLC | 6,000 | 93 |
| | AZZ Inc. | 2,100 | 90 |
| | HNI Corp. | 2,900 | 83 |
| | Courier Corp. | 5,800 | 82 |
| | NACCO | | |
| | Industries Inc. Class A | 942 | 82 |
| * | Exponent Inc. | 2,200 | 74 |
| | Lindsay Corp. | 1,700 | 74 |
| * | ATC Technology Corp. | 2,700 | 67 |
| | Kimball | | |
| | International Inc. Class B | 10,900 | 64 |
| | Tredegar Corp. | 3,300 | 63 |
| * | EnPro Industries Inc. | 1,900 | 59 |
| | Standex International Corp. | 2,300 | 56 |
| | TAL International Group Inc. | 2,167 | 52 |
| | ABM Industries Inc. | 2,200 | 47 |
| * | GenCorp Inc. | 9,100 | 45 |
| * | Furmanite Corp. | 9,000 | 44 |
| * | Layne Christensen Co. | 1,600 | 41 |
| | Interface Inc. Class A | 2,800 | 40 |
| * | US Airways Group Inc. | 4,300 | 40 |
| | Quanex | | |
| | Building Products Corp. | 2,100 | 36 |
| * | Griffon Corp. | 2,300 | 28 |
| | | | 27,018 |
| Information Technology (17.7%) | |
| * | VeriFone Systems Inc. | 45,300 | 1,407 |
| | Solera Holdings Inc. | 30,200 | 1,334 |
| * | Gartner Inc. | 39,300 | 1,157 |
| * | Riverbed Technology Inc. | 24,900 | 1,135 |
| * | RF Micro Devices Inc. | 182,694 | 1,122 |
| * | Tech Data Corp. | 27,400 | 1,104 |
| * | Rovi Corp. | 18,683 | 942 |
| | MAXIMUS Inc. | 14,933 | 920 |
| * | Teradyne Inc. | 80,431 | 896 |
| | Syntel Inc. | 18,752 | 834 |
| * | Vishay Intertechnology Inc. | 84,600 | 819 |
| * | TriQuint Semiconductor Inc. | 83,568 | 802 |
| | Earthlink Inc. | 88,200 | 802 |
| * | Anixter International Inc. | 14,800 | 799 |
| * | Unisys Corp. | 28,460 | 794 |
| * | Plexus Corp. | 26,265 | 771 |
| * | Sanmina-SCI Corp. | 63,200 | 763 |
| * | Atmel Corp. | 90,900 | 724 |
| *^ | Veeco Instruments Inc. | 19,900 | 694 |
| * | Acxiom Corp. | 41,400 | 657 |
| * | Lattice Semiconductor Corp. | 134,600 | 639 |
| * | TIBCO Software Inc. | 35,800 | 635 |
| | Micrel Inc. | 64,100 | 632 |
| * | CSG Systems | | |
| | International Inc. | 32,884 | 599 |
| | | | |
| | | | | Market |
| | | | | Value |
| | | | Shares | ($000) |
| * | Quantum Corp. | 278,600 | 591 |
| * | InterDigital Inc. | | 18,700 | 554 |
| | iGate Corp. | | 28,871 | 524 |
| * | QLogic Corp. | | 27,300 | 482 |
| | Plantronics Inc. | | 13,800 | 466 |
| * | Synaptics Inc. | | 15,100 | 425 |
| | Opnet Technologies Inc. | | 22,300 | 405 |
| * | MercadoLibre Inc. | | 5,500 | 397 |
| * | Insight Enterprises Inc. | | 23,700 | 371 |
| * | Mantech | | | |
| | International Corp. Class A | | 8,925 | 353 |
| * | Aruba Networks Inc. | | 16,300 | 348 |
| * | Liquidity Services Inc. | | 20,300 | 325 |
| * | Isilon Systems Inc. | | 14,168 | 316 |
| * | SYNNEX Corp. | | 11,100 | 312 |
| * | Fairchild Semiconductor | | | |
| | International Inc. Class A | | 31,500 | 296 |
| * | Conexant Systems Inc. | 175,400 | 288 |
| * | OSI Systems Inc. | | 7,600 | 276 |
| * | Manhattan Associates Inc. | | 8,700 | 255 |
| * | NeuStar Inc. Class A | | 9,700 | 241 |
| * | MICROS Systems Inc. | | 5,400 | 229 |
| * | Power-One Inc. | | 24,083 | 219 |
| * | MicroStrategy Inc. Class A | | 2,200 | 191 |
| | Blackbaud Inc. | | 7,700 | 185 |
| * | Diodes Inc. | | 10,500 | 179 |
| * | TeleTech Holdings Inc. | | 12,000 | 178 |
| * | Netscout Systems Inc. | | 8,400 | 172 |
| * | Volterra Semiconductor Corp. | 7,900 | 170 |
| * | Global | | | |
| | Cash Access Holdings Inc. | | 38,500 | 157 |
| * | Extreme Networks | | 42,600 | 132 |
| * | ADC Telecommunications Inc. | 9,800 | 124 |
| * | Brightpoint Inc. | | 17,700 | 124 |
| * | Netgear Inc. | | 3,100 | 84 |
| * | Cadence Design Systems Inc. 10,200 | 78 |
| * | AsiaInfo-Linkage Inc. | | 3,900 | 77 |
| | Renaissance Learning Inc. | | 7,500 | 76 |
| * | RealNetworks Inc. | | 21,900 | 71 |
| * | Arris Group Inc. | | 6,500 | 63 |
| * | THQ Inc. | | 15,600 | 63 |
| | Heartland | | | |
| | Payment Systems Inc. | | 4,000 | 61 |
| * | Quest Software Inc. | | 2,200 | 54 |
| * | Amkor Technology Inc. | | 8,100 | 53 |
| * | Entegris Inc. | | 10,900 | 51 |
| * | Progress Software Corp. | | 1,400 | 46 |
| * | Interactive Intelligence Inc. | | 2,522 | 44 |
| * | Kulicke & Soffa Industries Inc. | 6,900 | 43 |
| * | Littelfuse Inc. | | 966 | 42 |
| * | Radiant Systems Inc. | | 2,200 | 38 |
| * | Take-Two | | | |
| | Interactive Software Inc. | | 3,700 | 37 |
| * | CACI | | | |
| | International Inc. Class A | | 800 | 36 |
16
Strategic Small-Cap Equity Fund
| | | |
| | | | Market |
| | | | Value |
| | | Shares | ($000) |
| * | Omnivision Technologies Inc. | 1,500 | 35 |
| * | Powerwave Technologies Inc. | 18,300 | 33 |
| * | Cypress Semiconductor Corp. | 2,600 | 33 |
| * | Magma Design | | |
| | Automation Inc. | 8,800 | 33 |
| * | SMART Modular | | |
| | Technologies WWH Inc. | 5,200 | 31 |
| | | | 31,448 |
| Materials (5.7%) | | |
| * | PolyOne Corp. | 95,300 | 1,152 |
| * | Clearwater Paper Corp. | 14,800 | 1,126 |
| | Domtar Corp. | 17,000 | 1,098 |
| | Rock-Tenn Co. Class A | 22,000 | 1,096 |
| | Innophos Holdings Inc. | 32,700 | 1,082 |
| | Silgan Holdings Inc. | 29,600 | 938 |
| | Ashland Inc. | 11,548 | 563 |
| * | Solutia Inc. | 33,000 | 529 |
| | NewMarket Corp. | 3,600 | 409 |
| | Cytec Industries Inc. | 7,200 | 406 |
| | Schweitzer-Mauduit | | |
| | International Inc. | 5,600 | 327 |
| | Arch Chemicals Inc. | 7,000 | 246 |
| | Stepan Co. | 4,100 | 242 |
| * | Innospec Inc. | 8,800 | 134 |
| | Worthington Industries Inc. | 7,500 | 113 |
| * | Rockwood Holdings Inc. | 3,400 | 107 |
| * | Graphic Packaging | | |
| | Holding Co. | 29,400 | 98 |
| * | Wausau Paper Corp. | 10,000 | 83 |
| * | Boise Inc. | 11,402 | 74 |
| | Neenah Paper Inc. | 4,544 | 69 |
| * | WR Grace & Co. | 2,300 | 64 |
| | Buckeye Technologies Inc. | 3,500 | 51 |
| | Hawkins Inc. | 1,200 | 43 |
| | Cabot Corp. | 1,100 | 36 |
| | Minerals Technologies Inc. | 600 | 35 |
| * | Ferro Corp. | 2,700 | 35 |
| | | | 10,156 |
| | Telecommunication Services (1.0%) | |
| * | tw telecom inc Class A | 32,400 | 602 |
| | USA Mobility Inc. | 34,300 | 550 |
| | NTELOS Holdings Corp. | 16,900 | 286 |
| * | Cincinnati Bell Inc. | 67,800 | 181 |
| | Consolidated | | |
| | Communications | | |
| | Holdings Inc. | 4,500 | 84 |
| * | ICO Global Communications | | |
| | Holdings Ltd. | 31,900 | 52 |
| * | Vonage Holdings Corp. | 17,600 | 45 |
| | | | 1,800 |
| | |
| | | Market |
| | | Value |
| | Shares | ($000) |
| Utilities (4.0%) | | |
| Atmos Energy Corp. | 41,400 | 1,211 |
| IDACORP Inc. | 23,700 | 851 |
| NorthWestern Corp. | 28,900 | 824 |
| Hawaiian Electric | | |
| Industries Inc. | 31,900 | 719 |
| Southwest Gas Corp. | 18,500 | 621 |
| Unisource Energy Corp. | 17,700 | 592 |
| WGL Holdings Inc. | 13,600 | 514 |
| Cleco Corp. | 16,900 | 501 |
| Nicor Inc. | 9,500 | 435 |
| AGL Resources Inc. | 8,980 | 345 |
| UIL Holdings Corp. | 5,900 | 166 |
| PNM Resources Inc. | 13,900 | 158 |
| CMS Energy Corp. | 7,200 | 130 |
| * El Paso Electric Co. | 3,000 | 71 |
| Chesapeake Utilities Corp. | 1,300 | 47 |
| | | 7,185 |
| Total Common Stocks | | |
| (Cost $148,007) | | 177,193 |
| Temporary Cash Investments (1.1%)1 | |
| Money Market Fund (1.0%) | | |
| 2,3 Vanguard Market | | |
| Liquidity Fund, 0.261% | 1,922,897 | 1,923 |
| |
| | Face | |
| | Amount | |
| | ($000) | |
| U.S. Government and Agency Obligations (0.1%) |
| 4,5 Fannie Mae Discount | | |
| Notes, 0.321%, 3/1/11 | 100 | 100 |
| Total Temporary Cash Investments | |
| (Cost $2,023) | | 2,023 |
| Total Investments (100.6%) | | |
| (Cost $150,030) | | 179,216 |
| Other Assets and Liabilities (-0.6%) | |
| Other Assets | | 467 |
| Liabilities3 | | (1,585) |
| | | (1,118) |
| Net Assets (100%) | | |
| Applicable to 10,772,107 outstanding | |
| $.001 par value shares of beneficial | |
| interest (unlimited authorization) | 178,098 |
| Net Asset Value Per Share | | $16.53 |
17
Strategic Small-Cap Equity Fund
| |
| At September 30, 2010, net assets consisted of: |
| | Amount |
| | ($000) |
| Paid-in Capital | 227,985 |
| Undistributed Net Investment Income | 510 |
| Accumulated Net Realized Losses | (79,623) |
| Unrealized Appreciation (Depreciation) | |
| Investment Securities | 29,186 |
| Futures Contracts | 40 |
| Net Assets | 178,098 |
See Note A in Notes to Financial Statements.
* Non-income-producing security.
^ Part of security position is on loan to broker-dealers. The total value of securities on loan is $242,000.
1 The fund invests a portion of its cash reserves in equity markets through the use of index futures contracts. After giving effect to futures investments, the fund’s effective common stock and temporary cash investment positions represent 100.3% and 0.3%, respectively, of net assets.
2 Affiliated money market fund available only to Vanguard funds and certain trusts and accounts managed by Vanguard. Rate shown is the 7-day yield.
3 Includes $260,000 of collateral received for securities on loan.
4 The issuer operates under a congressional charter; its securities are not backed by the full faith and credit of the U.S. government.
5 Securities with a value of $100,000 have been segregated as initial margin for open futures contracts.
See accompanying Notes, which are an integral part of the Financial Statements.
18
Strategic Small-Cap Equity Fund
| |
| Statement of Operations | |
| |
| |
| | Year Ended |
| | September 30, 2010 |
| | ($000) |
| Investment Income | |
| Income | |
| Dividends | 2,271 |
| Interest1 | 3 |
| Security Lending | 54 |
| Total Income | 2,328 |
| Expenses | |
| The Vanguard Group—Note B | |
| Investment Advisory Services | 144 |
| Management and Administrative | 472 |
| Marketing and Distribution | 43 |
| Custodian Fees | 16 |
| Auditing Fees | 26 |
| Shareholders’ Reports | 9 |
| Total Expenses | 710 |
| Net Investment Income | 1,618 |
| Realized Net Gain (Loss) | |
| Investment Securities Sold | 7,944 |
| Futures Contracts | 189 |
| Realized Net Gain (Loss) | 8,133 |
| Change in Unrealized Appreciation (Depreciation) | |
| Investment Securities | 14,594 |
| Futures Contracts | 44 |
| Change in Unrealized Appreciation (Depreciation) | 14,638 |
| Net Increase (Decrease) in Net Assets Resulting from Operations | 24,389 |
| 1 Interest income from an affiliated company of the fund was $3,000. | |
See accompanying Notes, which are an integral part of the Financial Statements.
19
Strategic Small-Cap Equity Fund
| | |
| Statement of Changes in Net Assets | | |
| |
| | Year Ended September 30, |
| | 2010 | 2009 |
| | ($000) | ($000) |
| Increase (Decrease) in Net Assets | | |
| Operations | | |
| Net Investment Income | 1,618 | 1,650 |
| Realized Net Gain (Loss) | 8,133 | (65,678) |
| Change in Unrealized Appreciation (Depreciation) | 14,638 | 37,159 |
| Net Increase (Decrease) in Net Assets Resulting from Operations | 24,389 | (26,869) |
| Distributions | | |
| Net Investment Income | (1,717) | (1,950) |
| Realized Capital Gain | — | — |
| Total Distributions | (1,717) | (1,950) |
| Capital Share Transactions | | |
| Issued | 42,151 | 36,953 |
| Issued in Lieu of Cash Distributions | 1,618 | 1,815 |
| Redeemed | (52,860) | (45,230) |
| Net Increase (Decrease) from Capital Share Transactions | (9,091) | (6,462) |
| Total Increase (Decrease) | 13,581 | (35,281) |
| Net Assets | | |
| Beginning of Period | 164,517 | 199,798 |
| End of Period1 | 178,098 | 164,517 |
| 1 Net Assets—End of Period includes undistributed net investment income of $510,000 and $609,000. | | |
See accompanying Notes, which are an integral part of the Financial Statements.
20
Strategic Small-Cap Equity Fund
| | | | | |
| Financial Highlights | | | | | |
| |
| |
| | | | | | April 20, |
| | | | 20061 to |
| For a Share Outstanding | Year Ended September 30, | Sept. 30, |
| Throughout Each Period | 2010 | 2009 | 2008 | 2007 | 2006 |
| Net Asset Value, Beginning of Period | $14.32 | $16.60 | $21.28 | $19.04 | $20.00 |
| Investment Operations | | | | | |
| Net Investment Income | .154 | .145 | .160 | .220 | .090 |
| Net Realized and Unrealized Gain | | | | | |
| (Loss) on Investments | 2.216 | (2.257) | (4.479) | 2.170 | (1.050) |
| Total from Investment Operations | 2.370 | (2.112) | (4.319) | 2.390 | (.960) |
| Distributions | | | | | |
| Dividends from Net Investment Income | (.160) | (.168) | (.210) | (.150) | — |
| Distributions from Realized Capital Gains | — | — | (.151) | — | — |
| Total Distributions | (.160) | (.168) | (.361) | (.150) | — |
| Net Asset Value, End of Period | $16.53 | $14.32 | $16.60 | $21.28 | $19.04 |
| |
| Total Return2 | 16.70% | -12.48% | -20.50% | 12.58% | -4.85% |
| |
| Ratios/Supplemental Data | | | | | |
| Net Assets, End of Period (Millions) | $178 | $165 | $200 | $257 | $180 |
| Ratio of Total Expenses to | | | | | |
| Average Net Assets | 0.43% | 0.43% | 0.38% | 0.38% | 0.40%3 |
| Ratio of Net Investment Income to | | | | | |
| Average Net Assets | 0.98% | 1.18% | 0.83% | 1.07% | 1.20%3 |
| Portfolio Turnover Rate | 66% | 76% | 99% | 73% | 35% |
1 Subscription period for the fund was April 20, 2006, to April 24, 2006, during which time all assets were held in money market instruments. Performance measurement began April 24, 2006, at a net asset value of $20.01.
2 Total returns do not include account service fees that may have applied in the periods shown. Fund prospectuses provide information about any applicable account service fees.
3 Annualized.
See accompanying Notes, which are an integral part of the Financial Statements.
21
Strategic Small-Cap Equity Fund
Notes to Financial Statements
Vanguard Strategic Small-Cap Equity Fund is registered under the Investment Company Act of 1940 as an open-end investment company, or mutual fund.
A. The following significant accounting policies conform to generally accepted accounting principles for U.S. mutual funds. The fund consistently follows such policies in preparing its financial statements.
1. Security Valuation: Securities are valued as of the close of trading on the New York Stock Exchange (generally 4 p.m., Eastern time) on the valuation date. Equity securities are valued at the latest quoted sales prices or official closing prices taken from the primary market in which each security trades; such securities not traded on the valuation date are valued at the mean of the latest quoted bid and asked prices. Securities for which market quotations are not readily available, or whose values have been materially affected by events occurring before the fund’s pricing time but after the close of the securities’ primary markets, are valued by methods deemed by the board of trustees to represent fair value. Investments in Vanguard Market Liquidity Fund are valued at that fund’s net asset value. Temporary cash investments acquired over 60 days to maturity are valued using the latest bid prices or using valuations based on a matrix system (which considers such factors as security prices, yields, maturities, and ratings), both as furnished by independent pricing services. Other temporary cash investments are valued at amortized cost, which approximates market value.
2. Futures Contracts: The fund uses index futures contracts to a limited extent, with the objective of maintaining full exposure to the stock market while maintaining liquidity. The fund may purchase or sell futures contracts to achieve a desired level of investment, whether to accommodate portfolio turnover or cash flows from capital share transactions. The primary risks associated with the use of futures contracts are imperfect correlation between changes in market values of stocks held by the fund and the prices of futures contracts, and the possibility of an illiquid market.
Futures contracts are valued at their quoted daily settlement prices. The aggregate principal amounts of the contracts are not recorded in the Statement of Net Assets. Fluctuations in the value of the contracts are recorded in the Statement of Net Assets as an asset (liability) and in the Statement of Operations as unrealized appreciation (depreciation) until the contracts are closed, when they are recorded as realized futures gains (losses).
3. Federal Income Taxes: The fund intends to continue to qualify as a regulated investment company and distribute all of its taxable income. Management has analyzed the fund’s tax positions taken for all open federal income tax years (September 30, 2007–2010), and has concluded that no provision for federal income tax is required in the fund’s financial statements.
4. Distributions: Distributions to shareholders are recorded on the ex-dividend date.
5. Security Lending: The fund may lend its securities to qualified institutional borrowers to earn additional income. Security loans are required to be secured at all times by collateral at least equal to the market value of securities loaned. The fund invests cash collateral received in Vanguard Market Liquidity Fund, and records a liability for the return of the collateral, during the period the securities are on loan. Security lending income represents fees charged to borrowers plus income earned on investing cash collateral, less expenses associated with the loan.
6. Other: Dividend income is recorded on the ex-dividend date. Interest income includes income distributions received from Vanguard Market Liquidity Fund and is accrued daily. Security transactions are accounted for on the date securities are bought or sold. Costs used to determine realized gains (losses) on the sale of investment securities are those of the specific securities sold.
22
Strategic Small-Cap Equity Fund
B. The Vanguard Group furnishes at cost investment advisory, corporate management, administrative, marketing, and distribution services. The costs of such services are allocated to the fund under methods approved by the board of trustees. The fund has committed to provide up to 0.40% of its net assets in capital contributions to Vanguard. At September 30, 2010, the fund had contributed capital of $30,000 to Vanguard (included in Other Assets), representing 0.02% of the fund’s net assets and 0.01% of Vanguard’s capitalization. The fund’s trustees and officers are also directors and officers of Vanguard.
C. Various inputs may be used to determine the value of the fund’s investments. These inputs are summarized in three broad levels for financial statement purposes. The inputs or methodologies used to value securities are not necessarily an indication of the risk associated with investing in those securities.
Level 1—Quoted prices in active markets for identical securities.
Level 2—Other significant observable inputs (including quoted prices for similar securities, interest rates, prepayment speeds, credit risk, etc.).
Level 3—Significant unobservable inputs (including the fund’s own assumptions used to determine the fair value of investments).
The following table summarizes the fund’s investments as of September 30, 2010, based on the inputs
used to value them:
| | | |
| | Level 1 | Level 2 | Level 3 |
| Investments | ($000) | ($000) | ($000) |
| Common Stocks | 177,193 | — | — |
| Temporary Cash Investments | 1,923 | 100 | — |
| Futures Contracts—Liabilities1 | (2) | — | — |
| Total | 179,114 | 100 | — |
| 1 Represents variation margin on the last day of the reporting period. | | | |
D. At September 30, 2010, the aggregate settlement value of open futures contracts and the related unrealized appreciation (depreciation) were:
| | | | |
| | | | | ($000) |
| | | | Aggregate | |
| | | Number of | Settlement | Unrealized |
| | | Long (Short) | Value | Appreciation |
| Futures Contracts | Expiration | Contracts | Long (Short) | (Depreciation) |
| E-mini Russell 2000 Index | December 2010 | 21 | 1,416 | 40 |
Unrealized appreciation (depreciation) on open futures contracts is required to be treated as realized gain (loss) for tax purposes.
23
Strategic Small-Cap Equity Fund
E. Distributions are determined on a tax basis and may differ from net investment income and realized capital gains for financial reporting purposes. Differences may be permanent or temporary. Permanent differences are reclassified among capital accounts in the financial statements to reflect their tax character. Temporary differences arise when certain items of income, expense, gain, or loss are recognized in different periods for financial statement and tax purposes; these differences will reverse at some time in the future. Differences in classification may also result from the treatment of short-term gains as ordinary income for tax purposes.
For tax purposes, at September 30, 2010, the fund had $912,000 of ordinary income available for distribution. The fund had available capital loss carryforwards totaling $79,532,000 to offset future net capital gains of $31,060,000 through September 30, 2017, and $48,472,000 through September 30, 2018.
At September 30, 2010, the cost of investment securities for tax purposes was $150,087,000. Net unrealized appreciation of investment securities for tax purposes was $29,129,000, consisting of unrealized gains of $35,952,000 on securities that had risen in value since their purchase and $6,823,000 in unrealized losses on securities that had fallen in value since their purchase.
F. During the year ended September 30, 2010, the fund purchased $107,593,000 of investment securities and sold $115,927,000 of investment securities, other than temporary cash investments.
G. Capital shares issued and redeemed were:
| | |
| | Year Ended September 30, |
| | 2010 | 2009 |
| | Shares | Shares |
| | (000) | (000) |
| Issued | 2,676 | 3,107 |
| Issued in Lieu of Cash Distributions | 111 | 157 |
| Redeemed | (3,504) | (3,808) |
| Net Increase (Decrease) in Shares Outstanding | (717) | (544) |
H. In preparing the financial statements as of September 30, 2010, management considered the impact of subsequent events for potential recognition or disclosure in these financial statements.
24
Report of Independent Registered Public Accounting Firm
To the Trustees of Vanguard Horizon Funds and the Shareholders of Vanguard Strategic Small-Cap Equity Fund:
In our opinion, the accompanying statement of net assets and the related statements of operations and of changes in net assets and the financial highlights present fairly, in all material respects, the financial position of Vanguard Strategic Small-Cap Equity Fund (constituting a separate portfolio of Vanguard Horizon Funds, hereafter referred to as the “Fund”) at September 30, 2010, the results of its operations for the year then ended, the changes in its net assets for each of the two years in the period then ended and the financial highlights for each of the periods indicated, in conformity with accounting principles generally accepted in the United States of America. These financial statements and financial highlights (hereafter referred to as “financial statements”) are the responsibility of the Fund’s management; our responsibility is to express an opinion on these financial statements based on our audits. We conducted our aud its of these financial statements in accordance with the standards of the Public Company Accounting Oversight Board (United States). Those standards require that we plan and perform the audit to obtain reasonable assurance about whether the financial statements are free of material misstatement. An audit includes examining, on a test basis, evidence supporting the amounts and disclosures in the financial statements, assessing the accounting principles used and significant estimates made by management, and evaluating the overall financial statement presentation. We believe that our audits, which included confirmation of securities at September 30, 2010 by correspondence with the custodian and broker and by agreement to the underlying ownership records of Vanguard Market Liquidity Fund, provide a reasonable basis for our opinion.
PricewaterhouseCoopers LLP
Philadelphia, Pennsylvania
November 17, 2010
| Special 2010 tax information (unaudited) for Vanguard Strategic Small-Cap Equity Fund |
This information for the fiscal year ended September 30, 2010, is included pursuant to provisions of the Internal Revenue Code.
The fund distributed $1,717,000 of qualified dividend income to shareholders during the fiscal year.
For corporate shareholders, 100% of investment income (dividend income plus short-term gains, if any) qualifies for the dividends-received deduction.
25
Your Fund’s After-Tax Returns
This table presents returns for your fund both before and after taxes. The after-tax returns are shown in two ways: (1) assuming that an investor owned the fund during the entire period and paid taxes on the fund’s distributions, and (2) assuming that an investor paid taxes on the fund’s distributions and sold all shares at the end of each period.
Calculations are based on the highest individual federal income tax and capital gains tax rates in effect at the times of the distributions and the hypothetical sales. State and local taxes were not considered. After-tax returns reflect any qualified dividend income , using actual prior-year figures and estimates for 2010. (In the example, returns after the sale of fund shares may be higher than those assuming no sale. This occurs when the sale would have produced a capital loss. The calculation assumes that the investor received a tax deduction for the loss.) Please note that your actual after-tax returns will depend on your tax situation and may differ from those shown. Also note that if you own the fund in a tax-deferred account, such as an individual retirement account or a 401(k) plan, this information does not apply to you. Such accounts are not subject to current taxes.
Finally, keep in mind that a fund’s performance—whether before or after taxes—does not guarantee future results.
| | |
| Average Annual Total Returns: Strategic Small-Cap Equity Fund | | |
| Periods Ended September 30, 2010 | | |
| | | Since |
| | One | Inception |
| | Year | (4/24/2006) |
| Returns Before Taxes | 16.70% | -3.10% |
| Returns After Taxes on Distributions | 16.51 | -3.29 |
| Returns After Taxes on Distributions and Sale of Fund Shares | 11.06 | -2.64 |
26
About Your Fund’s Expenses
As a shareholder of the fund, you incur ongoing costs, which include costs for portfolio management, administrative services, and shareholder reports (like this one), among others. Operating expenses, which are deducted from a fund’s gross income, directly reduce the investment return of the fund.
A fund’s expenses are expressed as a percentage of its average net assets. This figure is known as the expense ratio. The following examples are intended to help you understand the ongoing costs (in dollars) of investing in your fund and to compare these costs with those of other mutual funds. The examples are based on an investment of $1,000 made at the beginning of the period shown and held for the entire period.
The accompanying table illustrates your fund’s costs in two ways:
• Based on actual fund return. This section helps you to estimate the actual expenses that you paid over the period. The ”Ending Account Value“ shown is derived from the fund‘s actual return, and the third column shows the dollar amount that would have been paid by an investor who started with $1,000 in the fund. You may use the information here, together with the amount you invested, to estimate the expenses that you paid over the period.
To do so, simply divide your account value by $1,000 (for example, an $8,600 account value divided by $1,000 = 8.6), then multiply the result by the number given for your fund under the heading ”Expenses Paid During Period.“
• Based on hypothetical 5% yearly return. This section is intended to help you compare your fund‘s costs with those of other mutual funds. It assumes that the fund had a yearly return of 5% before expenses, but that the expense ratio is unchanged. In this case—because the return used is not the fund’s actual return—the results do not apply to your investment. The example is useful in making comparisons because the Securities and Exchange Commission requires all mutual funds to calculate expenses based on a 5% return. You can assess your fund’s costs by comparing this hypothetical example with the hypothetical examples that appear in shareholder reports of other funds.
Note that the expenses shown in the table are meant to highlight and help you compare ongoing costs only and do not reflect transaction costs incurred by the fund for buying and selling securities. Further, the expenses do not include the account service fee described in the prospectus. If such a fee were applied to your account, your costs would be higher. Your fund does not charge transaction fees, such as purchase or redemption fees, nor does it carry a “sales load.” The calculations assume no shares were bought or sold during the period. Your actual costs may have been higher or lower, depending on the amount of your investment and the timing of any purchases or redemptions.
You can find more information about the fund’s expenses, including annual expense ratios, in the Financial Statements section of this report. For additional information on operating expenses and other shareholder costs, please refer to your fund’s current prospectus.
27
| | | |
| Six Months Ended September 30, 2010 | | | |
| | Beginning | Ending | Expenses |
| | Account Value | Account Value | Paid During |
| Strategic Small-Cap Equity Fund | 3/31/2010 | 9/30/2010 | Period |
| Based on Actual Fund Return | $1,000.00 | $1,012.25 | $2.17 |
| Based on Hypothetical 5% Yearly Return | 1,000.00 | 1,022.91 | 2.18 |
The calculations are based on expenses incurred in the most recent six-month period. The fund’s annualized six-month expense ratio for that period is 0.43%. The dollar amounts shown as “Expenses Paid” are equal to the expense ratio multiplied by the average account value over the period, multiplied by the number of days in the most recent six-month period, then divided by the number of days in the most recent 12-month period.
28
Glossary
30-Day SEC Yield. A fund’s 30-day SEC yield is derived using a formula specified by the U.S. Securities and Exchange Commission. Under the formula, data related to the fund’s security holdings in the previous 30 days are used to calculate the fund’s hypothetical net income for that period, which is then annualized and divided by the fund’s estimated average net assets over the calculation period. For the purposes of this calculation, a security’s income is based on its current market yield to maturity (in the case of bonds) or its projected dividend yield (for stocks). Because the SEC yield represents hypothetical annualized income, it will differ—at times significantly—from the fund’s actual experience. As a result, the fund’s income distributions may be higher or lower than implied by the SEC yield.
Beta. A measure of the magnitude of a fund’s past share-price fluctuations in relation to the ups and downs of a given market index. The index is assigned a beta of 1.00. Compared with a given index, a fund with a beta of 1.20 typically would have seen its share price rise or fall by 12% when the index rose or fell by 10%. For this report, beta is based on returns over the past 36 months for both the fund and the index. Note that a fund’s beta should be reviewed in conjunction with its R-squared (see definition). The lower the R-squared, the less correlation there is between the fund and the index, and the less reliable beta is as an indicator of volatility.
Dividend Yield. Dividend income earned by stocks, expressed as a percentage of the aggregate market value (or of net asset value, for a fund). The yield is determined by dividing the amount of the annual dividends by the aggregate value (or net asset value) at the end of the period. For a fund, the dividend yield is based solely on stock holdings and does not include any income produced by other investments.
Earnings Growth Rate. The average annual rate of growth in earnings over the past five years for the stocks now in a fund.
Equity Exposure. A measure that reflects a fund’s investments in stocks and stock futures. Any holdings in short-term reserves are excluded.
Expense Ratio. The percentage of a fund’s average net assets used to pay its annual administrative and advisory expenses. These expenses directly reduce returns to investors.
Foreign Holdings. The percentage of a fund represented by stocks or depositary receipts of companies based outside the United States.
Inception Date. The date on which the assets of a fund (or one of its share classes) are first invested in accordance with the fund’s investment objective. For funds with a subscription period, the inception date is the day after that period ends. Investment performance is measured from the inception date.
Median Market Cap. An indicator of the size of companies in which a fund invests; the midpoint of market capitalization (market price x shares outstanding) of a fund’s stocks, weighted by the proportion of the fund’s assets invested in each stock. Stocks representing half of the fund’s assets have market capitalizations above the median, and the rest are below it.
Price/Book Ratio. The share price of a stock divided by its net worth, or book value, per share. For a fund, the weighted average price/book ratio of the stocks it holds.
29
Price/Earnings Ratio. The ratio of a stock’s current price to its per-share earnings over the past year. For a fund, the weighted average P/E of the stocks it holds. P/E is an indicator of market expectations about corporate prospects; the higher the P/E, the greater the expectations for a company’s future growth.
R-Squared. A measure of how much of a fund’s past returns can be explained by the returns from the market in general, as measured by a given index. If a fund’s total returns were precisely synchronized with an index’s returns, its R-squared would be 1.00. If the fund’s returns bore no relationship to the index’s returns, its R-squared would be 0. For this report, R-squared is based on returns over the past 36 months for both the fund and the index.
Return on Equity. The annual average rate of return generated by a company during the past five years for each dollar of shareholder’s equity (net income divided by shareholder’s equity). For a fund, the weighted average return on equity for the companies whose stocks it holds.
Short-Term Reserves. The percentage of a fund invested in highly liquid, short-term securities that can be readily converted to cash.
Turnover Rate. An indication of the fund’s trading activity. Funds with high turnover rates incur higher transaction costs and may be more likely to distribute capital gains (which may be taxable to investors). The turnover rate excludes in-kind transactions, which have minimal impact on costs.
30
This page intentionally left blank.
The People Who Govern Your Fund
The trustees of your mutual fund are there to see that the fund is operated and managed in your best interests since, as a shareholder, you are a part owner of the fund. Your fund’s trustees also serve on the board of directors of The Vanguard Group, Inc., which is owned by the Vanguard funds and provides services to them on an at-cost basis.
A majority of Vanguard’s board members are independent, meaning that they have no affiliation with Vanguard or the funds they oversee, apart from the sizable personal investments they have made as private individuals. The independent board members have distinguished backgrounds in business, academia, and public service. Each of the trustees and executive officers oversees 178 Vanguard funds.
The following table provides information for each trustee and executive officer of the fund. More information about the trustees is in the Statement of Additional Information, which can be obtained, without charge, by contacting Vanguard at 800-662-7447, or online at Vanguard.com.
| |
| Interested Trustee1 | Amy Gutmann |
| | Born 1949. Trustee Since June 2006. Principal |
| F. William McNabb III | Occupation(s) During the Past Five Years: President |
| Born 1957. Trustee Since July 2009. Chairman of the | of the University of Pennsylvania; Christopher H. |
| Board. Principal Occupation(s) During the Past Five | Browne Distinguished Professor of Political Science |
| Years: Chairman of the Board of The Vanguard Group, | in the School of Arts and Sciences with secondary |
| Inc., and of each of the investment companies served | appointments at the Annenberg School for Commu- |
| by The Vanguard Group, since January 2010; Director | nication and the Graduate School of Education |
| of The Vanguard Group since 2008; Chief Executive | of the University of Pennsylvania; Director of |
| Officer and President of The Vanguard Group and of | Carnegie Corporation of New York, Schuylkill River |
| each of the investment companies served by The | Development Corporation, and Greater Philadelphia |
| Vanguard Group since 2008; Director of Vanguard | Chamber of Commerce; Trustee of the National |
| Marketing Corporation; Managing Director of The | Constitution Center; Chair of the Presidential |
| Vanguard Group (1995–2008) . | Commission for the Study of Bioethical Issues. |
| |
| | JoAnn Heffernan Heisen |
| Independent Trustees | Born 1950. Trustee Since July 1998. Principal |
| | Occupation(s) During the Past Five Years: Corporate |
| Emerson U. Fullwood | Vice President and Chief Global Diversity Officer |
| Born 1948. Trustee Since January 2008. Principal | since 2006 (retired 2008) and Member of the |
| Occupation(s) During the Past Five Years: Executive | Executive Committee (retired 2008) of Johnson & |
| Chief Staff and Marketing Officer for North America | Johnson (pharmaceuticals/consumer products); Vice |
| and Corporate Vice President (retired 2008) of Xerox | President and Chief Information Officer of Johnson & |
| Corporation (document management products and | Johnson (1997–2005); Director of the University |
| services); Director of SPX Corporation (multi-industry | Medical Center at Princeton and Women’s Research |
| manufacturing), the United Way of Rochester, | and Education Institute; Member of the Advisory |
| Amerigroup Corporation (managed health care), | Board of the Maxwell School of Citizenship and Public |
| the University of Rochester Medical Center, and | Affairs at Syracuse University. |
| Monroe Community College Foundation. | |
| | F. Joseph Loughrey |
| Rajiv L. Gupta | Born 1949. Trustee Since October 2009. Principal |
| Born 1945. Trustee Since December 2001.2 | Occupation(s) During the Past Five Years: President |
| Principal Occupation(s) During the Past Five Years: | and Chief Operating Officer since 2005 (retired 2009) |
| Chairman and Chief Executive Officer (retired 2009) | and Vice Chairman of the Board (2008–2009) of |
| and President (2006–2008) of Rohm and Haas Co. | Cummins Inc. (industrial machinery); Director of |
| (chemicals); Director of Tyco International, Ltd. | SKF AB (industrial machinery), Hillenbrand, Inc. |
| (diversified manufacturing and services) and Hewlett- | (specialized consumer services), Sauer-Danfoss Inc. |
| Packard Co. (electronic computer manufacturing); | (machinery), the Lumina Foundation for Education, |
| Trustee of The Conference Board; Member of the | and Oxfam America; Chairman of the Advisory |
| Board of Managers of Delphi Automotive LLP | Council for the College of Arts and Letters at the |
| (automotive components) . | University of Notre Dame. |
| | |
| André F. Perold | Kathryn J. Hyatt | |
| Born 1952. Trustee Since December 2004. Principal | Born 1955. Treasurer Since November 2008. Principal |
| Occupation(s) During the Past Five Years: George | Occupation(s) During the Past Five Years: Principal |
| Gund Professor of Finance and Banking at the Harvard | of The Vanguard Group, Inc.; Treasurer of each of |
| Business School; Chair of the Investment Committee | the investment companies served by The Vanguard |
| of HighVista Strategies LLC (private investment firm) . | Group since 2008; Assistant Treasurer of each of the |
| | investment companies served by The Vanguard Group |
| Alfred M. Rankin, Jr. | (1988–2008) . | |
| Born 1941. Trustee Since January 1993. Principal | | |
| Occupation(s) During the Past Five Years: Chairman, | Heidi Stam | |
| President, and Chief Executive Officer of NACCO | Born 1956. Secretary Since July 2005. Principal |
| Industries, Inc. (forklift trucks/housewares/lignite); | Occupation(s) During the Past Five Years: Managing |
| Director of Goodrich Corporation (industrial products/ | Director of The Vanguard Group, Inc., since 2006; |
| aircraft systems and services); Chairman of the | General Counsel of The Vanguard Group since 2005; |
| Federal Reserve Bank of Cleveland; Trustee of The | Secretary of The Vanguard Group and of each of the |
| Cleveland Museum of Art. | investment companies served by The Vanguard Group |
| | since 2005; Director and Senior Vice President of |
| Peter F. Volanakis | Vanguard Marketing Corporation since 2005; |
| Born 1955. Trustee Since July 2009. Principal | Principal of The Vanguard Group (1997–2006). |
| Occupation(s) During the Past Five Years: President | | |
| since 2007 and Chief Operating Officer since 2005 | | |
| of Corning Incorporated (communications equipment); | Vanguard Senior Management Team |
| President of Corning Technologies (2001–2005); | | |
| Director of Corning Incorporated and Dow Corning; | R. Gregory Barton | Michael S. Miller |
| Trustee of the Corning Incorporated Foundation and | Mortimer J. Buckley | JamesM. Norris |
| the Corning Museum of Glass; Overseer of the | Kathleen C. Gubanich | Glenn W. Reed |
| Amos Tuck School of Business Administration at | Paul A. Heller | George U. Sauter |
| Dartmouth College. | | |
| |
| | Chairman Emeritus and Senior Advisor |
| Executive Officers | | |
| | John J. Brennan | |
| Glenn Booraem | Chairman, 1996–2009 | |
| Born 1967. Controller Since July 2010. Principal | Chief Executive Officer and President, 1996–2008 |
| Occupation(s) During the Past Five Years: Principal | | |
| of The Vanguard Group, Inc.; Controller of each of | | |
| the investment companies served by The Vanguard | Founder | |
| Group since 2010; Assistant Controller of each of | | |
| the investment companies served by The Vanguard | John C. Bogle | |
| Group (2001–2010) . | Chairman and Chief Executive Officer, 1974–1996 |
| |
| Thomas J. Higgins | | |
| Born 1957. Chief Financial Officer Since September | | |
| 2008. Principal Occupation(s) During the Past Five | | |
| Years: Principal of The Vanguard Group, Inc.; Chief | | |
| Financial Officer of each of the investment companies | | |
| served by The Vanguard Group since 2008; Treasurer | | |
| of each of the investment companies served by The | | |
| Vanguard Group (1998–2008) . | | |
1 Mr. McNabb is considered an “interested person,” as defined in the Investment Company Act of 1940, because he is an officer of the Vanguard funds.
2 December 2002 for Vanguard Equity Income Fund, Vanguard Growth Equity Fund, the Vanguard Municipal Bond Funds, and the Vanguard State Tax-Exempt Funds.
|  |
| P.O. Box 2600 |
| Valley Forge, PA 19482-2600 |
Connect with Vanguard® > Vanguard.com
| |
| Fund Information > 800-662-7447 | |
| Direct Investor Account Services > 800-662-2739 | |
| Institutional Investor Services > 800-523-1036 | |
| Text Telephone for People | |
| With Hearing Impairment > 800-749-7273 | |
| |
| This material may be used in conjunction | |
| with the offering of shares of any Vanguard | |
| fund only if preceded or accompanied by | |
| the fund’s current prospectus. | |
| |
| All comparative mutual fund data are from Lipper Inc. or | |
| Morningstar, Inc., unless otherwise noted. | |
| |
| You can obtain a free copy of Vanguard’s proxy voting | |
| guidelines by visiting vanguard.com/proxyreporting or by | |
| calling Vanguard at 800-662-2739. The guidelines are | |
| also available from the SEC’s website, sec.gov. In | |
| addition, you may obtain a free report on how your fund | |
| voted the proxies for securities it owned during the 12 | |
| months ended June 30. To get the report, visit either | |
| vanguard.com/proxyreporting or sec.gov. | |
| |
| You can review and copy information about your fund at | |
| the SEC’s Public Reference Room in Washington, D.C. To | |
| find out more about this public service, call the SEC at | |
| 202-551-8090. Information about your fund is also | |
| available on the SEC’s website, and you can receive | |
| copies of this information, for a fee, by sending a | |
| request in either of two ways: via e-mail addressed to | |
| publicinfo@sec.gov or via regular mail addressed to the | |
| Public Reference Section, Securities and Exchange | |
| Commission, Washington, DC 20549-1520. | |
| |
| |
| | © 2010 The Vanguard Group, Inc. |
| | All rights reserved. |
| | Vanguard Marketing Corporation, Distributor. |
| |
| | Q6150 112010 |
Item 2: Code of Ethics. The Registrant has adopted a code of ethics that applies to the Registrant’s principal executive officer, principal financial officer, principal accounting officer or controller or persons performing similar functions. The Code of Ethics was amended during the reporting period covered by this report to make certain technical, non-material changes.
Item 3: Audit Committee Financial Expert. The following members of the Audit Committee have been determined by the Registrant’s Board of Trustees to be Audit Committee Financial Experts serving on its Audit Committee, and to be independent: Charles D. Ellis, Rajiv L. Gupta, JoAnn Heffernan Heisen, André F. Perold, and Alfred M. Rankin, Jr.
Item 4: Principal Accountant Fees and Services.
(a) Audit Fees.
Audit Fees of the Registrant
Fiscal Year Ended September 30, 2010: $114,000
Fiscal Year Ended September 30, 2009: $105,000
Aggregate Audit Fees of Registered Investment Companies in the Vanguard Group.
Fiscal Year Ended September 30, 2010: $3,607,060
Fiscal Year Ended September 30, 2009: $3,354,640
(b) Audit-Related Fees.
Fiscal Year Ended September 30, 2010: $791,350
Fiscal Year Ended September 30, 2009: $876,210
Includes fees billed in connection with assurance and related services provided to the Registrant, The Vanguard Group, Inc., Vanguard Marketing Corporation, and other registered investment companies in the Vanguard Group.
(c) Tax Fees.
Fiscal Year Ended September 30, 2010: $336,090
Fiscal Year Ended September 30, 2009: $423,070
Includes fees billed in connection with tax compliance, planning and advice services provided to the Registrant, The Vanguard Group, Inc., Vanguard Marketing Corporation, and other registered investment companies in the Vanguard Group and related to income and excise taxes.
(d) All Other Fees.
Fiscal Year Ended September 30, 2010: $16,000
Fiscal Year Ended September 30, 2009: $0
Includes fees billed for services related to risk management and privacy matters. Services were provided to the Registrant, The Vanguard Group, Inc., Vanguard Marketing Corporation, and other registered i
nvestment companies in the Vanguard Group.
(e) (1) Pre-Approval Policies. The policy of the Registrant’s Audit Committee is to consider and, if appropriate, approve before the principal accountant is engaged for such services, all specific audit and non-audit services provided to: (1) the Registrant; (2) The Vanguard Group, Inc.; (3) other entities controlled by The Vanguard Group, Inc. that provide ongoing services to the Registrant; and (4) other registered investment companies in the Vanguard Group. In making a determination, the Audit Committee considers whether the services are consistent with maintaining the principal accountant’s independence.
In the event of a contingency situation in which the principal accountant is needed to provide services in between scheduled Audit Committee meetings, the Chairman of the Audit Committee would be called on to consider and, if appropriate, pre-approve audit or permitted non-audit services in an amount sufficient to complete services through the next Audit Committee meeting, and to determine if such services would be consistent with maintaining the accountant’s independence. At the next scheduled Audit Committee meeting, services and fees would be presented to the Audit Committee for formal consideration, and, if appropriate, approval by the entire Audit Committee. The Audit Committee would again consider whether such services and fees are consistent with maintaining the principal accountant’s independence.
The Registrant’s Audit Committee is informed at least annually of all audit and non-audit services provided by the principal accountant to the Vanguard complex, whether such services are provided to: (1) the Registrant; (2) The Vanguard Group, Inc.; (3) other entities controlled by The Vanguard Group, Inc. that provide ongoing services to the Registrant; or (4) other registered investment companies in the Vanguard Group.
(2) No percentage of the principal accountant’s fees or services were approved pursuant to the waiver provision of paragraph (c)(7)(i)(C) of Rule 2-01 of Regulation S-X.
(f) For the most recent fiscal year, over 50% of the hours worked under the principal accountant’s engagement were not performed by persons other than full-time, permanent employees of the principal accountant.
(g) Aggregate Non-Audit Fees.
Fiscal Year Ended September 30, 2010: $352,090
Fiscal Year Ended September 30, 2009: $423,070
Includes fees billed for non-audit services provided to the Registrant, The Vanguard Group, Inc., Vanguard Marketing Corporation, and other registered investment companies in the Vanguard Group.
(h) For the most recent fiscal year, the Audit Committee has determined that the provision of all non-audit services was consistent with maintaining the principal accountant’s independence.
Item 5: Audit Committee of Listed Registrants.
Not Applicable.
Item 6: Investments.
Not Applicable.
Item 7: Disclosure of Proxy Voting Policies and Procedures for Closed-End Management Investment Companies.
Not Applicable.
Item 8: Portfolio Managers of Closed-End Management Investment Companies.
Not Applicable.
Item 9: Purchase of Equity Securities by Closed-End Management Investment Company and Affiliated Purchasers.
Not Applicable.
Item 10: Submission of Matters to a Vote of Security Holders.
Not Applicable.
Item 11: Controls and Procedures.
(a) Disclosure Controls and Procedures. The Principal Executive and Financial Officers concluded that the Registrant's Disclosure Controls and Procedures are effective based on their evaluation of the Disclosure Controls and Procedures as of a date within 90 days of the filing date of this report.
(b) Internal Control Over Financial Reporting. There were no significant changes in Registrant’s Internal Control Over Financial Reporting or in other factors that could significantly affect this control subsequent to the date of the evaluation, including any corrective actions with regard to significant deficiencies and material weaknesses.
Item 12: Exhibits.
(a) Code of Ethics.
(b) Certifications.
Pursuant to the requirements of the Securities Exchange Act of 1934 and the Investment Company Act of 1940, the registrant has duly caused this report to be signed on its behalf by the undersigned, thereunto duly authorized.
| |
| | VANGUARD HORIZON FUNDS |
| |
| By: | /s/ F. WILLIAM MCNABB III* |
| | F. WILLIAM MCNABB III |
| | CHIEF EXECUTIVE OFFICER |
| |
| Date: November 18, 2010 |
Pursuant to the requirements of the Securities Exchange Act of 1934 and the Investment Company Act of 1940, this report has been signed below by the following persons on behalf of the registrant and in the capacities and on the dates indicated.
| |
| | VANGUARD HORIZON FUNDS |
| |
| By: | /s/ F. WILLIAM MCNABB III* |
| | F. WILLIAM MCNABB III |
| | CHIEF EXECUTIVE OFFICER |
| |
| Date: November 18, 2010 |
| |
| | VANGUARD HORIZON FUNDS |
| |
| By: | /s/ THOMAS J. HIGGINS* |
| | THOMAS J. HIGGINS |
| | CHIEF FINANCIAL OFFICER |
| |
| Date: November 18, 2010 |
* By: /s/ Heidi Stam
Heidi Stam, pursuant to a Power of Attorney filed on April 26, 2010, see file Number 33-53683,
Incorporated by Reference.