UNITED STATES
SECURITIES AND EXCHANGE COMMISSION
Washington, D.C. 20549
FORM N-CSR
CERTIFIED SHAREHOLDER REPORT
OF
REGISTERED MANAGEMENT INVESTMENT COMPANIES
Investment Company Act file number: 811-07239
Name of Registrant: Vanguard Horizon Funds
Address of Registrant:
P.O. Box 2600
Valley Forge, PA 19482
Name and address of agent for service:
Heidi Stam, Esquire
P.O. Box 876
Valley Forge, PA 19482
Registrant’s telephone number, including area code: (610) 669-1000
Date of fiscal year end: September 30
Date of reporting period: October 1, 2007–September 30, 2008
Item 1: Reports to Shareholders |
> The broad U.S. stock market fell –21.2% during the fiscal year ended September 30, 2008, as the credit crisis deepened.
> Vanguard Strategic Equity Fund returned –25.4% for the 12-month period, measurably lagging both the benchmark return and peer-fund average.
> During the period, the fund posted negative results in all market sectors.
Contents | |
| |
Your Fund’s Total Returns | 1 |
President’s Letter | 2 |
Advisor’s Report | 7 |
Fund Profile | 9 |
Performance Summary | 10 |
Financial Statements | 11 |
Your Fund’s After-Tax Returns | 25 |
About Your Fund’s Expenses | 26 |
Glossary | 28 |
Please note: The opinions expressed in this report are just that—informed opinions. They should not be considered promises or advice. Also, please keep in mind that the information and opinions cover the period through the date on the front of this report. Of course, the risks of investing in your fund are spelled out in the prospectus.
Your Fund’s Total Returns
Fiscal Year Ended September 30, 2008 | | |
| Ticker | Total |
| Symbol | Returns |
Vanguard Strategic Equity Fund | VSEQX | –25.4% |
MSCI US Small + Mid Cap 2200 Index | | –21.5 |
Average Mid-Cap Core Fund1 | | –20.7 |
Your Fund’s Performance at a Glance |
September 30, 2007–September 30, 2008 |
| | | Distributions Per Share |
| Starting | Ending | Income | Capital |
| Share Price | Share Price | Dividends | Gains |
Vanguard Strategic Equity Fund | $24.94 | $16.42 | $0.240 | $2.430 |
1 Derived from data provided by Lipper Inc.
1

President’s Letter
Dear Shareholder,
For the fiscal year ended September 30, 2008, Vanguard Strategic Equity Fund returned –25.4%. The fund’s return lagged that of its benchmark, the MSCI US Small + Mid Cap 2200 Index, as well as the average return of peer funds.
Virtually all areas of the U.S. stock market struggled during the 12-month period. The Strategic Equity Fund featured a few (relatively) bright spots, such as in health care and consumer staples, but on balance the advisor’s stock selections worked against the fund.
Note that if you hold the Strategic Equity Fund in a taxable account, you may wish to review our report on the fund’s after-tax returns on page 25.
Credit market turbulence weighed heavily on stock prices
Troubles simmering in the credit markets for much of the past year came to a boil at the end of the fiscal period, producing several high-profile bankruptcies and putting severe pressure on stock prices around the world. The broad U.S. stock market returned –21.2% for the 12 months ended September 30. In September alone, stock prices fell more than 9%. International stock markets were similarly disappointing, returning –30.0% for the full 12 months.
Policymakers and elected officials, both in the United States and abroad, responded to the upheavals with dramatic new programs designed to help stabilize the
2
credit markets. As participants struggled to make sense of the markets’ fast-changing dynamics, stock prices were exceptionally volatile, with daily ups and downs of 2 percentage points or more becoming commonplace.
U.S. Treasuries rallied in a nervous market
Nervousness in the stock market was echoed, and even amplified, in the bond market. For the 12 months, the broad U.S. bond market returned 3.7%, largely on the strength of Treasuries—investors’ security of choice in times of duress. Corporate bonds generally produced negative returns for the period, coming under heavy selling pressure during investors’ flight to safety. Even the municipal market, made up of generally high-quality securities issued by states and municipalities, recorded a negative 12-month return.
The U.S. Federal Reserve Board responded to the turmoil with a dramatic easing of monetary policy. Over the full 12 months, the Fed reduced its target for the federal funds rate from 4.75% to 2.00%. On October 8, shortly after the close of the fiscal period, the Fed cut rates again, to 1.50%. The move was made in coordination with rate cuts by several other central banks.
Severe market volatility hurts fund’s performance
Vanguard Strategic Equity Fund employs a proprietary stock-selection system in an attempt to outperform its benchmark index
Market Barometer | | | |
| Average Annual Total Returns |
| Periods Ended September 30, 2008 |
| One Year | Three Years | Five Years |
Stocks | | | |
Russell 1000 Index (Large-caps) | –22.1% | 0.1% | 5.5% |
Russell 2000 Index (Small-caps) | –14.5 | 1.8 | 8.1 |
Dow Jones Wilshire 5000 Index (Entire market) | –21.2 | 0.6 | 6.0 |
MSCI All Country World Index ex USA (International) | –30.0 | 3.1 | 11.8 |
| | | |
| | | |
Bonds | | | |
Lehman U.S. Aggregate Bond Index (Broad taxable market) | 3.7% | 4.2% | 3.8% |
Lehman Municipal Bond Index | –1.9 | 1.9 | 2.8 |
Citigroup 3-Month Treasury Bill Index | 2.6 | 4.0 | 3.1 |
| | | |
| | | |
CPI | | | |
Consumer Price Index | 4.9% | 3.2% | 3.4% |
3
while keeping the fund’s risk exposure in line with that of the index. The fund’s advisor, Vanguard Quantitative Equity Group, seeks to identify the most attractive stocks with a model that incorporates investor sentiment, valuation, and the quality of earnings. The fund tries to outperform the index by slightly overweighting or underweighting individual stocks, while maintaining sector weightings that are in line with those of the fund’s benchmark.
However, the extreme turbulence in the U.S. market during the fiscal year proved challenging for the fund. The portfolio suffered particularly from poor stock selection in industrials, information technology, and consumer discretionary, significantly underperforming its benchmark in these sectors.
In industrials, companies suffered as the global credit crisis threatened to restrain demand for heavy equipment, freight services, and other industrial goods and services. A relatively heavy weighting in equipment companies Manitowoc (–65%) and Terex (–66%) hurt the fund’s performance relative to the benchmark.
Information technology stocks were down overall for the period. In particular, semiconductor manufacturers registered declines because of weakened consumer demand for electronics and cuts in business technology spending. And in the consumer discretionary sector, the fund was hurt by its relatively heavy exposure to Internet retailers.
Expense Ratios1 | | |
Your Fund Compared With Its Peer Group |
| | Average |
| | Mid-Cap |
| Fund | Core Fund |
Strategic Equity Fund | 0.30% | 1.33% |
1 The fund expense ratio shown is from the prospectus dated January 25, 2008. For the fiscal year ended September 30, 2008, the fund’s expense ratio was 0.25%. The peer-group expense ratio is derived from data provided by Lipper Inc. and captures information through year-end 2007.
4
The fund performed better relative to the benchmark in the health care sector, where it benefited from good stock selection in pharmaceutical and health care services stocks. Stock selection was stronger, too, in consumer staples, particularly among companies focused on agricultural products and soft drinks.
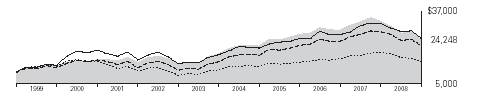
Despite the recent challenging fiscal year, the Strategic Equity Fund recorded a 9.3% average annual total return for the ten years ended September 30. A hypothetical investment of $10,000 made in the fund ten years ago would have more than doubled to $24,248 by September 30. The fund’s average ten-year performance surpassed that of its benchmark, but slightly trailed the average return for peer funds.
Regardless of market conditions, a long-term focus is key
As the credit crisis persisted, the U.S. markets continued to experience sometimes startling volatility. Over the fiscal year, Vanguard Strategic Equity Fund was no stranger to the ups and downs of the markets.
As I mentioned previously, Vanguard’s Quantitative Equity Group relies on a quantitative stock-selection process as it seeks to outperform the benchmark index while keeping the fund’s risk level similar to that of the index. However, it’s important to keep in mind that while the fund’s advisor can control the fund’s relative risk exposures, the advisor cannot control market risk. Over the past year, exposure to the stock market came at a
Total Returns | |
Ten Years Ended September 30, 2008 | |
| Average |
| Annual Return |
Strategic Equity Fund | 9.3% |
Spliced Small and Mid Cap Index1 | 8.1 |
Average Mid-Cap Core Fund2 | 9.6 |
The figures shown represent past performance, which is not a guarantee of future results. (Current performance may be lower or higher than the performance data cited. For performance data current to the most recent month-end, visit our website at www.vanguard.com/performance.) Note, too, that both investment returns and principal value can fluctuate widely, so an investor's shares, when sold, could be worth more or less than their original cost.
1 The Spliced Small and Mid Cap Index reflects the returns of the Russell 2800 Index through May 31, 2003, and the MSCI US Small + Mid Cap 2200 Index thereafter.
2 Derived from data provided by Lipper Inc.
5
high cost. This period of market turbulence is a good example of why we remind shareholders to maintain a balanced portfolio with a long-term perspective.
During the past 12 months, of course, even balanced portfolios of stocks and bonds have faced tough times, although they’ve outperformed many all-stock portfolios. Everything that history has taught us about the markets, however, suggests that these principles can help put you in a position to achieve long-term investment success. We believe that the advisor’s experience and approach make
Vanguard Strategic Equity Fund an excellent choice as part of such a well-balanced investment portfolio.
Thank you for investing with Vanguard.
Sincerely,

F. William McNabb III
President and Chief Executive Officer
October 16, 2008
6
Advisor’s Report
For the fiscal year ended September 30, Vanguard Strategic Equity Fund returned –25.4%, underperforming the MSCI US Small + Mid Cap 2200 Index, which returned –21.5%. The entire market, as measured by the MSCI Broad Market Index, returned –21.2%.
Quantitative management, as we implement it, is similar to traditional stock selection, although we use computer models to make our choices. We attempt to identify attributes that will indicate whether a stock’s market price is too high or too low relative to the company’s fundamentals. Overall, we are trying to find several hundred stocks that individually, and as a group, will outperform their peers. This aspect of our strategy differs from a traditional stock-picking approach, which generally tries to spot a small number of stocks that will outperform.
However, the resulting characteristics of our quantitative portfolio are similar to those of a traditional portfolio. Our portfolio holdings typically exhibit growth rates similar to the market average but were purchased at price/earnings ratios below the market average. Both our investment judgment and our simulations tell us that buying a growth rate like the market’s but at a discount to the market is an attractive proposition, over the long run.
Our specific quantitative approach uses computer models to assess stocks in terms of three components: market sentiment, valuation, and earnings quality.
Our research indicates that each of these models individually has the ability to identify a group of stocks that will outperform their industry peers over the long term. By combining the results from the three models, we benefit from their relatively low correlation with one another, which diversifies the risk in our portfolio. Just as adding bonds and international stocks to a domestic stock investment can help to reduce risk through diversification, using multiple models to pick stocks should improve our overall ability to add value consistently. Our three-component approach doesn’t work every year, but over the long run we are confident in the power of its stock-selection capability and in the diversification it provides.
Last year none of our three models was particularly powerful, as they all struggled against the strong systematic factors sweeping the market. Our best performance came from the insurance industry, where Safeco was up more than 14% for the period. Another bright spot was pharmaceuticals, where Perrigo rose 81%. The industry that hurt performance the most was capital goods; Terex, for example, declined 66%. Semiconductors were our second-worst industry, held back in particular by ON Semiconductor, down –46%.
As disappointed as we are with the investment environment and with our relative performance, we are confident that the stock market will have worthwhile returns for long-term investors in the
7
future, and that our focus on value and sentiment will reward patience. We thank you for your decision to entrust your investment dollars to us, and we look forward to the future.
James D. Troyer, Principal and
Portfolio Manager
Joel M. Dickson, Principal
Vanguard Quantitative Equity Group
October 20, 2008
8
Fund Profile
As of September 30, 2008
Portfolio Characteristics | | |
| | Comparative | Broad |
| Fund | Index1 | Index2 |
Number of Stocks | 537 | 2,172 | 4,679 |
Median Market Cap | $3.2B | $3.2B | $29.6B |
Price/Earnings Ratio | 11.9x | 17.5x | 15.5x |
Price/Book Ratio | 1.8x | 1.9x | 2.2x |
Yield3 | 1.6% | 1.7% | 2.3% |
Return on Equity | 16.1% | 15.7% | 20.0% |
Earnings Growth Rate | 19.4% | 17.3% | 17.7% |
Foreign Holdings | 0.2% | 0% | 0% |
Turnover Rate | 79% | — | — |
Expense Ratio | | | |
(9/30/2007)4 | 0.30% | — | — |
Short-Term Reserves | –0.1%5 | — | — |
Sector Diversification (% of equity exposure) |
| | Comparative | Broad |
| Fund | Index1 | Index2 |
Consumer Discretionary | 13.6% | 13.5% | 9.2% |
Consumer Staples | 4.8 | 4.6 | 10.5 |
Energy | 9.3 | 9.3 | 12.6 |
Financials | 19.1 | 19.0 | 17.3 |
Health Care | 11.4 | 11.7 | 13.0 |
Industrials | 15.1 | 15.5 | 11.4 |
Information Technology | 14.1 | 13.9 | 15.7 |
Materials | 5.1 | 5.2 | 3.7 |
Telecommunication | | | |
Services | 2.0 | 1.9 | 2.8 |
Utilities | 5.5 | 5.4 | 3.8 |
Volatility Measures6 | |
| Fund Versus | Fund Versus |
| Comparative Index1 | Broad Index2 |
R-Squared | 0.98 | 0.88 |
Beta | 1.04 | 1.18 |
Ten Largest Holdings7 (% of total net assets) |
| | |
Cooper Industries, Inc. | electrical components | |
Class A | and equipment | 1.0% |
Intuitive Surgical, Inc. | health care | |
| equipment | 1.0 |
AmerisourceBergen Corp. | health care | |
| distributors | 1.0 |
Murphy Oil Corp. | integrated oil | |
| and gas | 1.0 |
AutoZone Inc. | automotive retail | 1.0 |
Whirlpool Corp. | household | |
| appliances | 1.0 |
ENSCO International, Inc. | oil and gas drilling | 1.0 |
Molson Coors | | |
Brewing Co. Class B | brewers | 0.9 |
Parker Hannifin Corp. | industrial machinery | 0.9 |
SCANA Corp. | multi-utilities | 0.9 |
Top Ten | | 9.7% |
Investment Focus
1 MSCI US Small + Mid Cap 2200 Index.
2 Dow Jones Wilshire 5000 Index.
3 30-day SEC yield for the fund; annualized dividend yield for the indexes. See the Glossary.
4 The expense ratio shown is from the prospectus dated January 25, 2008. For the fiscal year ended September 30, 2008, the expense ratio was 0.25%.
5 The fund invested a portion of its cash reserves in equity markets through the use of index futures contracts. After the effect of the futures investments, the fund’s temporary cash position was negative.
6 For an explanation of R-squared, beta, and other terms used here, see the Glossary.
7 The holdings listed exclude any temporary cash investments and equity index products.
9
Performance Summary
All of the returns in this report represent past performance, which is not a guarantee of future results that may be achieved by the fund. (Current performance may be lower or higher than the performance data cited. For performance data current to the most recent month-end, visit our website at www.vanguard.com/performance.) Note, too, that both investment returns and principal value can fluctuate widely, so an investor’s shares, when sold, could be worth more or less than their original cost. The returns shown do not reflect taxes that a shareholder would pay on fund distributions or on the sale of fund shares.
Cumulative Performance: September 30, 1998–September 30, 2008
Initial Investment of $10,000
| | | |
| | | | |
| Average Annual Total Returns | Final Value |
| Periods Ended September 30, 2008 | of a $10,000 |
| One Year | Five Years | Ten Years | Investment |
Strategic Equity Fund1 | –25.37% | 5.96% | 9.26% | $24,248 |
Dow Jones Wilshire 5000 Index | –21.20 | 6.04 | 4.00 | 14,801 |
Spliced Small and Mid Cap Index2 | –21.50 | 8.28 | 8.14 | 21,874 |
Average Mid-Cap Core Fund3 | –20.65 | 7.07 | 9.59 | 24,978 |
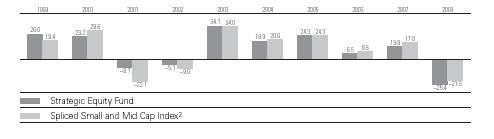
Fiscal-Year Total Returns (%): September 30, 1998–September 30, 2008
1 Total returns do not include the account service fee that may be applicable to certain accounts with balances below $10,000.
2 The Spliced Small and Mid Cap Index reflects the returns of the Russell 2800 Index through May 31, 2003, and the MSCI US Small + Mid Cap 2200 Index thereafter.
3 Derived from data provided by Lipper Inc.
Note: See Financial Highlights table for dividend and capital gains information.
10
Financial Statements
Statement of Net Assets
As of September 30, 2008
The fund provides a complete list of its holdings four times in each fiscal year, at the quarter-ends. For the second and fourth fiscal quarters, the lists appear in the fund’s semiannual and annual reports to shareholders. For the first and third fiscal quarters, the fund files the lists with the Securities and Exchange Commission on Form N-Q. Shareholders can look up the fund’s Forms N-Q on the SEC’s website at www.sec.gov. Forms N-Q may also be reviewed and copied at the SEC’s Public Reference Room (see the back cover of this report for further information).
| | | Market |
| | | Value• |
| | Shares | ($000) |
Common Stocks (99.5%)1 | | |
Consumer Discretionary (13.5%) | | |
* | AutoZone Inc. | 382,400 | 47,165 |
| Whirlpool Corp. | 585,500 | 46,424 |
| Darden Restaurants Inc. | 1,496,932 | 42,857 |
* | Dollar Tree, Inc. | 1,079,490 | 39,250 |
*,^ | Mohawk Industries, Inc. | 517,125 | 34,849 |
* | Expedia, Inc. | 1,605,251 | 24,255 |
* | Marvel Entertainment, Inc. | 635,600 | 21,699 |
* | Hanesbrands Inc. | 948,900 | 20,639 |
^ | New York Times Co. | | |
| Class A | 1,436,100 | 20,522 |
| Sherwin-Williams Co. | 322,257 | 18,420 |
| DeVry, Inc. | 368,000 | 18,231 |
| Abercrombie & Fitch Co. | 427,700 | 16,873 |
* | Priceline.com, Inc. | 237,100 | 16,225 |
* | Aeropostale, Inc. | 504,650 | 16,204 |
| Newell Rubbermaid, Inc. | 919,326 | 15,868 |
| H & R Block, Inc. | 667,100 | 15,043 |
* | JAKKS Pacific, Inc. | 527,499 | 13,140 |
| Autoliv, Inc. | 380,414 | 12,839 |
^ | Meredith Corp. | 433,720 | 12,166 |
| Wyndham Worldwide Corp. | 711,900 | 11,184 |
| Cablevision Systems NY | | |
| Group Class A | 405,200 | 10,195 |
| The Stanley Works | 226,000 | 9,433 |
*,^ | Chipotle Mexican Grill, Inc. | 161,600 | 8,967 |
* | ITT Educational | | |
| Services, Inc. | 107,200 | 8,674 |
| Bob Evans Farms, Inc. | 302,417 | 8,253 |
* | Big Lots Inc. | 280,900 | 7,817 |
* | Jack in the Box Inc. | 370,065 | 7,808 |
* | ATC Technology Corp. | 326,100 | 7,742 |
* | DreamWorks | | |
| Animation SKG, Inc. | 238,000 | 7,485 |
| Burger King Holdings Inc. | 227,700 | 5,592 |
* | Helen of Troy Ltd. | 244,400 | 5,565 |
* | NVR, Inc. | 9,500 | 5,434 |
* | Denny’s Corp. | 1,886,795 | 4,868 |
* | The Goodyear Tire & | | |
| Rubber Co. | 307,700 | 4,711 |
* | Capella Education Co. | 109,500 | 4,693 |
| Ross Stores, Inc. | 124,949 | 4,599 |
| Sinclair Broadcast Group, Inc. | 898,516 | 4,529 |
* | Exide Technologies | 507,800 | 3,748 |
| International Speedway Corp. | 93,600 | 3,642 |
*,^ | Jos. A. Bank Clothiers, Inc. | 100,900 | 3,390 |
* | Lear Corp. | 301,600 | 3,167 |
* | Lin TV Corp. | 597,872 | 3,085 |
| UniFirst Corp. | 65,103 | 2,805 |
^ | Polaris Industries, Inc. | 60,500 | 2,752 |
| American Greetings Corp. | | |
| Class A | 179,200 | 2,740 |
| Regal Entertainment Group | | |
| Class A | 164,047 | 2,589 |
| Interactive Data Corp. | 96,534 | 2,435 |
| CSS Industries, Inc. | 92,500 | 2,381 |
* | Valassis | | |
| Communications, Inc. | 270,950 | 2,346 |
* | Rent-A-Center, Inc. | 103,700 | 2,310 |
| Black & Decker Corp. | 37,800 | 2,296 |
| Sonic Automotive, Inc. | 268,000 | 2,267 |
| Dover Downs Gaming & | | |
| Entertainment, Inc. | 276,250 | 2,149 |
^ | Ethan Allen Interiors, Inc. | 75,906 | 2,127 |
| Scripps Networks Interactive | 55,600 | 2,019 |
| Hillenbrand Inc. | 100,100 | 2,018 |
| Regis Corp. | 68,600 | 1,887 |
* | Papa John’s International, Inc. | 69,021 | 1,875 |
| Movado Group, Inc. | 70,400 | 1,573 |
| RadioShack Corp. | 90,500 | 1,564 |
| Journal Communications, Inc. | 312,800 | 1,527 |
* | Skechers U.S.A., Inc. | 79,106 | 1,331 |
| CBRL Group, Inc. | 41,300 | 1,086 |
| Service Corp. International | 123,107 | 1,029 |
* | Bally Technologies Inc. | 31,700 | 960 |
| Furniture Brands | | |
| International Inc. | 90,592 | 953 |
| ArvinMeritor, Inc. | 69,700 | 909 |
| Limited Brands, Inc. | 45,200 | 783 |
11
| | | Market |
| | | Value• |
| | Shares | ($000) |
* | AFC Enterprises, Inc. | 105,300 | 765 |
* | Red Robin Gourmet | | |
| Burgers, Inc. | 28,000 | 750 |
* | Town Sports International | | |
| Holdings, Inc. | 116,300 | 709 |
*,^ | Conn’s, Inc. | 27,600 | 516 |
| OfficeMax, Inc. | 52,200 | 464 |
* | 1-800-FLOWERS.COM, Inc. | 73,900 | 445 |
| Gray Television, Inc. | 251,300 | 432 |
* | Charlotte Russe Holding Inc. | 41,300 | 423 |
| Barnes & Noble, Inc. | 15,500 | 404 |
^ | Hearst-Argyle Television Inc. | 16,800 | 375 |
| Churchill Downs, Inc. | 7,239 | 355 |
| VF Corp. | 4,500 | 348 |
* | Jo-Ann Stores, Inc. | 14,800 | 311 |
* | CEC Entertainment Inc. | 8,600 | 286 |
| Stage Stores, Inc. | 18,300 | 250 |
| Group 1 Automotive, Inc. | 8,600 | 187 |
*,^ | Blockbuster Inc. Class A | 89,600 | 185 |
* | P.F. Chang’s China | | |
| Bistro, Inc. | 7,600 | 179 |
* | Quiksilver, Inc. | 22,200 | 127 |
* | Westwood One, Inc. | 107,602 | 54 |
* | Deckers Outdoor Corp. | 500 | 52 |
| The Buckle, Inc. | 700 | 39 |
* | TRW Automotive | | |
| Holdings Corp. | 1,600 | 26 |
| | | 653,643 |
Consumer Staples (4.8%) | | |
| Molson Coors Brewing Co. | | |
| Class B | 978,200 | 45,731 |
* | Dr. Pepper Snapple | | |
| Group, Inc. | 1,027,000 | 27,195 |
* | NBTY, Inc. | 768,183 | 22,677 |
| Nash-Finch Co. | 472,695 | 20,383 |
| The Pepsi Bottling | | |
| Group, Inc. | 496,000 | 14,468 |
* | Ralcorp Holdings, Inc. | 190,099 | 12,815 |
| The Clorox Co. | 191,400 | 11,999 |
^ | Cal-Maine Foods, Inc. | 416,997 | 11,442 |
| SuperValu Inc. | 512,000 | 11,110 |
* | Chiquita Brands | | |
| International, Inc. | 579,700 | 9,165 |
| Herbalife Ltd. | 177,300 | 7,007 |
| PepsiAmericas, Inc. | 322,905 | 6,691 |
| Universal Corp. (VA) | 132,136 | 6,487 |
| The Estee Lauder Cos. Inc. | | |
| Class A | 108,300 | 5,405 |
| Corn Products | | |
| International, Inc. | 112,500 | 3,631 |
* | Winn-Dixie Stores, Inc. | 254,000 | 3,531 |
| Del Monte Foods Co. | 364,662 | 2,844 |
* | Alliance One | | |
| International, Inc. | 542,200 | 2,060 |
* | Prestige Brands | | |
| Holdings Inc. | 215,300 | 1,912 |
| Bunge Ltd. | 21,800 | 1,377 |
* | National Beverage Corp. | 85,000 | 754 |
| Alberto-Culver Co. | 11,400 | 310 |
| Coca-Cola Bottling Co. | 6,800 | 297 |
* | BJ’s Wholesale Club, Inc. | 2,100 | 82 |
| | | 229,373 |
Energy (9.3%) | | |
| Murphy Oil Corp. | 741,300 | 47,547 |
| ENSCO International, Inc. | 804,309 | 46,352 |
* | Whiting Petroleum Corp. | 486,900 | 34,696 |
| Helmerich & Payne, Inc. | 793,442 | 34,269 |
* | Swift Energy Co. | 765,400 | 29,613 |
| Patterson-UTI Energy, Inc. | 1,359,269 | 27,213 |
* | Plains Exploration & | | |
| Production Co. | 757,300 | 26,627 |
| Massey Energy Co. | 630,100 | 22,476 |
| Noble Corp. | 496,022 | 21,775 |
| Noble Energy, Inc. | 354,100 | 19,684 |
| Tidewater Inc. | 321,200 | 17,782 |
* | Comstock Resources, Inc. | 299,096 | 14,970 |
* | Mariner Energy Inc. | 701,100 | 14,372 |
* | Bristow Group, Inc. | 418,900 | 14,176 |
| W&T Offshore, Inc. | 349,300 | 9,532 |
* | Stone Energy Corp. | 215,025 | 9,102 |
* | Denbury Resources, Inc. | 461,400 | 8,785 |
* | Ultra Petroleum Corp. | 157,100 | 8,694 |
* | Superior Energy | | |
| Services, Inc. | 248,647 | 7,743 |
* | Nabors Industries, Inc. | 278,062 | 6,929 |
* | Rosetta Resources, Inc. | 214,400 | 3,936 |
| Walter Industries, Inc. | 79,000 | 3,749 |
| Cimarex Energy Co. | 69,821 | 3,415 |
* | SEACOR Holdings Inc. | 42,500 | 3,355 |
* | McMoRan Exploration Co. | 123,100 | 2,910 |
* | Oil States International, Inc. | 81,007 | 2,864 |
* | Grey Wolf, Inc. | 271,319 | 2,111 |
* | Gulfmark Offshore, Inc. | 31,700 | 1,423 |
* | Clayton Williams | | |
| Energy, Inc. | 6,418 | 453 |
* | PetroQuest Energy, Inc. | 23,600 | 362 |
| Berry Petroleum Class A | 5,900 | 228 |
| Pioneer Natural | | |
| Resources Co. | 2,100 | 110 |
| | | 447,253 |
Financials (19.2%) | | |
* | Nasdaq Stock Market Inc. | 1,390,100 | 42,495 |
| Unum Group | 1,578,800 | 39,628 |
| Bank of Hawaii Corp. | 726,175 | 38,814 |
| Cullen/Frost Bankers, Inc. | 609,800 | 36,588 |
| Ameriprise Financial, Inc. | 848,121 | 32,398 |
* | Arch Capital Group Ltd. | 361,200 | 26,378 |
| Axis Capital Holdings Ltd. | 781,780 | 24,790 |
| Endurance Specialty | | |
| Holdings Ltd. | 787,700 | 24,356 |
| PartnerRe Ltd. | 352,219 | 23,983 |
| Torchmark Corp. | 379,455 | 22,691 |
12
| | | Market |
| | | Value• |
| | Shares | ($000) |
| Associated Banc-Corp. | 1,090,823 | 21,762 |
| HCP, Inc. REIT | 535,800 | 21,502 |
| Commerce Bancshares, Inc. | 385,430 | 17,884 |
^ | Pacific Capital Bancorp | 861,430 | 17,530 |
| Platinum Underwriters | | |
| Holdings, Ltd. | 474,000 | 16,818 |
| Ventas, Inc. REIT | 333,300 | 16,472 |
| Host Hotels & Resorts Inc. | | |
| REIT | 1,163,400 | 15,462 |
| FirstMerit Corp. | 723,401 | 15,191 |
^ | First Commonwealth | | |
| Financial Corp. | 978,620 | 13,182 |
^ | Popular, Inc. | 1,494,300 | 12,388 |
| Alexandria Real Estate | | |
| Equities, Inc. REIT | 104,600 | 11,768 |
| Aspen Insurance | | |
| Holdings Ltd. | 414,300 | 11,393 |
| Nationwide Health | | |
| Properties, Inc. REIT | 313,400 | 11,276 |
^ | Synovus Financial Corp. | 1,086,950 | 11,250 |
*,^ | The St. Joe Co. | 285,700 | 11,168 |
| Apartment Investment & | | |
| Management Co. | | |
| Class A REIT | 314,985 | 11,031 |
| Everest Re Group, Ltd. | 124,300 | 10,756 |
| Senior Housing Properties | | |
| Trust REIT | 446,800 | 10,647 |
* | EZCORP, Inc. | 563,426 | 10,592 |
| Taubman Co. REIT | 193,200 | 9,660 |
| Highwood | | |
| Properties, Inc. REIT | 269,200 | 9,573 |
| Leucadia National Corp. | 208,790 | 9,487 |
| Douglas Emmett, Inc. REIT | 405,100 | 9,346 |
| Home Properties, Inc. REIT | 156,700 | 9,081 |
| National Retail | | |
| Properties REIT | 373,100 | 8,936 |
| F.N.B. Corp. | 536,100 | 8,567 |
| Healthcare Realty | | |
| Trust Inc. REIT | 279,054 | 8,134 |
| CapitalSource Inc. REIT | 619,500 | 7,620 |
| Odyssey Re Holdings Corp. | 172,800 | 7,569 |
| NBT Bancorp, Inc. | 246,952 | 7,389 |
| Mid-America Apartment | | |
| Communities, Inc. REIT | 150,300 | 7,386 |
| Mack-Cali Realty Corp. REIT | 212,700 | 7,204 |
| Parkway Properties Inc. REIT | 184,000 | 6,966 |
* | Interactive Brokers | | |
| Group, Inc. | 314,000 | 6,961 |
| Plum Creek | | |
| Timber Co. Inc. REIT | 139,300 | 6,946 |
| City Holding Co. | 162,655 | 6,872 |
| Hospitality Properties | | |
| Trust REIT | 333,000 | 6,833 |
| AMB Property Corp. REIT | 150,782 | 6,830 |
| Kimco Realty Corp. REIT | 184,773 | 6,826 |
| Janus Capital Group Inc. | 278,900 | 6,772 |
| Rayonier Inc. REIT | 142,050 | 6,726 | |
| RenaissanceRe | | | |
| Holdings Ltd. | 124,566 | 6,477 | |
| Sun Communities, Inc. REIT | 322,700 | 6,393 | |
| S & T Bancorp, Inc. | 173,400 | 6,386 | |
| IPC Holdings Ltd. | 208,000 | 6,284 | |
| Tanger Factory Outlet | | | |
| Centers, Inc. REIT | 140,400 | 6,148 | |
| EastGroup | | | |
| Properties, Inc. REIT | 126,600 | 6,145 | |
| Washington REIT | 167,200 | 6,125 | |
| Post Properties, Inc. REIT | 216,700 | 6,061 | |
| Annaly Mortgage | | | |
| Management Inc. REIT | 421,700 | 5,672 | |
| Colonial Properties | | | |
| Trust REIT | 300,660 | 5,619 | |
* | CB Richard Ellis Group, Inc. | 418,200 | 5,591 | |
| Avalonbay | | | |
| Communities, Inc. REIT | 55,500 | 5,462 | |
| Camden Property Trust REIT | 118,500 | 5,434 | |
| Jones Lang LaSalle Inc. | 118,500 | 5,152 | |
| Pennsylvania REIT | 267,300 | 5,039 | |
* | TD Ameritrade | | | |
| Holding Corp. | 289,000 | 4,682 | |
| Allied World Assurance | | | |
| Holdings, Ltd. | 131,395 | 4,667 | |
| Sovereign Bancorp, Inc. | 1,107,500 | 4,375 |
| WSFS Financial Corp. | 72,150 | 4,329 | |
* | Penson Worldwide, Inc. | 270,100 | 3,746 | |
| Saul Centers, Inc. REIT | 72,200 | 3,649 | |
| BancFirst Corp. | 67,122 | 3,244 | |
^ | JER Investors | | | |
| Trust Inc. REIT | 620,900 | 3,042 | |
| Oriental Financial Group Inc. | 169,400 | 3,026 | |
| WesBanco, Inc. | 112,714 | 3,000 | |
| Cash America | | | |
| International Inc. | 81,000 | 2,919 | |
| Potlatch Corp. REIT | 62,900 | 2,918 | |
| First Community | | | |
| Bancshares, Inc. | 77,400 | 2,904 | |
| Gamco Investors Inc. | | | |
| Class A | 45,666 | 2,708 | |
| FelCor Lodging | | | |
| Trust, Inc. REIT | 364,700 | 2,611 | |
| City Bank Lynnwood (WA) | 154,609 | 2,412 | |
| LTC Properties, Inc. REIT | 79,600 | 2,334 | |
^ | Heartland Financial USA, Inc. | 69,500 | 1,742 | |
| SL Green Realty Corp. REIT | 24,326 | 1,576 | |
| First Merchants Corp. | 68,930 | 1,572 | |
*,^ | Guaranty Financial | | | |
| Group, Inc. | 390,700 | 1,543 | |
* | Virginia Commerce | | | |
| Bancorp, Inc. | 232,540 | 1,453 | |
| LaSalle Hotel | | | |
| Properties REIT | 59,600 | 1,390 | |
| | | | | |
13
| | | Market |
| | | Value• |
| | Shares | ($000) |
| Developers Diversified | | |
| Realty Corp. REIT | 42,200 | 1,337 |
| Republic Bancorp, Inc. | | |
| Class A | 41,157 | 1,248 |
| Regency Centers Corp. REIT | 16,400 | 1,094 |
* | Knight Capital Group, Inc. | | |
| Class A | 70,853 | 1,053 |
| The Macerich Co. REIT | 16,100 | 1,025 |
| First BanCorp Puerto Rico | 91,086 | 1,007 |
| Federal Realty Investment | | |
| Trust REIT | 10,900 | 933 |
| International | | |
| Bancshares Corp. | 33,900 | 915 |
| Health Care Inc. REIT | 16,500 | 878 |
^ | Crystal River | | |
| Capital Inc. REIT | 424,000 | 857 |
^ | Great Southern Bancorp, Inc. | 61,605 | 786 |
| Willis Group Holdings Ltd. | 23,800 | 768 |
* | Dollar Financial Corp. | 46,706 | 719 |
| Omega Healthcare | | |
| Investors, Inc. REIT | 33,500 | 659 |
| Presidential Life Corp. | 41,553 | 656 |
| Anworth Mortgage | | |
| Asset Corp. REIT | 88,800 | 526 |
^ | iStar Financial Inc. REIT | 201,800 | 525 |
| Acadia Realty Trust REIT | 20,100 | 508 |
| MFA Mortgage | | |
| Investments, Inc. REIT | 71,500 | 465 |
* | PHH Corp. | 25,002 | 332 |
| Financial Federal Corp. | 13,400 | 307 |
| S.Y. Bancorp, Inc. | 8,500 | 260 |
| Community Bank | | |
| System, Inc. | 10,100 | 254 |
| Getty Realty | | |
| Holding Corp. REIT | 11,100 | 247 |
* | FPIC Insurance Group, Inc. | 4,600 | 236 |
| UDR, Inc. REIT | 8,200 | 214 |
| American Campus | | |
| Communities, Inc. REIT | 4,585 | 155 |
| First Financial Bancorp | 7,500 | 110 |
| BOK Financial Corp. | 600 | 29 |
* | Cardtronics Inc. | 3,200 | 25 |
* | FCStone Group, Inc. | 1,100 | 20 |
| | | 923,855 |
Health Care (11.3%) | | |
* | Intuitive Surgical, Inc. | 200,600 | 48,341 |
| AmerisourceBergen Corp. | 1,267,957 | 47,739 |
| Perrigo Co. | 1,112,303 | 42,779 |
* | Lincare Holdings, Inc. | 1,378,996 | 41,494 |
| Beckman Coulter, Inc. | 453,546 | 32,197 |
* | Cephalon, Inc. | 380,600 | 29,493 |
* | PAREXEL International Corp. | 954,800 | 27,365 |
* | Express Scripts Inc. | 361,900 | 26,715 |
*,^ | Isis Pharmaceuticals, Inc. | 1,219,702 | 20,601 |
* | King Pharmaceuticals, Inc. | 1,912,600 | 18,323 |
* | Henry Schein, Inc. | 340,300 | 18,322 |
| Universal Health Services | | |
| Class B | 289,800 | 16,237 |
| STERIS Corp. | 348,400 | 13,093 |
* | Invitrogen Corp. | 323,000 | 12,209 |
* | BioMarin Pharmaceutical Inc. | 448,500 | 11,881 |
* | Onyx Pharmaceuticals, Inc. | 322,800 | 11,679 |
| Invacare Corp. | 362,400 | 8,748 |
* | Cynosure Inc. | 464,200 | 8,328 |
* | Myriad Genetics, Inc. | 115,900 | 7,520 |
| Chemed Corp. | 167,200 | 6,865 |
* | MedCath Corp. | 335,620 | 6,014 |
* | LifePoint Hospitals, Inc. | 182,435 | 5,863 |
* | PharMerica Corp. | 260,353 | 5,855 |
* | DaVita, Inc. | 98,900 | 5,638 |
* | OSI Pharmaceuticals, Inc. | 101,800 | 5,018 |
* | Watson Pharmaceuticals, Inc. | 172,500 | 4,916 |
* | Skilled Healthcare Group Inc. | 300,398 | 4,773 |
* | Warner Chilcott Ltd. | 285,900 | 4,323 |
* | Emergent BioSolutions Inc. | 293,488 | 3,842 |
* | Alexion Pharmaceuticals, Inc. | 97,200 | 3,820 |
* | Charles River | | |
| Laboratories, Inc. | 67,600 | 3,754 |
* | Merit Medical Systems, Inc. | 193,000 | 3,623 |
| Martek Biosciences Corp. | 103,100 | 3,239 |
* | CONMED Corp. | 96,400 | 3,085 |
* | Albany Molecular | | |
| Research, Inc. | 153,090 | 2,769 |
* | Bio-Rad Laboratories, Inc. | | |
| Class A | 27,500 | 2,726 |
* | Kindred Healthcare, Inc. | 92,700 | 2,556 |
* | AMERIGROUP Corp. | 91,400 | 2,308 |
* | Cambrex Corp. | 367,900 | 2,263 |
* | Genoptix, Inc. | 67,400 | 2,202 |
* | ViroPharma Inc. | 167,055 | 2,192 |
* | Xenoport Inc. | 33,040 | 1,602 |
| Sciele Pharma, Inc. | 50,408 | 1,552 |
* | K-V Pharmaceutical Co. | | |
| Class A | 62,000 | 1,408 |
* | Gentiva Health Services, Inc. | 48,600 | 1,309 |
* | Apria Healthcare Group Inc. | 66,352 | 1,210 |
| Medicis Pharmaceutical Corp. | 62,500 | 932 |
* | Affymetrix, Inc. | 113,100 | 875 |
* | eResearch Technology, Inc. | 66,400 | 791 |
* | Endo Pharmaceuticals | | |
| Holdings, Inc. | 36,600 | 732 |
* | Questcor | | |
| Pharmaceuticals, Inc. | 77,666 | 571 |
* | Amedisys Inc. | 7,800 | 380 |
| Datascope Corp. | 6,900 | 356 |
| Owens & Minor, Inc. | | |
| Holding Co. | 7,100 | 344 |
* | Alnylam Pharmaceuticals Inc. | 11,200 | 324 |
* | Sucampo | | |
| Pharmaceuticals Inc. | 38,000 | 324 |
* | Kendle International Inc. | 7,000 | 313 |
* | Res-Care, Inc. | 17,000 | 308 |
14
| | | Market |
| | | Value• |
| | Shares | ($000) |
* | Cross Country | | |
| Healthcare, Inc. | 13,475 | 219 |
* | CorVel Corp. | 7,300 | 209 |
* | Health Management | | |
| Associates Class A | 49,700 | 207 |
* | AmSurg Corp. | 7,020 | 179 |
* | Caraco Pharmaceutical | | |
| Laboratories, Ltd. | 9,000 | 113 |
* | Valeant Pharmaceuticals | | |
| International | 1,800 | 37 |
| | | 545,003 |
Industrials (15.0%) | | |
| Cooper Industries, Inc. | | |
| Class A | 1,232,300 | 49,230 |
| Parker Hannifin Corp. | 853,241 | 45,222 |
| Cummins Inc. | 943,582 | 41,253 |
| Manpower Inc. | 847,275 | 36,568 |
| Trinity Industries, Inc. | 1,323,720 | 34,059 |
| R.R. Donnelley & Sons Co. | 1,375,145 | 33,732 |
* | AGCO Corp. | 786,600 | 33,517 |
| Ryder System, Inc. | 384,800 | 23,858 |
* | Terex Corp. | 763,297 | 23,296 |
* | EnPro Industries, Inc. | 543,700 | 20,204 |
| The Manitowoc Co., Inc. | 1,268,280 | 19,722 |
* | Gardner Denver Inc. | 546,660 | 18,980 |
| Hubbell Inc. Class B | 540,500 | 18,945 |
* | EMCOR Group, Inc. | 696,700 | 18,337 |
* | United Stationers, Inc. | 379,230 | 18,139 |
| GATX Corp. | 435,220 | 17,222 |
* | Hertz Global Holdings Inc. | 2,244,609 | 16,992 |
| Steelcase Inc. | 1,489,662 | 16,014 |
*,^ | TBS International Ltd. | 1,108,600 | 14,922 |
* | Perini Corp. | 497,300 | 12,825 |
| Pitney Bowes, Inc. | 378,700 | 12,596 |
| Pacer International, Inc. | 737,422 | 12,145 |
| L-3 Communications | | |
| Holdings, Inc. | 110,300 | 10,845 |
* | Columbus McKinnon Corp. | 447,800 | 10,555 |
* | Consolidated Graphics, Inc. | 311,800 | 9,457 |
| SPX Corp. | 118,300 | 9,109 |
* | Ceradyne, Inc. | 240,100 | 8,802 |
* | Esterline | | |
| Technologies Corp. | 216,100 | 8,555 |
* | McDermott | | |
| International, Inc. | 325,000 | 8,304 |
| Acuity Brands, Inc. | 188,700 | 7,880 |
* | Sykes Enterprises, Inc. | 327,500 | 7,192 |
* | Allied Waste Industries, Inc. | 590,488 | 6,560 |
| Robbins & Myers, Inc. | 202,400 | 6,260 |
| Comfort Systems USA, Inc. | 424,000 | 5,665 |
*,^ | RSC Holdings Inc. | 473,000 | 5,373 |
| Bowne & Co., Inc. | 457,600 | 5,285 |
| Interface, Inc. | 456,100 | 5,186 |
* | United Rentals, Inc. | 339,781 | 5,178 |
| Herman Miller, Inc. | 189,000 | 4,625 |
| Con-way, Inc. | 104,743 | 4,620 |
| Apogee Enterprises, Inc. | 299,390 | 4,500 |
| Knoll, Inc. | 278,700 | 4,214 |
| Granite Construction Co. | 110,600 | 3,962 |
* | Kansas City Southern | 62,800 | 2,786 |
| The Toro Co. | 66,000 | 2,726 |
* | GrafTech International Ltd. | 171,900 | 2,597 |
| Arkansas Best Corp. | 76,497 | 2,577 |
| Goodrich Corp. | 58,300 | 2,425 |
| IKON Office Solutions, Inc. | 132,500 | 2,254 |
| Triumph Group, Inc. | 44,025 | 2,012 |
| Gibraltar Industries Inc. | 103,093 | 1,929 |
* | Cenveo Inc. | 243,200 | 1,870 |
^ | Genco Shipping and | | |
| Trading Ltd. | 54,400 | 1,808 |
| Cubic Corp. | 70,726 | 1,739 |
* | American Reprographics Co. | 96,500 | 1,665 |
* | Republic Airways | | |
| Holdings Inc. | 143,300 | 1,460 |
* | Tecumseh Products Co. | | |
| Class A | 56,240 | 1,408 |
| TAL International Group, Inc. | 65,400 | 1,362 |
| Kelly Services, Inc. Class A | 58,946 | 1,123 |
| McGrath RentCorp | 38,500 | 1,110 |
* | First Advantage Corp. | | |
| Class A | 76,000 | 1,068 |
| Republic Services, Inc. | | |
| Class A | 34,800 | 1,043 |
| Deluxe Corp. | 65,600 | 944 |
* | CBIZ Inc. | 93,684 | 793 |
| Textainer Group | | |
| Holdings Ltd. | 48,400 | 735 |
* | Old Dominion | | |
| Freight Line, Inc. | 24,000 | 680 |
* | Avis Budget Group, Inc. | 104,800 | 602 |
* | MPS Group, Inc. | 52,304 | 527 |
| Crane Co. | 17,700 | 526 |
* | Rush Enterprises, Inc. | | |
| Class A | 40,650 | 520 |
| A.O. Smith Corp. | 12,300 | 482 |
* | Kirby Corp. | 12,400 | 470 |
| HEICO Corp. Class A | 16,714 | 469 |
* | Alliant Techsystems, Inc. | 3,047 | 286 |
| Paragon Shipping, Inc. | 26,000 | 222 |
| Encore Wire Corp. | 10,911 | 198 |
| Belden Inc. | 6,100 | 194 |
| The Brink's Co. | 2,200 | 134 |
| HEICO Corp. | 3,000 | 98 |
| | | 722,747 |
Information Technology (14.0%) | |
* | Sybase, Inc. | 1,416,085 | 43,360 |
* | BMC Software, Inc. | 1,476,836 | 42,282 |
* | Western Digital Corp. | 1,804,400 | 38,470 |
* | salesforce.com, inc. | 794,500 | 38,454 |
* | Hewitt Associates, Inc. | 1,033,800 | 37,672 |
* | Avnet, Inc. | 1,511,800 | 37,236 |
* | Anixter International Inc. | 492,000 | 29,279 |
15
| | | Market |
| | | Value• |
| | Shares | ($000) |
* | Skyworks Solutions, Inc. | 3,436,500 | 28,729 |
* | Dolby Laboratories Inc. | 574,900 | 20,231 |
* | Lexmark International, Inc. | 596,000 | 19,412 |
* | Amkor Technology, Inc. | 2,854,951 | 18,186 |
* | Marvell Technology | | |
| Group Ltd. | 1,860,700 | 17,304 |
* | Integrated Device | | |
| Technology Inc. | 2,164,800 | 16,842 |
* | OmniVision | | |
| Technologies, Inc. | 1,425,939 | 16,270 |
* | EarthLink, Inc. | 1,892,800 | 16,089 |
* | CSG Systems | | |
| International, Inc. | 906,578 | 15,892 |
* | Plexus Corp. | 721,166 | 14,928 |
* | j2 Global | | |
| Communications, Inc. | 635,467 | 14,838 |
* | Interwoven Inc. | 1,026,566 | 14,495 |
* | Metavante Technologies | 691,639 | 13,321 |
| Xilinx, Inc. | 552,500 | 12,956 |
* | ManTech International Corp. | 216,100 | 12,813 |
| National | | |
| Semiconductor Corp. | 593,200 | 10,209 |
| Intersil Corp. | 597,700 | 9,910 |
| KLA-Tencor Corp. | 296,600 | 9,387 |
* | QLogic Corp. | 571,700 | 8,781 |
| United Online, Inc. | 869,520 | 8,182 |
| Technitrol, Inc. | 463,100 | 6,849 |
* | JDA Software Group, Inc. | 427,200 | 6,498 |
* | Progress Software Corp. | 202,924 | 5,274 |
* | Parametric Technology Corp. | 282,298 | 5,194 |
* | Flextronics International Ltd. | 732,700 | 5,187 |
| Fair Isaac, Inc. | 213,500 | 4,923 |
| Broadridge Financial | | |
| Solutions LLC | 274,700 | 4,228 |
* | S1 Corp. | 678,316 | 4,151 |
* | Fairchild Semiconductor | | |
| International, Inc. | 456,900 | 4,062 |
* | Brocade Communications | | |
| Systems, Inc. | 692,000 | 4,027 |
* | SAIC, Inc. | 182,900 | 3,700 |
*,^ | UTStarcom, Inc. | 1,022,400 | 3,445 |
* | MKS Instruments, Inc. | 170,950 | 3,404 |
* | LAM Research Corp. | 106,698 | 3,360 |
| Plantronics, Inc. | 147,500 | 3,322 |
* | Synopsys, Inc. | 160,170 | 3,195 |
* | SYNNEX Corp. | 143,000 | 3,195 |
* | Multi-Fineline | | |
| Electronix, Inc. | 204,002 | 3,017 |
* | Tech Data Corp. | 98,100 | 2,928 |
*,^ | DST Systems, Inc. | 44,000 | 2,464 |
* | Ciber, Inc. | 322,100 | 2,251 |
| CTS Corp. | 171,300 | 2,189 |
* | iGATE Corp. | 238,627 | 2,069 |
* | SRA International, Inc. | 87,200 | 1,973 |
* | Arrow Electronics, Inc. | 61,604 | 1,615 |
* | Cymer, Inc. | 63,600 | 1,611 |
* | Sapient Corp. | 194,600 | 1,446 |
| Black Box Corp. | 41,200 | 1,423 |
* | Checkpoint Systems, Inc. | 74,100 | 1,395 |
| ADTRAN Inc. | 70,600 | 1,376 |
| Methode Electronics, Inc. | | |
| Class A | 130,600 | 1,168 |
*,^ | Constant Contact, Inc. | 63,900 | 1,091 |
* | SPSS, Inc. | 29,800 | 875 |
| Bel Fuse, Inc. Class B | 30,300 | 863 |
*,^ | Sigma Designs, Inc. | 55,600 | 791 |
* | TNS Inc. | 38,400 | 744 |
* | Taleo Corp. Class A | 33,064 | 658 |
* | TTM Technologies, Inc. | 64,629 | 641 |
* | TriQuint Semiconductor, Inc. | 87,600 | 420 |
* | infoGROUP, Inc. | 61,837 | 409 |
* | Manhattan Associates, Inc. | 16,100 | 360 |
* | Entegris Inc. | 73,400 | 355 |
* | Quantum Corp. | 311,502 | 336 |
* | Eagle Test Systems, Inc. | 19,100 | 292 |
* | Harmonic, Inc. | 32,700 | 276 |
* | Standard Microsystem Corp. | 10,362 | 259 |
* | Convergys Corp. | 17,500 | 259 |
* | Benchmark Electronics, Inc. | 16,500 | 232 |
* | Mastech Holdings, Inc. | 15,908 | 121 |
| Renaissance Learning, Inc. | 7,905 | 103 |
* | Emulex Corp. | 7,500 | 80 |
* | Compuware Corp. | 3,300 | 32 |
| | | 675,664 |
Materials (5.0%) | | |
| CF Industries Holdings, Inc. | 368,200 | 33,676 |
| Celanese Corp. Series A | 1,194,200 | 33,330 |
* | Owens-Illinois, Inc. | 1,023,900 | 30,103 |
| Greif Inc. Class A | 447,200 | 29,345 |
| Eastman Chemical Co. | 478,260 | 26,333 |
| Terra Industries, Inc. | 862,800 | 25,366 |
| AK Steel Holding Corp. | 915,535 | 23,731 |
| Steel Dynamics, Inc. | 504,828 | 8,627 |
| Reliance Steel & | | |
| Aluminum Co. | 172,000 | 6,531 |
| Schnitzer Steel | | |
| Industries, Inc. Class A | 147,800 | 5,800 |
| Lubrizol Corp. | 116,900 | 5,043 |
| Compass Minerals | | |
| International, Inc. | 83,100 | 4,354 |
| Rock-Tenn Co. | 74,800 | 2,990 |
* | Buckeye Technology, Inc. | 347,858 | 2,849 |
| Olin Corp. | 79,900 | 1,550 |
| Innophos Holdings Inc. | 53,700 | 1,309 |
| Koppers Holdings, Inc. | 25,900 | 969 |
| Glatfelter | 17,000 | 230 |
| RPM International, Inc. | 1,000 | 19 |
| Innospec, Inc. | 1,400 | 17 |
| | | 242,172 |
Telecommunication Services (2.0%) | |
| Embarq Corp. | 930,823 | 37,745 |
* | Syniverse Holdings Inc. | 1,093,403 | 18,161 |
16
| | | Market |
| | | Value• |
| | Shares | ($000) |
| Telephone & Data | | |
| Systems, Inc. | 392,648 | 14,037 |
* | Cincinnati Bell Inc. | 4,000,300 | 12,361 |
| CenturyTel, Inc. | 165,500 | 6,066 |
| NTELOS Holdings Corp. | 131,800 | 3,544 |
| Windstream Corp. | 288,900 | 3,161 |
| Atlantic Tele-Network, Inc. | 22,400 | 627 |
| | | 95,702 |
Utilities (5.4%) | | |
| SCANA Corp. | 1,126,678 | 43,862 |
| Alliant Energy Corp. | 1,050,656 | 33,842 |
| Energen Corp. | 617,472 | 27,959 |
| Questar Corp. | 609,200 | 24,928 |
| Xcel Energy, Inc. | 1,090,745 | 21,804 |
| CMS Energy Corp. | 1,409,100 | 17,571 |
| ONEOK, Inc. | 506,100 | 17,410 |
| WGL Holdings Inc. | 437,800 | 14,207 |
| Wisconsin Energy Corp. | 203,700 | 9,146 |
| Pepco Holdings, Inc. | 391,934 | 8,979 |
| DPL Inc. | 358,500 | 8,891 |
| ITC Holdings Corp. | 137,200 | 7,103 |
* | Mirant Corp. | 324,400 | 5,933 |
| Atmos Energy Corp. | 208,611 | 5,553 |
| The Laclede Group, Inc. | 113,600 | 5,508 |
| Portland General | | |
| Electric Co. | 200,800 | 4,751 |
| DTE Energy Co. | 36,900 | 1,480 |
| Avista Corp. | 50,000 | 1,086 |
| UIL Holdings Corp. | 26,000 | 893 |
| Empire District Electric Co. | 23,900 | 510 |
* | El Paso Electric Co. | 23,700 | 498 |
| | | 261,914 |
Total Common Stocks | | |
(Cost $5,480,914) | | 4,797,326 |
Temporary Cash Investments (2.3%)1 | |
Money Market Fund (2.2%) | | |
2,3 | Vanguard Market | | |
| Liquidity Fund, 2.296% | 105,951,083 | 105,951 |
| Face | Market |
| Amount | Value• |
| ($000) | ($000) |
U.S. Government Agency Obligation (0.1%) | | |
4,5 Federal Home Loan Bank, | | |
2.576%, 11/24/08 | 3,000 | 2,985 |
Total Temporary Cash Investments | | |
(Cost $108,940) | | 108,936 |
Total Investments (101.8%) | | |
(Cost $5,589,854) | 4,906,262 |
Other Assets and Liabilities (–1.8%) | | |
Other Assets | | 24,572 |
Liabilities3 | | (109,172) |
| | (84,600) |
Net Assets (100%) | | |
Applicable to 293,687,951 outstanding | | |
$.001 par value shares of beneficial | | |
interest (unlimited authorization) | 4,821,662 |
Net Asset Value Per Share | | $16.42 |
| | |
| | |
| | |
At September 30, 2008, net assets consisted of: |
| Amount |
| ($000) |
Paid-in Capital | 5,839,019 |
Undistributed Net Investment Income | 38,101 |
Accumulated Net Realized Losses | (370,970) |
Unrealized Appreciation (Depreciation) | |
Investment Securities | (683,592) |
Futures Contracts | (896) |
Net Assets | 4,821,662 |
• See Note A in Notes to Financial Statements.
* Non-income-producing security.
^ Part of security position is on loan to broker-dealers.The total value of securities on loan is $83,848,000.
1 The fund invests a portion of its cash reserves in equity markets through the use of index futures contracts. After giving effect to futures investments, the fund’s effective common stock and temporary cash investment positions represent 100.1% and 1.7%, respectively, of net assets.
2 Affiliated money market fund available only to Vanguard funds and certain trusts and accounts managed by Vanguard. Rate shown is the 7-day yield.
3 Includes $85,825,000 of collateral received for securities on loan.
4 The issuer operates under a congressional charter; its securities are neither issued nor guaranteed by the U.S. government.
5 Securities with a value of $2,985,000 have been segregated as initial margin for open futures contracts. REIT—Real Estate Investment Trust See accompanying Notes, which are an integral part of the Financial Statements.
17
Statement of Operations
| Year Ended |
| September 30, 2008 |
| ($000) |
Investment Income | |
Income | |
Dividends | 74,463 |
Interest1 | 1,196 |
Security Lending | 5,401 |
Total Income | 81,060 |
Expenses | |
The Vanguard Group—Note B | |
Investment Advisory Services | 1,005 |
Management and Administrative | 12,353 |
Marketing and Distribution | 1,403 |
Custodian Fees | 145 |
Auditing Fees | 22 |
Shareholders’ Reports | 169 |
Trustees’ Fees and Expenses | 10 |
Total Expenses | 15,107 |
Net Investment Income | 65,953 |
Realized Net Gain (Loss) | |
Investment Securities Sold | (321,593) |
Futures Contracts | (9,796) |
Realized Net Gain (Loss) | (331,389) |
Change in Unrealized Appreciation (Depreciation) | |
Investment Securities | (1,491,594) |
Futures Contracts | (1,211) |
Change in Unrealized Appreciation (Depreciation) | (1,492,805) |
Net Increase (Decrease) in Net Assets Resulting from Operations | (1,758,241) |
1 Interest income from an affiliated company of the fund was $774,000.
See accompanying Notes, which are an integral part of the Financial Statements.
18
Statement of Changes in Net Assets
| Year Ended September 30, |
| 2008 | 2007 |
| ($000) | ($000) |
Increase (Decrease) in Net Assets | | |
Operations | | |
Net Investment Income | 65,953 | 78,672 |
Realized Net Gain (Loss) | (331,389) | 755,729 |
Change in Unrealized Appreciation (Depreciation) | (1,492,805) | 71,161 |
Net Increase (Decrease) in Net Assets Resulting from Operations | (1,758,241) | 905,562 |
Distributions | | |
Net Investment Income | (69,137) | (74,998) |
Realized Capital Gain1 | (700,017) | (282,684) |
Total Distributions | (769,154) | (357,682) |
Capital Share Transactions | | |
Issued | 774,976 | 1,437,921 |
Issued in Lieu of Cash Distributions | 726,971 | 338,749 |
Redeemed | (1,851,818) | (1,380,667) |
Net Increase (Decrease) from Capital Share Transactions | (349,871) | 396,003 |
Total Increase (Decrease) | (2,877,266) | 943,883 |
Net Assets | | |
Beginning of Period | 7,698,928 | 6,755,045 |
End of Period2 | 4,821,662 | 7,698,928 |
1 Includes fiscal 2008 and 2007 short-term gain distributions totaling $83,541,000 and $28,845,000, respectively. Short-term gain distributions are treated as ordinary income dividends for tax purposes.
2 Net Assets—End of Period includes undistributed net investment income of $38,101,000 and $41,285,000. See accompanying Notes, which are an integral part of the Financial Statements.
19
Financial Highlights
| | | | | | |
| | | | | Nov. 1, | Year |
| | | 2003, to | Ended |
For a Share Outstanding | Year Ended September 30, | Sept. 30, | Oct. 31, |
Throughout Each Period | 2008 | 2007 | 2006 | 2005 | 20041 | 2003 |
Net Asset Value, Beginning of Period | $24.94 | $23.07 | $23.28 | $19.70 | $17.85 | $13.01 |
Investment Operations | | | | | | |
Net Investment Income | .240 | .270 | .270 | .190 | .130 | .130 |
Net Realized and Unrealized Gain (Loss) on Investments | | | | | | |
(6.090) | 2.840 | 1.170 | 4.490 | 1.850 | 4.840 |
Total from Investment Operations | (5.850) | 3.110 | 1.440 | 4.680 | 1.980 | 4.970 |
Distributions | | | | | | |
Dividends from Net Investment Income | (.240) | (.260) | (.210) | (.140) | (.130) | (.130) |
Distributions from Realized Capital Gains | (2.430) | (.980) | (1.440) | (.960) | — | — |
Total Distributions | (2.670) | (1.240) | (1.650) | (1.100) | (.130) | (.130) |
Net Asset Value, End of Period | $16.42 | $24.94 | $23.07 | $23.28 | $19.70 | $17.85 |
| | | | | | |
| | | | | | |
Total Return2 | –25.37% | 13.76% | 6.49% | 24.32% | 11.14% | 38.55% |
| | | | | | |
| | | | | | |
Ratios/Supplemental Data | | | | | | |
Net Assets, End of Period (Millions) | $4,822 | $7,699 | $6,755 | $5,183 | $2,953 | $1,714 |
Ratio of Total Expenses to | | | | | | |
Average Net Assets | 0.25% | 0.30% | 0.35% | 0.40% | 0.45%3 | 0.50% |
Ratio of Net Investment Income to | | | | | | |
Average Net Assets | 1.09% | 1.03% | 1.18% | 0.99% | 0.83%3 | 1.04% |
Portfolio Turnover Rate | 79% | 75% | 80% | 75% | 66% | 100% |
1 The fund’s fiscal year-end changed from October 31 to September 30, effective September 30, 2004.
2 Total returns do not include the account service fee that may be applicable to certain accounts with balances below $10,000.
3 Annualized.
See accompanying Notes, which are an integral part of the Financial Statements.
20
Notes to Financial Statements
Vanguard Strategic Equity Fund is registered under the Investment Company Act of 1940 as an open-end investment company, or mutual fund.
A. The following significant accounting policies conform to generally accepted accounting principles for U.S. mutual funds. The fund consistently follows such policies in preparing its financial statements.
1. Security Valuation: Securities are valued as of the close of trading on the New York Stock Exchange (generally 4 p.m., Eastern time) on the valuation date. Equity securities are valued at the latest quoted sales prices or official closing prices taken from the primary market in which each security trades; such securities not traded on the valuation date are valued at the mean of the latest quoted bid and asked prices. Securities for which market quotations are not readily available, or whose values have been materially affected by events occurring before the fund’s pricing time but after the close of the securities’ primary markets, are valued by methods deemed by the board of trustees to represent fair value. Investments in Vanguard Market Liquidity Fund are valued at that fund’s net asset value.
Temporary cash investments acquired over 60 days to maturity are valued using the latest bid prices or using valuations based on a matrix system (which considers such factors as security prices, yields, maturities, and ratings), both as furnished by independent pricing services. Other temporary cash investments are valued at amortized cost, which approximates market value.
2. Futures Contracts: The fund uses index futures contracts to a limited extent, with the objective of maintaining full exposure to the stock market while maintaining liquidity. The fund may purchase or sell futures contracts to achieve a desired level of investment, whether to accommodate portfolio turnover or cash flows from capital share transactions. The primary risks associated with the use of futures contracts are imperfect correlation between changes in market values of stocks held by the fund and the prices of futures contracts, and the possibility of an illiquid market.
Futures contracts are valued at their quoted daily settlement prices. The aggregate principal amounts of the contracts are not recorded in the Statement of Net Assets. Fluctuations in the value of the contracts are recorded in the Statement of Net Assets as an asset (liability) and in the Statement of Operations as unrealized appreciation (depreciation) until the contracts are closed, when they are recorded as realized futures gains (losses).
3. Federal Income Taxes: The fund intends to continue to qualify as a regulated investment company and distribute all of its taxable income. Management has analyzed the fund’s tax positions taken on federal income tax returns for all open tax years (tax years ended September 30, 2005–2008), and has concluded that no provision for federal income tax is required in the fund’s financial statements.
4. Distributions: Distributions to shareholders are recorded on the ex-dividend date.
5. Security Lending: The fund may lend its securities to qualified institutional borrowers to earn additional income. Security loans are required to be secured at all times by collateral at least equal to the market value of securities loaned. The fund invests cash collateral received in Vanguard Market Liquidity Fund, and records a liability for the return of the collateral, during the period the securities are on loan. Security lending income represents the income earned on investing cash collateral, less expenses associated with the loan.
6. Other: Dividend income is recorded on the ex-dividend date. Interest income includes income distributions received from Vanguard Market Liquidity Fund and is accrued daily. Security transactions are accounted for on the date securities are bought or sold. Costs used to determine realized gains (losses) on the sale of investment securities are those of the specific securities sold.
21
B. The Vanguard Group furnishes at cost investment advisory, corporate management, administrative, marketing, and distribution services. The costs of such services are allocated to the fund under methods approved by the board of trustees. The fund has committed to provide up to 0.40% of its net assets in capital contributions to Vanguard. At September 30, 2008, the fund had contributed capital of $479,000 to Vanguard (included in Other Assets), representing 0.01% of the fund’s net assets and 0.48% of Vanguard’s capitalization. The fund’s trustees and officers are also directors and officers of Vanguard.
C. Distributions are determined on a tax basis and may differ from net investment income and realized capital gains for financial reporting purposes. Differences may be permanent or temporary. Permanent differences are reclassified among capital accounts in the financial statements to reflect their tax character. Temporary differences arise when certain items of income, expense, gain, or loss are recognized in different periods for financial statement and tax purposes; these differences will reverse at some time in the future. Differences in classification may also result from the treatment of short-term gains as ordinary income for tax purposes.
The fund used a tax accounting practice to treat a portion of the price of capital shares redeemed during the year as distributions from realized capital gains. Accordingly, the fund has reclassified $4,600,000 from accumulated net realized losses to paid-in capital.
For tax purposes, at September 30, 2008, the fund had $48,221,000 of ordinary income available for distribution. Tax-basis capital gains required to be distributed in December 2007 included net gains realized through October 31, 2007. Subsequently the fund realized capital losses of $371,403,000, which are available to offset future net capital gains.
At September 30, 2008, the cost of investment securities for tax purposes was $5,590,317,000. Net unrealized depreciation of investment securities for tax purposes was $684,055,000, consisting of unrealized gains of $309,713,000 on securities that had risen in value since their purchase and $993,768,000 in unrealized losses on securities that had fallen in value since their purchase.
At September 30, 2008, the aggregate settlement value of open futures contracts expiring in December 2008 and the related unrealized appreciation (depreciation) were:
| | | ($000) |
| Number of | Aggregate | Unrealized |
| Long (Short) | Settlement | Appreciation |
Futures Contracts | Contracts | Value | (Depreciation) |
S&P MidCap 400 Index | 40 | 14,606 | (791) |
E-mini Russell 2000 Index | 148 | 10,041 | (216) |
E-mini S&P MidCap Index | 43 | 3,140 | 111 |
Unrealized appreciation (depreciation) on open futures contracts is required to be treated as realized gain (loss) for tax purposes.
D. During the year ended September 30, 2008, the fund purchased $4,766,212,000 of investment securities and sold $5,818,502,000 of investment securities, other than temporary cash investments.
22
E. Capital shares issued and redeemed were:
| Year Ended Sept. 30, |
| 2008 | 2007 |
| Shares | Shares |
| (000) | (000) |
Issued | 39,124 | 57,380 |
Issued in Lieu of Cash Distributions | 36,367 | 14,281 |
Redeemed | (90,470) | (55,822) |
Net Increase (Decrease) in Shares Outstanding | (14,979) | 15,839 |
F. In September 2006, the Financial Accounting Standards Board issued Statement of Financial Accounting Standards No. 157 (“FAS 157”), “Fair Value Measurements.” FAS 157 establishes a framework for measuring fair value and expands disclosures about fair value measurements in financial statements.
The various inputs that may be used to determine the value of the fund’s investments are summarized in three broad levels. The inputs or methodologies used for valuing securities are not necessarily an indication of the risk associated with investing in those securities.
Level 1—Quoted prices in active markets for identical securities.
Level 2—Other significant observable inputs (including quoted prices for similar securities, interest rates, prepayment speeds, credit risk, etc.).
Level 3—Significant unobservable inputs (including the fund’s own assumptions used to determine the fair value of investments).
The following table summarizes the fund’s investments as of September 30, 2008, based on the inputs used to value them:
| Investments | Futures |
| in Securities | Contracts |
Valuation Inputs | ($000) | ($000) |
Level 1—Quoted prices | 4,903,277 | (896) |
Level 2—Other significant observable inputs | 2,985 | — |
Level 3—Significant unobservable inputs | — | — |
Total | 4,906,262 | (896) |
23
Report of Independent Registered
Public Accounting Firm
To the Trustees of Vanguard Horizon Funds and the Shareholders of Vanguard Strategic Equity Fund:
In our opinion, the accompanying statement of net assets and the related statements of operations and of changes in net assets and the financial highlights present fairly, in all material respects, the financial position of Vanguard Strategic Equity Fund (the “Fund”) at September 30, 2008, the results of its operations for the year then ended, the changes in its net assets for each of the two years in the period then ended, and the financial highlights for each of the periods indicated, in conformity with accounting principles generally accepted in the United States of America. These financial statements and financial highlights (hereafter referred to as “financial statements”) are the responsibility of the Fund’s management; our responsibility is to express an opinion on these financial statements based on our audits. We conducted our audits of these financial statements in accordance with the standards of the Public Company Accounting Oversight Board (United States). Those standards require that we plan and perform the audit to obtain reasonable assurance about whether the financial statements are free of material misstatement. An audit includes examining, on a test basis, evidence supporting the amounts and disclosures in the financial statements, assessing the accounting principles used and significant estimates made by management, and evaluating the overall financial statement presentation. We believe that our audits, which included confirmation of securities at September 30, 2008 by correspondence with the custodian and broker, and by agreement to the underlying ownership records for Vanguard Market Liquidity Fund, provide a reasonable basis for our opinion.
PricewaterhouseCoopers LLP
Philadelphia, Pennsylvania
November 19, 2008
Special 2008 tax information (unaudited) for Vanguard Strategic Equity Fund
This information for the fiscal year ended September 30, 2008, is included pursuant to provisions of the Internal Revenue Code.
The fund distributed $619,964,000 as capital gain dividends (from net long-term capital gains) to shareholders during the fiscal year.
For non-resident alien shareholders, 100% of short-term capital gain dividends distributed by the fund are qualified short-term capital gains.
The fund distributed $66,884,000 of qualified dividend income to shareholders during the fiscal year.
For corporate shareholders, 83.4% of investment income (dividend income plus short-term gains, if any) qualifies for the dividends-received deduction.
24
Your Fund’s After-Tax Returns
This table presents returns for your fund both before and after taxes. The after-tax returns are shown in two ways: (1) assuming that an investor owned the fund during the entire period and paid taxes on the fund’s distributions, and (2) assuming that an investor paid taxes on the fund’s distributions and sold all shares at the end of each period.
Calculations are based on the highest individual federal income tax and capital gains tax rates in effect at the times of the distributions and the hypothetical sales. State and local taxes were not considered. After-tax returns reflect any qualified dividend income, using actual prior-year figures and estimates for 2008. (In the example, returns after the sale of fund shares may be higher than those assuming no sale. This occurs when the sale would have produced a capital loss. The calculation assumes that the investor received a tax deduction for the loss.)
Please note that your actual after-tax returns will depend on your tax situation and may differ from those shown. Also note that if you own the fund in a tax-deferred account, such as an individual retirement account or a 401(k) plan, this information does not apply to you. Such accounts are not subject to current taxes.
Finally, keep in mind that a fund’s performance—whether before or after taxes—does not guarantee future results.
Average Annual Total Returns: Strategic Equity Fund1 | | | |
Periods Ended September 30, 2008 | | | |
| One | Five | Ten |
| Year | Years | Years |
Returns Before Taxes | –25.37% | 5.96% | 9.26% |
Returns After Taxes on Distributions | –26.88 | 4.84 | 7.79 |
Returns After Taxes on Distributions and Sale of Fund Shares | –14.37 | 5.17 | 7.59 |
1 Total returns do not include the account service fee that may be applicable to certain accounts with balances below $10,000.
25
About Your Fund’s Expenses
As a shareholder of the fund, you incur ongoing costs, which include costs for portfolio management, administrative services, and shareholder reports (like this one), among others. Operating expenses, which are deducted from a fund’s gross income, directly reduce the investment return of the fund.
A fund’s expenses are expressed as a percentage of its average net assets. This figure is known as the expense ratio. The following examples are intended to help you understand the ongoing costs (in dollars) of investing in your fund and to compare these costs with those of other mutual funds. The examples are based on an investment of $1,000 made at the beginning of the period shown and held for the entire period.
The accompanying table illustrates your fund’s costs in two ways:
• Based on actual fund return. This section helps you to estimate the actual expenses that you paid over the period. The “Ending Account Value” shown is derived from the fund’s actual return, and the third column shows the dollar amount that would have been paid by an investor who started with $1,000 in the fund. You may use the information here, together with the amount you invested, to estimate the expenses that you paid over the period.
To do so, simply divide your account value by $1,000 (for example, an $8,600 account value divided by $1,000 = 8.6), then multiply the result by the number given for your fund under the heading “Expenses Paid During Period.”
• Based on hypothetical 5% yearly return. This section is intended to help you compare your fund’s costs with those of other mutual funds. It assumes that the fund had a yearly return of 5% before expenses, but that the expense ratio is unchanged. In this case—because the return used is not the fund’s actual return—the results do not apply to your investment. The example is useful in making comparisons because the Securities and Exchange Commission requires all mutual funds to calculate expenses based on a 5% return. You can assess your fund’s costs by comparing this hypothetical example with the hypothetical examples that appear in shareholder reports of other funds.
Six Months Ended September 30, 2008 | | | |
| Beginning | Ending | Expenses |
| Account Value | Account Value | Paid During |
Strategic Equity Fund | 3/31/2008 | 9/30/2008 | Period1 |
Based on Actual Fund Return | $1,000.00 | $890.94 | $1.09 |
Based on Hypothetical 5% Yearly Return | $1,000.00 | $1,023.92 | $1.17 |
1 The calculations are based on expenses incurred in the most recent six-month period. The fund’s annualized six-month expense ratio for that period is 0.23%. The dollar amounts shown as “Expenses Paid” are equal to the annualized expense ratio multiplied by the average account value over the period, multiplied by the number of days in the most recent six-month period, then divided by the number of days in the most recent 12-month period.
26
Note that the expenses shown in the table are meant to highlight and help you compare ongoing costs only and do not reflect transaction costs incurred by the fund for buying and selling securities. Further, the expenses do not include the account service fee described in the prospectus. If such a fee were applied to your account, your costs would be higher. Your fund does not charge transaction fees, such as purchase or redemption fees, nor does it carry a “sales load.”
The calculations assume no shares were bought or sold during the period. Your actual costs may have been higher or lower, depending on the amount of your investment and the timing of any purchases or redemptions.
You can find more information about the fund’s expenses, including annual expense ratios, in the Financial Statements section of this report. For additional information on operating expenses and other shareholder costs, please refer to your fund’s current prospectus.
27
Glossary
Beta. A measure of the magnitude of a fund’s past share-price fluctuations in relation to the ups and downs of a given market index. The index is assigned a beta of 1.00. Compared with a given index, a fund with a beta of 1.20 typically would have seen its share price rise or fall by 12% when the index rose or fell by 10%. For this report, beta is based on returns over the past 36 months for both the fund and the index. Note that a fund’s beta should be reviewed in conjunction with its R-squared (see definition). The lower the R-squared, the less correlation there is between the fund and the index, and the less reliable beta is as an indicator of volatility.
Earnings Growth Rate. The average annual rate of growth in earnings over the past five years for the stocks now in a fund.
Equity Exposure. A measure that reflects a fund’s investments in stocks and stock futures. Any holdings in short-term reserves are excluded.
Expense Ratio. The percentage of a fund’s average net assets used to pay its annual administrative and advisory expenses. These expenses directly reduce returns to investors.
Foreign Holdings. The percentage of a fund represented by stocks or depositary receipts of companies based outside the United States.
Inception Date. The date on which the assets of a fund (or one of its share classes) are first invested in accordance with the fund’s investment objective. For funds with a subscription period, the inception date is the day after that period ends. Investment performance is measured from the inception date.
Median Market Cap. An indicator of the size of companies in which a fund invests; the midpoint of market capitalization (market price x shares outstanding) of a fund’s stocks, weighted by the proportion of the fund’s assets invested in each stock. Stocks representing half of the fund’s assets have market capitalizations above the median, and the rest are below it.
Price/Book Ratio. The share price of a stock divided by its net worth, or book value, per share. For a fund, the weighted average price/book ratio of the stocks it holds.
Price/Earnings Ratio. The ratio of a stock’s current price to its per-share earnings over the past year. For a fund, the weighted average P/E of the stocks it holds. P/E is an indicator of market expectations about corporate prospects; the higher the P/E, the greater the expectations for a company’s future growth.
R-Squared. A measure of how much of a fund’s past returns can be explained by the returns from the market in general, as measured by a given index. If a fund’s total returns were precisely synchronized with an index’s returns, its R-squared would be 1.00. If the fund’s returns bore no relationship to the index’s returns, its R-squared would be 0. For this report, R-squared is based on returns over the past 36 months for both the fund and the index.
Return on Equity. The annual average rate of return generated by a company during the past five years for each dollar of shareholder’s equity (net income divided by shareholder’s equity). For a fund, the weighted average return on equity for the companies whose stocks it holds.
Short-Term Reserves. The percentage of a fund invested in highly liquid, short-term securities that can be readily converted to cash.
Turnover Rate. An indication of the fund’s trading activity. Funds with high turnover rates incur higher transaction costs and may be more likely to distribute capital gains (which may be taxable to investors). The turnover rate excludes in-kind transactions, which have minimal impact on costs.
28
Yield. A fund’s 30-day SEC yield is derived using a formula specified by the U.S. Securities and Exchange Commission. Under the formula, data related to the fund’s security holdings in the previous 30 days are used to calculate the fund’s hypothetical net income for that period, which is then annualized and divided by the fund’s estimated average net assets over the calculation period. For the purposes of this calculation, a security’s income is based on its current market yield to maturity (in the case of bonds) or its projected dividend yield (for stocks). Because the SEC yield represents hypothetical annualized income, it will differ—at times significantly—from the fund’s actual experience. As a result, the fund’s income distributions may be higher or lower than implied by the SEC yield.
29
This page intentionally left blank.
This page intentionally left blank.
The People Who Govern Your Fund
The trustees of your mutual fund are there to see that the fund is operated and managed in your best interests since, as a shareholder, you are a part owner of the fund. Your fund’s trustees also serve on the board of directors of The Vanguard Group, Inc., which is owned by the Vanguard funds and provides services to them on an at-cost basis.
A majority of Vanguard’s board members are independent, meaning that they have no affiliation with Vanguard or the funds they oversee, apart from the sizable personal investments they have made as private individuals.
Our independent board members bring distinguished backgrounds in business, academia, and public service to their task of working with Vanguard officers to establish the policies and oversee the activities of the funds. Among board members’ responsibilities are selecting investment advisors for the funds; monitoring fund operations, performance, and costs; reviewing contracts; nominating and selecting new trustees/directors; and electing Vanguard officers.
Each trustee serves a fund until its termination; or until the trustee’s retirement, resignation, or death; or otherwise as specified in the fund’s organizational documents. Any trustee may be removed at a shareholders’ meeting by a vote representing two-thirds of the net asset value of all shares of the fund together with shares of other Vanguard funds organized within the same trust. The table on these two pages shows information for each trustee and executive officer of the fund. The mailing address of the trustees and officers is P.O. Box 876, Valley Forge, PA 19482.
Chairman of the Board and Trustee
John J. Brennan1
Born 1954 Principal Occupation(s) During the Past Five Years: Chairman of the Board and Director/ Trustee Since May 1987; Trustee of The Vanguard Group, Inc., and of each of the investment companies served Chairman of the Board by The Vanguard Group; Chief Executive Officer and President of The Vanguard Group 156 Vanguard Funds Overseen and of each of the investment companies served by The Vanguard Group (1996–2008).
Independent Trustees
Charles D. Ellis
Born 1937 Principal Occupation(s) During the Past Five Years: Applecore Partners (pro bono ventures Trustee Since January 2001 in education); Senior Advisor to Greenwich Associates (international business strategy 156 Vanguard Funds Overseen consulting); Successor Trustee of Yale University; Overseer of the Stern School of Business at New York University; Trustee of the Whitehead Institute for Biomedical Research.
Emerson U. Fullwood
Born 1948 Principal Occupation(s) During the Past Five Years: Executive Chief Staff and Marketing Trustee Since January 2008 Officer for North America since 2004 and Corporate Vice President of Xerox Corporation 156 Vanguard Funds Overseen (photocopiers and printers); Director of SPX Corporation (multi-industry manufacturing), of the United Way of Rochester, and of the Boy Scouts of America.
Rajiv L. Gupta
Born 1945 Principal Occupation(s) During the Past Five Years: Chairman, President, and Trustee Since December 20012 Chief Executive Officer of Rohm and Haas Co. (chemicals); Board Member of 156 Vanguard Funds Overseen the American Chemistry Council; Director of Tyco International, Ltd. (diversified manufacturing and services) since 2005.
Amy Gutmann
Born 1949 Principal Occupation(s) During the Past Five Years: President of the University of
Trustee Since June 2006 Pennsylvania since 2004; Professor in the School of Arts and Sciences, Annenberg School 156 Vanguard Funds Overseen for Communication, and Graduate School of Education of the University of Pennsylvania since 2004; Provost (2001–2004) and Laurance S. Rockefeller Professor of Politics and the University Center for Human Values (1990–2004), Princeton University; Director of Carnegie Corporation of New York since 2005 and of Schuylkill River Development Corporation and Greater Philadelphia Chamber of Commerce since 2004; Trustee of the National Constitution Center since 2007.
JoAnn Heffernan Heisen
Born 1950 Principal Occupation(s) During the Past Five Years: Corporate Vice President and Trustee Since July 1998 Chief Global Diversity Officer since 2006, Vice President and Chief Information 156 Vanguard Funds Overseen Officer (1997–2005), and Member of the Executive Committee of Johnson & Johnson (pharmaceuticals/consumer products); Director of the University Medical Center at Princeton and Women’s Research and Education Institute.
André F. Perold
Born 1952 Principal Occupation(s) During the Past Five Years: George Gund Professor of Finance Trustee Since December 2004 and Banking, Harvard Business School; Senior Associate Dean and Director of Faculty 156 Vanguard Funds Overseen Recruiting, Harvard Business School; Director and Chairman of UNX, Inc. (equities trading firm); Chair of the Investment Committee of HighVista Strategies LLC (private investment firm) since 2005.
Alfred M. Rankin, Jr.
Born 1941 Principal Occupation(s) During the Past Five Years: Chairman, President, Chief Executive Trustee Since January 1993 Officer, and Director of NACCO Industries, Inc. (forklift trucks/housewares/lignite); Director 156 Vanguard Funds Overseen of Goodrich Corporation (industrial products/aircraft systems and services).
J. Lawrence Wilson
Born 1936 Principal Occupation(s) During the Past Five Years: Retired Chairman and Chief Executive Trustee Since April 1985 Officer of Rohm and Haas Co. (chemicals); Director of Cummins Inc. (diesel engines) and 156 Vanguard Funds Overseen AmerisourceBergen Corp. (pharmaceutical distribution); Trustee of Vanderbilt University and of Culver Educational Foundation.
Executive Officers1
Thomas J. Higgins
Born 1957 Principal Occupation(s) During the Past Five Years: Principal of The Vanguard Group, Inc.; Chief Financial Officer Treasurer of each of the investment companies served by The Vanguard Group; Chief Since September 2008 Financial Officer of each of the investment companies served by The Vanguard Treasurer Since July 1998 Group since 2008. 156 Vanguard Funds Overseen
F. William McNabb III
Born 1957 Principal Occupation(s) During the Past Five Years: Chief Executive Officer, Director, Chief Executive Officer and President of The Vanguard Group, Inc., since 2008; Chief Executive Officer and Since August 31, 2008 President of each of the investment companies served by The Vanguard Group since President Since March 2008 2008; Director of Vanguard Marketing Corporation; Managing Director of The Vanguard 156 Vanguard Funds Overseen Group (1995–2008).
Heidi Stam
Born 1956 Principal Occupation(s) During the Past Five Years: Managing Director of The Vanguard Secretary Since July 2005 Group, Inc., since 2006; General Counsel of The Vanguard Group since 2005; Secretary of 156 Vanguard Funds Overseen The Vanguard Group and of each of the investment companies served by The Vanguard Group since 2005; Director and Senior Vice President of Vanguard Marketing Corporation since 2005; Principal of The Vanguard Group (1997–2006).
Vanguard Senior Management Team | | |
| | | |
R. Gregory Barton | Kathleen C. Gubanich | Michael S. Miller | Glenn W. Reed |
Mortimer J. Buckley | Paul A. Heller | Ralph K. Packard | George U. Sauter |
| | | | | |
Founder
John C. Bogle
Chairman and Chief Executive Officer, 1974–1996
1 These individuals are “interested persons” as defined in the Investment Company Act of 1940.
2 December 2002 for Vanguard Equity Income Fund, Vanguard Growth Equity Fund, the Vanguard Municipal Bond Funds, and the Vanguard State Tax-Exempt Funds.
More information about the trustees is in the Statement of Additional Information, available from The Vanguard Group.

P.O. Box 2600
Valley Forge, PA 19482-2600
Connect with Vanguard® > www.vanguard.com
Fund Information > 800-662-7447 | All comparative mutual fund data are from Lipper Inc. |
| or Morningstar, Inc., unless otherwise noted. |
Direct Investor Account Services > 800-662-2739 | |
| You can obtain a free copy of Vanguard’s proxy voting |
Institutional Investor Services > 800-523-1036 | guidelines by visiting our website, www.vanguard.com, |
| and searching for “proxy voting guidelines,” or by |
Text Telephone for People | calling Vanguard at 800-662-2739. The guidelines are |
With Hearing Impairment > 800-952-3335 | also available from the SEC’s website, www.sec.gov. |
| In addition, you may obtain a free report on how your |
| fund voted the proxies for securities it owned during |
| the 12 months ended June 30. To get the report, visit |
This material may be used in conjunction | either www.vanguard.com or www.sec.gov. |
with the offering of shares of any Vanguard | |
fund only if preceded or accompanied by | |
the fund’s current prospectus. | |
| |
| You can review and copy information about your fund |
| at the SEC’s Public Reference Room in Washington, D.C. |
| To find out more about this public service, call the SEC |
The funds or securities referred to herein are not | at 202-551-8090. Information about your fund is also |
sponsored, endorsed, or promoted by MSCI, and MSCI | available on the SEC’s website, and you can receive |
bears no liability with respect to any such funds or | copies of this information, for a fee, by sending a |
securities. For any such funds or securities, the | request in either of two ways: via e-mail addressed to |
prospectus or the Statement of Additional Information | publicinfo@sec.gov or via regular mail addressed to the |
contains a more detailed description of the limited | Public Reference Section, Securities and Exchange |
relationship MSCI has with The Vanguard Group and | Commission, Washington, DC 20549-0102. |
any related funds. | |
. | |
| |
Russell is a trademark of The Frank Russell Company | |
| |
| |
| |
| |
| |
| |
| |
| |
| © 2008 The Vanguard Group, Inc. |
| All rights reserved. |
| Vanguard Marketing Corporation, Distributor. |
| |
| Q1140 112008 |

> Both the Investor and Admiral Shares of Vanguard Capital Opportunity Fund returned –24.1% for the fiscal year as the stock market tumbled.
> The fund sustained its largest losses in information technology stocks.
> The fund’s sizable investment in Monsanto was a notable bright spot.
Contents | |
| |
Your Fund’s Total Returns | 1 |
President’s Letter | 2 |
Advisor’s Report | 7 |
Fund Profile | 10 |
Performance Summary | 11 |
Financial Statements | 13 |
Your Fund’s After-Tax Returns | 25 |
About Your Fund’s Expenses | 26 |
Glossary | 28 |
Please note: The opinions expressed in this report are just that—informed opinions. They should not be considered promises or advice. Also, please keep in mind that the information and opinions cover the period through the date on the front of this report. Of course, the risks of investing in your fund are spelled out in the prospectus.
Your Fund’s Total Returns
Fiscal Year Ended September 30, 2008 | | |
| Ticker | Total |
| Symbol | Returns |
Vanguard Capital Opportunity Fund | | |
Investor Shares | VHCOX | –24.1% |
Admiral™ Shares1 | VHCAX | –24.1 |
Russell Midcap Growth Index | | –24.7 |
Average Multi-Cap Growth Fund2 | | –24.1 |
Your Fund’s Performance at a Glance |
September 30, 2007–September 30, 2008 |
| | | Distributions Per Share |
| Starting | Ending | Income | Capital |
| Share Price | Share Price | Dividends | Gains |
Vanguard Capital Opportunity Fund | | | | |
Investor Shares | $42.70 | $29.41 | $0.218 | $3.442 |
Admiral Shares | 98.71 | 68.00 | 0.577 | 7.952 |
1 A lower-cost class of shares available to many longtime shareholders and to those with significant investments in the fund.
2 Derived from data provided by Lipper Inc.
1

President’s Letter
Dear Shareholder,
For the 12 months ended September 30, 2008, Vanguard Capital Opportunity Fund returned –24.1%, a disappointing performance that was consistent with the broad stock market’s poor returns. Distress in the U.S. financial sector reverberated throughout global financial markets, putting pressure on just about every stock portfolio.
As it has for the past several years, Vanguard Capital Opportunity Fund held sizable positions in health care and information technology stocks. Tech stocks were hit hard. Health care stocks held up better, but still declined in value. Among the few bright spots were select holdings in the materials sector.
If you own the Capital Opportunity Fund in a taxable account, see page 25 for a report on the fund’s after-tax returns for the 12 months ended September 30. Please note that our preliminary estimates suggest that the fund will distibute capital gains of roughly $2.00 per share for Investor Shares and $4.60 per share for Admiral Shares in December 2008.
Credit market turbulence weighed heavily on stock prices
Troubles simmering in the credit markets for much of the past year came to a boil at the end of the fiscal period, producing several high-profile bankruptcies and putting severe pressure on stock prices around the world. The broad U.S. stock market returned –21.2% for the 12 months ended September 30. In September alone,
2
stock prices fell more than 9%. International stock markets were similarly disappointing, returning –30.0% for the full 12 months.
Policymakers and elected officials, both in the United States and abroad, responded to the upheavals with dramatic new programs designed to help stabilize the credit markets. As participants struggled to make sense of the markets’ fast-changing dynamics, stock prices were exceptionally volatile, with daily ups and downs of 2 percentage points or more becoming commonplace.
U.S. Treasuries rallied in a nervous market
Nervousness in the stock market was echoed, and even amplified, in the bond market. For the 12 months, the broad U.S. bond market returned 3.7%, largely on the strength of Treasuries—investors’ security of choice in times of duress. Corporate bonds generally produced negative returns for the period, coming under heavy selling pressure during investors’ flight to safety. Even the municipal market, made up of generally high-quality securities issued by states and municipalities, recorded a negative 12-month return.
The U.S. Federal Reserve Board sought to subdue the turmoil with a dramatic easing of monetary policy. Over the full 12 months, the Fed reduced its target for the federal funds rate from 4.75% to 2.00%. On October 8, shortly after the close of the fiscal period, the Fed cut rates again, to 1.50%. The move was made in coordination with rate cuts by several other central banks.
Market Barometer | | | |
| | Average Annual Total Returns |
| Periods Ended September 30, 2008 |
| One Year | Three Years | Five Years |
Stocks | | | |
Russell 1000 Index (Large-caps) | –22.1% | 0.1% | 5.5% |
Russell 2000 Index (Small-caps) | –14.5 | 1.8 | 8.1 |
Dow Jones Wilshire 5000 Index (Entire market) | –21.2 | 0.6 | 6.0 |
MSCI All Country World Index ex USA (International) | –30.0 | 3.1 | 11.8 |
| | | |
| | | |
Bonds | | | |
Lehman U.S. Aggregate Bond Index (Broad taxable market) | 3.7% | 4.2% | 3.8% |
Lehman Municipal Bond Index | –1.9 | 1.9 | 2.8 |
Citigroup 3-Month Treasury Bill Index | 2.6 | 4.0 | 3.1 |
| | | |
| | | |
CPI | | | |
Consumer Price Index | 4.9% | 3.2% | 3.4% |
3
A short-term setback for a long-term strategy
During the past 12 months, Vanguard Capital Opportunity Fund featured many of the same themes that have driven performance over the past few years: outsized investments in health care and technology stocks, limited exposure to the financial services sector, and sizable positions in select consumer and industrial companies that stand to benefit from heavy investment in research and development.
As the financial markets’ turmoil intensified, however, systemic risks seemed to overwhelm the prospects of individual companies and industries. The Capital Opportunity Fund sustained its biggest losses among its information technology stocks, which lost more than one-third of their value.
Chip-related companies and communication technology providers were among the worst performers, stung by the expectation that ongoing problems in the IT-intensive financial services industry will trim profits.
Other notable weak spots included the fund’s industrial stocks, mainly airlines and air-freight companies, which struggled first with high energy prices and then with the threat of weaker demand in a slowing economy.
The fund’s health care stake was slightly more resilient, sustaining a 12-month decline in the single digits. Medical-device companies and large pharmaceutical companies were weak; biotech stocks fared better.
Expense Ratios1 | | | |
Your Fund Compared With Its Peer Group | | | |
| | | Average |
| Investor | Admiral | Multi-Cap |
| Shares | Shares | Growth Fund |
Capital Opportunity Fund | 0.45% | 0.37% | 1.43% |
1 The fund expense ratios shown are from the prospectus dated January 25, 2008. For the fiscal year ended September 30, 2008, the fund’s expense ratios were 0.45% for Investor Shares and 0.36% for Admiral Shares. The peer-group expense ratio is derived from data provided by Lipper Inc. and captures information through year-end 2007.
4
Materials stocks were the fund’s best performers. Producers of raw materials and industrial commodities have struggled during the past 12 months as economic growth slowed and commodity prices pulled back. The fund’s sizable investment in Monsanto, a leader in genetically engineered seeds, performed strongly, however, as global grain prices remained high.
The fund’s distinctive strategy has produced exceptional returns
Although recent performance has been dispiriting, Vanguard Capital Opportunity Fund’s longer-term performance has been exceptional. This is a credit to the advisor, PRIMECAP Management Company, and its disciplined, research-intensive investment strategy.
During the ten years ended September 30, the fund produced an average annual return of 14.9%, significantly more than its comparative
standards. An initial $25,000 investment in the Capital Opportunity Fund would have compounded to more than $100,000 in wealth. At the peer group’s average rate of return, the same initial investment would have compounded to about $35,000.
Balance and diversification can help investors avoid emotional extremes
The stock market’s recent volatility has been unsettling. History suggests, however, that these periods of turmoil are a trade-off for the potential to earn long-term returns superior to those of lower-risk assets. Of
Total Returns | |
Ten Years Ended September 30, 2008 | |
| Average |
| Annual Return |
Capital Opportunity Fund Investor Shares | 14.9% |
Russell Midcap Growth Index | 5.5 |
Average Multi-Cap Growth Fund1 | 3.5 |
The figures shown represent past performance, which is not a guarantee of future results. (Current performance may be lower or higher than the performance data cited. For performance data current to the most recent month-end, visit our website at www.vanguard.com/performance.) Note, too, that both investment returns and principal value can fluctuate widely, so an investor’s shares, when sold, could be worth more or less than their original cost.
1 Derived from data provided by Lipper Inc.
5
course, when risk materializes, anxiety runs high, and it’s easy to lose sight of this trade-off’s potential benefits.
Our experience suggests that diversification within and across asset classes can help investors to moderate an emotional response. A broadly diversified portfolio will never experience the highest highs, but it can help protect investors from the lowest lows.
During the past 12 months, of course, even balanced portfolios of stocks and bonds have struggled. The financial markets’ recent challenges will eventually be resolved, however, and we continue to believe that diversification and balance can help put you in a position to benefit from the markets’ long-term opportunities.
Thank you for entrusting your assets to Vanguard.
Sincerely,

F. William McNabb III
President and Chief Executive Officer
October 14, 2008
6
Advisor’s Report
For the fiscal year ended September 30, Vanguard Capital Opportunity Fund returned –24.1%, in line with the returns of its comparative standards.
Investment environment
As the fiscal year came to a close, the deterioration in the financial sector accelerated. Many of the larger players experienced significant asset write-downs, recapitalizations, and even bankruptcies. The urgency to deleverage and rapid stock-price declines led to a further decline in the sector.
The Federal Reserve Board and the U.S. Treasury responded swiftly, introducing a number of programs designed to help stabilize the markets, including the $700 billion Emergency Economic Stabilization Act of 2008. The act gives the Treasury broad authority to help banks strengthen their balance sheets. The bill’s passage by Congress was keenly anticipated, but initially, at least, the financial markets remained under severe pressure. Stock prices fell sharply, and credit market activity came to a near standstill.
These dramatic events capped a 12-month period of already poor stock market performance. What had at first looked like a slowdown seemed likely to become a recession. The employment situation has continued to deteriorate, and retail sales have declined significantly. While the sharp correction in energy and commodity prices has hurt investors, the cost relief to consumers will potentially have the same impact as a tax cut and help overextended household budgets.
Management of the fund
Our primary objective is to identify companies whose long-term fundamentals will evolve significantly better than the current Wall Street consensus or valuation suggests. To help find these underappreciated companies, we rely on rigorous fundamental research and meet not only with company management but also with competitors, suppliers, and customers. We invest with a long-term perspective, in the expectation that over a three- to five-year horizon our choices will outperform the market.
In recent years, this process has led us to establish large positions in information technology and health care stocks. Together, these holdings accounted for more than 65% of portfolio assets at the end of the period. Both sectors struggled during the past 12 months, with especially weak returns from our technology holdings. Bright spots included Amgen and Genentech, both of which have benefited from investors’ renewed interest in biotech stocks.
Among the weaker performers were computer chip-related companies NVIDIA, ASML Holding, and FormFactor, which have been hit by a collapse in demand for computers and computer chips. Research
7
In Motion, one of the fund’s largest holdings and maker of the ubiquitous BlackBerry, lost 31% of its value during the 12 months as investors worried about consumer weakness and a falloff in demand from the financial sector. We remain positive on the company’s prospects, as overall smartphone adoption continues and several new product introductions are anticipated in the fourth calendar quarter.
During the past 12 months, the fund also benefited from materials holding Monsanto. The producer of genetically engineered seeds and high-value-added herbicides has capitalized on the global boom in grain prices. Its share price gained more than 15% for the period and the company was the fund’s largest holding on September 30, 2008.
Outlook
As previously mentioned, our greatest areas of conviction remain health care and information technology. The bearish arguments on the health care sector are well-known: increased scrutiny during the Food and Drug Administration (FDA) approval process, patent expirations, generic competition, price controls, and government intervention. We have been surprised by and disappointed with the difficulties that pharmaceutical companies have encountered in trying to get new products approved by the FDA. In our view, however, investors are overlooking some companies’ promising drug pipelines, exciting and innovative new medical devices, and valuations that are near 30-year lows. We have positioned the portfolio to take advantage of a potential shift in market leadership and believe the innovation and financial strength of the health care industry is likely to be recognized in the coming years.
Historically, technology spending has been cyclical, and stocks of technology companies are trading at valuations that suggest this is still the case. There is also a pervasive fear that the meltdown in the financial sector will have a significant impact on technology spending, as financials have traditionally been large consumers of information technology. We think the tech industry has changed dramatically over the last 10 years. Market shares are more concentrated, companies are more global in nature, and balance sheets are among the strongest in corporate America. We maintain our conviction on the companies we own in this area and look for a recovery in 2009.
The most immediate concern is the financial-market turmoil. The lack of liquidity in many areas of the market is debilitating. Long term, we believe the equity markets will recover and investors will be rewarded for purchasing equities. However, the recovery in economic growth will take time, as the system needs to deleverage the excesses taken on during the past seven or eight years.
8
Unlike in some prior recoveries, we do not view the consumer as the engine for growth; consumers have taken on excessive debt and need to repair their damaged balance sheets. Personal saving has been nonexistent and needs to increase. The process will take time, and patience is required.
We remain optimistic about the fund’s portfolio. We believe that the companies we hold are positioned well in what might prove to be an increasingly difficult economic environment. In difficult times, fundamentals matter most, and we will continue to search for companies whose valuations now make them attractive long-term investments.
We thank you for entrusting your hard-earned capital with us. We will continue to work diligently to prove worthy of that trust.
Theo A. Kolokotrones | | Howard B. Schow |
Portfolio Manager | | Portfolio Manager |
| David H. Van Slooten | |
| Portfolio Manager | |
Joel P. Fried | | Alfred W. Mordecai |
Portfolio Manager | | Portfolio Manager |
PRIMECAP Management Company, LLP
October 14, 2008
9
Fund Profile
As of September 30, 2008
Portfolio Characteristics | | |
| | Comparative | Broad |
| Fund | Index1 | Index2 |
Number of Stocks | 118 | 505 | 4,679 |
Median Market Cap | $15.4B | $5.9B | $29.6B |
Price/Earnings Ratio | 17.9x | 16.7x | 15.5x |
Price/Book Ratio | 2.3x | 3.1x | 2.2x |
Yield3 | | 1.0% | 2.3% |
Investor Shares | 0.5% | | |
Admiral Shares | 0.6% | | |
Return on Equity | 16.3% | 21.6% | 20.0% |
Earnings Growth Rate | 25.8% | 24.0% | 17.7% |
Foreign Holdings | 10.7% | 0.0% | 0.0% |
Turnover Rate | 13% | — | — |
Expense Ratio | | | |
(9/30/2007)4 | | — | — |
Investor Shares | 0.45% | | |
Admiral Shares | 0.37% | | |
Short-Term Reserves | 2.9% | — | — |
Sector Diversification (% of equity exposure) |
| | Comparative | Broad |
| Fund | Index1 | Index2 |
Consumer Discretionary | 13.8% | 17.7% | 9.2% |
Consumer Staples | 0.0 | 4.7 | 10.5 |
Energy | 5.8 | 10.5 | 12.6 |
Financials | 0.7 | 6.5 | 17.3 |
Health Care | 28.0 | 13.4 | 13.0 |
Industrials | 8.2 | 17.6 | 11.4 |
Information Technology | 37.5 | 19.1 | 15.7 |
Materials | 5.1 | 4.6 | 3.7 |
Telecommunication | | | |
Services | 0.7 | 2.7 | 2.8 |
Utilities | 0.2 | 3.2 | 3.8 |
Volatility Measures5 | |
| Fund Versus | Fund Versus |
| Comparative Index1 | Broad Index2 |
R-Squared | 0.89 | 0.84 |
Beta | 0.91 | 1.17 |
Ten Largest Holdings6 (% of total net assets) |
| | |
Monsanto Co. | fertilizers and | |
| agricultural | |
| chemicals | 4.9% |
Eli Lilly & Co. | pharmaceuticals | 4.5 |
Research In Motion Ltd. | communications equipment | 4.1 |
Applied Biosystems Inc. | life sciences tools and services | 3.1 |
Biogen Idec Inc. | biotechnology | 3.0 |
Symantec Corp. | systems software | 3.0 |
FedEx Corp. | air freight and | |
| logistics | 2.9 |
Amgen, Inc. | biotechnology | 2.9 |
Medtronic, Inc. | health care | |
| equipment | 2.8 |
DIRECTV Group, Inc. | broadcasting and | |
cable television | 2.8 |
Top Ten | | 34.0% |
Investment Focus

1 Russell Midcap Growth Index.
2 Dow Jones Wilshire 5000 Index.
3 30-day SEC yield for the fund; annualized dividend yield for the indexes. See the Glossary.
4 The expense ratios shown are from the prospectus dated January 25, 2008. For the fiscal year ended September 30, 2008, expense ratios were 0.45% for Investor Shares and 0.36% for Admiral Shares.
5 For an explanation of R-squared, beta, and other terms used here, see the Glossary.
6 The holdings listed exclude any temporary cash investments and equity index products.
10
Performance Summary
All of the returns in this report represent past performance, which is not a guarantee of future results that may be achieved by the fund. (Current performance may be lower or higher than the performance data cited. For performance data current to the most recent month-end, visit our website at www.vanguard.com/performance.) Note, too, that both investment returns and principal value can fluctuate widely, so an investor’s shares, when sold, could be worth more or less than their original cost. The returns shown do not reflect taxes that a shareholder would pay on fund distributions or on the sale of fund shares.
Cumulative Performance: September 30, 1998–September 30, 2008
Initial Investment of $25,000
| | | |
| | | | |
| Average Annual Total Returns | Final Value |
| Periods Ended September 30, 2008 | of a $25,000 |
| One Year | Five Years | Ten Years | Investment |
Capital Opportunity Fund Investor Shares1,2 | –24.13% | 9.25% | 14.89% | $100,173 |
Dow Jones Wilshire 5000 Index | –21.20 | 6.04 | 4.00 | 37,001 |
Russell Midcap Growth Index | –24.65 | 6.53 | 5.51 | 42,726 |
Average Multi-Cap Growth Fund3 | –24.07 | 4.79 | 3.45 | 35,108 |
| | | | Final Value |
| | | Since | of a $100,000 |
| One Year | Five Years | Inception4 | Investment |
Capital Opportunity Fund Admiral Shares1 | –24.05% | 9.35% | 7.18% | $161,122 |
Dow Jones Wilshire 5000 Index | –21.20 | 6.04 | 3.84 | 129,579 |
Russell Midcap Growth Index | –24.65 | 6.53 | 4.66 | 136,840 |
1 Total returns do not reflect the 1% fee assessed on redemptions after March 23, 2005, of shares held for less than one year, or the 1% fee previously assessed on redemptions of shares held for less than five years.
2 Total returns do not include the account service fee that may be applicable to certain accounts with balances below $10,000.
3 Derived from data provided by Lipper Inc.
4 Performance for the fund’s Admiral Shares and comparative standards is calculated since the fund’s Admiral Shares’ inception: November 12, 2001.
11
Fiscal-Year Total Returns (%): September 30, 1998–September 30, 2008
Note: See Financial Highlights tables for dividend and capital gains information.
12
Financial Statements
Statement of Net Assets
As of September 30, 2008
The fund provides a complete list of its holdings four times in each fiscal year, at the quarter-ends. For the second and fourth fiscal quarters, the lists appear in the fund’s semiannual and annual reports to shareholders. For the first and third fiscal quarters, the fund files the lists with the Securities and Exchange Commission on Form N-Q. Shareholders can look up the fund’s Forms N-Q on the SEC’s website at www.sec.gov. Forms N-Q may also be reviewed and copied at the SEC’s Public Reference Room (see the back cover of this report for further information).
| | | Market |
| | | Value• |
| | Shares | ($000) |
Common Stocks (97.4%) | | |
Consumer Discretionary (13.4%) | | |
* | DIRECTV Group, Inc. | 8,222,335 | 215,179 |
| TJX Cos., Inc. | 5,352,400 | 163,355 |
* | Bed Bath & Beyond, Inc. | 3,303,400 | 103,760 |
| Whirlpool Corp. | 1,225,000 | 97,130 |
*,1 | The Dress Barn, Inc. | 4,970,000 | 75,991 |
*,^ | CarMax, Inc. | 4,512,800 | 63,179 |
1 | Men’s Wearhouse, Inc. | 2,800,000 | 59,472 |
| Nordstrom, Inc. | 1,536,400 | 44,279 |
| Best Buy Co., Inc. | 952,500 | 35,719 |
* | Quiksilver, Inc. | 5,871,500 | 33,702 |
| Lowe’s Cos., Inc. | 1,411,400 | 33,436 |
* | 99 Cents Only Stores | 2,200,000 | 24,134 |
| Gentex Corp. | 1,370,000 | 19,591 |
* | O’Reilly Automotive, Inc. | 650,000 | 17,401 |
* | Chico’s FAS, Inc. | 2,075,000 | 11,350 |
* | Amazon.com, Inc. | 133,600 | 9,721 |
| Abercrombie & Fitch Co. | 200,000 | 7,890 |
1 | Strattec Security Corp. | 220,000 | 5,812 |
* | Expedia, Inc. | 300,000 | 4,533 |
| | | 1,025,634 |
Consumer Staples (0.0%) | | |
* | Cott Corp. | 1,706,700 | 1,843 |
| | | |
Energy (5.7%) | | |
| Murphy Oil Corp. | 2,600,000 | 166,764 |
| Arch Coal, Inc. | 2,450,000 | 80,581 |
| Noble Energy, Inc. | 1,000,000 | 55,590 |
* | Plains Exploration & | | |
| Production Co. | 1,200,400 | 42,206 |
* | National Oilwell Varco Inc. | 805,000 | 40,435 |
| ConocoPhillips Co. | 400,000 | 29,300 |
* | Exterran Holdings, Inc. | 383,750 | 12,265 |
* | Pride International, Inc. | 245,000 | 7,254 |
| | | 434,395 |
Financials (0.7%) | | |
| The Chubb Corp. | 390,000 | 21,411 |
| Capital One Financial Corp. | 380,000 | 19,380 |
| TCF Financial Corp. | 330,000 | 5,940 |
^ | East West Bancorp, Inc. | 230,000 | 3,151 |
* | SLM Corp. | 50,000 | 617 |
*,^ | MF Global Ltd. | 93,000 | 404 |
| | | 50,903 |
Health Care (27.3%) | | |
| Eli Lilly & Co. | 7,806,700 | 343,729 |
| Applied Biosystems Inc. | 6,850,179 | 234,619 |
* | Biogen Idec Inc. | 4,500,000 | 226,305 |
* | Amgen, Inc. | 3,687,700 | 218,570 |
| Medtronic, Inc. | 4,326,400 | 216,753 |
| Novartis AG ADR | 3,700,000 | 195,508 |
* | Genentech, Inc. | 1,685,000 | 149,426 |
* | BioMarin | | |
| Pharmaceutical Inc. | 4,825,500 | 127,827 |
| Roche Holdings AG | 725,000 | 113,493 |
* | Boston Scientific Corp. | 8,582,700 | 105,310 |
* | Millipore Corp. | 1,011,500 | 69,591 |
* | Affymetrix, Inc. | 3,105,500 | 24,036 |
* | Edwards Lifesciences Corp. | 300,000 | 17,328 |
* | Cerner Corp. | 386,500 | 17,253 |
* | Sepracor Inc. | 550,000 | 10,070 |
*,^ | Dendreon Corp. | 1,525,000 | 8,708 |
* | Waters Corp. | 28,200 | 1,641 |
* | Pharmacyclics, Inc. | 740,500 | 1,496 |
* | Illumina, Inc. | 10,000 | 405 |
| | | 2,082,068 |
Industrials (7.9%) | | |
| FedEx Corp. | 2,815,150 | 222,510 |
*,1 | Thomas & Betts Corp. | 3,311,000 | 129,361 |
* | AMR Corp. | 6,912,400 | 67,880 |
* | McDermott | | |
| International, Inc. | 2,442,000 | 62,393 |
| Pall Corp. | 1,700,000 | 58,463 |
13
| | | Market |
| | | Value• |
| | Shares | ($000) |
| Union Pacific Corp. | 250,000 | 17,790 |
* | JetBlue Airways Corp. | 3,241,050 | 16,043 |
| Avery Dennison Corp. | 315,000 | 14,011 |
| Southwest Airlines Co. | 678,800 | 9,849 |
| Chicago Bridge & | | |
| Iron Co. N.V. | 288,000 | 5,541 |
| Expeditors International of | | |
| Washington, Inc. | 93,600 | 3,261 |
* | US Airways Group Inc. | 57,000 | 344 |
| | | 607,446 |
Information Technology (36.6%) | | |
| Communications Equipment (10.1%) | | |
* | Research In Motion Ltd. | 4,547,300 | 310,581 |
| Corning, Inc. | 12,205,000 | 190,886 |
* | Brocade Communications | | |
| Systems, Inc. | 14,726,000 | 85,705 |
*,1 | Emulex Corp. | 4,569,400 | 48,755 |
* | Avocent Corp. | 1,984,500 | 40,603 |
| Motorola, Inc. | 4,800,000 | 34,272 |
| Plantronics, Inc. | 1,150,000 | 25,898 |
* | Comverse Technology, Inc. | 1,660,000 | 15,878 |
| QUALCOMM Inc. | 267,000 | 11,473 |
* | Ciena Corp. | 607,142 | 6,120 |
* | Nortel Networks Corp. | 2,323,500 | 5,205 |
| | | |
| Computers & Peripherals (2.3%) | | |
| Hewlett-Packard Co. | 1,250,000 | 57,800 |
*,^,1Avid Technology, Inc. | 2,037,500 | 49,022 |
* | SanDisk Corp. | 1,958,962 | 38,298 |
* | EMC Corp. | 2,625,000 | 31,395 |
| | | |
| Electronic Equipment, | | |
| Instruments & Components (1.1%) | |
* | Trimble Navigation Ltd. | 2,900,000 | 74,994 |
* | Flextronics | | |
| International Ltd. | 1,125,000 | 7,965 |
| Jabil Circuit, Inc. | 220,000 | 2,099 |
| | | |
| Internet Software & Services (3.1%) | |
* | Google Inc. | 336,150 | 134,635 |
* | eBay Inc. | 3,600,000 | 80,568 |
* | VeriSign, Inc. | 17,000 | 443 |
* | Yahoo! Inc. | 592,168 | 10,245 |
* | Akamai Technologies, Inc. | 507,900 | 8,858 |
| | | |
| IT Services (0.7%) | | |
* | NeuStar, Inc. Class A | 2,518,000 | 50,083 |
| Satyam Computer | | |
| Services Ltd. ADR | 15,500 | 250 |
| | | |
| Semiconductors & | | |
| Semiconductor Equipment (11.9%) | |
| ASML Holding NV | | |
| (New York Shares) | 9,371,133 | 165,026 |
| Altera Corp. | 6,350,000 | 131,318 |
* | NVIDIA Corp. | 11,973,350 | 128,235 |
*,1 | FormFactor Inc. | 6,090,500 | 106,096 |
*,^ | Cree, Inc. | 4,263,900 | 97,132 |
* | Rambus Inc. | 5,235,000 | 67,270 |
| Intersil Corp. | 3,807,000 | 63,120 |
* | Micron Technology, Inc. | 10,350,000 | 41,917 |
| Texas Instruments, Inc. | 2,700,000 | 58,050 |
* | Cymer, Inc. | 650,000 | 16,464 |
| Xilinx, Inc. | 430,000 | 10,083 |
* | Entegris Inc. | 2,019,231 | 9,773 |
* | FEI Co. | 295,000 | 7,024 |
| Intel Corp. | 235,000 | 4,402 |
| | | |
| Software (7.4%) | | |
* | Symantec Corp. | 11,530,500 | 225,767 |
| Microsoft Corp. | 3,850,000 | 102,756 |
* | Adobe Systems, Inc. | 1,455,000 | 57,429 |
* | Autodesk, Inc. | 1,500,000 | 50,325 |
* | Citrix Systems, Inc. | 1,950,000 | 49,257 |
* | Macrovision | | |
| Solutions Corp. | 2,414,140 | 37,129 |
*,1 | The Descartes | | |
| Systems Group Inc. | 4,645,000 | 17,047 |
* | Intuit, Inc. | 470,000 | 14,857 |
* | THQ Inc. | 500,000 | 6,020 |
* | Nuance | | |
| Communications, Inc. | 320,000 | 3,901 |
* | McAfee Inc. | 32,000 | 1,087 |
| | | 2,793,516 |
Materials (4.9%) | | |
| Monsanto Co. | 3,819,486 | 378,053 |
| | | |
Telecommunication Services (0.7%) | | |
| Sprint Nextel Corp. | 8,219,700 | 50,140 |
| | | |
Utilities (0.2%) | | |
* | AES Corp. | 1,192,000 | 13,934 |
Total Common Stocks | | |
(Cost $6,562,129) | | 7,437,932 |
Temporary Cash Investment (3.7%) | | |
2,3 | Vanguard Market | | |
| Liquidity Fund, 2.296% | | |
| (Cost $280,877) | 280,876,666 | 280,877 |
Total Investments (101.1%) | | |
(Cost $6,843,006) | | 7,718,809 |
Other Assets and Liabilities—Net (–1.1%) | (80,912) |
Net Assets (100%) | | 7,637,897 |
14
| Market |
| Value• |
| ($000) |
Statement of Assets and Liabilities | |
Assets | |
Investments in Securities, at Value | 7,718,809 |
Receivables for Investment | |
Securities Sold | 4,796 |
Receivables for Capital Shares Issued | 4,908 |
Other Assets | 3,363 |
Total Assets | 7,731,876 |
Liabilities | |
Security Lending Collateral | |
Payable to Brokers | 48,698 |
Payables for Investment | |
Securities Purchased | 11,723 |
Payables for Capital Shares Redeemed | 11,939 |
Other Liabilities | 21,619 |
Total Liabilities | 93,979 |
Net Assets | 7,637,897 |
At September 30, 2008, net assets consisted of: |
| Amount |
| ($000) |
Paid-in Capital | 6,237,819 |
Undistributed Net Investment Income | 10,030 |
Accumulated Net Realized Gains | 514,284 |
Unrealized Appreciation (Depreciation) | |
Investment Securities | 875,803 |
Foreign Currencies | (39) |
Net Assets | 7,637,897 |
| |
| |
Investor Shares—Net Assets | |
Applicable to 130,931,208 outstanding | |
$.001 par value shares of beneficial | |
interest (unlimited authorization) | 3,850,936 |
Net Asset Value Per Share— | |
Investor Shares | $29.41 |
| |
| |
Admiral Shares—Net Assets | |
Applicable to 55,690,636 outstanding | |
$.001 par value shares of beneficial | |
interest (unlimited authorization) | 3,786,961 |
Net Asset Value Per Share— | |
Admiral Shares | $68.00 |
• See Note A in Notes to Financial Statements.
* Non-income-producing security.
^ Part of security position is on loan to broker-dealers. The total value of securities on loan is $46,675,000.
1 Considered an affiliated company of the fund as the fund owns more than 5% of the outstanding voting securities of such company.
2 Affiliated money market fund available only to Vanguard funds and certain trusts and accounts managed by Vanguard. Rate shown is the 7-day yield.
3 Includes $48,698,000 of collateral received for securities on loan. ADR—American Depositary Receipt.
See accompanying Notes, which are an integral part of the Financial Statements.
15
Statement of Operations
| Year Ended |
| September 30, 2008 |
| ($000) |
Investment Income | |
Income | |
Dividends1,2 | 84,749 |
Interest2 | 13,694 |
Security Lending | 5,189 |
Total Income | 103,632 |
Expenses | |
Investment Advisory Fees—Note B | 23,957 |
The Vanguard Group—Note C | |
Management and Administrative—Investor Shares | 8,031 |
Management and Administrative—Admiral Shares | 3,656 |
Marketing and Distribution—Investor Shares | 795 |
Marketing and Distribution—Admiral Shares | 734 |
Custodian Fees | 143 |
Auditing Fees | 21 |
Shareholders’ Reports—Investor Shares | 48 |
Shareholders’ Reports—Admiral Shares | 24 |
Trustees’ Fees and Expenses | 12 |
Total Expenses | 37,421 |
Expenses Paid Indirectly | (147) |
Net Expenses | 37,274 |
Net Investment Income | 66,358 |
Realized Net Gain (Loss) | |
Investment Securities Sold2 | 593,692 |
Foreign Currencies | (23) |
Realized Net Gain (Loss) | 593,669 |
Change in Unrealized Appreciation (Depreciation) | |
Investment Securities | (3,125,959) |
Foreign Currencies | (50) |
Change in Unrealized Appreciation (Depreciation) | (3,126,009) |
Net Increase (Decrease) in Net Assets Resulting from Operations | (2,465,982) |
1 Dividends are net of foreign withholding taxes of $1,886,000.
2 Dividend income, interest income, and realized net gain (loss) from affiliated companies of the fund were $911,000, $13,694,000, and $28,027,000, respectively.
See accompanying Notes, which are an integral part of the Financial Statements.
16
Statement of Changes in Net Assets
| Year Ended September 30, |
| 2008 | 2007 |
| ($000) | ($000) |
Increase (Decrease) in Net Assets | | |
Operations | | |
Net Investment Income | 66,358 | 20,796 |
Realized Net Gain (Loss) | 593,669 | 895,690 |
Change in Unrealized Appreciation (Depreciation) | (3,126,009) | 1,136,597 |
Net Increase (Decrease) in Net Assets Resulting from Operations | (2,465,982) | 2,053,083 |
Distributions | | |
Net Investment Income | | |
Investor Shares | (26,947) | (9,611) |
Admiral Shares | (29,293) | (10,882) |
Realized Capital Gain1 | | |
Investor Shares | (425,472) | (254,953) |
Admiral Shares | (403,705) | (196,140) |
Total Distributions | (885,417) | (471,586) |
Capital Share Transactions | | |
Investor Shares | 150,506 | (500,766) |
Admiral Shares | 663,727 | 293,890 |
Net Increase (Decrease) from Capital Share Transactions | 814,233 | (206,876) |
Total Increase (Decrease) | (2,537,166) | 1,374,621 |
Net Assets | | |
Beginning of Period | 10,175,063 | 8,800,442 |
End of Period2 | 7,637,897 | 10,175,063 |
1 Includes fiscal 2008 and 2007 short-term gain distributions totaling $23,367,000 and $7,045,000, respectively. Short-term gain distributions are treated as ordinary income dividends for tax purposes.
2 Net Assets—End of Period includes undistributed net investment income of $10,030,000 and $4,625,000. See accompanying Notes, which are an integral part of the Financial Statements.
17
Financial Highlights
Investor Shares | | | | | | |
| | | | | | |
| | | | | Nov. 1, | Year |
| | | 2003, to | Ended |
For a Share Outstanding | Year Ended September 30, | Sept. 30, | Oct. 31, |
Throughout Each Period | 2008 | 2007 | 2006 | 2005 | 20041 | 2003 |
Net Asset Value, Beginning of Period | $42.70 | $36.11 | $31.92 | $27.24 | $24.28 | $16.54 |
Investment Operations | | | | | | |
Net Investment Income | .2542 | .070 | .053 | .0903 | .017 | .009 |
Net Realized and Unrealized Gain (Loss) | | | | | | |
on Investments4 | (9.884) | 8.447 | 4.421 | 4.731 | 2.956 | 7.744 |
Total from Investment Operations | (9.630) | 8.517 | 4.474 | 4.821 | 2.973 | 7.753 |
Distributions | | | | | | |
Dividends from Net Investment Income | (.218) | (.070) | (.055) | (.070) | (.013) | (.013) |
Distributions from Realized Capital Gains | (3.442) | (1.857) | (.229) | (.071) | — | — |
Total Distributions | (3.660) | (1.927) | (.284) | (.141) | (.013) | (.013) |
Net Asset Value, End of Period | $29.41 | $42.70 | $36.11 | $31.92 | $27.24 | $24.28 |
| | | | | | |
| | | | | | |
Total Return5 | –24.13% | 24.35% | 14.10% | 17.72% | 12.25% | 46.91% |
| | | | | | |
| | | | | | |
Ratios/Supplemental Data | | | | | | |
Net Assets, End of Period (Millions) | $3,851 | $5,415 | $5,051 | $5,231 | $6,199 | $5,120 |
Ratio of Total Expenses to Average Net Assets | | | | | | |
0.45% | 0.45% | 0.49% | 0.51% | 0.52%6 | 0.59% |
Ratio of Net Investment Income to Average Net Assets | | | | | | |
0.67%2 | 0.18% | 0.15% | 0.33%3 | 0.06%6 | 0.04% |
Portfolio Turnover Rate | 13% | 14% | 11% | 12% | 10% | 14% |
1 The fund’s fiscal year-end changed from October 31 to September 30, effective September 30, 2004.
2 Net investment income per share and the ratio of net investment income to average net assets include $.125 and 0.33%, respectively, resulting from a special dividend from ASML Holding NV in October 2007.
3 Net investment income per share and the ratio of net investment income to average net assets include $.047 and 0.16%, respectively, resulting from a special dividend from Microsoft Corp. in November 2004.
4 Includes increases from redemption fees of $.00, $.00, $.00, $.01, $.01, and $.01.
5 Total returns do not reflect the 1% fee assessed on redemptions after March 23, 2005, of shares held for less than one year, nor do they include the 1% fee previously assessed on redemptions of shares held for less than five years, or the account service fee that may be applicable to certain accounts with balances below $10,000.
6 Annualized.
See accompanying Notes, which are an integral part of the Financial Statements.
18
Admiral Shares | | | | | | |
| | | | | | |
| | | | | Nov. 1, | Year |
| | | 2003, to | Ended |
For a Share Outstanding | Year Ended September 30, | Sept. 30, | Oct. 31, |
Throughout Each Period | 2008 | 2007 | 2006 | 2005 | 20041 | 2003 |
Net Asset Value, Beginning of Period | $98.71 | $83.49 | $73.77 | $62.96 | $56.11 | $38.22 |
Investment Operations | | | | | | |
Net Investment Income | .6642 | .240 | .198 | .2913 | .096 | .062 |
Net Realized and Unrealized Gain (Loss) | | | | | | |
on Investments4 | (22.845) | 19.508 | 10.229 | 10.911 | 6.828 | 17.894 |
Total from Investment Operations | (22.181) | 19.748 | 10.427 | 11.202 | 6.924 | 17.956 |
Distributions | | | | | | |
Dividends from Net Investment Income | (.577) | (.238) | (.178) | (.228) | (.074) | (.066) |
Distributions from Realized Capital Gains | (7.952) | (4.290) | (.529) | (.164) | — | — |
Total Distributions | (8.529) | (4.528) | (.707) | (.392) | (.074) | (.066) |
Net Asset Value, End of Period | $68.00 | $98.71 | $83.49 | $73.77 | $62.96 | $56.11 |
| | | | | | |
| | | | | | |
Total Return5 | –24.05% | 24.43% | 14.23% | 17.82% | 12.36% | 47.05% |
| | | | | | |
| | | | | | |
Ratios/Supplemental Data | | | | | | |
Net Assets, End of Period (Millions) | $3,787 | $4,760 | $3,750 | $3,004 | $1,337 | $840 |
Ratio of Total Expenses to Average Net Assets | | | | | | |
0.36% | 0.37% | 0.40% | 0.42% | 0.41%6 | 0.49% |
Ratio of Net Investment Income to Average Net Assets | | | | | | |
0.76%2 | 0.26% | 0.24% | 0.38%3 | 0.17%6 | 0.14% |
Portfolio Turnover Rate | 13% | 14% | 11% | 12% | 10% | 14% |
1 The fund’s fiscal year-end changed from October 31 to September 30, effective September 30, 2004.
2 Net investment income per share and the ratio of net investment income to average net assets include $.289 and 0.33%, respectively, resulting from a special dividend from ASML Holding NV in October 2007.
3 Net investment income per share and the ratio of net investment income to average net assets include $.108 and 0.16%, respectively, resulting from a special dividend from Microsoft Corp. in November 2004.
4 Includes increases from redemption fees of $.01, $.00, $.00, $.01, $.03, and $.03.
5 Total returns do not reflect the 1% fee assessed on redemptions after March 23, 2005, of shares held for less than one year, or the 1% fee previously assessed on redemptions of shares held for less than five years.
6 Annualized.
See accompanying Notes, which are an integral part of the Financial Statements.
19
Notes to Financial Statements
Vanguard Capital Opportunity Fund is registered under the Investment Company Act of 1940 as an open-end investment company, or mutual fund. The fund offers two classes of shares: Investor Shares and Admiral Shares. Investor Shares are available to any investor who meets the fund’s minimum purchase requirements. Admiral Shares are designed for investors who meet certain administrative, service, tenure, and account-size criteria.
A. The following significant accounting policies conform to generally accepted accounting principles for U.S. mutual funds. The fund consistently follows such policies in preparing its financial statements.
1. Security Valuation: Securities are valued as of the close of trading on the New York Stock Exchange (generally 4 p.m., Eastern time) on the valuation date. Equity securities are valued at the latest quoted sales prices or official closing prices taken from the primary market in which each security trades; such securities not traded on the valuation date are valued at the mean of the latest quoted bid and asked prices. Securities for which market quotations are not readily available, or whose values have been affected by events occurring before the fund’s pricing time but after the close of the securities’ primary markets, are valued at their fair values calculated according to procedures adopted by the board of trustees. These procedures include obtaining quotations from an independent pricing service, monitoring news to identify significant market- or security-specific events, and evaluating changes in the values of foreign market proxies (for example, ADRs, futures contracts, or exchange-traded funds), between the time the foreign markets close and the fund’s pricing time. When fair-value pricing is employed, the prices of securities used by a fund to calculate its net asset value may differ from quoted or published prices for the same securities. Investments in Vanguard Market Liquidity Fund are valued at that fund’s net asset value.
2. Foreign Currency: Securities and other assets and liabilities denominated in foreign currencies are translated into U.S. dollars using exchange rates obtained from an independent third party as of the fund’s pricing time on the valuation date. Realized gains (losses) and unrealized appreciation (depreciation) on investment securities include the effects of changes in exchange rates since the securities were purchased, combined with the effects of changes in security prices. Fluctuations in the value of other assets and liabilities resulting from changes in exchange rates are recorded as unrealized foreign currency gains (losses) until the assets or liabilities are settled in cash, at which time they are recorded as realized foreign currency gains (losses).
3. Federal Income Taxes: The fund intends to continue to qualify as a regulated investment company and distribute all of its taxable income. Management has analyzed the fund’s tax positions taken on federal income tax returns for all open tax years (tax years ended September 30, 2005–2008), and has concluded that no provision for federal income tax is required in the fund’s financial statements.
4. Distributions: Distributions to shareholders are recorded on the ex-dividend date.
5. Security Lending: The fund may lend its securities to qualified institutional borrowers to earn additional income. Security loans are required to be secured at all times by collateral at least equal to the market value of securities loaned. The fund invests cash collateral received in Vanguard Market Liquidity Fund, and records a liability for the return of the collateral, during the period the securities are on loan. Security lending income represents the income earned on investing cash collateral, less expenses associated with the loan.
6. Other: Dividend income is recorded on the ex-dividend date. Interest income includes income distributions received from Vanguard Market Liquidity Fund and is accrued daily. Security transactions are accounted for on the date securities are bought or sold. Costs used to determine realized gains (losses) on the sale of investment securities are those of the specific securities sold. Fees assessed on redemptions of capital shares are credited to paid-in capital.
20
Each class of shares has equal rights as to assets and earnings, except that each class separately bears certain class-specific expenses related to maintenance of shareholder accounts (included in Management and Administrative expenses) and shareholder reporting. Marketing and distribution expenses are allocated to each class of shares based on a method approved by the board of trustees. Income, other non-class-specific expenses, and gains and losses on investments are allocated to each class of shares based on its relative net assets.
B. PRIMECAP Management Company provides investment advisory services to the fund for a fee calculated at an annual percentage rate of average net assets. For the year ended September 30, 2008, the investment advisory fee represented an effective annual rate of 0.26% of the fund’s average net assets.
C. The Vanguard Group furnishes at cost corporate management, administrative, marketing, and distribution services. The costs of such services are allocated to the fund under methods approved by the board of trustees. The fund has committed to provide up to 0.40% of its net assets in capital contributions to Vanguard. At September 30, 2008, the fund had contributed capital of $767,000 to Vanguard (included in Other Assets), representing 0.01% of the fund’s net assets and 0.77% of Vanguard’s capitalization. The fund’s trustees and officers are also directors and officers of Vanguard.
D. The fund has asked its investment advisor to direct certain security trades, subject to obtaining the best price and execution, to brokers who have agreed to rebate to the fund part of the commissions generated. Such rebates are used solely to reduce the fund’s management and administrative expenses. The fund’s custodian bank has also agreed to reduce its fees when the fund maintains cash on deposit in the non-interest-bearing custody account. For the year ended September 30, 2008, these arrangements reduced the fund’s management and administrative expenses by $95,000 and custodian fees by $52,000. The total expense reduction represented an effective annual rate of 0.00% of the fund’s average net assets.
E. Distributions are determined on a tax basis and may differ from net investment income and realized capital gains for financial reporting purposes. Differences may be permanent or temporary. Permanent differences are reclassified among capital accounts in the financial statements to reflect their tax character. Temporary differences arise when certain items of income, expense, gain, or loss are recognized in different periods for financial statement and tax purposes; these differences will reverse at some time in the future. Differences in classification may also result from the treatment of short-term gains as ordinary income for tax purposes.
The fund used a tax accounting practice to treat a portion of the price of capital shares redeemed during the year as distributions from net investment income and realized capital gains. Accordingly, the fund has reclassified $4,690,000 from undistributed net investment income, and $40,857,000 from accumulated net realized gains, to paid-in capital.
For tax purposes, at September 30, 2008, the fund had $24,476,000 of ordinary income and $514,267,000 of long-term capital gains available for distribution.
During the year ended September 30, 2008, the fund realized net foreign currency losses of $23,000, which decreased distributable net income for tax purposes; accordingly, such losses have been reclassified from accumulated net realized gains to undistributed net investment income.
At September 30, 2008, the cost of investment securities for tax purposes was $6,843,006,000. Net unrealized appreciation of investment securities for tax purposes was $875,803,000, consisting of unrealized gains of $2,254,405,000 on securities that had risen in value since their purchase and $1,378,602,000 in unrealized losses on securities that had fallen in value since their purchase.
21
F. During the year ended September 30, 2008, the fund purchased $1,418,743,000 of investment securities and sold $1,125,047,000 of investment securities, other than temporary cash investments.
G. Capital share transactions for each class of shares were:
| | Year Ended September 30, |
| | 2008 | | | 2007 |
| Amount | Shares | | Amount | Shares |
| ($000) | (000) | | ($000) | (000) |
Investor Shares | | | | | |
Issued | 550,122 | 14,897 | | 353,165 | 9,164 |
Issued in Lieu of Cash Distributions | 425,525 | 11,807 | | 249,615 | 6,678 |
Redeemed1 | (825,141) | (22,596) | | (1,103,546) | (28,870) |
Net Increase (Decrease)—Investor Shares | 150,506 | 4,108 | | (500,766) | (13,028) |
Admiral Shares | | | | | |
Issued | 754,541 | 8,655 | | 623,496 | 6,994 |
Issued in Lieu of Cash Distributions | 392,708 | 4,717 | | 189,279 | 2,192 |
Redeemed1 | (483,522) | (5,904) | | (518,885) | (5,875) |
Net Increase (Decrease)—Admiral Shares | 663,727 | 7,468 | | 293,890 | 3,311 |
H. Certain of the fund’s investments are in companies that are considered to be affiliated companies of the fund because the fund owns more than 5% of the outstanding voting securities of the company. Transactions during the period in securities of these companies were as follows:
| | | Current Period Transactions | |
| Sept. 30, 2007 | | Proceeds from | | Sept. 30, 2008 |
| Market | Purchases | Securities | Dividend | Market |
| Value | at Cost | Sold | Income | Value |
| ($000) | ($000) | ($000) | ($000) | ($000) |
Avid Technology, Inc. | 55,176 | — | — | — | 49,022 |
Emulex Corp. | 87,595 | — | — | — | 48,755 |
FormFactor Inc. | 144,225 | 73,163 | — | — | 106,096 |
Men’s Wearhouse, Inc. | NA2 | 7,879 | 6,674 | 730 | 59,472 |
Minerals Technologies, Inc. | 82,179 | — | 79,448 | 49 | — |
Rambus Inc. | 99,468 | 568 | — | — | NA3 |
Strattec Security Corp. | 10,221 | — | — | 132 | 5,812 |
The Descartes Systems Group Inc. | 21,924 | — | — | — | 17,047 |
The Dress Barn, Inc. | 83,655 | 820 | — | — | 75,991 |
Thomas & Betts Corp. | 194,163 | — | 6 | — | 129,361 |
| 778,606 | | | 911 | 491,556 |
1 Net of redemption fees of $784,000 and $430,000 (fund totals).
2 At September 30, 2007, the issuer was not an affiliated company of the fund.
3 At September 30, 2008, the security was still held, but the issuer was no longer an affiliated company of the fund.
22
I. In September 2006, the Financial Accounting Standards Board issued Statement of Financial Accounting Standards No. 157 (“FAS 157”), “Fair Value Measurements.” FAS 157 establishes a framework for measuring fair value and expands disclosures about fair value measurements in financial statements.
The various inputs that may be used to determine the value of the fund’s investments are summarized in three broad levels. The inputs or methodologies used for valuing securities are not necessarily an indication of the risk associated with investing in those securities.
Level 1—Quoted prices in active markets for identical securities.
Level 2—Other significant observable inputs (including quoted prices for similar securities, interest rates, prepayment speeds, credit risk, etc.).
Level 3—Significant unobservable inputs (including the fund’s own assumptions used to determine the fair value of investments).
The following table summarizes the fund’s investments as of September 30, 2008, based on the inputs used to value them:
| Investments |
| in Securities |
Valuation Inputs | ($000) |
Level 1—Quoted prices | 7,605,316 |
Level 2—Other significant observable inputs | 113,493 |
Level 3—Significant unobservable inputs | — |
Total | 7,718,809 |
23
Report of Independent Registered
Public Accounting Firm
To the Trustees of Vanguard Horizon Funds and the Shareholders of Vanguard Capital Opportunity Fund:
In our opinion, the accompanying statement of net assets and statement of assets and liabilities, and the related statements of operations and of changes in net assets and the financial highlights present fairly, in all material respects, the financial position of Vanguard Capital Opportunity Fund (the “Fund”) at September 30, 2008, the results of its operations for the year then ended, the changes in its net assets for each of the two years in the period then ended and the financial highlights for each of the periods indicated, in conformity with accounting principles generally accepted in the United States of America. These financial statements and financial highlights (hereafter referred to as “financial statements”) are the responsibility of the Fund’s management; our responsibility is to express an opinion on these financial statements based on our audits. We conducted our audits of these financial statements in accordance with the standards of the Public Company Accounting Oversight Board (United States). Those standards require that we plan and perform the audit to obtain reasonable assurance about whether the financial statements are free of material misstatement. An audit includes examining, on a test basis, evidence supporting the amounts and disclosures in the financial statements, assessing the accounting principles used and significant estimates made by management, and evaluating the overall financial statement presentation. We believe that our audits, which included confirmation of securities at September 30, 2008 by correspondence with the custodian and by agreement to the underlying ownership records for Vanguard Market Liquidity Fund, provide a reasonable basis for our opinion.
PricewaterhouseCoopers LLP
Philadelphia, Pennsylvania
November 19, 2008
Special 2008 tax information (unaudited) for Vanguard Capital Opportunity Fund
This information for the fiscal year ended September 30, 2008, is included pursuant to provisions of the Internal Revenue Code.
The fund distributed $846,623,000 as capital gain dividends (from net long-term capital gains) to shareholders during the fiscal year.
For non-resident alien shareholders, 100% of short-term capital gain dividends distributed by the fund are qualified short term capital gains.
The fund distributed $69,812,000 of qualified dividend income to shareholders during the fiscal year.
For corporate shareholders, 63.6% of investment income (dividend income plus short-term gains, if any) qualifies for the dividends-received deduction.
24
Your Fund’s After-Tax Returns
This table presents returns for your fund both before and after taxes. The after-tax returns are shown in two ways: (1) assuming that an investor owned the fund during the entire period and paid taxes on the fund’s distributions, and (2) assuming that an investor paid taxes on the fund’s distributions and sold all shares at the end of each period.
Calculations are based on the highest individual federal income tax and capital gains tax rates in effect at the times of the distributions and the hypothetical sales. State and local taxes were not considered. After-tax returns reflect any qualified dividend income, using actual prior-year figures and estimates for 2008. (In the example, returns after the sale of fund shares may be higher than those assuming no sale. This occurs when the sale would have produced a capital loss. The calculation assumes that the investor received a tax deduction for the loss.)
The table shows returns for Investor Shares only; returns for other share classes will differ. Please note that your actual after-tax returns will depend on your tax situation and may differ from those shown. Also note that if you own the fund in a tax-deferred account, such as an individual retirement account or a 401(k) plan, this information does not apply to you. Such accounts are not subject to current taxes.
Finally, keep in mind that a fund’s performance—whether before or after taxes—does not guarantee future results.
Average Annual Total Returns: Capital Opportunity Fund Investor Shares1 |
Periods Ended September 30, 2008 | | | |
| One | Five | Ten |
| Year | Years | Years |
Returns Before Taxes | –24.13% | 9.25% | 14.89% |
Returns After Taxes on Distributions | –25.19 | 8.73 | 13.95 |
Returns After Taxes on Distributions and Sale of Fund Shares | –13.83 | 8.12 | 13.06 |
1 Total returns do not include the account service fee that may be applicable to certain accounts with balances below $10,000; nor do they include the 1% fee assessed on redemptions after March 23, 2005, of shares held for less than one year, or the 1% fee previously assessed on redemptions of shares held for less than five years.
25
About Your Fund’s Expenses
As a shareholder of the fund, you incur ongoing costs, which include costs for portfolio management, administrative services, and shareholder reports (like this one), among others. Operating expenses, which are deducted from a fund’s gross income, directly reduce the investment return of the fund.
A fund’s expenses are expressed as a percentage of its average net assets. This figure is known as the expense ratio. The following examples are intended to help you understand the ongoing costs (in dollars) of investing in your fund and to compare these costs with those of other mutual funds. The examples are based on an investment of $1,000 made at the beginning of the period shown and held for the entire period.
The accompanying table illustrates your fund’s costs in two ways:
• Based on actual fund return. This section helps you to estimate the actual expenses that you paid over the period. The “Ending Account Value” shown is derived from the fund’s actual return, and the third column shows the dollar amount that would have been paid by an investor who started with $1,000 in the fund. You may use the information here, together with the amount you invested, to estimate the expenses that you paid over the period.
To do so, simply divide your account value by $1,000 (for example, an $8,600 account value divided by $1,000 = 8.6), then multiply the result by the number given for your fund under the heading “Expenses Paid During Period.”
• Based on hypothetical 5% yearly return. This section is intended to help you compare your fund’s costs with those of other mutual funds. It assumes that the fund had a yearly return of 5% before expenses, but that the expense ratio is unchanged. In this case—because the return used is not the fund’s actual return—the results do not apply to your investment. The example is useful in making comparisons because the Securities and Exchange Commission requires all mutual funds to calculate expenses based on a 5% return. You can assess your fund’s costs by comparing this hypothetical example with the hypothetical examples that appear in shareholder reports of other funds.
Six Months Ended September 30, 2008 | | | |
| Beginning | Ending | Expenses |
| Account Value | Account Value | Paid During |
Capital Opportunity Fund | 3/31/2008 | 9/30/2008 | Period1 |
Based on Actual Fund Return | | | |
Investor Shares | $1,000.00 | $869.86 | $2.16 |
Admiral Shares | 1,000.00 | 870.34 | 1.73 |
Based on Hypothetical 5% Yearly Return | | |
Investor Shares | $1,000.00 | $1,022.76 | $2.33 |
Admiral Shares | 1,000.00 | 1,023.21 | 1.88 |
1 The calculations are based on expenses incurred in the most recent six-month period. The fund’s annualized six-month expense ratios for that period are 0.46% for Investor Shares and 0.37% for Admiral Shares. The dollar amounts shown as “Expenses Paid” are equal to the annualized expense ratio multiplied by the average account value over the period, multiplied by the number of days in the most recent six-month period, then divided by the number of days in the most recent 12-month period.
26
Note that the expenses shown in the table are meant to highlight and help you compare ongoing costs only and do not reflect transaction costs incurred by the fund for buying and selling securities. Further, the expenses do not include the 1% fee on redemptions of shares held for less than one year, nor do they include the account service fee described in the prospectus. If such fees were applied to your account, your costs would be higher. Your fund does not carry a “sales load.”
The calculations assume no shares were bought or sold during the period. Your actual costs may have been higher or lower, depending on the amount of your investment and the timing of any purchases or redemptions.
You can find more information about the fund’s expenses, including annual expense ratios, in the Financial Statements section of this report. For additional information on operating expenses and other shareholder costs, please refer to your fund’s current prospectus.
27
Glossary
Beta. A measure of the magnitude of a fund’s past share-price fluctuations in relation to the ups and downs of a given market index. The index is assigned a beta of 1.00. Compared with a given index, a fund with a beta of 1.20 typically would have seen its share price rise or fall by 12% when the index rose or fell by 10%. For this report, beta is based on returns over the past 36 months for both the fund and the index. Note that a fund’s beta should be reviewed in conjunction with its R-squared (see definition). The lower the R-squared, the less correlation there is between the fund and the index, and the less reliable beta is as an indicator of volatility.
Earnings Growth Rate. The average annual rate of growth in earnings over the past five years for the stocks now in a fund.
Equity Exposure. A measure that reflects a fund’s investments in stocks and stock futures. Any holdings in short-term reserves are excluded.
Expense Ratio. The percentage of a fund’s average net assets used to pay its annual administrative and advisory expenses. These expenses directly reduce returns to investors.
Foreign Holdings. The percentage of a fund represented by stocks or depositary receipts of companies based outside the United States.
Inception Date. The date on which the assets of a fund (or one of its share classes) are first invested in accordance with the fund’s investment objective. For funds with a subscription period, the inception date is the day after that period ends. Investment performance is measured from the inception date.
Median Market Cap. An indicator of the size of companies in which a fund invests; the midpoint of market capitalization (market price x shares outstanding) of a fund’s stocks, weighted by the proportion of the fund’s assets invested in each stock. Stocks representing half of the fund’s assets have market capitalizations above the median, and the rest are below it.
Price/Book Ratio. The share price of a stock divided by its net worth, or book value, per share. For a fund, the weighted average price/book ratio of the stocks it holds.
Price/Earnings Ratio. The ratio of a stock’s current price to its per-share earnings over the past year. For a fund, the weighted average P/E of the stocks it holds. P/E is an indicator of market expectations about corporate prospects; the higher the P/E, the greater the expectations for a company’s future growth.
R-Squared. A measure of how much of a fund’s past returns can be explained by the returns from the market in general, as measured by a given index. If a fund’s total returns were precisely synchronized with an index’s returns, its R-squared would be 1.00. If the fund’s returns bore no relationship to the index’s returns, its R-squared would be 0. For this report, R-squared is based on returns over the past 36 months for both the fund and the index.
Return on Equity. The annual average rate of return generated by a company during the past five years for each dollar of shareholder’s equity (net income divided by shareholder’s equity). For a fund, the weighted average return on equity for the companies whose stocks it holds.
28
Short-Term Reserves. The percentage of a fund invested in highly liquid, short-term securities that can be readily converted to cash.
Turnover Rate. An indication of the fund’s trading activity. Funds with high turnover rates incur higher transaction costs and may be more likely to distribute capital gains (which may be taxable to investors). The turnover rate excludes in-kind transactions, which have minimal impact on costs.
Yield. A fund’s 30-day SEC yield is derived using a formula specified by the U.S. Securities and Exchange Commission. Under the formula, data related to the fund’s security holdings in the previous 30 days are used to calculate the fund’s hypothetical net income for that period, which is then annualized and divided by the fund’s estimated average net assets over the calculation period. For the purposes of this calculation, a security’s income is based on its current market yield to maturity (in the case of bonds) or its projected dividend yield (for stocks). Because the SEC yield represents hypothetical annualized income, it will differ—at times significantly—from the fund’s actual experience. As a result, the fund’s income distributions may be higher or lower than implied by the SEC yield.
29
This page intentionally left blank.
This page intentionally left blank.
The People Who Govern Your Fund
The trustees of your mutual fund are there to see that the fund is operated and managed in your best interests since, as a shareholder, you are a part owner of the fund. Your fund’s trustees also serve on the board of directors of The Vanguard Group, Inc., which is owned by the Vanguard funds and provides services to them on an at-cost basis.
A majority of Vanguard’s board members are independent, meaning that they have no affiliation with Vanguard or the funds they oversee, apart from the sizable personal investments they have made as private individuals.
Our independent board members bring distinguished backgrounds in business, academia, and public service to their task of working with Vanguard officers to establish the policies and oversee the activities of the funds. Among board members’ responsibilities are selecting investment advisors for the funds; monitoring fund operations, performance, and costs; reviewing contracts; nominating and selecting new trustees/directors; and electing Vanguard officers.
Each trustee serves a fund until its termination; or until the trustee’s retirement, resignation, or death; or otherwise as specified in the fund’s organizational documents. Any trustee may be removed at a shareholders’ meeting by a vote representing two-thirds of the net asset value of all shares of the fund together with shares of other Vanguard funds organized within the same trust. The table on these two pages shows information for each trustee and executive officer of the fund. The mailing address of the trustees and officers is P.O. Box 876, Valley Forge, PA 19482.
Chairman of the Board and Trustee
John J. Brennan1
Born 1954 Principal Occupation(s) During the Past Five Years: Chairman of the Board and Director/ Trustee Since May 1987; Trustee of The Vanguard Group, Inc., and of each of the investment companies served Chairman of the Board by The Vanguard Group; Chief Executive Officer and President of The Vanguard Group 156 Vanguard Funds Overseen and of each of the investment companies served by The Vanguard Group (1996–2008).
Independent Trustees
Charles D. Ellis
Born 1937 Principal Occupation(s) During the Past Five Years: Applecore Partners (pro bono ventures Trustee Since January 2001 in education); Senior Advisor to Greenwich Associates (international business strategy 156 Vanguard Funds Overseen consulting); Successor Trustee of Yale University; Overseer of the Stern School of Business at New York University; Trustee of the Whitehead Institute for Biomedical Research.
Emerson U. Fullwood
Born 1948 Principal Occupation(s) During the Past Five Years: Executive Chief Staff and Marketing Trustee Since January 2008 Officer for North America since 2004 and Corporate Vice President of Xerox Corporation 156 Vanguard Funds Overseen (photocopiers and printers); Director of SPX Corporation (multi-industry manufacturing), of the United Way of Rochester, and of the Boy Scouts of America.
Rajiv L. Gupta
Born 1945 Principal Occupation(s) During the Past Five Years: Chairman, President, and Trustee Since December 20012 Chief Executive Officer of Rohm and Haas Co. (chemicals); Board Member of 156 Vanguard Funds Overseen the American Chemistry Council; Director of Tyco International, Ltd. (diversified manufacturing and services) since 2005.
Amy Gutmann
Born 1949 Principal Occupation(s) During the Past Five Years: President of the University of
Trustee Since June 2006 Pennsylvania since 2004; Professor in the School of Arts and Sciences, Annenberg School 156 Vanguard Funds Overseen for Communication, and Graduate School of Education of the University of Pennsylvania since 2004; Provost (2001–2004) and Laurance S. Rockefeller Professor of Politics and the University Center for Human Values (1990–2004), Princeton University; Director of Carnegie Corporation of New York since 2005 and of Schuylkill River Development Corporation and Greater Philadelphia Chamber of Commerce since 2004; Trustee of the National Constitution Center since 2007.
JoAnn Heffernan Heisen
Born 1950 Principal Occupation(s) During the Past Five Years: Corporate Vice President and Trustee Since July 1998 Chief Global Diversity Officer since 2006, Vice President and Chief Information 156 Vanguard Funds Overseen Officer (1997–2005), and Member of the Executive Committee of Johnson & Johnson (pharmaceuticals/consumer products); Director of the University Medical Center at Princeton and Women’s Research and Education Institute.
André F. Perold
Born 1952 Principal Occupation(s) During the Past Five Years: George Gund Professor of Finance Trustee Since December 2004 and Banking, Harvard Business School; Senior Associate Dean and Director of Faculty 156 Vanguard Funds Overseen Recruiting, Harvard Business School; Director and Chairman of UNX, Inc. (equities trading firm); Chair of the Investment Committee of HighVista Strategies LLC (private investment firm) since 2005.
Alfred M. Rankin, Jr.
Born 1941 Principal Occupation(s) During the Past Five Years: Chairman, President, Chief Executive Trustee Since January 1993 Officer, and Director of NACCO Industries, Inc. (forklift trucks/housewares/lignite); Director 156 Vanguard Funds Overseen of Goodrich Corporation (industrial products/aircraft systems and services).
J. Lawrence Wilson
Born 1936 Principal Occupation(s) During the Past Five Years: Retired Chairman and Chief Executive Trustee Since April 1985 Officer of Rohm and Haas Co. (chemicals); Director of Cummins Inc. (diesel engines) and 156 Vanguard Funds Overseen AmerisourceBergen Corp. (pharmaceutical distribution); Trustee of Vanderbilt University and of Culver Educational Foundation.
Executive Officers1
Thomas J. Higgins
Born 1957 Principal Occupation(s) During the Past Five Years: Principal of The Vanguard Group, Inc.; Chief Financial Officer Treasurer of each of the investment companies served by The Vanguard Group; Chief Since September 2008 Financial Officer of each of the investment companies served by The Vanguard Treasurer Since July 1998 Group since 2008. 156 Vanguard Funds Overseen
F. William McNabb III
Born 1957 Principal Occupation(s) During the Past Five Years: Chief Executive Officer, Director, Chief Executive Officer and President of The Vanguard Group, Inc., since 2008; Chief Executive Officer and Since August 31, 2008 President of each of the investment companies served by The Vanguard Group since President Since March 2008 2008; Director of Vanguard Marketing Corporation; Managing Director of The Vanguard 156 Vanguard Funds Overseen Group (1995–2008).
Heidi Stam
Born 1956 Principal Occupation(s) During the Past Five Years: Managing Director of The Vanguard Secretary Since July 2005 Group, Inc., since 2006; General Counsel of The Vanguard Group since 2005; Secretary of 156 Vanguard Funds Overseen The Vanguard Group and of each of the investment companies served by The Vanguard Group since 2005; Director and Senior Vice President of Vanguard Marketing Corporation since 2005; Principal of The Vanguard Group (1997–2006).
Vanguard Senior Management Team | | |
| | | |
R. Gregory Barton | Kathleen C. Gubanich | Michael S. Miller | Glenn W. Reed |
Mortimer J. Buckley | Paul A. Heller | Ralph K. Packard | George U. Sauter |
Founder
John C. Bogle
Chairman and Chief Executive Officer, 1974–1996
1 These individuals are “interested persons” as defined in the Investment Company Act of 1940.
2 December 2002 for Vanguard Equity Income Fund, Vanguard Growth Equity Fund, the Vanguard Municipal Bond Funds, and the Vanguard State Tax-Exempt Funds.
More information about the trustees is in the Statement of Additional Information, available from The Vanguard Group.

P.O. Box 2600
Valley Forge, PA 19482-2600
Connect with Vanguard® > www.vanguard.com
Fund Information > 800-662-7447 | All comparative mutual fund data are from Lipper Inc. |
| or Morningstar, Inc., unless otherwise noted. |
Direct Investor Account Services > 800-662-2739 | |
| You can obtain a free copy of Vanguard’s proxy voting |
Institutional Investor Services > 800-523-1036 | guidelines by visiting our website, www.vanguard.com, |
| and searching for “proxy voting guidelines,” or by |
Text Telephone for People | calling Vanguard at 800-662-2739. The guidelines are |
With Hearing Impairment > 800-952-3335 | also available from the SEC’s website, www.sec.gov. |
| In addition, you may obtain a free report on how your |
| fund voted the proxies for securities it owned during |
| the 12 months ended June 30. To get the report, visit |
This material may be used in conjunction | either www.vanguard.com or www.sec.gov. |
with the offering of shares of any Vanguard | |
fund only if preceded or accompanied by | |
the fund’s current prospectus. | |
| |
| You can review and copy information about your fund |
| at the SEC’s Public Reference Room in Washington, D.C. |
| To find out more about this public service, call the SEC |
The funds or securities referred to herein are not | at 202-551-8090. Information about your fund is also |
sponsored, endorsed, or promoted by MSCI, and MSCI | available on the SEC’s website, and you can receive |
bears no liability with respect to any such funds or | copies of this information, for a fee, by sending a |
securities. For any such funds or securities, the | request in either of two ways: via e-mail addressed to |
prospectus or the Statement of Additional Information | publicinfo@sec.gov or via regular mail addressed to the |
contains a more detailed description of the limited | Public Reference Section, Securities and Exchange |
relationship MSCI has with The Vanguard Group and | Commission, Washington, DC 20549-0102. |
any related funds. | |
| |
Russell is a trademark of The Frank Russell Company. | |
| |
| |
| |
| |
| |
| |
| |
| |
| |
| © 2008 The Vanguard Group, Inc. |
| All rights reserved. |
| Vanguard Marketing Corporation, Distributor. |
| |
| Q1110 112008 |

> For the fiscal year ended September 30, 2008, Vanguard Global Equity Fund declined –32.2%, posting a greater loss than either its benchmark index or the average return of competing global funds.
> Reversing a trend in recent years, returns from international stocks trailed those of U.S. stocks, which also lost significant ground.
> Poor stock selection in several sectors—particularly financials, materials, consumer discretionary, and energy—contributed to the fund’s disappointing result.
Contents | |
| |
Your Fund’s Total Returns | 1 |
President’s Letter | 2 |
Advisors’ Report | 7 |
Fund Profile | 13 |
Performance Summary | 15 |
Financial Statements | 16 |
Your Fund’s After-Tax Returns | 36 |
About Your Fund’s Expenses | 37 |
Glossary | 39 |
Please note: The opinions expressed in this report are just that—informed opinions. They should not be considered promises or advice. Also, please keep in mind that the information and opinions cover the period through the date on the front of this report. Of course, the risks of investing in your fund are spelled out in the prospectus.
Your Fund’s Total Returns
Fiscal Year Ended September 30, 2008 | | |
| Ticker | Total |
| Symbol | Returns |
Vanguard Global Equity Fund | VHGEX | –32.2% |
MSCI All Country World Index | | –26.9 |
Average Global Fund1 | | –26.5 |
Your Fund’s Performance at a Glance |
September 30, 2007–September 30, 2008 |
| | | Distributions Per Share |
| Starting | Ending | Income | Capital |
| Share Price | Share Price | Dividends | Gains |
Vanguard Global Equity Fund | $26.51 | $16.64 | $0.430 | $1.400 |
1 Derived from data provided by Lipper Inc.
1

President’s Letter
Dear Shareholder,
Vanguard Global Equity Fund returned –32.2% for the fiscal year ended September 30, 2008. The fund trailed both the average return of its peers in the global fund category and its unmanaged benchmark index by more than 5 percentage points. Much of the fund’s underperformance can be attributed to its advisors’ stock choices in several sectors.
If you hold shares of Vanguard Global Equity Fund in a taxable account, you may wish to review our report on after-tax returns on page 36.
Credit-market turbulence weighed heavily on stock prices
Troubles simmering in the credit markets for much of the past year came to a boil at the end of the fiscal period, producing several high-profile bankruptcies and putting severe pressure on stock prices around the world. International stock markets dropped –30.0% for the 12 months ended September 30. The broad U.S. stock market suffered less-severe losses, at –21.2% for the period; the last month was the most painful as stock prices fell more than –9%.
Policymakers and elected officials, both in the United States and abroad, responded to the upheavals with dramatic new programs designed to help stabilize the credit markets. As participants struggled to make sense of the markets’ fast-changing dynamics, stock
2
prices were exceptionally volatile, with daily ups and downs of 2 percentage points or more becoming commonplace.
U.S. Treasuries rallied in a nervous market
Nervousness in the stock market was echoed, and even amplified, in the bond market. For the 12 months, the broad U.S. bond market returned 3.7%, largely on the strength of Treasuries—investors’ security of choice in times of duress. Corporate bonds generally produced negative returns for the period, coming under heavy selling pressure during investors’ flight to safety. Even the municipal market, made up of generally high-quality securities issued by states and municipalities, recorded a negative 12-month return.
The U.S. Federal Reserve Board responded to the turmoil with a dramatic easing of monetary policy. Over the full 12 months, the Fed reduced its target for the federal funds rate from 4.75% to 2.00%. On October 8, shortly after the close of the fiscal period, the Fed cut rates again, to 1.50%. The move was made in coordination with rate cuts by several other central banks.
Fund was hurt by overexposure in some markets and poor stock-picking
Amid the worldwide credit crunch and declining markets, the Global Equity Fund lagged its unmanaged benchmark for the first time in the past eight fiscal years. The fund also did worse than the average return of competitor funds.
Market Barometer | | | |
| Average Annual Total Returns |
| Periods Ended September 30, 2008 |
| One Year | Three Years | Five Years |
Stocks | | | |
MSCI All Country World Index ex USA (International) | –30.0% | 3.1% | 11.8% |
Russell 1000 Index (Large-caps) | –22.1 | 0.1 | 5.5 |
Russell 2000 Index (Small-caps) | –14.5 | 1.8 | 8.1 |
Dow Jones Wilshire 5000 Index (Entire market) | –21.2 | 0.6 | 6.0 |
| | | |
| | | |
Bonds | | | |
Lehman U.S. Aggregate Bond Index (Broad taxable market) | 3.7% | 4.2% | 3.8% |
Lehman Municipal Bond Index | –1.9 | 1.9 | 2.8 |
Citigroup 3-Month Treasury Bill Index | 2.6 | 4.0 | 3.1 |
| | | |
| | | |
CPI | | | |
Consumer Price Index | 4.9% | 3.2% | 3.4% |
3
The fund’s underperformance was caused chiefly by two factors: first, the decision by the fund’s advisory team to overweight certain markets in Europe, Asia, and the Pacific region, where returns were worse than those in the United States; and second, the advisors’ selection of stocks that underperformed in eight out of ten industry sectors.
About 36% of the fund’s assets, on average, were invested in U.S. companies—more than 5 percentage points below the index weighting. The fund’s average weighting in the developed European markets was also slightly smaller than the corresponding benchmark weightings. The fund’s emerging-markets exposure was higher than the benchmark’s in the Pacific and Middle East/Africa regions, but a bit lower in European and Latin American emerging markets.
The entire fiscal year proved highly adversarial for stock investors. No country was immune to the downdraft. Fund holdings in every region posted losses of at least 19%. Only two nations managed more modest single-digit percentage losses—Brazil (–7.4%) and Israel (–6%).
Global Equity’s positions in the developed European markets had the highest negative return (–37%). However, because the United States constituted by far the fund’s single largest country weighting, the fund’s U.S. exposure (–31%) exerted the biggest performance drag. In fact, those holdings
Expense Ratios1 | | |
Your Fund Compared With Its Peer Group | | |
| | Average |
| | Global |
| Fund | Fund |
Global Equity Fund | 0.64% | 1.49% |
Total Returns | |
Ten Years Ended September 30, 2008 | |
| Average |
| Annual Return |
Global Equity Fund | 9.7% |
MSCI All Country World Index | 4.7 |
Average Global Fund2 | 4.8 |
The figures shown represent past performance, which is not a guarantee of future results. (Current performance may be lower or higher than the performance data cited. For performance data current to the most recent month-end, visit our website at www.vanguard.com/performance.) Note, too, that both investment returns and principal value can fluctuate widely, so an investor’s shares, when sold, could be worth more or less than their original cost.
1 The fund expense ratio shown is from the prospectus dated June 23, 2008. For the fiscal year ended September 30, 2008, the expense ratio was 0.51%. The peer-group expense ratio is derived from data provided by Lipper Inc. and captures information through year-end 2007.
2 Derived from data provided by Lipper Inc.
4
trailed the performance of the overall U.S. stock market by about 10 percentage points, due mainly to poor stock selection, particularly in financials, materials, consumer discretionary, and energy.
Some large companies suffered from the global slowdown
Regardless of borders, the biggest detractors within financials were the Dutch financial services provider ING Groep (–49%), the German exchange Deutsche Boerse (–33%), and U.S. insurance giant American International Group (–95%), the latter being rescued by the U.S. government. Expected declines in demand for materials hit some stocks hard, including global steel manufacturer ArcelorMittal (–37%).
Within consumer discretionary, the leading detractors included stocks in the sales-starved auto industry—notably Peugeot (–53%), Renault (–54%), and Fiat (–55%). In energy, projected declines in oil consumption dragged down Royal Dutch Shell (–27%), Lukoil Holdings (–29%), and Marathon Oil (–29%), with all three among the top-ten weightiest losers in the portfolio.
During a very negative 12 months, there were few positive notes. The fund’s telecommunication services (–21%) and utilities (–16%) holdings did manage to lose less ground than did each of the two benchmark sectors’ average losses. And a few notable holdings in the fund, including U.S. financial giant JPMorgan Chase (+6%), scored gains.
For more details on the fund’s positioning and performance, see the Advisors’ Report on page 7.
Global Equity’s long-term record remains superior to that of peers
Because we believe investing in stocks is a long-term endeavor, it’s best to measure a stock fund’s investment returns over longer time periods, particularly after such a tough 12-month period. Assessing a fund over extended market cycles can filter out short-term fluctuations and reveal how an investment performs through a variety of market conditions. This is particularly true of any fund that invests around the globe.
During the ten years ended September 30, 2008, the Global Equity Fund had an average annual return of 9.7%, outdistancing both its benchmark index and its peer-group average by about 5 percentage points per year. In U.S. dollar terms, a hypothetical investment of $10,000 in Global Equity made ten years ago would have grown to $25,278 by September 30—nearly $10,000 more than the result of a corresponding investment in the index, which bears no management expenses.
The driver of the fund’s outperformance record is, of course, the talent of its advisors. Their experience and skill have proven successful in identifying companies
5
with superior growth potential. The fund’s competitive results have been supported by its low expense ratio, which means that we are able to pass along a greater share of the total returns to you.
The fund has added a fourth investment advisor
About midway through the fiscal year, we added a fourth investment advisor to the fund’s management team. Baillie Gifford Overseas Ltd., based in Edinburgh, Scotland, employs a long-term, valuation-sensitive growth philosophy. Its bottom-up approach seeks high-quality companies whose earnings and cash flows increase faster than the market’s.
Baillie Gifford joins current Global Equity Fund advisors Acadian Asset Management LLC, AllianceBernstein L.P., and Marathon Asset Management LLP. The fund’s investment objective and policies have not changed.
As we often have done with our equity funds, we added a talented advisor to further diversify the fund’s investment strategies. The table on page 7 provides a breakdown of the fund’s assets that are managed independently by each advisor, and on pages 7–12, you’ll find separate reports from each of the fund’s four advisors.
Amid strong headwinds, global investing remains promising
In recent years, investing abroad has provided rewarding returns for U.S. investors. But as the past year has shown, investing in stocks, whether domestic or international, often involves setbacks and retreats—and occasionally severe ones, at that.
It’s anyone’s guess when the markets will turn around. But whether it’s sooner or later, seasoned investors know that remaining in the markets has historically been the best way to capitalize on the long-term growth of the global marketplace.
We believe that the Global Equity Fund—with its broad diversification across nations and sectors and its reliance on four advisors with different but complementary approaches—can provide investors a low-cost way to give their portfolios some exposure to opportunities beyond the United States. As one element of a stock portfolio, the fund can play a useful role in helping you to move toward your investment goals.
Thank you for your confidence in Vanguard.
Sincerely,

F. William McNabb III
President and Chief Executive Officer
October 17, 2008
6
Advisors’ Report
During the fiscal year ended September 30, 2008, the Global Equity Fund returned –32.2%, reflecting the combined results of your fund’s independent investment advisors. The use of multiple advisors provides exposure to distinct, yet complementary, investment approaches to a particular market segment, enhancing the diversification of your fund.
The advisors, their percentage of fund assets managed, and brief descriptions of their investment strategies are presented in the table below. The advisors have also prepared a discussion of the investment opportunities in their markets and of how their portfolio positioning reflects this assessment. These comments were prepared on October 22, 2008
Acadian Asset Management LLC
Portfolio Managers:
John Chisholm, CFA, Executive Vice President
and Co-Chief Investment Officer
Ronald Frashure, CFA, President and
Chief Executive Officer
Brian Wolahan, CFA, Senior Vice President
and Director of Alternative Strategies
During the 12 months ended
September 30, 2008, world equity
markets experienced unprecedented levels
Vanguard Global Equity Investment Advisors |
| Fund Assets Managed | |
Investment Advisor | % | $ Million | Investment Strategy |
Acadian Asset Management LLC | 44 | 2,250 | A quantitative, active, bottom-up investment process that combines stock and peer-group valuation to arrive at a return forecast for each of more than 40,000 securities in the global universe. |
| | |
| | |
| | |
AllianceBernstein L.P. | 27 | 1,416 | A fundamentally based, research-driven approach focused on finding companies whose long-term earnings power exceeds the level implied by their current stock price. Proprietary quantitative tools aid risk control and portfolio construction. |
| | |
| | |
| | |
| | |
Marathon Asset Management LLP | 23 | 1,196 | A long-term and contrarian investment philosophy and process with a focus on industry capital cycle analysis and in-depth management assessment. |
| | |
| | |
Baillie Gifford Overseas Ltd. | 3 | 159 | The advisor seeks stocks that can generate above- average growth in earnings and cash flow, producing a bottom-up, stock-driven approach to country and asset allocation. An in-depth view on each company is measured against the consensus view, leading to discrepancies and potential opportunities to add value. |
| | |
| | |
| | |
| | |
| | |
| | |
Cash Investments1 | 3 | 139 | —- |
1 These short-term reserves are invested by Vanguard in equity index products to simulate investment in stocks. Each advisor may also maintain a modest cash position.
7
of volatility as the credit crunch intensified, concerns about a global slowdown gave way to recessionary conditions in a number of major markets, and inflation pressures persisted. The reporting period culminated with the U.S. financial system in disarray as a number of key Wall Street players buckled under the weight of heavy losses on mortgage-linked securities. The U.S. government stepped in with a proposed $700 billion bailout package in an effort to resuscitate the market’s key banking and financial institutions and prevent the crisis from penetrating deeper into the economy.
The fiscal year also saw broad deleveraging of stocks by hedge funds and proprietary trading desks, and value-style underperformance. This made it a challenging period for Acadian’s process.
Bottom-up stock selection led our portfolio to take the largest positions in Russia, Germany, the Netherlands, Turkey, and South Korea. We underweighted the United Kingdom, Canada, Switzerland, and Spain. Materials, industrials, and energy were key sectors that we overweighted.
The portfolio’s weak spots included stock selection in the United States, with additional weakness in the Netherlands, Germany, France, and Japan. Finance, banking, and energy stocks were among the most costly during the period. ING Groep, Société Générale, and Dexia were vulnerable to the ongoing turmoil in credit and equity markets, while exchange operators Deutsche Boerse and Hong Kong
Exchanges & Clearing declined as investors traded equities unevenly during the period in response to rapidly changing market dynamics. Royal Dutch Shell, LUKOIL, and Marathon Oil also detracted notably, as gains earlier in the year were offset by declines in the third quarter. These stocks fell in tandem with receding crude prices, which peaked in July and began to drop amid concerns about the resilience of demand in an environment of slowing global growth.
The portfolio earned positive returns from a combination of stock- and country-level performance in Russia, stock selection combined with the underweighting in the United Kingdom, and stock selection in Australia. Key positions that added value in these markets included fertilizer producer Incitec Pivot and Mobile TeleSystems. Avoiding U.K. benchmark detractors such as Vodafone and BP also helped relative return.
AllianceBernstein L.P.
Portfolio Managers:
Sharon E. Fay, CFA, Executive Vice
President and Chief Investment
Officer–Global Value Equities
Kevin F. Simms, Co-Chief Investment
Officer–International Value Equities and
Director of Research–Global and
International Value Equities
Henry S. D’Auria, CFA, Co-Chief Investment
Officer–International Value Equities and Chief
Investment Officer–Emerging Markets
8
The credit crisis, which began in mid-2007, accelerated in the final months of the fiscal year. Turmoil in the global financial system, a loss of confidence in counterparties, and fear of global recession increased investors’ risk aversion, turning it into panic selling in September. Action by governments and central banks to rescue troubled institutions and boost liquidity averted a systemic meltdown, but equity markets remained extremely volatile.
Our setbacks during the period included troubled financial stocks and stock selection in the commodity sector. Among the most prominent detractors were AIG, Fannie Mae, Freddie Mac, and Fortis, which were all rescued by government intervention, and HBOS, which was forced into a merger with Lloyds TSB. These holdings have been diluted so much that we are unlikely to recover much of our original investments, which is regrettable.
We did not anticipate the intensity of emotion that took over the market. Our fundamental forecasts of companies’ operations have been the bedrock of our successful stock selection throughout our history. But in this environment, uncertainty and fear have driven investor behavior, and actions by governments and rating agencies have been unpredictable and overwhelming.
Nevertheless, the steps taken to shore up the financial system helped the performance of some of our other financial holdings. For example, JPMorgan Chase was among the biggest contributors to relative returns.
Although it is difficult to see through the dark clouds hanging over the markets, our research strongly suggests that recognition of the credit losses faced by financial institutions is at a very advanced stage. We expect that with state help, the banking industry will recover strongly from today’s woes, just as the U.S. financial industry rebounded from the banking crisis in the early 1990s. Consolidation should leave the survivors with improved market share and profitability, and several of the potential beneficiaries are among the portfolio’s holdings.
A dispassionate analysis of current conditions makes us cautiously optimistic. Coordinated action on the part of central banks and governments to inject liquidity into the markets and develop a systematic solution to the crisis are positive steps. Slower global growth is relieving inflationary pressures, which should improve consumer spending power. The oversupply of U.S. housing is being worked down. Finally, the balance sheets of nonfinancial companies around the world are robust, owing to cautious use of cash flow during the last
9
expansion, putting these companies in a strong position to weather the expected economic slowdown.
We harbor no illusions. There are many headwinds that will need to dissipate. Righting the global economy and the capital markets will take time, but corrective forces are at work.
Meanwhile, blind flight from risk has created rich opportunities for investors not swayed by emotion. We are prudently taking advantage of many of these opportunities. Most of our best periods of absolute and relative returns have been earned in the aftermath of market dislocations. It is a tough time for investors, but by sticking to well-designed principles of investing that have stood the test of time, we believe we can turn today’s turmoil and the extraordinary opportunities it is creating to the fund’s advantage.
Marathon Asset Management LLP
Portfolio Managers:
Jeremy J. Hosking, Investment Director
Neil M. Ostrer, Investment Director
William J. Arah, Investment Director
Over the last 12 months we made a small shift in the asset allocation of our portfolio, as we increased exposure to the U.S. market at the expense of the weighting in Japan. We also added to the beleaguered financial sector in both Europe and the United States. Following an unprecedented period of turbulence and upheaval in the sector, this move looks to have been premature. However, the total effect from financial exposure in our portfolio over a one-year period was muted, with the negative effect from stock selection marginally outweighed by the beneficial underweighting in the sector. Nonetheless, over the last year our portfolio underperformed the benchmark largely because of currency and geographical allocation, as well as stock selection.
The severity of the financial crisis seems certain to have important ramifications for other parts of the economy, and expectations for economic growth are more modest than they have been for some time. The good news is that inflationary expectations look set to subside as commodity prices fall. Accommodative monetary policy and the positively shaped yield curve should support profitability for financial firms in the United States, and the $700 billion bailout fund should provide liquidity if all else fails. Elsewhere, it looks likely that interest rates will be cut sharply, and this should help support equity prices.
More positive is the wide disparity in performance among financial stocks, which suggests, first, that we are in the eye of the storm and, second, that there will be winners as well as losers in the current crisis. Should the financial situation stabilize and credit markets normalize, we would expect companies to quickly resume buybacks (because share prices
10
are lower), which should benefit equity markets worldwide. Until we reach the point of maximum pain, both corporate cash flows and valuations will be under some pressure. However, firms that don’t have to raise new equity, which represent most of the shares in the portfolio, can look forward to significantly higher share prices in the next cycle. Firms that are forced to raise new equity at current prices are effectively being forced to incorporate current pessimism into their future potential.
Baillie Gifford Overseas Ltd.
Portfolio Managers:
Charles Plowden, Joint Senior Partner and
Lead Portfolio Manager
Spencer Adair, CFA, Investment Manager
Malcolm MacColl, Investment Manager
Across the globe, equity investors felt the continued effects of the credit crunch, and the fiscal period ended with another painful lurch as yet more financial companies lost their independence, or worse. Our stock-picking stance and emphasis on long-term investment means we continued to focus on the companies in the portfolio. Rather than react to the prophets of doom who dominated the headlines toward the end of the fiscal year, we considered the implications of the adjustments that took place over the 12 months.
Although September’s news was unwelcome, it may just herald the next stage in the process we are calling “The
Big Adjustment.” The global imbalances created by lax credit conditions may take some time to unwind, but that process should help improve the longer-term health of global economies. In general, companies’ balance sheets are in good shape (financial companies excepted), and firms have made good strides in reorienting themselves away from their home markets to areas where there is sustainable growth. One of our bigger holdings, Schlumberger, is a good example. This is an oil services company based in Texas, but it is generally acknowledged to be a key partner for many of the world’s rapidly developing oil regions—to the north in Canada, to the east in Russia, and to the south in Brazil.
Another piece of good news is that the world economy may have gotten beyond the worst of the inflationary pressure that was a concern earlier in the year. Hard commodity and oil prices have taken a step backward, and the annual rates of price increases for soft commodities have peaked and are falling off.
It would be naive to assume that the final period of the adjustment and the slowing of inflationary pressures will not continue to have a negative impact for several months. However, central banks are now in a better position to react to these events than they have been for some time, and arguably the urgency for them to do so is greater. All this means that for the long-term investor, the returns from global equity markets should be good.
11
Looking forward, it is likely that growth will be slower than it has been in the past, because the period of easy credit has ended. On the other hand, the developing world will continue to provide many exciting growth opportunities, and excessive investor pessimism in the mature economies should allow us to expand our exposure to traditional growth companies trading at compelling valuations.
12
Fund Profile
As of September 30, 2008
Portfolio Characteristics |
| | Comparative |
| Fund | Index1 |
Number of Stocks | 791 | 2,515 |
Turnover Rate | 73% | — |
Expense Ratio | | |
(9/30/2007)2 | 0.64% | — |
Short-Term Reserves | –1.3%3 | — |
Sector Diversification (% of equity exposure) |
| | Comparative |
| Fund | Index1 |
Consumer Discretionary | 13.8% | 8.7% |
Consumer Staples | 8.3 | 9.7 |
Energy | 11.3 | 12.2 |
Financials | 19.5 | 21.7 |
Health Care | 6.3 | 9.6 |
Industrials | 10.2 | 10.5 |
Information Technology | 11.7 | 10.6 |
Materials | 9.9 | 7.2 |
Telecommunication Services | 6.3 | 5.1 |
Utilities | 2.7 | 4.7 |
Volatility Measures4 | |
| Fund Versus |
| Comparative Index1 |
R-Squared | 0.98 |
Beta | 1.13 |
Ten Largest Holdings5 (% of total net assets) |
| | |
Royal Dutch Shell PLC | integrated oil | |
| and gas | 2.7% |
McDonald’s Corp. | restaurants | 1.7 |
E.On AG | electric utilities | 1.6 |
The Kroger Co. | food retail | 1.6 |
ING Groep NV | diversified financial | |
| services | 1.5 |
Nintendo Co. | home entertainment | |
| software | 1.4 |
Sumitomo Mitsui | diversified banks | |
Financial Group, Inc. | | 1.3 |
France Telecom SA | integrated | |
| telecommunication | |
| services | 1.3 |
State Street Corp. | asset management | |
| and custody banks | 1.1 |
Wal-Mart Stores, Inc. | hypermarkets and | |
| super centers | 1.0 |
Top Ten | | 15.2% |
Allocation by Region (% of equity exposure)
1 MSCI All Country World Index.
2 The expense ratio shown is from the prospectus dated June 23, 2008. For the fiscal year ended September 30, 2008, the expense ratio was 0.51%.
3 The fund invested a portion of its cash reserves in equity markets through the use of index futures contracts. After the effect of the futures investments, the fund’s temporary cash position was negative.
4 For an explanation of R-squared, beta, and other terms used here, see the Glossary.
5 The holdings listed exclude any temporary cash investments and equity index products.
13
Market Diversification (% of equity exposure) |
| | Comparative |
| Fund1 | Index2 |
Europe | | |
United Kingdom | 8.6% | 8.8% |
Germany | 5.8 | 3.7 |
France | 4.8 | 4.5 |
Netherlands | 2.0 | 1.0 |
Switzerland | 1.5 | 3.2 |
Italy | 1.2 | 1.5 |
Sweden | 1.0 | 0.9 |
Other European Markets | 4.0 | 4.2 |
Subtotal | 28.9% | 27.8% |
Pacific | | |
Japan | 10.9% | 9.0% |
Hong Kong | 1.8 | 0.8 |
Australia | 1.2 | 2.6 |
Other Pacific Markets | 0.4 | 0.5 |
Subtotal | 14.3% | 12.9% |
Emerging Markets | | |
South Korea | 3.8% | 1.3% |
Taiwan | 2.5 | 1.1 |
Brazil | 1.3 | 1.5 |
South Africa | 1.2 | 0.8 |
China | 1.1 | 1.5 |
Other Emerging Markets | 5.0 | 4.0 |
Subtotal | 14.9% | 10.2% |
North America | | |
United States | 38.8% | 45.0% |
Canada | 3.1 | 4.1 |
Subtotal | 41.9% | 49.1% |
1 Country percentages exclude currency contracts held by the fund.
2 MSCI All Country World Index.
14
Performance Summary
All of the returns in this report represent past performance, which is not a guarantee of future results that may be achieved by the fund. (Current performance may be lower or higher than the performance data cited. For performance data current to the most recent month-end, visit our website at www.vanguard.com/performance.) Note, too, that both investment returns and principal value can fluctuate widely, so an investor’s shares, when sold, could be worth more or less than their original cost. The returns shown do not reflect taxes that a shareholder would pay on fund distributions or on the sale of fund shares.
Cumulative Performance: September 30, 1998–September 30, 2008
Initial Investment of $10,000
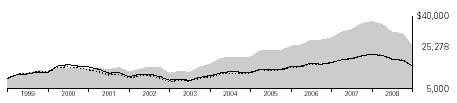
| | | |
| | | | |
| Average Annual Total Returns | Final Value |
| Periods Ended September 30, 2008 | of a $10,000 |
| One Year | Five Years | Ten Years | Investment |
Global Equity Fund1 | –32.24% | 8.55% | 9.72% | $25,278 |
MSCI All Country World Index | –26.87 | 8.35 | 4.69 | 15,813 |
Average Global Fund2 | –26.47 | 7.15 | 4.77 | 15,936 |
Fiscal Year Total Returns (%): September 30, 1998–September 30, 2008
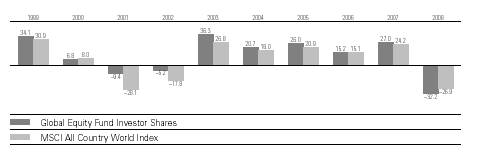
1 Total returns do not include the account service fee that may be applicable to certain accounts with balances below $10,000.
2 Derived from data provided by Lipper Inc.
Note: See Financial Highlights tables for dividend and capital gains information.
15
Financial Statements
Statement of Net Assets
As of September 30, 2008
The fund provides a complete list of its holdings four times in each fiscal year, at the quarter-ends. For the second and fourth fiscal quarters, the lists appear in the fund’s semiannual and annual reports to shareholders. For the first and third fiscal quarters, the fund files the lists with the Securities and Exchange Commission on Form N-Q. Shareholders can look up the fund’s Forms N-Q on the SEC’s website at www.sec.gov. Forms N-Q may also be reviewed and copied at the SEC’s Public Reference Room (see the back cover of this report for further information).
| | | Market |
| | | Value• |
| | Shares | ($000) |
Common Stocks (95.9%)1 | | |
Australia (0.9%) | | |
| BHP Billiton Ltd. | 1,001,608 | 25,912 |
^ | Macquarie Infrastructure | | |
| Group | 2,050,356 | 3,888 |
| Santos Ltd. | 218,037 | 3,336 |
| OZ Minerals Ltd. | 2,200,365 | 2,792 |
| Australia & New Zealand | | |
| Bank Group Ltd. | 146,324 | 2,261 |
| Sims Group Ltd. | 82,452 | 1,914 |
| Brambles Ltd. | 271,843 | 1,696 |
| BlueScope Steel Ltd. | 202,732 | 1,195 |
| Amcor Ltd. | 203,799 | 896 |
| Orica Ltd. | 44,610 | 753 |
| Caltex Australia Ltd. | 69,841 | 691 |
| Alumina Ltd. | 246,453 | 622 |
| Iluka Resources Ltd. | 76,078 | 289 |
| | | 46,245 |
Austria (0.2%) | | |
^ | Erste Bank der | | |
| Oesterreichischen | | |
| Sparkassen AG | 161,559 | 8,043 |
| Oesterreichische Post AG | 19,555 | 661 |
* | BETandWIN.com | | |
| Interactive | | |
| Entertainment AG | 8,217 | 219 |
| | | 8,923 |
Belgium (0.8%) | | |
^ | Dexia | 1,470,472 | 16,062 |
| Solvay SA | 99,500 | 12,214 |
| Fortis | 732,632 | 4,524 |
| Delhaize Group | 73,541 | 4,272 |
| Groupe Bruxelles | | |
| Lambert SA | 18,757 | 1,619 |
| InBev | 16,453 | 979 |
| Aquarius Platinum Ltd. | 100,227 | 452 |
| | | 40,122 |
Brazil (1.3%) | | |
| Petroleo Brasileiro SA Pfd. | 1,141,700 | 20,735 |
| Usiminas-Usinas | | |
| Siderugicas de Minas | | |
| Gerais SA Pfd. | 661,575 | 14,018 |
| Itausa-Investimentos | | |
| Itau SA | 1,647,524 | 8,078 |
| Uniao de Bancos | | |
| Brasileiros SA GDR | 79,500 | 8,023 |
| Banco do Brasil SA | 413,400 | 4,862 |
| Petroleo Brasileiro | | |
| SA Series A ADR | 91,200 | 3,413 |
| Banco Itau Holding | | |
| Financeira SA ADR | 150,750 | 2,638 |
| Gerdau SA ADR | 166,500 | 1,848 |
| Companhia Vale do | | |
| Rio Doce Sponsored ADR | 74,600 | 1,320 |
| Metalurgica Gerdau SA | 36,000 | 556 |
| | | 65,491 |
Canada (3.1%) | | |
| Rogers Communications, | | |
| Inc. Class B | 743,100 | 24,103 |
| Bombardier Inc. Class B | 4,182,000 | 22,713 |
| Potash Corp. of | | |
| Saskatchewan, Inc. | 145,900 | 18,915 |
| Petro-Canada | 376,300 | 12,517 |
| Imperial Oil Ltd. | 280,100 | 11,996 |
| Sun Life Financial Services | | |
| of Canada | 298,844 | 10,446 |
* | Research In Motion Ltd. | 127,400 | 8,701 |
| Canadian Imperial Bank | | |
| of Commerce | 143,541 | 8,238 |
| Toronto-Dominion Bank | 112,800 | 6,792 |
| Nexen Inc. | 259,700 | 6,027 |
| BCE Inc. | 142,465 | 4,913 |
| Methanex Corp. | 227,200 | 4,451 |
| ATCO, Ltd. | 87,200 | 3,163 |
^ | Gerdau AmeriSteel Corp. | 293,000 | 2,822 |
^ | ACE Aviation Holdings, Inc. | 311,800 | 2,303 |
| Onex Corp. | 83,300 | 2,150 |
16
| | | Market |
| | | Value• |
| | Shares | ($000) |
| Ritchie Brothers | | |
| Auctioneers Inc. | 54,510 | 1,273 |
* | KHD Humboldt International | 60,800 | 1,166 |
* | Ivanhoe Mines Ltd. | 186,808 | 1,132 |
^,* | AbitibiBowater, Inc. | 218,435 | 856 |
* | CGI Group Inc. | 95,200 | 833 |
* | Catalyst Paper Corp. | 1,158,844 | 751 |
* | Nortel Networks Corp. | 322,633 | 723 |
* | OPTI Canada Inc. | 52,940 | 550 |
* | Groupe Aeroplan, Inc. | 40,100 | 497 |
* | Fraser Papers Inc. | 337,960 | 479 |
| Biovail Corp. | 44,800 | 425 |
| | | 158,935 |
China (1.1%) | | |
| CNOOC Ltd. | 18,453,000 | 20,730 |
| China Petroleum & | | |
| Chemical Corp. | 20,116,000 | 15,876 |
| China Construction Bank | 7,167,000 | 4,782 |
| China Mobile | | |
| (Hong Kong) Ltd. | 396,000 | 3,967 |
| Tsingtao Brewery | | |
| Co., Ltd. | 2,144,000 | 3,876 |
| China COSCO | | |
| Holdings Co., Ltd. | 2,958,500 | 2,697 |
| China Telecom Corp. Ltd. | 5,688,000 | 2,334 |
* | SINA.com | 27,000 | 951 |
| | | 55,213 |
Denmark (0.3%) | | |
* | Vestas Wind Systems A/S | 65,019 | 5,675 |
^,* | William Demant A/S | 56,130 | 2,525 |
| Coloplast A/S B Shares | 32,210 | 2,390 |
^,* | GN Store Nord A/S | 420,379 | 1,835 |
| AP Moller-Maersk A/S | | |
| B Shares | 200 | 1,740 |
| Novo Nordisk A/S B Shares | 15,950 | 827 |
| Carlsberg A/S B Shares | 9,000 | 686 |
| Danske Bank A/S | 21,658 | 521 |
^ | Bang & Olufsen A/S | | |
| B Shares | 9,950 | 375 |
| | | 16,574 |
Egypt (0.1%) | | |
| Orascom Construction | | |
| Industries GDR | 11,150 | 1,164 |
* | TMG Holding | 1,103,412 | 1,141 |
* | Egyptian Financial Group- | | |
| Hermes Holding SAE | 109,800 | 682 |
* | Commercial International | | |
| Bank | 22,500 | 164 |
| | | 3,151 |
Finland (0.5%) | | |
| Stora Enso Oyj R Shares | 1,173,300 | 11,464 |
| Nokia Oyj | 345,222 | 6,439 |
| Sampo Oyj A Shares | 205,539 | 4,676 |
| Metso Oyj | 109,941 | 2,697 |
| TietoEnator Oyj B Shares | 62,105 | 914 |
| Wartsila Oyj B Shares | 12,083 | 509 |
| | | 26,699 |
| | | | |
France (4.5%) | | |
| France Telecom SA | 2,364,205 | 66,315 |
| Total SA | 377,278 | 22,920 |
| Sanofi-Aventis | 321,426 | 21,132 |
| BNP Paribas SA | 182,888 | 17,458 |
| Rénault SA | 233,900 | 14,906 |
| Credit Agricole SA | 773,493 | 14,897 |
| PSA Peugeot Citroën | 303,518 | 11,423 |
| Compagnie Générale | | |
| des Etablissements | | |
| Michelin SA | 136,800 | 8,861 |
* | UbiSoft Entertainment SA | 108,386 | 7,540 |
| Air France | 290,900 | 6,660 |
| Arkema | 135,800 | 5,013 |
| Lagardere S.C.A. | 99,687 | 4,494 |
| Carrefour SA | 83,950 | 3,959 |
| AXA | 117,068 | 3,832 |
| Thales SA | 59,092 | 2,982 |
| Neopost SA | 31,254 | 2,947 |
| Legrand SA | 129,040 | 2,910 |
| Alcatel-Lucent ADR | 479,973 | 1,843 |
| SCOR SA | 89,617 | 1,743 |
| Nexans SA | 17,819 | 1,585 |
* | Groupe Eurotunnel SA | | |
| Warrants Exp. 12/30/11 | 5,737,247 | 1,535 |
| Electricité de France | 20,575 | 1,488 |
| Essilor International SA | 22,218 | 1,110 |
| Société Générale Class A | 11,692 | 1,050 |
| Atos Origin SA | 22,838 | 1,005 |
| Cie. de St. Gobain SA | 16,331 | 845 |
| Société BIC SA | 13,656 | 709 |
| Rallye SA | 17,796 | 522 |
| SA des Ciments Vicat | 9,138 | 444 |
* | Groupe Eurotunnel SA | 25,867 | 309 |
| | | 232,437 |
Germany (5.6%) | | |
| E.On AG | 1,628,337 | 81,965 |
| Deutsche Boerse AG | 476,193 | 43,576 |
| BASF AG | 565,158 | 26,945 |
| Allianz AG | 163,200 | 22,374 |
| Muenchener | | |
| Rueckversicherungs- | | |
| Gesellschaft AG | | |
| (Registered) | 144,300 | 21,767 |
| Deutsche Lufthansa AG | 1,096,972 | 21,444 |
| Deutsche Bank AG | 179,003 | 12,805 |
| Man AG | 170,252 | 11,462 |
| ThyssenKrupp AG | 311,677 | 9,358 |
| Deutsche Telekom AG | 565,500 | 8,588 |
| Fresenius Medical Care AG | 107,534 | 5,567 |
| Celesio AG | 102,442 | 4,471 |
| Salzgitter AG | 39,157 | 3,960 |
| Daimler AG (Registered) | 78,784 | 3,912 |
| SAP AG | 36,920 | 1,966 |
17
| | | Market |
| | | Value• |
| | Shares | ($000) |
* | Q-Cells AG | 22,500 | 1,887 |
| Bayerische Motoren | | |
| Werke AG | 45,687 | 1,771 |
| Deutsche Post AG | 69,736 | 1,455 |
| Siemens AG | 11,664 | 1,088 |
| Bayer AG | 9,061 | 664 |
| Fresenius Medical Care | | |
| AG ADR | 11,744 | 610 |
| | | 287,635 |
Hong Kong (1.8%) | | |
| Jardine Matheson | | |
| Holdings Ltd. | 930,302 | 24,304 |
| Jardine Strategic | | |
| Holdings Ltd. | 1,266,400 | 18,010 |
| New World Development | | |
| Co., Ltd. | 7,894,665 | 8,793 |
| First Pacific Co. Ltd. | 10,152,000 | 5,371 |
| Television Broadcasts Ltd. | 1,123,000 | 4,769 |
| Henderson Land | | |
| Development Co. Ltd. | 1,028,000 | 4,583 |
| China Netcom Group Corp. | | |
| Hong Kong Ltd. | 1,534,000 | 3,397 |
| Wheelock and Co. Ltd. | 1,603,000 | 2,907 |
| Hong Kong and Shanghai | | |
| Hotels Ltd. | 2,757,538 | 2,696 |
| Hong Kong Aircraft & | | |
| Engineering Co., Ltd. | 226,000 | 2,599 |
| Kingboard Chemical | | |
| Holdings Ltd. | 694,000 | 2,370 |
| SmarTone | | |
| Telecommunications Ltd. | 2,730,790 | 1,985 |
| Cheung Kong Holdings Ltd. | 157,000 | 1,779 |
| Midland Holdings Ltd. | 3,904,000 | 1,234 |
| Mandarin Oriental | | |
| International Ltd. | 766,690 | 1,188 |
| Next Media Ltd. | 4,192,000 | 1,024 |
| Hong Kong Exchanges & | | |
| Clearing Ltd. | 54,000 | 665 |
| China Citic Bank | 1,449,000 | 651 |
| I-Cable | | |
| Communications Ltd. | 5,207,000 | 612 |
| Kowloon Development | | |
| Co., Ltd. | 600,000 | 537 |
| China National Building | | |
| Material Co., Ltd. | 412,000 | 476 |
* | Genting International PLC | 884,370 | 284 |
| Esprit Holdings Ltd. | 36,146 | 224 |
| Silver Grant International | | |
| Industries Ltd. | 1,752,000 | 175 |
| | | 90,633 |
India (0.3%) | | |
| Tata Iron and Steel Co. Ltd. | 977,241 | 9,042 |
| State Bank of India GDR | 66,230 | 4,002 |
| Bank of India | 403,977 | 2,492 |
| | | 15,536 |
Indonesia (0.3%) | | |
* | PT Bank Indonesia Tbk | 70,022,036 | 5,547 |
| PT Semen Gresik Tbk | 11,586,500 | 4,138 |
| PT Indofood Sukses | | |
| Makmur Tbk | 11,106,500 | 2,279 |
| PT Matahari Putra | | |
| Prima Tbk | 19,910,800 | 1,237 |
| PT Gudang Garam Tbk | 1,149,900 | 713 |
* | PT Bank Pan Indonesia | | |
| Tbk Warrants | | |
| Exp. 7/10/09 | 13,353,807 | 595 |
| PT Citra Marga | | |
| Nusaphala Persada Tbk | 1,709,500 | 232 |
* | PT Mulia Industrindo Tbk | 921,000 | 29 |
* | PT Matahari Putra Prima | | |
| Tbk Warrants | | |
| Exp. 7/21/10 | 3,859,975 | 10 |
| | | 14,780 |
Ireland (0.1%) | | |
| Independent News & | | |
| Media PLC | 936,699 | 1,530 |
| CRH PLC | 47,498 | 1,005 |
| DCC PLC | 28,986 | 570 |
^ | Anglo Irish Bank Corp. PLC | 95,104 | 518 |
| Fyffes PLC | 759,148 | 342 |
| Paddy Power PLC | 16,052 | 284 |
| Total Produce PLC | 389,036 | 218 |
| | | 4,467 |
Israel (0.1%) | | |
| Partner Communications | | |
| Co. Ltd. | 367,010 | 6,755 |
| Teva Pharmaceutical | | |
| Industries Ltd. | | |
| Sponsored ADR | 27,200 | 1,246 |
| | | 8,001 |
Italy (1.1%) | | |
| Eni SpA | 645,000 | 17,096 |
| Fiat SpA | 1,244,759 | 16,727 |
| Saipem SpA | 180,687 | 5,406 |
| Luxottica Group SpA ADR | 179,800 | 4,134 |
| Pirelli & C. Accomandita | | |
| per Azioni SpA | 6,059,531 | 3,575 |
| Unicredit SpA | 796,427 | 2,978 |
| Prysmian SpA | 96,104 | 1,890 |
| Fondiari-Sai SpA | 66,298 | 1,565 |
| Banco Popolare SpA | 94,543 | 1,469 |
| Luxottica Group SpA | 56,503 | 1,300 |
^,* | Seat Pagine Gialle SpA | 10,205,537 | 1,003 |
| Finmeccanica SpA | 29,298 | 635 |
* | Natuzzi SpA- | | |
| Sponsored ADR | 50,700 | 164 |
| | | 57,942 |
18
| | | Market |
| | | Value• |
| | Shares | ($000) |
Japan (10.4%) | | |
| Nintendo Co. | 166,800 | 70,752 |
| Sumitomo Mitsui | | |
| Financial Group, Inc. | 11,101 | 69,600 |
| Mitsui OSK Lines Ltd. | 3,374,000 | 29,315 |
| Hitachi Ltd. | 3,315,000 | 22,379 |
| Nippon Yusen Kabushiki | | |
| Kaisha Co. | 3,221,000 | 20,996 |
| Mitsui & Co., Ltd. | 1,593,000 | 19,776 |
| Nippon Telegraph and | | |
| Telephone Corp. | 4,036 | 18,014 |
| Nissan Motor Co., Ltd. | 2,423,400 | 16,387 |
| Tokyo Electric Power Co. | 664,900 | 16,359 |
| Mitsui Trust Holding Inc. | 2,971,000 | 16,040 |
| Marubeni Corp. | 3,377,000 | 15,308 |
| JFE Holdings, Inc. | 441,400 | 13,691 |
| Fujitsu Ltd. | 2,345,000 | 13,184 |
| Mitsubishi Chemical | | |
| Holdings Corp. | 2,352,500 | 12,435 |
| Sharp Corp. | 1,059,000 | 11,572 |
| Orix Corp. | 82,120 | 10,282 |
| Kawasaki Kisen Kaisha Ltd. | 1,471,000 | 9,101 |
| Aisin Seiki Co., Ltd. | 368,000 | 9,012 |
| Seiko Epson Corp. | 343,900 | 7,998 |
| Toshiba Corp. | 1,807,000 | 7,881 |
| Fuji Heavy Industries Ltd. | 1,339,000 | 6,783 |
| Nippon Mining | | |
| Holdings Inc. | 1,310,000 | 5,277 |
| Daihatsu Motor Co., Ltd. | 430,000 | 4,704 |
| Kao Corp. | 173,000 | 4,639 |
* | Sanyo Electric Co., Ltd. | 2,505,000 | 4,349 |
| Nippon Sheet | | |
| Glass Co., Ltd. | 824,000 | 4,267 |
| Mitsubishi UFJ | | |
| Financial Group | 469,900 | 4,098 |
| Nippon Meat Packers, Inc. | 225,000 | 3,412 |
| West Japan Railway Co. | 752 | 3,220 |
| Tokyo Gas Co., Ltd. | 748,000 | 3,121 |
| East Japan Railway Co. | 405 | 3,020 |
| Mazda Motor Corp. | 733,000 | 2,985 |
| Yamato Holdings Co., Ltd. | 210,000 | 2,352 |
| Toyota Motor Corp. | 55,000 | 2,351 |
| Secom Co., Ltd. | 51,200 | 2,133 |
| NTT DoCoMo, Inc. | 1,300 | 2,081 |
| Matsushita Electric | | |
| Works, Ltd. | 226,000 | 2,007 |
| KDDI Corp. | 354 | 2,005 |
| Canon, Inc. | 52,600 | 1,994 |
| Ajinomoto Co., Inc. | 203,000 | 1,935 |
| Asahi Breweries Ltd. | 109,300 | 1,916 |
| Takeda Pharmaceutical | | |
| Co. Ltd. | 37,100 | 1,868 |
| Mitsui Sumitomo Insurance | | |
| Group Holdings, Inc. | 54,200 | 1,846 |
| Mitsui Chemicals, Inc. | 402,000 | 1,772 |
| Tanabe Seiyaku Co., Ltd. | 116,000 | 1,612 |
| Nippon Sanso Corp. | 196,000 | 1,553 |
| NEC Corp. | 351,000 | 1,500 |
* | Isetan Mitsukoshi | | |
| Holdings Ltd. | 125,100 | 1,468 |
| Mizuho Financial Group, Inc. | 332 | 1,452 |
^ | Takefuji Corp. | 107,660 | 1,401 |
| Dai-Nippon | | |
| Printing Co., Ltd. | 102,000 | 1,376 |
* | NEC Electronics Corp. | 65,300 | 1,364 |
| Sony Corp. | 43,800 | 1,351 |
| Kyowa Hakko Kogyo Co. | 128,000 | 1,346 |
| Mitsubishi Corp. | 64,100 | 1,337 |
| Namco Bandai Holdings Inc. | 120,450 | 1,324 |
| Japan Tobacco, Inc. | 347 | 1,308 |
| Kawasaki Heavy | | |
| Industries Ltd. | 607,000 | 1,295 |
| Seven and I Holdings | | |
| Co., Ltd. | 44,700 | 1,284 |
| Denso Corp. | 51,400 | 1,261 |
| JS Group Corp. | 99,900 | 1,258 |
| Sekisui House Ltd. | 136,000 | 1,249 |
| Bridgestone Corp. | 65,300 | 1,236 |
| Sumitomo Electric | | |
| Industries Ltd. | 109,900 | 1,196 |
| Fukuoka Financial | | |
| Group, Inc. | 324,000 | 1,192 |
| Astellas Pharma Inc. | 28,100 | 1,181 |
| Sompo Japan | | |
| Insurance Inc. | 130,000 | 1,103 |
| Nippon Oil Corp. | 212,000 | 1,068 |
| TDK Corp. | 20,800 | 1,042 |
| FamilyMart Co., Ltd. | 24,400 | 1,032 |
| Kinden Corp. | 106,000 | 1,010 |
| Shiseido Co., Ltd. | 45,000 | 1,008 |
| Toyo Seikan Kaisha Ltd. | 65,300 | 1,002 |
| Sojitz Holdings Corp. | 426,900 | 989 |
| Daito Trust | | |
| Construction Co., Ltd. | 26,600 | 989 |
| Leopalace21 Corp. | 127,800 | 988 |
| Marui Co., Ltd. | 130,200 | 972 |
| Hitachi Chemical Co., Ltd. | 68,000 | 913 |
| Alfresa Holdings Corp. | 18,700 | 905 |
| Onward Kashiyama Co., Ltd. | 86,000 | 899 |
| NTT Data Corp. | 220 | 870 |
| Yamaguchi Financial | | |
| Group, Inc. | 71,000 | 866 |
| Nippon Suisan Kaisha Ltd. | 222,300 | 818 |
| Toppan Forms Co., Ltd. | 80,200 | 806 |
| Tokyo Electron Ltd. | 17,800 | 805 |
| Bank of Yokohama Ltd. | 156,000 | 773 |
| Ricoh Co. | 54,000 | 759 |
| Ohbayashi Corp. | 150,000 | 759 |
| Sumitomo Forestry Co. | 128,000 | 747 |
| Shimizu Corp. | 145,000 | 691 |
| Toyota Tsusho Corp. | 48,600 | 637 |
| Ryosan Co., Ltd. | 29,800 | 617 |
19
| | | Market |
| | | Value• |
| | Shares | ($000) |
| Omron Corp. | 33,700 | 523 |
| Yamatake Corp. | 31,800 | 512 |
| Tokyo Ohka Kogyo Co., Ltd. | 25,800 | 409 |
| Chiba Bank Ltd. | 63,000 | 330 |
| Fujitsu Fronttec Ltd. | 32,100 | 294 |
| Noritake Co., Ltd. | 58,000 | 190 |
| Fuji Photo Film Co., Ltd. | 6,000 | 155 |
| NSK Ltd. | 17,000 | 98 |
| Yaskawa Electric Corp. | 17,000 | 97 |
| Inabata & Co., Ltd. | 22,700 | 81 |
| | | 539,518 |
Luxembourg (0.7%) | | |
| ArcelorMittal | 677,458 | 34,318 |
| Evraz Group SA GDR | 13,500 | 520 |
| | | 34,838 |
Malaysia (0.5%) | | |
| Bumiputra-Commerce | | |
| Holdings Bhd. | 3,171,319 | 7,094 |
| Resorts World Bhd. | 8,843,700 | 6,588 |
| Sime Darby Bhd. | 1,875,457 | 3,626 |
| AMMB Holdings Bhd. | 3,875,887 | 3,361 |
| British American | | |
| Tobacco Bhd. | 165,000 | 1,994 |
| Malaysian Airline | | |
| System Bhd. | 1,127,133 | 1,136 |
| Multi-Purpose | | |
| Holdings Bhd. | 1,570,900 | 590 |
| Carlsberg Brewery | | |
| Malaysia Bhd. | 109,600 | 123 |
* | Malaysian Airlines | | |
| System Cvt. Pfd. | 183,333 | 44 |
* | Multi-Purpose Holdings | | |
| Bhd. Warrants | | |
| Exp. 2/26/09 | 254,000 | 22 |
| | | 24,578 |
Mexico (0.4%) | | |
| Grupo Mexico SA de CV | 9,063,074 | 9,530 |
| America Movil SA de CV | | |
| Series L ADR | 86,200 | 3,996 |
| Grupo Financerio | | |
| Banorte SA de CV | 984,301 | 3,143 |
| Telefonos de Mexico SA | 1,272,170 | 1,623 |
| Telefonos de Mexico SA | | |
| Class L ADR | 32,000 | 824 |
| Telmex Internacional | | |
| SAB de CV | 896,741 | 580 |
| Telmex Internacional | | |
| SAB Class L ADR | 32,000 | 416 |
| | | 20,112 |
Netherlands (1.9%) | | |
| ING Groep NV | 3,555,591 | 76,224 |
| Koninklijke KPN NV | 320,076 | 4,622 |
| Koninklijke Boskalis | | |
| Westminster NV | 92,367 | 4,378 |
| Heineken NV | 89,157 | 3,582 |
| Koninklijke (Royal) Philips | | |
| Electronics NV | 117,237 | 3,181 |
| Wolters Kluwer NV | 126,730 | 2,569 |
| Reed Elsevier NV | 116,200 | 1,724 |
* | AerCap Holdings NV | 113,772 | 1,207 |
| Akzo Nobel NV | 14,642 | 703 |
| Eurocastle Investment Ltd. | 82,241 | 342 |
| | | 98,532 |
New Zealand (0.0%) | | |
| Telecom Corp. of | | |
| New Zealand Ltd. | 284,906 | 527 |
| PGG Wrightson Ltd. | 22,410 | 24 |
| | | 551 |
Norway (0.5%) | | |
| StatoilHydro ASA | 755,440 | 17,952 |
| Norsk Hydro ASA | 1,126,900 | 7,624 |
| DnB NOR ASA | 203,710 | 1,580 |
| Seadrill Ltd. | 52,833 | 1,094 |
| | | 28,250 |
Philippines (0.6%) | | |
| Ayala Corp. | 2,160,613 | 13,684 |
| Globe Telecom, Inc. | 422,580 | 9,334 |
| ABS-CBN | | |
| Broadcasting Corp. | 10,077,900 | 3,394 |
| Jollibee Foods Corp. | 2,657,200 | 2,882 |
| Banco De Oro | 1,066,800 | 887 |
* | Benpres Holdings Corp. | 15,742,000 | 496 |
| DMCI Holdings, Inc. | 5,230,000 | 422 |
| | | 31,099 |
Poland (0.3%) | | |
| KGHM Polska Miedz SA | 259,267 | 5,492 |
| Powszechna Kasa | | |
| Oszczednosci Bank | | |
| Polski SA | 294,039 | 5,389 |
| Telekomunikacja Polska SA | 317,656 | 3,030 |
| Polski Koncern Naftowy SA | 85,057 | 1,228 |
| | | 15,139 |
Russia (0.8%) | | |
| LUKOIL Sponsored ADR | 393,300 | 23,575 |
| MMC Norilsk Nickel ADR | 1,058,550 | 14,788 |
| OAO Gazprom | | |
| Sponsored GDR | 94,350 | 3,015 |
| Tatneft GDR | 19,202 | 1,399 |
| Uralkali GDR | 18,250 | 578 |
| OAO Gazprom- | | |
| Sponsored ADR | 14,250 | 455 |
| | | 43,810 |
Singapore (0.4%) | | |
| Great Eastern Holdings Ltd. | 733,000 | 6,892 |
* | STATS ChipPAC Ltd. | 7,211,000 | 4,429 |
| DBS Group Holdings Ltd. | 220,000 | 2,622 |
| Neptune Orient Lines Ltd. | 1,213,000 | 1,547 |
| Keppel Corp., Ltd. | 271,000 | 1,497 |
| | | | |
20
| | | Market |
| | | Value• |
| | Shares | ($000) |
* | GuocoLeisure Ltd. | 4,656,000 | 1,480 |
| United Industrial Corp., Ltd. | 377,000 | 543 |
| Yellow Pages (Singapore) Ltd. | 704,000 | 193 |
| | | 19,203 |
South Africa (1.2%) | | |
| Sasol Ltd. | 257,593 | 10,994 |
| Hosken Consolidated | | |
| Investments Ltd. | 1,191,053 | 8,093 |
| Standard Bank Group Ltd. | 481,195 | 5,531 |
| RMB Holdings Ltd. | 1,620,811 | 5,197 |
| Sun International Ltd. | 464,839 | 5,122 |
| Anglo American PLC | 137,702 | 4,720 |
| MTN Group Ltd. | 304,139 | 4,292 |
| Nedbank Group Ltd. | 275,074 | 3,483 |
| FirstRand Ltd. | 1,566,606 | 3,226 |
| Naspers Ltd. | 147,700 | 2,917 |
| Anglo Platinum Ltd. | 19,348 | 1,764 |
| Aveng Ltd. | 184,935 | 1,412 |
| New Clicks Holdings Ltd. | 373,513 | 711 |
| Gold Fields Ltd. | 69,695 | 673 |
| City Lodge Hotels Ltd. | 70,616 | 618 |
| African Rainbow | | |
| Minerals Ltd. | 31,153 | 599 |
| JD Group Ltd. | 145,983 | 534 |
| AngloGold Ltd. | 20,395 | 474 |
| Discovery Holdings, Ltd. | 74,638 | 196 |
| Mondi Ltd. | 14,534 | 79 |
| | | 60,635 |
South Korea (3.8%) | | |
| Samsung | | |
| Electronics Co., Ltd. | 96,405 | 44,178 |
| LG Electronics Inc. | 397,158 | 36,748 |
| KT Corp. | 612,040 | 21,134 |
* | Samsung SDI Co. Ltd. | 162,653 | 11,882 |
| LG Chem Ltd. | 137,191 | 10,764 |
* | Hynix Semiconductor Inc. | 639,100 | 10,590 |
| SK Telecom Co., Ltd. | 60,247 | 10,313 |
| Kookmin Bank | 224,656 | 10,039 |
| Hana Financial Group Inc. | 307,000 | 7,220 |
| Hyundai Mobis | 73,830 | 5,719 |
| Samsung | | |
| Electronics Co., Ltd. Pfd. | 18,000 | 5,676 |
| Honam Petrochemical Corp. | 66,197 | 3,815 |
| LG. Philips LCD Co., Ltd. | 142,120 | 3,620 |
| Industrial Bank of Korea | 266,464 | 3,224 |
| Hyundai Steel Co. | 60,360 | 3,028 |
| SK Holdings Co Ltd | 29,026 | 2,703 |
| Korea Gas Corp. | 32,051 | 1,847 |
* | STX Pan Ocean Co., Ltd. | 671,800 | 1,029 |
| POSCO | 2,695 | 1,011 |
* | STX Pan Ocean Co. Ltd. | | |
| (Singapore Shares) | 465,000 | 647 |
| Korea Electric Power Corp. | 5,000 | 126 |
* | KISCO Corp. | 3,070 | 123 |
| KISCO Holdings Co. Ltd. | 930 | 36 |
| | | 195,472 |
Spain (0.7%) | | |
| Repsol YPF SA | 419,200 | 12,423 |
| Banco Santander Central | | |
| Hispano SA | 760,624 | 11,405 |
| Acciona SA | 27,507 | 4,192 |
^ | Acerinox SA | 217,661 | 3,899 |
| Telefonica SA | 130,438 | 3,101 |
| Industria de Diseno | | |
| Textil SA | 34,291 | 1,451 |
| Prosegur Cia de Seguridad | | |
| SA (Registered) | 30,977 | 1,078 |
| Viscofan SA | 53,995 | 887 |
| | | 38,436 |
Sweden (1.0%) | | |
| Telefonaktiebolaget LM | | |
| Ericsson AB Class B | 1,466,480 | 13,927 |
| Alfa Laval AB | 723,600 | 7,488 |
| Svenska Cellulosa | | |
| AB B Shares | 696,450 | 7,378 |
| Svenska Handelsbanken | | |
| AB A Shares | 234,390 | 5,249 |
| Investor AB B Shares | 219,368 | 4,108 |
| Electrolux AB Series B | 315,700 | 3,693 |
| Atlas Copco AB B Shares | 249,834 | 2,524 |
| Assa Abloy AB | 190,100 | 2,302 |
| Tele2 AB B Shares | 102,900 | 1,174 |
| Hoganas AB B Shares | 52,700 | 805 |
| Modern Times Group | | |
| AB B Shares | 15,780 | 569 |
| TeliaSonera AB | 63,500 | 361 |
| | | 49,578 |
Switzerland (1.5%) | | |
| Credit Suisse Group | | |
| (Registered) | 493,800 | 23,061 |
| Ace Ltd. | 195,450 | 10,580 |
* | UBS AG | 461,439 | 7,887 |
| Cie. Financiere | | |
| Richemont AG | 135,787 | 6,000 |
| Novartis AG (Registered) | 110,564 | 5,821 |
| Nestle SA (Registered) | 132,750 | 5,737 |
| Roche Holdings AG | 30,221 | 4,731 |
| Schindler Holding AG | | |
| (Bearer Participation | | |
| Certificates) | 54,141 | 3,259 |
| Adecco SA (Registered) | 67,278 | 2,923 |
| Geberit AG | 21,715 | 2,663 |
* | Logitech International SA | 89,777 | 2,049 |
| ABB Ltd. | 76,500 | 1,483 |
| Julius Baer Holding, Ltd. | 29,300 | 1,457 |
| Clariant AG | 88,352 | 860 |
| Publigroupe SA | 3,213 | 477 |
| Sonova Holding AG | 5,738 | 374 |
| | | 79,362 |
21
| | | Market |
| | | Value• |
| | Shares | ($000) |
Taiwan (2.4%) | | |
| AU Optronics Corp. | 22,713,558 | 25,690 |
| Taiwan Semiconductor | | |
| Manufacturing Co., Ltd. | 9,221,525 | 15,465 |
| Chunghwa Telecom | | |
| Co., Ltd. | 6,567,000 | 15,448 |
| Chi Mei | | |
| Optoelectronics Corp. | 17,381,700 | 11,445 |
| Quanta Computer Inc. | 8,768,830 | 10,983 |
| Compal Electronics Inc. | 11,938,329 | 8,745 |
| China Steel Corp. | 8,457,778 | 8,453 |
| Asustek Computer Inc. | 3,854,682 | 7,629 |
| United | | |
| Microelectronics Corp. | 14,693,956 | 4,733 |
| Siliconware Precision | | |
| Industries Co. | 3,539,018 | 4,025 |
| Taiwan Cellular Corp. | 1,744,382 | 2,796 |
| Acer Inc. | 1,623,015 | 2,764 |
| Taiwan Semiconductor | | |
| Manufacturing Co., | | |
| Ltd. ADR | 147,640 | 1,383 |
| Taiwan Cooperative Bank | 2,070,000 | 1,152 |
| Far EasTone | | |
| Telecommunications | | |
| Co., Ltd. | 695,000 | 891 |
* | Tatung Co., Ltd. | 2,093,000 | 457 |
| KGI Securities Co., Ltd. | 1,105,000 | 426 |
| Hau Nan Financial | | |
| Holdings Co., Ltd. | 496,000 | 308 |
| | | 122,793 |
Thailand (0.6%) | | |
| PTT Public Co. Ltd. | | |
| (Foreign) | 1,401,600 | 9,550 |
| Advanced Info Service | | |
| Public Co., Ltd. (Foreign) | 2,830,800 | 6,803 |
| Siam Cement Public | | |
| Co. Ltd. NVDR | 986,200 | 3,755 |
| Kasikornbank Public | | |
| Co. Ltd. (Foreign) | 1,837,800 | 3,481 |
| Siam Cement Public | | |
| Co. Ltd. (Foreign) | 664,300 | 2,649 |
| MBK Development | | |
| Public Co. Ltd. (Foreign) | 813,400 | 1,480 |
| Thanachart Capital Public | | |
| Co. Ltd. (Foreign) | 3,751,800 | 1,189 |
| Land and Houses Public | | |
| Co. Ltd. (Foreign) | 6,191,900 | 1,175 |
| GMM Grammy Public Co. | | |
| Ltd. Non-Voting | | |
| Depositary Receipt | 2,917,000 | 1,122 |
| GMM Grammy Public Co. | | |
| Ltd. (Foreign) | 1,688,200 | 650 |
| Post Publishing Public Co. | | |
| Ltd. (Foreign) | 1,300,000 | 180 |
| Matichon PLC (Foreign) | 625,000 | 149 |
| | | 32,183 |
Turkey (0.8%) | | |
| Eregli Demir ve Celik | | |
| Fabrikalari A.S. | 3,112,793 | 15,656 |
| Tupras-Turkiye Petrol | | |
| Rafinerileri A.S. | 666,109 | 12,151 |
| Turkcell Iletisim | | |
| Hizmetleri A.S. | 1,482,035 | 9,047 |
* | Dogan Sirketler Grubu | | |
| Holding A.S. | 3,348,725 | 3,881 |
* | Turk Hava Yollari Anonim | | |
| Ortakligi | 214,195 | 1,091 |
| | | 41,826 |
United Kingdom (8.1%) | | |
| Royal Dutch Shell PLC | | |
| Class A | | |
| (Amsterdam Shares) | 4,540,573 | 133,775 |
| AstraZeneca Group PLC | 848,670 | 37,137 |
| Vodafone Group PLC | 12,656,652 | 27,951 |
| GlaxoSmithKline PLC | 1,034,679 | 22,414 |
| Royal Bank of Scotland | | |
| Group PLC | 2,983,588 | 9,625 |
| Associated British | | |
| Foods PLC | 710,900 | 9,021 |
| Aviva PLC | 1,003,358 | 8,727 |
| BP PLC | 1,023,264 | 8,522 |
| British Energy Group PLC | 586,000 | 7,963 |
| Rolls-Royce Group PLC | 1,093,619 | 6,622 |
| Xstrata PLC | 198,010 | 6,171 |
| Lloyds TSB Group PLC | 1,436,745 | 5,773 |
| Reckitt Benckiser | | |
| Group PLC | 111,487 | 5,405 |
| Capita Group PLC | 429,680 | 5,348 |
| Diageo PLC | 312,460 | 5,330 |
| Tesco PLC | 759,631 | 5,283 |
| Royal Dutch Shell | | |
| PLC Class B | 176,881 | 4,969 |
| Cable and Wireless PLC | 1,615,001 | 4,796 |
| Enodis PLC | 836,842 | 4,712 |
| BAE Systems PLC | 628,420 | 4,633 |
| Arriva PLC | 343,048 | 4,259 |
| Kazakhmys PLC | 374,300 | 3,931 |
| Barclays PLC | 658,038 | 3,910 |
| Bunzl PLC | 320,744 | 3,773 |
| BHP Billiton PLC | 161,076 | 3,649 |
| HBOS PLC | 1,562,456 | 3,545 |
| The Sage Group PLC | 963,285 | 3,374 |
| Intertek Testing | | |
| Services PLC | 217,608 | 3,262 |
| Thomas Cook Group PLC | 797,030 | 3,163 |
| Rio Tinto PLC | 50,056 | 3,141 |
| Compass Group PLC | 489,496 | 3,036 |
| Reed Elsevier PLC | 294,804 | 2,936 |
| British American | | |
| Tobacco PLC | 84,760 | 2,767 |
| Stagecoach Group PLC | 589,519 | 2,679 |
| TUI Travel PLC | 685,352 | 2,650 |
22
| | | Market |
| | | Value• |
| | Shares | ($000) |
| ITV PLC | 3,528,311 | 2,650 |
| Carnival PLC | 88,391 | 2,634 |
| ICAP PLC | 384,958 | 2,483 |
| Wolseley PLC | 314,283 | 2,376 |
* | Invensys PLC | 636,107 | 2,364 |
| Informa PLC | 413,312 | 2,331 |
| Rexam PLC | 301,330 | 2,141 |
| Provident Financial PLC | 131,580 | 2,041 |
| Antofagasta PLC | 266,000 | 1,932 |
| HSBC Holdings PLC | 118,666 | 1,920 |
| Smiths Group PLC | 87,521 | 1,587 |
| WPP Group PLC | 193,113 | 1,562 |
| International Personal | | |
| Finance | 331,088 | 1,483 |
| Michael Page | | |
| International PLC | 291,632 | 1,213 |
| 3i Group PLC | 90,913 | 1,151 |
| Amec PLC | 85,291 | 978 |
* | Cairn Energy PLC | 25,719 | 960 |
| Hays PLC | 605,818 | 877 |
| Aggreko PLC | 87,698 | 863 |
| Royal & Sun Alliance | | |
| Insurance Group PLC | 320,989 | 858 |
| Lonmin PLC | 19,714 | 806 |
| Enterprise Inns PLC | 235,093 | 759 |
| Homeserve PLC | 27,858 | 740 |
| Man Group PLC | 116,750 | 713 |
| Ladbrokes PLC | 200,751 | 678 |
| The Berkeley Group | | |
| Holdings PLC | 48,842 | 667 |
| Next PLC | 26,841 | 495 |
^ | HMV Group PLC | 215,229 | 493 |
| Devro PLC | 330,762 | 462 |
| Carphone Warehouse PLC | 138,994 | 429 |
| Daily Mail and General | | |
| Trust PLC | 57,575 | 332 |
* | Sportingbet PLC | 621,287 | 313 |
| Galiform PLC | 541,728 | 253 |
^ | Bradford & Bingley PLC | 642,595 | 228 |
| Mondi PLC (South | | |
| African Shares) | 36,336 | 177 |
| Northgate PLC | 45,511 | 168 |
| | | 416,369 |
United States (37.2%) | | |
| Consumer Discretionary (8.3%) | |
| McDonald’s Corp. | 1,444,053 | 89,098 |
| Cablevision Systems NY | | |
| Group Class A | 1,505,813 | 37,886 |
* | GameStop Corp. Class A | 941,800 | 32,219 |
| Time Warner, Inc. | 1,426,017 | 18,695 |
| Polo Ralph Lauren Corp. | 272,200 | 18,139 |
* | Liberty Global, Inc. Class A | 474,260 | 14,370 |
* | Liberty Global, Inc. Series C | 446,460 | 12,541 |
| Family Dollar Stores, Inc. | 522,200 | 12,376 |
* | The Warnaco Group, Inc. | 250,112 | 11,328 |
| Macy’s Inc. | 614,500 | 11,049 |
* | Priceline.com, Inc. | 158,566 | 10,851 |
| CBS Corp. | 667,600 | 9,734 |
* | Amazon.com, Inc. | 123,300 | 8,971 |
| The Buckle, Inc. | 153,402 | 8,520 |
| J.C. Penney Co., Inc. | | |
| (Holding Co.) | 237,300 | 7,912 |
| Foot Locker, Inc. | 477,700 | 7,720 |
* | Bally Technologies Inc. | 242,226 | 7,335 |
| Autoliv, Inc. | 217,200 | 7,330 |
^,* | Blue Nile Inc. | 168,500 | 7,224 |
| American Greetings Corp. | | |
| Class A | 445,900 | 6,818 |
* | The Children’s Place | | |
| Retail Stores, Inc. | 201,400 | 6,717 |
| Pulte Homes, Inc. | 349,400 | 4,881 |
* | Liberty Media Corp. | 192,500 | 4,807 |
| Hasbro, Inc. | 125,514 | 4,358 |
* | CC Media Holdings, Inc. | 292,110 | 3,922 |
| KB Home | 179,900 | 3,540 |
^,* | Netflix.com, Inc. | 109,700 | 3,387 |
| RadioShack Corp. | 186,385 | 3,221 |
* | Exide Technologies | 435,320 | 3,213 |
* | Liberty Media Corp. | | |
| -Interactive Series A | 244,526 | 3,157 |
* | The Dress Barn, Inc. | 191,476 | 2,928 |
* | Hanesbrands Inc. | 132,600 | 2,884 |
| Black & Decker Corp. | 46,000 | 2,794 |
| Genesco, Inc. | 72,800 | 2,437 |
* | Rent-A-Center, Inc. | 107,463 | 2,394 |
* | Jos. A. Bank Clothiers, Inc. | 68,100 | 2,288 |
^ | Systemax Inc. | 157,270 | 2,211 |
* | Zale Corp. | 87,000 | 2,175 |
* | DISH Network Corp. | 100,100 | 2,102 |
* | Liberty Media Corp.-Capital | | |
| Series A | 153,725 | 2,057 |
* | Discovery Communications | | |
| Inc. Class A | 134,025 | 1,910 |
* | Discovery Communications | | |
| Inc. Class C | 134,025 | 1,898 |
* | CEC Entertainment Inc. | 55,100 | 1,829 |
| Cooper Tire & Rubber Co. | 204,600 | 1,760 |
* | Quiksilver, Inc. | 300,400 | 1,724 |
| Omnicom Group Inc. | 44,063 | 1,699 |
| Bob Evans Farms, Inc. | 52,000 | 1,419 |
| Advance Auto Parts, Inc. | 35,200 | 1,396 |
* | Jo-Ann Stores, Inc. | 62,759 | 1,317 |
| CBS Corp. Class A | 89,900 | 1,315 |
^,* | Fleetwood | | |
| Enterprises, Inc. | 1,152,800 | 1,187 |
* | America’s Car-Mart, Inc. | 55,200 | 1,026 |
| UniFirst Corp. | 22,100 | 952 |
| PRIMEDIA Inc. | 372,566 | 905 |
* | NVR, Inc. | 1,433 | 820 |
* | Blockbuster Inc. Class B | 482,090 | 636 |
* | Ascent Media Corporation | 13,402 | 327 |
| Sherwin-Williams Co. | 5,000 | 286 |
23
| | | Market |
| | | Value• |
| | Shares | ($000) |
^,* | Krispy Kreme | | |
| Doughnuts, Inc. | 71,913 | 237 |
* | Sun-Times Media | | |
| Group, Inc. | 220,100 | 37 |
| Circuit City Stores, Inc. | 31,500 | 24 |
| | | |
| Consumer Staples (6.3%) | | |
| The Kroger Co. | 2,959,400 | 81,324 |
| Wal-Mart Stores, Inc. | 862,799 | 51,673 |
| Altria Group, Inc. | 2,231,453 | 44,272 |
| Costco Wholesale Corp. | 546,100 | 35,458 |
| Philip Morris | | |
| International Inc. | 715,209 | 34,402 |
| Bunge Ltd. | 185,820 | 11,740 |
* | BJ’s Wholesale Club, Inc. | 245,200 | 9,528 |
| Safeway, Inc. | 399,983 | 9,488 |
* | Fresh Del Monte | | |
| Produce Inc. | 354,617 | 7,873 |
* | Ralcorp Holdings, Inc. | 92,500 | 6,235 |
| Walgreen Co. | 151,390 | 4,687 |
| Herbalife Ltd. | 116,588 | 4,608 |
| The Estee Lauder Cos. | | |
| Inc. Class A | 86,800 | 4,332 |
| PepsiCo, Inc. | 56,849 | 4,052 |
| Nash-Finch Co. | 72,300 | 3,118 |
^ | Cal-Maine Foods, Inc. | 101,024 | 2,772 |
| Casey’s General | | |
| Stores, Inc. | 71,700 | 2,163 |
* | Darling International, Inc. | 193,332 | 2,148 |
* | Chiquita Brands | | |
| International, Inc. | 119,000 | 1,881 |
| Universal Corp. (VA) | 26,500 | 1,301 |
| Imperial Sugar Co. | 76,700 | 1,039 |
| Whole Foods Market, Inc. | 48,400 | 969 |
| | | |
| Energy (3.2%) | | |
| ConocoPhillips Co. | 546,700 | 40,046 |
| Chevron Corp. | 456,200 | 37,627 |
| Anadarko Petroleum Corp. | 723,961 | 35,119 |
| Apache Corp. | 113,100 | 11,794 |
| ExxonMobil Corp. | 141,000 | 10,950 |
| Devon Energy Corp. | 114,200 | 10,415 |
* | Stone Energy Corp. | 196,000 | 8,297 |
| Schlumberger Ltd. | 74,386 | 5,809 |
| EOG Resources, Inc. | 40,159 | 3,593 |
* | National Oilwell Varco Inc. | 31,414 | 1,578 |
* | Clayton Williams Energy, Inc. | 9,900 | 698 |
| Baker Hughes, Inc. | 11,500 | 696 |
| | | |
| Financials (5.7%) | | |
| State Street Corp. | 973,100 | 55,350 |
| JPMorgan Chase & Co. | 709,027 | 33,112 |
* | Berkshire Hathaway Inc. | | |
| Class B | 5,739 | 25,223 |
| MetLife, Inc. | 295,900 | 16,570 |
| Bank of America Corp. | 472,243 | 16,528 |
| | | | |
| Citigroup, Inc. | 739,700 | 15,171 |
| The Travelers Cos., Inc. | 221,100 | 9,994 |
| The Hartford Financial | | |
| Services Group Inc. | 231,400 | 9,485 |
| Platinum Underwriters | | |
| Holdings, Ltd. | 235,039 | 8,339 |
| Moody’s Corp. | 225,214 | 7,657 |
| The Goldman Sachs | | |
| Group, Inc. | 56,700 | 7,258 |
| Lazard Ltd. Class A | 169,600 | 7,252 |
| Morgan Stanley | 314,600 | 7,236 |
* | Arch Capital Group Ltd. | 94,921 | 6,932 |
* | Interactive Brokers | | |
| Group, Inc. | 272,859 | 6,049 |
| American International | | |
| Group, Inc. | 1,508,000 | 5,022 |
^ | MBIA, Inc. | 404,100 | 4,809 |
| Discover Financial Services | 347,400 | 4,801 |
| Mercury General Corp. | 87,500 | 4,791 |
| XL Capital Ltd. Class A | 239,282 | 4,293 |
| American Express Co. | 114,297 | 4,050 |
| Aspen Insurance | | |
| Holdings Ltd. | 144,584 | 3,976 |
| Merrill Lynch & Co., Inc. | 145,983 | 3,693 |
| Axis Capital Holdings Ltd. | 105,087 | 3,332 |
* | CB Richard Ellis Group, Inc. | 215,800 | 2,885 |
* | Knight Capital Group, | | |
| Inc. Class A | 193,200 | 2,871 |
| Genworth Financial Inc. | 269,900 | 2,324 |
* | PHH Corp. | 170,600 | 2,267 |
| MGIC Investment Corp. | 289,800 | 2,037 |
| Fidelity National Financial, | | |
| Inc. Class A | 134,600 | 1,979 |
*,2 | J.G. Wentworth Inc. | 147,900 | 1,775 |
* | Markel Corp. | 3,330 | 1,170 |
| Progressive Corp. of Ohio | 55,570 | 967 |
* | Conseco, Inc. | 269,831 | 950 |
| Endurance Specialty | | |
| Holdings Ltd. | 30,273 | 936 |
| The PMI Group Inc. | 256,929 | 758 |
| Republic Bancorp, Inc. | | |
| Class A | 23,900 | 725 |
| Fifth Third Bancorp | 55,900 | 665 |
| Allied World Assurance | | |
| Holdings, Ltd. | 15,349 | 545 |
^ | RAIT Financial Trust REIT | 66,292 | 364 |
| Turkiye Garanti Bankasi A.S. | 149,300 | 353 |
| Ameriprise Financial, Inc. | 8,900 | 340 |
| Sovereign Bancorp, Inc. | 27,900 | 110 |
^ | Washington Mutual, Inc. | 166,300 | 14 |
| | | |
| Health Care (3.6%) | | |
| Pfizer Inc. | 2,526,000 | 46,579 |
| AmerisourceBergen Corp. | 961,971 | 36,218 |
* | King Pharmaceuticals, Inc. | 2,036,070 | 19,506 |
| McKesson Corp. | 310,000 | 16,681 |
| Merck & Co., Inc. | 528,500 | 16,680 |
24
| | | Market |
| | | Value• |
| | Shares | ($000) |
| Wyeth | 391,700 | 14,469 |
* | Invitrogen Corp. | 201,100 | 7,602 |
| CIGNA Corp. | 142,000 | 4,825 |
* | Kinetic Concepts, Inc. | 131,900 | 3,771 |
* | WellCare Health Plans Inc. | 100,800 | 3,629 |
* | LifePoint Hospitals, Inc. | 94,100 | 3,024 |
* | WellPoint Inc. | 52,938 | 2,476 |
* | Genentech, Inc. | 19,520 | 1,731 |
* | Almost Family Inc. | 40,500 | 1,602 |
| IMS Health, Inc. | 79,918 | 1,511 |
* | Patterson Cos. | 48,592 | 1,478 |
* | HealthSouth Corp. | 71,900 | 1,325 |
| Bristol-Myers Squibb Co. | 52,000 | 1,084 |
* | Health Management | | |
| Associates Class A | 209,900 | 873 |
| Schering-Plough Corp. | 43,800 | 809 |
| | | |
| Industrials (2.4%) | | |
| UAL Corp. | 1,857,182 | 16,325 |
* | Kansas City Southern | 337,350 | 14,965 |
| Watson Wyatt & Co. | | |
| Holdings | 205,200 | 10,205 |
| Parker Hannifin Corp. | 185,100 | 9,810 |
| Northrop Grumman Corp. | 156,429 | 9,470 |
| Viad Corp. | 259,400 | 7,468 |
* | GrafTech International Ltd. | 493,456 | 7,456 |
* | Continental Airlines, Inc. | | |
| Class B | 445,381 | 7,429 |
| Pitney Bowes, Inc. | 218,961 | 7,283 |
| Raytheon Co. | 94,800 | 5,073 |
* | Perini Corp. | 186,577 | 4,812 |
| L-3 Communications | | |
| Holdings, Inc. | 46,100 | 4,533 |
* | AMR Corp. | 443,000 | 4,350 |
* | Northwest Airlines Corp. | 384,100 | 3,468 |
* | United Rentals, Inc. | 156,500 | 2,385 |
* | US Airways Group Inc. | 294,700 | 1,777 |
* | NCI Building Systems, Inc. | 48,683 | 1,546 |
| Titan International, Inc. | 67,800 | 1,445 |
* | WESCO International, Inc. | 44,600 | 1,435 |
| Armstrong Worldwide | | |
| Industries, Inc. | 40,500 | 1,170 |
| Gibraltar Industries Inc. | 62,400 | 1,168 |
| Deere & Co. | 22,424 | 1,110 |
| Fastenal Co. | 21,723 | 1,073 |
* | AGCO Corp. | 15,400 | 656 |
* | L.B. Foster Co. Class A | 11,500 | 350 |
* | Ultrapetrol Bahamas Ltd. | 40,200 | 316 |
* | TBS International Ltd. | 17,702 | 238 |
| | | |
| Information Technology (4.2%) | | |
| Hewlett-Packard Co. | 1,109,500 | 51,303 |
* | Western Digital Corp. | 1,122,300 | 23,927 |
| Gartner, Inc. Class A | 634,107 | 14,382 |
* | Activision Blizzard, Inc. | 832,600 | 12,847 |
* | Lexmark International, Inc. | 336,691 | 10,966 |
| Xerox Corp. | 928,700 | 10,708 |
| Microsoft Corp. | 310,428 | 8,285 |
* | eBay Inc. | 352,142 | 7,881 |
| Motorola, Inc. | 1,004,000 | 7,169 |
* | NVIDIA Corp. | 607,300 | 6,504 |
* | LSI Corp. | 955,665 | 5,122 |
| Accenture Ltd. | 132,777 | 5,046 |
* | Sun Microsystems, Inc. | 651,110 | 4,948 |
* | Amkor Technology, Inc. | 722,000 | 4,599 |
^,* | DST Systems, Inc. | 77,300 | 4,328 |
* | SAIC, Inc. | 197,900 | 4,004 |
* | EarthLink, Inc. | 440,720 | 3,746 |
* | Ingram Micro, Inc. Class A | 219,500 | 3,527 |
* | Integrated Device | | |
| Technology Inc. | 418,310 | 3,255 |
* | Tech Data Corp. | 100,600 | 3,003 |
* | Avocent Corp. | 118,284 | 2,420 |
* | Avnet, Inc. | 87,300 | 2,150 |
* | Zoran Corp. | 240,800 | 1,965 |
* | Integral Systems, Inc. | 87,466 | 1,817 |
* | Forrester Research, Inc. | 43,700 | 1,281 |
* | Google Inc. | 2,800 | 1,122 |
| Microchip Technology, Inc. | 34,188 | 1,006 |
| United Online, Inc. | 91,700 | 863 |
* | Volterra | | |
| Semiconductor Corp. | 66,161 | 842 |
* | Novatel Wireless, Inc. | 136,000 | 824 |
* | Avid Technology, Inc. | 34,100 | 820 |
| Plantronics, Inc. | 33,600 | 757 |
* | 3Com Corp. | 323,000 | 753 |
| Black Box Corp. | 19,900 | 687 |
* | Sohu.com Inc. | 10,924 | 609 |
* | Adaptec, Inc. | 173,900 | 570 |
* | UTStarcom, Inc. | 154,800 | 522 |
* | Dell Inc. | 25,900 | 427 |
* | The9 Limited | 22,445 | 377 |
* | Multi-Fineline Electronix, Inc. | 23,483 | 347 |
| | | |
| Materials (2.6%) | | |
| The Mosaic Co. | 688,430 | 46,841 |
| CF Industries Holdings, Inc. | 262,993 | 24,053 |
| Dow Chemical Co. | 506,900 | 16,109 |
| United States Steel Corp. | 141,906 | 11,013 |
| E.I. du Pont de | | |
| Nemours & Co. | 193,700 | 7,806 |
| AK Steel Holding Corp. | 291,275 | 7,550 |
| Scotts Miracle-Gro Co. | 265,900 | 6,286 |
| Nucor Corp. | 143,200 | 5,657 |
| Cleveland-Cliffs Inc. | 74,500 | 3,944 |
| Innophos Holdings Inc. | 79,400 | 1,936 |
| Praxair, Inc. | 17,943 | 1,287 |
| Olympic Steel, Inc. | 34,100 | 1,006 |
25
| | | Market |
| | | Value• |
| | Shares | ($000) |
| Telecommunication Services (0.7%) | |
| AT&T Inc. | 366,100 | 10,222 |
| Sprint Nextel Corp. | 1,570,400 | 9,579 |
* | NII Holdings Inc. | 207,550 | 7,870 |
* | Cincinnati Bell Inc. | 1,248,600 | 3,858 |
^,* | Level 3 | | |
| Communications, Inc. | 1,123,700 | 3,034 |
| Embarq Corp. | 57,400 | 2,328 |
| | | |
| Utilities (0.2%) | | |
| Wisconsin Energy Corp. | 149,700 | 6,721 |
| OGE Energy Corp. | 47,200 | 1,458 |
| | | 1,922,392 |
Total Common Stocks | |
(Cost $5,965,172) | | 4,947,460 |
Temporary Cash Investments (3.6%)1 | |
Money Market Fund (3.2%) | |
3, 4 | Vanguard Market | | |
| Liquidity Fund 2.296% | 166,617,852 | 166,618 |
| | | |
| | | |
| | | |
| | Face | |
| | Amount | |
| | ($000) | |
U.S. Agency Obligations (0.4%) | |
5, 6 | Federal National | | |
| Mortgage Assn., | | |
| 2.576%, 10/15/08 | 5,000 | 4,994 |
5, 6 | Federal National | | |
| Mortgage Assn., | | |
| 2.464%, 11/5/08 | 10,000 | 9,969 |
5 | Federal National | | |
| Mortgage Assn., | | |
| 2.150%, 11/25/08 | 7,000 | 6,965 |
| | | 21,928 |
Total Temporary Cash Investments | |
(Cost $188,566) | | 188,546 |
| Market |
| Value• |
| ($000) |
Total Investments (99.5%) | |
(Cost $6,153,738) | 5,136,006 |
Other Assets and Liabilities (0.5%) | |
Other Assets6 | 183,479 |
Liabilities4 | (159,009) |
| 24,470 |
Net Assets (100%) | |
Applicable to 310,036,821 outstanding | |
$.001 par value shares of beneficial | |
interest (unlimited authorization) | 5,160,476 |
Net Asset Value Per Share | $16.64 |
At September 30, 2008, net assets consisted of: |
| Amount |
| ($000) |
Paid-in Capital | 6,358,226 |
Undistributed Net | |
Investment Income | 123,465 |
Accumulated Net | |
Realized Losses | (302,696) |
Unrealized Appreciation (Depreciation) | |
Investment Securities | (1,017,732) |
Futures Contracts | (334) |
Foreign Currencies and | |
Forward Currency Contracts | (453) |
Net Assets | 5,160,476 |
• See Note A in Notes to Financial Statements.
^ Part of security position is on loan to broker-dealers. The total value of securities on loan is $52,462,000.
* Non-income-producing security.
1 The fund invests a portion of its cash reserves in equity markets through the use of index futures contracts. After giving effect to futures investments, the fund’s effective common stock and temporary cash investment positions represent 99.7% and –0.2%, respectively, of net assets.
2 Restricted security represents 0.0% of net assets.
3 Affiliated money market fund available only to Vanguard funds and certain trusts and accounts managed by Vanguard. Rate shown is the 7-day yield.
4 Includes $55,939,000 of collateral received for securities on loan.
5 The issuer operates under a congressional charter; its securities are neither issued nor guaranteed by the U.S. government.
6 Securities with a value of $14,963,000 and cash of $2,505,000 have been segregated as initial margin for open futures contracts.
ADR—American Depositary Receipt.
GDR—Global Depositary Receipt.
REIT—Real Estate Investment Trust.
See accompanying Notes, which are an integral part of the Financial Statements.
26
Statement of Operations
| Year Ended |
| September 30, 2008 |
| ($000) |
Investment Income | |
Income | |
Dividends1 | 180,531 |
Interest2 | 12,465 |
Security Lending | 7,426 |
Total Income | 200,422 |
Expenses | |
Investment Advisory Fees—Note B | |
Basic Fee | 15,185 |
Performance Adjustment | (1,590) |
The Vanguard Group—Note C | |
Management and Administrative | 18,620 |
Marketing and Distribution | 1,803 |
Custodian Fees | 1,155 |
Auditing Fees | 34 |
Shareholders’ Reports | 216 |
Trustees’ Fees and Expenses | 11 |
Total Expenses | 35,434 |
Expenses Paid Indirectly | (144) |
Net Expenses | 35,290 |
Net Investment Income | 165,132 |
Realized Net Gain (Loss) | |
Investment Securities Sold | (187,768) |
Futures Contracts | (75,244) |
Foreign Currencies and Forward Currency Contracts | 4,073 |
Realized Net Gain (Loss) | (258,939) |
Change in Unrealized Appreciation (Depreciation) | |
Investment Securities | (2,443,494) |
Futures Contracts | (9,518) |
Foreign Currencies and Forward Currency Contracts | (2,113) |
Change in Unrealized Appreciation (Depreciation) | (2,455,125) |
Net Increase (Decrease) in Net Assets Resulting from Operations | (2,548,932) |
1 Dividends are net of foreign withholding taxes of $9,623,000.
2 Interest income from an affiliated company of the fund was $11,774,000.
See accompanying Notes, which are an integral part of the Financial Statements.
27
Statement of Changes in Net Assets
| Year Ended September 30, |
| 2008 | 2007 |
| ($000) | ($000) |
Increase (Decrease) in Net Assets | | |
Operations | | |
Net Investment Income | 165,132 | 116,967 |
Realized Net Gain (Loss) | (258,939) | 404,444 |
Change in Unrealized Appreciation (Depreciation) | (2,455,125) | 795,069 |
Net Increase (Decrease) in Net Assets Resulting from Operations | (2,548,932) | 1,316,480 |
Distributions | | |
Net Investment Income | (127,498) | (63,112) |
Realized Capital Gain1 | (415,111) | (179,158) |
Total Distributions | (542,609) | (242,270) |
Capital Share Transactions | | |
Issued | 1,886,150 | 2,937,614 |
Issued in Lieu of Cash Distributions | 503,326 | 224,234 |
Redeemed | (1,689,191) | (875,763) |
Net Increase (Decrease) from Capital Share Transactions | 700,285 | 2,286,085 |
Total Increase (Decrease) | (2,391,256) | 3,360,295 |
Net Assets | | |
Beginning of Period | 7,551,732 | 4,191,437 |
End of Period2 | 5,160,476 | 7,551,732 |
1 Includes fiscal 2008 and 2007 short-term gain distributions totaling $188,283,000 and $70,849,000, respectively. Short-term gain distributions are treated as ordinary income dividends for tax purposes.
2 Net Assets—End of Period includes undistributed net investment income of $123,465,000 and $89,224,000. See accompanying Notes, which are an integral part of the Financial Statements.
28
Financial Highlights
| | | | | | |
| | | | | Nov. 1, | Year |
| | | 2003, to | Ended |
For a Share Outstanding | Year Ended September 30, | Sept. 30, | Oct. 31, |
Throughout Each Period | 2008 | 2007 | 2006 | 2005 | 20041 | 2003 |
Net Asset Value, | | | | | | |
Beginning of Period | $26.51 | $21.96 | $19.72 | $16.08 | $14.46 | $10.48 |
Investment Operations | | | | | | |
Net Investment Income | .529 | .4902 | .320 | .250 | .191 | .120 |
Net Realized and Unrealized | | | | | | |
Gain (Loss) on Investments | (8.569) | 5.250 | 2.595 | 3.870 | 1.624 | 3.960 |
Total from | | | | | | |
Investment Operations | (8.040) | 5.740 | 2.915 | 4.120 | 1.815 | 4.080 |
Distributions | | | | | | |
Dividends from Net | | | | | | |
Investment Income | (.430) | (.310) | (.240) | (.210) | (.130) | (.080) |
Distributions from | | | | | | |
Realized Capital Gains | (1.400) | (.880) | (.435) | (.270) | (.065) | (.020) |
Total Distributions | (1.830) | (1.190) | (.675) | (.480) | (.195) | (.100) |
Net Asset Value, | | | | | | |
End of Period | $16.64 | $26.51 | $21.96 | $19.72 | $16.08 | $14.46 |
| | | | | | |
| | | | | | |
Total Return3 | –32.24% | 27.00% | 15.22% | 25.99% | 12.64% | 39.25% |
| | | | | | |
| | | | | | |
Ratios/Supplemental Data | | | | | | |
Net Assets, End of | | | | | | |
Period (Millions) | $5,160 | $7,552 | $4,191 | $2,302 | $965 | $664 |
Ratio of Total Expenses to | | | | | | |
Average Net Assets4 | 0.51% | 0.64% | 0.72% | 0.80% | 0.90%5 | 1.05% |
Ratio of Net Investment | | | | | | |
Income to Average Net Assets | 2.35% | 1.98% | 1.76% | 1.60% | 1.47%5 | 1.14% |
Portfolio Turnover Rate | 73% | 64% | 88% | 83% | 19% | 13% |
1 The fund’s fiscal year-end changed from October 31 to September 30, effective September 30, 2004.
2 Calculated based on average shares outstanding.
3 Total returns do not include the account service fee that may be applicable to certain accounts with balances below $10,000.
4 Includes performance-based investment advisory fee increases (decreases) of (0.02%), 0.05%, 0.05%, 0.06%, 0.08%, and 0.11%.
5 Annualized.
See accompanying Notes, which are an integral part of the Financial Statements.
29
Notes to Financial Statements
Vanguard Global Equity Fund is registered under the Investment Company Act of 1940 as an open-end investment company, or mutual fund. The fund invests in securities of foreign issuers, which may subject it to investment risks not normally associated with investing in securities of United States corporations.
A. The following significant accounting policies conform to generally accepted accounting principles for U.S. mutual funds. The fund consistently follows such policies in preparing its financial statements.
1. Security Valuation: Securities are valued as of the close of trading on the New York Stock Exchange (generally 4 p.m., Eastern time) on the valuation date. Equity securities are valued at the latest quoted sales prices or official closing prices taken from the primary market in which each security trades; such securities not traded on the valuation date are valued at the mean of the latest quoted bid and asked prices. Securities for which market quotations are not readily available, or whose values have been affected by events occurring before the fund’s pricing time but after the close of the securities’ primary markets, are valued at their fair values calculated according to procedures adopted by the board of trustees. These procedures include obtaining quotations from an independent pricing service, monitoring news to identify significant market- or security-specific events, and evaluating changes in the values of foreign market proxies (for example, ADRs, futures contracts, or exchange-traded funds), between the time the foreign markets close and the fund’s pricing time. When fair-value pricing is employed, the prices of securities used by a fund to calculate its net asset value may differ from quoted or published prices for the same securities. Investments in Vanguard Market Liquidity Fund are valued at that fund’s net asset value. Temporary cash investments acquired over 60 days to maturity are valued using the latest bid prices or using valuations based on a matrix system (which considers such factors as security prices, yields, maturities, and ratings), both as furnished by independent pricing services. Other temporary cash investments are valued at amortized cost, which approximates market value.
2. Foreign Currency: Securities and other assets and liabilities denominated in foreign currencies are translated into U.S. dollars using exchange rates obtained from an independent third party as of the fund’s pricing time on the valuation date. Realized gains (losses) and unrealized appreciation (depreciation) on investment securities include the effects of changes in exchange rates since the securities were purchased, combined with the effects of changes in security prices. Fluctuations in the value of other assets and liabilities resulting from changes in exchange rates are recorded as unrealized foreign currency gains (losses) until the assets or liabilities are settled in cash, at which time they are recorded as realized foreign currency gains (losses).
3. Futures and Forward Currency Contracts: The fund uses index futures contracts to a limited extent, with the objective of maintaining full exposure to the U.S., European, and Pacific stock markets while maintaining liquidity. The fund may purchase or sell futures contracts to achieve a desired level of investment, whether to accommodate portfolio turnover or cash flows from capital share transactions. The primary risks associated with the use of futures contracts are imperfect correlation between changes in market values of stocks held by the fund and the prices of futures contracts, and the possibility of an illiquid market.
The fund may also enter into forward currency contracts to provide the appropriate currency exposure related to any open futures contracts or to protect the value of securities and related receivables and payables against changes in foreign exchange rates. The primary risk associated with the fund’s use of these contracts is that a counterparty will fail to fulfill its obligation to pay gains due to the fund under the contracts.
30
Futures and forward currency contracts are valued at their quoted daily settlement prices. The aggregate principal amounts of the contracts are not recorded in the Statement of Net Assets. Fluctuations in the value of the contracts are recorded in the Statement of Net Assets as an asset (liability) and in the Statement of Operations as unrealized appreciation (depreciation) until the contracts are closed, when they are recorded as realized gains (losses) on futures or forward currency contracts.
4. Federal Income Taxes: The fund intends to continue to qualify as a regulated investment company and distribute all of its taxable income. Management has analyzed the fund’s tax positions taken on federal income tax returns for all open tax years (tax years ended September 30, 2005–2008), and has concluded that no provision for federal income tax is required in the fund’s financial statements.
5. Distributions: Distributions to shareholders are recorded on the ex-dividend date.
6. Security Lending: The fund may lend its securities to qualified institutional borrowers to earn additional income. Security loans are required to be secured at all times by collateral at least equal to the market value of securities loaned. The fund invests cash collateral received in Vanguard Market Liquidity Fund, and records a liability for the return of the collateral, during the period the securities are on loan. Security lending income represents the income earned on investing cash collateral, less expenses associated with the loan.
7. Other: Dividend income is recorded on the ex-dividend date. Interest income includes income distributions received from Vanguard Market Liquidity Fund and is accrued daily. Security transactions are accounted for on the date securities are bought or sold. Costs used to determine realized gains (losses) on the sale of investment securities are those of the specific securities sold.
B. Acadian Asset Management LLC, AllianceBernstein L.P., Marathon Asset Management LLP and, beginning in April 2008, Baillie Gifford Overseas Ltd., each provide investment advisory services to a portion of the fund for a fee calculated at an annual percentage rate of average net assets managed by the advisor. The basic fees of Acadian Asset Management LLC, and Marathon Asset Management LLP are subject to quarterly adjustments based on performance for the preceding three years relative to the Morgan Stanley Capital International All Country World Index. The basic fee of AllianceBernstein L.P. is subject to quarterly adjustments based on performance since June 30, 2006, relative to the Morgan Stanley Capital International All Country World Index. In accordance with the advisory contract entered into with Baillie Gifford Overseas Ltd. in April 2008, beginning April 1, 2009, the investment advisory fee will be subject to quarterly adjustments based on performance since June 30, 2008 relative to the Morgan Stanley Capital International All Country World Index.
The Vanguard Group manages the cash reserves of the fund at an at-cost basis.
For the year ended September 30, 2008, the aggregate investment advisory fee represented an effective annual basic rate of 0.22% of the fund’s average net assets, before a decrease of $1,590,000 (0.02%) based on performance.
C. The Vanguard Group furnishes at cost corporate management, administrative, marketing, and distribution services. The costs of such services are allocated to the fund under methods approved by the board of trustees. The fund has committed to provide up to 0.40% of its net assets in capital contributions to Vanguard. At September 30, 2008, the fund had contributed capital of $532,000 to Vanguard (included in Other Assets), representing 0.01% of the fund’s net assets and 0.53% of Vanguard’s capitalization. The fund’s trustees and officers are also directors and officers of Vanguard.
31
D. The fund’s custodian bank has agreed to reduce its fees when the fund maintains cash on deposit in the non-interest-bearing custody account. For the year ended September 30, 2008, custodian fee offset arrangements reduced the fund’s expenses by $144,000 (an annual rate of 0.00% of average net assets).
E. Distributions are determined on a tax basis and may differ from net investment income and realized capital gains for financial reporting purposes. Differences may be permanent or temporary. Permanent differences are reclassified among capital accounts in the financial statements to reflect their tax character. Temporary differences arise when certain items of income, expense, gain, or loss are recognized in different periods for financial statement and tax purposes; these differences will reverse at some time in the future. Differences in classification may also result from the treatment of short-term gains as ordinary income for tax purposes.
During the year ended September 30, 2008, the fund realized net foreign currency losses of $3,298,000, which decreased distributable net income for tax purposes; accordingly, such losses have been reclassified from accumulated net realized losses to undistributed net investment income. The fund’s realized losses for the year ended September 30, 2008, include taxes paid on realized capital gains on Indian securities of $209,000, which are treated as decreases to taxable income; accordingly these amounts have been reclassified from accumulated net realized losses to undistributed net investment income.
Certain of the fund’s investments are in securities considered to be “passive foreign investment companies,” for which any unrealized appreciation and/or realized gains are required to be included in distributable net income for tax purposes. During the year ended September 30, 2008, the fund realized gains on the sale of passive foreign investment companies of $114,000, which have been included in current and prior periods’ taxable income; accordingly, such gains have been reclassified from accumulated net realized losses to undistributed net investment income. Unrealized appreciation on the fund’s passive foreign investment company holdings at September 30, 2008, was $14,498,000.
For tax purposes, at September 30, 2008, the fund had $150,306,000 of ordinary income available for distribution. Tax-basis capital gains required to be distributed in December 2007 included net capital gains realized through October 31, 2007. Subsequently, the fund realized capital losses of $299,469,000, which are available to offset future net capital gains.
At September 30, 2008, the cost of investment securities for tax purposes was $6,173,529,000. Net unrealized depreciation of investment securities for tax purposes was $1,037,523,000, consisting of unrealized gains of $407,523,000 on securities that had risen in value since their purchase and $1,445,046,000 in unrealized losses on securities that had fallen in value since their purchase.
At September 30, 2008, the aggregate settlement value of open futures contracts expiring in December 2008 and the related unrealized appreciation (depreciation) were:
| | | ($000) |
| | Aggregate | Unrealized |
| Number of | Settlement | Appreciation |
Futures Contracts | Long (Short) Contracts | Value | (Depreciation) |
S&P 500 Index | 299 | 87,383 | (837) |
Dow Jones EURO STOXX 50 Index | 1,045 | 44,946 | 740 |
FTSE 100 Index | 272 | 24,110 | 592 |
Topix Index | 201 | 20,561 | (695) |
S&P ASX 200 Index | 180 | 16,630 | 67 |
MSCI Taiwan Index | 285 | 6,222 | (201) |
32
Unrealized appreciation (depreciation) on open S&P 500 Index futures contracts is required to be treated as realized gain (loss) for tax purposes.
At September 30, 2008, the fund had open forward currency contracts to receive and deliver currencies as follows:
| | | | | Unrealized |
| | | | | Appreciation |
| | Contract Amount (000) | (Depreciation) |
Contract Settlement Date | | Receive | | Deliver | ($000) |
12/23/2008 | EUR | 22,823 | USD | 32,187 | (302) |
12/23/2008 | GBP | 12,866 | USD | 22,997 | (156) |
12/17/2008 | JPY | 2,297,360 | USD | 21,889 | 207 |
12/23/2008 | AUD | 20,578 | USD | 16,154 | (19) |
| | | | | |
AUD—Australian dollar. | | | | | |
EUR—Euro. | | | | | |
GBP—British pound. | | | | | |
JPY—Japanese yen. | | | | | |
USD—U.S. dollar. | | | | | |
Unrealized appreciation (depreciation) on open forward currency contracts is treated as realized gain (loss) for tax purposes.
The fund had net unrealized foreign currency losses of $183,000 resulting from the translation of other assets and liabilities at September 30, 2008.
F. During the year ended September 30, 2008, the fund purchased $5,314,937,000 of investment securities and sold $4,866,498,000 of investment securities, other than temporary cash investments.
G. Capital shares issued and redeemed were:
| Year Ended September 30, |
| 2008 | 2007 |
| Shares | Shares |
| (000) | (000) |
Issued | 82,584 | 120,219 |
Issued In Lieu of Cash Distributions | 21,874 | 9,809 |
Redeemed | (79,275) | (36,004) |
Net Increase (Decrease) in Shares Outstanding | 25,183 | 94,024 |
H. In September 2006, the Financial Accounting Standards Board issued Statement of Financial Accounting Standards No. 157 (“FAS 157”), “Fair Value Measurements.” FAS 157 establishes a framework for measuring fair value and expands disclosures about fair value measurements in financial statements.
The various inputs that may be used to determine the value of the fund’s investments are summarized in three broad levels. The inputs or methodologies used for valuing securities are not necessarily an indication of the risk associated with investing in those securities.
33
Level 1—Quoted prices in active markets for identical securities.
Level 2—Other significant observable inputs (including quoted prices for similar securities, interest rates, prepayment speeds, credit risk, etc.).
Level 3—Significant unobservable inputs (including the fund’s own assumptions used to determine the fair value of investments).
The following table summarizes the fund’s investments as of September 30, 2008, based on the inputs used to value them:
| | | Forward |
| Investments | Futures | Currency |
| in Securities | Contracts | Contracts |
Valuation Inputs | ($000) | ($000) | ($000) |
Level 1— Quoted prices | 2,353,890 | (334) | (270) |
Level 2—Other significant observable inputs | 2,780,341 | — | |
Level 3— Significant unobservable inputs | 1,775 | — | — |
Total | 5,136,006 | (334) | (270) |
There were no changes in investments valued based on level 3 inputs during the year ended September 30, 2008.
34
Report of Independent Registered
Public Accounting Firm
To the Trustees of Vanguard Horizon Fund and the Shareholders of Vanguard Global Equity Fund:
In our opinion, the accompanying statement of net assets and the related statements of operations and of changes in net assets and the financial highlights present fairly, in all material respects, the financial position of Vanguard Global Equity Fund (the “Fund”) at September 30, 2008, the results of its operations for the year then ended, the changes in its net assets for each of the two years in the period then ended and the financial highlights for each of the periods indicated, in conformity with accounting principles generally accepted in the United States of America. These financial statements and financial highlights (hereafter referred to as “financial statements”) are the responsibility of the Fund’s management; our responsibility is to express an opinion on these financial statements based on our audits. We conducted our audits of these financial statements in accordance with the standards of the Public Company Accounting Oversight Board (United States). Those standards require that we plan and perform the audit to obtain reasonable assurance about whether the financial statements are free of material misstatement. An audit includes examining, on a test basis, evidence supporting the amounts and disclosures in the financial statements, assessing the accounting principles used and significant estimates made by management, and evaluating the overall financial statement presentation. We believe that our audits, which included confirmation of securities at September 30, 2008 by correspondence with the custodian and brokers, and by agreement to the underlying ownership records for Vanguard Market Liquidity Fund, provide a reasonable basis for our opinion.
PricewaterhouseCoopers LLP
Philadelphia, Pennsylvania
November 19, 2008
Special 2008 tax information (unaudited) for Vanguard Global Equity Fund
This information for the fiscal year ended September 30, 2008, is included pursuant to provisions of the Internal Revenue Code.
The fund distributed $227,141,000 as capital gain dividends (from net long-term capital gains) to shareholders during the fiscal year.
For non-resident alien shareholders, 100% of short-term capital gain dividends distributed by the fund are qualified short term capital gains.
The fund distributed $106,181,000 of qualified dividend income to shareholders during the fiscal year.
For corporate shareholders, 20.7% of investment income (dividend income plus short-term gains, if any) qualifies for the dividends-received deduction.
The fund will pass through to shareholders foreign source income of $149,365,000 and foreign taxes paid of $9,562,000. The pass-through of foreign taxes paid will affect only shareholders on the dividend record date in December 2008. Shareholders will receive more detailed information along with their Form 1099-DIV in January 2009. .
35
Your Fund’s After-Tax Returns
This table presents returns for your fund both before and after taxes. The after-tax returns are shown in two ways: (1) assuming that an investor owned the fund during the entire period and paid taxes on the fund’s distributions, and (2) assuming that an investor paid taxes on the fund’s distributions and sold all shares at the end of each period.
Calculations are based on the highest individual federal income tax and capital gains tax rates in effect at the times of the distributions and the hypothetical sales. State and local taxes were not considered. After-tax returns reflect any qualified dividend income, using actual prior-year figures and estimates for 2008. (In the example, returns after the sale of fund shares may be higher than those assuming no sale. This occurs when the sale would have produced a capital loss. The calculation assumes that the investor received a tax deduction for the loss.)
Please note that your actual after-tax returns will depend on your tax situation and may differ from those shown. Also note that if you own the fund in a tax-deferred account, such as an individual retirement account or a 401(k) plan, this information does not apply to you. Such accounts are not subject to current taxes.
Finally, keep in mind that a fund’s performance—whether before or after taxes—does not guarantee future results.
Average Annual Total Returns: Global Equity Fund1 | | | |
Periods Ended September 30, 2008 | | | |
| One | Five | Ten |
| Year | Years | Years |
Returns Before Taxes | –32.24% | 8.55% | 9.72% |
Returns After Taxes on Distributions | –33.33 | 7.67 | 8.39 |
Returns After Taxes on Distributions and Sale of Fund Shares | –19.77 | 7.28 | 8.01 |
1 Total returns do not include the account service fee that may be applicable to certain accounts with balances below $10,000.
36
About Your Fund’s Expenses
As a shareholder of the fund, you incur ongoing costs, which include costs for portfolio management, administrative services, and shareholder reports (like this one), among others. Operating expenses, which are deducted from a fund’s gross income, directly reduce the investment return of the fund.
A fund’s expenses are expressed as a percentage of its average net assets. This figure is known as the expense ratio. The following examples are intended to help you understand the ongoing costs (in dollars) of investing in your fund and to compare these costs with those of other mutual funds. The examples are based on an investment of $1,000 made at the beginning of the period shown and held for the entire period.
The accompanying table illustrates your fund’s costs in two ways:
• Based on actual fund return. This section helps you to estimate the actual expenses that you paid over the period. The “Ending Account Value” shown is derived from the fund’s actual return, and the third column shows the dollar amount that would have been paid by an investor who started with $1,000 in the fund. You may use the information here, together with the amount you invested, to estimate the expenses that you paid over the period.
To do so, simply divide your account value by $1,000 (for example, an $8,600 account value divided by $1,000 = 8.6), then multiply the result by the number given for your fund under the heading “Expenses Paid During Period.”
• Based on hypothetical 5% yearly return. This section is intended to help you compare your fund’s costs with those of other mutual funds. It assumes that the fund had a yearly return of 5% before expenses, but that the expense ratio is unchanged. In this case—because the return used is not the fund’s actual return—the results do not apply to your investment. The example is useful in making comparisons because the Securities and Exchange Commission requires all mutual funds to calculate expenses based on a 5% return. You can assess your fund’s costs by comparing this hypothetical example with the hypothetical examples that appear in shareholder reports of other funds.
Six Months Ended September 30, 2008 | | | |
| Beginning | Ending | Expenses |
| Account Value | Account Value | Paid During |
Global Equity Fund | 3/31/2008 | 9/30/2008 | Period1 |
Based on Actual Fund Return | $1,000.00 | $789.37 | $2.11 |
Based on Hypothetical 5% Yearly Return | 1,000.00 | 1,022.71 | 2.38 |
1 The calculations are based on expenses incurred in the most recent six-month period. The fund’s annualized six-month expense ratio for that period is 0.47%. The dollar amounts shown as “Expenses Paid” are equal to the annualized expense ratio multiplied by the average account value over the period, multiplied by the number of days in the most recent six month period, then divided by the number of days in the most recent 12-month period.
37
Note that the expenses shown in the table are meant to highlight and help you compare ongoing costs only and do not reflect transaction costs incurred by the fund for buying and selling securities. Further, the expenses do not include the account service fee described in the prospectus. If such a fee were applied to your account, your costs would be higher. Your fund does not charge transaction fees, such as purchase or redemption fees, nor does it carry a “sales load.”
The calculations assume no shares were bought or sold during the period. Your actual costs may have been higher or lower, depending on the amount of your investment and the timing of any purchases or redemptions.
You can find more information about the fund’s expenses, including annual expense ratios, in the Financial Statements section of this report. For additional information on operating expenses and other shareholder costs, please refer to your fund’s current prospectus.
38
Glossary
Beta. A measure of the magnitude of a fund’s past share-price fluctuations in relation to the ups and downs of a given market index. The index is assigned a beta of 1.00. Compared with a given index, a fund with a beta of 1.20 typically would have seen its share price rise or fall by 12% when the index rose or fell by 10%. For this report, beta is based on returns over the past 36 months for both the fund and the index. Note that a fund’s beta should be reviewed in conjunction with its R-squared (see definition). The lower the R-squared, the less correlation there is between the fund and the index, and the less reliable beta is as an indicator of volatility.
Equity Exposure. A measure that reflects a fund’s investments in stocks and stock futures. Any holdings in short-term reserves are excluded.
Expense Ratio. The percentage of a fund’s average net assets used to pay its annual administrative and advisory expenses. These expenses directly reduce returns to investors.
Inception Date. The date on which the assets of a fund (or one of its share classes) are first invested in accordance with the fund’s investment objective. For funds with a subscription period, the inception date is the day after that period ends. Investment performance is measured from the inception date.
R-Squared. A measure of how much of a fund’s past returns can be explained by the returns from the market in general, as measured by a given index. If a fund’s total returns were precisely synchronized with an index’s returns, its R-squared would be 1.00. If the fund’s returns bore no relationship to the index’s returns, its R-squared would be 0. For this report, R-squared is based on returns over the past 36 months for both the fund and the index.
Short-Term Reserves. The percentage of a fund invested in highly liquid, short-term securities that can be readily converted to cash.
Turnover Rate. An indication of the fund’s trading activity. Funds with high turnover rates incur higher transaction costs and may be more likely to distribute capital gains (which may be taxable to investors). The turnover rate excludes in-kind transactions, which have minimal impact on costs.
39
The People Who Govern Your Fund
The trustees of your mutual fund are there to see that the fund is operated and managed in your best interests since, as a shareholder, you are a part owner of the fund. Your fund’s trustees also serve on the board of directors of The Vanguard Group, Inc., which is owned by the Vanguard funds and provides services to them on an at-cost basis.
A majority of Vanguard’s board members are independent, meaning that they have no affiliation with Vanguard or the funds they oversee, apart from the sizable personal investments they have made as private individuals.
Our independent board members bring distinguished backgrounds in business, academia, and public service to their task of working with Vanguard officers to establish the policies and oversee the activities of the funds. Among board members’ responsibilities are selecting investment advisors for the funds; monitoring fund operations, performance, and costs; reviewing contracts; nominating and selecting new trustees/directors; and electing Vanguard officers.
Each trustee serves a fund until its termination; or until the trustee’s retirement, resignation, or death; or otherwise as specified in the fund’s organizational documents. Any trustee may be removed at a shareholders’ meeting by a vote representing two-thirds of the net asset value of all shares of the fund together with shares of other Vanguard funds organized within the same trust. The table on these two pages shows information for each trustee and executive officer of the fund. The mailing address of the trustees and officers is P.O. Box 876, Valley Forge, PA 19482.
Chairman of the Board and Trustee
John J. Brennan1
Born 1954 Principal Occupation(s) During the Past Five Years: Chairman of the Board and Director/ Trustee Since May 1987; Trustee of The Vanguard Group, Inc., and of each of the investment companies served Chairman of the Board by The Vanguard Group; Chief Executive Officer and President of The Vanguard Group 156 Vanguard Funds Overseen and of each of the investment companies served by The Vanguard Group (1996–2008).
Independent Trustees
Charles D. Ellis
Born 1937 Principal Occupation(s) During the Past Five Years: Applecore Partners (pro bono ventures Trustee Since January 2001 in education); Senior Advisor to Greenwich Associates (international business strategy 156 Vanguard Funds Overseen consulting); Successor Trustee of Yale University; Overseer of the Stern School of Business at New York University; Trustee of the Whitehead Institute for Biomedical Research.
Emerson U. Fullwood
Born 1948 Principal Occupation(s) During the Past Five Years: Executive Chief Staff and Marketing Trustee Since January 2008 Officer for North America since 2004 and Corporate Vice President of Xerox Corporation 156 Vanguard Funds Overseen (photocopiers and printers); Director of SPX Corporation (multi-industry manufacturing), of the United Way of Rochester, and of the Boy Scouts of America.
Rajiv L. Gupta
Born 1945 Principal Occupation(s) During the Past Five Years: Chairman, President, and Trustee Since December 20012 Chief Executive Officer of Rohm and Haas Co. (chemicals); Board Member of 156 Vanguard Funds Overseen the American Chemistry Council; Director of Tyco International, Ltd. (diversified manufacturing and services) since 2005.
Amy Gutmann
Born 1949 Principal Occupation(s) During the Past Five Years: President of the University of
Trustee Since June 2006 Pennsylvania since 2004; Professor in the School of Arts and Sciences, Annenberg School 156 Vanguard Funds Overseen for Communication, and Graduate School of Education of the University of Pennsylvania since 2004; Provost (2001–2004) and Laurance S. Rockefeller Professor of Politics and the University Center for Human Values (1990–2004), Princeton University; Director of Carnegie Corporation of New York since 2005 and of Schuylkill River Development Corporation and Greater Philadelphia Chamber of Commerce since 2004; Trustee of the National Constitution Center since 2007.
JoAnn Heffernan Heisen
Born 1950 Principal Occupation(s) During the Past Five Years: Corporate Vice President and Trustee Since July 1998 Chief Global Diversity Officer since 2006, Vice President and Chief Information 156 Vanguard Funds Overseen Officer (1997–2005), and Member of the Executive Committee of Johnson & Johnson (pharmaceuticals/consumer products); Director of the University Medical Center at Princeton and Women’s Research and Education Institute.
André F. Perold
Born 1952 Principal Occupation(s) During the Past Five Years: George Gund Professor of Finance Trustee Since December 2004 and Banking, Harvard Business School; Senior Associate Dean and Director of Faculty 156 Vanguard Funds Overseen Recruiting, Harvard Business School; Director and Chairman of UNX, Inc. (equities trading firm); Chair of the Investment Committee of HighVista Strategies LLC (private investment firm) since 2005.
Alfred M. Rankin, Jr.
Born 1941 Principal Occupation(s) During the Past Five Years: Chairman, President, Chief Executive Trustee Since January 1993 Officer, and Director of NACCO Industries, Inc. (forklift trucks/housewares/lignite); Director 156 Vanguard Funds Overseen of Goodrich Corporation (industrial products/aircraft systems and services).
J. Lawrence Wilson
Born 1936 Principal Occupation(s) During the Past Five Years: Retired Chairman and Chief Executive Trustee Since April 1985 Officer of Rohm and Haas Co. (chemicals); Director of Cummins Inc. (diesel engines) and 156 Vanguard Funds Overseen AmerisourceBergen Corp. (pharmaceutical distribution); Trustee of Vanderbilt University and of Culver Educational Foundation.
Executive Officers1
Thomas J. Higgins
Born 1957 Principal Occupation(s) During the Past Five Years: Principal of The Vanguard Group, Inc.; Chief Financial Officer Treasurer of each of the investment companies served by The Vanguard Group; Chief Since September 2008 Financial Officer of each of the investment companies served by The Vanguard Treasurer Since July 1998 Group since 2008. 156 Vanguard Funds Overseen
F. William McNabb III
Born 1957 Principal Occupation(s) During the Past Five Years: Chief Executive Officer, Director, Chief Executive Officer and President of The Vanguard Group, Inc., since 2008; Chief Executive Officer and Since August 31, 2008 President of each of the investment companies served by The Vanguard Group since President Since March 2008 2008; Director of Vanguard Marketing Corporation; Managing Director of The Vanguard 156 Vanguard Funds Overseen Group (1995–2008).
Heidi Stam
Born 1956 Principal Occupation(s) During the Past Five Years: Managing Director of The Vanguard Secretary Since July 2005 Group, Inc., since 2006; General Counsel of The Vanguard Group since 2005; Secretary of 156 Vanguard Funds Overseen The Vanguard Group and of each of the investment companies served by The Vanguard Group since 2005; Director and Senior Vice President of Vanguard Marketing Corporation since 2005; Principal of The Vanguard Group (1997–2006).
Vanguard Senior Management Team | | |
| | | |
R. Gregory Barton | Kathleen C. Gubanich | Michael S. Miller | Glenn W. Reed |
Mortimer J. Buckley | Paul A. Heller | Ralph K. Packard | George U. Sauter |
Founder
John C. Bogle
Chairman and Chief Executive Officer, 1974–1996
1 These individuals are “interested persons” as defined in the Investment Company Act of 1940.
2 December 2002 for Vanguard Equity Income Fund, Vanguard Growth Equity Fund, the Vanguard Municipal Bond Funds, and the Vanguard State Tax-Exempt Funds.
More information about the trustees is in the Statement of Additional Information, available from The Vanguard Group.

P.O. Box 2600
Valley Forge, PA 19482-2600
Connect with Vanguard® > www.vanguard.com
Fund Information > 800-662-7447 |
|
Direct Investor Account Services > 800-662-2739 |
|
Institutional Investor Services > 800-523-1036 |
|
Text Telephone for People |
With Hearing Impairment > 800-952-3335 |
|
This material may be used in conjunction |
with the offering of shares of any Vanguard |
fund only if preceded or accompanied by |
the fund’s current prospectus. |
|
The funds or securities referred to herein are not |
sponsored, endorsed, or promoted by MSCI, and MSCI |
bears no liability with respect to any such funds or |
securities. For any such funds or securities, the |
prospectus or the Statement of Additional Information |
contains a more detailed description of the limited |
relationship MSCI has with The Vanguard Group and |
any related funds. |
© 2008 The Vanguard Group, Inc. |
All rights reserved. |
Vanguard Marketing Corporation, Distributor. |
|
Q1290 112008 |
> The broad U.S. stock market fell –21.2% during the fiscal year ended September 30, 2008, as the credit crisis intensified.
> Vanguard Strategic Small-Cap Equity Fund returned –20.5% for the 12 months, trailing its benchmark index and peer group.
> The fund posted negative results in all market sectors except for utilities.
Contents | |
| |
Your Fund’s Total Returns | 1 |
President’s Letter | 2 |
Advisor’s Report | 7 |
Fund Profile | 9 |
Performance Summary | 10 |
Financial Statements | 11 |
Your Fund’s After-Tax Returns | 25 |
About Your Fund’s Expenses | 26 |
Glossary | 28 |
Please note: The opinions expressed in this report are just that—informed opinions. They should not be considered promises or advice. Also, please keep in mind that the information and opinions cover the period through the date on the front of this report. Of course, the risks of investing in your fund are spelled out in the prospectus.
Your Fund’s Total Returns
Fiscal Year Ended September 30, 2008 | | |
| Ticker | Total |
| Symbol | Returns |
Vanguard Strategic Small-Cap Equity Fund | VSTCX | –20.5% |
MSCI US Small Cap 1750 Index | | –17.3 |
Average Small-Cap Core Fund1 | | –18.7 |
Your Fund’s Performance at a Glance |
September 30, 2007–September 30, 2008 |
| | | Distributions Per Share |
| Starting | Ending | Income | Capital |
| Share Price | Share Price | Dividends | Gains |
Vanguard Strategic Small-Cap Equity Fund | $21.28 | $16.60 | $0.210 | $0.151 |
1 Derived from data provided by Lipper Inc.
1

President’s Letter
Dear Shareholder,
For the fiscal year ended September 30, 2008, Vanguard Strategic Small-Cap Equity Fund returned –20.5%. The fund declined somewhat more than its market benchmark, the MSCI US Small Cap 1750 Index, which returned –17.3%, and also lagged the average result for competing funds.
Virtually all areas of the U.S. stock market struggled during the 12-month period. The fund had negative returns in all sectors with the exception of utilities.
If you hold the Strategic Small-Cap Equity Fund in a taxable account, you may wish to review our report on the fund’s after-tax returns on page 25.
Credit market turbulence weighed heavily on stock prices
Troubles simmering in the credit markets for much of the past year came to a boil at the end of the fiscal period, producing several high-profile bankruptcies and putting severe pressure on stock prices around the world. The broad U.S. stock market returned –21.2% for the 12 months ended September 30. In September alone, stock prices fell more than 9%. International stock markets were similarly disappointing, returning –30.0% for the full 12 months.
2
Policymakers and elected officials, both in the United States and abroad, responded to the upheavals with dramatic new programs designed to help stabilize the credit markets. As participants struggled to make sense of the markets’ fast-changing dynamics, stock prices were exceptionally volatile, with daily ups and downs of 2 percentage points or more becoming commonplace.
U.S. Treasuries rallied in a nervous market
Nervousness in the stock market was echoed, and even amplified, in the bond market. For the 12 months, the broad U.S. bond market returned 3.7%, largely on the strength of Treasuries—investors’ security of choice in times of duress.
Corporate bonds generally produced negative returns for the period, coming under heavy selling pressure during investors’ flight to safety. Even the municipal market, made up of generally high-quality securities issued by states and municipalities, recorded a negative 12-month return.
The U.S. Federal Reserve Board responded to the turmoil with a dramatic easing of monetary policy. Over the full 12 months, the Fed reduced its target for the federal funds rate from 4.75% to 2.00%. On October 8, shortly after the close of the fiscal period, the Fed cut rates again, to 1.50%. The move was made in coordination with rate cuts by several other central banks.
Market Barometer | | | |
| | Average Annual Total Returns |
| Periods Ended September 30, 2008 |
| One Year | Three Years | Five Years |
Stocks | | | |
Russell 1000 Index (Large-caps) | –22.1% | 0.1% | 5.5% |
Russell 2000 Index (Small-caps) | –14.5 | 1.8 | 8.1 |
Dow Jones Wilshire 5000 Index (Entire market) | –21.2 | 0.6 | 6.0 |
MSCI All Country World Index ex USA (International) | –30.0 | 3.1 | 11.8 |
| | | |
| | | |
Bonds | | | |
Lehman U.S. Aggregate Bond Index (Broad taxable market) | 3.7% | 4.2% | 3.8% |
Lehman Municipal Bond Index | –1.9 | 1.9 | 2.8 |
Citigroup 3-Month Treasury Bill Index | 2.6 | 4.0 | 3.1 |
| | | |
| | | |
CPI | | | |
Consumer Price Index | 4.9% | 3.2% | 3.4% |
3
Severe market volatility hurts fund’s performance
The investment advisor to the Strategic Small-Cap Equity Fund, Vanguard Quantitative Equity Group, seeks to outperform its benchmark index by using a stock-selection model that incorporates investor sentiment, valuation, and the quality of earnings. The advisor slightly overweights those stocks that seem most attractive and underweights those that seem least attractive, while maintaining sector weightings similar to the benchmark’s.
During the past year, the model came up short, as the extreme turbulence in the U.S. market proved challenging for the fund. The portfolio suffered from poor stock selection in industrials, information technology, and energy.
Returns fell in the industrial sector as the global credit crisis threatened to restrain demand for heavy equipment, freight services, and other industrial goods and services. Relatively heavy weightings in the equipment companies Manitowoc (–65%) and Trinity Industries (–31%) hurt the fund’s performance relative to the benchmark. In information technology, semiconductor manufacturers suffered as investors anticipated weakened consumer demand for electronics and cuts in business technology spending. Energy stocks were hurt by the retreat of oil prices in recent months.
Expense Ratios1 | | |
Your Fund Compared With Its Peer Group | | |
| | Average |
| Investor | Small-Cap |
| Shares | Core Fund |
Strategic Small-Cap Equity Fund | 0.38% | 1.47% |
1 The fund expense ratio shown is from the prospectus dated January 25, 2008. For the fiscal year ended September 30, 2008, the fund’s expense ratio was 0.38%. The peer-group expense ratio is derived from data provided by Lipper Inc. and captures information through year-end 2007.
4
The fund performed better than the benchmark in the financial sector, where stock selection was strong among regional banks and insurers. The fund’s utilities holdings produced its only positive sector return. Relative to the index, the fund benefited from an underweighted exposure to multi-utilities (companies providing two or more utility services).
Regardless of market conditions, a long-term focus is key
In recent months, the U.S. stock market has experienced sometimes startling volatility. As can be expected, given the fund’s investment approach, the Strategic Small-Cap Equity Fund participated in the market’s ups and downs.
As I mentioned previously, the strategy employed by Vanguard Quantitative Equity Group seeks to provide above-market returns while keeping the portfolio’s risk characteristics—such as sector and market-capitalization weightings—close to those of the benchmark index. It’s important to keep in mind that, while the portfolio managers can control some aspects of risk exposure, they cannot control overall stock market risk.
During the past year, exposure to the stock market came at a high cost. History shows, however, that simply avoiding stocks can have an even higher long-term cost, because over decades stocks have delivered returns higher than those provided by bonds or cash investments.
Total Returns | |
April 24, 2006,1 Through September 30, 2008 | |
| Average |
| Annual Return |
Strategic Small-Cap Equity Fund | –6.4% |
MSCI US Small Cap 1750 Index | –3.9 |
Average Small-Cap Core Fund2 | –5.7 |
The figures shown represent past performance, which is not a guarantee of future results. (Current performance may be lower or higher than the performance data cited. For performance data current to the most recent month-end, visit our website at www.vanguard.com/performance.) Note, too, that both investment returns and principal value can fluctuate widely, so an investor's shares, when sold, could be worth more or less than their original cost.
1 The fund’s inception date.
2 Derived from data provided by Lipper Inc.
5
That is why Vanguard always encourages investors to maintain a long-term perspective—and also to make sure that they own not only stock funds but also bond and money market funds. A well-balanced portfolio and a long-term view can be useful allies for investors in difficult periods such as we are seeing.
Since its inception in April 2006, the Strategic Small-Cap Equity Fund has experienced extremely turbulent periods in the market. Given the short time frame and volatile conditions, it’s not yet possible to make a fair judgment about the fund’s long-term strategy. However, we continue to believe that the advisor’s experience and approach make this fund a solid choice as part of a well-balanced investment portfolio.
Thank you for investing with Vanguard.
Sincerely,

F. William McNabb III
President and Chief Executive Officer
October 16, 2008
6
Advisor’s Report
As 2008 comes to a close, global economies have decelerated, credit markets continue to stagnate, and the actions taken by world governments have yet to reduce uncertainty and stimulate recovery. Clearly, our just-ended fiscal year was an extremely difficult time for equity markets both in the United States and abroad. Over the 12 months ended September 30, the broad U.S. market returned –21.1%, as measured by the MSCI US Investable Market 2500 Index. International equities performed even worse, dropping –30.5% as measured by the MSCI EAFE Index.
Small-capitalization stocks declined less than the broader market in the period: The MSCI Small Cap 1750 Index returned –17.3%. The Strategic Small-Cap Equity Fund, with a return of –20.5%, underperformed its benchmark by 3.2 percentage points.
Although we focus our investment process on longer-term results, we are disappointed by any period of under-performance. The 2008 fiscal year was the second in a row in which we failed to deliver a return better than that of the benchmark index.
Quantitative management, as we implement it, is not drastically different from traditional stock selection, which relies on fundamental security analysis. Our fund’s performance relative to its benchmark relies on the ability of our stock evaluation methodology to rank stocks against their industry and market-cap peers and separate the potential outperformers from the underperformers. This evaluation process uses three independent selection models to rank companies in terms of their relative valuation, market sentiment, and earnings-quality characteristics.
We use three models that have relatively low correlation with one another to diversify our evaluation process. Just as adding bonds, international stocks, and cash to a domestic stock investment has the potential to reduce risk through diversification, using multiple selection models to pick stocks should improve our overall ability to add value consistently. It does not work every year, but over the long run we are confident in the power of this diversification.
7
When our stock selection methodology is combined with our risk-control process, the resulting portfolio matches the benchmark’s risk exposure in terms of industry weightings, market capitalization, and other style factors. Relative to the benchmark, our portfolio will generally have a lower price/earnings profile, a return-on-equity premium, and a similar expected earnings growth rate and dividend yield. In other words, we’re looking to invest in profitable companies that are trading at lower valuation levels than their industry peers. We believe this is a formula for long-term success.
During the past fiscal year, our model was successful in selecting stocks in seven of ten sectors. Our results were strongest in the financial and materials sectors, with holdings such as Univest, First Financial, and Steel Dynamics. One might expect that having positive stock selection in seven of ten sectors would lead to overall success. However, our stock selection was very poor in the industrial, technology, and energy sectors. Negative performance from holdings such as HNI, Ceradyne, Perini, and Manitowoc swamped the results from other sectors.
We continue to believe that our strategy will add value over the long term by creating a portfolio of securities featuring attractive valuations, high earnings quality, and market acceptance coupled with disciplined risk control. As we enter the 2009 fiscal year, we know that heightened uncertainty and volatility may be with us for a while. However, we will continue to manage the portfolio in a disciplined and prudent fashion, and we look forward to reporting to you six months from now.
James P. Stetler,
Principal and Portfolio Manager
Joel M. Dickson, Principal
Vanguard Quantitative Equity Group
October 20, 2008
8
Fund Profile
As of September 30, 2008
Portfolio Characteristics | | |
| | Comparative | Broad |
| Fund | Index1 | Index2 |
Number of Stocks | 461 | 1,732 | 4,679 |
Median Market Cap | $1.4B | $1.4B | $29.6B |
Price/Earnings Ratio | 13.8x | 20.0x | 15.5x |
Price/Book Ratio | 1.8x | 1.8x | 2.2x |
Yield3 | 1.2% | 1.5% | 2.3% |
Return on Equity | 13.4% | 13.2% | 20.0% |
Earnings Growth Rate | 16.3% | 15.7% | 17.7% |
Foreign Holdings | 0.9% | 0.0% | 0.0% |
Turnover Rate | 99% | — | — |
Expense Ratio | | | |
(9/30/2007)4 | 0.38% | — | — |
Short-Term Reserves | 0.1% | — | — |
Sector Diversification (% of equity exposure) |
| | Comparative | Broad |
| Fund | Index1 | Index2 |
Consumer Discretionary | 13.0% | 13.1% | 9.2% |
Consumer Staples | 3.3 | 3.4 | 10.5 |
Energy | 7.1 | 7.1 | 12.6 |
Financials | 21.0 | 20.7 | 17.3 |
Health Care | 12.8 | 13.0 | 13.0 |
Industrials | 16.5 | 16.4 | 11.4 |
Information Technology | 16.6 | 16.6 | 15.7 |
Materials | 4.5 | 4.5 | 3.7 |
Telecommunication | | | |
Services | 1.1 | 1.0 | 2.8 |
Utilities | 4.1 | 4.2 | 3.8 |
Ten Largest Holdings5 (% of total net assets) |
| | |
Mettler-Toledo International Inc. | electronic equipment manufacturers | 0.5% |
Myriad Genetics, Inc. | biotechnology | 0.5 |
Kansas City Southern | railroads | 0.5 |
OSI Pharmaceuticals, Inc. | biotechnology | 0.5 |
DeVry, Inc. | education services | 0.5 |
Aspen Insurance | property and | |
Holdings Ltd. | casualty insurance | 0.5 |
Hawaiian Electric | | |
Industries Inc. | electric utilities | 0.5 |
Atmos Energy Corp. | gas utilities | 0.4 |
Universal Health Services | health care | |
Class B | facilities | 0.4 |
The Hanover Insurance | property and | |
Group Inc. | casualty insurance | 0.4 |
Top Ten | | 4.7% |
Investment Focus

1 MSCI US Small Cap 1750 Index.
2 Dow Jones Wilshire 5000 Index.
3 30-day SEC yield for the fund; annualized dividend yield for the indexes. See the Glossary.
4 The expense ratio shown is from the prospectus dated January 25, 2008. For the fiscal year ended September 30, 2008, the expense ratio was 0.38%.
5 The holdings listed exclude any temporary cash investments and equity index products.
9
Performance Summary
All of the returns in this report represent past performance, which is not a guarantee of future results that may be achieved by the fund. (Current performance may be lower or higher than the performance data cited. For performance data current to the most recent month-end, visit our website at www.vanguard.com/performance.) Note, too, that both investment returns and principal value can fluctuate widely, so an investor’s shares, when sold, could be worth more or less than their original cost. The returns shown do not reflect taxes that a shareholder would pay on fund distributions or on the sale of fund shares.
Cumulative Performance: April 24, 2006–September 30, 2008
Initial Investment of $10,000
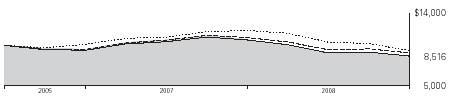
| | | |
| | | |
| Average Annual Total Returns | Final Value |
| Periods Ended September 30, 2008 | of a $10,000 |
| One Year | Since Inception1 | Investment |
Strategic Small-Cap Equity Fund2 | –20.50% | –6.38% | $8,516 |
Dow Jones Wilshire 5000 Index | –21.20 | –2.72 | 9,350 |
MSCI US Small Cap 1750 Index | –17.28 | –3.90 | 9,077 |
Average Small-Cap Core Fund3 | –18.73 | –5.68 | 8,672 |
Fiscal-Year Total Returns (%): April 24, 2006–September 30, 2008
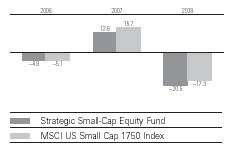
1 Performance for the fund and its comparative standards is calculated since the fund’s inception: April 24, 2006.
2 Total returns do not include the account service fee that may be applicable to certain accounts with balances below $10,000.
3 Derived from data provided by Lipper Inc.
Note: See Financial Highlights table for dividend and capital gains information.
10
Financial Statements
Statement of Net Assets
As of September 30, 2008
The fund provides a complete list of its holdings four times in each fiscal year, at the quarter-ends. For the second and fourth fiscal quarters, the lists appear in the fund’s semiannual and annual reports to shareholders. For the first and third fiscal quarters, the fund files the lists with the Securities and Exchange Commission on Form N-Q. Shareholders can look up the fund’s Forms N-Q on the SEC’s website at www.sec.gov. Forms N-Q may also be reviewed and copied at the SEC’s Public Reference Room (see the back cover of this report for further information).
| | | Market |
| | | Value• |
| | Shares | ($000) |
Common Stocks (98.9%)1 | | |
Consumer Discretionary (12.8%) | | |
| DeVry, Inc. | 18,800 | 931 |
* | Aeropostale, Inc. | 26,500 | 851 |
* | Big Lots Inc. | 30,300 | 843 |
* | Marvel Entertainment, Inc. | 23,100 | 789 |
* | Hanesbrands Inc. | 35,000 | 761 |
* | Rent-A-Center, Inc. | 33,500 | 746 |
* | WMS Industries, Inc. | 23,000 | 703 |
| Snap-On Inc. | 12,900 | 679 |
| Brown Shoe Co., Inc. | 40,755 | 668 |
| Bob Evans Farms, Inc. | 23,587 | 644 |
| Interactive Data Corp. | 25,400 | 641 |
* | The Gymboree Corp. | 18,000 | 639 |
* | The Warnaco Group, Inc. | 13,900 | 630 |
* | Jack in the Box Inc. | 29,800 | 629 |
* | Papa John’s International, Inc. | 22,415 | 609 |
*,^ | Jos. A. Bank Clothiers, Inc. | 18,000 | 605 |
| Hillenbrand Inc. | 29,851 | 602 |
| ArvinMeritor, Inc. | 45,900 | 599 |
* | Fossil, Inc. | 21,200 | 598 |
| John Wiley & Sons Class A | 14,300 | 578 |
* | DreamWorks | | |
| Animation SKG, Inc. | 17,100 | 538 |
| Oxford Industries, Inc. | 20,000 | 517 |
| Movado Group, Inc. | 22,703 | 507 |
| Burger King Holdings Inc. | 20,396 | 501 |
*,^ | P.F. Chang’s China Bistro, Inc. | 20,800 | 490 |
| Service Corp. International | 57,790 | 483 |
* | New York & Co., Inc. | 49,900 | 476 |
* | Denny’s Corp. | 175,200 | 452 |
| CSS Industries, Inc. | 17,500 | 450 |
| Meredith Corp. | 15,700 | 440 |
| Finish Line, Inc. | 43,800 | 438 |
| Barnes & Noble, Inc. | 15,700 | 409 |
* | Town Sports International | | |
| Holdings, Inc. | 66,048 | 403 |
^ | Ethan Allen Interiors, Inc. | 14,328 | 401 |
| International Speedway Corp. | 10,000 | 389 |
* | Lear Corp. | 35,600 | 374 |
| UniFirst Corp. | 8,100 | 349 |
| CBRL Group, Inc. | 13,124 | 345 |
| Systemax Inc. | 24,100 | 339 |
| American Greetings Corp. | | |
| Class A | 22,100 | 338 |
* | Sally Beauty Co. Inc. | 37,300 | 321 |
* | Exide Technologies | 39,700 | 293 |
| Furniture Brands | | |
| International Inc. | 26,900 | 283 |
| Blyth, Inc. | 24,500 | 278 |
* | Valassis | | |
| Communications, Inc. | 27,400 | 237 |
| Polaris Industries, Inc. | 4,500 | 205 |
| Idearc Inc. | 163,200 | 204 |
* | Bally Technologies Inc. | 6,200 | 188 |
* | Deckers Outdoor Corp. | 1,800 | 187 |
| E.W. Scripps Co. Class A | 20,166 | 143 |
| Asbury Automotive Group, Inc. | 10,557 | 122 |
| Regis Corp. | 4,400 | 121 |
* | Steven Madden, Ltd. | 4,600 | 114 |
| Tempur-Pedic | | |
| International Inc. | 9,600 | 113 |
* | The Dress Barn, Inc. | 6,392 | 98 |
| Sonic Automotive, Inc. | 9,200 | 78 |
* | TRW Automotive | | |
| Holdings Corp. | 4,300 | 68 |
* | Blockbuster Inc. Class A | 27,900 | 57 |
* | Skechers U.S.A., Inc. | 3,200 | 54 |
| Gray Television, Inc. | 31,100 | 53 |
* | Carter’s, Inc. | 2,600 | 51 |
| | | 25,652 |
Consumer Staples (3.3%) | | |
* | NBTY, Inc. | 25,200 | 744 |
| Universal Corp. (VA) | 14,900 | 731 |
| Nash-Finch Co. | 14,800 | 638 |
* | Winn-Dixie Stores, Inc. | 38,842 | 540 |
^ | Cal-Maine Foods, Inc. | 15,400 | 423 |
| Alberto-Culver Co. | 15,100 | 411 |
11
| | | Market |
| | | Value• |
| | Shares | ($000) |
| Herbalife Ltd. | 10,000 | 395 |
* | Alliance One | | |
| International, Inc. | 88,200 | 335 |
| Longs Drug Stores, Inc. | 4,400 | 333 |
| Corn Products | | |
| International, Inc. | 10,305 | 333 |
* | Chiquita Brands | | |
| International, Inc. | 20,700 | 327 |
| J.M. Smucker Co. | 5,600 | 284 |
| Coca-Cola Bottling Co. | 4,600 | 201 |
| Sanderson Farms, Inc. | 5,400 | 198 |
* | Central European | | |
| Distribution Corp. | 3,800 | 173 |
* | BJ’s Wholesale Club, Inc. | 3,600 | 140 |
* | Ralcorp Holdings, Inc. | 2,000 | 135 |
| Spartan Stores, Inc. | 4,200 | 104 |
| Del Monte Foods Co. | 7,800 | 61 |
| Nu Skin Enterprises, Inc. | 2,800 | 45 |
* | Darling International, Inc. | 2,400 | 27 |
| | | 6,578 |
Energy (7.0%) | | |
* | Whiting Petroleum Corp. | 12,100 | 862 |
* | Comstock Resources, Inc. | 14,600 | 731 |
* | Unit Corp. | 14,490 | 722 |
* | Superior Energy | | |
| Services, Inc. | 22,053 | 687 |
| St. Mary Land & | | |
| Exploration Co. | 19,086 | 680 |
* | Concho Resources, Inc. | 22,800 | 629 |
| W&T Offshore, Inc. | 22,700 | 619 |
| Overseas Shipholding | | |
| Group Inc. | 10,300 | 601 |
* | Mariner Energy Inc. | 29,000 | 594 |
* | Encore Acquisition Co. | 14,000 | 585 |
* | McMoRan Exploration Co. | 24,600 | 581 |
* | Oil States International, Inc. | 16,297 | 576 |
* | Stone Energy Corp. | 13,462 | 570 |
* | Rosetta Resources, Inc. | 30,200 | 554 |
* | Contango Oil & Gas Co. | 10,000 | 540 |
* | Gulfmark Offshore, Inc. | 12,000 | 539 |
| Berry Petroleum Class A | 13,500 | 523 |
* | Swift Energy Co. | 13,229 | 512 |
* | SEACOR Holdings Inc. | 5,771 | 456 |
* | Complete Production | | |
| Services, Inc. | 22,300 | 449 |
* | PetroQuest Energy, Inc. | 22,000 | 338 |
* | Alpha Natural Resources, Inc. | 6,400 | 329 |
| Walter Industries, Inc. | 6,600 | 313 |
* | Warren Resources Inc. | 29,700 | 296 |
* | Grey Wolf, Inc. | 25,200 | 196 |
* | Willbros Group, Inc. | 5,500 | 146 |
| Core Laboratories N.V. | 1,400 | 142 |
* | ATP Oil & Gas Corp. | 4,000 | 71 |
* | Cal Dive International, Inc. | 6,500 | 69 |
* | Bristow Group, Inc. | 2,000 | 68 |
* | Basic Energy Services Inc. | 2,800 | 60 |
| | | 14,038 |
Financials (20.7%) | | |
| | | | |
| Aspen Insurance | | |
| Holdings Ltd. | 33,800 | 929 |
| The Hanover Insurance | | |
| Group Inc. | 19,500 | 888 |
| Cullen/Frost Bankers, Inc. | 14,300 | 858 |
| Bank of Hawaii Corp. | 16,000 | 855 |
| Platinum Underwriters | | |
| Holdings, Ltd. | 23,400 | 830 |
* | SVB Financial Group | 14,300 | 828 |
| IPC Holdings Ltd. | 26,700 | 807 |
* | Stifel Financial Corp. | 15,150 | 756 |
| Rayonier Inc. REIT | 15,820 | 749 |
| Endurance Specialty | | |
| Holdings Ltd. | 23,800 | 736 |
| FirstMerit Corp. | 34,800 | 731 |
| Univest Corp. of | | |
| Pennsylvania | 19,700 | 729 |
| Alexandria Real Estate | | |
| Equities, Inc. REIT | 6,400 | 720 |
| Nationwide Health | | |
| Properties, Inc. REIT | 19,600 | 705 |
* | EZCORP, Inc. | 37,039 | 696 |
| Allied World Assurance | | |
| Holdings, Ltd. | 19,000 | 675 |
* | Knight Capital Group, Inc. | | |
| Class A | 45,300 | 673 |
| City Holding Co. | 15,662 | 662 |
| Astoria Financial Corp. | 31,300 | 649 |
| First Financial Corp. (IN) | 13,700 | 644 |
| Pacific Capital Bancorp | 31,600 | 643 |
| Cash America | | |
| International Inc. | 17,713 | 638 |
| First Commonwealth | | |
| Financial Corp. | 47,300 | 637 |
| Montpelier Re Holdings Ltd. | 38,000 | 627 |
| First Community | | |
| Bancshares, Inc. | 16,350 | 613 |
| Trustmark Corp. | 28,022 | 581 |
| City Bank Lynnwood (WA) | 37,023 | 578 |
| Senior Housing | | |
| Properties Trust REIT | 24,200 | 577 |
| First Niagara Financial | | |
| Group, Inc. | 36,600 | 576 |
| United Bankshares, Inc. | 15,800 | 553 |
* | Interactive Brokers | | |
| Group, Inc. | 23,900 | 530 |
| Highwood Properties, Inc. | | |
| REIT | 14,810 | 527 |
12
| | | Market |
| | | Value• |
| | Shares | ($000) |
| Douglas Emmett, Inc. REIT | 22,800 | 526 |
| Home Properties, Inc. REIT | 8,900 | 516 |
| Raymond James | | |
| Financial, Inc. | 15,400 | 508 |
| WSFS Financial Corp. | 8,350 | 501 |
| Washington REIT | 13,400 | 491 |
* | PHH Corp. | 36,600 | 486 |
| Advanta Corp. Class B | 58,450 | 481 |
| National Retail Properties | | |
| REIT | 19,900 | 477 |
| BancFirst Corp. | 9,626 | 465 |
| F.N.B. Corp. | 28,400 | 454 |
| Healthcare Realty Trust Inc. | | |
| REIT | 15,200 | 443 |
| First Industrial Realty Trust | | |
| REIT | 15,100 | 433 |
| American Physicians | | |
| Capital, Inc. | 9,700 | 411 |
| EastGroup Properties, Inc. | | |
| REIT | 8,100 | 393 |
| Mid-America Apartment | | |
| Communities, Inc. REIT | 7,970 | 392 |
| Bank Mutual Corp. | 34,200 | 388 |
| Sovran Self Storage, Inc. | | |
| REIT | 8,600 | 384 |
| Extra Space Storage Inc. | | |
| REIT | 23,800 | 366 |
| DCT Industrial Trust Inc. | | |
| REIT | 48,200 | 361 |
| Odyssey Re Holdings Corp. | 8,000 | 350 |
* | Ocwen Financial Corp. | 42,659 | 343 |
| Presidential Life Corp. | 21,600 | 341 |
| LTC Properties, Inc. REIT | 11,300 | 331 |
| Taubman Co. REIT | 6,610 | 330 |
* | FCStone Group, Inc. | 18,100 | 326 |
* | Philadelphia Consolidated | | |
| Holding Corp. | 5,542 | 325 |
| Parkway Properties Inc. REIT | 8,500 | 322 |
| WesBanco, Inc. | 12,000 | 319 |
| Saul Centers, Inc. REIT | 6,300 | 318 |
| Post Properties, Inc. REIT | 11,260 | 315 |
| Safety Insurance Group, Inc. | 8,300 | 315 |
| PS Business Parks, Inc. REIT | 5,400 | 311 |
| Chemical Financial Corp. | 9,900 | 308 |
| Colonial Properties Trust REIT | 16,170 | 302 |
| Capitol Federal Financial | 6,700 | 297 |
| Baldwin & Lyons, Inc. | | |
| Class B | 11,383 | 273 |
| Entertainment | | |
| Properties Trust REIT | 4,700 | 257 |
| Equity Lifestyle | | |
| Properties, Inc. REIT | 4,800 | 255 |
| Pennsylvania REIT | 13,470 | 254 |
| Health Care Inc. REIT | 4,600 | 245 |
| First BanCorp Puerto Rico | 22,100 | 244 |
^ | Greenhill & Co., Inc. | 3,300 | 243 |
| Tanger Factory Outlet | | |
| Centers, Inc. REIT | 5,500 | 241 |
| R.L.I. Corp. | 3,800 | 236 |
| Corporate Office | | |
| Properties Trust, Inc. REIT | 5,700 | 230 |
| Jones Lang LaSalle Inc. | 5,270 | 229 |
| Kilroy Realty Corp. REIT | 4,700 | 225 |
* | Navigators Group, Inc. | 3,700 | 215 |
| Potlatch Corp. REIT | 4,000 | 186 |
| First Financial Bancorp | 12,500 | 182 |
* | ProAssurance Corp. | 3,200 | 179 |
| HRPT Properties Trust REIT | 23,400 | 161 |
| Digital Realty Trust, Inc. REIT | 3,310 | 156 |
| Essex Property Trust, Inc. | | |
| REIT | 1,100 | 130 |
| Realty Income Corp. REIT | 4,800 | 123 |
| Sun Communities, Inc. REIT | 5,800 | 115 |
| Mack-Cali Realty Corp. REIT | 3,220 | 109 |
| Old National Bancorp | 5,340 | 107 |
*,^ | Primus Guaranty, Ltd. | 39,600 | 104 |
| LaSalle Hotel Properties | | |
| REIT | 4,100 | 96 |
| Sunstone Hotel | | |
| Investors, Inc. REIT | 6,873 | 93 |
| BRE Properties Inc. | | |
| Class A REIT | 1,400 | 69 |
| Franklin Street | | |
| Properties Corp. REIT | 5,270 | 69 |
| Strategic Hotels and | | |
| Resorts, Inc. REIT | 7,600 | 57 |
| Westamerica Bancorporation | 900 | 52 |
| Umpqua Holdings Corp. | 3,100 | 46 |
| UMB Financial Corp. | 800 | 42 |
| Flagstone Reinsurance | | |
| Holdings Ltd. | 3,500 | 36 |
| FelCor Lodging Trust, Inc. | | |
| REIT | 5,010 | 36 |
* | MF Global Ltd. | 7,900 | 34 |
| Friedman, Billings, | | |
| Ramsey Group, Inc. REIT | 16,600 | 33 |
*,^ | Thornburg Mortgage, Inc. | 18,707 | 33 |
| Community Trust Bancorp Inc. | 916 | 32 |
* | Darwin Professional | | |
| Underwriters, Inc. | 900 | 28 |
| Gramercy Capital Corp. REIT | 5,402 | 14 |
| | | 41,298 |
Health Care (12.6%) | | |
* | Myriad Genetics, Inc. | 15,100 | 980 |
* | OSI Pharmaceuticals, Inc. | 19,549 | 964 |
| Universal Health Services | | |
| Class B | 15,900 | 891 |
13
| | | Market |
| | | Value• |
| | Shares | ($000) |
* | Alexion Pharmaceuticals, Inc. | 22,400 | 880 |
| STERIS Corp. | 22,300 | 838 |
* | Psychiatric Solutions, Inc. | 22,000 | 835 |
| Owens & Minor, Inc. | | |
| Holding Co. | 17,000 | 824 |
* | Onyx Pharmaceuticals, Inc. | 21,500 | 778 |
| West Pharmaceutical | | |
| Services, Inc. | 15,900 | 776 |
* | LifePoint Hospitals, Inc. | 23,800 | 765 |
* | BioMarin Pharmaceutical Inc. | 28,146 | 746 |
* | Cubist Pharmaceuticals, Inc. | 33,200 | 738 |
* | AMERIGROUP Corp. | 28,500 | 720 |
* | Healthspring, Inc. | 33,000 | 698 |
* | CONMED Corp. | 21,800 | 698 |
| Datascope Corp. | 12,831 | 662 |
* | Questcor | | |
| Pharmaceuticals, Inc. | 87,300 | 642 |
* | Amedisys Inc. | 12,900 | 628 |
* | Kindred Healthcare, Inc. | 21,600 | 595 |
| Chemed Corp. | 14,400 | 591 |
* | Sun Healthcare Group Inc. | 39,900 | 585 |
* | The Medicines Co. | 24,900 | 578 |
* | Molina Healthcare Inc. | 18,206 | 564 |
| Perrigo Co. | 14,100 | 542 |
* | Emergent BioSolutions Inc. | 39,900 | 522 |
* | Bio-Rad Laboratories, Inc. | | |
| Class A | 5,206 | 516 |
| Analogic Corp. | 10,000 | 498 |
| Medicis | | |
| Pharmaceutical Corp. | 31,200 | 465 |
* | Watson | | |
| Pharmaceuticals, Inc. | 16,100 | 459 |
* | Cynosure Inc. | 24,800 | 445 |
* | Cross Country | | |
| Healthcare, Inc. | 26,864 | 438 |
* | CorVel Corp. | 14,500 | 415 |
* | HealthSouth Corp. | 22,500 | 415 |
* | AmSurg Corp. | 13,700 | 349 |
* | Gentiva Health Services, Inc. | 12,100 | 326 |
* | AthenaHealth Inc. | 9,400 | 313 |
* | Isis Pharmaceuticals, Inc. | 15,900 | 269 |
* | PAREXEL International Corp. | 9,300 | 266 |
* | Bruker BioSciences Corp. | 19,400 | 259 |
* | Alnylam Pharmaceuticals Inc. | 8,300 | 240 |
| PDL BioPharma Inc. | 23,300 | 217 |
* | eResearch Technology, Inc. | 16,800 | 200 |
* | AMN Healthcare | | |
| Services, Inc. | 10,139 | 178 |
* | Celera Corp. | 10,600 | 164 |
| Sciele Pharma, Inc. | 4,784 | 147 |
* | Apria Healthcare Group Inc. | 6,000 | 109 |
* | Masimo Corp. | 2,700 | 100 |
* | Air Methods Corp. | 3,000 | 85 |
* | Tenet Healthcare Corp. | 12,600 | 70 |
* | MedCath Corp. | 2,952 | 53 |
* | Albany Molecular | | |
| Research, Inc. | 2,600 | 47 |
| LCA-Vision Inc. | 10,000 | 46 |
* | Dionex Corp. | 600 | 38 |
| Martek Biosciences Corp. | 1,200 | 38 |
* | Omrix | | |
| Biopharmaceuticals, Inc. | 2,056 | 37 |
| | | 25,242 |
Industrials (16.4%) | | |
* | Kansas City Southern | 21,800 | 967 |
| The Brink’s Co. | 13,500 | 824 |
| The Timken Co. | 28,300 | 802 |
| GATX Corp. | 19,500 | 772 |
* | Energy Conversion | | |
| Devices, Inc. | 13,100 | 763 |
| Watson Wyatt & Co. | | |
| Holdings | 15,300 | 761 |
* | Kirby Corp. | 19,600 | 744 |
| Acuity Brands, Inc. | 17,642 | 737 |
| The Toro Co. | 17,509 | 723 |
* | EMCOR Group, Inc. | 27,300 | 719 |
| Trinity Industries, Inc. | 27,060 | 696 |
* | Sykes Enterprises, Inc. | 30,900 | 679 |
| Hubbell Inc. Class B | 19,100 | 669 |
| Belden Inc. | 20,900 | 665 |
* | RSC Holdings Inc. | 57,500 | 653 |
* | GrafTech International Ltd. | 41,900 | 633 |
* | Gardner Denver Inc. | 17,900 | 621 |
| Steelcase Inc. | 56,574 | 608 |
* | American Reprographics Co. | 35,200 | 607 |
* | TransDigm Group, Inc. | 17,600 | 602 |
| Lennox International Inc. | 17,448 | 581 |
| Arkansas Best Corp. | 17,200 | 579 |
* | United Rentals, Inc. | 37,319 | 569 |
| Triumph Group, Inc. | 12,100 | 553 |
| Pacer International, Inc. | 33,300 | 548 |
* | Esterline Technologies Corp. | 13,800 | 546 |
| Genco Shipping and | | |
| Trading Ltd. | 16,100 | 535 |
| Mueller Industries Inc. | 23,200 | 534 |
* | Polypore International Inc. | 24,800 | 533 |
* | United Stationers, Inc. | 11,141 | 533 |
* | Republic Airways | | |
| Holdings Inc. | 51,700 | 527 |
* | Alliant Techsystems, Inc. | 5,600 | 526 |
| Gibraltar Industries Inc. | 27,800 | 520 |
* | Columbus McKinnon Corp. | 21,900 | 516 |
* | FTI Consulting, Inc. | 7,000 | 506 |
| Ryder System, Inc. | 8,009 | 497 |
* | MPS Group, Inc. | 49,250 | 496 |
* | Perini Corp. | 18,600 | 480 |
| Herman Miller, Inc. | 19,400 | 475 |
14
| | | Market |
| | | Value• |
| | Shares | ($000) |
| Robbins & Myers, Inc. | 15,300 | 473 |
| Lindsay Manufacturing Co. | 6,400 | 466 |
| Titan International, Inc. | 21,300 | 454 |
| Textainer Group Holdings Ltd. | 29,500 | 448 |
| Apogee Enterprises, Inc. | 29,342 | 441 |
* | Chart Industries, Inc. | 14,900 | 426 |
* | Tecumseh Products Co. | | |
| Class A | 16,700 | 418 |
| Deluxe Corp. | 28,000 | 403 |
| Applied Industrial | | |
| Technology, Inc. | 14,600 | 393 |
| CIRCOR International, Inc. | 8,500 | 369 |
| A.O. Smith Corp. | 9,300 | 364 |
* | NCI Building Systems, Inc. | 10,800 | 343 |
* | First Advantage Corp. | | |
| Class A | 22,800 | 320 |
* | Consolidated Graphics, Inc. | 9,753 | 296 |
* | TBS International Ltd. | 20,600 | 277 |
| Skywest, Inc. | 14,600 | 233 |
* | Cenveo Inc. | 29,400 | 226 |
* | Corrections Corp. of America | 9,000 | 224 |
| IKON Office Solutions, Inc. | 13,100 | 223 |
| Armstrong Worldwide | | |
| Industries, Inc. | 7,700 | 223 |
| The Manitowoc Co., Inc. | 13,800 | 215 |
| CDI Corp. | 8,900 | 199 |
* | Rush Enterprises, Inc. | | |
| Class A | 14,298 | 183 |
* | Interline Brands, Inc. | 11,200 | 182 |
| Carlisle Co., Inc. | 5,200 | 156 |
* | General Cable Corp. | 3,900 | 139 |
* | M&F Worldwide Corp. | 3,000 | 120 |
* | Ceradyne, Inc. | 2,100 | 77 |
* | Thomas & Betts Corp. | 1,800 | 70 |
| | | 32,660 |
Information Technology (16.4%) | | |
* | Mettler-Toledo | | |
| International Inc. | 10,166 | 996 |
* | Sybase, Inc. | 27,582 | 845 |
* | ManTech International Corp. | 12,925 | 766 |
* | QLogic Corp. | 49,600 | 762 |
* | Anixter International Inc. | 12,800 | 762 |
* | Compuware Corp. | 75,000 | 727 |
| Diebold, Inc. | 21,400 | 708 |
* | Tech Data Corp. | 22,400 | 669 |
* | Metavante Technologies | 34,600 | 666 |
* | MICROS Systems, Inc. | 24,548 | 654 |
* | 3Com Corp. | 278,000 | 648 |
* | Skyworks Solutions, Inc. | 76,700 | 641 |
* | j2 Global | | |
| Communications, Inc. | 27,400 | 640 |
* | EarthLink, Inc. | 74,700 | 635 |
* | Interwoven Inc. | 44,828 | 633 |
* | SAIC, Inc. | 31,100 | 629 |
* | Sohu.com Inc. | 10,800 | 602 |
* | Integrated Device | | |
| Technology Inc. | 77,200 | 601 |
* | Progress Software Corp. | 22,800 | 593 |
* | Cabot Microelectronics Corp. | 17,800 | 571 |
* | Amkor Technology, Inc. | 86,165 | 549 |
* | Plexus Corp. | 26,265 | 544 |
* | Net 1 UEPS | | |
| Technologies, Inc. | 24,300 | 543 |
* | Brocade Communications | | |
| Systems, Inc. | 92,200 | 537 |
* | Sapient Corp. | 71,900 | 534 |
* | TNS Inc. | 27,300 | 529 |
| United Online, Inc. | 55,900 | 526 |
* | SPSS, Inc. | 17,560 | 516 |
* | Checkpoint Systems, Inc. | 27,300 | 514 |
* | iGATE Corp. | 57,471 | 498 |
* | Starent Networks Corp. | 38,300 | 496 |
* | JDA Software Group, Inc. | 32,400 | 493 |
* | MKS Instruments, Inc. | 24,700 | 492 |
* | S1 Corp. | 79,218 | 485 |
* | Fairchild Semiconductor | | |
| International, Inc. | 54,200 | 482 |
* | Silicon Image, Inc. | 90,200 | 482 |
| Syntel, Inc. | 19,352 | 474 |
* | TriQuint Semiconductor, Inc. | 98,100 | 470 |
* | Dolby Laboratories Inc. | 13,280 | 467 |
* | Avocent Corp. | 22,200 | 454 |
* | Vignette Corp. | 41,000 | 440 |
* | Insight Enterprises, Inc. | 31,900 | 428 |
* | Multi-Fineline Electronix, Inc. | 28,900 | 427 |
* | ADC | | |
| Telecommunications, Inc. | 50,500 | 427 |
| Technitrol, Inc. | 28,490 | 421 |
| Methode Electronics, Inc. | | |
| Class A | 46,900 | 419 |
* | UTStarcom, Inc. | 120,800 | 407 |
* | OmniVision | | |
| Technologies, Inc. | 34,400 | 392 |
* | Emulex Corp. | 34,370 | 367 |
* | Genpact, Ltd. | 32,200 | 334 |
* | Gartner, Inc. Class A | 14,700 | 333 |
* | Tekelec | 23,700 | 332 |
* | Internet Brands Inc. | 45,900 | 320 |
| Marchex, Inc. | 29,900 | 308 |
* | Verigy Ltd. | 18,700 | 304 |
* | Lawson Software, Inc. | 41,500 | 290 |
* | ModusLink Global | | |
| Solutions, Inc. | 28,800 | 277 |
* | AsiaInfo Holdings, Inc. | 29,700 | 273 |
* | Quantum Corp. | 243,700 | 263 |
* | Novell, Inc. | 47,600 | 245 |
*,^ | Sigma Designs, Inc. | 16,900 | 240 |
* | Semtech Corp. | 16,500 | 230 |
15
| | | Market | |
| | | Value• | |
| | Shares | ($000) | |
* | Silicon Laboratories Inc. | 6,900 | 212 | |
* | Monolithic Power Systems | 12,100 | 210 | |
* | ATMI, Inc. | 10,100 | 182 | |
* | CSG Systems | | | |
| International, Inc. | 9,684 | 170 | |
* | Kenexa Corp. | 9,700 | 153 | |
| Jack Henry & | | | |
| Associates Inc. | 6,600 | 134 | |
* | ANADIGICS, Inc. | 45,600 | 128 | |
* | NeuStar, Inc. Class A | 4,800 | 95 | |
| InfoSpace, Inc. | 4,700 | 51 | |
* | Comtech | | | |
| Telecommunications Corp. | 900 | 44 | |
* | Mastech Holdings, Inc. | 3,831 | 29 | |
* | Eagle Test Systems, Inc. | 1,800 | 28 | |
| Micrel, Inc. | 2,100 | 19 | |
* | ON Semiconductor Corp. | 2,000 | 13 | |
| | | 32,778 | |
Materials (4.5%) | | |
| Greif Inc. Class A | 11,934 | 783 | |
| Rock-Tenn Co. | 18,800 | 752 | |
| Olin Corp. | 36,200 | 702 | |
| Compass Minerals | | | |
| International, Inc. | 12,300 | 644 | |
| Cytec Industries, Inc. | 16,300 | 634 | |
| Koppers Holdings, Inc. | 14,700 | 550 | |
| Worthington Industries, Inc. | 33,200 | 496 | |
| Airgas, Inc. | 9,600 | 477 | |
| Hercules, Inc. | 23,900 | 473 | |
| Innophos Holdings Inc. | 19,300 | 471 | |
| Schnitzer Steel | | | |
| Industries, Inc. Class A | 11,200 | 440 | |
* | Buckeye Technology, Inc. | 51,500 | 422 | |
| Carpenter Technology Corp. | 16,100 | 413 | |
* | W.R. Grace & Co. | 24,100 | 364 | |
| Kaiser Aluminum Corp. | 7,700 | 331 | |
| Terra Industries, Inc. | 11,200 | 329 | |
| Silgan Holdings, Inc. | 5,311 | 271 | |
* | Rockwood Holdings, Inc. | 8,200 | 210 | |
| H.B. Fuller Co. | 9,400 | 196 | |
| | | 8,958 | |
Telecommunication Services (1.1%) | | |
* | Syniverse Holdings Inc. | 34,840 | 579 | |
* | Cincinnati Bell Inc. | 160,300 | 495 | |
* | Premiere Global | | | |
| Services, Inc. | 35,200 | 495 | |
| Atlantic Tele-Network, Inc. | 11,100 | 311 | |
| NTELOS Holdings Corp. | 4,800 | 129 | |
* | Centennial | | | |
| Communications Corp. | | | |
| Class A | 19,610 | 122 | |
* | iPCS, Inc. | 3,800 | 85 | |
| | | 2,216 | |
Utilities (4.1%) | | |
| Hawaiian Electric | | |
| Industries Inc. | 31,100 | 902 |
| Atmos Energy Corp. | 33,600 | 894 |
| ITC Holdings Corp. | 16,500 | 854 |
| Portland General Electric Co. | 30,400 | 719 |
| Cleco Corp. | 28,300 | 715 |
| Northwest Natural Gas Co. | 12,500 | 650 |
| Empire District Electric Co. | 30,000 | 641 |
| UIL Holdings Corp. | 18,300 | 628 |
| NorthWestern Corp. | 24,600 | 618 |
| The Laclede Group, Inc. | 9,300 | 451 |
| Southwest Gas Corp. | 8,800 | 266 |
| Avista Corp. | 10,800 | 235 |
| National Fuel Gas Co. | 4,500 | 190 |
| Energen Corp. | 3,844 | 174 |
| MGE Energy, Inc. | 4,100 | 146 |
| CMS Energy Corp. | 7,200 | 90 |
| Vectren Corp. | 1,410 | 39 |
| | | 8,212 |
Total Common Stocks | | |
(Cost $220,063) | | 197,632 |
Temporary Cash Investments (1.8%)1 | |
Money Market Fund (1.7%) | |
2,3 | Vanguard Market | | |
| Liquidity Fund, 2.296% | 3,455,257 | 3,455 |
| | | |
| | | |
| | Face | |
| | Amount | |
| | ($000) | |
U.S. Government Agency Obligation (0.1%) |
4,5 | Federal Home Loan Bank, | | |
| 2.432%, 10/15/08 | 200 | 200 |
Total Temporary Cash Investments | |
(Cost $3,655) | | 3,655 |
Total Investments (100.7%) | | |
(Cost $223,718) | | 201,287 |
Other Assets and Liabilities (–0.7%) | |
Other Assets | | 3,746 |
Liabilities3 | | (5,235) |
| | | (1,489) |
Net Assets (100%) | | |
Applicable to 12,033,035 outstanding | |
$.001 par value shares of beneficial | |
interest (unlimited authorization) | 199,798 |
Net Asset Value Per Share | | $16.60 |
| | | | | |
At September 30, 2008, net assets consisted of: |
| Amount |
| ($000) |
Paid-in Capital | 243,538 |
Undistributed Net Investment Income | 909 |
Accumulated Net Realized Losses | (22,078) |
Unrealized Appreciation (Depreciation) | |
Investment Securities | (22,431) |
Futures Contracts | (140) |
Net Assets | 199,798 |
• See Note A in Notes to Financial Statements.
* Non-income-producing security.
^ Part of security position is on loan to broker-dealers. The total value of securities on loan is $1,190,000.
1 The fund invests a portion of its cash reserves in equity markets through the use of index futures contracts. After giving effect to futures investments, the fund’s effective common stock and temporary cash investment positions represent 99.9% and 0.8%, respectively, of net assets.
2 Affiliated money market fund available only to Vanguard funds and certain trusts and accounts managed by Vanguard. Rate shown is the 7-day yield.
3 Includes $1,291,000 of collateral received for securities on loan.
4 Securities with a value of $200,000 have been segregated as initial margin for open futures contracts.
5 The issuer operates under a congressional charter; its securities are neither issued nor guaranteed by the U.S. government. REIT—Real Estate Investment Trust.
See accompanying Notes, which are an integral part of the Financial Statements.
17
Statement of Operations
| Year Ended |
| September 30, 2008 |
| ($000) |
Investment Income | |
Income | |
Dividends | 2,433 |
Interest1 | 66 |
Security Lending | 178 |
Total Income | 2,677 |
Expenses | |
The Vanguard Group—Note B | |
Investment Advisory Services | 161 |
Management and Administrative | 555 |
Marketing and Distribution | 58 |
Custodian Fees | 34 |
Auditing Fees | 23 |
Shareholders’ Reports | 9 |
Total Expenses | 840 |
Net Investment Income | 1,837 |
Realized Net Gain (Loss) | |
Investment Securities Sold | (20,654) |
Futures Contracts | (141) |
Realized Net Gain (Loss) | (20,795) |
Change in Unrealized Appreciation (Depreciation) | |
Investment Securities | (33,210) |
Futures Contracts | (149) |
Change in Unrealized Appreciation (Depreciation) | (33,359) |
Net Increase (Decrease) in Net Assets Resulting from Operations | (52,317) |
1 Interest income from an affiliated company of the fund was $46,000.
See accompanying Notes, which are an integral part of the Financial Statements.
18
Statement of Changes in Net Assets
| Year Ended September 30, |
| 2008 | 2007 |
| ($000) | ($000) |
Increase (Decrease) in Net Assets | | |
Operations | | |
Net Investment Income | 1,837 | 2,529 |
Realized Net Gain (Loss) | (20,795) | 3,133 |
Change in Unrealized Appreciation (Depreciation) | (33,359) | 15,604 |
Net Increase (Decrease) in Net Assets Resulting from Operations | (52,317) | 21,266 |
Distributions | | |
Net Investment Income | (2,555) | (1,472) |
Realized Capital Gain1 | (1,837) | — |
Total Distributions | (4,392) | (1,472) |
Capital Share Transactions | | |
Issued | 79,470 | 132,076 |
Issued in Lieu of Cash Distributions | 3,832 | 1,347 |
Redeemed | (83,796) | (76,625) |
Net Increase (Decrease) from Capital Share Transactions | (494) | 56,798 |
Total Increase (Decrease) | (57,203) | 76,592 |
Net Assets | | |
Beginning of Period | 257,001 | 180,409 |
End of Period2 | 199,798 | 257,001 |
1 Includes fiscal 2008 short-term gain distributions totaling $657,000. Short-term gain distributions are treated as ordinary income dividends for tax purposes.
2 Net Assets—End of Period includes undistributed net investment income of $909,000 and $1,627,000. See accompanying Notes, which are an integral part of the Financial Statements.
19
Financial Highlights
| | | |
| | April 20, |
| Year Ended | 20061 to |
| September 30, | Sept. 30, |
For a Share Outstanding Throughout Each Period | 2008 | 2007 | 2006 |
Net Asset Value, Beginning of Period | $21.28 | $19.04 | $20.00 |
Investment Operations | | | |
Net Investment Income | .160 | .220 | .090 |
Net Realized and Unrealized Gain (Loss) on Investments | (4.479) | 2.170 | (1.050) |
Total from Investment Operations | (4.319) | 2.390 | (.960) |
Distributions | | | |
Dividends from Net Investment Income | (.210) | (.150) | — |
Distributions from Realized Capital Gains | (.151) | — | — |
Total Distributions | (.361) | (.150) | — |
Net Asset Value, End of Period | $16.60 | $21.28 | $19.04 |
| | | |
| | | |
Total Return2 | –20.50% | 12.58% | –4.85% |
| | | |
| | | |
Ratios/Supplemental Data | | | |
Net Assets, End of Period (Millions) | $200 | $257 | $180 |
Ratio of Total Expenses to Average Net Assets | 0.38% | 0.38% | 0.40%3 |
Ratio of Net Investment Income to Average Net Assets | 0.83% | 1.07% | 1.20%3 |
Portfolio Turnover Rate | 99% | 73% | 35% |
1 Subscription period for the fund was April 20, 2006, to April 24, 2006, during which time all assets were held in money market instruments. Performance measurement began April 24, 2006, at a net asset value of $20.01.
2 Total returns do not include the account service fee that may be applicable to certain accounts with balances below $10,000.
3 Annualized.
See accompanying Notes, which are an integral part of the Financial Statements.
20
Notes to Financial Statements
Vanguard Strategic Small-Cap Equity Fund is registered under the Investment Company Act of 1940 as an open-end investment company, or mutual fund.
A. The following significant accounting policies conform to generally accepted accounting principles for U.S. mutual funds. The fund consistently follows such policies in preparing its financial statements.
1. Security Valuation: Securities are valued as of the close of trading on the New York Stock Exchange (generally 4 p.m., Eastern time) on the valuation date. Equity securities are valued at the latest quoted sales prices or official closing prices taken from the primary market in which each security trades; such securities not traded on the valuation date are valued at the mean of the latest quoted bid and asked prices. Securities for which market quotations are not readily available, or whose values have been materially affected by events occurring before the fund’s pricing time but after the close of the securities’ primary markets, are valued by methods deemed by the board of trustees to represent fair value. Investments in Vanguard Market Liquidity Fund are valued at that fund’s net asset value. Temporary cash investments acquired over 60 days to maturity are valued using the latest bid prices or using valuations based on a matrix system (which considers such factors as security prices, yields, maturities, and ratings), both as furnished by independent pricing services. Other temporary cash investments are valued at amortized cost, which approximates market value.
2. Futures Contracts: The fund uses index futures contracts to a limited extent, with the objective of maintaining full exposure to the stock market while maintaining liquidity. The fund may purchase or sell futures contracts to achieve a desired level of investment, whether to accommodate portfolio turnover or cash flows from capital share transactions. The primary risks associated with the use of futures contracts are imperfect correlation between changes in market values of stocks held by the fund and the prices of futures contracts, and the possibility of an illiquid market.
Futures contracts are valued at their quoted daily settlement prices. The aggregate principal amounts of the contracts are not recorded in the Statement of Net Assets. Fluctuations in the value of the contracts are recorded in the Statement of Net Assets as an asset (liability) and in the Statement of Operations as unrealized appreciation (depreciation) until the contracts are closed, when they are recorded as realized futures gains (losses).
3. Federal Income Taxes: The fund intends to continue to qualify as a regulated investment company and distribute all of its taxable income. Management has analyzed the fund’s tax positions taken on federal income tax returns for all open tax years (tax years ended September 30, 2006–2008), and has concluded that no provision for federal income tax is required in the fund’s financial statements.
4. Distributions: Distributions to shareholders are recorded on the ex-dividend date.
5. Security Lending: The fund may lend its securities to qualified institutional borrowers to earn additional income. Security loans are required to be secured at all times by collateral at least equal to the market value of securities loaned. The fund invests cash collateral received in Vanguard Market Liquidity Fund, and records a liability for the return of the collateral, during the period the securities are on loan. Security lending income represents the income earned on investing cash collateral, less expenses associated with the loan.
6. Other: Dividend income is recorded on the ex-dividend date. Interest income includes income distributions received from Vanguard Market Liquidity Fund and is accrued daily. Security transactions are accounted for on the date securities are bought or sold. Costs used to determine realized gains (losses) on the sale of investment securities are those of the specific securities sold.
21
B. The Vanguard Group furnishes at cost investment advisory, corporate management, administrative, marketing, and distribution services. The costs of such services are allocated to the fund under methods approved by the board of trustees. The fund has committed to provide up to 0.40% of its net assets in capital contributions to Vanguard. At September 30, 2008, the fund had contributed capital of $19,000 to Vanguard (included in Other Assets), representing 0.01% of the fund’s net assets and 0.02% of Vanguard’s capitalization. The fund’s trustees and officers are also directors and officers of Vanguard.
C. Distributions are determined on a tax basis and may differ from net investment income and realized capital gains for financial reporting purposes. Differences may be permanent or temporary. Permanent differences are reclassified among capital accounts in the financial statements to reflect their tax character. Temporary differences arise when certain items of income, expense, gain, or loss are recognized in different periods for financial statement and tax purposes; these differences will reverse at some time in the future. Differences in classification may also result from the treatment of short-term gains as ordinary income for tax purposes.
For tax purposes, at September 30, 2008, the fund had $1,183,000 of ordinary income available for distribution. Tax-basis capital gains required to be distributed in December 2007 included net gains realized through October 31, 2007. Subsequently, the fund realized capital losses of $22,223,000, which are available to offset future net capital gains.
At September 30, 2008, the cost of investment securities for tax purposes was $223,718,000. Net unrealized depreciation of investment securities for tax purposes was $22,431,000, consisting of unrealized gains of $12,842,000 on securities that had risen in value since their purchase and $35,273,000 in unrealized losses on securities that had fallen in value since their purchase.
At September 30, 2008, the aggregate settlement value of open futures contracts expiring in December 2008 and the related unrealized appreciation (depreciation) were:
| | | ($000) |
| Number of | Aggregate | Unrealized |
| Long (Short) | Settlement | Appreciation |
Futures Contracts | Contracts | Value | (Depreciation) |
E-mini Russell 2000 Index | 31 | 2,103 | (140) |
Unrealized appreciation (depreciation) on open futures contracts is required to be treated as realized gain (loss) for tax purposes.
D. During the year ended September 30, 2008, the fund purchased $219,318,000 of investment securities and sold $222,321,000 of investment securities, other than temporary cash investments.
22
E. Capital shares issued and redeemed were:
| Year Ended September 30, |
| 2008 | 2007 |
| Shares | Shares |
| (000) | (000) |
Issued | 4,152 | 6,183 |
Issued in Lieu of Cash Distributions | 203 | 65 |
Redeemed | (4,398) | (3,649) |
Net Increase (Decrease) in Shares Outstanding | (43) | 2,599 |
F. In September 2006, the Financial Accounting Standards Board issued Statement of Financial Accounting Standards No. 157 (“FAS 157”), “Fair Value Measurements.” FAS 157 establishes a framework for measuring fair value and expands disclosures about fair value measurements in financial statements.
The various inputs that may be used to determine the value of the fund’s investments are summarized in three broad levels. The inputs or methodologies used for valuing securities are not necessarily an indication of the risk associated with investing in those securities.
Level 1—Quoted prices in active markets for identical securities.
Level 2—Other significant observable inputs (including quoted prices for similar securities, interest rates, prepayment speeds, credit risk, etc.).
Level 3—Significant unobservable inputs (including the fund’s own assumptions used to determine the fair value of investments).
The following table summarizes the fund’s investments as of September 30, 2008, based on the inputs used to value them:
| Investments |
| in Securities |
Valuation Inputs | ($000) |
Level 1—Quoted prices | 201,087 |
Level 2—Other significant observable inputs | 200 |
Level 3—Significant unobservable inputs | — |
Total | 201,287 |
23
Report of Independent Registered
Public Accounting Firm
To the Trustees of Vanguard Horizon Funds and the Shareholders of Vanguard Strategic Small-Cap Equity Fund:
In our opinion, the accompanying statement of net assets and the related statements of operations and of changes in net assets and the financial highlights present fairly, in all material respects, the financial position of Vanguard Strategic Small-Cap Equity Fund (the “Fund”) at September 30, 2008, the results of its operations for the year then ended, the changes in its net assets for each of the two years in the period then ended, and the financial highlights for each of the periods indicated, in conformity with accounting principles generally accepted in the United States of America. These financial statements and financial highlights (hereafter referred to as “financial statements”) are the responsibility of the Fund’s management; our responsibility is to express an opinion on these financial statements based on our audits. We conducted our audits of these financial statements in accordance with the standards of the Public Company Accounting Oversight Board (United States). Those standards require that we plan and perform the audit to obtain reasonable assurance about whether the financial statements are free of material misstatement. An audit includes examining, on a test basis, evidence supporting the amounts and disclosures in the financial statements, assessing the accounting principles used and significant estimates made by management, and evaluating the overall financial statement presentation. We believe that our audits, which included confirmation of securities at September 30, 2008 by correspondence with the custodian and broker, and by agreement to the underlying ownership records for Vanguard Market Liquidity Fund, provide a reasonable basis for our opinion.
PricewaterhouseCoopers LLP
Philadelphia, Pennsylvania
November 19, 2008
Special 2008 tax information (unaudited) for Vanguard Strategic Small-Cap Equity Fund
This information for the fiscal year ended September 30, 2008, is included pursuant to provisions of the Internal Revenue Code.
The fund distributed $1,180,000 as capital gain dividends (from net long-term capital gains) to shareholders during the fiscal year.
For non-resident alien shareholders, 100% of short-term capital gain dividends distributed by the fund are qualified short-term gains.
The fund distributed $2,445,000 of qualified dividend income to shareholders during the fiscal year.
For corporate shareholders, 70.8% of investment income (dividend income plus short-term gains, if any) qualifies for the dividends-received deduction.
24
Your Fund’s After-Tax Returns
This table presents returns for your fund both before and after taxes. The after-tax returns are shown in two ways: (1) assuming that an investor owned the fund during the entire period and paid taxes on the fund’s distributions, and (2) assuming that an investor paid taxes on the fund’s distributions and sold all shares at the end of each period.
Calculations are based on the highest individual federal income tax and capital gains tax rates in effect at the times of the distributions and the hypothetical sales. State and local taxes were not considered. After-tax returns reflect any qualified dividend income, using actual prior-year figures and estimates for 2008. (In the example, returns after the sale of fund shares may be higher than those assuming no sale. This occurs when the sale would have produced a capital loss. The calculation assumes that the investor received a tax deduction for the loss.)
Please note that your actual after-tax returns will depend on your tax situation and may differ from those shown. Also note that if you own the fund in a tax-deferred account, such as an individual retirement account or a 401(k) plan, this information does not apply to you. Such accounts are not subject to current taxes.
Finally, keep in mind that a fund’s performance—whether before or after taxes—does not guarantee future results.
Average Annual Total Returns: Strategic Small-Cap Equity Fund1 |
Periods Ended September 30, 2008 | | |
| One | Since |
| Year | Inception2 |
Returns Before Taxes | –20.50% | –6.38% |
Returns After Taxes on Distributions | –20.78 | –6.57 |
Returns After Taxes on Distributions and Sale of Fund Shares | –13.02 | –5.39 |
1 Total returns do not include the account service fee that may be applicable to certain accounts with balances below $10,000.
2 April 24, 2006.
25
About Your Fund’s Expenses
As a shareholder of the fund, you incur ongoing costs, which include costs for portfolio management, administrative services, and shareholder reports (like this one), among others. Operating expenses, which are deducted from a fund’s gross income, directly reduce the investment return of the fund.
A fund’s expenses are expressed as a percentage of its average net assets. This figure is known as the expense ratio. The following examples are intended to help you understand the ongoing costs (in dollars) of investing in your fund and to compare these costs with those of other mutual funds. The examples are based on an investment of $1,000 made at the beginning of the period shown and held for the entire period.
The accompanying table illustrates your fund’s costs in two ways:
• Based on actual fund return. This helps you to estimate the actual expenses that you paid over the period. The “Ending Account Value” shown is derived from the fund’s actual return, and the third column shows the dollar amount that would have been paid by an investor who started with $1,000 in the fund. You may use the information here, together with the amount you invested, to estimate the expenses that you paid over the period.
To do so, simply divide your account value by $1,000 (for example, an $8,600 account value divided by $1,000 = 8.6), then multiply the result by the number given for your fund under the heading “Expenses Paid During Period.”
• Based on hypothetical 5% yearly return. This section is intended to help you compare your fund’s costs with those of other mutual funds. It assumes that the fund had a yearly return of 5% before expenses, but that the expense ratio is unchanged. In this case—because the return used is not the fund’s actual return—the results do not apply to your investment. The example is useful in making comparisons because the Securities and Exchange Commission requires all mutual funds to calculate expenses based on a 5% return. You can assess your fund’s costs by comparing this hypothetical example with the hypothetical examples that appear in shareholder reports of other funds.
Six Months Ended September 30, 2008 | | | |
| Beginning | Ending | Expenses |
| Account Value | Account Value | Paid During |
Strategic Small-Cap Equity Fund | 3/31/2008 | 9/30/2008 | Period1 |
Based on Actual Fund Return | $1,000.00 | $935.74 | $1.94 |
Based on Hypothetical 5% Yearly Return | 1,000.00 | 1,023.06 | 2.03 |
Note that the expenses shown in the table are meant to highlight and help you compare ongoing costs only and do not reflect transaction costs incurred by the fund for buying and selling securities. Further, the expenses do not include the account service fee described in the prospectus. If such a fee were applied to your account, your costs would be higher. Your fund does not charge transaction fees, such as purchase or redemption fees, nor does it carry a “sales load.”
1 The calculations are based on expenses incurred in the most recent six-month period. The fund’s annualized six-month expense ratio for that period is 0.40%. The dollar amounts shown as “Expenses Paid” are equal to the annualized expense ratio multiplied by the average account value over the period, multiplied by the number of days in the most recent six-month period, then divided by the number of days in the most recent 12-month period.
26
The calculations assume no shares were bought or sold during the period. Your actual costs may have been higher or lower, depending on the amount of your investment and the timing of any purchases or redemptions.
You can find more information about the fund’s expenses, including annual expense ratios, in the Financial Statements section of this report. For additional information on operating expenses and other shareholder costs, please refer to your fund’s current prospectus.
27
Glossary
Earnings Growth Rate. The average annual rate of growth in earnings over the past five years for the stocks now in a fund.
Equity Exposure. A measure that reflects a fund’s investments in stocks and stock futures. Any holdings in short-term reserves are excluded.
Expense Ratio. The percentage of a fund’s average net assets used to pay its annual administrative and advisory expenses. These expenses directly reduce returns to investors.
Foreign Holdings. The percentage of a fund represented by stocks or depositary receipts of companies based outside the United States.
Inception Date. The date on which the assets of a fund (or one of its share classes) are first invested in accordance with the fund’s investment objective. For funds with a subscription period, the inception date is the day after that period ends. Investment performance is measured from the inception date.
Median Market Cap. An indicator of the size of companies in which a fund invests; the midpoint of market capitalization (market price x shares outstanding) of a fund’s stocks, weighted by the proportion of the fund’s assets invested in each stock. Stocks representing half of the fund’s assets have market capitalizations above the median, and the rest are below it.
Price/Book Ratio. The share price of a stock divided by its net worth, or book value, per share. For a fund, the weighted average price/book ratio of the stocks it holds.
Price/Earnings Ratio. The ratio of a stock’s current price to its per-share earnings over the past year. For a fund, the weighted average P/E of the stocks it holds. P/E is an indicator of market expectations about corporate prospects; the higher the P/E, the greater the expectations for a company’s future growth.
Return on Equity. The annual average rate of return generated by a company during the past five years for each dollar of shareholder’s equity (net income divided by shareholder’s equity). For a fund, the weighted average return on equity for the companies whose stocks it holds.
Short-Term Reserves. The percentage of a fund invested in highly liquid, short-term securities that can be readily converted to cash.
Turnover Rate. An indication of the fund’s trading activity. Funds with high turnover rates incur higher transaction costs and may be more likely to distribute capital gains (which may be taxable to investors). The turnover rate excludes in-kind transactions, which have minimal impact on costs.
Yield. A fund’s 30-day SEC yield is derived using a formula specified by the U.S. Securities and Exchange Commission. Under the formula, data related to the fund’s security holdings in the previous 30 days are used to calculate the fund’s hypothetical net income for that period, which is then annualized and divided by the fund’s estimated average net assets over the calculation period. For the purposes of this calculation, a security’s income is based on its current market yield to maturity (in the case of bonds) or its projected dividend yield (for stocks). Because the SEC yield represents hypothetical annualized income, it will differ—at times significantly—from the fund’s actual experience. As a result, the fund’s income distributions may be higher or lower than implied by the SEC yield.
28
This page intentionally left blank.
This page intentionally left blank.
This page intentionally left blank.
The People Who Govern Your Fund
The trustees of your mutual fund are there to see that the fund is operated and managed in your best interests since, as a shareholder, you are a part owner of the fund. Your fund’s trustees also serve on the board of directors of The Vanguard Group, Inc., which is owned by the Vanguard funds and provides services to them on an at-cost basis.
A majority of Vanguard’s board members are independent, meaning that they have no affiliation with Vanguard or the funds they oversee, apart from the sizable personal investments they have made as private individuals.
Our independent board members bring distinguished backgrounds in business, academia, and public service to their task of working with Vanguard officers to establish the policies and oversee the activities of the funds. Among board members’ responsibilities are selecting investment advisors for the funds; monitoring fund operations, performance, and costs; reviewing contracts; nominating and selecting new trustees/directors; and electing Vanguard officers.
Each trustee serves a fund until its termination; or until the trustee’s retirement, resignation, or death; or otherwise as specified in the fund’s organizational documents. Any trustee may be removed at a shareholders’ meeting by a vote representing two-thirds of the net asset value of all shares of the fund together with shares of other Vanguard funds organized within the same trust. The table on these two pages shows information for each trustee and executive officer of the fund. The mailing address of the trustees and officers is P.O. Box 876, Valley Forge, PA 19482.
Chairman of the Board and Trustee
John J. Brennan1
Born 1954 Principal Occupation(s) During the Past Five Years: Chairman of the Board and Director/ Trustee Since May 1987; Trustee of The Vanguard Group, Inc., and of each of the investment companies served Chairman of the Board by The Vanguard Group; Chief Executive Officer and President of The Vanguard Group 156 Vanguard Funds Overseen and of each of the investment companies served by The Vanguard Group (1996–2008).
Independent Trustees
Charles D. Ellis
Born 1937 Principal Occupation(s) During the Past Five Years: Applecore Partners (pro bono ventures Trustee Since January 2001 in education); Senior Advisor to Greenwich Associates (international business strategy 156 Vanguard Funds Overseen consulting); Successor Trustee of Yale University; Overseer of the Stern School of Business at New York University; Trustee of the Whitehead Institute for Biomedical Research.
Emerson U. Fullwood
Born 1948 Principal Occupation(s) During the Past Five Years: Executive Chief Staff and Marketing Trustee Since January 2008 Officer for North America since 2004 and Corporate Vice President of Xerox Corporation 156 Vanguard Funds Overseen (photocopiers and printers); Director of SPX Corporation (multi-industry manufacturing), of the United Way of Rochester, and of the Boy Scouts of America.
Rajiv L. Gupta
Born 1945 Principal Occupation(s) During the Past Five Years: Chairman, President, and Trustee Since December 20012 Chief Executive Officer of Rohm and Haas Co. (chemicals); Board Member of 156 Vanguard Funds Overseen the American Chemistry Council; Director of Tyco International, Ltd. (diversified manufacturing and services) since 2005.
Amy Gutmann
Born 1949 Principal Occupation(s) During the Past Five Years: President of the University of
Trustee Since June 2006 Pennsylvania since 2004; Professor in the School of Arts and Sciences, Annenberg School 156 Vanguard Funds Overseen for Communication, and Graduate School of Education of the University of Pennsylvania since 2004; Provost (2001–2004) and Laurance S. Rockefeller Professor of Politics and the University Center for Human Values (1990–2004), Princeton University; Director of Carnegie Corporation of New York since 2005 and of Schuylkill River Development Corporation and Greater Philadelphia Chamber of Commerce since 2004; Trustee of the National Constitution Center since 2007.
JoAnn Heffernan Heisen
Born 1950 Principal Occupation(s) During the Past Five Years: Corporate Vice President and Trustee Since July 1998 Chief Global Diversity Officer since 2006, Vice President and Chief Information 156 Vanguard Funds Overseen Officer (1997–2005), and Member of the Executive Committee of Johnson & Johnson (pharmaceuticals/consumer products); Director of the University Medical Center at Princeton and Women’s Research and Education Institute.
André F. Perold
Born 1952 Principal Occupation(s) During the Past Five Years: George Gund Professor of Finance Trustee Since December 2004 and Banking, Harvard Business School; Senior Associate Dean and Director of Faculty 156 Vanguard Funds Overseen Recruiting, Harvard Business School; Director and Chairman of UNX, Inc. (equities trading firm); Chair of the Investment Committee of HighVista Strategies LLC (private investment firm) since 2005.
Alfred M. Rankin, Jr.
Born 1941 Principal Occupation(s) During the Past Five Years: Chairman, President, Chief Executive Trustee Since January 1993 Officer, and Director of NACCO Industries, Inc. (forklift trucks/housewares/lignite); Director 156 Vanguard Funds Overseen of Goodrich Corporation (industrial products/aircraft systems and services).
J. Lawrence Wilson
Born 1936 Principal Occupation(s) During the Past Five Years: Retired Chairman and Chief Executive Trustee Since April 1985 Officer of Rohm and Haas Co. (chemicals); Director of Cummins Inc. (diesel engines) and 156 Vanguard Funds Overseen AmerisourceBergen Corp. (pharmaceutical distribution); Trustee of Vanderbilt University and of Culver Educational Foundation.
Executive Officers1
Thomas J. Higgins
Born 1957 Principal Occupation(s) During the Past Five Years: Principal of The Vanguard Group, Inc.; Chief Financial Officer Treasurer of each of the investment companies served by The Vanguard Group; Chief Since September 2008 Financial Officer of each of the investment companies served by The Vanguard Treasurer Since July 1998 Group since 2008. 156 Vanguard Funds Overseen
F. William McNabb III
Born 1957 Principal Occupation(s) During the Past Five Years: Chief Executive Officer, Director, Chief Executive Officer and President of The Vanguard Group, Inc., since 2008; Chief Executive Officer and Since August 31, 2008 President of each of the investment companies served by The Vanguard Group since President Since March 2008 2008; Director of Vanguard Marketing Corporation; Managing Director of The Vanguard 156 Vanguard Funds Overseen Group (1995–2008).
Heidi Stam
Born 1956 Principal Occupation(s) During the Past Five Years: Managing Director of The Vanguard Secretary Since July 2005 Group, Inc., since 2006; General Counsel of The Vanguard Group since 2005; Secretary of 156 Vanguard Funds Overseen The Vanguard Group and of each of the investment companies served by The Vanguard Group since 2005; Director and Senior Vice President of Vanguard Marketing Corporation since 2005; Principal of The Vanguard Group (1997–2006).
Vanguard Senior Management Team | | |
| | | |
R. Gregory Barton | Kathleen C. Gubanich | Michael S. Miller | Glenn W. Reed |
Mortimer J. Buckley | Paul A. Heller | Ralph K. Packard | George U. Sauter |
Founder
John C. Bogle
Chairman and Chief Executive Officer, 1974–1996
1 These individuals are “interested persons” as defined in the Investment Company Act of 1940.
2 December 2002 for Vanguard Equity Income Fund, Vanguard Growth Equity Fund, the Vanguard Municipal Bond Funds, and the Vanguard State Tax-Exempt Funds.
More information about the trustees is in the Statement of Additional Information, available from The Vanguard Group.

P.O. Box 2600
Valley Forge, PA 19482-2600
Connect with Vanguard® > www.vanguard.com
Fund Information > 800-662-7447 | All comparative mutual fund data are from Lipper Inc. |
| or Morningstar, Inc., unless otherwise noted. |
Direct Investor Account Services > 800-662-2739 | |
| You can obtain a free copy of Vanguard’s proxy voting |
Institutional Investor Services > 800-523-1036 | |
| guidelines by visiting our website, www.vanguard.com, |
Text Telephone for People | and searching for “proxy voting guidelines,” or by |
With Hearing Impairment > 800-952-3335 | calling Vanguard at 800-662-2739. The guidelines are |
| also available from the SEC’s website, www.sec.gov. |
| In addition, you may obtain a free report on how your |
| fund voted the proxies for securities it owned during |
This material may be used in conjunction | the 12 months ended June 30. To get the report, visit |
with the offering of shares of any Vanguard | either www.vanguard.com or www.sec.gov. |
fund only if preceded or accompanied by | |
the fund’s current prospectus. | |
| |
| You can review and copy information about your fund |
| at the SEC’s Public Reference Room in Washington, D.C. |
| To find out more about this public service, call the SEC |
The funds or securities referred to herein are not | at 202-551-8090. Information about your fund is also |
sponsored, endorsed, or promoted by MSCI, and MSCI | available on the SEC’s website, and you can receive |
bears no liability with respect to any such funds or | copies of this information, for a fee, by sending a |
securities. For any such funds or securities, the | request in either of two ways: via e-mail addressed to |
prospectus or the Statement of Additional Information | publicinfo@sec.gov or via regular mail addressed to the |
contains a more detailed description of the limited | Public Reference Section, Securities and Exchange |
relationship MSCI has with The Vanguard Group and | Commission, Washington, DC 20549-0102. |
any related funds. | |
Russell is a trademark of The Frank Russell Company. | |
| |
| |
| |
| |
| |
| |
| |
| |
| |
| |
| © 2008 The Vanguard Group, Inc. |
| All rights reserved. |
| Vanguard Marketing Corporation, Distributor. |
| |
| Q6150 112008 |
Item 2: Code of Ethics. The Registrant has adopted a code of ethics that applies to the Registrant’s principal executive officer, principal financial officer, principal accounting officer or controller or persons performing similar functions. The Code of Ethics was amended during the reporting period covered by this report to make certain technical, non-material changes.
Item 3: Audit Committee Financial Expert. The following members of the Audit Committee have been determined by the Registrant’s Board of Trustees to be Audit Committee Financial Experts serving on its Audit Committee, and to be independent: Charles D. Ellis, Rajiv L. Gupta, JoAnn Heffernan Heisen, André F. Perold, Alfred M. Rankin, Jr., and J. Lawrence Wilson.
Item 4: Principal Accountant Fees and Services.
(a) Audit Fees.
Audit Fees of the Registrant
Fiscal Year Ended September 30, 2008: $100,000
Fiscal Year Ended September 30, 2007: $102,000
Aggregate Audit Fees of Registered Investment Companies in the Vanguard Group.
Fiscal Year Ended September 30, 2008: $3,055,590
Fiscal Year Ended September 30, 2007: $2,835,320
(b) Audit-Related Fees.
Fiscal Year Ended September 30, 2008: $626,240
Fiscal Year Ended September 30, 2007: $630,400
Includes fees billed in connection with assurance and related services provided to the Registrant, The Vanguard Group, Inc., Vanguard Marketing Corporation, and other registered investment companies in the Vanguard Group.
(c) Tax Fees.
Fiscal Year Ended September 30, 2008: $230,400
Fiscal Year Ended September 30, 2007: $215,900
Includes fees billed in connection with tax compliance, planning and advice services provided to the Registrant, The Vanguard Group, Inc., Vanguard Marketing Corporation, and other registered investment companies in the Vanguard Group and related to income and excise taxes.
(d) All Other Fees.
Fiscal Year Ended September 30, 2008: $0
Fiscal Year Ended September 30, 2007: $0
Includes fees billed for services related to risk management and privacy matters. Services were provided to the Registrant, The Vanguard Group, Inc., Vanguard Marketing Corporation, and other registered investment companies in the Vanguard Group.
(e) (1) Pre-Approval Policies. The policy of the Registrant’s Audit Committee is to consider and, if appropriate, approve before the principal accountant is engaged for such services, all specific audit and non-audit services provided to: (1) the Registrant; (2) The Vanguard Group, Inc.; (3) other entities controlled by The Vanguard Group, Inc. that provide ongoing services to the Registrant; and (4) other registered investment companies in the Vanguard Group. In making a determination, the Audit Committee considers whether the services are consistent with maintaining the principal accountant’s independence.
In the event of a contingency situation in which the principal accountant is needed to provide services in between scheduled Audit Committee meetings, the Chairman of the Audit Committee would be called on to consider and, if appropriate, pre-approve audit or permitted non-audit services in an amount sufficient to complete services through the next Audit Committee meeting, and to determine if such services would be
consistent with maintaining the accountant’s independence. At the next scheduled Audit Committee meeting, services and fees would be presented to the Audit Committee for formal consideration, and, if appropriate, approval by the entire Audit Committee. The Audit Committee would again consider whether such services and fees are consistent with maintaining the principal accountant’s independence.
The Registrant’s Audit Committee is informed at least annually of all audit and non-audit services provided by the principal accountant to the Vanguard complex, whether such services are provided to: (1) the Registrant; (2) The Vanguard Group, Inc.; (3) other entities controlled by The Vanguard Group, Inc. that provide ongoing services to the Registrant; or (4) other registered investment companies in the Vanguard Group.
(2) No percentage of the principal accountant’s fees or services were approved pursuant to the waiver provision of paragraph (c)(7)(i)(C) of Rule 2-01 of Regulation S-X.
(f) For the most recent fiscal year, over 50% of the hours worked under the principal accountant’s engagement were not performed by persons other than full-time, permanent employees of the principal accountant.
(g) Aggregate Non-Audit Fees.
Fiscal Year Ended September 30, 2008: $230,400
Fiscal Year Ended September 30, 2007: $215,900
Includes fees billed for non-audit services provided to the Registrant, The Vanguard Group, Inc., Vanguard Marketing Corporation, and other registered investment companies in the Vanguard Group.
(h) For the most recent fiscal year, the Audit Committee has determined that the provision of all non-audit services was consistent with maintaining the principal accountant’s independence.
Item 5: Not Applicable.
Item 6: Not Applicable.
Item 7: Not Applicable.
Item 8: Not Applicable.
Item 9: Not Applicable.
Item 10: Not Applicable.
Item 11: Controls and Procedures.
(a) Disclosure Controls and Procedures. The Principal Executive and Financial Officers concluded that the Registrant's Disclosure Controls and Procedures are effective based on their evaluation of the Disclosure Controls and Procedures as of a date within 90 days of the filing date of this report.
(b) Internal Control Over Financial Reporting. There were no significant changes in Registrant’s Internal Control Over Financial Reporting or in other factors that could significantly affect this control subsequent to the date of the evaluation, including any corrective actions with regard to significant deficiencies and material weaknesses.
Item 12: Exhibits.
(a) | Code of Ethics |
(b) | Certifications. |
Pursuant to the requirements of the Securities Exchange Act of 1934 and the Investment Company Act of 1940, the registrant has duly caused this report to be signed on its behalf by the undersigned, thereunto duly authorized.
| VANGUARD HORIZON FUNDS |
| |
BY: | /s/ F. WILLIAM MCNABB III* |
| F. WILLIAM MCNABB III |
| CHIEF EXECUTIVE OFFICER |
Date: November 18, 2008
Pursuant to the requirements of the Securities Exchange Act of 1934 and the Investment Company Act of 1940, this report has been signed below by the following persons on behalf of the registrant and in the capacities and on the dates indicated.
| VANGUARD HORIZON FUNDS |
| |
BY: | /s/ F. WILLIAM MCNABB III* |
| F. WILLIAM MCNABB III |
| CHIEF EXECUTIVE OFFICER |
Date: November 18, 2008
| VANGUARD HORIZON FUNDS |
| |
BY: | /s/ THOMAS J. HIGGINS * |
| THOMAS J. HIGGINS |
| CHIEF FINANCIAL OFFICER |
Date: November 18, 2008
* By: /s/ Heidi Stam
Heidi Stam, pursuant to a Power of Attorney filed on January 18, 2008, see file Number2-29601, Incorporated by Reference; and pursuant to a Power of Attorney filed on September 26, 2008, see File Number 2-47371, Incorporated by Reference.