UNITED STATES
SECURITIES AND EXCHANGE COMMISSION
Washington, D.C. 20549
FORM N-CSR
CERTIFIED SHAREHOLDER REPORT
OF
REGISTERED MANAGEMENT INVESTMENT COMPANIES
Investment Company Act file number: 811-07239
Name of Registrant: Vanguard Horizon Funds
Address of Registrant: | P.O. Box 2600 |
Name and address of agent for service: | Heidi Stam, Esquire |
Registrant’s telephone number, including area code: (610) 669-1000
Date of fiscal year end: September 30
Date of reporting period: October 1, 2006–September 30, 2007
Item 1: Reports to Shareholders |

> | Vanguard Strategic Equity Fund returned a solid 13.8% for the 2007 fiscal year, |
| with each sector making a positive contribution to the fund’s absolute return. |
| |
| |
> | The fund’s return significantly trailed that of its benchmark and the average |
| return for peer funds, most notably because of a change in market dynamics |
| that favored stocks with higher valuations. |
| |
| |
> | The fund’s ten-year average annual return of 9.7% matched the result of its |
| benchmark and slightly trailed the average return of its peers. |
Contents | |
| |
Your Fund’s Total Returns | 1 |
Chairman’s Letter | 2 |
Advisor’s Report | 7 |
Fund Profile | 9 |
Performance Summary | 10 |
Financial Statements | 11 |
Your Fund’s After-Tax Returns | 27 |
About Your Fund’s Expenses | 28 |
Glossary | 30 |
Please note: The opinions expressed in this report are just that—informed opinions. They should not be considered promises or advice. Also, please keep in mind that the information and opinions cover the period through the date on the cover of this report. Of course, the risks of investing in your fund are spelled out in the prospectus.
Your Fund’s Total Returns
Fiscal Year Ended September 30, 2007 | | |
| Ticker | Total |
| Symbol | Returns |
Vanguard Strategic Equity Fund | VSEQX | 13.8% |
MSCI US Small + Mid Cap 2200 Index | | 17.0 |
Average Mid-Cap Core Fund1 | | 17.9 |
Your Fund’s Performance at a Glance | | | | |
September 30, 2006–September 30, 2007 | | | |
| | | Distributions Per Share |
| Starting | Ending | Income | Capital |
| Share Price | Share Price | Dividends | Gains |
Vanguard Strategic Equity Fund | $23.07 | $24.94 | $0.260 | $0.980 |
1 Derived from data provided by Lipper Inc.
1

Chairman’s Letter
Dear Shareholder,
Vanguard Strategic Equity Fund returned 13.8% for the fiscal year ended September 30, 2007. Although a solid result in its own right, the fund’s return trailed the return of its benchmark and the average return of its competitive peers.
Broadly underlying the shortfall was a growing shift in investor preference during the year toward growth stocks and away from the more reasonably valued stocks favored by the fund’s advisor, Vanguard Quantitative Equity Group. This shift accelerated during the quarter ended September 30 as a result of shorter-term, worldwide concerns about the impact of the subprime mortgage market crises. This period of turbulence coincided with a sharp uptick in the prices of large-capitalization, growth-oriented stocks. The fund faced some headwinds, despite the balanced nature of its investment approach that gives it simultaneously, an exposure to attractively valued stocks and also stocks that have higher earnings growth. The valuation component hurt more than the growth exposure helped.
In other developments during the fiscal year, the fund was reopened to investors on November 9, 2006, and the minimum investment was raised to $10,000. The fund had been closed the previous April to moderate cash flow and to protect the interests of its shareholders.
2
Please note: Our preliminary estimates suggest that the fund will distribute capital gains of roughly $2.15 per share in December 2007. Also, if you hold the Strategic Equity Fund in a taxable account, you may wish to review our report on the fund’s after-tax returns on page 27.
Strong returns for U.S. stocks; even better for markets abroad
U.S. stocks produced excellent returns for the fiscal year. The gains came despite a midsummer shakeup brought on by problems in the subprime mortgage-loan market. Financials stocks—which represent a sizable share of the U.S. market’s value—were hardest hit, as investment banking and consumer lending businesses throttled back.
The broad U.S. equity market returned 17.1% for the year. Returns from large-capitalization stocks outpaced those of small-caps, and growth-oriented stocks outperformed their value-oriented counterparts. As investors took account of risk, they seemed to exhibit a preference for large-cap growth stocks, which seem better positioned to thrive in a period of economic uncertainty.
Although not immune from the effects of the turmoil in U.S. credit markets, international stocks handily surpassed the returns of domestic stocks over the 12 months. The dollar’s ongoing weakness further enhanced foreign market gains for U.S.-based investors.
Market Barometer | | | |
| Average Annual Total Returns |
| Periods Ended September 30, 2007 |
| One Year | Three Years | Five Years |
Stocks | | | |
Russell 1000 Index (Large-caps) | 16.9% | 13.8% | 16.0% |
Russell 2000 Index (Small-caps) | 12.3 | 13.4 | 18.8 |
Dow Jones Wilshire 5000 Index (Entire market) | 17.1 | 14.0 | 16.5 |
MSCI All Country World Index ex USA (International) | 31.1 | 26.5 | 26.3 |
| | | |
| | | |
Bonds | | | |
Lehman U.S. Aggregate Bond Index (Broad taxable market) | 5.1% | 3.9% | 4.1% |
Lehman Municipal Bond Index | 3.1 | 3.9 | 4.0 |
Citigroup 3-Month Treasury Bill Index | 5.0 | 4.0 | 2.8 |
| | | |
| | | |
CPI | | | |
Consumer Price Index | 2.8% | 3.2% | 2.9% |
| | | | | |
3
The bond market was shaken, but regained ground in the end
Turmoil in the corporate bond and subprime lending markets caused a “flight to quality” that drove prices of U.S. Treasury bonds sharply higher, particularly toward the end of the fiscal period. As the bonds’ prices rose, their yields fell. The declines were greatest among Treasury securities with the shortest maturities. The yield of the 3-month Treasury bill, which started the fiscal year at 4.89%, dropped more than a full percentage point to 3.81%.
As short-term yields fell, the yield curve—which illustrates the relationship between short- and long-term bond yields—returned to its usual, upward-sloping pattern. The curve had been mildly inverted at the start of the period, with yields of shorter-term bonds above those of longer-term issues. For the year ended September 30, the broad taxable bond market returned 5.1%. Returns from tax-exempt bonds were lower, as these issues did not benefit from the late-summer rally in Treasuries.
A positive year includes a second-half downshift
The second half of the fund’s fiscal year differed significantly from its first half. As you may recall from our semiannual report, the Strategic Equity Fund did quite well during the six months ended March 31, 2007, on both an absolute basis and relative to its benchmark. Its gains were restrained during the second
Expense Ratios1 | | |
Your fund compared with its peer group | | |
| | Average |
| | Mid-Cap |
| Fund | Core Fund |
Strategic Equity Fund | 0.30% | 1.83% |
1 Fund expense ratio reflects the 12 months ended September 30, 2007. Peer-group expense ratio is derived from data provided by Lipper Inc. and captures information through year-end 2006.
4
half by a negative return in the final fiscal quarter as investors favored large-cap stocks, as we discussed above.
More broadly, your fund’s investment methodology was under pressure during the entire year. It’s not unusual for an investment approach to be out of sync with the market from time to time, and fiscal 2007 was one of those periods. As described in more detail in the advisor’s letter on page 7, the fund seeks to limit its deviations from the market’s sector and industry weightings and risk characteristics. Instead, the fund relies on a sophisticated computer model to attempt to outperform its benchmark through superior security selection, and the success of this selection process is, of course, what determines the fund’s out- or underperformance.
The three components of the fund’s model work together to identify attractive stocks. One component seeks stocks that are favorably valued—investment bargains, so to speak. Another focuses on earnings quality, or growth potential. And a third component plugs into market sentiment, as reflected by the direction and pace of change in a stock’s price.
During the past year, the fund’s stock selections came up short more often than not. Stocks in the information technology, health care, and financials sectors were a significant source of underperformance.
Total Returns | |
Ten Years Ended September 30, 2007 | |
| Average |
| Annual Return |
Strategic Equity Fund | 9.7% |
Spliced Small and Mid Cap Index1 | 9.7 |
Average Mid-Cap Core Fund2 | 10.4 |
The figures shown represent past performance, which is not a guarantee of future results. (Current performance |
may be lower or higher than the performance data cited. For performance data current to the most recent month- |
end, visit our website at www.vanguard.com/performance.) Note, too, that both investment returns and principal |
value can fluctuate widely, so an investor’s shares, when sold, could be worth more or less than their original |
cost. |
1 The Spliced Small and Mid Cap Index reflects the returns of the Russell 2800 Index through May 31, 2003, and the MSCI US Small + Mid Cap 2200 Index thereafter.
2 Derived from data provided by Lipper Inc.
5
The financials sector, the largest weighting for both the fund and its benchmark, was most directly affected by the subprime mortgage crises.
Even so, the Strategic Equity Fund rang up a solid 13.8% return, and every sector made a positive contribution. About two-thirds of the fund’s absolute return came from stocks in the industrials, materials, and energy sectors.
Looking at a longer time horizon, the Strategic Equity Fund has recorded a 9.7% average annual total return for the ten years ended September 30, a period that includes one of the worst bear markets in modern financial history. This means that a hypothetical investment of $10,000 made in the fund ten years ago would have more than doubled to $25,334. The fund’s result matched that of its benchmark, but trailed slightly behind the performance of peer funds.
The fund’s methodology bypasses market fickleness
As we know, the stock market is unpredictable in the short run. The market experienced severe volatility during the final fiscal quarter amid fears associated with subprime mortgage lending and investing. During times like these, the discipline and consistency of Vanguard Strategic Equity Fund’s investment methodology can be invaluable. The advisor’s stock-selection model helps to immunize the fund’s portfolio against the emotional impulses that can occasionally bedevil even the most experienced and disciplined manager.
Like any fund employing an actively managed strategy, of course, this fund can be expected to go through periods of relative strength and weakness. Over the long term, however, we expect those periods of strength to more than offset the occasional downturns. When held as part of a portfolio that is balanced across stocks, bonds, and money market assets and diversified within each asset class, the Strategic Equity Fund offers you an excellent long-term wealth-building opportunity.
Thank you for entrusting your assets to Vanguard.
Sincerely,

John J. Brennan
Chairman and Chief Executive Officer
October 15, 2007
6
Advisor’s Report
For the fiscal year ended September 30, 2007, Vanguard Strategic Equity Fund returned 13.8%, underperforming the 17.0% return of the MSCI US Small + Mid Cap 2200 Index. The entire U.S. stock market, as measured by the MSCI US Broad Market Index, also returned 17.0%.
In a change from previous years, during fiscal 2007 growth stocks outperformed value stocks across the capitalization spectrum. This contributed to the fund’s underperformance this year since, all things being equal, we have a preference for stocks that are valued below market multiples albeit with superior growth prospects.
To put the change in context, for the three years ended September 30, 2006, value-oriented stocks in our benchmark outperformed growth-oriented stocks by 5.5 percentage points per year, as measured by MSCI indexes. This year, growth stocks in our benchmark returned almost 24%, while value stocks returned about 11%, and our valuation signals suffered as a consequence. This change in market preference is, in our opinion, unpredictable, so we do not try to capture these changes. Because our model is attracted to stocks with reasonably strong valuation signals, managing our portfolio in extremely strong growth markets, such as we experienced this past year, is like walking up a hill.
Our model, however, has more to it than just valuation signals. We do not want to outperform only when the market prefers value stocks, so we diversify our model with signals from two other components—earnings quality and market sentiment. Ideally, the combination of these signals allows our model to identify attractive stocks regardless of the market environment.
Our process begins by evaluating each stock in the benchmark relative to its peers based on the three components. We construct a portfolio consisting of the most attractive stocks that match the benchmark’s exposure to industry, market capitalization, and other risk factors. Relative to the benchmark, the stocks in our portfolio generally have lower price-to-earnings ratios, slightly higher returns on equity, superior growth, and similar dividend yields. We attempt to add value by taking many small positions across several hundred stocks, without tilting toward specific industries or trying to time changes in market leadership.
The fund’s performance depends on our model’s stock-picking ability, which this year was disappointing. Strong returns in materials and capital goods stocks were erased by weak returns in financials stocks. Cummins (+116%) and AK Steel Holdings (+200%) were two of our best selections, while Indymac Bancorp (–39%) and Americredit (–30%) were among our largest losses.
7
As mentioned, the valuation component of our model did not add value during the period. Although our sentiment and earnings-quality indicators were positive, their contributions were not enough to overcome the drag from our valuation measures. Given that the sentiment component of our model was successful this year, you might ask why we didn’t increase our reliance on it. We feel that doing so would have been counterproductive because we try to add value through expert stock selection, not style timing. Investing relatively small amounts in a large number of stocks provides more diversification than making bets on broad market-style changes. Additionally, betting on style requires that you be right twice—when you initially make the bet and when you remove it. Being wrong on either decision can wreck the return of the portfolio.
Quantitative models experience times when they fail to add value, and we have weathered such periods in the past. Over the long run, our process has demonstrated its effectiveness. We believe that the fund’s attractive combination of reasonable valuations, high earnings quality, and market acceptance, as well as disciplined risk control, can play an important role in a diversified investment plan.
We thank you for your investment and look forward to the upcoming fiscal year.
James D. Troyer, Principal and Portfolio Manager
Joel M. Dickson, Principal
Vanguard Quantitative Equity Group
October 18, 2007
8
Fund Profile
As of September 30, 2007
Portfolio Characteristics | | |
| Comparative | Broad |
| Fund | Index1 | Index2 |
Number of Stocks | 703 | 2,123 | 4,887 |
Median Market Cap | $4.1B | $4.3B | $36.1B |
Price/Earnings Ratio | 15.9x | 21.4x | 18.1x |
Price/Book Ratio | 2.4x | 2.6x | 2.8x |
Yield | 1.0% | 1.2% | 1.7% |
Return on Equity | 14.3% | 14.8% | 18.8% |
Earnings Growth Rate | 24.4% | 20.3% | 21.6% |
Foreign Holdings | 0.2% | 0.0% | 0.0% |
Turnover Rate | 75% | — | — |
Expense Ratio | 0.30% | — | — |
Short-Term Reserves | –0.1%3 | — | — |
| | | | |
Sector Diversification (% of equity exposure) |
| Comparative | Broad |
| Fund | Index1 | Index2 |
Consumer Discretionary | 14.9% | 15.0% | 10.4% |
Consumer Staples | 3.9 | 3.8 | 8.2 |
Energy | 7.7 | 7.9 | 11.2 |
Financials | 19.3 | 19.3 | 20.0 |
Health Care | 10.5 | 10.3 | 11.6 |
Industrials | 14.7 | 14.8 | 11.8 |
Information Technology | 15.8 | 15.8 | 16.0 |
Materials | 6.2 | 6.0 | 3.7 |
Telecommunication Services | 2.0 | 2.1 | 3.5 |
Utilities | 5.0 | 5.0 | 3.6 |
Volatility Measures4 | |
| Fund Versus | Fund Versus |
| Comparative Index1 | Broad Index2 |
R-Squared | 0.98 | 0.87 |
Beta | 1.08 | 1.38 |
Ten Largest Holdings5 (% of total net assets) |
| | |
Ameriprise Financial, Inc. | asset management | |
| and custody banks | 1.1% |
Parker Hannifin Corp. | industrial machinery | 1.1 |
Terex Corp. | construction, | |
| farm machinery, | |
| and heavy trucks | 1.0 |
Laboratory Corp. of | | |
America Holdings | health care services | 1.0 |
Mirant Corp. | independent power | |
| producers and | |
| energy traders | 1.0 |
Celanese Corp. | commodity | |
Series A | chemicals | 1.0 |
Activision, Inc. | home entertainment | |
| software | 0.9 |
AmerisourceBergen Corp. | health care | |
| distributors | 0.9 |
Synovus Financial Corp. | regional banks | 0.9 |
Safeco Corp. | property and | |
| casualty insurance | 0.9 |
Top Ten | | 9.8% |
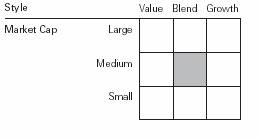
Investment Focus
1 MSCI US Small + Mid Cap 2200 Index.
2 Dow Jones Wilshire 5000 Index.
3 The fund invested a portion of its cash reserves in equity markets through the use of index futures contracts. After the effect of the futures investments, the fund’s temporary cash position was negative.
4 For an explanation of R-squared, beta, and other terms used here, see the Glossary on page 30.
5 “Ten Largest Holdings” excludes any temporary cash investments and equity index products.
9
Performance Summary
All of the returns in this report represent past performance, which is not a guarantee of future results that may be achieved by the fund. (Current performance may be lower or higher than the performance data cited. For performance data current to the most recent month-end, visit our website at www.vanguard.com/performance.) Note, too, that both investment returns and principal value can fluctuate widely, so an investor’s shares, when sold, could be worth more or less than their original cost. The returns shown do not reflect taxes that a shareholder would pay on fund distributions or on the sale of fund shares.
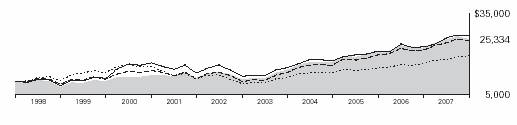
Cumulative Performance: September 30, 1997–September 30, 2007
Initial Investment of $10,000
| | |
| | | | |
| Average Annual Total Returns | Final Value |
| Periods Ended September 30, 2007 | of a $10,000 |
| One Year | Five Years | Ten Years | Investment |
Strategic Equity Fund1 | 13.76% | 19.14% | 9.74% | $25,334 |
Dow Jones Wilshire 5000 Index | 17.08 | 16.53 | 6.85 | 19,399 |
Spliced Small and Mid Cap Index2 | 17.05 | 20.51 | 9.68 | 25,182 |
Average Mid-Cap Core Fund3 | 17.86 | 17.58 | 10.36 | 26,801 |
Fiscal-Year Total Returns (%): September 30, 1997–September 30, 2007

1 Total returns do not include the account service fee that may be applicable to certain accounts with balances below $10,000.
2 The Spliced Small and Mid Cap Index reflects the returns of the Russell 2800 Index through May 31, 2003, and the MSCI US Small + Mid Cap 2200 Index thereafter.
3 Derived from data provided by Lipper Inc.
Note: See Financial Highlights table on page 22 for dividend and capital gains information.
10
Financial Statements
Statement of Net Assets
As of September 30, 2007
The fund provides a complete list of its holdings four times in each fiscal year, at the quarter-ends. For the second and fourth fiscal quarters, the lists appear in the fund’s semiannual and annual reports to shareholders. For the first and third fiscal quarters, the fund files the lists with the Securities and Exchange Commission on Form N-Q. Shareholders can look up the fund’s Forms N-Q on the SEC’s website at www.sec.gov. Forms N-Q may also be reviewed and copied at the SEC’s Public Reference Room (see the back cover of this report for further information).
| | | Market |
| | | Value• |
| | Shares | ($000) |
Common Stocks (99.8%)1 | | |
Consumer Discretionary (14.9%) | |
| Whirlpool Corp. | 717,900 | 63,965 |
| Nordstrom, Inc. | 1,199,000 | 56,221 |
| Sotheby’s | 1,134,978 | 54,241 |
| Men’s Wearhouse, Inc. | 1,066,150 | 53,862 |
| Polo Ralph Lauren Corp. | 660,580 | 51,360 |
* | Mohawk Industries, Inc. | 546,125 | 44,400 |
| Royal Caribbean | | |
| Cruises, Ltd. | 1,022,219 | 39,897 |
| Newell Rubbermaid, Inc. | 1,157,926 | 33,371 |
| Phillips-Van Heusen Corp. | 557,700 | 29,268 |
| Brinker International, Inc. | 1,065,600 | 29,240 |
| American Eagle | | |
| Outfitters, Inc. | 1,088,200 | 28,631 |
| Idearc Inc. | 839,973 | 26,434 |
* | Liberty Media Corp.– | | |
| Capital Series A | 194,089 | 24,228 |
* | Gemstar-TV Guide | | |
| International, Inc. | 3,264,285 | 22,719 |
| Wyndham Worldwide Corp. | 675,300 | 22,123 |
| Lamar Advertising Co. | | |
| Class A | 408,861 | 20,022 |
*^Chipotle Mexican Grill, Inc. | 161,600 | 19,090 |
| Jackson Hewitt | | |
| Tax Service Inc. | 671,000 | 18,761 |
| Sherwin-Williams Co. | 278,957 | 18,330 |
* | Expedia, Inc. | 545,151 | 17,379 |
* | Jack in the Box Inc. | 265,500 | 17,215 |
* | ITT Educational | | |
| Services, Inc. | 130,500 | 15,881 |
* | Dollar Tree Stores, Inc. | 320,490 | 12,993 |
| WABCO Holdings Inc. | 265,500 | 12,412 |
* | Tenneco Automotive, Inc. | 375,400 | 11,641 |
| Tim Hortons, Inc. | 326,800 | 11,389 |
| Meredith Corp. | 193,320 | 11,077 |
| Eastman Kodak Co. | 399,900 | 10,701 |
| Sinclair Broadcast | | |
| Group, Inc. | 887,816 | 10,689 |
* | AnnTaylor Stores Corp. | 334,576 | 10,596 |
| | | | | |
| | | Market |
| | | Value• |
| | Shares | ($000) |
* | Collective Brands, Inc. | 464,000 | 10,236 |
| Modine Manufacturing Co. | 347,200 | 9,242 |
| ^New York Times Co. Class A | 461,900 | 9,127 |
| Bob Evans Farms, Inc. | 301,417 | 9,097 |
| Belo Corp. Class A | 500,200 | 8,683 |
| Abercrombie & Fitch Co. | 105,954 | 8,550 |
| Ruby Tuesday, Inc. | 463,500 | 8,501 |
* | TRW Automotive | | |
| Holdings Corp. | 266,400 | 8,440 |
* | Big Lots Inc. | 280,000 | 8,355 |
*^DSW Inc. Class A | 323,200 | 8,135 |
| Regal Entertainment Group | | |
| Class A | 359,947 | 7,901 |
* | JAKKS Pacific, Inc. | 295,500 | 7,893 |
| Cooper Tire & Rubber Co. | 317,500 | 7,747 |
* | Cablevision Systems | | |
| NY Group Class A | 219,299 | 7,662 |
| Brown Shoe Co., Inc. | 389,000 | 7,547 |
| H & R Block, Inc. | 353,200 | 7,481 |
* | AutoNation, Inc. | 412,547 | 7,310 |
* | Lear Corp. | 205,700 | 6,603 |
* | CSK Auto Corp. | 606,700 | 6,461 |
*^NutriSystem Inc. | 134,276 | 6,296 |
* | Marvel Entertainment, Inc. | 265,800 | 6,230 |
| Mattel, Inc. | 261,067 | 6,125 |
| Sonic Automotive, Inc. | 254,800 | 6,100 |
| FTD Group, Inc. | 366,000 | 5,446 |
| Wendy’s International, Inc. | 154,100 | 5,380 |
| K-Swiss, Inc. | 229,151 | 5,250 |
| RadioShack Corp. | 252,000 | 5,206 |
| Cato Corp. Class A | 254,550 | 5,203 |
| Stewart Enterprises, Inc. | | |
| Class A | 633,158 | 4,825 |
* | Cox Radio, Inc. | 350,331 | 4,572 |
* | The Gymboree Corp. | 128,400 | 4,525 |
| ^Tempur-Pedic | | |
| International Inc. | 123,600 | 4,419 |
* | NVR, Inc. | 9,000 | 4,232 |
| Wynn Resorts Ltd. | 25,100 | 3,955 |
| Thor Industries, Inc. | 83,700 | 3,766 |
| Domino’s Pizza, Inc. | 221,400 | 3,673 |
11
| | | Market |
| | | Value• |
| | Shares | ($000) |
| Burger King Holdings Inc. | 143,200 | 3,650 |
| Lithia Motors, Inc. | 212,400 | 3,624 |
* | AutoZone Inc. | 30,700 | 3,565 |
| Service Corp. International | 273,000 | 3,522 |
* | Aeropostale, Inc. | 183,150 | 3,491 |
| Steven Madden, Ltd. | 177,780 | 3,369 |
*^Jos. A. Bank Clothiers, Inc. | 99,800 | 3,335 |
| Applebee’s | | |
| International, Inc. | 132,000 | 3,284 |
| Asbury Automotive | | |
| Group, Inc. | 163,800 | 3,245 |
* | DreamWorks | | |
| Animation SKG, Inc. | 94,600 | 3,162 |
| World Wrestling | | |
| Entertainment, Inc. | 209,087 | 3,153 |
* | Entravision | | |
| Communications Corp. | 327,373 | 3,018 |
| Journal | | |
| Communications, Inc. | 312,800 | 2,965 |
| Monaco Coach Corp. | 208,400 | 2,924 |
| Dover Downs Gaming & | | |
| Entertainment, Inc. | 276,250 | 2,870 |
| Group 1 Automotive, Inc. | 85,400 | 2,867 |
| American Axle | | |
| & Manufacturing | | |
| Holdings, Inc. | 113,300 | 2,861 |
| Guess ?, Inc. | 56,500 | 2,770 |
* | Denny’s Corp. | 684,002 | 2,736 |
| Interactive Data Corp. | 96,534 | 2,722 |
* | The Dress Barn, Inc. | 154,780 | 2,633 |
| Ross Stores, Inc. | 96,249 | 2,468 |
| E.W. Scripps Co. Class A | 58,400 | 2,453 |
| UniFirst Corp. | 65,103 | 2,439 |
* | The Warnaco Group, Inc. | 59,100 | 2,309 |
| Movado Group, Inc. | 70,400 | 2,247 |
| Lee Enterprises, Inc. | 140,000 | 2,180 |
* | Jo-Ann Stores, Inc. | 95,100 | 2,007 |
| International Speedway Corp. | 41,300 | 1,894 |
| ^Sealy Corp. | 132,900 | 1,866 |
| IHOP Corp. | 27,800 | 1,761 |
| Speedway Motorsports, Inc. | 47,100 | 1,743 |
* | Papa John’s International, Inc. | 69,021 | 1,687 |
| CBRL Group, Inc. | 41,300 | 1,685 |
| Westwood One, Inc. | 561,602 | 1,544 |
* | Getty Images, Inc. | 47,700 | 1,328 |
* | Steiner Leisure Ltd. | 28,600 | 1,241 |
* | Harris Interactive Inc. | 278,396 | 1,200 |
* | Charlotte Russe Holding Inc. | 67,800 | 993 |
| Darden Restaurants Inc. | 22,532 | 943 |
| RCN Corp. | 72,896 | 897 |
* | Town Sports International | | |
| Holdings, Inc. | 56,800 | 864 |
* | AFC Enterprises, Inc. | 50,000 | 752 |
| The Marcus Corp. | 38,200 | 733 |
* | Spanish Broadcasting | | |
| System, Inc. | 276,855 | 714 |
| | | Market |
| | | Value• |
| | Shares | ($000) |
| Regis Corp. | 16,600 | 530 |
| Salem Communications Corp. | 61,489 | 492 |
| OfficeMax, Inc. | 13,500 | 463 |
| Blyth, Inc. | 21,400 | 438 |
| ^Journal Register Co. | 178,600 | 429 |
| ^Building Materials | | |
| Holding Corp. | 35,300 | 373 |
| American Greetings Corp. | | |
| Class A | 14,100 | 372 |
* | ValueVision Media, Inc. | 48,761 | 361 |
* | RC2 Corp. | 4,660 | 129 |
* | Lin TV Corp. | 7,800 | 101 |
| | | 1,145,712 |
Consumer Staples (3.9%) | | |
| Carolina Group | 778,200 | 63,991 |
| Molson Coors | | |
| Brewing Co. Class B | 349,100 | 34,795 |
| The Pepsi Bottling | | |
| Group, Inc. | 916,100 | 34,051 |
* | NBTY, Inc. | 768,183 | 31,188 |
| The Estee Lauder Cos. Inc. | | |
| Class A | 465,600 | 19,769 |
| Nash-Finch Co. | 454,195 | 18,091 |
| Del Monte Foods Co. | 1,452,427 | 15,250 |
| The Kroger Co. | 526,500 | 15,016 |
| Longs Drug Stores, Inc. | 282,910 | 14,052 |
| Corn Products | | |
| International, Inc. | 159,800 | 7,330 |
* | Energizer Holdings, Inc. | 61,800 | 6,851 |
| PepsiAmericas, Inc. | 169,300 | 5,492 |
| J.M. Smucker Co. | 97,700 | 5,219 |
| Seaboard Corp. | 2,290 | 4,488 |
* | Winn-Dixie Stores, Inc. | 184,511 | 3,454 |
| Dean Foods Co. | 129,200 | 3,305 |
| Herbalife Ltd. | 69,700 | 3,169 |
* | Prestige Brands | | |
| Holdings Inc. | 227,500 | 2,498 |
* | Ralcorp Holdings, Inc. | 38,800 | 2,166 |
* | American Oriental | | |
| Bioengineering, Inc. | 161,200 | 1,797 |
| Ingles Markets, Inc. | 44,400 | 1,273 |
* | Alliance One | | |
| International, Inc. | 194,400 | 1,271 |
*^USANA Health | | |
| Sciences, Inc. | 19,600 | 858 |
| Weis Markets, Inc. | 18,300 | 781 |
| ^Mannatech, Inc. | 86,684 | 702 |
| Universal Corp. (VA) | 12,200 | 597 |
* | Smithfield Foods, Inc. | 10,074 | 317 |
| Sanderson Farms, Inc. | 7,400 | 308 |
| Alberto-Culver Co. | 4,600 | 114 |
| Tyson Foods, Inc. | 5,400 | 96 |
| | | 298,289 |
12
| | | Market |
| | | Value• |
| | Shares | ($000) |
Energy (7.7%) | | |
| Helmerich & Payne, Inc. | 1,997,642 | 65,583 |
* | National Oilwell Varco Inc. | 393,800 | 56,904 |
* | Nabors Industries, Inc. | 1,772,662 | 54,545 |
| Tesoro Corp. | 1,170,200 | 53,853 |
| Tidewater Inc. | 766,500 | 48,167 |
| ENSCO International, Inc. | 822,509 | 46,143 |
| Frontier Oil Corp. | 857,300 | 35,698 |
* | Cameron International Corp. | 359,800 | 33,206 |
| Sunoco, Inc. | 464,200 | 32,856 |
| Patterson-UTI Energy, Inc. | 1,359,269 | 30,679 |
* | Swift Energy Co. | 614,100 | 25,129 |
| Noble Corp. | 511,022 | 25,066 |
* | Grey Wolf, Inc. | 2,442,719 | 16,000 |
* | Atwood Oceanics, Inc. | 189,600 | 14,516 |
| Noble Energy, Inc. | 150,200 | 10,520 |
* | Comstock Resources, Inc. | 299,096 | 9,224 |
* | Superior Energy | | |
| Services, Inc. | 170,447 | 6,041 |
* | Parker Drilling Co. | 724,200 | 5,881 |
* | Hercules Offshore, Inc. | 210,918 | 5,507 |
| Overseas Shipholding | | |
| Group Inc. | 58,300 | 4,479 |
* | W-H Energy Services, Inc. | 50,200 | 3,702 |
* | Oil States International, Inc. | 50,107 | 2,420 |
* | Rosetta Resources, Inc. | 64,900 | 1,190 |
| Holly Corp. | 19,258 | 1,152 |
* | Mariner Energy Inc. | 50,700 | 1,050 |
* | Basic Energy Services Inc. | 49,400 | 1,038 |
| General Maritime Corp. | 32,800 | 915 |
* | Trico Marine Services, Inc. | 30,200 | 900 |
| St. Mary Land & | | |
| Exploration Co. | 22,800 | 813 |
* | Global Industries Ltd. | 12,887 | 332 |
* | PetroQuest Energy, Inc. | 25,200 | 270 |
| Delek US Holdings, Inc. | 7,600 | 191 |
* | Bristow Group, Inc. | 3,900 | 170 |
* | Brigham Exploration Co. | 20,000 | 119 |
* | Hornbeck Offshore | | |
| Services, Inc. | 2,900 | 106 |
* | Gulfmark Offshore, Inc. | 1,900 | 92 |
* | SEACOR Holdings Inc. | 400 | 38 |
| | | 594,495 |
Financials (19.2%) | | |
| Capital Markets (2.3%) | | |
| Ameriprise Financial, Inc. | 1,319,821 | 83,294 |
| ^American Capital | | |
| Strategies, Ltd. | 500,200 | 21,374 |
| Raymond James | | |
| Financial, Inc. | 424,850 | 13,956 |
| Janus Capital Group Inc. | 445,700 | 12,604 |
| A.G. Edwards, Inc. | 133,900 | 11,214 |
| MCG Capital Corp. | 504,308 | 7,257 |
* | Affiliated Managers | | |
| Group, Inc. | 54,100 | 6,898 |
| | | | |
| | Market |
| | Value• |
| Shares | ($000) |
* Knight Capital Group, Inc. | | |
Class A | 472,753 | 5,654 |
Jefferies Group, Inc. | 179,700 | 5,001 |
Federated Investors, Inc. | 98,998 | 3,930 |
Apollo Investment Corp. | 177,900 | 3,700 |
Gamco Investors Inc. | | |
Class A | 29,466 | 1,615 |
SWS Group, Inc. | 42,500 | 752 |
Capital Southwest Corp. | 1,000 | 123 |
| | |
Commercial Banks (3.3%) | | |
Synovus Financial Corp. | 2,462,550 | 69,075 |
Bank of Hawaii Corp. | 747,175 | 39,488 |
Colonial BancGroup, Inc. | 1,055,500 | 22,820 |
^Popular, Inc. | 1,525,400 | 18,732 |
FirstMerit Corp. | 646,801 | 12,781 |
Trustmark Corp. | 400,200 | 11,222 |
Commerce Bancshares, Inc. | 243,806 | 11,188 |
Susquehanna | | |
Bancshares, Inc. | 403,900 | 8,118 |
^W Holding Co., Inc. | 2,395,500 | 5,366 |
Webster Financial Corp. | 125,700 | 5,294 |
Pacific Capital Bancorp | 180,021 | 4,735 |
Wilmington Trust Corp. | 107,100 | 4,166 |
City Holding Co. | 113,455 | 4,131 |
Westbanco Inc. | 145,614 | 3,637 |
NBT Bancorp, Inc. | 138,152 | 3,003 |
BancFirst Corp. | 60,622 | 2,720 |
Nara Bancorp, Inc. | 157,105 | 2,454 |
First Community | | |
Bancshares, Inc. | 61,414 | 2,225 |
First Financial Corp. (IN) | 64,300 | 1,948 |
Old National Bancorp | 104,100 | 1,725 |
Hanmi Financial Corp. | 110,200 | 1,707 |
Washington Trust | | |
Bancorp, Inc. | 61,606 | 1,662 |
F.N.B. Corp. | 99,500 | 1,646 |
Great Southern Bancorp, Inc. | 61,605 | 1,530 |
City Bank Lynnwood (WA) | 42,509 | 1,221 |
Independent Bank Corp. (MI) | 110,135 | 1,217 |
Simmons First National Corp. | 41,942 | 1,105 |
S.Y. Bancorp, Inc. | 40,000 | 1,082 |
United Bankshares, Inc. | 30,981 | 943 |
Associated Banc-Corp. | 31,300 | 927 |
Sterling Financial Corp. (PA) | 45,633 | 783 |
First Merchants Corp. | 35,686 | 769 |
First Source Corp. | 25,845 | 592 |
First BanCorp Puerto Rico | 55,800 | 530 |
Peoples Bancorp, Inc. | 19,800 | 518 |
Integra Bank Corp. | 25,674 | 465 |
Republic Bancorp, Inc.Class A | 28,200 | 447 |
Taylor Capital Group, Inc. | 13,900 | 388 |
Central Pacific Financial Co. | 12,700 | 371 |
Renasant Corp. | 13,500 | 292 |
13
| | | Market |
| | | Value• |
| | Shares | ($000) |
| Sterling Bancshares, Inc. | 15,200 | 173 |
| First Midwest Bancorp, Inc. | 3,100 | 106 |
| First Financial Bancorp | 7,500 | 96 |
| East West Bancorp, Inc. | 1,100 | 40 |
| | | |
| Consumer Finance (0.9%) | | |
| ^The First Marblehead Corp. | 945,000 | 35,844 |
| Advanta Corp. Class B | 442,395 | 12,130 |
* | EZCORP, Inc. | 666,649 | 8,966 |
* | AmeriCredit Corp. | 443,106 | 7,790 |
| Cash America | | |
| International Inc. | 52,700 | 1,981 |
| | | |
| Diversified Financial Services (0.5%) | |
| Leucadia National Corp. | 790,990 | 38,142 |
*^Primus Guaranty, Ltd. | 264,400 | 2,781 |
| Resource America, Inc. | 40,520 | 640 |
| | | |
| Insurance (4.5%) | | |
| Safeco Corp. | 1,085,302 | 66,442 |
| PartnerRe Ltd. | 561,400 | 44,345 |
* | Arch Capital Group Ltd. | 361,200 | 26,877 |
| Nationwide Financial | | |
| Services, Inc. | 492,600 | 26,512 |
| W.R. Berkley Corp. | 680,735 | 20,170 |
| Torchmark Corp. | 321,655 | 20,046 |
| Endurance Specialty | | |
| Holdings Ltd. | 456,900 | 18,984 |
| Everest Re Group, Ltd. | 157,300 | 17,341 |
| Zenith National | | |
| Insurance Corp. | 385,909 | 17,323 |
* | Philadelphia Consolidated | | |
| Holding Corp. | 416,724 | 17,227 |
| American Financial | | |
| Group, Inc. | 439,500 | 12,521 |
| Platinum Underwriters | | |
| Holdings, Ltd. | 344,200 | 12,377 |
| Aspen Insurance | | |
| Holdings Ltd. | 401,400 | 11,203 |
| The Phoenix Cos., Inc. | 767,600 | 10,831 |
| Axis Capital Holdings Ltd. | 232,380 | 9,042 |
| Odyssey Re Holdings Corp. | 181,700 | 6,743 |
| RenaissanceRe | | |
| Holdings Ltd. | 70,700 | 4,624 |
| Safety Insurance | | |
| Group, Inc. | 100,020 | 3,595 |
* | United America | | |
| Indemnity, Ltd. | 6,900 | 148 |
| Reinsurance Group of | | |
| America, Inc. | 2,000 | 114 |
| Max Re Capital Ltd. | 1,500 | 42 |
| | | |
| Real Estate Investment Trusts (5.9%) | |
| Boston Properties, Inc. REIT | 291,400 | 30,276 |
| Host Hotels & | | |
| Resorts Inc. REIT | 1,225,200 | 27,493 |
| Archstone-Smith Trust REIT | 386,400 | 23,238 |
| | Market |
| | Value• |
| Shares | ($000) |
SL Green Realty Corp. REIT | 177,226 | 20,695 |
HCP Inc. REIT | 619,600 | 20,552 |
Regency Centers Corp. REIT | 233,400 | 17,913 |
The Macerich Co. REIT | 203,700 | 17,840 |
Federal Realty Investment Trust REIT | 193,600 | 17,153 |
Apartment Investment &Management Co.Class A REIT | 350,500 | 15,818 |
Taubman Co. REIT | 252,000 | 13,797 |
Essex Property Trust, Inc. REIT | 107,300 | 12,615 |
Camden Property Trust REIT | 196,300 | 12,612 |
UDR, Inc. REIT | 517,500 | 12,586 |
BRE Properties Inc. | | |
Class A REIT | 197,300 | 11,035 |
Pennsylvania REIT | 267,300 | 10,409 |
Highwood Properties, Inc. | | |
REIT | 280,400 | 10,282 |
Colonial Properties Trust | | |
REIT | 298,760 | 10,247 |
Kimco Realty Corp. REIT | 225,273 | 10,185 |
Digital Realty Trust, Inc. | | |
REIT | 245,149 | 9,656 |
Nationwide Health | | |
Properties, Inc. REIT | 313,400 | 9,443 |
Equity Lifestyle | | |
Properties, Inc. REIT | 175,900 | 9,112 |
Avalonbay | | |
Communities, Inc. REIT | 75,500 | 8,914 |
Healthcare Realty Trust Inc. | | |
REIT | 333,200 | 8,883 |
Mack-Cali Realty Corp. REIT | 212,700 | 8,742 |
iStar Financial Inc. REIT | 236,800 | 8,049 |
American Campus | | |
Communities, Inc. REIT | 260,400 | 7,627 |
FelCor Lodging Trust, Inc. | | |
REIT | 364,700 | 7,268 |
Duke Realty Corp. REIT | 206,900 | 6,995 |
Rayonier Inc. REIT | 142,050 | 6,824 |
Maguire Properties, Inc. | | |
REIT | 250,100 | 6,460 |
Glimcher Realty Trust REIT | 257,200 | 6,044 |
HRPT Properties Trust REIT | 598,900 | 5,923 |
Plum Creek Timber Co. Inc. | | |
REIT | 117,500 | 5,259 |
Saul Centers, Inc. REIT | 82,900 | 4,269 |
Douglas Emmett, Inc. REIT | 164,400 | 4,066 |
First Industrial Realty Trust | | |
REIT | 98,500 | 3,829 |
CapitalSource Inc. REIT | 171,400 | 3,469 |
Developers Diversified | | |
Realty Corp. REIT | 54,200 | 3,028 |
Potlatch Corp. REIT | 65,400 | 2,945 |
^Thornburg Mortgage, Inc. | | |
REIT | 214,300 | 2,754 |
AMB Property Corp. REIT | 42,400 | 2,536 |
14
| | | Market |
| | | Value• |
| | Shares | ($000) |
| LaSalle Hotel Properties REIT | 59,600 | 2,508 |
| Senior Housing | | |
| Properties Trust REIT | 106,100 | 2,341 |
| Equity Inns, Inc. REIT | 98,300 | 2,220 |
| American Financial | | |
| Realty Trust REIT | 275,500 | 2,218 |
| JER Investors Trust Inc. | | |
| REIT | 142,400 | 1,773 |
| Kilroy Realty Corp. REIT | 23,600 | 1,431 |
| Post Properties, Inc. REIT | 27,800 | 1,076 |
| Parkway Properties Inc. REIT | 22,200 | 980 |
| GMH Communities Trust | | |
| REIT | 101,500 | 787 |
| MFA Mortgage | | |
| Investments, Inc. REIT | 71,500 | 573 |
| Acadia Realty Trust REIT | 20,100 | 545 |
| Omega Healthcare | | |
| Investors, Inc. REIT | 33,500 | 520 |
| Inland Real Estate Corp. REIT | 30,700 | 476 |
| Sun Communities, Inc. REIT | 7,500 | 226 |
| Education Realty Trust, Inc. | | |
| REIT | 12,200 | 165 |
| Annaly Mortgage | | |
| Management Inc. REIT | 7,600 | 121 |
| Hospitality Properties Trust | | |
| REIT | 2,500 | 102 |
| Kite Realty Group Trust REIT | 1,900 | 36 |
| | | |
| Real Estate Management & Development (0.5%) | |
| Forest City Enterprise | | |
| Class A | 251,800 | 13,889 |
| Jones Lang LaSalle Inc. | 126,700 | 13,020 |
* | CB Richard Ellis Group, Inc. | 418,200 | 11,643 |
* | Move, Inc. | 513,100 | 1,416 |
| | | |
| Thrifts & Mortgage Finance (1.3%) | |
| ^Downey Financial Corp. | 417,000 | 24,103 |
*^First Federal Financial Corp. | 357,500 | 17,714 |
| ^Corus Bankshares Inc. | 1,308,728 | 17,040 |
| Sovereign Bancorp, Inc. | 813,800 | 13,867 |
| BankUnited Financial Corp. | 565,400 | 8,786 |
* | Franklin Bank Corp. | 729,300 | 6,710 |
| WSFS Financial Corp. | 67,050 | 4,184 |
| First Financial Holdings, Inc. | 79,753 | 2,495 |
| PFF Bancorp, Inc. | 130,200 | 1,997 |
* | Ocwen Financial Corp. | 98,100 | 925 |
| United Community | | |
| Financial Corp. | 44,500 | 321 |
| | | 1,478,640 |
Health Care (10.5%) | | |
* | Laboratory Corp. of | | |
| America Holdings | 986,364 | 77,163 |
| AmerisourceBergen Corp. | 1,599,657 | 72,512 |
* | Express Scripts Inc. | 1,100,200 | 61,413 |
* | Humana Inc. | 870,600 | 60,837 |
*^Sciele Pharma, Inc. | 1,338,208 | 34,820 |
| | | Market |
| | | Value• |
| | Shares | ($000) |
* | Pediatrix Medical | | |
| Group, Inc. | 522,300 | 34,169 |
| Mylan Inc. | 1,947,514 | 31,082 |
* | Haemonetics Corp. | 625,187 | 30,897 |
* | Apria Healthcare Group Inc. | 913,652 | 23,764 |
* | King Pharmaceuticals, Inc. | 1,912,600 | 22,416 |
* | WellCare Health Plans Inc. | 191,100 | 20,148 |
* | Medarex, Inc. | 1,270,287 | 17,987 |
* | Invitrogen Corp. | 161,500 | 13,199 |
* | Cephalon, Inc. | 178,474 | 13,039 |
* | Health Net Inc. | 238,300 | 12,880 |
* | Onyx Pharmaceuticals, Inc. | 268,100 | 11,668 |
| Health Management | | |
| Associates Class A | 1,635,705 | 11,352 |
* | Alkermes, Inc. | 613,175 | 11,282 |
| Chemed Corp. | 167,200 | 10,393 |
* | ICU Medical, Inc. | 255,284 | 9,892 |
* | Applera Corp.– | | |
| Celera Genomics Group | 679,500 | 9,554 |
* | Valeant Pharmaceuticals | | |
| International | 580,900 | 8,992 |
* | LifePoint Hospitals, Inc. | 280,100 | 8,406 |
* | Magellan Health | | |
| Services, Inc. | 204,003 | 8,278 |
| Manor Care, Inc. | 127,076 | 8,184 |
* | Zoll Medical Corp. | 314,734 | 8,158 |
* | Lincare Holdings, Inc. | 218,596 | 8,012 |
* | K-V Pharmaceutical Co. | | |
| Class A | 263,700 | 7,542 |
* | MedCath Corp. | 263,920 | 7,247 |
| West Pharmaceutical | | |
| Services, Inc. | 170,600 | 7,107 |
* | Savient | | |
| Pharmaceuticals Inc. | 483,751 | 7,039 |
* | Techne Corp. | 108,521 | 6,846 |
| ^Medicis | | |
| Pharmaceutical Corp. | 216,700 | 6,612 |
* | Isis Pharmaceuticals, Inc. | 432,900 | 6,481 |
* | The Medicines Co. | 343,000 | 6,109 |
* | Bruker BioSciences Corp. | 667,829 | 5,877 |
* | Ventana Medical | | |
| Systems, Inc. | 65,061 | 5,589 |
* | Watson | | |
| Pharmaceuticals, Inc. | 171,300 | 5,550 |
| Mentor Corp. | 115,700 | 5,328 |
*^Nighthawk Radiology | | |
| Holdings, Inc. | 194,492 | 4,767 |
* | Myriad Genetics, Inc. | 91,100 | 4,751 |
* | Xenoport Inc. | 99,940 | 4,702 |
* | Noven Pharmaceuticals, Inc. | 291,785 | 4,648 |
* | Progenics | | |
| Pharmaceuticals, Inc. | 195,461 | 4,322 |
| Perrigo Co. | 194,803 | 4,159 |
* | Warner Chilcott Ltd. | 227,600 | 4,044 |
* | Alliance Imaging, Inc. | 430,491 | 3,900 |
* | Par Pharmaceutical Cos. Inc. | 208,656 | 3,873 |
* | Sierra Health Services, Inc. | 88,500 | 3,734 |
15
| | | Market |
| | | Value• |
| | Shares | ($000) |
| Cambrex Corp. | 338,200 | 3,683 |
* | Pharmion Corp. | 78,500 | 3,622 |
* | OSI Pharmaceuticals, Inc. | 101,800 | 3,460 |
* | PAREXEL International Corp. | 75,650 | 3,122 |
* | Kinetic Concepts, Inc. | 55,100 | 3,101 |
* | Immucor Inc. | 76,700 | 2,742 |
* | GTx, Inc. | 160,659 | 2,615 |
* | Bio-Rad Laboratories, Inc. | | |
| Class A | 27,500 | 2,489 |
*^Hologic, Inc. | 34,957 | 2,132 |
* | Cubist Pharmaceuticals, Inc. | 97,700 | 2,064 |
* | Omrix | | |
| Biopharmaceuticals, Inc. | 43,921 | 1,551 |
* | Albany Molecular | | |
| Research, Inc. | 100,590 | 1,519 |
* | BioMarin Pharmaceutical Inc. | 55,600 | 1,384 |
| Alpharma, Inc. Class A | 64,100 | 1,369 |
* | AMAG Pharmaceuticals, Inc. | 18,800 | 1,075 |
* | VCA Antech, Inc. | 23,500 | 981 |
| STERIS Corp. | 34,800 | 951 |
* | Martek Biosciences Corp. | 32,600 | 946 |
* | Gentiva Health Services, Inc. | 48,600 | 934 |
| Vital Signs, Inc. | 15,855 | 827 |
* | Greatbatch, Inc. | 29,478 | 784 |
| Datascope Corp. | 22,335 | 755 |
*^PharMerica corp. | 50,500 | 753 |
* | MGI Pharma, Inc. | 19,100 | 531 |
* | ViroPharma Inc. | 40,500 | 360 |
* | Endo Pharmaceuticals | | |
| Holdings, Inc. | 11,000 | 341 |
* | AMERIGROUP Corp. | 9,000 | 310 |
* | Sirona Dental Systems Inc. | 7,500 | 268 |
* | AMN Healthcare | | |
| Services, Inc. | 13,900 | 260 |
* | CONMED Corp. | 7,000 | 196 |
* | AmSurg Corp. | 7,020 | 162 |
* | Emergent Biosolutions inc. | 16,600 | 147 |
* | Centene Corp. | 6,000 | 129 |
* | Charles River Laboratories, Inc. | 1,900 | 107 |
* | Amedisys Inc. | 1,500 | 58 |
| Ligand Pharmaceuticals Inc. | | |
| Class B | 7,600 | 41 |
* | DaVita, Inc. | 500 | 32 |
| | | 806,525 |
Industrials (14.7%) | | |
| Parker Hannifin Corp. | 742,694 | 83,055 |
* | Terex Corp. | 874,697 | 77,866 |
| Cooper Industries, Inc. | | |
| Class A | 1,270,700 | 64,920 |
| Cummins Inc. | 490,491 | 62,729 |
*^AMR Corp. | 2,776,051 | 61,878 |
| Trinity Industries, Inc. | 1,522,220 | 57,144 |
| Manpower Inc. | 866,375 | 55,751 |
* | UAL Corp. | 1,140,129 | 53,050 |
* | Allied Waste | | |
| Industries, Inc. | 3,516,088 | 44,830 |
| R.R. Donnelley & Sons Co. | 1,015,220 | 37,116 |
| | | | |
| | | Market |
| | | Value• |
| | Shares | ($000) |
* | McDermott | | |
| International, Inc. | 516,300 | 27,922 |
* | URS Corp. | 473,000 | 26,701 |
| Steelcase Inc. | 1,445,062 | 25,982 |
| A.O. Smith Corp. | 578,000 | 25,363 |
| The Manitowoc Co., Inc. | 528,980 | 23,423 |
* | Gardner Denver Inc. | 569,660 | 22,217 |
* | EMCOR Group, Inc. | 638,800 | 20,033 |
| Cubic Corp. | 460,132 | 19,404 |
* | Ceradyne, Inc. | 240,100 | 18,185 |
| GATX Corp. | 381,120 | 16,293 |
* | Hertz Global Holdings Inc. | 681,909 | 15,493 |
| L-3 Communications | | |
| Holdings, Inc. | 149,400 | 15,260 |
| Lincoln Electric | | |
| Holdings, Inc. | 170,411 | 13,226 |
| Republic Services, Inc. | | |
| Class A | 375,763 | 12,291 |
* | AGCO Corp. | 221,300 | 11,235 |
| Lennox International Inc. | 328,300 | 11,097 |
* | Thomas & Betts Corp. | 188,600 | 11,060 |
* | Genlyte Group, Inc. | 163,016 | 10,475 |
| Kennametal, Inc. | 117,600 | 9,876 |
* | Perini Corp. | 174,300 | 9,749 |
* | Armstrong Worldwide Industries, Inc. | 234,314 | 9,511 |
| Con-way, Inc. | 204,743 | 9,418 |
| Acuity Brands, Inc. | 182,600 | 9,218 |
* | Labor Ready, Inc. | 485,700 | 8,990 |
| Herman Miller, Inc. | 315,941 | 8,575 |
| Crane Co. | 163,200 | 7,829 |
| Apogee Enterprises, Inc. | 299,390 | 7,766 |
* | General Cable Corp. | 112,500 | 7,551 |
* | Owens Corning Inc. | 288,900 | 7,237 |
| Walter Industries, Inc. | 236,900 | 6,373 |
* | Continental Airlines, Inc.Class B | 172,500 | 5,698 |
| Robbins & Myers, Inc. | 97,700 | 5,597 |
* | TransDigm Group, Inc. | 120,900 | 5,526 |
* | Acco Brands Corp. | 240,200 | 5,390 |
| Cascade Corp. | 79,900 | 5,207 |
* | Consolidated Graphics, Inc. | 77,400 | 4,860 |
* | United Stationers, Inc. | 85,530 | 4,749 |
* | United Rentals, Inc. | 131,900 | 4,243 |
| W.W. Grainger, Inc. | 46,400 | 4,231 |
| Teleflex Inc. | 53,800 | 4,192 |
* | Corrections Corp. of America | 159,900 | 4,185 |
| Viad Corp. | 111,350 | 4,009 |
| The Toro Co. | 66,000 | 3,883 |
| McGrath RentCorp | 115,213 | 3,830 |
| Triumph Group, Inc. | 44,025 | 3,597 |
| Barnes Group, Inc. | 109,300 | 3,489 |
| Ameron International Corp. | 27,900 | 2,951 |
* | Astec Industries, Inc. | 50,900 | 2,924 |
* | Spherion Corp. | 342,600 | 2,830 |
* | Alliant Techsystems, Inc. | 25,647 | 2,803 |
| Deluxe Corp. | 65,600 | 2,417 |
16
| | | | Market |
| | | | Value• |
| | | Shares | ($000) |
* | Rush Enterprises, Inc. | | | |
| Class A | | 65,900 | 1,671 |
| TAL International Group, Inc. | | 65,400 | 1,640 |
* | Republic Airways | | | |
| Holdings Inc. | | 70,300 | 1,488 |
| Cintas Corp. | | 40,000 | 1,484 |
| Pacer International, Inc. | | 77,300 | 1,473 |
| Kelly Services, Inc. Class A | | 60,846 | 1,205 |
| American Railcar | | | |
| Industries, Inc. | | 54,300 | 1,196 |
| Rockwell Automation, Inc. | | 17,100 | 1,189 |
| Fluor Corp. | | 6,500 | 936 |
* | Accuride Corp. | | 65,900 | 798 |
* | GrafTech International Ltd. | | 44,100 | 787 |
| Bluelinx Holdings Inc. | | 105,700 | 744 |
| NACCO Industries, Inc. | | | |
| Class A | | 7,100 | 735 |
* | ExpressJet Holdings, Inc. | | 195,980 | 606 |
| Bowne & Co., Inc. | | 34,500 | 575 |
| Tredegar Corp. | | 25,700 | 443 |
* | DynCorp International Inc. | | | |
| Class A | | 17,300 | 400 |
* | Goodman Global, Inc. | | 15,070 | 360 |
* | Rush Enterprises, Inc. | | | |
| Class B | | 14,000 | 334 |
| Belden Inc. | | 6,100 | 286 |
| Wabtec Corp. | | 6,700 | 251 |
* | Amerco, Inc. | | 3,900 | 247 |
| Heartland Express, Inc. | | 13,600 | 194 |
| The Brink’s Co. | | 3,400 | 190 |
| Schawk, Inc. | | 8,000 | 181 |
| Kaman Corp. Class A | | 4,557 | 157 |
* | H&E Equipment Services, Inc. | 3,607 | 65 |
| Horizon Lines Inc. | | 1,600 | 49 |
* | Kforce Inc. | | 3,700 | 48 |
| CDI Corp. | | 1,500 | 42 |
* | Old Dominion Freight Line, Inc. | 1,700 | 41 |
| Arkansas Best Corp. | | 1,200 | 39 |
| Kaydon Corp. | | 700 | 36 |
| | | | 1,132,593 |
Information Technology (15.8%) | | |
* | Activision, Inc. | 3,386,500 | 73,115 |
* | ON Semiconductor Corp. | 4,495,400 | 56,462 |
* | Computer Sciences Corp. | 990,400 | 55,363 |
* | Novellus Systems, Inc. | 1,948,500 | 53,116 |
* | Flextronics | | | |
| International Ltd. | 4,602,100 | 51,451 |
* | Fiserv, Inc. | 917,383 | 46,658 |
* | Anixter International Inc. | | 496,000 | 40,895 |
* | LAM Research Corp. | 746,398 | 39,753 |
* | Avnet, Inc. | 993,400 | 39,597 |
* | Amkor Technology, Inc. | 3,376,651 | 38,899 |
* | SAVVIS, Inc. | | 986,479 | 38,256 |
* | CommScope, Inc. | 646,400 | 32,475 |
* | MEMC Electronic | | | |
| Materials, Inc. | | 517,700 | 30,472 |
| | | Market |
| | | Value• |
| | Shares | ($000) |
* | Arris Group Inc. | 2,397,451 | 29,608 |
* | Lexmark International, Inc. | 608,900 | 25,288 |
| Harris Corp. | 414,266 | 23,940 |
* | Plexus Corp. | 835,800 | 22,901 |
* | InterDigital, Inc. | 1,057,567 | 21,976 |
* | Zoran Corp. | 1,079,150 | 21,799 |
* | CSG Systems | | |
| International, Inc. | 1,002,578 | 21,305 |
* | j2 Global | | |
| Communications, Inc. | 635,467 | 20,799 |
* | Sybase, Inc. | 830,185 | 19,202 |
* | Dolby Laboratories Inc. | 525,400 | 18,294 |
| Technitrol, Inc. | 665,600 | 17,938 |
* | Informatica Corp. | 1,081,656 | 16,982 |
* | Cadence Design | | |
| Systems, Inc. | 743,400 | 16,496 |
* | International Rectifier Corp. | 486,579 | 16,052 |
* | TIBCO Software Inc. | 2,070,600 | 15,302 |
* | BMC Software, Inc. | 488,536 | 15,257 |
| National | | |
| Semiconductor Corp. | 552,800 | 14,992 |
* | Vishay Intertechnology, Inc. | 945,400 | 12,319 |
* | Coherent, Inc. | 382,898 | 12,283 |
* | Synopsys, Inc. | 417,570 | 11,308 |
* | Brocade Communications | | |
| Systems, Inc. | 1,278,943 | 10,948 |
* | Interwoven Inc. | 768,566 | 10,937 |
| MTS Systems Corp. | 260,926 | 10,855 |
* | Convergys Corp. | 580,200 | 10,072 |
* | Mentor Graphics Corp. | 665,287 | 10,046 |
* | CMGI Inc. | 6,915,215 | 9,405 |
* | Vignette Corp. | 462,407 | 9,281 |
* | Alliance Data Systems Corp. | 119,800 | 9,277 |
* | JDA Software Group, Inc. | 437,800 | 9,045 |
* | Fairchild Semiconductor | | |
| International, Inc. | 456,900 | 8,535 |
* | MicroStrategy Inc. | 97,919 | 7,769 |
* | NVIDIA Corp. | 212,250 | 7,692 |
* | Sykes Enterprises, Inc. | 433,500 | 7,200 |
* | ManTech International Corp. | 199,200 | 7,167 |
* | Teradyne, Inc. | 493,900 | 6,816 |
* | ADC | | |
| Telecommunications, Inc. | 336,300 | 6,595 |
* | Arrow Electronics, Inc. | 148,004 | 6,293 |
* | Smart Modular | | |
| Technologies Inc. | 868,600 | 6,210 |
* | Rofin-Sinar Technologies Inc. | 87,102 | 6,115 |
* | RF Micro Devices, Inc. | 883,426 | 5,945 |
* | Progress Software Corp. | 193,524 | 5,864 |
* | MKS Instruments, Inc. | 278,650 | 5,300 |
* | Advanced Energy | | |
| Industries, Inc. | 326,357 | 4,928 |
| United Online, Inc. | 307,968 | 4,623 |
* | Unisys Corp. | 595,700 | 3,944 |
| CTS Corp. | 280,700 | 3,621 |
* | Mattson Technology, Inc. | 417,220 | 3,609 |
17
| | | Market |
| | | Value• |
| | Shares | ($000) |
* | Euronet Worldwide, Inc. | 118,800 | 3,537 |
* | SRA International, Inc. | 100,000 | 2,808 |
* | Cymer, Inc. | 63,600 | 2,442 |
* | Ciber, Inc. | 299,000 | 2,335 |
* | Checkpoint Systems, Inc. | 87,800 | 2,317 |
| Total System Services, Inc. | 81,300 | 2,259 |
* | Nuance | | |
| Communications, Inc. | 110,799 | 2,140 |
| Jack Henry & Associates Inc. | 82,700 | 2,139 |
* | eSPEED, Inc. Class A | 208,899 | 1,782 |
* | Brooks Automation, Inc. | 123,000 | 1,751 |
* | Silicon Storage | | |
| Technology, Inc. | 508,753 | 1,638 |
* | NCR Corp. | 32,700 | 1,628 |
* | WebMD Health Corp. | | |
| Class A | 30,851 | 1,607 |
* | Asyst Technologies, Inc. | 273,291 | 1,446 |
* | Riverbed Technology, Inc. | 35,100 | 1,418 |
* | SPSS, Inc. | 34,400 | 1,415 |
* | Dycom Industries, Inc. | 42,200 | 1,293 |
| Methode Electronics, Inc. | | |
| Class A | 79,900 | 1,202 |
* | THQ Inc. | 35,500 | 887 |
| MasterCard, Inc. Class A | 5,900 | 873 |
* | Skyworks Solutions, Inc. | 92,100 | 833 |
* | Kulicke & Soffa Industries, Inc. | 90,907 | 771 |
* | C-COR Inc. | 52,800 | 607 |
* | Aspen Technologies, Inc. | 40,900 | 586 |
* | Tyler Technologies, Inc. | 43,400 | 579 |
* | MPS Group, Inc. | 42,704 | 476 |
* | Manhattan Associates, Inc. | 16,100 | 441 |
* | Verigy Ltd. | 15,600 | 385 |
* | SAIC, Inc. | 15,600 | 299 |
* | Ansoft Corp. | 8,847 | 292 |
* | Newport Corp. | 17,800 | 271 |
| AVX Corp. | 12,200 | 196 |
* | Comtech | | |
| Telecommunications Corp. | 3,400 | 182 |
| Seagate Technology | 6,200 | 159 |
* | Emulex Corp. | 7,500 | 144 |
| Xilinx, Inc. | 4,300 | 112 |
| Broadridge Financial | | |
| Solutions LLC | 5,800 | 110 |
* | IXYS Corp. | 7,102 | 74 |
* | SonicWALL, Inc. | 8,000 | 70 |
* | MICROS Systems, Inc. | 1,000 | 65 |
* | AMIS Holdings Inc. | 5,600 | 54 |
* | KEMET Corp. | 6,900 | 51 |
| MoneyGram International, Inc. | 2,100 | 47 |
* | Hewitt Associates, Inc. | 1,300 | 46 |
* | Tech Data Corp. | 1,000 | 40 |
* | Mastec Inc. | 2,800 | 39 |
| Fidelity National Information | | |
| Services, Inc. | 700 | 31 |
| | | 1,212,522 |
| | | Market |
| | | Value• |
| | Shares | ($000) |
Materials (6.1%) | | |
| Celanese Corp. Series A | 1,933,300 | 75,360 |
| United States Steel Corp. | 587,700 | 62,261 |
| Ball Corp. | 887,100 | 47,682 |
* | AK Steel Holding Corp. | 930,235 | 40,884 |
| Ashland, Inc. | 572,800 | 34,488 |
| Texas Industries, Inc. | 409,600 | 32,154 |
| Steel Dynamics, Inc. | 624,064 | 29,144 |
| Eastman Chemical Co. | 395,460 | 26,389 |
| Greif Inc. Class A | 425,000 | 25,789 |
* | Pactiv Corp. | 811,364 | 23,254 |
| RPM International, Inc. | 916,000 | 21,938 |
* | OM Group, Inc. | 328,700 | 17,359 |
* | Terra Industries, Inc. | 254,000 | 7,940 |
| Quanex Corp. | 144,400 | 6,784 |
| Cleveland-Cliffs Inc. | 73,900 | 6,501 |
* | Owens-Illinois, Inc. | 131,400 | 5,447 |
| Koppers Holdings, Inc. | 111,200 | 4,293 |
* | Crown Holdings, Inc. | 93,700 | 2,133 |
| Lubrizol Corp. | 12,400 | 807 |
| Spartech Corp. | 42,700 | 728 |
| Rock-Tenn Co. | 14,900 | 431 |
| Metal Management, Inc. | 6,800 | 369 |
| Kaiser Aluminum Corp. | 4,100 | 289 |
| Silgan Holdings, Inc. | 4,600 | 247 |
* | Buckeye Technology, Inc. | 15,100 | 229 |
* | Headwaters Inc. | 11,900 | 177 |
| Schnitzer Steel | | |
| Industries, Inc. Class A | 2,200 | 161 |
| CF Industries Holdings, Inc. | 1,500 | 114 |
* | Century Aluminum Co. | 1,100 | 58 |
| | | 473,410 |
Telecommunication Services (2.0%) | |
| Telephone & | | |
| Data Systems, Inc. | 615,748 | 41,101 |
| Embarq Corp. | 712,223 | 39,600 |
* | Cincinnati Bell Inc. | 5,358,600 | 26,471 |
| Citizens | | |
| Communications Co. | 596,718 | 8,545 |
| USA Mobility, Inc. | 499,865 | 8,433 |
| Alaska Communications | | |
| Systems Holdings, Inc. | 541,946 | 7,831 |
| CenturyTel, Inc. | 164,600 | 7,608 |
| NTELOS Holdings Corp. | 206,500 | 6,083 |
* | Qwest Communications | | |
| International Inc. | 461,000 | 4,223 |
* | U.S. Cellular Corp. | 21,105 | 2,073 |
| Golden Telecom, Inc. | 12,400 | 998 |
* | Centennial | | |
| Communications Corp. | | |
| Class A | 43,890 | 444 |
| | | 153,410 |
| | | | |
18
| | | | Market |
| | | | Value• |
| | | Shares | ($000) |
Utilities (5.0%) | | | |
* | Mirant Corp. | 1,879,700 | 76,466 |
| Xcel Energy, Inc. | 2,498,845 | 53,825 |
| CenterPoint Energy Inc. | 2,259,449 | 36,219 |
| Energen Corp. | | 617,472 | 35,270 |
| PNM Resources Inc. | | 999,960 | 23,279 |
| Westar Energy, Inc. | | 913,400 | 22,433 |
| NiSource, Inc. | | 850,035 | 16,270 |
| Alliant Energy Corp. | | 414,856 | 15,897 |
| Portland General Electric Co. | | 483,100 | 13,430 |
| WGL Holdings Inc. | | 392,500 | 13,302 |
* | NRG Energy, Inc. | | 246,600 | 10,429 |
| Atmos Energy Corp. | | 338,201 | 9,578 |
| NSTAR | | 258,600 | 9,002 |
| Northwest Natural Gas Co. | | 174,000 | 7,952 |
| ALLETE, Inc. | | 175,635 | 7,861 |
* | El Paso Electric Co. | | 254,000 | 5,875 |
| Northeast Utilities | | 183,200 | 5,234 |
| Pepco Holdings, Inc. | | 141,000 | 3,818 |
| The Laclede Group, Inc. | | 113,600 | 3,667 |
| Nicor Inc. | | 79,700 | 3,419 |
| OGE Energy Corp. | | 99,000 | 3,277 |
| Black Hills Corp. | | 78,100 | 3,204 |
| TECO Energy, Inc. | | 189,125 | 3,107 |
| Southwest Gas Corp. | | 58,640 | 1,659 |
| Southern Union Co. | | 22,900 | 712 |
| Vectren Corp. | | 1,300 | 35 |
| | | | 385,220 |
Total Common Stocks | | | |
(Cost $6,872,814) | | | 7,680,816 |
Temporary Cash Investments (1.5%)1 | | |
Money Market Funds (1.5%) | | | |
2 | Vanguard Market | | | |
| Liquidity Fund, 5.153% | 3,649,490 | 3,649 |
2 | Vanguard Market | | | |
| Liquidity Fund, | | | |
| 5.153%—Note E | 111,004,706 | 111,005 |
| | | | 114,654 |
| | | | | | |
| Face | Market |
| Amount | Value• |
| ($000) | ($000) |
U.S. Agency Obligation (0.0%) | | |
3 Federal National Mortgage Assn. | | |
4 5.204%, 10/3/07 | 3,000 | 2,999 |
Total Temporary Cash Investments | |
(Cost $117,653) | | 117,653 |
Total Investments (101.3%) | | |
(Cost $6,990,467) | | 7,798,469 |
Other Assets and Liabilities (–1.3%) | |
Other Assets—Note B | | 104,112 |
Liabilities—Note E | | (203,653) |
| | (99,541) |
Net Assets (100%) | | |
Applicable to 308,666,524 outstanding | |
$.001 par value shares of beneficial | |
interest (unlimited authorization) | | 7,698,928 |
Net Asset Value Per Share | | $24.94 |
| | |
| | |
| | |
At September 30, 2007, net assets consisted of:5 |
| Amount | Per |
| ($000) | Share |
Paid-in Capital | 6,184,290 | $20.04 |
Undistributed Net | | |
Investment Income | 41,285 | .13 |
Accumulated Net | | |
Realized Gains | 665,036 | 2.15 |
Unrealized Appreciation | | |
Investment Securities | 808,002 | 2.62 |
Futures Contracts | 315 | — |
Net Assets | 7,698,928 | $24.94 |
| | | | | |
• See Note A in Notes to Financial Statements.
* Non-income-producing security.
^ Part of security position is on loan to broker-dealers. See Note E in Notes to Financial Statements.
1 The fund invests a portion of its cash reserves in equity markets through the use of index futures contracts. After giving effect to futures investments, the fund’s effective common stock and temporary cash investment positions represent 100.0% and 1.3%, respectively, of net assets. See Note C in Notes to Financial Statements.
2 Affiliated money market fund available only to Vanguard funds and certain trusts and accounts managed by Vanguard. Rate shown is the 7-day yield.
3 The issuer operates under a congressional charter; its securities are neither issued nor guaranteed by the U.S. government. If needed, access to additional funding from the U.S. Treasury (beyond the issuer’s line of credit) would require congressional action.
4 Securities with a value of $2,999,000 have been segregated as initial margin for open futures contracts.
5 See Note C in Notes to Financial Statements for the tax-basis components of net assets.
REIT—Real Estate Investment Trust.
19
Statement of Operations
| Year Ended |
| September 30, 2007 |
| ($000) |
Investment Income | |
Income | |
Dividends | 96,237 |
Interest1 | 1,434 |
Security Lending | 3,700 |
Total Income | 101,371 |
Expenses | |
The Vanguard Group—Note B | |
Investment Advisory Services | 1,962 |
Management and Administrative | 18,462 |
Marketing and Distribution | 1,944 |
Custodian Fees | 140 |
Auditing Fees | 23 |
Shareholders’ Reports | 157 |
Trustees’ Fees and Expenses | 11 |
Total Expenses | 22,699 |
Net Investment Income | 78,672 |
Realized Net Gain (Loss) | |
Investment Securities Sold | 752,589 |
Futures Contracts | 3,140 |
Realized Net Gain (Loss) | 755,729 |
Change in Unrealized Appreciation (Depreciation) | |
Investment Securities | 70,863 |
Futures Contracts | 298 |
Change in Unrealized Appreciation (Depreciation) | 71,161 |
Net Increase (Decrease) in Net Assets Resulting from Operations | 905,562 |
1 Interest income from an affiliated company of the fund was $1,307,000.
20
Statement of Changes in Net Assets
| Year Ended September 30, |
| 2007 | 2006 |
| ($000) | ($000) |
Increase (Decrease) in Net Assets | | |
Operations | | |
Net Investment Income | 78,672 | 74,818 |
Realized Net Gain (Loss) | 755,729 | 331,726 |
Change in Unrealized Appreciation (Depreciation) | 71,161 | (51,941) |
Net Increase (Decrease) in Net Assets Resulting from Operations | 905,562 | 354,603 |
Distributions | | |
Net Investment Income | (74,998) | (49,617) |
Realized Capital Gain1 | (282,684) | (340,229) |
Total Distributions | (357,682) | (389,846) |
Capital Share Transactions—Note F | | |
Issued | 1,437,921 | 2,273,341 |
Issued in Lieu of Cash Distributions | 338,749 | 365,856 |
Redeemed | (1,380,667) | (1,031,900) |
Net Increase (Decrease) from Capital Share Transactions | 396,003 | 1,607,297 |
Total Increase (Decrease) | 943,883 | 1,572,054 |
Net Assets | | |
Beginning of Period | 6,755,045 | 5,182,991 |
End of Period2 | 7,698,928 | 6,755,045 |
1 Includes fiscal 2007 and 2006 short-term gain distributions totaling $28,845,000 and $92,145,000, respectively. Short-term gain distributions are treated as ordinary income dividends for tax purposes.
2 Net Assets—End of Period includes undistributed net investment income of $41,285,000 and $45,366,000.
21
Financial Highlights
| | | | | | |
| | | | | |
| | | | | | |
| | Year Ended | Nov. 1, | |
For a Share Outstanding | | September 30, | 2003, to | October 31, |
Throughout Each Period | 2007 | 2006 | 2005 | 20041 | 2003 | 2002 |
Net Asset Value, Beginning of Period | $23.07 | $23.28 | $19.70 | $17.85 | $13.01 | $13.68 |
Investment Operations | | | | | | |
Net Investment Income | .27 | .27 | .19 | .13 | .13 | .14 |
Net Realized and Unrealized Gain (Loss) | | | | | | |
on Investments | 2.84 | 1.17 | 4.49 | 1.85 | 4.84 | (.67) |
Total from Investment Operations | 3.11 | 1.44 | 4.68 | 1.98 | 4.97 | (.53) |
Distributions | | | | | | |
Dividends from Net Investment Income | (.26) | (.21) | (.14) | (.13) | (.13) | (.14) |
Distributions from Realized Capital Gains | (.98) | (1.44) | (.96) | — | — | — |
Total Distributions | (1.24) | (1.65) | (1.10) | (.13) | (.13) | (.14) |
Net Asset Value, End of Period | $24.94 | $23.07 | $23.28 | $19.70 | $17.85 | $13.01 |
| | | | | | |
| | | | | | |
Total Return2 | 13.76% | 6.49% | 24.32% | 11.14% | 38.55% | –4.02% |
| | | | | | |
| | | | | | |
Ratios/Supplemental Data | | | | | | |
Net Assets, End of Period (Millions) | $7,699 | $6,755 | $5,183 | $2,953 | $1,714 | $876 |
Ratio of Total Expenses to | | | | | | |
Average Net Assets | 0.30% | 0.35% | 0.40% | 0.45%* | 0.50% | 0.50% |
Ratio of Net Investment Income to | | | | | | |
Average Net Assets | 1.03% | 1.18% | 0.99% | 0.83%* | 1.04% | 0.94% |
Portfolio Turnover Rate | 75% | 80% | 75% | 66% | 100% | 73% |
| | | | | | | | |
1 The fund’s fiscal year-end changed from October 31 to September 30, effective September 30, 2004.
2 Total returns do not reflect the account service fee that may be applicable to certain accounts with balances below $10,000.
* Annualized.
See accompanying Notes, which are an integral part of the Financial Statements.
22
Notes to Financial Statements
Vanguard Strategic Equity Fund is registered under the Investment Company Act of 1940 as an open-end investment company, or mutual fund. The fund files reports with the SEC under the company name Vanguard Horizon Funds.
A. The following significant accounting policies conform to generally accepted accounting principles for U.S. mutual funds. The fund consistently follows such policies in preparing its financial statements.
1. Security Valuation: Securities are valued as of the close of trading on the New York Stock Exchange (generally 4 p.m., Eastern time) on the valuation date. Equity securities are valued at the latest quoted sales prices or official closing prices taken from the primary market in which each security trades; such securities not traded on the valuation date are valued at the mean of the latest quoted bid and asked prices. Securities for which market quotations are not readily available, or whose values have been materially affected by events occurring before the fund’s pricing time but after the close of the securities’ primary markets, are valued by methods deemed by the board of trustees to represent fair value. Investments in Vanguard Market Liquidity Fund are valued at that fund’s net asset value. Temporary cash investments acquired over 60 days to maturity are valued using the latest bid prices or using valuations based on a matrix system (which considers such factors as security prices, yields, maturities, and ratings), both as furnished by independent pricing services. Other temporary cash investments are valued at amortized cost, which approximates market value.
2. Futures Contracts: The fund uses index futures contracts to a limited extent, with the objective of maintaining full exposure to the stock market while maintaining liquidity. The fund may purchase or sell futures contracts to achieve a desired level of investment, whether to accommodate portfolio turnover or cash flows from capital share transactions. The primary risks associated with the use of futures contracts are imperfect correlation between changes in market values of stocks held by the fund and the prices of futures contracts, and the possibility of an illiquid market.
Futures contracts are valued at their quoted daily settlement prices. The aggregate principal amounts of the contracts are not recorded in the Statement of Net Assets. Fluctuations in the value of the contracts are recorded in the Statement of Net Assets as an asset (liability) and in the Statement of Operations as unrealized appreciation (depreciation) until the contracts are closed, when they are recorded as realized futures gains (losses).
3. Federal Income Taxes: The fund intends to continue to qualify as a regulated investment company and distribute all of its taxable income. Accordingly, no provision for federal income taxes is required in the financial statements.
4. Distributions: Distributions to shareholders are recorded on the ex-dividend date.
5. Security Lending: The fund may lend its securities to qualified institutional borrowers to earn additional income. Security loans are required to be secured at all times by collateral at least equal to the market value of securities loaned. The fund invests cash collateral received in Vanguard Market Liquidity Fund, and records a liability for the return of the collateral, during the period the securities are on loan. Security lending income represents the income earned on investing cash collateral, less expenses associated with the loan.
6. Other: Dividend income is recorded on the ex-dividend date. Interest income includes income distributions received from Vanguard Market Liquidity Fund and is accrued daily. Security transactions are accounted for on the date securities are bought or sold. Costs used to determine realized gains (losses) on the sale of investment securities are those of the specific securities sold.
23
B. The Vanguard Group furnishes at cost investment advisory, corporate management, administrative, marketing, and distribution services. The costs of such services are allocated to the fund under methods approved by the board of trustees. The fund has committed to provide up to 0.40% of its net assets in capital contributions to Vanguard. At September 30, 2007, the fund had contributed capital of $664,000 to Vanguard (included in Other Assets), representing 0.01% of the fund’s net assets and 0.66% of Vanguard’s capitalization. The fund’s trustees and officers are also directors and officers of Vanguard.
C. Distributions are determined on a tax basis and may differ from net investment income and realized capital gains for financial reporting purposes. Differences may be permanent or temporary. Permanent differences are reclassified among capital accounts in the financial statements to reflect their tax character. Temporary differences arise when certain items of income, expense, gain, or loss are recognized in different periods for financial statement and tax purposes; these differences will reverse at some time in the future. Differences in classification may also result from the treatment of short-term gains as ordinary income for tax purposes.
The fund used a tax accounting practice to treat a portion of the price of capital shares redeemed during the year as distributions from net investment income and realized capital gains. Accordingly, the fund has reclassified $7,755,000 from undistributed net investment income, and $74,018,000 from accumulated net realized gains, to paid-in capital.
For tax purposes, at September 30, 2007, the fund had $130,349,000 of ordinary income and $580,698,000 of long-term capital gains available for distribution.
At September 30, 2007, the cost of investment securities for tax purposes was $6,990,467,000. Net unrealized appreciation of investment securities for tax purposes was $808,002,000, consisting of unrealized gains of $1,168,250,000 on securities that had risen in value since their purchase and $360,248,000 in unrealized losses on securities that had fallen in value since their purchase.
At September 30, 2007, the aggregate settlement value of open futures contracts expiring in December 2007 and the related unrealized appreciation (depreciation) were:
| | | ($000) |
| | Aggregate | Unrealized |
| Number of | Settlement | Appreciation |
Futures Contracts | Long Contracts | Value | (Depreciation) |
S&P 500 Index | 31 | 11,920 | 311 |
E-mini S&P 500 Index | 57 | 4,384 | 4 |
Unrealized appreciation (depreciation) on open futures contracts is required to be treated as realized gain (loss) for tax purposes.
D. During the year ended September 30, 2007, the fund purchased $5,740,874,000 of investment securities and sold $5,629,120,000 of investment securities, other than temporary cash investments.
E. The market value of securities on loan to broker-dealers at September 30, 2007, was $106,138,000, for which the fund received cash collateral of $111,005,000.
24
F. Capital shares issued and redeemed were:
| Year Ended September 30, |
| 2007 | 2006 |
| Shares | Shares |
| (000) | (000) |
Issued | 57,380 | 98,757 |
Issued in Lieu of Cash Distributions | 14,281 | 16,547 |
Redeemed | (55,822) | (45,160) |
Net Increase (Decrease) in Shares Outstanding | 15,839 | 70,144 |
G. In June 2006, the Financial Accounting Standards Board issued Interpretation No. 48 (“FIN 48”), “Accounting for Uncertainty in Income Taxes.” FIN 48 establishes the minimum threshold for recognizing, and a system for measuring, the benefits of tax-return positions in financial statements, and is effective for the fund’s fiscal year beginning October 1, 2007. Management has analyzed the fund’s tax positions taken on federal income tax returns for all open tax years (tax years ended September 30, 2004–2007) for purposes of implementing FIN 48, and has concluded that as of September 30, 2007, no provision for income tax would be required in the fund’s financial statements.
25
Report of Independent Registered Public Accounting Firm
To the Trustees of Vanguard Horizon Funds and the Shareholders of Vanguard Strategic Equity Fund:
In our opinion, the accompanying statement of net assets and the related statements of operations and of changes in net assets and the financial highlights present fairly, in all material respects, the financial position of Vanguard Strategic Equity Fund (the “Fund”) at September 30, 2007, the results of its operations for the year then ended, the changes in its net assets for each of the two years in the period then ended, and the financial highlights for each of the periods indicated, in conformity with accounting principles generally accepted in the United States of America. These financial statements and financial highlights (hereafter referred to as “financial statements”) are the responsibility of the Fund’s management; our responsibility is to express an opinion on these financial statements based on our audits. We conducted our audits of these financial statements in accordance with the standards of the Public Company Accounting Oversight Board (United States), which require that we plan and perform the audit to obtain reasonable assurance about whether the financial statements are free of material misstatement. An audit includes examining, on a test basis, evidence supporting the amounts and disclosures in the financial statements, assessing the accounting principles used and significant estimates made by management, and evaluating the overall financial statement presentation. We believe that our audits, which included confirmation of securities at September 30, 2007 by correspondence with the custodian and broker, and by agreement to the underlying ownership records for Vanguard Market Liquidity Fund, provide a reasonable basis for our opinion.
PricewaterhouseCoopers LLP
Philadelphia, Pennsylvania
November 7, 2007
Special 2007 tax information (unaudited) for Vanguard Strategic Equity Fund |
|
This information for the fiscal year ended September 30, 2007, is included pursuant to provisions of |
the Internal Revenue Code. |
|
The fund distributed $317,109,000 as capital gain dividends (from net long-term capital gains) to |
shareholders during the fiscal year. |
|
The fund distributed $73,385,000 of qualified dividend income to shareholders during the fiscal year. |
|
For corporate shareholders, 41.3% of investment income (dividend income plus short-term gains, |
if any) qualifies for the dividends-received deduction. |
26
Your Fund’s After-Tax Returns
This table presents returns for your fund both before and after taxes. The after-tax returns are shown in two ways: (1) assuming that an investor owned the fund during the entire period and paid taxes on the fund’s distributions, and (2) assuming that an investor paid taxes on the fund’s distributions and sold all shares at the end of each period.
Calculations are based on the highest individual federal income tax and capital gains tax rates in effect at the times of the distributions and the hypothetical sales. State and local taxes were not considered. After-tax returns reflect any qualified dividend income, using actual prior-year figures and estimates for 2007. (In the example, returns after the sale of fund shares may be higher than those assuming no sale. This occurs when the sale would have produced a capital loss. The calculation assumes that the investor received a tax deduction for the loss.)
Please note that your actual after-tax returns will depend on your tax situation and may differ from those shown. Also note that if you own the fund in a tax-deferred account, such as an individual retirement account or a 401(k) plan, this information does not apply to you. Such accounts are not subject to current taxes.
Finally, keep in mind that a fund’s performance—whether before or after taxes—does not guarantee future results.
Average Annual Total Returns: Strategic Equity Fund1 | | | |
Periods Ended September 30, 2007 | | | |
| One | Five | Ten |
| Year | Years | Years |
Returns Before Taxes | 13.76% | 19.14% | 9.74% |
Returns After Taxes on Distributions | 12.81 | 18.27 | 8.22 |
Returns After Taxes on Distributions and Sale of Fund Shares | 9.90 | 16.64 | 7.69 |
1 Total returns do not include the account service fee that may be applicable to certain accounts with balances below $10,000.
27
About Your Fund’s Expenses
As a shareholder of the fund, you incur ongoing costs, which include costs for portfolio management, administrative services, and shareholder reports (like this one), among others. Operating expenses, which are deducted from a fund’s gross income, directly reduce the investment return of the fund.
A fund’s expenses are expressed as a percentage of its average net assets. This figure is known as the expense ratio. The following examples are intended to help you understand the ongoing costs (in dollars) of investing in your fund and to compare these costs with those of other mutual funds. The examples are based on an investment of $1,000 made at the beginning of the period shown and held for the entire period.
The table below illustrates your fund’s costs in two ways:
• Based on actual fund return. This section helps you to estimate the actual expenses that you paid over the period. The “Ending Account Value” shown is derived from the fund’s actual return, and the third column shows the dollar amount that would have been paid by an investor who started with $1,000 in the fund. You may use the information here, together with the amount you invested, to estimate the expenses that you paid over the period.
To do so, simply divide your account value by $1,000 (for example, an $8,600 account value divided by $1,000 = 8.6), then multiply the result by the number given for your fund under the heading “Expenses Paid During Period.”
• Based on hypothetical 5% yearly return. This section is intended to help you compare your fund’s costs with those of other mutual funds. It assumes that the fund had a yearly return of 5% before expenses, but that the expense ratio is unchanged. In this case—because the return used is not the fund’s actual return—the results do not apply to your investment. The example is useful in making comparisons because the Securities and Exchange Commission requires all mutual funds to calculate expenses based on a 5% return. You can assess your fund’s costs by comparing this hypothetical example with the hypothetical examples that appear in shareholder reports of other funds.
Six Months Ended September 30, 2007 | | | |
| Beginning | Ending | Expenses |
| Account Value | Account Value | Paid During |
Strategic Equity Fund | 3/31/2007 | 9/30/2007 | Period1 |
Based on Actual Fund Return | $1,000.00 | $1,006.05 | $1.46 |
Based on Hypothetical 5% Yearly Return | 1,000.00 | 1,023.61 | 1.47 |
Note that the expenses shown in the table are meant to highlight and help you compare ongoing costs only and do not reflect transaction costs incurred by the fund for buying and selling securities. Further, the expenses do not include the account service fee described in the prospectus. If such a fee were applied to your account, your costs would be higher. Your fund does not charge transaction fees, such as purchase or redemption fees, nor does it carry a “sales load.”
1 The calculations are based on expenses incurred in the most recent six-month period. The fund’s annualized six-month expense ratio for that period is 0.29%. The dollar amounts shown as “Expenses Paid” are equal to the annualized expense ratio multiplied by the average account value over the period, multiplied by the number of days in the most recent six-month period, then divided by the number of days in the most recent 12-month period.
28
The calculations assume no shares were bought or sold during the period. Your actual costs may have been higher or lower, depending on the amount of your investment and the timing of any purchases or redemptions.
You can find more information about the fund’s expenses, including annual expense ratios, in the Financial Statements section of this report. For additional information on operating expenses and other shareholder costs, please refer to your fund’s current prospectus.
29
Glossary
Beta. A measure of the magnitude of a fund’s past share-price fluctuations in relation to the ups and downs of a given market index. The index is assigned a beta of 1.00. Compared with a given index, a fund with a beta of 1.20 typically would have seen its share price rise or fall by 12% when the index rose or fell by 10%. A fund’s beta should be reviewed in conjunction with its R-squared (see definition below). The lower the R-squared, the less correlation there is between the fund and the index, and the less reliable beta is as an indicator of volatility.
Earnings Growth Rate. The average annual rate of growth in earnings over the past five years for the stocks now in a fund.
Equity Exposure. A measure that reflects a fund’s investments in stocks and stock futures. Any holdings in short-term reserves are excluded.
Expense Ratio. The percentage of a fund’s average net assets used to pay its annual administrative and advisory expenses. These expenses directly reduce returns to investors.
Foreign Holdings. The percentage of a fund represented by stocks or depositary receipts of companies based outside the United States.
Median Market Cap. An indicator of the size of companies in which a fund invests; the midpoint of market capitalization (market price x shares outstanding) of a fund’s stocks, weighted by the proportion of the fund’s assets invested in each stock. Stocks representing half of the fund’s assets have market capitalizations above the median, and the rest are below it.
Price/Book Ratio. The share price of a stock divided by its net worth, or book value, per share. For a fund, the weighted average price/book ratio of the stocks it holds.
Price/Earnings Ratio. The ratio of a stock’s current price to its per-share earnings over the past year. For a fund, the weighted average P/E of the stocks it holds. P/E is an indicator of market expectations about corporate prospects; the higher the P/E, the greater the expectations for a company’s future growth.
R-Squared. A measure of how much of a fund’s past returns can be explained by the returns from the market in general, as measured by a given index. If a fund’s total returns were precisely synchronized with an index’s returns, its R-squared would be 1.00. If the fund’s returns bore no relationship to the index’s returns, its R-squared would be 0.
Return on Equity. The annual average rate of return generated by a company during the past five years for each dollar of shareholder’s equity (net income divided by shareholder’s equity). For a fund, the weighted average return on equity for the companies whose stocks it holds.
Short-Term Reserves. The percentage of a fund invested in highly liquid, short-term securities that can be readily converted to cash.
Turnover Rate. An indication of the fund’s trading activity. Funds with high turnover rates incur higher transaction costs and may be more likely to distribute capital gains (which may be taxable to investors). The turnover rate excludes in-kind transactions, which have minimal impact on costs.
Yield. A snapshot of a fund’s income from interest and dividends. The yield, expressed as a percentage of the fund’s net asset value, is based on income earned over the past 30 days and is annualized, or projected forward for the coming year. The index yield is based on the current annualized rate of income provided by securities in the index.
30
This page intentionally left blank.
The People Who Govern Your Fund
The trustees of your mutual fund are there to see that the fund is operated and managed in your best interests since, as a shareholder, you are a part owner of the fund. Your fund’s trustees also serve on the board of directors of The Vanguard Group, Inc., which is owned by the Vanguard funds and provides services to them on an at-cost basis.
A majority of Vanguard’s board members are independent, meaning that they have no affiliation with Vanguard or the funds they oversee, apart from the sizable personal investments they have made as private individuals.
Our independent board members bring distinguished backgrounds in business, academia, and public service to their task of working with Vanguard officers to establish the policies and oversee the activities of the funds. Among board members’ responsibilities are selecting investment advisors for the funds; monitoring fund operations, performance, and costs; reviewing contracts; nominating and selecting new trustees/directors; and electing Vanguard officers.
Each trustee serves a fund until its termination; or until the trustee’s retirement, resignation, or death; or otherwise as specified in the fund’s organizational documents. Any trustee may be removed at a shareholders’ meeting by a vote representing two-thirds of the net asset value of all shares of the fund together with shares of other Vanguard funds organized within the same trust. The table on these two pages shows information for each trustee and executive officer of the fund. The mailing address of the trustees and officers is P.O. Box 876, Valley Forge, PA 19482.
Chairman of the Board, Chief Executive Officer, and Trustee |
| |
John J. Brennan1 | |
Born 1954 | Principal Occupation(s) During the Past Five Years: Chairman of the Board, |
Trustee since May 1987; | Chief Executive Officer, and Director/Trustee of The Vanguard Group, Inc., and |
Chairman of the Board and | of each of the investment companies served by The Vanguard Group. |
Chief Executive Officer | |
148 Vanguard Funds Overseen | |
| |
Independent Trustees | |
| |
Charles D. Ellis | |
Born 1937 | Principal Occupation(s) During the Past Five Years: Applecore Partners (pro |
Trustee since January 2001 | bono ventures in education); Senior Advisor to Greenwich Associates |
148 Vanguard Funds Overseen | (international business strategy consulting); Successor Trustee of Yale |
| University; Overseer of the Stern School of Business at New York University; |
| Trustee of the Whitehead Institute for Biomedical Research. |
| |
Rajiv L. Gupta | |
Born 1945 | Principal Occupation(s) During the Past Five Years: Chairman, President, and |
Trustee since December 20012 | Chief Executive Officer of Rohm and Haas Co. (chemicals); Board Member of |
148 Vanguard Funds Overseen | the American Chemistry Council; Director of Tyco International, Ltd. (diversified |
| manufacturing and services) since 2005; Trustee of Drexel University and of the |
| Chemical Heritage Foundation. |
| |
Amy Gutmann | |
Born 1949 | Principal Occupation(s) During the Past Five Years: President of the University |
Trustee since June 2006 | of Pennsylvania since 2004; Professor in the School of Arts and Sciences, |
148 Vanguard Funds Overseen | Annenberg School for Communication, and Graduate School of Education of the |
| University of Pennsylvania since 2004; Provost (2001–2004) and Laurance S. |
| Rockefeller Professor of Politics and the University Center for Human Values |
| (1990–2004), Princeton University; Director of Carnegie Corporation of New |
| York since 2005 and of Schuylkill River Development Corporation and Greater |
| Philadelphia Chamber of Commerce since 2004. |
JoAnn Heffernan Heisen | |
Born 1950 | Principal Occupation(s) During the Past Five Years: Corporate Vice President |
Trustee since July 1998 | and Chief Global Diversity Officer since 2006, Vice President and Chief |
148 Vanguard Funds Overseen | Information Officer (1997–2005), and Member of the Executive Committee of |
| Johnson &Johnson (pharmaceuticals/consumer products); Director of the |
| University Medical Center at Princeton and Women’s Research and Education |
| Institute. |
| |
André F. Perold | |
Born 1952 | Principal Occupation(s) During the Past Five Years: George Gund Professor of |
Trustee since December 2004 | Finance and Banking, Harvard Business School; Senior Associate Dean, Director |
148 Vanguard Funds Overseen | of Faculty Recruiting, and Chair of Finance Faculty, Harvard Business School; |
| Director and Chairman of UNX, Inc. (equities trading firm) since 2003; Chair of |
| the Investment Committee of HighVista Strategies LLC (private investment firm) |
| since 2005. |
| |
Alfred M. Rankin, Jr. | |
Born 1941 | Principal Occupation(s) During the Past Five Years: Chairman, President, Chief |
Trustee since January 1993 | Executive Officer, and Director of NACCO Industries, Inc. (forklift |
148 Vanguard Funds Overseen | trucks/housewares/lignite); Director of Goodrich Corporation (industrial |
| products/aircraft systems and services). |
| |
J. Lawrence Wilson | |
Born 1936 | Principal Occupation(s) During the Past Five Years: Retired Chairman and Chief |
Trustee since April 1985 | Executive Officer of Rohm and Haas Co. (chemicals); Director of Cummins Inc. |
148 Vanguard Funds Overseen | (diesel engines) and AmerisourceBergen Corp. (pharmaceutical distribution); |
| Trustee of Vanderbilt University and of Culver Educational Foundation. |
| |
Executive Officers1 | |
| |
Thomas J. Higgins | |
Born 1957 | Principal Occupation(s) During the Past Five Years: Principal of The Vanguard |
Treasurer since July 1998 | Group, Inc.;Treasurer of each of the investment companies served by The |
148 Vanguard Funds Overseen | Vanguard Group. |
| |
| |
Heidi Stam | |
Born 1956 | Principal Occupation(s) During the Past Five Years: Managing Director of The |
Secretary since July 2005 | Vanguard Group, Inc., since 2006; General Counsel of The Vanguard Group |
148 Vanguard Funds Overseen | since 2005; Secretary of The Vanguard Group, and of each of the investment |
| companies served by The Vanguard Group, since 2005; Principal of The |
| Vanguard Group (1997–2006). |
Vanguard Senior Management Team |
| |
R. Gregory Barton | Kathleen C. Gubanich | F. William McNabb, III | Ralph K. Packard |
Mortimer J. Buckley | Paul A. Heller | Michael S. Miller | George U. Sauter |
| |
| |
Founder | |
| |
John C. Bogle | |
Chairman and Chief Executive Officer, 1974–1996 |
1 Officers of the funds are “interested persons” as defined in the Investment Company Act of 1940.
2 December 2002 for Vanguard Equity Income Fund, Vanguard Growth Equity Fund, the Vanguard Municipal Bond Funds, and the Vanguard State Tax-Exempt Funds.
More information about the trustees is in the Statement of Additional Information, available from The Vanguard Group.

P.O. Box 2600
Valley Forge, PA 19482-2600
Connect with Vanguard® > www.vanguard.com
Fund Information > 800-662-7447 | Vanguard, Connect with Vanguard, and the ship logo |
| are trademarks of The Vanguard Group, Inc. |
Direct Investor Account Services > 800-662-2739 | |
| All other marks are the exclusive property of their |
Institutional Investor Services > 800-523-1036 | respective owners. |
| |
Text Telephone for People | |
With Hearing Impairment > 800-952-3335 | |
| All comparative mutual fund data are from Lipper Inc. |
| or Morningstar, Inc., unless otherwise noted. |
| |
| You can obtain a free copy of Vanguard’s proxy voting |
| guidelines by visiting our website, www.vanguard.com, |
This material may be used in conjunction | and searching for “proxy voting guidelines,” or by |
with the offering of shares of any Vanguard | calling Vanguard at 800-662-2739. The guidelines are |
fund only if preceded or accompanied by | also available from the SEC’s website, www.sec.gov. |
the fund’s current prospectus. | In addition, you may obtain a free report on how your |
| fund voted the proxies for securities it owned during |
| the 12 months ended June 30. To get the report, visit |
| either www.vanguard.com or www.sec.gov. |
| |
| You can review and copy information about your fund |
| at the SEC’s Public Reference Room in Washington, |
| D.C.To find out more about this public service, call the |
| SEC at 202-551-8090. Information about your fund is |
| also available on the SEC’s website, and you can |
| receive copies of this information, for a fee, by sending a |
| request in either of two ways: via e-mail addressed to |
| publicinfo@sec.gov or via regular mail addressed to the |
| Public Reference Section, Securities and Exchange |
| Commission, Washington, DC 20549-0102. |
| |
| |
| |
| |
| |
| © 2007 The Vanguard Group, Inc. |
| All rights reserved. |
| Vanguard Marketing Corporation, Distributor. |
| |
| Q1140 112007 |
> Vanguard Capital Opportunity Fund returned more than 24% for its fiscal year, outpacing its market benchmark and peer-group average.
> The fund benefited from strong performances in the technology sector and from the high returns of select materials and energy stocks.
> Health care stocks delivered solid double-digit returns, but were nevertheless a relative weak spot.
Contents | |
| |
Your Fund’s Total Returns | 1 |
Chairman’s Letter | 2 |
Advisor’s Report | 7 |
Fund Profile | 10 |
Performance Summary | 11 |
Financial Statements | 13 |
Your Fund’s After-Tax Returns | 25 |
About Your Fund’s Expenses | 26 |
Glossary | 28 |
Please note: The opinions expressed in this report are just that—informed opinions. They should not be considered promises or advice. Also, please keep in mind that the information and opinions cover the period through the date on the cover of this report. Of course, the risks of investing in your fund are spelled out in the prospectus.
Your Fund’s Total Returns
Fiscal Year Ended September 30, 2007 | | |
| Ticker | Total |
| Symbol | Returns |
Vanguard Capital Opportunity Fund | | |
Investor Shares | VHCOX | 24.3% |
AdmiralTM Shares1 | VHCAX | 24.4 |
Russell Midcap Growth Index | | 21.2 |
Average Multi-Cap Growth Fund2 | | 22.9 |
Your Fund’s Performance at a Glance |
September 30, 2006–September 30, 2007 |
| | | Distributions Per Share |
| Starting | Ending | Income | Capital |
| Share Price | Share Price | Dividends | Gains |
Vanguard Capital Opportunity Fund | | | | |
Investor Shares | $36.11 | $42.70 | $0.070 | $1.857 |
Admiral Shares | 83.49 | 98.71 | 0.238 | 4.290 |
1 A lower-cost class of shares available to many longtime shareholders and to those with significant investments in the fund.
2 Derived from data provided by Lipper Inc.
1

Chairman’s Letter
Dear Shareholder,
During the fiscal year ended September 30, 2007, Vanguard Capital Opportunity Fund returned more than 24%, outpacing its benchmark, the Russell Midcap Growth Index, and the average return of multi-cap growth funds. The fund’s return was also superior to the performance of the broad U.S. stock market.
The fund’s strong performance reflected outsized returns from an interesting mix of holdings. Information technology stocks, the fund’s largest commitment and a longtime focus of advisor PRIMECAP Management Company, returned more than 30%. At the other end of the industrial production chain, energy and materials stocks also earned strong returns for the fund; these sectors benefited from high prices for oil, fertilizer, and the economy’s other basic building blocks.
If you own the Capital Opportunity Fund in a taxable account, see page 25 for a report on the fund’s after-tax returns for the 12 months ended September 30. Please note that our preliminary estimates suggest that the fund will distribute capital gains of roughly $3.30 per share for Investor Shares and $7.65 per share for Admiral Shares in December 2007. As of September 30, the fund remained closed to most new investors. Existing accounts may contribute up to $25,000 per year. (The fund closure and contribution limits do not apply to Flagship members.)
Strong returns for U.S. stocks; even better for markets abroad
U.S. stocks produced excellent returns for the fiscal year. The gains came despite a midsummer shakeup brought on by problems in the subprime mortgage-loan market. Financials stocks—which represent a sizable share of the U.S. market’s value—were hardest hit, as investment banking and consumer lending businesses throttled back.
The broad U.S. equity market returned 17.1% for the year. Returns from large-capitalization stocks outpaced those of small-caps, and growth-oriented stocks outperformed their value-oriented counterparts. As investors took account of risk, they seemed to exhibit a preference for large-cap growth stocks, which seem better positioned to thrive in a period of economic uncertainty.
Although not immune from the effects of the turmoil in U.S. credit markets, international stocks handily surpassed the returns of domestic stocks over the 12 months. The dollar’s ongoing weakness further enhanced foreign market gains for U.S.-based investors.
The bond market was shaken, but regained ground in the end
Turmoil in the corporate bond and subprime lending markets caused a “flight to quality” that drove prices of U.S. Treasury bonds sharply higher, particularly toward the end of the fiscal period. As the bonds’ prices rose, their yields fell. The declines were greatest among Treasury securities with the shortest maturities. The yield of the 3-month Treasury bill, which started the fiscal year at 4.89%, dropped more than a full percentage point to 3.81%.
2
Market Barometer | | | |
| Average Annual Total Returns |
| Periods Ended September 30, 2007 |
| One Year | Three Years | Five Years |
Stocks | | | |
Russell 1000 Index (Large-caps) | 16.9% | 13.8% | 16.0% |
Russell 2000 Index (Small-caps) | 12.3 | 13.4 | 18.8 |
Dow Jones Wilshire 5000 Index (Entire market) | 17.1 | 14.0 | 16.5 |
MSCI All Country World Index ex USA (International) | 31.1 | 26.5 | 26.3 |
| | | |
| | | |
Bonds | | | |
Lehman U.S. Aggregate Bond Index (Broad taxable market) | 5.1% | 3.9% | 4.1% |
Lehman Municipal Bond Index | 3.1 | 3.9 | 4.0 |
Citigroup 3-Month Treasury Bill Index | 5.0 | 4.0 | 2.8 |
| | | |
| | | |
CPI | | | |
Consumer Price Index | 2.8% | 3.2% | 2.9% |
As short-term yields fell, the yield curve—which illustrates the relationship between short- and long-term bond yields—returned to its usual, upward-sloping pattern. The curve had been mildly inverted at the start of the period, with yields of shorter-term bonds above those of longer-term issues. For the year ended September 30, the broad taxable bond market returned 5.1%. Returns from tax-exempt bonds were lower, as these issues did not benefit from the late-summer rally in Treasuries.
Tech stocks took the stage with an unlikely supporting cast
Over the past few years, Vanguard Capital Opportunity Fund has established sizable stakes in technology and health care stocks. At the end of the period, these broad categories accounted for almost 65% of fund assets.
During the past 12 months, tech stocks helped power your fund to a peer-group and benchmark-beating return of more than 24%. The most notable holding was Research In Motion—maker of the ubiquitous BlackBerry—representing almost 6% of fund assets. The stock returned 188% during the past 12 months.
Expense Ratios1 | | | |
Your fund compared with its peer group | | | |
| | | Average |
| Investor | Admiral | Multi-Cap |
| Shares | Shares | Growth Fund |
Capital Opportunity Fund | 0.45% | 0.37% | 1.49% |
1 Fund expense ratios reflect the 12 months ended September 30, 2007. Peer-group expense ratio is derived from data provided by Lipper Inc. and captures information through year-end 2006.
3
Health care stocks, the fund’s other major position, were less successful on a relative basis. Although these holdings generated a very respectable 14.7% return, the gain fell short of the returns available more generally among health care stocks. Those in the Russell Midcap Growth Index, for example, returned 19%. Weak spots included pharmaceuticals companies, many of which have struggled with regulatory and product-development challenges.
The relative weakness in health care was more than offset by the exceptionally strong returns of the fund’s energy and materials stocks. At first glance, these sectors might seem odd complements to the fund’s high-tech tilt, but labels rarely provide meaningful insight to the advisor’s approach. The advisor relies on exhaustive research to identify stocks with long-term growth prospects unrecognized by the market—often found at the economy’s cutting edge, but not exclusively. In materials, the fund earned an exceptional return from its sizable position in Monsanto, which has invested heavily in research and development to produce high-value-added seeds and fertilizer. Monsanto has benefited from soaring grain and agricultural prices. Among energy stocks, the story was simply the continued boom in energy prices.
Total Returns | |
Ten Years Ended September 30, 2007 | |
| Average |
| Annual Return |
Capital Opportunity Fund Investor Shares | 16.7% |
Russell Midcap Growth Index | 7.5 |
Average Multi-Cap Growth Fund1 | 5.9 |
The figures shown represent past performance, which is not a guarantee of future results. (Current performance may be lower or higher than the performance data cited. For performance data current to the most recent month-end, visit our website at www.vanguard.com/performance.) Note, too, that both investment returns and principal value can fluctuate widely, so an investor’s shares, when sold, could be worth more or less than their original cost.
1 Derived from data provided by Lipper Inc.
4
Don’t let exceptional performance give rise to unreasonable expectations
Over the past ten years, Vanguard Capital Opportunity Fund has relied on its wide-ranging search for growth to produce an exceptional annualized return of 16.7%, more than twice the return of its benchmark index for the period and a full 10.8 percentage points better than the peer group’s average annual return. An initial investment of $25,000 in Vanguard Capital Opportunity Fund would have compounded to more than $116,000 in wealth. At the peer group’s average rate of return, the same $25,000 investment would have compounded to just $44,541.
It would be unreasonable to expect such margins of superiority to persist. Even the best investment managers go through periods of weakness. But we remain confident that, over time, the advisor’s strategy will prove a formula for success. And in both good times and bad, the fund’s modest expense ratio will help investors maximize their share of the fund’s returns.
Uncertainty is par for the course
After several years of unusual calm, the financial markets experienced a jolt in the last three months of your fund’s fiscal year. Stock market volatility increased sharply, and several other long-established trends seemed to shift into reverse. The changes were dramatic, but a long-term perspective suggests that these occasional—and unpredictable—dislocations are an enduring feature of the financial markets.
A prudent response to uncertainty is diversification both within and across asset classes, which is why we counsel investors to hold a broadly diversified portfolio of stocks and fixed income investments in proportions consistent with their goals, risk tolerance, and time horizon. Vanguard Capital Opportunity Fund can play a valuable role in such a portfolio.
Thank you for entrusting your assets to Vanguard.
Sincerely,

John J. Brennan
Chairman and Chief Executive Officer
October 16, 2007
5
Advisor’s Report
During the past 12 months, the Investor and Admiral Shares of Vanguard Capital Opportunity Fund returned 24.3% and 24.4%, respectively, outpacing the 21.2% return of the Russell Midcap Growth Index and multi-capitalization growth funds’ average return of 22.9%.
Investment environment
In recent years, investors have favored stocks with high relative free cash flow and dividend yields and disfavored stocks that, in our view, offered compelling growth prospects—a theme that we’ve explored in several of our recent shareholder letters. These dynamics had pushed the valuation differential between growth and value stocks toward historical lows, even as growth-oriented companies increased earnings at an impressive clip.
This multiyear trend began to reverse in fiscal 2007, providing a more favorable environment for growth stocks and the Capital Opportunity Fund. For the past 12 months, the Russell Midcap Growth Index was up 21.22%, versus the Russell Midcap Value Index’s total return of 13.75%. The fund benefited significantly from its large weighting in technology stocks. (The performance of our health care stocks was mixed.) Despite the recent uptick, many traditional growth stocks still trade at small premiums or, in many cases, discounts to traditional value stocks. Even if this valuation anomaly were to persist, we would expect growth companies to outperform the broad market by virtue of their superior earnings growth. If growth stocks’ recent valuation compression continues to reverse and the historical premium awarded to earnings growth begins to return, it could provide a favorable tailwind for some of the major positions in our portfolio, most notably technology and health care stocks.
Our successes
The fund’s most significant contributor, and its largest holding, was Research In Motion. The stock returned 188% for the full 12 months, benefiting from strong sales of its wireless e-mail devices and technologies. NVIDIA was another important contributor, gaining 84% as its graphics chips have continued to gain acceptance in a number of markets.
Outside the technology arena, materials and energy stocks were excellent performers. Monsanto, which develops high-yielding genetically modified seeds and fertilizers, returned 84% over the full 12 months. Dietary changes in the developing world such as increased beef consumption are pushing demand for—and the prices of—grain, corn, and other feedstocks to record levels. Relatively little new land is being cleared for agriculture, which puts a premium on the value of fertilizers and seeds that can increase the yields of existing farmland.
Our shortfalls
The portfolio’s significant detractors included Micron Technology and Motorola. Micron and Motorola have crafted sensible business strategies in their respective markets for memory chips and cell phones, but both companies have struggled to execute their plans. The missteps have weighed heavily on their stock prices.
Outlook
Although our health care stocks turned in mixed results, we remain optimistic about the sector, particularly pharmaceuticals. The major pharmaceutical companies boast above-average long-term growth prospects, as the emergence of a global middle class produces significant demand for pharmaceuticals. The companies maintain enviable balance sheets, and their relative valuations are at historic lows. Biotech companies should experience even faster growth as they capitalize on advances in the scientific community’s understanding of the genome to develop new therapies.
We also expect both groups of companies to benefit from a dramatic increase in pharmaceutical use by the aging baby-boom generation. People over age 65 are consuming an increasing amount of prescription drugs per capita, and this area of consumption is relatively insensitive to the economic cycle.
6
Our tech stocks also seem positioned to benefit from rising wealth around the world. China’s and India’s enormous populations are accelerating their adoption of the latest technologies, which bodes well for semiconductor and equipment manufacturers. One of our larger holdings is ASML Holding, which is poised to take advantage of these trends. As advanced electronics become increasingly important components of even the most mundane devices—including toasters and telephones—chipmakers and their suppliers are moving into new markets.
We remain pessimistic about most financials companies. The recent problems in the subprime mortgage market are likely just the beginning of consequences for loose lending standards, in our view. Risky loans are routinely packaged into collateralized debt obligations (CDOs), which are in turn often repackaged into additional CDOs (called CDO-squared); the underlying credit risk has been sliced, diced, and often redistributed in highly concentrated forms. The proliferation of these products makes it difficult to pinpoint precisely where the risk ultimately resides, though we believe the publicly traded financial firms continue to retain some of this risk, often in new and less understood forms. Reflecting this view, we have minimal exposure to banks and the financial sector overall.
In closing, we would like to thank you for entrusting your hard-earned capital with us. We will continue to work diligently to prove worthy of that trust.
Theo A. Kolokotrones | | Howard B. Schow |
Portfolio Manager | | Portfolio Manager |
| David H. Van Slooten | |
| Portfolio Manager | |
Joel P. Fried | | Alfred W. Mordecai |
Portfolio Manager | | Portfolio Manager |
PRIMECAP Management Company, LLP
October 16, 2007
7
Fund Profile
As of September 30, 2007
Portfolio Characteristics | | |
| | Comparative | Broad |
| Fund | Index1 | Index2 |
Number of Stocks | 121 | 555 | 4,887 |
Median Market Cap | $15.7B | $8.5B | $36.1B |
Price/Earnings Ratio | 27.5x | 23.4x | 18.1x |
Price/Book Ratio | 3.3x | 4.2x | 2.8x |
Yield | | 0.8% | 1.7% |
Investor Shares | 0.3% | | |
Admiral Shares | 0.4% | | |
Return on Equity | 13.3% | 18.6% | 18.8% |
Earnings Growth Rate | 25.7% | 25.7% | 21.6% |
Foreign Holdings | 12.9% | 0.0% | 0.0% |
Turnover Rate | 14% | — | — |
Expense Ratio | | — | — |
Investor Shares | 0.45% | | |
Admiral Shares | 0.37% | | |
Short-Term Reserves | 5.0% | — | — |
Sector Diversification (% of equity exposure) |
| | Comparative | Broad |
| Fund | Index1 | Index2 |
Consumer Discretionary | 12.9% | 18.5% | 10.4% |
Consumer Staples | 0.2 | 4.2 | 8.2 |
Energy | 7.2 | 11.1 | 11.2 |
Financials | 1.3 | 7.8 | 20.0 |
Health Care | 17.9 | 12.5 | 11.6 |
Industrials | 7.5 | 15.6 | 11.8 |
Information Technology | 45.9 | 20.0 | 16.0 |
Materials | 5.1 | 4.7 | 3.7 |
Telecommunication | | | |
Services | 2.0 | 2.6 | 3.5 |
Utilities | 0.0 | 3.0 | 3.6 |
Volatility Measures3 | |
| Fund Versus | Fund Versus |
| Comparative Index1 | Broad Index2 |
R-Squared | 0.81 | 0.74 |
Beta | 0.99 | 1.26 |
8
Ten Largest Holdings4 (% of total net assets) |
| | |
Research In Motion Ltd. | communications | |
| equipment | 5.4% |
NVIDIA Corp. | semiconductors | 4.5 |
Monsanto Co. | fertilizers and | |
| agricultural | |
| chemicals | 4.0 |
ASML Holding NV | semiconductor | |
(New York) | equipment | 3.4 |
Biogen Idec Inc. | biotechnology | 2.9 |
FedEx Corp. | air freight and | |
| logistics | 2.9 |
Corning, Inc. | communications | |
| equipment | 2.9 |
Applera Corp.–Applied | life sciences tools | |
Biosystems Group | and services | 2.5 |
Symantec Corp. | systems software | 2.2 |
DIRECTV Group, Inc. | broadcasting and | |
| cable television | 2.0 |
Top Ten | | 32.7% |
Investment Focus

1 Russell Midcap Growth Index.
2 Dow Jones Wilshire 5000 Index.
3 For an explanation of R-squared, beta, and other terms used here, see the Glossary on page 28.
4 “Ten Largest Holdings” excludes any temporary cash investments and equity index products.
9
Performance Summary
All of the returns in this report represent past performance, which is not a guarantee of future results that may be achieved by the fund. (Current performance may be lower or higher than the performance data cited. For performance data current to the most recent month-end, visit our website at www.vanguard.com/performance.) Note, too, that both investment returns and principal value can fluctuate widely, so an investor’s shares, when sold, could be worth more or less than their original cost. The returns shown do not reflect taxes that a shareholder would pay on fund distributions or on the sale of fund shares.
Cumulative Performance: September 30, 1997–September 30, 2007
Initial Investment of $25,000
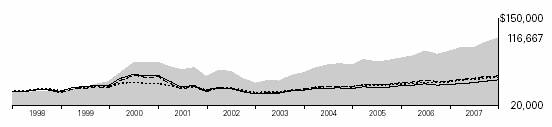
| Average Annual Total Returns | Final Value |
| Periods Ended September 30, 2007 | of a $25,000 |
| One Year | Five Years | Ten Years | Investment |
Capital Opportunity Fund Investor Shares1,2 | 24.35% | 24.78% | 16.65% | $116,667 |
Dow Jones Wilshire 5000 Index | 17.08 | 16.53 | 6.85 | 48,498 |
Russell Midcap Growth Index | 21.22 | 20.39 | 7.47 | 51,392 |
Average Multi-Cap Growth Fund3 | 22.92 | 16.44 | 5.95 | 44,541 |
| | | | Final Value |
| | | Since | of a $100,000 |
| One Year | Five Years | Inception4 | Investment |
Capital Opportunity Fund Admiral Shares1 | 24.43% | 24.88% | 13.64% | $212,155 |
Dow Jones Wilshire 5000 Index | 17.08 | 16.53 | 8.82 | 164,440 |
Russell Midcap Growth Index | 21.22 | 20.39 | 10.68 | 181,607 |
1 Total returns do not reflect the 1% fee assessed on redemptions after March 23, 2005, of shares held for less than one year, or the 1% fee previously assessed on redemptions of shares held for less than five years.
2 Total returns do not include the account service fee that may be applicable to certain accounts with balances below $10,000.
3 Derived from data provided by Lipper Inc.
4 Performance for the fund and its comparative standards is calculated since the fund's inception: November 12, 2001.
10
Fiscal-Year Total Returns (%): September 30, 1997–September 30, 2007
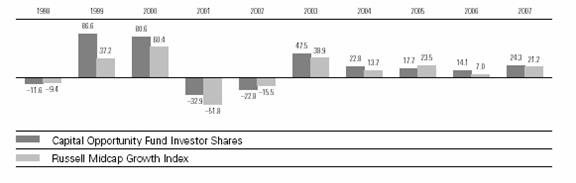
Note: See Financial Highlights tables on pages 18 and 19 for dividend and capital gains information.
11
Financial Statements
Statement of Net Assets
As of September 30, 2007
The fund provides a complete list of its holdings four times in each fiscal year, at the quarter-ends. For the second and fourth fiscal quarters, the lists appear in the fund’s semiannual and annual reports to shareholders. For the first and third fiscal quarters, the fund files the lists with the Securities and Exchange Commission on Form N-Q. Shareholders can look up the fund’s Forms N-Q on the SEC’s website at www.sec.gov. Forms N-Q may also be reviewed and copied at the SEC’s Public Reference Room (see the back cover of this report for further information).
| | | Market |
| | | Value• |
| | Shares | ($000) |
Common Stocks (95.1%) | | |
Consumer Discretionary (12.3%) | | |
* | DIRECTV Group, Inc. | 8,222,335 | 199,638 |
| TJX Cos., Inc. | 5,167,400 | 150,216 |
| Men's Wearhouse, Inc. | 2,496,632 | 126,130 |
| Nordstrom, Inc. | 2,500,000 | 117,225 |
* | Bed Bath & Beyond, Inc. | 2,830,900 | 96,590 |
| Whirlpool Corp. | 1,000,000 | 89,100 |
* | CarMax, Inc. | 4,194,600 | 85,276 |
*1 | The Dress Barn, Inc. | 4,918,000 | 83,655 |
* | Quiksilver, Inc. | 5,821,500 | 83,247 |
| Best Buy Co., Inc. | 952,500 | 43,834 |
| Lowe’s Cos., Inc. | 1,411,400 | 39,547 |
* | 99 Cents Only Stores | 2,400,000 | 24,648 |
* | Chico's FAS, Inc. | 1,501,000 | 21,089 |
* | O’Reilly Automotive, Inc. | 627,000 | 20,948 |
| Gentex Corp. | 900,000 | 19,296 |
| Abercrombie & Fitch Co. | 200,000 | 16,140 |
1 | Strattec Security Corp. | 220,000 | 10,221 |
* | Expedia, Inc. | 300,000 | 9,564 |
* | DreamWorks | | |
| Animation SKG, Inc. | 282,000 | 9,424 |
* | Amazon.com, Inc. | 18,200 | 1,695 |
| E.W. Scripps Co. Class A | 30,000 | 1,260 |
| | | 1,248,743 |
Consumer Staples (0.1%) | | |
* | Cott Corp. | 1,870,000 | 14,904 |
| | | |
Energy (6.9%) | | |
| Murphy Oil Corp. | 2,600,000 | 181,714 |
| ConocoPhillips Co. | 1,750,000 | 153,598 |
* | National Oilwell Varco Inc. | 602,700 | 87,090 |
| Arch Coal, Inc. | 2,511,000 | 84,721 |
| Noble Energy, Inc. | 1,200,000 | 84,048 |
| Pogo Producing Co. | 1,200,000 | 63,732 |
* | Exterran Holdings, Inc. | 442,325 | 35,536 |
* | Pride International, Inc. | 242,000 | 8,845 |
| | | 699,284 |
| Financials(1.2%) | | |
| | | | | |
12
| | | Market |
| | | Value• |
| | Shares | ($000) |
| MBIA, Inc. | 562,500 | 34,341 |
| Capital One Financial Corp. | 345,500 | 22,952 |
^ | IndyMac Bancorp, Inc. | 940,000 | 22,193 |
| The Chubb Corp. | 390,000 | 20,920 |
| TCF Financial Corp. | 330,000 | 8,639 |
| East West Bancorp, Inc. | 230,000 | 8,271 |
| SLM Corp. | 50,000 | 2,484 |
* | MF Global Ltd. | 62,500 | 1,813 |
| Nymex Holdings Inc. | 300 | 39 |
| | | 121,652 |
Health Care (17.0%) | | |
* | Biogen Idec Inc. | 4,500,000 | 298,485 |
| Applera Corp.–Applied | | |
| Biosystems Group | 7,298,400 | 252,817 |
| Novartis AG ADR | 3,556,500 | 195,465 |
| Medtronic, Inc. | 3,436,100 | 193,830 |
| Eli Lilly & Co. | 2,522,900 | 143,629 |
| Roche Holdings AG | 725,000 | 131,277 |
* | BioMarin | | |
| Pharmaceutical Inc. | 4,670,500 | 116,295 |
* | Boston Scientific Corp. | 7,257,700 | 101,245 |
* | Amgen, Inc. | 1,725,000 | 97,583 |
* | Affymetrix, Inc. | 3,105,500 | 78,787 |
* | Millipore Corp. | 1,011,500 | 76,672 |
* | Sepracor Inc. | 550,000 | 15,125 |
* | Edwards Lifesciences Corp. | 300,000 | 14,793 |
*^ | Dendreon Corp. | 1,525,000 | 11,727 |
*^ | Pharmacyclics, Inc. | 740,500 | 1,703 |
* | Waters Corp. | 2,000 | 134 |
| | | 1,729,567 |
Industrials (7.1%) | | |
| FedEx Corp. | 2,806,200 | 293,949 |
*1 | Thomas & Betts Corp. | 3,311,100 | 194,163 |
| Pall Corp. | 2,066,500 | 80,387 |
*^ | AMR Corp. | 3,050,000 | 67,985 |
*^ | JetBlue Airways Corp. | 3,241,050 | 29,882 |
| Avery Dennison Corp. | 390,500 | 22,266 |
| Union Pacific Corp. | 125,000 | 14,133 |
| Chicago Bridge & Iron Co. N.V. | 225,000 | 9,689 |
| Southwest Airlines Co. | 481,300 | 7,123 |
| Fluor Corp. | 19,100 | 2,750 |
* | Monster Worldwide Inc. | 77,250 | 2,631 |
* | US Airways Group Inc. | 59,300 | 1,557 |
* | UAL Corp. | 3,950 | 184 |
| | | 726,699 |
Information Technology (43.7%) | | |
| Communications Equipment (11.8%) | | |
* | Research In Motion Ltd. | 5,578,500 | 549,761 |
| Corning, Inc. | 11,820,200 | 291,368 |
* | Comverse Technology, Inc. | 4,860,000 | 96,228 |
| Motorola, Inc. | 4,500,000 | 83,385 |
| | | | | |
13
| | | Market |
| | | Value• |
| | Shares | ($000) |
* | Avocent Corp. | 2,484,500 | 72,349 |
* | Nortel Networks Corp. | 2,323,500 | 39,453 |
| Plantronics, Inc. | 1,150,000 | 32,833 |
* | Ciena Corp. | 607,142 | 23,120 |
| QUALCOMM Inc. | 200,000 | 8,452 |
| | | |
| Computers & Peripherals (2.8%) | | |
*1 | Emulex Corp. | 4,569,400 | 87,595 |
| Hewlett-Packard Co. | 1,200,000 | 59,748 |
* | Brocade Communications | | |
| Systems, Inc. | 6,485,000 | 55,512 |
*1 | ^Avid Technology, Inc. | 2,037,500 | 55,176 |
* | EMC Corp. | 1,375,000 | 28,600 |
| | | |
| Electronic Equipment & Instruments (1.8%) |
* | Trimble Navigation Ltd. | 2,900,000 | 113,709 |
| Tektronix, Inc. | 2,000,000 | 55,480 |
* | Coherent, Inc. | 500,000 | 16,040 |
| | | |
| Internet Software & Services (4.0%) | | |
* | eBay Inc. | 3,600,000 | 140,472 |
* | VeriSign, Inc. | 3,415,000 | 115,222 |
* | Google Inc. | 142,650 | 80,921 |
* | Yahoo! Inc. | 2,174,600 | 58,366 |
* | Akamai Technologies, Inc. | 403,900 | 11,604 |
| | | |
| IT Services (0.0%) | | |
| Satyam Computer | | |
| Services Ltd. ADR | 12,500 | 324 |
| | | |
| Semiconductors & | | |
| Semiconductor Equipment (15.4%) | | |
* | NVIDIA Corp. | 12,658,350 | 458,739 |
* | ASML Holding NV | | |
| (New York) | 10,514,400 | 345,503 |
| Altera Corp. | 6,060,000 | 145,925 |
*1 | FormFactor Inc. | 3,250,500 | 144,225 |
| Intersil Corp. | 3,705,000 | 123,858 |
* | Micron Technology, Inc. | 10,350,000 | 114,885 |
*1 | Rambus Inc. | 5,205,000 | 99,468 |
| Texas Instruments, Inc. | 1,900,000 | 69,521 |
* | Cymer, Inc. | 730,000 | 28,025 |
* | Entegris Inc. | 2,019,231 | 17,527 |
* | FEI Co. | 275,000 | 8,643 |
| Intel Corp. | 235,000 | 6,077 |
| Xilinx, Inc. | 145,000 | 3,790 |
* | Cree, Inc. | 10,000 | 311 |
| | | |
| Software (7.9%) | | |
| | | | |
14
| | | Market |
| | | Value• |
| | Shares | ($000) |
* | Symantec Corp. | 11,530,500 | 223,461 |
| Microsoft Corp. | 3,850,000 | 113,421 |
* | NAVTEQ Corp. | 1,370,000 | 106,819 |
* | Autodesk, Inc. | 1,505,000 | 75,205 |
* | Citrix Systems, Inc. | 1,750,000 | 70,560 |
* | Adobe Systems, Inc. | 1,558,000 | 68,022 |
* | Macrovision Corp. | 2,055,000 | 50,615 |
* | THQ Inc. | 1,946,200 | 48,616 |
*1 | The Descartes Systems | | |
| Group Inc. | 4,645,000 | 21,924 |
* | Intuit, Inc. | 470,000 | 14,241 |
* | McAfee Inc. | 200,000 | 6,974 |
* | Nuance | | |
| Communications, Inc. | 320,000 | 6,179 |
| | | 4,448,252 |
Materials (4.8%) | | |
| Monsanto Co. | 4,773,968 | 409,320 |
1 | Minerals Technologies, Inc. | 1,226,551 | 82,179 |
| | | 491,499 |
Telecommunication Services (2.0%) | |
| Sprint Nextel Corp. | 7,252,700 | 137,801 |
* | NeuStar, Inc. Class A | 1,766,700 | 60,580 |
| | | 198,381 |
Total Common Stocks | | |
(Cost $5,677,219) | | 9,678,981 |
Temporary Cash Investments (5.4%) | |
2 | Vanguard Market Liquidity | | |
| Fund, 5.153% | 482,842,786 | 482,843 |
2 | Vanguard Market Liquidity | | |
| Fund, 5.153%—Note F | 63,576,800 | 63,577 |
Total Temporary Cash Investments | |
(Cost $546,420) | | 546,420 |
Total Investments (100.5%) | | |
(Cost $6,223,639) | | 10,225,401 |
Other Assets and Liabilities—Net (–0.5%) | (50,338) |
Net Assets (100%) | | 10,175,063 |
15
| Market |
| Value• |
| ($000) |
Statement of Assets and Liabilities | |
Assets | |
Investment in Securities, at Value | 10,225,401 |
Receivables for Investment | |
Securities Sold | 31,466 |
Receivables for Capital Shares Issued | 18,269 |
Other Assets—Note C | 4,317 |
Total Assets | 10,279,453 |
Liabilities | |
Security Lending Collateral | |
Payable to Brokers—Note F | 63,577 |
Payable for Investment | |
Securities Purchased | 16,754 |
Payable for Capital Shares Redeemed | 4,217 |
Other Liabilities | 19,842 |
Total Liabilities | 104,390 |
Net Assets | 10,175,063 |
16
At September 30, 2007, net assets consisted of:3 |
| Amount |
| ($000) |
Paid-in Capital | 5,378,039 |
Undistributed Net Investment Income | 4,625 |
Accumulated Net Realized Gains | 790,626 |
Unrealized Appreciation | |
Investment Securities | 4,001,762 |
Foreign Currencies | 11 |
Net Assets | 10,175,063 |
| |
| |
Investor Shares—Net Assets | |
Applicable to 126,822,862 outstanding | |
$.001 par value shares of beneficial | |
interest (unlimited authorization) | 5,415,108 |
Net Asset Value Per Share— | |
Investor Shares | $42.70 |
| |
| |
Admiral Shares—Net Assets | |
Applicable to 48,222,738 outstanding | |
$.001 par value shares of beneficial | |
interest (unlimited authorization) | 4,759,955 |
Net Asset Value Per Share— | |
Admiral Shares | $98.71 |
• See Note A in Notes to Financial Statements.
* Non-income-producing security.
^ Part of security position is on loan to broker-dealers. See Note F in Notes to Financial Statements.
1 Considered an affiliated company of the fund as the fund owns more than 5% of the outstanding voting securities of such company. See Note H in Notes to Financial Statements.
2 Affiliated money market fund available only to Vanguard funds and certain trusts and accounts managed by Vanguard. Rate shown is the 7-day yield.
3 See Note D in Notes to Financial Statements for the tax-basis components of net assets.
ADR—American Depositary Receipt.
17
Statement of Operations
| Year Ended |
| September 30, 2007 |
| ($000) |
Investment Income | |
Income | |
Dividends1,2 | 44,110 |
Interest2 | 14,231 |
Security Lending | 1,195 |
Total Income | 59,536 |
Expenses | |
Investment Advisory Fees—Note B | 24,345 |
The Vanguard Group—Note C | |
Management and Administrative | |
Investor Shares | 8,804 |
Admiral Shares | 3,843 |
Marketing and Distribution | |
Investor Shares | 793 |
Admiral Shares | 629 |
Custodian Fees | 148 |
Auditing Fees | 21 |
Shareholders’ Reports | |
Investor Shares | 118 |
Admiral Shares | 27 |
Trustees’ Fees and Expenses | 12 |
Total Expenses | 38,740 |
Net Investment Income | 20,796 |
Realized Net Gain (Loss) | |
Investment Securities Sold2 | 895,666 |
Foreign Currencies | 24 |
Realized Net Gain (Loss) | 895,690 |
Change in Unrealized Appreciation (Depreciation) | |
Investment Securities | 1,136,595 |
Foreign Currencies | 2 |
Change in Unrealized Appreciation (Depreciation) | 1,136,597 |
Net Increase (Decrease) in Net Assets Resulting from Operations | 2,053,083 |
1 Dividends are net of foreign withholding taxes of $781,000.
2 Dividend income, interest income, and realized net gain (loss) from affiliated companies of the fund were $1,211,000, $14,229,000, and $112,474,000, respectively.
18
Statement of Changes in Net Assets
| Year Ended September 30, |
| 2007 | 2006 |
| ($000) | ($000) |
Increase (Decrease) in Net Assets | | |
Operations | | |
Net Investment Income | 20,796 | 16,648 |
Realized Net Gain (Loss) | 895,690 | 457,492 |
Change in Unrealized Appreciation (Depreciation) | 1,136,597 | 643,108 |
Net Increase (Decrease) in Net Assets Resulting from Operations | 2,053,083 | 1,117,248 |
Distributions | | |
Net Investment Income | | |
Investor Shares | (9,611) | (8,621) |
Admiral Shares | (10,882) | (7,418) |
Realized Capital Gain1 | | |
Investor Shares | (254,953) | (35,894) |
Admiral Shares | (196,140) | (22,044) |
Total Distributions | (471,586) | (73,977) |
Capital Share Transactions—Note G | | |
Investor Shares | (500,766) | (815,293) |
Admiral Shares | 293,890 | 337,555 |
Net Increase (Decrease) from Capital Share Transactions | (206,876) | (477,738) |
Total Increase (Decrease) | 1,374,621 | 565,533 |
Net Assets | | |
Beginning of Period | 8,800,442 | 8,234,909 |
End of Period2 | 10,175,063 | 8,800,442 |
1 Includes fiscal 2007 and 2006 short-term gain distributions totaling $7,045,000 and $32,891,000, respectively. Short-term gain distributions are treated as ordinary income dividends for tax purposes.
2 Net Assets—End of Period includes undistributed net investment income of $4,625,000 and $5,128,000.
19
Financial Highlights
Investor Shares | | | | | | |
| | | | | | |
| | | | | |
| | | | | Nov. 1, | | | | |
| Year Ended | | 2003, to | | Year Ended | |
For a Share Outstanding | September 30, | | Sept. 30, | | October 31, | |
Throughout Each Period | 2007 | 2006 | 2005 | | 20041 | | 2003 | 2002 | |
Net Asset Value, Beginning of Period | $36.11 | $31.92 | $27.24 | | $24.28 | | $16.54 | $20.73 | |
Investment Operations | | | | | | | | | |
Net Investment Income | .070 | .053 | .0902 | | .017 | | .009 | .01 | |
Net Realized and Unrealized Gain (Loss) | | | | | | | | | |
on Investments3 | 8.447 | 4.421 | 4.731 | | 2.956 | | 7.744 | (4.13) | |
Total from Investment Operations | 8.517 | 4.474 | 4.821 | | 2.973 | | 7.753 | (4.12) | |
Distributions | | | | | | | | | |
Dividends from Net Investment Income | (.070) | (.055) | (.070) | | (.013) | | (.013) | (.07) | |
Distributions from Realized Capital Gains | (1.857) | (.229) | (.071) | | — | | — | — | |
Total Distributions | (1.927) | (.284) | (.141) | | (.013) | | (.013) | (.07) | |
Net Asset Value, End of Period | $42.70 | $36.11 | $31.92 | | $27.24 | | $24.28 | $16.54 | |
| | | | | | | | | |
| | | | | | | | | |
Total Return4 | 24.35% | 14.10% | 17.72% | | 12.25% | | 46.91% | –19.97% | |
| | | | | | | | | |
| | | | | | | | | |
Ratios/Supplemental Data | | | | | | | | | |
Net Assets, End of Period (Millions) | $5,415 | $5,051 | $5,231 | | $6,199 | | $5,120 | $3,181 | |
Ratio of Total Expenses to | | | | | | | | | |
Average Net Assets | 0.45% | 0.49% | 0.51% | | 0.52%* | | 0.59% | 0.58% | |
Ratio of Net Investment Income to | | | | | | | | | |
Average Net Assets | 0.18% | 0.15% | 0.33%2 | | 0.06%* | | 0.04% | 0.07% | |
Portfolio Turnover Rate | 14% | 11% | 12% | | 10% | | 14% | 14% | |
| | | | | | | | | | | | | | |
1 The fund’s fiscal year-end changed from October 31 to September 30, effective September 30, 2004.
2 Net investment income per share and the ratio of net investment income to average net assets include $.047 and 0.16%, respectively, resulting from a special dividend from Microsoft Corp. in November 2004.
3 Includes increases from redemption fees of $.00, $.00, $.01, $.01, $.01, and $.03.
4 Total returns do not reflect the 1% fee assessed on redemptions after March 23, 2005, of shares held for less than one year; nor do they include the 1% fee previously assessed on redemptions of shares held for less than five years, or the account service fee that may be applicable to certain accounts with balances below $10,000.
* Annualized.
20
Admiral Shares | | | | | | |
| | | | | | |
| | | | | |
| | | | Nov. 1, | Year, | Nov. 12, |
| Year Ended | 2003, to | Ended | 20012 to |
For a Share Outstanding | September 30, | Sept. 30, | Oct. 31, | Oct. 31, |
Throughout Each Period | 2007 | 2006 | 2005 | 20041 | 2003 | 2002 |
Net Asset Value, Beginning of Period | $83.49 | $73.77 | $62.96 | $56.11 | $38.22 | $50.00 |
Investment Operations | | | | | | |
Net Investment Income | .240 | .198 | .2913 | .096 | .062 | .07 |
Net Realized and Unrealized Gain (Loss) | | | | | | |
on Investments4 | 19.508 | 10.229 | 10.911 | 6.828 | 17.894 | (11.68) |
Total from Investment Operations | 19.748 | 10.427 | 11.202 | 6.924 | 17.956 | (11.61) |
Distributions | | | | | | |
Dividends from Net Investment Income | (.238) | (.178) | (.228) | (.074) | (.066) | (.17) |
Distributions from Realized Capital Gains | (4.290) | (.529) | (.164) | — | — | — |
Total Distributions | (4.528) | (.707) | (.392) | (.074) | (.066) | (.17) |
Net Asset Value, End of Period | $98.71 | $83.49 | $73.77 | $62.96 | $56.11 | $38.22 |
| | | | | | |
| | | | | | |
Total Return5 | 24.43% | 14.23% | 17.82% | 12.36% | 47.05% | –23.32% |
| | | | | | |
| | | | | | |
Ratios/Supplemental Data | | | | | | |
Net Assets, End of Period (Millions) | $4,760 | $3,750 | $3,004 | $1,337 | $840 | $395 |
Ratio of Total Expenses to | | | | | | |
Average Net Assets | 0.37% | 0.40% | 0.42% | 0.41%* | 0.49% | 0.50%* |
Ratio of Net Investment Income to | | | | | | |
Average Net Assets | 0.26% | 0.24% | 0.38%3 | 0.17%* | 0.14% | 0.17%* |
Portfolio Turnover Rate | 14% | 11% | 12% | 10% | 14% | 14% |
1 The fund’s fiscal year-end changed from October 31 to September 30, effective September 30, 2004.
2 Inception.
3 Net investment income per share and the ratio of net investment income to average net assets include $.108 and 0.16%, respectively, resulting from a special dividend from Microsoft Corp. in November 2004.
4 Includes increases from redemption fees of $.00, $.00, $.01, $.03, $.03, and $.07.
5 Total returns do not reflect the 1% fee assessed on redemptions after March 23, 2005, of shares held for less than one year, or the 1% fee previously assessed on redemptions of shares held for less than five years.
* Annualized.
See accompanying Notes, which are an integral part of the Financial Statements.
21
Notes to Financial Statements
Vanguard Capital Opportunity Fund is registered under the Investment Company Act of 1940 as an open-end investment company, or mutual fund. The fund files reports with the SEC under the company name Vanguard Horizon Funds. The fund offers two classes of shares, Investor Shares and Admiral Shares. Investor Shares are available to any investor who meets the fund’s minimum purchase requirements. Admiral Shares are designed for investors who meet certain administrative, service, tenure, and account-size criteria.
A. The following significant accounting policies conform to generally accepted accounting principles for U.S. mutual funds. The fund consistently follows such policies in preparing its financial statements.
1. Security Valuation: Securities are valued as of the close of trading on the New York Stock Exchange (generally 4 p.m., Eastern time) on the valuation date. Equity securities are valued at the latest quoted sales prices or official closing prices taken from the primary market in which each security trades; such securities not traded on the valuation date are valued at the mean of the latest quoted bid and asked prices. Securities for which market quotations are not readily available, or whose values have been affected by events occurring before the fund’s pricing time but after the close of the securities’ primary markets, are valued at their fair values calculated according to procedures adopted by the board of trustees. These procedures include obtaining quotations from an independent pricing service, monitoring news to identify significant market- or security-specific events, and evaluating changes in the values of foreign market proxies (for example, ADRs, futures contracts, or exchange-traded funds), between the time the foreign markets close and the fund’s pricing time. When fair-value pricing is employed, the prices of securities used by a fund to calculate its net asset value may differ from quoted or published prices for the same securities. Investments in Vanguard Market Liquidity Fund are valued at that fund’s net asset value.
2. Foreign Currency: Securities and other assets and liabilities denominated in foreign currencies are translated into U.S. dollars using exchange rates obtained from an independent third party as of the fund’s pricing time on the valuation date. Realized gains (losses) and unrealized appreciation (depreciation) on investment securities include the effects of changes in exchange rates since the securities were purchased, combined with the effects of changes in security prices. Fluctuations in the value of other assets and liabilities resulting from changes in exchange rates are recorded as unrealized foreign currency gains (losses) until the assets or liabilities are settled in cash, at which time they are recorded as realized foreign currency gains (losses).
3. Federal Income Taxes: The fund intends to continue to qualify as a regulated investment company and distribute all of its taxable income. Accordingly, no provision for federal income taxes is required in the financial statements.
4. Distributions: Distributions to shareholders are recorded on the ex-dividend date.
5. Security Lending: The fund may lend its securities to qualified institutional borrowers to earn additional income. Security loans are required to be secured at all times by collateral at least equal to the market value of securities loaned. The fund invests cash collateral received in Vanguard Market Liquidity Fund, and records a liability for the return of the collateral, during the period the securities are on loan. Security lending income represents the income earned on investing cash collateral, less expenses associated with the loan.
22
6. Other: Dividend income is recorded on the ex-dividend date. Interest income includes income distributions received from Vanguard Market Liquidity Fund and is accrued daily. Security transactions are accounted for on the date securities are bought or sold. Costs used to determine realized gains (losses) on the sale of investment securities are those of the specific securities sold. Fees assessed on redemptions of capital shares are credited to paid-in capital.
Each class of shares has equal rights as to assets and earnings, except that each class separately bears certain class-specific expenses related to maintenance of shareholder accounts (included in Management and Administrative expenses) and shareholder reporting. Marketing and distribution expenses are allocated to each class of shares based on a method approved by the board of trustees. Income, other non-class-specific expenses, and gains and losses on investments are allocated to each class of shares based on its relative net assets.
B. PRIMECAP Management Company provides investment advisory services to the fund for a fee calculated at an annual percentage rate of average net assets. For the year ended September 30, 2007, the investment advisory fee represented an effective annual rate of 0.26% of the fund’s average net assets.
C. The Vanguard Group furnishes at cost corporate management, administrative, marketing, and distribution services. The costs of such services are allocated to the fund under methods approved by the board of trustees. The fund has committed to provide up to 0.40% of its net assets in capital contributions to Vanguard. At September 30, 2007, the fund had contributed capital of $836,000 to Vanguard (included in Other Assets), representing 0.01% of the fund’s net assets and 0.84% of Vanguard’s capitalization. The fund’s trustees and officers are also directors and officers of Vanguard.
D. Distributions are determined on a tax basis and may differ from net investment income and realized capital gains for financial reporting purposes. Differences may be permanent or temporary. Permanent differences are reclassified among capital accounts in the financial statements to reflect their tax character. Temporary differences arise when certain items of income, expense, gain, or loss are recognized in different periods for financial statement and tax purposes; these differences will reverse at some time in the future. Differences in classification may also result from the treatment of short-term gains as ordinary income for tax purposes.
The fund used a tax accounting practice to treat a portion of the price of capital shares redeemed during the year as distributions from net investment income and realized capital gains. Accordingly, the fund has reclassified $830,000 from undistributed net investment income, and $33,079,000 from accumulated net realized gains, to paid-in capital.
For tax purposes, at September 30, 2007, the fund had $40,023,000 of ordinary income and $767,837,000 of long-term capital gains available for distribution.
During the year ended September 30, 2007, the fund realized net foreign currency gains of $24,000, which increased distributable net income for tax purposes; accordingly, such gains have been reclassified from accumulated net realized gains to undistributed net investment income.
At September 30, 2007, the cost of investment securities for tax purposes was $6,223,639,000. Net unrealized appreciation of investment securities for tax purposes was $4,001,762,000, consisting of unrealized gains of $4,387,874,000 on securities that had risen in value since their purchase and $386,112,000 in unrealized losses on securities that had fallen in value since their purchase.
23
E. During the year ended September 30, 2007, the fund purchased $1,232,611,000 of investment securities and sold $2,192,325,000 of investment securities, other than temporary cash investments.
F. The market value of securities on loan to broker-dealers at September 30, 2007, was $60,247,000, for which the fund received cash collateral of $63,577,000.
G. Capital share transactions for each class of shares were:
| | Year Ended September 30, |
| | 2007 | | | 2006 |
| Amount | Shares | | Amount | Shares |
| ($000) | (000) | | ($000) | (000) |
Investor Shares | | | | | |
Issued | 353,165 | 9,164 | | 331,413 | 9,663 |
Issued in Lieu of Cash Distributions | 249,615 | 6,678 | | 42,032 | 1,273 |
Redeemed1 | (1,103,546) | (28,870) | | (1,188,738) | (34,982) |
Net Increase (Decrease)—Investor Shares | (500,766) | (13,028) | | (815,293) | (24,046) |
Admiral Shares | | | | | |
Issued | 623,496 | 6,994 | | 743,335 | 9,382 |
Issued in Lieu of Cash Distributions | 189,279 | 2,192 | | 26,959 | 353 |
Redeemed1 | (518,885) | (5,875) | | (432,739) | (5,543) |
Net Increase (Decrease)—Admiral Shares | 293,890 | 3,311 | | 337,555 | 4,192 |
1 Net of redemption fees of $430,000 and $1,595,000 (fund totals).
24
H. Certain of the fund’s investments are in companies that are considered to be affiliated companies of the fund because the fund owns more than 5% of the outstanding voting securities of the company. Transactions during the year ended September 30, 2007, in securities of these companies were as follows:
| | Current-Period Transactions | |
| Sept. 30, 2006 | | Proceeds from | | Sept. 30, 2007 |
| Market | Purchases | Securities | Dividend | Market |
| Value | at Cost | Sold | Income | Value |
| ($000) | ($000) | ($000) | ($000) | ($000) |
Avid Technology, Inc. | n/a1 | 1,843 | — | — | 55,176 |
BioMarin Pharmaceutical Inc. | 66,461 | — | — | — | n/a2 |
The Descartes Systems Group Inc. | 18,208 | — | — | — | 21,924 |
The Dress Barn, Inc. | 96,008 | 10,214 | — | — | 83,655 |
Emulex Corp. | 82,753 | 264 | — | — | 87,595 |
FormFactor Inc. | n/a1 | 108,804 | — | — | 144,225 |
Macrovision Corp. | 84,879 | — | 40,037 | — | n/a2 |
Men's Wearhouse Inc. | 132,676 | — | 51,413 | 652 | n/a2 |
Minerals Technologies, Inc. | 83,304 | — | 21,983 | 306 | 82,179 |
Rambus Inc. | 90,775 | — | — | — | 99,468 |
Strattec Security Corp. | 8,419 | — | — | 253 | 10,221 |
Thomas & Betts Corp. | 179,547 | — | 25,878 | — | 194,163 |
THQ Inc. | 143,371 | — | 98,251 | — | n/a2 |
| 986,401 | | | 1,211 | 778,606 |
I. In June 2006, the Financial Accounting Standards Board issued Interpretation No. 48 (“FIN 48”), “Accounting for Uncertainty in Income Taxes.” FIN 48 establishes the minimum threshold for recognizing, and a system for measuring, the benefits of tax-return positions in financial statements, and is effective for the fund’s fiscal year beginning October 1, 2007. Management has analyzed the fund’s tax positions taken on federal income tax returns for all open tax years (tax years ended September 30, 2004–2007) for purposes of implementing FIN 48, and has concluded that as of September 30, 2007, no provision for income tax would be required in the fund’s financial statements.
1 At September 30, 2006, the issuer was not an affiliated company of the fund.
2 At September 30, 2007, the security was still held but the issuer was no longer an affiliated company of the fund.
25
Report of Independent Registered
Public Accounting Firm
To the Trustees of Vanguard Horizon Funds and the Shareholders of Vanguard Capital Opportunity Fund:
In our opinion, the accompanying statement of net assets, including the statement of assets and liabilities, and the related statements of operations and of changes in net assets and the financial highlights present fairly, in all material respects, the financial position of Vanguard Capital Opportunity Fund (the “Fund”) at September 30, 2007, the results of its operations for the year then ended, the changes in its net assets for each of the two years in the period then ended, and the financial highlights for each of the periods indicated, in conformity with accounting principles generally accepted in the United States of America. These financial statements and financial highlights (hereafter referred to as “financial statements”) are the responsibility of the Fund’s management; our responsibility is to express an opinion on these financial statements based on our audits. We conducted our audits of these financial statements in accordance with the standards of the Public Company Accounting Oversight Board (United States), which require that we plan and perform the audit to obtain reasonable assurance about whether the financial statements are free of material misstatement. An audit includes examining, on a test basis, evidence supporting the amounts and disclosures in the financial statements, assessing the accounting principles used and significant estimates made by management, and evaluating the overall financial statement presentation. We believe that our audits, which included confirmation of securities at September 30, 2007 by correspondence with the custodian and by agreement to the underlying ownership records for Vanguard Market Liquidity Fund, provide a reasonable basis for our opinion.
PricewaterhouseCoopers LLP
Philadelphia, Pennsylvania
November 7, 2007
Special 2007 tax information (unaudited) for Vanguard Capital Opportunity Fund
This information for the fiscal year ended September 30, 2007, is included pursuant to provisions of the Internal Revenue Code.
The fund distributed $476,243,000 as capital gain dividends (from net long-term capital gains) to shareholders during the fiscal year.
The fund distributed $27,537,000 of qualified dividend income to shareholders during the fiscal year.
For corporate shareholders, 100% of investment income (dividend income plus short-term gains, if any) qualifies for the dividends-received deduction.
26
Your Fund’s After-Tax Returns
This table presents returns for your fund both before and after taxes. The after-tax returns are shown in two ways: (1) assuming that an investor owned the fund during the entire period and paid taxes on the fund’s distributions, and (2) assuming that an investor paid taxes on the fund’s distributions and sold all shares at the end of each period.
Calculations are based on the highest individual federal income tax and capital gains tax rates in effect at the times of the distributions and the hypothetical sales. State and local taxes were not considered. After-tax returns reflect any qualified dividend income, using actual prior-year figures and estimates for 2007. (In the example, returns after the sale of fund shares may be higher than those assuming no sale. This occurs when the sale would have produced a capital loss. The calculation assumes that the investor received a tax deduction for the loss.)
The table shows returns for Investor Shares only; returns for other share classes will differ. Please note that your actual after-tax returns will depend on your tax situation and may differ from those shown. Also note that if you own the fund in a tax-deferred account, such as an individual retirement account or a 401(k) plan, this information does not apply to you. Such accounts are not subject to current taxes.
Finally, keep in mind that a fund’s performance—whether before or after taxes—does not guarantee future results.
Average Annual Total Returns: Capital Opportunity Fund Investor Shares1 |
Periods Ended September 30, 2007 |
| One | Five | Ten |
| Year | Years | Years |
Returns Before Taxes | 24.35% | 24.78% | 16.65% |
Returns After Taxes on Distributions | 23.43 | 24.53 | 15.85 |
Returns After Taxes on Distributions and Sale of Fund Shares | 16.82 | 22.09 | 14.61 |
1 Total returns do not include the account service fee that may be applicable to certain accounts with balances below $10,000; nor do they include the 1% fee assessed on redemptions after March 23, 2005, of shares held for less than one year, or the 1% fee previously assessed on redemptions of shares held for less than five years.
27
About Your Fund’s Expenses
As a shareholder of the fund, you incur ongoing costs, which include costs for portfolio management, administrative services, and shareholder reports (like this one), among others. Operating expenses, which are deducted from a fund’s gross income, directly reduce the investment return of the fund.
A fund’s expenses are expressed as a percentage of its average net assets. This figure is known as the expense ratio. The following examples are intended to help you understand the ongoing costs (in dollars) of investing in your fund and to compare these costs with those of other mutual funds. The examples are based on an investment of $1,000 made at the beginning of the period shown and held for the entire period.
The table below illustrates your fund’s costs in two ways:
• Based on actual fund return. This section helps you to estimate the actual expenses that you paid over the period. The “Ending Account Value” shown is derived from the fund’s actual return, and the third column shows the dollar amount that would have been paid by an investor who started with $1,000 in the fund. You may use the information here, together with the amount you invested, to estimate the expenses that you paid over the period.
To do so, simply divide your account value by $1,000 (for example, an $8,600 account value divided by $1,000 = 8.6), then multiply the result by the number given for your fund under the heading “Expenses Paid During Period.”
• Based on hypothetical 5% yearly return. This section is intended to help you compare your fund’s costs with those of other mutual funds. It assumes that the fund had a yearly return of 5% before expenses, but that the expense ratio is unchanged. In this case—because the return used is not the fund’s actual return—the results do not apply to your investment. The example is useful in making comparisons because the Securities and Exchange Commission requires all mutual funds to calculate expenses based on a 5% return. You can assess your fund’s costs by comparing this hypothetical example with the hypothetical examples that appear in shareholder reports of other funds.
Six Months Ended September 30, 2007 | | | |
| Beginning | Ending | Expenses |
| Account Value | Account Value | Paid During |
Capital Opportunity Fund | 3/31/2007 | 9/30/2007 | Period1 |
Based on Actual Fund Return | | | |
Investor Shares | $1,000.00 | $1,171.15 | $2.29 |
Admiral Shares | 1,000.00 | 1,171.49 | 1.91 |
Based on Hypothetical 5% Yearly Return | | | |
Investor Shares | $1,000.00 | $1,022.96 | $2.13 |
Admiral Shares | 1,000.00 | 1,023.31 | 1.78 |
1 The calculations are based on expenses incurred in the most recent six-month period. The fund’s annualized six-month expense ratios for that period are 0.42% for Investor Shares and 0.35% for Admiral Shares. The dollar amounts shown as “Expenses Paid” are equal to the annualized expense ratio multiplied by the average account value over the period, multiplied by the number of days in the most recent six-month period, then divided by the number of days in the most recent 12-month period.
28
Note that the expenses shown in the table are meant to highlight and help you compare ongoing costs only and do not reflect transaction costs incurred by the fund for buying and selling securities. Further, the expenses do not include the 1% fee on redemptions of shares held for less than one year, nor do they include the account service fee described in the prospectus. If such fees were applied to your account, your costs would be higher. Your fund does not carry a “sales load.”
The calculations assume no shares were bought or sold during the period. Your actual costs may have been higher or lower, depending on the amount of your investment and the timing of any purchases or redemptions.
You can find more information about the fund’s expenses, including annual expense ratios, in the Financial Statements section of this report. For additional information on operating expenses and other shareholder costs, please refer to your fund’s current prospectus.
29
Glossary
Beta. A measure of the magnitude of a fund’s past share-price fluctuations in relation to the ups and downs of a given market index. The index is assigned a beta of 1.00. Compared with a given index, a fund with a beta of 1.20 typically would have seen its share price rise or fall by 12% when the index rose or fell by 10%. A fund’s beta should be reviewed in conjunction with its R-squared (see definition below). The lower the R-squared, the less correlation there is between the fund and the index, and the less reliable beta is as an indicator of volatility.
Earnings Growth Rate. The average annual rate of growth in earnings over the past five years for the stocks now in a fund.
Equity Exposure. A measure that reflects a fund’s investments in stocks and stock futures. Any holdings in short-term reserves are excluded.
Expense Ratio. The percentage of a fund’s average net assets used to pay its annual administrative and advisory expenses. These expenses directly reduce returns to investors.
Foreign Holdings. The percentage of a fund represented by stocks or depositary receipts of companies based outside the United States.
Inception Date. The date on which the assets of a fund (or one of its share classes) are first invested in accordance with the fund’s investment objective. For funds with a subscription period, the inception date is the day after that period ends. Investment performance is measured from the inception date.
Median Market Cap. An indicator of the size of companies in which a fund invests; the midpoint of market capitalization (market price x shares outstanding) of a fund’s stocks, weighted by the proportion of the fund’s assets invested in each stock. Stocks representing half of the fund’s assets have market capitalizations above the median, and the rest are below it.
Price/Book Ratio. The share price of a stock divided by its net worth, or book value, per share. For a fund, the weighted average price/book ratio of the stocks it holds.
Price/Earnings Ratio. The ratio of a stock’s current price to its per-share earnings over the past year. For a fund, the weighted average P/E of the stocks it holds. P/E is an indicator of market expectations about corporate prospects; the higher the P/E, the greater the expectations for a company’s future growth.
R-Squared. A measure of how much of a fund’s past returns can be explained by the returns from the market in general, as measured by a given index. If a fund’s total returns were precisely synchronized with an index’s returns, its R-squared would be 1.00. If the fund’s returns bore no relationship to the index’s returns, its R-squared would be 0.
Return on Equity. The annual average rate of return generated by a company during the past five years for each dollar of shareholder’s equity (net income divided by shareholder’s equity). For a fund, the weighted average return on equity for the companies whose stocks it holds.
Short-Term Reserves. The percentage of a fund invested in highly liquid, short-term securities that can be readily converted to cash.
Turnover Rate. An indication of the fund’s trading activity. Funds with high turnover rates incur higher transaction costs and may be more likely to distribute capital gains (which may be taxable to investors). The turnover rate excludes in-kind transactions, which have minimal impact on costs.
Yield. A snapshot of a fund’s income from interest and dividends. The yield, expressed as a percentage of the fund’s net asset value, is based on income earned over the past 30 days and is annualized, or projected forward for the coming year. The index yield is based on the current annualized rate of income provided by securities in the index.
30
This page intentionally left blank.
This page intentionally left blank.
This page intentionally left blank.
The People Who Govern Your Fund
The trustees of your mutual fund are there to see that the fund is operated and managed in your best interests since, as a shareholder, you are a part owner of the fund. Your fund’s trustees also serve on the board of directors of The Vanguard Group, Inc., which is owned by the Vanguard funds and provides services to them on an at-cost basis.
A majority of Vanguard’s board members are independent, meaning that they have no affiliation with Vanguard or the funds they oversee, apart from the sizable personal investments they have made as private individuals.
Our independent board members bring distinguished backgrounds in business, academia, and public service to their task of working with Vanguard officers to establish the policies and oversee the activities of the funds. Among board members’ responsibilities are selecting investment advisors for the funds; monitoring fund operations, performance, and costs; reviewing contracts; nominating and selecting new trustees/directors; and electing Vanguard officers.
Each trustee serves a fund until its termination; or until the trustee’s retirement, resignation, or death; or otherwise as specified in the fund’s organizational documents. Any trustee may be removed at a shareholders’ meeting by a vote representing two-thirds of the net asset value of all shares of the fund together with shares of other Vanguard funds organized within the same trust. The table on these two pages shows information for each trustee and executive officer of the fund. The mailing address of the trustees and officers is P.O. Box 876, Valley Forge, PA 19482.
Chairman of the Board, Chief Executive Officer, and Trustee |
| |
John J. Brennan1 | |
Born 1954 | Principal Occupation(s) During the Past Five Years: Chairman of the Board, Chief Executive |
Trustee since May 1987; | Officer, and Director/Trustee of The Vanguard Group, Inc., and of each of the investment |
Chairman of the Board and | companies served by The Vanguard Group. |
Chief Executive Officer | |
148 Vanguard Funds Overseen | |
| |
Independent Trustees | |
| |
Charles D. Ellis | |
Born 1937 | Principal Occupation(s) During the Past Five Years: Applecore Partners (pro bono ventures |
Trustee since January 2001 | in education); Senior Advisor to Greenwich Associates (international business strategy |
148 Vanguard Funds Overseen | consulting); Successor Trustee of Yale University; Overseer of the Stern School of Business |
| at New York University; Trustee of the Whitehead Institute for Biomedical Research. |
| |
Rajiv L. Gupta | |
Born 1945 | Principal Occupation(s) During the Past Five Years: Chairman, President, and |
Trustee since December 20012 | Chief Executive Officer of Rohm and Haas Co. (chemicals); Board Member of |
148 Vanguard Funds Overseen | the American Chemistry Council; Director of Tyco International, Ltd. (diversified |
| manufacturing and services) since 2005; Trustee of Drexel University and of the |
| Chemical Heritage Foundation. |
| |
Amy Gutmann | |
Born 1949 | Principal Occupation(s) During the Past Five Years: President of the University of |
Trustee since June 2006 | Pennsylvania since 2004; Professor in the School of Arts and Sciences, Annenberg School |
148 Vanguard Funds Overseen | for Communication, and Graduate School of Education of the University of Pennsylvania |
| since 2004; Provost (2001–2004) and Laurance S. Rockefeller Professor of Politics and |
| the University Center for Human Values (1990–2004), Princeton University; Director of |
| Carnegie Corporation of New York since 2005 and of Schuylkill River Development |
| Corporation and Greater Philadelphia Chamber of Commerce since 2004. |
JoAnn Heffernan Heisen | |
Born 1950 | Principal Occupation(s) During the Past Five Years: Corporate Vice President and |
Trustee since July 1998 | Chief Global Diversity Officer since 2006, Vice President and Chief Information |
148 Vanguard Funds Overseen | Officer (1997–2005), and Member of the Executive Committee of Johnson & |
| Johnson (pharmaceuticals/consumer products); Director of the University Medical |
| Center at Princeton and Women’s Research and Education Institute. |
| |
André F. Perold | |
Born 1952 | Principal Occupation(s) During the Past Five Years: George Gund Professor of Finance |
Trustee since December 2004 | and Banking, Harvard Business School; Senior Associate Dean, Director of Faculty |
148 Vanguard Funds Overseen | Recruiting, and Chair of Finance Faculty, Harvard Business School; Director and Chairman |
| of UNX, Inc. (equities trading firm) since 2003; Chair of the Investment Committee of |
| HighVista Strategies LLC (private investment firm) since 2005. |
| |
Alfred M. Rankin, Jr. | |
Born 1941 | Principal Occupation(s) During the Past Five Years: Chairman, President, Chief Executive |
Trustee since January 1993 | Officer, and Director of NACCO Industries, Inc. (forklift trucks/housewares/lignite); Director |
148 Vanguard Funds Overseen | of Goodrich Corporation (industrial products/aircraft systems and services). |
| |
| |
J. Lawrence Wilson | |
Born 1936 | Principal Occupation(s) During the Past Five Years: Retired Chairman and Chief Executive |
Trustee since April 1985 | Officer of Rohm and Haas Co. (chemicals); Director of Cummins Inc. (diesel engines) and |
148 Vanguard Funds Overseen | AmerisourceBergen Corp. (pharmaceutical distribution); Trustee of Vanderbilt University |
| and of Culver Educational Foundation. |
| |
Executive Officers1 | |
| |
Thomas J. Higgins | |
Born 1957 | Principal Occupation(s) During the Past Five Years: Principal of The Vanguard Group, Inc.; |
Treasurer since July 1998 | Treasurer of each of the investment companies served by The Vanguard Group. |
148 Vanguard Funds Overseen | |
| |
| |
Heidi Stam | |
Born 1956 | Principal Occupation(s) During the Past Five Years: Managing Director of The Vanguard |
Secretary since July 2005 | Group, Inc., since 2006; General Counsel of The Vanguard Group since 2005; Secretary of |
148 Vanguard Funds Overseen | The Vanguard Group, and of each of the investment companies served by The Vanguard |
| Group, since 2005; Principal of The Vanguard Group (1997–2006). |
Vanguard Senior Management Team | | |
| | | |
R. Gregory Barton | Kathleen C. Gubanich | F. William McNabb, III | Ralph K. Packard |
Mortimer J. Buckley | Paul A. Heller | Michael S. Miller | George U. Sauter |
Founder |
|
John C. Bogle |
Chairman and Chief Executive Officer, 1974–1996 |
1 Officers of the funds are “interested persons” as defined in the Investment Company Act of 1940.
2 December 2002 for Vanguard Equity Income Fund, Vanguard Growth Equity Fund, the Vanguard Municipal Bond Funds, and the Vanguard State Tax-Exempt Funds.
More information about the trustees is in the Statement of Additional Information, available from The Vanguard Group.

P.O. Box 2600
Valley Forge, PA 19482-2600
Connect with Vanguard® > www.vanguard.com
Fund Information > 800-662-7447 | Vanguard, Admiral, Connect with Vanguard, and the ship |
| logo are trademarks of The Vanguard Group, Inc. |
Direct Investor Account Services > 800-662-2739 | |
| All other marks are the exclusive property of their |
Institutional Investor Services > 800-523-1036 | respective owners. |
| |
Text Telephone for People | |
With Hearing Impairment > 800-952-3335 | All comparative mutual fund data are from Lipper Inc. |
| or Morningstar, Inc., unless otherwise noted. |
| |
| |
| You can obtain a free copy of Vanguard’s proxy voting |
| guidelines by visiting our website, www.vanguard.com, |
This material may be used in conjunction | and searching for “proxy voting guidelines,” or by calling |
with the offering of shares of any Vanguard | Vanguard at 800-662-2739. The guidelines are also |
fund only if preceded or accompanied by | available from the SEC’s website, www.sec.gov. In |
the fund’s current prospectus. | addition, you may obtain a free report on how your fund |
| voted the proxies for securities it owned during the 12 |
| months ended June 30. To get the report, visit either |
| www.vanguard.com or www.sec.gov. |
| |
| |
| |
| You can review and copy information about your fund |
| at the SEC’s Public Reference Room in Washington, D.C. |
| To find out more about this public service, call the SEC |
| at 202-551-8090. Information about your fund is also |
| available on the SEC’s website, and you can receive |
| copies of this information, for a fee, by sending a |
| request in either of two ways: via e-mail addressed to |
| publicinfo@sec.gov or via regular mail addressed to the |
| Public Reference Section, Securities and Exchange |
| Commission, Washington, DC 20549-0102. |
| |
| |
| |
| |
| |
| © 2007 The Vanguard Group, Inc. |
| All rights reserved. |
| Vanguard Marketing Corporation, Distributor. |
| |
| Q1110 112007 |

> | For the fiscal year ended September 30, 2007, Vanguard Global Equity Fund |
| returned 27.0%, exceeding the result of its benchmark index and the average |
| return of competing global funds. |
| |
| |
> | Extending a long-term trend, the gains of international stocks surpassed those |
| of U.S. stocks. |
| |
| |
> | Strong stock selection in several sectors—particularly consumer discretionary, |
| industrials, and materials—contributed to the fund’s impressive result. Health |
| care and technology holdings were the weakest performers. |
Contents | |
| |
Your Fund’s Total Returns | 1 |
Chairman’s Letter | 2 |
Advisors’ Report | 7 |
Fund Profile | 11 |
Performance Summary | 13 |
Financial Statements | 14 |
Your Fund’s After-Tax Returns | 32 |
About Your Fund’s Expenses | 33 |
Trustees Approve Advisory Agreements | 35 |
Glossary | 37 |
Please note: The opinions expressed in this report are just that—informed opinions. They should not be considered promises or advice. Also, please keep in mind that the information and opinions cover the period through the date on the cover of this report. Of course, the risks of investing in your fund are spelled out in the prospectus.
Your Fund’s Total Returns
Fiscal Year Ended September 30, 2007 | | |
| Ticker | Total |
| Symbol | Returns |
Vanguard Global Equity Fund | VHGEX | 27.0% |
MSCI All Country World Index | | 24.6 |
Average Global Fund1 | | 22.5 |
Your Fund’s Performance at a Glance | | | | |
September 30, 2006–September 30, 2007 | | | | |
| | | Distributions Per Share |
| Starting | Ending | Income | Capital |
| Share Price | Share Price | Dividends | Gains |
Vanguard Global Equity Fund | $21.96 | $26.51 | $0.310 | $0.880 |
1 Derived from data provided by Lipper Inc.
1

Chairman’s Letter
Dear Shareholder,
Vanguard Global Equity Fund returned 27.0% for the fiscal year ended September 30, 2007. The fund topped the average return of its peers in the global fund category and its unmanaged benchmark index. Much of the fund’s success relative to its comparative standards can be attributed to its advisors’ strong stock choices in several sectors.
If you hold shares of Vanguard Global Equity Fund in a taxable account, you may wish to review our report on after-tax returns on page 32.
Overseas markets continued to outpace the U.S. market
Although they were not immune from some effects of the turmoil that rattled the U.S. stock and bond markets, international stocks handily surpassed their domestic counterparts over the 12 months.
In Europe, the largest markets showed some weaknesses amid inflationary and economic growth concerns; some of the smaller, more peripheral markets, though, boasted solid returns. Japan, the dominant Pacific market, produced mediocre returns, but smaller markets in that region posted solid results, and several reached record highs. Emerging markets continued to post extremely strong results. The dollar’s ongoing weakness further enhanced foreign market gains for U.S.-based investors.
In the U.S. market, stocks produced excellent returns for the fiscal year, with the broad U.S. equity market up 17.1%.
2
Returns from large-capitalization stocks outpaced those of small-caps, and growth-oriented stocks outperformed their value-oriented counterparts. As investors took account of risk, they seemed to exhibit a preference for large-cap growth stocks, which appeared better positioned to thrive in a period of economic uncertainty.
The U.S. bond market was shaken, but regained ground in the end
Turbulence in the corporate bond and sub-prime lending markets caused a “flight to quality” that drove prices of U.S. Treasury bonds sharply higher, particularly toward the end of the fiscal period. As the bonds’ prices rose, their yields fell. The declines were greatest among Treasury securities with the shortest maturities. The yield of the 3-month Treasury bill, which started the fiscal year at 4.89%, dropped more than a full percentage point to 3.81%.
As short-term yields fell, the yield curve—which illustrates the relationship between short- and long-term bond yields—returned to its usual, upward-sloping pattern. The curve had been mildly inverted at the start of the period, with yields of shorter-term bonds above those of longer-term issues. For the year ended September 30, the broad taxable bond market returned 5.1%. Returns from tax-exempt bonds were lower, as these issues did not benefit from the late-summer rally in Treasuries.
The fund’s advance was driven by strong stock-picking worldwide
During the fiscal year, the Global Equity Fund’s advisory team skillfully navigated the choppy waters of the domestic and international markets to earn an outstanding 27.0% return. The fund’s success is a credit to the fundamental research skills of Marathon Asset
Market Barometer | | | |
| Average Annual Total Returns |
| Periods Ended September 30, 2007 |
| One Year | Three Years | Five Years |
Stocks | | | |
MSCI All Country World Index ex USA (International) | 31.1% | 26.5% | 26.3% |
Russell 1000 Index (Large-caps) | 16.9 | 13.8 | 16.0 |
Russell 2000 Index (Small-caps) | 12.3 | 13.4 | 18.8 |
Dow Jones Wilshire 5000 Index (Entire market) | 17.1 | 14.0 | 16.5 |
| | | |
| | | |
Bonds | | | |
Lehman U.S. Aggregate Bond Index (Broad taxable market) | 5.1% | 3.9% | 4.1% |
Lehman Municipal Bond Index | 3.1 | 3.9 | 4.0 |
Citigroup 3-Month Treasury Bill Index | 5.0 | 4.0 | 2.8 |
| | | |
| | | |
CPI | | | |
Consumer Price Index | 2.8% | 3.2% | 2.9% |
| | | | | |
3
Management LLP and AllianceBernstein L.P. as well as to the quantitative approach of Acadian Asset Management, Inc. Together, the advisors generated positive returns in nine of ten industry sectors in which the fund invested.
Around 40% of the fund’s assets, on average, were invested in U.S. companies—roughly 6 percentage points below the index weighting. The fund’s average weightings in the developed markets of Europe and the Pacific region were also slightly smaller than the corresponding benchmark weightings. The fund’s emerging-markets exposure was higher than the benchmark’s in the Pacific and Middle East/Africa regions, but a bit lower in Europe and Latin America.
Among the fund’s European holdings, those in smaller markets—particularly Italy, Finland, and Denmark—offered the best returns, while many larger markets—including the United Kingdom, France, and the Netherlands—were less impressive. In the Pacific region, the fund’s Australian, Hong Kong, and Singaporean holdings had strong returns. Brazilian and Mexican stocks gave the fund its strongest gains among emerging markets.
Central to the fund’s success was strong stock selection. The advisors’ choices were especially good in the industrials and materials sectors. Among industrials, several companies that make machinery for agricultural and industrial applications turned in strong results, as did some of
Expense Ratios1 | | |
Your fund compared with its peer group | | |
| | Average |
| | Global |
| Fund | Fund |
Global Equity Fund | 0.64% | 1.56% |
Total Returns | |
Ten Years Ended September 30, 2007 | |
| Average |
| Annual Return |
Global Equity Fund | 12.5% |
MSCI All Country World Index | 7.8 |
Average Global Fund2 | 7.2 |
The figures shown represent past performance, which is not a guarantee of future results. (Current performance |
may be lower or higher than the performance data cited. For performance data current to the most recent month- |
end, visit our website at www.vanguard.com/performance.) Note, too, that both investment returns and principal |
value can fluctuate widely, so an investor’s shares, when sold, could be worth more or less than their original cost. |
1 Fund expense ratio reflects the fiscal year ended September 30, 2007. Peer-group expense ratio is derived from data provided by Lipper Inc. and captures information through year-end 2006.
2 Derived from data provided by Lipper Inc. the fund’s holdings in the aerospace & defense subsector. A modest overweighting in industrials also proved beneficial.
4
In the materials sector, several chemical makers, construction companies, diversified metals companies, and steel makers turned in outstanding results. Many of these businesses have profited from high commodity prices and industry consolidation. Demand for building materials, chemicals, and metals—primarily from developing economies—drove the double- and triple-digit returns of several stocks in these subsectors. Security selection also added value in the consumer discretionary area, where a number of hotel, resort, cruise, and restaurant operators, automobile manufacturers, and media companies made sizable contributions.
On the negative side, the fund’s holdings in health care and information technology were the largest detractors. In health care, several drug makers around the world posted disappointing results because of poor clinical trial results, a weak pipeline of new drugs, and a tightened regulatory environment. Tech holdings were hurt by weakness among chip makers and manufacturers of storage devices and peripherals.
For U.S.-based investors, the dollar’s weakness enhanced the results from several countries once returns were converted from the local currencies into dollars.
For more details on the fund’s positioning and performance, see the Advisors’ Report on page 7.
The fund’s long-term record has been outstanding
As you know, it’s best to measure a mutual fund’s investment returns over several years, not months or quarters. Assessing a fund over extended market cycles can filter out short-term fluctuations and reveal how an investment performs through a variety of market conditions. This is particularly true of any fund that invests outside the United States.
During the ten years ended September 30, 2007, the Global Equity Fund had an average annual return of 12.5%, outpacing both its benchmark index and its peer-group average by roughly five percentage points per year. In fact, a hypothetical investment of $10,000 in Global Equity made ten years ago would have grown to $32,472—more than $10,000 better than the result of a corresponding investment in the index, which bears no expenses.
The driver of the fund’s strong record is, of course, the talent of its advisors. Their commitment and skill in researching and identifying solid companies with growth potential is first-rate. The fund’s competitive results have been supported by its low expense ratio, which means that we are able to pass along a greater share of the total returns to you.
5
Don’t discount the risks of international investing
International investments involve many risks—including geopolitical uncertainties, country-specific risk, and currency volatility—that aren’t present in domestic investments. Because the global economy is increasingly interdependent, what happens in one country or region is likely to have some influence on what occurs elsewhere.
We saw this interconnection in the latter half of the fiscal year, as international markets showed that they were not immune from the turmoil that swept through the U.S. stock and bond markets. However, the international markets seemed to weather the jolt a bit better than the U.S. markets did.
We believe that the Global Equity Fund—with its broad diversification in terms of countries and sectors—can provide investors looking for exposure abroad a low-cost way to give their portfolios an international flair. As a small part of the stock portion of a balanced portfolio, the fund can play a vital role in helping you to move toward your investment goals.
Thank you for investing with Vanguard.
Sincerely,

John J. Brennan
Chairman and Chief Executive Officer
October 16, 2007
6
Advisors’ Report
During the fiscal year ended September 30, 2007, the Global Equity Fund returned 27.0%, reflecting the combined results of your fund’s independent investment advisors. The use of multiple advisors provides exposure to distinct, yet complementary, investment approaches to a particular market segment, enhancing the diversification of your fund.
The advisors, their percentage of fund assets managed, and a brief description of their investment strategies are presented in the table below. The advisors have also prepared a discussion of the investment opportunities in their markets and of how their portfolio positioning reflects this assessment. These comments were prepared on October 18, 2007.
Acadian Asset Management, Inc.
Portfolio Managers:
John Chisholm, CFA, Executive Vice President and Co-Chief Investment Officer
Ronald Frashure, CFA, President and Co-Chief Investment Officer
Brian Wolahan, CFA, Senior Vice President and Co-Director of Research
World markets finished the 12-month period ended September 30 in firmly positive territory. Despite increased volatility triggered by a global credit market crunch in August, markets generally demonstrated resilience in the face of high energy prices, inflationary pressures, and other global concerns. In late February, sharp drops in the Chinese market triggered a brief global
Vanguard Global Equity Fund Investment Advisors | |
| | | |
| Fund Assets Managed | |
Investment Advisor | | % | $ Million | Investment Strategy |
Acadian Asset Management, Inc. | 49 | 3,668 | A quantitative, active, bottom-up investment |
| | | process that combines stock and peer-group |
| | | valuation to arrive at a return forecast for each of |
| | | the more than 25,000securities in its global |
AllianceBernstein L.P. | 25 | 1,903 | universe.A fundamentally based, research-driven |
| | | approach,focused on finding companies whose |
| | | long-term earnings power exceeds the level |
| | | implied by their current stock price. Proprietary |
| | | quantitative tools aid risk control and portfolio |
Marathon Asset Management LLP | 22 | 1,654 | construction.A long-term and contrarian |
| | | investment philosophy and process with a focus |
| | | on industry capital cycle analysis and in-depth |
| | | management assessment. |
Cash investments1 | 4 | 327 | — |
| | | | | |
1 These short-term reserves are invested by Vanguard in equity index products to simulate investment in stocks. Each advisor may also maintain a modest cash position.
7
sell-off that had little lasting impact; likewise, August’s surge in volatility was followed by recovery in September.
Subprime mortgage problems in the United States and the ensuing problems in credit markets globally were assessed by investors against generally solid fundamentals, including positive economic growth and year-to-date earnings. Although August saw some quantitative strategies underperform as equity prices lost their normal relationship to fundamentals, this disruption appears to have been temporary.
Our portfolio was focused on attractively valued stocks that appeared likely to rise in price based on earnings data, price characteristics, and quality. Relative to the benchmark index, our bottom-up selection process led to overweighted positions in certain key markets, including the emerging markets of South Korea, Taiwan, Turkey, and Russia. We also overweighted the Netherlands, France, and Germany. On the other hand, we were underweighted in Japan, the United Kingdom, and Switzerland. Our sector allocations also made a positive contribution in materials, energy, financials, and telecommunication services.
Stock selection in the United States was the most significant contributor to our portfolio’s return. Holdings in the materials and capital equipment sectors delivered particularly strong results, as commodity prices surged and business investment spending in the United States remained firm over the period. The portfolio also benefited from stock selection in Turkey, along with the overweighting in that market.
Stock selection in some key European markets detracted from performance, particularly in the banking, finance, and capital equipment areas. In addition, our technology selections in Asian emerging markets were challenged by uneven global demand and fluctuating prices for electronics exports.
Looking ahead, heightened volatility means that there will likely be a broader range of returns going forward, both within markets and across markets. Such an environment supports the value of active stock selection and underscores the importance of global diversification.
AllianceBernstein L.P.
Portfolio Managers:
Sharon E. Fay, CFA, Executive Vice President and Chief Investment Officer–Global Value Equities
Kevin F. Simms, Co-Chief Investment Officer–International Value Equities and Director of Research–Global and International Value Equities
Henry S. D’Auria, CFA, Co-Chief Investment Officer–International Value Equities and Chief Investment Officer–Emerging Markets
After an extended period of unusual calm, volatility returned with a vengeance to the global capital markets during July and August. Despite this, stock markets
8
worldwide posted healthy gains for the 12 months ended September 30, thanks to a supportive economic outlook, strong corporate earnings, and—for the first nine months of the period—booming merger-and-acquisition activity.
Our portfolio benefited from holdings related to industrial commodities, particularly steel companies JFE Holdings (based in Japan), ArcelorMittal (Luxembourg), and POSCO (South Korea), as well as the U.K.-based diversified mining company Xstrata. These stocks were boosted by a combination of strong demand and consolidation among companies in the metals industries.
Offsetting these positives was stock selection in the financials sector. The largest detractors were the Japanese leasing group ORIX and Sumitomo Mitsui Financial Group, which were hurt by concerns over the outlook for economic growth in Japan, as well as by market jitters related to the subprime loan crisis (although neither company had much exposure to it). Countrywide Financial was also a significant detractor. Although our long-term earnings forecasts had assumed steep declines in mortgage originations and higher credit losses, we had not anticipated how rapidly the company would lose access to short-term financing, nor had we predicted the depth of the contraction in the mortgage-backed securitization market. Management’s response to the crisis also reduced our expectations. On our new forecast, the stock was no longer attractive, leading us to sell it.
Valuation spreads are beginning to widen modestly as investors’ anxiety increases, which may increase the opportunity for future returns. If this trend continues, we may have the chance to adopt more concentrated positions in undervalued stocks. Our action will be guided by the results of our research as market developments unfold. At this point, however, valuations are still relatively compressed, and the portfolio remains more diversified than usual. Financials remain our single largest exposure, but our reasons for owning these stocks vary by industry and geography. We continue to find industrial commodities attractive, because our research indicates that global demand is likely to stay strong.
We recently added Pfizer, which we thought was selling at a very attractive valuation for a world-class pharmaceutical firm. We have been rotating out of Toyota in favor of Nissan, as our research suggests that—even in a weaker export environment—Nissan’s business remains fundamentally sound and the company is attractively valued on a normalized earnings basis. We have also increased our position in Northrop Grumman, which is likely to benefit from continued high levels of U.S. defense spending and the need to replace aging military equipment.
In the energy sector, we have been rotating out of Total and into the more attractively valued Royal Dutch Shell. Despite rising exploration and development costs, we believe Royal
9
Dutch Shell is likely to benefit from its strong position in liquefied natural gas and its exposure to European refining.
Marathon Asset Management LLP
Portfolio Managers:
Jeremy J. Hosking, Investment Director
Neil M. Ostrer, Investment Director
William J. Arah, Investment Director
There were no major changes to our subportfolio’s geographical allocation during the 12 months, and overall stock turnover remained low. The minimal activity involved a number of small purchases in Europe. Over the year, the portfolio benefited considerably from strong stock selection in North America, Europe, and Asia excepting Japan.
Having endured a difficult year with our Japanese holdings, we continue to see strong evidence of an increasing focus by management on returns, capital structures, and shareholders. With our Japanese portfolio aggressively aligned toward domestically oriented, stable, cash-generating stocks, we expect increasingly positive market developments going forward.
The question remains whether the recent credit crisis is a wobble in a bull market or a harbinger of a bear market and a global recession. We were encouraged by the spirited way in which equities in September shrugged off the problems of subprime credit and certain quantitative hedge funds. Moreover, this “market-derived” optimism is supported by some of the fundamentals. For example, emerging economies are growing robustly, and there has been a significant upturn both in corporate buying of equities (via in-place buyback programs) and insider buying. Thus, we have reached the conclusion that this financial turbulence is more likely to be associated with a mid-cycle slowdown in the bull market than with a more adverse outcome.
It is interesting to note that the strategies that fared poorly over the volatile period were credit-based investments and quantitative hedge funds with their promise of monthly incremental returns. To put it another way, these strategies were marketed as being safe, offering investors predictable short-term results. One of the most enduring outcomes of the recent turmoil may be the reassessment of the link between volatility and investment risk. Such a reassessment is long overdue, as the concept is flawed in a number of ways. The fact that nonvolatile investment strategies can be riskier than volatile ones is an important lesson learned, despite appearances (and representations) to the contrary.
10
Fund Profile | | |
As of September 30, 2007 | | |
| | |
Portfolio Characteristics | | |
| | Comparative |
| Fund | Index1 |
Number of Stocks | 665 | 2,702 |
Turnover Rate | 64% | — |
Expense Ratio | 0.64% | — |
Short-Term Reserves | 1.4% | — |
Sector Diversification (% of equity exposure) |
| | Comparative |
| Fund | Index1 |
Consumer Discretionary | 11.7% | 9.9% |
Consumer Staples | 5.7 | 7.8 |
Energy | 11.3 | 10.6 |
Financials | 22.9 | 23.8 |
Health Care | 4.7 | 7.8 |
Industrials | 12.8 | 11.2 |
Information Technology | 10.5 | 11.1 |
Materials | 11.5 | 8.0 |
Telecommunication Services | 6.5 | 5.5 |
Utilities | 2.4 | 4.3 |
Volatility Measures2 | |
| Fund Versus |
| Comparative Index1 |
R-Squared | 0.95 |
Beta | 1.12 |
Ten Largest Holdings3(% of total net assets) | |
| | |
Royal Dutch Shell PLC | integrated oil | |
| and gas | 2.0% |
ING Groep NV | diversified | |
| financial services | 2.0 |
Research In Motion Ltd. | communications | |
| equipment | 2.0 |
E.On AG | electric utilities | 1.7 |
Freeport-McMoRan | diversified metals | |
Copper & Gold, Inc. | and mining | 1.7 |
LUKOIL Sponsored ADR | integrated oil | |
| and gas | 1.5 |
Marathon Oil Corp. | integrated oil | |
| and gas | 1.4 |
Nintendo Co. | home entertainment | |
| software | 1.3 |
Societe Generale | diversified banks | 1.3 |
ExxonMobil Corp. | integrated oil | |
| and gas | 1.2 |
Top Ten | | 16.1% |
Allocation by Region (% of portfolio)
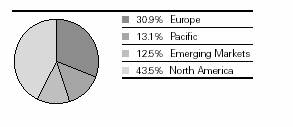
1 MSCI All Country World Index.
2 For an explanation of R-squared, beta, and other terms used here, see the Glossary on page 37.
3 “Ten Largest Holdings” excludes any temporary cash investments and equity index products.
11
Market Diversification (% of equity exposure) |
| | Comparative |
| Fund | Index1 |
Europe | | |
United Kingdom | 9.8% | 9.7% |
Germany | 5.7 | 3.7 |
France | 5.3 | 4.2 |
Netherlands | 3.1 | 1.6 |
Sweden | 2.0 | 1.1 |
Other European Markets | 5.0 | 9.7 |
Subtotal | 30.9% | 30.0% |
Pacific | | |
Japan | 8.6% | 9.0% |
Australia | 1.9 | 2.9 |
Hong Kong | 1.6 | 1.5 |
Other Pacific Markets | 1.0 | 0.8 |
Subtotal | 13.1% | 14.2% |
Emerging Markets | | |
Russia | 2.7% | 0.9% |
South Korea | 2.1 | 1.6 |
Taiwan | 1.5 | 1.2 |
Turkey | 1.1 | 0.2 |
Brazil | 1.0 | 1.2 |
Other Emerging Markets | 4.1 | 4.7 |
Subtotal | 12.5% | 9.8% |
North America | | |
United States | 38.4% | 42.3% |
Canada | 5.1 | 3.7 |
Subtotal | 43.5% | 46.0% |
12
Performance Summary
All of the returns in this report represent past performance, which is not a guarantee of future results that may be achieved by the fund. (Current performance may be lower or higher than the performance data cited. For performance data current to the most recent month-end, visit our website at www.vanguard.com/performance.) Note, too, that both investment returns and principal value can fluctuate widely, so an investor’s shares, when sold, could be worth more or less than their original cost. The returns shown do not reflect taxes that a shareholder would pay on fund distributions or on the sale of fund shares.
Cumulative Performance: September 30, 1997–September 30, 2007
Initial Investment of $10,000
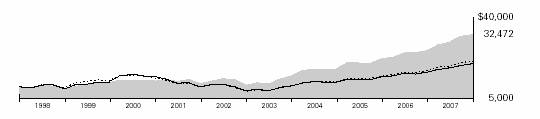
| | | |
| | | | |
| Average Annual Total Returns | Final Value |
| Periods Ended September 30, 2007 | of a $10,000 |
| One Year | Five Years | Ten Years | Investment |
Global Equity Fund1 | 27.00% | 24.83% | 12.50% | $32,472 |
MSCI All Country World Index | 24.59 | 21.02 | 7.76 | 21,121 |
Average Global Fund2 | 22.47 | 18.84 | 7.19 | 20,032 |
Fiscal-Year Total Returns (%): September 30, 1997–September 30, 2007

1 Total returns do not include the account service fee that may be applicable to certain accounts with balances below $10,000.
2 Derived from data provided by Lipper Inc.
Note: See Financial Highlights table on page 26 for dividend and capital gains information.
13
Financial Statements
Statement of Net Assets
As of September 30, 2007
The fund provides a complete list of its holdings four times in each fiscal year, at the quarter-ends. For the second and fourth fiscal quarters, the lists appear in the fund’s semiannual and annual reports to shareholders. For the first and third fiscal quarters, the fund files the lists with the Securities and Exchange Commission on Form N-Q. Shareholders can look up the fund’s Forms N-Q on the SEC’s website at www.sec.gov. Forms N-Q may also be reviewed and copied at the SEC’s Public Reference Room (see the back cover of this report for further information).
| | | Market |
| | | Value• |
| | Shares | ($000) |
Common Stocks (94.4%)1 | | |
Australia (1.6%) | | |
| QBE Insurance Group Ltd. | 1,073,351 | 32,075 |
| Qantas Airways Ltd. | 4,552,110 | 22,491 |
| Zinifex Ltd. | 953,156 | 14,952 |
| Leighton Holdings Ltd. | 292,937 | 13,320 |
| Santos Ltd. | 469,145 | 6,242 |
| Suncorp-Metway Ltd. | 313,548 | 5,630 |
| Macquarie | | |
| Infrastructure Group | 1,911,245 | 5,274 |
| Australia & New Zealand | | |
| Bank Group Ltd. | 179,613 | 4,721 |
| Caltex Australia Ltd. | 174,022 | 3,629 |
| Orica Ltd. | 99,854 | 2,662 |
| Iluka Resources Ltd. | 429,393 | 2,099 |
| Macquarie Airports Group | 531,890 | 2,047 |
| Amcor Ltd. | 302,310 | 1,975 |
| Centro Properties Group | 219,617 | 1,433 |
| Alumina Ltd. | 204,000 | 1,290 |
| | | 119,840 |
Austria (0.2%) | | |
| Voestalpine AG | 183,476 | 15,863 |
* | BETandWIN.com Interactive | |
| Entertainment AG | 8,970 | 213 |
| Oesterreichische Post AG | 3,686 | 148 |
| | | 16,224 |
Belgium (0.7%) | | |
| KBC Bank & | | |
| Verzekerings Holding | 142,978 | 19,646 |
| Fortis | 494,000 | 14,565 |
| Delhaize Group | 110,393 | 10,597 |
| Dexia | 165,204 | 5,002 |
* | Fortis | | |
| Rights Exp. 10/9/07 | 389,600 | 2,067 |
| InBev | 9,037 | 818 |
| | | 52,695 |
Brazil (1.0%) | | |
| Petroleo Brasileiro SA Pfd. | 485,100 | 15,707 |
| Gerdau SA ADR | 451,350 | 11,834 |
| | | | |
| | | Market |
| | | Value• |
| | Shares | ($000) |
| Companhia Vale do | | |
| Rio Doce Pfd. Class A | 408,800 | 11,675 |
| Usiminas-Usinas | | |
| Siderugicas de Minas | | |
| Gerais SA Pfd. | 165,300 | 11,544 |
| Uniao de Bancos | | |
| Brasileiros SA GDR | 79,500 | 10,458 |
| Banco do Brasil SA | 413,400 | 6,958 |
| Itausa-Investimentos | | |
| Itau SA | 606,500 | 4,186 |
| | | 72,362 |
Canada (5.0%) | | |
* | Research In Motion Ltd. | 1,528,500 | 150,634 |
| Rogers | | |
| Communications, Inc. | | |
| Class B | 735,800 | 33,496 |
* | Bombardier Inc. Class B | 4,268,200 | 25,361 |
| Teck Cominco Ltd. Class B | 480,500 | 22,811 |
| Canadian Imperial | | |
| Bank of Commerce | 222,808 | 22,257 |
| Imperial Oil Ltd. | 360,300 | 17,855 |
* | Alcan Inc. | 158,800 | 15,842 |
| Sun Life Financial | | |
| Services of Canada | 297,000 | 15,587 |
* | Royal Bank of Canada | 281,500 | 15,580 |
| EnCana Corp. | 220,900 | 13,658 |
| Methanex Corp. | 227,200 | 5,717 |
| BCE Inc. | 142,465 | 5,715 |
* | Nortel Networks Corp. | 298,833 | 5,074 |
* | ACE Aviation Holdings, Inc. | 174,100 | 4,656 |
* | HudBay Minerals, Inc. | 164,400 | 4,256 |
| ING Canada Inc. | 84,063 | 3,773 |
| Gerdau AmeriSteel Corp. | 293,000 | 3,473 |
* | Inmet Mining Corp. | 29,200 | 2,928 |
| Bank of Nova Scotia, Halifax | 50,700 | 2,663 |
| Onex Corp. | 66,800 | 2,455 |
* | Abitibi-Consolidated Inc. | 660,200 | 1,168 |
* | Fraser Papers Inc. | 198,800 | 1,001 |
| Biovail Corp. | 44,800 | 780 |
| Rothmans Inc. | 5,600 | 130 |
14
| | | Market |
| | | Value• |
| | Shares | ($000) |
| Bell Aliant Regional | | |
| Communications | | |
| Income Fund | 630 | 20 |
| | | 376,890 |
China (0.3%) | | |
| China Petroleum & | | |
| Chemical Corp. | 11,332,000 | 13,967 |
| Tsingtao Brewery Co., Ltd. | 1,548,000 | 5,620 |
| China Telecom Corp. Ltd. | 5,688,000 | 4,329 |
| | | 23,916 |
Denmark (0.3%) | | |
* | Vestas Wind Systems A/S | 95,699 | 7,565 |
* | William Demant A/S | 65,300 | 5,784 |
| Coloplast A/S B Shares | 35,400 | 3,367 |
* | GN Store Nord A/S | 251,200 | 2,548 |
* | Topdanmark A/S | 3,925 | 647 |
| | | 19,911 |
Finland (0.5%) | | |
| Nokia Oyj | 296,700 | 11,258 |
| Stora Enso Oyj R Shares | 505,400 | 9,814 |
| Metso Oyj | 129,540 | 8,907 |
| Sampo Oyj A Shares | 242,900 | 7,400 |
| TietoEnator Oyj B Shares | 78,020 | 1,750 |
| Wartsila Oyj B Shares | 15,220 | 1,042 |
| | | 40,171 |
France (5.0%) | | |
| Societe Generale Class A | 563,467 | 94,809 |
| BNP Paribas SA | 535,883 | 58,645 |
| Vivendi SA | 750,049 | 31,694 |
| Renault SA | 200,200 | 29,049 |
| Sanofi-Aventis | 303,180 | 25,694 |
| France Telecom SA | 677,761 | 22,623 |
| Compagnie Generale | | |
| des Etablissements | | |
| Michelin SA | 136,800 | 18,446 |
| Credit Agricole SA | 465,839 | 17,830 |
| Air France | 383,704 | 14,095 |
| Total SA | 129,800 | 10,518 |
| Lagardere S.C.A. | 100,453 | 8,556 |
| Cap Gemini SA | 124,669 | 7,669 |
| AXA | 139,000 | 6,225 |
| Alcatel-Lucent ADR | 572,560 | 5,829 |
| Carrefour SA | 78,808 | 5,517 |
| Thales SA | 79,700 | 4,670 |
| SCOR SA | 107,872 | 2,888 |
* | Business Objects SA | 59,764 | 2,677 |
| Legrand SA | 68,670 | 2,307 |
| Cie. de St. Gobain SA | 18,960 | 1,980 |
* | Atos Origin SA | 26,400 | 1,535 |
| SA des Ciments Vicat | 9,770 | 992 |
| | | 374,248 |
Germany (5.5%) | | |
| E.On AG | 711,404 | 131,340 |
| ThyssenKrupp AG | 635,952 | 40,419 |
| Deutsche Lufthansa AG | 1,274,321 | 36,594 |
| | Market |
| | Value• |
| Shares | ($000) |
Volkswagen AG | 147,655 | 33,332 |
BASF AG | 225,200 | 31,126 |
Muenchener | | |
Rueckversicherungs- | | |
Gesellschaft AG | | |
(Registered) | 161,590 | 31,019 |
Allianz AG | 123,400 | 28,744 |
Man AG | 170,252 | 24,742 |
Deutsche Bank AG | 144,700 | 18,593 |
DaimlerChrysler AG | | |
(Registered) | 76,700 | 7,681 |
Salzgitter AG | 39,157 | 7,674 |
Fresenius Medical Care AG | 122,700 | 6,513 |
Bayerische | | |
Motoren Werke AG | 61,480 | 3,958 |
Beiersdorf AG | 49,025 | 3,668 |
Deutsche Post AG | 82,200 | 2,389 |
Deutsche Boerse AG | 17,012 | 2,314 |
Fresenius Medical Care | | |
AG ADR | 29,244 | 1,552 |
Heidelberger | | |
Druckmaschinen AG | 15,765 | 689 |
| | 412,347 |
Hong Kong (1.6%) | | |
Jardine Matheson | | |
Holdings Ltd. | 965,102 | 27,597 |
New World | | |
Development Co., Ltd. | 7,610,310 | 20,958 |
Jardine Strategic | | |
Holdings Ltd. | 1,233,900 | 19,501 |
Henderson Land | | |
Development Co. Ltd. | 1,117,000 | 8,825 |
China Netcom Group Corp. | | |
Hong Kong Ltd. | 3,037,500 | 8,105 |
Hong Kong Aircraft & | | |
Engineering Co., Ltd. | 320,000 | 7,230 |
First Pacific Co. Ltd. | 9,396,000 | 6,993 |
Television Broadcasts Ltd. | 1,068,000 | 6,399 |
Wheelock and Co. Ltd. | 1,883,000 | 5,178 |
Hong Kong and | | |
Shanghai Hotels Ltd. | 2,593,602 | 4,592 |
SmarTone | | |
Telecommunications Ltd. | 2,082,790 | 2,578 |
Mandarin Oriental | | |
International Ltd. | 881,690 | 1,980 |
Next Media Ltd. | 4,192,000 | 1,184 |
I-Cable | | |
Communications Ltd. | 5,207,000 | 1,081 |
Silver Grant International | | |
Industries Ltd. | 1,752,000 | 364 |
Asia Satellite | | |
Telecommunications | | |
Holdings Ltd. | 148,500 | 306 |
| | 122,871 |
15
| | | Market |
| | | Value• |
| | Shares | ($000) |
Hungary (0.1%) | | |
| MOL Hungarian | | |
| Oil and Gas Nyrt. | 23,910 | 3,874 |
| | | |
India (0.2%) | | |
| State Bank of India GDR | 66,230 | 7,413 |
| Tata Iron and Steel Co. Ltd. | 110,168 | 2,342 |
| Kesoram Industries Ltd. | 77,269 | 1,121 |
| Canara Bank Ltd. | 102,591 | 713 |
| | | 11,589 |
Indonesia (0.2%) | | |
| PT Semen Gresik Tbk | 11,550,000 | 6,693 |
* | PT Bank Indonesia Tbk | 66,769,036 | 5,103 |
| PT Indofood Sukses | | |
| Makmur Tbk | 10,823,000 | 2,281 |
| PT Matahari Putra | | |
| Prima Tbk | 19,851,300 | 1,669 |
| PT Gudang Garam Tbk | 1,149,900 | 1,182 |
| PT International Nickel | | |
| Indonesia Tbk | 136,000 | 944 |
* | PT Bank Pan Indonesia Tbk | | |
| Warrants Exp. 7/10/09 | 13,353,807 | 416 |
| PT Citra Marga Nusaphala | | |
| Persada Tbk | 774,000 | 205 |
* | Matahari Putra Prima | | |
| Warrants Exp. 7/21/10 | 3,859,975 | 42 |
* | PT Mulia Industrindo Tbk | 921,000 | 30 |
| | | 18,565 |
Ireland (0.1%) | | |
| Independent | | |
| News & Media PLC | 1,063,718 | 3,964 |
| DCC PLC | 25,208 | 747 |
| Fyffes PLC | 512,200 | 664 |
* | Total Produce PLC | 512,200 | 490 |
| | | 5,865 |
Israel (0.3%) | | |
| Bank Hapoalim Ltd. | 2,806,730 | 14,518 |
| Bank Leumi Le-Israel | 1,964,369 | 8,708 |
| | | 23,226 |
Italy (0.8%) | | |
| Eni SpA | 577,500 | 21,326 |
| Saipem SpA | 256,000 | 10,914 |
| Fiat SpA | 309,700 | 9,355 |
| Luxottica Group SpA ADR | 179,800 | 6,095 |
| Fondiaria—Sai SpA | 98,100 | 4,609 |
| Unicredito Italiano SpA | 528,100 | 4,521 |
| Seat Pagine Gialle SpA | 4,714,910 | 2,627 |
* | Banco Popolare SpA | 109,214 | 2,447 |
| Finmeccanica SpA | 31,400 | 912 |
| Fondiaria—Sai SpA RNC | 18,000 | 586 |
* | Natuzzi | | |
| SpA-Sponsored ADR | 50,700 | 299 |
| | | 63,691 |
| | | | |
| | | Market |
| | | Value• |
| | Shares | ($000) |
Japan (8.0%) | | |
| Nintendo Co. | 195,700 | 101,041 |
| Marubeni Corp. | 3,377,000 | 30,818 |
| Sumitomo Mitsui | | |
| Financial Group, Inc. | 3,222 | 24,997 |
| Central Japan Railway Co. | 2,227 | 23,609 |
| JFE Holdings, Inc. | 332,300 | 23,436 |
| Nissan Motor Co., Ltd. | 2,142,300 | 21,374 |
| Sumco Corp. | 466,900 | 18,891 |
| Orix Corp. | 82,120 | 18,611 |
| Sharp Corp. | 898,000 | 16,230 |
| Mitsubishi Chemical | | |
| Holdings Corp. | 1,639,000 | 14,233 |
| Isuzu Motors Ltd. | 2,492,000 | 14,177 |
| Nippon Yusen | | |
| Kabushiki Kaisha Co. | 1,423,000 | 13,819 |
| Kyushu Electric | | |
| Power Co., Inc. | 507,200 | 13,398 |
| Toshiba Corp. | 1,438,000 | 13,363 |
| Mitsui OSK Lines Ltd. | 771,000 | 12,406 |
| Toyota Motor Corp. | 172,200 | 10,074 |
| Fujitsu Ltd. | 1,393,000 | 9,801 |
| Tokyo Electric Power Co. | 385,400 | 9,710 |
| KDDI Corp. | 1,305 | 9,670 |
| Fuji Photo Film Co., Ltd. | 181,400 | 8,334 |
| Nikon Corp. | 217,000 | 7,416 |
| Kawasaki Kisen Kaisha Ltd. | 467,000 | 6,817 |
| Mitsubishi Corp. | 211,300 | 6,655 |
| Leopalace21 Corp. | 188,900 | 6,177 |
| Nippon Mining Holdings Inc. | 577,000 | 5,753 |
| Kao Corp. | 184,000 | 5,485 |
| East Japan Railway Co. | 660 | 5,203 |
| Mitsui Chemicals, Inc. | 488,000 | 4,817 |
| West Japan Railway Co. | 1,010 | 4,812 |
| Nippon Telegraph and | | |
| Telephone Corp. | 1,023 | 4,753 |
| Mitsubishi Materials Corp. | 720,000 | 4,448 |
| Tokyo Gas Co., Ltd. | 898,000 | 4,168 |
| Takeda | | |
| Pharmaceutical Co. Ltd. | 56,900 | 3,990 |
| Komatsu Ltd. | 119,000 | 3,967 |
| Sony Corp. | 70,100 | 3,370 |
| Secom Co., Ltd. | 68,500 | 3,285 |
| Itochu Corp. | 272,000 | 3,284 |
| Kirin Brewery Co., Ltd. | 246,000 | 3,243 |
| Matsushita | | |
| Electric Works, Ltd. | 251,000 | 3,014 |
| FamilyMart Co., Ltd. | 114,900 | 2,989 |
| Bridgestone Corp. | 135,700 | 2,987 |
| Rengo Co., Ltd. | 434,000 | 2,922 |
| Mitsubishi UFJ | | |
| Financial Group | 328 | 2,864 |
| TDK Corp. | 32,100 | 2,814 |
* | Elpida Memory Inc. | 76,700 | 2,799 |
| Sojitz Holdings Corp. | 630,600 | 2,727 |
16
| | Market |
| | Value• |
| Shares | ($000) |
Kawasaki Heavy | | |
Industries Ltd. | 698,000 | 2,718 |
Mitsumi Electric Co., Ltd. | 64,300 | 2,611 |
Sekisui House Ltd. | 200,000 | 2,513 |
Sumitomo Electric | | |
Industries Ltd. | 158,000 | 2,505 |
Yamato Holdings Co., Ltd. | 165,000 | 2,467 |
Nisshin Steel Co. | 547,000 | 2,454 |
Nippon Sanso Corp. | 264,000 | 2,370 |
Ajinomoto Co., Inc. | 189,000 | 2,361 |
Seven and I | | |
Holdings Co., Ltd. | 91,700 | 2,350 |
Namco Bandai Holdings Inc. | 160,650 | 2,327 |
Sumitomo Metal Mining Co. | 93,000 | 2,242 |
Nippon Oil Corp. | 241,000 | 2,225 |
Makita Corp. | 50,600 | 2,204 |
Marui Co., Ltd. | 195,600 | 2,153 |
Tanabe Seiyaku Co., Ltd. | 169,000 | 2,128 |
Hitachi Ltd. | 319,000 | 2,111 |
Sompo Japan Insurance Inc. | 184,000 | 2,105 |
NTT DoCoMo, Inc. | 1,475 | 2,097 |
JS Group Corp. | 119,000 | 2,067 |
Ricoh Co. | 95,000 | 1,999 |
Nippon Suisan Kaisha Ltd. | 372,000 | 1,959 |
Seiko Epson Corp. | 77,800 | 1,920 |
Fukuoka | | |
Financial Group, Inc. | 328,000 | 1,912 |
Dai-Nippon Printing Co., Ltd. | 130,000 | 1,854 |
Alfresa Holdings Corp. | 28,200 | 1,795 |
Sumitomo Forestry Co. | 218,000 | 1,795 |
Astellas Pharma Inc. | 37,300 | 1,783 |
Yamatake Corp. | 50,000 | 1,671 |
Nippon Meat Packers, Inc. | 148,000 | 1,642 |
Shiseido Co., Ltd. | 72,000 | 1,596 |
Kinden Corp. | 164,000 | 1,495 |
NEC Corp. | 308,000 | 1,489 |
Sumitomo Trust & | | |
Banking Co., Ltd. | 194,000 | 1,461 |
Mizuho Financial Group, Inc. | 239 | 1,350 |
Toyo Seikan Kaisha Ltd. | 68,000 | 1,278 |
Onward Kashiyama Co., Ltd. | 126,000 | 1,271 |
Bank of Yokohama Ltd. | 181,000 | 1,243 |
Ryosan Co., Ltd. | 48,500 | 1,213 |
Toppan Forms Co., Ltd. | 101,600 | 1,022 |
Rohm Co., Ltd. | 11,000 | 969 |
Shimizu Corp. | 176,000 | 954 |
Chiba Bank Ltd. | 123,000 | 946 |
Tokyo Ohka Kogyo Co., Ltd. | 35,400 | 764 |
Ebara Corp. | 157,000 | 722 |
Nisshinbo Industries, Inc. | 48,000 | 664 |
Isetan Co. | 49,000 | 660 |
Ohbayashi Corp. | 107,000 | 494 |
Sankyo Co., Ltd. | 11,700 | 473 |
Daifuku Co., Ltd. | 36,000 | 409 |
Noritake Co., Ltd. | 81,000 | 386 |
| | | Market |
| | | Value• |
| | Shares | ($000) |
| Inabata & Co., Ltd. | 49,000 | 319 |
| Fujitsu Fronttec Ltd. | 32,700 | 290 |
| Matsushita Electric | | |
| Industrial Co., Ltd. | 12,000 | 223 |
| Omron Corp. | 4,700 | 124 |
| | | 602,904 |
Luxembourg (0.5%) | | |
| ArcelorMittal | 458,342 | 36,131 |
| | | |
Malaysia (0.4%) | | |
| Resorts World Bhd. | 8,710,000 | 10,012 |
| Bumiputra-Commerce | | |
| Holdings Bhd. | 3,107,619 | 9,740 |
| Sime Darby Bhd. | 1,446,100 | 4,413 |
| British American | | |
| Tobacco Bhd. | 165,000 | 1,997 |
| Kumpulan Guthrie Bhd. | 965,000 | 1,865 |
| Multi-Purpose | | |
| Holdings Bhd. | 1,855,000 | 994 |
* | Malaysian Airline | | |
| System Bhd. | 550,000 | 694 |
* | Multi-Purpose Holdings Bhd. | |
| Warrants Exp. 2/26/09 | 254,000 | 88 |
* | Malaysian Airline | | |
| System Bhd. | | |
| Rights Exp. 10/30/07 | 183,333 | 85 |
| | | 29,888 |
Mexico (0.8%) | | |
| Grupo Mexico SA de CV | 2,749,518 | 19,744 |
| America Movil SA de CV | 6,072,908 | 19,372 |
| Telefonos de Mexico SA | 6,802,041 | 11,188 |
| Grupo Financerio | | |
| Banorte SA de CV | 1,024,401 | 4,020 |
| Grupo Televisa SA CPO | 713,300 | 3,436 |
| America Movil SA de CV | | |
| Series L ADR | 46,200 | 2,957 |
| Telefonos de Mexico SA | | |
| Class L ADR | 32,000 | 1,052 |
| | | 61,769 |
Netherlands (3.0%) | | |
| ING Groep NV | 3,398,335 | 151,020 |
| Heineken NV | 509,220 | 33,404 |
* | ASML Holding NV | 334,835 | 11,048 |
| Koninklijke Ahold NV | 485,639 | 7,329 |
| Koninklijke (Royal) Philips | | |
| Electronics NV | 134,171 | 6,038 |
| Koninklijke Boskalis | | |
| Westminster NV | 118,911 | 6,010 |
| Koninklijke KPN NV | 293,054 | 5,079 |
| Wolters Kluwer NV | 110,737 | 3,280 |
| European Aeronautic | | |
| Defence and Space Co. | 91,360 | 2,807 |
| Vedior NV | 48,900 | 1,076 |
| | | 227,091 |
17
| | | Market |
| | | Value• |
| | Shares | ($000) |
New Zealand (0.1%) | | |
| Fletcher Building Ltd. | 391,497 | 3,762 |
| Telecom Corp. of New | | |
| Zealand Ltd. | 416,459 | 1,409 |
| PGG Wrightson Ltd. | 58,578 | 85 |
| | | 5,256 |
Norway (0.1%) | | |
| Statoil ASA | 109,200 | 3,726 |
| Petroleum Geo-Services ASA | 117,750 | 3,400 |
| DnB NOR ASA | 216,900 | 3,327 |
| | | 10,453 |
Pakistan (0.0%) | | |
* | Arif Habib Securities Ltd. | 835,000 | 1,841 |
* | The Bank of Punjab | 564,500 | 948 |
| | | 2,789 |
Philippines (0.7%) | | |
| Ayala Corp. | 1,727,551 | 21,015 |
| Globe Telecom, Inc. | 419,400 | 13,653 |
| Philippine Long Distance | | |
| Telephone Co. | 101,200 | 6,516 |
| ABS-CBN | | |
| Broadcasting Corp. | 7,731,200 | 5,448 |
| Jollibee Foods Corp. | 2,574,900 | 3,018 |
* | Benpres Holdings Corp. | 15,641,000 | 1,430 |
| Banco De Oro | 951,800 | 1,240 |
| DMCI Holdings, Inc. | 5,230,000 | 1,051 |
| | | 53,371 |
Poland (0.0%) | | |
| KGHM Polska Miedz SA | 50,003 | 2,345 |
| | | |
Portugal (0.0%) | | |
| Galp Energia, SGPS, SA | 82,443 | 1,276 |
| | | |
Russia (2.7%) | | |
| LUKOIL Sponsored ADR | 1,339,254 | 110,721 |
* | Mobile TeleSystems ADR | 1,077,526 | 74,683 |
| OAO Vimpel- | | |
| Communications | | |
| Sponsored ADR | 321,600 | 8,696 |
| Novolipetsk Steel GDR | 178,875 | 6,054 |
| Wimm-Bill-Dann Foods ADR | 16,014 | 1,751 |
| | | 201,905 |
Singapore (0.4%) | | |
| Great Eastern Holdings Ltd. | 697,000 | 8,469 |
* | STATS ChipPAC Ltd. | 6,993,000 | 7,656 |
| Singapore Airlines Ltd. | 467,600 | 5,843 |
| Neptune Orient Lines Ltd. | 1,517,000 | 5,401 |
| BIL International Ltd. | 4,553,000 | 3,962 |
* | Yongnam Holdings Limited | 3,261,000 | 895 |
| United Industrial Corp., Ltd. | 377,000 | 775 |
| Yellow Pages | | |
| (Singapore) Ltd. | 704,000 | 567 |
| | | 33,568 |
| | | Market |
| | | Value• |
| | Shares | ($000) |
South Africa (0.9%) | | |
| Hosken Consolidated | | |
| Investments Ltd. | 1,103,148 | 11,914 |
| Sun International Ltd. | 461,887 | 9,879 |
| Anglo American PLC | 132,263 | 8,779 |
| RMB Holdings Ltd. | 1,550,600 | 7,528 |
| Sanlan Ltd. | 2,096,100 | 6,795 |
| Nedbank Group Ltd. | 271,805 | 4,935 |
| Standard Bank Group Ltd. | 305,600 | 4,413 |
| FirstRand Ltd. | 1,329,636 | 4,265 |
| Anglo Platinum Ltd. | 18,000 | 2,725 |
| Gold Fields Ltd. | 62,340 | 1,125 |
| City Lodge Hotels Ltd. | 83,078 | 978 |
| JD Group Ltd. | 88,246 | 745 |
| New Clicks Holdings Ltd. | 301,750 | 732 |
| Mondi Ltd. | 14,534 | 144 |
| | | 64,957 |
South Korea (2.0%) | | |
| KT Corp. | 669,220 | 33,611 |
| POSCO | 29,593 | 21,415 |
| Woori Finance | | |
| Holdings Co., Ltd. | 570,040 | 12,930 |
| Honam Petrochemical Corp. | 66,197 | 10,887 |
| Samsung | | |
| Electronics Co., Ltd. | 15,453 | 9,670 |
| Samsung | | |
| Electronics Co., Ltd. Pfd. | 18,000 | 8,342 |
| Hyundai Mobis | 73,830 | 7,814 |
| Kookmin Bank | 90,500 | 7,464 |
| Hana Financial Group Inc. | 123,900 | 5,828 |
* | Hynix Semiconductor Inc. | 156,200 | 5,323 |
| Mirae Asset | | |
| Securities Co., Ltd. | 54,276 | 5,159 |
| Industrial Bank of Korea | 234,690 | 5,050 |
| Shinhan Financial Group Ltd. | 71,490 | 4,630 |
| LG Corp. | 62,380 | 4,281 |
| Hyundai | | |
| Motor Co., Ltd. 2nd Pfd. | 77,640 | 3,108 |
| Hyundai Heavy | | |
| Industries Co., Inc. | 6,548 | 3,012 |
| Daishin Securities Co. | 67,714 | 2,227 |
| Korea Investment | | |
| Holdings Co., Ltd. | 21,295 | 1,393 |
| Korea Iron & Steel Co., Ltd. | 4,000 | 412 |
| Hyundai Motor Co., Ltd. | 5,000 | 403 |
| Korea Electric Power Corp. | 5,000 | 233 |
| Kiswire Ltd. | 3,000 | 196 |
| | | 153,388 |
Spain (0.7%) | | |
| Repsol YPF SA | 419,200 | 14,917 |
| Acciona SA | 36,700 | 9,956 |
| Acerinox SA | 249,170 | 7,482 |
| Banco Popular Espanol SA | 293,610 | 5,063 |
| Banco Santander | | |
| Central Hispano SA | 256,462 | 4,995 |
| Telefonica SA | 157,607 | 4,403 |
18
| | | | Market |
| | | | Value• |
| | | Shares | ($000) |
| Iberia (Linea Aerea Espana) | 448,913 | 2,194 |
| Viscofan SA | | 60,700 | 1,415 |
* | Sogecable SA | | 37,566 | 1,360 |
| Prosegur Cia de | | | |
| Seguridad SA (Registered) | | 37,100 | 1,353 |
| | | | 53,138 |
Sweden (2.0%) | | | |
| Volvo AB B Shares | 4,915,110 | 85,294 |
| Scania AB—B Shares | | 615,800 | 14,962 |
| Electrolux AB Series B | 643,300 | 13,642 |
| Skandinaviska Enskilda | | | |
| Banken AB A Shares | 296,800 | 9,641 |
| Svenska Handelsbanken | | | |
| AB A Shares | | 176,100 | 5,447 |
| Telefonaktiebolaget LM | | | |
| Ericsson AB Class B | 1,324,700 | 5,274 |
| Assa Abloy AB | 218,200 | 4,523 |
| Svenska Cellulosa AB-B | | 231,180 | 4,300 |
| Atlas Copco AB—A Shares | | 120,000 | 2,067 |
* | SAS AB | | 88,700 | 1,587 |
| Hoganas AB B Shares | | 53,250 | 1,419 |
| Modern Times Group AB | | | |
| B Shares | | 17,020 | 1,100 |
| TeliaSonera AB | | 76,500 | 689 |
| | | | 149,945 |
Switzerland (0.8%) | | | |
| Credit Suisse Group | | | |
| (Registered) | | 358,900 | 23,854 |
| Cie. Financiere | | | |
| Richemont AG | | 109,600 | 7,249 |
| Novartis AG (Registered) | 100,840 | 5,548 |
| Roche Holdings AG | | 25,440 | 4,606 |
| Geberit AG | | 28,240 | 3,702 |
| Adecco SA (Registered) | | 60,800 | 3,590 |
* | Logitech International SA | 113,520 | 3,370 |
| Zurich Financial Services AG | | 11,092 | 3,325 |
| Publigroupe SA | | 3,540 | 1,234 |
| Swatch Group AG (Bearer) | | 3,699 | 1,212 |
| Sonova Holding AG | | 9,680 | 969 |
| Georg Fischer AG (Registered) | | 1,074 | 739 |
| | | | 59,398 |
Taiwan (1.4%) | | | |
| United | | | |
| Microelectronics Corp. | 21,659,639 | 15,395 |
| China Steel Corp. | 9,788,090 | 14,306 |
| Siliconware Precision | | | |
| Industries Co. | 5,783,170 | 13,076 |
| Powerchip | | | |
| Semiconductor Corp. | 24,800,910 | 12,284 |
| Compal Electronics Inc. | 7,926,935 | 8,979 |
| AU Optronics Corp. | 4,520,194 | 7,707 |
| Chunghwa | | | |
| Telecom Co., Ltd. | 3,780,258 | 7,059 |
| Taiwan Semiconductor | | | |
| Manufacturing Co., Ltd. | 3,439,266 | 6,630 |
| | | | | |
| | Market |
| | Value• |
| Shares | ($000) |
Nan Ya Plastic Corp. | 2,217,000 | 5,768 |
Formosa Chemicals & | | |
Fibre Corp. | 1,871,000 | 4,788 |
Asustek Computer Inc. | 1,536,827 | 4,668 |
Taiwan Cellular Corp. | 1,407,000 | 1,915 |
Mosel Vitelic Inc. | 1,142,270 | 1,539 |
Universal Scientific | | |
Industrial Co., Ltd. | 1,891,838 | 1,314 |
Advanced Semiconductor | | |
Engineering Inc. | 1,021,659 | 1,117 |
U-Ming Marine | | |
Transport Corp. | 249,000 | 818 |
Ruentex | | |
Development Co., Ltd. | 642,000 | 739 |
Powertech Technology Inc. | 111,000 | 448 |
MediaTek Inc. | 16,800 | 302 |
Vanguard International | | |
Semiconductor Corp. | 264,174 | 237 |
Mitac International Corp. | 35,255 | 49 |
| | 109,138 |
Thailand (0.6%) | | |
PTT Chemical | | |
Public Co. Ltd. (Foreign) | 1,463,200 | 14,344 |
Siam Cement | | |
Public Co. Ltd. Non-Voting | | |
Depositary Receipt | 986,200 | 7,308 |
Advanced Info Service | | |
Public Co. Ltd. (Foreign) | 2,826,000 | 7,245 |
Siam Cement | | |
“Public Co. Ltd. (Foreign) | 664,300 | 5,037 |
Kasikornbank | | |
Public Co. Ltd. (Foreign) | 1,701,900 | 4,089 |
Thai Oil PCL (Foreign) | 891,700 | 2,237 |
MBK Development | | |
Public Co. Ltd. (Foreign) | 813,400 | 1,554 |
Land and Houses | | |
Public Co. Ltd. (Foreign) | 5,830,000 | 1,478 |
Rayong Refinery | | |
Public Co. Ltd. (Foreign) | 1,249,200 | 929 |
Thanachart Capital | | |
Public Co. Ltd. (Foreign) | 1,855,000 | 850 |
GMM Grammy | | |
Public Co. Ltd. Non-Voting | | |
Depositary Receipt | 2,917,000 | 753 |
Post Publishing | | |
Public Co. Ltd. (Foreign) | 1,300,000 | 199 |
Matichon PLC (Foreign) | 625,000 | 168 |
GMM Grammy | | |
Public Co. Ltd. (Foreign) | 642,000 | 166 |
| | 46,357 |
Turkey (1.1%) | | |
Eregli Demir ve Celik | | |
Fabrikalari A.S. | 3,040,606 | 28,484 |
Tupras-Turkiye Petrol | | |
Rafinerileri A.S. | 666,109 | 17,617 |
| | | | | |
19
| | | Market |
| | | Value• |
| | Shares | ($000) |
| Turkiye Garanti | | |
| Bankasi A.S. | 1,862,797 | 14,185 |
* | Dogan Sirketler Grubu | | |
| Holding A.S. | 3,348,725 | 7,330 |
* | Petkim Petrokimya | | |
| Holding A.S. | 729,730 | 5,970 |
| Turkcell Iletisim | | |
| Hizmetleri A.S. | 387,318 | 3,300 |
| Akbank T.A.S. | 273,845 | 2,079 |
| Turkiye Vakiflar | | |
| Bankasi TAO | 491,188 | 1,671 |
* | Turk Hava Yollari | | |
| Anonim Ortakligi | 214,195 | 1,668 |
* | Vestel Elektronik | | |
| Sanayi ve Ticaret A.S. | 489,269 | 1,358 |
| Anadolu Efes Biracilik ve | | |
| Malt Sanayii A.S. | 64,408 | 673 |
| | | 84,335 |
United Kingdom (8.8%) | | |
| Royal Dutch Shell | | |
| PLC Class A | | |
| (Amsterdam Shares) | 3,602,078 | 148,400 |
| BT Group PLC | 12,960,585 | 81,319 |
| AstraZeneca Group PLC | 1,192,570 | 59,689 |
| Vodafone Group PLC | 8,702,837 | 31,369 |
| Royal Bank of | | |
| Scotland Group PLC | 2,215,301 | 23,903 |
| HBOS PLC | 1,148,550 | 21,493 |
| Xstrata PLC | 287,490 | 19,092 |
| Barclays PLC | 1,534,100 | 18,649 |
| Antofagasta PLC | 1,166,421 | 18,196 |
| Kazakhmys PLC | 554,652 | 15,876 |
| Aviva PLC | 920,300 | 13,799 |
| BP PLC | 1,089,600 | 12,604 |
| Rio Tinto PLC | 131,600 | 11,326 |
| ITV PLC | 5,005,635 | 10,508 |
* | British Airways PLC | 1,338,058 | 10,466 |
| Home Retail Group | 1,183,400 | 8,990 |
| BAE Systems PLC | 865,690 | 8,699 |
| Reckitt Benckiser PLC | 131,890 | 7,732 |
| Capita Group Plc | 508,838 | 7,524 |
| Cable and Wireless PLC | 1,918,800 | 7,204 |
| Diageo PLC | 292,528 | 6,414 |
| British Energy Group PLC | 586,000 | 6,366 |
| Tesco PLC | 699,500 | 6,270 |
| Arriva PLC | 394,733 | 6,224 |
| ICAP PLC | 544,600 | 5,855 |
| Royal Dutch Shell PLC | | |
| Class B | 141,322 | 5,799 |
| The Sage Group PLC | 1,127,900 | 5,741 |
| GlaxoSmithKline PLC | 213,200 | 5,655 |
| Reed Elsevier PLC | 440,100 | 5,564 |
| Intertek Testing | | |
| Services PLC | 252,100 | 4,863 |
* | Thomas Cook Group PLC | 835,166 | 4,759 |
| Greene King PLC | 242,200 | 4,371 |
| | | Market |
| | | Value• |
| | Shares | ($000) |
| Informa PLC | 413,400 | 4,241 |
* | Invensys PLC | 622,440 | 3,931 |
| Invesco PLC | 282,960 | 3,822 |
| Stagecoach Group PLC | 806,607 | 3,734 |
| Carnival PLC | 76,414 | 3,644 |
| Rexam PLC | 313,600 | 3,523 |
| Compass Group PLC | 548,835 | 3,384 |
* | TUI Travel PLC | 651,778 | 3,360 |
| Enterprise Inns PLC | 267,520 | 3,231 |
| WPP Group PLC | 235,300 | 3,175 |
| Enodis PLC | 872,900 | 3,119 |
| Provident Financial plc | 147,928 | 2,698 |
| Smiths Group PLC | 95,607 | 2,091 |
| Bunzl PLC | 128,533 | 1,826 |
| Hays PLC | 650,560 | 1,763 |
| Ladbrokes PLC | 186,223 | 1,643 |
| Amec PLC | 108,180 | 1,628 |
| International | | |
| Personal Finance | 381,356 | 1,537 |
| Rolls-Royce Group PLC | 109,850 | 1,173 |
| Homeserve PLC | 31,010 | 1,093 |
| Royal & Sun Alliance | | |
| Insurance Group PLC | 343,000 | 1,086 |
| Northgate PLC | 36,390 | 689 |
| Devro PLC | 365,700 | 660 |
| Daily Mail and | | |
| General Trust PLC | 43,060 | 554 |
| Mondi PLC. (ZAR) | 36,336 | 343 |
| HMV Group PLC | 116,800 | 278 |
* | Sportingbet PLC | 310,040 | 262 |
| Kier Group PLC | 3,500 | 131 |
| | | 663,338 |
United States (36.0%) | | |
| Consumer Discretionary (5.6%) | |
* | Cablevision Systems NY | | |
| Group Class A | 1,287,800 | 44,996 |
* | DIRECTV Group, Inc. | 1,835,600 | 44,568 |
| General Motors Corp. | 941,869 | 34,567 |
| Darden Restaurants Inc. | 542,659 | 22,716 |
| CBS Corp. | 661,900 | 20,850 |
| Clear Channel | | |
| Communications, Inc. | 499,900 | 18,716 |
* | Liberty Global, Inc. Class A | 444,660 | 18,240 |
| Macy’s Inc. | 541,100 | 17,488 |
| Sotheby’s | 345,889 | 16,530 |
* | Liberty Global, Inc. Series C | 411,560 | 15,911 |
*^Priceline.com, Inc. | 159,800 | 14,182 |
| Time Warner, Inc. | 723,900 | 13,291 |
*^Blue Nile Inc. | 137,500 | 12,942 |
| American Greetings Corp. | | |
| Class A | 431,800 | 11,400 |
| VF Corp. | 138,400 | 11,176 |
| Eastman Kodak Co. | 385,700 | 10,321 |
* | Amazon.com, Inc. | 108,600 | 10,116 |
* | Marvel Entertainment, Inc. | 379,548 | 8,897 |
20
| | | Market |
| | | Value• |
| | Shares | ($000) |
| Tempur-Pedic | | |
| International Inc. | 242,646 | 8,675 |
* | Discovery Holding Co. | | |
| Class A | 284,850 | 8,218 |
* | NVR, Inc. | 15,600 | 7,336 |
* | Jack in the Box Inc. | 112,528 | 7,296 |
| Hasbro, Inc. | 218,614 | 6,095 |
* | Liberty Media Corp.– | | |
| Capital Series A | 44,225 | 5,521 |
| PRIMEDIA Inc. | 345,466 | 4,850 |
* | Fleetwood Enterprises, Inc. | 530,300 | 4,534 |
* | Liberty Media Corp.– | | |
| Interactive Series A | 221,126 | 4,248 |
| Black & Decker Corp. | 46,000 | 3,832 |
* | Blockbuster Inc. Class B | 770,100 | 3,735 |
| Idearc Inc. | 90,500 | 2,848 |
* | Hanesbrands Inc. | 97,600 | 2,739 |
| CBS Corp. Class A | 86,000 | 2,710 |
* | 99 Cents Only Stores | 170,100 | 1,747 |
* | Comcast Corp. | | |
| Special Class A | 42,700 | 1,023 |
* | Sun-Times | | |
| Media Group, Inc. | 321,800 | 730 |
| The Pep Boys | | |
| (Manny, Moe & Jack) | 39,700 | 557 |
* | Live Nation, Inc. | 21,512 | 457 |
| | | |
| Consumer Staples (3.7%) | | |
| The Kroger Co. | 2,827,700 | 80,646 |
| Carolina Group | 671,043 | 55,180 |
| Altria Group, Inc. | 606,800 | 42,191 |
| Costco Wholesale Corp. | 581,500 | 35,687 |
| Kraft Foods Inc. | 602,957 | 20,808 |
| Safeway, Inc. | 447,500 | 14,817 |
* | NBTY, Inc. | 197,000 | 7,998 |
| Alberto-Culver Co. | 241,934 | 5,998 |
| Sara Lee Corp. | 345,100 | 5,760 |
| The Clorox Co. | 43,900 | 2,677 |
* | Winn-Dixie Stores, Inc. | 120,600 | 2,258 |
*^USANA Health Sciences, Inc. | 50,600 | 2,214 |
| ^Imperial Sugar Co. | 76,700 | 2,004 |
| Sanderson Farms, Inc. | 44,700 | 1,863 |
| Corn Products | | |
| International, Inc. | 19,500 | 894 |
| | | |
| Energy (4.6%) | | |
| Marathon Oil Corp. | 1,861,400 | 106,137 |
| ExxonMobil Corp. | 1,009,500 | 93,439 |
| Tesoro Corp. | 1,020,063 | 46,943 |
| Tidewater Inc. | 536,700 | 33,726 |
| Chevron Corp. | 358,900 | 33,586 |
| ConocoPhillips Co. | 202,500 | 17,773 |
| Baker Hughes, Inc. | 63,200 | 5,711 |
*^USEC Inc. | 349,400 | 3,581 |
* | SEACOR Holdings Inc. | 17,600 | 1,674 |
| | | Market |
| | | Value• |
| | Shares | ($000) |
* | Bolt Technology Corp. | 28,760 | 939 |
* | Gulfmark Offshore, Inc. | 18,600 | 905 |
| | | |
| Financials (7.0%) | | |
| MetLife, Inc. | 903,600 | 63,009 |
| The Chubb Corp. | 884,100 | 47,423 |
| The Hartford Financial | | |
| Services Group Inc. | 344,470 | 31,881 |
| JPMorgan Chase & Co. | 662,300 | 30,347 |
| The Travelers Cos., Inc. | 588,800 | 29,640 |
| Morgan Stanley | 468,100 | 29,490 |
| Merrill Lynch & Co., Inc. | 313,900 | 22,375 |
| XL Capital Ltd. Class A | 282,182 | 22,349 |
| Citigroup, Inc. | 478,200 | 22,318 |
* | Berkshire Hathaway Inc. | | |
| Class B | 5,063 | 20,009 |
| Fannie Mae | 311,000 | 18,912 |
| Freddie Mac | 316,300 | 18,665 |
| W.R. Berkley Corp. | 541,400 | 16,042 |
| Bank of America Corp. | 311,500 | 15,659 |
| Assurant, Inc. | 244,400 | 13,075 |
| ACE Ltd. | 195,450 | 11,838 |
| Axis Capital Holdings Ltd. | 279,077 | 10,859 |
* | Arch Capital Group Ltd. | 137,303 | 10,217 |
| MBIA, Inc. | 158,800 | 9,695 |
| Moody’s Corp. | 184,000 | 9,274 |
| The Goldman Sachs | | |
| Group, Inc. | 39,400 | 8,540 |
| Genworth Financial Inc. | 269,900 | 8,294 |
| American Express Co. | 132,497 | 7,866 |
| PartnerRe Ltd. | 93,413 | 7,379 |
| Lazard Ltd. Class A | 148,700 | 6,305 |
| Mercury General Corp. | 114,000 | 6,148 |
| RenaissanceRe Holdings Ltd. | 90,956 | 5,949 |
| American International | | |
| Group, Inc. | 84,900 | 5,743 |
*^First Federal Financial Corp. | 92,551 | 4,586 |
| MGIC Investment Corp. | 85,900 | 2,775 |
| Fidelity National | | |
| Financial, Inc. Class A | 134,600 | 2,353 |
2 | J.G. Wentworth Inc. | 147,900 | 1,775 |
| Ameriprise Financial, Inc. | 21,459 | 1,354 |
| Endurance Specialty | | |
| Holdings Ltd. | 30,273 | 1,258 |
| American Financial | | |
| Group, Inc. | 32,550 | 927 |
| | | |
| Health Care (2.7%) | | |
| AmerisourceBergen Corp. | 1,076,271 | 48,787 |
| UnitedHealth Group Inc. | 921,500 | 44,628 |
| Pfizer Inc. | 1,179,200 | 28,808 |
* | King Pharmaceuticals, Inc. | 2,036,070 | 23,863 |
| McKesson Corp. | 261,800 | 15,391 |
| Merck & Co., Inc. | 164,300 | 8,493 |
| Schering-Plough Corp. | 262,600 | 8,306 |
21
| | | Market |
| | | Value• |
| | Shares | ($000) |
| CIGNA Corp. | 142,000 | 7,567 |
* | WellPoint Inc. | 77,800 | 6,140 |
| Bristol-Myers Squibb Co. | 206,900 | 5,963 |
* | WellCare Health Plans Inc. | 46,300 | 4,881 |
| Alpharma, Inc. Class A | 76,400 | 1,632 |
* | PharMerica Corp. | 20,001 | 298 |
| | | |
| Industrials (4.7%) | | |
| Cummins Inc. | 529,400 | 67,705 |
* | Terex Corp. | 536,939 | 47,798 |
| Parker Hannifin Corp. | 269,500 | 30,138 |
| General Electric Co. | 685,300 | 28,371 |
| Northrop Grumman Corp. | 219,400 | 17,113 |
* | US Airways Group Inc. | 756,700 | 19,863 |
| Pitney Bowes, Inc. | 303,500 | 13,785 |
| Ingersoll-Rand Co. | 240,900 | 13,122 |
* | Superior Essex Inc. | 329,100 | 12,269 |
* | Kansas City Southern | 368,700 | 11,861 |
* | Continental Airlines, Inc. | | |
| Class B | 318,600 | 10,523 |
* | AMR Corp. | 463,200 | 10,325 |
| Excel Maritime Carriers, Ltd. | 178,733 | 9,973 |
| Viad Corp. | 252,500 | 9,090 |
| Watson Wyatt & Co. | | |
| Holdings | 197,500 | 8,876 |
| Eaton Corp. | 72,600 | 7,190 |
| SPX Corp. | 67,800 | 6,276 |
| Raytheon Co. | 92,400 | 5,897 |
* | Northwest Airlines Corp. | 301,300 | 5,363 |
| L-3 Communications | | |
| Holdings, Inc. | 46,100 | 4,709 |
| Robbins & Myers, Inc. | 78,600 | 4,503 |
| The Manitowoc Co., Inc. | 61,906 | 2,741 |
* | TBS International Ltd. | 62,283 | 2,569 |
| Horizon Lines Inc. | 54,400 | 1,661 |
| Deluxe Corp. | 35,956 | 1,325 |
* | Saia, Inc. | 35,700 | 590 |
* | Learning Tree | | |
| International, Inc. | 20,900 | 371 |
*^Northwest Airlines Corp. | | |
| Class A | 270,500 | — |
| | | |
| Information Technology (3.4%) | |
| International Business | | |
| Machines Corp. | 782,700 | 92,202 |
| Accenture Ltd. | 879,319 | 35,393 |
| Microsoft Corp. | 745,700 | 21,968 |
| Hewlett-Packard Co. | 361,600 | 18,004 |
* | Xerox Corp. | 832,900 | 14,442 |
* | Lexmark International, Inc. | 336,691 | 13,983 |
* | Sun Microsystems, Inc. | 2,398,100 | 13,453 |
* | Gartner, Inc. Class A | 536,500 | 13,123 |
* | LSI Corp. | 1,135,231 | 8,423 |
| | | Market |
| | | Value• |
| | Shares | ($000) |
* | Dell Inc. | 245,700 | 6,781 |
* | DST Systems, Inc. | 77,300 | 6,633 |
* | LAM Research Corp. | 117,100 | 6,237 |
| MasterCard, Inc. Class A | 42,000 | 6,215 |
* | Forrester Research, Inc. | 37,000 | 872 |
* | InterDigital, Inc. | 28,600 | 594 |
| | | |
| Materials (3.6%) | | |
| Freeport-McMoRan | | |
| Copper & Gold, Inc. | | |
| Class B | 1,230,300 | 129,046 |
| United States Steel Corp. | 356,400 | 37,757 |
| Nucor Corp. | 460,700 | 27,398 |
| Cleveland-Cliffs Inc. | 239,599 | 21,078 |
| Dow Chemical Co. | 359,400 | 15,476 |
| Scotts Miracle-Gro Co. | 250,900 | 10,726 |
| CF Industries Holdings, Inc. | 117,800 | 8,942 |
| Steel Dynamics, Inc. | 188,000 | 8,780 |
| Eastman Chemical Co. | 102,300 | 6,826 |
| Ryerson Tull, Inc. | 56,000 | 1,889 |
| | | |
| Telecommunication Services (0.6%) | |
| Sprint Nextel Corp. | 869,600 | 16,522 |
* | NII Holdings Inc. | 98,000 | 8,051 |
* | Qwest Communications | | |
| International Inc. | 690,085 | 6,321 |
* | Cincinnati Bell Inc. | 994,400 | 4,912 |
| Embarq Corp. | 83,187 | 4,625 |
* | Level 3 | | |
| Communications, Inc. | 868,200 | 4,037 |
| Golden Telecom, Inc. | 33,200 | 2,672 |
| | | |
| Utilities(0.1%) | | |
| FirstEnergy Corp. | 115,949 | 7,344 |
| OGE Energy Corp. | 47,200 | 1,562 |
| | | 2,714,847 |
Total Common Stocks | | |
(Cost $5,700,111) | | 7,125,872 |
22
| | | Market |
| | | Value• |
| | Shares | ($000) |
Temporary Cash Investments (5.8%)1 | |
Money Market Fund (5.5%) | | |
3 | Vanguard Market Liquidity | | |
| Fund, 5.153% 404,171,836 | 404,172 |
3 | Vanguard Market Liquidity | | |
| Fund, 5.153%—Note G | 15,961,800 | 15,962 |
| | | 420,134 |
| | Face | |
| | Amount | |
| | ($000) | |
U.S. Government & Agency Obligations (0.3%) |
4 | Federal Home Loan Bank | | |
5 | 5.204%, 10/17/07 | 5,000 | 4,989 |
4 | Federal Home Loan | | |
| Mortgage Corp. | | |
5 | 5.213%, 10/9/07 | 5,000 | 4,995 |
5 | 5.217%, 10/15/07 | 5,000 | 4,991 |
4 | Federal National | | |
| Mortgage Assn. | | |
5 | 4.711%, 2/27/08 | 5,000 | 4,903 |
| | | 19,878 |
Total Temporary Cash Investments | |
(Cost $440,011) | | 440,012 |
Total Investments (100.2%) | | |
(Cost $6,140,122) | | 7,565,884 |
Other Assets and Liabilities (–0.2%) | |
Other Assets—Note C | | 98,576 |
Liabilities—Note G | | (112,728) |
| | | (14,152) |
Net Assets (100%) | | |
Applicable to 284,853,940 outstanding | |
$.001 par value shares of beneficial | |
interest (unlimited authorization) | 7,551,732 |
Net Asset Value Per Share | | $26.51 |
| | | | | |
At September 30, 2007, net assets consisted of:6 |
| Amount | Per |
| ($000) | Share |
Paid-in Capital | 5,657,941 | 19.87 |
Undistributed Net | | |
Investment Income | 89,224 | .31 |
Accumulated Net | | |
Realized Gains | 367,961 | 1.29 |
Unrealized Appreciation | | |
Investment Securities | 1,425,762 | 5.01 |
Futures Contracts | 9,184 | .03 |
Foreign Currencies and | | |
Forward Currency Contracts | 1,660 | — |
Net Assets | 7,551,732 | $26.51 |
• See Note A in Notes to Financial Statements.
* Non-income-producing security.
^ Part of security position is on loan to broker-dealers. See Note G in Notes to Financial Statements.
1 The fund invests a portion of its cash reserves in equity markets through the use of index futures contracts. After giving effect to futures investments, the fund’s effective common stock and temporary cash investment positions represent 98.6% and 1.6%, respectively, of net assets. See Note E in Notes to Financial Statements.
2 Restricted security represents 0.0% of net assets.
3 Affiliated money market fund available only to Vanguard funds and certain trusts and accounts managed by Vanguard. Rate shown is the 7-day yield.
4 The issuer operates under a congressional charter; its securities are neither issued nor guaranteed by the U.S. government. If needed, access to additional funding from the U.S. Treasury (beyond the issuer’s line of credit) would require congressional action.
5 Securities with a value of $19,878,000 and cash of $1,537,000 have been segregated as initial margin for open futures contracts.
6 See Note E in Notes to Financial Statements for the tax-basis components of net assets.
ADR—American Depositary Receipt.
GDR—Global Depositary Receipt.
23
Statement of Operations | |
| |
| Year Ended |
| September 30, 2007 |
| ($000) |
Investment Income | |
Income | |
Dividends1 | 139,398 |
Interest2 | 11,720 |
Security Lending | 3,301 |
Total Income | 154,419 |
Expenses | |
Investment Advisory Fees—Note B | |
Basic Fee | 13,304 |
Performance Adjustment | 2,951 |
The Vanguard Group—Note C | |
Management and Administrative | 18,466 |
Marketing and Distribution | 1,432 |
Custodian Fees | 1,224 |
Auditing Fees | 37 |
Shareholders’ Reports | 114 |
Trustees’ Fees and Expenses | 8 |
Total Expenses | 37,536 |
Expenses Paid Indirectly—Note D | (84) |
Net Expenses | 37,452 |
Net Investment Income | 116,967 |
Realized Net Gain (Loss) | |
Investment Securities Sold | 406,091 |
Futures Contracts | (4,267) |
Foreign Currencies and Forward Currency Contracts | 2,620 |
Realized Net Gain (Loss) | 404,444 |
Change in Unrealized Appreciation (Depreciation) | |
Investment Securities | 784,800 |
Futures Contracts | 8,319 |
Foreign Currencies and Forward Currency Contracts | 1,950 |
Change in Unrealized Appreciation (Depreciation) | 795,069 |
Net Increase (Decrease) in Net Assets Resulting from Operations | 1,316,480 |
1 Dividends are net of foreign withholding taxes of $10,703,000.
2 Interest income from an affiliated company of the fund was $11,425,000.
24
Statement of Changes in Net Assets | | |
| | |
| Year Ended September 30, |
| 2007 | 2006 |
| ($000) | ($000) |
Increase (Decrease) in Net Assets | | |
Operations | | |
Net Investment Income | 116,967 | 58,112 |
Realized Net Gain (Loss) | 404,444 | 186,941 |
Change in Unrealized Appreciation (Depreciation) | 795,069 | 205,761 |
Net Increase (Decrease) in Net Assets Resulting from Operations | 1,316,480 | 450,814 |
Distributions | | |
Net Investment Income | (63,112) | (31,222) |
Realized Capital Gain1 | (179,158) | (56,590) |
Total Distributions | (242,270) | (87,812) |
Capital Share Transactions—Note H | | |
Issued | 2,937,614 | 1,908,165 |
Issued in Lieu of Cash Distributions | 224,234 | 80,656 |
Redeemed | (875,763) | (462,226) |
Net Increase (Decrease) from Capital Share Transactions | 2,286,085 | 1,526,595 |
Total Increase (Decrease) | 3,360,295 | 1,889,597 |
Net Assets | | |
Beginning of Period | 4,191,437 | 2,301,840 |
End of Period2 | 7,551,732 | 4,191,437 |
1 Includes fiscal 2007 and 2006 short-term gain distributions totaling $70,849,000 and $20,164,000, respectively. Short-term gain distributions are treated as ordinary income dividends for tax purposes.
2 Net Assets—End of Period includes undistributed net investment income of $89,224,000 and $45,245,000.
25
Financial Highlights | | | | | | |
| | | | | | |
| | | | | | |
| | | | | | |
| | | | | | |
| | Nov. 1, | Year Ended |
For a Share Outstanding | Year Ended September 30, | 2003, to | October 31, |
Throughout Each Period | 2007 | 2006 | 2005 | 20041 | 2003 | 2002 |
Net Asset Value, Beginning of Period | $21.96 | $19.72 | $16.08 | $14.46 | $10.48 | $11.31 |
Investment Operations | | | | | | |
Net Investment Income | .492 | .320 | .25 | .191 | .12 | .09 |
Net Realized and Unrealized Gain (Loss) | | | | | | |
on Investments | 5.25 | 2.595 | 3.87 | 1.624 | 3.96 | (.36) |
Total from Investment Operations | 5.74 | 2.915 | 4.12 | 1.815 | 4.08 | (.27) |
Distributions | | | | | | |
Dividends from Net Investment Income | (.31) | (.240) | (.21) | (.130) | (.08) | (.12) |
Distributions from Realized Capital Gains | (.88) | (.435) | (.27) | (.065) | (.02) | (.44) |
Total Distributions | (1.19) | (.675) | (.48) | (.195) | (.10) | (.56) |
Net Asset Value, | | | | | | |
End of Period | $26.51 | $21.96 | $19.72 | $16.08 | $14.46 | $10.48 |
| | | | | | |
| | | | | | |
Total Return3 | 27.00% | 15.22% | 25.99% | 12.64% | 39.25% | –2.78% |
| | | | | | |
| | | | | | |
Ratios/Supplemental Data | | | | | | |
Net Assets, End of Period (Millions) | $7,552 | $4,191 | $2,302 | $965 | $664 | $223 |
Ratio of Total Expenses to | | | | | | |
Average Net Assets4 | 0.64% | 0.72% | 0.80% | 0.90%* | 1.05% | 1.19% |
Ratio of Net Investment Income to | | | | | | |
Average Net Assets | 1.98% | 1.76% | 1.60% | 1.47%* | 1.14% | 0.86% |
Portfolio Turnover Rate | 64% | 88% | 83% | 19% | 13% | 14% |
| | | | | | | | | |
1 The fund’s fiscal year-end changed from October 31 to September 30, effective September 30, 2004.
2 Calculated based on average shares outstanding.
3 Total returns do not reflect the account service fee that may be applicable to certain accounts with balances below $10,000.
4 Includes performance-based investment advisory fee increases (decreases) of 0.05%, 0.05%, 0.06%, 0.08%, 0.11%, and 0.17%.
* Annualized.
See accompanying Notes, which are an integral part of the Financial Statements.
26
Notes to Financial Statements
Vanguard Global Equity Fund is registered under the Investment Company Act of 1940 as an open-end investment company, or mutual fund. The fund invests in securities of foreign issuers, which may subject it to investment risks not normally associated with investing in securities of United States corporations. The fund files reports with the SEC under the company name Vanguard Horizon Funds.
A. The following significant accounting policies conform to generally accepted accounting principles for U.S. mutual funds. The fund consistently follows such policies in preparing its financial statements.
1. Security Valuation: Securities are valued as of the close of trading on the New York Stock Exchange (generally 4 p.m., Eastern time) on the valuation date. Equity securities are valued at the latest quoted sales prices or official closing prices taken from the primary market in which each security trades; such securities not traded on the valuation date are valued at the mean of the latest quoted bid and asked prices. Securities for which market quotations are not readily available, or whose values have been affected by events occurring before the fund’s pricing time but after the close of the securities’ primary markets, are valued at their fair values calculated according to procedures adopted by the board of trustees. These procedures include obtaining quotations from an independent pricing service, monitoring news to identify significant market- or security-specific events, and evaluating changes in the values of foreign market proxies (for example, ADRs, futures contracts, or exchange-traded funds), between the time the foreign markets close and the fund’s pricing time. When fair-value pricing is employed, the prices of securities used by a fund to calculate its net asset value may differ from quoted or published prices for the same securities. Investments in Vanguard Market Liquidity Fund are valued at that fund’s net asset value. Temporary cash investments acquired over 60 days to maturity are valued using the latest bid prices or using valuations based on a matrix system (which considers such factors as security prices, yields, maturities, and ratings), both as furnished by independent pricing services. Other temporary cash investments are valued at amortized cost, which approximates market value.
2. Foreign Currency: Securities and other assets and liabilities denominated in foreign currencies are translated into U.S. dollars using exchange rates obtained from an independent third party as of the fund’s pricing time on the valuation date. Realized gains (losses) and unrealized appreciation (depreciation) on investment securities include the effects of changes in exchange rates since the securities were purchased, combined with the effects of changes in security prices. Fluctuations in the value of other assets and liabilities resulting from changes in exchange rates are recorded as unrealized foreign currency gains (losses) until the assets or liabilities are settled in cash, at which time they are recorded as realized foreign currency gains (losses).
3. Futures and Forward Currency Contracts: The fund uses index futures contracts to a limited extent, with the objective of maintaining full exposure to U.S., European, and Pacific stock markets while maintaining liquidity. The fund may purchase or sell futures contracts to achieve a desired level of investment, whether to accommodate portfolio turnover or cash flows from capital share transactions. The primary risks associated with the use of futures contracts are imperfect correlation between changes in market values of stocks held by the fund and the prices of futures contracts, and the possibility of an illiquid market.
The fund also may enter into forward currency contracts to provide the appropriate currency exposure related to any open futures contracts, or to protect the value of securities and related receivables and payables against changes in foreign exchange rates. The primary risk associated with the fund’s use of these contracts is that a counterparty will fail to fulfill its obligation to pay gains due to the fund under the contracts.
27
Futures and forward currency contracts are valued at their quoted daily settlement prices. The aggregate principal amounts of the contracts are not recorded in the Statement of Net Assets. Fluctuations in the value of the contracts are recorded in the Statement of Net Assets as an asset (liability) and in the Statement of Operations as unrealized appreciation (depreciation) until the contracts are closed, when they are recorded as realized gains (losses) on futures or forward currency contracts.
4. Federal Income Taxes: The fund intends to continue to qualify as a regulated investment company and distribute all of its taxable income. Accordingly, no provision for federal income taxes is required in the financial statements.
5. Distributions: Distributions to shareholders are recorded on the ex-dividend date.
6. Security Lending: The fund may lend its securities to qualified institutional borrowers to earn additional income. Security loans are required to be secured at all times by collateral at least equal to the market value of securities loaned. The fund invests cash collateral received in Vanguard Market Liquidity Fund, and records a liability for the return of the collateral, during the period the securities are on loan. Security lending income represents the income earned on investing cash collateral, less expenses associated with the loan.
7. Other: Dividend income is recorded on the ex-dividend date. Interest income includes income distributions received from Vanguard Market Liquidity Fund and is accrued daily. Security transactions are accounted for on the date securities are bought or sold. Costs used to determine realized gains (losses) on the sale of investment securities are those of the specific securities sold.
B. Acadian Asset Management, Inc., AllianceBernstein L.P., and Marathon Asset Management LLP each provide investment advisory services to a portion of the fund for a fee calculated at an annual percentage rate of average net assets managed by the advisor. The basic fee of Acadian Asset Management, Inc. is subject to quarterly adjustments based on performance since December 31, 2004, relative to the Morgan Stanley Capital International All Country World Index. The basic fee of AllianceBernstein L.P. is subject to quarterly adjustments based on performance since June 30, 2006, relative to the Morgan Stanley Capital International All Country World Index. The basic fee of Marathon Asset Management LLP is subject to quarterly adjustments based on performance for the preceding three years relative to the Morgan Stanley Capital International All Country World Index.
The Vanguard Group manages the cash reserves of the fund at an at-cost basis.
For the year ended September 30, 2007, the aggregate investment advisory fee represented an effective annual basic rate of 0.23% of the fund’s average net assets before an increase of $2,951,000 (0.05%) based on performance.
C. The Vanguard Group furnishes at cost corporate management, administrative, marketing, and distribution services. The costs of such services are allocated to the fund under methods approved by the board of trustees. The fund has committed to provide up to 0.40% of its net assets in capital contributions to Vanguard. At September 30, 2007, the fund had contributed capital of $614,000 to Vanguard (included in Other Assets), representing 0.01% of the fund’s net assets and 0.61% of Vanguard’s capitalization. The fund’s trustees and officers are also directors and officers of Vanguard.
28
D. The fund’s custodian bank has agreed to reduce its fees when the fund maintains cash on deposit in the non-interest-bearing custody account. For the year ended September 30, 2007, custodian fee offset arrangements reduced the fund’s expenses by $84,000.
E. Distributions are determined on a tax basis and may differ from net investment income and realized capital gains for financial reporting purposes. Differences may be permanent or temporary. Permanent differences are reclassified among capital accounts in the financial statements to reflect their tax character. Temporary differences arise when certain items of income, expense, gain, or loss are recognized in different periods for financial statement and tax purposes; these differences will reverse at some time in the future. Differences in classification may also result from the treatment of short-term gains as ordinary income for tax purposes.
During the year ended September 30, 2007, the fund realized net foreign currency losses of $1,286,000, which decreased distributable net income for tax purposes; accordingly, such losses have been reclassified from accumulated net realized gains to undistributed net investment income. Certain of the fund’s investments are in securities considered to be “passive foreign investment companies,” for which any unrealized appreciation and/or realized gains are required to be included in distributable net income for tax purposes. Unrealized appreciation on passive foreign investment company holdings at September 30, 2007, was $11,943,000.
The fund used a tax accounting practice to treat a portion of the price of capital shares redeemed during the year as distributions from net investment income and realized capital gains. Accordingly, the fund has reclassified $8,590,000 from undistributed net investment income, and $28,752,000 from accumulated net realized gains, to paid-in capital.
For tax purposes, at September 30, 2007, the fund had $278,814,000 of ordinary income and $202,978,000 of long-term capital gains available for distribution.
At September 30, 2007, the cost of investment securities for tax purposes was $6,154,184,000. Net unrealized appreciation of investment securities for tax purposes was $1,411,700,000, consisting of unrealized gains of $1,567,588,000 on securities that had risen in value since their purchase and $155,888,000 in unrealized losses on securities that had fallen in value since their purchase.
At September 30, 2007, the aggregate settlement value of open futures contracts expiring in December 2007 and the related unrealized appreciation (depreciation) were:
| | | ($000) |
| | Aggregate | Unrealized |
| Number of | Settlement | Appreciation |
Futures Contracts | Long Contracts | Value | (Depreciation) |
S&P 500 Index | 363 | 139,583 | 4,624 |
FTSE 100 Index | 494 | 65,616 | 1,111 |
Dow Jones EURO STOXX 50 Index | 806 | 50,561 | 198 |
Topix Index | 265 | 37,418 | 2,467 |
S&P ASX 200 Index | 170 | 24,845 | 784 |
Unrealized appreciation (depreciation) on open S&P 500 Index futures contracts is required to be treated as realized gain (loss) for tax purposes.
29
At September 30, 2007, the fund had open forward currency contracts to receive and deliver currencies as follows:
| | | | | Unrealized |
| | | | | Appreciation |
| | Contract Amount (000) | (Depreciation) |
Contract Settlement Date | | Receive | | Deliver | ($000) |
12/28/2007 | EUR | 35,446 | USD | 50,034 | 456 |
12/28/2007 | GBP | 19,311 | USD | 38,792 | 472 |
12/19/2007 | JPY | 4,009,313 | USD | 35,589 | (386) |
12/28/2007 | AUD | 27,100 | USD | 23,122 | 768 |
| | | | | |
AUD—Australian dollar. | | | | | |
EUR—Euro. | | | | | |
GBP—British pound. | | | | | |
JPY—Japanese yen. | | | | | |
USD—U.S. dollar. | | | | | |
Unrealized appreciation (depreciation) on open forward currency contracts is treated as realized gain (loss) for tax purposes.
The fund had net unrealized foreign currency gains of $350,000 resulting from the translation of other assets and liabilities at September 30, 2007.
F. During the year ended September 30, 2007, the fund purchased $5,560,619,000 of investment securities and sold $3,637,952,000 of investment securities, other than temporary cash investments.
G. The market value of securities on loan to broker-dealers at September 30, 2007, was $15,079,000, for which the fund received cash collateral of $15,962,000.
H. Capital shares issued and redeemed were:
| Year Ended September 30, |
| 2007 | 2006 |
| Shares | Shares |
| (000) | (000) |
Issued | 120,219 | 92,291 |
Issued in Lieu of Cash Distributions | 9,809 | 4,143 |
Redeemed | (36,004) | (22,344) |
Net Increase (Decrease) in Shares Outstanding | 94,024 | 74,090 |
I.In June 2006, the Financial Accounting Standards Board issued Interpretation No. 48 (“FIN 48”), “Accounting for Uncertainty in Income Taxes.” FIN 48 establishes the minimum threshold for recognizing, and a system for measuring, the benefits of tax-return positions in financial statements, and is effective for the fund’s fiscal year beginning October 1, 2007. Management has analyzed the fund’s tax positions taken on federal income tax returns for all open tax years (tax years ended September 30, 2004–2007) for purposes of implementing FIN 48, and has concluded that as of September 30, 2007, no provision for income tax would be required in the fund’s financial statements.
30
Report of Independent Registered Public Accounting Firm
To the Trustees of Vanguard Horizon Funds and the Shareholders of Vanguard Global Equity Fund:
In our opinion, the accompanying statement of net assets and the related statements of operations and of changes in net assets and the financial highlights present fairly, in all material respects, the financial position of Vanguard Global Equity Fund (the “Fund”) at September 30, 2007, the results of its operations for the year then ended, the changes in its net assets for each of the two years in the period then ended, and the financial highlights for each of the periods indicated, in conformity with accounting principles generally accepted in the United States of America. These financial statements and financial highlights (hereafter referred to as “financial statements”) are the responsibility of the Fund’s management; our responsibility is to express an opinion on these financial statements based on our audits. We conducted our audits of these financial statements in accordance with the standards of the Public Company Accounting Oversight Board (United States), which require that we plan and perform the audit to obtain reasonable assurance about whether the financial statements are free of material misstatement. An audit includes examining, on a test basis, evidence supporting the amounts and disclosures in the financial statements, assessing the accounting principles used and significant estimates made by management, and evaluating the overall financial statement presentation. We believe that our audits, which included confirmation of securities at September 30, 2007 by correspondence with the custodian and brokers, and by agreement to the underlying ownership records for Vanguard Market Liquidity Fund, provide a reasonable basis for our opinion.
PricewaterhouseCoopers LLP
Philadelphia, Pennsylvania
November 7, 2007
Special 2007 tax information (unaudited) for Vanguard Global Equity Fund |
|
|
This information for the fiscal year ended September 30, 2007, is included pursuant to provisions of |
the Internal Revenue Code. |
|
The fund distributed $123,753,000 as capital gain dividends (from net long-term capital gains) to |
shareholders during the fiscal year. |
|
The fund distributed $56,372,000 of qualified dividend income to shareholders during the fiscal year. |
|
For corporate shareholders, 10.2% of investment income (dividend income plus short-term gains, |
if any) qualifies for the dividends-received deduction. |
|
The fund will pass through to shareholders foreign source income of $112,664,000 and foreign taxes |
paid of $6,551,000. The pass-through of foreign taxes paid will affect only shareholders on the dividend |
record date in December 2007. Shareholders will receive more detailed information along with their |
Form 1099-DIV in January 2008. |
31
Your Fund’s After-Tax Returns
This table presents returns for your fund both before and after taxes. The after-tax returns are shown in two ways: (1) assuming that an investor owned the fund during the entire period and paid taxes on the fund’s distributions, and (2) assuming that an investor paid taxes on the fund’s distributions and sold all shares at the end of each period.
Calculations are based on the highest individual federal income tax and capital gains tax rates in effect at the times of the distributions and the hypothetical sales. State and local taxes were not considered. After-tax returns reflect any qualified dividend income, using actual prior-year figures and estimates for 2007. (In the example, returns after the sale of fund shares may be higher than those assuming no sale. This occurs when the sale would have produced a capital loss. The calculation assumes that the investor received a tax deduction for the loss.)
Please note that your actual after-tax returns will depend on your tax situation and may differ from those shown. Also note that if you own the fund in a tax-deferred account, such as an individual retirement account or a 401(k) plan, this information does not apply to you. Such accounts are not subject to current taxes.
Finally, keep in mind that a fund’s performance—whether before or after taxes—does not guarantee future results.
Average Annual Total Returns: Global Equity Fund1 | | | |
Periods Ended September 30, 2007 | | | |
| One | Five | Ten |
| Year | Years | Years |
Returns Before Taxes | 27.00% | 24.83% | 12.50% |
Returns After Taxes on Distributions | 25.71 | 24.15 | 11.14 |
Returns After Taxes on Distributions and Sale of Fund Shares | 18.22 | 21.86 | 10.31 |
1 Total returns do not include the account service fee that may be applicable to certain accounts with balances below $10,000.
32
About Your Fund’s Expenses
As a shareholder of the fund, you incur ongoing costs, which include costs for portfolio management, administrative services, and shareholder reports (like this one), among others. Operating expenses, which are deducted from a fund’s gross income, directly reduce the investment return of the fund.
A fund’s expenses are expressed as a percentage of its average net assets. This figure is known as the expense ratio. The following examples are intended to help you understand the ongoing costs (in dollars) of investing in your fund and to compare these costs with those of other mutual funds. The examples are based on an investment of $1,000 made at the beginning of the period shown and held for the entire period.
The table below illustrates your fund’s costs in two ways:
• Based on actual fund return. This section helps you to estimate the actual expenses that you paid over the period. The “Ending Account Value” shown is derived from the fund’s actual return, and the third column shows the dollar amount that would have been paid by an investor who started with $1,000 in the fund. You may use the information here, together with the amount you invested, to estimate the expenses that you paid over the period.
To do so, simply divide your account value by $1,000 (for example, an $8,600 account value divided by $1,000 = 8.6), then multiply the result by the number given for your fund under the heading “Expenses Paid During Period.”
• Based on hypothetical 5% yearly return. This section is intended to help you compare your fund’s costs with those of other mutual funds. It assumes that the fund had a yearly return of 5% before expenses, but that the expense ratio is unchanged. In this case—because the return used is not the fund’s actual return—the results do not apply to your investment. The example is useful in making comparisons because the Securities and Exchange Commission requires all mutual funds to calculate expenses based on a 5% return. You can assess your fund’s costs by comparing this hypothetical example with the hypothetical examples that appear in shareholder reports of other funds.
Six Months Ended September 30, 2007 | | | |
| Beginning | Ending | Expenses |
| Account Value | Account Value | Paid During |
Global Equity Fund | 3/31/2007 | 9/30/2007 | Period1 |
Based on Actual Fund Return | $1,000.00 | $1,113.87 | $3.29 |
Based on Hypothetical 5% Yearly Return | 1,000.00 | 1,021.96 | 3.14 |
1 The calculations are based on expenses incurred in the most recent six-month period. The fund’s annualized six-month expense ratio for that period is 0.62%. The dollar amounts shown as “Expenses Paid” are equal to the annualized expense ratio multiplied by the average account value over the period, multiplied by the number of days in the most recent six-month period, then divided by the number of days in the most recent 12-month period.
33
Note that the expenses shown in the table on page 33 are meant to highlight and help you compare ongoing costs only and do not reflect transaction costs incurred by the fund for buying and selling securities. Further, the expenses do not include the account service fee described in the prospectus. If such a fee were applied to your account, your costs would be higher. Your fund does not charge transaction fees, such as purchase or redemption fees, nor does it carry a “sales load.”
The calculations assume no shares were bought or sold during the period. Your actual costs may have been higher or lower, depending on the amount of your investment and the timing of any purchases or redemptions.
You can find more information about the fund’s expenses, including annual expense ratios, in the Financial Statements section of this report. For additional information on operating expenses and other shareholder costs, please refer to your fund’s current prospectus.
34
Trustees Approve Advisory Agreements
The board of trustees of Vanguard Global Equity Fund has renewed the fund’s investment advisory agreements with Marathon Asset Management LLP and Acadian Asset Management, Inc. The board determined that the retention of the advisors was in the best interests of the fund and its shareholders.
(The board had previously acted to renew the fund’s agreement with its other investment advisor, AllianceBernstein L.P. A report on that approval was included in the fund’s semiannual report to shareholders dated March 31, 2007.)
The board decided to renew the agreements with Marathon and Acadian based upon an evaluation of each firm’s investment staff, portfolio management process, and performance. The trustees considered the factors discussed below, among others. However, no single factor determined whether the board approved the agreements. Rather, it was the totality of the circumstances that drove the board’s decision.
Nature, extent, and quality of services
The board considered the quality of the fund’s investment management over both short- and long-term periods and took into account the organizational depth and stability of each firm. The board noted the following:
Marathon Asset Management. Founded in 1986, Marathon Asset Management of London, England, has advised the Global Equity Fund since the fund’s inception in 1995. Marathon continues to use a bottom-up approach that focuses on stock selection. Its three regional teams focus on each company’s corporate strategy and industry competition, while its sector analysis is conducted using long-term capital cycle data. Each of these teams is led by one of the firm’s three founders: Jeremy J. Hosking, William J. Arah, and Neil M. Ostrer.
Acadian Asset Management. Founded in 1986, Acadian Asset Management is a Boston-based investment management firm specializing in quantitative equity strategies for developed and emerging markets. The firm has advised the Global Equity Fund since 2004. Acadian’s investment process builds portfolios from the bottom up using proprietary valuation models. The investment team includes the three portfolio managers—John R. Chisholm, Ronald D. Frashure, and Brian K. Wolahan—who are all involved in the firm’s ongoing research.
The board concluded that each advisor’s experience, stability, depth, and performance, among other factors, warranted continuation of the advisory agreements.
Investment performance
The board considered the short- and long-term performance of the fund, including any periods of outperformance or underperformance of a relevant benchmark and peer group. The board concluded that each advisor has carried out its investment strategy in disciplined fashion, and the results have been in line with expectations. Information about the fund’s most recent performance can be found in the Performance Summary section of this report.
35
Cost
The board concluded that the fund’s expense ratio was far below the average expense ratio charged by funds in its peer group. The board noted that the fund’s advisory fees were also well below the peer-group average. Information about the fund’s expense ratio appears in the About Your Fund’s Expenses section of this report as well as in the Financial Statements section, which also includes information about the advisory fee rates. The board did not consider profitability of the advisors in determining whether to approve the advisory fees, because both Marathon and Acadian are independent of Vanguard, and the advisory fees are the result of arm’s-length negotiations.
The benefit of economies of scale
The board concluded that the fund’s shareholders benefit from economies of scale because of breakpoints in the fund’s advisory fee schedules. The breakpoints reduce the effective rate of the fees as the fund’s assets managed by Marathon and Acadian increase.
The board will consider whether to renew the advisory agreements again after a one-year period.
36
Glossary
Beta. A measure of the magnitude of a fund’s past share-price fluctuations in relation to the ups and downs of a given market index. The index is assigned a beta of 1.00. Compared with a given index, a fund with a beta of 1.20 typically would have seen its share price rise or fall by 12% when the index rose or fell by 10%. A fund’s beta should be reviewed in conjunction with its R-squared (see definition below). The lower the R-squared, the less correlation there is between the fund and the index, and the less reliable beta is as an indicator of volatility.
Equity Exposure. A measure that reflects a fund’s investments in stocks and stock futures. Any holdings in short-term reserves are excluded.
Expense Ratio. The percentage of a fund’s average net assets used to pay its annual administrative and advisory expenses. These expenses directly reduce returns to investors.
Inception Date. The date on which the assets of a fund (or one of its share classes) are first invested in accordance with the fund’s investment objective. For funds with a subscription period, the inception date is the day after that period ends. Investment performance is measured from the inception date.
R-Squared. A measure of how much of a fund’s past returns can be explained by the returns from the market in general, as measured by a given index. If a fund’s total returns were precisely synchronized with an index’s returns, its R-squared would be 1.00. If the fund’s returns bore no relationship to the index’s returns, its R-squared would be 0.
Short-Term Reserves. The percentage of a fund invested in highly liquid, short-term securities that can be readily converted to cash.
Turnover Rate. An indication of the fund’s trading activity. Funds with high turnover rates incur higher transaction costs and may be more likely to distribute capital gains (which may be taxable to investors). The turnover rate excludes in-kind transactions, which have minimal impact on costs.
37
This page intentionally left blank.
This page intentionally left blank.
The People Who Govern Your Fund
The trustees of your mutual fund are there to see that the fund is operated and managed in your best interests since, as a shareholder, you are a part owner of the fund. Your fund’s trustees also serve on the board of directors of The Vanguard Group, Inc., which is owned by the Vanguard funds and provides services to them on an at-cost basis.
A majority of Vanguard’s board members are independent, meaning that they have no affiliation with Vanguard or the funds they oversee, apart from the sizable personal investments they have made as private individuals.
Our independent board members bring distinguished backgrounds in business, academia, and public service to their task of working with Vanguard officers to establish the policies and oversee the activities of the funds. Among board members’ responsibilities are selecting investment advisors for the funds; monitoring fund operations, performance, and costs; reviewing contracts; nominating and selecting new trustees/directors; and electing Vanguard officers.
Each trustee serves a fund until its termination; or until the trustee’s retirement, resignation, or death; or otherwise as specified in the fund’s organizational documents. Any trustee may be removed at a shareholders’ meeting by a vote representing two-thirds of the net asset value of all shares of the fund together with shares of other Vanguard funds organized within the same trust. The table on these two pages shows information for each trustee and executive officer of the fund. The mailing address of the trustees and officers is P.O. Box 876, Valley Forge, PA 19482.
Chairman of the Board, Chief Executive Officer, and Trustee |
| |
John J. Brennan1 | |
Born 1954 | Principal Occupation(s) During the Past Five Years: Chairman of the Board, |
Trustee since May 1987; | Chief Executive Officer, and Director/Trustee of The Vanguard Group, Inc., and |
Chairman of the Board and | of each of the investment companies served by The Vanguard Group. |
Chief Executive Officer | |
148 Vanguard Funds Overseen | |
| |
Independent Trustees | |
| |
Charles D. Ellis | |
Born 1937 | Principal Occupation(s) During the Past Five Years: Applecore Partners (pro |
Trustee since January 2001 | bono ventures in education); Senior Advisor to Greenwich Associates |
148 Vanguard Funds Overseen | (international business strategy consulting); Successor Trustee of Yale |
| University; Overseer of the Stern School of Business at New York University; |
| Trustee of the Whitehead Institute for Biomedical Research. |
| |
Rajiv L. Gupta | |
Born 1945 | Principal Occupation(s) During the Past Five Years: Chairman, President, and |
Trustee since December 20012 | Chief Executive Officer of Rohm and Haas Co. (chemicals); Board Member of |
148 Vanguard Funds Overseen | the American Chemistry Council; Director of Tyco International, Ltd. (diversified |
| manufacturing and services) since 2005; Trustee of Drexel University and of the |
| Chemical Heritage Foundation. |
| |
Amy Gutmann | |
Born 1949 | Principal Occupation(s) During the Past Five Years: President of the University |
Trustee since June 2006 | of Pennsylvania since 2004; Professor in the School of Arts and Sciences, |
148 Vanguard Funds Overseen | Annenberg School for Communication, and Graduate School of Education of the |
| University of Pennsylvania since 2004; Provost (2001–2004) and Laurance S. |
| Rockefeller Professor of Politics and the University Center for Human Values |
| (1990–2004), Princeton University; Director of Carnegie Corporation of New |
| York since 2005 and of Schuylkill River Development Corporation and Greater |
| Philadelphia Chamber of Commerce since 2004. |
JoAnn Heffernan Heisen | |
Born 1950 | Principal Occupation(s) During the Past Five Years: Corporate Vice President |
Trustee since July 1998 | and Chief Global Diversity Officer since 2006, Vice President and Chief |
148 Vanguard Funds Overseen | Information Officer (1997–2005), and Member of the Executive Committee of |
| Johnson &Johnson (pharmaceuticals/consumer products); Director of the |
| University Medical Center at Princeton and Women’s Research and Education |
| Institute. |
| |
André F. Perold | |
Born 1952 | Principal Occupation(s) During the Past Five Years: George Gund Professor of |
Trustee since December 2004 | Finance and Banking, Harvard Business School; Senior Associate Dean, Director |
148 Vanguard Funds Overseen | of Faculty Recruiting, and Chair of Finance Faculty, Harvard Business School; |
| Director and Chairman of UNX, Inc. (equities trading firm) since 2003; Chair of |
| the Investment Committee of HighVista Strategies LLC (private investment firm) |
| since 2005. |
| |
Alfred M. Rankin, Jr. | |
Born 1941 | Principal Occupation(s) During the Past Five Years: Chairman, President, Chief |
Trustee since January 1993 | Executive Officer, and Director of NACCO Industries, Inc. (forklift |
148 Vanguard Funds Overseen | trucks/housewares/lignite); Director of Goodrich Corporation (industrial |
| products/aircraft systems and services). |
| |
J. Lawrence Wilson | |
Born 1936 | Principal Occupation(s) During the Past Five Years: Retired Chairman and Chief |
Trustee since April 1985 | Executive Officer of Rohm and Haas Co. (chemicals); Director of Cummins Inc. |
148 Vanguard Funds Overseen | (diesel engines) and AmerisourceBergen Corp. (pharmaceutical distribution); |
| Trustee of Vanderbilt University and of Culver Educational Foundation. |
| |
Executive Officers1 | |
| |
Thomas J. Higgins | |
Born 1957 | Principal Occupation(s) During the Past Five Years: Principal of The Vanguard |
Treasurer since July 1998 | Group, Inc.;Treasurer of each of the investment companies served by The |
148 Vanguard Funds Overseen | Vanguard Group. |
| |
| |
Heidi Stam | |
Born 1956 | Principal Occupation(s) During the Past Five Years: Managing Director of The |
Secretary since July 2005 | Vanguard Group, Inc., since 2006; General Counsel of The Vanguard Group |
148 Vanguard Funds Overseen | since 2005; Secretary of The Vanguard Group, and of each of the investment |
| companies served by The Vanguard Group, since 2005; Principal of The |
| Vanguard Group (1997–2006). |
Vanguard Senior Management Team | | |
| | | |
R. Gregory Barton | Kathleen C. Gubanich | F. William McNabb, III | Ralph K. Packard |
Mortimer J. Buckley | Paul A. Heller | Michael S. Miller | George U. Sauter |
Founder |
|
John C. Bogle |
Chairman and Chief Executive Officer, 1974–1996 |
1 Officers of the funds are “interested persons” as defined in the Investment Company Act of 1940.
2 December 2002 for Vanguard Equity Income Fund, Vanguard Growth Equity Fund, the Vanguard Municipal Bond Funds, and the Vanguard State Tax-Exempt Funds.
More information about the trustees is in the Statement of Additional Information, available from The Vanguard Group.

P.O. Box 2600
Valley Forge, PA 19482-2600
Connect with Vanguard® | > | www.vanguard.com |
Fund Information > 800-662-7447 | Vanguard, Connect with Vanguard, and the ship logo |
| are trademarks of The Vanguard Group, Inc. |
Direct Investor Account Services > 800-662-2739 | |
| All other marks are the exclusive property of their |
Institutional Investor Services > 800-523-1036 | respective owners. |
| |
Text Telephone for People | |
With Hearing Impairment > 800-952-3335 | All comparative mutual fund data are from Lipper Inc. |
| or Morningstar, Inc., unless otherwise noted. |
| |
| |
This material may be used in conjunction | You can obtain a free copy of Vanguard’s proxy voting |
with the offering of shares of any Vanguard | guidelines by visiting our website, www.vanguard.com, |
fund only if preceded or accompanied by | and searching for “proxy voting guidelines,” or by calling |
the fund’s current prospectus. | Vanguard at 800-662-2739. The guidelines are also |
| available from the SEC’s website, www.sec.gov. In |
| addition, you may obtain a free report on how your |
| fund voted the proxies for securities it owned during |
| the 12 months ended June 30. To get the report, visit |
| either www.vanguard.com or www.sec.gov. |
| |
| You can review and copy information about your fund |
| at the SEC’s Public Reference Room in Washington, |
| D.C.To find out more about this public service, call the |
| SEC at 202-551-8090. Information about your fund is |
| also available on the SEC’s website, and you can receive |
| copies of this information, for a fee, by sending a |
| request in either of two ways: via e-mail addressed to |
| publicinfo@sec.gov or via regular mail addressed to the |
| Public Reference Section, Securities and Exchange |
| Commission, Washington, DC 20549-0102. |
| |
| |
| |
| |
| |
| © 2007 The Vanguard Group, Inc. |
| All rights reserved. |
| Vanguard Marketing Corporation, Distributor. |
| |
| Q1290 112007 |
> In its first full year of operations, Vanguard Strategic Small-Cap Equity Fund returned a solid 12.6% for the 2007 fiscal year.
> Every sector except for financials made a positive contribution to the fund’s absolute return.
> The fund’s return significantly trailed that of its benchmark index, most notably because of a change in market dynamics that favored more highly valued stocks.
Contents | |
| |
Your Fund’s Total Returns | 1 |
Chairman’s Letter | 2 |
Advisor’s Report | 7 |
Fund Profile | 9 |
Performance Summary | 10 |
Financial Statements | 11 |
Your Fund’s After-Tax Returns | 25 |
About Your Fund’s Expenses | 26 |
Glossary | 28 |
Please note: The opinions expressed in this report are just that—informed opinions. They should not be considered promises or advice. Also, please keep in mind that the information and opinions cover the period through the date on the cover of this report. Of course, the risks of investing in your fund are spelled out in the prospectus.
Your Fund’s Total Returns
Fiscal Year Ended September 30, 2007 | | |
| Ticker | Total |
| Symbol | Returns |
Vanguard Strategic Small-Cap Equity Fund | VSTCX | 12.6% |
MSCI US Small Cap 1750 Index | | 15.7 |
Average Small-Cap Core Fund1 | | 13.4 |
Your Fund’s Performance at a Glance |
September 30, 2006–September 30, 2007 |
| | | Distributions Per Share |
| Starting | Ending | Income | Capital |
| Share Price | Share Price | Dividends | Gains |
Vanguard Strategic Small-Cap Equity Fund | $19.04 | $21.28 | $0.150 | $0.000 |
| 1 | Derived from data provided by Lipper Inc. |
1

Chairman’s Letter
Dear Shareholder,
Vanguard Strategic Small-Cap Equity Fund returned 12.6% for the fiscal year ended September 30, 2007—its first full fiscal year of operations. Though a solid result in its own right, the fund’s return trailed the return of its benchmark and the average return of its competitive peers.
Broadly underlying the shortfall was a growing shift in investor preference during the year toward growth stocks and away from the more reasonably valued stocks favored by the fund’s advisor, Vanguard Quantitative Equity Group. This shift accelerated during the quarter ended September 30 on shorter-term, worldwide concerns about the impact of the subprime mortgage market crises. This period of turbulence coincided with a sharp uptick in the prices of large-capitalization, growth-oriented stocks. The fund faced some headwinds despite the balanced nature of its investment approach, which simultaneously gives it exposure to attractively valued stocks and stocks with above-average earnings growth. The valuation component hurt more than the growth exposure helped.
Note that if you hold the Strategic Small-Cap Equity Fund in a taxable account, you may wish to review our report on the fund’s after-tax returns on page 25.
2
Strong returns for U.S. stocks; even better for markets abroad
U.S. stocks produced excellent returns for the fiscal year. The gains came despite a midsummer shakeup brought on by problems in the subprime mortgage-loan market. Financials stocks—which represent a sizable share of the U.S. market’s value—were hardest hit, as investment banking and consumer lending businesses throttled back.
The broad U.S. equity market returned 17.1% for the year. Returns from large-capitalization stocks outpaced those of small-caps, and growth-oriented stocks outperformed their value-oriented counterparts. As investors took account of risk, they seemed to exhibit a preference for large-cap growth stocks, which seem better positioned to thrive in a period of economic uncertainty.
Although not immune from the effects of the turmoil in U.S. credit markets, international stocks handily surpassed the returns of domestic stocks over the 12 months. The dollar’s ongoing weakness further enhanced foreign market gains for U.S.-based investors.
The bond market was shaken, but regained ground in the end
Turmoil in the corporate bond and subprime lending markets caused a “flight to quality” that drove prices of U.S. Treasury bonds sharply higher, particularly toward the end of the fiscal period. As the bonds’
Market Barometer | | | |
| Average Annual Total Returns |
| Periods Ended September 30, 2007 |
| One Year | Three Years | Five Years |
Stocks | | | |
Russell 1000 Index (Large-caps) | 16.9% | 13.8% | 16.0% |
Russell 2000 Index (Small-caps) | 12.3 | 13.4 | 18.8 |
Dow Jones Wilshire 5000 Index (Entire market) | 17.1 | 14.0 | 16.5 |
MSCI All Country World Index ex USA (International) | 31.1 | 26.5 | 26.3 |
| | | |
| | | |
Bonds | | | |
Lehman U.S. Aggregate Bond Index (Broad taxable market) | 5.1% | 3.9% | 4.1% |
Lehman Municipal Bond Index | 3.1 | 3.9 | 4.0 |
Citigroup 3-Month Treasury Bill Index | 5.0 | 4.0 | 2.8 |
| | | |
| | | |
CPI | | | |
Consumer Price Index | 2.8% | 3.2% | 2.9% |
3
prices rose, their yields fell. The declines were greatest among Treasury securities with the shortest maturities. The yield of the 3-month Treasury bill, which started the fiscal year at 4.89%, dropped more than a full percentage point to 3.81%.
As short-term yields fell, the yield curve—which illustrates the relationship between short- and long-term bond yields—returned to its usual, upward-sloping pattern. The curve had been mildly inverted at the start of the period, with yields of shorter-term bonds above those of longer-term issues. For the year ended September 30, the broad taxable bond market returned 5.1%. Returns from tax-exempt bonds were lower, as these issues did not benefit from the late-summer rally in Treasuries.
A positive year includes a second-half downshift
The second half of the fund’s fiscal year differed significantly from its first half. As you may recall from our semiannual report, for the six months ended March 31, 2007, the Strategic Small-Cap Equity Fund’s return was in line with that of its benchmark and was ahead of both the broad market’s return and the average return of its mutual fund peers. During the second half, however, the fund’s gains were restrained by a negative return in the final fiscal quarter as investors favored large-cap stocks, as we discussed above.
More broadly, your fund’s investment methodology was under pressure during the entire year. It’s not unusual for an investment approach to be out of sync with the market from time to time, and fiscal 2007 was one of those periods. As described in more detail in the advisor’s letter on page 7, the fund seeks to limit its deviations from the market’s sector and industry weightings and risk characteristics. Instead, the fund relies on a sophisticated computer model that seeks to outperform its benchmark through superior security selection, and the success of this selection process is, of course, what determines the fund’s out- or underperformance.
Expense Ratios1 | | |
Your fund compared with its peer group | | |
| | Average |
| Investor | Small-Cap |
| Shares | Core Fund |
Strategic Small-Cap Equity Fund | 0.38% | 1.50% |
1 Fund expense ratio reflects the 12 months ended September 30, 2007. Peer-group expense ratio is derived from data provided by Lipper Inc. and captures information through year-end 2006.
4
4
The three components of the fund’s model work together to identify attractive stocks. One component seeks stocks that are favorably valued—investment bargains, so to speak. Another focuses on earnings quality, or growth potential. A third component plugs into market sentiment, as reflected by the direction and pace of change in a stock’s price.
During the past year, the fund’s stock selections came up short in almost all sectors when compared with benchmark sector returns. The most disappointing was the consumer discretionary group, which encompasses a wide variety of companies that compete for the consumer’s spare dollar. The only sector that provided a positive relative return was materials, which received a boost from the fund’s stock choices in the steel and metals and mining industries.
Total Returns | |
April 24, 20061 Through September 30, 2007 | |
| Average |
| Annual Return |
Strategic Small-Cap Equity Fund | 4.9% |
MSCI US Small Cap 1750 Index | 6.7 |
Average Small-Cap Core Fund2 | 4.6 |
The figures shown represent past performance, which is not a guarantee of future results. (Current performance may be lower or higher than the performance data cited. For performance data current to the most recent month-end, visit our website at www.vanguard.com/performance.) Note, too, that both investment returns and principal value can fluctuate widely, so an investor’s shares, when sold, could be worth more or less than their original cost.
1 Fund’s inception date.
2 Derived from data provided by Lipper Inc.
5
Even so, the Strategic Small-Cap Equity Fund rang up a solid 12.6% return, and almost every sector made a positive contribution to the fund’s absolute return. The exception was financials, the largest sector weighting for both the fund and its benchmark, which was most directly affected by the subprime mortgage crises.
The fund’s methodology bypasses market fickleness
Since it came out of the chute in April 2006, Vanguard Strategic Small-Cap Equity Fund has had a rough ride. During its initial months of operations, the fund experienced a down market. Most recently, in its fiscal fourth quarter, the fund faced a market that was extremely challenging for quantitatively managed portfolios.
More to the point, prudent investing is a long-term proposition, and there has not been sufficient time to judge the merits of the fund’s long-term strategy. One thing we can say with certainty: the market can be capricious. That is why the discipline and consistency of Vanguard Strategic Small-Cap Equity Fund’s investment methodology can be invaluable. The advisor’s stock-selection model helps to immunize the fund’s holdings against the emotional impulses that can occasionally bedevil even the most experienced and disciplined manager.
Like any fund employing an actively managed strategy, of course, this fund can be expected to go through periods of relative strength and weakness. Over the long term, however, we expect the fund’s periods of strength to more than offset the occasional downturns. The Strategic Small-Cap Equity Fund offers you an excellent long-term wealth-building opportunity as part of a balanced portfolio of stocks, bonds, and money market assets that is also diversified within each asset class.
Thank you for entrusting your assets to Vanguard.
Sincerely,

John J. Brennan
Chairman and Chief Executive Officer
October 15, 2007
6
Advisor’s Report
The Strategic Small-Cap Equity Fund returned 12.6% for the fiscal year ended September 30, 2007. Although attractive on an absolute and historical basis, we are disappointed to report that the fund’s return lagged that of its benchmark, the MSCI US Small Cap 1750 Index, which gained 15.7%. The total U.S. equity market, as measured by the MSCI US Broad Market Index, was up 17.0%, as large-capitalization issues outperformed small-caps.
A noteworthy shift in market leadership occurred over the past year as growth stocks outperformed value stocks across all capitalization ranges. Small-cap growth stocks returned 23.3% for the fiscal year as measured by the MSCI US Small Cap Growth Index, while small-cap value stocks returned 8.3% as measured by the MSCI US Small Cap Value Index. To put this change in context, for the three years ended September 30, 2006, small-cap value stocks had outperformed small-cap growth stocks by five percentage points each year, as measured by MSCI’s small-cap indexes.
The strong performance of growth stocks contributed to the fund’s underperformance because we favor stocks with both attractive valuation characteristics and growth prospects. Changes in market preference are, in our opinion, unpredictable, so we do not try to capture this type of occurrence in our investment methodology. In markets that strongly favor growth stocks and in which stocks with attractive valuation levels are not in vogue, our results can suffer, as they did this fiscal year.
Our investment methodology does not solely rely on valuation characteristics. Our investment process begins by evaluating each stock in the benchmark relative to its peers, based on our measures of market sentiment and earnings quality in addition to valuation. We then construct a portfolio of our most attractive stocks that matches the benchmark’s industry exposures, market capitalization, and overall risk framework. Relative to the benchmark, our portfolio generally has a lower price-to-earnings ratio, a higher return-on-equity profile, and superior earnings growth. We attempt to add value by taking many small positions across several hundred stocks without tilting toward specific industries or risk factors. We do not try to time changes in market leadership. Our research indicates that the risk of doing so is not worth the potential return.
The fund’s performance is dependent on our model’s stock-ranking ability. For this fiscal year, the model’s performance was disappointing. The valuation component of our model underperformed the market. The market sentiment and earnings-quality components were positive contributors, but their performances were not enough to offset the poor results from the valuation component.
7
We expect that there will be periods when our model is unable to outperform the benchmark, and this year, while a disappointment, is within our expectations for our investment process. Over the longer term, our process has demonstrated an ability to add value. We continue to believe that the fund’s combination of reasonable valuations, high earnings quality, and market acceptance, coupled with disciplined risk control, can play an important role in a diversified investment plan.
We thank you for your investment and trust, and look forward to the upcoming fiscal year.
James P. Stetler,
Principal and Portfolio Manager
Joel M. Dickson, Principal
Vanguard Quantitative Equity Group
October 18, 2007
8
Fund Profile
As of September 30, 2007
Portfolio Characteristics | | |
| | Comparative | Broad |
| Fund | Index1 | Index2 |
Number of Stocks | 465 | 1,680 | 4,887 |
Median Market Cap | $1.9B | $1.8B | $36.1B |
Price/Earnings Ratio | 17.2x | 23.0x | 18.1x |
Price/Book Ratio | 2.3x | 2.4x | 2.8x |
Yield | 1.0% | 1.2% | 1.7% |
Return on Equity | 12.2% | 12.3% | 18.8% |
Earnings Growth Rate | 20.5% | 18.9% | 21.6% |
Foreign Holdings | 0.5% | 0.0% | 0.0% |
Turnover Rate | 73% | — | — |
Expense Ratio | 0.38% | — | — |
Short-Term Reserves | –0.2%3 | — | — |
Sector Diversification (% of equity exposure) |
| | Comparative | Broad |
| Fund | Index1 | Index2 |
Consumer Discretionary | 14.1% | 14.2% | 10.4% |
Consumer Staples | 3.3 | 3.3 | 8.2 |
Energy | 7.3 | 7.4 | 11.2 |
Financials | 18.5 | 18.4 | 20.0 |
Health Care | 11.2 | 11.1 | 11.6 |
Industrials | 17.0 | 17.1 | 11.8 |
Information Technology | 16.9 | 16.8 | 16.0 |
Materials | 6.3 | 6.3 | 3.7 |
Telecommunication | | | |
Services | 1.2 | 1.2 | 3.5 |
Utilities | 4.2 | 4.2 | 3.6 |
Ten Largest Holdings4 (% of total net assets) |
| | |
The Manitowoc Co., Inc. | construction and | |
| farm machinery and | |
| heavy trucks | 0.6% |
AK Steel Holding Corp. | steel | 0.6 |
AGCO Corp. | construction and | |
| farm machinery and | |
| heavy trucks | 0.5 |
Lubrizol Corp. | specialty chemicals | 0.5 |
Frontier Oil Corp. | oil and gas refining | |
| and marketing | 0.5 |
Mettler-Toledo | electronic equipment | |
International Inc. | manufacturers | 0.5 |
Cleveland-Cliffs Inc. | steel | 0.5 |
Energen Corp. | gas utilities | 0.5 |
ON Semiconductor Corp. | semiconductors | 0.5 |
WellCare Health Plans Inc. | managed health care | 0.5 |
Top Ten | | 5.2% |
Investment Focus

1 MSCI US Small Cap 1750 Index.
2 Dow Jones Wilshire 5000 Index.
3 The fund invested a portion of its cash reserves in equity markets through the use of index futures contracts. After the effect of the futures investments, the fund’s temporary cash position was negative.
4 ”Ten Largest Holdings” excludes any temporary cash investments and equity index products. See page 28 for a glossary of investment terms.
9
Performance Summary
All of the returns in this report represent past performance, which is not a guarantee of future results that may be achieved by the fund. (Current performance may be lower or higher than the performance data cited. For performance data current to the most recent month-end, visit our website at www.vanguard.com/performance.) Note, too, that both investment returns and principal value can fluctuate widely, so an investor’s shares, when sold, could be worth more or less than their original cost. The returns shown do not reflect taxes that a shareholder would pay on fund distributions or on the sale of fund shares.
Cumulative Performance: April 24, 2006–September 30, 2007
Initial Investment of $10,000
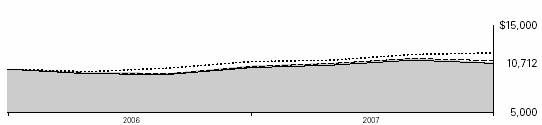
| Average Annual Total Returns | Final Value |
| Periods Ended September 30, 2007 | of a $10,000 |
| One Year | Since Inception1 | Investment |
Strategic Small-Cap Equity Fund2 | 12.58% | 4.91% | $10,712 |
Dow Jones Wilshire 5000 Index | 17.08 | 12.65 | 11,865 |
MSCI US Small Cap 1750 Index | 15.66 | 6.68 | 10,972 |
Average Small-Cap Core Fund3 | 13.40 | 4.63 | 10,671 |
Fiscal-Year Total Returns (%): April 24, 2006–September 30, 2007

1 Performance for the fund and its comparative standards are calculated since the fund’s inception: April 24, 2006.
2 Total returns do not include the account service fee that may be applicable to certain accounts with balances below $10,000.
3 Derived from data provided by Lipper Inc.
Note: See Financial Highlights table on page 20 for dividend and capital gains information.
10
Financial Statements
Statement of Net Assets
As of September 30, 2007
The fund provides a complete list of its holdings four times in each fiscal year, at the quarter-ends. For the second and fourth fiscal quarters, the lists appear in the fund’s semiannual and annual reports to shareholders. For the first and third fiscal quarters, the fund files the lists with the Securities and Exchange Commission on Form N-Q. Shareholders can look up the fund’s Forms N-Q on the SEC’s website at www.sec.gov. Forms N-Q may also be reviewed and copied at the SEC’s Public Reference Room (see the back cover of this report for further information).
| | | Market |
| | | Value• |
| | Shares | ($000) |
Common Stocks (99.4%)1 | | |
Consumer Discretionary (14.0%) | | |
| Sotheby’s | 23,011 | 1,100 |
| Phillips-Van Heusen Corp. | 20,900 | 1,097 |
| Men’s Wearhouse, Inc. | 21,255 | 1,074 |
* | DreamWorks | | |
| Animation SKG, Inc. | 31,700 | 1,059 |
* | Gemstar-TV Guide | | |
| International, Inc. | 146,400 | 1,019 |
* | Big Lots Inc. | 33,300 | 994 |
| Tempur-Pedic International Inc. | 27,400 | 980 |
* | Jack in the Box Inc. | 14,500 | 940 |
| Burger King Holdings Inc. | 35,596 | 907 |
| Meredith Corp. | 15,700 | 900 |
| Regal Entertainment Group | | |
| Class A | 40,000 | 878 |
| Interactive Data Corp. | 30,400 | 857 |
| Jackson Hewitt Tax | | |
| Service Inc. | 28,952 | 809 |
| Service Corp. International | 59,590 | 769 |
* | NutriSystem, Inc. | 16,300 | 764 |
* | TRW Automotive | | |
| Holdings Corp. | 23,710 | 751 |
| Movado Group, Inc. | 22,703 | 725 |
| Brown Shoe Co., Inc. | 37,055 | 719 |
* | Aeropostale, Inc. | 36,800 | 701 |
* | Jos. A. Bank Clothiers, Inc. | 20,200 | 675 |
| CSS Industries, Inc. | 18,600 | 669 |
| Asbury Automotive | | |
| Group, Inc. | 32,657 | 647 |
| Bob Evans Farms, Inc. | 21,087 | 636 |
| Ethan Allen Interiors, Inc. | 19,428 | 635 |
| American Greetings Corp. | | |
| Class A | 23,700 | 626 |
| Stewart Enterprises, Inc. | | |
| Class A | 81,920 | 624 |
| Domino’s Pizza, Inc. | 36,912 | 612 |
| ^Sealy Corp. | 42,800 | 601 |
| | | Market |
| | | Value• |
| | Shares | ($000) |
| Speedway Motorsports, Inc. | 15,700 | 581 |
* | WMS Industries, Inc. | 17,250 | 571 |
* | The Dress Barn, Inc. | 32,592 | 554 |
* | Collective Brands, Inc. | 25,003 | 552 |
* | Papa John’s International, Inc. | 22,415 | 548 |
* | Lear Corp. | 16,900 | 542 |
| Dover Downs Gaming & | | |
| Entertainment, Inc. | 48,928 | 508 |
| Oxford Industries, Inc. | 13,900 | 502 |
| Ruby Tuesday, Inc. | 25,798 | 473 |
* | DSW Inc. Class A | 18,700 | 471 |
| Steven Madden, Ltd. | 24,395 | 462 |
* | Chipotle Mexican Grill, Inc. | 3,800 | 449 |
| International Speedway Corp. | 9,700 | 445 |
| Group 1 Automotive, Inc. | 13,189 | 443 |
* | Aftermarket Technology Corp. | 13,700 | 435 |
| DeVry, Inc. | 11,700 | 433 |
* | Crocs, Inc. | 5,900 | 397 |
| Blyth, Inc. | 18,900 | 386 |
| World Wrestling Entertainment, Inc. | 25,600 | 386 |
* | The Gymboree Corp. | 8,700 | 307 |
* | J. Crew Group, Inc. | 7,200 | 299 |
* | CSK Auto Corp. | 27,600 | 294 |
| OfficeMax, Inc. | 8,300 | 284 |
* | AnnTaylor Stores Corp. | 8,245 | 261 |
| Lithia Motors, Inc. | 14,320 | 244 |
* | Charlotte Russe Holding Inc. | 15,500 | 227 |
| Thor Industries, Inc. | 5,000 | 225 |
| Sonic Automotive, Inc. | 9,200 | 220 |
| UniFirst Corp. | 5,700 | 214 |
* | Denny’s Corp. | 52,300 | 209 |
| Triarc Cos., Inc. Class B | 14,728 | 184 |
| John Wiley & Sons Class A | 4,100 | 184 |
| K-Swiss, Inc. | 7,105 | 163 |
| Saks Inc. | 8,161 | 140 |
| Salem Communications Corp. | 13,700 | 110 |
| The Buckle, Inc. | 2,748 | 104 |
| Cooper Tire & Rubber Co. | 3,000 | 73 |
* | The Warnaco Group, Inc. | 1,700 | 66 |
| Kellwood Co. | 3,600 | 61 |
| CBRL Group, Inc. | 1,224 | 50 |
* | Entravision | | |
| Communications Corp. | 4,800 | 44 |
| Stage Stores, Inc. | 2,300 | 42 |
| Harte-Hanks, Inc. | 846 | 17 |
| | | 35,928 |
Consumer Staples (3.3%) | | |
| Corn Products | | |
| International, Inc. | 26,005 | 1,193 |
* | NBTY, Inc. | 24,500 | 995 |
11
| | | Market |
| | | Value• |
| | Shares | ($000) |
| Universal Corp. (VA) | 16,200 | 793 |
| Nash-Finch Co. | 19,200 | 765 |
| Ruddick Corp. | 20,181 | 677 |
| Del Monte Foods Co. | 53,361 | 560 |
* | American Oriental | | |
| Bioengineering, Inc. | 43,200 | 482 |
* | Prestige Brands Holdings Inc. | 43,600 | 479 |
| Pilgrim’s Pride Corp. | 11,900 | 413 |
| Longs Drug Stores, Inc. | 8,100 | 402 |
| Sanderson Farms, Inc. | 9,400 | 392 |
* | Winn-Dixie Stores, Inc. | 18,098 | 339 |
| Flowers Foods, Inc. | 12,300 | 268 |
* | Alliance One | | |
| International, Inc. | 32,700 | 214 |
| Herbalife Ltd. | 4,500 | 205 |
| J.M. Smucker Co. | 3,500 | 187 |
| | | 8,364 |
Energy (7.3%) | | |
| Frontier Oil Corp. | 30,744 | 1,280 |
| Helmerich & Payne, Inc. | 35,428 | 1,163 |
| Tidewater Inc. | 17,765 | 1,116 |
* | Superior Energy Services, Inc. | 29,953 | 1,062 |
| Holly Corp. | 17,536 | 1,049 |
* | Global Industries Ltd. | 40,700 | 1,048 |
* | W-H Energy Services, Inc. | 13,948 | 1,029 |
* | SEACOR Holdings Inc. | 8,371 | 796 |
* | Gulfmark Offshore, Inc. | 16,300 | 793 |
* | Parker Drilling Co. | 92,800 | 753 |
* | Complete Production | | |
| Services, Inc. | 36,400 | 745 |
* | Unit Corp. | 15,190 | 735 |
* | Grey Wolf, Inc. | 109,700 | 719 |
* | Swift Energy Co. | 17,029 | 697 |
| St. Mary Land & | | |
| Exploration Co. | 17,286 | 617 |
* | Rosetta Resources, Inc. | 33,200 | 609 |
* | Mariner Energy Inc. | 29,100 | 603 |
* | Trico Marine Services, Inc. | 19,700 | 587 |
* | Basic Energy Services Inc. | 25,700 | 540 |
* | Atwood Oceanics, Inc. | 6,259 | 479 |
| General Maritime Corp. | 15,600 | 435 |
* | Core Laboratories N.V. | 3,300 | 420 |
* | Bois d’Arc Energy, Inc. | 20,200 | 387 |
* | Oil States International, Inc. | 6,997 | 338 |
* | Plains Exploration & | | |
| Production Co. | 7,200 | 318 |
| Western Refining, Inc. | 4,400 | 179 |
* | Pioneer Drilling Co. | 10,400 | 127 |
| RPC Inc. | 3,200 | 45 |
* | ATP Oil & Gas Corp. | 900 | 42 |
| | | Market |
| | | Value• |
| | Shares | ($000) |
* | Bristow Group, Inc. | 900 | 39 |
| | | 18,750 |
Financials (18.4%) | | |
| Capital Markets (1.0%) | | |
| Raymond James | | |
| Financial, Inc. | 32,900 | 1,081 |
* | Affiliated Managers | | |
| Group, Inc. | 7,200 | 918 |
| Gamco Investors Inc. Class A | 3,500 | 192 |
| Jefferies Group, Inc. | 6,500 | 181 |
| MCG Capital Corp. | 9,500 | 137 |
| | | |
| Commercial Banks (5.1%) | | |
| Bank of Hawaii Corp. | 20,200 | 1,068 |
| Webster Financial Corp. | 23,008 | 969 |
| FirstMerit Corp. | 47,400 | 937 |
| Pacific Capital Bancorp | 34,300 | 902 |
| Trustmark Corp. | 31,022 | 870 |
| Wilmington Trust Corp. | 21,500 | 836 |
| United Bankshares, Inc. | 26,000 | 791 |
| Susquehanna | | |
| Bancshares, Inc. | 37,900 | 762 |
| City Holding Co. | 20,562 | 749 |
| First Community | | |
| Bancshares, Inc. | 19,650 | 712 |
| City Bank Lynnwood (WA) | 24,400 | 701 |
| First BanCorp Puerto Rico | 66,500 | 632 |
| BancFirst Corp. | 13,726 | 616 |
| Central Pacific Financial Co. | 16,000 | 467 |
| Old Second Bancorp, Inc. | 15,200 | 433 |
| Peoples Bancorp, Inc. | 16,212 | 424 |
| WesBanco Inc. | 14,700 | 367 |
| Great Southern Bancorp, Inc. | 14,000 | 348 |
| Old National Bancorp | 16,740 | 277 |
| East West Bancorp, Inc. | 6,900 | 248 |
| Community Trust Bancorp Inc. | 916 | 27 |
| | | |
| Consumer Finance (1.0%) | | |
* | EZCORP, Inc. | 60,239 | 810 |
| Cash America | | |
| International Inc. | 19,413 | 730 |
| Advanta Corp. Class B | 24,150 | 662 |
| The First Marblehead Corp. | 7,350 | 279 |
| Advance America, | | |
| Cash Advance Centers, Inc. | 9,852 | 105 |
| | | |
| Diversified Financial Services (0.2%) | | |
12
| | | Market |
| | | Value• |
| | Shares | ($000) |
*^ | Primus Guaranty, Ltd. | 50,992 | 536 |
| Insurance (3.5%) | | |
| Aspen Insurance | | |
| Holdings Ltd. | 38,100 | 1,063 |
| Platinum Underwriters | | |
| Holdings, Ltd. | 29,000 | 1,043 |
| Reinsurance Group of | | |
| America, Inc. | 15,680 | 890 |
* | Philadelphia Consolidated | | |
| Holding Corp. | 21,477 | 888 |
| Endurance Specialty | | |
| Holdings Ltd. | 21,300 | 885 |
| Odyssey Re Holdings Corp. | 21,300 | 790 |
| Zenith National | | |
| Insurance Corp. | 15,291 | 686 |
| The Hanover | | |
| Insurance Group Inc. | 15,400 | 681 |
| Max Re Capital Ltd. | 23,300 | 653 |
| The Phoenix Cos., Inc. | 44,700 | 631 |
| American Financial | | |
| Group, Inc. | 21,500 | 613 |
* | Hilltop Holdings Inc. | 18,500 | 217 |
| | | |
| Real Estate Investment Trusts (6.3%) | | |
| Annaly Mortgage | | |
| Management Inc. REIT | 48,800 | 777 |
| Essex Property | | |
| Trust, Inc. REIT | 5,860 | 689 |
| Taubman Co. REIT | 12,510 | 685 |
| BRE Properties Inc. | | |
| Class A REIT | 12,140 | 679 |
| Nationwide Health | | |
| Properties, Inc. REIT | 22,300 | 672 |
| Mack-Cali Realty Corp. REIT | 15,920 | 654 |
| Digital Realty Trust, Inc. REIT | 13,810 | 544 |
| Highwood | | |
| Properties, Inc. REIT | 14,810 | 543 |
| HRPT Properties Trust REIT | 54,200 | 536 |
| Home Properties, Inc. REIT | 10,200 | 532 |
| First Industrial Realty | | |
| Trust REIT | 12,700 | 494 |
| CBL & Associates | | |
| Properties, Inc. REIT | 13,810 | 484 |
| Rayonier Inc. REIT | 9,620 | 462 |
| Colonial Properties Trust REIT | 13,370 | 459 |
| Equity Lifestyle | | |
| Properties, Inc. REIT | 8,800 | 456 |
| Cousins Properties, Inc. REIT | 15,100 | 443 |
| Mid-America Apartment | | |
| Communities, Inc. REIT | 8,870 | 442 |
| Pennsylvania REIT | 11,270 | 439 |
| Healthcare Realty | | |
| | | Market |
| | | Value• |
| | Shares | ($000) |
| Trust Inc. REIT | 15,200 | 405 |
| Tanger Factory Outlet | | |
| Centers, Inc. REIT | 9,800 | 398 |
| Health Care Inc. REIT | 8,500 | 376 |
| Saul Centers, Inc. REIT | 6,700 | 345 |
| Maguire Properties, Inc. REIT | 12,780 | 330 |
| Federal Realty | | |
| Investment Trust REIT | 3,370 | 299 |
| SL Green Realty Corp. REIT | 2,471 | 289 |
| Camden Property Trust REIT | 4,400 | 283 |
| American Campus | | |
| Communities, Inc. REIT | 8,300 | 243 |
| GMH Communities Trust REIT | 30,100 | 233 |
| Brandywine Realty Trust REIT | 9,070 | 230 |
| Post Properties, Inc. REIT | 5,260 | 204 |
| Senior Housing | | |
| Properties Trust REIT | 9,000 | 199 |
| Sunstone Hotel | | |
| Investors, Inc. REIT | 7,600 | 195 |
| ^Thornburg Mortgage, Inc. | | |
| REIT | 14,170 | 182 |
| Potlatch Corp. REIT | 4,000 | 180 |
| LaSalle Hotel Properties REIT | 4,100 | 173 |
| Sun Communities, Inc. REIT | 5,700 | 171 |
| Cedar Shopping | | |
| Centers, Inc. REIT | 12,300 | 167 |
| Strategic Hotels and | | |
| Resorts, Inc. REIT | 7,600 | 156 |
| Realty Income Corp. REIT | 4,800 | 134 |
| U-Store-It Trust REIT | 9,900 | 131 |
| Equity One, Inc. REIT | 4,400 | 120 |
| American Financial | | |
| Realty Trust REIT | 13,400 | 108 |
| Alexandria Real Estate | | |
| Equities, Inc. REIT | 1,100 | 106 |
| FelCor Lodging | | |
| Trust, Inc. REIT | 5,010 | 100 |
| Equity Inns, Inc. REIT | 4,200 | 95 |
| Franklin Street | | |
| Properties Corp. REIT | 5,270 | 91 |
| Friedman, Billings, | | |
| Ramsey Group, Inc. REIT | 16,600 | 76 |
| ^Redwood Trust, Inc. REIT | 2,000 | 66 |
| National Retail Properties REIT | 2,200 | 54 |
| Glimcher Realty Trust REIT | 1,700 | 40 |
| Corporate Office | | |
| Properties Trust, Inc. REIT | 420 | 17 |
| | | |
| Real Estate Management & Development (0.2%) | |
| Jones Lang LaSalle Inc. | 4,570 | 470 |
13
| | | Market |
| | | Value• |
| | Shares | ($000) |
| | | |
| Thrifts & Mortgage Finance (1.1%) | | |
*^ | First Federal Financial Corp. | 13,828 | 685 |
^ | Downey Financial Corp. | 9,936 | 574 |
^ | Corus Bankshares Inc. | 42,756 | 557 |
| WSFS Financial Corp. | 7,750 | 484 |
| BankUnited Financial Corp. | 23,000 | 357 |
| Bank Mutual Corp. | 15,600 | 184 |
| | | 47,304 |
| Health Care (11.1%) | | |
* | WellCare Health Plans Inc. | 11,500 | 1,212 |
* | Pediatrix Medical Group, Inc. | 17,940 | 1,174 |
* | Myriad Genetics, Inc. | 20,600 | 1,074 |
* | AMERIGROUP Corp. | 26,200 | 903 |
| West Pharmaceutical | | |
| Services, Inc. | 21,590 | 899 |
| STERIS Corp. | 32,700 | 894 |
| Mentor Corp. | 18,800 | 866 |
| Chemed Corp. | 13,500 | 839 |
* | Onyx Pharmaceuticals, Inc. | 19,200 | 836 |
* | Sciele Pharma, Inc. | 31,684 | 824 |
* | Medarex, Inc. | 57,600 | 816 |
| Medicis Pharmaceutical Corp. | 25,900 | 790 |
* | Magellan Health Services, Inc. | 18,994 | 771 |
* | Xenoport Inc. | 16,082 | 757 |
* | Psychiatric Solutions, Inc. | 19,100 | 750 |
* | Apria Healthcare Group Inc. | 28,400 | 739 |
* | OSI Pharmaceuticals, Inc. | 21,449 | 729 |
* | Savient Pharmaceuticals Inc. | 50,100 | 729 |
* | Molina Healthcare Inc. | 18,806 | 682 |
* | MedCath Corp. | 24,752 | 680 |
* | Nighthawk Radiology | | |
| Holdings, Inc. | 27,200 | 667 |
* | PAREXEL International Corp. | 16,132 | 666 |
* | K-V Pharmaceutical Co. | | |
| Class A | 22,443 | 642 |
* | MGI Pharma, Inc. | 22,600 | 628 |
| Vital Signs, Inc. | 11,846 | 618 |
* | Hologic, Inc. | 10,000 | 610 |
* | Alkermes, Inc. | 32,251 | 593 |
* | CONMED Corp. | 21,100 | 591 |
* | Alliance Imaging, Inc. | 62,725 | 568 |
* | Align Technology, Inc. | 21,600 | 547 |
| Datascope Corp. | 15,731 | 532 |
| Ligand Pharmaceuticals Inc. | | |
| Class B | 91,400 | 488 |
* | Applera Corp.–Celera | | |
| Genomics Group | 34,500 | 485 |
* | Haemonetics Corp. | 8,595 | 425 |
* | BioMarin Pharmaceutical Inc. | 15,546 | 387 |
| Perrigo Co. | 17,700 | 378 |
| | | Market |
| | | Value• |
| | Shares | ($000) |
* | Zoll Medical Corp. | 14,494 | 376 |
* | Omrix | | |
| Biopharmaceuticals, Inc. | 9,356 | 330 |
* | Radiation Therapy | | |
| Services, Inc. | 15,183 | 316 |
* | Healthspring, Inc. | 15,700 | 306 |
* | VCA Antech, Inc. | 6,890 | 288 |
* | Bio-Rad Laboratories, Inc. | | |
| Class A | 2,506 | 227 |
* | AMN Healthcare | | |
| Services, Inc. | 10,139 | 190 |
* | PSS World Medical, Inc. | 8,500 | 163 |
| Dade Behring Holdings Inc. | 2,100 | 160 |
* | Cubist Pharmaceuticals, Inc. | 5,800 | 123 |
* | Noven Pharmaceuticals, Inc. | 4,500 | 72 |
* | Varian, Inc. | 1,100 | 70 |
* | eResearch Technology, Inc. | 5,700 | 65 |
* | Albany Molecular | | |
| Research, Inc. | 1,462 | 22 |
| | | 28,497 |
Industrials (16.9%) | | |
| The Manitowoc Co., Inc. | 34,000 | 1,505 |
* | AGCO Corp. | 27,700 | 1,406 |
* | Continental Airlines, Inc. | | |
| Class B | 33,812 | 1,117 |
| Teleflex Inc. | 14,031 | 1,093 |
| Crane Co. | 22,500 | 1,079 |
| Harsco Corp. | 18,078 | 1,071 |
| Trinity Industries, Inc. | 28,060 | 1,053 |
* | Corrections Corp. of America | 39,900 | 1,044 |
* | Ceradyne, Inc. | 13,300 | 1,007 |
| Deluxe Corp. | 26,900 | 991 |
* | Gardner Denver Inc. | 25,000 | 975 |
* | GrafTech International Ltd. | 54,400 | 970 |
| Lincoln Electric Holdings, Inc. | 12,365 | 960 |
| Ryder System, Inc. | 19,409 | 951 |
| GATX Corp. | 22,100 | 945 |
| Triumph Group, Inc. | 11,267 | 921 |
| Belden Inc. | 19,400 | 910 |
| Acuity Brands, Inc. | 17,842 | 901 |
| Steelcase Inc. | 49,474 | 890 |
| The Toro Co. | 15,009 | 883 |
* | TransDigm Group, Inc. | 19,100 | 873 |
* | EMCOR Group, Inc. | 27,200 | 853 |
* | Genlyte Group, Inc. | 13,061 | 839 |
* | PHH Corp. | 31,900 | 838 |
* | United Stationers, Inc. | 15,041 | 835 |
| Kennametal, Inc. | 9,867 | 829 |
* | Republic Airways | | |
| Holdings Inc. | 39,000 | 826 |
| | | | |
14
| | | Market |
| | | Value• |
| | Shares | ($000) |
| Lennox International Inc. | 23,748 | 803 |
| A.O. Smith Corp. | 17,800 | 781 |
* | Kansas City Southern | 24,000 | 772 |
| Mueller Industries Inc. | 21,000 | 759 |
* | Labor Ready, Inc. | 39,707 | 735 |
*^ | Amerco, Inc. | 11,356 | 721 |
* | Spherion Corp. | 87,040 | 719 |
* | Old Dominion | | |
| Freight Line, Inc. | 26,900 | 645 |
* | Consolidated Graphics, Inc. | 10,053 | 631 |
| Regal-Beloit Corp. | 13,084 | 627 |
| Herman Miller, Inc. | 22,354 | 607 |
| Apogee Enterprises, Inc. | 23,042 | 598 |
* | TeleTech Holdings, Inc. | 24,800 | 593 |
* | AirTran Holdings, Inc. | 59,700 | 587 |
* | Thomas & Betts Corp. | 8,920 | 523 |
| Kelly Services, Inc. Class A | 25,657 | 508 |
* | Alliant Techsystems, Inc. | 4,400 | 481 |
* | Rush Enterprises, Inc. Class A | 18,132 | 460 |
* | General Cable Corp. | 6,500 | 436 |
* | NCI Building Systems, Inc. | 9,500 | 410 |
| American Railcar | | |
| Industries, Inc. | 16,920 | 373 |
* | Perini Corp. | 6,600 | 369 |
| Pacer International, Inc. | 19,200 | 366 |
* | United Rentals, Inc. | 10,482 | 337 |
| IKON Office Solutions, Inc. | 24,128 | 310 |
* | Goodman Global, Inc. | 11,900 | 284 |
| Watson Wyatt & Co. Holdings | 6,300 | 283 |
* | Builders FirstSource, Inc. | 25,069 | 270 |
| Cascade Corp. | 4,100 | 267 |
* | Waste Connections, Inc. | 8,400 | 267 |
| The Brink’s Co. | 4,000 | 223 |
| Arkansas Best Corp. | 6,700 | 219 |
| Tredegar Corp. | 10,100 | 174 |
| Quintana Maritime Ltd. | 8,300 | 158 |
| Horizon Lines Inc. | 3,700 | 113 |
| Bluelinx Holdings Inc. | 15,000 | 106 |
| Robbins & Myers, Inc. | 1,800 | 103 |
| Ennis, Inc. | 3,200 | 71 |
| Skywest, Inc. | 2,200 | 55 |
| Schawk, Inc. | 2,400 | 54 |
* | Acco Brands Corp. | 1,700 | 38 |
* | Armstrong Worldwide | | |
| Industries, Inc. | 700 | 28 |
| Knoll, Inc. | 1,300 | 23 |
| Con-way, Inc. | 479 | 22 |
| | | 43,474 |
| | | Market |
| | | Value• |
| | Shares | ($000) |
Information Technology (16.7%) | | |
* | Mettler-Toledo | | |
| International Inc. | 12,266 | 1,251 |
* | ON Semiconductor Corp. | 97,024 | 1,219 |
* | Brocade Communications | | |
| Systems, Inc. | 138,900 | 1,189 |
* | Anixter International Inc. | 12,800 | 1,055 |
* | CommScope, Inc. | 20,600 | 1,035 |
* | Fairchild Semiconductor | | |
| International, Inc. | 53,500 | 999 |
* | ADC Telecommunications, Inc. | 50,500 | 990 |
* | MICROS Systems, Inc. | 15,074 | 981 |
* | Sybase, Inc. | 42,315 | 979 |
* | Vishay Intertechnology, Inc. | 73,800 | 962 |
* | Plexus Corp. | 34,365 | 942 |
* | Dolby Laboratories Inc. | 26,480 | 922 |
* | Skyworks Solutions, Inc. | 101,300 | 916 |
* | RF Micro Devices, Inc. | 135,000 | 909 |
* | j2 Global | | |
| Communications, Inc. | 27,400 | 897 |
* | Zoran Corp. | 43,616 | 881 |
* | Informatica Corp. | 56,092 | 881 |
* | SAIC, Inc. | 45,500 | 873 |
* | Emulex Corp. | 44,070 | 845 |
* | Equinix, Inc. | 9,500 | 843 |
| United Online, Inc. | 55,900 | 839 |
| Technitrol, Inc. | 30,690 | 827 |
* | Checkpoint Systems, Inc. | 31,200 | 823 |
* | Vignette Corp. | 41,000 | 823 |
* | Amkor Technology, Inc. | 70,265 | 809 |
| Syntel, Inc. | 19,352 | 805 |
* | Interwoven Inc. | 53,528 | 762 |
* | Arris Group Inc. | 60,910 | 752 |
* | SPSS, Inc. | 17,960 | 739 |
* | Convergys Corp. | 42,340 | 735 |
* | Mentor Graphics Corp. | 48,107 | 726 |
* | Avnet, Inc. | 17,999 | 717 |
* | CSG Systems | | |
| International, Inc. | 33,184 | 705 |
* | Synopsys, Inc. | 25,900 | 701 |
* | Coherent, Inc. | 20,758 | 666 |
* | SAVVIS, Inc. | 16,700 | 648 |
* | ANADIGICS, Inc. | 35,400 | 640 |
* | Mattson Technology, Inc. | 64,200 | 555 |
* | MPS Group, Inc. | 49,250 | 549 |
| MoneyGram | | |
| International, Inc. | 23,976 | 542 |
* | Atmel Corp. | 103,500 | 534 |
* | Advanced Energy | | |
15
| | | Market | |
| | | Value• | |
| | Shares | ($000) | |
| Industries, Inc. | 35,346 | 534 | |
* | ManTech International Corp. | 12,525 | 451 | |
* | Omniture, Inc. | 14,800 | 449 | |
* | Verigy Ltd. | 17,800 | 440 | |
| Agilysys, Inc. | 24,905 | 421 | |
* | Newport Corp. | 27,200 | 414 | |
* | Dycom Industries, Inc. | 12,800 | 392 | |
* | ScanSource, Inc. | 13,300 | 374 | |
* | International Rectifier Corp. | 10,300 | 340 | |
* | Smart Modular | | | |
| Technologies Inc. | 45,927 | 328 | |
* | Asyst Technologies, Inc. | 58,800 | 311 | |
* | Varian Semiconductor | | | |
| Equipment Associates, Inc. | 5,800 | 310 | |
* | Credence Systems Corp. | 95,100 | 294 | |
* | Ciena Corp. | 7,400 | 282 | |
* | ExlService Holdings Inc. | 11,600 | 247 | |
* | Brooks Automation, Inc. | 17,200 | 245 | |
* | TIBCO Software Inc. | 32,700 | 242 | |
* | THQ Inc. | 9,200 | 230 | |
| CTS Corp. | 14,900 | 192 | |
* | ANSYS, Inc. | 5,300 | 181 | |
* | Riverbed Technology, Inc. | 4,300 | 174 | |
* | Tech Data Corp. | 4,300 | 172 | |
| Jack Henry & Associates Inc. | 6,600 | 171 | |
| Broadridge Financial | | | |
| Solutions LLC | 7,400 | 140 | |
* | LoopNet, Inc. | 6,800 | 140 | |
* | Euronet Worldwide, Inc. | 4,600 | 137 | |
* | Forrester Research, Inc. | 5,700 | 134 | |
* | Trident Microsystems, Inc. | 8,112 | 129 | |
| Gevity HR, Inc. | 12,414 | 127 | |
* | RealNetworks, Inc. | 14,847 | 101 | |
* | Sykes Enterprises, Inc. | 5,400 | 90 | |
* | Manhattan Associates, Inc. | 3,100 | 85 | |
* | Unisys Corp. | 10,400 | 69 | |
* | Comtech | | | |
| Telecommunications Corp. | 900 | 48 | |
* | Rudolph Technologies, Inc. | 3,200 | 44 | |
* | Aspen Technologies, Inc. | 2,500 | 36 | |
* | C-COR Inc. | 2,500 | 29 | |
* | Cirrus Logic, Inc. | 3,848 | 25 | |
* | Polycom, Inc. | 900 | 24 | |
* | Digital River, Inc. | 400 | 18 | |
| | | 43,036 | |
Materials (6.3%) | | | |
* | AK Steel Holding Corp. | 32,260 | 1,418 | |
| Lubrizol Corp. | 20,700 | 1,347 | |
| Cleveland-Cliffs Inc. | 14,223 | 1,251 | |
* | Terra Industries, Inc. | 36,900 | 1,153 | |
| | | | | |
| | | Market |
| | | Value• |
| | Shares | ($000) |
| RPM International, Inc. | 45,000 | 1,078 |
| Greif Inc. Class A | 15,634 | 949 |
| Metal Management, Inc. | 16,900 | 916 |
* | Century Aluminum Co. | 17,100 | 900 |
| Kaiser Aluminum Corp. | 12,500 | 882 |
* | OM Group, Inc. | 16,400 | 866 |
| Silgan Holdings, Inc. | 15,711 | 844 |
| Quanex Corp. | 16,548 | 777 |
| Celanese Corp. Series A | 19,422 | 757 |
| Steel Dynamics, Inc. | 15,866 | 741 |
| Commercial Metals Co. | 15,600 | 494 |
| Rock-Tenn Co. | 15,700 | 454 |
| Nalco Holding Co. | 14,600 | 433 |
| Ryerson Tull, Inc. | 7,700 | 260 |
* | Buckeye Technology, Inc. | 16,800 | 254 |
* | Rockwood Holdings, Inc. | 6,100 | 219 |
| Eagle Materials, Inc. | 5,555 | 199 |
| Texas Industries, Inc. | 500 | 39 |
| | | 16,231 |
Telecommunication Services (1.2%) | |
* | Cincinnati Bell Inc. | 160,300 | 792 |
* | Syniverse Holdings Inc. | 49,440 | 786 |
| USA Mobility, Inc. | 38,000 | 641 |
* | Centennial Communications | | |
| Corp. Class A | 55,510 | 562 |
| Alaska Communications | | |
| Systems Holdings, Inc. | 13,500 | 195 |
| NTELOS Holdings Corp. | 6,300 | 186 |
| | | 3,162 |
Utilities (4.2%) | | |
| Energen Corp. | 21,644 | 1,236 |
| Puget Energy, Inc. | 42,650 | 1,044 |
| Southern Union Co. | 32,100 | 999 |
| Westar Energy, Inc. | 39,000 | 958 |
| OGE Energy Corp. | 27,700 | 917 |
| Portland General Electric Co. | 31,700 | 881 |
| Atmos Energy Corp. | 31,100 | 881 |
| Black Hills Corp. | 20,500 | 841 |
| ALLETE, Inc. | 15,504 | 694 |
| Northwest Natural Gas Co. | 12,500 | 571 |
| WGL Holdings Inc. | 13,700 | 464 |
| Avista Corp. | 17,028 | 346 |
* | El Paso Electric Co. | 13,200 | 305 |
| Vectren Corp. | 9,610 | 262 |
| AGL Resources Inc. | 5,000 | 198 |
| CH Energy Group, Inc. | 1,400 | 67 |
| | | 10,664 |
16
| | | Market |
| | | Value• |
| | Shares | ($000) |
Total Common Stocks | | |
(Cost $244,631) | | 255,410 |
Temporary Cash Investments (1.4%)1 | |
Money Market Funds (1.3%) | | |
2 | Vanguard Market Liquidity | | |
| Fund, 5.153% | 1,030,532 | 1,031 |
2 | Vanguard Market Liquidity | | |
| Fund, 5.153%—Note E | 2,372,020 | 2,372 |
| | | 3,403 |
| | | |
| | | |
| | Face | |
| | Amount | |
| | ($000) | |
U.S. Agency Obligation (0.1%) | | |
3 | Federal National Mortgage Assn. | |
4 | 5.208%, 10/24/07 | 200 | 199 |
Total Temporary Cash Investments | |
(Cost $3,602) | | 3,602 |
Total Investments (100.8%) | | |
(Cost $248,233) | | 259,012 |
Other Assets and Liabilities (–0.8%) | | |
Other Assets—Note B | | 2,095 |
Liabilities—Note E | | (4,106) |
| | | (2,011) |
Net Assets (100%) | | |
Applicable to 12,076,172 outstanding | | |
$.001 par value shares of beneficial | | |
interest (unlimited authorization) | | 257,001 |
Net Asset Value Per Share | | $21.28 |
At September 30, 2007, net assets consisted of:5 |
| Amount | Per |
| ($000) | Share |
Paid-in Capital | 244,032 | $20.21 |
Undistributed Net | | |
Investment Income | 1,627 | .13 |
Accumulated Net Realized Gains | 554 | .05 |
Unrealized Appreciation | | |
Investment Securities | 10,779 | .89 |
Futures Contracts | 9 | — |
Net Assets | 257,001 | $21.28 |
• See Note A in Notes to Financial Statements.
* Non-income-producing security.
^ Part of security position is on loan to broker-dealers. See Note E in Notes to Financial Statements.
1 The fund invests a portion of its cash reserves in equity markets through the use of index futures contracts. After giving effect to futures investments, the fund’s effective common stock and temporary cash investment positions represent 100.0% and 0.8%, respectively, of net assets. See Note C in Notes to Financial Statements.
2 Affiliated money market fund available only to Vanguard funds and certain trusts and accounts managed by Vanguard. Rate shown is the 7-day yield.
3 The issuer operates under a congressional charter; its securities are neither issued nor guaranteed by the U.S. government. If needed, access to additional funding from the U.S. Treasury (beyond the issuer’s line of credit) would require congressional action.
4 Securities with a value of $199,000 have been segregated as initial margin for open futures contracts.
5 See Note C in Notes to Financial Statements for the tax-basis components of net assets.
REIT—Real Estate Investment Trust.
17
Statement of Operations
| Year Ended |
| September 30, 2007 |
| ($000) |
Investment Income | |
Income | |
Dividends | 3,284 |
Interest1 | 71 |
Security Lending | 72 |
Total Income | 3,427 |
Expenses | |
The Vanguard Group—Note B | |
Investment Advisory Services | 189 |
Management and Administrative | 620 |
Marketing and Distribution | 51 |
Custodian Fees | 5 |
Auditing Fees | 21 |
Shareholders’ Reports | 12 |
Total Expenses | 898 |
Net Investment Income | 2,529 |
Realized Net Gain (Loss) | |
Investment Securities Sold | 2,969 |
Futures Contracts | 164 |
Realized Net Gain (Loss) | 3,133 |
Change in Unrealized Appreciation (Depreciation) | |
Investment Securities | 15,595 |
Futures Contracts | 9 |
Change in Unrealized Appreciation (Depreciation) | 15,604 |
Net Increase (Decrease) in Net Assets Resulting from Operations | 21,266 |
| 1 | Interest income from an affiliated company of the fund was $54,000. |
18
Statement of Changes in Net Assets
| Year Ended | April 201 to |
| September 30, | September 30, |
| 2007 | 2006 |
| ($000) | ($000) |
Increase (Decrease) in Net Assets | | |
Operations | | |
Net Investment Income | 2,529 | 834 |
Realized Net Gain (Loss) | 3,133 | (2,368) |
Change in Unrealized Appreciation (Depreciation) | 15,604 | (4,816) |
Net Increase (Decrease) in Net Assets Resulting from Operations | 21,266 | (6,350) |
Distributions | | |
Net Investment Income | (1,472) | — |
Realized Capital Gain | — | — |
Total Distributions | (1,472) | — |
Capital Share Transactions—Note F | | |
Issued | 132,076 | 210,458 |
Issued in Lieu of Cash Distributions | 1,347 | — |
Redeemed | (76,625) | (23,699) |
Net Increase (Decrease) from Capital Share Transactions | 56,798 | 186,759 |
Total Increase (Decrease) | 76,592 | 180,409 |
Net Assets | | |
Beginning of Period | 180,409 | — |
End of Period2 | 257,001 | 180,409 |
1 Commencement of subscription period for the fund.
| 2 | Net Assets—End of Period includes undistributed net investment income of $1,627,000 and $834,000. |
19
Financial Highlights
| Year | April 20, |
| Ended | 20061 to |
| Sept. 30, | Sept. 30, |
For a Share Outstanding Throughout Each Period | 2007 | 2006 |
Net Asset Value, Beginning of Period | $19.04 | $20.00 |
Investment Operations | | |
Net Investment Income | .22 | .09 |
Net Realized and Unrealized Gain (Loss) on Investments | 2.17 | (1.05) |
Total from Investment Operations | 2.39 | (.96) |
Distributions | | |
Dividends from Net Investment Income | (.15) | — |
Distributions from Realized Capital Gains | — | — |
Total Distributions | (.15) | — |
Net Asset Value, End of Period | $21.28 | $19.04 |
| | |
| | |
Total Return2 | 12.58% | –4.85% |
| | |
| | |
Ratios/Supplemental Data | | |
Net Assets, End of Period (Millions) | $257 | $180 |
Ratio of Total Expenses to Average Net Assets | 0.38% | 0.40%* |
Ratio of Net Investment Income to Average Net Assets | 1.07% | 1.20%* |
Portfolio Turnover Rate | 73% | 35% |
1 Subscription period for the fund was April 20, 2006, to April 24, 2006, during which time all assets were held in money market instruments. Performance measurement began April 24, 2006, at a net asset value of $20.01.
2 Total returns do not reflect the account service fee that may be applicable to certain accounts with balances below $10,000.
* Annualized.
See accompanying Notes, which are an integral part of the Financial Statements.
20
Notes to Financial Statements
Vanguard Strategic Small-Cap Equity Fund is registered under the Investment Company Act of 1940 as an open-end investment company, or mutual fund. The fund files reports with the SEC under the company name Vanguard Horizon Funds.
A. The following significant accounting policies conform to generally accepted accounting principles for U.S. mutual funds. The fund consistently follows such policies in preparing its financial statements.
1. Security Valuation: Securities are valued as of the close of trading on the New York Stock Exchange (generally 4 p.m., Eastern time) on the valuation date. Equity securities are valued at the latest quoted sales prices or official closing prices taken from the primary market in which each security trades; such securities not traded on the valuation date are valued at the mean of the latest quoted bid and asked prices. Securities for which market quotations are not readily available, or whose values have been materially affected by events occurring before the fund’s pricing time but after the close of the securities’ primary markets, are valued by methods deemed by the board of trustees to represent fair value. Investments in Vanguard Market Liquidity Fund are valued at that fund’s net asset value. Temporary cash investments acquired over 60 days to maturity are valued using the latest bid prices or using valuations based on a matrix system (which considers such factors as security prices, yields, maturities, and ratings), both as furnished by independent pricing services. Other temporary cash investments are valued at amortized cost, which approximates market value.
2. Futures Contracts: The fund uses index futures contracts to a limited extent, with the objective of maintaining full exposure to the stock market while maintaining liquidity. The fund may purchase or sell futures contracts to achieve a desired level of investment, whether to accommodate portfolio turnover or cash flows from capital share transactions. The primary risks associated with the use of futures contracts are imperfect correlation between changes in market values of stocks held by the fund and the prices of futures contracts, and the possibility of an illiquid market.
Futures contracts are valued at their quoted daily settlement prices. The aggregate principal amounts of the contracts are not recorded in the Statement of Net Assets. Fluctuations in the value of the contracts are recorded in the Statement of Net Assets as an asset (liability) and in the Statement of Operations as unrealized appreciation (depreciation) until the contracts are closed, when they are recorded as realized futures gains (losses).
3. Federal Income Taxes: The fund intends to continue to qualify as a regulated investment company and distribute all of its taxable income. Accordingly, no provision for federal income taxes is required in the financial statements.
4. Distributions: Distributions to shareholders are recorded on the ex-dividend date.
5. Security Lending: The fund may lend its securities to qualified institutional borrowers to earn additional income. Security loans are required to be secured at all times by collateral at least equal to the market value of securities loaned. The fund invests cash collateral received in Vanguard Market Liquidity Fund, and records a liability for the return of the collateral, during the period the securities are on loan. Security lending income represents the income earned on investing cash collateral, less expenses associated with the loan.
6. Other: Dividend income is recorded on the ex-dividend date. Interest income includes income distributions received from Vanguard Market Liquidity Fund and is accrued daily. Security transactions are accounted for on the date securities are bought or sold. Costs used to determine realized gains (losses) on the sale of investment securities are those of the specific securities sold.
21
B. The Vanguard Group furnishes at cost investment advisory, corporate management, administrative, marketing, and distribution services. The costs of such services are allocated to the fund under methods approved by the board of trustees. The fund has committed to provide up to 0.40% of its net assets in capital contributions to Vanguard. At September 30, 2007, the fund had contributed capital of $22,000 to Vanguard (included in Other Assets), representing 0.01% of the fund’s net assets and 0.02% of Vanguard’s capitalization. The fund’s trustees and officers are also directors and officers of Vanguard.
C. Distributions are determined on a tax basis and may differ from net investment income and realized capital gains for financial reporting purposes. Differences may be permanent or temporary. Permanent differences are reclassified among capital accounts in the financial statements to reflect their tax character. Temporary differences arise when certain items of income, expense, gain, or loss are recognized in different periods for financial statement and tax purposes; these differences will reverse at some time in the future. Differences in classification may also result from the treatment of short-term gains as ordinary income for tax purposes.
The fund used a tax accounting practice to treat a portion of the price of capital shares redeemed during the year as distributions from net investment income and realized capital gains. Accordingly, the fund has reclassified $264,000 from undistributed net investment income, and $211,000 from accumulated net realized gains, to paid-in capital.
The fund used a capital loss carryforward of 2,355,000 to offset taxable capital gains realized during the year ended September 30, 2007, reducing the amount of capital gains that would otherwise be available to distribute to shareholders. For tax purposes, at September 30, 2007, the fund had $1,778,000 of ordinary income and $563,000 of long-term capital gains available for distribution.
At September 30, 2007, the cost of investment securities for tax purposes was $248,233,000. Net unrealized appreciation of investment securities for tax purposes was $10,779,000, consisting of unrealized gains of $27,273,000 on securities that had risen in value since their purchase and $16,494,000 in unrealized losses on securities that had fallen in value since their purchase.
At September 30, 2007, the aggregate settlement value of open futures contracts expiring in December 2007 and the related unrealized appreciation (depreciation) were:
| | | ($000) |
| | Aggregate | Unrealized |
| Number of | Settlement | Appreciation |
Futures Contracts | Long Contracts | Value | (Depreciation) |
E-mini Russell 2000 Index | 20 | 1,626 | 9 |
Unrealized appreciation (depreciation) on open futures contracts is required to be treated as realized gain (loss) for tax purposes.
D. During the year ended September 30, 2007, the fund purchased $226,828,000 of investment securities and sold $170,170,000 of investment securities, other than temporary cash investments.
E. The market value of securities on loan to broker-dealers at September 30, 2007, was $2,236,000, for which the fund received cash collateral of $2,372,000.
22
F. Capital shares issued and redeemed were:
| Year Ended | | April 201 to |
| September 30, 2007 | | September 30, 2006 |
| Shares | | Shares |
| (000) | | (000) |
Issued | 6,183 | | 10,744 |
Issued in Lieu of Cash Distributions | 65 | | — |
Redeemed | (3,649) | | (1,266) |
Net Increase (Decrease) in Shares Outstanding | 2,599 | | 9,478 |
G. In June 2006, the Financial Accounting Standards Board issued Interpretation No. 48 (“FIN 48”), “Accounting for Uncertainty in Income Taxes.” FIN 48 establishes the minimum threshold for recognizing, and a system for measuring, the benefits of tax-return positions in financial statements, and is effective for the fund’s fiscal year beginning October 1, 2007. Management has analyzed the fund’s tax positions taken on federal income tax returns for all open tax years (tax years ended September 30, 2006–2007) for purposes of implementing FIN 48, and has concluded that as of September 30, 2007, no provision for income tax would be required in the fund’s financial statements.
| 1 | Commencement of subscription period for the fund. |
23
Report of Independent Registered
Public Accounting Firm
To the Trustees of Vanguard Horizon Funds and the Shareholders of Vanguard Strategic Small-Cap Equity Fund:
In our opinion, the accompanying statement of net assets and the related statements of operations and of changes in net assets and the financial highlights present fairly, in all material respects, the financial position of Vanguard Strategic Small-Cap Equity Fund (the “Fund”) at September 30, 2007, the results of its operations for the year then ended, and the changes in its net assets and the financial highlights for the year then ended and for the period from April 20, 2006 (commencement of operations) through September 30, 2006, in conformity with accounting principles generally accepted in the United States of America. These financial statements and financial highlights (hereafter referred to as “financial statements”) are the responsibility of the Fund’s management; our responsibility is to express an opinion on these financial statements based on our audits. We conducted our audits of these financial statements in accordance with the standards of the Public Company Accounting Oversight Board (United States), which require that we plan and perform the audit to obtain reasonable assurance about whether the financial statements are free of material misstatement. An audit includes examining, on a test basis, evidence supporting the amounts and disclosures in the financial statements, assessing the accounting principles used and significant estimates made by management, and evaluating the overall financial statement presentation. We believe that our audits, which included confirmation of securities at September 30, 2007 by correspondence with the custodian and broker, and by agreement to the underlying ownership records for Vanguard Market Liquidity Fund, provide a reasonable basis for our opinion.
PricewaterhouseCoopers LLP
Philadelphia, Pennsylvania
November 7, 2007
Special 2007 tax information (unaudited) for Vanguard Strategic Small-Cap Equity Fund
This information for the fiscal period ended September 30, 2007, is included pursuant to provisions of the Internal Revenue Code.
The fund distributed $1,169,000 of qualified dividend income to shareholders during the fiscal year.
For corporate shareholders, 91.7% of investment income (dividend income plus short-term gains, if any) qualifies for the dividends-received deduction.
24
Your Fund’s After-Tax Returns
This table presents returns for your fund both before and after taxes. The after-tax returns are shown in two ways: (1) assuming that an investor owned the fund during the entire period and paid taxes on the fund’s distributions, and (2) assuming that an investor paid taxes on the fund’s distributions and sold all shares at the end of each period.
Calculations are based on the highest individual federal income tax and capital gains tax rates in effect at the times of the distributions and the hypothetical sales. State and local taxes were not considered. After-tax returns reflect any qualified dividend income, using actual prior-year figures and estimates for 2007. (In the example, returns after the sale of fund shares may be higher than those assuming no sale. This occurs when the sale would have produced a capital loss. The calculation assumes that the investor received a tax deduction for the loss.)
Please note that your actual after-tax returns will depend on your tax situation and may differ from those shown. Also note that if you own the fund in a tax-deferred account, such as an individual retirement account or a 401(k) plan, this information does not apply to you. Such accounts are not subject to current taxes.
Finally, keep in mind that a fund’s performance—whether before or after taxes—does not guarantee future results.
Average Annual Total Returns: Strategic Small-Cap Equity Fund1 |
Periods Ended September 30, 2007 | | |
| One | Since |
| Year | Inception2 |
Returns Before Taxes | 12.58% | 4.91% |
Returns After Taxes on Distributions | 12.42 | 4.81 |
Returns After Taxes on Distributions and Sale of Fund Shares | 8.30 | 4.15 |
1 Total returns do not include the account service fee that may be applicable to certain accounts with balances below $10,000.
2 April 24, 2006.
25
About Your Fund’s Expenses
As a shareholder of the fund, you incur ongoing costs, which include costs for portfolio management, administrative services, and shareholder reports (like this one), among others. Operating expenses, which are deducted from a fund’s gross income, directly reduce the investment return of the fund.
A fund’s expenses are expressed as a percentage of its average net assets. This figure is known as the expense ratio. The following examples are intended to help you understand the ongoing costs (in dollars) of investing in your fund and to compare these costs with those of other mutual funds. The examples are based on an investment of $1,000 made at the beginning of the period shown and held for the entire period.
The table below illustrates your fund’s costs in two ways:
• Based on actual fund return. This helps you to estimate the actual expenses that you paid over the period. The “Ending Account Value” shown is derived from the fund’s actual return, and the third column shows the dollar amount that would have been paid by an investor who started with $1,000 in the fund. You may use the information here, together with the amount you invested, to estimate the expenses that you paid over the period.
To do so, simply divide your account value by $1,000 (for example, an $8,600 account value divided by $1,000 = 8.6), then multiply the result by the number given for your fund under the heading “Expenses Paid During Period.”
• Based on hypothetical 5% yearly return. This section is intended to help you compare your fund’s costs with those of other mutual funds. It assumes that the fund had a yearly return of 5% before expenses, but that the expense ratio is unchanged. In this case—because the return used is not the fund’s actual return—the results do not apply to your investment. The example is useful in making comparisons because the Securities and Exchange Commission requires all mutual funds to calculate expenses based on a 5% return. You can assess your fund’s costs by comparing this hypothetical example with the hypothetical examples that appear in shareholder reports of other funds.
Six Months Ended September 30, 2007 | | | |
| Beginning | Ending | Expenses |
| Account Value | Account Value | Paid During |
Strategic Small-Cap Equity Fund | 3/31/2007 | 9/30/2007 | Period1 |
Based on Actual Fund Return | $1,000.00 | $1,002.83 | $1.86 |
Based on Hypothetical 5% Yearly Return | $1,000.00 | $1,023.21 | $1.88 |
Note that the expenses shown in the table are meant to highlight and help you compare ongoing costs only and do not reflect transaction costs incurred by the fund for buying and selling securities. Further, the expenses do not include the account service fee described in the prospectus. If such a fee were applied to your account, your costs would be higher. Your fund does not charge transaction fees, such as purchase or redemption fees, nor does it carry a “sales load.”
| 1 | The calculations are based on expenses incurred in the most recent six-month period. The fund’s annualized six-month expense ratio for that period is 0.37%. The dollar amounts shown as “Expenses Paid” are equal to the annualized expense ratio multiplied by the average account value over the period, multiplied by the number of days in the most recent six-month period, then divided by the number of days in the most recent 12-month period. |
26
The calculations assume no shares were bought or sold during the period. Your actual costs may have been higher or lower, depending on the amount of your investment and the timing of any purchases or redemptions.
You can find more information about the fund’s expenses, including annual expense ratios, in the Financial Statements section of this report. For additional information on operating expenses and other shareholder costs, please refer to your fund’s current prospectus.
27
Glossary
Earnings Growth Rate. The average annual rate of growth in earnings over the past five years for the stocks now in a fund.
Equity Exposure. A measure that reflects a fund’s investments in stocks and stock futures. Any holdings in short-term reserves are excluded.
Expense Ratio. The percentage of a fund’s average net assets used to pay its annual administrative and advisory expenses. These expenses directly reduce returns to investors.
Foreign Holdings. The percentage of a fund represented by stocks or depositary receipts of companies based outside the United States.
Inception Date. The date on which the assets of a fund (or one of its share classes) are first invested in accordance with the fund’s investment objective. For funds with a subscription period, the inception date is the day after that period ends. Investment performance is measured from the inception date.
Median Market Cap. An indicator of the size of companies in which a fund invests; the midpoint of market capitalization (market price x shares outstanding) of a fund’s stocks, weighted by the proportion of the fund’s assets invested in each stock. Stocks representing half of the fund’s assets have market capitalizations above the median, and the rest are below it.
Price/Book Ratio. The share price of a stock divided by its net worth, or book value, per share. For a fund, the weighted average price/book ratio of the stocks it holds.
Price/Earnings Ratio. The ratio of a stock’s current price to its per-share earnings over the past year. For a fund, the weighted average P/E of the stocks it holds. P/E is an indicator of market expectations about corporate prospects; the higher the P/E, the greater the expectations for a company’s future growth.
Return on Equity. The annual average rate of return generated by a company during the past five years for each dollar of shareholder’s equity (net income divided by shareholder’s equity). For a fund, the weighted average return on equity for the companies whose stocks it holds.
Short-Term Reserves. The percentage of a fund invested in highly liquid, short-term securities that can be readily converted to cash.
Turnover Rate. An indication of the fund’s trading activity. Funds with high turnover rates incur higher transaction costs and may be more likely to distribute capital gains (which may be taxable to investors). The turnover rate excludes in-kind transactions, which have minimal impact on costs.
Yield. A snapshot of a fund’s income from interest and dividends. The yield, expressed as a percentage of the fund’s net asset value, is based on income earned over the past 30 days and is annualized, or projected forward for the coming year. The index yield is based on the current annualized rate of income provided by securities in the index.
28
This page intentionally left blank.
This page intentionally left blank.
This page intentionally left blank.
The People Who Govern Your Fund
The trustees of your mutual fund are there to see that the fund is operated and managed in your best interests since, as a shareholder, you are a part owner of the fund. Your fund’s trustees also serve on the board of directors of The Vanguard Group, Inc., which is owned by the Vanguard funds and provides services to them on an at-cost basis.
A majority of Vanguard’s board members are independent, meaning that they have no affiliation with Vanguard or the funds they oversee, apart from the sizable personal investments they have made as private individuals.
Our independent board members bring distinguished backgrounds in business, academia, and public service to their task of working with Vanguard officers to establish the policies and oversee the activities of the funds. Among board members’ responsibilities are selecting investment advisors for the funds; monitoring fund operations, performance, and costs; reviewing contracts; nominating and selecting new trustees/directors; and electing Vanguard officers.
Each trustee serves a fund until its termination; or until the trustee’s retirement, resignation, or death; or otherwise as specified in the fund’s organizational documents. Any trustee may be removed at a shareholders’ meeting by a vote representing two-thirds of the net asset value of all shares of the fund together with shares of other Vanguard funds organized within the same trust. The table on these two pages shows information for each trustee and executive officer of the fund. The mailing address of the trustees and officers is P.O. Box 876, Valley Forge, PA 19482.
Chairman of the Board, Chief Executive Officer, and Trustee |
| |
John J. Brennan1 | |
Born 1954 | Principal Occupation(s) During the Past Five Years: Chairman of the Board, Chief Executive |
Trustee since May 1987; | Officer, and Director/Trustee of The Vanguard Group, Inc., and of each of the investment |
Chairman of the Board and | companies served by The Vanguard Group. |
Chief Executive Officer | |
148 Vanguard Funds Overseen | |
| |
Independent Trustees | |
| |
Charles D. Ellis | |
Born 1937 | Principal Occupation(s) During the Past Five Years: Applecore Partners (pro bono ventures |
Trustee since January 2001 | in education); Senior Advisor to Greenwich Associates (international business strategy |
148 Vanguard Funds Overseen | consulting); Successor Trustee of Yale University; Overseer of the Stern School of Business |
| at New York University; Trustee of the Whitehead Institute for Biomedical Research. |
| |
Rajiv L. Gupta | |
Born 1945 | Principal Occupation(s) During the Past Five Years: Chairman, President, and |
Trustee since December 20012 | Chief Executive Officer of Rohm and Haas Co. (chemicals); Board Member of |
148 Vanguard Funds Overseen | the American Chemistry Council; Director of Tyco International, Ltd. (diversified |
| manufacturing and services) since 2005; Trustee of Drexel University and of the |
| Chemical Heritage Foundation. |
| |
Amy Gutmann | |
Born 1949 | Principal Occupation(s) During the Past Five Years: President of the University of |
Trustee since June 2006 | Pennsylvania since 2004; Professor in the School of Arts and Sciences, Annenberg School |
148 Vanguard Funds Overseen | for Communication, and Graduate School of Education of the University of Pennsylvania |
| since 2004; Provost (2001–2004) and Laurance S. Rockefeller Professor of Politics and |
| the University Center for Human Values (1990–2004), Princeton University; Director of |
| Carnegie Corporation of New York since 2005 and of Schuylkill River Development |
| Corporation and Greater Philadelphia Chamber of Commerce since 2004. |
JoAnn Heffernan Heisen | |
Born 1950 | Principal Occupation(s) During the Past Five Years: Corporate Vice President and |
Trustee since July 1998 | Chief Global Diversity Officer since 2006, Vice President and Chief Information |
148 Vanguard Funds Overseen | Officer (1997–2005), and Member of the Executive Committee of Johnson & |
| Johnson (pharmaceuticals/consumer products); Director of the University Medical |
| Center at Princeton and Women’s Research and Education Institute. |
| |
André F. Perold | |
Born 1952 | Principal Occupation(s) During the Past Five Years: George Gund Professor of Finance |
Trustee since December 2004 | and Banking, Harvard Business School; Senior Associate Dean, Director of Faculty |
148 Vanguard Funds Overseen | Recruiting, and Chair of Finance Faculty, Harvard Business School; Director and Chairman |
| of UNX, Inc. (equities trading firm) since 2003; Chair of the Investment Committee of |
| HighVista Strategies LLC (private investment firm) since 2005. |
| |
Alfred M. Rankin, Jr. | |
Born 1941 | Principal Occupation(s) During the Past Five Years: Chairman, President, Chief Executive |
Trustee since January 1993 | Officer, and Director of NACCO Industries, Inc. (forklift trucks/housewares/lignite); Director |
148 Vanguard Funds Overseen | of Goodrich Corporation (industrial products/aircraft systems and services). |
| |
| |
J. Lawrence Wilson | |
Born 1936 | Principal Occupation(s) During the Past Five Years: Retired Chairman and Chief Executive |
Trustee since April 1985 | Officer of Rohm and Haas Co. (chemicals); Director of Cummins Inc. (diesel engines) and |
148 Vanguard Funds Overseen | AmerisourceBergen Corp. (pharmaceutical distribution); Trustee of Vanderbilt University |
| and of Culver Educational Foundation. |
| |
Executive Officers1 | |
| |
Thomas J. Higgins | |
Born 1957 | Principal Occupation(s) During the Past Five Years: Principal of The Vanguard Group, Inc.; |
Treasurer since July 1998 | Treasurer of each of the investment companies served by The Vanguard Group. |
148 Vanguard Funds Overseen | |
| |
| |
Heidi Stam | |
Born 1956 | Principal Occupation(s) During the Past Five Years: Managing Director of The Vanguard |
Secretary since July 2005 | Group, Inc., since 2006; General Counsel of The Vanguard Group since 2005; Secretary of |
148 Vanguard Funds Overseen | The Vanguard Group, and of each of the investment companies served by The Vanguard |
| Group, since 2005; Principal of The Vanguard Group (1997–2006). |
Vanguard Senior Management Team | | |
| | | |
R. Gregory Barton | Kathleen C. Gubanich | F. William McNabb, III | Ralph K. Packard |
Mortimer J. Buckley | Paul A. Heller | Michael S. Miller | George U. Sauter |
Founder |
|
John C. Bogle |
Chairman and Chief Executive Officer, 1974–1996 |
1 Officers of the funds are “interested persons” as defined in the Investment Company Act of 1940.
2 December 2002 for Vanguard Equity Income Fund, Vanguard Growth Equity Fund, the Vanguard Municipal Bond Funds, and the Vanguard State Tax-Exempt Funds.
More information about the trustees is in the Statement of Additional Information, available from The Vanguard Group.

P.O. Box 2600
Valley Forge, PA 19482-2600
Connect with Vanguard® > www.vanguard.com
Fund Information > 800-662-7447 | Vanguard, Connect with Vanguard, and the ship logo are |
| trademarks of The Vanguard Group, Inc. |
Direct Investor Account Services > 800-662-2739 | |
| All other marks are the exclusive property of their |
Institutional Investor Services > 800-523-1036 | respective owners. |
| |
Text Telephone for People | |
With Hearing Impairment > 800-952-3335 | All comparative mutual fund data are from Lipper Inc. |
| or Morningstar, Inc., unless otherwise noted. |
| |
| |
| You can obtain a free copy of Vanguard’s proxy voting |
| guidelines by visiting our website, www.vanguard.com, |
This material may be used in conjunction | and searching for “proxy voting guidelines,” or by calling |
with the offering of shares of any Vanguard | Vanguard at 800-662-2739. The guidelines are also |
fund only if preceded or accompanied by | available from the SEC’s website, www.sec.gov. In |
the fund’s current prospectus. | addition, you may obtain a free report on how your fund |
| voted the proxies for securities it owned during the 12 |
| months ended June 30. To get the report, visit either |
| www.vanguard.com or www.sec.gov. |
| |
| |
| You can review and copy information about your fund |
| at the SEC’s Public Reference Room in Washington, D.C. |
| To find out more about this public service, call the SEC |
| at 202-551-8090. Information about your fund is also |
| available on the SEC’s website, and you can receive |
| copies of this information, for a fee, by sending a |
| request in either of two ways: via e-mail addressed to |
| publicinfo@sec.gov or via regular mail addressed to the |
| Public Reference Section, Securities and Exchange |
| Commission, Washington, DC 20549-0102. |
| |
| |
| |
| |
| |
| © 2007 The Vanguard Group, Inc. |
| All rights reserved. |
| Vanguard Marketing Corporation, Distributor. |
| |
| Q6150 112007 |
Item 2: Code of Ethics. The Registrant has adopted a code of ethics that applies to the Registrant’s principal executive officer, principal financial officer, principal accounting officer or controller or persons performing similar functions. The Code of Ethics was amended during the reporting period covered by this report to make certain technical, non-material changes.
Item 3: Audit Committee Financial Expert. The following members of the Audit Committee have been determined by the Registrant’s Board of Trustees to be Audit Committee Financial Experts serving on its Audit Committee, and to be independent: Charles D. Ellis, Rajiv L. Gupta, JoAnn Heffernan Heisen, André F. Perold, Alfred M. Rankin, Jr., and J. Lawrence Wilson.
Item 4: Principal Accountant Fees and Services.
Audit Fees of the Registrant
Fiscal Year Ended September 30, 2007: $102,000
Fiscal Year Ended September 30, 2006: $96,000
Aggregate Audit Fees of Registered Investment Companies in the Vanguard Group.
Fiscal Year Ended September 30, 2007: $2,835,320
Fiscal Year Ended September 30, 2006: $2,347,620
Fiscal Year Ended September 30, 2007: $630,400
Fiscal Year Ended September 30, 2006: $530,000
Includes fees billed in connection with assurance and related services provided to the Registrant, The Vanguard Group, Inc., Vanguard Marketing Corporation, and other registered investment companies in the Vanguard Group.
Fiscal Year Ended September 30, 2007: $215,900
Fiscal Year Ended September 30, 2006: $101,300
Includes fees billed in connection with tax compliance, planning and advice services provided to the Registrant, The Vanguard Group, Inc., Vanguard Marketing Corporation, and other registered investment companies in the Vanguard Group and related to income and excise taxes.
Fiscal Year Ended September 30, 2007: $0
Fiscal Year Ended September 30, 2006: $0
Includes fees billed for services related to risk management and privacy matters. Services were provided to the Registrant, The Vanguard Group, Inc., Vanguard Marketing Corporation, and other registered investment companies in the Vanguard Group.
(e) (1) Pre-Approval Policies. The policy of the Registrant’s Audit Committee is to consider and, if appropriate, approve before the principal accountant is engaged for such services, all specific audit and non-audit services provided to: (1) the Registrant; (2) The Vanguard Group, Inc.; (3) other entities controlled by The Vanguard Group, Inc. that provide ongoing services to the Registrant; and (4) other registered investment companies in the Vanguard Group. In making a determination, the Audit Committee considers whether the services are consistent with maintaining the principal accountant’s independence.
In the event of a contingency situation in which the principal accountant is needed to provide services in between scheduled Audit Committee meetings, the Chairman of the Audit Committee would be called on to consider and, if appropriate, pre-approve audit or permitted non-audit services in an amount sufficient to complete services through the next Audit Committee meeting, and to determine if such services would be consistent with maintaining the accountant’s independence. At the next scheduled Audit Committee meeting, services and fees would be presented to the Audit Committee for formal consideration, and, if appropriate, approval by the entire Audit Committee. The Audit Committee would again
consider whether such services and fees are consistent with maintaining the principal accountant’s independence.
The Registrant’s Audit Committee is informed at least annually of all audit and non-audit services provided by the principal accountant to the Vanguard complex, whether such services are provided to: (1) the Registrant; (2) The Vanguard Group, Inc.; (3) other entities controlled by The Vanguard Group, Inc. that provide ongoing services to the Registrant; or (4) other registered investment companies in the Vanguard Group.
(2) No percentage of the principal accountant’s fees or services were approved pursuant to the waiver provision of paragraph (c)(7)(i)(C) of Rule 2-01 of Regulation S-X.
(f) For the most recent fiscal year, over 50% of the hours worked under the principal accountant’s engagement were not performed by persons other than full-time, permanent employees of the principal accountant.
(g) | Aggregate Non-Audit Fees. |
Fiscal Year Ended September 30, 2007: $215,900
Fiscal Year Ended September 30, 2006: $101,300
Includes fees billed for non-audit services provided to the Registrant, The Vanguard Group, Inc., Vanguard Marketing Corporation, and other registered investment companies in the Vanguard Group.
(h) For the most recent fiscal year, the Audit Committee has determined that the provision of all non-audit services was consistent with maintaining the principal accountant’s independence.
Item 5: Not Applicable.
Item 6: Not Applicable.
Item 7: Not Applicable.
Item 8: Not Applicable.
Item 9: Not Applicable.
Item 10: Not Applicable.
Item 11: Controls and Procedures.
(a) Disclosure Controls and Procedures. The Principal Executive and Financial Officers concluded that the Registrant's Disclosure Controls and Procedures are effective based on their evaluation of the Disclosure Controls and Procedures as of a date within 90 days of the filing date of this report.
(b) Internal Control Over Financial Reporting. There were no significant changes in Registrant’s Internal Control Over Financial Reporting or in other factors that could
significantly affect this control subsequent to the date of the evaluation, including any corrective actions with regard to significant deficiencies and material weaknesses.
Item 12: Exhibits.
Pursuant to the requirements of the Securities Exchange Act of 1934 and the Investment Company Act of 1940, the registrant has duly caused this report to be signed on its behalf by the undersigned, thereunto duly authorized.
| BY:_____________(signature)________________ |
Date: November 14, 2007
Pursuant to the requirements of the Securities Exchange Act of 1934 and the Investment Company Act of 1940, this report has been signed below by the following persons on behalf of the registrant and in the capacities and on the dates indicated.
| BY:_____________(signature)________________ |
Date: November 14, 2007
| BY:_____________(signature)________________ |
Date: November 14, 2007
*By Power of Attorney. See File Number 333-145624, filed on August 22, 2007. Incorporated by Reference.