UNITED STATES
SECURITIES AND EXCHANGE COMMISSION
Washington, D.C. 20549
FORM N-CSR
CERTIFIED SHAREHOLDER REPORT
OF
REGISTERED MANAGEMENT INVESTMENT COMPANIES
Investment Company Act file number: 811-07239
Name of Registrant: Vanguard Horizon Funds
Address of Registrant: | P.O. Box 2600
Valley Forge, PA 19482 |
Name and address of agent for service: | Heidi Stam, Esquire |
Registrant’s telephone number, including area code: (610) 669-1000
Date of fiscal year end: September 30
Date of reporting period: October 1, 2005– September 30, 2006
Item 1: Reports to Shareholders |
Vanguard® Strategic Equity Fund |
| |
| |
> Annual Report | |
| |
| |
| |
| |
September 30, 2006 | |
| |
| |
| 
|
| |
| |
| |
| |
| |
| |
| |
> | Vanguard Strategic Equity Fund returned 6.5% for the 2006 fiscal year. The fund underperformed both its benchmark index and the average peer fund. |
> | The advisor made some disappointing stock selections in the energy, health care, and financials sectors during the period. Its choices in the consumer discretionary and consumer staples sectors, however, made strong relative contributions to the fund’s return. |
> | The fund’s ten-year record is excellent; for the decade it has solidly outperformed both its benchmark index and peer group. |
Contents | |
| |
Your Fund’s Total Returns | 1 |
Chairman’s Letter | 2 |
Advisor’s Report | 7 |
Fund Profile | 9 |
Performance Summary | 10 |
Financial Statements | 11 |
Your Fund’s After-Tax Returns | 28 |
About Your Fund’s Expenses | 29 |
Glossary | 31 |
Please note: The opinions expressed in this report are just that—informed opinions. They should not be considered promises or advice. Also, please keep in mind that the information and opinions cover the period through the date on the cover of this report. Of course, the risks of investing in your fund are spelled out in the prospectus.
Your Fund’s Total Returns
Fiscal Year Ended September 30, 2006 | |
| Total |
| Returns |
Vanguard Strategic Equity Fund | 6.5% |
MSCI US Small + Mid Cap 2200 Index | 8.6 |
Average Mid-Cap Core Fund1 | 7.3 |
Dow Jones Wilshire 5000 Index | 10.5 |
Your Fund’s Performance at a Glance |
September 30, 2005–September 30, 2006 |
| | | Distributions Per Share |
| Starting | Ending | Income | Capital |
| Share Price | Share Price | Dividends | Gains |
Vanguard Strategic Equity Fund | $23.28 | $23.07 | $0.21 | $1.44 |
1 | Derived from data provided by Lipper Inc. |
1

Chairman’s Letter
Dear Shareholder,
Vanguard Strategic Equity Fund returned 6.5% for the fiscal year ended September 30, 2006. This result fell short of the return of its benchmark, the Morgan Stanley Capital International (MSCI) US Small + Mid Cap 2200 Index, as well as of the average return of its competitive peers. The fund’s subpar performance resulted from some poorly performing stock choices and missed opportunities in key sectors.
Please note: On November 9, 2006, after the close of the fiscal period, the fund reopened to new accounts. It had been closed since April 20, 2006. The fund’s minimum initial investment was increased to $10,000.
Stocks endured some rough going, then recovered to post strong results
The stock market advanced through the first part of the fund’s fiscal year, then hit a speed bump in May, as investors feared that the economy was growing too rapidly. But a slowdown in the housing market, coupled with a late-summer decline in oil prices, helped to allay inflation concerns. The broad market rebounded to post a solid 10.5% return for the 12-month period. Value-oriented stocks outperformed growth stocks, and large-capitalization stocks edged out small-caps, one of the market’s best-performing segments in recent years.
2
International stocks handily outpaced domestic issues, continuing a multiyear trend. European and emerging market stocks fared particularly well. Stocks in the Pacific region also performed admirably, even though Japanese stocks did not fully participate in the global market’s summer recovery.
In the bond market, prices rallied as the Fed paused
At its August and September meetings, the Federal Reserve Board twice voted to maintain the federal funds rate at 5.25%, marking a pause in the central bank’s two-year inflation-fighting campaign. With investor sentiment buoyed by the
Fed’s near-term inflation outlook, interest rates decreased, driving bond prices higher. The broad taxable bond market finished the period with a 3.7% return, and municipal bonds performed slightly better.
Although rates decreased along the entire maturity spectrum in late summer, the difference between the yields of the shortest- and longest-term issues remained narrow by historical standards. At the end of September, the U.S. Treasury yield curve was actually inverted, meaning that short-term issues such as 3-month and 6-month Treasury notes offered higher yields than those with longer maturities.
Market Barometer | | | |
| Average Annual Total Returns |
| Periods Ended September 30, 2006 |
| One Year | Three Years | Five Years |
Stocks | | | |
Russell 1000 Index (Large-caps) | 10.2% | 12.8% | 7.6% |
Russell 2000 Index (Small-caps) | 9.9 | 15.5 | 13.8 |
Dow Jones Wilshire 5000 Index (Entire market) |
10.5
|
13.3
|
8.6
|
MSCI All Country World Index ex USA (International) | 19.4 | 23.9 | 16.4 |
| | | |
Bonds | | | |
Lehman Aggregate Bond Index (Broad taxable market) |
3.7%
|
3.4%
|
4.8%
|
Lehman Municipal Bond Index | 4.5 | 4.4 | 5.2 |
Citigroup 3-Month Treasury Bill Index | 4.4 | 2.6 | 2.2 |
| | | |
CPI | | | |
Consumer Price Index | 2.1% | 3.1% | 2.6% |
3
Stock-selection challenges led to performance deficit
The period was a challenging one for the Strategic Equity Fund’s computer-driven stock-selection process, which seeks to match the risk profile of the fund’s benchmark while outperforming the index through superior stock selection. The advisor had some miscues and missed opportunities in a few of the fund’s larger sectors—namely energy, health care, and financials—which together accounted for much of the fund’s shortfall versus the benchmark. In short, the advisor’s assessment of the prospects for some of its stock picks proved a bit more positive than the market’s sentiment. Among energy holdings, the fund’s oil and gas drillers turned in much poorer returns than those in the index. In the health care sector, the fund’s equipment makers and biotech holdings proved to be detractors versus those in the index. And among financials—the fund’s (and the benchmark’s) largest sector, at roughly one-fifth of assets, on average—insurance companies and asset managers in the fund’s portfolio failed to keep pace with their index counterparts.
On the positive side, the advisor made a number of good stock choices in consumer-oriented sectors. These sectors were aided by moderating energy prices and the unflinching strength of consumer spending. The fund’s consumer discretionary holdings were boosted by the surprisingly strong performances of apparel retailers and restaurants, particularly Guess? and Darden Restaurants. In consumer staples, tobacco maker Carolina Group and beverage distributor Pepsi Bottling Group were the top contributors to the fund’s relative return.
As the fiscal year’s results attest, the fund’s stock-selection models, which emphasize attractive valuations and earnings quality, are not always in sync with the short-term dynamics of the mid- and small-cap marketplace. The models also incorporate measures of market, or investor, sentiment, which can shift abruptly. As with any active strategy, the same characteristics that differentiate the fund from its benchmark, giving it the chance to outperform, can also lead to occasional periods of weakness. For more details on factors that influenced the fund’s performance over the period, see the Advisor’s Report on page 7.
Long-term record is excellent
Despite its challenging recent fiscal period, the fund has proven the merit of its investment process by producing impressive long-term results. Indeed, the fund’s average annual return over the past ten years has surpassed that of its benchmark index by 1.4 percentage points. A hypothetical investment of $10,000 made in the fund ten years ago would have grown to $32,838 by September 30. By comparison, the same investment in the fund’s benchmark index would have
4
been worth $28,950. The second table below compares your fund’s performance with those of its comparative measures.
Your fund’s advisor, Vanguard Quantitative Equity Group, has worked diligently to hone its quantitative models in seeking superior results for the fund. The Strategic Equity Fund’s very low costs are also vital to its long-term success. Low costs help investors maximize their share of the fund’s returns. The first table below compares the fund’s expense ratio with that of its peer group.
Don’t let short-term performance cloud your long-term view
The short-term results of the latest “hot” mutual fund can divert some investors’ attention from the discipline and focus of long-term investing. For those investors, the lure of powerful short-term performance assumes priority over longer-term results.
At Vanguard, we counsel investors to discount short-term performance and, instead, to thoughtfully evaluate a fund’s long-term role within their portfolio. Is it a core holding or does it play a smaller role? Crucial to long-term investing is a well-thought-out, diversified portfolio of stock, bond, and money market funds tailored to meet your personal goals. Once you have completed this “advance” work, we suggest that you stay the course through the market’s ups and downs, resisting the short-term urge to tinker.
Expense Ratios1 | | |
Your fund compared with its peer group | | |
| | Average |
| | Mid-Cap |
| Fund | Core Fund |
Strategic Equity Fund | 0.35% | 1.52% |
Total Returns | | |
Ten Years Ended September 30, 2006 | | |
| Average | Final Value of a $10,000 |
| Annual Return | Initial Investment |
Strategic Equity Fund | 12.6% | $32,838 |
Spliced Small and Mid Cap Index2 | 11.2 | 28,950 |
Average Mid-Cap Core Fund | 11.5 | 29,632 |
Dow Jones Wilshire 5000 Index | 8.6 | 22,871 |
1 | Fund expense ratio reflects the 12 months ended September 30, 2006. Peer-group expense ratio is derived from data provided by Lipper Inc. and captures information through year-end 2005. |
2 | The Spliced Small and Mid Cap Index reflects the returns of the Russell 2800 Index through May 31, 2003, and the MSCI US Small + Mid Cap 2200 Index thereafter. |
5
As a part of the stock component of a balanced, diversified investment plan, the Strategic Equity Fund can play an important role in helping you to reach your long-term financial goals. Considering the advisor’s proven skill and the fund’s low operating expenses, we are optimistic about the fund’s prospects for posting competitive long-term results.
Thank you for your continued confidence in Vanguard.
Sincerely,

John J. Brennan
Chairman and Chief Executive Officer
November 9, 2006
6
Advisor’s Report
For the fiscal year ended September 30, 2006, the Vanguard Strategic Equity Fund returned 6.5%, underperforming its benchmark, the MSCI US Small + Mid Cap 2200 Index, which posted an 8.6% return. During the year, small- and mid-cap value stocks in the benchmark returned 10.3% and 10.0%, respectively, while its small- and mid-cap growth components earned comparatively less—5.4% and 8.1%, respectively. Energy stocks in the benchmark declined –6.5%, while its telecommunication services stocks rose 39.1%.
The investment environment
The benchmark’s solid, but unspectacular, return hid the instability underlying the market during the fiscal year. At the beginning of the period, the price of a barrel of West Texas Intermediate Crude oil was $66.25, the federal funds rate was 3.75%, and the 10-year U.S. Treasury note yielded 4.3%. In May 2006, the fund’s benchmark dropped –4.2% and in June, stock market volatility jumped to levels not seen in three years. During the summer, oil reached $77.03 per barrel, and the 10-year Treasury’s yield reached 5.2%. At the close of the fiscal year, oil stood at $62.92, the federal funds rate was 5.25%, and the 10-year Treasury yielded 4.6%. When we began the fiscal year, markets were extremely concerned about the Federal Reserve Board’s inflation-fighting resolve; as we end the fiscal year, the market’s concern seems to be assuaged.
In our view, it seems unlikely that the Fed’s inflation-fighting commitment has changed dramatically in the last year or that the supply-and-demand dynamics of petroleum have shifted significantly. We still maintain that the markets often overreact to short-term news—that is the basis of our stock-selection strategy.
Our investment approach
Our investment process evaluates each stock in the benchmark for its relative performance potential based on market sentiment, valuation, and earnings quality compared with its peers. We believe that at least one of these three elements captures the market’s overreaction to news. We construct our portfolio from the stocks that have the most attractive expected returns, while remaining neutral to industry and other risk factors. Thus, financials—our largest sector—represents 22% of the portfolio, not because of our view about financial stocks but because the benchmark has a weighting of 22.0% in this sector.
We aggressively buy and sell stocks within sectors in an attempt to provide higher returns than the benchmark. Based on our research to date, we have
7
concluded that attempting to add value by over- or underweighting sectors is not worth the additional risk. Chiefly, this is because we prefer to take many small positions in stocks, rather than a few big ones. With only ten sectors, one wrong over- or underweighting can adversely affect performance much more than one much smaller stock selection gone awry in a well-diversified portfolio. Similarly, we do not tilt toward or away from the benchmark’s smaller-capitalization stocks. The changes in the market environment highlighted earlier in this report demonstrate how difficult it is to add value by leaning toward specific industries or market segments.
The fund’s successes and shortfalls
During the fiscal year, our overall model was modestly successful in assessing future prospects. We add value in two ways: by purchasing stocks that outperform the market and by avoiding stocks that underperform. This year, the stocks that we identified for sale strongly underperformed the benchmark, while our candidates for purchase barely matched the market. Unfortunately, the stocks we held in the portfolio did not match the success of our model. This factor, together with our sentiment indicator’s lackluster results, was the main contributor to the year’s subpar performance.
Our best performance relative to the benchmark was in consumer discretionary stocks, where our overweighted positions in Guess? (+126% for the fiscal year) and Abercrombie & Fitch (+41%) helped the portfolio outperform the benchmark sector. On the other hand, health care was our worst-performing sector relative to the benchmark; our positions in Manor Care (+38%) and Andrx Group (+58%) were unable to overcome the drag from our holdings in Apria Health-care Group (–38%) and United Therapeutics (–25%).
We expect occasional periods of underperformance in our portfolio, since we take significant stock-specific risks in our effort to outperform our universe. While the past year was not a total success, our process has worked well over time. We feel that the fund offers an attractive mix of stocks with high earnings quality, market acceptance, and reasonable valuations. We look forward to the coming fiscal year with confidence in our process.
James D. Troyer,
Principal and Portfolio Manager
Joel M. Dickson, Principal
Vanguard Quantitative Equity Group
October 19, 2006
8
Fund Profile
As of September 30, 2006
Portfolio Characteristics | | |
| | Comparative | Broad |
| Fund | Index1 | Index2 |
Number of Stocks | 777 | 2,174 | 4,974 |
Median Market Cap | $3.5B | $3.8B | $27.5B |
Price/Earnings Ratio | 15.6x | 20.7x | 17.2x |
Price/Book Ratio | 2.4x | 2.5x | 3.7x |
Yield | 1.1% | 1.3% | 1.7% |
Return on Equity | 14.0% | 13.4% | 15.4% |
Earnings Growth Rate | 17.9% | 16.4% | 15.7% |
Foreign Holdings | 0.2% | 0.0% | 1.1% |
Turnover Rate | 80% | — | — |
Expense Ratio | 0.35% | — | — |
Short-Term Reserves | 0% | — | — |
Sector Diversification (% of portfolio) |
| | Comparative | Broad |
| Fund | Index1 | Index2 |
Consumer Discretionary | 16% | 16% | 12% |
Consumer Staples | 3 | 3 | 9 |
Energy | 8 | 8 | 9 |
Financials | 22 | 22 | 23 |
Health Care | 10 | 10 | 12 |
Industrials | 13 | 13 | 11 |
Information Technology | 15 | 15 | 15 |
Materials | 5 | 5 | 3 |
Telecommunication | | | |
Services | 2 | 2 | 3 |
Utilities | 6 | 6 | 3 |
Volatility Measures3 | |
| Fund Versus | Fund Versus |
| Comparative Index1 | Broad Index2 |
R-Squared | 0.98 | 0.84 |
Beta | 1.03 | 1.35 |
Ten Largest Holdings4 (% of total net assets) |
| | |
AmerisourceBergen Corp. | health care | |
| distributors | 1.0% |
Parker Hannifin Corp. | industrial machinery | 1.0 |
Fiserv, Inc. | data processing and | |
| outsourced services | 1.0 |
Safeco Corp. | property and | |
| casualty insurance | 1.0 |
Nordstrom, Inc. | department stores | 1.0 |
Whirlpool Corp. | household appliances | 1.0 |
Freeport-McMoRan | | |
Copper & Gold, Inc. | diversified metals | |
Class B | and mining | 0.9 |
Cummins Inc. | construction and | |
| farm machinery and | |
| heavy trucks | 0.9 |
Darden Restaurants Inc. | restaurants | 0.9 |
Radian Group, Inc. | thrifts and | |
| mortgage finance | 0.9 |
Top Ten | | 9.6% |
Investment Focus

1 | MSCI US Small + Mid Cap 2200 Index. |
2 | Dow Jones Wilshire 5000 Index. |
3 | For an explanation of R-squared, beta, and other terms used here, see the Glossary on page 31. |
4 | “Ten Largest Holdings” excludes any temporary cash investments and equity index products. |
9
Performance Summary
All of the returns in this report represent past performance, which is not a guarantee of future results that may be achieved by the fund. (Current performance may be lower or higher than the performance data cited. For performance data current to the most recent month-end, visit our website at www.vanguard.com.) Note, too, that both investment returns and principal value can fluctuate widely, so an investor’s shares, when sold, could be worth more or less than their original cost. The returns shown do not reflect taxes that a shareholder would pay on fund distributions or on the sale of fund shares.
Cumulative Performance: September 30, 1996–September 30, 2006
Initial Investment of $10,000

| | | | |
| Average Annual Total Returns | Final Value |
| Periods Ended September 30, 2006 | of a $10,000 |
| One Year | Five Years | Ten Years | Investment |
Strategic Equity Fund | 6.49% | 14.89% | 12.63% | $32,838 |
Dow Jones Wilshire 5000 Index | 10.48 | 8.64 | 8.62 | 22,871 |
Spliced Small and Mid Cap Index1 | 8.61 | 14.59 | 11.22 | 28,950 |
Average Mid-Cap Core Fund2 | 7.27 | 11.61 | 11.47 | 29,632 |
Fiscal-Year Total Returns (%): September 30, 1996–September 30, 2006
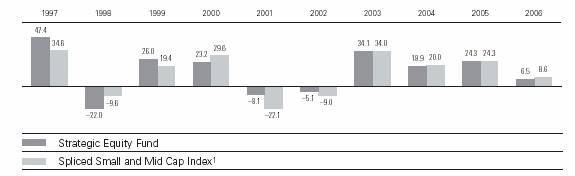
| 1 | The Spliced Small and Mid Cap Index reflects the returns of the Russell 2800 Index through May 31, 2003, and the MSCI US Small + Mid Cap 2200 Index thereafter. |
| 2 | Derived from data provided by Lipper Inc. |
Note: See Financial Highlights table on page 23 for dividend and capital gains information.
10
Financial Statements
Statement of Net Assets
As of September 30, 2006
The fund provides a complete list of its holdings four times in each fiscal year, at the quarter-ends. For the second and fourth fiscal quarters, the lists appear in the fund’s semiannual and annual reports to shareholders. For the first and third fiscal quarters, the fund files the lists with the Securities and Exchange Commission on Form N-Q. Shareholders can look up the fund’s Forms N-Q on the SEC’s website at www.sec.gov. Forms N-Q may also be reviewed and copied at the SEC’s Public Reference Room (see the back cover of this report for further information).
| | | Market |
| | | Value• |
| | Shares | ($000) |
Common Stocks (100.0%)1 | | |
Consumer Discretionary (15.7%) | |
| Nordstrom, Inc. | 1,536,900 | 65,011 |
| Whirlpool Corp. | 770,800 | 64,832 |
| Darden Restaurants Inc. | 1,411,300 | 59,938 |
| VF Corp. | 749,294 | 54,661 |
| Royal Caribbean | | |
| Cruises, Ltd. | 1,229,019 | 47,698 |
| Abercrombie & Fitch Co. | 496,300 | 34,483 |
| Polo Ralph Lauren Corp. | 523,380 | 33,857 |
* | Guess ?, Inc. | 687,900 | 33,384 |
* | AutoNation, Inc. | 1,493,347 | 31,211 |
| Phillips-Van Heusen Corp. | 719,100 | 30,037 |
* | Liberty Media Capital A | 303,947 | 25,401 |
| Brinker International, Inc. | 612,800 | 24,567 |
| Men’s Wearhouse, Inc. | 603,350 | 22,451 |
| Newell Rubbermaid, Inc. | 675,146 | 19,120 |
| Cablevision Systems | | |
| NY Group Class A | 805,600 | 18,295 |
| Dillard’s Inc. | 555,200 | 18,172 |
| Jackson Hewitt Tax | | |
| Service Inc. | 580,000 | 17,406 |
| Catalina Marketing Corp. | 610,570 | 16,791 |
| Ruby Tuesday, Inc. | 581,800 | 16,401 |
* | The Goodyear Tire & | | |
| Rubber Co. | 1,037,799 | 15,048 |
| New York Times Co. | | |
| Class A | 643,386 | 14,785 |
| Barnes & Noble, Inc. | 370,045 | 14,040 |
| ^Regal Entertainment Group | |
| Class A | 681,147 | 13,500 |
* | CSK Auto Corp. | 879,600 | 12,402 |
* | Skechers U.S.A., Inc. | 501,200 | 11,783 |
| Sherwin-Williams Co. | 208,357 | 11,622 |
| Jones Apparel Group, Inc. | 352,800 | 11,445 |
* | Payless ShoeSource, Inc. | 459,400 | 11,439 |
* | Charming Shoppes, Inc. | 777,258 | 11,099 |
| Meredith Corp. | 193,320 | 9,536 |
* | The Pantry, Inc. | 166,400 | 9,380 |
| Washington Post Co. Class B | 12,378 | 9,123 |
* | NVR, Inc. | 17,000 | 9,095 |
* | Jack in the Box Inc. | 173,100 | 9,032 |
* | MGM Mirage, Inc. | 228,422 | 9,020 |
| Bob Evans Farms, Inc. | 284,017 | 8,600 |
| Claire’s Stores, Inc. | 268,300 | 7,824 |
* | RCN Corp. | 273,012 | 7,726 |
| K-Swiss, Inc. | 252,351 | 7,586 |
| Belo Corp. Class A | 448,900 | 7,097 |
* | Genesco, Inc. | 200,200 | 6,901 |
| Mattel, Inc. | 343,400 | 6,765 |
| Cato Corp. Class A | 271,350 | 5,945 |
* | DreamWorks | | |
| Animation SKG, Inc. | 234,133 | 5,832 |
| Domino’s Pizza, Inc. | 218,100 | 5,594 |
* | Mohawk Industries, Inc. | 73,925 | 5,504 |
* | Gemstar-TV Guide | | |
| International, Inc. | 1,603,422 | 5,323 |
* | ProQuest Co. | 408,440 | 5,318 |
* | JAKKS Pacific, Inc. | 285,500 | 5,090 |
| Entercom | | |
| Communications Corp. | 199,999 | 5,040 |
| John Wiley & Sons Class A | 133,800 | 4,818 |
| ServiceMaster Co. | 427,200 | 4,789 |
| Brown Shoe Co., Inc. | 122,900 | 4,405 |
| Modine Manufacturing Co. | 174,700 | 4,250 |
| ^Bandag, Inc. | 103,500 | 4,248 |
* | Laureate Education Inc. | 88,224 | 4,222 |
| Group 1 Automotive, Inc. | 83,500 | 4,167 |
| ^Furniture Brands | | |
| International Inc. | 217,000 | 4,132 |
| Sonic Automotive, Inc. | 175,000 | 4,041 |
* | Wyndham Worldwide Corp. | 142,900 | 3,997 |
* | Career Education Corp. | 163,900 | 3,688 |
| United Auto Group, Inc. | 156,000 | 3,650 |
| World Wrestling | | |
| Entertainment, Inc. | 209,087 | 3,435 |
* | Cox Radio, Inc. | 222,131 | 3,410 |
| Harte-Hanks, Inc. | 128,200 | 3,378 |
* | The Dress Barn, Inc. | 154,780 | 3,377 |
| Warner Music Group Corp. | 122,163 | 3,170 |
11
| | | Market |
| | | Value• |
| | Shares | ($000) |
* | Visteon Corp. | 382,900 | 3,121 |
* | TRW Automotive | | |
| Holdings Corp. | 129,546 | 3,118 |
| Steven Madden, Ltd. | 74,131 | 2,909 |
| Beazer Homes USA, Inc. | 69,800 | 2,725 |
| Building Materials | | |
| Holding Corp. | 103,900 | 2,703 |
| ArvinMeritor, Inc. | 189,300 | 2,696 |
* | Select Comfort Corp. | 112,900 | 2,470 |
* | Corinthian Colleges, Inc. | 223,600 | 2,417 |
* | Meritage Corp. | 57,700 | 2,401 |
| American Greetings Corp. | | |
| Class A | 100,700 | 2,328 |
| IHOP Corp. | 47,300 | 2,192 |
* | Papa John’s International, Inc. | 60,621 | 2,189 |
| Sotheby’s | 66,278 | 2,137 |
* | Blockbuster Inc. Class A | 544,000 | 2,089 |
* | Steak n Shake Co. | 121,208 | 2,047 |
| Ethan Allen Interiors, Inc. | 59,000 | 2,045 |
| Advance Auto Parts, Inc. | 55,786 | 1,838 |
| Journal Communications, Inc. | 160,900 | 1,813 |
| Ross Stores, Inc. | 70,643 | 1,795 |
| Dow Jones & Co., Inc. | 53,000 | 1,778 |
| Aaron Rents, Inc. Class B | 68,800 | 1,581 |
| Asbury Automotive Group, Inc. | 76,300 | 1,572 |
| Movado Group, Inc. | 61,100 | 1,553 |
| Kimball International, Inc. | | |
| Class B | 78,786 | 1,521 |
| International Speedway Corp. | 29,684 | 1,479 |
* | Dollar Tree Stores, Inc. | 46,704 | 1,446 |
| Stage Stores, Inc. | 48,000 | 1,408 |
| UniFirst Corp. | 44,200 | 1,381 |
* | Spanish Broadcasting | | |
| System, Inc. | 313,574 | 1,370 |
| Service Corp. International | 139,900 | 1,307 |
| The Buckle, Inc. | 34,100 | 1,294 |
| Dover Downs Gaming & | | |
| Entertainment, Inc. | 104,450 | 1,269 |
| Winnebago Industries, Inc. | 39,600 | 1,243 |
* | FTD Group, Inc. | 79,900 | 1,234 |
* | ^Tempur-Pedic International Inc. | 66,000 | 1,133 |
| ^Brookfield Homes Corp. | 31,800 | 896 |
* | ^Netflix.com, Inc. | 38,025 | 866 |
| Kellwood Co. | 27,400 | 790 |
* | O’Charley’s Inc. | 40,900 | 776 |
| Haverty Furniture Cos., Inc. | 48,200 | 769 |
| Landry’s Restaurants, Inc. | 24,600 | 742 |
* | Tenneco Automotive, Inc. | 27,800 | 650 |
| Lithia Motors, Inc. | 20,900 | 517 |
* | Interactive Data Corp. | 25,000 | 499 |
| Liz Claiborne, Inc. | 12,300 | 486 |
* | Vertrue Inc. | 11,600 | 456 |
* | Harris Interactive Inc. | 73,070 | 446 |
| Technical Olympic USA, Inc. | 43,000 | 423 |
| CSS Industries, Inc. | 12,700 | 377 |
| Xerium Technologies Inc. | 31,600 | 350 |
* | Penn National Gaming, Inc. | 8,566 | 313 |
| Stewart Enterprises, Inc. | | |
| Class A | 45,958 | 269 |
* | ITT Educational Services, Inc. | 3,800 | 252 |
| American Eagle Outfitters, Inc. | 5,600 | 245 |
* | Denny’s Corp. | 56,917 | 194 |
| Journal Register Co. | 31,300 | 177 |
| Salem Communications Corp. | 7,207 | 82 |
| | | 1,057,564 |
Consumer Staples (3.2%) | | |
| Carolina Group | 867,600 | 48,056 |
| The Pepsi Bottling | | |
| Group, Inc. | 951,500 | 33,778 |
| The Kroger Co. | 622,000 | 14,393 |
* | Central Garden and Pet Co. | 264,440 | 12,762 |
| Del Monte Foods Co. | 1,139,527 | 11,908 |
| Brown-Forman Corp. | | |
| Class B | 155,107 | 11,889 |
| Longs Drug Stores, Inc. | 244,410 | 11,245 |
* | Herbalife Ltd. | 274,700 | 10,406 |
* | Energizer Holdings, Inc. | 142,800 | 10,280 |
* | Hansen Natural Corp. | 266,324 | 8,650 |
| The Great Atlantic & | | |
| Pacific Tea Co., Inc. | 300,199 | 7,229 |
| Estee Lauder Cos. Class A | 139,300 | 5,618 |
* | NBTY, Inc. | 169,783 | 4,970 |
| Lancaster Colony Corp. | 90,100 | 4,033 |
| Ruddick Corp. | 120,700 | 3,142 |
| Corn Products | | |
| International, Inc. | 93,500 | 3,043 |
| Seaboard Corp. | 2,290 | 2,759 |
* | Dean Foods Co. | 65,602 | 2,757 |
* | Prestige Brands Holdings Inc. | 197,000 | 2,195 |
| Molson Coors Brewing Co. | | |
| Class B | 28,200 | 1,943 |
* | Performance Food Group Co. | 57,991 | 1,629 |
| Ingles Markets, Inc. | 44,400 | 1,171 |
| ^Mannatech, Inc. | 62,984 | 1,116 |
| Weis Markets, Inc. | 18,300 | 728 |
| Premium Standard Farms Inc. | 34,770 | 662 |
* | Wild Oats Markets Inc. | 36,667 | 593 |
* | BJ’s Wholesale Club, Inc. | 20,200 | 589 |
* | Alliance One | | |
| International, Inc. | 120,000 | 492 |
| Vector Group Ltd. | 26,590 | 431 |
| Chiquita Brands | | |
| International, Inc. | 10,748 | 144 |
| | | 218,611 |
Energy (8.1%) | | |
| Patterson-UTI Energy, Inc. | 2,112,927 | 50,203 |
| Helmerich & Payne, Inc. | 2,142,242 | 49,336 |
| Sunoco, Inc. | 584,900 | 36,375 |
| Chesapeake Energy Corp. | 1,240,729 | 35,956 |
| Hess Corp. | 813,627 | 33,700 |
| Tesoro Petroleum Corp. | 483,500 | 28,033 |
* | Swift Energy Co. | 609,600 | 25,493 |
12
| | | Market |
| | | Value• |
| | Shares | ($000) |
* | Nabors Industries, Inc. | 778,762 | 23,168 |
| Frontier Oil Corp. | 853,200 | 22,678 |
* | Todco Class A | 633,825 | 21,930 |
| Holly Corp. | 502,958 | 21,793 |
* | Helix Energy | | |
| Solutions Group, Inc. | 622,682 | 20,798 |
* | Unit Corp. | 405,012 | 18,618 |
| ENSCO International, Inc. | 409,709 | 17,958 |
| Rowan Cos., Inc. | 516,506 | 16,337 |
* | Veritas DGC Inc. | 243,433 | 16,023 |
* | Grey Wolf, Inc. | 2,017,419 | 13,476 |
* | Atwood Oceanics, Inc. | 294,100 | 13,226 |
| Diamond Offshore | | |
| Drilling, Inc. | 179,750 | 13,009 |
* | Pioneer Drilling Co. | 957,400 | 12,293 |
* | Denbury Resources, Inc. | 424,097 | 12,256 |
| El Paso Corp. | 746,900 | 10,188 |
| Tidewater Inc. | 164,000 | 7,247 |
* | Maverick Tube Corp. | 73,800 | 4,784 |
* | Pride International, Inc. | 155,500 | 4,264 |
* | SEACOR Holdings Inc. | 43,300 | 3,572 |
* | Parker Drilling Co. | 363,500 | 2,574 |
* | NS Group Inc. | 37,700 | 2,434 |
| W&T Offshore, Inc. | 79,800 | 2,331 |
* | Lone Star Technologies, Inc. | 46,792 | 2,264 |
| Foundation Coal Holdings, Inc. | 66,000 | 2,136 |
* | Giant Industries, Inc. | 24,675 | 2,004 |
* | Stone Energy Corp. | 41,800 | 1,692 |
* | Energy Partners, Ltd. | 61,300 | 1,511 |
* | Hercules Offshore, Inc. | 5,000 | 155 |
| | | 549,815 |
Financials (22.1%) | | |
| Capital Markets (2.1%) | | |
| Ameriprise Financial, Inc. | 1,213,121 | 56,895 |
* | E*TRADE Financial Corp. | 1,557,744 | 37,261 |
| Raymond James | | |
| Financial, Inc. | 411,150 | 12,022 |
* | Investment Technology | | |
| Group, Inc. | 215,280 | 9,634 |
| A.G. Edwards & Sons, Inc. | 165,700 | 8,829 |
* | Knight Capital Group, Inc. | | |
| Class A | 472,753 | 8,604 |
| MCG Capital Corp. | 296,008 | 4,834 |
* | Piper Jaffray Cos., Inc. | 58,200 | 3,528 |
| Gamco Investors Inc. Class A | 59,929 | 2,281 |
| T. Rowe Price Group Inc. | 22,383 | 1,071 |
| Capital Southwest Corp. | 1,000 | 119 |
| | | |
| Commercial Banks (3.1%) | | |
| Synovus Financial Corp. | 1,211,657 | 35,586 |
| Huntington Bancshares Inc. | 1,060,551 | 25,379 |
| TCF Financial Corp. | 841,500 | 22,123 |
| Colonial BancGroup, Inc. | 887,200 | 21,736 |
| Bank of Hawaii Corp. | 412,986 | 19,889 |
| First Republic Bank | 199,331 | 8,484 |
| Sterling Bancshares, Inc. | 251,700 | 5,097 |
| Hancock Holding Co. | 92,195 | 4,937 |
| BancorpSouth, Inc. | 170,933 | 4,745 |
| United Bankshares, Inc. | 118,080 | 4,395 |
| City Holding Co. | 106,855 | 4,260 |
| Whitney Holdings Corp. | 104,700 | 3,745 |
| Greater Bay Bancorp | 130,701 | 3,687 |
| Independent Bank Corp. (MI) | 149,035 | 3,619 |
| Compass Bancshares Inc. | 53,700 | 3,060 |
| Columbia Banking | | |
| System, Inc. | 81,828 | 2,619 |
| F.N.B. Corp. | 154,100 | 2,567 |
| Trustmark Corp. | 79,500 | 2,499 |
| BOK Financial Corp. | 44,886 | 2,361 |
| Republic Bancorp, Inc. | 141,800 | 1,890 |
| Citizens Banking Corp. | 64,900 | 1,704 |
| Susquehanna Bancshares, Inc. | 58,600 | 1,432 |
| Pacific Capital Bancorp | 50,000 | 1,349 |
| NBT Bancorp, Inc. | 56,252 | 1,308 |
| Old National Bancorp | 64,200 | 1,226 |
| BancFirst Corp. | 25,322 | 1,183 |
| Chittenden Corp. | 37,300 | 1,070 |
| Sterling Financial Corp. | 31,300 | 1,015 |
| IBERIABANK Corp. | 14,700 | 897 |
| Sterling Financial Corp. (PA) | 38,588 | 849 |
| Community Trust Bancorp Inc. | 21,356 | 804 |
| First Indiana Corp. | 27,587 | 718 |
| Nara Bancorp, Inc. | 38,605 | 706 |
| Integra Bank Corp. | 26,401 | 667 |
| Hanmi Financial Corp. | 32,800 | 643 |
| Sky Financial Group, Inc. | 25,736 | 641 |
| Union Bankshares Corp. | 14,000 | 620 |
| United Community Banks, Inc. | 19,603 | 589 |
| Peoples Bancorp, Inc. | 19,800 | 579 |
| R & G Financial Corp. Class B | 74,100 | 552 |
| West Coast Bancorp | 17,842 | 545 |
| Banner Corp. | 13,037 | 535 |
| First Community | | |
| Bancshares, Inc. | 16,018 | 535 |
| TriCo Bancshares | 21,042 | 521 |
| Capitol Bancorp Ltd. | 11,300 | 503 |
| Center Financial Corp. | 19,300 | 459 |
| U.S.B. Holding Co., Inc. | 19,124 | 422 |
| Great Southern Bancorp, Inc. | 14,280 | 401 |
| CVB Financial Corp. | 22,467 | 332 |
| First Citizens BancShares | | |
| Class A | 1,700 | 325 |
| Provident Bankshares Corp. | 7,903 | 293 |
| Independent Bank Corp. (MA) | 7,411 | 241 |
| First Merchants Corp. | 7,586 | 179 |
First Source Corp. | 5,845 | 173 |
Simmons First National Corp. | 5,942 | 172 |
FirstMerit Corp. | 6,101 | 141 |
Suffolk Bancorp | 4,423 | 141 |
Harleysville National Corp. | 6,019 | 121 |
First Financial Bankshares, Inc. | 2,900 | 111 |
First Financial Corp. (IN) | 3,122 | 100 |
| | |
| | |
13
| | | Market |
| | | Value• |
| | Shares | ($000) |
| Heartland Financial USA, Inc. | 3,169 | 81 |
| First Bancorp (NC) | 3,946 | 80 |
| Washington Trust Bancorp, Inc. | 2,200 | 58 |
| | | |
| Consumer Finance (0.9%) | | |
* | AmeriCredit Corp. | 1,057,545 | 26,428 |
| ^The First Marblehead Corp. | 179,000 | 12,398 |
| Advanta Corp. Class B | 235,197 | 8,679 |
* | World Acceptance Corp. | 136,100 | 5,986 |
| Cash America | | |
| International Inc. | 114,624 | 4,480 |
| Advance America, Cash | | |
| Advance Centers, Inc. | 14,723 | 212 |
| | | |
| Diversified Financial Services (0.4%) | |
| Leucadia National Corp. | 864,290 | 22,618 |
| Resource America, Inc. | 65,020 | 1,352 |
* | Primus Guaranty, Ltd. | 75,722 | 917 |
* | Asset Acceptance | | |
| Capital Corp. | 52,933 | 860 |
| | | |
| Insurance (4.0%) | | |
| Safeco Corp. | 1,109,502 | 65,383 |
| First American Corp. | 763,821 | 32,340 |
| W.R. Berkley Corp. | 680,735 | 24,091 |
| Nationwide Financial | | |
| Services, Inc. | 450,400 | 21,664 |
| Assurant, Inc. | 344,500 | 18,400 |
| LandAmerica Financial | | |
| Group, Inc. | 249,300 | 16,401 |
| UnumProvident Corp. | 841,900 | 16,324 |
| Zenith National | | |
| Insurance Corp. | 375,909 | 14,995 |
| Ohio Casualty Corp. | 499,483 | 12,922 |
| American Financial | | |
| Group, Inc. | 188,200 | 8,832 |
| Hanover Insurance | | |
| Group Inc. | 191,400 | 8,542 |
| Stewart Information | | |
| Services Corp. | 209,900 | 7,298 |
* | Philadelphia Consolidated | | |
| Holding Corp. | 100,300 | 3,990 |
| Safety Insurance Group, Inc. | 81,220 | 3,952 |
| Fidelity National Financial, Inc. | 64,200 | 2,674 |
| ^Fidelity National Title | | |
| Group, Inc. Class A | 113,200 | 2,373 |
| Cincinnati Financial Corp. | 49,118 | 2,361 |
| ^Odyssey Re Holdings Corp. | 48,100 | 1,625 |
| Scottish Re Group Ltd. | 134,200 | 1,459 |
* | Argonaut Group, Inc. | 33,599 | 1,043 |
| Infinity Property & | | |
| Casualty Corp. | 22,589 | 929 |
| Commerce Group, Inc. | 27,010 | 812 |
| IPC Holdings Ltd. | 22,000 | 669 |
| Horace Mann Educators Corp. | 34,200 | 658 |
| National Western Life | | |
| Insurance Co. Class A | 2,720 | 625 |
| Bristol West Holdings, Inc. | 31,000 | 451 |
| Presidential Life Corp. | 19,000 | 425 |
| Harleysville Group, Inc. | 11,100 | 388 |
| Axis Capital Holdings Ltd. | 11,000 | 382 |
| Torchmark Corp. | 6,000 | 379 |
* | CNA Surety Corp. | 15,800 | 319 |
| Crawford & Co. Class B | 3,200 | 22 |
| | | |
| Real Estate Investment Trusts (7.6%) | |
| Archstone-Smith Trust REIT | 725,200 | 39,480 |
| Host Marriott Corp. REIT | 1,384,400 | 31,744 |
| ProLogis REIT | 444,824 | 25,382 |
| Avalonbay Communities, Inc. | | |
| REIT | 202,300 | 24,357 |
| Boston Properties, Inc. REIT | 220,100 | 22,745 |
| Essex Property Trust, Inc. | | |
| REIT | 152,700 | 18,538 |
| General Growth | | |
| Properties Inc. REIT | 366,400 | 17,459 |
| Plum Creek | | |
| Timber Co. Inc. REIT | 495,600 | 16,870 |
| Pan Pacific Retail | | |
| Properties, Inc. REIT | 186,300 | 12,933 |
| Camden Property Trust REIT | 168,100 | 12,777 |
| Developers Diversified | | |
| Realty Corp. REIT | 228,900 | 12,763 |
| Apartment Investment & | | |
| Management Co. Class A | | |
| REIT | 211,200 | 11,491 |
| SL Green Realty Corp. REIT | 94,600 | 10,567 |
| Regency Centers Corp. REIT | 151,700 | 10,431 |
| iStar Financial Inc. REIT | 236,800 | 9,875 |
| United Dominion Realty Trust | | |
| REIT | 312,400 | 9,434 |
| Federal Realty | | |
| Investment Trust REIT | 121,900 | 9,057 |
| Taubman Co. REIT | 200,800 | 8,920 |
| Maguire Properties, Inc. REIT | 217,100 | 8,845 |
| New Plan Excel Realty Trust | | |
| REIT | 312,700 | 8,459 |
| Reckson Associates | | |
| Realty Corp. REIT | 194,726 | 8,334 |
| AMB Property Corp. REIT | 149,100 | 8,217 |
| Kimco Realty Corp. REIT | 187,600 | 8,042 |
| Tanger Factory Outlet | | |
| Centers, Inc. REIT | 223,300 | 7,954 |
| BRE Properties Inc. Class A | | |
| REIT | 128,000 | 7,645 |
| The Macerich Co. REIT | 96,300 | 7,353 |
| FelCor Lodging Trust, Inc. | | |
| REIT | 364,700 | 7,312 |
| Kilroy Realty Corp. REIT | 92,500 | 6,969 |
| Post Properties, Inc. REIT | 129,600 | 6,159 |
14
| | Market |
| | Value• |
| Shares | ($000) |
Home Properties, Inc. REIT | 104,700 | 5,985 |
Colonial Properties Trust REIT | 120,800 | 5,775 |
Thornburg Mortgage, Inc. | | |
REIT | 214,300 | 5,458 |
^New Century Financial Corp. | | |
REIT | 137,692 | 5,413 |
Rayonier Inc. REIT | 142,050 | 5,370 |
HRPT Properties Trust REIT | 443,500 | 5,300 |
Heritage Property | | |
Investment Trust REIT | 139,200 | 5,075 |
Global Signal, Inc. REIT | 90,000 | 4,552 |
CapitalSource Inc. REIT | 171,400 | 4,426 |
^Novastar Financial, Inc. REIT | 149,600 | 4,367 |
American Home Mortgage | | |
Investment Corp. REIT | 125,000 | 4,359 |
Annaly Mortgage | | |
Management Inc. REIT | 316,600 | 4,160 |
Equity Inns, Inc. REIT | 257,300 | 4,096 |
Glimcher Realty Trust REIT | 159,700 | 3,957 |
Innkeepers USA Trust REIT | 236,100 | 3,846 |
Sunstone Hotel | | |
Investors, Inc. REIT | 121,800 | 3,620 |
KKR Financial Corp. REIT | 145,100 | 3,561 |
Saul Centers, Inc. REIT | 75,700 | 3,407 |
^Redwood Trust, Inc. REIT | 62,900 | 3,168 |
Weingarten Realty Investors | | |
REIT | 68,300 | 2,938 |
Friedman, Billings, | | |
Ramsey Group, Inc. REIT | 359,900 | 2,890 |
Impac Mortgage | | |
Holdings, Inc. REIT | 281,600 | 2,639 |
Senior Housing | | |
Properties Trust REIT | 122,400 | 2,612 |
LaSalle Hotel Properties REIT | 59,600 | 2,583 |
Potlatch Corp. REIT | 65,400 | 2,426 |
BioMed Realty Trust, Inc. | | |
REIT | 79,500 | 2,412 |
Pennsylvania REIT | 48,100 | 2,048 |
American Financial | | |
Realty Trust REIT | 179,800 | 2,007 |
Strategic Hotels and | | |
Resorts, Inc. REIT | 99,900 | 1,986 |
Saxon Inc. REIT | 130,000 | 1,825 |
GMH Communities Trust | | |
REIT | 115,000 | 1,451 |
Mills Corp. REIT | 71,700 | 1,198 |
Inland Real Estate Corp. REIT | 30,700 | 538 |
MFA Mortgage | | |
Investments, Inc. REIT | 71,500 | 533 |
Franklin Street | | |
Properties Corp. REIT | 26,300 | 522 |
Highland Hospitality Corp. | | |
| REIT | 36,400 | 522 |
| Digital Realty Trust, Inc. REIT | 16,600 | 520 |
| Spirit Finance Corp. REIT | 44,600 | 518 |
| National Health Investors REIT | 18,200 | 516 |
| Acadia Realty Trust REIT | 20,100 | 513 |
| RAIT Investment Trust REIT | 17,700 | 511 |
| Trustreet Properties, Inc. REIT | 40,800 | 510 |
| Hospitality Properties Trust | | |
| REIT | 10,700 | 505 |
| Lexington Corporate | | |
| Properties Trust REIT | 23,800 | 504 |
| Omega Healthcare | | |
| Investors, Inc. REIT | 33,500 | 503 |
| Ashford Hospitality Trust REIT | 41,900 | 500 |
| Newcastle Investment Corp. | | |
| REIT | 18,200 | 499 |
| Anthracite Capital Inc. REIT | 38,700 | 498 |
| Deerfield Triarc Capital Corp. | | |
| REIT | 37,900 | 497 |
| DiamondRock Hospitality Co. | | |
| REIT | 29,700 | 493 |
| First Potomac REIT | 16,000 | 484 |
| Longview Fibre Co. REIT | 23,300 | 473 |
| Sun Communities, Inc. REIT | 5,700 | 182 |
| | | |
| Real Estate Management & Development (0.7%) |
| ^The St. Joe Co. | 260,100 | 14,272 |
* | CB Richard Ellis Group, Inc. | 418,200 | 10,288 |
| Jones Lang LaSalle Inc. | 118,800 | 10,155 |
| Forest City Enterprise | | |
| Class A | 154,400 | 8,384 |
* | Trammell Crow Co. | 58,300 | 2,129 |
* | Move, Inc. | 108,900 | 535 |
| | | |
| Thrifts & Mortgage Finance (3.3%) | |
| Radian Group, Inc. | 965,541 | 57,932 |
| IndyMac Bancorp, Inc. | 1,286,505 | 52,953 |
| ^Corus Bankshares Inc. | 1,251,628 | 27,986 |
| MGIC Investment Corp. | 448,164 | 26,876 |
| Downey Financial Corp. | 240,600 | 16,010 |
| The PMI Group Inc. | 228,800 | 10,024 |
* | ^First Federal Financial Corp. | 169,900 | 9,637 |
| PFF Bancorp, Inc. | 117,600 | 4,356 |
| WSFS Financial Corp. | 45,550 | 2,833 |
* | Triad Guaranty, Inc. | 48,300 | 2,472 |
| First Financial Holdings, Inc. | 63,953 | 2,188 |
| Anchor Bancorp | | |
| Wisconsin Inc. | 76,545 | 2,186 |
| BankUnited Financial Corp. | 54,000 | 1,408 |
| TierOne Corp. | 41,201 | 1,398 |
| City Bank Lynnwood (WA) | 14,873 | 699 |
* | Accredited Home Lenders | | |
| Holding Co. | 13,000 | 467 |
* | Ocwen Financial Corp. | 31,000 | 462 |
| ITLA Capital Corp. | 4,130 | 222 |
| United Community | | |
| Financial Corp. | 14,500 | 179 |
| | | 1,490,849 |
15
| | | Market |
| | | Value• |
| | Shares | ($000) |
Health Care (10.3%) | | |
| AmerisourceBergen Corp. | 1,540,157 | 69,615 |
* | Barr Pharmaceuticals Inc. | 1,109,200 | 57,612 |
* | Sierra Health Services, Inc. | 1,122,900 | 42,491 |
* | Community Health | | |
| Systems, Inc. | 991,399 | 37,029 |
* | Laboratory Corp. of | | |
| America Holdings | 467,764 | 30,671 |
* | Triad Hospitals, Inc. | 692,475 | 30,490 |
* | Haemonetics Corp. | 604,499 | 28,291 |
* | ICOS Corp. | 1,084,483 | 27,177 |
* | Pediatrix Medical | | |
| Group, Inc. | 521,300 | 23,771 |
* | Sciele Pharma, Inc. | 1,235,890 | 23,284 |
| Valeant Pharmaceuticals | | |
| International | 1,077,600 | 21,315 |
| Mylan Laboratories, Inc. | 1,054,214 | 21,221 |
| Manor Care, Inc. | 403,800 | 21,111 |
* | Alkermes, Inc. | 1,132,975 | 17,958 |
* | King Pharmaceuticals, Inc. | 821,900 | 13,997 |
* | ImClone Systems, Inc. | 451,400 | 12,784 |
* | IDEXX Laboratories Corp. | 125,348 | 11,424 |
* | Myriad Genetics, Inc. | 459,107 | 11,317 |
* | Kinetic Concepts, Inc. | 326,200 | 10,262 |
* | Apria Healthcare Group Inc. | 514,600 | 10,158 |
* | The TriZetto Group, Inc. | 638,688 | 9,670 |
* | Advanced Medical | | |
| Optics, Inc. | 242,694 | 9,599 |
* | Applera Corp.–Celera | | |
| Genomics Group | 679,500 | 9,459 |
* | Illumina, Inc. | 286,100 | 9,453 |
* | Adams Respiratory | | |
| Therapeutics, Inc. | 251,358 | 9,197 |
* | Viasys Healthcare Inc. | 305,200 | 8,314 |
* | LifePoint Hospitals, Inc. | 210,900 | 7,449 |
| Medicis | | |
| Pharmaceutical Corp. | 216,700 | 7,010 |
* | ^Enzon Pharmaceuticals, Inc. | 842,300 | 6,949 |
* | Magellan Health | | |
| Services, Inc. | 131,903 | 5,619 |
* | Lincare Holdings, Inc. | 162,096 | 5,615 |
| Dade Behring Holdings Inc. | 137,726 | 5,531 |
* | Techne Corp. | 108,521 | 5,519 |
* | Zoll Medical Corp. | 147,267 | 5,285 |
| Universal Health Services | | |
| Class B | 84,900 | 5,088 |
| Chemed Corp. | 147,800 | 4,768 |
* | ^New River | | |
| Pharmaceuticals Inc. | 172,838 | 4,447 |
* | ^Palomar Medical | | |
| Technologies, Inc. | 99,057 | 4,180 |
* | Sunrise Senior Living, Inc. | 138,300 | 4,131 |
* | SonoSite, Inc. | 124,018 | 3,522 |
| Perrigo Co. | 190,400 | 3,231 |
| IMS Health, Inc. | 120,900 | 3,221 |
* | Kindred Healthcare, Inc. | 101,290 | 3,011 |
* | Molecular Devices Corp. | 157,669 | 2,915 |
* | K-V Pharmaceutical Co. | | |
| Class A | 118,700 | 2,813 |
| Hillenbrand Industries, Inc. | 48,000 | 2,735 |
* | PAREXEL International Corp. | 75,650 | 2,503 |
| Owens & Minor, Inc. | | |
| Holding Co. | 73,400 | 2,414 |
* | Bio-Rad Laboratories, Inc. | | |
| Class A | 27,500 | 1,945 |
* | ICU Medical, Inc. | 38,800 | 1,765 |
* | Progenics | | |
| Pharmaceuticals, Inc. | 74,063 | 1,738 |
* | ^Telik, Inc. | 88,200 | 1,569 |
* | Radiation Therapy | | |
| Services, Inc. | 51,900 | 1,517 |
| Alpharma, Inc. Class A | 64,100 | 1,499 |
* | PSS World Medical, Inc. | 64,400 | 1,287 |
| Datascope Corp. | 38,271 | 1,281 |
* | Symmetry Medical Inc. | 81,900 | 1,236 |
* | Bruker BioSciences Corp. | 168,026 | 1,178 |
* | Tanox, Inc. | 94,526 | 1,117 |
* | VCA Antech, Inc. | 26,300 | 948 |
| Vital Signs, Inc. | 15,855 | 898 |
* | Greatbatch, Inc. | 29,478 | 667 |
* | Odyssey Healthcare, Inc. | 42,022 | 596 |
* | AMN Healthcare Services, Inc. | 13,900 | 330 |
* | Lexicon Genetics Inc. | 46,670 | 176 |
* | IntraLase Corp. | 8,073 | 159 |
* | AmSurg Corp. | 7,020 | 156 |
| Young Innovations, Inc. | 3,400 | 122 |
* | Alliance Imaging, Inc. | 5,200 | 41 |
* | SurModics, Inc. | 474 | 17 |
| | | 695,868 |
Industrials (12.9%) | | |
| Parker Hannifin Corp. | 883,494 | 68,674 |
| Cummins Inc. | 520,900 | 62,107 |
| Manpower Inc. | 899,275 | 55,099 |
| CSX Corp. | 1,583,914 | 52,000 |
* | ^USG Corp. | 912,400 | 42,919 |
| Precision Castparts Corp. | 618,691 | 39,077 |
| The Timken Co. | 1,060,800 | 31,591 |
* | AMR Corp. | 1,253,151 | 28,998 |
| JLG Industries, Inc. | 1,383,400 | 27,405 |
| Trinity Industries, Inc. | 814,640 | 26,207 |
| A.O. Smith Corp. | 574,600 | 22,656 |
| Ryder System, Inc. | 435,300 | 22,496 |
* | EMCOR Group, Inc. | 367,700 | 20,165 |
| John H. Harland Co. | 501,300 | 18,272 |
| R.R. Donnelley & Sons Co. | 519,520 | 17,123 |
* | Monster Worldwide Inc. | 466,458 | 16,881 |
| Steelcase Inc. | 1,074,100 | 16,853 |
| Con-way, Inc. | 364,600 | 16,341 |
* | Navistar International Corp. | 580,374 | 14,985 |
| Adesa, Inc. | 621,300 | 14,358 |
* | PHH Corp. | 453,400 | 12,423 |
16
| | | Market |
| | | Value• |
| | Shares | ($000) |
| Applied Industrial | | |
| Technology, Inc. | 474,975 | 11,589 |
| Universal Forest | | |
| Products, Inc. | 221,249 | 10,852 |
* | Allied Waste Industries, Inc. | 836,688 | 9,429 |
* | NCI Building Systems, Inc. | 161,000 | 9,365 |
* | McDermott International, Inc. | 223,250 | 9,332 |
| Lincoln Electric Holdings, Inc. | 152,011 | 8,277 |
* | Alaska Air Group, Inc. | 206,900 | 7,870 |
| Lennox International Inc. | 313,200 | 7,172 |
* | Dollar Thrifty Automotive | | |
| Group, Inc. | 150,900 | 6,726 |
| Freightcar America Inc. | 126,087 | 6,683 |
| Kennametal, Inc. | 117,600 | 6,662 |
* | United Rentals, Inc. | 276,400 | 6,426 |
* | Labor Ready, Inc. | 403,000 | 6,420 |
| Watsco, Inc. | 131,500 | 6,050 |
* | EnPro Industries, Inc. | 185,300 | 5,570 |
* | Foster Wheeler Ltd. | 137,900 | 5,322 |
| Aramark Corp. Class B | 161,400 | 5,304 |
| Belden CDT Inc. | 125,500 | 4,798 |
| Harsco Corp. | 60,000 | 4,659 |
* | Consolidated Graphics, Inc. | 77,400 | 4,657 |
| Watson Wyatt & | | |
| Co. Holdings | 111,700 | 4,571 |
| Apogee Enterprises, Inc. | 297,558 | 4,526 |
| ElkCorp | 165,289 | 4,488 |
* | General Cable Corp. | 112,500 | 4,299 |
* | US Airways Group Inc. | 94,800 | 4,203 |
| Acuity Brands, Inc. | 91,300 | 4,145 |
| IKON Office Solutions, Inc. | 307,400 | 4,131 |
| Republic Services, Inc. | | |
| Class A | 100,869 | 4,056 |
* | ^Encore Wire Corp. | 112,000 | 3,952 |
| Herman Miller, Inc. | 114,500 | 3,917 |
* | Amerco, Inc. | 47,500 | 3,522 |
* | Corrections Corp. of America | 79,950 | 3,458 |
* | Mobile Mini, Inc. | 110,956 | 3,152 |
* | Builders FirstSource, Inc. | 198,048 | 3,016 |
| McGrath RentCorp | 115,213 | 2,949 |
* | Volt Information Sciences Inc. | 77,400 | 2,752 |
| Arkansas Best Corp. | 58,640 | 2,523 |
| Crane Co. | 60,200 | 2,516 |
| The Manitowoc Co., Inc. | 55,090 | 2,467 |
* | Spherion Corp. | 342,600 | 2,450 |
| The Toro Co. | 52,600 | 2,218 |
* | Genlyte Group, Inc. | 28,216 | 2,009 |
| Barnes Group, Inc. | 106,000 | 1,861 |
* | American Commercial | | |
| Lines Inc. | 28,200 | 1,677 |
| Kelly Services, Inc. Class A | 60,846 | 1,668 |
| Cintas Corp. | 40,000 | 1,633 |
| Regal-Beloit Corp. | 36,700 | 1,596 |
| Triumph Group, Inc. | 37,600 | 1,592 |
* | Cenveo Inc. | 79,900 | 1,504 |
* | West Corp. | 29,257 | 1,413 |
| Mueller Industries Inc. | 38,600 | 1,358 |
* | ABX Air, Inc. | 190,210 | 1,069 |
* | Continental Airlines, Inc. | | |
| Class B | 37,000 | 1,047 |
| Viad Corp. | 28,350 | 1,004 |
| Joy Global Inc. | 26,601 | 1,000 |
| NACCO Industries, Inc. | | |
| Class A | 7,100 | 965 |
* | Kforce Inc. | 70,679 | 843 |
| Carlisle Co., Inc. | 9,102 | 765 |
| Ennis, Inc. | 34,500 | 747 |
* | CBIZ Inc. | 100,600 | 734 |
| Bluelinx Holdings Inc. | 76,300 | 726 |
* | Accuride Corp. | 65,900 | 726 |
* | Terex Corp. | 15,500 | 701 |
| Kaydon Corp. | 18,400 | 681 |
| ^Simpson Manufacturing Co. | 20,900 | 565 |
| Albany International Corp. | 17,700 | 563 |
* | Swift Transportation Co., Inc. | 20,000 | 474 |
* | Thomas & Betts Corp. | 5,400 | 258 |
* | K&F Industries Holdings | 13,700 | 257 |
| Tennant Co. | 8,200 | 200 |
| Kaman Corp. Class A | 9,157 | 165 |
| | | 872,905 |
Information Technology (14.8%) | |
* | Fiserv, Inc. | 1,451,583 | 68,355 |
* | Computer Sciences Corp. | 1,103,200 | 54,189 |
* | RealNetworks, Inc. | 3,841,698 | 40,760 |
| National | | |
| Semiconductor Corp. | 1,457,700 | 34,300 |
* | LAM Research Corp. | 677,498 | 30,711 |
| Anixter International Inc. | 496,000 | 28,009 |
* | Arris Group Inc. | 2,388,551 | 27,373 |
* | Alliance Data Systems Corp. | 483,900 | 26,706 |
| Harris Corp. | 563,000 | 25,048 |
* | CSG Systems | | |
| International, Inc. | 932,678 | 24,651 |
* | Silicon Image, Inc. | 1,861,047 | 23,673 |
* | Micron Technology, Inc. | 1,359,842 | 23,661 |
* | Lexmark International, Inc. | 404,500 | 23,323 |
* | Palm, Inc. | 1,491,514 | 21,716 |
| Seagate Technology | 900,800 | 20,799 |
* | Transaction Systems | | |
| Architects, Inc. | 553,191 | 18,986 |
* | Ceridian Corp. | 828,239 | 18,519 |
* | CommScope, Inc. | 506,000 | 16,627 |
* | Global Imaging Systems, Inc. | 720,354 | 15,898 |
* | j2 Global | | |
| Communications, Inc. | 566,567 | 15,394 |
* | ^Genesis Microchip Inc. | 1,264,948 | 14,888 |
* | Coherent, Inc. | 380,398 | 13,185 |
* | Zoran Corp. | 794,750 | 12,780 |
* | Freescale | | |
| Semiconductor, Inc. | | |
| Class A | 314,800 | 11,978 |
17
| | | Market |
| | | Value• |
| | Shares | ($000) |
* | Arrow Electronics, Inc. | 432,900 | 11,874 |
* | Western Digital Corp. | 613,800 | 11,110 |
* | Informatica Corp. | 813,856 | 11,060 |
* | EarthLink, Inc. | 1,505,369 | 10,944 |
* | Interdigital | | |
| Communications Corp. | 306,943 | 10,467 |
* | ^Finisar Corp. | 2,882,941 | 10,465 |
* | MicroStrategy Inc. | 96,819 | 9,859 |
* | MEMC Electronic | | |
| Materials, Inc. | 262,800 | 9,626 |
* | Cadence Design | | |
| Systems, Inc. | 547,400 | 9,284 |
* | ^Komag, Inc. | 282,700 | 9,035 |
* | Brocade Communications | | |
| Systems, Inc. | 1,278,943 | 9,029 |
* | Benchmark Electronics, Inc. | 335,175 | 9,010 |
* | Sybase, Inc. | 361,785 | 8,770 |
| MTS Systems Corp. | 260,926 | 8,438 |
* | ON Semiconductor Corp. | 1,411,400 | 8,299 |
* | Nuance | | |
| Communications, Inc. | 1,008,299 | 8,238 |
* | Fairchild Semiconductor | | |
| International, Inc. | 437,400 | 8,179 |
* | UTStarcom, Inc. | 910,889 | 8,080 |
* | DST Systems, Inc. | 130,400 | 8,042 |
* | MPS Group, Inc. | 520,104 | 7,859 |
| Imation Corp. | 173,500 | 6,966 |
| Molex, Inc. | 175,062 | 6,822 |
* | ^Atheros Communications | 347,735 | 6,304 |
* | Vishay Intertechnology, Inc. | 420,900 | 5,909 |
* | Advanced Energy | | |
| Industries, Inc. | 326,357 | 5,561 |
* | MKS Instruments, Inc. | 273,450 | 5,554 |
* | Novellus Systems, Inc. | 193,700 | 5,358 |
* | Freescale | | |
| Semiconductor, Inc. | | |
| Class B | 137,600 | 5,230 |
| Park Electrochemical Corp. | 160,000 | 5,069 |
* | Progress Software Corp. | 193,524 | 5,032 |
* | Plexus Corp. | 248,700 | 4,775 |
* | Cirrus Logic, Inc. | 654,946 | 4,775 |
* | LTX Corp. | 928,444 | 4,652 |
* | ManTech International Corp. | 134,000 | 4,423 |
* | Avnet, Inc. | 223,400 | 4,383 |
* | Paxar Corp. | 218,700 | 4,370 |
* | Perot Systems Corp. | 306,700 | 4,229 |
| Fidelity National Information | | |
| Services, Inc. | 113,100 | 4,185 |
| Reynolds & Reynolds Class A | 105,657 | 4,175 |
* | Rofin-Sinar Technologies Inc. | 67,202 | 4,084 |
* | Tellabs, Inc. | 367,842 | 4,032 |
* | Hyperion Solutions Corp. | 116,100 | 4,003 |
* | Photronics Inc. | 282,463 | 3,991 |
| MoneyGram | | |
| International, Inc. | 135,200 | 3,929 |
* | Sykes Enterprises, Inc. | 188,400 | 3,834 |
* | Cymer, Inc. | 83,702 | 3,675 |
* | Conexant Systems, Inc. | 1,783,466 | 3,567 |
* | Dolby Laboratories Inc. | 175,400 | 3,482 |
| AVX Corp. | 191,800 | 3,393 |
* | Teradyne, Inc. | 250,300 | 3,294 |
* | Euronet Worldwide, Inc. | 132,291 | 3,248 |
| Technitrol, Inc. | 98,400 | 2,937 |
* | OmniVision Technologies, Inc. | 197,300 | 2,815 |
| Bel Fuse, Inc. Class B | 87,218 | 2,799 |
* | BMC Software, Inc. | 94,836 | 2,581 |
| Fair Isaac, Inc. | 66,500 | 2,432 |
* | Amkor Technology, Inc. | 467,000 | 2,410 |
* | SPSS, Inc. | 95,243 | 2,374 |
* | Trident Microsystems, Inc. | 99,490 | 2,314 |
| United Online, Inc. | 188,768 | 2,299 |
| CTS Corp. | 165,300 | 2,278 |
* | Macrovision Corp. | 95,400 | 2,260 |
* | Veeco Instruments, Inc. | 111,908 | 2,255 |
* | LSI Logic Corp. | 271,100 | 2,228 |
* | Agere Systems Inc. | 149,000 | 2,225 |
* | Avocent Corp. | 69,300 | 2,087 |
* | Interwoven Inc. | 183,314 | 2,022 |
* | Aeroflex, Inc. | 194,300 | 1,997 |
| Jack Henry & Associates Inc. | 80,400 | 1,750 |
* | BearingPoint, Inc. | 207,200 | 1,629 |
* | Cabot Microelectronics Corp. | 53,299 | 1,536 |
* | eFunds Corp. | 59,800 | 1,446 |
* | Silicon Storage | | |
| Technology, Inc. | 328,653 | 1,354 |
* | Ciber, Inc. | 200,700 | 1,331 |
* | TTM Technologies, Inc. | 109,600 | 1,282 |
| Black Box Corp. | 29,682 | 1,155 |
* | Mattson Technology, Inc. | 129,324 | 1,073 |
* | MRO Software Inc. | 37,600 | 965 |
* | Insight Enterprises, Inc. | 45,000 | 927 |
* | DTS Inc. | 38,452 | 814 |
* | Asyst Technologies, Inc. | 107,016 | 723 |
| Methode Electronics, Inc. | | |
| Class A | 64,000 | 609 |
* | Rogers Corp. | 9,400 | 580 |
* | SYNNEX Corp. | 20,100 | 463 |
* | MICROS Systems, Inc. | 9,000 | 440 |
* | DealerTrack Holdings Inc. | 19,304 | 427 |
* | eSPEED, Inc. Class A | 38,816 | 357 |
* | Vignette Corp. | 25,600 | 347 |
| Agilysys, Inc. | 21,700 | 305 |
* | Tyler Technologies, Inc. | 19,300 | 250 |
* | IXYS Corp. | 25,841 | 217 |
* | Kopin Corp. | 49,116 | 165 |
* | Keane, Inc. | 10,100 | 146 |
* | Digital Insight Corp. | 4,210 | 123 |
| infoUSA Inc. | 1,500 | 12 |
| | | 1,002,240 |
18
| | | Market |
| | | Value• |
| | Shares | ($000) |
Materials (4.8%) | | |
| Freeport-McMoRan | | |
| Copper & Gold, Inc. | | |
| Class B | 1,202,500 | 64,045 |
| Eagle Materials, Inc. | 1,420,175 | 47,832 |
| Reliance Steel & | | |
| Aluminum Co. | 1,282,000 | 41,203 |
| Nucor Corp. | 672,900 | 33,302 |
| Phelps Dodge Corp. | 231,308 | 19,592 |
| Martin Marietta | | |
| Materials, Inc. | 228,900 | 19,370 |
| Temple-Inland Inc. | 471,362 | 18,902 |
| Greif Inc. Class A | 212,500 | 17,023 |
| Louisiana-Pacific Corp. | 705,300 | 13,239 |
| United States Steel Corp. | 228,300 | 13,168 |
| Commercial Metals Co. | 392,600 | 7,982 |
| Celanese Corp. Series A | 343,200 | 6,143 |
| Lubrizol Corp. | 107,700 | 4,925 |
| Quanex Corp. | 144,400 | 4,383 |
| ^Cleveland-Cliffs Inc. | 93,200 | 3,552 |
| Steel Dynamics, Inc. | 55,532 | 2,802 |
| Sonoco Products Co. | 73,000 | 2,456 |
| Metal Management, Inc. | 62,700 | 1,746 |
| Silgan Holdings, Inc. | 37,205 | 1,397 |
| Gibraltar Industries Inc. | 62,289 | 1,382 |
* | Pactiv Corp. | 29,700 | 844 |
| H.B. Fuller Co. | 27,800 | 652 |
| | | 325,940 |
Telecommunication Services (2.4%) | |
* | Qwest Communications | | |
| International Inc. | 6,444,100 | 56,193 |
| Citizens | | |
| Communications Co. | 1,639,602 | 23,020 |
| Embarq Corp. | 441,500 | 21,355 |
* | Leap Wireless | | |
| International, Inc. | 310,474 | 15,055 |
* | Cincinnati Bell Inc. | 2,623,900 | 12,647 |
| Telephone & | | |
| Data Systems, Inc. | 273,045 | 11,495 |
| CenturyTel, Inc. | 108,600 | 4,308 |
* | Premiere Global | | |
| Services, Inc. | 308,958 | 2,682 |
| Windstream Corp. | 198,766 | 2,622 |
| North Pittsburgh | | |
| Systems, Inc. | 70,142 | 1,765 |
* | U.S. Cellular Corp. | 26,800 | 1,600 |
| Commonwealth Telephone | | |
| Enterprises, Inc. | 35,832 | 1,477 |
* | Syniverse Holdings Inc. | 96,800 | 1,452 |
* | General Communication, Inc. | 58,900 | 730 |
* | Broadwing Corp. | 36,500 | 461 |
| Centennial | | |
| Communications Corp. | | |
| Class A | 55,100 | 294 |
* | Covad Communications | | |
| Group, Inc. | 183,900 | 274 |
* | American Tower Corp. | | |
| Class A | 6,900 | 252 |
| Surewest Communications | 9,600 | 187 |
| Consolidated Communications | | |
| Holdings, Inc. | 9,353 | 175 |
| Iowa Telecommunications | | |
| Services Inc. | 4,100 | 81 |
* | Cbeyond Inc. | 2,500 | 69 |
| | | 158,194 |
Utilities (5.7%) | | |
| CenterPoint Energy Inc. | 2,259,449 | 32,355 |
| Xcel Energy, Inc. | 1,455,745 | 30,061 |
| Energen Corp. | 705,172 | 29,526 |
* | Allegheny Energy, Inc. | 701,000 | 28,159 |
| DTE Energy Co. | 604,015 | 25,073 |
| Pepco Holdings, Inc. | 948,405 | 22,923 |
| ONEOK, Inc. | 540,039 | 20,408 |
| Cleco Corp. | 597,075 | 15,070 |
| Pinnacle West Capital Corp. | 331,568 | 14,937 |
| Westar Energy, Inc. | 606,200 | 14,252 |
| Wisconsin Energy Corp. | 311,861 | 13,454 |
| Edison International | 321,000 | 13,366 |
| FirstEnergy Corp. | 234,300 | 13,088 |
| Avista Corp. | 384,100 | 9,096 |
| Southwest Gas Corp. | 268,800 | 8,956 |
* | NRG Energy, Inc. | 191,900 | 8,693 |
| Puget Energy, Inc. | 366,300 | 8,326 |
| OGE Energy Corp. | 202,300 | 7,305 |
| NSTAR | 200,100 | 6,675 |
* | CMS Energy Corp. | 429,700 | 6,205 |
| Energy East Corp. | 247,700 | 5,875 |
| MDU Resources Group, Inc. | 260,050 | 5,810 |
| PNM Resources Inc. | 153,700 | 4,238 |
| Hawaiian Electric | | |
| Industries Inc. | 140,200 | 3,794 |
| Nicor Inc. | 85,400 | 3,652 |
| TECO Energy, Inc. | 224,725 | 3,517 |
| Vectren Corp. | 127,900 | 3,434 |
| IDACORP, Inc. | 84,096 | 3,180 |
| WGL Holdings Inc. | 90,800 | 2,846 |
* | AES Corp. | 126,100 | 2,571 |
| Black Hills Corp. | 76,200 | 2,561 |
| ALLETE, Inc. | 54,835 | 2,383 |
| Northwest Natural Gas Co. | 58,600 | 2,302 |
| Otter Tail Corp. | 75,675 | 2,213 |
| Great Plains Energy, Inc. | 60,130 | 1,865 |
| Empire District Electric Co. | 74,208 | 1,661 |
* | El Paso Electric Co. | 70,900 | 1,584 |
| American Electric | | |
| Power Co., Inc. | 33,380 | 1,214 |
| UGI Corp. Holding Co. | 35,500 | 868 |
| MGE Energy, Inc. | 4,800 | 155 |
| | | 383,651 |
Total Common Stocks | | |
(Cost $6,018,498) | | 6,755,637 |
19
| | Market |
| | Value• |
| Shares | ($000) |
Temporary Cash Investments (1.6%)1 | |
Money Market Fund (1.6%) | | |
2 Vanguard Market Liquidity | |
Fund, 5.306%—Note E | 103,910,400 | 103,910 |
| | |
| Face | |
| Amount | |
| ($000) | |
U.S. Agency Obligation (0.0%) | |
3 Federal Home Loan | | |
Mortgage Corp. | | |
4 5.150%, 12/26/06 | 2,000 | 1,976 |
Total Temporary Cash Investments | |
(Cost $105,886) | | 105,886 |
Total Investments (101.6%) | | |
(Cost $6,124,384) | | 6,861,523 |
Other Assets and Liabilities (–1.6%) | |
Other Assets—Note B | | 65,461 |
Liabilities—Note E | | (171,939) |
| | (106,478) |
Net Assets (100%) | | |
Applicable to 292,827,049 outstanding $.001 |
par value shares of beneficial interest | |
(unlimited authorization) | | 6,755,045 |
Net Asset Value Per Share | | $23.07 |
At September 30, 2006, net assets consisted of:5 |
| Amount | Per |
| ($000) | Share |
Paid-in Capital | 5,706,514 | $19.49 |
Undistributed Net | | |
Investment Income | 45,366 | .15 |
Accumulated Net | | |
Realized Gains | 266,009 | .91 |
Unrealized Appreciation | | |
Investment Securities | 737,139 | 2.52 |
Futures Contracts | 17 | — |
Net Assets | 6,755,045 | $23.07 |
| • | See Note A in Notes to Financial Statements. |
| * | Non-income-producing security. |
| ^ | Part of security position is on loan to broker-dealers. See Note E in Notes to Financial Statements. |
| 1 | The fund invests a portion of its cash reserves in equity markets through the use of index futures contracts. After giving effect to futures investments, the fund’s effective common stock and temporary cash investment positions represent 100.0% and 1.6%, respectively, of net assets. See Note C in Notes to Financial Statements. |
| 2 | Affiliated money market fund available only to Vanguard funds and certain trusts and accounts managed by Vanguard. Rate shown is the 7-day yield. |
| 3 | The issuer operates under a congressional charter; its securities are neither issued nor guaranteed by the U.S. government. If needed, access to additional funding from the U.S. Treasury (beyond the issuer’s line of credit) would require congressional action. |
| 4 | Securities with a value of $1,976,000 have been segregated as initial margin for open futures contracts. |
| 5 | See Note C in Notes to Financial Statements for the tax-basis components of net assets. |
20
Statement of Operations
| Year Ended |
| September 30, 2006 |
| ($000) |
Investment Income | |
Income | |
Dividends | 94,066 |
Interest1 | 824 |
Security Lending | 2,262 |
Total Income | 97,152 |
Expenses | |
The Vanguard Group—Note B | |
Investment Advisory Services | 1,244 |
Management and Administrative | 19,159 |
Marketing and Distribution | 1,559 |
Custodian Fees | 177 |
Auditing Fees | 21 |
Shareholders’ Reports | 167 |
Trustees’ Fees and Expenses | 7 |
Total Expenses | 22,334 |
Net Investment Income | 74,818 |
Realized Net Gain (Loss) | |
Investment Securities Sold | 332,108 |
Futures Contracts | (382) |
Realized Net Gain (Loss) | 331,726 |
Change in Unrealized Appreciation (Depreciation) | |
Investment Securities | (51,964) |
Futures Contracts | 23 |
Change in Unrealized Appreciation (Depreciation) | (51,941) |
Net Increase (Decrease) in Net Assets Resulting from Operations | 354,603 |
1 | Interest income from an affiliated company of the fund was $727,000. |
21
Statement of Changes in Net Assets
| Year Ended September 30, |
| 2006 | 2005 |
| ($000) | ($000) |
Increase (Decrease) in Net Assets | | |
Operations | | |
Net Investment Income | 74,818 | 40,401 |
Realized Net Gain (Loss) | 331,726 | 356,210 |
Change in Unrealized Appreciation (Depreciation) | (51,941) | 442,538 |
Net Increase (Decrease) in Net Assets Resulting from Operations | 354,603 | 839,149 |
Distributions | | |
Net Investment Income | (49,617) | (22,893) |
Realized Capital Gain1 | (340,229) | (156,981) |
Total Distributions | (389,846) | (179,874) |
Capital Share Transactions—Note F | | |
Issued | 2,273,341 | 1,959,945 |
Issued in Lieu of Cash Distributions | 365,856 | 168,947 |
Redeemed | (1,031,900) | (558,509) |
Net Increase (Decrease) from Capital Share Transactions | 1,607,297 | 1,570,383 |
Total Increase (Decrease) | 1,572,054 | 2,229,658 |
Net Assets | | |
Beginning of Period | 5,182,991 | 2,953,333 |
End of Period2 | 6,755,045 | 5,182,991 |
| 1 | Includes fiscal 2006 and 2005 short-term gain distributions totaling $92,145,000 and $37,610,000, respectively. Short-term gain distributions are treated as ordinary income dividends for tax purposes. |
| 2 | Net Assets—End of Period includes undistributed net investment income of $45,366,000 and $27,314,000. |
22
Financial Highlights
| | | Nov. 1, | | | |
| Year Ended | 2003, to | |
For a Share Outstanding | September 30, | Sept. 30, | Year Ended October 31, |
Throughout Each Period | 2006 | 2005 | 20041 | 2003 | 2002 | 2001 |
Net Asset Value, | | | | | | |
Beginning of Period | $23.28 | $19.70 | $17.85 | $13.01 | $13.68 | $18.07 |
Investment Operations | | | | | | |
Net Investment Income | .27 | .19 | .13 | .13 | .14 | .16 |
Net Realized and Unrealized | | | | | | |
Gain (Loss) on Investments | 1.17 | 4.49 | 1.85 | 4.84 | (.67) | (1.31) |
Total from | | | | | | |
Investment Operations | 1.44 | 4.68 | 1.98 | 4.97 | (.53) | (1.15) |
Distributions | | | | | | |
Dividends from | | | | | | |
Net Investment Income | (.21) | (.14) | (.13) | (.13) | (.14) | (.21) |
Distributions from | | | | | | |
Realized Capital Gains | (1.44) | (.96) | — | — | — | (3.03) |
Total Distributions | (1.65) | (1.10) | (.13) | (.13) | (.14) | (3.24) |
Net Asset Value, | | | | | | |
End of Period | $23.07 | $23.28 | $19.70 | $17.85 | $13.01 | $13.68 |
| | | | | | |
Total Return2 | 6.49% | 24.32% | 11.14% | 38.55% | –4.02% | –6.48% |
| | | | | | |
Ratios/Supplemental Data | | | | | | |
Net Assets, | | | | | | |
End of Period (Millions) | $6,755 | $5,183 | $2,953 | $1,714 | $876 | $767 |
Ratio of Total Expenses to | | | | | | |
Average Net Assets | 0.35% | 0.40% | 0.45%* | 0.50% | 0.50% | 0.54% |
Ratio of Net Investment | | | | | | |
Income to Average Net Assets | 1.18% | 0.99% | 0.83%* | 1.04% | 0.94% | 1.06% |
Portfolio Turnover Rate | 80% | 75% | 66% | 100% | 73% | 82% |
1 | The fund’s fiscal year-end changed from October 31 to September 30, effective September 30, 2004. |
2 | Total returns do not reflect the 1% fee assessed through April 6, 2001, on redemptions of shares held in the fund for less than five years. |
See accompanying Notes, which are an integral part of the Financial Statements.
23
Notes to Financial Statements
Vanguard Strategic Equity Fund is registered under the Investment Company Act of 1940 as an open-end investment company, or mutual fund. The fund files reports with the SEC under the company name Vanguard Horizon Funds.
A. The following significant accounting policies conform to generally accepted accounting principles for U.S. mutual funds. The fund consistently follows such policies in preparing its financial statements.
1. Security Valuation: Securities are valued as of the close of trading on the New York Stock Exchange (generally 4:00 p.m. Eastern time) on the valuation date. Equity securities are valued at the latest quoted sales prices or official closing prices taken from the primary market in which each security trades; such securities not traded on the valuation date are valued at the mean of the latest quoted bid and asked prices. Securities for which market quotations are not readily available, or whose values have been materially affected by events occurring before the fund’s pricing time but after the close of the securities’ primary markets, are valued by methods deemed by the board of trustees to represent fair value. Investments in Vanguard Market Liquidity Fund are valued at that fund’s net asset value. Temporary cash investments acquired over 60 days to maturity are valued using the latest bid prices or using valuations based on a matrix system (which considers such factors as security prices, yields, maturities, and ratings), both as furnished by independent pricing services. Other temporary cash investments are valued at amortized cost, which approximates market value.
2. Futures Contracts: The fund uses index futures contracts to a limited extent, with the objective of maintaining full exposure to the stock market while maintaining liquidity. The fund may purchase or sell futures contracts to achieve a desired level of investment, whether to accommodate portfolio turnover or cash flows from capital share transactions. The primary risks associated with the use of futures contracts are imperfect correlation between changes in market values of stocks held by the fund and the prices of futures contracts, and the possibility of an illiquid market.
Futures contracts are valued at their quoted daily settlement prices. The aggregate principal amounts of the contracts are not recorded in the Statement of Net Assets. Fluctuations in the value of the contracts are recorded in the Statement of Net Assets as an asset (liability) and in the Statement of Operations as unrealized appreciation (depreciation) until the contracts are closed, when they are recorded as realized futures gains (losses).
3. Federal Income Taxes: The fund intends to continue to qualify as a regulated investment company and distribute all of its taxable income. Accordingly, no provision for federal income taxes is required in the financial statements.
4. Distributions: Distributions to shareholders are recorded on the ex-dividend date.
5. Security Lending: The fund may lend its securities to qualified institutional borrowers to earn additional income. Security loans are required to be secured at all times by collateral at least equal to the market value of securities loaned. The fund invests cash collateral received in Vanguard Market Liquidity Fund, and records a liability for the return of the collateral, during the period the securities are on loan. Security lending income represents the income earned on investing cash collateral, less expenses associated with the loan.
6. Other: Dividend income is recorded on the ex-dividend date. Interest income includes income distributions
received from Vanguard Market Liquidity Fund and is accrued daily. Security transactions are accounted for on the date securities are bought or sold. Costs used to determine realized gains (losses) on the sale of investment securities are those of the specific securities sold.
24
B. The Vanguard Group furnishes at cost investment advisory, corporate management, administrative, marketing, and distribution services. The costs of such services are allocated to the fund under methods approved by the board of trustees. The fund has committed to provide up to 0.40% of its net assets in capital contributions to Vanguard. At September 30, 2006, the fund had contributed capital of $709,000 to Vanguard (included in Other Assets), representing 0.01% of the fund’s net assets and 0.71% of Vanguard’s capitalization. The fund’s trustees and officers are also directors and officers of Vanguard.
C. Distributions are determined on a tax basis and may differ from net investment income and realized capital gains for financial reporting purposes. Differences may be permanent or temporary. Permanent differences are reclassified among capital accounts in the financial statements to reflect their tax character. Temporary differences arise when certain items of income, expense, gain, or loss are recognized in different periods for financial statement and tax purposes; these differences will reverse at some time in the future. Differences in classification may also result from the treatment of short-term gains as ordinary income for tax purposes.
The fund used a tax accounting practice to treat a portion of the price of capital shares redeemed during the year as distributions from net investment income and realized capital gains. Accordingly, the fund has reclassified $7,149,000 from undistributed net investment income, and $30,701,000 from accumulated net realized gains, to paid-in capital.
For tax purposes, at September 30, 2006, the fund had $67,363,000 of ordinary income and $250,390,000 of long-term capital gains available for distribution.
At September 30, 2006, the cost of investment securities for tax purposes was $6,124,531,000. Net unrealized appreciation of investment securities for tax purposes was $736,992,000, consisting of unrealized gains of $972,659,000 on securities that had risen in value since their purchase and $235,667,000 in unrealized losses on securities that had fallen in value since their purchase.
At September 30, 2006, the aggregate settlement value of open futures contracts expiring in December 2006 and the related unrealized appreciation (depreciation) were:
| | ($000) |
| | Aggregate | Unrealized |
| Number of | Settlement | Appreciation |
Futures Contracts | Long Contracts | Value | (Depreciation) |
S&P 500 Index | 2 | 673 | 17 |
Unrealized appreciation (depreciation) on open futures contracts is required to be treated as realized gain (loss) for tax purposes.
D. During the year ended September 30, 2006, the fund purchased $6,393,756,000 of investment securities and sold $5,093,992,000 of investment securities, other than temporary cash investments.
E. The market value of securities on loan to broker-dealers at September 30, 2006, was $99,125,000, for which the fund received cash collateral of $103,910,000.
25
F. Capital shares issued and redeemed were:
| Year Ended September 30, |
| 2006 | 2005 |
| Shares | Shares |
| (000) | (000) |
Issued | 98,757 | 90,730 |
Issued in Lieu of Cash Distributions | 16,547 | 7,988 |
Redeemed | (45,160) | (25,966) |
Net Increase (Decrease) in Shares Outstanding | 70,144 | 72,752 |
G. In June 2006, the Financial Accounting Standards Board issued Interpretation No. 48 (“FIN 48”), “Accounting for Uncertainty in Income Taxes.” FIN 48 establishes the minimum threshold for recognizing, and a system for measuring, the benefits of tax-return positions in financial statements. FIN 48 will be effective for the fund’s fiscal year beginning October 1, 2007. Management is in the process of analyzing the fund’s tax positions for purposes of implementing FIN 48; based on the analysis completed to date, management does not believe the adoption of FIN 48 will result in any material impact to the fund’s financial statements.
26
Report of Independent Registered
Public Accounting Firm
To the Trustees of Vanguard Horizon Funds and the Shareholders of Vanguard Strategic Equity Fund:
In our opinion, the accompanying statement of net assets and the related statements of operations and of changes in net assets and the financial highlights present fairly, in all material respects, the financial position of Vanguard Strategic Equity Fund (the “Fund”) at September 30, 2006, the results of its operations for the year then ended, the changes in its net assets for each of the two years in the period then ended, and the financial highlights for each of the periods indicated, in conformity with accounting principles generally accepted in the United States of America. These financial statements and financial highlights (hereafter referred to as “financial statements”) are the responsibility of the Fund’s management; our responsibility is to express an opinion on these financial statements based on our audits. We conducted our audits of these financial statements in accordance with the standards of the Public Company Accounting Oversight Board (United States), which require that we plan and perform the audit to obtain reasonable assurance about whether the financial statements are free of material misstatement. An audit includes examining, on a test basis, evidence supporting the amounts and disclosures in the financial statements, assessing the accounting principles used and significant estimates made by management, and evaluating the overall financial statement presentation. We believe that our audits, which included confirmation of securities at September 30, 2006 by correspondence with the custodian and broker, and by agreement to the underlying ownership records for Vanguard Market Liquidity Fund, provide a reasonable basis for our opinion.
PricewaterhouseCoopers LLP
Philadelphia, Pennsylvania
November 13, 2006
Special 2006 tax information (unaudited) for Vanguard Strategic Equity Fund
This information for the fiscal year ended September 30, 2006, is included pursuant to provisions of the Internal Revenue Code.
The fund distributed $277,131,000 as capital gain dividends (from net long-term capital gains) to shareholders during the fiscal year.
The fund distributed $49,755,000 of qualified dividend income to shareholders during the fiscal year.
For corporate shareholders, 81.2% of investment income (dividend income plus short-term gains, if any) qualifies for the dividends-received deduction.
27
Your Fund’s After-Tax Returns
This table presents returns for your fund both before and after taxes. The after-tax returns are shown in two ways: (1) assuming that an investor owned the fund during the entire period and paid taxes on the fund’s distributions, and (2) assuming that an investor paid taxes on the fund’s distributions and sold all shares at the end of each period.
Calculations are based on the highest individual federal income tax and capital gains tax rates in effect at the times of the distributions and the hypothetical sales. State and local taxes were not considered. After-tax returns reflect any qualified dividend income, using actual prior-year figures and estimates for 2006. (In the example, returns after the sale of fund shares may be higher than those assuming no sale. This occurs when the sale would have produced a capital loss. The calculation assumes that the investor received a tax deduction for the loss.)
Please note that your actual after-tax returns will depend on your tax situation and may differ from those shown. Also note that if you own the fund in a tax-deferred account, such as an individual retirement account or a 401(k) plan, this information does not apply to you. Such accounts are not subject to current taxes.
Finally, keep in mind that a fund’s performance—whether before or after taxes—does not guarantee future results.
Average Annual Total Returns: Strategic Equity Fund | | | |
Periods Ended September 30, 2006 | | | |
| One | Five | Ten |
| Year | Years | Years |
Returns Before Taxes | 6.49% | 14.89% | 12.63% |
Returns After Taxes on Distributions | 5.03 | 14.16 | 10.87 |
Returns After Taxes on Distributions and Sale of Fund Shares | 5.26 | 12.80 | 10.15 |
28
About Your Fund’s Expenses
As a shareholder of the fund, you incur ongoing costs, which include costs for portfolio management, administrative services, and shareholder reports (like this one), among others. Operating expenses, which are deducted from a fund’s gross income, directly reduce the investment return of the fund.
A fund’s expenses are expressed as a percentage of its average net assets. This figure is known as the expense ratio. The following examples are intended to help you understand the ongoing costs (in dollars) of investing in your fund and to compare these costs with those of other mutual funds. The examples are based on an investment of $1,000 made at the beginning of the period shown and held for the entire period.
The table below illustrates your fund’s costs in two ways:
• Based on actual fund return. This section helps you to estimate the actual expenses that you paid over the period. The “Ending Account Value” shown is derived from the fund’s actual return, and the third column shows the dollar amount that would have been paid by an investor who started with $1,000 in the fund. You may use the information here, together with the amount you invested, to estimate the expenses that you paid over the period.
To do so, simply divide your account value by $1,000 (for example, an $8,600 account value divided by $1,000 = 8.6), then multiply the result by the number given for your fund under the heading “Expenses Paid During Period.”
• Based on hypothetical 5% yearly return. This section is intended to help you compare your fund’s costs with those of other mutual funds. It assumes that the fund had a yearly return of 5% before expenses, but that the expense ratio is unchanged. In this case—because the return used is not the fund’s actual return—the results do not apply to your investment. The example is useful in making comparisons because the Securities and Exchange Commission requires all mutual funds to calculate expenses based on a 5% return. You can assess your fund’s costs by comparing this hypothetical example with the hypothetical examples that appear in shareholder reports of other funds.
Six Months Ended September 30, 2006 | | | |
| Beginning | Ending | Expenses |
| Account Value | Account Value | Paid During |
Strategic Equity Fund | 3/31/2006 | 9/30/2006 | Period1 |
Based on Actual Fund Return | $1,000.00 | $964.06 | $1.67 |
Based on Hypothetical 5% Yearly Return | 1,000.00 | 1,023.36 | 1.72 |
1 | These calculations are based on expenses incurred in the most recent six-month period. The fund’s annualized six-month expense ratio for that period is 0.34%. The dollar amounts shown as “Expenses Paid” are equal to the annualized expense ratio multiplied by the average account value over the period, multiplied by the number of days in the most recent six-month period, then divided by the number of days in the most recent 12-month period. |
29
Note that the expenses shown in the table on page 29 are meant to highlight and help you compare ongoing costs only and do not reflect any transactional costs or account maintenance fees. They do not include your fund’s low-balance fee, which is described in the prospectus. If this fee were applied to your account, your costs would be higher. Your fund does not charge transaction fees, such as purchase or redemption fees, nor does it carry a “sales load.”
The calculations assume no shares were bought or sold during the period. Your actual costs may have been higher or lower, depending on the amount of your investment and the timing of any purchases or redemptions.
You can find more information about the fund’s expenses, including annual expense ratios, in the Financial Statements section of this report. For additional information on operating expenses and other shareholder costs, please refer to the fund prospectus.
30
Glossary
Beta. A measure of the magnitude of a fund’s past share-price fluctuations in relation to the ups and downs of a given market index. The index is assigned a beta of 1.00. Compared with a given index, a fund with a beta of 1.20 typically would have seen its share price rise or fall by 12% when the index rose or fell by 10%. A fund’s beta should be reviewed in conjunction with its R-squared (see definition below). The lower the R-squared, the less correlation there is between the fund and the index, and the less reliable beta is as an indicator of volatility.
Earnings Growth Rate. The average annual rate of growth in earnings over the past five years for the stocks now in a fund.
Expense Ratio. The percentage of a fund’s average net assets used to pay its annual administrative and advisory expenses. These expenses directly reduce returns to investors.
Foreign Holdings. The percentage of a fund represented by stocks or depositary receipts of companies based outside the United States.
Median Market Cap. An indicator of the size of companies in which a fund invests; the midpoint of market capitalization (market price x shares outstanding) of a fund’s stocks, weighted by the proportion of the fund’s assets invested in each stock. Stocks representing half of the fund’s assets have market capitalizations above the median, and the rest are below it.
Price/Book Ratio. The share price of a stock divided by its net worth, or book value, per share. For a fund, the weighted average price/book ratio of the stocks it holds.
Price/Earnings Ratio. The ratio of a stock’s current price to its per-share earnings over the past year. For a fund, the weighted average P/E of the stocks it holds. P/E is an indicator of market expectations about corporate prospects; the higher the P/E, the greater the expectations for a company’s future growth.
R-Squared. A measure of how much of a fund’s past returns can be explained by the returns from the market in general, as measured by a given index. If a fund’s total returns were precisely synchronized with an index’s returns, its R-squared would be 1.00. If the fund’s returns bore no relationship to the index’s returns, its R-squared would be 0.
Return on Equity. The annual average rate of return generated by a company during the past five years for each dollar of shareholder’s equity (net income divided by shareholder’s equity). For a fund, the weighted average return on equity for the companies whose stocks it holds.
Short-Term Reserves. The percentage of a fund invested in highly liquid, short-term securities that can be readily converted to cash.
Turnover Rate. An indication of the fund’s trading activity. Funds with high turnover rates incur higher transaction costs and may be more likely to distribute capital gains (which may be taxable to investors). The turnover rate excludes in-kind transactions, which have minimal impact on costs.
Yield. A snapshot of a fund’s income from interest and dividends. The yield, expressed as a percentage of the fund’s net asset value, is based on income earned over the past 30 days and is annualized, or projected forward for the coming year. The index yield is based on the current annualized rate of income provided by securities in the index.
31
The People Who Govern Your Fund
The trustees of your mutual fund are there to see that the fund is operated and managed in your best interests since, as a shareholder, you are a part owner of the fund. Your fund's trustees also serve on the board of directors of The Vanguard Group, Inc., which is owned by the Vanguard funds and provides services to them on an at-cost basis.
A majority of Vanguard’s board members are independent, meaning that they have no affiliation with Vanguard or the funds they oversee, apart from the sizable personal investments they have made as private individuals.
Our independent board members bring distinguished backgrounds in business, academia, and public service to their task of working with Vanguard officers to establish the policies and oversee the activities of the funds. Among board members’ responsibilities are selecting investment advisors for the funds; monitoring fund operations, performance, and costs; reviewing contracts; nominating and selecting new trustees/directors; and electing Vanguard officers.
Each trustee serves a fund until its termination; or until the trustee’s retirement, resignation, or death; or otherwise as specified in the fund’s organizational documents. Any trustee may be removed at a shareholders’ meeting by a vote representing two-thirds of the net asset value of all shares of the fund together with shares of other Vanguard funds organized within the same trust. The table on these two pages shows information for each trustee and executive officer of the fund. The mailing address of the trustees and officers is P.O. Box 876, Valley Forge, PA 19482.
Chairman of the Board, Chief Executive Officer, and Trustee |
| |
John J. Brennan1 | |
Born 1954 | Principal Occupation(s) During the Past Five Years: Chairman of |
Trustee since May 1987; | the Board, Chief Executive Officer, and Director/Trustee of The |
Chairman of the Board and | Vanguard Group, Inc., and of each of the investment companies |
Chief Executive Officer | served by The Vanguard Group. |
142 Vanguard Funds Overseen | |
| |
Independent Trustees | |
| |
Charles D. Ellis | |
Born 1937 | Principal Occupation(s) During the Past Five Years: Applecore |
Trustee since January 2001 | Partners (pro bono ventures in education); Senior Advisor to |
142 Vanguard Funds Overseen | Greenwich Associates (international business strategy |
| consulting); Successor Trustee of Yale University; Overseer |
| of the Stern School of Business at New York University; |
| Trustee of the Whitehead Institute for Biomedical Research. |
| |
Rajiv L. Gupta | |
Born 1945 | Principal Occupation(s) During the Past Five Years: Chairman |
Trustee since December 20012 | and Chief Executive Officer of Rohm and Haas Co. (chemicals); |
142 Vanguard Funds Overseen | since 1999; Board Member of the American Chemistry Council; |
| Director of Tyco International, Ltd. (diversified manufac- |
| turing and services) since 2005;Trustee of Drexel |
| University and of the Chemical Heritage Foundation. |
| |
Amy Gutmann | |
Born 1949 | Principal Occupation(s) During the Past Five Years: President of the |
Trustee since July 2006 | University of Pennsylvania since 2004; Professor in the School of Arts |
142 Vanguard Funds Overseen | and Sciences, Annenberg School for Communication, and Graduate |
| School of Education of the University of Pennsylvania since 2004; |
| Provost (2001-2004) and Laurance S. Rockefeller Professor of |
| Politics and the University Center for Human Values (1990-2004), |
| Princeton University; Director of Carnegie Corporation of New |
| York since 2005 and of Schuylkill River Development Corporation |
| and Greater Philadelphia Chamber of Commerce since 2004. |
JoAnn Heffernan Heisen | |
Born 1950 | Principal Occupation(s) During the Past Five Years: Corporate |
Trustee since July 1998 | Vice President and Chief Global Diversity Officer since 2006 |
142 Vanguard Funds Overseen | Vice President and Chief Information Officer (1997–2005), |
| and Member of the Executive Committee of Johnson & Johnson |
| (pharmaceuticals/consumer products); Director of the University |
| Medical Center at Princeton and Women’s Research and |
| Education Institute. |
| |
André F. Perold | |
Born 1952 | Principal Occupation(s) During the Past Five Years: |
Trustee since December 2004 | George Gund Professor of Finance and Banking, Harvard Business |
142 Vanguard Funds Overseen | School since 2000; Senior Associate Dean, Director of Faculty |
| Recruiting, and Chair of Finance Faculty, Harvard Business |
| School; Director and Chairman of UNX, Inc. (equities trading firm) |
| since 2003; Director of registered investment companies advised by |
| Merrill Lynch Investment Managers and affiliates (1985-2004), Genbel |
| Securities Limited (South African financial services firm) (1999-2003), |
| Gensec Bank (1999-2003), Sanlam, Ltd. (South African insurance company) |
| (2001-2003), and Stockback, Inc. (credit card firm) (2000-2002). |
| |
Alfred M. Rankin, Jr. | |
Born 1941 | Principal Occupation(s) During the Past Five Years: |
Trustee since January 1993 | Chairman, President, Chief Executive Officer, and Director of NACCO |
142 Vanguard Funds Overseen | Industries, Inc.(forklift trucks/housewares/lignite); Director of |
| Goodrich Corporation (industrialproducts/aircraft systems and services). |
| |
J. Lawrence Wilson | |
Born 1936 | Principal Occupation(s) During the Past Five Years: |
Trustee since April 1985 | Retired Chairman and Chief Executive Officer of Rohm and Haas Co. |
142 Vanguard Funds Overseen | (chemicals);Director of Cummins Inc. (diesel engines), MeadWestvaco |
| Corp. (packing products),and AmerisourceBergen Corp. (pharmaceutical |
| distribution); Trustee of Vanderbilt University and of Culver |
| Educational Foundation. |
| |
Executive Officers 1 | |
| |
Heidi Stam | |
Born 1956 | Principal Occupation(s) During the Past Five Years: |
Trustee since July 2005 | Managing Director since July 2006, General Counsel since July 2005, and |
142 Vanguard Funds Overseen | Secretary of Vanguard and of each of the investment companies served |
| by The Vanguard Group since July 2005; Principal of The Vanguard Group, Inc. |
| (1997-2006). |
| |
Thomas J. Higgins | |
Born 1957 | Principal Occupation(s) During the Past Five Years: |
Trustee since July 1998 | Principal of the Vanguard Group, Inc.; Treasurer of each of the investment |
142 Vanguard Funds Overseen | companies served by the Vanguard Group. |
| |
| |
| Vanguard Senior Management Team |
|---|
| | |
|---|
| R. Gregory Barton | Kathleen C. Gubanich | Michael S. Miller |
| Mortimer J. Buckley | Paul A. Heller | Ralph K. Packard |
| James H. Gately | F. William McNabb, III | George U. Sauter |
|
Founder
|
|---|
| | |
|---|
| John C. Bogle |
|
| Chairman and Chief Executive Officer, 1974-1996 |
1 Officers of the funds are “interested persons” as defined in the Investment Company Act of 1940.
2 December 2002 for Vanguard Equity Income Fund, Vanguard Growth Equity Fund, the Vanguard Municipal Bond Funds, and the Vanguard State Tax-Exempt Funds.
More information about the trustees is in the Statement of Additional Information, available from The Vanguard Group.
|
|
| P.O. Box 2600 Valley Forge, PA 19482-2600 |
Connect with Vanguard™ > www.vanguard.com
| |
|---|
| Fund Information > 800-662-7447 | Vanguard, Connect with Vanguard, and the ship |
| | logo are trademarks of The Vanguard Group, Inc. |
| Direct Investor Account Services > 800-662-2739 | |
| | All other marks are the exclusive property of their |
| Institutional Investor Services > 800-523-1036 | respective owners. |
| | |
| Text Telephone > 800-952-3335 | All comparative mutual fund data are from Lipper Inc. |
| | or Morningstar, Inc., unless otherwise noted. |
| | |
| | |
| | |
| | |
| | You can obtain a free copy of Vanguard’s proxy voting |
| This material may be used in conjunction | guidelines by visiting our website, www.vanguard.com, |
| with the offering of shares of any Vanguard | and searching for “proxy voting guidelines,” or by calling |
| fund only if preceded or accompanied by | Vanguard at 800-662-2739. They are also available from |
| the fund’s current prospectus. | the SEC’s website, www.sec.gov. In addition, you may |
| | obtain a free report on how your fund voted the proxies for |
| | securities it owned during the 12 months ended June 30. |
| | To get the report, visit either www.vanguard.com |
| | or www.sec.gov. |
| | |
| | You can review and copy information about your fund |
| | at the SEC’s Public Reference Room in Washington, D.C. |
| | To find out more about this public service, call the SEC |
| | at 202-551-8090. Information about your fund is also |
| | available on the SEC’s website, and you can receive |
| | copies of this information, for a fee, by sending a |
| | request in either of two ways: via e-mail addressed to |
| | publicinfo@sec.gov or via regular mail addressed to the |
| | Public Reference Section, Securities and Exchange |
| | Commission, Washington, DC 20549-0102. |
| | |
| | |
| | |
| | |
| | © 2006 The Vanguard Group, Inc. |
| | All rights reserved. |
| | Vanguard Marketing Corporation, Distributor. |
| | |
| | Q1140 112006 |
Vanguard® Capital Opportunity Fund |
| |
| |
> Annual Report | |
| |
| |
| |
| |
| |
September 30, 2006 | |
| |
| |
| 
|
| |
| |
| |
| |
> | Vanguard Capital Opportunity Fund returned more than 14%, handily outpacing its comparative standards, in the 2006 fiscal year. |
> | The fund’s success reflected excellent stock selection among information technology, consumer discretionary, and industrials companies. |
> | The fund’s weak spots were a combination of missed opportunities and hard-hit holdings. |
Contents | |
| |
Your Fund’s Total Returns | 1 |
Chairman’s Letter | 2 |
Advisor’s Report | 7 |
Fund Profile | 10 |
Performance Summary | 11 |
Financial Statements | 13 |
Your Fund’s After-Tax Returns | 25 |
About Your Fund’s Expenses | 26 |
Glossary | 28 |
Please note: The opinions expressed in this report are just that—informed opinions. They should not be considered promises or advice. Also, please keep in mind that the information and opinions cover the period through the date on the cover of this report. Of course, the risks of investing in your fund are spelled out in the prospectus.
Your Fund’s Total Returns
Fiscal Year Ended September 30, 2006 | |
| Total |
| Return |
Vanguard Capital Opportunity Fund | |
Investor Shares | 14.1% |
Admiral™ Shares1 | 14.2 |
Russell Midcap Growth Index | 7.0 |
Average Multi-Cap Growth Fund2 | 4.9 |
Dow Jones Wilshire 5000 Composite Index | 10.5 |
Your Fund’s Performance at a Glance |
September 30, 2005–September 30, 2006 |
| | | Distributions Per Share |
| Starting | Ending | Income | Capital |
| Share Price | Share Price | Dividends | Gains |
Vanguard Capital Opportunity Fund | | | | |
Investor Shares | $31.92 | $36.11 | $0.055 | $0.229 |
Admiral Shares | 73.77 | 83.49 | 0.178 | 0.529 |
1 A lower-cost class of shares available to many longtime shareholders and to those with significant investments in the fund.
2 Derived from data provided by Lipper Inc.
1

Chairman’s Letter
Dear Shareholder,
In its 2006 fiscal year, Vanguard Capital Opportunity Fund returned more than 14%, even as midsized growth stocks trailed the broad market. The fund handily outpaced the returns of its benchmark and the average gain of its peers on the strength of stock selections in the information technology, consumer discretionary, and industrials sectors. Missed opportunities in the financials sector and a heavy commitment to the subdued health care sector cast faint shadows on these bright spots.
If you own the Capital Opportunity Fund in a taxable account, see page 25 for a report on the fund’s after-tax returns for the 12 months ended September 30. Please note that as of the fiscal year-end, the fund remained closed to new investors. Existing shareholders may make additional purchases of up to $25,000 per calendar year.
Stocks endured some rough going, then recovered to post strong results
The stock market advanced through the first part of the fund’s fiscal year, then hit a speed bump in May, as investors feared that the economy was growing too rapidly. But a slowdown in the housing market, coupled with a late-summer decline in oil prices, helped to allay inflation concerns. The broad market rebounded to post a solid 10.5% return for the 12 months. Value-oriented stocks outperformed growth stocks, and large-capitalization
2
stocks edged out small-caps, one of the market’s best-performing segments in recent years.
International stocks handily outpaced domestic issues, continuing a multiyear trend. European and emerging market stocks fared particularly well. Stocks in the Pacific region also performed admirably, even though Japanese stocks did not fully participate in the global market’s summer recovery.
In the bond market, prices rallied as the Fed paused
At its August and September meetings, the Federal Reserve Board twice voted to maintain the federal funds rate at 5.25%, marking a pause in the central bank’s two-year inflation-fighting campaign. With investor sentiment buoyed by the Fed’s near-term inflation outlook, interest rates decreased, driving bond prices higher. The broad taxable bond market finished the period with a 3.7% return, and municipal bonds performed slightly better.
Although rates decreased along the entire maturity spectrum in late summer, the difference between the yields of the shortest- and longest-term issues remained narrow by historical standards. At the end of September, the U.S. Treasury yield curve was actually inverted, meaning that short-term issues such as 3-month and 6-month Treasury notes offered higher yields than those with longer maturities.
Market Barometer | | | |
| Average Annual Total Returns |
| Periods Ended September 30, 2006 |
| One Year | Three Years | Five Years |
Stocks | | | |
Russell 1000 Index (Large-caps) | 10.2% | 12.8% | 7.6% |
Russell 2000 Index (Small-caps) | 9.9 | 15.5 | 13.8 |
Dow Jones Wilshire 5000 Index (Entire market) | 10.5 | 13.3 | 8.6 |
MSCI All Country World Index ex USA (International) | 19.4 | 23.9 | 16.4 |
| | | |
Bonds | | | |
Lehman Aggregate Bond Index (Broad taxable market) | 3.7% | 3.4% | 4.8% |
Lehman Municipal Bond Index | 4.5 | 4.4 | 5.2 |
Citigroup 3-Month Treasury Bill Index | 4.4 | 2.6 | 2.2 |
| | | |
CPI | | | |
Consumer Price Index | 2.1% | 3.1% | 2.6% |
3
The fund charted a distinctive path to market-beating performance
An analysis of Vanguard Capital Opportunity Fund’s fiscal-year performance illustrates two distinctive features of the long-term strategy followed by the investment advisor, PRIMECAP Management Company: stock selection based solely on a company’s merits, and the advisor’s willingness to invest heavily in support of its strongest convictions. The strategy produces a portfolio that looks and behaves unlike market benchmarks.
In the broad market, for example, information technology stocks were relatively tepid performers during the past 12 months. The fund’s large technology position, by contrast, generated excellent returns, powered by sizable, longtime holdings such as Research In Motion and NVIDIA. Both stocks were up by more than 50%.
The fund also distinguished itself in the consumer discretionary sector, earning returns of more than 20% from an eclectic mix of retailers that included high-end emporiums such as Nordstrom and low-price merchandisers such as 99 Cents Only Stores. Other pockets of strength for the fund included the industrials and materials sectors.
Of course, the fund’s willingness to go its own way can have a cost, too. During the past 12 months, it missed out on opportunities in the strongly performing financials sector. The fund’s sizable health care stake worked against it, as its
Expense Ratios1 | | | |
Your fund compared with its peer group |
| | | Average |
| Investor | Admiral | Multi-Cap |
| Shares | Shares | Growth Fund |
Capital Opportunity Fund | 0.49% | 0.40% | 1.65% |
1 Fund expense ratios reflect the 12 months ended September 30, 2006. Peer-group expense ratio is derived from data provided by Lipper Inc. and captures information through year-end 2005.
4
medical-device and diagnostics stocks struggled. The fund’s investment in Sprint Nextel—representing a bit less than 2% of assets during the period—also backfired.
The fund has made the most of its opportunities
Over the long term, the success of Capital Opportunity Fund’s bold approach depends on its ability to maximize the return from its favorable stock selections while limiting the damage from its occasional missteps. Since 1998, when PRIMECAP Management Company assumed responsibility for the fund’s investments, the results have been excellent for shareholders.
During the past decade—a period that includes some difficult years before PRIMECAP Management became the advisor—Vanguard Capital Opportunity Fund has returned an average of 14.6% annually. At that rate, a hypothetical $25,000 investment made at the start of the period would have grown to $97,439. The same investment compounded at the average return of the fund’s peer group would be worth less than half as much. Although it would be unreasonable to expect such a margin of superiority to endure, we remain confident in the advisor’s ability to continue delivering strong long-term performance.
Total Returns | | |
Ten Years Ended September 30, 2006 | | |
| Average | Final Value of a $25,000 |
| Annual Return | Initial Investment |
Capital Opportunity Fund Investor Shares | 14.6% | $97,439 |
Russell Midcap Growth Index | 8.2 | 54,961 |
Average Multi-Cap Growth Fund | 6.5 | 46,751 |
Dow Jones Wilshire 5000 Index | 8.6 | 57,178 |
5
Provision your portfolio for a long-term journey
Although the U.S. stock market finished the 12-month period with a solid return, the journey was circuitous: a strong start, a mid-May swoon, a powerful finish. These ups and downs are an unavoidable fact of investing life.
Our time-tested counsel to shareholders traveling across the market’s peaks and valleys toward long-term goals is to diversify both within and across asset classes. Within the stock market portion of your portfolio, for example, you can complement the small- and mid-cap-oriented Capital Opportunity Fund with larger stocks, potentially moderating the overall volatility of your stock investments. You can temper portfolio risk more dramatically by balancing stock funds with bond and money market funds in an allocation consistent with your goals and circumstances.
This simple plan gives you the opportunity to pursue the potentially high returns available from stocks while paying heed to risk control. Vanguard Capital Opportunity Fund can play an important role in such a plan.
Thank you for entrusting your assets to Vanguard.
Sincerely,

John J. Brennan
Chairman and Chief Executive Officer
October 16, 2006
6
Advisor’s Report
During the past 12 months, equity markets delivered solid returns. Vanguard Capital Opportunity Fund returned 14.1%, exceeding the 7.0% return of the Russell Midcap Growth Index and the 4.9% average gain of the fund’s peer group.
Investment environment
Overall, fiscal 2006 was a strong year for stocks; however, it was a relatively challenging environment for growth stocks, as investors showed a strong preference for value stocks. Stocks struggled during the summer as the market wrestled with whether the Federal Reserve Board would continue to hike interest rates, threatening economic growth, or would pause, satisfied that the specter of inflation was less of a concern than preserving economic growth.
Since the Fed’s August 8 decision to leave short-term interest rates unchanged, stocks have trended higher. In addition, energy and commodity prices have recently declined from historical highs, providing much-needed relief to consumers and further mitigating inflationary concerns. Valuations, in our view, appear attractive in light of low long-term interest rates and modest inflationary expectations; however, with corporate profit margins at record highs, multiple expansion from the current level may prove difficult.
We continue to see relatively low premiums for high-quality growth stocks. The valuation differential between growth and value stocks remains near a 20-year low. Because our objective is to buy companies with superior growth at reasonable prices, we believe this valuation compression has afforded us some compelling investment opportunities.
Our successes
The fund’s strong absolute and relative returns reflected stock selections in the information technology and consumer discretionary sectors. Together, these sectors account for 58% of fund assets. Our more modest position in industrials stocks also made an important contribution.
In the consumer discretionary sector, the fund benefited from its investments in Nordstrom, CarMax, Dress Barn, and other innovative specialty retailers. We also earned strong returns from entertainment-related companies such as DIRECTV and News Corporation.
In technology, long-time holding Research In Motion returned more than 50%. The company settled outstanding patent litigation that had slowed customer adoption of its messaging platform, and it enjoyed a successful launch of its next-generation device, the Pearl. Other strong performers included several top-ten holdings: graphics chip maker NVIDIA; Corning, the leading manufacturer of glass substrate used in LCD televisions; and semiconductor equipment company ASML Holding. Our strongly performing industrials companies included air-freight giant FedEx, airlines, and select engineering and electrical equipment companies. Monsanto, Applera Corp.–Applied
7
Biosystems Group, Thomas & Betts, Akamai Technologies, and THQ also made strong contributions to our returns during the fiscal year.
Our shortfalls
Our shortfalls relative to the index included our relatively light exposure to the rallying financials sector and our heavy emphasis on struggling health care stocks.
Medical device makers Boston Scientific and Medtronic performed poorly. Product recalls, Federal Drug Administration inquiries, safety concerns, and declining reimbursement rates have had a short-term impact on growth rates and investor psychology. In addition, Boston Scientific has found the initial integration of Guidant to be more challenging than expected. We have increased our holdings of these stocks, as we believe the short-term issues will eventually be favorably resolved and the long-term growth prospects of the implantable device and stent industries remain intact. Performance was also hurt by diagnostics company Affymetrix. A pioneer in the gene expression and genotyping markets, Affymetrix has seen its early lead in genotyping eroded by newer technologies.
Sprint Nextel, which has struggled to execute its postmerger business plans, was our major disappointment in the telecommunication services sector. We believe the company has unique technology, is attractively valued, and will ultimately address the operational issues that have plagued recent results.
Outlook
We remain especially enthusiastic about information technology and health care companies—sectors that accounted for many of our largest purchases during the past 12 months, including—in IT—software companies Symantec and Avid Technology. We believe that four major trends will drive strong demand for software through the rest of the decade and beyond: (1) the availability of inexpensive bandwidth as broadband penetration among U.S. households doubles from 40%; (2) the sharing and storage of digital information, such as photos, data files, music, and video; (3) the convergence of voice, data, video, and wireless services; and (4) the need to protect and secure data and identities. We’ve also been adding to Internet companies such as Yahoo!, eBay, and Google.
Health care is our second-largest sector position, with significant holdings in pharmaceuticals companies, biotech firms, and makers of medical devices. The sector has been a poor performer in recent years, which has given us an opportunity to add to or establish new positions at attractive prices. Despite public concern about drug prices, we see pharmaceuticals as part of the solution to higher health care costs. A recent study of nearly 200,000 patients published in the New England Journal
8
of Medicine showed that capping drug benefits not only resulted in increased hospitalizations and deaths but produced no net cost savings. The money saved by spending less on drugs was spent on increased medical care for those patients whose drug benefits were capped. With the difference between the price/earnings ratios of pharmaceutical stocks and that of the Standard & Poor’s 500 Index close to a 40-year low, they appear undervalued.
We believe that the two segments of the economy most vulnerable to a slowdown are consumers and financial institutions. Consumer home-equity extractions, which ranged between $100 billion and $200 billion for most of the 1980s and early 1990s, increased to $700 billion in 2005. With short-term interest rates rising and the housing market seemingly slowing, this source of liquidity is drying up.
Financial institutions will be hurt by deteriorating consumer finances, as well as the relatively flat yield curve, which makes it more difficult for banks to arbitrage the difference between the interest rates of short-term deposits and long-term investments. While financial stocks account for 9% of the Russell Midcap Growth Index’s value, the sector makes up only 2% of portfolio assets, reflecting our pessimism for this area.
Theo A. Kolokotrones | Howard B. Schow |
Portfolio Manager | Portfolio Manager |
| |
Joel P. Fried | Alfred W. Mordecai |
Portfolio Manager | Portfolio Manager |
PRIMECAP Management Company, LLP
October 18, 2006
9
Fund Profile
As of September 30, 2006
Total Fund Characteristics |
| | Comparative | Broad |
| Fund | Index1 | Index2 |
Number of Stocks | 120 | 539 | 4,974 |
Median Market Cap | $11.3B | $7.0B | $27.5B |
Price/Earnings Ratio | 25.4x | 23.5x | 17.2x |
Price/Book Ratio | 3.0x | 3.9x | 3.7x |
Yield | | 0.8% | 1.7% |
Investor Shares | 0.2% | | |
Admiral Shares | 0.2% | | |
Return on Equity | 10.6% | 17.3% | 15.4% |
Earnings Growth Rate | 19.4% | 20.9% | 15.7% |
Foreign Holdings | 11.5% | 0.0% | 1.1% |
Turnover Rate | 11% | — | — |
Expense Ratio | | — | — |
Investor Shares | 0.49% | | |
Admiral Shares | 0.40% | | |
Short-Term Reserves | 2% | — | — |
Sector Diversification (% of portfolio) |
| | Comparative | Broad |
| Fund | Index1 | Index2 |
Consumer Discretionary | 15% | 22% | 12% |
Consumer Staples | 0 | 5 | 9 |
Energy | 6 | 8 | 9 |
Financials | 2 | 9 | 23 |
Health Care | 19 | 15 | 12 |
Industrials | 9 | 14 | 11 |
Information Technology | 43 | 19 | 15 |
Materials | 3 | 4 | 3 |
Telecommunication Services | 1 | 2 | 3 |
Utilities | 0 | 2 | 3 |
Short-Term Reserves | 2% | — | — |
Volatility Measures3 | |
| Fund Versus | Fund Versus |
| Comparative Index1 | Broad Index2 |
R-Squared | 0.88 | 0.82 |
Beta | 1.09 | 1.48 |
Ten Largest Holdings4 (% of total net assets) |
| | |
Research In Motion Ltd. | communications | |
| equipment | 4.4% |
Corning, Inc. | communications | |
| equipment | 3.8 |
Symantec Corp. | systems software | 3.2 |
FedEx Corp. | air freight | |
| and logistics | 3.1 |
NVIDIA Corp. | semiconductors | 3.0 |
Applera Corp.–Applied | life sciences tools | |
Biosystems Group | and services | 2.9 |
Biogen Idec Inc. | biotechnology | 2.9 |
ASML Holding (New York) | semiconductor | |
| equipment | 2.6 |
Monsanto Co. | fertilizers and | |
| agricultural | |
| chemicals | 2.6 |
Pfizer Inc. | pharmaceuticals | 2.5 |
Top Ten | | 31.0% |
Investment Focus
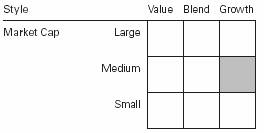
1 Russell Midcap Growth Index.
2 Dow Jones Wilshire 5000 Index.
3 For an explanation of R-squared, beta, and other items used here, see the Glossary on page 28.
4 “Ten Largest Holdings” excludes any temporary cash investments and equity index products.
10
Performance Summary
All of the returns in this report represent past performance, which is not a guarantee of future results that may be achieved by the fund. (Current performance may be lower or higher than the performance data cited. For performance data current to the most recent month-end, visit our website at www.vanguard.com.) Note, too, that both investment returns and principal value can fluctuate widely, so an investor’s shares, when sold, could be worth more or less than their original cost. The returns shown do not reflect taxes that a shareholder would pay on fund distributions or on the sale of fund shares.
Cumulative Performance: September 30, 1996–September 30, 2006
Initial Investment of $25,000
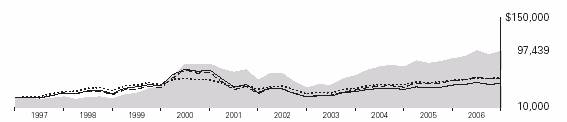
| Average Annual Total Returns | Final Value |
| Periods Ended September 30, 2006 | of a $25,000 |
| One Year | Five Years | Ten Years | Investment |
Capital Opportunity Fund Investor Shares1 | 14.10% | 13.43% | 14.57% | $97,439 |
Dow Jones Wilshire 5000 Index | 10.48 | 8.64 | 8.62 | 57,178 |
Russell Midcap Growth Index | 7.03 | 12.01 | 8.20 | 54,961 |
Average Multi-Cap Growth Fund2 | 4.86 | 6.75 | 6.46 | 46,751 |
| | | Final Value |
| | Since | of a $100,000 |
| One Year | Inception3 | Investment |
Capital Opportunity Fund Admiral Shares1 | 14.23% | 11.55% | $170,504 |
Dow Jones Wilshire 5000 Index | 10.48 | 7.21 | 140,456 |
Russell Midcap Growth Index | 7.03 | 8.63 | 149,812 |
1 Total returns do not reflect the 1% fee assessed on redemptions after March 23, 2005, of shares held for less than one year, or the 1% fee previously assessed on redemptions of shares held for less than five years.
2 Derived from data provided by Lipper Inc.
3 November 12, 2001.
11
Fiscal-Year Total Returns (%): September 30, 1996–September 30, 2006
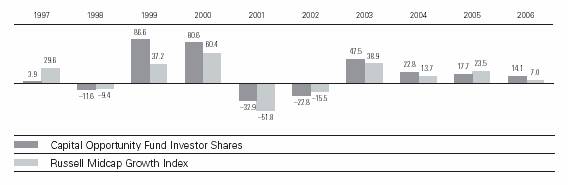
Note: See Financial Highlights tables on pages 18 and 19 for dividend and capital gains information.
12
Financial Statements
Statement of Net Assets
As of September 30, 2006
The fund provides a complete list of its holdings four times in each fiscal year, at the quarter-ends. For the second and fourth fiscal quarters, the lists appear in the fund’s semiannual and annual reports to shareholders. For the first and third fiscal quarters, the fund files the lists with the Securities and Exchange Commission on Form N-Q. Shareholders can look up the fund’s Forms N-Q on the SEC’s website at www.sec.gov. Forms N-Q may also be reviewed and copied at the SEC’s Public Reference Room (see the back cover of this report for further information).
| | | Market |
| | | Value• |
| | Shares | ($000) |
Common Stocks (97.8%) | | |
Consumer Discretionary (14.4%) | |
* | DIRECTV Group, Inc. | 10,096,335 | 198,695 |
| TJX Cos., Inc. | 5,167,400 | 144,842 |
1 Men’s Wearhouse, Inc. | 3,565,600 | 132,676 |
| Nordstrom, Inc. | 3,100,000 | 131,130 |
| Yum! Brands, Inc. | 2,085,500 | 108,550 |
* | CarMax, Inc. | 2,359,800 | 98,427 |
* 1 The Dress Barn, Inc. | 4,400,000 | 96,008 |
* | Bed Bath & Beyond, Inc. | 2,061,200 | 78,862 |
| Best Buy Co., Inc. | 952,500 | 51,015 |
* | Quiksilver, Inc. | 3,878,800 | 47,127 |
| Lowe’s Cos., Inc. | 1,411,400 | 39,603 |
| Harman International | | |
| Industries, Inc. | 342,100 | 28,545 |
* | 99 Cents Only Stores | 2,400,000 | 28,392 |
| Tiffany & Co. | 547,800 | 18,187 |
| Abercrombie & Fitch Co. | 200,000 | 13,896 |
| Gentex Corp. | 900,000 | 12,789 |
* | Comcast Corp. Class A | 257,000 | 9,470 |
* 1 Strattec Security Corp. | 220,000 | 8,419 |
* | DreamWorks | | |
| Animation SKG, Inc. | 262,000 | 6,526 |
| Mattel, Inc. | 240,000 | 4,728 |
* | Expedia, Inc. | 300,000 | 4,704 |
| Weight Watchers | | |
| International, Inc. | 70,000 | 3,104 |
* | REX Stores Corp. | 202,300 | 2,852 |
| E.W. Scripps Co. Class A | 31,000 | 1,486 |
| | | 1,270,033 |
Consumer Staples (0.4%) | | |
* | Cott Corp. | 1,740,000 | 29,876 |
| Bunge Ltd. | 100,000 | 5,795 |
| | | 35,671 |
Energy (6.0%) | | |
| Murphy Oil Corp. | 2,900,000 | 137,895 |
| ConocoPhillips Co. | 1,750,000 | 104,177 |
| Noble Energy, Inc. | 1,500,000 | 68,385 |
* | National Oilwell Varco Inc. | 1,003,560 | 58,758 |
| Pogo Producing Co. | 1,200,000 | 49,140 |
| Pioneer Natural | | |
| Resources Co. | 1,120,000 | 43,814 |
* | Hanover Compressor Co. | 1,325,000 | 24,142 |
| Arch Coal, Inc. | 825,000 | 23,851 |
* | Pride International, Inc. | 530,700 | 14,551 |
| | | 524,713 |
Financials (1.5%) | | |
| MBIA, Inc. | 562,500 | 34,560 |
| Capital One Financial Corp. | 325,000 | 25,565 |
| East West Bancorp, Inc. | 640,000 | 25,350 |
| The Chubb Corp. | 440,000 | 22,862 |
| IndyMac Bancorp, Inc. | 425,000 | 17,493 |
| TCF Financial Corp. | 330,000 | 8,676 |
| Commerce Bancorp, Inc. | 30,000 | 1,101 |
| | | 135,607 |
Health Care (18.6%) | | |
| Applera Corp.–Applied | | |
| Biosystems Group | 7,775,000 | 257,430 |
* | Biogen Idec Inc. | 5,650,000 | 252,442 |
| Pfizer Inc. | 7,617,780 | 216,040 |
| Novartis AG ADR | 3,130,000 | 182,917 |
| Medtronic, Inc. | 2,358,100 | 109,510 |
* | Millipore Corp. | 1,755,000 | 107,582 |
| Roche Holdings AG | 550,000 | 94,757 |
* | ICOS Corp. | 3,107,500 | 77,874 |
| Eli Lilly & Co. | 1,300,000 | 74,100 |
* | Boston Scientific Corp. | 4,507,700 | 66,669 |
* 1 BioMarin | | |
| Pharmaceutical Inc. | 4,670,500 | 66,461 |
* | Affymetrix, Inc. | 3,016,500 | 65,036 |
* | Sepracor Inc. | 700,000 | 33,908 |
* | Edwards Lifesciences Corp. | 300,000 | 13,977 |
* | Waters Corp. | 200,000 | 9,056 |
* | ^Dendreon Corp. | 1,861,750 | 8,322 |
* | ^Pharmacyclics, Inc. | 713,250 | 3,466 |
| | | 1,639,547 |
13
| | | Market |
| | | Value• |
| | Shares | ($000) |
Industrials (9.4%) | | |
| FedEx Corp. | 2,544,800 | 276,569 |
* 1 | Thomas & Betts Corp. | 3,763,300 | 179,547 |
| Avery Dennison Corp. | 1,592,000 | 95,791 |
| Pall Corp. | 2,926,300 | 90,159 |
* | AMR Corp. | 3,000,000 | 69,420 |
| Fluor Corp. | 523,000 | 40,213 |
| Union Pacific Corp. | 450,000 | 39,600 |
* ^JetBlue Airways Corp. | 3,241,050 | 30,045 |
| Chicago Bridge | | |
| & Iron Co. N.V. | 225,000 | 5,414 |
* | US Airways Group Inc. | 53,900 | 2,389 |
| Southwest Airlines Co. | 16,300 | 272 |
| | | 829,419 |
InformationTechnology (42.5%) | |
| Communications Equipment (12.7%) | |
* | Research In Motion Ltd. | 3,746,000 | 384,564 |
* | Corning, Inc. | 13,624,200 | 332,567 |
* | Comverse Technology, Inc. | 6,360,000 | 136,358 |
| Motorola, Inc. | 4,500,000 | 112,500 |
* | Nortel Networks Corp. | 26,800,100 | 61,640 |
* | Avocent Corp. | 1,828,600 | 55,077 |
| Plantronics, Inc. | 1,150,000 | 20,160 |
* | Ciena Corp. | 607,142 | 16,545 |
| | | |
| Computers & Peripherals (3.0%) | |
| Hewlett-Packard Co. | 2,400,000 | 88,056 |
*1 | Emulex Corp. | 4,554,400 | 82,753 |
* ^Avid Technology, Inc. | 1,985,000 | 72,294 |
* | EMC Corp. | 1,250,000 | 14,975 |
* | Concurrent Computer Corp. | 3,224,880 | 5,708 |
* | Brocade Communications | | |
| Systems, Inc. | 173,935 | 1,228 |
| | | |
| Electronic Equipment & Instruments (2.0%) |
| Tektronix, Inc. | 2,557,200 | 73,980 |
* | Trimble Navigation Ltd. | 1,500,000 | 70,620 |
* | Coherent, Inc. | 720,000 | 24,955 |
| | | |
| Internet Software & Services (2.7%) | |
* | eBay Inc. | 3,000,000 | 85,080 |
* | VeriSign, Inc. | 3,315,000 | 66,963 |
* | Yahoo! Inc. | 1,964,100 | 49,652 |
* | Google Inc. | 89,850 | 36,111 |
| | | |
| Semiconductors & | | |
| Semiconductor Equipment (11.5%) | |
* | NVIDIA Corp. | 9,068,900 | 268,349 |
* | ASML Holding (New York) | 9,914,400 | 230,807 |
* | Micron Technology, Inc. | 10,350,000 | 180,090 |
*1 ^Rambus Inc. | 5,205,000 | 90,775 |
| Intersil Corp. | 3,630,000 | 89,117 |
* | Altera Corp. | 2,060,000 | 37,863 |
* | Cymer, Inc. | 642,258 | 28,202 |
* | Entegris Inc. | 2,019,231 | 22,030 |
| Texas Instruments, Inc. | 550,000 | 18,288 |
* | Freescale | | |
| Semiconductor, Inc. | | |
| Class B | 450,000 | 17,105 |
* | FormFactor Inc. | 400,000 | 16,852 |
* | AMIS Holdings Inc. | 700,000 | 6,643 |
| Intel Corp. | 235,000 | 4,834 |
* | Silicon Laboratories Inc. | 80,000 | 2,482 |
| | | |
| Software (10.6%) | | |
* | Symantec Corp. | 13,145,100 | 279,728 |
*1 | THQ Inc. | 4,915,000 | 143,371 |
| Microsoft Corp. | 4,350,000 | 118,886 |
* | Adobe Systems, Inc. | 3,042,714 | 113,950 |
* | Autodesk, Inc. | 2,540,000 | 88,341 |
*1 | Macrovision Corp. | 3,582,900 | 84,879 |
* | Citrix Systems, Inc. | 1,675,000 | 60,652 |
*1 | The Descartes Systems | | |
| Group Inc. | 4,645,000 | 18,208 |
* | Intuit, Inc. | 440,000 | 14,120 |
* | McAfee Inc. | 220,000 | 5,381 |
* | NAVTEQ Corp. | 205,000 | 5,353 |
| | | 3,738,092 |
Materials (3.5%) | | |
| Monsanto Co. | 4,773,968 | 224,424 |
1 | Minerals Technologies, Inc. | 1,560,000 | 83,304 |
| | | 307,728 |
Telecommunication Services (1.5%) | |
| Sprint Nextel Corp. | 7,159,700 | 122,789 |
| Embarq Corp. | 175,000 | 8,465 |
| | | 131,254 |
Total Common Stocks | | |
(Cost $5,746,897) | | 8,612,064 |
Temporary Cash Investments (2.7%) | |
2 | Vanguard Market Liquidity | | |
| Fund, 5.306% | 203,145,578 | 203,146 |
2 | Vanguard Market Liquidity | | |
| Fund, 5.306%—Note G | 30,085,500 | 30,086 |
Total Temporary Cash Investments | |
(Cost $233,232) | | 233,232 |
Total Investments (100.5%) | | |
(Cost $5,980,129) | | 8,845,296 |
Other Assets and | | |
Liabilities—Net (–0.5%) | | (44,854) |
Net Assets (100%) | | 8,800,442 |
14
| Market |
| Value• |
| ($000) |
Statement of Assets and Liabilities | |
Assets | |
Investment in Securities, at Value | 8,845,296 |
Receivables for Investment | |
Securities Sold | 10,551 |
Receivables for Capital Shares Issued | 4,103 |
Other Assets—Note C | 4,080 |
Total Assets | 8,864,030 |
Liabilities | |
Security Lending Collateral | |
Payable to Brokers—Note G | 30,086 |
Payables for Investment Securities Purchased | 11,894 |
Payables for Capital Shares Redeemed | 4,496 |
Other Liabilities | 17,112 |
Total Liabilities | 63,588 |
Net Assets | 8,800,442 |
At September 30, 2006, net assets consisted of:3 |
| Amount |
| ($000) |
Paid-in Capital | 5,551,006 |
Undistributed Net Investment Income | 5,128 |
Accumulated Net Realized Gains | 379,132 |
Unrealized Appreciation | |
Investment Securities | 2,865,167 |
Foreign Currencies | 9 |
Net Assets | 8,800,442 |
| |
Investor Shares—Net Assets | |
Applicable to 139,850,780 outstanding $.001 |
par value shares of beneficial interest | |
(unlimited authorization) | 5,050,660 |
Net Asset Value Per Share— | |
Investor Shares | $36.11 |
| |
Admiral Shares—Net Assets | |
Applicable to 44,911,700 outstanding $.001 |
par value shares of beneficial interest | |
(unlimited authorization) | 3,749,782 |
Net Asset Value Per Share— | |
Admiral Shares | $83.49 |
• | See Note A in Notes to Financial Statements. |
* | Non-income-producing security. |
^ | Part of security position is on loan to broker/dealers. See Note G in Notes to Financial Statements. |
1 | Considered an affiliated company of the fund as the fund owns more than 5% of the outstanding voting securities of such company. See Note I in Notes to Financial Statements. |
2 | Affiliated money market fund available only to Vanguard funds and certain trusts and accounts managed by Vanguard. Rate shown is the 7-day yield. |
3 | See Note E in Notes to Financial Statements for the tax-basis components of net assets.
ADR—American Depositary Receipt. |
15
Statement of Operations
| Year Ended |
| September 30, 2006 |
| ($000) |
Investment Income | |
Income | |
Dividends1,2 | 43,145 |
Interest 2 | 10,919 |
Security Lending | 809 |
Total Income | 54,873 |
Expenses | |
Investment Advisory Fees—Note B | 22,399 |
The Vanguard Group—Note C | |
Management and Administrative | |
Investor Shares | 10,197 |
Admiral Shares | 3,957 |
Marketing and Distribution | |
Investor Shares | 1,109 |
Admiral Shares | 630 |
Custodian Fees | 118 |
Auditing Fees | 19 |
Shareholders’ Reports | |
Investor Shares | 103 |
Admiral Shares | 17 |
Trustees’ Fees and Expenses | 9 |
Total Expenses | 38,558 |
Expenses Paid Indirectly—Note D | (333) |
Net Expenses | 38,225 |
Net Investment Income | 16,648 |
Realized Net Gain (Loss) | |
Investment Securities Sold2 | 457,481 |
Foreign Currencies | 11 |
Realized Net Gain (Loss) | 457,492 |
Change in Unrealized Appreciation (Depreciation) | |
Investment Securities | 643,099 |
Foreign Currencies | 9 |
Change in Unrealized Appreciation (Depreciation) | 643,108 |
Net Increase (Decrease) in Net Assets Resulting from Operations | 1,117,248 |
1 Dividends are net of foreign withholding taxes of $621,000.
2 Dividend income, interest income and realized net gain (loss) from affiliated companies of the fund were $849,000, $10,912,000, and $33,292,000, respectively.
16
Statement of Changes in Net Assets
| Year Ended September 30, |
| 2006 | 2005 |
| ($000) | ($000) |
Increase (Decrease) in Net Assets | | |
Operations | | |
Net Investment Income | 16,648 | 27,628 |
Realized Net Gain (Loss) | 457,492 | 52,452 |
Change in Unrealized Appreciation (Depreciation) | 643,108 | 1,220,533 |
Net Increase (Decrease) in Net Assets Resulting from Operations | 1,117,248 | 1,300,613 |
Distributions | | |
Net Investment Income | | |
Investor Shares | (8,621) | (15,773) |
Admiral Shares | (7,418) | (5,045) |
Realized Capital Gain1 | | |
Investor Shares | (35,894) | (15,997) |
Admiral Shares | (22,044) | (3,629) |
Total Distributions | (73,977) | (40,444) |
Capital Share Transactions—Note H | | |
Investor Shares | (815,293) | (1,964,142) |
Admiral Shares | 337,555 | 1,403,339 |
Net Increase (Decrease) from Capital Share Transactions | (477,738) | (560,803) |
Total Increase (Decrease) | 565,533 | 699,366 |
Net Assets | | |
Beginning of Period | 8,234,909 | 7,535,543 |
End of Period2 | 8,800,442 | 8,234,909 |
1 Includes fiscal 2006 and 2005 short-term gain distributions totaling $32,891,000 and $0, respectively. Short-term gain distributions are treated as ordinary income dividends for tax purposes.
2 Net Assets–End of Period includes undistributed net investment income of $5,128,000 and $5,342,000.
17
Financial Highlights
Capital Opportunity Fund Investor Shares
| | | Nov. 1, | | | |
| Year Ended | 2003, to | | |
For a Share Outstanding | Sept. 30, | Sept. 30, | Year Ended October 31, |
Throughout Each Period | 2006 | 2005 | 20041 | 2003 | 2002 | 2001 |
Net Asset Value, Beginning of Period | $31.92 | $27.24 | $24.28 | $16.54 | $20.73 | $30.16 |
Investment Operations | | | | | | |
Net Investment Income | .053 | .0902 | .017 | .009 | .01 | .07 |
Net Realized and Unrealized | | | | | | |
Gain (Loss) on Investments3 | 4.421 | 4.731 | 2.956 | 7.744 | (4.13) | (7.42) |
Total from Investment Operations | 4.474 | 4.821 | 2.973 | 7.753 | (4.12) | (7.35) |
Distributions | | | | | | |
Dividends from Net Investment Income | (.055) | (.070) | (.013) | (.013) | (.07) | (.16) |
Distributions from Realized Capital Gains | (.229) | (.071) | — | — | — | (1.92) |
Total Distributions | (.284) | (.141) | (.013) | (.013) | (.07) | (2.08) |
Net Asset Value, End of Period | $36.11 | $31.92 | $27.24 | $24.28 | $16.54 | $20.73 |
| | | | | | |
Total Return4 | 14.10% | 17.72% | 12.25% | 46.91% | –19.97% | –25.68% |
| | | | | | |
Ratios/Supplemental Data | | | | | | |
Net Assets, End of Period (Millions) | $5,051 | $5,231 | $6,199 | $5,120 | $3,181 | $4,454 |
Ratio of Total Expenses to | | | | | | |
Average Net Assets | 0.49% | 0.51% | 0.52%* | 0.59% | 0.58% | 0.60% |
Ratio of Net Investment Income to | | | | | | |
Average Net Assets | 0.15% | 0.33%2 | 0.06%* | 0.04% | 0.07% | 0.28% |
Portfolio Turnover Rate | 11% | 12% | 10% | 14% | 14% | 20% |
1 | The fund’s fiscal year-end changed from October 31 to September 30, effective September 30, 2004. |
2 | Net investment income per share and the ratio of net investment income to average net assets include $.047 and 0.16%, respectively, resulting from a special dividend from Microsoft Corp. in November 2004. |
3 | Includes increases from redemption fees of $.00, $.01, $.01, $.01, $.03, and $.03. |
4 | Total returns do not reflect the 1% fee assessed on redemptions after March 23, 2005, of shares held for less than one year, or the 1% fee previously assessed on redemptions of shares held for less than five years. |
18
Capital Opportunity Fund Admiral Shares |
| | | Nov. 1, | Year | Nov. 12, |
| Year Ended | 2003, to | Ended | 20012 to |
| Sept. 30, | Sept. 30, | Oct. 31, | Oct. 31, |
For a Share Outstanding Throughout Each Period | 2006 | 2005 | 20041 | 2003 | 2002 |
Net Asset Value, Beginning of Period | $73.77 | $62.96 | $56.11 | $38.22 | $50.00 |
Investment Operations | | | | | |
Net Investment Income | .198 | .2913 | .096 | .062 | .07 |
Net Realized and Unrealized | | | | | |
Gain (Loss) on Investments4 | 10.229 | 10.911 | 6.828 | 17.894 | (11.68) |
Total from Investment Operations | 10.427 | 11.202 | 6.924 | 17.956 | (11.61) |
Distributions | | | | | |
Dividends from Net Investment Income | (.178) | (.228) | (.074) | (.066) | (.17) |
Distributions from Realized Capital Gains | (.529) | (.164) | — | — | — |
Total Distributions | (.707) | (.392) | (.074) | (.066) | (.17) |
Net Asset Value, End of Period | $83.49 | $73.77 | $62.96 | $56.11 | $38.22 |
| | | | | |
Total Return5 | 14.23% | 17.82% | 12.36% | 47.05% | –23.32% |
| | | | | |
Ratios/Supplemental Data | | | | | |
Net Assets, End of Period (Millions) | $3,750 | $3,004 | $1,337 | $840 | $395 |
Ratio of Total Expenses to Average Net Assets | 0.40% | 0.42% | 0.41%* | 0.49% | 0.50%* |
Ratio of Net Investment Income to | | | | | |
Average Net Assets | 0.24% | 0.38%3 | 0.17%* | 0.14% | 0.17%* |
Portfolio Turnover Rate | 11% | 12% | 10% | 14% | 14% |
1 | The fund’s fiscal year-end changed from October 31 to September 30, effective September 30, 2004. |
3 | Net investment income per share and the ratio of net investment income to average net assets include $.108 and 0.16%, respectively, resulting from a special dividend from Microsoft Corp. in November 2004. |
4 | Includes increases from redemption fees of $.00, $.01, $.03, $.03, and $.07. |
5 | Total returns do not reflect the 1% fee assessed on redemptions after March 23, 2005, of shares held for less than one year, or the 1% fee previously assessed on redemptions of shares held for less than five years. |
See accompanying Notes, which are an integral part of the Financial Statements.
19
Notes to Financial Statements
Vanguard Capital Opportunity Fund is registered under the Investment Company Act of 1940 as an open-end investment company, or mutual fund. The fund files reports with the SEC under the company name Vanguard Horizon Funds. The fund offers two classes of shares, Investor Shares and Admiral Shares. Investor Shares are available to any investor who meets the fund’s minimum purchase requirements. Admiral Shares are designed for investors who meet certain administrative, servicing, tenure, and account-size criteria.
A. The following significant accounting policies conform to generally accepted accounting principles for U.S. mutual funds. The fund consistently follows such policies in preparing its financial statements.
1. Security Valuation: Securities are valued as of the close of trading on the New York Stock Exchange (generally 4:00 p.m., Eastern time) on the valuation date. Equity securities are valued at the latest quoted sales prices or official closing prices taken from the primary market in which each security trades; such securities not traded on the valuation date are valued at the mean of the latest quoted bid and asked prices. Securities for which market quotations are not readily available, or whose values have been affected by events occurring before the fund’s pricing time but after the close of the securities’ primary markets, are valued at their fair values calculated according to procedures adopted by the board of trustees. These procedures include obtaining quotations from an independent pricing service, monitoring news to identify significant market- or security-specific events, and evaluating changes in the values of foreign market proxies (for example, ADRs, futures contracts, or exchange-traded funds) between the time the foreign markets close and the fund’s pricing time. When fair-value pricing is employed, the prices of securities used by a fund to calculate its net asset value may differ from quoted or published prices for the same securities. Investments in Vanguard Market Liquidity Fund are valued at that fund’s net asset value.
2. Foreign Currency: Securities and other assets and liabilities denominated in foreign currencies are translated into U.S. dollars at the exchange rates on the valuation date as employed by Morgan Stanley Capital International (MSCI) in the calculation of its indexes. As part of the fund’s fair-value procedures, exchange rates may be adjusted if they change significantly before the fund’s pricing time but after the time at which the MSCI rates are determined (generally 11:00 a.m., Eastern time).
Realized gains (losses) and unrealized appreciation (depreciation) on investment securities include the effects of changes in exchange rates since the securities were purchased, combined with the effects of changes in security prices. Fluctuations in the value of other assets and liabilities resulting from changes in exchange rates are recorded as unrealized foreign currency gains (losses) until the asset or liability is settled in cash, when they are recorded as realized foreign currency gains (losses).
3. Federal Income Taxes: The fund intends to continue to qualify as a regulated investment company and distribute all of its taxable income. Accordingly, no provision for federal income taxes is required in the financial statements.
4. Distributions: Distributions to shareholders are recorded on the ex-dividend date.
5. Security Lending: The fund may lend its securities to qualified institutional borrowers to earn additional income. Security loans are required to be secured at all times by collateral at least equal to the market value of securities loaned. The fund invests cash collateral received in Vanguard Market Liquidity Fund, and records a liability for the return of the collateral, during the period the securities are on loan. Security lending income represents the income earned on investing cash collateral, less expenses associated with the loan.
20
6. Other: Dividend income is recorded on the ex-dividend date. Interest income includes income distributions received from Vanguard Market Liquidity Fund and is accrued daily. Security transactions are accounted for on the date securities are bought or sold. Costs used to determine realized gains (losses) on the sale of investment securities are those of the specific securities sold. Fees assessed on redemptions of capital shares are credited to paid-in capital.
Each class of shares has equal rights as to assets and earnings, except that each class separately bears certain class-specific expenses related to maintenance of shareholder accounts (included in Management and Administrative expenses) and shareholder reporting. Marketing and distribution expenses are allocated to each class of shares based on a method approved by the board of trustees. Income, other non-class-specific expenses, and gains and losses on investments are allocated to each class of shares based on its relative net assets.
B. PRIMECAP Management Company provides investment advisory services to the fund for a fee calculated at an annual percentage rate of average net assets. For the year ended September 30, 2006, the investment advisory fee represented an effective annual rate of 0.26% of the fund’s average net assets.
C. The Vanguard Group furnishes at cost corporate management, administrative, marketing, and distribution services. The costs of such services are allocated to the fund under methods approved by the board of trustees. The fund has committed to provide up to 0.40% of its net assets in capital contributions to Vanguard. At September 30, 2006, the fund had contributed capital of $898,000 to Vanguard (included in Other Assets), representing 0.01% of the fund’s net assets and 0.90% of Vanguard’s capitalization. The fund’s trustees and officers are also directors and officers of Vanguard.
D. The fund has asked its investment advisor to direct certain security trades, subject to obtaining the best price and execution, to brokers who have agreed to rebate to the fund part of the commissions generated. Such rebates are used solely to reduce the fund’s management and administrative expenses. The fund’s custodian bank has also agreed to reduce its fees when the fund maintains cash on deposit in the non-interest-bearing custody account. For the year ended September 30, 2006, these arrangements reduced the fund’s management and administrative expenses by $332,000 and custodian fees by $1,000.
E. Distributions are determined on a tax basis and may differ from net investment income and realized capital gains for financial reporting purposes. Differences may be permanent or temporary. Permanent differences are reclassified among capital accounts in the financial statements to reflect their tax character. Temporary differences arise when certain items of income, expense, gain, or loss are recognized in different periods for financial statement and tax purposes; these differences will reverse at some time in the future. Differences in classification may also result from the treatment of short-term gains as ordinary income for tax purposes.
During the year ended September 30, 2006, the fund realized net foreign currency gains of $11,000, which increased distributable net income for tax purposes; accordingly, such gains have been reclassified from accumulated net realized gains to undistributed net investment income.
The fund used a tax accounting practice to treat a portion of the price of capital shares redeemed during the year as distributions from net investment income and realized capital gains. Accordingly, the fund has reclassified $834,000 from undistributed net investment income, and $17,643,000 from accumulated net realized gains, to paid-in capital.
21
The fund used a capital loss carryforward of $60,706,000 to offset taxable capital gains realized during the year ended September 30, 2006, reducing the amount of capital gains that would otherwise be available to distribute to shareholders. For tax purposes, at September 30, 2006, the fund had $22,870,000 of ordinary income and $372,346,000 of long-term capital gains available for distribution.
At September 30, 2006, the cost of investment securities for tax purposes was $5,980,129,000. Net unrealized appreciation of investment securities for tax purposes was $2,865,167,000, consisting of unrealized gains of $3,279,806,000 on securities that had risen in value since their purchase and $414,639,000 in unrealized losses on securities that had fallen in value since their purchase.
F. During the year ended September 30, 2006, the fund purchased $903,767,000 of investment securities and sold $1,431,780,000 of investment securities, other than temporary cash investments.
G. The market value of securities on loan to broker-dealers at September 30, 2006, was $28,193,000, for which the fund received cash collateral of $30,086,000.
H. Capital share transactions for each class of shares were:
| Year Ended September 30, |
| 2006 | | 2005 |
| Amount | Shares | | Amount | Shares |
| ($000) | (000) | | ($000) | (000) |
Investor Shares | | | | | |
Issued | 331,413 | 9,663 | | 381,565 | 12,824 |
Issued in Lieu of Cash Distributions | 42,032 | 1,273 | | 29,794 | 967 |
Redeemed1 | (1,188,738) | (34,982) | | (2,375,501) | (77,454) |
Net Increase (Decrease)—Investor Shares | (815,293) | (24,046) | | (1,964,142) | (63,663) |
Admiral Shares | | | | | |
Issued | 743,335 | 9,382 | | 1,643,729 | 22,950 |
Issued in Lieu of Cash Distributions | 26,959 | 353 | | 7,922 | 111 |
Redeemed1 | (432,739) | (5,543) | | (248,312) | (3,575) |
Net Increase (Decrease)—Admiral Shares | 337,555 | 4,192 | | 1,403,339 | 19,486 |
| 1 | Net of redemption fees of $294,000 and $1,595,000 (fund totals). |
22
I. Certain of the fund’s investments are in companies that are considered to be affiliated companies of the fund because the fund owns more than 5% of the outstanding voting securities of the company. Transactions during the year ended September 30, 2006, in securities of these companies were as follows:
| | Current Period Transactions | |
| Sept. 30, 2005 | | Proceeds from | | Sept. 30, 2006 |
| Market | Purchases | Securities | Dividend | Market |
| Value | at Cost | Sold | Income | Value |
| ($000) | ($000) | ($000) | ($000) | ($000) |
BioMarin Pharmaceutical Inc. | 40,773 | — | — | — | 66,461 |
Concurrent Computer Corp. | 6,814 | — | 1,621 | — | n/a1 |
The Descartes Systems Group Inc. | 11,241 | — | — | — | 18,208 |
The Dress Barn, Inc. | 50,072 | — | — | — | 96,008 |
Emulex Corp. | 91,539 | 433 | — | — | 82,753 |
Linens ‘n Things, Inc. | 61,410 | — | 64,325 | — | — |
Macrovision Corp. | 70,097 | — | 2,010 | — | 84,879 |
Men’s Wearhouse, Inc. | 96,120 | — | 1,188 | 537 | 132,676 |
Minerals Technologies, Inc. | 89,248 | — | — | 312 | 83,304 |
Rambus Inc. | 62,981 | — | — | — | 90,775 |
Strattec Security Corp. | 11,407 | — | — | — | 8,419 |
Thomas & Betts Corp. | 174,631 | — | 63,368 | — | 179,547 |
THQ Inc. | 106,813 | 102 | 3,093 | — | 143,371 |
| 873,146 | | | 849 | 986,401 |
J. In June 2006, the Financial Accounting Standards Board issued Interpretation No. 48 (“FIN 48”), “Accounting for Uncertainty in Income Taxes.” FIN 48 establishes the minimum threshold for recognizing, and a system for measuring, the benefits of tax-return positions in financial statements. FIN 48 will be effective for the fund’s fiscal year beginning October 1, 2007. Management is in the process of analyzing the fund’s tax positions for purposes of implementing FIN 48; based on the analysis completed to date, management does not believe the adoption of FIN 48 will result in any material impact to the fund’s financial statements.
1 | At September 30, 2006, the security is still held but the issuer is no longer an affiliated company of the fund. |
23
Report of Independent Registered
Public Accounting Firm
To the Trustees of Vanguard Horizon Funds and the Shareholders of Vanguard Capital Opportunity Fund:
In our opinion, the accompanying statement of net assets, including the statement of assets and liabilities, and the related statements of operations and of changes in net assets and the financial highlights present fairly, in all material respects, the financial position of Vanguard Capital Opportunity Fund (the “Fund”) at September 30, 2006, the results of its operations for the year then ended, the changes in its net assets for each of the two years in the period then ended, and the financial highlights for each of the periods indicated, in conformity with accounting principles generally accepted in the United States of America. These financial statements and financial highlights (hereafter referred to as “financial statements”) are the responsibility of the Fund’s management; our responsibility is to express an opinion on these financial statements based on our audits. We conducted our audits of these financial statements in accordance with the standards of the Public Company Accounting Oversight Board (United States), which require that we plan and perform the audit to obtain reasonable assurance about whether the financial statements are free of material misstatement. An audit includes examining, on a test basis, evidence supporting the amounts and disclosures in the financial statements, assessing the accounting principles used and significant estimates made by management, and evaluating the overall financial statement presentation. We believe that our audits, which included confirmation of securities at September 30, 2006 by correspondence with the custodian and by agreement to the underlying ownership records for Vanguard Market Liquidity Fund, provide a reasonable basis for our opinion.
PricewaterhouseCoopers LLP
Philadelphia, Pennsylvania
November 13, 2006
Special 2006 tax information (unaudited) for Vanguard Capital Opportunity Fund
This information for the fiscal year ended September 30, 2006, is included pursuant to provisions of the Internal Revenue Code.
The fund distributed $42,382,000 as capital gain dividends (from net long-term capital gains) to shareholders during the fiscal year.
The fund distributed $38,338,000 of qualified dividend income to shareholders during the fiscal year.
For corporate shareholders, 100% of investment income (dividend income plus short-term gains, if any) qualifies for the dividends-received deduction.
24
Your Fund’s After-Tax Returns
This table presents returns for your fund both before and after taxes. The after-tax returns are shown in two ways: (1) assuming that an investor owned the fund during the entire period and paid taxes on the fund’s distributions, and (2) assuming that an investor paid taxes on the fund’s distributions and sold all shares at the end of each period.
Calculations are based on the highest individual federal income tax and capital gains tax rates in effect at the times of the distributions and the hypothetical sales. State and local taxes were not considered. After-tax returns reflect any qualified dividend income, using actual prior-year figures and estimates for 2006. (In the example, returns after the sale of fund shares may be higher than those assuming no sale. This occurs when the sale would have produced a capital loss. The calculation assumes that the investor received a tax deduction for the loss.)
The table shows returns for Investor Shares only; returns for other share classes will differ. Please note that your actual after-tax returns will depend on your tax situation and may differ from those shown. Also note that if you own the fund in a tax-deferred account, such as an individual retirement account or a 401(k) plan, this information does not apply to you. Such accounts are not subject to current taxes.
Finally, keep in mind that a fund’s performance—whether before or after taxes—does not guarantee future results.
Average Annual Total Returns: Capital Opportunity Fund Investor Shares |
Periods Ended September 30, 2006 | | | |
| One | Five | Ten |
| Year1 | Years | Years |
Returns Before Taxes | 14.10% | 13.43% | 14.57% |
Returns After Taxes on Distributions | 13.92 | 13.34 | 13.86 |
Returns After Taxes on Distributions and Sale of Fund Shares | 9.31 | 11.75 | 12.69 |
1 | Total returns do not reflect the 1% fee assessed on redemptions after March 23, 2005, of shares held for less than one year, or the 1% fee |
previously assessed on redemptions of shares held for less than five years.
25
About Your Fund’s Expenses
As a shareholder of the fund, you incur ongoing costs, which include costs for portfolio management, administrative services, and shareholder reports (like this one), among others. Operating expenses, which are deducted from a fund’s gross income, directly reduce the investment return of the fund.
A fund’s expenses are expressed as a percentage of its average net assets. This figure is known as the expense ratio. The following examples are intended to help you understand the ongoing costs (in dollars) of investing in your fund and to compare these costs with those of other mutual funds. The examples are based on an investment of $1,000 made at the beginning of the period shown and held for the entire period.
The table below illustrates your fund’s costs in two ways:
• Based on actual fund return. This section helps you to estimate the actual expenses that you paid over the period. The “Ending Account Value” shown is derived from the fund’s actual return, and the third column shows the dollar amount that would have been paid by an investor who started with $1,000 in the fund. You may use the information here, together with the amount you invested, to estimate the expenses that you paid over the period.
To do so, simply divide your account value by $1,000 (for example, an $8,600 account value divided by $1,000 = 8.6), then multiply the result by the number given for your fund under the heading “Expenses Paid During Period.”
• Based on hypothetical 5% yearly return. This section is intended to help you compare your fund’s costs with those of other mutual funds. It assumes that the fund had a yearly return of 5% before expenses, but that the expense ratio is unchanged. In this case—because the return used is not the fund’s actual return—the results do not apply to your investment. The example is useful in making comparisons because the Securities and Exchange Commission requires all mutual funds to calculate expenses based on a 5% return. You can assess your fund’s costs by comparing this hypothetical example with the hypothetical examples that appear in shareholder reports of other funds.
Six Months Ended September 30, 2006 | | | |
| Beginning | Ending | Expenses |
| Account Value | Account Value | Paid During |
Capital Opportunity Fund | 3/31/2006 | 9/30/2006 | Period1 |
Based on Actual Fund Return | | | |
Investor Shares | $1,000.00 | $994.77 | $2.30 |
Admiral Shares | 1,000.00 | 995.35 | 1.95 |
Based on Hypothetical 5% Yearly Return | | | |
Investor Shares | $1,000.00 | $1,022.76 | $2.33 |
Admiral Shares | 1,000.00 | 1,023.11 | 1.98 |
| 1 | The calculations are based on expenses incurred in the most recent six-month period. The fund’s annualized six-month expense ratios for that period are 0.46% for Investor Shares and 0.39% for Admiral Shares. The dollar amounts shown as “Expenses Paid” are equal to the annualized expense ratio multiplied by the average account value over the period, multiplied by the number of days in the most recent six-month period, then divided by the number of days in the most recent 12-month period. |
26
Note that the expenses shown in the table are meant to highlight and help you compare ongoing costs only; they do not include your fund’s low-balance fee or the transaction fee on redemptions. These fees are fully described in the prospectus. Your fund does not carry a “sales load.”
The calculations assume no shares were bought or sold during the period. Your actual costs may have been higher or lower, depending on the amount of your investment and the timing of any purchases or redemptions.
You can find more information about the fund’s expenses, including annual expense ratios, in the Financial Statements section of this report. For additional information on operating expenses and other shareholder costs, please refer to the appropriate fund prospectus.
27
Glossary
Beta. A measure of the magnitude of a fund’s past share-price fluctuations in relation to the ups and downs of a given market index. The index is assigned a beta of 1.00. Compared with a given index, a fund with a beta of 1.20 typically would have seen its share price rise or fall by 12% when the index rose or fell by 10%. A fund’s beta should be reviewed in conjunction with its R-squared (see definition below). The lower the R-squared, the less correlation there is between the fund and the index, and the less reliable beta is as an indicator of volatility.
Earnings Growth Rate. The average annual rate of growth in earnings over the past five years for the stocks now in a fund.
Expense Ratio. The percentage of a fund’s average net assets used to pay its annual administrative and advisory expenses. These expenses directly reduce returns to investors.
Foreign Holdings. The percentage of a fund represented by stocks or depositary receipts of companies based outside the United States.
Median Market Cap. An indicator of the size of companies in which a fund invests; the midpoint of market capitalization (market price x shares outstanding) of a fund’s stocks, weighted by the proportion of the fund’s assets invested in each stock. Stocks representing half of the fund’s assets have market capitalizations above the median, and the rest are below it.
Price/Book Ratio. The share price of a stock divided by its net worth, or book value, per share. For a fund, the weighted average price/book ratio of the stocks it holds.
Price/Earnings Ratio. The ratio of a stock’s current price to its per-share earnings over the past year. For a fund, the weighted average P/E of the stocks it holds. P/E is an indicator of market expectations about corporate prospects; the higher the P/E, the greater the expectations for a company’s future growth.
R-Squared. A measure of how much of a fund’s past returns can be explained by the returns from the market in general, as measured by a given index. If a fund’s total returns were precisely synchronized with an index’s returns, its R-squared would be 1.00. If the fund’s returns bore no relationship to the index’s returns, its R-squared would be 0.
Return on Equity. The annual average rate of return generated by a company during the past five years for each dollar of shareholder’s equity (net income divided by shareholder’s equity). For a fund, the weighted average return on equity for the companies whose stocks it holds.
Short-Term Reserves. The percentage of a fund invested in highly liquid, short-term securities that can be readily converted to cash.
Turnover Rate. An indication of the fund’s trading activity. Funds with high turnover rates incur higher transaction costs and may be more likely to distribute capital gains (which may be taxable to investors). The turnover rate excludes in-kind transactions, which have minimal impact on costs.
Yield. A snapshot of a fund’s income from interest and dividends. The yield, expressed as a percentage of the fund’s net asset value, is based on income earned over the past 30 days and is annualized, or projected forward for the coming year. The index yield is based on the current annualized rate of income provided by securities in the index.
28
This page intentionally left blank.
This page intentionally left blank.
This page intentionally left blank.
The People Who Govern Your Fund
The trustees of your mutual fund are there to see that the fund is operated and managed in your best interests since, as a shareholder, you are a part owner of the fund. Your fund's trustees also serve on the board of directors of The Vanguard Group, Inc., which is owned by the Vanguard funds and provides services to them on an at-cost basis.
A majority of Vanguard’s board members are independent, meaning that they have no affiliation with Vanguard or the funds they oversee, apart from the sizable personal investments they have made as private individuals.
Our independent board members bring distinguished backgrounds in business, academia, and public service to their task of working with Vanguard officers to establish the policies and oversee the activities of the funds. Among board members’ responsibilities are selecting investment advisors for the funds; monitoring fund operations, performance, and costs; reviewing contracts; nominating and selecting new trustees/directors; and electing Vanguard officers.
Each trustee serves a fund until its termination; or until the trustee’s retirement, resignation, or death; or otherwise as specified in the fund’s organizational documents. Any trustee may be removed at a shareholders’ meeting by a vote representing two-thirds of the net asset value of all shares of the fund together with shares of other Vanguard funds organized within the same trust. The table on these two pages shows information for each trustee and executive officer of the fund. The mailing address of the trustees and officers is P.O. Box 876, Valley Forge, PA 19482.
Chairman of the Board, Chief Executive Officer, and Trustee |
| |
John J. Brennan1 | |
Born 1954 | Principal Occupation(s) During the Past Five Years: Chairman of |
Trustee since May 1987; | the Board, Chief Executive Officer, and Director/Trustee of The |
Chairman of the Board and | Vanguard Group, Inc., and of each of the investment companies |
Chief Executive Officer | served by The Vanguard Group. |
142 Vanguard Funds Overseen | |
| |
Independent Trustees | |
| |
Charles D. Ellis | |
Born 1937 | Principal Occupation(s) During the Past Five Years: Applecore |
Trustee since January 2001 | Partners (pro bono ventures in education); Senior Advisor to |
142 Vanguard Funds Overseen | Greenwich Associates (international business strategy |
| consulting); Successor Trustee of Yale University; Overseer |
| of the Stern School of Business at New York University; |
| Trustee of the Whitehead Institute for Biomedical Research. |
| |
Rajiv L. Gupta | |
Born 1945 | Principal Occupation(s) During the Past Five Years: Chairman |
Trustee since December 20012 | and Chief Executive Officer of Rohm and Haas Co. (chemicals); |
142 Vanguard Funds Overseen | since 1999; Board Member of the American Chemistry Council; |
| Director of Tyco International, Ltd. (diversified manufac- |
| turing and services) since 2005;Trustee of Drexel |
| University and of the Chemical Heritage Foundation. |
| |
Amy Gutmann | |
Born 1949 | Principal Occupation(s) During the Past Five Years: President of the |
Trustee since July 2006 | University of Pennsylvania since 2004; Professor in the School of Arts |
142 Vanguard Funds Overseen | and Sciences, Annenberg School for Communication, and Graduate |
| School of Education of the University of Pennsylvania since 2004; |
| Provost (2001-2004) and Laurance S. Rockefeller Professor of |
| Politics and the University Center for Human Values (1990-2004), |
| Princeton University; Director of Carnegie Corporation of New |
| York since 2005 and of Schuylkill River Development Corporation |
| and Greater Philadelphia Chamber of Commerce since 2004. |
JoAnn Heffernan Heisen | |
Born 1950 | Principal Occupation(s) During the Past Five Years: Corporate |
Trustee since July 1998 | Vice President and Chief Global Diversity Officer since 2006 |
142 Vanguard Funds Overseen | Vice President and Chief Information Officer (1997–2005), |
| and Member of the Executive Committee of Johnson & Johnson |
| (pharmaceuticals/consumer products); Director of the University |
| Medical Center at Princeton and Women’s Research and |
| Education Institute. |
| |
André F. Perold | |
Born 1952 | Principal Occupation(s) During the Past Five Years: |
Trustee since December 2004 | George Gund Professor of Finance and Banking, Harvard Business |
142 Vanguard Funds Overseen | School since 2000; Senior Associate Dean, Director of Faculty |
| Recruiting, and Chair of Finance Faculty, Harvard Business |
| School; Director and Chairman of UNX, Inc. (equities trading firm) |
| since 2003; Director of registered investment companies advised by |
| Merrill Lynch Investment Managers and affiliates (1985-2004), Genbel |
| Securities Limited (South African financial services firm) (1999-2003), |
| Gensec Bank (1999-2003), Sanlam, Ltd. (South African insurance company) |
| (2001-2003), and Stockback, Inc. (credit card firm) (2000-2002). |
| |
Alfred M. Rankin, Jr. | |
Born 1941 | Principal Occupation(s) During the Past Five Years: |
Trustee since January 1993 | Chairman, President, Chief Executive Officer, and Director of NACCO |
142 Vanguard Funds Overseen | Industries, Inc.(forklift trucks/housewares/lignite); Director of |
| Goodrich Corporation (industrialproducts/aircraft systems and services). |
| |
J. Lawrence Wilson | |
Born 1936 | Principal Occupation(s) During the Past Five Years: |
Trustee since April 1985 | Retired Chairman and Chief Executive Officer of Rohm and Haas Co. |
142 Vanguard Funds Overseen | (chemicals);Director of Cummins Inc. (diesel engines), MeadWestvaco |
| Corp. (packing products),and AmerisourceBergen Corp. (pharmaceutical |
| distribution); Trustee of Vanderbilt University and of Culver |
| Educational Foundation. |
| |
Executive Officers 1 | |
| |
Heidi Stam | |
Born 1956 | Principal Occupation(s) During the Past Five Years: |
Trustee since July 2005 | Managing Director since July 2006, General Counsel since July 2005, and |
142 Vanguard Funds Overseen | Secretary of Vanguard and of each of the investment companies served |
| by The Vanguard Group since July 2005; Principal of The Vanguard Group, Inc. |
| (1997-2006). |
| |
Thomas J. Higgins | |
Born 1957 | Principal Occupation(s) During the Past Five Years: |
Trustee since July 1998 | Principal of the Vanguard Group, Inc.; Treasurer of each of the investment |
142 Vanguard Funds Overseen | companies served by the Vanguard Group. |
| |
| |
| Vanguard Senior Management Team |
|---|
| | |
|---|
| R. Gregory Barton | Kathleen C. Gubanich | Michael S. Miller |
| Mortimer J. Buckley | Paul A. Heller | Ralph K. Packard |
| James H. Gately | F. William McNabb, III | George U. Sauter |
|
Founder
|
|---|
| | |
|---|
| John C. Bogle |
|
| Chairman and Chief Executive Officer, 1974-1996 |
1 Officers of the funds are “interested persons” as defined in the Investment Company Act of 1940.
2 December 2002 for Vanguard Equity Income Fund, Vanguard Growth Equity Fund, the Vanguard Municipal Bond Funds, and the Vanguard State Tax-Exempt Funds.
More information about the trustees is in the Statement of Additional Information, available from The Vanguard Group.
|
|
| P.O. Box 2600 Valley Forge, PA 19482-2600 |
Connect with Vanguard™ > www.vanguard.com
| |
|---|
| Fund Information > 800-662-7447 | Vanguard, Admiral, Connect with Vanguard, and the ship |
| | logo are trademarks of The Vanguard Group, Inc. |
| Direct Investor Account Services > 800-662-2739 | |
| | All other marks are the exclusive property of their |
| Institutional Investor Services > 800-523-1036 | respective owners. |
| | |
| Text Telephone > 800-952-3335 | All comparative mutual fund data are from Lipper Inc. |
| | or Morningstar, Inc., unless otherwise noted. |
| | |
| | |
| | |
| | |
| | You can obtain a free copy of Vanguard’s proxy voting |
| This material may be used in conjunction | guidelines by visiting our website, www.vanguard.com, |
| with the offering of shares of any Vanguard | and searching for “proxy voting guidelines,” or by calling |
| fund only if preceded or accompanied by | Vanguard at 800-662-2739. They are also available from |
| the fund’s current prospectus. | the SEC’s website, www.sec.gov. In addition, you may |
| | obtain a free report on how your fund voted the proxies for |
| | securities it owned during the 12 months ended June 30. |
| | To get the report, visit either www.vanguard.com |
| | or www.sec.gov. |
| | |
| | You can review and copy information about your fund |
| | at the SEC’s Public Reference Room in Washington, D.C. |
| | To find out more about this public service, call the SEC |
| | at 202-551-8090. Information about your fund is also |
| | available on the SEC’s website, and you can receive |
| | copies of this information, for a fee, by sending a |
| | request in either of two ways: via e-mail addressed to |
| | publicinfo@sec.gov or via regular mail addressed to the |
| | Public Reference Section, Securities and Exchange |
| | Commission, Washington, DC 20549-0102. |
| | |
| | |
| | |
| | |
| | © 2006 The Vanguard Group, Inc. |
| | All rights reserved. |
| | Vanguard Marketing Corporation, Distributor. |
| | |
| | Q1110 112006 |
Vanguard® Global Equity Fund |
| |
| |
| |
| |
> Annual Report | |
| |
| |
| |
| |
| |
September 30, 2006 | |
| |
| |
| 
|
| |
| |
| |
| |
| |
| |
| |
> | For the fiscal year ended September 30, 2006, Vanguard Global Equity Fund returned 15.2%, beating the result of its benchmark index and the average return of competing global funds. |
> | International stocks outperformed U.S. stocks, continuing a long-term trend. |
> | The U.S. dollar’s weakness versus several major foreign currencies provided a boost to U.S.-based investors. |
Contents | |
| |
Your Fund’s Total Returns | 1 |
Chairman’s Letter | 2 |
Advisors’ Report | 7 |
Fund Profile | 11 |
Performance Summary | 13 |
Financial Statements | 15 |
Your Fund’s After-Tax Returns | 33 |
About Your Fund’s Expenses | 34 |
Trustees Approve Advisory Agreements | 36 |
Glossary | 38 |
Please note: The opinions expressed in this report are just that—informed opinions. They should not be considered promises or advice. Also, please keep in mind that the information and opinions cover the period through the date on the cover of this report. Of course, the risks of investing in your fund are spelled out in the prospectus.
Your Fund’s Total Returns
Fiscal Year Ended September 30, 2006 | |
| Total |
| Returns |
Vanguard Global Equity Fund | 15.2% |
MSCI All Country World Index | 15.1 |
Average Global Fund1 | 13.4 |
Your Fund’s Performance at a Glance |
September 30, 2005–September 30, 2006 |
| | | Distributions Per Share |
| Starting | Ending | Income | Capital |
| Share Price | Share Price | Dividends | Gains |
Vanguard Global Equity Fund | $19.72 | $21.96 | $0.240 | $0.435 |
1 | Derived from data provided by Lipper Inc. |
1

Chairman’s Letter
Dear Shareholder,
Vanguard Global Equity Fund returned 15.2% for the 12 months ended September 30, 2006. The fund topped the average return of its peers in the global fund category and edged past the results of its unmanaged benchmark index. The fund also outpaced the 10.5% return of the broad U.S. stock market as measured by the Dow Jones Wilshire 5000 Composite Index.
Much of the fund’s success relative to its comparative standards can be attributed to its overweighting of international stocks and underweighting of the relatively weaker U.S. market.
International stocks outstripped their U.S. counterparts
International stocks handily outpaced domestic issues, continuing a multiyear trend. European and emerging market stocks fared particularly well. Stocks in the Pacific region also performed admirably, even though Japanese stocks did not fully participate in the global market’s summer recovery. For the fiscal year, the weakness of the U.S. dollar versus the euro benefited U.S.-based shareholders, because it meant that European returns translated into more dollars. Conversely, the dollar’s strength against the Japanese yen created a headwind for U.S.-based investors in that market.
In the U.S. market, stocks advanced through the first part of the fund’s fiscal year, then hit a speed bump in May, as
2
investors feared that the economy was growing too rapidly. But a slowdown in the housing market, coupled with a late-summer decline in oil prices, helped to allay inflation concerns. The broad market rebounded to post a solid 10.5% return for the 12-month period. Value-oriented stocks outperformed growth stocks, and large-capitalization stocks edged out small-caps, one of the market’s best-performing segments in recent years.
In the bond market, prices rallied as the Fed paused
At its August and September meetings, the Federal Reserve Board twice voted to maintain the federal funds rate at 5.25%, marking a pause in the central bank’s two-year inflation-fighting campaign. With investor sentiment buoyed by the Fed’s near-term inflation outlook, interest rates decreased, driving bond prices higher. The broad taxable bond market finished the period with a 3.7% return, and municipal bonds performed slightly better.
Although rates decreased along the entire maturity spectrum in late summer, the difference between the yields of the shortest- and longest-term issues remained narrow by historical standards. At the end of September, the U.S. Treasury yield curve was actually inverted, meaning that short-term issues such as 3-month and 6-month Treasury notes offered higher yields than those with longer maturities.
Stock-picking drove both successes and shortfalls for the fund
Vanguard Global Equity Fund’s market benchmark, the Morgan Stanley Capital International (MSCI) All Country World
Market Barometer | | | |
| | Average Annual Total Returns |
| | Periods Ended September 30, 2006 |
| One Year | Three Years | Five Years |
Stocks | | | |
MSCI All Country World Index ex USA (International) | 19.4% | 23.9% | 16.4% |
Russell 1000 Index (Large-caps) | 10.2 | 12.8 | 7.6 |
Russell 2000 Index (Small-caps) | 9.9 | 15.5 | 13.8 |
Dow Jones Wilshire 5000 Index (Entire market) | 10.5 | 13.3 | 8.6 |
| | | |
Bonds | | | |
Lehman Aggregate Bond Index (Broad taxable market) | 3.7% | 3.4% | 4.8% |
Lehman Municipal Bond Index | 4.5 | 4.4 | 5.2 |
Citigroup 3-Month Treasury Bill Index | 4.4 | 2.6 | 2.2 |
| | | |
CPI | | | |
Consumer Price Index | 2.1% | 3.1% | 2.6% |
3
Index, includes about 3,000 stocks in nearly 50 countries. That represents a full palette of opportunities and challenges for the fund’s three advisors, Marathon Asset Management LLP, Acadian Asset Management, Inc., and AllianceBernstein L.P. During fiscal 2006, the advisors’ collective stock selection drove the fund to outperform its benchmark in nine of its ten largest countries of investment.
Although the fund held a relatively light weighting in Europe, the best-performing region in the global market, the advisors made up for that with fine stock-picking in markets such as the Netherlands, Germany, France, Spain, and the United Kingdom. In Asia, the top contributors were markets in China, Hong Kong, and the Philippines. Japanese stocks faltered somewhat in the final stretch of the fiscal year, and the fund’s holdings in that country underperformed the Japanese issues in the benchmark index.
Among market sectors, the fund posted impressive results in several areas. The advisors’ stock selection in the industrials group proved particularly beneficial, as the fund’s 31% return in that segment almost doubled the gain of the benchmark sector. Transport was a theme for the period, with airline and railroad stocks among the top industrial contributors. Machinery and construction stocks also did well.
Strong stock selection also came into play in three of the fund’s smaller sectors: health care (where biotechnology stocks did well), telecommunication services (particularly in the Chinese and U.S. markets), and consumer staples. In financials, the fund’s largest sector, the advisors’ stock selections kept pace with their strongly performing counterparts in the index. Large European firms such as the Dutch financial services company ING Groep and French bank BNP Paribas drove positive performance in the sector.
The fund’s stock positioning detracted from performance in a few areas. In the volatile energy sector, which struggled as oil prices fell throughout the summer, holdings in a number of U.S. and Canadian companies produced the fund’s only
Expense Ratios1 | | |
Your fund compared with its peer group | | |
| | Average |
| | Global |
| Fund | Fund |
Global Equity Fund | 0.72% | 1.77% |
1 Fund expense ratio reflects the 12 months ended September 30, 2006. Peer-group expense ratio is derived from data provided by Lipper Inc. and captures information through year-end 2005.
4
negative sector return. In information technology, a handful of semiconductor and communications equipment stocks hampered performance. The fund’s consumer discretionary holdings were hurt by poorly performing media, retailer, and homebuilder stocks.
For perspective on performance, take the long-term view
At Vanguard, we advocate a long-term perspective when evaluating the performance of an investment. Assessing a fund over extended market cycles, rather than over a few months or a single year, can filter out short-term fluctuations and reveal how an investment performs through a variety of market conditions.
During the ten years ended September 30, the Global Equity Fund posted an average annual return of 11.9%, outpacing both the result for its benchmark and the average return of competitors by more than four percentage points per year. A hypothetical investment of $10,000 in Global Equity made ten years ago would have more than tripled in value, to $30,665.
The fund’s strong performance over the decade (and, in fact, since its 1995 inception) is a tribute to the skills of its advisors, principally Marathon Asset Management, which has overseen the fund since its inception. Marathon was joined by Acadian Asset Management in 2004 and by AllianceBernstein earlier this year. The advisors’ task is aided by the fund’s low expense ratio, which historically has been significantly below the average fee charged by its peers. This cost structure means that a greater portion of the fund’s total returns go to shareholders.
The Global Equity Fund works best in a supporting role
During the past 12 months, different segments of the global stock market rose to the top of the performance charts: first the Pacific region, then emerging markets, and more recently Europe. Despite their solid fiscal-year returns, an investment in any one of these regions would have been a bumpy ride. The Global Equity Fund, with its broad worldwide exposure, allowed investors to participate in the
Total Returns | | |
Ten Years Ended September 30, 2006 |
| Average | Final Value of a $10,000 |
| Annual Return | Initial Investment |
Global Equity Fund | 11.9% | $30,665 |
MSCI All Country World Index | 7.7 | 21,006 |
Average Global Fund | 7.4 | 20,385 |
5
successes of these markets while moderating the potential negative effect of a downturn in any one region.
We believe Global Equity provides a smart and diversified way to invest in stocks around the world. However, its diverse holdings are not sufficient to make it a stand-alone investment in your portfolio. Even though more than one-third of its assets are invested in U.S.-based companies, it is still very much an international fund. International stocks have outpaced the U.S. market for many years, but markets move in cycles, and investors should expect the tables to turn.
We believe Global Equity is best used in a supporting role within a balanced and diversified portfolio.
Thank you for investing with Vanguard.
Sincerely,

John J. Brennan
Chairman and Chief Executive Officer
October 16, 2006
Total Returns | | | |
| Twelve Months Ended September 30, 2006 |
| Based on | Currency | Based on |
Index/Country | Local Currency | Impact | U.S. Dollars |
MSCI Europe | 17.0% | 5.3% | 22.3% |
United Kingdom | 12.4 | 6.3 | 18.7 |
France | 17.4 | 6.0 | 23.4 |
Germany | 18.9 | 6.0 | 24.9 |
Switzerland | 24.1 | 3.5 | 27.6 |
Netherlands | 27.2 | 6.4 | 33.6 |
Italy | 13.7 | 5.8 | 19.5 |
MSCI Pacific | 17.0 | –4.1 | 12.9 |
Japan | 18.0 | –4.7 | 13.3 |
Hong Kong | 10.9 | –0.5 | 10.4 |
Singapore | 16.6 | 7.5 | 24.1 |
Australia | 15.9 | –2.6 | 13.3 |
MSCI EAFE | 17.0 | 2.2 | 19.2 |
MSCI Emerging Markets | 19.9 | 0.6 | 20.5 |
Dow Jones Wilshire 5000 (United States) | 10.5 | — | 10.5 |
6
Advisors’ Report
During the fiscal year ended September 30, 2006, the Global Equity Fund returned 15.2%, reflecting the combined results of your fund’s independent investment advisors. The use of multiple advisors provides exposure to distinct, yet complementary, investment approaches to a particular market segment, enhancing the diversification of your fund.
The advisors, their percentage of fund assets managed, and a brief description of their investment strategies are presented in the table below. The advisors have also prepared a discussion of the investment opportunities in their markets and of how their portfolio positioning reflects this assessment.
Acadian Asset Management, Inc.
Portfolio Managers:
John Chisholm, CFA, Executive Vice
President and Co-Chief Investment Officer
Ronald Frashure, CFA, President and
Co-Chief Investment Officer
Brian Wolahan, CFA, Senior Vice President
and Co-Director of Research
The Chinese telecommunications provider China Mobile was a significant contributor to our portfolio’s results during the 2006 fiscal year, as the company enjoyed solid growth and profitability throughout the period. Banking and finance selections in Europe also did well, as these stocks exhibited attractive valuations and strong earnings in an environment of higher
Vanguard Global Equity Fund Investment Advisors |
| | | |
Fund Assets Managed | |
Investment Advisor | % | | $ Million | | Investment Strategy |
Acadian Asset Management, Inc. | 51 | | 2,142 | | A quantitative, active, bottom-up |
| | | | | investment process that combines stock |
| | | | | and country/sector valuation to arrive at a |
| | | | | return forecast for each of more than |
| | | | | 20,000 securities in the global universe. |
Marathon Asset Management LLP | 30 | | 1,272 | | A long-term and contrarian investment |
| | | | | philosophy and process with a focus on |
| | | | | industry capital cycle analysis and |
| | | | | in-depth management assessment. |
AllianceBernstein L.P. | 16 | | 671 | | A fundamentally based, research-driven |
| | | | | approach, focused on finding companies |
| | | | | whose long-term earnings power exceeds |
| | | | | the level implied by their current stock price. |
| | | | | Proprietary quantitative tools aid risk control |
| | | | | and portfolio construction. |
1 | These short-term reserves are invested by Vanguard in equity index products to simulate investment in stocks. Each advisor may also maintain a modest cash position. |
7
interest rates. Our holdings in ING Groep and Aegon in the Netherlands, BNP Paribas and Crédit Agricole in France, and Banco Santander Central Hispano in Spain also helped the portfolio’s performance. Airline Deutsche Lufthansa and commercial vehicle manufacturer MAN were the top contributors in Germany.
On the other hand, stock selection in Japan proved costly to the portfolio. Transportation company Mitsui O.S.K. Lines and telecommunications provider KDDI posted returns significantly below that of the Japanese component of our benchmark. In Australia, selections in the materials sector—such as BHP Billiton and Rinker Group—were particularly costly as prices for oil, gas, and metals began to retreat from record-high levels. In the United States, investors’ concern about an economic slowdown detracted from returns for our holdings, most notably those in the energy sector.
Compared with the benchmark index, our portion of the portfolio was overweighted in emerging markets such as China, Turkey, and Taiwan, as well as in the developed markets of Spain, the Netherlands, and the United States. The portfolio was underweighted in the United Kingdom and Japan.
We continue to have a positive outlook for most major markets in Europe, as inflation remains contained and the region’s major economies show signs of sustained, albeit moderate, growth. Regarding emerging markets, the outlook is mixed—those in Asia generally possess attractive valuations, while European and Latin American emerging markets appear volatile amid recent fluctuations in commodity prices.
Our short-term forecast for Japan remains negative; we see a potential for underperformance across most sectors in this market. It is important to note, however, that our process will typically uncover individual holdings that are highly attractive even in sectors that we view negatively as a whole. We believe that the economic recovery in Japan will continue, with inflationary pressures remaining modest. However, valuations remain high relative to likely near-term earnings, and this makes Japanese equities less attractive at the moment than many alternatives.
Marathon Asset Management LLP
Portfolio Managers:
Jeremy Hosking, Investment Director .
Neil M. Ostrer, Investment Director
William J. Arah, Investment Director
Geographically, we instituted a gradual shift from the portfolio’s still-overweighted exposure in Southeast Asia and South Africa to add to our Japanese positions.
The gradual pullback in Southeast Asia has enabled us to harvest a few of the many investments we made around 1997–1998 in the wake of an Asian currency crisis that created many bargains. Many of these holdings have appreciated significantly. Similarly, over the last five years, the
8
South African stock market has been a huge success story built on disciplined monetary policy and a recovery in investor sentiment, both domestically and internationally. The country’s currency and the stock market have both enjoyed significant bull markets.
Over the last year, our portfolio benefited from its bias toward mid- and smaller-capitalization issues; ten of our European holdings were on the receiving end of actual or rumored merger-and-acquisition activity. Unlike previous takeover feeding frenzies, this one is fueled by low interest rates, as well as by corporations, private equity funds, and “infrastructure funds” that are all awash with cash. We have reinvested the proceeds of takeovers into larger businesses with more defensive, predictable earnings, such as pharmaceutical firms.
From a longer-term perspective, which is how we invest, we remain positive on the structural change that is happening in Japan, hence our slight increase in the portion of the portfolio invested there. The fund’s Japanese holdings have become increasingly biased toward longer duration, larger capitalization, and less economically sensitive names (specifically telecom, pharmaceuticals, food, consumer nondurables, and utilities). These areas have provided some protection during the turmoil in the small- and mid-cap market segments over the last few months. The portfolio has consciously moved away from “global” cyclicals toward domestically oriented holdings for which there is greater leverage for change. Stocks in Japan’s automotive sector, an area in which the portfolio is notably underweighted, have enjoyed a strong ten-year run (aided by the yen’s recent weakness), and several automotive companies plan significant increases in capital expenditure.
Although market pundits seem to be unanimous in their pessimism toward the U.S. market based on global economic imbalances, the precarious position of the U.S. consumer, and the fall in the U.S. housing market, we take a somewhat different view on the ground that individual equity securities seem rather attractively priced.
AllianceBernstein L.P.
Portfolio Managers:
Sharon E. Fay, CFA, Executive Vice
President and Chief Investment
Officer–Global Value Equities
Kevin F. Simms, Co-Chief Investment
Officer–International Value Equities and
Director of Research–Global and
International Value Equities
Henry S. D’Auria, CFA, Co-Chief Investment
Officer–International Value Equities and
Chief Investment Officer–Emerging Markets
Note: AllianceBernstein L.P. was added as an advisor to the fund in April 2006. The commentary below reflects the period since April.
Global equity markets stumbled in May and June amid fears that high interest rates would slow economic growth; volatility rose sharply and investors
9
became more risk-averse. However, markets subsequently recovered as concerns about inflation and interest rates receded.
Our portfolio benefited from positive stock selection across most sectors, especially financials. European bank-and-insurance companies ING Groep and Fortis posted strong quarterly gains, driven by progress in their restructuring efforts. Other contributors included Canadian copper mining firm Falconbridge, which rose on acquisition activity by U.K.-based Xstrata, and transportation companies Deutsche Lufthansa and Mitsui O.S.K. Lines. Partially offsetting these positives was our underweighted position in the utilities sector, which far outpaced the broad market over the period, and stock selection in telecommunications, specifically the portfolio’s holding in Sprint Nextel. The company has suffered from worries about slow growth in net subscribers, but our research suggests that investors’ concern has been excessive.
Lower energy prices and the relatively favorable outlook for economic and corporate profit growth outside the United States have reassured investors, despite uncertainty about the extent of the U.S. slowdown. Overall, global growth in gross domestic product (GDP) is expected to decelerate modestly in 2007 but to remain generally healthy. A reasonably benign economic outlook seems plausible, but we doubt that equity markets will be quite as calm and stable as they have been in recent years. History shows that episodes of investor complacency are typically followed by market turbulence. Thus, the recent drop in volatility is more likely to represent a temporary reprieve than a return to normality. Recent events—including a weakening of the U.S. housing market, a military coup in Thailand, and the collapse of a large U.S. hedge fund—serve as a reminder of the myriad potential risks.
The very low-anxiety, low-volatility environment of the past few years has led investors to discount the risks inherent in many traditional value stocks. At the same time, investors have been unwilling to reward higher expectations for earnings growth. As a result, stock valuations have remained unusually compressed.
Given the relatively modest value opportunity and our expectation that volatility will return to more historically normal levels, our portfolio is more diversified than usual. In addition, while the portfolio continues to be constructed on the basis of bottom-up stock selection, we think that larger-cap stocks appear relatively more attractive than usual. We have reduced our overweighted stake in energy, trimmed our holdings in consumer staples, and rotated out of successful holdings in the financials sector to take advantage of new opportunities.
10
Fund Profile
As of September 30, 2006
Portfolio Characteristics | | |
| | Comparative |
| Fund | Index1 |
Number of Stocks | 641 | 2,758 |
Turnover Rate | 88% | — |
Expense Ratio | 0.72% | — |
Short-Term Reserves | 2% | — |
Sector Diversification (% of portfolio) |
| | Comparative |
| Fund | Index1 |
Consumer Discretionary | 10% | 11% |
Consumer Staples | 5 | 8 |
Energy | 9 | 10 |
Financials | 27 | 26 |
Health Care | 7 | 9 |
Industrials | 13 | 10 |
Information Technology | 8 | 11 |
Materials | 9 | 6 |
Telecommunication Services | 8 | 5 |
Utilities | 2 | 4 |
Short-Term Reserves | 2% | — |
Volatility Measures2 | |
| Fund |
| Versus |
| Comparative |
| Index1 |
R-Squared | 0.94 |
Beta | 1.14 |
Ten Largest Holdings3 (% of total net assets) |
| | |
ING Groep NV | diversified | |
| financial services | 1.9% |
BNP Paribas SA | diversified banks | 1.9 |
China Mobile | wireless | |
(Hong Kong) Ltd. | telecommunication | |
| services | 1.9 |
Caterpillar, Inc. | construction, | |
| farm machinery, | |
| and heavy trucks | 1.7 |
Nucor Corp. | steel | 1.5 |
ConocoPhillips Co. | integrated | |
| oil and gas | 1.5 |
Banco Santander | | |
Central Hispano SA | diversified banks | 1.5 |
Canon, Inc. | office electronics | 1.2 |
AstraZeneca Group PLC | pharmaceuticals | 1.2 |
AmerisourceBergen Corp. | health care | |
| distributors | 1.1 |
Top Ten | | 15.4% |
Fund Asset Allocation

1 MSCI All Country World Index.
2 For an explanation of R-squared, beta, and other terms used here, see the Glossary on page 38.
3 “Ten Largest Holdings” excludes any temporary cash investments and equity index products.
11
| Country Diversification (% of portfolio) |
|---|
| Fund | Comparative
Index 1 |
|---|
|
| Europe | | |
|
| United Kingdom | 9% | 10% |
|
| France | 4 | 4 |
|
| Netherlands | 4 | 2 |
|
| Germany | 4 | 3 |
|
| Spain | 4 | 2 ; |
|
| Italy | 1 | 2 ; |
|
| Switzerland | 1 | 3 |
|
| Belgium | 1 | 1 |
|
| Sweden | 1 | 1 |
|
| Finland | 0 | 1 |
|
| Subtotal | 29% | 29% |
|
| Pacific |
|
| Japan | 9% | 10% |
|
| Hong Kong | 2 | 1 |
|
| Australia | 1 | 2 |
|
| Malaysia | 1 | 0 |
|
| Subtotal | 13% | 13% |
|
| Emerging Markets |
|
| China | 3% | 1% |
|
| Taiwan | 2 | 1 |
|
| South Korea | 2 | 1 |
|
| South Africa | 1 | 1 |
|
| Turkey | 1 | 0 |
|
| Philippines | 1 | 0 |
|
| Thailand | 1 | 0 |
|
| Brazil | 1 | 1 |
|
| Russia | 0 | 1 |
|
| Other Emerging Markets | 0 | 3 |
|
| Subtotal | 12% | 9% |
|
| North America |
|
| United States | 41% | 46% |
|
| Canada | 3 | 3 |
|
| Subtotal | 44% | 49% |
|
| Short-Term Reserves | 2% | — |
|
1 MSCI All Country World Index.
See page 38 for a glossary of investment terms.
12
Performance Summary
All of the returns in this report represent past performance, which is not a guarantee of future results that may be achieved by the fund. (Current performance may be lower or higher than the performance data cited. For performance data current to the most recent month-end, visit our website at www.vanguard.com.) Note, too, that both investment returns and principal value can fluctuate widely, so an investor’s shares, when sold, could be worth more or less than their original cost. The returns shown do not reflect taxes that a shareholder would pay on fund distributions or on the sale of fund shares.
Cumulative Performance: September 30, 1996–September 30, 2006
Initial Investment of $10,000
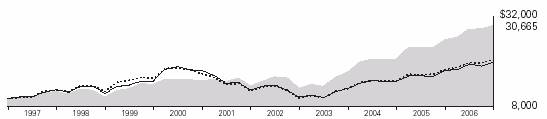
| Average Annual Total Returns | Final Value |
| Periods Ended September 30, 2006 | of a $10,000 |
| One Year | Five Years | Ten Years | Investment |
Global Equity Fund | 15.22% | 17.73% | 11.86% | $30,665 |
MSCI All Country World Index | 15.14 | 11.37 | 7.70 | 21,006 |
Average Global Fund1 | 13.36 | 10.18 | 7.38 | 20,385 |
1 Derived from data provided by Lipper Inc.
13
Fiscal-Year Total Returns (%): September 30, 1996–September 30, 2006

Note: See Financial Highlights table on page 27 for dividend and capital gains information.
14
Financial Statements
Statement of Net Assets
As of September 30, 2006
The fund provides a complete list of its holdings four times in each fiscal year, at the quarter-ends. For the second and fourth fiscal quarters, the lists appear in the fund’s semiannual and annual reports to shareholders. For the first and third fiscal quarters, the fund files the lists with the Securities and Exchange Commission on Form N-Q. Shareholders can look up the fund’s Forms N-Q on the SEC’s website at www.sec.gov. Forms N-Q may also be reviewed and copied at the SEC’s Public Reference Room (see the back cover of this report for further information).
| | Market |
| | Value• |
| Shares | ($000) |
Common Stocks (95.8%)1 | | |
Australia (1.4%) | | |
Santos Ltd. | 1,598,854 | 13,322 |
QBE Insurance Group Ltd. | 365,285 | 6,672 |
Oxiana Ltd. | 2,911,682 | 6,281 |
Promina Group Ltd. | 1,160,000 | 5,131 |
Australia & New Zealand | | |
Bank Group Ltd. | 179,613 | 3,594 |
Caltex Australia Ltd. | 174,022 | 3,104 |
Coles Myer Ltd. | 266,000 | 2,856 |
Suncorp-Metway Ltd. | 136,280 | 2,230 |
Woolworths Ltd. | 147,425 | 2,228 |
Iluka Resources Ltd. | 420,516 | 2,227 |
Leighton Holdings Ltd. | 123,747 | 1,785 |
Amcor Ltd. | 295,616 | 1,639 |
Orica Ltd. | 96,714 | 1,620 |
Alumina Ltd. | 204,000 | 939 |
Rinker Group Ltd. | 65,098 | 671 |
| | 54,299 |
Austria (0.1%) | | |
OMV AG | 43,300 | 2,243 |
| | |
Belgium (0.9%) | | |
Dexia | 561,131 | 14,516 |
Fortis | 199,413 | 8,078 |
Fortis (UK Shares) | 191,700 | 7,769 |
InBev | 69,033 | 3,798 |
Colruyt NV | 18,243 | 3,111 |
Belgacom SA | 56,834 | 2,213 |
| | 39,485 |
Brazil (0.5%) | | |
Gerdau SA ADR | 451,350 | 6,116 |
Usiminas-Usinas | | |
Siderugicas de Minas | | |
Gerais SA Pfd | 165,300 | 4,922 |
Petroleo Brasileiro SA Pfd. | 229,900 | 4,293 |
Uniao de Bancos | | |
Brasileiros SA GDR | 35,200 | 2,605 |
| Banco do Brasil SA | 63,300 | 1,387 |
| Banco Bradesco SA | 33,700 | 1,119 |
| Itausa-Investimentos | | |
| Itau SA | 113,000 | 465 |
| | | 20,907 |
Canada (3.0%) | | |
| Rogers Communications, | | |
| Inc. Class B | 367,900 | 20,181 |
| ^Bank of Nova | | |
| Scotia Halifax | 346,500 | 14,920 |
* | Bombardier Inc. Class B | 4,268,200 | 13,352 |
| Imperial Oil Ltd. | 360,300 | 12,101 |
| Telus Corp.– | | |
| Non Voting Shares | 185,900 | 10,431 |
* | Nortel Networks Corp. | 2,988,330 | 6,873 |
| Teck Cominco Ltd. Class B | 106,900 | 6,707 |
| Alcan Inc. | 158,800 | 6,341 |
* | Nexen Inc. | 110,700 | 5,929 |
* | ACE Aviation Holdings, Inc. | 174,100 | 5,393 |
| ING Canada Inc. | 83,300 | 4,162 |
| ^BCE Inc. | 142,465 | 3,872 |
| IPSCO, Inc. | 37,945 | 3,295 |
| Gerdau AmeriSteel Corp. | 293,000 | 2,666 |
| Husky Energy Inc. | 40,700 | 2,625 |
| Telus Communications Inc. | 29,789 | 1,679 |
| ^Abitibi-Consolidated Inc. | 660,200 | 1,639 |
| Onex Corp. | 66,800 | 1,498 |
| Canadian Natural | | |
| Resources Ltd. | 27,000 | 1,233 |
* | Fraser Papers Inc. | 198,800 | 1,205 |
| Novelis Inc. | 31,760 | 815 |
| Bell Aliant Regional | | |
| Communications | | |
| Income Fund | 11,287 | 354 |
*^ | Fortis Inc. | 7,680 | 168 |
| AUR Resources Inc. | 7,732 | 125 |
| ^Rothmans Inc. | 5,600 | 103 |
| | | 127,667 |
15
| | Market |
| | Value• |
| Shares | ($000) |
China (2.8%) | | |
China Mobile | | |
(Hong Kong) Ltd. | 11,018,500 | 77,729 |
China Petroleum | | |
& Chemical Corp. | 27,258,000 | 16,892 |
PetroChina Co. Ltd. | 13,650,000 | 14,691 |
CNOOC Ltd. | 6,499,000 | 5,410 |
Tsingtao Brewery Co., Ltd. | 1,548,000 | 2,083 |
China Telecom Corp. Ltd. | 3,890,000 | 1,408 |
| | 118,213 |
Denmark (0.2%) | | |
* William Demant A/S | 64,200 | 4,919 |
^Coloplast A/S B Shares | 35,400 | 2,841 |
* ^Vestas Wind Systems A/S | 95,699 | 2,546 |
| | 10,306 |
Finland (0.3%) | | |
Metso Oyj | 167,300 | 6,151 |
Sampo Oyj A Shares | 242,900 | 5,052 |
TietoEnator Oyj B Shares | 78,020 | 2,290 |
| | 13,493 |
France (4.1%) | | |
BNP Paribas SA | 726,262 | 77,968 |
Sanofi-Aventis | 142,580 | 12,663 |
Renault SA | 90,100 | 10,310 |
Societe Generale Class A | 64,535 | 10,243 |
Total SA | 154,600 | 10,130 |
Vivendi SA | 280,259 | 10,083 |
Credit Agricole SA | 212,399 | 9,303 |
AXA | 139,000 | 5,117 |
Carrefour SA | 70,208 | 4,426 |
Groupe Danone | 29,600 | 4,147 |
SCOR SA | 1,277,400 | 3,099 |
Air France | 92,804 | 2,790 |
Cie. de St. Gobain SA | 37,200 | 2,694 |
^Alcatel SA | 212,600 | 2,590 |
Thales SA | 57,800 | 2,560 |
Societe Centrale des | | |
Assurances Generales de | 12,600 | 1,583 |
* Atos Origin SA | 26,400 | 1,450 |
Vinci SA | 9,385 | 1,042 |
| | 172,198 |
Germany (3.6%) | | |
Allianz AG | 185,754 | 32,043 |
Deutsche Lufthansa AG | 1,274,321 | 26,911 |
Muenchener | | |
Rueckversicherungs– | | |
Gesellschaft AG (Registered) | 89,400 | 14,094 |
Man AG | 164,465 | 13,877 |
E.On AG | 97,820 | 11,589 |
Bayerische Motoren | | |
Werke AG | 186,800 | 9,982 |
Deutsche Boerse AG | 55,666 | 8,346 |
Continental AG | 58,900 | 6,811 |
Fresenius Medical Care AG | 40,900 | 5,296 |
ThyssenKrupp AG | 141,272 | 4,741 |
BASF AG | 55,100 | 4,401 |
TUI AG | 213,200 | 4,395 |
DaimlerChrysler AG | | |
(Registered) | 76,700 | 3,821 |
Deutsche Post AG | 82,200 | 2,154 |
Beiersdorf AG | 26,985 | 1,434 |
Fresenius Medical Care | | |
AG ADR | 29,244 | 1,264 |
Heidelberger | | |
Druckmaschinen AG | 15,765 | 648 |
| | 151,807 |
Greece (0.1%) | | |
Public Power Corp. | 137,300 | 3,301 |
| | |
Hong Kong (2.3%) | | |
Jardine Matheson | | |
Holdings Ltd. | 965,102 | 17,661 |
Jardine Strategic | | |
Holdings Ltd. | 1,233,900 | 14,039 |
New World | | |
Development Co., Ltd. | 7,550,300 | 12,966 |
China Netcom Group Corp. | | |
Hong Kong Ltd. | 6,830,500 | 12,229 |
Hong Kong Aircraft & | | |
Engineering Co., Ltd. | 486,800 | 6,912 |
Henderson Land | | |
Development Co. Ltd. | 1,117,000 | 6,270 |
Television Broadcasts Ltd. | 1,068,000 | 5,754 |
Wheelock and Co. Ltd. | 1,883,000 | 3,291 |
First Pacific Co. Ltd. | 6,988,000 | 3,279 |
Hong Kong and Shanghai | | |
Hotels Ltd. | 2,558,498 | 3,247 |
SmarTone | | |
Telecommunications Ltd. | 2,082,790 | 1,999 |
Sino Land Co. | 928,000 | 1,641 |
Next Media Ltd. | 2,894,000 | 1,577 |
Orient Overseas | | |
International Ltd. | 364,000 | 1,480 |
Kerry Properties Ltd. | 377,388 | 1,380 |
Mandarin Oriental | | |
International Ltd. | 881,690 | 1,074 |
I-Cable | | |
Communications Ltd. | 5,207,000 | 1,020 |
Silver Grant International | | |
Industries Ltd. | 1,752,000 | 415 |
Asia Satellite | | |
Telecommunications | | |
Holdings Ltd. | 208,500 | 348 |
| | 96,582 |
Hungary (0.1%) | | |
Mol Hungarian | | |
Oil and Gas Nyrt. | 34,600 | 3,156 |
16
| | | Market |
| | | Value• |
| | Shares | ($000) |
India (0.1%) | | |
| State Bank of India GDR | 62,480 | 3,468 |
| | | |
Indonesia (0.3%) | | |
| PT Bank Indonesia Tbk | 66,769,036 | 3,435 |
| PT Semen Gresik Tbk | 1,155,000 | 3,389 |
| PT Indofood Sukses | | |
| Makmur Tbk | 10,823,000 | 1,464 |
| PT Gudang Garam Tbk | 1,149,900 | 1,290 |
| PT Telekomunikasi | | |
| Indonesia Tbk | 1,350,000 | 1,228 |
| PT Matahari Putra | | |
| Prima Tbk | 11,028,500 | 991 |
* | Bank Pan Indonesia | | |
| TBK Wts. | 13,353,807 | 253 |
| PT Citra Marga | | |
| Nusaphala Persada Tbk | 774,000 | 70 |
* | PT Mulia Industrindo Tbk | 921,000 | 18 |
| | | 12,138 |
Ireland (0.1%) | | |
| Independent News & | | |
| Media PLC | 974,918 | 2,937 |
| Fyffes PLC | 469,800 | 912 |
* | Blackrock International | | |
| Land PLC | 462,500 | 223 |
| | | 4,072 |
Israel (0.2%) | | |
| Teva Pharmaceutical | | |
| Industries Ltd. | | |
| Sponsored ADR | 222,500 | 7,585 |
| | | |
Italy (1.3%) | | |
| Unicredito Italiano SpA | 2,753,908 | 22,831 |
* | ^Fiat SpA | 507,000 | 8,068 |
| ^ENI SpA | 195,100 | 5,791 |
| Saipem SpA | 256,000 | 5,560 |
| Luxottica Group SpA ADR | 179,800 | 5,292 |
| Fondiaria—Sai SpA | 54,000 | 2,365 |
* | Banca Popolare Italiana | 116,281 | 1,404 |
| ^Banca Monte dei Paschi | | |
| di Siena SpA | 207,500 | 1,257 |
| Compagnia Assicuratrice | | |
| Unipol SpA | 159,833 | 536 |
* | Natuzzi SpA-Sponsored ADR | 50,700 | 367 |
| Fondiaria—Sai SpA | 9,700 | 320 |
| | | 53,791 |
Japan (8.7%) | | |
Canon, Inc. | 942,500 | 49,280 |
Central Japan Railway Co. | 1,904 | 20,301 |
Sumitomo Mitsui | | |
Financial Group, Inc. | 1,450 | 15,234 |
Toyota Motor Corp. | 217,300 | 11,831 |
Resona Holdings Inc. | 3,820 | 11,478 |
Sumitomo Metal Mining Co. | 773,000 | 10,156 |
Orix Corp. | 32,470 | 8,976 |
^Mitsui & Co., Ltd. | 656,000 | 8,365 |
KDDI Corp. | 1,337 | 8,350 |
JFE Holdings, Inc. | 204,200 | 8,014 |
SBI Holdings, Inc. | 21,025 | 7,537 |
Japan Tobacco, Inc. | 1,773 | 6,905 |
Sharp Corp. | 334,000 | 5,735 |
Mitsui OSK Lines Ltd. | 771,000 | 5,712 |
East Japan Railway Co. | 720 | 5,039 |
Nippon Mining Holdings Inc. | 637,000 | 4,517 |
Tokyo Gas Co., Ltd. | 898,000 | 4,505 |
Tokyo Electric Power Co. | 153,500 | 4,422 |
Nippon Telegraph | | |
and Telephone Corp. | 900 | 4,402 |
^Kao Corp. | 157,000 | 4,188 |
Tokyo Electron Ltd. | 53,900 | 3,987 |
West Japan Railway Co. | 932 | 3,984 |
Leopalace21 Corp. | 107,900 | 3,943 |
Kirin Brewery Co., Ltd. | 284,000 | 3,796 |
Mizuho Financial Group, Inc. | 486 | 3,775 |
Mazda Motor Corp. | 589,000 | 3,575 |
Takeda Pharmaceutical | | |
Co. Ltd. | 56,900 | 3,557 |
Mitsui Chemicals, Inc. | 488,000 | 3,517 |
Suzuki Motor Corp. | 138,200 | 3,513 |
Fuji Photo Film Co., Ltd. | 94,000 | 3,429 |
Sumitomo Trust | | |
& Banking Co., Ltd. | 320,000 | 3,358 |
Marubeni Corp. | 653,000 | 3,256 |
FamilyMart Co., Ltd. | 114,900 | 3,146 |
Nippon Sanso Corp. | 368,000 | 3,124 |
Sekisui House Ltd. | 200,000 | 3,029 |
Secom Co., Ltd. | 60,500 | 3,000 |
NTT DoCoMo, Inc. | 1,888 | 2,910 |
Tanabe Seiyaku Co., Ltd. | 212,000 | 2,664 |
Mitsubishi Corp. | 138,000 | 2,601 |
Dai-Nippon Printing Co., Ltd. | 168,000 | 2,593 |
Seven and I Holdings Co., Ltd. | 79,300 | 2,556 |
Namco Bandai Holdings Inc. | 160,650 | 2,530 |
Nintendo Co. | 12,000 | 2,476 |
Sumitomo Heavy | | |
Industries Ltd. | 293,000 | 2,454 |
Sompo Japan Insurance Inc. | 181,000 | 2,374 |
Shiseido Co., Ltd. | 118,000 | 2,358 |
Sony Corp. | 57,900 | 2,340 |
Kobe Steel Ltd. | 729,000 | 2,292 |
Sumitomo Forestry Co. | 218,000 | 2,275 |
Ricoh Co. | 113,000 | 2,250 |
JS Group Corp. | 104,000 | 2,178 |
Matsushita Electric | | |
Works, Ltd. | 205,000 | 2,171 |
^Kawasaki Heavy | | |
Industries Ltd. | 651,000 | 2,159 |
Nippon Steel Corp. | 520,000 | 2,142 |
Komatsu Ltd. | 119,000 | 2,060 |
Nippon Suisan Kaisha Ltd. | 372,000 | 2,049 |
Bank of Fukuoka, Ltd. | 278,000 | 2,045 |
17
| | Market |
| | Value• |
| Shares | ($000) |
Sumitomo Electric | | |
Industries Ltd. | 147,000 | 1,989 |
Sankyo Co., Ltd. | 36,700 | 1,961 |
Hitachi Ltd. | 319,000 | 1,859 |
Bank of Yokohama Ltd. | 233,000 | 1,839 |
Mitsubishi UFJ | | |
Financial Group | 142 | 1,828 |
Onward Kashiyama Co., Ltd. | 126,000 | 1,814 |
^Alfresa Holdings Corp. | 28,200 | 1,790 |
Nippon Oil Corp. | 241,000 | 1,780 |
Astellas Pharma Inc. | 42,800 | 1,724 |
Chiba Bank Ltd. | 189,000 | 1,688 |
Nippon Meat Packers, Inc. | 148,000 | 1,663 |
NEC Corp. | 284,000 | 1,557 |
Yamato Holdings Co., Ltd. | 104,000 | 1,506 |
Sumitomo Metal | | |
Industries Ltd. | 390,000 | 1,498 |
TDK Corp. | 17,900 | 1,434 |
Kinden Corp. | 164,000 | 1,356 |
Matsushita Electric | | |
Industrial Co., Ltd. | 64,000 | 1,354 |
Ajinomoto Co., Inc. | 121,000 | 1,304 |
Toyo Seikan Kaisha Ltd. | 68,000 | 1,303 |
Daiwa Securities Group Inc. | 110,000 | 1,288 |
Toppan Forms Co., Ltd. | 101,600 | 1,285 |
^Ryosan Co., Ltd. | 48,500 | 1,244 |
Yamatake Corp. | 50,000 | 1,233 |
Nisshinbo Industries, Inc. | 107,000 | 1,129 |
Bridgestone Corp. | 55,000 | 1,115 |
Ebara Corp. | 304,000 | 1,103 |
All Nippon Airways Co., Ltd. | 268,000 | 1,085 |
Toyota Boshoku Corp. | 56,000 | 1,039 |
Shimizu Corp. | 176,000 | 1,007 |
Promise Co., Ltd. | 25,250 | 1,004 |
Tokyo Ohka Kogyo Co., Ltd. | 35,400 | 942 |
Yamaha Motor Co., Ltd. | 33,000 | 877 |
Isetan Co. | 49,000 | 828 |
^Pioneer Corp. | 45,200 | 796 |
Fuji Heavy Industries Ltd. | 138,000 | 787 |
Rengo Co., Ltd. | 101,000 | 673 |
Brother Industries Ltd. | 48,000 | 604 |
Daifuku Co., Ltd. | 36,000 | 454 |
Noritake Co., Ltd. | 81,000 | 452 |
Cosmo Oil Co., Ltd. | 95,000 | 393 |
Inabata & Co., Ltd. | 49,000 | 363 |
NGK Insulators Ltd. | 25,000 | 352 |
Fujitsu Fronttec Ltd. | 32,700 | 253 |
| | | 361,966 |
Malaysia (0.5%) | | |
| Bumiputra–Commerce | | |
| Holdings Bhd. | 3,669,619 | 6,612 |
| Resorts World Bhd. | 1,742,000 | 5,242 |
| Telekom Malaysia Bhd. | 888,000 | 2,202 |
| British American | | |
| Tobacco Bhd. | 165,000 | 1,912 |
| Maxis Communications Bhd. | 586,300 | 1,415 |
| Kumpulan Guthrie Bhd. | 965,000 | 957 |
| Digi.com Bhd. | 157,200 | 533 |
| Malaysian Airline | | |
| System Bhd. | 550,000 | 522 |
| Genting Bhd. | 79,400 | 519 |
* | Multi-Purpose | | |
| Holdings Bhd. | 1,855,000 | 433 |
| Lion Industries | | |
| Corp. Bhd. | 368,600 | 84 |
* | Multi-Purpose | | |
| Holdings Bhd. | | |
| Warrants Exp. 2/26/09 | 254,000 | 13 |
| | | 20,444 |
Mexico (0.1%) | | |
| America Movil SA | | |
| de CV Series L ADR | 46,200 | 1,819 |
| Telefonos de Mexico | | |
| SA Class L ADR | 32,000 | 819 |
| | | 2,638 |
Netherlands (3.7%) | | |
| ING Groep NV | 1,854,826 | 81,430 |
| ^Aegon NV | 1,033,994 | 19,367 |
| Heineken NV | 390,238 | 17,834 |
| Mittal Steel Company | | |
| NV (Paris Shares) | 341,042 | 11,898 |
| Koninklijke KPN NV | 840,785 | 10,702 |
| European Aeronautic | | |
| Defence and Space Co. | 232,190 | 6,666 |
| Koninklijke (Royal) Philips | | |
| Electronics NV | 134,171 | 4,691 |
| Koninklijke Boskalis | | |
| Westminster NV | 36,537 | 2,374 |
| Wolters Kluwer NV | 74,224 | 1,932 |
| | | 156,894 |
New Zealand (0.0%) | | |
| ^Telecom Corp. of | | |
| New Zealand Ltd. | 468,517 | 1,319 |
| PGG Wrightson Ltd. | 58,578 | 63 |
| | | 1,382 |
Norway (0.1%) | | |
| DnB NOR ASA | 216,900 | 2,656 |
| Statoil ASA | 69,000 | 1,645 |
| | | 4,301 |
Philippines (0.7%) | | |
| Ayala Corp. | 1,439,626 | 13,698 |
| Globe Telecom, Inc. | 419,400 | 9,065 |
| Jollibee Foods Corp. | 2,574,900 | 1,830 |
* | ABS-CBN | | |
| Broadcasting Corp. | 5,006,300 | 1,652 |
* | Banco De Oro | 1,479,800 | 1,175 |
| Philippine Long | | |
| Distance Telephone Co. | 21,700 | 973 |
| | | 28,393 |
18
| Shares | Market
Value•
($000) |
|---|
|
| Poland (0.0%) | | |
| KGHM Polska Miedz SA | 54,322 | 1,739 |
| Russia (0.1%) |
| Lukoil Sponsored ADR | 71,963 | 5,433 |
| Singapore (0.4%) |
| Great Eastern Holdings Ltd. | 692,000 | 7,189 |
| BIL International Ltd. | 4,553,000 | 4,162 |
| United Industrial Corp., Ltd. | 2,593,000 | 2,663 |
| Neptune Orient Lines Ltd. | 1,213,000 | 1,547 |
| Yellow Pages |
| (Singapore) Ltd. | 466,000 | 308 |
|
|
| | 15,869 |
| South Africa (1.1%) |
| Sun International Ltd. | 549,866 | 6,968 |
| * Hosken Consolidated |
| Investments Ltd. | 1,103,148 | 6,397 |
| Anglo American PLC | 145,345 | 6,069 |
| RMB Holdings Ltd. | 1,550,600 | 5,379 |
| Nedbank Group Ltd. | 271,805 | 3,991 |
| Anglo Platinum Ltd. | 34,000 | 3,431 |
| FirstRand Ltd. | 1,329,636 | 3,024 |
| Sanlan Ltd. | 1,258,700 | 2,767 |
| Standard Bank Group Ltd. | 246,800 | 2,467 |
| Tiger Brands Ltd. | 115,400 | 2,102 |
| Gold Fields Ltd. | 62,340 | 1,106 |
| JD Group Ltd. | 88,246 | 739 |
| City Lodge Hotels Ltd. | 83,078 | 567 |
| New Clicks Holdings Ltd. | 301,750 | 392 |
|
|
| | 45,399 |
| South Korea (1.9%) |
| POSCO | 74,264 | 19,328 |
| KT Corp. | 245,310 | 10,575 |
| * Hynix Semiconductor Inc. | 252,580 | 9,939 |
| Samsung Electronics Co., Ltd. | 12,022 | 8,426 |
| Hana Financial Group Inc. | 105,050 | 4,812 |
| Industrial Bank of Korea | 197,230 | 3,374 |
| Hyundai Motor Co. | 63,840 | 3,333 |
| Kookmin Bank | 37,000 | 2,897 |
| SK Corp. | 42,399 | 2,817 |
| Samsung Electronics |
| Co., Ltd. Pfd. | 4,700 | 2,467 |
| Shinhan Financial Group Ltd. | 54,790 | 2,463 |
| KT & G Corp. | 39,425 | 2,395 |
| Hyundai Mobis | 18,130 | 1,860 |
| Honam Petrochemical Corp. | 28,700 | 1,787 |
| * LG. Philips LCD Co., Ltd. | 36,800 | 1,220 |
| Woori Finance |
| Holdings Co., Ltd. | 55,370 | 1,167 |
| Samyang Corp. | 8,820 | 548 |
| Hyundai Motor Co. Ltd. | 5,000 | 428 |
| Korea Electric Power Corp. | 5,000 | 195 |
| Korea Iron & Steel Co., Ltd. | 4,000 | 142 |
| Kiswire Ltd. | 3,000 | 72 |
|
|
| | 80,245 |
| Spain (3.5%) |
| Banco Santander |
| Central Hispano SA | 3,984,491 | 62,861 |
| ACS, Actividades de |
| Contruccion y Servisios, SA | 327,697 | 15,511 |
| Telefonica SA | 868,261 | 15,015 |
| Banco Bilbao Vizcaya |
| Argentaria SA | 561,736 | 12,977 |
| Repsol YPF SA | 429,709 | 12,761 |
| Acciona SA | 56,049 | 8,514 |
| Acerinox SA | 272,500 | 5,249 |
| Banco Popular Espanol SA | 316,500 | 5,184 |
| Industria de Diseno Textil SA | 69,672 | 3,246 |
| Fomento de Construc y |
| Contra SA | 24,484 | 1,954 |
| * Sogecable SA | 45,032 | 1,606 |
| Corporacion Mapfre SA | 53,378 | 1,115 |
| Viscofan SA | 58,000 | 897 |
| Prosegur Cia de Seguridad |
| SA (Registered) | 28,400 | 852 |
|
|
| | 147,742 |
| Sweden (0.8%) |
| Nordea Bank AB | 835,000 | 10,936 |
| Svenska Handelsbanken |
| AB A Shares | 176,100 | 4,759 |
| Telefonaktiebolaget LM |
| Ericsson AB Class B | 1,324,700 | 4,577 |
| Skandinaviska Enskilda |
| Banken AB A Shares | 151,200 | 4,066 |
| Svenska Cellulosa AB |
| B Shares | 77,060 | 3,536 |
| Assa Abloy AB | 178,900 | 3,324 |
| ^Hoganas AB B Shares | 54,350 | 1,439 |
| Lindex AB | 33,200 | 501 |
|
|
| | 33,138 |
| Switzerland (1.1%) |
| Zurich Financial Services AG | 43,547 | 10,662 |
| Credit Suisse Group |
| (Registered) | 155,700 | 8,978 |
| Cie. Financiere |
| Richemont AG | 109,600 | 5,264 |
| Novartis AG (Registered) | 90,340 | 5,256 |
| Roche Holdings AG | 29,400 | 5,065 |
| Geberit AG | 3,106 | 3,775 |
| Adecco SA (Registered) | 60,800 | 3,655 |
| * Logitech International SA | 124,600 | 2,702 |
| Publigroupe SA | 3,440 | 1,061 |
| Phonak Holding AG | 12,100 | 764 |
| Kudelski SA | 2,200 | 65 |
|
|
| | 47,247 |
| Taiwan (2.2%) |
| Taiwan Semiconductor |
| Manufacturing Co., Ltd. | 9,767,932 | 17,630 |
| Chi Mei |
| Optoelectronics Corp. | 13,381,912 | 14,785 |
19 |
| | | Market |
| | | Value• |
| | Shares | ($000) |
| United | | |
| Microelectronics Corp. | 18,948,105 | 10,603 |
| High Tech Computer Corp. | 349,200 | 9,231 |
| Powerchip | | |
| Semiconductor Corp. | 13,596,253 | 8,672 |
| Chunghwa Telecom | | |
| Co., Ltd. | 4,160,780 | 6,940 |
| Siliconware Precision | | |
| Industries Co. | 4,811,284 | 5,723 |
| AU Optronics Corp. | 2,937,960 | 4,155 |
| Nanya Technology Corp. | 4,541,000 | 2,985 |
| Compal Electronics Inc. | 3,194,588 | 2,825 |
| Nan Ya Plastic Corp. | 1,201,000 | 1,679 |
| Taiwan Cellular Corp. | 1,407,000 | 1,345 |
| China Steel Corp. | 1,325,000 | 1,142 |
* | Winbond Electronics Corp. | 2,940,000 | 882 |
* | Advanced Semiconductor | | |
| Engineering Inc. | 890,000 | 828 |
| Far EasTone | | |
| Telecommunications | | |
| Co., Ltd. | 627,000 | 679 |
| Unimicron Technology Corp. | 297,670 | 367 |
| AV Tech Co. | 65,587 | 285 |
* | Ritek Corp. | 1,178,000 | 281 |
| U-Ming Marine | | |
| Transport Corp. | 249,000 | 272 |
| Vanguard International | | |
| Semiconductor Corp. | 261,585 | 167 |
| MediaTek Inc. | 16,000 | 152 |
| Foxconn Technology Co., Ltd. | 7,650 | 69 |
| | | 91,697 |
Thailand (0.6%) | | |
| Siam Cement Public | | |
| Co. Ltd. Non-Voting | | |
| Depositary Receipt | 986,200 | 6,245 |
| Advanced Info Service | | |
| Public Co. Ltd. (Foreign) | 2,406,000 | 5,761 |
| Siam Cement | | |
| Public Co. Ltd. (Foreign) | 664,300 | 4,515 |
| Kasikornbank Public Co. | | |
| Ltd. (Foreign) | 1,701,900 | 3,121 |
| PTT Public Co., Ltd. | | |
| (Foreign) | 300,400 | 1,726 |
| MBK Development | | |
| Public Co. Ltd. (Foreign) | 813,400 | 1,180 |
| Thanachart Capital | | |
| Public Co. Ltd. (Foreign) | 1,855,000 | 735 |
* | Thai Petrochemical | | |
| Industry PLC (Foreign) | 2,155,900 | 393 |
| Post Publishing Public | | |
| Co. Ltd. (Foreign) | 1,300,000 | 259 |
| GMM Grammy Public | | |
| Co. Ltd. Non-Voting | | |
| Depositary Receipt | 997,000 | 198 |
| Matichon PLC (Foreign) | 625,000 | 187 |
| GMM Grammy | | |
| Public Co. Ltd. (Foreign) | 642,000 | 127 |
| | | 24,447 |
Turkey (0.7%) | | |
| Eregli Demir ve Celik | | |
| Fabrikalari A.S. | 1,958,502 | 8,712 |
| Tupras-Turkiye Petrol | | |
| Rafinerileri A.S. | 543,146 | 8,312 |
| Dogan Sirketler Grubu | | |
| Holding A.S. | 1,288,096 | 4,980 |
| Turkcell Iletisim | | |
| Hizmetleri A.S. | 376,541 | 1,937 |
* | Petkim Petrokimya | | |
| Holding A.S. | 533,110 | 1,774 |
| Tofas Turk Otomobil | | |
| Fabrikasi A.S. | 661,482 | 1,764 |
| Petrol Ofisi A.S. | 298,870 | 933 |
* | Vestel Elektronik Sanayi | | |
| ve Ticaret A.S. | 236,362 | 552 |
| Anadolu Efes Biracilik | | |
| ve Malt Sanayii A.S. | 16,156 | 400 |
| | | 29,364 |
United Kingdom (8.4%) | | |
| AstraZeneca Group PLC | 781,296 | 48,684 |
| Royal Dutch Shell | | |
| PLC Class A | | |
| (Amsterdam Shares) | 1,081,736 | 35,688 |
| HBOS PLC | 780,711 | 15,401 |
| Marks & Spencer | | |
| Group PLC | 1,202,356 | 14,431 |
| Rio Tinto PLC | 273,939 | 12,933 |
| Vodafone Group PLC | 5,270,037 | 12,009 |
| Antofagasta PLC | 1,295,495 | 11,075 |
* | British Airways PLC | 1,338,058 | 10,668 |
| HSBC Holdings PLC | 554,442 | 10,091 |
| Royal Bank of Scotland | | |
| Group PLC | 261,400 | 8,973 |
| Aviva PLC | 604,900 | 8,842 |
| BP PLC | 773,700 | 8,438 |
| Barclays PLC | 615,105 | 7,739 |
| Royal Dutch Shell | | |
| PLC Class B | 207,022 | 7,026 |
| BAE Systems PLC | 946,600 | 6,984 |
| BT Group PLC | 1,292,667 | 6,478 |
| Xstrata PLC | 153,740 | 6,332 |
| Hanson Building | | |
| Materials PLC | 397,650 | 5,730 |
| GlaxoSmithKline PLC | 213,200 | 5,657 |
| Reckitt Benckiser PLC | 131,890 | 5,451 |
| Capita Group PLC | 525,800 | 5,375 |
| ICAP PLC | 544,600 | 5,254 |
| Diageo PLC | 292,528 | 5,154 |
| J. Sainsbury PLC | 710,200 | 4,978 |
20
| | | Market |
| | | Value• |
| | Shares | ($000) |
| Cable and Wireless PLC | 1,918,800 | 4,964 |
| Reed Elsevier PLC | 440,100 | 4,874 |
| Arriva PLC | 394,733 | 4,866 |
| The Sage Group PLC | 1,029,900 | 4,829 |
| Tesco PLC | 699,500 | 4,702 |
| Amvescap PLC | 407,600 | 4,412 |
| Kazakhmys PLC | 180,352 | 3,857 |
| Intertek Testing | | |
| Services PLC | 252,100 | 3,678 |
| Carnival PLC | 76,414 | 3,644 |
| Provident Financial PLC | 295,856 | 3,461 |
| Enterprise Inns PLC | 167,200 | 3,293 |
| Stagecoach Group PLC | 1,254,723 | 2,980 |
| Rexam PLC | 276,200 | 2,947 |
| Informa PLC | 316,700 | 2,925 |
* | MyTravel Group | | |
| PLC A Shares | 835,166 | 2,909 |
| WPP Group PLC | 235,300 | 2,908 |
| Enodis PLC | 879,500 | 2,850 |
| Compass Group PLC | 548,835 | 2,751 |
* | Invensys PLC | 622,440 | 2,416 |
| Smiths Group PLC | 143,410 | 2,399 |
| Hays PLC | 813,200 | 2,195 |
| ITV PLC | 1,199,435 | 2,165 |
| Alliance Boots PLC | 118,277 | 1,710 |
| Ladbrokes PLC | 186,223 | 1,353 |
| International Power PLC | 230,660 | 1,348 |
| PartyGaming PLC | 607,500 | 1,212 |
| Bunzl PLC | 91,233 | 1,139 |
| Devro PLC | 313,600 | 723 |
| Homeserve PLC | 12,400 | 385 |
| Sportingbet PLC | 68,624 | 236 |
| Kier Group PLC | 3,500 | 120 |
| | | 353,642 |
Venezuela (0.0%) | | |
* | Compania Anonima Nacional | |
| Telefonos de Venezuela | 98,619 | 1,874 |
| | | |
United States (39.8%) | | |
| Consumer Discretionary (4.6%) | |
* | Comcast Corp. | | |
| Special Class A | 394,200 | 14,511 |
* | Apollo Group, Inc. Class A | 235,900 | 11,616 |
* | Liberty Global, Inc. Class A | 444,660 | 11,446 |
* | Liberty Global, Inc. Series C | 444,660 | 11,143 |
| American Greetings Corp. | | |
| Class A | 431,800 | 9,983 |
| Cablevision Systems | | |
| NY Group Class A | 408,100 | 9,268 |
| Clear Channel | | |
| Communications, Inc. | 311,700 | 8,993 |
| Time Warner, Inc. | 420,400 | 7,664 |
| CBS Corp. | 269,600 | 7,595 |
| Sherwin-Williams Co. | 135,300 | 7,547 |
* | ^priceline.com, Inc. | 201,400 | 7,410 |
* | Marvel Entertainment, Inc. | 286,098 | 6,906 |
* | DIRECTV Group, Inc. | 314,100 | 6,181 |
| NIKE, Inc. Class B | 68,600 | 6,011 |
| McDonald’s Corp. | 149,000 | 5,829 |
| Autoliv, Inc. | 104,400 | 5,753 |
* | ^Blue Nile Inc. | 137,500 | 4,998 |
* | Liberty Media-Interactive A | 221,126 | 4,507 |
* | Discovery Holding Co. | | |
| Class A | 284,850 | 4,119 |
| Dow Jones & Co., Inc. | 114,600 | 3,844 |
* | Liberty Media Capital A | 44,225 | 3,696 |
* | Amazon.com, Inc. | 108,600 | 3,488 |
* | 99 Cents Only Stores | 288,200 | 3,409 |
* | PRIMEDIA Inc. | 2,072,800 | 3,151 |
| Building Materials | | |
| Holding Corp. | 114,959 | 2,991 |
* | Fleetwood Enterprises, Inc. | 417,900 | 2,812 |
* | Blockbuster Inc. Class B | 770,100 | 2,718 |
| Sun-Times Media Group, Inc. | 381,800 | 2,512 |
* | Viacom Inc. Class A | 50,300 | 1,876 |
| CBS Corp. Class A | 50,300 | 1,419 |
| Mattel, Inc. | 57,680 | 1,136 |
| BorgWarner, Inc. | 16,100 | 920 |
| International Speedway Corp. | 18,050 | 900 |
* | Office Depot, Inc. | 18,500 | 734 |
* | Live Nation | 24,412 | 499 |
* | JAKKS Pacific, Inc. | 21,000 | 374 |
| | | |
| Consumer Staples (2.8%) | | |
| Costco Wholesale Corp. | 581,500 | 28,889 |
| Carolina Group | 511,143 | 28,312 |
| Altria Group, Inc. | 273,700 | 20,952 |
| The Kroger Co. | 486,100 | 11,248 |
| Coca-Cola Enterprises, Inc. | 524,700 | 10,930 |
| Safeway, Inc. | 134,200 | 4,073 |
| CVS Corp. | 113,100 | 3,633 |
| Pilgrim’s Pride Corp. | 111,700 | 3,055 |
| The Clorox Co. | 43,900 | 2,766 |
| Corn Products | | |
| International, Inc. | 65,600 | 2,135 |
| Casey’s General Stores, Inc. | 56,298 | 1,254 |
| | | |
| Energy (4.5%) | | |
| ConocoPhillips Co. | 1,061,300 | 63,179 |
| ExxonMobil Corp. | 503,400 | 33,778 |
| XTO Energy, Inc. | 627,800 | 26,449 |
| Hess Corp. | 336,500 | 13,938 |
| Frontier Oil Corp. | 520,200 | 13,827 |
| Tidewater Inc. | 215,000 | 9,501 |
| Chevron Corp. | 145,000 | 9,405 |
* | Helix Energy Solutions | | |
| Group, Inc. | 209,400 | 6,994 |
| Baker Hughes, Inc. | 63,200 | 4,310 |
| Noble Corp. | 45,300 | 2,907 |
| Western Refining, Inc. | 110,900 | 2,577 |
| Teekay Shipping Corp. | 49,449 | 2,033 |
| Tsakos Energy Navigation Ltd. | 14,826 | 661 |
21
| | | Market |
| | | Value• |
| | Shares | ($000) |
* | Unit Corp. | 10,900 | 501 |
| Alon USA Energy, Inc. | 16,400 | 484 |
| | | |
| Financials (8.5%) | | |
| The Chubb Corp. | 644,500 | 33,488 |
| MetLife, Inc. | 534,500 | 30,295 |
| Bear Stearns Co., Inc. | 195,100 | 27,334 |
| Progressive Corp. of Ohio | 1,047,200 | 25,698 |
| W.R. Berkley Corp. | 494,600 | 17,504 |
* | Berkshire Hathaway Inc. | | |
| Class B | 5,063 | 16,070 |
| Moody’s Corp. | 235,000 | 15,364 |
| The Hartford Financial | | |
| Services Group Inc. | 149,070 | 12,932 |
| JPMorgan Chase & Co. | 246,400 | 11,571 |
| Citigroup, Inc. | 230,800 | 11,464 |
* | IntercontinentalExchange Inc. | 147,600 | 11,080 |
| Bank of America Corp. | 180,400 | 9,664 |
| The Goldman Sachs | | |
| Group, Inc. | 52,700 | 8,915 |
| Freddie Mac | 123,600 | 8,198 |
| Assurant, Inc. | 152,200 | 8,129 |
| Merrill Lynch & Co., Inc. | 100,800 | 7,885 |
| Fannie Mae | 139,600 | 7,805 |
| American Express Co. | 132,497 | 7,430 |
| Axis Capital Holdings Ltd. | 208,335 | 7,227 |
| PartnerRe Ltd. | 95,310 | 6,440 |
| MBIA, Inc. | 93,900 | 5,769 |
| Lincoln National Corp. | 92,900 | 5,767 |
| Mercury General Corp. | 114,000 | 5,656 |
| American International | | |
| Group, Inc. | 84,900 | 5,625 |
* | Arch Capital Group Ltd. | 84,937 | 5,393 |
| Radian Group, Inc. | 84,400 | 5,064 |
| XL Capital Ltd. Class A | 72,800 | 5,001 |
| Franklin Resources Corp. | 44,100 | 4,664 |
| National City Corp. | 116,400 | 4,260 |
| MGIC Investment Corp. | 57,900 | 3,472 |
| Genworth Financial Inc. | 96,800 | 3,389 |
* | First Federal Financial Corp. | 51,451 | 2,918 |
| The St. Paul Travelers, | | |
| Cos. Inc. | 60,400 | 2,832 |
| Zenith National | | |
| Insurance Corp. | 45,500 | 1,815 |
| Wachovia Corp. | 26,700 | 1,490 |
| First American Corp. | 29,800 | 1,262 |
| Endurance Specialty | | |
| Holdings Ltd. | 30,273 | 1,067 |
| American Financial Group, Inc. | 21,700 | 1,018 |
| Ameriprise Financial, Inc. | 21,459 | 1,006 |
| RenaissanceRe Holdings Ltd. | 10,498 | 584 |
| LandAmerica Financial | | |
| Group, Inc. | 7,900 | 520 |
| Health Care (3.7%) | | |
| AmerisourceBergen Corp. | 1,004,225 | 45,391 |
* | King Pharmaceuticals, Inc. | 2,036,070 | 34,674 |
* | Biogen Idec Inc. | 387,600 | 17,318 |
| Schering-Plough Corp. | 669,000 | 14,778 |
| Pfizer Inc. | 368,400 | 10,448 |
| IMS Health, Inc. | 355,630 | 9,474 |
| Bristol-Myers Squibb Co. | 206,900 | 5,156 |
| Dade Behring Holdings Inc. | 121,900 | 4,896 |
| Merck & Co., Inc. | 70,600 | 2,958 |
* | Amgen, Inc. | 33,800 | 2,418 |
| Alpharma, Inc. Class A | 76,400 | 1,787 |
* | Magellan Health Services, Inc. | 36,200 | 1,542 |
* | ^New River | | |
| Pharmaceuticals Inc. | 58,900 | 1,516 |
* | Sierra Health Services, Inc. | 31,800 | 1,203 |
* | Kinetic Concepts, Inc. | 20,800 | 654 |
| | | |
| Industrials (6.3%) | | |
| Caterpillar, Inc. | 1,057,100 | 69,557 |
| Cummins Inc. | 264,700 | 31,560 |
* | Terex Corp. | 510,039 | 23,064 |
| Northrop Grumman Corp. | 203,691 | 13,865 |
| General Electric Co. | 355,000 | 12,532 |
* | Superior Essex Inc. | 329,100 | 11,272 |
* | Kansas City Southern | 368,700 | 10,069 |
| The Manitowoc Co., Inc. | 220,659 | 9,883 |
| Parker Hannifin Corp. | 123,400 | 9,592 |
* | AMR Corp. | 414,300 | 9,587 |
| PACCAR, Inc. | 160,350 | 9,143 |
| Viad Corp. | 234,000 | 8,286 |
| Arkansas Best Corp. | 135,988 | 5,852 |
| Watson Wyatt & | | |
| Co. Holdings | 140,800 | 5,762 |
| Eaton Corp. | 72,600 | 4,999 |
| Pitney Bowes, Inc. | 108,300 | 4,805 |
| Norfolk Southern Corp. | 109,000 | 4,801 |
| The Timken Co. | 152,200 | 4,533 |
* | US Airways Group Inc. | 97,900 | 4,340 |
| The Boeing Co. | 37,400 | 2,949 |
| Raytheon Co. | 60,800 | 2,919 |
| ^PW Eagle, Inc. | 53,200 | 1,597 |
* | Swift Transportation Co., Inc. | 61,413 | 1,457 |
| Freightcar America Inc. | 24,400 | 1,293 |
* | Saia, Inc. | 35,700 | 1,164 |
* | Ceradyne, Inc. | 14,500 | 596 |
* | Learning Tree | | |
| International, Inc. | 36,900 | 300 |
* | ^Northwest Airlines | | |
| Corp. Class A | 324,000 | 220 |
| | | |
| Information Technology (3.4%) | |
* | Advanced Micro | | |
| Devices, Inc. | 827,000 | 20,551 |
* | Lexmark International, Inc. | 336,691 | 19,414 |
22
| | | Market |
| | | Value• |
| | Shares | ($000) |
| Hewlett-Packard Co. | 509,600 | 18,697 |
* | Xerox Corp. | 832,900 | 12,960 |
| Microsoft Corp. | 382,800 | 10,462 |
* | Sun Microsystems, Inc. | 1,922,300 | 9,554 |
* | Gartner, Inc. Class A | 452,100 | 7,952 |
* | Agere Systems Inc. | 525,570 | 7,847 |
* | Lucent Technologies, Inc. | 2,933,200 | 6,864 |
| Electronic Data | | |
| Systems Corp. | 261,200 | 6,405 |
* | Dell Inc. | 245,700 | 5,612 |
* | Komag, Inc. | 169,600 | 5,420 |
* | DST Systems, Inc. | 77,300 | 4,767 |
| International Business | | |
| Machines Corp. | 34,200 | 2,802 |
* | ON Semiconductor Corp. | 267,100 | 1,571 |
* | Tech Data Corp. | 22,600 | 826 |
* | Solectron Corp. | 242,800 | 792 |
| | | |
| Materials (3.5%) | | |
| Nucor Corp. | 1,278,600 | 63,278 |
| Freeport-McMoRan | | |
| Copper & Gold, Inc. | | |
| Class B | 507,700 | 27,040 |
| Phelps Dodge Corp. | 205,500 | 17,406 |
| Steel Dynamics, Inc. | 299,100 | 15,090 |
| Scotts Miracle-Gro Co. | 215,200 | 9,574 |
| United States Steel Corp. | 117,600 | 6,783 |
| Reliance Steel & | | |
| Aluminum Co. | 137,800 | 4,429 |
* | Chaparral Steel Co. | 111,000 | 3,781 |
* | Owens-Illinois, Inc. | 35,900 | 554 |
| | | |
| Telecommunication Services (1.7%) | |
* | Qwest Communications | | |
| International Inc. | 2,495,985 | 21,765 |
| Embarq Corp. | 410,955 | 19,878 |
| Sprint Nextel Corp. | 827,646 | 14,194 |
* | NII Holdings Inc. | 98,000 | 6,092 |
* | Cincinnati Bell Inc. | 994,400 | 4,793 |
* | Level 3 Communications, Inc. | 868,200 | 4,645 |
| AT&T Inc. | 49,300 | 1,605 |
| | | |
| Utilities (0.8%) | | |
| FirstEnergy Corp. | 312,949 | 17,481 |
| TXU Corp. | 113,100 | 7,071 |
| Constellation Energy | | |
| Group, Inc. | 77,500 | 4,588 |
| Entergy Corp. | 30,000 | 2,347 |
| Wisconsin Energy Corp. | 48,100 | 2,075 |
| OGE Energy Corp. | 47,200 | 1,704 |
| | | 1,667,694 |
Total Common Stocks | | |
(Cost $3,375,298) | | 4,016,259 |
Temporary Cash Investments (5.5%)1 | |
Money Market Funds (5.4%) | |
2 | Vanguard Market | | |
| Liquidity Fund, 5.306% | 142,483,471 | 142,483 |
2 | Vanguard Market | | |
| Liquidity Fund, | | |
| 5.306%—Note G | 81,911,217 | 81,911 |
| | | 224,394 |
| | Face | |
| | Amount | |
| | ($000) | |
U.S. Agency Obligations (0.1%) | |
3 | Federal National Mortgage Assn. | |
4 | 5.376%, 10/4/06 | 1,000 | 1,000 |
3 | Federal Home Loan Mortgage Corp. | |
4 | 5.198%, 1/3/07 | 3,000 | 2,961 |
| | | 3,961 |
Total Temporary Cash Investments | |
(Cost $228,354) | | 228,355 |
Total Investments (101.3%) | | |
(Cost $3,603,652) | | 4,244,614 |
Other Assets and Liabilities (–1.3%) | |
Other Assets—Note C | | 58,356 |
Liabilities—Note G | | (111,533) |
| | | (53,177) |
Net Assets (100%) | | |
Applicable to 190,829,756 outstanding $.001 |
par value shares of beneficial interest | |
(unlimited authorization) | | 4,191,437 |
Net Asset Value Per Share | | $21.96 |
23
At September 30, 2006, net assets consisted of:5 |
| Amount | Per |
| ($000) | Share |
Paid-in Capital | 3,334,514 | $17.47 |
Undistributed Net | | |
Investment Income | 45,245 | .24 |
Accumulated Net | | |
Realized Gains | 170,141 | .89 |
Unrealized Appreciation | | |
(Depreciation) | | |
Investment Securities | 640,962 | 3.36 |
Futures Contracts | 865 | — |
Foreign Currencies and | | |
Forward Currency Contracts | (290) | — |
Net Assets | 4,191,437 | $21.96 |
| • | See Note A in Notes to Financial Statements. |
| * | Non-income-producing security. |
^ Part of security position is on loan to broker-dealers. See Note G in Notes to Financial Statements.
1 The fund invests a portion of its cash reserves in equity markets through the use of index futures contracts. After giving effect to futures investments, the fund’s effective common stock and temporary cash investment positions represent 97.4% and 3.9%, respectively, of net assets. See Note E in Notes to Financial Statements.
| 2 | Affiliated money market fund available only to Vanguard funds and certain trusts and accounts managed by Vanguard. Rate shown is the 7-day yield. |
3 The issuer operates under a congressional charter; its securities are neither issued nor guaranteed by the U.S. government. If needed, access to additional funding from the U.S. Treasury (beyond the issuer’s line of credit) would require congressional action.
4 Securities with a value of $3,961,000 have been segregated as initial margin for open futures contracts.
5 See Note E in Notes to Financial Statements for the tax-basis components of net assets.
ADR—American Depositary Receipt.
GDR—Global Depositary Receipt.
24
Statement of Operations
| Year Ended |
| September 30, 2006 |
| ($000) |
Investment Income | |
Income | |
Dividends1 | 72,792 |
Interest2 | 7,026 |
Security Lending | 1,801 |
Total Income | 81,619 |
Expenses | |
Investment Advisory Fees—Note B | |
Basic Fee | 8,022 |
Performance Adjustment | 1,647 |
The Vanguard Group—Note C | |
Management and Administrative | 12,527 |
Marketing and Distribution | 682 |
Custodian Fees | 592 |
Auditing Fees | 34 |
Shareholders’ Reports | 103 |
Trustees’ Fees and Expenses | 4 |
Total Expenses | 23,611 |
Expenses Paid Indirectly—Note D | (104) |
Net Expenses | 23,507 |
Net Investment Income | 58,112 |
Realized Net Gain (Loss) | |
Investment Securities Sold | 182,853 |
Futures Contracts | 5,324 |
Foreign Currencies and Forward Currency Contracts | (1,236) |
Realized Net Gain (Loss) | 186,941 |
Change in Unrealized Appreciation (Depreciation) | |
Investment Securities | 205,938 |
Futures Contracts | (289) |
Foreign Currencies and Forward Currency Contracts | 112 |
Change in Unrealized Appreciation (Depreciation) | 205,761 |
Net Increase (Decrease) in Net Assets Resulting from Operations | 450,814 |
1 Dividends are net of foreign withholding taxes of $3,415,000.
2 Interest income from an affiliated company of the fund was $6,480,000.
25
Statement of Changes in Net Assets
| Year Ended September 30, |
| 2006 | 2005 |
| ($000) | ($000) |
Increase (Decrease) in Net Assets | | |
Operations | | |
Net Investment Income | 58,112 | 25,957 |
Realized Net Gain (Loss) | 186,941 | 55,890 |
Change in Unrealized Appreciation (Depreciation) | 205,761 | 265,299 |
Net Increase (Decrease) in Net Assets Resulting from Operations | 450,814 | 347,146 |
Distributions | | |
Net Investment Income | (31,222) | (13,896) |
Realized Capital Gain1 | (56,590) | (17,866) |
Total Distributions | (87,812) | (31,762) |
Capital Share Transactions—Note H | | |
Issued | 1,908,165 | 1,254,744 |
Issued in Lieu of Cash Distributions | 80,656 | 28,549 |
Redeemed | (462,226) | (261,895) |
Net Increase (Decrease) from Capital Share Transactions | 1,526,595 | 1,021,398 |
Total Increase (Decrease) | 1,889,597 | 1,336,782 |
Net Assets | | |
Beginning of Period | 2,301,840 | 965,058 |
End of Period2 | 4,191,437 | 2,301,840 |
1 Includes fiscal 2006 and 2005 short-term gain distributions totaling $20,164,000 and $8,933,000, respectively. Short-term gain distributions are treated as ordinary income dividends for tax purposes.
2 Including undistributed net investment income of $45,245,000 and $18,617,000.
26
Financial Highlights
| | | | | | |
| | | | | | |
| | | | | | |
| | Year | Nov. 1, | | | |
| | Ended | 2003, to | |
For a Share Outstanding | | Sept. 30, | Sept. 30, | Year Ended October 31, |
Throughout Each Period | 2006 | 2005 | 20041 | 2003 | 2002 | 2001 |
Net Asset Value, | | | | | | |
Beginning of Period | $19.72 | $16.08 | $14.46 | $10.48 | $11.31 | $13.71 |
Investment Operations | | | | | | |
Net Investment Income | .320 | .25 | .191 | .12 | .09 | .13 |
Net Realized and Unrealized | | | | | | |
Gain (Loss) on Investments | 2.595 | 3.87 | 1.624 | 3.96 | (.36) | (1.10) |
Total from | | | | | | |
Investment Operations | 2.915 | 4.12 | 1.815 | 4.08 | (.27) | (.97) |
Distributions | | | | | | |
Dividends from | | | | | | |
Net Investment Income | (.240) | (.21) | (.130) | (.08) | (.12) | (.26) |
Distributions from | | | | | | |
Realized Capital Gains | (.435) | (.27) | (.065) | (.02) | (.44) | (1.17) |
Total Distributions | (.675) | (.48) | (.195) | (.10) | (.56) | (1.43) |
Net Asset Value, | | | | | | |
End of Period | $21.96 | $19.72 | $16.08 | $14.46 | $10.48 | $11.31 |
| | | | | | |
Total Return2 | 15.22% | 25.99% | 12.64% | 39.25% | –2.78% | –7.72% |
| | | | | | |
Ratios/Supplemental Data | | | | | | |
Net Assets, | | | | | | |
End of Period (Millions) | $4,191 | $2,302 | $965 | $664 | $223 | $144 |
Ratio of Total Expenses to | | | | | | |
Average Net Assets3 | 0.72% | 0.80% | 0.90%* | 1.05% | 1.19% | 1.08% |
Ratio of Net Investment | | | | | | |
Income to Average | | | | | | |
Net Assets | 1.76% | 1.60% | 1.47%* | 1.14% | 0.86% | 1.10% |
Portfolio Turnover Rate | 88% | 83% | 19% | 13% | 14% | 27% |
1 The fund’s fiscal year-end changed from October 31 to September 30, effective September 30, 2004.
2 Total returns do not reflect the 1% fee assessed through April 6, 2001, on redemptions of shares held for less than five years.
3 Includes performance-based investment advisory fee increases (decreases) of 0.05%, 0.06%, 0.08%, 0.11%, 0.17%, and 0.13%.
* Annualized.
See accompanying Notes, which are an integral part of the Financial Statements.
27
Notes to Financial Statements
Vanguard Global Equity Fund is registered under the Investment Company Act of 1940 as an open-end investment company, or mutual fund. The fund invests in securities of foreign issuers, which may subject it to investment risks not normally associated with investing in securities of United States corporations. The fund files reports with the SEC under the company name Vanguard Horizon Funds.
A. The following significant accounting policies conform to generally accepted accounting principles for U.S. mutual funds. The fund consistently follows such policies in preparing its financial statements.
1. Security Valuation: Securities are valued as of the close of trading on the New York Stock Exchange (generally 4:00 p.m. Eastern time) on the valuation date. Equity securities are valued at the latest quoted sales prices or official closing prices taken from the primary market in which each security trades; such securities not traded on the valuation date are valued at the mean of the latest quoted bid and asked prices. Securities for which market quotations are not readily available, or whose values have been affected by events occurring before the fund’s pricing time but after the close of the securities’ primary markets, are valued at their fair values calculated according to procedures adopted by the board of trustees. These procedures include obtaining quotations from an independent pricing service, monitoring news to identify significant market- or security-specific events, and evaluating changes in the values of foreign market proxies (for example, ADRs, futures contracts, or exchange-traded funds), between the time the foreign markets close and the fund’s pricing time. When fair-value pricing is employed, the prices of securities used by a fund to calculate its net asset value may differ from quoted or published prices for the same securities. Investments in Vanguard Market Liquidity Fund are valued at that fund’s net asset value. Temporary cash investments acquired over 60 days to maturity are valued using the latest bid prices or using valuations based on a matrix system (which considers such factors as security prices, yields, maturities, and ratings), both as furnished by independent pricing services. Other temporary cash investments are valued at amortized cost, which approximates market value.
2. Foreign Currency: Securities and other assets and liabilities denominated in foreign currencies are translated into U.S. dollars at the exchange rates on the valuation date as employed by Morgan Stanley Capital International (MSCI) in the calculation of its indexes. As part of the fund’s fair-value procedures, exchange rates may be adjusted if they change significantly before the fund’s pricing time but after the time at which the MSCI rates are determined (generally 11:00 a.m. Eastern time).
Realized gains (losses) and unrealized appreciation (depreciation) on investment securities include the effects of changes in exchange rates since the securities were purchased, combined with the effects of changes in security prices. Fluctuations in the value of other assets and liabilities resulting from changes in exchange rates are recorded as unrealized foreign currency gains (losses) until the asset or liability is settled in cash, when they are recorded as realized foreign currency gains (losses).
3. Futures and Forward Currency Contracts: The fund uses index futures contracts to a limited extent, with the objective of maintaining full exposure to U.S., European, and Pacific stock markets while maintaining liquidity. The fund may purchase or sell futures contracts to achieve a desired level of investment, whether to accommodate portfolio turnover or cash flows from capital share transactions. The primary risks associated with the use of futures contracts are imperfect correlation between changes in market values of stocks held by the fund and the prices of futures contracts, and
the possibility of an illiquid market.
The fund also may enter into forward currency contracts to provide the appropriate currency exposure related to any open futures contracts, or to protect the value of securities and related receivables and payables against changes in foreign exchange rates. The primary risk associated with the fund’s use of these contracts is that a counterparty will fail to fulfill its obligation to pay gains due to the fund under the contracts.
28
Futures and forward currency contracts are valued at their quoted daily settlement prices. The aggregate principal amounts of the contracts are not recorded in the Statement of Net Assets. Fluctuations in the value of the contracts are recorded in the Statement of Net Assets as an asset (liability) and in the Statement of Operations as unrealized appreciation (depreciation) until the contracts are closed, when they are recorded as realized gains (losses) on futures or forward currency contracts.
4. Federal Income Taxes: The fund intends to continue to qualify as a regulated investment company and distribute all of its taxable income. Accordingly, no provision for federal income taxes is required in the financial statements.
5. Distributions: Distributions to shareholders are recorded on the ex-dividend date.
6. Security Lending: The fund may lend its securities to qualified institutional borrowers to earn additional income. Security loans are required to be secured at all times by collateral at least equal to the market value of securities loaned. The fund invests cash collateral received in Vanguard Market Liquidity Fund, and records a liability for the return of the collateral, during the period the securities are on loan. Security lending income represents the income earned on investing cash collateral, less expenses associated with the loan.
7. Other: Dividend income is recorded on the ex-dividend date. Interest income includes income distributions received from Vanguard Market Liquidity Fund and is accrued daily. Security transactions are accounted for on the date securities are bought or sold. Costs used to determine realized gains (losses) on the sale of investment securities are those of the specific securities sold.
B. Marathon Asset Management LLP, Acadian Asset Management, Inc., and beginning April 17, 2006, AllianceBernstein L.P. each provide investment advisory services to a portion of the fund for a fee calculated at an annual percentage rate of average net assets managed by the advisor. The basic fee of Marathon Asset Management LLP is subject to quarterly adjustments based on performance for the preceding three years relative to the Morgan Stanley Capital International All Country World Index. The basic fee of Acadian Asset Management, Inc. is subject to quarterly adjustments based on performance since December 31, 2004, relative to the Morgan Stanley Capital International All Country World Index. In accordance with the advisory contract entered into with AllianceBernstein L.P. in April 2006, beginning in April 2007 the investment advisory fee will be subject to quarterly adjustments based on performance since June 30, 2006, relative to the Morgan Stanley Capital International All Country World Index.
The Vanguard Group manages the cash reserves of the fund at an at-cost basis.
For the year ended September 30, 2006, the aggregate investment advisory fee represented an effective annual basic rate of 0.24% of the fund’s average net assets before an increase of $1,647,000 (0.05%) based on performance.
C. The Vanguard Group furnishes at cost corporate management, administrative, marketing, and distribution services. The costs of such services are allocated to the fund under methods approved by
the board of trustees. The fund has committed to provide up to 0.40% of its net assets in capital contributions to Vanguard. At September 30, 2006, the fund had contributed capital of $425,000 to Vanguard (included in Other Assets), representing 0.01% of the fund’s net assets and 0.43% of Vanguard’s capitalization. The fund’s trustees and officers are also directors and officers of Vanguard.
D. The fund has asked its investment advisors to direct certain security trades, subject to obtaining the best price and execution, to brokers who have agreed to rebate to the fund part of the commissions generated. Such rebates are used solely to reduce the fund’s management and administrative expenses. The fund’s custodian bank has also agreed to reduce its fees when the fund maintains cash on deposit
29
in the non-interest-bearing custody account. For the year ended September 30, 2006, these arrangements reduced the fund’s management and administrative expenses by $32,000 and custodian fees by $72,000.
E. Distributions are determined on a tax basis and may differ from net investment income and realized capital gains for financial reporting purposes. Differences may be permanent or temporary. Permanent differences are reclassified among capital accounts in the financial statements to reflect their tax character Temporary differences arise when certain items of income, expense, gain, or loss are recognized in different periods for financial statement and tax purposes; these differences will reverse at some time in the future. Differences in classification may also result from the treatment of short-term gains as ordinary income for tax purposes.
During the year ended September 30, 2006, the fund realized net foreign currency losses of $1,906,000, which decreased distributable net income for tax purposes; accordingly, such losses have been reclassified from accumulated net realized gains to undistributed net investment income. Certain of the fund’s investments are in securities considered to be “passive foreign investment companies,” for which any unrealized appreciation and/or realized gains are required to be included in distributable net income for tax purposes. During the year ended September 30, 2006, the fund realized gains on the sale of passive foreign investment companies of $4,778,000, which have been included in current and prior periods’ taxable income; accordingly, such gains have been reclassified from accumulated net realized gains to undistributed net investment income. Unrealized appreciation on passive foreign investment company holdings at September 30, 2006, was $6,155,000.
The fund used a tax accounting practice to treat a portion of the price of capital shares redeemed during the year as distributions from net investment income and realized capital gains. Accordingly, the fund has reclassified $3,134,000 from undistributed net investment income, and $9,400,000 from accumulated net realized gains, to paid-in capital.
For tax purposes, at September 30, 2006, the fund had $122,778,000 of ordinary income and $102,143,000 of long-term capital gains available for distribution.
At September 30, 2006, the cost of investment securities for tax purposes was $3,610,222,000. Net unrealized appreciation of investment securities for tax purposes was $634,392,000, consisting of unrealized gains of $700,883,000 on securities that had risen in value since their purchase and $66,491,000 in unrealized losses on securities that had fallen in value since their purchase.
At September 30, 2006, the aggregate settlement value of open futures contracts expiring in December 2006 and the related unrealized appreciation (depreciation) were:
| | | ($000) |
| Number | Aggregate | Unrealized |
| of Long | Settlement | Appreciation |
Futures Contracts | Contracts | Value | (Depreciation) |
S&P 500 Index | 72 | 24,217 | 494 |
Dow Jones EURO STOXX 50 Index | 302 | 14,990 | 361 |
Topix Index | 79 | 10,807 | (149) |
FTSE 100 Index | 85 | 9,524 | 59 |
S&P ASX 200 Index | 54 | 5,215 | 100 |
Unrealized appreciation (depreciation) on open S&P 500 Index futures contracts is required to be treated as realized gain (loss) for tax purposes.
30
At September 30, 2006, the fund had open forward currency contracts to receive and deliver currencies as follows:
| | | | | Unrealized |
| | | | | Appreciation |
| Contract Amount (000) | (Depreciation) |
Contract Settlement Date | | Receive | | Deliver | ($000) |
12/20/2006 | EUR | 11,533 | USD | 14,670 | (29) |
12/13/2006 | JPY | 1,293,400 | USD | 11,062 | (182) |
12/20/2006 | GBP | 5,057 | USD | 9,455 | (37) |
12/15/2006 | CHF | 9,000 | USD | 7,229 | 86 |
12/29/2006 | AUD | 6,803 | USD | 5,068 | (37) |
AUD—Australian dollar. | | | | | |
CHF—Swiss Franc. | | | | | |
EUR—Euro. | | | | | |
GBP—British pound. | | | | | |
JPY—Japanese yen. | | | | | |
USD—U.S. dollar. | | | | | |
Unrealized appreciation (depreciation) on open forward currency contracts is treated as realized gain (loss) for tax purposes.
The fund had net unrealized foreign currency losses of $91,000 resulting from the translation of other assets and liabilities at September 30, 2006.
F. During the year ended September 30, 2006, the fund purchased $4,186,640,000 of investment securities and sold $2,769,699,000 of investment securities, other than temporary cash investments.
G. The market value of securities on loan to broker-dealers at September 30, 2006, was $78,147,000, for which the fund received cash collateral of $81,911,000.
H. Capital shares issued and redeemed were:
| Year Ended September 30, |
| 2006 | 2005 |
| Shares | Shares |
| (000) | (000) |
Issued | 92,291 | 69,584 |
Issued in Lieu of Cash Distributions | 4,143 | 1,626 |
Redeemed | (22,344) | (14,502) |
Net Increase (Decrease) in Shares Outstanding | 74,090 | 56,708 |
I. In June 2006, the Financial Accounting Standards Board issued Interpretation No. 48 (“FIN 48”), “Accounting for Uncertainty in Income Taxes”. FIN 48 establishes the minimum threshold for recognizing, and a system for measuring, the benefits of tax-return positions in financial statements. FIN 48 will be effective for the fund’s fiscal year beginning October 1, 2007. Management is in the process of analyzing the fund’s tax positions for purposes of implementing FIN 48; based on the analysis completed to date, management does not believe the adoption of FIN 48 will result in any material impact to the fund’s financial statements.
31
Report of Independent Registered
Public Accounting Firm
To the Trustees of Vanguard Horizon Fund and the Shareholders of Vanguard Global Equity Fund:
In our opinion, the accompanying statement of net assets and the related statements of operations and of changes in net assets and the financial highlights present fairly, in all material respects, the financial position of Vanguard Global Equity Fund (the “Fund”) at September 30, 2006, the results of its operations for the year then ended, the changes in its net assets for each of the two years in the period then ended, and the financial highlights for each of the periods indicated, in conformity with accounting principles generally accepted in the United States of America. These financial statements and financial highlights (hereafter referred to as “financial statements”) are the responsibility of the Fund’s management; our responsibility is to express an opinion on these financial statements based on our audits. We conducted our audits of these financial statements in accordance with the standards of the Public Company Accounting Oversight Board (United States), which require that we plan and perform the audit to obtain reasonable assurance about whether the financial statements are free of material misstatement. An audit includes examining, on a test basis, evidence supporting the amounts and disclosures in the financial statements, assessing the accounting principles used and significant estimates made by management, and evaluating the overall financial statement presentation. We believe that our audits, which included confirmation of securities at September 30, 2006 by correspondence with the custodian and brokers, and by agreement to the underlying ownership records for Vanguard Market Liquidity Fund, provide a reasonable basis for our opinion.
PricewaterhouseCoopers LLP
Philadelphia, Pennsylvania
November 13, 2006
Special 2006 tax information (unaudited) for Vanguard Global Equity Fund
This information for the fiscal year ended September 30, 2006, is included pursuant to provisions of the Internal Revenue Code.
The fund distributed $42,150,000 as capital gain dividends (from net long-term capital gains) to shareholders during the fiscal year.
The fund distributed $27,613,000 of qualified dividend income to shareholders during the fiscal year.
For corporate shareholders, 13.2% of investment income (dividend income plus short-term gains, if any) qualifies for the dividends-received deduction.
The fund will pass through to shareholders foreign source income of $54,488,000 and foreign taxes paid of $3,350,000. The pass-through of foreign taxes paid will affect only shareholders on the dividend record date in December 2006. Shareholders will receive more detailed information along with their Form 1099-DIV in January 2007.
32
Your Fund’s After-Tax Returns
This table presents returns for your fund both before and after taxes. The after-tax returns are shown in two ways: (1) assuming that an investor owned the fund during the entire period and paid taxes on the fund’s distributions, and (2) assuming that an investor paid taxes on the fund’s distributions and sold all shares at the end of each period.
Calculations are based on the highest individual federal income tax and capital gains tax rates in effect at the times of the distributions and the hypothetical sales. State and local taxes were not considered. After-tax returns reflect any qualified dividend income, using actual prior-year figures and estimates for 2006. (In the example, returns after the sale of fund shares may be higher than those assuming no sale. This occurs when the sale would have produced a capital loss. The calculation assumes that the investor received a tax deduction for the loss.)
Please note that your actual after-tax returns will depend on your tax situation and may differ from those shown. Also note that if you own the fund in a tax-deferred account, such as an individual retirement account or a 401(k) plan, this information does not apply to you. Such accounts are not subject to current taxes.
Finally, keep in mind that a fund’s performance—whether before or after taxes—does not guarantee future results.
Average Annual Total Returns: Global Equity Fund | | | |
Periods Ended September 30, 2006 | | | |
| One | Five | Ten |
| Year | Years | Years |
Returns Before Taxes | 15.22% | 17.73% | 11.86% |
Returns After Taxes on Distributions | 14.43 | 17.10 | 10.51 |
Returns After Taxes on Distributions and Sale of Fund Shares | 10.33 | 15.36 | 9.73 |
33
About Your Fund’s Expenses
As a shareholder of the fund, you incur ongoing costs, which include costs for portfolio management, administrative services, and shareholder reports (like this one), among others. Operating expenses, which are deducted from a fund’s gross income, directly reduce the investment return of the fund.
A fund’s expenses are expressed as a percentage of its average net assets. This figure is known as the expense ratio. The following examples are intended to help you understand the ongoing costs (in dollars) of investing in your fund and to compare these costs with those of other mutual funds. The examples are based on an investment of $1,000 made at the beginning of the period shown and held for the entire period.
The table below illustrates your fund’s costs in two ways:
• Based on actual fund return. This section helps you to estimate the actual expenses that you paid over the period. The “Ending Account Value” shown is derived from the fund’s actual return, and the third column shows the dollar amount that would have been paid by an investor who started with $1,000 in the fund. You may use the information here, together with the amount you invested, to estimate the expenses that you paid over the period.
To do so, simply divide your account value by $1,000 (for example, an $8,600 account value divided by $1,000 = 8.6), then multiply the result by the number given for your fund under the heading “Expenses Paid During Period.”
• Based on hypothetical 5% yearly return. This section is intended to help you compare your fund’s costs with those of other mutual funds. It assumes that the fund had a yearly return of 5% before expenses, but that the expense ratio is unchanged. In this case—because the return used is not the fund’s actual return—the results do not apply to your investment. The example is useful in making comparisons because the Securities and Exchange Commission requires all mutual funds to calculate expenses based on a 5% return. You can assess your fund’s costs by comparing this hypothetical example with the hypothetical examples that appear in shareholder reports of other funds.
Six Months Ended September 30, 2006 |
| Beginning | Ending | Expenses |
| Account Value | Account Value | Paid During |
Global Equity Fund | 3/31/2006 | 9/30/2006 | Period1 |
Based on Actual Fund Return | $1,000.00 | $1,036.83 | $3.57 |
Based on Hypothetical 5% Yearly Return | 1,000.00 | 1,021.56 | 3.55 |
| 1 | The calculations are based on expenses incurred in the most recent six-month period. The fund’s annualized six-month expense ratio for that period is 0.70%. The dollar amounts shown as “Expenses Paid” are equal to the annualized expense ratio multiplied by the average account value over the period, multiplied by the number of days in the most recent six-month period, then divided by the number of days in the most recent 12-month period. |
34
Note that the expenses shown in the table on page 34 are meant to highlight and help you compare ongoing costs only and do not reflect any transactional costs or account maintenance fees. They do not include your fund’s low-balance fee, which is described in the prospectus. If this fee were applied to your account, your costs would be higher. Your fund does not charge transaction fees, such as purchase or redemption fees, nor does it carry a “sales load.”
The calculations assume no shares were bought or sold during the period. Your actual costs may have been higher or lower, depending on the amount of your investment and the timing of any purchases or redemptions.
You can find more information about the fund’s expenses, including annual expense ratios for the past five years, in the Financial Statements section of this report. For additional information on operating expenses and other shareholder costs, please refer to the appropriate fund prospectus.
35
Trustees Approve Advisory Agreements
The board of trustees of Vanguard Global Equity Fund has renewed the fund’s investment advisory agreements with Marathon Asset Management LLP and Acadian Asset Management, Inc. The board determined that the retention of the advisors was in the best interests of the fund and its shareholders.
(The board had previously acted to approve the fund’s agreement with its other investment advisor, AllianceBernstein L.P. A report on that approval was included in the fund’s semiannual report to shareholders dated March 31, 2006.)
The board decided to renew the agreements with Marathon and Acadian based upon an evaluation of each firm’s investment staff, portfolio management process, and performance. The trustees considered the factors discussed below, among others. However, no single factor determined whether the board approved the agreements. Rather, it was the totality of the circumstances that drove the board’s decision.
Nature, extent, and quality of services
The board considered the quality of the fund’s investment management over both short- and long-term periods and took into account the organizational depth and stability of each firm. The board noted the following:
• Marathon Asset Management LLP. Founded in 1986, Marathon Asset Management of London, England, has advised the Global Equity Fund since the fund’s inception in 1995. Marathon continues to use a bottom-up approach that focuses on stock selection. Its three regional teams focus on each company’s corporate strategy and industry competition, while sector analysis is conducted using long-term capital cycle data. Each of these teams is led by one of the firm’s three founders: Jeremy J. Hosking, William J. Arah, and Neil M. Ostrer.
• Acadian Asset Management, Inc. Founded in 1986, Acadian Asset Management is a Boston-based investment management firm specializing in quantitative equity strategies for developed and emerging markets. The firm has advised the Global Equity Fund since 2004. Acadian’s investment process builds portfolios from the bottom up using proprietary valuation models. The investment team includes the three portfolio managers, John R. Chisholm, Ronald D. Frashure, and Brian K. Wolahan. All are involved in the firm’s ongoing research.
The board concluded that each advisor’s experience, stability, depth, and performance, among other factors, warranted continuation of the advisory agreements.
Investment performance
The board considered the short- and long-term performance of the fund, including any periods of outperformance or underperformance of a relevant benchmark and peer group. Each advisor has carried out its investment strategy in disciplined fashion, and the results have been in line with expectations. Information about the fund’s performance, including some of the data considered by the board, can be found in the Performance Summary section of this report.
36
Cost
The board concluded that the fund’s expense ratio was far below the average expense ratio charged by funds in its peer group. The board noted that the fund’s advisory fees were also well below the peer-group average. Information about the fund’s expense ratio appears in the About Your Fund’s Expenses section of this report as well as in the Financial Statements section, which also includes information about the advisory fee rates. The board did not consider profitability of the advisors in determining whether to approve the advisory fees, because both Marathon and Acadian are independent of Vanguard, and the advisory fees are the result of arm’s-length negotiations.
The benefit of economies of scale
The board concluded that the fund’s shareholders benefit from economies of scale because of breakpoints in the fund’s advisory fee schedules. The breakpoints reduce the effective rate of the fees as the fund’s assets managed by Marathon and Acadian increase.
The board also approved a change to the process for the quarterly calculation of Marathon’s and Acadian’s asset-based advisory fees. The calculation now will be based on the average daily net assets of the fund rather than on the average month-end net assets.
The advisory agreements will continue for one year and are renewable by the fund’s board after that for successive one-year periods.
37
Glossary
Beta. A measure of the magnitude of a fund’s past share-price fluctuations in relation to the ups and downs of a given market index. The index is assigned a beta of 1.00. Compared with a given index, a fund with a beta of 1.20 typically would have seen its share price rise or fall by 12% when the index rose or fell by 10%. A fund’s beta should be reviewed in conjunction with its R-squared (see definition below). The lower the R-squared, the less correlation there is between the fund and the index, and the less reliable beta is as an indicator of volatility.
Expense Ratio. The percentage of a fund’s average net assets used to pay its annual administrative and advisory expenses. These expenses directly reduce returns to investors.
R-Squared. A measure of how much of a fund’s past returns can be explained by the returns from the market in general, as measured by a given index. If a fund’s total returns were precisely synchronized with an index’s returns, its R-squared would be 1.00. If the fund’s returns bore no relationship to the index’s returns, its R-squared would be 0.
Short-Term Reserves. The percentage of a fund invested in highly liquid, short-term securities that can be readily converted to cash.
Turnover Rate. An indication of the fund’s trading activity. Funds with high turnover rates incur higher transaction costs and may be more likely to distribute capital gains (which may be taxable to investors). The turnover rate excludes in-kind transactions, which have minimal impact on costs.
38
This page intentionally left blank.
The People Who Govern Your Fund
The trustees of your mutual fund are there to see that the fund is operated and managed in your best interests since, as a shareholder, you are a part owner of the fund. Your fund's trustees also serve on the board of directors of The Vanguard Group, Inc., which is owned by the Vanguard funds and provides services to them on an at-cost basis.
A majority of Vanguard’s board members are independent, meaning that they have no affiliation with Vanguard or the funds they oversee, apart from the sizable personal investments they have made as private individuals.
Our independent board members bring distinguished backgrounds in business, academia, and public service to their task of working with Vanguard officers to establish the policies and oversee the activities of the funds. Among board members’ responsibilities are selecting investment advisors for the funds; monitoring fund operations, performance, and costs; reviewing contracts; nominating and selecting new trustees/directors; and electing Vanguard officers.
Each trustee serves a fund until its termination; or until the trustee’s retirement, resignation, or death; or otherwise as specified in the fund’s organizational documents. Any trustee may be removed at a shareholders’ meeting by a vote representing two-thirds of the net asset value of all shares of the fund together with shares of other Vanguard funds organized within the same trust. The table on these two pages shows information for each trustee and executive officer of the fund. The mailing address of the trustees and officers is P.O. Box 876, Valley Forge, PA 19482.
Chairman of the Board, Chief Executive Officer, and Trustee |
| |
John J. Brennan1 | |
Born 1954 | Principal Occupation(s) During the Past Five Years: Chairman of |
Trustee since May 1987; | the Board, Chief Executive Officer, and Director/Trustee of The |
Chairman of the Board and | Vanguard Group, Inc., and of each of the investment companies |
Chief Executive Officer | served by The Vanguard Group. |
142 Vanguard Funds Overseen | |
| |
Independent Trustees | |
| |
Charles D. Ellis | |
Born 1937 | Principal Occupation(s) During the Past Five Years: Applecore |
Trustee since January 2001 | Partners (pro bono ventures in education); Senior Advisor to |
142 Vanguard Funds Overseen | Greenwich Associates (international business strategy |
| consulting); Successor Trustee of Yale University; Overseer |
| of the Stern School of Business at New York University; |
| Trustee of the Whitehead Institute for Biomedical Research. |
| |
Rajiv L. Gupta | |
Born 1945 | Principal Occupation(s) During the Past Five Years: Chairman |
Trustee since December 20012 | and Chief Executive Officer of Rohm and Haas Co. (chemicals); |
142 Vanguard Funds Overseen | Board Member of the American Chemistry Council; |
| Director of Tyco International, Ltd. (diversified manufac- |
| turing and services) since 2005; Trustee of Drexel |
| University and of the Chemical Heritage Foundation. |
| |
Amy Gutmann | |
Born 1949 | Principal Occupation(s) During the Past Five Years: President of the |
Trustee since July 2006 | University of Pennsylvania since 2004; Professor in the School of Arts |
142 Vanguard Funds Overseen | and Sciences, Annenberg School for Communication, and Graduate |
| School of Education of the University of Pennsylvania since 2004; |
| Provost (2001-2004) and Laurance S. Rockefeller Professor of |
| Politics and the University Center for Human Values (1990-2004), |
| Princeton University; Director of Carnegie Corporation of New |
| York since 2005 and of Schuylkill River Development Corporation |
| and Greater Philadelphia Chamber of Commerce since 2004. |
JoAnn Heffernan Heisen | |
Born 1950 | Principal Occupation(s) During the Past Five Years: Corporate |
Trustee since July 1998 | Vice President and Chief Global Diversity Officer since 2006 |
142 Vanguard Funds Overseen | Vice President and Chief Information Officer (1997–2005), |
| and Member of the Executive Committee of Johnson & Johnson |
| (pharmaceuticals/consumer products); Director of the University |
| Medical Center at Princeton and Women’s Research and |
| Education Institute. |
| |
André F. Perold | |
Born 1952 | Principal Occupation(s) During the Past Five Years: |
Trustee since December 2004 | George Gund Professor of Finance and Banking, Harvard Business |
142 Vanguard Funds Overseen | School since 2000; Senior Associate Dean, Director of Faculty |
| Recruiting, and Chair of Finance Faculty, Harvard Business |
| School; Director and Chairman of UNX, Inc. (equities trading firm) |
| since 2003; Director of registered investment companies advised by |
| Merrill Lynch Investment Managers and affiliates (1985-2004), Genbel |
| Securities Limited (South African financial services firm) (1999-2003), |
| Gensec Bank (1999-2003), Sanlam, Ltd. (South African insurance company) |
| (2001-2003), and Stockback, Inc. (credit card firm) (2000-2002). |
| |
Alfred M. Rankin, Jr. | |
Born 1941 | Principal Occupation(s) During the Past Five Years: |
Trustee since January 1993 | Chairman, President, Chief Executive Officer, and Director of NACCO |
142 Vanguard Funds Overseen | Industries, Inc.(forklift trucks/housewares/lignite); Director of |
| Goodrich Corporation (industrialproducts/aircraft systems and services). |
| |
J. Lawrence Wilson | |
Born 1936 | Principal Occupation(s) During the Past Five Years: |
Trustee since April 1985 | Retired Chairman and Chief Executive Officer of Rohm and Haas Co. |
142 Vanguard Funds Overseen | (chemicals);Director of Cummins Inc. (diesel engines), MeadWestvaco |
| Corp. (packing products),and AmerisourceBergen Corp. (pharmaceutical |
| distribution); Trustee of Vanderbilt University and of Culver |
| Educational Foundation. |
| |
Executive Officers 1 | |
| |
Heidi Stam | |
Born 1956 | Principal Occupation(s) During the Past Five Years: |
Trustee since July 2005 | Managing Director since July 2006, General Counsel since July 2005, and |
142 Vanguard Funds Overseen | Secretary of Vanguard and of each of the investment companies served |
| by The Vanguard Group since July 2005; Principal of The Vanguard Group, Inc. |
| (1997-2006). |
| |
Thomas J. Higgins | |
Born 1957 | Principal Occupation(s) During the Past Five Years: |
Trustee since July 1998 | Principal of the Vanguard Group, Inc.; Treasurer of each of the investment |
142 Vanguard Funds Overseen | companies served by the Vanguard Group. |
| |
| |
| Vanguard Senior Management Team |
|---|
| | |
|---|
| R. Gregory Barton | Kathleen C. Gubanich | Michael S. Miller |
| Mortimer J. Buckley | Paul A. Heller | Ralph K. Packard |
| James H. Gately | F. William McNabb, III | George U. Sauter |
|
| Founder |
|---|
| | |
|---|
| John C. Bogle |
|
| Chairman and Chief Executive Officer, 1974-1996 |
1 Officers of the funds are “interested persons” as defined in the Investment Company Act of 1940.
2 December 2002 for Vanguard Equity Income Fund, Vanguard Growth Equity Fund, the Vanguard Municipal Bond Funds, and the Vanguard State Tax-Exempt Funds.
More information about the trustees is in the Statement of Additional Information, available from The Vanguard Group.
|
|
| P.O. Box 2600 Valley Forge, PA 19482-2600 |
Connect with Vanguard™ > www.vanguard.com
| |
|---|
| Fund Information > 800-662-7447 | Vanguard, Connect with Vanguard, |
| | and the ship logo are trademarks of The Vanguard Group, Inc. |
| Direct Investor Account Services > 800-662-2739 | |
| | All other marks are the exclusive property of their |
| Institutional Investor Services > 800-523-1036 | respective owners. |
| | |
| Text Telephone > 800-952-3335 | All comparative mutual fund data are from Lipper Inc. |
| | or Morningstar, Inc., unless otherwise noted. |
| | |
| | |
| | |
| | |
| | You can obtain a free copy of Vanguard’s proxy voting |
| This material may be used in conjunction | guidelines by visiting our website, www.vanguard.com, |
| with the offering of shares of any Vanguard | and searching for “proxy voting guidelines,” or by calling |
| fund only if preceded or accompanied by | Vanguard at 800-662-2739. They are also available from |
| the fund’s current prospectus. | the SEC’s website, www.sec.gov. In addition, you may |
| | obtain a free report on how your fund voted the proxies for |
| | securities it owned during the 12 months ended June 30. |
| | To get the report, visit either www.vanguard.com |
| | or www.sec.gov. |
| | |
| | You can review and copy information about your fund |
| | at the SEC’s Public Reference Room in Washington, D.C. |
| | To find out more about this public service, call the SEC |
| | at 202-551-8090. Information about your fund is also |
| | available on the SEC’s website, and you can receive |
| | copies of this information, for a fee, by sending a |
| | request in either of two ways: via e-mail addressed to |
| | publicinfo@sec.gov or via regular mail addressed to the |
| | Public Reference Section, Securities and Exchange |
| | Commission, Washington, DC 20549-0102. |
| | |
| | |
| | |
| | |
| | © 2006 The Vanguard Group, Inc. |
| | All rights reserved. |
| | Vanguard Marketing Corporation, Distributor. |
| | |
| | Q1290 112006 |
Vanguard® Strategic Small-Cap |
Equity Fund | |
| |
| |
> Annual Report | |
| |
| |
| |
| |
| |
September 30, 2006 | |
| |
| |
| |
| 
|
| |
| |
| |
| |
| |
| |
> | In a tough market for smaller stocks, Vanguard Strategic Small-Cap Equity Fund declined –4.8% in an abbreviated fiscal period from April 24, 2006, through September 30. The fund outperformed its benchmark index and the peer group’s average return. |
> | Good stock selection in the health care, consumer discretionary, and financials sectors made strong relative contributions to the fund’s return. |
> | Weaker stock selections included companies in the materials and industrials sectors. |
Contents | |
| |
Your Fund’s Total Returns | 1 |
Chairman’s Letter | 2 |
Advisor’s Report | 6 |
Fund Profile | 8 |
Performance Summary | 9 |
Financial Statements | 10 |
Glossary | 23 |
Please note: The opinions expressed in this report are just that—informed opinions. They should not be considered promises or advice. Also, please keep in mind that the information and opinions cover the period through the date on the cover of this report. Of course, the risks of investing in your fund are spelled out in the prospectus.
Your Fund’s Total Returns
April 24, 2006,1 Through September 30, 2006 | |
| Total |
| Return |
Vanguard Strategic Small-Cap Equity Fund | –4.8% |
MSCI US Small Cap 1750 Index | –5.1 |
Average Small-Cap Core Fund2 | –5.9 |
Dow Jones Wilshire 5000 Index | 1.3 |
Your Fund’s Performance at a Glance |
April 24, 20061–September 30, 2006 | | | | |
| | | Distributions Per Share |
| Starting | Ending | Income | Capital |
| Share Price | Share Price | Dividends | Gains |
Vanguard Strategic Small-Cap Equity Fund | $20.01 | $19.04 | $0.00 | $0.00 |
1 | From April 20, 2006, until April 24, 2006, the fund conducted a subscription period during which its assets were held in money market instruments. Returns are measured from April 24, when the fund began to follow its investment strategy. |
2 | Derived from data provided by Lipper Inc. |
1

Chairman’s Letter
Dear Shareholder,
Welcome to our first progress report for Vanguard Strategic Small-Cap Equity Fund, which began executing its strategy on April 24, 2006. In a generally tough environment for smaller stocks, the fund returned –4.8% for the five-plus months through September 30. This result was somewhat better than the return of the Morgan Stanley Capital International (MSCI) US Small Cap 1750 Index and of the average return of the fund’s peers. It’s worth noting, of course, that this abbreviated period reveals little about the merits of the fund’s long-term investment strategy.
Stocks endured some rough going, then recovered to post strong results
The stock market advanced through the first part of the fund’s fiscal year, then hit a speed bump in May, as investors feared that the economy was growing too rapidly. But a slowdown in the housing market, coupled with a late-summer decline in oil prices, helped to allay inflation concerns.
The broad market rebounded to post a solid 10.5% return for the 12-month period. Value-oriented stocks outperformed growth stocks, and large-capitalization stocks edged out small-caps, one of the market’s best-performing segments in recent years. (Please note: This discussion of the market environment encompasses the full 12 months of the fund’s fiscal year. The fund began operations a bit after the year’s halfway point.)
2
International stocks handily outpaced domestic issues, continuing a multiyear trend. European and emerging market stocks fared particularly well. Stocks in the Pacific region also performed admirably, even though Japanese stocks did not fully participate in the global market’s summer recovery.
In the bond market, prices rallied as the Fed paused
At its August and September meetings, the Federal Reserve Board twice voted to maintain the federal funds rate at 5.25%, marking a pause in the central bank’s two-year inflation-fighting campaign. With investor sentiment buoyed by the Fed’s near-term inflation outlook, interest rates decreased, driving bond prices higher. The broad taxable bond market finished the period with a 3.7% return, and municipal bonds performed slightly better.
Although rates decreased along the entire maturity spectrum in later summer, the difference between the yields of the shortest- and longest-term issues remained narrow by historical standards. At the end of September, the U.S. Treasury yield curve was actually inverted, meaning that short-term issues such as 3-month and 6-month Treasury notes offered higher yields than those with longer maturities.
Relative success in a challenging environment
The Strategic Small-Cap Equity Fund’s advisor, Vanguard Quantitative Equity Group, seeks to construct a portfolio
Market Barometer | | | |
| | Average Annual Total Returns |
| | Periods Ended September 30, 2006 |
| One Year | Three Years | Five Years |
Stocks | | | |
Russell 1000 Index (Large-caps) | 10.2% | 12.8% | 7.6% |
Russell 2000 Index (Small-caps) | 9.9 | 15.5 | 13.8 |
Dow Jones Wilshire 5000 Index (Entire market) | 10.5 | 13.3 | 8.6 |
MSCI All Country World Index ex USA (International) | 19.4 | 23.9 | 16.4 |
| | | |
| | | |
Bonds | | | |
Lehman Aggregate Bond Index (Broad taxable market) | 3.7% | 3.4% | 4.8% |
Lehman Municipal Bond Index | 4.5 | 4.4 | 5.2 |
Citigroup 3-Month Treasury Bill Index | 4.4 | 2.6 | 2.2 |
| | | |
| | | |
CPI | | | |
Consumer Price Index | 2.1% | 3.1% | 2.6% |
3
whose characteristics—stock size, investment style (value or growth), sector allocation, and risk profile—closely match those of the MSCI US Small Cap 1750 Index. Using a series of computer-driven models, the advisor selects portfolio holdings that it believes have the potential to outperform the index. In the short time since the fund’s inception, and in a challenging atmosphere for small-cap investing, the fund surpassed its benchmark by a small margin. Although it’s hard to be pleased with a negative return, the fund clearly met its goal of producing superior relative performance.
The advisor found some opportunities to add value versus the benchmark—particularly in the health care, consumer discretionary, and financials sectors. It did this by underweighting or altogether avoiding some of the benchmark’s poorly performing constituents. In health care, the fund’s biotechnology stocks suffered losses, but the advisor’s aversion to speculative, highly valued stocks resulted in more moderately valued holdings whose losses were roughly half the magnitude of those in the index sector. Returns of the fund’s health care facilities and managed-care holdings also surpassed those of the index sector. Among consumer discretionary stocks, the fund’s holdings bested those of the index sector because the advisor avoided exposure to several poorly performing restaurant and apparel-maker index constituents. In financials—the fund’s largest sector—good stock picks among commercial banks, consumer finance businesses, and insurance companies provided a strong contribution to return.
Total Returns | | |
April 24, 2006,1 Through September 30, 2006 | | |
| Since | Final Value of a $10,000 |
| Inception1 | Initial Investment |
Strategic Small-Cap Equity Fund | –4.8% | $9,515 |
MSCI US Small Cap 1750 Index | –5.1 | 9,486 |
Average Small-Cap Core Fund | –5.9 | 9,410 |
Dow Jones Wilshire 5000 Index | 1.3 | 10,135 |
| 1 | From April 20, 2006, until April 24, 2006, the fund conducted a subscription period during which its assets were held in money market instruments. Returns are measured from April 24, when the fund began to follow its investment strategy. |
4
At the same time, the advisor’s assessment of the prospects for some of its stock choices proved a bit more positive than the market’s sentiment. Sources of weakness included some miscues and missed opportunities in the materials and industrials sectors. In materials, the advisor held some chemical and construction materials companies that failed to meet its expectations. And in industrials, some holdings among building products and trucking businesses posted poor returns.
To form a more complete assessment of the fund’s strategy, we will need to evaluate it over longer time periods. In its early months, the fund has performed in line with expectations, outpacing its benchmark with superior stock selection. This achievement would be easier to celebrate during a period of positive returns, of course, but the early results are encouraging.
We are optimistic that a talented advisory team and low costs will help the fund in its quest to provide superior long-term results. Vanguard Quantitative Equity Group, which has managed Vanguard Strategic Equity Fund, your fund’s mid-cap sibling, for more than 11 years, applies essentially the same earnings- and valuation-driven strategies to run both funds. In the process, the Strategic Small-Cap Equity Fund’s very low costs help investors maximize their share of the fund’s returns.
Don’t let short-term performance cloud your long-term view
The short-term results of the latest “hot” mutual fund can divert some investors’ attention from the discipline and focus of long-term investing. For those investors, the lure of powerful short-term performance assumes priority over longer-term results.
At Vanguard, we counsel investors to discount short-term performance and, instead, to thoughtfully evaluate a fund’s long-term role within their portfolio. Is the fund a core holding or does it play a smaller role? Crucial to long-term investing is a well-thought-out, diversified portfolio of stock, bond, and money market funds tailored to meet your personal goals. Once you have completed this “advance” work, we suggest that you stay the course through the market’s ups and downs, resisting the short-term urge to tinker.
As a part of the stock component of a balanced, diversified investment plan, the Strategic Small-Cap Equity Fund can play an important role in helping you to reach your long-term financial goals. Thank you for your confidence in Vanguard.
Sincerely,

John J. Brennan
Chairman and Chief Executive Officer
October 18, 2006
5
Advisor’s Report
The Strategic Small-Cap Equity Fund began operations in April and returned –4.8% during an abbreviated fiscal period through September 30. We are pleased to have the opportunity to report our results to you.
During the five-plus months of the fund’s fiscal period, small-capitalization stocks, which had outperformed large-caps for several years, came under pressure because of uncertainties surrounding U.S. economic growth, inflation risk, and the direction of interest rates. Although registering disappointing performance in absolute terms, the fund outperformed its benchmark, the MSCI US Small Cap 1750 Index, by 0.3 percentage point for the period.
Our investment management process combines three stock-ranking models (valuation, marketplace sentiment, and earnings prospects) to determine attractive investment opportunities among companies of similar size and business characteristics. Over the long term, we expect all three models to generate positive and consistent excess returns while providing diversification within our stock-ranking strategy. Our long-term experience has given us confidence in this regard. However, over shorter time periods, the models can vary in their effectiveness. In the months since the fund’s inception, for example, our valuation model performed quite well, while both the sentiment and earnings-growth models were ineffective.
This variance in model contribution is normal within a quantitative framework. Our process seeks to add value in two ways: by purchasing stocks that outperform the market and by avoiding stocks that underperform the market. For this partial fiscal year, the companies our model identified as stocks that were likely to underperform—and which we subsequently underweighted—made much stronger contributions to our relative performance than did the higher-ranked stocks we purchased.
Because we maintain sector weightings that are essentially the same as those in the benchmark index, our results are driven by our success (or lack thereof) in choosing the better-performing stocks in each group. During this period, strong stock selection within the health care, consumer discretionary, and financials sectors boosted our results. However, the results were offset by less successful picks in the materials and industrials sectors.
For example, overweight positions in Palomar Medical Technologies (+17% since the fund’s inception), Illumina (+8%), and VCA Antech (+31%) led our health care picks. Select consumer stocks, including Movado Group (+30%), were strong contributors, and First Marblehead (+63%) and Harleysville Group (+21%) were successful picks in the financials sector. On the other hand, materials companies Eagle Materials (–52%), Quanex (–33%), and Reliance
6
Steel & Aluminum (–31%) performed poorly and detracted from overall relative performance. Industrial companies Builders FirstSource (–36%) and Simpson Manufacturing (–38%) were also overweighted and muted our relative results.
We continue to believe that the best way to deliver consistent investment results is through a quantitative assessment of fundamental stock factors coupled with a disciplined risk-control framework that neutralizes those market and company factors that we do not believe can add value over long-term investment horizons. We are also confident that the fund offers an attractive mix of stocks with high earnings quality, market acceptance, and reasonable valuations. We thank you for your trust in our group and its investment process.
James P. Stetler, Principal and
Portfolio Manager
Joel M. Dickson, Principal
Vanguard Quantitative Equity Group
October 23, 2006
7
Fund Profile
As of September 30, 2006
Portfolio Characteristics | | |
| | Comparative | Broad |
| Fund | Index1 | Index2 |
Number of Stocks | 449 | 1,725 | 4,974 |
Median Market Cap | $1.6B | $1.6B | $27.5B |
Price/Earnings Ratio | 17.0x | 22.5x | 17.2x |
Price/Book Ratio | 2.3x | 2.3x | 3.7x |
Yield | 1.0% | 1.3% | 1.7% |
Return on Equity | 11.0% | 11.4% | 15.4% |
Earnings Growth Rate | 13.3% | 14.1% | 15.7% |
Foreign Holdings | 0.4% | 0.0% | 1.1% |
Turnover Rate | 35% | — | — |
Expense Ratio | 0.40%3 | — | — |
Short-Term Reserves | 0% | — | — |
Sector Diversification (% of portfolio) | |
| | Comparative | Broad |
| Fund | Index1 | Index2 |
Consumer Discretionary | 15% | 15% | 12% |
Consumer Staples | 3 | 3 | 9 |
Energy | 7 | 7 | 9 |
Financials | 23 | 22 | 23 |
Health Care | 10 | 10 | 12 |
Industrials | 15 | 16 | 11 |
Information Technology | 15 | 15 | 15 |
Materials | 6 | 6 | 3 |
Telecommunication | | | |
Services | 1 | 1 | 3 |
Utilities | 5 | 5 | 3 |
Ten Largest Holdings4 (% of total net assets) |
| | |
Harsco Corp. | industrial machinery | 0.4% |
AnnTaylor Stores Corp. | apparel retail | 0.4 |
The Manitowoc Co., Inc. | construction and | |
| farm machinery and | |
| heavy trucks | 0.4 |
OGE Energy Corp. | multi-utilities | 0.4 |
VCA Antech, Inc. | health care facilities | 0.4 |
Atmel Corp. | semiconductors | 0.4 |
Convergys Corp. | data processing and | |
| outsourced services | 0.4 |
Service Corp. International | specialized | |
| consumer services | 0.4 |
IndyMac Bancorp, Inc. | thrifts and | |
| mortgage finance | 0.4 |
Phillips-Van Heusen Corp. | apparel accessories | |
| and luxury goods | 0.4 |
Top Ten | | 4.0% |
Investment Focus

| 1 | MSCI US Small Cap 1750 Index. |
| 2 | Dow Jones Wilshire 5000 Index. |
| 4 | “Ten Largest Holdings” excludes any temporary cash investments and equity index products. See page 23 for a glossary of investment terms. |
8
Performance Summary
All of the returns in this report represent past performance, which is not a guarantee of future results that may be achieved by the fund. (Current performance may be lower or higher than the performance data cited. For performance data current to the most recent month-end, visit our website at www.vanguard.com.) Note, too, that both investment returns and principal value can fluctuate widely, so an investor’s shares, when sold, could be worth more or less than their original cost. The returns shown do not reflect taxes that a shareholder would pay on fund distributions or on the sale of fund shares.
Cumulative Performance: April 24, 2006–September 30, 2006
Initial Investment of $10,000
| | Final Value |
| Total Returns | of a $10,000 |
| Since Inception1 | Investment |
Strategic Small-Cap Equity Fund | –4.85% | $9,515 |
Dow Jones Wilshire 5000 Index | 1.35 | 10,135 |
MSCI US Small Cap 1750 Index | –5.14 | 9,486 |
Average Small-Cap Core Fund2 | –5.90 | 9,410 |
Total Returns (%): April 24, 2006–September 30, 2006

1 | From April 20, 2006, until April 24, 2006, the fund conducted a subscription period during which its assets were held in money market instruments. Returns are measured from April 24, when the fund began to follow its investment strategy. |
2 | Derived from data provided by Lipper Inc. |
Note: See Financial Highlights table on page 18 for dividend and capital gains information.
9
Financial Statements
Statement of Net Assets
As of September 30, 2006
The fund provides a complete list of its holdings four times in each fiscal year, at the quarter-ends. For the second and fourth fiscal quarters, the lists appear in the fund’s semiannual and annual reports to shareholders. For the first and third fiscal quarters, the fund files the lists with the Securities and Exchange Commission on Form N-Q. Shareholders can look up the fund’s Forms N-Q on the SEC’s website at www.sec.gov. Forms N-Q may also be reviewed and copied at the SEC’s Public Reference Room (see the back cover of this report for further information).
| | | Market |
| | | Value• |
| | Shares | ($000) |
Common Stocks (100.0%) | | |
Consumer Discretionary (14.6%) | | |
* | AnnTaylor Stores Corp. | 18,845 | 789 |
| Service Corp. International | 82,490 | 770 |
| Phillips-Van Heusen Corp. | 18,300 | 764 |
| Barnes & Noble, Inc. | 18,900 | 717 |
| Ruby Tuesday, Inc. | 24,998 | 705 |
* | Jack in the Box Inc. | 13,000 | 678 |
| CBRL Group, Inc. | 16,443 | 665 |
| Dillard’s Inc. | 19,533 | 639 |
| Men’s Wearhouse, Inc. | 17,155 | 638 |
| Bob Evans Farms, Inc. | 20,987 | 636 |
* | Payless ShoeSource, Inc. | 25,003 | 623 |
* | The Dress Barn, Inc. | 27,692 | 604 |
| Harte-Hanks, Inc. | 22,846 | 602 |
| Steven Madden, Ltd. | 15,295 | 600 |
| Group 1 Automotive, Inc. | 11,989 | 598 |
* | Laureate Education Inc. | 12,453 | 596 |
| Domino’s Pizza, Inc. | 23,012 | 590 |
* | Papa John’s International, Inc. | 16,115 | 582 |
| K-Swiss, Inc. | 19,005 | 571 |
* | Select Comfort Corp. | 26,069 | 570 |
* | The Pantry, Inc. | 10,114 | 570 |
| ArvinMeritor, Inc. | 40,000 | 570 |
| Ethan Allen Interiors, Inc. | 16,328 | 566 |
| Movado Group, Inc. | 22,003 | 559 |
| United Auto Group, Inc. | 23,900 | 559 |
* | Charming Shoppes, Inc. | 38,950 | 556 |
* | TRW Automotive | | |
| Holdings Corp. | 22,510 | 542 |
| Meredith Corp. | 10,900 | 538 |
| Jackson Hewitt Tax | | |
| Service Inc. | 17,752 | 533 |
| Furniture Brands | | |
| International Inc. | 27,652 | 527 |
| Brown Shoe Co., Inc. | 14,570 | 522 |
* | Spanish Broadcasting | | |
| System, Inc. | 114,465 | 500 |
* | Cox Radio, Inc. | 31,806 | 488 |
| Saks Inc. | 27,661 | 478 |
| Dover Downs Gaming & | | |
| Entertainment, Inc. | 39,328 | 478 |
* | Skechers U.S.A., Inc. | 20,218 | 475 |
| Asbury Automotive | | |
| Group, Inc. | 19,157 | 395 |
| Claire’s Stores, Inc. | 13,270 | 387 |
| Building Materials | | |
| Holding Corp. | 14,400 | 375 |
| Sotheby’s | 10,911 | 352 |
| IHOP Corp. | 7,589 | 352 |
| Beazer Homes USA, Inc. | 8,700 | 340 |
* | Harris Interactive Inc. | 53,292 | 325 |
| John Wiley & Sons Class A | 9,000 | 324 |
| Catalina Marketing Corp. | 10,400 | 286 |
| Technical Olympic USA, Inc. | 28,285 | 278 |
| Stewart Enterprises, Inc. | | |
| Class A | 41,020 | 240 |
* | Tenneco Automotive, Inc. | 8,100 | 189 |
| Ryland Group, Inc. | 4,130 | 178 |
| Choice Hotel International, Inc. | 3,800 | 155 |
| Kimball International, Inc. | | |
| Class B | 6,300 | 122 |
* | Pacific Sunwear of | | |
| California, Inc. | 7,682 | 116 |
| Journal Register Co. | 18,900 | 107 |
* | The Goodyear Tire & | | |
| Rubber Co. | 7,100 | 103 |
| Thor Industries, Inc. | 2,300 | 95 |
| CKE Restaurants Inc. | 5,600 | 94 |
| The Buckle, Inc. | 1,832 | 70 |
* | ProQuest Co. | 3,918 | 51 |
* | Denny’s Corp. | 5,693 | 19 |
| | | 26,351 |
Consumer Staples (2.7%) | | |
| Corn Products | | |
| International, Inc. | 21,305 | 693 |
* | Herbalife Ltd. | 16,000 | 606 |
| Del Monte Foods Co. | 55,661 | 582 |
| Lancaster Colony Corp. | 12,744 | 570 |
10
| | | Market |
| | | Value• |
| | Shares | ($000) |
| The Great Atlantic & | | |
| Pacific Tea Co., Inc. | 22,000 | 530 |
| Ruddick Corp. | 20,181 | 525 |
| ^Vector Group Ltd. | 30,143 | 489 |
* | NBTY, Inc. | 12,600 | 369 |
* | BJ’s Wholesale Club, Inc. | 7,000 | 204 |
* | Central Garden and Pet Co. | 3,765 | 182 |
* | Hansen Natural Corp. | 2,700 | 88 |
| Premium Standard Farms Inc. | 2,186 | 42 |
| | | 4,880 |
Energy (6.8%) | | |
| Tidewater Inc. | 15,665 | 692 |
| Holly Corp. | 15,636 | 678 |
| Helmerich & Payne, Inc. | 28,828 | 664 |
| Frontier Oil Corp. | 23,744 | 631 |
* | SEACOR Holdings Inc. | 7,371 | 608 |
* | Unit Corp. | 13,190 | 606 |
* | Swift Energy Co. | 13,829 | 578 |
* | Grey Wolf, Inc. | 82,800 | 553 |
* | Parker Drilling Co. | 75,700 | 536 |
* | Pioneer Drilling Co. | 40,900 | 525 |
| OMI Corp. | 23,000 | 499 |
* | W-H Energy Services, Inc. | 11,948 | 495 |
* | Helix Energy Solutions | | |
| Group, Inc. | 14,440 | 482 |
* | Todco Class A | 13,372 | 463 |
| W&T Offshore, Inc. | 15,352 | 448 |
| RPC Inc. | 23,900 | 438 |
* | Denbury Resources, Inc. | 15,000 | 434 |
* | Basic Energy Services Inc. | 15,800 | 386 |
* | Atwood Oceanics, Inc. | 8,259 | 371 |
* | Veritas DGC Inc. | 5,140 | 338 |
* | Maverick Tube Corp. | 4,230 | 274 |
| USEC Inc. | 23,700 | 228 |
* | Giant Industries, Inc. | 2,700 | 219 |
| St. Mary Land & | | |
| Exploration Co. | 5,286 | 194 |
* | Hanover Compressor Co. | 8,900 | 162 |
* | Lone Star Technologies, Inc. | 3,350 | 162 |
* | NS Group Inc. | 2,300 | 148 |
* | Hercules Offshore, Inc. | 4,400 | 137 |
* | Oil States International, Inc. | 4,100 | 113 |
| Berry Petroleum Class A | 3,900 | 110 |
* | FMC Technologies Inc. | 1,000 | 54 |
| | | 12,226 |
Financials (22.8%) | | |
| Capital Markets (1.3%) | | |
* | Investment Technology | | |
| Group, Inc. | 13,300 | 595 |
* | Piper Jaffray Cos., Inc. | 9,186 | 557 |
| Raymond James | | |
| Financial, Inc. | 18,700 | 547 |
* | Knight Capital Group, Inc. | | |
| Class A | 20,900 | 380 |
| Jefferies Group, Inc. | 10,444 | 298 |
| Commercial Banks (5.7%) | | |
| Whitney Holdings Corp. | 19,435 | 695 |
| BancorpSouth, Inc. | 22,688 | 630 |
| Trustmark Corp. | 18,622 | 585 |
| Hancock Holding Co. | 10,310 | 552 |
| Citizens Banking Corp. | 20,512 | 539 |
| First Republic Bank | 12,345 | 525 |
| Community Trust Bancorp Inc. | 13,816 | 520 |
| Bank of Hawaii Corp. | 10,500 | 506 |
| Peoples Bancorp, Inc. | 16,212 | 474 |
| City Holding Co. | 11,762 | 469 |
| First Community | | |
| Bancshares, Inc. | 13,620 | 455 |
| Sterling Bancshares, Inc. | 21,928 | 444 |
| Susquehanna Bancshares, Inc. | 18,100 | 442 |
| Independent Bank Corp. (MI) | 17,955 | 436 |
| Sterling Financial Corp. | 12,336 | 400 |
| BancFirst Corp. | 8,526 | 398 |
| Park National Corp. | 3,900 | 390 |
| Sky Financial Group, Inc. | 15,603 | 389 |
| Capitol Bancorp Ltd. | 8,233 | 366 |
| United Bankshares, Inc. | 7,200 | 268 |
| West Coast Bancorp | 8,020 | 245 |
| Old National Bancorp | 11,640 | 222 |
| U.S.B. Holding Co., Inc. | 6,186 | 136 |
| R & G Financial Corp. Class B | 15,200 | 113 |
| FirstMerit Corp. | 3,000 | 70 |
| First Financial Corp. (IN) | 1,012 | 32 |
| Tompkins Trustco, Inc. | 690 | 31 |
| | | |
| Consumer Finance (0.8%) | | |
| The First Marblehead Corp. | 10,800 | 748 |
| Cash America | | |
| International Inc. | 16,513 | 645 |
| Advance America, Cash | | |
| Advance Centers, Inc. | 4,752 | 69 |
| | | |
| Diversified Financial Services (0.2%) | | |
| Primus Guaranty, Ltd. | 32,392 | 392 |
| | | |
| Insurance (3.6%) | | |
| American Financial Group, Inc. | 15,000 | 704 |
| Hanover Insurance Group Inc. | 15,400 | 687 |
| Philadelphia Consolidated | | |
| Holding Corp. | 16,947 | 674 |
| Zenith National | | |
| Insurance Corp. | 15,291 | 610 |
| Commerce Group, Inc. | 20,200 | 607 |
| Infinity Property & | | |
| Casualty Corp. | 13,257 | 545 |
^Odyssey Re Holdings Corp. | 15,800 | 534 |
Harleysville Group, Inc. | 13,598 | 476 |
Safety Insurance Group, Inc. | 9,655 | 470 |
Ohio Casualty Corp. | 15,100 | 391 |
11
| | Market |
| | Value• |
| Shares | ($000) |
LandAmerica Financial | | |
Group, Inc. | 4,500 | 296 |
AmerUs Group Co. | 3,900 | 265 |
Reinsurance Group of | | |
America, Inc. | 2,880 | 150 |
Stewart Information | | |
Services Corp. | 1,796 | 62 |
| | |
Real Estate Investment Trusts (8.7%) | |
Camden Property Trust REIT | 9,500 | 722 |
Federal Realty Investment | | |
Trust REIT | 9,570 | 711 |
Reckson Associates | | |
Realty Corp. REIT | 15,130 | 648 |
BRE Properties Inc. | | |
Class A REIT | 10,240 | 612 |
Mack-Cali Realty Corp. REIT | 11,520 | 597 |
Essex Property Trust, Inc. | | |
REIT | 4,560 | 554 |
Taubman Co. REIT | 12,410 | 551 |
Kilroy Realty Corp. REIT | 6,770 | 510 |
Colonial Properties Trust REIT | 10,470 | 501 |
Post Properties, Inc. REIT | 10,360 | 492 |
Maguire Properties, Inc. REIT | 12,080 | 492 |
Home Properties, Inc. REIT | 8,300 | 474 |
Highwood Properties, Inc. | | |
REIT | 12,110 | 451 |
Mid-America Apartment | | |
Communities, Inc. REIT | 6,970 | 427 |
Tanger Factory Outlet | | |
Centers, Inc. REIT | 11,300 | 403 |
Heritage Property | | |
Investment Trust REIT | 10,440 | 381 |
Pan Pacific Retail | | |
Properties, Inc. REIT | 5,470 | 380 |
Glimcher Realty Trust REIT | 14,600 | 362 |
Saul Centers, Inc. REIT | 7,780 | 350 |
Trizec Properties, Inc. REIT | 10,570 | 306 |
Rayonier Inc. REIT | 8,020 | 303 |
Thornburg Mortgage, Inc. | | |
REIT | 10,970 | 279 |
Annaly Mortgage | | |
Management Inc. REIT | 20,400 | 268 |
CBL & Associates | | |
Properties, Inc. REIT | 6,210 | 260 |
HRPT Properties Trust REIT | 20,800 | 249 |
Equity One, Inc. REIT | 9,100 | 218 |
Crescent Real Estate, Inc. REIT | 9,960 | 217 |
Brandywine Realty Trust REIT | 6,570 | 214 |
New Century Financial Corp. | | |
REIT | 5,260 | 207 |
KKR Financial Corp. REIT | 8,330 | 204 |
| BioMed Realty Trust, Inc. REIT | 6,600 | 200 |
| Corporate Office Properties | | |
| Trust, Inc. REIT | 4,020 | 180 |
| Sunstone Hotel | | |
| Investors, Inc. REIT | 6,000 | 178 |
| LaSalle Hotel Properties REIT | 4,100 | 178 |
| American Home Mortgage | | |
| Investment Corp. REIT | 4,900 | 171 |
| Senior Housing | | |
| Properties Trust REIT | 7,500 | 160 |
| Pennsylvania REIT | 3,570 | 152 |
| Strategic Hotels and | | |
| Resorts, Inc. REIT | 7,600 | 151 |
| American Financial | | |
| Realty Trust REIT | 13,400 | 150 |
| Potlatch Corp. REIT | 4,000 | 148 |
| Sun Communities, Inc. REIT | 4,600 | 147 |
| Friedman, Billings, Ramsey | | |
| Group, Inc. REIT | 16,600 | 133 |
| Cousins Properties, Inc. REIT | 3,660 | 125 |
| Digital Realty Trust, Inc. REIT | 3,610 | 113 |
| Equity Lifestyle | | |
| Properties, Inc. REIT | 2,310 | 106 |
| Franklin Street | | |
| Properties Corp. REIT | 5,270 | 105 |
| National Retail Properties REIT | 4,800 | 104 |
| Redwood Trust, Inc. REIT | 2,000 | 101 |
| FelCor Lodging Trust, Inc. REIT | 5,010 | 100 |
| PS Business Parks, Inc. REIT | 1,620 | 98 |
| Sovran Self Storage, Inc. REIT | 1,740 | 97 |
| Mills Corp. REIT | 5,690 | 95 |
| Global Signal, Inc. REIT | 1,790 | 91 |
| Equity Inns, Inc. REIT | 4,200 | 67 |
| Innkeepers USA Trust REIT | 3,700 | 60 |
| Newcastle Investment Corp. | | |
| REIT | 1,000 | 27 |
| GMH Communities Trust REIT | 2,080 | 26 |
| Lexington Corporate | | |
| Properties Trust REIT | 1,000 | 21 |
| Spirit Finance Corp. REIT | 1,800 | 21 |
| Inland Real Estate Corp. REIT | 1,100 | 19 |
| | | |
| Real Estate Management & Development (0.2%) |
| Jones Lang LaSalle Inc. | 3,670 | 314 |
* | Trammell Crow Co. | 3,300 | 121 |
| | | |
| Thrifts & Mortgage Finance (2.3%) | |
| IndyMac Bancorp, Inc. | 18,631 | 767 |
| Downey Financial Corp. | 9,036 | 601 |
| PFF Bancorp, Inc. | 13,857 | 513 |
| Corus Bankshares Inc. | 22,856 | 511 |
* | Triad Guaranty, Inc. | 9,577 | 490 |
| WSFS Financial Corp. | 7,750 | 482 |
| | | | | |
* | Accredited Home | | |
| Lenders Holding Co. | 11,607 | 417 |
| Anchor Bancorp | | |
| Wisconsin Inc. | 11,357 | 324 |
| | | 41,241 |
12
| | | Market |
| | | Value• |
| | Shares | ($000) |
Health Care (10.4%) | | |
* | VCA Antech, Inc. | 21,490 | 775 |
* | Pediatrix Medical Group, Inc. | 15,440 | 704 |
* | ICOS Corp. | 26,043 | 653 |
* | Sierra Health Services, Inc. | 16,450 | 622 |
| West Pharmaceutical | | |
| Services, Inc. | 15,690 | 616 |
* | Bio-Rad Laboratories, Inc. | | |
| Class A | 8,706 | 616 |
* | PSS World Medical, Inc. | 30,400 | 608 |
* | Illumina, Inc. | 17,800 | 588 |
* | Magellan Health Services, Inc. | 13,694 | 583 |
* | Palomar Medical | | |
| Technologies, Inc. | 13,612 | 574 |
| Alpharma, Inc. Class A | 24,512 | 573 |
* | Viasys Healthcare Inc. | 20,429 | 557 |
| Vital Signs, Inc. | 9,746 | 552 |
* | Myogen, Inc. | 15,100 | 530 |
| Datascope Corp. | 15,731 | 527 |
* | Alkermes, Inc. | 32,251 | 511 |
* | Haemonetics Corp. | 10,895 | 510 |
* | Molina Healthcare Inc. | 14,406 | 509 |
* | Enzon Pharmaceuticals, Inc. | 60,795 | 502 |
* | ViroPharma Inc. | 39,698 | 483 |
* | Radiation Therapy | | |
| Services, Inc. | 16,183 | 473 |
* | Genesis Healthcare Corp. | 9,822 | 468 |
| Valeant Pharmaceuticals | | |
| International | 23,540 | 466 |
* | Adams Respiratory | | |
| Therapeutics, Inc. | 12,400 | 454 |
* | IDEXX Laboratories Corp. | 4,415 | 402 |
| Medicis Pharmaceutical Corp. | 11,900 | 385 |
* | Zoll Medical Corp. | 9,847 | 353 |
* | Sunrise Senior Living, Inc. | 11,040 | 330 |
* | Sciele Pharma, Inc. | 17,184 | 324 |
* | BioMarin Pharmaceutical Inc. | 22,446 | 319 |
* | Digene Corp. | 7,202 | 311 |
| Dade Behring Holdings Inc. | 7,507 | 301 |
* | K-V Pharmaceutical Co. | | |
| Class A | 12,643 | 300 |
* | WellCare Health Plans Inc. | 5,200 | 294 |
* | Applera Corp.–Celera | | |
| Genomics Group | 20,700 | 288 |
* | AMN Healthcare Services, Inc. | 10,139 | 241 |
* | Telik, Inc. | 11,800 | 210 |
| STERIS Corp. | 8,400 | 202 |
* | The TriZetto Group, Inc. | 12,200 | 185 |
* | Hologic, Inc. | 4,200 | 183 |
* | United Surgical Partners | | |
| International, Inc. | 6,100 | 151 |
* | PAREXEL International Corp. | 3,732 | 124 |
* | United Therapeutics Corp. | 2,168 | 114 |
* | Tanox, Inc. | 9,300 | 110 |
* | Orthofix International NV | 1,841 | 84 |
* | IntraLase Corp. | 2,200 | 43 |
* | Symmetry Medical Inc. | 2,200 | 33 |
* | Medarex, Inc. | 2,200 | 24 |
| | | 18,765 |
Industrials (15.5%) | | |
| Harsco Corp. | 10,439 | 811 |
| The Manitowoc Co., Inc. | 17,500 | 784 |
* | Thomas & Betts Corp. | 16,020 | 764 |
| Carlisle Co., Inc. | 8,838 | 743 |
| Ryder System, Inc. | 14,309 | 740 |
| Trinity Industries, Inc. | 22,760 | 732 |
* | Wesco International, Inc. | 12,315 | 715 |
| JLG Industries, Inc. | 36,019 | 714 |
| Crane Co. | 16,600 | 694 |
* | Genlyte Group, Inc. | 9,661 | 688 |
| The Timken Co. | 21,800 | 649 |
| The Toro Co. | 15,009 | 633 |
| IKON Office Solutions, Inc. | 46,228 | 621 |
* | US Airways Group Inc. | 14,000 | 621 |
* | Dollar Thrifty Automotive | | |
| Group, Inc. | 13,798 | 615 |
* | Swift Transportation Co., Inc. | 25,140 | 596 |
| Steelcase Inc. | 37,474 | 588 |
| Regal-Beloit Corp. | 13,484 | 587 |
* | Alaska Air Group, Inc. | 15,400 | 586 |
* | United Stationers, Inc. | 12,541 | 583 |
| Mueller Industries Inc. | 16,000 | 563 |
* | Amerco, Inc. | 7,456 | 553 |
* | Kforce Inc. | 45,720 | 545 |
| Triumph Group, Inc. | 12,667 | 536 |
| Acuity Brands, Inc. | 11,542 | 524 |
| A.O. Smith Corp. | 13,200 | 520 |
* | Spherion Corp. | 71,465 | 511 |
* | Consolidated Graphics, Inc. | 8,453 | 509 |
| Adesa, Inc. | 21,800 | 504 |
* | Labor Ready, Inc. | 31,200 | 497 |
| Kennametal, Inc. | 8,767 | 497 |
* | CBIZ Inc. | 67,800 | 495 |
| ^Simpson Manufacturing Co. | 17,350 | 469 |
* | EMCOR Group, Inc. | 8,500 | 466 |
* | United Rentals, Inc. | 19,982 | 465 |
| Herman Miller, Inc. | 13,469 | 461 |
* | Corrections Corp. of America | 10,200 | 441 |
| The Greenbrier Cos., Inc. | 15,100 | 438 |
| Con-way, Inc. | 9,179 | 411 |
| Lennox International Inc. | 17,648 | 404 |
* | Builders FirstSource, Inc. | 25,069 | 382 |
| Teleflex Inc. | 6,831 | 380 |
| Lincoln Electric Holdings, Inc. | 6,965 | 379 |
* | Continental Airlines, Inc. | | |
| Class B | 12,712 | 360 |
| John H. Harland Co. | 9,771 | 356 |
* | PHH Corp. | 11,300 | 310 |
* | Armor Holdings, Inc. | 5,120 | 294 |
* | YRC Worldwide, Inc. | 6,882 | 255 |
13
| | | Market |
| | | Value• |
| | Shares | ($000) |
| Apogee Enterprises, Inc. | 15,142 | 230 |
* | Accuride Corp. | 20,557 | 226 |
| Mine Safety Appliances Co. | 6,314 | 225 |
* | Commercial Vehicle Group Inc. | 8,900 | 171 |
* | Foster Wheeler Ltd. | 4,200 | 162 |
| Bluelinx Holdings Inc. | 15,000 | 143 |
* | Kirby Corp. | 4,500 | 141 |
* | West Corp. | 2,914 | 141 |
| Watsco, Inc. | 3,000 | 138 |
* | AAR Corp. | 3,400 | 81 |
* | FTI Consulting, Inc. | 2,862 | 72 |
| Kelly Services, Inc. Class A | 2,057 | 56 |
| Tennant Co. | 1,800 | 44 |
* | Navistar International Corp. | 1,510 | 39 |
| MSC Industrial Direct Co., Inc. | | |
| Class A | 900 | 37 |
| | | 27,895 |
Information Technology (15.6%) | | |
* | Atmel Corp. | 127,800 | 772 |
* | Convergys Corp. | 37,340 | 771 |
* | Fairchild Semiconductor | | |
| International, Inc. | 40,000 | 748 |
* | Brocade Communications | | |
| Systems, Inc. | 100,300 | 708 |
| MoneyGram | | |
| International, Inc. | 23,976 | 697 |
* | Vishay Intertechnology, Inc. | 49,100 | 689 |
* | Sybase, Inc. | 28,115 | 682 |
* | Interdigital | | |
| Communications Corp. | 19,852 | 677 |
* | MPS Group, Inc. | 43,650 | 660 |
* | Avocent Corp. | 21,600 | 651 |
* | CommScope, Inc. | 18,900 | 621 |
* | RealNetworks, Inc. | 56,647 | 601 |
* | BearingPoint, Inc. | 75,809 | 596 |
* | Advanced Energy | | |
| Industries, Inc. | 34,746 | 592 |
* | Plexus Corp. | 30,065 | 577 |
* | ON Semiconductor Corp. | 97,824 | 575 |
* | Mentor Graphics Corp. | 40,407 | 569 |
| Technitrol, Inc. | 18,890 | 564 |
* | CSG Systems | | |
| International, Inc. | 21,084 | 557 |
* | Dolby Laboratories Inc. | 27,980 | 555 |
| Anixter International Inc. | 9,700 | 548 |
* | Hyperion Solutions Corp. | 15,400 | 531 |
* | Zoran Corp. | 32,516 | 523 |
* | Informatica Corp. | 38,192 | 519 |
* | MICROS Systems, Inc. | 10,574 | 517 |
* | Conexant Systems, Inc. | 254,945 | 510 |
* | Arris Group Inc. | 43,510 | 499 |
* | Transaction Systems | | |
| Architects, Inc. | 14,400 | 494 |
* | Interwoven Inc. | 44,160 | 487 |
* | Digitas Inc. | 50,205 | 483 |
* | Covansys Corp. | 26,971 | 462 |
| Gevity HR, Inc. | 20,214 | 460 |
* | Amkor Technology, Inc. | 86,865 | 448 |
* | Silicon Storage | | |
| Technology, Inc. | 107,100 | 441 |
* | SPSS, Inc. | 17,560 | 438 |
* | Avnet, Inc. | 21,799 | 428 |
* | Ditech Networks Inc. | 54,216 | 418 |
* | OmniVision Technologies, Inc. | 28,768 | 411 |
* | Komag, Inc. | 12,700 | 406 |
* | Asyst Technologies, Inc. | 59,500 | 402 |
| Agilysys, Inc. | 24,905 | 350 |
* | Newport Corp. | 20,200 | 329 |
| Syntel, Inc. | 13,952 | 316 |
| Global Payments Inc. | 7,100 | 312 |
| Imation Corp. | 7,500 | 301 |
* | Wright Express Corp. | 12,504 | 301 |
* | Mettler-Toledo | | |
| International Inc. | 4,200 | 278 |
* | eFunds Corp. | 11,369 | 275 |
* | LTX Corp. | 52,500 | 263 |
| Reynolds & Reynolds Class A | 6,500 | 257 |
* | Palm, Inc. | 17,136 | 250 |
* | j2 Global | | |
| Communications, Inc. | 8,900 | 242 |
* | Cirrus Logic, Inc. | 32,548 | 237 |
* | Coherent, Inc. | 6,558 | 227 |
* | Finisar Corp. | 60,500 | 220 |
* | Genesis Microchip Inc. | 18,348 | 216 |
* | Tech Data Corp. | 5,800 | 212 |
| Acxiom Corp. | 8,003 | 197 |
* | Cymer, Inc. | 4,082 | 179 |
* | Emulex Corp. | 9,570 | 174 |
* | EarthLink, Inc. | 22,472 | 163 |
| CTS Corp. | 11,100 | 153 |
| ADTRAN Inc. | 4,700 | 112 |
* | Websense, Inc. | 4,935 | 107 |
* | MRO Software Inc. | 2,300 | 59 |
| Methode Electronics, Inc. | | |
| Class A | 3,998 | 38 |
* | Trident Microsystems, Inc. | 1,000 | 23 |
* | PortalPlayer Inc. | 1,713 | 19 |
| | | 28,097 |
Materials (5.6%) | | |
| Carpenter Technology Corp. | 7,000 | 753 |
| Cleveland-Cliffs Inc. | 17,623 | 672 |
* | Oregon Steel Mills, Inc. | 13,600 | 665 |
| Steel Dynamics, Inc. | 12,933 | 652 |
| Eagle Materials, Inc. | 18,355 | 618 |
| Celanese Corp. Series A | 34,522 | 618 |
* | AK Steel Corp. | 49,860 | 605 |
| Greif Inc. Class A | 7,517 | 602 |
| Texas Industries, Inc. | 11,300 | 588 |
| Lubrizol Corp. | 12,000 | 549 |
* | Chaparral Steel Co. | 15,976 | 544 |
14
| | | Market |
| | | Value• |
| | Shares | ($000) |
| Quanex Corp. | 15,548 | 472 |
| Reliance Steel & | | |
| Aluminum Co. | 12,270 | 394 |
| Gibraltar Industries Inc. | 16,725 | 371 |
| Westlake Chemical Corp. | 11,500 | 368 |
| Sensient Technologies Corp. | 17,570 | 344 |
* | Rockwood Holdings, Inc. | 16,700 | 334 |
| Commercial Metals Co. | 16,200 | 329 |
| H.B. Fuller Co. | 12,400 | 291 |
| Louisiana-Pacific Corp. | 11,000 | 206 |
| Silgan Holdings, Inc. | 2,511 | 94 |
* | Titanium Metals Corp. | 1,560 | 39 |
| | | 10,108 |
Telecommunication Services (1.3%) | |
* | Cincinnati Bell Inc. | 116,300 | 561 |
| North Pittsburgh | | |
| Systems, Inc. | 19,456 | 490 |
* | Leap Wireless | | |
| International, Inc. | 8,416 | 408 |
* | Syniverse Holdings Inc. | 24,700 | 371 |
| Surewest Communications | 8,469 | 165 |
| Centennial | | |
| Communications Corp. | | |
| Class A | 28,573 | 152 |
| Commonwealth Telephone | | |
| Enterprises, Inc. | 3,097 | 128 |
* | Level 3 Communications, Inc. | 21,160 | 113 |
| | | 2,388 |
Utilities (4.7%) | | |
| OGE Energy Corp. | 21,600 | 780 |
| Puget Energy, Inc. | 31,950 | 726 |
| Westar Energy, Inc. | 28,400 | 668 |
| Energen Corp. | 15,244 | 638 |
| Cleco Corp. | 23,900 | 603 |
| Southwest Gas Corp. | 17,500 | 583 |
| PNM Resources Inc. | 20,800 | 573 |
| Avista Corp. | 24,028 | 569 |
| ALLETE, Inc. | 12,404 | 539 |
| IDACORP, Inc. | 14,040 | 531 |
* | CMS Energy Corp. | 35,000 | 505 |
| Black Hills Corp. | 10,700 | 360 |
* | El Paso Electric Co. | 11,600 | 259 |
* | Sierra Pacific Resources | 18,032 | 259 |
| Otter Tail Corp. | 7,982 | 233 |
| Hawaiian Electric Industries Inc. | 8,419 | 228 |
| Vectren Corp. | 7,910 | 212 |
| Great Plains Energy, Inc. | 4,660 | 145 |
| | | 8,411 |
| Total Common Stocks | | |
| (Cost $185,178) | | 180,362 |
| Temporary Cash Investments (0.7%) | |
| Money Market Fund (0.6%) | | |
1 Vanguard Market Liquidity | | |
Fund, 5.306%—Note E | 1,042,700 | 1,043 |
| | |
| Face | |
| Amount | |
| ($000) | |
U.S. Agency Obligation (0.1%) | |
2 Federal Home Loan | | |
Mortgage Corp. | | |
5.301%, 10/3/06 | 200 | 200 |
Total Temporary Cash Investments | |
(Cost $1,243) | | 1,243 |
Total Investments (100.7%) | | |
(Cost $186,421) | | 181,605 |
Other Assets and Liabilities (–0.7%) | |
Other Assets—Note B | | 3,056 |
Liabilities—Note E | | (4,252) |
| | (1,196) |
Net Assets (100%) | | |
Applicable to 9,477,597 outstanding $.001 | |
par value shares of beneficial interest | |
(unlimited authorization) | | 180,409 |
Net Asset Value Per Share | | $19.04 |
| | |
| | |
| | |
At September 30, 2006, net assets consisted of:3 |
| Amount | Per |
| ($000) | Share |
Paid-in Capital | 186,759 | $19.71 |
Undistributed Net | | |
Investment Income | 834 | .09 |
Accumulated Net | | |
Realized Losses | (2,368) | (.25) |
Unrealized Depreciation | (4,816) | (.51) |
Net Assets | 180,409 | $19.04 |
• | See Note A in Notes to Financial Statements. |
* | Non-income-producing security. |
^ | Part of security position is on loan to broker-dealers. See Note E in Notes to Financial Statements. |
1 | Affiliated money market fund available only to Vanguard funds and certain trusts and accounts managed by Vanguard. Rate shown is the 7-day yield. |
2 | The issuer operates under a congressional charter; its securities are neither issued nor guaranteed by the U.S. government. If needed, access to additional funding from the U.S. Treasury (beyond the issuer’s line of credit) would require congressional action. |
3 | See Note C in Notes to Financial Statements for the tax-basis components of net assets. |
15
Statement of Operations
| April 201 to |
| September 30, 2006 |
| ($000) |
Investment Income | |
Income | |
Dividends | 1,008 |
Interest2 | 80 |
Security Lending | 23 |
Total Income | 1,111 |
Expenses | |
The Vanguard Group—Note B | |
Investment Advisory Services | 43 |
Management and Administrative | 168 |
Marketing and Distribution | 6 |
Custodian Fees | 34 |
Auditing Fees | 22 |
Shareholders’ Reports | 4 |
Total Expenses | 277 |
Net Investment Income | 834 |
Realized Net Gain (Loss) | |
Investment Securities Sold | (2,387) |
Futures Contracts | 19 |
Realized Net Gain (Loss) | (2,368) |
Unrealized Appreciation (Depreciation) | |
Investment Securities | (4,816) |
Futures Contracts | — |
Unrealized Appreciation (Depreciation) | (4,816) |
Net Increase (Decrease) in Net Assets Resulting from Operations | (6,350) |
| 2 | Interest income from an affiliated company of the fund was $77,000. |
16
Statement of Changes in Net Assets
| April 201 to |
| September 30, 2006 |
| ($000) |
Increase (Decrease) in Net Assets | |
Operations | |
Net Investment Income | 834 |
Realized Net Gain (Loss) | (2,368) |
Unrealized Appreciation (Depreciation) | (4,816) |
Net Increase (Decrease) in Net Assets Resulting from Operations | (6,350) |
Distributions | |
Net Investment Income | — |
Realized Capital Gain | — |
Total Distributions | — |
Capital Share Transactions—Note F | |
Issued | 210,458 |
Issued in Lieu of Cash Distributions | — |
Redeemed | (23,699) |
Net Increase (Decrease) from Capital Share Transactions | 186,759 |
Total Increase (Decrease) | 180,409 |
Net Assets | |
Beginning of Period | — |
End of Period2 | 180,409 |
2 | Net Assets—End of Period includes undistributed net investment income of $834,000. |
17
Financial Highlights
| April 201 to |
For a Share Outstanding Throughout the Period | September 30, 2006 |
Net Asset Value, Beginning of Period | $20.00 |
Investment Operations | |
Net Investment Income | .09 |
Net Realized and Unrealized Gain (Loss) on Investments | (1.05) |
Total from Investment Operations | (.96) |
Distributions | |
Dividends from Net Investment Income | — |
Distributions from Realized Capital Gains | — |
Total Distributions | — |
Net Asset Value, End of Period | $19.04 |
| |
Total Return | –4.85% |
| |
Ratios/Supplemental Data | |
Net Assets, End of Period (Millions) | $180 |
Ratio of Total Expenses to Average Net Assets | 0.40%* |
Ratio of Net Investment Income to Average Net Assets | 1.20%* |
Portfolio Turnover Rate | 35% |
| 1 | Subscription period for the fund was April 20, 2006, to April 24, 2006, during which time all assets were held in money market instruments. Performance measurement began April 24, 2006, at a net asset value of $20.01. |
See accompanying Notes, which are an integral part of the Financial Statements.
18
Notes to Financial Statements
Vanguard Strategic Small-Cap Equity Fund is registered under the Investment Company Act of 1940 as an open-end investment company, or mutual fund. The fund files reports with the SEC under the company name Vanguard Horizon Funds.
A. The following significant accounting policies conform to generally accepted accounting principles for U.S. mutual funds. The fund consistently follows such policies in preparing its financial statements.
1. Security Valuation: Securities are valued as of the close of trading on the New York Stock Exchange (generally 4:00 p.m., Eastern time) on the valuation date. Equity securities are valued at the latest quoted sales prices or official closing prices taken from the primary market in which each security trades; such securities not traded on the valuation date are valued at the mean of the latest quoted bid and asked prices. Securities for which market quotations are not readily available, or whose values have been materially affected by events occurring before the fund’s pricing time but after the close of the securities’ primary markets, are valued by methods deemed by the board of trustees to represent fair value. Investments in Vanguard Market Liquidity Fund are valued at that fund’s net asset value. Temporary cash investments acquired over 60 days to maturity are valued using the latest bid prices or using valuations based on a matrix system (which considers such factors as security prices, yields, maturities, and ratings), both as furnished by independent pricing services. Other temporary cash investments are valued at amortized cost, which approximates market value.
2. Futures Contracts: The fund uses index futures contracts to a limited extent, with the objective of maintaining full exposure to the stock market while maintaining liquidity. The fund may purchase or sell futures contracts to achieve a desired level of investment, whether to accommodate portfolio turnover or cash flows from capital share transactions. The primary risks associated with the use of futures contracts are imperfect correlation between changes in market values of stocks held by the fund and the prices of futures contracts, and the possibility of an illiquid market.
Futures contracts are valued at their quoted daily settlement prices. The aggregate principal amounts of the contracts are not recorded in the Statement of Net Assets. Fluctuations in the value of the contracts are recorded in the Statement of Net Assets as an asset (liability) and in the Statement of Operations as unrealized appreciation (depreciation) until the contracts are closed, when they are recorded as realized futures gains (losses).
3. Federal Income Taxes: The fund intends to qualify as a regulated investment company and distribute all of its taxable income. Accordingly, no provision for federal income taxes is required in the financial statements.
4. Distributions: Distributions to shareholders are recorded on the ex-dividend date.
5. Security Lending: The fund may lend its securities to qualified institutional borrowers to earn additional income. Security loans are required to be secured at all times by collateral at least equal to the market value of securities loaned. The fund invests cash collateral received in Vanguard Market Liquidity Fund, and records a liability for the return of the collateral, during the period the securities are on loan. Security lending income represents the income earned on investing cash collateral, less expenses associated with the loan.
19
6. Other: Dividend income is recorded on the ex-dividend date. Interest income includes income distributions received from Vanguard Market Liquidity Fund and is accrued daily. Security transactions are accounted for on the date securities are bought or sold. Costs used to determine realized gains (losses) on the sale of investment securities are those of the specific securities sold.
B. The Vanguard Group furnishes at cost investment advisory, corporate management, administrative, marketing, and distribution services. The costs of such services are allocated to the fund under methods approved by the board of trustees. The fund has committed to provide up to 0.40% of its net assets in capital contributions to Vanguard. At September 30, 2006, the fund had contributed capital of $19,000 to Vanguard (included in Other Assets), representing 0.01% of the fund’s net assets and 0.02% of Vanguard’s capitalization. The fund’s trustees and officers are also directors and officers of Vanguard.
C. Distributions are determined on a tax basis and may differ from net investment income and realized capital gains for financial reporting purposes. Differences may be permanent or temporary. Permanent differences are reclassified among capital accounts in the financial statements to reflect their tax character. Temporary differences arise when certain items of income, expense, gain, or loss are recognized in different periods for financial statement and tax purposes; these differences will reverse at some time in the future. Differences in classification may also result from the treatment of short-term gains as ordinary income for tax purposes.
For tax purposes, at September 30, 2006, the fund had $873,000 of ordinary income available for distribution. The fund had available realized losses of $2,355,000 to offset future net capital gains through September 30, 2015.
At September 30, 2006, the cost of investment securities for tax purposes was $186,434,000. Net unrealized depreciation of investment securities for tax purposes was $4,829,000, consisting of unrealized gains of $8,371,000 on securities that had risen in value since their purchase and $13,200,000 in unrealized losses on securities that had fallen in value since their purchase.
D. During the period ended September 30, 2006, the fund purchased $242,049,000 of investment securities and sold $54,484,000 of investment securities, other than temporary cash investments.
E. The market value of securities on loan to broker-dealers at September 30, 2006, was $1,024,000, for which the fund received cash collateral of $1,043,000.
F. Capital shares issued and redeemed were:
| April 201 to Sept. 30, 2006 |
| Shares |
| (000) |
Issued | 10,744 |
Issued in Lieu of Cash Distributions | — |
Redeemed | (1,266) |
Net Shares Outstanding | 9,478 |
20
G. In June 2006, the Financial Accounting Standards Board issued Interpretation No. 48 (“FIN 48“), “Accounting for Uncertainty in Income Taxes.” FIN 48 establishes the minimum threshold for recognizing, and a system for measuring, the benefits of tax-return positions in financial statements. FIN 48 will be effective for the fund’s fiscal year beginning October 1, 2007. Management is in the process of analyzing the fund’s tax positions for purposes of implementing FIN 48; based on the analysis completed to date, management does not believe the adoption of FIN 48 will result in any material impact to the fund’s financial statements.
21
Report of Independent Registered
Public Accounting Firm
To the Trustees of Vanguard Horizon Funds and the Shareholders of Vanguard Strategic Small-Cap Equity Fund:
In our opinion, the accompanying statement of net assets and the related statements of operations and of changes in net assets and the financial highlights present fairly, in all material respects, the financial position of Vanguard Strategic Small-Cap Equity Fund (the “Fund”) at September 30, 2006, and the results of its operations, the changes in its net assets, and the financial highlights for the period from April 20, 2006 (commencement of operations) to September 30, 2006, in conformity with accounting principles generally accepted in the United States of America. These financial statements and financial highlights (hereafter referred to as “financial statements”) are the responsibility of the Fund’s management; our responsibility is to express an opinion on these financial statements based on our audit. We conducted our audit of these financial statements in accordance with the standards of the Public Company Accounting Oversight Board (United States), which require that we plan and perform the audit to obtain reasonable assurance about whether the financial statements are free of material misstatement. An audit includes examining, on a test basis, evidence supporting the amounts and disclosures in the financial statements, assessing the accounting principles used and significant estimates made by management, and evaluating the overall financial statement presentation. We believe that our audit, which included confirmation of securities at September 30, 2006 by correspondence with the custodian and by agreement to the underlying ownership records for Vanguard Market Liquidity Fund, provides a reasonable basis for our opinion.
PricewaterhouseCoopers LLP
Philadelphia, Pennsylvania
November 13, 2006
Special 2006 tax information (unaudited) for Vanguard Strategic Small-Cap Equity Fund
This information for the fiscal period ended September 30, 2006, is included pursuant to provisions of the Internal Revenue Code.
For corporate shareholders, 81.9% of investment income (dividend income plus short-term gains, if any) qualifies for the dividends-received deduction.
22
Glossary
Earnings Growth Rate. The average annual rate of growth in earnings over the past five years for the stocks now in a fund.
Expense Ratio. The percentage of a fund’s average net assets used to pay its annual administrative and advisory expenses. These expenses directly reduce returns to investors.
Foreign Holdings. The percentage of a fund represented by stocks or depositary receipts of companies based outside the United States.
Median Market Cap. An indicator of the size of companies in which a fund invests; the midpoint of market capitalization (market price x shares outstanding) of a fund’s stocks, weighted by the proportion of the fund’s assets invested in each stock. Stocks representing half of the fund’s assets have market capitalizations above the median, and the rest are below it.
Price/Book Ratio. The share price of a stock divided by its net worth, or book value, per share. For a fund, the weighted average price/book ratio of the stocks it holds.
Price/Earnings Ratio. The ratio of a stock’s current price to its per-share earnings over the past year. For a fund, the weighted average P/E of the stocks it holds. P/E is an indicator of market expectations about corporate prospects; the higher the P/E, the greater the expectations for a company’s future growth.
Return on Equity. The annual average rate of return generated by a company during the past five years for each dollar of shareholder’s equity (net income divided by shareholder’s equity). For a fund, the weighted average return on equity for the companies whose stocks it holds.
Short-Term Reserves. The percentage of a fund invested in highly liquid, short-term securities that can be readily converted to cash.
Turnover Rate. An indication of the fund’s trading activity. Funds with high turnover rates incur higher transaction costs and may be more likely to distribute capital gains (which may be taxable to investors). The turnover rate excludes in-kind transactions, which have minimal impact on costs.
Yield. A snapshot of a fund’s income from interest and dividends. The yield, expressed as a percentage of the fund’s net asset value, is based on income earned over the past 30 days and is annualized, or projected forward for the coming year. The index yield is based on the current annualized rate of income provided by securities in the index.
23
The People Who Govern Your Fund
The trustees of your mutual fund are there to see that the fund is operated and managed in your best interests since, as a shareholder, you are a part owner of the fund. Your fund's trustees also serve on the board of directors of The Vanguard Group, Inc., which is owned by the Vanguard funds and provides services to them on an at-cost basis.
A majority of Vanguard’s board members are independent, meaning that they have no affiliation with Vanguard or the funds they oversee, apart from the sizable personal investments they have made as private individuals.
Our independent board members bring distinguished backgrounds in business, academia, and public service to their task of working with Vanguard officers to establish the policies and oversee the activities of the funds. Among board members’ responsibilities are selecting investment advisors for the funds; monitoring fund operations, performance, and costs; reviewing contracts; nominating and selecting new trustees/directors; and electing Vanguard officers.
Each trustee serves a fund until its termination; or until the trustee’s retirement, resignation, or death; or otherwise as specified in the fund’s organizational documents. Any trustee may be removed at a shareholders’ meeting by a vote representing two-thirds of the net asset value of all shares of the fund together with shares of other Vanguard funds organized within the same trust. The table on these two pages shows information for each trustee and executive officer of the fund. The mailing address of the trustees and officers is P.O. Box 876, Valley Forge, PA 19482.
Chairman of the Board, Chief Executive Officer, and Trustee |
| |
John J. Brennan1 | |
Born 1954 | Principal Occupation(s) During the Past Five Years: Chairman of |
Trustee since May 1987; | the Board, Chief Executive Officer, and Director/Trustee of The |
Chairman of the Board and | Vanguard Group, Inc., and of each of the investment companies |
Chief Executive Officer | served by The Vanguard Group. |
142 Vanguard Funds Overseen | |
| |
Independent Trustees | |
| |
Charles D. Ellis | |
Born 1937 | Principal Occupation(s) During the Past Five Years: Applecore |
Trustee since January 2001 | Partners (pro bono ventures in education); Senior Advisor to |
142 Vanguard Funds Overseen | Greenwich Associates (international business strategy |
| consulting); Successor Trustee of Yale University; Overseer |
| of the Stern School of Business at New York University; |
| Trustee of the Whitehead Institute for Biomedical Research. |
| |
Rajiv L. Gupta | |
Born 1945 | Principal Occupation(s) During the Past Five Years: Chairman |
Trustee since December 20012 | and Chief Executive Officer of Rohm and Haas Co. (chemicals); |
142 Vanguard Funds Overseen | Board Member of the American Chemistry Council; |
| Director of Tyco International, Ltd. (diversified manufac- |
| turing and services) since 2005; Trustee of Drexel |
| University and of the Chemical Heritage Foundation. |
| |
Amy Gutmann | |
Born 1949 | Principal Occupation(s) During the Past Five Years: President of the |
Trustee since July 2006 | University of Pennsylvania since 2004; Professor in the School of Arts |
142 Vanguard Funds Overseen | and Sciences, Annenberg School for Communication, and Graduate |
| School of Education of the University of Pennsylvania since 2004; |
| Provost (2001-2004) and Laurance S. Rockefeller Professor of |
| Politics and the University Center for Human Values (1990-2004), |
| Princeton University; Director of Carnegie Corporation of New |
| York since 2005 and of Schuylkill River Development Corporation |
| and Greater Philadelphia Chamber of Commerce since 2004. |
JoAnn Heffernan Heisen | |
Born 1950 | Principal Occupation(s) During the Past Five Years: Corporate |
Trustee since July 1998 | Vice President and Chief Global Diversity Officer since 2006 |
142 Vanguard Funds Overseen | Vice President and Chief Information Officer (1997–2005), |
| and Member of the Executive Committee of Johnson & Johnson |
| (pharmaceuticals/consumer products); Director of the University |
| Medical Center at Princeton and Women’s Research and |
| Education Institute. |
| |
André F. Perold | |
Born 1952 | Principal Occupation(s) During the Past Five Years: |
Trustee since December 2004 | George Gund Professor of Finance and Banking, Harvard Business |
142 Vanguard Funds Overseen | School since 2000; Senior Associate Dean, Director of Faculty |
| Recruiting, and Chair of Finance Faculty, Harvard Business |
| School; Director and Chairman of UNX, Inc. (equities trading firm) |
| since 2003; Director of registered investment companies advised by |
| Merrill Lynch Investment Managers and affiliates (1985-2004), Genbel |
| Securities Limited (South African financial services firm) (1999-2003), |
| Gensec Bank (1999-2003), Sanlam, Ltd. (South African insurance company) |
| (2001-2003), and Stockback, Inc. (credit card firm) (2000-2002). |
| |
Alfred M. Rankin, Jr. | |
Born 1941 | Principal Occupation(s) During the Past Five Years: |
Trustee since January 1993 | Chairman, President, Chief Executive Officer, and Director of NACCO |
142 Vanguard Funds Overseen | Industries, Inc.(forklift trucks/housewares/lignite); Director of |
| Goodrich Corporation (industrialproducts/aircraft systems and services). |
| |
J. Lawrence Wilson | |
Born 1936 | Principal Occupation(s) During the Past Five Years: |
Trustee since April 1985 | Retired Chairman and Chief Executive Officer of Rohm and Haas Co. |
142 Vanguard Funds Overseen | (chemicals);Director of Cummins Inc. (diesel engines), MeadWestvaco |
| Corp. (packing products),and AmerisourceBergen Corp. (pharmaceutical |
| distribution); Trustee of Vanderbilt University and of Culver |
| Educational Foundation. |
| |
Executive Officers 1 | |
| |
Heidi Stam | |
Born 1956 | Principal Occupation(s) During the Past Five Years: |
Trustee since July 2005 | Managing Director since July 2006, General Counsel since July 2005, and |
142 Vanguard Funds Overseen | Secretary of Vanguard and of each of the investment companies served |
| by The Vanguard Group since July 2005; Principal of The Vanguard Group, Inc. |
| (1997-2006). |
| |
Thomas J. Higgins | |
Born 1957 | Principal Occupation(s) During the Past Five Years: |
Trustee since July 1998 | Principal of the Vanguard Group, Inc.; Treasurer of each of the investment |
142 Vanguard Funds Overseen | companies served by the Vanguard Group. |
| |
| |
| Vanguard Senior Management Team |
|---|
| | |
|---|
| R. Gregory Barton | Kathleen C. Gubanich | Michael S. Miller |
| Mortimer J. Buckley | Paul A. Heller | Ralph K. Packard |
| James H. Gately | F. William McNabb, III | George U. Sauter |
|
Founder
|
|---|
| | |
|---|
| John C. Bogle |
|
| Chairman and Chief Executive Officer, 1974-1996 |
1 Officers of the funds are “interested persons” as defined in the Investment Company Act of 1940.
2 December 2002 for Vanguard Equity Income Fund, Vanguard Growth Equity Fund, the Vanguard Municipal Bond Funds, and the Vanguard State Tax-Exempt Funds.
More information about the trustees is in the Statement of Additional Information, available from The Vanguard Group.
|
|
| P.O. Box 2600 Valley Forge, PA 19482-2600 |
Connect with Vanguard™ > www.vanguard.com
| |
|---|
| Fund Information > 800-662-7447 | Vanguard, Connect with Vanguard, and the ship |
| | logo are trademarks of The Vanguard Group, Inc. |
| Direct Investor Account Services > 800-662-2739 | |
| | All other marks are the exclusive property of their |
| Institutional Investor Services > 800-523-1036 | respective owners. |
| | |
| Text Telephone > 800-952-3335 | All comparative mutual fund data are from Lipper Inc. |
| | or Morningstar, Inc., unless otherwise noted. |
| | |
| | |
| | |
| | |
| | You can obtain a free copy of Vanguard’s proxy voting |
| This material may be used in conjunction | guidelines by visiting our website, www.vanguard.com, |
| with the offering of shares of any Vanguard | and searching for “proxy voting guidelines,” or by calling |
| fund only if preceded or accompanied by | Vanguard at 800-662-2739. They are also available from |
| the fund’s current prospectus. | the SEC’s website, www.sec.gov. In addition, you may |
| | obtain a free report on how your fund voted the proxies for |
| | securities it owned during the 12 months ended June 30. |
| | To get the report, visit either www.vanguard.com |
| | or www.sec.gov. |
| | |
| | You can review and copy information about your fund |
| | at the SEC’s Public Reference Room in Washington, D.C. |
| | To find out more about this public service, call the SEC |
| | at 202-551-8090. Information about your fund is also |
| | available on the SEC’s website, and you can receive |
| | copies of this information, for a fee, by sending a |
| | request in either of two ways: via e-mail addressed to |
| | publicinfo@sec.gov or via regular mail addressed to the |
| | Public Reference Section, Securities and Exchange |
| | Commission, Washington, DC 20549-0102. |
| | |
| | |
| | |
| | |
| | © 2006 The Vanguard Group, Inc. |
| | All rights reserved. |
| | Vanguard Marketing Corporation, Distributor. |
| | |
| | Q6150 112006 |
Item 2: Code of Ethics. The Registrant has adopted a code of ethics that applies to the Registrant’s principal executive officer, principal financial officer, principal accounting officer or controller or persons performing similar functions. The Code of Ethics was amended during the reporting period covered by this report to make certain technical, non-material changes.
Item 3: Audit Committee Financial Expert. The following members of the Audit Committee have been determined by the Registrant’s Board of Trustees to be Audit Committee Financial Experts serving on its Audit Committee, and to be independent: Charles D. Ellis, Rajiv L. Gupta, JoAnn Heffernan Heisen, André F. Perold, Alfred M. Rankin, Jr., and J. Lawrence Wilson.
Item 4: Principal Accountant Fees and Services.
(a) Audit Fees.
Audit Fees of the Registrant
Fiscal Year Ended September 30, 2006: $96,000
Fiscal Year Ended September 30, 2005: $57,000
Aggregate Audit Fees of Registered Investment Companies in the Vanguard Group.
Fiscal Year Ended September 30, 2006: $2,347,620 |
Fiscal Year Ended September 30, 2005: $2,152,740
(b) Audit-Related Fees.
Fiscal Year Ended September 30, 2006: $530,000
Fiscal Year Ended September 30, 2005: $382,200
Includes fees billed in connection with assurance and related services provided to the Registrant, The Vanguard Group, Inc., Vanguard Marketing Corporation, and other registered investment companies in the Vanguard Group.
(c) Tax Fees.
Fiscal Year Ended September 30, 2006: $101,300
Fiscal Year Ended September 30, 2005: $98,400
Includes fees billed in connection with tax compliance, planning and advice services provided to the Registrant, The Vanguard Group, Inc., Vanguard Marketing Corporation, and other registered investment companies in the Vanguard Group and related to income and excise taxes.
(c) All Other Fees.
Fiscal Year Ended September 30, 2006: $0
Fiscal Year Ended September 30, 2005: $0
Includes fees billed for services related to risk management and privacy matters. Services were provided to the Registrant, The Vanguard Group, Inc., Vanguard Marketing Corporation, and other registered investment companies in the Vanguard Group.
(e) (1) Pre-Approval Policies. The policy of the Registrant’s Audit Committee is to consider and, if appropriate, approve before the principal accountant is engaged for such services, all specific audit and non-audit services provided to: (1) the Registrant; (2) The Vanguard Group, Inc.; (3) other entities controlled by The Vanguard Group, Inc. that provide ongoing services to the Registrant; and (4) other registered investment companies in the Vanguard Group. In making a determination, the Audit Committee considers whether the services are consistent with maintaining the principal accountant’s independence.
In the event of a contingency situation in which the principal accountant is needed to provide services in between scheduled Audit Committee meetings, the Chairman of the Audit Committee would be called on to consider and, if appropriate, pre-approve audit or permitted non-audit services in an amount sufficient to complete services through the next Audit Committee meeting, and to determine if such services would be consistent with maintaining the accountant’s independence. At the next scheduled Audit Committee meeting, services and fees would be presented to the Audit Committee for formal consideration, and, if appropriate, approval by the entire Audit Committee. The Audit Committee would again
consider whether such services and fees are consistent with maintaining the principal accountant’s independence.
The Registrant’s Audit Committee is informed at least annually of all audit and non-audit services provided by the principal accountant to the Vanguard complex, whether such services are provided to: (1) the Registrant; (2) The Vanguard Group, Inc.; (3) other entities controlled by The Vanguard Group, Inc. that provide ongoing services to the Registrant; or other registered investment companies in the Vanguard Group.
(2) No percentage of the principal accountant’s fees or services were approved pursuant to the waiver provision of paragraph (c)(7)(i)(C) of Rule 2-01 of Regulation S-X.
(f) For the most recent fiscal year, over 50% of the hours worked under the principal accountant’s engagement were not performed by persons other than full-time, permanent employees of the principal accountant.
(g) Aggregate Non-Audit Fees.
Fiscal Year Ended September 30, 2006: $101,300
Fiscal Year Ended September 30, 2005: $98,400
Includes fees billed for non-audit services provided to the Registrant, The Vanguard Group, Inc., Vanguard Marketing Corporation, and other registered investment companies in the Vanguard Group.
(h) For the most recent fiscal year, the Audit Committee has determined that the provision of all non-audit services was consistent with maintaining the principal accountant’s independence.
Item 5: Not Applicable.
Item 6: Not Applicable.
Item 7: Not Applicable.
Item 8: Not Applicable.
Item 9: Not Applicable.
Item 10: Not Applicable.
Item 11: Controls and Procedures.
(a) Disclosure Controls and Procedures. The Principal Executive and Financial Officers concluded that the Registrant's Disclosure Controls and Procedures are effective based on their evaluation of the Disclosure Controls and Procedures as of a date within 90 days of the filing date of this report.
(b) Internal Control Over Financial Reporting. There were no significant changes in Registrant’s Internal Control Over Financial Reporting or in other factors that could significantly affect this control subsequent to the date of the evaluation, including any corrective actions with regard to significant deficiencies and material weaknesses.
Item 12: Exhibits.
Pursuant to the requirements of the Securities Exchange Act of 1934 and the Investment Company Act of 1940, the registrant has duly caused this report to be signed on its behalf by the undersigned, thereunto duly authorized.
| VANGUARD HORIZON FUNDS
|
| BY: | (signature)
|
| (HEIDI STAM)
JOHN J. BRENNAN*
CHIEF EXECUTIVE OFFICER |
Pursuant to the requirements of the Securities Exchange Act of 1934 and the Investment Company Act of 1940, this report has been signed below by the following persons on behalf of the registrant and in the capacities and on the dates indicated.
| VANGUARD HORIZON FUNDS
|
| BY: | (signature)
|
| (HEIDI STAM)
THOMAS J. HIGGINS*
TREASURER |
| VANGUARD HORIZON FUNDS
|
| BY: | (signature)
|
| (HEIDI STAM)
THOMAS J. HIGGINS*
TREASURER |
*By Power of Attorney. See File Number 002-65955-99, filed on July 27, 2006. Incorporated by Reference.