UNITED STATES
SECURITIES AND EXCHANGE COMMISSION
Washington, D.C. 20549
FORM N-CSR
CERTIFIED SHAREHOLDER REPORT
OF
REGISTERED MANAGEMENT COMPANY
| Investment Company Act file number: | 811-07239 |
| Name of Registrant: | Vanguard Horizon Funds |
| Address of Registrant: | P.O. Box 2600
Valley Forge, PA 19482 |
| Name and address of agent for service: | R. Gregory Barton, Esquire
P.O. Box 876
Valley Forge, PA 19482 |
Registrant’s telephone number, including area code: (610) 669-1000
| Date of fiscal year end: | September 30 |
| Date of reporting period: | November 1, 2003 - September 30, 2004 |
| Item 1: | Reports to Shareholders |
Vanguard® Strategic Equity Fund
September 30, 2004


YOUR FUND REPORT
| CONTENTS |
|---|
| 1 | LETTER FROM THE CHAIRMAN |
| 6 | REPORT FROM THE ADVISOR |
| 9 | FUND PROFILE |
| 10 | GLOSSARY OF INVESTMENT TERMS |
| 11 | PERFORMANCE SUMMARY |
| 12 | YOUR FUND'S AFTER-TAX RETURNS |
| 13 | ABOUT YOUR FUND'S EXPENSES |
| 15 | FINANCIAL STATEMENTS |
| 27 | ADVANTAGES OF VANGUARD.COM |
SUMMARY
• Vanguard Strategic Equity Fund recently changed its fiscal year-end from October to September.
• Your fund delivered a strong absolute return for the 11 months ended September 30, 2004. It outpaced its peer-group average,
but modestly lagged its target index.
• The investment advisor identified excellent performers in the financial services and “other” sectors, but some of those gains were
offset by poor performers in the technology and consumer discretionary sectors.
VANGUARD’S PLEDGE TO CLIENTS
We recognize that your relationship with Vanguard rests on the twin pillars of trust and excellence, each of which is built upon the character of our people. Our Pledge to Clients reflects our ongoing efforts to deserve your trust and to continually improve so that we can offer you excellence in all that we do.
We will:
• Put your interests first at all times.
• Continually seek to earn your trust by adhering to the highest standards of ethical behavior and fiduciary responsibility.
• Strive to be the highest-value provider of investment services, which means outstanding investment performance and service,
both at the lowest possible cost.
• Communicate candidly not only about the rewards of investing but also about the risks and costs.
• Maintain highly effective controls to safeguard your assets and protect your confidential information.
• Invest a majority of our personal assets alongside yours.
Please note: The opinions expressed in this report are just that—informed opinions. They should not be considered promises or advice.
Want less clutter in your mailbox? Just register with Vanguard.com® and opt to get fund reports online.
LETTER FROM THE CHAIRMAN

Dear Shareholder,
Please note that Vanguard Strategic Equity Fund has changed its fiscal year-end from October to September. This report covers the 11 months from October 31, 2003, to September 30, 2004.
During fiscal 2004, Vanguard Strategic Equity Fund returned 11.1%, a bit less than the return of its target benchmark but more than the returns of its peer-group average and the broad stock market. The total returns of your fund and its comparative standards appear in the adjacent table. As was the case for the fund’s benchmark, the fund’s strong absolute return reflected good performances by its holdings in the financial services, “other energy,” and materials & processing sectors. In absolute terms, the fund’s most notable weakness was its holdings in the hard-hit technology sector.
2004 Total Returns
| October 31, 2003,
Through
September 30, 2004
|
|---|
| Vanguard Strategic Equity Fund | 11.1% |
| MSCI US Small + Mid Cap 2200 Index | 11.3 |
| Average Mid-Cap Core Fund* | 8.8 |
| Dow Jones Wilshire 5000 Index | 8.2 |
|
*Derived from data provided by Lipper Inc.
Your fund’s distributions per share and beginning and ending net asset values are shown in the table on page 5. We expect the fund to make a year-end distribution from net realized capital gains of about $0.84 per share. This distribution will be made in December 2004.
If you own Vanguard Strategic Equity Fund in a taxable account, see page 12 for a report on the fund’s after-tax returns.
STOCKS FARED WELL, THEN COOLED OFF
A strong rally in U.S. stock prices from the beginning of fiscal 2004 through February produced solid gains for most major indexes. These advances were fueled by solid corporate earnings growth and a slew
1
of economic reports suggesting robust growth and job-market improvement. However, from March through September, most indexes saw relatively little change. The earlier enthusiasm for stocks wore thin, as economic reports turned less favorable and the economy showed the strain of rising crude-oil prices. For the 11 months, the broad U.S. stock market, as measured by the Dow Jones Wilshire 5000 Composite Index, returned 8.2%.
Smaller-capitalization stocks provided higher returns for the fiscal period than did large-caps. Across the market-cap spectrum, value-oriented stocks (those that generally trade at below-market valuations relative to their book values and other fundamental measures) outpaced growth-oriented issues (those expected to return above-average earnings growth). Returns from most international markets were enhanced for U.S.-based investors by the continued weakness of the greenback relative to major currencies.
BOND MARKET WAS SWAYED BY ECONOMIC UNCERTAINTIES
For the first half of the period, the continued decline in bond yields boosted bond prices and returns. In April, however, yields began to march higher as reports showed higher-than-expected inflation and strong job growth. Yields tailed off again in August and September, as reports suggested the economic recovery had lost some steam. The yield of the 10-year U.S. Treasury note, a benchmark for longer-term interest rates, dropped to a low of 3.69% in March, climbed to 4.65% by the end of May, and finished the period at 4.12%.
| Market Barometer | | Average Annual Total Returns |
|---|
| | | Periods Ended September 30, 2004
|
|---|
|
| One
Year
| Three
Years
| Five
Years
|
|---|
| Stocks | Russell 1000 Index (Large-caps) | 13.9% | 4.7% | -0.7% |
| | Russell 2000 Index (Small-caps) | 18.8 | 13.7 | 7.4 |
| | Dow Jones Wilshire 5000 Index | 14.8 | 6.1 | 0.0 |
| | (Entire market) | | | |
| | MSCI All Country World Index | | | |
| | ex USA (International) | 23.1 | 11.4 | 0.5 |
|
| Bonds | Lehman Aggregate Bond Index | 3.7% | 5.9% | 7.5% |
| | (Broad taxable market) | | | |
| | Lehman Municipal Bond Index | 4.6 | 5.8 | 6.8 |
| | Citigroup 3-Month Treasury Bill Index | 1.0 | 1.4 | 3.0 |
|
| CPI | Consumer Price Index | 2.5% | 2.1% | 2.5% |
|
Investment-grade taxable bonds, as measured by the Lehman Brothers Aggregate Bond Index, returned 4.7% for the 11 months. Corporate
2
bonds continued to offer competitive returns relative to their government counterparts. The yield of the 3-month Treasury bill (a proxy for money market rates) rose 0.76 percentage point in the last six months of the period in response to the Federal Reserve Board’s three separate actions—in June, August, and September—to raise its target for the federal funds rate. The T-bill, which yielded 0.94% at the end of March, yielded 1.70% as of September 30.
FUND HAD MIXED SUCCESS
Vanguard Strategic Equity Fund seeks to provide higher returns than the Morgan Stanley Capital International (MSCI) US Small + Mid Cap 2200 Index while maintaining a similar risk profile. The fund delivered mixed results during fiscal 2004. It generated a strong absolute return, but modestly trailed its index. (A more impressive relative result was its 2.3-percentage-point advantage over the average return of mid-cap core funds.)
In both stocks and bonds, the fiscal year was a tale of two markets-long returns during the first half, and stagnation in the second.
The fund’s investment process combines an emphasis on relative risk control with quantitative stock-selection models that seek to exploit investors’ over- and underreactions to changes in companies’ earnings growth, valuations, and stock prices. This approach implies that the fund’s success—or shortfall—relative to its index is a function of stock selection (as opposed to sector bets or timing strategies).
During the past 11 months, the fund outperformed its target index in several sectors, including the sizable financial services group and the “other” category, which includes a number of conglomerates operating in a variety of industries. The fund came up short among technology shares and consumer discretionary stocks (a group made up of retailers, restaurants, entertainment purveyors, and other companies that compete for the consumer’s spare dollar). The negatives more or less offset the positives, and the result was an index-like return.
MEANINGFUL PERSPECTIVE OFFERS IMPRESSIVE VIEW
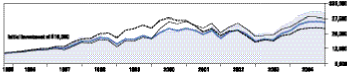
As we’ve cautioned before, it’s a mistake to make too much of a one-year—or in this case an 11-month—result. The fund’s advisor,
3
Vanguard Quantitative Equity Group, has created an investment strategy that attempts to provide index-beating results over the long term. Since its 1995 inception through September 30, 2004, the Strategic Equity Fund returned an annualized 13.0%, transforming a hypothetical initial investment of $10,000 into $30,404. As illustrated in the adjacent table, the same investment in the fund’s comparative standards would have experienced more modest growth. For example, a $10,000 investment compounded at the annualized rate of return of the fund’s target index would have been worth $25,691 on September 30.
| Total Returns | | August 14, 1995,* |
|---|
|
| Through
September 30, 2004
|
|---|
| Average
Annual
Return
| Final Value of
a $10,000
Initial Investment
|
|---|
| Strategic Equity Fund | 13.0% | $30,404 |
| | | |
| Spliced Small and | | |
| | | |
| Mid Cap Index** | 10.9 | 25,691 |
| | | |
| Average Mid-Cap | | |
| | | |
| Core Fund | 11.6 | 27,277 |
| | | |
| Dow Jones | | |
| | | |
| Wilshire 5000 Index | 9.3 | 22,523 |
|
*The fund’s inception date.
**The Spliced Small and Mid Cap Index reflects the returns of the Russell 2800 Index through May 31, 2003, and the MSCI US
Small + Mid Cap 2200 Index thereafter.
In any given period, the Strategic Equity Fund may lead or lag its index. Over time, however, its disciplined and consistent investment strategy has produced index-beating returns of sufficient duration and magnitude to increase shareholder wealth at a rate faster than that of the index.
LESSONS OF YOUR FUND
Your fund’s long-term orientation holds important lessons for the way you manage your own investment program. Inevitably, any portfolio hits a rough patch. How you respond is a critical determinant of your success in reaching your long-term financial goals.
The advisor to Vanguard Strategic Equity Fund recognizes that the market’s—and the fund’s—short-term ups and downs are often simply noise. The advisor remains focused on the goal of developing quantitative strategies that can create long-term wealth through a variety of market conditions, not on vaulting past the index at a discrete moment in time.
In a similar vein, if you accept periodic downturns in your investment program as inevitable and remain focused on holding a diversified
4
portfolio of stock, bond, and money market funds tailored to your unique circumstances, you’ll be better positioned to reach your long-term financial goals.
Thank you for entrusting your assets to Vanguard.
Sincerely,

John J. Brennan
CHAIRMAN AND CHIEF EXECUTIVE OFFICER
OCTOBER 12, 2004
| Your Fund's Performance at a Glance | October 31, 2003-September 30, 2004 |
|---|
| | | | | |
|---|
| | | | Distributions Per Share
|
|---|
| | Starting | Ending | Income | Capital |
| Share Price
| Share Price
| Dividends
| Gains
|
| Strategic Equity Fund | $17.85 | $19.70 | $0.13 | $0.00 |
|
5
REPORT FROM THE ADVISOR
Small- and mid-capitalization U.S. stocks rose during the Strategic Equity Fund’s fiscal year (which for this report spanned just 11 months, because of a change in our fiscal year-end). Overall, our benchmark for these stocks, the MSCI US Small + Mid Cap 2200 Index, gained more than 11% for the period. The fund trailed the benchmark by about 0.2 percentage point in return.
The stock market’s overall gain masked significant performance reversals during the fiscal period—particularly in April and July, when small- and mid-cap stocks fell sharply—as investors grappled with uncertainty about the expected pace of economic growth, inflationary pressures, interest-rate policy, geopolitical developments, and the ability to sustain recent corporate profit gains. Returns also diverged dramatically among industry sectors. A sharp rise in oil prices fueled gains for energy-related stocks (up 54% as a group). On the other hand, worries about the level of investment spending weighed heavily on technology companies. Semiconductor stocks were particularly depressed, falling nearly –30% for the fiscal year. Continuing a trend that has been generally in place since the market “bubble” burst in March 2000, value stocks (those with lower valuation multiples and higher dividend yields) outperformed growth companies.
Investment Philosophy
The advisor believes that superior long-term investment results can be achieved by using quantitative models to identify mid- and small-capitalization stocks that offer the best investment opportunities. Among the characteristics the advisor believes will distinguish such opportunities are relative value, earnings potential, and recognition in the marketplace.
Our goal with Strategic Equity is to outperform the small- and mid-cap market indexes over time. We fell just short of this goal during the abbreviated 2004 fiscal year—the first time in four years that we trailed our index benchmark. However, investing is for the long run, and our results have been profitable overall since Strategic Equity’s inception in 1995. Although we do not know what the future will bring, we are confident that long-run success is possible so long as we adhere to our objective, disciplined, risk-controlled investment process.
6
OUR INVESTMENT APPROACH
Our investment approach combines two key features: a stock-selection methodology, which is aimed at generating a return better than that of the MSCI US Small + Mid Cap 2200 Index, and a risk-control framework, which is designed to deliver consistency and relative predictability by matching the benchmark’s characteristics. We analyze the available opportunities through the use of quantitative techniques, gauging each company’s potential to outperform its industry peers. Using a process rooted in fundamental investment research, we assess a company’s balance sheet, income statement, relative valuation, and degree of acceptance in the marketplace. The benefits of a quantitative approach, we believe, lie in its objectivity and consistency; we let a company’s track record and prospective opportunities drive our decision-making, rather than any “spin” that may come from company management. Another key benefit of our process is its capacity: We constantly assess thousands of opportunities through automated processes without having to employ dozens of analysts (all with different biases) to cover the marketplace.
Our approach to portfolio construction limits the influence of various factors that may explain short-run differences in return but that, in our view, do not affect long-term relative performance. For example, an essential part of our investment process is comparing companies with their industry counterparts; therefore, we do not make bets on which market sectors are going to outperform. In fact, our research suggests that trying to capture sector deviations through so-called sector rotation strategies is both extremely difficult and fraught with risk that is unlikely to be rewarded with higher returns. This is why we keep the fund’s sector weightings “neutral” relative to those of the benchmark index. The 2004 fiscal period demonstrated the benefits of this view; our portfolio was largely immune to the substantial sector-return differences in the market because of our sector-neutral positioning.
Over the course of the fiscal period, our stock selection models performed quite well, particularly the component focused on stock valuations. Unfortunately, the portfolio was not able to fully capture the return indicated by our models. We were hurt disproportionately by poor results among our retail and technology hardware holdings. Of the eight securities that cost the fund more than 0.2 percentage point each in relative performance; seven were technology issues and one (Blockbuster) was a retailer.
7
On the other hand, a broad array of securities worked to offset most of these negative results. Six stocks—ranging from Sierra Health Services (+106% for the period) to Sunoco (+73%), and from Ryder System (+59%), a transportation company, to the telecom concern NII Holdings (+61%)—each contributed more than 0.3 percentage point of outperformance relative to the benchmark.
THE FUND’S POSITIONING
Strategic Equity’s positioning remains unchanged in that we are invested in the stocks ranked most attractive by our quantitative models while maintaining a risk profile similar to that of the broad small- and mid-cap stock market, as reflected in our benchmark. We consciously increased the number of holdings in the fund during the period to better capture the return of our stock-selection models. Strong cash flow (more than $1 billion in net new money) made this change easy to implement and also helped to lower our turnover rate, because we did not need to sell as many existing holdings to buy new ones. We hope to build upon Strategic Equity’s success as the fund approaches its ten-year anniversary in August 2005. Thank you for your continued investment and support.
George U. Sauter, CHIEF INVESTMENT OFFICER AND MANAGING DIRECTOR
Joel M. Dickson, PRINCIPAL
VANGUARD QUANTITATIVE EQUITY GROUP
OCTOBER 14, 2004
8
As of 9/30/2004
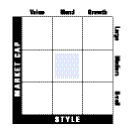
FUND PROFILE
This Profile provides a snapshot of the fund’s characteristics, compared where indicated with both an appropriate market index and a broad market index. Key terms are defined on page 10.
STRATEGIC EQUITY FUND
|
|
|
|---|
| Portfolio Characteristics | | | |
|---|
| Comparative
Fund
|
Index*
| Broad
Index**
|
|---|
| Number of Stocks | 388 | 2,170 | 5,018 |
| Median Market Cap | $3.0B | $3.0B | $25.7B |
| Price/Earnings Ratio | 16.6x | 21.4x | 21.5x |
| Price/Book Ratio | 2.2x | 2.3x | 2.7x |
| Yield | 0.9% | 1.3% | 1.6% |
| Return on Equity | 12.4% | 13.3% | 15.9% |
| Earnings Growth Rate | 11.7% | 10.5% | 7.4% |
| Foreign Holdings | 0.1% | 0.0% | 0.8% |
| Turnover Rate | 66% | — | — |
| Expense Ratio | 0.45%† | — | — |
| Short-Term Reserves | 0% | — | — |
|
| Volatility Measures | | | | |
|---|
| | | | | |
|---|
|
Fund
| Spliced††
Index
|
Fund
| Broad
Index**
|
|---|
| R-Squared | 0.97 | 1.00 | 0.86 | 1.00 |
| Beta | 0.86 | 1.00 | 0.89 | 1.00 |
|
| Sector Diversification (% of portfolio) | | |
|---|
|
Fund
| Comparative
Index*
| Broad
Index**
|
|---|
| Auto & Transportation | 4% | 4% | 3% |
| Consumer Discretionary | 18 | 18 | 16 |
| Consumer Staples | 2 | 2 | 6 |
| Financial Services | 23 | 23 | 23 |
| Health Care | 11 | 10 | 12 |
| Integrated Oils | 0 | 1 | 4 |
| Other Energy | 6 | 7 | 3 |
| Materials & Processing | 8 | 8 | 4 |
| Producer Durables | 7 | 7 | 5 |
| Technology | 11 | 12 | 13 |
| Utilities | 8 | 7 | 7 |
| Other | 2 | 1 | 4 |
|
| Short-Term Reserves | 0% | — | — |
|
| Ten Largest Holdings (% of total net assets) |
|---|
| | |
|---|
| Xerox Corp. | 1.1% |
| (electronic business equipment) | |
| PACCAR, Inc. | 1.1 |
| (automotive and transport) | |
| Eaton Corp. | 1.1 |
| (manufacturing) | |
| Georgia-Pacific Group | 1.0 |
| (diversified manufacturing) | |
| D. R. Horton, Inc. | 1.0 |
| (home-building) | |
| Phelps Dodge Corp. | 1.0 |
| (copper) | |
| Sunoco, Inc. | 1.0 |
| (energy) | |
| Monsanto Co. | 1.0 |
| (chemicals) | |
| Providian Financial Corp. | 0.9 |
| (financial services) | |
| Textron, Inc. | 0.9 |
| (conglomerate) | |
|
| Top Ten | 10.1% |
|
"Ten Largest Holdings" excludes any temporary cash investments and equity index products.
Investment Focus
*MSCI Small + Mid Cap 2200 Index.
**Dow Jones Wilshire 5000 Index.
†Annualized.
††Russell 2800 Index through May 31, 2003, MSCI Small + Mid Cap 2200 Index thereafter.
Visit our website at Vanguard.com for regularly updated fund information.
9
GLOSSARY OF INVESTMENT TERMS
Beta. A measure of the magnitude of a fund's past share-price fluctuations in relation to the ups and downs of a given market index. The index is assigned a beta of 1.00. Compared with a given index, a fund with a beta of 1.20 typically would have seen its share price rise or fall by 12% when the index rose or fell by 10%. A fund's beta should be reviewed in conjunction with its R-squared (see definition below). The lower the R-squared, the less correlation there is between the fund and the index, and the less reliable beta is as an indicator of volatility.
Earnings Growth Rate. The average annual rate of growth in earnings over the past five years for the stocks now in a fund.
Expense Ratio. The percentage of a fund's average net assets used to pay its annual administrative and advisory expenses. These expenses directly reduce returns to investors.
Foreign Holdings. The percentage of a fund's equity assets represented by stocks or depositary receipts of companies based outside the United States.
Median Market Cap. An indicator of the size of companies in which a fund invests; the midpoint of market capitalization (market price x shares outstanding) of a fund's stocks, weighted by the proportion of the fund's assets invested in each stock. Stocks representing half of the fund's assets have market capitalizations above the median, and the rest are below it.
Price/Book Ratio. The share price of a stock divided by its net worth, or book value, per share. For a fund, the weighted average price/book ratio of the stocks it holds.
Price/Earnings Ratio. The ratio of a stock's current price to its per-share earnings over the past year. For a fund, the weighted average P/E of the stocks it holds. P/E is an indicator of market expectations about corporate prospects; the higher the P/E, the greater the expectations for a company's future growth.
R-Squared. A measure of how much of a fund's past returns can be explained by the returns from the market in general, as measured by a given index. If a fund's total returns were precisely synchronized with an index's returns, its R-squared would be 1.00. If the fund's returns bore no relationship to the index's returns, its R-squared would be 0.
Return on Equity. The annual average rate of return generated by a company during the past five years for each dollar of shareholder's equity (net income divided by shareholder's equity). For a fund, the weighted average return on equity for the companies whose stocks it holds.
Short-Term Reserves. The percentage of a fund invested in highly liquid, short-term securities that can be readily converted to cash.
Turnover Rate. An indication of the fund's trading activity. Funds with high turnover rates incur higher transaction costs and may be more likely to distribute capital gains (which may be taxable to investors).
Yield. A snapshot of a fund's income from interest and dividends. The yield, expressed as a percentage of the fund's net asset value, is based on income earned over the past 30 days and is annualized, or projected forward for the coming year. The index yield is based on the current annualized rate of income provided by securities in the index.
10
As of 9/30/2004
PERFORMANCE SUMMARY
All of the returns in this report represent past performance, which is not a guarantee of future results that may be achieved by the fund. (For the performance data current to the most recent month-end, which may be higher or lower than that cited, visit our website at www.vanguard.com.) Note, too, that both investment returns and principal value can fluctuate widely, so an investor's shares, when sold, could be worth more or less than their original cost. The returns shown do not reflect taxes that a shareholder would pay on fund distributions or on the sale of fund shares. All average annual returns are based on the fund's new fiscal year-end.
STRATEGIC EQUITY FUND
Cumulative Performance August 14, 1995-September 30, 2004
| | | Average Annual Total Returns | |
|---|
| | | Periods Ended September 30, 2004
| Final Value |
|---|
| Eleven
Months
| One
Year
| Five
Years
| Since
Inception*
| of a $10,000
Investment
|
|---|
| Strategic Equity Fund | 11.14% | 18.86% | 11.36% | 12.95% | $30,404 |
| Dow Jones Wilshire 5000 Index | 8.15 | 14.76 | -0.05 | 9.30 | 22,523 |
| Spliced Small and Mid Cap Index** | 11.35 | 20.01 | 8.12 | 10.89 | 25,691 |
| Average Mid-Cap Core Fund† | 8.77 | 16.59 | 9.62 | 11.62 | 27,277 |
|
Total Investment Returns (%) August 14, 1995–September 30, 2004
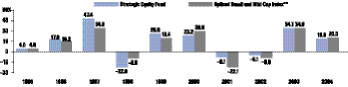
*August 14, 1995.
**The Spliced Small and Mid Cap Index reflects the returns of the Russell 2800 Index through May 31, 2003, and the MSCI US Small + Mid Cap 2200 Index thereafter.
†Derived from data provided by Lipper Inc.
Note: See Financial Highlights table on page 23 for dividend and capital gains information.
11
YOUR FUND’S AFTER-TAX RETURNS
This table presents returns for your fund both before and after taxes. The after-tax returns are shown in two ways: (1) assuming that an investor owned the fund during the entire period and paid taxes on the fund’s distributions, and (2) assuming that an investor paid taxes on the fund’s distributions and sold all shares at the end of each period.
Calculations are based on the highest individual federal income tax and capital gains tax rates in effect at the times of the distributions and the hypothetical sales. State and local taxes were not considered. After-tax returns reflect the reduced tax rates on ordinary income (including qualified dividend income) and short-term capital gains that became effective as of January 1, 2003, and on long-term capital gains realized on or after May 6, 2003. To calculate qualified dividend income, we used actual 2003 figures and estimates for 2004. (In the example, returns after the sale of fund shares may be higher than those assuming no sale. This occurs when the sale would have produced a capital loss. The calculation assumes that the investor received a tax deduction for the loss.)
Please note that your actual after-tax returns will depend on your tax situation and may differ from those shown. Also note that if you own the fund in a tax-deferred account, such as an individual retirement account or a 401(k) plan, this information does not apply to you. Such accounts are not subject to current taxes.
Finally, keep in mind that a fund’s performance—whether before or after taxes—does not guarantee future results.
| Average Annual Total Returns | Periods Ended September 30, 2004 |
|---|
| | | | |
|---|
|
One Year
|
Five Years
| Since
Inception*
|
|---|
| Strategic Equity Fund | | | |
| Returns Before Taxes | 18.86% | 11.36% | 12.95% |
| Returns After Taxes on Distributions | 18.71 | 9.61 | 11.27 |
| Returns After Taxes on Distributions and Sale of Fund Shares | 12.39 | 8.80 | 10.44 |
|
*August 14, 1995.
12
ABOUT YOUR FUND’S EXPENSES
We believe it is important for you to understand the impact of costs on your investment. All mutual funds have operating expenses. As a shareholder of the fund, you incur ongoing costs, which include costs for portfolio management, administrative services, and shareholder reports (like this one), among others. Operating expenses, which are deducted from a fund’s gross income, directly reduce the investment return of the fund.
A fund’s expenses are expressed as a percentage of its average net assets. This figure is known as the expense ratio. The following examples are intended to help you understand the ongoing costs (in dollars) of investing in your fund and to compare these costs with those of other mutual funds. The examples are based on an investment of $1,000 made at the beginning of the period shown and held for the entire period.
The table below illustrates your fund’s costs in two ways:
• Based on actual fund return. This section helps you to estimate the actual expenses that you paid over the period. The “Ending Account Value” shown is derived from the fund’s actual return, and the third column shows the dollar amount that would have been paid by an investor who started with $1,000 in the fund. You may use the information here, together with the amount you invested, to estimate the expenses that you paid over the period.
To do so, simply divide your account value by $1,000 (for example, an $8,600 account value divided by $1,000 = 8.6), then multiply the result by the number given for your fund under the heading “Expenses Paid During Period.”
• Based on hypothetical 5% return. This section is intended to help you compare your fund’s costs with those of other mutual funds. It assumes that the fund had a yearly return of 5% before expenses, but that the expense ratio is unchanged. In this case—because the return used is not the fund’s actual return—the results do not apply to your investment. The example is useful in making comparisons because the Securities and Exchange Commission requires all mutual funds to calculate expenses based on a 5% return.
You can assess your fund’s costs by comparing this hypothetical example with the hypothetical examples that appear in shareholder reports of other funds.
| Six Months Ended September 30, 2004 | | |
|---|
| | | | |
|---|
Strategic Equity Fund
| Beginning
Account Value
3/31/2004
| Ending
Account Value
9/30/2004
| Expenses
Paid During
Period*
|
|---|
| Based on | | | |
| Actual Fund Return | $1,000.00 | $993.95 | $2.25 |
| | | | |
| Based on Hypothetical | | | |
| 5% Yearly Return | $1,000.00 | $1,022.75 | $2.28 |
|
*These calculations are based on expenses incurred in the most recent six-month period. The fund’s annualized six-month expense ratio for that period is 0.45%. The dollar amounts shown as “Expenses Paid” are equal to the annualized expense ratio multiplied by the average account value over the period, multiplied by the number of days in the most recent six-month period, then divided by the number of days in the most recent 12-month period.
Note that the expenses shown in the table are meant to highlight and help you compare ongoing costs only and do not reflect any transactional costs or account maintenance fees. They do not include your fund’s low-balance fee, which is described in the prospectus. If this fee were applied to your account, your costs would be higher. Your fund does not
13
| Annualized Expense Ratios: | |
|---|
| Your fund compared with its peer group | |
|---|
|
|
|---|
| Strategic Equity Fund | 0.45% |
| Average Mid-Cap Core Fund | 1.53%* |
|
*Peer-group expense ratio is derived from data provided by Lipper Inc. and captures information through year-end 2003.
charge transaction fees, such as purchase or redemption fees, nor does it carry a “sales load.”
The calculations assume no shares were bought or sold during the period. Your actual costs may have been higher or lower, depending on the amount of your investment and the timing of any purchases or redemptions.
You can find more information about the fund’s expenses, including annual expense ratios, in the Financial Statements section of this report. For additional information on operating expenses and other shareholder costs, please refer to the appropriate fund prospectus.
14
As of 9/30/2004
FINANCIAL STATEMENTS
STATEMENT OF NET ASSETS
This Statement provides a detailed list of the fund’s holdings, including each security’s market value on the last day of the reporting period. Securities are grouped and subtotaled by asset type (common stocks, bonds, etc.) and by industry sector. Other assets are added to, and liabilities are subtracted from, the value of Total Investments to calculate the fund’s Net Assets. Finally, Net Assets are divided by the outstanding shares of the fund to arrive at its share price, or Net Asset Value (NAV) Per Share.
At the end of the Statement of Net Assets, you will find a table displaying the composition of the fund’s net assets. Because all income and any realized gains must be distributed to shareholders each year, the bulk of net assets consists of Paid-in Capital (money invested by shareholders). The amounts shown for Undistributed Net Investment Income and Accumulated Net Realized Gains usually approximate the sums the fund had available to distribute to shareholders as income dividends or capital gains as of the statement date, but may differ because certain investments or transactions may be treated differently for financial statement and tax purposes. Any Accumulated Net Realized Losses, and any cumulative excess of distributions over net income or net realized gains, will appear as negative balances. Unrealized Appreciation (Depreciation) is the difference between the market value of the fund’s investments and their cost, and reflects the gains (losses) that would be realized if the fund were to sell all of its investments at their statement-date values.
The fund provides a complete list of its holdings four times in each fiscal year, at the quarter-ends. For the second and fourth quarters, the lists appear in the fund’s semiannual and annual reports to shareholders. For the first and third quarters, the fund files the lists with the Securities and Exchange Commission on Form N-Q. Shareholders can look up the fund’s Forms N-Q on the SEC’s website at www.sec.gov. Forms N-Q may also be reviewed and copied at the SEC’s Public Reference Room (see the back cover of this report for further information).
Strategic Equity Fund
|
Shares
| Market
Value^
(000)
|
|---|
| COMMON STOCKS (99.2%) (1) | | |
|
|
|
| Auto & Transportation (3.6%) | | |
| PACCAR, Inc. | 475,650 | $ 32,877 |
| J.B. Hunt Transport Services, Inc. | 565,200 | 20,992 |
| Overseas Shipholding Group Inc. | 371,600 | 18,446 |
| American Axle & | | |
| Manufacturing Holdings, Inc. | 269,247 | 7,878 |
| Dana Corp. | 297,900 | 5,270 |
| *ExpressJet Holdings, Inc. | 397,000 | 3,974 |
| *Tenneco Automotive, Inc. | 293,300 | 3,842 |
| *Wabash National Corp. | 116,700 | 3,206 |
| Overnite Corp. | 97,300 | 3,058 |
| Winnebago Industries, Inc. | 80,800 | 2,799 |
| *Mesa Air Group Inc. | 381,344 | 1,945 |
| *TRW Automotive Holdings Corp. | 65,500 | 1,235 |
| Arkansas Best Corp. | 32,338 | 1,184 |
| |
|
| | | 106,706 |
| |
|
| Consumer Discretionary (17.8%) | | |
| *MGM Mirage, Inc. | 551,800 | 27,397 |
| RadioShack Corp. | 907,400 | 25,988 |
| *Barnes & Noble, Inc. | 668,400 | 24,731 |
| *Getty Images, Inc. | 418,100 | 23,121 |
| Whirlpool Corp. | 363,700 | 21,855 |
| Belo Corp. Class A | 913,000 | 20,579 |
| Estee Lauder Cos. Class A | 490,200 | 20,490 |
| Starwood Hotels & | | |
| Resorts Worldwide, Inc. | 440,400 | 20,443 |
| *Advance Auto Parts, Inc. | 544,452 | 18,729 |
| Republic Services, Inc. Class A | 606,000 | 18,035 |
| *AnnTaylor Stores Corp. | 711,950 | 16,660 |
| *Timberland Co. | 283,900 | 16,126 |
| Harrah's Entertainment, Inc. | 248,700 | 13,176 |
| The Neiman Marcus Group, Inc. | | |
| Class A | 213,900 | 12,299 |
| The Stanley Works | 272,600 | 11,594 |
| Knight Ridder | 163,700 | 10,714 |
| *Ask Jeeves, Inc. | 294,332 | 9,628 |
| *Global Imaging Systems, Inc. | 305,291 | 9,488 |
| American Eagle Outfitters, Inc. | 255,800 | 9,426 |
| *Career Education Corp. | 298,200 | 8,478 |
15
Strategic Equity Fund
|
Shares
| Market
Value^
(000)
|
|---|
| K-Swiss, Inc. | 386,711 | $ 7,444 |
| Finish Line, Inc. | 240,054 | 7,422 |
| *United Stationers, Inc. | 169,300 | 7,348 |
| Hollinger International, Inc. | 416,400 | 7,200 |
| *Rent-A-Center, Inc. | 272,650 | 7,051 |
| *Earthlink, Inc. | 654,069 | 6,737 |
| Polo Ralph Lauren Corp. | 176,800 | 6,430 |
| *Korn/Ferry International | 344,400 | 6,278 |
| *Activision, Inc. | 444,387 | 6,164 |
| *Men's Wearhouse, Inc. | 210,200 | 6,106 |
| Meredith Corp. | 118,400 | 6,083 |
| *Scientific Games Corp. | 314,645 | 6,010 |
| The McClatchy Co. Class A | 84,200 | 5,964 |
| Wendy's International, Inc. | 157,100 | 5,279 |
| Hearst-Argyle Television Inc. | 213,000 | 5,208 |
| J.C. Penney Co., Inc. (Holding Co.) | 136,400 | 4,812 |
| *Caesars Entertainment, Inc. | 278,800 | 4,656 |
| *Lamar Advertising Co. Class A | 109,148 | 4,542 |
| *Laureate Education Inc. | 106,400 | 3,960 |
| *Tommy Hilfiger Corp. | 389,600 | 3,845 |
| *Charming Shoppes, Inc. | 538,602 | 3,835 |
| *GameStop Corp. | 203,300 | 3,763 |
| *Central Garden and Pet Co. | 116,200 | 3,558 |
| Brown Shoe Co., Inc. | 137,600 | 3,448 |
| *SOURCECORP, Inc. | 153,294 | 3,394 |
| *Guess ?, Inc. | 182,400 | 3,249 |
| Mandalay Resort Group | 47,100 | 3,233 |
| *Jack in the Box Inc. | 97,700 | 3,100 |
| *Zale Corp. | 107,600 | 3,024 |
| *United Online, Inc. | 303,921 | 2,924 |
| *Corrections Corp. of | | |
| America REIT | 79,800 | 2,822 |
| Oxford Industries, Inc. | 74,700 | 2,783 |
| *Heidrick & Struggles | | |
| International, Inc. | 96,500 | 2,781 |
| *Education Management Corp. | 99,100 | 2,640 |
| *Pacific Sunwear of | | |
| California, Inc. | 118,625 | 2,497 |
| Wolverine World Wide, Inc. | 97,600 | 2,460 |
| ServiceMaster Co. | 190,500 | 2,450 |
| *Teletech Holdings Inc. | 228,300 | 2,155 |
| *Isle of Capri Casinos, Inc. | 105,836 | 2,050 |
| The Toro Co. | 26,300 | 1,796 |
| *Genesco, Inc. | 66,100 | 1,557 |
| *Service Corp. International | 219,900 | 1,366 |
| *Skechers U.S.A., Inc. | 91,300 | 1,326 |
| *MPS Group, Inc. | 140,400 | 1,181 |
| Borders Group, Inc. | 38,400 | 952 |
| *Ryan's Restaurant Group, Inc. | 63,700 | 945 |
| *Volt Information Sciences Inc. | 26,800 | 771 |
| *Dex Media, Inc. | 33,200 | 703 |
| Speedway Motorsports, Inc. | 20,200 | 673 |
| Jones Apparel Group, Inc. | 14,400 | 516 |
| The Neiman Marcus Group, Inc. | | |
| Class B | 7,600 | 405 |
| *Vail Resorts Inc. | 18,600 | 336 |
| Matthews International Corp. | 7,200 | 244 |
| Robert Half International, Inc. | 8,600 | 222 |
| |
|
| | | 526,655 |
| |
|
| | | |
| Consumer Staples (1.6%) | | |
| Tyson Foods, Inc. | 1,375,700 | 22,039 |
| SuperValu Inc. | 388,500 | 10,703 |
| Sanderson Farms, Inc. | 274,242 | 9,173 |
| Ruddick Corp. | 105,800 | 2,078 |
| PepsiAmericas, Inc. | 97,900 | 1,870 |
| Schweitzer-Mauduit | | |
| International, Inc. | 39,200 | 1,270 |
| |
|
| | | 47,133 |
| |
|
| | | |
| Financial Services (23.0%) | | |
| Banks—Outside New York City (3.7%) | |
| Huntington Bancshares Inc. | 1,075,277 | 26,785 |
| Hibernia Corp. Class A | 650,600 | 17,182 |
| First Horizon National Corp. | 271,500 | 11,772 |
| The South Financial Group, Inc. | 300,239 | 8,467 |
| Hudson United Bancorp | 218,900 | 8,066 |
| City National Corp. | 111,800 | 7,261 |
| Associated Banc-Corp | 202,478 | 6,493 |
| R & G Financial Corp. Class B | 158,200 | 6,114 |
| Trustmark Corp. | 142,700 | 4,435 |
| Doral Financial Corp. | 75,500 | 3,131 |
| Irwin Financial Corp. | 106,000 | 2,737 |
| Colonial BancGroup, Inc. | 109,700 | 2,243 |
| Popular, Inc. | 62,106 | 1,633 |
| City Holding Co. | 35,600 | 1,171 |
| Commerce Bancshares, Inc. | 21,200 | 1,020 |
| Columbia Banking System, Inc. | 41,155 | 979 |
| Independent Bank Corp. (MI) | 12,029 | 325 |
| | | |
| Diversified Financial Services (0.8%) | |
| CIT Group Inc. | 507,100 | 18,960 |
| The Chicago Mercantile Exchange | 31,900 | 5,145 |
| F.N.B. Corp. | 42,700 | 945 |
| | | |
| Finance—Small Loan | | |
| *AmeriCredit Corp. | 27,000 | 564 |
| | | |
| Financial Data Processing Services (1.4%) | |
| *DST Systems, Inc. | 346,100 | 15,391 |
| Global Payments Inc. | 215,300 | 11,529 |
| John H. Harland Co. | 217,800 | 6,828 |
| *Digital Insight Corp. | 406,830 | 5,545 |
| *CompuCredit Corp. | 65,870 | 1,226 |
16
|
Shares
| Market
Value^
(000)
|
|---|
| Financial Information Services (0.1%) | | |
| Equifax, Inc. | 125,000 | $ 3,295 |
| | | |
| Financial Miscellaneous (2.5%) |
| *Providian Financial Corp. | 1,787,600 | 27,779 |
| Fidelity National Financial, Inc. | 364,530 | 13,889 |
| New Century Financial Corp. | 182,482 | 10,989 |
| First American Corp. | 310,600 | 9,576 |
| LandAmerica Financial |
| Group, Inc. | 155,800 | 7,089 |
| Stewart Information |
| Services Corp. | 93,700 | 3,692 |
| WFS Financial, Inc. | 23,000 | 1,071 |
| Advanta Corp. Class B | 28,300 | 685 |
| | | |
| Insurance—Multiline (1.3%) |
| SAFECO Corp. | 566,604 | 25,865 |
| CIGNA Corp. | 79,600 | 5,543 |
| Zenith National Insurance Corp. | 100,900 | 4,269 |
| UICI | 80,000 | 2,619 |
| | | |
| Insurance—Property-Casualty (2.0%) | |
| Fremont General Corp. | 897,100 | 20,768 |
| W.R. Berkley Corp. | 270,400 | 11,400 |
| *Arch Capital Group Ltd. | 225,385 | 8,777 |
| Platinum Underwriters | | |
| Holdings, Ltd. | 253,700 | 7,428 |
| RenaissanceRe Holdings Ltd. | 53,000 | 2,734 |
| IPC Holdings Ltd. | 56,873 | 2,162 |
| PXRE Group Ltd. | 88,600 | 2,074 |
| *Ohio Casualty Corp. | 85,462 | 1,789 |
| Axis Capital Holdings Ltd. | 29,600 | 770 |
| United Fire & Casualty Co. | 12,100 | 694 |
| | | |
| Real Estate Investment Trust (7.1%) | |
| Avalonbay Communities, | | |
| Inc. REIT | 194,800 | 11,731 |
| Kimco Realty Corp. REIT | 223,700 | 11,476 |
| Boston Properties, Inc. REIT | 197,200 | 10,923 |
| AMB Property Corp. REIT | 266,700 | 9,873 |
| Vornado Realty Trust REIT | 153,200 | 9,603 |
| Plum Creek Timber Co. | | |
| Inc. REIT | 273,700 | 9,588 |
| Liberty Property Trust REIT | 229,000 | 9,123 |
| Developers Diversified Realty | | |
| Corp. REIT | 206,300 | 8,077 |
| The Macerich Co. REIT | 147,700 | 7,871 |
| Public Storage, Inc. REIT | 155,200 | 7,690 |
| Impac Mortgage Holdings, | | |
| Inc. REIT | 280,300 | 7,372 |
| Apartment Investment & | | |
| Management Co. Class A REIT | 193,800 | 6,740 |
| Hospitality Properties Trust REIT | 156,900 | 6,667 |
| Health Care Properties | | |
| Investors REIT | 245,900 | 6,393 |
| Mack-Cali Realty Corp. REIT | 144,300 | 6,392 |
| Rouse Co. REIT | 93,300 | 6,240 |
| Camden Property Trust REIT | 134,800 | 6,228 |
| iStar Financial Inc. REIT | 143,000 | 5,896 |
| Catellus Development | | |
| Corp. REIT | 215,400 | 5,710 |
| Archstone-Smith Trust REIT | 177,300 | 5,610 |
| New Plan Excel Realty | | |
| Trust REIT | 212,700 | 5,318 |
| HRPT Properties Trust REIT | 441,500 | 4,852 |
| Cousins Properties, Inc. REIT | 136,300 | 4,676 |
| *Host Marriott Corp. REIT | 300,400 | 4,215 |
| Ventas, Inc. REIT | 161,900 | 4,196 |
| Duke Realty Corp. REIT | 125,700 | 4,173 |
| Alexandria Real Estate Equities, | | |
| Inc. REIT | 59,800 | 3,930 |
| Entertainment Properties | | |
| Trust REIT | 103,300 | 3,905 |
| Thornburg Mortgage, Inc. REIT | 132,100 | 3,832 |
| Home Properties, Inc. REIT | 90,600 | 3,584 |
| Friedman, Billings, Ramsey | | |
| Group, Inc. REIT | 179,900 | 3,436 |
| *Saxon Inc. REIT | 108,900 | 2,341 |
| Novastar Financial, Inc. REIT | 42,500 | 1,853 |
| | | |
| Rent & Lease Services—Commercial (1.1%) | |
| Ryder System, Inc. | 532,200 | 25,035 |
| *United Rentals, Inc. | 385,200 | 6,121 |
| McGrath Rent Corp | 21,986 | 804 |
| | | |
| Savings & Loan (2.3%) | | |
| Sovereign Bancorp, Inc. | 1,063,300 | 23,201 |
| Net.Bank, Inc. | 717,627 | 7,183 |
| *First Federal Financial Corp. | 141,300 | 6,907 |
| Astoria Financial Corp. | 193,100 | 6,853 |
| BankAtlantic Bancorp, Inc. | | |
| Class A | 352,700 | 6,461 |
| *Ocwen Financial Corp. | 423,223 | 3,872 |
| Flagstar Bancorp, Inc. | 151,500 | 3,224 |
| PFF Bancorp, Inc. | 82,800 | 3,169 |
| Westcorp, Inc. | 65,000 | 2,764 |
| First Republic Bank | 34,500 | 1,587 |
| Hudson River Bancorp. Inc. | 57,888 | 1,099 |
| First Financial Holdings, Inc. | 15,500 | 485 |
17
Strategic Equity Fund
|
Shares
| Market
Value^
(000)
|
|---|
| Securities Brokers & Services (0.7%) | | |
| *E*TRADE FINANCIAL Corp. | 1,060,700 | 12,113 |
| A.G. Edwards & Sons, Inc. | 276,200 | 9,562 |
| |
|
| | | 680,858 |
| |
|
| Health Care (10.7%) | | |
| *Coventry Health Care Inc. | 458,424 | 24,466 |
| *Dade Behring Holdings Inc. | 434,000 | 24,182 |
| *Sierra Health Services, Inc. | 502,600 | 24,090 |
| *Connetics Corp. | 861,796 | 23,286 |
| Select Medical Corp. | 1,102,800 | 14,811 |
| *MGI Pharma, Inc. | 510,694 | 13,630 |
| *IDEXX Laboratories Corp. | 262,346 | 13,311 |
| PolyMedica Corp. | 424,662 | 13,080 |
| *Lincare Holdings, Inc. | 431,700 | 12,826 |
| Mylan Laboratories, Inc. | 634,850 | 11,427 |
| *Medco Health Solutions, Inc. | 344,400 | 10,642 |
| *Watson Pharmaceuticals, Inc. | 360,800 | 10,629 |
| *Respironics, Inc. | 197,300 | 10,544 |
| *DaVita, Inc. | 326,517 | 10,171 |
| *ImClone Systems, Inc. | 174,600 | 9,228 |
| *Eon Labs, Inc. | 420,376 | 9,122 |
| Universal Health Services | | |
| Class B | 200,400 | 8,717 |
| Bausch & Lomb, Inc. | 114,000 | 7,575 |
| *Apria Healthcare Group Inc. | 265,300 | 7,229 |
| *Pediatrix Medical Group, Inc. | 112,300 | 6,160 |
| *Affymetrix, Inc. | 193,500 | 5,942 |
| *Kos Pharmaceuticals, Inc. | 165,600 | 5,897 |
| Manor Care, Inc. | 168,200 | 5,039 |
| *United Surgical Partners | | |
| International, Inc. | 136,295 | 4,682 |
| *First Horizon | | |
| Pharmaceutical Corp. | 215,600 | 4,314 |
| *Impax Laboratories, Inc. | 236,800 | 3,637 |
| *Techne Corp. | 89,496 | 3,417 |
| *Sybron Dental Specialties, Inc. | 102,300 | 3,037 |
| *Endo Pharmaceuticals | | |
| Holdings, Inc. | 133,815 | 2,457 |
| *VISX Inc. | 97,500 | 2,009 |
| Medicis Pharmaceutical Corp. | 50,400 | 1,968 |
| *Humana Inc. | 92,600 | 1,850 |
| *Onyx Pharmaceuticals, Inc. | 40,200 | 1,729 |
| *United Therapeutics Corp. | 37,332 | 1,304 |
| *LifePoint Hospitals, Inc. | 38,900 | 1,167 |
| *SciClone Pharmaceuticals, Inc. | 251,092 | 894 |
| Perrigo Co. | 21,775 | 447 |
| |
|
| | | 314,916 |
| |
|
| Integrated Oils (0.2%) | | |
| Amerada Hess Corp. | 71,909 | 6,400 |
| |
|
| | | |
| Other Energy (6.3%) | | |
| Sunoco, Inc. | 395,700 | 29,274 |
| Chesapeake Energy Corp. | 1,415,800 | 22,412 |
| Valero Energy Corp. | 175,500 | 14,077 |
| *Newfield Exploration Co. | 224,300 | 13,736 |
| EOG Resources, Inc. | 207,800 | 13,684 |
| Pogo Producing Co. | 288,200 | 13,675 |
| XTO Energy, Inc. | 357,416 | 11,609 |
| *Plains Exploration & | | |
| Production Co. | 439,661 | 10,490 |
| Patina Oil & Gas Corp. | 295,400 | 8,735 |
| *Veritas DGC Inc. | 358,800 | 8,173 |
| *Swift Energy Co. | 293,100 | 7,023 |
| Vintage Petroleum, Inc. | 330,500 | 6,633 |
| *Tesoro Petroleum Corp. | 221,200 | 6,532 |
| *Dynegy, Inc. | 1,258,700 | 6,281 |
| *Denbury Resources, Inc. | 221,500 | 5,626 |
| *Stone Energy Corp. | 104,500 | 4,573 |
| St. Mary Land & Exploration Co. | 67,400 | 2,683 |
| *Magnum Hunter Resources Inc. | 81,300 | 938 |
| Frontier Oil Corp. | 28,200 | 666 |
| |
|
| | | 186,820 |
| |
|
| Materials & Processing (7.8%) | | |
| Georgia-Pacific Group | 849,600 | 30,543 |
| Phelps Dodge Corp. | 322,000 | 29,634 |
| Monsanto Co. | 803,400 | 29,260 |
| Ball Corp. | 652,400 | 24,419 |
| *FMC Corp. | 304,599 | 14,794 |
| Schnitzer Steel Industries, Inc. | | |
| Class A | 374,907 | 12,128 |
| Eagle Materials, Inc. | 133,284 | 9,503 |
| Corn Products International, Inc. | 194,600 | 8,971 |
| Reliance Steel & Aluminum Co. | 225,000 | 8,933 |
| Temple-Inland Inc. | 128,100 | 8,602 |
| *USG Corp. | 448,400 | 8,174 |
| Steel Dynamics, Inc. | 183,832 | 7,100 |
| *NCI Building Systems, Inc. | 179,600 | 5,729 |
| The Timken Co. | 186,900 | 4,601 |
| Watsco, Inc. | 144,900 | 4,351 |
| United States Steel Corp. | 114,300 | 4,300 |
| Lennox International Inc. | 224,800 | 3,359 |
| Acuity Brands, Inc. | 125,600 | 2,986 |
| *Cleveland-Cliffs Inc. | 34,400 | 2,782 |
| *Griffon Corp. | 106,800 | 2,253 |
| *Jacuzzi Brands, Inc. | 186,200 | 1,732 |
| Brady Corp. Class A | 23,600 | 1,151 |
| Pope & Talbot, Inc. | 62,800 | 1,105 |
| *AK Steel Corp. | 127,300 | 1,039 |
| Eagle Materials, Inc. B Shares | 11,042 | 762 |
| *Mobile Mini, Inc. | 26,900 | 667 |
| Tredegar Corp. | 23,700 | 431 |
| |
|
| | | 229,309 |
| |
|
18
|
Shares
| Market
Value^
(000)
|
|---|
| Producer Durables (6.6%) | | |
| *Xerox Corp. | 2,348,200 | $ 33,063 |
| D. R. Horton, Inc. | 896,100 | 29,670 |
| *AGCO Corp. | 701,400 | 15,866 |
| Briggs & Stratton Corp. | 192,200 | 15,607 |
| Tektronix, Inc. | 391,300 | 13,011 |
| Ryland Group, Inc. | 138,500 | 12,833 |
| Applied Industrial | | |
| Technology, Inc. | 204,100 | 7,295 |
| *Hovnanian Enterprises Inc. | | |
| Class A | 161,800 | 6,488 |
| Parker Hannifin Corp. | 104,200 | 6,133 |
| *Orbital Sciences Corp. | 479,200 | 5,472 |
| *MKS Instruments, Inc. | 355,796 | 5,451 |
| *Photronics Inc. | 322,503 | 5,360 |
| MTS Systems Corp. | 249,832 | 5,309 |
| MDC Holdings, Inc. | 66,400 | 4,854 |
| *Terex Corp. | 106,500 | 4,622 |
| *Imagistics International Inc. | 120,900 | 4,062 |
| *Electro Scientific Industries, Inc. | 155,937 | 2,706 |
| *Photon Dynamics, Inc. | 126,569 | 2,569 |
| The Manitowoc Co., Inc. | 59,900 | 2,124 |
| Herman Miller, Inc. | 82,941 | 2,044 |
| *Littelfuse, Inc. | 54,693 | 1,889 |
| Crane Co. | 60,200 | 1,741 |
| *Esterline Technologies Corp. | 55,400 | 1,695 |
| *Varian Semiconductor | | |
| Equipment Associates, Inc. | 54,200 | 1,675 |
| Cummins Inc. | 13,600 | 1,005 |
| Steelcase Inc. | 65,600 | 918 |
| HNI Corp. | 16,400 | 649 |
| *Axcelis Technologies, Inc. | 70,400 | 583 |
| *Arris Group Inc. | 96,334 | 503 |
| United Industrial Corp. | 15,000 | 493 |
| Watts Water Technologies, Inc. | 12,300 | 330 |
| |
|
| | | 196,020 |
| |
|
| Technology (11.1%) | | |
| *Solectron Corp. | 5,244,800 | 25,962 |
| *National Semiconductor Corp. | 1,468,000 | 22,739 |
| *Cree, Inc. | 718,850 | 21,946 |
| *RSA Security Inc. | 1,041,965 | 20,110 |
| PerkinElmer, Inc. | 1,122,365 | 19,327 |
| *Storage Technology Corp. | 666,200 | 16,828 |
| *Computer Sciences Corp. | 290,800 | 13,697 |
| *Silicon Storage | | |
| Technology, Inc. | 2,133,960 | 13,593 |
| *Sanmina-SCI Corp. | 1,727,514 | 12,179 |
| Autodesk, Inc. | 221,800 | 10,786 |
| *Avnet, Inc. | 608,200 | 10,412 |
| *Digital River, Inc. | 342,050 | 10,186 |
| *SpectraSite, Inc. | 190,100 | 8,840 |
| *DSP Group Inc. | 407,301 | 8,574 |
| *j2 Global Communications, Inc. | 239,585 | 7,568 |
| Scientific-Atlanta, Inc. | 290,300 | 7,525 |
| *Unisys Corp. | 722,500 | 7,456 |
| *Vishay Intertechnology, Inc. | 571,300 | 7,370 |
| *UNOVA, Inc. | 478,600 | 6,724 |
| *Advanced Micro Devices, Inc. | 450,000 | 5,850 |
| *NCR Corp. | 112,600 | 5,584 |
| *Ditech Communications Corp. | 234,900 | 5,259 |
| *Transaction Systems | | |
| Architects, Inc. | 281,752 | 5,236 |
| *Benchmark Electronics, Inc. | 156,450 | 4,662 |
| *ESS Technology, Inc. | 640,072 | 4,384 |
| *Avocent Corp. | 164,265 | 4,276 |
| *Komag, Inc. | 276,700 | 3,846 |
| Anixter International Inc. | 107,900 | 3,786 |
| *MICROS Systems, Inc. | 66,900 | 3,350 |
| Harris Corp. | 57,200 | 3,143 |
| *Parametric Technology Corp. | 573,700 | 3,029 |
| *Westell Technologies, Inc. | 574,737 | 2,971 |
| *Keane, Inc. | 185,800 | 2,854 |
| *Cirrus Logic, Inc. | 563,072 | 2,686 |
| *Atmel Corp. | 474,600 | 1,718 |
| *Avid Technology, Inc. | 35,500 | 1,664 |
| *Tyler Technologies, Inc. | 181,700 | 1,606 |
| *InterVoice, Inc. | 141,709 | 1,526 |
| *Freescale Semiconductor Inc. | 106,000 | 1,516 |
| *Digitas Inc. | 137,202 | 1,061 |
| *PalmOne, Inc. | 34,400 | 1,047 |
| *Netegrity, Inc. | 124,900 | 938 |
| Bel Fuse, Inc. Class B | 26,900 | 890 |
| *Conexant Systems, Inc. | 461,736 | 743 |
| *MRO Software Inc. | 65,500 | 655 |
| *Epicor Software Corp. | 54,400 | 654 |
| *DRS Technologies, Inc. | 13,200 | 494 |
| *TTM Technologies, Inc. | 29,892 | 266 |
| QAD Inc. | 27,200 | 190 |
| |
|
| | | 327,706 |
| |
|
| Utilities (8.0%) | | |
| Xcel Energy, Inc. | 1,286,600 | 22,284 |
| TXU Corp. | 423,900 | 20,313 |
| ONEOK, Inc. | 634,800 | 16,517 |
| CenterPoint Energy Inc. | 1,528,900 | 15,839 |
| *AES Corp. | 1,532,700 | 15,312 |
| Westar Energy, Inc. | 749,800 | 15,146 |
| *Western Wireless Corp. | | |
| Class A | 575,473 | 14,795 |
| KeySpan Corp. | 312,800 | 12,262 |
| Energen Corp. | 228,200 | 11,764 |
| Alliant Energy Corp. | 438,100 | 10,900 |
| PPL Corp. | 215,500 | 10,167 |
19
Strategic Equity Fund
|
Shares
| Market
Value^
(000)
|
|---|
| *Southwestern Energy Co. | 219,800 | 9,229 |
| CenturyTel, Inc. | 242,300 | 8,296 |
| MCI Inc. | 468,700 | 7,851 |
| *UnitedGlobalCom Inc. Class A | 892,402 | 6,666 |
| Pinnacle West Capital Corp. | 133,700 | 5,549 |
| Pepco Holdings, Inc. | 237,100 | 4,718 |
| Energy East Corp. | 184,700 | 4,651 |
| IDACORP, Inc. | 155,800 | 4,528 |
| PNM Resources Inc. | 192,750 | 4,339 |
| *PTEK Holdings, Inc. | 446,400 | 3,826 |
| *Intrado Inc. | 257,926 | 2,608 |
| *Boston Communications | | |
| Group, Inc. | 251,032 | 2,202 |
| *Mediacom Communications Corp. | 318,260 | 2,078 |
| Southwest Gas Corp. | 57,400 | 1,375 |
| Avista Corp. | 47,500 | 860 |
| *Commonwealth Telephone | | |
| Enterprises, Inc. | 14,100 | 614 |
| Citizens Communications Co. | 19,100 | 256 |
| |
|
| | | 234,945 |
| |
|
| Other (2.5%) | | |
| Eaton Corp. | 493,500 | 31,293 |
| Textron, Inc. | 431,800 | 27,752 |
| Brunswick Corp. | 253,700 | 11,609 |
| Walter Industries, Inc. | 113,000 | 1,810 |
| |
|
| | | 72,464 |
| |
|
|
|
|
| TOTAL COMMON STOCKS | | |
| (Cost $2,583,495) | | 2,929,932 |
|
|
|
| TEMPORARY CASH INVESTMENTS (2.7%) (1) | |
|
|
|
| Money Market Fund (2.6%) | | |
| Vanguard Market | | |
| Liquidity Fund, | | |
| 1.74%** | 10,741,848 | 10,742 |
| Vanguard Market | | |
| Liquidity Fund, | | |
| 1.74%**&Note E | 64,914,360 | 64,914 |
| |
|
| | | 75,656 |
| |
|
| | | |
|
| |
| | Face | |
| | Amount | |
| | (000) | |
|
| |
| U.S. Agency Obligation (0.1%) |
| Federal National Mortgage Assn.† |
| (2) 1.48%, 10/13/2004 | $3,000 | 2,998 |
|
|
|
| TOTAL TEMPORARY CASH INVESTMENTS |
| (Cost $78,654) | | 78,654 |
|
|
|
| TOTAL INVESTMENTS (101.9%) |
| (Cost $2,662,149) | | 3,008,586 |
|
|
|
| Market
Value^
(000)
|
|---|
| OTHER ASSETS AND LIABILITIES (-1.9%) | |
|
| Other Assets—Note B | 86,448 |
| Liabilities—Note E | (141,701) |
|
|
| | (55,253) |
|
|
|
| NET ASSETS (100%) | |
|
| Applicable to 149,930,623 outstanding $.001 | |
| par value shares of beneficial interest | |
| (unlimited authorization) | $2,953,333 |
|
| | |
| NET ASSET VALUE PER SHARE | $19.70 |
|
^See Note A in Notes to Financial Statements.
*Non-income-producing security.
**Money market fund available only to Vanguard funds and certain trusts and accounts
managed by Vanguard. Rate shown is the 7-day yield.
† The issuer operates under a congressional charter; its securities are neither issued nor
guaranteed by the U.S. government. If needed, access to additional funding from the U.S.
Treasury (beyond the issuer’s line of credit) would require congressional action.
(1)The fund invests a portion of its cash reserves in equity markets through the use of index
futures contracts. After giving effect to futures investments, the fund’s effective common stock
and temporary cash investment positions represent 99.8% and 2.1%, respectively, of net assets.
See Note C in Notes to Financial Statements.
(2)Security segregated as initial margin for open futures contracts.
REIT—Real Estate Investment Trust.
AT SEPTEMBER 30, 2004, NET ASSETS CONSISTED OF:
|
|---|
| Amount
(000)
| Per
Share
|
|---|
| Paid-in Capital | $2,469,648 | $16.48 |
| Undistributed Net | | |
| Investment Income | 12,068 | .08 |
| Accumulated Net | | |
| Realized Gains | 125,058 | .83 |
| Unrealized Appreciation | | |
| Investment Securities | 346,437 | 2.31 |
| Futures Contracts | 122 | — |
|
| NET ASSETS | $2,953,333 | $19.70 |
|
See Note C in Notes to Financial Statements for the tax-basis components of net assets.
20
STATEMENT OF OPERATIONS
This Statement shows the types of income earned by the fund during the two most recent reporting periods, and details the operating expenses charged to the fund. These expenses directly reduce the amount of investment income available to pay to shareholders as income dividends. This Statement also shows any Net Gain (Loss) realized on the sale of investments, and the increase or decrease in the Unrealized Appreciation (Depreciation) of investments during each period.
| | Strategic Equity Fund
|
|---|
| Nov. 1, 2003, to
Sept. 30, 2004*
(000)
| Year Ended
Oct. 31, 2003
(000)
|
|---|
| INVESTMENT INCOME | | |
| Income | | |
| Dividends | $ 27,220 | $ 16,468 |
| Interest | 186 | 220 |
| Security Lending | 899 | 639 |
|
| Total Income | 28,305 | 17,327 |
|
| Expenses | | |
| The Vanguard Group—Note B | | |
| Investment Advisory Services | 497 | 532 |
| Management and Administrative | 9,062 | 4,847 |
| Marketing and Distribution | 262 | 119 |
| Custodian Fees | 58 | 47 |
| Auditing Fees | 16 | 14 |
| Shareholders' Reports | 62 | 93 |
| Trustees' Fees and Expenses | 3 | 2 |
|
| Total Expenses | 9,960 | 5,654 |
|
| NET INVESTMENT INCOME | 18,345 | 11,673 |
|
| REALIZED NET GAIN (LOSS) | | |
| Investment Securities Sold | 153,944 | 70,947 |
| Futures Contracts | (155) | 2,397 |
|
| REALIZED NET GAIN (LOSS) | 153,789 | 73,344 |
|
| CHANGE IN UNREALIZED APPRECIATION (DEPRECIATION) | | |
| Investment Securities | 43,264 | 309,178 |
| Futures Contracts | (316) | 474 |
|
| CHANGE IN UNREALIZED APPRECIATION (DEPRECIATION) | 42,948 | 309,652 |
|
| NET INCREASE (DECREASE) IN NET ASSETS RESULTING FROM OPERATIONS | $215,082 | $394,669 |
|
*The fund’s fiscal year-end changed from October 31 to September 30, effective September 30, 2004.
21
STATEMENT OF CHANGES IN NET ASSETS
This Statement shows how the fund’s total net assets changed during the three most recent reporting periods. The Operations section summarizes information detailed in the Statement of Operations. The amounts shown as Distributions to shareholders from the fund’s net income and capital gains may not match the amounts shown in the Operations section, because distributions are determined on a tax basis and may be made in a period different from the one in which the income was earned or the gains were realized on the financial statements. The Capital Share Transactions section shows the amount shareholders invested in the fund, either by purchasing shares or by reinvesting distributions, as well as the amounts redeemed. The corresponding numbers of Shares Issued and Redeemed are shown at the end of the statement.
| | Strategic Equity Fund
|
|---|
| Nov. 1, 2003, to
Sept. 30, 2004*
(000)
| Year Ended
Oct. 31, 2003
(000)
| Year Ended
Oct. 31, 2002
(000)
|
|---|
| INCREASE (DECREASE) IN NET ASSETS | | | |
| Operations | | | |
| Net Investment Income | $ 18,345 | $ 11,673 | $ 8,573 |
| Realized Net Gain (Loss) | 153,789 | 73,344 | (43,820) |
| Change in Unrealized Appreciation (Depreciation) | 42,948 | 309,652 | (20,330) |
|
| Net Increase (Decrease) in Net Assets | | | |
| Resulting from Operations | 215,082 | 394,669 | (55,577) |
|
| Distributions | | | |
| Net Investment Income | (13,531) | (9,001) | (7,979) |
| Realized Capital Gain | — | — | — |
|
| Total Distributions | (13,531) | (9,001) | (7,979) |
|
| Capital Share Transactions 1 | | | |
| Issued | 1,379,907 | 592,217 | 296,841 |
| Issued in Lieu of Cash Distributions | 12,627 | 8,543 | 7,575 |
| Redeemed | (354,612) | (148,570) | (131,577) |
|
| Net Increase (Decrease) from | | | |
| Capital Share Transactions | 1,037,922 | 452,190 | 172,839 |
|
| Total Increase (Decrease) | 1,239,473 | 837,858 | 109,283 |
| Net Assets | | | |
|
| Beginning of Period | 1,713,860 | 876,002 | 766,719 |
|
| End of Period | $ 2,953,333 | $ 1,713,860 | $ 876,002 |
|
| | | |
| 1 Shares Issued (Redeemed) | | | |
| Issued | 71,934 | 38,262 | 20,105 |
| Issued in Lieu of Cash Distributions | 681 | 645 | 500 |
| Redeemed | (18,673) | (10,232) | (9,353) |
|
| Net Increase (Decrease) in Shares Outstanding | 53,942 | 28,675 | 11,252 |
|
*The fund’s fiscal year-end changed from October 31 to September 30, effective September 30, 2004.
22
FINANCIAL HIGHLIGHTS
This table summarizes the fund’s investment results and distributions to shareholders on a per-share basis. It also presents the Total Return and shows net investment income and expenses as percentages of average net assets. These data will help you assess: the variability of the fund’s net income and total returns from year to year; the relative contributions of net income and capital gains to the fund’s total return; how much it costs to operate the fund; and the extent to which the fund tends to distribute capital gains. The table also shows the Portfolio Turnover Rate, a measure of trading activity. A turnover rate of 100% means that the average security is held in the fund for one year.
Strategic Equity Fund
|
|
|
|
|
|
|
|---|
| | | | | | | |
|---|
| | Nov.1,
2003, to | Year Ended October 31,
|
|---|
For a Share Outstanding Throughout Each Period
| Sept. 30,
2004*
|
2003
|
2002
|
2001
|
2000
|
1999
|
|---|
| Net Asset Value, Beginning of Period | $17.85 | $13.01 | $13.68 | $18.07 | $15.73 | $13.11 |
|
| Investment Operations | | | | | | |
| Net Investment Income | .13 | .13 | .14 | .16 | .21 | .15 |
| Net Realized and Unrealized Gain (Loss) | | | | | | |
| on Investments | 1.85 | 4.84 | (.67) | (1.31) | 2.66 | 2.62 |
|
| Total from Investment Operations | 1.98 | 4.97 | (.53) | (1.15) | 2.87 | 2.77 |
|
| Distributions | | | | | | |
| Dividends from Net Investment Income | (.13) | (.13) | (.14) | (.21) | (.16) | (.15) |
| Distributions from Realized Capital Gains | — | — | — | (3.03) | (.37) | — |
|
| Total Distributions | (.13) | (.13) | (.14) | (3.24) | (.53) | (.15) |
|
| Net Asset Value, End of Period | $19.70 | $17.85 | $13.01 | $13.68 | $18.07 | $15.73 |
|
| | | | | | | |
| Total Return** | 11.14% | 38.55% | -4.02% | -6.48% | 18.76% | 21.30% |
|
| Ratios/Supplemental Data | | | | | | |
| Net Assets, End of Period (Millions) | $2,953 | $1,714 | $876 | $767 | $746 | $561 |
| Ratio of Total Expenses to Average Net Assets | 0.45%† | 0.50% | 0.50% | 0.54% | 0.49% | 0.46% |
| Ratio of Net Investment Income to | | | | | | |
| Average Net Assets | 0.83%† | 1.04% | 0.94% | 1.06% | 1.31% | 1.00% |
| Portfolio Turnover Rate | 66% | 100% | 73% | 82% | 83% | 51% |
|
*The fund’s fiscal year-end changed from October 31 to September 30, effective September 30, 2004.
**Total returns do not reflect the 1% fee assessed through April 6, 2001, on redemptions of shares held in the fund for less than
five years.
† Annualized.
SEE ACCOMPANYING NOTES, WHICH ARE AN INTEGRAL PART OF THE FINANCIAL STATEMENTS.
23
NOTES TO FINANCIAL STATEMENTS
Vanguard Strategic Equity Fund is registered under the Investment Company Act of 1940 as an open-end investment company, or mutual fund.
A. The following significant accounting policies conform to generally accepted accounting principles for U.S. mutual funds. The fund consistently follows such policies in preparing its financial statements.
| 1. | Security Valuation: Securities are valued as of the close of trading on the New York Stock Exchange (generally 4:00 p.m. Eastern time) on the valuation date. Equity securities are valued at the latest quoted sales prices or official closing prices taken from the primary market in which each security trades; such securities not traded on the valuation date are valued at the mean of the latest quoted bid and asked prices. Securities for which market quotations are not readily available, or whose values have been materially affected by events occurring before the fund’s pricing time but after the close of the securities’ primary markets, are valued by methods deemed by the board of trustees to represent fair value. Investments in Vanguard® Market Liquidity Fund are valued at that fund’s net asset value. Temporary cash investments acquired over 60 days to maturity are valued using the latest bid prices or using valuations based on a matrix system (which considers such factors as security prices, yields, maturities, and ratings), both as furnished by independent pricing services. Other temporary cash investments are valued at amortized cost, which approximates market value. |
| 2. | Futures Contracts: The fund uses S&P 500 Index, S&P MidCap 400 Index and Russell 2000 Index futures contracts to a limited extent, with the objective of maintaining full exposure to the stock market while maintaining liquidity. The fund may purchase or sell futures contracts to achieve a desired level of investment, whether to accommodate portfolio turnover or cash flows from capital share transactions. The primary risks associated with the use of futures contracts are imperfect correlation between changes in market values of stocks held by the fund and the prices of futures contracts, and the possibility of an illiquid market. |
| | Futures contracts are valued at their quoted daily settlement prices. The aggregate principal amounts of the contracts are not recorded in the financial statements. Fluctuations in the value of the contracts are recorded in the Statement of Net Assets as an asset (liability) and in the Statement of Operations as unrealized appreciation (depreciation) until the contracts are closed, when they are recorded as realized futures gains (losses). |
| 3. | Repurchase Agreements: The fund, along with other members of The Vanguard Group, may transfer uninvested cash balances to a pooled cash account, which is invested in repurchase agreements secured by U.S. government and agency securities. Securities pledged as collateral for repurchase agreements are held by a custodian bank until the agreements mature. Each agreement requires that the market value of the collateral be sufficient to cover payments of interest and principal; however, in the event of default or bankruptcy by the other party to the agreement, retention of the collateral may be subject to legal proceedings. |
| 4. | Federal Income Taxes: The fund intends to continue to qualify as a regulated investment company and distribute all of its taxable income. Accordingly, no provision for federal income taxes is required in the financial statements. |
| 5. | Distributions: Distributions to shareholders are recorded on the ex-dividend date. |
| 6. | Other: Dividend income is recorded on the ex-dividend date. Interest income includes income distributions received from Vanguard Market Liquidity Fund and is accrued daily. Security transactions are accounted for on the date the securities are bought or sold. Costs used to determine realized gains (losses) on the sale of investment securities are those of the specific securities sold. |
24
B. The Vanguard Group furnishes at cost investment advisory, corporate management, administrative, marketing, and distribution services. The costs of such services are allocated to the fund under methods approved by the board of trustees. The fund has committed to provide up to 0.40% of its net assets in capital contributions to Vanguard. At September 30, 2004, the fund had contributed capital of $397,000 to Vanguard (included in Other Assets), representing 0.01% of the fund’s net assets and 0.40% of Vanguard’s capitalization. The fund’s trustees and officers are also directors and officers of Vanguard.
C. Distributions are determined on a tax basis and may differ from net investment income and realized capital gains for financial reporting purposes. Differences may be permanent or temporary. Permanent differences are reclassified among capital accounts in the financial statements to reflect their tax character. Temporary differences arise when certain items of income, expense, gain, or loss are recognized in different periods for financial statement and tax purposes; these differences will reverse at some time in the future. Differences in classification may also result from the treatment of short-term gains as ordinary income for tax purposes.
The fund used a tax accounting practice to treat a portion of the price of capital shares redeemed during the year as distributions from net investment income and realized capital gains. Accordingly, the fund has reclassified $1,173,000 from undistributed net investment income, and $8,384,000 from accumulated net realized gains, to paid-in capital.
The fund used a capital loss carryforward of $19,765,000 to offset taxable capital gains realized during the period ended September 30, 2004, reducing the amount of capital gains that would otherwise be available to distribute to shareholders. For tax purposes, at September 30, 2004, the fund had $46,357,000 of ordinary income and $94,221,000 of long-term capital gains available for distribution.
At September 30, 2004, net unrealized appreciation of investment securities for tax purposes was $345,187,000, consisting of unrealized gains of $449,760,000 on securities that had risen in value since their purchase and $104,573,000 in unrealized losses on securities that had fallen in value since their purchase.
At September 30, 2004, the aggregate settlement value of open futures contracts expiring in December 2004 and the related unrealized appreciation (depreciation) were:
| | | (000)
|
|---|
Futures Contracts
|
Number of
Long Contracts
| Aggregate
Settlement
Value
| Unrealized
Appreciation
(Depreciation)
|
|---|
| E-mini Russell 2000 Index | 206 | $11,824 | $80 |
| S&P MidCap 400 Index | 10 | 2,971 | 2 |
| Russell 2000 Index | 10 | 2,870 | 40 |
|
Unrealized appreciation (depreciation) on open futures contracts is required to be treated as realized gain (loss) for tax purposes.
D. During the period ended September 30, 2004, the fund purchased $2,627,799,000 of investment securities and sold $1,592,212,000 of investment securities, other than temporary cash investments.
E. The market value of securities on loan to broker/dealers at September 30, 2004, was $63,478,000, for which the fund held cash collateral of $64,914,000. The fund invests cash collateral received in temporary cash investments, and records a liability for the return of the collateral, during the period the securities are on loan.
25
REPORT OF INDEPENDENT REGISTERED PUBLIC ACCOUNTING FIRM
To the Shareholders and Trustees of Vanguard Strategic Equity Fund:
In our opinion, the accompanying statement of net assets and the related statements of operations and of changes in net assets and the financial highlights present fairly, in all material respects, the financial position of Vanguard Strategic Equity Fund (the “Fund”) at September 30, 2004, the results of its operations for the period from November 1, 2003 to September 30, 2004, and for the year ended October 31, 2003, and the changes in its net assets for the period from November 1, 2003 to September 30, 2004 and for the two years ended October 31, 2003, and the financial highlights for each of the periods indicated, in conformity with accounting principles generally accepted in the United States of America. These financial statements and financial highlights (hereafter referred to as “financial statements”) are the responsibility of the Fund’s management; our responsibility is to express an opinion on these financial statements based on our audits. We conducted our audits of these financial statements in accordance with the standards of the Public Company Accounting Oversight Board (United States), which require that we plan and perform the audit to obtain reasonable assurance about whether the financial statements are free of material misstatement. An audit includes examining, on a test basis, evidence supporting the amounts and disclosures in the financial statements, assessing the accounting principles used and significant estimates made by management, and evaluating the overall financial statement presentation. We believe that our audits, which included confirmation of securities at September 30, 2004 by correspondence with the custodian and brokers, provide a reasonable basis for our opinion.
PricewaterhouseCoopers LLP
Philadelphia,Pennsylvania
November 3, 2004
SPECIAL 2004 TAX INFORMATION
(UNAUDITED) FOR VANGUARD STRATEGIC EQUITY FUND
This information for the period ended September 30, 2004, is included pursuant to provisions of the Internal Revenue Code.
The fund distributed $6,241,000 as capital gain dividends (from net long-term capital gains) to shareholders during the period.
The fund distributed $11,615,000 of qualified dividend income to shareholders during the period.
For corporate shareholders, 36.1% of investment income (dividend income plus short-term gains, if any) qualifies for the dividends-received deduction.
26
INVESTING IS FAST, EASY, AND SECURE ON VANGUARD.COM
If you're like many Vanguard investors, you believe in planning and taking control of your own investments. Vanguard.com was built for you—and it keeps getting better.
RESEARCH AND PLAN YOUR INVESTMENTS WITH CONFIDENCE
Use our Planning & Advice and Research Funds & Stocks sections to:
• Determine what asset allocation might best suit your needs—by taking our Investor Questionnaire.
• Find out how much to save for retirement and your children's college education—by using our planning tools.
• Learn how to achieve your goals—by reading our PlainTalk® investment guides.
• Find your next fund--by using the Compare Funds, Compare Costs, and Narrow Your Fund Choices tools.
• Look up fund price, performance history, and distribution information—in a snap.
INVEST AND MANAGE ACCOUNTS WITH EASE
Log on to Vanguard.com to:
• See what you own (at Vanguard and elsewhere) and how your investments are doing.
• Elect to receive online statements, fund reports (like this one), prospectuses, and tax forms.
• Analyze your portfolio's holdings and performance.
• Open new accounts, buy and sell shares, and exchange money between funds—securely and easily.
• Sign up to receive electronic newsletters from Vanguard informing you of news on our funds, products, and services, as well as on investing and the financial markets.
Find out what Vanguard.com can do for you. Log on today!
THE PEOPLE WHO GOVERN YOUR FUND
The trustees of your mutual fund are there to see that the fund is operated and managed in your best interests since, as a shareholder, you are a part owner of the fund. Your fund trustees also serve on the board of directors of The Vanguard Group, Inc., which is owned by the Vanguard® funds and provides services to them on an at-cost basis.
A majority of Vanguard's board members are independent, meaning that they have no affiliation with Vanguard or the funds they oversee, apart from the sizable personal investments they have made as private individuals.
Our independent board members bring distinguished backgrounds in business, academia, and public service to their task of working with Vanguard officers to establish the policies and oversee the activities of
Name
(Year of Birth)
Trustee/Officer
Since
| Position(s) Held with
Fund (Number of
Vanguard Funds
Overseen by
Trustee/Officer)
| Principal Occupation(s) During the Past Five Years
|
|---|
John J. Brennan*
(1954)
May 1987
| Chairman of the
Board, Chief
Executive Officer,
and Trustee
(131) | Chairman of the Board,Chief Executive Officer, and Director/Trustee of
The Vanguard Group, Inc., and of each of the investment companies
served by The Vanguard Group. |
|
| INDEPENDENT TRUSTEES |
| |
Charles D. Ellis
(1937)
January 2001 | Trustee
(131) | The Partners of `63 (pro bono ventures in education); Senior Advisor
to Greenwich Associates (international business strategy consulting);
Successor Trustee of Yale University; Overseer of the Stern School of
Business at New York University; Trustee of the Whitehead Institute
for Biomedical Research. |
|
Rajiv L. Gupta
(1945)
December 2001† | Trustee
(131) | Chairman and Chief Executive Officer (since October 1999), Vice
Chairman (January-September 1999), and Vice President (prior to
September 1999) of Rohm and Haas Co. (chemicals); Director of
Technitrol, Inc. (electronic components), and Agere Systems (commu-
nications components); Board Member of the American Chemistry
Council; Trustee of Drexel University. |
|
JoAnn Heffernan
Heisen
(1950)
July 1998 | Trustee
(131)
| Vice President, Chief Information Officer, and Member of the
Executive Committee of Johnson & Johnson (pharmaceuticals/
consumer products); Director of the University Medical Center at
Princeton and Women's Research and Education Institute. |
|
Burton G. Malkiel
(1932)
May 1977 | Trustee
(129) | Chemical Bank Chairman's Professor of Economics, Princeton
University; Director of Vanguard Investment Series plc (Irish invest-
ment fund) (since November 2001), Vanguard Group (Ireland)
Limited (investment management) (since November 2001),
Prudential Insurance Co. of America, BKF Capital (investment
management), The Jeffrey Co. (holding company), and NeuVis, Inc.
(software company). |
|
| † | December 2002 for Vanguard® Equity Income Fund, Vanguard® Growth Equity Fund, the Vanguard® Municipal Bond Funds, and the Vanguard® State Tax-Exempt Funds. |
the funds. Among board members’ responsibilities are selecting investment advisors for the funds; monitoring fund operations, performance, and costs; reviewing contracts; nominating and selecting new trustees/directors; and electing Vanguard officers.
Each trustee serves a fund until its termination; or until the trustee’s retirement, resignation, or death; or otherwise as specified in the fund’s organizational documents. Any trustee may be removed at a shareholders’ meeting by a vote representing two-thirds of the net asset value of all shares of the fund together with shares of other Vanguard funds organized within the same trust. The table on these two pages shows information for each trustee and executive officer of the fund. The mailing address of the trustees and officers is P.O. Box 876, Valley Forge, PA 19482.
Name
(Year of Birth)
Trustee/Officer
Since
| Position(s) Held with
Fund (Number of
Vanguard Funds
Overseen by
Trustee/Officer)
| Principal Occupation(s) During the Past Five Years
|
|---|
Alfred M. Rankin, Jr.
(1941)
January 1993
| Trustee
(131) | Chairman, President, Chief Executive Officer, and Director of NACCO
Industries, Inc. (forklift trucks/housewares/lignite); Director of
Goodrich Corporation (industrial products/aircraft systems and
services); Director of Standard Products Company (supplier for
the automotive industry) until 1998. |
|
J. Lawrence Wilson
(1936)
April 1985
| Trustee
(131)
| Retired Chairman and Chief Executive Officer of Rohm and Haas Co.
(chemicals); Director of Cummins Inc. (diesel engines), MeadWestvaco
Corp. (paper products), and AmerisourceBergen Corp. (pharmaceutical
distribution); Trustee of Vanderbilt University. |
|
| EXECUTIVE OFFICERS* |
R. Gregory Barton
(1951)
June 2001 |
Secretary
(131)
|
Managing Director and General Counsel of The Vanguard Group, Inc.;
Secretary of The Vanguard Group and of each of the investment
companies served by The Vanguard Group. |
|
Thomas J. Higgins
(1957)
July 1998 | Treasurer
(131) | Principal of The Vanguard Group, Inc.; Treasurer of each of the
investment companies served by The Vanguard Group. |
|
*Officers of the funds are “interested persons” as defined in the Investment Company Act of 1940.
More information about the trustees is in the Statement of Additional Information, available from The Vanguard Group.
VANGUARD SENIOR MANAGEMENT TEAM
|
|---|
Mortimer J. Buckley, Information Technology.
James H. Gately, Investment Programs and Services.
Kathleen C. Gubanich, Human Resources.
F. William McNabb, III, Client Relationship Group.
| Michael S. Miller, Planning and Development.
Ralph K. Packard, Finance.
George U. Sauter, Chief Investment Officer.
|
John C. Bogle, Founder; Chairman and Chief Executive Officer, 1974-1996. |
|

Post Office Box 2600
Valley Forge, PA 19482-2600
Vanguard, The Vanguard Group, Vanguard.com, PlainTalk, and the ship logo are trademarks of The Vanguard Group, Inc.
All other marks are the exclusive property of their respective owners.
All comparative mutual fund data are from Lipper Inc. or Morningstar, Inc., unless otherwise noted.
For More Information
This report is intended for the fund’s shareholders. It may not be distributed to prospective investors unless it is preceded or accompanied by the current fund prospectus. To receive a free copy of the prospectus or the Statement of Additional Information, or to request additional information about the fund or other Vanguard funds, please contact us at one of the adjacent telephone numbers or by e-mail through Vanguard.com. Prospectuses may also be viewed online.
You can obtain a free copy of Vanguard’s proxy voting guidelines by visiting our website, www.vanguard.com, and searching for “proxy voting guidelines,” or by calling Vanguard at 1- 800- 662-2739. They are also available from the SEC’s website, www.sec.gov. In addition, you may obtain a free report on how the fund voted the proxies for securities it owned during the 12 months ended June 30. To get the report, visit either www.vanguard.com or www.sec.gov.
You can review and copy information about your fund at the SEC’s Public Reference Room in Washington, D.C. To find out more about this public service, call the SEC at 1-202-942- 8090. Information about your fund is also available on the SEC’s website, and you can receive copies of this information, for a fee, by sending a request in either of two ways: via e-mail addressed to publicinfo@sec.gov or via regular mail addressed to the Public Reference Section, Securities and Exchange Commission, Washington, DC 20549–0102.
World Wide Web
www.vanguard.com
Fund Information
1-800-662-7447
Direct Investor
Account Services
1-800-662-2739
Institutional Investor
Services
1-800-523-1036
Text Telephone
1-800-952-3335
© 2004 The Vanguard Group, Inc.
All rights reserved.
Vanguard Marketing
Corporation, Distributor.
Q1140 112004
Vanguard® Capital Opportunity Fund
September 30, 2004
YOUR FUND REPORT
CONTENTS
1 LETTER FROM THE CHAIRMAN
6 REPORT FROM THE ADVISOR
9 FUND PROFILE
10 GLOSSARY OF INVESTMENT TERMS
11 PERFORMANCE SUMMARY
12 YOUR FUND'S AFTER-TAX RETURNS
13 ABOUT YOUR FUND'S EXPENSES
15 FINANCIAL STATEMENTS
27 ADVANTAGES OF VANGUARD.COM
SUMMARY
• Vanguard Capital Opportunity Fund recently changed its fiscal year-end from October to September. This report covers the period from October 31, 2003, through September 30, 2004.
• For the 11 months, your fund outperformed its comparative standards.
• The fund earned especially strong returns from technology stocks, a striking achievement because the sector was among the market’s worst.
VANGUARD’S PLEDGE TO CLIENTS
We recognize that your relationship with Vanguard rests on the twin pillars of trust and excellence, each of which is built upon the character of our people. Our Pledge to Clients reflects our ongoing efforts to deserve your trust and to continually improve so that we can offer you excellence in all that we do.
We will:
• Put your interests first at all times.
• Continually seek to earn your trust by adhering to the highest standards of ethical behavior and fiduciary responsibility.
• Strive to be the highest-value provider of investment services, which means outstanding investment performance and service, both at the lowest possible cost.
• Communicate candidly not only about the rewards of investing but also about the risks and costs.
• Maintain highly effective controls to safeguard your assets and protect your confidential information.
• Invest a majority of our personal assets alongside yours.
Please note: The opinions expressed in this report are just that—informed opinions. They should not be considered promises or advice.
Want less clutter in your mailbox? Just register with Vanguard.com® and opt to get fund reports online.
LETTER FROM THE CHAIRMAN

Dear Shareholder,
Please note that Vanguard Capital Opportunity Fund has changed its fiscal year-end from October to September. This report covers the 11 months from October 31, 2003, the end of fiscal year 2003, through September 30, 2004.
Over that period the Capital Opportunity Fund delivered a strong return in a volatile market, topping the average return of its peer group and the gains of both the broad market and the Russell Midcap Growth Index, a benchmark that, like your fund, includes mid-size growth-oriented companies. These returns appear in the adjacent table. The fund earned strong results from technology stocks—a notable achievement because the tech sector was among the broad market’s weaker performers in fiscal 2004.
Your fund’s distributions per share and beginning and ending net asset values are shown in the table on page 5. If you own the Capital Opportunity Fund in a taxable account, see page 12 for a report on the fund’s after-tax returns.
|
| Total Returns | October 31, 2003,
Through September 30, 2004 |
|---|
|
| Vanguard Capital Opportunity Fund | |
| Investor Shares | 12.3% |
| Admiral Shares | 12.4 |
| Russell Midcap Growth Index | 5.2 |
| Average Multi-Cap Growth Fund* | 2.3 |
| Dow Jones Wilshire 5000 Index | 8.2 |
|
| *Derived from data provided by Lipper Inc. |
STOCKS FARED WELL, THEN COOLED OFF
A strong rally in U.S. stock prices that started last fall and endured through February produced solid gains for most major indexes. These advances were fueled by solid corporate earnings growth and a slew of economic reports suggesting robust growth and job-market improvement.
However, in the remainder of the fiscal period--from March through September--most indexes saw relatively little change. The earlier
enthusiasm for stocks wore thin, as economic reports turned less favorable and the economy showed the strain of rising crude-oil prices. For the 11 months from October 31, 2003, through September 30, the broad U.S. stock market, as measured by the Dow Jones Wilshire 5000 Composite Index, returned 8.2%.
Admiral(TM)Shares A lower-cost class of shares available to many longtime shareholders and to those with significant investments in the fund.
Smaller-capitalization stocks provided higher returns for the fiscal period than did large-caps. Across the market-cap spectrum, value-oriented stocks (those that generally trade at below-market valuations relative to their book values and other fundamental measures) outpaced growth-oriented issues (those expected to return above-average earnings growth). Returns from most international markets were enhanced for U.S.-based investors by the continued weakness of the greenback relative to major currencies.
THE BOND MARKET WAS SWAYED BY ECONOMIC UNCERTAINTIES
For the first five months of the fiscal period, the continued decline in bond yields boosted bond prices and returns. In April, however, yields began to march higher as reports showed higher-than-expected inflation and strong job growth. Yields tailed off again in August and September, as reports suggested the economic recovery had lost some steam. The yield of the 10-year U.S. Treasury note, a benchmark for longer-term interest rates, dropped to a low of 3.69% in March, climbed to 4.65% by the end of May, and finished September at 4.12%.
|
| Market Barometer | Average Annual Total Returns
Periods Ended September 30, 2004
|
|---|
| One
Year | Three
Years | Five
Years |
|---|
|
| Stocks | | | |
| Russell 1000 Index (Large-caps) | 13.9% | 4.7% | -0.7% |
| Russell 2000 Index (Small-caps) | 18.8 | 13.7 | 7.4 |
| Dow Jones Wilshire 5000 Index | 14.8 | 6.1 | 0.0 |
| (Entire market) |
| MSCI All Country World Index |
| ex USA (International) | 23.1 | 11.4 | 0.5 |
|
| Bonds |
| Lehman Aggregate Bond Index | 3.7% | 5.9% | 7.5% |
| (Broad taxable market) |
| Lehman Municipal Bond Index | 4.6 | 5.8 | 6.8 |
| Citigroup 3-Month Treasury Bill Index | 1.0 | 1.4 | 3.0 |
|
| CPI |
| Consumer Price Index | 2.5% | 2.1% | 2.5% |
|
Investment-grade taxable bonds, as measured by the Lehman Brothers Aggregate Bond Index, returned 4.7% for the 11 months. Corporate
bonds continued to offer competitive returns relative to their government counterparts. The yield of the 3-month Treasury bill (a proxy for money market rates) rose in response to the Federal Reserve Board’s three separate actions—in June, August, and September—to raise its target for the federal funds rate. The Treasury bill, which had a 0.95% yield at the start of the fiscal period, yielded 1.70% on September 30.
FAMILIAR THEMES DROVE THE FUND’S PERFORMANCE
The Capital Opportunity Fund’s strong 11-month return was the product of themes that have driven its performance in recent years: enthusiasm about health care stocks, particularly in biotechnology, and an emphasis on fast-growing technology providers, some of which had been hit unduly hard during the market slump that lasted from 2000 through 2002.
Your fund’s success in technology stocks was especially noteworthy because tech stocks were some of the overall market’s worst performers in the 2004 fiscal period. The tech sector in the Russell Midcap Growth Index declined –14%, depressed by signs that the economic expansion might not be sufficiently robust to support corporate investment in equipment and software. By contrast, Capital Opportunity’s tech stocks returned more than 16%, with especially strong performance from investments in wireless technology and computer-security providers.
The fund’s weaker holdings were auto & transportation stocks, principally airlines. The struggles of airline stocks have been another recurring theme for Capital Opportunity in recent years. Among the industry’s many woes are high fuel prices and intense pricing competition. PRIMECAP Management Company, the fund’s advisor, believes one potential bright spot is that an industry shakeout may be accelerating. The process, while painful, should free the stronger airlines from profit-crunching competition with weaker carriers that have been kept alive by federal aid.
DISCIPLINE HAS YIELDED LONG-TERM REWARDS
Your fund’s success during fiscal 2004 and its fine longer-term record both derive from a disciplined, strategic approach to the stock market. The advisor identifies companies that boast compelling growth prospects not yet recognized by the market, and then invests with the patience and perspective to allow those prospects to become realized.
Since the fund’s 1995 inception (a period that included about 21/2rough years before PRIMECAP assumed management of the portfolio), it has returned an average of 14.0% a year. A hypothetical initial investment of $25,000 in Capital Opportunity would have grown to $82,420 over that span. As shown in the adjacent table, the fund’s comparative standards would have created far less wealth. A $25,000 investment compounded at the peer group’s average return of 6.6% per year would have been worth only $44,810 as of September 30.
|
Total Returns
| August 14, 1995,* through
September 30, 2004
|
|---|
| Average
Annual
Return | Final Value of
a $25,000
Initial Investment |
|---|
|
| Capital Opportunity Fund | | |
| Investor Shares | 14.0% | $82,420 |
| Russell Midcap Growth Index 7.9 | 50,194 |
| Average Multi-Cap |
| Growth Fund | 6.6 | 44,810 |
| Dow Jones Wilshire |
| 5000 Index | 9.3 | 56,307 |
|
*Inception.
LESSONS FROM YOUR FUND
Your fund's long-term orientation holds important lessons for the way you manage your own investment program. In our past few reports to Capital Opportunity Fund shareholders, we have been able to celebrate the rewards of the advisor's investment strategy. But inevitably, there will be periods when your fund's long-term approach will be out of step with whatever the market is favoring at the moment. The managers at PRIMECAP recognize these periods as inevitable and will remain focused on their long-term strategic approach.
In the same way, your own investment program is sure to experience rough patches. If you accept periodic downturns as inevitable and remain focused on your own strategy--holding a diversified portfolio of stock, bond, and money market funds tailored to your unique circumstances--you'll be better positioned to reach your long-term financial goals.
Thank you for entrusting your assets to Vanguard.
Sincerely,

CHAIRMAN AND CHIEF EXECUTIVE OFFICER
OCTOBER 11, 2004
|
| Your Fund's Performance at a Glance | | October 31, 2003-September 30, 2004 |
|---|
| | |
Distributions Per Share
|
|---|
| Starting
Share Price | Ending
Share Price | Income
Dividends | Capital
Gains |
|---|
|
| Capital Opportunity Fund | | | | |
| Investor Shares | $24.28 | $27.24 | $0.013 | $0.000 |
| Admiral Shares | 56.11 | 62.96 | 0.074 | 0.000 |
|
REPORT FROM THE ADVISOR
Because the fund’s fiscal year recently changed from October to September, this letter covers only the 11 months ended September 30, 2004. During that period, the Investor Shares of Vanguard Capital Opportunity Fund returned 12.3% and the Admiral Shares 12.4%. Our result surpassed the 5.2% return of our primary benchmark, the Russell Midcap Growth Index, and the average 2.3% return of multi-capitalization growth funds.
INVESTMENT ENVIRONMENT
The U.S. stock market enjoyed a strong rally through the first half of the fiscal year, but then stalled as rising interest rates and hints of price inflation left a cloud of uncertainty over the market. Despite some mixed signals, the nation’s economic growth has remained strong, and in our view the outlook remains positive. Notable risks to the economy include the impact of rising rates on the housing market, which has been a key driver of consumer spending and sentiment over the past few years. The Madrid train bombing in March, continued hostilities in Iraq, and stubbornly high energy prices also remind us that the potential impact of geopolitical factors cannot be ignored or controlled by investors.
Investment Philosophy
The fund reflects the belief that superior long-term investment results can be achieved by concentrating assets in small-and mid-capitalization stocks whose prices are lower than the fundamental value of the underlying companies.
Companies have generated much of the recent earnings growth by boosting productivity—doing more with fewer workers—and by working hard to keep revenues from shrinking. If U.S. stocks are to thrive, the next driver of economic growth will have to be a continued pickup in industrial activity and business investment; this will allow corporations to remain competitive and accommodate growth. We’re optimistic that this process is under way. Corporations have taken advantage of an extended period of low interest rates to shore up their balance sheets, which puts them in a good position to make the capital investments that were deferred over the past few years.
OUR SUCCESSES
During the past 11 months, we earned some of our best results from technology stocks. In broad terms, the technology sector was among the market’s weakest performers during the fiscal period, but we benefited from owning companies that are less dependent on growth in corporate capital budgets than is the industry as a whole. Among these are Autodesk (computer aided design and building technologies), Research In Motion (wireless technologies, including BlackBerry messaging devices), and Motorola (computer chips and cell-phone technologies).
Overall, our technology stocks, which made up just over 30% of the fund’s assets on September 30, contributed almost 6 percentage points to our 11-month return. We also earned strong returns from integrated oil companies ConocoPhillips and Murphy Oil, which have benefited from persistently high energy prices.
OUR SHORTFALLS
The portfolio’s auto & transportation stocks—primarily its airline stocks—were poor performers during the period. We sustained losses in Delta Air Lines and AMR (the parent company of American Airlines). While travel demand has been strong, low-fare carriers are putting pressure on pricing throughout the industry. The airlines are also grappling with high fuel prices. We believe that the industry is in the midst of a longer-term restructuring that has been delayed—and rendered more painful for the stronger companies—by supports such as the federal loan guarantees granted to major carriers after September 11, 2001. As these supports disappear, we expect the restructuring to accelerate and the fortunes of the industry’s survivors to improve.
OUR OUTLOOK
Although the stock market has cooled in recent months, the fundamental backdrop remains sound. We continue to believe that stocks are a more attractive investment than bonds or cash equivalents, and that the potential for earnings and stock-price growth still lies more in the industrial sectors than with the consumer. Many of our
technology and producer durables stocks have performed well during the past two years, and we believe they stand to benefit yet more from the recovery we expect in capital spending. We also remain enthusiastic about health care stocks, particularly in biotech.
Theo A. Kolokotrones
PORTFOLIO MANAGER
Howard B. Schow
PORTFOLIO MANAGER
Joel P. Fried
PORTFOLIO MANAGER
Alfred W. Mordecai
PORTFOLIO MANAGER
PRIMECAP MANAGEMENT COMPANY
OCTOBER 18, 2004
As of 9/30/2004
FUND PROFILE
This Profile provides a snapshot of the fund’s characteristics, compared where indicated with both an appropriate market index and a broad market index. Key terms are defined on page 10.
CAPITAL OPPORTUNITY FUND
|
| Portfolio Characteristics | | | |
|---|
| Fund | Comparative
Index* | Broad
Index** |
|---|
|
| Number of Stocks | 122 | 484 | 5,018 |
| Median Market Cap | $8.0B | $4.8B | $25.7B |
| Price/Earnings Ratio | 33.3x | 25.3x | 21.5x |
| Price/Book Ratio | 2.8x | 3.7x | 2.7x |
| Yield | 0.6% | 1.6% |
| Investor Shares | 0.1% |
| Admiral Shares | 0.2% |
| Return on Equity | 10.9% | 17.7% | 15.9% |
| Earnings Growth Rate | 11.6% | 15.5% | 7.4% |
| Foreign Holdings | 9.6% | 0.0% | 0.8% |
| Turnover Rate | 10% | -- | -- |
| Expense Ratio | -- | -- |
| Investor Shares | 0.52%† |
| Admiral Shares | 0.41%† |
| Short-Term Reserves | 6% | -- | -- |
|
|
| Volatility Measures | | | | |
|---|
| Fund | Comparative
Index* | Fund | Broad
Index** |
|---|
|
| R-Squared | 0.91 | 1.00 | 0.91 | 1.00 |
| Beta | 1.03 | 1.00 | 1.34 | 1.00 |
|
|
| Sector Diversification (% of portfolio) | | | |
|---|
| Fund | Comparative
Index* | Broad
Index** |
|---|
|
| Auto & Transportation | 5% | 3% | 3% |
| Consumer Discretionary | 18 | 24 | 16 |
| Consumer Staples | 0 | 3 | 6 |
| Financial Services | 2 | 12 | 23 |
| Health Care | 16 | 18 | 12 |
| Integrated Oils | 4 | 0 | 4 |
| Other Energy | 4 | 5 | 3 |
| Materials & Processing | 4 | 5 | 4 |
| Producer Durables | 7 | 8 | 5 |
| Technology | 31 | 19 | 13 |
| Utilities | 3 | 2 | 7 |
| Other | 0 | 1 | 4 |
| Short-Term Reserves | 6% | -- | -- |
|
*Russell Midcap Growth Index.
**Dow Jones Wilshire 5000 Index.
† Annualized.
|
| Ten Largest Holdings (% of total net assets) | |
|---|
| |
|---|
Biogen Idec Inc. | 4.8% |
| (pharmaceuticals) |
| Research In Motion Ltd. | 4.5 |
| (computer hardware) |
| FedEx Corp. | 3.5 |
| (express delivery services) |
| Symantec Corp. | 3.1 |
| (software) |
| DirecTV Group, Inc. | 2.6 |
| (telecommunications services) |
| Sprint Corp. | 2.6 |
| (telecommunications services) |
| Monsanto Co. | 2.4 |
| (chemicals) |
| Murphy Oil Corp. | 2.3 |
| (energy and utilities) |
| Micron Technology, Inc. | 2.0 |
| (electronics) |
| ConocoPhillips Co. | 2.0 |
| (energy and utilities) |
|
| Top Ten | 29.8% |
|
“Ten Largest Holdings” excludes any temporary cash investments and equity index products.
Investment Focus

Visit our website at Vanguard.com
for regularly updated fund information.
GLOSSARY OF INVESTMENT TERMS
Beta. A measure of the magnitude of a fund’s past share-price fluctuations in relation to the ups and downs of a given market index. The index is assigned a beta of 1.00. Compared with a given index, a fund with a beta of 1.20 typically would have seen its share price rise or fall by 12% when the index rose or fell by 10%. A fund’s beta should be reviewed in conjunction with its R-squared (see definition below). The lower the R-squared, the less correlation there is between the fund and the index, and the less reliable beta is as an indicator of volatility.
Earnings Growth Rate. The average annual rate of growth in earnings over the past five years for the stocks now in a fund.
Expense Ratio. The percentage of a fund’s average net assets used to pay its annual administrative and advisory expenses. These expenses directly reduce returns to investors.
Foreign Holdings. The percentage of a fund’s equity assets represented by stocks or depositary receipts of companies based outside the United States.
Median Market Cap. An indicator of the size of companies in which a fund invests; the midpoint of market capitalization (market price x shares outstanding) of a fund’s stocks, weighted by the proportion of the fund’s assets invested in each stock. Stocks representing half of the fund’s assets have market capitalizations above the median, and the rest are below it.
Price/Book Ratio. The share price of a stock divided by its net worth, or book value, per share. For a fund, the weighted average price/book ratio of the stocks it holds.
Price/Earnings Ratio. The ratio of a stock’s current price to its per-share earnings over the past year. For a fund, the weighted average P/E of the stocks it holds. P/E is an indicator of market expectations about corporate prospects; the higher the P/E, the greater the expectations for a company’s future growth.
R-Squared. A measure of how much of a fund’s past returns can be explained by the returns from the market in general, as measured by a given index. If a fund’s total returns were precisely synchronized with an index’s returns, its R-squared would be 1.00. If the fund’s returns bore no relationship to the index’s returns, its R-squared would be 0.
Return on Equity. The annual average rate of return generated by a company during the past five years for each dollar of shareholder’s equity (net income divided by shareholder’s equity). For a fund, the weighted average return on equity for the companies whose stocks it holds.
Short-Term Reserves. The percentage of a fund invested in highly liquid, short-term securities that can be readily converted to cash.
Turnover Rate. An indication of the fund’s trading activity. Funds with high turnover rates incur higher transaction costs and may be more likely to distribute capital gains (which may be taxable to investors).
Yield. A snapshot of a fund’s income from interest and dividends. The yield, expressed as a percentage of the fund’s net asset value, is based on income earned over the past 30 days and is annualized, or projected forward for the coming year. The index yield is based on the current annualized rate of income provided by securities in the index.
As of 9/30/2004
PERFORMANCE SUMMARY
All of the returns in this report represent past performance, which is not a guarantee of future results that may be achieved by the fund. (For the performance data current to the most recent month-end, which may be higher or lower than that cited, visit our website at www.vanguard.com.) Note, too, that both investment returns and principal value can fluctuate widely, so an investor’s shares, when sold, could be worth more or less than their original cost. The returns shown do not reflect taxes that a shareholder would pay on fund distributions or on the sale of fund shares. All average annual returns are based on the fund’s new fiscal year-end.
CAPITAL OPPORTUNITY FUND
Cumulative Performance August 14, 1995–September 30, 2004
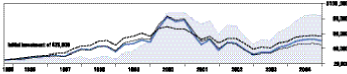
| | Average Annual Total Returns
Periods Ended September 30, 2004
| Final Value | |
|---|
| Eleven
Months | One
Year | Five
Years
| Since
Inception* | of a $25,000
Investment |
|---|
|
| Capital Opportunity Fund Investor Shares** | 11.13% | 21.60% | 11.13% | 13.96% | $82,420 |
| Dow Jones Wilshire 5000 Index | 8.15 | 14.76 | -0.05 | 9.30 | 56,307 |
| Russell Midcap Growth Index | 5.20 | 13.68 | 0.63 | 7.93 | 50,194 |
| Average Multi-Cap Growth Fund† | 2.30 | 9.64 | -2.99 | 6.60 | 44,810 |
|
| Eleven
Months | One
Year | Since
Inception†† | Final Value
of a $250,000
Investment |
|---|
| | | | |
|---|
|
| Capital Opportunity Fund Admiral Shares** | 11.23% | 21.73% | 8.18% | $313,598 |
| Dow Jones Wilshire 5000 Index | 8.15 | 14.76 | 3.65 | 277,223 |
| Russell Midcap Growth Index | 5.20 | 13.68 | 4.45 | 283,397 |
|
Total Investment Returns (%) August 14, 1995–September 30, 2004

*August 14, 1995.
**Reflective of the 1% fee assessed on redemptions of shares held for less than five years.
† Derived from data provided by Lipper Inc.
†† November 12, 2001.
Note: See Financial Highlights tables on pages 21 and 22 for dividend and capital gains information.
YOUR FUND’S AFTER-TAX RETURNS
This table presents returns for your fund both before and after taxes. The after-tax returns are shown in two ways: (1) assuming that an investor owned the fund during the entire period and paid taxes on the fund’s distributions, and (2) assuming that an investor paid taxes on the fund’s distributions and sold all shares at the end of each period.
Calculations are based on the highest individual federal income tax and capital gains tax rates in effect at the times of the distributions and the hypothetical sales. State and local taxes were not considered. After-tax returns reflect the reduced tax rates on ordinary income (including qualified dividend income) and short-term capital gains that became effective as of January 1, 2003, and on long-term capital gains realized on or after May 6, 2003. To calculate qualified dividend income, we used actual 2003 figures and estimates for 2004. (In the example, returns after the sale of fund shares may be higher than those assuming no sale. This occurs when the sale would have produced a capital loss. The calculation assumes that the investor received a tax deduction for the loss.) The table shows returns for Investor Shares only; returns for other share classes will differ. Please note that your actual after-tax returns will depend on your tax situation and may differ from those shown. Also note that if you own the fund in a tax-deferred account, such as an individual retirement account or a 401(k) plan, this information does not apply to you. Such accounts are not subject to current taxes.
Finally, keep in mind that a fund’s performance—whether before or after taxes—does not guarantee future results.
|
| Average Annual Total Returns | Periods Ended September 30, 2004 | |
|---|
|
One Year* | Five Years |
Since
Inception** |
|---|
|
|
| Capital Opportunity Fund Investor Shares | | | |
| Returns Before Taxes | 21.60% | 11.13% | 13.96% |
| Returns After Taxes on Distributions | 21.59 | 10.36 | 13.19 |
| Returns After Taxes on Distributions and Sale of Fund Shares | 14.05 | 9.27 | 12.05 |
|
*Reflective of the 1% fee assessed on redemptions of shares held for less than five years.
**August 14, 1995.
ABOUT YOUR FUND’S EXPENSES
We believe it is important for you to understand the impact of costs on your investment. All mutual funds have operating expenses. As a shareholder of the fund, you incur ongoing costs, which include costs for portfolio management, administrative services, and shareholder reports (like this one), among others. Operating expenses, which are deducted from a fund’s gross income, directly reduce the investment return of the fund. A fund’s expenses are expressed as a percentage of its average net assets. This figure is known as the expense ratio. The following examples are intended to help you understand the ongoing costs (in dollars) of investing in your fund and to compare these costs with those of other mutual funds. The examples are based on an investment of $1,000 made at the beginning of the period shown and held for the entire period. The table below illustrates your fund’s costs in two ways:
• Based on actual fund return. This section helps you to estimate the actual expenses that you paid over the period. The “Ending Account Value” shown is derived from the fund’s actual return, and the third column shows the dollar amount that would have been paid by an investor who started with $1,000 in the fund. You may use the information here, together with the amount you invested, to estimate the expenses that you paid over the period. To do so, simply divide your account value by $1,000 (for example, an $8,600 account value divided by $1,000 = 8.6), then multiply the result by the number given for your fund under the heading “Expenses Paid During Period.”
|
| Six Months Ended September 30, 2004 | | | |
|---|
| Capital Opportunity Fund | Beginning
Account Value
3/31/2004 | Ending
Account Value
9/30/2004 | Expenses
Paid During
Period* |
|---|
|
| Based on Actual Fund Return | | | |
| Investor Shares | $1,000.00 | $995.61 | $2.49 |
| Admiral Shares | 1,000.00 | 995.89 | 2.05 |
| Based on Hypothetical 5% Yearly Return |
| Investor Shares | $1,000.00 | $1,022.50 | $2.53 |
| Admiral Shares | 1,000.00 | 1,022.95 | 2.07 |
|
*These calculations are based on expenses incurred in the most recent six-month period. The fund’s annualized six-month expense ratios for that period are 0.50% for Investor Shares and 0.41% for Admiral Shares. The dollar amounts shown as “Expenses Paid” are equal to the annualized expense ratio multiplied by the average account value over the period, multiplied by the number of days in the most recent six-month period, then divided by the number of days in the most recent 12-month period.
• Based on hypothetical 5% return. This section is intended to help you compare your fund’s costs with those of other mutual funds. It assumes that the fund had a yearly return of 5% before expenses, but that the expense ratio is unchanged. In this case—because the return used is not the fund’s actual return—the results do not apply to your investment. The example is useful in making comparisons because the Securities and Exchange Commission requires all mutual funds to calculate expenses based on a 5% return. You can assess your fund’s costs by comparing this hypothetical example with the hypothetical examples that appear in shareholder reports of other funds.
|
Annualized Expense Ratios:
Your fund compared with its peer group | | | |
|---|
| Investor
Shares | Admiral
Shares | Average
Multi-Cap
Growth Fund |
|---|
|
| Capital Opportunity Fund | 0.52% | 0.41% | 1.71%* |
|
*Peer-group expense ratio is derived from data provided by Lipper Inc. and captures information through year-end 2003.
Note that the expenses shown in the table on page 13 are meant to highlight and help you compare ongoing costs only and do not reflect any transactional costs or account maintenance fees. They do not include your fund’s low-balance fee or the 1% fee assessed on redemptions of shares held for less than five years. These fees are fully described in the prospectus. If the fees were applied to your account, your costs would be higher. Your fund does not carry a “sales load.” The calculations assume no shares were bought or sold during the period. Your actual costs may have been higher or lower, depending on the amount of your investment and the timing of any purchases or redemptions. You can find more information about the fund’s expenses, including annual expense ratios for the past five years, in the Financial Statements section of this report. For additional information on operating expenses and other shareholder costs, please refer to the appropriate fund prospectus.
As of 9/30/2004
FINANCIAL STATEMENTS
STATEMENT OF NET ASSETS
This Statement provides a detailed list of the fund’s holdings, including each security’s market value on the last day of the reporting period. Securities are grouped and subtotaled by asset type (common stocks, bonds, etc.) and by industry sector. Other assets are added to, and liabilities are subtracted from, the value of Total Investments to calculate the fund’s Net Assets. Finally, Net Assets are divided by the outstanding shares of the fund to arrive at its share price, or Net Asset Value (NAV) Per Share.
At the end of the Statement of Net Assets, you will find a table displaying the composition of the fund’s net assets. Because all income and any realized gains must be distributed to shareholders each year, the bulk of net assets consists of Paid-in Capital (money invested by shareholders).
The amounts shown for Undistributed Net Investment Income and Accumulated Net Realized Gains usually approximate the sums the fund had available to distribute to shareholders as income dividends or capital gains as of the statement date, but may differ because certain investments or transactions may be treated differently for financial statement and tax purposes. Any Accumulated Net Realized Losses, and any cumulative excess of distributions over net income or net realized gains, will appear as negative balances. Unrealized Appreciation (Depreciation) is the difference between the market value of the fund’s investments and their cost, and reflects the gains (losses) that would be realized if the fund were to sell all of its investments at their statement-date values.
The fund provides a complete list of its holdings four times in each fiscal year, at the quarter-ends. For the second and fourth quarters, the lists appear in the fund’s semiannual and annual reports to shareholders. For the first and third quarters, the fund files the lists with the Securities and Exchange Commission on Form N-Q. Shareholders can look up the fund’s Forms N-Q on the SEC’s website at www.sec.gov. Forms N-Q may also be reviewed and copied at the SEC’s Public Reference Room (see the back cover of this report for further information).
|
Capital Opportunity Fund
| Shares
| Market
Value^
(000)
|
|---|
| COMMON STOCKS (93.4%) | | |
|---|
|
| Auto & Transportation (5.4%) | | |
| FedEx Corp. | 3,118,000 | $ 267,181 |
| Union Pacific Corp. | 1,150,000 | 67,390 |
| *AMR Corp. | 3,000,000 | 21,990 |
| *(1) Strattec Security Corp. | 220,000 | 13,697 |
| United Parcel Service, Inc. | 150,000 | 11,388 |
| *Delta Air Lines, Inc. | 3,170,000 | 10,429 |
| *FLYI, Inc. | 2,200,000 | 8,602 |
| *(1) Midwest Air Group Inc. | 1,073,000 | 3,165 |
| |
|
| | | 403,842 |
| |
|
| Consumer Discretionary (17.1%) |
| *DirecTV Group, Inc. | 11,344,759 | 199,554 |
| *VeriSign, Inc. | 7,085,000 | 140,850 |
| Nordstrom, Inc. | 2,930,000 | 112,043 |
| TJX Cos., Inc. | 4,167,400 | 91,850 |
| *(1) Men's Wearhouse, Inc. | 3,000,000 | 87,150 |
| *CarMax, Inc. | 4,022,100 | 86,676 |
| Lowe's Cos., Inc. | 1,246,100 | 67,726 |
| *eBay Inc. | 725,000 | 66,657 |
| Yum! Brands, Inc. | 1,369,500 | 55,684 |
| *(1) Linens `n Things, Inc. | 2,300,000 | 53,291 |
| Best Buy Co., Inc. | 860,000 | 46,646 |
| Robert Half International, Inc. | 1,600,000 | 41,232 |
| *(1) The Dress Barn, Inc. | 2,027,500 | 35,380 |
| *99 Cents Only Stores | 2,400,000 | 34,152 |
| Tiffany & Co. | 900,800 | 27,691 |
| *Tommy Hilfiger Corp. | 2,000,200 | 19,742 |
| Family Dollar Stores, Inc. | 537,300 | 14,561 |
| *IAC/InterActiveCorp | 650,000 | 14,313 |
| *Tetra Tech, Inc. | 1,121,875 | 14,214 |
| *THQ Inc. | 730,000 | 14,206 |
| Royal Caribbean Cruises, Ltd. | 290,500 | 12,666 |
| *Accenture Ltd. | 448,600 | 12,135 |
| Sabre Holdings Corp. | 478,700 | 11,743 |
| Abercrombie & Fitch Co. | 300,000 | 9,450 |
| *(1) REX Stores Corp. | 605,000 | 8,500 |
| Darden Restaurants Inc. | 211,410 | 4,930 |
|
| Capital Opportunity Fund | Shares | Market
Value^
(000) |
|---|
| | |
|---|
|
| *Weight Watchers | | |
| International, Inc. | 120,000 | $4,658 |
| Mattel, Inc. | 197,000 | 3,572 |
| |
|
| | | 1,291,272 |
| |
|
| Financial Services (2.0%) |
| First Data Corp. | 970,717 | 42,226 |
| MBIA, Inc. | 562,500 | 32,743 |
| JPMorgan Chase & Co. | 528,000 | 20,977 |
| Capital One Financial Corp. | 275,000 | 20,323 |
| The Chubb Corp. | 230,000 | 16,164 |
| TCF Financial Corp. | 230,000 | 6,967 |
| Cincinnati Financial Corp. | 157,500 | 6,492 |
| Commerce Bancorp, Inc. | 65,000 | 3,588 |
| |
|
| | | 149,480 |
| |
|
| Health Care (16.1%) |
| *Biogen Idec Inc. | 5,935,000 | 363,044 |
| Novartis AG ADR | 3,150,000 | 147,011 |
| Pfizer Inc. | 4,287,780 | 131,206 |
| *(1)Affymetrix, Inc. | 3,211,000 | 98,610 |
| *Millipore Corp. | 2,005,000 | 95,939 |
| *ICOS Corp. | 3,107,500 | 75,015 |
| Guidant Corp. | 900,000 | 59,436 |
| *(1)Ligand Pharmaceuticals Inc. |
| Class B | 5,220,900 | 52,313 |
| Eli Lilly & Co. | 800,000 | 48,040 |
| *Sepracor Inc. | 950,000 | 46,341 |
| *Charles River Laboratories, Inc. | 700,000 | 32,060 |
| *(1)BioMarin Pharmaceutical Inc. | 4,670,500 | 24,240 |
| *Dendreon Corp. | 1,561,750 | 13,134 |
| *Edwards Lifesciences Corp. | 386,000 | 12,931 |
| *XOMA Ltd. | 3,500,000 | 8,120 |
| *Pharmacyclics, Inc. | 713,250 | 7,354 |
| |
|
| | | 1,214,794 |
| |
|
| Integrated Oils (4.3%) |
| Murphy Oil Corp. | 2,000,000 | 173,540 |
| ConocoPhillips Co. | 1,850,000 | 153,273 |
| |
|
| | | 326,813 |
| |
|
| Other Energy (4.4%) |
| Pioneer Natural Resources Co. | 3,150,000 | 108,612 |
| Pogo Producing Co. | 1,420,000 | 67,379 |
| Noble Energy, Inc. | 1,100,000 | 64,064 |
| *Varco International, Inc. | 1,200,000 | 32,184 |
| *Hanover Compressor Co. | 1,480,000 | 19,906 |
| *Noble Corp. | 400,000 | 17,980 |
| *Pride International, Inc. | 900,000 | 17,811 |
| *Input/Output, Inc. | 85,000 | 876 |
| |
|
| | | 328,812 |
| |
|
| Materials & Processing (3.5%) |
| Monsanto Co. | 4,889,734 | 178,084 |
| (1)Minerals Technologies, Inc. | 1,060,000 | 62,392 |
| Avery Dennison Corp. | 372,000 | 24,470 |
| |
|
| | | 264,946 |
| |
|
| Producer Durables (6.9%) |
| (1)Thomas & Betts Corp. | 5,450,000 | 146,169 |
| Pall Corp. | 4,499,800 | 110,155 |
| Tektronix, Inc. | 2,557,200 | 85,027 |
| *ASML Holding (New York) | 6,100,000 | 78,507 |
| Plantronics, Inc. | 1,150,000 | 49,726 |
| *(1) Mykrolis Corp. | 2,126,410 | 21,413 |
| *CUNO Inc. | 175,500 | 10,135 |
| *Cymer, Inc. | 350,000 | 10,031 |
| W.W. Grainger, Inc. | 125,000 | 7,206 |
| *Agilent Technologies, Inc. | 108,245 | 2,335 |
| |
|
| | | 520,704 |
| |
|
| Technology (31.1%) |
| Communications Technology (11.1%) |
| *Research In Motion Ltd. | 4,396,000 | 335,591 |
| *Corning, Inc. | 12,449,800 | 137,944 |
| Motorola, Inc. | 6,655,500 | 120,065 |
| *Comverse Technology, Inc. | 5,684,750 | 107,044 |
| *Nortel Networks Corp. | 24,415,100 | 83,011 |
| *Advanced Fibre |
| Communications, Inc. | 1,600,000 | 25,440 |
| *McAfee Inc. | 1,030,000 | 20,703 |
| *CIENA Corp. | 4,450,000 | 8,811 |
Computer Services Software & Systems (9.0%) |
| *Symantec Corp. | 4,210,000 | 231,045 |
| Microsoft Corp. | 4,300,000 | 118,895 |
| *(1) Macrovision Corp. | 3,670,000 | 88,374 |
| Autodesk, Inc. | 1,720,000 | 83,644 |
| Adobe Systems, Inc. | 960,000 | 47,491 |
| *Macromedia, Inc. | 2,105,000 | 42,268 |
| *Citrix Systems, Inc. | 1,532,700 | 26,853 |
| *NAVTEQ Corp. | 483,900 | 17,246 |
| *Cognizant Technology |
| Solutions Corp. | 429,200 | 13,095 |
| *Intuit, Inc. | 130,000 | 5,902 |
| *(1) The Descartes Systems |
| Group Inc. | 4,645,000 | 5,388 |
Computer Technology (2.6%) |
| Hewlett-Packard Co. | 3,855,000 | 72,281 |
| *(1) Emulex Corp. | 4,529,400 | 52,179 |
| *NVIDIA Corp. | 3,550,000 | 51,546 |
| *Maxtor Corp. | 2,010,000 | 10,452 |
| *(1) Concurrent Computer Corp. | 4,831,000 | 8,116 |
Electronics (0.4%) |
| *Amphenol Corp. | 844,200 | 28,922 |
|
| Shares | Market
Value^
(000) |
|---|
| | |
|---|
|
| Electronics--Semiconductors/Components (5.1%) | | |
| *Micron Technology, Inc. | 12,800,000 | $153,984 |
| *(1)Rambus Inc. | 5,205,000 | 81,666 |
| Intersil Corp. | 3,630,000 | 57,826 |
| *Skyworks Solutions, Inc. | 4,250,000 | 40,375 |
| *AMIS Holdings Inc. | 1,645,000 | 22,240 |
| Texas Instruments, Inc. | 550,000 | 11,704 |
| *Semiconductor Manufacturing |
| International Corp. | 820,000 | 8,102 |
| Intel Corp. | 235,000 | 4,714 |
| *Lattice Semiconductor Corp. | 645,000 | 3,167 |
| Electronics--Technology (0.9%) |
| *Trimble Navigation Ltd. | 1,500,000 | 47,400 |
| *Coherent, Inc. | 720,000 | 18,677 |
| Scientific Equipment & Supplies (2.0%) |
| Applera Corp.-Applied |
| Biosystems Group | 7,944,700 | 149,917 |
| |
|
| | | 2,342,078 |
| |
|
| Utilities (2.6%) |
| Sprint Corp. | 9,889,700 | 199,080 |
|
| TOTAL COMMON STOCKS |
| (Cost $6,042,671) | | 7,041,821 |
|
| PREFERRED STOCK (0.5%) |
|
| The News Corp. Ltd. Pfd. ADR |
| (Cost $33,206) | 1,136,012 | 35,591 |
|
| TEMPORARY CASH INVESTMENTS (9.1%) |
|
| Vanguard Market |
| Liquidity Fund, |
| 1.74 | 484,437,403 | $484,437,403 |
| Vanguard Market |
| Liquidity Fund, |
| 1.74%**--Note G | 202,181,200 | 202,181,200 |
|
| TOTAL TEMPORARY CASH INVESTMENTS |
| (Cost $686,618) | | 686,618 |
|
| TOTAL INVESTMENTS (103.0%) |
| (Cost $6,762,495) | | 7,764,030 |
|
| OTHER ASSETS AND |
| LIABILITIES--NET (-3.0%) | | (228,487) |
|
| NET ASSETS | | $7,535,543 |
|
ˆSee Note A in Notes to Financial Statements.
*Non-income-producing security.
**Money market fund available only to Vanguard funds and certain trusts and accounts managed by Vanguard. Rate shown is the 7-day yield.
(1)Considered an affiliated company of the fund, as the fund owns more than 5% of the outstanding voting securities of such company. The total market value of investments in affiliated companies was $842,043,000. See Note I in Notes to Financial Statements.
ADR--American Depositary Receipt.
|
| STATEMENT OF ASSETS AND LIABILITIES | |
|---|
| |
|---|
|
| Assets | |
| Investments in Securities, at Value | $ 7,764,030 |
| Receivables for Capital Shares Issued | 3,854 |
| Other Assets--Note C | 8,669 |
|
|
| Total Assets | 7,776,553 |
|
|
| Liabilities |
| Payables for Investment Securities |
| Purchased | 25,687 |
| Security Lending |
| Collateral |
| Payable to Brokers--Note G | 202,181 |
| Other Liabilities | 13,142 |
|
|
| Total Liabilities | 241,010 |
|
|
|
| NET ASSETS (100%) | $ 7,535,543 |
|
|
Capital Opportunity Fund
| Amount
(000)
|
|---|
| AT SEPTEMBER 30, 2004, NET ASSETS CONSISTED OF: | |
|---|
|
| Paid-in Capital | $ 6,565,787 |
| Overdistributed Net Investment Income | (50) |
| Accumulated Net Realized Losses | (31,729) |
| Unrealized Appreciation | 1,001,535 |
|
| NET ASSETS | $ 7,535,543 |
|
| Investor Shares--Net Assets |
| Applicable to 227,560,070 outstanding $.001 |
| par value shares of beneficial interest |
| (unlimited authorization) | $ 6,198,666 |
|
| NET ASSET VALUE PER SHARE-- |
| INVESTOR SHARES | $ 27.24 |
|
| Admiral Shares--Net Assets |
| Applicable to 21,233,677 outstanding $.001 |
| par value shares of beneficial interest |
| (unlimited authorization) | $ 1,336,877 |
|
| NET ASSET VALUE PER SHARE-- |
| ADMIRAL SHARES | $ 62.96 |
|
See Note E in Notes to Financial Statements for the tax-basis components of net assets.
STATEMENT OF OPERATIONS
This Statement shows the types of income earned by the fund during the two most recent reporting periods, and details the operating expenses charged to each class of its shares. These expenses directly reduce the amount of investment income available to pay to shareholders as income dividends. This Statement also shows any Net Gain (Loss) realized on the sale of investments, and the increase or decrease in the Unrealized Appreciation (Depreciation) of investments during each period.
|
| Capital Opportunity Fund
|
|---|
| Nov. 1, 2003,
to Sept. 30, 2004*
(000) | Year Ended
Oct. 31, 2003
(000) |
|---|
|
| INVESTMENT INCOME | | |
| Income |
| Dividends** | $31,545 | $23,870 |
| Interest | 5,201 | 2,714 |
| Security Lending | 594 | 425 |
|
| Total Income | 37,340 | 27,009 |
|
| Expenses |
| Investment Advisory Fees--Note B | 14,537 | 10,741 |
| The Vanguard Group--Note C |
| Management and Administrative |
| Investor Shares | 15,136 | 12,238 |
| Admiral Shares | 1,883 | 1,234 |
| Marketing and Distribution |
| Investor Shares | 641 | 459 |
| Admiral Shares | 144 | 59 |
| Custodian Fees | 84 | 66 |
| Auditing Fees | 16 | 13 |
| Shareholders' Reports |
| Investor Shares | 87 | 141 |
| Admiral Shares | 1 | 1 |
| Trustees' Fees and Expenses | 6 | 5 |
|
| Total Expenses | 32,535 | 24,957 |
| Expenses Paid Indirectly--Note D | (401) | (289) |
|
| Net Expenses | 32,134 | 24,668 |
|
| NET INVESTMENT INCOME | 5,206 | 2,341 |
|
| REALIZED NET GAIN (LOSS) ON INVESTMENT SECURITIES SOLD** | 159,885 | (67,979) |
|
| CHANGE IN UNREALIZED APPRECIATION (DEPRECIATION) |
| OF INVESTMENT SECURITIES | 576,461 | 1,814,096 |
|
| NET INCREASE (DECREASE) IN NET ASSETS |
| RESULTING FROM OPERATIONS | $741,552 | $1,748,458 |
|
*The fund’s fiscal year-end changed from October 31 to September 30, effective September 30, 2004.
**Dividend income and realized net gain (loss) from affiliated companies of the fund were $209,000 and $192,390,000, respectively, for the period ended September 30, 2004, and $100,000 and $13,469,000, respectively, for the year ended October 31, 2003.
STATEMENT OF CHANGES IN NET ASSETS
This Statement shows how the fund’s total net assets changed during the three most recent reporting periods. The Operations section summarizes information detailed in the Statement of Operations. The amounts shown as Distributions to shareholders from the fund’s net income and capital gains may not match the amounts shown in the Operations section, because distributions are determined on a tax basis and may be made in a period different from the one in which the income was earned or the gains were realized on the financial statements. The Capital Share Transactions section shows the net amount shareholders invested in or redeemed from the fund. Distributions and Capital Share Transactions are shown separately for each class of shares.
|
| Capital Opportunity Fund
|
|---|
| Nov. 1, 2003, to
Sept. 30, 2004*
(000) | Year Ended
Oct. 31, 2003
(000) | Year Ended
Oct. 31, 2002
(000) |
|---|
|
| INCREASE (DECREASE) IN NET ASSETS | | | |
| Operations |
| Net Investment Income | $5,206 | $2,341 | $3,744 |
| Realized Net Gain (Loss) | 159,885 | (67,979) | (108,224) |
| Change in Unrealized Appreciation (Depreciation) | 576,461 | 1,814,096 | (901,728) |
|
| Net Increase (Decrease) in Net Assets |
| Resulting from Operations | 741,552 | 1,748,458 | (1,006,208) |
|
| Distributions |
| Net Investment Income |
| Investor Shares | (2,793) | (2,518) | (14,327) |
| Admiral Shares | (1,164) | (695) | (1,013) |
| Realized Capital Gain |
| Investor Shares | -- | -- | -- |
| Admiral Shares | -- | -- | -- |
|
| Total Distributions | (3,957) | (3,213) | (15,340) |
|
| Capital Share Transactions--Note H |
| Investor Shares | 448,941 | 416,321 | (402,042) |
| Admiral Shares | 389,020 | 222,935 | 545,308 |
|
| Net Increase (Decrease) from Capital Share Transactions | 837,961 | 639,256 | 143,266 |
|
| Total Increase (Decrease) | 1,575,556 | 2,384,501 | (878,282) |
|
| Net Assets |
| Beginning of Period | 5,959,987 | 3,575,486 | 4,453,768 |
|
| End of Period | $7,535,543 | $5,959,987 | $3,575,486 |
|
*The fund’s fiscal year-end changed from October 31 to September 30, effective September 30, 2004.
FINANCIAL HIGHLIGHTS
This table summarizes the fund’s investment results and distributions to shareholders on a per-share basis for each class of shares. It also presents the Total Return and shows net investment income and expenses as percentages of average net assets. These data will help you assess: the variability of the fund’s net income and total returns from year to year; the relative contributions of net income and capital gains to the fund’s total return; how much it costs to operate the fund; and the extent to which the fund tends to distribute capital gains. The table also shows the Portfolio Turnover Rate, a measure of trading activity. A turnover rate of 100% means that the average security is held in the fund for one year.
|
Capital Opportunity Fund Investor Shares
|
|
|
|
|
|
|
|---|
| Nov.1,
2003, to | Year Ended October 31,
|
|---|
| For a Share Outstanding Throughout Each Period | Sept. 30,
2004* | 2003 | 2002 | 2001 | 2000 | 1999 |
|---|
|
| Net Asset Value, Beginning of Period | $24.28 | $16.54 | $20.73 | $30.16 | $19.34 | $11.47 |
|
| Investment Operations |
| Net Investment Income | .017 | .009 | .01 | .07 | .161 | .029 |
| Net Realized and Unrealized Gain (Loss) |
| on Investments** | 2.956 | 7.744 | (4.13) | (7.42) | 11.284 | 8.751 |
|
| Total from Investment Operations | 2.973 | 7.753 | (4.12) | (7.35) | 11.445 | 8.780 |
|
| Distributions |
| Dividends from Net Investment Income | (.013) | (.013) | (.07) | (.16) | (.035) | (.015) |
| Distributions from Realized Capital Gains | -- | -- | -- | (1.92) | (.590) | (.895) |
|
| Total Distributions | (.013) | (.013) | (.07) | (2.08) | (.625) | (.910) |
|
| Net Asset Value, End of Period | $27.24 | $24.28 | $16.54 | $20.73 | $30.16 | $19.34 |
|
| Total Return† | 12.25% | 46.91% | -19.97% | -25.68% | 60.37% | 81.74% |
|
| Ratios/Supplemental Data |
| Net Assets, End of Period (Millions) | $6,199 | $5,120 | $3,181 | $4,454 | $5,437 | $1,289 |
| Ratio of Total Expenses to Average Net Assets | 0.52%†† | 0.59% | 0.58% | 0.60% | 0.62% | 0.75% |
| Ratio of Net Investment Income to Average Net Assets | 0.06%†† | 0.04% | 0.07% | 0.28% | 0.64% | 0.31% |
| Portfolio Turnover Rate | 10% | 14% | 14% | 20% | 15% | 22% |
|
*The fund’s fiscal year-end changed from October 31 to September 30, effective September 30, 2004.
**Includes increases from redemption fees of $.01, $.01, $.03, $.03, $.02, and $.01.
† Total returns do not reflect the 1% fee assessed on redemptions of shares held for less than five years.
†† Annualized.
FINANCIAL HIGHLIGHTS (CONTINUED)
| Capital Opportunity Fund Admiral Shares | | | |
|---|
|
| For a Share Outstanding Throughout Each Period | Nov.1,
2003, to
Sept. 30,
2004* | Year
Ended
Oct. 31,
2003
| Nov.12,
2001** to
Oct. 31,
2002 |
|---|
|
| Net Asset Value, Beginning of Period | $56.11 | $38.22 | $50.00 |
|
| Investment Operations |
| Net Investment Income | .096 | .062 | .07 |
| Net Realized and Unrealized Gain (Loss) on Investments† | 6.828 | 17.894 | (11.68) |
|
| Total from Investment Operations | 6.924 | 17.956 | (11.61) |
|
| Distributions |
| Dividends from Net Investment Income | (.074) | (.066) | (.17) |
| Distributions from Realized Capital Gains | -- | -- | -- |
|
| Total Distributions | (.074) | (.066) | (.17) |
|
| Net Asset Value, End of Period | $62.96 | $56.11 | $38.22 |
|
| Total Return†† | 12.36% | 47.05% | -23.32% |
|
| Ratios/Supplemental Data |
| Net Assets, End of Period (Millions) | $1,337 | $840 | $395 |
| Ratio of Total Expenses to Average Net Assets | 0.41%‡ | 0.49% | 0.50%‡ |
| Ratio of Net Investment Income to Average Net Assets | 0.17%‡ | 0.14% | 0.17%‡ |
| Portfolio Turnover Rate | 10% | 14% | 14% |
|
*The fund’s fiscal year-end changed from October 31 to September 30, effective September 30, 2004.
**Inception. †Includes increases from redemption fees of $.03, $.03, and $.07.
††Total returns do not reflect the 1% fee assessed on redemptions of shares held for less than five years.
‡Annualized.
SEE ACCOMPANYING NOTES, WHICH ARE AN INTEGRAL PART OF THE fiNANCIAL STATEMENTS.
NOTES TO FINANCIAL STATEMENTS
Vanguard Capital Opportunity Fund is registered under the Investment Company Act of 1940 as an open-end investment company, or mutual fund. The fund offers two classes of shares, Investor Shares and Admiral Shares. Investor Shares are available to any investor who meets the fund’s minimum purchase requirements. Admiral Shares are designed for investors who meet certain administrative, servicing, tenure, and account-size criteria.
A. The following significant accounting policies conform to generally accepted accounting principles for U.S. mutual funds. The fund consistently follows such policies in preparing its financial statements.
1. Security Valuation: Securities are valued as of the close of trading on the New York Stock Exchange (generally 4:00 p.m. Eastern time) on the valuation date. Equity securities are valued at the latest quoted sales prices or official closing prices taken from the primary market in which each security trades; such securities not traded on the valuation date are valued at the mean of the latest quoted bid and asked prices. Securities for which market quotations are not readily available, or whose values have been materially affected by events occurring before the fund’s pricing time but after the close of the securities’ primary markets, are valued by methods deemed by the board of trustees to represent fair value. Investments in Vanguard® Market Liquidity Fund are valued at that fund’s net asset value. Temporary cash investments acquired over 60 days to maturity are valued using the latest bid prices or using valuations based on a matrix system (which considers such factors as security prices, yields, maturities, and ratings), both as furnished by independent pricing services. Other temporary cash investments are valued at amortized cost, which approximates market value.
2. Repurchase Agreements: The fund, along with other members of The Vanguard Group, may transfer uninvested cash balances into a pooled cash account, which is invested in repurchase agreements secured by U.S. government and agency securities. Securities pledged as collateral for repurchase agreements are held by a custodian bank until the agreements mature. Each agreement requires that the market value of the collateral be sufficient to cover payments of interest and principal; however, in the event of default or bankruptcy by the other party to the agreement, retention of the collateral may be subject to legal proceedings.
3. Federal Income Taxes: The fund intends to continue to qualify as a regulated investment company and distribute all of its taxable income. Accordingly, no provision for federal income taxes is required in the financial statements.
4. Distributions: Distributions to shareholders are recorded on the ex-dividend date.
5. Other: Dividend income is recorded on the ex-dividend date. Interest income includes income distributions received from Vanguard Market Liquidity Fund and is accrued daily. Security transactions are accounted for on the date the securities are bought or sold. Costs used to determine realized gains (losses) on the sale of investment securities are those of the specific securities sold. Fees assessed on redemptions of capital shares are credited to paid-in capital.
Each class of shares has equal rights as to assets and earnings, except that each class separately bears certain class-specific expenses related to maintenance of shareholder accounts (included in Management and Administrative expenses) and shareholder reporting. Marketing and distribution expenses are allocated to each class of shares based on a method approved by the board of trustees. Income, other non-class-specific expenses, and gains and losses on investments are allocated to each class of shares based on its relative net assets.
B. PRIMECAP Management Company provides investment advisory services to the fund for a fee calculated at an annual percentage rate of average net assets. For the period ended September 30, 2004,
NOTES TO FINANCIAL STATEMENTS (CONTINUED)
and the year ended October 31, 2003, the investment advisory fee represented effective annual rates of 0.22% and 0.25%, respectively, of the fund’s average net assets.
C. The Vanguard Group furnishes at cost corporate management, administrative, marketing, and distribution services. The costs of such services are allocated to the fund under methods approved by the board of trustees. The fund has committed to provide up to 0.40% of its net assets in capital contributions to Vanguard. At September 30, 2004, the fund had contributed capital of $1,033,000 to Vanguard (included in Other Assets), representing 0.01% of the fund’s net assets and 1.03% of Vanguard’s capitalization. The fund’s trustees and officers are also directors and officers of Vanguard.
D. The fund has asked its investment advisor to direct certain security trades, subject to obtaining the best price and execution, to brokers who have agreed to rebate to the fund part of the commissions generated. Such rebates are used solely to reduce the fund’s management and administrative expenses. The fund’s custodian bank has also agreed to reduce its fees when the fund maintains cash on deposit in the non-interest-bearing custody account. For the period ended September 30, 2004, these arrangements reduced the fund’s management and administrative expenses by $401,000. For the year ended October 31, 2003, these arrangements reduced the fund’s management and administrative expenses by $287,000 and custodian fees by $2,000. The total expense reduction represented an effective annual rate of 0.01% of the fund’s average net assets for each period.
E. Distributions are determined on a tax basis and may differ from net investment income and realized capital gains for financial reporting purposes. Differences may be permanent or temporary. Permanent differences are reclassified among capital accounts in the financial statements to reflect their tax character. Temporary differences arise when certain items of income, expense, gain, or loss are recognized in different periods for financial statement and tax purposes; these differences will reverse at some time in the future. Differences in classification may also result from the treatment of short-term gains as ordinary income for tax purposes.
For tax purposes, at September 30, 2004, the fund had $5,516,000 of ordinary income available for distribution. The fund had available realized losses of $30,968,000 to offset future net capital gains through September 30, 2011.
At September 30, 2004, net unrealized appreciation of investment securities for tax purposes was $1,001,535,000, consisting of unrealized gains of $2,031,451,000 on securities that had risen in value since their purchase and $1,029,916,000 in unrealized losses on securities that had fallen in value since their purchase.
F. During the period ended September 30, 2004, the fund purchased $1,394,359,000 of investment securities and sold $678,012,000 of investment securities, other than temporary cash investments.
G. The market value of securities on loan to broker/dealers at September 30, 2004, was $189,073,000, for which the fund held cash collateral of $202,181,000. The fund invests cash collateral received in temporary cash investments, and records a liability for the return of the collateral, during the period the securities are on loan.
H. Capital share transactions for each class of shares were:
|
| November 1, 2003, to
September 30, 2004
| Year Ended
October 31, 2003
| Year Ended
October 31, 2002
|
|---|
| Amount
(000) | Shares
(000) | Amount
(000) | Shares
(000) | Amount
(000) | Shares
(000) |
|---|
| | | | | | |
|---|
|
| Investor Shares | | | | | | |
| Issued | $1,106,681 | 41,697 | $933,509 | 46,152 | $1,000,146 | 47,555 |
| Issued in Lieu of Cash Distributions | 2,611 | 107 | 2,348 | 136 | 13,416 | 584 |
| Redeemed* | (660,351) | (25,109) | (519,536) | (27,713) | (1,415,604) | (70,648) |
|
| Net Increase (Decrease)-- |
| Investor Shares | 448,941 | 16,695 | 416,321 | 18,575 | (402,042) | (22,509) |
|
| Admiral Shares |
| Issued | 532,781 | 8,642 | 303,864 | 6,477 | 635,222 | 12,472 |
| Issued in Lieu of Cash Distributions | 1,042 | 18 | 603 | 15 | 891 | 17 |
| Redeemed* | (144,803) | (2,402) | (81,532) | (1,843) | (90,805) | (2,162) |
| Net Increase (Decrease)-- |
|
| Admiral Shares | 389,020 | 6,258 | 222,935 | 4,649 | 545,308 | 10,327 |
|
*Net of redemption fees of $3,128,000, $2,964,000, and $6,760,000, respectively (fund totals).
I. Certain of the fund’s investments are in companies that are considered to be affiliated companies of the fund because the fund owns more than 5% of the outstanding voting securities of the company. Transactions during the period ended September 30, 2004 in securities of affiliated companies were as follows:
|
| (000)
| |
|---|
| | Current Period Transactions
| |
|---|
| Oct. 31, 2003
Market
Value | Purchases
at Cost
| Proceeds from
Securities
Sold | Dividend
Income | Sept. 30, 2004
Market
Value |
|---|
|
| Affymetrix, Inc. | n/a* | $102,118 | -- | -- | $98,610 |
| BioMarin Pharmaceutical Inc. | $32,693 | -- | -- | -- | 24,240 |
| Concurrent Computer Corp. | 24,250 | -- | $2,211 | -- | 8,116 |
| The Descartes Systems Group Inc. | 13,006 | -- | -- | -- | 5,388 |
| The Dress Barn, Inc. | 29,400 | -- | 1,249 | -- | 35,380 |
| Emulex Corp. | n/a* | 78,954 | -- | -- | 52,179 |
| Ligand Pharmaceuticals Inc. Class B | n/a* | 50,349 | -- | -- | 52,313 |
| Linens `n Things, Inc. | 67,896 | -- | -- | -- | 53,291 |
| Macrovision Corp. | n/a* | 46,100 | -- | -- | 88,374 |
| Men's Wearhouse, Inc. | 94,272 | -- | 5,374 | -- | 87,150 |
| Midwest Air Group Inc. | 5,172 | -- | -- | -- | 3,165 |
| Minerals Technologies, Inc. | 58,088 | -- | -- | $186 | 62,392 |
| Mykrolis Corp. | 31,365 | -- | -- | -- | 21,413 |
| Rambus Inc. | n/a* | 69,233 | -- | -- | 81,666 |
| Research In Motion Ltd. | 192,741 | -- | 224,367 | -- | n/a** |
| REX Stores Corp. | 15,208 | -- | 4,995 | -- | 8,500 |
| Strattec Security Corp. | 11,660 | -- | -- | -- | 13,697 |
| Thomas & Betts Corp. | 83,660 | 16,342 | -- | 23 | 146,169 |
|
|
| | $659,411 | | | $209 | $842,043 |
|
|
|
*At October 31, 2003, the security was not an affiliated company of the fund.
**At September 30, 2004, the security is still held but the issuer is no longer an affiliated company of the fund.
REPORT OF INDEPENDENT REGISTERED PUBLIC ACCOUNTING FIRM
To the Shareholders and Trustees of Vanguard Capital Opportunity Fund:
In our opinion, the accompanying statement of net assets, statement of assets and liabilities, and the related statements of operations and of changes in net assets and the financial highlights present fairly, in all material respects, the financial position of Vanguard Capital Opportunity Fund (the “Fund”) at September 30, 2004, the results of its operations for the period from November 1, 2003 to September 30, 2004 and for the year ended October 31, 2003, and the changes in its net assets for the period from November 1, 2003 to September 30, 2004 and for the two years ended October 31, 2003, and the financial highlights for each of the periods indicated, in conformity with accounting principles generally accepted in the United States of America. These financial statements and financial highlights (hereafter referred to as “financial statements) are the responsibility of the Fund’s management; our responsibility is to express an opinion on these financial statements based on our audits. We conducted our audits of these financial statements in accordance with the standards of the Public Company Accounting Oversight Board (United States), which require that we plan and perform the audit to obtain reasonable assurance about whether the financial statements are free of material misstatement. An audit includes examining, on a test basis, evidence supporting the amounts and disclosures in the financial statements, assessing the accounting principles used and significant estimates made by management, and evaluating the overall financial statement presentation. We believe that our audits, which included confirmation of securities at September 30, 2004 by correspondence with the custodian and broker, provide a reasonable basis for our opinion.
PricewaterhouseCoopers LLP
Philadelphia, Pennsylvania
November 3, 2004
SPECIAL 2004 TAX INFORMATION
(UNAUDITED) FOR VANGUARD CAPITAL OPPORTUNITY FUND
This information for the period ended September 30, 2004, is included pursuant to provisions of the Internal Revenue Code.
The fund distributed $3,957,000 of qualified dividend income to shareholders during the period.
For corporate shareholders, 100% of investment income (dividend income plus short-term gains, if any) qualifies for the dividends-received deduction.
INVESTING IS FAST, EASY, AND SECURE ON VANGUARD.COM
If you’re like many Vanguard investors, you believe in planning and taking control of your own investments. Vanguard.com was built for you—and it keeps getting better.
RESEARCH AND PLAN YOUR INVESTMENTS WITH CONFIDENCE
Use our Planning & Advice and Research Funds & Stocks sections to:
• Determine what asset allocation might best suit your needs—by taking our Investor Questionnaire.
• Find out how much to save for retirement and your children’s college education—by using our planning tools.
• Learn how to achieve your goals—by reading our PlainTalk® investment guides.
• Find your next fund—by using the Compare Funds, Compare Costs, and Narrow Your Fund Choices tools.
• Look up fund price, performance history, and distribution information—in a snap.
INVEST AND MANAGE ACCOUNTS WITH EASE
Log on to Vanguard.com to:
• See what you own (at Vanguard and elsewhere) and how your investments are doing.
• Elect to receive online statements, fund reports (like this one), prospectuses, and tax forms.
• Analyze your portfolio’s holdings and performance.
• Open new accounts, buy and sell shares, and exchange money between funds—securely and easily.
• Sign up to receive electronic newsletters from Vanguard informing you of news on our funds, products, and services, as well as on investing and the financial markets.
Find out what Vanguard.com can do for you. Log on today!
THE PEOPLE WHO GOVERN YOUR FUND
The trustees of your mutual fund are there to see that the fund is operated and managed in your best interests since, as a shareholder, you are a part owner of the fund. Your fund trustees also serve on the board of directors of The Vanguard Group, Inc., which is owned by the Vanguard® funds and provides services to them on an at-cost basis.
A majority of Vanguard’s board members are independent, meaning that they have no affiliation with Vanguard or the funds they oversee, apart from the sizable personal investments they have made as private individuals.
Our independent board members bring distinguished backgrounds in business, academia, and public service to their task of working with Vanguard officers to establish the policies and oversee the activities of
Name
(Year of Birth)
Trustee/Officer
Since
| Position(s) Held with
Fund (Number of
Vanguard Funds
Overseen by
Trustee/Officer)
| Principal Occupation(s) During the Past Five Years
|
|---|
John J. Brennan*
(1954)
May 1987
| Chairman of the
Board, Chief
Executive Officer,
and Trustee
(131) | Chairman of the Board,Chief Executive Officer, and Director/Trustee of
The Vanguard Group, Inc., and of each of the investment companies
served by The Vanguard Group. |
|
| INDEPENDENT TRUSTEES |
| |
Charles D. Ellis
(1937)
January 2001 | Trustee
(131) | The Partners of `63 (pro bono ventures in education); Senior Advisor
to Greenwich Associates (international business strategy consulting);
Successor Trustee of Yale University; Overseer of the Stern School of
Business at New York University; Trustee of the Whitehead Institute
for Biomedical Research. |
|
Rajiv L. Gupta
(1945)
December 2001† | Trustee
(131) | Chairman and Chief Executive Officer (since October 1999), Vice
Chairman (January-September 1999), and Vice President (prior to
September 1999) of Rohm and Haas Co. (chemicals); Director of
Technitrol, Inc. (electronic components), and Agere Systems (commu-
nications components); Board Member of the American Chemistry
Council; Trustee of Drexel University. |
|
JoAnn Heffernan
Heisen
(1950)
July 1998 | Trustee
(131)
| Vice President, Chief Information Officer, and Member of the
Executive Committee of Johnson & Johnson (pharmaceuticals/
consumer products); Director of the University Medical Center at
Princeton and Women's Research and Education Institute. |
|
Burton G. Malkiel
(1932)
May 1977 | Trustee
(129) | Chemical Bank Chairman's Professor of Economics, Princeton
University; Director of Vanguard Investment Series plc (Irish invest-
ment fund) (since November 2001), Vanguard Group (Ireland)
Limited (investment management) (since November 2001),
Prudential Insurance Co. of America, BKF Capital (investment
management), The Jeffrey Co. (holding company), and NeuVis, Inc.
(software company). |
|
| † | December 2002 for Vanguard® Equity Income Fund, Vanguard® Growth Equity Fund, the Vanguard® Municipal Bond Funds, and the Vanguard® State Tax-Exempt Funds. |
the funds. Among board members’ responsibilities are selecting investment advisors for the funds; monitoring fund operations, performance, and costs; reviewing contracts; nominating and selecting new trustees/directors; and electing Vanguard officers.
Each trustee serves a fund until its termination; or until the trustee’s retirement, resignation, or death; or otherwise as specified in the fund’s organizational documents. Any trustee may be removed at a shareholders’ meeting by a vote representing two-thirds of the net asset value of all shares of the fund together with shares of other Vanguard funds organized within the same trust. The table on these two pages shows information for each trustee and executive officer of the fund. The mailing address of the trustees and officers is P.O. Box 876, Valley Forge, PA 19482.
Name
(Year of Birth)
Trustee/Officer
Since
| Position(s) Held with
Fund (Number of
Vanguard Funds
Overseen by
Trustee/Officer)
| Principal Occupation(s) During the Past Five Years
|
|---|
Alfred M. Rankin, Jr.
(1941)
January 1993
| Trustee
(131) | Chairman, President, Chief Executive Officer, and Director of NACCO
Industries, Inc. (forklift trucks/housewares/lignite); Director of
Goodrich Corporation (industrial products/aircraft systems and
services); Director of Standard Products Company (supplier for
the automotive industry) until 1998. |
|
J. Lawrence Wilson
(1936)
April 1985
| Trustee
(131)
| Retired Chairman and Chief Executive Officer of Rohm and Haas Co.
(chemicals); Director of Cummins Inc. (diesel engines), MeadWestvaco
Corp. (paper products), and AmerisourceBergen Corp. (pharmaceutical
distribution); Trustee of Vanderbilt University. |
|
| EXECUTIVE OFFICERS* |
R. Gregory Barton
(1951)
June 2001 |
Secretary
(131)
|
Managing Director and General Counsel of The Vanguard Group, Inc.;
Secretary of The Vanguard Group and of each of the investment
companies served by The Vanguard Group. |
|
Thomas J. Higgins
(1957)
July 1998 | Treasurer
(131) | Principal of The Vanguard Group, Inc.; Treasurer of each of the
investment companies served by The Vanguard Group. |
|
*Officers of the funds are “interested persons” as defined in the Investment Company Act of 1940.
More information about the trustees is in the Statement of Additional Information, available from The Vanguard Group.
VANGUARD SENIOR MANAGEMENT TEAM
|
|---|
Mortimer J. Buckley, Information Technology.
James H. Gately, Investment Programs and Services.
Kathleen C. Gubanich, Human Resources.
F. William McNabb, III, Client Relationship Group.
| Michael S. Miller, Planning and Development.
Ralph K. Packard, Finance.
George U. Sauter, Chief Investment Officer.
|
John C. Bogle, Founder; Chairman and Chief Executive Officer, 1974-1996. |
|

Post Office Box 2600
Valley Forge, PA 19482-2600
Vanguard, The Vanguard Group, Vanguard.com, Admiral, PlainTalk , and the ship logo are trademarks of The Vanguard Group, Inc.
All other marks are the exclusive property of their respective owners.
All comparative mutual fund data are from Lipper Inc. or Morningstar, Inc., unless otherwise noted.
For More Information
This report is intended for the fund’s shareholders. It may not be distributed to prospective investors unless it is preceded or accompanied by the current fund prospectus. To receive a free copy of the prospectus or the Statement of Additional Information, or to request additional information about the fund or other Vanguard funds, please contact us at one of the adjacent telephone numbers or by e-mail through Vanguard.com. Prospectuses may also be viewed online.
You can obtain a free copy of Vanguard’s proxy voting guidelines by visiting our website, www.vanguard.com, and searching for “proxy voting guidelines,” or by calling Vanguard at 1- 800- 662-2739. They are also available from the SEC’s website, www.sec.gov. In addition, you may obtain a free report on how the fund voted the proxies for securities it owned during the 12 months ended June 30. To get the report, visit either www.vanguard.com or www.sec.gov.
You can review and copy information about your fund at the SEC’s Public Reference Room in Washington, D.C. To find out more about this public service, call the SEC at 1-202-942- 8090. Information about your fund is also available on the SEC’s website, and you can receive copies of this information, for a fee, by sending a request in either of two ways: via e-mail addressed to publicinfo@sec.gov or via regular mail addressed to the Public Reference Section, Securities and Exchange Commission, Washington, DC 20549–0102.
World Wide Web
www.vanguard.com
Fund Information
1-800-662-7447
Direct Investor
Account Services
1-800-662-2739
Institutional Investor Services
1-800-523-1036
Text Telephone
1-800-952-3335
© 2004 The Vanguard Group, Inc.
All rights reserved.
Vanguard Marketing
Corporation, Distributor.
Q1110 112004
Vanguard® Global Equity Fund
September 30, 2004
YOUR FUND REPORT
| CONTENTS |
| 1 | LETTER FROM THE CHAIRMAN |
| 6 | REPORT FROM THE ADVISOR |
| 9 | FUND PROFILE |
| 11 | GLOSSARY OF INVESTMENT TERMS |
| 12 | PERFORMANCE SUMMARY |
| 13 | YOUR FUND'S AFTER-TAX RETURNS |
| 14 | ABOUT YOUR FUND'S EXPENSES |
| 16 | FINANCIAL STATEMENTS |
| 29 | ADVANTAGES OF VANGUARD.COM |
SUMMARY
• Vanguard Global Equity Fund, which recently changed its fiscal year-end from October to September, returned 12.6% for the 11 months ended September 30, 2004, surpassing the returns of both its primary benchmark index and its average peer fund.
• U.S. and international stock markets performed well. The weakness of the U.S. dollar relative to many currencies, especially the euro, improved foreign-stock returns for U.S.-based investors.
• The advisor’s flexibility to diverge from the composition of the fund’s benchmark index and solid stock selections were the primary factors in the fund’s success.
VANGUARD’S PLEDGE TO CLIENTS
We recognize that your relationship with Vanguard rests on the twin pillars of trust and excellence, each of which is built upon the character of our people. Our Pledge to Clients reflects our ongoing efforts to deserve your trust and to continually improve so that we can offer you excellence in all that we do.
We will:
| • | Put your interests first at all times. |
| • | Continually seek to earn your trust by adhering to the highest standards of ethical behavior and fiduciary responsibility. |
| • | Strive to be the highest-value provider of investment services, which means outstanding investment performance and service, both at the lowest possible cost. |
| • | Communicate candidly not only about the rewards of investing but also about the risks and costs. |
| • | Maintain highly effective controls to safeguard your assets and protect your confidential information. |
| • | Invest a majority of our personal assets alongside yours. |
Please note: The opinions expressed in this report are just that—informed opinions. They should not be considered promises or advice.
Want less clutter in your mailbox? Just register with Vanguard.com® and opt to get fund reports online.
LETTER FROM THE CHAIRMAN
Dear Shareholder,
Please note that Vanguard Global Equity Fund recently changed its fiscal year-end from October to September. This report covers the 11 months from October 31, 2003, through September 30, 2004.
Following its outstanding 2003 fiscal-year performance, the Global Equity Fund advanced 12.6% during fiscal 2004. The fund’s advance was the result of the advisor’s tactical decisions regarding country allocations as well as good stock selections. The continued weakness of the U.S. dollar was also a factor, as it bolstered returns from foreign markets for U.S.-based investors.
| Total Returns | October 31, 2003, Through
September 30, 2004 |
|---|
|
| Vanguard Global Equity Fund | 12.6% |
| MSCI All Country World Index | 11.3 |
| Average Global Fund* | 9.3 |
|
| *Derived from data provided by Lipper Inc. |
The table at left presents the total returns (capital change plus reinvested distributions) for the fund and its main performance yardsticks. Information on the fund’s starting and ending net asset values and per-share distributions can be found on page 5. If you own the fund in a taxable account, you may wish to review our report on the fund’s after-tax returns on page 13.
U.S. STOCKS DID WELL, BUT WORLD MARKETS FARED EVEN BETTER
A strong rally in U.S. stock prices from the beginning of fiscal 2004 through February produced solid gains for most major indexes. These advances were fueled by solid corporate earnings growth and a slew of economic reports suggesting robust growth and job-market improvement.
However, despite volatility during the final seven months of the period—from March through September—most indexes saw relatively little change. The earlier enthusiasm for stocks wore thin, as economic reports turned less favorable and the economy showed the strain of rising crude-oil prices. For the 11 months, the broad U.S. stock market, as measured by the Dow Jones Wilshire 5000 Composite Index, returned 8.2%.
1
In U.S. dollar terms, returns from international markets were even stronger than those from the domestic market. As measured by the Morgan Stanley Capital International (MSCI) All Country World Index ex USA, stocks outside the United States rose 15.6% in the fiscal period, surpassing the return of the Dow Jones Wilshire 5000 Index by more than 7 percentage points. The MSCI Europe, Australasia, Far East (EAFE) Index, a measure of stock performance in 21 developed nations, also turned in an impressive result, with a 14.9% gain in U.S. dollars. (For additional perspective, the tables below and on page 3 reflect market performance over a full 12 months.)
YOUR FUND ENJOYED ANOTHER STRONG YEAR
The fund’s success over the past 11 months added to the momentum that the fund generated in fiscal 2003, when its nearly 40% advance led it out of the doldrums after two years of modest losses. The fund’s mandate allows its advisor, Marathon Asset Management LLP (Marathon–London), to position the fund’s country and sector allocations independently of those of the fund’s benchmark, the MSCI All Country World Index. In fact, as of September 30, the fund held 31% of its assets in the United States and 12% in emerging markets, versus allocations of 52% and 5%, respectively, for the benchmark. This flexibility entails risk, of course, but it also makes for more opportunities for outperformance. Fiscal 2004 marked the fifth full fiscal period in which the fund surpassed its benchmark due to Marathon–London’s identification of stronger-performing economies, sectors, and companies.
| Market Barometer | Average Annual Total Returns
Periods Ended September 30, 2004
|
|---|
| One
Year | Three
Years | Five
Years |
|---|
|
| Stocks | | | |
| MSCI All Country World Index |
| ex USA (International) | 23.1% | 11.4% | 0.5% |
| Russell 1000 Index (Large-caps) | 13.9 | 4.7 | -0.7 |
| Russell 2000 Index (Small-caps) | 18.8 | 13.7 | 7.4 |
| Dow Jones Wilshire 5000 Index | 14.8 | 6.1 | 0.0 |
| (Entire market) |
|
| Bonds |
| Lehman Aggregate Bond Index | 3.7% | 5.9% | 7.5% |
| (Broad taxable market) |
| Lehman Municipal Bond Index | 4.6 | 5.8 | 6.8 |
| Citigroup 3-Month Treasury Bill Index | 1.0 | 1.4 | 3.0 |
|
| CPI |
| Consumer Price Index | 2.5% | 2.1% | 2.5% |
|
In addition to benefiting from Marathon–London’s flexibility to deviate from the weighting of countries in the index, the fund profited from the advisor’s solid stock-picking decisions. The advisor’s preference for midsize companies, which, in general, outpaced larger-capitalization
2
companies in the period, helped to enhance the fund’s return. Financials, consumer discretionary, and materials stocks turned in excellent results, and the fund’s overweight position in the materials sector paid off handsomely.
| Total Returns | 12 Months Ended
September 30, 2004
|
|---|
| Index/Country | Based on
Local
Currency | Currency
Impact | Based on
U.S.
Dollars |
|---|
|
| MSCI Europe | 17.4% | 8.1% | 25.5% |
| United Kingdom | 15.2 | 10.3 | 25.5 |
| France | 19.1 | 7.9 | 27.0 |
| Germany | 20.3 | 8.0 | 28.3 |
| Switzerland | 11.1 | 6.4 | 17.5 |
| Netherlands | 9.4 | 7.3 | 16.7 |
| Italy | 20.7 | 8.1 | 28.8 |
|
| MSCI Pacific | 12.3% | 2.3% | 14.6% |
| Japan | 9.6 | 1.5 | 11.1 |
| Hong Kong | 19.7 | -0.8 | 18.9 |
| Singapore | 22.5 | 3.2 | 25.7 |
| Australia | 20.7 | 8.4 | 29.1 |
|
| MSCI EAFE | 15.7% | 6.4% | 22.1% |
|
| Select Emerging Markets | 31.5% | -4.5% | 27.0% |
|
| Dow Jones Wilshire 5000 |
| (United States) | 14.8% | — | 14.8% |
|
Currency fluctuations enhanced the fund’s return, particularly in the major European markets. The euro rose to a new high relative to the dollar, which improved the returns of stocks in the Eurozone for investors in the United States. The currency effect added to the returns of all of the European markets shown in the table above and three of the four Pacific markets.
On the negative side, the fund held a few weak performers—or missed out on some good opportunities—in energy, industrials, telecommunication services, and utilities, which diminished its lead over the MSCI All Country World Index.
For more details on the fund’s positioning and performance, see the Report from the Advisor on page 6.
LONG-TERM RECORD CONTINUES TO IMPROVE
The Global Equity Fund’s performance during its nine-year existence, despite some bumps at the start, has been excellent. The table on page 4 shows your fund’s average annual return—along with those of its comparative benchmarks—since the fund’s inception. It also presents the results of hypothetical $10,000 investments made in the fund, its average competitor, and the MSCI All Country World Index at the fund’s inception. The fund’s average annual return of 10.3% is significantly
3
higher than the results of the average global fund and the unmanaged index. Indeed, the difference in dollar terms between your fund’s end result and that of the index—$6,826—is more than two-thirds the amount of the initial investment.
Total Returns
| August 14, 1995,* Through
September 30, 2004
|
|---|
| Average
Annual
Return | Final Value of
a $10,000
Initial Investment |
|---|
|
| Global Equity Fund | 10.3% | $24,552 |
| MSCI All Country World Index | 6.5 | 17,726 |
| Average Global Fund | 6.3 | 17,427 |
|
| *The fund's inception date. |
There are important lessons in Global Equity’s long-term record. The fund’s performance in its early years was mediocre, as the fund lagged its benchmark index in three of its first four full fiscal years. However, this was a period in which the advisor’s value-oriented strategy was at odds with investors’ sharp preferences for growth stocks. The past few years have been much more amenable to the advisor’s approach, and for the full period, the results are outstanding. The lesson is that a disciplined strategy will pay off in the long run.
DON’T TURN AWAY FROM YOUR PLAN
The stock and bond markets are continually enticing investors with an ever-changing array of investment options. However, we urge you to resist the temptation to invest in the “next big thing.” Rather, as always, we advise you to stick with a carefully determined investment plan through good times and bad. A balanced portfolio of stocks, bonds, and cash investments that is consistent with your risk tolerance and tailored to your individual needs and goals can help you blunt the pain of a decline in one asset class with a strong performance in another.
For investors who have a balanced plan, the Global Equity Fund, with its combination of domestic and international stocks, can play an important role as a part of the stock portion of their portfolios. Thank you for your ongoing confidence in Vanguard.
Sincerely,
JOHN J. BRENNAN
CHAIRMAN AND CHIEF EXECUTIVE OFFICER
OCTOBER 12, 2004
4
THE GLOBAL EQUITY FUND ADOPTS MULTIMANAGER APPROACH, REOPENS
As you may already know, the board of trustees of Vanguard Global Equity Fund approved the adoption of a multimanager structure for the fund, effective October 22, 2004. Also effective October 22, the fund, which was closed to new accounts on December 4, 2003, reopened to new accounts.
Under the new multimanager structure, Acadian Asset Management, Inc., a Boston-based investment advisory firm, is managing approximately 5% of the fund’s existing assets. Over time, the share of assets the firm manages will increase, as the majority of net new cash flow will be directed to Acadian. Acadian’s strategy can be expected to complement the investment strategy of Marathon–London, which has managed the fund since its 1995 inception.
| Your Fund's Performance at a Glance | October 31, 2003-September 30, 2004 |
|---|
| | |
Distributions Per Share
|
|---|
| Starting
Share Price | Ending
Share Price | Income
Dividends | Capital
Gains |
|---|
|
| Global Equity Fund | $14.46 | $16.08 | $0.130 | $0.065 |
|
5
REPORT FROM THE ADVISOR
Vanguard Global Equity Fund returned 12.6% during its shortened 2004 fiscal year ended September 30. (The fund’s board of trustees authorized a change in the fund’s fiscal year-end from October 31 to September 30.) The fund’s comparative standards, the MSCI All Country World Index and average global fund, rose 11.3% and 9.3%, respectively, during the 11-month period.
While the fund vastly outperformed its benchmark index and average peer fund in the 2003 fiscal year, the outcome in fiscal 2004 was a more pedestrian affair, which is all the more surprising since the fund is invested quite differently from its benchmark. Traditionally, and unsurprisingly, we have produced rather significant divergences relative to the index. That was not the case this time, however, for reasons to be explained.
THE INVESTMENT ENVIRONMENT
During the period, the strong post-Iraqi war rally in equity markets fizzled out as investors came to fret about the “three bears” stalking the bull market party. The first bear was higher short-term interest rates. The second was the buoyancy of commodity prices, especially oil. The third was concern about the sustainability of the Chinese industrialization boom. All three served to stop the stock market recovery in its tracks; as a result, the stocks of companies that had risen the most in the prior 12 months were among those most adversely affected.
Investment Philosophy
The advisor believes that superior long-term investment results can be achieved by investing in a widely diversified group of stocks chosen on the basis of industry analysis as well as an assessment of each company’s strategies for new investment and for dealing with competition within its industry.
We believe that concern about the Chinese investment boom is probably something of a red herring. However, the outlook for interest rates and commodity prices is of considerable relevance. Interest rates in the United States and elsewhere have been held down at the short end of the yield curve by a variety of schemes and devices. Meanwhile, commodity prices are being boosted by economic growth
6
and an extended period of underinvestment. The very underinvestment that seemed the appropriate management response to low returns on capital in commodity-based industries has indeed solved the problem it was designed to reverse. It is similar to the effect of overinvestment on telecommunications profitability, and just as effective. Strangely, as we saw in the final quarter of fiscal 2004, the surge in commodity prices actually combined with lower bond yields. The logic behind this appears to be that higher commodity prices will suppress economic growth to the point that they obviate the need for higher interest rates. There seems to be considerable wishful thinking behind this scenario.
THE FUND’S SUCCESSES
The Global Equity Fund’s relative outperformance was modest and attributable to solid stock selections in Japan and the rest of the Asia-Pacific region. In contrast, stock selections in the United States and Europe were rather disappointing, despite our significant overweighting of the materials sector, home to some of the period’s better-performing industries. To our benefit, we maintained a considerable overweight in the Asia-Pacific region, and our selections in this group outperformed those in the benchmark index. Our exposure to stocks from Hong Kong, Thailand, Indonesia, and the Philippines had a significantly positive effect on the fund’s return. In Hong Kong, we adopted a bullish position, both in terms of an overweighted position versus the index and in terms of the likely recovery in the local property market. With exposure about seven times greater than that of the benchmark, the fund’s Hong Kong-based investments recorded a 35% return versus 13% for the index component; this marked the second consecutive year of significant outperformance. We also took a positive stance on the evolving situation in South Africa. Here, the country index rose 27%, and the value of the fund’s investments increased by 41%, comfortably ahead of the benchmark index’s 11.3% overall return in fiscal 2004.
THE FUND’S SHORTFALLS
The extent of the fund’s successes might lead to the conclusion that sig-nificant outperformance was assured. Unfortunately, this wasn’t the case, as many sectors that had done well in the 2003 fiscal year succumbed to profit taking. Not only had prior-year gains been spectacular in some industries, such as media and telecommunications, but the aforementioned “three bears” caused something of a risk-aversion tendency on
7
the part of investors, who adopted a “show me” attitude to recovery stocks all over the globe. (This attitude did not necessarily help consumer staples and pharmaceuticals stocks, by the way, as these former safe havens became, in part, victims of their own success.) What this “market rotation” meant for the Global Equity Fund was an underperformance of 2 percentage points in the United States, 5 percentage points in the United Kingdom, and 10 percentage points in Canada relative to the index. In turn, we attribute this to the dismal performances of stocks such as AMR, Qwest Communications International, and PRIMEDIA in the United States and Bombardier in Canada. Finally, the fund’s cash position (on average, around 4% of fund assets during the period) also hurt relative performance in a rising market.
THE FUND’S POSITIONING
It is important to remember that the Global Equity Fund’s portfolio is constructed on a bottom-up basis, and it held 309 companies as of September 30. Also, in the last five months of the 2004 fiscal period, the portfolio’s turnover rate was only 6.3%, implying a holding period of 6.7 years. What this suggests is that we did not take drastic action in the portfolio despite the commodity surge of the last few months. We are the first to admit that we don’t know how extended this period of commodity inflation will be; what we do know is that we don’t generally wish to disturb investments in which we have long-term conviction in favor of macro-induced portfolio bets which give us no clear competitive advantage. The prediction is that oil prices will rise in the short term and fall back significantly next fiscal year. This is tantamount to an assertion that surging oil prices have no medium-term investment relevance, and as a consensus conclusion, this may prove overoptimistic. Choppy waters ahead suggest that the Global Equity Fund’s value bias and out-of-favor investment orientation (especially with regard to market capitalization) may be a reasonably safe place to be in the year ahead, while offering upside potential should markets continue their current rally. In our last two annual letters to you we have said we are optimistic about stocks. That optimism remains, but to a considerably reduced extent than we expressed in the earlier letters.
Jeremy Hosking, PORTFOLIO MANAGER
MARATHON ASSET MANAGEMENT LLP, LONDON
OCTOBER 20, 2004
8
| As of 9/30/2004 | FUND PROFILE
This Profile provides a snapshot of the fund’s characteristics, compared where appropriate with an unmanaged market index. Key terms are defined on page 11. |
|
GLOBAL EQUITY FUND
|
|---|
| Portfolio Characteristics | Fund | Comparative
Index* |
|---|
|
| Number of Stocks | 309 | 2,395 |
| Turnover Rate | 19% | — |
| Expense Ratio | 0.90%** | — |
| Short-Term Reserves | 3% | — |
|
| Volatility Measures | Fund | Comparative
Index* |
|---|
|
| R-Squared | 0.88 | 1.00 |
| Beta | 0.96 | 1.00 |
|
| Sector Diversification (% of portfolio) | Fund | Comparative
Index* |
|---|
|
| Consumer Discretionary | 17% | 12% |
| Consumer Staples | 8 | 8 |
| Energy | 4 | 9 |
| Financials | 20 | 24 |
| Health Care | 5 | 10 |
| Industrials | 13 | 10 |
| Information Technology | 10 | 12 |
| Materials | 11 | 6 |
| Telecommunication Services | 8 | 5 |
| Utilities | 1 | 4 |
|
| Short-Term Reserves | 3% | — |
|
Ten Largest Holdings (% of total net assets)
|
|---|
| Jardine Matheson Holdings Ltd. | 1.7% |
| (retail) |
| Costco Wholesale Corp. | 1.5 |
| (retail) |
| Schering-Plough Corp. | 1.4 |
| (pharmaceuticals) |
| Xerox Corp. | 1.1 |
| (electronic business equipment) |
| Berkshire Hathaway Inc. Class B | 1.1 |
| (financial services) |
| Nextel Communications, Inc. | 1.1 |
| (telecommunications) |
| Imperial Oil Ltd. | 1.1 |
| (energy and utilities) |
| Lucent Technologies, Inc. | 1.0 |
| (telecommunications) |
| Jardine Strategic Holdings Ltd. | 1.0 |
| (retail) |
| Moody's Corp. | 1.0 |
| (financial services) |
|
| Top Ten | 12.0% |
|
| “Ten Largest Stocks” excludes any temporary cash investments and equity index products. |
Allocation by Region (% of portfolio)

*MSCI All Country World Index.
**Annualized.
9
FUND PROFILE (CONTINUED)
Country Diversification (% of portfolio)
| Fund | Comparative
Index* |
|---|
|
| EUROPE | | |
| United Kingdom | 11% | 10% |
| France | 3 | 4 |
| Netherlands | 2 | 2 |
| Spain | 2 | 1 |
| Germany | 2 | 3 |
| Sweden | 2 | 1 |
| Switzerland | 1 | 3 |
| Italy | 1 | 2 |
| Finland | 1 | 1 |
| Denmark | 1 | 0 |
| Ireland | 1 | 0 |
| Belgium | 0 | 1 |
|
| Subtotal | 27% | 28% |
|
| PACIFIC |
| Japan | 11% | 9% |
| Hong Kong | 7 | 1 |
| Australia | 2 | 2 |
| Singapore | 1 | 0 |
|
| Subtotal | 21% | 12% |
|
| EMERGING MARKETS |
| South Africa | 4% | 1% |
| Thailand | 3 | 0 |
| Malaysia | 2 | 0 |
| Philippines | 2 | 0 |
| Indonesia | 1 | 0 |
| South Korea | 0 | 1 |
| Taiwan | 0 | 1 |
| Other Emerging Markets | 0 | 2 |
|
| Subtotal | 12% | 5% |
|
| NORTH AMERICA |
| United States | 31% | 52% |
| Canada | 6 | 3 |
|
| Subtotal | 37% | 55% |
|
| Short-Term Reserves | 3% | — |
|
| Total | 100% | 100% |
|
*MSCI All Country World Index.
Visit our website at Vanguard.com for regularly updated fund information.
10
GLOSSARY OF INVESTMENT TERMS
Beta. A measure of the magnitude of a fund’s past share-price fluctuations in relation to the ups and downs of a given market index. The index is assigned a beta of 1.00. Compared with a given index, a fund with a beta of 1.20 typically would have seen its share price rise or fall by 12% when the index rose or fell by 10%. A fund’s beta should be reviewed in conjunction with its R-squared (see definition below). The lower the R-squared, the less correlation there is between the fund and the index, and the less reliable beta is as an indicator of volatility.
Expense Ratio. The percentage of a fund’s average net assets used to pay its annual administrative and advisory expenses. These expenses directly reduce returns to investors.
R-Squared. A measure of how much of a fund’s past returns can be explained by the returns from the market in general, as measured by a given index. If a fund’s total returns were precisely synchronized with an index’s returns, its R-squared would be 1.00. If the fund’s returns bore no relationship to the index’s returns, its R-squared would be 0.
Short-Term Reserves. The percentage of a fund invested in highly liquid, short-term securities that can be readily converted to cash.
Turnover Rate. An indication of the fund’s trading activity. Funds with high turnover rates incur higher transaction costs and may be more likely to distribute capital gains (which may be taxable to investors).
11
| As of 9/30/2004 | PERFORMANCE SUMMARY
All of the returns in this report represent past performance, which is not a guarantee of future results that may be achieved by the fund. (For the performance data current to the most recent month-end, which may be higher or lower than that cited, visit our website at www.vanguard.com.) Note, too, that both investment returns and principal value can fluctuate widely, so an investor’s shares, when sold, could be worth more or less than their original cost. The returns shown do not reflect taxes that a shareholder would pay on fund distributions or on the sale of fund shares. All average annual returns are based on the fund’s new fiscal year-end. |
GLOBAL EQUITY FUND
Cumulative Performance August 14, 1995–September 30, 2004

| | Average Annual Total Returns
Periods Ended September 30, 2004
| Final Value |
|---|
| Eleven
Months | One
Year | Five
Years | Since
Inception* | of a $10,000
Investment |
|---|
|
| Global Equity Fund | 12.64% | 20.65% | 8.57% | 10.34% | $24,552 |
| MSCI All Country World Index | 11.28 | 18.03 | -0.92 | 6.47 | 17,726 |
| Average Global Fund** | 9.27 | 15.63 | -0.01 | 6.27 | 17,427 |
|
Total Investment Returns (%) August 14, 1995-September 30, 2004

*August 14, 1995.
**Derived from data provided by Lipper Inc.
Note: See Financial Highlights table on page 24 for dividend and capital gains information.
12
YOUR FUND’S AFTER-TAX RETURNS
This table presents returns for your fund both before and after taxes. The after-tax returns are shown in two ways: (1) assuming that an investor owned the fund during the entire period and paid taxes on the fund’s distributions, and (2) assuming that an investor paid taxes on the fund’s distributions and sold all shares at the end of each period.
Calculations are based on the highest individual federal income tax and capital gains tax rates in effect at the times of the distributions and the hypothetical sales. State and local taxes were not considered. After-tax returns reflect the reduced tax rates on ordinary income (including qualified dividend income) and short-term capital gains that became effective as of January 1, 2003, and on long-term capital gains realized on or after May 6, 2003. To calculate qualified dividend income, we used actual 2003 figures and estimates for 2004. (In the example, returns after the sale of fund shares may be higher than those assuming no sale. This occurs when the sale would have produced a capital loss. The calculation assumes that the investor received a tax deduction for the loss.)
Please note that your actual after-tax returns will depend on your tax situation and may differ from those shown. Also note that if you own the fund in a tax-deferred account, such as an individual retirement account or a 401(k) plan, this information does not apply to you. Such accounts are not subject to current taxes.
Finally, keep in mind that a fund’s performance—whether before or after taxes—does not guarantee future results.
Average Annual Total Returns
| Periods Ended September 30, 2004
|
|---|
| One Year
| Five Years
| Since
Inception*
|
|---|
| Global Equity Fund | | | |
| Returns Before Taxes | 20.65% | 8.57% | 10.34% |
| Returns After Taxes on Distributions | 20.37 | 7.27 | 9.00 |
| Returns After Taxes on Distributions and Sale of Fund Shares | 13.65 | 6.75 | 8.37 |
|
| *August 14, 1995. |
13
ABOUT YOUR FUND’S EXPENSES
We believe it is important for you to understand the impact of costs on your investment. All mutual funds have operating expenses. As a shareholder of the fund, you incur ongoing costs, which include costs for portfolio management, administrative services, and shareholder reports (like this one), among others. Operating expenses, which are deducted from a fund’s gross income, directly reduce the investment return of the fund.
A fund’s expenses are expressed as a percentage of its average net assets. This figure is known as the expense ratio. The following examples are intended to help you understand the ongoing costs (in dollars) of investing in your fund and to compare these costs with those of other mutual funds. The examples are based on an investment of $1,000 made at the beginning of the period shown and held for the entire period.
The table below illustrates your fund’s costs in two ways:
• Based on actual fund return. This section helps you to estimate the actual expenses that you paid over the period. The “Ending Account Value” shown is derived from the fund’s actual return, and the third column shows the dollar amount that would have been paid by an investor who started with $1,000 in the fund. You may use the information here, together with the amount you invested, to estimate the expenses that you paid over the period.
To do so, simply divide your account value by $1,000 (for example, an $8,600 account value divided by $1,000 = 8.6), then multiply the result by the number given for your fund under the heading “Expenses Paid During Period.”
| Six Months Ended September 30, 2004 |
|---|
| Global Equity Fund | Beginning
Account Value
3/31/2004 | Ending
Account Value
9/30/2004 | Expenses
Paid During
Period* |
|---|
|
| Based on | | | |
| Actual Fund Return | $1,000.00 | $998.14 | $4.40 |
| Based on Hypothetical |
| 5% Yearly Return | $1,000.00 | $1,020.60 | $4.45 |
|
*The calculations are based on expenses incurred in the most recent six-month period. The fund’s annualized six-month expense ratio for that period is 0.88%. The dollar amounts shown as “Expenses Paid” are equal to the annualized expense ratio multiplied by the average account value over the period, multiplied by the number of days in the most recent six-month period, then divided by the number of days in the most recent 12-month period.
• Based on hypothetical 5% return. This section is intended to help you compare your fund’s costs with those of other mutual funds. It assumes that the fund had a yearly return of 5% before expenses, but that the expense ratio is unchanged. In this case—because the return used is not the fund’s actual return—the results do not apply to your investment. The example is useful in making comparisons because the Securities and Exchange Commission requires all mutual funds to calculate expenses based on a 5% return. You can assess your fund’s costs by comparing this hypothetical example with the hypothetical examples that appear in shareholder reports of other funds.
Note that the expenses shown in the table are meant to highlight and help you compare ongoing costs only and do not reflect any transactional costs or account maintenance fees. They do not include your fund’s low-balance fee, which is described in the prospectus. If this fee were applied to your account, your costs would be higher. Your fund does not
14
Annualized Expense Ratios:
Your fund compared with its peer group |
|---|
| Fund | Average
Global
Fund |
|---|
|
| Global Equity Fund | 0.90% | 1.85%* |
|
*Peer-group expense ratio is derived from data provided by Lipper Inc. and captures information through year-end 2003.
charge transaction fees, such as purchase or redemption fees, nor does it carry a “sales load.”
The calculations assume no shares were bought or sold during the period. Your actual costs may have been higher or lower, depending on the amount of your investment and the timing of any purchases or redemptions.
You can find more information about the fund’s expenses, including annual expense ratios for the past five years, in the Financial Statements section of this report. For additional information on operating expenses and other shareholder costs, please refer to the appropriate fund prospectus.
15
| As of 9/30/2004 | FINANCIAL STATEMENTS |
STATEMENT OF NET ASSETS
This Statement provides a detailed list of the fund’s holdings, including each security’s market value on the last day of the reporting period. Securities are grouped and subtotaled by asset type (common stocks, bonds, etc.) and by country. Other assets are added to, and liabilities are subtracted from, the value of Total Investments to calculate the fund’s Net Assets. Finally, Net Assets are divided by the outstanding shares of the fund to arrive at its share price, or Net Asset Value (NAV) Per Share.
At the end of the Statement of Net Assets, you will find a table displaying the composition of the fund’s net assets. Because all income and any realized gains must be distributed to shareholders each year, the bulk of net assets consists of Paid-in Capital (money invested by shareholders). The amounts shown for Undistributed Net Investment Income and Accumulated Net Realized Gains usually approximate the sums the fund had available to distribute to shareholders as income dividends or capital gains as of the statement date, but may differ because certain investments or transactions may be treated differently for financial statement and tax purposes. Any Accumulated Net Realized Losses, and any cumulative excess of distributions over net income or net realized gains, will appear as negative balances. Unrealized Appreciation (Depreciation) is the difference between the market value of the fund’s investments and their cost, and reflects the gains (losses) that would be realized if the fund were to sell all of its investments at their statement-date values.
The fund provides a complete list of its holdings four times in each fiscal year, at the quarter-ends. For the second and fourth quarters, the lists appear in the fund’s semiannual and annual reports to shareholders. For the first and third quarters, the fund files the lists with the Securities and Exchange Commission on Form N-Q. Shareholders can look up the fund’s Forms N-Q on the SEC’s website at www.sec.gov. Forms N-Q may also be reviewed and copied at the SEC’s Public Reference Room (see the back cover of this report for further information).
Global Equity Fund
| Shares
| Market
Value^
(000)
|
|---|
COMMON STOCKS (96.7%)
|
|---|
| Australia (1.4%) | | |
| Australia & New Zealand |
| Bank Group Ltd. | 194,093 | $2,674 |
| Santos Ltd. | 454,000 | 2,417 |
| Caltex Australia Ltd. | 302,022 | 2,028 |
| Iluka Resources Ltd. | 460,516 | 1,621 |
| WMC Resources Ltd. | 391,636 | 1,521 |
| Amcor Ltd. | 212,826 | 1,107 |
| Orica Ltd. | 87,264 | 1,094 |
| Alumina Ltd. | 224,000 | 912 |
| Rinker Group Ltd. | 71,098 | 444 |
| CSR Ltd. | 71,098 | 126 |
| |
|
| | 13,944 |
| |
|
| Canada (6.2%) |
| Imperial Oil Ltd. | 197,900 | 10,239 |
| *Nortel Networks Corp. | 2,650,530 | 9,012 |
| *Inco Ltd. | 223,800 | 8,739 |
| Alcan Inc. | 172,300 | 8,237 |
| Rogers Communications, Inc. |
| Class B | 396,500 | $8,017 |
| Bombardier Inc. Class B | 1,785,700 | 4,106 |
| BCE INC. | 167,300 | 3,602 |
| Agrium, Inc. | 176,150 | 3,128 |
| Abitibi-Consolidated Inc. | 481,000 | 3,022 |
| Fairmont Hotels & Resorts Inc. | 79,500 | 2,174 |
| |
|
| | 60,276 |
| |
|
| China (0.1%) |
| The Guangshen |
| Railway Co., Ltd. | 2,303,500 | 657 |
| |
|
| Denmark (0.6%) |
| *William Demant A/S | 49,800 | 2,198 |
| *Vestas Wind Systems A/S | 129,599 | 1,876 |
| Coloplast A/S B Shares | 19,200 | 1,855 |
| |
|
| | 5,929 |
| |
|
| Finland (1.0%) |
| Sampo Oyj A Shares | 276,500 | 3,056 |
| TietoEnator Oyj B Shares | 82,620 | 2,393 |
16
| Shares
| Market
Value^
(000)
|
|---|
| Metso Oyj | 186,500 | $2,393 |
| M-Real Oyj B Shares | 280,315 | 1,619 |
| |
|
| | 9,461 |
| |
|
| | |
| France (3.1%) |
| Arcelor | 221,320 | 4,090 |
| Cie. de St. Gobain SA | 71,300 | 3,660 |
| BNP Paribas SA | 52,722 | 3,406 |
| Carrefour SA | 68,808 | 3,236 |
| Groupe Danone | 34,200 | 2,689 |
| *Alcatel SA | 227,400 | 2,658 |
| Sanofi-Aventis | 34,480 | 2,501 |
| *SCOR SA | 1,350,300 | 2,080 |
| AXA | 102,300 | 2,070 |
| *Atos Origin SA | 29,900 | 1,651 |
| Thales SA | 47,700 | 1,588 |
| Sanofi-Aventis | 3,800 | 276 |
| *JCDecaux SA | 2,700 | 61 |
| |
|
| | 29,966 |
| |
|
| Germany (1.6%) |
| BASF AG | 59,700 | 3,518 |
| E.On AG | 43,320 | 3,196 |
| Fresenius Medical Care AG | 40,900 | 3,132 |
| Bayerische Motoren Werke AG | 66,780 | 2,745 |
| Deutsche Post AG | 87,400 | 1,697 |
| Fresenius Medical Care AG ADR | 44,544 | 1,136 |
| |
|
| | 15,424 |
| |
|
| Hong Kong (7.2%) |
| Jardine Matheson |
| Holdings Ltd. | 1,156,702 | 16,309 |
| Jardine Strategic Holdings Ltd. | 1,456,500 | 9,759 |
| New World |
| Development Co., Ltd. | 8,168,060 | 7,699 |
| Henderson Land |
| Development Co. Ltd. | 1,251,000 | 5,984 |
| Television Broadcasts Ltd. | 1,177,000 | 5,268 |
| Hysan Development Co., Ltd. | 2,301,122 | 4,057 |
| Hong Kong Aircraft & |
| Engineering Co., Ltd. | 668,000 | 3,238 |
| Wheelock and Co. Ltd. | 2,150,000 | 3,129 |
| Hong Kong Exchanges & |
| Clearing Ltd. | 1,281,000 | 2,916 |
| SmarTone |
| Telecommunications Ltd. | 2,302,290 | 2,480 |
| i-CABLE Communications Ltd. | 5,795,000 | 1,988 |
| Hong Kong and |
| Shanghai Hotels Ltd. | 2,701,000 | 1,974 |
| *First Pacific Co. Ltd. | 6,786,000 | 1,893 |
| *Next Media Ltd. | 2,732,000 | 990 |
| *Mandarin Oriental |
| International Ltd. | 1,384,690 | 838 |
| Asia Satellite |
| Telecommunications |
| Holdings Ltd. | 401,000 | $761 |
| |
|
| | 69,283 |
| |
|
| Indonesia (0.9%) |
| PT Astra International Tbk | 3,457,076 | 2,585 |
| PT Gudang Garam Tbk | 1,350,000 | 1,916 |
| PT Semen Gresik Tbk | 1,399,000 | 1,527 |
| PT Bank Indonesia Tbk | 44,673,129 | 1,512 |
| PT Matahari Putra Prima Tbk | 13,362,000 | 875 |
| *PT Citra Marga Nusaphala |
| Persada Tbk | 774,000 | 46 |
| *PT Mulia Industrindo Tbk | 921,000 | 26 |
| |
|
| | 8,487 |
| |
|
| Ireland (0.5%) |
| Independent News & |
| Media PLC | 1,030,718 | 2,612 |
| *Eircom Group PLC | 688,900 | 1,301 |
| Fyffes PLC | 481,600 | 1,071 |
| |
|
| | 4,984 |
| |
|
| Italy (1.4%) |
| Saipem SpA | 305,600 | 3,435 |
| *Luxottica Group SpA ADR | 188,100 | 3,358 |
| Unicredito Italiano SpA | 564,100 | 2,844 |
| *e.Biscom SpA | 38,600 | 1,917 |
| *Fiat SpA | 235,900 | 1,699 |
| Natuzzi SpA-SP ADR | 50,700 | 548 |
| | |
| |
|
| | 13,801 |
| |
|
| Japan (10.7%) |
| Nippon Oil Corp. | 556,000 | 3,506 |
| Japan Tobacco, Inc. | 418 | 3,497 |
| Hitachi Ltd. | 566,000 | 3,420 |
| East Japan Railway Co. | 628 | 3,248 |
| FamilyMart Co., Ltd. | 114,900 | 3,081 |
| Sumitomo Mitsui |
| Financial Group, Inc. | 534 | 3,052 |
| Nippon Telegraph and |
| Telephone Corp. | 752 | 2,995 |
| Fuji Photo Film Co., Ltd. | 90,000 | 2,956 |
| Takeda Chemical Industries Ltd. | 64,000 | 2,903 |
| Kirin Brewery Co., Ltd. | 326,000 | 2,816 |
| Tokyo Gas Co., Ltd. | 780,000 | 2,767 |
| Sumitomo Electric |
| Industries Ltd. | 295,000 | 2,618 |
| Aisin Seiki Co., Ltd. | 92,900 | 2,293 |
| Dai-Nippon Printing Co., Ltd. | 168,000 | 2,247 |
| Sumitomo Metal Mining Co. | 316,000 | 2,190 |
| Toyota Motor Corp. | 56,000 | 2,144 |
| Sumitomo Forestry Co. | 218,000 | 2,035 |
| Nippon Mining Holdings Inc. | 400,000 | 2,026 |
17
Global Equity Fund
| Shares
| Market
Value^
(000)
|
|---|
| Sumitomo Trust & | | |
| Banking Co., Ltd. | 334,000 | $1,976 |
| Nippon Sanso Corp. | 368,000 | 1,927 |
| Tanabe Seiyaku Co., Ltd. | 212,000 | 1,887 |
| Matsushita Electric |
| Industrial Co., Ltd. | 140,000 | 1,869 |
| NGK Insulators Ltd. | 220,000 | 1,850 |
| Nintendo Co. | 15,000 | 1,835 |
| Bank of Yokohama Ltd. | 338,000 | 1,816 |
| NTT DoCoMo, Inc. | 1,066 | 1,809 |
| Chiba Bank Ltd. | 342,000 | 1,794 |
| Onward Kashiyama Co., Ltd. | 126,000 | 1,749 |
| Sankyo Co., Ltd. | 41,000 | 1,619 |
| Yamaha Motor Co., Ltd. | 104,000 | 1,576 |
| Mitsubishi Gas Chemical Co. | 366,000 | 1,561 |
| Mitsubishi Corp. | 142,000 | 1,534 |
| Matsushita Electric Works, Ltd. | 192,000 | 1,517 |
| Ito-Yokado Co., Ltd. | 44,000 | 1,509 |
| Nippon Suisan Kaisha Ltd. | 508,000 | 1,507 |
| Tostem Inax Holding Corp. | 82,000 | 1,499 |
| Nippon Meat Packers, Inc. | 111,000 | 1,484 |
| Secom Co., Ltd. | 40,000 | 1,390 |
| Tokyo Broadcasting System, Inc. | 88,000 | 1,373 |
| Kao Corp. | 62,000 | 1,370 |
| Nisshinbo Industries, Inc. | 200,000 | 1,345 |
| Koito Manufacturing Co., Ltd. | 156,000 | 1,323 |
| Shiseido Co., Ltd. | 102,000 | 1,254 |
| Kawasaki Heavy Industries Ltd. | 808,000 | 1,217 |
| Sompo Japan Insurance Inc. | 142,000 | 1,203 |
| Ono Pharmaceutical Co., Ltd. | 26,500 | 1,176 |
| Toppan Forms Co., Ltd. | 87,600 | 1,071 |
| Toyo Seikan Kaisha Ltd. | 68,000 | 1,050 |
| Ryosan Co., Ltd. | 48,500 | 1,039 |
| Kinden Corp. | 164,000 | 1,025 |
| Daifuku Co., Ltd. | 156,000 | 856 |
| Tokyo Ohka Kogyo Co., Ltd. | 35,400 | 631 |
| Lion Corp. | 108,000 | 600 |
| Lintec Corp. | 38,000 | 506 |
| Noritake Co., Ltd. | 122,000 | 476 |
| Yamatake Corp. | 50,000 | 474 |
| Nippon Broadcasting |
| System, Inc. | 10,000 | 463 |
| Inabata & Co., Ltd. | 49,000 | 380 |
| Fujitsu Fronttec Ltd. | 32,700 | 282 |
| Tsuzuki Denki Co., Ltd. | 20,000 | 68 |
| |
|
| | |
| | 102,684 |
| |
|
| | |
| Malaysia (2.0%) |
| Resorts World Bhd. | 1,982,000 | 5,216 |
| Telekom Malaysia Bhd. | 963,000 | 2,838 |
| CIMB Bhd. | 1,783,000 | 2,318 |
| British American Tobacco Bhd. | 177,000 | 2,154 |
| Commerce Asset |
| Holdings Bhd. | 1,468,000 | $1,738 |
| Carlsberg Brewery |
| Malaysia Bhd. | 506,500 | 1,346 |
| PPB Group Bhd. | 597,000 | 1,029 |
| Malaysian Airline System Bhd. | 803,000 | 841 |
| Kumpulan Guthrie Bhd. | 1,128,000 | 772 |
| *Multi-Purpose Holdings Bhd. | 2,540,000 | 762 |
| *Multi-Purpose Holdings Bhd. |
| Warrants Exp. 2/26/2009 | 254,000 | 30 |
| | |
| |
|
| | 19,044 |
| |
|
| | |
| Mexico (0.1%) |
| America Movil SA |
| de CV Series L ADR | 15,400 | 601 |
| Telefonos de Mexico SA |
| Class L ADR | 16,000 | 516 |
| | |
| |
|
| | 1,117 |
| | |
| |
|
| Netherlands (2.1%) |
| Royal Dutch Petroleum Co. | 104,100 | 5,362 |
| Koninklijke (Royal) Philips |
| Electronics NV | 156,371 | 3,581 |
| Heineken NV | 117,950 | 3,551 |
| Koninklijke Nedlloyd NV | 65,021 | 2,938 |
| Koninklijke KPN NV | 331,454 | 2,482 |
| Wolters Kluwer NV | 77,492 | 1,304 |
| Koninklijke Boskalis |
| Westminster NV | 34,574 | 917 |
| | |
| |
|
| | 20,135 |
| | |
| |
|
| New Zealand (0.3%) |
| Telecom Corp. of |
| New Zealand Ltd. | 498,217 | 1,983 |
| Carter Holt Harvey Ltd. | 720,000 | 1,095 |
| Wrightson Ltd. | 55,783 | 56 |
| | |
| |
|
| | 3,134 |
| | |
| |
|
| Norway (0.4%) |
| DnB NOR ASA | 256,400 | 2,028 |
| Schibsted ASA | 75,400 | 1,605 |
| | 3,633 |
| Philippines (1.9%) |
| Ayala Corp. | 71,022,800 | 8,202 |
| Globe Telecom, Inc. | 355,300 | 6,881 |
| ABS-CBN Broadcasting Corp. | 4,182,000 | 1,579 |
| Jollibee Foods Corp. | 2,999,000 | 1,385 |
| |
|
| | 18,047 |
| |
|
| Singapore (1.2%) |
| SembCorp Marine Ltd. | 4,841,000 | 2,990 |
| *BIL International Ltd. | 5,116,000 | 2,978 |
| Great Eastern Holdings Ltd. | 309,000 | 2,147 |
| Overseas Union Enterprise Ltd. | 391,000 | 1,695 |
| United Industrial Corp., Ltd. | 2,826,000 | 1,536 |
| |
|
| | 11,346 |
| |
|
18
| Shares
| Market
Value^
(000)
|
|---|
| South Africa (4.2%) | | |
| RMB Holdings Ltd. | 1,727,200 | $5,012 |
| Pretoria Portland |
| Cement Co., Ltd. | 169,500 | 4,738 |
| Sun International Ltd. | 640,081 | 4,251 |
| Anglo American PLC | 167,445 | 3,982 |
| Nedcor Ltd. | 377,247 | 3,468 |
| Edgars Consolidated |
| Stores Ltd. | 105,449 | 3,078 |
| FirstRand Ltd. | 1,625,600 | 3,043 |
| JD Group Ltd. | 358,646 | 2,841 |
| Anglo American Platinum Corp. | 64,100 | 2,693 |
| Venfin Ltd. | 712,090 | 2,375 |
| Gold Fields Ltd. | 160,040 | 2,163 |
| *Hosken Consolidated |
| Investments Ltd. | 1,103,148 | 1,797 |
| Aveng Ltd. | 1,083,400 | 1,439 |
| |
|
| | |
| | 40,880 |
| |
|
| | |
| South Korea (0.1%) |
| Samsung Electronics Co., Ltd. | 950 | 378 |
| Hyundai Motor Co. Ltd. | 5,000 | 231 |
| *Kookmin Bank | 7,000 | 222 |
| POSCO | 1,000 | 149 |
| Korea Electric Power Corp. | 5,000 | 94 |
| | |
| |
|
| | 1,074 |
| | |
| |
|
| Spain (1.9%) |
| Acerinox SA | 295,000 | 4,074 |
| Banco Popular Espanol SA | 68,400 | 3,801 |
| Acciona SA | 53,200 | 3,406 |
| *Sogecable SA | 64,547 | 2,597 |
| Telefonica SA | 151,340 | 2,265 |
| NH Hoteles SA | 145,740 | 1,615 |
| Viscofan SA | 58,000 | 550 |
| Prosegur Cia de Seguridad |
| SA (Registered) | 20,000 | 329 |
| | |
| |
|
| | 18,637 |
| |
|
| | |
| Sweden (1.6%) |
| *Telefonaktiebolaget LM |
| Ericsson AB Class B | 1,436,800 | 4,460 |
| Svenska Handelsbanken |
| AB A Shares | 200,700 | 4,204 |
| Svenska Cellulosa |
| AB B Shares | 68,300 | 2,655 |
| Assa Abloy AB | 205,600 | 2,577 |
| Hoganas AB B Shares | 48,350 | 1,119 |
| |
|
| | |
| | 15,015 |
| | |
| |
|
| Switzerland (1.4%) |
| Novartis AG (Registered) | 91,340 | 4,257 |
| Cie. Financiere Richemont AG | 127,300 | 3,522 |
| Adecco SA (Registered) | 39,300 | 1,951 |
| Geberit AG | 2,440 | 1,895 |
| *Logitech International SA | 26,900 | $1,303 |
| Publigroupe SA | 3,140 | 913 |
| |
|
| | |
| | 13,841 |
| |
|
| | |
| Thailand (2.6%) |
| Siam Cement PLC Non-Voting |
| Depository Receipts | 1,298,200 | 7,459 |
| Advanced Information |
| Services Co. Ltd. (Foreign) | 2,682,000 | 6,474 |
| Siam Cement PLC (Foreign) | 844,800 | 5,425 |
| *Kasikornbank |
| Public Co. Ltd. (Foreign) | 2,557,000 | 2,870 |
| MBK Development |
| Public Co. Ltd. (Foreign) | 901,000 | 1,098 |
| National Finance & |
| Securities PLC (Foreign) | 2,571,000 | 770 |
| Siam Commercial Bank |
| PLC (Foreign) | 568,000 | 610 |
| GMM Grammy Public Co. Ltd. |
| Non-Voting Depository |
| Receipts | 997,000 | 375 |
| GMM Grammy |
| Public Co. Ltd. (Foreign) | 642,000 | 242 |
| Post Publishing Public Co. Ltd. | 1,300,000 | 174 |
| Matichon PLC (Foreign) | 25,000 | 53 |
| | |
| |
|
| | 25,550 |
| |
|
| | |
| United Kingdom (11.2%) |
| Shell Transport & |
| Trading Co. PLC | 718,800 | 5,274 |
| Rio Tinto PLC | 182,600 | 4,910 |
| Barclays PLC | 508,500 | 4,877 |
| Hanson Building Materials PLC | 642,050 | 4,752 |
| BAE Systems PLC | 1,080,400 | 4,394 |
| Diageo PLC | 326,328 | 4,075 |
| Tesco PLC | 755,600 | 3,900 |
| Reed Elsevier PLC | 425,300 | 3,733 |
| Abbey National PLC | 351,400 | 3,561 |
| Arriva PLC | 424,633 | 3,419 |
| Associated British |
| Ports Holdings PLC | 425,800 | 3,398 |
| Vodafone Group PLC | 1,374,400 | 3,289 |
| BP PLC | 334,600 | 3,194 |
| Reckitt Benckiser PLC | 129,890 | 3,182 |
| BAA PLC | 311,500 | 3,120 |
| Carnival PLC | 62,914 | 3,093 |
| Pilkington PLC | 1,776,400 | 2,909 |
| Boots Group PLC | 249,800 | 2,902 |
| Intertek Testing Services PLC | 260,000 | 2,823 |
| Amvescap PLC | 502,500 | 2,717 |
| Cable and Wireless PLC | 1,526,300 | 2,700 |
| The Sage Group PLC | 832,900 | 2,445 |
| Provident Financial PLC | 227,556 | 2,320 |
19
Global Equity Fund
| Shares
| Market
Value^
(000)
|
|---|
| Capita Group PLC | 383,500 | $2,283 |
| ICAP PLC | 569,800 | 2,268 |
| Smiths Group PLC | 165,310 | 2,221 |
| ITV PLC | 1,092,335 | 2,130 |
| Stagecoach Group PLC | 1,264,323 | 2,088 |
| WPP Group PLC | 219,700 | 2,045 |
| Hilton Group PLC | 361,400 | 1,810 |
| Compass Group PLC | 392,235 | 1,565 |
| Kidde PLC | 685,400 | 1,532 |
| Enterprise Inns PLC | 142,800 | 1,473 |
| BT Group PLC | 428,200 | 1,393 |
| *Enodis PLC | 860,100 | 1,300 |
| *Invensys PLC | 5,973,600 | 1,216 |
| Bunzl PLC | 117,300 | 884 |
| TBI PLC | 580,000 | 708 |
| EMI Group PLC | 169,500 | 677 |
| Travis Perkins PLC | 25,100 | 652 |
| Devro PLC | 305,000 | 618 |
| Sygen International PLC | 408,600 | 274 |
| *MyTravel Group PLC | 748,200 | 76 |
| |
|
| | |
| | 108,200 |
| |
|
| | |
| United States (31.0%) |
| Auto & Transportation (2.2%) |
| Burlington Northern |
| Santa Fe Corp. | 219,600 | 8,413 |
| *Northwest Airlines Corp. |
| Class A | 687,200 | 5,642 |
| *Kansas City Southern | 264,800 | 4,017 |
| *AMR Corp. | 434,000 | 3,181 |
Consumer Discretionary (7.4%) |
| Costco Wholesale Corp. | 339,700 | 14,118 |
| Hollinger International, Inc. | 493,000 | 8,524 |
| Liberty Media Corp. | 958,004 | 8,354 |
| International Speedway Corp. | 150,350 | 7,502 |
| *Liberty Media International Inc. |
| Class A | 216,228 | 7,214 |
| Waste Management, Inc. | 256,700 | 7,018 |
| Sabre Holdings Corp. | 261,730 | 6,420 |
| Ethan Allen Interiors, Inc. | 153,800 | 5,345 |
| *PRIMEDIA Inc. | 2,245,000 | 5,276 |
| *Learning Tree International, Inc. | 105,100 | 1,482 |
Consumer Staples (1.3%) |
| Altria Group, Inc. | 165,800 | 7,799 |
| Sara Lee Corp. | 202,000 | 4,618 |
Financial Services (4.4%) |
| Moody's Corp. | 126,200 | 9,244 |
| Mercury General Corp. | 123,500 | 6,532 |
| American Express Co. | 115,897 | 5,964 |
| MBIA, Inc. | 100,400 | $5,845 |
| Unitrin, Inc. | 130,800 | 5,437 |
| The Goldman Sachs Group, Inc. | 55,300 | 5,156 |
| MGIC Investment Corp. | 62,800 | 4,179 |
Health Care (3.3%) |
| Schering-Plough Corp. | 702,800 | 13,395 |
| IMS Health, Inc. | 384,030 | 9,186 |
| Bristol-Myers Squibb Co. | 224,100 | 5,304 |
| Baxter International, Inc. | 127,300 | 4,094 |
Materials & Processing (1.3%) |
| *Scotts Co. | 116,000 | 7,441 |
| PPG Industries, Inc. | 80,700 | 4,945 |
Producer Durables (1.1%) |
| *Xerox Corp. | 768,800 | 10,825 |
Technology (4.8%) |
| *Lucent Technologies, Inc. | 3,172,400 | 10,057 |
| *Sun Microsystems, Inc. | 2,040,400 | 8,243 |
| *Apple Computer, Inc. | 161,000 | 6,239 |
| *Dell Inc. | 160,000 | 5,696 |
| Microsoft Corp. | 126,600 | 3,500 |
| Raytheon Co. | 88,500 | 3,361 |
| *Unisys Corp. | 310,400 | 3,203 |
| *Agere Systems Inc. Class B | 2,980,400 | 3,040 |
| Intel Corp. | 135,300 | 2,714 |
Utilities (4.1%) |
| *Nextel Communications, Inc. | 440,300 | 10,497 |
| SBC Communications Inc. | 315,716 | 8,193 |
| *Comcast Corp. Special Class A | 291,500 | 8,139 |
| *UnitedGlobalCom Inc. Class A | 881,064 | 6,582 |
| *Qwest Communications |
| International Inc. | 1,959,100 | 6,524 |
Other (1.1%) |
| *Berkshire Hathaway Inc. Class B | 3,724 | 10,692 |
| |
|
| | |
| | 299,150 |
| |
|
|
| TOTAL COMMON STOCKS |
| (Cost $763,234) | 933,699 |
|
20
| Shares
| Market
Value^
(000)
|
|---|
| TEMPORARY CASH INVESTMENTS (8.9%) |
|---|
|
| Vanguard Market | | |
| Liquidity Fund, 1.74%** | 29,622,956 | $29,623 |
| Vanguard Market |
| Liquidity Fund, |
| 1.74%**--Note G | 55,834,739 | 55,835 |
|
| TOTAL TEMPORARY CASH INVESTMENTS |
| (Cost $85,458) | 85,458 |
|
| TOTAL INVESTMENTS (105.6%) |
| (Cost $848,692) | 1,019,157 |
|
| OTHER ASSETS AND LIABILITIES (-5.6%) |
|
| Other Assets--Note C | 4,207 |
| Security Lending Collateral Payable |
| to Brokers--Note G | (55,835) |
| Other Liabilities | (2,471) |
| |
|
| | (54,099) |
| |
|
|
| NET ASSETS (100%) |
|
| Applicable to 60,032,569 outstanding $.001 |
| par value shares of beneficial interest |
| (unlimited authorization) | $965,058 |
|
NET ASSET VALUE PER SHARE |
$16.08 |
|
^See Note A in Notes to Financial Statements.
*Non-income-producing security.
**Money market fund available only to Vanguard funds and certain trusts and accounts managed by Vanguard. Rate shown is the 7-day yield.
ADR—American Depositary Receipt.
| Amount
(000)
| Per
Share
|
|---|
| AT SEPTEMBER 30, 2004, NET ASSETS CONSISTED OF: |
|---|
|
| Paid-in Capital | $768,730 | $12.81 |
| Undistributed Net |
| Investment Income | 8,453 | .14 |
| Accumulated Net Realized Gains | 17,398 | .29 |
| Unrealized Appreciation |
| Investment Securities | 170,465 | 2.84 |
| Foreign Currencies | 12 | -- |
|
| NET ASSETS | $965,058 | $16.08 |
|
See Note E in Notes to Financial Statements for the tax-basis components of net assets.
21
STATEMENT OF OPERATIONS
This Statement shows the types of income earned by the fund during the two most recent reporting periods, and details the operating expenses charged to the fund. These expenses directly reduce the amount of investment income available to pay to shareholders as income dividends. This Statement also shows any Net Gain (Loss) realized on the sale of investments, and the increase or decrease in the Unrealized Appreciation (Depreciation) of investments during each period.
| | Global Equity Fund |
|---|
| Nov. 1, 2003, to
Sept. 30, 2004*
(000) | Year Ended
Oct. 31, 2003
(000) |
|---|
|
| INVESTMENT INCOME | | |
| Income |
| Dividends** | $18,082 | $8,013 |
| Interest | 374 | 269 |
| Security Lending | 318 | 187 |
|
| Total Income | 18,774 | 8,469 |
|
| Expenses |
| Investment Advisory Fees--Note B |
| Basic Fee | 2,423 | 1,444 |
| Performance Adjustment | 646 | 442 |
| The Vanguard Group--Note C |
| Management and Administrative | 3,526 | 1,879 |
| Marketing and Distribution | 115 | 49 |
| Custodian Fees | 436 | 272 |
| Auditing Fees | 21 | 19 |
| Shareholders' Reports | 34 | 32 |
| Trustees' Fees and Expenses | 1 | 1 |
|
| Total Expenses | 7,202 | 4,138 |
| Expenses Paid Indirectly--Note D | (180) | (152) |
|
| Net Expenses | 7,022 | 3,986 |
|
| NET INVESTMENT INCOME | 11,752 | 4,483 |
|
| REALIZED NET GAIN (LOSS) |
| Investment Securities Sold | 18,621 | 3,419 |
| Foreign Currencies | (108) | 113 |
|
| REALIZED NET GAIN (LOSS) | 18,513 | 3,532 |
|
| CHANGE IN UNREALIZED APPRECIATION (DEPRECIATION) |
| Investment Securities | 66,077 | 138,110 |
| Foreign Currencies | (24) | 32 |
|
| CHANGE IN UNREALIZED APPRECIATION (DEPRECIATION) | 66,053 | 138,142 |
|
| NET INCREASE (DECREASE) IN NET ASSETS |
| RESULTING FROM OPERATIONS | $96,318 | $146,157 |
|
*The fund’s fiscal year-end changed from October 31 to September 30, effective September 30, 2004.
**Dividends are net of foreign withholding taxes of $885,000 and $586,000, respectively.
22
STATEMENT OF CHANGES IN NET ASSETS
This Statement shows how the fund’s total net assets changed during the three most recent reporting periods. The Operations section summarizes information detailed in the Statement of Operations. The amounts shown as Distributions to shareholders from the fund’s net income and capital gains may not match the amounts shown in the Operations section, because distributions are determined on a tax basis and may be made in a period different from the one in which the income was earned or the gains were realized on the financial statements. The Capital Share Transactions section shows the amount shareholders invested in the fund, either by purchasing shares or by reinvesting distributions, as well as the amounts redeemed. The corresponding numbers of Shares Issued and Redeemed are shown at the end of the Statement.
| Global Equity Fund
|
|---|
| November 1, 2003,
to September 30, | Year Ended October 31,
|
|---|
| 2004*
(000) | 2003
(000) | 2002
(000) |
|---|
|
| INCREASE (DECREASE) IN NET ASSETS | | | |
| Operations |
| Net Investment Income | $11,752 | $4,483 | $1,720 |
| Realized Net Gain (Loss) | 18,513 | 3,532 | 987 |
| Change in Unrealized Appreciation (Depreciation) | 66,053 | 138,142 | (20,941) |
|
| Net Increase (Decrease) in Net Assets |
| Resulting from Operations | 96,318 | 146,157 | (18,234) |
|
| Distributions |
| Net Investment Income | (6,819) | (1,743) | (1,529) |
| Realized Capital Gain** | (3,409) | (436) | (5,605) |
|
| Total Distributions | (10,228) | (2,179) | (7,134) |
|
| Capital Share Transactions1 |
| Issued | 341,628 | 401,703 | 168,543 |
| Issued in Lieu of Cash Distributions | 9,216 | 2,014 | 6,619 |
| Redeemed | (135,487) | (106,603) | (71,244) |
|
| Net Increase (Decrease) from |
| Capital Share Transactions | 215,357 | 297,114 | 103,918 |
|
| Total Increase (Decrease) | 301,447 | 441,092 | 78,550 |
|
| Net Assets |
| Beginning of Period | 663,611 | 222,519 | 143,969 |
|
| End of Period | $965,058 | $663,611 | $222,519 |
|
1Shares Issued (Redeemed) |
| Issued | 22,206 | 33,416 | 14,143 |
| Issued in Lieu of Cash Distributions | 612 | 186 | 582 |
| Redeemed | (8,680) | (8,950) | (6,217) |
|
| Net Increase (Decrease) in Shares Outstanding | 14,138 | 24,652 | 8,508 |
|
*The fund’s fiscal year-end changed from October 31 to September 30, effective September 30, 2004.
**Includes fiscal 2004, 2003, and 2002 short-term gain distributions totaling $3,409,000, $0, and $510,000, respectively. Short-term gain distributions are treated as ordinary income dividends for tax purposes.
23
FINANCIAL HIGHLIGHTS
This table summarizes the fund’s investment results and distributions to shareholders on a per-share basis. It also presents the Total Return and shows net investment income and expenses as percentages of average net assets. These data will help you assess: the variability of the fund’s net income and total returns from year to year; the relative contributions of net income and capital gains to the fund’s total return; how much it costs to operate the fund; and the extent to which the fund tends to distribute capital gains. The table also shows the Portfolio Turnover Rate, a measure of trading activity. A turnover rate of 100% means that the average security is held in the fund for one year.
Global Equity Fund
|
|---|
| Nov.1, 2003,
to Sept. 30, | Year Ended October 31,
|
|---|
| For a Share Outstanding Throughout Each Period | 2004* | 2003 | 2002 | 2001 | 2000 | 1999 |
|---|
|
| Net Asset Value, Beginning of Period | $14.46 | $10.48 | $11.31 | $13.71 | $14.10 | $12.11 |
|
| Investment Operations |
| Net Investment Income | .191 | .12 | .09 | .13 | .26 | .20 |
| Net Realized and Unrealized Gain (Loss) |
| on Investments | 1.624 | 3.96 | (.36) | (1.10) | .37 | 2.80 |
|
| Total from Investment Operations | 1.815 | 4.08 | (.27) | (.97) | .63 | 3.00 |
|
| Distributions |
| Dividends from Net Investment Income | (.130) | (.08) | (.12) | (.26) | (.18) | (.26) |
| Distributions from Realized Capital Gains | (.065) | (.02) | (.44) | (1.17) | (.84) | (.75) |
|
| Total Distributions | (.195) | (.10) | (.56) | (1.43) | (1.02) | (1.01) |
|
| Net Asset Value, End of Period | $16.08 | $14.46 | $10.48 | $11.31 | $13.71 | $14.10 |
|
| Total Return** | 12.64% | 39.25% | -2.78% | -7.72% | 4.45% | 26.52% |
|
Ratios/Supplemental Data |
| Net Assets, End of Period (Millions) | $965 | $664 | $223 | $144 | $140 | $125 |
| Ratio of Total Expenses to Average Net Assets† | 0.90%†† | 1.05% | 1.19% | 1.08% | 0.70% | 0.71% |
| Ratio of Net Investment Income |
| to Average Net Assets | 1.47%†† | 1.14% | 0.86% | 1.10% | 1.88% | 1.39% |
| Portfolio Turnover Rate | 19% | 13% | 14% | 27% | 31% | 36% |
|
*The fund’s fiscal year-end changed from October 31 to September 30, effective September 30, 2004.
**Total returns do not reflect the 1% fee assessed through April 6, 2001, on redemptions of shares held for less than five years.
†Includes performance-based investment advisory fee increases (decreases) of 0.08%, 0.11%, 0.17%, 0.13%, (0.22%), and (0.20%).
††Annualized.
SEE ACCOMPANYING NOTES, WHICH ARE AN INTEGRAL PART OF THE FINANCIAL STATEMENTS.
24
NOTES TO FINANCIAL STATEMENTS
Vanguard Global Equity Fund is registered under the Investment Company Act of 1940 as an open-end investment company, or mutual fund. The fund invests in securities of foreign issuers, which may subject it to investment risks not normally associated with investing in securities of United States corporations.
A. The following significant accounting policies conform to generally accepted accounting principles for U.S. mutual funds. The fund consistently follows such policies in preparing its financial statements.
1. Security Valuation: Securities are valued as of the close of trading on the New York Stock Exchange (generally 4:00 p.m. Eastern time) on the valuation date. Equity securities are valued at the latest quoted sales prices or official closing prices taken from the primary market in which each security trades; such securities not traded on the valuation date are valued at the mean of the latest quoted bid and asked prices. Securities for which market quotations are not readily available, or whose values have been materially affected by events occurring before the fund’s pricing time but after the close of the securities’ primary markets, are valued at their fair values calculated according to procedures adopted by the board of trustees. These procedures include monitoring news to identify significant market- or security-specific events, and evaluating changes in the values of foreign market proxies (for example, futures contracts or exchange-traded funds), between the time the foreign markets close and the fund’s pricing time to determine whether a significant change in value has occurred. When fair-value pricing is employed, the prices of securities used by a fund to calculate its net asset value may differ from quoted or published prices for the same securities. Investments in Vanguard® Market Liquidity Fund are valued at that fund’s net asset value. Temporary cash investments acquired over 60 days to maturity are valued using the latest bid prices or using valuations based on a matrix system (which considers such factors as security prices, yields, maturities, and ratings), both as furnished by independent pricing services. Other temporary cash investments are valued at amortized cost, which approximates market value.
2. Foreign Currency: Securities and other assets and liabilities denominated in foreign currencies are translated into U.S. dollars at the exchange rates on the valuation date as employed by Morgan Stanley Capital International (MSCI) in the calculation of its indexes. As part of the fund’s fair-value procedures, exchange rates may be adjusted if they change significantly before the fund’s pricing time but after the time at which the MSCI rates are determined (generally 11:00 a.m. Eastern time). Realized gains (losses) and unrealized appreciation (depreciation) on investment securities include the effects of changes in exchange rates since the securities were purchased, combined with the effects of changes in security prices. Fluctuations in the value of other assets and liabilities resulting from changes in exchange rates are recorded as unrealized foreign currency gains (losses) until the asset or liability is settled in cash, when they are recorded as realized foreign currency gains (losses).
3. Repurchase Agreements: The fund, along with other members of The Vanguard Group, may transfer uninvested cash balances into a pooled cash account, which is invested in repurchase agreements secured by U.S. government and agency securities. Securities pledged as collateral for repurchase agreements are held by a custodian bank until the agreements mature. Each agreement requires that the market value of the collateral be sufficient to cover payments of interest and principal; however, in the event of default or bankruptcy by the other party to the agreement, retention of the collateral may be subject to legal proceedings.
4. Federal Income Taxes: The fund intends to continue to qualify as a regulated investment company and distribute all of its taxable income. Accordingly, no provision for federal income taxes is required in the financial statements.
5. Distributions: Distributions to shareholders are recorded on the ex-dividend date.
25
NOTES TO FINANCIAL STATEMENTS (CONTINUED)
6. Other: Dividend income is recorded on the ex-dividend date. Interest income includes income distributions received from Vanguard Market Liquidity Fund and is accrued daily. Security transactions are accounted for on the date the securities are bought or sold. Costs used to determine realized gains (losses) on the sale of investment securities are those of the specific securities sold.
B. Marathon Asset Management LLP provides investment advisory services to the fund for a fee calculated at an annual percentage rate of average net assets. The basic fee is subject to quarterly adjustments based on the fund’s performance for the preceding three years relative to the Morgan Stanley Capital International All Country World Index. For the period ended September 30, 2004, the investment advisory fee represented an effective annual basic rate of 0.30% of the fund’s average net assets before an increase of $646,000 (0.08%) based on performance. For the year ended October 31, 2003, the investment advisory fee represented an effective annual basic rate of 0.37% of the fund’s average net assets before an increase of $442,000 (0.11%) based on performance.
The board of trustees approved the addition of a second advisor, Acadian Asset Management, to manage a portion of the fund’s assets effective in October 2004.
C. The Vanguard Group furnishes at cost corporate management, administrative, marketing, and distribution services. The costs of such services are allocated to the fund under methods approved by the board of trustees. The fund has committed to provide up to 0.40% of its net assets in capital contributions to Vanguard. At September 30, 2004, the fund had contributed capital of $129,000 to Vanguard (included in Other Assets), representing 0.01% of the fund’s net assets and 0.13% of Vanguard’s capitalization. The fund’s trustees and officers are also directors and officers of Vanguard.
D. The fund has asked its investment advisor to direct certain security trades, subject to obtaining the best price and execution, to brokers who have agreed to rebate to the fund part of the commissions generated. Such rebates are used solely to reduce the fund’s management and administrative expenses. For the period ended September 30, 2004, these arrangements reduced the fund’s expenses by $180,000 (an annual rate of 0.02% of average net assets). For the year ended October 31, 2003, these arrangements reduced the fund’s expenses by $152,000 (an annual rate of 0.04% of average net assets).
E. Distributions are determined on a tax basis and may differ from net investment income and realized capital gains for financial reporting purposes. Differences may be permanent or temporary. Permanent differences are reclassified among capital accounts in the financial statements to reflect their tax character. Temporary differences arise when certain items of income, expense, gain, or loss are recognized in different periods for financial statement and tax purposes; these differences will reverse at some time in the future. Differences in classification may also result from the treatment of short-term gains as ordinary income for tax purposes.
During the period ended September 30, 2004, the fund realized net foreign currency losses of $108,000, which decreased distributable net income for tax purposes; accordingly, such losses have been reclassified from accumulated net realized gains to undistributed net investment income.
The fund used a tax accounting practice to treat a portion of the price of capital shares redeemed during the period ended September 30, 2004, as distributions from net investment income and realized capital gains. Accordingly, the fund has reclassified $698,000 from undistributed net investment income, and $1,019,000 from accumulated net realized gains, to paid-in capital.
For tax purposes, at September 30, 2004, the fund had $19,346,000 of ordinary income and $8,727,000 of long-term capital gains available for distribution.
At September 30, 2004, net unrealized appreciation of investment securities for tax purposes was
26
$168,897,000, consisting of unrealized gains of $193,432,000 on securities that had risen in value since their purchase and $24,535,000 in unrealized losses on securities that had fallen in value since their purchase.
F. During the period ended September 30, 2004, the fund purchased $381,358,000 of investment securities and sold $155,599,000 of investment securities, other than temporary cash investments.
G. The market value of securities on loan to broker/dealers at September 30, 2004, was $52,906,000, for which the fund held cash collateral of $55,835,000. The fund invests cash collateral received in temporary cash investments, and records a liability for the return of the collateral, during the period the securities are on loan.
27
REPORT OF INDEPENDENT REGISTERED PUBLIC ACCOUNTING FIRM
To the Shareholders and Trustees of Vanguard Global Equity Fund:
In our opinion, the accompanying statement of net assets and the related statements of operations and of changes in net assets and the financial highlights present fairly, in all material respects, the financial position of Vanguard Global Equity Fund (the “Fund”) at September 30, 2004, the results of its operations for the period from November 1, 2003 to September 30, 2004 and for the year ended October 31, 2003, and the changes in its net assets for the period from November 1, 2003 to September 30, 2004 and for the two years ended October 31, 2003 and the financial highlights for each of the periods indicated, in conformity with accounting principles generally accepted in the United States of America. These financial statements and financial highlights (hereafter referred to as “financial statements”) are the responsibility of the Fund’s management; our responsibility is to express an opinion on these financial statements based on our audits. We conducted our audits of these financial statements in accordance with the standards of the Public Company Accounting Oversight Board (United States), which require that we plan and perform the audit to obtain reasonable assurance about whether the financial statements are free of material misstatement. An audit includes examining, on a test basis, evidence supporting the amounts and disclosures in the financial statements, assessing the accounting principles used and significant estimates made by management, and evaluating the overall financial statement presentation. We believe that our audits, which included confirmation of securities at September 30, 2004 by correspondence with the custodian, provide a reasonable basis for our opinion.
PricewaterhouseCoopers LLP
Philadelphia, Pennsylvania
November 3, 2004
SPECIAL 2004 TAX INFORMATION
(UNAUDITED) FOR VANGUARD GLOBAL EQUITY FUND
This information for the period ended September 30, 2004, is included pursuant to provisions of the Internal Revenue Code.
The fund distributed $510,000 as capital gain dividends (from net long-term capital gains) to shareholders during the period.
The fund distributed $6,451,000 of qualified dividend income to shareholders during the period.
For corporate shareholders, 14.2% of investment income (dividend income plus short-term gains, if any) qualifies for the dividends-received deduction.
The fund will pass through to shareholders foreign source income of $15,647,000 and foreign taxes paid of $780,000. The pass-through of foreign taxes paid will affect only shareholders on the dividend record date in December 2004. Shareholders will receive more detailed information along with their Form 1099-DIV in January 2005.
28
INVESTING IS FAST, EASY, AND SECURE ON VANGUARD.COM
If you’re like many Vanguard investors, you believe in planning and taking control of your own investments. Vanguard.com was built for you—and it keeps getting better.
RESEARCH AND PLAN YOUR INVESTMENTS WITH CONFIDENCE
Use our Planning & Advice and Research Funds & Stocks sections to:
| • | Determine what asset allocation might best suit your needs--by taking our Investor Questionnaire. |
| • | Find out how much to save for retirement and your children's college education--by using our planning tools. |
| • | Learn how to achieve your goals--by reading our PlainTalk(R)investment guides. |
| • | Find your next fund--by using the Compare Funds, Compare Costs, and Narrow Your Fund Choices tools. |
| • | Look up fund price, performance history, and distribution information--in a snap. |
INVEST AND MANAGE ACCOUNTS WITH EASE
Log on to Vanguard.com to:
| • | See what you own (at Vanguard and elsewhere) and how your investments are doing. o Elect to receive online statements, fund reports (like this one), prospectuses, and tax forms. |
| • | Analyze your portfolio's holdings and performance. |
| • | Open new accounts, buy and sell shares, and exchange money between funds--securely and easily. |
| • | Sign up to receive electronic newsletters from Vanguard informing you of news on our funds, products, and services, as well as on investing and the financial markets. |
Find out what Vanguard.com can do for you. Log on today!
29
CAPITALIZE ON YOUR IRA
Are you taking full advantage of your individual retirement account? You really should be. These tax-deferred accounts are powerful options for retirement savers.
Here’s how you can exploit your IRA—and improve your chances of having the retirement of your dreams.
CONTRIBUTE THE MAXIMUM AMOUNT EACH YEAR
It may be an obvious point, but if you invest as much in your IRA as the law allows—currently $3,000 per tax year if you are under age 50 and $3,500 if you are age 50 or over—you will increase the odds of meeting your retirement goals. “Max out” every year you can.
MAKE IT AUTOMATIC
Put your IRA on autopilot by taking advantage of Vanguard’s Automatic Investment Plan. Your IRA contributions will be deducted from your bank account on a schedule of your choosing, making retirement investing a healthy habit.
CONSIDER COST
The owners of low-cost investments keep a larger portion of their gross returns than the owners of high-cost investments. Over the long term, avoiding costlier mutual funds and brokerage commissions could significantly boost your retirement savings. Our low costs are one reason a Vanguard IRA® is such a smart choice.
REQUEST A DIRECT ROLLOVER WHEN YOU CHANGE JOBS
Don’t spend your retirement assets before you’ve retired. When you change jobs, roll your 401(k) or other employer-sponsored retirement plan assets directly into your IRA.
If you have questions about your IRA, want to transfer an IRA from another institution to Vanguard, or need help with any other IRA transaction, call our Retirement Resource Center at 1-800-205-6189 or visit Vanguard.com. You can open or fund your IRA on our website and have a confirmation in your hand within minutes.
THIS PAGE INTENTIONALLY LEFT BLANK.
THE PEOPLE WHO GOVERN YOUR FUND
The trustees of your mutual fund are there to see that the fund is operated and managed in your best interests since, as a shareholder, you are a part owner of the fund. Your fund trustees also serve on the board of directors of The Vanguard Group, Inc., which is owned by the Vanguard® funds and provides services to them on an at-cost basis.
A majority of Vanguard's board members are independent, meaning that they have no affiliation with Vanguard or the funds they oversee, apart from the sizable personal investments they have made as private individuals.
Our independent board members bring distinguished backgrounds in business, academia, and public service to their task of working with Vanguard officers to establish the policies and oversee the activities of
Name
(Year of Birth)
Trustee/Officer
Since
| Position(s) Held with
Fund (Number of
Vanguard Funds
Overseen by
Trustee/Officer)
| Principal Occupation(s) During the Past Five Years
|
|---|
John J. Brennan*
(1954)
May 1987
| Chairman of the
Board, Chief
Executive Officer,
and Trustee
(131) | Chairman of the Board,Chief Executive Officer, and Director/Trustee of
The Vanguard Group, Inc., and of each of the investment companies
served by The Vanguard Group. |
|
| INDEPENDENT TRUSTEES |
| |
Charles D. Ellis
(1937)
January 2001 | Trustee
(131) | The Partners of `63 (pro bono ventures in education); Senior Advisor
to Greenwich Associates (international business strategy consulting);
Successor Trustee of Yale University; Overseer of the Stern School of
Business at New York University; Trustee of the Whitehead Institute
for Biomedical Research. |
|
Rajiv L. Gupta
(1945)
December 2001† | Trustee
(131) | Chairman and Chief Executive Officer (since October 1999), Vice
Chairman (January-September 1999), and Vice President (prior to
September 1999) of Rohm and Haas Co. (chemicals); Director of
Technitrol, Inc. (electronic components), and Agere Systems (commu-
nications components); Board Member of the American Chemistry
Council; Trustee of Drexel University. |
|
JoAnn Heffernan
Heisen
(1950)
July 1998 | Trustee
(131)
| Vice President, Chief Information Officer, and Member of the
Executive Committee of Johnson & Johnson (pharmaceuticals/
consumer products); Director of the University Medical Center at
Princeton and Women's Research and Education Institute. |
|
Burton G. Malkiel
(1932)
May 1977 | Trustee
(129) | Chemical Bank Chairman's Professor of Economics, Princeton
University; Director of Vanguard Investment Series plc (Irish invest-
ment fund) (since November 2001), Vanguard Group (Ireland)
Limited (investment management) (since November 2001),
Prudential Insurance Co. of America, BKF Capital (investment
management), The Jeffrey Co. (holding company), and NeuVis, Inc.
(software company). |
|
| † | December 2002 for Vanguard® Equity Income Fund, Vanguard® Growth Equity Fund, the Vanguard® Municipal Bond Funds, and the Vanguard® State Tax-Exempt Funds. |
the funds. Among board members’ responsibilities are selecting investment advisors for the funds; monitoring fund operations, performance, and costs; reviewing contracts; nominating and selecting new trustees/directors; and electing Vanguard officers.
Each trustee serves a fund until its termination; or until the trustee’s retirement, resignation, or death; or otherwise as specified in the fund’s organizational documents. Any trustee may be removed at a shareholders’ meeting by a vote representing two-thirds of the net asset value of all shares of the fund together with shares of other Vanguard funds organized within the same trust. The table on these two pages shows information for each trustee and executive officer of the fund. The mailing address of the trustees and officers is P.O. Box 876, Valley Forge, PA 19482.
Name
(Year of Birth)
Trustee/Officer
Since
| Position(s) Held with
Fund (Number of
Vanguard Funds
Overseen by
Trustee/Officer)
| Principal Occupation(s) During the Past Five Years
|
|---|
Alfred M. Rankin, Jr.
(1941)
January 1993
| Trustee
(131) | Chairman, President, Chief Executive Officer, and Director of NACCO
Industries, Inc. (forklift trucks/housewares/lignite); Director of
Goodrich Corporation (industrial products/aircraft systems and
services); Director of Standard Products Company (supplier for
the automotive industry) until 1998. |
|
J. Lawrence Wilson
(1936)
April 1985
| Trustee
(131)
| Retired Chairman and Chief Executive Officer of Rohm and Haas Co.
(chemicals); Director of Cummins Inc. (diesel engines), MeadWestvaco
Corp. (paper products), and AmerisourceBergen Corp. (pharmaceutical
distribution); Trustee of Vanderbilt University. |
|
| EXECUTIVE OFFICERS* |
R. Gregory Barton
(1951)
June 2001 |
Secretary
(131)
|
Managing Director and General Counsel of The Vanguard Group, Inc.;
Secretary of The Vanguard Group and of each of the investment
companies served by The Vanguard Group. |
|
Thomas J. Higgins
(1957)
July 1998 | Treasurer
(131) | Principal of The Vanguard Group, Inc.; Treasurer of each of the
investment companies served by The Vanguard Group. |
|
*Officers of the funds are “interested persons” as defined in the Investment Company Act of 1940.
More information about the trustees is in the Statement of Additional Information, available from The Vanguard Group.
VANGUARD SENIOR MANAGEMENT TEAM
|
|---|
Mortimer J. Buckley, Information Technology.
James H. Gately, Investment Programs and Services.
Kathleen C. Gubanich, Human Resources.
F. William McNabb, III, Client Relationship Group.
| Michael S. Miller, Planning and Development.
Ralph K. Packard, Finance.
George U. Sauter, Chief Investment Officer.
|
John C. Bogle, Founder; Chairman and Chief Executive Officer, 1974-1996. |
|
| |
Post Office Box 2600
Valley Forge, PA 19482-2600 |
Vanguard, The Vanguard Group, Vanguard.com, Vanguard IRA, PlainTalk , and the ship logo are trademarks of The Vanguard Group, Inc.
All other marks are the exclusive property of their respective owners.
All comparative mutual fund data are from Lipper Inc. or Morningstar, Inc., unless otherwise noted.
For More Information
This report is intended for the fund’s shareholders. It may not be distributed to prospective investors unless it is preceded or accompanied by the current fund prospectus. To receive a free copy of the prospectus or the Statement of Additional Information, or to request additional information about the fund or other Vanguard funds, please contact us at one of the adjacent telephone numbers or by e-mail through Vanguard.com. Prospectuses may also be viewed online.
You can obtain a free copy of Vanguard’s proxy voting guidelines by visiting our website, www.vanguard.com, and searching for “proxy voting guidelines,” or by calling Vanguard at 1-800- 662-2739. They are also available from the SEC’s website, www.sec.gov. In addition, you may obtain a free report on how the fund voted the proxies for securities it owned during the 12 months ended June 30. To get the report, visit either www.vanguard.com or www.sec.gov.
You can review and copy information about your fund at the SEC’s Public Reference Room in Washington, D.C. To find out more about this public service, call the SEC at 1-202-942-8090. Information about your fund is also available on the SEC’s website, and you can receive copies of this information, for a fee, by sending a request in either of two ways: via e-mail addressed to publicinfo@sec.gov or via regular mail addressed to the Public Reference Section, Securities and Exchange Commission, Washington, DC 20549–0102.
World Wide Web
www.vanguard.com
Fund Information
1-800-662-7447
Direct Investor
Account Services
1-800-662-2739
Institutional Investor
Services
1-800-523-1036
Text Telephone
1-800-952-3335
© 2004 The Vanguard Group, Inc.
All rights reserved.
Vanguard Marketing
Corporation, Distributor.
Q1290 112004
Item 2: Code of Ethics. The Board of Trustees has adopted a code of ethics that applies to the principal executive officer, principal financial officer, principal accounting officer or controller of the Registrant and The Vanguard Group, Inc., and to persons performing similar functions.
Item 3: Audit Committee Financial Expert. All of the members of the Audit Committee have been determined by the Registrant’s Board of Trustees to be Audit Committee Financial Experts. The members of the Audit Committee are: Charles D. Ellis, Rajiv L. Gupta, JoAnn Heffernan Heisen, Burton G. Malkiel, Alfred M. Rankin, Jr., and J. Lawrence Wilson. All Audit Committee members are independent under applicable rules.
Item 4: Principal Accountant Fees and Services.
(a) Audit Fees.
Audit Fees of the Registrant
Fiscal Year Ended September 30, 2004: $53,000
Fiscal Year Ended September 30, 2004: $46,000
Aggregate Audit Fees of Registered Investment Companies in the Vanguard Group
Fiscal Year Ended September 30, 2004: $1,685,500
Fiscal Year Ended September 30, 2004: $1,620,200
(b) Audit-Related Fees.
Fiscal Year Ended September 30, 2004: $257,800
Fiscal Year Ended September 30, 2004: $324,460
Includes fees billed in connection with assurance and related services provided to the Registrant, The Vanguard Group, Inc., Vanguard Marketing Corporation, and other registered investment companies in the Vanguard Group.
(c) Tax Fees.
Fiscal Year Ended September 30, 2004: $76,400
Fiscal Year Ended September 30, 2004: $409,900
Includes fees billed in connection with tax compliance, planning and advice services provided to the Registrant, The Vanguard Group, Inc., Vanguard Marketing Corporation, and other registered investment companies in the Vanguard Group and related to income and excise taxes.
(d) All Other Fees.
Fiscal Year Ended September 30, 2004: $0
Fiscal Year Ended September 30, 2004: $31,000
Includes fees billed for services related to risk management and privacy matters. Services were provided to the Registrant, The Vanguard Group, Inc., Vanguard Marketing Corporation, and other registered investment companies in the Vanguard Group.
(e) (1) Pre-Approval Policies. The policy of the Registrant’s Audit Committee is to consider and, if appropriate, approve before the principal accountant is engaged for such services, all specific audit and non-audit services provided to: (1) the Registrant; (2) The Vanguard Group, Inc.; (3) other entities controlled by The Vanguard Group, Inc. that provide ongoing services to the Registrant; and (4) other registered investment companies in the Vanguard Group. In making a determination, the Audit Committee considers whether the services are consistent with maintaining the principal accountant’s independence.
In the event of a contingency situation in which the principal accountant is needed to provide services in between scheduled Audit Committee meetings, members of the Audit Committee would be called on to consider and, if appropriate, pre-approve audit or permitted non-audit services in an amount sufficient to complete services through the next Audit Committee meeting, and to determine if such services would be consistent with maintaining the accountant’s independence. At the next scheduled Audit Committee meeting, services and fees would be presented to the Audit Committee for formal consideration, and, if appropriate, approval by the entire Audit Committee. The Audit Committee would again consider whether such services and fees are consistent with maintaining the principal accountant’s independence.
The Registrant’s Audit Committee is informed at least annually of all audit and non-audit services provided by the principal accountant to the Vanguard complex, whether such services are provided to: (1) the Registrant; (2) The Vanguard Group, Inc.; (3) other entities controlled by The Vanguard Group, Inc. that provide ongoing services to the Registrant; or other registered investment companies in the Vanguard Group.
(2) No percentage of the principal accountant’s fees or services were approved pursuant to the waiver provision of paragraph (c)(7)(i)(C) of Rule 2-01 of Regulation S-X.
(f) For the most recent fiscal year, over 50% of the hours worked under the principal accountant’s engagement were not performed by persons other than full-time, permanent employees of the principal accountant.
(g) Aggregate Non-Audit Fees.
Fiscal Year Ended September 30, 2004: $76,400
Fiscal Year Ended September 30, 2004: $440,900
Includes fees billed for non-audit services provided to the Registrant, The Vanguard Group, Inc., Vanguard Marketing Corporation, and other registered investment companies in the Vanguard Group.
(h) For the most recent fiscal year, the Audit Committee has determined that the provision of all non-audit services was consistent with maintaining the principal accountant’s independence.
Item 5: Not applicable.
Item 6: Not applicable.
Item 7: Not applicable.
Item 8: Not applicable.
Item 9: Not applicable.
Item 10: Controls and Procedures.
(a) Disclosure Controls and Procedures. The Principal Executive and Financial Officers concluded that the Registrant’s Disclosure Controls and Procedures are effective based on their evaluation of the Disclosure Controls and Procedures as of a date within 90 days of the filing date of this report.
(b) Internal Control Over Financial Reporting. There were no significant changes in Registrant’s internal control over financial reporting or in other factors that could significantly affect this control subsequent to the date of the evaluation, including any corrective actions with regard to significant deficiencies and material weaknesses.
Item 11: Exhibits.
(a) Code of Ethics.
(b) Certifications.
Pursuant to the requirements of the Securities Exchange Act of 1934 and the Investment Company Act of 1940, the registrant has duly caused this report to be signed on its behalf by the undersigned, thereunto duly authorized.
| VANGUARD HORIZON FUNDS
|
| BY: | (signature)
|
| (HEIDI STAM)
JOHN J. BRENNAN*
CHIEF EXECUTIVE OFFICER |
Pursuant to the requirements of the Securities Exchange Act of 1934 and the Investment Company Act of 1940, this report has been signed below by the following persons on behalf of the registrant and in the capacities and on the dates indicated.
| VANGUARD HORIZON FUNDS
|
| BY: | (signature)
|
| (HEIDI STAM)
JOHN J. BRENNAN*
CHIEF EXECUTIVE OFFICER |
| VANGUARD HORIZON FUNDS
|
| BY: | (signature)
|
| (HEIDI STAM)
THOMAS J. HIGGINS*
TREASURER |
*By Power of Attorney. See File Number 2-57689, filed on December 26, 2002. Incorporated by Reference.