UNITED STATES
SECURITIES AND EXCHANGE COMMISSION
Washington, D.C. 20549
FORM N-CSR
CERTIFIED SHAREHOLDER REPORT
OF
REGISTERED MANAGEMENT INVESTMENT COMPANIES
Investment Company Act file number: 811-07239
Name of Registrant: Vanguard Horizon Funds
Address of Registrant:
P.O. Box 2600
Valley Forge, PA 19482
Name and address of agent for service:
Heidi Stam, Esquire
P.O. Box 876
Valley Forge, PA 19482
Registrant’s telephone number, including area code: (610) 669-1000
Date of fiscal year end: September 30
Date of reporting period: October 1, 2008 – September 30, 2009
Item 1: Reports to Shareholders
 |
| Vanguard Strategic Equity Fund |
| Annual Report |
|
|
| September 30, 2009 |
|
 |
|
|
> For the fiscal year ended September 30, 2009, Vanguard Strategic Equity Fund returned –9.66%.
> The fund’s results for the fiscal year covered two very different market environments—a first half of dramatic declines followed by a second half of robust gains.
> For the 12-month period, Strategic Equity Fund substantially lagged both its benchmark return and the average return of peer-group funds.
| |
| Contents | |
| |
| Your Fund’s Total Returns | 1 |
| President’s Letter | 2 |
| Advisor’s Report | 7 |
| Results of Proxy Voting | 9 |
| Fund Profile | 10 |
| Performance Summary | 11 |
| Financial Statements | 12 |
| Your Fund’s After-Tax Returns | 28 |
| About Your Fund’s Expenses | 29 |
| Glossary | 31 |
Please note: The opinions expressed in this report are just that—informed opinions. They should not be considered promises or advice. Also, please keep in mind that the information and opinions cover the period through the date on the front of this report. Of course, the risks of investing in your fund are spelled out in the prospectus.
Cover photograph: Veronica Coia.
Your Fund’s Total Returns
| | |
| Fiscal Year Ended September 30, 2009 | | |
| | Ticker | Total |
| | Symbol | Returns |
| Vanguard Strategic Equity Fund | VSEQX | –9.66% |
| MSCI® US Small + Mid Cap 2200 Index | | –3.00 |
| Mid-Cap Core Funds Average1 | | –3.02 |
| | | | |
| Your Fund’s Performance at a Glance | | | | |
| September 30, 2008–September 30, 2009 | | | | |
| | | | Distributions Per Share |
| | Starting | Ending | Income | Capital |
| | Share Price | Share Price | Dividends | Gains |
| Vanguard Strategic Equity Fund | $16.42 | $14.52 | $0.241 | $0.000 |
1 Derived from data provided by Lipper Inc.
1

President’s Letter
Dear Shareholder,
The results for Vanguard Strategic Equity Fund for the 12 months ended September 30, 2009, were disappointing. However, they masked a dramatic turnaround in market sentiment and fund performance that began midway through the fund’s fiscal year.
Investor confidence abruptly revived in March in both the stock and bond markets, as turmoil in the credit markets began to subside and economic reports began to suggest that the economy was on the mend. The Strategic Equity Fund returned about –37% for the six months ended March 31, 2009, while the fund returned about 43% for the subsequent six months.
Considered together, these almost perfectly inverse results produced a 12-month loss of –9.66%. If you hold the Strategic Equity Fund in a taxable account, you may wish to review our report on the fund’s after-tax returns on page 28.
After a precipitous fall, stock markets rebound
In recent months, the financial markets have performed so strongly that it’s almost hard to remember that less than a year ago the global financial system stood on the brink of collapse. Since then, markets have pulled back from the abyss. Although unemployment remains near generational highs, and the prospects of a robust recovery seem dim, the global economy has begun to grind into gear.
2
Reminders of the markets’ dark days are nevertheless apparent in the index returns for both the past 12 months and the past three years. Over both periods, U.S. stocks recorded negative returns. Global stocks did better over the past 12 months, recouping their late-2008 losses thanks to general strength in developed economies and a powerful rally in emerging markets. Over the past three years, however, international stocks posted a modestly negative return.
The bond market’s turnabout has been equally dramatic
The stock market’s collapse and recovery echo even more dramatic developments in the bond market. At the end of 2008, as the credit markets nearly ceased to function, the difference between the yields of corporate bonds and U.S. Treasury bonds spiked to levels last seen during the Great Depression.
The Federal Reserve and its central bank counterparts around the world responded with aggressive monetary stimulus efforts, while global governments opened the fiscal taps. Investors first tiptoed, then stampeded, back into the market, boosting bond prices and bringing down yields. Over the past 12 months, taxable U.S. bonds returned more than 10%; municipal securities did even better, returning almost 15%, as measured by the Barclays Capital Municipal Bond Index.
The Fed’s rescue campaign has imposed a heavy price on short-term savings vehicles such as money market funds. In December
| | | |
| Market Barometer | | | |
| | | Average Annual Total Returns |
| | | Periods Ended September 30, 2009 |
| | One Year | Three Years | Five Years |
| Stocks | | | |
| Russell 1000 Index (Large-caps) | –6.14% | –5.10% | 1.49% |
| Russell 2000 Index (Small-caps) | –9.55 | –4.57 | 2.41 |
| Dow Jones U.S. Total Stock Market Index | –5.83 | –4.58 | 1.93 |
| MSCI All Country World Index ex USA (International) | 6.43 | –0.78 | 8.59 |
| |
| Bonds | | | |
| Barclays Capital U.S. Aggregate Bond Index (Broad taxable market) | 10.56% | 6.41% | 5.13% |
| Barclays Capital Municipal Bond Index | 14.85 | 5.13 | 4.78 |
| Citigroup 3-Month Treasury Bill Index | 0.39 | 2.63 | 2.96 |
| |
| CPI | | | |
| Consumer Price Index | –1.29% | 2.10% | 2.61% |
3
2008, the Fed reduced its target for the federal funds rate, a benchmark for the interest rates paid by money market instruments and other very short-term securities, to between 0% and 0.25%. The Fed has said it expects to maintain its target at this level “for an extended period.”
Early-in-the-year results weigh on full-year returns
The recent fiscal year has been a historically anomalous period in the financial markets, to say the least. One consequence for stocks has been that the worst-performing stocks in the dizzying market of the first six months of the period were among the best performers during the exceptionally strong rally that characterized the final six months.
| | |
| Expense Ratios1 | | |
| Your Fund Compared With Its Peer Group | | |
| | | Mid-Cap |
| | | Core Funds |
| | Fund | Average |
| Strategic Equity Fund | 0.32% | 1.30% |
The first-half results weighed heavily on the performance of stocks for the full year, so it’s not surprising that the fund posted a negative return. It was disappointing, however, that the fund fell measurably short of its benchmark index—an obvious setback in its effort to capture most of the index’s risk and investment characteristics while producing index-beating returns through superior stock selection.
Although financial-sector stocks, the fund’s largest weighting, were a major negative contributor to return on an absolute basis, good stock selection helped somewhat to minimize the difference between the fund’s returns and its benchmark index.
1 The fund expense ratio shown is from the prospectus dated January 28, 2009, and represents estimated costs for the current fiscal year based on the fund’s net assets as of the prospectus date. For the fiscal year ended September 30, 2009, the fund’s expense ratio was 0.30%. The peer-group expense ratio is derived from data provided by Lipper Inc. and captures information through year-end 2008.
4
The fund’s information technology and consumer discretionary holdings—which together represented about one-third of the fund’s assets—helped to cushion the effect of the general market downdraft by contributing a total of 7 percentage points to return. Good stock selection among consumer discretionary stocks also benefited the fund on a relative basis.
However, good stock picking in sectors such as financials and consumer discretionary were outweighed by poor choices elsewhere, especially among energy, health care, and industrial stocks.
A long-term view can curb short-term distractions
A stock market rally is always welcome, of course. But not all rallies are alike when you look under the hood.
The stock market rally that characterized the final six months of your fund’s 2009 fiscal year was led, in general, by the stocks of companies whose financial health is suspect. However, the models that Vanguard Quantitative Equity Group uses in managing the fund are designed to sift through thousands of stocks to find those with higher-quality characteristics. We believe those stocks have the potential to produce the strongest results over the long term.
| |
| Total Returns | |
| Ten Years Ended September 30, 2009 | |
| | Average |
| | Annual Return |
| Strategic Equity Fund | 5.69% |
| Spliced Small and Mid Cap Index1 | 5.92 |
| Mid-Cap Core Funds Average2 | 5.93 |
The figures shown represent past performance, which is not a guarantee of future results. (Current performance may be lower or higher than the performance data cited. For performance data current to the most recent month-end, visit our website at www.vanguard.com/performance.) Note, too, that both investment returns and principal value can fluctuate widely, so an investor’s shares, when sold, could be worth more or less than their original cost.
1 The Spliced Small and Mid Cap Index reflects the returns of the Russell 2800 Index through May 31, 2003, and the MSCI US Small + Mid Cap 2200 Index thereafter.
2 Derived from data provided by Lipper Inc.
5
That is why we maintain confidence in Strategic Equity Fund’s underlying stock-selection methodology, despite the disappointing short-term results and, indeed, its modest shortfall relative to its benchmark over the past decade.
In recent months, the market’s and the fund’s performance have improved. The latest rally reinforces our belief that it’s important to step back (difficult as it may be) from the distraction of short-term results and consider investing as a long-term process—one that’s set in motion after you’ve developed a low-cost portfolio that is balanced and diversified among the major asset classes and aligned with your investing goals.
Thank you for entrusting your assets to Vanguard.
Sincerely,

F. William McNabb III
President and Chief Executive Officer
October 14, 2009
Advisor’s Report
The financial crisis that began in 2007 continued to influence the stock market during the past fiscal year. The Strategic Equity Fund returned about –10%, compared with a return of about –3% for the MSCI US Small + Mid Cap 2200 Index.
During the panic that ruled the market in the first half of the fiscal year, the fund’s benchmark returned about –34%. The worst-performing stocks during those six months became the best-returning stocks of the second six months. This “junk” rally in stocks, which began after the market’s close brush with financial disaster, led the benchmark to a gain of about 47% in the final half of the period.
Our quantitative fundamental investment-management process led to mixed results for the full 12 months. We use a model that assesses the attractiveness of stocks relative to their peers based on five components: valuation, earnings quality, growth, management decisions, and market sentiment.
Valuation measures the price we will pay for a stock’s earnings or cash flow. By itself, valuation can be a powerful investment tool, but our research leads us to conclude that other components improve upon a valuation signal. Our earnings-quality score separates cheap stocks that deserve their low valuations, because of poor margins, from their more-profitable peers.
Our growth indicator likewise differentiates between companies with low valuations due to poor growth prospects and firms with more attractive prospects. Since actions often speak louder than words, the management-decisions component of our model helps determine the attractiveness of a stock by evaluating the decisions corporate managers make. These include decisions to issue stock, raise debt, and make capital investments. Finally, our market sentiment score measures the market’s overall evaluation of the company’s value. Our logic is that a stock’s performance reflects the news affecting that stock, which helps to verify the results of our other scores.
We combine the five components into an overall score, with each indicator serving as a verification of the others. Our research tells us that the attributes we prefer in stocks—such as low ratios of price/earnings and price/cash flow, as well as higher return on equity compared with other stocks—are likely to be successful in the long term, but may not work in some periods, such as this fiscal year.
The extreme anxiety in the first part of the year drove down all stocks, regardless of individual characteristics, as investors sought to exit the market. In March, once companies that had almost ceased to exist seemed more likely to survive, the stocks of those firms roared back to life. This happened even though the firms had
7
attributes that our model does not favor, such as negative earnings, low margins, and low growth.
Value-oriented stocks, which we prefer, were particularly out of favor during the year. Although we are disappointed that our performance for the year was below that of the benchmark, we are not surprised that we lagged during this period. All investment styles endure periods of underperformance, and there have been earlier periods—such as the dot-com bubble—when our process similarly underperformed.
In contrast to the recent stock-market meltdown, the dot-com bubble that began in the late 1990s was a “melt-up”—stock prices climbed strongly and steeply before plummeting. Nevertheless, just as in the past year, a very few factors dominated performance during that time: For example, it was acceptable for a stock to have little or no earnings if it had an Internet-related story line. Throughout the dot-com bubble, our model rejected many stocks that did not pass the test of our earnings and quality models; thus, our portfolios underperformed.
Last year, the dominating factor was the credit crisis. In an environment such as 2008 or the late 1990s, when one or two factors prevail in investor decision-making, our process suffers. We continue to maintain our commitment to a portfolio with lower price/earnings and price/cash flow ratios, growth rates near the market’s overall rate, and a slightly higher return on equity. Such a portfolio offers an attractive profile that we expect the market will reward over the long term.
We thank you for your investment, and we look forward to the upcoming year.
James D. Troyer, CFA, Principal and Portfolio Manager
Joel M. Dickson,
Prinicipal and Head,
Vanguard Active Quantitative Equity
Management
October 16, 2009
8
Results of Proxy Voting
At a special meeting of shareholders on July 2, 2009, fund shareholders approved the following two proposals:
Proposal 1—Elect trustees for each fund.*
The individuals listed in the table below were elected as trustees for each fund. All trustees with the exception of Messrs. McNabb and Volanakis (both of whom already served as directors of The Vanguard Group, Inc.) served as trustees to the funds prior to the shareholder meeting.
| | | |
| | | | Percentage |
| Trustee | For | Withheld | For |
| John J. Brennan | 517,264,433 | 14,297,196 | 97.3% |
| Charles D. Ellis | 501,913,782 | 29,647,847 | 94.4% |
| Emerson U. Fullwood | 507,851,847 | 23,709,782 | 95.5% |
| Rajiv L. Gupta | 515,891,359 | 15,670,270 | 97.1% |
| Amy Gutmann | 517,356,594 | 14,205,035 | 97.3% |
| JoAnn Heffernan Heisen | 516,532,227 | 15,029,403 | 97.2% |
| F. William McNabb III | 516,660,098 | 14,901,531 | 97.2% |
| André F. Perold | 507,715,282 | 23,846,348 | 95.5% |
| Alfred M. Rankin, Jr. | 516,327,018 | 15,234,611 | 97.1% |
| Peter F. Volanakis | 516,503,576 | 15,058,053 | 97.2% |
| * Results are for all funds within the same trust. | | | |
Proposal 2—Update and standardize the funds’ fundamental policies regarding:
(a) Purchasing and selling real estate.
(b) Issuing senior securities.
(c) Borrowing money.
(d) Making loans.
(e) Purchasing and selling commodities.
(f) Concentrating investments in a particular industry or group of industries.
(g) Eliminating outdated fundamental investment policies not required by law.
The revised fundamental policies are clearly stated and simple, yet comprehensive, making oversight and compliance more efficient than under the former policies. The revised fundamental policies will allow the funds to respond more quickly to regulatory and market changes, while avoiding the costs and delays associated with successive shareholder meetings.
| | | | | |
| | | | | Broker | Percentage |
| Vanguard Fund | For | Abstain | Against | Non-Votes | For |
| Strategic Equity Fund | | | | | |
| 2a | 178,164,129 | 3,534,815 | 10,024,312 | 5,730,570 | 90.2% |
| 2b | 177,486,762 | 3,801,136 | 10,435,358 | 5,730,570 | 89.9% |
| 2c | 176,246,489 | 3,646,003 | 11,830,765 | 5,730,570 | 89.3% |
| 2d | 176,671,295 | 3,691,730 | 11,360,235 | 5,730,566 | 89.5% |
| 2e | 176,761,443 | 3,516,471 | 11,445,346 | 5,730,566 | 89.5% |
| 2f | 177,545,769 | 3,665,294 | 10,512,194 | 5,730,570 | 89.9% |
| 2g | 178,712,026 | 3,657,543 | 9,353,685 | 5,730,572 | 90.5% |
9
Strategic Equity Fund
Fund Profile
As of September 30, 2009
| | | |
| Portfolio Characteristics | | |
| | | Comparative | Broad |
| | Fund | Index1 | Index2 |
| Number of Stocks | 706 | 2,197 | 4,324 |
| Median Market Cap | $2.7B | $3.0B | $29.0B |
| Price/Earnings Ratio | 21.0x | 105.6x | 27.9x |
| Price/Book Ratio | 2.0x | 1.8x | 2.1x |
| Yield3 | 1.3% | 1.4% | 1.9% |
| Return on Equity | 15.8% | 13.2% | 19.1% |
| Earnings Growth Rate | 17.5% | 9.2% | 9.6% |
| Foreign Holdings | 0.1% | 0.0% | 0.0% |
| Turnover Rate | 60% | — | — |
| Expense Ratio4 | 0.32% | — | — |
| Short-Term Reserves | 0.3% | — | — |
| | | |
| Sector Diversification (% of equity exposure) |
| | Comparative | Broad |
| | Fund | Index1 | Index2 |
| Consumer Discretionary | 15.4% | 14.9% | 10.1% |
| Consumer Staples | 3.2 | 4.0 | 9.9 |
| Energy | 7.7 | 7.3 | 11.0 |
| Financials | 18.7 | 18.8 | 16.7 |
| Health Care | 11.0 | 11.3 | 12.9 |
| Industrials | 13.5 | 13.9 | 10.6 |
| Information Technology | 17.8 | 17.1 | 18.2 |
| Materials | 6.6 | 6.1 | 3.9 |
| Telecommunication | | | |
| Services | 1.2 | 1.2 | 2.9 |
| Utilities | 4.9 | 5.4 | 3.8 |
| | |
| Volatility Measures5 | |
| | Fund Versus | Fund Versus |
| | Comparative Index1 | Broad Index2 |
| R-Squared | 0.99 | 0.95 |
| Beta | 1.00 | 1.18 |
| | |
| Ten Largest Holdings6 (% of total net assets) |
| |
| Marvell Technology | | |
| Group Ltd. | semiconductors | 1.1% |
| Western Digital Corp. | computer storage | |
| | and peripherals | 1.1 |
| AmerisourceBergen | health care | |
| Corp. Class A | distributors | 1.1 |
| NRG Energy Inc. | independent power | |
| | producers and | |
| | energy traders | 1.1 |
| Dr Pepper Snapple | | |
| Group Inc. | soft drinks | 1.1 |
| priceline.com Inc. | Internet retail | 1.0 |
| Cooper Industries PLC | electrical components | |
| Class A | and equipment | 1.0 |
| Unum Group | life and health | |
| | insurance | 1.0 |
| Goodrich Corp. | aerospace and | |
| | defense | 1.0 |
| Owens-Illinois Inc. | metal and glass | |
| | containers | 1.0 |
| Top Ten | | 10.5% |
Investment Focus
1 MSCI US Small + Mid Cap 2200 Index.
2 Dow Jones U.S. Total Stock Market Index.
3 30-day SEC yield for the fund; annualized dividend yield for the indexes. See the Glossary.
4 The expense ratio shown is from the prospectus dated January 28, 2009, and represents estimated costs for the current fiscal year based on the fund’s net assets as of the prospectus date. For the fiscal year ended September 30, 2009, the expense ratio was 0.30%.
5 For an explanation of R-squared, beta, and other terms used here, see the Glossary.
6 The holdings listed exclude any temporary cash investments and equity index products.
10
Strategic Equity Fund
Performance Summary
All of the returns in this report represent past performance, which is not a guarantee of future results that may be achieved by the fund. (Current performance may be lower or higher than the performance data cited. For performance data current to the most recent month-end, visit our website at www.vanguard.com/performance.) Note, too, that both investment returns and principal value can fluctuate widely, so an investor’s shares, when sold, could be worth more or less than their original cost. The returns shown do not reflect taxes that a shareholder would pay on fund distributions or on the sale of fund shares.
Cumulative Performance: September 30, 1999–September 30, 2009
Initial Investment of $10,000

| | | | |
| | | Average Annual Total Returns | Final Value |
| | Periods Ended September 30, 2009 | of a $10,000 |
| | One Year | Five Years | Ten Years | Investment |
| Strategic Equity Fund1 | –9.66% | 0.31% | 5.69% | $17,385 |
| Dow Jones U.S. Total Stock Market Index | –5.83 | 1.93 | 0.94 | 10,978 |
| Spliced Small and Mid Cap Index2 | –3.00 | 3.77 | 5.92 | 17,777 |
| Mid-Cap Core Funds Average3 | –3.02 | 2.99 | 5.93 | 17,795 |
Fiscal-Year Total Returns (%): September 30, 1999–September 30, 2009

1 Total returns do not include the account service fee that may be applicable to certain accounts with balances below $10,000.
2 The Spliced Small and Mid Cap Index reflects the returns of the Russell 2800 Index through May 31, 2003, and the MSCI US Small + Mid Cap 2200 Index thereafter.
3 Derived from data provided by Lipper Inc.
Note: See Financial Highlights table for dividend and capital gains information.
11
Strategic Equity Fund
Financial Statements
Statement of Net Assets
As of September 30, 2009
The fund reports a complete list of its holdings in regulatory filings four times in each fiscal year, at the quarter-ends. For the second and fourth fiscal quarters, the lists appear in the fund’s semiannual and annual reports to shareholders. For the first and third fiscal quarters, the fund files the lists with the Securities and Exchange Commission on Form N-Q. Shareholders can look up the fund’s Forms N-Q on the SEC’s website at www.sec.gov. Forms N-Q may also be reviewed and copied at the SEC’s Public Reference Room (see the back cover of this report for further information).
| | | |
| | | | Market |
| | | | Value• |
| | | Shares | ($000) |
| Common Stocks (99.5%)1 | | |
| Consumer Discretionary (15.3%) | |
| * | priceline.com Inc. | 224,200 | 37,177 |
| | Whirlpool Corp. | 505,711 | 35,380 |
| * | Dollar Tree Inc. | 671,747 | 32,701 |
| | H&R Block Inc. | 1,636,150 | 30,072 |
| | Ross Stores Inc. | 502,262 | 23,993 |
| * | Aeropostale Inc. | 549,650 | 23,893 |
| * | AutoZone Inc. | 154,400 | 22,576 |
| | DR Horton Inc. | 1,671,902 | 19,076 |
| | Wyndham Worldwide Corp. | 1,050,183 | 17,139 |
| | Darden Restaurants Inc. | 435,032 | 14,848 |
| * | Big Lots Inc. | 480,385 | 12,019 |
| * | ITT Educational | | |
| | Services Inc. | 107,000 | 11,814 |
| | Jarden Corp. | 412,528 | 11,580 |
| | RadioShack Corp. | 662,778 | 10,982 |
| * | Tempur-Pedic | | |
| | International Inc. | 578,399 | 10,955 |
| | Cablevision Systems | | |
| | Corp. Class A | 445,400 | 10,578 |
| | Autoliv Inc. | 281,014 | 9,442 |
| * | Valassis | | |
| | Communications Inc. | 514,780 | 9,204 |
| | Bob Evans Farms Inc. | 312,617 | 9,085 |
| * | Warnaco Group Inc. | 186,459 | 8,178 |
| * | True Religion Apparel Inc. | 310,939 | 8,063 |
| * | WMS Industries Inc. | 173,407 | 7,727 |
| | Meredith Corp. | 253,620 | 7,593 |
| | Polaris Industries Inc. | 175,178 | 7,144 |
| * | Rent-A-Center Inc. | 346,198 | 6,536 |
| | Scripps Networks | | |
| | Interactive Inc. Class A | 165,437 | 6,113 |
| * | Panera Bread Co. Class A | 102,157 | 5,619 |
| * | Denny’s Corp. | 2,039,080 | 5,424 |
| | DeVry Inc. | 93,500 | 5,172 |
| | Unifirst Corp. | 115,203 | 5,121 |
| * | CEC Entertainment Inc. | 191,451 | 4,951 |
| * | Helen of Troy Ltd. | 249,900 | 4,856 |
| | Tupperware Brands Corp. | 120,328 | 4,804 |
| | | |
| | | | Market |
| | | | Value• |
| | | Shares | ($000) |
| * | JOS A Bank Clothiers Inc. | 106,600 | 4,773 |
| * | Dana Holding Corp. | 608,958 | 4,147 |
| * | Jo-Ann Stores Inc. | 148,238 | 3,977 |
| * | Pre-Paid Legal Services Inc. | 70,812 | 3,597 |
| * | Carter’s Inc. | 132,900 | 3,548 |
| * | Marvel Entertainment Inc. | 66,400 | 3,295 |
| | Cooper Tire & Rubber Co. | 183,621 | 3,228 |
| * | Bally Technologies Inc. | 81,090 | 3,111 |
| * | Steiner Leisure Ltd. | 82,209 | 2,940 |
| | Scholastic Corp. | 120,574 | 2,935 |
| * | NVR Inc. | 4,400 | 2,804 |
| * | Lincoln Educational | | |
| | Services Corp. | 112,018 | 2,563 |
| | Interactive Data Corp. | 95,734 | 2,509 |
| ^ | Buckle Inc. | 71,150 | 2,429 |
| *,^ | Fuel Systems Solutions Inc. | 67,393 | 2,426 |
| * | Isle of Capri Casinos Inc. | 195,000 | 2,299 |
| * | PF Chang’s China Bistro Inc. | 65,702 | 2,232 |
| * | Timberland Co. Class A | 154,661 | 2,153 |
| | La-Z-Boy Inc. | 248,035 | 2,146 |
| | Regal Entertainment | | |
| | Group Class A | 172,925 | 2,130 |
| | Brinker International Inc. | 126,900 | 1,996 |
| * | Sally Beauty Holdings Inc. | 265,724 | 1,889 |
| | Advance Auto Parts Inc. | 46,900 | 1,842 |
| | Burger King Holdings Inc. | 102,600 | 1,805 |
| | Fred’s Inc. Class A | 141,500 | 1,801 |
| * | Steven Madden Ltd. | 47,578 | 1,751 |
| * | Mediacom Communications | | |
| | Corp. Class A | 283,456 | 1,633 |
| | CSS Industries Inc. | 70,397 | 1,392 |
| * | Tenneco Inc. | 103,900 | 1,355 |
| | KB Home | 78,954 | 1,311 |
| * | Papa John’s International Inc. | 52,300 | 1,285 |
| | Limited Brands Inc. | 59,200 | 1,006 |
| * | Career Education Corp. | 39,200 | 956 |
| | Aaron’s Inc. | 33,956 | 896 |
| * | Corinthian Colleges Inc. | 47,900 | 889 |
| ^ | Sturm Ruger & Co. Inc. | 67,650 | 875 |
| * | AFC Enterprises Inc. | 103,426 | 871 |
12
Strategic Equity Fund
| | | |
| | | | Market |
| | | | Value• |
| | | Shares | ($000) |
| | Cracker Barrel Old | | |
| | Country Store Inc. | 24,823 | 854 |
| * | Beazer Homes USA Inc. | 152,475 | 852 |
| | Regis Corp. | 51,100 | 792 |
| * | EW Scripps Co. Class A | 104,622 | 785 |
| | MDC Holdings Inc. | 21,700 | 754 |
| | Family Dollar Stores Inc. | 28,500 | 752 |
| | Barnes & Noble Inc. | 33,800 | 751 |
| * | Stein Mart Inc. | 54,545 | 693 |
| * | Knology Inc. | 70,900 | 691 |
| * | Meritage Homes Corp. | 33,200 | 674 |
| * | Dorman Products Inc. | 44,649 | 671 |
| | Cato Corp. Class A | 31,694 | 643 |
| | Weight Watchers | | |
| | International Inc. | 23,422 | 643 |
| | American Axle & | | |
| | Manufacturing Holdings Inc. | 86,900 | 615 |
| * | Domino’s Pizza Inc. | 68,400 | 605 |
| | CKE Restaurants Inc. | 55,500 | 582 |
| * | NetFlix Inc. | 12,300 | 568 |
| | Stage Stores Inc. | 42,500 | 551 |
| * | Pier 1 Imports Inc. | 142,300 | 551 |
| | Service Corp. International | 74,207 | 520 |
| *,^ | Chipotle Mexican | | |
| | Grill Inc. Class A | 5,200 | 505 |
| | Pulte Homes Inc. | 43,900 | 482 |
| | Leggett & Platt Inc. | 21,800 | 423 |
| * | Steak N Shake Co. | 31,700 | 373 |
| | National Presto Industries Inc. | 4,300 | 372 |
| | Newell Rubbermaid Inc. | 23,400 | 367 |
| | Finish Line Inc. Class A | 35,300 | 359 |
| * | Smith & Wesson | | |
| | Holding Corp. | 63,445 | 332 |
| | John Wiley & Sons Inc. | | |
| | Class A | 9,400 | 327 |
| * | CKX Inc. | 45,868 | 308 |
| * | HSN Inc. | 17,900 | 291 |
| | Harte-Hanks Inc. | 19,800 | 274 |
| * | Penn National Gaming Inc. | 8,208 | 227 |
| * | Dolan Media Co. | 18,300 | 219 |
| * | Capella Education Co. | 3,200 | 216 |
| | Cinemark Holdings Inc. | 17,300 | 179 |
| | Mattel Inc. | 9,200 | 170 |
| | Big 5 Sporting Goods Corp. | 11,100 | 168 |
| | Jones Apparel Group Inc. | 8,700 | 156 |
| * | Warner Music Group Corp. | 28,074 | 155 |
| | PetMed Express Inc. | 5,284 | 100 |
| * | California Pizza Kitchen Inc. | 5,700 | 89 |
| | World Wrestling | | |
| | Entertainment Inc. Class A | 5,600 | 78 |
| * | Blockbuster Inc. Class B | 66,881 | 40 |
| | | | 542,367 |
| | | |
| | | | Market |
| | | | Value• |
| | | Shares | ($000) |
| Consumer Staples (3.2%) | | |
| * | Dr Pepper Snapple | | |
| | Group Inc. | 1,299,008 | 37,346 |
| | Del Monte Foods Co. | 1,565,761 | 18,132 |
| | Mead Johnson Nutrition | | |
| | Co. Class A | 200,260 | 9,034 |
| | Herbalife Ltd. | 200,929 | 6,578 |
| | Lancaster Colony Corp. | 107,918 | 5,533 |
| * | Central Garden and Pet | | |
| | Co. Class A | 495,079 | 5,411 |
| | Universal Corp. | 115,936 | 4,848 |
| | Nash Finch Co. | 144,986 | 3,964 |
| | Andersons Inc. | 87,445 | 3,078 |
| * | Revlon Inc. Class A | 547,726 | 2,662 |
| | Molson Coors Brewing | | |
| | Co. Class B | 49,398 | 2,405 |
| | PepsiAmericas Inc. | 69,805 | 1,994 |
| * | Chiquita Brands | | |
| | International Inc. | 118,611 | 1,917 |
| * | Pantry Inc. | 122,219 | 1,916 |
| * | Central Garden and Pet Co. | 144,451 | 1,697 |
| * | Prestige Brands | | |
| | Holdings Inc. | 238,903 | 1,682 |
| * | Alliance One | | |
| | International Inc. | 270,200 | 1,211 |
| | Village Super Market Inc. | | |
| | Class A | 39,202 | 1,155 |
| | Coca-Cola Bottling Co. | | |
| | Consolidated | 11,608 | 562 |
| * | American Italian Pasta Co. | 19,168 | 521 |
| | Bunge Ltd. | 7,500 | 470 |
| | Pepsi Bottling Group Inc. | 11,140 | 406 |
| | Alberto-Culver Co. Class B | 14,100 | 390 |
| | J&J Snack Foods Corp. | 6,500 | 281 |
| * | TreeHouse Foods Inc. | 7,400 | 264 |
| | Sanderson Farms Inc. | 6,100 | 230 |
| | Weis Markets Inc. | 6,400 | 204 |
| * | National Beverage Corp. | 16,746 | 193 |
| * | BJ’s Wholesale Club Inc. | 4,500 | 163 |
| | Calavo Growers Inc. | 8,124 | 154 |
| | | | 114,401 |
| Energy (7.7%) | | |
| | ENSCO International Inc. | 803,609 | 34,186 |
| | Helmerich & Payne Inc. | 753,542 | 29,788 |
| | Tidewater Inc. | 483,683 | 22,777 |
| * | FMC Technologies Inc. | 390,100 | 20,379 |
| * | Cameron International Corp. | 509,400 | 19,265 |
| | Murphy Oil Corp. | 327,696 | 18,865 |
| | El Paso Corp. | 1,723,154 | 17,783 |
| | Tesoro Corp. | 1,163,000 | 17,422 |
| * | Alpha Natural | | |
| | Resources Inc. | 274,725 | 9,643 |
| * | SEACOR Holdings Inc. | 114,469 | 9,344 |
13
| | | |
| Strategic Equity Fund | | |
| |
| |
| |
| | | | Market |
| | | | Value• |
| | | Shares | ($000) |
| * | Oil States International Inc. | 234,728 | 8,246 |
| | World Fuel Services Corp. | 164,312 | 7,898 |
| * | Newfield Exploration Co. | 183,851 | 7,825 |
| * | Dresser-Rand Group Inc. | 217,160 | 6,747 |
| * | USEC Inc. | 1,106,734 | 5,191 |
| * | Oceaneering | | |
| | International Inc. | 82,910 | 4,705 |
| | Massey Energy Co. | 126,312 | 3,523 |
| | CARBO Ceramics Inc. | 58,566 | 3,019 |
| * | Matrix Service Co. | 236,915 | 2,575 |
| | Rowan Cos. Inc. | 105,000 | 2,422 |
| * | Contango Oil & Gas Co. | 41,605 | 2,124 |
| * | Pride International Inc. | 65,600 | 1,997 |
| | Overseas Shipholding | | |
| | Group Inc. | 51,309 | 1,917 |
| * | Nabors Industries Ltd. | 90,662 | 1,895 |
| | Southern Union Co. | 83,242 | 1,731 |
| | Holly Corp. | 67,400 | 1,727 |
| * | CVR Energy Inc. | 135,212 | 1,682 |
| * | Bristow Group Inc. | 52,699 | 1,565 |
| * | Gulfmark Offshore Inc. | 39,900 | 1,306 |
| | Frontier Oil Corp. | 84,400 | 1,175 |
| * | James River Coal Co. | 42,865 | 819 |
| * | Superior Energy Services Inc. | 26,809 | 604 |
| | Consol Energy Inc. | 12,000 | 541 |
| * | Cal Dive International Inc. | 40,852 | 404 |
| * | Concho Resources Inc. | 10,277 | 373 |
| * | McMoRan Exploration Co. | 42,400 | 320 |
| * | Endeavour International | | |
| | Corp. | 217,500 | 263 |
| * | Global Industries Ltd. | 22,400 | 213 |
| | | | 272,259 |
| Financials (18.5%) | | |
| | Unum Group | 1,724,135 | 36,965 |
| * | TD Ameritrade | | |
| | Holding Corp. | 1,468,347 | 28,809 |
| | Cullen/Frost Bankers Inc. | 547,053 | 28,250 |
| | Bank of Hawaii Corp. | 677,564 | 28,146 |
| | Axis Capital Holdings Ltd. | 808,872 | 24,412 |
| | Torchmark Corp. | 454,947 | 19,758 |
| | Platinum Underwriters | | |
| | Holdings Ltd. | 491,800 | 17,626 |
| | FirstMerit Corp. | 890,366 | 16,944 |
| | Host Hotels & Resorts Inc. | 1,117,400 | 13,152 |
| * | Arch Capital Group Ltd. | 193,292 | 13,055 |
| | Aspen Insurance | | |
| | Holdings Ltd. | 443,300 | 11,734 |
| * | Ezcorp Inc. Class A | 675,417 | 9,226 |
| | PartnerRe Ltd. | 114,419 | 8,803 |
| * | Knight Capital Group Inc. | | |
| | Class A | 398,776 | 8,673 |
| | Plum Creek Timber Co. Inc. | 271,900 | 8,331 |
| | UMB Financial Corp. | 205,888 | 8,326 |
| | HRPT Properties Trust | 1,080,800 | 8,128 |
| | NBT Bancorp Inc. | 352,499 | 7,945 |
| | Everest Re Group Ltd. | 88,600 | 7,770 |
| | | |
| | | | Market |
| | | | Value• |
| | | Shares | ($000) |
| | Nationwide Health | | |
| | Properties Inc. | 249,300 | 7,726 |
| | Odyssey Re Holdings Corp. | 118,571 | 7,685 |
| | Highwoods Properties Inc. | 238,346 | 7,496 |
| | Oriental Financial | | |
| | Group Inc. | 587,694 | 7,464 |
| *,^ | St Joe Co. | 255,300 | 7,434 |
| | Hospitality Properties Trust | 362,800 | 7,390 |
| | Federated Investors Inc. | | |
| | Class B | 278,530 | 7,345 |
| | Senior Housing | | |
| | Properties Trust | 379,600 | 7,254 |
| | American Financial | | |
| | Group Inc. | 280,244 | 7,146 |
| | BOK Financial Corp. | 153,521 | 7,111 |
| | Washington Real Estate | | |
| | Investment Trust | 232,316 | 6,691 |
| | National Retail | | |
| | Properties Inc. | 295,500 | 6,344 |
| | Entertainment | | |
| | Properties Trust | 177,800 | 6,070 |
| | Mack-Cali Realty Corp. | 185,600 | 6,000 |
| | Rayonier Inc. | 141,450 | 5,787 |
| | Mid-America Apartment | | |
| | Communities Inc. | 124,508 | 5,619 |
| | Jones Lang LaSalle Inc. | 117,800 | 5,580 |
| | Home Properties Inc. | 127,456 | 5,492 |
| | Sun Communities Inc. | 251,668 | 5,416 |
| | Kilroy Realty Corp. | 189,447 | 5,255 |
| | Parkway Properties Inc. | 261,775 | 5,157 |
| | HCP Inc. | 176,059 | 5,060 |
| | Sovran Self Storage Inc. | 166,124 | 5,055 |
| | PS Business Parks Inc. | 97,632 | 5,011 |
| | City Holding Co. | 166,255 | 4,956 |
| | Equity Lifestyle | | |
| | Properties Inc. | 115,683 | 4,950 |
| | EastGroup Properties Inc. | 128,800 | 4,923 |
| * | MBIA Inc. | 633,049 | 4,912 |
| * | CB Richard Ellis Group Inc. | | |
| | Class A | 413,600 | 4,856 |
| * | Ocwen Financial Corp. | 399,981 | 4,528 |
| | Alexandria Real Estate | | |
| | Equities Inc. | 82,600 | 4,489 |
| | LTC Properties Inc. | 186,494 | 4,483 |
| | Allied World Assurance Co. | | |
| | Holdings Ltd. | 92,973 | 4,456 |
| | Bank of the Ozarks Inc. | 166,987 | 4,430 |
| * | Conseco Inc. | 826,700 | 4,348 |
| * | Nelnet Inc. Class A | 323,399 | 4,023 |
| | Ventas Inc. | 103,000 | 3,966 |
| | Saul Centers Inc. | 122,855 | 3,944 |
| | First Financial | | |
| | Bankshares Inc. | 79,722 | 3,943 |
| * | Jefferies Group Inc. | 137,200 | 3,736 |
| | AvalonBay Communities Inc. | 48,114 | 3,499 |
14
| | | |
| Strategic Equity Fund | | |
| |
| |
| |
| | | | Market |
| | | | Value• |
| | | Shares | ($000) |
| | American Physicians | | |
| | Capital Inc. | 118,676 | 3,419 |
| | Getty Realty Corp. | 135,564 | 3,327 |
| | Republic Bancorp Inc. | | |
| | Class A | 163,411 | 3,262 |
| | Healthcare Realty Trust Inc. | 151,954 | 3,211 |
| | Reinsurance Group of | | |
| | America Inc. Class A | 70,007 | 3,122 |
| * | AMERISAFE Inc. | 179,960 | 3,104 |
| | Provident Financial | | |
| | Services Inc. | 298,225 | 3,069 |
| | Health Care REIT Inc. | 71,800 | 2,988 |
| * | PHH Corp. | 149,900 | 2,974 |
| | Ares Capital Corp. | 264,812 | 2,918 |
| | International | | |
| | Bancshares Corp. | 174,425 | 2,845 |
| | Colonial Properties Trust | 286,560 | 2,788 |
| * | World Acceptance Corp. | 109,735 | 2,766 |
| | Westamerica | | |
| | Bancorporation | 52,819 | 2,747 |
| | Douglas Emmett Inc. | 205,300 | 2,521 |
| | Bancfirst Corp. | 67,922 | 2,508 |
| | Extra Space Storage Inc. | 236,200 | 2,492 |
| | Community Bank | | |
| | System Inc. | 129,761 | 2,371 |
| | Employers Holdings Inc. | 143,582 | 2,223 |
| | Cash America | | |
| | International Inc. | 72,200 | 2,178 |
| | Kimco Realty Corp. | 165,173 | 2,154 |
| | ProLogis | 175,900 | 2,097 |
| ^ | Pennsylvania Real Estate | | |
| | Investment Trust | 264,600 | 2,014 |
| | Advance America Cash | | |
| | Advance Centers Inc. | 357,325 | 2,001 |
| | Arrow Financial Corp. | 70,009 | 1,911 |
| | Provident New York Bancorp | 198,119 | 1,892 |
| | Tompkins Financial Corp. | 42,569 | 1,860 |
| * | CNA Surety Corp. | 110,533 | 1,791 |
| | Potlatch Corp. | 62,100 | 1,767 |
| | Suffolk Bancorp | 58,893 | 1,744 |
| | Prosperity Bancshares Inc. | 49,100 | 1,708 |
| | Financial Federal Corp. | 68,237 | 1,684 |
| * | First Cash Financial | | |
| | Services Inc. | 97,984 | 1,679 |
| * | FPIC Insurance Group Inc. | 49,984 | 1,677 |
| * | Credit Acceptance Corp. | 50,500 | 1,626 |
| | Capitol Federal Financial | 48,427 | 1,594 |
| | Lakeland Financial Corp. | 76,707 | 1,584 |
| | New York Community | | |
| | Bancorp Inc. | 135,400 | 1,546 |
| | Endurance Specialty | | |
| | Holdings Ltd. | 42,026 | 1,533 |
| ^ | Life Partners Holdings Inc. | 84,077 | 1,505 |
| | Bank Mutual Corp. | 142,345 | 1,258 |
| * | Altisource Portfolio | | |
| | Solutions SA | 80,286 | 1,159 |
| | | |
| | | | Market |
| | | | Value• |
| | | Shares | ($000) |
| | HCC Insurance Holdings Inc. | 42,000 | 1,149 |
| | LaSalle Hotel Properties | 57,800 | 1,136 |
| | Southside Bancshares Inc. | 48,848 | 1,100 |
| | Trico Bancshares | 66,041 | 1,083 |
| * | ProAssurance Corp. | 19,917 | 1,040 |
| | Montpelier Re Holdings Ltd. | 61,500 | 1,004 |
| | Corporate Office Properties | | |
| | Trust SBI | 26,320 | 971 |
| | Safety Insurance Group Inc. | 28,553 | 940 |
| | Heartland Financial USA Inc. | 62,162 | 917 |
| ^ | United Bankshares Inc. | 46,547 | 912 |
| | TFS Financial Corp. | 76,185 | 907 |
| | Validus Holdings Ltd. | 34,191 | 882 |
| | Hudson City Bancorp Inc. | 66,600 | 876 |
| | Federal Realty | | |
| | Investment Trust | 13,900 | 853 |
| * | First Horizon National Corp. | 63,669 | 842 |
| | Simmons First National Corp. | | |
| | Class A | 29,009 | 836 |
| * | LaBranche & Co. Inc. | 240,329 | 817 |
| | Hanover Insurance | | |
| | Group Inc. | 17,900 | 740 |
| | Digital Realty Trust Inc. | 15,000 | 686 |
| | Anworth Mortgage | | |
| | Asset Corp. | 85,700 | 675 |
| | NewAlliance Bancshares Inc. | 59,004 | 631 |
| | GAMCO Investors Inc. | 13,400 | 612 |
| | Clifton Savings Bancorp Inc. | 60,281 | 591 |
| | Camden National Corp. | 16,945 | 560 |
| | Park National Corp. | 9,500 | 554 |
| | MFA Financial Inc. | 68,100 | 542 |
| * | Cardtronics Inc. | 68,900 | 539 |
| | Omega Healthcare | | |
| | Investors Inc. | 32,200 | 516 |
| | 1st Source Corp. | 31,054 | 506 |
| | Commerce Bancshares Inc. | 12,701 | 473 |
| | Infinity Property & | | |
| | Casualty Corp. | 10,900 | 463 |
| | Baldwin & Lyons Inc. | 15,991 | 375 |
| | Trustco Bank Corp. NY | 53,400 | 334 |
| | NASB Financial Inc. | 12,604 | 332 |
| | Danvers Bancorp Inc. | 24,172 | 329 |
| | Kearny Financial Corp. | 29,400 | 306 |
| | Calamos Asset | | |
| | Management Inc. Class A | 23,400 | 306 |
| | Trustmark Corp. | 13,200 | 251 |
| | Amtrust Financial | | |
| | Services Inc. | 22,000 | 251 |
| | U-Store-It Trust | 37,477 | 234 |
| | Flagstone Reinsurance | | |
| | Holdings Ltd. | 20,200 | 228 |
| | First Bancorp | 12,200 | 220 |
| | Wilshire Bancorp Inc. | 27,800 | 204 |
| | Radian Group Inc. | 19,200 | 203 |
| * | Greenlight Capital Re Ltd. | | |
| | Class A | 10,300 | 194 |
15
| | | | |
| Strategic Equity Fund | | | |
| |
| |
| |
| | | | | Market |
| | | | | Value• |
| | | | Shares | ($000) |
| | Brandywine Realty Trust | | 17,500 | 193 |
| | SY Bancorp Inc. | | 8,300 | 192 |
| | Great Southern Bancorp Inc. | | 7,500 | 178 |
| | Fifth Street Finance Corp. | | 16,200 | 177 |
| * | American International | | | |
| | Group Inc. | | 3,900 | 172 |
| | Walter Investment | | | |
| | Management Corp. | | 9,795 | 157 |
| | First Financial Holdings Inc. | | 9,200 | 147 |
| | BGC Partners Inc. Class A | | 33,500 | 143 |
| * | Meridian Interstate | | | |
| | Bancorp Inc. | | 16,500 | 140 |
| | DCT Industrial Trust Inc. | | 26,900 | 137 |
| | Ames National Corp. | | 3,494 | 84 |
| | National Interstate Corp. | | 1,600 | 28 |
| * | Interactive Brokers Group Inc. | 13 | — |
| | | | | 657,568 |
| Health Care (10.9%) | | | |
| | AmerisourceBergen Corp. | | | |
| | Class A | 1,704,204 | 38,140 |
| * | Lincare Holdings Inc. | 1,003,471 | 31,359 |
| | STERIS Corp. | | 793,143 | 24,151 |
| * | Isis Pharmaceuticals Inc. | 1,549,602 | 22,578 |
| * | Cephalon Inc. | | 383,300 | 22,323 |
| * | Warner Chilcott PLC | | | |
| | Class A | 1,020,250 | 22,058 |
| | Universal Health Services | | | |
| | Inc. Class B | | 316,106 | 19,576 |
| * | Watson | | | |
| | Pharmaceuticals Inc. | | 384,700 | 14,095 |
| * | Emergency Medical | | | |
| | Services Corp. Class A | | 254,973 | 11,856 |
| * | Valeant Pharmaceuticals | | | |
| | International | | 366,638 | 10,288 |
| * | Mylan Inc. | | 561,638 | 8,992 |
| * | Human Genome | | | |
| | Sciences Inc. | | 470,810 | 8,861 |
| | Invacare Corp. | | 373,954 | 8,332 |
| * | Emergent Biosolutions Inc. | | 451,708 | 7,977 |
| * | Dendreon Corp. | | 253,524 | 7,096 |
| | Cooper Cos. Inc. | | 230,515 | 6,853 |
| * | Myriad Genetics Inc. | | 241,600 | 6,620 |
| * | PharMerica Corp. | | 352,573 | 6,547 |
| * | Gentiva Health | | | |
| | Services Inc. | | 249,756 | 6,246 |
| * | Cubist Pharmaceuticals Inc. | | 287,985 | 5,817 |
| | PDL BioPharma Inc. | | 577,149 | 4,548 |
| * | Questcor | | | |
| | Pharmaceuticals Inc. | | 811,144 | 4,478 |
| * | Psychiatric Solutions Inc. | | 162,000 | 4,335 |
| * | AMERIGROUP Corp. | | 193,027 | 4,279 |
| | Martek Biosciences Corp. | | 182,800 | 4,129 |
| | Beckman Coulter Inc. | | 57,900 | 3,992 |
| * | LifePoint Hospitals Inc. | | 144,835 | 3,919 |
| * | Hospira Inc. | | 86,190 | 3,844 |
| * | Cyberonics Inc. | | 239,984 | 3,825 |
| | | |
| | | | Market |
| | | | Value• |
| | | Shares | ($000) |
| * | Sirona Dental Systems Inc. | 127,900 | 3,805 |
| * | RehabCare Group Inc. | 164,364 | 3,565 |
| * | Bio-Rad Laboratories Inc. | | |
| | Class A | 38,700 | 3,556 |
| * | Endo Pharmaceuticals | | |
| | Holdings Inc. | 155,300 | 3,514 |
| * | Skilled Healthcare | | |
| | Group Inc. | 436,383 | 3,504 |
| * | Kensey Nash Corp. | 115,475 | 3,343 |
| * | American Medical Systems | | |
| | Holdings Inc. | 188,989 | 3,198 |
| * | LHC Group Inc. | 93,121 | 2,787 |
| * | Millipore Corp. | 35,000 | 2,462 |
| * | Centene Corp. | 128,466 | 2,433 |
| * | DaVita Inc. | 40,991 | 2,322 |
| * | Dionex Corp. | 31,755 | 2,063 |
| * | Cambrex Corp. | 326,503 | 2,057 |
| * | Healthsouth Corp. | 115,700 | 1,810 |
| | Chemed Corp. | 40,500 | 1,778 |
| * | Amsurg Corp. Class A | 77,520 | 1,646 |
| | IMS Health Inc. | 80,800 | 1,240 |
| * | Health Management | | |
| | Associates Inc. Class A | 116,848 | 875 |
| * | Mettler-Toledo | | |
| | International Inc. | 9,451 | 856 |
| * | Kindred Healthcare Inc. | 50,600 | 821 |
| * | ResMed Inc. | 18,000 | 814 |
| * | Henry Schein Inc. | 14,400 | 791 |
| * | Immunogen Inc. | 95,880 | 778 |
| * | Merit Medical Systems Inc. | 43,858 | 760 |
| * | Nektar Therapeutics | 65,872 | 642 |
| * | Medivation Inc. | 23,400 | 635 |
| * | Micromet Inc. | 90,242 | 601 |
| * | Odyssey HealthCare Inc. | 47,397 | 593 |
| * | Corvel Corp. | 20,825 | 591 |
| * | Cantel Medical Corp. | 32,700 | 492 |
| | Atrion Corp. | 3,200 | 462 |
| * | Maxygen Inc. | 65,200 | 436 |
| * | HMS Holdings Corp. | 11,400 | 436 |
| * | Par Pharmaceutical Cos. Inc. | 18,804 | 405 |
| * | eResearchTechnology Inc. | 53,700 | 376 |
| * | PSS World Medical Inc. | 16,195 | 354 |
| * | Auxilium | | |
| | Pharmaceuticals Inc. | 10,068 | 344 |
| * | Greatbatch Inc. | 14,900 | 335 |
| | Ensign Group Inc. | 23,299 | 327 |
| * | Affymetrix Inc. | 31,200 | 274 |
| * | Tenet Healthcare Corp. | 45,700 | 269 |
| * | Hanger Orthopedic | | |
| | Group Inc. | 17,600 | 244 |
| * | Kinetic Concepts Inc. | 6,300 | 233 |
| * | Symmetry Medical Inc. | 22,200 | 230 |
| * | Catalyst Health Solutions Inc. | 7,600 | 222 |
| * | Triple-S Management Corp. | | |
| | Class B | 10,800 | 181 |
| * | ICU Medical Inc. | 2,800 | 103 |
16
| | | | |
| Strategic Equity Fund | | | |
| |
| |
| |
| | | | | Market |
| | | | | Value• |
| | | | Shares | ($000) |
| * | Cadence Pharmaceuticals Inc. | | 7,360 | 81 |
| * | Air Methods Corp. | | 2,100 | 68 |
| *,^ | Osiris Therapeutics Inc. | | 10,100 | 67 |
| | | | | 386,893 |
| Industrials (13.4%) | | | |
| * | Cooper Industries PLC | | | |
| | Class A | | 987,900 | 37,115 |
| | Goodrich Corp. | | 671,676 | 36,499 |
| | Pitney Bowes Inc. | 1,191,600 | 29,611 |
| * | EMCOR Group Inc. | 1,004,867 | 25,443 |
| | Ryder System Inc. | | 607,400 | 23,725 |
| | Hubbell Inc. Class B | | 552,300 | 23,197 |
| * | Hertz Global Holdings Inc. | 1,839,332 | 19,920 |
| | Fluor Corp. | | 378,727 | 19,258 |
| | Flowserve Corp. | | 184,594 | 18,190 |
| | Manpower Inc. | | 288,403 | 16,355 |
| * | United Stationers Inc. | | 240,961 | 11,472 |
| | Watson Wyatt | | | |
| | Worldwide Inc. Class A | | 215,400 | 9,383 |
| | Joy Global Inc. | | 190,917 | 9,344 |
| * | SYKES Enterprises Inc. | | 412,790 | 8,594 |
| | Comfort Systems USA Inc. | | 690,178 | 7,999 |
| * | TransDigm Group Inc. | | 144,900 | 7,217 |
| * | Alliant Techsystems Inc. | | 86,669 | 6,747 |
| * | GrafTech International Ltd. | | 437,864 | 6,437 |
| * | URS Corp. | | 137,500 | 6,002 |
| | Dun & Bradstreet Corp. | | 76,799 | 5,785 |
| | Knoll Inc. | | 537,404 | 5,605 |
| | Triumph Group Inc. | | 114,783 | 5,508 |
| | GATX Corp. | | 186,635 | 5,216 |
| | Robbins & Myers Inc. | | 220,800 | 5,184 |
| * | Force Protection Inc. | | 866,200 | 4,729 |
| | Briggs & Stratton Corp. | | 240,243 | 4,663 |
| | Bucyrus International Inc. | | | |
| | Class A | | 129,200 | 4,602 |
| * | Iron Mountain Inc. | | 161,572 | 4,308 |
| | Cubic Corp. | | 103,133 | 4,071 |
| | Stanley Works | | 93,300 | 3,983 |
| | Carlisle Cos. Inc. | | 107,900 | 3,659 |
| * | ATC Technology Corp. | | 180,700 | 3,571 |
| *,^ | Allegiant Travel Co. Class A | | 85,973 | 3,275 |
| | Trinity Industries Inc. | | 185,234 | 3,184 |
| * | School Specialty Inc. | | 130,688 | 3,100 |
| | SPX Corp. | | 50,300 | 3,082 |
| * | Esterline Technologies Corp. | 77,150 | 3,025 |
| * | Beacon Roofing Supply Inc. | | 189,210 | 3,024 |
| | Werner Enterprises Inc. | | 157,437 | 2,933 |
| | Apogee Enterprises Inc. | | 179,676 | 2,699 |
| * | Hawaiian Holdings Inc. | | 303,725 | 2,509 |
| * | Marten Transport Ltd. | | 143,274 | 2,444 |
| * | EnerSys | | 106,157 | 2,348 |
| | Textainer Group | | | |
| | Holdings Ltd. | | 143,576 | 2,299 |
| | AAON Inc. | | 112,465 | 2,258 |
| | Lincoln Electric Holdings Inc. | 47,536 | 2,256* |
| | Powell Industries Inc. | | 58,727 | 2,255 |
| | | |
| | | | Market |
| | | | Value• |
| | | Shares | ($000) |
| * | Chart Industries Inc. | 99,400 | 2,146 |
| * | Kirby Corp. | 53,600 | 1,974 |
| | Federal Signal Corp. | 269,706 | 1,939 |
| * | DynCorp International Inc. | | |
| | Class A | 105,941 | 1,907 |
| * | Cornell Cos. Inc. | 84,716 | 1,901 |
| | Granite Construction Inc. | 59,277 | 1,834 |
| | ABM Industries Inc. | 84,942 | 1,787 |
| | Kaman Corp. | 81,141 | 1,784 |
| | Encore Wire Corp. | 75,707 | 1,691 |
| | Universal Forest | | |
| | Products Inc. | 42,200 | 1,665 |
| * | CBIZ Inc. | 215,186 | 1,605 |
| * | Pike Electric Corp. | 124,699 | 1,494 |
| * | First Advantage Corp. | | |
| | Class A | 74,600 | 1,384 |
| | AO Smith Corp. | 35,700 | 1,360 |
| * | EnPro Industries Inc. | 55,402 | 1,267 |
| | John Bean | | |
| | Technologies Corp. | 67,077 | 1,219 |
| | TAL International Group Inc. | 82,400 | 1,172 |
| | American Science & | | |
| | Engineering Inc. | 17,200 | 1,170 |
| * | Blount International Inc. | 118,582 | 1,123 |
| * | Airtran Holdings Inc. | 178,800 | 1,118 |
| * | Thomas & Betts Corp. | 33,500 | 1,008 |
| | Interface Inc. Class A | 119,445 | 991 |
| | Standard Register Co. | 151,253 | 889 |
| | RR Donnelley & Sons Co. | 41,800 | 889 |
| | Mcgrath Rentcorp | 37,600 | 800 |
| * | American Reprographics Co. | 82,000 | 781 |
| * | Alaska Air Group Inc. | 27,765 | 744 |
| * | General Cable Corp. | 18,600 | 728 |
| * | Orion Marine Group Inc. | 35,300 | 725 |
| * | Navistar International Corp. | 18,900 | 707 |
| * | Waste Services Inc. | 144,201 | 666 |
| * | AZZ Inc. | 15,000 | 603 |
| * | GenCorp Inc. | 110,600 | 593 |
| | Applied Signal | | |
| | Technology Inc. | 24,254 | 564 |
| | Tredegar Corp. | 36,320 | 527 |
| * | Avis Budget Group Inc. | 39,400 | 526 |
| * | Geo Group Inc. | 24,600 | 496 |
| * | M&F Worldwide Corp. | 24,500 | 496 |
| | Kimball International Inc. | | |
| | Class B | 62,690 | 478 |
| * | WESCO International Inc. | 16,200 | 467 |
| | CIRCOR International Inc. | 16,128 | 456 |
| | Brink’s Co. | 16,288 | 438 |
| * | Armstrong World | | |
| | Industries Inc. | 12,400 | 427 |
| * | Exponent Inc. | 14,527 | 409 |
| | Ennis Inc. | 25,300 | 408 |
| * | Sterling Construction Co. Inc. | 21,480 | 385 |
| * | Michael Baker Corp. | 10,342 | 376 |
17
| | | |
| Strategic Equity Fund | | |
| |
| |
| |
| | | | Market |
| | | | Value• |
| | | Shares | ($000) |
| * | APAC Customer | | |
| | Services Inc. | 62,710 | 371 |
| * | Standard Parking Corp. | 21,068 | 369 |
| * | MasTec Inc. | 30,300 | 368 |
| * | Republic Airways | | |
| | Holdings Inc. | 34,310 | 320 |
| | Macquarie Infrastructure | | |
| | Co. LLC | 32,200 | 290 |
| | Lennox International Inc. | 7,204 | 260 |
| * | Owens Corning | 11,500 | 258 |
| | Deluxe Corp. | 12,513 | 214 |
| | Aceto Corp. | 26,100 | 172 |
| | Toro Co. | 4,100 | 163 |
| | Timken Co. | 6,931 | 162 |
| | Lawson Products Inc. | 8,632 | 150 |
| | Great Lakes Dredge & | | |
| | Dock Corp. | 21,300 | 149 |
| * | Metalico Inc. | 32,238 | 134 |
| | Raven Industries Inc. | 4,902 | 131 |
| | Ampco-Pittsburgh Corp. | 4,374 | 116 |
| * | Colfax Corp. | 8,679 | 92 |
| * | Builders FirstSource Inc. | 13,836 | 60 |
| | | | 475,979 |
| Information Technology (17.8%) | |
| * | Marvell Technology | | |
| | Group Ltd. | 2,467,819 | 39,954 |
| * | Western Digital Corp. | 1,083,400 | 39,577 |
| * | Sybase Inc. | 853,585 | 33,204 |
| * | Hewitt Associates Inc. | | |
| | Class A | 875,623 | 31,899 |
| | Xilinx Inc. | 1,334,812 | 31,261 |
| * | Skyworks Solutions Inc. | 2,356,616 | 31,202 |
| * | Computer Sciences Corp. | 589,692 | 31,083 |
| * | Sohu.com Inc. | 444,186 | 30,551 |
| * | Avnet Inc. | 1,159,500 | 30,112 |
| | Earthlink Inc. | 2,426,105 | 20,404 |
| * | Dolby Laboratories Inc. | | |
| | Class A | 493,400 | 18,843 |
| * | CSG Systems | | |
| | International Inc. | 1,122,136 | 17,965 |
| * | QLogic Corp. | 994,628 | 17,108 |
| * | ON Semiconductor Corp. | 1,916,994 | 15,815 |
| *,^ | Alliance Data Systems Corp. | 240,981 | 14,719 |
| * | Plexus Corp. | 556,466 | 14,657 |
| * | Anixter International Inc. | 298,868 | 11,988 |
| * | Mantech International Corp. | |
| | Class A | 232,680 | 10,973 |
| * | JDA Software Group Inc. | 459,275 | 10,076 |
| * | PMC - Sierra Inc. | 1,051,825 | 10,055 |
| * | Multi-Fineline | | |
| | Electronix Inc. | 347,697 | 9,982 |
| | Solera Holdings Inc. | 297,880 | 9,267 |
| * | LSI Corp. | 1,503,400 | 8,254 |
| * | RF Micro Devices Inc. | 1,376,200 | 7,473 |
| * | NCR Corp. | 497,362 | 6,874 |
| * | Teradata Corp. | 201,302 | 5,540 |
| | | |
| | | | Market |
| | | | Value• |
| | | Shares | ($000) |
| * | SAIC Inc. | 310,700 | 5,450 |
| | Syntel Inc. | 108,723 | 5,189 |
| * | SYNNEX Corp. | 166,974 | 5,089 |
| * | Starent Networks Corp. | 199,192 | 5,063 |
| * | TNS Inc. | 180,300 | 4,940 |
| * | S1 Corp. | 721,980 | 4,462 |
| | Shares | Market | |
| | Diebold Inc. | 129,861 | 4,276 |
| * | TIBCO Software Inc.�� | 386,069 | 3,664 |
| * | Synopsys Inc. | 140,470 | 3,149 |
| * | Lawson Software Inc. | 494,813 | 3,088 |
| | iGate Corp. | 356,314 | 3,057 |
| *,^ | STEC Inc. | 103,879 | 3,053 |
| * | j2 Global | | |
| | Communications Inc. | 131,165 | 3,018 |
| * | Acxiom Corp. | 313,696 | 2,968 |
| * | Genpact Ltd. | 240,157 | 2,954 |
| * | Netscout Systems Inc. | 208,405 | 2,816 |
| | Broadridge Financial | | |
| | Solutions Inc. | 138,779 | 2,789 |
| * | Gartner Inc. | 145,300 | 2,655 |
| | Black Box Corp. | 105,541 | 2,648 |
| | Adtran Inc. | 105,200 | 2,583 |
| * | 3Com Corp. | 488,900 | 2,557 |
| * | Semtech Corp. | 130,513 | 2,220 |
| * | Cogent Inc. | 215,974 | 2,181 |
| * | Micron Technology Inc. | 258,900 | 2,123 |
| * | Affiliated Computer | | |
| | Services Inc. Class A | 33,000 | 1,788 |
| * | BMC Software Inc. | 44,200 | 1,659 |
| * | Sapient Corp. | 197,761 | 1,590 |
| * | Tessera Technologies Inc. | 54,189 | 1,511 |
| * | Tech Data Corp. | 36,000 | 1,498 |
| | CTS Corp. | 157,015 | 1,460 |
| * | NCI Inc. Class A | 47,906 | 1,373 |
| *,^ | Synaptics Inc. | 48,400 | 1,220 |
| * | Scansource Inc. | 43,000 | 1,218 |
| * | SPSS Inc. | 24,116 | 1,205 |
| * | VistaPrint NV | 23,700 | 1,203 |
| * | Netlogic Microsystems Inc. | 23,657 | 1,065 |
| * | Hittite Microwave Corp. | 27,603 | 1,015 |
| * | Ingram Micro Inc. | 60,200 | 1,014 |
| | Linear Technology Corp. | 36,500 | 1,008 |
| | Pegasystems Inc. | 29,100 | 1,005 |
| * | OSI Systems Inc. | 52,695 | 964 |
| * | Cirrus Logic Inc. | 172,296 | 958 |
| * | BigBand Networks Inc. | 227,042 | 910 |
| * | Art Technology Group Inc. | 232,200 | 896 |
| * | Global Cash Access | | |
| | Holdings Inc. | 122,600 | 896 |
| * | Wright Express Corp. | 30,000 | 885 |
| * | DTS Inc. | 29,200 | 799 |
| * | Arris Group Inc. | 61,400 | 799 |
| * | Benchmark Electronics Inc. | 42,908 | 772 |
| * | Tekelec | 43,200 | 710 |
| | MAXIMUS Inc. | 14,700 | 685 |
18
| | | |
| Strategic Equity Fund | | |
| |
| |
| |
| | | | Market |
| | | | Value• |
| | | Shares | ($000) |
| * | Ariba Inc. | 58,100 | 674 |
| * | Avocent Corp. | 29,551 | 599 |
| * | Kopin Corp. | 122,122 | 586 |
| * | Monotype Imaging | | |
| | Holdings Inc. | 59,800 | 503 |
| * | Polycom Inc. | 18,500 | 495 |
| * | InterDigital Inc. | 20,700 | 479 |
| | Lender Processing | | |
| | Services Inc. | 12,200 | 466 |
| * | Compuware Corp. | 62,500 | 458 |
| * | NeuStar Inc. Class A | 19,600 | 443 |
| * | Ebix Inc. | 8,000 | 443 |
| * | Applied Micro Circuits Corp. | 33,700 | 337 |
| * | TeleTech Holdings Inc. | 17,500 | 299 |
| * | Riverbed Technology Inc. | 12,600 | 277 |
| * | Interactive Intelligence Inc. | 14,200 | 271 |
| * | Insight Enterprises Inc. | 18,200 | 222 |
| * | Unisys Corp. | 81,700 | 218 |
| * | Loral Space & | | |
| | Communications Inc. | 7,800 | 214 |
| * | Volterra Semiconductor Corp. | 11,500 | 211 |
| * | Quantum Corp. | 165,200 | 208 |
| * | Blue Coat Systems Inc. | 9,000 | 203 |
| * | Acme Packet Inc. | 20,104 | 201 |
| * | TriQuint Semiconductor Inc. | 24,100 | 186 |
| * | Conexant Systems Inc. | 66,800 | 183 |
| * | Manhattan Associates Inc. | 8,100 | 164 |
| * | CACI International Inc. | | |
| | Class A | 3,300 | 156 |
| * | Smith Micro Software Inc. | 11,907 | 147 |
| * | SonicWALL Inc. | 17,100 | 144 |
| * | Ciber Inc. | 35,486 | 142 |
| * | Aruba Networks Inc. | 15,800 | 140 |
| * | Euronet Worldwide Inc. | 2,855 | 69 |
| * | Brightpoint Inc. | 6,011 | 53 |
| | | | 630,125 |
| Materials (6.6%) | | |
| * | Owens-Illinois Inc. | 977,000 | 36,051 |
| | Eastman Chemical Co. | 594,728 | 31,842 |
| | Celanese Corp. Class A | 1,202,100 | 30,052 |
| | Greif Inc. Class A | 447,400 | 24,629 |
| | FMC Corp. | 264,741 | 14,892 |
| | Rock-Tenn Co. Class A | 233,458 | 10,998 |
| | Compass Minerals | | |
| | International Inc. | 174,275 | 10,739 |
| | Schnitzer Steel | | |
| | Industries Inc. | 153,000 | 8,147 |
| | Silgan Holdings Inc. | 131,186 | 6,917 |
| * | Pactiv Corp. | 247,618 | 6,450 |
| | Glatfelter | 551,883 | 6,336 |
| | Terra Industries Inc. | 164,199 | 5,693 |
| | Koppers Holdings Inc. | 171,338 | 5,080 |
| | Walter Energy Inc. | 83,400 | 5,009 |
| | Schweitzer-Mauduit | | |
| | International Inc. | 84,639 | 4,601 |
| | Ball Corp. | 85,000 | 4,182 |
| | | | |
| | | | | Market |
| | | | | Value• |
| | | | Shares | ($000) |
| | Innophos Holdings Inc. | | 201,584�� | 3,729 |
| * | Crown Holdings Inc. | | 112,200 | 3,052 |
| | NewMarket Corp. | | 32,722 | 3,044 |
| * | Buckeye Technologies Inc. | | 240,158 | 2,577 |
| | CF Industries Holdings Inc. | | 28,007 | 2,415 |
| | Stepan Co. | | 28,538 | 1,715 |
| | A Schulman Inc. | | 75,709 | 1,509 |
| * | Clearwater Paper Corp. | | 32,271 | 1,334 |
| | Bemis Co. Inc. | | 41,900 | 1,086 |
| | Sonoco Products Co. | | 36,603 | 1,008 |
| * | Graphic Packaging | | | |
| | Holding Co. | | 248,729 | 575 |
| | Sensient Technologies Corp. | 19,272 | 535 |
| * | Bway Holding Co. | | 26,368 | 488 |
| * | LSB Industries Inc. | | 15,600 | 243 |
| | | | | 234,928 |
| Telecommunication Services (1.2%) | |
| * | Syniverse Holdings Inc. | 1,166,403 | 20,412 |
| * | Cincinnati Bell Inc. | 3,873,500 | 13,557 |
| | Windstream Corp. | | 306,200 | 3,102 |
| | NTELOS Holdings Corp. | | 152,027 | 2,685 |
| | USA Mobility Inc. | | 105,215 | 1,355 |
| * | Premiere Global | | | |
| | Services Inc. | | 148,562 | 1,235 |
| | Consolidated | | | |
| | Communications | | | |
| | Holdings Inc. | | 34,800 | 557 |
| * | Centennial | | | |
| | Communications Corp. | | 69,400 | 554 |
| * | iPCS Inc. | | 14,100 | 245 |
| * | Neutral Tandem Inc. | | 9,300 | 212 |
| | | | | 43,914 |
| Utilities (4.9%) | | | |
| * | NRG Energy Inc. | 1,337,100 | 37,693 |
| | CMS Energy Corp. | 2,023,269 | 27,112 |
| | Centerpoint Energy Inc. | 2,014,308 | 25,038 |
| | SCANA Corp. | | 488,356 | 17,044 |
| * | Mirant Corp. | | 793,452 | 13,036 |
| | Atmos Energy Corp. | | 355,211 | 10,010 |
| | UGI Corp. | | 236,700 | 5,932 |
| | DPL Inc. | | 174,900 | 4,565 |
| | NSTAR | | 136,155 | 4,332 |
| | IDACORP Inc. | | 144,444 | 4,159 |
| | AGL Resources Inc. | | 114,790 | 4,049 |
| | NorthWestern Corp. | | 133,497 | 3,261 |
| | Avista Corp. | | 151,929 | 3,072 |
| | WGL Holdings Inc. | | 82,603 | 2,737 |
| | NiSource Inc. | | 131,300 | 1,824 |
| | PNM Resources Inc. | | 151,735 | 1,772 |
| | Vectren Corp. | | 76,367 | 1,759 |
| | Unisource Energy Corp. | | 31,800 | 978 |
| | Southwest Gas Corp. | | 37,400 | 957 |
| | New Jersey Resources Corp. | 22,000 | 799 |
| | CH Energy Group Inc. | | 13,300 | 589 |
| * | El Paso Electric Co. | | 29,100 | 514 |
| | South Jersey Industries Inc. | 13,890 | 490 |
19
| | | |
| Strategic Equity Fund | | |
| |
| |
| | | | Market |
| | | | Value• |
| | | Shares | ($000) |
| | Central Vermont Public | | |
| | Service Corp. | 6,900 | 133 |
| | Chesapeake Utilities Corp. | 3,800 | 118 |
| | | | 171,973 |
| Total Common Stocks | | |
| (Cost $3,292,283) | | 3,530,407 |
| Temporary Cash Investments (1.2%)1 | |
| Money Market Fund (1.0%) | | |
| 2,3 | Vanguard Market Liquidity | | |
| | Fund, 0.267% | 36,073,853 | 36,074 |
| |
| | | Face | |
| | | Amount | |
| | | ($000) | |
| U.S. Government and Agency Obligations (0.2%) |
| 4,5 | Freddie Mac Discount Notes, | |
| | 0.351% 11/23/09 | 2,000 | 2,000 |
| 4,5 | Freddie Mac Discount Notes, | |
| | 0.260% 2/22/10 | 4,000 | 3,997 |
| | | | 5,997 |
| Total Temporary Cash Investments | |
| (Cost $42,069) | | 42,071 |
| Total Investments (100.7%) | | |
| (Cost $3,334,352) | | 3,572,478 |
| Other Assets and Liabilities (–0.7%) | |
| Other Assets | | 90,425 |
| Liabilities3 | | (114,169) |
| | | | (23,744) |
| Net Assets (100%) | | |
| Applicable to 244,480,810 outstanding | |
| $.001 par value shares of beneficial | |
| interest (unlimited authorization) | 3,548,734 |
| Net Asset Value Per Share | | $14.52 |
| |
| At September 30, 2009, net assets consisted of: |
| | Amount |
| | ($000) |
| Paid-in Capital | 5,233,220 |
| Undistributed Net Investment Income | 17,851 |
| Accumulated Net Realized Losses | (1,940,388) |
| Unrealized Appreciation (Depreciation) | |
| Investment Securities | 238,126 |
| Futures Contracts | (75) |
| Net Assets | 3,548,734 |
• See Note A in Notes to Financial Statements. * Non-income-producing security.
^ Part of security position is on loan to broker-dealers. The total value of securities on loan is $14,307,000.
1 The fund invests a portion of its cash reserves in equity markets through the use of index futures contracts. After giving effect to futures investments, the fund’s effective common stock and temporary cash investment positions represent 100.0% and 0.7%, respectively, of net assets.
2 Affiliated money market fund available only to Vanguard funds and certain trusts and accounts managed by Vanguard. Rate shown is the 7-day yield.
3 Includes $14,993,000 of collateral received for securities on loan.
4 The issuer operates under a congressional charter; its securities are not backed by the full faith and credit of the U.S. government. 5 Securities with a value of $5,997,000 have been segregated as initial margin for open futures contracts.
REIT–Real Estate Investment Trust.
See accompanying Notes, which are an integral part of the Financial Statements.
20
| |
| Strategic Equity Fund | |
| |
| |
| Statement of Operations | |
| |
| | Year Ended |
| | September 30, 2009 |
| | ($000) |
| Investment Income | |
| Income | |
| Dividends1 | 50,755 |
| Interest1 | 4,778 |
| Security Lending | 1,706 |
| Total Income | 57,239 |
| Expenses | |
| The Vanguard Group—Note B | |
| Investment Advisory Services | 683 |
| Management and Administrative | 7,436 |
| Marketing and Distribution | 1,026 |
| Custodian Fees | 99 |
| Auditing Fees | 24 |
| Shareholders’ Reports and Proxies | 373 |
| Trustees’ Fees and Expenses | 8 |
| Total Expenses | 9,649 |
| Net Investment Income | 47,590 |
| Realized Net Gain (Loss) | |
| Investment Securities Sold1 | (1,457,352) |
| Futures Contracts | (112,066) |
| Realized Net Gain (Loss) | (1,569,418) |
| Change in Unrealized Appreciation (Depreciation) | |
| Investment Securities | 921,718 |
| Futures Contracts | 821 |
| Change in Unrealized Appreciation (Depreciation) | 922,539 |
| Net Increase (Decrease) in Net Assets Resulting from Operations | (599,289) |
1 Dividend income, interest income, and realized net gain (loss) from affiliated companies of the fund were $0, $619,000, and ($21,261,000), respectively.
See accompanying Notes, which are an integral part of the Financial Statements.
21
| | |
| Strategic Equity Fund | | |
| |
| |
| Statement of Changes in Net Assets | | |
| |
| | Year Ended September 30, |
| | 2009 | 2008 |
| | ($000) | ($000) |
| Increase (Decrease) in Net Assets | | |
| Operations | | |
| Net Investment Income | 47,590 | 65,953 |
| Realized Net Gain (Loss) | (1,569,418) | (331,389) |
| Change in Unrealized Appreciation (Depreciation) | 922,539 | (1,492,805) |
| Net Increase (Decrease) in Net Assets Resulting from Operations | (599,289) | (1,758,241) |
| Distributions | | |
| Net Investment Income | (67,840) | (69,137) |
| Realized Capital Gain1 | — | (700,017) |
| Total Distributions | (67,840) | (769,154) |
| Capital Share Transactions | | |
| Issued | 436,608 | 774,976 |
| Issued in Lieu of Cash Distributions | 63,748 | 726,971 |
| Redeemed | (1,106,155) | (1,851,818) |
| Net Increase (Decrease) from Capital Share Transactions | (605,799) | (349,871) |
| Total Increase (Decrease) | (1,272,928) | (2,877,266) |
| Net Assets | | |
| Beginning of Period | 4,821,662 | 7,698,928 |
| End of Period2 | 3,548,734 | 4,821,662 |
1 Includes fiscal 2008 short-term gain distributions totaling $83,541,000. Short-term gain distributions are treated as ordinary income dividends for tax purposes.
2 Net Assets—End of Period includes undistributed net investment income of $17,851,000 and $38,101,000.
See accompanying Notes, which are an integral part of the Financial Statements.
22
| | | | | |
| Strategic Equity Fund | | | | | |
| |
| |
| Financial Highlights | | | | | |
| |
| |
| For a Share Outstanding | | | Year Ended September 30, |
| Throughout Each Period | 2009 | 2008 | 2007 | 2006 | 2005 |
| Net Asset Value, Beginning of Period | $16.42 | $24.94 | $23.07 | $23.28 | $19.70 |
| Investment Operations | | | | | |
| Net Investment Income | .184 | .240 | .270 | .270 | .190 |
| Net Realized and Unrealized Gain (Loss) | | | | | |
| on Investments | (1.843) | (6.090) | 2.840 | 1.170 | 4.490 |
| Total from Investment Operations | (1.659) | (5.850) | 3.110 | 1.440 | 4.680 |
| Distributions | | | | | |
| Dividends from Net Investment Income | (.241) | (.240) | (.260) | (.210) | (.140) |
| Distributions from Realized Capital Gains | — | (2.430) | (.980) | (1.440) | (.960) |
| Total Distributions | (.241) | (2.670) | (1.240) | (1.650) | (1.100) |
| Net Asset Value, End of Period | $14.52 | $16.42 | $24.94 | $23.07 | $23.28 |
| |
| Total Return1 | –9.66% | –25.37% | 13.76% | 6.49% | 24.32% |
| |
| Ratios/Supplemental Data | | | | | |
| Net Assets, End of Period (Millions) | $3,549 | $4,822 | $7,699 | $6,755 | $5,183 |
| Ratio of Total Expenses to | | | | | |
| Average Net Assets | 0.30% | 0.25% | 0.30% | 0.35% | 0.40% |
| Ratio of Net Investment Income to | | | | | |
| Average Net Assets | 1.47% | 1.09% | 1.03% | 1.18% | 0.99% |
| Portfolio Turnover Rate | 60% | 79% | 75% | 80% | 75% |
| 1 Total returns do not include the account service fee that may be applicable to certain accounts with balances below $10,000. | |
See accompanying Notes, which are an integral part of the Financial Statements.
23
Strategic Equity Fund
Notes to Financial Statements
Vanguard Strategic Equity Fund is registered under the Investment Company Act of 1940 as an open-end investment company, or mutual fund.
A. The following significant accounting policies conform to generally accepted accounting principles for U.S. mutual funds. The fund consistently follows such policies in preparing its financial statements.
1. Security Valuation: Securities are valued as of the close of trading on the New York Stock Exchange (generally 4 p.m., Eastern time) on the valuation date. Equity securities are valued at the latest quoted sales prices or official closing prices taken from the primary market in which each security trades; such securities not traded on the valuation date are valued at the mean of the latest quoted bid and asked prices. Securities for which market quotations are not readily available, or whose values have been materially affected by events occurring before the fund’s pricing time but after the close of the securities’ primary markets, are valued by methods deemed by the board of trustees to represent fair value. Investments in Vanguard Market Liquidity Fund are valued at that fund’s net asset value. Temporary cash investments acquired over 60 days to maturity are valued using the latest bid prices or using valuations based on a matrix system (which considers such factors as security prices, yields, maturities, and ratings), both as furnished by independent pricing services. Other temporary cash investments are valued at amortized cost, which approximates market value.
2. Futures Contracts: The fund uses index futures contracts to a limited extent, with the objective of maintaining full exposure to the stock market while maintaining liquidity. The fund may purchase or sell futures contracts to achieve a desired level of investment, whether to accommodate portfolio turnover or cash flows from capital share transactions. The primary risks associated with the use of futures contracts are imperfect correlation between changes in market values of stocks held by the fund and the prices of futures contracts, and the possibility of an illiquid market.
Futures contracts are valued at their quoted daily settlement prices. The aggregate principal amounts of the contracts are not recorded in the Statement of Net Assets. Fluctuations in the value of the contracts are recorded in the Statement of Net Assets as an asset (liability) and in the Statement of Operations as unrealized appreciation (depreciation) until the contracts are closed, when they are recorded as realized futures gains (losses).
3. Federal Income Taxes: The fund intends to continue to qualify as a regulated investment company and distribute all of its taxable income. Management has analyzed the fund’s tax positions taken for all open federal income tax years (September 30, 2006–2009), and has concluded that no provision for federal income tax is required in the fund’s financial statements.
4. Distributions: Distributions to shareholders are recorded on the ex-dividend date.
5. Security Lending: The fund may lend its securities to qualified institutional borrowers to earn additional income. Security loans are required to be secured at all times by collateral at least equal to the market value of securities loaned. The fund invests cash collateral received in Vanguard Market Liquidity Fund, and records a liability for the return of the collateral, during the period the securities are on loan. Security lending income represents the income earned on investing cash collateral, less expenses associated with the loan.
6. Other: Dividend income is recorded on the ex-dividend date. Interest income includes income distributions received from Vanguard Market Liquidity Fund and is accrued daily. Security transactions are accounted for on the date securities are bought or sold. Costs used to determine realized gains (losses) on the sale of investment securities are those of the specific securities sold.
24
Strategic Equity Fund
B. The Vanguard Group furnishes at cost investment advisory, corporate management, administrative, marketing, and distribution services. The costs of such services are allocated to the fund under methods approved by the board of trustees. The fund has committed to provide up to 0.40% of its net assets in capital contributions to Vanguard. At September 30, 2009, the fund had contributed capital of $755,000 to Vanguard (included in Other Assets), representing 0.02% of the fund’s net assets and 0.30% of Vanguard’s capitalization. The fund’s trustees and officers are also directors and officers of Vanguard.
C. Various inputs may be used to determine the value of the fund’s investments. These inputs are summarized in three broad levels for financial statement purposes. The inputs or methodologies used to value securities are not necessarily an indication of the risk associated with investing in those securities.
Level 1—Quoted prices in active markets for identical securities.
Level 2—Other significant observable inputs (including quoted prices for similar securities, interest rates, prepayment speeds, credit risk, etc.).
Level 3—Significant unobservable inputs (including the fund’s own assumptions used to determine the fair value of investments).
The following table summarizes the fund’s investments as of September 30, 2009, based on the inputs used to value them:
| | | |
| | Level 1 | Level 2 | Level 3 |
| Investments | ($000) | ($000) | ($000) |
| Common Stocks | 3,530,407 | — | — |
| Temporary Cash Investments | 36,074 | 5,997 | — |
| Futures Contracts—Assets1 | 518 | — | — |
| Futures Contracts—Liabilities1 | (714) | — | — |
| Total | 3,566,285 | 5,997 | — |
| 1 Represents variation margin on the last day of the reporting period. | | | |
D. At September 30, 2009, the aggregate settlement value of open futures contracts and the related unrealized appreciation (depreciation) were:
| | | | |
| | | | | ($000) |
| | | Number of | Aggregate | Unrealized |
| | | Long (Short) | Settlement | Appreciation |
| Futures Contracts | Expiration | Contracts | Value | (Depreciation) |
| E-mini Russell 2000 Index | December 2009 | 176 | 10,613 | (146) |
| S&P MidCap 400 Index | December 2009 | 13 | 4,480 | 43 |
| E-mini S&P MidCap Index | December 2009 | 30 | 2,068 | 28 |
Unrealized appreciation (depreciation) on open futures contracts is required to be treated as realized gain (loss) for tax purposes.
25
Strategic Equity Fund
E. Distributions are determined on a tax basis and may differ from net investment income and realized capital gains for financial reporting purposes. Differences may be permanent or temporary. Permanent differences are reclassified among capital accounts in the financial statements to reflect their tax character. Temporary differences arise when certain items of income, expense, gain, or loss are recognized in different periods for financial statement and tax purposes; these differences will reverse at some time in the future. Differences in classification may also result from the treatment of short-term gains as ordinary income for tax purposes.
For tax purposes, at September 30, 2009, the fund had $27,713,000 of ordinary income available for distribution. The fund had available capital loss carryforwards totaling $755,793,000 to offset future net capital gains through September 30, 2017. In addition, the fund realized losses of $1,184,670,000 during the period from November 1, 2008, through September 30, 2009, which are deferred and will be treated as realized for tax purposes in fiscal 2010.
At September 30, 2009, the cost of investment securities for tax purposes was $3,334,352,000. Net unrealized appreciation of investment securities for tax purposes was $238,126,000, consisting of unrealized gains of $483,855,000 on securities that had risen in value since their purchase and $245,729,000 in unrealized losses on securities that had fallen in value since their purchase.
F. During the year ended September 30, 2009, the fund purchased $1,932,454,000 of investment securities and sold $2,653,609,000 of investment securities, other than temporary cash investments.
G. Capital shares issued and redeemed were:
| | |
| | Year Ended September 30, |
| | 2009 | 2008 |
| | Shares | Shares |
| | (000) | (000) |
| Issued | 37,584 | 39,124 |
| Issued in Lieu of Cash Distributions | 5,712 | 36,367 |
| Redeemed | (92,503) | (90,470) |
| Net Increase (Decrease) in Shares Outstanding | (49,207) | (14,979) |
H. The fund invested in a company that was considered to be an affiliated company of the fund because the fund owned more than 5% of the outstanding voting securities of the company. Transactions during the period in securities of this company were as follows:
| | | | | |
| | | | Current Period Transactions | |
| | Sept. 30, 2008 | | Proceeds from | | Sept. 30, 2009 |
| | Market | Purchases | Securities | Dividend | Market |
| | Value | at Cost | Sold | Income | Value |
| | ($000) | ($000) | ($000) | ($000) | ($000) |
| TBS International Ltd. | NA1 | 2,487 | 13,742 | — | — |
| 1 Not applicable—At September 30, 2008, the issuer was not an affiliated company of the fund. | | |
I. In preparing the financial statements as of September 30, 2009, management considered the impact of subsequent events occurring through November 10, 2009, for potential recognition or disclosure in these financial statements.
26
Report of Independent Registered Public Accounting Firm
To the Trustees of Vanguard Horizon Funds and the Shareholders of Vanguard Strategic Equity Fund:
In our opinion, the accompanying statement of net assets and the related statements of operations and of changes in net assets and the financial highlights present fairly, in all material respects, the financial position of Vanguard Strategic Equity Fund (the “Fund”) at September 30, 2009, the results of its operations for the year then ended, the changes in its net assets for each of the two years in the period then ended and the financial highlights for each of the five years in the period then ended, in conformity with accounting principles generally accepted in the United States of America. These financial statements and financial highlights (hereafter referred to as “financial statements”) are the responsibility of the Fund’s management; our responsibility is to express an opinion on these financial statements based on our audits. We conducted our audits of these financial statements in accord ance with the standards of the Public Company Accounting Oversight Board (United States). Those standards require that we plan and perform the audit to obtain reasonable assurance about whether the financial statements are free of material misstatement. An audit includes examining, on a test basis, evidence supporting the amounts and disclosures in the financial statements, assessing the accounting principles used and significant estimates made by management, and evaluating the overall financial statement presentation. We believe that our audits, which included confirmation of securities at September 30, 2009 by correspondence with the custodian and broker, and by agreement to the underlying ownership records for Vanguard Market Liquidity Fund, provide a reasonable basis for our opinion.
PricewaterhouseCoopers LLP
Philadelphia, Pennsylvania
November 10, 2009
|
| Special 2009 tax information (unaudited) for Vanguard Strategic Equity Fund |
This information for the fiscal year ended September 30, 2009, is included pursuant to provisions of the Internal Revenue Code.
The fund distributed $57,847,000 of qualified dividend income to shareholders during the fiscal year.
For corporate shareholders, 88.4% of investment income (dividend income plus short-term gains, if any) qualifies for the dividends-received deduction.
27
Your Fund’s After-Tax Returns
This table presents returns for your fund both before and after taxes. The after-tax returns are shown in two ways: (1) assuming that an investor owned the fund during the entire period and paid taxes on the fund’s distributions, and (2) assuming that an investor paid taxes on the fund’s distributions and sold all shares at the end of each period.
Calculations are based on the highest individual federal income tax and capital gains tax rates in effect at the times of the distributions and the hypothetical sales. State and local taxes were not considered. After-tax returns reflect any qualified dividend income, using actual prior-year figures and estimates for 2009. (In the example, returns after the sale of fund shares may be higher than those assuming no sale. This occurs when the sale would have produced a capital loss. The calculation assumes that the investor received a tax deduction for the loss.)
Please note that your actual after-tax returns will depend on your tax situation and may differ from those shown. Also note that if you own the fund in a tax-deferred account, such as an individual retirement account or a 401(k) plan, this information does not apply to you. Such accounts are not subject to current taxes.
Finally, keep in mind that a fund’s performance—whether before or after taxes—does not guarantee future results.
| | | |
| Average Annual Total Returns: Strategic Equity Fund1 | | | |
| Periods Ended September 30, 2009 | | | |
| | One | Five | Ten |
| | Year | Years | Years |
| Returns Before Taxes | –9.66% | 0.31% | 5.69% |
| Returns After Taxes on Distributions | –10.00 | –0.81 | 4.27 |
| Returns After Taxes on Distributions and Sale of Fund Shares | –6.08 | 0.26 | 4.45 |
| 1 Total returns do not include the account service fee that may be applicable to certain accounts with balances below $10,000. | |
28
About Your Fund’s Expenses
As a shareholder of the fund, you incur ongoing costs, which include costs for portfolio management, administrative services, and shareholder reports (like this one), among others. Operating expenses, which are deducted from a fund’s gross income, directly reduce the investment return of the fund.
A fund’s expenses are expressed as a percentage of its average net assets. This figure is known as the expense ratio. The following examples are intended to help you understand the ongoing costs (in dollars) of investing in your fund and to compare these costs with those of other mutual funds. The examples are based on an investment of $1,000 made at the beginning of the period shown and held for the entire period.
The accompanying table illustrates your fund’s costs in two ways:
• Based on actual fund return. This section helps you to estimate the actual expenses that you paid over the period. The “Ending Account Value” shown is derived from the fund’s actual return, and the third column shows the dollar amount that would have been paid by an investor who started with $1,000 in the fund. You may use the information here, together with the amount you invested, to estimate the expenses that you paid over the period.
To do so, simply divide your account value by $1,000 (for example, an $8,600 account value divided by $1,000 = 8.6), then multiply the result by the number given for your fund under the heading “Expenses Paid During Period.”
• Based on hypothetical 5% yearly return. This section is intended to help you compare your fund’s costs with those of other mutual funds. It assumes that the fund had a yearly return of 5% before expenses, but that the expense ratio is unchanged. In this case—because the return used is not the fund’s actual return—the results do not apply to your investment. The example is useful in making comparisons because the Securities and Exchange Commission requires all mutual funds to calculate expenses based on a 5% return. You can assess your fund’s costs by comparing this hypothetical example with the hypothetical examples that appear in shareholder reports of other funds.
| | | |
| Six Months Ended September 30, 2009 | | | |
| | Beginning | Ending | Expenses |
| | Account Value | Account Value | Paid During |
| Strategic Equity Fund | 3/31/2009 | 9/30/2009 | Period1 |
| Based on Actual Fund Return | $1,000.00 | $1,426.33 | $1.76 |
| Based on Hypothetical 5% Yearly Return | 1,000.00 | 1,023.61 | 1.47 |
1 The calculations are based on expenses incurred in the most recent six-month period. The fund’s annualized six-month expense ratios for that period is 0.29%. The dollar amounts shown as “Expenses Paid” are equal to the annualized expense ratio multiplied by the average account value over the period, multiplied by the number of days in the most recent six-month period, then divided by the number of days in the most recent 12-month period.
29
Note that the expenses shown in the table are meant to highlight and help you compare ongoing costs only and do not reflect transaction costs incurred by the fund for buying and selling securities. Further, the expenses do not include the account service fee described in the prospectus. If such a fee were applied to your account, your costs would be higher. Your fund does not charge transaction fees, such as purchase or redemption fees, nor does it carry a “sales load.”
The calculations assume no shares were bought or sold during the period. Your actual costs may have been higher or lower, depending on the amount of your investment and the timing of any purchases or redemptions.
You can find more information about the fund’s expenses, including annual expense ratios, in the Financial Statements section of this report. For additional information on operating expenses and other shareholder costs, please refer to your fund’s current prospectus.
30
Glossary
Beta. A measure of the magnitude of a fund’s past share-price fluctuations in relation to the ups and downs of a given market index. The index is assigned a beta of 1.00. Compared with a given index, a fund with a beta of 1.20 typically would have seen its share price rise or fall by 12% when the index rose or fell by 10%. For this report, beta is based on returns over the past 36 months for both the fund and the index. Note that a fund’s beta should be reviewed in conjunction with its R-squared (see definition). The lower the R-squared, the less correlation there is between the fund and the index, and the less reliable beta is as an indicator of volatility.
Earnings Growth Rate. The average annual rate of growth in earnings over the past five years for the stocks now in a fund.
Equity Exposure. A measure that reflects a fund’s investments in stocks and stock futures. Any holdings in short-term reserves are excluded.
Expense Ratio. The percentage of a fund’s average net assets used to pay its annual administrative and advisory expenses. These expenses directly reduce returns to investors.
Foreign Holdings. The percentage of a fund represented by stocks or depositary receipts of companies based outside the United States.
Inception Date. The date on which the assets of a fund (or one of its share classes) are first invested in accordance with the fund’s investment objective. For funds with a subscription period, the inception date is the day after that period ends. Investment performance is measured from the inception date.
Median Market Cap. An indicator of the size of companies in which a fund invests; the midpoint of market capitalization (market price x shares outstanding) of a fund’s stocks, weighted by the proportion of the fund’s assets invested in each stock. Stocks representing half of the fund’s assets have market capitalizations above the median, and the rest are below it.
Price/Book Ratio. The share price of a stock divided by its net worth, or book value, per share. For a fund, the weighted average price/book ratio of the stocks it holds.
Price/Earnings Ratio. The ratio of a stock’s current price to its per-share earnings over the past year. For a fund, the weighted average P/E of the stocks it holds. P/E is an indicator of market expectations about corporate prospects; the higher the P/E, the greater the expectations for a company’s future growth.
R-Squared. A measure of how much of a fund’s past returns can be explained by the returns from the market in general, as measured by a given index. If a fund’s total returns were precisely synchronized with an index’s returns, its R-squared would be 1.00. If the fund’s returns bore no relationship to the index’s returns, its R-squared would be 0. For this report, R-squared is based on returns over the past 36 months for both the fund and the index.
Return on Equity. The annual average rate of return generated by a company during the past five years for each dollar of shareholder’s equity (net income divided by shareholder’s equity). For a fund, the weighted average return on equity for the companies whose stocks it holds.
Short-Term Reserves. The percentage of a fund invested in highly liquid, short-term securities that can be readily converted to cash.
Turnover Rate. An indication of the fund’s trading activity. Funds with high turnover rates incur higher transaction costs and may be more likely to distribute capital gains (which may be taxable to investors). The turnover rate excludes in-kind transactions, which have minimal impact on costs.
31
Yield. A fund’s 30-day SEC yield is derived using a formula specified by the U.S. Securities and Exchange Commission. Under the formula, data related to the fund’s security holdings in the previous 30 days are used to calculate the fund’s hypothetical net income for that period, which is then annualized and divided by the fund’s estimated average net assets over the calculation period. For the purposes of this calculation, a security’s income is based on its current market yield to maturity (in the case of bonds) or its projected dividend yield (for stocks). Because the SEC yield represents hypothetical annualized income, it will differ—at times significantly—from the fund’s actual experience. As a result, the fund’s income distributions may be higher or lower than implied by the SEC yield.
32
This page intentionally left blank.
This page intentionally left blank.
This page intentionally left blank.
The People Who Govern Your Fund
The trustees of your mutual fund are there to see that the fund is operated and managed in your best interests since, as a shareholder, you are a part owner of the fund. Your fund’s trustees also serve on the board of directors of The Vanguard Group, Inc., which is owned by the Vanguard funds and provides services to them on an at-cost basis.
A majority of Vanguard’s board members are independent, meaning that they have no affiliation with Vanguard or the funds they oversee, apart from the sizable personal investments they have made as private individuals. The independent board members have distinguished backgrounds in business, academia, and public service. Each of the trustees and executive officers oversees 156 Vanguard funds.
The following table provides information for each trustee and executive officer of the fund. More information about the trustees is in the Statement of Additional Information, which can be obtained, without charge, by contacting Vanguard at 800-662-7447, or online at www.vanguard.com.
| |
| Interested Trustees | Emerson U. Fullwood |
| | Born 1948. Trustee Since January 2008. Principal |
| John J. Brennan1 | Occupation(s) During the Past Five Years: Executive |
| Born 1954. Trustee Since May 1987. Chairman of | Chief Staff and Marketing Officer for North America |
| the Board. Principal Occupation(s) During the Past | and Corporate Vice President (retired 2008) of Xerox |
| Five Years: Chairman of the Board and Director/Trustee | Corporation (photocopiers and printers); Director of |
| of The Vanguard Group, Inc., and of each of the | SPX Corporation (multi-industry manufacturing), the |
| investment companies served by The Vanguard Group; | United Way of Rochester, the Boy Scouts of America, |
| Chief Executive Officer (1996–2008) and President | Amerigroup Corporation (direct health and medical |
| (1989–2008) of The Vanguard Group and of each of the | insurance carriers), and Monroe Community College |
| investment companies served by The Vanguard Group; | Foundation. |
| Chairman of the Financial Accounting Foundation; | |
| Governor of the Financial Industry Regulatory Authority | Rajiv L. Gupta |
| (FINRA); Director of United Way of Southeastern | Born 1945. Trustee Since December 2001.2 Principal |
| Pennsylvania. | Occupation(s) During the Past Five Years: Chairman |
| | and Chief Executive Officer (retired 2009) and President |
| F. William McNabb III1 | (2006–2008) of Rohm and Haas Co. (chemicals); Board |
| Born 1957. Trustee Since July 2009. Principal | Member of American Chemistry Council; Director of |
| Occupation(s) During the Past Five Years: Director of | Tyco International, Ltd. (diversified manufacturing and |
| The Vanguard Group, Inc., since 2008; Chief Executive | services) and Hewlett-Packard Co. (electronic computer |
| Officer and President of The Vanguard Group and of | manufacturing); Trustee of The Conference Board. |
| each of the investment companies served by The | |
| Vanguard Group since 2008; Director of Vanguard | Amy Gutmann |
| Marketing Corporation; Managing Director of The | Born 1949. Trustee Since June 2006. Principal |
| Vanguard Group (1995–2008). | Occupation(s) During the Past Five Years: President of |
| | the University of Pennsylvania; Christopher H. Browne |
| | Distinguished Professor of Political Science in the School |
| Independent Trustees | of Arts and Sciences with secondary appointments |
| | at the Annenberg School for Communication and the |
| Charles D. Ellis | Graduate School of Education of the University of |
| Born 1937. Trustee Since January 2001. Principal | Pennsylvania; Director of Carnegie Corporation of |
| Occupation(s) During the Past Five Years: Applecore | New York, Schuylkill River Development Corporation, |
| Partners (pro bono ventures in education); Senior | and Greater Philadelphia Chamber of Commerce; |
| Advisor to Greenwich Associates (international business | Trustee of the National Constitution Center. |
| strategy consulting); Successor Trustee of Yale University; | |
| Overseer of the Stern School of Business at New York | |
| University; Trustee of the Whitehead Institute for | |
| Biomedical Research. | |
| | |
| JoAnn Heffernan Heisen | Executive Officers | |
| Born 1950. Trustee Since July 1998. Principal | | |
| Occupation(s) During the Past Five Years: Corporate | Thomas J. Higgins1 | |
| Vice President and Chief Global Diversity Officer since | Born 1957. Chief Financial Officer Since September |
| 2006 (retired 2008) and Member of the Executive | 2008. Principal Occupation(s) During the Past Five |
| Committee (retired 2008) of Johnson & Johnson | Years: Principal of The Vanguard Group, Inc.; Chief |
| (pharmaceuticals/consumer products); Vice President | Financial Officer of each of the investment companies |
| and Chief Information Officer of Johnson & Johnson | served by The Vanguard Group since 2008; Treasurer |
| (1997–2005); Director of the University Medical Center | of each of the investment companies served by The |
| at Princeton and Women’s Research and Education | Vanguard Group (1998–2008). |
| Institute. | | |
| |
| | Kathryn J. Hyatt1 | |
| André F. Perold | Born 1955. Treasurer Since November 2008. Principal |
| Born 1952. Trustee Since December 2004. Principal | Occupation(s) During the Past Five Years: Principal of |
| Occupation(s) During the Past Five Years: George Gund | The Vanguard Group, Inc.; Treasurer of each of the |
| Professor of Finance and Banking, Harvard Business | investment companies served by The Vanguard |
| School; Chairman of UNX, Inc. (equities trading firm); | Group since 2008; Assistant Treasurer of each of the |
| Chair of the Investment Committee of HighVista | investment companies served by The Vanguard Group |
| Strategies LLC (private investment firm). | (1988–2008). | |
| |
| Alfred M. Rankin, Jr. | Heidi Stam1 | |
| Born 1941. Trustee Since January 1993. Principal | Born 1956. Secretary Since July 2005. Principal |
| Occupation(s) During the Past Five Years: Chairman, | Occupation(s) During the Past Five Years: Managing |
| President, and Chief Executive Officer of NACCO | Director of The Vanguard Group, Inc., since 2006; |
| Industries, Inc. (forklift trucks/housewares/lignite); | General Counsel of The Vanguard Group since 2005; |
| Director of Goodrich Corporation (industrial products/ | Secretary of The Vanguard Group and of each of the |
| aircraft systems and services); Deputy Chairman of | investment companies served by The Vanguard Group |
| the Federal Reserve Bank of Cleveland. | since 2005; Director and Senior Vice President of |
| | Vanguard Marketing Corporation since 2005; Principal |
| Peter F. Volanakis | of The Vanguard Group (1997–2006). |
| Born 1955. Trustee Since July 2009. Principal | | |
| Occupation(s) During the Past Five Years: President | | |
| since 2007 and Chief Operating Officer since 2005 | Vanguard Senior Management Team |
| of Corning Incorporated (communications equipment); | | |
| President of Corning Technologies (2001–2005); Director | R. Gregory Barton | Michael S. Miller |
| of Corning Incorporated and Dow Corning; Trustee of | Mortimer J. Buckley | James M. Norris |
| the Corning Incorporated Foundation and the Corning | Kathleen C. Gubanich | Glenn W. Reed |
| Museum of Glass; Overseer of the Amos Tuck School | Paul A. Heller | George U. Sauter |
| of Business Administration at Dartmouth College. | | |
| |
| | Founder | |
| |
| | John C. Bogle | |
| | Chairman and Chief Executive Officer, 1974–1996 |
1 These individuals are “interested persons” as defined in the Investment Company Act of 1940.
2 December 2002 for Vanguard Equity Income Fund, Vanguard Growth Equity Fund, the Vanguard Municipal Bond Funds, and the Vanguard State Tax-Exempt Funds.
| |  |
| | | P.O. Box 2600 |
| | | Valley Forge, PA 19482-2600 |
| |
| |
| |
| |
| Connect with Vanguard® > www.vanguard.com |
| |
| Fund Information > 800-662-7447 | All comparative mutual fund data are from Lipper Inc. |
| | or Morningstar, Inc., unless otherwise noted. |
| Direct Investor Account Services > 800-662-2739 | |
| | |
| Institutional Investor Services > 800-523-1036 | You can obtain a free copy of Vanguard’s proxy voting |
| | guidelines by visiting our website, www.vanguard.com, |
| Text Telephone for People | and searching for “proxy voting guidelines,” or by |
| With Hearing Impairment > 800-952-3335 | calling Vanguard at 800-662-2739. The guidelines are |
| | also available from the SEC’s website, www.sec.gov. |
| | In addition, you may obtain a free report on how your |
| | fund voted the proxies for securities it owned during |
| This material may be used in conjunction | the 12 months ended June 30. To get the report, visit |
| with the offering of shares of any Vanguard | either www.vanguard.com or www.sec.gov. |
| fund only if preceded or accompanied by | |
| the fund’s current prospectus. | You can review and copy information about your fund |
| | at the SEC’s Public Reference Room in Washington, D.C. |
| CFA® is a trademark owned by CFA Institute. | To find out more about this public service, call the SEC |
| | at 202-551-8090. Information about your fund is also |
| | available on the SEC’s website, and you can receive |
| | copies of this information, for a fee, by sending a |
| | request in either of two ways: via e-mail addressed to |
| | publicinfo@sec.gov or via regular mail addressed to the |
| | Public Reference Section, Securities and Exchange |
| | Commission, Washington, DC 20549-0102. |
| |
| |
| |
| |
| | © 2009 The Vanguard Group, Inc. |
| | All rights reserved. |
| | Vanguard Marketing Corporation, Distributor. |
| | Q1140 112009 |
 |
| Vanguard Capital Opportunity Fund |
| Annual Report |
|
| September 30, 2009 |
|
 |
|
|
> Vanguard Capital Opportunity Fund returned more than 4% for the 2009 fiscal year, while its comparative standards sustained losses.
> Information technology, the fund’s largest sector, contributed the most to its success.
> For the decade ended September 30, 2009, the fund earned an average annual return of more than 8%, far outpacing the comparable return of its benchmark and the average result for peer funds.
| |
| Contents | |
| |
| Your Fund’s Total Returns | 1 |
| President’s Letter | 2 |
| Advisor’s Report | 8 |
| Results of Proxy Voting | 13 |
| Fund Profile | 14 |
| Performance Summary | 15 |
| Financial Statements | 17 |
| Your Fund’s After-Tax Returns | 29 |
| About Your Fund’s Expenses | 30 |
| Glossary | 32 |
The figures shown represent past performance, which is not a guarantee of future results. (Current performance may be lower or higher than the performance data cited. For performance data current to the most recent month-end, visit our website at www.vanguard.com/performance.)
Please note: The opinions expressed in this report are just that—informed opinions. They should not be considered promises or advice. Also, please keep in mind that the information and opinions cover the period through the date on the front of this report. Of course, the risks of investing in your fund are spelled out in the prospectus.
Cover photograph: Veronica Coia.
| | | | |
| Your Fund’s Total Returns | | | |
| |
| |
| |
| |
| Fiscal Year Ended September 30, 2009 | | | | |
| | | | Ticker | Total |
| | | | Symbol | Returns |
| Vanguard Capital Opportunity Fund | | | | |
| Investor Shares | | | VHCOX | 4.41% |
| Admiral™ Shares1 | | | VHCAX | 4.52 |
| Russell Midcap Growth Index | | | | –0.40 |
| Multi-Cap Growth Funds Average2 | | | | –3.19 |
| |
| |
| Your Fund’s Performance at a Glance | | | | |
| September 30, 2008–September 30, 2009 | | | | |
| | | | Distributions Per Share |
| | Starting | Ending | Income | Capital |
| | Share Price | Share Price | Dividends | Gains |
| Vanguard Capital Opportunity Fund | | | | |
| Investor Shares | $29.41 | $27.71 | $0.114 | $2.062 |
| Admiral Shares | 68.00 | 64.04 | 0.339 | 4.761 |
1 A lower-cost class of shares available to many longtime shareholders and to those with significant investments in the fund.
2 Derived from data provided by Lipper Inc.
1

President’s Letter
Dear Shareholder,
The 12 months ended September 30 spanned two strikingly different half-years. Stocks continued to fall steeply and broadly during the first half, then dramatically turned around in March as investors became more confident about credit markets and the economy. After losing almost one-quarter of its value in the first half, Vanguard Capital Opportunity Fund posted returns of 4.41% for Investor Shares and 4.52% for Admiral Shares for the full fiscal year, more than 7 percentage points ahead of the average return of multi-capitalization growth funds.
Amid the market’s remarkable inconsistency, the strategy followed by PRIMECAP Management Company, the fund’s advisor, was remarkably consistent—staying the course and sparing investors the worst of the downturn, then participating in the recovery. An outsized commitment to, and astute stock selection within, information technology contributed significantly to the fund’s absolute and relative success.
It’s worth noting that, even though the fund’s share price dropped $1.70 for the full year, at the end of the period you owned about 1.1 shares for each share you owned at the start of the year (assuming reinvestment of the December dividend and capital gain distributions, and no sales)—resulting in a positive total return.
2
If you hold shares in a taxable account, you may wish to review the table and discussion on after-tax returns for the fiscal year, based on the highest tax bracket, later in this report.
After a precipitous fall, stock markets rebound
In recent months, the financial markets have performed so strongly that it’s almost hard to remember that less than a year ago the global financial system stood on the brink of collapse. Since then, markets have pulled back from the abyss. Although unemployment remains near generational highs, and the prospects of a robust recovery seem dim, the global economy has begun to grind into gear.
Reminders of the markets’ dark days are nevertheless apparent in the index returns for both the past 12 months and the past three years. Over both periods, U.S. stocks recorded negative returns. Global stocks did better over the past 12 months, recouping their late-2008 losses thanks to general strength in developed economies and a powerful rally in emerging markets. Over the past three years, however, international stocks posted a modestly negative return.
The bond market’s turnabout has been equally dramatic
The stock market’s collapse and recovery echo even more dramatic developments in the bond market. At the end of 2008,
| | | |
| Market Barometer | | | |
| | | Average Annual Total Returns |
| | | Periods Ended September 30, 2009 |
| | One Year | Three Years | Five Years |
| Stocks | | | |
| Russell 1000 Index (Large-caps) | –6.14% | –5.10% | 1.49% |
| Russell 2000 Index (Small-caps) | –9.55 | –4.57 | 2.41 |
| Dow Jones U.S. Total Stock Market Index | –5.83 | –4.58 | 1.93 |
| MSCI All Country World Index ex USA (International) | 6.43 | –0.78 | 8.59 |
| |
| Bonds | | | |
| Barclays Capital U.S. Aggregate Bond Index | | | |
| (Broad taxable market) | 10.56% | 6.41% | 5.13% |
| Barclays Capital Municipal Bond Index | 14.85 | 5.13 | 4.78 |
| Citigroup 3-Month Treasury Bill Index | 0.39 | 2.63 | 2.96 |
| |
| CPI | | | |
| Consumer Price Index | –1.29% | 2.10% | 2.61% |
3
as the credit markets nearly ceased to function, the difference between the yields of corporate bonds and Treasury bonds spiked to levels last seen during the Great Depression.
The Federal Reserve and its central bank counterparts around the world responded with aggressive monetary stimulus efforts, while global governments opened the fiscal taps. Investors first tiptoed, then stampeded, back into the market, boosting bond prices and bringing down yields. Over the past 12 months, taxable U.S. bonds returned more than 10%; municipal securities did even better, returning almost 15%, as measured by the Barclays Capital Municipal Bond Index.
| | | |
| Expense Ratios1 | | | |
| Your Fund Compared With Its Peer Group | | | |
| | | | Multi-Cap |
| | Investor | Admiral | Growth Fund |
| | Shares | Shares | Average |
| Capital Opportunity Fund | 0.52% | 0.43% | 1.41% |
The Fed’s rescue campaign has imposed a heavy price on short-term savings vehicles such as money market funds. In December 2008, the Fed reduced its target for the federal funds rate, a benchmark for the interest rates paid by money market instruments and other very short-term securities, to between 0% and 0.25%. The Fed has said it expects to maintain its target at this level “for an extended period.”
Rewarding stock selection in most sectors
PRIMECAP seeks to identify companies that appear out of favor and are expected to outperform the market over an investment horizon of about three to five years. Over the years, this strategy has produced a portfolio (concentrated in slightly more than 100 stocks) whose composition and
1 The fund expense ratios shown are from the prospectus dated January 28, 2009, and represent estimated costs for the current fiscal year based on the fund’s net assets as of the prospectus date. For the fiscal year ended September 30, 2009, the fund’s expense ratios were 0.50% for Investor Shares and 0.41% for Admiral Shares. The peer-group expense ratio is derived from data provided by Lipper Inc. and captures information through year-end 2008.
4
performance differ—sometimes significantly—from those of its benchmark index and peers. For example, the benchmark Russell Midcap Growth Index consists of about 500 stocks and has a median market capitalization considerably smaller than that of the Capital Opportunity Fund—which also invests in large-cap companies.
In recent years, the advisor has built up sizable stakes in information technology and health care, two research-and-development-intensive sectors that are expected to benefit from global growth in electronics and the aging baby boomers’ increasing demand for medical care and prescription medications. IT and health care stocks continued to represent about two-thirds of the fund’s assets, on average, in the fiscal year (approximately double the weighting in the benchmark index). The heavy commitment to tech stocks was a key driver of the fund’s success during the year, but health care stocks lagged.
Tech stocks were a consistent strength for the fund—relatively resilient during the downturn, and robust during the rally. Among the standout contributors for the year were several semiconductor makers—including top-ten holding ASML Holding, a Netherlands-based supplier of lithography systems used in microchip manufacturing. Other notable performers were Rovi (formerly Macrovision, a provider of digital entertainment discovery solutions), Google, and Citrix Systems (a developer and marketer of computer applications delivery and sharing solutions).
| |
| Total Returns | |
| Ten Years Ended September 30, 2009 | |
| | Average |
| | Annual Return |
| Capital Opportunity Fund Investor Shares | 8.41% |
| Russell Midcap Growth Index | 2.18 |
| Multi-Cap Growth Funds Average1 | –1.11 |
1 Derived from data provided by Lipper Inc.
5
In contrast, the health care sector—which held up relatively well during the market’s steep drop—ended the year with a modest decline, partly reflecting uncertainty surrounding the ongoing debate over health care reform and the movement toward generic drugs. Amgen and Biogen Idec, two top-ten biotechnology holdings, eked out modest gains for the year. However, major pharmaceutical maker Eli Lilly (also a top-ten holding) and medical-device maker Medtronic sustained double-digit losses. The fund’s standout performer was Dendreon (up almost 400%), which reported success with clinical trials of a prostate cancer treatment.
The fund’s third-largest sector, consumer discretionary, became a bright spot when consumer confidence turned the corner. After losing more than one-fifth of its value in the first half of the fiscal year, the sector’s strong second-half comeback led to a double-digit 12-month gain. Satellite television provider DIRECTV Group (a top-ten holding), off-price apparel retailer The TJX Companies, and CarMax were among the leading contributors.
This letter would not be complete without mentioning Monsanto, the fund’s largest holding (both during the year and at September 30). Monsanto was a standout performer in fiscal years 2007 and 2008—rising with soaring demand for genetically engineered seeds. The company struggled last year, however, as farmers reduced their crop plantings in the face of falling corn, soybean, and wheat prices.
For more on the advisor’s strategy and outlook, please see the Advisor’s Report following this letter.
Ten-year record topped benchmark and peers
PRIMECAP Management Company, which has managed the fund since 1998, has distinguished itself by not wavering from its disciplined, focused, and patient investment philosophy. The advisor’s low-turnover, research-intensive approach to identifying underappreciated growth companies has generated impressive long-term results for shareholders.
For the ten years ended September 30, 2009, the Investor Shares of Capital Opportunity Fund posted an average annual return of 8.41%, more than 9 percentage points above the average return of competing multi-cap growth funds and more than 6 percentage points above the result for the benchmark.
Old-fashioned precepts still work in today’s markets
Stocks have taken investors on a roller-coaster ride over the last two years. After soaring to record highs in October 2007, the U.S. stock market in 2008 suffered its worst calendar year since the 1930s before turning around this past spring. Investors were given a strong dose of reality—not only by the volatile stock market but also by the demise of some major financial institutions and the persistence of the longest recession in seven decades.
6
Now that the markets and the economy have pulled back from the brink, it’s a good opportunity for you to reevaluate your long-term investment objectives, time frame, and risk tolerance, and to make sure your investment plan is still appropriate. Remember that patience is often rewarded: Many investors who did not panic and sell out as stocks sank have recovered a substantial share of their paper losses.
The old-fashioned principles of discipline, patience, and a long-term view have been key to the growth-oriented investment strategy of Capital Opportunity Fund’s advisor—and to the fund’s success. The fund’s low costs help shareholders keep more of the returns, a benefit that can compound over time and help the fund play a valuable role within a diversified portfolio.
Thank you for entrusting your assets to Vanguard.
Sincerely,

F. William McNabb III
President and Chief Executive Officer
October 16, 2009
7
Advisor’s Report
For the fiscal year ended September 30, Vanguard Capital Opportunity Fund returned 4.41% for Investor Shares and 4.52% for Admiral Shares. In contrast, both the Russell Midcap Growth Index (–0.40%) and the average return of multi-cap growth fund competitors (–3.19%) ended the year in negative territory. Our significantly overweighted position in, and favorable stock selection within, information technology—the fund’s largest sector—contributed notably to the fund’s success.
Investment environment
The turmoil in the financial markets that began in the summer of 2007 intensified last fall following the failure of Lehman Brothers and the government rescue of AIG. The capital markets were effectively frozen, with the exception of government-guaranteed programs, through the early months of 2009 because of concerns about the solvency of major financial institutions, widening credit spreads, and uncertainty about the valuation of financial assets. The resulting lack of availability of credit as well as general fears of a further collapse of the financial system contributed to a dramatic decline in economic activity.
In an effort to restore confidence and trust in the financial markets, the U.S. government initiated massive fiscal and monetary stimulus programs along with numerous facilities to guarantee investments in commercial paper, bank debt, and other securities. These actions began to take hold and investor sentiment began to improve in March. This turnaround was evident not only in the dramatic stock market rally that ensued—which was led by lower-quality, higher-risk stocks—but also in the return of investors’ appetite for risk in the bond markets. Credit spreads above the yields on U.S. Treasury bonds began falling to more normal levels, leading to strong performance for corporate bonds—especially high-yield bonds—at the expense of Treasuries.
Despite improvement in the short-term funding markets, access to credit has remained difficult for many consumers and businesses. Banks and other financial institutions continued to experience mounting credit losses from loans and securities that were originated during an extended period of underpriced risk and excessive leverage. For example, the Federal Deposit Insurance Corporation’s list of problem banks rose above 400 at the end of June, the highest number since 1994.
There are, however, encouraging signs that the economy is emerging from recession: Real gross domestic product (GDP) has been shrinking at a slower rate. (On October 29, the preliminary report for third-quarter GDP showed growth for the first time in more than a year.) Still, unemployment and home foreclosures have continued to rise, and consumer and business spending has remained weak.
From its peak in October 2007 through March 2009, the S&P 500 experienced the largest market decline since the Great Depression, a reflection of investors’ anxiety about the failing global economy. Since early March, however, the S&P 500 has rebounded sharply on signs that the
8
financial markets are stabilizing and that the decline in economic activity has slowed. As a result of the market’s dramatic rally, we believe that equity investment opportunities are no longer as compelling as they were earlier this year, but we continue to find promising stocks into which we can deploy capital.
Management of the fund
We have not wavered in our investment objective or strategy throughout the large swings in the stock market over the past 18 months: We seek to find companies whose long-term fundamentals will, in our estimation, evolve significantly better than current valuation suggests. We rely on rigorous fundamental research and meet not only with company management but also with competitors, suppliers, and customers to help identify potential opportunities and to reassess our conviction in our holdings. And we invest with a long-term perspective, in the expectation that over a three- to five-year horizon, our selections will outperform the market.
In the past few years, we have established significant investments in technology and health care stocks. Together, these two sectors represented almost two-thirds of the fund’s assets, on average, during the year, almost twice the weighting in the benchmark index.
In technology, we are particularly enthusiastic about the growth opportunities represented by trends in mobile broadband communications. The global population of broadband users continues to grow; at the same time, the mix of users continues to shift to mobile devices from fixed-line equipment. Traffic growth is accelerated further by the increased demand for data transmission in addition to voice. The world’s developing countries are expected to continue to adopt broadband and to become more reliant on mobile devices such as smart phones and netbook computers.
The fund has invested in several companies that should benefit from the anticipated growth in broadband usage as well as the growth in software applications, e-commerce, and other activities that should result from this broad shift in the behavior of consumers and businesses throughout the world. Research in Motion and Brocade Communications Systems are expected to benefit from the growth in mobile devices, networks, and communications infrastructure. Google and Amazon.com are well positioned in Internet advertising and e-commerce, respectively, two areas that are expected to experience rapid growth with more mobile broadband subscribers and expanded usage of the Internet. Adobe Systems, Microsoft, Trimble Navigation, and EMC provide many of the software applications and data storage systems needed to support the increased Internet activity enabled by mobile broadband. During the year, we took some profits and reduced our holdings in some of these companies—notably Brocade Communications Systems—and we opportunistically increased our stake in some of the others, including Adobe Systems.
9
For the year, the technology sector—which represented almost 40% of fund assets, on average, during the fiscal year—was the leading contributor to the fund’s absolute and relative performance. Semiconductor firms ASML Holding, Cree, and FormFactor were among our most successful holdings. Chipmakers tend to lead the way during economic upturns, and this year was no exception: These firms delivered modest positive returns while the broad market declined during the first six months, and they enjoyed even stronger gains in the second half of the fiscal year.
In the health care sector, our investment thesis is based on global demographic trends and a belief in the power of science. The demand for health care will continue to grow, given the growth in worldwide population, increasing life expectancy, and the rapid increase in income in developing countries such as China and India. At the same time, scientific developments such as the sequencing of the human genome earlier this decade are expected to lead to the development of new drugs, medical devices, and other treatments. We are particularly excited about the potential for more customized treatments for diseases and other ailments.
Consistent with these themes, three of the fund’s ten largest holdings at September 30, 2009, were pharmaceutical firms Eli Lilly, Amgen, and Novartis. Among these three, only Amgen (+2%) posted a positive total return for the fiscal year. Amgen has been awaiting Food and Drug
Administration (FDA) approval of a biologics license application for Denosumab, a new treatment for osteoporosis and certain forms of cancer. (On October 19, the FDA requested additional information from Amgen, postponing a final approval decision.) Unlike some other major drug makers, Amgen does not face the expiration of major patents and we believe the company has a solid pipeline of future drugs that may be brought to market.
Eli Lilly (–21%) does face patent expirations and has suffered setbacks with two drugs in late-stage clinical trials this year. In July, the FDA gave final approval to Eli Lilly’s blood thinner Prasugrel (which will be marketed in the United States as Effient), but the drug’s rollout has been slower than anticipated. We believe that these challenges are fully reflected in Eli Lilly’s stock price; the stock trades at less than eight times earnings. We remain optimistic about the company’s long-term prospects. For example, significant resources are being invested in research and development of protein inhibitors that may prove successful in treating Alzheimer’s disease.
Overall, the health care sector weighed on the fund’s performance for the year, especially in the second half. Both Eli Lilly and medical-device maker Medtronic (–25%) were among the notable detractors. Medtronic’s valuation fell to its lowest level in about two decades—in part because of integration issues related to the company’s November 2007 acquisition of Kyphon, which specialized
10
in spinal treatments. Spinal therapies are among the fastest-growing areas in orthopedics. We believe Medtronic is well-positioned there, and in solutions for cardiac rhythm management, diabetes, and neurological diseases, and we took advantage of weakness in the company’s stock price to add to our position.
We had mixed results in two sectors that are more sensitive to economic cycles: success in consumer discretionary but disappointment in industrials. Some of the best contributors were: The TJX Companies (+24%), owners of off-price retailers T.J. Maxx and Marshalls; CarMax (+49%), which has gained market share, benefiting from used-car demand and the fragmented nature of the dealer network; and Bed Bath & Beyond (+20%). We modestly increased our holdings in Bed Bath & Beyond—which we regard as well managed and well capitalized—when inventory liquidation by a bankrupt competitor created a buying opportunity for us.
In industrials, our top-ten holding FedEx (–4%), plus Southwest Airlines (–34%) and American Airlines’ parent AMR (–19%), faced weak demand amid the sluggish economy. We added to our holdings of all three companies based on the strength of their brands, with Southwest Airlines being one of our largest purchases.
In the materials sector, after major gains in fiscal years 2007 and 2008, Monsanto struggled. Year-over-year, our stake in Monsanto increased modestly—although we selectively sold shares during the year—and it remains the fund’s largest holding. We anticipate strong demand for the company’s next generation of genetically modified corn and soybean seeds. And we continue to underweight the financial sector overall as we remain concerned about the deleveraging process throughout the financial system, the ongoing credit issues faced by many financial institutions, and the prospect of tighter regulation and oversight.
Outlook
Looking beyond the collective sigh of relief that the economy and credit markets appear to have averted disaster, it is difficult to predict the future course of the economy and the markets. Although we do not know whether the economic recovery will be U-shaped, W-shaped, or otherwise, we expect the economy will begin to grow modestly in what is likely to be the most notably jobless recovery in generations. On balance, our outlook for the rest of 2009 and into 2010 remains uncertain but cautiously optimistic.
We see two potential areas of concern stemming from the fiscal and monetary policy actions undertaken to avert disaster: inflation risk and the unintended consequences of the increased government involvement in the private sector. While near-term inflation appears not to be a threat, the longer-term effects of the massive economic stimulus could portend future price pressure and continued weakness in the U.S. dollar.
11
We are also concerned about the government’s significantly expanded role in owning and/or overseeing financial institutions and private industry (for example, the auto industry), and the potential impact of this involvement on entrepreneurship and productivity growth in the future. We believe that, over time, scarce economic resources such as capital and labor are better allocated by free markets than by regulations and other government involvement.
Although the outcome of the ongoing debate over health care reform remains unknown, the outline of a possible consensus has been emerging recently. It appears that final legislation will not be as sweeping as initially anticipated, and that price controls are unlikely—at least in the near future. Our biotech holdings are intrinsically less vulnerable to health care reform, and it is possible that pharmaceutical companies could benefit as several million uninsured Americans gain access to health insurance.
As has been the case for several years, we remain enthusiastic about our holdings and their potential to deliver superior performance going forward.
| | |
| Theo A. Kolokotrones | | Howard B. Schow |
| Portfolio Manager | | Portfolio Manager |
| David H. Van Slooten | |
| Portfolio Manager | |
| Joel P. Fried | | Alfred W. Mordecai |
| Portfolio Manager | | Portfolio Manager |
| |
| |
| |
| PRIMECAP Management Company | |
| October 30, 2009 | |
12
Results of Proxy Voting
At a special meeting of shareholders on July 2, 2009, fund shareholders approved the following two proposals:
Proposal 1—Elect trustees for each fund.*
The individuals listed in the table below were elected as trustees for each fund. All trustees with the exception of Messrs. McNabb and Volanakis (both of whom already served as directors of The Vanguard Group, Inc.) served as trustees to the funds prior to the shareholder meeting.
| | | |
| | | | Percentage |
| Trustee | For | Withheld | For |
| John J. Brennan | 517,264,433 | 14,297,196 | 97.3% |
| Charles D. Ellis | 501,913,782 | 29,647,847 | 94.4% |
| Emerson U. Fullwood | 507,851,847 | 23,709,782 | 95.5% |
| Rajiv L. Gupta | 515,891,359 | 15,670,270 | 97.1% |
| Amy Gutmann | 517,356,594 | 14,205,035 | 97.3% |
| JoAnn Heffernan Heisen | 516,532,227 | 15,029,403 | 97.2% |
| F. William McNabb III | 516,660,098 | 14,901,531 | 97.2% |
| André F. Perold | 507,715,282 | 23,846,348 | 95.5% |
| Alfred M. Rankin, Jr. | 516,327,018 | 15,234,611 | 97.1% |
| Peter F. Volanakis | 516,503,576 | 15,058,053 | 97.2% |
| * Results are for all funds within the same trust. | | | |
Proposal 2—Update and standardize the funds’ fundamental policies regarding:
(a) Purchasing and selling real estate.
(b) Issuing senior securities.
(c) Borrowing money.
(d) Making loans.
(e) Purchasing and selling commodities.
(f) Concentrating investments in a particular industry or group of industries.
(g) Eliminating outdated fundamental investment policies not required by law.
The revised fundamental policies are clearly stated and simple, yet comprehensive, making oversight and compliance more efficient than under the former policies. The revised fundamental policies will allow the funds to respond more quickly to regulatory and market changes, while avoiding the costs and delays associated with successive shareholder meetings.
| | | | | |
| | | | | Broker | Percentage |
| | For | Abstain | Against | Non-Votes | For |
| Capital Opportunity Fund | | | | | |
| 2a | 129,735,970 | 3,102,998 | 3,854,091 | 5,312,491 | 91.4% |
| 2b | 129,272,744 | 3,479,454 | 3,940,862 | 5,312,490 | 91.0% |
| 2c | 127,960,367 | 3,356,007 | 5,376,686 | 5,312,490 | 90.1% |
| 2d | 128,482,736 | 3,447,317 | 4,763,006 | 5,312,491 | 90.5% |
| 2e | 129,316,497 | 3,250,837 | 4,125,724 | 5,312,491 | 91.1% |
| 2f | 129,116,664 | 3,280,675 | 4,295,721 | 5,312,490 | 90.9% |
| 2g | 130,458,646 | 3,181,999 | 3,052,414 | 5,312,490 | 91.9% |
13
Capital Opportunity Fund
Fund Profile
As of September 30, 2009
| | | |
| Portfolio Characteristics | | |
| | | Comparative | Broad |
| | Fund | Index1 | Index2 |
| Number of Stocks | 109 | 491 | 4,324 |
| Median Market Cap | $13.5B | $5.5B | $29.0B |
| Price/Earnings Ratio | 83.7x | 43.0x | 27.9x |
| Price/Book Ratio | 2.6x | 3.2x | 2.1x |
| Yield3 | | 1.1% | 1.9% |
| Investor Shares | 0.4% | | |
| Admiral Shares | 0.4% | | |
| Return on Equity | 16.0% | 19.5% | 19.1% |
| Earnings Growth Rate | 17.4% | 14.6% | 9.6% |
| Foreign Holdings | 12.5% | 0.0% | 0.0% |
| Turnover Rate | 12% | — | — |
| Expense Ratio4 | | — | — |
| Investor Shares | 0.52% | | |
| Admiral Shares | 0.43% | | |
| Short-Term Reserves | 4.7% | — | — |
| | | |
| Sector Diversification (% of equity exposure) |
| | Comparative | Broad |
| | Fund | Index1 | Index2 |
| Consumer Discretionary | 15.0% | 17.9% | 10.1% |
| Consumer Staples | 0.0 | 7.3 | 9.9 |
| Energy | 5.4 | 5.5 | 11.0 |
| Financials | 0.3 | 8.9 | 16.7 |
| Health Care | 25.1 | 13.6 | 12.9 |
| Industrials | 10.5 | 14.9 | 10.6 |
| Information Technology | 38.7 | 22.8 | 18.2 |
| Materials | 4.3 | 4.9 | 3.9 |
| Telecommunication | | | |
| Services | 0.4 | 1.1 | 2.9 |
| Utilities | 0.3 | 3.1 | 3.8 |
| | |
| Volatility Measures5 | |
| | Fund Versus | Fund Versus |
| | Comparative Index1 | Broad Index2 |
| R-Squared | 0.95 | 0.91 |
| Beta | 0.91 | 1.05 |
| | |
| Ten Largest Holdings6 (% of total net assets) |
| |
| Monsanto Co. | fertilizers and | |
| | agricultural | |
| | chemicals | 4.1% |
| Research In Motion Ltd. | communications | |
| | equipment | 4.0 |
| Amgen Inc. | biotechnology | 3.5 |
| ASML Holding NV | semiconductor | |
| | equipment | 3.5 |
| FedEx Corp. | air freight and | |
| | logistics | 3.3 |
| Eli Lilly & Co. | pharmaceuticals | 3.3 |
| Biogen Idec Inc. | biotechnology | 3.0 |
| DIRECTV Group Inc. | cable and satellite | 2.7 |
| TJX Cos. Inc. | apparel retail | 2.5 |
| Novartis AG ADR | pharmaceuticals | 2.4 |
| Top Ten | | 32.3% |
Investment Focus
1 Russell Midcap Growth Index.
2 Dow Jones U.S. Total Stock Market Index.
3 30-day SEC yield for the fund; annualized dividend yield for the indexes. See the Glossary.
4 The expense ratios shown are from the prospectus dated January 28, 2009, and represent estimated costs for the current fiscal year based on the fund’s net assets as of the prospectus date. For the fiscal year ended September 30, 2009, the expense ratios were 0.50% for Investor Shares and 0.41% for Admiral Shares.
5 For an explanation of R-squared, beta, and other terms used here, see the Glossary.
6 The holdings listed exclude any temporary cash investments and equity index products.
14
Capital Opportunity Fund
Performance Summary
All of the returns in this report represent past performance, which is not a guarantee of future results that may be achieved by the fund. (Current performance may be lower or higher than the performance data cited. For performance data current to the most recent month-end, visit our website at www.vanguard.com/performance.) Note, too, that both investment returns and principal value can fluctuate widely, so an investor’s shares, when sold, could be worth more or less than their original cost. The returns shown do not reflect taxes that a shareholder would pay on fund distributions or on the sale of fund shares.
Cumulative Performance: September 30, 1999–September 30, 2009
Initial Investment of $25,000
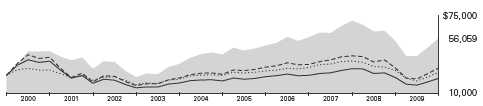
| | | | |
| | | Average Annual Total Returns | Final Value |
| | Periods Ended September 30, 2009 | of a $25,000 |
| | One Year | Five Years | Ten Years | Investment |
| Capital Opportunity Fund Investor Shares1,2 | 4.41% | 5.76% | 8.41% | $56,059 |
| Dow Jones U.S. Total Stock Market Index | –5.83 | 1.93 | 0.94 | 27,446 |
| Russell Midcap Growth Index | –0.40 | 3.75 | 2.18 | 31,018 |
| Multi-Cap Growth Funds Average3 | –3.19 | 2.04 | –1.11 | 22,355 |
| | | | |
| | | | | Final Value |
| | | | Since | of a $100,000 |
| | One Year | Five Years | Inception4 | Investment |
| Capital Opportunity Fund Admiral Shares1 | 4.52% | 5.86% | 6.84% | $168,400 |
| Dow Jones U.S. Total Stock Market Index | –5.83 | 1.93 | 2.56 | 122,019 |
| Russell Midcap Growth Index | –0.40 | 3.75 | 4.01 | 136,288 |
1 Total returns do not reflect the 1% fee assessed on redemptions after March 23, 2005, of shares held for less than one year, or the 1% fee previously assessed on redemptions of shares held for less than five years.
2 Total returns do not include the account service fee that may be applicable to certain accounts with balances below $10,000. 3 Derived from data provided by Lipper Inc.
4 Performance for the fund’s Admiral Shares and comparative standards is calculated since the fund’s Admiral Shares’ inception: November 12, 2001.
Note: See Financial Highlights tables for dividend and capital gains information.
15
Capital Opportunity Fund
Fiscal Year Total Returns (%): September 30, 1999–September 30, 2009
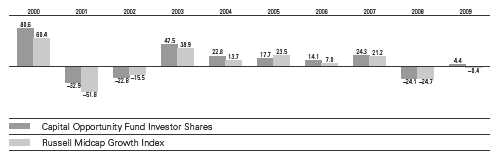
Note: See Financial Highlights tables for dividend and capital gains information.
16
Capital Opportunity Fund
Financial Statements
Statement of Net Assets
As of September 30, 2009
The fund reports a complete list of its holdings in regulatory filings four times in each fiscal year, at the quarter-ends. For the second and fourth fiscal quarters, the lists appear in the fund’s semiannual and annual reports to shareholders. For the first and third fiscal quarters, the fund files the lists with the Securities and Exchange Commission on Form N-Q. Shareholders can look up the fund’s Forms N-Q on the SEC’s website at www.sec.gov. Forms N-Q may also be reviewed and copied at the SEC’s Public Reference Room (see the back cover of this report for further information).
| | | |
| | | | Market |
| | | | Value• |
| | | Shares | ($000) |
| Common Stocks (95.3%) | | |
| Consumer Discretionary (14.3%) | |
| *,^ | DIRECTV Group Inc. | 7,605,935 | 209,772 |
| | TJX Cos. Inc. | 5,252,400 | 195,127 |
| * | Bed Bath & Beyond Inc. | 3,383,400 | 127,013 |
| * | CarMax Inc. | 4,812,800 | 100,588 |
| *,^,1 | Dress Barn Inc. | 4,851,500 | 86,987 |
| | Whirlpool Corp. | 1,191,100 | 83,329 |
| | Men’s Wearhouse Inc. | 2,500,000 | 61,750 |
| | Nordstrom Inc. | 1,425,000 | 43,519 |
| | Best Buy Co. Inc. | 850,000 | 31,892 |
| * | 99 Cents Only Stores | 2,200,000 | 29,590 |
| | Lowe’s Cos. Inc. | 1,411,400 | 29,555 |
| * | O’Reilly Automotive Inc. | 800,000 | 28,912 |
| * | Chico’s FAS Inc. | 2,000,000 | 26,000 |
| * | Amazon.com Inc. | 260,300 | 24,302 |
| | Gentex Corp. | 1,501,100 | 21,241 |
| * | Quiksilver Inc. | 5,796,500 | 15,940 |
| | Abercrombie & Fitch Co. | 200,000 | 6,576 |
| 1 | Strattec Security Corp. | 217,000 | 3,094 |
| | | | 1,125,187 |
| Energy (5.1%) | | |
| | Murphy Oil Corp. | 2,000,000 | 115,140 |
| | Noble Energy Inc. | 971,800 | 64,100 |
| | Arch Coal Inc. | 2,150,000 | 47,580 |
| * | National Oilwell Varco Inc. | 1,050,000 | 45,287 |
| * | Oceaneering | | |
| | International Inc. | 600,000 | 34,050 |
| * | Plains Exploration & | | |
| | Production Co. | 1,166,500 | 32,265 |
| | ConocoPhillips | 400,000 | 18,064 |
| * | Exterran Holdings Inc. | 594,400 | 14,111 |
| * | Pride International Inc. | 392,000 | 11,932 |
| | Cabot Oil & Gas Corp. | 273,000 | 9,760 |
| * | Transocean Ltd. | 100,000 | 8,553 |
| * | Seahawk Drilling Inc. | 26,933 | 837 |
| | | | 401,679 |
| | | |
| | | | Market |
| | | | Value• |
| | | Shares | ($000) |
| Financials (0.3%) | | |
| | Chubb Corp. | 390,000 | 19,660 |
| |
| Health Care (24.0%) | | |
| * | Amgen Inc. | 4,564,700 | 274,932 |
| | Eli Lilly & Co. | 7,754,700 | 256,138 |
| * | Biogen Idec Inc. | 4,632,531 | 234,035 |
| | Novartis AG ADR | 3,785,000 | 190,688 |
| | Medtronic Inc. | 5,151,800 | 189,586 |
| | Roche Holdings AG | 1,019,000 | 164,761 |
| * | Boston Scientific Corp. | 10,310,500 | 109,188 |
| * | Dendreon Corp. | 3,414,000 | 95,558 |
| * | BioMarin | | |
| | Pharmaceutical Inc. | 4,969,100 | 89,841 |
| * | Life Technologies Corp. | 1,924,445 | 89,583 |
| * | Millipore Corp. | 1,011,500 | 71,139 |
| * | Cerner Corp. | 450,000 | 33,660 |
| * | Charles River | | |
| | Laboratories | | |
| | International Inc. | 606,722 | 22,437 |
| * | Edwards Lifesciences Corp. | 300,000 | 20,973 |
| * | Illumina Inc. | 457,000 | 19,422 |
| * | Affymetrix Inc. | 1,425,500 | 12,516 |
| * | Waters Corp. | 80,000 | 4,469 |
| * | Pharmacyclics Inc. | 728,962 | 1,429 |
| | | | 1,880,355 |
| Industrials (10.1%) | | |
| | FedEx Corp. | 3,426,750 | 257,760 |
| *,1 | Thomas & Betts Corp. | 3,311,000 | 99,595 |
| | Southwest Airlines Co. | 9,919,100 | 95,223 |
| * | AMR Corp. | 8,914,500 | 70,870 |
| | Rockwell | | |
| | Automation Inc. | 1,650,000 | 70,290 |
| * | McDermott | | |
| | International Inc. | 2,750,000 | 69,492 |
| | Pall Corp. | 1,400,000 | 45,192 |
| * | JetBlue Airways Corp. | 4,641,050 | 27,753 |
17
| | | |
| Capital Opportunity Fund | | |
| |
| |
| |
| | | | Market |
| | | | Value• |
| | | Shares | ($000) |
| | Union Pacific Corp. | 250,000 | 14,588 |
| | Expeditors International | | |
| | of Washington Inc. | 390,000 | 13,709 |
| | CH Robinson | | |
| | Worldwide Inc. | 222,000 | 12,821 |
| | Chicago Bridge & | | |
| | Iron Co. NV | 568,930 | 10,628 |
| * | US Airways Group Inc. | 57,000 | 268 |
| | | | 788,189 |
| Information Technology (36.8%) | |
| * | Research In Motion Ltd. | 4,679,600 | 316,107 |
| | ASML Holding NV | 9,295,933 | 274,881 |
| * | Google Inc. Class A | 374,250 | 185,572 |
| * | Symantec Corp. | 10,379,600 | 170,952 |
| * | Cree Inc. | 4,263,900 | 156,698 |
| * | NVIDIA Corp. | 10,407,650 | 156,427 |
| | Corning Inc. | 10,132,400 | 155,127 |
| *,1 | FormFactor Inc. | 5,983,300 | 143,121 |
| | Altera Corp. | 6,272,700 | 128,653 |
| | Microsoft Corp. | 3,865,000 | 100,065 |
| * | Rambus Inc. | 5,235,000 | 91,089 |
| * | Adobe Systems Inc. | 2,265,000 | 74,836 |
| * | Citrix Systems Inc. | 1,750,000 | 68,652 |
| * | Trimble Navigation Ltd. | 2,818,200 | 67,383 |
| | Texas Instruments Inc. | 2,691,600 | 63,764 |
| * | NeuStar Inc. Class A | 2,631,000 | 59,461 |
| | Hewlett-Packard Co. | 1,250,000 | 59,012 |
| | Intersil Corp. Class A | 3,644,700 | 55,800 |
| * | SanDisk Corp. | 2,543,262 | 55,189 |
| * | Flextronics | | |
| | International Ltd. | 7,025,000 | 52,406 |
| * | EMC Corp. | 2,825,000 | 48,138 |
| * | eBay Inc. | 2,000,000 | 47,220 |
| * | Micron Technology Inc. | 5,550,000 | 45,510 |
| | Motorola Inc. | 4,800,000 | 41,232 |
| * | Avocent Corp. | 1,984,500 | 40,226 |
| | Plantronics Inc. | 1,150,000 | 30,832 |
| * | Rovi Corp. | 800,000 | 26,880 |
| * | Electronic Arts Inc. | 1,315,000 | 25,051 |
| *,1 | Descartes Systems | | |
| | Group Inc. | 4,645,000 | 24,851 |
| * | Comverse | | |
| | Technology Inc. | 1,660,000 | 14,550 |
| * | Akamai Technologies Inc. | 732,900 | 14,423 |
| * | Intuit Inc. | 470,000 | 13,395 |
| * | Brocade Communications | | |
| | Systems Inc. | 1,350,000 | 10,611 |
| | Xilinx Inc. | 430,000 | 10,071 |
| * | Entegris Inc. | 2,019,231 | 9,995 |
| * | Ciena Corp. | 607,142 | 9,884 |
| * | Cymer Inc. | 250,000 | 9,715 |
| | | |
| | | | Market |
| | | | Value• |
| | | Shares | ($000) |
| * | FEI Co. | 320,000 | 7,888 |
| * | Nuance | | |
| | Communications Inc. | 425,000 | 6,358 |
| | QUALCOMM Inc. | 138,000 | 6,207 |
| * | THQ Inc. | 500,000 | 3,420 |
| | Jabil Circuit Inc. | 220,000 | 2,950 |
| * | Apple Inc. | 12,000 | 2,224 |
| * | Avid Technology Inc. | 45,000 | 634 |
| | | | 2,887,460 |
| Materials (4.1%) | | |
| | Monsanto Co. | 4,186,386 | 324,026 |
| |
| Telecommunication Services (0.4%) | |
| * | Sprint Nextel Corp. | 7,814,700 | 30,868 |
| |
| Utilities (0.2%) | | |
| * | AES Corp. | 1,322,000 | 19,592 |
| Total Common Stocks | | |
| (Cost $6,016,764) | | 7,477,016 |
| Temporary Cash Investment (5.6%) | |
| Money Market Fund (5.6%) | | |
| 2,3 | Vanguard Market | | |
| | Liquidity Fund, 0.267% | | |
| | (Cost $437,177) | 437,176,963 | 437,177 |
| Total Investments (100.9%) | | |
| (Cost $6,453,941) | | 7,914,193 |
| Other Assets and Liabilities (–0.9%) | |
| Other Assets | | 21,182 |
| Liabilities3 | | (94,129) |
| | | | (72,947) |
| Net Assets (100%) | | 7,841,246 |
18
Capital Opportunity Fund
| |
| At September 30, 2009, net assets consisted of: |
| | Amount |
| | ($000) |
| Paid-in Capital | 6,735,946 |
| Undistributed Net Investment Income | 11,392 |
| Accumulated Net Realized Losses | (366,338) |
| Unrealized Appreciation (Depreciation) | |
| Investment Securities | 1,460,252 |
| Foreign Currencies | (6) |
| Net Assets | 7,841,246 |
| |
| |
| Investor Shares—Net Assets | |
| Applicable to 140,830,198 outstanding | |
| $.001 par value shares of beneficial | |
| interest (unlimited authorization) | 3,902,980 |
| Net Asset Value Per Share— | |
| Investor Shares | $27.71 |
| |
| |
| Admiral Shares—Net Assets | |
| Applicable to 61,498,855 outstanding | |
| $.001 par value shares of beneficial | |
| interest (unlimited authorization) | 3,938,266 |
| Net Asset Value Per Share— | |
| Admiral Shares | $64.04 |
• See Note A in Notes to Financial Statements. * Non-income-producing security.
^ Part of security position is on loan to broker-dealers. The total value of securities on loan is $62,786,000.
1 Considered an affiliated company of the fund as the fund owns more than 5% of the outstanding voting securities of such company.
2 Affiliated money market fund available only to Vanguard funds and certain trusts and accounts managed by Vanguard. Rate shown is the 7-day yield.
3 Includes $66,022,000 of collateral received for securities on loan. ADR—American Depositary Receipt.
See accompanying Notes, which are an integral part of the Financial Statements.
19
| |
| Capital Opportunity Fund | |
| |
| |
| Statement of Operations | |
| |
| | Year Ended |
| | September 30, 2009 |
| | ($000) |
| Investment Income | |
| Income | |
| Dividends1,2 | 58,929 |
| Interest2 | 1,795 |
| Security Lending | 1,129 |
| Total Income | 61,853 |
| Expenses | |
| Investment Advisory Fees—Note B | 16,194 |
| The Vanguard Group—Note C | |
| Management and Administrative—Investor Shares | 6,348 |
| Management and Administrative—Admiral Shares | 3,693 |
| Marketing and Distribution—Investor Shares | 756 |
| Marketing and Distribution—Admiral Shares | 732 |
| Custodian Fees | 100 |
| Auditing Fees | 22 |
| Shareholders’ Reports and Proxies—Investor Shares | 166 |
| Shareholders’ Reports and Proxies—Admiral Shares | 52 |
| Trustees’ Fees and Expenses | 11 |
| Total Expenses | 28,074 |
| Net Investment Income | 33,779 |
| Realized Net Gain (Loss) | |
| Investment Securities Sold2 | (367,929) |
| Foreign Currencies | (41) |
| Realized Net Gain (Loss) | (367,970) |
| Change in Unrealized Appreciation (Depreciation) | |
| Investment Securities | 584,449 |
| Foreign Currencies | 33 |
| Change in Unrealized Appreciation (Depreciation) | 584,482 |
| Net Increase (Decrease) in Net Assets Resulting from Operations | 250,291 |
1 Dividends are net of foreign withholding taxes of $1,755,000.
2 Dividend income, interest income, and realized net gain (loss) from affiliated companies of the fund were $752,000, $1,795,000, and ($104,870,000), respectively.
See accompanying Notes, which are an integral part of the Financial Statements.
20
| | |
| Capital Opportunity Fund | | |
| |
| |
| Statement of Changes in Net Assets | | |
| |
| | Year Ended September 30, |
| | 2009 | 2008 |
| | ($000) | ($000) |
| Increase (Decrease) in Net Assets | | |
| Operations | | |
| Net Investment Income | 33,779 | 66,358 |
| Realized Net Gain (Loss) | (367,970) | 593,669 |
| Change in Unrealized Appreciation (Depreciation) | 584,482 | (3,126,009) |
| Net Increase (Decrease) in Net Assets Resulting from Operations | 250,291 | (2,465,982) |
| Distributions | | |
| Net Investment Income | | |
| Investor Shares | (14,339) | (26,947) |
| Admiral Shares | (18,037) | (29,293) |
| Realized Capital Gain1 | | |
| Investor Shares | (259,376) | (425,472) |
| Admiral Shares | (253,317) | (403,705) |
| Total Distributions | (545,069) | (885,417) |
| Capital Share Transactions | | |
| Investor Shares | 207,062 | 150,506 |
| Admiral Shares | 291,065 | 663,727 |
| Net Increase (Decrease) from Capital Share Transactions | 498,127 | 814,233 |
| Total Increase (Decrease) | 203,349 | (2,537,166) |
| Net Assets | | |
| Beginning of Period | 7,637,897 | 10,175,063 |
| End of Period2 | 7,841,246 | 7,637,897 |
1 Includes fiscal 2009 and 2008 short-term gain distributions totaling $0 and $23,367,000, respectively. Short-term gain distributions are treated as ordinary income dividends for tax purposes.
2 Net Assets—End of Period includes undistributed net investment income of $11,392,000 and $10,030,000.
See accompanying Notes, which are an integral part of the Financial Statements.
21
| | | | | |
| Capital Opportunity Fund | | | | | |
| |
| |
| Financial Highlights | | | | | |
| |
| |
| Investor Shares | | | | | |
| |
| For a Share Outstanding | | | Year Ended September 30, |
| Throughout Each Period | 2009 | 2008 | 2007 | 2006 | 2005 |
| Net Asset Value, Beginning of Period | $29.41 | $42.70 | $36.11 | $31.92 | $27.24 |
| Investment Operations | | | | | |
| Net Investment Income | .121 | .2541 | .070 | .053 | .090 |
| Net Realized and Unrealized Gain (Loss) | | | | | |
| on Investments | .355 | (9.884) | 8.447 | 4.421 | 4.731 |
| Total from Investment Operations | .476 | (9.630) | 8.517 | 4.474 | 4.821 |
| Distributions | | | | | |
| Dividends from Net Investment Income | (.114) | (.218) | (.070) | (.055) | (.070) |
| Distributions from Realized Capital Gains | (2.062) | (3.442) | (1.857) | (.229) | (.071) |
| Total Distributions | (2.176) | (3.660) | (1.927) | (.284) | (.141) |
| Net Asset Value, End of Period | $27.71 | $29.41 | $42.70 | $36.11 | $31.92 |
| |
| Total Return2 | 4.41% | –24.13% | 24.35% | 14.10% | 17.72% |
| |
| Ratios/Supplemental Data | | | | | |
| Net Assets, End of Period (Millions) | $3,903 | $3,851 | $5,415 | $5,051 | $5,231 |
| Ratio of Total Expenses to | | | | | |
| Average Net Assets | 0.50% | 0.45% | 0.45% | 0.49% | 0.51% |
| Ratio of Net Investment Income to | | | | | |
| Average Net Assets | 0.50% | 0.67%1 | 0.18% | 0.15% | 0.33% |
| Portfolio Turnover Rate | 12% | 13% | 14% | 11% | 12% |
1 Net investment income per share and the ratio of net investment income to average net assets include $.125 and 0.33%, respectively, resulting from a special dividend from ASML Holding NV in October 2007.
2 Total returns do not reflect the 1% fee assessed on redemptions after March 23, 2005, of shares held for less than one year, nor do they include the 1% fee previously assessed on redemptions of shares held for less than five years, or the account service fee that may be applicable to certain accounts with balances below $10,000.
See accompanying Notes, which are an integral part of the Financial Statements.
22
| | | | | |
| Capital Opportunity Fund | | | | | |
| |
| |
| Financial Highlights | | | | | |
| |
| |
| Admiral Shares | | | | | |
| |
| For a Share Outstanding | | | Year Ended September 30, |
| Throughout Each Period | 2009 | 2008 | 2007 | 2006 | 2005 |
| Net Asset Value, Beginning of Period | $68.00 | $98.71 | $83.49 | $73.77 | $62.96 |
| Investment Operations | | | | | |
| Net Investment Income | .329 | .6641 | .240 | .198 | .291 |
| Net Realized and Unrealized Gain (Loss) | | | | | |
| on Investments | .811 | (22.845) | 19.508 | 10.229 | 10.911 |
| Total from Investment Operations | 1.140 | (22.181) | 19.748 | 10.427 | 11.202 |
| Distributions | | | | | |
| Dividends from Net Investment Income | (.339) | (.577) | (.238) | (.178) | (.228) |
| Distributions from Realized Capital Gains | (4.761) | (7.952) | (4.290) | (.529) | (.164) |
| Total Distributions | (5.100) | (8.529) | (4.528) | (.707) | (.392) |
| Net Asset Value, End of Period | $64.04 | $68.00 | $98.71 | $83.49 | $73.77 |
| |
| Total Return2 | 4.52% | –24.05% | 24.43% | 14.23% | 17.82% |
| |
| Ratios/Supplemental Data | | | | | |
| Net Assets, End of Period (Millions) | $3,938 | $3,787 | $4,760 | $3,750 | $3,004 |
| Ratio of Total Expenses to | | | | | |
| Average Net Assets | 0.41% | 0.36% | 0.37% | 0.40% | 0.42% |
| Ratio of Net Investment Income to | | | | | |
| Average Net Assets | 0.59% | 0.76%1 | 0.26% | 0.24% | 0.38% |
| Portfolio Turnover Rate | 12% | 13% | 14% | 11% | 12% |
1 Net investment income per share and the ratio of net investment income to average net assets include $.289 and 0.33%, respectively, resulting from a special dividend from ASML Holding NV in October 2007.
2 Total returns do not reflect the 1% fee assessed on redemptions after March 23, 2005, of shares held for less than one year, nor do they include the 1% fee previously assessed on redemptions of shares held for less than five years.
See accompanying Notes, which are an integral part of the Financial Statements.
23
Capital Opportunity Fund
Notes to Financial Statements
Vanguard Capital Opportunity Fund is registered under the Investment Company Act of 1940 as an open-end investment company, or mutual fund. The fund offers two classes of shares: Investor Shares and Admiral Shares. Investor Shares are available to any investor who meets the fund’s minimum purchase requirements. Admiral Shares are designed for investors who meet certain administrative, service, tenure, and account-size criteria.
A. The following significant accounting policies conform to generally accepted accounting principles for U.S. mutual funds. The fund consistently follows such policies in preparing its financial statements.
1. Security Valuation: Securities are valued as of the close of trading on the New York Stock Exchange (generally 4 p.m., Eastern time) on the valuation date. Equity securities are valued at the latest quoted sales prices or official closing prices taken from the primary market in which each security trades; such securities not traded on the valuation date are valued at the mean of the latest quoted bid and asked prices. Securities for which market quotations are not readily available, or whose values have been affected by events occurring before the fund’s pricing time but after the close of the securities’ primary markets, are valued at their fair values calculated according to procedures adopted by the board of trustees. These procedures include obtaining quotations from an independent pricing service, monitoring news to identify significant market- or security-specific events, and evaluating changes in the va lues of foreign market proxies (for example, ADRs, futures contracts, or exchange-traded funds), between the time the foreign markets close and the fund’s pricing time. When fair-value pricing is employed, the prices of securities used by a fund to calculate its net asset value may differ from quoted or published prices for the same securities. Investments in Vanguard Market Liquidity Fund are valued at that fund’s net asset value.
2. Foreign Currency: Securities and other assets and liabilities denominated in foreign currencies are translated into U.S. dollars using exchange rates obtained from an independent third party as of the fund’s pricing time on the valuation date. Realized gains (losses) and unrealized appreciation (depreciation) on investment securities include the effects of changes in exchange rates since the securities were purchased, combined with the effects of changes in security prices. Fluctuations in the value of other assets and liabilities resulting from changes in exchange rates are recorded as unrealized foreign currency gains (losses) until the assets or liabilities are settled in cash, at which time they are recorded as realized foreign currency gains (losses).
3. Federal Income Taxes: The fund intends to continue to qualify as a regulated investment company and distribute all of its taxable income. Management has analyzed the fund’s tax positions taken for all open federal income tax years (September 30, 2006–2009), and has concluded that no provision for federal income tax is required in the fund’s financial statements.
4. Distributions: Distributions to shareholders are recorded on the ex-dividend date.
5. Security Lending: The fund may lend its securities to qualified institutional borrowers to earn additional income. Security loans are required to be secured at all times by collateral at least equal to the market value of securities loaned. The fund invests cash collateral received in Vanguard Market Liquidity Fund, and records a liability for the return of the collateral, during the period the securities are on loan. Security lending income represents the income earned on investing cash collateral, less expenses associated with the loan.
24
Capital Opportunity Fund
6. Other: Dividend income is recorded on the ex-dividend date. Interest income includes income distributions received from Vanguard Market Liquidity Fund and is accrued daily. Security transactions are accounted for on the date securities are bought or sold. Costs used to determine realized gains (losses) on the sale of investment securities are those of the specific securities sold. Fees assessed on redemptions of capital shares are credited to paid-in capital.
Each class of shares has equal rights as to assets and earnings, except that each class separately bears certain class-specific expenses related to maintenance of shareholder accounts (included in Management and Administrative expenses), shareholder reporting, and proxies. Marketing and distribution expenses are allocated to each class of shares based on a method approved by the board of trustees. Income, other non-class-specific expenses, and gains and losses on investments are allocated to each class of shares based on its relative net assets.
B. PRIMECAP Management Company provides investment advisory services to the fund for a fee calculated at an annual percentage rate of average net assets. For the year ended September 30, 2009, the investment advisory fee represented an effective annual rate of 0.26% of the fund’s average net assets.
C. The Vanguard Group furnishes at cost corporate management, administrative, marketing, and distribution services. The costs of such services are allocated to the fund under methods approved by the board of trustees. The fund has committed to provide up to 0.40% of its net assets in capital contributions to Vanguard. At September 30, 2009, the fund had contributed capital of $1,610,000 to Vanguard (included in Other Assets), representing 0.02% of the fund’s net assets and 0.64% of Vanguard’s capitalization. The fund’s trustees and officers are also directors and officers of Vanguard.
D. Various inputs may be used to determine the value of the fund’s investments. These inputs are summarized in three broad levels for financial statement purposes. The inputs or methodologies used to value securities are not necessarily an indication of the risk associated with investing in those securities.
Level 1—Quoted prices in active markets for identical securities.
Level 2—Other significant observable inputs (including quoted prices for similar securities, interest rates, prepayment speeds, credit risk, etc.).
Level 3—Significant unobservable inputs (including the fund’s own assumptions used to determine the fair value of investments).
The following table summarizes the fund’s investments as of September 30, 2009, based on the inputs used to value them:
| | | |
| | Level 1 | Level 2 | Level 3 |
| Investments | ($000) | ($000) | ($000) |
| Common Stocks | 7,312,255 | 164,761 | — |
| Temporary Cash Investments | 437,177 | — | — |
| Total | 7,749,432 | 164,761 | — |
25
Capital Opportunity Fund
E. Distributions are determined on a tax basis and may differ from net investment income and realized capital gains for financial reporting purposes. Differences may be permanent or temporary. Permanent differences are reclassified among capital accounts in the financial statements to reflect their tax character. Temporary differences arise when certain items of income, expense, gain, or loss are recognized in different periods for financial statement and tax purposes; these differences will reverse at some time in the future. Differences in classification may also result from the treatment of short-term gains as ordinary income for tax purposes.
During the year ended September 30, 2009, the fund realized net foreign currency losses of $41,000, which decreased distributable net income for tax purposes; accordingly, such losses have been reclassified from accumulated net realized losses to undistributed net investment income.
For tax purposes, at September 30, 2009, the fund had $27,084,000 of ordinary income available for distribution. The fund had available capital loss carryforwards totaling $42,246,000 to offset future net capital gains through September 30, 2017. In addition, the fund realized losses of $325,683,000 during the period from November 1, 2008, through September 30, 2009, which are deferred and will be treated as realized for tax purposes in fiscal 2010.
At September 30, 2009, the cost of investment securities for tax purposes was $6,453,941,000.
Net unrealized appreciation of investment securities for tax purposes was $1,460,252,000, consisting of unrealized gains of $2,388,343,000 on securities that had risen in value since their purchase and $928,091,000 in unrealized losses on securities that had fallen in value since their purchase.
F. During the year ended September 30, 2009, the fund purchased $708,577,000 of investment securities and sold $884,277,000 of investment securities, other than temporary cash investments.
G. Certain of the fund’s investments are in companies that are considered to be affiliated companies of the fund because the fund owns more than 5% of the outstanding voting securities of the company. Transactions during the period in securities of these companies were as follows:
| | | | | |
| | | | Current Period Transactions | |
| | Sept. 30, 2008 | | Proceeds from | | Sept. 30, 2009 |
| | Market | Purchases | Securities | Dividend | Market |
| | Value | At Cost | Sold | Income | Value |
| | ($000) | ($000) | ($000) | ($000) | ($000) |
| Avid Technology Inc. | 49,022 | — | 21,298 | — | NA1 |
| Descartes Systems Group Inc. | 17,047 | — | — | — | 24,851 |
| Dress Barn Inc. | 75,991 | — | 1,116 | — | 86,987 |
| Emulex Corp. | 48,755 | — | 38,158 | — | — |
| FormFactor Inc. | 106,096 | — | 1,749 | — | 143,121 |
| Men’s Wearhouse Inc. | 59,472 | — | 3,185 | 719 | NA1 |
| Strattec Security Corp. | 5,812 | — | 46 | 33 | 3,094 |
| Thomas & Betts Corp. | 129,361 | — | — | — | 99,595 |
| | 491,556 | | | 752 | 357,648 |
| 1 Not applicable—At September 30, 2009, the security was still held but the issuer was no longer an affiliated company of the fund. |
26
Capital Opportunity Fund
| | | | |
| H. Capital share transactions for each class of shares were: | | | |
| | | | Year Ended September 30, |
| | | 2009 | | 2008 |
| | Amount | Shares | Amount | Shares |
| | ($000) | (000) | ($000) | (000) |
| Investor Shares | | | | |
| Issued | 483,233 | 21,004 | 550,122 | 14,897 |
| Issued in Lieu of Cash Distributions | 260,191 | 12,932 | 425,525 | 11,807 |
| Redeemed1 | (536,362) | (24,037) | (825,141) | (22,596) |
| Net Increase (Decrease)—Investor Shares | 207,062 | 9,899 | 150,506 | 4,108 |
| Admiral Shares | | | | |
| Issued | 549,289 | 10,483 | 754,541 | 8,655 |
| Issued in Lieu of Cash Distributions | 245,987 | 5,296 | 392,708 | 4,717 |
| Redeemed1 | (504,211) | (9,971) | (483,522) | (5,904) |
| Net Increase (Decrease)—Admiral Shares | 291,065 | 5,808 | 663,727 | 7,468 |
| 1 Net of redemption fees for fiscal 2009 and 2008 of $841,000 and $784,000, respectively (fund totals). | | |
I. In preparing the financial statements as of September 30, 2009, management considered the impact of subsequent events occurring through November 10, 2009, for potential recognition or disclosure in these financial statements.
27
Report of Independent Registered Public Accounting Firm
To the Trustees of Vanguard Horizon Funds and the Shareholders of Vanguard Capital Opportunity Fund:
In our opinion, the accompanying statement of net assets and the related statements of operations and of changes in net assets and the financial highlights present fairly, in all material respects, the financial position of Vanguard Capital Opportunity Fund (the “Fund”) at September 30, 2009, the results of its operations for the year then ended, the changes in its net assets for each of the two years in the period then ended and the financial highlights for each of the five years in the period then ended, in conformity with accounting principles generally accepted in the United States of America. These financial statements and financial highlights (hereafter referred to as “financial statements”) are the responsibility of the Fund’s management; our responsibility is to express an opinion on these financial statements based on our audits. We conducted our audits of these financial statements in acc ordance with the standards of the Public Company Accounting Oversight Board (United States). Those standards require that we plan and perform the audit to obtain reasonable assurance about whether the financial statements are free of material misstatement. An audit includes examining, on a test basis, evidence supporting the amounts and disclosures in the financial statements, assessing the accounting principles used and significant estimates made by management, and evaluating the overall financial statement presentation. We believe that our audits, which included confirmation of securities at September 30, 2009 by correspondence with the custodian and by agreement to the underlying ownership records for Vanguard Market Liquidity Fund, provide a reasonable basis for our opinion.
PricewaterhouseCoopers LLP
Philadelphia, Pennsylvania
November 10, 2009
| Special 2009 tax information (unaudited) for Vanguard Capital Opportunity Fund |
This information for the fiscal year ended September 30, 2009, is included pursuant to provisions of the Internal Revenue Code.
The fund distributed $514,267,000 as capital gain dividends (from net long-term capital gains) to shareholders during the fiscal year.
The fund distributed $32,376,000 of qualified dividend income to shareholders during the fiscal year.
For corporate shareholders, 100% of investment income (dividend income plus short-term gains, if any) qualifies for the dividends-received deduction.
28
Your Fund’s After-Tax Returns
This table presents returns for your fund both before and after taxes. The after-tax returns are shown in two ways: (1) assuming that an investor owned the fund during the entire period and paid taxes on the fund’s distributions, and (2) assuming that an investor paid taxes on the fund’s distributions and sold all shares at the end of each period.
Calculations are based on the highest individual federal income tax and capital gains tax rates in effect at the times of the distributions and the hypothetical sales. State and local taxes were not considered. After-tax returns reflect any qualified dividend income, using actual prior-year figures and estimates for 2009. (In the example, returns after the sale of fund shares may be higher than those assuming no sale. This occurs when the sale would have produced a capital loss. The calculation assumes that the investor received a tax deduction for the loss.)
The table shows returns for Investor Shares only; returns for other share classes will differ. Please note that your actual after-tax returns will depend on your tax situation and may differ from those shown. Also note that if you own the fund in a tax-deferred account, such as an individual retirement account or a 401(k) plan, this information does not apply to you. Such accounts are not subject to current taxes.
Finally, keep in mind that a fund’s performance—whether before or after taxes—does not guarantee future results.
| | | |
| Average Annual Total Returns: Capital Opportunity Investor Shares1 | | | |
| Periods Ended September 30, 2009 | | | |
| | One | Five | Ten |
| | Year | Years | Years |
| Returns Before Taxes | 4.41% | 5.76% | 8.41% |
| Returns After Taxes on Distributions | 2.88 | 4.95 | 7.62 |
| Returns After Taxes on Distributions and Sale of Fund Shares | 4.07 | 4.94 | 7.15 |
1 Total returns do not include the account service fee that may be applicable to certain accounts with balances below $10,000; nor do they include the 1% fee assessed on redemptions after March 23, 2005, of shares held for less than one year, or the 1% fee previously assessed on redemptions of shares held for less than five years.
29
About Your Fund’s Expenses
As a shareholder of the fund, you incur ongoing costs, which include costs for portfolio management, administrative services, and shareholder reports (like this one), among others. Operating expenses, which are deducted from a fund’s gross income, directly reduce the investment return of the fund.
A fund’s expenses are expressed as a percentage of its average net assets. This figure is known as the expense ratio. The following examples are intended to help you understand the ongoing costs (in dollars) of investing in your fund and to compare these costs with those of other mutual funds. The examples are based on an investment of $1,000 made at the beginning of the period shown and held for the entire period.
The accompanying table illustrates your fund’s costs in two ways:
• Based on actual fund return. This section helps you to estimate the actual expenses that you paid over the period. The “Ending Account Value” shown is derived from the fund’s actual return, and the third column shows the dollar amount that would have been paid by an investor who started with $1,000 in the fund. You may use the information here, together with the amount you invested, to estimate the expenses that you paid over the period.
To do so, simply divide your account value by $1,000 (for example, an $8,600 account value divided by $1,000 = 8.6), then multiply the result by the number given for your fund under the heading “Expenses Paid During Period.”
• Based on hypothetical 5% yearly return. This section is intended to help you compare your fund’s costs with those of other mutual funds. It assumes that the fund had a yearly return of 5% before expenses, but that the expense ratio is unchanged. In this case—because the return used is not the fund’s actual return—the results do not apply to your investment. The example is useful in making comparisons because the Securities and Exchange Commission requires all mutual funds to calculate expenses based on a 5% return. You can assess your fund’s costs by comparing this hypothetical example with the hypothetical examples that appear in shareholder reports of other funds.
| | | |
| Six Months Ended September 30, 2009 | | | |
| | Beginning | Ending | Expenses |
| | Account Value | Account Value | Paid During |
| | 3/31/2009 | 9/30/2009 | Period1 |
| Based on Actual Fund Return | | | |
| Investor Shares | $1,000.00 | $1,365.70 | $2.91 |
| Admiral Shares | 1,000.00 | 1,366.33 | 2.37 |
| Based on Hypothetical 5% Yearly Return | | | |
| Investor Shares | $1,000.00 | $1,022.61 | $2.48 |
| Admiral Shares | 1,000.00 | 1,023.06 | 2.03 |
1 The calculations are based on expenses incurred in the most recent six-month period. The fund’s annualized six-month expense ratios for that period are 0.49% for Investor Shares and 0.40% for Admiral Shares. The dollar amounts shown as “Expenses Paid” are equal to the annualized expense ratio multiplied by the average account value over the period, multiplied by the number of days in the most recent six-month period, then divided by the number of days in the most recent 12-month period.
30
Note that the expenses shown in the table are meant to highlight and help you compare ongoing costs only and do not reflect transaction costs incurred by the fund for buying and selling securities. Further, the expenses do not include the 1% fee on redemptions of shares held for less than one year, nor do they include the account service fee described in the prospectus. If such fees were applied to your account, your costs would be higher. Your fund does not carry a “sales load.”
The calculations assume no shares were bought or sold during the period. Your actual costs may have been higher or lower, depending on the amount of your investment and the timing of any purchases or redemptions.
You can find more information about the fund’s expenses, including annual expense ratios, in the Financial Statements section of this report. For additional information on operating expenses and other shareholder costs, please refer to your fund’s current prospectus.
31
Glossary
Beta. A measure of the magnitude of a fund’s past share-price fluctuations in relation to the ups and downs of a given market index. The index is assigned a beta of 1.00. Compared with a given index, a fund with a beta of 1.20 typically would have seen its share price rise or fall by 12% when the index rose or fell by 10%. For this report, beta is based on returns over the past 36 months for both the fund and the index. Note that a fund’s beta should be reviewed in conjunction with its R-squared (see definition). The lower the R-squared, the less correlation there is between the fund and the index, and the less reliable beta is as an indicator of volatility.
Earnings Growth Rate. The average annual rate of growth in earnings over the past five years for the stocks now in a fund.
Equity Exposure. A measure that reflects a fund’s investments in stocks and stock futures. Any holdings in short-term reserves are excluded.
Expense Ratio. The percentage of a fund’s average net assets used to pay its annual administrative and advisory expenses. These expenses directly reduce returns to investors.
Foreign Holdings. The percentage of a fund represented by stocks or depositary receipts of companies based outside the United States.
Inception Date. The date on which the assets of a fund (or one of its share classes) are first invested in accordance with the fund’s investment objective. For funds with a subscription period, the inception date is the day after that period ends. Investment performance is measured from the inception date.
Median Market Cap. An indicator of the size of companies in which a fund invests; the midpoint of market capitalization (market price x shares outstanding) of a fund’s stocks, weighted by the proportion of the fund’s assets invested in each stock. Stocks representing half of the fund’s assets have market capitalizations above the median, and the rest are below it.
Price/Book Ratio. The share price of a stock divided by its net worth, or book value, per share. For a fund, the weighted average price/book ratio of the stocks it holds.
Price/Earnings Ratio. The ratio of a stock’s current price to its per-share earnings over the past year. For a fund, the weighted average P/E of the stocks it holds. P/E is an indicator of market expectations about corporate prospects; the higher the P/E, the greater the expectations for a company’s future growth.
R-Squared. A measure of how much of a fund’s past returns can be explained by the returns from the market in general, as measured by a given index. If a fund’s total returns were precisely synchronized with an index’s returns, its R-squared would be 1.00. If the fund’s returns bore no relationship to the index’s returns, its R-squared would be 0. For this report, R-squared is based on returns over the past 36 months for both the fund and the index.
Return on Equity. The annual average rate of return generated by a company during the past five years for each dollar of shareholder’s equity (net income divided by shareholder’s equity). For a fund, the weighted average return on equity for the companies whose stocks it holds.
32
Short-Term Reserves. The percentage of a fund invested in highly liquid, short-term securities that can be readily converted to cash.
Turnover Rate. An indication of the fund’s trading activity. Funds with high turnover rates incur higher transaction costs and may be more likely to distribute capital gains (which may be taxable to investors). The turnover rate excludes in-kind transactions, which have minimal impact on costs.
Yield. A fund’s 30-day SEC yield is derived using a formula specified by the U.S. Securities and Exchange Commission. Under the formula, data related to the fund’s security holdings in the previous 30 days are used to calculate the fund’s hypothetical net income for that period, which is then annualized and divided by the fund’s estimated average net assets over the calculation period. For the purposes of this calculation, a security’s income is based on its current market yield to maturity (in the case of bonds) or its projected dividend yield (for stocks). Because the SEC yield represents hypothetical annualized income, it will differ—at times significantly—from the fund’s actual experience. As a result, the fund’s income distributions may be higher or lower than implied by the SEC yield.
33
This page intentionally left blank.
This page intentionally left blank.
The People Who Govern Your Fund
The trustees of your mutual fund are there to see that the fund is operated and managed in your best interests since, as a shareholder, you are a part owner of the fund. Your fund’s trustees also serve on the board of directors of The Vanguard Group, Inc., which is owned by the Vanguard funds and provides services to them on an at-cost basis.
A majority of Vanguard’s board members are independent, meaning that they have no affiliation with Vanguard or the funds they oversee, apart from the sizable personal investments they have made as private individuals. The independent board members have distinguished backgrounds in business, academia, and public service. Each of the trustees and executive officers oversees 156 Vanguard funds.
The following table provides information for each trustee and executive officer of the fund. More information about the trustees is in the Statement of Additional Information, which can be obtained, without charge, by contacting Vanguard at 800-662-7447, or online at www.vanguard.com.
| |
| Interested Trustees | Emerson U. Fullwood |
| | Born 1948. Trustee Since January 2008. Principal |
| John J. Brennan1 | Occupation(s) During the Past Five Years: Executive |
| Born 1954. Trustee Since May 1987. Chairman of | Chief Staff and Marketing Officer for North America |
| the Board. Principal Occupation(s) During the Past | and Corporate Vice President (retired 2008) of Xerox |
| Five Years: Chairman of the Board and Director/Trustee | Corporation (photocopiers and printers); Director of |
| of The Vanguard Group, Inc., and of each of the | SPX Corporation (multi-industry manufacturing), the |
| investment companies served by The Vanguard Group; | United Way of Rochester, the Boy Scouts of America, |
| Chief Executive Officer (1996–2008) and President | Amerigroup Corporation (direct health and medical |
| (1989–2008) of The Vanguard Group and of each of the | insurance carriers), and Monroe Community College |
| investment companies served by The Vanguard Group; | Foundation. |
| Chairman of the Financial Accounting Foundation; | |
| Governor of the Financial Industry Regulatory Authority | Rajiv L. Gupta |
| (FINRA); Director of United Way of Southeastern | Born 1945. Trustee Since December 2001.2 Principal |
| Pennsylvania. | Occupation(s) During the Past Five Years: Chairman |
| | and Chief Executive Officer (retired 2009) and President |
| F. William McNabb III1 | (2006–2008) of Rohm and Haas Co. (chemicals); Board |
| Born 1957. Trustee Since July 2009. Principal | Member of American Chemistry Council; Director of |
| Occupation(s) During the Past Five Years: Director of | Tyco International, Ltd. (diversified manufacturing and |
| The Vanguard Group, Inc., since 2008; Chief Executive | services) and Hewlett-Packard Co. (electronic computer |
| Officer and President of The Vanguard Group and of | manufacturing); Trustee of The Conference Board. |
| each of the investment companies served by The | |
| Vanguard Group since 2008; Director of Vanguard | Amy Gutmann |
| Marketing Corporation; Managing Director of The | Born 1949. Trustee Since June 2006. Principal |
| Vanguard Group (1995–2008). | Occupation(s) During the Past Five Years: President of |
| | the University of Pennsylvania; Christopher H. Browne |
| | Distinguished Professor of Political Science in the School |
| Independent Trustees | of Arts and Sciences with secondary appointments |
| | at the Annenberg School for Communication and the |
| Charles D. Ellis | Graduate School of Education of the University of |
| Born 1937. Trustee Since January 2001. Principal | Pennsylvania; Director of Carnegie Corporation of |
| Occupation(s) During the Past Five Years: Applecore | New York, Schuylkill River Development Corporation, |
| Partners (pro bono ventures in education); Senior | and Greater Philadelphia Chamber of Commerce; |
| Advisor to Greenwich Associates (international business | Trustee of the National Constitution Center. |
| strategy consulting); Successor Trustee of Yale University; | |
| Overseer of the Stern School of Business at New York | |
| University; Trustee of the Whitehead Institute for | |
| Biomedical Research. | |
| | |
| JoAnn Heffernan Heisen | Executive Officers | |
| Born 1950. Trustee Since July 1998. Principal | | |
| Occupation(s) During the Past Five Years: Corporate | Thomas J. Higgins1 | |
| Vice President and Chief Global Diversity Officer since | Born 1957. Chief Financial Officer Since September |
| 2006 (retired 2008) and Member of the Executive | 2008. Principal Occupation(s) During the Past Five |
| Committee (retired 2008) of Johnson & Johnson | Years: Principal of The Vanguard Group, Inc.; Chief |
| (pharmaceuticals/consumer products); Vice President | Financial Officer of each of the investment companies |
| and Chief Information Officer of Johnson & Johnson | served by The Vanguard Group since 2008; Treasurer |
| (1997–2005); Director of the University Medical Center | of each of the investment companies served by The |
| at Princeton and Women’s Research and Education | Vanguard Group (1998–2008). |
| Institute. | | |
| |
| | Kathryn J. Hyatt1 | |
| André F. Perold | Born 1955. Treasurer Since November 2008. Principal |
| Born 1952. Trustee Since December 2004. Principal | Occupation(s) During the Past Five Years: Principal of |
| Occupation(s) During the Past Five Years: George Gund | The Vanguard Group, Inc.; Treasurer of each of the |
| Professor of Finance and Banking, Harvard Business | investment companies served by The Vanguard |
| School; Chairman of UNX, Inc. (equities trading firm); | Group since 2008; Assistant Treasurer of each of the |
| Chair of the Investment Committee of HighVista | investment companies served by The Vanguard Group |
| Strategies LLC (private investment firm). | (1988–2008). | |
| |
| Alfred M. Rankin, Jr. | Heidi Stam1 | |
| Born 1941. Trustee Since January 1993. Principal | Born 1956. Secretary Since July 2005. Principal |
| Occupation(s) During the Past Five Years: Chairman, | Occupation(s) During the Past Five Years: Managing |
| President, and Chief Executive Officer of NACCO | Director of The Vanguard Group, Inc., since 2006; |
| Industries, Inc. (forklift trucks/housewares/lignite); | General Counsel of The Vanguard Group since 2005; |
| Director of Goodrich Corporation (industrial products/ | Secretary of The Vanguard Group and of each of the |
| aircraft systems and services); Deputy Chairman of | investment companies served by The Vanguard Group |
| the Federal Reserve Bank of Cleveland. | since 2005; Director and Senior Vice President of |
| | Vanguard Marketing Corporation since 2005; Principal |
| Peter F. Volanakis | of The Vanguard Group (1997–2006). |
| Born 1955. Trustee Since July 2009. Principal | | |
| Occupation(s) During the Past Five Years: President | | |
| since 2007 and Chief Operating Officer since 2005 | Vanguard Senior Management Team |
| of Corning Incorporated (communications equipment); | | |
| President of Corning Technologies (2001–2005); Director | R. Gregory Barton | Michael S. Miller |
| of Corning Incorporated and Dow Corning; Trustee of | Mortimer J. Buckley | James M. Norris |
| the Corning Incorporated Foundation and the Corning | Kathleen C. Gubanich | Glenn W. Reed |
| Museum of Glass; Overseer of the Amos Tuck School | Paul A. Heller | George U. Sauter |
| of Business Administration at Dartmouth College. | | |
| |
| | Founder | |
| |
| | John C. Bogle | |
| | Chairman and Chief Executive Officer, 1974–1996 |
1 These individuals are “interested persons” as defined in the Investment Company Act of 1940.
2 December 2002 for Vanguard Equity Income Fund, Vanguard Growth Equity Fund, the Vanguard Municipal Bond Funds, and the Vanguard
State Tax-Exempt Funds.
| |  |
| | | P.O. Box 2600 |
| | | Valley Forge, PA 19482-2600 |
| |
| |
| |
| |
| Connect with Vanguard® > www.vanguard.com |
| |
| Fund Information > 800-662-7447 | All comparative mutual fund data are from Lipper Inc. |
| | or Morningstar, Inc., unless otherwise noted. |
| Direct Investor Account Services > 800-662-2739 | |
| | |
| Institutional Investor Services > 800-523-1036 | You can obtain a free copy of Vanguard’s proxy voting |
| | guidelines by visiting our website, www.vanguard.com, |
| Text Telephone for People | and searching for “proxy voting guidelines,” or by |
| With Hearing Impairment > 800-952-3335 | calling Vanguard at 800-662-2739. The guidelines are |
| | also available from the SEC’s website, www.sec.gov. |
| | In addition, you may obtain a free report on how your |
| | fund voted the proxies for securities it owned during |
| This material may be used in conjunction | the 12 months ended June 30. To get the report, visit |
| with the offering of shares of any Vanguard | either www.vanguard.com or www.sec.gov. |
| fund only if preceded or accompanied by | |
| the fund’s current prospectus. | You can review and copy information about your fund |
| | at the SEC’s Public Reference Room in Washington, D.C. |
| | To find out more about this public service, call the SEC |
| | at 202-551-8090. Information about your fund is also |
| | available on the SEC’s website, and you can receive |
| | copies of this information, for a fee, by sending a |
| | request in either of two ways: via e-mail addressed to |
| | publicinfo@sec.gov or via regular mail addressed to the |
| | Public Reference Section, Securities and Exchange |
| | Commission, Washington, DC 20549-0102. |
| |
| |
| |
| |
| | © 2009 The Vanguard Group, Inc. |
| | All rights reserved. |
| | Vanguard Marketing Corporation, Distributor. |
| | Q1110 112009 |
 |
| Vanguard Global Equity Fund |
| Annual Report |
|
|
| September 30, 2009 |
|
 |
|
|
> For the fiscal year ended September 30, 2009, Vanguard Global Equity Fund returned about –2%.
> The fund’s performance trailed the return of its benchmark index and the average return of peer funds.
> Rebounding from a global sell-off, emerging-market stocks posted healthy gains; returns were negative in the United States and tepid in other developed markets.
| See page 41 for a Notice to Shareholders concerning one of the fund’s investment advisors. |
| |
| Contents | |
| |
| Your Fund’s Total Returns | 1 |
| President’s Letter | 2 |
| Advisors’ Report | 8 |
| Results of Proxy Voting | 13 |
| Fund Profile | 14 |
| Performance Summary | 16 |
| Financial Statements | 17 |
| Your Fund’s After-Tax Returns | 38 |
| About Your Fund’s Expenses | 39 |
| Glossary | 43 |
Please note: The opinions expressed in this report are just that—informed opinions. They should not be considered promises or advice. Also, please keep in mind that the information and opinions cover the period through the date on the front of this report. Of course, the risks of investing in your fund are spelled out in the prospectus.
Cover photograph: Veronica Coia.
Your Fund’s Total Returns
| | |
| Fiscal Year Ended September 30, 2009 | | |
| | Ticker | Total |
| | Symbol | Returns |
| Vanguard Global Equity Fund | VHGEX | –2.30% |
| MSCI All Country World Index | | –0.11 |
| Global Funds Average1 | | 0.10 |
| | | | |
| Your Fund’s Performance at a Glance | | | | |
| September 30, 2008–September 30, 2009 | | | | |
| | | | Distributions Per Share |
| | Starting | Ending | Income | Capital |
| | Share Price | Share Price | Dividends | Gains |
| Vanguard Global Equity Fund | $16.64 | $15.49 | $0.573 | $0.000 |
1 Derived from data provided by Lipper Inc.
1

President’s Letter
Dear Shareholder,
In an extremely volatile period in the global stock markets, Vanguard Global Equity Fund returned about –2% for the fiscal year ended September 30, 2009. This performance trailed that of the fund’s market benchmark, the Morgan Stanley Capital International All Country World Index, and the average return of global peer funds.
The first six months of the fiscal year were a time of severe gloom in global stock markets as credit markets froze and economic activity downshifted. Foreign governments’ stimulus programs gained traction during the second half of the fiscal year, and global stock markets bounced back strongly.
Emerging markets outperformed developed markets during the period, which helped performance because the fund’s advisors emphasized investments in these markets. But those gains were more than offset by underperforming stocks in the United States and Europe.
If you invest in the fund through a taxable account, page 38 shows after-tax returns for investors in the highest tax bracket.
After a precipitous fall, stock markets rebound
In recent months, the financial markets have performed so strongly that it’s almost hard to remember that less than a year ago the global financial system stood on
2
the brink of collapse. Since then, markets have pulled back from the abyss. Although unemployment remains near generational highs and the prospect of a rapid recovery seems dim, the global economy has begun to grind into gear.
Reminders of the markets’ dark days are nevertheless apparent in the index returns for both the past 12 months and the past three years. Over both periods, U.S. stocks recorded negative returns. Global stocks did better over the past 12 months, recouping their late-2008 losses thanks to general strength in developed economies and a powerful rally in emerging markets.
Over the past three years, however, international stocks posted a modestly negative return.
The bond market’s turnabout has been equally dramatic
The stock market’s collapse and recovery echo even more dramatic developments in the bond market. At the end of 2008, as the credit markets nearly ceased to function, the difference between the yields of corporate bonds and Treasury bonds spiked to levels last seen during the Great Depression.
The Federal Reserve and its central bank counterparts around the world responded with aggressive monetary stimulus efforts, while global governments opened the fiscal taps. Investors first tiptoed, then stampeded, back into the market, boosting bond prices and bringing down yields. Over the past 12 months, taxable U.S. bonds returned more than 10%; municipal
| | | |
| Market Barometer | | | |
| | | Average Annual Total Returns |
| | | Periods Ended September 30, 2009 |
| | One Year | Three Years | Five Years |
| Stocks | | | |
| MSCI All Country World Index ex USA (International) | 6.43% | –0.78% | 8.59% |
| Russell 1000 Index (Large-caps) | –6.14 | –5.10 | 1.49 |
| Russell 2000 Index (Small-caps) | –9.55 | –4.57 | 2.41 |
| Dow Jones U.S. Total Stock Market Index | –5.83 | –4.58 | 1.93 |
| |
| Bonds | | | |
| Barclays Capital U.S. Aggregate Bond Index | | | |
| (Broad taxable market) | 10.56% | 6.41% | 5.13% |
| Barclays Capital Municipal Bond Index | 14.85 | 5.13 | 4.78 |
| Citigroup 3-Month Treasury Bill Index | 0.39 | 2.63 | 2.96 |
| |
| CPI | | | |
| Consumer Price Index | –1.29% | 2.10% | 2.61% |
3
securities did even better, returning almost 15%, as measured by the Barclays Capital Municipal Bond Index.
The Fed’s rescue campaign has imposed a heavy price on short-term savings vehicles such as money market funds. In December 2008, the Fed reduced its target for the federal funds rate—a benchmark for the interest rates paid by money market instruments and other very short-term securities—to between 0% and 0.25%. The Fed has said it expects to maintain its target at this level “for an extended period.”
Second-half rally nearly offset earlier losses
Global stock markets opened the fiscal year plagued by the credit crisis that began in the United States and the economic slowdown that followed. While the markets staged a solid rally over the year’s second half, the gains weren’t quite enough to offset the steep losses incurred earlier in the period.
Emerging-market stocks were the best performers as they made an impressive comeback over the last six months. Your fund’s advisors reaped the benefits of opportunistically investing more in emerging markets (about 15% of fund assets, on average) than if they had matched these markets’ overall share of global capitalization. The fund benefited
| | |
| Expense Ratios1 | | |
| Your Fund Compared With Its Peer Group | | |
| |
| | | Global Funds |
| | Fund | Average |
| Global Equity Fund | 0.58% | 1.49% |
1 The fund expense ratio shown is from the prospectus dated January 28, 2009, and represents estimated costs for the current fiscal year based on the fund’s net assets as of the prospectus date. For the fiscal year ended September 30, 2009, the fund’s expense ratio was 0.47%. The peer-group expense ratio is derived from data provided by Lipper Inc. and captures information through year-end 2008.
4
particularly from investments in South Korea, Taiwan, and India, where economies less burdened by banking woes were able to reenergize themselves quickly. While the largest emerging market, China, performed very well, the fund’s advisors underemphasized Chinese stocks during the period, holding back the fund’s performance a bit.
The fund was hurt the most by its holdings in the United States and Canada. Stocks such as energy companies ConocoPhillips and Sunoco dragged down returns as oil demand fell. Reduced demand for commodities and natural resources also hurt holdings such as Mosaic, the fertilizer producer. On the other hand, the fund’s four best contributors proved to be U.S. holdings: food provider McDonald’s, conglomerate General Electric, asset manager State Street, and internet travel agent Priceline.com.
Elsewhere, the advisors’ selections in Europe and Japan proved to be subpar performers. In fact, the fund’s biggest detractors were Japanese electronics manufacturer Hitachi, German energy services provider E. ON AG, and the Dutch insurance giant ING Groep. On the positive side of the ledger, the fund’s best-performing holdings in any one market proved to be those in Hong Kong, where profitable selections were rewarded in the world’s gateway to the fast-growing Asian marketplace.
| |
| Total Returns | |
| Ten Years Ended September 30, 2009 | |
| | Average |
| | Annual Return |
| Global Equity Fund | 6.29% |
| MSCI All Country World Index | 1.90 |
| Global Funds Average1 | 1.63 |
The figures shown represent past performance, which is not a guarantee of future results. (Current performance may be lower or higher than the performance data cited. For performance data current to the most recent month-end, visit our website at www.vanguard.com/performance.) Note, too, that both investment returns and principal value can fluctuate widely, so an investor’s shares, when sold, could be worth more or less than their original cost.
1 Derived from data provided by Lipper Inc.
5
Among sectors, the fund’s best holdings were in consumer discretionary, especially in the restaurant segment. The advisors also managed to limit the damage inflicted on the financial sector, by emphasizing the better-performing names in that troubled industry. But poor selection among information technology firms, particularly in IT services, hurt performance. Lagging holdings also hurt in telecommunications and energy.
For more about the advisors’ strategies and the fund’s positioning during the year, see the Advisors’ Report that follows this letter.
Ten-year record tops benchmark, peers
In a decade marked by historic volatility and two severe bear markets, Vanguard Global Equity Fund has outperformed its unmanaged benchmark index and its peer group. The fund’s average annual return of more than 6% during the past 10 years was more than 4 percentage points better than that of its benchmark and its peer-group average.
This performance is a credit to the skills, knowledge, and experience of the investment professionals who advise your fund. Marathon Asset Management LLP has managed the fund since its 1995 inception; Acadian Asset Management LLC joined as an advisor in 2004, followed by AllianceBernstein L.P. in 2006 and Baillie Gifford Overseas Ltd. in 2008. All four firms have many years of experience in investing around the world.
As a shareholder, you have also benefited from the fund’s low costs, which allow you to keep more of its return.
Global investing has a role in a diversified portfolio
After several years of superior returns, international markets suffered even more than U.S. stocks during the global financial crisis. The results led some U.S. investors to question the value of investing abroad and enlivened the debate about whether international stocks truly serve to diversify a portfolio.
However, the recovery we’ve seen in the spring and summer shows the value of diversifying across the world. While the U.S. market grappled with a historic credit crisis, other developed countries were less damaged by the fallout. And emerging markets proved to be even more resilient, generating strong returns as their growth was slowed but not stopped by the banking problems elsewhere. Global investing also provides currency diversification. The U.S. dollar declined against most currencies during the fiscal year, which provided a bit of extra return for U.S. investors holding foreign assets.
6
In short, while the past year’s extreme turbulence has no doubt been frustrating for investors, it’s crucial not to let short-term volatility prevent you from considering the long-term merits of investing across the world. As stocks worldwide rode a roller coaster last year, an impulsive retreat from the markets would have kept an investor from participating in the strong rally in the second half of the period. The Global Equity Fund provides continual exposure to the worldwide marketplace, allowing it to play a valuable role in a well-balanced and diversified portfolio.
Thank you for investing with Vanguard.
Sincerely,

F. William McNabb III
President and Chief Executive Officer
October 15, 2009
7
Advisors’ Report
During the fiscal year ended September 30, 2009, the Global Equity Fund returned –2.30%, reflecting the combined results of your fund’s independent investment advisors. The use of multiple advisors enhances the fund’s diversification by providing exposure to distinct, yet complementary, investment approaches. It’s not uncommon for different advisors to have different views about individual securities or the broader investment environment.
The advisors, the percentage of fund assets each manages, and brief descriptions of their investment strategies are presented in the table below. The advisors have also prepared a discussion of the investment environment that existed during the fiscal year and of how portfolio positioning reflects this assessment. These comments were prepared on October 21, 2009.
Acadian Asset Management LLC
Portfolio Managers:
John R. Chisholm, CFA, Executive Vice President and Co-Chief Investment Officer
Ronald D. Frashure, CFA, President and Chief Executive Officer
Brian K. Wolahan, CFA, Senior Vice President and Director of Alternative Strategies
Amid a severe recession and the complete restructuring of the global financial system, markets in late 2008 were roiled by historic volatility. This period was also characterized by sweeping external trends such as
| | | |
| Vanguard Global Equity Fund Investment Advisors | |
| |
| Fund Assets Managed | |
| Investment Advisor | % | $ Million | Investment Strategy |
| Acadian Asset Management LLC | 35 | 1,322 | A quantitative, active, bottom-up investment process |
| | | | that combines stock and peer-group valuation to arrive at |
| | | | a return forecast for each of more than 40,000 securities |
| | | | in the global universe. |
| Marathon Asset Management LLP | 33 | 1,256 | A long-term and contrarian investment philosophy and |
| | | | process with a focus on industry capital cycle analysis |
| | | | and in-depth management assessment. |
| AllianceBernstein L.P. | 25 | 950 | A fundamentally based, research-driven approach, |
| | | | focused on finding companies whose long-term |
| | | | earnings power exceeds the level implied by their |
| | | | current stock price. Proprietary quantitative tools |
| | | | aid risk control and portfolio construction. |
| Baillie Gifford Overseas Ltd. | 4 | 160 | The advisor seeks stocks that can generate above- |
| | | | average growth in earnings and cash flow, producing |
| | | | a bottom-up, stock-driven approach to country and |
| | | | asset allocation. An in-depth view on each company |
| | | | is measured against the consensus view, leading to |
| | | | discrepancies and potential opportunities to add value. |
| Cash Investments | 3 | 125 | These short-term reserves are invested by Vanguard in |
| | | | equity index products to simulate investment in stocks. |
| | | | Each advisor may also maintain a modest cash position. |
8
deleveraging and forced outflows from hedge funds, mutual funds, and trading desks. In addition, the decline of the global economy and crash in oil prices led to rapid sector regime shifts, in particular away from materials and energy stocks. Financial stocks also saw unprecedented volatility in prices.
The difficult conditions continued into 2009. The first quarter saw a V-shaped pattern in which deeply negative returns in January and February were mitigated by more favorable results beginning in March, accompanied by a dramatic shift in market sentiment. A focus on lower-quality stocks with depressed share prices led to a “junk rally” in which many factors used in quantitative strategies, especially momentum, underperformed severely. Value stocks faced two distinct environments, under-performing sharply in the earlier, risk-averse part of the period, and later recovering, although higher-quality value stocks remained depressed. Equity markets rebounded in the third quarter of 2009 as signs of global economic recovery became more abundant and corporate profits exceeded investors’ reduced expectations, although low-quality stocks continued to dominate.
In this environment, our portfolio continued to be focused on attractively valued stocks that appeared likely to rise in price based on earnings data, price characteristics, and quality. Key overweighted markets in the portfolio, based on bottom-up stock selection, were the United States, Japan, and France. Korea, Taiwan, and India were also overweighted. The United Kingdom, Switzerland, and Canada were under-weighted. Important sector weights included health care, information technology, and telecommunication services.
Stock selection in the United States was the largest source of negative return in our portfolio. Selections in the energy and materials sectors were among the most costly, as commodities retreated from their mid-2008 highs before showing some recovery in the second half of the period. U.S. technology stocks also hurt the portfolio as lower earnings and a muted outlook led companies to reduce their expenditures on hardware and services. Stock selection in Japan and France also proved costly.
From a sector standpoint, an underweighted allocation to financials added value, while overweighting health care stocks detracted notably.
Marathon Asset Management LLP
Portfolio Managers:
Jeremy J. Hosking, Investment Director
Neil M. Ostrer, Investment Director
William J. Arah, Investment Director
The incredible volatility in stock markets over the last 12 months has been well documented, including the striking split between the decline into March and the subsequent sharp rally. The portfolio’s positioning has been largely consistent throughout, with turnover low even by Marathon standards. Our incremental purchases have modestly increased cyclical positioning such as U.S. homebuilders, financials, and Hong Kong real estate.
9
On a geographical basis, stock selection in Europe, Japan, and especially Asia outside of Japan provided a significant boost. Among sectors, primary contributors included our holdings in financials—such as real estate companies like New World Development in Hong Kong and SL Green in New York—and consumer discretionary—notably longstanding positions in Internet retail firms such as Priceline.com, Amazon.com, and Blue Nile.
Looking forward, the overall prognosis continues to be that conditions will remain favorable for capital markets, especially equities, while mixed for the real economy. In 12 months’ time we expect global equities to be at higher levels as delever-aging continues to create “equity value” despite new-share issuance. Economic recovery and the positive effect that would have on corporate profits would be an added bonus.
The past decade has included the technology, media, and telecom bust at the beginning and the financial crisis at the end. It has been a poor extended period for equity investing and, to judge by the low interest rates and the very high level of outstanding balances in money market funds (about $3.5 trillion at the end of the period), has been marked by a tendency toward extreme risk aversion. This should lay the foundation for improved equity returns. The main risk may be a return of inflation owing to the extreme monetary policies pursued over the past year. However, given current interest rates, government bonds would be especially vulnerable to inflationary fears. In contrast, equities might take this in their stride, and indeed benefit, because of their inflation-hedge attributes.
All this having been said, it remains possible that the equity markets are overheated in the short run and a correction is in order. Should this occur, investor sentiment would deteriorate quickly and arguably lay the foundation for a further rally. With regard to emerging markets, their outperformance this year reflects the fact that they are less exposed to the Western credit crisis than most analysts thought last year, and going forward these economies are likely to grow even faster, relatively speaking, than those in the West. Thus the outlook is for valuations of emerging markets stocks to increase relative to those of developed market equities.
AllianceBernstein L.P.
Portfolio Managers:
Sharon E. Fay, CFA, Head of Bernstein Value Equities and Chief Investment Officer–Global Value Equities
Kevin F. Simms, Co-Chief Investment Officer–International Value Equities and Director of Research–Global Value Equities
Henry S. D’Auria, CFA, Co-Chief Investment Officer–International Value Equities and Chief Investment Officer–Emerging Markets Value Equities
After heightened investor anxiety dominated the first five months of the period, a sense of normality is returning to markets. Equities rallied from March through September, as investors gained confidence that the global
10
economy was emerging from a deep recession and business conditions began to gradually improve.
However, there is still uncertainty about the outlook for corporate earnings. In this environment, research-based stock selection is likely to be a key to resolving the controversies faced by companies as they claw their way back to profitability.
We’re focusing on many company-specific opportunities. We have some exposure to economically sensitive companies as well as to stocks from sectors that are not traditionally viewed as “value” but offer a rare combination of attractive valuations and resilient cash flows.
In the economically sensitive camp, we have increased our portfolio’s exposure to consumer cyclicals, such as Vivendi, the French media and telecom group. Weakening margins have undermined confidence in Vivendi’s wireless unit, SFR. We expect synergies from the integration of SFR with Vivendi’s fixed-line unit and strong market share in France to restore profitability. Vivendi’s shares trade at a deep discount to the value of its component parts.
Medical stocks have historically traded at expensive valuations. But the sector has recently traded at a substantial discount to the market because of concern about U.S. health care reform and fears of a wave of patent expirations across the industry. In our view, some drug makers are being unfairly tarnished by the controversies.
For example, AstraZeneca is vulnerable to patent expirations, with $21.5 billion of its revenue at risk over the next seven years. But the U.K. company’s strong pipeline appears underappreciated by the market, and could generate between $8.5 billion and $9.5 billion in annual revenue to partially offset lost revenues. AstraZeneca has also been cutting costs aggressively.
The portfolio’s performance was a tale of two distinct periods. During the first five months through the end of February, the portfolio struggled as value stocks suffered. Since March, the portfolio has rebounded during the market rally.
Since the rally began, financials and consumer cyclicals have been the biggest contributors to portfolio performance. Gains have been widespread across sectors and bolster our confidence that the portfolio is well-positioned for the current market environment.
The portfolio has delivered healthy performance since the trough, raising questions about how much more progress it can make. But the pace of recovery has not been unusual by historical standards. Returns generated from value strategies so far are about average since 1971.
We believe that there is still significant potential for strong performance ahead, as the current value recovery began just two quarters ago, while the last five value cycles have lasted nearly five years on average.
11
Baillie Gifford Overseas Ltd.
Portfolio Managers:
Charles Plowden, Joint Senior Partner and Lead Portfolio Manager
Spencer Adair, CFA, Investment Manager
Malcolm MacColl, Investment Manager
The great recession of 2009 did not turn out to be as great as some had feared, and the market rose strongly during the second half of the period. There have been two principal reasons for this. First, governments reacted swiftly and in a coordinated fashion to reduce interest rates and pump liquidity into the market. Second, those markets that are termed “emerging” have sailed through the choppy waters without serious mishap. The very fact that this has happened should call into question the name we have burdened these economies with.
We are pleased to find that our companies are in good health. We continue to see opportunities for businesses that have protected their balance sheets, and can take market share as their competitors falter. Svenska Handelsbanken (a Swedish bank), Cisco (the U.S. company providing the nuts and bolts for the Internet), and Walmex (the Mexican retailer) are good examples. We have added several new holdings, among them financial companies with strong growth prospects, such as Garanti Bankasi (Turkey), New York Community Bancorp (United States), and Deutsche Boerse (Germany).
Turning our eyes to the horizon, it appears that consumers and governments in Asia and Latin America will continue to have robust balance sheets, and therefore this segment of the global economy looks promising. The Chinese economy is benefiting from a stimulus package that at purchasing power parity is at least as large as that of the United States. The larger-than-expected majority with which the Congress Party won the Indian election has given it a mandate to significantly improve the country’s infrastructure. And Brazil’s oil wealth and sensible economic management have helped it avoid a crisis that has been the norm in previous downturns. It can also now look forward to holding the Olympics in 2016.
The backdrop in the traditionally established economies is less exciting, especially given that the monetary support we have seen will need to be withdrawn at some stage. As the period closed, Australia became the first G20 country to raise interest rates. As other countries follow suit with tighter monetary policies, there will be a new headwind to contend with.
Growth is likely to be slower than before the recession, but prospects for investors remain exciting. The withdrawal of capital from the world economy provides strong companies that have genuine competitive advantages with opportunities to prosper as their edge is less likely to be eroded by rivals financed in an unsustainable manner by cheap money.
12
Results of Proxy Voting
At a special meeting of shareholders on July 2, 2009, fund shareholders approved the following two proposals:
Proposal 1—Elect trustees for each fund.*
The individuals listed in the table below were elected as trustees for each fund. All trustees with the exception of Messrs. McNabb and Volanakis (both of whom already served as directors of The Vanguard Group, Inc.) served as trustees to the funds prior to the shareholder meeting.
| | | |
| | | | Percentage |
| Trustee | For | Withheld | For |
| John J. Brennan | 517,264,433 | 14,297,196 | 97.3% |
| Charles D. Ellis | 501,913,782 | 29,647,847 | 94.4% |
| Emerson U. Fullwood | 507,851,847 | 23,709,782 | 95.5% |
| Rajiv L. Gupta | 515,891,359 | 15,670,270 | 97.1% |
| Amy Gutmann | 517,356,594 | 14,205,035 | 97.3% |
| JoAnn Heffernan Heisen | 516,532,227 | 15,029,403 | 97.2% |
| F. William McNabb III | 516,660,098 | 14,901,531 | 97.2% |
| André F. Perold | 507,715,282 | 23,846,348 | 95.5% |
| Alfred M. Rankin, Jr. | 516,327,018 | 15,234,611 | 97.1% |
| Peter F. Volanakis | 516,503,576 | 15,058,053 | 97.2% |
| * Results are for all funds within the same trust. | | | |
Proposal 2—Update and standardize the funds’ fundamental policies regarding:
(a) Purchasing and selling real estate. (b) Issuing senior securities.
(c) Borrowing money. (d) Making loans.
(e) Purchasing and selling commodities.
(f) Concentrating investments in a particular industry or group of industries.
(g) Eliminating outdated fundamental investment policies not required by law.
The revised fundamental policies are clearly stated and simple, yet comprehensive, making oversight and compliance more efficient than under the former policies. The revised fundamental policies will allow the funds to respond more quickly to regulatory and market changes, while avoiding the costs and delays associated with successive shareholder meetings.
| | | | | |
| | | | | Broker | Percentage |
| Global Equity Fund | For | Abstain | Against | Non-Votes | For |
| 2a | 159,807,866 | 4,326,012 | 4,427,315 | 15,326,285 | 86.9% |
| 2b | 158,846,090 | 4,831,696 | 4,883,414 | 15,326,278 | 86.4% |
| 2c | 156,945,661 | 4,618,279 | 6,997,258 | 15,326,279 | 85.3% |
| 2d | 157,039,602 | 4,705,298 | 6,816,298 | 15,326,279 | 85.4% |
| 2e | 158,420,395 | 4,500,665 | 5,640,136 | 15,326,281 | 86.2% |
| 2f | 158,729,804 | 4,553,593 | 5,277,801 | 15,326,280 | 86.3% |
| 2g | 158,339,235 | 4,879,020 | 5,342,945 | 15,326,278 | 86.1% |
13
Global Equity Fund
Fund Profile
As of September 30, 2009
| | |
| Portfolio Characteristics | | |
| | | Comparative |
| | Fund | Index1 |
| Number of Stocks | 785 | 2,405 |
| Turnover Rate | 71% | — |
| Expense Ratio2 | 0.58% | — |
| Short-Term Reserves | 0.5% | — |
| | |
| Sector Diversification (% of equity exposure) |
| | | Comparative |
| | Fund | Index1 |
| Consumer Discretionary | 13.3% | 8.8% |
| Consumer Staples | 7.6 | 9.4 |
| Energy | 7.3 | 11.4 |
| Financials | 22.0 | 21.8 |
| Health Care | 10.0 | 9.1 |
| Industrials | 12.4 | 10.1 |
| Information Technology | 12.1 | 11.8 |
| Materials | 5.4 | 7.9 |
| Telecommunication Services | 7.3 | 5.1 |
| Utilities | 2.6 | 4.6 |
| |
| Volatility Measures3 | |
| | Fund Versus |
| | Comparative Index1 |
| R-Squared | 0.99 |
| Beta | 1.12 |
| | |
| Ten Largest Holdings4 (% of total net assets) |
| |
| Royal Dutch Shell PLC | integrated oil | |
| | and gas | 1.9% |
| Pfizer Inc. | pharmaceuticals | 1.6 |
| Sanofi-Aventis SA | pharmaceuticals | 1.5 |
| Altria Group Inc. | tobacco | 1.1 |
| Cablevision Systems Corp. | | |
| Class A | cable and satellite | 0.9 |
| Wal-Mart Stores, Inc. | hypermarkets and | |
| | super centers | 0.8 |
| Enel SPA | electric utilities | 0.8 |
| AmerisourceBergen Corp. | health care | |
| Class A | distributors | 0.8 |
| Vodafone Group PLC | wireless | |
| | telecommunication | |
| | services | 0.8 |
| State Street Corp. | asset management | |
| | and custody banks | 0.8 |
| Top Ten | | 11.0% |
Allocation by Region (% of equity exposure)
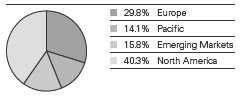
1 MSCI All Country World Index.
2 The expense ratio shown is from the prospectus dated January 28, 2009, and represents estimated costs for the current fiscal year based on the fund’s net assets as of the prospectus date. For the fiscal year ended September 30, 2009, the fund’s expense ratio was 0.47%.
3 For an explanation of R-squared, beta, and other terms used here, see the Glossary.
4 The holdings listed exclude any temporary cash investments and equity index products.
14
Global Equity Fund
| | |
| Market Diversification (% of equity exposure) |
| | | Comparative |
| | Fund1 | Index2 |
| Europe | | |
| United Kingdom | 10.0% | 8.7% |
| France | 5.5 | 4.6 |
| Germany | 4.8 | 3.4 |
| Italy | 2.5 | 1.6 |
| Switzerland | 1.4 | 3.2 |
| Sweden | 1.3 | 1.1 |
| Netherlands | 1.2 | 1.1 |
| Spain | 1.2 | 2.0 |
| Other European Markets | 1.9 | 2.2 |
| Subtotal | 29.8% | 27.9% |
| Pacific | | |
| Japan | 8.1% | 8.9% |
| Australia | 2.1 | 3.4 |
| Singapore | 2.1 | 0.6 |
| Hong Kong | 1.8 | 1.0 |
| Other Pacific Markets | 0.0 | 0.1 |
| Subtotal | 14.1% | 14.0% |
| Emerging Markets | | |
| South Korea | 2.6% | 1.7% |
| Taiwan | 2.6 | 1.4 |
| South Africa | 1.5 | 0.9 |
| India | 1.5 | 0.9 |
| Brazil | 1.0 | 1.9 |
| Other Emerging Markets | 6.6 | 5.7 |
| Subtotal | 15.8% | 12.5% |
| North America | | |
| United States | 37.7% | 41.4% |
| Canada | 2.6 | 4.2 |
| Subtotal | 40.3% | 45.6% |
1 Country percentages exclude currency contracts held by the fund.
2 MSCI All Country World Index.
15
Global Equity Fund
Performance Summary
All of the returns in this report represent past performance, which is not a guarantee of future results that may be achieved by the fund. (Current performance may be lower or higher than the performance data cited. For performance data current to the most recent month-end, visit our website at www.vanguard.com/performance.) Note, too, that both investment returns and principal value can fluctuate widely, so an investor’s shares, when sold, could be worth more or less than their original cost. The returns shown do not reflect taxes that a shareholder would pay on fund distributions or on the sale of fund shares.
Cumulative Performance: September 30, 1999–September 30, 2009
Initial Investment of $10,000

| | | | |
| | | Average Annual Total Returns | Final Value |
| | Periods Ended September 30, 2009 | of a $10,000 |
| | One Year | Five Years | Ten Years | Investment |
| Global Equity Fund1 | –2.30% | 4.07% | 6.29% | $18,410 |
| MSCI All Country World Index | –0.11 | 4.79 | 1.90 | 12,067 |
| Global Funds Average2 | 0.10 | 3.99 | 1.63 | 11,750 |
Fiscal-Year Total Returns (%): September 30, 1999–September 30, 2009
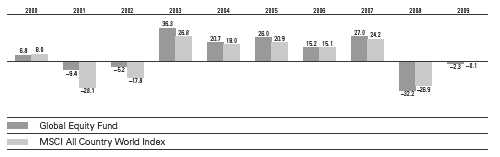
1 Total returns do not include the account service fee that may be applicable to certain accounts with balances below $10,000. 2 Derived from data provided by Lipper Inc.
Note: See Financial Highlights table for dividend and capital gains information.
16
Global Equity Fund
Financial Statements
Statement of Net Assets
As of September 30, 2009
The fund reports a complete list of its holdings in regulatory filings four times in each fiscal year, at the quarter-ends. For the second and fourth fiscal quarters, the lists appear in the fund’s semiannual and annual reports to shareholders. For the first and third fiscal quarters, the fund files the lists with the Securities and Exchange Commission on Form N-Q. Shareholders can look up the fund’s Forms N-Q on the SEC’s website at www.sec.gov. Forms N-Q may also be reviewed and copied at the SEC’s Public Reference Room (see the back cover of this report for further information).
| | | |
| | | | Market |
| | | | Value• |
| | | Shares | ($000) |
| Common Stocks (95.7%)1 | | |
| Australia (1.7%) | | |
| | Santos Ltd. | 1,515,655 | 20,279 |
| | Australia & New Zealand | | |
| | Banking Group Ltd. | 786,767 | 16,853 |
| | National Australia Bank Ltd. | 279,800 | 7,572 |
| | News Corp. | 418,400 | 5,871 |
| | BHP Billiton Ltd. | 111,566 | 3,679 |
| | Macquarie | | |
| | Infrastructure Group | 2,050,356 | 2,658 |
| | Brambles Ltd. | 271,843 | 1,932 |
| | Amcor Ltd. | 322,127 | 1,552 |
| | Macquarie Group Ltd. | 22,372 | 1,155 |
| | Orica Ltd. | 47,163 | 975 |
| * | Caltex Australia Ltd. | 69,841 | 744 |
| | Alumina Ltd. | 418,968 | 670 |
| | Rio Tinto Ltd. | 12,810 | 666 |
| | Origin Energy Ltd. | 32,107 | 461 |
| | Australian Worldwide | | |
| | Exploration Ltd. | 165,982 | 397 |
| | Beach Petroleum Ltd. | 500,099 | 330 |
| * | Iluka Resources Ltd. | 76,078 | 267 |
| | | | 66,061 |
| Austria (0.0%) | | |
| | Oesterreichische Post AG | 19,555 | 542 |
| * | bwin Interactive | | |
| | Entertainment AG | 8,217 | 374 |
| | | | 916 |
| Belgium (0.1%) | | |
| | Groupe Bruxelles Lambert SA | 30,257 | 2,804 |
| | Anheuser-Busch InBev NV | 45,412 | 2,083 |
| | | | 4,887 |
| Brazil (1.0%) | | |
| | Banco do Brasil SA | 1,332,116 | 23,603 |
| | Petroleo Brasileiro SA ADR | 112,200 | 4,411 |
| | Itau Unibanco Holding | | |
| | SA ADR | 165,825 | 3,341 |
| | | |
| | | | Market |
| | | | Value• |
| | | Shares | ($000) |
| | Usinas Siderurgicas de | | |
| | Minas Gerais SA | 100,525 | 2,659 |
| | Vale SA Class B ADR | 74,600 | 1,530 |
| | BM&FBOVESPA SA | 119,000 | 879 |
| | Ferbasa-Ferro Ligas DA Bahia | 75,400 | 552 |
| | | | 36,975 |
| Canada (2.7%) | | |
| | Rogers | | |
| | Communications Inc. | | |
| | Class B | 757,200 | 21,380 |
| | Bombardier Inc. | 4,191,952 | 19,459 |
| | EnCana Corp. | 231,900 | 13,429 |
| | Suncor Energy Inc. | 317,568 | 11,093 |
| | Imperial Oil Ltd. | 219,672 | 8,361 |
| | Nexen Inc. | 261,586 | 5,947 |
| | Talisman Energy Inc. | 291,200 | 5,067 |
| | BCE Inc. | 142,465 | 3,512 |
| | Royal Bank of Canada | 49,000 | 2,634 |
| | Onex Corp. | 83,300 | 2,041 |
| *,^ | ACE Aviation | | |
| | Holdings Inc. Class A | 410,000 | 1,930 |
| ^ | Ritchie Bros | | |
| | Auctioneers Inc. | 54,510 | 1,338 |
| | Fairfax Financial | | |
| | Holdings Ltd. | 3,550 | 1,316 |
| | Fairfax Financial | | |
| | Holdings Ltd. (U.S. Shares) | 3,400 | 1,263 |
| * | CGI Group Inc. Class A | 95,200 | 1,115 |
| | Metro Inc. Class A | 33,700 | 1,101 |
| | Groupe Aeroplan Inc. | 58,600 | 542 |
| * | Catalyst Paper Corp. | 1,158,844 | 287 |
| *,^ | AbitibiBowater Inc. | 218,435 | 30 |
| * | Nortel Networks Corp. | 241,295 | 21 |
| * | Fraser Papers Inc. | 337,960 | 20 |
| | Canadian Imperial | | |
| | Bank of Commerce | 241 | 15 |
| | | | 101,901 |
| Chile (0.1%) | | |
| | Enersis SA ADR | 232,900 | 4,297 |
17
| | | |
| Global Equity Fund | | |
| |
| |
| |
| | | | Market |
| | | | Value• |
| | | Shares | ($000) |
| China (0.7%) | | |
| | Bank of China Ltd. | 17,010,000 | 8,923 |
| | Tsingtao Brewery Co. Ltd. | 2,290,000 | 8,622 |
| | China Petroleum & | | |
| | Chemical Corp. | 3,606,000 | 3,062 |
| | China Telecom Corp. Ltd. | 5,688,000 | 2,687 |
| | China National Building | | |
| | Material Co. Ltd. | 738,000 | 1,727 |
| | China Mobile Ltd. | 124,500 | 1,219 |
| | | | 26,240 |
| Czech Republic (0.0%) | | |
| | Komercni Banka AS | 6,181 | 1,238 |
| |
| Denmark (0.6%) | | |
| * | Danske Bank A/S | 215,024 | 5,682 |
| * | Vestas Wind Systems A/S | 65,019 | 4,739 |
| *,^ | William Demant Holding | 56,130 | 4,188 |
| | Coloplast A/S Class B | 32,210 | 2,705 |
| * | GN Store Nord | 420,379 | 2,302 |
| | Novo Nordisk A/S Class B | 29,057 | 1,828 |
| | A P Moller - Maersk A/S | | |
| | Class B | 200 | 1,385 |
| | Carlsberg A/S Class B | 15,066 | 1,096 |
| | Bang & Olufsen A/S | 33,672 | 433 |
| | | | 24,358 |
| Egypt (0.1%) | | |
| | El Ezz Steel Co. | 1,553,777 | 4,318 |
| | Egyptian Financial | | |
| | Group-Hermes Holding | 223,300 | 1,219 |
| | | | 5,537 |
| Finland (0.7%) | | |
| | Nokia Oyj | 886,062 | 12,996 |
| | Sampo Oyj | 236,523 | 5,971 |
| | Metso Oyj | 145,621 | 4,105 |
| | Stora Enso Oyj | 268,552 | 1,875 |
| | Tieto Oyj | 62,105 | 1,239 |
| | Wartsila Oyj | 12,083 | 485 |
| | | | 26,671 |
| France (5.2%) | | |
| | Sanofi-Aventis SA | 787,122 | 58,047 |
| | BNP Paribas | 329,652 | 26,455 |
| | France Telecom SA | 922,596 | 24,603 |
| | Societe Generale | 175,470 | 14,193 |
| | European Aeronautic | | |
| | Defence and | | |
| | Space Co. NV | 596,757 | 13,452 |
| * | Renault SA | 188,600 | 8,861 |
| | ArcelorMittal | 150,462 | 5,610 |
| | Lagardere SCA | 99,687 | 4,658 |
| | Carrefour SA | 83,950 | 3,822 |
| | Legrand SA | 130,665 | 3,644 |
| | Thales SA | 64,812 | 3,223 |
| | AXA SA | 117,068 | 3,178 |
| | Groupe Eurotunnel SA | 288,589 | 2,960 |
| | Vivendi | 91,360 | 2,839 |
| | | |
| | | | Market |
| | | | Value• |
| | | Shares | ($000) |
| | Neopost SA | 31,254 | 2,810 |
| | Total SA | 44,592 | 2,651 |
| * | Alcatel-Lucent ADR | 509,351 | 2,287 |
| | SCOR SE | 77,986 | 2,136 |
| | Nexans SA | 17,819 | 1,446 |
| | Cie Generale d’Optique | | |
| | Essilor International SA | 22,218 | 1,269 |
| | EDF SA | 20,575 | 1,225 |
| * | Valeo SA | 46,215 | 1,219 |
| * | Atos Origin SA | 22,838 | 1,157 |
| | Cie de Saint-Gobain | 21,777 | 1,138 |
| | Societe BIC SA | 15,210 | 1,083 |
| * | BNP Paribas SA Rights | | |
| | Exp. 10/13/2009 | 329,652 | 714 |
| ^ | SA des Ciments Vicat | 9,138 | 702 |
| | Safran SA | 18,745 | 352 |
| | Eurofins Scientific | 6,873 | 324 |
| | Eiffage SA | 4,014 | 256 |
| | | | 196,314 |
| Germany (4.5%) | | |
| | Deutsche Bank AG | 306,177 | 23,389 |
| | Deutsche Post AG | 1,110,100 | 20,681 |
| | E.ON AG | 408,505 | 17,290 |
| �� | BASF SE | 314,924 | 16,674 |
| | Allianz SE | 129,764 | 16,189 |
| | Bayer AG | 175,261 | 12,131 |
| | Muenchener | | |
| | Rueckversicherungs AG | 73,200 | 11,667 |
| | Deutsche Lufthansa AG | 601,772 | 10,623 |
| | Deutsche Telekom AG | 669,128 | 9,132 |
| | RWE AG | 97,430 | 9,037 |
| * | Infineon Technologies AG | 1,064,558 | 5,983 |
| | Daimler AG | 118,662 | 5,953 |
| | Fresenius Medical Care | | |
| | AG & Co. KGaA | 107,534 | 5,349 |
| | Bayerische Motoren | | |
| | Werke AG | 45,687 | 2,199 |
| | Deutsche Boerse AG | 17,900 | 1,460 |
| | Celesio AG | 49,942 | 1,376 |
| | Siemens AG | 11,664 | 1,074 |
| | SAP AG | 16,320 | 792 |
| | Fresenius Medical | | |
| | Care AG & Co. KGaA ADR | 11,744 | 584 |
| *,^ | Q-Cells SE | 22,500 | 427 |
| | | | 172,010 |
| Greece (0.0%) | | |
| | Bank of Cyprus | | |
| | Public Co. Ltd. | 161,117 | 1,234 |
| |
| Hong Kong (1.8%) | | |
| | New World | | |
| | Development Ltd. | 8,143,275 | 17,444 |
| | First Pacific Co. | 12,308,000 | 8,205 |
| | Henderson Land | | |
| | Development Co. Ltd. | 1,033,000 | 6,766 |
18
| | | | |
| Global Equity Fund | | | |
| |
| |
| |
| | | | | Market |
| | | | | Value• |
| | | | Shares | ($000) |
| | Hutchison Whampoa Ltd. | | 879,000 | 6,321 |
| | Wheelock & Co. Ltd. | 1,603,000 | 5,238 |
| | Television Broadcasts Ltd. | 1,126,000 | 4,840 |
| | Midland Holdings Ltd. | 4,718,000 | 3,919 |
| | Hongkong & | | | |
| | Shanghai Hotels | 2,826,477 | 3,652 |
| | CLP Holdings Ltd. | | 463,000 | 3,139 |
| | Hong Kong Aircraft | | | |
| | Engineerg Co. Ltd. | | 226,000 | 2,693 |
| | SmarTone | | | |
| | Telecommunications | | | |
| | Holding Ltd. | 3,036,790 | 2,340 |
| | Mandarin Oriental | | | |
| | International Ltd. | | 766,690 | 1,016 |
| | Hong Kong Exchanges | | | |
| | and Clearing Ltd. | | 54,000 | 974 |
| * | I-CABLE | | | |
| | Communications Ltd. | 6,561,000 | 821 |
| * | Next Media Ltd. | 6,300,000 | 803 |
| | Esprit Holdings Ltd. | | 56,346 | 378 |
| | Silver Grant International | 1,752,000 | 291 |
| * | Genting Singapore PLC | | | |
| | Rights Exp. 10/06/2009 | | 176,874 | 40 |
| | | | | 68,880 |
| Hungary (0.1%) | | | |
| *,^ | OTP Bank PLC | | 166,226 | 4,786 |
| |
| India (1.5%) | | | |
| | Bank of India | 1,795,047 | 15,406 |
| | State Bank of India Ltd. | | 265,577 | 12,075 |
| | Punjab National Bank Ltd. | | 540,514 | 8,924 |
| | State Bank of India Ltd. GDR | 66,230 | 6,028 |
| | Bank of Baroda | | 493,517 | 4,924 |
| | IDBI Bank Ltd. | | 991,988 | 2,616 |
| | Canara Bank | | 370,088 | 2,468 |
| | Oil & Natural Gas Corp. Ltd. | 87,450 | 2,122 |
| | Union Bank Of India | | 174,181 | 865 |
| | Dena Bank | | 200,586 | 282 |
| | Vijaya Bank | | 243,810 | 260 |
| | | | | 55,970 |
| Indonesia (0.6%) | | | |
| * | Bank Pan | | | |
| | Indonesia Tbk PT | 83,375,843 | 7,376 |
| | Semen Gresik | | | |
| | Persero Tbk PT | 11,321,500 | 7,337 |
| | Indofood Sukses | | | |
| | Makmur Tbk PT | 11,106,500 | 3,460 |
| * | Matahari Putra | | | |
| | Prima Tbk PT | 19,910,800 | 2,117 |
| | Gudang Garam Tbk PT | 1,149,900 | 1,768 |
| | Citra Marga Nusaphala | | | |
| | Persada Tbk PT | 1,709,500 | 169 |
| | | |
| | | | Market |
| | | | Value• |
| | | Shares | ($000) |
| * | Matahari Putra Prima | | |
| | Tbk PT Warrants | | |
| | Exp 12/07/10 | 3,859,975 | 55 |
| * | Mulia Industrindo Tbk PT | 921,000 | 33 |
| | | | 22,315 |
| Ireland (0.1%) | | |
| | CRH PLC | 66,967 | 1,854 |
| | Fyffes PLC | 1,283,082 | 770 |
| | DCC PLC | 28,986 | 747 |
| | Paddy Power PLC | | |
| | (London Shares) | 16,052 | 488 |
| | Paddy Power PLC | 9,642 | 294 |
| | Independent News & | | |
| | Media PLC | 936,699 | 275 |
| | Total Produce PLC | 389,036 | 205 |
| * | Anglo Irish Bank Corp. Ltd. | 122,273 | 39 |
| | | | 4,672 |
| Israel (0.4%) | | |
| | Bezeq Israeli | | |
| | Telecommunication | | |
| | Corp. Ltd. | 2,686,300 | 5,787 |
| | Partner | | |
| | Communications Co. Ltd. | 259,170 | 4,899 |
| | Israel Chemicals Ltd. | 260,000 | 2,999 |
| | Teva Pharmaceutical | | |
| | Industries Ltd. ADR | 27,200 | 1,375 |
| * | Bank Hapoalim BM | 105,306 | 376 |
| | | | 15,436 |
| Italy (2.4%) | | |
| | Enel SPA | 4,988,717 | 31,731 |
| * | UniCredit SPA | 4,183,918 | 16,421 |
| | ENI SPA | 411,400 | 10,281 |
| | Telecom Italia SPA | 3,703,100 | 6,511 |
| | Saipem SPA | 186,440 | 5,631 |
| * | Intesa Sanpaolo SPA | 1,178,200 | 5,228 |
| * | Fiat SPA | 376,976 | 4,863 |
| * | Luxottica Group SPA ADR | 179,800 | 4,644 |
| | Telecom Italia SPA RNC | 2,707,300 | 3,335 |
| * | Luxottica Group SPA | 61,709 | 1,596 |
| * | Banco Popolare SC | 94,543 | 911 |
| | Finmeccanica SPA | 39,845 | 706 |
| * | Natuzzi SPA ADR | 50,700 | 139 |
| | | | 91,997 |
| Japan (7.4%) | | |
| | Nippon Telegraph & | | |
| | Telephone Corp. | 560,600 | 25,873 |
| | Nissan Motor Co. Ltd. | 3,302,600 | 22,256 |
| | Sony Corp. | 666,400 | 19,528 |
| | Mitsui & Co. Ltd. | 1,394,200 | 18,138 |
| | Marubeni Corp. | 3,253,000 | 16,338 |
| | Astellas Pharma Inc. | 304,000 | 12,465 |
| | Hitachi Ltd. | 3,757,000 | 11,536 |
| | Sumitomo Mitsui | | |
| | Financial Group Inc. | 312,800 | 10,842 |
19
| | | |
| Global Equity Fund | | |
| |
| |
| |
| | | | Market |
| | | | Value• |
| | | Shares | ($000) |
| | Daito Trust | | |
| | Construction Co. Ltd. | 219,200 | 9,556 |
| | Nippon Oil Corp. | 1,356,000 | 7,588 |
| | Yamato Holdings Co. Ltd. | 329,000 | 5,399 |
| | FUJIFILM Holdings Corp. | 170,400 | 5,088 |
| | Japan Tobacco Inc. | 1,192 | 4,075 |
| | Kao Corp. | 160,000 | 3,951 |
| | Seiko Epson Corp. | 249,000 | 3,720 |
| | Toyo Seikan Kaisha Ltd. | 175,900 | 3,368 |
| | Aisin Seiki Co. Ltd. | 135,300 | 3,286 |
| | Mitsubishi Chemical | | |
| | Holdings Corp. | 711,500 | 2,948 |
| | Sumitomo Electric | | |
| | Industries Ltd. | 224,900 | 2,937 |
| | Toyota Tsusho Corp. | 187,200 | 2,814 |
| | Panasonic Electric | | |
| | Works Co. Ltd. | 230,000 | 2,743 |
| | West Japan Railway Co. | 724 | 2,740 |
| | Mitsubishi Corp. | 134,400 | 2,703 |
| | Tokyo Gas Co. Ltd. | 632,000 | 2,622 |
| *,^ | Shinsei Bank Ltd. | 1,697,000 | 2,591 |
| | Secom Co. Ltd. | 50,800 | 2,552 |
| | KDDI Corp. | 434 | 2,442 |
| | Mitsubishi UFJ | | |
| | Financial Group Inc. | 455,600 | 2,435 |
| | Toyota Motor Corp. | 60,400 | 2,377 |
| | JS Group Corp. | 125,100 | 2,187 |
| | Fujitsu Ltd. | 325,000 | 2,120 |
| | Hitachi Chemical Co. Ltd. | 103,000 | 2,099 |
| | Asahi Breweries Ltd. | 109,300 | 1,996 |
| | Kyowa Hakko Kirin Co. Ltd. | 155,000 | 1,958 |
| | Mitsui Sumitomo Insurance | | |
| | Group Holdings Inc. | 70,400 | 1,929 |
| | Isetan Mitsukoshi | | |
| | Holdings Ltd. | 163,300 | 1,871 |
| | East Japan Railway Co. | 22,400 | 1,615 |
| | Kawasaki Heavy | | |
| | Industries Ltd. | 615,000 | 1,558 |
| | Seven & I Holdings Co. Ltd. | 62,900 | 1,501 |
| | Dai Nippon Printing Co. Ltd. | 108,000 | 1,481 |
| | Fukuoka Financial Group Inc. | 354,000 | 1,465 |
| | Sompo Japan Insurance Inc. | 206,000 | 1,378 |
| | Taiyo Nippon Sanso Corp. | 115,000 | 1,365 |
| | NTT DoCoMo Inc. | 843 | 1,343 |
| | Ajinomoto Co. Inc. | 130,000 | 1,302 |
| | Canon Inc. | 32,300 | 1,294 |
| | Nippon Meat Packers Inc. | 96,000 | 1,229 |
| | Sekisui House Ltd. | 136,000 | 1,224 |
| | Yamada Denki Co. Ltd. | 18,060 | 1,218 |
| | NSK Ltd. | 195,000 | 1,205 |
| | Yaskawa Electric Corp. | 166,000 | 1,194 |
| | Tokyo Electric Power Co. Inc. | 45,000 | 1,179 |
| | Mitsubishi Tanabe | | |
| | Pharma Corp. | 88,000 | 1,171 |
| | Obayashi Corp. | 264,000 | 1,158 |
| | Shiseido Co. Ltd. | 65,000 | 1,132 |
| | Sumitomo Corp. | 107,100 | 1,099 |
| | | |
| | | | Market |
| | | | Value• |
| | | Shares | ($000) |
| | Toppan Forms Co. Ltd. | 80,200 | 1,098 |
| | Sumitomo Forestry Co. Ltd. | 128,000 | 1,070 |
| | Kinden Corp. | 125,000 | 1,042 |
| * | NEC Corp. | 330,000 | 1,033 |
| | Bank of Yokohama Ltd. | 211,000 | 1,031 |
| | Leopalace21 Corp. | 127,800 | 1,023 |
| | Olympus Corp. | 38,000 | 1,003 |
| | Namco Bandai Holdings Inc. | 96,350 | 984 |
| | Mizuho Financial Group Inc. | 492,800 | 971 |
| | Marui Group Co. Ltd. | 130,200 | 928 |
| ^ | Alfresa Holdings Corp. | 21,400 | 872 |
| | Dainippon Sumitomo | | |
| | Pharma Co. Ltd. | 80,000 | 871 |
| | Rohm Co. Ltd. | 12,200 | 850 |
| | Denso Corp. | 28,600 | 839 |
| | Takeda | | |
| | Pharmaceutical Co. Ltd. | 19,500 | 811 |
| | TDK Corp. | 13,800 | 795 |
| | Ricoh Co. Ltd. | 54,000 | 784 |
| | Yamaha Motor Co. Ltd. | 62,800 | 772 |
| | Idemitsu Kosan Co. Ltd. | 9,300 | 766 |
| | Ryosan Co. Ltd. | 29,800 | 765 |
| | Yamatake Corp. | 31,800 | 713 |
| | NTT Data Corp. | 220 | 703 |
| | Shimizu Corp. | 167,000 | 657 |
| | Toppan Printing Co. Ltd. | 68,000 | 642 |
| ^ | Nippon Suisan Kaisha Ltd. | 215,400 | 639 |
| | Onward Holdings Co. Ltd. | 86,000 | 638 |
| | Omron Corp. | 33,700 | 633 |
| ^ | Tokyo Ohka Kogyo Co. Ltd. | 25,800 | 579 |
| * | NEC Electronics Corp. | 65,300 | 578 |
| | Tokyo Electron Ltd. | 9,000 | 572 |
| | Hitachi Metals Ltd. | 47,000 | 480 |
| | Nippon Express Co. Ltd. | 114,000 | 463 |
| | Mitsubishi Electric Corp. | 56,000 | 423 |
| | Fujitsu Frontech Ltd. | 32,100 | 318 |
| | Nintendo Co. Ltd. | 1,200 | 306 |
| * | Arnest One Corp. | 30,300 | 275 |
| | Fuji Media Holdings Inc. | 151 | 247 |
| | Takasago Thermal | | |
| | Engineering Co. Ltd. | 26,000 | 225 |
| | Noritake Co. Ltd. | 58,000 | 179 |
| | Inabata & Co. Ltd. | 22,700 | 94 |
| | | | 282,854 |
| Malaysia (0.9%) | | |
| | CIMB Group | | |
| | Holdings Bhd. | 3,193,119 | 10,216 |
| | Genting Malaysia Bhd. | 10,411,500 | 8,219 |
| | AMMB Holdings Bhd. | 3,927,587 | 4,821 |
| | Sime Darby Bhd. | 1,875,457 | 4,595 |
| | British American Tobacco | | |
| | Malaysia Bhd. | 165,000 | 2,098 |
| * | Malaysian Airline | | |
| | System Bhd. | 1,605,433 | 1,380 |
| | Telekom Malaysia Bhd. | 1,218,275 | 1,079 |
| | Multi-Purpose | | |
| | Holdings Bhd. | 2,007,390 | 1,076 |
20
| | | |
| Global Equity Fund | | |
| |
| |
| |
| | | | Market |
| | | | Value• |
| | | Shares | ($000) |
| | Carlsberg | | |
| | Brewery-Malay Bhd. | 109,600 | 133 |
| | Malaysian Airline | | |
| | System Bhd. Pfd. | 183,333 | 40 |
| | | | 33,657 |
| Mexico (0.7%) | | |
| | America Movil SAB de CV | 8,577,200 | 18,779 |
| | America Movil SAB de | | |
| | CV ADR | 87,900 | 3,852 |
| | Wal-Mart de Mexico | | |
| | SAB de CV | 298,100 | 1,037 |
| | Telefonos de Mexico | | |
| | SAB de CV ADR | 33,943 | 592 |
| | Telmex Internacional | | |
| | SAB de CV ADR | 33,620 | 469 |
| | | | 24,729 |
| Morocco (0.0%) | | |
| | Maroc Telecom | 22,195 | 400 |
| |
| Netherlands (1.2%) | | |
| | Unilever NV | 234,920 | 6,797 |
| * | ING Groep NV | 368,879 | 6,624 |
| | Koninklijke KPN NV | 329,272 | 5,470 |
| | Koninklijke Ahold NV | 433,600 | 5,234 |
| | Heineken NV | 89,157 | 4,134 |
| * | Randstad Holding NV | 83,600 | 3,621 |
| | Koninklijke Boskalis | | |
| | Westminster NV | 98,736 | 3,385 |
| | Koninklijke Philips | | |
| | Electronics NV | 117,237 | 2,860 |
| | Wolters Kluwer NV | 133,066 | 2,851 |
| | Reed Elsevier NV | 167,800 | 1,906 |
| | Koninklijke DSM NV | 27,523 | 1,152 |
| | Akzo Nobel NV | 15,434 | 959 |
| * | Eurocastle Investment Ltd. | 275,977 | 179 |
| | | | 45,172 |
| New Zealand (0.0%) | | |
| | Telecom Corp. of | | |
| | New Zealand Ltd. | 284,906 | 547 |
| | PGG Wrightson Ltd. | 24,469 | 11 |
| | | | 558 |
| Norway (0.4%) | | |
| | StatoilHydro ASA | 528,540 | 11,933 |
| * | DnB NOR ASA | 203,710 | 2,372 |
| | Seadrill Ltd. | 52,833 | 1,106 |
| | | | 15,411 |
| Philippines (0.9%) | | |
| | Ayala Corp. | 2,108,913 | 13,426 |
| | Globe Telecom Inc. | 426,680 | 8,802 |
| | ABS-CBN Holdings Corp. | 10,077,900 | 6,378 |
| | Jollibee Foods Corp. | 2,065,400 | 2,154 |
| * | Benpres Holdings Corp. | 15,742,000 | 1,144 |
| | DMCI Holdings Inc. | 5,230,000 | 958 |
| | Banco de Oro Unibank Inc. | 1,248,200 | 906 |
| | | | 33,768 |
| | | |
| | | | Market |
| | | | Value• |
| | | Shares | ($000) |
| Poland (0.2%) | | |
| | KGHM Polska Miedz SA | 259,267 | 7,871 |
| |
| Russia (0.7%) | | |
| | Lukoil OAO ADR | 312,600 | 17,040 |
| | MMC Norilsk Nickel ADR | 465,321 | 5,793 |
| | Gazprom OAO ADR | | |
| | (U.K. Shares) | 115,700 | 2,703 |
| | Surgutneftegaz ADR | 150,066 | 1,288 |
| | Gazprom OAO ADR | | |
| | (U.S. Shares) | 15,167 | 355 |
| | | | 27,179 |
| Singapore (2.1%) | | |
| | Jardine Matheson | | |
| | Holdings Ltd. | 935,102 | 28,384 |
| | Jardine Strategic | | |
| | Holdings Ltd. | 1,272,400 | 21,496 |
| | DBS Group Holdings Ltd. | 1,274,000 | 11,958 |
| | Great Eastern Holdings Ltd. | 733,000 | 7,069 |
| * | STATS ChipPAC Ltd. | 8,551,000 | 5,458 |
| | GuocoLeisure Ltd. | 4,656,000 | 2,337 |
| * | Golden | | |
| | Agri-Resources Ltd. | 3,796,069 | 1,149 |
| * | Genting Singapore PLC | 884,370 | 701 |
| | United Industrial Corp. Ltd. | 377,000 | 491 |
| | Noble Group Ltd. | 228,000 | 393 |
| | Global Yellow Pages Ltd. | 2,464,000 | 305 |
| * | Global Yellow Pages Ltd. | | |
| | Warrants Exp. 08/13/2014 | 704,000 | — |
| | | | 79,741 |
| South Africa (1.5%) | | |
| | Standard Bank Group Ltd. | 1,133,695 | 14,717 |
| * | Hosken Consolidated | | |
| | Investments Ltd. | 1,455,870 | 11,895 |
| | RMB Holdings Ltd. | 1,620,811 | 5,915 |
| * | Sun International Ltd. | 464,839 | 5,440 |
| | Nedbank Group Ltd. | 291,850 | 4,653 |
| | Naspers Ltd. | 129,700 | 4,440 |
| | FirstRand Ltd. | 1,566,606 | 3,460 |
| | Anglo Platinum Ltd. | 19,348 | 1,726 |
| | Clicks Group Ltd. | 373,513 | 1,139 |
| | Aveng Ltd. | 184,935 | 1,066 |
| | Gold Fields Ltd. | 69,695 | 954 |
| | JD Group Ltd. | 145,983 | 871 |
| | AngloGold Ashanti Ltd. | 20,395 | 827 |
| | City Lodge Hotels Ltd. | 70,616 | 771 |
| | Discovery Holdings Ltd. | 74,638 | 290 |
| | Mondi Ltd. | 14,641 | 76 |
| | | | 58,240 |
| South Korea (2.7%) | | |
| | LG Display Co. Ltd. | 769,170 | 22,079 |
| | Samsung | | |
| | Electronics Co. Ltd. | 25,630 | 17,695 |
| | LG Corp. | 241,847 | 16,156 |
| | KT Corp. | 355,925 | 12,254 |
21
| | | |
| Global Equity Fund | | |
| |
| |
| |
| | | | Market |
| | | | Value• |
| | | Shares | ($000) |
| * | KB Financial Group Inc. | 212,473 | 10,903 |
| | Hana Financial Group Inc. | 222,110 | 7,618 |
| * | Woori Finance | | |
| | Holdings Co. Ltd. | 537,010 | 7,231 |
| | SK Holdings Co. Ltd. | 35,691 | 3,397 |
| 2 | Samsung | | |
| | Electronics Co. Ltd. GDR | 5,600 | 1,912 |
| | LG Electronics Inc. | 14,931 | 1,585 |
| | SK Telecom Co. Ltd. | 2,930 | 455 |
| | POSCO | 1,000 | 414 |
| * | Korea Electric Power Corp. | 5,000 | 152 |
| | | | 101,851 |
| Spain (1.1%) | | |
| | Banco Santander SA | 947,585 | 15,308 |
| | Telefonica SA | 406,075 | 11,235 |
| | Acerinox SA | 226,282 | 4,872 |
| | Acciona SA | 27,507 | 3,757 |
| | Inditex SA | 34,291 | 1,972 |
| | Viscofan SA | 53,995 | 1,316 |
| | Prosegur Cia de | | |
| | Seguridad SA | 30,977 | 1,235 |
| | Banco Santander SA ADR | 17,216 | 278 |
| | | | 39,973 |
| Sweden (1.3%) | | |
| | Telefonaktiebolaget LM | | |
| | Ericsson Class B | 1,474,125 | 14,838 |
| | Svenska Cellulosa AB | | |
| | Class B | 696,450 | 9,461 |
| | Svenska Handelsbanken | | |
| | AB Class A | 298,818 | 7,650 |
| * | Electrolux AB Class B | 333,294 | 7,629 |
| | Assa Abloy AB Class B | 190,100 | 3,091 |
| | Atlas Copco AB Class B | 187,334 | 2,139 |
| | Investor AB Class A | 89,516 | 1,584 |
| | Investor AB Class B | 78,468 | 1,437 |
| ^ | Hoganas AB Class B | 52,700 | 884 |
| | Modern Times Group | | |
| | AB Class B | 15,780 | 683 |
| | | | 49,396 |
| Switzerland (1.4%) | | |
| * | UBS AG | 467,063 | 8,564 |
| | Roche Holdings AG | 45,619 | 7,376 |
| | Adecco SA | 127,492 | 6,790 |
| | Novartis AG | 130,269 | 6,543 |
| | Nestle SA | 102,948 | 4,395 |
| | Compagnie Financiere | | |
| | Richemont SA | 135,787 | 3,844 |
| | Schindler Holding AG | 54,141 | 3,723 |
| | Geberit AG | 21,715 | 3,343 |
| * | Logitech International SA | 89,777 | 1,640 |
| | Credit Suisse Group AG | 28,318 | 1,575 |
| | ABB Ltd. | 76,500 | 1,538 |
| | Julius Baer Holding AG | 29,300 | 1,469 |
| * | Clariant AG | 104,066 | 949 |
| | | |
| | | | Market |
| | | | Value• |
| | | Shares | ($000) |
| | Sonova Holding AG | 5,738 | 581 |
| * | PubliGroupe AG | 4,579 | 528 |
| | | | 52,858 |
| Taiwan (2.5%) | | |
| | AU Optronics Corp. | 22,675,734 | 22,042 |
| * | Fubon Financial | | |
| | Holding Co. Ltd. | 18,761,000 | 21,089 |
| | Quanta Computer Inc. | 7,265,768 | 15,207 |
| | Compal Electronics Inc. | 11,998,020 | 13,910 |
| * | United | | |
| | Microelectronics Corp. | 12,912,000 | 6,322 |
| | Siliconware Precision | | |
| | Industries Co. | 3,539,017 | 4,980 |
| | Taiwan Semiconductor | | |
| | Manufacturing Co. Ltd. | 2,363,306 | 4,677 |
| | Taiwan Semiconductor | | |
| | Manufacturing Co. Ltd. | | |
| | ADR | 148,378 | 1,626 |
| * | Taishin Financial | | |
| | Holding Co. Ltd. | 2,918,000 | 1,265 |
| | Uni-President | | |
| | Enterprises Corp. | 1,011,636 | 1,188 |
| | Chunghwa | | |
| | Telecom Co. Ltd. | 555,500 | 1,002 |
| | Yageo Corp. | 1,392,000 | 389 |
| * | Tatung Co. Ltd. | 1,687,000 | 383 |
| | Inventec Co. Ltd. | 645,700 | 373 |
| | Gigabyte | | |
| | Technology Co. Ltd. | 314,000 | 265 |
| | | | 94,718 |
| Thailand (0.9%) | | |
| | Advanced Info | | |
| | Service PCL (Foreign) | 3,030,400 | 8,533 |
| | Siam Cement PCL NVDR | 986,200 | 6,535 |
| | Kasikornbank PCL (Foreign) | 1,847,000 | 4,846 |
| | Siam Cement PCL (Foreign) | 664,300 | 4,422 |
| | PTT PCL (Foreign) | 316,700 | 2,473 |
| | Thanachart Capital | | |
| | PCL (Foreign) | 3,856,900 | 2,001 |
| | MBK PCL (Foreign) | 813,400 | 1,531 |
| | GMM Grammy PCL | 2,917,000 | 1,317 |
| | Land and Houses | | |
| | PCL (Foreign) | 6,191,900 | 1,282 |
| | GMM Grammy | | |
| | PCL (Foreign) | 1,688,200 | 762 |
| * | Bangkok Bank PCL (Local) | 150,700 | 544 |
| | Post Publishing | | |
| | PCL (Foreign) | 1,300,000 | 190 |
| | Matichon PCL (Foreign) | 625,000 | 127 |
| | | | 34,563 |
| Turkey (0.5%) | | |
| | Turkiye Garanti Bankasi AS | 2,841,100 | 10,793 |
| | Turkiye Garanti | | |
| | Bankasi AS ADR | 533,500 | 2,027 |
22
| | | |
| Global Equity Fund | | |
| |
| |
| |
| | | | Market |
| | | | Value• |
| | | Shares | ($000) |
| | Haci Omer Sabanci | | |
| | Holding AS | 512,653 | 1,999 |
| * | Turkiye Vakiflar Bankasi Tao | 826,048 | 1,901 |
| | Turk Hava Yollari | 145,756 | 380 |
| | | | 17,100 |
| United Kingdom (9.6%) | | |
| | Royal Dutch Shell | | |
| | PLC Class A | 2,391,755 | 68,497 |
| | Vodafone Group PLC | 13,123,401 | 29,481 |
| | AstraZeneca PLC | 416,451 | 18,677 |
| | Lloyds Banking | | |
| | Group PLC | 10,561,856 | 17,542 |
| | Rolls-Royce Group PLC | 2,056,580 | 15,519 |
| | Barclays PLC | 2,471,440 | 14,647 |
| * | Wolseley PLC | 585,424 | 14,156 |
| | Aviva PLC | 1,570,330 | 11,289 |
| | GlaxoSmithKline PLC | 505,700 | 9,971 |
| | BP PLC | 1,102,071 | 9,763 |
| | Centrica PLC | 2,292,900 | 9,235 |
| | Associated British | | |
| | Foods PLC | 575,400 | 7,806 |
| | WPP PLC | 754,168 | 6,487 |
| | Thomas Cook Group PLC | 1,587,323 | 5,907 |
| | Reckitt Benckiser | | |
| | Group PLC | 114,861 | 5,623 |
| | Royal Dutch Shell | | |
| | PLC Class B | 200,155 | 5,560 |
| | Capita Group PLC | 447,029 | 5,171 |
| | Tesco PLC | 781,384 | 5,002 |
| | Diageo PLC | 321,745 | 4,950 |
| | Intertek Group PLC | 217,608 | 4,422 |
| | BHP Billiton PLC | 161,076 | 4,411 |
| * | Anglo American PLC | 137,702 | 4,404 |
| | BT Group PLC | 2,037,120 | 4,246 |
| | Drax Group PLC | 516,500 | 3,899 |
| | Sage Group PLC | 997,935 | 3,732 |
| | Cable & Wireless PLC | 1,615,001 | 3,713 |
| | BAE Systems PLC | 645,876 | 3,613 |
| | Bunzl PLC | 320,744 | 3,261 |
| | British American | | |
| | Tobacco PLC | 103,762 | 3,260 |
| | Rio Tinto PLC | 76,335 | 3,245 |
| | TUI Travel PLC | 765,120 | 3,117 |
| | Carnival PLC | 88,987 | 3,054 |
| | Compass Group PLC | 489,496 | 2,998 |
| | Invensys PLC | 636,107 | 2,970 |
| | Arriva PLC | 357,337 | 2,865 |
| | ICAP PLC | 421,647 | 2,858 |
| | Informa PLC | 485,273 | 2,444 |
| | Reed Elsevier PLC | 309,343 | 2,325 |
| | Michael Page | | |
| | International PLC | 406,363 | 2,178 |
| | HSBC Holdings PLC | 168,110 | 1,925 |
| | Provident Financial PLC | 131,580 | 1,913 |
| | Rexam PLC | 410,904 | 1,720 |
| | | |
| | | | Market |
| | | | Value• |
| | | Shares | ($000) |
| * | Galiform PLC | 1,285,986 | 1,633 |
| | Prudential PLC | 169,000 | 1,629 |
| | Old Mutual PLC | 972,200 | 1,558 |
| | Stagecoach Group PLC | 589,519 | 1,538 |
| | ITV PLC | 1,997,353 | 1,412 |
| | Smiths Group PLC | 87,521 | 1,247 |
| * | Cairn Energy PLC | 25,719 | 1,150 |
| | Ladbrokes PLC | 353,483 | 1,061 |
| | International Personal | | |
| | Finance PLC | 397,645 | 1,038 |
| * | Sportingbet PLC | 912,747 | 1,017 |
| | Hays PLC | 605,818 | 1,009 |
| | Aggreko PLC | 87,698 | 987 |
| | Next PLC | 30,890 | 886 |
| * | Royal Bank of | | |
| | Scotland Group PLC | 1,028,758 | 871 |
| | Admiral Group PLC | 42,610 | 789 |
| | Devro plc | 330,762 | 722 |
| | Homeserve PLC | 27,858 | 709 |
| | AMEC PLC | 58,557 | 709 |
| | Rightmove PLC | 79,629 | 707 |
| * | Berkeley Group | | |
| | Holdings PLC | 48,842 | 693 |
| | RSA Insurance Group PLC | 320,989 | 688 |
| | Carphone Warehouse | | |
| | Group PLC | 208,373 | 640 |
| | Man Group PLC | 116,750 | 620 |
| | Tullett Prebon PLC | 78,331 | 490 |
| | Logica PLC | 232,519 | 485 |
| | Enterprise Inns PLC | 235,093 | 469 |
| *,^ | Yell Group PLC | 484,105 | 457 |
| | Daily Mail & General Trust | 57,575 | 425 |
| ^ | HMV Group PLC | 215,229 | 362 |
| | Meggitt PLC | 95,013 | 354 |
| | Regus PLC | 202,633 | 325 |
| * | Northgate PLC | 50,062 | 190 |
| | Mondi PLC | 36,612 | 184 |
| *,^ | Bradford & Bingley PLC | 642,595 | — |
| | | | 364,910 |
| United States (35.4%) | | |
| | Consumer Discretionary (7.5%) | |
| | Cablevision Systems | | |
| | Corp. Class A | 1,429,492 | 33,950 |
| | Comcast Corp. Class A | 1,058,700 | 17,881 |
| * | priceline.com Inc. | 106,101 | 17,594 |
| | CBS Corp. Class B | 1,069,482 | 12,887 |
| | Time Warner Inc. | 412,155 | 11,862 |
| * | Amazon.com Inc. | 125,662 | 11,732 |
| * | Liberty Global Inc. Class A | 504,382 | 11,384 |
| *,^ | Blue Nile Inc. | 182,338 | 11,327 |
| | Macy’s Inc. | 614,500 | 11,239 |
| * | Viacom Inc. Class B | 393,000 | 11,020 |
| | Time Warner Cable Inc. | 233,715 | 10,071 |
| | Lowe’s Cos. Inc. | 465,600 | 9,750 |
| * | Liberty Global Inc. | 415,931 | 9,342 |
23
| | | |
| Global Equity Fund | | |
| |
| |
| |
| | | | Market |
| | | | Value• |
| | | Shares | ($000) |
| | American Greetings | | |
| | Corp. Class A | 410,976 | 9,165 |
| | Gannett Co. Inc. | 713,646 | 8,928 |
| | JC Penney Co. Inc. | 237,300 | 8,009 |
| | Pulte Homes Inc. | 605,545 | 6,655 |
| ^ | News Corp. Class B | 431,000 | 6,030 |
| | News Corp. Class A | 472,100 | 5,660 |
| * | Liberty Media Corp. - | | |
| | Entertainment Class A | 181,308 | 5,640 |
| | Sotheby’s | 260,939 | 4,496 |
| * | Discovery | | |
| | Communications Inc. | | |
| | Class A | 130,290 | 3,764 |
| | KB Home | 226,197 | 3,757 |
| | Home Depot Inc. | 136,700 | 3,642 |
| | Aaron’s Inc. | 137,600 | 3,633 |
| * | Cabela’s Inc. | 259,600 | 3,463 |
| * | Discovery | | |
| | Communications Inc. | 130,648 | 3,401 |
| * | Hanesbrands Inc. | 140,119 | 2,998 |
| * | Ford Motor Co. | 370,700 | 2,673 |
| | International Game | | |
| | Technology | 116,600 | 2,505 |
| * | Liberty Media | | |
| | Corp. - Interactive | 225,367 | 2,472 |
| * | Rent-A-Center Inc. | 110,992 | 2,095 |
| | Barnes & Noble Inc. | 93,600 | 2,080 |
| | Omnicom Group Inc. | 44,063 | 1,628 |
| | Primedia Inc. | 539,135 | 1,359 |
| * | Mohawk Industries Inc. | 25,590 | 1,220 |
| | CBS Corp. Class A | 85,148 | 1,027 |
| | Virgin Media Inc. | 72,100 | 1,004 |
| * | Liberty Media Corp. - Capital | 43,899 | 918 |
| * | Bed Bath & Beyond Inc. | 23,300 | 875 |
| | Scholastic Corp. | 32,700 | 796 |
| | Walt Disney Co. | 24,700 | 678 |
| * | HSN Inc. | 28,100 | 457 |
| * | Interpublic Group of | | |
| | Cos. Inc. | 54,878 | 413 |
| * | CC Media | | |
| | Holdings Inc. Class A | 292,110 | 394 |
| | Superior Industries | | |
| | International Inc. | 26,500 | 376 |
| | Finish Line Inc. Class A | 34,100 | 346 |
| * | Ascent Media Corp. Class A | 13,402 | 343 |
| | Sherwin-Williams Co. | 5,502 | 331 |
| * | EW Scripps Co. Class A | 43,200 | 324 |
| * | Standard Pacific Corp. | 76,600 | 283 |
| * | Blockbuster Inc. Class B | 470,128 | 282 |
| * | Jo-Ann Stores Inc. | 10,300 | 276 |
| * | Pre-Paid Legal Services Inc. | 5,300 | 269 |
| * | Steak N Shake Co. | 22,600 | 266 |
| * | Asbury Automotive | | |
| | Group Inc. | 19,300 | 245 |
| * | Kirkland’s Inc. | 13,450 | 192 |
| | DR Horton Inc. | 13,561 | 155 |
| | | |
| | | | Market |
| | | | Value• |
| | | Shares | ($000) |
| | Dillard’s Inc. Class A | 4,646 | 65 |
| * | Fleetwood | | |
| | Enterprises Inc. | 2,250,448 | 16 |
| * | Sun-Times Media | | |
| | Group Inc. Class A | 130,959 | 1 |
| |
| | Consumer Staples (4.5%) | | |
| | Altria Group Inc. | 2,423,045 | 43,154 |
| | Wal-Mart Stores Inc. | 647,599 | 31,791 |
| | Costco Wholesale Corp. | 471,941 | 26,646 |
| | Procter & Gamble Co. | 223,100 | 12,922 |
| | Archer-Daniels-Midland Co. | 360,300 | 10,528 |
| | Bunge Ltd. | 134,400 | 8,415 |
| | Philip Morris | | |
| | International Inc. | 147,202 | 7,175 |
| | Walgreen Co. | 177,690 | 6,658 |
| | Kroger Co. | 256,347 | 5,291 |
| | Estee Lauder Cos. Inc. | | |
| | Class A | 141,972 | 5,264 |
| * | Fresh Del Monte | | |
| | Produce Inc. | 160,417 | 3,627 |
| | PepsiCo Inc. | 56,849 | 3,335 |
| | Del Monte Foods Co. | 285,247 | 3,303 |
| * | Central Garden and Pet Co. | | |
| | Class A | 112,730 | 1,232 |
| * | Pantry Inc. | 64,980 | 1,019 |
| * | Whole Foods Market Inc. | 31,200 | 951 |
| | Nash Finch Co. | 21,000 | 574 |
| * | Alliance One International Inc. 57,800 | 259 |
| | SUPERVALU Inc. | 16,485 | 248 |
| |
| | Energy (0.9%) | | |
| | ConocoPhillips | 231,200 | 10,441 |
| | Apache Corp. | 62,500 | 5,739 |
| | ENSCO International Inc. | 125,700 | 5,347 |
| | Devon Energy Corp. | 72,100 | 4,855 |
| | EOG Resources Inc. | 40,159 | 3,354 |
| | Anadarko Petroleum Corp. | 27,600 | 1,731 |
| | Schlumberger Ltd. | 23,786 | 1,418 |
| | World Fuel Services Corp. | 19,100 | 918 |
| * | National Oilwell Varco Inc. | 18,814 | 811 |
| | Baker Hughes Inc. | 11,500 | 491 |
| * | Cal Dive International Inc. | 25,400 | 251 |
| |
| | Financials (5.2%) | | |
| | State Street Corp. | 559,385 | 29,424 |
| * | Berkshire Hathaway Inc. | | |
| | Class B | 5,301 | 17,615 |
| | Travelers Cos. Inc. | 221,100 | 10,885 |
| | Legg Mason Inc. | 350,053 | 10,862 |
| | MetLife Inc. | 278,900 | 10,618 |
| | Bank of America Corp. | 626,966 | 10,608 |
| | Goldman Sachs Group Inc. | 56,700 | 10,453 |
| | Capital One Financial Corp. | 280,500 | 10,022 |
| | SL Green Realty Corp. | 194,339 | 8,522 |
| | Rayonier Inc. | 192,700 | 7,883 |
24
| | | | |
| Global Equity Fund | | | |
| |
| |
| |
| | | | | Market |
| | | | | Value• |
| | | | Shares | ($000) |
| | Lazard Ltd. Class A | | 180,103 | 7,440 |
| | Ventas Inc. | | 181,000 | 6,968 |
| * | MBIA Inc. | | 716,565 | 5,561 |
| | Morgan Stanley | | 174,550 | 5,390 |
| | JPMorgan Chase & Co. | | 115,122 | 5,045 |
| * | CB Richard Ellis Group Inc. | | | |
| | Class A | | 356,706 | 4,188 |
| * | PHH Corp. | | 209,426 | 4,155 |
| * | Conseco Inc. | | 743,031 | 3,908 |
| | American Express Co. | | 105,380 | 3,572 |
| | Moody’s Corp. | | 164,778 | 3,371 |
| *,^ | MGIC Investment Corp. | | 440,500 | 3,264 |
| | Mercury General Corp. | | 87,500 | 3,166 |
| | PartnerRe Ltd. | | 40,478 | 3,114 |
| | Fidelity National | | | |
| | Financial Inc. Class A | | 134,600 | 2,030 |
| * | Markel Corp. | | 5,270 | 1,738 |
| | PS Business Parks Inc. | | 31,329 | 1,608 |
| ^ | M&T Bank Corp. | | 21,900 | 1,365 |
| | Citigroup Inc. | | 263,048 | 1,273 |
| | Discover Financial Services | | 68,500 | 1,112 |
| * | E*Trade Financial Corp. | | 585,700 | 1,025 |
| * | Progressive Corp. | | 55,570 | 921 |
| | New York Community | | | |
| | Bancorp Inc. | | 62,410 | 713 |
| | Republic Bancorp Inc. | | | |
| | Class A | | 27,308 | 545 |
| | Ameriprise Financial Inc. | | 9,332 | 339 |
| * | Washington Mutual Inc. | | 166,300 | 41 |
| *,3 | JG Wentworth Inc. | | 1 | — |
| |
| | Health Care (5.6%) | | | |
| | Pfizer Inc. | 3,713,500 | 61,458 |
| | AmerisourceBergen Corp. | | | |
| | Class A | 1,406,342 | 31,474 |
| | Bristol-Myers Squibb Co. | 1,049,300 | 23,630 |
| | Merck & Co. Inc. | | 540,500 | 17,096 |
| | CIGNA Corp. | | 519,699 | 14,598 |
| | UnitedHealth Group Inc. | | 513,500 | 12,858 |
| | Schering-Plough Corp. | | 305,900 | 8,642 |
| | McKesson Corp. | | 117,700 | 7,009 |
| * | Community Health | | | |
| | Systems Inc. | | 192,900 | 6,159 |
| * | Watson Pharmaceuticals Inc. | | 148,700 | 5,448 |
| | Johnson & Johnson | | 80,200 | 4,883 |
| * | WellPoint Inc. | | 52,938 | 2,507 |
| | Cardinal Health Inc. | | 76,400 | 2,048 |
| * | Gentiva Health Services Inc. | 77,300 | 1,933 |
| * | Health Management | | | |
| | Associates Inc. Class A | | 209,900 | 1,572 |
| | IMS Health Inc. | | 79,918 | 1,227 |
| * | Emergency Medical | | | |
| | Services Corp. Class A | | 25,200 | 1,172 |
| * | Kindred Healthcare Inc. | | 59,522 | 966 |
| * | Patterson Cos. Inc. | | 34,392 | 937 |
| * | Magellan Health Services Inc. | 29,500 | 916 |
| | | |
| | | | Market |
| | | | Value• |
| | | Shares | ($000) |
| | PDL BioPharma Inc. | 109,930 | 866 |
| * | Varian Medical Systems Inc. | 19,000 | 801 |
| * | Medco Health Solutions Inc. | 13,800 | 763 |
| | Wyeth | 14,200 | 690 |
| | Invacare Corp. | 25,700 | 573 |
| * | Questcor Pharmaceuticals Inc. 97,910 | 541 |
| * | Centene Corp. | 28,500 | 540 |
| * | Insmed Inc. | 353,900 | 290 |
| * | Healthspring Inc. | 22,700 | 278 |
| * | Universal American Corp. | 28,000 | 264 |
| * | Mylan Inc. | 16,400 | 263 |
| |
| | Industrials (2.4%) | | |
| | General Electric Co. | 740,100 | 12,153 |
| | Northrop Grumman Corp. | 177,901 | 9,206 |
| * | Kansas City Southern | 330,250 | 8,748 |
| | Watson Wyatt | | |
| | Worldwide Inc. Class A | 194,068 | 8,454 |
| * | Delta Air Lines Inc. | 727,641 | 6,520 |
| | Viad Corp. | 304,386 | 6,060 |
| * | AMR Corp. | 662,639 | 5,268 |
| | SPX Corp. | 78,000 | 4,779 |
| | Raytheon Co. | 78,280 | 3,755 |
| | RR Donnelley & Sons Co. | 175,925 | 3,740 |
| | Pitney Bowes Inc. | 111,406 | 2,768 |
| * | Armstrong World | | |
| | Industries Inc. | 74,337 | 2,562 |
| | Brink’s Co. | 93,300 | 2,511 |
| | Skywest Inc. | 139,700 | 2,316 |
| * | US Airways Group Inc. | 414,528 | 1,948 |
| * | EMCOR Group Inc. | 69,276 | 1,754 |
| * | Ultrapetrol Bahamas Ltd. | 346,405 | 1,704 |
| * | Avis Budget Group Inc. | 125,200 | 1,673 |
| * | Hawaiian Holdings Inc. | 122,800 | 1,014 |
| | Deere & Co. | 22,424 | 962 |
| | Universal Forest | | |
| | Products Inc. | 22,600 | 892 |
| | Timken Co. | 33,974 | 796 |
| * | AGCO Corp. | 15,400 | 426 |
| * | Dollar Thrifty | | |
| | Automotive Group Inc. | 17,300 | 425 |
| | Standex International Corp. | 19,500 | 387 |
| * | Hertz Global Holdings Inc. | 33,100 | 359 |
| * | DynCorp International Inc. | | |
| | Class A | 15,200 | 274 |
| * | Marten Transport Ltd. | 16,000 | 273 |
| | Aircastle Ltd. | 27,600 | 267 |
| * | American Reprographics Co. | 21,100 | 201 |
| | Heidrick & Struggles | | |
| | International Inc. | 7,655 | 178 |
| |
| | Information Technology (6.3%) | |
| | International Business | | |
| | Machines Corp. | 239,100 | 28,599 |
| * | Computer Sciences Corp. | 421,500 | 22,217 |
| * | Accenture PLC Class A | 448,946 | 16,732 |
25
| | | |
| Global Equity Fund | | |
| |
| |
| |
| | | | Market |
| | | | Value• |
| | | Shares | ($000) |
| | Automatic Data | | |
| | Processing Inc. | 365,500 | 14,364 |
| | Hewlett-Packard Co. | 247,540 | 11,686 |
| * | Western Digital Corp. | 314,300 | 11,481 |
| * | Gartner Inc. | 624,708 | 11,413 |
| | Xerox Corp. | 1,259,008 | 9,745 |
| | Microsoft Corp. | 349,392 | 9,046 |
| * | eBay Inc. | 367,531 | 8,677 |
| | Fidelity National | | |
| | Information Services Inc. | 320,600 | 8,178 |
| * | Fiserv Inc. | 165,500 | 7,977 |
| | Motorola Inc. | 858,700 | 7,376 |
| * | Tech Data Corp. | 171,800 | 7,149 |
| | Texas Instruments Inc. | 276,000 | 6,538 |
| | Corning Inc. | 404,744 | 6,197 |
| * | LSI Corp. | 955,665 | 5,247 |
| | Tyco Electronics Ltd. | 233,510 | 5,203 |
| * | SAIC Inc. | 284,500 | 4,990 |
| * | IAC/InterActiveCorp | 215,200 | 4,345 |
| | Earthlink Inc. | 500,420 | 4,209 |
| * | Affiliated Computer | | |
| | Services Inc. Class A | 67,000 | 3,629 |
| * | Quest Software Inc. | 203,200 | 3,424 |
| * | Unisys Corp. | 1,053,138 | 2,812 |
| * | DST Systems Inc. | 58,663 | 2,628 |
| * | Google Inc. Class A | 4,075 | 2,021 |
| * | Hewitt Associates Inc. | | |
| | Class A | 50,340 | 1,834 |
| * | Cisco Systems Inc. | 67,600 | 1,591 |
| * | Compuware Corp. | 174,735 | 1,281 |
| * | Forrester Research Inc. | 43,700 | 1,164 |
| * | Sina Corp. | 27,000 | 1,025 |
| * | Wright Express Corp. | 32,800 | 968 |
| | Seagate Technology | 61,900 | 941 |
| | Microchip Technology Inc. | 34,188 | 906 |
| * | CACI International Inc. | | |
| | Class A | 14,300 | 676 |
| * | Adaptec Inc. | 173,900 | 581 |
| * | JDA Software Group Inc. | 25,200 | 553 |
| * | Brightpoint Inc. | 46,700 | 409 |
| * | Dell Inc. | 25,900 | 395 |
| * | Net 1 UEPS Technologies Inc. 15,400 | 323 |
| * | Acxiom Corp. | 29,900 | 283 |
| * | Benchmark Electronics Inc. | 15,300 | 275 |
| * | Integral Systems Inc. | 38,962 | 269 |
| * | CSG Systems International Inc. 14,400 | 231 |
| * | i2 Technologies Inc. | 8,700 | 140 |
| |
| | Materials (1.7%) | | |
| | Lubrizol Corp. | 176,400 | 12,605 |
| | Eastman Chemical Co. | 168,400 | 9,016 |
| | International Paper Co. | 390,000 | 8,670 |
| | Scotts Miracle-Gro Co. | | |
| | Class A | 133,678 | 5,741 |
| | Compass Minerals | | |
| | International Inc. | 82,600 | 5,090 |
| | | |
| | | | Market |
| | | | Value• |
| | | Shares | ($000) |
| | Huntsman Corp. | 411,900 | 3,752 |
| * | Pactiv Corp. | 116,200 | 3,027 |
| | Ashland Inc. | 59,900 | 2,589 |
| | MeadWestvaco Corp. | 114,600 | 2,557 |
| | Temple-Inland Inc. | 138,400 | 2,272 |
| | A Schulman Inc. | 83,400 | 1,662 |
| | Sonoco Products Co. | 55,453 | 1,527 |
| | Innophos Holdings Inc. | 79,400 | 1,469 |
| | Praxair Inc. | 17,943 | 1,466 |
| | Packaging Corp. of America | 36,600 | 747 |
| | Schweitzer-Mauduit | | |
| | International Inc. | 13,695 | 744 |
| * | Clearwater Paper Corp. | 14,700 | 608 |
| | Bemis Co. Inc. | 20,800 | 539 |
| | Rock-Tenn Co. Class A | 9,100 | 429 |
| * | Omnova Solutions Inc. | 58,800 | 381 |
| | Glatfelter | 27,000 | 310 |
| | Wausau Paper Corp. | 26,200 | 262 |
| * | Buckeye Technologies Inc. | 24,400 | 262 |
| * | Louisiana-Pacific Corp. | 38,100 | 254 |
| * | OM Group Inc. | 1,700 | 52 |
| |
| | Telecommunication Services (1.2%) | |
| | AT&T Inc. | 713,100 | 19,261 |
| * | Sprint Nextel Corp. | 2,516,000 | 9,938 |
| * | NII Holdings Inc. | 210,335 | 6,306 |
| * | Cincinnati Bell Inc. | 1,441,142 | 5,044 |
| * | Level 3 | | |
| | Communications Inc. | 2,150,482 | 2,989 |
| | USA Mobility Inc. | 21,200 | 273 |
| |
| | Utilities (0.1%) | | |
| * | NRG Energy Inc. | 73,500 | 2,072 |
| | PNM Resources Inc. | 47,900 | 559 |
| * | Mirant Corp. | 21,300 | 350 |
| | | | 1,349,462 |
| Total Common Stocks | | |
| (Cost $3,339,397) | | 3,647,106 |
| |
| | | Face | |
| | | Amount | |
| | | ($000) | |
| Convertible Bonds (0.1%) | | |
| Consumer Discretionary (0.0%) | |
| | Sotheby’s, 3.125%, 6/15/13 | 787 | 687 |
| |
| Financials (0.0%) | | |
| 2 | SL Green Realty Corp., | | |
| | 3.000%, 3/30/27 | 1,032 | 929 |
| |
| Industrials (0.0%) | | |
| | AMR Corp., | | |
| | 6.250%, 10/15/14 | 452,000 | 478 |
| | US Airways Group Inc., | | |
| | 7.250%, 5/15/14 | 184 | 233 |
26
| | | |
| Global Equity Fund | | |
| |
| |
| |
| | | Face | Market |
| | | Amount | Value• |
| | | ($000) | ($000) |
| Telecommunication Services (0.1%) | |
| | NII Holdings Inc., | | |
| | 3.125%, 6/15/12 | 2,998 | 2,619 |
| Total Convertible Bonds | | |
| (Cost $3,722) | | 4,946 |
| |
| | | Shares | |
| Temporary Cash Investments (6.5%)1 | |
| Money Market Fund (6.0%) | | |
| 4,5 | Vanguard Market | | |
| | Liquidity Fund, 0.267% | 227,247,547 | 227,248 |
| |
| | | Face | |
| | | Amount | |
| | | ($000) | |
| U.S. Government and Agency Obligations (0.5%) |
| 6,7 | Federal Home Loan | | |
| | Bank Discount Notes, | | |
| | 0.275%, 2/19/10 | 15,000 | 14,991 |
| 6,7 | Freddie Mac Discount | | |
| | Notes, 0.260%, 12/22/09 | 5,000 | 4,998 |
| | | | 19,989 |
| Total Temporary Cash Investments | |
| (Cost $247,229) | | 247,237 |
| Total Investments (102.3%) | | |
| (Cost $3,590,348) | | 3,899,289 |
| |
| | Market |
| | Value• |
| | ($000) |
| Other Assets and Liabilities (–2.3%) | |
| Other Assets7 | 110,171 |
| Liabilities5 | (196,065) |
| | (85,894) |
| Net Assets (100%) | |
| Applicable to 246,137,621 outstanding | |
| $.001 par value shares of beneficial | |
| interest (unlimited authorization) | 3,813,395 |
| Net Asset Value Per Share | $15.49 |
| |
| |
| At September 30, 2009, net assets consisted of: |
| | Amount |
| | ($000) |
| Paid-in Capital | 5,538,575 |
| Undistributed Net Investment Income | 46,693 |
| Accumulated Net Realized Losses | (2,082,485) |
| Unrealized Appreciation (Depreciation) | |
| Investment Securities | 308,941 |
| Futures Contracts | 1,487 |
| Foreign Currencies and | |
| Forward Currency Contracts | 184 |
| Net Assets | 3,813,395 |
• See Note A in Notes to Financial Statements.
* Non-income-producing security.
^ Part of security position is on loan to broker-dealers. The total value of securities on loan is $20,184,000.
1 The fund invests a portion of its cash reserves in equity markets through the use of index futures contracts. After giving effect to futures
investments, the fund’s effective common stock and temporary cash investment positions represent 101.1% and 1.1%, respectively, of
net assets.
2 Security exempt from registration under Rule 144A of the Securities Act of 1933. Such securities may be sold in transactions exempt from
registration, normally to qualified institutional buyers. At September 30, 2009, the aggregate value of these securities was $2,841,000,
representing 0.1% of net assets.
3 Restricted security represents 0.0% of net assets.
4 Affiliated money market fund available only to Vanguard funds and certain trusts and accounts managed by Vanguard. Rate shown is the
7-day yield.
5 Includes $21,373,000 of collateral received for securities on loan.
6 The issuer operates under a congressional charter; its securities are not backed by the full faith and credit of the U.S. government.
7 Securities with a value of $19,989,000 and cash of $6,734,000 have been segregated as initial margin for open futures contracts.
ADR—American Depositary Receipt.
GDR—Global Depositary Receipt.
See accompanying Notes, which are an integral part of the Financial Statements.
27
| |
| Global Equity Fund | |
| |
| |
| Statement of Operations | |
| |
| | Year Ended |
| | September 30, 2009 |
| | ($000) |
| Investment Income | |
| Income | |
| Dividends1 | 98,756 |
| Interest2 | 1,898 |
| Security Lending | 3,947 |
| Total Income | 104,601 |
| Expenses | |
| Investment Advisory Fees—Note B | |
| Basic Fee | 8,406 |
| Performance Adjustment | (4,375) |
| The Vanguard Group—Note C | |
| Management and Administrative | 10,167 |
| Marketing and Distribution | 1,223 |
| Custodian Fees | 516 |
| Auditing Fees | 35 |
| Shareholders’ Reports and Proxies | 394 |
| Trustees’ Fees and Expenses | 8 |
| Total Expenses | 16,374 |
| Net Investment Income | 88,227 |
| Realized Net Gain (Loss) | |
| Investment Securities Sold | (1,747,600) |
| Futures Contracts | (18,997) |
| Foreign Currencies and Forward Currency Contracts | (14,758) |
| Realized Net Gain (Loss) | (1,781,355) |
| Change in Unrealized Appreciation (Depreciation) | |
| Investment Securities | 1,326,673 |
| Futures Contracts | 1,821 |
| Foreign Currencies and Forward Currency Contracts | 637 |
| Change in Unrealized Appreciation (Depreciation) | 1,329,131 |
| Net Increase (Decrease) in Net Assets Resulting from Operations | (363,997) |
1 Dividends are net of foreign withholding taxes of $6,000,000.
2 Interest income from an affiliated company of the fund was $1,205,000.
See accompanying Notes, which are an integral part of the Financial Statements.
28
| | |
| Global Equity Fund | | |
| |
| |
| Statement of Changes in Net Assets | | |
| |
| | Year Ended September 30, |
| | 2009 | 2008 |
| | ($000) | ($000) |
| Increase (Decrease) in Net Assets | | |
| Operations | | |
| Net Investment Income | 88,227 | 165,132 |
| Realized Net Gain (Loss) | (1,781,355) | (258,939) |
| Change in Unrealized Appreciation (Depreciation) | 1,329,131 | (2,455,125) |
| Net Increase (Decrease) in Net Assets Resulting from Operations | (363,997) | (2,548,932) |
| Distributions | | |
| Net Investment Income | (163,433) | (127,498) |
| Realized Capital Gain1 | — | (415,111) |
| Total Distributions | (163,433) | (542,609) |
| Capital Share Transactions | | |
| Issued | 490,456 | 1,886,150 |
| Issued in Lieu of Cash Distributions | 150,795 | 503,326 |
| Redeemed | (1,460,902) | (1,689,191) |
| Net Increase (Decrease) from Capital Share Transactions | (819,651) | 700,285 |
| Total Increase (Decrease) | (1,347,081) | (2,391,256) |
| Net Assets | | |
| Beginning of Period | 5,160,476 | 7,551,732 |
| End of Period2 | 3,813,395 | 5,160,476 |
1 Includes fiscal 2008 short-term gain distributions totaling $188,283,000. Short-term gain distributions are treated as ordinary income dividends for tax purposes.
2 Net Assets—End of Period includes undistributed net investment income of $46,693,000 and $123,465,000.
See accompanying Notes, which are an integral part of the Financial Statements.
29
| | | | | |
| Global Equity Fund | | | | | |
| |
| |
| Financial Highlights | | | | | |
| |
| |
| For a Share Outstanding | | | Year Ended September 30, |
| Throughout Each Period | 2009 | 2008 | 2007 | 2006 | 2005 |
| Net Asset Value, Beginning of Period | $16.64 | $26.51 | $21.96 | $19.72 | $16.08 |
| Investment Operations | | | | | |
| Net Investment Income | .371 | .529 | .4901 | .320 | .250 |
| Net Realized and Unrealized Gain (Loss) | | | | | |
| on Investments | (.948) | (8.569) | 5.250 | 2.595 | 3.870 |
| Total from Investment Operations | (.577) | (8.040) | 5.740 | 2.915 | 4.120 |
| Distributions | | | | | |
| Dividends from Net Investment Income | (.573) | (.430) | (.310) | (.240) | (.210) |
| Distributions from Realized Capital Gains | — | (1.400) | (.880) | (.435) | (.270) |
| Total Distributions | (.573) | (1.830) | (1.190) | (.675) | (.480) |
| Net Asset Value, End of Period | $15.49 | $16.64 | $26.51 | $21.96 | $19.72 |
| |
| Total Return2 | –2.30% | –32.24% | 27.00% | 15.22% | 25.99% |
| |
| Ratios/Supplemental Data | | | | | |
| Net Assets, End of Period (Millions) | $3,813 | $5,160 | $7,552 | $4,191 | $2,302 |
| Ratio of Total Expenses to | | | | | |
| Average Net Assets3 | 0.47% | 0.51% | 0.64% | 0.72% | 0.80% |
| Ratio of Net Investment Income to | | | | | |
| Average Net Assets | 2.55% | 2.35% | 1.98% | 1.76% | 1.60% |
| Portfolio Turnover Rate | 71% | 73% | 64% | 88% | 83% |
1 Calculated based on average shares outstanding.
2 Total returns do not include the account service fee that may be applicable to certain accounts with balances below $10,000.
3 Includes performance-based investment advisory fee increases (decreases) of (0.13%), (0.02%), 0.05%, 0.05%, and 0.06%.
See accompanying Notes, which are an integral part of the Financial Statements.
30
Global Equity Fund
Notes to Financial Statements
Vanguard Global Equity Fund is registered under the Investment Company Act of 1940 as an open-end investment company, or mutual fund. The fund invests in securities of foreign issuers, which may subject it to investment risks not normally associated with investing in securities of United States corporations.
A. The following significant accounting policies conform to generally accepted accounting principles for U.S. mutual funds. The fund consistently follows such policies in preparing its financial statements.
1. Security Valuation: Securities are valued as of the close of trading on the New York Stock Exchange (generally 4 p.m., Eastern time) on the valuation date. Equity securities are valued at the latest quoted sales prices or official closing prices taken from the primary market in which each security trades; such securities not traded on the valuation date are valued at the mean of the latest quoted bid and asked prices. Bonds, and temporary cash investments acquired over 60 days to maturity, are valued using the latest bid prices or using valuations based on a matrix system (which considers such factors as security prices, yields, maturities, and ratings), both as furnished by independent pricing services. Investments in Vanguard Market Liquidity Fund are valued at that fund’s net asset value. Other temporary cash investments are valued at amortized cost, which approximates market value. Securities for which market q uotations are not readily available, or whose values have been affected by events occurring before the fund’s pricing time but after the close of the securities’ primary markets, are valued at their fair values calculated according to procedures adopted by the board of trustees. These procedures include obtaining quotations from an independent pricing service, monitoring news to identify significant market- or security-specific events, and evaluating changes in the values of foreign market proxies (for example, ADRs, futures contracts or exchange-traded funds), between the time the foreign markets close and the fund’s pricing time. When fair-value pricing is employed, the prices of securities used by a fund to calculate its net asset value may differ from quoted or published prices for the same securities.
2. Foreign Currency: Securities and other assets and liabilities denominated in foreign currencies are translated into U.S. dollars using exchange rates obtained from an independent third party as of the fund’s pricing time on the valuation date. Realized gains (losses) and unrealized appreciation (depreciation) on investment securities include the effects of changes in exchange rates since the securities were purchased, combined with the effects of changes in security prices. Fluctuations in the value of other assets and liabilities resulting from changes in exchange rates are recorded as unrealized foreign currency gains (losses) until the assets or liabilities are settled in cash, at which time they are recorded as realized foreign currency gains (losses).
3. Futures and Forward Currency Contracts: The fund uses index futures contracts to a limited extent, with the objective of maintaining full exposure to the stock market while maintaining liquidity. The fund may purchase or sell futures contracts to achieve a desired level of investment, whether to accommodate portfolio turnover or cash flows from capital share transactions. The primary risks associated with the use of futures contracts are imperfect correlation between changes in market values of stocks held by the fund and the prices of futures contracts, and the possibility of an illiquid market.
The fund may also enter into forward currency contracts to provide the appropriate currency exposure related to any open futures contracts or to protect the value of securities and related receivables and payables against changes in foreign exchange rates. The primary risk associated with the fund’s use of these contracts is that a counterparty will fail to fulfill its obligation to pay gains due to the fund under the contracts. Counterparty risk is mitigated by entering into forward currency contracts only with highly rated counterparties, by a master netting arrangement between the fund and the counterparty, and by the posting of collateral by the counterparty. The forward currency contracts contain provisions
31
Global Equity Fund
whereby a counterparty may terminate open contracts if the fund’s net assets decline below a certain level, triggering a payment by the fund if the fund is in a net liability position at the time of the termination. The payment amount would be reduced by any collateral the fund has posted. Any securities posted as collateral for open contracts are noted in the Statement of Net Assets.
Futures and forward currency contracts are valued at their quoted daily settlement prices. The aggregate principal amounts of the contracts are not recorded in the Statement of Net Assets. Fluctuations in the value of the contracts are recorded in the Statement of Net Assets as an asset (liability) and in the Statement of Operations as unrealized appreciation (depreciation) until the contracts are closed, when they are recorded as realized gains (losses) on futures or forward currency contracts.
4. Federal Income Taxes: The fund intends to continue to qualify as a regulated investment company and distribute all of its taxable income. Management has analyzed the fund’s tax positions taken for all open federal income tax years (September 30, 2006–2009), and has concluded that no provision for federal income tax is required in the fund’s financial statements.
5. Distributions: Distributions to shareholders are recorded on the ex-dividend date.
6. Security Lending: The fund may lend its securities to qualified institutional borrowers to earn additional income. Security loans are required to be secured at all times by collateral at least equal to the market value of securities loaned. The fund invests cash collateral received in Vanguard Market Liquidity Fund, and records a liability for the return of the collateral, during the period the securities are on loan. Security lending income represents the income earned on investing cash collateral, less expenses associated with the loan.
7. Other: Dividend income is recorded on the ex-dividend date. Interest income includes income distributions received from Vanguard Market Liquidity Fund and is accrued daily. Security transactions are accounted for on the date securities are bought or sold. Costs used to determine realized gains (losses) on the sale of investment securities are those of the specific securities sold.
B. Acadian Asset Management LLC, Marathon Asset Management LLP, AllianceBernstein L.P., and Baillie Gifford Overseas Ltd each provide investment advisory services to a portion of the fund for a fee calculated at an annual percentage rate of average net assets managed by the advisor. The basic fees of Acadian Asset Management LLC and Marathon Asset Management LLP are subject to quarterly adjustments based on performance for the preceding three years relative to the MSCI All Country World Index. The basic fee of AllianceBernstein L.P. is subject to quarterly adjustments based on performance since June 30, 2006, relative to the MSCI All Country World Index. The basic fee of Baillie Gifford Overseas Ltd. is subject to quarterly adjustments based on performance since June 30, 2008, relative to the MSCI All Country World Index.
The Vanguard Group manages the cash reserves of the fund at an at-cost basis.
For the year ended September 30, 2009, the aggregate investment advisory fee represented an effective annual basic rate of 0.24% of the fund’s average net assets, before a decrease of $4,375,000 (0.13%) based on performance.
32
Global Equity Fund
C. The Vanguard Group furnishes at cost corporate management, administrative, marketing, and distribution services. The costs of such services are allocated to the fund under methods approved by the board of trustees. The fund has committed to provide up to 0.40% of its net assets in capital contributions to Vanguard. At September 30, 2009, the fund had contributed capital of $811,000 to Vanguard (included in Other Assets), representing 0.02% of the fund’s net assets and 0.32% of Vanguard’s capitalization. The fund’s trustees and officers are also directors and officers of Vanguard.
D. Various inputs may be used to determine the value of the fund’s investments. These inputs are summarized in three broad levels for financial statement purposes. The inputs or methodologies used to value securities are not necessarily an indication of the risk associated with investing in those securities.
Level 1—Quoted prices in active markets for identical securities.
Level 2—Other significant observable inputs (including quoted prices for similar securities, interest rates, prepayment speeds, credit risk, etc.).
Level 3—Significant unobservable inputs (including the fund’s own assumptions used to determine the fair value of investments).
The following table summarizes the fund’s investments as of September 30, 2009, based on the inputs used to value them:
| | | |
| | Level 1 | Level 2 | Level 3 |
| Investments | ($000) | ($000) | ($000) |
| Common Stocks—International | 178,787 | 2,118,798 | 59 |
| Common Stocks—U.S. | 1,349,462 | — | — |
| Convertible Bonds | — | 4,946 | — |
| Temporary Cash Investments | 227,248 | 19,989 | — |
| Futures Contracts—Liabilities1 | (474) | — | — |
| Forward Currency Contracts—Assets | 882 | — | — |
| Forward Currency Contracts—Liabilities | (790) | — | — |
| Total | 1,755,115 | 2,143,733 | 59 |
| 1 Represents variation margin on the last day of the reporting period. | | | |
The following table summarizes changes in investments valued based on Level 3 inputs during the year ended September 30, 2009:
| |
| | Investments in |
| | Common Stocks |
| Amount Valued Based on Level 3 Inputs | ($000) |
| Balance as of September 30, 2008 | 1,775 |
| Transfers in and/or out of Level 3 | 53 |
| Change in Unrealized Appreciation (Depreciation) | (1,769) |
| Balance as of September 30, 2009 | 59 |
33
Global Equity Fund
E. At September 30, 2009, the fair values of derivatives were reflected in the Statement of Net Assets as follows:
| | | |
| | | Foreign | |
| | Equity | Exchange | |
| | Contracts1 | Contracts | Total |
| Statement of Net Assets Caption | ($000) | ($000) | ($000) |
| Other Assets | — | 882 | 882 |
| Liabilities | (474) | (790) | (1,264) |
| 1 Represents variation margin on the last day of the reporting period. | | | |
Realized net gain (loss) and the change in unrealized appreciation (depreciation) on derivatives for the year ended September 30, 2009, were:
| | | |
| | | Foreign | |
| | Equity | Exchange | |
| | Contracts | Contracts | Total |
| Realized Net Gain (Loss) on Derivatives | ($000) | ($000) | ($000) |
| Futures Contracts | (18,997) | — | (18,997) |
| Forward Currency Contracts | — | (13,130) | (13,130) |
| Realized Net Gain (Loss) on Derivatives | (18,997) | (13,130) | (32,127) |
| |
| Change in Unrealized Appreciation (Depreciation) on Derivatives | | | |
| Futures Contracts | 1,821 | — | 1,821 |
| Forward Currency Contracts | — | 362 | 362 |
| Change in Unrealized Appreciation (Depreciation) on Derivatives | 1,821 | 362 | 2,183 |
At September 30, 2009, the aggregate settlement value of open futures contracts and the related unrealized appreciation (depreciation) were:
| | | | |
| | | | | ($000) |
| | | Number of | Aggregate | Unrealized |
| | | Long (Short) | Settlement | Appreciation |
| Futures Contracts | Expiration | Contracts | Value | (Depreciation) |
| S&P 500 Index | December 2009 | 269 | 70,808 | 2,212 |
| Dow Jones EURO STOXX 50 Index | December 2009 | 1,065 | 44,475 | (170) |
| Topix Index | December 2009 | 284 | 28,865 | (872) |
| FTSE 100 Index | December 2009 | 272 | 22,147 | (118) |
| E-mini S&P 500 Index | December 2009 | 330 | 17,373 | (156) |
| S&P ASX 200 Index | December 2009 | 148 | 15,501 | 371 |
| MSCI Taiwan Index | October 2009 | 267 | 7,302 | 220 |
Unrealized appreciation (depreciation) on open S&P 500 Index and E-mini S&P 500 Index futures contracts is required to be treated as realized gain (loss) for tax purposes.
34
Global Equity Fund
At September 30, 2009, the fund had open forward currency contracts to receive and deliver currencies as follows. Unrealized appreciation (depreciation) on open forward currency contracts is treated as realized gain (loss) for tax purposes.
| | | | | |
| | | | | | Unrealized |
| | | | | | Appreciation |
| | | | Contract Amount (000) | (Depreciation) |
| Contract Settlement Date | | Receive | | Deliver | ($000) |
| 12/23/09 | EUR | 27,166 | USD | 39,705 | (306) |
| 12/16/09 | JPY | 2,672,427 | USD | 29,864 | 552 |
| 12/23/09 | GBP | 13,825 | USD | 22,106 | (484) |
| 12/23/09 | AUD | 16,976 | USD | 14,872 | 330 |
| AUD—Australian dollar. | | | | | |
| EUR—Euro. | | | | | |
| GBP—British pound. | | | | | |
| JPY—Japanese yen. | | | | | |
| USD—U.S. dollar. | | | | | |
The fund had net unrealized foreign currency gains of $92,000 resulting from the translation of other assets and liabilities at September 30, 2009.
F. Distributions are determined on a tax basis and may differ from net investment income and realized capital gains for financial reporting purposes. Differences may be permanent or temporary. Permanent differences are reclassified among capital accounts in the financial statements to reflect their tax character. Temporary differences arise when certain items of income, expense, gain, or loss are recognized in different periods for financial statement and tax purposes; these differences will reverse at some time in the future. Differences in classification may also result from the treatment of short-term gains as ordinary income for tax purposes.
During the year ended September 30, 2009, the fund realized net foreign currency losses of $1,628,000, which decreased distributable net income for tax purposes; accordingly, such losses have been reclassified from accumulated net realized losses to undistributed net investment income. Certain of the fund’s investments are in securities considered to be “passive foreign investment companies,” for which any unrealized appreciation and/or realized gains are required to be included in distributable net income for tax purposes. During the year ended September 30, 2009, the fund realized gains on the sale of passive foreign investment companies of $62,000, which have been included in current and prior periods’ taxable income; accordingly, such gains have been reclassified from accumulated net realized losses to undistributed net investment income. Unrealized appreciation on the fund’s passive foreign in vestment company holdings at September 30, 2009, was $14,922,000.
For tax purposes, at September 30, 2009, the fund had $70,033,000 of ordinary income available for distribution. The fund had available capital loss carryforwards totaling $831,935,000 to offset future net capital gains through September 30, 2017. In addition, the fund realized losses of $1,243,906,000 during the period from November 1, 2008, through September 30, 2009, which are deferred and will be treated as realized for tax purposes in fiscal 2010.
35
Global Equity Fund
At September 30, 2009, the cost of investment securities for tax purposes was $3,610,725,000. Net unrealized appreciation of investment securities for tax purposes was $288,564,000, consisting of unrealized gains of $732,836,000 on securities that had risen in value since their purchase and $444,272,000 in unrealized losses on securities that had fallen in value since their purchase.
G. During the year ended September 30, 2009, the fund purchased $2,419,413,000 of investment securities and sold $3,295,964,000 of investment securities, other than temporary cash investments.
| | |
| H. Capital shares issued and redeemed were: | | |
| | Year Ended September 30, |
| | 2009 | 2008 |
| | Shares | Shares |
| | (000) | (000) |
| Issued | 39,924 | 82,584 |
| Issued in Lieu of Cash Distributions | 13,022 | 21,874 |
| Redeemed | (116,845) | (79,275) |
| Net Increase (Decrease) in Shares Outstanding | (63,899) | 25,183 |
I. In preparing the financial statements as of September 30, 2009, management considered the impact of subsequent events occurring through November 10, 2009, for potential recognition or disclosure in these financial statements.
36
Report of Independent Registered Public Accounting Firm
To the Trustees of Vanguard Horizon Funds and the Shareholders of Vanguard Global Equity Fund:
In our opinion, the accompanying statement of net assets and the related statements of operations and of changes in net assets and the financial highlights present fairly, in all material respects, the financial position of Vanguard Global Equity Fund (the “Fund”) at September 30, 2009, the results of its operations for the year then ended, the changes in its net assets for each of the two years in the period then ended and the financial highlights for each of the periods indicated, in conformity with accounting principles generally accepted in the United States of America. These financial statements and financial highlights (hereafter referred to as “financial statements”) are the responsibility of the Fund’s management; our responsibility is to express an opinion on these financial statements based on our audits. We conducted our audits of these financial statements in accordance with the standar ds of the Public Company Accounting Oversight Board (United States). Those standards require that we plan and perform the audit to obtain reasonable assurance about whether the financial statements are free of material misstatement. An audit includes examining, on a test basis, evidence supporting the amounts and disclosures in the financial statements, assessing the accounting principles used and significant estimates made by management, and evaluating the overall financial statement presentation. We believe that our audits, which included confirmation of securities at September 30, 2009 by correspondence with the custodian and brokers, and by agreement to the underlying ownership records for Vanguard Market Liquidity Fund, provide a reasonable basis for our opinion.
PricewaterhouseCoopers LLP
Philadelphia, Pennsylvania
November 10, 2009
| Special 2009 tax information (unaudited) for Vanguard Global Equity Fund |
This information for the fiscal year ended September 30, 2009, is included pursuant to provisions of the Internal Revenue Code.
The fund distributed $119,371,000 of qualified dividend income to shareholders during the fiscal year.
For corporate shareholders, 33.5% of investment income (dividend income plus short-term gains, if any) qualifies for the dividends-received deduction.
The fund will pass through foreign source income of $67,482,000 and foreign taxes paid of $6,548,000 to shareholders. The pass-through of foreign taxes paid will affect only shareholders on the fund’s dividend record date in December 2009. Shareholders will receive more detailed information along with their Form 1099-DIV in January 2010.
37
Your Fund’s After-Tax Returns
This table presents returns for your fund both before and after taxes. The after-tax returns are shown in two ways: (1) assuming that an investor owned the fund during the entire period and paid taxes on the fund’s distributions, and (2) assuming that an investor paid taxes on the fund’s distributions and sold all shares at the end of each period.
Calculations are based on the highest individual federal income tax and capital gains tax rates in effect at the times of the distributions and the hypothetical sales. State and local taxes were not considered. After-tax returns reflect any qualified dividend income, using actual prior-year figures and estimates for 2009. (In the example, returns after the sale of fund shares may be higher than those assuming no sale. This occurs when the sale would have produced a capital loss. The calculation assumes that the investor received a tax deduction for the loss.)
Please note that your actual after-tax returns will depend on your tax situation and may differ from those shown. Also note that if you own the fund in a tax-deferred account, such as an individual retirement account or a 401(k) plan, this information does not apply to you. Such accounts are not subject to current taxes.
Finally, keep in mind that a fund’s performance—whether before or after taxes—does not guarantee future results.
| | | |
| Average Annual Total Returns: Global Equity Fund1 | | | |
| Periods Ended September 30, 2009 | | | |
| | One | Five | Ten |
| | Year | Years | Years |
| Returns Before Taxes | –2.30% | 4.07% | 6.29% |
| Returns After Taxes on Distributions | –3.07 | 3.11 | 5.17 |
| Returns After Taxes on Distributions and Sale of Fund Shares | –0.99 | 3.34 | 5.05 |
1 Total returns do not include the account service fee that may be applicable to certain accounts with balances below $10,000.
38
About Your Fund’s Expenses
As a shareholder of the fund, you incur ongoing costs, which include costs for portfolio management, administrative services, and shareholder reports (like this one), among others. Operating expenses, which are deducted from a fund’s gross income, directly reduce the investment return of the fund.
A fund’s expenses are expressed as a percentage of its average net assets. This figure is known as the expense ratio. The following examples are intended to help you understand the ongoing costs (in dollars) of investing in your fund and to compare these costs with those of other mutual funds. The examples are based on an investment of $1,000 made at the beginning of the period shown and held for the entire period.
The accompanying table illustrates your fund’s costs in two ways:
• Based on actual fund return. This section helps you to estimate the actual expenses that you paid over the period. The “Ending Account Value” shown is derived from the fund’s actual return, and the third column shows the dollar amount that would have been paid by an investor who started with $1,000 in the fund. You may use the information here, together with the amount you invested, to estimate the expenses that you paid over the period.
To do so, simply divide your account value by $1,000 (for example, an $8,600 account value divided by $1,000 = 8.6), then multiply the result by the number given for your fund under the heading “Expenses Paid During Period.”
• Based on hypothetical 5% yearly return. This section is intended to help you compare your fund’s costs with those of other mutual funds. It assumes that the fund had a yearly return of 5% before expenses, but that the expense ratio is unchanged. In this case—because the return used is not the fund’s actual return—the results do not apply to your investment. The example is useful in making comparisons because the Securities and Exchange Commission requires all mutual funds to calculate expenses based on a 5% return. You can assess your fund’s costs by comparing this hypothetical example with the hypothetical examples that appear in shareholder reports of other funds.
| | | |
| Six Months Ended September 30, 2009 | | | |
| | Beginning | Ending | Expenses |
| | Account Value | Account Value | Paid During |
| Global Equity Fund | 3/31/2009 | 9/30/2009 | Period1 |
| Based on Actual Fund Return | $1,000.00 | $1,478.05 | $2.92 |
| Based on Hypothetical 5% Yearly Return | 1,000.00 | 1,022.71 | 2.38 |
Note that the expenses shown in the table are meant to highlight and help you compare ongoing costs only and do not reflect transaction costs incurred by the fund for buying and selling securities. Further, the expenses do not include the account service fee described in the prospectus. If such a fee were applied to your account, your costs would be higher. Your fund does not charge transaction fees, such as purchase or redemption fees, nor does it carry a “sales load.”
1 The calculations are based on expenses incurred in the most recent six-month period. The fund’s annualized six-month expense ratio for that period is 0.47%. The dollar amounts shown as “Expenses Paid” are equal to the annualized expense ratio multiplied by the average account value over the period, multiplied by the number of days in the most recent six-month period, then divided by the number of days in the most recent 12-month period.
39
The calculations assume no shares were bought or sold during the period. Your actual costs may have been higher or lower, depending on the amount of your investment and the timing of any purchases or redemptions.
You can find more information about the fund’s expenses, including annual expense ratios, in the Financial Statements section of this report. For additional information on operating expenses and other shareholder costs, please refer to your fund’s current prospectus.
40
Notice to Shareholders
The board of trustees of Vanguard Global Equity Fund has adopted a new performance adjustment schedule for one of the fund’s advisors, Marathon Asset Management LLP (Marathon), effective October 1, 2009. The new performance adjustment schedule is expected to link the advisor’s compensation more closely to actual performance. This change will not affect the fund’s investment objective, policies, or strategies. Acadian Asset Management LLC, AllianceBernstein L.P., and Baillie Gifford Overseas Ltd. also provide investment advisory services to the fund.
The fund’s trustees regularly evaluate its investment advisory arrangements, focusing on factors such as the advisor’s investment process, style consistency, and performance, as well as the composition and depth of the management and research teams. In deciding to adopt the new adjustment schedule, the trustees considered the fund’s performance together with a wide range of information relating to Marathon, which has managed the fund since the fund’s inception in 1995.
The fund has entered into a new investment advisory agreement with Marathon to reflect the new adjustment schedule; however, other terms of the prior agreement remain unchanged. Under the terms of the agreement, the fund will pay Marathon a fee at the end of each fiscal quarter. The fee is calculated by applying an annual percentage rate to the average daily net assets of the portion of the fund advised by Marathon (the Marathon portfolio) for the quarter. The quarterly payments to Marathon may be increased or decreased by applying the new performance adjustment schedule. The adjustment will be based on the cumulative total performance of the Marathon portfolio over a trailing 36-month period (subject to certain transition rules that will be in place until 36 months have elapsed from the date of the new agreement) as compared with that of the Morgan Stanley Capital International All Country World Index over the same period .
Board approval of the investment advisory agreement
Marathon is responsible for managing the investment and reinvestment of the Marathon portfolio, which represents a portion of the Global Equity Fund’s assets. In managing these assets, Marathon is responsible for continuously reviewing, supervising, and administering the investment program. The advisor discharges its responsibilities subject to the supervision and oversight of the officers and trustees of the fund.
The board’s decision to revise the performance adjustment schedule was based upon its most recent evaluation of the advisor’s investment staff, portfolio management process, and performance results. In considering whether to approve the new agreement, the board engaged in arm’s-length negotiations with Marathon and considered the following factors, among others:
• The trustees considered the benefits to shareholders of continuing to retain Marathon as advisor to the fund, particularly in light of the nature, extent, and quality of services provided by Marathon. The board considered the quality of investment management to the fund over both the short and long term and the organizational depth and stability of the firm.
Specifically, the board noted that Marathon, founded in 1986, has advised the fund since the fund’s inception in 1995. Marathon continues to use a bottom-up approach that focuses on stock selection. Its three regional teams focus on each company’s corporate strategy and industry competition, while its sector analysis is conducted using long-term capital cycle data. Each of these teams is led by one of the firm’s three founders: Jeremy Hosking, William Arah, and Neil Ostrer. The board concluded that the prior performance adjustment schedule should be adjusted to provide Marathon with total compensation sufficient to retain its services.
41
• The trustees considered the Marathon portfolio’s investment performance as compared with that of the fund’s peer group and a relevant market benchmark. The board concluded that short- and long-term performance has been consistently strong versus the fund’s benchmark, the MSCI All Country World Index. The board also concluded that short- and long-term performance has been competitive versus the fund’s peer group of global funds (as defined by Lipper Inc.).
• The trustees considered the cost of services to be provided, including competitive fee rates and the fact that, after the adjustment, Marathon’s advisory fee rate will remain significantly below the global funds average.
• The trustees noted that because of breakpoints in the fund’s advisory fee schedule with Marathon, which reduce the effective rate of Marathon’s fee as the assets of the Marathon portfolio grow, the fund’s shareholders benefit from economies of scale.
• The trustees considered all of the circumstances and information provided by both Marathon and Vanguard regarding Marathon’s performance and concluded that approval of the new investment advisory agreement is in the best interests of the fund and its shareholders.
The advisory agreement will continue for a period of one year from its effective date and is renewable after that for successive one-year periods. The agreement will be reviewed annually by the fund’s trustees, a majority of whom are not “interested persons,” as defined in federal securities laws, of either the fund or Marathon.
Background information on Marathon
Marathon Asset Management LLP, Orion House, 5 Upper St. Martin’s Lane, London, WC2H 9EA, England, is an investment advisory firm founded in 1986. Marathon provides asset management services to companies and institutions. As of June 30, 2009, Marathon managed approximately $24.5 billion in assets. The managers primarily responsible for overseeing the Marathon portfolio are:
William J. Arah, Director of Marathon. He has worked in investment management since 1982; has managed assets at Marathon since 1987; and has co-managed a portion of the fund since its inception. Education: M.A., Oxford University.
Jeremy J. Hosking, Director of Marathon. He has worked in investment management and has managed assets since 1979; has been with Marathon since 1986; and has co-managed a portion of the fund since its inception. Education: M.A., Cambridge University.
Neil M. Ostrer, Director of Marathon. He has worked in investment management and has managed assets since 1981; has been with Marathon since 1986; and has co-managed a portion of the fund since its inception. Education: M.A., Cambridge University.
42
Glossary
Beta. A measure of the magnitude of a fund’s past share-price fluctuations in relation to the ups and downs of a given market index. The index is assigned a beta of 1.00. Compared with a given index, a fund with a beta of 1.20 typically would have seen its share price rise or fall by 12% when the index rose or fell by 10%. For this report, beta is based on returns over the past 36 months for both the fund and the index. Note that a fund’s beta should be reviewed in conjunction with its R-squared (see definition). The lower the R-squared, the less correlation there is between the fund and the index, and the less reliable beta is as an indicator of volatility.
Equity Exposure. A measure that reflects a fund’s investments in stocks and stock futures. Any holdings in short-term reserves are excluded.
Expense Ratio. The percentage of a fund’s average net assets used to pay its annual administrative and advisory expenses. These expenses directly reduce returns to investors.
Inception Date. The date on which the assets of a fund (or one of its share classes) are first invested in accordance with the fund’s investment objective. For funds with a subscription period, the inception date is the day after that period ends. Investment performance is measured from the inception date.
R-Squared. A measure of how much of a fund’s past returns can be explained by the returns from the market in general, as measured by a given index. If a fund’s total returns were precisely synchronized with an index’s returns, its R-squared would be 1.00. If the fund’s returns bore no relationship to the index’s returns, its R-squared would be 0. For this report, R-squared is based on returns over the past 36 months for both the fund and the index.
Short-Term Reserves. The percentage of a fund invested in highly liquid, short-term securities that can be readily converted to cash.
Turnover Rate. An indication of the fund’s trading activity. Funds with high turnover rates incur higher transaction costs and may be more likely to distribute capital gains (which may be taxable to investors). The turnover rate excludes in-kind transactions, which have minimal impact on costs.
43
The People Who Govern Your Fund
The trustees of your mutual fund are there to see that the fund is operated and managed in your best interests since, as a shareholder, you are a part owner of the fund. Your fund’s trustees also serve on the board of directors of The Vanguard Group, Inc., which is owned by the Vanguard funds and provides services to them on an at-cost basis.
A majority of Vanguard’s board members are independent, meaning that they have no affiliation with Vanguard or the funds they oversee, apart from the sizable personal investments they have made as private individuals. The independent board members have distinguished backgrounds in business, academia, and public service. Each of the trustees and executive officers oversees 156 Vanguard funds.
The following table provides information for each trustee and executive officer of the fund. More information about the trustees is in the Statement of Additional Information, which can be obtained, without charge, by contacting Vanguard at 800-662-7447, or online at www.vanguard.com.
| |
| Interested Trustees | Emerson U. Fullwood |
| | Born 1948. Trustee Since January 2008. Principal |
| John J. Brennan1 | Occupation(s) During the Past Five Years: Executive |
| Born 1954. Trustee Since May 1987. Chairman of | Chief Staff and Marketing Officer for North America |
| the Board. Principal Occupation(s) During the Past | and Corporate Vice President (retired 2008) of Xerox |
| Five Years: Chairman of the Board and Director/Trustee | Corporation (photocopiers and printers); Director of |
| of The Vanguard Group, Inc., and of each of the | SPX Corporation (multi-industry manufacturing), the |
| investment companies served by The Vanguard Group; | United Way of Rochester, the Boy Scouts of America, |
| Chief Executive Officer (1996–2008) and President | Amerigroup Corporation (direct health and medical |
| (1989–2008) of The Vanguard Group and of each of the | insurance carriers), and Monroe Community College |
| investment companies served by The Vanguard Group; | Foundation. |
| Chairman of the Financial Accounting Foundation; | |
| Governor of the Financial Industry Regulatory Authority | Rajiv L. Gupta |
| (FINRA); Director of United Way of Southeastern | Born 1945. Trustee Since December 2001.2 Principal |
| Pennsylvania. | Occupation(s) During the Past Five Years: Chairman |
| | and Chief Executive Officer (retired 2009) and President |
| F. William McNabb III1 | (2006–2008) of Rohm and Haas Co. (chemicals); Board |
| Born 1957. Trustee Since July 2009. Principal | Member of American Chemistry Council; Director of |
| Occupation(s) During the Past Five Years: Director of | Tyco International, Ltd. (diversified manufacturing and |
| The Vanguard Group, Inc., since 2008; Chief Executive | services) and Hewlett-Packard Co. (electronic computer |
| Officer and President of The Vanguard Group and of | manufacturing); Trustee of The Conference Board. |
| each of the investment companies served by The | |
| Vanguard Group since 2008; Director of Vanguard | Amy Gutmann |
| Marketing Corporation; Managing Director of The | Born 1949. Trustee Since June 2006. Principal |
| Vanguard Group (1995–2008). | Occupation(s) During the Past Five Years: President of |
| | the University of Pennsylvania; Christopher H. Browne |
| | Distinguished Professor of Political Science in the School |
| Independent Trustees | of Arts and Sciences with secondary appointments |
| | at the Annenberg School for Communication and the |
| Charles D. Ellis | Graduate School of Education of the University of |
| Born 1937. Trustee Since January 2001. Principal | Pennsylvania; Director of Carnegie Corporation of |
| Occupation(s) During the Past Five Years: Applecore | New York, Schuylkill River Development Corporation, |
| Partners (pro bono ventures in education); Senior | and Greater Philadelphia Chamber of Commerce; |
| Advisor to Greenwich Associates (international business | Trustee of the National Constitution Center. |
| strategy consulting); Successor Trustee of Yale University; | |
| Overseer of the Stern School of Business at New York | |
| University; Trustee of the Whitehead Institute for | |
| Biomedical Research. | |
| | |
| JoAnn Heffernan Heisen | Executive Officers | |
| Born 1950. Trustee Since July 1998. Principal | | |
| Occupation(s) During the Past Five Years: Corporate | Thomas J. Higgins1 | |
| Vice President and Chief Global Diversity Officer since | Born 1957. Chief Financial Officer Since September |
| 2006 (retired 2008) and Member of the Executive | 2008. Principal Occupation(s) During the Past Five |
| Committee (retired 2008) of Johnson & Johnson | Years: Principal of The Vanguard Group, Inc.; Chief |
| (pharmaceuticals/consumer products); Vice President | Financial Officer of each of the investment companies |
| and Chief Information Officer of Johnson & Johnson | served by The Vanguard Group since 2008; Treasurer |
| (1997–2005); Director of the University Medical Center | of each of the investment companies served by The |
| at Princeton and Women’s Research and Education | Vanguard Group (1998–2008). |
| Institute. | | |
| |
| | Kathryn J. Hyatt1 | |
| André F. Perold | Born 1955. Treasurer Since November 2008. Principal |
| Born 1952. Trustee Since December 2004. Principal | Occupation(s) During the Past Five Years: Principal of |
| Occupation(s) During the Past Five Years: George Gund | The Vanguard Group, Inc.; Treasurer of each of the |
| Professor of Finance and Banking, Harvard Business | investment companies served by The Vanguard |
| School; Chairman of UNX, Inc. (equities trading firm); | Group since 2008; Assistant Treasurer of each of the |
| Chair of the Investment Committee of HighVista | investment companies served by The Vanguard Group |
| Strategies LLC (private investment firm). | (1988–2008). | |
| |
| Alfred M. Rankin, Jr. | Heidi Stam1 | |
| Born 1941. Trustee Since January 1993. Principal | Born 1956. Secretary Since July 2005. Principal |
| Occupation(s) During the Past Five Years: Chairman, | Occupation(s) During the Past Five Years: Managing |
| President, and Chief Executive Officer of NACCO | Director of The Vanguard Group, Inc., since 2006; |
| Industries, Inc. (forklift trucks/housewares/lignite); | General Counsel of The Vanguard Group since 2005; |
| Director of Goodrich Corporation (industrial products/ | Secretary of The Vanguard Group and of each of the |
| aircraft systems and services); Deputy Chairman of | investment companies served by The Vanguard Group |
| the Federal Reserve Bank of Cleveland. | since 2005; Director and Senior Vice President of |
| | Vanguard Marketing Corporation since 2005; Principal |
| Peter F. Volanakis | of The Vanguard Group (1997–2006). |
| Born 1955. Trustee Since July 2009. Principal | | |
| Occupation(s) During the Past Five Years: President | | |
| since 2007 and Chief Operating Officer since 2005 | Vanguard Senior Management Team |
| of Corning Incorporated (communications equipment); | | |
| President of Corning Technologies (2001–2005); Director | R. Gregory Barton | Michael S. Miller |
| of Corning Incorporated and Dow Corning; Trustee of | Mortimer J. Buckley | James M. Norris |
| the Corning Incorporated Foundation and the Corning | Kathleen C. Gubanich | Glenn W. Reed |
| Museum of Glass; Overseer of the Amos Tuck School | Paul A. Heller | George U. Sauter |
| of Business Administration at Dartmouth College. | | |
| |
| | Founder | |
| |
| | John C. Bogle | |
| | Chairman and Chief Executive Officer, 1974–1996 |
1 These individuals are “interested persons” as defined in the Investment Company Act of 1940.
2 December 2002 for Vanguard Equity Income Fund, Vanguard Growth Equity Fund, the Vanguard Municipal Bond Funds, and the Vanguard State Tax-Exempt Funds.
| |  |
| | | P.O. Box 2600 |
| | | Valley Forge, PA 19482-2600 |
| |
| |
| |
| |
| Connect with Vanguard® > www.vanguard.com |
| |
| Fund Information > 800-662-7447 | All comparative mutual fund data are from Lipper Inc. |
| | or Morningstar, Inc., unless otherwise noted. |
| Direct Investor Account Services > 800-662-2739 | |
| | |
| Institutional Investor Services > 800-523-1036 | You can obtain a free copy of Vanguard’s proxy voting |
| | guidelines by visiting our website, www.vanguard.com, |
| Text Telephone for People | and searching for “proxy voting guidelines,” or by |
| With Hearing Impairment > 800-952-3335 | calling Vanguard at 800-662-2739. The guidelines are |
| | also available from the SEC’s website, www.sec.gov. |
| | In addition, you may obtain a free report on how your |
| | fund voted the proxies for securities it owned during |
| This material may be used in conjunction | the 12 months ended June 30. To get the report, visit |
| with the offering of shares of any Vanguard | either www.vanguard.com or www.sec.gov. |
| fund only if preceded or accompanied by | |
| the fund’s current prospectus. | You can review and copy information about your fund |
| | at the SEC’s Public Reference Room in Washington, D.C. |
| CFA® is a trademark owned by CFA Institute. | To find out more about this public service, call the SEC |
| | at 202-551-8090. Information about your fund is also |
| | available on the SEC’s website, and you can receive |
| | copies of this information, for a fee, by sending a |
| | request in either of two ways: via e-mail addressed to |
| | publicinfo@sec.gov or via regular mail addressed to the |
| | Public Reference Section, Securities and Exchange |
| | Commission, Washington, DC 20549-0102. |
| |
| |
| |
| |
| | © 2009 The Vanguard Group, Inc. |
| | All rights reserved. |
| | Vanguard Marketing Corporation, Distributor. |
| | Q1290 112009 |
 |
| Vanguard Strategic Small-Cap |
| Equity Fund Annual Report |
|
| September 30, 2009 |
|
 |
|
|
> For the fiscal year ended September 30, 2009, Vanguard Strategic Small-Cap Equity Fund returned –12.48%.
> The fund’s results for the fiscal year covered two very different market environments—a first half of dramatic declines followed by a second half of robust gains.
> For the 12-month period, the fund’s performance substantially lagged both the benchmark return and the average return of peer-group funds.
| |
| Contents | |
| |
| Your Fund’s Total Returns | 1 |
| President’s Letter | 2 |
| Advisor’s Report | 7 |
| Results of Proxy Voting | 9 |
| Fund Profile | 10 |
| Performance Summary | 11 |
| Financial Statements | 12 |
| Your Fund’s After-Tax Returns | 25 |
| About Your Fund’s Expenses | 26 |
| Glossary | 28 |
Please note: The opinions expressed in this report are just that—informed opinions. They should not be considered promises or advice. Also, please keep in mind that the information and opinions cover the period through the date on the front of this report. Of course, the risks of investing in your fund are spelled out in the prospectus.
Cover photograph: Veronica Coia.
Your Fund’s Total Returns
| | |
| Fiscal Year Ended September 30, 2009 | | |
| | Ticker | Total |
| | Symbol | Returns |
| Vanguard Strategic Small-Cap Equity Fund | VSTCX | –12.48% |
| MSCI US Small Cap 1750 Index | | –4.20 |
| Small-Cap Core Funds Average1 | | –7.00 |
| | | | |
| Your Fund’s Performance at a Glance | | | | |
| September 30, 2008–September 30, 2009 | | | | |
| | | | Distributions Per Share |
| | Starting | Ending | Income | Capital |
| | Share Price | Share Price | Dividends | Gains |
| Vanguard Strategic Small-Cap Equity Fund | $16.60 | $14.32 | $0.168 | $0.000 |
1 Derived from data provided by Lipper Inc.
1

President's Letter
Dear Shareholder,
The results for Vanguard Strategic Small-Cap Equity Fund for the 12 months ended September 30, 2009, were disappointing. However, they masked a dramatic turnaround in market sentiment and fund performance that began midway through the fund’s fiscal year.
Investor confidence revived abruptly in March in both the stock and bond markets, as turmoil in the credit markets began to subside and economic reports began to suggest that the economy was on the mend.
The Strategic Small-Cap Equity Fund returned about –38% for the six months ended March 31, 2009, while the fund returned about 42% for the subsequent six months.
Considered together, these almost perfectly inverse results produced a 12-month loss of –12.48%. If you hold the Strategic Small-Cap Equity Fund in a taxable account, you may wish to review our report on the fund’s after-tax returns on page 25.
After a precipitous fall, stock markets rebound
In recent months, the financial markets have performed so strongly that it’s almost hard to remember that less than a year ago the global financial system stood on the brink of collapse. Since then, markets have pulled back from the abyss. Although unemployment remains near generational
2
highs, and the prospects of a robust recovery seem dim, the global economy has begun to grind into gear.
Reminders of the markets’ dark days are nevertheless apparent in the index returns for both the past 12 months and the past three years. Over both periods, U.S. stocks recorded negative returns. Global stocks did better over the past 12 months, recouping their late-2008 losses thanks to general strength in developed economies and a powerful rally in emerging markets. Over the past three years, however, international stocks posted a modestly negative return.
The bond market’s turnabout has been equally dramatic
The stock market’s collapse and recovery echo even more dramatic developments in the bond market. At the end of 2008, as the credit markets nearly ceased to function, the difference between the yields of corporate bonds and U.S. Treasury bonds spiked to levels last seen during the Great Depression.
The Federal Reserve and its central bank counterparts around the world responded with aggressive monetary stimulus efforts, while global governments opened the fiscal taps. Investors first tiptoed, then stampeded, back into the market, boosting bond prices and bringing down yields. Over the past 12 months, taxable U.S.
| | | |
| Market Barometer | | | |
| | | Average Annual Total Returns |
| | | Periods Ended September 30, 2009 |
| | One Year | Three Years | Five Years |
| Stocks | | | |
| Russell 1000 Index (Large-caps) | –6.14% | –5.10% | 1.49% |
| Russell 2000 Index (Small-caps) | –9.55 | –4.57 | 2.41 |
| Dow Jones U.S. Total Stock Market Index | –5.83 | –4.58 | 1.93 |
| MSCI All Country World Index ex USA (International) | 6.43 | –0.78 | 8.59 |
| |
| Bonds | | | |
| Barclays Capital U.S. Aggregate Bond Index | | | |
| (Broad taxable market) | 10.56% | 6.41% | 5.13% |
| Barclays Capital Municipal Bond Index | 14.85 | 5.13 | 4.78 |
| Citigroup 3-Month Treasury Bill Index | 0.39 | 2.63 | 2.96 |
| |
| CPI | | | |
| Consumer Price Index | –1.29% | 2.10% | 2.61% |
3
bonds returned more than 10%; municipal securities did even better, returning almost 15%, as measured by the Barclays Capital Municipal Bond Index.
The Fed’s rescue campaign has imposed a heavy price on short-term savings vehicles, such as money market funds. In December 2008, the Fed reduced its target for the federal funds rate, a benchmark for the interest rates paid by money market instruments and other very short-term securities, to between 0% and 0.25%. The Fed has said it expects to maintain its target at this level “for an extended period.”
Early-in-the-year results weigh on full-year returns
The recent fiscal year has been a historically anomalous period in the financial markets, to say the least. One consequence for stocks has been that the worst-performing stocks in the dizzying market of the first six months of the period were among the best performers during the exceptionally strong rally that characterized the final six months.
The first-half results weighed heavily on the performance of stocks for the full fiscal year, so it’s not surprising that the fund posted negative returns. It was disappointing, however, that the fund fell
| | |
| Expense Ratios1 | | |
| Your Fund Compared With Its Peer Group | | |
| | | Small-Cap |
| | | Core Funds |
| | Fund | Average |
| Strategic Small-Cap Equity Fund | 0.45% | 1.43% |
1 The fund expense ratio shown is from the prospectus dated January 28, 2009, and represents estimated costs for the current fiscal year based on the fund’s net assets as of the prospectus date. The expense ratio for the fiscal year ended September 30, 2009, was 0.43%. The peer-group expense ratio is derived from data provided by Lipper Inc. and captures information through year-end 2008.
4
measurably short of its benchmark index—please see the accompanying Advisor’s Report for more discussion.
Although financial-sector stocks, which accounted for about one-fifth of the fund’s assets, were among the major negative contributors to return on an absolute basis, good stock selection helped somewhat to minimize the difference between the fund’s return and that of its benchmark index.
The fund’s information technology and consumer discretionary holdings—which together represented about one-third of the fund’s assets—helped to cushion the effect of the general market downdraft by contributing a total of 5 percentage points to return. Poor stock picking in those sectors, however, detracted from returns relative to their benchmark, as did selections of health care and industrial stocks, which accounted for about one-quarter of assets.
A long-term view can curb short-term distractions
A stock market rally is always welcome, of course. But not all rallies are alike when you look under the hood.
The stock market rally that characterized the final six months of your fund’s 2009 fiscal year was led, in general, by the stocks of companies whose financial health is suspect. However, the models that Vanguard Quantitative Equity Group uses in managing the fund are designed to sift through thousands of stocks to find those with higher-quality characteristics.
| |
| Total Returns | |
| April 24, 2006,1 Through September 30, 2009 | |
| | Average |
| | Annual Return |
| Strategic Small-Cap Equity Fund | –8.20% |
| MSCI US Small Cap 1750 Index | –3.99 |
| Small-Cap Core Funds Average2 | –6.25 |
The figures shown represent past performance, which is not a guarantee of future results. (Current performance may be lower or higher than the performance data cited. For performance data current to the most recent month-end, visit our website at www.vanguard.com/performance.) Note, too, that both investment returns and principal value can fluctuate widely, so an investor’s shares, when sold, could be worth more or less than their original cost.
1 Fund’s inception date.
2 Derived from data provided by Lipper Inc.
5
We believe those stocks have the potential to produce the strongest results over the long term.
That is why we maintain confidence in Strategic Small-Cap Equity Fund’s underlying stock-selection methodology, despite the disappointing short-term results, and, indeed, the unsatisfactory performance in the roughly three years since the fund’s inception.
In recent months, the market and fund performance have taken a turn for the better. The latest rally reinforces our belief that it’s important to step back (difficult as it may be) from the distraction of short-term results and consider investing as a long-term process—one that’s set in motion after you’ve developed a low-cost portfolio that is balanced and diversified among the major asset classes and aligned with your investing goals.
Thank you for entrusting your assets to Vanguard.
Sincerely,

F. William McNabb III
President and Chief Executive Officer
October 14, 2009
6
Advisor’s Report
It has been a roller-coaster year for the Strategic Small-Cap Equity Fund and equity markets in general. The credit crisis that began in 2007 accelerated with the failure of Lehman Brothers in the later part of 2008. Equity markets plunged for the first six months of the fund’s fiscal year by about –31%, as measured by the broad-market MSCI US Investable Market 2500 Index. Small-capitalization stocks fell farther than larger-cap companies, returning about –37% and about –20%, respectively, while growth stocks fared better than their value counterparts, returning about –28% versus about –34%. (All figures in this letter are drawn from the respective MSCI indexes.)
As government rescue and stimulus plans were announced and it became apparent that the financial markets were not going to implode, the second half of the fiscal year witnessed a dramatic snapback as the MSCI US Investable Market 2500 Index reversed course and climbed back about 36%, leaving the total return of the U.S. equity market for the 12-month period at about –6%.
Many investment professionals are indicating that the worst recession in decades, although not officially over, came to an end during the third quarter of this year. On October 29, the U.S. Commerce Department reported that the economy grew by 3.5% in the three months ended September 30. However, the challenges that lie ahead are many and are not easily resolved. Rising unemployment, the state of credit markets, and massive government deficits are just a few of the issues that need to be addressed for long-term economic growth to be restored.
Against this backdrop, we are disappointed with the overall performance of the Strategic Small-Cap Equity Fund; we trailed our benchmark index by about 8 percentage points. Our quantitative fundamental investment-management process led to mixed results for the full 12 months. We use a model that assesses the attractiveness of stocks relative to their peers based on five components: valuation, earnings quality, growth, management decisions, and market sentiment.
Valuation measures the price that we will pay for a stock’s earnings or cash flow. Our quality score separates cheap stocks that deserve their low valuation because of poor margins from their more-profitable peers. Our growth indicator likewise differentiates between companies with low valuations due to poor growth prospects and firms with more attractive prospects. Since actions often speak louder than words, another component of our model helps determine the attractiveness of a stock by evaluating the decisions corporate managers make to enhance shareholder value. Finally, our market-sentiment score measures the market’s overall evaluation of the company’s value.
7
When we wrote to you at the semiannual mark, the Strategic Small-Cap Equity Fund was trailing its benchmark by 1.7 percentage points. The second half of the fiscal year saw the MSCI US Small Cap 1750 Index rocket up by more than 51%, while the portfolio did not keep pace and appreciated by “only” about 42%.
The panic of the first part of the year drove down all stocks, regardless of individual characteristics, as investors sought to exit the market. In March, once companies that had almost ceased to exist seemed more likely to survive, the stocks of those firms roared back to life. Our company-ranking process was ineffective during this period because those suddenly booming firms had attributes that our model does not favor, such as negative earnings, low margins, and low growth. Some are calling the market recovery a “junk rally,” because companies with the poorest prospects fell the most during the onset of the crisis, only to rally the strongest during the market comeback.
While we regret that our performance for the year fell behind that of the benchmark, we are not surprised that we lagged during this period. In an environment such as last year’s, and particularly that of the last six months, in which market leadership is from companies whose attributes run counter to the factors we deem important, our performance will likely disappoint. We continue to maintain our commitment to a portfolio of companies with lower relative ratios of price/earnings and price/cash flow, growth rates near the market’s overall rate, a higher relative return on equity, and positive market sentiment. Such a portfolio offers an attractive profile that we expect the market will reward over the long term.
For the year, our relative stock-selection results were positive in only one sector: financials. Selections such as Oriental Financial Group and Ocwen Financial led our results there. Our stock picks that detracted most were in the industrial, health care, and technology sectors as companies such as Kindred Healthcare, CONMED, Pacer International, Amkor Technology, and Brocade Communications did not perform as expected.
James P. Stetler, Principal and Portfolio Manager
Joel M. Dickson, Principal and Head, Vanguard Active Quantitative Equity Management
Vanguard Quantitative Equity Group
October 16, 2009
8
Results of Proxy Voting
At a special meeting of shareholders on July 2, 2009, fund shareholders approved the following two proposals:
Proposal 1—Elect trustees for each fund.*
The individuals listed in the table below were elected as trustees for each fund. All trustees with the exception of Messrs. McNabb and Volanakis (both of whom already served as directors of The Vanguard Group, Inc.) served as trustees to the funds prior to the shareholder meeting.
| | | |
| | | | Percentage |
| Trustee | For | Withheld | For |
| John J. Brennan | 517,264,433 | 14,297,196 | 97.3% |
| Charles D. Ellis | 501,913,782 | 29,647,847 | 94.4% |
| Emerson U. Fullwood | 507,851,847 | 23,709,782 | 95.5% |
| Rajiv L. Gupta | 515,891,359 | 15,670,270 | 97.1% |
| Amy Gutmann | 517,356,594 | 14,205,035 | 97.3% |
| JoAnn Heffernan Heisen | 516,532,227 | 15,029,403 | 97.2% |
| F. William McNabb III | 516,660,098 | 14,901,531 | 97.2% |
| André F. Perold | 507,715,282 | 23,846,348 | 95.5% |
| Alfred M. Rankin, Jr. | 516,327,018 | 15,234,611 | 97.1% |
| Peter F. Volanakis | 516,503,576 | 15,058,053 | 97.2% |
| *Results are for all funds within the same trust. | | | |
Proposal 2—Update and standardize the funds’ fundamental policies regarding:
(a) Purchasing and selling real estate. (b) Issuing senior securities.
(c) Borrowing money. (d) Making loans.
(e) Purchasing and selling commodities.
(f) Concentrating investments in a particular industry or group of industries.
(g) Eliminating outdated fundamental investment policies not required by law.
The revised fundamental policies are clearly stated and simple, yet comprehensive, making oversight and compliance more efficient than under the former policies. The revised fundamental policies will allow the funds to respond more quickly to regulatory and market changes, while avoiding the costs and delays associated with successive shareholder meetings.
| | | | | |
| | | | | Broker | Percentage |
| Strategic Small-Cap Equity Fund | For | Abstain | Against | Non-Votes | For |
| 2a | 7,620,449 | 263,896 | 218,494 | 111,936 | 92.8% |
| 2b | 7,529,002 | 284,957 | 288,881 | 111,936 | 91.7% |
| 2c | 7,533,161 | 264,234 | 305,444 | 111,936 | 91.7% |
| 2d | 7,520,079 | 291,917 | 290,844 | 111,936 | 91.5% |
| 2e | 7,559,257 | 272,526 | 271,056 | 111,936 | 92.0% |
| 2f | 7,646,743 | 267,966 | 188,130 | 111,936 | 93.1% |
| 2g | 7,682,003 | 264,618 | 156,218 | 111,936 | 93.5% |
9
Strategic Small-Cap Equity Fund
Fund Profile
As of September 30, 2009
| | | |
| Portfolio Characteristics | | |
| | | Comparative | Broad |
| | Fund | Index1 | Index2 |
| Number of Stocks | 433 | 1,745 | 4,324 |
| Median Market Cap | $1.2B | $1.2B | $29.0B |
| Price/Earnings Ratio | 17.7x | 118.5x | 27.9x |
| Price/Book Ratio | 1.8x | 1.7x | 2.1x |
| Yield3 | 1.1% | 1.3% | 1.9 |
| Return on Equity | 13.2% | 10.8% | 19.1 |
| Earnings Growth Rate | 12.7% | 6.6% | 9.6 |
| Foreign Holdings | 0.0% | 0.0% | 0.0% |
| Turnover Rate | 76% | — | — |
| Expense Ratio4 | 0.45% | — | — |
| Short-Term Reserves | 0.1% | — | — |
| | |
| Volatility Measures5 | |
| | Fund Versus | Fund Versus |
| | Comparative Index1 | Broad Index2 |
| R-Squared | 0.99 | 0.94 |
| Beta | 0.94 | 1.16 |
| | | |
| Sector Diversification (% of equity exposure) |
| | | Comparative | Broad |
| | Fund | Index1 | Index2 |
| Consumer Discretionary | 15.2% | 14.7% | 10.1% |
| Consumer Staples | 2.9 | 3.4 | 9.9 |
| Energy | 5.6 | 5.8 | 11.0 |
| Financials | 20.4 | 20.8 | 16.7 |
| Health Care | 12.4 | 12.3 | 12.9 |
| Industrials | 15.3 | 15.6 | 10.6 |
| Information Technology | 18.6 | 17.9 | 18.2 |
| Materials | 5.0 | 5.0 | 3.9 |
| Telecommunication | | | |
| Services | 1.3 | 0.9 | 2.9 |
| Utilities | 3.3 | 3.6 | 3.8 |
| | |
| Ten Largest Holdings6 (% of total net assets) |
| |
| Dendreon Corp. | biotechnology | 0.8% |
| Warnaco Group Inc. | apparel, accessories | |
| | and luxury goods | 0.8 |
| PMC—Sierra Inc. | semiconductors | 0.7 |
| Skyworks Solutions Inc. | semiconductors | 0.7 |
| Atmos Energy Corp. | gas utilities | 0.7 |
| 3Com Corp. | communications | |
| | equipment | 0.7 |
| Del Monte Foods Co. | packaged foods | |
| | and meats | 0.7 |
| Aeropostale Inc. | apparel retail | 0.7 |
| WMS Industries Inc. | casinos and gaming | 0.7 |
| General Cable Corp. | electrical components | |
| | and equipment | 0.7 |
| Top Ten | | 7.2% |
Investment Focus
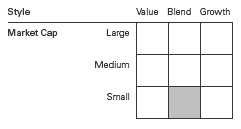
1 MSCI US Small Cap 1750 Index.
2 Dow Jones U.S. Total Stock Market Index.
3 30-day SEC yield for the fund; annualized dividend yield for the indexes. See the Glossary.
4 The fund expense ratio shown is from the prospectus dated January 28, 2009, and represents estimated costs for the current fiscal year based on the fund’s net assets as of the prospectus date. The expense ratio for the fiscal year ended September 30, 2009, was 0.43%.
5 For an explanation of R-squared, beta, and other terms used here, see the Glossary.
6 The holdings listed exclude any temporary cash investments and equity index products.
10
Strategic Small-Cap Equity Fund
Performance Summary
All of the returns in this report represent past performance, which is not a guarantee of future results that may be achieved by the fund. (Current performance may be lower or higher than the performance data cited. For performance data current to the most recent month-end, visit our website at www.vanguard.com/performance.) Note, too, that both investment returns and principal value can fluctuate widely, so an investor’s shares, when sold, could be worth more or less than their original cost. The returns shown do not reflect taxes that a shareholder would pay on fund distributions or on the sale of fund shares.
Cumulative Performance: April 24, 2006–September 30, 2009
Initial Investment of $10,000
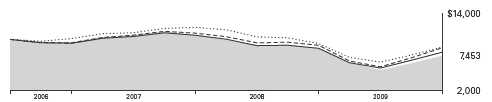
| | | |
| | Average Annual Total Returns | Final Value |
| | Periods Ended September 30, 2009 | of a $10,000 |
| | One Year | Since Inception1 | Investment |
| Strategic Small-Cap Equity Fund2 | –12.48% | –8.20% | $7,453 |
| Dow Jones U.S. Total Stock Market Index | –5.83 | –3.64 | 8,804 |
| MSCI US Small Cap 1750 Index | –4.20 | –3.99 | 8,696 |
| Small-Cap Core Funds Average3 | –7.00 | –6.25 | 8,010 |
Fiscal-Year Total Returns (%): April 24, 2006–September 30, 2009
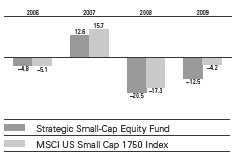
1 Performance for the fund and its comparative standards is calculated since the fund’s inception: April 24, 2006.
2 Total return figures do not include the account service fee that may be applicable to certain accounts with balances below $10,000.
3 Derived from data provided by Lipper Inc.
Note: See Financial Highlights table for dividend and capital gains information.

Statement of Net Assets
As of September 30, 2009
The fund reports a complete list of its holdings in regulatory filings four times in each fiscal year, at the quarter-ends. For the second and fourth fiscal quarters, the lists appear in the fund’s semiannual and annual reports to shareholders. For the first and third fiscal quarters, the fund files the lists with the Securities and Exchange Commission on Form N-Q. Shareholders can look up the fund’s Forms N-Q on the SEC’s website at www.sec.gov. Forms N-Q may also be reviewed and copied at the SEC’s Public Reference Room (see the back cover of this report for further information).
| | | |
| | | | Market |
| | | | Value• |
| | | Shares | ($000) |
| Common Stocks (99.3%)1 | | |
| Consumer Discretionary (15.1%) | |
| * | Warnaco Group Inc. | 28,200 | 1,237 |
| * | Aeropostale Inc. | 26,600 | 1,156 |
| * | WMS Industries Inc. | 25,500 | 1,136 |
| * | Tempur-Pedic | | |
| | International Inc. | 58,900 | 1,116 |
| * | Valassis | | |
| | Communications Inc. | 59,900 | 1,071 |
| | Jarden Corp. | 37,900 | 1,064 |
| | Tupperware Brands Corp. | 21,300 | 850 |
| * | Sally Beauty Holdings Inc. | 119,500 | 850 |
| * | Gymboree Corp. | 17,400 | 842 |
| * | Big Lots Inc. | 31,700 | 793 |
| * | Rent-A-Center Inc. | 37,700 | 712 |
| | Cooper Tire & Rubber Co. | 39,700 | 698 |
| * | JOS A Bank Clothiers Inc. | 15,200 | 681 |
| | Polaris Industries Inc. | 16,600 | 677 |
| | Finish Line Inc. Class A | 62,800 | 638 |
| * | CEC Entertainment Inc. | 23,200 | 600 |
| * | Panera Bread Co. Class A | 10,900 | 600 |
| * | Pre-Paid Legal Services Inc. | 10,300 | 523 |
| * | Knology Inc. | 52,800 | 515 |
| * | Papa John’s International Inc. | 20,915 | 514 |
| * | PF Chang’s China Bistro Inc. | 15,100 | 513 |
| * | Steiner Leisure Ltd. | 14,300 | 511 |
| | John Wiley & Sons Inc. | | |
| | Class A | 14,300 | 497 |
| | La-Z-Boy Inc. | 56,400 | 488 |
| | Cracker Barrel Old | | |
| | Country Store Inc. | 13,124 | 451 |
| | RadioShack Corp. | 26,900 | 446 |
| * | True Religion Apparel Inc. | 16,900 | 438 |
| | Interactive Data Corp. | 13,900 | 364 |
| * | Jo-Ann Stores Inc. | 12,100 | 325 |
| | Spartan Motors Inc. | 61,764 | 317 |
| * | Career Education Corp. | 12,700 | 310 |
| | MDC Holdings Inc. | 7,900 | 274 |
| * | Dorman Products Inc. | 17,800 | 267 |
| * | Stein Mart Inc. | 20,500 | 261 |
| | | |
| | | | Market |
| | | | Value• |
| | | Shares | ($000) |
| * | Mediacom Communications | | |
| | Corp. Class A | 44,700 | 258 |
| * | Bally Technologies Inc. | 6,200 | 238 |
| * | Fuel Systems Solutions Inc. | 6,300 | 227 |
| * | Denny’s Corp. | 80,772 | 215 |
| * | Carter’s Inc. | 7,100 | 190 |
| * | Dana Holding Corp. | 26,500 | 180 |
| * | Steven Madden Ltd. | 4,600 | 169 |
| | Barnes & Noble Inc. | 7,500 | 167 |
| | CSS Industries Inc. | 8,200 | 162 |
| ^ | Buckle Inc. | 3,500 | 120 |
| | Gannett Co. Inc. | 9,500 | 119 |
| * | Childrens Place | | |
| | Retail Stores Inc. | 3,900 | 117 |
| * | Isle of Capri Casinos Inc. | 9,700 | 114 |
| | Scholastic Corp. | 4,200 | 102 |
| * | Dolan Media Co. | 7,200 | 86 |
| * | Timberland Co. Class A | 5,400 | 75 |
| * | Blockbuster Inc. Class A | 66,700 | 71 |
| | Meredith Corp. | 2,300 | 69 |
| * | Steak N Shake Co. | 5,800 | 68 |
| | Regis Corp. | 4,400 | 68 |
| * | Smith & Wesson | | |
| | Holding Corp. | 11,400 | 60 |
| * | Domino’s Pizza Inc. | 5,600 | 50 |
| | National CineMedia Inc. | 2,300 | 39 |
| | Phillips-Van Heusen Corp. | 900 | 39 |
| | Cinemark Holdings Inc. | 3,200 | 33 |
| | Unifirst Corp. | 700 | 31 |
| | Harte-Hanks Inc. | 2,200 | 30 |
| * | Citi Trends Inc. | 1,000 | 28 |
| | Aaron’s Inc. | 600 | 16 |
| | | | 24,876 |
| Consumer Staples (2.8%) | | |
| | Del Monte Foods Co. | 100,100 | 1,159 |
| | Lancaster Colony Corp. | 8,900 | 456 |
| * | Central Garden and Pet Co. | | |
| | Class A | 41,206 | 450 |
| * | Alliance One | | |
| | International Inc. | 88,200 | 395 |
12
| | | |
| Strategic Small-Cap Equity Fund | | |
| |
| |
| |
| | | | Market |
| | | | Value• |
| | | Shares | ($000) |
| | Andersons Inc. | 10,000 | 352 |
| * | Pantry Inc. | 19,515 | 306 |
| | Nu Skin Enterprises Inc. | | |
| | Class A | 16,000 | 297 |
| * | TreeHouse Foods Inc. | 7,800 | 278 |
| | Coca-Cola Bottling Co. | | |
| | Consolidated | 4,800 | 233 |
| * | Revlon Inc. Class A | 32,800 | 160 |
| * | BJ’s Wholesale Club Inc. | 4,400 | 159 |
| | Village Super Market Inc. | | |
| | Class A | 5,293 | 156 |
| * | Prestige Brands Holdings Inc. | 18,600 | 131 |
| | J&J Snack Foods Corp. | 2,900 | 125 |
| | | | 4,657 |
| Energy (5.6%) | | |
| * | Oil States International Inc. | 27,197 | 955 |
| * | Dresser-Rand Group Inc. | 28,700 | 892 |
| * | Global Industries Ltd. | 92,600 | 880 |
| * | Cal Dive International Inc. | 83,200 | 823 |
| * | CVR Energy Inc. | 57,500 | 715 |
| | World Fuel Services Corp. | 12,100 | 582 |
| * | Contango Oil & Gas Co. | 11,200 | 572 |
| * | SEACOR Holdings Inc. | 6,900 | 563 |
| | Overseas Shipholding | | |
| | Group Inc. | 14,700 | 549 |
| * | Matrix Service Co. | 40,842 | 444 |
| * | Bristow Group Inc. | 12,500 | 371 |
| * | PHI Inc. | 16,200 | 329 |
| | Core Laboratories NV | 3,000 | 309 |
| * | Gulfmark Offshore Inc. | 8,600 | 282 |
| | Southern Union Co. | 12,100 | 252 |
| * | McMoRan Exploration Co. | 24,600 | 186 |
| * | James River Coal Co. | 8,700 | 166 |
| | CARBO Ceramics Inc. | 2,900 | 149 |
| * | Goodrich Petroleum Corp. | 5,400 | 139 |
| | | | 9,158 |
| Financials (20.3%) | | |
| | Endurance Specialty | | |
| | Holdings Ltd. | 30,400 | 1,109 |
| * | Knight Capital Group Inc. | | |
| | Class A | 41,100 | 894 |
| | Allied World Assurance Co. | | |
| | Holdings Ltd. | 17,200 | 824 |
| | Oriental Financial Group Inc. | 63,600 | 808 |
| | Bank of Hawaii Corp. | 19,300 | 802 |
| | Horace Mann | | |
| | Educators Corp. | 54,300 | 759 |
| | International | | |
| | Bancshares Corp. | 45,400 | 740 |
| | Ares Capital Corp. | 62,000 | 683 |
| | FirstMerit Corp. | 35,817 | 682 |
| * | MBIA Inc. | 84,500 | 656 |
| * | Ocwen Financial Corp. | 57,359 | 649 |
| | Platinum Underwriters | | |
| | Holdings Ltd. | 17,200 | 616 |
| | | |
| | | | Market |
| | | | Value• |
| | | Shares | ($000) |
| | Hanover Insurance | | |
| | Group Inc. | 14,200 | 587 |
| | UMB Financial Corp. | 13,800 | 558 |
| | Highwoods Properties Inc. | 16,710 | 525 |
| * | Nelnet Inc. Class A | 40,900 | 509 |
| | Senior Housing | | |
| | Properties Trust | 26,400 | 504 |
| * | Dollar Financial Corp. | 30,956 | 496 |
| | Cash America | | |
| | International Inc. | 16,213 | 489 |
| | HRPT Properties Trust | 62,500 | 470 |
| | Washington Real Estate | | |
| | Investment Trust | 15,700 | 452 |
| | First Niagara Financial | | |
| | Group Inc. | 35,900 | 443 |
| | Trustmark Corp. | 23,222 | 442 |
| | Advance America Cash | | |
| | Advance Centers Inc. | 76,200 | 427 |
| | American Physicians | | |
| | Capital Inc. | 14,772 | 426 |
| | Alexandria Real Estate | | |
| | Equities Inc. | 7,700 | 418 |
| | United Bankshares Inc. | 21,200 | 415 |
| | National Retail Properties Inc. | 19,300 | 414 |
| | Brandywine Realty Trust | 37,100 | 410 |
| | Home Properties Inc. | 9,400 | 405 |
| | Mid-America Apartment | | |
| | Communities Inc. | 8,570 | 387 |
| | Entertainment | | |
| | Properties Trust | 11,100 | 379 |
| | Healthcare Realty Trust Inc. | 17,900 | 378 |
| | Amtrust Financial | | |
| | Services Inc. | 32,600 | 372 |
| | Corporate Office | | |
| | Properties Trust SBI | 9,700 | 358 |
| | City Holding Co. | 11,662 | 348 |
| | Aspen Insurance | | |
| | Holdings Ltd. | 13,000 | 344 |
| | Safety Insurance Group Inc. | 10,400 | 342 |
| | Extra Space Storage Inc. | 32,200 | 340 |
| | Financial Federal Corp. | 13,600 | 336 |
| | Kilroy Realty Corp. | 11,900 | 330 |
| | Provident New York Bancorp | 34,443 | 329 |
| * | CNA Surety Corp. | 20,031 | 324 |
| * | Ezcorp Inc. Class A | 22,839 | 312 |
| | PS Business Parks Inc. | 6,036 | 310 |
| | First Financial Corp. | 10,100 | 309 |
| | Infinity Property & | | |
| | Casualty Corp. | 7,200 | 306 |
| | Trico Bancshares | 18,600 | 305 |
| | Sun Communities Inc. | 14,000 | 301 |
| * | World Acceptance Corp. | 11,400 | 287 |
| | Equity Lifestyle Properties Inc. | 6,700 | 287 |
| | Sovran Self Storage Inc. | 9,400 | 286 |
| * | FPIC Insurance Group Inc. | 8,400 | 282 |
| | Bank of the Ozarks Inc. | 10,600 | 281 |
13
| | | |
| Strategic Small-Cap Equity Fund | | |
| |
| |
| |
| | | | Market |
| | | | Value• |
| | | Shares | ($000) |
| | Douglas Emmett Inc. | 21,900 | 269 |
| | Camden National Corp. | 8,000 | 264 |
| | Bancfirst Corp. | 7,126 | 263 |
| | LTC Properties Inc. | 10,900 | 262 |
| * | Investment Technology | | |
| | Group Inc. | 9,300 | 260 |
| | Jones Lang LaSalle Inc. | 5,270 | 250 |
| | Saul Centers Inc. | 7,702 | 247 |
| | U-Store-It Trust | 39,300 | 246 |
| | Suffolk Bancorp | 8,000 | 237 |
| | Pennsylvania Real Estate | | |
| | Investment Trust | 30,870 | 235 |
| | Parkway Properties Inc. | 11,800 | 232 |
| | BRE Properties Inc. | 7,400 | 232 |
| * | ProAssurance Corp. | 4,400 | 230 |
| ^ | Life Partners Holdings Inc. | 12,600 | 226 |
| | Digital Realty Trust Inc. | 4,810 | 220 |
| | Colonial Properties Trust | 21,870 | 213 |
| | First Financial Bankshares Inc. | 4,100 | 203 |
| | Mack-Cali Realty Corp. | 6,120 | 198 |
| * | AMERISAFE Inc. | 11,400 | 197 |
| | NBT Bancorp Inc. | 8,600 | 194 |
| | Realty Income Corp. | 7,400 | 190 |
| * | LaBranche & Co. Inc. | 53,300 | 181 |
| * | Stifel Financial Corp. | 3,250 | 178 |
| | SL Green Realty Corp. | 3,900 | 171 |
| | Republic Bancorp Inc. | | |
| | Class A | 7,600 | 152 |
| | NASB Financial Inc. | 5,500 | 145 |
| * | PHH Corp. | 6,800 | 135 |
| | Prosperity Bancshares Inc. | 3,500 | 122 |
| | Westamerica Bancorporation | 2,300 | 120 |
| | Chimera Investment Corp. | 30,400 | 116 |
| | Potlatch Corp. | 4,000 | 114 |
| | Baldwin & Lyons Inc. | 4,683 | 110 |
| | Simmons First National | | |
| | Corp. Class A | 3,800 | 109 |
| | Community Bank System Inc. | 5,800 | 106 |
| | Wilshire Bancorp Inc. | 13,100 | 96 |
| | Essex Property Trust Inc. | 1,200 | 95 |
| | Lakeland Financial Corp. | 4,600 | 95 |
| | LaSalle Hotel Properties | 4,100 | 81 |
| | Provident Financial | | |
| | Services Inc. | 7,400 | 76 |
| | MFA Financial Inc. | 9,200 | 73 |
| | Franklin Street | | |
| | Properties Corp. | 5,270 | 69 |
| | Bank Mutual Corp. | 7,505 | 66 |
| | 1st Source Corp. | 4,000 | 65 |
| | First Industrial Realty | | |
| | Trust Inc. | 12,200 | 64 |
| | Arrow Financial Corp. | 2,134 | 58 |
| | Tompkins Financial Corp. | 1,300 | 57 |
| * | TD Ameritrade Holding Corp. | 2,786 | 55 |
| | Sunstone Hotel Investors Inc. | 7,526 | 53 |
| | Clifton Savings Bancorp Inc. | 5,322 | 52 |
| | | |
| | | | Market |
| | | | Value• |
| | | Shares | ($000) |
| | Southside Bancshares Inc. | 2,000 | 45 |
| * | First Cash Financial | | |
| | Services Inc. | 1,800 | 31 |
| | WesBanco Inc. | 1,900 | 29 |
| | Park National Corp. | 500 | 29 |
| | GAMCO Investors Inc. | 600 | 27 |
| | Trustco Bank Corp. | 3,400 | 21 |
| | SY Bancorp Inc. | 900 | 21 |
| | Taubman Centers Inc. | 500 | 18 |
| | | | 33,348 |
| Health Care (12.3%) | | |
| * | Dendreon Corp. | 44,400 | 1,243 |
| * | Valeant Pharmaceuticals | | |
| | International | 37,700 | 1,058 |
| * | Isis Pharmaceuticals Inc. | 58,400 | 851 |
| | STERIS Corp. | 27,400 | 834 |
| | Martek Biosciences Corp. | 30,100 | 680 |
| * | Emergency Medical | | |
| | Services Corp. Class A | 14,200 | 660 |
| * | American Medical Systems | | |
| | Holdings Inc. | 38,700 | 655 |
| * | LifePoint Hospitals Inc. | 23,100 | 625 |
| | PDL BioPharma Inc. | 77,800 | 613 |
| * | Bio-Rad Laboratories Inc. | | |
| | Class A | 6,506 | 598 |
| | Cooper Cos. Inc. | 19,600 | 583 |
| * | Human Genome | | |
| | Sciences Inc. | 30,500 | 574 |
| * | AMERIGROUP Corp. | 24,900 | 552 |
| * | Tenet Healthcare Corp. | 93,400 | 549 |
| * | Psychiatric Solutions Inc. | 20,300 | 543 |
| | Chemed Corp. | 11,500 | 505 |
| * | Healthsouth Corp. | 31,600 | 494 |
| * | Questcor | | |
| | Pharmaceuticals Inc. | 88,700 | 490 |
| * | Health Management | | |
| | Associates Inc. Class A | 65,300 | 489 |
| * | Gentiva Health Services Inc. | 17,900 | 448 |
| * | Amedisys Inc. | 9,900 | 432 |
| | Owens & Minor Inc. | 9,500 | 430 |
| * | Affymetrix Inc. | 46,500 | 408 |
| * | Kensey Nash Corp. | 13,600 | 394 |
| * | Dionex Corp. | 5,800 | 377 |
| * | Molina Healthcare Inc. | 16,906 | 350 |
| * | Emergent Biosolutions Inc. | 19,500 | 344 |
| | Invacare Corp. | 15,100 | 336 |
| * | Immunogen Inc. | 39,400 | 320 |
| * | Healthspring Inc. | 26,000 | 318 |
| * | RehabCare Group Inc. | 14,100 | 306 |
| * | Amsurg Corp. Class A | 13,700 | 291 |
| * | Corvel Corp. | 9,900 | 281 |
| * | Maxygen Inc. | 41,900 | 280 |
| * | Myriad Genetics Inc. | 9,200 | 252 |
| * | LHC Group Inc. | 8,100 | 242 |
| * | Cyberonics Inc. | 15,191 | 242 |
| * | Enzon Pharmaceuticals Inc. | 28,600 | 236 |
14
| | | | |
| Strategic Small-Cap Equity Fund | | |
| |
| |
| |
| | | | | Market |
| | | | | Value• |
| | | | Shares | ($000) |
| * | PharMerica Corp. | | 12,500 | 232 |
| * | Centene Corp. | | 8,800 | 167 |
| * | Skilled Healthcare Group Inc. | | 20,614 | 166 |
| * | eResearchTechnology Inc. | | 16,800 | 118 |
| | Ensign Group Inc. | | 8,200 | 115 |
| * | Nektar Therapeutics | | 11,300 | 110 |
| * | Cambrex Corp. | | 16,400 | 103 |
| * | Cadence Pharmaceuticals Inc. | 5,700 | 63 |
| * | Medivation Inc. | | 2,200 | 60 |
| | Atrion Corp. | | 400 | 58 |
| | National Healthcare Corp. | | 1,200 | 45 |
| * | Auxilium Pharmaceuticals Inc. | 1,000 | 34 |
| * | Greatbatch Inc. | | 1,400 | 31 |
| * | Watson Pharmaceuticals Inc. | | 800 | 29 |
| * | Hanger Orthopedic Group Inc. | 1,500 | 21 |
| | | | | 20,235 |
| Industrials (15.1%) | | | |
| * | General Cable Corp. | | 28,700 | 1,124 |
| * | EMCOR Group Inc. | | 41,400 | 1,048 |
| * | EnerSys | | 45,476 | 1,006 |
| * | Hawaiian Holdings Inc. | 118,400 | 978 |
| * | Armstrong World | | | |
| | Industries Inc. | | 28,200 | 972 |
| * | Chart Industries Inc. | | 43,800 | 946 |
| * | TransDigm Group Inc. | | 17,900 | 892 |
| | Apogee Enterprises Inc. | | 52,042 | 782 |
| * | Airtran Holdings Inc. | 123,100 | 769 |
| | Triumph Group Inc. | | 15,100 | 725 |
| | Watson Wyatt | | | |
| | Worldwide Inc. Class A | | 16,500 | 719 |
| | Ameron International Corp. | | 10,100 | 707 |
| | Textainer Group | | | |
| | Holdings Ltd. | | 43,356 | 694 |
| * | WESCO International Inc. | | 23,900 | 688 |
| | Briggs & Stratton Corp. | | 35,400 | 687 |
| | Lennox International Inc. | | 18,448 | 666 |
| | Knoll Inc. | | 58,600 | 611 |
| | Brink’s Co. | | 21,400 | 576 |
| * | Esterline Technologies Corp. | | 14,100 | 553 |
| * | SYKES Enterprises Inc. | | 26,057 | 542 |
| | Robbins & Myers Inc. | | 22,700 | 533 |
| | AO Smith Corp. | | 13,900 | 530 |
| | Federal Signal Corp. | | 73,600 | 529 |
| | Deluxe Corp. | | 29,400 | 503 |
| * | Allegiant Travel Co. Class A | | 11,000 | 419 |
| | Timken Co. | | 16,600 | 389 |
| * | Marten Transport Ltd. | | 22,500 | 384 |
| * | First Advantage Corp. | | | |
| | Class A | | 20,300 | 377 |
| | Herman Miller Inc. | | 21,600 | 365 |
| | Werner Enterprises Inc. | | 18,900 | 352 |
| | Ampco-Pittsburgh Corp. | | 12,130 | 322 |
| * | M&F Worldwide Corp. | | 15,000 | 304 |
| * | Pike Electric Corp. | | 24,300 | 291 |
| * | MasTec Inc. | | 22,300 | 271 |
| * | Thomas & Betts Corp. | | 9,000 | 271 |
| | | | |
| | | | | Market |
| | | | | Value• |
| | | | Shares | ($000) |
| * | American Reprographics Co. | | 25,700 | 245 |
| * | Republic Airways | | | |
| | Holdings Inc. | | 25,900 | 242 |
| * | JetBlue Airways Corp. | | 39,900 | 239 |
| * | Cornell Cos. Inc. | | 10,531 | 236 |
| * | Force Protection Inc. | | 34,900 | 190 |
| | Kimball International Inc. | | | |
| | Class B | | 24,500 | 187 |
| | Comfort Systems USA Inc. | | 15,000 | 174 |
| | AAON Inc. | | 8,200 | 165 |
| * | ATC Technology Corp. | | 7,900 | 156 |
| | Lincoln Electric Holdings Inc. | | 3,100 | 147 |
| * | Powell Industries Inc. | | 3,793 | 146 |
| * | Avis Budget Group Inc. | | 10,700 | 143 |
| | Universal Forest Products Inc. | 2,900 | 114 |
| | John Bean Technologies Corp. | 5,400 | 98 |
| | Raven Industries Inc. | | 3,500 | 94 |
| | Hubbell Inc. Class B | | 2,200 | 92 |
| * | Waste Services Inc. | | 17,646 | 81 |
| * | Sterling Construction Co. Inc. | | 4,500 | 81 |
| | Carlisle Cos. Inc. | | 2,200 | 75 |
| * | DynCorp International Inc. | | | |
| | Class A | | 3,800 | 68 |
| * | Exponent Inc. | | 1,700 | 48 |
| | Tredegar Corp. | | 3,300 | 48 |
| | Cubic Corp. | | 1,200 | 47 |
| * | Michael Baker Corp. | | 1,300 | 47 |
| | ABM Industries Inc. | | 2,200 | 46 |
| * | Beacon Roofing Supply Inc. | | 2,600 | 41 |
| | Granite Construction Inc. | | 1,300 | 40 |
| * | CBIZ Inc. | | 4,700 | 35 |
| * | Standard Parking Corp. | | 1,700 | 30 |
| | Encore Wire Corp. | | 1,300 | 29 |
| | American Science & | | | |
| | Engineering Inc. | | 400 | 27 |
| | | | | 24,936 |
| Information Technology (18.5%) | | |
| * | PMC—Sierra Inc. | 123,800 | 1,184 |
| * | Skyworks Solutions Inc. | | 88,700 | 1,174 |
| * | 3Com Corp. | 222,800 | 1,165 |
| * | QLogic Corp. | | 60,000 | 1,032 |
| * | Genpact Ltd. | | 79,400 | 977 |
| * | Sohu.com Inc. | | 14,100 | 970 |
| * | Starent Networks Corp. | | 38,000 | 966 |
| * | Multi-Fineline Electronix Inc. | | 32,500 | 933 |
| * | Sybase Inc. | | 23,482 | 913 |
| | Syntel Inc. | | 18,152 | 866 |
| * | JDA Software Group Inc. | | 39,400 | 864 |
| * | ON Semiconductor Corp. | 104,100 | 859 |
| * | Tessera Technologies Inc. | | 27,300 | 761 |
| | Diebold Inc. | | 23,000 | 757 |
| * | TNS Inc. | | 27,300 | 748 |
| * | Plexus Corp. | | 26,265 | 692 |
| | Earthlink Inc. | | 81,300 | 684 |
| | Solera Holdings Inc. | | 21,900 | 681 |
| * | Gartner Inc. | | 35,700 | 652 |
15
| | | |
| Strategic Small-Cap Equity Fund | |
| |
| |
| |
| | | | Market |
| | | | Value• |
| | | Shares | ($000) |
| * | Lawson Software Inc. | 102,700 | 641 |
| * | Tech Data Corp. | 14,500 | 603 |
| * | AsiaInfo Holdings Inc. | 29,700 | 593 |
| * | j2 Global | | |
| | Communications Inc. | 24,500 | 564 |
| * | RF Micro Devices Inc. | 102,600 | 557 |
| * | Riverbed Technology Inc. | 24,900 | 547 |
| * | Semtech Corp. | 29,700 | 505 |
| * | Hittite Microwave Corp. | 13,700 | 504 |
| * | Anixter International Inc. | 12,000 | 481 |
| * | Dolby Laboratories Inc. | | |
| | Class A | 12,380 | 473 |
| * | Monolithic Power | | |
| | Systems Inc. | 20,100 | 471 |
| * | Mantech International Corp. | | |
| | Class A | 8,925 | 421 |
| * | Tekelec | 23,700 | 389 |
| * | S1 Corp. | 56,718 | 351 |
| * | Perot Systems Corp. Class A | 11,536 | 343 |
| * | CSG Systems | | |
| | International Inc. | 20,784 | 333 |
| * | Quantum Corp. | 258,800 | 326 |
| *,^ | Synaptics Inc. | 12,900 | 325 |
| * | Silicon Laboratories Inc. | 6,900 | 320 |
| * | TriQuint Semiconductor Inc. | 39,700 | 307 |
| * | TIBCO Software Inc. | 31,700 | 301 |
| * | Acxiom Corp. | 31,000 | 293 |
| * | Insight Enterprises Inc. | 23,700 | 289 |
| | Black Box Corp. | 10,900 | 274 |
| * | Scansource Inc. | 9,000 | 255 |
| * | Polycom Inc. | 9,500 | 254 |
| | iGate Corp. | 28,871 | 248 |
| * | Cogent Inc. | 23,900 | 241 |
| * | NeuStar Inc. Class A | 8,900 | 201 |
| * | BigBand Networks Inc. | 45,732 | 183 |
| * | Netlogic Microsystems Inc. | 4,000 | 180 |
| | Jack Henry & Associates Inc. | 6,600 | 155 |
| * | SAIC Inc. | 8,100 | 142 |
| * | InterDigital Inc. | 5,700 | 132 |
| * | SPSS Inc. | 2,560 | 128 |
| * | FEI Co. | 4,900 | 121 |
| * | STEC Inc. | 4,100 | 121 |
| * | Emulex Corp. | 11,670 | 120 |
| | Broadridge Financial | | |
| | Solutions Inc. | 5,900 | 119 |
| * | Netscout Systems Inc. | 8,400 | 114 |
| * | Kopin Corp. | 19,800 | 95 |
| | Micrel Inc. | 9,500 | 77 |
| * | SYNNEX Corp. | 2,500 | 76 |
| * | VistaPrint NV | 1,500 | 76 |
| * | DTS Inc. | 2,686 | 74 |
| * | OSI Systems Inc. | 3,400 | 62 |
| * | Wright Express Corp. | 2,100 | 62 |
| | Adtran Inc. | 2,000 | 49 |
| | | | 30,374 |
| | | | |
| | | | | Market |
| | | | | Value• |
| | | | Shares | ($000) |
| Materials (5.0%) | | | |
| | Rock-Tenn Co. Class A | | 22,000 | 1,036 |
| | Silgan Holdings Inc. | | 14,800 | 780 |
| | Compass Minerals | | | |
| | International Inc. | | 12,200 | 752 |
| | Innophos Holdings Inc. | | 39,400 | 729 |
| * | Clearwater Paper Corp. | | 17,300 | 715 |
| | Glatfelter | | 60,637 | 696 |
| | Koppers Holdings Inc. | | 22,400 | 664 |
| * | PolyOne Corp. | | 96,100 | 641 |
| | Greif Inc. Class A | | 11,034 | 608 |
| | Worthington Industries Inc. | 27,700 | 385 |
| | Schweitzer-Mauduit | | | |
| | International Inc. | | 5,600 | 304 |
| | Scotts Miracle-Gro Co. | | | |
| | Class A | | 5,800 | 249 |
| | Stepan Co. | | 2,900 | 174 |
| * | Bway Holding Co. | | 8,700 | 161 |
| | NewMarket Corp. | | 800 | 75 |
| | Schnitzer Steel Industries Inc. | 1,300 | 69 |
| * | Solutia Inc. | | 4,000 | 46 |
| | A Schulman Inc. | | 2,200 | 44 |
| | Sensient Technologies Corp. | 1,100 | 31 |
| | | | | 8,159 |
| Telecommunication Services (1.3%) | |
| * | Syniverse Holdings Inc. | | 36,340 | 636 |
| * | Cincinnati Bell Inc. | 160,300 | 561 |
| | NTELOS Holdings Corp. | | 16,900 | 298 |
| * | Premiere Global Services Inc. | 28,600 | 238 |
| | Atlantic Tele-Network Inc. | 3,404 | 182 |
| * | Cogent Communications | | |
| | Group Inc. | | 8,200 | 92 |
| | USA Mobility Inc. | | 6,300 | 81 |
| * | Centennial | | | |
| | Communications Corp. | | 10,110 | 81 |
| * | Neutral Tandem Inc. | | 1,000 | 23 |
| | | | | 2,192 |
| Utilities (3.3%) | | | |
| | Atmos Energy Corp. | | 41,400 | 1,167 |
| | NorthWestern Corp. | | 28,900 | 706 |
| | IDACORP Inc. | | 22,600 | 651 |
| | Avista Corp. | | 30,400 | 615 |
| | UGI Corp. | | 22,200 | 556 |
| | WGL Holdings Inc. | | 13,600 | 451 |
| | Unisource Energy Corp. | | 11,900 | 366 |
| | UIL Holdings Corp. | | 13,400 | 354 |
| | Southwest Gas Corp. | | 8,800 | 225 |
| | PNM Resources Inc. | | 13,900 | 162 |
| | CMS Energy Corp. | | 7,200 | 96 |
| | South Jersey Industries Inc. | 600 | 21 |
| | | | | 5,370 |
| Total Common Stocks | | | |
| (Cost $148,713) | | | 163,305 |
16
| | | |
| Strategic Small-Cap Equity Fund | |
| |
| |
| |
| | | | Market |
| | | | Value• |
| | | Shares | ($000) |
| Temporary Cash Investments (0.9%)1 | |
| Money Market Fund (0.5%) | | |
| 2,3 | Vanguard Market | | |
| | Liquidity Fund, 0.267% | 870,000 | 870 |
| |
| | | Face | |
| | | Amount | |
| | | ($000) | |
| U.S. Government and Agency Obligations (0.4%) |
| 4,5 | Fannie Mae Discount | | |
| | Notes, 0.315%, 11/25/09 | 500 | 500 |
| 4,5 | Federal Home Loan | | |
| | Bank Discount Notes, | | |
| | 0.275%, 2/19/10 | 100 | 100 |
| | | | 600 |
| Total Temporary Cash Investments | |
| (Cost $1,470) | | 1,470 |
| Total Investments (100.2%) | | |
| (Cost $150,183) | | 164,775 |
| Other Assets and Liabilities (–0.2%) | |
| Other Assets | | 675 |
| Liabilities3 | | (933) |
| | | | (258) |
| Net Assets (100%) | | |
| Applicable to 11,489,017 outstanding | |
| $.001 par value shares of beneficial | |
| interest (unlimited authorization) | 164,517 |
| Net Asset Value Per Share | | $14.32 |
| |
| At September 30, 2009, net assets consisted of: |
| | Amount |
| | ($000) |
| Paid-in Capital | 237,076 |
| Undistributed Net Investment Income | 609 |
| Accumulated Net Realized Losses | (87,756) |
| Unrealized Appreciation (Depreciation) | |
| Investment Securities | 14,592 |
| Futures Contracts | (4) |
| Net Assets | 164,517 |
• See Note A in Notes to Financial Statements. * Non-income-producing security.
^ Part of security position is on loan to broker-dealers. The total value of securities on loan is $294,000.
1 The fund invests a portion of its cash reserves in equity markets through the use of index futures contracts. After giving effect to futures investments, the fund’s effective common stock and temporary cash investment positions represent 99.9% and 0.3%, respectively, of net assets.
2 Affiliated money market fund available only to Vanguard funds and certain trusts and accounts managed by Vanguard. Rate shown is the 7-day yield.
3 Includes $306,000 of collateral received for securities on loan.
4 The issuer operates under a congressional charter; its securities are not backed by the full faith and credit of the U.S. government. 5 Securities with a value of $600,000 have been segregated as initial margin for open futures contracts.
See accompanying Notes, which are an integral part of the Financial Statements.
17
| |
| Strategic Small-Cap Equity Fund | |
| |
| |
| Statement of Operations | |
| |
| | Year Ended |
| | September 30, 2009 |
| | ($000) |
| Investment Income | |
| Income | |
| Dividends | 1,988 |
| Interest1 | 207 |
| Security Lending | 51 |
| Total Income | 2,246 |
| Expenses | |
| The Vanguard Group—Note B | |
| Investment Advisory Services | 104 |
| Management and Administrative | 369 |
| Marketing and Distribution | 48 |
| Custodian Fees | 26 |
| Auditing Fees | 24 |
| Shareholders’ Reports and Proxies | 25 |
| Total Expenses | 596 |
| Net Investment Income | 1,650 |
| Realized Net Gain (Loss) | |
| Investment Securities Sold | (59,922) |
| Futures Contracts | (5,756) |
| Realized Net Gain (Loss) | (65,678) |
| Change in Unrealized Appreciation (Depreciation) | |
| Investment Securities | 37,023 |
| Futures Contracts | 136 |
| Change in Unrealized Appreciation (Depreciation) | 37,159 |
| Net Increase (Decrease) in Net Assets Resulting from Operations | (26,869) |
| 1 Interest income from an affiliated company of the fund was $35,000. | |
See accompanying Notes, which are an integral part of the Financial Statements.
18
| | |
| Strategic Small-Cap Equity Fund | | |
| |
| |
| Statement of Changes in Net Assets | | |
| |
| | Year Ended September 30, |
| | 2009 | 2008 |
| | ($000) | ($000) |
| Increase (Decrease) in Net Assets | | |
| Operations | | |
| Net Investment Income | 1,650 | 1,837 |
| Realized Net Gain (Loss) | (65,678) | (20,795) |
| Change in Unrealized Appreciation (Depreciation) | 37,159 | (33,359) |
| Net Increase (Decrease) in Net Assets Resulting from Operations | (26,869) | (52,317) |
| Distributions | | |
| Net Investment Income | (1,950) | (2,555) |
| Realized Capital Gain1 | — | (1,837) |
| Total Distributions | (1,950) | (4,392) |
| Capital Share Transactions | | |
| Issued | 36,953 | 79,470 |
| Issued in Lieu of Cash Distributions | 1,815 | 3,832 |
| Redeemed | (45,230) | (83,796) |
| Net Increase (Decrease) from Capital Share Transactions | (6,462) | (494) |
| Total Increase (Decrease) | (35,281) | (57,203) |
| Net Assets | | |
| Beginning of Period | 199,798 | 257,001 |
| End of Period2 | 164,517 | 199,798 |
1 Includes fiscal 2008 short-term gain distributions totaling $657,000. Short-term gain distributions are treated as ordinary income dividends for tax purposes.
2 Net Assets—End of Period includes undistributed net investment income of $609,000 and $909,000.
See accompanying Notes, which are an integral part of the Financial Statements.
19
| | | | |
| Strategic Small-Cap Equity Fund | | | | |
| |
| |
| Financial Highlights | | | | |
| |
| |
| | | | | April 20, |
| | | | | 20061 to |
| | Year Ended September 30, | Sept. 30, |
| For a Share Outstanding Throughout Each Period | 2009 | 2008 | 2007 | 2006 |
| Net Asset Value, Beginning of Period | $16.60 | $21.28 | $19.04 | $20.00 |
| Investment Operations | | | | |
| Net Investment Income | .145 | .160 | .220 | .090 |
| Net Realized and Unrealized Gain (Loss) on Investments | (2.257) | (4.479) | 2.170 | (1.050) |
| Total from Investment Operations | (2.112) | (4.319) | 2.390 | (.960) |
| Distributions | | | | |
| Dividends from Net Investment Income | (.168) | (.210) | (.150) | — |
| Distributions from Realized Capital Gains | — | (.151) | — | — |
| Total Distributions | (.168) | (.361) | (.150) | — |
| Net Asset Value, End of Period | $14.32 | $16.60 | $21.28 | $19.04 |
| |
| Total Return2 | –12.48% | –20.50% | 12.58% | –4.85% |
| |
| Ratios/Supplemental Data | | | | |
| Net Assets, End of Period (Millions) | $165 | $200 | $257 | $180 |
| Ratio of Total Expenses to Average Net Assets | 0.43% | 0.38% | 0.38% | 0.40%3 |
| Ratio of Net Investment Income to Average Net Assets | 1.18% | 0.83% | 1.07% | 1.20%3 |
| Portfolio Turnover Rate | 76% | 99% | 73% | 35% |
1 Subscription period for the fund was April 20, 2006, to April 24, 2006, during which time all assets were held in money market instruments. Performance measurement began April 24, 2006, at a net asset value of $20.01.
2 Total returns do not include the account service fee that may be applicable to certain accounts with balances below $10,000.
3 Annualized.
See accompanying Notes, which are an integral part of the Financial Statements.
20
Strategic Small-Cap Equity Fund
Notes to Financial Statements
Vanguard Strategic Small-Cap Equity Fund is registered under the Investment Company Act of 1940 as an open-end investment company, or mutual fund.
A. The following significant accounting policies conform to generally accepted accounting principles for U.S. mutual funds. The fund consistently follows such policies in preparing its financial statements.
1. Security Valuation: Securities are valued as of the close of trading on the New York Stock Exchange (generally 4 p.m., Eastern time) on the valuation date. Equity securities are valued at the latest quoted sales prices or official closing prices taken from the primary market in which each security trades; such securities not traded on the valuation date are valued at the mean of the latest quoted bid and asked prices. Securities for which market quotations are not readily available, or whose values have been materially affected by events occurring before the fund’s pricing time but after the close of the securities’ primary markets, are valued by methods deemed by the board of trustees to represent fair value. Investments in Vanguard Market Liquidity Fund are valued at that fund’s net asset value. Temporary cash investments acquired over 60 days to maturity are valued using the latest bid prices or using valuations based on a matrix system (which considers such factors as security prices, yields, maturities, and ratings), both as furnished by independent pricing services. Other temporary cash investments are valued at amortized cost, which approximates market value.
2. Futures Contracts: The fund uses index futures contracts to a limited extent, with the objective of maintaining full exposure to the stock market while maintaining liquidity. The fund may purchase or sell futures contracts to achieve a desired level of investment, whether to accommodate portfolio turnover or cash flows from capital share transactions. The primary risks associated with the use of futures contracts are imperfect correlation between changes in market values of stocks held by the fund and the prices of futures contracts, and the possibility of an illiquid market.
Futures contracts are valued at their quoted daily settlement prices. The aggregate principal amounts of the contracts are not recorded in the Statement of Net Assets. Fluctuations in the value of the contracts are recorded in the Statement of Net Assets as an asset (liability) and in the Statement of Operations as unrealized appreciation (depreciation) until the contracts are closed, when they are recorded as realized futures gains (losses).
3. Federal Income Taxes: The fund intends to continue to qualify as a regulated investment company and distribute all of its taxable income. Management has analyzed the fund’s tax positions taken for all open federal income tax years (September 30, 2006–2009), and has concluded that no provision for federal income tax is required in the fund’s financial statements.
4. Distributions: Distributions to shareholders are recorded on the ex-dividend date.
5. Security Lending: The fund may lend its securities to qualified institutional borrowers to earn additional income. Security loans are required to be secured at all times by collateral at least equal to the market value of securities loaned. The fund invests cash collateral received in Vanguard Market Liquidity Fund, and records a liability for the return of the collateral, during the period the securities are on loan. Security lending income represents the income earned on investing cash collateral, less expenses associated with the loan.
6. Other: Dividend income is recorded on the ex-dividend date. Interest income includes income distributions received from Vanguard Market Liquidity Fund and is accrued daily. Security transactions are accounted for on the date securities are bought or sold. Costs used to determine realized gains (losses) on the sale of investment securities are those of the specific securities sold.
21
Strategic Small-Cap Equity Fund
B. The Vanguard Group furnishes at cost investment advisory, corporate management, administrative, marketing, and distribution services. The costs of such services are allocated to the fund under methods approved by the board of trustees. The fund has committed to provide up to 0.40% of its net assets in capital contributions to Vanguard. At September 30, 2009, the fund had contributed capital of $34,000 to Vanguard (included in Other Assets), representing 0.02% of the fund’s net assets and 0.01% of Vanguard’s capitalization. The fund’s trustees and officers are also directors and officers of Vanguard.
C. Various inputs may be used to determine the value of the fund’s investments. These inputs are summarized in three broad levels for financial statement purposes. The inputs or methodologies used to value securities are not necessarily an indication of the risk associated with investing in those securities.
Level 1—Quoted prices in active markets for identical securities.
Level 2—Other significant observable inputs (including quoted prices for similar securities, interest rates, prepayment speeds, credit risk, etc.).
Level 3—Significant unobservable inputs (including the fund’s own assumptions used to determine the fair value of investments).
The following table summarizes the fund’s investments as of September 30, 2009, based on the inputs used to value them:
| | | |
| | Level 1 | Level 2 | Level 3 |
| Investments | ($000) | ($000) | ($000) |
| Common Stocks | 163,305 | — | — |
| Temporary Cash Investments | 870 | 600 | — |
| Futures Contracts—Liabilities1 | (6) | — | — |
| Total | 164,169 | 600 | — |
| 1 Represents variation margin on the last day of the reporting period. | | | |
D. At September 30, 2009, the aggregate settlement value of open futures contracts and the related unrealized appreciation (depreciation) were:
| | | | |
| | | | | ($000) |
| | | Number of | Aggregate | Unrealized |
| | | Long (Short) | Settlement | Appreciation |
| Futures Contracts | Expiration | Contracts | Value | (Depreciation) |
| E-mini Russell 2000 Index | December 2009 | 12 | 724 | (7) |
| S&P Midcap 400 Index | December 2009 | 1 | 345 | 3 |
Unrealized appreciation (depreciation) on open futures contracts is required to be treated as realized gain (loss) for tax purposes.
E. Distributions are determined on a tax basis and may differ from net investment income and realized capital gains for financial reporting purposes. Differences may be permanent or temporary. Permanent differences are reclassified among capital accounts in the financial statements to reflect their tax character. Temporary differences arise when certain items of income, expense, gain, or loss are
22
Strategic Small-Cap Equity Fund
recognized in different periods for financial statement and tax purposes; these differences will reverse at some time in the future. Differences in classification may also result from the treatment of short-term gains as ordinary income for tax purposes.
For tax purposes, at September 30, 2009, the fund had $909,000 of ordinary income available for distribution. The fund had available capital loss carryforwards totaling $31,060,000 to offset future net capital gains through September 30, 2017. In addition, the fund realized losses of $56,707,000 during the period from November 1, 2008, through September 30, 2009, which are deferred and will be treated as realized for tax purposes in fiscal 2010.
At September 30, 2009, the cost of investment securities for tax purposes was $150,183,000. Net unrealized appreciation of investment securities for tax purposes was $14,592,000, consisting of unrealized gains of $26,228,000 on securities that had risen in value since their purchase and $11,636,000 in unrealized losses on securities that had fallen in value since their purchase.
F. During the year ended September 30, 2009, the fund purchased $106,248,000 of investment securities and sold $117,266,000 of investment securities, other than temporary cash investments.
| | |
| G. Capital shares issued and redeemed were: | | |
| | Year Ended September 30, |
| | 2009 | 2008 |
| | Shares | Shares |
| | (000) | (000) |
| Issued | 3,107 | 4,152 |
| Issued in Lieu of Cash Distributions | 157 | 203 |
| Redeemed | (3,808) | (4,398) |
| Net Increase (Decrease) in Shares Outstanding | (544) | (43) |
H. In preparing the financial statements as of September 30, 2009, management considered the impact of subsequent events occurring through November 10, 2009, for potential recognition or disclosure in these financial statements.
23
Report of Independent Registered Public Accounting Firm
To the Trustees of Vanguard Horizon Funds and the Shareholders of Vanguard Strategic Small-Cap Equity Fund:
In our opinion, the accompanying statement of net assets and the related statements of operations and of changes in net assets and the financial highlights present fairly, in all material respects, the financial position of Vanguard Strategic Small-Cap Equity Fund (the “Fund”) at September 30, 2009, the results of its operations for the year then ended, the changes in its net assets for each of the two years in the period then ended and the financial highlights for each of the periods indicated, in conformity with accounting principles generally accepted in the United States of America. These financial statements and financial highlights (hereafter referred to as “financial statements”) are the responsibility of the Fund’s management; our responsibility is to express an opinion on these financial statements based on our audits. We conducted our audits of these financial statements in accordance wit h the standards of the Public Company Accounting Oversight Board (United States). Those standards require that we plan and perform the audit to obtain reasonable assurance about whether the financial statements are free of material misstatement. An audit includes examining, on a test basis, evidence supporting the amounts and disclosures in the financial statements, assessing the accounting principles used and significant estimates made by management, and evaluating the overall financial statement presentation. We believe that our audits, which included confirmation of securities at September 30, 2009 by correspondence with the custodian and broker, and by agreement to the underlying ownership records for Vanguard Market Liquidity Fund, provide a reasonable basis for our opinion.
PricewaterhouseCoopers LLP
Philadelphia, Pennsylvania
November 10, 2009
| Special 2009 tax information (unaudited) for Vanguard Strategic Small-Cap Equity Fund |
This information for the fiscal year ended September 30, 2009, is included pursuant to provisions of the Internal Revenue Code.
The fund distributed $1,840,000 of qualified dividend income to shareholders during the fiscal year.
For corporate shareholders, 93.2% of investment income (dividend income plus short-term gains, if any) qualifies for the dividends-received deduction.
24
Your Fund’s After-Tax Returns
This table presents returns for your fund both before and after taxes. The after-tax returns are shown in two ways: (1) assuming that an investor owned the fund during the entire period and paid taxes on the fund’s distributions, and (2) assuming that an investor paid taxes on the fund’s distributions and sold all shares at the end of each period.
Calculations are based on the highest individual federal income tax and capital gains tax rates in effect at the times of the distributions and the hypothetical sales. State and local taxes were not considered. After-tax returns reflect any qualified dividend income, using actual prior-year figures and estimates for 2009. (In the example, returns after the sale of fund shares may be higher than those assuming no sale. This occurs when the sale would have produced a capital loss. The calculation assumes that the investor received a tax deduction for the loss.)
Please note that your actual after-tax returns will depend on your tax situation and may differ from those shown. Also note that if you own the fund in a tax-deferred account, such as an individual retirement account or a 401(k) plan, this information does not apply to you. Such accounts are not subject to current taxes.
Finally, keep in mind that a fund’s performance—whether before or after taxes—does not guarantee future results.
| | |
| Average Annual Total Returns: Strategic Small-Cap Equity Fund1 | | |
| Periods Ended September 30, 2009 | | |
| | One | Since |
| | Year | Inception2 |
| Returns Before Taxes | –12.48% | –8.20% |
| Returns After Taxes on Distributions | –12.68 | –8.39 |
| Returns After Taxes on Distributions and Sale of Fund Shares | –7.95 | –6.87 |
1 Total return figures do not include the account service fee that may be applicable to certain accounts with balances below $10,000.
2 April 24, 2006.
25
About Your Fund’s Expenses
As a shareholder of the fund, you incur ongoing costs, which include costs for portfolio management, administrative services, and shareholder reports (like this one), among others. Operating expenses, which are deducted from a fund’s gross income, directly reduce the investment return of the fund.
A fund’s expenses are expressed as a percentage of its average net assets. This figure is known as the expense ratio. The following examples are intended to help you understand the ongoing costs (in dollars) of investing in your fund and to compare these costs with those of other mutual funds. The examples are based on an investment of $1,000 made at the beginning of the period shown and held for the entire period.
The accompanying table illustrates your fund’s costs in two ways:
• Based on actual fund return. This helps you to estimate the actual expenses that you paid over the period. The “Ending Account Value” shown is derived from the fund’s actual return, and the third column shows the dollar amount that would have been paid by an investor who started with $1,000 in the fund. You may use the information here, together with the amount you invested, to estimate the expenses that you paid over the period.
To do so, simply divide your account value by $1,000 (for example, an $8,600 account value divided by $1,000 = 8.6), then multiply the result by the number given for your fund under the heading “Expenses Paid During Period.”
• Based on hypothetical 5% yearly return. This section is intended to help you compare your fund’s costs with those of other mutual funds. It assumes that the fund had a yearly return of 5% before expenses, but that the expense ratio is unchanged. In this case—because the return used is not the fund’s actual return—the results do not apply to your investment. The example is useful in making comparisons because the Securities and Exchange Commission requires all mutual funds to calculate expenses based on a 5% return. You can assess your fund’s costs by comparing this hypothetical example with the hypothetical examples that appear in shareholder reports of other funds.
| | | |
| Six Months Ended September 30, 2009 | | | |
| | Beginning | Ending | Expenses |
| | Account Value | Account Value | Paid During |
| Strategic Small-Cap Equity Fund | 3/31/2009 | 9/30/2009 | Period1 |
| Based on Actual Fund Return | $1,000.00 | $1,419.23 | $2.55 |
| Based on Hypothetical 5% Yearly Return | 1,000.00 | 1,022.96 | 2.13 |
Note that the expenses shown in the table are meant to highlight and help you compare ongoing costs only and do not reflect transaction costs incurred by the fund for buying and selling securities. Further, the expenses do not include the account service fee described in the prospectus. If such a fee were applied to your account, your costs would be higher. Your fund does not charge transaction fees, such as purchase or redemption fees, nor does it carry a “sales load.”
1 The calculations are based on expenses incurred in the most recent six-month period. The fund’s annualized six-month expense ratio for that period is 0.42%. The dollar amounts shown as “Expenses Paid” are equal to the annualized expense ratio multiplied by the average account value over the period, multiplied by the number of days in the most recent six-month period, then divided by the number of days in the most recent 12-month period.
26
The calculations assume no shares were bought or sold during the period. Your actual costs may have been higher or lower, depending on the amount of your investment and the timing of any purchases or redemptions.
You can find more information about the fund’s expenses, including annual expense ratios, in the Financial Statements section of this report. For additional information on operating expenses and other shareholder costs, please refer to your fund’s current prospectus.
27
Glossary
Beta. A measure of the magnitude of a fund’s past share-price fluctuations in relation to the ups and downs of a given market index. The index is assigned a beta of 1.00. Compared with a given index, a fund with a beta of 1.20 typically would have seen its share price rise or fall by 12% when the index rose or fell by 10%. For this report, beta is based on returns over the past 36 months for both the fund and the index. Note that a fund’s beta should be reviewed in conjunction with its R-squared (see definition). The lower the R-squared, the less correlation there is between the fund and the index, and the less reliable beta is as an indicator of volatility.
Earnings Growth Rate. The average annual rate of growth in earnings over the past five years for the stocks now in a fund.
Equity Exposure. A measure that reflects a fund’s investments in stocks and stock futures. Any holdings in short-term reserves are excluded.
Expense Ratio. The percentage of a fund’s average net assets used to pay its annual administrative and advisory expenses. These expenses directly reduce returns to investors.
Foreign Holdings. The percentage of a fund represented by stocks or depositary receipts of companies based outside the United States.
Inception Date. The date on which the assets of a fund (or one of its share classes) are first invested in accordance with the fund’s investment objective. For funds with a subscription period, the inception date is the day after that period ends. Investment performance is measured from the inception date.
Median Market Cap. An indicator of the size of companies in which a fund invests; the midpoint of market capitalization (market price x shares outstanding) of a fund’s stocks, weighted by the proportion of the fund’s assets invested in each stock. Stocks representing half of the fund’s assets have market capitalizations above the median, and the rest are below it.
Price/Book Ratio. The share price of a stock divided by its net worth, or book value, per share. For a fund, the weighted average price/book ratio of the stocks it holds.
Price/Earnings Ratio. The ratio of a stock’s current price to its per-share earnings over the past year. For a fund, the weighted average P/E of the stocks it holds. P/E is an indicator of market expectations about corporate prospects; the higher the P/E, the greater the expectations for a company’s future growth.
R-Squared. A measure of how much of a fund’s past returns can be explained by the returns from the market in general, as measured by a given index. If a fund’s total returns were precisely synchronized with an index’s returns, its R-squared would be 1.00. If the fund’s returns bore no relationship to the index’s returns, its R-squared would be 0. For this report, R-squared is based on returns over the past 36 months for both the fund and the index.
Return on Equity. The annual average rate of return generated by a company during the past five years for each dollar of shareholder’s equity (net income divided by shareholder’s equity). For a fund, the weighted average return on equity for the companies whose stocks it holds.
Short-Term Reserves. The percentage of a fund invested in highly liquid, short-term securities that can be readily converted to cash.
28
Turnover Rate. An indication of the fund’s trading activity. Funds with high turnover rates incur higher transaction costs and may be more likely to distribute capital gains (which may be taxable to investors). The turnover rate excludes in-kind transactions, which have minimal impact on costs.
Yield. A fund’s 30-day SEC yield is derived using a formula specified by the U.S. Securities and Exchange Commission. Under the formula, data related to the fund’s security holdings in the previous 30 days are used to calculate the fund’s hypothetical net income for that period, which is then annualized and divided by the fund’s estimated average net assets over the calculation period. For the purposes of this calculation, a security’s income is based on its current market yield to maturity (in the case of bonds) or its projected dividend yield (for stocks). Because the SEC yield represents hypothetical annualized income, it will differ—at times significantly—from the fund’s actual experience. As a result, the fund’s income distributions may be higher or lower than implied by the SEC yield.
This page intentionally left blank.
This page intentionally left blank.
The People Who Govern Your Fund
The trustees of your mutual fund are there to see that the fund is operated and managed in your best interests since, as a shareholder, you are a part owner of the fund. Your fund’s trustees also serve on the board of directors of The Vanguard Group, Inc., which is owned by the Vanguard funds and provides services to them on an at-cost basis.
A majority of Vanguard’s board members are independent, meaning that they have no affiliation with Vanguard or the funds they oversee, apart from the sizable personal investments they have made as private individuals. The independent board members have distinguished backgrounds in business, academia, and public service. Each of the trustees and executive officers oversees 156 Vanguard funds.
The following table provides information for each trustee and executive officer of the fund. More information about the trustees is in the Statement of Additional Information, which can be obtained, without charge, by contacting Vanguard at 800-662-7447, or online at www.vanguard.com.
| |
| Interested Trustees | Emerson U. Fullwood |
| | Born 1948. Trustee Since January 2008. Principal |
| John J. Brennan1 | Occupation(s) During the Past Five Years: Executive |
| Born 1954. Trustee Since May 1987. Chairman of | Chief Staff and Marketing Officer for North America |
| the Board. Principal Occupation(s) During the Past | and Corporate Vice President (retired 2008) of Xerox |
| Five Years: Chairman of the Board and Director/Trustee | Corporation (photocopiers and printers); Director of |
| of The Vanguard Group, Inc., and of each of the | SPX Corporation (multi-industry manufacturing), the |
| investment companies served by The Vanguard Group; | United Way of Rochester, the Boy Scouts of America, |
| Chief Executive Officer (1996–2008) and President | Amerigroup Corporation (direct health and medical |
| (1989–2008) of The Vanguard Group and of each of the | insurance carriers), and Monroe Community College |
| investment companies served by The Vanguard Group; | Foundation. |
| Chairman of the Financial Accounting Foundation; | |
| Governor of the Financial Industry Regulatory Authority | Rajiv L. Gupta |
| (FINRA); Director of United Way of Southeastern | Born 1945. Trustee Since December 2001.2 Principal |
| Pennsylvania. | Occupation(s) During the Past Five Years: Chairman |
| | and Chief Executive Officer (retired 2009) and President |
| F. William McNabb III1 | (2006–2008) of Rohm and Haas Co. (chemicals); Board |
| Born 1957. Trustee Since July 2009. Principal | Member of American Chemistry Council; Director of |
| Occupation(s) During the Past Five Years: Director of | Tyco International, Ltd. (diversified manufacturing and |
| The Vanguard Group, Inc., since 2008; Chief Executive | services) and Hewlett-Packard Co. (electronic computer |
| Officer and President of The Vanguard Group and of | manufacturing); Trustee of The Conference Board. |
| each of the investment companies served by The | |
| Vanguard Group since 2008; Director of Vanguard | Amy Gutmann |
| Marketing Corporation; Managing Director of The | Born 1949. Trustee Since June 2006. Principal |
| Vanguard Group (1995–2008). | Occupation(s) During the Past Five Years: President of |
| | the University of Pennsylvania; Christopher H. Browne |
| | Distinguished Professor of Political Science in the School |
| Independent Trustees | of Arts and Sciences with secondary appointments |
| | at the Annenberg School for Communication and the |
| Charles D. Ellis | Graduate School of Education of the University of |
| Born 1937. Trustee Since January 2001. Principal | Pennsylvania; Director of Carnegie Corporation of |
| Occupation(s) During the Past Five Years: Applecore | New York, Schuylkill River Development Corporation, |
| Partners (pro bono ventures in education); Senior | and Greater Philadelphia Chamber of Commerce; |
| Advisor to Greenwich Associates (international business | Trustee of the National Constitution Center. |
| strategy consulting); Successor Trustee of Yale University; | |
| Overseer of the Stern School of Business at New York | |
| University; Trustee of the Whitehead Institute for | |
| Biomedical Research. | |
| | |
| JoAnn Heffernan Heisen | Executive Officers | |
| Born 1950. Trustee Since July 1998. Principal | | |
| Occupation(s) During the Past Five Years: Corporate | Thomas J. Higgins1 | |
| Vice President and Chief Global Diversity Officer since | Born 1957. Chief Financial Officer Since September |
| 2006 (retired 2008) and Member of the Executive | 2008. Principal Occupation(s) During the Past Five |
| Committee (retired 2008) of Johnson & Johnson | Years: Principal of The Vanguard Group, Inc.; Chief |
| (pharmaceuticals/consumer products); Vice President | Financial Officer of each of the investment companies |
| and Chief Information Officer of Johnson & Johnson | served by The Vanguard Group since 2008; Treasurer |
| (1997–2005); Director of the University Medical Center | of each of the investment companies served by The |
| at Princeton and Women’s Research and Education | Vanguard Group (1998–2008). |
| Institute. | | |
| |
| | Kathryn J. Hyatt1 | |
| André F. Perold | Born 1955. Treasurer Since November 2008. Principal |
| Born 1952. Trustee Since December 2004. Principal | Occupation(s) During the Past Five Years: Principal of |
| Occupation(s) During the Past Five Years: George Gund | The Vanguard Group, Inc.; Treasurer of each of the |
| Professor of Finance and Banking, Harvard Business | investment companies served by The Vanguard |
| School; Chairman of UNX, Inc. (equities trading firm); | Group since 2008; Assistant Treasurer of each of the |
| Chair of the Investment Committee of HighVista | investment companies served by The Vanguard Group |
| Strategies LLC (private investment firm). | (1988–2008). | |
| |
| Alfred M. Rankin, Jr. | Heidi Stam1 | |
| Born 1941. Trustee Since January 1993. Principal | Born 1956. Secretary Since July 2005. Principal |
| Occupation(s) During the Past Five Years: Chairman, | Occupation(s) During the Past Five Years: Managing |
| President, and Chief Executive Officer of NACCO | Director of The Vanguard Group, Inc., since 2006; |
| Industries, Inc. (forklift trucks/housewares/lignite); | General Counsel of The Vanguard Group since 2005; |
| Director of Goodrich Corporation (industrial products/ | Secretary of The Vanguard Group and of each of the |
| aircraft systems and services); Deputy Chairman of | investment companies served by The Vanguard Group |
| the Federal Reserve Bank of Cleveland. | since 2005; Director and Senior Vice President of |
| | Vanguard Marketing Corporation since 2005; Principal |
| Peter F. Volanakis | of The Vanguard Group (1997–2006). |
| Born 1955. Trustee Since July 2009. Principal | | |
| Occupation(s) During the Past Five Years: President | | |
| since 2007 and Chief Operating Officer since 2005 | Vanguard Senior Management Team |
| of Corning Incorporated (communications equipment); | | |
| President of Corning Technologies (2001–2005); Director | R. Gregory Barton | Michael S. Miller |
| of Corning Incorporated and Dow Corning; Trustee of | Mortimer J. Buckley | James M. Norris |
| the Corning Incorporated Foundation and the Corning | Kathleen C. Gubanich | Glenn W. Reed |
| Museum of Glass; Overseer of the Amos Tuck School | Paul A. Heller | George U. Sauter |
| of Business Administration at Dartmouth College. | | |
| |
| | Founder | |
| |
| | John C. Bogle | |
| | Chairman and Chief Executive Officer, 1974–1996 |
1 These individuals are “interested persons” as defined in the Investment Company Act of 1940.
2 December 2002 for Vanguard Equity Income Fund, Vanguard Growth Equity Fund, the Vanguard Municipal Bond Funds, and the Vanguard State Tax-Exempt Funds.

P.O. Box 2600
Valley Forge, PA 19482-2600
Connect with Vanguard® > www.vanguard.com
| |
| Fund Information > 800-662-7447 | All comparative mutual fund data are from Lipper Inc. |
| | or Morningstar, Inc., unless otherwise noted. |
| Direct Investor Account Services > 800-662-2739 | |
| | |
| Institutional Investor Services > 800-523-1036 | You can obtain a free copy of Vanguard’s proxy voting |
| | guidelines by visiting our website, www.vanguard.com, |
| Text Telephone for People | and searching for “proxy voting guidelines,” or by |
| With Hearing Impairment > 800-749-7273 | calling Vanguard at 800-662-2739. The guidelines are |
| | also available from the SEC’s website, www.sec.gov. |
| | In addition, you may obtain a free report on how your |
| | fund voted the proxies for securities it owned during |
| This material may be used in conjunction | the 12 months ended June 30. To get the report, visit |
| with the offering of shares of any Vanguard | either www.vanguard.com or www.sec.gov. |
| fund only if preceded or accompanied by | |
| the fund’s current prospectus. | You can review and copy information about your fund |
| | at the SEC’s Public Reference Room in Washington, D.C. |
| | To find out more about this public service, call the SEC |
| | at 202-551-8090. Information about your fund is also |
| | available on the SEC’s website, and you can receive |
| | copies of this information, for a fee, by sending a |
| | request in either of two ways: via e-mail addressed to |
| | publicinfo@sec.gov or via regular mail addressed to the |
| | Public Reference Section, Securities and Exchange |
| | Commission, Washington, DC 20549-0102. |
| |
| |
| |
| |
| | © 2009 The Vanguard Group, Inc. |
| | All rights reserved. |
| | Vanguard Marketing Corporation, Distributor. |
| | Q6150 112009 |
Item 2: Code of Ethics. The Registrant has adopted a code of ethics that applies to the Registrant’s principal executive officer, principal financial officer, principal accounting officer or controller or persons performing similar functions. The Code of Ethics was amended during the reporting period covered by this report to make certain technical, non-material changes.
Item 3: Audit Committee Financial Expert. The following members of the Audit Committee have been determined by the Registrant’s Board of Trustees to be Audit Committee Financial Experts serving on its Audit Committee, and to be independent: Charles D. Ellis, Rajiv L. Gupta, JoAnn Heffernan Heisen, André F. Perold, and Alfred M. Rankin, Jr.
Item 4: Principal Accountant Fees and Services.
(a) Audit Fees.
Audit Fees of the Registrant
Fiscal Year Ended September 30, 2009: $105,000
Fiscal Year Ended September 30, 2008: $100,000
Aggregate Audit Fees of Registered Investment Companies in the Vanguard Group.
Fiscal Year Ended September 30, 2009: $3,354,640
Fiscal Year Ended September 30, 2008: $3,055,590
(b) Audit-Related Fees.
Fiscal Year Ended September 30, 2009: $876,210
Fiscal Year Ended September 30, 2008: $626,240
Includes fees billed in connection with assurance and related services provided to the Registrant, The Vanguard Group, Inc., Vanguard Marketing Corporation, and other registered investment companies in the Vanguard Group.
(c) Tax Fees.
Fiscal Year Ended September 30, 2009: $423,070
Fiscal Year Ended September 30, 2008: $230,400
Includes fees billed in connection with tax compliance, planning and advice services provided to the Registrant, The Vanguard Group, Inc., Vanguard Marketing Corporation, and other registered investment companies in the Vanguard Group and related to income and excise taxes.
(d) All Other Fees.
Fiscal Year Ended September 30, 2009: $0
Fiscal Year Ended September 30, 2008: $0
Includes fees billed for services related to risk management and privacy matters. Services were provided to the Registrant, The Vanguard Group, Inc., Vanguard Marketing Corporation, and other registered investment companies in the Vanguard Group.
(e) (1) Pre-Approval Policies. The policy of the Registrant’s Audit Committee is to consider and, if appropriate, approve before the principal accountant is engaged for such services, all specific audit and non-audit services provided to: (1) the Registrant; (2) The Vanguard Group, Inc.; (3) other entities controlled by The Vanguard Group, Inc. that provide ongoing services to the Registrant; and (4) other registered investment companies in the Vanguard Group. In making a determination, the Audit Committee considers whether the services are consistent with maintaining the principal accountant’s independence.
In the event of a contingency situation in which the principal accountant is needed to provide services in between scheduled Audit Committee meetings, the Chairman of the Audit Committee would be called on to consider and, if appropriate, pre-approve audit or permitted non-audit services in an amount sufficient to complete services through the next Audit Committee meeting, and to determine if such services would be consistent with maintaining the accountant’s independence. At the next scheduled Audit Committee meeting, services and fees would be presented to the Audit Committee for formal consideration, and, if appropriate, approval by the entire Audit Committee. The Audit Committee would again consider whether such services and fees are consistent with maintaining the principal accountant’s independence.
The Registrant’s Audit Committee is informed at least annually of all audit and non-audit services provided by the principal accountant to the Vanguard complex, whether such services are provided to: (1) the Registrant; (2) The Vanguard Group, Inc.; (3) other entities controlled by The Vanguard Group, Inc. that provide ongoing services to the Registrant; or (4) other registered investment companies in the Vanguard Group.
(2) No percentage of the principal accountant’s fees or services were approved pursuant to the waiver provision of paragraph (c)(7)(i)(C) of Rule 2-01 of Regulation S-X.
(f) For the most recent fiscal year, over 50% of the hours worked under the principal accountant’s engagement were not performed by persons other than full-time, permanent employees of the principal accountant.
(g) Aggregate Non-Audit Fees.
Fiscal Year Ended September 30, 2009: $423,070
Fiscal Year Ended September 30, 2008: $230,400
Includes fees billed for non-audit services provided to the Registrant, The Vanguard Group, Inc., Vanguard Marketing Corporation, and other registered investment companies in the Vanguard Group.
(h) For the most recent fiscal year, the Audit Committee has determined that the provision of all non-audit services was consistent with maintaining the principal accountant’s independence.
Item 5: Not Applicable.
Item 6: Not Applicable.
Item 7: Not Applicable.
Item 8: Not Applicable.
Item 9: Not Applicable.
Item 10: Not Applicable.
Item 11: Controls and Procedures.
(a) Disclosure Controls and Procedures. The Principal Executive and Financial Officers concluded that the Registrant's Disclosure Controls and Procedures are effective based on their evaluation of the Disclosure Controls and Procedures as of a date within 90 days of the filing date of this report.
(b) Internal Control Over Financial Reporting. There were no significant changes in Registrant’s Internal Control Over Financial Reporting or in other factors that could significantly affect this control subsequent to the date of the evaluation, including any corrective actions with regard to significant deficiencies and material weaknesses.
Item 12: Exhibits.
(a) Code of Ethics.
(b) Certifications.
Pursuant to the requirements of the Securities Exchange Act of 1934 and the Investment Company Act of 1940, the registrant has duly caused this report to be signed on its behalf by the undersigned, thereunto duly authorized.
| |
| | VANGUARD HORIZON FUNDS |
| |
| By: | /s/ F. WILLIAM MCNABB III* |
| | F. WILLIAM MCNABB III |
| | CHIEF EXECUTIVE OFFICER |
| |
| Date: November 20, 2009 |
Pursuant to the requirements of the Securities Exchange Act of 1934 and the Investment Company Act of 1940, this report has been signed below by the following persons on behalf of the registrant and in the capacities and on the dates indicated.
| |
| | VANGUARD HORIZON FUNDS |
| |
| By: | /s/ F. WILLIAM MCNABB III* |
| | F. WILLIAM MCNABB III |
| | CHIEF EXECUTIVE OFFICER |
| |
| Date: November 20, 2009 |
| |
| | VANGUARD HORIZON FUNDS |
| |
| By: | /s/ THOMAS J. HIGGINS* |
| | THOMAS J. HIGGINS |
| | CHIEF FINANCIAL OFFICER |
| |
| Date: November 20, 2009 |
*By: /s/ Heidi Stam
Heidi Stam, pursuant to a Power of Attorney filed on July 24, 2009, see File Number 2-88373,
and a Power of Attorney filed on October 16, 2009, see File Number 2-52698,
both Incorporated by Reference.