UNITED STATES
SECURITIES AND EXCHANGE COMMISSION
Washington, D.C. 20549
FORM N-CSR
CERTIFIED SHAREHOLDER REPORT
OF
REGISTERED MANAGEMENT INVESTMENT COMPANIES
Investment Company Act file number: 811-07239
Name of Registrant: Vanguard Horizon Funds
Address of Registrant:
P.O. Box 2600
Valley Forge, PA 19482
Name and address of agent for service:
Heidi Stam, Esquire
P.O. Box 876
Valley Forge, PA 19482
Registrant’s telephone number, including area code: (610) 669-1000
Date of fiscal year end: September 30
Date of reporting period: October 1, 2011 – March 31, 2012
Item 1: Reports to Shareholders
 |
| Semiannual Report | March 31, 2012 |
| Vanguard Strategic Equity Fund |
> For the six months ended March 31, 2012, Vanguard Strategic Equity Fund returned almost 30%, with small- and mid-capitalization stocks outpacing their large-cap counterparts.
> The fund outpaced the return of its benchmark and the average return of peer-group funds.
> Stock selection in energy and materials drove the fund’s performance.
| |
| Contents | |
| Your Fund’s Total Returns. | 1 |
| Chairman’s Letter. | 2 |
| Advisor’s Report. | 6 |
| Fund Profile. | 8 |
| Performance Summary. | 9 |
| Financial Statements. | 10 |
| About Your Fund’s Expenses. | 22 |
| Trustees Approve Advisory Arrangement. | 24 |
| Glossary. | 25 |
Please note: The opinions expressed in this report are just that—informed opinions. They should not be considered promises or advice.
Also, please keep in mind that the information and opinions cover the period through the date on the front of this report. Of course, the
risks of investing in your fund are spelled out in the prospectus.
See the Glossary for definitions of investment terms used in this report.
About the cover: Vanguard was named for the HMS Vanguard, flagship of British Admiral Horatio Nelson. A ship—whose
performance and safety depend on the work of all hands—has served as a fitting metaphor for the Vanguard crew as we
strive to help clients reach their financial goals.
Your Fund’s Total Returns
Six Months Ended March 31, 2012
| |
| | Total |
| | Returns |
| Vanguard Strategic Equity Fund | 29.82% |
| MSCI US Small + Mid Cap 2200 Index | 28.32 |
| Mid-Cap Core Funds Average | 26.50 |
| Mid-Cap Core Funds Average: Derived from data provided by Lipper Inc. | |
Your Fund’s Performance at a Glance
September 30, 2011, Through March 31, 2012
| | | | |
| | | | Distributions Per Share |
| | Starting | Ending | Income | Capital |
| | Share Price | Share Price | Dividends | Gains |
| Vanguard Strategic Equity Fund | $16.30 | $20.94 | $0.196 | $0.000 |
1

Chairman’s Letter
Dear Shareholder,
The stock market made significant gains in the six months ended March 31. With investors’ appetite for risk on the rise, small- and mid-cap stocks generally outpaced their large-cap counterparts, and Vanguard Strategic Equity Fund performed even better, thanks to skillful stock selection. The fund returned 29.82%, more than a percentage point ahead of the return of its benchmark, the MSCI US Small + Mid Cap 2200 Index, and more than 3 percentage points ahead of the average return for peer funds.
A surge of optimism fueled a powerful global rally in stocks
During the past six months, optimism displaced the apprehension that had restrained stock prices through summer 2011. The broad U.S. stock market returned more than 26%. Markets abroad returned more than 15%. Investors’ good spirits reflected confidence that the slow, grinding economic expansion in the United States was at last gathering momentum, and that Europe’s debt crisis could be contained.
By the end of the period, however, that confidence had begun to evaporate in the face of ambiguous economic reports and renewed concern about Europe. The abrupt mood swing was consistent with the financial markets’ volatility since the 2008–2009 financial crisis.
2
Aside from munis, most bonds saw subdued six-month returns
The broad taxable bond market produced a modest six-month return of 1.43%. In general, interest rates remained more or less steady at very low levels. In some segments of the bond market, however, yields crept lower still, boosting bond prices. The broad municipal bond market, for example, produced a solid six-month return of 3.91% as investors bid up muni prices.
As it has since December 2008, the Federal Reserve Board kept its target for the shortest-term interest rates between 0% and 0.25%. That policy has kept a tight lid on the returns available from money market funds and savings accounts.
Good stock selection, good market performance
With Greece apparently stepping back from the brink and the U.S. economy seeming to gain traction, domestic stocks rose higher across all sectors and market capitalization segments during the period. Within the small- and mid-cap segment, sector returns ranged from 4.5% for telecommunication services and 8.6% for utilities to more than 30% for sectors more sensitive to the economic cycle, including industrials, materials, consumer discretionary, and information technology.
While the fund’s benchmark benefited from the overall upswing in the market, the fund did even better, thanks to strong security selection by the fund’s advisor.
Market Barometer
| | | |
| | | | Total Returns |
| | | Periods Ended March 31, 2012 |
| | Six | One | Five Years |
| | Months | Year | (Annualized) |
| Stocks | | | |
| Russell 1000 Index (Large-caps) | 26.27% | 7.86% | 2.19% |
| Russell 2000 Index (Small-caps) | 29.83 | -0.18 | 2.13 |
| Dow Jones U.S. Total Stock Market Index | 26.60 | 7.16 | 2.47 |
| MSCI All Country World Index ex USA (International) | 15.37 | -7.18 | -1.56 |
| |
| Bonds | | | |
| Barclays Capital U.S. Aggregate Bond Index (Broad | | | |
| taxable market) | 1.43% | 7.71% | 6.25% |
| Barclays Capital Municipal Bond Index (Broad | | | |
| tax-exempt market) | 3.91 | 12.07 | 5.42 |
| Citigroup Three-Month U.S. Treasury Bill Index | 0.00 | 0.05 | 1.11 |
| |
| CPI | | | |
| Consumer Price Index | 1.10% | 2.65% | 2.24% |
3
Vanguard’s Equity Investment Group maintains sector weightings very close to those of the fund’s benchmark but uses sophisticated computer models to identify and invest in a limited number of stocks in each sector. Its models seek to identify stocks with attractive valuations, positive earnings momentum, and strong balance sheets. The fund held about 400 stocks during the six-month period; its benchmark comprises around 2,200 stocks.
The strength of the fund’s security selection was notable in the energy sector, where the fund’s holdings returned better than 43%, compared with about 27% for the benchmark. The fund’s return was driven by strong stock choices in the oil and gas segment, which benefited from an increase in the price of oil from less than
$80 to more than $100 per barrel during the six months. At the same time, the fund benefited from largely avoiding the coal segment, where prospects dimmed in the face of rapidly expanding supplies of cheap natural gas.
Within materials, the fund’s concentration on chemical companies allowed this sector to outperform. Information technology was another sector where the fund bested its benchmark; its holdings in computers and peripherals were helped by robust business spending.
Stock selection in health care was the main detractor from performance, largely because of missed opportunities among a few biotechnology and pharmaceutical stocks.
Expense Ratios
Your Fund Compared With Its Peer Group
| | |
| | | Peer Group |
| | Fund | Average |
| Strategic Equity Fund | 0.33% | 1.28% |
The fund expense ratio shown is from the prospectus dated January 26, 2012, and represents estimated costs for the current fiscal year. For the six months ended March 31, 2012, the fund’s annualized expense ratio was 0.30%. The peer-group expense ratio is derived from data provided by Lipper Inc. and captures information through year-end 2011.
Peer group: Mid-Cap Core Funds.
4
Staying the course has its advantages
Ups and downs in the market, as all seasoned investors know, are part and parcel of investing. The level of volatility seen last summer, however, as U.S. government debt was downgraded and the possibility of European government defaults loomed large, was unnerving to say the least.
Yet investors who rode out the storm were there to benefit from the strong upswing that followed. We believe that investors are best served by maintaining, through good markets and bad, a portfolio that is diversified across and within asset classes and that is consistent with their tolerance for risk.
Vanguard Strategic Equity Fund can play an important role in such a portfolio as it affords investors broad exposure to both small- and mid-cap U.S. stocks identified by our Equity Investment Group as having improving fundamentals and attractive valuations. And it does so at a low cost, which leaves more of the fund’s return in your pocket.
As always, thank you for entrusting your assets to Vanguard.
Sincerely,

F. William McNabb III
Chairman and Chief Executive Officer
April 19, 2012
5
Advisor’s Report
For the six months ended March 31, 2012, the Strategic Equity Fund returned a robust 29.82%, outperforming its benchmark, the MSCI US Small + Mid Cap 2200 Index, by 1.5 percentage points. The fund also outperformed the broad market as risk appetites increased due to brighter economic news, increased investor confidence, and coordinated action by central banks.
At the sector level, industrials, materials, and consumer discretionary companies led mid- and small-cap results. Telecommunications and utilities were the laggards for the period. All ten sectors posted positive returns. These results mirrored trends in the broader market, where more economically sensitive sectors generally outperformed more defensive ones.
Since the equity market started its current rally last fall, investor concerns regarding a possible double-dip recession, slowing growth in China, and Europe’s troubles appear to have eased. Against this backdrop, data showing improvements in U.S. employment and housing and continued strength in U.S. manufacturing activity seem to have whetted investor appetite for equities. Valuations of U.S. stocks relative to bonds, measured by comparing earnings yields of stocks with coupon yields of 10-year U.S. Treasury bonds, indicate a level of attractiveness not seen since the early 1970s.
Although market volatility declined more than 60% during the period to below-average levels, it will likely stay with us for a while. U.S. budget and deficit problems remain unresolved, world economic growth is uncertain, and the outcome of the presidential election is still months away. (Volatility is measured by the CBOE Volatility Index, or VIX.)
Although overall portfolio performance is affected by the macroeconomic factors described above, our approach to investing focuses on specific stock fundamentals. Our model consists of these five components:
1. Valuation, which measures the price we pay for earnings and cash flows.
2. Growth, which considers the growth of earnings.
3. Management decisions, an assessment of the actions taken by company management that signal its informed opinions of a firm’s future.
4. Market sentiment, which captures how investors reflect their opinions of a company through their activity in the market.
5. Quality, which measures balancesheet strength and the sustainability of earnings.
6
Our risk-control process then neutralizes our exposure to market-capitalization, volatility, and industry risks relative to our benchmark. In our view, such risk exposures are not justified by the rewards available. The effect of these risk controls can be seen by analyzing the fund’s tracking error (a measure of performance volatility relative to its benchmark). The trailing 3-year tracking error of 2.35% is well within an acceptable range given the risk tolerance of this fund.
For the fiscal half-year, our stock selection model produced mixed results. Our management decisions and quality components were effective in distinguishing outperformers from underperformers, but our growth indicator was flat. Our market-sentiment and valuation indicators were not effective and, in fact, detracted from our results.
Our stock selection results were positive in seven out of ten sectors, neutral in two, and negative in one. Company selections within energy, materials, and consumer staples added most to our relative returns. In energy, Pioneer Natural Resources, CVR Energy, and Core Laboratories were the largest contributors. In materials, Rockwood Holdings, Eastman Chemical, and CF Industries boosted results. In consumer staples, Herbalife, and B&G Foods were the top performers. Selection results were disappointing in health care; most of our underperformance in this sector resulted from underweighted positions in Regeneron Pharmaceuticals and Pharmasset.
While we cannot predict how broader political or economic events will affect the markets, we are confident that the stock market can provide worthwhile returns for long-term investors. With that in mind, we believe that equity exposure will continue to play an important part in a diversified investment plan.
We thank you for your investment and look forward to the second half of the fiscal year.
James D. Troyer, CFA Principal and Portfolio Manager
James P. Stetler Principal and Portfolio Manager
Michael R. Roach, CFA Portfolio Manager
Vanguard Equity Investment Group
April 12, 2012
7
Strategic Equity Fund
Fund Profile
As of March 31, 2012
| | | |
| Portfolio Characteristics | | |
| | | MSCI US | |
| | | Small + | DJ |
| | | Mid Cap | U.S. Total |
| | | 2200 | Market |
| | Fund | Index | Index |
| Number of Stocks | 389 | 2,176 | 3,716 |
| Median Market Cap | $3.8B | $4.2B | $35.6B |
| Price/Earnings Ratio | 15.6x | 22.2x | 17.1x |
| Price/Book Ratio | 2.4x | 2.1x | 2.3x |
| Return on Equity | 11.5% | 12.2% | 18.1% |
| Earnings Growth Rate 12.1% | 6.7% | 8.5% |
| Dividend Yield | 1.2% | 1.4% | 1.9% |
| Foreign Holdings | 0.0% | 0.0% | 0.0% |
| Turnover Rate | | | |
| (Annualized) | 64% | — | — |
| Ticker Symbol | VSEQX | — | — |
| Expense Ratio1 | 0.33% | — | — |
| 30-Day SEC Yield | 0.95% | — | — |
| Short-Term Reserves | 0.3% | — | — |
| | | |
| Sector Diversification (% of equity exposure) |
| | | MSCI US | |
| | | Small + | DJ |
| | | Mid Cap | U.S. Total |
| | | 2200 | Market |
| | Fund | Index | Index |
| Consumer | | | |
| Discretionary | 16.8% | 16.4% | 12.0% |
| Consumer Staples | 5.0 | 4.4 | 9.4 |
| Energy | 7.6 | 7.0 | 10.5 |
| Financials | 18.5 | 18.9 | 15.9 |
| Health Care | 10.7 | 10.8 | 11.5 |
| Industrials | 13.6 | 14.1 | 11.0 |
| Information | | | |
| Technology | 16.3 | 16.1 | 19.8 |
| Materials | 6.4 | 6.5 | 4.0 |
| Telecommunication | | | |
| Services | 0.7 | 1.0 | 2.5 |
| Utilities | 4.4 | 4.8 | 3.4 |
| | |
| Volatility Measures | | |
| | MSCI US | |
| | Small + | DJ |
| | Mid Cap | U.S. Total |
| | 2200 | Market |
| | Index | Index |
| R-Squared | 0.99 | 0.94 |
| Beta | 1.00 | 1.21 |
These measures show the degree and timing of the fund’s fluctuations compared with the indexes over 36 months.
| | |
| Ten Largest Holdings (% of total net assets) |
| |
| Limited Brands Inc. | Apparel Retail | 1.1% |
| CF Industries Holdings | Fertilizers & | |
| Inc. | Agricultural | |
| | Chemicals | 1.1 |
| Seagate Technology plc | Computer Storage | |
| | & Peripherals | 1.1 |
| KLA-Tencor Corp. | Semiconductor | |
| | Equipment | 1.0 |
| Western Digital Corp. | Computer Storage | |
| | & Peripherals | 1.0 |
| Pioneer Natural | Oil & Gas | |
| Resources Co. | Exploration & | |
| | Production | 1.0 |
| AmerisourceBergen | Health Care | |
| Corp. | Distributors | 1.0 |
| Herbalife Ltd. | Personal Products | 1.0 |
| Alliance Data Systems | Data Processing & | |
| Corp. | Outsourced | |
| | Services | 1.0 |
| Tempur-Pedic | | |
| International Inc. | Home Furnishings | 1.0 |
| Top Ten | | 10.3% |
The holdings listed exclude any temporary cash investments and equity index products.
Investment Focus

1 The expense ratio shown is from the prospectus dated January 26, 2012, and represents estimated costs for the current fiscal year. For the six months ended March 31, 2012, the annualized expense ratio was 0.30%.
8
Strategic Equity Fund
Performance Summary
All of the returns in this report represent past performance, which is not a guarantee of future results that may be achieved by the fund. (Current performance may be lower or higher than the performance data cited. For performance data current to the most recent month-end, visit our website at vanguard.com/performance.) Note, too, that both investment returns and principal value can fluctuate widely, so an investor’s shares, when sold, could be worth more or less than their original cost. The returns shown do not reflect taxes that a shareholder would pay on fund distributions or on the sale of fund shares.
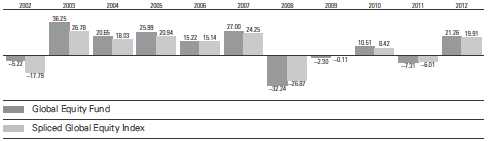
Fiscal-Year Total Returns (%): September 30, 2001, Through March 31, 2012
Spliced Small and Mid Cap Index: Russell 2800 Index through May 31, 2003; MSCI US Small + Mid Cap 2200 Index thereafter.
Note: For 2012, performance data reflect the six months ended March 31, 2012.
Average Annual Total Returns: Periods Ended March 31, 2012
| | | | |
| | Inception | One | Five | Ten |
| | Date | Year | Years | Years |
| Strategic Equity Fund | 8/14/1995 | 4.34% | 0.27% | 6.69% |
See Financial Highlights for dividend and capital gains information.
9
Strategic Equity Fund
Financial Statements (unaudited)
Statement of Net Assets
As of March 31, 2012
The fund reports a complete list of its holdings in regulatory filings four times in each fiscal year, at the quarter-ends. For the second and fourth fiscal quarters, the lists appear in the fund’s semiannual and annual reports to shareholders. For the first and third fiscal quarters, the fund files the lists with the Securities and Exchange Commission on Form N-Q. Shareholders can look up the fund’s Forms N-Q on the SEC’s website at sec.gov. Forms N-Q may also be reviewed and copied at the SEC’s Public Reference Room (see the back cover of this report for further information).
| | | |
| | | | Market |
| | | | Value |
| | | Shares | ($000) |
| Common Stocks (99.4%)1 | | |
| Consumer Discretionary (16.7%) | |
| | Limited Brands Inc. | 773,850 | 37,145 |
| * | Tempur-Pedic | | |
| | International Inc. | 387,949 | 32,755 |
| | Polaris Industries Inc. | 436,782 | 31,514 |
| | Dillard’s Inc. Class A | 458,920 | 28,921 |
| * | Dollar Tree Inc. | 282,820 | 26,724 |
| * | Goodyear Tire & | | |
| | Rubber Co. | 2,068,700 | 23,211 |
| | Domino’s Pizza Inc. | 582,420 | 21,142 |
| | Wyndham | | |
| | Worldwide Corp. | 445,900 | 20,739 |
| | Garmin Ltd. | 435,200 | 20,433 |
| | Advance Auto Parts Inc. | 227,300 | 20,132 |
| | Virgin Media Inc. | 698,300 | 17,444 |
| * | Coinstar Inc. | 260,390 | 16,548 |
| | Ulta Salon Cosmetics & | | |
| | Fragrance Inc. | 172,700 | 16,042 |
| | Sotheby’s | 377,220 | 14,840 |
| | Dana Holding Corp. | 933,000 | 14,461 |
| * | Sirius XM Radio Inc. | 5,826,300 | 13,459 |
| | Buckle Inc. | 263,400 | 12,617 |
| * | Liz Claiborne Inc. | 895,300 | 11,961 |
| * | O’Reilly Automotive Inc. | 124,600 | 11,382 |
| | Brinker International Inc. | 404,250 | 11,137 |
| | Signet Jewelers Ltd. | 234,000 | 11,063 |
| ^ | Weight Watchers | | |
| | International Inc. | 137,720 | 10,631 |
| * | Tenneco Inc. | 277,995 | 10,327 |
| * | Crocs Inc. | 491,000 | 10,272 |
| * | Iconix Brand Group Inc. | 520,300 | 9,043 |
| *,^ | ITT Educational | | |
| | Services Inc. | 128,700 | 8,512 |
| | Harley-Davidson Inc. | 170,000 | 8,344 |
| | Bob Evans Farms Inc. | 206,751 | 7,799 |
| * | AMC Networks Inc. | | |
| | Class A | 154,425 | 6,892 |
| | Ameristar Casinos Inc. | 367,800 | 6,852 |
| | | |
| | | | Market |
| | | | Value |
| | | Shares | ($000) |
| * | Express Inc. | 251,500 | 6,282 |
| | Sinclair Broadcast | | |
| | Group Inc. Class A | 502,640 | 5,559 |
| * | Cheesecake Factory Inc. | 185,500 | 5,452 |
| | Sturm Ruger & Co. Inc. | 108,200 | 5,313 |
| * | Helen of Troy Ltd. | 152,500 | 5,186 |
| | Expedia Inc. | 132,850 | 4,442 |
| | Ross Stores Inc. | 69,524 | 4,039 |
| | PetSmart Inc. | 68,200 | 3,902 |
| | Foot Locker Inc. | 125,000 | 3,881 |
| | Regal Entertainment Group | | |
| | Class A | 257,500 | 3,502 |
| | Aaron’s Inc. | 106,200 | 2,751 |
| | Standard Motor | | |
| | Products Inc. | 145,150 | 2,575 |
| * | Vitamin Shoppe Inc. | 54,800 | 2,423 |
| * | Pier 1 Imports Inc. | 125,900 | 2,289 |
| | Blyth Inc. | 26,700 | 1,998 |
| * | Liberty Interactive Corp. | | |
| | Class A | 86,900 | 1,659 |
| * | Red Robin Gourmet | | |
| | Burgers Inc. | 43,300 | 1,610 |
| | Service Corp. International | 128,200 | 1,443 |
| | Interpublic Group | | |
| | of Cos. Inc. | 113,400 | 1,294 |
| * | Journal | | |
| | Communications Inc. | | |
| | Class A | 215,261 | 1,212 |
| * | BorgWarner Inc. | 13,900 | 1,172 |
| | DSW Inc. Class A | 21,100 | 1,156 |
| * | AFC Enterprises Inc. | 60,045 | 1,018 |
| | Cato Corp. Class A | 36,294 | 1,003 |
| * | American Public | | |
| | Education Inc. | 26,200 | 996 |
| | | | 564,499 |
| Consumer Staples (5.0%) | | |
| | Herbalife Ltd. | 482,478 | 33,204 |
| | Dr Pepper Snapple | | |
| | Group Inc. | 772,908 | 31,079 |
| | Whole Foods Market Inc. | 273,000 | 22,714 |
10
Strategic Equity Fund
| | | |
| | | | Market |
| | | | Value |
| | | Shares | ($000) |
| * | Constellation Brands Inc. | | |
| | Class A | 638,900 | 15,072 |
| * | Dean Foods Co. | 1,240,604 | 15,024 |
| | B&G Foods Inc. Class A | 471,620 | 10,616 |
| * | Monster Beverage Corp. | 155,854 | 9,677 |
| | Lancaster Colony Corp. | 108,519 | 7,212 |
| * | Boston Beer Co. Inc. | | |
| | Class A | 62,000 | 6,621 |
| | Safeway Inc. | 276,000 | 5,578 |
| * | Energizer Holdings Inc. | 50,100 | 3,716 |
| * | Smithfield Foods Inc. | 155,677 | 3,429 |
| | Andersons Inc. | 36,700 | 1,787 |
| | SUPERVALU Inc. | 204,100 | 1,165 |
| | Cal-Maine Foods Inc. | 26,000 | 995 |
| | Nu Skin Enterprises Inc. | | |
| | Class A | 15,000 | 869 |
| | | | 168,758 |
| Energy (7.6%) | | |
| | Pioneer Natural | | |
| | Resources Co. | 299,300 | 33,399 |
| * | Tesoro Corp. | 1,055,000 | 28,316 |
| * | CVR Energy Inc. | 985,850 | 26,372 |
| | Helmerich & Payne Inc. | 482,092 | 26,009 |
| | Core Laboratories NV | 192,000 | 25,261 |
| | Western Refining Inc. | 1,035,300 | 19,484 |
| * | Rosetta Resources Inc. | 311,645 | 15,196 |
| * | Denbury Resources Inc. | 616,800 | 11,244 |
| * | Superior Energy | | |
| | Services Inc. | 399,951 | 10,543 |
| * | Stone Energy Corp. | 323,212 | 9,241 |
| | HollyFrontier Corp. | 219,200 | 7,047 |
| | Range Resources Corp. | 120,700 | 7,018 |
| * | SEACOR Holdings Inc. | 70,600 | 6,762 |
| * | Helix Energy Solutions | | |
| | Group Inc. | 354,800 | 6,315 |
| | W&T Offshore Inc. | 158,250 | 3,336 |
| | Kinder Morgan | | |
| | Management LLC | 40,378 | 3,013 |
| * | Plains Exploration & | | |
| | Production Co. | 58,000 | 2,474 |
| | Crosstex Energy Inc. | 172,475 | 2,439 |
| * | Cloud Peak Energy Inc. | 151,300 | 2,410 |
| * | OYO Geospace Corp. | 17,250 | 1,817 |
| * | Contango Oil & Gas Co. | 29,000 | 1,708 |
| * | Energy Partners Ltd. | 101,600 | 1,688 |
| | Delek US Holdings Inc. | 105,300 | 1,633 |
| | Alon USA Energy Inc. | 157,800 | 1,428 |
| * | Swift Energy Co. | 34,300 | 996 |
| | Berry Petroleum Co. | | |
| | Class A | 18,800 | 886 |
| | Cabot Oil & Gas Corp. | 21,400 | 667 |
| | | | 256,702 |
| | | |
| | | | Market |
| | | | Value |
| | | Shares | ($000) |
| Financials (18.4%) | | |
| | Torchmark Corp. | 635,595 | 31,684 |
| * | Arch Capital Group Ltd. | 771,726 | 28,739 |
| | Discover Financial Services | 816,225 | 27,213 |
| | American Financial | | |
| | Group Inc. | 539,689 | 20,821 |
| * | World Acceptance Corp. | 338,783 | 20,751 |
| | KeyCorp | 2,401,630 | 20,414 |
| * | NASDAQ OMX Group Inc. | 729,200 | 18,886 |
| | Kimco Realty Corp. | 828,000 | 15,947 |
| | Commerce Bancshares Inc. | 388,530 | 15,743 |
| | Bank of the Ozarks Inc. | 483,720 | 15,121 |
| | Moody’s Corp. | 356,400 | 15,004 |
| | Digital Realty Trust Inc. | 201,200 | 14,883 |
| | Camden Property Trust | 208,900 | 13,735 |
| | Taubman Centers Inc. | 178,750 | 13,040 |
| | CBL & Associates | | |
| | Properties Inc. | 679,874 | 12,863 |
| | Extra Space Storage Inc. | 445,840 | 12,836 |
| | Northwest Bancshares Inc. | 948,000 | 12,040 |
| | Post Properties Inc. | 256,600 | 12,024 |
| | Douglas Emmett Inc. | 525,300 | 11,982 |
| | Hospitality Properties Trust | 445,200 | 11,785 |
| | Lexington Realty Trust | 1,268,300 | 11,402 |
| | Sun Communities Inc. | 260,743 | 11,298 |
| * | Forest City Enterprises Inc. | | |
| | Class A | 656,805 | 10,286 |
| | Brandywine Realty Trust | 870,832 | 9,997 |
| | Entertainment | | |
| | Properties Trust | 215,200 | 9,981 |
| | Cash America | | |
| | International Inc. | 207,300 | 9,936 |
| | Assured Guaranty Ltd. | 571,200 | 9,436 |
| | Huntington | | |
| | Bancshares Inc. | 1,459,000 | 9,411 |
| | ProAssurance Corp. | 99,800 | 8,793 |
| | Assurant Inc. | 216,300 | 8,760 |
| * | Credit Acceptance Corp. | 85,779 | 8,665 |
| * | First Industrial Realty | | |
| | Trust Inc. | 687,825 | 8,495 |
| * | Strategic Hotels & | | |
| | Resorts Inc. | 1,279,200 | 8,417 |
| | American Campus | | |
| | Communities Inc. | 178,000 | 7,960 |
| | Allied World Assurance Co. | | |
| | Holdings AG | 107,800 | 7,403 |
| * | Altisource Portfolio | | |
| | Solutions SA | 119,709 | 7,259 |
| | Nelnet Inc. Class A | 278,312 | 7,211 |
| | BOK Financial Corp. | 127,221 | 7,160 |
| | Colonial Properties Trust | 313,160 | 6,805 |
| * | Ezcorp Inc. Class A | 196,709 | 6,384 |
| | DCT Industrial Trust Inc. | 1,043,500 | 6,157 |
11
Strategic Equity Fund
| | | |
| | | | Market |
| | | | Value |
| | | Shares | ($000) |
| | International | | |
| | Bancshares Corp. | 238,425 | 5,043 |
| | UMB Financial Corp. | 109,088 | 4,880 |
| | Omega Healthcare | | |
| | Investors Inc. | 222,700 | 4,735 |
| | Liberty Property Trust | 123,500 | 4,411 |
| | City Holding Co. | 125,905 | 4,371 |
| | Provident Financial | | |
| | Services Inc. | 293,425 | 4,264 |
| | People’s United | | |
| | Financial Inc. | 312,600 | 4,139 |
| | Amtrust Financial | | |
| | Services Inc. | 130,400 | 3,505 |
| | Cathay General Bancorp | 185,510 | 3,284 |
| | Erie Indemnity Co. Class A | 42,100 | 3,281 |
| | First Horizon National Corp. | 316,000 | 3,280 |
| | Fulton Financial Corp. | 306,600 | 3,219 |
| | Highwoods Properties Inc. | 96,046 | 3,200 |
| | CVB Financial Corp. | 255,300 | 2,997 |
| | First Financial | | |
| | Bankshares Inc. | 85,032 | 2,994 |
| | Republic Bancorp Inc. | | |
| | Class A | 106,911 | 2,557 |
| * | American Capital Ltd. | 288,089 | 2,498 |
| | CubeSmart | 200,900 | 2,391 |
| | Prosperity Bancshares Inc. | 47,900 | 2,194 |
| | Umpqua Holdings Corp. | 154,000 | 2,088 |
| * | iStar Financial Inc. | 279,055 | 2,023 |
| | Webster Financial Corp. | 82,500 | 1,870 |
| | Ramco-Gershenson | | |
| | Properties Trust | 148,300 | 1,812 |
| | First Citizens | | |
| | BancShares Inc. Class A | 9,300 | 1,699 |
| | Bancfirst Corp. | 38,783 | 1,689 |
| * | Texas Capital | | |
| | Bancshares Inc. | 48,400 | 1,676 |
| | American Capital | | |
| | Agency Corp. | 51,300 | 1,515 |
| | Oritani Financial Corp. | 94,900 | 1,393 |
| | Apartment Investment & | | |
| | Management Co. | 51,300 | 1,355 |
| | RLI Corp. | 18,300 | 1,311 |
| | Southside Bancshares Inc. | 53,966 | 1,193 |
| | Old National Bancorp | 87,200 | 1,146 |
| | AvalonBay Communities Inc. | 7,600 | 1,074 |
| * | Investors Bancorp Inc. | 71,400 | 1,072 |
| | Ashford Hospitality | | |
| | Trust Inc. | 110,790 | 998 |
| | NBT Bancorp Inc. | 41,330 | 913 |
| | Camden National Corp. | 25,345 | 891 |
| * | Rouse Properties Inc. | 63,100 | 854 |
| | MFA Financial Inc. | 92,300 | 690 |
| | | | 621,232 |
| | | |
| | | | Market |
| | | | Value |
| | | Shares | ($000) |
| Health Care (10.6%) | | |
| | AmerisourceBergen Corp. | | |
| | Class A | 841,604 | 33,395 |
| * | Watson | | |
| | Pharmaceuticals Inc. | 468,000 | 31,384 |
| * | WellCare Health Plans Inc. | 434,100 | 31,203 |
| | Perrigo Co. | 282,650 | 29,201 |
| | Omnicare Inc. | 816,600 | 29,046 |
| | Humana Inc. | 312,400 | 28,891 |
| | Cooper Cos. Inc. | 323,015 | 26,394 |
| * | Mylan Inc. | 896,800 | 21,030 |
| * | Cubist Pharmaceuticals Inc. | 290,900 | 12,581 |
| * | Health Net Inc. | 303,900 | 12,071 |
| * | Salix Pharmaceuticals Ltd. | 183,305 | 9,623 |
| * | Magellan Health | | |
| | Services Inc. | 188,600 | 9,206 |
| * | Charles River Laboratories | | |
| | International Inc. | 234,900 | 8,478 |
| * | Medicines Co. | 400,975 | 8,048 |
| * | Alexion | | |
| | Pharmaceuticals Inc. | 80,300 | 7,457 |
| | Medicis | | |
| | Pharmaceutical Corp. | | |
| | Class A | 180,700 | 6,792 |
| * | Idenix Pharmaceuticals Inc. | 656,178 | 6,424 |
| * | LifePoint Hospitals Inc. | 143,135 | 5,645 |
| * | Akorn Inc. | 447,367 | 5,234 |
| * | Viropharma Inc. | 160,600 | 4,829 |
| * | Par | | |
| | Pharmaceutical Cos. Inc. | 109,221 | 4,230 |
| * | Centene Corp. | 60,300 | 2,953 |
| * | Thoratec Corp. | 83,400 | 2,811 |
| * | Health Management | | |
| | Associates Inc. Class A | 361,348 | 2,428 |
| * | Arthrocare Corp. | 85,200 | 2,288 |
| * | Vertex | | |
| | Pharmaceuticals Inc. | 55,500 | 2,276 |
| * | Mettler-Toledo | | |
| | International Inc. | 10,291 | 1,901 |
| | Ensign Group Inc. | 67,000 | 1,820 |
| * | Spectrum | | |
| | Pharmaceuticals Inc. | 133,900 | 1,691 |
| | Universal American Corp. | 130,700 | 1,409 |
| | PDL BioPharma Inc. | 185,400 | 1,177 |
| * | Genomic Health Inc. | 38,408 | 1,176 |
| * | Greatbatch Inc. | 47,400 | 1,162 |
| | Chemed Corp. | 18,200 | 1,141 |
| * | Jazz Pharmaceuticals plc | 19,200 | 931 |
| | Computer Programs & | | |
| | Systems Inc. | 15,100 | 853 |
| * | Bio-Rad Laboratories Inc. | | |
| | Class A | 8,200 | 850 |
| * | RTI Biologics Inc. | 166,700 | 617 |
| | | | 358,646 |
12
Strategic Equity Fund
| | | |
| | | | Market |
| | | | Value |
| | | Shares | ($000) |
| Industrials (13.5%) | | |
| * | United Rentals Inc. | 682,162 | 29,258 |
| | KBR Inc. | 786,200 | 27,949 |
| * | BE Aerospace Inc. | 583,850 | 27,132 |
| | Gardner Denver Inc. | 394,652 | 24,871 |
| | Iron Mountain Inc. | 840,600 | 24,209 |
| | Pitney Bowes Inc. | 1,228,650 | 21,600 |
| | Sauer-Danfoss Inc. | 406,923 | 19,125 |
| | Towers Watson & Co. | | |
| | Class A | 265,100 | 17,515 |
| * | Delta Air Lines Inc. | 1,606,200 | 15,917 |
| | Triumph Group Inc. | 236,866 | 14,842 |
| | Cintas Corp. | 281,300 | 11,004 |
| | Toro Co. | 148,200 | 10,539 |
| * | AGCO Corp. | 222,950 | 10,525 |
| * | Alaska Air Group Inc. | 279,790 | 10,022 |
| | Textron Inc. | 344,800 | 9,596 |
| * | Colfax Corp. | 260,900 | 9,194 |
| | Kennametal Inc. | 190,600 | 8,487 |
| * | EnerSys | 242,357 | 8,398 |
| | Applied Industrial | | |
| | Technologies Inc. | 179,200 | 7,370 |
| | Cubic Corp. | 148,520 | 7,022 |
| | HEICO Corp. | 125,700 | 6,485 |
| * | Moog Inc. Class A | 126,500 | 5,426 |
| * | Avis Budget Group Inc. | 379,900 | 5,376 |
| | Barnes Group Inc. | 202,000 | 5,315 |
| * | US Airways Group Inc. | 675,000 | 5,123 |
| | NACCO Industries Inc. | | |
| | Class A | 44,000 | 5,120 |
| * | Trimas Corp. | 225,800 | 5,056 |
| * | Generac Holdings Inc. | 199,800 | 4,905 |
| | AO Smith Corp. | 108,500 | 4,877 |
| | Amerco Inc. | 45,740 | 4,826 |
| * | Dollar Thrifty Automotive | | |
| | Group Inc. | 59,640 | 4,825 |
| | Macquarie | | |
| | Infrastructure Co. LLC | 141,900 | 4,681 |
| * | Consolidated Graphics Inc. | 102,073 | 4,619 |
| | Donaldson Co. Inc. | 126,800 | 4,531 |
| * | Corrections Corp. of | | |
| | America | 161,300 | 4,405 |
| * | JetBlue Airways Corp. | 847,500 | 4,144 |
| | Werner Enterprises Inc. | 154,737 | 3,847 |
| | Belden Inc. | 99,300 | 3,764 |
| | Aircastle Ltd. | 285,200 | 3,491 |
| | Ceradyne Inc. | 95,300 | 3,103 |
| * | Hexcel Corp. | 125,400 | 3,011 |
| * | KAR Auction Services Inc. | 178,000 | 2,885 |
| | Armstrong World | | |
| | Industries Inc. | 58,800 | 2,868 |
| | Crane Co. | 55,400 | 2,687 |
| * | United Continental | | |
| | Holdings Inc. | 122,100 | 2,625 |
| | | |
| | | | Market |
| | | | Value |
| | | Shares | ($000) |
| | Steelcase Inc. Class A | 255,700 | 2,455 |
| * | General Cable Corp. | 83,500 | 2,428 |
| * | Nielsen Holdings NV | 79,700 | 2,402 |
| | Standex International Corp. | 57,750 | 2,379 |
| * | Thomas & Betts Corp. | 32,800 | 2,359 |
| | Mueller Industries Inc. | 48,800 | 2,218 |
| | Hubbell Inc. Class B | 27,000 | 2,122 |
| | Deluxe Corp. | 86,113 | 2,017 |
| | Primoris Services Corp. | 93,500 | 1,502 |
| * | WESCO International Inc. | 22,000 | 1,437 |
| | Actuant Corp. Class A | 49,100 | 1,423 |
| * | Blount International Inc. | 84,082 | 1,402 |
| | ITT Corp. | 56,500 | 1,296 |
| | United Stationers Inc. | 39,922 | 1,239 |
| * | Huntington Ingalls | | |
| | Industries Inc. | 29,100 | 1,171 |
| | JB Hunt Transport | | |
| | Services Inc. | 20,000 | 1,087 |
| | G&K Services Inc. Class A | 31,100 | 1,064 |
| * | RSC Holdings Inc. | 46,300 | 1,046 |
| * | Huron Consulting | | |
| | Group Inc. | 26,100 | 980 |
| * | Orbital Sciences Corp. | 68,700 | 903 |
| * | ICF International Inc. | 35,000 | 888 |
| | Franklin Electric Co. Inc. | 17,600 | 864 |
| * | Taser International Inc. | 170,000 | 738 |
| | | | 457,990 |
| Information Technology (16.2%) | |
| | Seagate Technology plc | 1,327,150 | 35,767 |
| | KLA-Tencor Corp. | 638,475 | 34,746 |
| * | Western Digital Corp. | 814,300 | 33,704 |
| * | Alliance Data | | |
| | Systems Corp. | 260,600 | 32,825 |
| * | Gartner Inc. | 706,269 | 30,115 |
| * | Anixter International Inc. | 412,108 | 29,890 |
| | IAC/InterActiveCorp | 499,500 | 24,521 |
| * | CACI International Inc. | | |
| | Class A | 349,000 | 21,739 |
| * | Electronic Arts Inc. | 1,298,500 | 21,399 |
| * | Fiserv Inc. | 282,900 | 19,630 |
| * | Cadence Design | | |
| | Systems Inc. | 1,598,200 | 18,923 |
| * | LSI Corp. | 2,000,700 | 17,366 |
| * | Avnet Inc. | 456,000 | 16,594 |
| | Cypress | | |
| | Semiconductor Corp. | 875,200 | 13,679 |
| * | FEI Co. | 240,900 | 11,831 |
| | Lexmark International Inc. | | |
| | Class A | 353,806 | 11,761 |
| | Avago Technologies Ltd. | 285,600 | 11,130 |
| * | Freescale Semiconductor | | |
| | Holdings I Ltd. | 658,150 | 10,129 |
| * | Tech Data Corp. | 182,700 | 9,913 |
13
Strategic Equity Fund
| | | |
| | | | Market |
| | | | Value |
| | | Shares | ($000) |
| * | Kulicke & Soffa | | |
| | Industries Inc. | 712,600 | 8,858 |
| * | Advanced Micro | | |
| | Devices Inc. | 1,044,535 | 8,377 |
| | Jabil Circuit Inc. | 332,900 | 8,362 |
| * | Cardtronics Inc. | 283,896 | 7,452 |
| | OPNET | 236,574 | 6,861 |
| | Fair Isaac Corp. | 155,500 | 6,827 |
| | DST Systems Inc. | 103,230 | 5,598 |
| * | Lattice | | |
| | Semiconductor Corp. | 855,850 | 5,503 |
| * | Fairchild Semiconductor | | |
| | International Inc. Class A | 357,290 | 5,252 |
| * | Silicon Graphics | | |
| | International Corp. | 500,588 | 4,846 |
| | Plantronics Inc. | 110,900 | 4,465 |
| * | Insight Enterprises Inc. | 198,800 | 4,360 |
| * | SYNNEX Corp. | 113,274 | 4,320 |
| | Diebold Inc. | 105,800 | 4,075 |
| * | Aspen Technology Inc. | 195,500 | 4,014 |
| * | Manhattan Associates Inc. | 79,200 | 3,764 |
| * | Ultratech Inc. | 115,400 | 3,344 |
| * | Teradyne Inc. | 186,917 | 3,157 |
| * | Netgear Inc. | 81,106 | 3,098 |
| | MAXIMUS Inc. | 74,940 | 3,048 |
| * | Novellus Systems Inc. | 51,400 | 2,565 |
| * | JDA Software Group Inc. | 87,900 | 2,416 |
| * | Mentor Graphics Corp. | 150,000 | 2,229 |
| * | Stamps.com Inc. | 76,900 | 2,144 |
| * | Plexus Corp. | 58,900 | 2,061 |
| * | Electronics for Imaging Inc. | 122,300 | 2,033 |
| * | Unisys Corp. | 92,400 | 1,822 |
| * | Integrated Device | | |
| | Technology Inc. | 249,800 | 1,786 |
| * | BMC Software Inc. | 43,800 | 1,759 |
| * | CommVault Systems Inc. | 33,900 | 1,683 |
| * | Formfactor Inc. | 267,200 | 1,491 |
| * | Monolithic Power | | |
| | Systems Inc. | 75,600 | 1,487 |
| | NIC Inc. | 115,750 | 1,404 |
| | Heartland Payment | | |
| | Systems Inc. | 47,600 | 1,373 |
| | MercadoLibre Inc. | 14,000 | 1,369 |
| * | Liquidity Services Inc. | 26,500 | 1,187 |
| | MKS Instruments Inc. | 34,400 | 1,016 |
| | Blackbaud Inc. | 30,300 | 1,007 |
| * | Flextronics | | |
| | International Ltd. | 134,670 | 974 |
| * | Quantum Corp. | 340,600 | 892 |
| * | Brightpoint Inc. | 105,000 | 845 |
| * | Anadigics Inc. | 334,200 | 792 |
| * | Ceva Inc. | 34,800 | 790 |
| | | | 546,368 |
| | | |
| | | | Market |
| | | | Value |
| | | Shares | ($000) |
| Materials (6.3%) | | |
| | CF Industries Holdings Inc. | 198,500 | 36,256 |
| | Eastman Chemical Co. | 622,736 | 32,189 |
| | Domtar Corp. | 310,125 | 29,580 |
| * | Rockwood Holdings Inc. | 534,010 | 27,849 |
| * | Coeur d’Alene Mines Corp. | 697,300 | 16,554 |
| | Buckeye Technologies Inc. | 279,608 | 9,498 |
| * | WR Grace & Co. | 144,800 | 8,370 |
| | Westlake Chemical Corp. | 127,386 | 8,253 |
| | Innophos Holdings Inc. | 162,985 | 8,169 |
| * | Graphic Packaging | | |
| | Holding Co. | 999,019 | 5,515 |
| * | Georgia Gulf Corp. | 134,900 | 4,705 |
| | Sherwin-Williams Co. | 35,900 | 3,901 |
| | Noranda Aluminum | | |
| | Holding Corp. | 366,600 | 3,655 |
| * | KapStone Paper and | | |
| | Packaging Corp. | 161,600 | 3,184 |
| | Neenah Paper Inc. | 93,600 | 2,784 |
| | Haynes International Inc. | 43,100 | 2,730 |
| * | Innospec Inc. | 87,200 | 2,649 |
| * | TPC Group Inc. | 48,540 | 2,146 |
| * | LSB Industries Inc. | 52,400 | 2,039 |
| | Schweitzer-Mauduit | | |
| | International Inc. | 27,589 | 1,905 |
| | NewMarket Corp. | 5,222 | 979 |
| | Albemarle Corp. | 14,600 | 933 |
| | | | 213,843 |
| Telecommunication Services (0.7%) | |
| * | MetroPCS | | |
| | Communications Inc. | 2,050,587 | 18,496 |
| * | Vonage Holdings Corp. | 2,490,680 | 5,504 |
| | Consolidated | | |
| | Communications | | |
| | Holdings Inc. | 61,874 | 1,215 |
| | | | 25,215 |
| Utilities (4.4%) | | |
| | CMS Energy Corp. | 1,346,062 | 29,613 |
| | CenterPoint Energy Inc. | 820,300 | 16,176 |
| | Portland General | | |
| | Electric Co. | 554,800 | 13,859 |
| | Northeast Utilities | 367,720 | 13,650 |
| | DTE Energy Co. | 223,350 | 12,291 |
| | Southwest Gas Corp. | 271,640 | 11,610 |
| | PNM Resources Inc. | 567,935 | 10,393 |
| | El Paso Electric Co. | 296,600 | 9,637 |
| | TECO Energy Inc. | 485,500 | 8,520 |
| | ONEOK Inc. | 92,345 | 7,541 |
| | NSTAR | 81,255 | 3,951 |
| | NorthWestern Corp. | 88,397 | 3,135 |
| | WGL Holdings Inc. | 44,671 | 1,818 |
| | Vectren Corp. | 39,700 | 1,154 |
| | Pinnacle West Capital Corp. | 23,700 | 1,135 |
14
Strategic Equity Fund
| | | |
| | | | Market |
| | | | Value |
| | | Shares | ($000) |
| | MGE Energy Inc. | 25,000 | 1,110 |
| | Laclede Group Inc. | 27,600 | 1,077 |
| | Ameren Corp. | 28,700 | 935 |
| | | | 147,605 |
| Total Common Stocks | | |
| (Cost $2,704,480) | | 3,360,858 |
| Temporary Cash Investments (1.0%)1 | |
| Money Market Fund (0.9%) | | |
| 2,3 | Vanguard Market | | |
| | Liquidity Fund, | | |
| | 0.123% | 32,869,993 | 32,870 |
| |
| | | Face | |
| | | Amount | |
| | | ($000) | |
| U.S. Government and Agency Obligations (0.1%) |
| 4,5 | Fannie Mae | | |
| | Discount Notes, | | |
| | 0.040%, 4/24/12 | 1,000 | 1,000 |
| 4,5 | Freddie Mac | | |
| | Discount Notes, | | |
| | 0.050%, 4/4/12 | 1,000 | 1,000 |
| 4,5 | Freddie Mac | | |
| | Discount Notes, | | |
| | 0.050%, 4/24/12 | 600 | 600 |
| | | | 2,600 |
| Total Temporary Cash Investments | |
| (Cost $35,470) | | 35,470 |
| Total Investments (100.4%) | | |
| (Cost $2,739,950) | | 3,396,328 |
| |
| | Market |
| | Value |
| | ($000) |
| Other Assets and Liabilities (-0.4%) | |
| Other Assets | 8,326 |
| Liabilities3 | (22,774) |
| | (14,448) |
| Net Assets (100%) | |
| Applicable to 161,481,005 outstanding | |
| $.001 par value shares of beneficial | |
| interest (unlimited authorization) | 3,381,880 |
| Net Asset Value Per Share | $20.94 |
| |
| |
| At March 31, 2012, net assets consisted of: |
| | Amount |
| | ($000) |
| Paid-in Capital | 3,879,369 |
| Overdistributed Net Investment Income | (982) |
| Accumulated Net Realized Losses | (1,153,059) |
| Unrealized Appreciation (Depreciation) | |
| Investment Securities | 656,378 |
| Futures Contracts | 174 |
| Net Assets | 3,381,880 |
See Note A in Notes to Financial Statements.
* Non-income-producing security.
^ Part of security position is on loan to broker-dealers. The total value of securities on loan is $3,473,000.
1 The fund invests a portion of its cash reserves in equity markets through the use of index futures contracts. After giving effect to futures investments, the fund’s effective common stock and temporary cash investment positions represent 100% and 0.4%, respectively, of net assets.
2 Affiliated money market fund available only to Vanguard funds and certain trusts and accounts managed by Vanguard. Rate shown is the
7-day yield.
3 Includes $3,636,000 of collateral received for securities on loan.
4 The issuer was placed under federal conservatorship in September 2008; since that time, its daily operations have been managed by the Federal Housing Finance Agency and it receives capital from the U.S. Treasury in exchange for senior preferred stock.
5 Securities with a value of $2,600,000 have been segregated as initial margin for open futures contracts.
See accompanying Notes, which are an integral part of the Financial Statements.
15
Strategic Equity Fund
Statement of Operations
| |
| | Six Months Ended |
| | March 31, 2012 |
| | ($000) |
| Investment Income | |
| Income | |
| Dividends | 23,000 |
| Interest1 | 15 |
| Security Lending | 336 |
| Total Income | 23,351 |
| Expenses | |
| The Vanguard Group—Note B | |
| Investment Advisory Services | 341 |
| Management and Administrative | 4,056 |
| Marketing and Distribution | 304 |
| Custodian Fees | 28 |
| Shareholders’ Reports | 6 |
| Trustees’ Fees and Expenses | 2 |
| Total Expenses | 4,737 |
| Net Investment Income | 18,614 |
| Realized Net Gain (Loss) | |
| Investment Securities Sold | 123,503 |
| Futures Contracts | 3,296 |
| Realized Net Gain (Loss) | 126,799 |
| Change in Unrealized Appreciation (Depreciation) | |
| Investment Securities | 654,963 |
| Futures Contracts | 1,646 |
| Change in Unrealized Appreciation (Depreciation) | 656,609 |
| Net Increase (Decrease) in Net Assets Resulting from Operations | 802,022 |
| 1 Interest income from an affiliated company of the fund was $15,000. | |
See accompanying Notes, which are an integral part of the Financial Statements.
16
Strategic Equity Fund
Statement of Changes in Net Assets
| | |
| | Six Months Ended | Year Ended |
| | March 31, | September 30, |
| | 2012 | 2011 |
| | ($000) | ($000) |
| Increase (Decrease) in Net Assets | | |
| Operations | | |
| Net Investment Income | 18,614 | 36,888 |
| Realized Net Gain (Loss) | 126,799 | 521,680 |
| Change in Unrealized Appreciation (Depreciation) | 656,609 | (474,353) |
| Net Increase (Decrease) in Net Assets Resulting from Operations | 802,022 | 84,215 |
| Distributions | | |
| Net Investment Income | (32,559) | (41,795) |
| Realized Capital Gain | — | — |
| Total Distributions | (32,559) | (41,795) |
| Capital Share Transactions | | |
| Issued | 150,599 | 421,286 |
| Issued in Lieu of Cash Distributions | 30,266 | 39,080 |
| Redeemed | (324,906) | (849,470) |
| Net Increase (Decrease) from Capital Share Transactions | (144,041) | (389,104) |
| Total Increase (Decrease) | 625,422 | (346,684) |
| Net Assets | | |
| Beginning of Period | 2,756,458 | 3,103,142 |
| End of Period1 | 3,381,880 | 2,756,458 |
| 1 Net Assets—End of Period includes undistributed (overdistributed) net investment income of ($982,000) and $12,963,000. |
See accompanying Notes, which are an integral part of the Financial Statements.
17
Strategic Equity Fund
Financial Highlights
| | | | | | | |
| | Six Months | | | | | |
| | | Ended | | | | | |
| For a Share Outstanding | March 31, | | | Year Ended September 30, |
| Throughout Each Period | | 2012 | 2011 | 2010 | 2009 | 2008 | 2007 |
| Net Asset Value, Beginning of Period | $16.30 | $16.30 | $14.52 | $16.42 | $24.94 | $23.07 |
| Investment Operations | | | | | | | |
| Net Investment Income | | .113 | .210 | .221 | .184 | .240 | .270 |
| Net Realized and Unrealized Gain (Loss) | | | | | | |
| on Investments | | 4.723 | .017 | 1.759 | (1.843) | (6.090) | 2.840 |
| Total from Investment Operations | | 4.836 | .227 | 1.980 | (1.659) | (5.850) | 3.110 |
| Distributions | | | | | | | |
| Dividends from Net Investment Income | (.196) | (.227) | (.200) | (.241) | (.240) | (.260) |
| Distributions from Realized Capital Gains | — | — | — | — | (2.430) | (.980) |
| Total Distributions | | (.196) | (.227) | (.200) | (.241) | (2.670) | (1.240) |
| Net Asset Value, End of Period | | $20.94 | $16.30 | $16.30 | $14.52 | $16.42 | $24.94 |
| |
| Total Return1 | | 29.82% | 1.23% | 13.71% | -9.66% | -25.37% | 13.76% |
| |
| Ratios/Supplemental Data | | | | | | | |
| Net Assets, End of Period (Millions) | $3,382 | $2,756 | $3,103 | $3,549 | $4,822 | $7,699 |
| Ratio of Total Expenses to | | | | | | | |
| Average Net Assets | | 0.30% | 0.30% | 0.30% | 0.30% | 0.25% | 0.30% |
| Ratio of Net Investment Income to | | | | | | |
| Average Net Assets | | 1.17% | 1.09% | 1.37% | 1.47% | 1.09% | 1.03% |
| Portfolio Turnover Rate | | 64% | 73% | 60% | 60% | 79% | 75% |
The expense ratio, net income ratio, and turnover rate for the current period have been annualized.
1 Total returns do not include account service fees that may have applied in the periods shown. Fund prospectuses provide information about any applicable account service fees.
See accompanying Notes, which are an integral part of the Financial Statements.
18
Strategic Equity Fund
Notes to Financial Statements
Vanguard Strategic Equity Fund is registered under the Investment Company Act of 1940 as an open-end investment company, or mutual fund.
A. The following significant accounting policies conform to generally accepted accounting principles for U.S. mutual funds. The fund consistently follows such policies in preparing its financial statements.
1. Security Valuation: Securities are valued as of the close of trading on the New York Stock Exchange (generally 4 p.m., Eastern time) on the valuation date. Equity securities are valued at the latest quoted sales prices or official closing prices taken from the primary market in which each security trades; such securities not traded on the valuation date are valued at the mean of the latest quoted bid and asked prices. Securities for which market quotations are not readily available, or whose values have been materially affected by events occurring before the fund’s pricing time but after the close of the securities’ primary markets, are valued by methods deemed by the board of trustees to represent fair value. Investments in Vanguard Market Liquidity Fund are valued at that fund’s net asset value. Temporary cash investments acquired over 60 days to maturity are valued using the latest bid prices or using valuations based on a matrix system (which considers such factors as security prices, yields, maturities, and ratings), both as furnished by independent pricing services. Other temporary cash investments are valued at amortized cost, which approximates market value.
2. Futures Contracts: The fund uses index futures contracts to a limited extent, with the objective of maintaining full exposure to the stock market while maintaining liquidity. The fund may purchase or sell futures contracts to achieve a desired level of investment, whether to accommodate portfolio turnover or cash flows from capital share transactions. The primary risks associated with the use of futures contracts are imperfect correlation between changes in market values of stocks held by the fund and the prices of futures contracts, and the possibility of an illiquid market.
Futures contracts are valued at their quoted daily settlement prices. The aggregate principal amounts of the contracts are not recorded in the Statement of Net Assets. Fluctuations in the value of the contracts are recorded in the Statement of Net Assets as an asset (liability) and in the Statement of Operations as unrealized appreciation (depreciation) until the contracts are closed, when they are recorded as realized futures gains (losses).
3. Federal Income Taxes: The fund intends to continue to qualify as a regulated investment company and distribute all of its taxable income. Management has analyzed the fund’s tax positions taken for all open federal income tax years (September 30, 2008–2011), and for the period ended March 31, 2012, and has concluded that no provision for federal income tax is required in the fund’s financial statements.
4. Distributions: Distributions to shareholders are recorded on the ex-dividend date.
5. Security Lending: The fund may lend its securities to qualified institutional borrowers to earn additional income. Security loans are required to be secured at all times by collateral at least equal to the market value of securities loaned. The fund invests cash collateral received in Vanguard Market Liquidity Fund, and records a liability for the return of the collateral, during the period the securities are on loan. Security lending income represents fees charged to borrowers plus income earned on investing cash collateral, less expenses associated with the loan.
6. Other: Dividend income is recorded on the ex-dividend date. Interest income includes income distributions received from Vanguard Market Liquidity Fund and is accrued daily. Security transactions are accounted for on the date securities are bought or sold. Costs used to determine realized gains (losses) on the sale of investment securities are those of the specific securities sold.
19
Strategic Equity Fund
B. The Vanguard Group furnishes at cost investment advisory, corporate management, administrative, marketing, and distribution services. The costs of such services are allocated to the fund under methods approved by the board of trustees. The fund has committed to provide up to 0.40% of its net assets in capital contributions to Vanguard. At March 31, 2012, the fund had contributed capital of $497,000 to Vanguard (included in Other Assets), representing 0.01% of the fund’s net assets and 0.20% of Vanguard’s capitalization. The fund’s trustees and officers are also directors and officers of Vanguard.
C. Various inputs may be used to determine the value of the fund’s investments. These inputs are summarized in three broad levels for financial statement purposes. The inputs or methodologies used to value securities are not necessarily an indication of the risk associated with investing in those securities.
Level 1—Quoted prices in active markets for identical securities.
Level 2—Other significant observable inputs (including quoted prices for similar securities, interest rates, prepayment speeds, credit risk, etc.).
Level 3—Significant unobservable inputs (including the fund’s own assumptions used to determine the fair value of investments).
The following table summarizes the market value of the fund’s investments as of March 31, 2012, based on the inputs used to value them:
| | | |
| | Level 1 | Level 2 | Level 3 |
| Investments | ($000) | ($000) | ($000) |
| Common Stocks | 3,360,858 | — | — |
| Temporary Cash Investments | 32,870 | 2,600 | — |
| Futures Contracts—Liabilities1 | (64) | — | — |
| Total | 3,393,664 | 2,600 | — |
| 1 Represents variation margin on the last day of the reporting period. | | | |
D. At March 31, 2012, the aggregate settlement value of open futures contracts and the related unrealized appreciation (depreciation) were:
| | | | |
| | | | | ($000) |
| | | | Aggregate | |
| | | Number of | Settlement | Unrealized |
| | | Long (Short) | Value | Appreciation |
| Futures Contracts | Expiration | Contracts | Long (Short) | (Depreciation) |
| E-mini Russell 2000 Index | June 2012 | 196 | 16,223 | 149 |
| E-mini S&P MidCap 400 Index | June 2012 | 69 | 6,847 | 25 |
Unrealized appreciation (depreciation) on open futures contracts is required to be treated as realized gain (loss) for tax purposes.
20
Strategic Equity Fund
E. Distributions are determined on a tax basis and may differ from net investment income and realized capital gains for financial reporting purposes. Differences may be permanent or temporary. Permanent differences are reclassified among capital accounts in the financial statements to reflect their tax character. Temporary differences arise when certain items of income, expense, gain, or loss are recognized in different periods for financial statement and tax purposes; these differences will reverse at some time in the future. Differences in classification may also result from the treatment of short-term gains as ordinary income for tax purposes.
The fund’s tax-basis capital gains and losses are determined only at the end of each fiscal year. For tax purposes, at September 30, 2011, the fund had available capital loss carryforwards totaling $1,281,317,000 to offset future net capital gains of $236,621,000 through September 30, 2017, and $1,044,696,000 through September 30, 2018. The fund will use these capital losses to offset net taxable capital gains, if any, realized during the year ending September 30, 2012; should the fund realize net capital losses for the year, the losses will be added to the loss carryforward balance above.
At March 31, 2012, the cost of investment securities for tax purposes was $2,739,950,000. Net unrealized appreciation of investment securities for tax purposes was $656,378,000, consisting of unrealized gains of $729,787,000 on securities that had risen in value since their purchase and $73,409,000 in unrealized losses on securities that had fallen in value since their purchase.
F. During the six months ended March 31, 2012, the fund purchased $1,005,409,000 of investment securities and sold $1,152,557,000 of investment securities, other than temporary cash investments.
G. Capital shares issued and redeemed were:
| | |
| | Six Months Ended | Year Ended |
| | March 31, 2012 | September 30, 2011 |
| | Shares | Shares |
| | (000) | (000) |
| Issued | 7,829 | 21,858 |
| Issued in Lieu of Cash Distributions | 1,630 | 2,125 |
| Redeemed | (17,118) | (45,260) |
| Net Increase (Decrease) in Shares Outstanding | (7,659) | (21,277) |
H. In preparing the financial statements as of March 31, 2012, management considered the impact of subsequent events for potential recognition or disclosure in these financial statements.
21
About Your Fund’s Expenses
As a shareholder of the fund, you incur ongoing costs, which include costs for portfolio management, administrative services, and shareholder reports (like this one), among others. Operating expenses, which are deducted from a fund’s gross income, directly reduce the investment return of the fund.
A fund’s expenses are expressed as a percentage of its average net assets. This figure is known as the expense ratio. The following examples are intended to help you understand the ongoing costs (in dollars) of investing in your fund and to compare these costs with those of other mutual funds. The examples are based on an investment of $1,000 made at the beginning of the period shown and held for the entire period.
The accompanying table illustrates your fund’s costs in two ways:
• Based on actual fund return. This section helps you to estimate the actual expenses that you paid over the period. The ”Ending Account Value“ shown is derived from the fund‘s actual return, and the third column shows the dollar amount that would have been paid by an investor who started with $1,000 in the fund. You may use the information here, together with the amount you invested, to estimate the expenses that you paid over the period.
To do so, simply divide your account value by $1,000 (for example, an $8,600 account value divided by $1,000 = 8.6), then multiply the result by the number given for your fund under the heading ”Expenses Paid During Period.“
• Based on hypothetical 5% yearly return. This section is intended to help you compare your fund‘s costs with those of other mutual funds. It assumes that the fund had a yearly return of 5% before expenses, but that the expense ratio is unchanged. In this case—because the return used is not the fund’s actual return—the results do not apply to your investment. The example is useful in making comparisons because the Securities and Exchange Commission requires all mutual funds to calculate expenses based on a 5% return. You can assess your fund’s costs by comparing this hypothetical example with the hypothetical examples that appear in shareholder reports of other funds.
Note that the expenses shown in the table are meant to highlight and help you compare ongoing costs only and do not reflect transaction costs incurred by the fund for buying and selling securities. Further, the expenses do not include any purchase, redemption, or account service fees described in the fund prospectus. If such fees were applied to your account, your costs would be higher. Your fund does not carry a “sales load.”
The calculations assume no shares were bought or sold during the period. Your actual costs may have been higher or lower, depending on the amount of your investment and the timing of any purchases or redemptions.
You can find more information about the fund’s expenses, including annual expense ratios, in the Financial Statements section of this report. For additional information on operating expenses and other shareholder costs, please refer to your fund’s current prospectus.
22
| | | |
| Six Months Ended March 31, 2012 | | | |
| | Beginning | Ending | Expenses |
| | Account Value | Account Value | Paid During |
| Strategic Equity Fund | 9/30/2011 | 3/31/2012 | Period |
| Based on Actual Fund Return | $1,000.00 | $1,298.22 | $1.72 |
| Based on Hypothetical 5% Yearly Return | 1,000.00 | 1,023.50 | 1.52 |
The calculations are based on expenses incurred in the most recent six-month period. The fund’s annualized six-month expense ratio for that period is 0.30%. The dollar amounts shown as “Expenses Paid” are equal to the annualized expense ratio multiplied by the average account value over the period, multiplied by the number of days in the most recent six-month period, then divided by the number of days in the most recent 12-month period.
Trustees Approve Advisory Arrangement
The board of trustees of Vanguard Strategic Equity Fund has renewed the fund’s investment advisory arrangement with The Vanguard Group, Inc. Vanguard—through its Equity Investment Group—serves as the investment advisor to the fund. The board determined that continuing the fund’s internalized management structure was in the best interests of the fund and its shareholders.
The board based its decision upon an evaluation of the advisor’s investment staff, portfolio management process, and performance. The trustees considered the factors discussed below, among others. However, no single factor determined whether the board approved the arrangement. Rather, it was the totality of the circumstances that drove the board’s decision.
Nature, extent, and quality of services
The board considered the quality of the fund’s investment management over both the short and long term, and took into account the organizational depth and stability of the advisor. The board noted that Vanguard has been managing investments for more than three decades. The Equity Investment Group adheres to a sound, disciplined investment management process; the team has considerable experience, stability, and depth.
The board concluded that Vanguard’s experience, stability, depth, and performance, among other factors, warranted continuation of the advisory arrangement.
Investment performance
The board considered the short- and long-term performance of the fund, including any periods of outperformance or underperformance of a relevant benchmark and peer group. The board concluded that the advisor has carried out the fund’s investment strategy in disciplined fashion and that the fund has outperformed its benchmark over the most recent one-year period but underperformed it over the long term. The board noted that the fund has outperformed its peer group over both the short and long term. Information about the fund’s most recent performance can be found in the Performance Summary section of this report.
Cost
The board concluded that the fund’s expense ratio was well below the average expense ratio charged by funds in its peer group and that the fund’s advisory fee rate was also well below its peer-group average. Information about the fund’s expenses appears in the About Your Fund’s Expenses section of this report as well as in the Financial Statements section.
The board does not conduct a profitability analysis of Vanguard, because of Vanguard’s unique “at-cost” structure. Unlike most other mutual fund management companies, Vanguard is owned by the funds it oversees, and produces “profits” only in the form of reduced expenses for fund shareholders.
The benefit of economies of scale
The board concluded that the fund’s low-cost arrangement with Vanguard ensures that the fund will
realize economies of scale as it grows, with the cost to shareholders declining as fund assets increase.
The board will consider whether to renew the advisory arrangement again after a one-year period.
24
Glossary
30-Day SEC Yield. A fund’s 30-day SEC yield is derived using a formula specified by the U.S. Securities and Exchange Commission. Under the formula, data related to the fund’s security holdings in the previous 30 days are used to calculate the fund’s hypothetical net income for that period, which is then annualized and divided by the fund’s estimated average net assets over the calculation period. For the purposes of this calculation, a security’s income is based on its current market yield to maturity (for bonds), its actual income (for asset-backed securities), or its projected dividend yield (for stocks). Because the SEC yield represents hypothetical annualized income, it will differ—at times significantly—from the fund’s actual experience. As a result, the fund’s income distributions may be higher or lower than implied by the SEC yield.
Beta. A measure of the magnitude of a fund’s past share-price fluctuations in relation to the ups and downs of a given market index. The index is assigned a beta of 1.00. Compared with a given index, a fund with a beta of 1.20 typically would have seen its share price rise or fall by 12% when the index rose or fell by 10%. For this report, beta is based on returns over the past 36 months for both the fund and the index. Note that a fund’s beta should be reviewed in conjunction with its R-squared (see definition). The lower the R-squared, the less correlation there is between the fund and the index, and the less reliable beta is as an indicator of volatility.
Dividend Yield. Dividend income earned by stocks, expressed as a percentage of the aggregate market value (or of net asset value, for a fund). The yield is determined by dividing the amount of the annual dividends by the aggregate value (or net asset value) at the end of the period. For a fund, the dividend yield is based solely on stock holdings and does not include any income produced by other investments.
Earnings Growth Rate. The average annual rate of growth in earnings over the past five years for the stocks now in a fund.
Equity Exposure. A measure that reflects a fund’s investments in stocks and stock futures. Any holdings in short-term reserves are excluded.
Expense Ratio. A fund’s total annual operating expenses expressed as a percentage of the fund’s average net assets. The expense ratio includes management and administrative expenses, but does not include the transaction costs of buying and selling portfolio securities.
Foreign Holdings. The percentage of a fund represented by securities or depositary receipts of companies based outside the United States.
Inception Date. The date on which the assets of a fund (or one of its share classes) are first invested in accordance with the fund’s investment objective. For funds with a subscription period, the inception date is the day after that period ends. Investment performance is measured from the inception date.
Median Market Cap. An indicator of the size of companies in which a fund invests; the midpoint of market capitalization (market price x shares outstanding) of a fund’s stocks, weighted by the proportion of the fund’s assets invested in each stock. Stocks representing half of the fund’s assets have market capitalizations above the median, and the rest are below it.
Price/Book Ratio. The share price of a stock divided by its net worth, or book value, per share. For a fund, the weighted average price/book ratio of the stocks it holds.
25
Price/Earnings Ratio. The ratio of a stock’s current price to its per-share earnings over the past year. For a fund, the weighted average P/E of the stocks it holds. P/E is an indicator of market expectations about corporate prospects; the higher the P/E, the greater the expectations for a company’s future growth.
R-Squared. A measure of how much of a fund’s past returns can be explained by the returns from the market in general, as measured by a given index. If a fund’s total returns were precisely synchronized with an index’s returns, its R-squared would be 1.00. If the fund’s returns bore no relationship to the index’s returns, its R-squared would be 0. For this report, R-squared is based on returns over the past 36 months for both the fund and the index.
Return on Equity. The annual average rate of return generated by a company during the past five years for each dollar of shareholder’s equity (net income divided by shareholder’s equity). For a fund, the weighted average return on equity for the companies whose stocks it holds.
Short-Term Reserves. The percentage of a fund invested in highly liquid, short-term securities that can be readily converted to cash.
Turnover Rate. An indication of the fund’s trading activity. Funds with high turnover rates incur higher transaction costs and may be more likely to distribute capital gains (which may be taxable to investors). The turnover rate excludes in-kind transactions, which have minimal impact on costs.
26
This page intentionally left blank.
The People Who Govern Your Fund
The trustees of your mutual fund are there to see that the fund is operated and managed in your best interests since, as a shareholder, you are a part owner of the fund. Your fund’s trustees also serve on the board of directors of The Vanguard Group, Inc., which is owned by the Vanguard funds and provides services to them on an at-cost basis.
A majority of Vanguard’s board members are independent, meaning that they have no affiliation with Vanguard or the funds they oversee, apart from the sizable personal investments they have made as private individuals. The independent board members have distinguished backgrounds in business, academia, and public service. Each of the trustees and executive officers oversees 179 Vanguard funds.
The following table provides information for each trustee and executive officer of the fund. More information about the trustees is in the Statement of Additional Information, which can be obtained, without charge, by contacting Vanguard at 800-662-7447, or online at vanguard.com.
| |
| InterestedTrustee1 | and Delphi Automotive LLP (automotive components); |
| Senior Advisor at New Mountain Capital; Trustee of |
| F. William McNabb III | The Conference Board. |
| Born 1957. Trustee Since July 2009. Chairman of the | |
| Board. Principal Occupation(s) During the Past Five | Amy Gutmann |
| Years: Chairman of the Board of The Vanguard Group, | Born 1949. Trustee Since June 2006. Principal |
| Inc., and of each of the investment companies served | Occupation(s) During the Past Five Years: President |
| by The Vanguard Group, since January 2010; Director | of the University of Pennsylvania; Christopher H. |
| of The Vanguard Group since 2008; Chief Executive | Browne Distinguished Professor of Political Science |
| Officer and President of The Vanguard Group and of | in the School of Arts and Sciences with secondary |
| each of the investment companies served by The | appointments at the Annenberg School for Commu- |
| Vanguard Group since 2008; Director of Vanguard | nication and the Graduate School of Education |
| Marketing Corporation; Managing Director of The | of the University of Pennsylvania; Director of |
| Vanguard Group (1995–2008). | Carnegie Corporation of New York, Schuylkill River |
| Development Corporation, and Greater Philadelphia |
| Chamber of Commerce; Trustee of the National |
| IndependentTrustees | Constitution Center; Chair of the Presidential |
| Commission for the Study of Bioethical Issues. |
| |
| Emerson U. Fullwood | JoAnn Heffernan Heisen |
| Born 1948. Trustee Since January 2008. Principal | Born 1950. Trustee Since July 1998. Principal |
| Occupation(s) During the Past Five Years: Executive | Occupation(s) During the Past Five Years: Corporate |
| Chief Staff and Marketing Officer for North America | Vice President and Chief Global Diversity Officer |
| and Corporate Vice President (retired 2008) of Xerox | (retired 2008) and Member of the Executive |
| Corporation (document management products and | Committee (1997–2008) of Johnson & Johnson |
| services); Executive in Residence and 2010 | (pharmaceuticals/medical devices/consumer |
| Distinguished Minett Professor at the Rochester | products); Director of Skytop Lodge Corporation |
| Institute of Technology; Director of SPX Corporation | (hotels), the University Medical Center at Princeton, |
| (multi-industry manufacturing), the United Way of | the Robert Wood Johnson Foundation, and the Center |
| Rochester, Amerigroup Corporation (managed health | for Talent Innovation; Member of the Advisory Board |
| care), the University of Rochester Medical Center, | of the Maxwell School of Citizenship and Public Affairs |
| Monroe Community College Foundation, and North | at Syracuse University. |
| Carolina A&T University. | |
| F. Joseph Loughrey |
| Rajiv L. Gupta | Born 1949. Trustee Since October 2009. Principal |
| Born 1945. Trustee Since December 2001.2 | Occupation(s) During the Past Five Years: President |
| Principal Occupation(s) During the Past Five Years: | and Chief Operating Officer (retired 2009) of Cummins |
| Chairman and Chief Executive Officer (retired 2009) | Inc. (industrial machinery); Director of SKF AB |
| and President (2006–2008) of Rohm Haas Co. | (industrial machinery), Hillenbrand, Inc. (specialized |
| (chemicals); Director of Tyco International, Ltd. | consumer services), the Lumina Foundation for |
| (diversified manufacturing and services), Hewlett- | |
| Packard Co. (electronic computer manufacturing), | |
| |
| | |
| Education, and Oxfam America; Chairman of the | Executive Officers | |
| Advisory Council for the College of Arts and Letters | | |
| and Member of the Advisory Board to the Kellogg | Glenn Booraem | |
| Institute for International Studies at the University | Born 1967. Controller Since July 2010. Principal |
| of Notre Dame. | Occupation(s) During the Past Five Years: Principal |
| | of The Vanguard Group, Inc.; Controller of each of |
| Mark Loughridge | the investment companies served by The Vanguard |
| Born 1953. Trustee Since March 2012. Principal | Group; Assistant Controller of each of the investment |
| Occupation(s) During the Past Five Years: Senior Vice | companies served by The Vanguard Group (2001–2010). |
| President and Chief Financial Officer at IBM (information | | |
| technology services); Fiduciary Member of IBM’s | Thomas J. Higgins | |
| Retirement Plan Committee. | Born 1957. Chief Financial Officer Since September |
| | 2008. Principal Occupation(s) During the Past Five |
| Scott C. Malpass | Years: Principal of The Vanguard Group, Inc.; Chief |
| Born 1962. Trustee Since March 2012. Principal | Financial Officer of each of the investment companies |
| Occupation(s) During the Past Five Years: Chief | served by The Vanguard Group; Treasurer of each of |
| Investment Officer and Vice President at the University | the investment companies served by The Vanguard |
| of Notre Dame; Assistant Professor of Finance at the | Group (1998–2008). | |
| Mendoza College of Business at Notre Dame; Member | | |
| of the Notre Dame 403(b) Investment Committee; | Kathryn J. Hyatt | |
| Director of TIFF Advisory Services, Inc. (investment | Born 1955. Treasurer Since November 2008. Principal |
| advisor); Member of the Investment Advisory | Occupation(s) During the Past Five Years: Principal of |
| Committees of the Financial Industry Regulatory | The Vanguard Group, Inc.; Treasurer of each of the |
| Authority (FINRA) and of Major League Baseball. | investment companies served by The Vanguard |
| | Group; Assistant Treasurer of each of the investment |
| André F. Perold | companies served by The Vanguard Group (1988–2008). |
| Born 1952. Trustee Since December 2004. Principal | | |
| Occupation(s) During the Past Five Years: George | Heidi Stam | |
| Gund Professor of Finance and Banking at the Harvard | Born 1956. Secretary Since July 2005. Principal |
| Business School (retired 2011); Chief Investment | Occupation(s) During the Past Five Years: Managing |
| Officer and Managing Partner of HighVista Strategies | Director of The Vanguard Group, Inc.; General Counsel |
| LLC (private investment firm); Director of Rand | of The Vanguard Group; Secretary of The Vanguard |
| Merchant Bank; Overseer of the Museum of Fine | Group and of each of the investment companies |
| Arts Boston. | served by The Vanguard Group; Director and Senior |
| | Vice President of Vanguard Marketing Corporation; |
| Alfred M. Rankin, Jr. | Principal of The Vanguard Group (1997–2006). |
| Born 1941. Trustee Since January 1993. Principal | | |
| Occupation(s) During the Past Five Years: Chairman, | | |
| President, and Chief Executive Officer of NACCO | Vanguard Senior ManagementTeam |
| Industries, Inc. (forklift trucks/housewares/lignite); | | |
| Director of Goodrich Corporation (industrial products/ | Mortimer J. Buckley | Michael S. Miller |
| aircraft systems and services) and the National | Kathleen C. Gubanich | James M. Norris |
| Association of Manufacturers; Chairman of the Board | Paul A. Heller | Glenn W. Reed |
| of the Federal Reserve Bank of Cleveland and of | Martha G. King | George U. Sauter |
| University Hospitals of Cleveland; Advisory Chairman | Chris D. McIsaac | |
| of the Board of The Cleveland Museum of Art. | | |
| | |
| Peter F. Volanakis | Chairman Emeritus and Senior Advisor |
| Born 1955. Trustee Since July 2009. Principal | | |
| Occupation(s) During the Past Five Years: President | John J. Brennan | |
| and Chief Operating Officer (retired 2010) of Corning | Chairman, 1996–2009 | |
| Incorporated (communications equipment); Director | Chief Executive Officer and President, 1996–2008 | |
| of SPX Corporation (multi-industry manufacturing); | | |
| Overseer of the Amos Tuck School of Business | |
| Administration at Dartmouth College; Advisor to the | Founder | |
| Norris Cotton Cancer Center. | | |
| John C. Bogle | |
| Chairman and Chief Executive Officer, 1974–1996 | |
| | | |
1 Mr. McNabb is considered an “interested person,” as defined in the Investment Company Act of 1940, because he is an officer of the Vanguard funds.
2 December 2002 for Vanguard Equity Income Fund, Vanguard Growth Equity Fund, the Vanguard Municipal Bond Funds, and the Vanguard State Tax-Exempt Funds.
|  |
| P.O. Box 2600 |
| Valley Forge, PA 19482-2600 |
Connect with Vanguard® > vanguard.com
| |
| Fund Information > 800-662-7447 | CFA® is a trademark owned by CFA Institute. |
| Direct Investor Account Services > 800-662-2739 | |
| Institutional Investor Services > 800-523-1036 | |
| Text Telephone for People | |
| With Hearing Impairment > 800-749-7273 | |
| |
| This material may be used in conjunction | |
| with the offering of shares of any Vanguard | |
| fund only if preceded or accompanied by | |
| the fund’s current prospectus. | |
| |
| All comparative mutual fund data are from Lipper Inc. or | |
| Morningstar, Inc., unless otherwise noted. | |
| |
| You can obtain a free copy of Vanguard’s proxy voting | |
| guidelines by visiting vanguard.com/proxyreporting or by | |
| calling Vanguard at 800-662-2739. The guidelines are | |
| also available from the SEC’s website, sec.gov. In | |
| addition, you may obtain a free report on how your fund | |
| voted the proxies for securities it owned during the 12 | |
| months ended June 30. To get the report, visit either | |
| vanguard.com/proxyreporting or sec.gov. | |
| |
| You can review and copy information about your fund at | |
| the SEC’s Public Reference Room in Washington, D.C. To | |
| find out more about this public service, call the SEC at | |
| 202-551-8090. Information about your fund is also | |
| available on the SEC’s website, and you can receive | |
| copies of this information, for a fee, by sending a | |
| request in either of two ways: via e-mail addressed to | |
| publicinfo@sec.gov or via regular mail addressed to the | |
| Public Reference Section, Securities and Exchange | |
| Commission, Washington, DC 20549-1520. | |
| |
| |
| | © 2012 The Vanguard Group, Inc. |
| | All rights reserved. |
| | Vanguard Marketing Corporation, Distributor. |
| |
| | Q1142 052012 |
 |
| Semiannual Report | March 31, 2012 |
| Vanguard Capital Opportunity Fund |
> Vanguard Capital Opportunity Fund returned about 23% for the six months ended March 31, 2012, trailing the performance of its benchmark index and the average return of peer funds.
> Disappointing stock choices in information technology, the largest sector in the portfolio, contributed to the fund’s underperformance compared to its comparative standards.
> We note with deep sadness that shortly after the end of the period, PRIMECAP Management Company co-founder Howard Schow, a trusted friend and wonderful steward of shareholder assets, died at age 84.
| |
| Contents | |
| Your Fund’s Total Returns. | 1 |
| Chairman’s Letter. | 2 |
| Advisor’s Report. | 6 |
| Fund Profile. | 10 |
| Performance Summary. | 11 |
| Financial Statements. | 12 |
| About Your Fund’s Expenses. | 22 |
| Trustees Approve Advisory Agreement. | 24 |
| Glossary. | 25 |
Please note: The opinions expressed in this report are just that—informed opinions. They should not be considered promises or advice.
Also, please keep in mind that the information and opinions cover the period through the date on the front of this report. Of course, the
risks of investing in your fund are spelled out in the prospectus.
See the Glossary for definitions of investment terms used in this report.
About the cover: Vanguard was named for the HMS Vanguard, flagship of British Admiral Horatio Nelson. A ship—whose
performance and safety depend on the work of all hands—has served as a fitting metaphor for the Vanguard crew as we
strive to help clients reach their financial goals.
Your Fund’s Total Returns
| |
| Six Months Ended March 31, 2012 | |
| | Total |
| | Returns |
| Vanguard Capital Opportunity Fund | |
| Investor Shares | 23.27% |
| Admiral™ Shares | 23.31 |
| Russell Midcap Growth Index | 27.39 |
| Multi-Cap Growth Funds Average | 25.92 |
Multi-Cap Growth Funds Average: Derived from data provided by Lipper Inc.
Admiral Shares carry lower expenses and are available to investors who meet certain account-balance requirements.
Your Fund’s Performance at a Glance
September 30, 2011, Through March 31, 2012
| | | | |
| | | | Distributions Per Share |
| | Starting | Ending | Income | Capital |
| | Share Price | Share Price | Dividends | Gains |
| Vanguard Capital Opportunity Fund | | | | |
| Investor Shares | $28.17 | $32.86 | $0.161 | $1.469 |
| Admiral Shares | 65.10 | 75.90 | 0.434 | 3.392 |
1

Chairman’s Letter
Dear Shareholder,
Stocks rallied in the six months ended March 31, 2012. In this environment, Vanguard Capital Opportunity Fund returned 23.27% for Investor Shares and 23.31% for Admiral Shares.
Although sizable, the fund’s returns lagged both the benchmark Russell Midcap Growth Index and the average return of peer funds. Disappointing choices among technology stocks, a traditional focus of the fund, contributed to its underperformance relative to these comparative standards.
Of course, six months is too brief a period to be the basis for definitive judgments about a fund’s performance. Your fund’s advisor, PRIMECAP Management Company, has a distinctive investment strategy, the virtues of which are most apparent over the long term.
A surge of optimism fueled a powerful global rally in stocks
During the past six months, optimism displaced the apprehension that had restrained stock prices through summer 2011. The broad U.S. stock market returned more than 26%. Markets abroad returned 15.37%. Investors’ good spirits reflected confidence that the slow, grinding economic expansion in the United States was at last gathering momentum, and that Europe’s debt crisis could be contained.
2
By the end of the period, however, that confidence had begun to evaporate in the face of ambiguous economic reports and renewed concern about Europe. The abrupt mood swing was consistent with the financial markets’ volatility since the 2008–2009 financial crisis.
For most bonds except munis, six-month returns were subdued
The broad taxable bond market produced a modest six-month return of 1.43%. In general, interest rates remained more or less steady at very low levels. In some segments of the bond market, however, yields crept lower still, boosting bond prices. The broad municipal bond market, for example, produced a solid six-month return of 3.91% as investors bid up muni prices.
As it has since December 2008, the Federal Reserve Board kept its target for the shortest-term interest rates between 0% and 0.25%. That policy has kept a tight lid on the returns available from money market funds and savings accounts.
The advisor’s singular approach drives fund performance
In-depth research and a long-term perspective are hallmarks of PRIMECAP Management Company’s approach to investing. The advisor often takes a contrarian view and focuses on opportunities it believes have been overlooked by other investors. This distinctive style leads to a portfolio that has a low rate of turnover and that differs markedly from the composition of the benchmark index.
| | | |
| Market Barometer | | | |
| |
| | | | Total Returns |
| | | Periods Ended March 31, 2012 |
| | Six | One | Five Years |
| | Months | Year | (Annualized) |
| Stocks | | | |
| Russell 1000 Index (Large-caps) | 26.27% | 7.86% | 2.19% |
| Russell 2000 Index (Small-caps) | 29.83 | -0.18 | 2.13 |
| Dow Jones U.S. Total Stock Market Index | 26.60 | 7.16 | 2.47 |
| MSCI All Country World Index ex USA (International) | 15.37 | -7.18 | -1.56 |
| |
| Bonds | | | |
| Barclays Capital U.S. Aggregate Bond Index (Broad | | | |
| taxable market) | 1.43% | 7.71% | 6.25% |
| Barclays Capital Municipal Bond Index (Broad | | | |
| tax-exempt market) | 3.91 | 12.07 | 5.42 |
| Citigroup Three-Month U.S. Treasury Bill Index | 0.00 | 0.05 | 1.11 |
| |
| CPI | | | |
| Consumer Price Index | 1.10% | 2.65% | 2.24% |
3
PRIMECAP Management’s strategy has been rewarding for long-term investors. From February 1, 1998—when PRIMECAP Management became the fund’s advisor—through March 31, 2012, the fund delivered an average annual return of 12.49%, compared with 6.38% for the Russell Midcap Growth Index. These superior returns reflect a willingness to be out of step with the broader market. The flip side is that being out of step can occasionally produce subpar performance.
For the most recent half-year, the fund’s technology stocks as a group posted a gain of about 20%. But that return trailed the performance of the technology sector in the benchmark index. Some of the fund’s tech holdings were perceived as suffering, at least in the near term, from changing consumer tastes in smartphones and tablet computers. The advisor continues to be optimistic about the long-term prospects for technology companies, particularly given the evolving uses of the internet and growing demand for hardware and software. At the end of the period, more than a third of the fund’s assets were invested in technology stocks.
Stock choices in the health care sector also hurt performance in this period. Health care, like technology, represents a significant part of the portfolio, about 30% at the end of the fiscal half-year. As with technology, the advisor remains encouraged about the long-term outlook for this sector, including the potential for medical breakthroughs arising out of advancements in genetic research.
Expense Ratios
Your Fund Compared With Its Peer Group
| | | |
| | Investor | Admiral | Peer Group |
| | Shares | Shares | Average |
| Capital Opportunity Fund | 0.48% | 0.41% | 1.34% |
The fund expense ratios shown are from the prospectus dated January 26, 2012, and represent estimated costs for the current fiscal year. For the six months ended March 31, 2012, the fund’s annualized expense ratios were 0.48% for Investor Shares and 0.41% for Admiral Shares. The peer-group expense ratio is derived from data provided by Lipper Inc. and captures information through year-end 2011.
Peer group: Multi-Cap Growth Funds.
4
For more about the advisor’s strategy and the fund’s positioning during the six months, please see the Advisor’s Report that follows this letter.
Howard Schow’s legacy of long-term excellence
Shortly after the end of this reporting period, we learned of the passing of Howard B. Schow, co-founder and chairman emeritus of PRIMECAP Management Company and a co-manager of several Vanguard funds, including the Capital Opportunity Fund.
We at Vanguard were, of course, saddened by the loss. Our relationship with Howard began nearly 30 years ago, and we will always be grateful to him for his stewardship of clients’ assets. Personally, I learned a great deal from Howard, and I will miss his perspective, his candor, and his balance of optimism and pragmatism. Howard and his colleagues had the prescience to identify emerging opportunities in technology and health care, and the discipline to capitalize on those opportunities for the benefit of fund shareholders. His commitment to taking the long view set an example for all investors.
One of Howard’s lasting accomplishments is the deep and talented team of portfolio managers he helped to build at PRIMECAP Management. His co-managers—Joel P. Fried, Theo A. Kolokotrones, Alfred W. Mordecai, and M. Mohsin Ansari—have assumed responsibility for the assets Howard had managed. I am confident that they will continue to pursue the standards of excellence that PRIMECAP Management has become known for over the decades.
As always, thank you for entrusting your assets to Vanguard.
Sincerely,

F. William McNabb III
Chairman and Chief Executive Officer
April 18, 2012
5
Advisor’s Report
For the six months ended March 31, 2012, Vanguard Capital Opportunity Fund returned 23.27% for Investor Shares and 23.31% for Admiral Shares, trailing both the 27.39% return of its benchmark, the unmanaged Russell Midcap Growth Index, and the 25.92% average return of its multi-capitalization growth fund competitors. While the fund provided solid absolute returns for the half-year, we are disappointed with our relative returns. The fund’s holdings in the information technology and health care sectors hurt its results relative to the Russell Midcap Growth Index. This was partially offset by the fund’s underweighted position in the consumer staples sector.
The investment environment
The U.S. stock market provided strong returns during the past six months, with most major indexes posting two consecutive quarters of double-digit gains. The S&P 500 Index enjoyed its highest return for a six-month period since mid-2009, when the stock market was rebounding from the lows reached in March 2009 during the depths of the financial crisis.
The U.S. economy appears to have resumed its recovery from the recession after a period of slower growth. The 3.0% growth in real gross domestic product (GDP) in the fourth calendar quarter of 2011 was the highest rate of growth since the second quarter of 2010. Consumer spending has also reaccelerated. Corporate profits continue to grow with increased industrial production and higher capacity utilization. However, there are reasons for caution regarding the sustainability of this recovery. Unemployment has declined from 9.0% a year ago, but it remains high at 8.2%. Housing markets are still weak, and governments at the federal, state, and local levels face significant fiscal challenges. Furthermore, concerns about the sovereign debt crisis in Europe and the political unrest in the Middle East add uncertainty to the global economic outlook.
Management of the fund
Although the fund’s results over the past 18 months have been disappointing, our investment approach remains consistent. We rely on fundamental research to find companies whose revenues and earnings will, in our opinion, grow more rapidly over a three-to-five-year period than current valuations might suggest. We seek to capitalize on situations in which we believe the fundamental value of a company significantly exceeds its current market value.
This investment strategy has led us to build and maintain significant investments in information technology and health care companies that we believe offer the potential for higher returns than the overall market. These two sectors make up almost two-thirds of the fund’s holdings, or more than twice their weighting in the Russell Midcap Growth Index (about 32%). Nine of the ten largest holdings in the fund are information technology or health care stocks.
6
Information technology
The information technology sector returned 28.6% for the last six-month period, slightly ahead of the 27.4% overall return for the Russell Midcap Growth Index. However, the fund’s holdings in the sector returned 20.7% because of negative stock selection. The largest detractors from the fund’s relative returns were Rambus (–54%), Research in Motion (–28%), and Electronic Arts (–19%). These results were partially offset by Trimble Navigation (+62%) and ASML Holding (+45%).
We remain enthusiastic about investment opportunities in the information technology sector. A groundswell of innovation continues to drive the evolution of the internet. Cloud computing, social networking, search, mobility, and e-commerce are changing the ways in which individuals and enterprises interact with each other. Cheaper and faster wi-fi and 3G- and 4G-capable devices are enabling people to connect to the internet at any time, from any location. As users engage more with the internet, they are generating and sharing an increasing amount of data, photos, videos, and other content, which in turn should drive higher demand for semiconductors, computer hardware, software, and storage. Some of the largest holdings in the portfolio, such as Google, Symantec, Texas Instruments, Microsoft, Adobe, and EMC, are well-positioned to capitalize on these trends.
Health care
The health care sector, usually considered more defensive than the broader market, returned 24.8% for the six-month period, trailing the overall benchmark. The fund’s holdings in health care fared even worse, returning 19.4%, because of poor stock selection. The three largest detractors from the fund’s relative returns were Novartis (+3%), Eli Lilly (+12%), and Roche (+12%). These results were partially offset by Biogen Idec (+35%) and Pharmacyclics (+135%).
The fund’s significant holdings in the underperforming health care sector have hurt relative returns for the past few years, but we retain a positive outlook for this sector. Following a period of considerable political and regulatory challenges, we are encouraged by the uptick in new drug approvals by the U.S. Food and Drug Administration (FDA) in the past year. The aging of the global population, combined with rising standards of living in developing markets such as China and India, should lead to greater demand for health care products and services. We continue to believe that the pharmaceutical, biotech-nology, and medical device products currently in development represent more efficient ways to treat diseases.
We are particularly excited about the prospects for targeted, personalized medicines. Advances in genetic research, diagnostic tools, and targeted therapies may lead to more effective treatments for individuals in the near future. The dramatic decline in the cost of sequencing human genomes, and the corresponding increase in available genetic information, is one element that is enabling advances in this area. Another enabling factor is the increase in computing power available to analyze this information. Combined, these two factors are helping researchers to
7
develop a more fundamental understanding of the causes of diseases, which in turn supports the development of therapies to treat these diseases.
At the same time, new diagnostic tools are helping to identify patients or groups of patients for whom specific treatments are more effective. For example, Roche, a large holding in the fund, recently received FDA and European marketing approval for Zelboraf, a therapy for metastatic melanoma patients whose cancer exhibits a certain type of abnormal, mutated gene identified by a companion diagnostic test. Several other promising new treatments, such as antibody-drug conjugates that target cancer cells with fewer side effects, have either received regulatory approval or are in clinical trials and nearing approval.
Other sector highlights
The fund’s underweighted position in the materials and financials sectors hurt relative returns for the half-year. Poor stock selection and a slight underweighting in the industrial sector also hurt results. Southwest Airlines (+3%) and AMR (–89%) were notable detractors. AMR filed for bankruptcy after it was unable to negotiate new labor contracts with its employees’ unions.
On a positive note, the fund’s minimal holdings in consumer staples helped relative returns. The 10.9% return for the consumer staples sector was the second-lowest among the ten sectors in the Russell Midcap Growth Index. The fund’s stock selection in the consumer discretionary and energy sectors also helped results. Ascena Retail Group
(+64%), Whirlpool (+57%), and CarMax (+45%) were among the largest contributors in the consumer discretionary sector, while National Oilwell Varco (+56%) and Oceaneering International (+53%) were the two largest contributors in the energy sector.
The outlook
Looking ahead to the rest of fiscal year 2012 and beyond, we continue to view U.S. equities as attractive investment opportunities, especially relative to most other asset classes. Interest rates remain low, inflation appears to be under control, and corporate profits continue to grow at a healthy pace. We are further encouraged by what we consider to be low valuations in the information technology and health care sectors, where the fund is significantly overweighted. In addition, many of the fund’s holdings in these sectors have very strong balance sheets and generate significant free cash flow.
Although correlation among stocks in the S&P 500 Index has been exceptionally high during the past year, we believe stock selection will be more critical than ever going forward. During periods of heightened fear and uncertainty, such as the recent recession, investors are less likely to differentiate among stocks. However, as the economy and financial markets return to greater stability, correlation among stocks tends to decrease, and stock selection is rewarded. While we do not expect strong growth in U.S. GDP in the near term, we think there are opportunities to increase the fund’s holdings in existing positions as well as to establish new positions at attractive valuations.
8
In loving memory
We are saddened to announce the passing of Howard B. Schow on April 8, 2012, at the age of 84. Mr. Schow co-founded PRIMECAP Management Company in 1983 and had co-managed Vanguard Capital Opportunity Fund since 1998. His unwavering focus, persistent optimism, and competitive spirit inspired all of us.
Although he will be greatly missed, Mr. Schow’s indelible imprint on the Capital Opportunity Fund lives on. The other co-managers of the fund will assume responsibility for the portion of the portfolio that had been managed by Mr. Schow. As we honor his life and celebrate his extraordinary career, we will continue to pursue the same long-term investment approach that he was so instrumental in creating at PRIMECAP Management Company.
Theo A. Kolokotrones
Joel P. Fried
Alfred W. Mordecai
M. Mohsin Ansari
PRIMECAP Management Company
April 12, 2012
9
Capital Opportunity Fund
Fund Profile
As of March 31, 2012
| | |
| Share-Class Characteristics | |
| | Investor | Admiral |
| | Shares | Shares |
| Ticker Symbol | VHCOX | VHCAX |
| Expense Ratio1 | 0.48% | 0.41% |
| 30-Day SEC Yield | 0.63% | 0.70% |
| | | |
| Portfolio Characteristics | | |
| | | Russell | DJ |
| | | Midcap | U.S. Total |
| | | Growth | Market |
| | Fund | Index | Index |
| Number of Stocks | 123 | 463 | 3,716 |
| Median Market Cap $17.3B | $8.4B | $35.6B |
| Price/Earnings Ratio | 18.9x | 21.8x | 17.1x |
| Price/Book Ratio | 2.6x | 3.9x | 2.3x |
| Return on Equity | 18.6% | 18.5% | 18.1% |
| Earnings Growth Rate 12.8% | 10.1% | 8.5% |
| Dividend Yield | 1.1% | 1.0% | 1.9% |
| Foreign Holdings | 11.9% | 0.0% | 0.0% |
| Turnover Rate | | | |
| (Annualized) | 5% | — | — |
| Short-Term Reserves | 1.6% | — | — |
| | | |
| Sector Diversification (% of equity exposure) |
| | | Russell | DJ |
| | | Midcap | U.S. Total |
| | | Growth | Market |
| | Fund | Index | Index |
| Consumer | | | |
| Discretionary | 10.5% | 20.6% | 12.0% |
| Consumer Staples | 0.0 | 5.9 | 9.4 |
| Energy | 4.9 | 9.0 | 10.5 |
| Financials | 1.6 | 6.9 | 15.9 |
| Health Care | 29.8 | 13.3 | 11.5 |
| Industrials | 13.8 | 14.9 | 11.0 |
| Information | | | |
| Technology | 35.7 | 18.9 | 19.8 |
| Materials | 2.4 | 8.6 | 4.0 |
| Telecommunication | | | |
| Services | 0.1 | 1.6 | 2.5 |
| Utilities | 1.2 | 0.3 | 3.4 |
| | |
| Volatility Measures | | |
| | Russell | DJ |
| | Midcap | U.S. Total |
| | Growth | Market |
| | Index | Index |
| R-Squared | 0.95 | 0.95 |
| Beta | 1.00 | 1.16 |
These measures show the degree and timing of the fund’s fluctuations compared with the indexes over 36 months.
| | |
| Ten Largest Holdings (% of total net assets) |
| Biogen Idec Inc. | Biotechnology | 5.7% |
| Amgen Inc. | Biotechnology | 5.0 |
| Eli Lilly & Co. | Pharmaceuticals | 3.7 |
| Altera Corp. | Semiconductors | 3.5 |
| Roche Holding AG | Pharmaceuticals | 3.4 |
| FedEx Corp. | Air Freight & | |
| | Logistics | 3.2 |
| ASML Holding NV | Semiconductor | |
| | Equipment | 2.7 |
| Medtronic Inc. | Health Care | |
| | Equipment | 2.5 |
| Google Inc. Class A | Internet Software & | |
| | Services | 2.4 |
| Symantec Corp. | Systems Software | 2.4 |
| Top Ten | | 34.5% |
The holdings listed exclude any temporary cash investments and equity index products.
Investment Focus
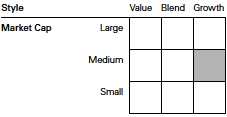
1 The expense ratios shown are from the prospectus dated January 26, 2012, and represent estimated costs for the current fiscal year. For the six months ended March 31, 2012, the annualized expense ratios were 0.48% for Investor Shares and 0.41% for Admiral Shares.
10
Capital Opportunity Fund
Performance Summary
All of the returns in this report represent past performance, which is not a guarantee of future results that may be achieved by the fund. (Current performance may be lower or higher than the performance data cited. For performance data current to the most recent month-end, visit our website at vanguard.com/performance.) Note, too, that both investment returns and principal value can fluctuate widely, so an investor’s shares, when sold, could be worth more or less than their original cost. The returns shown do not reflect taxes that a shareholder would pay on fund distributions or on the sale of fund shares.
Fiscal-Year Total Returns (%): September 30, 2001, Through March 31, 2012
Note: For 2012, performance data reflect the six months ended March 31, 2012.
Average Annual Total Returns: Periods Ended March 31, 2012
| | | | |
| | Inception | One | Five | Ten |
| | Date | Year | Years | Years |
| Investor Shares | 8/14/1995 | -0.79% | 3.20% | 6.95% |
| Admiral Shares | 11/12/2001 | -0.71 | 3.28 | 7.05 |
Vanguard fund returns do not reflect the 1% fee on redemptions of shares held for less than one year.
See Financial Highlights for dividend and capital gains information.
11
Capital Opportunity Fund
Financial Statements (unaudited)
Statement of Net Assets
As of March 31, 2012
The fund reports a complete list of its holdings in regulatory filings four times in each fiscal year, at the quarter-ends. For the second and fourth fiscal quarters, the lists appear in the fund’s semiannual and annual reports to shareholders. For the first and third fiscal quarters, the fund files the lists with the Securities and Exchange Commission on Form N-Q. Shareholders can look up the fund’s Forms N-Q on the SEC’s website at sec.gov. Forms N-Q may also be reviewed and copied at the SEC’s Public Reference Room (see the back cover of this report for further information).
| | | |
| | | | Market |
| | | | Value |
| | | Shares | ($000) |
| Common Stocks (98.5%) | | |
| Consumer Discretionary (10.4%) | |
| * | CarMax Inc. | 4,436,797 | 153,735 |
| * | Ascena Retail Group Inc. | 3,450,200 | 152,913 |
| * | DIRECTV Class A | 2,946,576 | 145,384 |
| | TJX Cos. Inc. | 2,680,000 | 106,423 |
| | Whirlpool Corp. | 1,122,200 | 86,252 |
| | Carnival Corp. | 2,033,900 | 65,248 |
| * | Bed Bath & Beyond Inc. | 903,700 | 59,436 |
| | Lowe’s Cos. Inc. | 375,000 | 11,767 |
| * | Amazon.com Inc. | 54,700 | 11,077 |
| | Nordstrom Inc. | 175,000 | 9,751 |
| | Gentex Corp. | 210,000 | 5,145 |
| 1 | Strattec Security Corp. | 209,993 | 4,914 |
| | Limited Brands Inc. | 80,400 | 3,859 |
| * | DreamWorks Animation | | |
| | SKG Inc. Class A | 155,000 | 2,860 |
| *,^ | Tesla Motors Inc. | 23,000 | 857 |
| | Dunkin’ Brands Group Inc. | 16,300 | 491 |
| | Ross Stores Inc. | 3,500 | 203 |
| * | Warnaco Group Inc. | 3,390 | 198 |
| * | Deckers Outdoor Corp. | 1,000 | 63 |
| | | | 820,576 |
| Consumer Staples (0.0%) | | |
| | CVS Caremark Corp. | 15,000 | 672 |
| |
| Energy (4.9%) | | |
| | Oceaneering | | |
| | International Inc. | 1,868,100 | 100,672 |
| | Noble Energy Inc. | 880,100 | 86,056 |
| | National Oilwell Varco Inc. | 997,500 | 79,271 |
| * | McDermott | | |
| | International Inc. | 2,545,900 | 32,613 |
| | Cabot Oil & Gas Corp. | 898,000 | 27,991 |
| | ConocoPhillips | 250,000 | 19,002 |
| | Range Resources Corp. | 181,800 | 10,570 |
| * | Southwestern Energy Co. | 341,800 | 10,459 |
| | | |
| | | | Market |
| | | | Value |
| | | Shares | ($000) |
| | Ensco plc ADR | 193,340 | 10,233 |
| | Transocean Ltd. | 100,000 | 5,470 |
| | Hess Corp. | 30,000 | 1,769 |
| | | | 384,106 |
| Financials (1.5%) | | |
| | Charles Schwab Corp. | 6,477,100 | 93,076 |
| | Chubb Corp. | 350,000 | 24,188 |
| * | MSCI Inc. Class A | 127,000 | 4,675 |
| | | | 121,939 |
| Health Care (29.3%) | | |
| * | Biogen Idec Inc. | 3,541,600 | 446,135 |
| | Amgen Inc. | 5,794,500 | 393,968 |
| | Eli Lilly & Co. | 7,311,000 | 294,414 |
| | Roche Holding AG | 1,563,700 | 272,131 |
| | Medtronic Inc. | 5,136,500 | 201,299 |
| | Novartis AG ADR | 3,128,000 | 173,323 |
| * | BioMarin | | |
| | Pharmaceutical Inc. | 4,941,700 | 169,253 |
| * | Life Technologies Corp. | 2,693,416 | 131,493 |
| * | Dendreon Corp. | 4,510,700 | 48,062 |
| * | Boston Scientific Corp. | 7,608,600 | 45,499 |
| * | Illumina Inc. | 634,500 | 33,381 |
| * | Pharmacyclics Inc. | 1,103,724 | 30,639 |
| * | Edwards Lifesciences Corp. | 300,000 | 21,819 |
| * | Waters Corp. | 169,000 | 15,660 |
| * | Charles River Laboratories | | |
| | International Inc. | 326,812 | 11,795 |
| * | InterMune Inc. | 683,000 | 10,020 |
| | PerkinElmer Inc. | 245,400 | 6,788 |
| * | Affymetrix Inc. | 800,000 | 3,416 |
| | Zimmer Holdings Inc. | 50,000 | 3,214 |
| * | Cerner Corp. | 20,000 | 1,523 |
| | | | 2,313,832 |
| Industrials (13.6%) | | |
| | FedEx Corp. | 2,766,450 | 254,403 |
| * | Thomas & Betts Corp. | 2,457,000 | 176,683 |
| | Rockwell Automation Inc. | 1,658,500 | 132,182 |
12
Capital Opportunity Fund
| | | |
| | | | Market |
| | | | Value |
| | | Shares | ($000) |
| | Southwest Airlines Co. | 9,919,100 | 81,733 |
| ^ | Ritchie Bros | | |
| | Auctioneers Inc. | 3,033,800 | 72,083 |
| | Pall Corp. | 1,106,600 | 65,987 |
| | CH Robinson | | |
| | Worldwide Inc. | 690,200 | 45,201 |
| * | Babcock & Wilcox Co. | 1,673,323 | 43,088 |
| | Union Pacific Corp. | 325,000 | 34,931 |
| * | JetBlue Airways Corp. | 5,940,150 | 29,047 |
| * | AECOM Technology Corp. | 1,150,400 | 25,734 |
| | European Aeronautic | | |
| | Defence and | | |
| | Space Co. NV | 540,050 | 22,116 |
| | Expeditors International | | |
| | of Washington Inc. | 462,300 | 21,502 |
| * | Jacobs Engineering | | |
| | Group Inc. | 370,000 | 16,417 |
| | Chicago Bridge & | | |
| | Iron Co. NV | 363,900 | 15,717 |
| | SPX Corp. | 175,000 | 13,568 |
| | IDEX Corp. | 187,029 | 7,880 |
| * | United Continental | | |
| | Holdings Inc. | 291,600 | 6,269 |
| * | Delta Air Lines Inc. | 620,900 | 6,153 |
| * | US Airways Group Inc. | 57,000 | 433 |
| | | | 1,071,127 |
| Information Technology (35.1%) | |
| | Altera Corp. | 6,988,500 | 278,282 |
| | ASML Holding NV | 4,248,189 | 213,004 |
| * | Google Inc. Class A | 294,605 | 188,912 |
| * | Symantec Corp. | 10,011,000 | 187,206 |
| * | Trimble Navigation Ltd. | 2,812,600 | 153,062 |
| | Texas Instruments Inc. | 3,945,500 | 132,608 |
| * | NVIDIA Corp. | 8,384,700 | 129,040 |
| | Microsoft Corp. | 4,000,000 | 129,000 |
| * | Cree Inc. | 3,944,900 | 124,777 |
| | Corning Inc. | 8,505,000 | 119,750 |
| * | Electronic Arts Inc. | 7,022,000 | 115,723 |
| * | Research In Motion Ltd. | 7,108,700 | 104,569 |
| * | Adobe Systems Inc. | 3,045,900 | 104,505 |
| * | Flextronics | | |
| | International Ltd. | 10,321,800 | 74,627 |
| * | SanDisk Corp. | 1,374,948 | 68,184 |
| * | EMC Corp. | 2,200,000 | 65,736 |
| * | NeuStar Inc. Class A | 1,623,416 | 60,472 |
| | Plantronics Inc. | 1,150,000 | 46,299 |
| * | Micron Technology Inc. | 5,550,000 | 44,955 |
| *,1 | Descartes Systems | | |
| | Group Inc. | 4,645,000 | 40,272 |
| | Visa Inc. Class A | 326,930 | 38,578 |
| | QUALCOMM Inc. | 549,325 | 37,365 |
| *,1 | Formfactor Inc. | 5,769,300 | 32,193 |
| * | Rambus Inc. | 4,920,000 | 31,734 |
| | | |
| | | | Market |
| | | | Value |
| | | Shares | ($000) |
| | Hewlett-Packard Co. | 1,300,000 | 30,979 |
| | Intuit Inc. | 350,000 | 21,045 |
| | Motorola Solutions Inc. | 375,000 | 19,061 |
| * | Entegris Inc. | 2,019,231 | 18,860 |
| * | FEI Co. | 345,000 | 16,943 |
| * | Nuance | | |
| | Communications Inc. | 650,000 | 16,627 |
| * | Apple Inc. | 24,000 | 14,387 |
| * | Smart Technologies Inc. | | |
| | Class A | 4,672,304 | 13,877 |
| * | Cymer Inc. | 250,000 | 12,500 |
| * | NetApp Inc. | 245,000 | 10,969 |
| | Xilinx Inc. | 300,000 | 10,929 |
| * | Ciena Corp. | 607,142 | 9,830 |
| | Mastercard Inc. Class A | 22,100 | 9,294 |
| | Analog Devices Inc. | 200,000 | 8,080 |
| | Jabil Circuit Inc. | 300,000 | 7,536 |
| | KLA-Tencor Corp. | 130,000 | 7,075 |
| * | Brocade Communications | |
| | Systems Inc. | 1,200,000 | 6,900 |
| | Accenture plc Class A | 95,700 | 6,173 |
| * | Rovi Corp. | 170,000 | 5,533 |
| * | Citrix Systems Inc. | 50,000 | 3,945 |
| * | Zynga Inc. Class A | 60,000 | 789 |
| | | | 2,772,185 |
| Materials (2.4%) | | |
| | Monsanto Co. | 2,328,786 | 185,744 |
| |
| Telecommunication Services (0.1%) | |
| * | Sprint Nextel Corp. | 4,200,000 | 11,970 |
| |
| Utilities (1.2%) | | |
| * | AES Corp. | 4,688,425 | 61,278 |
| | Public Service | | |
| | Enterprise Group Inc. | 1,005,600 | 30,781 |
| | | | 92,059 |
| Total Common Stocks | | |
| (Cost $5,223,732) | | 7,774,210 |
| Temporary Cash Investment (1.8%) | |
| Money Market Fund (1.8%) | | |
| 2,3 | Vanguard Market Liquidity | |
| | Fund, 0.123% | | |
| | (Cost $142,927) | 142,926,857 | 142,927 |
| Total Investments (100.3%) | | |
| (Cost $5,366,659) | | 7,917,137 |
| Other Assets and Liabilities (-0.3%) | |
| Other Assets | | 50,177 |
| Liabilities3 | | (72,709) |
| | | | (22,532) |
| Net Assets (100%) | | 7,894,605 |
13
Capital Opportunity Fund
| |
| At March 31, 2012, net assets consisted of: |
| | Amount |
| | ($000) |
| Paid-in Capital | 5,407,851 |
| Undistributed Net Investment Income | 10,295 |
| Accumulated Net Realized Losses | (74,547) |
| Unrealized Appreciation (Depreciation) | |
| Investment Securities | 2,550,478 |
| Foreign Currencies | 528 |
| Net Assets | 7,894,605 |
| |
| |
| Investor Shares—Net Assets | |
| Applicable to 80,538,127 outstanding | |
| $.001 par value shares of beneficial | |
| interest (unlimited authorization) | 2,646,733 |
| Net Asset Value Per Share— | |
| Investor Shares | $32.86 |
| |
| |
| Admiral Shares—Net Assets | |
| Applicable to 69,138,179 outstanding | |
| $.001 par value shares of beneficial | |
| interest (unlimited authorization) | 5,247,872 |
| Net Asset Value Per Share— | |
| Admiral Shares | $75.90 |
See Note A in Notes to Financial Statements.
* Non-income-producing security.
^ Part of security position is on loan to broker-dealers. The total value of securities on loan is $12,635,000.
1 Considered an affiliated company of the fund as the fund owns more than 5% of the outstanding voting securities of such company.
2 Affiliated money market fund available only to Vanguard funds and certain trusts and accounts managed by Vanguard. Rate shown is the 7-day yield.
3 Includes $13,291,000 of collateral received for securities on loan.
ADR—American Depositary Receipt.
See accompanying Notes, which are an integral part of the Financial Statements.
14
Capital Opportunity Fund
Statement of Operations
| |
| | Six Months Ended |
| | March 31, 2012 |
| | ($000) |
| Investment Income | |
| Income | |
| Dividends1,2 | 49,990 |
| Interest2 | 100 |
| Security Lending | 197 |
| Total Income | 50,287 |
| Expenses | |
| Investment Advisory Fees—Note B | 9,737 |
| The Vanguard Group—Note C | |
| Management and Administrative—Investor Shares | 2,539 |
| Management and Administrative—Admiral Shares | 3,192 |
| Marketing and Distribution—Investor Shares | 269 |
| Marketing and Distribution—Admiral Shares | 429 |
| Custodian Fees | 65 |
| Shareholders’ Reports—Investor Shares | 19 |
| Shareholders’ Reports—Admiral Shares | 15 |
| Trustees’ Fees and Expenses | 7 |
| Total Expenses | 16,272 |
| Net Investment Income | 34,015 |
| Realized Net Gain (Loss) | |
| Investment Securities Sold2 | (74,859) |
| Foreign Currencies | (7) |
| Realized Net Gain (Loss) | (74,866) |
| Change in Unrealized Appreciation (Depreciation) | |
| Investment Securities | 1,581,913 |
| Foreign Currencies | 310 |
| Change in Unrealized Appreciation (Depreciation) | 1,582,223 |
| Net Increase (Decrease) in Net Assets Resulting from Operations | 1,541,372 |
1 Dividends are net of foreign withholding taxes of $3,004,000.
2 Dividend income, interest income, and realized net gain (loss) from affiliated companies of the fund were $42,000, $100,000, and $43,294,000, respectively.
See accompanying Notes, which are an integral part of the Financial Statements.
15
Capital Opportunity Fund
Statement of Changes in Net Assets
| | |
| | Six Months Ended | Year Ended |
| | March 31, | September 30, |
| | 2012 | 2011 |
| | ($000) | ($000) |
| Increase (Decrease) in Net Assets | | |
| Operations | | |
| Net Investment Income | 34,015 | 41,306 |
| Realized Net Gain (Loss) | (74,866) | 507,469 |
| Change in Unrealized Appreciation (Depreciation) | 1,582,223 | (779,207) |
| Net Increase (Decrease) in Net Assets Resulting from Operations | 1,541,372 | (230,432) |
| Distributions | | |
| Net Investment Income | | |
| Investor Shares | (13,132) | (11,536) |
| Admiral Shares | (28,694) | (22,920) |
| Realized Capital Gain1 | | |
| Investor Shares | (119,827) | — |
| Admiral Shares | (224,273) | — |
| Total Distributions | (385,926) | (34,456) |
| Capital Share Transactions | | |
| Investor Shares | (166,633) | (1,228,183) |
| Admiral Shares | 151,101 | 349,482 |
| Net Increase (Decrease) from Capital Share Transactions | (15,532) | (878,701) |
| Total Increase (Decrease) | 1,139,914 | (1,143,589) |
| Net Assets | | |
| Beginning of Period | 6,754,691 | 7,898,280 |
| End of Period2 | 7,894,605 | 6,754,691 |
1 Includes fiscal 2012 short-term gain distributions totaling $1,640,000. Short-term gain distributions are treated as ordinary income dividends for tax purposes.
2 Net Assets—End of Period includes undistributed net investment income of $10,295,000 and $18,113,000.
See accompanying Notes, which are an integral part of the Financial Statements.
16
Capital Opportunity Fund
Financial Highlights
| | | | | | | |
| Investor Shares | | | | | | | |
| | Six Months | | | | | |
| | | Ended | | | | | |
| For a Share Outstanding | March 31, | | | Year Ended September 30, |
| Throughout Each Period | | 2012 | 2011 | 2010 | 2009 | 2008 | 2007 |
| Net Asset Value, Beginning of Period | $28.17 | $29.59 | $27.71 | $29.41 | $42.70 | $36.11 |
| Investment Operations | | | | | | | |
| Net Investment Income | | .137 | .151 | .106 | .121 | .2541 | .070 |
| Net Realized and Unrealized Gain (Loss) | | | | | | |
| on Investments | | 6.183 | (1.450) | 1.871 | .355 | (9.884) | 8.447 |
| Total from Investment Operations | | 6.320 | (1.299) | 1.977 | .476 | (9.630) | 8.517 |
| Distributions | | | | | | | |
| Dividends from Net Investment Income | (.161) | (.121) | (.097) | (.114) | (.218) | (.070) |
| Distributions from Realized Capital Gains | (1.469) | — | — | (2.062) | (3.442) | (1.857) |
| Total Distributions | | (1.630) | (.121) | (.097) | (2.176) | (3.660) | (1.927) |
| Net Asset Value, End of Period | | $32.86 | $28.17 | $29.59 | $27.71 | $29.41 | $42.70 |
| |
| Total Return2 | | 23.27% | -4.45% | 7.14% | 4.41% | -24.13% | 24.35% |
| |
| Ratios/Supplemental Data | | | | | | | |
| Net Assets, End of Period (Millions) | $2,647 | $2,412 | $3,675 | $3,903 | $3,851 | $5,415 |
| Ratio of Total Expenses to | | | | | | | |
| Average Net Assets | | 0.48% | 0.48% | 0.48% | 0.50% | 0.45% | 0.45% |
| Ratio of Net Investment Income to | | | | | | |
| Average Net Assets | | 0.86% | 0.45% | 0.36% | 0.50% | 0.67%1 | 0.18% |
| Portfolio Turnover Rate | | 5% | 9% | 8% | 12% | 13% | 14% |
The expense ratio, net income ratio, and turnover rate for the current period have been annualized.
1 Net investment income per share and the ratio of net investment income to average net assets include $.125 and 0.33%, respectively, resulting from a special dividend from ASML Holding NV in October 2007.
2 Total returns do not include transaction or account service fees that may have applied in the periods shown. Fund prospectuses provide information about any applicable transaction and account service fees.
See accompanying Notes, which are an integral part of the Financial Statements.
17
Capital Opportunity Fund
Financial Highlights
| | | | | | | |
| Admiral Shares | | | | | | | |
| | Six Months | | | | | |
| | | Ended | | | | | |
| For a Share Outstanding | March 31, | | | Year Ended September 30, |
| Throughout Each Period | | 2012 | 2011 | 2010 | 2009 | 2008 | 2007 |
| Net Asset Value, Beginning of Period | $65.10 | $68.38 | $64.04 | $68.00 | $98.71 | $83.49 |
| Investment Operations | | | | | | | |
| Net Investment Income | | .347 | .400 | .298 | .329 | .6641 | .240 |
| Net Realized and Unrealized Gain (Loss) | | | | | | |
| on Investments | | 14.279 | (3.358) | 4.315 | .811 | (22.845) | 19.508 |
| Total from Investment Operations | | 14.626 | (2.958) | 4.613 | 1.140 | (22.181) | 19.748 |
| Distributions | | | | | | | |
| Dividends from Net Investment Income | (.434) | (.322) | (.273) | (.339) | (.577) | (.238) |
| Distributions from Realized Capital Gains | (3.392) | — | — | (4.761) | (7.952) | (4.290) |
| Total Distributions | | (3.826) | (.322) | (.273) | (5.100) | (8.529) | (4.528) |
| Net Asset Value, End of Period | | $75.90 | $65.10 | $68.38 | $64.04 | $68.00 | $98.71 |
| |
| Total Return2 | | 23.31% | -4.39% | 7.21% | 4.52% | -24.05% | 24.43% |
| |
| Ratios/Supplemental Data | | | | | | | |
| Net Assets, End of Period (Millions) | $5,248 | $4,342 | $4,223 | $3,938 | $3,787 | $4,760 |
| Ratio of Total Expenses to | | | | | | | |
| Average Net Assets | | 0.41% | 0.41% | 0.41% | 0.41% | 0.36% | 0.37% |
| Ratio of Net Investment Income to | | | | | | |
| Average Net Assets | | 0.93% | 0.52% | 0.43% | 0.59% | 0.76%1 | 0.26% |
| Portfolio Turnover Rate | | 5% | 9% | 8% | 12% | 13% | 14% |
The expense ratio, net income ratio, and turnover rate for the current period have been annualized.
1 Net investment income per share and the ratio of net investment income to average net assets include $.289 and 0.33%, respectively, resulting from a special dividend from ASML Holding NV in October 2007.
2 Total returns do not include transaction or account service fees that may have applied in the periods shown. Fund prospectuses provide information about any applicable transaction and account service fees.
See accompanying Notes, which are an integral part of the Financial Statements.
18
Capital Opportunity Fund
Notes to Financial Statements
Vanguard Capital Opportunity Fund is registered under the Investment Company Act of 1940 as an open-end investment company, or mutual fund. The fund offers two classes of shares: Investor Shares and Admiral Shares. Investor Shares are available to any investor who meets the fund’s minimum purchase requirements. Admiral Shares are designed for investors who meet certain administrative, service, and account-size criteria.
A. The following significant accounting policies conform to generally accepted accounting principles for U.S. mutual funds. The fund consistently follows such policies in preparing its financial statements.
1. Security Valuation: Securities are valued as of the close of trading on the New York Stock Exchange (generally 4 p.m., Eastern time) on the valuation date. Equity securities are valued at the latest quoted sales prices or official closing prices taken from the primary market in which each security trades; such securities not traded on the valuation date are valued at the mean of the latest quoted bid and asked prices. Securities for which market quotations are not readily available, or whose values have been affected by events occurring before the fund’s pricing time but after the close of the securities’ primary markets, are valued at their fair values calculated according to procedures adopted by the board of trustees. These procedures include obtaining quotations from an independent pricing service, monitoring news to identify significant market- or security-specific events, and evaluating changes in the values of foreign market proxies (for example, ADRs, futures contracts, or exchange-traded funds), between the time the foreign markets close and the fund’s pricing time. When fair-value pricing is employed, the prices of securities used by a fund to calculate its net asset value may differ from quoted or published prices for the same securities. Investments in Vanguard Market Liquidity Fund are valued at that fund’s net asset value.
2. Foreign Currency: Securities and other assets and liabilities denominated in foreign currencies are translated into U.S. dollars using exchange rates obtained from an independent third party as of the fund’s pricing time on the valuation date. Realized gains (losses) and unrealized appreciation (depreciation) on investment securities include the effects of changes in exchange rates since the securities were purchased, combined with the effects of changes in security prices. Fluctuations in the value of other assets and liabilities resulting from changes in exchange rates are recorded as unrealized foreign currency gains (losses) until the assets or liabilities are settled in cash, at which time they are recorded as realized foreign currency gains (losses).
3. Federal Income Taxes: The fund intends to continue to qualify as a regulated investment company and distribute all of its taxable income. Management has analyzed the fund’s tax positions taken for all open federal income tax years (September 30, 2008–2011), and for the period ended March 31, 2012, and has concluded that no provision for federal income tax is required in the fund’s financial statements.
4. Distributions: Distributions to shareholders are recorded on the ex-dividend date.
5. Security Lending: The fund may lend its securities to qualified institutional borrowers to earn additional income. Security loans are required to be secured at all times by collateral at least equal to the market value of securities loaned. The fund invests cash collateral received in Vanguard Market Liquidity Fund, and records a liability for the return of the collateral, during the period the securities are on loan. Security lending income represents fees charged to borrowers plus income earned on investing cash collateral, less expenses associated with the loan.
6. Other: Dividend income is recorded on the ex-dividend date. Interest income includes income distributions received from Vanguard Market Liquidity Fund and is accrued daily. Security transactions are accounted for on the date securities are bought or sold. Costs used to determine realized gains (losses) on the sale of investment securities are those of the specific securities sold. Fees assessed on redemptions of capital shares are credited to paid-in capital.
19
Capital Opportunity Fund
Each class of shares has equal rights as to assets and earnings, except that each class separately bears certain class-specific expenses related to maintenance of shareholder accounts (included in Management and Administrative expenses) and shareholder reporting. Marketing and distribution expenses are allocated to each class of shares based on a method approved by the board of trustees. Income, other non-class-specific expenses, and gains and losses on investments are allocated to each class of shares based on its relative net assets.
B. PRIMECAP Management Company provides investment advisory services to the fund for a fee calculated at an annual percentage rate of average net assets. For the six months ended March 31, 2012, the investment advisory fee represented an effective annual rate of 0.26% of the fund’s average net assets.
C. The Vanguard Group furnishes at cost corporate management, administrative, marketing, and distribution services. The costs of such services are allocated to the fund under methods approved by the board of trustees. The fund has committed to provide up to 0.40% of its net assets in capital contributions to Vanguard. At March 31, 2012, the fund had contributed capital of $1,153,000 to Vanguard (included in Other Assets), representing 0.01% of the fund’s net assets and 0.46% of Vanguard’s capitalization. The fund’s trustees and officers are also directors and officers of Vanguard.
D. Various inputs may be used to determine the value of the fund’s investments. These inputs are summarized in three broad levels for financial statement purposes. The inputs or methodologies used to value securities are not necessarily an indication of the risk associated with investing in those securities.
Level 1—Quoted prices in active markets for identical securities.
Level 2—Other significant observable inputs (including quoted prices for similar securities, interest rates, prepayment speeds, credit risk, etc.).
Level 3—Significant unobservable inputs (including the fund’s own assumptions used to determine the fair value of investments).
The following table summarizes the market value of the fund’s investments as of March 31, 2012, based on the inputs used to value them:
| | | |
| | Level 1 | Level 2 | Level 3 |
| Investments | ($000) | ($000) | ($000) |
| Common Stocks | 7,479,963 | 294,247 | — |
| Temporary Cash Investments | 142,927 | — | — |
| Total | 7,622,890 | 294,247 | — |
E. Distributions are determined on a tax basis and may differ from net investment income and realized capital gains for financial reporting purposes. Differences may be permanent or temporary. Permanent differences are reclassified among capital accounts in the financial statements to reflect their tax character. Temporary differences arise when certain items of income, expense, gain, or loss are recognized in different periods for financial statement and tax purposes; these differences will reverse at some time in the future. Differences in classification may also result from the treatment of short-term gains as ordinary income for tax purposes.
During the six months ended March 31, 2012, the fund realized net foreign currency losses of $7,000, which decreased distributable net income for tax purposes; accordingly, such losses have been reclassified from accumulated net realized losses to undistributed net investment income.
20
At March 31, 2012, the cost of investment securities for tax purposes was $5,366,659,000. Net unrealized appreciation of investment securities for tax purposes was $2,550,478,000, consisting of unrealized gains of $3,262,404,000 on securities that had risen in value since their purchase and $711,926,000 in unrealized losses on securities that had fallen in value since their purchase.
F. During the six months ended March 31, 2012, the fund purchased $176,642,000 of investment securities and sold $480,105,000 of investment securities, other than temporary cash investments.
G. Certain of the fund’s investments are in companies that are considered to be affiliated companies of the fund because the fund owns more than 5% of the outstanding voting securities of the company. Transactions during the period in securities of these companies were as follows:
| | | | | |
| | | | Current Period Transactions | |
| | Sept. 30, 2011 | | Proceeds from | | March 31, 2012 |
| | Market | Purchases | Securities | Dividend | Market |
| | Value | at Cost | Sold | Income | Value |
| | ($000) | ($000) | ($000) | ($000) | ($000) |
| Ascena Retail Group Inc. | 112,246 | — | 30,089 | — | NA1 |
| Descartes Systems Group Inc. | 28,892 | — | — | — | 40,272 |
| Formfactor Inc. | 35,864 | 303 | 223 | — | 32,193 |
| Strattec Security Corp. | 5,088 | — | 49 | 42 | 4,914 |
| Thomas & Betts Corp. | 115,739 | — | 25,425 | — | NA1 |
| | 297,829 | | | 42 | 77,379 |
| 1 Not applicable — At March 31, 2012, the security was still held, but the issuer was no longer an affiliated company of the fund. |
H. Capital share transactions for each class of shares were:
| | | | |
| | Six Months Ended | | Year Ended |
| | March 31, 2012 | September 30, 2011 |
| | Amount | Shares | Amount | Shares |
| | ($000) | (000) | ($000) | (000) |
| Investor Shares | | | | |
| Issued | 100,246 | 3,219 | 223,210 | 6,730 |
| Issued in Lieu of Cash Distributions | 127,508 | 4,438 | 11,042 | 334 |
| Redeemed1 | (394,387) | (12,752) | (1,462,435) | (45,617) |
| Net Increase (Decrease)—Investor Shares | (166,633) | (5,095) | (1,228,183) | (38,553) |
| Admiral Shares | | | | |
| Issued | 316,096 | 4,459 | 1,053,781 | 14,293 |
| Issued in Lieu of Cash Distributions | 231,551 | 3,490 | 20,865 | 274 |
| Redeemed1 | (396,546) | (5,509) | (725,164) | (9,629) |
| Net Increase (Decrease)—Admiral Shares | 151,101 | 2,440 | 349,482 | 4,938 |
| 1 Net of redemption fees for fiscal 2012 and 2011 of $105,000 and $356,000, respectively (fund totals). | | |
I. In preparing the financial statements as of March 31, 2012, management considered the impact of subsequent events for potential recognition or disclosure in these financial statements.
21
About Your Fund’s Expenses
As a shareholder of the fund, you incur ongoing costs, which include costs for portfolio management, administrative services, and shareholder reports (like this one), among others. Operating expenses, which are deducted from a fund’s gross income, directly reduce the investment return of the fund.
A fund’s expenses are expressed as a percentage of its average net assets. This figure is known as the expense ratio. The following examples are intended to help you understand the ongoing costs (in dollars) of investing in your fund and to compare these costs with those of other mutual funds. The examples are based on an investment of $1,000 made at the beginning of the period shown and held for the entire period.
The accompanying table illustrates your fund’s costs in two ways:
• Based on actual fund return. This section helps you to estimate the actual expenses that you paid over the period. The ”Ending Account Value“ shown is derived from the fund‘s actual return, and the third column shows the dollar amount that would have been paid by an investor who started with $1,000 in the fund. You may use the information here, together with the amount you invested, to estimate the expenses that you paid over the period.
To do so, simply divide your account value by $1,000 (for example, an $8,600 account value divided by $1,000 = 8.6), then multiply the result by the number given for your fund under the heading ”Expenses Paid During Period.“
• Based on hypothetical 5% yearly return. This section is intended to help you compare your fund‘s costs with those of other mutual funds. It assumes that the fund had a yearly return of 5% before expenses, but that the expense ratio is unchanged. In this case—because the return used is not the fund’s actual return—the results do not apply to your investment. The example is useful in making comparisons because the Securities and Exchange Commission requires all mutual funds to calculate expenses based on a 5% return. You can assess your fund’s costs by comparing this hypothetical example with the hypothetical examples that appear in shareholder reports of other funds.
Note that the expenses shown in the table are meant to highlight and help you compare ongoing costs only and do not reflect transaction costs incurred by the fund for buying and selling securities. Further, the expenses do not include any purchase, redemption, or account service fees described in the fund prospectus. If such fees were applied to your account, your costs would be higher. Your fund does not carry a “sales load.”
The calculations assume no shares were bought or sold during the period. Your actual costs may have been higher or lower, depending on the amount of your investment and the timing of any purchases or redemptions.
You can find more information about the fund’s expenses, including annual expense ratios, in the Financial Statements section of this report. For additional information on operating expenses and other shareholder costs, please refer to your fund’s current prospectus.
22
| | | |
| Six Months Ended March 31, 2012 | | | |
| | Beginning | Ending | Expenses |
| | Account Value | Account Value | Paid During |
| Capital Opportunity Fund | 9/30/2011 | 3/31/2012 | Period |
| Based on Actual Fund Return | | | |
| Investor Shares | $1,000.00 | $1,232.67 | $2.68 |
| Admiral Shares | 1,000.00 | 1,233.14 | 2.29 |
| Based on Hypothetical 5% Yearly Return | | | |
| Investor Shares | $1,000.00 | $1,022.60 | $2.43 |
| Admiral Shares | 1,000.00 | 1,022.95 | 2.07 |
The calculations are based on expenses incurred in the most recent six-month period. The fund’s annualized six-month expense ratios for that period are 0.48% for Investor Shares and 0.41% for Admiral Shares. The dollar amounts shown as “Expenses Paid” are equal to the annualized expense ratio multiplied by the average account value over the period, multiplied by the number of days in the most recent six-month period, then divided by the number of days in the most recent 12-month period.
23
Trustees Approve Advisory Agreement
The board of trustees of Vanguard Capital Opportunity Fund has renewed the fund’s investment advisory agreement with PRIMECAP Management Company. The board determined that the retention of the advisor was in the best interests of the fund and its shareholders.
The board based its decision upon an evaluation of the advisor’s investment staff, portfolio management process, and performance. The trustees considered the factors discussed below, among others. However, no single factor determined whether the board approved the agreement. Rather, it was the totality of the circumstances that drove the board’s decision.
Nature, extent, and quality of services
The board considered the quality of the fund’s investment management over both the short and long term, and took into account the organizational depth and stability of the advisor. The board noted that PRIMECAP Management, founded in 1983, is recognized for its long-term approach to growth-equity investing. Four experienced portfolio managers are responsible for separate sub-portfolios, and each portfolio manager employs a fundamental, research-driven approach in seeking to identify companies with long-term growth potential overlooked by the market and whose stock is trading at attractive valuation levels. The firm has managed the fund since 1998.
The board concluded that the advisor’s experience, stability, depth, and performance, among other factors, warranted continuation of the advisory agreement.
Investment performance
The board considered the short- and long-term performance of the fund, including any periods of outperformance or underperformance of a relevant benchmark and peer group. The board concluded that the advisor has carried out the fund’s investment strategy in disciplined fashion and that the fund has underperformed its benchmark over the short term. The board noted that the fund has underperformed its peer group over the short term, but has outperformed it over the long term. Information about the fund’s most recent performance can be found in the Performance Summary section of this report.
Cost
The board concluded that the fund’s expense ratio was well below the average expense ratio charged by funds in its peer group and that the fund’s advisory fee rate was also well below its peer-group average. Information about the fund’s expenses appears in the About Your Fund’s Expenses section of this report as well as in the Financial Statements section, which also includes information about the fund’s advisory fee rate.
The board did not consider profitability of PRIMECAP Management in determining whether to approve the advisory fee, because PRIMECAP Management is independent of Vanguard, and the advisory fee is the result of arm’s-length negotiations.
The benefit of economies of scale
The board concluded that the fund’s shareholders benefit from economies of scale because of the breakpoints in the fund’s advisory fee schedule. The breakpoints reduce the effective rate of the fee as the fund’s assets increase.
The board will consider whether to renew the advisory agreement again after a one-year period.
24
Glossary
30-Day SEC Yield. A fund’s 30-day SEC yield is derived using a formula specified by the U.S. Securities and Exchange Commission. Under the formula, data related to the fund’s security holdings in the previous 30 days are used to calculate the fund’s hypothetical net income for that period, which is then annualized and divided by the fund’s estimated average net assets over the calculation period. For the purposes of this calculation, a security’s income is based on its current market yield to maturity (for bonds), its actual income (for asset-backed securities), or its projected dividend yield (for stocks). Because the SEC yield represents hypothetical annualized income, it will differ—at times significantly—from the fund’s actual experience. As a result, the fund’s income distributions may be higher or lower than implied by the SEC yield.
Beta. A measure of the magnitude of a fund’s past share-price fluctuations in relation to the ups and downs of a given market index. The index is assigned a beta of 1.00. Compared with a given index, a fund with a beta of 1.20 typically would have seen its share price rise or fall by 12% when the index rose or fell by 10%. For this report, beta is based on returns over the past 36 months for both the fund and the index. Note that a fund’s beta should be reviewed in conjunction with its R-squared (see definition). The lower the R-squared, the less correlation there is between the fund and the index, and the less reliable beta is as an indicator of volatility.
Dividend Yield. Dividend income earned by stocks, expressed as a percentage of the aggregate market value (or of net asset value, for a fund). The yield is determined by dividing the amount of the annual dividends by the aggregate value (or net asset value) at the end of the period. For a fund, the dividend yield is based solely on stock holdings and does not include any income produced by other investments.
Earnings Growth Rate. The average annual rate of growth in earnings over the past five years for the stocks now in a fund.
Equity Exposure. A measure that reflects a fund’s investments in stocks and stock futures. Any holdings in short-term reserves are excluded.
Expense Ratio. A fund’s total annual operating expenses expressed as a percentage of the fund’s average net assets. The expense ratio includes management and administrative expenses, but does not include the transaction costs of buying and selling portfolio securities.
Foreign Holdings. The percentage of a fund represented by securities or depositary receipts of companies based outside the United States.
Inception Date. The date on which the assets of a fund (or one of its share classes) are first invested in accordance with the fund’s investment objective. For funds with a subscription period, the inception date is the day after that period ends. Investment performance is measured from the inception date.
Median Market Cap. An indicator of the size of companies in which a fund invests; the midpoint of market capitalization (market price x shares outstanding) of a fund’s stocks, weighted by the proportion of the fund’s assets invested in each stock. Stocks representing half of the fund’s assets have market capitalizations above the median, and the rest are below it.
Price/Book Ratio. The share price of a stock divided by its net worth, or book value, per share. For a fund, the weighted average price/book ratio of the stocks it holds.
25
Price/Earnings Ratio. The ratio of a stock’s current price to its per-share earnings over the past year. For a fund, the weighted average P/E of the stocks it holds. P/E is an indicator of market expectations about corporate prospects; the higher the P/E, the greater the expectations for a company’s future growth.
R-Squared. A measure of how much of a fund’s past returns can be explained by the returns from the market in general, as measured by a given index. If a fund’s total returns were precisely synchronized with an index’s returns, its R-squared would be 1.00. If the fund’s returns bore no relationship to the index’s returns, its R-squared would be 0. For this report, R-squared is based on returns over the past 36 months for both the fund and the index.
Return on Equity. The annual average rate of return generated by a company during the past five years for each dollar of shareholder’s equity (net income divided by shareholder’s equity). For a fund, the weighted average return on equity for the companies whose stocks it holds.
Short-Term Reserves. The percentage of a fund invested in highly liquid, short-term securities that can be readily converted to cash.
Turnover Rate. An indication of the fund’s trading activity. Funds with high turnover rates incur higher transaction costs and may be more likely to distribute capital gains (which may be taxable to investors). The turnover rate excludes in-kind transactions, which have minimal impact on costs.
26
This page intentionally left blank.
The People Who Govern Your Fund
The trustees of your mutual fund are there to see that the fund is operated and managed in your best interests since, as a shareholder, you are a part owner of the fund. Your fund’s trustees also serve on the board of directors of The Vanguard Group, Inc., which is owned by the Vanguard funds and provides services to them on an at-cost basis.
A majority of Vanguard’s board members are independent, meaning that they have no affiliation with Vanguard or the funds they oversee, apart from the sizable personal investments they have made as private individuals. The independent board members have distinguished backgrounds in business, academia, and public service. Each of the trustees and executive officers oversees 179 Vanguard funds.
The following table provides information for each trustee and executive officer of the fund. More information about the trustees is in the Statement of Additional Information, which can be obtained, without charge, by contacting Vanguard at 800-662-7447, or online at vanguard.com.
| |
| InterestedTrustee1 | and Delphi Automotive LLP (automotive components); |
| Senior Advisor at New Mountain Capital; Trustee of |
| The Conference Board. |
| F. William McNabb III | |
| Born 1957. Trustee Since July 2009. Chairman of the | Amy Gutmann |
| Board. Principal Occupation(s) During the Past Five | Born 1949. Trustee Since June 2006. Principal |
| Years: Chairman of the Board of The Vanguard Group, | Occupation(s) During the Past Five Years: President |
| Inc., and of each of the investment companies served | of the University of Pennsylvania; Christopher H. |
| by The Vanguard Group, since January 2010; Director | Browne Distinguished Professor of Political Science |
| of The Vanguard Group since 2008; Chief Executive | in the School of Arts and Sciences with secondary |
| Officer and President of The Vanguard Group and of | appointments at the Annenberg School for Commu- |
| each of the investment companies served by The | nication and the Graduate School of Education |
| Vanguard Group since 2008; Director of Vanguard | of the University of Pennsylvania; Director of |
| Marketing Corporation; Managing Director of The | Carnegie Corporation of New York, Schuylkill River |
| Vanguard Group (1995–2008). | Development Corporation, and Greater Philadelphia |
| Chamber of Commerce; Trustee of the National |
| Constitution Center; Chair of the Presidential |
| IndependentTrustees | Commission for the Study of Bioethical Issues. |
| |
| JoAnn Heffernan Heisen |
| Emerson U. Fullwood | Born 1950. Trustee Since July 1998. Principal |
| Born 1948. Trustee Since January 2008. Principal | Occupation(s) During the Past Five Years: Corporate |
| Occupation(s) During the Past Five Years: Executive | Vice President and Chief Global Diversity Officer |
| Chief Staff and Marketing Officer for North America | (retired 2008) and Member of the Executive |
| and Corporate Vice President (retired 2008) of Xerox | Committee (1997–2008) of Johnson & Johnson |
| Corporation (document management products and | (pharmaceuticals/medical devices/consumer |
| services); Executive in Residence and 2010 | products); Director of Skytop Lodge Corporation |
| Distinguished Minett Professor at the Rochester | (hotels), the University Medical Center at Princeton, |
| Institute of Technology; Director of SPX Corporation | the Robert Wood Johnson Foundation, and the Center |
| (multi-industry manufacturing), the United Way of | for Talent Innovation; Member of the Advisory Board |
| Rochester, Amerigroup Corporation (managed health | of the Maxwell School of Citizenship and Public Affairs |
| care), the University of Rochester Medical Center, | at Syracuse University. |
| Monroe Community College Foundation, and North | |
| Carolina A&T University. | F. Joseph Loughrey |
| Born 1949. Trustee Since October 2009. Principal |
| Rajiv L. Gupta | Occupation(s) During the Past Five Years: President |
| Born 1945. Trustee Since December 2001.2 | and Chief Operating Officer (retired 2009) of Cummins |
| Principal Occupation(s) During the Past Five Years: | Inc. (industrial machinery); Director of SKF AB |
| Chairman and Chief Executive Officer (retired 2009) | (industrial machinery), Hillenbrand, Inc. (specialized |
| and President (2006–2008) of Rohm Haas Co. | consumer services), the Lumina Foundation for |
| (chemicals); Director of Tyco International, Ltd. | |
| (diversified manufacturing and services), Hewlett- | |
| Packard Co. (electronic computer manufacturing), | |
| |
| | |
| Education, and Oxfam America; Chairman of the | Executive Officers | |
| Advisory Council for the College of Arts and Letters | | |
| and Member of the Advisory Board to the Kellogg | Glenn Booraem | |
| Institute for International Studies at the University | Born 1967. Controller Since July 2010. Principal |
| of Notre Dame. | Occupation(s) During the Past Five Years: Principal |
| | of The Vanguard Group, Inc.; Controller of each of |
| Mark Loughridge | the investment companies served by The Vanguard |
| Born 1953. Trustee Since March 2012. Principal | Group; Assistant Controller of each of the investment |
| Occupation(s) During the Past Five Years: Senior Vice | companies served by The Vanguard Group (2001–2010). |
| President and Chief Financial Officer at IBM (information | | |
| technology services); Fiduciary Member of IBM’s | Thomas J. Higgins | |
| Retirement Plan Committee. | Born 1957. Chief Financial Officer Since September |
| | 2008. Principal Occupation(s) During the Past Five |
| Scott C. Malpass | Years: Principal of The Vanguard Group, Inc.; Chief |
| Born 1962. Trustee Since March 2012. Principal | Financial Officer of each of the investment companies |
| Occupation(s) During the Past Five Years: Chief | served by The Vanguard Group; Treasurer of each of |
| Investment Officer and Vice President at the University | the investment companies served by The Vanguard |
| of Notre Dame; Assistant Professor of Finance at the | Group (1998–2008). | |
| Mendoza College of Business at Notre Dame; Member | | |
| of the Notre Dame 403(b) Investment Committee; | Kathryn J. Hyatt | |
| Director of TIFF Advisory Services, Inc. (investment | Born 1955. Treasurer Since November 2008. Principal |
| advisor); Member of the Investment Advisory | Occupation(s) During the Past Five Years: Principal of |
| Committees of the Financial Industry Regulatory | The Vanguard Group, Inc.; Treasurer of each of the |
| Authority (FINRA) and of Major League Baseball. | investment companies served by The Vanguard |
| | Group; Assistant Treasurer of each of the investment |
| André F. Perold | companies served by The Vanguard Group (1988–2008). |
| Born 1952. Trustee Since December 2004. Principal | | |
| Occupation(s) During the Past Five Years: George | Heidi Stam | |
| Gund Professor of Finance and Banking at the Harvard | Born 1956. Secretary Since July 2005. Principal |
| Business School (retired 2011); Chief Investment | Occupation(s) During the Past Five Years: Managing |
| Officer and Managing Partner of HighVista Strategies | Director of The Vanguard Group, Inc.; General Counsel |
| LLC (private investment firm); Director of Rand | of The Vanguard Group; Secretary of The Vanguard |
| Merchant Bank; Overseer of the Museum of Fine | Group and of each of the investment companies |
| Arts Boston. | served by The Vanguard Group; Director and Senior |
| | Vice President of Vanguard Marketing Corporation; |
| Alfred M. Rankin, Jr. | Principal of The Vanguard Group (1997–2006). |
| Born 1941. Trustee Since January 1993. Principal | | |
| Occupation(s) During the Past Five Years: Chairman, | | |
| President, and Chief Executive Officer of NACCO | Vanguard Senior ManagementTeam |
| Industries, Inc. (forklift trucks/housewares/lignite); | | |
| Director of Goodrich Corporation (industrial products/ | Mortimer J. Buckley | Michael S. Miller |
| aircraft systems and services) and the National | Kathleen C. Gubanich | James M. Norris |
| Association of Manufacturers; Chairman of the Board | Paul A. Heller | Glenn W. Reed |
| of the Federal Reserve Bank of Cleveland and of | Martha G. King | George U. Sauter |
| University Hospitals of Cleveland; Advisory Chairman | Chris D. McIsaac | |
| of the Board of The Cleveland Museum of Art. | | |
| | |
| Peter F. Volanakis | Chairman Emeritus and Senior Advisor |
| Born 1955. Trustee Since July 2009. Principal | | |
| Occupation(s) During the Past Five Years: President | John J. Brennan | |
| and Chief Operating Officer (retired 2010) of Corning | Chairman, 1996–2009 | |
| Incorporated (communications equipment); Director | Chief Executive Officer and President, 1996–2008 | |
| of SPX Corporation (multi-industry manufacturing); | | |
| Overseer of the Amos Tuck School of Business | |
| Administration at Dartmouth College; Advisor to the | Founder | |
| Norris Cotton Cancer Center. | | |
| John C. Bogle | |
| Chairman and Chief Executive Officer, 1974–1996 | |
| | | |
1 Mr. McNabb is considered an “interested person,” as defined in the Investment Company Act of 1940, because he is an officer of the Vanguard funds.
2 December 2002 for Vanguard Equity Income Fund, Vanguard Growth Equity Fund, the Vanguard Municipal Bond Funds, and the Vanguard State Tax-Exempt Funds.
|  |
| P.O. Box 2600 |
| Valley Forge, PA 19482-2600 |
Connect with Vanguard® > vanguard.com
| |
| Fund Information > 800-662-7447 | |
| Direct Investor Account Services > 800-662-2739 | |
| Institutional Investor Services > 800-523-1036 | |
| Text Telephone for People | |
| With Hearing Impairment > 800-749-7273 | |
| |
| This material may be used in conjunction | |
| with the offering of shares of any Vanguard | |
| fund only if preceded or accompanied by | |
| the fund’s current prospectus. | |
| |
| All comparative mutual fund data are from Lipper Inc. or | |
| Morningstar, Inc., unless otherwise noted. | |
| |
| You can obtain a free copy of Vanguard’s proxy voting | |
| guidelines by visiting vanguard.com/proxyreporting or by | |
| calling Vanguard at 800-662-2739. The guidelines are | |
| also available from the SEC’s website, sec.gov. In | |
| addition, you may obtain a free report on how your fund | |
| voted the proxies for securities it owned during the 12 | |
| months ended June 30. To get the report, visit either | |
| vanguard.com/proxyreporting or sec.gov. | |
| |
| You can review and copy information about your fund at | |
| the SEC’s Public Reference Room in Washington, D.C. To | |
| find out more about this public service, call the SEC at | |
| 202-551-8090. Information about your fund is also | |
| available on the SEC’s website, and you can receive | |
| copies of this information, for a fee, by sending a | |
| request in either of two ways: via e-mail addressed to | |
| publicinfo@sec.gov or via regular mail addressed to the | |
| Public Reference Section, Securities and Exchange | |
| Commission, Washington, DC 20549-1520. | |
| |
| |
| | © 2012 The Vanguard Group, Inc. |
| | All rights reserved. |
| | Vanguard Marketing Corporation, Distributor. |
| |
| | Q1112 052012 |
 |
| Semiannual Report | March 31, 2012 |
| Vanguard Global Equity Fund |
> Vanguard Global Equity Fund returned more than 21% for the six months ended March 31, 2012, a step ahead of its benchmark and the average for its peer funds.
> Global stock markets rallied in the period, buoyed largely by seemingly improved prospects regarding the European debt crisis and the U.S. economy.
> Although markets in all regions posted positive results, more than half the fund’s return came from the United States.
| |
| Contents | |
| Your Fund’s Total Returns. | 1 |
| Chairman’s Letter. | 2 |
| Advisors’ Report. | 6 |
| Fund Profile. | 10 |
| Performance Summary. | 12 |
| Financial Statements. | 13 |
| About Your Fund’s Expenses. | 28 |
| Trustees Approve Advisory Agreements. | 30 |
| Glossary. | 32 |
Please note: The opinions expressed in this report are just that—informed opinions. They should not be considered promises or advice.
Also, please keep in mind that the information and opinions cover the period through the date on the front of this report. Of course, the
risks of investing in your fund are spelled out in the prospectus.
See the Glossary for definitions of investment terms used in this report.
About the cover: Vanguard was named for the HMS Vanguard, flagship of British Admiral Horatio Nelson. A ship—whose
performance and safety depend on the work of all hands—has served as a fitting metaphor for the Vanguard crew as we
strive to help clients reach their financial goals.
Your Fund’s Total Returns
| |
| Six Months Ended March 31, 2012 | |
| | Total |
| | Returns |
| Vanguard Global Equity Fund | 21.26% |
| MSCI All Country World Index | 19.91 |
| Global Funds Average | 19.75 |
| Global Funds Average: Derived from data provided by Lipper Inc. | |
Your Fund’s Performance at a Glance
September 30, 2011, Through March 31, 2012
| | | | |
| | | | Distributions Per Share |
| | Starting | Ending | Income | Capital |
| | Share Price | Share Price | Dividends | Gains |
| Vanguard Global Equity Fund | $15.24 | $18.07 | $0.362 | $0.000 |
1

Chairman’s Letter
Dear Shareholder,
Global stock markets made an impressive recovery from last summer’s lows. With fears abating about the likelihood of a disorderly default in Greece, a hard landing for the Chinese economy, or a double-dip recession in the United States, stock markets rose across the board, with all regions and sectors posting positive six-month returns.
Vanguard Global Equity Fund returned 21.26% for the fiscal half-year ended March 31, 2012, outpacing the 19.91% return of its benchmark, the MSCI All Country World Index, as well as the 19.75% average return of its peer funds.
A surge of optimism fueled a powerful global rally in stocks
During the past six months, optimism displaced the apprehension that had restrained stock prices through summer 2011. Investors’ improving spirits reflected confidence that the slow, grinding economic expansion in the United States was at last gathering momentum, that Europe’s debt crisis could be contained, and that China’s economy would slow but remain strong.
The broad U.S. stock market returned more than 26%. Markets abroad returned more than 15% in aggregate, with Europe and China faring even better (the MSCI Europe Index rose nearly 17% and the MSCI China Index nearly 19%).
2
For most bonds except munis, six-month returns were subdued
The broad taxable bond market produced a modest six-month return of 1.43%. In general, interest rates remained more or less steady at very low levels. In some segments of the market, however, yields crept lower still, boosting bond prices. The broad municipal bond market, for example, produced a solid six-month return of 3.91% as investors bid up muni prices.
As it has since December 2008, the Federal Reserve Board kept its target for the shortest-term interest rates between 0% and 0.25%. That policy has kept a tight lid on the returns available from money market funds and savings accounts.
For the Global Equity Fund, U.S. stocks drove performance
During the six months under review, the Global Equity Fund remained very broadly diversified. It was invested in more than 900 stocks representing more than 40 countries.
Compared with its benchmark, the fund’s holdings were tilted slightly away from North America, where markets performed strongly, in favor of emerging markets and the Pacific region’s developed markets, which were relative laggards. However, the advisors’ skillful stock selection in North America and particularly in Europe enabled the fund to outpace its comparative standards by more than a percentage point. Viewed from an industry perspective, stock selection in health care and
| | | |
| Market Barometer | | | |
| |
| | | | Total Returns |
| | | Periods Ended March 31, 2012 |
| | Six | One | Five Years |
| | Months | Year | (Annualized) |
| Stocks | | | |
| Russell 1000 Index (Large-caps) | 26.27% | 7.86% | 2.19% |
| Russell 2000 Index (Small-caps) | 29.83 | -0.18 | 2.13 |
| Dow Jones U.S. Total Stock Market Index | 26.60 | 7.16 | 2.47 |
| MSCI All Country World Index ex USA (International) | 15.37 | -7.18 | -1.56 |
| |
| Bonds | | | |
| Barclays Capital U.S. Aggregate Bond Index (Broad | | | |
| taxable market) | 1.43% | 7.71% | 6.25% |
| Barclays Capital Municipal Bond Index (Broad | | | |
| tax-exempt market) | 3.91 | 12.07 | 5.42 |
| Citigroup Three-Month U.S. Treasury Bill Index | 0.00 | 0.05 | 1.11 |
| |
| CPI | | | |
| Consumer Price Index | 1.10% | 2.65% | 2.24% |
3
materials was notable, boosting the overall return significantly. The fund’s consumer discretionary and industrial holdings were its main detractors.
U.S. stocks, which represented about 40% of the fund’s assets on average, accounted for more than half of its six-month return. Data released during the period painted a picture of an economy on the mend: The employment situation got a little better, manufacturing activity expanded, and business investment held steady. Given this environment, nine out of ten sectors posted double-digit returns for the index. The fund performed even better overall, with the advisors’ positioning among health care and consumer staples stocks offsetting subpar positions in industrials and information technology.
The fund’s European holdings contributed just over 4 percentage points to the overall return. In this region, too, more cyclical sectors performed well—materials, consumer discretionary, and industrials returned more than 26% each for the fund—while telecom and utilities were a drag on performance.
Returns varied greatly by country. Markets in many of the more fiscally stable European countries, including Germany, Sweden, Denmark, and Norway, posted gains of more than 25%. The markets in countries more scarred by the debt crisis, including Portugal, Spain, and Greece, ended the period in negative territory. Careful stock selection enabled the fund to do better than its index in the latter markets.
Expense Ratios
Your Fund Compared With Its Peer Group
| | |
| | | Peer Group |
| | Fund | Average |
| Global Equity Fund | 0.54% | 1.44% |
The fund expense ratio shown is from the prospectus dated January 26, 2012, and represents estimated costs for the current fiscal year. For the six months ended March 31, 2012, the fund’s annualized expense ratio was 0.56%. The peer-group expense ratio is derived from data provided by Lipper Inc. and captures information through year-end 2011.
Peer group: Global Funds.
4
Financial stocks did well in both the United States and Europe. The implementation of a bailout plan for Greece, along with a move by the European Central Bank to provide liquidity to European banks, helped investors to feel more positive regarding financial stocks, as did the favorable results of the Federal Reserve’s “stress tests” on U.S. banks. For the fund, U.S. financials gained about 33% and European financials about 18%.
Some of the largest emerging-market economies experienced headwinds during the period. Tight monetary policy imposed by governments in China, India, and Brazil to counter inflationary concerns had a dampening effect on economic activity. Yet investors’ appetite for greater risk resulted in solid gains from emerging markets, which contributed more than 3 percentage points to the fund’s return. Subpar stock selection in the consumer staples and energy sectors was more than offset by the performance of the fund’s information technology and materials holdings within these markets.
For more about the advisors’ strategies and the fund’s positioning during the six months, please see the Advisors’ Report that follows this letter.
The benefit of diversification on a worldwide scale
One of our core investment beliefs at Vanguard is that adding diversification to a portfolio is a powerful strategy for managing risk. Because markets behave differently from one another over time, owning a portfolio with broad exposure to a number of markets helps mitigate the impact of the weaker performers while ensuring some participation in those that do better.
Diversifying your portfolio across the U.S. stock market gives you exposure to almost half of the global equity market, and even some exposure to international markets, as many U.S. companies generate revenues abroad. But even broader diversification can work better in terms of managing risk, as a recent Vanguard research paper explains. An analysis of market returns over more than three decades indicates that a portfolio containing both U.S. and non-U.S. stocks would have experienced lower volatility than a U.S.-only portfolio while providing similar returns. (The paper, Considerations for Investing in Non-U.S. Equities, is available at vanguard.com/research.)
Vanguard Global Equity Fund offers one avenue toward such broad diversification, providing investors with opportunities to benefit from stock market performance across developed and emerging markets worldwide.
Thank you for investing with Vanguard.
Sincerely,

F. William McNabb III
Chairman and Chief Executive Officer
April 19, 2012
5
Advisors’ Report
For the six months ended March 31, 2012, Vanguard Global Equity Fund returned 21.26%.Your fund is managed by four independent advisors. This provides exposure to distinct, yet complementary, investment approaches, enhancing the fund’s diversification. It’s not uncommon for different advisors to have different views about individual securities or the broader investment environment.
The advisors, the amount and percentage of fund assets each manages, and brief descriptions of their investment strategies are presented in the table below. Each advisor has also prepared a discussion of the investment environment that existed during the fiscal period and of how portfolio positioning reflects this assessment. These comments were prepared on April 23, 2012.
| | | |
| Vanguard Global Equity Fund Investment Advisors | |
| |
| | Fund Assets Managed | |
| Investment Advisor | % | $ Million | Investment Strategy |
| Marathon Asset Management | 43 | 1,705 | A long-term and contrarian investment philosophy and |
| LLP | | | process with a focus on industry capital cycle analysis |
| | | | and in-depth management assessment. |
| Acadian Asset Management LLC | 33 | 1,283 | A quantitative, active, bottom-up investment process |
| | | | that combines stock and peer-group valuation to arrive |
| | | | at a return forecast for each of more than 40,000 |
| | | | securities in the global universe. |
| AllianceBernstein L.P. | 14 | 545 | A fundamentally based, research-driven approach, |
| | | | focused on finding companies whose long-term |
| | | | earnings power exceeds the level implied by their |
| | | | current stock price. Proprietary quantitative tools aid |
| | | | risk control and portfolio construction. |
| Baillie Gifford Overseas Ltd. | 5 | 213 | The advisor seeks stocks that can generate |
| | | | above-average growth in earnings and cash flow, |
| | | | producing a bottom-up, stock-driven approach to |
| | | | country and asset allocation. An in-depth view on each |
| | | | company is measured against the consensus view, |
| | | | leading to discrepancies and potential opportunities to |
| | | | add value. |
| Cash Investments | 5 | 201 | These short-term reserves are invested by Vanguard in |
| | | | equity index products to simulate investment in stocks. |
| | | | Each advisor may also maintain a modest cash |
| | | | position. |
6
Marathon Asset Management LLP
Portfolio Managers:
Jeremy J. Hosking, Investment Director
Neil M. Ostrer, Investment Director
William J. Arah, Investment Director
The third anniversary of the stock market’s worst point during the financial crisis has now passed. Since then, the MSCI World Index has risen more than 20% a year. Over the six months just ended, the cyclical bias of our portfolio helped performance relative to its benchmark, as did stock selection in all regions except Japan.
Our holdings in Asian markets other than Japan produced the strongest results, with Ayala, the Philippine conglomerate, being the best performer. This stock rose even more than its buoyant domestic market, with investors rewarding the company for its effective growth and efficiency strategies.
U.S. stock selection was weak overall, but a number of U.S. holdings nevertheless made significant contributions to returns. In particular, Liberty Global, the cable company, continued to deliver solid growth, and its share buybacks are ongoing.
The question that now arises is how sustainable the market’s performance will be. Unfortunately, given that company profit margins are at all-time highs and that they tend to revert toward the mean, the market may be out of juice from this source. From here on, the winners will have to be firms that can grow in a mediocre environment or those whose profit margins are still depressed (the financial and housing sectors are good examples of the latter).
The macroeconomic environment remains benign, with government-suppressed interest rates enhancing the relative attractiveness of stocks and other assets. Companies themselves seem to have recognized this, as so many have been buying back their shares; the amount of buybacks in 2011 was one of the highest on record. Slow growth in the economy, if it continues, will support this trend until it is reversed by higher valuations and stock issuance.
Acadian Asset Management LLC
Portfolio Managers:
John R. Chisholm, CFA, Chief Investment Officer
Ronald D. Frashure, CFA, Chairman, President, and CEO
Brian K. Wolahan, CFA, Senior Vice President, Director of Portfolio Management
Global equities rose solidly over the past six months, recovering from the tumult that plagued much of 2011 as investors worried about a potential Greek default, weakness in Europe’s banking system, and a sense of deteriorating economic and financial conditions worldwide.
7
Whereas risk aversion characterized most of last year, with defensive sectors leading in many markets, the first months of 2012 saw cyclical and higher-risk stocks outperforming. Investors appear to have taken heart from a number of hopeful economic signals in the United States as well as from stronger measures to address Europe’s debt problems.
Our portfolio was focused on attractively valued stocks that appeared likely to rise in price based on earnings data, price characteristics, and quality. Our bottom-up stock selection process led to an overweighting of Japan, the United States, China, and South Korea, while Canada, the United Kingdom, and Switzerland were underweighted in comparison with the benchmark. In terms of sectors, our allocation to energy and health care strayed furthest from the benchmark.
Stock selection in the United States was the most productive during the period, with holdings in the health care and technology sectors leading the gains. Our relative performance also benefited from a combination of stock selection and a market underweighting in Canada.
The major drawback in the half-year was stock selection in China, where holdings in the telecom and energy sectors proved costly. Our overweighting of the Japanese market also hurt performance relative to the benchmark. Sector allocations further worked against relative results.
AllianceBernstein L.P.
Portfolio Managers:
Sharon E. Fay, CFA, Head of Bernstein Value Equities and Chief Investment Officer–Global Value Equities
Kevin F. Simms, Co-Chief Investment Officer–International Value Equities and Director of Research–Global and International Value Equities
Henry S. D’Auria, CFA, Co-Chief Investment Officer–International Value Equities and Chief Investment Officer– Emerging Markets Value Equities
Global equities recovered during the past six months after the European Central Bank took decisive action late in 2011 to stem the Eurozone sovereign-debt crisis. Stocks rallied across the world, and volatility began to ease from extremely high levels.
In our portfolio, good stock selection in several sectors, including energy and industrial commodities, was balanced by poor returns from technology holdings. As performance improved in the January–March period, we saw especially strong returns from banks and auto stocks, including many holdings that were among the portfolio’s detractors in 2011.
Trends in the first quarter of 2012 bolstered our confidence in the portfolio’s positioning. We believe that sticking with attractively valued stocks with strong fundamentals is the right strategy as market conditions continue to improve.
8
As the reporting period ended, the spreads in valuation between the cheapest and most expensive quintiles of stocks were still wider than during the financial crisis in 2008. When these spreads have narrowed in the past, our portfolio has tended to outperform. Today, our portfolio holdings as a group rank among the cheapest in the industry; their valuations are nearly as low as they were in 2008–2009, yet with much stronger profitability levels and balance sheets.
Corporate strength, better economic prospects, and growing investor confidence may be creating a virtuous circle for equity markets. Not only has volatility declined, but risk appetite has been improving. Moreover, global equity correlations dropped sharply during the first quarter, which implies that investors are now drawing greater distinctions among companies based on their fundamentals. We believe that lower correlations are a key ingredient for the success of research-driven investment strategies, and in our view, market conditions now look more promising than at any time in recent years.
Baillie Gifford Overseas Ltd.
Portfolio Managers:
Charles Plowden, Joint Senior Partner and Lead Portfolio Manager
Spencer Adair, CFA, Investment Manager
Malcolm MacColl, Investment Manager
Two recent developments stand out as indications that the worst threats left behind by the financial crisis have been averted and that brighter days lie ahead.
First, we have seen strong policy intervention by the European Central Bank to stabilize the Eurozone financial system, and second, we have started to see signs of a recovery in the U.S. economy. Although we still expect the recovery from the credit crisis to be protracted, these are very positive developments.
Even with headwinds in Europe and the United States, the global economy is set to expand at a respectable rate in 2012. Our portfolio remains oriented toward emerging markets, which are the one area of the global economy that will continue to grow strongly. However, we have been anticipating a strong recovery in developed markets and have been gradually taking selective positions in these areas over the past 18 months. Examples of stock purchases we think are strong given our outlook include Harley Davidson and Carlsberg, whose investment cases are partly predicated on recoveries in the United States and Europe.
Despite the optimistic signs and the recent stock rally, we think market sentiment remains quite gloomy. There is still too little differentiation between companies with sustainably strong growth and those with inferior competitive positions. We believe this is an excellent time to be a global stockpicker with an eye for companies that have a combination of strong balance sheets, innovative employees, and superior products or inventive business models. As our portfolio is full of these, and we expect further recovery in the economy, we look forward with continuing confidence.
9
Global Equity Fund
Fund Profile
As of March 31, 2012
| | |
| Portfolio Characteristics | | |
| | | MSCI All |
| | | Country |
| | Fund | World Index |
| Number of Stocks | 968 | 2,424 |
| Median Market Cap | $16.6B | $36.0B |
| Price/Earnings Ratio | 13.1x | 14.7x |
| Price/Book Ratio | 1.6x | 1.8x |
| Return on Equity | 15.5% | 18.2% |
| Earnings Growth Rate | 9.3% | 6.0% |
| Dividend Yield | 2.3% | 2.7% |
| Turnover Rate | | |
| (Annualized) | 42% | — |
| Ticker Symbol | VHGEX | — |
| Expense Ratio1 | 0.54% | — |
| Short-Term Reserves | 1.0% | — |
| | |
| Sector Diversification (% of equity exposure) |
| | | MSCI All |
| | | Country |
| | Fund | World Index |
| Consumer Discretionary | 16.8% | 10.5% |
| Consumer Staples | 9.6 | 10.2 |
| Energy | 9.2 | 11.3 |
| Financials | 20.6 | 19.5 |
| Health Care | 7.9 | 8.9 |
| Industrials | 12.1 | 10.5 |
| Information Technology | 10.6 | 13.0 |
| Materials | 6.4 | 7.9 |
| Telecommunication | | |
| Services | 5.4 | 4.5 |
| Utilities | 1.4 | 3.7 |
| |
| Volatility Measures | |
| | MSCI All |
| | Country |
| | World Index |
| R-Squared | 0.99 |
| Beta | 1.05 |
These measures show the degree and timing of the fund’s fluctuations compared with the index over 36 months.
| | |
| Ten Largest Holdings (% of total net assets) |
| Jardine Holdings Ltd. | Industrial | |
| | Conglomerates | 1.7% |
| Apple Inc. | Computer | |
| | Hardware | 1.2 |
| Philip Morris | | |
| International Inc. | Tobacco | 1.2 |
| Royal Dutch Shell plc | Integrated Oil & | |
| | Gas | 1.1 |
| Liberty Global Inc. | Cable & Satellite | 1.0 |
| BP plc | Integrated Oil & | |
| | Gas | 1.0 |
| Samsung Electronics Co. | | |
| Ltd. | Semiconductors | 1.0 |
| Amazon.com Inc. | Internet Retail | 0.9 |
| Costco Wholesale Corp. | Hypermarkets & | |
| | Super Centers | 0.8 |
| Nippon Telegraph & | Integrated | |
| Telephone Corp. | Telecommunication | |
| | Services | 0.8 |
| Top Ten | | 10.7% |
The holdings listed exclude any temporary cash investments and equity index products.
Allocation by Region (% of equity exposure)

1 The expense ratio shown is from the prospectus dated January 26, 2012, and represents estimated costs for the current fiscal year. For the six months ended March 31, 2012, the annualized expense ratio was 0.56%.
10
Global Equity Fund
| | |
| Market Diversification (% of equity exposure) |
| | | MSCI All |
| | | Country |
| | | World |
| | Fund | Index |
| Europe | | |
| United Kingdom | 8.6% | 8.2% |
| France | 2.6 | 3.4 |
| Germany | 2.1 | 3.2 |
| Switzerland | 1.4 | 3.1 |
| Other | 5.0 | 5.7 |
| Subtotal | 19.7% | 23.6% |
| Pacific | | |
| Japan | 8.3% | 7.9% |
| Hong Kong | 3.8 | 1.1 |
| Australia | 2.6 | 3.1 |
| Other | 0.8 | 0.7 |
| Subtotal | 15.5% | 12.8% |
| Emerging Markets | | |
| South Korea | 2.9% | 2.0% |
| China | 2.4 | 2.2 |
| Philippines | 1.8 | 0.1 |
| South Africa | 1.7 | 1.0 |
| Taiwan | 1.7 | 1.4 |
| Thailand | 1.7 | 0.3 |
| Malaysia | 1.5 | 0.4 |
| Russia | 1.2 | 0.9 |
| Brazil | 1.0 | 1.9 |
| Other | 1.9 | 2.8 |
| Subtotal | 17.8% | 13.0% |
| North America | | |
| United States | 43.7% | 46.1% |
| Canada | 3.3 | 4.3 |
| Subtotal | 47.0% | 50.4% |
| Middle East | 0.0% | 0.2% |
11
Global Equity Fund
Performance Summary
All of the returns in this report represent past performance, which is not a guarantee of future results that may be achieved by the fund. (Current performance may be lower or higher than the performance data cited. For performance data current to the most recent month-end, visit our website at vanguard.com/performance.) Note, too, that both investment returns and principal value can fluctuate widely, so an investor’s shares, when sold, could be worth more or less than their original cost. The returns shown do not reflect taxes that a shareholder would pay on fund distributions or on the sale of fund shares.
Fiscal-Year Total Returns (%): September 30, 2001, Through March 31, 2012
Spliced Global Equity Index: MSCI All Country World Index returns gross of taxes through March 31, 2007; MSCI All Country World Index returns net of withholding taxes applicable to Luxembourg holding companies thereafter.
Note: For 2012, performance data reflect the six months ended March 31, 2012.
Average Annual Total Returns: Periods Ended March 31, 2012
| | | | |
| | Inception | One | Five | Ten |
| | Date | Year | Years | Years |
| Global Equity Fund | 8/14/1995 | -1.23% | -1.74% | 7.11% |
See Financial Highlights for dividend and capital gains information.
12
Global Equity Fund
Financial Statements (unaudited)
Statement of Net Assets—Investments Summary
As of March 31, 2012
This Statement summarizes the fund’s holdings by asset type. Details are reported for each of the fund’s 50 largest individual holdings and for investments that, in total for any issuer, represent more than 1% of the fund’s net assets. The total value of smaller holdings is reported as a single amount within each category.
The fund reports a complete list of its holdings in regulatory filings four times in each fiscal year, at the quarter-ends. For the second and fourth fiscal quarters, the complete listing of the fund’s holdings is available electronically on vanguard.com and on the Securities and Exchange Commission’s website (sec.gov), or you can have it mailed to you without charge by calling 800-662-7447. For the first and third fiscal quarters, the fund files the lists with the SEC on Form N-Q. Shareholders can look up the fund’s Forms N-Q on the SEC’s website. Forms N-Q may also be reviewed and copied at the SEC’s Public Reference Room (see the back cover of this report for further information).
| | | |
| | | Market | Percentage |
| | | Value | of Net |
| | Shares | ($000) | Assets |
| Common Stocks | | | |
| Australia | | | |
| BHP Billiton Ltd. | 637,347 | 22,976 | 0.6% |
| Santos Ltd. | 1,165,917 | 17,216 | 0.5% |
| Australia—Other † | | 40,879 | 1.0% |
| | | 81,071 | 2.1% |
| |
| Austria † | | 2,402 | 0.1% |
| |
| Belgium † | | 10,408 | 0.3% |
| |
| Brazil † | | 38,625 | 1.0% |
| |
| Canada | | | |
| Rogers Communications Inc. Class B | 732,006 | 29,061 | 0.7% |
| Bombardier Inc. Class B | 3,931,616 | 16,318 | 0.4% |
| Canada—Other † | | 84,912 | 2.2% |
| | | 130,291 | 3.3% |
| |
| Chile † | | 5,788 | 0.1% |
| |
| China | | | |
| China Mobile Ltd. | 2,281,500 | 25,123 | 0.7% |
| China Petroleum & Chemical Corp. | 22,904,000 | 24,937 | 0.6% |
| PetroChina Co. Ltd. | 11,302,000 | 15,915 | 0.4% |
| China Telecom Corp. Ltd. | 6,112,000 | 3,373 | 0.1% |
| China Resources Enterprise Ltd. | 336,067 | 1,173 | 0.0% |
| Dongfeng Motor Group Co. Ltd. | 310,000 | 562 | 0.0% |
| China—Other † | | 22,999 | 0.6% |
| | | 94,082 | 2.4% |
13
Global Equity Fund
| | | |
| | | Market | Percentage |
| | | Value• | of Net |
| | Shares | ($000) | Assets |
| Colombia † | | 399 | 0.0% |
| |
| Cyprus † | | 914 | 0.0% |
| |
| Denmark † | | 21,029 | 0.5% |
| |
| Egypt † | | 2,523 | 0.1% |
| |
| Finland † | | 10,983 | 0.3% |
| |
| France | | | |
| European Aeronautic Defence and Space Co. NV | 582,109 | 23,839 | 0.6% |
| France—Other † | | 69,063 | 1.7% |
| | | 92,902 | 2.3% |
| |
| Germany † | | 71,924 | 1.8% |
| |
| Greece † | | 2,855 | 0.1% |
| |
| Hong Kong | | | |
| Jardine Strategic Holdings Ltd. | 1,227,900 | 37,497 | 0.9% |
| Jardine Matheson Holdings Ltd. | 616,302 | 30,871 | 0.8% |
| Mandarin Oriental International Ltd. | 806,690 | 1,304 | 0.0% |
| Hong Kong—Other † | | 78,160 | 2.0% |
| | | 147,832 | 3.7% |
| |
| Hungary † | | 307 | 0.0% |
| |
| India † | | 8,553 | 0.2% |
| |
| Indonesia † | | 19,024 | 0.5% |
| |
| Ireland † | | 10,628 | 0.3% |
| |
| Israel † | | 780 | 0.0% |
| |
| Italy † | | 27,296 | 0.7% |
| |
| Japan | | | |
| Nippon Telegraph & Telephone Corp. | 676,000 | 30,639 | 0.8% |
| Hitachi Ltd. | 3,102,000 | 20,070 | 0.5% |
| Daito Trust Construction Co. Ltd. | 217,200 | 19,614 | 0.5% |
| Japan—Other † | | 235,979 | 6.0% |
| | | 306,302 | 7.8% |
| Malaysia | | | |
| CIMB Group Holdings Bhd. | 6,616,838 | 16,616 | 0.4% |
| Malaysia—Other † | | 41,751 | 1.1% |
| | | 58,367 | 1.5% |
| |
| Mexico † | | 11,696 | 0.3% |
| |
| Netherlands † | | 24,276 | 0.6% |
| |
| New Zealand † | | 750 | 0.0% |
14
Global Equity Fund
| | | |
| | | Market | Percentage |
| | | Value | of Net |
| | Shares | ($000) | Assets |
| |
| Norway † | | 18,194 | 0.5% |
| |
| Philippines | | | |
| Ayala Corp. | 2,458,573 | 23,301 | 0.6% |
| Philippines—Other † | | 45,596 | 1.1% |
| | | 68,897 | 1.7% |
| |
| Poland † | | 16,861 | 0.4% |
| |
| Portugal † | | 2,118 | 0.1% |
| |
| Russia | | | |
| Gazprom OAO ADR | 1,911,418 | 23,377 | 0.6% |
| Lukoil OAO ADR | 362,739 | 21,891 | 0.5% |
| Russia—Other † | | 3,052 | 0.1% |
| | | 48,320 | 1.2% |
| |
| Singapore † | | 30,986 | 0.8% |
| |
| South Africa † | | 67,262 | 1.7% |
| |
| South Korea | | | |
| Samsung Electronics Co. Ltd. | 31,035 | 35,009 | 0.9% |
| Hyundai Motor Co. | 97,255 | 20,083 | 0.5% |
| Kia Motors Corp. | 256,128 | 16,807 | 0.4% |
| 1 South Korea—Other † | | 40,000 | 1.0% |
| | | 111,899 | 2.8% |
| |
| Spain † | | 16,170 | 0.4% |
| |
| Sweden † | | 30,503 | 0.8% |
| |
| Switzerland † | | 54,796 | 1.4% |
| |
| Taiwan | | | |
| Fubon Financial Holding Co. Ltd. | 14,392,445 | 16,245 | 0.4% |
| Taiwan—Other † | | 39,036 | 1.0% |
| | | 55,281 | 1.4% |
| |
| Thailand † | | 65,048 | 1.6% |
| |
| Turkey † | | 13,229 | 0.3% |
| |
| United Kingdom | | | |
| Royal Dutch Shell plc Class A | 1,125,175 | 39,422 | 1.0% |
| BP plc | 4,136,462 | 30,806 | 0.8% |
| Vodafone Group plc | 7,010,952 | 19,339 | 0.5% |
| Rio Tinto plc | 292,821 | 16,230 | 0.4% |
| Royal Dutch Shell plc Class B | 146,694 | 5,166 | 0.1% |
| United Kingdom—Other † | | 195,878 | 5.0% |
| | | 306,841 | 7.8% |
15
Global Equity Fund
| | | |
| | | Market | Percentage |
| | | Value | of Net |
| | Shares | ($000) | Assets |
| United States | | | |
| Consumer Discretionary | | | |
| * Amazon.com Inc. | 171,610 | 34,753 | 0.9% |
| * Liberty Global Inc. Class A | 471,275 | 23,601 | 0.6% |
| Cablevision Systems Corp. Class A | 1,493,963 | 21,931 | 0.6% |
| * priceline.com Inc. | 26,343 | 18,901 | 0.5% |
| * Liberty Global Inc. | 349,117 | 16,719 | 0.4% |
| Consumer Discretionary—Other † | | 238,660 | 6.0% |
| | | 354,565 | 9.0% |
| Consumer Staples | | | |
| Philip Morris International Inc. | 535,893 | 47,486 | 1.2% |
| Costco Wholesale Corp. | 355,015 | 32,235 | 0.8% |
| Lorillard Inc. | 212,093 | 27,462 | 0.7% |
| Tyson Foods Inc. Class A | 1,230,277 | 23,560 | 0.6% |
| Kroger Co. | 778,483 | 18,863 | 0.5% |
| Consumer Staples—Other † | | 94,199 | 2.4% |
| | | 243,805 | 6.2% |
| Energy | | | |
| ConocoPhillips | 352,830 | 26,818 | 0.7% |
| Energy—Other † | | 36,946 | 0.9% |
| | | 63,764 | 1.6% |
| Financials | | | |
| Citigroup Inc. | 649,776 | 23,749 | 0.6% |
| Capital One Financial Corp. | 366,293 | 20,417 | 0.5% |
| * Berkshire Hathaway Inc. Class B | 244,855 | 19,870 | 0.5% |
| SL Green Realty Corp. | 246,803 | 19,140 | 0.5% |
| Bank of America Corp. | 1,894,205 | 18,128 | 0.5% |
| Financials—Other † | | 215,015 | 5.4% |
| | | 316,319 | 8.0% |
| Health Care | | | |
| Merck & Co. Inc. | 726,643 | 27,903 | 0.7% |
| WellPoint Inc. | 335,282 | 24,744 | 0.6% |
| Eli Lilly & Co. | 565,033 | 22,754 | 0.6% |
| Aetna Inc. | 452,126 | 22,679 | 0.6% |
| Pfizer Inc. | 877,946 | 19,894 | 0.5% |
| Humana Inc. | 194,673 | 18,003 | 0.5% |
| UnitedHealth Group Inc. | 300,270 | 17,698 | 0.4% |
| Health Care—Other † | | 50,480 | 1.3% |
| | | 204,155 | 5.2% |
| Industrials | | | |
| Northrop Grumman Corp. | 432,634 | 26,425 | 0.7% |
| * Kansas City Southern | 251,776 | 18,050 | 0.5% |
| Industrials—Other † | | 72,078 | 1.8% |
| | | 116,553 | 3.0% |
| Information Technology | | | |
| * Apple Inc. | 80,338 | 48,160 | 1.2% |
| Information Technology—Other † | | 171,689 | 4.4% |
| | | 219,849 | 5.6% |
16
Global Equity Fund
| | | | |
| | | | Market | Percentage |
| | | | Value | of Net |
| | | | ($000) | Assets |
| Materials † | | | 68,698 | 1.7% |
| |
| Telecommunication Services † | | | 17,117 | 0.4% |
| |
| Utilities † | | | 7,732 | 0.2% |
| | | | 1,612,557 | 40.9% |
| Total Common Stocks (Cost $3,059,119) | | | 3,700,969 | 93.8%2 |
| Preferred Stocks (Cost $75) † | | | 53 | 0.0% |
| Convertible Bonds | | | | |
| Consumer Discretionary † | | | — | 0.0% |
| |
| 1Financials † | | | 1,032 | 0.0% |
| |
| Industrials † | | | 1,089 | 0.0% |
| |
| Telecommunication Services † | | | 3,002 | 0.1% |
| Total Convertible Bonds (Cost $4,434) | | | 5,123 | 0.1% |
| |
| | Coupon | Shares | | |
| Temporary Cash Investments | | | | |
| Money Market Fund | | | | |
| 3,4 Vanguard Market Liquidity Fund | 0.123% | 247,584,000 | 247,584 | 6.3% |
| |
| 5,6 U. S. Government and Agency Obligations † | | | 15,999 | 0.4% |
| Total Temporary Cash Investments (Cost $263,583) | | | 263,583 | 6.7%2 |
| 7Total Investments (Cost $3,327,211) | | | 3,969,728 | 100.6% |
| Other Assets and Liabilities | | | | |
| Other Assets5 | | | 53,080 | 1.3% |
| Liabilities4 | | | (75,924) | (1.9%) |
| | | | (22,844) | (0.6%) |
| Net Assets | | | 3,946,884 | 100.0% |
17
Global Equity Fund
| |
| At March 31, 2012, net assets consisted of: | |
| | Amount |
| | ($000) |
| Paid-in Capital | 5,086,345 |
| Overdistributed Net Investment Income | (11,192) |
| Accumulated Net Realized Losses | (1,771,773) |
| Unrealized Appreciation (Depreciation) | |
| Investment Securities | 642,517 |
| Futures Contracts | 521 |
| Forward Currency Contracts | 583 |
| Foreign Currencies | (117) |
| Net Assets | 3,946,884 |
| |
| |
| Net Assets | |
| Applicable to 218,458,062 outstanding $.001 par value shares of beneficial | |
| interest (unlimited authorization) | 3,946,884 |
| Net Asset Value Per Share | $18.07 |
See Note A in Notes to Financial Statements.
* Non-income-producing security.
† Represents the aggregate value, by category, of securities that are not among the 50 largest holdings and, in total for any issuer, represent 1% or less of net assets.
1 Certain of the fund’s securities are exempt from registration under Rule 144A of the Securities Act of 1933. Such securities may be sold in transactions exempt from registration, normally to qualified institutional buyers. At March 31, 2012, the aggregate value of these securities was $4,194,000, representing 0.1% of net assets.
2 The fund invests a portion of its cash reserves in equity markets through the use of index futures contracts. After giving effect to futures investments, the fund’s effective common stock and temporary cash investment positions represent 98.9% and 1.6%, respectively, of net assets.
3 Affiliated money market fund available only to Vanguard funds and certain trusts and accounts managed by Vanguard. Rate shown is the 7-day yield.
4 Includes $21,127,000 of collateral received for securities on loan.
5 Securities with a value of $14,999,000 and cash of $500,000 have been segregated as initial margin for open futures contracts.
6 Securities with a value of $710,000 have been segregated as collateral for open forward currency contracts.
7 The total value of securities on loan is $19,666,000.
ADR—American Depositary Receipt.
See accompanying Notes, which are an integral part of the Financial Statements.

Global Equity Fund
Statement of Operations
| |
| | Six Months Ended |
| | March 31, 2012 |
| | ($000) |
| Investment Income | |
| Income | |
| Dividends1 | 35,535 |
| Interest2 | 390 |
| Security Lending | 835 |
| Total Income | 36,760 |
| Expenses | |
| Investment Advisory Fees—Note B | |
| Basic Fee | 4,470 |
| Performance Adjustment | 98 |
| The Vanguard Group—Note C | |
| Management and Administrative | 4,866 |
| Marketing and Distribution | 403 |
| Custodian Fees | 292 |
| Shareholders’ Reports | 38 |
| Trustees’ Fees and Expenses | 5 |
| Total Expenses | 10,172 |
| Net Investment Income | 26,588 |
| Realized Net Gain (Loss) | |
| Investment Securities Sold | 39,326 |
| Futures Contracts | 14,755 |
| Foreign Currencies and Forward Currency Contracts | (1,135) |
| Realized Net Gain (Loss) | 52,946 |
| Change in Unrealized Appreciation (Depreciation) | |
| Investment Securities | 603,622 |
| Futures Contracts | 1,313 |
| Foreign Currencies and Forward Currency Contracts | 1,398 |
| Change in Unrealized Appreciation (Depreciation) | 606,333 |
| Net Increase (Decrease) in Net Assets Resulting from Operations | 685,867 |
1 Dividends are net of foreign withholding taxes of $1,799,000.
2 Interest income from an affiliated company of the fund was $71,000.
See accompanying Notes, which are an integral part of the Financial Statements.
19
Global Equity Fund
Statement of Changes in Net Assets
| | |
| | Six Months Ended | Year Ended |
| | March 31, | September 30, |
| | 2012 | 2011 |
| | ($000) | ($000) |
| Increase (Decrease) in Net Assets | | |
| Operations | | |
| Net Investment Income | 26,588 | 78,752 |
| Realized Net Gain (Loss) | 52,946 | 254,579 |
| Change in Unrealized Appreciation (Depreciation) | 606,333 | (568,777) |
| Net Increase (Decrease) in Net Assets Resulting from Operations | 685,867 | (235,446) |
| Distributions | | |
| Net Investment Income | (76,901) | (73,523) |
| Realized Capital Gain | — | — |
| Total Distributions | (76,901) | (73,523) |
| Capital Share Transactions | | |
| Issued | 286,840 | 446,848 |
| Issued in Lieu of Cash Distributions | 72,487 | 69,613 |
| Redeemed | (351,356) | (783,383) |
| Net Increase (Decrease) from Capital Share Transactions | 7,971 | (266,922) |
| Total Increase (Decrease) | 616,937 | (575,891) |
| Net Assets | | |
| Beginning of Period | 3,329,947 | 3,905,838 |
| End of Period1 | 3,946,884 | 3,329,947 |
1 Net Assets—End of Period includes undistributed (overdistributed) net investment income of ($11,192,000) and $38,960,000.
See accompanying Notes, which are an integral part of the Financial Statements.
20
Global Equity Fund
Financial Highlights
| | | | | | | |
| | Six Months | | | | | |
| | | Ended | | | | | |
| For a Share Outstanding | March 31, | | | Year Ended September 30, |
| Throughout Each Period | | 2012 | 2011 | 2010 | 2009 | 2008 | 2007 |
| Net Asset Value, Beginning of Period | $15.24 | $16.74 | $15.49 | $16.64 | $26.51 | $21.96 |
| Investment Operations | | | | | | | |
| Net Investment Income | | .132 | .3451 | .314 | .371 | .529 | .4901 |
| Net Realized and Unrealized Gain (Loss) | | | | | | |
| on Investments | | 3.060 | (1.525) | 1.292 | (.948) | (8.569) | 5.250 |
| Total from Investment Operations | | 3.192 | (1.180) | 1.606 | (.577) | (8.040) | 5.740 |
| Distributions | | | | | | | |
| Dividends from Net Investment Income | (.362) | (.320) | (.356) | (.573) | (.430) | (.310) |
| Distributions from Realized Capital Gains | — | — | — | — | (1.400) | (.880) |
| Total Distributions | | (.362) | (.320) | (.356) | (.573) | (1.830) | (1.190) |
| Net Asset Value, End of Period | | $18.07 | $15.24 | $16.74 | $15.49 | $16.64 | $26.51 |
| |
| Total Return2 | | 21.26% | -7.31% | 10.51% | -2.30% | -32.24% | 27.00% |
| |
| Ratios/Supplemental Data | | | | | | | |
| Net Assets, End of Period (Millions) | $3,947 | $3,330 | $3,906 | $3,813 | $5,160 | $7,552 |
| Ratio of Total Expenses to | | | | | | | |
| Average Net Assets3 | | 0.56% | 0.54% | 0.44% | 0.47% | 0.51% | 0.64% |
| Ratio of Net Investment Income to | | | | | | |
| Average Net Assets | | 1.47% | 1.92% | 1.94% | 2.55% | 2.35% | 1.98% |
| Portfolio Turnover Rate | | 42% | 44% | 64% | 71% | 73% | 64% |
The expense ratio, net income ratio, and turnover rate for the current period have been annualized.
1 Calculated based on average shares outstanding.
2 Total returns do not include account service fees that may have applied in the periods shown. Fund prospectuses provide information about any applicable account service fees.
3 Includes performance-based investment advisory fee increases (decreases) of 0.01%, (0.02%), (0.11%), (0.13%), (0.02%), and 0.05%.
See accompanying Notes, which are an integral part of the Financial Statements.
21
Global Equity Fund
Notes to Financial Statements
Vanguard Global Equity Fund is registered under the Investment Company Act of 1940 as an open-end investment company, or mutual fund. The fund invests in securities of foreign issuers, which may subject it to investment risks not normally associated with investing in securities of United States corporations.
A. The following significant accounting policies conform to generally accepted accounting principles for U.S. mutual funds. The fund consistently follows such policies in preparing its financial statements.
1. Security Valuation: Securities are valued as of the close of trading on the New York Stock Exchange (generally 4 p.m., Eastern time) on the valuation date. Equity securities are valued at the latest quoted sales prices or official closing prices taken from the primary market in which each security trades; such securities not traded on the valuation date are valued at the mean of the latest quoted bid and asked prices. Bonds, and temporary cash investments acquired over 60 days to maturity, are valued using the latest bid prices or using valuations based on a matrix system (which considers such factors as security prices, yields, maturities, and ratings), both as furnished by independent pricing services. Investments in Vanguard Market Liquidity Fund are valued at that fund’s net asset value. Other temporary cash investments are valued at amortized cost, which approximates market value. Securities for which market quotations are not readily available, or whose values have been affected by events occurring before the fund’s pricing time but after the close of the securities’ primary markets, are valued at their fair values calculated according to procedures adopted by the board of trustees. These procedures include obtaining quotations from an independent pricing service, monitoring news to identify significant market- or security-specific events, and evaluating changes in the values of foreign market proxies (for example, ADRs, futures contracts, or exchange-traded funds), between the time the foreign markets close and the fund’s pricing time. When fair-value pricing is employed, the prices of securities used by a fund to calculate its net asset value may differ from quoted or published prices for the same securities.
2. Foreign Currency: Securities and other assets and liabilities denominated in foreign currencies are translated into U.S. dollars using exchange rates obtained from an independent third party as of the fund’s pricing time on the valuation date. Realized gains (losses) and unrealized appreciation (depreciation) on investment securities include the effects of changes in exchange rates since the securities were purchased, combined with the effects of changes in security prices. Fluctuations in the value of other assets and liabilities resulting from changes in exchange rates are recorded as unrealized foreign currency gains (losses) until the assets or liabilities are settled in cash, at which time they are recorded as realized foreign currency gains (losses).
3. Futures and Forward Currency Contracts: The fund uses index futures contracts to a limited extent, with the objective of maintaining full exposure to the stock market while maintaining liquidity. The fund may purchase or sell futures contracts to achieve a desired level of investment, whether to accommodate portfolio turnover or cash flows from capital share transactions. The primary risks associated with the use of futures contracts are imperfect correlation between changes in market values of stocks held by the fund and the prices of futures contracts, and the possibility of an illiquid market.
The fund also enters into forward currency contracts to provide the appropriate currency exposure related to any open futures contracts or to protect the value of securities and related receivables and payables against changes in foreign exchange rates. The primary risk associated with the fund’s use of these contracts is that a counterparty will fail to fulfill its obligation to pay gains due to the fund under the contracts. Counterparty risk is mitigated by entering into forward currency contracts only with highly rated counterparties, by a master netting arrangement between the fund and the counterparty, and by the posting of collateral by the counterparty. The forward currency contracts contain provisions
22
Global Equity Fund
whereby a counterparty may terminate open contracts if the fund’s net assets decline below a certain level, triggering a payment by the fund if the fund is in a net liability position at the time of the termination. The payment amount would be reduced by any collateral the fund has posted. Any securities posted as collateral for open contracts are noted in the Statement of Net Assets.
Futures contracts are valued at their quoted daily settlement prices. Forward currency contracts are valued at their quoted daily prices obtained from an independent third party, adjusted for currency risk based on the expiration date of each contract. The aggregate principal amounts of the contracts are not recorded in the Statement of Net Assets. Fluctuations in the value of the contracts are recorded in the Statement of Net Assets as an asset (liability) and in the Statement of Operations as unrealized appreciation (depreciation) until the contracts are closed, when they are recorded as realized gains (losses) on futures or forward currency contracts.
4. Federal Income Taxes: The fund intends to continue to qualify as a regulated investment company and distribute all of its taxable income. Management has analyzed the fund’s tax positions taken for all open federal income tax years (September 30, 2008–2011), and for the period ended March 31, 2012, and has concluded that no provision for federal income tax is required in the fund’s financial statements.
5. Distributions: Distributions to shareholders are recorded on the ex-dividend date.
6. Security Lending: The fund may lend its securities to qualified institutional borrowers to earn additional income. Security loans are required to be secured at all times by collateral at least equal to the market value of securities loaned. The fund invests cash collateral received in Vanguard Market Liquidity Fund, and records a liability for the return of the collateral, during the period the securities are on loan. Security lending income represents fees charged to borrowers plus income earned on investing cash collateral, less expenses associated with the loan.
7. Other: Dividend income is recorded on the ex-dividend date. Interest income includes income distributions received from Vanguard Market Liquidity Fund and is accrued daily. Security transactions are accounted for on the date securities are bought or sold. Costs used to determine realized gains (losses) on the sale of investment securities are those of the specific securities sold.
B. Marathon Asset Management LLP, Acadian Asset Management LLC, AllianceBernstein L.P., and Baillie Gifford Overseas Ltd. each provide investment advisory services to a portion of the fund for a fee calculated at an annual percentage rate of average net assets managed by the advisor. The basic fees of Marathon Asset Management LLP, Acadian Asset Management LLC, and Baillie Gifford Overseas Ltd. are subject to quarterly adjustments based on performance for the preceding three years relative to the MSCI All Country World Index. The basic fee of AllianceBernstein L.P. is subject to quarterly adjustments based on performance for the preceding five years relative to the MSCI All Country World Index.
The Vanguard Group manages the cash reserves of the fund on an at-cost basis.
For the six months ended March 31, 2012, the aggregate investment advisory fee represented an effective annual basic rate of 0.25% of the fund’s average net assets, before an increase of $98,000 (0.01%) based on performance.
C. The Vanguard Group furnishes at cost corporate management, administrative, marketing, and distribution services. The costs of such services are allocated to the fund under methods approved by the board of trustees. The fund has committed to provide up to 0.40% of its net assets in capital
23
Global Equity Fund
contributions to Vanguard. At March 31, 2012, the fund had contributed capital of $566,000 to Vanguard (included in Other Assets), representing 0.01% of the fund’s net assets and 0.23% of Vanguard’s capitalization. The fund’s trustees and officers are also directors and officers of Vanguard.
D. Various inputs may be used to determine the value of the fund’s investments. These inputs are summarized in three broad levels for financial statement purposes. The inputs or methodologies used to value securities are not necessarily an indication of the risk associated with investing in those securities.
Level 1—Quoted prices in active markets for identical securities.
Level 2—Other significant observable inputs (including quoted prices for similar securities, interest rates, prepayment speeds, credit risk, etc.).
Level 3—Significant unobservable inputs (including the fund’s own assumptions used to determine the fair value of investments).
The following table summarizes the market value of the fund’s investments as of March 31, 2012, based on the inputs used to value them:
| | | |
| | Level 1 | Level 2 | Level 3 |
| Investments | ($000) | ($000) | ($000) |
| Common Stocks—International | 218,699 | 1,869,713 | — |
| Common Stocks—United States | 1,612,557 | — | — |
| Preferred Stocks | — | 53 | — |
| Convertible Bonds | — | 5,123 | — |
| Temporary Cash Investments | 247,584 | 15,999 | — |
| Futures Contracts—Assets1 | 819 | — | — |
| Forward Currency Contracts—Assets | — | 1,059 | — |
| Forward Currency Contracts—Liabilities | — | (476) | — |
| Total | 2,079,659 | 1,891,471 | — |
| 1 Represents variation margin on the last day of the reporting period. | | | |
E. At March 31, 2012, the fair values of derivatives were reflected in the Statement of Net Assets as follows:
| | | |
| | | Foreign | |
| | Equity | Exchange | |
| | Contracts | Contracts | Total |
| Statement of Net Assets Caption | ($000) | ($000) | ($000) |
| Other Assets | 819 | 1,059 | 1,878 |
| Liabilities | — | (476) | (476) |
24
Global Equity Fund
Realized net gain (loss) and the change in unrealized appreciation (depreciation) on derivatives for the six months ended March 31, 2012, were:
| | | |
| | | Foreign | |
| | Equity | Exchange | |
| | Contracts | Contracts | Total |
| Realized Net Gain (Loss) on Derivatives | ($000) | ($000) | ($000) |
| Futures Contracts | 14,755 | — | 14,755 |
| Forward Currency Contracts | — | (928) | (928) |
| Realized Net Gain (Loss) on Derivatives | 14,755 | (928) | 13,827 |
| |
| Change in Unrealized Appreciation (Depreciation) on Derivatives | | | |
| Futures Contracts | 1,313 | — | 1,313 |
| Forward Currency Contracts | — | 1,216 | 1,216 |
| Change in Unrealized Appreciation (Depreciation) on Derivatives | 1,313 | 1,216 | 2,529 |
At March 31, 2012, the aggregate settlement value of open futures contracts and the related unrealized appreciation (depreciation) were:
| | | | |
| | | | | ($000) |
| | | | Aggregate | |
| | | Number of | Settlement | Unrealized |
| | | Long (Short) | Value | Appreciation |
| Futures Contracts | Expiration | Contracts | Long (Short) | (Depreciation) |
| E-mini S&P 500 Index | June 2012 | 869 | 60,969 | 558 |
| S&P 500 Index | June 2012 | 105 | 36,834 | 1,079 |
| Dow Jones EURO STOXX 50 Index | June 2012 | 854 | 27,397 | (965) |
| FTSE 100 Index | June 2012 | 296 | 27,097 | (631) |
| S&P ASX 200 Index | June 2012 | 195 | 21,943 | 315 |
| Topix Index | June 2012 | 159 | 16,558 | 254 |
| MSCI Taiwan Index | April 2012 | 386 | 10,897 | (89) |
Unrealized appreciation (depreciation) on open E-mini S&P 500 Index, S&P 500 Index, and FTSE 100 Index futures is required to be treated as realized gain (loss) for tax purposes.
At March 31, 2012, the fund had open forward currency contracts to receive and deliver currencies as follows. Unrealized appreciation (depreciation) on open forward currency contracts is treated as realized gain (loss) for tax purposes.
25
Global Equity Fund
| | | | | | |
| | | | | | | Unrealized |
| | Contract | | | | | Appreciation |
| | Settlement | | | Contract Amount (000) | (Depreciation) |
| Counterparty | Date | | Receive | | Deliver | ($000) |
| UBS AG | 6/20/12 | EUR | 21,297 | USD | 28,374 | 418 |
| UBS AG | 6/20/12 | GBP | 17,356 | USD | 27,715 | 446 |
| UBS AG | 6/26/12 | AUD | 20,877 | USD | 21,419 | (355) |
| UBS AG | 6/12/12 | JPY | 829,865 | USD | 10,091 | 121 |
| UBS AG | 6/12/12 | JPY | 507,166 | USD | 6,167 | (121) |
| Goldman Sachs Bank USA | 4/16/12 | USD | 35,791 | JPY | 2,952,855 | 74 |
AUD—Australian dollar.
EUR—Euro.
GBP—British pound.
JPY—Japanese yen.
USD—U.S. dollar.
At March 31, 2012, the counterparties had deposited in segregated accounts securities with a value sufficient to cover substantially all amounts due to the fund in connection with open forward currency contracts.
F. Distributions are determined on a tax basis and may differ from net investment income and realized capital gains for financial reporting purposes. Differences may be permanent or temporary. Permanent differences are reclassified among capital accounts in the financial statements to reflect their tax character. Temporary differences arise when certain items of income, expense, gain, or loss are recognized in different periods for financial statement and tax purposes; these differences will reverse at some time in the future. Differences in classification may also result from the treatment of short-term gains as ordinary income for tax purposes.
During the six months ended March 31, 2012, the fund realized net foreign currency losses of $207,000, which decreased distributable net income for tax purposes; accordingly, such losses have been reclassified from accumulated net realized losses to overdistributed net investment income. Certain of the fund’s investments are in securities considered to be “passive foreign investment companies,” for which any unrealized appreciation and/or realized gains are required to be included in distributable net income for tax purposes. During the six months ended March 31, 2012, the fund realized gains on the sale of passive foreign investment companies of $368,000, which have been included in current and prior periods’ taxable income; accordingly, such gains have been reclassified from accumulated net realized losses to overdistributed net investment income. Passive foreign investment companies held at March 31, 2012, had unrealized appreciation of $16,131,000 as of October 31, 2011, the most recent mark-to-market date for tax purposes. This amount has been distributed and is reflected in the balance of overdistributed net investment income.
The fund’s tax-basis capital gains and losses are determined only at the end of each fiscal year. For tax purposes, at September 30, 2011, the fund had available capital loss carryforwards totaling $1,826,759,000 to offset future net capital gains of $596,476,000 through September 30, 2017, and $1,230,283,000 through September 30, 2018. The fund will use these capital losses to offset net taxable capital gains, if any, realized during the year ending September 30, 2012; should the fund realize net capital losses for the year, the losses will be added to the loss carryforward balance above
26
Global Equity Fund
At March 31, 2012, the cost of investment securities for tax purposes was $3,343,342,000. Net unrealized appreciation of investment securities for tax purposes was $626,386,000, consisting of unrealized gains of $890,860,000 on securities that had risen in value since their purchase and $264,474,000 in unrealized losses on securities that had fallen in value since their purchase.
G. During the six months ended March 31, 2012, the fund purchased $737,489,000 of investment securities and sold $896,389,000 of investment securities, other than temporary cash investments.
H. Capital shares issued and redeemed were:
| | |
| | Six Months Ended | Year Ended |
| | March 31, 2012 | September 30, 2011 |
| | Shares | Shares |
| | (000) | (000) |
| Issued | 16,528 | 24,878 |
| Issued in Lieu of Cash Distributions | 4,542 | 3,933 |
| Redeemed | (21,055) | (43,692) |
| Net Increase (Decrease) in Shares Outstanding | 15 | (14,881) |
I. In preparing the financial statements as of March 31, 2012, management considered the impact of subsequent events for potential recognition or disclosure in these financial statements
27
About Your Fund’s Expenses
As a shareholder of the fund, you incur ongoing costs, which include costs for portfolio management, administrative services, and shareholder reports (like this one), among others. Operating expenses, which are deducted from a fund’s gross income, directly reduce the investment return of the fund.
A fund’s expenses are expressed as a percentage of its average net assets. This figure is known as the expense ratio. The following examples are intended to help you understand the ongoing costs (in dollars) of investing in your fund and to compare these costs with those of other mutual funds. The examples are based on an investment of $1,000 made at the beginning of the period shown and held for the entire period.
The accompanying table illustrates your fund’s costs in two ways:
• Based on actual fund return. This section helps you to estimate the actual expenses that you paid over the period. The ”Ending Account Value“ shown is derived from the fund‘s actual return, and the third column shows the dollar amount that would have been paid by an investor who started with $1,000 in the fund. You may use the information here, together with the amount you invested, to estimate the expenses that you paid over the period.
To do so, simply divide your account value by $1,000 (for example, an $8,600 account value divided by $1,000 = 8.6), then multiply the result by the number given for your fund under the heading ”Expenses Paid During Period.“
• Based on hypothetical 5% yearly return. This section is intended to help you compare your fund‘s costs with those of other mutual funds. It assumes that the fund had a yearly return of 5% before expenses, but that the expense ratio is unchanged. In this case—because the return used is not the fund’s actual return—the results do not apply to your investment. The example is useful in making comparisons because the Securities and Exchange Commission requires all mutual funds to calculate expenses based on a 5% return. You can assess your fund’s costs by comparing this hypothetical example with the hypothetical examples that appear in shareholder reports of other funds.
Note that the expenses shown in the table are meant to highlight and help you compare ongoing costs only and do not reflect transaction costs incurred by the fund for buying and selling securities. Further, the expenses do not include any purchase, redemption, or account service fees described in the fund prospectus. If such fees were applied to your account, your costs would be higher. Your fund does not carry a “sales load.”
The calculations assume no shares were bought or sold during the period. Your actual costs may have been higher or lower, depending on the amount of your investment and the timing of any purchases or redemptions.
You can find more information about the fund’s expenses, including annual expense ratios, in the Financial Statements section of this report. For additional information on operating expenses and other shareholder costs, please refer to your fund’s current prospectus.
28
| | | |
| Six Months Ended March 31, 2012 | | | |
| | Beginning | Ending | Expenses |
| | Account Value | Account Value | Paid During |
| Global Equity Fund | 9/30/2011 | 3/31/2012 | Period |
| Based on Actual Fund Return | $1,000.00 | $1,212.59 | $3.10 |
| Based on Hypothetical 5% Yearly Return | 1,000.00 | 1,022.20 | 2.83 |
The calculations are based on expenses incurred in the most recent six-month period. The fund’s annualized six-month expense ratio for that period is 0.56%. The dollar amounts shown as “Expenses Paid” are equal to the annualized expense ratio multiplied by the average account value over the period, multiplied by the number of days in the most recent six-month period, then divided by the number of days in the most recent 12-month period.
29
Trustees Approve Advisory Agreements
The board of trustees of Vanguard Global Equity Fund has renewed the fund’s investment advisory agreements with Acadian Asset Management LLC, AllianceBernstein L.P., Baillie Gifford Overseas Ltd., and Marathon Asset Management LLP. The board determined that the retention of the advisors was in the best interests of the fund and its shareholders.
The board based its decisions upon an evaluation of each advisor’s investment staff, portfolio management process, and performance. The trustees considered the factors discussed below, among others. However, no single factor determined whether the board approved the agreements. Rather, it was the totality of the circumstances that drove the board’s decisions.
Nature, extent, and quality of services
The board considered the quality of the fund’s investment management over both the short and long term, and took into account the organizational depth and stability of each advisor. The board noted the following:
Acadian Asset Management LLC. Acadian, founded in 1986, is a Boston-based investment management firm specializing in quantitative equity strategies for developed and emerging markets. The firm’s investment process builds portfolios from the bottom up using proprietary valuation models measuring more than 20 stock factors and focusing on those that have proven most effective in predicting returns. The result is a rating of all securities in the Acadian database in terms of each stock’s expected return relative to its country and sector group. Acadian has managed a portion of the fund since 2004.
AllianceBernstein L.P. AllianceBernstein, founded in 1971, is a global asset management firm that provides diversified, global investment management services involving growth and value equities, blend strategies, and fixed income securities to clients worldwide. The firm employs a bottom-up, research-driven, value-based equity investment philosophy in selecting stocks. It relies on deep investment research to understand companies and industries that may be undergoing stress, and it seeks to exploit mispricings created by investor overreaction. AllianceBernstein remains one of the largest investment managers in the industry with experienced research analysts and portfolio managers. AllianceBernstein has managed a portion of the fund since 2006.
Baillie Gifford Overseas Ltd. Baillie Gifford, a unit of Baillie Gifford & Co., founded in 1908, is among the largest independently owned investment management firms in the United Kingdom. Baillie Gifford’s investment approach is based on long-term investments in well-researched and well-managed businesses that enjoy sustainable competitive advantages in their marketplaces. The firm employs a fundamental, bottom-up approach to identify growth companies, screening them for quality, then value. The main factors considered are sustainable earnings growth, cash-flow generation, profitability, interest coverage, and valuation. Baillie Gifford has managed a portion of the fund since 2008.
Marathon Asset Management LLP. Marathon, founded in 1986, continues to use a bottom-up approach that focuses on stock selection. Historically, the portfolio was managed by the three founders (Jeremy Hosking, Neil Ostrer, and William Arah), who were all regional specialists. The process has evolved in recent years to focus on global generalists rather than regional specialists. While the three founders don’t plan to retire for years, they have transitioned the firm to a multi-counselor approach, allocating 25% of the portfolio to four members of the firm’s second generation. Marathon has advised the fund since its inception in 1995.
The board concluded that each advisor’s experience, stability, depth, and performance, among other factors, warranted continuation of the advisory agreements.
30
Investment performance
The board considered the short and longterm performance of the fund, including any periods of outperformance or underperformance of a relevant benchmark and peer group. The board concluded that each advisor has carried out the fund’s investment strategy in disciplined fashion and that performance results have allowed the fund to remain competitive versus its benchmark and peer group. The board noted that AllianceBernstein has underperformed its benchmark and peer group over the short and long term, in part because of AllianceBernstein’s deep value orientation. Information about the fund’s most recent performance can be found in the Performance Summary section of this report.
Cost
The board concluded that the fund’s expense ratio was well below the average expense ratio charged
by funds in its peer group and that the fund’s advisory fee rate was also well below the peergroup
average. Information about the fund’s expenses appears in the About Your Fund’s Expenses section
of this report as well as in the Financial Statements section, which also includes information about the
fund’s advisory fee rate.
The board did not consider profitability of the fund’s advisors in determining whether to approve the
advisory fees, because the firms are independent of Vanguard, and the advisory fees are the result of
arm’slength negotiations.
The benefit of economies of scale
The board concluded that the fund’s shareholders benefit from economies of scale because of
breakpoints in the advisory fee schedules. The breakpoints reduce the effective rate of the fees as the
fund’s assets managed by each advisor increase.
The board will consider whether to renew the advisory agreements again after a oneyear period.
31
Glossary
Beta. A measure of the magnitude of a fund’s past share-price fluctuations in relation to the ups and downs of a given market index. The index is assigned a beta of 1.00. Compared with a given index, a fund with a beta of 1.20 typically would have seen its share price rise or fall by 12% when the index rose or fell by 10%. For this report, beta is based on returns over the past 36 months for both the fund and the index. Note that a fund’s beta should be reviewed in conjunction with its R-squared (see definition). The lower the R-squared, the less correlation there is between the fund and the index, and the less reliable beta is as an indicator of volatility.
Dividend Yield. Dividend income earned by stocks, expressed as a percentage of the aggregate market value (or of net asset value, for a fund). The yield is determined by dividing the amount of the annual dividends by the aggregate value (or net asset value) at the end of the period. For a fund, the dividend yield is based solely on stock holdings and does not include any income produced by other investments.
Earnings Growth Rate. The average annual rate of growth in earnings over the past five years for the stocks now in a fund.
Equity Exposure. A measure that reflects a fund’s investments in stocks and stock futures. Any holdings in short-term reserves are excluded.
Expense Ratio. A fund’s total annual operating expenses expressed as a percentage of the fund’s average net assets. The expense ratio includes management and administrative expenses, but does not include the transaction costs of buying and selling portfolio securities.
Inception Date. The date on which the assets of a fund (or one of its share classes) are first invested in accordance with the fund’s investment objective. For funds with a subscription period, the inception date is the day after that period ends. Investment performance is measured from the inception date.
Median Market Cap. An indicator of the size of companies in which a fund invests; the midpoint of market capitalization (market price x shares outstanding) of a fund’s stocks, weighted by the proportion of the fund’s assets invested in each stock. Stocks representing half of the fund’s assets have market capitalizations above the median, and the rest are below it.
Price/Book Ratio. The share price of a stock divided by its net worth, or book value, per share. For a fund, the weighted average price/book ratio of the stocks it holds.
Price/Earnings Ratio. The ratio of a stock’s current price to its per-share earnings over the past year. For a fund, the weighted average P/E of the stocks it holds. P/E is an indicator of market expectations about corporate prospects; the higher the P/E, the greater the expectations for a company’s future growth.
R-Squared. A measure of how much of a fund’s past returns can be explained by the returns from the market in general, as measured by a given index. If a fund’s total returns were precisely synchronized with an index’s returns, its R-squared would be 1.00. If the fund’s returns bore no relationship to the index’s returns, its R-squared would be 0. For this report, R-squared is based on returns over the past 36 months for both the fund and the index.
32
Return on Equity. The annual average rate of return generated by a company during the past five years for each dollar of shareholder’s equity (net income divided by shareholder’s equity). For a fund, the weighted average return on equity for the companies whose stocks it holds.
Short-Term Reserves. The percentage of a fund invested in highly liquid, short-term securities that can be readily converted to cash.
Turnover Rate. An indication of the fund’s trading activity. Funds with high turnover rates incur higher transaction costs and may be more likely to distribute capital gains (which may be taxable to investors). The turnover rate excludes in-kind transactions, which have minimal impact on costs.
33
This page intentionally left blank.
This page intentionally left blank.
The People Who Govern Your Fund
The trustees of your mutual fund are there to see that the fund is operated and managed in your best interests since, as a shareholder, you are a part owner of the fund. Your fund’s trustees also serve on the board of directors of The Vanguard Group, Inc., which is owned by the Vanguard funds and provides services to them on an at-cost basis.
A majority of Vanguard’s board members are independent, meaning that they have no affiliation with Vanguard or the funds they oversee, apart from the sizable personal investments they have made as private individuals. The independent board members have distinguished backgrounds in business, academia, and public service. Each of the trustees and executive officers oversees 179 Vanguard funds.
The following table provides information for each trustee and executive officer of the fund. More information about the trustees is in the Statement of Additional Information, which can be obtained, without charge, by contacting Vanguard at 800-662-7447, or online at vanguard.com.
| |
| InterestedTrustee1 | and Delphi Automotive LLP (automotive components); |
| | Senior Advisor at New Mountain Capital; Trustee of |
| | The Conference Board. |
| | |
| F. William McNabb III | Amy Gutmann |
| Born 1957. Trustee Since July 2009. Chairman of the | Born 1949. Trustee Since June 2006. Principal |
| Board. Principal Occupation(s) During the Past Five | Occupation(s) During the Past Five Years: President |
| Years: Chairman of the Board of The Vanguard Group, | of the University of Pennsylvania; Christopher H. |
| Inc., and of each of the investment companies served | Browne Distinguished Professor of Political Science |
| by The Vanguard Group, since January 2010; Director | in the School of Arts and Sciences with secondary |
| of The Vanguard Group since 2008; Chief Executive | appointments at the Annenberg School for Commu- |
| Officer and President of The Vanguard Group and of | nication and the Graduate School of Education |
| each of the investment companies served by The | of the University of Pennsylvania; Director of |
| Vanguard Group since 2008; Director of Vanguard | Carnegie Corporation of New York, Schuylkill River |
| Marketing Corporation; Managing Director of The | Development Corporation, and Greater Philadelphia |
| Vanguard Group (1995–2008). | Chamber of Commerce; Trustee of the National |
| Constitution Center; Chair of the Presidential |
| Commission for the Study of Bioethical Issues. |
| IndependentTrustees | |
| JoAnn Heffernan Heisen |
| Emerson U. Fullwood | Born 1950. Trustee Since July 1998. Principal |
| Born 1948. Trustee Since January 2008. Principal | Occupation(s) During the Past Five Years: Corporate |
| Occupation(s) During the Past Five Years: Executive | Vice President and Chief Global Diversity Officer |
| Chief Staff and Marketing Officer for North America | (retired 2008) and Member of the Executive |
| and Corporate Vice President (retired 2008) of Xerox | Committee (1997–2008) of Johnson & Johnson |
| Corporation (document management products and | (pharmaceuticals/medical devices/consumer |
| services); Executive in Residence and 2010 | products); Director of Skytop Lodge Corporation |
| Distinguished Minett Professor at the Rochester | the Robert Wood Johnson Foundation, and the Center |
| Institute of Technology; Director of SPX Corporation | (hotels), the University Medical Center at Princeton, |
| (multi-industry manufacturing), the United Way of | for Talent Innovation; Member of the Advisory Board |
| Rochester, Amerigroup Corporation (managed health | of the Maxwell School of Citizenship and Public Affairs |
| care), the University of Rochester Medical Center, | at Syracuse University. |
| Monroe Community College Foundation, and North | |
| Carolina A&T University. | F. Joseph Loughrey |
| Born 1949. Trustee Since October 2009. Principal |
| Rajiv L. Gupta | Occupation(s) During the Past Five Years: President |
| Born 1945. Trustee Since December 2001.2 | and Chief Operating Officer (retired 2009) of Cummins |
| Principal Occupation(s) During the Past Five Years: | Inc. (industrial machinery); Director of SKF AB |
| Chairman and Chief Executive Officer (retired 2009) | (industrial machinery), Hillenbrand, Inc. (specialized |
| and President (2006–2008) of Rohm Haas Co. | consumer services), the Lumina Foundation for |
| (chemicals); Director of Tyco International, Ltd. | |
| (diversified manufacturing and services), Hewlett- | |
| Packard Co. (electronic computer manufacturing), | |
| |
| | |
| Education, and Oxfam America; Chairman of the | Executive Officers | |
| Advisory Council for the College of Arts and Letters | | |
| and Member of the Advisory Board to the Kellogg | Glenn Booraem | |
| Institute for International Studies at the University | Born 1967. Controller Since July 2010. Principal |
| of Notre Dame. | Occupation(s) During the Past Five Years: Principal |
| | of The Vanguard Group, Inc.; Controller of each of |
| Mark Loughridge | the investment companies served by The Vanguard |
| Born 1953. Trustee Since March 2012. Principal | Group; Assistant Controller of each of the investment |
| Occupation(s) During the Past Five Years: Senior Vice | companies served by The Vanguard Group (2001–2010). |
| President and Chief Financial Officer at IBM (information | | |
| technology services); Fiduciary Member of IBM’s | Thomas J. Higgins | |
| Retirement Plan Committee. | Born 1957. Chief Financial Officer Since September |
| | 2008. Principal Occupation(s) During the Past Five |
| Scott C. Malpass | Years: Principal of The Vanguard Group, Inc.; Chief |
| Born 1962. Trustee Since March 2012. Principal | Financial Officer of each of the investment companies |
| Occupation(s) During the Past Five Years: Chief | served by The Vanguard Group; Treasurer of each of |
| Investment Officer and Vice President at the University | the investment companies served by The Vanguard |
| of Notre Dame; Assistant Professor of Finance at the | Group (1998–2008). | |
| Mendoza College of Business at Notre Dame; Member | | |
| of the Notre Dame 403(b) Investment Committee; | Kathryn J. Hyatt | |
| Director of TIFF Advisory Services, Inc. (investment | Born 1955. Treasurer Since November 2008. Principal |
| advisor); Member of the Investment Advisory | Occupation(s) During the Past Five Years: Principal of |
| Committees of the Financial Industry Regulatory | The Vanguard Group, Inc.; Treasurer of each of the |
| Authority (FINRA) and of Major League Baseball. | investment companies served by The Vanguard |
| | Group; Assistant Treasurer of each of the investment |
| André F. Perold | companies served by The Vanguard Group (1988–2008). |
| Born 1952. Trustee Since December 2004. Principal | | |
| Occupation(s) During the Past Five Years: George | Heidi Stam | |
| Gund Professor of Finance and Banking at the Harvard | Born 1956. Secretary Since July 2005. Principal |
| Business School (retired 2011); Chief Investment | Occupation(s) During the Past Five Years: Managing |
| Officer and Managing Partner of HighVista Strategies | Director of The Vanguard Group, Inc.; General Counsel |
| LLC (private investment firm); Director of Rand | of The Vanguard Group; Secretary of The Vanguard |
| Merchant Bank; Overseer of the Museum of Fine | Group and of each of the investment companies |
| Arts Boston. | served by The Vanguard Group; Director and Senior |
| | Vice President of Vanguard Marketing Corporation; |
| Alfred M. Rankin, Jr. | Principal of The Vanguard Group (1997–2006). |
| Born 1941. Trustee Since January 1993. Principal | | |
| Occupation(s) During the Past Five Years: Chairman, | | |
| | Vanguard Senior ManagementTeam |
| President, and Chief Executive Officer of NACCO | | |
| Industries, Inc. (forklift trucks/housewares/lignite); | Mortimer J. Buckley | Michael S. Miller |
| Director of Goodrich Corporation (industrial products/ | Kathleen C. Gubanich | James M. Norris |
| aircraft systems and services) and the National | Paul A. Heller | Glenn W. Reed |
| Association of Manufacturers; Chairman of the Board | Martha G. King | George U. Sauter |
| of the Federal Reserve Bank of Cleveland and of | Chris D. McIsaac | |
| University Hospitals of Cleveland; Advisory Chairman | | |
| of the Board of The Cleveland Museum of Art. | | |
| | Chairman Emeritus and Senior Advisor |
| Peter F. Volanakis | | |
| John J. Brennan | |
| Born 1955. Trustee Since July 2009. Principal | Chairman, 1996–2009 | |
| Occupation(s) During the Past Five Years: President | Chief Executive Officer and President, 1996–2008 | |
| and Chief Operating Officer (retired 2010) of Corning | | |
| Incorporated (communications equipment); Director | |
| of SPX Corporation (multi-industry manufacturing); | Founder | |
| Overseer of the Amos Tuck School of Business | | |
| Administration at Dartmouth College; Advisor to the | John C. Bogle | |
| Norris Cotton Cancer Center. | Chairman and Chief Executive Officer, 1974–1996 | |
| | |
1 Mr. McNabb is considered an “interested person,” as defined in the Investment Company Act of 1940, because he is an officer of the Vanguard funds.
2 December 2002 for Vanguard Equity Income Fund, Vanguard Growth Equity Fund, the Vanguard Municipal Bond Funds, and the Vanguard State Tax-Exempt Funds.
|  |
| P.O. Box 2600 |
| Valley Forge, PA 19482-2600 |
Connect with Vanguard® > vanguard.com
| |
| Fund Information > 800-662-7447 | CFA® is a trademark owned by CFA Institute. |
| Direct Investor Account Services > 800-662-2739 | |
| Institutional Investor Services > 800-523-1036 | |
| Text Telephone for People | |
| With Hearing Impairment > 800-749-7273 | |
| |
| This material may be used in conjunction | |
| with the offering of shares of any Vanguard | |
| fund only if preceded or accompanied by | |
| the fund’s current prospectus. | |
| |
| All comparative mutual fund data are from Lipper Inc. or | |
| Morningstar, Inc., unless otherwise noted. | |
| |
| You can obtain a free copy of Vanguard’s proxy voting | |
| guidelines by visiting vanguard.com/proxyreporting or by | |
| calling Vanguard at 800-662-2739. The guidelines are | |
| also available from the SEC’s website, sec.gov. In | |
| addition, you may obtain a free report on how your fund | |
| voted the proxies for securities it owned during the 12 | |
| months ended June 30. To get the report, visit either | |
| vanguard.com/proxyreporting or sec.gov. | |
| |
| You can review and copy information about your fund at | |
| the SEC’s Public Reference Room in Washington, D.C. To | |
| find out more about this public service, call the SEC at | |
| 202-551-8090. Information about your fund is also | |
| available on the SEC’s website, and you can receive | |
| copies of this information, for a fee, by sending a | |
| request in either of two ways: via e-mail addressed to | |
| publicinfo@sec.gov or via regular mail addressed to the | |
| Public Reference Section, Securities and Exchange | |
| Commission, Washington, DC 20549-1520. | |
| |
| |
| | © 2012 The Vanguard Group, Inc. |
| | All rights reserved. |
| | Vanguard Marketing Corporation, Distributor. |
| |
| | Q1292 052012 |
Vanguard® Global Equity Fund
Schedule of Investments
March 31, 2012
| | |
| | | Market |
| | | Value |
| | Shares | ($000) |
| |
| Common Stocks (93.8%)1 | | |
| Australia (2.1%) | | |
| BHP Billiton Ltd. | 637,347 | 22,976 |
| Santos Ltd. | 1,165,917 | 17,216 |
| Rio Tinto Ltd. | 178,959 | 12,140 |
| Australia & New Zealand Banking Group Ltd. | 460,953 | 11,120 |
| National Australia Bank Ltd. | 164,640 | 4,203 |
| Brambles Ltd. | 480,876 | 3,538 |
| Amcor Ltd. | 389,798 | 3,006 |
| Iluka Resources Ltd. | 117,143 | 2,172 |
| Orica Ltd. | 59,242 | 1,723 |
| Cochlear Ltd. | 12,620 | 809 |
| Beach Energy Ltd. | 500,099 | 762 |
| Challenger Ltd. | 162,067 | 638 |
| Alumina Ltd. | 455,071 | 584 |
| DuluxGroup Ltd. | 59,322 | 184 |
| | | 81,071 |
| Austria (0.1%) | | |
| Andritz AG | 10,903 | 1,067 |
| Oesterreichische Post AG | 27,351 | 952 |
| Raiffeisen Bank International AG | 5,662 | 201 |
| Erste Group Bank AG | 7,881 | 182 |
| | | 2,402 |
| Belgium (0.3%) | | |
| Anheuser-Busch InBev NV | 74,627 | 5,435 |
| Groupe Bruxelles Lambert SA | 30,257 | 2,343 |
| KBC Groep NV | 59,700 | 1,501 |
| Delhaize Group SA | 21,460 | 1,129 |
| | | 10,408 |
| Brazil (1.0%) | | |
| Vale SA Class B ADR | 414,100 | 9,396 |
| Petroleo Brasileiro SA ADR Type A | 355,030 | 9,075 |
| Banco do Brasil SA | 542,900 | 7,712 |
| * OGX Petroleo e Gas Participacoes SA | 340,403 | 2,819 |
| BM&FBovespa SA | 366,500 | 2,247 |
| Odontoprev SA | 109,951 | 1,849 |
| Embraer SA ADR | 49,231 | 1,574 |
| Petroleo Brasileiro SA ADR | 34,900 | 927 |
| Multiplan Empreendimentos Imobiliarios SA | 34,500 | 792 |
| MRV Engenharia e Participacoes SA | 94,400 | 669 |
| Diagnosticos da America SA | 74,700 | 574 |
| Duratex SA | 65,600 | 414 |
| Localiza Rent a Car SA | 18,147 | 334 |
| Weg SA | 22,100 | 243 |
| | | 38,625 |
| Canada (3.3%) | | |
| Rogers Communications Inc. Class B | 732,006 | 29,061 |
| Bombardier Inc. Class B | 3,931,616 | 16,318 |
| Magna International Inc. | 297,190 | 14,170 |
| Imperial Oil Ltd. | 257,892 | 11,718 |
| Toronto-Dominion Bank | 133,300 | 11,314 |
| Suncor Energy Inc. | 208,200 | 6,803 |
| Onex Corp. | 164,704 | 6,062 |
| BCE Inc. | 132,531 | 5,307 |
| Bank of Montreal | 84,294 | 5,009 |
| Nexen Inc. | 227,721 | 4,176 |
| Agrium Inc. | 44,990 | 3,883 |
| Fairfax Financial Holdings Ltd. | 7,379 | 2,972 |
| Kinross Gold Corp. | 214,030 | 2,092 |
| Goldcorp Inc. | 44,800 | 2,019 |
| Ritchie Bros Auctioneers Inc. | 76,607 | 1,820 |
| * BCE Inc. | 45,310 | 1,815 |
| Saputo Inc. | 31,600 | 1,369 |
1
Vanguard® Global Equity Fund
Schedule of Investments
March 31, 2012
| | | |
| | | | Market |
| | | | Value |
| | | Shares | ($000) |
| | Groupe Aeroplan Inc. | 86,213 | 1,066 |
| | MI Developments Inc. | 20,241 | 700 |
| * | CGI Group Inc. Class A | 27,900 | 622 |
| | Royal Bank of Canada | 10,300 | 597 |
| | TELUS Corp. Class A | 8,600 | 489 |
| | Alimentation Couche Tard Inc. Class B | 13,900 | 456 |
| | Empire Co. Ltd. Class A | 4,500 | 260 |
| * | ACE Aviation Holdings Inc. Class A | 15,135 | 163 |
| * | Catalyst Paper Corp. | 1,158,844 | 17 |
| | Yellow Media Inc. | 83,441 | 8 |
| * | Nortel Networks Corp. | 241,295 | 5 |
| | | | 130,291 |
| Chile (0.1%) | | |
| | Enersis SA ADR | 229,729 | 4,638 |
| | Vina Concha y Toro SA | 299,789 | 687 |
| * | Quinenco SA | 146,924 | 463 |
| | | | 5,788 |
| China (2.4%) | | |
| | China Mobile Ltd. | 2,281,500 | 25,123 |
| | China Petroleum & Chemical Corp. | 22,904,000 | 24,937 |
| | PetroChina Co. Ltd. | 11,302,000 | 15,915 |
| | Tsingtao Brewery Co. Ltd. | 1,774,000 | 9,594 |
| | China Telecom Corp. Ltd. | 6,112,000 | 3,373 |
| | Mindray Medical International Ltd. ADR | 98,792 | 3,257 |
| | Evergrande Real Estate Group Ltd. | 3,654,000 | 1,958 |
| | Shandong Weigao Group Medical Polymer Co. Ltd. | 1,244,000 | 1,426 |
| * | Baidu Inc. ADR | 9,600 | 1,399 |
| * | Netease.com ADR | 20,400 | 1,185 |
| | China Resources Enterprise Ltd. | 336,067 | 1,173 |
| | GCL-Poly Energy Holdings Ltd. | 3,633,000 | 1,010 |
| | Want Want China Holdings Ltd. | 695,994 | 779 |
| * | Sina Corp. | 8,900 | 579 |
| | Dongfeng Motor Group Co. Ltd. | 310,000 | 562 |
| | Tingyi Cayman Islands Holding Corp. | 186,373 | 538 |
| *,^ | Sohu.com Inc. | 9,200 | 508 |
| | Weiqiao Textile Co. | 778,185 | 402 |
| | Silver Grant International | 1,692,000 | 364 |
| | | | 94,082 |
| Colombia (0.0%) | | |
| | Cementos Argos SA | 64,150 | 399 |
| |
| Cyprus (0.0%) | | |
| * | Globaltrans Investment plc GDR | 53,384 | 914 |
| |
| Denmark (0.5%) | | |
| | Carlsberg A/S Class B | 54,630 | 4,532 |
| | Coloplast A/S Class B | 24,145 | 4,185 |
| | Novo Nordisk A/S Class B | 26,127 | 3,628 |
| * | William Demant Holding A/S | 26,776 | 2,502 |
| | GN Store Nord A/S | 216,874 | 2,322 |
| * | Danske Bank A/S | 62,838 | 1,068 |
| * | Jyske Bank A/S | 31,113 | 986 |
| * | Topdanmark A/S | 3,899 | 678 |
| * | Bang & Olufsen A/S | 33,672 | 441 |
| * | Vestas Wind Systems A/S | 39,297 | 400 |
| | AP Moeller - Maersk A/S Class B | 37 | 287 |
| | | | 21,029 |
| Egypt (0.1%) | | |
| | Ezz Steel | 1,397,944 | 1,635 |
2
Vanguard® Global Equity Fund
Schedule of Investments
March 31, 2012
| | | |
| | | | Market |
| | | | Value |
| | | Shares | ($000) |
| * | Egyptian Financial Group-Hermes Holding | 391,843 | 888 |
| | | | 2,523 |
| Finland (0.3%) | | |
| | Sampo Oyj | 164,626 | 4,757 |
| ^ | Metso Oyj | 78,220 | 3,342 |
| | Wartsila OYJ Abp | 19,854 | 749 |
| ^ | Tieto Oyj | 38,558 | 724 |
| ^ | Cargotec Oyj Class B | 15,037 | 574 |
| ^ | Outokumpu Oyj | 214,800 | 451 |
| | Nokia Oyj | 70,491 | 386 |
| | | | 10,983 |
| France (2.3%) | | |
| | European Aeronautic Defence and Space Co. NV | 582,109 | 23,839 |
| | Total SA | 307,103 | 15,687 |
| | BNP Paribas SA | 290,082 | 13,799 |
| | Bouygues SA | 238,521 | 7,274 |
| | Societe Generale SA | 150,757 | 4,424 |
| | Renault SA | 70,190 | 3,702 |
| | Legrand SA | 91,749 | 3,378 |
| | Sanofi | 41,189 | 3,196 |
| | Vivendi SA | 138,080 | 2,536 |
| | ArcelorMittal | 101,392 | 1,941 |
| | AXA SA | 110,826 | 1,839 |
| | Groupe Eurotunnel SA | 161,478 | 1,403 |
| | Societe BIC SA | 13,803 | 1,385 |
| | Thales SA | 36,712 | 1,375 |
| | Neopost SA | 21,174 | 1,363 |
| | Carrefour SA | 56,773 | 1,361 |
| | Eurofins Scientific | 9,450 | 1,032 |
| | Technip SA | 8,255 | 975 |
| | Edenred | 26,202 | 789 |
| | SA des Ciments Vicat | 7,459 | 495 |
| | Imerys SA | 7,677 | 467 |
| | Alstom SA | 8,304 | 324 |
| * | Alcatel-Lucent ADR | 131,498 | 298 |
| | APERAM | 722 | 13 |
| *,^ | Eurofins Scientific Warrants Exp. 06/29/2017 | 249 | 7 |
| | | | 92,902 |
| Germany (1.8%) | | |
| | Deutsche Post AG | 565,549 | 10,886 |
| | Allianz SE | 56,820 | 6,782 |
| | E.ON AG | 279,286 | 6,691 |
| | Bayerische Motoren Werke AG | 68,244 | 6,139 |
| | BASF SE | 68,437 | 5,984 |
| | Fresenius Medical Care AG & Co. KGaA | 71,944 | 5,093 |
| | Daimler AG | 77,968 | 4,701 |
| | Deutsche Lufthansa AG | 328,258 | 4,590 |
| | Volkswagen AG Prior Pfd. | 22,300 | 3,922 |
| | Bayer AG | 55,485 | 3,902 |
| | SAP AG | 47,553 | 3,321 |
| | Infineon Technologies AG | 190,360 | 1,946 |
| | Deutsche Boerse AG | 27,166 | 1,829 |
| | Siemens AG | 11,664 | 1,176 |
| | Suedzucker AG | 33,188 | 1,057 |
| | Deutsche Bank AG | 15,904 | 792 |
| | Hannover Rueckversicherung AG | 13,240 | 787 |
| | Adidas AG | 9,352 | 731 |
| | GEA Group AG | 21,137 | 729 |
| | Axel Springer AG | 11,289 | 570 |
| | Celesio AG | 15,140 | 274 |
| | ThyssenKrupp AG | 870 | 22 |
| | | | 71,924 |
3
Vanguard® Global Equity Fund
Schedule of Investments
March 31, 2012
| | |
| | | Market |
| | | Value |
| | Shares | ($000) |
| Greece (0.1%) | | |
| Coca Cola Hellenic Bottling Co. SA | 149,026 | 2,855 |
| |
| Hong Kong (3.7%) | | |
| Jardine Strategic Holdings Ltd. | 1,227,900 | 37,497 |
| Jardine Matheson Holdings Ltd. | 616,302 | 30,871 |
| New World Development Co. Ltd. | 12,054,097 | 14,514 |
| First Pacific Co. Ltd. | 10,213,600 | 11,326 |
| Esprit Holdings Ltd. | 5,174,743 | 10,449 |
| SmarTone Telecommunications Holdings Ltd. | 4,419,580 | 9,083 |
| Television Broadcasts Ltd. | 1,142,000 | 7,710 |
| Wheelock & Co. Ltd. | 1,788,000 | 5,408 |
| CLP Holdings Ltd. | 538,000 | 4,640 |
| Hongkong & Shanghai Hotels | 3,058,378 | 4,162 |
| Midland Holdings Ltd. | 6,608,000 | 3,485 |
| Henderson Land Development Co. Ltd. | 458,466 | 2,533 |
| Hong Kong Aircraft Engineering Co. Ltd. | 170,400 | 2,316 |
| Mandarin Oriental International Ltd. | 806,690 | 1,304 |
| Hong Kong Exchanges and Clearing Ltd. | 54,000 | 909 |
| Texwinca Holdings Ltd. | 487,139 | 594 |
| * Next Media Ltd. | 6,072,000 | 469 |
| * I-CABLE Communications Ltd. | 6,402,000 | 331 |
| City Telecom HK Ltd. ADR | 17,300 | 231 |
| | | 147,832 |
| Hungary (0.0%) | | |
| OTP Bank plc | 17,667 | 307 |
| |
| India (0.2%) | | |
| Allahabad Bank | 288,248 | 1,055 |
| Zee Entertainment Enterprises Ltd. | 423,471 | 1,053 |
| Indian Bank | 179,327 | 859 |
| * Tata Motors Ltd. | 151,827 | 821 |
| Grasim Industries Ltd. | 14,244 | 734 |
| Havells India Ltd. | 56,327 | 632 |
| United Breweries Ltd. | 56,578 | 597 |
| * Dish TV India Ltd. | 445,283 | 559 |
| Tata Consultancy Services Ltd. | 20,910 | 480 |
| Bank of Baroda | 29,468 | 460 |
| Infosys Ltd. ADR | 7,900 | 451 |
| Sun TV Network Ltd. | 61,060 | 365 |
| Punjab National Bank | 14,305 | 260 |
| * Idea Cellular Ltd. | 116,891 | 227 |
| | | 8,553 |
| Indonesia (0.5%) | | |
| * Bank Pan Indonesia Tbk PT | 75,662,343 | 6,888 |
| Indofood Sukses Makmur Tbk PT | 8,187,500 | 4,350 |
| * Matahari Putra Prima Tbk PT | 23,927,775 | 2,301 |
| Semen Gresik Persero Tbk PT | 1,644,000 | 2,207 |
| Bank Negara Indonesia Persero Tbk PT | 2,338,111 | 1,025 |
| Gajah Tunggal Tbk PT | 2,642,500 | 773 |
| Citra Marga Nusaphala Persada Tbk PT | 2,020,500 | 459 |
| Bank Rakyat Indonesia Persero Tbk PT | 588,768 | 449 |
| Gudang Garam Tbk PT | 42,000 | 253 |
| * Mayora Indah Tbk PT | 70,000 | 147 |
| * Ace Hardware Indonesia Tbk PT | 264,000 | 129 |
| * Mulia Industrindo Tbk PT | 921,000 | 34 |
| * Sumber Alfaria Trijaya Tbk PT | 17,180 | 9 |
| | | 19,024 |
| Ireland (0.3%) | | |
| Paddy Power plc | 35,818 | 2,256 |
| * Ryanair Holdings plc ADR | 59,879 | 2,172 |
| Dragon Oil plc | 137,335 | 1,373 |
| * Governor & Co. of the Bank of Ireland | 7,513,588 | 1,246 |
| CRH plc | 48,801 | 998 |
4
Vanguard® Global Equity Fund
Schedule of Investments
March 31, 2012
| | | |
| | | | Market |
| | | | Value |
| | | Shares | ($000) |
| | CRH plc (London Shares) | 38,614 | 791 |
| | DCC plc (London Shares) | 28,986 | 732 |
| | Irish Continental Group plc | 28,622 | 603 |
| | DCC plc | 14,768 | 366 |
| * | Independent News & Media plc | 318,558 | 91 |
| * | Irish Bank Resolution Corp. Ltd. | 122,273 | — |
| | | | 10,628 |
| Israel (0.0%) | | |
| | Teva Pharmaceutical Industries Ltd. ADR | 17,300 | 780 |
| |
| Italy (0.7%) | | |
| | Saipem SPA | 107,207 | 5,539 |
| | Telecom Italia SPA (Registered) | 3,703,100 | 4,408 |
| | Luxottica Group SPA ADR | 94,994 | 3,426 |
| | Enel SPA | 891,540 | 3,223 |
| | Telecom Italia SPA (Bearer) | 2,707,300 | 2,658 |
| * | Fiat Industrial SPA | 219,090 | 2,338 |
| | Luxottica Group SPA | 61,709 | 2,230 |
| | Fiat SPA | 218,604 | 1,285 |
| * | UniCredit SPA | 190,215 | 953 |
| | Davide Campari-Milano SPA | 92,610 | 630 |
| | Intesa Sanpaolo SPA (Registered) | 218,567 | 392 |
| | Finmeccanica SPA | 39,468 | 214 |
| | | | 27,296 |
| Japan (7.8%) | | |
| | Nippon Telegraph & Telephone Corp. | 676,000 | 30,639 |
| | Hitachi Ltd. | 3,102,000 | 20,070 |
| | Daito Trust Construction Co. Ltd. | 217,200 | 19,614 |
| | Marubeni Corp. | 2,045,000 | 14,872 |
| | Fujitsu Ltd. | 2,476,000 | 13,144 |
| | Japan Tobacco Inc. | 1,454 | 8,230 |
| | Nissan Motor Co. Ltd. | 735,900 | 7,912 |
| | NTT Data Corp. | 2,066 | 7,320 |
| | Mitsubishi UFJ Financial Group Inc. | 1,412,800 | 7,090 |
| | Sumitomo Mitsui Financial Group Inc. | 208,300 | 6,894 |
| | Namco Bandai Holdings Inc. | 452,450 | 6,564 |
| | Otsuka Holdings Co. Ltd. | 218,400 | 6,474 |
| | JX Holdings Inc. | 915,950 | 5,715 |
| | Sharp Corp. | 758,000 | 5,583 |
| | Toyota Motor Corp. | 121,300 | 5,278 |
| | ORIX Corp. | 44,440 | 4,270 |
| | Kao Corp. | 158,300 | 4,174 |
| * | Pioneer Corp. | 800,700 | 4,126 |
| | Toyota Tsusho Corp. | 187,200 | 3,841 |
| | Dainippon Sumitomo Pharma Co. Ltd. | 320,700 | 3,414 |
| | Sumitomo Electric Industries Ltd. | 237,500 | 3,289 |
| | East Japan Railway Co. | 51,800 | 3,270 |
| | Inpex Corp. | 471 | 3,203 |
| | Yamaha Motor Co. Ltd. | 233,900 | 3,165 |
| | Tokyo Electron Ltd. | 52,200 | 3,010 |
| | Bridgestone Corp. | 123,000 | 3,008 |
| | Seven & I Holdings Co. Ltd. | 100,200 | 2,988 |
| | JFE Holdings Inc. | 125,400 | 2,726 |
| | Tokyo Gas Co. Ltd. | 552,000 | 2,605 |
| | JS Group Corp. | 112,900 | 2,377 |
| | Nintendo Co. Ltd. | 15,000 | 2,278 |
| | Toyo Seikan Kaisha Ltd. | 156,700 | 2,269 |
| | Honda Motor Co. Ltd. | 56,500 | 2,176 |
| | Astellas Pharma Inc. | 51,400 | 2,117 |
| | Secom Co. Ltd. | 41,600 | 2,050 |
| | Dai-ichi Life Insurance Co. Ltd. | 1,304 | 1,822 |
| | Daiwa House Industry Co. Ltd. | 134,000 | 1,781 |
| | MS&AD Insurance Group Holdings | 85,100 | 1,761 |
| | Isetan Mitsukoshi Holdings Ltd. | 145,700 | 1,721 |
5
Vanguard® Global Equity Fund
Schedule of Investments
March 31, 2012
| | |
| | | Market |
| | | Value |
| | Shares | ($000) |
| Yamato Holdings Co. Ltd. | 108,700 | 1,688 |
| Aisin Seiki Co. Ltd. | 47,200 | 1,679 |
| Alfresa Holdings Corp. | 34,700 | 1,654 |
| FUJIFILM Holdings Corp. | 69,600 | 1,647 |
| West Japan Railway Co. | 40,400 | 1,626 |
| Dentsu Inc. | 50,500 | 1,618 |
| Calsonic Kansei Corp. | 259,000 | 1,591 |
| Daihatsu Motor Co. Ltd. | 86,000 | 1,587 |
| Nichii Gakkan Co. | 118,000 | 1,586 |
| * Mazda Motor Corp. | 887,000 | 1,571 |
| Rohm Co. Ltd. | 31,400 | 1,558 |
| Kirin Holdings Co. Ltd. | 118,000 | 1,536 |
| Ship Healthcare Holdings Inc. | 74,300 | 1,523 |
| Mitsubishi Estate Co. Ltd. | 83,000 | 1,493 |
| Fukuoka Financial Group Inc. | 321,000 | 1,431 |
| * Sumco Corp. | 112,400 | 1,384 |
| Sekisui House Ltd. | 139,000 | 1,372 |
| Mitsubishi Corp. | 58,500 | 1,369 |
| Obayashi Corp. | 310,000 | 1,358 |
| NET One Systems Co. Ltd. | 109,400 | 1,341 |
| ITOCHU Corp. | 122,100 | 1,338 |
| Mitsui & Co. Ltd. | 76,700 | 1,266 |
| Nippon Meat Packers Inc. | 98,000 | 1,251 |
| Yamada Denki Co. Ltd. | 18,950 | 1,190 |
| Konica Minolta Holdings Inc. | 128,500 | 1,134 |
| SKY Perfect JSAT Holdings Inc. | 2,509 | 1,111 |
| NKSJ Holdings Inc. | 48,200 | 1,086 |
| Marui Group Co. Ltd. | 128,600 | 1,078 |
| Olympus Corp. | 64,800 | 1,064 |
| Zeon Corp. | 110,000 | 1,028 |
| Sumitomo Forestry Co. Ltd. | 112,400 | 1,026 |
| Toyo Suisan Kaisha Ltd. | 36,000 | 936 |
| Shiseido Co. Ltd. | 54,000 | 935 |
| NSK Ltd. | 116,000 | 903 |
| Shinsei Bank Ltd. | 683,000 | 899 |
| Onward Holdings Co. Ltd. | 109,000 | 890 |
| Shimizu Corp. | 220,000 | 885 |
| Central Japan Railway Co. | 106 | 875 |
| Kinden Corp. | 112,000 | 867 |
| Hitachi Chemical Co. Ltd. | 46,800 | 849 |
| Omron Corp. | 38,400 | 832 |
| IHI Corp. | 327,000 | 831 |
| Bank of Yokohama Ltd. | 162,000 | 815 |
| Brother Industries Ltd. | 58,000 | 792 |
| Kyowa Hakko Kirin Co. Ltd. | 70,000 | 782 |
| Hitachi Metals Ltd. | 60,000 | 752 |
| Chiba Bank Ltd. | 117,000 | 750 |
| Azbil Corp. | 29,300 | 651 |
| Taiyo Nippon Sanso Corp. | 80,000 | 568 |
| Nippon Suisan Kaisha Ltd. | 163,200 | 558 |
| Unipres Corp. | 17,600 | 550 |
| NTT DoCoMo Inc. | 297 | 494 |
| Ryosan Co. Ltd. | 22,500 | 453 |
| Idemitsu Kosan Co. Ltd. | 4,200 | 420 |
| HIS Co. Ltd. | 13,500 | 413 |
| IT Holdings Corp. | 34,900 | 411 |
| Nippo Corp. | 34,000 | 378 |
| Nomura Research Institute Ltd. | 14,700 | 367 |
| Sekisui Chemical Co. Ltd. | 41,000 | 357 |
| Toho Holdings Co. Ltd. | 19,400 | 346 |
| Tokyo Ohka Kogyo Co. Ltd. | 15,000 | 343 |
| Shimachu Co. Ltd. | 14,500 | 342 |
| Press Kogyo Co. Ltd. | 49,000 | 334 |
| Seino Holdings Corp. | 45,000 | 327 |
6
Vanguard® Global Equity Fund
Schedule of Investments
March 31, 2012
| | |
| | | Market |
| | | Value |
| | Shares | ($000) |
| Aoyama Trading Co. Ltd. | 14,900 | 317 |
| Fuji Soft Inc. | 16,300 | 314 |
| Alpine Electronics Inc. | 23,000 | 313 |
| Nagase & Co. Ltd. | 25,000 | 311 |
| United Arrows Ltd. | 14,800 | 310 |
| MediPal Holdings Corp. | 23,500 | 306 |
| Xebio Co. Ltd. | 11,400 | 304 |
| Nomura Real Estate Holdings Inc. | 16,700 | 297 |
| * Misawa Homes Co. Ltd. | 28,000 | 295 |
| Sega Sammy Holdings Inc. | 14,000 | 294 |
| Fuji Media Holdings Inc. | 169 | 292 |
| eAccess Ltd. | 1,300 | 291 |
| Itochu Techno-Solutions Corp. | 6,500 | 291 |
| Geo Holdings Corp. | 244 | 289 |
| Otsuka Corp. | 3,500 | 285 |
| Tsuruha Holdings Inc. | 4,700 | 278 |
| Nihon Unisys Ltd. | 39,100 | 275 |
| Gulliver International Co. Ltd. | 6,790 | 268 |
| Asahi Kasei Corp. | 43,000 | 267 |
| Autobacs Seven Co. Ltd. | 5,400 | 261 |
| Koito Manufacturing Co. Ltd. | 16,000 | 260 |
| TS Tech Co. Ltd. | 13,100 | 260 |
| Suzuken Co. Ltd. | 8,300 | 257 |
| Resorttrust Inc. | 15,600 | 254 |
| Tokyo Seimitsu Co. Ltd. | 12,100 | 253 |
| Taikisha Ltd. | 11,900 | 245 |
| Musashi Seimitsu Industry Co. Ltd. | 10,200 | 245 |
| Avex Group Holdings Inc. | 20,200 | 244 |
| Yellow Hat Ltd. | 14,700 | 244 |
| Daicel Corp. | 36,000 | 233 |
| Melco Holdings Inc. | 8,600 | 218 |
| EDION Corp. | 29,600 | 208 |
| Toppan Forms Co. Ltd. | 20,100 | 185 |
| * JVC Kenwood Corp. | 38,100 | 170 |
| Fujitsu Frontech Ltd. | 25,500 | 168 |
| * Tokyo Electric Power Co. Inc. | 17,500 | 44 |
| Dowa Holdings Co. Ltd. | 4,000 | 27 |
| | | 306,302 |
| Malaysia (1.5%) | | |
| CIMB Group Holdings Bhd. | 6,616,838 | 16,616 |
| Genting Malaysia Bhd. | 10,524,800 | 13,482 |
| AMMB Holdings Bhd. | 4,214,287 | 8,697 |
| Sime Darby Bhd. | 1,962,057 | 6,245 |
| Telekom Malaysia Bhd. | 3,043,375 | 5,297 |
| British American Tobacco Malaysia Bhd. | 160,400 | 2,967 |
| Multi-Purpose Holdings Bhd. | 1,744,190 | 1,574 |
| * Malaysian Airline System Bhd. | 3,279,566 | 1,433 |
| Carlsberg Brewery Malaysia Bhd. | 400,300 | 1,344 |
| Genting Bhd. | 135,800 | 481 |
| * UEM Land Holdings Bhd. | 315,900 | 231 |
| | | 58,367 |
| Mexico (0.3%) | | |
| America Movil SAB de CV ADR | 251,416 | 6,243 |
| * Cemex SAB de CV ADR | 279,271 | 2,167 |
| * Fomento Economico Mexicano SAB de CV ADR | 10,300 | 847 |
| Bolsa Mexicana de Valores SAB de CV | 373,700 | 754 |
| * Genomma Lab Internacional SAB de CV Class B | 360,531 | 657 |
| Grupo Carso SAB de CV | 197,600 | 620 |
| Grupo Financiero Banorte SAB de CV | 91,500 | 408 |
| | | 11,696 |
| Netherlands (0.6%) | | |
| * ING Groep NV | 832,910 | 6,937 |
| Koninklijke DSM NV | 69,341 | 4,014 |
7
Vanguard® Global Equity Fund
Schedule of Investments
March 31, 2012
| | | |
| | | | Market |
| | | | Value |
| | | Shares | ($000) |
| | Heineken NV | 65,866 | 3,662 |
| | Koninklijke KPN NV | 254,981 | 2,806 |
| | Koninklijke Boskalis Westminster NV | 62,410 | 2,343 |
| * | QIAGEN NV | 64,500 | 1,004 |
| | Akzo Nobel NV | 15,434 | 912 |
| | ASML Holding NV | 16,662 | 835 |
| | Koninklijke Philips Electronics NV | 27,074 | 549 |
| | Randstad Holding NV | 13,740 | 519 |
| | Wolters Kluwer NV | 22,352 | 423 |
| | TNT Express NV | 12,503 | 155 |
| | PostNL NV | 12,503 | 77 |
| *,^ | Eurocastle Investment Ltd. | 275,977 | 40 |
| | | | 24,276 |
| New Zealand (0.0%) | | |
| | Telecom Corp. of New Zealand Ltd. | 282,806 | 562 |
| * | Chorus Ltd. | 56,561 | 171 |
| * | PGG Wrightson Ltd. | 51,996 | 17 |
| | | | 750 |
| Norway (0.5%) | | |
| | Statoil ASA | 350,138 | 9,504 |
| | Seadrill Ltd. | 101,920 | 3,827 |
| | DNB ASA | 160,452 | 2,064 |
| | Norsk Hydro ASA | 249,000 | 1,358 |
| | Schibsted ASA | 30,176 | 1,121 |
| | Storebrand ASA | 63,234 | 320 |
| | | | 18,194 |
| Philippines (1.7%) | | |
| | Ayala Corp. | 2,458,573 | 23,301 |
| | ABS-CBN Holdings Corp. | 13,521,188 | 12,074 |
| | Globe Telecom Inc. | 368,370 | 9,733 |
| | Jollibee Foods Corp. | 2,802,990 | 7,645 |
| | DMCI Holdings Inc. | 5,814,900 | 7,326 |
| | Lopez Holdings Corp. | 33,935,874 | 4,342 |
| * | BDO Unibank Inc. | 1,276,150 | 1,970 |
| | SM Investments Corp. | 105,900 | 1,631 |
| | Bank of the Philippine Islands | 268,300 | 463 |
| | Universal Robina Corp. | 280,300 | 412 |
| | | | 68,897 |
| Poland (0.4%) | | |
| | KGHM Polska Miedz SA | 331,457 | 15,283 |
| | Bank Pekao SA | 15,911 | 793 |
| | Tauron Polska Energia SA | 480,699 | 785 |
| | | | 16,861 |
| Portugal (0.1%) | | |
| | EDP - Energias de Portugal SA | 728,290 | 2,118 |
| |
| Russia (1.2%) | | |
| | Gazprom OAO ADR | 1,911,418 | 23,377 |
| | Lukoil OAO ADR | 362,739 | 21,891 |
| * | Sberbank of Russia ADR | 107,007 | 1,376 |
| | Sistema JSFC GDR | 30,421 | 599 |
| | Gazprom OAO ADR (U.S. Shares) | 30,334 | 371 |
| | Eurasia Drilling Co. Ltd. GDR | 13,254 | 366 |
| | LSR Group GDR | 57,897 | 340 |
| | | | 48,320 |
| Singapore (0.8%) | | |
| | DBS Group Holdings Ltd. | 1,154,000 | 13,040 |
| | Great Eastern Holdings Ltd. | 711,000 | 7,873 |
| | GuocoLeisure Ltd. | 6,677,000 | 3,351 |
| * | STATS ChipPAC Ltd. | 8,243,000 | 3,191 |
| * | Genting Singapore plc | 1,066,244 | 1,447 |
| | United Industrial Corp. Ltd. | 368,000 | 817 |
| | Golden Agri-Resources Ltd. | 1,010,000 | 631 |
8
Vanguard® Global Equity Fund
Schedule of Investments
March 31, 2012
| | |
| | | Market |
| | | Value |
| | Shares | ($000) |
| Global Yellow Pages Ltd. | 2,403,000 | 258 |
| Yangzijiang Shipbuilding Holdings Ltd. | 200,000 | 212 |
| * Yoma Strategic Holdings Ltd. | 380,000 | 154 |
| * Global Yellow Pages Ltd. Warrants Exp. 08/13/2014 | 704,000 | 12 |
| | | 30,986 |
| South Africa (1.7%) | | |
| Hosken Consolidated Investments Ltd. | 1,443,083 | 15,269 |
| RMB Holdings Ltd. | 1,483,238 | 6,055 |
| Nedbank Group Ltd. | 256,991 | 5,502 |
| Clicks Group Ltd. | 856,450 | 5,000 |
| Anglo American plc | 120,722 | 4,505 |
| FirstRand Ltd. | 1,357,077 | 4,200 |
| Naspers Ltd. | 73,302 | 4,124 |
| Sun International Ltd. | 368,158 | 4,008 |
| RMI Holdings | 1,583,806 | 3,552 |
| Anglo American Platinum Ltd. | 29,391 | 2,053 |
| JD Group Ltd. | 296,836 | 1,916 |
| Remgro Ltd. | 96,537 | 1,680 |
| * Old Mutual plc | 654,874 | 1,663 |
| Exxaro Resources Ltd. | 58,520 | 1,515 |
| Gold Fields Ltd. | 66,432 | 918 |
| Foschini Group Ltd. | 45,988 | 742 |
| AngloGold Ashanti Ltd. | 20,027 | 739 |
| JSE Ltd. | 64,370 | 667 |
| Steinhoff International Holdings Ltd. | 165,153 | 593 |
| City Lodge Hotels Ltd. | 56,350 | 583 |
| MMI Holdings Ltd. | 226,203 | 523 |
| * Murray & Roberts Holdings Ltd. | 136,573 | 502 |
| Imperial Holdings Ltd. | 19,096 | 387 |
| Discovery Holdings Ltd. | 53,846 | 354 |
| Mondi Ltd. | 12,320 | 116 |
| * Murray & Roberts Holdings Ltd. Rights | 46,434 | 61 |
| * Mpact Ltd. | 15,297 | 35 |
| | | 67,262 |
| South Korea (2.8%) | | |
| Samsung Electronics Co. Ltd. | 31,035 | 35,009 |
| Hyundai Motor Co. | 97,255 | 20,083 |
| Kia Motors Corp. | 256,128 | 16,807 |
| KB Financial Group Inc. | 234,443 | 8,597 |
| SK Holdings Co. Ltd. | 60,007 | 7,825 |
| Woori Finance Holdings Co. Ltd. | 627,920 | 7,252 |
| LG Display Co. Ltd. | 222,590 | 5,220 |
| 2 Samsung Electronics Co. Ltd. GDR | 5,600 | 3,162 |
| SK Telecom Co. Ltd. | 15,326 | 1,895 |
| Hyundai Mobis | 6,554 | 1,663 |
| OCI Co. Ltd. | 7,030 | 1,433 |
| Hankook Tire Co. Ltd. | 32,426 | 1,203 |
| Hana Financial Group Inc. | 21,261 | 806 |
| NHN Corp. | 2,224 | 510 |
| POSCO | 1,000 | 335 |
| * Korea Electric Power Corp. | 5,000 | 99 |
| | | 111,899 |
| Spain (0.4%) | | |
| Gas Natural SDG SA | 236,884 | 3,787 |
| Inditex SA | 31,573 | 3,021 |
| Banco Santander SA | 331,892 | 2,552 |
| Viscofan SA | 34,273 | 1,535 |
| Acerinox SA | 112,159 | 1,444 |
| Acciona SA | 18,381 | 1,281 |
| Telefonica SA | 62,231 | 1,021 |
| Mediaset Espana Comunicacion SA | 150,750 | 865 |
| * Distribuidora Internacional de Alimentacion SA | 55,629 | 276 |
| Banco Bilbao Vizcaya Argentaria SA | 31,471 | 251 |
9
Vanguard® Global Equity Fund
Schedule of Investments
March 31, 2012
| | |
| | | Market |
| | | Value |
| | Shares | ($000) |
| Banco Santander SA ADR | 17,899 | 137 |
| | | 16,170 |
| Sweden (0.8%) | | |
| ^ Svenska Handelsbanken AB Class A | 277,021 | 8,832 |
| Assa Abloy AB Class B | 145,340 | 4,553 |
| Atlas Copco AB Class B | 187,334 | 4,038 |
| Investor AB Class B | 148,473 | 3,292 |
| Telefonaktiebolaget LM Ericsson Class B | 276,076 | 2,857 |
| Swedish Match AB | 56,037 | 2,230 |
| Oriflame Cosmetics SA | 32,321 | 1,247 |
| ^ Nordea Bank AB | 115,648 | 1,052 |
| Hoganas AB Class B | 26,417 | 965 |
| Modern Times Group AB Class B | 12,334 | 679 |
| Millicom International Cellular SA | 5,491 | 623 |
| * CDON Group AB | 15,780 | 135 |
| | | 30,503 |
| Switzerland (1.4%) | | |
| Roche Holding AG | 76,808 | 13,367 |
| Cie Financiere Richemont SA | 121,793 | 7,634 |
| Nestle SA | 114,097 | 7,179 |
| * UBS AG | 412,467 | 5,781 |
| Novartis AG | 95,419 | 5,282 |
| Schindler Holding AG | 24,049 | 2,893 |
| Geberit AG | 13,661 | 2,854 |
| Adecco SA | 47,134 | 2,469 |
| ABB Ltd. | 95,048 | 1,945 |
| Julius Baer Group Ltd. | 44,759 | 1,807 |
| * Clariant AG | 114,473 | 1,579 |
| Sonova Holding AG | 9,584 | 1,065 |
| Helvetia Holding AG | 1,492 | 553 |
| * Logitech International SA | 49,852 | 388 |
| | | 54,796 |
| Taiwan (1.4%) | | |
| Fubon Financial Holding Co. Ltd. | 14,392,445 | 16,245 |
| United Microelectronics Corp. | 21,180,000 | 10,317 |
| Taiwan Semiconductor Manufacturing Co. Ltd. | 2,303,431 | 6,622 |
| Taiwan Semiconductor Manufacturing Co. Ltd. ADR | 327,446 | 5,003 |
| AU Optronics Corp. | 8,932,700 | 4,112 |
| Pegatron Corp. | 1,706,000 | 2,670 |
| Advanced Semiconductor Engineering Inc. | 1,957,000 | 1,986 |
| Uni-President Enterprises Corp. | 1,412,706 | 1,961 |
| Hon Hai Precision Industry Co. Ltd. | 499,000 | 1,943 |
| Taishin Financial Holding Co. Ltd. | 3,660,214 | 1,469 |
| Chunghwa Telecom Co. Ltd. | 353,000 | 1,089 |
| Wistron Corp. | 495,000 | 750 |
| Lite-On Technology Corp. | 307,106 | 372 |
| Giant Manufacturing Co. Ltd. | 81,000 | 357 |
| Chin-Poon Industrial Co. | 337,000 | 308 |
| King Yuan Electronics Co. Ltd. | 203,000 | 77 |
| | | 55,281 |
| Thailand (1.6%) | | |
| Kasikornbank PCL (Foreign) | 1,944,400 | 9,869 |
| Bangkok Bank PCL (Foreign) | 1,459,400 | 9,184 |
| Siam Cement PCL (Foreign) | 567,700 | 7,649 |
| Advanced Info Service PCL (Foreign) | 1,130,000 | 6,735 |
| * Advanced Info Service PCL (Local) | 917,300 | 5,467 |
| Thanachart Capital PCL | 4,655,100 | 5,058 |
| MBK PCL (Foreign) | 1,495,900 | 4,591 |
| * Advanced Info Service PCL | 416,700 | 2,483 |
| * Total Access Communication PCL (Local) | 896,616 | 2,383 |
| Land and Houses PCL (Foreign) | 9,411,400 | 2,133 |
| GMM Grammy PCL NVDR | 2,917,000 | 1,902 |
| * Big C Supercenter PCL | 289,800 | 1,541 |
10
Vanguard® Global Equity Fund
Schedule of Investments
March 31, 2012
| | |
| | | Market |
| | | Value |
| | Shares | ($000) |
| * Siam Commercial Bank PCL (Local) | 294,700 | 1,373 |
| GMM Grammy PCL (Foreign) | 1,829,500 | 1,193 |
| PTT PCL | 98,300 | 1,128 |
| Total Access Communication PCL | 384,000 | 1,020 |
| * BEC World PCL | 282,256 | 466 |
| Major Cineplex Group PCL | 534,400 | 311 |
| Matichon PCL (Foreign) | 833,800 | 164 |
| Siam Commercial Bank PCL (Foreign) | 30,900 | 144 |
| BEC World PCL (Foreign) | 85,285 | 141 |
| Post Publishing PCL (Foreign) | 1,188,500 | 113 |
| | | 65,048 |
| Turkey (0.3%) | | |
| Turkiye Is Bankasi | 1,145,010 | 2,825 |
| KOC Holding AS | 488,227 | 1,985 |
| Turkiye Garanti Bankasi AS ADR | 495,900 | 1,971 |
| BIM Birlesik Magazalar AS | 51,883 | 1,969 |
| Turkiye Vakiflar Bankasi Tao | 566,900 | 1,076 |
| Turkiye Garanti Bankasi AS | 267,100 | 1,059 |
| Turkiye Halk Bankasi AS | 121,992 | 873 |
| Tupras Turkiye Petrol Rafinerileri AS | 32,443 | 829 |
| Haci Omer Sabanci Holding AS (Bearer) | 149,304 | 642 |
| | | 13,229 |
| United Kingdom (7.8%) | | |
| Royal Dutch Shell plc Class A | 1,125,175 | 39,422 |
| BP plc | 4,136,462 | 30,806 |
| Vodafone Group plc | 7,010,952 | 19,339 |
| Rio Tinto plc | 292,821 | 16,230 |
| Rolls-Royce Holdings plc | 1,053,370 | 13,684 |
| AstraZeneca plc | 259,500 | 11,534 |
| BP plc ADR | 181,499 | 8,167 |
| * Lloyds Banking Group plc | 14,770,461 | 7,949 |
| Wolseley plc | 183,781 | 7,022 |
| BHP Billiton plc | 225,125 | 6,900 |
| Intertek Group plc | 152,092 | 6,111 |
| Invensys plc | 1,661,588 | 5,292 |
| Royal Dutch Shell plc Class B | 146,694 | 5,166 |
| Diageo plc | 210,732 | 5,074 |
| Prudential plc | 413,000 | 4,949 |
| Michael Page International plc | 613,159 | 4,721 |
| Bunzl plc | 282,324 | 4,540 |
| Reckitt Benckiser Group plc | 77,908 | 4,408 |
| National Grid plc | 398,930 | 4,021 |
| Compass Group plc | 379,871 | 3,982 |
| TESCO plc | 692,356 | 3,654 |
| Capita plc | 308,296 | 3,616 |
| Legal & General Group plc | 1,695,842 | 3,547 |
| Anglo American plc | 93,533 | 3,506 |
| * Howden Joinery Group plc | 1,712,015 | 3,406 |
| Unilever plc | 102,049 | 3,367 |
| * APR Energy plc | 215,059 | 3,251 |
| Informa plc | 400,127 | 2,828 |
| Sage Group plc | 584,097 | 2,796 |
| British American Tobacco plc | 54,434 | 2,742 |
| Rightmove plc | 116,953 | 2,714 |
| Carnival plc | 74,985 | 2,396 |
| Barclays plc | 603,276 | 2,273 |
| WPP plc | 166,154 | 2,272 |
| BAE Systems plc | 439,829 | 2,111 |
| Provident Financial plc | 110,686 | 2,029 |
| ICAP plc | 292,757 | 1,840 |
| Aggreko plc | 49,357 | 1,777 |
| ITV plc | 1,235,916 | 1,748 |
| Paragon Group of Cos. plc | 560,900 | 1,705 |
11
Vanguard® Global Equity Fund
Schedule of Investments
March 31, 2012
| | |
| | | Market |
| | | Value |
| | Shares | ($000) |
| Spectris plc | 59,017 | 1,703 |
| Rexam plc | 247,791 | 1,697 |
| G4S plc | 381,122 | 1,661 |
| Experian plc | 105,558 | 1,647 |
| Reed Elsevier plc | 185,743 | 1,646 |
| Stagecoach Group plc | 389,906 | 1,591 |
| GlaxoSmithKline plc | 68,991 | 1,542 |
| Hays plc | 1,131,553 | 1,531 |
| Smiths Group plc | 89,603 | 1,508 |
| Admiral Group plc | 78,614 | 1,494 |
| HSBC Holdings plc | 168,110 | 1,493 |
| International Personal Finance plc | 334,803 | 1,436 |
| TUI Travel plc | 456,943 | 1,434 |
| Glencore International plc | 226,171 | 1,412 |
| Xyratex Ltd. | 83,632 | 1,331 |
| Next plc | 24,563 | 1,171 |
| Homeserve plc | 306,876 | 1,146 |
| * Berkeley Group Holdings plc | 43,010 | 909 |
| Bwin.Party Digital Entertainment plc | 359,387 | 892 |
| AMEC plc | 45,722 | 811 |
| Petrofac Ltd. | 28,459 | 793 |
| WH Smith plc | 89,551 | 781 |
| Devro plc | 159,231 | 779 |
| Sthree plc | 143,910 | 772 |
| Kazakhmys plc | 52,836 | 769 |
| Man Group plc | 345,750 | 747 |
| IG Group Holdings plc | 100,548 | 724 |
| Cable & Wireless Communications plc | 1,393,728 | 721 |
| TalkTalk Telecom Group plc | 311,659 | 680 |
| Millennium & Copthorne Hotels plc | 86,358 | 664 |
| Smith & Nephew plc | 58,521 | 593 |
| Aviva plc | 111,346 | 591 |
| Centrica plc | 115,309 | 584 |
| Jupiter Fund Management plc | 140,892 | 561 |
| * Royal Bank of Scotland Group plc | 1,254,683 | 555 |
| Sportingbet plc | 906,197 | 548 |
| British Sky Broadcasting Group plc | 49,898 | 540 |
| Cable & Wireless Worldwide plc | 961,761 | 523 |
| Thomas Cook Group plc | 1,421,073 | 512 |
| Ladbrokes plc | 193,711 | 496 |
| Close Brothers Group plc | 34,692 | 436 |
| National Express Group plc | 112,685 | 434 |
| Standard Chartered plc | 15,804 | 395 |
| * Barratt Developments plc | 172,408 | 389 |
| Mondi plc | 38,261 | 360 |
| Daily Mail & General Trust plc | 43,118 | 312 |
| Carphone Warehouse Group plc | 104,186 | 250 |
| Marshalls plc | 155,051 | 243 |
| * Northgate plc | 41,164 | 139 |
| * Connaught plc | 103,081 | — |
| | | 306,841 |
| United States (40.9%) | | |
| Consumer Discretionary (9.0%) | | |
| * Amazon.com Inc. | 171,610 | 34,753 |
| * Liberty Global Inc. Class A | 471,275 | 23,601 |
| Cablevision Systems Corp. Class A | 1,493,963 | 21,931 |
| * priceline.com Inc. | 26,343 | 18,901 |
| * Liberty Global Inc. | 349,117 | 16,719 |
| * MGM Resorts International | 1,119,591 | 15,249 |
| * DIRECTV Class A | 290,529 | 14,335 |
| Brinker International Inc. | 493,837 | 13,605 |
| Dillard's Inc. Class A | 179,656 | 11,322 |
| Time Warner Cable Inc. | 127,638 | 10,402 |
| * Coinstar Inc. | 161,158 | 10,242 |
12
Vanguard® Global Equity Fund
Schedule of Investments
March 31, 2012
| | | |
| | | | Market |
| | | | Value |
| | | Shares | ($000) |
| ^ | GameStop Corp. Class A | 447,431 | 9,772 |
| | CBS Corp. Class B | 261,143 | 8,855 |
| * | PulteGroup Inc. | 935,192 | 8,276 |
| | Sotheby's | 199,219 | 7,837 |
| | Viacom Inc. Class B | 156,700 | 7,437 |
| | American Greetings Corp. Class A | 481,723 | 7,390 |
| * | AMC Networks Inc. Class A | 155,026 | 6,919 |
| *,^ | Blue Nile Inc. | 202,858 | 6,690 |
| | Liberty Media Corp. - Liberty Capital Class A | 68,849 | 6,069 |
| | Time Warner Inc. | 146,644 | 5,536 |
| * | TRW Automotive Holdings Corp. | 112,341 | 5,218 |
| * | Liberty Interactive Corp. Class A | 260,839 | 4,979 |
| | Lear Corp. | 97,300 | 4,523 |
| * | General Motors Co. | 166,310 | 4,266 |
| * | Hanesbrands Inc. | 140,912 | 4,163 |
| *,^ | ITT Educational Services Inc. | 54,207 | 3,585 |
| | McGraw-Hill Cos. Inc. | 65,620 | 3,181 |
| | Royal Caribbean Cruises Ltd. | 103,350 | 3,042 |
| * | K12 Inc. | 125,927 | 2,976 |
| * | Apollo Group Inc. Class A | 76,030 | 2,938 |
| | CBS Corp. Class A | 85,395 | 2,922 |
| | Omnicom Group Inc. | 56,224 | 2,848 |
| | International Game Technology | 157,171 | 2,639 |
| * | Pier 1 Imports Inc. | 139,838 | 2,542 |
| | Gannett Co. Inc. | 157,910 | 2,421 |
| | Interpublic Group of Cos. Inc. | 206,795 | 2,360 |
| | Walt Disney Co. | 50,300 | 2,202 |
| | Ford Motor Co. | 176,290 | 2,202 |
| | Bob Evans Farms Inc. | 57,306 | 2,162 |
| | Whirlpool Corp. | 23,960 | 1,842 |
| | KB Home | 206,028 | 1,834 |
| | Newell Rubbermaid Inc. | 100,411 | 1,788 |
| *,^ | CC Media Holdings Inc. Class A | 292,110 | 1,753 |
| * | Mohawk Industries Inc. | 25,590 | 1,702 |
| * | Bed Bath & Beyond Inc. | 23,300 | 1,532 |
| | Yum! Brands Inc. | 20,948 | 1,491 |
| * | Red Robin Gourmet Burgers Inc. | 36,818 | 1,369 |
| * | CarMax Inc. | 35,800 | 1,240 |
| | Harley-Davidson Inc. | 23,291 | 1,143 |
| * | Madison Square Garden Co. Class A | 32,740 | 1,120 |
| | Sturm Ruger & Co. Inc. | 20,139 | 989 |
| | Jakks Pacific Inc. | 47,423 | 828 |
| | Polaris Industries Inc. | 11,159 | 805 |
| | Ameristar Casinos Inc. | 42,679 | 795 |
| | Aaron's Inc. | 26,739 | 693 |
| * | Cavco Industries Inc. | 14,618 | 681 |
| * | Standard Pacific Corp. | 151,172 | 674 |
| * | La-Z-Boy Inc. | 43,601 | 652 |
| * | Discovery Communications Inc. Class A | 12,827 | 649 |
| * | Live Nation Entertainment Inc. | 52,419 | 493 |
| * | Biglari Holdings Inc. | 1,130 | 455 |
| * | TripAdvisor Inc. | 12,100 | 432 |
| | CTC Media Inc. | 33,336 | 388 |
| * | Papa John's International Inc. | 9,571 | 360 |
| * | Leapfrog Enterprises Inc. | 42,644 | 357 |
| * | Discovery Communications Inc. | 7,303 | 342 |
| | Ethan Allen Interiors Inc. | 11,623 | 294 |
| * | Arctic Cat Inc. | 5,932 | 254 |
| | CEC Entertainment Inc. | 6,680 | 253 |
| * | Office Depot Inc. | 68,658 | 237 |
| * | Ascent Capital Group Inc. Class A | 2,330 | 110 |
| * | Sun-Times Media Group Inc. Class A | 130,959 | — |
| | | | 354,565 |
13
Vanguard® Global Equity Fund
Schedule of Investments
March 31, 2012
| | |
| | | Market |
| | | Value |
| | Shares | ($000) |
| Consumer Staples (6.2%) | | |
| Philip Morris International Inc. | 535,893 | 47,486 |
| Costco Wholesale Corp. | 355,015 | 32,235 |
| Lorillard Inc. | 212,093 | 27,462 |
| Tyson Foods Inc. Class A | 1,230,277 | 23,560 |
| Kroger Co. | 778,483 | 18,863 |
| Estee Lauder Cos. Inc. Class A | 259,144 | 16,051 |
| Safeway Inc. | 792,829 | 16,023 |
| * Smithfield Foods Inc. | 711,315 | 15,670 |
| Altria Group Inc. | 209,106 | 6,455 |
| Bunge Ltd. | 86,030 | 5,888 |
| * Constellation Brands Inc. Class A | 213,810 | 5,044 |
| Archer-Daniels-Midland Co. | 139,844 | 4,427 |
| PepsiCo Inc. | 56,849 | 3,772 |
| Herbalife Ltd. | 48,583 | 3,344 |
| Walgreen Co. | 97,051 | 3,250 |
| Universal Corp. | 69,738 | 3,250 |
| ConAgra Foods Inc. | 98,399 | 2,584 |
| Wal-Mart Stores Inc. | 30,999 | 1,897 |
| Nu Skin Enterprises Inc. Class A | 24,348 | 1,410 |
| * Medifast Inc. | 56,425 | 985 |
| Andersons Inc. | 17,807 | 867 |
| Church & Dwight Co. Inc. | 13,563 | 667 |
| SUPERVALU Inc. | 84,588 | 483 |
| * Omega Protein Corp. | 52,359 | 398 |
| * Susser Holdings Corp. | 12,839 | 330 |
| * Elizabeth Arden Inc. | 8,708 | 305 |
| * Spectrum Brands Holdings Inc. | 8,305 | 290 |
| * USANA Health Sciences Inc. | 7,763 | 290 |
| PriceSmart Inc. | 3,632 | 264 |
| * Central Garden and Pet Co. Class A | 26,454 | 255 |
| | | 243,805 |
| Energy (1.6%) | | |
| ConocoPhillips | 352,830 | 26,818 |
| Marathon Petroleum Corp. | 215,056 | 9,325 |
| Chevron Corp. | 65,616 | 7,037 |
| Devon Energy Corp. | 82,490 | 5,867 |
| Transocean Ltd. | 88,140 | 4,821 |
| Marathon Oil Corp. | 138,540 | 4,392 |
| EOG Resources Inc. | 23,282 | 2,587 |
| National Oilwell Varco Inc. | 18,814 | 1,495 |
| * Ultra Petroleum Corp. | 41,534 | 940 |
| Baker Hughes Inc. | 11,500 | 482 |
| | | 63,764 |
| Financials (8.0%) | | |
| Citigroup Inc. | 649,776 | 23,749 |
| Capital One Financial Corp. | 366,293 | 20,417 |
| * Berkshire Hathaway Inc. Class B | 244,855 | 19,870 |
| SL Green Realty Corp. | 246,803 | 19,140 |
| Bank of America Corp. | 1,894,205 | 18,128 |
| JPMorgan Chase & Co. | 348,648 | 16,031 |
| * American International Group Inc. | 472,180 | 14,557 |
| * CBRE Group Inc. Class A | 699,356 | 13,959 |
| * CIT Group Inc. | 318,957 | 13,154 |
| Discover Financial Services | 378,269 | 12,612 |
| Lazard Ltd. Class A | 428,032 | 12,225 |
| KeyCorp | 1,437,033 | 12,215 |
| Legg Mason Inc. | 417,094 | 11,649 |
| American Express Co. | 182,540 | 10,562 |
| * MBIA Inc. | 940,330 | 9,215 |
| Huntington Bancshares Inc. | 1,217,077 | 7,850 |
| Regions Financial Corp. | 795,900 | 5,245 |
| Wells Fargo & Co. | 153,420 | 5,238 |
14
Vanguard® Global Equity Fund
Schedule of Investments
March 31, 2012
| | |
| | | Market |
| | | Value |
| | Shares | ($000) |
| Prosperity Bancshares Inc. | 108,355 | 4,963 |
| Moody's Corp. | 104,824 | 4,413 |
| Assurant Inc. | 108,753 | 4,405 |
| M&T Bank Corp. | 47,816 | 4,154 |
| Cash America International Inc. | 84,800 | 4,064 |
| * MGIC Investment Corp. | 733,889 | 3,640 |
| Mercury General Corp. | 81,370 | 3,559 |
| Morgan Stanley | 176,340 | 3,463 |
| * Markel Corp. | 7,262 | 3,260 |
| * PHH Corp. | 178,545 | 2,762 |
| Hatteras Financial Corp. | 96,899 | 2,704 |
| New York Community Bancorp Inc. | 185,390 | 2,579 |
| Janus Capital Group Inc. | 285,416 | 2,543 |
| Synovus Financial Corp. | 1,166,300 | 2,391 |
| * CNO Financial Group Inc. | 303,005 | 2,357 |
| Brandywine Realty Trust | 192,101 | 2,205 |
| CBOE Holdings Inc. | 74,486 | 2,117 |
| Interactive Brokers Group Inc. | 122,621 | 2,085 |
| * Altisource Portfolio Solutions SA | 34,367 | 2,084 |
| Federated Investors Inc. Class B | 91,705 | 2,055 |
| * First Cash Financial Services Inc. | 45,638 | 1,957 |
| * World Acceptance Corp. | 29,681 | 1,818 |
| Progressive Corp. | 55,570 | 1,288 |
| American Equity Investment Life Holding Co. | 62,120 | 793 |
| Republic Bancorp Inc. Class A | 27,308 | 653 |
| Ameriprise Financial Inc. | 9,332 | 533 |
| Symetra Financial Corp. | 43,115 | 497 |
| * National Financial Partners Corp. | 22,384 | 339 |
| * Citizens Republic Bancorp Inc. | 18,998 | 297 |
| Maiden Holdings Ltd. | 32,585 | 293 |
| Calamos Asset Management Inc. Class A | 17,710 | 232 |
| * Washington Mutual Inc. | 166,300 | — |
| | | 316,319 |
| Health Care (5.2%) | | |
| Merck & Co. Inc. | 726,643 | 27,903 |
| WellPoint Inc. | 335,282 | 24,744 |
| Eli Lilly & Co. | 565,033 | 22,754 |
| Aetna Inc. | 452,126 | 22,679 |
| Pfizer Inc. | 877,946 | 19,894 |
| Humana Inc. | 194,673 | 18,003 |
| UnitedHealth Group Inc. | 300,270 | 17,698 |
| Johnson & Johnson | 125,110 | 8,252 |
| * Gilead Sciences Inc. | 103,927 | 5,077 |
| * Molina Healthcare Inc. | 116,604 | 3,921 |
| * Centene Corp. | 65,920 | 3,228 |
| * Magellan Health Services Inc. | 61,045 | 2,980 |
| * Viropharma Inc. | 89,696 | 2,697 |
| * Waters Corp. | 26,521 | 2,457 |
| * Momenta Pharmaceuticals Inc. | 141,139 | 2,162 |
| Bristol-Myers Squibb Co. | 64,062 | 2,162 |
| PDL BioPharma Inc. | 332,292 | 2,110 |
| * Health Net Inc. | 43,244 | 1,718 |
| * Intuitive Surgical Inc. | 3,069 | 1,663 |
| * Hi-Tech Pharmacal Co. Inc. | 45,356 | 1,630 |
| * WellCare Health Plans Inc. | 20,833 | 1,497 |
| Chemed Corp. | 20,160 | 1,264 |
| * Health Management Associates Inc. Class A | 174,837 | 1,175 |
| * Spectrum Pharmaceuticals Inc. | 89,739 | 1,133 |
| * Illumina Inc. | 21,529 | 1,133 |
| * Medco Health Solutions Inc. | 13,800 | 970 |
| * Seattle Genetics Inc. | 44,600 | 909 |
| Omnicare Inc. | 22,334 | 794 |
| * Par Pharmaceutical Cos. Inc. | 11,279 | 437 |
| * Warner Chilcott plc Class A | 25,028 | 421 |
15
Vanguard® Global Equity Fund
Schedule of Investments
March 31, 2012
| | | |
| | | | Market |
| | | | Value |
| | | Shares | ($000) |
| * | Triple-S Management Corp. Class B | 13,306 | 307 |
| * | Cambrex Corp. | 32,835 | 230 |
| * | Sun Healthcare Group Inc. | 22,294 | 153 |
| | | | 204,155 |
| Industrials (3.0%) | | |
| | Northrop Grumman Corp. | 432,634 | 26,425 |
| * | Kansas City Southern | 251,776 | 18,050 |
| * | Delta Air Lines Inc. | 1,337,711 | 13,257 |
| | Towers Watson & Co. Class A | 176,904 | 11,688 |
| | General Electric Co. | 453,410 | 9,100 |
| | Viad Corp. | 305,697 | 5,940 |
| * | United Rentals Inc. | 107,376 | 4,605 |
| | Raytheon Co. | 79,950 | 4,220 |
| * | US Airways Group Inc. | 529,881 | 4,022 |
| * | AGCO Corp. | 71,762 | 3,388 |
| | General Dynamics Corp. | 34,120 | 2,504 |
| | Expeditors International of Washington Inc. | 46,929 | 2,183 |
| | Deere & Co. | 22,424 | 1,814 |
| | Aircastle Ltd. | 101,143 | 1,238 |
| | JB Hunt Transport Services Inc. | 20,464 | 1,113 |
| | Exelis Inc. | 86,566 | 1,084 |
| *,^ | Ultrapetrol Bahamas Ltd. | 416,979 | 834 |
| * | Hawaiian Holdings Inc. | 121,528 | 636 |
| | Heidrick & Struggles International Inc. | 28,147 | 620 |
| * | Oshkosh Corp. | 23,026 | 533 |
| | Pitney Bowes Inc. | 26,200 | 461 |
| * | GenCorp Inc. | 52,040 | 369 |
| * | Consolidated Graphics Inc. | 7,804 | 353 |
| * | DXP Enterprises Inc. | 7,322 | 318 |
| | Norfolk Southern Corp. | 4,652 | 306 |
| * | ICF International Inc. | 11,524 | 292 |
| | Deluxe Corp. | 12,269 | 287 |
| | Primoris Services Corp. | 16,405 | 263 |
| | Sauer-Danfoss Inc. | 5,544 | 261 |
| * | H&E Equipment Services Inc. | 12,371 | 234 |
| * | Huntington Ingalls Industries Inc. | 3,847 | 155 |
| | | | 116,553 |
| Information Technology (5.6%) | | |
| * | Apple Inc. | 80,338 | 48,160 |
| * | Western Digital Corp. | 382,767 | 15,843 |
| * | Gartner Inc. | 364,035 | 15,522 |
| * | eBay Inc. | 353,921 | 13,056 |
| * | Flextronics International Ltd. | 1,750,248 | 12,654 |
| | Hewlett-Packard Co. | 481,769 | 11,481 |
| * | LSI Corp. | 1,088,340 | 9,447 |
| * | CACI International Inc. Class A | 151,344 | 9,427 |
| * | Alliance Data Systems Corp. | 69,040 | 8,696 |
| | Microsoft Corp. | 265,578 | 8,565 |
| | Corning Inc. | 429,444 | 6,047 |
| | DST Systems Inc. | 108,062 | 5,860 |
| | Applied Materials Inc. | 458,860 | 5,708 |
| * | Vishay Intertechnology Inc. | 464,514 | 5,649 |
| | Sapient Corp. | 406,377 | 5,059 |
| * | Micron Technology Inc. | 578,950 | 4,690 |
| * | Lam Research Corp. | 94,960 | 4,237 |
| | Forrester Research Inc. | 99,605 | 3,227 |
| | Mastercard Inc. Class A | 7,627 | 3,207 |
| * | Google Inc. Class A | 4,949 | 3,174 |
| | Cisco Systems Inc. | 148,230 | 3,135 |
| * | Tech Data Corp. | 49,001 | 2,659 |
| | Xerox Corp. | 324,264 | 2,620 |
| | FLIR Systems Inc. | 101,717 | 2,574 |
| * | VistaPrint NV | 43,165 | 1,668 |
| | Xilinx Inc. | 27,322 | 995 |
16
Vanguard® Global Equity Fund
Schedule of Investments
March 31, 2012
| | |
| | | Market |
| | | Value |
| | Shares | ($000) |
| * GT Advanced Technologies Inc. | 93,588 | 774 |
| * Magnachip Semiconductor Corp. | 57,252 | 687 |
| * Hackett Group Inc. | 94,592 | 565 |
| * Synopsys Inc. | 17,176 | 527 |
| * Unisys Corp. | 26,178 | 516 |
| * Dell Inc. | 25,900 | 430 |
| * Kulicke & Soffa Industries Inc. | 34,268 | 426 |
| * Photronics Inc. | 54,881 | 365 |
| * Symantec Corp. | 17,221 | 322 |
| * Amkor Technology Inc. | 50,089 | 308 |
| * Convergys Corp. | 19,867 | 265 |
| * SS&C Technologies Holdings Inc. | 11,157 | 260 |
| * Cognizant Technology Solutions Corp. Class A | 3,335 | 257 |
| * Entegris Inc. | 27,152 | 254 |
| * Kemet Corp. | 23,369 | 219 |
| United Online Inc. | 43,338 | 212 |
| * AOL Inc. | 5,380 | 102 |
| | | 219,849 |
| Materials (1.7%) | | |
| Domtar Corp. | 149,766 | 14,285 |
| CF Industries Holdings Inc. | 54,433 | 9,942 |
| Freeport-McMoRan Copper & Gold Inc. | 258,856 | 9,847 |
| Monsanto Co. | 96,542 | 7,700 |
| Scotts Miracle-Gro Co. Class A | 126,269 | 6,839 |
| LyondellBasell Industries NV Class A | 90,026 | 3,930 |
| Boise Inc. | 342,773 | 2,814 |
| Praxair Inc. | 17,943 | 2,057 |
| Minerals Technologies Inc. | 22,108 | 1,446 |
| * Coeur d'Alene Mines Corp. | 57,426 | 1,363 |
| Buckeye Technologies Inc. | 35,630 | 1,210 |
| * AbitibiBowater Inc. | 78,674 | 1,123 |
| * Chemtura Corp. | 58,997 | 1,002 |
| * KapStone Paper and Packaging Corp. | 44,552 | 878 |
| Eastman Chemical Co. | 14,561 | 753 |
| Sherwin-Williams Co. | 5,502 | 598 |
| Neenah Paper Inc. | 19,183 | 570 |
| Huntsman Corp. | 32,835 | 460 |
| PH Glatfelter Co. | 27,000 | 426 |
| HB Fuller Co. | 11,497 | 377 |
| Myers Industries Inc. | 22,426 | 331 |
| A Schulman Inc. | 11,027 | 298 |
| * LSB Industries Inc. | 6,656 | 259 |
| * Mercer International Inc. | 23,757 | 190 |
| | | 68,698 |
| Telecommunication Services (0.4%) | | |
| * Level 3 Communications Inc. | 191,696 | 4,932 |
| CenturyLink Inc. | 120,050 | 4,640 |
| * NII Holdings Inc. | 212,981 | 3,900 |
| Telephone & Data Systems Inc. | 134,611 | 3,116 |
| * Cincinnati Bell Inc. | 118,179 | 475 |
| * Vonage Holdings Corp. | 24,536 | 54 |
| | | 17,117 |
| Utilities (0.2%) | | |
| NV Energy Inc. | 190,400 | 3,069 |
| DTE Energy Co. | 50,040 | 2,754 |
| CenterPoint Energy Inc. | 56,080 | 1,106 |
| Edison International | 18,900 | 803 |
| | | 7,732 |
| | | 1,612,557 |
| Total Common Stocks (Cost $3,059,119) | | 3,700,969 |
17
Vanguard® Global Equity Fund
Schedule of Investments
March 31, 2012
| | | | | |
| | | | | | Market |
| | | | | | Value |
| | | Coupon | | Shares | ($000) |
| Preferred Stocks (0.0%) | | | | |
| | Malaysian Airline System Bhd. Pfd. (Cost $75) | 30.000% | | 183,333 | 53 |
| |
| | | | | Face | |
| | | | Maturity | Amount | |
| | | | Date | ($000) | |
| Convertible Bonds (0.1%) | | | | |
| Consumer Discretionary (0.0%) | | | | |
| | Sotheby's Cvt. | 3.125% | 6/15/13 | 394 | — |
| Financials (0.0%) | | | | |
| 2 | SL Green Operating Partnership LP Cvt. | 3.000% | 3/30/27 | 1,032 | 1,032 |
| Industrials (0.0%) | | | | |
| | AMR Corp. Cvt. | 6.250% | 10/15/14 | 1,635 | 756 |
| | US Airways Group Inc. Cvt. | 7.250% | 5/15/14 | 184 | 333 |
| | | | | | 1,089 |
| Telecommunication Services (0.1%) | | | | |
| | NII Holdings Inc. Cvt. | 3.125% | 6/15/12 | 2,998 | 3,002 |
| |
| Total Convertible Bonds (Cost $4,434) | | | | 5,123 |
| |
| | | | | Shares | |
| Temporary Cash Investments (6.7%)1 | | | | |
| Money Market Fund (6.3%) | | | | |
| 3,4 | Vanguard Market Liquidity Fund | 0.123% | | 247,584,000 | 247,584 |
| |
| | | | | Face | |
| | | | | Amount | |
| | | | | ($000) | |
| U.S. Government and Agency Obligations (0.4%) | | | | |
| 5,6 | Fannie Mae Discount Notes | 0.040% | 4/24/12 | 10,000 | 9,999 |
| 5,6 | Freddie Mac Discount Notes | 0.050% | 4/4/12 | 5,000 | 5,000 |
| 7 | United States Treasury Bill | 0.054% | 4/12/12 | 1,000 | 1,000 |
| | | | | | 15,999 |
| Total Temporary Cash Investments (Cost $263,583) | | | | 263,583 |
| Total Investments (100.6%) (Cost $3,327,211) | | | | 3,969,728 |
| Other Assets and Liabilities—Net (-0.6%)4 | | | | (22,844) |
| Net Assets (100%) | | | | 3,946,884 |
* Non-income-producing security.
^ Part of security position is on loan to broker-dealers. The total value of securities on loan is $19,666,000.
1 The fund invests a portion of its cash reserves in equity markets through the use of index futures contracts. After giving effect to futures investments, the fund's effective common stock and temporary cash investment positions represent 98.9% and 1.6%, respectively, of net assets.
2 Security exempt from registration under Rule 144A of the Securities Act of 1933. Such securities may be sold in transactions exempt from registration, normally to qualified institutional buyers. At March 31, 2012, the aggregate value of these securities was $4,194,000, representing 0.1% of net assets.
3 Affiliated money market fund available only to Vanguard funds and certain trusts and accounts managed by Vanguard. Rate shown is the 7-day yield.
4 Includes $21,127,000 of collateral received for securities on loan.
5 The issuer was placed under federal conservatorship in September 2008; since that time, its daily operations have been managed by the Federal Housing Finance Agency and it receives capital from the U.S. Treasury in exchange for senior preferred stock.
6 Securities with a value of $14,999,000 and cash of $500,000 have been segregated as initial margin for open futures contracts.
7 Securities with a value of $710,000 have been segregated as collateral for open forward currency contracts.
18
Vanguard® Global Equity Fund
Schedule of Investments
March 31, 2012
ADR—American Depositary Receipt.
GDR—Global Depositary Receipt.
NVDR—Non-Voting Depository Receipt.
19
© 2011 The Vanguard Group. Inc.
All rights reserved.
Vanguard Marketing Corporation, Distributor.
SNA 1292 052012
|
| Semiannual Report | March 31, 2012 |
| |
| Vanguard Strategic Small-Cap |
| Equity Fund |
> For the six months ended March 31, 2012, Vanguard Strategic Small-Cap Equity Fund returned 29.90%, as small-capitalization stocks outpaced large-cap stocks.
> The fund’s return was in line with that of its benchmark and outpaced the 28.88% average return of competitive funds.
> Stock selection in the industrial, consumer discretionary, and materials sectors was a major driver of results.
| |
| Contents | |
| Your Fund’s Total Returns. | 1 |
| Chairman’s Letter. | 2 |
| Advisor’s Report. | 6 |
| Fund Profile. | 8 |
| Performance Summary. | 9 |
| Financial Statements. | 10 |
| About Your Fund’s Expenses. | 21 |
| Trustees Approve Advisory Arrangement. | 23 |
| Glossary. | 24 |
Please note: The opinions expressed in this report are just that—informed opinions. They should not be considered promises or advice.
Also, please keep in mind that the information and opinions cover the period through the date on the front of this report. Of course, the
risks of investing in your fund are spelled out in the prospectus.
See the Glossary for definitions of investment terms used in this report.
About the cover: Vanguard was named for the HMS Vanguard, flagship of British Admiral Horatio Nelson. A ship—whose
performance and safety depend on the work of all hands—has served as a fitting metaphor for the Vanguard crew as we
strive to help clients reach their financial goals.
Your Fund’s Total Returns
| |
| Six Months Ended March 31, 2012 | |
| | Total |
| | Returns |
| Vanguard Strategic Small-Cap Equity Fund | 29.90% |
| MSCI US Small Cap 1750 Index | 29.93 |
| Small-Cap Core Funds Average | 28.88 |
| Small-Cap Core Funds Average: Derived from data provided by Lipper Inc. | |
Your Fund’s Performance at a Glance
September 30, 2011, Through March 31, 2012
| | | | |
| | | | Distributions Per Share |
| | Starting | Ending | Income | Capital |
| | Share Price | Share Price | Dividends | Gains |
| Vanguard Strategic Small-Cap Equity Fund | $16.44 | $21.13 | $0.196 | $0.000 |
1

Chairman’s Letter
Dear Shareholder,
For the six months ended March 31, 2012, small-capitalization stocks snapped back from their double-digit plunge of the preceding six-month period to post a double-digit gain. Although all stocks participated in the rally, small-cap stocks climbed at a faster pace than their large-cap counterparts.
Vanguard Strategic Small-Cap Equity Fund returned 29.90%, in line with its benchmark and ahead of its peers. The benchmark index, the MSCI US Small Cap 1750 Index, returned 29.93%, and the average return for small-cap core funds was 28.88%.
The fund clearly benefited from the bull market in stocks during this period. However, its quantitative investment approach is designed to make discriminating choices among stocks that are expected to pay off over the long term, regardless of the direction of the market. At the same time, the portfolio’s risk profile should remain similar to that of the benchmark index. In other words, the goal is “same risk, better returns.”
To this end, the advisor relies on sophisticated computer models that evaluate stocks based on characteristics such as issuers’ balance sheet strength, earnings growth, and valuations. The Advisor’s Report that follows this letter describes this investment approach in more detail. During the past six months, a period that offers limited insight, the fund’s focus on risk control was more evident than the strength of its stock selection methodology.
2
A surge of optimism fueleda powerful global rally in stocks
During the past six months, optimism displaced the apprehension that had restrained stock prices through summer 2011. The broad U.S. stock market returned 26.27%. Markets abroad returned 15.37%. Investors’ good spirits reflected confidence that the slow, grinding economic expansion in the United States was at last gathering momentum and that Europe’s debt crisis could be contained.
By the end of the period, however, that confidence had begun to evaporate in the face of ambiguous economic reports and renewed concern about Europe. The abrupt mood swing was consistent with the financial markets’ volatility since the 2008–2009 financial crisis.
Aside from munis, most bonds saw subdued six-month returns
The broad taxable bond market produced a modest six-month return of 1.43%. In general, interest rates remained more or less steady at very low levels. In some segments of the bond market, however, yields crept lower still, boosting bond prices. The broad municipal bond market, for example, produced a solid six-month return of 3.91% as investors bid up muni prices.
Market Barometer
| | | |
| | | | Total Returns |
| | | Periods Ended March 31, 2012 |
| | Six | One | Five Years |
| | Months | Year | (Annualized) |
| Stocks | | | |
| Russell 1000 Index (Large-caps) | 26.27% | 7.86% | 2.19% |
| Russell 2000 Index (Small-caps) | 29.83 | -0.18 | 2.13 |
| Dow Jones U.S. Total Stock Market Index | 26.60 | 7.16 | 2.47 |
| MSCI All Country World Index ex USA (International) | 15.37 | -7.18 | -1.56 |
| |
| Bonds | | | |
| Barclays Capital U.S. Aggregate Bond Index (Broad | | | |
| taxable market) | 1.43% | 7.71% | 6.25% |
| Barclays Capital Municipal Bond Index (Broad | | | |
| tax-exempt market) | 3.91 | 12.07 | 5.42 |
| Citigroup Three-Month U.S. Treasury Bill Index | 0.00 | 0.05 | 1.11 |
| |
| CPI | | | |
| Consumer Price Index | 1.10% | 2.65% | 2.24% |
3
As it has since December 2008, the Federal Reserve Board kept its target for the shortest-term interest rates between 0% and 0.25%. That policy has kept a tight lid on the returns available from money market funds and savings accounts.
Performance of cyclical stocks aided the fund’s return
The fund’s stock selection during the period was strongest in sectors, such as industrials and materials, that are tied to the rhythms of the economic cycle. Similarly, the consumer discretionary sector, where swings in consumer sentiment play an important role, was also a source of strength.
Financials were another top contributor. Here, returns were helped by selection in real estate investment trusts (REITs) but hurt by a lack of capital markets stocks, such as those of asset-management companies, which rallied.
Overall, the fund’s stock selection process allowed it to outpace the index’s returns in seven of the ten sectors, with results in health care, information technology, and the tiny telecommunications sector lagging those of their benchmark counterparts. In health care, the model’s strong choices in health care providers were outweighed by its poor choices in biotech and health care equipment and supply companies.
Expense Ratios
Your Fund Compared With Its Peer Group
| | |
| | | Peer Group |
| | Fund | Average |
| Strategic Small-Cap Equity Fund | 0.43% | 1.37% |
The fund expense ratio shown is from the prospectus dated January 26, 2012, and represents estimated costs for the current fiscal year. For the six months ended March 31, 2012, the fund’s annualized expense ratio was 0.38%. The peer-group expense ratio is derived from data provided by Lipper Inc. and captures information through year-end 2011.
Peer group: Small-Cap Core Funds.
4
Similarly, in information technology, the model’s choices among software and IT services stocks held back returns.
Volatility is the norm, but there’s an antidote
As the fund’s advisor, Vanguard Equity Investment Group, notes in the report that follows this letter, stock market volatility has substantially declined after the big swings we saw last year. What that bodes for the future is unclear: It has been shown time and again that nobody can consistently predict which way the market is headed, or when the next dip or climb will arrive.
Because the market is so unpredictable, we believe the best way to invest is to create a diversified and balanced portfolio that includes a mix of stocks, bonds, and cash reserves tailored to your unique goals, time horizon, and risk tolerance.
Such a portfolio can help you to keep your footing when the markets are turbulent, as we point out in our research paper, Recent Stock Market Volatility: Extraordinary or “Ordinary”? The paper describes why bouts of high volatility have always been a feature of stock market investing and how balanced, diversified portfolios have experienced lower levels of volatility than the headlines would suggest. You can find the paper at vanguard.com/research.
As always, thank you for entrusting your assets to Vanguard.
Sincerely,

F. William McNabb III
Chairman and Chief Executive Officer
April 19, 2012
|
| A note on expense ratios |
| The Expense Ratios table in each report’s Chairman’s Letter displays fund expense |
| ratios from the most recent prospectus. These figures include the funds’ actual |
| operating expenses. For some funds, the figures also include “acquired fund fees |
| and expenses,” which result from the funds’ holdings in business development |
| companies (BDCs). |
| |
| Although the Securities and Exchange Commission requires that BDC costs be |
| included in a fund’s expense ratio, these fees are not incurred by the fund. They |
| have no impact on a fund’s total return or on its tracking error relative to an index. |
| A footnote to the Expense Ratios table reports an annualized calculation of the |
| fund’s actual expenses for the period, a more relevant tally of the operating costs |
| incurred by shareholders. |
5
Advisor’s Report
For the first half of the fiscal year, Vanguard Strategic Small-Cap Equity Fund returned a robust 29.90%, in line with its benchmark, the MSCI US Small Cap 1750 Index. Smaller-capitalization stocks, the focus of your fund, outpaced larger caps by more than 3 percentage points, led by the returns of industrial, consumer discretionary, materials, and information technology companies. Utilities and consumer staples underperformed for the period, although all ten sector groups provided positive returns. These results mirror trends in the broader market, where more economically sensitive sectors generally outperformed their defensive counterparts.
Since the equity market started its rally last fall, investor concerns about a possible double-dip recession, slowing growth in China, and Europe’s fiscal troubles appear to have eased. Against this backdrop, data showing improvements in the U.S. employment and housing pictures and continued strength in manufacturing activity seem to have whetted investor appetite for equities. Valuations of U.S. stocks relative to bonds, measured by comparing earnings yields of stocks with coupon yields of 10-year U.S. Treasury bonds, indicate a level of attractiveness not seen since the early 1970s.
Market volatility declined by more than 60% during the six months, but it will likely stay with us for some time. U.S. budget and deficit problems remain unresolved, the pace of world economic growth is still uncertain, gas prices continue to worry many, and the outcome of the presidential election is still months away. (Volatility is measured by the CBOE Volatility Index®, or VIX®.)
Our approach to investing
Although overall portfolio performance is affected by the macroeconomic factors described above, our approach to investing focuses on specific stock fundamentals. Our model consists of these five components:
1. Valuation, which measures the price
we pay for earnings and cash flows.
2. Growth, which considers the growth
of earnings.
3. Management decisions, an
assessment of the actions taken by
company management that signal its
informed opinions of a firm’s future.
4. Market sentiment, which captures
how investors reflect their opinions
of a company through their activity in
the market.
5. Quality, which measures balance-sheet
strength and the sustainability of earnings.
For the fiscal half-year, our stock selection model produced mixed results. Our management decisions and quality components were effective in identifying
6
outperformers. However, our growth, valuation, and market sentiment indicators were not effective and in fact detracted from our results.
A look at portfolio decisions
Our stock selection results were positive in seven of ten sectors and negative in three. Company selections among industrial, materials, and financial stocks added most to our relative returns.
In industrials, United Rentals, Sauer-Danfoss, and Colfax Corporation were the top performers. In materials, the largest contributors to relative returns were Rockwood Holdings, Buckeye Technologies, and Domtar, while real estate-related stocks lifted results in financials.
Stock selection was disappointing in information technology and health care. Detractors in the former sector included Powerwave Technologies and underweight positions in Novellus Systems. In health care, Invacare, AVEO Pharmaceuticals, and Targacept did not perform as expected.
While we cannot predict how broader political or economic events will affect the markets, we are confident that the stock market can provide worthwhile returns for long-term investors. With that in mind, we believe that equity exposure will continue to play an important part of a diversified investment plan.
We thank you for your investment and look forward to the second half of the fiscal year.
James P. Stetler Principal and Portfolio Manager
James D. Troyer, CFA Principal and Portfolio Manager
Michael R. Roach, CFA Portfolio Manager
Vanguard Equity Investment Group
April 23, 2012
Strategic Small-Cap Equity Fund
Fund Profile
As of March 31, 2012
| | | |
| Portfolio Characteristics | | |
| | | | DJ |
| | | MSCI US | U.S. Total |
| | | Small Cap | Market |
| | Fund 1750 Index | Index |
| Number of Stocks | 288 | 1,732 | 3,716 |
| Median Market Cap | $1.6B | $1.8B | $35.6B |
| Price/Earnings Ratio | 15.7x | 23.7x | 17.1x |
| Price/Book Ratio | 2.2x | 2.0x | 2.3x |
| Return on Equity | 9.5% | 9.1% | 18.1% |
| Earnings Growth Rate | 7.3% | 4.9% | 8.5% |
| Dividend Yield | 1.2% | 1.3% | 1.9% |
| Foreign Holdings | 0.0% | 0.0% | 0.0% |
| Turnover Rate | | | |
| (Annualized) | 59% | — | — |
| Ticker Symbol | VSTCX | — | — |
| Expense Ratio1 | 0.43% | — | — |
| 30-Day SEC Yield | 0.89% | — | — |
| Short-Term Reserves | 0.2% | — | — |
| | | |
| Sector Diversification (% of equity exposure) |
| | | | DJ |
| | | MSCI US | U.S. Total |
| | | Small Cap | Market |
| | Fund 1750 | Index | Index |
| Consumer | | | |
| Discretionary | 13.5% | 13.7% | 12.0% |
| Consumer Staples | 3.2 | 3.0 | 9.4 |
| Energy | 6.1 | 5.6 | 10.5 |
| Financials | 21.3 | 21.4 | 15.9 |
| Health Care | 11.9 | 12.4 | 11.5 |
| Industrials | 16.9 | 17.1 | 11.0 |
| Information | | | |
| Technology | 17.4 | 16.5 | 19.8 |
| Materials | 5.8 | 6.1 | 4.0 |
| Telecommunication | | | |
| Services | 0.6 | 0.7 | 2.5 |
| Utilities | 3.3 | 3.5 | 3.4 |
| | |
| Volatility Measures | | |
| | | DJ |
| | MSCI US | U.S. Total |
| | Small Cap | Market |
| | 1750 Index | Index |
| R-Squared | 0.99 | 0.92 |
| Beta | 0.97 | 1.26 |
These measures show the degree and timing of the fund’s fluctuations compared with the indexes over 36 months.
| | |
| Ten Largest Holdings (% of total net assets) |
| Foot Locker Inc. | Apparel Retail | 0.8% |
| Gartner Inc. | IT Consulting & | |
| | Other Services | 0.8 |
| WellCare Health Plans | Managed Health | |
| Inc. | Care | 0.8 |
| Rockwood Holdings Inc. | Specialty Chemicals | 0.7 |
| Cooper Cos Inc. | Health Care | |
| | Supplies | 0.7 |
| Kennametal Inc. | Industrial | |
| | Machinery | 0.7 |
| Cubist Pharmaceuticals | | |
| Inc. | Biotechnology | 0.7 |
| Health Net Inc. | Managed Health | |
| | Care | 0.7 |
| United Rentals Inc. | Trading Companies | |
| | & Distributors | 0.7 |
| ProAssurance Corp. | Property & Casualty | |
| | Insurance | 0.7 |
| Top Ten | | 7.3% |
The holdings listed exclude any temporary cash investments and equity index products.
Investment Focus
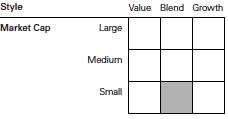
1 The expense ratio shown is from the prospectus dated January 26, 2012, and represents estimated costs for the current fiscal year. For the six months ended March 31, 2012, the annualized expense ratio was 0.38%.
8
Strategic Small-Cap Equity Fund
Performance Summary
All of the returns in this report represent past performance, which is not a guarantee of future results that may be achieved by the fund. (Current performance may be lower or higher than the performance data cited. For performance data current to the most recent month-end, visit our website at vanguard.com/performance.) Note, too, that both investment returns and principal value can fluctuate widely, so an investor’s shares, when sold, could be worth more or less than their original cost. The returns shown do not reflect taxes that a shareholder would pay on fund distributions or on the sale of fund shares.
Fiscal-Year Total Returns (%): April 24, 2006, Through March 31, 2012
Note: For 2012, performance data reflect the six months ended March 31, 2012.
Average Annual Total Returns: Periods Ended March 31, 2012
| | | | |
| | Inception | One | Five | Since |
| | Date | Year | Years | Inception |
| Strategic Small-Cap Equity Fund | 4/24/2006 | 2.03% | 1.17% | 2.11% |
See Financial Highlights for dividend and capital gains information.
9
Strategic Small-Cap Equity Fund
Financial Statements (unaudited)
Statement of Net Assets
As of March 31, 2012
The fund reports a complete list of its holdings in regulatory filings four times in each fiscal year, at the quarter-ends. For the second and fourth fiscal quarters, the lists appear in the fund’s semiannual and annual reports to shareholders. For the first and third fiscal quarters, the fund files the lists with the Securities and Exchange Commission on Form N-Q. Shareholders can look up the fund’s Forms N-Q on the SEC’s website at sec.gov. Forms N-Q may also be reviewed and copied at the SEC’s Public Reference Room (see the back cover of this report for further information).
| | | |
| | | | Market |
| | | | Value |
| | | Shares | ($000) |
| Common Stocks (99.4%)1 | | |
| Consumer Discretionary (13.5%) | |
| | Foot Locker Inc. | 69,100 | 2,146 |
| * | Coinstar Inc. | 29,300 | 1,862 |
| | Dillard’s Inc. Class A | 29,150 | 1,837 |
| | Brinker International Inc. | 64,700 | 1,783 |
| * | Express Inc. | 70,000 | 1,749 |
| * | Liz Claiborne Inc. | 126,200 | 1,686 |
| | Domino’s Pizza Inc. | 45,300 | 1,644 |
| * | Tempur-Pedic | | |
| | International Inc. | 18,240 | 1,540 |
| * | Pier 1 Imports Inc. | 79,100 | 1,438 |
| * | ANN Inc. | 49,100 | 1,406 |
| | Sinclair Broadcast | | |
| | Group Inc. Class A | 119,604 | 1,323 |
| * | Corinthian Colleges Inc. | 319,100 | 1,321 |
| ^ | Weight Watchers | | |
| | International Inc. | 16,900 | 1,305 |
| | Dana Holding Corp. | 79,600 | 1,234 |
| * | Journal Communications | | |
| | Inc. Class A | 214,075 | 1,205 |
| | Movado Group Inc. | 46,000 | 1,129 |
| * | Sally Beauty Holdings Inc. | 45,000 | 1,116 |
| | Williams-Sonoma Inc. | 28,518 | 1,069 |
| | Regal Entertainment | | |
| | Group Class A | 75,600 | 1,028 |
| * | Crocs Inc. | 42,900 | 897 |
| * | Tenneco Inc. | 22,000 | 817 |
| * | Biglari Holdings Inc. | 1,947 | 784 |
| | Standard Motor | | |
| | Products Inc. | 44,000 | 781 |
| * | iRobot Corp. | 27,800 | 758 |
| | DSW Inc. Class A | 11,600 | 635 |
| | Oxford Industries Inc. | 12,500 | 635 |
| | Ameristar Casinos Inc. | 31,900 | 594 |
| * | Papa John’s | | |
| | International Inc. | 13,615 | 513 |
| | Buckle Inc. | 10,000 | 479 |
| * | Cheesecake Factory Inc. | 15,200 | 447 |
| | | |
| | | | Market |
| | | | Value |
| | | Shares | ($000) |
| | Cato Corp. Class A | 11,000 | 304 |
| * | Vitamin Shoppe Inc. | 5,500 | 243 |
| | Ulta Salon Cosmetics | | |
| | & Fragrance Inc. | 2,600 | 242 |
| | | | 35,950 |
| Consumer Staples (3.2%) | | |
| * | Rite Aid Corp. | 867,100 | 1,509 |
| * | Boston Beer Co. Inc. | | |
| | Class A | 14,000 | 1,495 |
| | B&G Foods Inc. Class A | 66,000 | 1,486 |
| * | Susser Holdings Corp. | 55,100 | 1,414 |
| | Nu Skin Enterprises Inc. | | |
| | Class A | 16,500 | 956 |
| * | Elizabeth Arden Inc. | 21,900 | 766 |
| | Coca-Cola Bottling Co. | | |
| | Consolidated | 7,400 | 464 |
| | Herbalife Ltd. | 2,800 | 193 |
| * | National Beverage Corp. | 8,800 | 141 |
| | | | 8,424 |
| Energy (6.0%) | | |
| * | CVR Energy Inc. | 66,900 | 1,790 |
| * | Rosetta Resources Inc. | 35,600 | 1,736 |
| * | Helix Energy | | |
| | Solutions Group Inc. | 90,300 | 1,607 |
| * | Stone Energy Corp. | 52,300 | 1,495 |
| | Delek US Holdings Inc. | 83,700 | 1,298 |
| | W&T Offshore Inc. | 61,200 | 1,290 |
| | HollyFrontier Corp. | 33,634 | 1,081 |
| * | Energy Partners Ltd. | 62,300 | 1,035 |
| | Crosstex Energy Inc. | 63,600 | 899 |
| | RPC Inc. | 84,675 | 898 |
| | Western Refining Inc. | 43,300 | 815 |
| * | Parker Drilling Co. | 77,100 | 460 |
| * | Gulfport Energy Corp. | 14,300 | 417 |
| * | Newpark Resources Inc. | 38,000 | 311 |
| * | Superior Energy | | |
| | Services Inc. | 9,450 | 249 |
| * | Hercules Offshore Inc. | 42,000 | 199 |
| * | Swift Energy Co. | 6,700 | 195 |
10
Strategic Small-Cap Equity Fund
| | | |
| | | | Market |
| | | | Value |
| | | Shares | ($000) |
| * | Tetra Technologies Inc. | 16,300 | 154 |
| * | Energy XXI Bermuda Ltd. | 3,800 | 137 |
| * | Cloud Peak Energy Inc. | 4,200 | 67 |
| | | | 16,133 |
| Financials (21.2%) | | |
| | ProAssurance Corp. | 21,600 | 1,903 |
| * | Credit Acceptance Corp. | 16,310 | 1,648 |
| | Nelnet Inc. Class A | 62,248 | 1,613 |
| | RLI Corp. | 22,100 | 1,583 |
| | Bank of the Ozarks Inc. | 49,400 | 1,544 |
| | CVB Financial Corp. | 130,100 | 1,527 |
| | Cash America | | |
| | International Inc. | 31,613 | 1,515 |
| | Allied World Assurance Co. | | |
| | Holdings AG | 21,400 | 1,470 |
| | NBT Bancorp Inc. | 62,914 | 1,389 |
| | Taubman Centers Inc. | 18,500 | 1,350 |
| * | World Acceptance Corp. | 21,600 | 1,323 |
| | Webster Financial Corp. | 52,530 | 1,191 |
| * | CNO Financial Group Inc. | 150,300 | 1,169 |
| | Erie Indemnity Co. Class A | 14,600 | 1,138 |
| | Extra Space Storage Inc. | 38,300 | 1,103 |
| | CBL & Associates | | |
| | Properties Inc. | 57,800 | 1,094 |
| | Douglas Emmett Inc. | 46,700 | 1,065 |
| | Post Properties Inc. | 22,200 | 1,040 |
| | Southside Bancshares Inc. | 45,820 | 1,013 |
| | 1st Source Corp. | 40,596 | 993 |
| | Entertainment | | |
| | Properties Trust | 20,900 | 969 |
| | MarketAxess Holdings Inc. | 25,800 | 962 |
| | Prosperity Bancshares Inc. | 20,700 | 948 |
| | WesBanco Inc. | 46,911 | 945 |
| | Omega Healthcare | | |
| | Investors Inc. | 43,600 | 927 |
| | Apartment Investment | | |
| | & Management Co. | 35,000 | 924 |
| * | American Capital Ltd. | 100,000 | 867 |
| * | Forest City Enterprises Inc. | | |
| | Class A | 54,700 | 857 |
| | Brandywine Realty Trust | 74,400 | 854 |
| * | Strategic Hotels | | |
| | & Resorts Inc. | 129,700 | 853 |
| | National Health | | |
| | Investors Inc. | 17,100 | 834 |
| | Meadowbrook | | |
| | Insurance Group Inc. | 88,400 | 825 |
| | Lexington Realty Trust | 91,700 | 824 |
| | Sun Communities Inc. | 19,000 | 823 |
| | Amtrust Financial | | |
| | Services Inc. | 30,500 | 820 |
| | Oritani Financial Corp. | 55,800 | 819 |
| | CubeSmart | 68,600 | 816 |
| * | First Industrial | | |
| | Realty Trust Inc. | 65,900 | 814 |
| | | |
| | | | Market |
| | | | Value |
| | | Shares | ($000) |
| | Highwoods Properties Inc. | 23,700 | 790 |
| | DCT Industrial Trust Inc. | 132,700 | 783 |
| | Provident Financial | | |
| | Services Inc. | 52,500 | 763 |
| | Colonial Properties Trust | 34,070 | 740 |
| | Inland Real Estate Corp. | 80,400 | 713 |
| | City Holding Co. | 20,200 | 701 |
| | First Citizens | | |
| | BancShares Inc. Class A | 3,800 | 694 |
| | DDR Corp. | 45,100 | 658 |
| | Ramco-Gershenson | | |
| | Properties Trust | 53,800 | 657 |
| | First Financial Corp. | 20,400 | 648 |
| | Trustmark Corp. | 23,222 | 580 |
| | Cedar Realty Trust Inc. | 112,700 | 577 |
| | National Retail | | |
| | Properties Inc. | 21,100 | 574 |
| * | Rouse Properties Inc. | 38,200 | 517 |
| | Mack-Cali Realty Corp. | 16,500 | 476 |
| | Chemical Financial Corp. | 18,000 | 422 |
| | Washington Federal Inc. | 24,500 | 412 |
| | Republic Bancorp Inc. | | |
| | Class A | 16,200 | 388 |
| * | Ezcorp Inc. Class A | 11,600 | 377 |
| | Oriental Financial | | |
| | Group Inc. | 30,758 | 372 |
| | Camden Property Trust | 5,400 | 355 |
| | ViewPoint Financial Group | 22,950 | 353 |
| | FBL Financial Group Inc. | | |
| | Class A | 8,000 | 270 |
| | Fulton Financial Corp. | 24,700 | 259 |
| | Protective Life Corp. | 8,500 | 252 |
| | Community Trust | | |
| | Bancorp Inc. | 6,600 | 212 |
| | Cardinal Financial Corp. | 17,700 | 200 |
| | Essex Property Trust Inc. | 1,000 | 152 |
| | MainSource Financial | | |
| | Group Inc. | 11,200 | 135 |
| | GAMCO Investors Inc. | 2,200 | 109 |
| | BRE Properties Inc. | 1,500 | 76 |
| | Washington Trust | | |
| | Bancorp Inc. | 3,000 | 72 |
| | Advance America Cash | | |
| | Advance Centers Inc. | 6,730 | 71 |
| | | | 56,710 |
| Health Care (11.8%) | | |
| * | WellCare Health Plans Inc. | 29,000 | 2,085 |
| | Cooper Cos. Inc. | 23,800 | 1,945 |
| * | Cubist Pharmaceuticals Inc. | 44,700 | 1,933 |
| * | Health Net Inc. | 48,300 | 1,919 |
| * | Par Pharmaceutical Cos. Inc. | 45,500 | 1,762 |
| * | Pharmacyclics Inc. | 59,700 | 1,657 |
| * | Magellan Health | | |
| | Services Inc. | 30,500 | 1,489 |
11
Strategic Small-Cap Equity Fund
| | | |
| | | | Market |
| | | | Value |
| | | Shares | ($000) |
| * | Charles River Laboratories | | |
| | International Inc. | 41,100 | 1,483 |
| * | Molina Healthcare Inc. | 41,709 | 1,403 |
| * | Team Health Holdings Inc. | 65,800 | 1,353 |
| * | Cepheid Inc. | 30,300 | 1,267 |
| * | Questcor | | |
| | Pharmaceuticals Inc. | 33,300 | 1,253 |
| | PDL BioPharma Inc. | 196,000 | 1,245 |
| * | LifePoint Hospitals Inc. | 30,700 | 1,211 |
| * | Arthrocare Corp. | 43,700 | 1,173 |
| * | Medicines Co. | 57,300 | 1,150 |
| * | Auxilium | | |
| | Pharmaceuticals Inc. | 59,200 | 1,099 |
| | Chemed Corp. | 16,900 | 1,059 |
| * | AVEO Pharmaceuticals Inc. | 80,668 | 1,001 |
| * | Centene Corp. | 16,900 | 828 |
| | National Healthcare Corp. | 17,700 | 806 |
| * | Health Management | | |
| | Associates Inc. Class A | 117,000 | 786 |
| * | Thoratec Corp. | 16,400 | 553 |
| * | Greatbatch Inc. | 13,600 | 333 |
| * | Acorda Therapeutics Inc. | 9,400 | 250 |
| * | Salix Pharmaceuticals Ltd. | 3,100 | 163 |
| * | Genomic Health Inc. | 4,500 | 138 |
| | Atrion Corp. | 500 | 105 |
| * | Enzon Pharmaceuticals Inc. | 13,600 | 93 |
| * | RTI Biologics Inc. | 16,000 | 59 |
| | | | 31,601 |
| Industrials (16.8%) | | |
| | Kennametal Inc. | 43,500 | 1,937 |
| * | United Rentals Inc. | 44,500 | 1,909 |
| * | WESCO International Inc. | 27,700 | 1,809 |
| * | Alaska Air Group Inc. | 48,800 | 1,748 |
| | Toro Co. | 21,600 | 1,536 |
| | Applied Industrial | | |
| | Technologies Inc. | 37,200 | 1,530 |
| | Amerco Inc. | 14,500 | 1,530 |
| | Barnes Group Inc. | 56,700 | 1,492 |
| * | JetBlue Airways Corp. | 299,600 | 1,465 |
| | Sauer-Danfoss Inc. | 30,400 | 1,429 |
| * | Colfax Corp. | 38,500 | 1,357 |
| * | Moog Inc. Class A | 31,299 | 1,342 |
| * | Kadant Inc. | 54,285 | 1,293 |
| * | EnerSys | 37,176 | 1,288 |
| | Albany International Corp. | 55,100 | 1,265 |
| * | Generac Holdings Inc. | 50,900 | 1,250 |
| | Cascade Corp. | 24,691 | 1,238 |
| | NACCO Industries Inc. | | |
| | Class A | 10,342 | 1,203 |
| * | Navigant Consulting Inc. | 85,300 | 1,187 |
| | Armstrong World | | |
| | Industries Inc. | 23,200 | 1,131 |
| | Deluxe Corp. | 48,000 | 1,124 |
| * | Corrections Corp. | | |
| | of America | 40,500 | 1,106 |
| | | |
| | | | Market |
| | | | Value |
| | | Shares | ($000) |
| | Gardner Denver Inc. | 16,700 | 1,052 |
| | Belden Inc. | 27,700 | 1,050 |
| * | Huron Consulting | | |
| | Group Inc. | 27,138 | 1,019 |
| | Steelcase Inc. Class A | 103,300 | 992 |
| | Ryder System Inc. | 18,400 | 972 |
| | Actuant Corp. Class A | 31,500 | 913 |
| * | Trimas Corp. | 37,800 | 846 |
| | Cubic Corp. | 16,600 | 785 |
| * | Dollar Thrifty Automotive | | |
| | Group Inc. | 9,345 | 756 |
| | Douglas Dynamics Inc. | 45,479 | 625 |
| * | Exponent Inc. | 12,000 | 582 |
| | Standex International Corp. | 12,800 | 527 |
| | Werner Enterprises Inc. | 18,900 | 470 |
| * | InnerWorkings Inc. | 38,900 | 453 |
| | McGrath Rentcorp | 12,100 | 389 |
| | Primoris Services Corp. | 23,600 | 379 |
| * | US Airways Group Inc. | 48,400 | 367 |
| * | ICF International Inc. | 14,000 | 355 |
| * | Pacer International Inc. | 41,300 | 261 |
| | United Stationers Inc. | 8,200 | 254 |
| | FreightCar America Inc. | 11,100 | 250 |
| | Aircastle Ltd. | 13,700 | 168 |
| | HEICO Corp. Class A | 3,125 | 125 |
| | HEICO Corp. | 2,375 | 123 |
| | | | 44,882 |
| Information Technology (17.3%) | |
| * | Gartner Inc. | 50,200 | 2,141 |
| | Diebold Inc. | 46,800 | 1,803 |
| * | CACI International Inc. | | |
| | Class A | 28,900 | 1,800 |
| * | Brocade Communications | | |
| | Systems Inc. | 307,300 | 1,767 |
| * | Cadence Design | | |
| | Systems Inc. | 145,800 | 1,726 |
| | Fair Isaac Corp. | 39,300 | 1,725 |
| * | Tech Data Corp. | 31,400 | 1,704 |
| * | Kulicke & Soffa | | |
| | Industries Inc. | 136,900 | 1,702 |
| | MercadoLibre Inc. | 17,000 | 1,662 |
| * | Anixter International Inc. | 22,200 | 1,610 |
| | MAXIMUS Inc. | 37,666 | 1,532 |
| * | Liquidity Services Inc. | 33,704 | 1,510 |
| * | Cardtronics Inc. | 57,400 | 1,507 |
| * | Insight Enterprises Inc. | 67,348 | 1,477 |
| * | GT Advanced | | |
| | Technologies Inc. | 158,700 | 1,312 |
| * | Entegris Inc. | 140,300 | 1,310 |
| * | Unisys Corp. | 64,712 | 1,276 |
| * | MicroStrategy Inc. Class A | 8,400 | 1,176 |
| * | Spansion Inc. Class A | 89,100 | 1,085 |
| * | Teradyne Inc. | 61,531 | 1,039 |
| | OPNET | 34,200 | 992 |
| * | Newport Corp. | 54,000 | 957 |
12
Strategic Small-Cap Equity Fund
| | | |
| | | | Market |
| | | | Value |
| | | Shares | ($000) |
| * | OSI Systems Inc. | 15,100 | 926 |
| * | Manhattan Associates Inc. | 18,500 | 879 |
| * | Lattice Semiconductor | | |
| | Corp. | 126,200 | 812 |
| * | Brightpoint Inc. | 96,900 | 780 |
| * | CommVault Systems Inc. | 15,700 | 779 |
| | Cypress | | |
| | Semiconductor Corp. | 47,400 | 741 |
| * | SYNNEX Corp. | 18,900 | 721 |
| * | Synaptics Inc. | 19,500 | 712 |
| * | Quantum Corp. | 266,700 | 699 |
| | MKS Instruments Inc. | 22,600 | 667 |
| * | Veeco Instruments Inc. | 22,100 | 632 |
| | Plantronics Inc. | 13,800 | 556 |
| * | TeleTech Holdings Inc. | 34,500 | 556 |
| * | Kemet Corp. | 58,800 | 550 |
| * | Plexus Corp. | 14,500 | 507 |
| * | Silicon Graphics | | |
| | International Corp. | 41,500 | 402 |
| | NIC Inc. | 27,100 | 329 |
| * | QLogic Corp. | 17,000 | 302 |
| | Mantech International Corp. | | |
| | Class A | 8,325 | 287 |
| * | Novellus Systems Inc. | 5,400 | 270 |
| | Blackbaud Inc. | 7,700 | 256 |
| * | Stamps.com Inc. | 9,100 | 254 |
| | Pulse Electronics Corp. | 89,800 | 225 |
| * | TeleNav Inc. | 25,400 | 178 |
| | Heartland Payment | | |
| | Systems Inc. | 4,000 | 115 |
| * | DSP Group Inc. | 13,700 | 91 |
| * | Ancestry.com Inc. | 3,000 | 68 |
| * | Websense Inc. | 3,000 | 63 |
| | | | 46,170 |
| Materials (5.7%) | | |
| * | Rockwood Holdings Inc. | 38,100 | 1,987 |
| | Buckeye Technologies Inc. | 45,100 | 1,532 |
| * | LSB Industries Inc. | 38,800 | 1,510 |
| | Cytec Industries Inc. | 24,400 | 1,483 |
| | Domtar Corp. | 15,200 | 1,450 |
| * | TPC Group Inc. | 30,300 | 1,340 |
| | Myers Industries Inc. | 90,500 | 1,335 |
| | Neenah Paper Inc. | 35,244 | 1,048 |
| * | Coeur d’Alene Mines Corp. | 30,900 | 734 |
| | NewMarket Corp. | 3,600 | 675 |
| | Westlake Chemical Corp. | 10,300 | 667 |
| | Koppers Holdings Inc. | 16,200 | 625 |
| | Haynes International Inc. | 9,400 | 595 |
| * | Graphic Packaging | | |
| | Holding Co. | 39,400 | 217 |
| * | WR Grace & Co. | 2,300 | 133 |
| | | | 15,331 |
| | | |
| | | | Market |
| | | | Value |
| | | Shares | ($000) |
| Telecommunication Services (0.6%) | |
| * | Vonage Holdings Corp. | 393,200 | 869 |
| * | Premiere Global | | |
| | Services Inc. | 42,000 | 380 |
| | Consolidated | | |
| | Communications | | |
| | Holdings Inc. | 15,200 | 298 |
| | | | 1,547 |
| Utilities (3.3%) | | |
| | WGL Holdings Inc. | 35,700 | 1,453 |
| | PNM Resources Inc. | 79,100 | 1,448 |
| | Portland General | | |
| | Electric Co. | 42,800 | 1,069 |
| | NorthWestern Corp. | 28,900 | 1,025 |
| | Laclede Group Inc. | 26,000 | 1,014 |
| | Avista Corp. | 37,300 | 954 |
| | Vectren Corp. | 17,700 | 514 |
| | Cleco Corp. | 11,200 | 444 |
| | El Paso Electric Co. | 11,700 | 380 |
| | MGE Energy Inc. | 7,700 | 342 |
| | CH Energy Group Inc. | 1,500 | 100 |
| | | | 8,743 |
| Total Common Stocks | | |
| (Cost $222,959) | | 265,491 |
| Temporary Cash Investments (1.2%)1 | |
| Money Market Fund (1.1%) | | |
| 2,3 | Vanguard Market | | |
| | Liquidity Fund, 0.123% | 2,915,253 | 2,915 |
| |
| | | Face | |
| | | Amount | |
| | | ($000) | |
| U.S. Government and Agency Obligations (0.1%) |
| 4,5 | Freddie Mac Discount | | |
| | Notes, 0.100%, 4/30/12 | 200 | 200 |
| Total Temporary Cash Investments | |
| (Cost $3,115) | | 3,115 |
| Total Investments (100.6%) | | |
| (Cost $226,074) | | 268,606 |
| Other Assets and Liabilities (-0.6%) | |
| Other Assets | | 1,194 |
| Liabilities3 | | (2,855) |
| | | | (1,661) |
| Net Assets (100%) | | |
| Applicable to 12,632,684 outstanding | |
| $.001 par value shares of beneficial | |
| interest (unlimited authorization) | 266,945 |
| Net Asset Value Per Share | | $21.13 |
13
Strategic Small-Cap Equity Fund
| |
| At March 31, 2012, net assets consisted of: | |
| | Amount |
| | ($000) |
| Paid-in Capital | 268,351 |
| Undistributed Net Investment Income | 88 |
| Accumulated Net Realized Losses | (44,033) |
| Unrealized Appreciation (Depreciation) | |
| Investment Securities | 42,532 |
| Futures Contracts | 7 |
| Net Assets | 266,945 |
See Note A in Notes to Financial Statements.
* Non-income-producing security.
^ Part of security position is on loan to broker-dealers. The total value of securities on loan is $1,173,000.
1 The fund invests a portion of its cash reserves in equity markets through the use of index futures contracts. After giving effect to futures investments, the fund’s effective common stock and temporary cash investment positions represent 99.9% and 0.7%, respectively, of net assets.
2 Affiliated money market fund available only to Vanguard funds and certain trusts and accounts managed by Vanguard. Rate shown is the 7-day yield.
3 Includes $1,201,000 of collateral received for securities on loan.
4 The issuer was placed under federal conservatorship in September 2008; since that time, its daily operations have been managed by the Federal Housing Finance Agency and it receives capital from the U.S. Treasury in exchange for senior preferred stock.
5 Securities with a value of $200,000 have been segregated as initial margin for open futures contracts.
See accompanying Notes, which are an integral part of the Financial Statements.
14
Strategic Small-Cap Equity Fund
Statement of Operations
| |
| | Six Months Ended |
| | March 31, 2012 |
| | ($000) |
| Investment Income | |
| Income | |
| Dividends | 1,882 |
| Interest1 | 2 |
| Security Lending | 69 |
| Total Income | 1,953 |
| Expenses | |
| The Vanguard Group—Note B | |
| Investment Advisory Services | 108 |
| Management and Administrative | 330 |
| Marketing and Distribution | 30 |
| Custodian Fees | 7 |
| Shareholders’ Reports | 3 |
| Total Expenses | 478 |
| Net Investment Income | 1,475 |
| Realized Net Gain (Loss) | |
| Investment Securities Sold | 8,257 |
| Futures Contracts | 136 |
| Realized Net Gain (Loss) | 8,393 |
| Change in Unrealized Appreciation (Depreciation) | |
| Investment Securities | 54,297 |
| Futures Contracts | 90 |
| Change in Unrealized Appreciation (Depreciation) | 54,387 |
| Net Increase (Decrease) in Net Assets Resulting from Operations | 64,255 |
| 1 Interest income from an affiliated company of the fund was $1,000. | |
See accompanying Notes, which are an integral part of the Financial Statements.
15
Strategic Small-Cap Equity Fund
Statement of Changes in Net Assets
| | |
| | Six Months Ended | Year Ended |
| | March 31, | September 30, |
| | 2012 | 2011 |
| | ($000) | ($000) |
| Increase (Decrease) in Net Assets | | |
| Operations | | |
| Net Investment Income | 1,475 | 2,186 |
| Realized Net Gain (Loss) | 8,393 | 27,197 |
| Change in Unrealized Appreciation (Depreciation) | 54,387 | (41,074) |
| Net Increase (Decrease) in Net Assets Resulting from Operations | 64,255 | (11,691) |
| Distributions | | |
| Net Investment Income | (2,511) | (1,572) |
| Realized Capital Gain | — | — |
| Total Distributions | (2,511) | (1,572) |
| Capital Share Transactions | | |
| Issued | 26,876 | 142,411 |
| Issued in Lieu of Cash Distributions | 2,343 | 1,479 |
| Redeemed | (47,009) | (85,734) |
| Net Increase (Decrease) from Capital Share Transactions | (17,790) | 58,156 |
| Total Increase (Decrease) | 43,954 | 44,893 |
| Net Assets | | |
| Beginning of Period | 222,991 | 178,098 |
| End of Period1 | 266,945 | 222,991 |
| 1 Net Assets—End of Period includes undistributed net investment income of $88,000 and $1,124,000. | |
See accompanying Notes, which are an integral part of the Financial Statements.
16
Strategic Small-Cap Equity Fund
Financial Highlights
| | | | | | | |
| | Six Months | | | | | |
| | | Ended | | | | | |
| For a Share Outstanding | March 31, | | | Year Ended September 30, |
| Throughout Each Period | | 2012 | 2011 | 2010 | 2009 | 2008 | 2007 |
| Net Asset Value, Beginning of Period | $16.44 | $16.53 | $14.32 | $16.60 | $21.28 | $19.04 |
| Investment Operations | | | | | | | |
| Net Investment Income | | .120 | .176 | .154 | .145 | .160 | .220 |
| Net Realized and Unrealized Gain (Loss) | | | | | | |
| on Investments | | 4.766 | (.126) | 2.216 | (2.257) | (4.479) | 2.170 |
| Total from Investment Operations | | 4.886 | .050 | 2.370 | (2.112) | (4.319) | 2.390 |
| Distributions | | | | | | | |
| Dividends from Net Investment Income | (.196) | (.140) | (.160) | (.168) | (.210) | (.150) |
| Distributions from Realized Capital Gains | — | — | — | — | (.151) | — |
| Total Distributions | | (.196) | (.140) | (.160) | (.168) | (.361) | (.150) |
| Net Asset Value, End of Period | | $21.13 | $16.44 | $16.53 | $14.32 | $16.60 | $21.28 |
| |
| Total Return1 | | 29.90% | 0.20% | 16.70% | -12.48% | -20.50% | 12.58% |
| |
| Ratios/Supplemental Data | | | | | | | |
| Net Assets, End of Period (Millions) | $267 | $223 | $178 | $165 | $200 | $257 |
| Ratio of Total Expenses to | | | | | | | |
| Average Net Assets | | 0.38% | 0.38% | 0.43% | 0.43% | 0.38% | 0.38% |
| Ratio of Net Investment Income to | | | | | | |
| Average Net Assets | | 1.17% | 0.89% | 0.98% | 1.18% | 0.83% | 1.07% |
| Portfolio Turnover Rate | | 59% | 64% | 66% | 76% | 99% | 73% |
The expense ratio, net income ratio, and turnover rate for the current period have been annualized.
1 Total returns do not include account service fees that may have applied in the periods shown. Fund prospectuses provide information about any applicable transaction fees.
See accompanying Notes, which are an integral part of the Financial Statements.
17
Strategic Small-Cap Equity Fund
Notes to Financial Statements
Vanguard Strategic Small-Cap Equity Fund is registered under the Investment Company Act of 1940 as an open-end investment company, or mutual fund.
A. The following significant accounting policies conform to generally accepted accounting principles for U.S. mutual funds. The fund consistently follows such policies in preparing its financial statements.
1. Security Valuation: Securities are valued as of the close of trading on the New York Stock Exchange (generally 4 p.m., Eastern time) on the valuation date. Equity securities are valued at the latest quoted sales prices or official closing prices taken from the primary market in which each security trades; such securities not traded on the valuation date are valued at the mean of the latest quoted bid and asked prices. Securities for which market quotations are not readily available, or whose values have been materially affected by events occurring before the fund’s pricing time but after the close of the securities’ primary markets, are valued by methods deemed by the board of trustees to represent fair value. Investments in Vanguard Market Liquidity Fund are valued at that fund’s net asset value. Temporary cash investments acquired over 60 days to maturity are valued using the latest bid prices or using valuations based on a matrix system (which considers such factors as security prices, yields, maturities, and ratings), both as furnished by independent pricing services. Other temporary cash investments are valued at amortized cost, which approximates market value.
2. Futures Contracts: The fund uses index futures contracts to a limited extent, with the objective of maintaining full exposure to the stock market while maintaining liquidity. The fund may purchase or sell futures contracts to achieve a desired level of investment, whether to accommodate portfolio turnover or cash flows from capital share transactions. The primary risks associated with the use of futures contracts are imperfect correlation between changes in market values of stocks held by the fund and the prices of futures contracts, and the possibility of an illiquid market.
Futures contracts are valued at their quoted daily settlement prices. The aggregate principal amounts of the contracts are not recorded in the Statement of Net Assets. Fluctuations in the value of the contracts are recorded in the Statement of Net Assets as an asset (liability) and in the Statement of Operations as unrealized appreciation (depreciation) until the contracts are closed, when they are recorded as realized futures gains (losses).
3. Federal Income Taxes: The fund intends to continue to qualify as a regulated investment company and distribute all of its taxable income. Management has analyzed the fund’s tax positions taken for all open federal income tax years (September 30, 2008–2011), and for the period ended March 31, 2012, and has concluded that no provision for federal income tax is required in the fund’s financial statements.
4. Distributions: Distributions to shareholders are recorded on the ex-dividend date.
5. Security Lending: The fund may lend its securities to qualified institutional borrowers to earn additional income. Security loans are required to be secured at all times by collateral at least equal to the market value of securities loaned. The fund invests cash collateral received in Vanguard Market Liquidity Fund, and records a liability for the return of the collateral, during the period the securities are on loan. Security lending income represents fees charged to borrowers plus income earned on investing cash collateral, less expenses associated with the loan.
6. Other: Dividend income is recorded on the ex-dividend date. Interest income includes income distributions received from Vanguard Market Liquidity Fund and is accrued daily. Security transactions are accounted for on the date securities are bought or sold. Costs used to determine realized gains (losses) on the sale of investment securities are those of the specific securities sold.
18
Strategic Small-Cap Equity Fund
B. The Vanguard Group furnishes at cost investment advisory, corporate management, administrative, marketing, and distribution services. The costs of such services are allocated to the fund under methods approved by the board of trustees. The fund has committed to provide up to 0.40% of its net assets in capital contributions to Vanguard. At March 31, 2012, the fund had contributed capital of $40,000 to Vanguard (included in Other Assets), representing 0.01% of the fund’s net assets and 0.02% of Vanguard’s capitalization. The fund’s trustees and officers are also directors and officers of Vanguard.
C. Various inputs may be used to determine the value of the fund’s investments. These inputs are summarized in three broad levels for financial statement purposes. The inputs or methodologies used to value securities are not necessarily an indication of the risk associated with investing in those securities.
Level 1—Quoted prices in active markets for identical securities.
Level 2—Other significant observable inputs (including quoted prices for similar securities, interest rates, prepayment speeds, credit risk, etc.).
Level 3—Significant unobservable inputs (including the fund’s own assumptions used to determine the fair value of investments).
The following table summarizes the market value of the fund’s investments as of March 31, 2012, based on the inputs used to value them:
| | | |
| | Level 1 | Level 2 | Level 3 |
| Investments | ($000) | ($000) | ($000) |
| Common Stocks | 265,491 | — | — |
| Temporary Cash Investments | 2,915 | 200 | — |
| Futures Contracts—Assets1 | 2 | — | — |
| Futures Contracts—Liabilities1 | (8) | — | — |
| Total | 268,400 | 200 | — |
| 1 Represents variation margin on the last day of the reporting period. | | | |
D. At March 31, 2012, the aggregate settlement value of open futures contracts and the related unrealized appreciation (depreciation) were:
| | | | |
| | | | | ($000) |
| | | | Aggregate | |
| | | Number of | Settlement | Unrealized |
| | | Long (Short) | Value | Appreciation |
| Futures Contracts | Expiration | Contracts | Long (Short) | (Depreciation) |
| E-mini Russell 2000 Index | June 2012 | 16 | 1,324 | 7 |
Unrealized appreciation (depreciation) on open futures contracts is required to be treated as realized gain (loss) for tax purposes.
19
Strategic Small-Cap Equity Fund
E. Distributions are determined on a tax basis and may differ from net investment income and realized capital gains for financial reporting purposes. Differences may be permanent or temporary. Permanent differences are reclassified among capital accounts in the financial statements to reflect their tax character. Temporary differences arise when certain items of income, expense, gain, or loss are recognized in different periods for financial statement and tax purposes; these differences will reverse at some time in the future. Differences in classification may also result from the treatment of short-term gains as ordinary income for tax purposes.
The fund’s tax-basis capital gains and losses are determined only at the end of each fiscal year. For tax purposes, at September 30, 2011, the fund had available capital loss carryforwards totaling $52,387,000 to offset future net capital gains of $3,915,000 through September 30, 2017, and $48,472,000 through September 30, 2018. The fund will use these capital losses to offset net taxable capital gains, if any, realized during the year ending September 30, 2012; should the fund realize net capital losses for the year, the losses will be added to the loss carryforward balance above.
At March 31, 2012, the cost of investment securities for tax purposes was $226,074,000. Net unrealized appreciation of investment securities for tax purposes was $42,532,000, consisting of unrealized gains of $50,248,000 on securities that had risen in value since their purchase and $7,716,000 in unrealized losses on securities that had fallen in value since their purchase.
F. During the six months ended March 31, 2012, the fund purchased $73,725,000 of investment securities and sold $92,091,000 of investment securities, other than temporary cash investments.
G. Capital shares issued and redeemed were:
| | |
| | Six Months Ended | Year Ended |
| | March 31, 2012 | September 30, 2011 |
| | Shares | Shares |
| | (000) | (000) |
| Issued | 1,373 | 7,150 |
| Issued in Lieu of Cash Distributions | 128 | 79 |
| Redeemed | (2,434) | (4,435) |
| Net Increase (Decrease) in Shares Outstanding | (933) | 2,794 |
H. In preparing the financial statements as of March 31, 2012, management considered the impact of subsequent events for potential recognition or disclosure in these financial statements.
20
About Your Fund’s Expenses
As a shareholder of the fund, you incur ongoing costs, which include costs for portfolio management, administrative services, and shareholder reports (like this one), among others. Operating expenses, which are deducted from a fund’s gross income, directly reduce the investment return of the fund.
A fund’s expenses are expressed as a percentage of its average net assets. This figure is known as the expense ratio. The following examples are intended to help you understand the ongoing costs (in dollars) of investing in your fund and to compare these costs with those of other mutual funds. The examples are based on an investment of $1,000 made at the beginning of the period shown and held for the entire period.
The accompanying table illustrates your fund’s costs in two ways:
• Based on actual fund return. This section helps you to estimate the actual expenses that you paid over the period. The ”Ending Account Value“ shown is derived from the fund‘s actual return, and the third column shows the dollar amount that would have been paid by an investor who started with $1,000 in the fund. You may use the information here, together with the amount you invested, to estimate the expenses that you paid over the period.
To do so, simply divide your account value by $1,000 (for example, an $8,600 account value divided by $1,000 = 8.6), then multiply the result by the number given for your fund under the heading ”Expenses Paid During Period.“
• Based on hypothetical 5% yearly return. This section is intended to help you compare your fund‘s costs with those of other mutual funds. It assumes that the fund had a yearly return of 5% before expenses, but that the expense ratio is unchanged. In this case—because the return used is not the fund’s actual return—the results do not apply to your investment. The example is useful in making comparisons because the Securities and Exchange Commission requires all mutual funds to calculate expenses based on a 5% return. You can assess your fund’s costs by comparing this hypothetical example with the hypothetical examples that appear in shareholder reports of other funds.
Note that the expenses shown in the table are meant to highlight and help you compare ongoing costs only and do not reflect transaction costs incurred by the fund for buying and selling securities. Further, the expenses do not include any purchase, redemption, or account service fees described in the fund prospectus. If such fees were applied to your account, your costs would be higher. Your fund does not carry a “sales load.”
The calculations assume no shares were bought or sold during the period. Your actual costs may have been higher or lower, depending on the amount of your investment and the timing of any purchases or redemptions.
You can find more information about the fund’s expenses, including annual expense ratios, in the Financial Statements section of this report. For additional information on operating expenses and other shareholder costs, please refer to your fund’s current prospectus.
21
| | | |
| Six Months Ended March 31, 2012 | | | |
| | Beginning | Ending | Expenses |
| | Account Value | Account Value | Paid During |
| Strategic Small-Cap Equity Fund | 9/30/2011 | 3/31/2012 | Period |
| Based on Actual Fund Return | $1,000.00 | $1,299.00 | $2.18 |
| Based on Hypothetical 5% Yearly Return | 1,000.00 | 1,023.10 | 1.92 |
The calculations are based on expenses incurred in the most recent six-month period. The fund’s annualized six-month expense ratio for that period is 0.38%. The dollar amounts shown as “Expenses Paid” are equal to the expense ratio multiplied by the average account value over the period, multiplied by the number of days in the most recent six-month period, then divided by the number of days in the most recent 12-month period.
Trustees Approve Advisory Arrangement
The board of trustees of Vanguard Strategic Small-Cap Equity Fund has renewed the fund’s investment advisory arrangement with The Vanguard Group, Inc. Vanguard—through its Equity Investment Group—serves as the investment advisor to the fund. The board determined that continuing the fund’s internalized management structure was in the best interests of the fund and its shareholders.
The board based its decision upon an evaluation of the advisor’s investment staff, portfolio management process, and performance. The trustees considered the factors discussed below, among others. However, no single factor determined whether the board approved the arrangement. Rather, it was the totality of the circumstances that drove the board’s decision.
Nature, extent, and quality of services
The board considered the quality of the fund’s investment management since its inception in 2006, and took into account the organizational depth and stability of the advisor. The board noted that Vanguard has been managing investments for more than three decades. The Equity Investment Group adheres to a sound, disciplined investment management process; the team has considerable experience, stability, and depth.
The board concluded that Vanguard’s experience, stability, depth, and performance, among other factors, warranted continuation of the advisory arrangement.
Investment performance
The board considered the fund’s performance since inception, including any periods of outperformance or underperformance of a relevant benchmark and peer group. The board concluded that the advisor has carried out the fund’s investment strategy in disciplined fashion, and that the fund has outperformed its benchmark and peer group over the most recent one-year period; over the longer term, however, the fund has either underperformed or only modestly outperformed its benchmark and peer group. Information about the fund’s most recent performance can be found in the Performance Summary section of this report.
Cost
The board concluded that the fund’s expense ratio was well below the average expense ratio charged by funds in its peer group and that the fund’s advisory fee rate was also well below its peer-group average. Information about the fund’s expenses appears in the About Your Fund’s Expenses section of this report as well as in the Financial Statements section.
The board does not conduct a profitability analysis of Vanguard, because of Vanguard’s unique “at-cost” structure. Unlike most other mutual fund management companies, Vanguard is owned by the funds it oversees, and produces “profits” only in the form of reduced expenses for fund shareholders.
The benefit of economies of scale
The board concluded that the fund’s low-cost arrangement with Vanguard ensures that the fund will realize economies of scale as it grows, with the cost to shareholders declining as fund assets increase.
The board will consider whether to renew the advisory arrangement again after a one-year period.
23
Glossary
30-Day SEC Yield. A fund’s 30-day SEC yield is derived using a formula specified by the U.S. Securities and Exchange Commission. Under the formula, data related to the fund’s security holdings in the previous 30 days are used to calculate the fund’s hypothetical net income for that period, which is then annualized and divided by the fund’s estimated average net assets over the calculation period. For the purposes of this calculation, a security’s income is based on its current market yield to maturity (for bonds), its actual income (for asset-backed securities), or its projected dividend yield (for stocks). Because the SEC yield represents hypothetical annualized income, it will differ—at times significantly—from the fund’s actual experience. As a result, the fund’s income distributions may be higher or lower than implied by the SEC yield.
Beta. A measure of the magnitude of a fund’s past share-price fluctuations in relation to the ups and downs of a given market index. The index is assigned a beta of 1.00. Compared with a given index, a fund with a beta of 1.20 typically would have seen its share price rise or fall by 12% when the index rose or fell by 10%. For this report, beta is based on returns over the past 36 months for both the fund and the index. Note that a fund’s beta should be reviewed in conjunction with its R-squared (see definition). The lower the R-squared, the less correlation there is between the fund and the index, and the less reliable beta is as an indicator of volatility.
Dividend Yield. Dividend income earned by stocks, expressed as a percentage of the aggregate market value (or of net asset value, for a fund). The yield is determined by dividing the amount of the annual dividends by the aggregate value (or net asset value) at the end of the period. For a fund, the dividend yield is based solely on stock holdings and does not include any income produced by other investments.
Earnings Growth Rate. The average annual rate of growth in earnings over the past five years for the stocks now in a fund.
Equity Exposure. A measure that reflects a fund’s investments in stocks and stock futures. Any holdings in short-term reserves are excluded.
Expense Ratio. A fund’s total annual operating expenses expressed as a percentage of the fund’s average net assets. The expense ratio includes management and administrative expenses, but does not include the transaction costs of buying and selling portfolio securities.
Foreign Holdings. The percentage of a fund represented by securities or depositary receipts of companies based outside the United States.
Inception Date. The date on which the assets of a fund (or one of its share classes) are first invested in accordance with the fund’s investment objective. For funds with a subscription period, the inception date is the day after that period ends. Investment performance is measured from the inception date.
Median Market Cap. An indicator of the size of companies in which a fund invests; the midpoint of market capitalization (market price x shares outstanding) of a fund’s stocks, weighted by the proportion of the fund’s assets invested in each stock. Stocks representing half of the fund’s assets have market capitalizations above the median, and the rest are below it.
Price/Book Ratio. The share price of a stock divided by its net worth, or book value, per share. For a fund, the weighted average price/book ratio of the stocks it holds.
24
Price/Earnings Ratio. The ratio of a stock’s current price to its per-share earnings over the past year. For a fund, the weighted average P/E of the stocks it holds. P/E is an indicator of market expectations about corporate prospects; the higher the P/E, the greater the expectations for a company’s future growth.
R-Squared. A measure of how much of a fund’s past returns can be explained by the returns from the market in general, as measured by a given index. If a fund’s total returns were precisely synchronized with an index’s returns, its R-squared would be 1.00. If the fund’s returns bore no relationship to the index’s returns, its R-squared would be 0. For this report, R-squared is based on returns over the past 36 months for both the fund and the index.
Return on Equity. The annual average rate of return generated by a company during the past five years for each dollar of shareholder’s equity (net income divided by shareholder’s equity). For a fund, the weighted average return on equity for the companies whose stocks it holds.
Short-Term Reserves. The percentage of a fund invested in highly liquid, short-term securities that can be readily converted to cash.
Turnover Rate. An indication of the fund’s trading activity. Funds with high turnover rates incur higher transaction costs and may be more likely to distribute capital gains (which may be taxable to investors). The turnover rate excludes in-kind transactions, which have minimal impact on costs.
25
This page intentionally left blank.
This page intentionally left blank.
The People Who Govern Your Fund
The trustees of your mutual fund are there to see that the fund is operated and managed in your best interests since, as a shareholder, you are a part owner of the fund. Your fund’s trustees also serve on the board of directors of The Vanguard Group, Inc., which is owned by the Vanguard funds and provides services to them on an at-cost basis.
A majority of Vanguard’s board members are independent, meaning that they have no affiliation with Vanguard or the funds they oversee, apart from the sizable personal investments they have made as private individuals. The independent board members have distinguished backgrounds in business, academia, and public service. Each of the trustees and executive officers oversees 179 Vanguard funds.
The following table provides information for each trustee and executive officer of the fund. More information about the trustees is in the Statement of Additional Information, which can be obtained, without charge, by contacting Vanguard at 800-662-7447, or online at vanguard.com.
| |
| InterestedTrustee1 | and Delphi Automotive LLP (automotive components); |
| Senior Advisor at New Mountain Capital; Trustee of |
| The Conference Board. |
| F. William McNabb III | |
| Born 1957. Trustee Since July 2009. Chairman of the | Amy Gutmann |
| Board. Principal Occupation(s) During the Past Five | Born 1949. Trustee Since June 2006. Principal |
| Years: Chairman of the Board of The Vanguard Group, | Occupation(s) During the Past Five Years: President |
| Inc., and of each of the investment companies served | of the University of Pennsylvania; Christopher H. |
| by The Vanguard Group, since January 2010; Director | Browne Distinguished Professor of Political Science |
| of The Vanguard Group since 2008; Chief Executive | in the School of Arts and Sciences with secondary |
| Officer and President of The Vanguard Group and of | appointments at the Annenberg School for Commu- |
| each of the investment companies served by The | nication and the Graduate School of Education |
| Vanguard Group since 2008; Director of Vanguard | of the University of Pennsylvania; Director of |
| Marketing Corporation; Managing Director of The | Carnegie Corporation of New York, Schuylkill River |
| Vanguard Group (1995–2008). | Development Corporation, and Greater Philadelphia |
| Chamber of Commerce; Trustee of the National |
| Constitution Center; Chair of the Presidential |
| Independent Trustees | Commission for the Study of Bioethical Issues. |
| |
| |
| |
| JoAnn Heffernan Heisen |
| Emerson U. Fullwood | Born 1950. Trustee Since July 1998. Principal |
| Born 1948. Trustee Since January 2008. Principal | Occupation(s) During the Past Five Years: Corporate |
| Occupation(s) During the Past Five Years: Executive | Vice President and Chief Global Diversity Officer |
| Chief Staff and Marketing Officer for North America | (retired 2008) and Member of the Executive |
| and Corporate Vice President (retired 2008) of Xerox | Committee (1997–2008) of Johnson & Johnson |
| Corporation (document management products and | (pharmaceuticals/medical devices/consumer |
| services); Executive in Residence and 2010 | products); Director of Skytop Lodge Corporation |
| Distinguished Minett Professor at the Rochester | (hotels), the University Medical Center at Princeton, |
| Institute of Technology; Director of SPX Corporation | the Robert Wood Johnson Foundation, and the Center |
| (multi-industry manufacturing), the United Way of | for Talent Innovation; Member of the Advisory Board |
| Rochester, Amerigroup Corporation (managed health | of the Maxwell School of Citizenship and Public Affairs |
| care), the University of Rochester Medical Center, | at Syracuse University. |
| Monroe Community College Foundation, and North | |
| Carolina A&T University. | F. Joseph Loughrey |
| Born 1949. Trustee Since October 2009. Principal |
| Rajiv L. Gupta | Occupation(s) During the Past Five Years: President |
| Born 1945. Trustee Since December 2001.2 | and Chief Operating Officer (retired 2009) of Cummins |
| Principal Occupation(s) During the Past Five Years: | Inc. (industrial machinery); Director of SKF AB |
| Chairman and Chief Executive Officer (retired 2009) | (industrial machinery), Hillenbrand, Inc. (specialized |
| and President (2006–2008) of Rohm Haas Co. | consumer services), the Lumina Foundation for |
| (chemicals); Director of Tyco International, Ltd. | |
| (diversified manufacturing and services), Hewlett- | |
| Packard Co. (electronic computer manufacturing), | |
| |
| |
| | |
| Education, and Oxfam America; Chairman of the | Executive Officers | |
| Advisory Council for the College of Arts and Letters | | |
| and Member of the Advisory Board to the Kellogg | Glenn Booraem | |
| Institute for International Studies at the University | Born 1967. Controller Since July 2010. Principal |
| of Notre Dame. | Occupation(s) During the Past Five Years: Principal |
| | of The Vanguard Group, Inc.; Controller of each of |
| Mark Loughridge | the investment companies served by The Vanguard |
| Born 1953. Trustee Since March 2012. Principal | Group; Assistant Controller of each of the investment |
| Occupation(s) During the Past Five Years: Senior Vice | companies served by The Vanguard Group (2001–2010). |
| President and Chief Financial Officer at IBM (information | | |
| technology services); Fiduciary Member of IBM’s | Thomas J. Higgins | |
| Retirement Plan Committee. | Born 1957. Chief Financial Officer Since September |
| | 2008. Principal Occupation(s) During the Past Five |
| Scott C. Malpass | Years: Principal of The Vanguard Group, Inc.; Chief |
| Born 1962. Trustee Since March 2012. Principal | Financial Officer of each of the investment companies |
| Occupation(s) During the Past Five Years: Chief | served by The Vanguard Group; Treasurer of each of |
| Investment Officer and Vice President at the University | the investment companies served by The Vanguard |
| of Notre Dame; Assistant Professor of Finance at the | Group (1998–2008). | |
| Mendoza College of Business at Notre Dame; Member | | |
| of the Notre Dame 403(b) Investment Committee; | Kathryn J. Hyatt | |
| Director of TIFF Advisory Services, Inc. (investment | Born 1955. Treasurer Since November 2008. Principal |
| advisor); Member of the Investment Advisory | Occupation(s) During the Past Five Years: Principal of |
| Committees of the Financial Industry Regulatory | The Vanguard Group, Inc.; Treasurer of each of the |
| Authority (FINRA) and of Major League Baseball. | investment companies served by The Vanguard |
| | Group; Assistant Treasurer of each of the investment |
| André F. Perold | companies served by The Vanguard Group (1988–2008). |
| Born 1952. Trustee Since December 2004. Principal | | |
| Occupation(s) During the Past Five Years: George | Heidi Stam | |
| Gund Professor of Finance and Banking at the Harvard | Born 1956. Secretary Since July 2005. Principal |
| Business School (retired 2011); Chief Investment | Occupation(s) During the Past Five Years: Managing |
| Officer and Managing Partner of HighVista Strategies | Director of The Vanguard Group, Inc.; General Counsel |
| LLC (private investment firm); Director of Rand | of The Vanguard Group; Secretary of The Vanguard |
| Merchant Bank; Overseer of the Museum of Fine | Group and of each of the investment companies |
| Arts Boston. | served by The Vanguard Group; Director and Senior |
| | Vice President of Vanguard Marketing Corporation; |
| Alfred M. Rankin, Jr. | Principal of The Vanguard Group (1997–2006). |
| Born 1941. Trustee Since January 1993. Principal | | |
| Occupation(s) During the Past Five Years: Chairman, | | |
| President, and Chief Executive Officer of NACCO | Vanguard Senior ManagementTeam |
| Industries, Inc. (forklift trucks/housewares/lignite); | | |
| Director of Goodrich Corporation (industrial products/ | Mortimer J. Buckley | Michael S. Miller |
| aircraft systems and services) and the National | Kathleen C. Gubanich | James M. Norris |
| Association of Manufacturers; Chairman of the Board | Paul A. Heller | Glenn W. Reed |
| of the Federal Reserve Bank of Cleveland and of | Martha G. King | George U. Sauter |
| University Hospitals of Cleveland; Advisory Chairman | Chris D. McIsaac | |
| of the Board of The Cleveland Museum of Art. | | |
| | |
| Peter F. Volanakis | Chairman Emeritus and Senior Advisor | |
| Born 1955. Trustee Since July 2009. Principal | | |
| Occupation(s) During the Past Five Years: President | John J. Brennan | |
| and Chief Operating Officer (retired 2010) of Corning | Chairman, 1996–2009 | |
| Incorporated (communications equipment); Director | Chief Executive Officer and President, 1996–2008 | |
| of SPX Corporation (multi-industry manufacturing); | |
| Overseer of the Amos Tuck School of Business | Founder | |
| Administration at Dartmouth College; Advisor to the | | |
| Norris Cotton Cancer Center. | John C. Bogle | |
| Chairman and Chief Executive Officer, 1974–1996 | |
| | |
1 Mr. McNabb is considered an “interested person,” as defined in the Investment Company Act of 1940, because he is an officer of the Vanguard funds.
2 December 2002 for Vanguard Equity Income Fund, Vanguard Growth Equity Fund, the Vanguard Municipal Bond Funds, and the Vanguard State Tax-Exempt Funds.
|  |
| P.O. Box 2600 |
| Valley Forge, PA 19482-2600 |
Connect with Vanguard® > vanguard.com
| |
| Fund Information > 800-662-7447 | CFA® is a trademark owned by CFA Institute. |
| Direct Investor Account Services > 800-662-2739 | |
| Institutional Investor Services > 800-523-1036 | |
| Text Telephone for People | |
| With Hearing Impairment > 800-749-7273 | |
| |
| This material may be used in conjunction | |
| with the offering of shares of any Vanguard | |
| fund only if preceded or accompanied by | |
| the fund’s current prospectus. | |
| |
| All comparative mutual fund data are from Lipper Inc. or | |
| Morningstar, Inc., unless otherwise noted. | |
| |
| You can obtain a free copy of Vanguard’s proxy voting | |
| guidelines by visiting vanguard.com/proxyreporting or by | |
| calling Vanguard at 800-662-2739. The guidelines are | |
| also available from the SEC’s website, sec.gov. In | |
| addition, you may obtain a free report on how your fund | |
| voted the proxies for securities it owned during the 12 | |
| months ended June 30. To get the report, visit either | |
| vanguard.com/proxyreporting or sec.gov. | |
| |
| You can review and copy information about your fund at | |
| the SEC’s Public Reference Room in Washington, D.C. To | |
| find out more about this public service, call the SEC at | |
| 202-551-8090. Information about your fund is also | |
| available on the SEC’s website, and you can receive | |
| copies of this information, for a fee, by sending a | |
| request in either of two ways: via e-mail addressed to | |
| publicinfo@sec.gov or via regular mail addressed to the | |
| Public Reference Section, Securities and Exchange | |
| Commission, Washington, DC 20549-1520. | |
| |
| |
| | © 2012 The Vanguard Group, Inc. |
| | All rights reserved. |
| | Vanguard Marketing Corporation, Distributor. |
| |
| | Q6152 052012 |
Item 2:
Not Applicable.
Item 3:
Not Applicable.
Item 4: Principal Accountant Fees and Services.
Not Applicable.
Item 5: Audit Committee of Listed Registrants.
Not Applicable.
Item 6: Investments.
Not Applicable.
Item 7: Disclosure of Proxy Voting Policies and Procedures for Closed-End Management Investment Companies.
Not Applicable.
Item 8: Portfolio Managers of Closed-End Management Investment Companies.
Not Applicable.
Item 9: Purchase of Equity Securities by Closed-End Management Investment Company and Affiliated Purchasers.
Not Applicable.
Item 10: Submission of Matters to a Vote of Security Holders.
Not Applicable.
Item 11: Controls and Procedures.
(a) Disclosure Controls and Procedures. The Principal Executive and Financial Officers concluded that the Registrant's Disclosure Controls and Procedures are effective based on their evaluation of the Disclosure Controls and Procedures as of a date within 90 days of the filing date of this report.
(b) Internal Control Over Financial Reporting. There were no significant changes in Registrant’s Internal Control Over Financial Reporting or in other factors that could significantly affect this control subsequent to the date of the evaluation, including any corrective actions with regard to significant deficiencies and material weaknesses.
Item 12: Exhibits.
(a) Certifications.
Pursuant to the requirements of the Securities Exchange Act of 1934 and the Investment Company Act of 1940, the registrant has duly caused this report to be signed on its behalf by the undersigned, thereunto duly authorized.
|
| VANGUARD HORIZON FUNDS |
| |
| /s/ F. WILLIAM MCNABB III* |
| F. WILLIAM MCNABB III |
| CHIEF EXECUTIVE OFFICER |
| |
| Date: May 22, 2012 |
Pursuant to the requirements of the Securities Exchange Act of 1934 and the Investment Company Act of 1940, this report has been signed below by the following persons on behalf of the registrant and in the capacities and on the dates indicated.
|
| VANGUARD HORIZON FUNDS |
| |
| /s/ F. WILLIAM MCNABB III* |
| F. WILLIAM MCNABB III |
| CHIEF EXECUTIVE OFFICER |
| |
| Date: May 22, 2012 |
|
| VANGUARD HORIZON FUNDS |
| |
| /s/ THOMAS J. HIGGINS* |
| THOMAS J. HIGGINS |
| CHIEF FINANCIAL OFFICER |
| |
| Date: May 22, 2012 |
* By: /s/ Heidi Stam
Heidi Stam, pursuant to a Power of Attorney filed on March 27, 2012 see file Number 2-11444, Incorporated by Reference.