UNITED STATES
SECURITIES AND EXCHANGE COMMISSION Washington, D.C. 20549
FORM N-CSR
CERTIFIED SHAREHOLDER REPORT OF
REGISTERED MANAGEMENT INVESTMENT COMPANIES
| | |
| Investment Company Act file number: | 811-07239 |
Name of Registrant: | Vanguard Horizon Funds |
Address of Registrant: | P.O. Box 2600 |
| | Valley Forge, PA 19482 |
Name and address of agent for service: | Heidi Stam, Esquire |
| | P.O. Box 876 |
| | Valley Forge, PA 19482 |
Registrant’s telephone number, including area code: (610) 669-1000 |
Date of fiscal year end: September 30 | |
Date of reporting period: October 1, 2012 – September 30, 2013 |
Item 1: Reports to Shareholders | |

Annual Report | September 30, 2013
Vanguard Strategic Equity Fund

Vanguard’s Principles for Investing Success
We want to give you the best chance of investment success. These principles,
grounded in Vanguard’s research and experience, can put you on the right path.
Goals. Create clear, appropriate investment goals.
Balance. Develop a suitable asset allocation using broadly diversified funds.
Cost. Minimize cost.
Discipline. Maintain perspective and long-term discipline.
A single theme unites these principles: Focus on the things you can control.
We believe there is no wiser course for any investor.
| |
| Contents | |
| Your Fund’s Total Returns. | 1 |
| Chairman’s Letter. | 2 |
| Advisor’s Report. | 9 |
| Fund Profile. | 11 |
| Performance Summary. | 12 |
| Financial Statements. | 14 |
| Your Fund’s After-Tax Returns. | 29 |
| About Your Fund’s Expenses. | 30 |
| Glossary. | 32 |
Please note: The opinions expressed in this report are just that—informed opinions. They should not be considered promises or advice.
Also, please keep in mind that the information and opinions cover the period through the date on the front of this report. Of course, the
risks of investing in your fund are spelled out in the prospectus.
See the Glossary for definitions of investment terms used in this report.
About the cover: The ship's wheel represents leadership and guidance, essential qualities in navigating difficult seas.
This one is a replica based on an 18th-century British vessel. The HMS Vanguard, another ship of that era, served as the
flagship for Admiral Horatio Nelson when he defeated a French fleet at the Battle of the Nile.
Your Fund’s Total Returns
| |
| Fiscal Year Ended September 30, 2013 | |
| |
| | Total |
| | Returns |
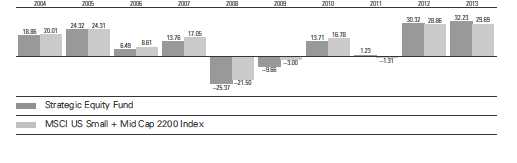
| Vanguard Strategic Equity Fund | 32.23% |
| MSCI US Small + Mid Cap 2200 Index | 29.69 |
| Mid-Cap Core Funds Average | 27.58 |
| Mid-Cap Core Funds Average: Derived from data provided by Lipper, a Thomson Reuters Company. |
| | | | |
| Your Fund’s Performance at a Glance | | | | |
| September 30, 2012, Through September 30, 2013 | | | |
| |
| | | | Distributions Per Share |
| | Starting | Ending | | |
| | Share | Share | Income | Capital |
| | Price | Price | Dividends | Gains |
| Vanguard Strategic Equity Fund | $21.02 | $27.34 | $0.350 | $0.000 |
1

Chairman’s Letter
Dear Shareholder,
Sluggish but sustained growth in the U.S. economy was enough to lift investor sentiment and push the broad stock market significantly higher during the fiscal year ended September 30, 2013. Small- and mid-capitalization stocks, the focus of Vanguard Strategic Equity Fund, gained even more than their large-cap counterparts as investors looked to these riskier investments for potentially greater returns.
The Strategic Equity Fund returned a very strong 32.23% for the 12 months, with all ten sectors posting double-digit gains. The fund’s result was more than two percentage points higher than the return of its benchmark, the MSCI US Small + Mid Cap 2200 Index, and more than four percentage points higher than the average return of its peer funds. Much of the outperformance came from the fund’s holdings in the industrial sector, although telecommunication services and health care made strong contributions as well.
Note: If you hold shares in a taxable account, you may wish to review the table of after-tax returns for the fiscal year, based on the highest federal income tax bracket, later in this report.
Stocks dodged obstacles to produce strong gains
Although their path wasn’t always smooth, U.S. stocks powered to a return of about 22% for the 12 months ended September 30. The U.S. economy
2
delivered only modest growth over the fiscal year, but investors’ appetite for stocks seemed to increase faster than companies’ profits.
In mid-September, U.S. stocks jumped when the Federal Reserve surprised investors by announcing that it had no immediate plans to unwind its stimulative bond-buying program. But in the waning days of that month, stocks slid ahead of the partial federal government shutdown that began October 1.
It’s natural for investors to be concerned by the situation in Washington. But as Sarah Hammer, a senior analyst in Vanguard Investment Strategy Group, noted in the midst of the temporary shutdown, they shouldn’t be unduly influenced by these events. “Investors are often best served by sticking to their long-term investment plans and avoiding short-term decisions based on the legislative outlook,” Ms. Hammer said. Our recurrent advice to stick to your plan may lack pizzazz, but it’s proven to be sound counsel over the decades.
International stocks generally posted strong results. Emerging market stocks, however, lagged amid worries about slowing economic growth.
Bond returns were negative despite September’s bounce
Investor concern about the Fed’s potential scaling back of its bond-buying program also affected the performance of bonds, which posted declines for the year. In
| | | |
| Market Barometer | | | |
| |
| | Average Annual Total Returns |
| | Periods Ended September 30, 2013 |
| | One | Three | Five |
| | Year | Years | Years |
| Stocks | | | |
| Russell 1000 Index (Large-caps) | 20.91% | 16.64% | 10.53% |
| Russell 2000 Index (Small-caps) | 30.06 | 18.29 | 11.15 |
| Russell 3000 Index (Broad U.S. market) | 21.60 | 16.76 | 10.58 |
| MSCI All Country World Index ex USA (International) | 16.48 | 5.95 | 6.26 |
| |
| Bonds | | | |
| Barclays U.S. Aggregate Bond Index (Broad taxable market) | -1.68% | 2.86% | 5.41% |
| Barclays Municipal Bond Index (Broad tax-exempt market) | -2.21 | 3.24 | 5.98 |
| Citigroup Three-Month U.S. Treasury Bill Index | 0.07 | 0.07 | 0.14 |
| |
| CPI | | | |
| Consumer Price Index | 1.18% | 2.34% | 1.37% |
3
September, however, bonds trimmed their losses after the Fed said it would continue the purchases.
The broad U.S. taxable bond market returned –1.68% for the fiscal year, and the yield of the 10-year Treasury note closed at 2.63%, down from 2.76% a month earlier. (Bond yields and prices move in opposite directions.) Municipal bonds returned –2.21% after rebounding a bit in September.
Money markets and savings accounts barely budged as the Fed’s target for short-term interest rates remained between 0% and 0.25%.
Industrials gave an outsized boost to 12-month performance
Like other funds that employ a quantitative investment strategy, Vanguard Strategic Equity Fund relies on a computer model to drive its stock selection process. What that model is looking for as it scans the mid- and small-cap segment of the U.S. market reflects the convictions of your fund’s advisor, Vanguard Equity Investment Group, about which characteristics of a stock are most predictive of future outperformance. Specifically, the fund’s model tries to identify companies with attractive valuations, positive earnings momentum, and strong balance sheets. At the same time, it tries not to stray
| | |
| Expense Ratios | | |
| Your Fund Compared With Its Peer Group | | |
| | | Peer Group |
| | Fund | Average |
| Strategic Equity Fund | 0.29% | 1.23% |
The fund expense ratio shown is from the prospectus dated January 25, 2013, and represents estimated costs for the current fiscal year. For
the fiscal year ended September 30, 2013, the fund’s expense ratio was 0.28%. The peer-group expense ratio is derived from data provided
by Lipper, a Thomson Reuters Company, and captures information through year-end 2012.
Peer group: Mid-Cap Core Funds.
4
very far from the sector weightings of the benchmark. That process resulted in the fund’s holding about 440 stocks at the end of the fiscal year, compared with about 2,170 in its benchmark.
The advisor’s quantitative analysis proved particularly successful among industrial stocks, which accounted for roughly half of the fund’s advantage over the index. Airline holdings were among the top performers. There has been some consolidation in the industry leading to fuller flights, less intense competition, and higher ticket prices, all meaning opportunity for higher profit margins. Manufacturers of construction and industrial machinery stood out as well in this sector.
The telecommunication services sector represents a very small portion of the mid- and small-cap market, but strong gains for a few service providers nevertheless gave a significant boost to the fund’s return versus its benchmark.
| |
| Total Returns | |
| Ten Years Ended September 30, 2013 | |
| | Average |
| | Annual Return |
| Strategic Equity Fund | 9.12% |
| MSCI US Small + Mid Cap 2200 Index | 10.77 |
| Mid-Cap Core Funds Average | 9.20 |
| Mid-Cap Core Funds Average: Derived from data provided by Lipper, a Thomson Reuters Company. |
The figures shown represent past performance, which is not a guarantee of future results. (Current performance may be
lower or higher than the performance data cited. For performance data current to the most recent month-end, visit our
website at vanguard.com/performance.) Note, too, that both investment returns and principal value can fluctuate widely, so
an investor’s shares, when sold, could be worth more or less than their original cost.
5
| Investment insight | |
| Don’t let a trick of the calendar alter your course | |
| When making investment decisions, it’s important to weigh past returns with caution. |
| That’s because investment returns from any particular period are an unreliable anchor |
| for gauging the future. They can be highly date-dependent. | |
| |
| For example, take the five-year average annual return for the broad U.S. stock |
| market. That average just made a startling bounce: from 1.30% for the period |
| ended September 30, 2012, to 10.58% for the period ended September 30, 2013. |
| True, the market returned a hearty 21.60% in the most recent 12 months, but that’s |
| not enough to explain such a big leap in the average. Significantly, the year ended |
| September 30, 2008––when U.S. stocks returned –21.52% during the financial |
| crisis––has now rolled off the five-year calculation. | |
| |
| The important thing to remember is that historical returns are just that: historical. |
| Basing investment decisions on such date-dependent snapshots could easily lead |
| you to alter course––possibly in the wrong direction. Instead, Vanguard believes, you |
| should build your asset allocation strategy on long-term risk-and-return relationships, |
| always recognizing that no level of return is guaranteed. | |
| |
| Which five-year average should you count on? | |
| (Answer: None of them!) | |
| Average annual returns for U.S. stocks over five-year periods ended September 30 |
| |
| 2007 | 16.18% |
| 2008 | 5.70 |
| 2009 | 1.56 |
| 2010 | 0.92 |
| 2011 | –0.92 |
| 2012 | 1.30 |
| 2013 | 10.58 |
| Note: The U.S. stock market is represented by the Russell 3000 Index. |
| Source: Vanguard. |
6
In addition, the advisor found pockets of success among biopharmaceuticals, food and drug retailers, and computer storage and software companies.
Stock selection was less successful in materials, utilities, and, especially, energy. Some of the fund’s holdings in the oil and gas drilling segment did well, and avoiding coal stocks also helped. However, disappointments among oil and gas refiners and some companies involved in exploration and production caused the fund to lag its benchmark in this sector.
A challenging decade for quantitative funds
As all seasoned investors can tell you, any given investment strategy tends to work better under some market conditions than others. Quantitative funds in general struggled during the financial crisis, when the stock market dropped sharply across the board, and then post-crisis, when the overall market rebounded. That’s not surprising, as the advisors of quantitative funds use computer models to identify individual stocks that they believe are likely to perform better than their peers over time. This strategy has worked better in recent years, when stocks have generally moved less in lock-step with one another as investors focused more closely on the merits of individual companies.
So although the fund has outpaced both its benchmark and the average return of peer funds in each of the last three fiscal years, its average annual return over the past decade has lagged that of the index, 9.12% to 10.77%. The fund was just a step behind the 9.20% average for its peer group, which includes actively managed funds that do not use a quantitative approach.
Staying out of the rough by staying the course
Back in September 2008, global financial markets were stunned by the collapse of Lehman Brothers, which transformed the economic downturn already under way into the Great Recession. Fast-forward to 2013: The U.S. economy is growing, albeit slowly, and stock markets have set record highs.
When headlines are blaring and stock markets are sinking, it’s human nature to be tempted to head for the exits. But it’s important to stick with the principles of balance and diversification—and the portfolio asset allocation you established to meet your long-term goals. Bonds can provide ballast if stock prices keep falling, and, by remaining in the stock market, you will be able to participate when stocks begin to recover.
The benefit of staying the course was confirmed in a recent analysis of the performance of more than 58,000 self-directed Vanguard IRA® investors over the five years ended December 31, 2012. Vanguard compared actual returns earned by each investor with the hypothetical results of personalized index benchmarks, taking into consideration investors’ beginning and ending balances and any intervening cash flow.
7
The key finding: Those who stayed with their investment plans earned five-year returns commensurate with the calculated benchmarks, generally outperforming those who changed course. Investors who reacted to market events were much more likely to miss out on potential returns. (You can read more in Most Vanguard IRA Investors Shot Par by Staying the Course: 2008–2012 at vanguard.com/research.)
The results for the five years through 2012 are a good reminder that sticking with a simple, broad-based portfolio—even amid a financial tempest—can help minimize the chances of making a mistake that can reduce returns.
As always, thank you for investing with Vanguard.
Sincerely,

F. William McNabb III
Chairman and Chief Executive Officer
October 16, 2013
8
Advisor’s Report
For the fiscal year ended September 30, 2013, Vanguard Strategic Equity Fund rewarded investors with a total return of 32.23%, outperforming its benchmark by 2.54 percentage points. While the broad U.S. equity market delivered a robust return above 20%, small-capitalization stocks outpaced larger-cap equities by around 10 percentage points. The U.S. equity market provided returns similar to those from other developed countries; emerging-market returns were basically flat.
The gains within our benchmark index were broad-based, coming from all ten sectors. Results were best in industrials, consumer discretionary, and consumer staples. The utilities and materials sectors were the laggards for the period, although their returns were positive.
Investors seemed to gain confidence at the start of the fiscal year as economic data around the world continued to improve, albeit at a snail’s pace. Here in the United States, the housing market continued its recovery, the unemployment rate slowly decreased, corporate balance sheets were strong, and profits held up. And the longer-term economic outlook was one of cautious optimism, with GDP growth expected to accelerate in 2014 and 2015.
More recently, however, macroeconomic events grabbed the headlines, which translated into greater market volatility. The Federal Reserve’s mixed signals on tapering its quantitative easing program, a jump in interest rates, and the budget deadlock between Congress and the White House that threatened to shut down the federal government (and did so on October 1) left investors guessing about the market’s prospects for the near term.
Although such dramas influence stock performance in the short term, we believe that long-term investing requires a focus on the underlying factors that influence companies’ growth.
Our investment approach is not unlike that of traditional fundamental managers, in that we employ a combination of valuation and other basic measures in assessing stocks. However, we do this through a strict quantitative process that compares all the stocks in our investment universe to highlight those with the potential to outperform the rest over the long run.
As we construct a portfolio based on the results from our model, we seek to minimize deviations from the benchmark’s characteristics in areas where we think there would be no reward. We believe that this metrics-focused process enables us to take advantage of inefficiencies in the market caused by biases in investor behavior.
9
Our model’s effectiveness across sectors was pleasing over the fiscal year, as our stock selection produced above-benchmark gains in seven of the ten sectors. The strongest relative results came from selection in industrials, telecommunication services, and health care. Selection results were negative in materials, utilities, and energy.
At the individual stock level, the largest contributors were overweight positions in Delta Air Lines, Virgin Media, Western Digital, and Rite Aid. In addition, we benefited in relative terms from underweighting or avoiding poorly performing stocks such as American Capital Agency and Royal Gold.
Unfortunately, we were not able to avoid all bad performers. Overweight positions in Energy XXI, CF Industries, and IAC/InterActiveCorp detracted from performance. Also, underweighting certain companies that our model’s metrics did not highlight, such as Netflix and Tesla Motors, reduced our outperformance relative to our benchmark.
Overall, the increased volatility we have seen in the markets is not surprising, considering how quickly stocks had been rising domestically and internationally. Markets will always be subject to
fluctuations brought on by new headline risks. We find that often there is too much focus on these typical market gyrations, the latest economic news, and short-term performance, and not enough on the fundamental principles that give investors the best chance of success.
Strategies such as ours shift the focus back to fundamentals by seeking to capture the spread between undervalued and overvalued stocks, which we believe will provide worthwhile returns for long-term investors. With that in mind, we believe that equity exposure will continue to play an important part of a diversified investment plan.
We thank you for your investment and look forward to the new fiscal year.
Portfolio Managers:
James D. Troyer, CFA, Principal
James P. Stetler, Principal
Michael R. Roach, CFA
Vanguard Equity Investment Group
October 18, 2013
10
Strategic Equity Fund
Fund Profile
As of September 30, 2013
| | | |
| Portfolio Characteristics | | |
| | | MSCI US | |
| | | Small + | DJ U.S |
| | | Mid Cap | Total |
| | | 2200 | Market |
| | Fund | Index | FA Index |
| Number of Stocks | 437 | 2,172 | 3,636 |
| Median Market Cap | $4.4B | $5.2B | $40.2B |
| Price/Earnings Ratio | 19.2x | 26.1x | 19.5x |
| Price/Book Ratio | 2.6x | 2.4x | 2.5x |
| Return on Equity | 11.6% | 11.4% | 16.5% |
| Earnings Growth Rate | 15.1% | 11.1% | 11.1% |
| Dividend Yield | 1.5% | 1.4% | 1.9% |
| Foreign Holdings | 0.0% | 0.0% | 0.0% |
| Turnover Rate | 64% | — | — |
| Ticker Symbol | VSEQX | — | — |
| Expense Ratio1 | 0.29% | — | — |
| 30-Day SEC Yield | 1.20% | — | — |
| Short-Term Reserves | 0.3% | — | — |
| | | |
| Sector Diversification (% of equity exposure) |
| | | MSCI US | DJ U.S. |
| | | Small + | Total |
| | | Mid Cap | Market |
| | | 2200 | FA |
| | Fund | Index | Index |
| Consumer Discretionary | 16.0% | 16.9% | 13.3% |
| Consumer Staples | 5.3 | 4.4 | 8.7 |
| Energy | 6.0 | 6.6 | 9.6 |
| Financials | 19.7 | 20.0 | 17.3 |
| Health Care | 11.4 | 11.3 | 12.6 |
| Industrials | 14.8 | 14.3 | 11.4 |
| Information Technology | 16.0 | 15.4 | 17.9 |
| Materials | 5.8 | 5.8 | 3.8 |
| Telecommunication | | | |
| Services | 0.3 | 0.8 | 2.2 |
| Utilities | 4.7 | 4.5 | 3.2 |
| | |
| Volatility Measures | | |
| | MSCI US | |
| | Small + | |
| | Mid Cap | DJ U.S. |
| | 2200 | Total Market |
| | Index | FA Index |
| R-Squared | 0.98 | 0.94 |
| Beta | 1.04 | 1.22 |
| These measures show the degree and timing of the fund’s fluctuations compared with the indexes over 36 months. |
| | |
| Ten Largest Holdings (% of total net assets) |
| Delta Air Lines Inc. | Airlines | 1.2% |
| O'Reilly Automotive Inc. | Automotive Retail | 1.1 |
| Fidelity National | Data Processing & | |
| Information Services Inc. Outsourced Services | 1.0 |
| Western Digital Corp. | Computer Storage & | |
| | Peripherals | 1.0 |
| Seagate Technology plc | Computer Storage & | |
| | Peripherals | 1.0 |
| Alliance Data Systems | Data Processing & | |
| Corp. | Outsourced Services | 0.9 |
| ResMed Inc. | Health Care | |
| | Equipment | 0.9 |
| Core Laboratories NV | Oil & Gas Equipment | |
| | & Services | 0.9 |
| Mylan Inc. | Pharmaceuticals | 0.9 |
| Omnicare Inc. | Health Care Services | 0.9 |
| Top Ten | | 9.8% |
| The holdings listed exclude any temporary cash investments and equity index products. |
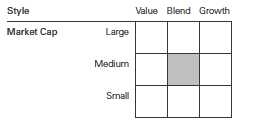
Investment Focus
1 The expense ratio shown is from the prospectus dated January 25, 2013, and represents estimated costs for the current fiscal year. For the fiscal year ended September 30, 2013, the expense ratio was 0.28%.
11
Strategic Equity Fund
Performance Summary
All of the returns in this report represent past performance, which is not a guarantee of future results that may be achieved by the fund. (Current performance may be lower or higher than the performance data cited. For performance data current to the most recent month-end, visit our website at vanguard.com/performance.) Note, too, that both investment returns and principal value can fluctuate widely, so an investor’s shares, when sold, could be worth more or less than their original cost. The returns shown do not reflect taxes that a shareholder would pay on fund distributions or on the sale of fund shares.
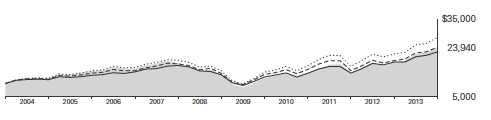
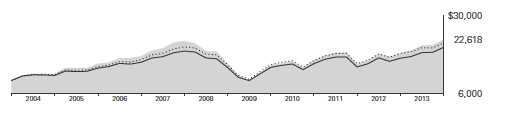
Cumulative Performance: September 30, 2003, Through September 30, 2013
Initial Investment of $10,000
| | | | | |
| | | Average Annual Total Returns | |
| | | Periods Ended September 30, 2013 | |
| | | | | | Final Value |
| | | One | Five | Ten | of a $10,000 |
| | | Year | Years | Years | Investment |
| | Strategic Equity Fund* | 32.23% | 12.37% | 9.12% | $23,940 |
| | MSCI US Small + Mid Cap 2200 | | | | |
| •••••••• | Index | 29.69 | 13.31 | 10.77 | 27,810 |
| – – – – | Mid-Cap Core Funds Average | 27.58 | 11.59 | 9.20 | 24,113 |
| | Dow Jones U.S. Total Stock Market | | | | |
| | Float Adjusted Index | 21.44 | 10.69 | 8.32 | 22,235 |
| Mid-Cap Core Funds Average: Derived from data provided by Lipper, a Thomson Reuters Company. |
See Financial Highlights for dividend and capital gains information.
12
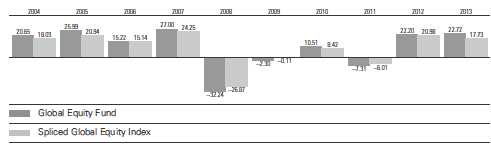
Strategic Equity Fund
Fiscal-Year Total Returns (%): September 30, 2003, Through September 30, 2013
13
Strategic Equity Fund
Financial Statements
Statement of Net Assets
As of September 30, 2013
The fund reports a complete list of its holdings in regulatory filings four times in each fiscal year, at the quarter-ends. For the second and fourth fiscal quarters, the lists appear in the fund’s semiannual and annual reports to shareholders. For the first and third fiscal quarters, the fund files the lists with the Securities and Exchange Commission on Form N-Q. Shareholders can look up the fund’s Forms N-Q on the SEC’s website at sec.gov. Forms N-Q may also be reviewed and copied at the SEC’s Public Reference Room (see the back cover of this report for further information).
| | | |
| | | | Market |
| | | | Value |
| | | Shares | ($000) |
| Common Stocks (99.6%)1 | | |
| Consumer Discretionary (15.9%) | |
| * | O’Reilly Automotive Inc. | 349,300 | 44,567 |
| | Domino’s Pizza Inc. | 498,520 | 33,874 |
| | Gannett Co. Inc. | 1,114,500 | 29,857 |
| | GameStop Corp. Class A | 570,900 | 28,345 |
| | Dillard’s Inc. Class A | 337,170 | 26,400 |
| | Buckle Inc. | 445,000 | 24,052 |
| | PetSmart Inc. | 287,800 | 21,948 |
| | Brinker International Inc. | 516,950 | 20,952 |
| ^ | Sturm Ruger & Co. Inc. | 299,800 | 18,776 |
| | Hanesbrands Inc. | 262,800 | 16,375 |
| * | Conn’s Inc. | 283,900 | 14,206 |
| *,^ | Smith & Wesson | | |
| | Holding Corp. | 1,284,100 | 14,112 |
| * | Tenneco Inc. | 277,995 | 14,039 |
| | Wyndham Worldwide Corp. | 226,100 | 13,785 |
| * | Starz | 472,900 | 13,303 |
| | Hasbro Inc. | 268,000 | 12,633 |
| | Polaris Industries Inc. | 92,482 | 11,947 |
| | Foot Locker Inc. | 340,000 | 11,540 |
| * | Grand Canyon | | |
| | Education Inc. | 256,000 | 10,312 |
| * | Jack in the Box Inc. | 255,500 | 10,220 |
| | Thor Industries Inc. | 172,100 | 9,989 |
| * | Outerwall Inc. | 197,990 | 9,897 |
| | PulteGroup Inc. | 598,500 | 9,875 |
| *,^ | Hovnanian Enterprises | | |
| | Inc. Class A | 1,880,200 | 9,833 |
| * | Cabela’s Inc. | 150,300 | 9,473 |
| | Brown Shoe Co. Inc. | 401,600 | 9,426 |
| | Starwood Hotels & | | |
| | Resorts Worldwide Inc. | 141,200 | 9,383 |
| * | Goodyear Tire & | | |
| | Rubber Co. | 409,700 | 9,198 |
| * | ANN Inc. | 253,400 | 9,178 |
| | Best Buy Co. Inc. | 242,500 | 9,094 |
| | Whirlpool Corp. | 59,800 | 8,757 |
| | Dana Holding Corp. | 373,000 | 8,519 |
| | | |
| | Cheesecake Factory Inc. | 185,500 | 8,153 |
| * | TRW Automotive | | |
| | Holdings Corp. | 106,400 | 7,587 |
| * | Charter Communications | | |
| | Inc. Class A | 55,800 | 7,520 |
| | Newell Rubbermaid Inc. | 261,600 | 7,194 |
| | Brunswick Corp. | 177,100 | 7,068 |
| | Genuine Parts Co. | 85,000 | 6,876 |
| * | LeapFrog Enterprises Inc. | 702,400 | 6,617 |
| | Lear Corp. | 86,400 | 6,184 |
| | Delphi Automotive plc | 99,000 | 5,784 |
| * | Red Robin Gourmet | | |
| | Burgers Inc. | 81,100 | 5,766 |
| | Service Corp. International | 302,600 | 5,634 |
| | Abercrombie & Fitch Co. | 154,800 | 5,475 |
| | H&R Block Inc. | 200,900 | 5,356 |
| | Cracker Barrel Old | | |
| | Country Store Inc. | 50,400 | 5,203 |
| * | Bloomin’ Brands Inc. | 217,100 | 5,126 |
| * | MGM Resorts International | 244,500 | 4,998 |
| * | AMC Networks Inc. Class A | 68,200 | 4,670 |
| | Regal Entertainment Group | | |
| | Class A | 234,400 | 4,449 |
| | Tupperware Brands Corp. | 48,800 | 4,215 |
| * | Visteon Corp. | 52,600 | 3,979 |
| | Rent-A-Center Inc. | 103,400 | 3,940 |
| | Leggett & Platt Inc. | 118,200 | 3,564 |
| * | Overstock.com Inc. | 113,800 | 3,376 |
| | Meredith Corp. | 68,200 | 3,248 |
| | Mattel Inc. | 76,800 | 3,215 |
| * | News Corp. Class A | 196,700 | 3,159 |
| | BorgWarner Inc. | 29,900 | 3,032 |
| * | Fossil Group Inc. | 24,600 | 2,859 |
| * | Bally Technologies Inc. | 36,300 | 2,616 |
| * | Lamar Advertising Co. | | |
| | Class A | 53,300 | 2,507 |
| * | Liberty Interactive Corp. | | |
| | Class A | 104,300 | 2,448 |
| * | Lumber Liquidators | | |
| | Holdings Inc. | 22,100 | 2,357 |
14
| | | |
| Strategic Equity Fund | | |
| |
| |
| |
| | | | Market |
| | | | Value |
| | | Shares | ($000) |
| | International Game | | |
| | Technology | 115,000 | 2,177 |
| * | Madison Square | | |
| | Garden Co. Class A | 37,400 | 2,172 |
| | Gentex Corp. | 84,400 | 2,160 |
| | Washington Post Co. | | |
| | Class B | 3,500 | 2,140 |
| * | Tower International Inc. | 102,600 | 2,051 |
| | NACCO Industries Inc. | | |
| | Class A | 34,000 | 1,884 |
| * | Journal Communications | | |
| | Inc. Class A | 215,261 | 1,840 |
| * | Marriott Vacations | | |
| | Worldwide Corp. | 41,500 | 1,826 |
| | OfficeMax Inc. | 69,750 | 892 |
| | | | 675,182 |
| Consumer Staples (5.3%) | | |
| | JM Smucker Co. | 338,200 | 35,525 |
| | Ingredion Inc. | 328,600 | 21,743 |
| * | Rite Aid Corp. | 3,880,900 | 18,473 |
| | Clorox Co. | 193,200 | 15,788 |
| | Dean Foods Co. | 761,852 | 14,704 |
| | Tyson Foods Inc. Class A | 436,100 | 12,333 |
| | Energizer Holdings Inc. | 134,900 | 12,296 |
| * | SUPERVALU Inc. | 1,331,700 | 10,960 |
| | Herbalife Ltd. | 143,178 | 9,990 |
| | Coca-Cola Enterprises Inc. | 246,700 | 9,920 |
| | Lancaster Colony Corp. | 108,519 | 8,496 |
| | Universal Corp. | 157,800 | 8,037 |
| | Nu Skin Enterprises Inc. | | |
| | Class A | 80,300 | 7,688 |
| | Sanderson Farms Inc. | 116,800 | 7,620 |
| * | Green Mountain Coffee | | |
| | Roasters Inc. | 88,400 | 6,659 |
| * | USANA Health | | |
| | Sciences Inc. | 65,700 | 5,702 |
| * | Pilgrim’s Pride Corp. | 299,200 | 5,024 |
| | Molson Coors Brewing | | |
| | Co. Class B | 80,600 | 4,040 |
| | Safeway Inc. | 125,300 | 4,008 |
| | Dr Pepper Snapple | | |
| | Group Inc. | 84,700 | 3,796 |
| * | WhiteWave Foods Co. | | |
| | Class A | 154,906 | 3,093 |
| | | | 225,895 |
| Energy (6.0%) | | |
| ^ | Core Laboratories NV | 224,800 | 38,038 |
| | Helmerich & Payne Inc. | 501,192 | 34,557 |
| ^ | Western Refining Inc. | 841,400 | 25,276 |
| | Cabot Oil & Gas Corp. | 572,800 | 21,377 |
| * | Ultra Petroleum Corp. | 875,100 | 18,001 |
| | Delek US Holdings Inc. | 595,000 | 12,548 |
| | HollyFrontier Corp. | 284,100 | 11,963 |
| * | Exterran Holdings Inc. | 393,800 | 10,857 |
| | | |
| * | Stone Energy Corp. | 323,212 | 10,482 |
| * | EPL Oil & Gas Inc. | 280,200 | 10,398 |
| | CVR Energy Inc. | 208,400 | 8,028 |
| | Cimarex Energy Co. | 75,000 | 7,230 |
| * | Denbury Resources Inc. | 369,800 | 6,808 |
| | EXCO Resources Inc. | 799,900 | 5,391 |
| | Bristow Group Inc. | 57,500 | 4,184 |
| * | Matador Resources Co. | 238,400 | 3,893 |
| * | Hornbeck Offshore | | |
| | Services Inc. | 52,900 | 3,039 |
| | Oceaneering | | |
| | International Inc. | 37,000 | 3,006 |
| * | Oasis Petroleum Inc. | 55,000 | 2,702 |
| ^ | PBF Energy Inc. Class A | 111,800 | 2,510 |
| * | Hercules Offshore Inc. | 326,000 | 2,403 |
| | SM Energy Co. | 28,700 | 2,215 |
| | Alon USA Energy Inc. | 204,900 | 2,092 |
| | RPC Inc. | 129,400 | 2,002 |
| | Diamond Offshore | | |
| | Drilling Inc. | 29,300 | 1,826 |
| | Patterson-UTI Energy Inc. | 78,200 | 1,672 |
| | Berry Petroleum Co. | | |
| | Class A | 18,800 | 811 |
| | | | 253,309 |
| Financials (19.6%) | | |
| | Huntington | | |
| | Bancshares Inc. | 4,332,800 | 35,789 |
| | Torchmark Corp. | 443,795 | 32,109 |
| | Regions Financial Corp. | 3,239,100 | 29,994 |
| | KeyCorp | 2,599,930 | 29,639 |
| | Discover Financial | | |
| | Services | 569,925 | 28,804 |
| * | Portfolio Recovery | | |
| | Associates Inc. | 455,000 | 27,273 |
| * | World Acceptance Corp. | 257,019 | 23,111 |
| | Comerica Inc. | 572,300 | 22,497 |
| | XL Group plc Class A | 729,400 | 22,480 |
| * | Arch Capital Group Ltd. | 409,826 | 22,184 |
| | Host Hotels & | | |
| | Resorts Inc. | 1,142,900 | 20,195 |
| | Moody’s Corp. | 261,900 | 18,419 |
| | East West Bancorp Inc. | 540,100 | 17,256 |
| | Plum Creek | | |
| | Timber Co. Inc. | 363,200 | 17,009 |
| | Protective Life Corp. | 378,900 | 16,122 |
| | Kimco Realty Corp. | 759,500 | 15,327 |
| | Extra Space Storage Inc. | 313,540 | 14,344 |
| | Corrections Corp. of | | |
| | America | 408,532 | 14,115 |
| | Platinum Underwriters | | |
| | Holdings Ltd. | 231,400 | 13,822 |
| | Allied World Assurance | | |
| | Co. Holdings AG | 135,200 | 13,438 |
| | PartnerRe Ltd. | 141,000 | 12,907 |
15
| | | |
| Strategic Equity Fund | | |
| |
| |
| |
| | | | Market |
| | | | Value |
| | | Shares | ($000) |
| | Retail Properties of | | |
| | America Inc. | 900,500 | 12,382 |
| * | Popular Inc. | 459,300 | 12,047 |
| | Geo Group Inc. | 357,100 | 11,874 |
| | Omega Healthcare | | |
| | Investors Inc. | 388,900 | 11,616 |
| | Sunstone Hotel | | |
| | Investors Inc. | 881,000 | 11,224 |
| | Weingarten Realty | | |
| | Investors | 374,500 | 10,984 |
| | National Retail | | |
| | Properties Inc. | 340,000 | 10,819 |
| | EPR Properties | 215,200 | 10,489 |
| ^ | Lexington Realty Trust | 912,700 | 10,250 |
| | Brandywine Realty Trust | 757,032 | 9,978 |
| * | Credit Acceptance Corp. | 89,022 | 9,865 |
| | Regency Centers Corp. | 202,700 | 9,801 |
| | Everest Re Group Ltd. | 67,000 | 9,742 |
| | Apartment Investment & | | |
| | Management Co. Class A | 338,700 | 9,463 |
| | Pennsylvania REIT | 482,400 | 9,021 |
| | American Financial | | |
| | Group Inc. | 164,689 | 8,903 |
| | Medical Properties | | |
| | Trust Inc. | 683,200 | 8,315 |
| | Ryman Hospitality | | |
| | Properties Inc. | 240,500 | 8,300 |
| | Post Properties Inc. | 181,700 | 8,180 |
| | Lincoln National Corp. | 187,000 | 7,852 |
| | Nelnet Inc. Class A | 203,912 | 7,840 |
| | Unum Group | 256,300 | 7,802 |
| | Associated Banc-Corp | 464,200 | 7,190 |
| | Primerica Inc. | 166,100 | 6,700 |
| * | Howard Hughes Corp. | 58,800 | 6,607 |
| | Montpelier Re | | |
| | Holdings Ltd. | 244,300 | 6,364 |
| | HCC Insurance | | |
| | Holdings Inc. | 140,200 | 6,144 |
| | CoreSite Realty Corp. | 164,300 | 5,576 |
| | Umpqua Holdings Corp. | 338,000 | 5,482 |
| * | St. Joe Co. | 243,900 | 4,785 |
| | Provident Financial | | |
| | Services Inc. | 293,425 | 4,756 |
| | Washington Federal Inc. | 225,400 | 4,661 |
| | RLJ Lodging Trust | 196,100 | 4,606 |
| | Sovran Self Storage Inc. | 59,800 | 4,526 |
| | Cathay General Bancorp | 185,510 | 4,335 |
| | Realty Income Corp. | 105,600 | 4,198 |
| | Susquehanna | | |
| | Bancshares Inc. | 324,800 | 4,076 |
| | CNO Financial Group Inc. | 277,200 | 3,992 |
| | Axis Capital Holdings Ltd. | 91,400 | 3,959 |
| | StanCorp Financial | | |
| | Group Inc. | 65,800 | 3,620 |
| | Inland Real Estate Corp. | 342,300 | 3,502 |
| | | |
| | PrivateBancorp Inc. | 152,500 | 3,263 |
| | RenaissanceRe | | |
| | Holdings Ltd. | 35,500 | 3,214 |
| | Home Properties Inc. | 55,500 | 3,205 |
| | Principal Financial Group Inc. | 70,900 | 3,036 |
| | Zions Bancorporation | 103,800 | 2,846 |
| | UDR Inc. | 120,000 | 2,844 |
| | CBOE Holdings Inc. | 61,900 | 2,800 |
| | Stewart Information | | |
| | Services Corp. | 77,400 | 2,476 |
| | Spirit Realty Capital Inc. | 259,600 | 2,383 |
| | Flagstar Bancorp Inc. | 157,100 | 2,319 |
| | Webster Financial Corp. | 90,500 | 2,310 |
| | Ramco-Gershenson | | |
| | Properties Trust | 148,300 | 2,285 |
| | Federated Investors Inc. | | |
| | Class B | 83,100 | 2,257 |
| | Sabra Health Care REIT Inc. | 97,500 | 2,243 |
| | Apollo Residential | | |
| | Mortgage Inc. | 153,400 | 2,238 |
| | MB Financial Inc. | 78,700 | 2,222 |
| * | First Cash Financial | | |
| | Services Inc. | 37,300 | 2,162 |
| | Highwoods Properties Inc. | 61,000 | 2,154 |
| | STAG Industrial Inc. | 104,300 | 2,099 |
| | First Niagara Financial | | |
| | Group Inc. | 201,000 | 2,084 |
| | Hancock Holding Co. | 64,400 | 2,021 |
| * | MSCI Inc. Class A | 50,000 | 2,013 |
| | Home Loan Servicing | | |
| | Solutions Ltd. | 90,900 | 2,001 |
| | Equity Lifestyle | | |
| | Properties Inc. | 57,200 | 1,955 |
| | BioMed Realty Trust Inc. | 104,700 | 1,946 |
| | First Horizon National Corp. | 169,900 | 1,867 |
| | Douglas Emmett Inc. | 78,900 | 1,852 |
| | Aspen Insurance | | |
| | Holdings Ltd. | 49,700 | 1,804 |
| | Oritani Financial Corp. | 94,900 | 1,562 |
| | Bancfirst Corp. | 25,783 | 1,394 |
| | Republic Bancorp Inc. | | |
| | Class A | 50,311 | 1,386 |
| | MFA Financial Inc. | 92,300 | 688 |
| | American Capital | | |
| | Agency Corp. | 21,300 | 481 |
| | | | 830,070 |
| Health Care (11.4%) | | |
| ^ | ResMed Inc. | 740,783 | 39,128 |
| * | Mylan Inc. | 986,300 | 37,647 |
| | Omnicare Inc. | 672,100 | 37,302 |
| | AmerisourceBergen Corp. | | |
| | Class A | 434,504 | 26,548 |
| * | Cyberonics Inc. | 370,500 | 18,799 |
| * | Endo Health Solutions Inc. | 408,300 | 18,553 |
| * | Isis Pharmaceuticals Inc. | 486,200 | 18,252 |
16
| | | | |
| Strategic Equity Fund | | | |
| |
| |
| |
| | | | | Market |
| | | | | Value |
| | | | Shares | ($000) |
| * | Celldex Therapeutics Inc. | 475,600 | 16,850 |
| * | Thoratec Corp. | | 400,200 | 14,923 |
| * | Covance Inc. | | 172,600 | 14,923 |
| * | Magellan Health | | | |
| | Services Inc. | | 237,100 | 14,217 |
| * | Charles River Laboratories | | |
| | International Inc. | | 286,100 | 13,235 |
| | West Pharmaceutical | | | |
| | Services Inc. | | 313,600 | 12,905 |
| * | Sirona Dental Systems Inc. | 171,600 | 11,485 |
| * | Boston Scientific Corp. | 925,000 | 10,859 |
| ^ | PDL BioPharma Inc. | 1,344,400 | 10,715 |
| * | PAREXEL | | | |
| | International Corp. | | 202,200 | 10,156 |
| * | Centene Corp. | | 130,300 | 8,334 |
| * | Santarus Inc. | | 368,800 | 8,324 |
| * | Seattle Genetics Inc. | | 184,900 | 8,104 |
| * | Brookdale Senior Living Inc. | | |
| | Class A | | 304,700 | 8,014 |
| * | United Therapeutics Corp. | 95,600 | 7,538 |
| * | CareFusion Corp. | | 191,100 | 7,052 |
| *,^ | Myriad Genetics Inc. | | 298,600 | 7,017 |
| * | NPS Pharmaceuticals Inc. | 218,700 | 6,957 |
| * | Bruker Corp. | | 323,400 | 6,678 |
| ^ | Chemed Corp. | | 88,700 | 6,342 |
| * | Salix Pharmaceuticals Ltd. | 79,200 | 5,297 |
| *,^ | Bio-Reference Labs Inc. | 170,700 | 5,101 |
| * | Quintiles Transnational | | |
| | Holdings Inc. | | 107,100 | 4,807 |
| * | Life Technologies Corp. | 61,200 | 4,580 |
| * | Medicines Co. | | 125,675 | 4,213 |
| * | Mettler-Toledo | | | |
| | International Inc. | | 16,300 | 3,913 |
| * | Vertex Pharmaceuticals Inc. | 49,400 | 3,746 |
| * | Molina Healthcare Inc. | 94,000 | 3,346 |
| | Universal Health | | | |
| | Services Inc. Class B | 44,000 | 3,300 |
| *,^ | Arena Pharmaceuticals Inc. | 621,200 | 3,274 |
| * | Nektar Therapeutics | | 302,900 | 3,165 |
| * | Alkermes plc | | 92,900 | 3,123 |
| * | Henry Schein Inc. | | 30,000 | 3,111 |
| | Warner Chilcott plc Class A | 132,100 | 3,018 |
| | Ensign Group Inc. | | 67,000 | 2,754 |
| * | MedAssets Inc. | | 97,900 | 2,489 |
| * | Align Technology Inc. | | 48,800 | 2,348 |
| * | VCA Antech Inc. | | 85,400 | 2,345 |
| | HealthSouth Corp. | | 68,260 | 2,354 |
| | Select Medical | | | |
| | Holdings Corp. | | 279,300 | 2,254 |
| * | Health Management | | | |
| | Associates Inc. Class A | 162,800 | 2,084 |
| * | Health Net Inc. | | 64,500 | 2,045 |
| * | Cubist Pharmaceuticals Inc. | 31,800 | 2,021 |
| | Questcor | | | |
| | Pharmaceuticals Inc. | | 30,500 | 1,769 |
| | | |
| * | Auxilium | | |
| | Pharmaceuticals Inc. | 92,500 | 1,686 |
| * | Gentiva Health | | |
| | Services Inc. | 104,400 | 1,257 |
| * | SurModics Inc. | 30,200 | 718 |
| | | | 480,975 |
| Industrials (14.7%) | | |
| | Delta Air Lines Inc. | 2,180,400 | 51,436 |
| | Dun & Bradstreet Corp. | 341,300 | 35,444 |
| | L-3 Communications | | |
| | Holdings Inc. | 356,700 | 33,708 |
| | Huntington Ingalls | | |
| | Industries Inc. | 478,000 | 32,217 |
| | Cintas Corp. | 568,900 | 29,128 |
| * | US Airways Group Inc. | 1,507,900 | 28,590 |
| | EnerSys Inc. | 448,557 | 27,196 |
| | Trinity Industries Inc. | 577,500 | 26,190 |
| | AO Smith Corp. | 568,200 | 25,683 |
| | Towers Watson & Co. | | |
| | Class A | 205,100 | 21,937 |
| | Flowserve Corp. | 340,800 | 21,262 |
| | Alaska Air Group Inc. | 319,490 | 20,006 |
| * | USG Corp. | 679,300 | 19,414 |
| | Alliant Techsystems Inc. | 151,700 | 14,800 |
| | Rockwell Collins Inc. | 177,700 | 12,059 |
| | Lincoln Electric | | |
| | Holdings Inc. | 163,600 | 10,899 |
| | Hyster-Yale Materials | | |
| | Handling Inc. | 105,600 | 9,469 |
| | Deluxe Corp. | 223,013 | 9,291 |
| | Fortune Brands Home & | | |
| | Security Inc. | 213,400 | 8,884 |
| | Steelcase Inc. Class A | 518,400 | 8,616 |
| | AMERCO | 45,740 | 8,422 |
| * | Taser International Inc. | 553,000 | 8,245 |
| | Masco Corp. | 378,900 | 8,063 |
| | Robert Half | | |
| | International Inc. | 179,300 | 6,998 |
| * | AECOM Technology Corp. | 218,900 | 6,845 |
| | Southwest Airlines Co. | 463,600 | 6,750 |
| | Nielsen Holdings NV | 184,700 | 6,732 |
| | Toro Co. | 119,200 | 6,478 |
| | ITT Corp. | 179,300 | 6,446 |
| * | Hertz Global Holdings Inc. | 274,000 | 6,072 |
| | Equifax Inc. | 94,600 | 5,662 |
| * | Oshkosh Corp. | 114,600 | 5,613 |
| | Exelis Inc. | 330,500 | 5,192 |
| * | B/E Aerospace Inc. | 66,800 | 4,931 |
| * | Hexcel Corp. | 125,400 | 4,865 |
| | Generac Holdings Inc. | 114,100 | 4,865 |
| | Standex International Corp. | 76,450 | 4,541 |
| | Lennox International Inc. | 55,000 | 4,139 |
| | Pall Corp. | 51,500 | 3,968 |
| | Manpowergroup Inc. | 53,400 | 3,884 |
| * | MRC Global Inc. | 141,900 | 3,803 |
17
| | | |
| Strategic Equity Fund | | |
| |
| |
| |
| | | | Market |
| | | | Value |
| | | Shares | ($000) |
| | RR Donnelley & Sons Co. | 230,000 | 3,634 |
| | Mueller Water | | |
| | Products Inc. Class A | 446,500 | 3,568 |
| * | Trex Co. Inc. | 68,700 | 3,403 |
| | AGCO Corp. | 55,000 | 3,323 |
| | Manitowoc Co. Inc. | 156,800 | 3,070 |
| | GATX Corp. | 61,400 | 2,918 |
| * | Jacobs Engineering | | |
| | Group Inc. | 49,000 | 2,851 |
| | Mueller Industries Inc. | 48,800 | 2,717 |
| * | Spirit Airlines Inc. | 75,000 | 2,570 |
| | ADT Corp. | 63,200 | 2,570 |
| | IDEX Corp. | 36,700 | 2,395 |
| * | Saia Inc. | 76,050 | 2,371 |
| * | United Rentals Inc. | 40,600 | 2,367 |
| | Crane Co. | 37,900 | 2,337 |
| | Apogee Enterprises Inc. | 78,600 | 2,333 |
| * | Terex Corp. | 67,700 | 2,275 |
| | Mine Safety Appliances Co. | 40,500 | 2,090 |
| | Brink’s Co. | 70,800 | 2,004 |
| | Ryder System Inc. | 32,900 | 1,964 |
| | G&K Services Inc. Class A | 31,100 | 1,878 |
| | Valmont Industries Inc. | 13,000 | 1,806 |
| | | | 623,187 |
| Information Technology (15.9%) | |
| | Fidelity National | | |
| | Information Services Inc. | 918,200 | 42,641 |
| | Western Digital Corp. | 668,000 | 42,351 |
| | Seagate Technology plc | 953,750 | 41,717 |
| * | Alliance Data Systems Corp. | 189,800 | 40,137 |
| * | Gartner Inc. | 578,791 | 34,727 |
| *,^ | SunPower Corp. Class A | 1,260,700 | 32,980 |
| | LSI Corp. | 4,211,600 | 32,935 |
| * | Anixter International Inc. | 372,508 | 32,654 |
| * | Micron Technology Inc. | 1,696,100 | 29,631 |
| * | CACI International Inc. | | |
| | Class A | 349,000 | 24,119 |
| | Maxim Integrated | | |
| | Products Inc. | 748,850 | 22,316 |
| * | CommVault Systems Inc. | 225,700 | 19,823 |
| * | CoreLogic Inc. | 626,000 | 16,933 |
| | Jack Henry & | | |
| | Associates Inc. | 307,200 | 15,855 |
| * | Manhattan Associates Inc. | 145,300 | 13,869 |
| * | LinkedIn Corp. Class A | 54,000 | 13,287 |
| | SanDisk Corp. | 194,100 | 11,551 |
| | Avnet Inc. | 269,100 | 11,224 |
| | Heartland Payment | | |
| | Systems Inc. | 268,500 | 10,665 |
| | MAXIMUS Inc. | 227,080 | 10,228 |
| * | Tech Data Corp. | 198,900 | 9,927 |
| * | Freescale | | |
| | Semiconductor Ltd. | 577,000 | 9,607 |
| | Broadridge Financial | | |
| | Solutions Inc. | 301,000 | 9,557 |
| | | |
| * | Electronics For Imaging Inc. | 282,100 | 8,937 |
| * | Fiserv Inc. | 87,000 | 8,791 |
| * | Brocade Communications | | |
| | Systems Inc. | 1,031,700 | 8,305 |
| *,^ | Advanced Micro | | |
| | Devices Inc. | 2,126,635 | 8,081 |
| | DST Systems Inc. | 103,230 | 7,785 |
| | Computer Sciences Corp. | 147,700 | 7,642 |
| * | Electronic Arts Inc. | 287,500 | 7,346 |
| * | Aspen Technology Inc. | 203,000 | 7,014 |
| * | SYNNEX Corp. | 113,274 | 6,961 |
| * | Ingram Micro Inc. | 299,500 | 6,903 |
| | AOL Inc. | 196,900 | 6,809 |
| * | Acxiom Corp. | 223,200 | 6,337 |
| * | ValueClick Inc. | 291,200 | 6,071 |
| * | Kulicke & Soffa | | |
| | Industries Inc. | 456,000 | 5,267 |
| * | Unisys Corp. | 205,900 | 5,187 |
| * | Advanced Energy | | |
| | Industries Inc. | 276,100 | 4,837 |
| * | ON Semiconductor Corp. | 500,000 | 3,650 |
| * | RF Micro Devices Inc. | 630,100 | 3,554 |
| | Mentor Graphics Corp. | 150,000 | 3,505 |
| | Harris Corp. | 53,900 | 3,196 |
| * | Ciena Corp. | 117,000 | 2,923 |
| *,^ | Angie’s List Inc. | 111,000 | 2,497 |
| * | Vantiv Inc. Class A | 86,600 | 2,420 |
| | KLA-Tencor Corp. | 39,100 | 2,379 |
| * | Rambus Inc. | 249,300 | 2,343 |
| | Lexmark International Inc. | | |
| | Class A | 67,600 | 2,231 |
| * | NeuStar Inc. Class A | 41,200 | 2,039 |
| | Lender Processing | | |
| | Services Inc. | 59,400 | 1,976 |
| * | Zebra Technologies Corp. | 40,700 | 1,853 |
| | | | 675,573 |
| Materials (5.8%) | | |
| | CF Industries Holdings Inc. | 170,200 | 35,883 |
| | Valspar Corp. | 389,900 | 24,731 |
| | Eastman Chemical Co. | 262,486 | 20,448 |
| | Westlake Chemical Corp. | 165,386 | 17,309 |
| | Packaging Corp. of America | 260,200 | 14,855 |
| | Avery Dennison Corp. | 333,800 | 14,527 |
| | Schweitzer-Mauduit | | |
| | International Inc. | 237,278 | 14,363 |
| * | Owens-Illinois Inc. | 397,000 | 11,918 |
| * | WR Grace & Co. | 121,800 | 10,645 |
| * | Graphic Packaging | | |
| | Holding Co. | 1,154,119 | 9,879 |
| | NewMarket Corp. | 32,822 | 9,450 |
| | Rock Tenn Co. Class A | 83,900 | 8,497 |
| | KapStone Paper and | | |
| | Packaging Corp. | 154,800 | 6,626 |
| | Worthington Industries Inc. | 120,800 | 4,159 |
| | Neenah Paper Inc. | 93,600 | 3,679 |
18
Strategic Equity Fund
| | | |
| | | | Market |
| | | | Value |
| | | Shares | ($000) |
| * | Headwaters Inc. | 385,300 | 3,464 |
| * | Louisiana-Pacific Corp. | 190,800 | 3,356 |
| | International Flavors & | | |
| | Fragrances Inc. | 36,600 | 3,012 |
| | Minerals Technologies Inc. | 59,300 | 2,928 |
| | Cytec Industries Inc. | 35,700 | 2,905 |
| * | Chemtura Corp. | 125,500 | 2,885 |
| | Kaiser Aluminum Corp. | 36,600 | 2,608 |
| * | Calgon Carbon Corp. | 129,200 | 2,454 |
| | American Vanguard Corp. | 91,100 | 2,452 |
| | Sealed Air Corp. | 81,700 | 2,221 |
| | Sonoco Products Co. | 54,000 | 2,103 |
| | Steel Dynamics Inc. | 121,500 | 2,030 |
| * | Berry Plastics Group Inc. | 100,200 | 2,001 |
| | Bemis Co. Inc. | 48,200 | 1,880 |
| | | | 243,268 |
| Telecommunication Services (0.3%) | |
| | Frontier | | |
| | Communications Corp. | 2,589,700 | 10,799 |
| | Telephone & Data | | |
| | Systems Inc. | 73,300 | 2,166 |
| | | | 12,965 |
| Utilities (4.7%) | | |
| | Ameren Corp. | 846,800 | 29,503 |
| | Pinnacle West Capital Corp. | 413,500 | 22,635 |
| | DTE Energy Co. | 298,050 | 19,665 |
| | Portland General | | |
| | Electric Co. | 687,500 | 19,408 |
| | AES Corp. | 1,136,300 | 15,101 |
| | Southwest Gas Corp. | 271,640 | 13,582 |
| | CMS Energy Corp. | 421,100 | 11,083 |
| | PNM Resources Inc. | 387,735 | 8,775 |
| | AGL Resources Inc. | 176,300 | 8,115 |
| | Black Hills Corp. | 158,000 | 7,878 |
| | Vectren Corp. | 230,700 | 7,694 |
| | CenterPoint Energy Inc. | 252,400 | 6,050 |
| | Wisconsin Energy Corp. | 134,300 | 5,423 |
| | UGI Corp. | 136,400 | 5,337 |
| | NV Energy Inc. | 158,000 | 3,730 |
| | American States Water Co. | 108,000 | 2,977 |
| | Westar Energy Inc. | | |
| | Class A | 84,700 | 2,596 |
| | Great Plains Energy Inc. | 110,000 | 2,442 |
| | Atmos Energy Corp. | 51,700 | 2,202 |
| | UNS Energy Corp. | 42,900 | 2,000 |
| | IDACORP Inc. | 40,300 | 1,951 |
| | MGE Energy Inc. | 25,000 | 1,364 |
| | | | 199,511 |
| Total Common Stocks | | |
| (Cost $3,243,805) | | 4,219,935 |
| | | | |
| | | | | Market |
| | | | | Value |
| | | | Shares | ($000) |
| Temporary Cash Investments (1.9%)1 | |
| Money Market Fund (1.9%) | | |
| 2,3 | Vanguard Market Liquidity | | |
| | Fund, 0.112% | 79,934,769 | 79,935 |
| |
| | | | Face | |
| | | | Amount | |
| | | | ($000) | |
| U.S. Government and Agency Obligations (0.0%) |
| 4,5 | Fannie Mae Discount | | |
| | Notes, 0.060%, 3/19/14 | 500 | 499 |
| 5,6 | Federal Home Loan Bank | | |
| | Discount Notes, 0.095%, | | |
| | 10/4/13 | | 500 | 500 |
| 4,5 | Freddie Mac Discount | | |
| | Notes, 0.095%, 11/18/13 | 500 | 500 |
| 4 | Freddie Mac Discount | | |
| | Notes, 0.070%, 3/31/14 | 300 | 300 |
| | | | | 1,799 |
| Total Temporary Cash Investments | |
| (Cost $81,734) | | | 81,734 |
| Total Investments (101.5%) | | |
| (Cost $3,325,539) | | | 4,301,669 |
| Other Assets and Liabilities (-1.5%) | |
| Other Assets | | | 6,721 |
| Liabilities3 | | | (69,380) |
| | | | | (62,659) |
| Net Assets (100%) | | | |
| Applicable to 155,068,536 outstanding | |
| $.001 par value shares of beneficial | |
| interest (unlimited authorization) | 4,239,010 |
| Net Asset Value Per Share | | $27.34 |
19
Strategic Equity Fund
| |
| At September 30, 2013, net assets consisted of: |
| | Amount |
| | ($000) |
| Paid-in Capital | 3,752,110 |
| Undistributed Net Investment Income | 32,183 |
| Accumulated Net Realized Losses | (521,453) |
| Unrealized Appreciation (Depreciation) | |
| Investment Securities | 976,130 |
| Futures Contracts | 40 |
| Net Assets | 4,239,010 |
See Note A in Notes to Financial Statements.
* Non-income-producing security.
^ Part of security position is on loan to broker-dealers. The total value of securities on loan is $47,927,000.
1 The fund invests a portion of its cash reserves in equity markets through the use of index futures contracts. After giving effect to futures
investments, the fund’s effective common stock and temporary cash investment positions represent 100.0% and 1.5%, respectively, of
net assets.
2 Affiliated money market fund available only to Vanguard funds and certain trusts and accounts managed by Vanguard. Rate shown is the
7-day yield.
3 Includes $50,336,000 of collateral received for securities on loan.
4 The issuer was placed under federal conservatorship in September 2008; since that time, its daily operations have been managed by the
Federal Housing Finance Agency and it receives capital from the U.S. Treasury, as needed to maintain a positive net worth, in exchange
for senior preferred stock.
5 Securities with a value of $1,000,000 have been segregated as initial margin for open futures contracts.
6 The issuer operates under a congressional charter; its securities are generally neither guaranteed by the U.S. Treasury nor backed by the
full faith and credit of the U.S. government.
REIT—Real Estate Investment Trust.
See accompanying Notes, which are an integral part of the Financial Statements.
20
Strategic Equity Fund
Statement of Operations
| |
| | Year Ended |
| | September 30, 2013 |
| | ($000) |
| Investment Income | |
| Income | |
| Dividends | 73,078 |
| Interest1 | 45 |
| Securities Lending | 2,017 |
| Total Income | 75,140 |
| Expenses | |
| The Vanguard Group—Note B | |
| Investment Advisory Services | 1,248 |
| Management and Administrative | 8,457 |
| Marketing and Distribution | 542 |
| Custodian Fees | 42 |
| Auditing Fees | 28 |
| Shareholders’ Reports | 54 |
| Trustees’ Fees and Expenses | 6 |
| Total Expenses | 10,377 |
| Net Investment Income | 64,763 |
| Realized Net Gain (Loss) | |
| Investment Securities Sold | 460,017 |
| Futures Contracts | 5,326 |
| Realized Net Gain (Loss) | 465,343 |
| Change in Unrealized Appreciation (Depreciation) | |
| Investment Securities | 498,328 |
| Futures Contracts | 480 |
| Change in Unrealized Appreciation (Depreciation) | 498,808 |
| Net Increase (Decrease) in Net Assets Resulting from Operations | 1,028,914 |
| 1 Interest income from an affiliated company of the fund was $43,000. |
See accompanying Notes, which are an integral part of the Financial Statements.
21
Strategic Equity Fund
Statement of Changes in Net Assets
| | |
| | Year Ended September 30, |
| | 2013 | 2012 |
| | ($000) | ($000) |
| Increase (Decrease) in Net Assets | | |
| Operations | | |
| Net Investment Income | 64,763 | 39,685 |
| Realized Net Gain (Loss) | 465,343 | 293,306 |
| Change in Unrealized Appreciation (Depreciation) | 498,808 | 477,419 |
| Net Increase (Decrease) in Net Assets Resulting from Operations | 1,028,914 | 810,410 |
| Distributions | | |
| Net Investment Income | (52,913) | (32,559) |
| Realized Capital Gain | — | — |
| Total Distributions | (52,913) | (32,559) |
| Capital Share Transactions | | |
| Issued | 451,413 | 237,519 |
| Issued in Lieu of Cash Distributions | 49,012 | 30,266 |
| Redeemed | (491,012) | (548,498) |
| Net Increase (Decrease) from Capital Share Transactions | 9,413 | (280,713) |
| Total Increase (Decrease) | 985,414 | 497,138 |
| Net Assets | | |
| Beginning of Period | 3,253,596 | 2,756,458 |
| End of Period1 | 4,239,010 | 3,253,596 |
| 1 Net Assets—End of Period includes undistributed (overdistributed) net investment income of $32,183,000 and $20,089,000. |
See accompanying Notes, which are an integral part of the Financial Statements.
22
Strategic Equity Fund
Financial Highlights
| | | | | |
| For a Share Outstanding | Year Ended September 30, |
| Throughout Each Period | 2013 | 2012 | 2011 | 2010 | 2009 |
| Net Asset Value, Beginning of Period | $21.02 | $16.30 | $16.30 | $14.52 | $16.42 |
| Investment Operations | | | | | |
| Net Investment Income | . 4261 | .249 | .210 | .221 | .184 |
| Net Realized and Unrealized Gain (Loss) | | | | | |
| on Investments | 6.244 | 4.667 | .017 | 1.759 | (1.843) |
| Total from Investment Operations | 6.670 | 4.916 | . 227 | 1.980 | (1.659) |
| Distributions | | | | | |
| Dividends from Net Investment Income | (. 350) | (.196) | (. 227) | (. 200) | (. 241) |
| Distributions from Realized Capital Gains | — | — | — | — | — |
| Total Distributions | (. 350) | (.196) | (. 227) | (. 200) | (. 241) |
| Net Asset Value, End of Period | $27.34 | $21.02 | $16.30 | $16.30 | $14.52 |
| |
| Total Return2 | 32.23% | 30.32% | 1.23% | 13.71% | -9.66% |
| |
| Ratios/Supplemental Data | | | | | |
| Net Assets, End of Period (Millions) | $4,239 | $3,254 | $2,756 | $3,103 | $3,549 |
| Ratio of Total Expenses to | | | | | |
| Average Net Assets | 0.28% | 0.29% | 0.30% | 0.30% | 0.30% |
| Ratio of Net Investment Income to | | | | | |
| Average Net Assets | 1.75%1 | 1.25% | 1.09% | 1.37% | 1.47% |
| Portfolio Turnover Rate | 64% | 67% | 73% | 60% | 60% |
1 Net investment income per share and the ratio of net investment income to average net assets include $.043 and 0.18%, respectively,
resulting from a special dividend received in connection with a merger between T-Mobile US Inc. and Metro PCS Communications Inc.
in May 2013.
2 Total returns do not include account service fees that may have applied in the periods shown. Fund prospectuses provide information about
any applicable account service fees.
See accompanying Notes, which are an integral part of the Financial Statements.
23
Strategic Equity Fund
Notes to Financial Statements
Vanguard Strategic Equity Fund is registered under the Investment Company Act of 1940 as an open-end investment company, or mutual fund.
A. The following significant accounting policies conform to generally accepted accounting principles for U.S. mutual funds. The fund consistently follows such policies in preparing its financial statements.
1. Security Valuation: Securities are valued as of the close of trading on the New York Stock Exchange (generally 4 p.m., Eastern time) on the valuation date. Equity securities are valued at the latest quoted sales prices or official closing prices taken from the primary market in which each security trades; such securities not traded on the valuation date are valued at the mean of the latest quoted bid and asked prices. Securities for which market quotations are not readily available, or whose values have been materially affected by events occurring before the fund’s pricing time but after the close of the securities’ primary markets, are valued by methods deemed by the board of trustees to represent fair value. Investments in Vanguard Market Liquidity Fund are valued at that fund’s net asset value. Temporary cash investments acquired over 60 days to maturity are valued using the latest bid prices or using valuations based on a matrix system (which considers such factors as security prices, yields, maturities, and ratings), both as furnished by independent pricing services. Other temporary cash investments are valued at amortized cost, which approximates market value.
2. Futures Contracts: The fund may use index futures contracts to a limited extent, with the objective of maintaining full exposure to the stock market while maintaining liquidity. The fund may purchase or sell futures contracts to achieve a desired level of investment, whether to accommodate portfolio turnover or cash flows from capital share transactions. The primary risks associated with the use of futures contracts are imperfect correlation between changes in market values of stocks held by the fund and the prices of futures contracts, and the possibility of an illiquid market. Counterparty risk involving futures is mitigated because a regulated clearinghouse is the counterparty instead of the clearing broker. To further mitigate counterparty risk, the fund trades futures contracts on an exchange, monitors the financial strength of its clearing brokers and clearinghouse, and has entered into clearing agreements with its clearing brokers. The clearinghouse imposes initial margin requirements to secure the fund’s performance and requires daily settlement of variation margin representing changes in the market value of each contract.
Futures contracts are valued at their quoted daily settlement prices. The aggregate notional amounts of the contracts are not recorded in the Statement of Net Assets. Fluctuations in the value of the contracts are recorded in the Statement of Net Assets as an asset (liability) and in the Statement of Operations as unrealized appreciation (depreciation) until the contracts are closed, when they are recorded as realized futures gains (losses).
During the year ended September 30, 2013, the fund’s average investments in long and short futures contracts represented less than 1% and 0% of net assets, respectively, based on quarterly average aggregate settlement values.
3. Federal Income Taxes: The fund intends to continue to qualify as a regulated investment company and distribute all of its taxable income. Management has analyzed the fund’s tax positions taken for all open federal income tax years (September 30, 2010–2013), and has concluded that no provision for federal income tax is required in the fund’s financial statements.
4. Distributions: Distributions to shareholders are recorded on the ex-dividend date.
24
Strategic Equity Fund
5. Securities Lending: To earn additional income, the fund may lend its securities to qualified institutional borrowers. Security loans are required to be secured at all times by collateral in an amount at least equal to the market value of securities loaned. Daily market fluctuations could cause the value of loaned securities to be more or less than the value of the collateral received. When this occurs, the collateral is adjusted and settled on the next business day. The fund further mitigates its counterparty risk by entering into securities lending transactions only with a diverse group of prequalified counterparties, monitoring their financial strength, and entering into master securities lending agreements with its counterparties. The master securities lending agreements provide that, in the event of a counterparty’s default (including bankruptcy), the fund may terminate any loans with that borrower, determine the net amount owed, and sell or retain the collateral up to the net amount owed to the fund; however, such actions may be subject to legal proceedings. While collateral mitigates counterparty risk, in the absence of a default the fund may experience delays and costs in recovering the securities loaned. The fund invests cash collateral received in Vanguard Market Liquidity Fund, and records a liability for the return of the collateral, during the period the securities are on loan. Securities lending income represents fees charged to borrowers plus income earned on invested cash collateral, less expenses associated with the loan.
6. Other: Dividend income is recorded on the ex-dividend date. Interest income includes income distributions received from Vanguard Market Liquidity Fund and is accrued daily. Premiums and discounts on debt securities purchased are amortized and accreted, respectively, to interest income over the lives of the respective securities. Security transactions are accounted for on the date securities are bought or sold. Costs used to determine realized gains (losses) on the sale of investment securities are those of the specific securities sold.
B. The Vanguard Group furnishes at cost investment advisory, corporate management, administrative, marketing, and distribution services. The costs of such services are allocated to the fund under methods approved by the board of trustees. The fund has committed to provide up to 0.40% of its net assets in capital contributions to Vanguard. At September 30, 2013, the fund had contributed capital of $495,000 to Vanguard (included in Other Assets), representing 0.01% of the fund’s net assets and 0.20% of Vanguard’s capitalization. The fund’s trustees and officers are also directors and officers of Vanguard.
C. Various inputs may be used to determine the value of the fund’s investments. These inputs are summarized in three broad levels for financial statement purposes. The inputs or methodologies used to value securities are not necessarily an indication of the risk associated with investing in those securities.
Level 1—Quoted prices in active markets for identical securities.
Level 2—Other significant observable inputs (including quoted prices for similar securities, interest rates, prepayment speeds, credit risk, etc.).
Level 3—Significant unobservable inputs (including the fund’s own assumptions used to determine the fair value of investments).
25
Strategic Equity Fund
The following table summarizes the market value of the fund’s investments as of September 30, 2013, based on the inputs used to value them:
| | | |
| | Level 1 | Level 2 | Level 3 |
| Investments | ($000) | ($000) | ($000) |
| Common Stocks | 4,219,935 | — | — |
| Temporary Cash Investments | 79,935 | 1,799 | — |
| Futures Contracts—Assets1 | 1 | — | — |
| Futures Contracts—Liabilities1 | (16) | — | — |
| Total | 4,299,855 | 1,799 | — |
| 1 Represents variation margin on the last day of the reporting period. |
D. At September 30, 2013, the aggregate settlement value of open futures contracts and the related unrealized appreciation (depreciation) were:
| | | | |
| | | | ($000) |
| | | | Aggregate | |
| | | Number of | Settlement | Unrealized |
| | | Long (Short) | Value | Appreciation |
| Futures Contracts | Expiration | Contracts | Long (Short) | (Depreciation) |
| E-mini Russell 2000 Index | December 2013 | 84 | 9,000 | 42 |
| E-mini S&P MidCap 400 Index | December 2013 | 78 | 9,676 | (2) |
Unrealized appreciation (depreciation) on open futures contracts is required to be treated as realized gain (loss) for tax purposes.
E. Distributions are determined on a tax basis and may differ from net investment income and realized capital gains for financial reporting purposes. Differences may be permanent or temporary. Permanent differences are reclassified among capital accounts in the financial statements to reflect their tax character. Temporary differences arise when certain items of income, expense, gain, or loss are recognized in different periods for financial statement and tax purposes; these differences will reverse at some time in the future. Differences in classification may also result from the treatment of short-term gains as ordinary income for tax purposes.
Certain of the fund’s investments are in securities considered to be “passive foreign investment companies,” for which any unrealized appreciation and/or realized gains are required to be included in distributable net income for tax purposes. During the year ended September 30, 2013, the fund realized gains on the sale of passive foreign investment companies of $244,000, which have been included in current and prior periods’ taxable income; accordingly, such gains have been reclassified from accumulated net realized losses to undistributed net investment income. Passive foreign investment companies held at September 30, 2013, had unrealized appreciation of $84,000, of which all has been distributed and is reflected in the balance of undistributed net investment income.
26
Strategic Equity Fund
For tax purposes, at September 30, 2013, the fund had $39,685,000 of ordinary income available for distribution. The fund used capital loss carryforwards of $465,579,000 to offset taxable capital gains realized during the year ended September 30, 2013. At September 30, 2013, the fund had available capital losses totaling $521,412,000 to offset future net capital gains through September 30, 2018.
At September 30, 2013, the cost of investment securities for tax purposes was $3,325,623,000. Net unrealized appreciation of investment securities for tax purposes was $976,046,000, consisting of unrealized gains of $1,021,216,000 on securities that had risen in value since their purchase and $45,170,000 in unrealized losses on securities that had fallen in value since their purchase.
F. During the year ended September 30, 2013, the fund purchased $2,380,112,000 of investment securities and sold $2,346,920,000 of investment securities, other than temporary cash investments.
G. Capital shares issued and redeemed were:
| | |
| | Year Ended September 30, |
| | 2013 | 2012 |
| | Shares | Shares |
| | (000) | (000) |
| Issued | 18,636 | 12,157 |
| Issued in Lieu of Cash Distributions | 2,331 | 1,630 |
| Redeemed | (20,671) | (28,154) |
| Net Increase (Decrease) in Shares Outstanding | 296 | (14,367) |
H. Management has determined that no material events or transactions occurred subsequent to September 30, 2013, that would require recognition or disclosure in these financial statements.
27
Report of Independent Registered
Public Accounting Firm
To the Trustees of Vanguard Horizon Funds and the Shareholders of Vanguard Strategic Equity Fund:
In our opinion, the accompanying statement of net assets and the related statements of operations and of changes in net assets and the financial highlights present fairly, in all material respects, the financial position of Vanguard Strategic Equity Fund (constituting a separate portfolio of Vanguard Horizon Funds, hereafter referred to as the “Fund”) at September 30, 2013, the results of its operations for the year then ended, the changes in its net assets for each of the two years in the period then ended, and the financial highlights for each of the five years in the period then ended, in conformity with accounting principles generally accepted in the United States of America. These financial statements and financial highlights (hereafter referred to as “financial statements”) are the responsibility of the Fund’s management; our responsibility is to express an opinion on these financial statements based on our audits. We conducted our audits of these financial statements in accordance with the standards of the Public Company Accounting Oversight Board (United States). Those standards require that we plan and perform the audit to obtain reasonable assurance about whether the financial statements are free of material misstatement. An audit includes examining, on a test basis, evidence supporting the amounts and disclosures in the financial statements, assessing the accounting principles used and significant estimates made by management, and evaluating the overall financial statement presentation. We believe that our audits, which included confirmation of securities at September 30, 2013 by correspondence with the custodian and broker and by agreement to the underlying ownership records of the transfer agent, provide a reasonable basis for our opinion.
/s/PricewaterhouseCoopers LLP
Philadelphia, Pennsylvania
November 14, 2013
Special 2013 tax information (unaudited) for Vanguard Strategic Equity Fund
This information for the fiscal year ended September 30, 2013, is included pursuant to provisions of
the Internal Revenue Code.
The fund distributed $52,913,000 of qualified dividend income to shareholders during the fiscal year.
For corporate shareholders, 86.7% of investment income (dividend income plus short-term gains, if
any) qualifies for the dividends-received deduction.
28
Your Fund’s After-Tax Returns
This table presents returns for your fund both before and after taxes. The after-tax returns are shown in two ways: (1) assuming that an investor owned the fund during the entire period and paid taxes on the fund’s distributions, and (2) assuming that an investor paid taxes on the fund’s distributions and sold all shares at the end of each period.
Calculations are based on the highest individual federal income tax and capital gains tax rates in effect at the times of the distributions and the hypothetical sales. State and local taxes were not considered. After-tax returns reflect any qualified dividend income, using actual prior-year figures and estimates for 2013. (In the example, returns after the sale of fund shares may be higher than those assuming no sale. This occurs when the sale would have produced a capital loss. The calculation assumes that the investor received a tax deduction for the loss.)
Please note that your actual after-tax returns will depend on your tax situation and may differ from those shown. Also note that if you own the fund in a tax-deferred account, such as an individual retirement account or a 401(k) plan, this information does not apply to you. Such accounts are not subject to current taxes.
Finally, keep in mind that a fund’s performance—whether before or after taxes—does not guarantee future results.
| | | |
| Average Annual Total Returns: Strategic Equity Fund | | | |
| Periods Ended September 30, 2013 | | | |
| | One | Five | Ten |
| | Year | Years | Years |
| Returns Before Taxes | 32.23% | 12.37% | 9.12% |
| Returns After Taxes on Distributions | 31.91 | 12.11 | 8.41 |
| Returns After Taxes on Distributions and Sale of Fund Shares | 18.67 | 9.88 | 7.45 |
29
About Your Fund’s Expenses
As a shareholder of the fund, you incur ongoing costs, which include costs for portfolio management, administrative services, and shareholder reports (like this one), among others. Operating expenses, which are deducted from a fund’s gross income, directly reduce the investment return of the fund.
A fund’s expenses are expressed as a percentage of its average net assets. This figure is known as the expense ratio. The following examples are intended to help you understand the ongoing costs (in dollars) of investing in your fund and to compare these costs with those of other mutual funds. The examples are based on an investment of $1,000 made at the beginning of the period shown and held for the entire period.
The accompanying table illustrates your fund’s costs in two ways:
• Based on actual fund return. This section helps you to estimate the actual expenses that you paid over the period. The ”Ending Account Value“ shown is derived from the fund‘s actual return, and the third column shows the dollar amount that would have been paid by an investor who started with $1,000 in the fund. You may use the information here, together with the amount you invested, to estimate the expenses that you paid over the period.
To do so, simply divide your account value by $1,000 (for example, an $8,600 account value divided by $1,000 = 8.6), then multiply the result by the number given for your fund under the heading ”Expenses Paid During Period.“
• Based on hypothetical 5% yearly return. This section is intended to help you compare your fund‘s costs with those of other mutual funds. It assumes that the fund had a yearly return of 5% before expenses, but that the expense ratio is unchanged. In this case—because the return used is not the fund’s actual return—the results do not apply to your investment. The example is useful in making comparisons because the Securities and Exchange Commission requires all mutual funds to calculate expenses based on a 5% return. You can assess your fund’s costs by comparing this hypothetical example with the hypothetical examples that appear in shareholder reports of other funds.
Note that the expenses shown in the table are meant to highlight and help you compare ongoing costs only and do not reflect transaction costs incurred by the fund for buying and selling securities. Further, the expenses do not include any purchase, redemption, or account service fees described in the fund prospectus. If such fees were applied to your account, your costs would be higher. Your fund does not carry a “sales load.”
The calculations assume no shares were bought or sold during the period. Your actual costs may have been higher or lower, depending on the amount of your investment and the timing of any purchases or redemptions.
You can find more information about the fund’s expenses, including annual expense ratios, in the Financial Statements section of this report. For additional information on operating expenses and other shareholder costs, please refer to your fund’s current prospectus.
30
| | | |
| Six Months Ended September 30, 2013 | | | |
| | Beginning | Ending | Expenses |
| | Account Value | Account Value | Paid During |
| Strategic Equity Fund | 3/31/2013 | 9/30/2013 | Period |
| Based on Actual Fund Return | $1,000.00 | $1,120.49 | $1.49 |
| Based on Hypothetical 5% Yearly Return | 1,000.00 | 1,023.66 | 1.42 |
The calculations are based on expenses incurred in the most recent six-month period. The fund’s annualized six-month expense ratio for that
period is 0.28%. The dollar amounts shown as “Expenses Paid” are equal to the annualized expense ratio multiplied by the average account
value over the period, multiplied by the number of days in the most recent six-month period, then divided by the number of days in the most
recent 12-month period.
31
Glossary
30-Day SEC Yield. A fund’s 30-day SEC yield is derived using a formula specified by the U.S. Securities and Exchange Commission. Under the formula, data related to the fund’s security holdings in the previous 30 days are used to calculate the fund’s hypothetical net income for that period, which is then annualized and divided by the fund’s estimated average net assets over the calculation period. For the purposes of this calculation, a security’s income is based on its current market yield to maturity (for bonds), its actual income (for asset-backed securities), or its projected dividend yield (for stocks). Because the SEC yield represents hypothetical annualized income, it will differ—at times significantly—from the fund’s actual experience. As a result, the fund’s income distributions may be higher or lower than implied by the SEC yield.
Beta. A measure of the magnitude of a fund’s past share-price fluctuations in relation to the ups and downs of a given market index. The index is assigned a beta of 1.00. Compared with a given index, a fund with a beta of 1.20 typically would have seen its share price rise or fall by 12% when the index rose or fell by 10%. For this report, beta is based on returns over the past 36 months for both the fund and the index. Note that a fund’s beta should be reviewed in conjunction with its R-squared (see definition). The lower the R-squared, the less correlation there is between the fund and the index, and the less reliable beta is as an indicator of volatility.
Dividend Yield. Dividend income earned by stocks, expressed as a percentage of the aggregate market value (or of net asset value, for a fund). The yield is determined by dividing the amount of the annual dividends by the aggregate value (or net asset value) at the end of the period. For a fund, the dividend yield is based solely on stock holdings and does not include any income produced by other investments.
Earnings Growth Rate. The average annual rate of growth in earnings over the past five years for the stocks now in a fund.
Equity Exposure. A measure that reflects a fund’s investments in stocks and stock futures. Any holdings in short-term reserves are excluded.
Expense Ratio. A fund’s total annual operating expenses expressed as a percentage of the fund’s average net assets. The expense ratio includes management and administrative expenses, but does not include the transaction costs of buying and selling portfolio securities.
Foreign Holdings. The percentage of a fund represented by securities or depositary receipts of companies based outside the United States.
Inception Date. The date on which the assets of a fund (or one of its share classes) are first invested in accordance with the fund’s investment objective. For funds with a subscription period, the inception date is the day after that period ends. Investment performance is measured from the inception date.
Median Market Cap. An indicator of the size of companies in which a fund invests; the midpoint of market capitalization (market price x shares outstanding) of a fund’s stocks, weighted by the proportion of the fund’s assets invested in each stock. Stocks representing half of the fund’s assets have market capitalizations above the median, and the rest are below it.
Price/Book Ratio. The share price of a stock divided by its net worth, or book value, per share. For a fund, the weighted average price/book ratio of the stocks it holds.
32
Price/Earnings Ratio. The ratio of a stock’s current price to its per-share earnings over the past year. For a fund, the weighted average P/E of the stocks it holds. P/E is an indicator of market expectations about corporate prospects; the higher the P/E, the greater the expectations for a company’s future growth.
R-Squared. A measure of how much of a fund’s past returns can be explained by the returns from the market in general, as measured by a given index. If a fund’s total returns were precisely synchronized with an index’s returns, its R-squared would be 1.00. If the fund’s returns bore no relationship to the index’s returns, its R-squared would be 0. For this report, R-squared is based on returns over the past 36 months for both the fund and the index.
Return on Equity. The annual average rate of return generated by a company during the past five years for each dollar of shareholder’s equity (net income divided by shareholder’s equity). For a fund, the weighted average return on equity for the companies whose stocks it holds.
Short-Term Reserves. The percentage of a fund invested in highly liquid, short-term securities that can be readily converted to cash.
Turnover Rate. An indication of the fund’s trading activity. Funds with high turnover rates incur higher transaction costs and may be more likely to distribute capital gains (which may be taxable to investors). The turnover rate excludes in-kind transactions, which have minimal impact on costs.
33
This page intentionally left blank.
This page intentionally left blank.
The People Who Govern Your Fund
The trustees of your mutual fund are there to see that the fund is operated and managed in your best interests since, as a shareholder, you are a part owner of the fund. Your fund’s trustees also serve on the board of directors of The Vanguard Group, Inc., which is owned by the Vanguard funds and provides services to them on an at-cost basis.
A majority of Vanguard’s board members are independent, meaning that they have no affiliation with Vanguard or the funds they oversee, apart from the sizable personal investments they have made as private individuals. The independent board members have distinguished backgrounds in business, academia, and public service. Each of the trustees and executive officers oversees 181 Vanguard funds.
The following table provides information for each trustee and executive officer of the fund. More information about the trustees is in the Statement of Additional Information, which can be obtained, without charge, by contacting Vanguard at 800-662-7447, or online at vanguard.com.
| |
| InterestedTrustee1 | and Delphi Automotive LLP (automotive components); |
| | Senior Advisor at New Mountain Capital; Trustee of |
| F. William McNabb III | The Conference Board. |
| Born 1957. Trustee Since July 2009. Chairman of the | |
| Board. Principal Occupation(s) During the Past Five | Amy Gutmann |
| Years: Chairman of the Board of The Vanguard Group, | Born 1949. Trustee Since June 2006. Principal |
| Inc., and of each of the investment companies served | Occupation(s) During the Past Five Years: President |
| by The Vanguard Group, since January 2010; Director | of the University of Pennsylvania; Christopher H. |
| of The Vanguard Group since 2008; Chief Executive | Browne Distinguished Professor of Political Science |
| Officer and President of The Vanguard Group and of | in the School of Arts and Sciences with secondary |
| each of the investment companies served by The | appointments at the Annenberg School for |
| Vanguard Group since 2008; Director of Vanguard | Communication and the Graduate School of Education |
| Marketing Corporation; Managing Director of The | of the University of Pennsylvania; Member of the |
| Vanguard Group (1995–2008). | National Commission on the Humanities and Social |
| | Sciences; Trustee of Carnegie Corporation of New |
| York and of the National Constitution Center; Chair |
| of the U. S. Presidential Commission for the Study |
| IndependentTrustees | of Bioethical Issues. |
| |
| Emerson U. Fullwood | |
| Born 1948. Trustee Since January 2008. Principal | JoAnn Heffernan Heisen |
| Occupation(s) During the Past Five Years: Executive | Born 1950. Trustee Since July 1998. Principal |
| Chief Staff and Marketing Officer for North America | Occupation(s) During the Past Five Years: Corporate |
| and Corporate Vice President (retired 2008) of Xerox | Vice President and Chief Global Diversity Officer |
| Corporation (document management products and | (retired 2008) and Member of the Executive |
| services); Executive in Residence and 2010 | Committee (1997–2008) of Johnson & Johnson |
| Distinguished Minett Professor at the Rochester | (pharmaceuticals/medical devices/consumer |
| Institute of Technology; Director of SPX Corporation | products); Director of Skytop Lodge Corporation |
| (multi-industry manufacturing), the United Way of | (hotels), the University Medical Center at Princeton, |
| Rochester, Amerigroup Corporation (managed health | the Robert Wood Johnson Foundation, and the Center |
| care), the University of Rochester Medical Center, | for Talent Innovation; Member of the Advisory Board |
| Monroe Community College Foundation, and North | of the Maxwell School of Citizenship and Public Affairs |
| Carolina A&T University. | at Syracuse University. |
| | |
| Rajiv L. Gupta | F. Joseph Loughrey |
| Born 1945. Trustee Since December 2001. 2 | Born 1949. Trustee Since October 2009. Principal |
| Principal Occupation(s) During the Past Five Years: | Occupation(s) During the Past Five Years: President |
| Chairman and Chief Executive Officer (retired 2009) | and Chief Operating Officer (retired 2009) of Cummins |
| and President (2006–2008) of Rohm and Haas Co. | Inc. (industrial machinery); Chairman of the Board of |
| (chemicals); Director of Tyco International, Ltd. | Hillenbrand, Inc. (specialized consumer services) and |
| (diversified manufacturing and services), Hewlett- | of Oxfam America; Director of SKF AB (industrial |
| Packard Co. (electronic computer manufacturing), | |
| | |
| machinery) and the Lumina Foundation for Education; | Executive Officers | |
| Member of the Advisory Council for the College of | | |
| Arts and Letters and of the Advisory Board to the | Glenn Booraem | |
| Kellogg Institute for International Studies, both at | Born 1967. Controller Since July 2010. Principal |
| the University of Notre Dame. | Occupation(s) During the Past Five Years: Principal |
| | of The Vanguard Group, Inc.; Controller of each of |
| Mark Loughridge | the investment companies served by The Vanguard |
| Born 1953. Trustee Since March 2012. Principal | Group; Assistant Controller of each of the investment |
| Occupation(s) During the Past Five Years: Senior Vice | companies served by The Vanguard Group (2001–2010). |
| President and Chief Financial Officer at IBM (information | | |
| technology services); Fiduciary Member of IBM’s | Thomas J. Higgins | |
| Retirement Plan Committee. | Born 1957. Chief Financial Officer Since September |
| | 2008. Principal Occupation(s) During the Past Five |
| Scott C. Malpass | Years: Principal of The Vanguard Group, Inc.; Chief |
| Born 1962. Trustee Since March 2012. Principal | Financial Officer of each of the investment companies |
| Occupation(s) During the Past Five Years: Chief | served by The Vanguard Group; Treasurer of each of |
| Investment Officer and Vice President at the University | the investment companies served by The Vanguard |
| of Notre Dame; Assistant Professor of Finance at the | Group (1998–2008). | |
| Mendoza College of Business at Notre Dame; Member | | |
| of the Notre Dame 403(b) Investment Committee; | Kathryn J. Hyatt | |
| Director of TIFF Advisory Services, Inc. (investment | Born 1955. Treasurer Since November 2008. Principal |
| advisor); Member of the Investment Advisory | Occupation(s) During the Past Five Years: Principal of |
| Committees of the Financial Industry Regulatory | The Vanguard Group, Inc.; Treasurer of each of the |
| Authority (FINRA) and of Major League Baseball. | investment companies served by The Vanguard |
| | Group; Assistant Treasurer of each of the investment |
| André F. Perold | companies served by The Vanguard Group (1988–2008). |
| Born 1952. Trustee Since December 2004. Principal | | |
| Occupation(s) During the Past Five Years: George | Heidi Stam | |
| Gund Professor of Finance and Banking at the Harvard | Born 1956. Secretary Since July 2005. Principal |
| Business School (retired 2011); Chief Investment | Occupation(s) During the Past Five Years: Managing |
| Officer and Managing Partner of HighVista Strategies | Director of The Vanguard Group, Inc.; General Counsel |
| LLC (private investment firm); Director of Rand | of The Vanguard Group; Secretary of The Vanguard |
| Merchant Bank; Overseer of the Museum of Fine | Group and of each of the investment companies |
| Arts Boston. | served by The Vanguard Group; Director and Senior |
| | Vice President of Vanguard Marketing Corporation. |
| | |
| Alfred M. Rankin, Jr. | | |
| Born 1941. Trustee Since January 1993. Principal | Vanguard Senior ManagementTeam |
| Occupation(s) During the Past Five Years: Chairman, | | |
| President, and Chief Executive Officer of NACCO | Mortimer J. Buckley | Chris D. McIsaac |
| Industries, Inc. (housewares/lignite) and of Hyster-Yale | Kathleen C. Gubanich | Michael S. Miller |
| Materials Handling, Inc. (forklift trucks); Director of | Paul A. Heller | James M. Norris |
| the National Association of Manufacturers; Chairman | Martha G. King | Glenn W. Reed |
| of the Board of University Hospitals of Cleveland; | John T. Marcante | |
| Advisory Chairman of the Board of The Cleveland | | |
| Museum of Art. | | |
| | Chairman Emeritus and Senior Advisor |
| | |
| Peter F. Volanakis | John J. Brennan | |
| Born 1955. Trustee Since July 2009. Principal | Chairman, 1996–2009 | |
| Occupation(s) During the Past Five Years: President | Chief Executive Officer and President, 1996–2008 |
| and Chief Operating Officer (retired 2010) of Corning | | |
| Incorporated (communications equipment); Director | Founder | |
| of SPX Corporation (multi-industry manufacturing); | | |
| Overseer of the Amos Tuck School of Business | John C. Bogle | |
| Administration at Dartmouth College; Advisor to the | Chairman and Chief Executive Officer, 1974–1996 |
| Norris Cotton Cancer Center. | | |
1 Mr. McNabb is considered an “interested person,” as defined in the Investment Company Act of 1940, because he is an officer of the
Vanguard funds.
2 December 2002 for Vanguard Equity Income Fund, Vanguard Growth Equity Fund, the Vanguard Municipal Bond Funds, and the Vanguard
State Tax-Exempt Funds.
|  |
| | P.O. Box 2600 |
| | Valley Forge, PA 19482-2600 |
| |
| |
| |
| Connect with Vanguard® > vanguard.com | |
| |
| |
| |
| Fund Information > 800-662-7447 | CFA® is a trademark owned by CFA Institute. |
| Direct Investor Account Services > 800-662-2739 | |
| Institutional Investor Services > 800-523-1036 | |
| Text Telephone for People | |
| With Hearing Impairment > 800-749-7273 | |
| |
| This material may be used in conjunction | |
| with the offering of shares of any Vanguard | |
| fund only if preceded or accompanied by | |
| the fund’s current prospectus. | |
| |
| All comparative mutual fund data are from Lipper, a | |
| Thomson Reuters Company, or Morningstar, Inc., unless | |
| otherwise noted. | |
| |
| You can obtain a free copy of Vanguard’s proxy voting | |
| guidelines by visiting vanguard.com/proxyreporting or by | |
| calling Vanguard at 800-662-2739. The guidelines are | |
| also available from the SEC’s website, sec.gov. In | |
| addition, you may obtain a free report on how your fund | |
| voted the proxies for securities it owned during the 12 | |
| months ended June 30. To get the report, visit either | |
| vanguard.com/proxyreporting or sec.gov. | |
| |
| You can review and copy information about your fund at | |
| the SEC’s Public Reference Room in Washington, D.C. To | |
| find out more about this public service, call the SEC at | |
| 202-551-8090. Information about your fund is also | |
| available on the SEC’s website, and you can receive | |
| copies of this information, for a fee, by sending a | |
| request in either of two ways: via e-mail addressed to | |
| publicinfo@sec.gov or via regular mail addressed to the | |
| Public Reference Section, Securities and Exchange | |
| Commission, Washington, DC 20549-1520. | |
| |
| | © 2013 The Vanguard Group, Inc. |
| | All rights reserved. |
| | Vanguard Marketing Corporation, Distributor. |
| |
| | Q1140 112013 |

Annual Report | September 30, 2013
Vanguard Capital Opportunity Fund

Vanguard’s Principles for Investing Success
We want to give you the best chance of investment success. These principles,
grounded in Vanguard’s research and experience, can put you on the right path.
Goals. Create clear, appropriate investment goals.
Balance. Develop a suitable asset allocation using broadly diversified funds.
Cost. Minimize cost.
Discipline. Maintain perspective and long-term discipline.
A single theme unites these principles: Focus on the things you can control.
We believe there is no wiser course for any investor.
| |
| Contents | |
| Your Fund’s Total Returns. | 1 |
| Chairman’s Letter. | 2 |
| Advisor’s Report. | 9 |
| Fund Profile. | 12 |
| Performance Summary. | 13 |
| Financial Statements. | 15 |
| Your Fund’s After-Tax Returns. | 27 |
| About Your Fund’s Expenses. | 28 |
| Glossary. | 30 |
Please note: The opinions expressed in this report are just that—informed opinions. They should not be considered promises or advice.
Also, please keep in mind that the information and opinions cover the period through the date on the front of this report. Of course, the
risks of investing in your fund are spelled out in the prospectus.
See the Glossary for definitions of investment terms used in this report.
About the cover: The ship's wheel represents leadership and guidance, essential qualities in navigating difficult seas.
This one is a replica based on an 18th-century British vessel. The HMS Vanguard, another ship of that era, served as the
flagship for Admiral Horatio Nelson when he defeated a French fleet at the Battle of the Nile.
Your Fund’s Total Returns
| |
| Fiscal Year Ended September 30, 2013 | |
| |
| | Total |
| | Returns |
| Vanguard Capital Opportunity Fund | |
| Investor Shares | 39.40% |
| Admiral™ Shares | 39.50 |
| Russell Midcap Growth Index | 27.54 |
| Multi-Cap Growth Funds Average | 22.55 |
| Multi-Cap Growth Funds Average: Derived from data provided by Lipper, a Thomson Reuters Company. |
| Admiral Shares carry lower expenses and are available to investors who meet certain account-balance requirements. |
| | | | |
| Your Fund’s Performance at a Glance | | | | |
| September 30, 2012, Through September 30, 2013 | | | |
| | | | Distributions Per Share |
| | Starting | Ending | | |
| | Share | Share | Income | Capital |
| | Price | Price | Dividends | Gains |
| Vanguard Capital Opportunity Fund | | | | |
| Investor Shares | $33.22 | $44.57 | $0.385 | $0.930 |
| Admiral Shares | 76.75 | 102.97 | 0.953 | 2.147 |

Chairman’s Letter
Dear Shareholder,
Vanguard Capital Opportunity Fund made the most of a strong stock market––especially the thriving mid-and small-capitalization segments––and the expertise of its advisor during the 12 months ended September 30, 2013. The fund returned more than 39%, notably ahead of its comparative standards. Its benchmark, the Russell Midcap Growth Index, returned almost 28%, and its peer multi-capitalization growth funds an average of nearly 23%.
PRIMECAP Management Company, the fund’s advisor, has customarily made outsized investments in health care and technology. In the 2013 fiscal year, the advisor’s commitment to these sectors and its investment decisions within them significantly boosted returns. Stock selection in the industrial and consumer discretionary sectors was also a source of strength.
If you hold fund shares in a taxable account, you may wish to review the table of after-tax returns, based on the highest federal income tax bracket, that appears later in this report.
Stocks dodged obstacles to produce strong gains
Although their path wasn’t always smooth, U.S. stocks powered to a return of about 22% for the 12 months ended September 30. The U.S. economy delivered only modest growth over the fiscal year, but investors’ tolerance for risk seemed to increase faster than companies’ profits.
2
In mid-September, U.S. stocks jumped when the Federal Reserve surprised investors by announcing that it had no immediate plans to unwind its stimulative bond-buying program. But in the waning days of that month, stocks slid ahead of the partial federal government shutdown that began October 1.
It’s natural for investors to be concerned by the situation in Washington. But as Sarah Hammer, a senior analyst in Vanguard Investment Strategy Group, noted in the midst of the temporary shutdown, they shouldn’t be unduly influenced by these events. “Investors are often best served by sticking to their long-term investment plans and avoiding short-term decisions based on the legislative outlook,” Ms. Hammer said. Our recurrent advice to stick to your plan may lack pizzazz, but it’s proven to be sound counsel over the decades.
International stocks generally posted strong results. Emerging-market stocks, however, lagged amid worries about slowing growth.
Bond returns were negative despite September’s bounce
Investor concern about the Fed’s potential scaling back of its bond-buying program also affected the performance of bonds, which declined for the year. In September, however, bonds trimmed their losses after the Fed said it would maintain the level of purchases.
| | | |
| Market Barometer | | | |
| |
| | Average Annual Total Returns |
| | Periods Ended September 30, 2013 |
| | One | Three | Five |
| | Year | Years | Years |
| Stocks | | | |
| Russell 1000 Index (Large-caps) | 20.91% | 16.64% | 10.53% |
| Russell 2000 Index (Small-caps) | 30.06 | 18.29 | 11.15 |
| Russell 3000 Index (Broad U.S. market) | 21.60 | 16.76 | 10.58 |
| MSCI All Country World Index ex USA (International) | 16.48 | 5.95 | 6.26 |
| |
| Bonds | | | |
| Barclays U.S. Aggregate Bond Index (Broad taxable market) | -1.68% | 2.86% | 5.41% |
| Barclays Municipal Bond Index (Broad tax-exempt market) | -2.21 | 3.24 | 5.98 |
| Citigroup Three-Month U.S. Treasury Bill Index | 0.07 | 0.07 | 0.14 |
| |
| CPI | | | |
| Consumer Price Index | 1.18% | 2.34% | 1.37% |
3
The broad U.S. taxable bond market returned –1.68% for the fiscal year, and the yield of the 10-year Treasury note closed at 2.63%, down from 2.76% at the end of August. (Bond yields and prices move in opposite directions.) Municipal bonds returned –2.21% after rebounding a bit in September.
Money markets and savings accounts barely budged as the Fed’s target for short-term interest rates remained at 0%–0.25%.
Sizable holdings in two sectors powered the fund’s performance
Along with the expertise of its people, PRIMECAP Management Company relies on a carefully calculated investment process. In seeking to understand a
company or a business, PRIMECAP’s portfolio managers visit headquarters, factories, and stores; speak with employees and customers; build models; attend conferences; and analyze the links of the supply chain.
Over the years, this process has resulted in a concentrated portfolio whose composition and performance can differ considerably from those of its benchmark index and peers. The advisor’s selections from a landscape that includes large-, mid-, and small-cap stocks can also contribute to variations from the benchmark.
In the years both before and after the financial crisis, PRIMECAP Management built sizable investments in information technology and health care, two industries
| | | |
| Expense Ratios | | | |
| Your Fund Compared With Its Peer Group | | | |
| | Investor | Admiral | Peer Group |
| | Shares | Shares | Average |
| Capital Opportunity Fund | 0.48% | 0.41% | 1.31% |
The fund expense ratios shown are from the prospectus dated January 25, 2013, and represent estimated costs for the current fiscal year. For
the fiscal year ended September 30, 2013, the fund’s expense ratios were 0.48% for Investor Shares and 0.41% for Admiral Shares. The
peer-group expense ratio is derived from data provided by Lipper, a Thomson Reuters Company, and captures information through year-end
2012.
Peer group: Multi-Cap Growth Funds.
4
that rely on exhaustive and enterprising research and development. The advisor’s long-term interest in these areas reflects its expectation of global growth in electronics and the aging population’s increased need for medicine and managed care.
Capital Opportunity’s exposure to the two sectors accounted for close to three-fourths of its portfolio. As I mentioned earlier, the advisor’s astute stock selection and concentration produced impressive returns. The fund’s health care stocks surged about 42% and its IT holdings about 39%.
Biotechnology stocks were responsible for the largest portion of the fund’s gains in health care. Increased market share, wider pipelines for new medicines, and key approvals from the Food and Drug
Administration all contributed. In technology, a broad swath of companies performed strongly; the highly cyclical semiconductor industry led the way, followed by software, electronics, communications equipment, and IT services. Demand––or the expectation of demand––for new products and services helped some IT holdings; others benefited from streamlined operations and diversified product lines and revenue streams.
Capital Opportunity’s consumer discretionary stocks soared 51% and its industrial stocks about 47%, with each sector adding more than 4 percentage points to returns. In fact, all seven sectors represented in the fund at the close of the fiscal year produced double-digit returns, though allocations to financials, energy, and materials were
| |
| Total Returns | |
| Ten Years Ended September 30, 2013 | |
| | Average |
| | Annual Return |
| Capital Opportunity Fund Investor Shares | 11.19% |
| Russell Midcap Growth Index | 10.16 |
| Multi-Cap Growth Funds Average | 7.49 |
| Multi-Cap Growth Funds Average: Derived from data provided by Lipper, a Thomson Reuters Company. |
The figures shown represent past performance, which is not a guarantee of future results. (Current performance may be
lower or higher than the performance data cited. For performance data current to the most recent month-end, visit our
website at vanguard.com/performance.) Note, too, that both investment returns and principal value can fluctuate widely, so
an investor’s shares, when sold, could be worth more or less than their original cost.
5
small. The fund had no exposure as of the end of September to the traditionally defensive utilities, telecommunication services, and consumer staples sectors.
For more on the advisor’s strategy and outlook, please see the Advisor’s Report that follows this letter.
| Investment insight | |
| Don’t let a trick of the calendar alter your course | |
| When making investment decisions, it’s important to weigh past returns with caution. |
| That’s because investment returns from any particular period are an unreliable anchor |
| for gauging the future. They can be highly date-dependent. | |
| |
| For example, take the five-year average annual return for the broad U.S. stock |
| market. That average just made a startling bounce: from 1.30% for the period |
| ended September 30, 2012, to 10.58% for the period ended September 30, 2013. |
| True, the market returned a hearty 21.60% in the most recent 12 months, but that’s |
| not enough to explain such a big leap in the average. Significantly, the year ended |
| September 30, 2008––when U.S. stocks returned –21.52% during the financial |
| crisis––has now rolled off the five-year calculation. | |
| |
| The important thing to remember is that historical returns are just that: historical. |
| Basing investment decisions on such date-dependent snapshots could easily lead |
| you to alter course––possibly in the wrong direction. Instead, Vanguard believes, you |
| should build your asset allocation strategy on long-term risk-and-return relationships, |
| always recognizing that no level of return is guaranteed. | |
| |
| Which five-year average should you count on? | |
| (Answer: None of them!) | |
| Average annual returns for U.S. stocks over five-year periods ended September 30 |
| |
| 2007 | 16.18% |
| 2008 | 5.70 |
| 2009 | 1.56 |
| 2010 | 0.92 |
| 2011 | –0.92 |
| 2012 | 1.30 |
| 2013 | 10.58 |
| Note: The U.S. stock market is represented by the Russell 3000 Index. |
| Source: Vanguard. |
6
A patient approach has worked well for the fund in the long run
PRIMECAP Management Company has consistently taken a long-term, low-turnover approach to investing and shown conviction in constructing a portfolio that can differ greatly from the broad market. The strategy has served the fund well since PRIMECAP Management became its advisor in 1998, though during multiyear stretches it has underperformed its benchmark or peers.
Most recently, the fund lagged both of its comparative standards in each fiscal year from 2010 to 2012. During that period, however, PRIMECAP Management never veered from its investment plan, although its sector allocation and stock choices were sometimes out of sync with market trends. In 2013, the advisor’s patience and program were rewarded, and the fund surpassed both its benchmark and the average return of its peers by a wide margin.
For the ten years ended September 30, 2013, the Capital Opportunity Fund recorded an average annual return of 11.19% for Investor Shares and 11.29% for Admiral Shares, about 1 percentage point ahead of its benchmark index and nearly 4 percentage points ahead of its peer funds average.
Those results are a product of PRIMECAP Management’s skill and expertise and also of Vanguard’s historically low costs, which allow shareholders to keep more of the fund’s returns.
Staying out of the rough by staying the course
Back in September 2008, global financial markets were stunned by the collapse of Lehman Brothers, which transformed the economic downturn already under way into the Great Recession. Fast-forward to 2013: The U.S. economy is growing, albeit slowly, and stock markets have set record highs.
When headlines are blaring and stock markets are sinking, it’s human nature to be tempted to head for the exits. But it’s important to stick with the principles of balance and diversification—and the portfolio asset allocation you established to meet your long-term goals. Bonds can provide ballast if stock prices keep falling, and, by remaining in the stock market, you will be able to participate when stocks begin to recover.
The benefit of staying the course was confirmed in a recent analysis of the performance of more than 58,000 self-directed Vanguard IRA® investors over the five years ended December 31, 2012. Vanguard compared actual returns earned by each investor with the hypothetical results of personalized index benchmarks, taking into consideration investors’ beginning and ending balances and any intervening cash flow.
The key finding: Those who stayed with their investment plans earned five-year returns commensurate with the calculated benchmarks, generally outperforming those who changed course. Investors
7
who reacted to market events were much more likely to miss out on potential returns. (You can read more in Most Vanguard IRA Investors Shot Par by Staying the Course: 2008–2012, available at vanguard.com/research.)
The results for the five years through 2012 are a good reminder that sticking with a simple, broad-based portfolio—even amid a financial tempest—can help minimize the chances of making a mistake that can reduce returns.
As always, thank you for investing with Vanguard.
Sincerely,

F. William McNabb III
Chairman and Chief Executive Officer
October 11, 2013
8
Advisor’s Report
For the fiscal year ended September 30, 2013, Vanguard Capital Opportunity Fund returned 39.40% for Investor Shares and 39.50% for Admiral Shares, exceeding both the 27.54% return of its benchmark, the Russell Midcap Growth Index, and the 22.55% average return of its multi-capitalization growth fund peers. Favorable stock selection in information technology and health care was the main reason for the positive performance.
The investment environment
During the fiscal year, the actions of central banks, particularly in the United States, Japan, Europe, and the United Kingdom, heavily influenced the investment environment. Since the 2008–2009 financial crisis, these institutions have taken extraordinary measures to stimulate their countries’ economies, including large-scale quantitative easing, or QE. The banks have largely used the newly created money to buy government bonds, mortgage-backed securities, or both to try to reduce borrowing costs and encourage lending and investing. QE supports asset prices, because those who sell their securities to a central bank use some of the proceeds to buy other financial assets, and it often weakens currencies because of the increased supply.
For the 12 months, Japan’s stock market outperformed those of other major countries. When adjusted for the size of its economy, Japan’s QE program was the largest of any central bank’s. The Nikkei 225 index appreciated by 64% over the period after languishing since the financial crisis, and the yen depreciated by more than 25% relative to the U.S. dollar.
Outlook for U.S. equities
U.S. equities performed strongly for the fiscal year, with the Standard & Poor’s 500 Index returning 19.34%. In fact, the index reached a record high of 1,730 on September 18. Economically sensitive sectors such as consumer discretionary, financials, and industrials led the market. Defensive sectors including consumer staples, utilities, and telecommunications services underperformed. Bonds, which had enjoyed an extended period of outperformance, generally declined in price as interest rates increased.
We are less optimistic about U.S. equities than we were a year ago, though we still believe they are more attractive than bonds at current prices. At the end of the fiscal year, the S&P 500 was trading at approximately 15.5 times its calendar 2013 estimated earnings per share of $109, a reasonable valuation by historical standards. We are skeptical, though, that the index can sustain its earnings per share growth unless revenue growth accelerates. Much of the recent earnings growth has come from profit margin expansion, and corporate margins are near record highs. Favorable
9
trends from lower debt service costs and debt-funded share repurchases, which have also helped boost earnings per share, could become hindrances in a rising interest rate environment.
Portfolio update and outlook
Although our focus is on the long term, we are encouraged by the fund’s fiscal year results. After generally lagging the returns of the S&P 500 for 2½ years, they improved dramatically. The portfolio remains significantly overweighted in health care and information technology. As of September 30, these two sectors constituted about 72% of its assets (versus 31% for the S&P 500) and included eight of its ten largest holdings.
The fund’s outperformance was primarily driven by favorable stock selection in IT and health care. Even though the IT sector was the second-worst performer in the S&P 500, the fund’s stock picks more than offset the negative impact of its overweight position. Several longstanding investments appreciated significantly, including Cree (+136%), Electronic Arts (+101%), and ASML Holding (+78%). A minimal exposure to Apple (–27%) further helped relative returns.
The health care sector outpaced the broader market by a wide margin and was the third-best performer in the index. Favorable stock selection was about twice as important to the fund’s relative results as
its overweight position. Several long-held investments in pharmaceutical, biotech-nology, and medical device stocks, which together make up a significant portion of the overall portfolio, outperformed the benchmark sector and the broader market. Among them were BioMarin (+79%), Biogen Idec (+61%), and Roche Holding (+49%).
We believe that many of our IT and health care holdings are attractively valued. Both sectors are trading at discounts to their historical price-to-earnings ratios. IT is also currently valued at a discount to the overall market even though it has historically traded at a premium. We believe it has superior growth prospects.
Technology
In IT, the adoption of low-cost smartphones in developing countries will give billions of people access to the internet for the first time. The internet more recently has emerged as a platform for delivering software applications and cloud computing services. Thanks to exponential growth in processing power, network bandwidth, storage capacity, and other capabilities, cloud computing is replacing the client-server model as the dominant computing paradigm. It enables productivity growth through better use of technology assets and allows users to obtain and pay for software and computing resources as needed.
10
We expect that internet-connected sensor applications will raise productivity through increased automation and improved use of assets. We believe we have positioned the fund to benefit from the internet’s continuing growth by investing in companies that provide underlying processes as well as those that offer internet-based services directly to users.
We have also identified other areas in which new technologies should create growth opportunities. The fund has significant investments in companies whose ideas help boost productivity in agriculture, oil and gas production, and payments. And we remain optimistic that health care applications will keep advancing, as we discuss in greater detail below.
Health care
The fund’s substantial investments in health care reflect our belief that innovation in this area will continue, as well as our expectation that consumption of health care services will grow more rapidly than the overall economy for the foreseeable future. Global demographic trends support increased demand as populations age in most developed countries and in China (largely because of its one-child policy instituted in 1979). As the proportion of elderly people grows, so does health care spending; older age groups consume three times as many health care resources on average as the general population. We are also optimistic that the expected rise in living standards in many developing countries will open up new markets. As incomes grow and affordability improves, we anticipate that consumption will rise.
On the supply side, the industry’s considerable investments in research and development over the years are resulting in more effective therapies for many diseases such as cancer, diabetes, and Alzheimer’s. The precipitous decline in the cost of genetic sequencing is allowing researchers to identify diseases and rapidly devise therapies that improve the standard of care and save lives. Increasingly, drugs developed based on a better understanding of a disease’s genetic causes are providing higher cure rates with fewer side effects than conventional treatments.
Conclusion
We remain committed to our investment philosophy, which is based on individual stock selection. Although this “bottom-up” approach can lead to periods of underper-formance when the stocks in our portfolio fall out of favor, we believe it can generate superior results for investors over the long term.
PRIMECAP Management Company
October 11, 2013
11
Capital Opportunity Fund
Fund Profile
As of September 30, 2013
| | |
| Share-Class Characteristics | |
| | Investor | Admiral |
| | Shares | Shares |
| Ticker Symbol | VHCOX | VHCAX |
| Expense Ratio1 | 0.48% | 0.41% |
| 30-Day SEC Yield | 0.57% | 0.64% |
| | | |
| Portfolio Characteristics | | |
| | | | DJ U.S. |
| | | Russell | Total |
| | | Midcap | Market |
| | | Growth | FA |
| | Fund | Index | Index |
| Number of Stocks | 123 | 488 | 3,636 |
| Median Market Cap | $26.1B | $10.4B | $40.2B |
| Price/Earnings Ratio | 28.1x | 27.4x | 19.5x |
| Price/Book Ratio | 3.2x | 5.0x | 2.5x |
| Return on Equity | 15.2% | 17.9% | 16.5% |
| Earnings Growth | | | |
| Rate | 13.2% | 15.2% | 11.1% |
| Dividend Yield | 1.1% | 1.1% | 1.9% |
| Foreign Holdings | 10.3% | 0.0% | 0.0% |
| Turnover Rate | 9% | — | — |
| Short-Term Reserves | 6.1% | — | — |
| | | |
| Sector Diversification (% of equity exposure) |
| | | Russell | DJ U.S. |
| | | Midcap | Total |
| | | Growth | Market |
| | Fund | Index | FA Index |
| Consumer | | | |
| Discretionary | 10.1% | 24.9% | 13.3% |
| Consumer Staples | 0.0 | 8.0 | 8.7 |
| Energy | 1.9 | 6.4 | 9.6 |
| Financials | 2.0 | 8.2 | 17.3 |
| Health Care | 37.5 | 13.3 | 12.6 |
| Industrials | 11.5 | 14.6 | 11.4 |
| Information | | | |
| Technology | 34.5 | 16.6 | 17.9 |
| Materials | 2.5 | 5.8 | 3.8 |
| Telecommunication | | | |
| Services | 0.0 | 1.5 | 2.2 |
| Utilities | 0.0 | 0.7 | 3.2 |
| | |
| Volatility Measures | | |
| | Russell | |
| | Midcap | DJ U.S. |
| | Growth | Total Market |
| | Index | FA Index |
| R-Squared | 0.91 | 0.92 |
| Beta | 0.93 | 1.08 |
| These measures show the degree and timing of the fund’s fluctuations compared with the indexes over 36 months. |
| | |
| Ten Largest Holdings (% of total net assets) |
| Biogen Idec Inc. | Biotechnology | 6.3% |
| Amgen Inc. | Biotechnology | 5.3 |
| Roche Holding AG | Pharmaceuticals | 4.0 |
| BioMarin Pharmaceutical | | |
| Inc. | Biotechnology | 3.2 |
| Eli Lilly & Co. | Pharmaceuticals | 3.2 |
| FedEx Corp. | Air Freight & | |
| | Logistics | 3.0 |
| Google Inc. | Internet Software & | |
| | Services | 2.6 |
| Medtronic Inc. | Health Care | |
| | Equipment | 2.4 |
| Monsanto Co. | Fertilizers & | |
| | Agricultural | |
| | Chemicals | 2.3 |
| Novartis AG | Pharmaceuticals | 2.3 |
| Top Ten | | 34.6% |
| The holdings listed exclude any temporary cash investments and equity index products. |
Investment Focus
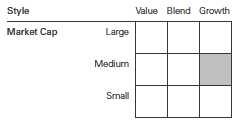
1 The expense ratios shown are from the prospectus dated January 25, 2013, and represent estimated costs for the current fiscal year. For
the fiscal year ended September 30, 2013, the expense ratios were 0.48% for Investor Shares and 0.41% for Admiral Shares.
12
Capital Opportunity Fund
Performance Summary
All of the returns in this report represent past performance, which is not a guarantee of future results that may be achieved by the fund. (Current performance may be lower or higher than the performance data cited. For performance data current to the most recent month-end, visit our website at vanguard.com/performance.) Note, too, that both investment returns and principal value can fluctuate widely, so an investor’s shares, when sold, could be worth more or less than their original cost. The returns shown do not reflect taxes that a shareholder would pay on fund distributions or on the sale of fund shares.
Cumulative Performance: September 30, 2003, Through September 30, 2013
Initial Investment of $10,000
| | | | | |
| | | Average Annual Total Returns | |
| | | Periods Ended September 30, 2013 | |
| | | | | | Final Value |
| | | One | Five | Ten | of a $10,000 |
| | | Year | Years | Years | Investment |
| | Capital Opportunity Fund*Investor | | | | |
| | Shares | 39.40% | 13.17% | 11.19% | $28,897 |
| •••••••• | Russell Midcap Growth Index | 27.54 | 13.92 | 10.16 | 26,324 |
| – – – – | Multi-Cap Growth Funds Average | 22.55 | 10.48 | 7.49 | 20,590 |
| | Dow Jones U.S. Total Stock Market | | | | |
| | Float Adjusted Index | 21.44 | 10.69 | 8.32 | 22,235 |
| Multi-Cap Growth Funds Average: Derived from data provided by Lipper, a Thomson Reuters Company. |
| | | | |
| | | | | Final Value |
| | One | Five | Ten | of a $50,000 |
| | Year | Years | Years | Investment |
| Capital Opportunity Fund Admiral Shares | 39.50% | 13.26% | 11.29% | $145,697 |
| Russell Midcap Growth Index | 27.54 | 13.92 | 10.16 | 131,619 |
| Dow Jones U.S. Total Stock Market Float | | | | |
| Adjusted Index | 21.44 | 10.69 | 8.32 | 111,177 |
See Financial Highlights for dividend and capital gains information.
13
Capital Opportunity Fund
Fiscal-Year Total Returns (%): September 30, 2003, Through September 30, 2013
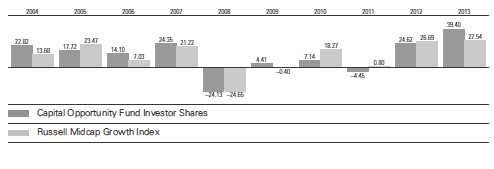
14
Capital Opportunity Fund
Financial Statements
Statement of Net Assets
As of September 30, 2013
The fund reports a complete list of its holdings in regulatory filings four times in each fiscal year, at the quarter-ends. For the second and fourth fiscal quarters, the lists appear in the fund’s semiannual and annual reports to shareholders. For the first and third fiscal quarters, the fund files the lists with the Securities and Exchange Commission on Form N-Q. Shareholders can look up the fund’s Forms N-Q on the SEC’s website at sec.gov. Forms N-Q may also be reviewed and copied at the SEC’s Public Reference Room (see the back cover of this report for further information).
| | | |
| | | | Market |
| | | | Value |
| | | Shares | ($000) |
| Common Stocks (94.1%) | | |
| Consumer Discretionary (9.5%) | |
| * | CarMax Inc. | 4,186,797 | 202,934 |
| | TJX Cos. Inc. | 2,580,000 | 145,486 |
| *,^ | Tesla Motors Inc. | 745,566 | 144,207 |
| * | DIRECTV | 2,081,476 | 124,368 |
| * | DreamWorks Animation | | |
| | SKG Inc. Class A | 2,510,000 | 71,435 |
| | Carnival Corp. | 2,038,900 | 66,550 |
| * | Ascena Retail Group Inc. | 2,735,200 | 54,513 |
| * | Bed Bath & Beyond Inc. | 703,700 | 54,438 |
| | Royal Caribbean | | |
| | Cruises Ltd. | 1,318,001 | 50,453 |
| | Las Vegas Sands Corp. | 340,000 | 22,583 |
| * | Tribune Co. | 330,000 | 20,820 |
| * | Amazon.com Inc. | 58,700 | 18,352 |
| | L Brands Inc. | 216,500 | 13,228 |
| | Lowe’s Cos. Inc. | 245,000 | 11,664 |
| | Ross Stores Inc. | 141,000 | 10,265 |
| * | Shutterfly Inc. | 18,700 | 1,045 |
| | Carter’s Inc. | 8,520 | 647 |
| * | Panera Bread Co. Class A | 3,705 | 587 |
| | | | 1,013,575 |
| Energy (1.8%) | | |
| | Cabot Oil & Gas Corp. | 1,450,800 | 54,144 |
| | Noble Energy Inc. | 596,000 | 39,938 |
| | Transocean Ltd. | 660,000 | 29,370 |
| | National Oilwell Varco Inc. | 237,000 | 18,512 |
| | Oceaneering | | |
| | International Inc. | 190,000 | 15,436 |
| * | Frank’s International NV | 355,200 | 10,631 |
| * | Southwestern Energy Co. | 220,000 | 8,004 |
| | Ensco plc Class A | 143,340 | 7,704 |
| | Range Resources Corp. | 65,000 | 4,933 |
| * | Cameron International Corp. | 65,000 | 3,794 |
| | Noble Corp. | 30,000 | 1,133 |
| | | | 193,599 |
| | | |
| Financials (1.9%) | | |
| | Charles Schwab Corp. | 7,420,000 | 156,859 |
| | Chubb Corp. | 300,000 | 26,778 |
| | CME Group Inc. Class A | 264,350 | 19,530 |
| | | | 203,167 |
| Health Care (35.3%) | | |
| * | Biogen Idec Inc. | 2,795,438 | 673,030 |
| | Amgen Inc. | 5,087,600 | 569,506 |
| | Roche Holding AG | 1,561,578 | 421,428 |
| * | BioMarin | | |
| | Pharmaceutical Inc. | 4,769,100 | 344,424 |
| | Eli Lilly & Co. | 6,819,000 | 343,200 |
| | Medtronic Inc. | 4,709,200 | 250,765 |
| | Novartis AG ADR | 3,131,000 | 240,179 |
| * | Life Technologies Corp. | 2,875,945 | 215,207 |
| *,^ | QIAGEN NV | 8,240,000 | 176,336 |
| * | Illumina Inc. | 1,209,100 | 97,731 |
| * | Boston Scientific Corp. | 7,216,300 | 84,719 |
| * | Pharmacyclics Inc. | 594,100 | 82,235 |
| * | Seattle Genetics Inc. | 1,372,500 | 60,157 |
| | Abbott Laboratories | 1,299,600 | 43,134 |
| * | Charles River | | |
| | Laboratories | | |
| | International Inc. | 660,000 | 30,532 |
| | PerkinElmer Inc. | 689,400 | 26,025 |
| * | ImmunoGen Inc. | 1,280,000 | 21,786 |
| * | Edwards | | |
| | Lifesciences Corp. | 280,000 | 19,496 |
| * | Affymetrix Inc. | 2,700,600 | 16,744 |
| * | InterMune Inc. | 983,000 | 15,109 |
| * | Waters Corp. | 115,000 | 12,214 |
| *,^ | Dendreon Corp. | 2,300,000 | 6,739 |
| | Zimmer Holdings Inc. | 54,000 | 4,436 |
| * | Cerner Corp. | 10,000 | 525 |
| | | | 3,755,657 |
| Industrials (10.8%) | | |
| | FedEx Corp. | 2,754,430 | 314,308 |
| | Southwest Airlines Co. | 10,935,100 | 159,215 |
| | Rockwell Automation Inc. | 955,000 | 102,128 |
15
Capital Opportunity Fund
| | | |
| | | | Market |
| | | | Value |
| | | Shares | ($000) |
| * | United Continental | | |
| | Holdings Inc. | 2,895,100 | 88,909 |
| | Delta Air Lines Inc. | 3,570,000 | 84,216 |
| ^ | Ritchie Bros | | |
| | Auctioneers Inc. | 2,962,000 | 59,773 |
| | Union Pacific Corp. | 351,000 | 54,524 |
| | European Aeronautic | | |
| | Defence and | | |
| | Space Co. NV | 731,440 | 46,609 |
| * | JetBlue Airways Corp. | 6,940,150 | 46,221 |
| * | Jacobs Engineering | | |
| | Group Inc. | 742,920 | 43,223 |
| * | AECOM | | |
| | Technology Corp. | 1,260,000 | 39,400 |
| | CH Robinson | | |
| | Worldwide Inc. | 569,600 | 33,925 |
| | IDEX Corp. | 387,000 | 25,252 |
| | Chicago Bridge | | |
| | & Iron Co. NV | 280,000 | 18,976 |
| | Expeditors International | | |
| | of Washington Inc. | 380,000 | 16,743 |
| | Babcock & Wilcox Co. | 150,000 | 5,058 |
| * | Spirit Airlines Inc. | 128,235 | 4,395 |
| * | US Airways Group Inc. | 200,000 | 3,792 |
| | | | 1,146,667 |
| Information Technology (32.5%) | |
| * | Google Inc. Class A | 321,240 | 281,377 |
| * | Cree Inc. | 3,944,900 | 237,444 |
| * | Adobe Systems Inc. | 4,124,500 | 214,227 |
| | Symantec Corp. | 7,923,174 | 196,099 |
| | Texas Instruments Inc. | 4,811,400 | 193,755 |
| | ASML Holding NV | 1,950,040 | 192,586 |
| * | Electronic Arts Inc. | 6,919,000 | 176,780 |
| * | Trimble Navigation Ltd. | 5,561,200 | 165,223 |
| | Altera Corp. | 4,365,000 | 162,203 |
| | Microsoft Corp. | 4,461,000 | 148,596 |
| | SanDisk Corp. | 2,152,248 | 128,080 |
| | Corning Inc. | 8,080,000 | 117,887 |
| * | Flextronics | | |
| | International Ltd. | 12,249,600 | 111,349 |
| | QUALCOMM Inc. | 1,502,725 | 101,224 |
| * | Micron Technology Inc. | 5,630,000 | 98,356 |
| * | NeuStar Inc. Class A | 1,623,416 | 80,327 |
| | NVIDIA Corp. | 4,894,000 | 76,151 |
| | EMC Corp. | 2,860,000 | 73,102 |
| | Visa Inc. Class A | 337,480 | 64,492 |
| | NetApp Inc. | 1,439,500 | 61,351 |
| * | Blackberry Ltd. | 7,108,700 | 56,514 |
| | Plantronics Inc. | 1,150,000 | 52,958 |
| *,1 | Descartes Systems | | |
| | Group Inc. | 4,645,000 | 52,907 |
| * | Rambus Inc. | 4,400,000 | 41,360 |
| *,1 | FormFactor Inc. | 5,634,700 | 38,654 |
| | Hewlett-Packard Co. | 1,694,000 | 35,540 |
| | FEI Co. | 370,000 | 32,486 |
| | | |
| | KLA-Tencor Corp. | 531,000 | 32,311 |
| * | Nuance | | |
| | Communications Inc. | 1,697,000 | 31,725 |
| | Intuit Inc. | 363,000 | 24,071 |
| | Motorola Solutions Inc. | 402,150 | 23,880 |
| | Jabil Circuit Inc. | 1,000,000 | 21,680 |
| * | Entegris Inc. | 2,019,231 | 20,495 |
| | Apple Inc. | 37,000 | 17,640 |
| | Mastercard Inc. Class A | 23,600 | 15,878 |
| * | Ciena Corp. | 607,142 | 15,166 |
| * | F5 Networks Inc. | 154,225 | 13,226 |
| *,^ | Smart Technologies Inc. | | |
| | Class A | 4,371,304 | 12,283 |
| | Analog Devices Inc. | 225,000 | 10,586 |
| | Applied Materials Inc. | 540,000 | 9,472 |
| | Xilinx Inc. | 200,000 | 9,372 |
| * | Brocade Communications | |
| | Systems Inc. | 1,100,000 | 8,855 |
| * | Workday Inc. Class A | 10,025 | 811 |
| | Accenture plc Class A | 10,000 | 736 |
| * | eBay Inc. | 10,000 | 558 |
| * | Salesforce.com Inc. | 7,300 | 379 |
| * | Facebook Inc. Class A | 100 | 5 |
| | | | 3,460,157 |
| Materials (2.3%) | | |
| | Monsanto Co. | 2,335,286 | 243,734 |
| * | Boise Cascade Co. | 33,900 | 913 |
| | | | 244,647 |
| Total Common Stocks | | |
| (Cost $5,309,214) | | 10,017,469 |
| Temporary Cash Investment (6.8%) | |
| Money Market Fund (6.8%) | | |
| 2,3 | Vanguard Market | | |
| | Liquidity Fund, 0.112% | | |
| | (Cost $719,829) | 719,829,000 | 719,829 |
| Total Investments (100.9%) | | |
| (Cost $6,029,043) | | 10,737,298 |
| Other Assets and Liabilities (-0.9%) | |
| Other Assets | | 21,207 |
| Liabilities3 | | (111,859) |
| | | | (90,652) |
| Net Assets (100%) | | 10,646,646 |
16
Capital Opportunity Fund
| |
| At September 30, 2013, net assets consisted of: |
| | Amount |
| | ($000) |
| Paid-in Capital | 5,576,295 |
| Overdistributed Net Investment Income | (4,184) |
| Accumulated Net Realized Gains | 365,873 |
| Unrealized Appreciation (Depreciation) | |
| Investment Securities | 4,708,255 |
| Foreign Currencies | 407 |
| Net Assets | 10,646,646 |
| |
| |
| Investor Shares—Net Assets | |
| Applicable to 61,024,513 outstanding | |
| $.001 par value shares of beneficial | |
| interest (unlimited authorization) | 2,719,818 |
| Net Asset Value Per Share— | |
| Investor Shares | $44.57 |
| |
| |
| Admiral Shares—Net Assets | |
| Applicable to 76,982,691 outstanding | |
| $.001 par value shares of beneficial | |
| interest (unlimited authorization) | 7,926,828 |
| Net Asset Value Per Share— | |
| Admiral Shares | $102.97 |
See Note A in Notes to Financial Statements.
* Non-income-producing security.
^ Part of security position is on loan to broker-dealers. The total value of securities on loan is $66,029,000.
1 Considered an affiliated company of the fund as the fund owns more than 5% of the outstanding voting securities of such company.
2 Affiliated money market fund available only to Vanguard funds and certain trusts and accounts managed by Vanguard. Rate shown is the
7-day yield.
3 Includes $68,055,000 of collateral received for securities on loan.
ADR—American Depositary Receipt.
See accompanying Notes, which are an integral part of the Financial Statements.
17
Capital Opportunity Fund
Statement of Operations
| |
| | Year Ended |
| | September 30, 2013 |
| | ($000) |
| Investment Income | |
| Income | |
| Dividends1,2 | 95,716 |
| Interest2 | 486 |
| Securities Lending | 5,541 |
| Total Income | 101,743 |
| Expenses | |
| Investment Advisory Fees—Note B | 22,615 |
| The Vanguard Group—Note C | |
| Management and Administrative—Investor Shares | 5,165 |
| Management and Administrative—Admiral Shares | 8,282 |
| Marketing and Distribution—Investor Shares | 400 |
| Marketing and Distribution—Admiral Shares | 830 |
| Custodian Fees | 123 |
| Auditing Fees | 26 |
| Shareholders’ Reports—Investor Shares | 44 |
| Shareholders’ Reports—Admiral Shares | 40 |
| Trustees’ Fees and Expenses | 21 |
| Total Expenses | 37,546 |
| Net Investment Income | 64,197 |
| Realized Net Gain (Loss) | |
| Investment Securities Sold2 | 396,237 |
| Foreign Currencies | (88) |
| Realized Net Gain (Loss) | 396,149 |
| Change in Unrealized Appreciation (Depreciation) | |
| Investment Securities | 2,408,283 |
| Foreign Currencies | 297 |
| Change in Unrealized Appreciation (Depreciation) | 2,408,580 |
| Net Increase (Decrease) in Net Assets Resulting from Operations | 2,868,926 |
| 1 Dividends are net of foreign withholding taxes of $3,459,000. |
| 2 Dividend income, interest income, and realized net gain (loss) from affiliated companies of the fund were $0, $486,000, and |
| ($4,995,000), respectively. |
See accompanying Notes, which are an integral part of the Financial Statements.
18
Capital Opportunity Fund
Statement of Changes in Net Assets
| | |
| | Year Ended September 30, |
| | 2013 | 2012 |
| | ($000) | ($000) |
| Increase (Decrease) in Net Assets | | |
| Operations | | |
| Net Investment Income | 64,197 | 53,016 |
| Realized Net Gain (Loss) | 396,149 | 221,332 |
| Change in Unrealized Appreciation (Depreciation) | 2,408,580 | 1,331,299 |
| Net Increase (Decrease) in Net Assets Resulting from Operations | 2,868,926 | 1,605,647 |
| Distributions | | |
| Net Investment Income1 | | |
| Investor Shares | (26,621) | (13,132) |
| Admiral Shares | (61,680) | (28,694) |
| Realized Capital Gain2 | | |
| Investor Shares | (64,306) | (119,830) |
| Admiral Shares | (138,957) | (224,279) |
| Total Distributions | (291,564) | (385,935) |
| Capital Share Transactions | | |
| Investor Shares | (475,094) | (401,140) |
| Admiral Shares | 1,067,845 | (96,730) |
| Net Increase (Decrease) from Capital Share Transactions | 592,751 | (497,870) |
| Total Increase (Decrease) | 3,170,113 | 721,842 |
| Net Assets | | |
| Beginning of Period | 7,476,533 | 6,754,691 |
| End of Period3 | 10,646,646 | 7,476,533 |
1 Fiscal 2013 distributions from net investment income include $34,400,000 from a dividend received from ASML Holding NV. Subsequent
to the fund’s distribution from net investment income made in December 2012, the ASML dividend was reallocated to return of capital.
The reallocation will reduce the fund’s net investment income distribution in December 2013.
2 Includes fiscal 2013 and 2012 short-term gain distributions totaling $0 and $1,640,000, respectively. Short-term gain distributions are
treated as ordinary income dividends for tax purposes.
3 Net Assets—End of Period includes undistributed (overdistributed) net investment income of ($4,184,000) and $25,047,000.
See accompanying Notes, which are an integral part of the Financial Statements.
19
Capital Opportunity Fund
Financial Highlights
| | | | | |
| Investor Shares | | | | | |
| |
| For a Share Outstanding | Year Ended September 30, |
| Throughout Each Period | 2013 | 2012 | 2011 | 2010 | 2009 |
| Net Asset Value, Beginning of Period | $33.22 | $28.17 | $29.59 | $27.71 | $29.41 |
| Investment Operations | | | | | |
| Net Investment Income | .270 | .216 | .151 | .106 | .121 |
| Net Realized and Unrealized Gain (Loss) | | | | | |
| on Investments | 12.395 | 6.464 | (1.450) | 1.871 | .355 |
| Total from Investment Operations | 12.665 | 6.680 | (1.299) | 1.977 | .476 |
| Distributions | | | | | |
| Dividends from Net Investment Income | (.385)1 | (.161) | (.121) | (.097) | (.114) |
| Distributions from Realized Capital Gains | (.930) | (1.469) | — | — | (2.062) |
| Total Distributions | (1.315) | (1.630) | (.121) | (.097) | (2.176) |
| Net Asset Value, End of Period | $44.57 | $33.22 | $28.17 | $29.59 | $27.71 |
| |
| Total Return2 | 39.40% | 24.62% | -4.45% | 7.14% | 4.41% |
| |
| Ratios/Supplemental Data | | | | | |
| Net Assets, End of Period (Millions) | $2,720 | $2,432 | $2,412 | $3,675 | $3,903 |
| Ratio of Total Expenses to | | | | | |
| Average Net Assets | 0.48% | 0.48% | 0.48% | 0.48% | 0.50% |
| Ratio of Net Investment Income to | | | | | |
| Average Net Assets | 0.68% | 0.67% | 0.45% | 0.36% | 0.50% |
| Portfolio Turnover Rate | 9% | 9% | 9% | 8% | 12% |
1 Fiscal 2013 dividends from net investment income include $.157 per share from a dividend received from ASML Holding NV. Subsequent to
the payment of the fund’s dividend from net investment income in December 2012, the ASML dividend was reallocated to return of capital.
The reallocation will reduce the fund’s dividend from net investment income in December 2013. The reallocation had no impact on net
assets, net asset values per share, or total returns.
2 Total returns do not include transaction or account service fees that may have applied in the periods shown. Fund prospectuses provide
information about any applicable transaction and account service fees.
See accompanying Notes, which are an integral part of the Financial Statements.
20
Capital Opportunity Fund
Financial Highlights
| | | | | |
| Admiral Shares | | | | | |
| |
| For a Share Outstanding | Year Ended September 30, |
| Throughout Each Period | 2013 | 2012 | 2011 | 2010 | 2009 |
| Net Asset Value, Beginning of Period | $76.75 | $65.10 | $68.38 | $64.04 | $68.00 |
| Investment Operations | | | | | |
| Net Investment Income | .707 | .559 | .400 | .298 | .329 |
| Net Realized and Unrealized Gain (Loss) | | | | | |
| on Investments | 28.613 | 14.917 | (3.358) | 4.315 | .811 |
| Total from Investment Operations | 29.320 | 15.476 | (2.958) | 4.613 | 1.140 |
| Distributions | | | | | |
| Dividends from Net Investment Income | (.953)1 | (.434) | (.322) | (.273) | (.339) |
| Distributions from Realized Capital Gains | (2.147) | (3.392) | — | — | (4.761) |
| Total Distributions | (3.100) | (3.826) | (.322) | (.273) | (5.100) |
| Net Asset Value, End of Period | $102.97 | $76.75 | $65.10 | $68.38 | $64.04 |
| |
| Total Return | 39.50% | 24.69% | -4.39% | 7.21% | 4.52% |
| |
| Ratios/Supplemental Data | | | | | |
| Net Assets, End of Period (Millions) | $7,927 | $5,045 | $4,342 | $4,223 | $3,938 |
| Ratio of Total Expenses to | | | | | |
| Average Net Assets | 0.41% | 0.41% | 0.41% | 0.41% | 0.41% |
| Ratio of Net Investment Income to | | | | | |
| Average Net Assets | 0.75% | 0.74% | 0.52% | 0.43% | 0.59% |
| Portfolio Turnover Rate | 9% | 9% | 9% | 8% | 12% |
1 Fiscal 2013 dividends from net investment income include $.363 per share from a dividend received from ASML Holding NV. Subsequent to
the payment of the fund’s dividend from net investment income in December 2012, the ASML dividend was reallocated to return of capital.
The reallocation will reduce the fund’s dividend from net investment income in December 2013. The reallocation had no impact on net
assets, net asset values per share, or total returns.
See accompanying Notes, which are an integral part of the Financial Statements.
21
Capital Opportunity Fund
Notes to Financial Statements
Vanguard Capital Opportunity Fund is registered under the Investment Company Act of 1940 as an open-end investment company, or mutual fund. The fund offers two classes of shares: Investor Shares and Admiral Shares. Investor Shares are available to any investor who meets the fund’s minimum purchase requirements. Admiral Shares are designed for investors who meet certain administrative, service, and account-size criteria.
A. The following significant accounting policies conform to generally accepted accounting principles for U.S. mutual funds. The fund consistently follows such policies in preparing its financial statements.
1. Security Valuation: Securities are valued as of the close of trading on the New York Stock Exchange (generally 4 p.m., Eastern time) on the valuation date. Equity securities are valued at the latest quoted sales prices or official closing prices taken from the primary market in which each security trades; such securities not traded on the valuation date are valued at the mean of the latest quoted bid and asked prices. Securities for which market quotations are not readily available, or whose values have been affected by events occurring before the fund’s pricing time but after the close of the securities’ primary markets, are valued at their fair values calculated according to procedures adopted by the board of trustees. These procedures include obtaining quotations from an independent pricing service, monitoring news to identify significant market- or security-specific events, and evaluating changes in the values of foreign market proxies (for example, ADRs, futures contracts, or exchange-traded funds), between the time the foreign markets close and the fund’s pricing time. When fair-value pricing is employed, the prices of securities used by a fund to calculate its net asset value may differ from quoted or published prices for the same securities. Investments in Vanguard Market Liquidity Fund are valued at that fund’s net asset value.
2. Foreign Currency: Securities and other assets and liabilities denominated in foreign currencies are translated into U.S. dollars using exchange rates obtained from an independent third party as of the fund’s pricing time on the valuation date. Realized gains (losses) and unrealized appreciation (depreciation) on investment securities include the effects of changes in exchange rates since the securities were purchased, combined with the effects of changes in security prices. Fluctuations in the value of other assets and liabilities resulting from changes in exchange rates are recorded as unrealized foreign currency gains (losses) until the assets or liabilities are settled in cash, at which time they are recorded as realized foreign currency gains (losses).
3. Federal Income Taxes: The fund intends to continue to qualify as a regulated investment company and distribute all of its taxable income. Management has analyzed the fund’s tax positions taken for all open federal income tax years (September 31, 2010–2013), and has concluded that no provision for federal income tax is required in the fund’s financial statements.
4. Distributions: Distributions to shareholders are recorded on the ex-dividend date.
5. Securities Lending: To earn additional income, the fund may lend its securities to qualified institutional borrowers. Security loans are required to be secured at all times by collateral in an amount at least equal to the market value of securities loaned. Daily market fluctuations could cause the value of loaned securities to be more or less than the value of the collateral received. When this occurs, the collateral is adjusted and settled on the next business day. The fund further mitigates its counterparty risk by entering into securities lending transactions only with a diverse group of prequalified counterparties, monitoring their financial strength, and entering into master securities lending agreements with its counterparties. The master securities lending agreements provide that, in the event of a counterparty’s default (including bankruptcy), the fund may terminate any loans with that borrower, determine the net amount owed, and sell or retain the collateral up to the net amount
22
Capital Opportunity Fund
owed to the fund; however, such actions may be subject to legal proceedings. While collateral mitigates counterparty risk, in the absence of a default the fund may experience delays and costs in recovering the securities loaned. The fund invests cash collateral received in Vanguard Market Liquidity Fund, and records a liability for the return of the collateral, during the period the securities are on loan. Securities lending income represents fees charged to borrowers plus income earned on invested cash collateral, less expenses associated with the loan.
6. Other: Dividend income is recorded on the ex-dividend date. Interest income includes income distributions received from Vanguard Market Liquidity Fund and is accrued daily. Security transactions are accounted for on the date securities are bought or sold. Costs used to determine realized gains (losses) on the sale of investment securities are those of the specific securities sold.
Each class of shares has equal rights as to assets and earnings, except that each class separately bears certain class-specific expenses related to maintenance of shareholder accounts (included in Management and Administrative expenses) and shareholder reporting. Marketing and distribution expenses are allocated to each class of shares based on a method approved by the board of trustees. Income, other non-class-specific expenses, and gains and losses on investments are allocated to each class of shares based on its relative net assets.
B. PRIMECAP Management Company provides investment advisory services to the fund for a fee calculated at an annual percentage rate of average net assets. For the year ended September 30, 2013, the investment advisory fee represented an effective annual rate of 0.26% of the fund’s average net assets.
C. The Vanguard Group furnishes at cost corporate management, administrative, marketing, and distribution services. The costs of such services are allocated to the fund under methods approved by the board of trustees. The fund has committed to provide up to 0.40% of its net assets in capital contributions to Vanguard. At September 30, 2013, the fund had contributed capital of $1,223,000 to Vanguard (included in Other Assets), representing 0.01% of the fund’s net assets and 0.49% of Vanguard’s capitalization. The fund’s trustees and officers are also directors and officers of Vanguard.
D. Various inputs may be used to determine the value of the fund’s investments. These inputs are summarized in three broad levels for financial statement purposes. The inputs or methodologies used to value securities are not necessarily an indication of the risk associated with investing in those securities.
Level 1—Quoted prices in active markets for identical securities.
Level 2—Other significant observable inputs (including quoted prices for similar securities, interest rates, prepayment speeds, credit risk, etc.).
Level 3—Significant unobservable inputs (including the fund’s own assumptions used to determine the fair value of investments).
The following table summarizes the market value of the fund’s investments as of September 30, 2013, based on the inputs used to value them:
| | | |
| | Level 1 | Level 2 | Level 3 |
| Investments | ($000) | ($000) | ($000) |
| Common Stocks | 9,549,432 | 468,037 | — |
| Temporary Cash Investments | 719,829 | — | — |
| Total | 10,269,261 | 468,037 | — |
Capital Opportunity Fund
E. Distributions are determined on a tax basis and may differ from net investment income and realized capital gains for financial reporting purposes. Differences may be permanent or temporary. Permanent differences are reclassified among capital accounts in the financial statements to reflect their tax character. Temporary differences arise when certain items of income, expense, gain, or loss are recognized in different periods for financial statement and tax purposes; these differences will reverse at some time in the future. Differences in classification may also result from the treatment of short-term gains as ordinary income for tax purposes.
During the year ended September 30, 2013, the fund realized net foreign currency losses of $88,000, which decreased distributable net income for tax purposes; accordingly, such losses have been reclassified from accumulated net realized gains to overdistributed net investment income.
The fund used a tax accounting practice to treat a portion of the price of capital shares redeemed during the year as distributions from net investment income and realized capital gains. Accordingly, the fund has reclassified $5,039,000 from overdistributed net investment income, and $30,946,000 from accumulated net realized gains, to paid-in capital.
For tax purposes, at September 30, 2013, the fund had $39,416,000 of ordinary income and $337,544,000 of long-term capital gains available for distribution.
At September 30, 2013, the cost of investment securities for tax purposes was $6,029,043,000.
Net unrealized appreciation of investment securities for tax purposes was $4,708,255,000, consisting of unrealized gains of $5,080,104,000 on securities that had risen in value since their purchase and $371,849,000 in unrealized losses on securities that had fallen in value since their purchase.
F. During the year ended September 30, 2013, the fund purchased $731,323,000 of investment securities and sold $852,325,000 of investment securities, other than temporary cash investments.
G. Capital share transactions for each class of shares were:
| | | | |
| | Year Ended September 30, |
| | | 2013 | | 2012 |
| | Amount | Shares | Amount | Shares |
| | ($000) | (000) | ($000) | (000) |
| Investor Shares | | | | |
| Issued | 601,607 | 14,972 | 169,576 | 5,405 |
| Issued in Lieu of Cash Distributions | 87,176 | 2,584 | 127,508 | 4,438 |
| Redeemed1 | (1,163,877) | (29,744) | (698,224) | (22,264) |
| Net Increase (Decrease)—Investor Shares | (475,094) | (12,188) | (401,140) | (12,421) |
| Admiral Shares | | | | |
| Issued | 1,581,096 | 16,902 | 459,825 | 6,387 |
| Issued in Lieu of Cash Distributions | 184,291 | 2,366 | 231,561 | 3,491 |
| Redeemed1 | (697,542) | (8,018) | (788,116) | (10,843) |
| Net Increase (Decrease) —Admiral Shares | 1,067,845 | 11,250 | (96,730) | (965) |
| 1 Net of redemption fees for fiscal 2012 of $131,000 (fund total). Effective May 23, 2012, the redemption fee was eliminated. |
24
Capital Opportunity Fund
H. Certain of the fund’s investments are in companies that are considered to be affiliated companies of the fund because the fund owns more than 5% of the outstanding voting securities of the company. Transactions during the period in securities of these companies were as follows:
| | | | | |
| | | Current Period Transactions | |
| | Sept. 30, 2012 | | Proceeds from | | Sept. 30, 2013 |
| | Market | Purchases | Securities | Dividend | Market |
| | Value | at Cost | Sold | Income | Value |
| | ($000) | ($000) | ($000) | ($000) | ($000) |
| Descartes Systems Group Inc. | 40,644 | — | — | — | 52,907 |
| FormFactor Inc. | 32,250 | — | 631 | — | 38,654 |
| | 72,894 | | | — | 91,561 |
I. Management has determined that no material events or transactions occurred subsequent to September 30, 2013, that would require recognition or disclosure in these financial statements.
25
Report of Independent Registered
Public Accounting Firm
To the Trustees of Vanguard Horizon Funds and the Shareholders of Vanguard Capital Opportunity Fund:
In our opinion, the accompanying statement of net assets and the related statements of operations and of changes in net assets and the financial highlights present fairly, in all material respects, the financial position of Vanguard Capital Opportunity Fund (constituting a separate portfolio of Vanguard Horizon Funds, hereafter referred to as the “Fund”) at September 30, 2013, the results of its operations for the year then ended, the changes in its net assets for each of the two years in the period then ended, and the financial highlights for each of the five years in the period then ended, in conformity with accounting principles generally accepted in the United States of America. These financial statements and financial highlights (hereafter referred to as “financial statements”) are the responsibility of the Fund’s management; our responsibility is to express an opinion on these financial statements based on our audits. We conducted our audits of these financial statements in accordance with the standards of the Public Company Accounting Oversight Board (United States). Those standards require that we plan and perform the audit to obtain reasonable assurance about whether the financial statements are free of material misstatement. An audit includes examining, on a test basis, evidence supporting the amounts and disclosures in the financial statements, assessing the accounting principles used and significant estimates made by management, and evaluating the overall financial statement presentation. We believe that our audits, which included confirmation of securities at September 30, 2013 by correspondence with the custodian and by agreement to the underlying ownership records of the transfer agent, provide a reasonable basis for our opinion.
/s/PricewaterhouseCoopers LLP
Philadelphia, Pennsylvania
November 14, 2013
Special 2013 tax information (unaudited) for Vanguard Capital Opportunity Fund
This information for the fiscal year ended September 30, 2013, is included pursuant to provisions of
the Internal Revenue Code.
The fund distributed $88,301,000 of qualified dividend income to shareholders during the fiscal year.
The fund distributed $232,137,000 as capital gain dividends (from net long-term capital gains) to
shareholders during the fiscal year.
For corporate shareholders, 75.4% of investment income (dividend income plus short-term gains,
if any) qualifies for the dividends-received deduction.
26
Your Fund’s After-Tax Returns
This table presents returns for your fund both before and after taxes. The after-tax returns are shown in two ways: (1) assuming that an investor owned the fund during the entire period and paid taxes on the fund’s distributions, and (2) assuming that an investor paid taxes on the fund’s distributions and sold all shares at the end of each period.
Calculations are based on the highest individual federal income tax and capital gains tax rates in effect at the times of the distributions and the hypothetical sales. State and local taxes were not considered. After-tax returns reflect any qualified dividend income, using actual prior-year figures and estimates for 2013. (In the example, returns after the sale of fund shares may be higher than those assuming no sale. This occurs when the sale would have produced a capital loss. The calculation assumes that the investor received a tax deduction for the loss.)
The table shows returns for one share class only; returns for other share classes will differ. Please note that your actual after-tax returns will depend on your tax situation and may differ from those shown. Also note that if you own the fund in a tax-deferred account, such as an individual retirement account or a 401(k) plan, this information does not apply to you. Such accounts are not subject to current taxes.
Finally, keep in mind that a fund’s performance—whether before or after taxes—does not guarantee future results.
Average Annual Total Returns: Capital Opportunity Fund Investor Shares
Periods Ended September 30, 2013
| | | |
| | One | Five | Ten |
| | Year | Years | Years |
| Returns Before Taxes | 39.40% | 13.17% | 11.19% |
| Returns After Taxes on Distributions | 38.61 | 12.51 | 10.60 |
| Returns After Taxes on Distributions and Sale of Fund Shares | 23.31 | 10.51 | 9.32 |
27
About Your Fund’s Expenses
As a shareholder of the fund, you incur ongoing costs, which include costs for portfolio management, administrative services, and shareholder reports (like this one), among others. Operating expenses, which are deducted from a fund’s gross income, directly reduce the investment return of the fund.
A fund’s expenses are expressed as a percentage of its average net assets. This figure is known as the expense ratio. The following examples are intended to help you understand the ongoing costs (in dollars) of investing in your fund and to compare these costs with those of other mutual funds. The examples are based on an investment of $1,000 made at the beginning of the period shown and held for the entire period.
The accompanying table illustrates your fund’s costs in two ways:
• Based on actual fund return. This section helps you to estimate the actual expenses that you paid over the period. The ”Ending Account Value“ shown is derived from the fund‘s actual return, and the third column shows the dollar amount that would have been paid by an investor who started with $1,000 in the fund. You may use the information here, together with the amount you invested, to estimate the expenses that you paid over the period.
To do so, simply divide your account value by $1,000 (for example, an $8,600 account value divided by $1,000 = 8.6), then multiply the result by the number given for your fund under the heading ”Expenses Paid During Period.“
• Based on hypothetical 5% yearly return. This section is intended to help you compare your fund‘s costs with those of other mutual funds. It assumes that the fund had a yearly return of 5% before expenses, but that the expense ratio is unchanged. In this case—because the return used is not the fund’s actual return—the results do not apply to your investment. The example is useful in making comparisons because the Securities and Exchange Commission requires all mutual funds to calculate expenses based on a 5% return. You can assess your fund’s costs by comparing this hypothetical example with the hypothetical examples that appear in shareholder reports of other funds.
Note that the expenses shown in the table are meant to highlight and help you compare ongoing costs only and do not reflect transaction costs incurred by the fund for buying and selling securities. Further, the expenses do not include any purchase, redemption, or account service fees described in the fund prospectus. If such fees were applied to your account, your costs would be higher. Your fund does not carry a “sales load.”
The calculations assume no shares were bought or sold during the period. Your actual costs may have been higher or lower, depending on the amount of your investment and the timing of any purchases or redemptions.
You can find more information about the fund’s expenses, including annual expense ratios, in the Financial Statements section of this report. For additional information on operating expenses and other shareholder costs, please refer to your fund’s current prospectus.
28
| | | |
| Six Months Ended September 30, 2013 | | | |
| | Beginning | Ending | Expenses |
| | Account Value | Account Value | Paid During |
| Capital Opportunity Fund | 3/31/2013 | 9/30/2013 | Period |
| Based on Actual Fund Return | | | |
| Investor Shares | $1,000.00 | $1,141.07 | $2.58 |
| Admiral Shares | 1,000.00 | 1,141.45 | 2.20 |
| Based on Hypothetical 5% Yearly Return | | | |
| Investor Shares | $1,000.00 | $1,022.66 | $2.43 |
| Admiral Shares | 1,000.00 | 1,023.01 | 2.08 |
The calculations are based on expenses incurred in the most recent six-month period. The fund’s annualized six-month expense ratios for that
period are 0.48% for Investor Shares and 0.41% for Admiral Shares. The dollar amounts shown as “Expenses Paid” are equal to the
annualized expense ratio multiplied by the average account value over the period, multiplied by the number of days in the most recent
six-month period, then divided by the number of days in the most recent 12-month period.
29
Glossary
30-Day SEC Yield. A fund’s 30-day SEC yield is derived using a formula specified by the U.S. Securities and Exchange Commission. Under the formula, data related to the fund’s security holdings in the previous 30 days are used to calculate the fund’s hypothetical net income for that period, which is then annualized and divided by the fund’s estimated average net assets over the calculation period. For the purposes of this calculation, a security’s income is based on its current market yield to maturity (for bonds), its actual income (for asset-backed securities), or its projected dividend yield (for stocks). Because the SEC yield represents hypothetical annualized income, it will differ—at times significantly—from the fund’s actual experience. As a result, the fund’s income distributions may be higher or lower than implied by the SEC yield.
Beta. A measure of the magnitude of a fund’s past share-price fluctuations in relation to the ups and downs of a given market index. The index is assigned a beta of 1.00. Compared with a given index, a fund with a beta of 1.20 typically would have seen its share price rise or fall by 12% when the index rose or fell by 10%. For this report, beta is based on returns over the past 36 months for both the fund and the index. Note that a fund’s beta should be reviewed in conjunction with its R-squared (see definition). The lower the R-squared, the less correlation there is between the fund and the index, and the less reliable beta is as an indicator of volatility.
Dividend Yield. Dividend income earned by stocks, expressed as a percentage of the aggregate market value (or of net asset value, for a fund). The yield is determined by dividing the amount of the annual dividends by the aggregate value (or net asset value) at the end of the period. For a fund, the dividend yield is based solely on stock holdings and does not include any income produced by other investments.
Earnings Growth Rate. The average annual rate of growth in earnings over the past five years for the stocks now in a fund.
Equity Exposure. A measure that reflects a fund’s investments in stocks and stock futures. Any holdings in short-term reserves are excluded.
Expense Ratio. A fund’s total annual operating expenses expressed as a percentage of the fund’s average net assets. The expense ratio includes management and administrative expenses, but does not include the transaction costs of buying and selling portfolio securities.
Foreign Holdings. The percentage of a fund represented by securities or depositary receipts of companies based outside the United States.
Inception Date. The date on which the assets of a fund (or one of its share classes) are first invested in accordance with the fund’s investment objective. For funds with a subscription period, the inception date is the day after that period ends. Investment performance is measured from the inception date.
Median Market Cap. An indicator of the size of companies in which a fund invests; the midpoint of market capitalization (market price x shares outstanding) of a fund’s stocks, weighted by the proportion of the fund’s assets invested in each stock. Stocks representing half of the fund’s assets have market capitalizations above the median, and the rest are below it.
Price/Book Ratio. The share price of a stock divided by its net worth, or book value, per share. For a fund, the weighted average price/book ratio of the stocks it holds.
30
Price/Earnings Ratio. The ratio of a stock’s current price to its per-share earnings over the past year. For a fund, the weighted average P/E of the stocks it holds. P/E is an indicator of market expectations about corporate prospects; the higher the P/E, the greater the expectations for a company’s future growth.
R-Squared. A measure of how much of a fund’s past returns can be explained by the returns from the market in general, as measured by a given index. If a fund’s total returns were precisely synchronized with an index’s returns, its R-squared would be 1.00. If the fund’s returns bore no relationship to the index’s returns, its R-squared would be 0. For this report, R-squared is based on returns over the past 36 months for both the fund and the index.
Return on Equity. The annual average rate of return generated by a company during the past five years for each dollar of shareholder’s equity (net income divided by shareholder’s equity). For a fund, the weighted average return on equity for the companies whose stocks it holds.
Short-Term Reserves. The percentage of a fund invested in highly liquid, short-term securities that can be readily converted to cash.
Turnover Rate. An indication of the fund’s trading activity. Funds with high turnover rates incur higher transaction costs and may be more likely to distribute capital gains (which may be taxable to investors). The turnover rate excludes in-kind transactions, which have minimal impact on costs.
31
The People Who Govern Your Fund
The trustees of your mutual fund are there to see that the fund is operated and managed in your best interests since, as a shareholder, you are a part owner of the fund. Your fund’s trustees also serve on the board of directors of The Vanguard Group, Inc., which is owned by the Vanguard funds and provides services to them on an at-cost basis.
A majority of Vanguard’s board members are independent, meaning that they have no affiliation with Vanguard or the funds they oversee, apart from the sizable personal investments they have made as private individuals. The independent board members have distinguished backgrounds in business, academia, and public service. Each of the trustees and executive officers oversees 181 Vanguard funds.
The following table provides information for each trustee and executive officer of the fund. More information about the trustees is in the Statement of Additional Information, which can be obtained, without charge, by contacting Vanguard at 800-662-7447, or online at vanguard.com.
| |
| InterestedTrustee1 | and Delphi Automotive LLP (automotive components); |
| | Senior Advisor at New Mountain Capital; Trustee of |
| F. William McNabb III | The Conference Board. |
| Born 1957. Trustee Since July 2009. Chairman of the | |
| Board. Principal Occupation(s) During the Past Five | Amy Gutmann |
| Years: Chairman of the Board of The Vanguard Group, | Born 1949. Trustee Since June 2006. Principal |
| Inc., and of each of the investment companies served | Occupation(s) During the Past Five Years: President |
| by The Vanguard Group, since January 2010; Director | of the University of Pennsylvania; Christopher H. |
| of The Vanguard Group since 2008; Chief Executive | Browne Distinguished Professor of Political Science |
| Officer and President of The Vanguard Group and of | in the School of Arts and Sciences with secondary |
| each of the investment companies served by The | appointments at the Annenberg School for |
| Vanguard Group since 2008; Director of Vanguard | Communication and the Graduate School of Education |
| Marketing Corporation; Managing Director of The | of the University of Pennsylvania; Member of the |
| Vanguard Group (1995–2008). | National Commission on the Humanities and Social |
| | Sciences; Trustee of Carnegie Corporation of New |
| | York and of the National Constitution Center; Chair |
| IndependentTrustees | of the U. S. Presidential Commission for the Study |
| of Bioethical Issues. |
| Emerson U. Fullwood | |
| Born 1948. Trustee Since January 2008. Principal | JoAnn Heffernan Heisen |
| Occupation(s) During the Past Five Years: Executive | Born 1950. Trustee Since July 1998. Principal |
| Chief Staff and Marketing Officer for North America | Occupation(s) During the Past Five Years: Corporate |
| and Corporate Vice President (retired 2008) of Xerox | Vice President and Chief Global Diversity Officer |
| Corporation (document management products and | (retired 2008) and Member of the Executive |
| services); Executive in Residence and 2010 | Committee (1997–2008) of Johnson & Johnson |
| Distinguished Minett Professor at the Rochester | (pharmaceuticals/medical devices/consumer |
| Institute of Technology; Director of SPX Corporation | products); Director of Skytop Lodge Corporation |
| (multi-industry manufacturing), the United Way of | (hotels), the University Medical Center at Princeton, |
| Rochester, Amerigroup Corporation (managed health | the Robert Wood Johnson Foundation, and the Center |
| care), the University of Rochester Medical Center, | for Talent Innovation; Member of the Advisory Board |
| Monroe Community College Foundation, and North | of the Maxwell School of Citizenship and Public Affairs |
| Carolina A&T University. | at Syracuse University. |
| |
| Rajiv L. Gupta | F. Joseph Loughrey |
| Born 1945. Trustee Since December 2001. 2 | Born 1949. Trustee Since October 2009. Principal |
| Principal Occupation(s) During the Past Five Years: | Occupation(s) During the Past Five Years: President |
| Chairman and Chief Executive Officer (retired 2009) | and Chief Operating Officer (retired 2009) of Cummins |
| and President (2006–2008) of Rohm and Haas Co. | Inc. (industrial machinery); Chairman of the Board of |
| (chemicals); Director of Tyco International, Ltd. | Hillenbrand, Inc. (specialized consumer services) and |
| (diversified manufacturing and services), Hewlett- | of Oxfam America; Director of SKF AB (industrial |
| Packard Co. (electronic computer manufacturing), | |
| | |
| machinery) and the Lumina Foundation for Education; | Executive Officers | |
| Member of the Advisory Council for the College of | | |
| Arts and Letters and of the Advisory Board to the | Glenn Booraem | |
| Kellogg Institute for International Studies, both at | Born 1967. Controller Since July 2010. Principal |
| the University of Notre Dame. | Occupation(s) During the Past Five Years: Principal |
| | of The Vanguard Group, Inc.; Controller of each of |
| Mark Loughridge | the investment companies served by The Vanguard |
| Born 1953. Trustee Since March 2012. Principal | Group; Assistant Controller of each of the investment |
| Occupation(s) During the Past Five Years: Senior Vice | companies served by The Vanguard Group (2001–2010). |
| President and Chief Financial Officer at IBM (information | | |
| technology services); Fiduciary Member of IBM’s | Thomas J. Higgins | |
| Retirement Plan Committee. | Born 1957. Chief Financial Officer Since September |
| | 2008. Principal Occupation(s) During the Past Five |
| Scott C. Malpass | Years: Principal of The Vanguard Group, Inc.; Chief |
| Born 1962. Trustee Since March 2012. Principal | Financial Officer of each of the investment companies |
| Occupation(s) During the Past Five Years: Chief | served by The Vanguard Group; Treasurer of each of |
| Investment Officer and Vice President at the University | the investment companies served by The Vanguard |
| of Notre Dame; Assistant Professor of Finance at the | Group (1998–2008). | |
| Mendoza College of Business at Notre Dame; Member | | |
| of the Notre Dame 403(b) Investment Committee; | Kathryn J. Hyatt | |
| Director of TIFF Advisory Services, Inc. (investment | Born 1955. Treasurer Since November 2008. Principal |
| advisor); Member of the Investment Advisory | Occupation(s) During the Past Five Years: Principal of |
| Committees of the Financial Industry Regulatory | The Vanguard Group, Inc.; Treasurer of each of the |
| Authority (FINRA) and of Major League Baseball. | investment companies served by The Vanguard |
| | Group; Assistant Treasurer of each of the investment |
| André F. Perold | companies served by The Vanguard Group (1988–2008). |
| Born 1952. Trustee Since December 2004. Principal | | |
| Occupation(s) During the Past Five Years: George | Heidi Stam | |
| Gund Professor of Finance and Banking at the Harvard | Born 1956. Secretary Since July 2005. Principal |
| Business School (retired 2011); Chief Investment | Occupation(s) During the Past Five Years: Managing |
| Officer and Managing Partner of HighVista Strategies | Director of The Vanguard Group, Inc.; General Counsel |
| LLC (private investment firm); Director of Rand | of The Vanguard Group; Secretary of The Vanguard |
| Merchant Bank; Overseer of the Museum of Fine | Group and of each of the investment companies |
| Arts Boston. | served by The Vanguard Group; Director and Senior |
| | Vice President of Vanguard Marketing Corporation. |
| | |
| Alfred M. Rankin, Jr. | | |
| Born 1941. Trustee Since January 1993. Principal | Vanguard Senior ManagementTeam |
| Occupation(s) During the Past Five Years: Chairman, | | |
| President, and Chief Executive Officer of NACCO | Mortimer J. Buckley | Chris D. McIsaac |
| Industries, Inc. (housewares/lignite) and of Hyster-Yale | Kathleen C. Gubanich | Michael S. Miller |
| Materials Handling, Inc. (forklift trucks); Director of | Paul A. Heller | James M. Norris |
| the National Association of Manufacturers; Chairman | Martha G. King | Glenn W. Reed |
| of the Board of University Hospitals of Cleveland; | John T. Marcante | |
| Advisory Chairman of the Board of The Cleveland | | |
| Museum of Art. | | |
| | Chairman Emeritus and Senior Advisor |
| | |
| John J. Brennan | |
| Peter F. Volanakis | Chairman, 1996–2009 | |
| Born 1955. Trustee Since July 2009. Principal | Chief Executive Officer and President, 1996–2008 |
| Occupation(s) During the Past Five Years: President | |
| and Chief Operating Officer (retired 2010) of Corning | | |
| Incorporated (communications equipment); Director | | |
| of SPX Corporation (multi-industry manufacturing); | Founder | |
| Overseer of the Amos Tuck School of Business | John C. Bogle | |
| Administration at Dartmouth College; Advisor to the | Chairman and Chief Executive Officer, 1974–1996 |
| Norris Cotton Cancer Center. | |
1 Mr. McNabb is considered an “interested person,” as defined in the Investment Company Act of 1940, because he is an officer of the
Vanguard funds.
2 December 2002 for Vanguard Equity Income Fund, Vanguard Growth Equity Fund, the Vanguard Municipal Bond Funds, and the Vanguard
State Tax-Exempt Funds.
|  |
| | P.O. Box 2600 |
| | Valley Forge, PA 19482-2600 |
| |
| |
| |
| Connect with Vanguard® > vanguard.com | |
| |
| |
| |
| Fund Information > 800-662-7447 | |
| Direct Investor Account Services > 800-662-2739 | |
| Institutional Investor Services > 800-523-1036 | |
| Text Telephone for People | |
| With Hearing Impairment > 800-749-7273 | |
| |
| This material may be used in conjunction | |
| with the offering of shares of any Vanguard | |
| fund only if preceded or accompanied by | |
| the fund’s current prospectus. | |
| |
| All comparative mutual fund data are from Lipper, a | |
| Thomson Reuters Company, or Morningstar, Inc., unless | |
| otherwise noted. | |
| |
| You can obtain a free copy of Vanguard’s proxy voting | |
| guidelines by visiting vanguard.com/proxyreporting or by | |
| calling Vanguard at 800-662-2739. The guidelines are | |
| also available from the SEC’s website, sec.gov. In | |
| addition, you may obtain a free report on how your fund | |
| voted the proxies for securities it owned during the 12 | |
| months ended June 30. To get the report, visit either | |
| vanguard.com/proxyreporting or sec.gov. | |
| |
| You can review and copy information about your fund at | |
| the SEC’s Public Reference Room in Washington, D.C. To | |
| find out more about this public service, call the SEC at | |
| 202-551-8090. Information about your fund is also | |
| available on the SEC’s website, and you can receive | |
| copies of this information, for a fee, by sending a | |
| request in either of two ways: via e-mail addressed to | |
| publicinfo@sec.gov or via regular mail addressed to the | |
| Public Reference Section, Securities and Exchange | |
| Commission, Washington, DC 20549-1520. | |
| |
| | © 2013 The Vanguard Group, Inc. |
| | All rights reserved. |
| | Vanguard Marketing Corporation, Distributor. |
| |
| | Q1110 112013 |

Annual Report | September 30, 2013
Vanguard Strategic Small-Cap
Equity Fund

Vanguard’s Principles for Investing Success
We want to give you the best chance of investment success. These principles,
grounded in Vanguard’s research and experience, can put you on the right path.
Goals. Create clear, appropriate investment goals.
Balance. Develop a suitable asset allocation using broadly diversified funds.
Cost. Minimize cost.
Discipline. Maintain perspective and long-term discipline.
A single theme unites these principles: Focus on the things you can control.
We believe there is no wiser course for any investor.
| |
| Contents | |
| Your Fund’s Total Returns. | 1 |
| Chairman’s Letter. | 2 |
| Advisor’s Report. | 8 |
| Fund Profile. | 10 |
| Performance Summary. | 11 |
| Financial Statements. | 13 |
| Your Fund’s After-Tax Returns. | 27 |
| About Your Fund’s Expenses. | 28 |
| Glossary. | 30 |
Please note: The opinions expressed in this report are just that—informed opinions. They should not be considered promises or advice.
Also, please keep in mind that the information and opinions cover the period through the date on the front of this report. Of course, the
risks of investing in your fund are spelled out in the prospectus.
See the Glossary for definitions of investment terms used in this report.
About the cover: The ship's wheel represents leadership and guidance, essential qualities in navigating difficult seas.
This one is a replica based on an 18th-century British vessel. The HMS Vanguard, another ship of that era, served as the
flagship for Admiral Horatio Nelson when he defeated a French fleet at the Battle of the Nile.
Your Fund’s Total Returns
| |
| Fiscal Year Ended September 30, 2013 | |
| |
| | Total |
| | Returns |
| Vanguard Strategic Small-Cap Equity Fund | 32.94% |
| MSCI US Small Cap 1750 Index | 31.08 |
| Small-Cap Core Funds Average | 28.65 |
| Small-Cap Core Funds Average: Derived from data provided by Lipper, a Thomson Reuters Company. |
| | | | |
| Your Fund’s Performance at a Glance | | | | |
| September 30, 2012, Through September 30, 2013 | | | |
| |
| | | | Distributions Per Share |
| | Starting | Ending | | |
| | Share | Share | Income | Capital |
| | Price | Price | Dividends | Gains |
| Vanguard Strategic Small-Cap Equity Fund | $21.37 | $27.94 | $0.360 | $0.000 |
1

Chairman’s Letter
Dear Shareholder,
Sluggish but sustained growth in the U.S. economy was enough to lift investor sentiment and push the broad stock market significantly higher during the fiscal year ended September 30, 2013. Small-capitalization stocks gained even more than their larger-cap counterparts as investors looked to these riskier investments for potentially greater returns.
Vanguard Strategic Small-Cap Equity Fund returned an impressive 32.94% for the 12 months, with nine of ten sectors posting double-digit gains. The fund’s result was almost two percentage points higher than the return of its benchmark, the MSCI US Small Cap 1750 Index, and more than four percentage points higher than the average return of its peer funds. Relative to the index, the fund’s returns were very strong in a number of sectors, notably consumer staples, industrials, and materials; these more than offset subpar returns in a few other sectors, including health care and information technology.
Note: If you hold shares in a taxable account, you may wish to review the table of after-tax returns, based on the highest federal income tax bracket, that appears later in this report.
Stocks dodged obstacles to produce strong gains
Although their path wasn’t always smooth, U.S. stocks powered to a return of about 22% for the 12 months ended
2
September 30. The U.S. economy delivered only modest growth over the fiscal year, but investors’ appetite for stocks seemed to increase faster than companies’ profits.
In mid-September, U.S. stocks jumped when the Federal Reserve surprised investors by announcing that it had no immediate plans to unwind its stimulative bond-buying program. But in the waning days of that month, stocks slid ahead of the partial federal government shutdown that began October 1.
It’s natural for investors to be concerned by the situation in Washington. But as Sarah Hammer, a senior analyst in Vanguard Investment Strategy Group, noted in the midst of the temporary shutdown, they shouldn’t be unduly influenced by these events. “Investors are often best served by sticking to their long-term investment plans and avoiding short-term decisions based on the legislative outlook,” Ms. Hammer said. Our recurrent advice to stick to your plan may lack pizzazz, but its proven to be sound counsel over the decades.
International stocks generally posted strong results. Emerging-market stocks, however, lagged amid worries about slowing economic growth.
Bond returns were negative despite September’s bounce
Investor concern about the Fed’s potential scaling back of its bond-buying program also affected the performance of bonds,
| | | |
| Market Barometer | | | |
| |
| | Average Annual Total Returns |
| | Periods Ended September 30, 2013 |
| | One | Three | Five |
| | Year | Years | Years |
| Stocks | | | |
| Russell 1000 Index (Large-caps) | 20.91% | 16.64% | 10.53% |
| Russell 2000 Index (Small-caps) | 30.06 | 18.29 | 11.15 |
| Russell 3000 Index (Broad U.S. market) | 21.60 | 16.76 | 10.58 |
| MSCI All Country World Index ex USA (International) | 16.48 | 5.95 | 6.26 |
| |
| Bonds | | | |
| Barclays U.S. Aggregate Bond Index (Broad taxable market) | -1.68% | 2.86% | 5.41% |
| Barclays Municipal Bond Index (Broad tax-exempt market) | -2.21 | 3.24 | 5.98 |
| Citigroup Three-Month U.S. Treasury Bill Index | 0.07 | 0.07 | 0.14 |
| |
| CPI | | | |
| Consumer Price Index | 1.18% | 2.34% | 1.37% |
3
which posted declines for the year.
In September, however, bonds trimmed their losses after the Fed said it would continue the purchases.
The broad U.S. taxable bond market returned –1.68% for the fiscal year, and the yield of the 10-year Treasury note closed at 2.63%, down from 2.76% a month earlier. (Bond yields and prices move in opposite directions.) Municipal bonds returned –2.21% after rebounding a bit in September.
Money markets and savings accounts barely budged as the Fed’s target for short-term interest rates remained between 0% and 0.25%.
More of the strong performers and fewer laggards in the fund
Like other funds that employ a quantitative investment strategy, Vanguard Strategic Small-Cap Equity Fund relies on a computer model to drive its stock selection process. What that model is looking for as it scans the securities of smaller companies within the U.S. market reflects the convictions of your fund’s advisor, Vanguard Equity Investment Group, about which characteristics of a stock are most predictive of future outperformance. That process resulted in the fund’s holding about 400 stocks at the end of the fiscal year, compared with about 1,720 in its benchmark.
| | |
| Expense Ratios | | |
| Your Fund Compared With Its Peer Group | | |
| | | Peer Group |
| | Fund | Average |
| Strategic Small-Cap Equity Fund | 0.40% | 1.34% |
The fund expense ratio shown is from the prospectus dated January 25, 2013, and represents estimated costs for the current fiscal year. For
the fiscal year ended September 30, 2013, the fund’s expense ratio was 0.38%. The peer-group expense ratio is derived from data provided
by Lipper, a Thomson Reuters Company, and captures information through year-end 2012.
Peer group: Small-Cap Core Funds.
4
The advisor’s quantitative analysis proved particularly successful in the consumer staples sector among a very narrow selection of food packagers, personal care companies, and drug stores. Industrials was another sector in which the fund outperformed its benchmark, but there its gains were made across a larger number of stocks, including those of airlines, commercial supply companies, machinery manufacturers, trucking companies, and electrical equipment makers.
While the quantitative screening singled out stocks that did better than the overall market, it also helped the fund to sidestep some pockets of stocks that performed poorly over the 12 months. This was true within the materials sector, where the fund had only limited exposure to precious
metals and mining stocks and no exposure to gold stocks during the period. The slump in commodity prices, and prices of metals in particular, led to declines in these stocks for the fiscal year.
Not all of the fund’s stock choices added to relative performance, however. Holdings in the energy, health care, and technology sectors produced subpar returns, although they were still positive.
Over the longer term, the fund has a more mixed track record
As all seasoned investors can tell you, any given investment strategy tends to work better under some market conditions than others. Quantitative funds in general struggled during the financial crisis, when the stock market dropped sharply across
| |
| Total Returns | |
| Inception Through September 30, 2013 | |
| | Average |
| | Annual Return |
| Strategic Small-Cap Equity Fund (Returns since inception: 4/24/2006) | 5.81% |
| MSCI US Small Cap 1750 Index | 7.37 |
| Small-Cap Core Funds Average | 5.15 |
| Small-Cap Core Funds Average: Derived from data provided by Lipper, a Thomson Reuters Company. |
The figures shown represent past performance, which is not a guarantee of future results. (Current performance may be
lower or higher than the performance data cited. For performance data current to the most recent month-end, visit our
website at vanguard.com/performance.) Note, too, that both investment returns and principal value can fluctuate widely, so
an investor’s shares, when sold, could be worth more or less than their original cost.
5
the board, and then post-crisis, when the overall market rebounded. That’s not surprising, as the advisors of quantitative funds use computer-based models to identify individual stocks that they think are likely to perform better than their
peers over time. This strategy has worked better in recent years, when stocks have generally moved less in lock-step with one another as investors focused more closely on the merits of individual companies.
| Investment insight |
| Don’t let a trick of the calendar alter your course |
| When making investment decisions, it’s important to weigh past returns with caution. |
| That’s because investment returns from any particular period are an unreliable anchor |
| for gauging the future. They can be highly date-dependent. |
| |
| For example, take the five-year average annual return for the broad U.S. stock |
| market. That average just made a startling bounce: from 1.30% for the period |
| ended September 30, 2012, to 10.58% for the period ended September 30, 2013. |
| True, the market returned a hearty 21.60% in the most recent 12 months, but that’s |
| not enough to explain such a big leap in the average. Significantly, the year ended |
| September 30, 2008––when U.S. stocks returned –21.52% during the financial |
| crisis––has now rolled off the five-year calculation. |
| |
| The important thing to remember is that historical returns are just that: historical. |
| Basing investment decisions on such date-dependent snapshots could easily lead |
| you to alter course––possibly in the wrong direction. Instead, Vanguard believes, you |
| should build your asset allocation strategy on long-term risk-and-return relationships, |
| always recognizing that no level of return is guaranteed. |
| |
| Which five-year average should you count on? |
| (Answer: None of them!) |
| Average annual returns for U.S. stocks over five-year periods ended September 30 |
| |
| 2007 | 16.18% |
| 2008 | 5.70 |
| 2009 | 1.56 |
| 2010 | 0.92 |
| 2011 | –0.92 |
| 2012 | 1.30 |
| 2013 | 10.58 |
| Note: The U.S. stock market is represented by the Russell 3000 Index. |
| Source: Vanguard. |
6
So, although the fund outpaced its benchmark in three of the four most recent fiscal years, its average annual return since inception in 2006 lagged that of the benchmark, 5.81% to 7.37%. The fund was nevertheless well ahead of the 5.15% average for its peer group, which includes actively managed funds that do not use a quantitative approach.
Staying out of the rough by staying the course
Back in September 2008, global financial markets were stunned by the collapse of Lehman Brothers, which transformed the economic downturn already under way into the Great Recession. Fast-forward to 2013: The U.S. economy is growing, albeit slowly, and stock markets have set record highs.
When headlines are blaring and stock markets are sinking, it’s human nature to be tempted to head for the exits. But it’s important to stick with the principles of balance and diversification—and the portfolio asset allocation you established to meet your long-term goals. Bonds can provide ballast if stock prices keep falling, and, by remaining in the stock market, you will be able to participate when stocks begin to recover.
The benefit of staying the course was confirmed in a recent analysis of the performance of more than 58,000 self-directed Vanguard IRA® investors over the five years ended December 31, 2012.
Vanguard compared actual returns earned by each investor with the hypothetical results of personalized index benchmarks, taking into consideration investors’ beginning and ending balances and any intervening cash flow.
The key finding: Those who stayed with their investment plans earned five-year returns commensurate with the calculated benchmarks, generally outperforming those who changed course. Investors who reacted to market events were much more likely to miss out on potential returns. (You can read more in Most Vanguard IRA Investors Shot Par by Staying the Course: 2008–2012 at vanguard.com/research.)
The results for the five years through 2012 are a good reminder that sticking with a simple, broad-based portfolio—even amid a financial tempest—can help minimize the chances of making a mistake that can reduce returns.
As always, thank you for investing with Vanguard.
Sincerely,

F. William McNabb III
Chairman and Chief Executive Officer
October 16, 2013
7
Advisor’s Report
For the fiscal year ended September 30, 2013, Vanguard Strategic Small-Cap Equity Fund rewarded investors with a total return of 32.94%, outpacing the MSCI Small Cap 1750 Index by 1.86 percentage points. While the broad U.S. equity market delivered a robust return above 20%, small-capitalization stocks outperformed larger-cap equities by around ten percentage points. The U.S. equity market provided returns similar to those from other developed countries; emerging-market returns were basically flat.
Gains within the small-cap benchmark were broadly based, with all ten sectors rising. The strongest returns came from industrial, consumer discretionary, and consumer staples stocks. The utilities and materials sectors, although their returns were positive, were the laggards for the period.
Investors seemed to gain confidence at the start of the fiscal year as economic data continued to improve worldwide, albeit at a snail’s pace. Here in the United States, the housing market continued its recovery, the unemployment rate slowly decreased, corporate balance sheets were strong, and profits held up. And the longer-term economic outlook was one of cautious optimism, with GDP growth expected to accelerate in 2014 and 2015.
More recently, however, macroeconomic events grabbed the headlines, which translated into greater market volatility. The Federal Reserve’s mixed signals on tapering its quantitative easing program, a jump in interest rates, and the budget deadlock between Congress and the White House that threatened to shut down the federal government (and did so on October 1) left investors guessing about the market’s prospects for the near term.
For the 12-month period, our stock-selection model was generally very effective in distinguishing outperforming companies from underperformers within each industry group. Four components of our model (those assessing valuation, quality, management decisions, and growth) raised the portfolio’s performance. The sentiment component was the sole detractor.
The returns of our holdings led those of the index in seven of ten sectors, with the largest contributors being consumer staples, industrials, and materials. Within consumer staples, Pilgrim’s Pride, Rite Aid, and Nu Skin Enterprises contributed the most to our relative results. Hyster-Yale, Alaska Air Group, and AMERCO led among industrial stocks, while Westlake Chemical and Axiall were our most successful selections in materials.
Stock selection in some sectors, however, disappointed us. OSI Systems and Cardtronics in information technology, Affymax and Auxilium Pharmaceuticals in health care, and ANN Inc. in consumer discretionary, for example, did not perform as expected.
8
Overall, the increased volatility we have seen is not surprising, considering how quickly stocks had been rising both domestically and internationally. Markets will always be subject to fluctuations brought on by new headline risks. We find that often there is too much focus on these typical market gyrations, the latest economic news, and short-term performance, and not enough on the fundamental principles that give investors the best chance of success.
Strategies such as ours shift the focus back to fundamentals by seeking to capture the spread between undervalued and overvalued stocks, an approach that we believe can provide worthwhile returns for long-term investors. With that in mind, we believe that equity exposure continues to play an important role in a diversified investment plan.
We thank you for your investment and look forward to the new fiscal year.
Portfolio Managers:
James P. Stetler, Principal
James D. Troyer, CFA, Principal
Michael R. Roach, CFA
Vanguard Equity Investment Group
October 18, 2013
9
Strategic Small-Cap Equity Fund
Fund Profile
As of September 30, 2013
| | | |
| Portfolio Characteristics | | |
| | | MSCI US | DJ U.S. |
| | | Small Cap | Total |
| | | 1750 | Market |
| | Fund | Index | FA Index |
| Number of Stocks | 397 | 1,724 | 3,636 |
| Median Market Cap | $2.1B | $2.2B | $40.2B |
| Price/Earnings Ratio | 19.5x | 28.0x | 19.5x |
| Price/Book Ratio | 2.4x | 2.2x | 2.5x |
| Return on Equity | 9.6% | 9.1% | 16.5% |
| Earnings Growth Rate | 14.4% | 10.3% | 11.1% |
| Dividend Yield | 1.3% | 1.4% | 1.9% |
| Foreign Holdings | 0.0% | 0.0% | 0.0% |
| Turnover Rate | 64% | — | — |
| Ticker Symbol | VSTCX | — | — |
| Expense Ratio1 | 0.40% | — | — |
| 30-Day SEC Yield | 0.94% | — | — |
| Short-Term Reserves | 0.1% | — | — |
| | | |
| Sector Diversification (% of equity exposure) |
| | | | DJ U.S. |
| | | MSCI US | Total |
| | | Small Cap | Market |
| | | 1750 | FA |
| | Fund | Index | Index |
| Consumer Discretionary | 13.5% | 14.1% | 13.3% |
| Consumer Staples | 3.9 | 3.5 | 8.7 |
| Energy | 4.7 | 5.2 | 9.6 |
| Financials | 22.7 | 23.0 | 17.3 |
| Health Care | 11.8 | 12.5 | 12.6 |
| Industrials | 17.5 | 16.5 | 11.4 |
| Information Technology | 16.9 | 16.8 | 17.9 |
| Materials | 5.3 | 5.0 | 3.8 |
| Telecommunication | | | |
| Services | 1.3 | 0.8 | 2.2 |
| Utilities | 2.4 | 2.6 | 3.2 |
| | |
| Volatility Measures | | |
| | MSCI US | |
| | Small Cap | DJ U.S. |
| | 1750 | Total Market |
| | Index | FA Index |
| R-Squared | 0.98 | 0.93 |
| Beta | 1.04 | 1.30 |
| These measures show the degree and timing of the fund’s fluctuations compared with the indexes over 36 months. |
| | |
| Ten Largest Holdings (% of total net assets) |
| Nu Skin Enterprises Inc. | Personal Products | 0.8% |
| Hanesbrands Inc. | Apparel, Accessories | |
| | & Luxury Goods | 0.8 |
| Packaging Corp. of | | |
| America | Paper Packaging | 0.7 |
| Portfolio Recovery | | |
| Associates Inc. | Consumer Finance | 0.7 |
| Rite Aid Corp. | Drug Retail | 0.7 |
| Domino's Pizza Inc. | Restaurants | 0.7 |
| AO Smith Corp. | Building Products | 0.7 |
| Jack Henry & Associates Data Processing & | |
| Inc. | Outsourced Services | 0.7 |
| Broadridge Financial | Data Processing & | |
| Solutions Inc. | Outsourced Services | 0.7 |
| Brocade | | |
| Communications | Communications | |
| Systems Inc. | Equipment | 0.7 |
| Top Ten | | 7.2% |
| The holdings listed exclude any temporary cash investments and equity index products. |
Investment Focus
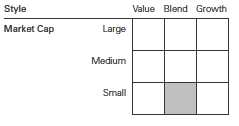
1 The expense ratio shown is from the prospectus dated January 25, 2013, and represents estimated costs for the current fiscal year. For the
fiscal year ended September 30, 2013, the expense ratio was 0.38%.
10
Strategic Small-Cap Equity Fund
Performance Summary
All of the returns in this report represent past performance, which is not a guarantee of future results that may be achieved by the fund. (Current performance may be lower or higher than the performance data cited. For performance data current to the most recent month-end, visit our website at vanguard.com/performance.) Note, too, that both investment returns and principal value can fluctuate widely, so an investor’s shares, when sold, could be worth more or less than their original cost. The returns shown do not reflect taxes that a shareholder would pay on fund distributions or on the sale of fund shares.
Cumulative Performance: April 24, 2006, Through September 30, 2013
Initial Investment of $10,000
| | | | | |
| | | Average Annual Total Returns | |
| | | Periods Ended September 30, 2013 | |
| | | | | Since | Final Value |
| | | One | Five | Inception | of a $10,000 |
| | | Year | Years | (4/24/2006) | Investment |
| | Strategic Small-Cap Equity Fund* | 32.94% | 12.32% | 5.81% | $15,221 |
| •••••••• | MSCI US Small Cap 1750 Index | 31.08 | 13.32 | 7.37 | 16,964 |
| – – – – | Small-Cap Core Funds Average | 28.65 | 11.02 | 5.15 | 14,525 |
| | Dow Jones U.S. Total Stock Market | | | | |
| | Float Adjusted Index | 21.44 | 10.69 | 6.10 | 15,529 |
Small-Cap Core Funds Average: Derived from data provided by Lipper, a Thomson Reuters Company.
"Since Inception" performance is calculated from the inception date for both the fund and its comparative standards.
See Financial Highlights for dividend and capital gains information.
11
Strategic Small-Cap Equity Fund
Fiscal-Year Total Returns (%): April 24, 2006, Through September 30, 2013
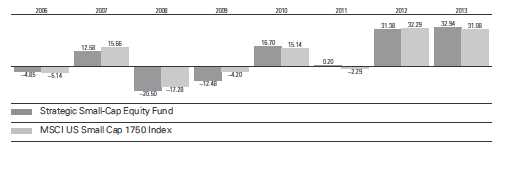
12
Strategic Small-Cap Equity Fund
Financial Statements
Statement of Net Assets
As of September 30, 2013
The fund reports a complete list of its holdings in regulatory filings four times in each fiscal year, at the quarter-ends. For the second and fourth fiscal quarters, the lists appear in the fund’s semiannual and annual reports to shareholders. For the first and third fiscal quarters, the fund files the lists with the Securities and Exchange Commission on Form N-Q. Shareholders can look up the fund’s Forms N-Q on the SEC’s website at sec.gov. Forms N-Q may also be reviewed and copied at the SEC’s Public Reference Room (see the back cover of this report for further information).
| | | |
| | | | Market |
| | | | Value |
| | | Shares | ($000) |
| Common Stocks (99.5%)1 | | |
| Consumer Discretionary (13.4%) | |
| | Hanesbrands Inc. | 45,800 | 2,854 |
| | Domino’s Pizza Inc. | 39,300 | 2,670 |
| | Brunswick Corp. | 57,400 | 2,291 |
| | Brinker International Inc. | 54,200 | 2,197 |
| * | Red Robin Gourmet | | |
| | Burgers Inc. | 29,100 | 2,069 |
| | Brown Shoe Co. Inc. | 85,600 | 2,009 |
| | Service Corp. International | 106,600 | 1,985 |
| * | Smith & Wesson | | |
| | Holding Corp. | 180,100 | 1,979 |
| | Dillard’s Inc. Class A | 25,050 | 1,961 |
| * | AMC Networks Inc. Class A | 28,100 | 1,924 |
| | Regal Entertainment Group | | |
| | Class A | 95,700 | 1,816 |
| | Buckle Inc. | 32,700 | 1,767 |
| * | Jack in the Box Inc. | 42,800 | 1,712 |
| * | Conn’s Inc. | 32,300 | 1,616 |
| | Dana Holding Corp. | 66,500 | 1,519 |
| ^ | Sturm Ruger & Co. Inc. | 21,900 | 1,372 |
| | Cheesecake Factory Inc. | 30,800 | 1,354 |
| | Cracker Barrel Old Country | | |
| | Store Inc. | 11,300 | 1,167 |
| * | Sonic Corp. | 65,400 | 1,161 |
| | Foot Locker Inc. | 31,500 | 1,069 |
| * | Overstock.com Inc. | 32,700 | 970 |
| * | Starz | 34,018 | 957 |
| | Harte-Hanks Inc. | 84,000 | 742 |
| | Big 5 Sporting Goods Corp. | 44,400 | 714 |
| | Haverty Furniture Cos. Inc. | 28,600 | 701 |
| | GNC Holdings Inc. Class A | 12,150 | 664 |
| | Chico’s FAS Inc. | 34,500 | 575 |
| * | Universal Electronics Inc. | 14,800 | 533 |
| * | Grand Canyon Education Inc. | 12,600 | 507 |
| * | EW Scripps Co. Class A | 24,900 | 457 |
| * | Orbitz Worldwide Inc. | 47,400 | 456 |
| * | Express Inc. | 18,000 | 425 |
| | Winmark Corp. | 5,300 | 391 |
| | | |
| | PetMed Express Inc. | 23,800 | 388 |
| * | Tenneco Inc. | 7,300 | 369 |
| * | Bloomin’ Brands Inc. | 14,200 | 335 |
| * | Live Nation | | |
| | Entertainment Inc. | 17,800 | 330 |
| | Valassis | | |
| | Communications Inc. | 11,400 | 329 |
| * | hhgregg Inc. | 18,201 | 326 |
| * | New York & Co. Inc. | 53,400 | 309 |
| * | Children’s Place Retail | | |
| | Stores Inc. | 5,200 | 301 |
| | Cooper Tire & Rubber Co. | 9,600 | 296 |
| | Nutrisystem Inc. | 20,400 | 293 |
| * | Marriott Vacations | | |
| | Worldwide Corp. | 6,400 | 282 |
| * | Tower International Inc. | 12,000 | 240 |
| * | Bally Technologies Inc. | 3,000 | 216 |
| | Belo Corp. Class A | 14,400 | 197 |
| | Destination Maternity Corp. | 6,000 | 191 |
| * | Asbury Automotive | | |
| | Group Inc. | 3,500 | 186 |
| | Stewart Enterprises Inc. | | |
| | Class A | 13,400 | 176 |
| * | ANN Inc. | 4,800 | 174 |
| | OfficeMax Inc. | 11,900 | 152 |
| | Columbia Sportswear Co. | 2,300 | 138 |
| * | Office Depot Inc. | 28,100 | 136 |
| * | Hovnanian Enterprises Inc. | | |
| | Class A | 25,700 | 134 |
| | CEC Entertainment Inc. | 2,500 | 115 |
| * | Libbey Inc. | 4,700 | 112 |
| | Standard Motor Products Inc. | 3,200 | 103 |
| * | Stoneridge Inc. | 9,000 | 97 |
| * | Denny’s Corp. | 12,900 | 79 |
| | CSS Industries Inc. | 3,200 | 77 |
| | | | 50,665 |
| Consumer Staples (3.9%) | | |
| | Nu Skin Enterprises Inc. | | |
| | Class A | 31,600 | 3,026 |
13
Strategic Small-Cap Equity Fund
| | | |
| | | | Market |
| | | | Value |
| | | Shares | ($000) |
| * | Rite Aid Corp. | 572,600 | 2,726 |
| * | Pilgrim’s Pride Corp. | 122,450 | 2,056 |
| | Andersons Inc. | 29,400 | 2,055 |
| | Sanderson Farms Inc. | 25,800 | 1,683 |
| | Universal Corp. | 18,500 | 942 |
| * | USANA Health Sciences Inc. | 8,500 | 738 |
| * | SUPERVALU Inc. | 65,600 | 540 |
| | Village Super Market Inc. | | |
| | Class A | 5,500 | 209 |
| | Inter Parfums Inc. | 6,800 | 204 |
| | Dean Foods Co. | 9,600 | 185 |
| * | WhiteWave Foods Co. | | |
| | Class A | 8,527 | 170 |
| | | | 14,534 |
| Energy (4.7%) | | |
| * | EPL Oil & Gas Inc. | 57,200 | 2,123 |
| | Western Refining Inc. | 63,000 | 1,893 |
| | Bristow Group Inc. | 25,900 | 1,884 |
| * | Exterran Holdings Inc. | 60,000 | 1,654 |
| | HollyFrontier Corp. | 29,434 | 1,239 |
| * | Gran Tierra Energy Inc. | 144,800 | 1,027 |
| | Delek US Holdings Inc. | 44,400 | 936 |
| * | Hercules Offshore Inc. | 118,400 | 873 |
| * | Stone Energy Corp. | 25,400 | 824 |
| | EXCO Resources Inc. | 121,100 | 816 |
| * | Dawson Geophysical Co. | 23,900 | 776 |
| | SEACOR Holdings Inc. | 7,400 | 669 |
| | Alon USA Energy Inc. | 50,200 | 513 |
| * | Parker Drilling Co. | 77,100 | 439 |
| | RPC Inc. | 27,800 | 430 |
| * | Era Group Inc. | 15,000 | 408 |
| | Green Plains Renewable | | |
| | Energy Inc. | 21,800 | 350 |
| * | Forest Oil Corp. | 56,900 | 347 |
| | CVR Energy Inc. | 7,300 | 281 |
| * | Abraxas Petroleum Corp. | 42,700 | 110 |
| * | PetroQuest Energy Inc. | 25,400 | 102 |
| * | Newpark Resources Inc. | 7,300 | 92 |
| | | | 17,786 |
| Financials (22.6%) | | |
| * | Portfolio Recovery | | |
| | Associates Inc. | 45,600 | 2,733 |
| | CNO Financial Group Inc. | 171,000 | 2,462 |
| | Protective Life Corp. | 54,900 | 2,336 |
| | Platinum Underwriters | | |
| | Holdings Ltd. | 36,200 | 2,162 |
| | East West Bancorp Inc. | 67,300 | 2,150 |
| | Susquehanna | | |
| | Bancshares Inc. | 164,700 | 2,067 |
| * | Credit Acceptance Corp. | 18,212 | 2,018 |
| | Union First Market | | |
| | Bankshares Corp. | 84,700 | 1,979 |
| | Nelnet Inc. Class A | 51,148 | 1,967 |
| | Cathay General Bancorp | 83,200 | 1,944 |
| | | |
| | Associated Banc-Corp | 125,400 | 1,942 |
| * | Encore Capital Group Inc. | 42,200 | 1,935 |
| * | World Acceptance Corp. | 20,800 | 1,870 |
| | Washington Federal Inc. | 84,400 | 1,745 |
| | Glacier Bancorp Inc. | 70,400 | 1,740 |
| | Primerica Inc. | 41,500 | 1,674 |
| | Umpqua Holdings Corp. | 102,500 | 1,663 |
| | Webster Financial Corp. | 64,030 | 1,635 |
| | WesBanco Inc. | 49,411 | 1,469 |
| | Extra Space Storage Inc. | 31,800 | 1,455 |
| | Corrections Corp. of | | |
| | America | 41,712 | 1,441 |
| | Montpelier Re Holdings Ltd. | 54,700 | 1,425 |
| * | Howard Hughes Corp. | 12,400 | 1,393 |
| | RLJ Lodging Trust | 56,800 | 1,334 |
| | Omega Healthcare | | |
| | Investors Inc. | 44,100 | 1,317 |
| | Home Properties Inc. | 22,200 | 1,282 |
| | National Retail Properties Inc. | 38,000 | 1,209 |
| | Geo Group Inc. | 35,900 | 1,194 |
| | Retail Properties of | | |
| | America Inc. | 83,900 | 1,154 |
| * | Popular Inc. | 41,800 | 1,096 |
| | Brandywine Realty Trust | 78,000 | 1,028 |
| | EPR Properties | 20,900 | 1,019 |
| | First Interstate | | |
| | Bancsystem Inc. | 41,100 | 993 |
| | PrivateBancorp Inc. | 46,000 | 984 |
| | CBL & Associates | | |
| | Properties Inc. | 50,900 | 972 |
| | Healthcare Trust of | | |
| | America Inc. Class A | 87,600 | 922 |
| | Oritani Financial Corp. | 55,800 | 919 |
| * | Forestar Group Inc. | 42,500 | 915 |
| | Pennsylvania REIT | 48,800 | 913 |
| | Inland Real Estate Corp. | 88,900 | 909 |
| | Ryman Hospitality | | |
| | Properties Inc. | 26,000 | 897 |
| * | FelCor Lodging Trust Inc. | 142,900 | 880 |
| | Medical Properties Trust Inc. | 71,600 | 871 |
| | Ashford Hospitality Trust Inc. | 70,400 | 869 |
| | Flagstar Bancorp Inc. | 58,400 | 862 |
| | Investors Real Estate Trust | 104,200 | 860 |
| | CoreSite Realty Corp. | 24,800 | 842 |
| | Universal Health Realty | | |
| | Income Trust | 19,400 | 812 |
| | Ramco-Gershenson | | |
| | Properties Trust | 51,900 | 800 |
| * | Piper Jaffray Cos. | 22,900 | 785 |
| | Highwoods Properties Inc. | 21,300 | 752 |
| | Lexington Realty Trust | 65,600 | 737 |
| | Franklin Street | | |
| | Properties Corp. | 57,300 | 730 |
14
Strategic Small-Cap Equity Fund
| | | | |
| | | | | Market |
| | | | | Value |
| | | | Shares | ($000) |
| | Apartment Investment & | | |
| | Management Co. Class A | 25,900 | 724 |
| | BioMed Realty Trust Inc. | 38,200 | 710 |
| | MB Financial Inc. | | 24,800 | 700 |
| | One Liberty Properties Inc. | 34,400 | 698 |
| | Equity Lifestyle | | | |
| | Properties Inc. | | 20,300 | 694 |
| | Spirit Realty Capital Inc. | | 75,000 | 689 |
| | Home BancShares Inc. | | 20,600 | 626 |
| | Select Income REIT | | 23,800 | 614 |
| | First Potomac Realty Trust | 47,300 | 595 |
| * | Western Alliance Bancorp | 30,000 | 568 |
| | First Citizens BancShares Inc. | | |
| | Class A | | 2,700 | 555 |
| | Trico Bancshares | | 22,300 | 508 |
| | Wilshire Bancorp Inc. | | 61,300 | 501 |
| | Federated Investors Inc. | | |
| | Class B | | 16,300 | 443 |
| * | United Community | | | |
| | Banks Inc. | | 23,800 | 357 |
| * | Investment Technology | | | |
| | Group Inc. | | 22,400 | 352 |
| | Aspen Insurance | | | |
| | Holdings Ltd. | | 8,600 | 312 |
| | Horace Mann | | | |
| | Educators Corp. | | 10,900 | 309 |
| | FBL Financial Group Inc. | | |
| | Class A | | 6,800 | 305 |
| | Synovus Financial Corp. | | 90,000 | 297 |
| | Enterprise Financial | | | |
| | Services Corp. | | 17,500 | 294 |
| | Sunstone Hotel | | | |
| | Investors Inc. | | 22,300 | 284 |
| | GAMCO Investors Inc. | | 3,470 | 264 |
| | WSFS Financial Corp. | | 4,100 | 247 |
| | First Merchants Corp. | | 11,300 | 196 |
| | Winthrop Realty Trust | | 16,200 | 181 |
| | Provident Financial | | | |
| | Services Inc. | | 10,700 | 173 |
| | United Fire Group Inc. | | 5,000 | 152 |
| | Central Pacific Financial Corp. | 8,400 | 149 |
| | CapLease Inc. | | 14,500 | 123 |
| | Oppenheimer Holdings Inc. | | |
| | Class A | | 6,100 | 108 |
| | Douglas Emmett Inc. | | 4,200 | 99 |
| | Federal Agricultural | | | |
| | Mortgage Corp. | | 2,900 | 97 |
| | Sandy Spring Bancorp Inc. | 3,900 | 91 |
| | EverBank Financial Corp. | 5,100 | 76 |
| | | | | 85,153 |
| Health Care (11.7%) | | | |
| * | PAREXEL International Corp. | 47,300 | 2,376 |
| * | Isis Pharmaceuticals Inc. | 63,200 | 2,373 |
| * | Bruker Corp. | 104,400 | 2,156 |
| | | |
| * | Charles River Laboratories | | |
| | International Inc. | 45,100 | 2,086 |
| * | Alkermes plc | 61,100 | 2,054 |
| | West Pharmaceutical | | |
| | Services Inc. | 44,400 | 1,827 |
| | Meridian Bioscience Inc. | 73,600 | 1,741 |
| * | United Therapeutics Corp. | 22,000 | 1,735 |
| * | Cyberonics Inc. | 33,900 | 1,720 |
| | PDL BioPharma Inc. | 214,400 | 1,709 |
| * | Magellan Health | | |
| | Services Inc. | 28,400 | 1,703 |
| | Questcor | | |
| | Pharmaceuticals Inc. | 26,400 | 1,531 |
| * | Gentiva Health Services Inc. | 125,000 | 1,505 |
| * | Salix Pharmaceuticals Ltd. | 22,200 | 1,485 |
| ^ | Chemed Corp. | 20,500 | 1,466 |
| * | SurModics Inc. | 60,931 | 1,449 |
| * | Molina Healthcare Inc. | 38,400 | 1,367 |
| * | MedAssets Inc. | 44,500 | 1,131 |
| * | Auxilium | | |
| | Pharmaceuticals Inc. | 60,900 | 1,110 |
| | STERIS Corp. | 24,800 | 1,065 |
| * | Nektar Therapeutics | 96,000 | 1,003 |
| | Select Medical | | |
| | Holdings Corp. | 123,200 | 994 |
| * | Bio-Reference Labs Inc. | 31,900 | 953 |
| * | Corvel Corp. | 25,700 | 950 |
| * | Santarus Inc. | 33,900 | 765 |
| * | Medicines Co. | 22,800 | 764 |
| * | Centene Corp. | 11,900 | 761 |
| * | AMN Healthcare | | |
| | Services Inc. | 54,000 | 743 |
| | Cantel Medical Corp. | 20,550 | 655 |
| * | Sirona Dental Systems Inc. | 8,200 | 549 |
| ^ | National Research Corp. | | |
| | Class B | 14,300 | 427 |
| * | PharMerica Corp. | 29,100 | 386 |
| * | Brookdale Senior Living Inc. | | |
| | Class A | 14,600 | 384 |
| * | Depomed Inc. | 36,200 | 271 |
| * | Quidel Corp. | 9,200 | 261 |
| * | Health Net Inc. | 6,600 | 209 |
| * | Seattle Genetics Inc. | 3,800 | 167 |
| * | Affymetrix Inc. | 21,000 | 130 |
| * | Omnicell Inc. | 5,100 | 121 |
| * | VCA Antech Inc. | 3,600 | 99 |
| * | Myriad Genetics Inc. | 3,800 | 89 |
| | | | 44,270 |
| Industrials (17.4%) | | |
| | AO Smith Corp. | 57,400 | 2,594 |
| | Trinity Industries Inc. | 54,500 | 2,472 |
| | Alaska Air Group Inc. | 38,800 | 2,430 |
| * | Oshkosh Corp. | 49,500 | 2,425 |
| * | Terex Corp. | 70,300 | 2,362 |
15
Strategic Small-Cap Equity Fund
| | | |
| | | | Market |
| | | | Value |
| | | Shares | ($000) |
| * | US Airways Group Inc. | 124,400 | 2,359 |
| | EnerSys Inc. | 38,676 | 2,345 |
| * | AECOM Technology Corp. | 74,300 | 2,323 |
| | Lincoln Electric Holdings Inc. | 34,300 | 2,285 |
| | Hyster-Yale Materials | | |
| | Handling Inc. | 24,584 | 2,204 |
| | Generac Holdings Inc. | 51,400 | 2,192 |
| | Deluxe Corp. | 50,000 | 2,083 |
| | Crane Co. | 33,100 | 2,041 |
| | Mine Safety Appliances Co. | 38,200 | 1,971 |
| | AMERCO | 10,500 | 1,933 |
| | Steelcase Inc. Class A | 112,400 | 1,868 |
| | G&K Services Inc. Class A | 28,800 | 1,739 |
| | Mueller Water Products Inc. | | |
| | Class A | 195,400 | 1,561 |
| | Apogee Enterprises Inc. | 52,300 | 1,552 |
| * | United Rentals Inc. | 25,000 | 1,457 |
| * | USG Corp. | 50,300 | 1,438 |
| * | Swift Transportation Co. | 69,700 | 1,407 |
| * | Taser International Inc. | 87,900 | 1,311 |
| | GATX Corp. | 27,200 | 1,293 |
| * | American Woodmark Corp. | 28,800 | 998 |
| | ITT Corp. | 27,500 | 989 |
| * | Republic Airways | | |
| | Holdings Inc. | 82,800 | 985 |
| * | ICF International Inc. | 25,300 | 896 |
| | AAR Corp. | 32,500 | 888 |
| | Altra Holdings Inc. | 31,700 | 853 |
| * | Engility Holdings Inc. | 26,700 | 847 |
| | Standex International Corp. | 13,300 | 790 |
| | Alliant Techsystems Inc. | 6,600 | 644 |
| | United Stationers Inc. | 14,400 | 626 |
| * | Consolidated Graphics Inc. | 11,100 | 622 |
| | LB Foster Co. Class A | 13,200 | 604 |
| * | Saia Inc. | 18,750 | 585 |
| | John Bean | | |
| | Technologies Corp. | 21,800 | 542 |
| | Kforce Inc. | 30,400 | 538 |
| | UniFirst Corp. | 5,000 | 522 |
| * | Greenbrier Cos. Inc. | 19,600 | 485 |
| | Lennox International Inc. | 5,900 | 444 |
| | Quad/Graphics Inc. | 12,800 | 389 |
| * | MRC Global Inc. | 13,500 | 362 |
| | American Railcar | | |
| | Industries Inc. | 9,100 | 357 |
| | Valmont Industries Inc. | 2,500 | 347 |
| | SkyWest Inc. | 22,900 | 333 |
| * | Ducommun Inc. | 11,500 | 330 |
| * | Trex Co. Inc. | 6,600 | 327 |
| | RR Donnelley & Sons Co. | 18,400 | 291 |
| | Kimball International Inc. | | |
| | Class B | 25,900 | 287 |
| | Viad Corp. | 10,400 | 259 |
| | US Ecology Inc. | 8,431 | 254 |
| | | |
| * | Federal Signal Corp. | 17,300 | 223 |
| * | Orion Marine Group Inc. | 16,300 | 170 |
| * | Columbus McKinnon Corp. | 6,000 | 144 |
| | Allegiant Travel Co. Class A | 1,100 | 116 |
| | Kaydon Corp. | 3,200 | 114 |
| | Alamo Group Inc. | 2,200 | 108 |
| * | Spirit Airlines Inc. | 3,100 | 106 |
| * | Nortek Inc. | 1,500 | 103 |
| | AAON Inc. | 3,800 | 101 |
| | Albany International Corp. | 2,800 | 100 |
| | Lindsay Corp. | 1,200 | 98 |
| | Manitowoc Co. Inc. | 4,400 | 86 |
| | | | 65,508 |
| Information Technology (16.8%) | |
| | Jack Henry & | | |
| | Associates Inc. | 49,700 | 2,565 |
| | Broadridge Financial | | |
| | Solutions Inc. | 80,700 | 2,562 |
| * | Brocade Communications | | |
| | Systems Inc. | 310,000 | 2,496 |
| | MAXIMUS Inc. | 54,732 | 2,465 |
| * | CommVault Systems Inc. | 27,700 | 2,433 |
| * | SYNNEX Corp. | 39,100 | 2,403 |
| * | Manhattan Associates Inc. | 23,800 | 2,272 |
| * | Ciena Corp. | 87,000 | 2,173 |
| * | Anixter International Inc. | 23,200 | 2,034 |
| * | Aspen Technology Inc. | 56,000 | 1,935 |
| * | CACI International Inc. | | |
| | Class A | 27,250 | 1,883 |
| * | CoreLogic Inc. | 67,300 | 1,820 |
| * | Tech Data Corp. | 35,700 | 1,782 |
| * | Gartner Inc. | 29,600 | 1,776 |
| * | Unisys Corp. | 67,012 | 1,688 |
| | Blackbaud Inc. | 42,400 | 1,655 |
| * | Zebra Technologies Corp. | 34,600 | 1,575 |
| * | Kulicke & Soffa | | |
| | Industries Inc. | 135,000 | 1,559 |
| * | Global Cash Access | | |
| | Holdings Inc. | 193,300 | 1,510 |
| * | Applied Micro Circuits Corp. | 110,000 | 1,419 |
| * | Spansion Inc. Class A | 126,600 | 1,277 |
| | Heartland Payment | | |
| | Systems Inc. | 29,900 | 1,188 |
| * | NCR Corp. | 29,400 | 1,165 |
| | Pegasystems Inc. | 29,000 | 1,155 |
| | Booz Allen Hamilton | | |
| | Holding Corp. | 56,600 | 1,094 |
| * | Silicon Graphics | | |
| | International Corp. | 63,300 | 1,029 |
| * | Itron Inc. | 22,400 | 959 |
| * | Advanced Energy | | |
| | Industries Inc. | 51,600 | 904 |
| * | Magnachip | | |
| | Semiconductor Corp. | 38,900 | 838 |
16
Strategic Small-Cap Equity Fund
| | | |
| | | | Market |
| | | | Value |
| | | Shares | ($000) |
| * | ARRIS Group Inc. | 47,500 | 810 |
| * | RF Micro Devices Inc. | 132,300 | 746 |
| * | Benchmark Electronics Inc. | 31,100 | 712 |
| * | Advanced Micro | | |
| | Devices Inc. | 168,300 | 640 |
| | Plantronics Inc. | 13,800 | 636 |
| * | TeleTech Holdings Inc. | 24,800 | 622 |
| * | Sanmina Corp. | 35,300 | 617 |
| * | Sigma Designs Inc. | 88,700 | 496 |
| | Advent Software Inc. | 15,600 | 495 |
| | Lender Processing | | |
| | Services Inc. | 13,600 | 453 |
| * | Seachange International Inc. | 38,800 | 445 |
| * | Electronics For Imaging Inc. | 13,700 | 434 |
| | DST Systems Inc. | 5,600 | 422 |
| * | Quantum Corp. | 292,200 | 403 |
| * | Comverse Inc. | 12,500 | 399 |
| * | Acxiom Corp. | 13,300 | 378 |
| * | XO Group Inc. | 27,800 | 359 |
| * | PMC - Sierra Inc. | 54,100 | 358 |
| * | Euronet Worldwide Inc. | 8,900 | 354 |
| | CSG Systems | | |
| | International Inc. | 14,100 | 353 |
| * | MaxLinear Inc. | 40,800 | 338 |
| * | Ingram Micro Inc. | 14,200 | 327 |
| * | Calix Inc. | 18,400 | 234 |
| *,^ | SunPower Corp. Class A | 7,900 | 207 |
| | Daktronics Inc. | 16,900 | 189 |
| * | Travelzoo Inc. | 7,000 | 186 |
| | United Online Inc. | 23,000 | 184 |
| * | PTC Inc. | 6,100 | 173 |
| * | DSP Group Inc. | 23,700 | 167 |
| | Lexmark International Inc. | | |
| | Class A | 4,900 | 162 |
| * | Newport Corp. | 9,500 | 149 |
| * | ValueClick Inc. | 6,300 | 131 |
| * | Carbonite Inc. | 7,700 | 116 |
| * | Rambus Inc. | 11,600 | 109 |
| * | VistaPrint NV | 1,900 | 107 |
| * | Synaptics Inc. | 2,400 | 106 |
| * | comScore Inc. | 3,600 | 104 |
| * | Silicon Image Inc. | 19,000 | 101 |
| * | Sapient Corp. | 6,500 | 101 |
| * | Angie’s List Inc. | 4,200 | 95 |
| * | Agilysys Inc. | 7,900 | 94 |
| * | CIBER Inc. | 26,800 | 88 |
| | | | 63,214 |
| Materials (5.3%) | | |
| | Packaging Corp. of America | 49,100 | 2,803 |
| | Schweitzer-Mauduit | | |
| | International Inc. | 35,900 | 2,173 |
| | NewMarket Corp. | 7,500 | 2,159 |
| | Westlake Chemical Corp. | 17,400 | 1,821 |
| | Neenah Paper Inc. | 37,044 | 1,456 |
| | | |
| * | Graphic Packaging | | |
| | Holding Co. | 167,600 | 1,435 |
| | PH Glatfelter Co. | 50,200 | 1,359 |
| * | Chemtura Corp. | 47,700 | 1,097 |
| | Quaker Chemical Corp. | 10,600 | 774 |
| | Worthington Industries Inc. | 20,200 | 695 |
| | Minerals Technologies Inc. | 13,300 | 657 |
| | Cytec Industries Inc. | 8,000 | 651 |
| | KapStone Paper and | | |
| | Packaging Corp. | 13,200 | 565 |
| * | SunCoke Energy Inc. | 27,200 | 462 |
| * | Louisiana-Pacific Corp. | 20,800 | 366 |
| | A Schulman Inc. | 12,000 | 354 |
| | Kaiser Aluminum Corp. | 4,000 | 285 |
| | Tredegar Corp. | 8,100 | 211 |
| | Olympic Steel Inc. | 7,400 | 206 |
| * | Ferro Corp. | 13,200 | 120 |
| | Silgan Holdings Inc. | 2,300 | 108 |
| | Greif Inc. Class A | 1,900 | 93 |
| * | Berry Plastics Group Inc. | 4,600 | 92 |
| | | | 19,942 |
| Telecommunication Services (1.3%) | |
| | Atlantic Tele-Network Inc. | 32,900 | 1,715 |
| * | Vonage Holdings Corp. | 292,900 | 920 |
| * | Premiere Global | | |
| | Services Inc. | 75,400 | 751 |
| | NTELOS Holdings Corp. | 33,000 | 620 |
| | Shenandoah | | |
| | Telecommunications Co. | 18,500 | 446 |
| | IDT Corp. Class B | 23,300 | 414 |
| | | | 4,866 |
| Utilities (2.4%) | | |
| | Black Hills Corp. | 40,900 | 2,039 |
| | American States Water Co. | 65,000 | 1,791 |
| | Portland General Electric Co. | 60,500 | 1,708 |
| | Otter Tail Corp. | 55,100 | 1,521 |
| | UNS Energy Corp. | 29,800 | 1,389 |
| | MGE Energy Inc. | 8,500 | 464 |
| | IDACORP Inc. | 2,200 | 107 |
| | Atmos Energy Corp. | 2,100 | 89 |
| | | | 9,108 |
| Total Common Stocks | | |
| (Cost $294,387) | | 375,046 |
17
Strategic Small-Cap Equity Fund
| | | |
| | | | Market |
| | | | Value |
| | | Shares | ($000) |
| Temporary Cash Investments (0.8%)1 | |
| Money Market Fund (0.7%) | | |
| 2,3 | Vanguard Market Liquidity | | |
| | Fund, 0.112% | 2,741,313 | 2,741 |
| |
| | | Face | |
| | | Amount | |
| | | ($000) | |
| U.S. Government and Agency Obligations (0.1%) |
| 4,5 | Federal Home Loan | | |
| | Bank Discount Notes, | | |
| | 0.090%, 10/25/13 | 100 | 100 |
| 5,6 | Freddie Mac Discount | | |
| | Notes, 0.100%, 1/27/14 | 100 | 100 |
| | | | 200 |
| Total Temporary Cash Investments | |
| (Cost $2,941) | | 2,941 |
| Total Investments (100.3%) | | |
| (Cost $297,328) | | 377,987 |
| Other Assets and Liabilities (-0.3%) | |
| Other Assets | | 1,022 |
| Liabilities3 | | (2,069) |
| | | | (1,047) |
| Net Assets (100%) | | |
| Applicable to 13,490,561 outstanding | |
| $.001 par value shares of beneficial | |
| interest (unlimited authorization) | 376,940 |
| Net Asset Value Per Share | | $27.94 |
| |
| At September 30, 2013, net assets consisted of: |
| | Amount |
| | ($000) |
| Paid-in Capital | 294,204 |
| Undistributed Net Investment Income | 1,465 |
| Accumulated Net Realized Gains | 601 |
| Unrealized Appreciation (Depreciation) | |
| Investment Securities | 80,659 |
| Futures Contracts | 11 |
| Net Assets | 376,940 |
See Note A in Notes to Financial Statements.
* Non-income-producing security.
^ Part of security position is on loan to broker-dealers. The total value of securities on loan is $583,000.
1 The fund invests a portion of its cash reserves in equity markets through the use of index futures contracts. After giving effect to futures
investments, the fund’s effective common stock and temporary cash investment positions represent 100.0% and 0.3%, respectively, of
net assets.
2 Affiliated money market fund available only to Vanguard funds and certain trusts and accounts managed by Vanguard. Rate shown is the
7-day yield.
3 Includes $581,000 of collateral received for securities on loan. The fund received additional collateral of $19,000 on the next business day.
4 The issuer operates under a congressional charter; its securities are generally neither guaranteed by the U.S. Treasury nor backed by the
full faith and credit of the U.S. government.
5 Securities with a value of $200,000 have been segregated as initial margin for open futures contracts.
6 The issuer was placed under federal conservatorship in September 2008; since that time, its daily operations have been managed by the
Federal Housing Finance Agency and it receives capital from the U.S. Treasury, as needed to maintain a positive net worth, in exchange
for senior preferred stock.
REIT—Real Estate Investment Trust.
See accompanying Notes, which are an integral part of the Financial Statements.
18
Strategic Small-Cap Equity Fund
Statement of Operations
| |
| | Year Ended |
| | September 30, 2013 |
| | ($000) |
| Investment Income | |
| Income | |
| Dividends | 5,322 |
| Interest1 | 3 |
| Securities Lending | 71 |
| Total Income | 5,396 |
| Expenses | |
| The Vanguard Group—Note B | |
| Investment Advisory Services | 271 |
| Management and Administrative | 784 |
| Marketing and Distribution | 54 |
| Custodian Fees | 9 |
| Auditing Fees | 28 |
| Shareholders’ Reports | 5 |
| Trustees’ Fees and Expenses | 1 |
| Total Expenses | 1,152 |
| Net Investment Income | 4,244 |
| Realized Net Gain (Loss) | |
| Investment Securities Sold | 37,060 |
| Futures Contracts | 385 |
| Realized Net Gain (Loss) | 37,445 |
| Change in Unrealized Appreciation (Depreciation) | |
| Investment Securities | 44,428 |
| Futures Contracts | 40 |
| Change in Unrealized Appreciation (Depreciation) | 44,468 |
| Net Increase (Decrease) in Net Assets Resulting from Operations | 86,157 |
| 1 Interest income from an affiliated company of the fund was $3,000. |
See accompanying Notes, which are an integral part of the Financial Statements.
19
Strategic Small-Cap Equity Fund
Statement of Changes in Net Assets
| | |
| | Year Ended September 30, |
| | 2013 | 2012 |
| | ($000) | ($000) |
| Increase (Decrease) in Net Assets | | |
| Operations | | |
| Net Investment Income | 4,244 | 2,906 |
| Realized Net Gain (Loss) | 37,445 | 15,584 |
| Change in Unrealized Appreciation (Depreciation) | 44,468 | 48,050 |
| Net Increase (Decrease) in Net Assets Resulting from Operations | 86,157 | 66,540 |
| Distributions | | |
| Net Investment Income | (4,284) | (2,511) |
| Realized Capital Gain | — | — |
| Total Distributions | (4,284) | (2,511) |
| Capital Share Transactions | | |
| Issued | 90,361 | 45,193 |
| Issued in Lieu of Cash Distributions | 3,965 | 2,343 |
| Redeemed | (58,434) | (75,381) |
| Net Increase (Decrease) from Capital Share Transactions | 35,892 | (27,845) |
| Total Increase (Decrease) | 117,765 | 36,184 |
| Net Assets | | |
| Beginning of Period | 259,175 | 222,991 |
| End of Period1 | 376,940 | 259,175 |
| 1 Net Assets—End of Period includes undistributed net investment income of $1,465,000 and $1,519,000. |
See accompanying Notes, which are an integral part of the Financial Statements.
20
Strategic Small-Cap Equity Fund
Financial Highlights
| | | | | |
| For a Share Outstanding | Year Ended September 30, |
| Throughout Each Period | 2013 | 2012 | 2011 | 2010 | 2009 |
| Net Asset Value, Beginning of Period | $21.37 | $16.44 | $16.53 | $14.32 | $16.60 |
| Investment Operations | | | | | |
| Net Investment Income | . 345 | . 238 | .176 | .154 | .145 |
| Net Realized and Unrealized Gain (Loss) | | | | | |
| on Investments | 6.585 | 4.888 | (.126) | 2.216 | (2.257) |
| Total from Investment Operations | 6.930 | 5.126 | .050 | 2.370 | (2.112) |
| Distributions | | | | | |
| Dividends from Net Investment Income | (. 360) | (.196) | (.140) | (.160) | (.168) |
| Distributions from Realized Capital Gains | — | — | — | — | — |
| Total Distributions | (. 360) | (.196) | (.140) | (.160) | (.168) |
| Net Asset Value, End of Period | $27.94 | $21.37 | $16.44 | $16.53 | $14.32 |
| |
| Total Return1 | 32.94% | 31.38% | 0.20% | 16.70% | -12.48% |
| |
| Ratios/Supplemental Data | | | | | |
| Net Assets, End of Period (Millions) | $377 | $259 | $223 | $178 | $165 |
| Ratio of Total Expenses to | | | | | |
| Average Net Assets | 0.38% | 0.38% | 0.38% | 0.43% | 0.43% |
| Ratio of Net Investment Income to | | | | | |
| Average Net Assets | 1.40% | 1.16% | 0.89% | 0.98% | 1.18% |
| Portfolio Turnover Rate | 64% | 66% | 64% | 66% | 76% |
| 1 Total returns do not include account service fees that may have applied in the periods shown. Fund prospectuses provide information |
| about any applicable account service fees. |
See accompanying Notes, which are an integral part of the Financial Statements.
21
Strategic Small-Cap Equity Fund
Notes to Financial Statements
Vanguard Strategic Small-Cap Equity Fund is registered under the Investment Company Act of 1940 as an open-end investment company, or mutual fund.
A. The following significant accounting policies conform to generally accepted accounting principles for U.S. mutual funds. The fund consistently follows such policies in preparing its financial statements.
1. Security Valuation: Securities are valued as of the close of trading on the New York Stock Exchange (generally 4 p.m., Eastern time) on the valuation date. Equity securities are valued at the latest quoted sales prices or official closing prices taken from the primary market in which each security trades; such securities not traded on the valuation date are valued at the mean of the latest quoted bid and asked prices. Securities for which market quotations are not readily available, or whose values have been materially affected by events occurring before the fund’s pricing time but after the close of the securities’ primary markets, are valued by methods deemed by the board of trustees to represent fair value. Investments in Vanguard Market Liquidity Fund are valued at that fund’s net asset value. Temporary cash investments acquired over 60 days to maturity are valued using the latest bid prices or using valuations based on a matrix system (which considers such factors as security prices, yields, maturities, and ratings), both as furnished by independent pricing services. Other temporary cash investments are valued at amortized cost, which approximates market value.
2. Futures Contracts: The fund may use index futures contracts to a limited extent, with the objective of maintaining full exposure to the stock market while maintaining liquidity. The fund may purchase or sell futures contracts to achieve a desired level of investment, whether to accommodate portfolio turnover or cash flows from capital share transactions. The primary risks associated with the use of futures contracts are imperfect correlation between changes in market values of stocks held by the fund and the prices of futures contracts, and the possibility of an illiquid market. Counterparty risk involving futures is mitigated because a regulated clearinghouse is the counterparty instead of the clearing broker. To further mitigate counterparty risk, the fund trades futures contracts on an exchange, monitors the financial strength of its clearing brokers and clearinghouse, and has entered into clearing agreements with its clearing brokers. The clearinghouse imposes initial margin requirements to secure the fund’s performance and requires daily settlement of variation margin representing changes in the market value of each contract.
Futures contracts are valued at their quoted daily settlement prices. The aggregate notional amounts of the contracts are not recorded in the Statement of Net Assets. Fluctuations in the value of the contracts are recorded in the Statement of Net Assets as an asset (liability) and in the Statement of Operations as unrealized appreciation (depreciation) until the contracts are closed, when they are recorded as realized futures gains (losses).
During the year ended September 30, 2013, the fund’s average investments in long and short futures contracts represented less than 1% and 0% of net assets, respectively, based on quarterly average aggregate settlement values.
3. Federal Income Taxes: The fund intends to continue to qualify as a regulated investment company and distribute all of its taxable income. Management has analyzed the fund’s tax positions taken for all open federal income tax years (September 30, 2010–2013), and has concluded that no provision for federal income tax is required in the fund’s financial statements.
22
Strategic Small-Cap Equity Fund
4. Distributions: Distributions to shareholders are recorded on the ex-dividend date.
5. Securities Lending: To earn additional income, the fund may lend its securities to qualified institutional borrowers. Security loans are required to be secured at all times by collateral in an amount at least equal to the market value of securities loaned. Daily market fluctuations could cause the value of loaned securities to be more or less than the value of the collateral received. When this occurs, the collateral is adjusted and settled on the next business day. The fund further mitigates its counterparty risk by entering into securities lending transactions only with a diverse group of prequalified counterparties, monitoring their financial strength, and entering into master securities lending agreements with its counterparties. The master securities lending agreements provide that, in the event of a counterparty’s default (including bankruptcy), the fund may terminate any loans that borrower, determine the net amount owed, and sell or retain the collateral up to the net amount owed to the fund; however, such actions may be subject to legal proceedings. While collateral mitigates counterparty risk, in the absence of a default the fund may experience delays and costs in recovering the securities loaned. The fund invests cash collateral received in Vanguard Market Liquidity Fund, and records a liability for the return of the collateral, during the period the securities are on loan. Securities lending income represents fees charged to borrowers plus income earned on invested cash collateral, less expenses associated with the loan.
6. Other: Dividend income is recorded on the ex-dividend date. Interest income includes income distributions received from Vanguard Market Liquidity Fund and is accrued daily. Premiums and discounts on debt securities purchased are amortized and accreted, respectively, to interest income over the lives of the respective securities. Security transactions are accounted for on the date securities are bought or sold. Costs used to determine realized gains (losses) on the sale of investment securities are those of the specific securities sold.
B. The Vanguard Group furnishes at cost investment advisory, corporate management, administrative, marketing, and distribution services. The costs of such services are allocated to the fund under methods approved by the board of trustees. The fund has committed to provide up to 0.40% of its net assets in capital contributions to Vanguard. At September 30, 2013, the fund had contributed capital of $43,000 to Vanguard (included in Other Assets), representing 0.01% of the fund’s net assets and 0.02% of Vanguard’s capitalization. The fund’s trustees and officers are also directors and officers of Vanguard.
C. Various inputs may be used to determine the value of the fund’s investments. These inputs are summarized in three broad levels for financial statement purposes. The inputs or methodologies used to value securities are not necessarily an indication of the risk associated with investing in those securities.
Level 1—Quoted prices in active markets for identical securities.
Level 2—Other significant observable inputs (including quoted prices for similar securities, interest rates, prepayment speeds, credit risk, etc.).
Level 3—Significant unobservable inputs (including the fund’s own assumptions used to determine the fair value of investments).
23
Strategic Small-Cap Equity Fund
The following table summarizes the market value of the fund’s investments as of September 30, 2013, based on the inputs used to value them:
| | | |
| | Level 1 | Level 2 | Level 3 |
| Investments | ($000) | ($000) | ($000) |
| Common Stocks | 375,046 | — | — |
| Temporary Cash Investments | 2,741 | 200 | — |
| Futures Contracts—Liabilities1 | (1) | — | — |
| Total | 377,786 | 200 | — |
| 1 Represents variation margin on the last day of the reporting period. |
D. At September 30, 2013, the aggregate settlement value of open futures contracts and the related unrealized appreciation (depreciation) were:
| | | | |
| | | | ($000) |
| | | | Aggregate | |
| | | Number of | Settlement | Unrealized |
| | | Long (Short) | Value | Appreciation |
| Futures Contracts | Expiration | Contracts | Long (Short) | (Depreciation) |
| E-mini Russell 2000 Index | December 2013 | 18 | 1,929 | 11 |
Unrealized appreciation (depreciation) on open futures contracts is required to be treated as realized gain (loss) for tax purposes.
E. Distributions are determined on a tax basis and may differ from net investment income and realized capital gains for financial reporting purposes. Differences may be permanent or temporary. Permanent differences are reclassified among capital accounts in the financial statements to reflect their tax character. Temporary differences arise when certain items of income, expense, gain, or loss are recognized in different periods for financial statement and tax purposes; these differences will reverse at some time in the future. Differences in classification may also result from the treatment of short-term gains as ordinary income for tax purposes.
The fund used a tax accounting practice to treat a portion of the price of capital shares redeemed during the year as distributions from net investment income and realized capital gains. Accordingly, the fund has reclassified $14,000 from undistributed net investment income, and $2,000 from accumulated net realized gains, to paid-in capital.
The fund used capital loss carryforwards of $36,878,000 to offset taxable capital gains realized during the year ended September 30, 2013, reducing the amount of capital gains that would otherwise be available to distribute to shareholders. For tax purposes, at September 30, 2013, the fund had $1,896,000 of ordinary income and $606,000 of long-term capital gains available for distribution.
At September 30, 2013, the cost of investment securities for tax purposes was $297,328,000. Net unrealized appreciation of investment securities for tax purposes was $80,659,000, consisting of unrealized gains of $85,350,000 on securities that had risen in value since their purchase and $4,691,000 in unrealized losses on securities that had fallen in value since their purchase.
24
Strategic Small-Cap Equity Fund
F. During the year ended September 30, 2013, the fund purchased $228,719,000 of investment securities and sold $192,315,000 of investment securities, other than temporary cash investments.
G. Capital shares issued and redeemed were:
| | |
| | Year Ended September 30, |
| | 2013 | 2012 |
| | Shares | Shares |
| | (000) | (000) |
| Issued | 3,625 | 2,260 |
| Issued in Lieu of Cash Distributions | 185 | 128 |
| Redeemed | (2,446) | (3,827) |
| Net Increase (Decrease) in Shares Outstanding | 1,364 | (1,439) |
H. Management has determined that no material events or transactions occurred subsequent to September 30, 2013, that would require recognition or disclosure in these financial statements.
25
Report of Independent Registered
Public Accounting Firm
To the Trustees of Vanguard Horizon Funds and the Shareholders of Vanguard Strategic Small-Cap Equity Fund:
In our opinion, the accompanying statement of net assets and the related statements of operations and of changes in net assets and the financial highlights present fairly, in all material respects, the financial position of Vanguard Strategic Small-Cap Equity Fund (constituting a separate portfolio of Vanguard Horizon Funds, hereafter referred to as the “Fund”) at September 30, 2013, the results of its operations for the year then ended, the changes in its net assets for each of the two years in the period then ended, and the financial highlights for each of the five years in the period then ended, in conformity with accounting principles generally accepted in the United States of America. These financial statements and financial highlights (hereafter referred to as “financial statements”) are the responsibility of the Fund’s management; our responsibility is to express an opinion on these financial statements based on our audits. We conducted our audits of these financial statements in accordance with the standards of the Public Company Accounting Oversight Board (United States). Those standards require that we plan and perform the audit to obtain reasonable assurance about whether the financial statements are free of material misstatement. An audit includes examining, on a test basis, evidence supporting the amounts and disclosures in the financial statements, assessing the accounting principles used and significant estimates made by management, and evaluating the overall financial statement presentation. We believe that our audits, which included confirmation of securities at September 30, 2013 by correspondence with the custodian and broker and by agreement to the underlying ownership records of the transfer agent, provide a reasonable basis for our opinion.
/s/PricewaterhouseCoopers LLP
Philadelphia, Pennsylvania
November 14, 2013
Special 2013 tax information (unaudited) for Vanguard Strategic Small-Cap Equity Fund
This information for the fiscal year ended September 30, 2013, is included pursuant to provisions
of the Internal Revenue Code.
The fund distributed $2,000 as capital gain dividends (from net long-term capital gains) to shareholders
during the fiscal year.
The fund distributed $4,284,000 of qualified dividend income to shareholders during the fiscal year.
For corporate shareholders, 96.5% of investment income (dividend income plus short-term gains,
if any) qualifies for the dividends-received deduction.
26
Your Fund’s After-Tax Returns
This table presents returns for your fund both before and after taxes. The after-tax returns are shown in two ways: (1) assuming that an investor owned the fund during the entire period and paid taxes on the fund’s distributions, and (2) assuming that an investor paid taxes on the fund’s distributions and sold all shares at the end of each period.
Calculations are based on the highest individual federal income tax and capital gains tax rates in effect at the times of the distributions and the hypothetical sales. State and local taxes were not considered. After-tax returns reflect any qualified dividend income, using actual prior-year figures and estimates for 2013. (In the example, returns after the sale of fund shares may be higher than those assuming no sale. This occurs when the sale would have produced a capital loss. The calculation assumes that the investor received a tax deduction for the loss.)
Please note that your actual after-tax returns will depend on your tax situation and may differ from those shown. Also note that if you own the fund in a tax-deferred account, such as an individual retirement account or a 401(k) plan, this information does not apply to you. Such accounts are not subject to current taxes.
Finally, keep in mind that a fund’s performance—whether before or after taxes—does not guarantee future results.
| | | |
| Average Annual Total Returns: Strategic Small-Cap Equity Fund | | |
| Periods Ended September 30, 2013 | | | |
| | | | Since |
| | One | Five | Inception |
| | Year | Years | (4/24/2006) |
| Returns Before Taxes | 32.94% | 12.32% | 5.81% |
| Returns After Taxes on Distributions | 32.61 | 12.11 | 5.61 |
| Returns After Taxes on Distributions and Sale of Fund Shares | 19.08 | 9.84 | 4.59 |
27
About Your Fund’s Expenses
As a shareholder of the fund, you incur ongoing costs, which include costs for portfolio management, administrative services, and shareholder reports (like this one), among others. Operating expenses, which are deducted from a fund’s gross income, directly reduce the investment return of the fund.
A fund’s expenses are expressed as a percentage of its average net assets. This figure is known as the expense ratio. The following examples are intended to help you understand the ongoing costs (in dollars) of investing in your fund and to compare these costs with those of other mutual funds. The examples are based on an investment of $1,000 made at the beginning of the period shown and held for the entire period.
The accompanying table illustrates your fund’s costs in two ways:
• Based on actual fund return. This section helps you to estimate the actual expenses that you paid over the period. The ”Ending Account Value“ shown is derived from the fund‘s actual return, and the third column shows the dollar amount that would have been paid by an investor who started with $1,000 in the fund. You may use the information here, together with the amount you invested, to estimate the expenses that you paid over the period.
To do so, simply divide your account value by $1,000 (for example, an $8,600 account value divided by $1,000 = 8.6), then multiply the result by the number given for your fund under the heading ”Expenses Paid During Period.“
• Based on hypothetical 5% yearly return. This section is intended to help you compare your fund‘s costs with those of other mutual funds. It assumes that the fund had a yearly return of 5% before expenses, but that the expense ratio is unchanged. In this case—because the return used is not the fund’s actual return—the results do not apply to your investment. The example is useful in making comparisons because the Securities and Exchange Commission requires all mutual funds to calculate expenses based on a 5% return. You can assess your fund’s costs by comparing this hypothetical example with the hypothetical examples that appear in shareholder reports of other funds.
Note that the expenses shown in the table are meant to highlight and help you compare ongoing costs only and do not reflect transaction costs incurred by the fund for buying and selling securities. Further, the expenses do not include any purchase, redemption, or account service fees described in the fund prospectus. If such fees were applied to your account, your costs would be higher. Your fund does not carry a “sales load.”
The calculations assume no shares were bought or sold during the period. Your actual costs may have been higher or lower, depending on the amount of your investment and the timing of any purchases or redemptions.
You can find more information about the fund’s expenses, including annual expense ratios, in the Financial Statements section of this report. For additional information on operating expenses and other shareholder costs, please refer to your fund’s current prospectus.
28
| | | |
| Six Months Ended September 30, 2013 | | | |
| | Beginning | Ending | Expenses |
| | Account Value | Account Value | Paid During |
| Strategic Small-Cap Equity Fund | 3/31/2013 | 9/30/2013 | Period |
| Based on Actual Fund Return | $1,000.00 | $1,132.09 | $2.03 |
| Based on Hypothetical 5% Yearly Return | 1,000.00 | 1,023.16 | 1.93 |
The calculations are based on expenses incurred in the most recent six-month period. The fund’s annualized six-month expense ratio for that
period is 0.38%. The dollar amounts shown as “Expenses Paid” are equal to the expense ratio multiplied by the average account value over
the period, multiplied by the number of days in the most recent six-month period, then divided by the number of days in the most recent
12-month period.
29
Glossary
30-Day SEC Yield. A fund’s 30-day SEC yield is derived using a formula specified by the U.S. Securities and Exchange Commission. Under the formula, data related to the fund’s security holdings in the previous 30 days are used to calculate the fund’s hypothetical net income for that period, which is then annualized and divided by the fund’s estimated average net assets over the calculation period. For the purposes of this calculation, a security’s income is based on its current market yield to maturity (for bonds), its actual income (for asset-backed securities), or its projected dividend yield (for stocks). Because the SEC yield represents hypothetical annualized income, it will differ—at times significantly—from the fund’s actual experience. As a result, the fund’s income distributions may be higher or lower than implied by the SEC yield.
Beta. A measure of the magnitude of a fund’s past share-price fluctuations in relation to the ups and downs of a given market index. The index is assigned a beta of 1.00. Compared with a given index, a fund with a beta of 1.20 typically would have seen its share price rise or fall by 12% when the index rose or fell by 10%. For this report, beta is based on returns over the past 36 months for both the fund and the index. Note that a fund’s beta should be reviewed in conjunction with its R-squared (see definition). The lower the R-squared, the less correlation there is between the fund and the index, and the less reliable beta is as an indicator of volatility.
Dividend Yield. Dividend income earned by stocks, expressed as a percentage of the aggregate market value (or of net asset value, for a fund). The yield is determined by dividing the amount of the annual dividends by the aggregate value (or net asset value) at the end of the period. For a fund, the dividend yield is based solely on stock holdings and does not include any income produced by other investments.
Earnings Growth Rate. The average annual rate of growth in earnings over the past five years for the stocks now in a fund.
Equity Exposure. A measure that reflects a fund’s investments in stocks and stock futures. Any holdings in short-term reserves are excluded.
Expense Ratio. A fund’s total annual operating expenses expressed as a percentage of the fund’s average net assets. The expense ratio includes management and administrative expenses, but does not include the transaction costs of buying and selling portfolio securities.
Foreign Holdings. The percentage of a fund represented by securities or depositary receipts of companies based outside the United States.
Inception Date. The date on which the assets of a fund (or one of its share classes) are first invested in accordance with the fund’s investment objective. For funds with a subscription period, the inception date is the day after that period ends. Investment performance is measured from the inception date.
Median Market Cap. An indicator of the size of companies in which a fund invests; the midpoint of market capitalization (market price x shares outstanding) of a fund’s stocks, weighted by the proportion of the fund’s assets invested in each stock. Stocks representing half of the fund’s assets have market capitalizations above the median, and the rest are below it.
Price/Book Ratio. The share price of a stock divided by its net worth, or book value, per share. For a fund, the weighted average price/book ratio of the stocks it holds.
30
Price/Earnings Ratio. The ratio of a stock’s current price to its per-share earnings over the past year. For a fund, the weighted average P/E of the stocks it holds. P/E is an indicator of market expectations about corporate prospects; the higher the P/E, the greater the expectations for a company’s future growth.
R-Squared. A measure of how much of a fund’s past returns can be explained by the returns from the market in general, as measured by a given index. If a fund’s total returns were precisely synchronized with an index’s returns, its R-squared would be 1.00. If the fund’s returns bore no relationship to the index’s returns, its R-squared would be 0. For this report, R-squared is based on returns over the past 36 months for both the fund and the index.
Return on Equity. The annual average rate of return generated by a company during the past five years for each dollar of shareholder’s equity (net income divided by shareholder’s equity). For a fund, the weighted average return on equity for the companies whose stocks it holds.
Short-Term Reserves. The percentage of a fund invested in highly liquid, short-term securities that can be readily converted to cash.
Turnover Rate. An indication of the fund’s trading activity. Funds with high turnover rates incur higher transaction costs and may be more likely to distribute capital gains (which may be taxable to investors). The turnover rate excludes in-kind transactions, which have minimal impact on costs.
31
The People Who Govern Your Fund
The trustees of your mutual fund are there to see that the fund is operated and managed in your best interests since, as a shareholder, you are a part owner of the fund. Your fund’s trustees also serve on the board of directors of The Vanguard Group, Inc., which is owned by the Vanguard funds and provides services to them on an at-cost basis.
A majority of Vanguard’s board members are independent, meaning that they have no affiliation with Vanguard or the funds they oversee, apart from the sizable personal investments they have made as private individuals. The independent board members have distinguished backgrounds in business, academia, and public service. Each of the trustees and executive officers oversees 181 Vanguard funds.
The following table provides information for each trustee and executive officer of the fund. More information about the trustees is in the Statement of Additional Information, which can be obtained, without charge, by contacting Vanguard at 800-662-7447, or online at vanguard.com.
| |
| InterestedTrustee1 | and Delphi Automotive LLP (automotive components); |
| | Senior Advisor at New Mountain Capital; Trustee of |
| F. William McNabb III | The Conference Board. |
| Born 1957. Trustee Since July 2009. Chairman of the | |
| Board. Principal Occupation(s) During the Past Five | Amy Gutmann |
| Years: Chairman of the Board of The Vanguard Group, | Born 1949. Trustee Since June 2006. Principal |
| Inc., and of each of the investment companies served | Occupation(s) During the Past Five Years: President |
| by The Vanguard Group, since January 2010; Director | of the University of Pennsylvania; Christopher H. |
| of The Vanguard Group since 2008; Chief Executive | Browne Distinguished Professor of Political Science |
| Officer and President of The Vanguard Group and of | in the School of Arts and Sciences with secondary |
| each of the investment companies served by The | appointments at the Annenberg School for |
| Vanguard Group since 2008; Director of Vanguard | Communication and the Graduate School of Education |
| Marketing Corporation; Managing Director of The | of the University of Pennsylvania; Member of the |
| Vanguard Group (1995–2008). | National Commission on the Humanities and Social |
| | Sciences; Trustee of Carnegie Corporation of New |
| | York and of the National Constitution Center; Chair |
| IndependentTrustees | of the U. S. Presidential Commission for the Study |
| | of Bioethical Issues. |
| Emerson U. Fullwood | |
| Born 1948. Trustee Since January 2008. Principal | JoAnn Heffernan Heisen |
| Occupation(s) During the Past Five Years: Executive | Born 1950. Trustee Since July 1998. Principal |
| Chief Staff and Marketing Officer for North America | Occupation(s) During the Past Five Years: Corporate |
| and Corporate Vice President (retired 2008) of Xerox | Vice President and Chief Global Diversity Officer |
| Corporation (document management products and | (retired 2008) and Member of the Executive |
| services); Executive in Residence and 2010 | Committee (1997–2008) of Johnson & Johnson |
| Distinguished Minett Professor at the Rochester | (pharmaceuticals/medical devices/consumer |
| Institute of Technology; Director of SPX Corporation | products); Director of Skytop Lodge Corporation |
| (multi-industry manufacturing), the United Way of | (hotels), the University Medical Center at Princeton, |
| Rochester, Amerigroup Corporation (managed health | the Robert Wood Johnson Foundation, and the Center |
| care), the University of Rochester Medical Center, | for Talent Innovation; Member of the Advisory Board |
| Monroe Community College Foundation, and North | of the Maxwell School of Citizenship and Public Affairs |
| Carolina A&T University. | at Syracuse University. |
| |
| Rajiv L. Gupta | F. Joseph Loughrey |
| Born 1945. Trustee Since December 2001.2 | Born 1949. Trustee Since October 2009. Principal |
| Principal Occupation(s) During the Past Five Years: | Occupation(s) During the Past Five Years: President |
| Chairman and Chief Executive Officer (retired 2009) | and Chief Operating Officer (retired 2009) of Cummins |
| and President (2006–2008) of Rohm and Haas Co. | Inc. (industrial machinery); Chairman of the Board of |
| (chemicals); Director of Tyco International, Ltd. | Hillenbrand, Inc. (specialized consumer services) and |
| (diversified manufacturing and services), Hewlett- | of Oxfam America; Director of SKF AB (industrial |
| Packard Co. (electronic computer manufacturing), | |
| | |
| machinery) and the Lumina Foundation for Education; | Executive Officers | |
| Member of the Advisory Council for the College of | | |
| Arts and Letters and of the Advisory Board to the | Glenn Booraem | |
| Kellogg Institute for International Studies, both at | Born 1967. Controller Since July 2010. Principal |
| the University of Notre Dame. | Occupation(s) During the Past Five Years: Principal |
| | of The Vanguard Group, Inc.; Controller of each of |
| Mark Loughridge | the investment companies served by The Vanguard |
| Born 1953. Trustee Since March 2012. Principal | Group; Assistant Controller of each of the investment |
| Occupation(s) During the Past Five Years: Senior Vice | companies served by The Vanguard Group (2001–2010). |
| President and Chief Financial Officer at IBM (information | | |
| technology services); Fiduciary Member of IBM’s | Thomas J. Higgins | |
| Retirement Plan Committee. | Born 1957. Chief Financial Officer Since September |
| | 2008. Principal Occupation(s) During the Past Five |
| Scott C. Malpass | Years: Principal of The Vanguard Group, Inc.; Chief |
| Born 1962. Trustee Since March 2012. Principal | Financial Officer of each of the investment companies |
| Occupation(s) During the Past Five Years: Chief | served by The Vanguard Group; Treasurer of each of |
| Investment Officer and Vice President at the University | the investment companies served by The Vanguard |
| of Notre Dame; Assistant Professor of Finance at the | Group (1998–2008). | |
| Mendoza College of Business at Notre Dame; Member | | |
| of the Notre Dame 403(b) Investment Committee; | Kathryn J. Hyatt | |
| Director of TIFF Advisory Services, Inc. (investment | Born 1955. Treasurer Since November 2008. Principal |
| advisor); Member of the Investment Advisory | Occupation(s) During the Past Five Years: Principal of |
| Committees of the Financial Industry Regulatory | The Vanguard Group, Inc.; Treasurer of each of the |
| Authority (FINRA) and of Major League Baseball. | investment companies served by The Vanguard |
| | Group; Assistant Treasurer of each of the investment |
| André F. Perold | companies served by The Vanguard Group (1988–2008). |
| Born 1952. Trustee Since December 2004. Principal | | |
| Occupation(s) During the Past Five Years: George | Heidi Stam | |
| Gund Professor of Finance and Banking at the Harvard | Born 1956. Secretary Since July 2005. Principal |
| Business School (retired 2011); Chief Investment | Occupation(s) During the Past Five Years: Managing |
| Officer and Managing Partner of HighVista Strategies | Director of The Vanguard Group, Inc.; General Counsel |
| LLC (private investment firm); Director of Rand | of The Vanguard Group; Secretary of The Vanguard |
| Merchant Bank; Overseer of the Museum of Fine | Group and of each of the investment companies |
| Arts Boston. | served by The Vanguard Group; Director and Senior |
| | Vice President of Vanguard Marketing Corporation. |
| | |
| Alfred M. Rankin, Jr. | | |
| Born 1941. Trustee Since January 1993. Principal | Vanguard Senior ManagementTeam |
| Occupation(s) During the Past Five Years: Chairman, | | |
| President, and Chief Executive Officer of NACCO | Mortimer J. Buckley | Chris D. McIsaac |
| Industries, Inc. (housewares/lignite) and of Hyster-Yale | Kathleen C. Gubanich | Michael S. Miller |
| Materials Handling, Inc. (forklift trucks); Director of | Paul A. Heller | James M. Norris |
| the National Association of Manufacturers; Chairman | Martha G. King | Glenn W. Reed |
| of the Board of University Hospitals of Cleveland; | John T. Marcante | |
| Advisory Chairman of the Board of The Cleveland | | |
| Museum of Art. | | |
| | Chairman Emeritus and Senior Advisor |
| | |
| Peter F. Volanakis | John J. Brennan | |
| Born 1955. Trustee Since July 2009. Principal | Chairman, 1996–2009 | |
| Occupation(s) During the Past Five Years: President | Chief Executive Officer and President, 1996–2008 |
| and Chief Operating Officer (retired 2010) of Corning | | |
| Incorporated (communications equipment); Director | | |
| of SPX Corporation (multi-industry manufacturing); | Founder | |
| Overseer of the Amos Tuck School of Business | | |
| Administration at Dartmouth College; Advisor to the | John C. Bogle | |
| Norris Cotton Cancer Center. | Chairman and Chief Executive Officer, 1974–1996 |
1 Mr. McNabb is considered an “interested person,” as defined in the Investment Company Act of 1940, because he is an officer of the
Vanguard funds.
2 December 2002 for Vanguard Equity Income Fund, Vanguard Growth Equity Fund, the Vanguard Municipal Bond Funds, and the Vanguard
State Tax-Exempt Funds.
|  |
| | P.O. Box 2600 |
| | Valley Forge, PA 19482-2600 |
| |
| |
| |
| Connect with Vanguard® > vanguard.com | |
| |
| |
| |
| Fund Information > 800-662-7447 | CFA® is a trademark owned by CFA Institute. |
| Direct Investor Account Services > 800-662-2739 | |
| Institutional Investor Services > 800-523-1036 | |
| Text Telephone for People | |
| With Hearing Impairment > 800-749-7273 | |
| |
| This material may be used in conjunction | |
| with the offering of shares of any Vanguard | |
| fund only if preceded or accompanied by | |
| the fund’s current prospectus. | |
| |
| All comparative mutual fund data are from Lipper, a | |
| Thomson Reuters Company, or Morningstar, Inc., unless | |
| otherwise noted. | |
| |
| You can obtain a free copy of Vanguard’s proxy voting | |
| guidelines by visiting vanguard.com/proxyreporting or by | |
| calling Vanguard at 800-662-2739. The guidelines are | |
| also available from the SEC’s website, sec.gov. In | |
| addition, you may obtain a free report on how your fund | |
| voted the proxies for securities it owned during the 12 | |
| months ended June 30. To get the report, visit either | |
| vanguard.com/proxyreporting or sec.gov. | |
| |
| You can review and copy information about your fund at | |
| the SEC’s Public Reference Room in Washington, D.C. To | |
| find out more about this public service, call the SEC at | |
| 202-551-8090. Information about your fund is also | |
| available on the SEC’s website, and you can receive | |
| copies of this information, for a fee, by sending a | |
| request in either of two ways: via e-mail addressed to | |
| publicinfo@sec.gov or via regular mail addressed to the | |
| Public Reference Section, Securities and Exchange | |
| Commission, Washington, DC 20549-1520. | |
| |
| | © 2013 The Vanguard Group, Inc. |
| | All rights reserved. |
| | Vanguard Marketing Corporation, Distributor. |
| |
| | Q6150 112013 |

Annual Report | September 30, 2013
Vanguard Global Equity Fund

Vanguard’s Principles for Investing Success
We want to give you the best chance of investment success. These principles,
grounded in Vanguard’s research and experience, can put you on the right path.
Goals. Create clear, appropriate investment goals.
Balance. Develop a suitable asset allocation using broadly diversified funds.
Cost. Minimize cost.
Discipline. Maintain perspective and long-term discipline.
A single theme unites these principles: Focus on the things you can control.
We believe there is no wiser course for any investor.
| |
| Contents | |
| Your Fund’s Total Returns. | 1 |
| Chairman’s Letter. | 2 |
| Advisors’ Report. | 8 |
| Fund Profile. | 13 |
| Performance Summary. | 15 |
| Financial Statements. | 17 |
| Your Fund’s After-Tax Returns. | 32 |
| About Your Fund’s Expenses. | 33 |
| Glossary. | 35 |
Please note: The opinions expressed in this report are just that—informed opinions. They should not be considered promises or advice.
Also, please keep in mind that the information and opinions cover the period through the date on the front of this report. Of course, the
risks of investing in your fund are spelled out in the prospectus.
See the Glossary for definitions of investment terms used in this report.
About the cover: The ship's wheel represents leadership and guidance, essential qualities in navigating difficult seas.
This one is a replica based on an 18th-century British vessel. The HMS Vanguard, another ship of that era, served as the
flagship for Admiral Horatio Nelson when he defeated a French fleet at the Battle of the Nile.
Your Fund’s Total Returns
| |
| Fiscal Year Ended September 30, 2013 | |
| |
| | Total |
| | Returns |
| Vanguard Global Equity Fund | 22.72% |
| MSCI All Country World Index | 17.73 |
| Global Funds Average | 19.83 |
| Global Funds Average: Derived from data provided by Lipper, a Thomson Reuters Company. |
| | | | |
| Your Fund’s Performance at a Glance | | | | |
| September 30, 2012, Through September 30, 2013 | | | | |
| |
| | | | Distributions Per Share |
| | Starting | Ending | | |
| | Share | Share | Income | Capital |
| | Price | Price | Dividends | Gains |
| Vanguard Global Equity Fund | $18.21 | $21.94 | $0.342 | $0.000 |
1

Chairman’s Letter
Dear Shareholder,
Favorable markets and adept stock choices combined to propel Vanguard Global Equity Fund to an impressive performance for the fiscal year ended September 30, 2013. The fund returned 22.72%, compared with 19.83%, on average, for its peer funds and 17.73% for its benchmark, the MSCI All Country World Index.
The Global Equity Fund’s holdings in the United States and the United Kingdom were instrumental to its advance. Disappointment came in the Pacific region, where the fund didn’t fully capitalize on the robust results for Japanese stocks.
This was the second straight fiscal year in which the fund returned more than 20% and outperformed its comparative standards. However, although we have great confidence in the Global Equity Fund’s advisors, we would not, of course, expect such positive results every year.
A key to reaping the potential for long-term outperformance in an actively managed fund such as yours is having the patience to weather inevitable periods of short-term underperformance. You can read more on this topic in The Bumpy Road to Outperformance, available at vanguard.com/research.
2
If you hold Vanguard Global Equity Fund in a taxable account, you may wish to review the discussion of after-tax returns later in this report.
Stocks dodged obstacles to produce strong gains
Although their path wasn’t always smooth, U.S. stocks powered to a return of about 22% for the 12 months ended September 30. The U.S. economy delivered only modest growth over the fiscal year, but investors’ appetite for risk seemed to increase faster than companies’ profits.
In mid-September, U.S. stocks jumped when the Federal Reserve surprised investors by announcing that it had no
immediate plans to unwind its stimulative bond-buying program. But in the waning days of that month, stocks slid ahead of the partial federal government shutdown that began October 1.
It’s natural for investors to be concerned by the situation in Washington. But as Sarah Hammer, a senior analyst in Vanguard Investment Strategy Group, noted in the midst of the temporary shutdown, they shouldn’t be unduly influenced by these events. “Investors are often best served by sticking to their long-term investment plans and avoiding short-term decisions based on the legislative outlook,” Ms. Hammer said.
| | | |
| Market Barometer | | | |
| |
| | Average Annual Total Returns |
| | Periods Ended September 30, 2013 |
| | One | Three | Five |
| | Year | Years | Years |
| Stocks | | | |
| Russell 1000 Index (Large-caps) | 20.91% | 16.64% | 10.53% |
| Russell 2000 Index (Small-caps) | 30.06 | 18.29 | 11.15 |
| Russell 3000 Index (Broad U.S. market) | 21.60 | 16.76 | 10.58 |
| MSCI All Country World Index ex USA (International) | 16.48 | 5.95 | 6.26 |
| |
| Bonds | | | |
| Barclays U.S. Aggregate Bond Index (Broad taxable market) | -1.68% | 2.86% | 5.41% |
| Barclays Municipal Bond Index (Broad tax-exempt market) | -2.21 | 3.24 | 5.98 |
| Citigroup Three-Month U.S. Treasury Bill Index | 0.07 | 0.07 | 0.14 |
| |
| CPI | | | |
| Consumer Price Index | 1.18% | 2.34% | 1.37% |
3
Our recurrent advice to stick to your plan may lack pizzazz, but it’s proven to be sound counsel over the decades.
International stocks generally posted strong results. Emerging-market stocks, however, lagged amid worries about slowing growth.
Bond returns were negative despite September’s bounce
Investor concern about the Fed’s potential scaling back of its bond-buying program also affected the performance of bonds, which declined for the year. In September, however, bonds trimmed their losses after the Fed said it would maintain the level of purchases.
The broad U.S. taxable bond market returned –1.68% for the fiscal year, and the yield of the 10-year Treasury note closed at 2.63%, down from 2.76% at the end of August. (Bond yields and prices move in opposite directions.) Municipal bonds returned –2.21% after rebounding a bit in September.
Money markets and savings accounts barely budged as the Fed’s target for short-term interest rates remained at 0%–0.25%.
Success in U.S. equities led the fund’s 12-month performance
In keeping with its name, Vanguard Global Equity Fund has a worldwide reach, with hundreds of stock holdings
| | |
| Expense Ratios | | |
| Your Fund Compared With Its Peer Group | | |
| | | Peer Group |
| | Fund | Average |
| Global Equity Fund | 0.59% | 1.42% |
The fund expense ratio shown is from the prospectus dated March 1, 2013, and represents estimated costs for the current fiscal year. For the
fiscal year ended September 30, 2013, the fund’s expense ratio was 0.61%. The peer-group expense ratio is derived from data provided by
Lipper, a Thomson Reuters Company, and captures information through year-end 2012.
Peer group: Global Funds.
4
across developed and emerging markets. But in this 12-month period, it was the investments closest to home that had the biggest impact on performance.
The fund’s U.S. stocks generated a return nearly 10 percentage points better than those of their counterparts in the U.S. portion of the MSCI All Country World Index. (U.S. stocks accounted for about 46% of fund assets on average during the period, somewhat less than the benchmark’s 47%.) The advisors’ choices in the consumer discretionary, financial, and industrial sectors contributed to this strong showing.
The fund also got a boost from owning the better-performing stocks in Canada and the United Kingdom. Standouts in both countries included shares of banks and other financial firms.
Japan was a weak spot for the fund, which didn’t match the benchmark’s outsized gains fueled by Prime Minister Shinzo Abe’s efforts to awaken the country’s long-slumbering economy.
The Advisors’ Report that follows this letter provides additional details about the management of the fund during the fiscal year.
| |
| Total Returns | |
| Ten Years Ended September 30, 2013 | |
| | Average |
| | Annual Return |
| Global Equity Fund | 8.50% |
| Spliced Global Equity Index | 8.03 |
| Global Funds Average | 7.31 |
For a benchmark description, see the Glossary.
Global Funds Average: Derived from data provided by Lipper, a Thomson Reuters Company.
The figures shown represent past performance, which is not a guarantee of future results. (Current performance may be
lower or higher than the performance data cited. For performance data current to the most recent month-end, visit our
website at vanguard.com/performance.) Note, too, that both investment returns and principal value can fluctuate widely, so
an investor’s shares, when sold, could be worth more or less than their original cost.
5
| Investment insight |
| Don’t let a trick of the calendar alter your course | |
| When making investment decisions, it’s important to weigh past returns with caution. |
| That’s because investment returns from any particular period are an unreliable anchor |
| for gauging the future. They can be highly date-dependent. | |
| |
| For example, take the five-year average annual return for the broad U.S. stock |
| market. That average just made a startling bounce: from 1.30% for the period |
| ended September 30, 2012, to 10.58% for the period ended September 30, 2013. |
| True, the market returned a hearty 21.60% in the most recent 12 months, but that’s |
| not enough to explain such a big leap in the average. Significantly, the year ended |
| September 30, 2008––when U.S. stocks returned –21.52% during the financial |
| crisis––has now rolled off the five-year calculation. | |
| |
| The important thing to remember is that historical returns are just that: historical. |
| Basing investment decisions on such date-dependent snapshots could easily lead |
| you to alter course––possibly in the wrong direction. Instead, Vanguard believes, you |
| should build your asset allocation strategy on long-term risk-and-return relationships, |
| always recognizing that no level of return is guaranteed. | |
| |
| Which five-year average should you count on? | |
| (Answer: None of them!) | |
| Average annual returns for U.S. stocks over five-year periods ended September 30 |
| |
| 2007 | 16.18% |
| 2008 | 5.70 |
| 2009 | 1.56 |
| 2010 | 0.92 |
| 2011 | –0.92 |
| 2012 | 1.30 |
| 2013 | 10.58 |
| Note: The U.S. stock market is represented by the Russell 3000 Index. |
| Source: Vanguard. |
6
The fund’s record was strong during a challenging decade
With an assist from another year of distinguished performance, Vanguard Global Equity Fund posted an average annual return of 8.50% for the decade ended September 30. As you can see in the table on page 5, the fund also outpaced its peer group’s average annual return and was ahead of its benchmark index.
This admirable long-term track record during a decade marked by the worst global recession since the Great Depression and several European sovereign-debt bailouts is a tribute to the discipline and expertise of the fund’s advisors.
Combining diversity of thought with low costs brings benefits
Investors sometimes ask why Vanguard uses a multi-advisor approach for many of its actively managed equity portfolios. Just as we recommend diversification within and across asset classes for an investor’s overall investments, we think significant benefits can accrue from using multiple advisory firms for a single portfolio: diversity of investment process and style, thought, and holdings.
All these elements can lead to less risk and better results. Because not all investment managers invest the same way, their returns relative to the benchmark don’t move in lockstep.
As with many investment topics, however, some misconceptions exist about the benefits of using a multi-manager approach. For example, it is often suggested that the best ideas of the advisors are diluted when combined in one portfolio. Recent Vanguard research has found otherwise.
Conventional wisdom also suggests that multi-manager funds tend to be expensive. At Vanguard, this is not the case: Low costs are a hallmark of all our offerings. And Vanguard research indicates that low costs can contribute greatly to investing success, helping investors keep more of a portfolio’s return. (You can read more in Analyzing Multi-Manager Funds: Does Management Structure Affect Performance?, available at vanguard.com/research.)
As always, thank you for investing with Vanguard.
Sincerely,

F. William McNabb III
Chairman and Chief Executive Officer
October 16, 2013
7
Advisors’ Report
For the fiscal year ended September 30, 2013, Vanguard Global Equity Fund returned 22.72%. Your fund is managed by three independent advisors, a strategy that enhances the fund’s diversification by providing exposure to distinct yet complementary investment approaches. It’s not uncommon for different advisors to have different views about individual securities or the broader investment environment.
The advisors, the percentage of fund assets each manages, and brief descriptions of their investment strategies are presented in the table below. Each advisor has also prepared a discussion of the investment environment that existed during the fiscal year and of how portfolio positioning reflects this assessment. These comments were prepared on October 18, 2013.
| | | |
| Vanguard Global Equity Fund Investment Advisors | |
| |
| | Fund Assets Managed | |
| Investment Advisor | % | $ Million | Investment Strategy |
| Marathon Asset Management | 33 | 1,500 | A long-term and contrarian investment philosophy and |
| LLP | | | process with a focus on industry capital cycle analysis |
| | | | and in-depth management assessment. |
| Baillie Gifford Overseas Ltd. | 33 | 1,495 | The advisor seeks stocks that can generate |
| | | | above-average growth in earnings and cash flow, |
| | | | producing a bottom-up, stock-driven approach to |
| | | | country and asset allocation. An in-depth view on each |
| | | | company is measured against the consensus view, |
| | | | leading to discrepancies and potential opportunities to |
| | | | add value. |
| Acadian Asset Management LLC | 31 | 1,397 | A quantitative, active, bottom-up investment process |
| | | | that combines stock and peer-group valuation to arrive |
| | | | at a return forecast for each of more than 40,000 |
| | | | securities in the global universe. |
| Cash Investments | 3 | 106 | These short-term reserves are invested by Vanguard in |
| | | | equity index products to simulate investment in stocks. |
| | | | Each advisor may also maintain a modest cash |
| | | | position. |
8
Marathon Asset Management LLP
Portfolio Managers:
Neil M. Ostrer, Co-Head of Global Equity
William J. Arah, Co-Head of Global Equity
For the fiscal year, the portfolio benefited from stock selection—most notably in North America, with significant contributions from the United Kingdom and emerging markets. An overweight position to the Japanese market more than offset the negative currency effect of the weakening yen. A small residual cash position hurt relative performance in a strong market environment.
At the stock level, the largest relative contribution came from a lack of shares in Apple, which returned –27% (in local terms) over the period. Rail company Kansas City Southern and consulting firm Towers Watson also strongly outperformed. Outside the United States, U.K. tour operator Thomas Cook benefited from a revival under new management. This coincided with stabilization in the package holiday market and an improved outlook for refinancing the company’s weak balance sheet. In Asia ex-Japan, conglomerate Ayala outperformed as the Philippine market attracted strong liquidity flows and investor attention.
Saipem, the Italian oil services group, was the worst-performing stock in the portfolio. Its reputation for consistent delivery was shattered by bribery allegations, the resignation of the longtime CEO, and his successor’s major revision of forecasts.
With U.S. companies at peak profitability, Japan and, to a lesser extent, Europe appear relatively inexpensive compared with the United States and other major markets. The portfolio maintains an overweight allocation to Japan and Europe, with a corresponding underweight to the United States. A small underweight to emerging markets reflects underlying valuations, particularly in Southeast Asia, where we reduced our exposure over the 12 months.
Growing confidence in the U.S. economy has lifted the Standard & Poor’s 500 Index to record highs. The Federal Reserve continues to provide support through its open-ended quantitative easing program, despite recent talk of tapering. It’s unclear what might follow this period of unprecedented policy response, or how the program can be withdrawn without a major shock to the system.
European equities have closed some of their valuation discount to U.S. equities in recent months but remain a relatively good value. Companies seem increasingly willing to engage in mergers and acquisitions—arguably a positive reflection on valuations and the outlook. The state of the European banking system remains a handicap, but this should not prevent larger corporations from continuing to prosper because of their relatively strong balance sheets and global orientation.
9
In Japan, investor focus has increasingly shifted toward Prime Minister Shinzo Abe’s “third arrow,” focusing on microeconomic reform and an accompanying growth strategy, with a growing sense of disappointment that little real effect has yet been achieved.
Baillie Gifford Overseas Ltd.
Portfolio Managers:
Charles Plowden, Joint Senior Partner
and Lead Portfolio Manager
Spencer Adair, CFA, Partner
and Investment Manager
Malcolm MacColl, Partner
and Investment Manager
Several factors affecting the world economy over the past year have contributed to the markets’ steady rise. The U.S. economy is improving, though the specter of Federal Reserve tapering has weighed on sentiment recently. Japan is enjoying the potential for reform and reflation, and Europe seems to be turning the corner. Set against this, emerging markets continue to struggle as disappointing growth expectations weighed on sentiment.
Although we observe the machinations of the global macroeconomy, it does not drive our investment decisions or asset allocation. The continuing recovery is good news, but we are most optimistic when we listen to the companies we
invest in and observe their ability to generate sustainable growth and returns for shareholders. The portfolio’s growth engines have been broad-based. Tesla Motors has further progressed toward improving the usability of electric cars. Richemont’s luxury goods “maisons” are enjoying a sales recovery in developed markets, and Prudential is reaping the rewards of recycling its U.K. profits into the more rapidly evolving Asian economies.
Our investing has focused on the improving developed markets. Because Japanese automation leaders should benefit from a weaker yen, we purchased THK (linear motion guides) and SMC (pneumatics). Our new U.S. holdings include Lincoln Electric (welding equipment) and M&T Bank (a Buffalo-based lender). We continue to seek out the most innovative companies that can dominate their markets. To this end, we have made initial investments in Facebook (social networking), Qualcomm (semiconductors and wireless device patents), and Myriad Genetics (genetic testing for disease risk).
As ever, we have relatively little to say about the short-term direction of markets. After a period of rising stock prices, we would not be surprised to see a period of increased volatility. This does not dismay us; uncertainty and volatility can provide opportunities for stock-pickers with a disciplined investment process. We remain focused on managing a balanced
10
equity portfolio of world-class growth businesses, and we are confident that we are well-placed to deliver attractive returns in the years ahead.
Acadian Asset Management LLC
Portfolio Managers:
John R. Chisholm, CFA,
Chief Investment Officer
Ronald D. Frashure, CFA, Chairman
Brian K. Wolahan, CFA,
Senior Vice President,
Senior Portfolio Manager
Global equities were in firmly positive territory for the 12 months, as signs of moderate growth in key economies joined continued stimulus from major central banks. Some volatility appeared later in the period as investors sought insights about the potential timing of changes in U.S. monetary policy.
The best-performing region was Europe. Equity markets got a boost from European Central Bank assurances of continued policy accommodation, from relative strength in Germany, and, later, from improvement in some weaker economies. Asian-Pacific markets posted solid gains stemming from Japanese equities, which benefited notably from the yen’s weakness and expectations of a more aggressive Bank of Japan policy. Indeed, that central bank surprised global markets in the second quarter by announcing a bolder-
than-expected set of stimulus measures. In the United States, moderate growth continued, and housing and employment indicators were generally upbeat.
Emerging-market equities notably trailed those of developed markets, hurt by a summer sell-off amid the Federal Reserve’s talk of tapering and expectations of rising U.S. interest rates. Individual market returns were wide-ranging. Countries that took advantage of prosperity in recent years to bolster reserves were better positioned to deal with outflows as investors exited those that had been depleting reserves the fastest. Despite concerns about China’s growth, expectations for a soft landing increased and helped balance a negative shift in sentiment toward the asset class.
The portfolio focused on attractively valued stocks that appeared likely to rise in price based on earnings data, price characteristics, and quality. The United States and Japan were key overweighted markets, based on bottom-up stock selection, along with South Korea, Taiwan, and China. We underweighted the United Kingdom, Switzerland, and Australia. Notable sector positioning featured an overweight to energy and an underweight to utilities.
Stock selection in the United States and France drove gains for the period, with holdings in the consumer staples and industrial sectors among the top
11
performers. The major downside for the portfolio was stock selection in Japan, where holdings in financials and telecommunications were costly. Country allocations as a whole detracted, particularly market overweighting in South Korea and Turkey and a lack of exposure to Switzerland. Sector allocations also hurt, particularly the overweight to energy and an underweight to financials.
12
Global Equity Fund
Fund Profile
As of September 30, 2013
| | |
| Portfolio Characteristics | | |
| | | MSCI All |
| | | Country |
| | Fund | World Index |
| Number of Stocks | 720 | 2,414 |
| Median Market Cap | $22.2B | $42.6B |
| Price/Earnings Ratio | 15.7x | 17.5x |
| Price/Book Ratio | 2.0x | 2.0x |
| Return on Equity | 15.5% | 16.1% |
| Earnings Growth | | |
| Rate | 11.8% | 9.0% |
| Dividend Yield | 2.1% | 2.6% |
| Turnover Rate | 70% | — |
| Ticker Symbol | VHGEX | — |
| Expense Ratio1 | 0.59% | — |
| Short-Term Reserves | 1.2% | — |
| | |
| Sector Diversification (% of equity exposure) |
| | | MSCI All |
| | | Country |
| | Fund | World Index |
| Consumer Discretionary | 14.4% | 11.8% |
| Consumer Staples | 10.7 | 10.0 |
| Energy | 6.5 | 9.9 |
| Financials | 19.9 | 21.5 |
| Health Care | 8.2 | 10.1 |
| Industrials | 16.0 | 10.8 |
| Information Technology | 15.1 | 12.1 |
| Materials | 4.8 | 6.3 |
| Telecommunication Services | 3.5 | 4.2 |
| Utilities | 0.9 | 3.3 |
| |
| Volatility Measures | |
| | MSCI All |
| | Country |
| | World Index |
| R-Squared | 0.98 |
| Beta | 1.02 |
| These measures show the degree and timing of the fund’s fluctuations compared with the index over 36 months. |
| | |
| Ten Largest Holdings (% of total net assets) |
| Samsung Electronics Co. | | |
| Ltd. | Semiconductors | 1.2% |
| Svenska Handelsbanken | | |
| AB | Diversified Banks | 1.1 |
| Roche Holding AG | Pharmaceuticals | 1.0 |
| Nestle SA | Packaged Foods & | |
| | Meats | 1.0 |
| Prudential plc | Life & Health | |
| | Insurance | 1.0 |
| eBay Inc. | Internet Software & | |
| | Services | 0.8 |
| Naspers Ltd. | Cable & Satellite | 0.8 |
| Royal Dutch Shell plc | Integrated Oil & Gas | 0.8 |
| Amazon.com Inc. | Internet Retail | 0.8 |
| China Mobile Ltd. | Wireless | |
| | Telecommunication | |
| | Services | 0.8 |
| Top Ten | | 9.3% |
| The holdings listed exclude any temporary cash investments and equity index products. |
Allocation by Region (% of equity exposure)
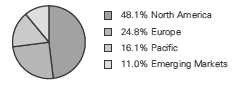
1 The expense ratio shown is from the prospectus dated March 1, 2013, and represents estimated costs for the current fiscal year. For the
fiscal year ended September 30, 2013, the expense ratio was 0.61%.
13
Global Equity Fund
| | |
| Market Diversification (% of equity exposure) |
| | | MSCI All |
| | | Country |
| | | World |
| | Fund | Index |
| Europe | | |
| United Kingdom | 8.3% | 8.2% |
| Switzerland | 4.2 | 3.4 |
| Sweden | 2.8 | 1.2 |
| France | 2.1 | 3.6 |
| Germany | 2.1 | 3.3 |
| Denmark | 1.1 | 0.4 |
| Ireland | 1.0 | 0.1 |
| Other | 3.2 | 4.4 |
| Subtotal | 24.8% | 24.6% |
| Pacific | | |
| Japan | 10.5% | 8.1% |
| South Korea | 2.9 | 1.8 |
| Australia | 1.1 | 3.0 |
| Hong Kong | 1.0 | 1.2 |
| Other | 0.6 | 0.6 |
| Subtotal | 16.1% | 14.7% |
| Emerging Markets | | |
| China | 4.1% | 2.1% |
| Taiwan | 1.6 | 1.3 |
| South Africa | 1.2 | 0.8 |
| Other | 4.1 | 5.0 |
| Subtotal | 11.0% | 9.2% |
| North America | | |
| United States | 46.2% | 47.5% |
| Canada | 1.9 | 3.8 |
| Subtotal | 48.1% | 51.3% |
| Middle East | 0.0% | 0.2% |
14
Global Equity Fund
Performance Summary
All of the returns in this report represent past performance, which is not a guarantee of future results that may be achieved by the fund. (Current performance may be lower or higher than the performance data cited. For performance data current to the most recent month-end, visit our website at vanguard.com/performance.) Note, too, that both investment returns and principal value can fluctuate widely, so an investor’s shares, when sold, could be worth more or less than their original cost. The returns shown do not reflect taxes that a shareholder would pay on fund distributions or on the sale of fund shares.
Cumulative Performance: September 30, 2003, Through September 30, 2013
Initial Investment of $10,000
| | | | |
| | Average Annual Total Returns | |
| | Periods Ended September 30, 2013 | |
| | | | | Final Value |
| | One | Five | Ten | of a $10,000 |
| | Year | Years | Years | Investment |
| Global Equity Fund* | 22.72% | 8.46% | 8.50% | $22,618 |
| |
| •••••••• Spliced Global Equity Index | 17.73 | 7.71 | 8.03 | 21,652 |
| Global Funds Average | 19.83 | 7.62 | 7.31 | 20,247 |
| For a benchmark description, see the Glossary. |
| Global Funds Average: Derived from data provided by Lipper, a Thomson Reuters Company. |
See Financial Highlights for dividend and capital gains information.
15
Global Equity Fund
Fiscal-Year Total Returns (%): September 30, 2003, Through September 30, 2013
For a benchmark description, see the Glossary.
16
Global Equity Fund
Financial Statements
Statement of Net Assets—Investments Summary
As of September 30, 2013
This Statement summarizes the fund’s holdings by asset type. Details are reported for each of the fund’s 50 largest individual holdings and for investments that, in total for any issuer, represent more than 1% of the fund’s net assets. The total value of smaller holdings is reported as a single amount within each category.
The fund reports a complete list of its holdings in regulatory filings four times in each fiscal year, at the quarter-ends. For the second and fourth fiscal quarters, the complete listing of the fund’s holdings is available electronically on vanguard.com and on the Securities and Exchange Commission’s website (sec.gov), or you can have it mailed to you without charge by calling 800-662-7447. For the first and third fiscal quarters, the fund files the lists with the SEC on Form N-Q. Shareholders can look up the fund’s Forms N-Q on the SEC’s website. Forms N-Q may also be reviewed and copied at the SEC’s Public Reference Room (see the back cover of this report for further information).
| | | |
| | | Market | Percentage |
| | | Value | of Net |
| | Shares | ($000) | Assets |
| Common Stocks | | | |
| Argentina † | | 7,019 | 0.2% |
| |
| Australia † | | 40,985 | 0.9% |
| |
| Austria † | | 2,724 | 0.1% |
| |
| Belgium † | | 4,366 | 0.1% |
| |
| Brazil † | | 41,941 | 0.9% |
| |
| Canada | | | |
| Magna International Inc. | 261,900 | 21,599 | 0.5% |
| Bank of Montreal | 321,700 | 21,471 | 0.5% |
| Canada—Other † | | 40,279 | 0.9% |
| | | 83,349 | 1.9% |
| |
| Chile † | | 7,551 | 0.2% |
| |
| China | | | |
| China Mobile Ltd. | 3,114,000 | 35,039 | 0.8% |
| * Baidu Inc. ADR | 154,832 | 24,027 | 0.5% |
| ^ Mindray Medical International Ltd. ADR | 544,680 | 21,183 | 0.5% |
| China Construction Bank Corp. | 26,246,000 | 20,227 | 0.4% |
| China Resources Enterprise Ltd. | 5,567,117 | 17,716 | 0.4% |
| Bank of China Ltd. | 37,357,000 | 17,071 | 0.4% |
| Industrial & Commercial Bank of China Ltd. | 22,160,000 | 15,489 | 0.3% |
| Agricultural Bank of China Ltd. | 2,488,000 | 1,147 | 0.0% |
| China—Other † | | 29,815 | 0.7% |
| | | 181,714 | 4.0% |
| |
| Colombia † | | 708 | 0.0% |
| | | |
| Global Equity Fund | | | |
| |
| | | Market | Percentage |
| | | Value | of Net |
| | Shares | ($000) | Assets |
| Cyprus † | | 486 | 0.0% |
| Czech Republic † | | 879 | 0.0% |
| Denmark † | | 48,618 | 1.1% |
| Finland † | | 19,675 | 0.4% |
| France | | | |
| European Aeronautic Defence and Space Co. NV | 480,538 | 30,621 | 0.7% |
| France—Other † | | 58,963 | 1.3% |
| | | 89,584 | 2.0% |
| Germany † | | 87,563 | 1.9% |
| Hong Kong † | | 43,752 | 1.0% |
| India † | | 22,759 | 0.5% |
| Indonesia † | | 7,511 | 0.2% |
| Ireland | | | |
| Ryanair Holdings plc ADR | 531,118 | 26,418 | 0.6% |
| Ireland—Other † | | 17,926 | 0.4% |
| | | 44,344 | 1.0% |
| Italy † | | 17,213 | 0.4% |
| Japan | | | |
| ^ Nippon Telegraph & Telephone Corp. | 614,000 | 31,959 | 0.7% |
| ^ Daito Trust Construction Co. Ltd. | 217,200 | 21,736 | 0.5% |
| Japan—Other † | | 404,149 | 9.0% |
| | | 457,844 | 10.2% |
| Malaysia † | | 9,377 | 0.2% |
| Mexico † | | 24,783 | 0.6% |
| Netherlands † | | 37,578 | 0.8% |
| New Zealand † | | 1,326 | 0.0% |
| Norway | | | |
| Statoil ASA | 930,447 | 21,133 | 0.5% |
| Norway—Other † | | 20,105 | 0.4% |
| | | 41,238 | 0.9% |
| Philippines † | | 4,479 | 0.1% |
| Poland † | | 899 | 0.0% |
| Russia † | | 11,150 | 0.2% |
18
| | | |
| Global Equity Fund | | | |
| |
| |
| |
| | | Market | Percentage |
| | | Value | of Net |
| | Shares | ($000) | Assets |
| Singapore | | | |
| DBS Group Holdings Ltd. | 1,846,000 | 24,165 | 0.5% |
| Singapore—Other † | | 4,605 | 0.1% |
| | | 28,770 | 0.6% |
| South Africa | | | |
| Naspers Ltd. | 408,494 | 37,819 | 0.9% |
| South Africa—Other † | | 14,210 | 0.3% |
| | | 52,029 | 1.2% |
| South Korea | | | |
| Samsung Electronics Co. Ltd. | 26,749 | 34,024 | 0.7% |
| Samsung Electronics Co. Ltd. GDR | 33,350 | 21,239 | 0.5% |
| South Korea—Other † | | 75,025 | 1.7% |
| | | 130,288 | 2.9% |
| |
| Spain † | | 17,606 | 0.4% |
| |
| Sweden | | | |
| Svenska Handelsbanken AB Class A | 1,134,427 | 48,536 | 1.1% |
| Atlas Copco AB Class B | 790,469 | 20,889 | 0.5% |
| Sweden—Other † | | 56,781 | 1.2% |
| | | 126,206 | 2.8% |
| Switzerland | | | |
| Roche Holding AG | 166,909 | 45,044 | 1.0% |
| Nestle SA | 634,563 | 44,251 | 1.0% |
| Coca-Cola HBC AG ADR | 787,200 | 23,514 | 0.5% |
| * Cie Financiere Richemont SA | 209,913 | 21,032 | 0.5% |
| Switzerland—Other † | | 51,821 | 1.1% |
| | | 185,662 | 4.1% |
| |
| Taiwan † | | 69,463 | 1.5% |
| |
| Thailand † | | 12,227 | 0.3% |
| |
| 1Turkey † | | 28,485 | 0.6% |
| |
| United Arab Emirates † | | 335 | 0.0% |
| |
| United Kingdom | | | |
| Prudential plc | 2,347,621 | 43,676 | 1.0% |
| Royal Dutch Shell plc Class A | 1,002,161 | 33,007 | 0.7% |
| Rolls-Royce Holdings plc | 1,302,534 | 23,435 | 0.5% |
| Wolseley plc | 422,077 | 21,837 | 0.5% |
| United Kingdom—Other † | | 231,311 | 5.2% |
| | | 353,266 | 7.9% |
| United States | | | |
| Consumer Discretionary | | | |
| * Amazon.com Inc. | 113,895 | 35,608 | 0.8% |
| Comcast Corp. Class A | 628,072 | 28,357 | 0.6% |
| Omnicom Group Inc. | 423,849 | 26,889 | 0.6% |
| McDonald’s Corp. | 276,042 | 26,558 | 0.6% |
| Harley-Davidson Inc. | 395,575 | 25,412 | 0.6% |
| Consumer Discretionary—Other † | | 173,571 | 3.8% |
| | | 316,395 | 7.0% |
19
| | | |
| Global Equity Fund | | | |
| |
| |
| |
| | | Market | Percentage |
| | | Value | of Net |
| | Shares | ($000) | Assets |
| Consumer Staples | | | |
| Tyson Foods Inc. Class A | 973,013 | 27,517 | 0.6% |
| Coca-Cola Co. | 634,922 | 24,051 | 0.6% |
| Procter & Gamble Co. | 311,640 | 23,557 | 0.5% |
| CVS Caremark Corp. | 409,295 | 23,227 | 0.5% |
| Consumer Staples—Other † | | 103,399 | 2.3% |
| | | 201,751 | 4.5% |
| Energy | | | |
| ConocoPhillips | 397,108 | 27,603 | 0.6% |
| EOG Resources Inc. | 129,912 | 21,991 | 0.5% |
| Energy—Other † | | 105,505 | 2.3% |
| | | 155,099 | 3.4% |
| Exchange-Traded Fund | | | |
| 2 Vanguard FTSE Emerging Markets ETF | 500,300 | 20,067 | 0.4% |
| |
| Financials | | | |
| JPMorgan Chase & Co. | 659,104 | 34,069 | 0.8% |
| Goldman Sachs Group Inc. | 166,355 | 26,319 | 0.6% |
| Moody’s Corp. | 339,884 | 23,904 | 0.5% |
| M&T Bank Corp. | 201,603 | 22,563 | 0.5% |
| * Berkshire Hathaway Inc. Class B | 188,779 | 21,428 | 0.5% |
| * Markel Corp. | 40,684 | 21,065 | 0.5% |
| Financials—Other † | | 150,258 | 3.3% |
| | | 299,606 | 6.7% |
| Health Care | | | |
| Johnson & Johnson | 311,112 | 26,970 | 0.6% |
| Health Care—Other † | | 161,367 | 3.6% |
| | | 188,337 | 4.2% |
| Industrials | | | |
| 3M Co. | 249,886 | 29,839 | 0.7% |
| Northrop Grumman Corp. | 310,986 | 29,625 | 0.6% |
| Boeing Co. | 222,798 | 26,179 | 0.6% |
| Industrials—Other † | | 155,657 | 3.5% |
| | | 241,300 | 5.4% |
| Information Technology | | | |
| * eBay Inc. | 680,414 | 37,960 | 0.8% |
| Mastercard Inc. Class A | 43,931 | 29,556 | 0.7% |
| * Google Inc. Class A | 29,052 | 25,447 | 0.6% |
| Computer Sciences Corp. | 454,615 | 23,522 | 0.5% |
| Information Technology—Other † | | 327,221 | 7.3% |
| | | 443,706 | 9.9% |
| Materials | | | |
| Praxair Inc. | 231,164 | 27,788 | 0.6% |
| Materials—Other † | | 97,474 | 2.2% |
| | | 125,262 | 2.8% |
| |
| Telecommunication Services † | | 927 | 0.0% |
| | | 1,992,450 | 44.3% |
| Total Common Stocks (Cost $3,624,139) | | 4,338,202 | 96.4%3 |
20
| | | | |
| Global Equity Fund | | | | |
| |
| |
| | | | Market | Percentage |
| | | | Value• | of Net |
| | Coupon | Shares | ($000) | Assets |
| Temporary Cash Investments | | | | |
| Money Market Fund | | | | |
| 4,5 Vanguard Market Liquidity Fund | 0.112% | 237,974,890 | 237,975 | 5.3% |
| |
| 6U.S. Government and Agency Obligations † | | | 7,496 | 0.2% |
| Total Temporary Cash Investments (Cost $245,473) | | | 245,471 | 5.5%3 |
| Total Investments (Cost $3,869,612) | | | 4,583,673 | 101.9% |
| Other Assets and Liabilities | | | | |
| Other Assets | | | 32,101 | 0.7% |
| Liabilities5 | | | (117,232) | (2.6%) |
| | | | (85,131) | (1.9%) |
| Net Assets | | | 4,498,542 | 100.0% |
| |
| Net Assets | | | | |
| Applicable to 205,021,234 outstanding $.001 par value shares of | | | |
| beneficial interest (unlimited authorization) | | | | 4,498,542 |
| Net Asset Value Per Share | | | | $21.94 |
| |
| |
| At September 30, 2013, net assets consisted of: | | | | |
| | | | | Amount |
| | | | | ($000) |
| Paid-in Capital | | | | 4,823,283 |
| Undistributed Net Investment Income | | | | 43,866 |
| Accumulated Net Realized Losses | | | | (1,082,680) |
| Unrealized Appreciation (Depreciation) | | | | |
| Investment Securities | | | | 714,061 |
| Futures Contracts | | | | (692) |
| Forward Currency Contracts | | | | 604 |
| Foreign Currencies | | | | 100 |
| Net Assets | | | | 4,498,542 |
• See Note A in Notes to Financial Statements.
* Non-income-producing security.
^ Part of security position is on loan to broker-dealers. The total value of securities on loan is $77,612,000.
† Represents the aggregate value, by category, of securities that are not among the 50 largest holdings and, in total for any issuer, represent
1% or less of net assets.
1 Includes a security exempt from registration under Rule 144A of the Securities Act of 1933. Such securities may be sold in transactions
exempt from registration, normally to qualified institutional buyers. At September 30, 2013, the value of this security was $730,000,
representing 0.0% of net assets.
2 Considered an affiliated company of the fund as the issuer is another member of The Vanguard Group.
3 The fund invests a portion of its cash reserves in equity markets through the use of index futures contracts. After giving effect to futures
investments, the fund’s effective common stock and temporary cash investment positions represent 98.7% and 3.2%, respectively, of
net assets.
4 Affiliated money market fund available only to Vanguard funds and certain trusts and accounts managed by Vanguard. Rate shown is
the 7-day yield.
5 Includes $86,669,000 of collateral received for securities on loan.
6 Securities with a value of $5,298,000 have been segregated as initial margin for open futures contracts.
ADR—American Depositary Receipt.
GDR—Global Depositary Receipt.
See accompanying Notes, which are an integral part of the Financial Statements.
21
Global Equity Fund
Statement of Operations
| |
| | Year Ended |
| | September 30, 2013 |
| | ($000) |
| Investment Income | |
| Income | |
| Dividends1,2 | 94,598 |
| Interest2 | 219 |
| Securities Lending | 1,956 |
| Total Income | 96,773 |
| Expenses | |
| Investment Advisory Fees—Note B | |
| Basic Fee | 10,187 |
| Performance Adjustment | 2,954 |
| The Vanguard Group—Note C | |
| Management and Administrative | 11,194 |
| Marketing and Distribution | 715 |
| Custodian Fees | 573 |
| Auditing Fees | 40 |
| Shareholders’ Reports | 60 |
| Trustees’ Fees and Expenses | 13 |
| Total Expenses | 25,736 |
| Net Investment Income | 71,037 |
| Realized Net Gain (Loss) | |
| Investment Securities Sold2 | 762,840 |
| Futures Contracts | 20,454 |
| Foreign Currencies and Forward Currency Contracts | (4,025) |
| Realized Net Gain (Loss) | 779,269 |
| Change in Unrealized Appreciation (Depreciation) | |
| Investment Securities | 10,664 |
| Futures Contracts | (170) |
| Foreign Currencies and Forward Currency Contracts | 691 |
| Change in Unrealized Appreciation (Depreciation) | 11,185 |
| Net Increase (Decrease) in Net Assets Resulting from Operations | 861,491 |
| 1 Dividends are net of foreign withholding taxes of $3,427,000. |
| 2 Dividend income, interest income, and realized net gain (loss) from affiliated companies of the fund were $578,000, $219,000, and |
| $1,052,000, respectively. |
See accompanying Notes, which are an integral part of the Financial Statements.
22
Global Equity Fund
Statement of Changes in Net Assets
| | |
| | Year Ended September 30, |
| | 2013 | 2012 |
| | ($000) | ($000) |
| Increase (Decrease) in Net Assets | | |
| Operations | | |
| Net Investment Income | 71,037 | 66,820 |
| Realized Net Gain (Loss) | 779,269 | (21,470) |
| Change in Unrealized Appreciation (Depreciation) | 11,185 | 665,717 |
| Net Increase (Decrease) in Net Assets Resulting from Operations | 861,491 | 711,067 |
| Distributions | | |
| Net Investment Income | (71,970) | (76,902) |
| Realized Capital Gain | — | — |
| Total Distributions | (71,970) | (76,902) |
| Capital Share Transactions | | |
| Issued | 518,731 | 452,881 |
| Issued in Lieu of Cash Distributions | 68,497 | 72,488 |
| Redeemed | (731,455) | (636,233) |
| Net Increase (Decrease) from Capital Share Transactions | (144,227) | (110,864) |
| Total Increase (Decrease) | 645,294 | 523,301 |
| Net Assets | | |
| Beginning of Period | 3,853,248 | 3,329,947 |
| End of Period1 | 4,498,542 | 3,853,248 |
| 1 Net Assets—End of Period includes undistributed net investment income of $43,866,000 and $30,043,000. |
See accompanying Notes, which are an integral part of the Financial Statements.
23
Global Equity Fund
Financial Highlights
| | | | | |
| For a Share Outstanding | Year Ended September 30, |
| Throughout Each Period | 2013 | 2012 | 2011 | 2010 | 2009 |
| Net Asset Value, Beginning of Period | $18.21 | $15.24 | $16.74 | $15.49 | $16.64 |
| Investment Operations | | | | | |
| Net Investment Income | . 342 | .320 | .3451 | .314 | .371 |
| Net Realized and Unrealized Gain (Loss) | | | | | |
| on Investments | 3.730 | 3.012 | (1.525) | 1.292 | (.948) |
| Total from Investment Operations | 4.072 | 3.332 | (1.180) | 1.606 | (.577) |
| Distributions | | | | | |
| Dividends from Net Investment Income | (.342) | (. 362) | (. 320) | (. 356) | (. 573) |
| Distributions from Realized Capital Gains | — | — | — | — | — |
| Total Distributions | (.342) | (. 362) | (. 320) | (. 356) | (. 573) |
| Net Asset Value, End of Period | $21.94 | $18.21 | $15.24 | $16.74 | $15.49 |
| |
| Total Return2 | 22.72% | 22.20% | -7.31% | 10.51% | -2.30% |
| |
| Ratios/Supplemental Data | | | | | |
| Net Assets, End of Period (Millions) | $4,499 | $3,853 | $3,330 | $3,906 | $3,813 |
| Ratio of Total Expenses to | | | | | |
| Average Net Assets3 | 0.61% | 0.57% | 0.54% | 0.44% | 0.47% |
| Ratio of Net Investment Income to | | | | | |
| Average Net Assets | 1.69% | 1.82% | 1.92% | 1.94% | 2.55% |
| Portfolio Turnover Rate | 70% | 67% | 44% | 64% | 71% |
1 Calculated based on average shares outstanding.
2 Total returns do not include account service fees that may have applied in the periods shown. Fund prospectuses provide information about
any applicable account service fees.
3 Includes performance-based investment advisory fee increases (decreases) of 0.07%, 0.02%, (0.02%), (0.11%), and (0.13%).
See accompanying Notes, which are an integral part of the Financial Statements.
24
Global Equity Fund
Notes to Financial Statements
Vanguard Global Equity Fund is registered under the Investment Company Act of 1940 as an open-end investment company, or mutual fund. The fund invests in securities of foreign issuers, which may subject it to investment risks not normally associated with investing in securities of United States corporations.
A. The following significant accounting policies conform to generally accepted accounting principles for U.S. mutual funds. The fund consistently follows such policies in preparing its financial statements.
1. Security Valuation: Securities are valued as of the close of trading on the New York Stock Exchange (generally 4 p.m., Eastern time) on the valuation date. Equity securities are valued at the latest quoted sales prices or official closing prices taken from the primary market in which each security trades; such securities not traded on the valuation date are valued at the mean of the latest quoted bid and asked prices. Bonds, and temporary cash investments acquired over 60 days to maturity, are valued using the latest bid prices or using valuations based on a matrix system (which considers such factors as security prices, yields, maturities, and ratings), both as furnished by independent pricing services. Other temporary cash investments are valued at amortized cost, which approximates market value. Securities for which market quotations are not readily available, or whose values have been affected by events occurring before the fund’s pricing time but after the close of the securities’ primary markets, are valued at their fair values calculated according to procedures adopted by the board of trustees. These procedures include obtaining quotations from an independent pricing service, monitoring news to identify significant market- or security-specific events, and evaluating changes in the values of foreign market proxies (for example, ADRs, futures contracts, or exchange-traded funds), between the time the foreign markets close and the fund’s pricing time. When fair-value pricing is employed, the prices of securities used by a fund to calculate its net asset value may differ from quoted or published prices for the same securities.
2. Foreign Currency: Securities and other assets and liabilities denominated in foreign currencies are translated into U.S. dollars using exchange rates obtained from an independent third party as of the fund’s pricing time on the valuation date. Realized gains (losses) and unrealized appreciation (depreciation) on investment securities include the effects of changes in exchange rates since the securities were purchased, combined with the effects of changes in security prices. Fluctuations in the value of other assets and liabilities resulting from changes in exchange rates are recorded as unrealized foreign currency gains (losses) until the assets or liabilities are settled in cash, at which time they are recorded as realized foreign currency gains (losses).
3. Futures and Forward Currency Contracts: The fund may use index futures contracts to a limited extent, with the objective of maintaining full exposure to the stock market while maintaining liquidity. The fund may purchase or sell futures contracts to achieve a desired level of investment, whether to accommodate portfolio turnover or cash flows from capital share transactions. The primary risks associated with the use of futures contracts are imperfect correlation between changes in market values of stocks held by the fund and the prices of futures contracts, and the possibility of an illiquid market. Counterparty risk involving futures is mitigated because a regulated clearinghouse is the counterparty instead of the clearing broker. To further mitigate counterparty risk, the fund trades futures contracts on an exchange, monitors the financial strength of its clearing brokers and clearing-house, and has entered into clearing agreements with its clearing brokers. The clearinghouse imposes initial margin requirements to secure the fund’s performance and requires daily settlement of variation margin representing changes in the market value of each contract.
25
Global Equity Fund
The fund may enter into forward currency contracts to provide the appropriate currency exposure related to any open futures contracts or to protect the value of securities and related receivables and payables against changes in foreign exchange rates. The fund’s risks in using these contracts include movement in the values of the foreign currencies relative to the U.S. dollar and the ability of the counterparties to fulfill their obligations under the contracts. The fund mitigates its counterparty risk by entering into forward currency contracts only with a diverse group of prequalified counter-parties, monitoring their financial strength, entering into master netting arrangements with its counterparties, and requiring its counterparties to transfer collateral as security for their performance. The master netting arrangements provide that, in the event of a counterparty’s default (including bankruptcy), the fund may terminate the forward currency contracts, determine the net amount owed by either party in accordance with its master netting arrangements, and sell or retain any collateral held up to the net amount owed to the fund under the master netting arrangements. The forward currency contracts contain provisions whereby a counterparty may terminate open contracts if the fund’s net assets decline below a certain level, triggering a payment by the fund if the fund is in a net liability position at the time of the termination. The payment amount would be reduced by any collateral the fund has pledged. Any assets pledged as collateral for open contracts are noted in the Statement of Net Assets. The value of collateral received or pledged is compared daily to the value of the forward currency contracts exposure with each counterparty, and any difference, if in excess of a specified minimum transfer amount, is adjusted and settled within two business days.
Futures contracts are valued at their quoted daily settlement prices. Forward currency contracts are valued at their quoted daily prices obtained from an independent third party, adjusted for currency risk based on the expiration date of each contract. The aggregate notional amounts of the contracts are not recorded in the Statement of Net Assets. Fluctuations in the value of the contracts are recorded in the Statement of Net Assets as an asset (liability) and in the Statement of Operations as unrealized appreciation (depreciation) until the contracts are closed, when they are recorded as realized gains (losses) on futures or forward currency contracts.
During the year ended September 30, 2013, the fund’s average investments in long and short futures contracts represented 2% and 0% of net assets, respectively, based on quarterly average aggregate settlement values. The fund’s average investment in forward currency contracts represented less than 1% of net assets, based on quarterly average notional amounts.
4. Federal Income Taxes: The fund intends to continue to qualify as a regulated investment company and distribute all of its taxable income. Management has analyzed the fund’s tax positions taken for all open federal income tax years (September 30, 2010–2013), and has concluded that no provision for federal income tax is required in the fund’s financial statements.
5. Distributions: Distributions to shareholders are recorded on the ex-dividend date.
6. Securities Lending: To earn additional income, the fund may lend its securities to qualified institutional borrowers. Security loans are required to be secured at all times by collateral in an amount at least equal to the market value of securities loaned. Daily market fluctuations could cause the value of loaned securities to be more or less than the value of the collateral received. When this occurs, the collateral is adjusted and settled on the next business day. The fund further mitigates its counterparty risk by entering into securities lending transactions only with a diverse group of prequalified counterparties, monitoring their financial strength, and entering into master securities lending agreements with its counterparties. The master securities lending agreements
26
Global Equity Fund
provide that, in the event of a counterparty’s default (including bankruptcy), the fund may terminate any loans with that borrower, determine the net amount owed, and sell or retain the collateral up to the net amount owed to the fund; however, such actions may be subject to legal proceedings. While collateral mitigates counterparty risk, in the absence of a default the fund may experience delays and costs in recovering the securities loaned. The fund invests cash collateral received in Vanguard Market Liquidity Fund, and records a liability for the return of the collateral, during the period the securities are on loan. Securities lending income represents fees charged to borrowers plus income earned on invested cash collateral, less expenses associated with the loan.
7. Other: Dividend income is recorded on the ex-dividend date. Interest income includes income distributions received from Vanguard Market Liquidity Fund and is accrued daily. Security transactions are accounted for on the date securities are bought or sold. Costs used to determine realized gains (losses) on the sale of investment securities are those of the specific securities sold.
B. Marathon Asset Management LLP, Baillie Gifford Overseas Ltd., and Acadian Asset Management LLC each provide investment advisory services to a portion of the fund for a fee calculated at an annual percentage rate of average net assets managed by the advisor. The basic fees of Marathon Asset Management LLP, Baillie Gifford Overseas Ltd., and Acadian Asset Management LLC are subject to quarterly adjustments based on performance for the preceding three years relative to the MSCI All Country World Index.
The Vanguard Group manages the cash reserves of the fund on an at-cost basis.
For the year ended September 30, 2013, the aggregate investment advisory fee represented an effective annual basic rate of 0.24% of the fund’s average net assets, before an increase of $2,954,000 (0.07%) based on performance.
C. The Vanguard Group furnishes at cost corporate management, administrative, marketing, and distribution services. The costs of such services are allocated to the fund under methods approved by the board of trustees. The fund has committed to provide up to 0.40% of its net assets in capital contributions to Vanguard. At September 30, 2013, the fund had contributed capital of $519,000 to Vanguard (included in Other Assets), representing 0.01% of the fund’s net assets and 0.21% of Vanguard’s capitalization. The fund’s trustees and officers are also directors and officers of Vanguard.
D. Various inputs may be used to determine the value of the fund’s investments. These inputs are summarized in three broad levels for financial statement purposes. The inputs or methodologies used to value securities are not necessarily an indication of the risk associated with investing in those securities.
Level 1—Quoted prices in active markets for identical securities.
Level 2—Other significant observable inputs (including quoted prices for similar securities, interest rates, prepayment speeds, credit risk, etc.).
Level 3—Significant unobservable inputs (including the fund’s own assumptions used to determine the fair value of investments).
27
Global Equity Fund
The following table summarizes the market value of the fund’s investments as of September 30, 2013, based on the inputs used to value them:
| | | |
| | Level 1 | Level 2 | Level 3 |
| Investments | ($000) | ($000) | ($000) |
| Common Stocks—International | 289,957 | 2,055,795 | — |
| Common Stocks—United States | 1,992,450 | — | — |
| Temporary Cash Investments | 237,975 | 7,496 | — |
| Futures Contracts—Liabilities1 | (947) | — | — |
| Forward Currency Contracts—Assets | — | 617 | — |
| Forward Currency Contracts—Liabilities | — | (13) | — |
| Total | 2,519,435 | 2,063,895 | — |
| 1 Represents variation margin on the last day of the reporting period. |
E. At September 30, 2013, the fair values of derivatives were reflected in the Statement of Net Assets as follows:
| | | |
| | | Foreign | |
| | Equity | Exchange | |
| | Contracts | Contracts | Total |
| Statement of Net Assets Caption | ($000) | ($000) | ($000) |
| Other Assets | — | 617 | 617 |
| Liabilities | (947) | (13) | (960) |
Realized net gain (loss) and the change in unrealized appreciation (depreciation) on derivatives for the year ended September 30, 2013, were:
| | | |
| | | Foreign | |
| | Equity | Exchange | |
| | Contracts | Contracts | Total |
| Realized Net Gain (Loss) on Derivatives | ($000) | ($000) | ($000) |
| Futures Contracts | 20,454 | — | 20,454 |
| Forward Currency Contracts | — | (2,530) | (2,530) |
| Realized Net Gain (Loss) on Derivatives | 20,454 | (2,530) | 17,924 |
| |
| Change in Unrealized Appreciation (Depreciation) on Derivatives | | | |
| Futures Contracts | (170) | — | (170) |
| Forward Currency Contracts | — | 689 | 689 |
| Change in Unrealized Appreciation (Depreciation) on Derivatives | (170) | 689 | 519 |
28
Global Equity Fund
At September 30, 2013, the aggregate settlement value of open futures contracts and the related unrealized appreciation (depreciation) were:
| | | | |
| | | | Aggregate | |
| | | Number of | Settlement | Unrealized |
| | | Long (Short) | Value | Appreciation |
| Futures Contracts | Expiration | Contracts | Long (Short) | (Depreciation) |
| S&P 500 Index | December 2013 | 146 | 61,112 | (623) |
| FTSE 100 Index | December 2013 | 128 | 13,327 | (276) |
| Dow Jones EURO STOXX 50 Index | December 2013 | 325 | 12,666 | 81 |
| Topix Index | December 2013 | 82 | 9,999 | 146 |
| S&P ASX 200 Index | December 2013 | 50 | 6,105 | (20) |
Unrealized appreciation (depreciation) on open S&P 500 Index, FTSE 100 Index, and Dow Jones EURO STOXX 50 Index futures contracts is required to be treated as realized gain (loss) for tax purposes.
At September 30, 2013, the fund had open forward currency contracts to receive and deliver currencies as follows. Unrealized appreciation (depreciation) on open forward currency contracts is treated as realized gain (loss) for tax purposes.
| | | | | | |
| | | | | | | Unrealized |
| | Contract | | | | | Appreciation |
| | Settlement | Contract Amount (000) | (Depreciation) |
| Counterparty | Date | | Receive | | Deliver | ($000) |
| Morgan Stanley Capital Services Inc. | 12/27/13 | GBP | 8,412 | USD | 13,368 | 242 |
| Morgan Stanley Capital Services Inc. | 12/27/13 | EUR | 9,334 | USD | 12,464 | 166 |
| Morgan Stanley Capital Services Inc. | 12/17/13 | JPY | 968,063 | USD | 9,645 | 209 |
| Morgan Stanley Capital Services Inc. | 12/24/13 | AUD | 6,558 | USD | 6,097 | (13) |
| AUD—Australian dollar. |
| EUR—Euro. |
| GBP—British pound. |
| JPY—Japanese yen. |
| USD—U.S. dollar. |
At September 30, 2013, the counterparty had deposited in segregated accounts securities with a value of $829,000 in connection with amounts due to the fund for open forward currency contracts.
F. Distributions are determined on a tax basis and may differ from net investment income and realized capital gains for financial reporting purposes. Differences may be permanent or temporary. Permanent differences are reclassified among capital accounts in the financial statements to reflect their tax character. Temporary differences arise when certain items of income, expense, gain, or loss are recognized in different periods for financial statement and tax purposes; these differences will reverse at some time in the future. Differences in classification may also result from the treatment of short-term gains as ordinary income for tax purposes.
29
Global Equity Fund
During the year ended September 30, 2013, the fund realized net foreign currency losses of $1,495,000, which decreased distributable net income for tax purposes; accordingly, such losses have been reclassified from accumulated net realized losses to undistributed net investment income. Certain of the fund’s investments are in securities considered to be “passive foreign investment companies,” for which any unrealized appreciation and/or realized gains are required to be included in distributable net income for tax purposes. During the year ended September 30, 2013, the fund realized gains on the sale of passive foreign investment companies of $16,251,000, which have been included in current and prior periods’ taxable income; accordingly, such gains have been reclassified from accumulated net realized losses to undistributed net investment income. Passive foreign investment companies held at September 30, 2013, had unrealized appreciation of $8,594,000, all of which has been distributed and is reflected in the balance of undistributed net investment income.
For tax purposes, at September 30, 2013, the fund had $61,131,000 of ordinary income available for distribution. The fund used capital loss carryforwards of $765,566,000 to offset taxable capital gains realized during the year ended September 30, 2013. At September 30, 2013, the fund had available capital losses totaling $1,083,047,000 to offset future net capital gains through September 30, 2018.
At September 30, 2013, the cost of investment securities for tax purposes was $3,879,011,000. Net unrealized appreciation of investment securities for tax purposes was $704,662,000, consisting of unrealized gains of $808,813,000 on securities that had risen in value since their purchase and $104,151,000 in unrealized losses on securities that had fallen in value since their purchase.
G. During the year ended September 30, 2013, the fund purchased $2,835,284,000 of investment securities and sold $3,021,796,000 of investment securities, other than temporary cash investments.
H. Capital shares issued and redeemed were:
| | |
| | Year Ended September 30, |
| | 2013 | 2012 |
| | Shares | Shares |
| | (000) | (000) |
| Issued | 26,345 | 26,113 |
| Issued in Lieu of Cash Distributions | 3,713 | 4,542 |
| Redeemed | (36,671) | (37,464) |
| Net Increase (Decrease) in Shares Outstanding | (6,613) | (6,809) |
I. Management has determined that no material events or transactions occurred subsequent to September 30, 2013, that would require recognition or disclosure in these financial statements.
30
Report of Independent Registered
Public Accounting Firm
To the Trustees of Vanguard Horizon Funds and the Shareholders of Vanguard Global Equity Fund: In our opinion, the accompanying statement of net assets—investment summary and the related statements of operations and of changes in net assets and the financial highlights present fairly, in all material respects, the financial position of Vanguard Global Equity Fund (constituting a separate portfolio of Vanguard Horizon Funds, hereafter referred to as the “Fund”) at September 30, 2013, the results of its operations for the year then ended, the changes in its net assets for each of the two years in the period then ended, and the financial highlights for each of the five years in the period then ended, in conformity with accounting principles generally accepted in the United States of America. These financial statements and financial highlights (hereafter referred to as “financial statements”) are the responsibility of the Fund’s management; our responsibility is to express an opinion on these financial statements based on our audits. We conducted our audits of these financial statements in accordance with the standards of the Public Company Accounting Oversight Board (United States). Those standards require that we plan and perform the audit to obtain reasonable assurance about whether the financial statements are free of material misstatement. An audit includes examining, on a test basis, evidence supporting the amounts and disclosures in the financial statements, assessing the accounting principles used and significant estimates made by management, and evaluating the overall financial statement presentation. We believe that our audits, which included confirmation of securities at September 30, 2013 by correspondence with the custodian and brokers and by agreement to the underlying ownership records of the transfer agent, provide a reasonable basis for our opinion.
/s/PricewaterhouseCoopers LLP
Philadelphia, Pennsylvania
November 15, 2013
Special 2013 tax information (unaudited) for Vanguard Global Equity Fund
This information for the fiscal year ended September 30, 2013, is included pursuant to provisions of
the Internal Revenue Code.
The fund distributed $62,089,000 of qualified dividend income to shareholders during the fiscal year.
For corporate shareholders, 93% of investment income (dividend income plus short-term gains,
if any) qualifies for the dividends-received deduction.
The fund designates to shareholders foreign source income of $53,295,000 and foreign taxes paid
of $3,579,000. Shareholders will receive more detailed information with their Form 1099-DIV in
January 2014 to determine the calendar-year amounts to be included on their 2013 tax returns.
31
Your Fund’s After-Tax Returns
This table presents returns for your fund both before and after taxes. The after-tax returns are shown in two ways: (1) assuming that an investor owned the fund during the entire period and paid taxes on the fund’s distributions, and (2) assuming that an investor paid taxes on the fund’s distributions and sold all shares at the end of each period.
Calculations are based on the highest individual federal income tax and capital gains tax rates in effect at the times of the distributions and the hypothetical sales. State and local taxes were not considered. After-tax returns reflect any qualified dividend income, using actual prior-year figures and estimates for 2013. (In the example, returns after the sale of fund shares may be higher than those assuming no sale. This occurs when the sale would have produced a capital loss. The calculation assumes that the investor received a tax deduction for the loss.)
Please note that your actual after-tax returns will depend on your tax situation and may differ from those shown. Also note that if you own the fund in a tax-deferred account, such as an individual retirement account or a 401(k) plan, this information does not apply to you. Such accounts are not subject to current taxes.
Finally, keep in mind that a fund’s performance—whether before or after taxes—does not guarantee future results.
| | | |
| Average Annual Total Returns: Global Equity Fund | | | |
| Periods Ended September 30, 2013 | | | |
| | One | Five | Ten |
| | Year | Years | Years |
| Returns Before Taxes | 22.72% | 8.46% | 8.50% |
| Returns After Taxes on Distributions | 22.39 | 8.04 | 7.85 |
| Returns After Taxes on Distributions and Sale of Fund Shares | 13.37 | 6.71 | 6.97 |
32
About Your Fund’s Expenses
As a shareholder of the fund, you incur ongoing costs, which include costs for portfolio management, administrative services, and shareholder reports (like this one), among others. Operating expenses, which are deducted from a fund’s gross income, directly reduce the investment return of the fund.
A fund’s expenses are expressed as a percentage of its average net assets. This figure is known as the expense ratio. The following examples are intended to help you understand the ongoing costs (in dollars) of investing in your fund and to compare these costs with those of other mutual funds. The examples are based on an investment of $1,000 made at the beginning of the period shown and held for the entire period.
The accompanying table illustrates your fund’s costs in two ways:
• Based on actual fund return. This section helps you to estimate the actual expenses that you paid over the period. The ”Ending Account Value“ shown is derived from the fund‘s actual return, and the third column shows the dollar amount that would have been paid by an investor who started with $1,000 in the fund. You may use the information here, together with the amount you invested, to estimate the expenses that you paid over the period.
To do so, simply divide your account value by $1,000 (for example, an $8,600 account value divided by $1,000 = 8.6), then multiply the result by the number given for your fund under the heading ”Expenses Paid During Period.“
• Based on hypothetical 5% yearly return. This section is intended to help you compare your fund‘s costs with those of other mutual funds. It assumes that the fund had a yearly return of 5% before expenses, but that the expense ratio is unchanged. In this case—because the return used is not the fund’s actual return—the results do not apply to your investment. The example is useful in making comparisons because the Securities and Exchange Commission requires all mutual funds to calculate expenses based on a 5% return. You can assess your fund’s costs by comparing this hypothetical example with the hypothetical examples that appear in shareholder reports of other funds.
Note that the expenses shown in the table are meant to highlight and help you compare ongoing costs only and do not reflect transaction costs incurred by the fund for buying and selling securities. Further, the expenses do not include any purchase, redemption, or account service fees described in the fund prospectus. If such fees were applied to your account, your costs would be higher. Your fund does not carry a “sales load.”
The calculations assume no shares were bought or sold during the period. Your actual costs may have been higher or lower, depending on the amount of your investment and the timing of any purchases or redemptions.
You can find more information about the fund’s expenses, including annual expense ratios, in the Financial Statements section of this report. For additional information on operating expenses and other shareholder costs, please refer to your fund’s current prospectus.
33
| | | |
| Six Months Ended September 30, 2013 | | | |
| | Beginning | Ending | Expenses |
| | Account Value | Account Value | Paid During |
| Global Equity Fund | 3/31/2013 | 9/30/2013 | Period |
| Based on Actual Fund Return | $1,000.00 | $1,085.06 | $3.19 |
| Based on Hypothetical 5% Yearly Return | 1,000.00 | 1,022.01 | 3.09 |
The calculations are based on expenses incurred in the most recent six-month period. The fund’s annualized six-month expense ratio for that
period is 0.61%. The dollar amounts shown as “Expenses Paid” are equal to the annualized expense ratio multiplied by the average account
value over the period, multiplied by the number of days in the most recent six-month period, then divided by the number of days in the most
recent 12-month period.
34
Glossary
Beta. A measure of the magnitude of a fund’s past share-price fluctuations in relation to the ups and downs of a given market index. The index is assigned a beta of 1.00. Compared with a given index, a fund with a beta of 1.20 typically would have seen its share price rise or fall by 12% when the index rose or fell by 10%. For this report, beta is based on returns over the past 36 months for both the fund and the index. Note that a fund’s beta should be reviewed in conjunction with its R-squared (see definition). The lower the R-squared, the less correlation there is between the fund and the index, and the less reliable beta is as an indicator of volatility.
Dividend Yield. Dividend income earned by stocks, expressed as a percentage of the aggregate market value (or of net asset value, for a fund). The yield is determined by dividing the amount of the annual dividends by the aggregate value (or net asset value) at the end of the period. For a fund, the dividend yield is based solely on stock holdings and does not include any income produced by other investments.
Earnings Growth Rate. The average annual rate of growth in earnings over the past five years for the stocks now in a fund.
Equity Exposure. A measure that reflects a fund’s investments in stocks and stock futures. Any holdings in short-term reserves are excluded.
Expense Ratio. A fund’s total annual operating expenses expressed as a percentage of the fund’s average net assets. The expense ratio includes management and administrative expenses, but does not include the transaction costs of buying and selling portfolio securities.
Inception Date. The date on which the assets of a fund (or one of its share classes) are first invested in accordance with the fund’s investment objective. For funds with a subscription period, the inception date is the day after that period ends. Investment performance is measured from the inception date.
Median Market Cap. An indicator of the size of companies in which a fund invests; the midpoint of market capitalization (market price x shares outstanding) of a fund’s stocks, weighted by the proportion of the fund’s assets invested in each stock. Stocks representing half of the fund’s assets have market capitalizations above the median, and the rest are below it.
Price/Book Ratio. The share price of a stock divided by its net worth, or book value, per share. For a fund, the weighted average price/book ratio of the stocks it holds.
Price/Earnings Ratio. The ratio of a stock’s current price to its per-share earnings over the past year. For a fund, the weighted average P/E of the stocks it holds. P/E is an indicator of market expectations about corporate prospects; the higher the P/E, the greater the expectations for a company’s future growth.
R-Squared. A measure of how much of a fund’s past returns can be explained by the returns from the market in general, as measured by a given index. If a fund’s total returns were precisely synchronized with an index’s returns, its R-squared would be 1.00. If the fund’s returns bore no relationship to the index’s returns, its R-squared would be 0. For this report, R-squared is based on returns over the past 36 months for both the fund and the index.
35
Return on Equity. The annual average rate of return generated by a company during the past five years for each dollar of shareholder’s equity (net income divided by shareholder’s equity). For a fund, the weighted average return on equity for the companies whose stocks it holds.
Short-Term Reserves. The percentage of a fund invested in highly liquid, short-term securities that can be readily converted to cash.
Turnover Rate. An indication of the fund’s trading activity. Funds with high turnover rates incur higher transaction costs and may be more likely to distribute capital gains (which may be taxable to investors). The turnover rate excludes in-kind transactions, which have minimal impact on costs.
Benchmark Information
Spliced Global Equity Index: MSCI All Country World Index returns gross of taxes through March 31, 2007; MSCI All Country World Index returns net of withholding taxes thereafter.
36
This page intentionally left blank.
This page intentionally left blank.
This page intentionally left blank.
The People Who Govern Your Fund
The trustees of your mutual fund are there to see that the fund is operated and managed in your best interests since, as a shareholder, you are a part owner of the fund. Your fund’s trustees also serve on the board of directors of The Vanguard Group, Inc., which is owned by the Vanguard funds and provides services to them on an at-cost basis.
A majority of Vanguard’s board members are independent, meaning that they have no affiliation with Vanguard or the funds they oversee, apart from the sizable personal investments they have made as private individuals. The independent board members have distinguished backgrounds in business, academia, and public service. Each of the trustees and executive officers oversees 181 Vanguard funds.
The following table provides information for each trustee and executive officer of the fund. More information about the trustees is in the Statement of Additional Information, which can be obtained, without charge, by contacting Vanguard at 800-662-7447, or online at vanguard.com.
| |
| InterestedTrustee1 | and Delphi Automotive LLP (automotive components); |
| | Senior Advisor at New Mountain Capital; Trustee of |
| F. William McNabb III | The Conference Board. |
| Born 1957. Trustee Since July 2009. Chairman of the | |
| Board. Principal Occupation(s) During the Past Five | Amy Gutmann |
| Years: Chairman of the Board of The Vanguard Group, | Born 1949. Trustee Since June 2006. Principal |
| Inc., and of each of the investment companies served | Occupation(s) During the Past Five Years: President |
| by The Vanguard Group, since January 2010; Director | of the University of Pennsylvania; Christopher H. |
| of The Vanguard Group since 2008; Chief Executive | Browne Distinguished Professor of Political Science |
| Officer and President of The Vanguard Group and of | in the School of Arts and Sciences with secondary |
| each of the investment companies served by The | appointments at the Annenberg School for |
| Vanguard Group since 2008; Director of Vanguard | Communication and the Graduate School of Education |
| Marketing Corporation; Managing Director of The | of the University of Pennsylvania; Member of the |
| Vanguard Group (1995–2008). | National Commission on the Humanities and Social |
| | Sciences; Trustee of Carnegie Corporation of New |
| | York and of the National Constitution Center; Chair |
| IndependentTrustees | of the U. S. Presidential Commission for the Study |
| | of Bioethical Issues. |
| Emerson U. Fullwood | |
| |
| Born 1948. Trustee Since January 2008. Principal | JoAnn Heffernan Heisen |
| Occupation(s) During the Past Five Years: Executive | Born 1950. Trustee Since July 1998. Principal |
| Chief Staff and Marketing Officer for North America | Occupation(s) During the Past Five Years: Corporate |
| and Corporate Vice President (retired 2008) of Xerox | Vice President and Chief Global Diversity Officer |
| Corporation (document management products and | (retired 2008) and Member of the Executive |
| services); Executive in Residence and 2010 | Committee (1997–2008) of Johnson & Johnson |
| Distinguished Minett Professor at the Rochester | (pharmaceuticals/medical devices/consumer |
| Institute of Technology; Director of SPX Corporation | products); Director of Skytop Lodge Corporation |
| (multi-industry manufacturing), the United Way of | (hotels), the University Medical Center at Princeton, |
| Rochester, Amerigroup Corporation (managed health | the Robert Wood Johnson Foundation, and the Center |
| care), the University of Rochester Medical Center, | for Talent Innovation; Member of the Advisory Board |
| Monroe Community College Foundation, and North | of the Maxwell School of Citizenship and Public Affairs |
| Carolina A&T University. | at Syracuse University. |
| |
| Rajiv L. Gupta | F. Joseph Loughrey |
| Born 1945. Trustee Since December 2001. 2 | Born 1949. Trustee Since October 2009. Principal |
| Principal Occupation(s) During the Past Five Years: | Occupation(s) During the Past Five Years: President |
| Chairman and Chief Executive Officer (retired 2009) | and Chief Operating Officer (retired 2009) of Cummins |
| and President (2006–2008) of Rohm and Haas Co. | Inc. (industrial machinery); Chairman of the Board of |
| (chemicals); Director of Tyco International, Ltd. | Hillenbrand, Inc. (specialized consumer services) and |
| (diversified manufacturing and services), Hewlett- | of Oxfam America; Director of SKF AB (industrial |
| Packard Co. (electronic computer manufacturing), | |
| | |
| machinery) and the Lumina Foundation for Education; | Executive Officers | |
| Member of the Advisory Council for the College of | | |
| Arts and Letters and of the Advisory Board to the | Glenn Booraem | |
| Kellogg Institute for International Studies, both at | Born 1967. Controller Since July 2010. Principal |
| the University of Notre Dame. | Occupation(s) During the Past Five Years: Principal |
| | of The Vanguard Group, Inc.; Controller of each of |
| Mark Loughridge | the investment companies served by The Vanguard |
| Born 1953. Trustee Since March 2012. Principal | Group; Assistant Controller of each of the investment |
| Occupation(s) During the Past Five Years: Senior Vice | companies served by The Vanguard Group (2001–2010). |
| President and Chief Financial Officer at IBM (information | | |
| technology services); Fiduciary Member of IBM’s | Thomas J. Higgins | |
| Retirement Plan Committee. | Born 1957. Chief Financial Officer Since September |
| | 2008. Principal Occupation(s) During the Past Five |
| Scott C. Malpass | Years: Principal of The Vanguard Group, Inc.; Chief |
| Born 1962. Trustee Since March 2012. Principal | Financial Officer of each of the investment companies |
| Occupation(s) During the Past Five Years: Chief | served by The Vanguard Group; Treasurer of each of |
| Investment Officer and Vice President at the University | the investment companies served by The Vanguard |
| of Notre Dame; Assistant Professor of Finance at the | Group (1998–2008). | |
| Mendoza College of Business at Notre Dame; Member | | |
| of the Notre Dame 403(b) Investment Committee; | Kathryn J. Hyatt | |
| Director of TIFF Advisory Services, Inc. (investment | Born 1955. Treasurer Since November 2008. Principal |
| advisor); Member of the Investment Advisory | Occupation(s) During the Past Five Years: Principal of |
| Committees of the Financial Industry Regulatory | The Vanguard Group, Inc.; Treasurer of each of the |
| Authority (FINRA) and of Major League Baseball. | investment companies served by The Vanguard |
| | Group; Assistant Treasurer of each of the investment |
| André F. Perold | companies served by The Vanguard Group (1988–2008). |
| Born 1952. Trustee Since December 2004. Principal | | |
| Occupation(s) During the Past Five Years: George | Heidi Stam | |
| Gund Professor of Finance and Banking at the Harvard | Born 1956. Secretary Since July 2005. Principal |
| Business School (retired 2011); Chief Investment | Occupation(s) During the Past Five Years: Managing |
| Officer and Managing Partner of HighVista Strategies | Director of The Vanguard Group, Inc.; General Counsel |
| LLC (private investment firm); Director of Rand | of The Vanguard Group; Secretary of The Vanguard |
| Merchant Bank; Overseer of the Museum of Fine | Group and of each of the investment companies |
| Arts Boston. | served by The Vanguard Group; Director and Senior |
| | Vice President of Vanguard Marketing Corporation. |
| | |
| Alfred M. Rankin, Jr. | | |
| Born 1941. Trustee Since January 1993. Principal | Vanguard Senior ManagementTeam |
| Occupation(s) During the Past Five Years: Chairman, | | |
| President, and Chief Executive Officer of NACCO | Mortimer J. Buckley | Chris D. McIsaac |
| Industries, Inc. (housewares/lignite) and of Hyster-Yale | Kathleen C. Gubanich | Michael S. Miller |
| Materials Handling, Inc. (forklift trucks); Director of | Paul A. Heller | James M. Norris |
| the National Association of Manufacturers; Chairman | Martha G. King | Glenn W. Reed |
| of the Board of University Hospitals of Cleveland; | John T. Marcante | |
| Advisory Chairman of the Board of The Cleveland | | |
| Museum of Art. | | |
| | Chairman Emeritus and Senior Advisor |
| | |
| Peter F. Volanakis | John J. Brennan | |
| Born 1955. Trustee Since July 2009. Principal | Chairman, 1996–2009 | |
| Occupation(s) During the Past Five Years: President | Chief Executive Officer and President, 1996–2008 |
| and Chief Operating Officer (retired 2010) of Corning | | |
| Incorporated (communications equipment); Director | | |
| of SPX Corporation (multi-industry manufacturing); | Founder | |
| Overseer of the Amos Tuck School of Business | John C. Bogle | |
| Administration at Dartmouth College; Advisor to the | Chairman and Chief Executive Officer, 1974–1996 |
| Norris Cotton Cancer Center. | | |
1 Mr. McNabb is considered an “interested person,” as defined in the Investment Company Act of 1940, because he is an officer of the
Vanguard funds.
2 December 2002 for Vanguard Equity Income Fund, Vanguard Growth Equity Fund, the Vanguard Municipal Bond Funds, and the Vanguard
State Tax-Exempt Funds.
|  |
| | P.O. Box 2600 |
| | Valley Forge, PA 19482-2600 |
| |
| |
| |
| Connect with Vanguard® > vanguard.com | |
| |
| |
| |
| Fund Information > 800-662-7447 | CFA® is a trademark owned by CFA Institute. |
| Direct Investor Account Services > 800-662-2739 | |
| Institutional Investor Services > 800-523-1036 | |
| Text Telephone for People | |
| With Hearing Impairment > 800-749-7273 | |
| |
| This material may be used in conjunction | |
| with the offering of shares of any Vanguard | |
| fund only if preceded or accompanied by | |
| the fund’s current prospectus. | |
| |
| All comparative mutual fund data are from Lipper, a | |
| Thomson Reuters Company, or Morningstar, Inc., unless | |
| otherwise noted. | |
| |
| You can obtain a free copy of Vanguard’s proxy voting | |
| guidelines by visiting vanguard.com/proxyreporting or by | |
| calling Vanguard at 800-662-2739. The guidelines are | |
| also available from the SEC’s website, sec.gov. In | |
| addition, you may obtain a free report on how your fund | |
| voted the proxies for securities it owned during the 12 | |
| months ended June 30. To get the report, visit either | |
| vanguard.com/proxyreporting or sec.gov. | |
| |
| You can review and copy information about your fund at | |
| the SEC’s Public Reference Room in Washington, D.C. To | |
| find out more about this public service, call the SEC at | |
| 202-551-8090. Information about your fund is also | |
| available on the SEC’s website, and you can receive | |
| copies of this information, for a fee, by sending a | |
| request in either of two ways: via e-mail addressed to | |
| publicinfo@sec.gov or via regular mail addressed to the | |
| Public Reference Section, Securities and Exchange | |
| Commission, Washington, DC 20549-1520. | |
| |
| | © 2013 The Vanguard Group, Inc. |
| | All rights reserved. |
| | Vanguard Marketing Corporation, Distributor. |
| |
| | Q1290 112013 |
Item 2: Code of Ethics. The Registrant has adopted a code of ethics that applies to the Registrant’s principal executive officer, principal financial officer, principal accounting officer or controller or persons performing similar functions. The Code of Ethics was amended during the reporting period covered by this report to make certain technical, non-material changes.
Item 3: Audit Committee Financial Expert. The following members of the Audit Committee have been determined by the Registrant’s Board of Trustees to be Audit Committee Financial Experts serving on its Audit Committee, and to be independent: Rajiv L. Gupta, Amy Gutmann, JoAnn Heffernan Heisen, F. Joseph Loughrey, Mark Loughridge, Scott C. Malpass, André F. Perold, and Alfred M. Rankin, Jr.
Item 4: Principal Accountant Fees and Services.
(a) Audit Fees.
Audit Fees of the Registrant
Fiscal Year Ended September 30, 2013: $122,000 Fiscal Year Ended September 30, 2012: $122,000
Aggregate Audit Fees of Registered Investment Companies in the Vanguard Group.
Fiscal Year Ended September 30, 2013: $5,714,113 Fiscal Year Ended September 30, 2012: $4,809,780
Includes fees billed in connection with audits of the Registrant and other registered investment companies in the Vanguard complex. Also includes fees billed in connection with audits of The Vanguard Group, Inc. and Vanguard Marketing Corporation for Fiscal Year Ended September 30, 2013.
(b) Audit-Related Fees.
Fiscal Year Ended September 30, 2013: $1,552,950 Fiscal Year Ended September 30, 2012: $1,812,565
Includes fees billed in connection with assurance and related services provided to the Registrant, other registered investment companies in the Vanguard complex, The Vanguard Group, Inc., and Vanguard Marketing Corporation.
(c) Tax Fees.
Fiscal Year Ended September 30, 2013: $110,000 Fiscal Year Ended September 30, 2012: $490,518
Includes fees billed in connection with tax compliance, planning, and advice services provided to the Registrant, other registered investment companies in the Vanguard complex, The Vanguard Group, Inc., and Vanguard Marketing Corporation. Also includes fees billed in connection with certain tax services related to audits of the Registrant and other registered investment companies in the Vanguard complex for Fiscal Year Ended September 30, 2012.
(d) All Other Fees.
Fiscal Year Ended September 30, 2013: $132,000 Fiscal Year Ended September 30, 2012: $16,000
Includes fees billed in connection with tax compliance, planning, and advice services provided to the Registrant, other registered investment companies in the Vanguard complex, The Vanguard Group, Inc., and Vanguard Marketing Corporation.
(e) (1) Pre-Approval Policies. The policy of the Registrant’s Audit Committee is to consider and, if appropriate, approve before the principal accountant is engaged for such services, all specific audit and non-audit services provided to: the Registrant, other registered investment companies in the Vanguard complex, The Vanguard Group, Inc., and entities controlled by The Vanguard Group, Inc. that provide ongoing services to the Registrant. In making a determination, the Audit Committee considers whether the services are consistent with maintaining the principal accountant’s independence.
In the event of a contingency situation in which the principal accountant is needed to provide services in between scheduled Audit Committee meetings, the Chairman of the Audit Committee would be called on to consider and, if appropriate, pre-approve audit or permitted non-audit services in an amount sufficient to complete services through the next Audit Committee meeting, and to determine if such services would be consistent with maintaining the accountant’s independence. At the next scheduled Audit Committee meeting, services and fees would be presented to the Audit Committee for formal consideration, and, if appropriate, approval by the entire Audit Committee. The Audit Committee would again consider whether such services and fees are consistent with maintaining the principal accountant’s independence.
The Registrant’s Audit Committee is informed at least annually of all audit and non-audit services provided by the principal accountant to the Vanguard complex, whether such services are provided to: the Registrant, other registered investment companies in the Vanguard complex, The Vanguard Group, Inc., or other entities controlled by The Vanguard Group, Inc. that provide ongoing services to the Registrant.
(2) No percentage of the principal accountant’s fees or services were approved pursuant to the waiver provision of paragraph (c)(7)(i)(C) of Rule 2-01 of Regulation S-X.
(f) For the most recent fiscal year, over 50% of the hours worked under the principal accountant’s engagement were not performed by persons other than full-time, permanent employees of the principal accountant.
(g) Aggregate Non-Audit Fees.
Fiscal Year Ended September 30, 2013: $242,000 Fiscal Year Ended September 30, 2012: $506,518
Includes fees billed for non-audit services provided to the Registrant, other registered investment companies in the Vanguard complex, The Vanguard Group, Inc., and Vanguard Marketing Corporation.
(h) For the most recent fiscal year, the Audit Committee has determined that the provision of all non-audit services was consistent with maintaining the principal accountant’s independence.
Item 5: Audit Committee of Listed Registrants.
Not Applicable.
Item 6: Investments.
| | |
| Vanguard® Global Equity Fund | | |
| Schedule of Investments | | |
| September 30, 2013 | | |
| |
| | | Market |
| | | Value |
| | Shares | ($000) |
| |
| Common Stocks (96.4%)1 | | |
| Argentina (0.2%) | | |
| Arcos Dorados Holdings Inc. Class A | 592,347 | 7,019 |
| |
| Australia (0.9%) | | |
| Brambles Ltd. | 1,704,100 | 14,492 |
| Amcor Ltd. | 570,810 | 5,569 |
| Australia & New Zealand Banking Group Ltd. | 77,035 | 2,215 |
| * Alumina Ltd. | 2,032,921 | 1,943 |
| Iluka Resources Ltd. | 173,561 | 1,861 |
| BHP Billiton Ltd. | 55,360 | 1,842 |
| Coca-Cola Amatil Ltd. | 156,839 | 1,796 |
| * BlueScope Steel Ltd. | 323,680 | 1,414 |
| Fairfax Media Ltd. | 2,814,384 | 1,408 |
| Orica Ltd. | 74,040 | 1,387 |
| Cochlear Ltd. | 20,840 | 1,177 |
| Toll Holdings Ltd. | 201,372 | 1,097 |
| * Transpacific Industries Group Ltd. | 1,139,646 | 1,041 |
| SAI Global Ltd. | 239,308 | 992 |
| Santos Ltd. | 69,318 | 977 |
| DuluxGroup Ltd. | 176,295 | 868 |
| Goodman Fielder Ltd. | 843,657 | 559 |
| Ansell Ltd. | 17,774 | 347 |
| | | 40,985 |
| Austria (0.1%) | | |
| Wienerberger AG | 55,404 | 973 |
| Andritz AG | 15,102 | 889 |
| Oesterreichische Post AG | 19,002 | 862 |
| | | 2,724 |
| Belgium (0.1%) | | |
| Anheuser-Busch InBev NV | 44,013 | 4,366 |
| |
| Brazil (0.9%) | | |
| BM&FBovespa SA | 2,024,900 | 11,311 |
| Petroleo Brasileiro SA Prior Pfd. | 1,037,100 | 8,591 |
| Petroleo Brasileiro SA ADR Type A | 430,000 | 7,194 |
| Vale SA Prior Pfd. | 299,100 | 4,257 |
| EDP - Energias do Brasil SA | 587,900 | 3,199 |
| Cia Energetica de Minas Gerais Prior Pfd. | 174,300 | 1,513 |
| Telefonica Brasil SA Prior Pfd. | 64,800 | 1,438 |
| * B2W Cia Digital | 176,800 | 1,130 |
| Totvs SA | 65,100 | 1,101 |
| Cremer SA | 106,800 | 710 |
| Tim Participacoes SA | 145,100 | 673 |
| Telefonica Brasil SA ADR | 22,084 | 496 |
| Petroleo Brasileiro SA ADR | 21,200 | 328 |
| | | 41,941 |
| Canada (1.9%) | | |
| Magna International Inc. | 261,900 | 21,599 |
| Bank of Montreal | 321,700 | 21,471 |
| Fairfax Financial Holdings Ltd. | 41,970 | 17,105 |
| Rogers Communications Inc. Class B | 199,007 | 8,557 |
| ^ Ritchie Bros Auctioneers Inc. | 398,952 | 8,051 |
| Canadian Natural Resources Ltd. | 159,800 | 5,022 |
| Canadian Imperial Bank of Commerce | 15,300 | 1,219 |
| Empire Co. Ltd. | 4,500 | 325 |
| | | 83,349 |
| Chile (0.2%) | | |
| Enersis SA ADR | 350,783 | 5,634 |
| Vina Concha y Toro SA | 1,014,305 | 1,917 |
| | | 7,551 |
| China (4.0%) | | |
| China Mobile Ltd. | 3,114,000 | 35,039 |
1
| | | |
| Vanguard® Global Equity Fund | | |
| Schedule of Investments | | |
| September 30, 2013 | | |
| |
| | | | Market |
| | | | Value |
| | | Shares | ($000) |
| * | Baidu Inc. ADR | 154,832 | 24,027 |
| ^ | Mindray Medical International Ltd. ADR | 544,680 | 21,183 |
| | China Construction Bank Corp. | 26,246,000 | 20,227 |
| | China Resources Enterprise Ltd. | 5,567,117 | 17,716 |
| | Bank of China Ltd. | 37,357,000 | 17,071 |
| | Industrial & Commercial Bank of China Ltd. | 22,160,000 | 15,489 |
| | Tsingtao Brewery Co. Ltd. | 1,600,000 | 12,183 |
| | Shandong Weigao Group Medical Polymer Co. Ltd. | 7,728,000 | 7,587 |
| | Shui On Land Ltd. | 8,914,500 | 2,871 |
| | China Mengniu Dairy Co. Ltd. | 615,000 | 2,759 |
| | Yingde Gases Group Co. Ltd. | 2,132,000 | 2,088 |
| * | Li Ning Co. Ltd. | 1,925,500 | 1,517 |
| | Agricultural Bank of China Ltd. | 2,488,000 | 1,147 |
| * | Ctrip.com International Ltd. ADR | 9,278 | 542 |
| | Yip's Chemical Holdings Ltd. | 308,000 | 268 |
| | | | 181,714 |
| Colombia (0.0%) | | |
| | Bancolombia SA ADR | 12,300 | 708 |
| |
| Cyprus (0.0%) | | |
| | Globaltrans Investment plc GDR | 33,512 | 486 |
| |
| Czech Republic (0.0%) | | |
| | Komercni Banka AS | 3,952 | 879 |
| |
| Denmark (1.1%) | | |
| | Carlsberg A/S Class B | 185,631 | 19,132 |
| * | Jyske Bank A/S | 165,007 | 8,205 |
| | Coloplast A/S Class B | 123,885 | 7,056 |
| * | Vestas Wind Systems A/S | 189,576 | 4,775 |
| | GN Store Nord A/S | 163,554 | 3,444 |
| * | William Demant Holding A/S | 27,397 | 2,533 |
| | Novo Nordisk A/S Class B | 7,084 | 1,200 |
| * | Danske Bank A/S | 52,793 | 1,138 |
| | Topdanmark A/S | 26,998 | 695 |
| | AP Moeller - Maersk A/S Class B | 48 | 440 |
| | | | 48,618 |
| Finland (0.4%) | | |
| | Sampo | 173,758 | 7,475 |
| | Tikkurila Oyj | 242,820 | 6,479 |
| | Metso Oyj | 76,551 | 3,008 |
| | Tieto Oyj | 43,869 | 937 |
| | Neste Oil Oyj | 29,155 | 645 |
| | Wartsila OYJ Abp | 13,820 | 625 |
| | Cargotec Oyj Class B | 10,414 | 404 |
| *,^ | Outokumpu Oyj | 151,829 | 102 |
| | | | 19,675 |
| France (2.0%) | | |
| | European Aeronautic Defence and Space Co. NV | 480,538 | 30,621 |
| | BNP Paribas SA | 235,443 | 15,926 |
| | Legrand SA | 181,831 | 10,091 |
| | Air Liquide SA | 36,135 | 5,035 |
| | Sanofi | 46,062 | 4,665 |
| | L'Oreal SA | 15,979 | 2,743 |
| | AXA SA | 112,338 | 2,607 |
| | Euler Hermes SA | 20,791 | 2,539 |
| *,^ | Air France-KLM | 199,412 | 1,986 |
| | Thales SA | 32,583 | 1,791 |
| | Carrefour SA | 51,159 | 1,755 |
| ^ | Neopost SA | 23,203 | 1,690 |
| | Groupe Eurotunnel SA | 168,965 | 1,540 |
| | ArcelorMittal | 109,190 | 1,497 |
| | Eurofins Scientific | 5,490 | 1,383 |
| | Vallourec SA | 13,312 | 798 |
2
| | |
| Vanguard® Global Equity Fund | | |
| Schedule of Investments | | |
| September 30, 2013 | | |
| |
| | | Market |
| | | Value |
| | Shares | ($000) |
| Technip SA | 5,717 | 671 |
| Edenred | 18,238 | 592 |
| ^ Total SA | 10,039 | 582 |
| Imerys SA | 5,316 | 371 |
| Vicat | 5,191 | 369 |
| Nexity SA | 9,290 | 332 |
| | | 89,584 |
| Germany (1.9%) | | |
| * Deutsche Lufthansa AG | 834,641 | 16,282 |
| Muenchener Rueckversicherungs AG | 66,894 | 13,077 |
| Deutsche Boerse AG | 151,974 | 11,437 |
| Merck KGaA | 54,230 | 8,464 |
| BASF SE | 61,813 | 5,928 |
| Fresenius Medical Care AG & Co. KGaA | 85,025 | 5,528 |
| Allianz SE | 32,348 | 5,089 |
| Bayerische Motoren Werke AG | 38,010 | 4,088 |
| Volkswagen AG Prior Pfd. | 17,101 | 4,032 |
| Deutsche Telekom AG | 239,577 | 3,470 |
| Continental AG | 9,652 | 1,636 |
| E.ON SE | 80,795 | 1,438 |
| Suedzucker AG | 44,182 | 1,301 |
| * TUI AG | 90,047 | 1,150 |
| Siemens AG | 8,831 | 1,065 |
| Adidas AG | 6,476 | 702 |
| GEA Group AG | 14,638 | 602 |
| Fielmann AG | 4,829 | 511 |
| Hannover Rueck SE | 6,653 | 489 |
| Henkel AG & Co. KGaA Prior Pfd. | 4,275 | 441 |
| Axel Springer AG | 7,818 | 436 |
| Gildemeister AG | 14,555 | 397 |
| | | 87,563 |
| Hong Kong (1.0%) | | |
| Jardine Matheson Holdings Ltd. | 297,200 | 16,323 |
| Hutchison Whampoa Ltd. | 780,000 | 9,355 |
| Esprit Holdings Ltd. | 3,196,814 | 5,119 |
| HSBC Holdings plc | 333,600 | 3,613 |
| CLP Holdings Ltd. | 311,000 | 2,533 |
| First Pacific Co. Ltd. | 2,039,250 | 2,254 |
| Hongkong & Shanghai Hotels | 1,101,458 | 1,666 |
| Television Broadcasts Ltd. | 203,300 | 1,283 |
| Goodbaby International Holdings Ltd. | 1,484,000 | 747 |
| SmarTone Telecommunications Holdings Ltd. | 325,476 | 431 |
| Texwinca Holdings Ltd. | 178,823 | 166 |
| New World Development Co. Ltd. | 104,000 | 156 |
| * Next Media Ltd. | 1,100,000 | 106 |
| | | 43,752 |
| India (0.5%) | | |
| ICICI Bank Ltd. | 723,100 | 10,297 |
| CESC Ltd. | 1,025,200 | 5,553 |
| Infosys Ltd. | 56,146 | 2,698 |
| Axis Bank Ltd. | 150,918 | 2,433 |
| Idea Cellular Ltd. | 661,039 | 1,778 |
| | | 22,759 |
| Indonesia (0.2%) | | |
| Bank Negara Indonesia Persero Tbk PT | 12,626,611 | 4,439 |
| Telekomunikasi Indonesia Persero Tbk PT ADR | 52,934 | 1,922 |
| * Telekomunikasi Indonesia Persero Tbk PT | 4,892,500 | 889 |
| Gajah Tunggal Tbk PT | 1,297,186 | 261 |
| | | 7,511 |
| Ireland (1.0%) | | |
| Ryanair Holdings plc ADR | 531,118 | 26,418 |
| Dragon Oil plc | 756,147 | 7,124 |
| CRH plc | 206,880 | 4,969 |
3
| | | |
| Vanguard® Global Equity Fund | | |
| Schedule of Investments | | |
| September 30, 2013 | | |
| |
| | | | Market |
| | | | Value |
| | | Shares | ($000) |
| * | Bank of Ireland | 10,783,759 | 3,059 |
| | Paddy Power plc | 24,872 | 1,994 |
| | Irish Continental Group plc | 21,959 | 759 |
| * | Independent News & Media plc | 318,558 | 21 |
| * | Irish Bank Resolution Corp. Ltd. | 122,273 | — |
| | | | 44,344 |
| Italy (0.4%) | | |
| ^ | Piaggio & C SPA | 2,113,081 | 5,588 |
| | Luxottica Group SPA ADR | 86,748 | 4,560 |
| | Saipem SPA | 155,065 | 3,368 |
| | Luxottica Group SPA | 17,912 | 949 |
| | UniCredit SPA | 125,676 | 803 |
| | Exor SPA | 19,437 | 732 |
| | Intesa Sanpaolo SPA (Registered) | 271,717 | 562 |
| | Davide Campari-Milano SPA | 64,138 | 557 |
| * | Finmeccanica SPA | 15,733 | 94 |
| | | | 17,213 |
| Japan (10.2%) | | |
| ^ | Nippon Telegraph & Telephone Corp. | 614,000 | 31,959 |
| ^ | Daito Trust Construction Co. Ltd. | 217,200 | 21,736 |
| | Hitachi Ltd. | 3,093,000 | 20,495 |
| | Namco Bandai Holdings Inc. | 1,078,350 | 20,164 |
| | Sumitomo Mitsui Financial Group Inc. | 351,400 | 17,017 |
| | Daiwa House Industry Co. Ltd. | 848,000 | 16,020 |
| | Yamaha Motor Co. Ltd. | 1,062,500 | 15,627 |
| | Toyota Motor Corp. | 220,400 | 14,136 |
| | THK Co. Ltd. | 623,800 | 13,895 |
| | Otsuka Holdings Co. Ltd. | 441,400 | 12,799 |
| | Inpex Corp. | 1,068,400 | 12,627 |
| | SMC Corp. | 52,700 | 12,578 |
| * | Olympus Corp. | 362,000 | 11,058 |
| | Tokyo Electron Ltd. | 194,500 | 10,464 |
| | NTT Data Corp. | 287,500 | 9,730 |
| | Secom Co. Ltd. | 152,700 | 9,571 |
| | Kao Corp. | 278,700 | 8,703 |
| | East Japan Railway Co. | 99,200 | 8,550 |
| | Mitsubishi UFJ Financial Group Inc. | 1,297,000 | 8,319 |
| | Rohm Co. Ltd. | 190,200 | 7,843 |
| | Yamato Holdings Co. Ltd. | 337,200 | 7,616 |
| | Seven & I Holdings Co. Ltd. | 191,600 | 7,024 |
| | FUJIFILM Holdings Corp. | 284,800 | 6,864 |
| | Dai-ichi Life Insurance Co. Ltd. | 456,600 | 6,539 |
| | MS&AD Insurance Group Holdings | 249,100 | 6,529 |
| * | Fujitsu Ltd. | 1,686,000 | 6,311 |
| | Astellas Pharma Inc. | 106,600 | 5,445 |
| | Central Japan Railway Co. | 39,600 | 5,083 |
| | Alfresa Holdings Corp. | 87,800 | 4,533 |
| | Isetan Mitsukoshi Holdings Ltd. | 299,100 | 4,447 |
| | Kirin Holdings Co. Ltd. | 295,000 | 4,307 |
| | Mitsubishi Heavy Industries Ltd. | 731,000 | 4,216 |
| ^ | ITOCHU Corp. | 342,000 | 4,213 |
| | Obayashi Corp. | 690,000 | 4,129 |
| | Sekisui House Ltd. | 301,000 | 4,060 |
| | Dentsu Inc. | 106,400 | 4,059 |
| | Toyo Seikan Group Holdings Ltd. | 205,100 | 4,042 |
| | Tokyo Gas Co. Ltd. | 725,000 | 3,977 |
| | Mitsubishi Estate Co. Ltd. | 133,000 | 3,942 |
| | Toyo Suisan Kaisha Ltd. | 123,000 | 3,611 |
| | Daiwa Securities Group Inc. | 374,000 | 3,375 |
| ^ | KDDI Corp. | 63,822 | 3,280 |
| | USS Co. Ltd. | 224,400 | 3,249 |
| | Sumitomo Electric Industries Ltd. | 217,000 | 3,156 |
| | LIXIL Group Corp. | 147,200 | 3,035 |
| | Resona Holdings Inc. | 577,100 | 2,963 |
4
| | |
| Vanguard® Global Equity Fund | | |
| Schedule of Investments | | |
| September 30, 2013 | | |
| |
| | | Market |
| | | Value |
| | Shares | ($000) |
| Mitsubishi Corp. | 135,600 | 2,753 |
| ^ NTT DOCOMO Inc. | 160,900 | 2,607 |
| Nippon Meat Packers Inc. | 181,000 | 2,598 |
| Sega Sammy Holdings Inc. | 89,900 | 2,594 |
| NKSJ Holdings Inc. | 96,100 | 2,479 |
| Marui Group Co. Ltd. | 260,100 | 2,444 |
| ^ Sumitomo Forestry Co. Ltd. | 221,800 | 2,412 |
| Shimizu Corp. | 433,000 | 2,116 |
| JX Holdings Inc. | 402,350 | 2,091 |
| Nintendo Co. Ltd. | 16,800 | 1,903 |
| Onward Holdings Co. Ltd. | 214,000 | 1,888 |
| Chiba Bank Ltd. | 256,000 | 1,875 |
| West Japan Railway Co. | 41,900 | 1,796 |
| Hitachi Metals Ltd. | 141,000 | 1,738 |
| Japan Airlines Co. Ltd. | 28,600 | 1,733 |
| Shiseido Co. Ltd. | 93,800 | 1,689 |
| Japan Exchange Group Inc. | 74,300 | 1,652 |
| Toyota Industries Corp. | 35,700 | 1,546 |
| Azbil Corp. | 59,700 | 1,389 |
| Bank of Yokohama Ltd. | 242,000 | 1,388 |
| Kinden Corp. | 128,000 | 1,381 |
| SKY Perfect JSAT Holdings Inc. | 250,900 | 1,308 |
| ^ Daihatsu Motor Co. Ltd. | 61,000 | 1,185 |
| Calsonic Kansei Corp. | 217,000 | 1,165 |
| Taiyo Nippon Sanso Corp. | 160,000 | 1,075 |
| Yamada Denki Co. Ltd. | 311,000 | 920 |
| Fukuoka Financial Group Inc. | 181,000 | 820 |
| * Nippon Suisan Kaisha Ltd. | 353,900 | 762 |
| Seino Holdings Co. Ltd. | 45,000 | 461 |
| Maeda Road Construction Co. Ltd. | 27,000 | 448 |
| Misawa Homes Co. Ltd. | 28,000 | 445 |
| Nippo Corp. | 24,000 | 411 |
| Aoyama Trading Co. Ltd. | 14,900 | 407 |
| Toho Holdings Co. Ltd. | 19,400 | 354 |
| Fuji Soft Inc. | 16,300 | 309 |
| Kuroda Electric Co. Ltd. | 21,700 | 290 |
| MediPal Holdings Corp. | 23,500 | 290 |
| IT Holdings Corp. | 21,900 | 277 |
| Yellow Hat Ltd. | 14,700 | 275 |
| Suzuken Co. Ltd. | 8,300 | 273 |
| Iwatani Corp. | 65,000 | 263 |
| Konaka Co. Ltd. | 27,400 | 259 |
| Gulliver International Co. Ltd. | 41,900 | 251 |
| ^ Geo Holdings Corp. | 24,400 | 228 |
| | | 457,844 |
| Malaysia (0.2%) | | |
| Tenaga Nasional Bhd. | 2,626,700 | 7,280 |
| AirAsia Bhd. | 2,326,800 | 1,827 |
| Malayan Banking Bhd. | 89,500 | 270 |
| | | 9,377 |
| Mexico (0.6%) | | |
| America Movil SAB de CV ADR | 849,545 | 16,829 |
| America Movil SAB de CV | 4,355,933 | 4,326 |
| Grupo Comercial Chedraui SA de CV | 984,200 | 3,116 |
| * Cemex SAB de CV ADR | 45,760 | 512 |
| | | 24,783 |
| Netherlands (0.8%) | | |
| Unilever NV | 539,663 | 20,597 |
| Heineken NV | 55,229 | 3,913 |
| * CNH Industrial NV | 268,720 | 3,446 |
| Koninklijke Boskalis Westminster NV | 68,256 | 3,026 |
| Koninklijke Philips NV | 80,868 | 2,609 |
| * Koninklijke KPN NV | 767,014 | 2,442 |
5
| | | |
| Vanguard® Global Equity Fund | | |
| Schedule of Investments | | |
| September 30, 2013 | | |
| |
| | | | Market |
| | | | Value |
| | | Shares | ($000) |
| | ASML Holding NV | 8,885 | 878 |
| | Randstad Holding NV | 9,516 | 537 |
| | TNT Express NV | 9,343 | 85 |
| * | PostNL NV | 10,477 | 45 |
| | | | 37,578 |
| New Zealand (0.0%) | | |
| | Telecom Corp. of New Zealand Ltd. | 678,665 | 1,309 |
| | PGG Wrightson Ltd. | 51,996 | 17 |
| | | | 1,326 |
| Norway (0.9%) | | |
| | Statoil ASA | 930,447 | 21,133 |
| | Schibsted ASA | 215,137 | 11,092 |
| | Norsk Hydro ASA | 1,488,817 | 6,175 |
| | DNB ASA | 170,860 | 2,595 |
| * | Storebrand ASA | 43,793 | 243 |
| | | | 41,238 |
| Philippines (0.1%) | | |
| | Energy Development Corp. | 24,791,300 | 3,105 |
| | Lopez Holdings Corp. | 13,195,849 | 1,374 |
| | | | 4,479 |
| Poland (0.0%) | | |
| | Bank Pekao SA | 9,958 | 569 |
| | Tauron Polska Energia SA | 215,055 | 330 |
| | | | 899 |
| Russia (0.2%) | | |
| | Sberbank of Russia ADR | 581,621 | 6,999 |
| | Lukoil OAO ADR | 52,706 | 3,335 |
| | Sistema JSFC GDR | 25,109 | 652 |
| | LSR Group GDR | 38,340 | 164 |
| | | | 11,150 |
| Singapore (0.6%) | | |
| | DBS Group Holdings Ltd. | 1,846,000 | 24,165 |
| | Great Eastern Holdings Ltd. | 246,000 | 3,345 |
| | GuocoLeisure Ltd. | 1,185,000 | 771 |
| | United Industrial Corp. Ltd. | 160,000 | 389 |
| * | STATS ChipPAC Ltd. | 384,000 | 100 |
| | | | 28,770 |
| South Africa (1.2%) | | |
| | Naspers Ltd. | 408,494 | 37,819 |
| | Standard Bank Group Ltd. | 425,168 | 5,076 |
| | MTN Group Ltd. | 173,469 | 3,387 |
| | Old Mutual plc | 713,329 | 2,160 |
| | African Bank Investments Ltd. | 850,101 | 1,411 |
| | Anglo American plc Ordinary Shares | 49,848 | 1,223 |
| | Liberty Holdings Ltd. | 43,283 | 505 |
| | MMI Holdings Ltd. | 97,905 | 238 |
| | RMI Holdings | 78,636 | 210 |
| | | | 52,029 |
| South Korea (2.9%) | | |
| | Samsung Electronics Co. Ltd. | 26,749 | 34,024 |
| | Samsung Electronics Co. Ltd. GDR | 33,350 | 21,239 |
| | Hyundai Motor Co. | 86,810 | 20,254 |
| | Kia Motors Corp. | 261,043 | 15,847 |
| | SK Holdings Co. Ltd. | 60,007 | 10,833 |
| | Shinhan Financial Group Co. Ltd. | 113,720 | 4,627 |
| * | LG Display Co. Ltd. | 186,430 | 4,489 |
| | Hana Financial Group Inc. | 124,631 | 4,271 |
| | Kolon Industries Inc. | 51,135 | 2,706 |
| | S-1 Corp. | 42,841 | 2,578 |
| | KB Financial Group Inc. | 69,067 | 2,432 |
| | Lotte Shopping Co. Ltd. | 6,653 | 2,355 |
| | LG Uplus Corp. | 188,950 | 2,031 |
| | SK Telecom Co. Ltd. | 8,519 | 1,742 |
6
| | |
| Vanguard® Global Equity Fund | | |
| Schedule of Investments | | |
| September 30, 2013 | | |
| |
| | | Market |
| | | Value |
| | Shares | ($000) |
| NAVER Corp. | 1,660 | 860 |
| | | 130,288 |
| Spain (0.4%) | | |
| Distribuidora Internacional de Alimentacion SA | 862,358 | 7,476 |
| * Banco Santander SA | 387,417 | 3,159 |
| Viscofan SA | 37,378 | 2,136 |
| Acerinox SA | 120,163 | 1,378 |
| * Mediaset Espana Comunicacion SA | 113,793 | 1,311 |
| Acciona SA | 19,519 | 1,113 |
| * Telefonica SA | 66,425 | 1,033 |
| | | 17,606 |
| Sweden (2.8%) | | |
| Svenska Handelsbanken AB Class A | 1,134,427 | 48,536 |
| Atlas Copco AB Class B | 790,469 | 20,889 |
| Investor AB Class B | 459,043 | 13,922 |
| Volvo AB Class B | 870,388 | 13,043 |
| Swedish Match AB | 267,132 | 9,424 |
| Assa Abloy AB Class B | 148,638 | 6,830 |
| Nordea Bank AB | 544,182 | 6,567 |
| Telefonaktiebolaget LM Ericsson Class B | 208,137 | 2,772 |
| Skandinaviska Enskilda Banken AB Class A | 222,624 | 2,360 |
| Modern Times Group AB Class B | 26,261 | 1,370 |
| Millicom International Cellular SA | 3,333 | 295 |
| Oriflame Cosmetics SA | 6,251 | 198 |
| | | 126,206 |
| Switzerland (4.1%) | | |
| Roche Holding AG | 166,909 | 45,044 |
| Nestle SA | 634,563 | 44,251 |
| Coca-Cola HBC AG ADR | 787,200 | 23,514 |
| * Cie Financiere Richemont SA | 209,913 | 21,032 |
| Schindler Holding AG | 131,289 | 19,727 |
| Novartis AG | 160,853 | 12,372 |
| Geberit AG | 42,104 | 11,377 |
| Adecco SA | 37,585 | 2,681 |
| UBS AG | 115,682 | 2,371 |
| Sonova Holding AG | 12,029 | 1,497 |
| Logitech International SA | 102,558 | 904 |
| Helvetia Holding AG | 1,034 | 459 |
| ABB Ltd. | 18,317 | 433 |
| | | 185,662 |
| Taiwan (1.5%) | | |
| Fubon Financial Holding Co. Ltd. | 13,957,279 | 19,317 |
| Taiwan Semiconductor Manufacturing Co. Ltd. ADR | 1,088,578 | 18,462 |
| United Microelectronics Corp. | 20,388,000 | 8,722 |
| Hon Hai Precision Industry Co. Ltd. | 3,278,000 | 8,413 |
| Yungtay Engineering Co. Ltd. | 1,627,000 | 4,272 |
| Delta Electronics Inc. | 807,000 | 3,919 |
| Taiwan Semiconductor Manufacturing Co. Ltd. | 1,029,285 | 3,505 |
| Taishin Financial Holding Co. Ltd. | 3,140,915 | 1,451 |
| * Innolux Corp. | 2,627,000 | 1,262 |
| King Yuan Electronics Co. Ltd. | 203,000 | 140 |
| | | 69,463 |
| Thailand (0.3%) | | |
| Advanced Info Service PCL | 491,700 | 4,018 |
| Thanachart Capital PCL | 2,679,600 | 2,831 |
| Bangkok Bank PCL (Foreign) | 321,300 | 2,025 |
| Krung Thai Bank PCL | 3,201,200 | 1,967 |
| * Advanced Info Service PCL (Local) | 67,400 | 551 |
| Krung Thai Bank PCL (Foreign) | 913,100 | 531 |
| PTT Global Chemical PCL | 127,400 | 304 |
| | | 12,227 |
7
| | |
| Vanguard® Global Equity Fund | | |
| Schedule of Investments | | |
| September 30, 2013 | | |
| |
| | | Market |
| | | Value |
| | Shares | ($000) |
| Turkey (0.6%) | | |
| Turkiye Is Bankasi | 3,510,445 | 9,281 |
| Turkiye Garanti Bankasi AS | 2,282,605 | 9,004 |
| Tupras Turkiye Petrol Rafinerileri AS | 131,739 | 2,784 |
| BIM Birlesik Magazalar AS | 108,539 | 2,235 |
| Turkiye Garanti Bankasi AS ADR | 530,100 | 2,101 |
| KOC Holding AS | 317,664 | 1,467 |
| * Asya Katilim Bankasi AS | 933,447 | 883 |
| 2 Ulker Biskuvi Sanayi AS | 106,656 | 730 |
| | | 28,485 |
| United Arab Emirates (0.0%) | | |
| DP World Ltd. | 20,737 | 335 |
| |
| United Kingdom (7.9%) | | |
| Prudential plc | 2,347,621 | 43,676 |
| Royal Dutch Shell plc Class A | 1,002,161 | 33,007 |
| Rolls-Royce Holdings plc | 1,302,534 | 23,435 |
| Wolseley plc | 422,077 | 21,837 |
| Reckitt Benckiser Group plc | 237,634 | 17,375 |
| Vodafone Group plc | 4,901,197 | 17,202 |
| Bunzl plc | 681,225 | 14,756 |
| British American Tobacco plc | 257,845 | 13,570 |
| WPP plc | 518,483 | 10,655 |
| Hays plc | 5,482,397 | 10,514 |
| Intertek Group plc | 149,681 | 8,016 |
| BP plc | 954,652 | 6,693 |
| Compass Group plc | 390,671 | 5,374 |
| Diageo plc | 167,863 | 5,336 |
| Capita plc | 322,916 | 5,205 |
| Aggreko plc | 199,806 | 5,185 |
| * Lloyds Banking Group plc | 4,092,343 | 4,873 |
| AstraZeneca plc | 92,347 | 4,801 |
| * Thomas Cook Group plc | 1,897,702 | 4,717 |
| Rightmove plc | 119,772 | 4,592 |
| Unilever plc | 117,120 | 4,554 |
| BHP Billiton plc | 122,904 | 3,615 |
| ITV plc | 1,269,841 | 3,603 |
| BAE Systems plc | 472,696 | 3,474 |
| Informa plc | 408,361 | 3,470 |
| International Personal Finance plc | 336,940 | 3,329 |
| * Sage Group plc | 621,165 | 3,317 |
| G4S plc | 792,142 | 3,263 |
| Reed Elsevier plc | 230,694 | 3,110 |
| Tesco plc | 534,068 | 3,105 |
| Royal Dutch Shell plc Class B | 89,327 | 3,082 |
| Associated British Foods plc | 100,257 | 3,043 |
| Rio Tinto plc | 62,113 | 3,032 |
| Provident Financial plc | 112,284 | 3,020 |
| Experian plc | 145,209 | 2,765 |
| Barclays plc | 555,999 | 2,376 |
| Rexam plc | 288,291 | 2,246 |
| Spectris plc | 60,292 | 2,152 |
| 3i Group plc | 363,406 | 2,139 |
| TUI Travel plc | 357,971 | 2,130 |
| Stagecoach Group plc | 396,250 | 2,091 |
| Glencore Xstrata plc | 365,553 | 1,991 |
| Carnival plc | 57,174 | 1,937 |
| Smiths Group plc | 83,952 | 1,899 |
| ICAP plc | 300,664 | 1,819 |
| Admiral Group plc | 79,523 | 1,586 |
| Homeserve plc | 356,925 | 1,482 |
| IG Group Holdings plc | 145,871 | 1,367 |
| DCC plc | 30,393 | 1,244 |
8
| | |
| Vanguard® Global Equity Fund | | |
| Schedule of Investments | | |
| September 30, 2013 | | |
| |
| | | Market |
| | | Value |
| | Shares | ($000) |
| WH Smith plc | 80,357 | 1,075 |
| Devro plc | 177,110 | 929 |
| Cable & Wireless Communications plc | 1,432,083 | 918 |
| Mondi plc | 52,859 | 892 |
| QinetiQ Group plc | 283,675 | 879 |
| British Sky Broadcasting Group plc | 54,678 | 770 |
| Ladbrokes plc | 243,150 | 666 |
| IMI plc | 25,589 | 602 |
| Jupiter Fund Management plc | 98,070 | 582 |
| * Perform Group plc | 64,133 | 581 |
| Home Retail Group plc | 205,092 | 557 |
| AMEC plc | 31,826 | 553 |
| Millennium & Copthorne Hotels plc | 59,808 | 537 |
| Daily Mail & General Trust plc | 42,809 | 528 |
| GlaxoSmithKline plc | 20,847 | 524 |
| Michael Page International plc | 65,306 | 521 |
| * Barratt Developments plc | 103,930 | 518 |
| Smith & Nephew plc | 40,529 | 506 |
| Bwin.Party Digital Entertainment plc | 249,695 | 493 |
| Centrica plc | 79,859 | 478 |
| Close Brothers Group plc | 24,027 | 455 |
| Petrofac Ltd. | 19,710 | 448 |
| National Express Group plc | 100,208 | 416 |
| Standard Chartered plc | 15,190 | 364 |
| CSR plc | 42,081 | 351 |
| BP plc ADR | 8,286 | 348 |
| Northgate plc | 29,242 | 204 |
| * Barclays plc Rights Expire 10/2/2013 | 138,999 | 182 |
| Anglo American plc London Shares | 7,120 | 175 |
| GVC Holdings plc | 28,002 | 154 |
| * Connaught plc | 103,081 | — |
| | | 353,266 |
| United States (44.3%) | | |
| Consumer Discretionary (7.0%) | | |
| * Amazon.com Inc. | 113,895 | 35,608 |
| Comcast Corp. Class A | 628,072 | 28,357 |
| Omnicom Group Inc. | 423,849 | 26,889 |
| McDonald's Corp. | 276,042 | 26,558 |
| Harley-Davidson Inc. | 395,575 | 25,412 |
| * CarMax Inc. | 378,869 | 18,364 |
| Walt Disney Co. | 281,439 | 18,150 |
| * Tesla Motors Inc. | 91,140 | 17,628 |
| Royal Caribbean Cruises Ltd. | 426,739 | 16,336 |
| Dillard's Inc. Class A | 205,398 | 16,083 |
| CBS Corp. Class B | 268,631 | 14,818 |
| * TripAdvisor Inc. | 190,873 | 14,476 |
| * Mohawk Industries Inc. | 109,636 | 14,280 |
| Time Warner Inc. | 214,089 | 14,089 |
| * Bed Bath & Beyond Inc. | 129,238 | 9,998 |
| Weight Watchers International Inc. | 95,471 | 3,568 |
| * Apollo Group Inc. Class A | 166,246 | 3,460 |
| * Red Robin Gourmet Burgers Inc. | 30,932 | 2,199 |
| * Smith & Wesson Holding Corp. | 124,617 | 1,369 |
| * LeapFrog Enterprises Inc. | 134,150 | 1,264 |
| PetMed Express Inc. | 70,811 | 1,153 |
| Cracker Barrel Old Country Store Inc. | 9,733 | 1,005 |
| * Multimedia Games Holding Co. Inc. | 24,709 | 854 |
| Valassis Communications Inc. | 15,186 | 439 |
| * EW Scripps Co. Class A | 21,340 | 392 |
| Destination Maternity Corp. | 11,763 | 374 |
| * Capella Education Co. | 6,318 | 357 |
| * Bridgepoint Education Inc. | 18,526 | 334 |
| * hhgregg Inc. | 16,737 | 300 |
| * TravelCenters of America LLC | 37,490 | 294 |
9
| | |
| Vanguard® Global Equity Fund | | |
| Schedule of Investments | | |
| September 30, 2013 | | |
| |
| | | Market |
| | | Value |
| | Shares | ($000) |
| * Overstock.com Inc. | 9,904 | 294 |
| * Liberty Ventures Class A | 3,297 | 291 |
| * Citi Trends Inc. | 15,977 | 279 |
| Brown Shoe Co. Inc. | 11,790 | 277 |
| Ruth's Hospitality Group Inc. | 23,318 | 276 |
| * Kirkland's Inc. | 14,000 | 258 |
| Entravision Communications Corp. Class A | 38,034 | 224 |
| * Nautilus Inc. | 12,217 | 88 |
| * Sun-Times Media Group Inc. Class A | 130,959 | — |
| | | 316,395 |
| Consumer Staples (4.5%) | | |
| Tyson Foods Inc. Class A | 973,013 | 27,517 |
| Coca-Cola Co. | 634,922 | 24,051 |
| Procter & Gamble Co. | 311,640 | 23,557 |
| CVS Caremark Corp. | 409,295 | 23,227 |
| PepsiCo Inc. | 242,391 | 19,270 |
| Kroger Co. | 426,898 | 17,221 |
| Colgate-Palmolive Co. | 287,178 | 17,030 |
| Estee Lauder Cos. Inc. Class A | 123,184 | 8,611 |
| Dean Foods Co. | 441,823 | 8,527 |
| Costco Wholesale Corp. | 69,405 | 7,990 |
| * Rite Aid Corp. | 1,560,555 | 7,428 |
| Universal Corp. | 88,191 | 4,492 |
| JM Smucker Co. | 39,973 | 4,199 |
| Clorox Co. | 47,054 | 3,845 |
| Sanderson Farms Inc. | 43,996 | 2,870 |
| * Omega Protein Corp. | 52,359 | 532 |
| * Harbinger Group Inc. | 31,329 | 325 |
| * Pantry Inc. | 27,035 | 300 |
| Inter Parfums Inc. | 9,987 | 299 |
| Andersons Inc. | 3,992 | 279 |
| * Central Garden and Pet Co. Class A | 26,454 | 181 |
| | | 201,751 |
| Energy (3.4%) | | |
| ConocoPhillips | 397,108 | 27,603 |
| EOG Resources Inc. | 129,912 | 21,991 |
| Phillips 66 | 334,409 | 19,336 |
| * Ultra Petroleum Corp. | 831,110 | 17,096 |
| Valero Energy Corp. | 476,649 | 16,278 |
| Marathon Petroleum Corp. | 236,542 | 15,214 |
| National Oilwell Varco Inc. | 136,297 | 10,646 |
| Western Refining Inc. | 237,234 | 7,126 |
| * Exterran Holdings Inc. | 149,468 | 4,121 |
| Delek US Holdings Inc. | 186,554 | 3,934 |
| Exxon Mobil Corp. | 36,702 | 3,158 |
| Alon USA Energy Inc. | 209,096 | 2,135 |
| Green Plains Renewable Energy Inc. | 81,984 | 1,316 |
| * Renewable Energy Group Inc. | 61,950 | 939 |
| * Stone Energy Corp. | 26,026 | 844 |
| Energy XXI Bermuda Ltd. | 26,946 | 814 |
| * Swift Energy Co. | 57,376 | 655 |
| * Newpark Resources Inc. | 35,586 | 451 |
| * Cloud Peak Energy Inc. | 22,360 | 328 |
| Comstock Resources Inc. | 18,091 | 288 |
| * Forest Oil Corp. | 46,720 | 285 |
| * Unit Corp. | 5,989 | 278 |
| * C&J Energy Services Inc. | 13,095 | 263 |
| | | 155,099 |
| Exchange-Traded Fund (0.4%) | | |
| 3 Vanguard FTSE Emerging Markets ETF | 500,300 | 20,067 |
| |
| Financials (6.7%) | | |
| JPMorgan Chase & Co. | 659,104 | 34,069 |
| Goldman Sachs Group Inc. | 166,355 | 26,319 |
10
| | | |
| Vanguard® Global Equity Fund | | |
| Schedule of Investments | | |
| September 30, 2013 | | |
| |
| | | | Market |
| | | | Value |
| | | Shares | ($000) |
| | Moody's Corp. | 339,884 | 23,904 |
| | M&T Bank Corp. | 201,603 | 22,563 |
| * | Berkshire Hathaway Inc. Class B | 188,779 | 21,428 |
| * | Markel Corp. | 40,684 | 21,065 |
| | TD Ameritrade Holding Corp. | 649,698 | 17,009 |
| | New York Community Bancorp Inc. | 1,070,730 | 16,179 |
| | Franklin Resources Inc. | 303,887 | 15,361 |
| | First Republic Bank | 328,569 | 15,321 |
| | US Bancorp | 302,570 | 11,068 |
| | Assurant Inc. | 179,085 | 9,689 |
| | Progressive Corp. | 298,542 | 8,129 |
| | Chubb Corp. | 88,918 | 7,937 |
| | American Express Co. | 87,805 | 6,631 |
| * | PHH Corp. | 276,586 | 6,566 |
| | Wells Fargo & Co. | 132,773 | 5,486 |
| | Lazard Ltd. Class A | 147,544 | 5,315 |
| | Legg Mason Inc. | 154,249 | 5,158 |
| | RenaissanceRe Holdings Ltd. | 51,981 | 4,706 |
| | Cash America International Inc. | 85,483 | 3,871 |
| | American Equity Investment Life Holding Co. | 166,399 | 3,531 |
| | Citigroup Inc. | 45,633 | 2,214 |
| * | World Acceptance Corp. | 23,977 | 2,156 |
| | Platinum Underwriters Holdings Ltd. | 23,749 | 1,419 |
| | Stewart Information Services Corp. | 26,115 | 835 |
| * | United Community Banks Inc. | 24,242 | 364 |
| | Union First Market Bankshares Corp. | 13,734 | 321 |
| * | Investment Technology Group Inc. | 18,190 | 286 |
| | Symetra Financial Corp. | 15,617 | 278 |
| * | FBR & Co. | 9,380 | 251 |
| | Calamos Asset Management Inc. Class A | 17,710 | 177 |
| | | | 299,606 |
| Health Care (4.2%) | | |
| | Johnson & Johnson | 311,112 | 26,970 |
| | WellPoint Inc. | 240,121 | 20,077 |
| * | United Therapeutics Corp. | 238,542 | 18,809 |
| * | Waters Corp. | 155,539 | 16,520 |
| | AbbVie Inc. | 261,569 | 11,700 |
| | Pfizer Inc. | 406,567 | 11,673 |
| * | Seattle Genetics Inc. | 250,900 | 10,997 |
| * | Illumina Inc. | 120,276 | 9,722 |
| | Abbott Laboratories | 285,957 | 9,491 |
| * | QIAGEN NV | 382,200 | 8,179 |
| | Merck & Co. Inc. | 168,039 | 8,000 |
| ^ | PDL BioPharma Inc. | 954,302 | 7,606 |
| *,^ | Myriad Genetics Inc. | 254,433 | 5,979 |
| * | Magellan Health Services Inc. | 72,060 | 4,321 |
| * | Intuitive Surgical Inc. | 11,256 | 4,235 |
| | Cigna Corp. | 25,141 | 1,932 |
| * | Molina Healthcare Inc. | 52,028 | 1,852 |
| | HealthSouth Corp. | 51,278 | 1,768 |
| | Kindred Healthcare Inc. | 93,251 | 1,252 |
| | Select Medical Holdings Corp. | 134,449 | 1,085 |
| * | Emergent Biosolutions Inc. | 47,130 | 898 |
| * | Repligen Corp. | 76,837 | 852 |
| * | Albany Molecular Research Inc. | 58,300 | 752 |
| * | Addus HomeCare Corp. | 24,641 | 714 |
| * | Triple-S Management Corp. Class B | 28,538 | 525 |
| * | Cambrex Corp. | 32,835 | 433 |
| * | Amedisys Inc. | 24,215 | 417 |
| * | Alliance HealthCare Services Inc. | 11,516 | 319 |
| * | Providence Service Corp. | 10,189 | 292 |
| * | AMN Healthcare Services Inc. | 19,625 | 270 |
| * | PharMerica Corp. | 20,090 | 267 |
11
| | |
| Vanguard® Global Equity Fund | | |
| Schedule of Investments | | |
| September 30, 2013 | | |
| |
| | | Market |
| | | Value |
| | Shares | ($000) |
| * Sciclone Pharmaceuticals Inc. | 43,800 | 222 |
| * Five Star Quality Care Inc. | 40,229 | 208 |
| | | 188,337 |
| Industrials (5.4%) | | |
| 3M Co. | 249,886 | 29,839 |
| Northrop Grumman Corp. | 310,986 | 29,625 |
| Boeing Co. | 222,798 | 26,179 |
| Alaska Air Group Inc. | 320,082 | 20,044 |
| Raytheon Co. | 218,335 | 16,827 |
| Lincoln Electric Holdings Inc. | 235,609 | 15,696 |
| Emerson Electric Co. | 221,141 | 14,308 |
| L-3 Communications Holdings Inc. | 137,959 | 13,037 |
| Towers Watson & Co. Class A | 114,822 | 12,281 |
| Exelis Inc. | 754,085 | 11,847 |
| Lockheed Martin Corp. | 82,029 | 10,463 |
| Alliant Techsystems Inc. | 105,819 | 10,324 |
| Deere & Co. | 115,091 | 9,367 |
| Expeditors International of Washington Inc. | 91,897 | 4,049 |
| CH Robinson Worldwide Inc. | 65,542 | 3,904 |
| AAR Corp. | 101,032 | 2,761 |
| * Hawaiian Holdings Inc. | 238,232 | 1,772 |
| * Republic Airways Holdings Inc. | 106,831 | 1,271 |
| SkyWest Inc. | 82,745 | 1,201 |
| Barnes Group Inc. | 20,516 | 716 |
| Kimball International Inc. Class B | 48,535 | 538 |
| * RPX Corp. | 28,264 | 495 |
| Argan Inc. | 20,418 | 449 |
| * Consolidated Graphics Inc. | 7,804 | 438 |
| Huntington Ingalls Industries Inc. | 6,345 | 428 |
| AGCO Corp. | 7,049 | 426 |
| * Saia Inc. | 12,908 | 403 |
| * Engility Holdings Inc. | 11,922 | 378 |
| * Ducommun Inc. | 12,486 | 358 |
| Standex International Corp. | 5,537 | 329 |
| Coleman Cable Inc. | 13,566 | 286 |
| Arkansas Best Corp. | 11,015 | 283 |
| * Kratos Defense & Security Solutions Inc. | 31,991 | 265 |
| Quad/Graphics Inc. | 8,603 | 261 |
| * ICF International Inc. | 6,832 | 242 |
| * Xerium Technologies Inc. | 10,380 | 120 |
| Barrett Business Services Inc. | 1,338 | 90 |
| | | 241,300 |
| Information Technology (9.9%) | | |
| * eBay Inc. | 680,414 | 37,960 |
| Mastercard Inc. Class A | 43,931 | 29,556 |
| * Google Inc. Class A | 29,052 | 25,447 |
| Computer Sciences Corp. | 454,615 | 23,522 |
| Microsoft Corp. | 607,773 | 20,245 |
| Linear Technology Corp. | 509,954 | 20,225 |
| Analog Devices Inc. | 391,000 | 18,396 |
| FLIR Systems Inc. | 584,508 | 18,353 |
| Accenture plc Class A | 235,685 | 17,356 |
| Seagate Technology plc | 377,013 | 16,490 |
| Visa Inc. Class A | 82,737 | 15,811 |
| Xilinx Inc. | 325,798 | 15,267 |
| Dolby Laboratories Inc. Class A | 431,348 | 14,886 |
| Cisco Systems Inc. | 536,406 | 12,563 |
| Western Digital Corp. | 192,866 | 12,228 |
| * Facebook Inc. Class A | 241,526 | 12,134 |
| Paychex Inc. | 276,270 | 11,228 |
| QUALCOMM Inc. | 165,321 | 11,136 |
| Automatic Data Processing Inc. | 147,425 | 10,671 |
| Intel Corp. | 429,800 | 9,851 |
| Oracle Corp. | 296,933 | 9,849 |
12
| | |
| Vanguard® Global Equity Fund | | |
| Schedule of Investments | | |
| September 30, 2013 | | |
| |
| | | Market |
| | | Value |
| | Shares | ($000) |
| Altera Corp. | 255,128 | 9,481 |
| * CACI International Inc. Class A | 124,902 | 8,632 |
| * Gartner Inc. | 134,628 | 8,078 |
| * Teradyne Inc. | 447,635 | 7,395 |
| * Teradata Corp. | 128,570 | 7,128 |
| AOL Inc. | 205,165 | 7,095 |
| * Sapient Corp. | 270,682 | 4,214 |
| Heartland Payment Systems Inc. | 89,217 | 3,544 |
| Activision Blizzard Inc. | 191,849 | 3,198 |
| * Unisys Corp. | 80,796 | 2,035 |
| * Kulicke & Soffa Industries Inc. | 174,695 | 2,018 |
| CSG Systems International Inc. | 72,359 | 1,813 |
| * Benchmark Electronics Inc. | 78,684 | 1,801 |
| Convergys Corp. | 88,504 | 1,659 |
| * Euronet Worldwide Inc. | 40,109 | 1,596 |
| United Online Inc. | 178,309 | 1,423 |
| * Cirrus Logic Inc. | 58,125 | 1,318 |
| * Magnachip Semiconductor Corp. | 57,252 | 1,233 |
| * Sanmina Corp. | 51,029 | 892 |
| InterDigital Inc. | 23,100 | 862 |
| * TiVo Inc. | 50,755 | 631 |
| * SYNNEX Corp. | 9,379 | 576 |
| * Ingram Micro Inc. | 23,083 | 532 |
| * Blucora Inc. | 20,419 | 469 |
| * Photronics Inc. | 54,881 | 430 |
| Booz Allen Hamilton Holding Corp. | 19,381 | 374 |
| ManTech International Corp. Class A | 12,263 | 353 |
| EarthLink Inc. | 67,157 | 332 |
| * Constant Contact Inc. | 12,932 | 306 |
| * comScore Inc. | 10,460 | 303 |
| * Harmonic Inc. | 37,143 | 286 |
| * Global Cash Access Holdings Inc. | 35,163 | 275 |
| Jabil Circuit Inc. | 11,511 | 250 |
| | | 443,706 |
| Materials (2.8%) | | |
| Praxair Inc. | 231,164 | 27,788 |
| LyondellBasell Industries NV Class A | 244,505 | 17,905 |
| Bemis Co. Inc. | 423,103 | 16,505 |
| Sigma-Aldrich Corp. | 186,990 | 15,950 |
| Domtar Corp. | 151,965 | 12,069 |
| * Graphic Packaging Holding Co. | 861,346 | 7,373 |
| Rock Tenn Co. Class A | 62,482 | 6,328 |
| Packaging Corp. of America | 94,832 | 5,414 |
| Greif Inc. Class A | 83,443 | 4,091 |
| Sonoco Products Co. | 82,218 | 3,202 |
| Minerals Technologies Inc. | 43,371 | 2,141 |
| PH Glatfelter Co. | 42,530 | 1,151 |
| Myers Industries Inc. | 56,409 | 1,134 |
| Olin Corp. | 47,640 | 1,099 |
| * Resolute Forest Products Inc. | 59,645 | 789 |
| Neenah Paper Inc. | 19,183 | 754 |
| Schweitzer-Mauduit International Inc. | 9,113 | 552 |
| Avery Dennison Corp. | 8,297 | 361 |
| FutureFuel Corp. | 19,296 | 347 |
| * American Pacific Corp. | 5,640 | 309 |
| | | 125,262 |
| Telecommunication Services (0.0%) | | |
| United States Cellular Corp. | 7,775 | 354 |
| * Vonage Holdings Corp. | 104,523 | 328 |
13
| | | | | |
| Vanguard® Global Equity Fund | | | | |
| Schedule of Investments | | | | |
| September 30, 2013 | | | | |
| |
| | | | | | Market |
| | | | | | Value |
| | | | | Shares | ($000) |
| | IDT Corp. Class B | | | 13,786 | 245 |
| | | | | | 927 |
| | | | | | 1,992,450 |
| Total Common Stocks (Cost $3,624,139) | | | | 4,338,202 |
| |
| | | Coupon | | | |
| Temporary Cash Investments (5.5%)1 | | | | |
| Money Market Fund (5.3%) | | | | |
| 4,5 | Vanguard Market Liquidity Fund | 0.112% | | 237,974,890 | 237,975 |
| |
| |
| | | | | Face | |
| | | | Maturity | Amount | |
| | | | Date | ($000) | |
| U.S. Government and Agency Obligations (0.2%) | | | |
| 6,7 | Federal Home Loan Bank Discount Notes | 0.095% | 10/4/13 | 1,000 | 1,000 |
| 6,7 | Federal Home Loan Bank Discount Notes | 0.090% | 10/11/13 | 2,000 | 2,000 |
| 6,7 | Federal Home Loan Bank Discount Notes | 0.090% | 2/21/14 | 2,500 | 2,498 |
| 7,8 | Freddie Mac Discount Notes | 0.085% | 3/3/14 | 1,000 | 999 |
| 8 | Freddie Mac Discount Notes | 0.070% | 3/31/14 | 1,000 | 999 |
| | | | | | 7,496 |
| Total Temporary Cash Investments (Cost $245,473) | | 245,471 |
| Total Investments (101.9%) (Cost $3,869,612) | | 4,583,673 |
| Other Assets and Liabilities—Net (-1.9%)5 | | | | (85,131) |
| Net Assets (100%) | | | | 4,498,542 |
* Non-income-producing security.
^ Part of security position is on loan to broker-dealers. The total value of securities on loan is $77,612,000.
1 The fund invests a portion of its cash reserves in equity markets through the use of index futures contracts. After giving effect to futures
investments, the fund's effective common stock and temporary cash investment positions represent 98.7% and 3.2%, respectively, of net
assets.
2 Security exempt from registration under Rule 144A of the Securities Act of 1933. Such securities may be sold in transactions exempt from
registration, normally to qualified institutional buyers. At September 30, 2013, the value of this security represented 0.0% of net assets.
3 Considered an affiliated company of the fund as the issuer is another member of The Vanguard Group.
4 Affiliated money market fund available only to Vanguard funds and certain trusts and accounts managed by Vanguard. Rate shown is the 7-day
yield.
5 Includes $86,669,000 of collateral received for securities on loan.
6 The issuer operates under a congressional charter; its securities are generally neither guaranteed by the U.S. Treasury nor backed by the full
faith and credit of the U.S. government.
7 Securities with a value of $5,298,000 have been segregated as initial margin for open futures contracts.
8 The issuer was placed under federal conservatorship in September 2008; since that time, its daily operations have been managed by the Federal
Housing Finance Agency and it receives capital from the U.S. Treasury, as needed to maintain a positive net worth, in exchange for senior
preferred stock.
ADR—American Depositary Receipt.
GDR—Global Depositary Receipt.
14
© 2013 The Vanguard Group. Inc.
All rights reserved.
Vanguard Marketing Corporation, Distributor.
SNA 1290 112013

Item 7: Disclosure of Proxy Voting Policies and Procedures for Closed-End Management Investment Companies.
Not Applicable.
Item 8: Portfolio Managers of Closed-End Management Investment Companies.
Not Applicable.
Item 9: Purchase of Equity Securities by Closed-End Management Investment Company and Affiliated Purchasers.
Not Applicable.
Item 10: Submission of Matters to a Vote of Security Holders.
Not Applicable.
Item 11: Controls and Procedures.
(a) Disclosure Controls and Procedures. The Principal Executive and Financial Officers concluded that the Registrant’s Disclosure Controls and Procedures are effective based on their evaluation of the Disclosure Controls and Procedures as of a date within 90 days of the filing date of this report.
(b) Internal Control Over Financial Reporting. There were no significant changes in Registrant’s Internal Control Over Financial Reporting or in other factors that could significantly affect this control subsequent to the date of the evaluation, including any corrective actions with regard to significant deficiencies and material weaknesses.
Item 12: Exhibits.
(a) Code of Ethics.
(b) Certifications.
Pursuant to the requirements of the Securities Exchange Act of 1934 and the Investment Company Act of 1940, the registrant has duly caused this report to be signed on its behalf by the undersigned, thereunto duly authorized.
| |
| | VANGUARD HORIZON FUNDS |
| |
| |
| BY: | /s/ F. WILLIAM MCNABB III* |
| | F. WILLIAM MCNABB III |
| | CHIEF EXECUTIVE OFFICER |
| |
| Date: November 15, 2013 |
Pursuant to the requirements of the Securities Exchange Act of 1934 and the Investment Company Act of 1940, this report has been signed below by the following persons on behalf of the registrant and in the capacities and on the dates indicated.
| |
| | VANGUARD HORIZON FUNDS |
| |
BY: | /s/ F. WILLIAM MCNABB III* |
| | F. WILLIAM MCNABB III |
| | CHIEF EXECUTIVE OFFICER |
Date: November 15, 2013 |
| VANGUARD HORIZON FUNDS |
BY: | /s/ THOMAS J. HIGGINS* |
| | THOMAS J. HIGGINS |
| | CHIEF FINANCIAL OFFICER |
Date: November 15, 2013 |
* By: /s/ Heidi Stam
Heidi Stam, pursuant to a Power of Attorney filed on March 27, 2012 see file Number 2-11444, Incorporated by Reference.