Insight Enterprises, Inc 2019 Investor Day Exhibit 99.1
Disclosures Safe harbor statement This presentation includes “forward-looking statements” within the meaning of the Private Securities Litigation Reform Act of 1995 related to Insight’s plans and expectations. Statements that are not historical facts, including statements about future trends in the IT market and our opportunities for growth, are forward-looking statements. These forward-looking statements are subject to assumptions, risks and uncertainties which could cause actual results or future events to differ materially from such statements. The Company undertakes no obligation to update publicly or revise any of the forward-looking statements, except as otherwise required by law. More detailed information about risk factors is included in today’s press release and discussed in the Company’s most recently filed periodic reports and subsequent filings with the Securities and Exchange Commission. Non-GAAP measures This presentation will reference certain non-GAAP financial information as ‘Adjusted’. A reconciliation of non-GAAP financial measures presented in this document to our actual GAAP results is attached to the back of this presentation and included in the press release issued today, which you may find on the Investor Relations section of our website at investor.insight.com. Constant currency In some instances the Company refers to changes in net sales, gross profit and earnings from operations on a consolidated basis and in North America, EMEA and APAC excluding the effects of fluctuating foreign currency exchange rates. In computing these changes and percentages, the Company compares the current year amount as translated into U.S. dollars under the applicable accounting standards to the prior year amount in local currency translated into U.S. dollars utilizing the weighted average translation rate for the current period.
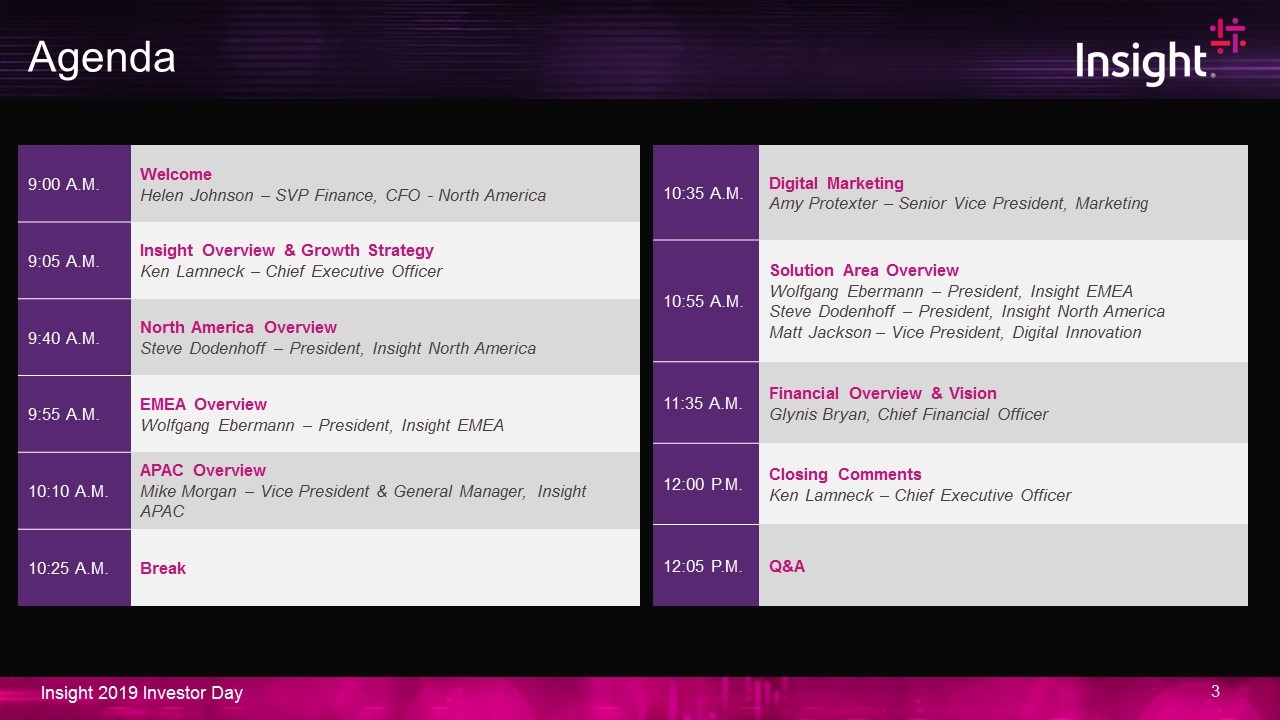
Agenda 9:00 A.M. Welcome Helen Johnson – SVP Finance, CFO - North America 9:05 A.M. Insight Overview & Growth Strategy Ken Lamneck – Chief Executive Officer 9:40 A.M. North America Overview Steve Dodenhoff – President, Insight North America 9:55 A.M. EMEA Overview Wolfgang Ebermann – President, Insight EMEA 10:10 A.M. APAC Overview Mike Morgan – Vice President & General Manager, Insight APAC 10:25 A.M. Break 10:35 A.M. Digital Marketing Amy Protexter – Senior Vice President, Marketing 10:55 A.M. Solution Area Overview Wolfgang Ebermann – President, Insight EMEA Steve Dodenhoff – President, Insight North America Matt Jackson – Vice President, Digital Innovation 11:35 A.M. Financial Overview & Vision Glynis Bryan, Chief Financial Officer 12:00 P.M. Closing Comments Ken Lamneck – Chief Executive Officer 12:05 P.M. Q&A

Global Intelligent Technology SolutionsTM provider that helps businesses run smarter. We architect, design, implement and manage IT Solutions that enable digital readiness and drive business outcomes.
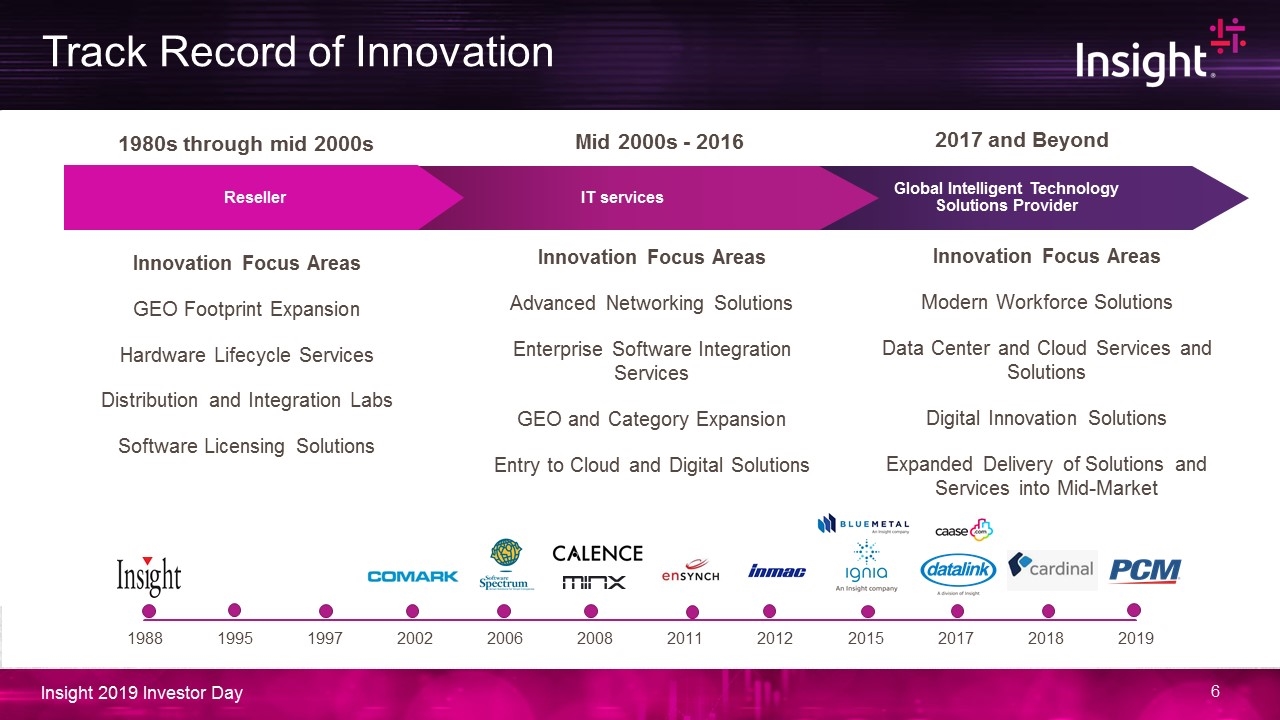
Innovation Focus Areas GEO Footprint Expansion Hardware Lifecycle Services Distribution and Integration Labs Software Licensing Solutions Innovation Focus Areas Advanced Networking Solutions Enterprise Software Integration Services GEO and Category Expansion Entry to Cloud and Digital Solutions Innovation Focus Areas Modern Workforce Solutions Data Center and Cloud Services and Solutions Digital Innovation Solutions Expanded Delivery of Solutions and Services into Mid-Market 2017 and Beyond Global Intelligent Technology Solutions Provider IT services Mid 2000s - 2016 1980s through mid 2000s Reseller Track Record of Innovation
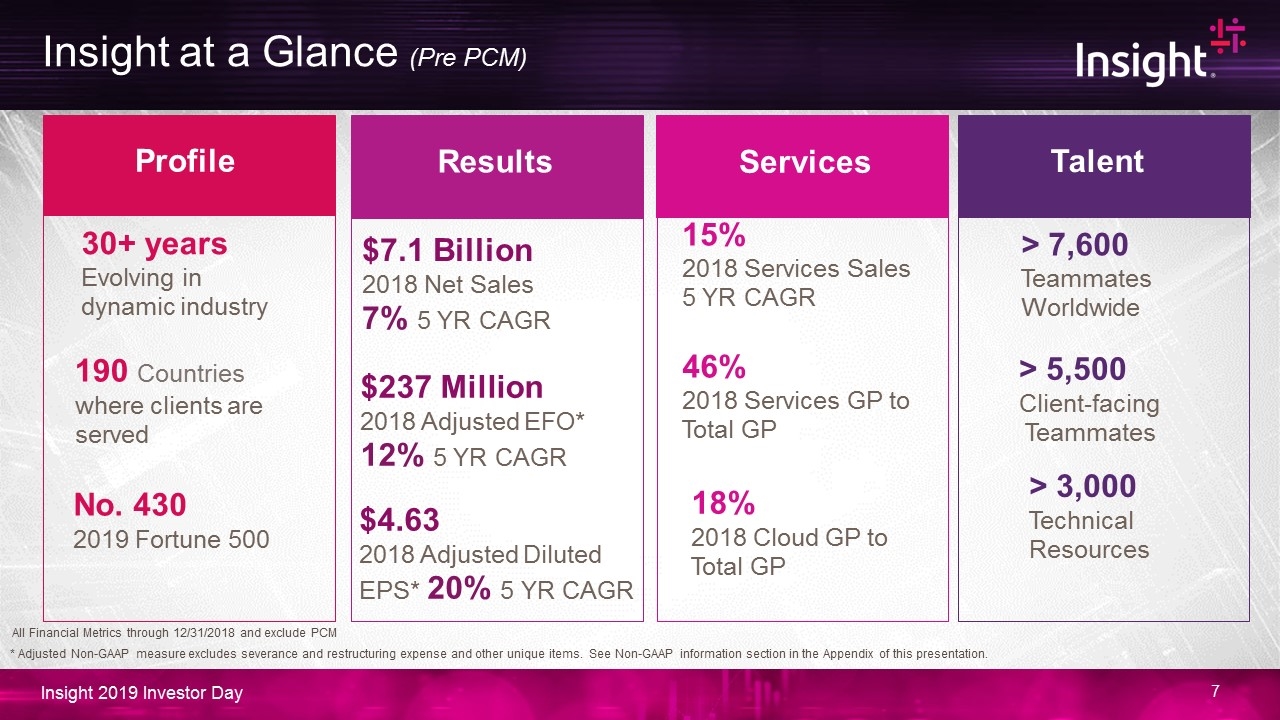
Profile $7.1 Billion 2018 Net Sales 7% 5 YR CAGR 30+ years Evolving in dynamic industry > 5,500 Client-facing Teammates > 7,600 Teammates Worldwide 18% 2018 Cloud GP to Total GP 46% 2018 Services GP to Total GP $237 Million 2018 Adjusted EFO* 12% 5 YR CAGR No. 430 2019 Fortune 500 > 3,000 Technical Resources $4.63 2018 Adjusted Diluted EPS* 20% 5 YR CAGR 15% 2018 Services Sales 5 YR CAGR 190 Countries where clients are served Results Services Talent All Financial Metrics through 12/31/2018 and exclude PCM Insight at a Glance (Pre PCM) * Adjusted Non-GAAP measure excludes severance and restructuring expense and other unique items. See Non-GAAP information section in the Appendix of this presentation.
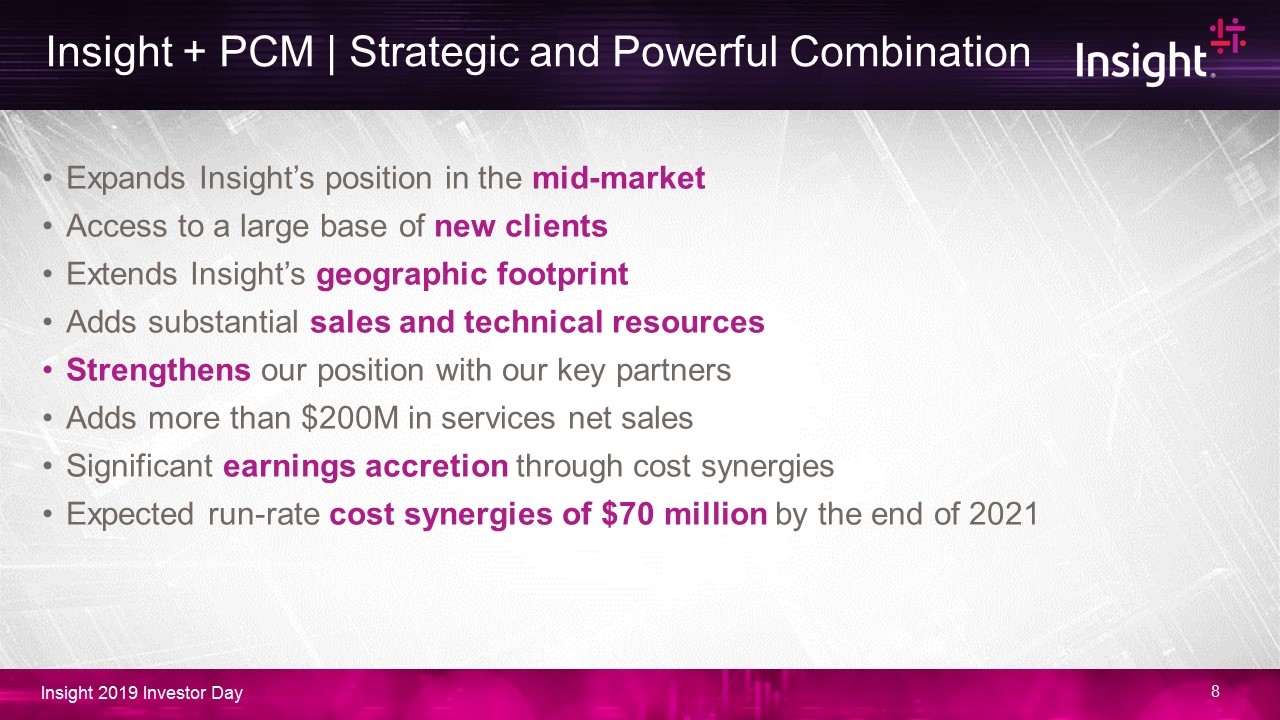
Expands Insight’s position in the mid-market Access to a large base of new clients Extends Insight’s geographic footprint Adds substantial sales and technical resources Strengthens our position with our key partners Adds more than $200M in services net sales Significant earnings accretion through cost synergies Expected run-rate cost synergies of $70 million by the end of 2021 Insight + PCM | Strategic and Powerful Combination
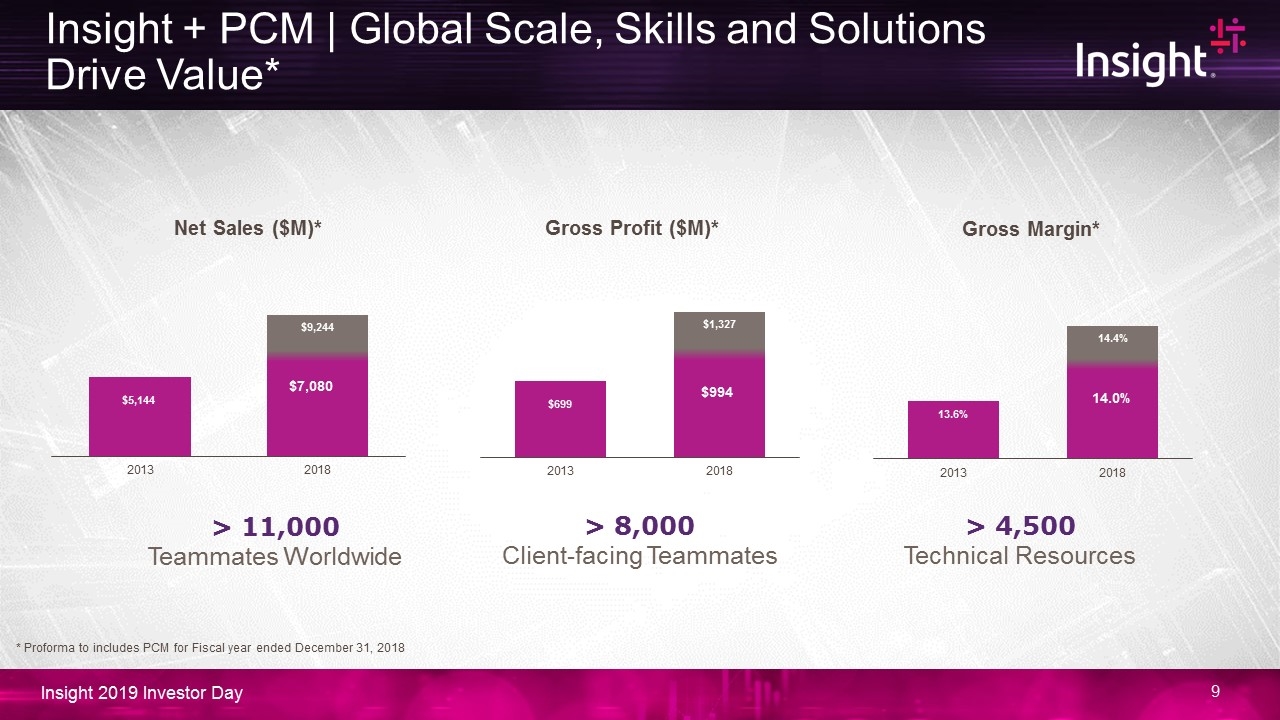
Insight + PCM | Global Scale, Skills and Solutions Drive Value* * Proforma to includes PCM for Fiscal year ended December 31, 2018 > 8,000 Client-facing Teammates > 11,000 Teammates Worldwide > 4,500 Technical Resources Gross Margin* $994 Gross Profit ($M)* Net Sales ($M)* 14.0% $7,080
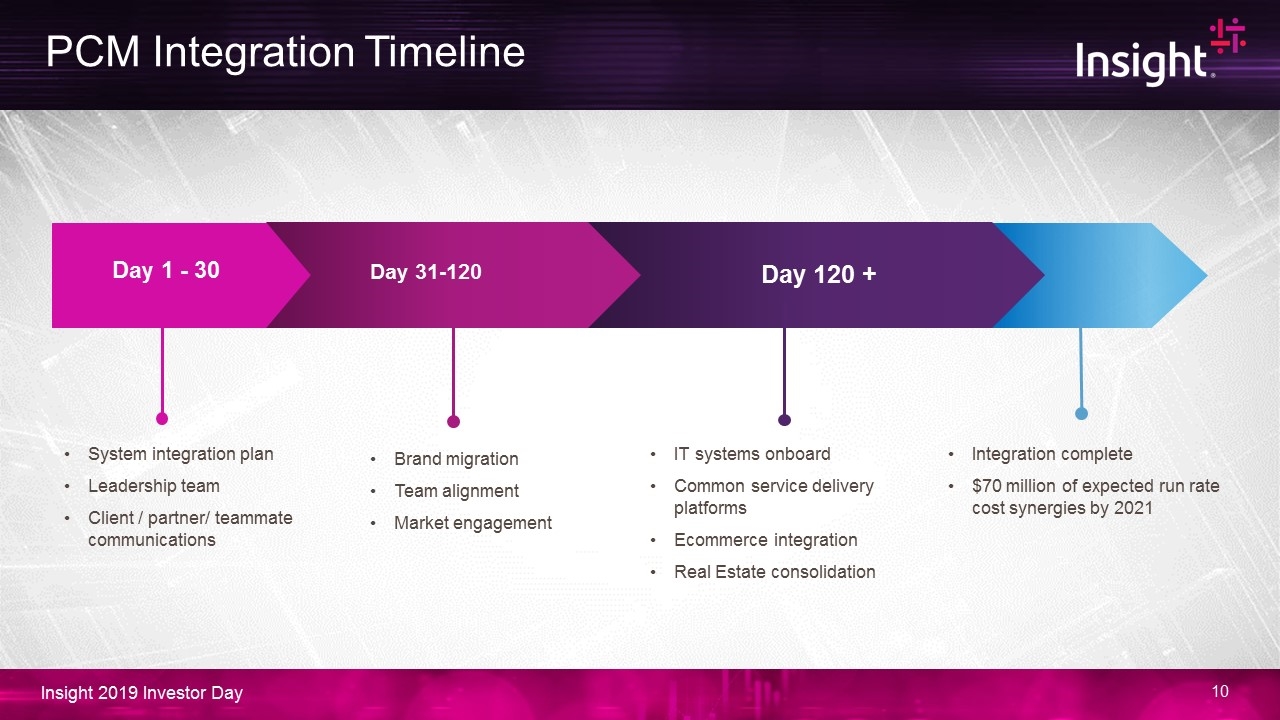
System integration plan Leadership team Client / partner/ teammate communications Day 120 + Day 1 - 30 Day 31-120 Integration complete $70 million of expected run rate cost synergies by 2021 Brand migration Team alignment Market engagement IT systems onboard Common service delivery platforms Ecommerce integration Real Estate consolidation PCM Integration Timeline
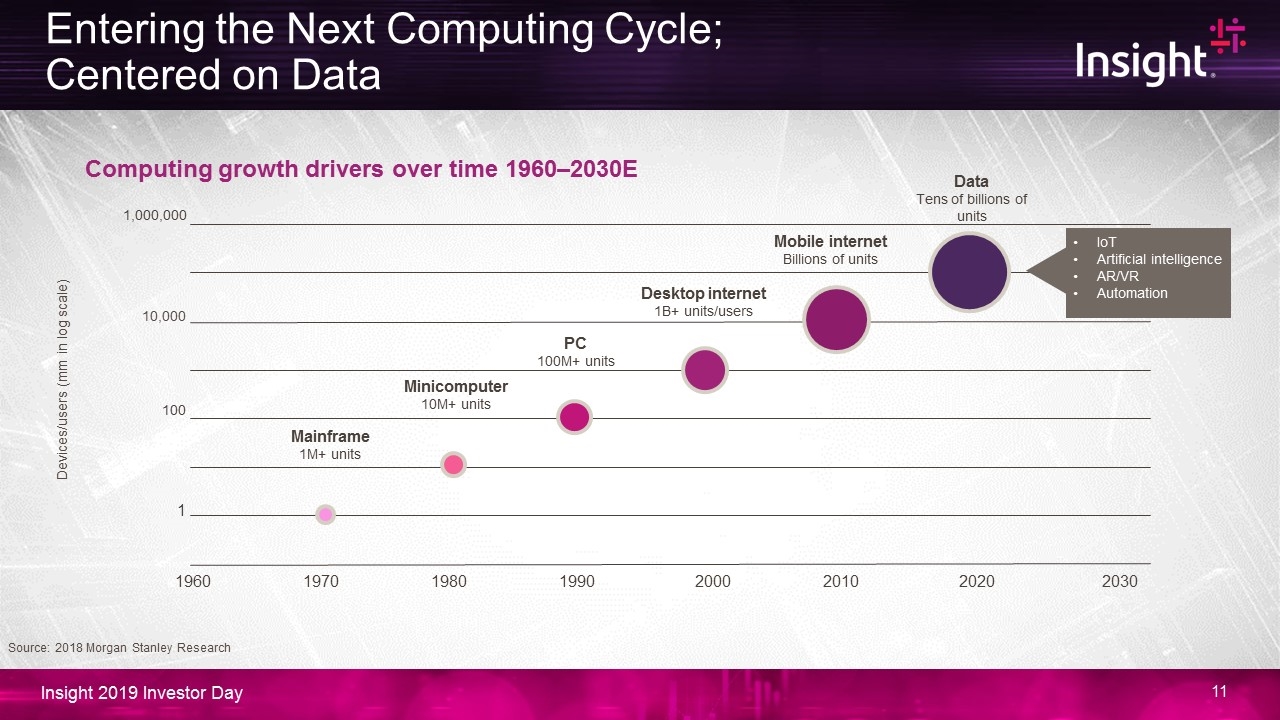
Computing growth drivers over time 1960–2030E Devices/users (mm in log scale) 1 100 10,000 1,000,000 19601970198019902000201020202030 Mainframe 1M+ units Minicomputer 10M+ units PC 100M+ units Desktop internet 1B+ units/users Mobile internet Billions of units Data Tens of billions of units IoT Artificial intelligence AR/VR Automation Source: 2018 Morgan Stanley Research Entering the Next Computing Cycle; Centered on Data
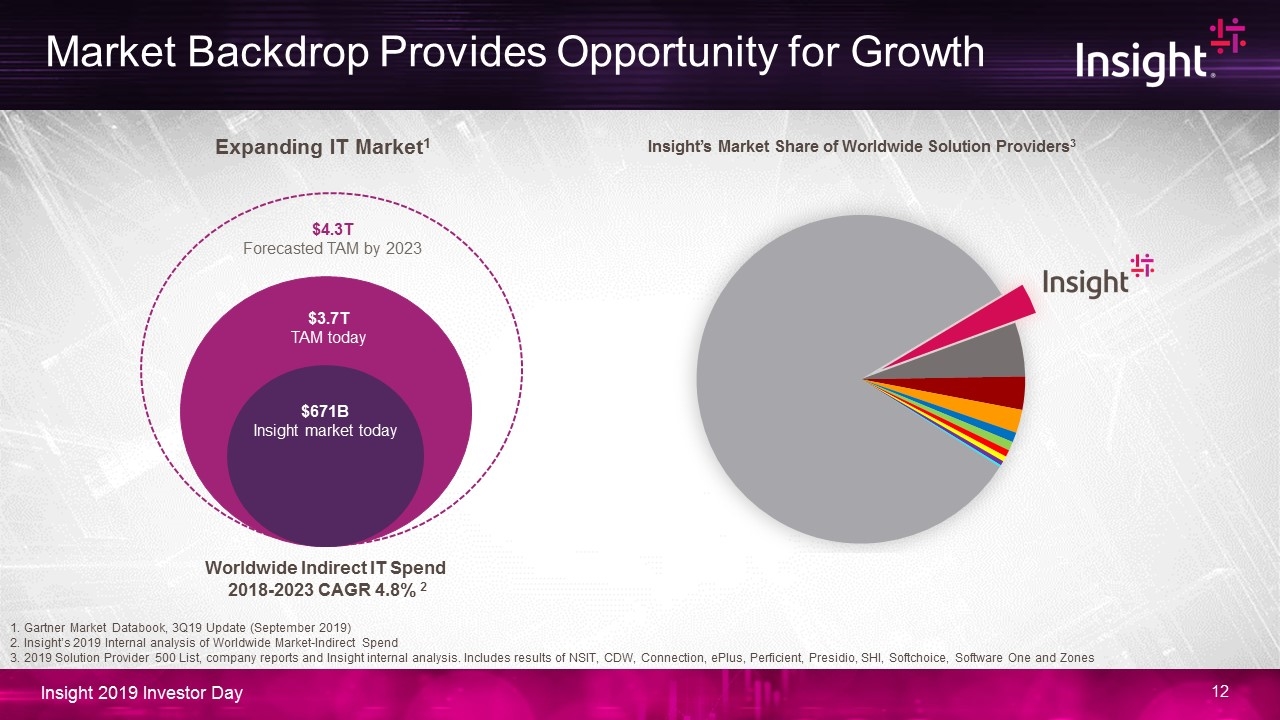
1. Gartner Market Databook, 3Q19 Update (September 2019) 2. Insight’s 2019 Internal analysis of Worldwide Market-Indirect Spend 3. 2019 Solution Provider 500 List, company reports and Insight internal analysis. Includes results of NSIT, CDW, Connection, ePlus, Perficient, Presidio, SHI, Softchoice, Software One and Zones $4.3T Forecasted TAM by 2023 $671B Insight market today $3.7T TAM today Expanding IT Market1 Worldwide Indirect IT Spend 2018-2023 CAGR 4.8% 2 Market Backdrop Provides Opportunity for Growth
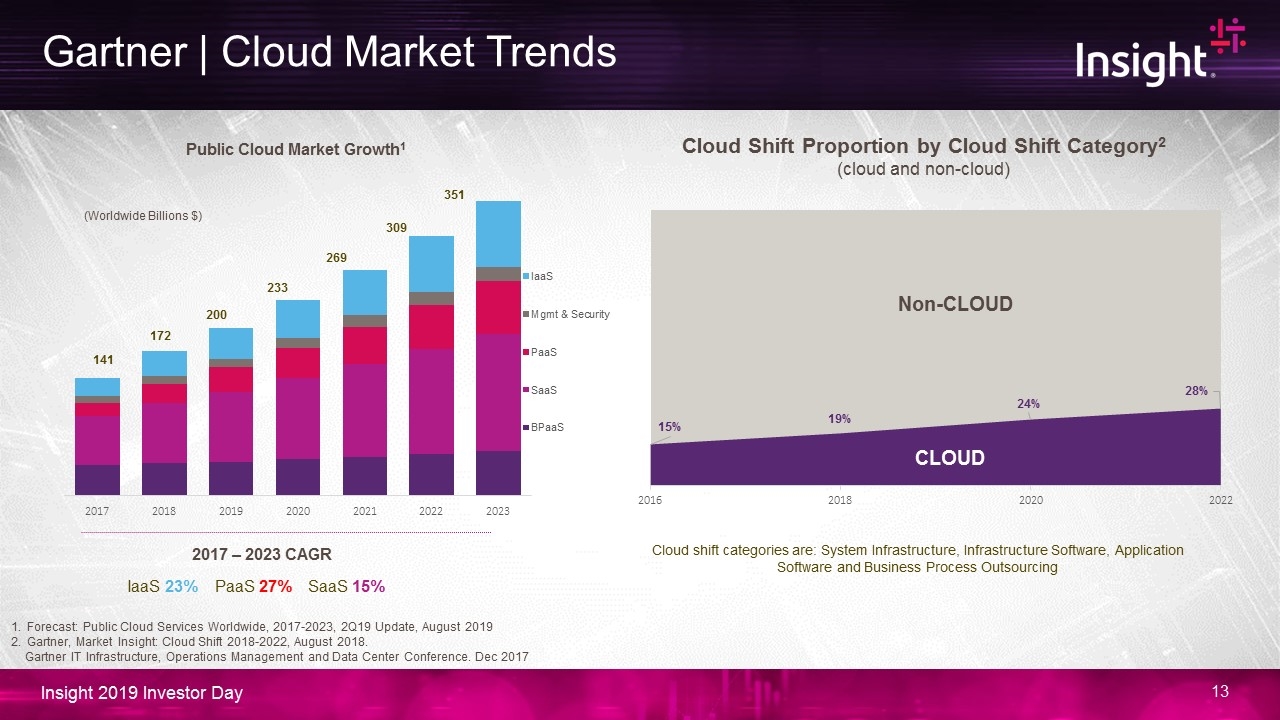
351 309 269 233 200 172 141 IaaS 23% PaaS 27% SaaS 15% 2017 – 2023 CAGR Non-CLOUD Cloud Shift Proportion by Cloud Shift Category2 (cloud and non-cloud) Forecast: Public Cloud Services Worldwide, 2017-2023, 2Q19 Update, August 2019 Gartner, Market Insight: Cloud Shift 2018-2022, August 2018. Gartner IT Infrastructure, Operations Management and Data Center Conference. Dec 2017 CLOUD Cloud shift categories are: System Infrastructure, Infrastructure Software, Application Software and Business Process Outsourcing Gartner | Cloud Market Trends

Multi-Cloud World Private cloud Public clouds Intelligent edge Moving focus from data centers to centers of data
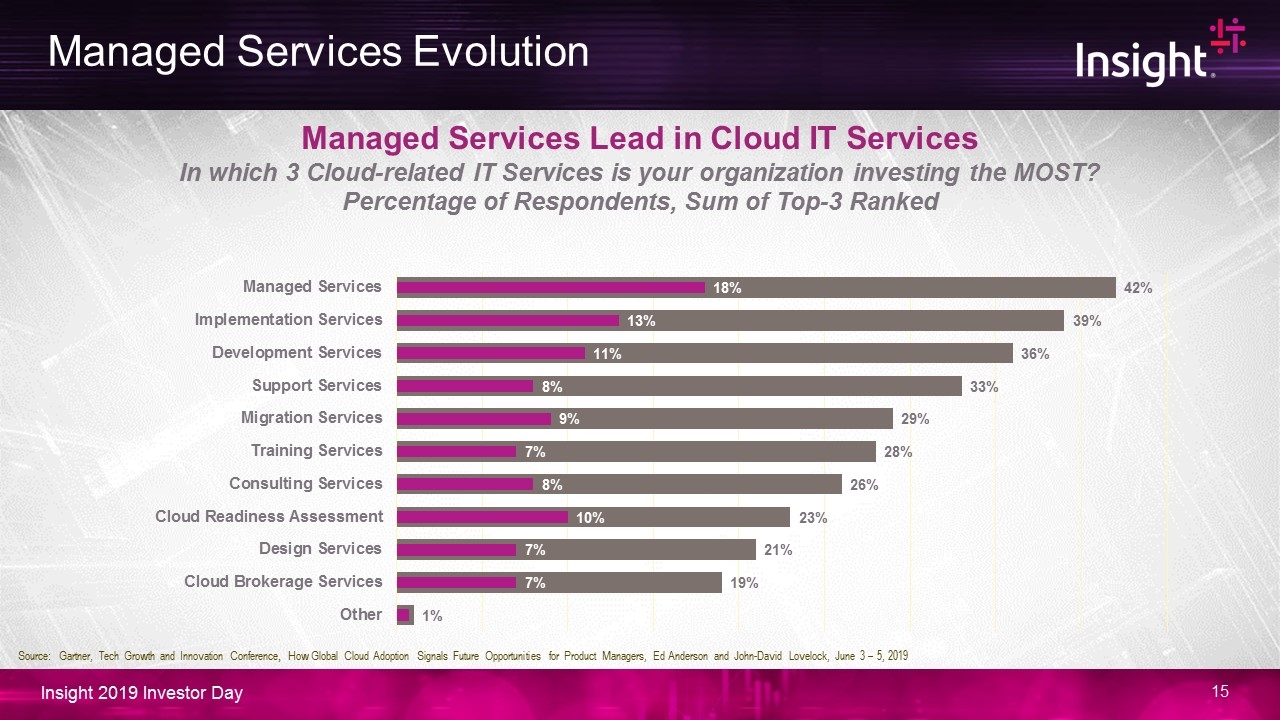
Managed Services Evolution Managed Services Lead in Cloud IT Services In which 3 Cloud-related IT Services is your organization investing the MOST? Percentage of Respondents, Sum of Top-3 Ranked Source: Gartner, Tech Growth and Innovation Conference, How Global Cloud Adoption Signals Future Opportunities for Product Managers, Ed Anderson and John-David Lovelock, June 3 – 5, 2019
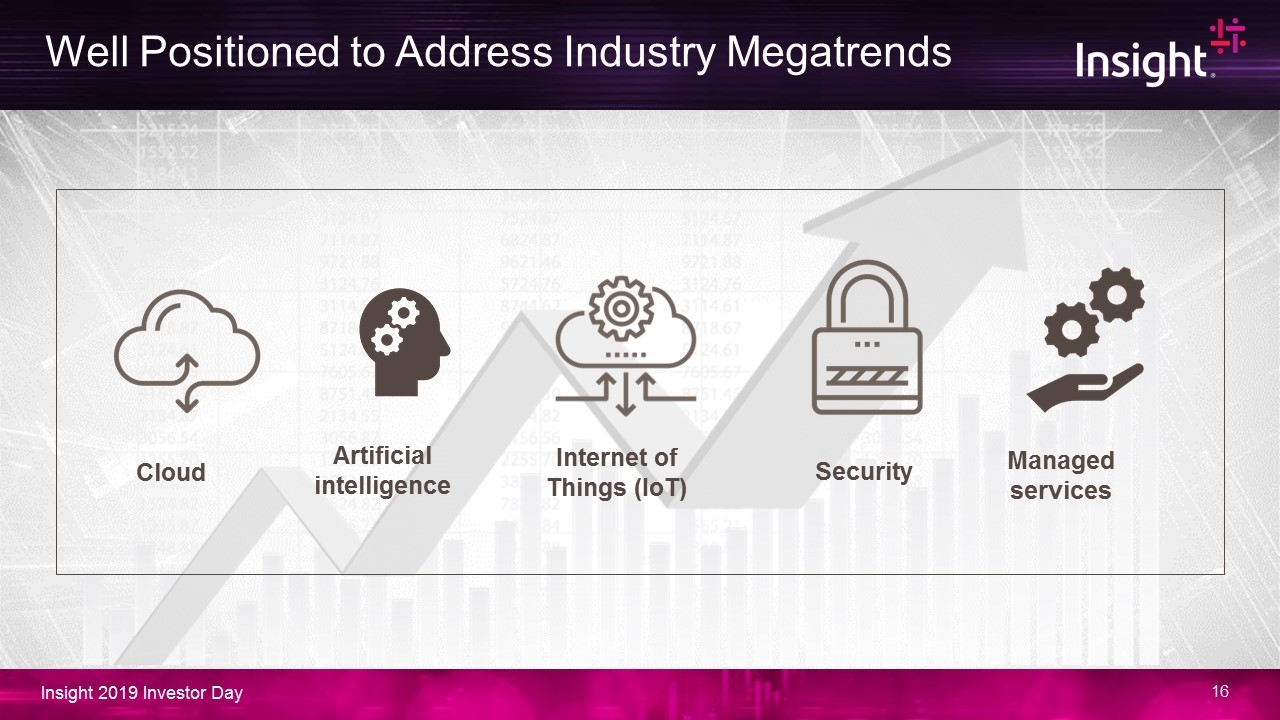
Cloud Artificial intelligence Internet of Things (IoT) Security Managed services Well Positioned to Address Industry Megatrends
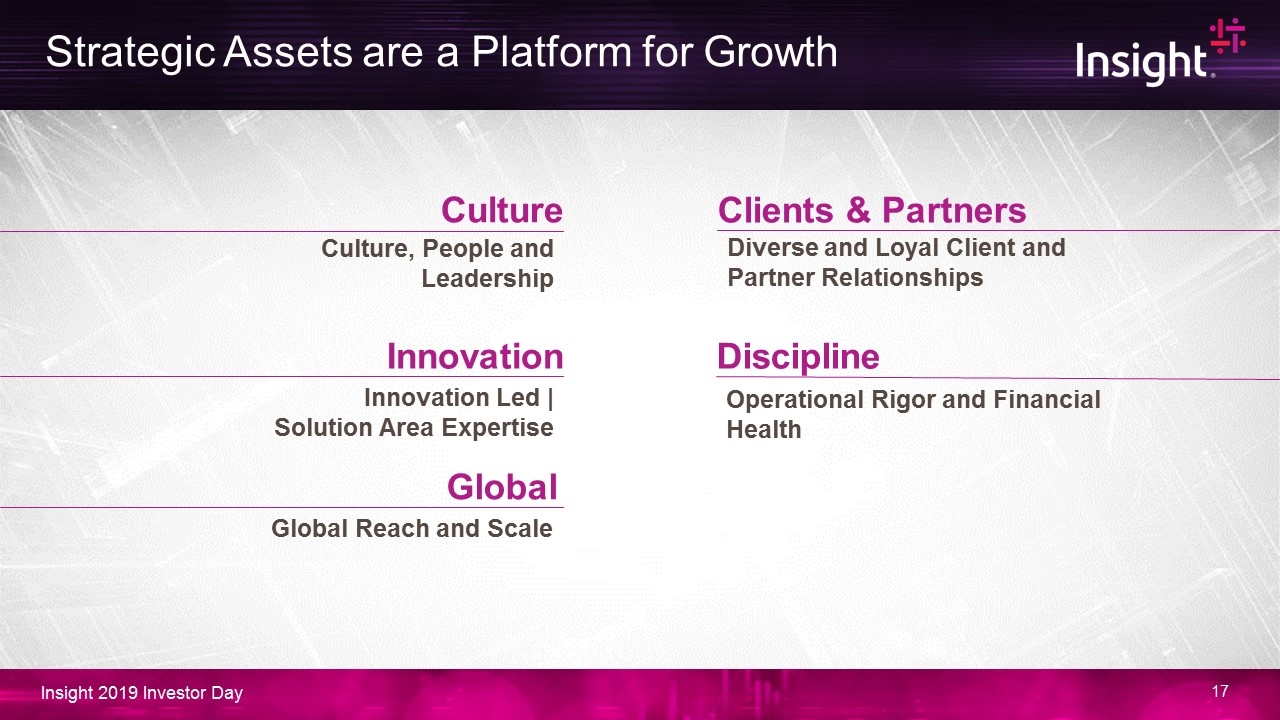
Diverse and Loyal Client and Partner Relationships Operational Rigor and Financial Health Clients & Partners Discipline Culture, People and Leadership Culture Innovation Led | Solution Area Expertise Innovation Global Reach and Scale Global Strategic Assets are a Platform for Growth
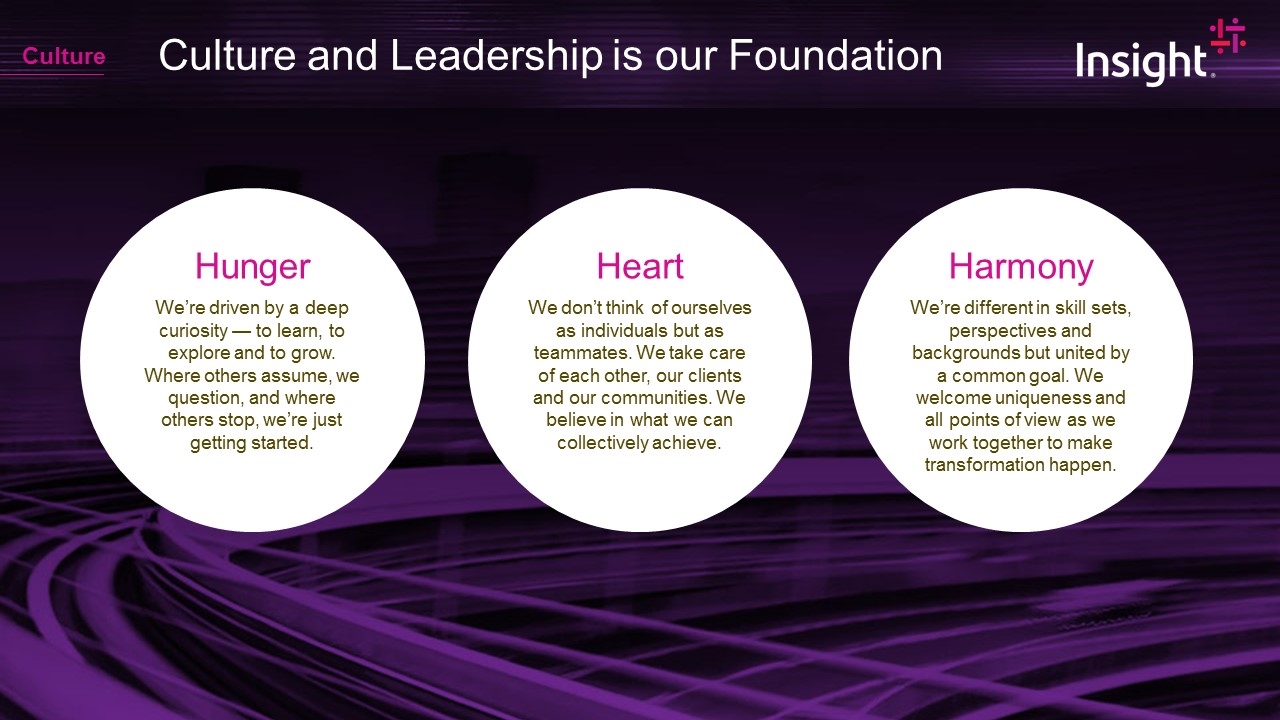
Culture and Leadership is our Foundation Hunger We’re driven by a deep curiosity — to learn, to explore and to grow. Where others assume, we question, and where others stop, we’re just getting started. Heart We don’t think of ourselves as individuals but as teammates. We take care of each other, our clients and our communities. We believe in what we can collectively achieve. Harmony We’re different in skill sets, perspectives and backgrounds but united by a common goal. We welcome uniqueness and all points of view as we work together to make transformation happen. Culture
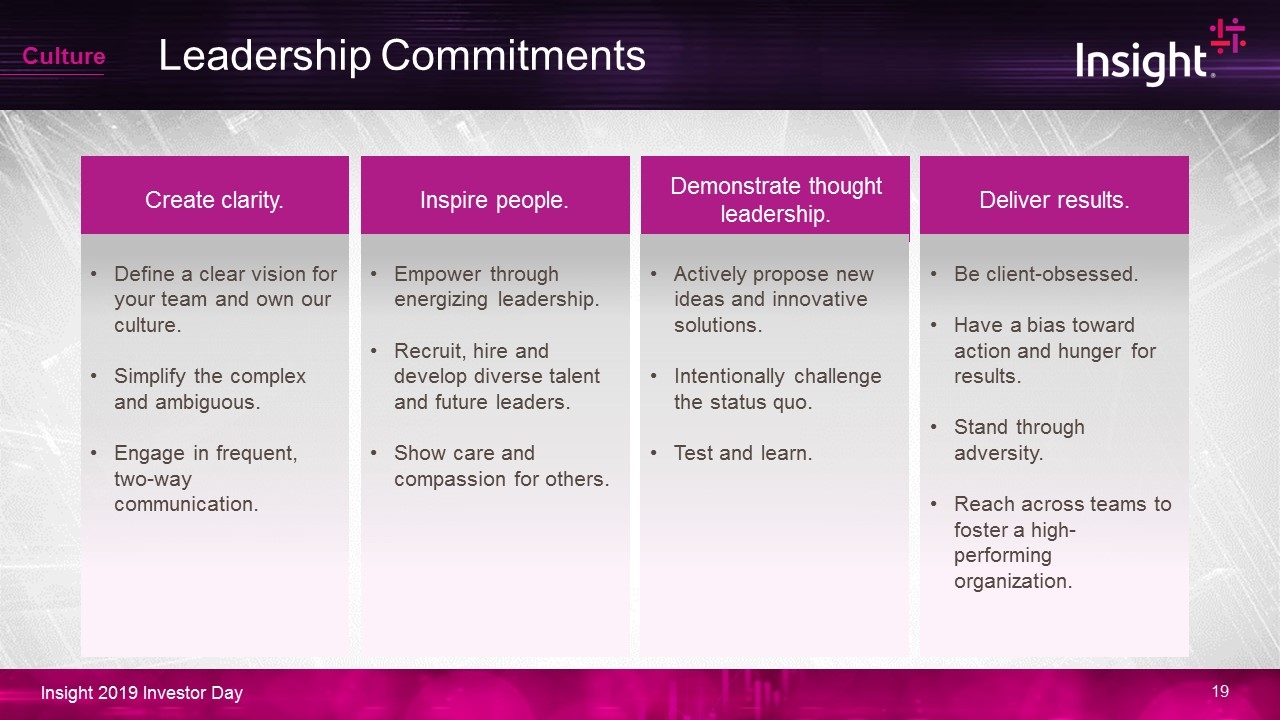
Leadership Commitments Culture Create clarity. Inspire people. Demonstrate thought leadership. Deliver results. Define a clear vision for your team and own our culture. Simplify the complex and ambiguous. Engage in frequent, two-way communication. Empower through energizing leadership. Recruit, hire and develop diverse talent and future leaders. Show care and compassion for others. Actively propose new ideas and innovative solutions. Intentionally challenge the status quo. Test and learn. Be client-obsessed. Have a bias toward action and hunger for results. Stand through adversity. Reach across teams to foster a high-performing organization.
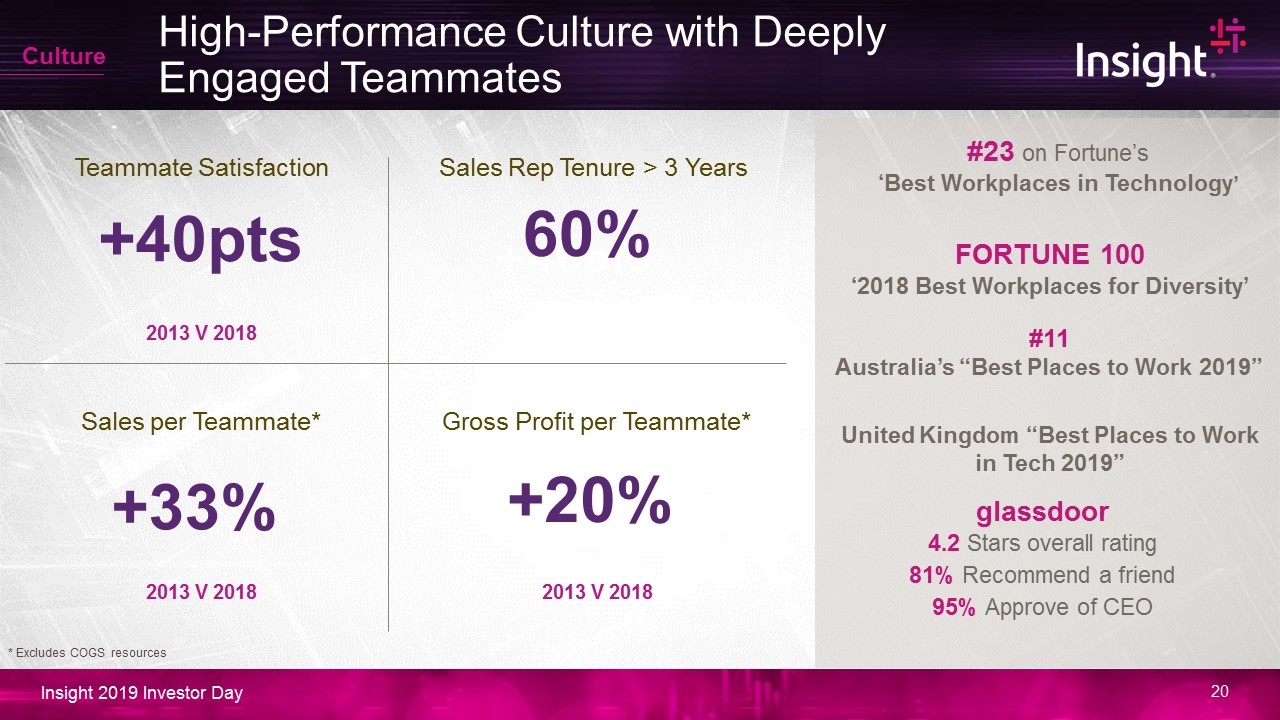
28.01 21.10 2013 V 2018 +40pts Teammate Satisfaction +20% Gross Profit per Teammate* 2013 V 2018 +33% Sales per Teammate* 2013 V 2018 +40pts Sales Rep Tenure > 3 Years 60% #23 on Fortune’s ‘Best Workplaces in Technology’ FORTUNE 100 ‘2018 Best Workplaces for Diversity’ #11 Australia’s “Best Places to Work 2019” glassdoor 4.2 Stars overall rating 81% Recommend a friend 95% Approve of CEO * Excludes COGS resources High-Performance Culture with Deeply Engaged Teammates Culture United Kingdom “Best Places to Work in Tech 2019”
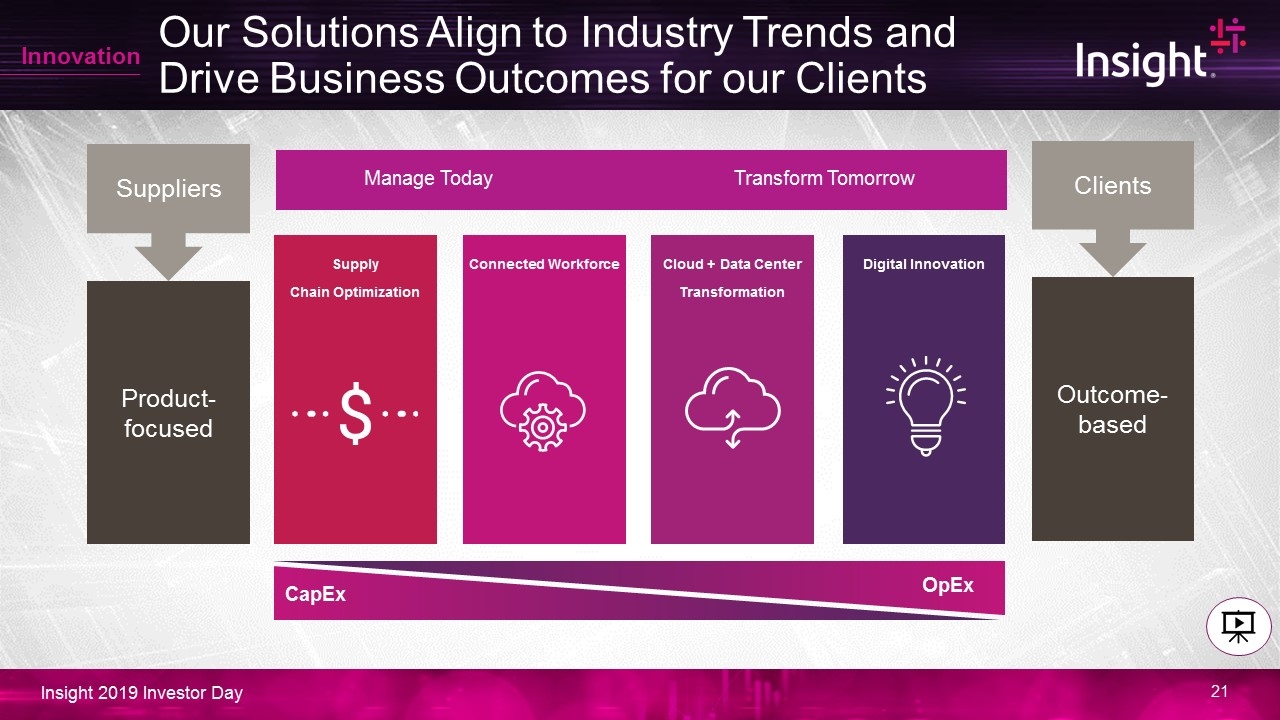
Our Solutions Align to Industry Trends and Drive Business Outcomes for our Clients Product-focused Suppliers Outcome-based Clients Supply Chain Optimization Connected Workforce Cloud + Data Center Transformation Digital Innovation CapEx OpEx Manage Today Transform Tomorrow Innovation
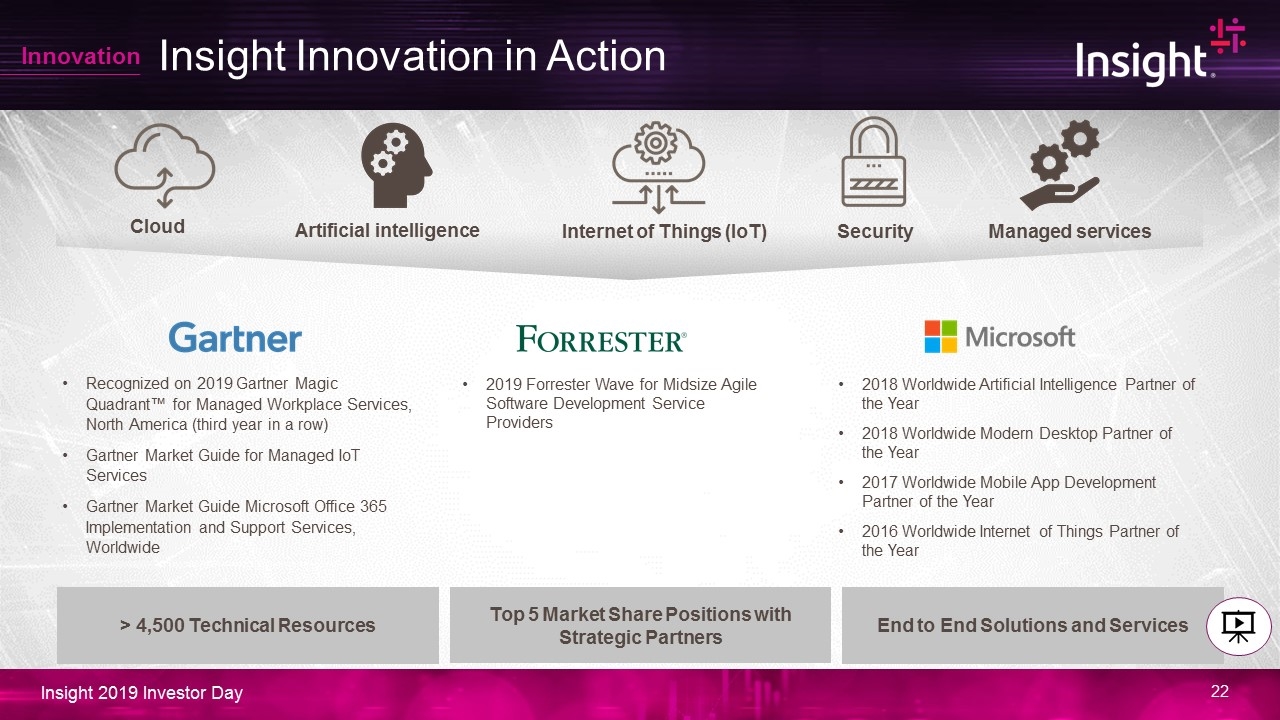
Insight Innovation in Action Recognized on 2019 Gartner Magic Quadrant™ for Managed Workplace Services, North America (third year in a row) Gartner Market Guide for Managed IoT Services Gartner Market Guide Microsoft Office 365 Implementation and Support Services, Worldwide Top 5 Market Share Positions with Strategic Partners > 4,500 Technical Resources 2019 Forrester Wave for Midsize Agile Software Development Service Providers Cloud Artificial intelligence Internet of Things (IoT) Security Managed services Innovation End to End Solutions and Services 2018 Worldwide Artificial Intelligence Partner of the Year 2018 Worldwide Modern Desktop Partner of the Year 2017 Worldwide Mobile App Development Partner of the Year 2016 Worldwide Internet of Things Partner of the Year
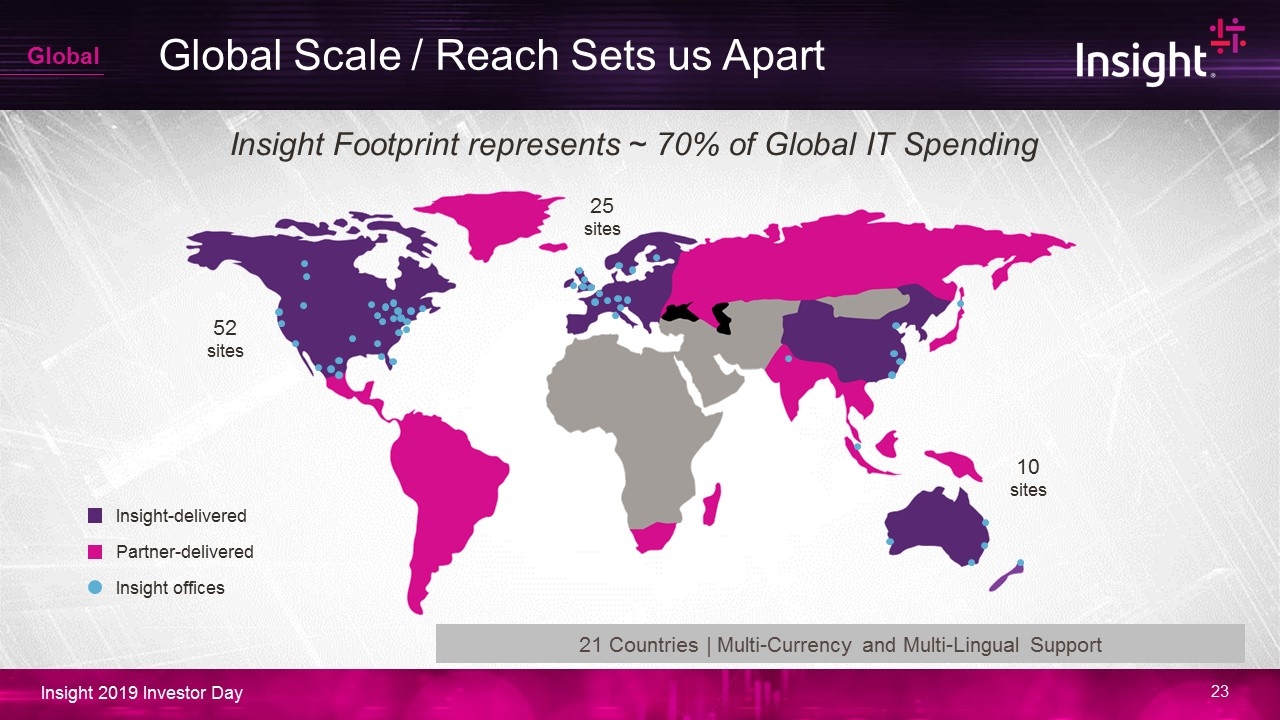
Global Scale / Reach Sets us Apart Insight-delivered Partner-delivered Insight offices Insight Footprint represents ~ 70% of Global IT Spending 52 sites 10 sites 25 sites 21 Countries | Multi-Currency and Multi-Lingual Support Global
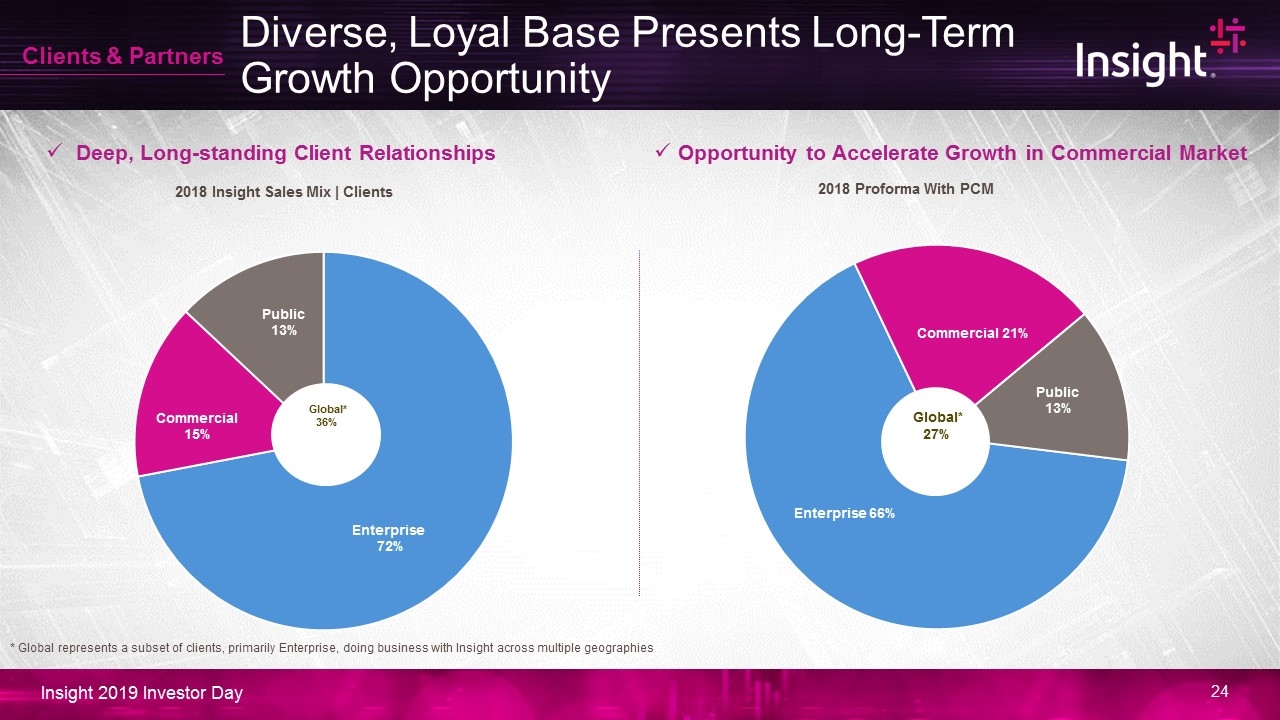
Diverse, Loyal Base Presents Long-Term Growth Opportunity Opportunity to Accelerate Growth in Commercial Market Deep, Long-standing Client Relationships * Global represents a subset of clients, primarily Enterprise, doing business with Insight across multiple geographies Clients & Partners Global* 27%
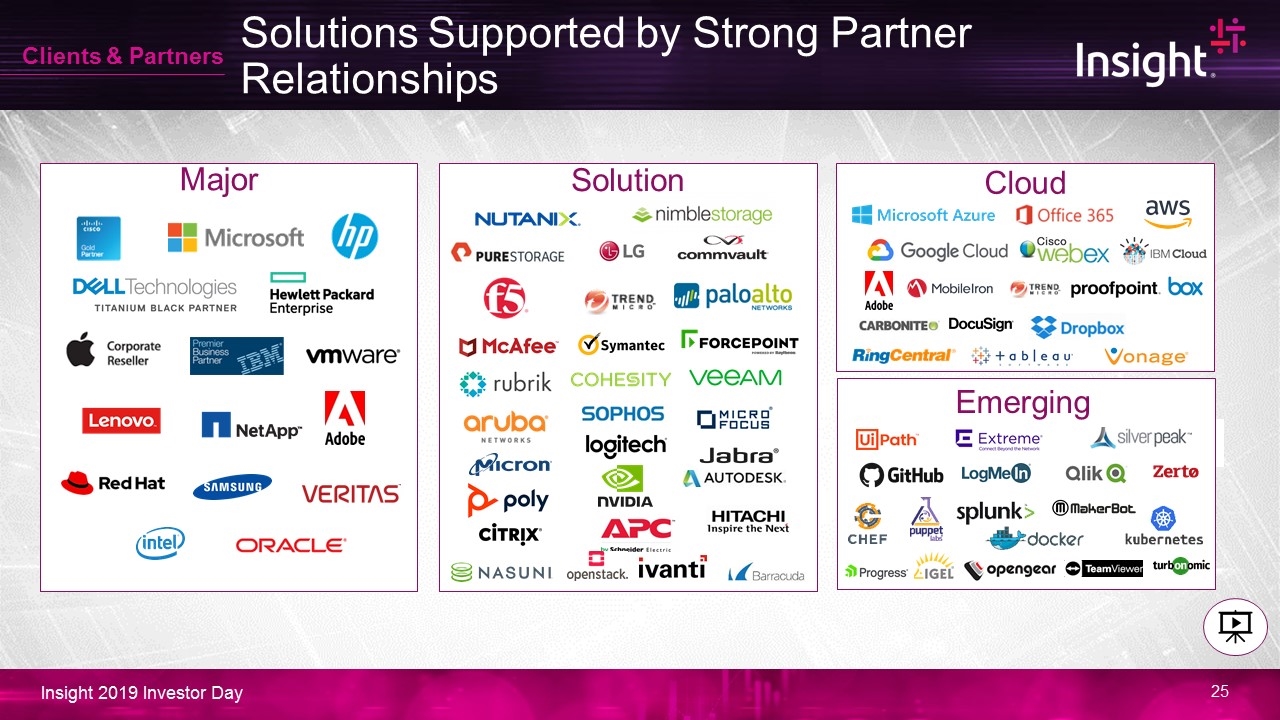
Solutions Supported by Strong Partner Relationships Major Solution Cloud Emerging Clients & Partners
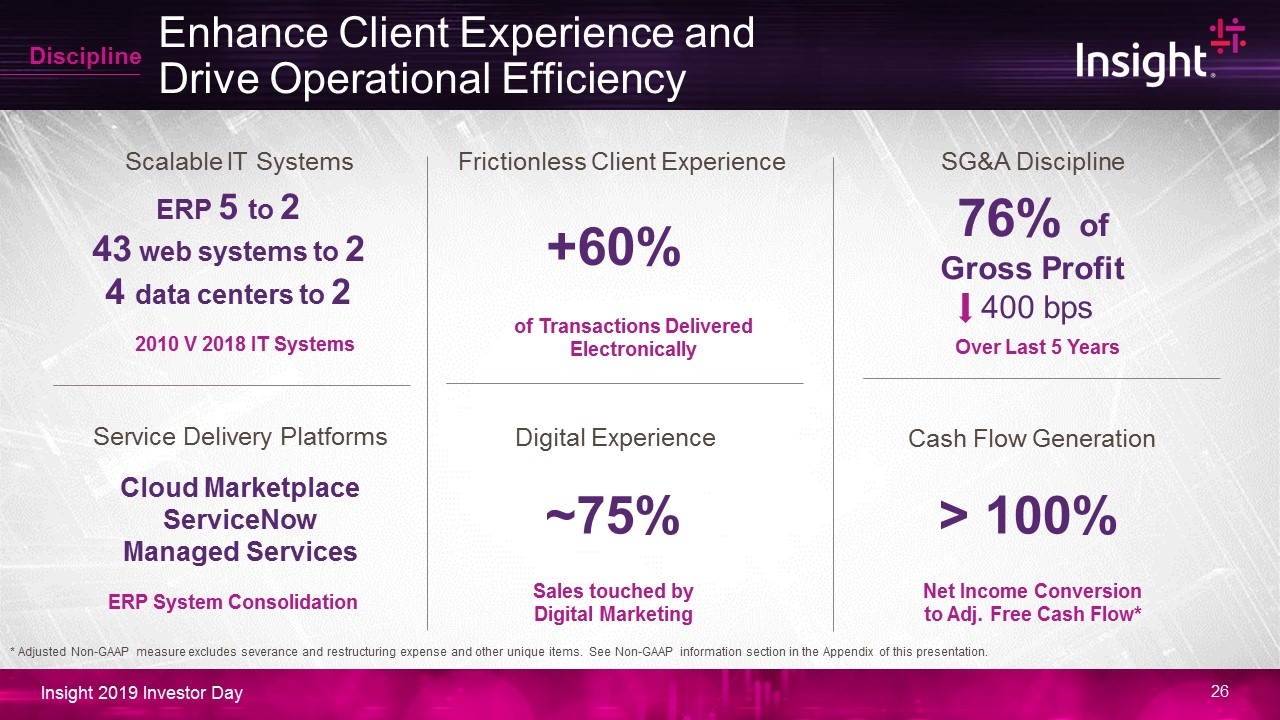
21.10 Enhance Client Experience and Drive Operational Efficiency 2010 V 2018 IT Systems ERP 5 to 2 43 web systems to 2 4 data centers to 2 Scalable IT Systems Cloud Marketplace ServiceNow Managed Services Service Delivery Platforms ERP System Consolidation Discipline of Transactions Delivered Electronically +60% Frictionless Client Experience ~75% Digital Experience Sales touched by Digital Marketing > 100% Cash Flow Generation Net Income Conversion to Adj. Free Cash Flow* SG&A Discipline 76% of Gross Profit 400 bps Over Last 5 Years * Adjusted Non-GAAP measure excludes severance and restructuring expense and other unique items. See Non-GAAP information section in the Appendix of this presentation.
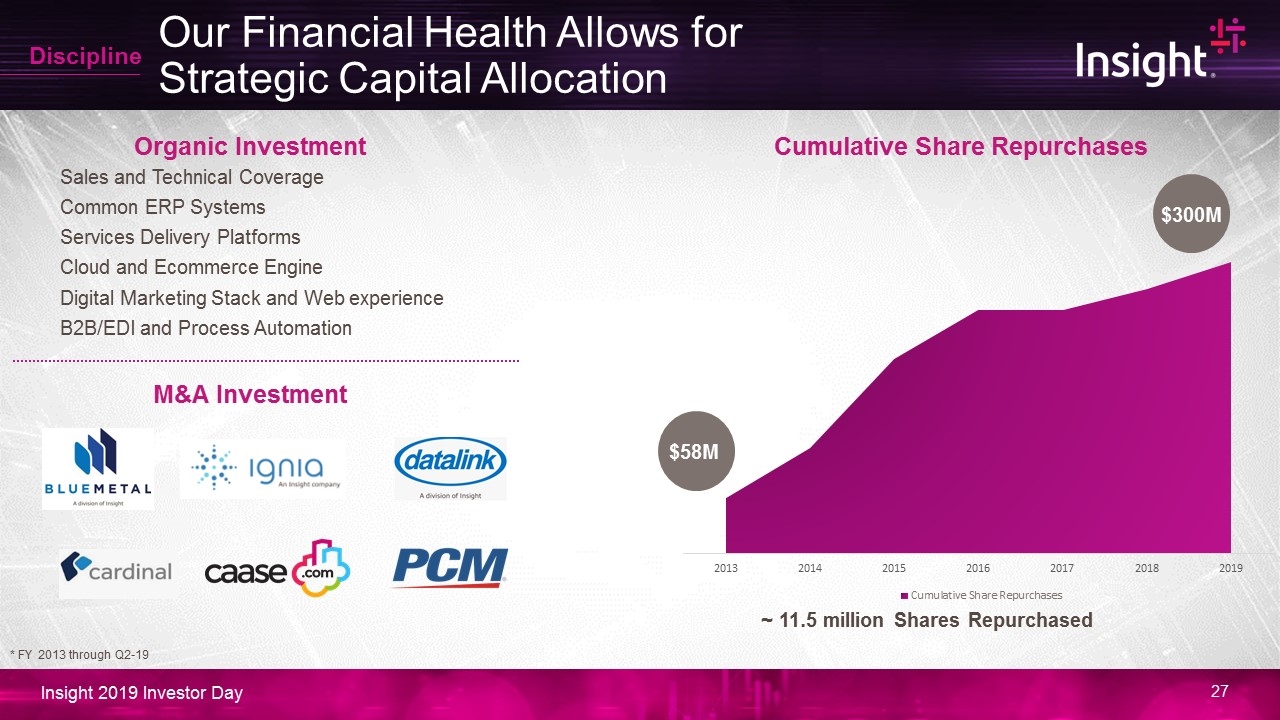
Our Financial Health Allows for Strategic Capital Allocation Cumulative Share Repurchases $58M $300M ~ 11.5 million Shares Repurchased M&A Investment Organic Investment Sales and Technical Coverage Common ERP Systems Services Delivery Platforms Cloud and Ecommerce Engine Digital Marketing Stack and Web experience B2B/EDI and Process Automation * FY 2013 through Q2-19 Discipline

Our Strategic Assets Support Continued Growth Grow with solutions that drive business outcomes for clients Continue to Innovate to capture share in high growth areas Expand and Scale in strategic clients and markets Optimize client experience and execution through operational excellence Strategic Priorities Innovation Led | Solution Area Expertise Culture, People and Leadership Global Reach and Scale Diverse and Loyal Client and Partner relationships Operational Rigor and Financial Health • • • • Strategic Assets Strategy
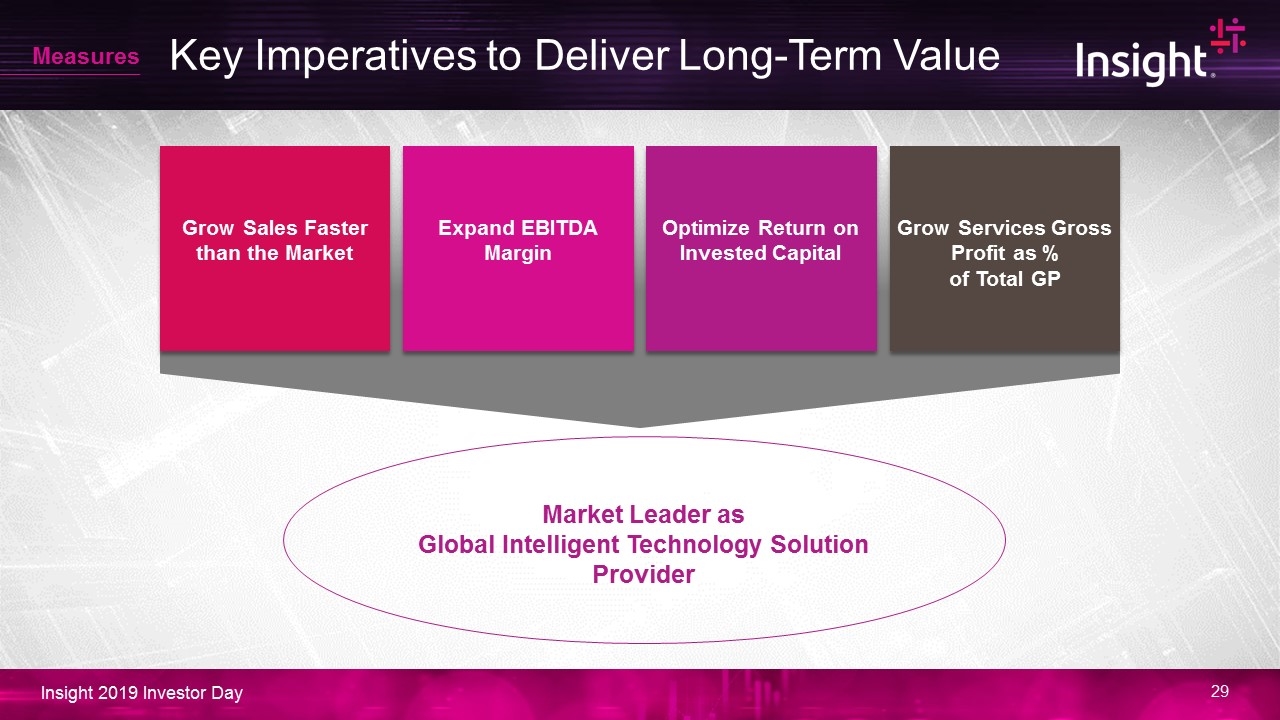
Key Imperatives to Deliver Long-Term Value Expand EBITDA Margin Optimize Return on Invested Capital Grow Services Gross Profit as % of Total GP Market Leader as Global Intelligent Technology Solution Provider Measures Grow Sales Faster than the Market

North America Steve Dodenhoff – President, Insight North America
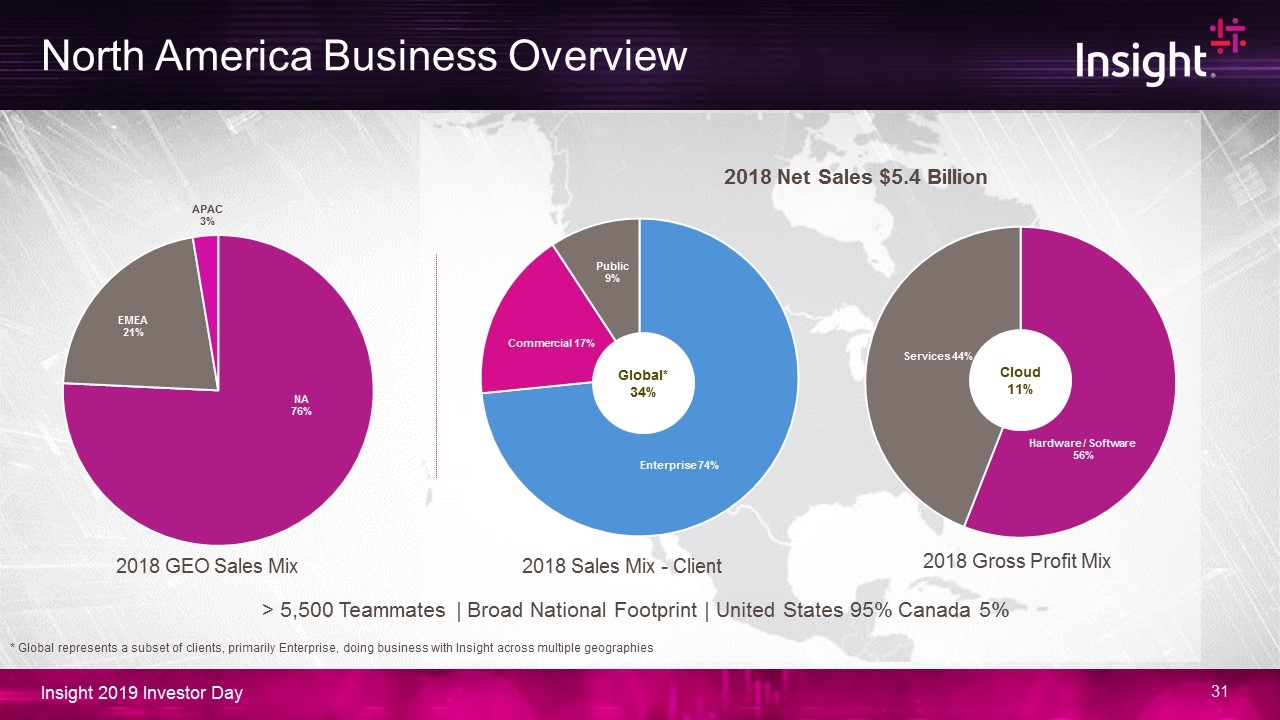
North America Business Overview 2018 Net Sales $5.4 Billion > 5,500 Teammates | Broad National Footprint | United States 95% Canada 5% Cloud 11% 2018 Gross Profit Mix 2018 Sales Mix - Client 2018 GEO Sales Mix Global* 34% * Global represents a subset of clients, primarily Enterprise, doing business with Insight across multiple geographies
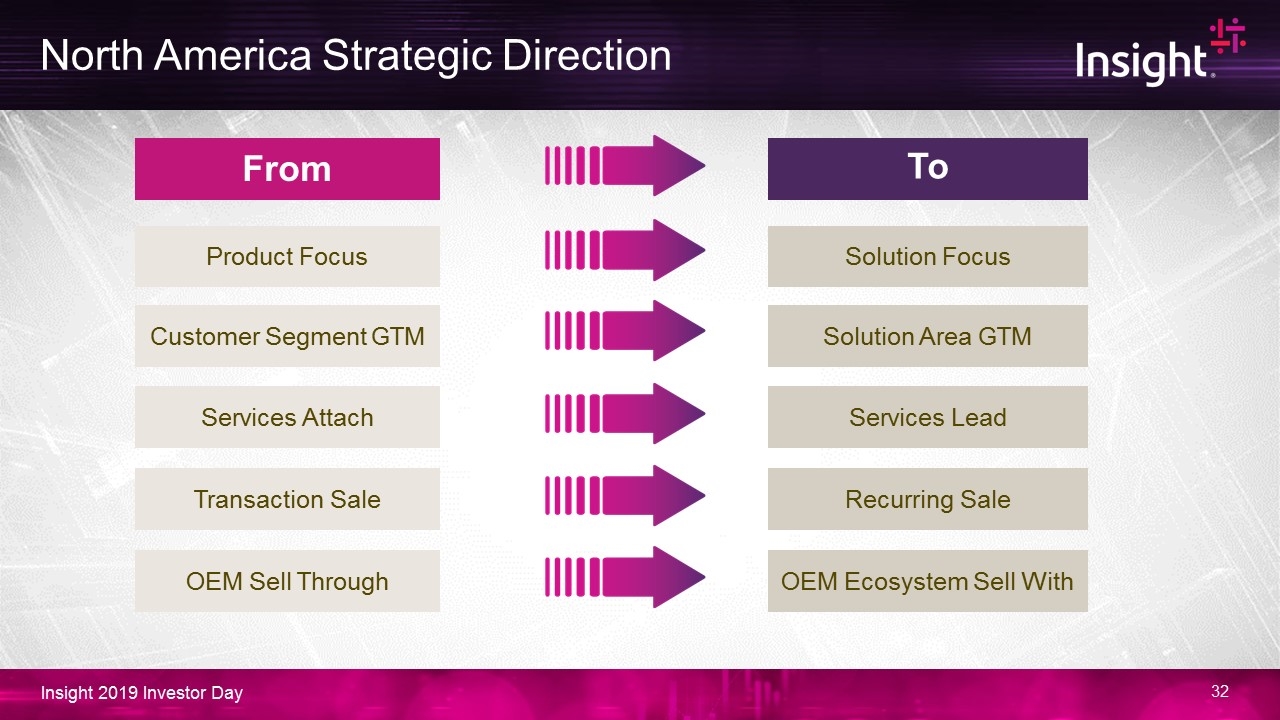
North America Strategic Direction From To Product Focus Solution Focus Customer Segment GTM Solution Area GTM Services Attach Services Lead Transaction Sale Recurring Sale OEM Sell Through OEM Ecosystem Sell With
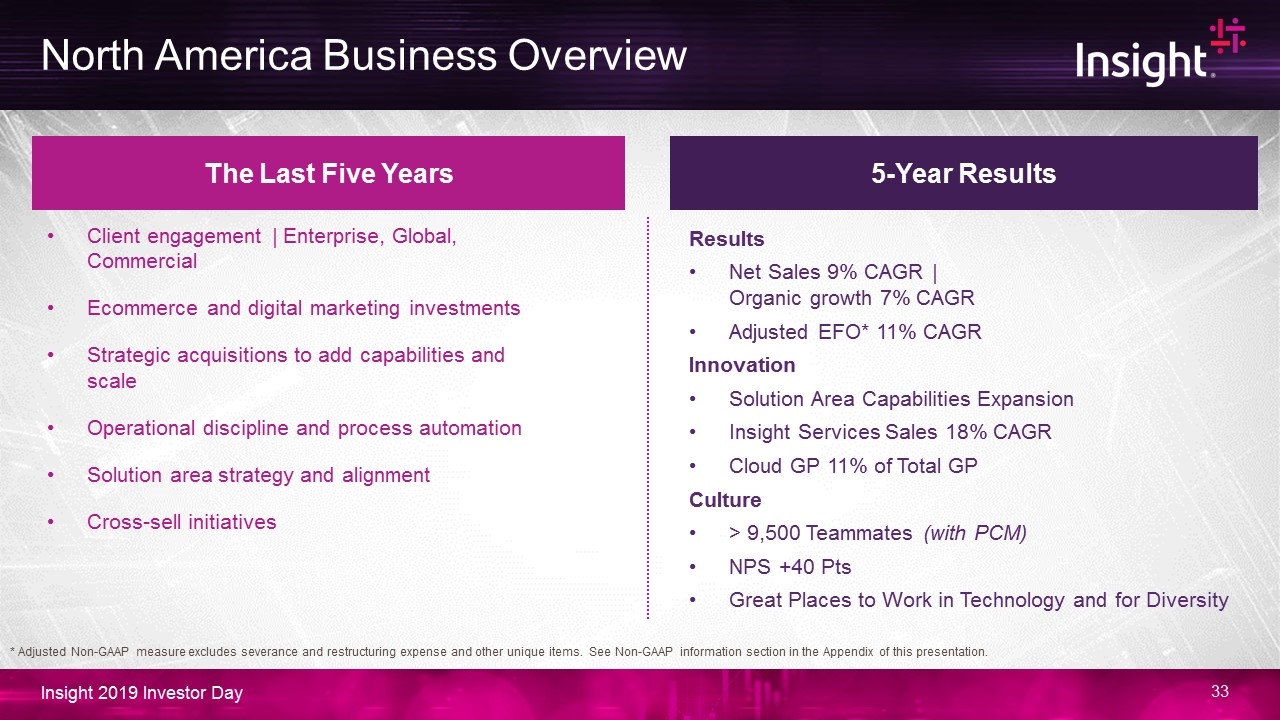
North America Business Overview The Last Five Years 5-Year Results Results Net Sales 9% CAGR | Organic growth 7% CAGR Adjusted EFO* 11% CAGR Innovation Solution Area Capabilities Expansion Insight Services Sales 18% CAGR Cloud GP 11% of Total GP Culture > 9,500 Teammates (with PCM) NPS +40 Pts Great Places to Work in Technology and for Diversity Client engagement | Enterprise, Global, Commercial Ecommerce and digital marketing investments Strategic acquisitions to add capabilities and scale Operational discipline and process automation Solution area strategy and alignment Cross-sell initiatives * Adjusted Non-GAAP measure excludes severance and restructuring expense and other unique items. See Non-GAAP information section in the Appendix of this presentation.
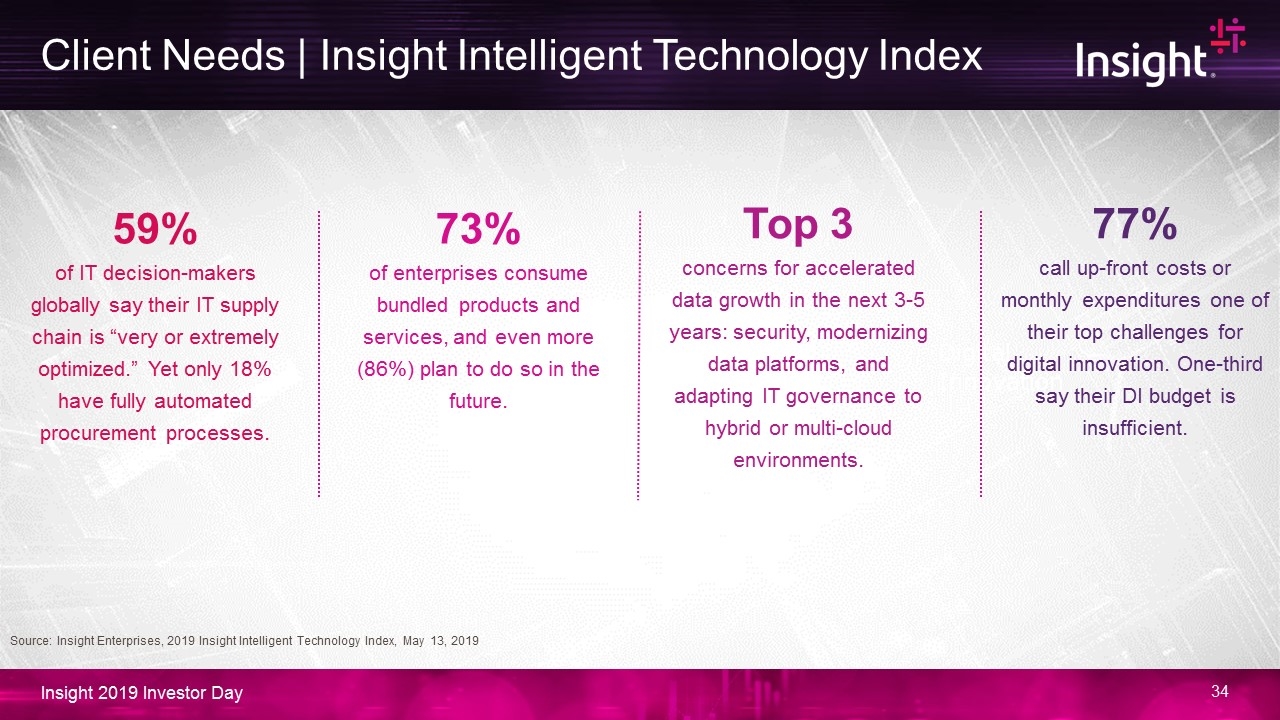
Digital Innovation Client Needs | Insight Intelligent Technology Index 59% of IT decision-makers globally say their IT supply chain is “very or extremely optimized.” Yet only 18% have fully automated procurement processes. 73% of enterprises consume bundled products and services, and even more (86%) plan to do so in the future. Top 3 concerns for accelerated data growth in the next 3-5 years: security, modernizing data platforms, and adapting IT governance to hybrid or multi-cloud environments. 77% call up-front costs or monthly expenditures one of their top challenges for digital innovation. One-third say their DI budget is insufficient. Source: Insight Enterprises, 2019 Insight Intelligent Technology Index, May 13, 2019
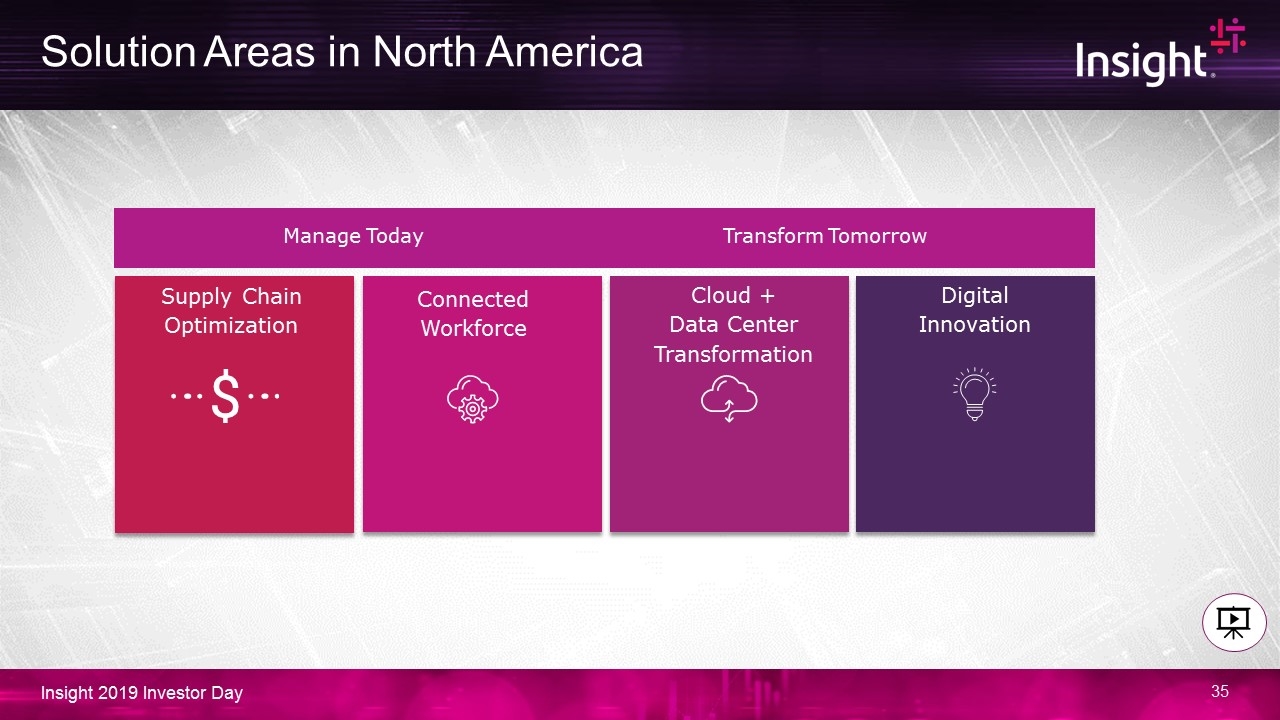
Solution Areas in North America Digital Innovation Supply Chain Optimization Connected Workforce Cloud + Data Center Transformation Manage Today Transform Tomorrow
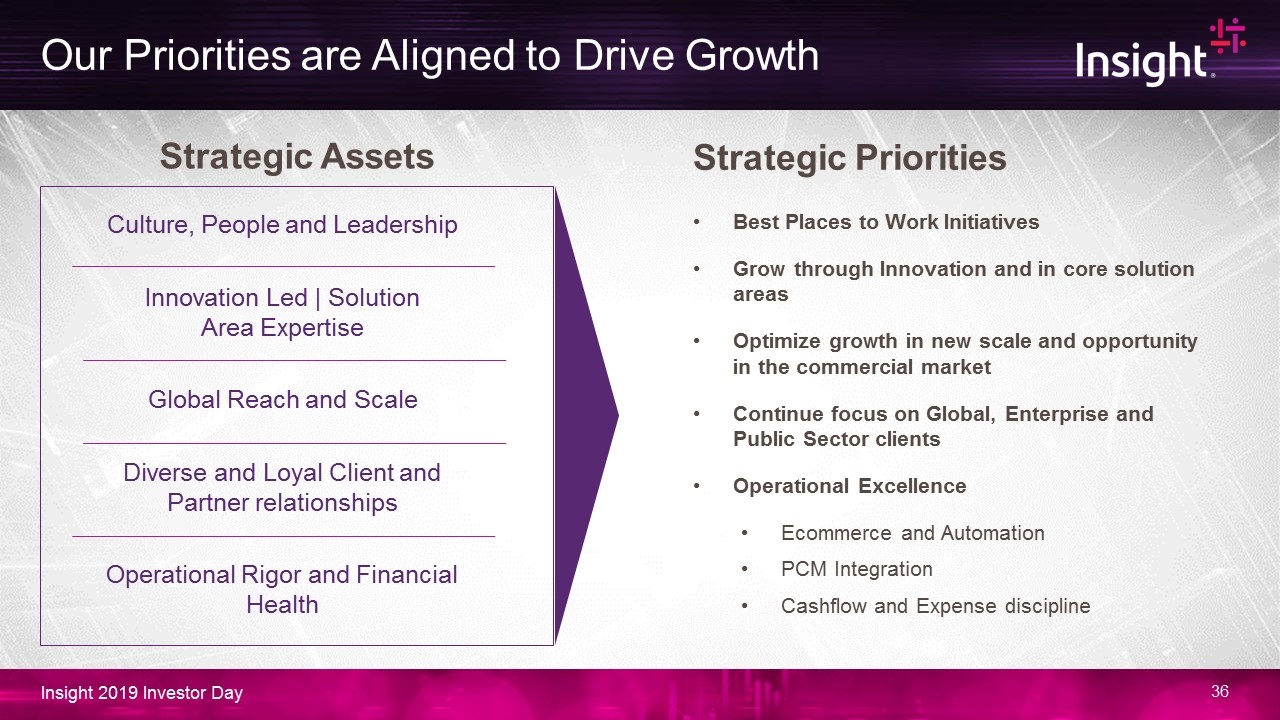
Our Priorities are Aligned to Drive Growth Best Places to Work Initiatives Grow through Innovation and in core solution areas Optimize growth in new scale and opportunity in the commercial market Continue focus on Global, Enterprise and Public Sector clients Operational Excellence Ecommerce and Automation PCM Integration Cashflow and Expense discipline Strategic Priorities Innovation Led | Solution Area Expertise Culture, People and Leadership Global Reach and Scale Diverse and Loyal Client and Partner relationships Operational Rigor and Financial Health Strategic Assets

EMEA Overview Wolfgang Ebermann – President, Insight EMEA
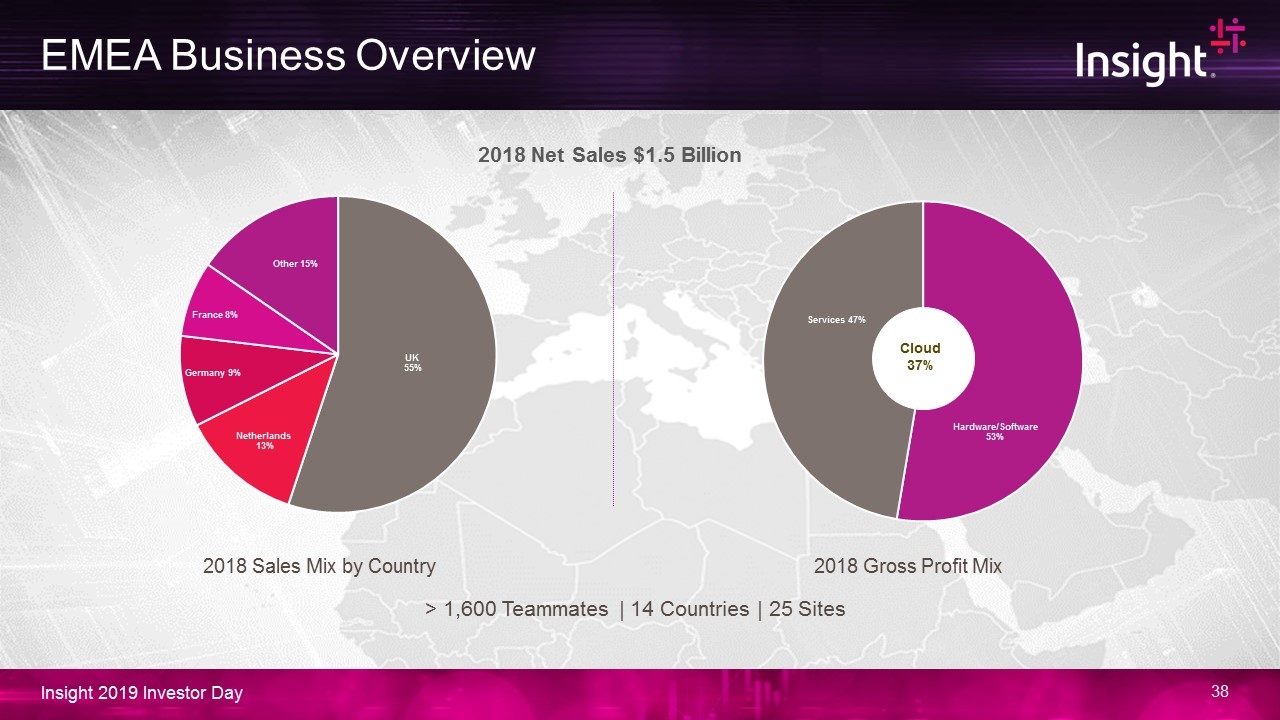
EMEA Business Overview > 1,600 Teammates | 14 Countries | 25 Sites 2018 Net Sales $1.5 Billion Cloud 37% 2018 Gross Profit Mix 2018 Sales Mix by Country
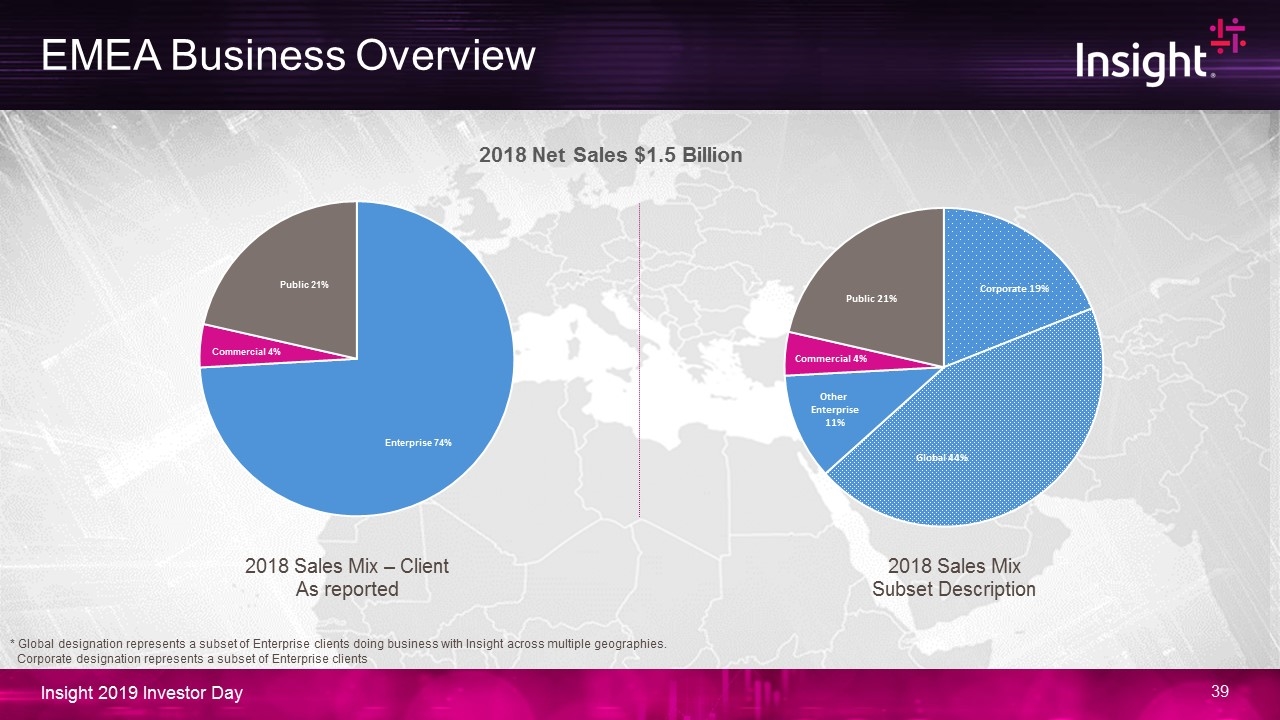
EMEA Business Overview 2018 Net Sales $1.5 Billion 2018 Sales Mix – Client As reported * Global designation represents a subset of Enterprise clients doing business with Insight across multiple geographies. Corporate designation represents a subset of Enterprise clients 2018 Sales Mix Subset Description
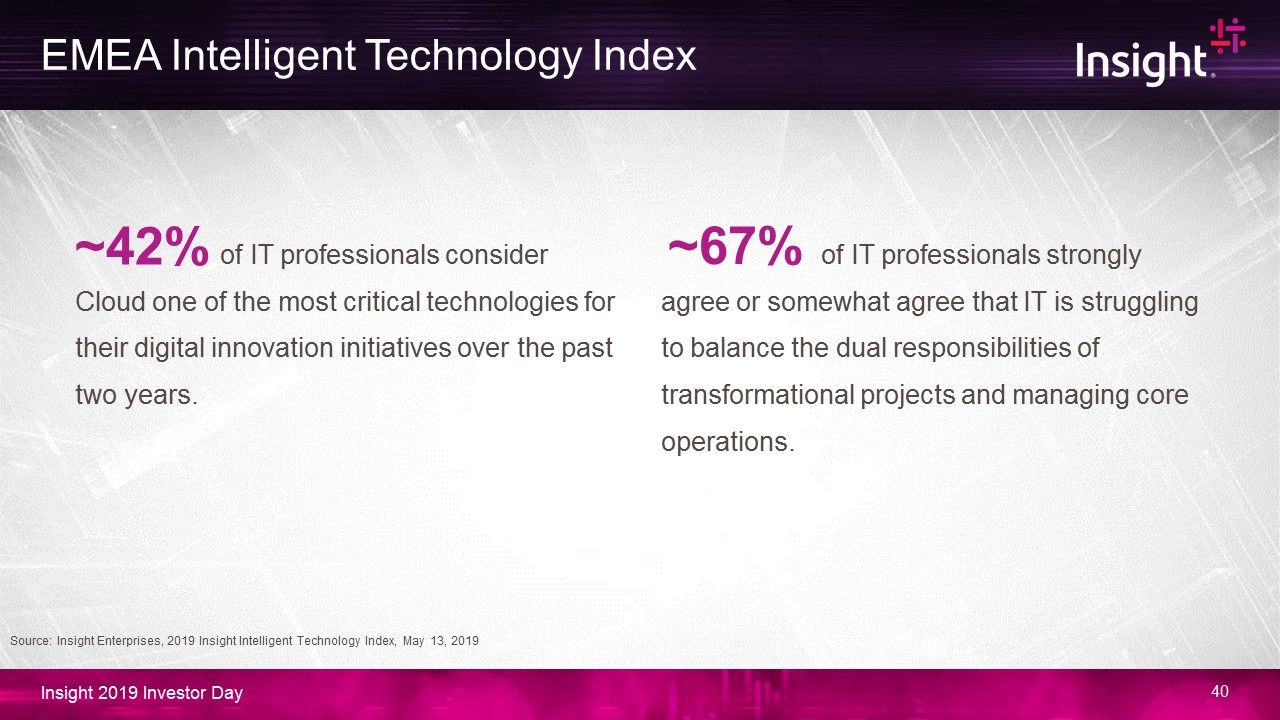
EMEA Intelligent Technology Index ~67% of IT professionals strongly agree or somewhat agree that IT is struggling to balance the dual responsibilities of transformational projects and managing core operations. ~42% of IT professionals consider Cloud one of the most critical technologies for their digital innovation initiatives over the past two years. Source: Insight Enterprises, 2019 Insight Intelligent Technology Index, May 13, 2019
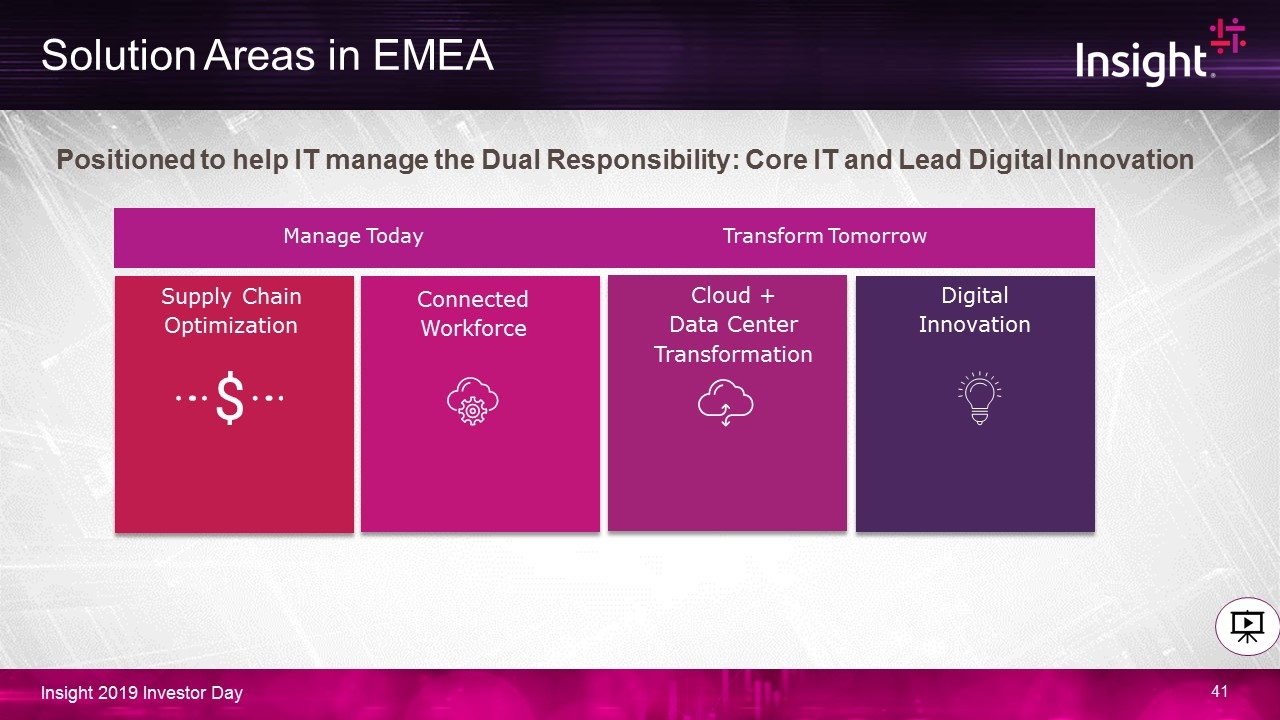
Solution Areas in EMEA Digital Innovation Supply Chain Optimization Connected Workforce Cloud + Data Center Transformation Positioned to help IT manage the Dual Responsibility: Core IT and Lead Digital Innovation Manage Today Transform Tomorrow
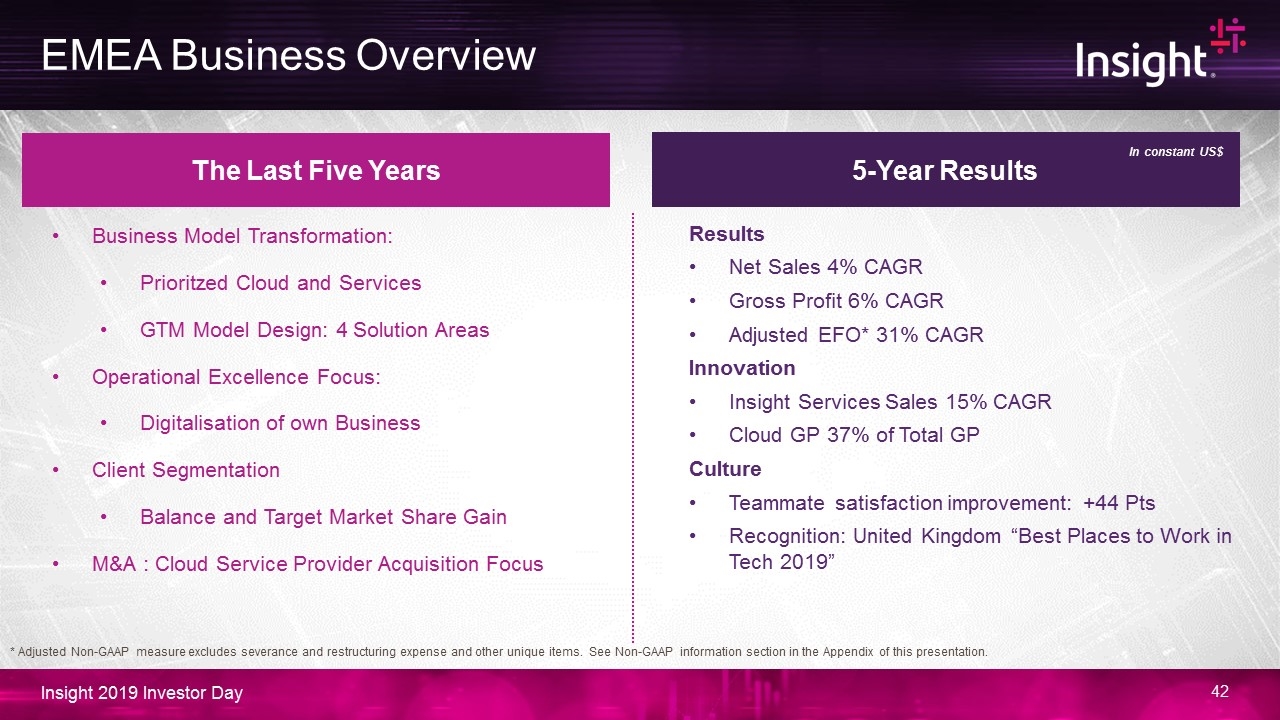
EMEA Business Overview The Last Five Years 5-Year Results Business Model Transformation: Prioritzed Cloud and Services GTM Model Design: 4 Solution Areas Operational Excellence Focus: Digitalisation of own Business Client Segmentation Balance and Target Market Share Gain M&A : Cloud Service Provider Acquisition Focus Results Net Sales 4% CAGR Gross Profit 6% CAGR Adjusted EFO* 31% CAGR Innovation Insight Services Sales 15% CAGR Cloud GP 37% of Total GP Culture Teammate satisfaction improvement: +44 Pts Recognition: United Kingdom “Best Places to Work in Tech 2019” In constant US$ * Adjusted Non-GAAP measure excludes severance and restructuring expense and other unique items. See Non-GAAP information section in the Appendix of this presentation.
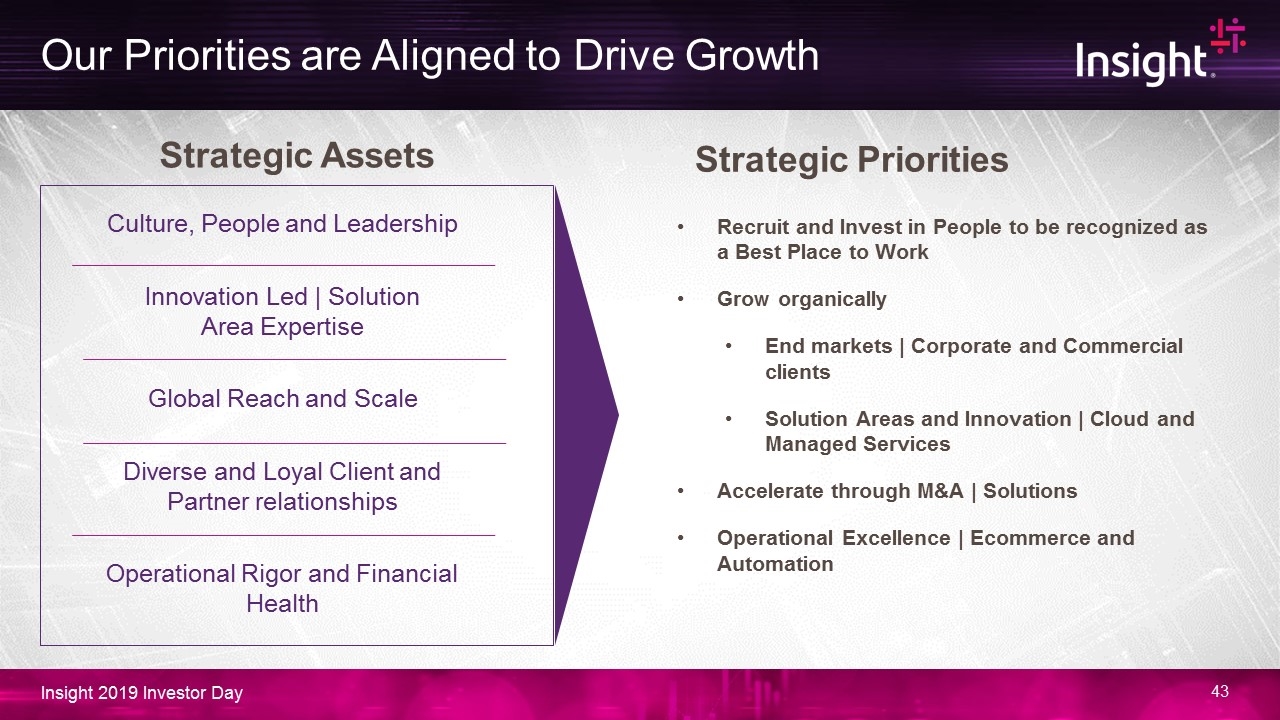
Our Priorities are Aligned to Drive Growth Strategic Priorities Recruit and Invest in People to be recognized as a Best Place to Work Grow organically End markets | Corporate and Commercial clients Solution Areas and Innovation | Cloud and Managed Services Accelerate through M&A | Solutions Operational Excellence | Ecommerce and Automation Innovation Led | Solution Area Expertise Culture, People and Leadership Global Reach and Scale Diverse and Loyal Client and Partner relationships Operational Rigor and Financial Health Strategic Assets

APAC Overview Mike Morgan – VP, General Manager, Insight Asia Pacific
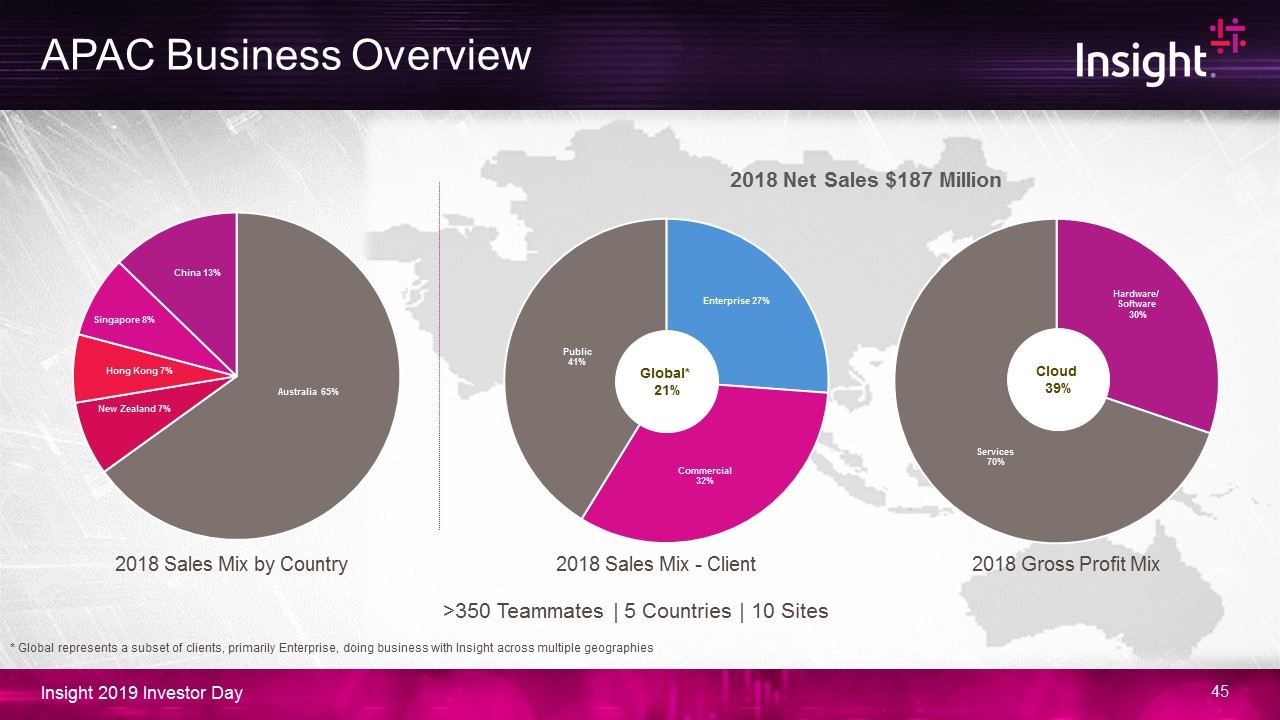
APAC Business Overview >350 Teammates | 5 Countries | 10 Sites 2018 Net Sales $187 Million Cloud 39% Cloud 39% 2018 Gross Profit Mix 2018 Sales Mix - Client 2018 Sales Mix by Country Global* 21% * Global represents a subset of clients, primarily Enterprise, doing business with Insight across multiple geographies
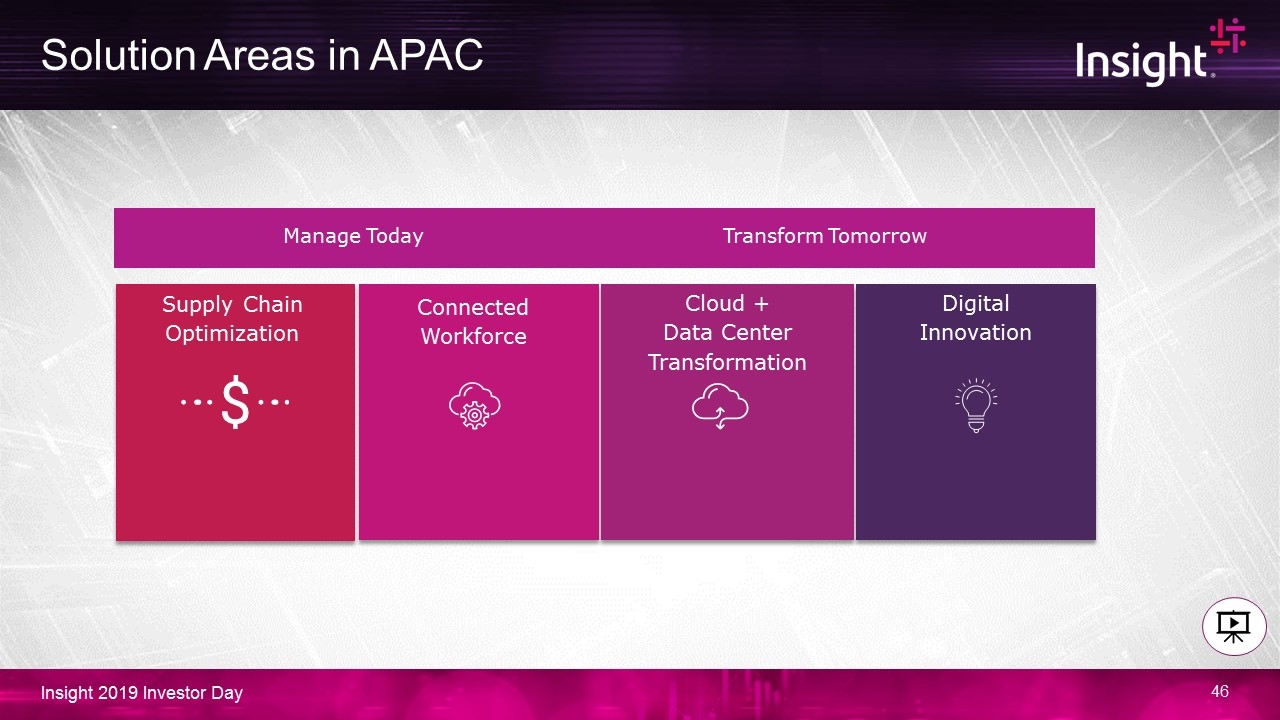
Solution Areas in APAC Digital Innovation Supply Chain Optimization Connected Workforce Cloud + Data Center Transformation Cloud + Data Center Transformation Manage Today Transform Tomorrow
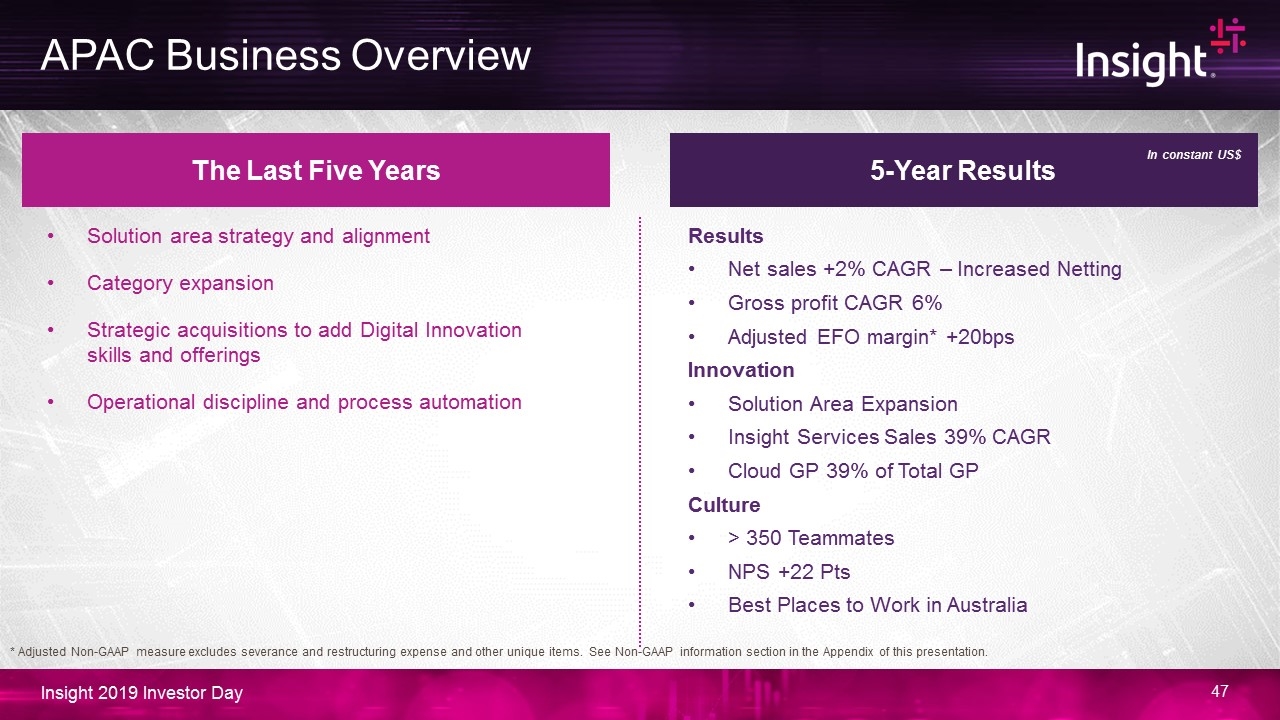
APAC Business Overview The Last Five Years 5-Year Results Results Net sales +2% CAGR – Increased Netting Gross profit CAGR 6% Adjusted EFO margin* +20bps Innovation Solution Area Expansion Insight Services Sales 39% CAGR Cloud GP 39% of Total GP Culture > 350 Teammates NPS +22 Pts Best Places to Work in Australia Solution area strategy and alignment Category expansion Strategic acquisitions to add Digital Innovation skills and offerings Operational discipline and process automation In constant US$ * Adjusted Non-GAAP measure excludes severance and restructuring expense and other unique items. See Non-GAAP information section in the Appendix of this presentation.
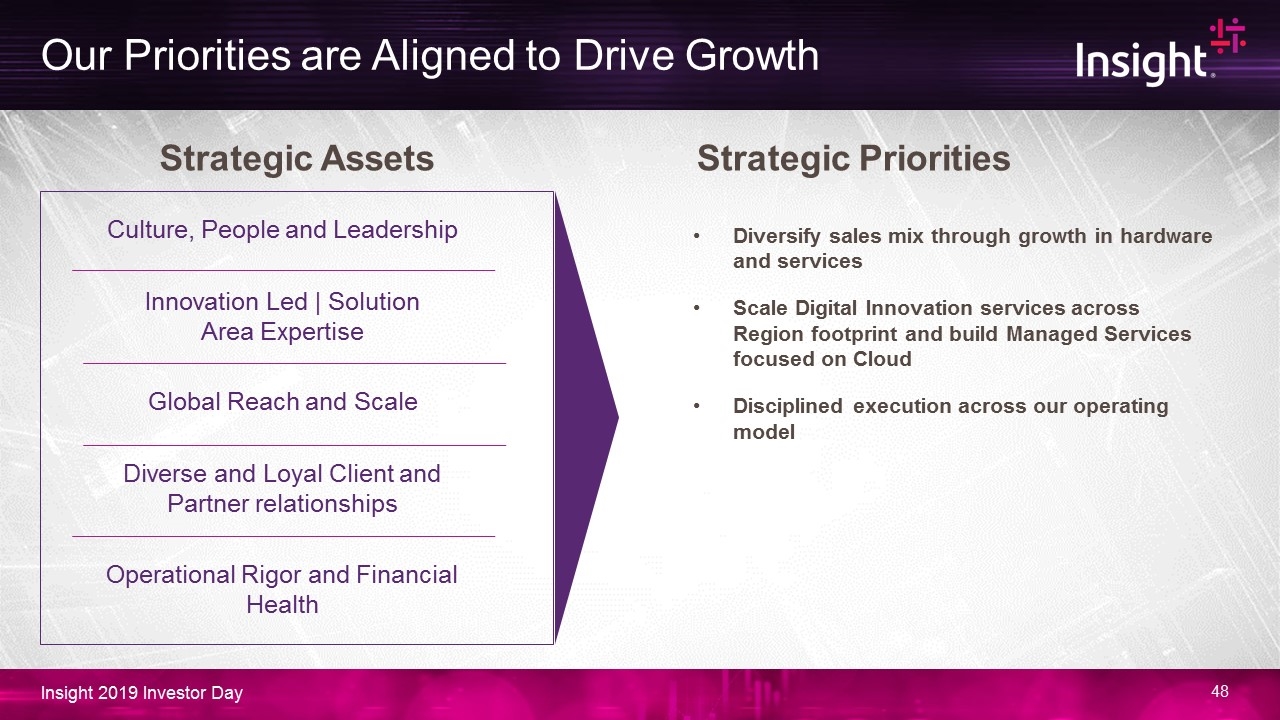
Our Priorities are Aligned to Drive Growth Diversify sales mix through growth in hardware and services Scale Digital Innovation services across Region footprint and build Managed Services focused on Cloud Disciplined execution across our operating model Strategic Priorities Innovation Led | Solution Area Expertise Culture, People and Leadership Global Reach and Scale Diverse and Loyal Client and Partner relationships Operational Rigor and Financial Health Strategic Assets

Break


