Brand and Digital Marketing Amy Protexter, SVP Marketing Exhibit 99.2
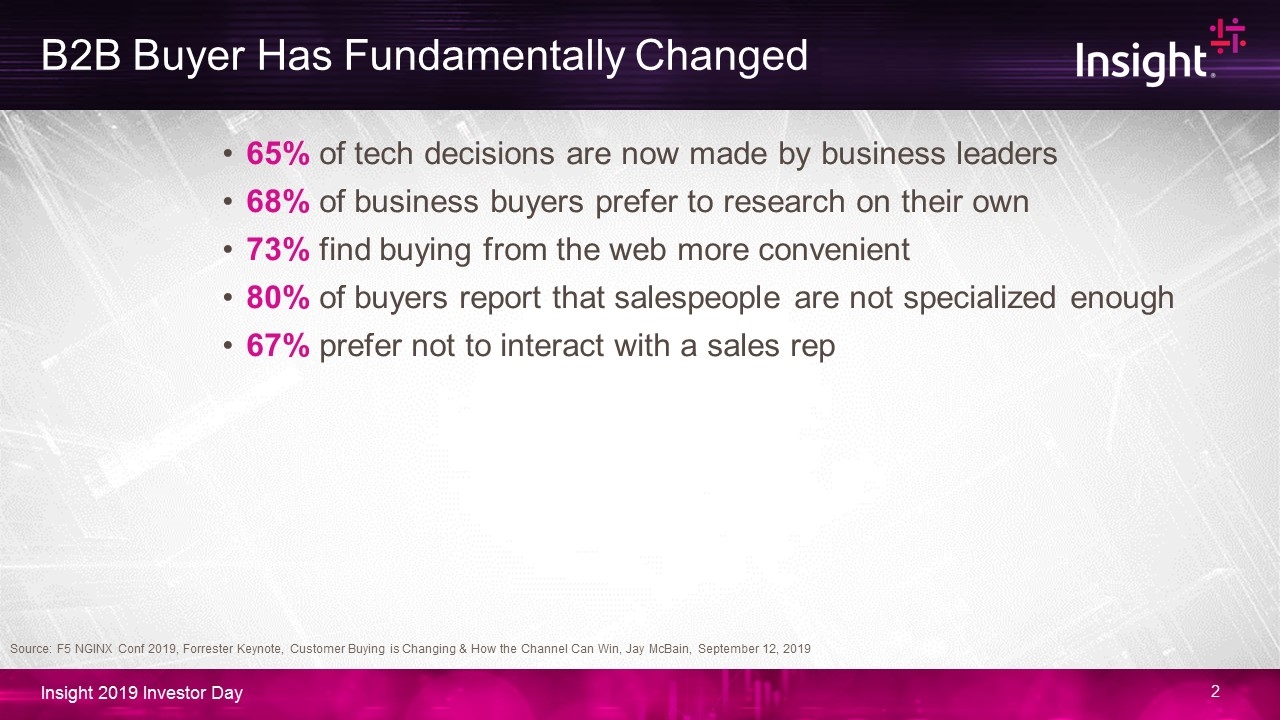
B2B Buyer Has Fundamentally Changed 65% of tech decisions are now made by business leaders 68% of business buyers prefer to research on their own 73% find buying from the web more convenient 80% of buyers report that salespeople are not specialized enough 67% prefer not to interact with a sales rep Source: F5 NGINX Conf 2019, Forrester Keynote, Customer Buying is Changing & How the Channel Can Win, Jay McBain, September 12, 2019
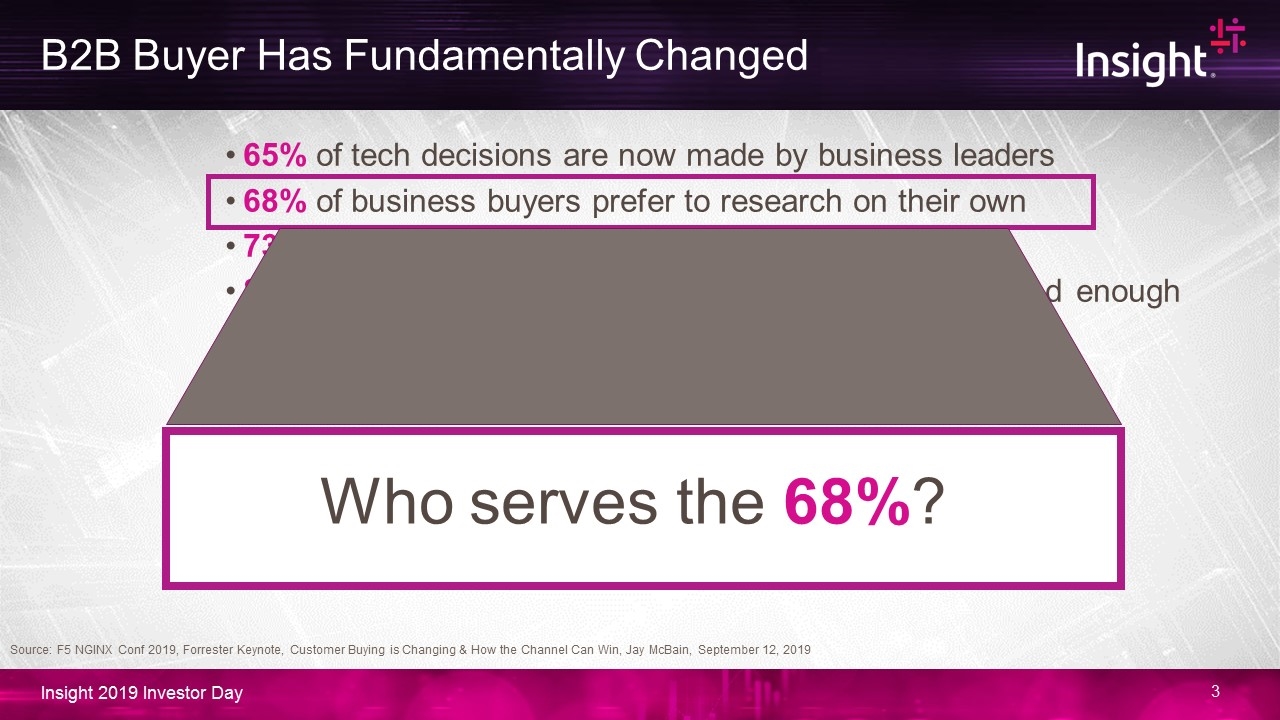
B2B Buyer Has Fundamentally Changed 65% of tech decisions are now made by business leaders 68% of business buyers prefer to research on their own 73% find buying from the web more convenient 80% of buyers report that sales people are not specialized enough 67% prefer not to interact with a sales rep Source: F5 NGINX Conf 2019, Forrester Keynote, Customer Buying is Changing & How the Channel Can Win, Jay McBain, September 12, 2019 Who serves the 68%?
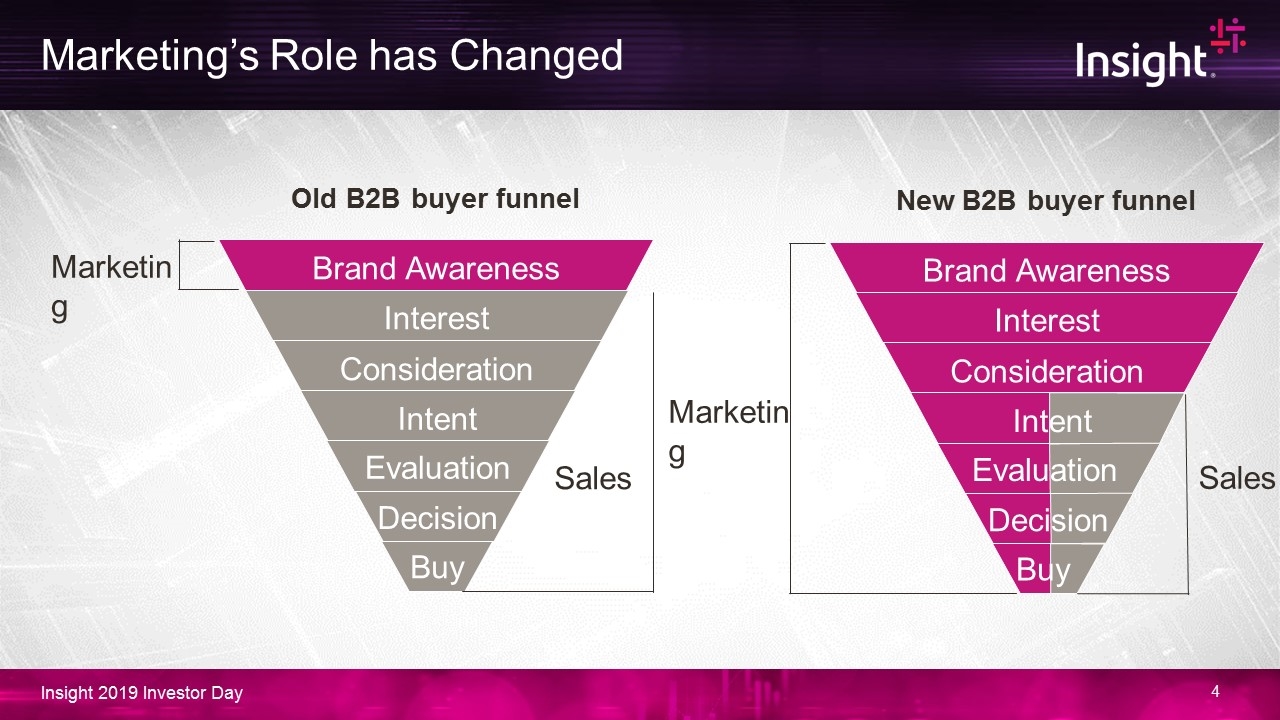
Marketing’s Role has Changed Old B2B buyer funnel Brand Awareness Interest Consideration Intent Evaluation Decision Buy Marketing Sales Brand Awareness Interest Consideration Marketing New B2B buyer funnel Intent Evaluation Decision Buy Sales
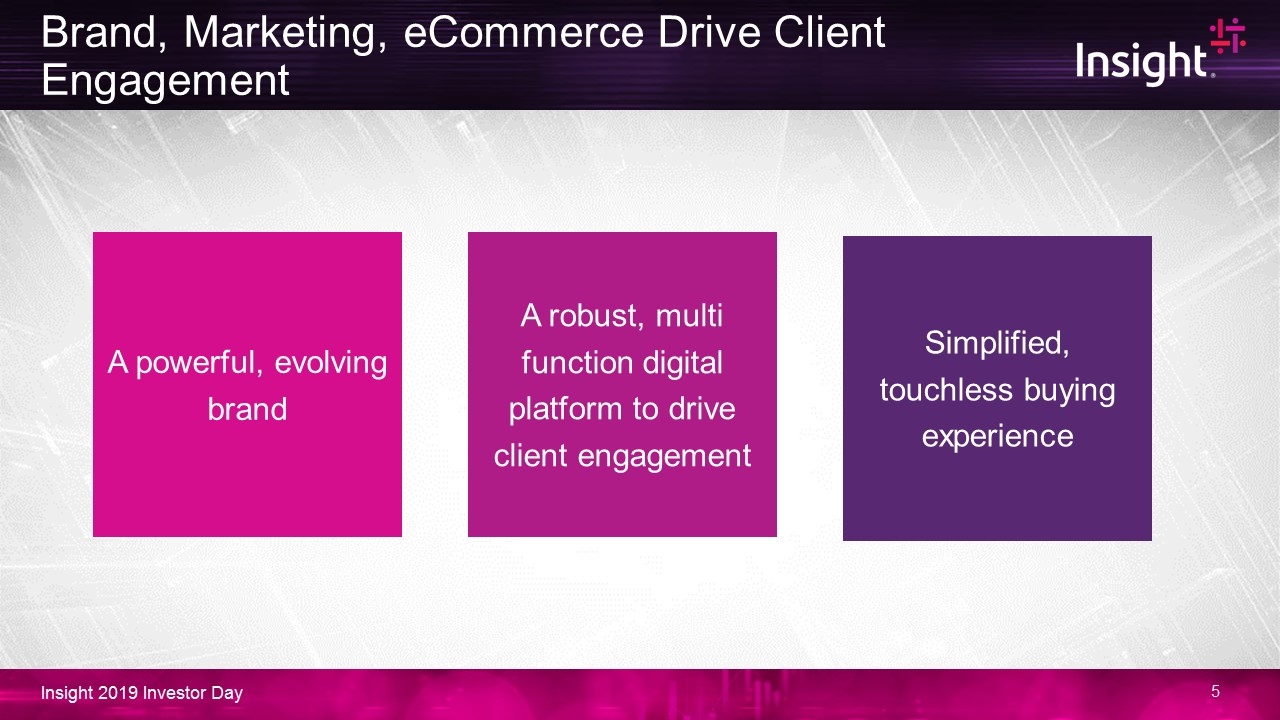
Brand, Marketing, eCommerce Drive Client Engagement A powerful, evolving brand A robust, multi function digital platform to drive client engagement Simplified, touchless buying experience
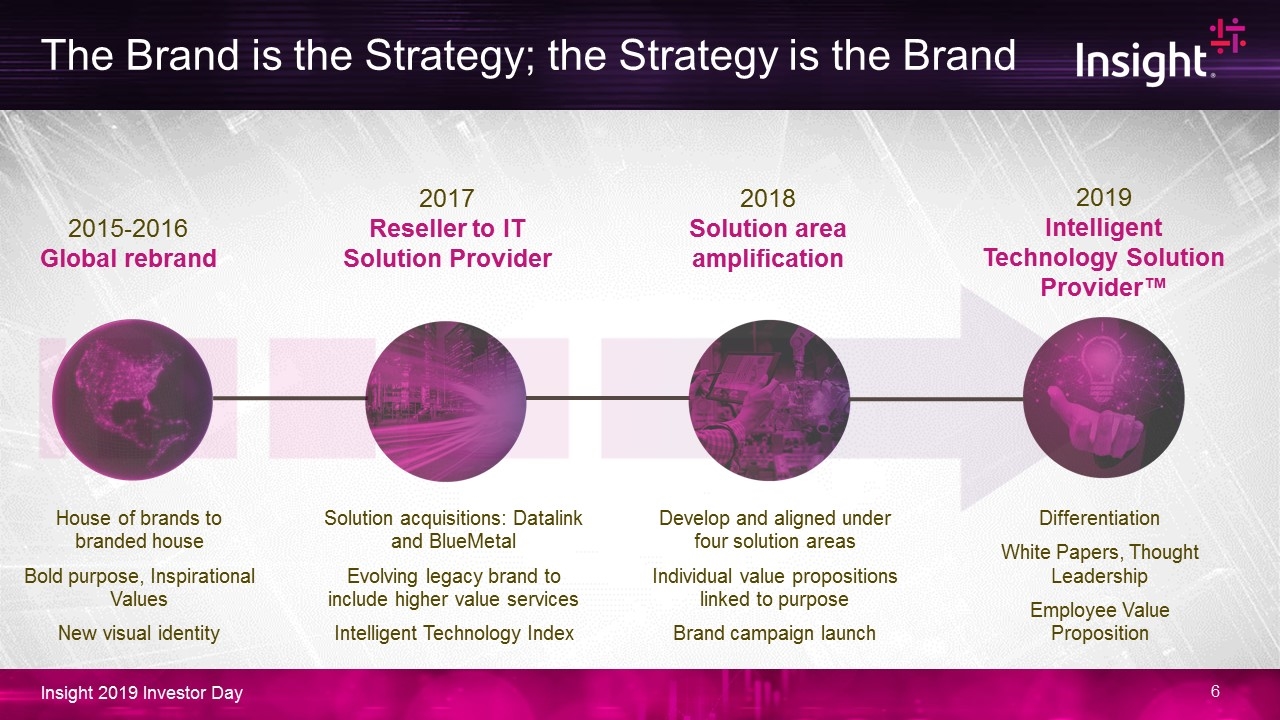
The Brand is the Strategy; the Strategy is the Brand 2019 Intelligent Technology Solution Provider™ Differentiation White Papers, Thought Leadership Employee Value Proposition 2015-2016 Global rebrand House of brands to branded house Bold purpose, Inspirational Values New visual identity 2017 Reseller to IT Solution Provider Solution acquisitions: Datalink and BlueMetal Evolving legacy brand to include higher value services Intelligent Technology Index 2018 Solution area amplification Develop and aligned under four solution areas Individual value propositions linked to purpose Brand campaign launch
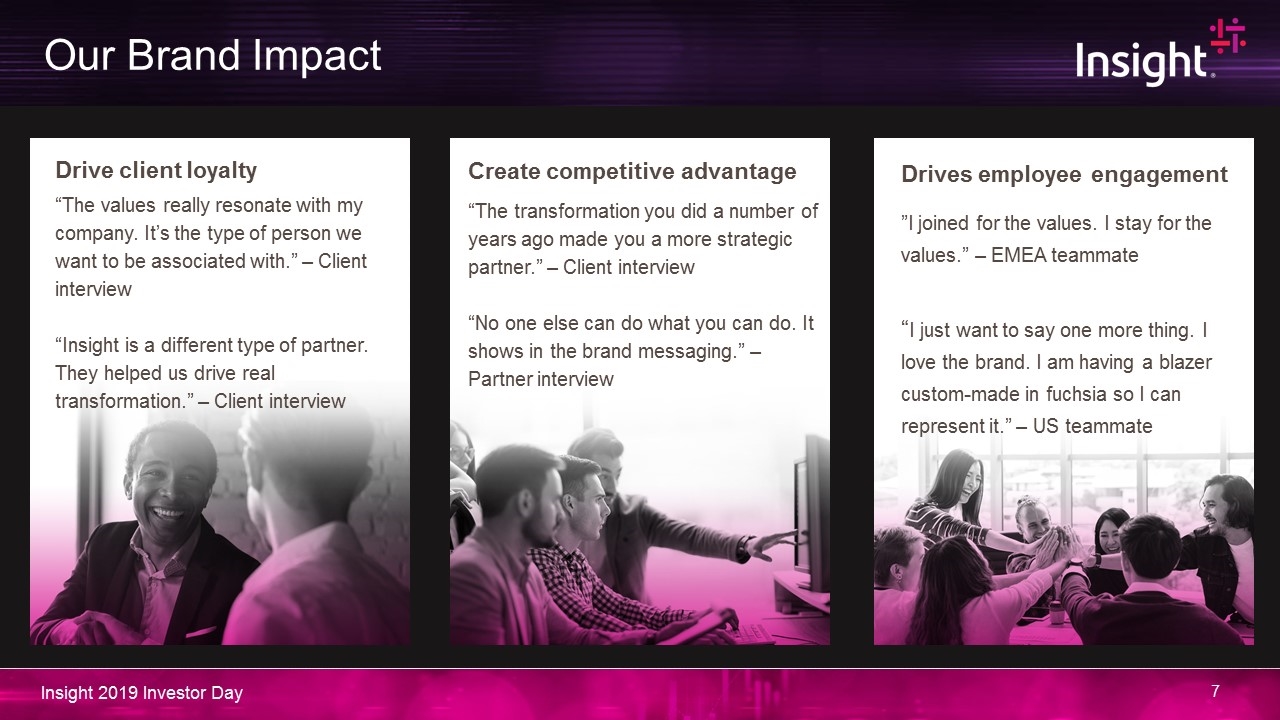
Our Brand Impact Drive client loyalty “The values really resonate with my company. It’s the type of person we want to be associated with.” – Client interview “Insight is a different type of partner. They helped us drive real transformation.” – Client interview Drives employee engagement ”I joined for the values. I stay for the values.” – EMEA teammate “I just want to say one more thing. I love the brand. I am having a blazer custom-made in fuchsia so I can represent it.” – US teammate Create competitive advantage “The transformation you did a number of years ago made you a more strategic partner.” – Client interview “No one else can do what you can do. It shows in the brand messaging.” – Partner interview Our Brand Impact
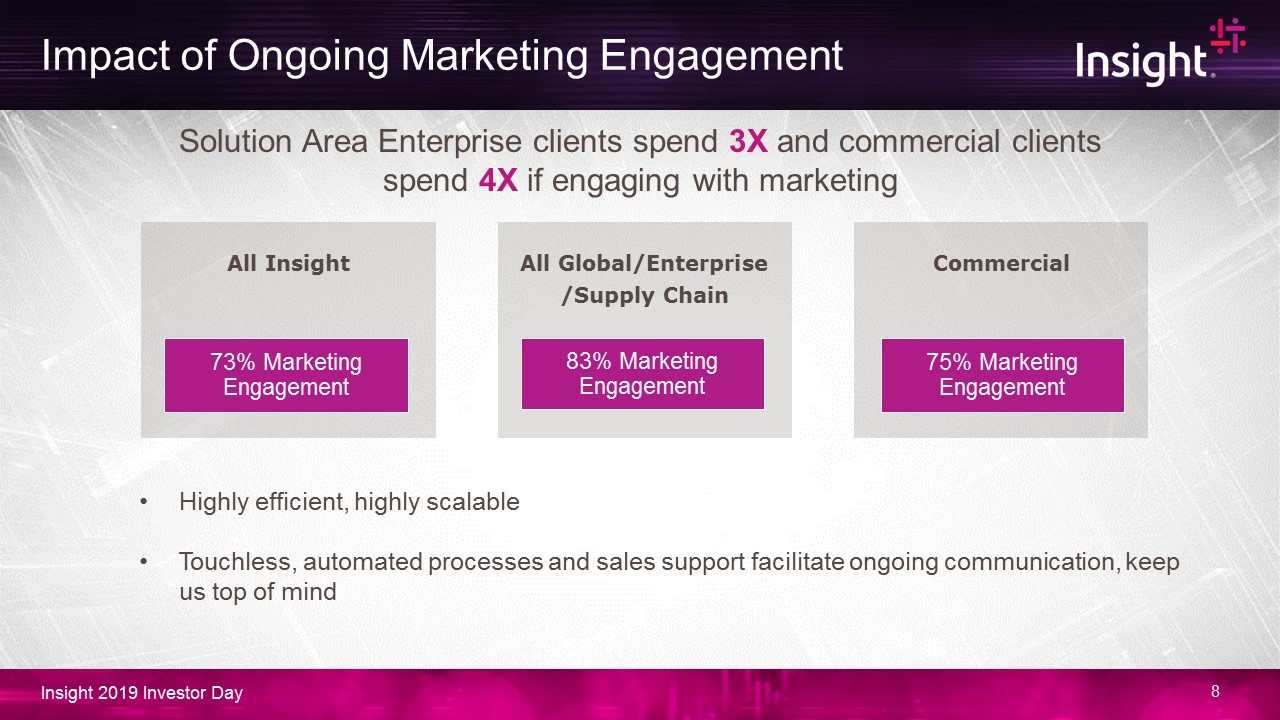
Impact of Ongoing Marketing Engagement All Insight 73% Marketing Engagement All Global/Enterprise /Supply Chain 83% Marketing Engagement Commercial 75% Marketing Engagement Solution Area Enterprise clients spend 3X and commercial clients spend 4X if engaging with marketing Highly efficient, highly scalable Touchless, automated processes and sales support facilitate ongoing communication, keep us top of mind
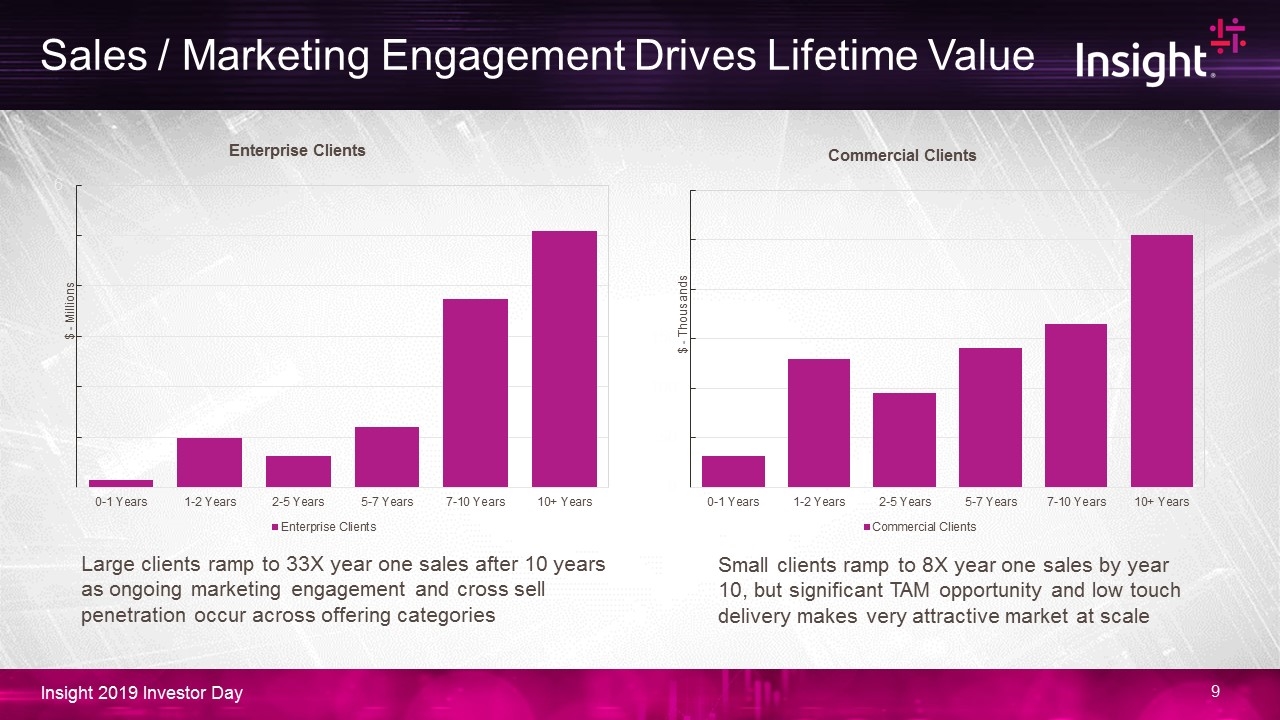
Sales / Marketing Engagement Drives Lifetime Value Small clients ramp to 8X year one sales by year 10, but significant TAM opportunity and low touch delivery makes very attractive market at scale Large clients ramp to 33X year one sales after 10 years as ongoing marketing engagement and cross sell penetration occur across offering categories
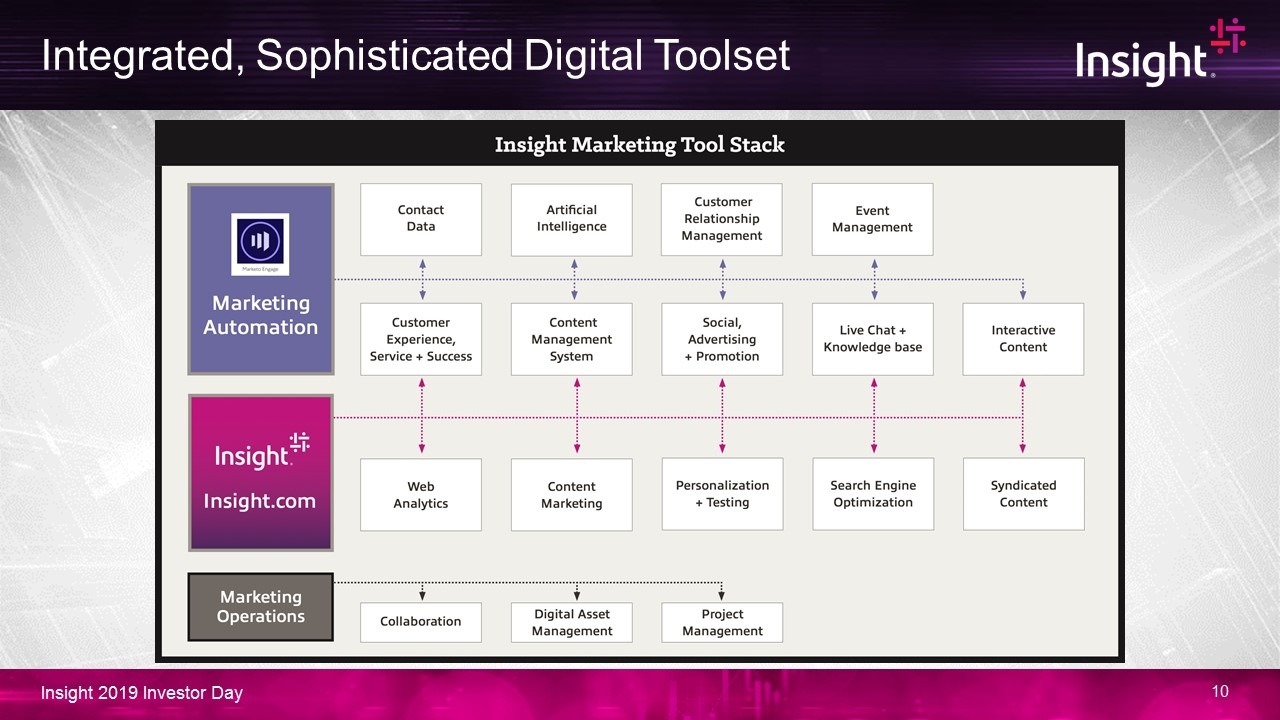
Integrated, Sophisticated Digital Toolset
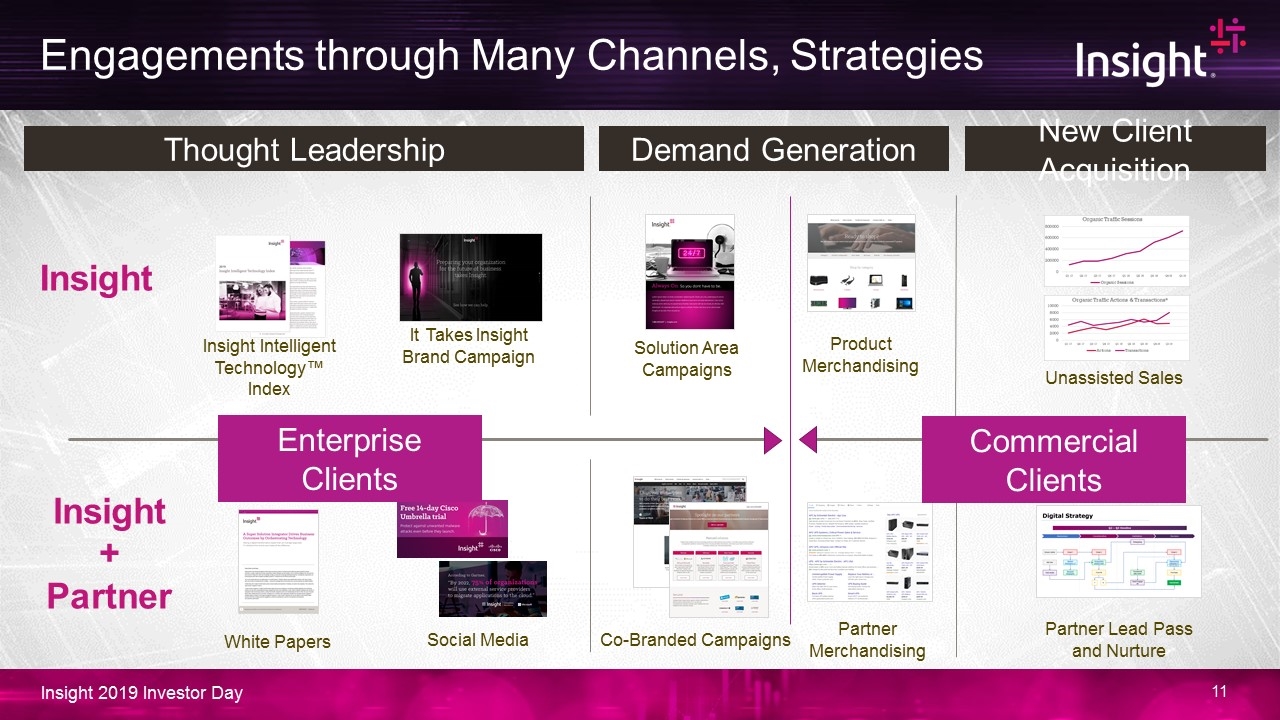
Insight Intelligent Technology™ Index It Takes Insight Brand Campaign Insight Solution Area Campaigns Product Merchandising Thought Leadership Engagements through Many Channels, Strategies Demand Generation New Client Acquisition Unassisted Sales Social Media Co-Branded Campaigns Partner Merchandising Partner Lead Pass and Nurture Insight + Partner White Papers Enterprise Clients Commercial Clients
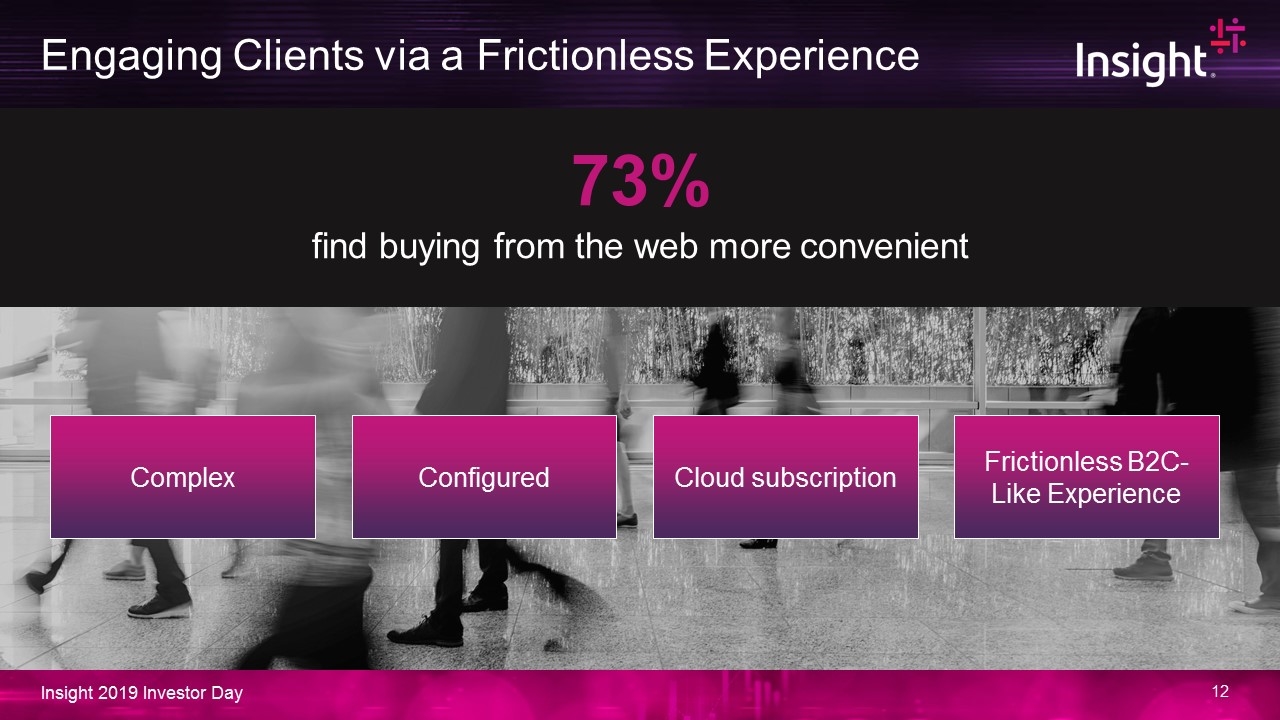
Engaging Clients via a Frictionless Experience 73% find buying from the web more convenient Complex Configured Cloud subscription Frictionless B2C-Like Experience
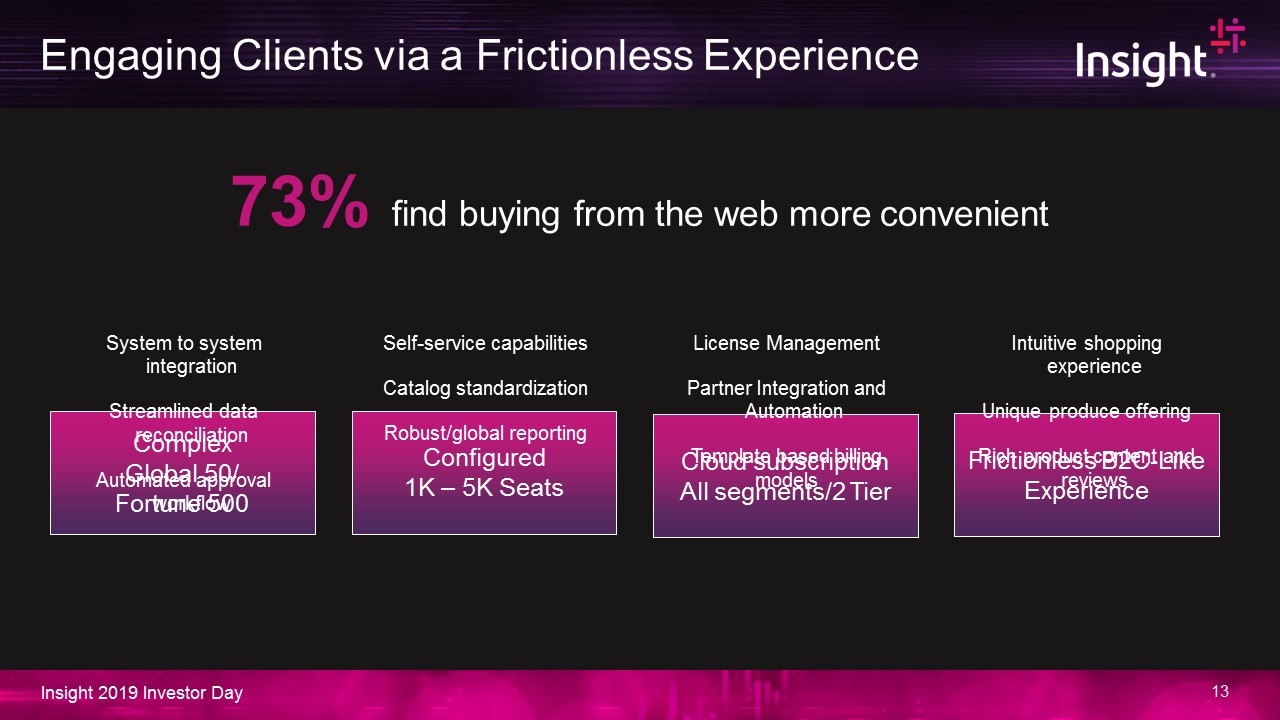
Engaging Clients via a Frictionless Experience 73% find buying from the web more convenient Complex Global 50/ Fortune 500 Configured 1K – 5K Seats Cloud subscription All segments/2 Tier Frictionless B2C-Like Experience System to system integration Streamlined data reconciliation Automated approval workflow Self-service capabilities Catalog standardization Robust/global reporting License Management Partner Integration and Automation Template based billing models Intuitive shopping experience Unique produce offering Rich product content and reviews
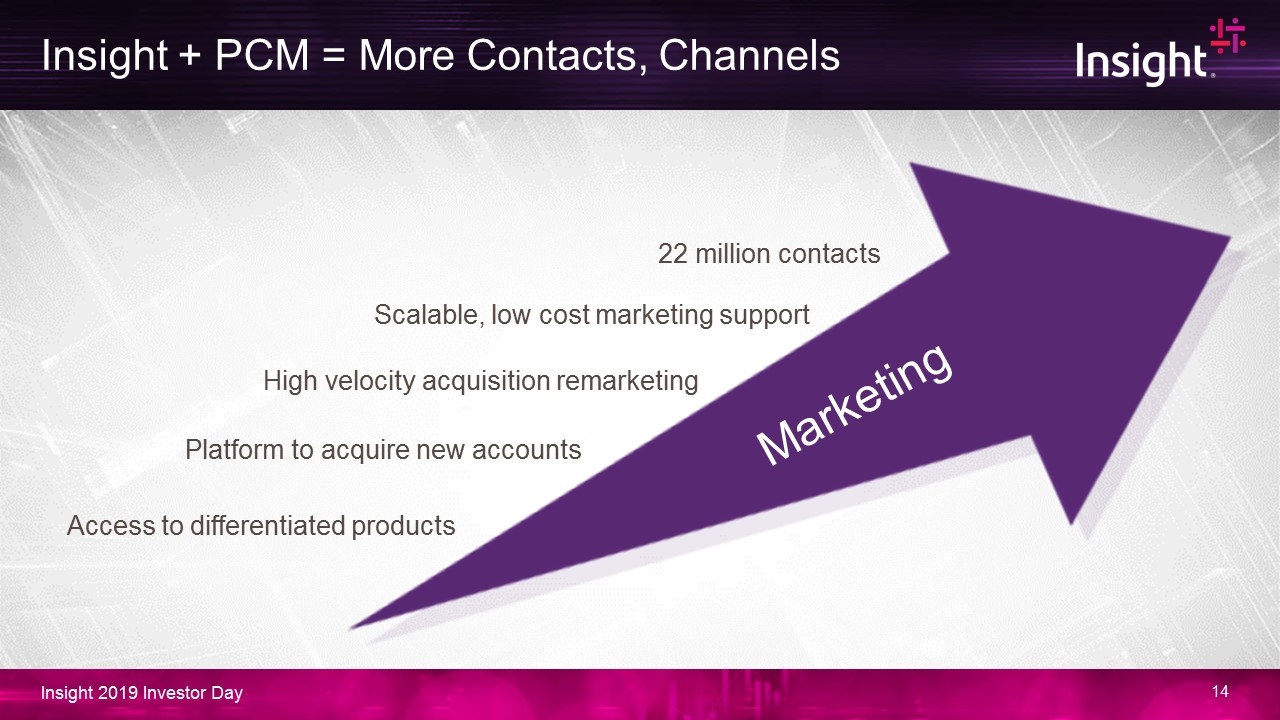
Insight + PCM = More Contacts, Channels 22 million contacts Platform to acquire new accounts Scalable, low cost marketing support High velocity acquisition remarketing Access to differentiated products Marketing
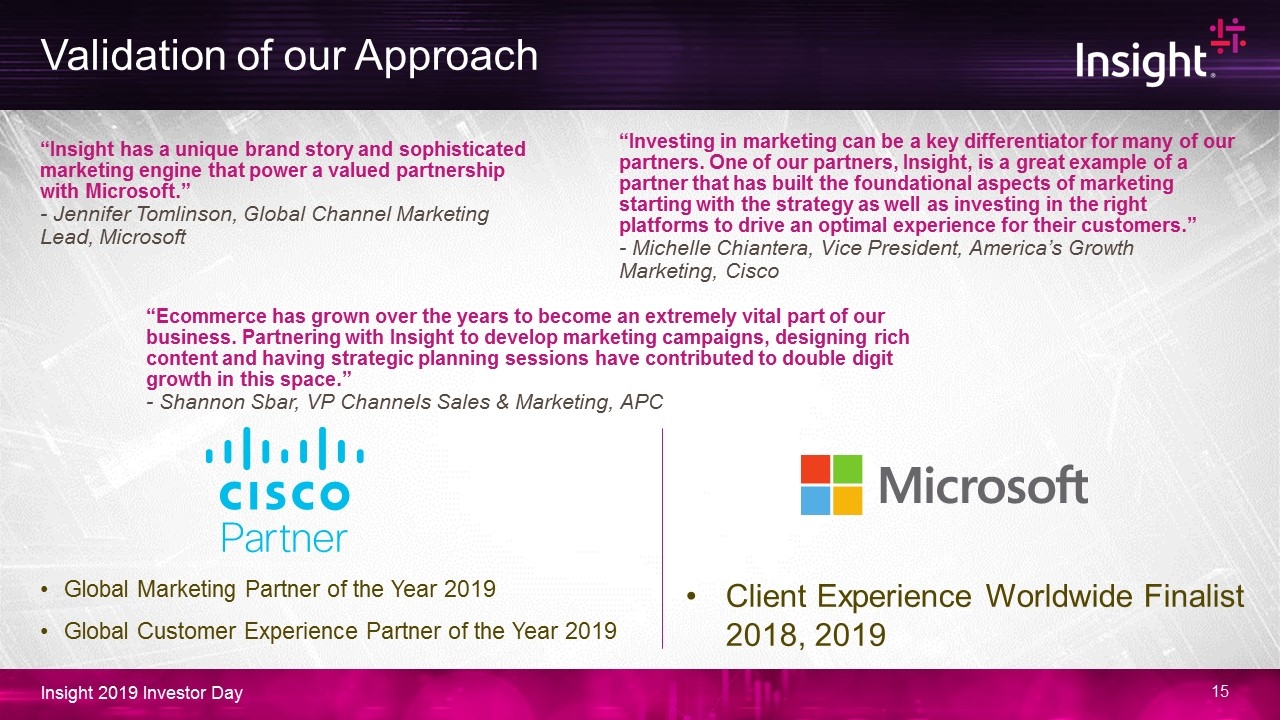
Validation of our Approach “Insight has a unique brand story and sophisticated marketing engine that power a valued partnership with Microsoft.” - Jennifer Tomlinson, Global Channel Marketing Lead, Microsoft This slide needs to be designed with three pull quotes (the top three paragraphs) and then the descriptions of the partner logos and partner award names. “Investing in marketing can be a key differentiator for many of our partners. One of our partners, Insight, is a great example of a partner that has built the foundational aspects of marketing starting with the strategy as well as investing in the right platforms to drive an optimal experience for their customers.” - Michelle Chiantera, Vice President, America’s Growth Marketing, Cisco “Ecommerce has grown over the years to become an extremely vital part of our business. Partnering with Insight to develop marketing campaigns, designing rich content and having strategic planning sessions have contributed to double digit growth in this space.” - Shannon Sbar, VP Channels Sales & Marketing, APC Global Marketing Partner of the Year 2019 Global Customer Experience Partner of the Year 2019 Client Experience Worldwide Finalist 2018, 2019
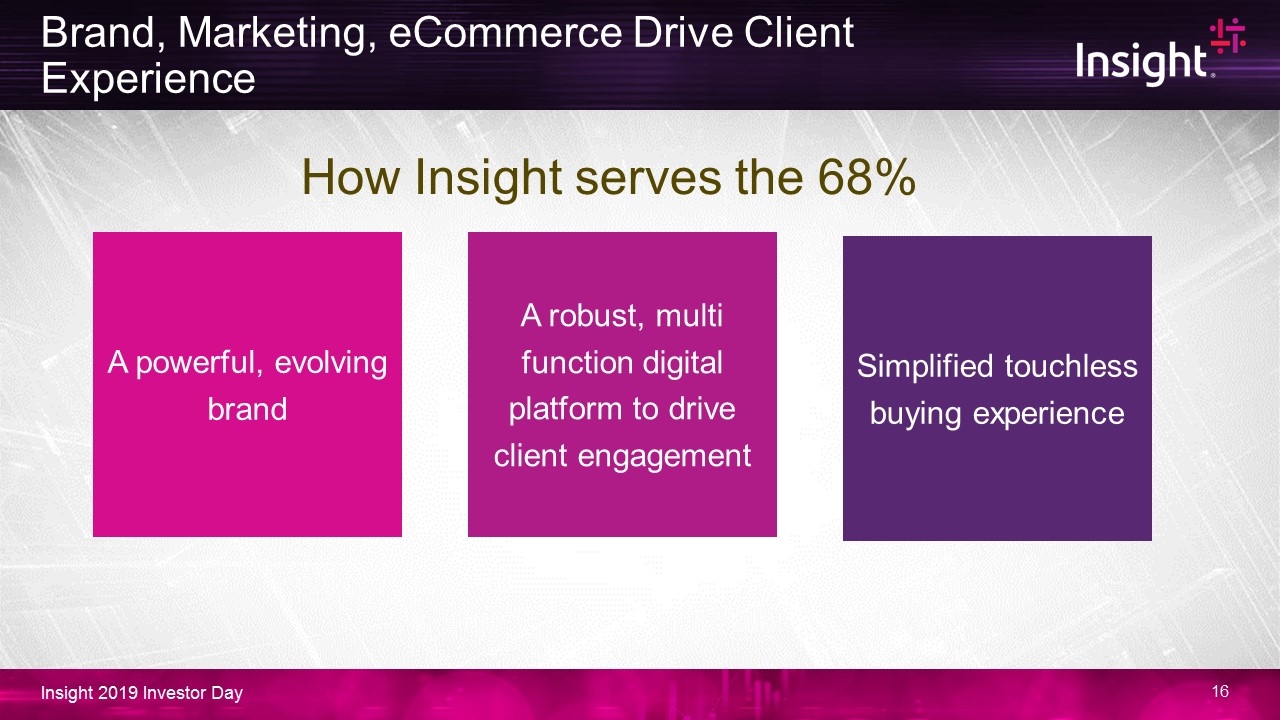
Brand, Marketing, eCommerce Drive Client Experience A powerful, evolving brand A robust, multi function digital platform to drive client engagement Simplified touchless buying experience How Insight serves the 68%

Solution Area Overview Wolfgang Ebermann, Steve Dodenhoff, Matt Jackson
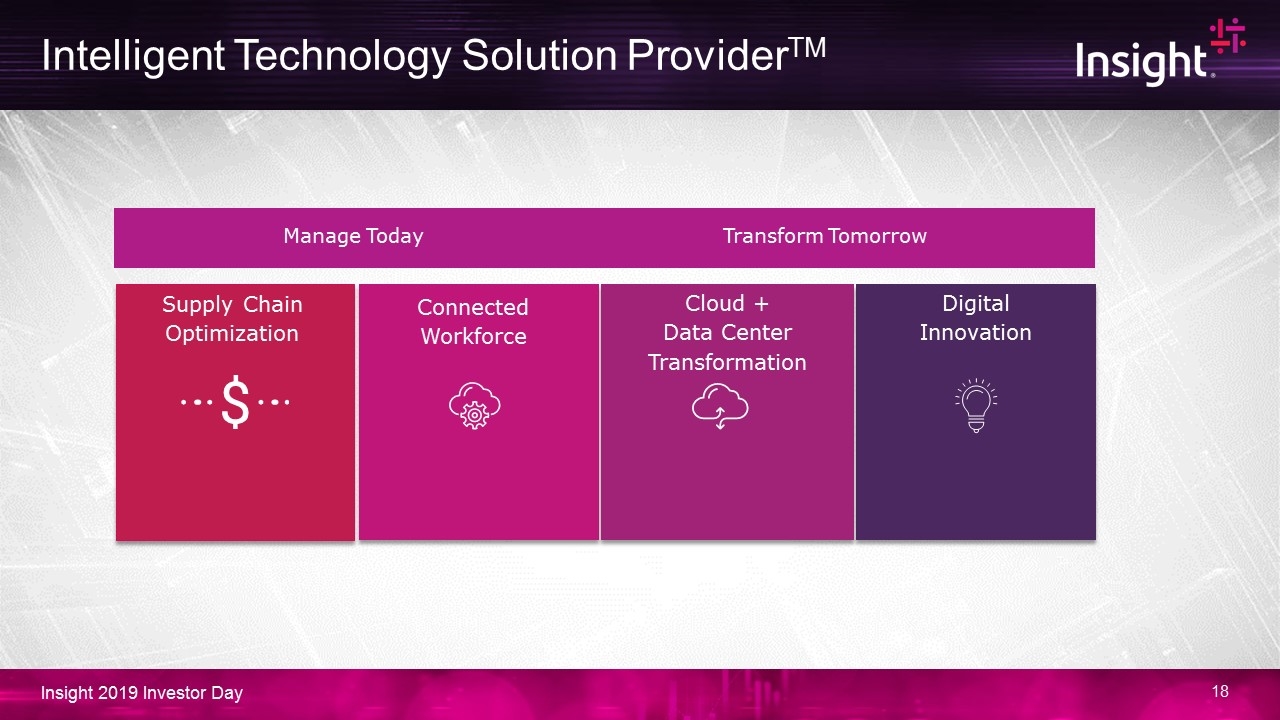
Intelligent Technology Solution ProviderTM Digital Innovation Supply Chain Optimization Connected Workforce Cloud + Data Center Transformation Cloud + Data Center Transformation Manage Today Transform Tomorrow
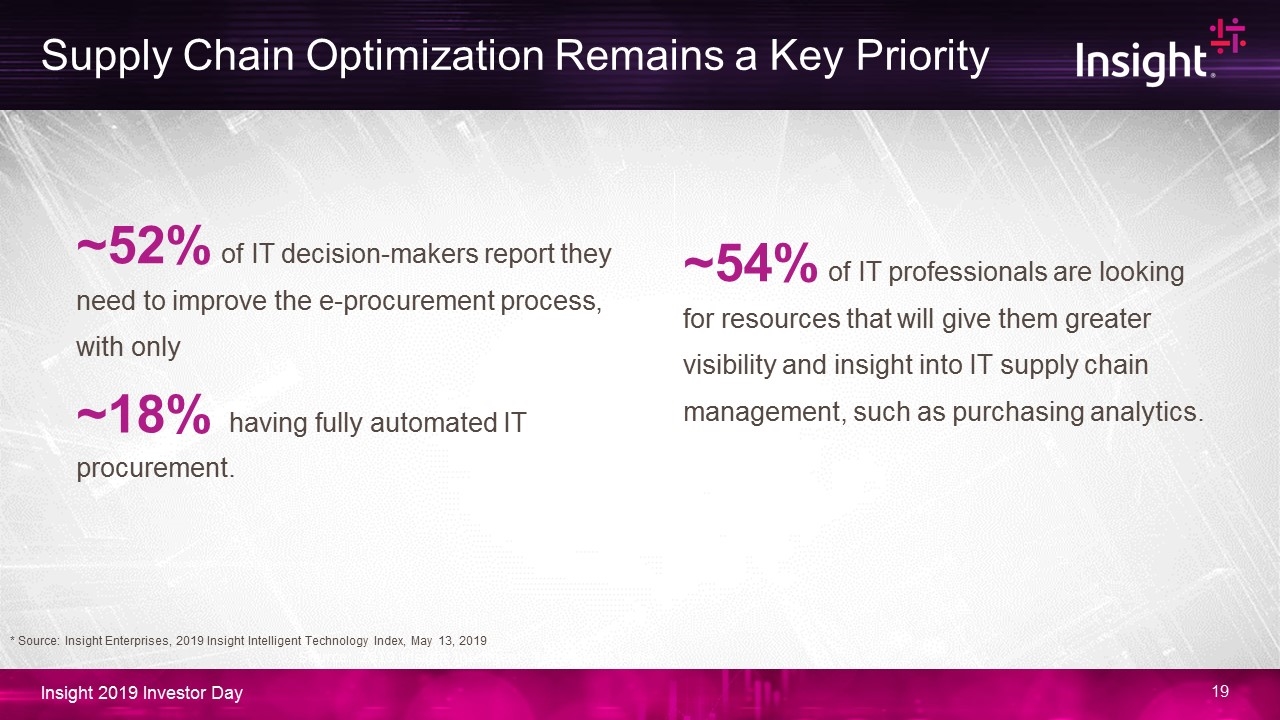
Supply Chain Optimization Remains a Key Priority ~54% of IT professionals are looking for resources that will give them greater visibility and insight into IT supply chain management, such as purchasing analytics. Source: 2019 Insight Intelligent Technology Index ~18% having fully automated IT procurement. ~52% of IT decision-makers report they need to improve the e-procurement process, with only * Source: Insight Enterprises, 2019 Insight Intelligent Technology Index, May 13, 2019
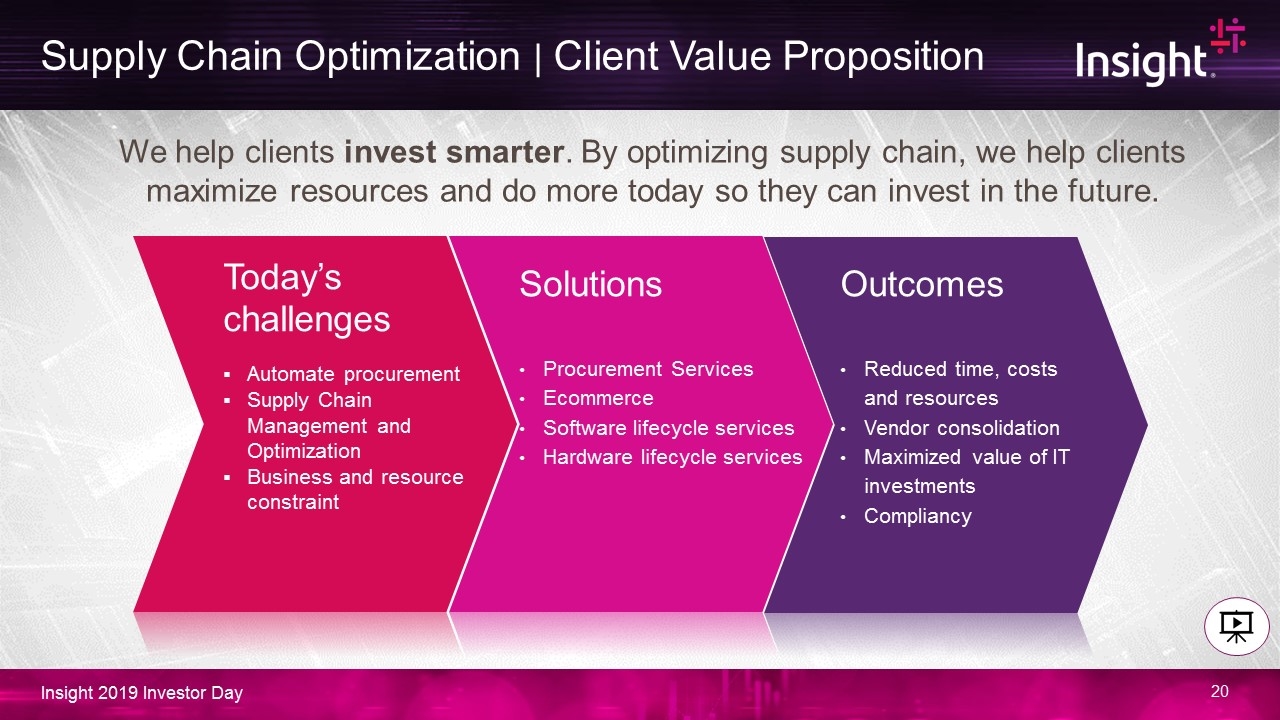
Supply Chain Optimization | Client Value Proposition Today’s challenges Automate procurement Supply Chain Management and Optimization Business and resource constraint Solutions Procurement Services Ecommerce Software lifecycle services Hardware lifecycle services Outcomes Reduced time, costs and resources Vendor consolidation Maximized value of IT investments Compliancy We help clients invest smarter. By optimizing supply chain, we help clients maximize resources and do more today so they can invest in the future.
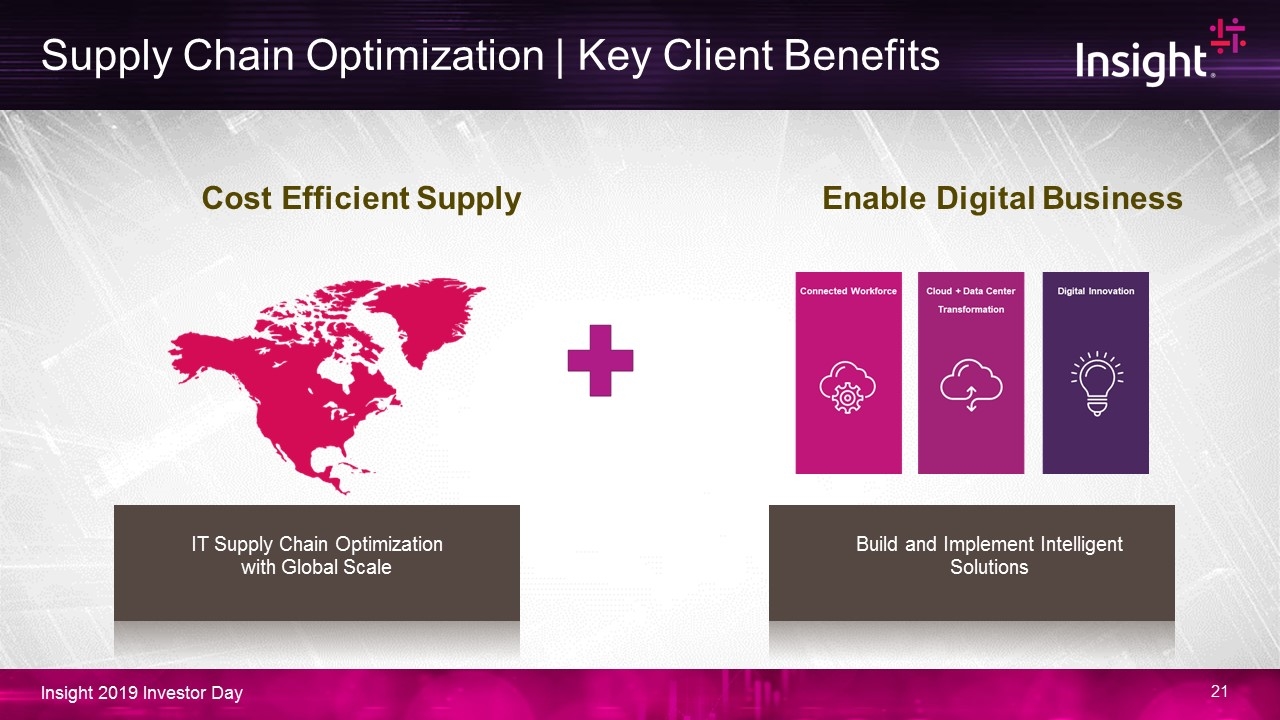
Supply Chain Optimization | Key Client Benefits IT Supply Chain Optimization with Global Scale Build and Implement Intelligent Solutions Cost Efficient Supply Enable Digital Business
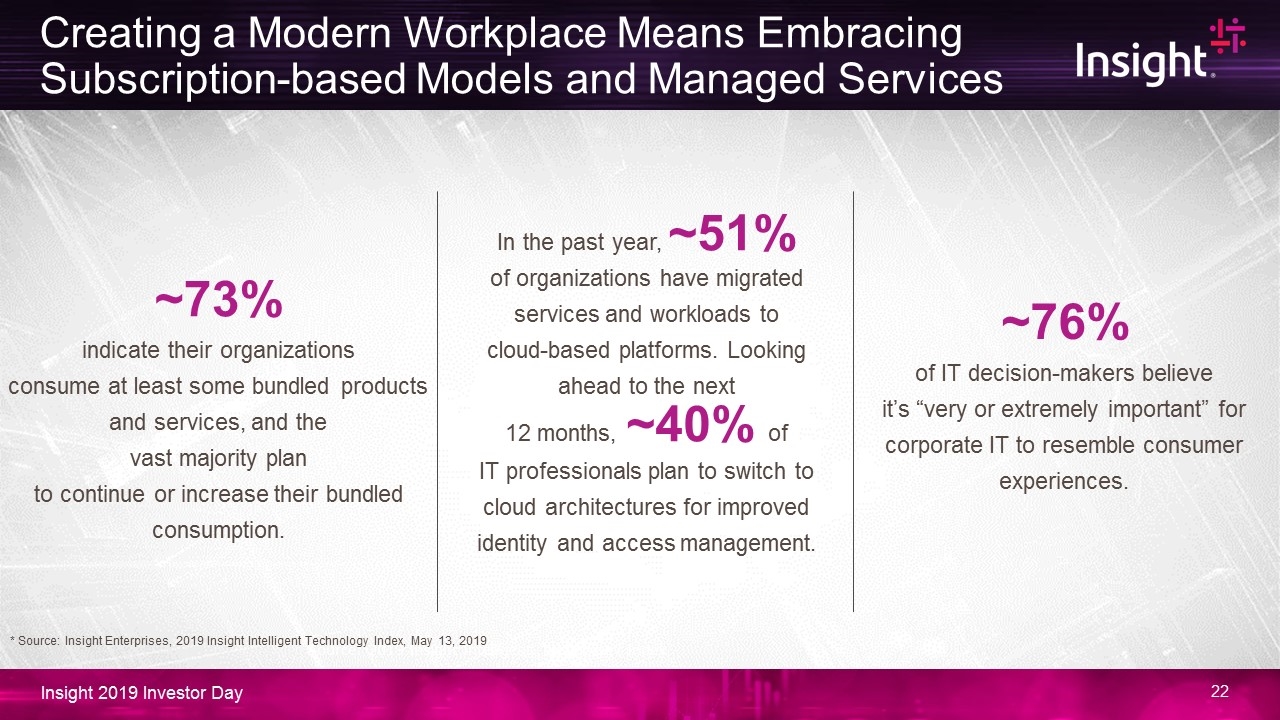
Creating a Modern Workplace Means Embracing Subscription-based Models and Managed Services ~73% indicate their organizations consume at least some bundled products and services, and the vast majority plan to continue or increase their bundled consumption. In the past year, ~51% of organizations have migrated services and workloads to cloud-based platforms. Looking ahead to the next 12 months, ~40% of IT professionals plan to switch to cloud architectures for improved identity and access management. ~76% of IT decision-makers believe it’s “very or extremely important” for corporate IT to resemble consumer experiences. Source: 2019 Insight Intelligent Technology Index * Source: Insight Enterprises, 2019 Insight Intelligent Technology Index, May 13, 2019
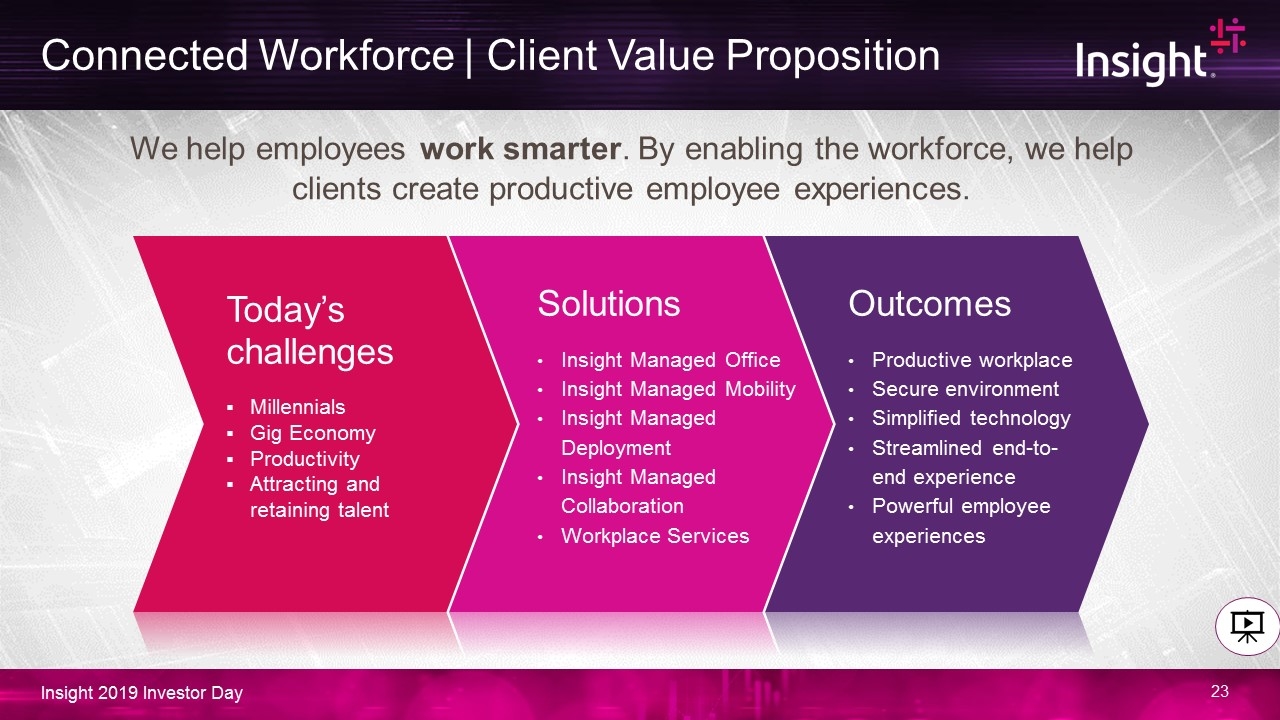
Today’s challenges Millennials Gig Economy Productivity Attracting and retaining talent Solutions Insight Managed Office Insight Managed Mobility Insight Managed Deployment Insight Managed Collaboration Workplace Services Outcomes Productive workplace Secure environment Simplified technology Streamlined end-to-end experience Powerful employee experiences We help employees work smarter. By enabling the workforce, we help clients create productive employee experiences. Connected Workforce | Client Value Proposition
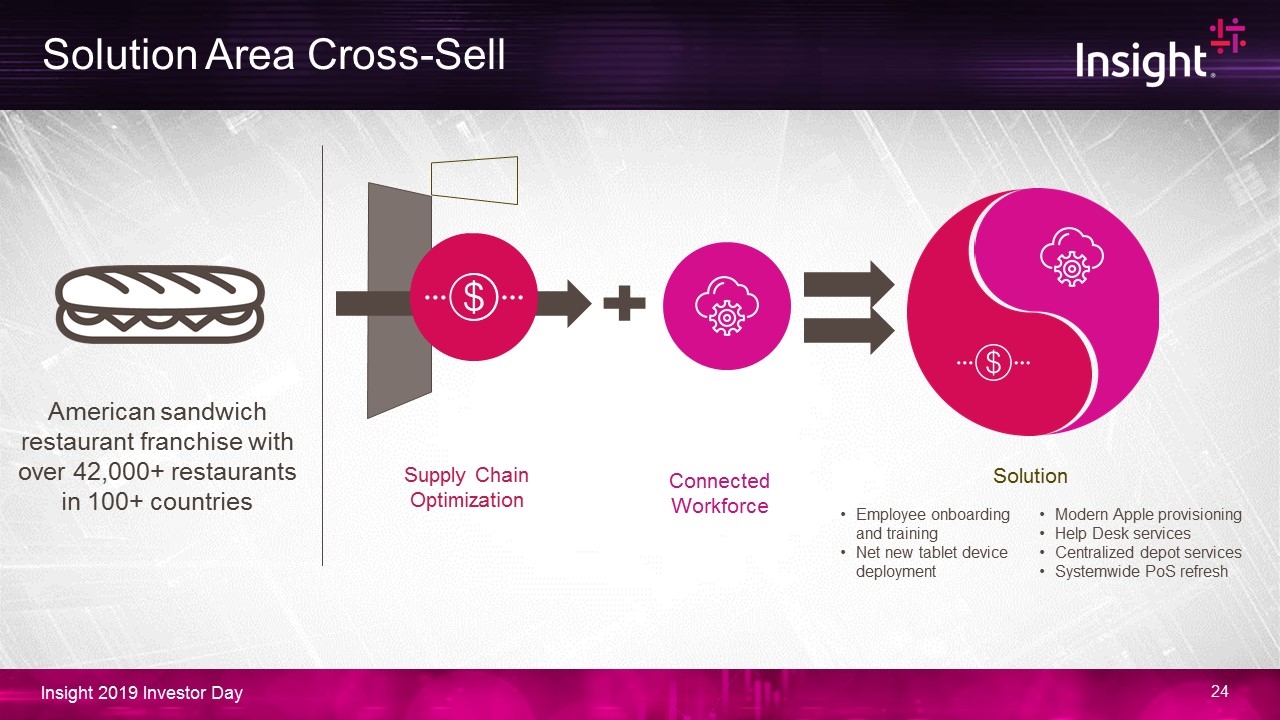
Solution Area Cross-Sell Supply Chain Optimization Connected Workforce American sandwich restaurant franchise with over 42,000+ restaurants in 100+ countries Employee onboarding and training Net new tablet device deployment Modern Apple provisioning Help Desk services Centralized depot services Systemwide PoS refresh Solution
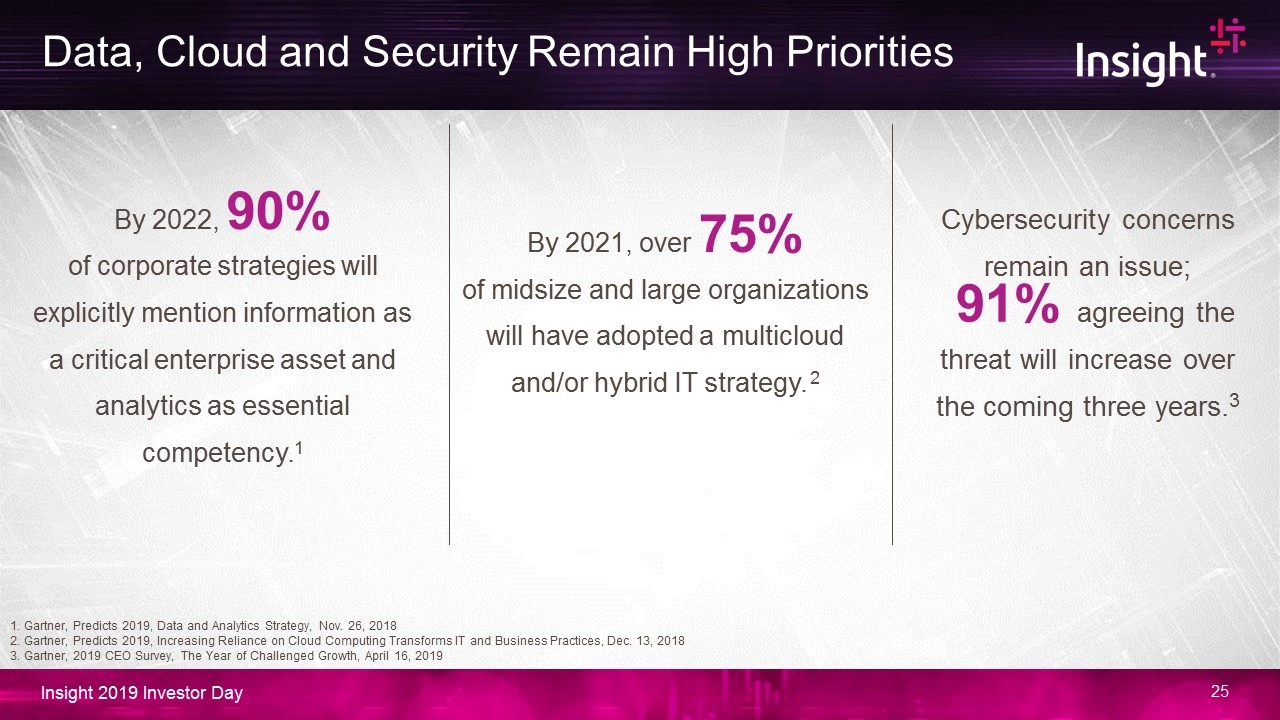
By 2022, 90% of corporate strategies will explicitly mention information as a critical enterprise asset and analytics as essential competency.1 By 2021, over 75% of midsize and large organizations will have adopted a multicloud and/or hybrid IT strategy. 2 Cybersecurity concerns remain an issue; 91% agreeing the threat will increase over the coming three years.3 1. Gartner, Predicts 2019, Data and Analytics Strategy, Nov. 26, 2018 2. Gartner, Predicts 2019, Increasing Reliance on Cloud Computing Transforms IT and Business Practices, Dec. 13, 2018 3. Gartner, 2019 CEO Survey, The Year of Challenged Growth, April 16, 2019 Data, Cloud and Security Remain High Priorities
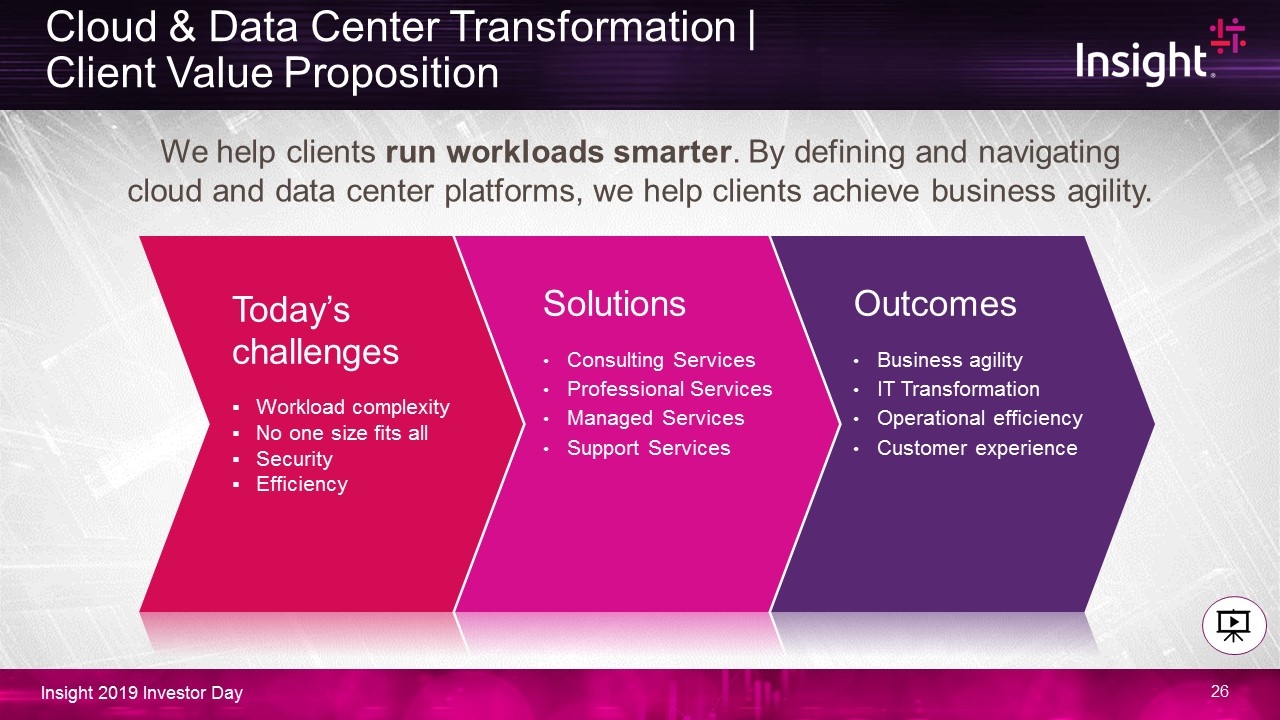
Today’s challenges Workload complexity No one size fits all Security Efficiency Solutions Consulting Services Professional Services Managed Services Support Services Outcomes Business agility IT Transformation Operational efficiency Customer experience We help clients run workloads smarter. By defining and navigating cloud and data center platforms, we help clients achieve business agility. Cloud & Data Center Transformation | Client Value Proposition
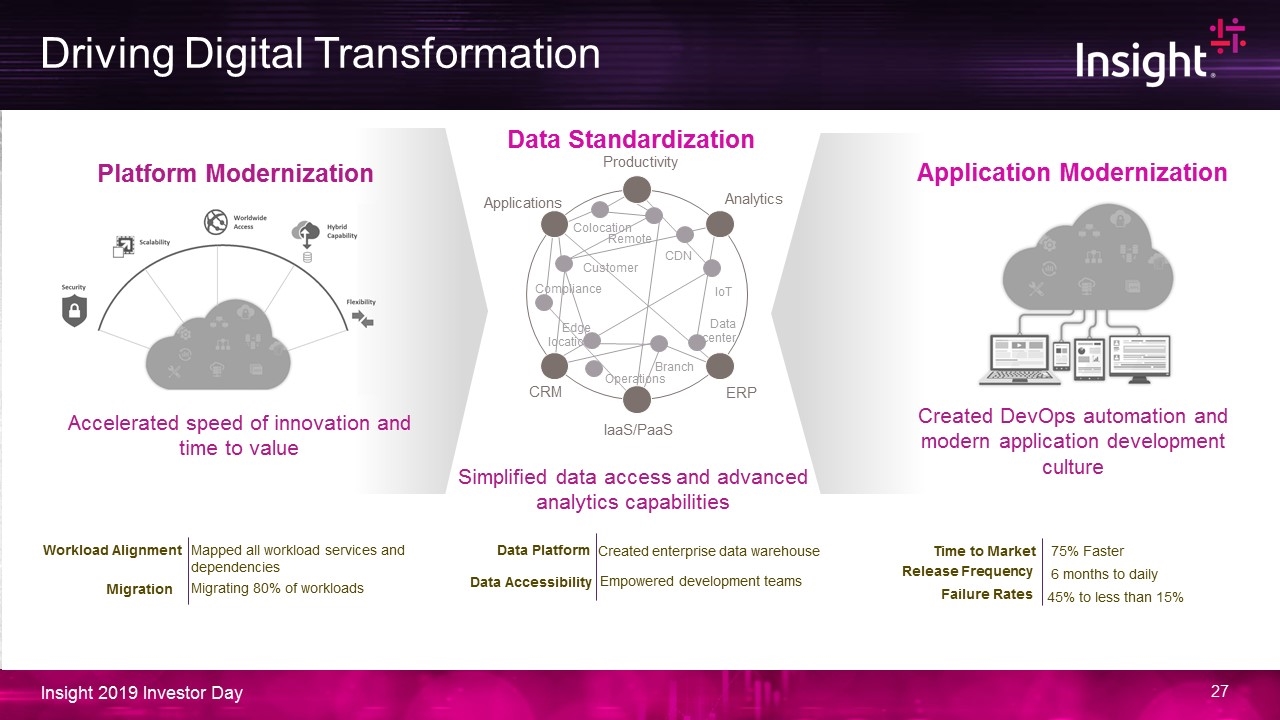
Driving Digital Transformation Platform Modernization Accelerated speed of innovation and time to value Application Modernization Workload Alignment Migration Mapped all workload services and dependencies Migrating 80% of workloads Data Standardization Data Platform Data Accessibility Created enterprise data warehouse Empowered development teams Time to Market Release Frequency 6 months to daily Simplified data access and advanced analytics capabilities 75% Faster Failure Rates 45% to less than 15% Created DevOps automation and modern application development culture CRM Productivity Branch Customer CDN IoT Edge location Remote Data center Compliance Operations Colocation IaaS/PaaS Analytics Applications ERP
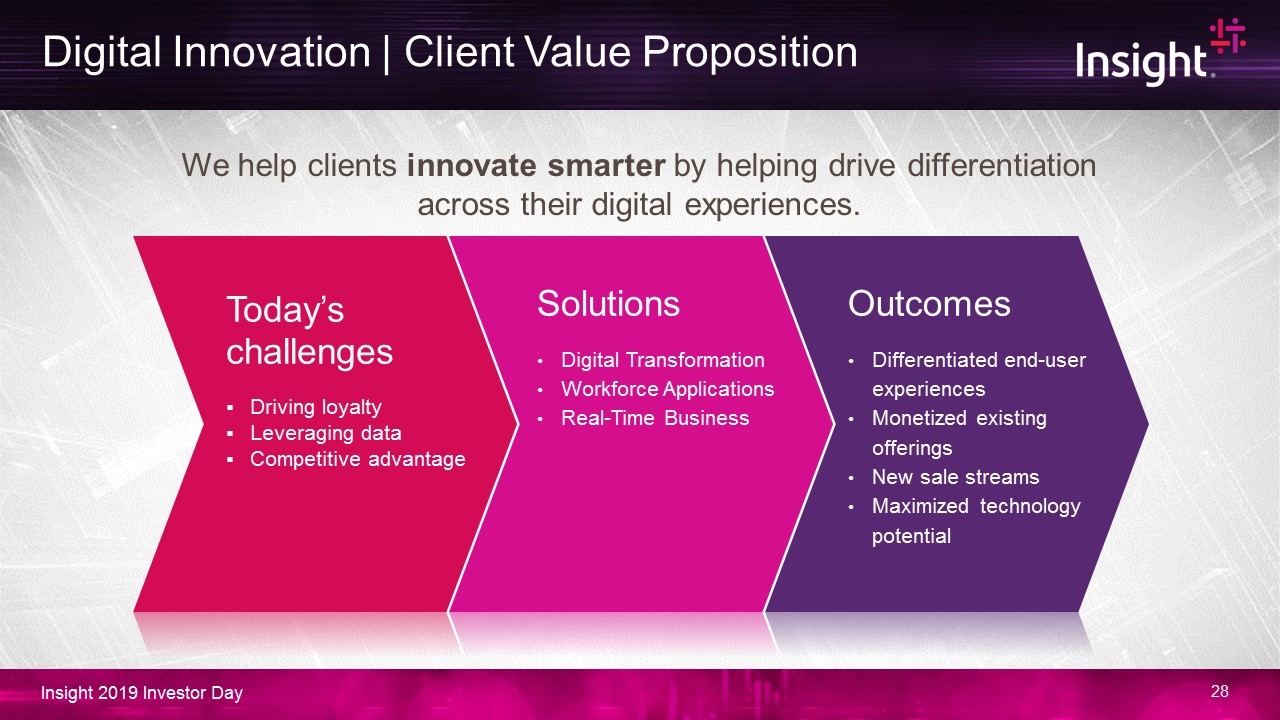
Today’s challenges Driving loyalty Leveraging data Competitive advantage Solutions Digital Transformation Workforce Applications Real-Time Business Outcomes Differentiated end-user experiences Monetized existing offerings New sale streams Maximized technology potential We help clients innovate smarter by helping drive differentiation across their digital experiences. Digital Innovation | Client Value Proposition
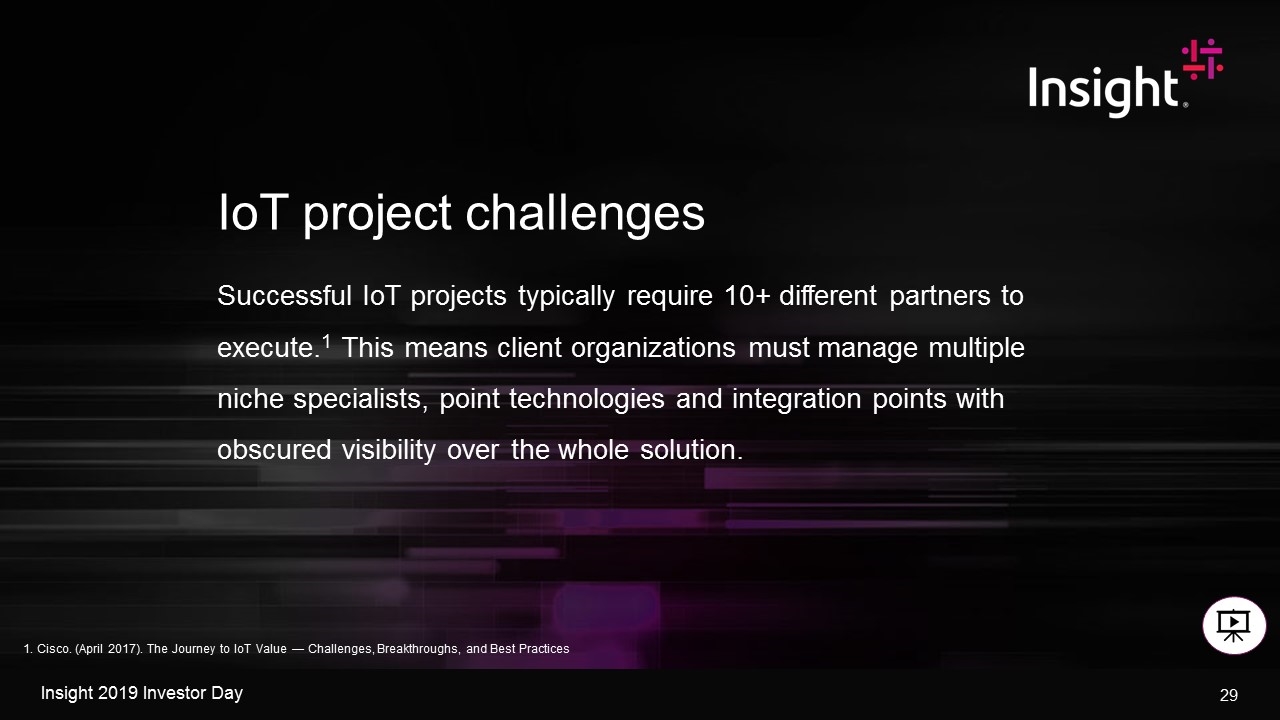
1. Cisco. (April 2017). The Journey to IoT Value — Challenges, Breakthroughs, and Best Practices IoT project challenges Successful IoT projects typically require 10+ different partners to execute.1 This means client organizations must manage multiple niche specialists, point technologies and integration points with obscured visibility over the whole solution.
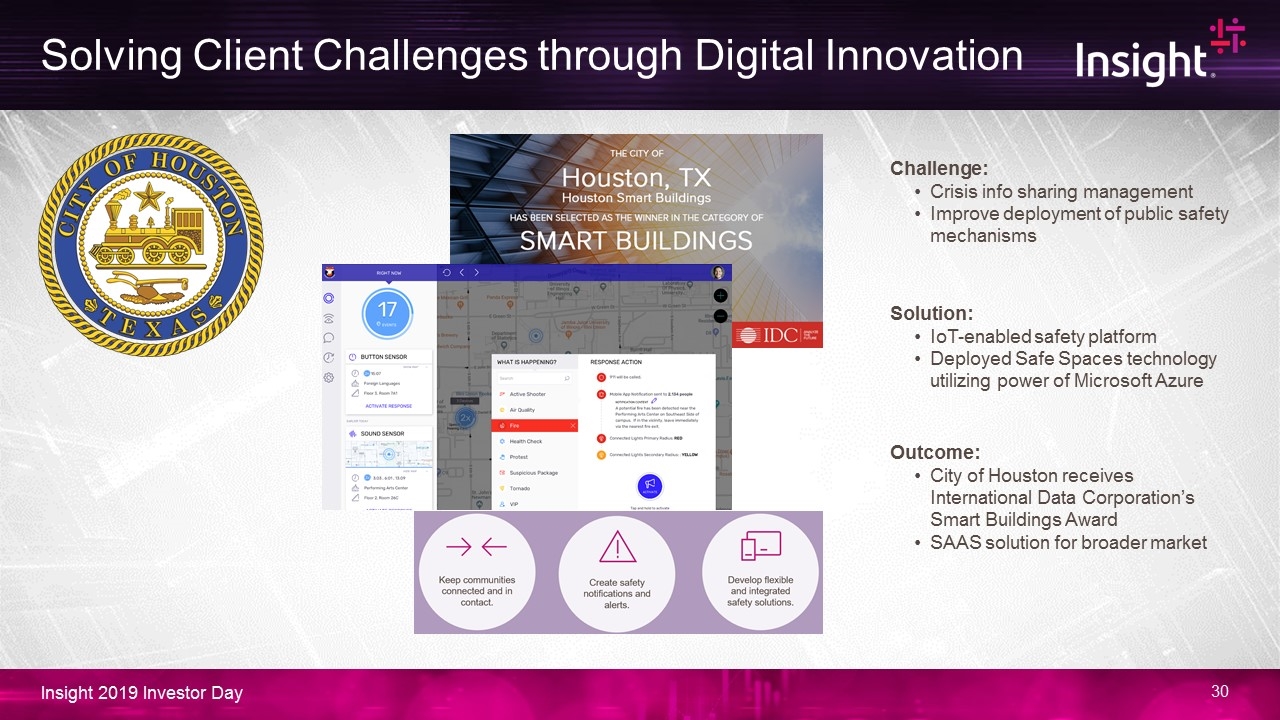
Solving Client Challenges through Digital Innovation Challenge: Crisis info sharing management Improve deployment of public safety mechanisms Solution: IoT-enabled safety platform Deployed Safe Spaces technology utilizing power of Microsoft Azure Outcome: City of Houston receives International Data Corporation’s Smart Buildings Award SAAS solution for broader market
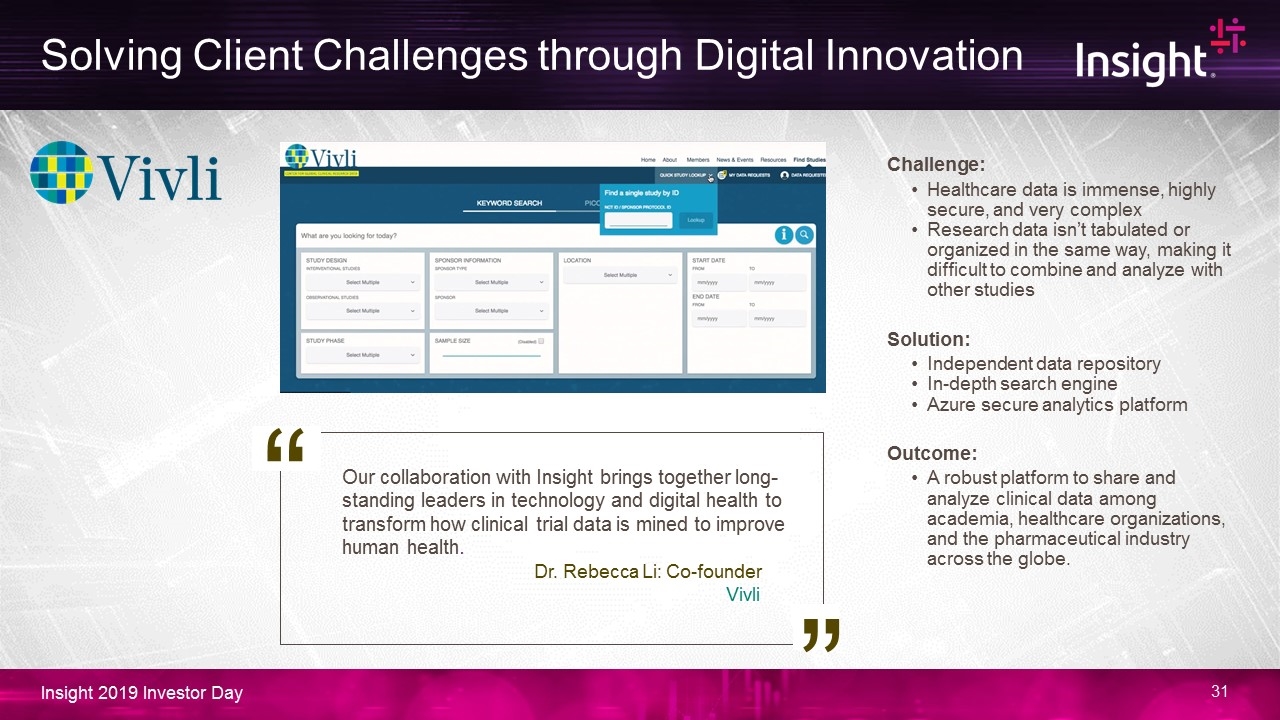
Challenge: Healthcare data is immense, highly secure, and very complex Research data isn’t tabulated or organized in the same way, making it difficult to combine and analyze with other studies Solution: Independent data repository In-depth search engine Azure secure analytics platform Outcome: A robust platform to share and analyze clinical data among academia, healthcare organizations, and the pharmaceutical industry across the globe. “ Our collaboration with Insight brings together long-standing leaders in technology and digital health to transform how clinical trial data is mined to improve human health. Dr. Rebecca Li: Co-founder Vivli Solving Client Challenges through Digital Innovation “
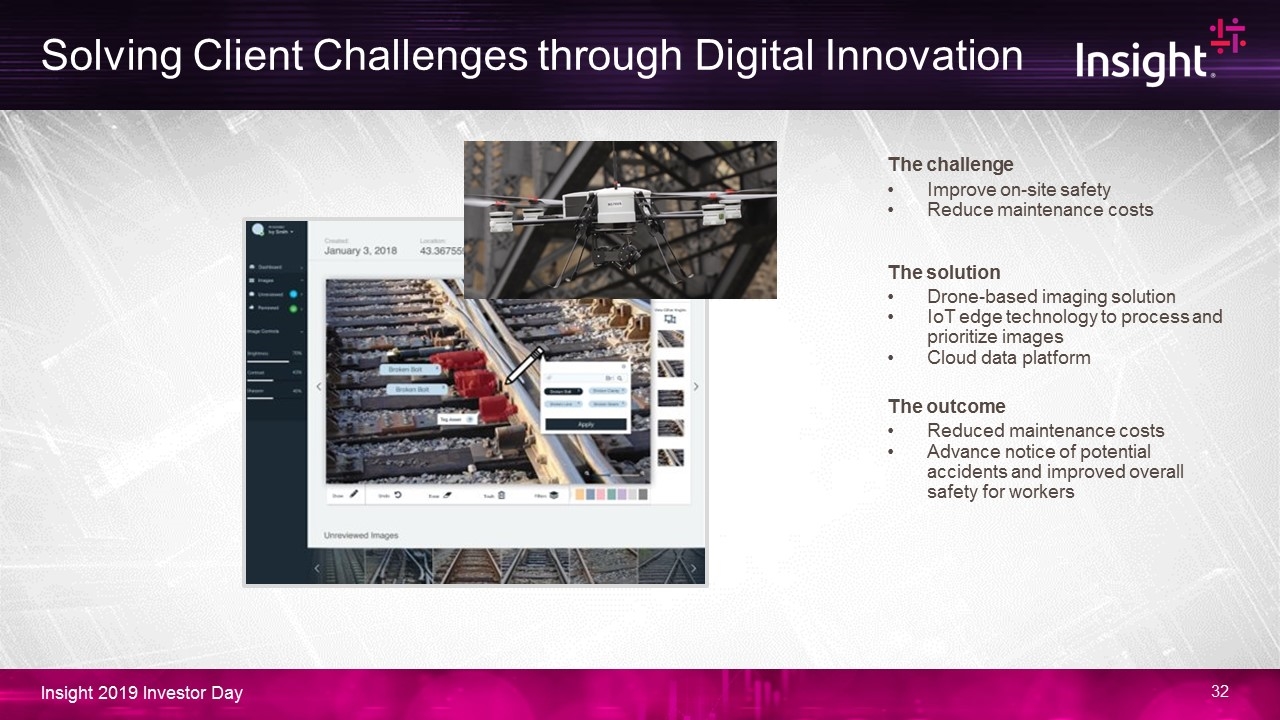
Solving Client Challenges through Digital Innovation The challenge Improve on-site safety Reduce maintenance costs The solution Drone-based imaging solution IoT edge technology to process and prioritize images Cloud data platform The outcome Reduced maintenance costs Advance notice of potential accidents and improved overall safety for workers
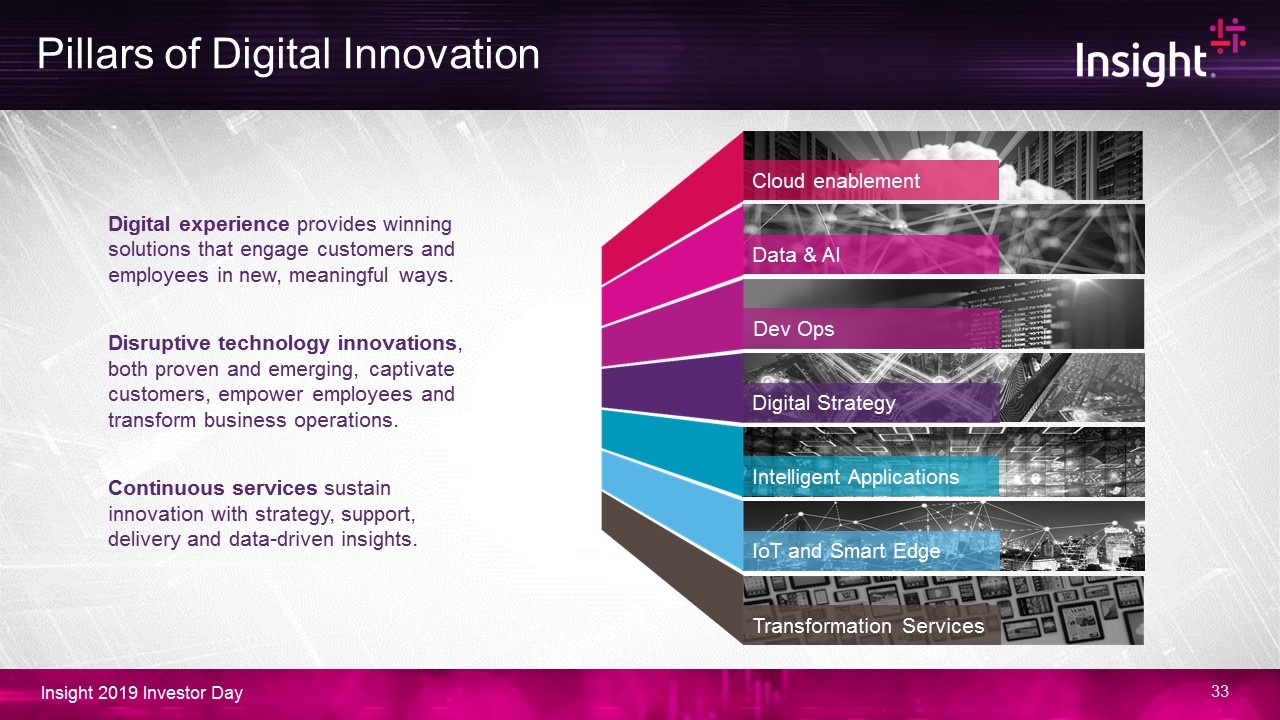
Cloud enablement Data & AI Dev Ops Intelligent Applications IoT and Smart Edge Digital Strategy Transformation Services Pillars of Digital Innovation Digital experience provides winning solutions that engage customers and employees in new, meaningful ways. Disruptive technology innovations, both proven and emerging, captivate customers, empower employees and transform business operations. Continuous services sustain innovation with strategy, support, delivery and data-driven insights.

Financial Overview and Vision Glynis Bryan – Chief Financial Officer
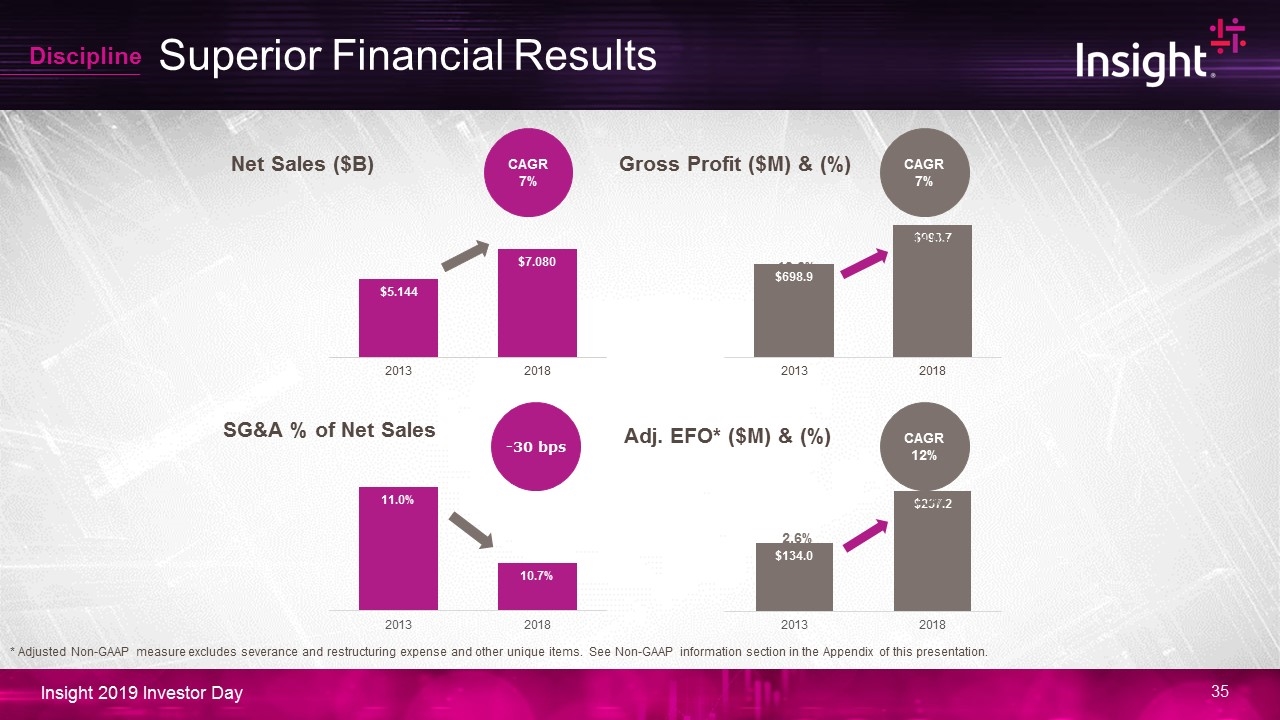
Superior Financial Results Net Sales ($B) Gross Profit ($M) & (%) SG&A % of Net Sales Adj. EFO* ($M) & (%) Discipline CAGR 7% CAGR 12% -30 bps CAGR 7% 13.6% 14.0% 2.6% 3.4% * Adjusted Non-GAAP measure excludes severance and restructuring expense and other unique items. See Non-GAAP information section in the Appendix of this presentation.
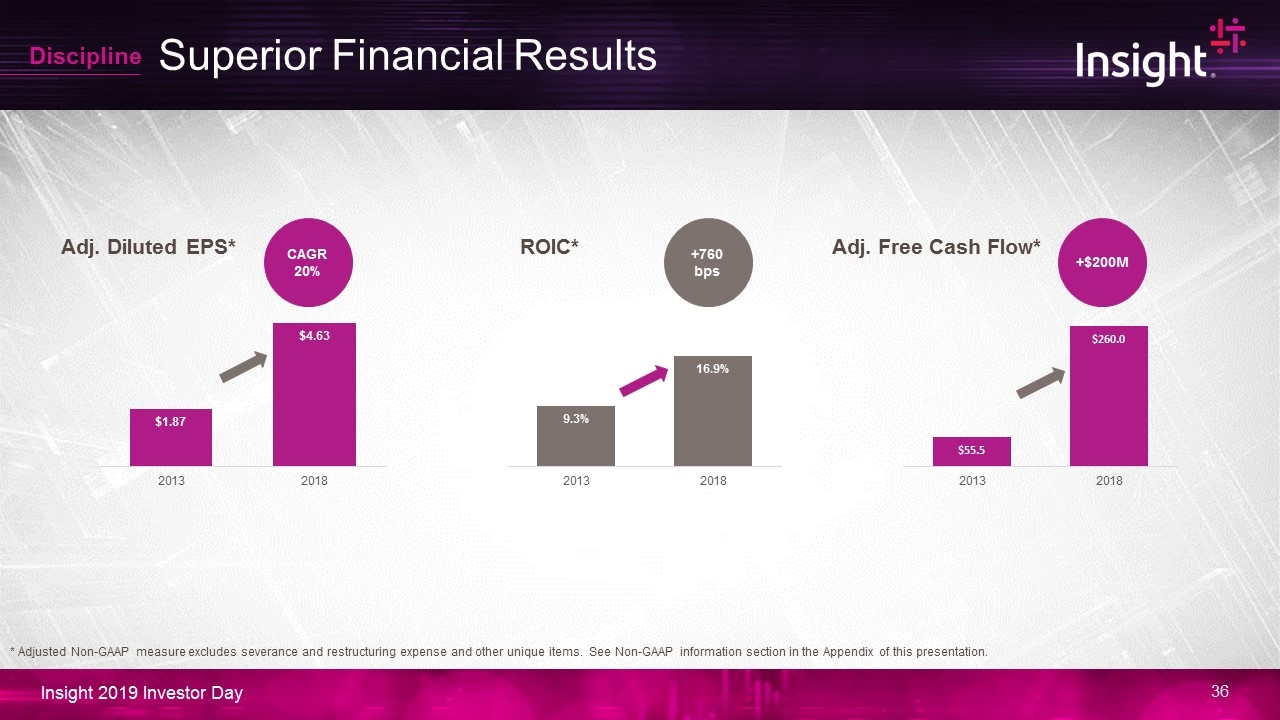
Superior Financial Results +45 bps ROIC* Adj. Diluted EPS* Discipline +760 bps CAGR 20% * Adjusted Non-GAAP measure excludes severance and restructuring expense and other unique items. See Non-GAAP information section in the Appendix of this presentation. +$200M Adj. Free Cash Flow*
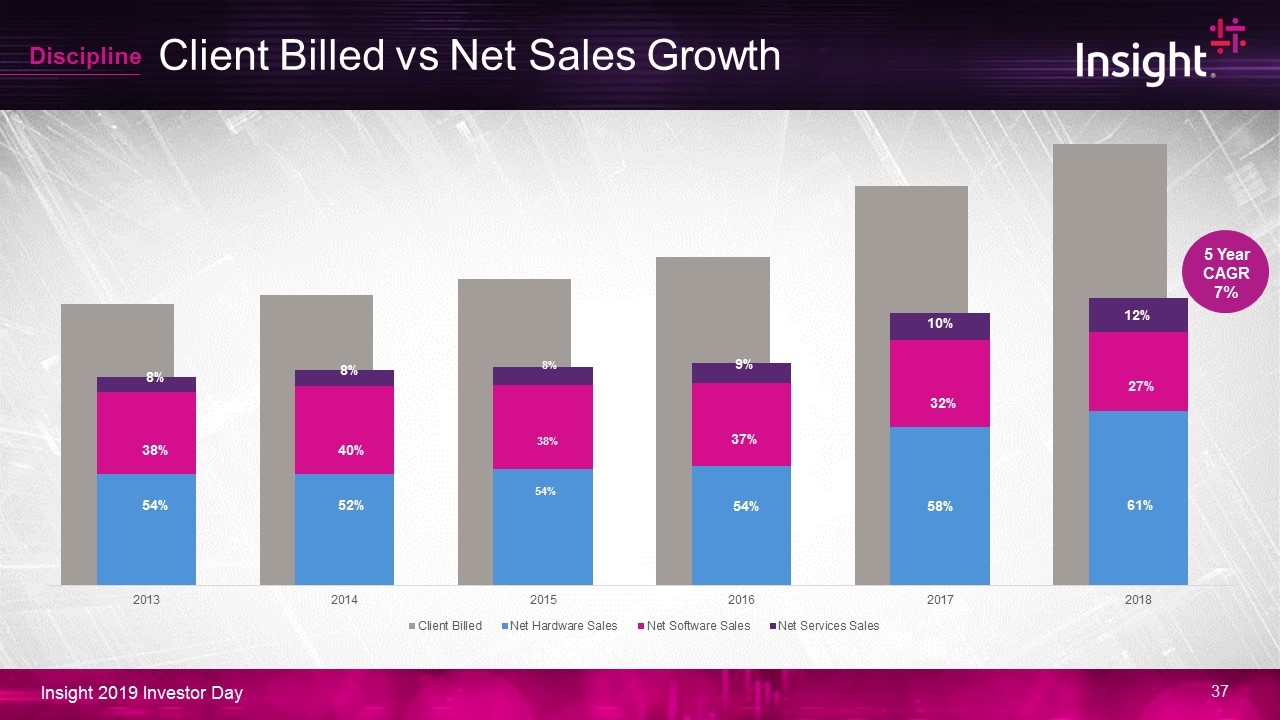
Client Billed vs Net Sales Growth 5 Year CAGR 7% Discipline 61% 27% 12% 58% 32% 10% 54% 37% 9% 52% 40% 8% 54% 38% 8%
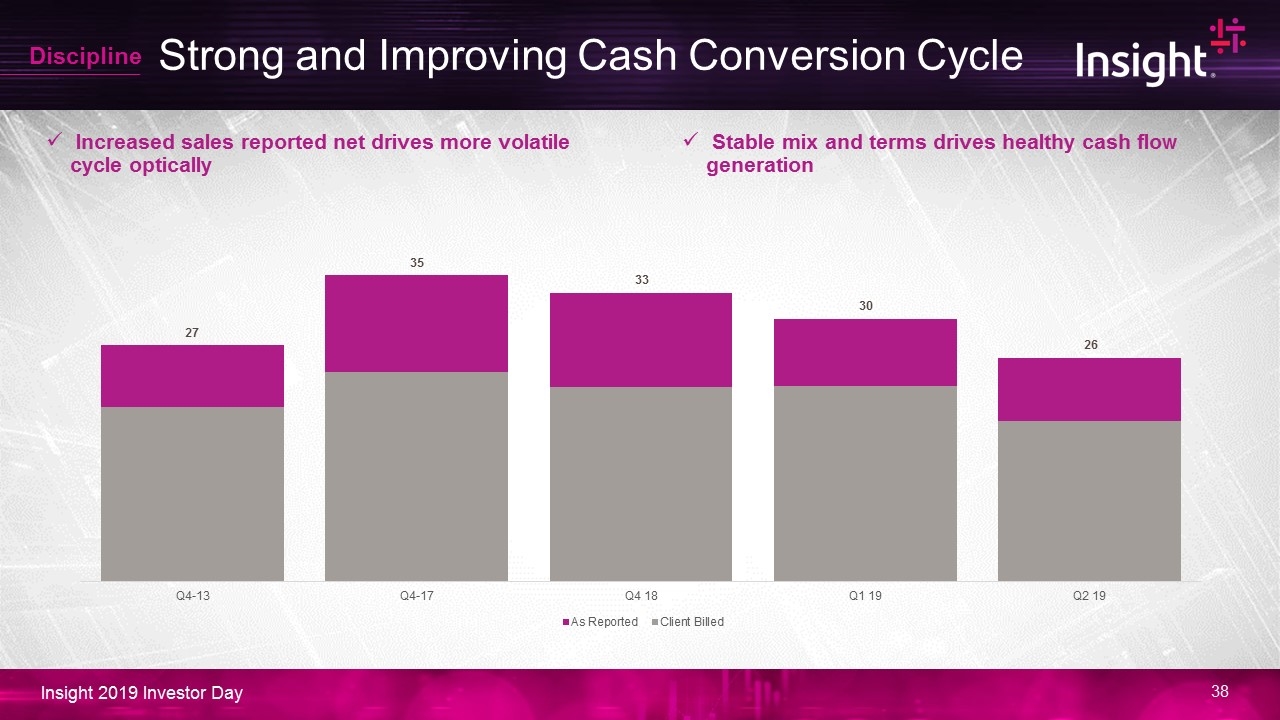
Strong and Improving Cash Conversion Cycle Discipline Increased sales reported net drives more volatile cycle optically Stable mix and terms drives healthy cash flow generation
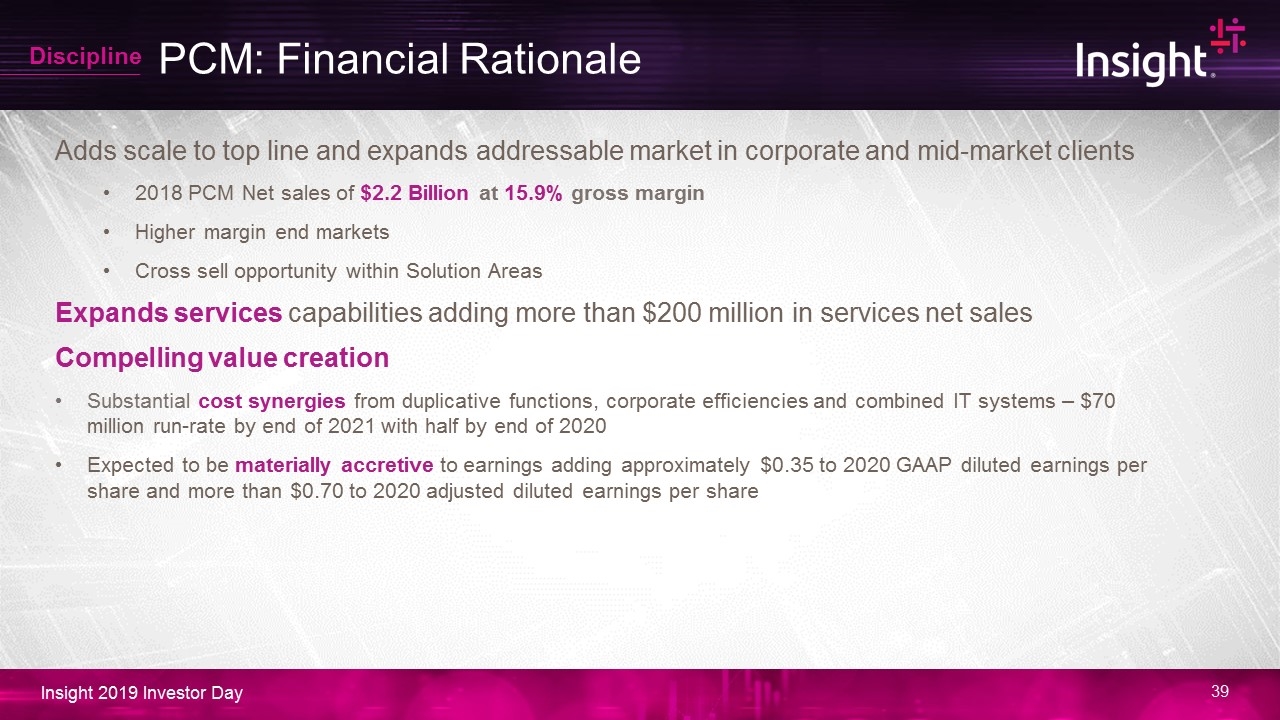
PCM: Financial Rationale Adds scale to top line and expands addressable market in corporate and mid-market clients 2018 PCM Net sales of $2.2 Billion at 15.9% gross margin Higher margin end markets Cross sell opportunity within Solution Areas Expands services capabilities adding more than $200 million in services net sales Compelling value creation Substantial cost synergies from duplicative functions, corporate efficiencies and combined IT systems – $70 million run-rate by end of 2021 with half by end of 2020 Expected to be materially accretive to earnings adding approximately $0.35 to 2020 GAAP diluted earnings per share and more than $0.70 to 2020 adjusted diluted earnings per share Discipline
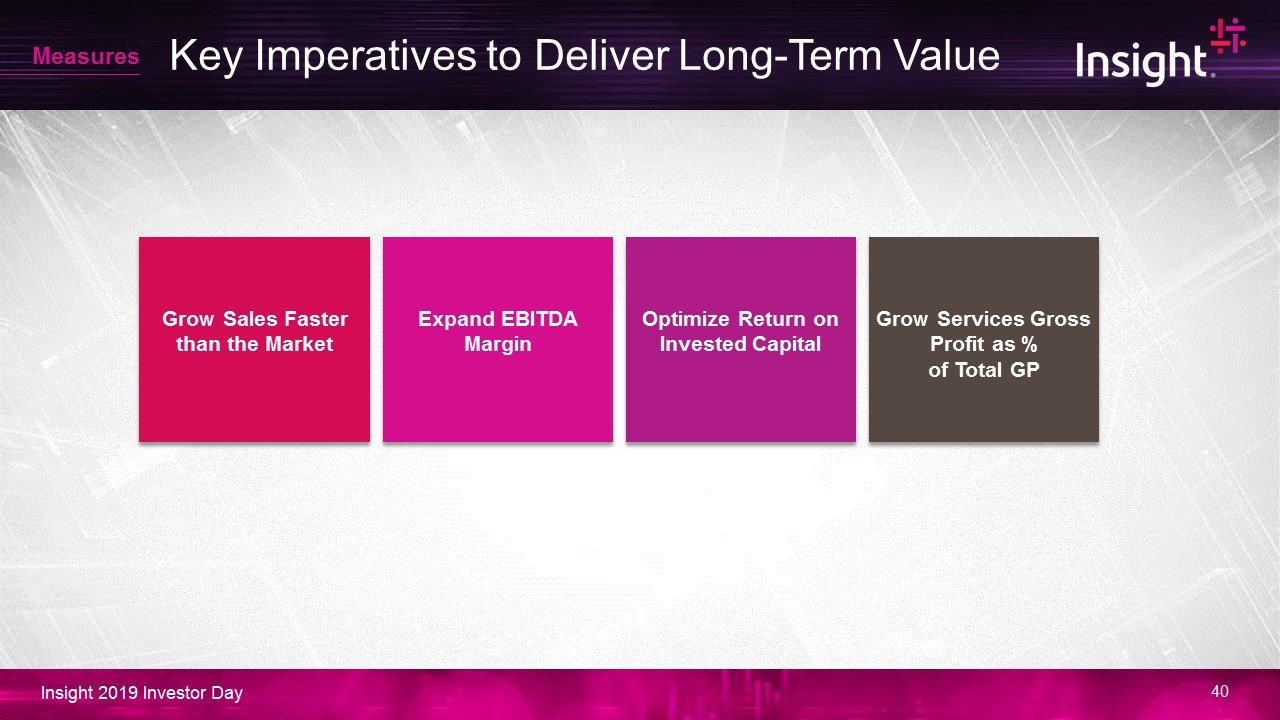
Key Imperatives to Deliver Long-Term Value Expand EBITDA Margin Optimize Return on Invested Capital Grow Services Gross Profit as % of Total GP Measures Grow Sales Faster than the Market
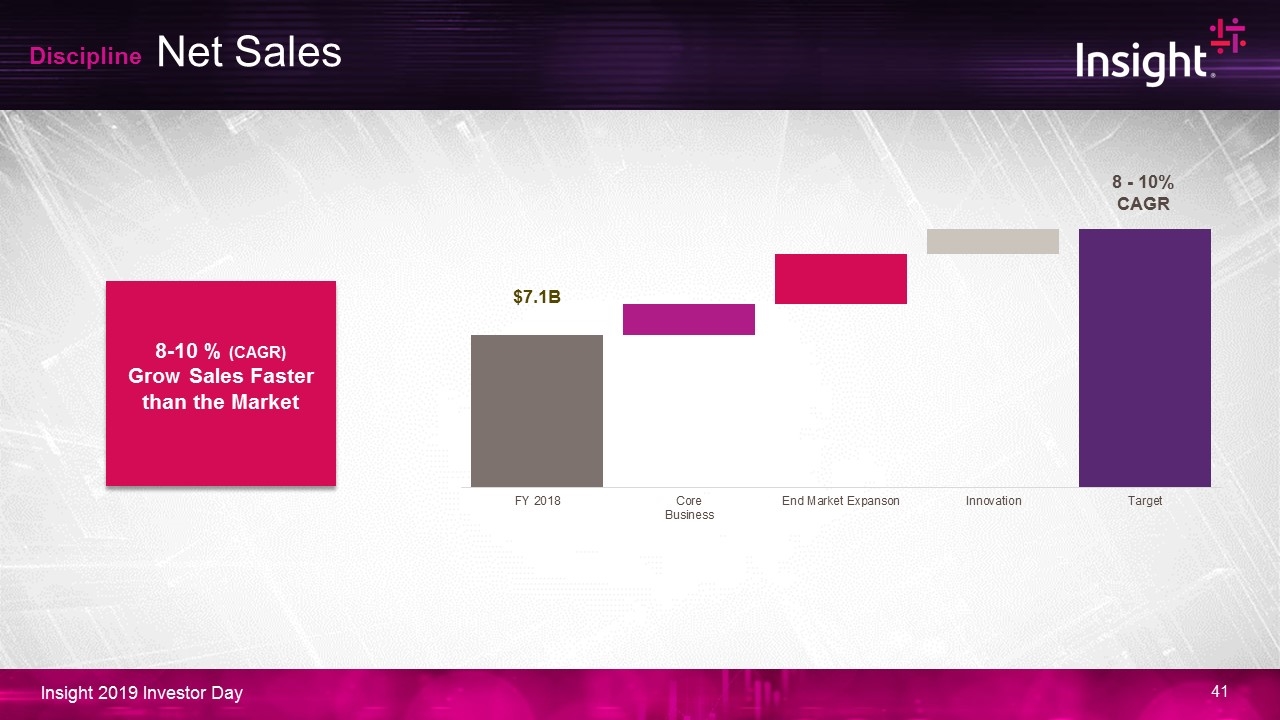
Net Sales 8-10 % (CAGR) Grow Sales Faster than the Market Discipline $7.1B 8 - 10% CAGR
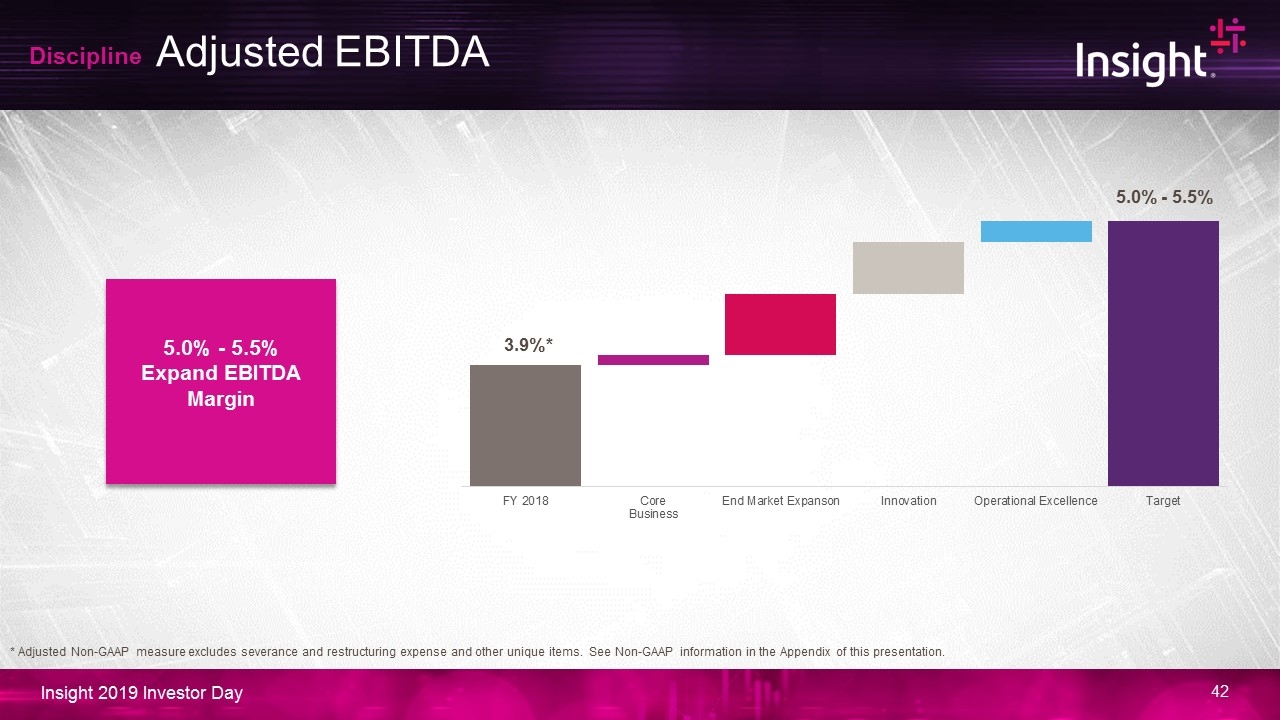
5.0% - 5.5% Expand EBITDA Margin Adjusted EBITDA Discipline 3.9%* 5.0% - 5.5% * Adjusted Non-GAAP measure excludes severance and restructuring expense and other unique items. See Non-GAAP information in the Appendix of this presentation.
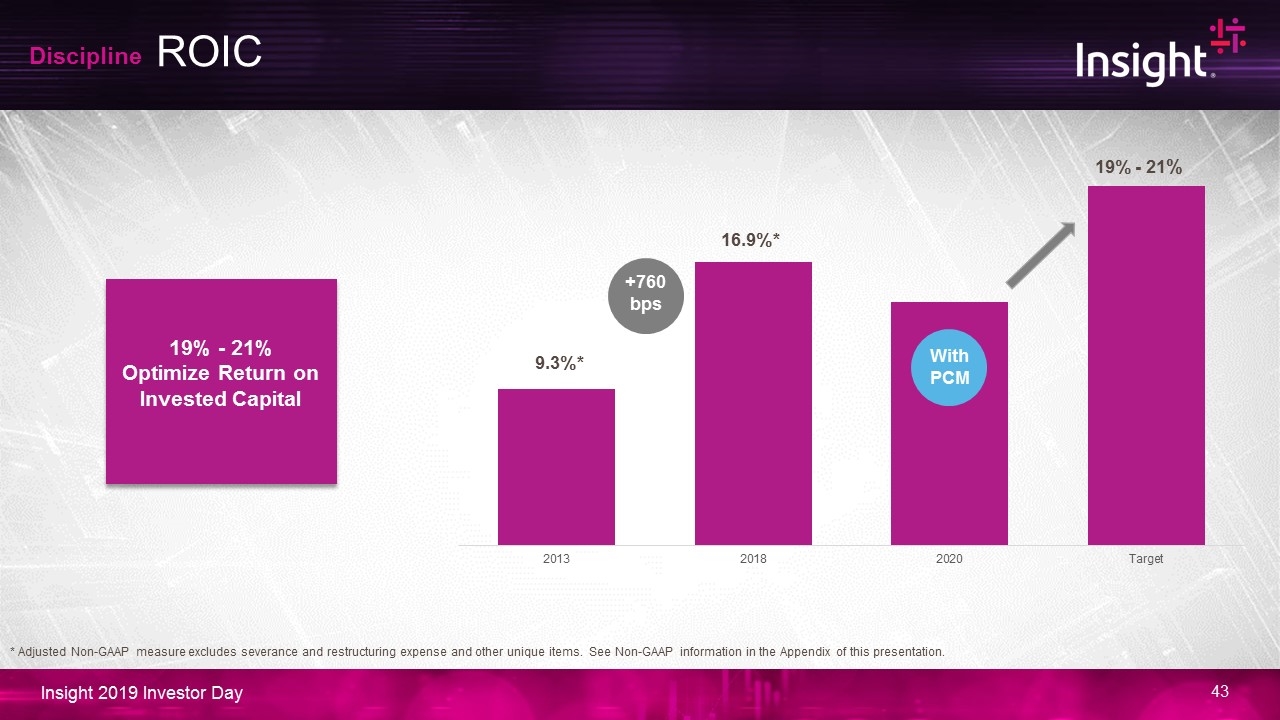
19% - 21% Optimize Return on Invested Capital ROIC Discipline 16.9%* 19% - 21% With PCM +760 bps 9.3%* * Adjusted Non-GAAP measure excludes severance and restructuring expense and other unique items. See Non-GAAP information in the Appendix of this presentation.
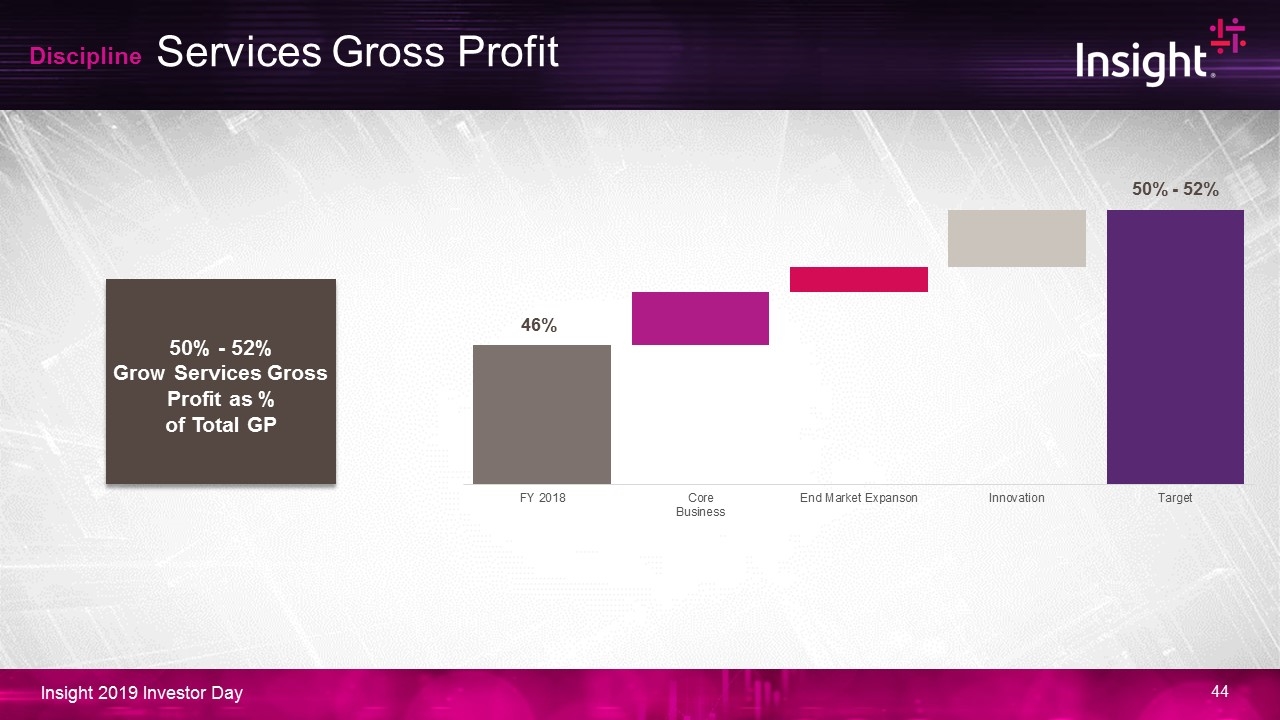
50% - 52% Grow Services Gross Profit as % of Total GP Services Gross Profit Discipline 46% 50% - 52%
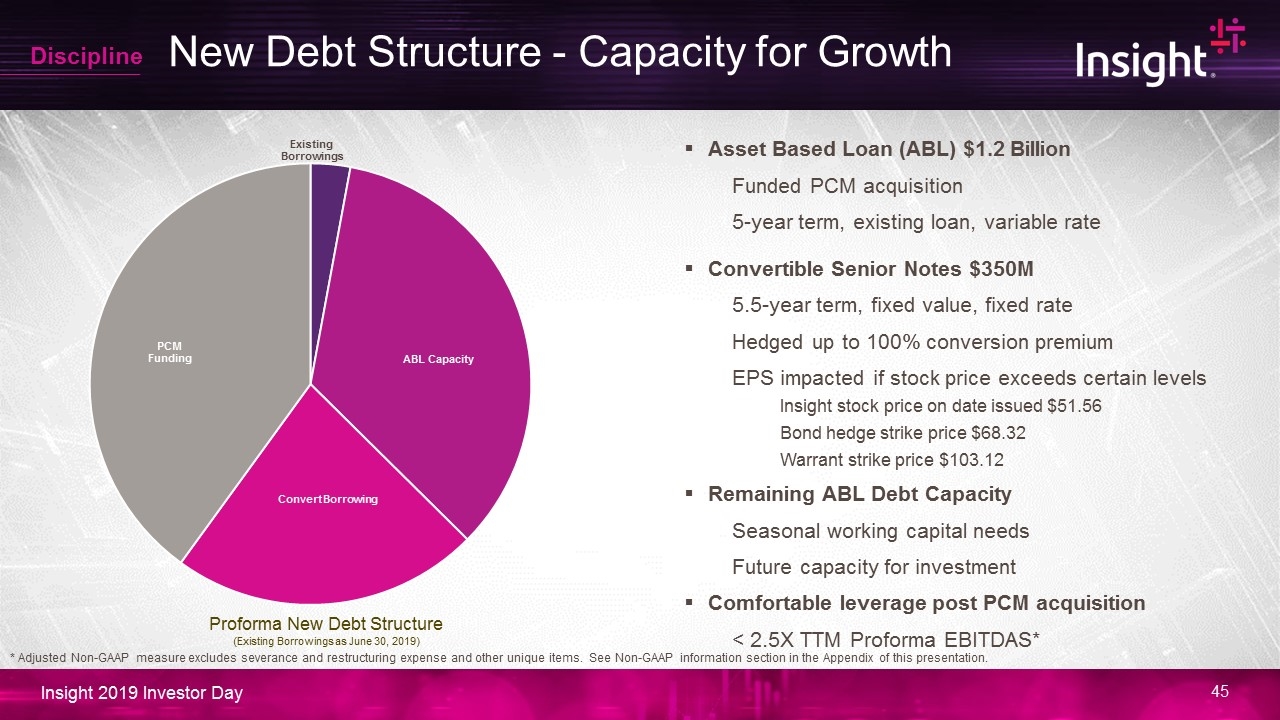
New Debt Structure - Capacity for Growth Asset Based Loan (ABL) $1.2 Billion Funded PCM acquisition 5-year term, existing loan, variable rate Convertible Senior Notes $350M 5.5-year term, fixed value, fixed rate Hedged up to 100% conversion premium EPS impacted if stock price exceeds certain levels Insight stock price on date issued $51.56 Bond hedge strike price $68.32 Warrant strike price $103.12 Remaining ABL Debt Capacity Seasonal working capital needs Future capacity for investment Comfortable leverage post PCM acquisition < 2.5X TTM Proforma EBITDAS* Discipline Proforma New Debt Structure (Existing Borrowings as June 30, 2019) * Adjusted Non-GAAP measure excludes severance and restructuring expense and other unique items. See Non-GAAP information section in the Appendix of this presentation.
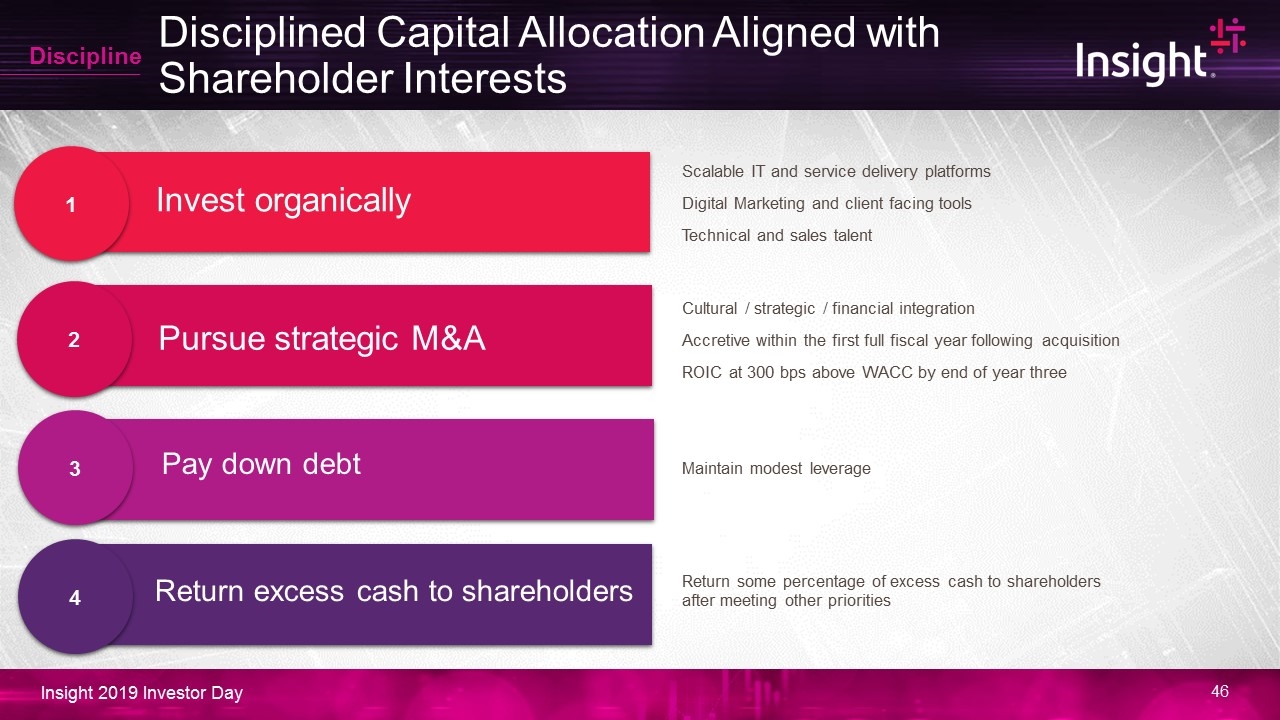
Disciplined Capital Allocation Aligned with Shareholder Interests 1 Pursue strategic M&A Invest organically 2 4 Return excess cash to shareholders Discipline Scalable IT and service delivery platforms Digital Marketing and client facing tools Technical and sales talent Cultural / strategic / financial integration Accretive within the first full fiscal year following acquisition ROIC at 300 bps above WACC by end of year three Return some percentage of excess cash to shareholders after meeting other priorities Pay down debt Maintain modest leverage 3

Closing Comments Ken Lamneck – Chief Executive Officer
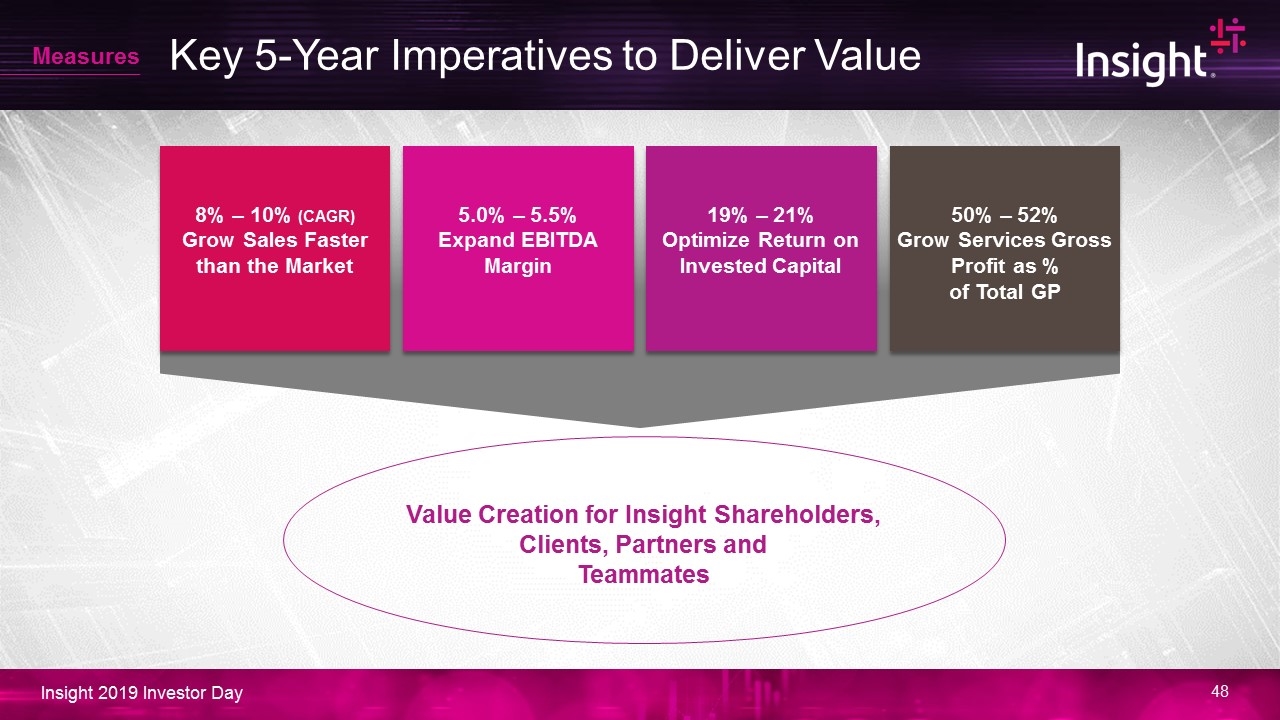
Key 5-Year Imperatives to Deliver Value 5.0% – 5.5% Expand EBITDA Margin 19% – 21% Optimize Return on Invested Capital 50% – 52% Grow Services Gross Profit as % of Total GP Value Creation for Insight Shareholders, Clients, Partners and Teammates Measures 8% – 10% (CAGR) Grow Sales Faster than the Market

Q&A Session Insight Executive Team

Appendix
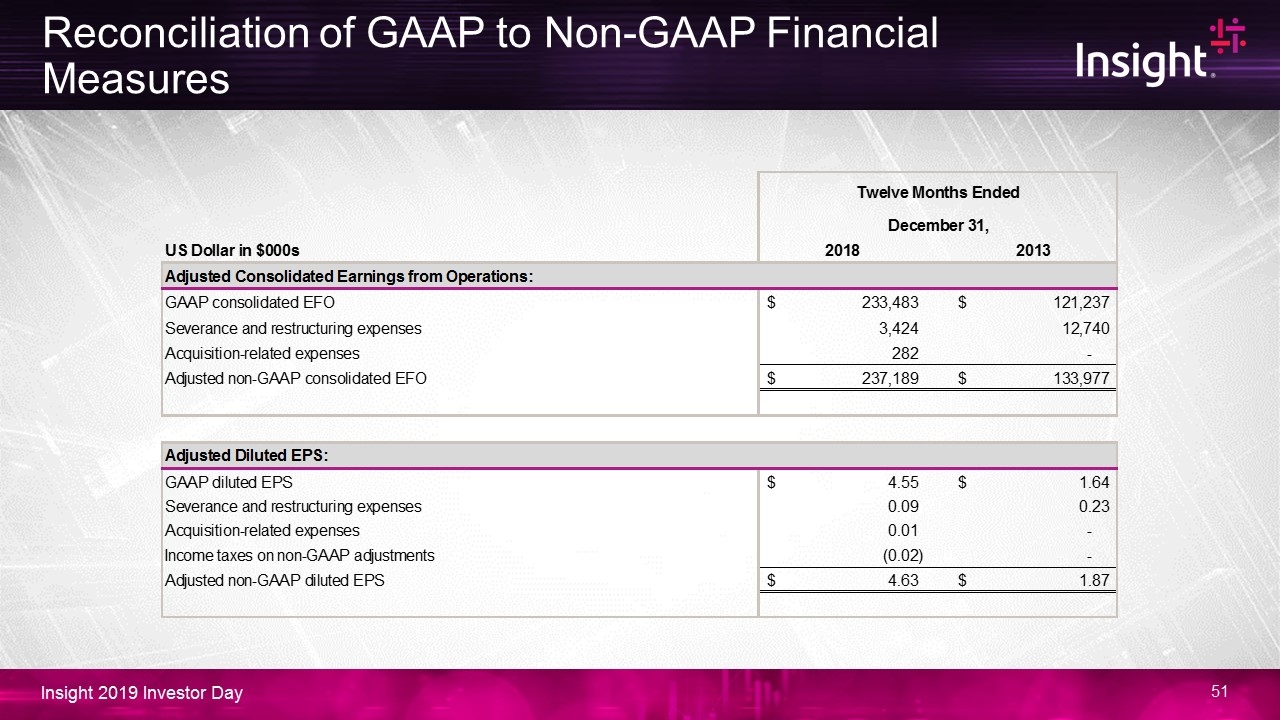
Reconciliation of GAAP to Non-GAAP Financial Measures
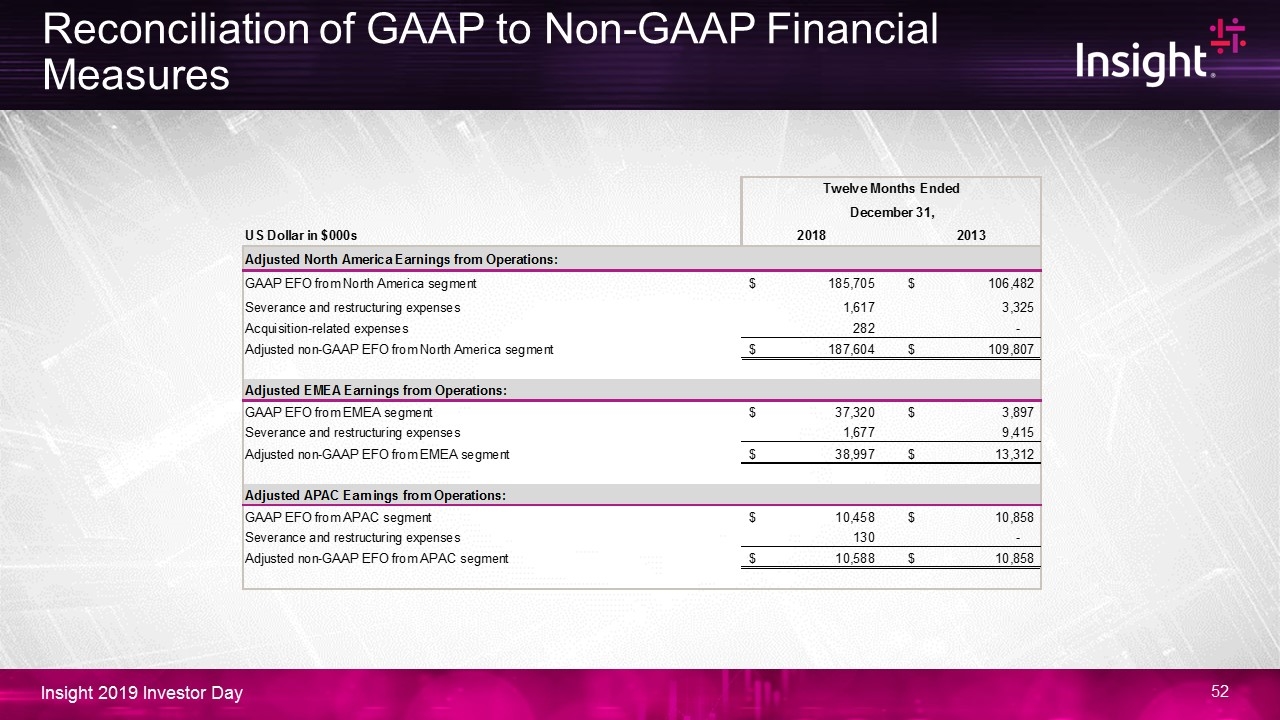
Reconciliation of GAAP to Non-GAAP Financial Measures
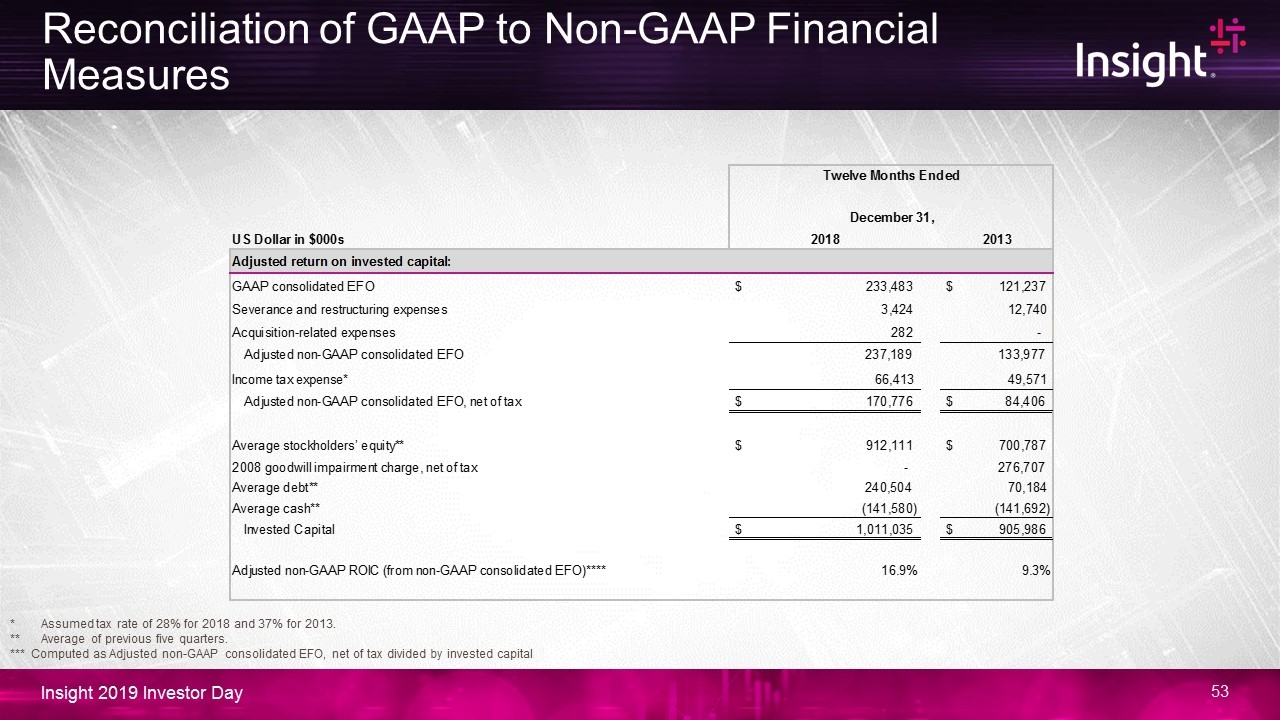
Reconciliation of GAAP to Non-GAAP Financial Measures * Assumed tax rate of 28% for 2018 and 37% for 2013. ** Average of previous five quarters. *** Computed as Adjusted non-GAAP consolidated EFO, net of tax divided by invested capital
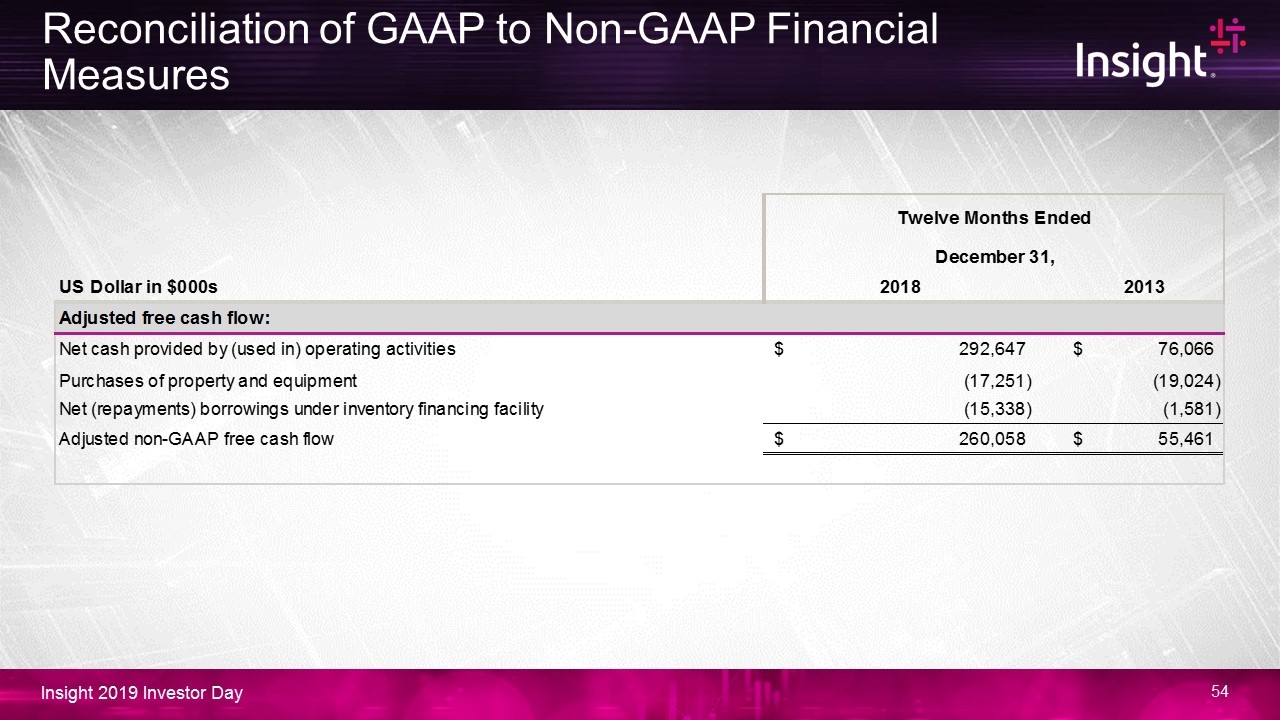
Reconciliation of GAAP to Non-GAAP Financial Measures
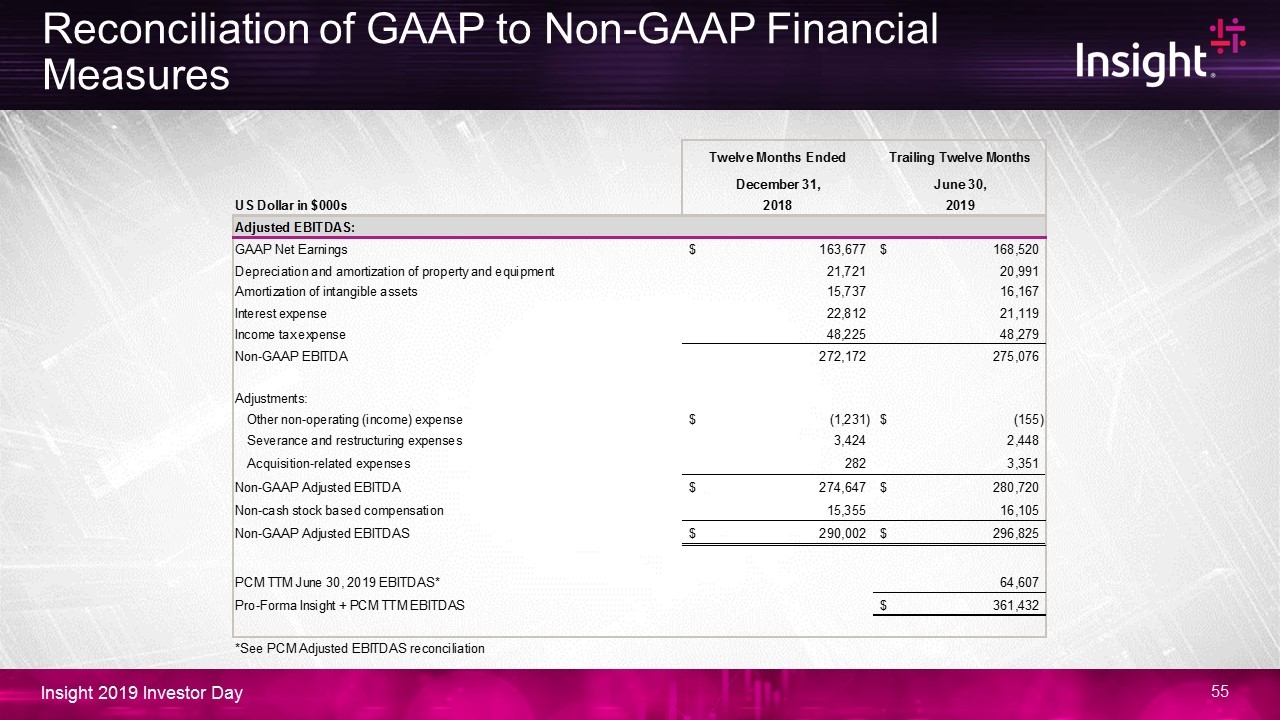
Reconciliation of GAAP to Non-GAAP Financial Measures
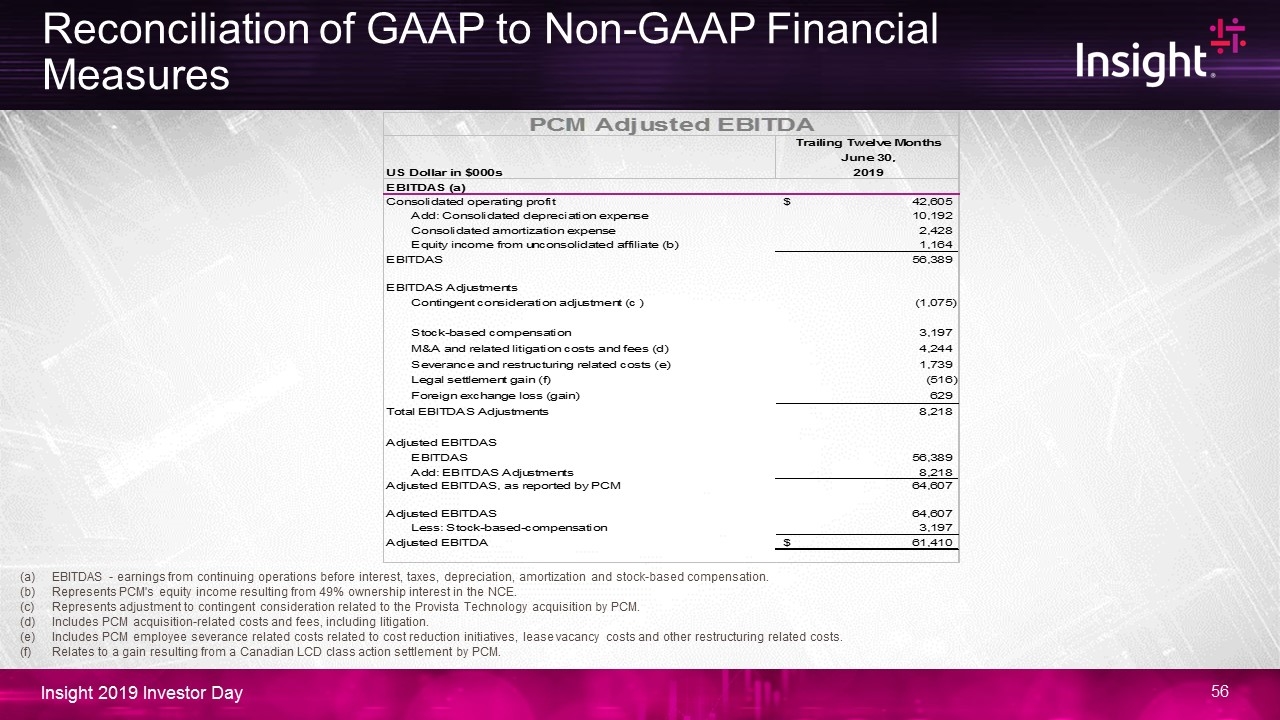
Reconciliation of GAAP to Non-GAAP Financial Measures EBITDAS - earnings from continuing operations before interest, taxes, depreciation, amortization and stock-based compensation. Represents PCM's equity income resulting from 49% ownership interest in the NCE. Represents adjustment to contingent consideration related to the Provista Technology acquisition by PCM. Includes PCM acquisition-related costs and fees, including litigation. Includes PCM employee severance related costs related to cost reduction initiatives, lease vacancy costs and other restructuring related costs. Relates to a gain resulting from a Canadian LCD class action settlement by PCM.


