Table of Contents
UNITED STATES
SECURITIES AND EXCHANGE COMMISSION
WASHINGTON, D.C. 20549
Form 20-F/A
AMENDMENT NO. 2 TO ANNUAL REPORT
PURSUANT TO SECTION 13 OR 15(d) OF
THE SECURITIES EXCHANGE ACT OF 1934
For the fiscal year ended December 31, 2004
Commission File Number: 0-99
PETRÓLEOS MEXICANOS
(Exact name of registrant as specified in its charter)
| Mexican Petroleum | United Mexican States | |
| (Translation of registrant’s name into English) | (Jurisdiction of incorporation or organization) |
Avenida Marina Nacional No. 329
Colonia Huasteca
México, D.F. 11311
México
(Address of principal executive offices)
Securities registered or to be registered pursuant to Section 12(b) of the Act.
None
Securities registered or to be registered pursuant to Section 12(g) of the Act.
None
Securities for which there is a reporting obligation pursuant to Section 15(d) of the Act.
Title of Each Class
8.85% Global Guaranteed Notes due 2007
9.50% Global Guaranteed Bonds due 2027
9 1/4% Global Guaranteed Bonds due 2018
9 3/8% Notes due December 2, 2008, Puttable at Par on December 2, 2001
9.50% Puttable or Mandatorily Exchangeable Securities (POMESSM) due 2027
8.50% Notes due 2008
9.125% Notes due 2010
8.00% Notes due 2011
7.875% Notes due 2009
8.625% Bonds due 2022
7.375% Notes due 2014
6.125% Notes due 2008
Indicate the number of outstanding shares of each of the issuer’s classes of capital or common stock as of the close of the period covered by the annual report:
None
Indicate by check mark whether the registrant (1) has filed all reports required to be filed by Section 13 or 15(d) of the Securities Exchange Act of 1934 during the preceding 12 months (or for such shorter period that the registrant was required to file such reports) and (2) has been subject to such filing requirements for the past 90 days. x Yes ¨ No
Indicate by check mark which financial statement item the registrant has elected to follow: ¨ Item 17 x Item 18
Table of Contents
| Identity of Directors, Senior Management and Advisers | 5 | |||
| Offer Statistics and Expected Timetable | 5 | |||
| Key Information | 6 | |||
| Information on the Company | 14 | |||
| Operating and Financial Review and Prospects | 93 | |||
| Directors, Senior Management and Employees | 129 | |||
| Major Shareholders and Related Party Transactions | 150 | |||
| Financial Information | 151 | |||
| The Offer and Listing | 157 | |||
| Additional Information | 157 | |||
| Quantitative and Qualitative Disclosures About Market Risk | 164 | |||
| Description of Securities Other than Equity Securities | 169 | |||
| Defaults, Dividend Arrearages and Delinquencies | 170 | |||
| Material Modifications to the Rights of Security Holders and Use of Proceeds | 170 | |||
| Controls and Procedures | 170 | |||
| Audit Committee Financial Expert | 170 | |||
| Code of Ethics | 170 | |||
| Principal Accountant Fees and Services | 171 | |||
| Exemptions from the Listing Standards for Audit Committees | 171 | |||
| Purchases of Equity Securities by the Issuer and Affiliated Purchasers | 171 | |||
| Financial Statements | 172 | |||
| Financial Statements | 172 | |||
| Exhibits | 172 |
Table of Contents
EXPLANATORY NOTE
We filed our annual report on Form 20-F for the fiscal year ended December 31, 2004 (which we refer to as the Form 20-F) on June 30, 2005. On October 17, 2005, we filed Amendment No. 1 to the Form 20-F (which we refer to as Amendment No. 1). This Amendment No. 2 to our Form 20-F (which we refer to as Amendment No. 2) is being filed solely for purpose of making certain additional revisions to the disclosure included in “Item 15—Controls and Procedures.”
Petróleos Mexicanos believes that these revisions are not material to its financial condition, operations or prospects.
Except as described above, no other change has been made to the Form 20-F. The filing of this Amendment No. 2 does not, and does not purport to, amend, update or restate the information in any other item of the Form 20-F or reflect any events that have occurred after the filing of the Form 20-F. In addition, the filing of this Amendment No. 2 should not be understood to mean that any statements contained herein are true or complete as of any date subsequent to June 30, 2005.
2
Table of Contents
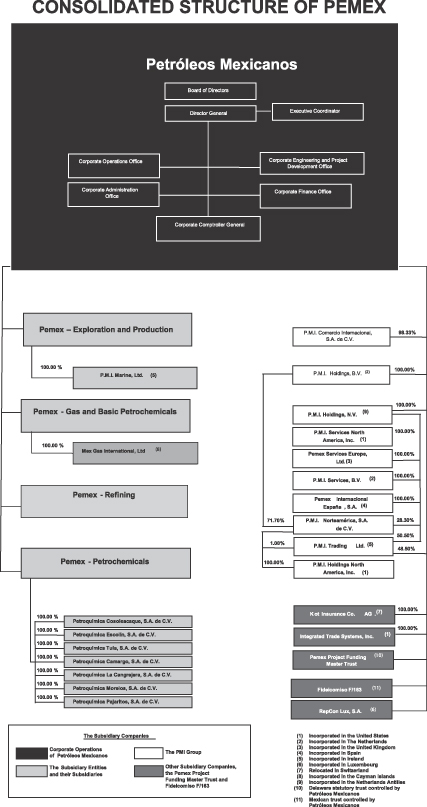
Petróleos Mexicanos and its four subsidiary entities,Pemex-Exploración y Producción (Pemex-Exploration and Production),Pemex-Refinación (Pemex-Refining),Pemex-Gas y Petroquímica Básica (Pemex-Gas and Basic Petrochemicals) andPemex-Petroquímica (Pemex-Petrochemicals), comprise the state oil and gas company of the United Mexican States, which we refer to as Mexico. Each of Petróleos Mexicanos and the subsidiary entities is a decentralized public entity of the Federal Government of Mexico, which we refer to as the Mexican Government, and is a legal entity empowered to own property and carry on business in its own name. In addition, a number of subsidiary companies that are defined in Note 1 and listed in Note 2 (c) to our consolidated financial statements included in Item 18, including the Pemex Project Funding Master Trust and the Fideicomiso F/163 (which are described below under “Item 5—Operating and Financial Review and Prospects—Liquidity and Capital Resources—Commitments for Capital Expenditures and Sources of Funding”), are incorporated into the consolidated financial statements; these subsidiary companies are also identified with the corresponding ownership percentages in “––Consolidated Structure of PEMEX” on page 3. Petróleos Mexicanos, the subsidiary entities and the consolidated subsidiary companies are collectively referred to as “PEMEX” or “we.”
References herein to “U.S. $,” “$,” “U.S. dollars” or “dollars” are to United States dollars. References herein to “pesos” or “Ps.” are to the lawful currency of Mexico. References herein to “euros” or “€” are to the lawful currency of the European Economic and Monetary Union. References herein to “pounds” or “£” are to the lawful currency of the United Kingdom. The term “billion” as used herein means one thousand million.
We maintain our consolidated financial statements and records in constant pesos. Unless otherwise indicated, we have translated all peso amounts to U.S. dollars in this Form 20-F, including all convenience translations of our consolidated financial statements included herein, at an exchange rate of Ps. 11.2648 = U.S. $1.00, which is the exchange rate that Secretaría de Hacienda y Crédito Público (Ministry of Finance and Public Credit) instructed us to use on December 31, 2004. You should not construe these translations from pesos into dollars as actually representing such U.S. dollar amounts or meaning that you could convert such amounts into U.S. dollars at the rates indicated. The peso has depreciated substantially in relation to the U.S. dollar since the end of 1994, when the Mexican Government allowed the peso to float freely against the U.S. dollar and the Mexican Government established a broad economic reform program in response to these and other events. Due to the volatility of the peso/dollar exchange rate, the exchange rate on any date subsequent to the date hereof could be materially different from the rate indicated above. See “Item 3—Key Information—Exchange Rates” for information regarding the rates of exchange between pesos and U.S. dollars.
The Private Securities Litigation Reform Act of 1995 provides for a safe harbor for forward-looking statements. This Form 20-F contains words, such as “believe,” “expect” and “anticipate” and similar expressions that identify forward-looking statements, which reflect our views about future events and financial performance. Actual results could differ materially from those projected in such forward-looking statements as a result of various factors that may be beyond our control, including, but not limited to, effects on us from competition, changes in the limitations on our access to sources of financing on competitive terms, significant economic or political developments in Mexico, particularly developments affecting the energy sector, and changes in our regulatory environment. Accordingly, you should not place undue reliance on these forward-looking statements. In any event, these statements speak only as of their dates, and we undertake no obligation to update or revise any of them, whether as a result of new information, future events or otherwise.
3
Table of Contents
4
Table of Contents
PART I
| Item 1. | Identity of Directors, Senior Management and Advisers |
Not applicable.
| Item 2. | Offer Statistics and Expected Timetable |
Not applicable.
5
Table of Contents
| Item 3. | Key Information |
SELECTED FINANCIAL DATA
The selected financial data set forth below should be read in conjunction with, and are qualified in their entirety by reference to, our consolidated financial statements included in Item 18. The selected financial data set forth below as of the five years ended December 31, 2004 have been derived from our consolidated financial statements for the years ended December 31, 2000 and 2001, which are not included herein, and the consolidated financial statements of PEMEX for the years ended December 31, 2002, 2003 and 2004. The consolidated financial statements included in this Form 20-F were audited by PricewaterhouseCoopers, S.C.
Our consolidated financial statements are prepared in accordance with Mexican Generally Accepted Accounting Principles (which we refer to as Mexican GAAP). Beginning January 1, 2003, we recognize the effects of inflation in accordance with NIF-06 BIS “A” Section C, which requires the adoption of Bulletin B-10, “Recognition of the Effects of Inflation on Financial Information,” under Mexican GAAP (which we refer to as Bulletin B-10). As a result of the adoption of Bulletin B-10, we have restated our consolidated financial statements for the years ended December 31, 2001, 2002 and 2003, in order to present our results for each of these years on the same basis as the results for the year ended December 31, 2004 with respect to the recognition of the effects of inflation. Consequently, the amounts shown in our consolidated financial statements are expressed in thousands of constant Mexican pesos as of December 31, 2004. The December 31, 2004 restatement factors applied to the financial statements at December 31, 2001, 2002 and 2003 were 15.6%, 9.4% and 5.2%, respectively, which correspond to inflation from January 1, 2002, 2003 and 2004 through December 31, 2004, respectively, based on the national consumer price index, or “NCPI.”
Our consolidated financial statements for the year ended December 31, 2000 previously recognized inflation in accordance with the guidelines established in Financial Reporting Standard NIF-06 BIS “A,” section A. The most significant differences between the recognition of inflation in accordance with the guidelines established in Financial Reporting Standard NIF-06 BIS “A,” section A, and the guidelines established in Bulletin B-10 relate to the recognition in the income statement of the comprehensive financing cost (including the determination of gains or losses in monetary position and treatment for foreign exchange gains or losses), the restatement of the equity accounts and the presentation of the financial statements for all periods in constant pesos as of the date of the latest financial statement. See Note 2 (b) to our consolidated financial statements included herein for a summary of the effects of adoption of Bulletin B-10 and Notes 2 (h), 2 (m), 2 (n), 2 (o) and 2(p) to our consolidated financial statements included herein for a discussion of the inflation accounting rules applied as a result of the adoption of Bulletin B-10.
We have not restated our consolidated financial statements for the year ended December 31, 2000 to present our results for this year on the same basis as the results for the four years ended December 31, 2004 with respect to the full application of Bulletin B-10, because such a restatement would have involved unreasonable effort and expense. However, we have presented certain selected financial data set forth below for the year ended December 31, 2000 which are available on a comparable basis with the data presented for subsequent years, and have restated such information to constant pesos as of December 31, 2004 by applying the change in inflation, 20.7%, as measured by the change in the NCPI, from January 1, 2001 through December 31, 2004. We believe that restating this historical information in accordance with the inflationary change measured by the NCPI provides meaningful information with regard to trends for the data included below for those years. However, the restatement into constant pesos as of December 31, 2004 of certain other items below for the year ended December 31, 2000 would result in information that is materially different from that which would result from the preparation of restated financial statements in accordance with Bulletin B-10. As a result, we believe that this information would not be comparable to the information presented for the four years ended December 31, 2004, and would thus not provide meaningful information with regard to trends relating to our results. Accordingly, we have omitted the selected financial data relating to these items for the year ended December 31, 2000.
6
Table of Contents
Mexican GAAP differs in certain significant respects from United States Generally Accepted Accounting Principles (which we refer to as U.S. GAAP). The principal differences between our net income and equity under U.S. and Mexican GAAP are described in Note 19 to our consolidated financial statements and “Item 5—Operating and Financial Review and Prospects—U.S. GAAP Reconciliation.”
Selected Financial Data of PEMEX
| Year Ended December 31,(1)(2) | |||||||||||||||||||
| 2000 | 2001 | 2002 | 2003 | 2004 | 2004(5) | ||||||||||||||
| (in millions of constant pesos as of December 31, 2004)(3) | (in millions of constant pesos as of December 31, 2004)(4) | (in millions of U.S. dollars) | |||||||||||||||||
Income Statement Data | |||||||||||||||||||
Amounts in accordance with Mexican GAAP: | |||||||||||||||||||
Net sales(6) | Ps. 565,198 | Ps. 526,177 | Ps. 541,574 | Ps. 657,893 | Ps. 773,587 | $ | 68,673 | ||||||||||||
Total revenues(6) | 577,774 | 527,965 | 541,480 | 661,008 | 784,741 | 69,663 | |||||||||||||
Total revenues net of the IEPS tax | 493,820 | 415,484 | 412,687 | 562,049 | 730,037 | 64,807 | |||||||||||||
Operating income | — | (7) | 281,682 | 311,070 | 386,647 | 455,201 | 40,409 | ||||||||||||
Comprehensive financing cost | — | (7) | 2,578 | 6,563 | 32,338 | 7,048 | 626 | ||||||||||||
Income (loss) for the period | — | (7) | (31,974 | ) | (25,850 | ) | (42,754 | ) | (25,496 | ) | (2,263 | ) | |||||||
Balance Sheet Data (end of period) | |||||||||||||||||||
Amounts in accordance with Mexican GAAP: | |||||||||||||||||||
Cash and cash equivalents | 33,587 | 16,696 | 47,989 | 77,143 | 84,872 | 7,534 | |||||||||||||
Total assets | — | (7) | 641,835 | 807,571 | 889,359 | 947,527 | 84,114 | ||||||||||||
Long-term debt | 125,974 | 142,396 | 208,956 | 319,373 | 394,549 | 35,025 | |||||||||||||
Total long-term liabilities | — | (7) | 418,584 | 573,812 | 697,094 | 773,702 | 68,683 | ||||||||||||
Equity | — | (7) | 140,048 | 109,300 | 48,241 | 33,343 | 2,960 | ||||||||||||
Amounts in accordance with U.S. GAAP: | |||||||||||||||||||
Total revenues net of IEPS tax(8) | 512,189 | 414,948 | 412,687 | 562,049 | 725,720 | 64,424 | |||||||||||||
Operating income net of IEPS tax(8) | — | (7) | 168,904 | 176,218 | 259,673 | 404,717 | 35,928 | ||||||||||||
Comprehensive financing (cost) income | 837 | (8,889 | ) | (28,204 | ) | 2,083 | 185 | ||||||||||||
Loss for the period | — | (7) | (24,556 | ) | (34,362 | ) | (69,751 | ) | (13,011 | ) | (1,155 | ) | |||||||
Total assets | — | (7) | 665,111 | 800,248 | 857,802 | 913,005 | 81,049 | ||||||||||||
Equity (deficit) | — | (7) | 66,729 | 18,020 | (46,726 | ) | (48,856 | ) | (4,337 | ) | |||||||||
Other Financial Data | |||||||||||||||||||
Amounts in accordance with Mexican GAAP: | |||||||||||||||||||
Depreciation and amortization | — | (7) | 33,619 | 35,570 | 42,649 | 41,900 | 3,720 | ||||||||||||
Investments in fixed assets at cost(9) | 92,012 | 59,737 | 99,900 | 71,387 | 75,062 | 6,663 | |||||||||||||
Ratio of earnings to fixed charges: | |||||||||||||||||||
Mexican GAAP(10) | — | (7) | — | — | — | — | — | ||||||||||||
U.S. GAAP(10) | — | (7) | — | — | — | — | — | ||||||||||||
7
Table of Contents
| (1) | Includes Petróleos Mexicanos, the subsidiary entities and the subsidiary companies (including the Pemex Project Funding Master Trust). For Mexican GAAP and U.S. GAAP purposes, beginning with the year ended December 31, 2003, we include the financial position and results of Fideicomiso F/163 and RepCon Lux S.A. For U.S. GAAP purposes, beginning with the year ended December 31, 2001, we include the financial position and results of Pemex Finance, Ltd. |
| (2) | Mexican GAAP differs from U.S. GAAP. For the most significant differences between U.S. GAAP and Mexican GAAP affecting our consolidated financial statements, see Note 19 to our consolidated financial statements included herein and “Item 5—Operating and Financial Review and Prospects—U.S. GAAP Reconciliation.” |
| (3) | As described above, the financial data included herein for the year ended December 31, 2000 have been translated into constant pesos as of December 31, 2004, but were not restated to recognize the effects of inflation in accordance with Bulletin B-10 because we were unable to do so without unreasonable effort and expense. |
| (4) | Our consolidated financial statements for each of the four years ended December 31, 2004 were prepared in accordance with Mexican GAAP, including the recognition of the effect of inflation in accordance with Bulletin B-10. |
| (5) | Translations into U.S. dollars of amounts in pesos have been made at the established exchange rate for accounting purposes of Ps. 11.2648 = U.S. $1.00 at December 31, 2004. Such translations should not be construed as a representation that the peso amounts have been or could be converted into U.S. dollar amounts at the foregoing or any other rate. |
| (6) | Includes the Special Tax on Production and Services (the “IEPS tax”) as part of the sales price of the products sold. |
| (7) | As described above, this data is omitted for the year ended December 31, 2000 because we were unable to restate our financial statements for that year to recognize the effects of inflation in accordance with Bulletin B-10 without unreasonable effort or expense, and, if presented in accordance with Financial Reporting Standard NIF-06 BIS “A,” section A (even if restated into constant pesos as of December 31, 2004), this data would not be comparable to the financial data presented for the four years ended December 31, 2004. |
| (8) | Figures are net of the IEPS tax. |
| (9) | Includes investments in fixed assets and capitalized interest. For 2003, it excludes certain expenditures charged to the oil field exploration and depletion reserve. See Note 2(e) to our financial statements included herein and “Item 5—Operating and Financial Review and Prospects—Liquidity and Capital Resources.” |
| (10) | Under U.S. GAAP, earnings for the years ended December 31, 2001, 2002, 2003 and 2004 were insufficient to cover fixed charges. The amount by which fixed charges exceeded earnings was Ps. 30,567 million, Ps. 40,674 million, Ps. 78,119 million and Ps. 18,239 million, respectively. Under Mexican GAAP, earnings for the years ended December 31, 2001, 2002, 2003 and 2004 were insufficient to cover fixed charges. The amount by which fixed charges exceeded earnings was Ps. 36,443 million, Ps. 31,654 million, Ps. 50,397 million and Ps. 29,836 million, respectively. |
Source: PEMEX’s financial statements.
8
Table of Contents
EXCHANGE RATES
The following table sets forth, for the periods indicated, the high, low, average and period-end exchange rate for the purchase of U.S. dollars, expressed in pesos per U.S. dollar. These rates have not been restated in constant currency units.
Period | Exchange Rate | |||||||
| High | Low | Average(1) | Period End | |||||
Year Ended December 31, | ||||||||
2000 | 10.087 | 9.183 | 9.472 | 9.618 | ||||
2001 | 9.972 | 8.946 | 9.326 | 9.156 | ||||
2002 | 10.425 | 9.001 | 9.746 | 10.425 | ||||
2003 | 11.406 | 10.113 | 10.846 | 11.242 | ||||
2004 | 11.635 | 10.805 | 11.309 | 11.154 | ||||
2005 | ||||||||
January | 11.411 | 11.172 | 11.263 | 11.207 | ||||
February | 11.206 | 11.043 | 11.137 | 11.089 | ||||
March | 11.330 | 10.976 | 11.155 | 11.177 | ||||
April | 11.230 | 11.036 | 11.112 | 11.082 | ||||
May | 11.033 | 10.885 | 10.976 | 10.913 | ||||
June(2) | 10.883 | 10.759 | 10.824 | 10.809 | ||||
| (1) | Average of month-end rates, except for 2005 monthly exchange rates. |
| (2) | For the period beginning June 1, 2005 to June 27, 2005. |
Source: Noon buying rate for cable transfers in New York reported by the Federal Reserve Bank of New York.
The noon buying rate for cable transfers in New York reported by the Federal Reserve Bank of New York on June 27, 2005 was Ps. 10.809 = U.S. $1.00.
RISK FACTORS
Risk Factors Related to the Operations of PEMEX
Crude oil prices are volatile, and low oil prices negatively affect PEMEX’s income
International crude oil prices are subject to global supply and demand and fluctuate due to many factors beyond our control. These factors include competition within the oil industry and with other industries in supplying clients with competing commodities, international economic trends, exchange rate fluctuations, expectations of inflation, domestic and foreign government regulations, political and other events in major oil producing and consuming nations and actions taken by Organization of the Petroleum Exporting Countries (OPEC) members and other oil exporting countries.
When international crude oil and natural gas prices are low, we earn less export sales revenue and, therefore, earn less income because our costs remain roughly constant. Conversely, when crude oil and natural gas prices are high, we earn more export sales revenue and our income increases. As a result, future fluctuations in international crude oil and natural gas prices will directly affect our results of operations and financial condition.
PEMEX is an integrated oil and gas company and is exposed to production, equipment and transportation risks
We are subject to several risks that are common among oil and gas companies. These risks include production risks (fluctuations in production due to operational hazards, natural disasters or weather, accidents, etc.), equipment risks (relating to the adequacy and condition of our facilities and equipment) and transportation risks (relating to the condition and vulnerability of pipelines and other modes of transportation).
9
Table of Contents
More specifically, our business is subject to the risks of explosions in pipelines, refineries, plants, drilling wells and other facilities, hurricanes in the Gulf of Mexico and other natural or geological disasters and accidents, fires and mechanical failures. The occurrence of any of these events could result in personal injuries, loss of life, equipment damage, and environmental damage and the resulting clean-up and repair expenses.
Although we have purchased insurance policies covering some of these risks, these policies may not cover all liabilities, and insurance may not be available for all risks. See “Item 4—Information on the Company—Business Overview—PEMEX Corporate Matters—Insurance.”
PEMEX has a substantial amount of debt that could adversely affect our financial health and results of operations
We have a substantial amount of debt. At December 31, 2004, our total indebtedness, excluding accrued interest, was approximately U.S. $39.0 billion, which is a 23.0% increase over our total indebtedness, excluding accrued interest, of U.S. $31.7 billion at December 31, 2003. Our level of debt may not decrease in the near or medium term and may have an adverse effect on our financial condition and results of operations.
To service our debt, we rely on a combination of cash flows provided by operations, drawdowns under our available credit facilities and the incurrence of additional indebtedness. Certain rating agencies have expressed concern regarding both the total amount of debt and our increase in indebtedness over the last several years. Any lowering of our credit ratings may have adverse consequences on our ability to access the financial markets and/or our cost of financing. We rely primarily on debt to finance our investments in capital expenditures. If we are unable to obtain financing on terms that are favorable, this may hamper our ability to obtain further financing, and, as a result, we may not be able to make the capital expenditures needed to maintain our current production levels and increase Mexico’s hydrocarbon reserves. See “—PEMEX must make significant capital expenditures to maintain its current production levels and increase Mexico’s hydrocarbon reserves. Mexican Government budget cuts, reductions in PEMEX’s income and inability to obtain financing may limit PEMEX’s ability to make capital investments” below.
PEMEX’s compliance with environmental regulations in Mexico could result in material adverse effects on our results of operations
A wide range of general and industry-specific Mexican federal and state environmental laws and regulations apply to our operations. Numerous Mexican Government agencies and departments issue rules and regulations which are often difficult and costly to comply with and which carry substantial penalties for non-compliance. This regulatory burden increases our costs because it requires us to make significant capital expenditures and limits our ability to extract hydrocarbons, resulting in lower revenues. For an estimate of our accrued environmental liabilities, see “Item 4—Information on the Company—Environmental Regulation—Environmental Liabilities.”
PEMEX publishes less financial information than U.S. companies are required to file with the U.S. Securities and Exchange Commission
We prepare our financial statements according to Mexican GAAP, which differs in certain significant respects from U.S. GAAP. See “Item 3—Key Information—Selected Financial Data” and Note 19 to our consolidated financial statements included herein. In addition, we generally prepare U.S. GAAP information on a yearly basis only. As a result, there may be less or different publicly available information about us than there is about U.S. issuers.
10
Table of Contents
Risk Factors Related to the Relationship between PEMEX and the Mexican Government
The Mexican Government controls PEMEX, it could limit PEMEX’s ability to satisfy its external debt obligations, and the Mexican Government could privatize PEMEX
Petróleos Mexicanos is a decentralized public entity of the Mexican Government, and therefore the Mexican Government controls us, as well as our annual budget, which is approved by the Mexican Congress. The Mexican Government has the power to intervene directly or indirectly in our commercial affairs. Such an intervention could adversely affect our ability to make payments under any securities issued or guaranteed by us.
The Mexican Government’s agreements with international creditors may affect our external debt obligations. In certain past debt restructurings of the Mexican Government, Petróleos Mexicanos’ external indebtedness was treated on the same terms as the debt of the Mexican Government and other public sector entities. In addition, Mexico has entered into agreements with official bilateral creditors to reschedule public sector external debt. Mexico has not requested restructuring of bonds or debt owed to multilateral agencies.
The Mexican Government would have the power, if federal law and theConstitución Política de los Estados Unidos Mexicanos(the Political Constitution of the United Mexican States) were amended, to privatize or transfer all or a portion of Petróleos Mexicanos and the subsidiary entities or its assets. A privatization could adversely affect production, cause a disruption in our workforce and our operations, and cause us to default on certain obligations. See also “—Considerations Related to Mexico” below.
Petróleos Mexicanos and the subsidiary entities pay special taxes, duties and dividends to the Mexican Government
The Mexican Government taxes Petróleos Mexicanos and the subsidiary entities heavily. In 2004, approximately 65.6% of the sales revenues of Petróleos Mexicanos and the subsidiary entities were used to pay taxes to the Mexican Government. The Mexican Congress determines the rates of taxes and duties applicable to Petróleos Mexicanos and the subsidiary entities from year to year depending on a variety of factors. For further information, see “Item 4—Information on the Company—Taxes and Duties” and “Item 5—Operating and Financial Review and Prospects—General—IEPS Tax, Excess Gains Duty, Hydrocarbon Duties and Other Taxes.” In addition, Petróleos Mexicanos is obligated to pay minimum guaranteed dividends to the Mexican Government. For further information on how the minimum guaranteed dividend is determined, see “Item 5—Operating and Financial Review and Prospects—Liquidity and Capital Resources—Equity Structure and the Certificates of Contribution ‘A,’” “Item 8—Financial Information—Dividends” and Note 13 to our consolidated financial statements included herein.
The Mexican Government has entered into agreements with other nations to limit production
Although Mexico is not a member of OPEC, in the past it has entered into agreements with OPEC and non-OPEC countries to reduce global crude oil supply. We do not control the Mexican Government’s international affairs and the Mexican Government could agree with OPEC or other countries to reduce our crude oil production or exports in the future. A reduction in our oil production or exports could reduce our revenues. For more information, see “Item 5—Operating and Financial Review and Prospects—Export Agreements.”
PEMEX does not own the hydrocarbon reserves in Mexico, and information on reserves is based on estimates
The Political Constitution of the United Mexican States provides that the Mexican nation, not PEMEX, owns the petroleum and other hydrocarbon reserves located in Mexico. Although Mexican law gives Petróleos Mexicanos and the subsidiary entities the exclusive right to exploit Mexico’s hydrocarbon reserves, it does not preclude the Mexican Congress from changing current law and assigning some or all of these rights to another company. Such an event would adversely affect our ability to generate income.
11
Table of Contents
The information on oil, gas and other reserves set forth in this Form 20-F is based on estimates. Reserves valuation is a subjective process of estimating underground accumulations of crude oil and natural gas that cannot be measured in an exact manner; the accuracy of any reserve estimate depends on the quality and reliability of available data, engineering and geological interpretation and subjective judgment. Additionally, estimates may be revised based on subsequent results of drilling, testing and production. Therefore, proved reserve estimates may differ materially from the ultimately recoverable quantities of crude oil and natural gas. Pemex-Exploration and Production revises its estimates of Mexico’s hydrocarbon reserves annually, which may result in material revisions to our estimates of Mexico’s hydrocarbon reserves.
PEMEX must make significant capital expenditures to maintain its current production levels and increase Mexico’s hydrocarbon reserves. Mexican Government budget cuts, reductions in PEMEX’s income and inability to obtain financing may limit PEMEX’s ability to make capital investments
We invest funds to increase the amount of extractable hydrocarbon reserves in Mexico. We also continually invest capital to enhance our hydrocarbon recovery ratio and improve the reliability and productivity of our infrastructure. Our ability to make these capital expenditures is limited by the substantial taxes that we pay and cyclical decreases in our revenues primarily related to lower oil prices. In addition, budget cuts imposed by the Mexican Government and the availability of financing may also limit our ability to make capital investments. For more information, see “Item 4—Information on the Company—Capital Expenditures and Investments.”
PEMEX may claim some immunities under the Foreign Sovereign Immunities Act and Mexican law, and your ability to sue or recover may be limited
Petróleos Mexicanos and the subsidiary entities are decentralized public entities of the Mexican Government. Accordingly, you may not be able to obtain a judgment in a U.S. court against us unless the U.S. court determines that we are not entitled to sovereign immunity with respect to that action. In addition, Mexican law does not allow attachment prior to judgment or attachment in aid of execution upon a judgment by Mexican courts upon the assets of Petróleos Mexicanos or the subsidiary entities. As a result, your ability to enforce judgments against us in the courts of Mexico may be limited. We also do not know whether Mexican courts would enforce judgments of U.S. courts based on the civil liability provisions of the U.S. federal securities laws. Therefore, even if you were able to obtain a U.S. judgment against us, you might not be able to obtain a judgment in Mexico that is based on that U.S. judgment. Moreover, you may not be able to enforce a judgment against our property in the United States except under the limited circumstances specified in the Foreign Sovereign Immunities Act. Finally, if you were to bring an action in Mexico seeking to enforce our obligations under any of our securities, satisfaction of those obligations would be made in pesos, pursuant to the laws of Mexico.
Our directors and officers, as well as some of the experts named in this Form 20-F, reside outside the United States. Substantially all of our assets and those of most of our directors, officers and experts are located outside the United States. As a result, you may not be able to effect service of process on our directors or officers or those experts within the United States.
Considerations Related to Mexico
Economic conditions and government policies in Mexico may have a material impact on PEMEX’s operations
A deterioration in Mexico’s economic conditions, social instability, political unrest or other adverse social developments in Mexico could adversely affect our business and financial condition. Those events could also lead to increased volatility in the foreign exchange and financial markets, thereby affecting our ability to obtain and service foreign debt. In addition, the Mexican Government may cut spending in the future. These cuts could adversely affect our business, financial condition and prospects. In the past, Mexico has experienced several periods of slow or negative economic growth, high inflation, high interest rates, currency devaluation and other economic problems. These problems may reemerge in the future, and could adversely affect our business and our ability to service our debt.
12
Table of Contents
Changes in exchange rates or in Mexico’s exchange control laws may hamper the ability of PEMEX to service its foreign currency debt
While the Mexican Government does not currently restrict the ability of Mexican companies or individuals to convert pesos into dollars or other currencies, in the future, the Mexican Government could impose a restrictive exchange control policy, as it has done in the past. We cannot assure you that the Mexican Government will maintain its current policies with regard to the peso or that the peso’s value will not fluctuate significantly in the future. The peso has been subject to significant devaluations against the U.S. dollar in the past and may be subject to significant fluctuations in the future. Mexican Government policies affecting the value of the peso could prevent us from paying our foreign currency obligations.
Most of our debt is denominated in U.S. dollars, as is all of the debt of Pemex Finance, Ltd., a Cayman Islands company with limited liability established to issue securities backed by crude oil receivables sold through our subsidiary P.M.I. Comercio Internacional, S.A. de C.V. (which we refer to as PMI, and together with P.M.I. Trading Ltd. and their affiliates, the PMI Group) to provide financing for investments in certain of our largest capital expenditures as long-term productive infrastructure projects, which we refer to as PIDIREGAS. In the future, Pemex Finance, Ltd. and we may incur additional indebtedness denominated in U.S. dollars or other currencies. Declines in the value of the peso relative to the U.S. dollar or other currencies may increase our interest costs in pesos and result in foreign exchange losses.
For information on historical peso/U.S. dollar exchange rates, see “Item 3—Key Information—Exchange Rates” above.
Political conditions in Mexico could materially and adversely affect Mexican economic policy and, in turn, PEMEX’s operations
The national elections held on July 2, 2000 ended 71 years of rule by the Institutional Revolutionary Party with the election of President Vicente Fox Quesada, a member of the National Action Party, and resulted in the increased representation of opposition parties in the Mexican Congress and in mayoral and gubernatorial positions. No political party has a majority in either house of the Mexican Congress. This shift in political power has transformed Mexico from a one-party state to a pluralist democracy. There have not been any material adverse repercussions for us resulting from this political change. Presidential and federal congressional elections in Mexico will be held in July 2006.
13
Table of Contents
| Item 4. | Information on the Company |
HISTORY AND DEVELOPMENT
We are the largest company in Mexico, and according to the December 13, 2004 issue ofPetroleum Intelligence Weekly, we were the ninth largest oil and gas company in the world based on data from the year 2003. In 1938, President Lázaro Cárdenas del Río nationalized the foreign-owned oil companies which were then operating in Mexico and the Mexican Congress established Petróleos Mexicanos by a decree, effective on July 20, 1938. Since 1938, Mexican federal laws and regulations have entrusted Petróleos Mexicanos with the central planning and management of Mexico’s petroleum industry. On July 17, 1992, the Mexican Congress created the subsidiary entities out of operations that had previously been directly managed by Petróleos Mexicanos. Petróleos Mexicanos and its four subsidiary entities, Pemex-Exploration and Production, Pemex-Refining, Pemex-Gas and Basic Petrochemicals and Pemex-Petrochemicals, are decentralized public entities of the Mexican Government, and each is a legal entity empowered to own property and carry on business in its own name.
PEMEX’s executive offices are located at Avenida Marina Nacional No. 329, Colonia Huasteca, México, D.F. 11311, México. PEMEX’s telephone number is (52-55) 1944-2500.
Organizational Laws
The activities of Petróleos Mexicanos and the subsidiary entities are regulated primarily by:
| • | theLey Reglamentaria del Artículo 27 Constitucional en el Ramo del Petróleo (the Regulatory Law to Article 27 of the Political Constitution of the United Mexican States Concerning Petroleum Affairs, which we refer to as the Regulatory Law); and |
| • | theLey Orgánica de Petróleos Mexicanos y Organismos Subsidiarios (the Organic Law of Petróleos Mexicanos and Subsidiary Entities, which we refer to as the Organic Law). |
The Organic Law and related regulations grant Petróleos Mexicanos and certain of the subsidiary entities the exclusive right to:
| • | explore, exploit, refine, transport, store, distribute and sell (first-hand) crude oil; |
| • | explore, exploit, produce and sell (first-hand) natural gas and transport and store natural gas, to the extent the transportation and storage activities are inextricably linked with such exploitation and production; and |
| • | produce, store, transport, distribute and sell (first-hand) the derivatives of petroleum (including petroleum products) and natural gas used as basic industrial raw materials that constitute basic petrochemicals, which include ethane, propane, butanes, pentanes, hexanes, heptanes, naphthas, carbon black feedstocks and methane, but in the case of methane, only if obtained from hydrocarbons used as basic raw materials by the petrochemical industry and obtained from deposits located in Mexico. |
The Organic Law allocates the operating functions of Petróleos Mexicanos among the four subsidiary entities, each of which has the characteristics of a subsidiary of Petróleos Mexicanos. The principal objectives of the subsidiary entities are as follows:
| • | Pemex-Exploration and Production explores for and exploits crude oil and natural gas and transports, stores and markets these hydrocarbons; |
| • | Pemex-Refining refines petroleum products and derivatives that may be used as basic industrial raw materials and stores, transports, distributes and markets these products and derivatives; |
14
Table of Contents
| • | Pemex-Gas and Basic Petrochemicals processes natural gas, natural gas liquids and derivatives that may be used as basic industrial raw materials and stores, transports, distributes and markets these products and produces, stores, transports, distributes and markets basic petrochemicals; and |
| • | Pemex-Petrochemicals engages in industrial petrochemical processes and stores, distributes and markets petrochemicals other than basic petrochemicals. |
In 1995, the Mexican Congress amended the Regulatory Law to allow private and social sector companies, which include labor-controlled organizations and industries, to participate, with the Mexican Government’s approval, in the storage, distribution and transportation of natural gas. Pursuant to the Regulatory Law, as amended, these types of companies may construct, own and operate pipelines, installations and equipment. Since 1997, the Mexican Government has required that we divest our existing natural gas distribution assets but has allowed us to retain exclusive authority over the exploration, exploitation, production and first-hand sale of natural gas, as well as the transportation and storage inextricably linked with this type of exploitation and production. See ”—Gas and Basic Petrochemicals—Private Sector Participation in Natural Gas Distribution” below.
Capital Expenditures and Investments
We fund our annual budget (not including PIDIREGAS) through revenue generated by our operations and financing activities. Capital expenditures are undertaken by Petróleos Mexicanos and the subsidiary entities. Capital expenditures and operating expenses must be authorized in our annual budget, which is approved by the Mexican Congress. PIDIREGAS are long-term productive infrastructure projects funded through financing activities of the Pemex Project Funding Master Trust and the Fideicomiso F/163 or directly by a contractor and must also be authorized in a budget approved by the Mexican Congress. Thus, each year, we submit proposals to and negotiate with the Mexican Government regarding how our after-tax funds should be allocated.
PIDIREGAS.An important component of our capital expenditures are PIDIREGAS. Because of federal budgetary constraints, the Mexican Government has sought private sector participation in the building and financing of PIDIREGAS. The Mexican Government approves the designation of certain infrastructure projects as PIDIREGAS. This designation means that these projects are treated as off-balance sheet items for annual budgetary purposes, until delivery of the completed project to us or until our payment obligations begin under the contract.
TheLey General de Deuda Pública (General Law of Public Debt) and theLey de Presupuesto, Contabilidad y Gasto Público Federal (Federal Law of Budget, Accounting and Public Expenditure) define the PIDIREGAS legal framework. Article 18 of the General Law of Public Debt outlines the treatment of financial obligations under PIDIREGAS, defining as a direct liability the amounts payable under a financing during the current and immediately following fiscal years, and the remaining amounts as a contingent liability until its full payment. Article 30 of the Federal Law of Budget, Accounting and Public Expenditure grants PIDIREGAS preferential and priority treatment for inclusion in the Mexican Government’s budget in future years, until the full payment of a project’s costs.
PIDIREGAS have three stages:
| • | The Mexican Government identifies a project as a PIDIREGAS and authorizes expenditures related to their development by the private sector; |
| • | Private sector companies, in cooperation with us, build and deliver the project to us; and |
| • | We, with the Mexican Government’s authorization, pay all amounts owing to contractors and make final payments to receive delivery of the completed project and then record as a liability the full principal amount of all indebtedness incurred to finance the project. |
15
Table of Contents
Compliance with the Mexican Government’s Financial Reporting Standards and the Guidelines for the Accounting Treatment of Investments in Long-Term Productive Infrastructure Projects (Technical Release NIF-09-B), which outlines the accounting and budgetary treatment applicable to PIDIREGAS, is mandatory during the construction period and after delivery of the PIDIREGAS. The distinction between PIDIREGAS and non-PIDIREGAS expenditures is an important factor for budgetary purposes, since a project’s designation as a PIDIREGAS guarantees that its financing is immune from across-the-board budget cuts. For the purposes of our consolidated financial statements included herein and in accordance with Mexican GAAP, all of the accounts related to PIDIREGAS were incorporated into the consolidated financial statements,i.e., all of the effects of Technical Release NIF-09-B are excluded. These expenditures and liabilities are included in our consolidated financial statements in accordance with Mexican GAAP Bulletin B-8 “Consolidated and Combined Financial Statements and Valuation of Permanent Investments in Stocks.”
In recent years, PIDIREGAS have represented a significant portion of our total annual capital expenditures. PIDIREGAS capital expenditures alone totaled Ps. 110.6 billion in nominal terms in 2004 (90% of our total capital expenditures), Ps. 94.7 billion in 2003 (83% of our total capital expenditures) and Ps. 57.8 billion in nominal terms in 2002 (72% of our total capital expenditures). For 2005, we have budgeted Ps. 114.9 billion in nominal terms for PIDIREGAS expenditures (or approximately 84% of our total budgeted capital expenditures).
The following table sets forth our capital expenditures for PIDIREGAS for the five years ended December 31, 2004, and the budget for such expenditures for 2005.
16
Table of Contents
PIDIREGAS Capital Expenditures
| Year ended December 31,(1)(2) | |||||||||||||
| 2000 | 2001 | 2002 | 2003 | 2004 | Budget 2005(3) | ||||||||
| (millions of nominal pesos) | (millions of constant 2005 pesos) | ||||||||||||
Pemex-Exploration and Production | |||||||||||||
Cantarell | Ps. 20,210 | Ps. 25,867 | Ps. 24,397 | Ps. 23,011 | Ps. 27,240 | Ps. 24,340 | |||||||
Strategic Gas Program(4) | — | 1,594 | 8,967 | 18,079 | 23,413 | 19,909 | |||||||
Burgos | 5,596 | 7,018 | 9,383 | 10,995 | 16,344 | 14,172 | |||||||
Ku-Maloob-Zaap | — | — | 865 | 3,072 | 10,222 | 17,226 | |||||||
Antonio J. Bermúdez | — | — | 471 | 3,622 | 6,270 | 6,867 | |||||||
Chuc | — | — | 302 | 1,753 | 4,152 | 3,246 | |||||||
Abkatún Integral | — | — | 529 | 1,856 | 2,769 | 1,330 | |||||||
Agua Fría-Coapechaca-Tajín | — | — | 93 | 1,860 | 2,402 | 1,560 | |||||||
Arenque | — | — | 183 | 1,089 | 2,274 | 1,995 | |||||||
Bellota-Chinchorro | — | — | 244 | 1,399 | 2,001 | 1,867 | |||||||
Jujo-Tecominoacán | — | — | 279 | 1,668 | 1,699 | 2,467 | |||||||
El Golpe-Puerto Ceiba | — | — | 396 | 1,915 | 1,695 | 1,863 | |||||||
Caan | — | — | 374 | 834 | 1,393 | 1,669 | |||||||
Integral Poza Rica | — | — | 22 | 424 | 938 | 719 | |||||||
Cactus-Sitio Grande | — | — | 114 | 1,276 | 918 | 453 | |||||||
Taratunich | — | — | 92 | 938 | 787 | 575 | |||||||
Delta del Grijalva | 1,431 | 1,466 | 1,439 | 641 | 728 | 781 | |||||||
Och-Uech-Kax | — | — | 261 | 750 | 718 | 460 | |||||||
Ek-Balam | — | — | 99 | 748 | 668 | 1,059 | |||||||
Amatitlán-Profeta-Tzapotempa-Vinazco | — | — | 8 | 465 | 650 | 1,397 | |||||||
Carmito-Artesa | — | — | 187 | 606 | 614 | 389 | |||||||
Integral Batab | — | — | 57 | 388 | 593 | 99 | |||||||
Pol | — | — | 720 | 1,466 | 481 | 508 | |||||||
Cárdenas | — | — | 44 | 241 | 215 | 198 | |||||||
Integral Kanaab | — | — | 13 | 284 | 186 | 108 | |||||||
Integral Yaxche | — | — | — | 18 | 158 | 712 | |||||||
Ayín-Alux | — | — | 17 | 37 | 108 | 57 | |||||||
Total | 27,236 | 35,945 | 49,557 | 79,435 | 109,638 | 106,025 | |||||||
Pemex-Refining | |||||||||||||
Cadereyta(5) | 15,652 | — | 115 | — | — | — | |||||||
Madero(6) | — | — | 6,608 | 11,323 | — | — | |||||||
Salamanca(7) | — | — | — | 2,679 | — | — | |||||||
Tula(8) | — | — | 1,461 | 133 | — | — | |||||||
Minatitlán | — | — | — | — | 445 | 7,079 | |||||||
Total | 15,652 | — | 8,184 | 14,134 | 445 | 7,079 | |||||||
Pemex-Gas and Basic Petrochemicals | |||||||||||||
Modular Cryogenic Plants in Reynosa | — | — | 75 | 1,105 | 537 | 1,524 | |||||||
Total | — | — | 75 | 1,105 | 537 | 1,524 | |||||||
Pemex-Petrochemicals | |||||||||||||
Aromatics Train 1 at Petroquímica La Cangrejera | — | — | — | — | — | 266 | |||||||
Total | — | — | — | — | — | 266 | |||||||
Total PIDIREGAS Expenditures | Ps. 42,888 | Ps. 35,945 | Ps. 57,815 | Ps. 94,674 | Ps. 110,620 | Ps. 114,894 | |||||||
17
Table of Contents
| Note: | Numbers may not total due to rounding. |
| (1) | Amounts based on cash basis method of accounting. |
| (2) | Includes capitalized interest during construction period. |
| (3) | Approved budget. |
| (4) | The Strategic Gas Program includes 23 different natural gas projects expected to increase domestic supply of natural gas, thereby minimizing imports. |
| (5) | In November 2003, the Cadereyta project was certified as 99.31% complete and formally concluded. |
| (6) | The Madero project was completed on October 24, 2002, and the final payment was made to the contractor on March 3, 2003. |
| (7) | The Salamanca project was completed on January 9, 2003. |
| (8) | The Tula project was completed and contractors were paid in August 2002, although amounts were budgeted for and paid in 2003 to cover potential adjustments or additional works required in connection with this project. |
Source: Petróleos Mexicanos.
During 2004, Pemex-Exploration and Production implemented 27 PIDIREGAS. Pemex-Exploration and Production will continue to implement these projects in 2005.
18
Table of Contents
The following table sets forth our approved capital expenditures budget for PIDIREGAS projects for 2005 through 2008.
PIDIREGAS Approved Budget Capital Expenditures
| Year ended December 31,(1)(2) | ||||||||
| 2005 | 2006 | 2007 | 2008 | |||||
| (millions of constant 2005 pesos) | ||||||||
Pemex-Exploration and Production | ||||||||
Cantarell | Ps. 24,340 | Ps. 23,456 | Ps. 21,793 | Ps. 19,139 | ||||
Strategic Gas Program | 19,909 | 14,243 | 19,267 | 20,332 | ||||
Burgos | 14,172 | 21,887 | 27,349 | 24,088 | ||||
Ku-Maloob-Zaap | 17,226 | 16,490 | 19,056 | 13,579 | ||||
Antonio J. Bermúdez | 6,867 | 3,479 | 3,426 | 3,543 | ||||
Chuc | 3,246 | 1,857 | 2,304 | 1,776 | ||||
Abkatún Integral | 1,330 | 2 | — | — | ||||
Agua Fría-Coapechaca-Tajín(3) | 1,560 | 3,481 | 5,686 | 6,901 | ||||
Arenque | 1,995 | 877 | 1,174 | 454 | ||||
Bellota-Chinchorro | 1,867 | 872 | 1,479 | 1,472 | ||||
Jujo-Tecominoacán | 2,467 | 740 | 1,276 | 1,004 | ||||
El Golpe-Puerto Ceiba | 1,863 | 902 | 679 | 536 | ||||
Caan | 1,669 | 856 | 1,544 | 1,286 | ||||
Integral Poza Rica | 719 | 868 | 774 | 668 | ||||
Cactus-Sitio Grande | 453 | 1,070 | 1,110 | 713 | ||||
Taratunich | 575 | 85 | 322 | 439 | ||||
Delta del Grijalva | 781 | 443 | 544 | 170 | ||||
Och-Uech-Kax | 460 | 239 | 167 | 76 | ||||
Ek-Balam | 1,059 | 614 | 803 | 433 | ||||
Amatitlán-Profeta-Tzapotempa-Vinazco(3) | 1,397 | 3,296 | 4,422 | 3,398 | ||||
Carmito-Artesa | 389 | 330 | 1,026 | 622 | ||||
Integral Batab | 99 | 153 | 350 | 79 | ||||
Pol | 508 | — | — | — | ||||
Cárdenas | 198 | 90 | 361 | 287 | ||||
Integral Kanaab | 108 | 11 | — | — | ||||
Integral Yaxche | 712 | 420 | 398 | 318 | ||||
Ayín-Alux | 57 | 934 | 1,654 | 1,638 | ||||
Total | 106,025 | 97,694 | 116,964 | 102,951 | ||||
Pemex-Refining | ||||||||
Minatitlán | 7,079 | 7,588 | 6,119 | 3,548 | ||||
Salina Cruz | — | — | 1,825 | 7,150 | ||||
Total | 7,079 | 7,588 | 7,944 | 10,698 | ||||
Pemex-Gas and Basic Petrochemicals | ||||||||
Modular Cryogenic Plants in Reynosa | 1,524 | 303 | — | — | ||||
Total | 1,524 | 303 | — | — | ||||
Pemex-Petrochemicals | ||||||||
Aromatics Train 1 at Petroquímica La Cangrejera | 266 | 622 | 666 | — | ||||
Total | 266 | 622 | 666 | — | ||||
Total PIDIREGAS Budget | Ps. 114,894 | Ps. 106,207 | Ps. 125,574 | Ps. 113,649 | ||||
19
Table of Contents
| Note: | Numbers may not total due to rounding. |
| (1) | Amounts based on cash basis method of accounting. |
| (2) | Includes capitalized interest during the construction period. |
| (3) | PIDIREGAS relating to the development of the Chicontepec field. |
Source: Petróleos Mexicanos.
Non-PIDIREGAS Capital Expenditures. In addition to the Ps. 110.6 billion spent on PIDIREGAS in 2004, in nominal terms we spent Ps. 12.2 billion in 2004 on other capital expenditures excluding PIDIREGAS (which we refer to as non-PIDIREGAS capital expenditures), which represents a 36% decrease from the Ps. 19.0 billion in nominal terms of non-PIDIREGAS capital expenditures in 2003. Of the Ps. 12.2 billion in non-PIDIREGAS capital expenditures during 2004, we directed Ps. 3.7 billion (or 30% of total non-PIDIREGAS capital expenditures) to exploration and production programs. Of the Ps. 19.0 billion in non-PIDIREGAS capital expenditures during 2003, we directed Ps. 8.9 billion (or 47% of total non-PIDIREGAS capital expenditures) to exploration and production programs.
Excluding PIDIREGAS expenditures, we have budgeted a total of Ps. 21.6 billion in nominal terms for capital expenditures in 2005. Ps. 17.3 billion of this amount corresponds to the allocation for theFondo de Aprovechamiento de Obras de Infraestructura (which we refer to as the infrastructure works fund) established by the Mexican Government in order to increase our capital expenditures. (See “Item 4—Information on the Company—Taxes and Duties” and “Item 5—Operating and Financial Review and Prospects—General—IEPS Tax, Excess Gains Duty, Hydrocarbon Duties and Other Taxes”). We expect to direct Ps. 8.8 billion (or 41% of total non-PIDIREGAS capital expenditures) to exploration and production programs in 2005. In addition to our budgeted capital expenditures, the Mexican Congress allocates money in our budget to make principal payments on our PIDIREGAS debt, which payments are expected to total Ps. 39.6 billion in 2005. The amounts allocated to us to make payments on our PIDIREGAS debt are not included in any of the tables or discussions of capital expenditures herein, as these amounts do not reflect actual capital expenditures.
Our non-PIDIREGAS capital expenditures for the five years ended December 31, 2004 and budgeted for 2005 and 2006 were distributed and budgeted among the subsidiary entities as follows:
Non-PIDIREGAS Capital Expenditures(1)
| Year ended December 31, | ||||||||||||||
| 2000 | 2001 | 2002 | 2003 | 2004 | Budget 2005(3) | Budget 2006(4) | ||||||||
| (in millions of nominal pesos) | ||||||||||||||
Pemex-Exploration and Production | Ps. 17,418 | Ps. 17,501 | Ps. 13,443 | Ps. 8,945 | Ps. 3,694 | Ps. 8,783 | Ps. 8,555 | |||||||
Pemex-Refining | 6,374 | 5,501 | 5,893 | 5,744 | 4,647 | 7,116 | 9,871 | |||||||
Pemex-Gas and Basic Petrochemicals | 3,620 | 2,567 | 1,721 | 2,148 | 1,961 | 2,884 | 3,750 | |||||||
Pemex-Petrochemicals | 996 | 1,058 | 1,454 | 1,627 | 1,598 | 2,227 | 3,746 | |||||||
Petróleos Mexicanos Corporate(2) | 429 | 366 | 432 | 549 | 343 | 607 | 700 | |||||||
Total | Ps. 28,837 | Ps. 26,993 | Ps. 22,942 | Ps. 19,013 | Ps. 12,243 | Ps. 21,617 | Ps. 26,622 | |||||||
| Note: | Numbers may not total due to rounding. |
| (1) | There are no capital expenditures at the subsidiary company level. |
| (2) | Petróleos Mexicanos Corporate consists of the operations of the central management of Petróleos Mexicanos. |
| (3) | Approved budget. |
| (4) | Subject to approval by the Mexican Congress during the 2006 budgetary process. |
Source: Petróleos Mexicanos.
20
Table of Contents
Our principal objectives for upstream investment are to increase and improve the quality of Mexico’s reserves, enhance Pemex-Exploration and Production’s recovery ratio and improve the reliability of its production and transportation infrastructure for crude oil and natural gas operations. In 2005, Pemex-Exploration and Production plans to continue its Strategic Gas Program to increase the supply of natural gas for the domestic market in the medium to long term. The 2005 budget objectives are to increase the supply of hydrocarbons, satisfy natural gas demand and increase refining capacity. Moreover, our increased production goals for 2005 include producing, on average, 1.7% more crude oil and 6.2% more natural gas as compared to 2004, in order to satisfy increased domestic demand for, and to slow the rate of increase of imports of, natural gas and derivatives of crude oil and natural gas.
Our downstream investment program seeks to improve the quality of our product selection, to achieve a level of efficiency similar to that of our international competitors and to continue to emphasize industrial safety and environmental compliance.
BUSINESS OVERVIEW
Overview by Business Segment
Exploration and Production
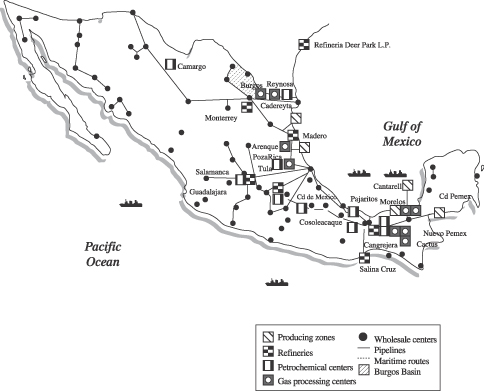
Pemex-Exploration and Production explores for and produces crude oil and natural gas, primarily in the northeastern and southeastern regions of Mexico and offshore in the Gulf of Mexico. In nominal peso terms, we increased our capital investment in exploration and production activities by 28% in 2004 by financing an array of programs to expand production capacity and efficiency. As a result of our investments in previous years, our total hydrocarbon production reached a level of approximately 4,401 thousand barrels of oil equivalent per day in 2004. Pemex-Exploration and Production’s crude oil production increased by 0.4% from 2003 to 2004, averaging 3,383 thousand barrels per day in 2004. Pemex-Exploration and Production’s natural gas production (excluding natural gas liquids) increased by 1.7% from 2003 to 2004, averaging 4,573 million cubic feet per day in 2004. Exploration drilling activity rose 17%, from 88 exploratory wells in 2003 to 103 exploratory wells in 2004, including the completion of the exploratory well Nab-1, which is located at a depth of 681 meters below sea level and is the deepest marine well drilled by Pemex-Exploration and Production. Development drilling activity rose 24%, from 505 development wells in 2003 to 624 development wells in 2004.
Refining
Pemex-Refining converts crude oil into gasoline, jet fuel, diesel, fuel oil, asphalts and lubricants. It also distributes and markets most of these products throughout Mexico, where it experiences a significant demand for its refined products. Pemex-Refining’s atmospheric distillation refining capacity remained constant at approximately 1,540 thousand barrels per day during 2004. In 2004, Pemex-Refining produced 1,361 thousand barrels per day of refined products, as compared to 1,343 thousand barrels per day of refined products in 2003.
Gas and Basic Petrochemicals
Pemex-Gas and Basic Petrochemicals processes wet natural gas in order to obtain dry natural gas, liquefied petroleum gas and other natural gas liquids. Furthermore, it transports, distributes and sells natural gas and liquefied petroleum gas throughout Mexico and produces and sells several basic petrochemical feedstocks, which are used by Pemex-Refining or Pemex-Petrochemicals. In 2004, Pemex-Gas and Basic Petrochemicals’ total sour natural gas processing capacity remained constant at approximately 4,503 million cubic feet per day in 2004. Pemex-Gas and Basic Petrochemicals processed 3,349 million cubic feet per day of sour natural gas in 2004, a 0.3% decrease from the 3,360 million cubic feet per day of sour natural gas processed in 2003. It produced 451 thousand barrels per day of natural gas liquids in 2004, a 5.4% increase from natural gas liquid production of 428 thousand barrels per day in 2003. It also produced 3,144 million cubic feet per day of dry gas in 2004, a 3.8% increase from the 3,029 million cubic feet per day produced in 2003.
21
Table of Contents
Petrochemicals
Pemex-Petrochemicals manufactures different petrochemical products, including: (1) methane derivatives, such as ammonia and methanol; (2) ethane derivatives, such as ethylene, polyethylenes, vinyl chloride monomer and ethylene oxide; (3) aromatics and their derivatives, such as styrene, toluene and paraxylene; (4) propylene and its derivatives, such as acrylonitrile; and (5) oxygen, nitrogen and other products. Pemex-Petrochemicals’ total annual production (excluding ethane and butane gases) increased by 2.3% in 2004, from 6,083 thousand tons in 2003 to 6,223 thousand tons in 2004.
International Trading
In 2004, our crude oil exports, which we export through our subsidiary PMI, increased by 1.4% in 2004, from 1,843.9 thousand barrels per day in 2003 to 1,870.3 thousand barrels per day in 2004. Natural gas imports increased by 1.2% in 2004, from 756.9 million cubic feet per day in 2003 to 766.0 million cubic feet per day in 2004. In 2004, exports of petrochemical products by volume increased by 9.7%, from 834.8 thousand metric tons in 2003 to 915.7 thousand metric tons in 2004, while imports of petrochemical products by volume decreased by 48.0%, from 532.4 thousand metric tons in 2003 to 276.6 thousand metric tons in 2004. In 2004, exports of refined products by volume decreased by 15.1%, from 178.9 thousand barrels per day in 2003 to 151.8 thousand barrels per day in 2004, while imports of refined products by volume increased by 8.1%, from 287.2 thousand barrels per day in 2003 to 310.5 thousand barrels per day in 2004.
We are a major supplier of crude oil to the United States. The PMI Group provides us and a number of independent customers with international trading, distribution and related services. PMI and P.M.I. Trading Ltd. sell, buy and transport crude oil, refined products and petrochemicals in world markets. The PMI Group also provides related risk management, insurance, transportation and storage services to us. The PMI Group has offices in Mexico City, Houston and London. The PMI Group’s trading volume of sales and imports totaled U.S. $30,712.6 million in 2004, including U.S. $21,257.8 million in crude oil sales.
Infrastructure of PEMEX
22
Table of Contents
Exploration and Production
Reserves
Under the Political Constitution of the United Mexican States and the Regulatory Law, all oil and other hydrocarbon reserves within Mexico are owned by the Mexican nation and not by us. Under the Organic Law, Petróleos Mexicanos and the subsidiary entities, except for Pemex-Petrochemicals, have the exclusive right to produce, not own, these reserves, and sell the resulting production. The exploration and development activities of Petróleos Mexicanos and the subsidiary entities are limited to reserves located in Mexico.
Proved oil and natural gas reserves are those estimated quantities of crude oil, natural gas and natural gas liquids which geological and engineering data demonstrate with reasonable certainty to be recoverable in future years from known reservoirs under existing economic and operating conditions—i.e., prices and costs at the date of estimation. Mexico’s proved reserves are estimated by Pemex-Exploration and Production’s technical staff.
Pemex-Exploration and Production estimates Mexico’s reserves using standard geological and engineering methods generally accepted by the petroleum industry. The choice of method or combinations of methods employed in the analysis of each reservoir is determined by:
| • | experience in the area; |
| • | stage of development; |
| • | quality and completeness of basic data; and |
| • | production and pressure histories. |
The reserves data set forth herein represent only estimates. Reserves valuation is a subjective process of estimating underground accumulations of crude oil and natural gas that cannot be measured in an exact manner. The accuracy of any reserve estimate depends on the quality of available data, engineering and geological interpretation and judgment. As a result, estimates of different engineers may vary. In addition, the results of drilling, testing and production subsequent to the date of an estimate may justify revision of an estimate.
Mexico’s total proved developed and undeveloped reserves of crude oil and condensates decreased by 7.7% in 2004, from 16.0 billion barrels of oil equivalent at December 31, 2003 to 14.8 billion barrels of oil equivalent at December 31, 2004. Mexico’s proved developed reserves of crude oil and condensates decreased by 7.6% in 2004, from 10.5 billion barrels of oil equivalent at December 31, 2003 to 9.7 billion barrels of oil equivalent at December 31, 2004. Mexico’s total proved developed and undeveloped dry gas reserves decreased by 0.7% in 2004, from 14.9 trillion cubic feet at December 31, 2003 to 14.8 trillion cubic feet at December 31, 2004. Mexico’s proved developed dry gas reserves increased by 2.9% in 2004, from 8.1 trillion cubic feet at December 31, 2003 to 8.3 trillion cubic feet at December 31, 2004.
23
Table of Contents
The following two tables of crude oil and dry gas reserves set forth our estimates of Mexico’s proved reserves determined in accordance with Rule 4-10(a) of Regulation S-X of the Securities Act.
Crude Oil and Condensate Reserves (including natural gas liquids)(1)
| 2000 | 2001 | 2002 | 2003 | 2004 | |||||||||||
| (in millions of barrels) | |||||||||||||||
Proved developed and undeveloped reserves | |||||||||||||||
At January 1 | 21,519 | 20,186 | 18,767 | 17,196 | 16,041 | ||||||||||
Revisions | (180 | ) | (144 | ) | (247 | ) | 120 | (109 | ) | ||||||
Extensions and discoveries(2) | 91 | 2 | (36 | ) | 84 | 245 | |||||||||
Production | (1,244 | ) | (1,277 | ) | (1,288 | ) | (1,359 | ) | (1,374 | ) | |||||
At December 31 | 20,186 | 18,767 | 17,196 | 16,041 | 14,803 | ||||||||||
Proved developed reserves at December 31 | 12,312 | 12,622 | 11,725 | 10,473 | 9,745 | ||||||||||
Note: Numbers may not total due to rounding.
| (1) | Crude oil and condensate reserves include the fraction of liquefiable hydrocarbons recoverable in natural gas processing plants. |
| (2) | Extensions include positive and negative changes due to new data gathered through drilling of extension wells. |
Source: Pemex-Exploration and Production.
Dry Gas Reserves
| 2000 | 2001 | 2002 | 2003 | 2004 | |||||||||||
| (in billions of cubic feet) | |||||||||||||||
Proved developed and undeveloped reserves | |||||||||||||||
At January 1 | 18,471 | 17,365 | 16,256 | 14,985 | 14,850 | ||||||||||
Revisions | 3 | (78 | ) | (443 | ) | 695 | 547 | ||||||||
Extensions and discoveries(1) | 58 | 98 | 313 | 354 | 641 | ||||||||||
Production(2) | (1,167 | ) | (1,129 | ) | (1,141 | ) | (1,184 | ) | (1,231 | ) | |||||
At December 31 | 17,365 | 16,256 | 14,985 | 14,850 | 14,807 | ||||||||||
Proved developed reserves at December 31 | 9,713 | 8,776 | 8,572 | 8,094 | 8,325 | ||||||||||
Note: Numbers may not total due to rounding.
| (1) | Extensions include positive and negative changes due to new data gathered through drilling of extension wells. |
| (2) | Natural gas production reported in other tables refers to wet, sour gas. There is a shrinkage in volume when natural gas liquids and impurities are extracted to obtain dry gas. Therefore, reported natural gas volumes are greater than dry gas volumes. |
Source: Pemex-Exploration and Production.
24
Table of Contents
The following table sets forth the number of proved developed and undeveloped reserves, the number of producing wells, and the number of proved undeveloped locations for the fields that contain over 85% of Mexico’s proved reserves, as of December 31, 2004.
Field | Proved Reserves | Developed Reserves | Undeveloped Reserves | Producing Wells | Undeveloped Locations | ||||||||
| (in millions of barrels of crude oil equivalent) | |||||||||||||
Akal | 6,592.8 | 5,447.6 | 1,144.9 | 197 | 26 | ||||||||
Ku-Maloob-Zaap | 1,618.4 | 870.9 | 747.5 | 49 | 55 | ||||||||
Samaria | 1,052.2 | 425.0 | 627.2 | 32 | 7 | ||||||||
Jujo-Tecominoacán | 888.5 | 488.0 | 400.5 | 44 | 15 | ||||||||
Chicontepec | 776.6 | 92.5 | 684.1 | 479 | 1,188 | ||||||||
Iride | 548.5 | 368.9 | 179.6 | 24 | 22 | ||||||||
Cunduacán | 422.1 | 214.3 | 207.8 | 18 | 4 | ||||||||
Sihil | 307.8 | 25.0 | 282.8 | 2 | 10 | ||||||||
Chuc | 196.9 | 196.9 | 0.0 | 16 | 3 | ||||||||
Ayín | 187.1 | 0.0 | 187.1 | 0 | 13 | ||||||||
Sinán | 183.8 | 26.2 | 157.6 | 3 | 15 | ||||||||
Puerto Ceiba | 183.7 | 114.8 | 68.9 | 12 | 16 | ||||||||
Caan | 173.5 | 173.5 | 0.0 | 25 | 0 | ||||||||
Oxiacaque | 172.3 | 86.5 | 85.8 | 8 | 1 | ||||||||
Muspac | 149.1 | 149.1 | 0.0 | 20 | 0 | ||||||||
Poza Rica | 142.0 | 100.8 | 41.2 | 169 | 26 | ||||||||
May | 133.9 | 0.0 | 133.9 | 0 | 14 | ||||||||
Ixtal | 132.8 | 0.0 | 132.8 | 0 | 8 | ||||||||
Cactus | 127.8 | 76.0 | 51.8 | 23 | 4 | ||||||||
Chiapas-Copano | 123.0 | 123.0 | 0.0 | 15 | 0 | ||||||||
Balam | 92.8 | 92.8 | 0.0 | 3 | 2 | ||||||||
Ogarrio | 89.9 | 57.8 | 32.1 | 39 | 32 | ||||||||
Cárdenas | 87.7 | 81.8 | 5.9 | 18 | 1 | ||||||||
Paredón | 70.0 | 70.0 | 0.0 | 7 | 0 | ||||||||
Caparroso-Pijije-Escuintle | 66.9 | 54.8 | 12.1 | 10 | 2 | ||||||||
Abkatún | 65.5 | 65.5 | 0.0 | 15 | 0 | ||||||||
Sen | 56.3 | 38.4 | 17.9 | 11 | 3 | ||||||||
Culebra | 55.0 | 47.7 | 7.3 | 371 | 53 | ||||||||
Lum | 54.6 | 0.0 | 54.6 | 0 | 2 | ||||||||
Misón | 52.7 | 0.0 | 52.7 | 0 | 4 | ||||||||
Bolontikú | 45.5 | 9.1 | 36.4 | 1 | 3 | ||||||||
Tizón | 37.1 | 13.3 | 23.8 | 2 | 4 | ||||||||
Cuitláhuac | 35.4 | 29.9 | 5.5 | 200 | 10 | ||||||||
Ek | 30.7 | 30.7 | 0.0 | 2 | 0 | ||||||||
Kutz | 27.7 | 15.4 | 12.3 | 1 | 0 | ||||||||
Ixtoc | 24.4 | 16.9 | 7.5 | 2 | 0 | ||||||||
Bacab | 17.2 | 17.2 | 0.0 | 2 | 0 | ||||||||
Arcabuz | 16.5 | 12.1 | 4.4 | 102 | 28 | ||||||||
Chac | 14.1 | 14.1 | 0.0 | 2 | 0 | ||||||||
Citam | 12.8 | 7.1 | 5.7 | 1 | 1 | ||||||||
Arcos | 12.2 | 11.7 | 0.5 | 131 | 2 | ||||||||
Pol | 10.9 | 10.9 | 0.0 | 13 | 0 | ||||||||
Nohoch | 9.0 | 9.0 | 0.0 | 5 | 0 | ||||||||
Luna-Palapa | 7.6 | 7.6 | 0.0 | 8 | 0 | ||||||||
Platanal | 4.3 | 4.3 | 0.0 | 1 | 0 | ||||||||
Escarbado | 1.4 | 1.4 | 0.0 | 2 | 0 | ||||||||
Total | 15,111.0 | 9,698.8 | 5,412.2 | 2,085 | 1,574 | ||||||||
Mexico’s proved reserves | 17,649.8 | 11,345.7 | 6,304.1 | ||||||||||
Percentage | 86 | % | 85 | % | 86 | % | |||||||
Note: Numbers may not total due to rounding.
Source: Pemex-Exploration and Production.
25
Table of Contents
Exploration and Drilling
We seek to identify new oil reservoirs through our exploration program in order to maintain an adequate level of reserves. From 1990 through 2004, we completed 3,818 exploration and development wells. During 2004, the average success rate for exploratory wells was 41%, and the average success rate for development wells was 94%. From 2000 to 2004, we discovered 22 new crude oil fields and 72 new natural gas fields, bringing the total number of our crude oil and natural gas fields in production to 355 at the end of 2004.
While most of our offshore production in the Gulf of Mexico occurs in waters less than 100 meters deep, our exploration program for 2004 included exploration of the Perdido, Golfo de México Sur and Golfo de México “B” regions located in deeper waters. In the Campeche Sound region, we completed the exploratory well Nab-1, which is located at a depth of 681 meters below sea level and is the deepest marine well drilled by Pemex-Exploration and Production. This well is located approximately 145 kilometers northwest of Ciudad del Carmen, Campeche. Our most productive crude oil and natural gas fields in the Gulf of Mexico are in the Cantarell complex, Ku-Maloob-Zaap in the Northeastern Marine region and Caan, Abkatún and Chuc in the Southwestern Marine region. The Cantarell complex, for example, produced 2,114 thousand barrels per day of crude oil in 2004, or 62.5% of our total 2004 crude oil production, and 773 million cubic feet per day of natural gas in 2004, or 16.9% of our total 2004 natural gas production.
The following table summarizes our drilling activity for the five years ended December 31, 2004.
| Year Ended December 31, | ||||||||||
| 2000 | 2001 | 2002 | 2003 | 2004 | ||||||
Wells drilled | 285 | 449 | 447 | 653 | 733 | |||||
Wells completed | 247 | 459 | 459 | 593 | 727 | |||||
Exploratory wells | 37 | 53 | 55 | 88 | 103 | |||||
Success rate % | 57 | 53 | 49 | 60 | 41 | |||||
Development wells | 210 | 406 | 404 | 505 | 624 | |||||
Success rate % | 95 | 91 | 88 | 90 | 94 | |||||
Producing wells (annual averages) | 4,184 | 4,435 | 4,590 | 4,941 | 5,286 | |||||
Marine region | 310 | 352 | 346 | 369 | 380 | |||||
Southern region | 1,113 | 1,066 | 1,000 | 979 | 935 | |||||
Northern region | 2,761 | 3,017 | 3,245 | 3,593 | 3,971 | |||||
Fields in production | 299 | 301 | 309 | 340 | 355 | |||||
Marine region | 18 | 19 | 20 | 23 | 25 | |||||
Southern region | 104 | 96 | 93 | 102 | 97 | |||||
Northern region | 177 | 186 | 196 | 215 | 233 | |||||
Drilling Rigs | 43 | 50 | 70 | 101 | 132 | |||||
Kilometers drilled | 782 | 1,098 | 1,186 | 1,793 | 2,106 | |||||
Average depth by well (meters) | 2,838 | 2,359 | 2,478 | 2,904 | 2,704 | |||||
Discovered fields(1) | 6 | 15 | 16 | 33 | 24 | |||||
Crude oil | 1 | 0 | 2 | 11 | 8 | |||||
Natural gas | 5 | 15 | 14 | 22 | 16 | |||||
Crude oil and natural gas output by well (barrels per day) | 959 | 923 | 900 | 880 | 833 | |||||
Note: Numbers may not total due to rounding.
| (1) | Includes only fields with proved reserves. |
| Source: | Pemex-Exploration and Production. |
26
Table of Contents
The following table sets forth our lifting costs (the average amount in U.S. dollars that it costs us to extract a barrel of oil equivalent) for each of the last three years.
Average Lifting Costs Year Ended December 31, | ||||
2002 | 2003 | 2004 | ||
| (U.S. dollars per barrel) | ||||
| $3.04 | $3.26 | $3.78 | ||
Source: Pemex-Exploration and Production.
Our lifting costs increased by 16% from 2003 to 2004, primarily as a result of an increase in maintenance expenses and in the average cost of gas used for pneumatic pumping, from U.S. $4.85 per million cubic feet in 2003 to U.S. $5.39 per million cubic feet in 2004, as well as due to an increase in the volume of gas used for pneumatic pumping, from 432.5 billion cubic feet in 2003 to 455.2 billion cubic feet in 2004.
Pemex-Exploration and Production calculates and discloses its lifting costs (the cost of producing oil from a well) in accordance with international practice. The lifting cost per barrel is calculated by dividing the total lifting cost (in U.S. dollars) into the total production of hydrocarbons (in barrels of oil equivalent) over the relevant period.The lifting costs are calculated in accordance with SFAS No. 19 “Financial Accounting and Reporting by Oil and Gas Producing Companies” for U.S. GAAP purposes.
The total lifting costs includes all direct and indirect costs incurred to produce oil and gas, which includes costs incurred to operate and maintain wells and related equipment and facilities. In addition, it includes costs of labor to operate the wells and facilities, the costs of materials, supplies and fuel consumed, including gas used for gas lifting, nitrogen and other chemicals, repair and non-capitalized maintenance costs, and other costs, such as fees for general services, a labor fund for active personnel, corporate services and indirect overhead, but excludes non-cash expenses such as reserves for depletion, amortization of capitalized well expenses, the depreciation of fixed assets, and expenses associated with the distribution and handling of hydrocarbons that are related to exploration and drilling activities.
Extensions and Discoveries
During the year 2004, we discovered new sources of crude oil and natural gas reserves in the Southwestern and Northeastern Marine regions, the Northern region and the Southern region. The new discoveries yielded a total of 240.8 million barrels of crude oil equivalent of proved reserves. The extensions yielded a total of 335.8 million barrels of crude oil equivalent of proved reserves.
In the Southwestern Marine region, the drilling of the Poctli-1, Tumut-1, Wayil-1, Itla-1, Men-1, Pokoch-1, and Etkal-101 wells led to the addition of 60.2 million barrels of proved oil reserves, and 249.1 billion cubic feet of proved natural gas reserves. In the Northeastern Marine region, the drilling of the Utan-1, Baksha-1 and Pohp-1 wells led to the addition of 16.8 million barrels of proved oil reserves and 15.9 billion cubic feet of proved natural gas reserves.Moreover, the drilling of wells in the Northern region led to the addition of 263.8 billion cubic feet of proved natural gas reserves, mainly in Veracruz, where Arquimia-1, Apertura-401, Kepler-1, Fourier-1, and Leida-1 wells added 104.0 billion cubic feet of proved natural gas reserves. Other important discoveries in the Burgos basin and Poza Rica led to the addition of 49.8 billion and 110.0 billion cubic feet of proved natural gas reserves, respectively. Poza Rica also led to the addition of 34.1 million barrels of proved oil reserves. Finally, in the Southern region the exploration activities in the Tizón-201 well led to the addition of 9.6 million barrels and 46.1 billion cubic feet of proved oil and natural gas reserves, respectively.
Investment in Exploration and Production
In nominal peso terms, we invested Ps. 113,332 million in exploration and production in 2004, as compared to Ps. 88,380 million in 2003, representing a 28% increase in nominal terms in investment in exploration and
27
Table of Contents
production. An important component of our investment budget consists of projects financed under the Mexican Government’s program for PIDIREGAS. In 2004, in nominal peso terms, Pemex-Exploration and Production’s PIDIREGAS investments totaled approximately Ps. 109,638 million, including Ps. 27,240 million in investments in the Cantarell fields, Ps. 23,413 million in the Strategic Gas Program, Ps. 16,344 million for development of the Burgos natural gas fields, Ps. 6,270 million in investments in the Antonio J. Bermúdez fields, Ps. 10,222 million in investments in the Ku-Maloob-Zaap fields, Ps. 4,152 million in investments in the Chuc fields, Ps. 2,769 million in investments in the Abkatún Integral project,Ps. 2,274 million in investments in the Arenque fields and Ps. 2,402 million in investments in the Agua Fría-Coapechaca-Tajín fields.During 2004, the investments in these nine projects amounted to 86.7% of all PIDIREGAS investments in exploration and production. The remaining 13.3% amounted to Ps. 14,552 million in nominal terms, which was invested in the 18 remaining projects, 17 of which were commenced in 2002. The Cantarell, Strategic Gas Program, Burgos, Antonio J. Bermúdez, Ku-Maloob-Zaap, Chuc, Abkatún Integral, Arenque and Agua Fría-Coapechaca-Tajín PIDIREGAS are described below.
Cantarell.In nominal peso terms, Pemex-Exploration and Production invested Ps. 24,397 million in 2002, Ps. 23,011 million in 2003 and Ps. 27,240 million in 2004 in the development of the Cantarell reservoirs in the Marine region. For 2005, we have budgeted Ps. 24,340 million for Cantarell investments. By the end of 2005, we expect our investments in the Cantarell project to total approximately U.S. $17.9 billion.
On October 10, 1997, we awarded a build-own-operate contract for a nitrogen cryogenic plant at the Cantarell oil and natural gas field to a consortium formed by BOC Holdings, Linde, Marubeni, West Coast Energy and ICA Fluor Daniel. Under this contract, the consortium is responsible for the financing, design, construction and operation of the plant. The plant cost approximately Ps. 10,131 million in nominal terms. Pursuant to the terms of the agreement, the consortium has legal ownership of the plant, and Pemex-Exploration and Production has committed to buy from the consortium 1.2 billion cubic feet per day of nitrogen for a period of 15 years. The plant began operations in 2000. During 2004, Pemex-Exploration and Production paid approximately U.S. $183 million under this contract for a total volume of approximately 419 billion cubic feet of nitrogen.We plan to inject approximately 1.18 billion cubic feet per day into the Cantarell reservoirs until 2016. We expect this project to increase our crude oil recovery rates by injecting nitrogen into the Cantarell reservoirs, which should help maintain pressure during crude oil extraction. By maintaining favorable crude oil recovery rates at Cantarell, we expect that the injection program will yield long-term benefits, including increasing the productive life of the wells and the volume of oil recovered. In the event that the agreement is rescinded due to a cause imputed to us, we will be obligated under the agreement to purchase the nitrogen production plant, the estimated value of which was approximately U.S. $492 million, as of December 31, 2004.
Strategic Gas Program. In 2001, Pemex-Exploration and Production initiated a nine-year, U.S. $8,105 million investment project named the Strategic Gas Program. Our total projected investment for the program increased from Ps. 8,967 million in 2002 to Ps. 18,079 million in 2003 and Ps. 23,413 million in 2004 to include three new exploratory projects: Integral Tampico Misantla Sur de Burgos, Veracruz Marino and Cazones. The purpose of the program is to increase Mexico’s supply of natural gas and develop a reserve that would satisfy the domestic demand for natural gas, thereby reducing future reliance on imports. Field development and optimization of production will represent 44% of investments, with the goal of increasing the production of natural gas to 3,699 million cubic feet per day by 2012. Exploration activities will represent 49% of investments with the goal of increasing proved reserves in twelve different exploratory natural gas and integral gas projects. Finally, development of newly discovered fields will represent 7% of the investment amount. In nominal peso terms, Pemex-Exploration and Production invested Ps. 23,413 million in the program in 2004, as compared with Ps. 18,079 million in 2003. For 2005, we expect to invest Ps. 19,909 million, which would bring our total investment in the program to approximately U.S. $5.6 billion through December 31, 2005. During the period from 2001 to 2004, average production was 456 million cubic feet per day of natural gas. Since 2001, 115 exploratory wells demonstrated offshore and onshore gas potential, resulting in a 53% exploratory success ratio. During 2004, eight fields were discovered: Arquimia, Apertura, Furier, Kepler and Leida in the Veracruz basin (onshore), Kosni in the Tampico-Misantla basin (offshore), and Men and Tizón in the Southern region.
28
Table of Contents
Important discoveries in 2003, such as Lankahuasa, Vistoso, Shihito, Madera, Viche and Playuela are currently under development.
Burgos.In 1997, Pemex-Exploration and Production initiated a 15-year project to develop the Burgos natural gas fields in Northern Mexico, which accounted for 11% of our total natural gas production in 1997. We expect that the Burgos project will better enable us to meet increasing domestic demand for natural gas and thereby reduce our imports of natural gas in the future. Three major turn-key contracts have been awarded to Dowell-Schlumberger México (worth U.S. $108 million), Industrial Perforadora de Campeche, S.A. de C.V. (worth U.S. $96.4 million) and Halliburton International Inc. (worth U.S. $71 million) for this project. From 2001 to 2004, exploration activities and reclassification of reserves in the Burgos area increased estimated proved reserves by 88.6 million barrels of oil equivalent, and production in this period was 82.6 million barrels of oil equivalent. During 2004, reserves increased by 31.0 million barrels of oil equivalent, from 396.8 million barrels of oil equivalent in 2003 to 427.8 million barrels of oil equivalent in 2004. In nominal peso terms, we invested Ps. 9,383 million in 2002, Ps. 10,995 million in 2003 and Ps. 16,344 million in 2004 in the Burgos project. For 2005, we anticipate that our investments in this project will amount to Ps. 14,172 million and that our total accumulated investments will reach approximately U.S. $7.5 billion.
Antonio J. Bermúdez.In 2002, we began investing in the Antonio J. Bermúdez project, the main PIDIREGAS project in the Southern region. This project is designed to accelerate reserve recovery, as well as increase the recovery factor by drilling additional wells and implementing a pressure maintenance system.In nominal peso terms, we invested Ps. 471 million in 2002, Ps. 3,622 million in 2003 and Ps. 6,270 million in 2004 in the Antonio J. Bermúdez project. For 2005, we anticipate that our investments in this project will amount to Ps. 6,867 million and that our total accumulated investments will reach approximately U.S. $1.5 billion.
Ku-Maloob-Zaap.The Ku-Maloob-Zaap project is one of our main producers of heavy crude oil and plays an important part in the production of the Maya crude oil mix. In order to maintain our volume of production, the project aims to increase drilling of wells and to implement pressure maintenance systems.In nominal peso terms, we invested Ps. 865 million in 2002, Ps. 3,072 million in 2003 and Ps. 10,222 million in 2004 in the Ku-Maloob-Zaap project. For 2005, we anticipate that our investments in this project will amount to Ps. 17,226 million and that our total accumulated investments will reach approximately U.S. $2.8 billion.
Chuc.The Chuc project is part of an integrated strategy of light crude oil production in the Southwestern Marine region. It is part of the operating and maintenance of the Pol-A facility and water injection complexes. In nominal peso terms, we invested Ps. 302 million in 2002, Ps. 1,753 million in 2003 and Ps. 4,152 million in 2004 in the Chuc project. For 2005, we anticipate that our investments in this project will amount to Ps. 3,246 million and that our total accumulated investments will reach approximately U.S. $852 million.
Abkatún Integral. In 1999, Pemex-Exploration and Production initiated a plan to optimize the recovery of light crude oil and natural gas. The Abkatún Integral project is an important part of the Abkatún-Pol-Chuc production complex and it shares the water injection secondary recovery process with this complex. In nominal peso terms, we invested Ps. 529 million in 2002, Ps. 1,856 million in 2003 and Ps. 2,769 million in 2004 in the Abkatún Integral project. For 2005, we anticipate that our investments in this project will amount to Ps. 1,330 million and that our total accumulated investments will reach approximately U.S. $591 million.
Arenque.In 2002, Pemex-Exploration and Production initiated this project to recover light crude oil reserves with high gas-oil relation. The Arenque project includes drilling and secondary recovery process, as well as exploratory studies. In nominal peso terms, we invested Ps. 183 million in 2002, Ps. 1,089 million in 2003 and Ps. 2,274 million in 2004 in the Arenque project. In 2005, we expect to invest Ps. 1,995 million in this project, bringing our total investment in the Arenque Project to approximately U.S. $500 million.
Agua Fría-Coapechaca-Tajín.This project is part of Paleocanal de Chicontepec field, which consists of a group of basins located in the northern region of Mexico that contain considerable volumes of hydrocarbon
29
Table of Contents
reserves. In 2002, Pemex-Exploration and Production initiated a plan to recover light crude oil with high gas-oil relation. In nominal peso terms, we invested Ps. 93 million in 2002, Ps. 1,860 million in 2003 and Ps. 2,402 million in 2004 in this project. In 2005, we expect to invest Ps. 1,560 million in this project, bringing our total investment in Agua Fría-Coapechaca-Tajín project to approximately U.S. $535 million.
Non-PIDIREGAS Investments.In addition to PIDIREGAS investments, Pemex-Exploration and Production makes non-PIDIREGAS investments calledRecursos Propios (Proprietary Funds) orInversiones Programables (Programmed Investments), authorized by the Ministry of Finance and Public Credit and the Mexican Congress. In nominal peso terms, in 2004, non-PIDIREGAS investments of Pemex-Exploration and Production totaled Ps. 3,694 million, of which Ps. 254 million, or 7%, was invested in strategic projects and Ps. 3,440 million, or 93%, in general operating improvements. Our investments consisted of Ps. 1.0 million in oil and gas exploration and Ps. 3,693 million in general field development and facilities.
2005 Exploration and Production Investment Budget. For 2005, Pemex-Exploration and Production anticipates investing Ps. 8,783 million in non-PIDIREGAS expenditures. Approximately Ps. 775 million, or 8.8% of this amount, is to be allocated to investments in projects relating to field development, pipelines and exploration activities, including the continuation of certain projects that began during the period from 1998 to 2004. Approximately Ps. 8,008 million, or 91.2%, will be allocated to operating projects as well as to projects relating to maintenance facilities, industrial safety and environmental projects. In addition to these non-PIDIREGAS investments, the 2005 budget includes all of the 27 on-going PIDIREGAS strategic exploration and production projects for a total PIDIREGAS budget of approximately Ps. 106,025 million. This amount includes Ps. 24,340 million for Cantarell, Ps. 19,909 million for the Strategic Gas Program, Ps. 14,172 million for Burgos, Ps. 17,226 million for Ku-Maloob-Zaap, Ps. 6,867 million for Antonio J. Bermúdez and Ps. 23,511 million for the other PIDIREGAS projects.
Exploration and Production Investment Trends.During the past four years, our investments in exploration have increased significantly. In nominal peso terms, in 2004, we invested Ps. 21,664 million, or 19.1% of the total capital expenditures for Pemex-Exploration and Production, in exploration activities, which represents a 31.9% increase from the Ps. 16,411 million, or 18.6% of the total capital expenditures of Pemex-Exploration and Production, invested in exploration activities in 2003. In 2004, we invested Ps. 69,129 million in nominal terms, or 61.0% of the total capital expenditures for Pemex-Exploration and Production in development activities, which represents a 55.1% increase from the amount invested in development activities in 2003, with the remaining investments directed towards major maintenance of production facilities. In 2003, we invested Ps. 44,577 million in nominal terms, or 50.4% of the total capital expenditures for Pemex-Exploration and Production, in development activities, with the remaining investments directed towards major maintenance in production facilities.
In 2005, we have budgeted Ps. 72,492 million, or 63.1% of capital expenditures, for the development activities of Pemex-Exploration and Production and Ps. 13,432 million, or 11.7% of total capital expenditures, for exploration activities, which represents a 4.9% increase in nominal terms and a 38.0% decrease in nominal terms from the amounts that Pemex-Exploration and Production invested in development and exploration activities, respectively, in 2004, and only a 1.3% increase in overall investment. Despite this decrease, which was due to budgetary restrictions, we anticipate increasing both the total amounts invested, as well as the amount allocated to exploration as a percentage of the total capital expenditures for Pemex-Exploration and Production, in future years. In 2006, we expect to spend Ps. 13,089 million, or 12.3% of the total capital expenditures for Pemex-Exploration and Production, in exploration activities, which represents a 2.6% decrease in nominal terms from the amount projected for 2005. In 2007, we expect to spend Ps. 18,316 million, or 14.9% of the total capital expenditures for Pemex-Exploration and Production, in exploration activities, which represents a 39.9% increase in nominal terms from the amount projected for 2006. In 2008, we expect to spend Ps. 31,014 million, or 29.8% of the total capital expenditures for Pemex-Exploration and Production, in exploration activities, which represents a 69.3% increase in nominal terms from the amount projected for 2007. These estimates are subject to the approval of the Mexican Congress of our budget for each year.
30
Table of Contents
Capital expenditures for Pemex-Exploration and Production as a percentage of PEMEX’s total capital expenditures have been increasing in recent years, from 62.2% in 2000 to 92.2% in 2004; however, this trend will reverse slightly in upcoming years, with capital expenditures for Pemex-Exploration and Production as a percentage of PEMEX’s total capital expenditures declining to 84.1% in 2005 and 80.0% in 2006.
The following table sets forth our capital expenditures related to exploration, development and maintenance during the five years ended December 31, 2004, and the budget for such expenditures for 2005.
Exploration, Development and Maintenance Capital Expenditures for 2000-2005
| Year ended December 31,(1) | ||||||||||||
| 2000 | 2001 | 2002 | 2003 | 2004 | Budget 2005(2) | |||||||
| (millions of nominal pesos) | ||||||||||||
Exploration | Ps. 4,511 | Ps. 4,186 | Ps. 8,552 | Ps. 16,411 | Ps. 21,664 | Ps. 13,432 | ||||||
Development | 27,525 | 32,504 | 32,630 | 44,577 | 69,129 | 72,492 | ||||||
Maintenance | 12,618 | 16,756 | 21,817 | 27,389 | 22,539 | 28,884 | ||||||
Total | Ps. 44,654 | Ps. 53,446 | Ps. 63,000 | Ps. 88,380 | Ps. 113,332 | Ps. 114,808 | ||||||
| Note: | Numbers may not total due to rounding. |
| (1) | Amounts based on cash basis method of accounting. |
| (2) | Approved budget. |
The following table sets forth our estimated capital expenditures budget for exploration, development and maintenance for 2005 through 2008:
Estimated Exploration, Development and Maintenance Capital Expenditures for 2005-2008
| Year ended December 31,(1) | ||||||||
| 2005(2) | 2006 | 2007 | 2008 | |||||
| (millions of nominal pesos) | ||||||||
Exploration(3) | Ps. 13,432 | Ps. 13,089 | Ps. 18,316 | Ps. 31,014 | ||||
Development(3) | 72,492 | 72,265 | 76,095 | 50,343 | ||||
Maintenance(3) | 28,884 | 20,895 | 28,136 | 22,772 | ||||
Total | Ps. 114,808 | Ps. 106,249 | Ps. 122,549 | Ps. 104,131 | ||||
| Note: | Numbers may not total due to rounding. |
| (1) | Amounts based on cash basis method of accounting. |
| (2) | Approved budget. |
| (3) | Amounts for 2006 through 2008 are estimated based on amounts budgeted for projects in 2005. |
Multiple Services Contracts
Our Multiple Services Contract, or MSC, program was first announced on December 2001. The objective of the program is to provide a contractual framework that promotes an efficient execution of public works, in order to increase Mexico’s hydrocarbons production. The MSCs are public works contracts based on unit prices that aggregate a number of different services into a single contract. Under the MSC framework, Pemex-Exploration and Production retains the rights and title to all extracted hydrocarbons and works performed.
31
Table of Contents
The invitation for bids for the two rounds of MSC bidding, corresponding to works and services necessary for natural gas production in eight blocks in the Burgos basin, occurred in July 2003 and in the second half of 2004, respectively. The following table summarizes the results of those rounds.
Block | Signature date | Winning bidder | Contract amount (in millions of U.S. dollars) | ||||
Reynosa-Monterrey | November 14, 2003 | Repsol Exploración México, S.A. de C.V. | $ | 2,437 | |||
Cuervito | November 21, 2003 | A consortium comprised by Petróleo Brasileiro, S.A. (Petrobras), Teikoku Oil Co., Ltd. and D&S Petroleum | 260 | ||||
Misión | November 28, 2003 | A consortium comprised by Tecpetrol (a subsidiary of Techint Group) and Industrial Perforadora de Campeche | 1,036 | ||||
Fronterizo | December 8, 2003 | A consortium comprised by Petróleo Brasileiro, S.A. (Petrobras), Teikoku Oil Co., Ltd. and D&S Petroleum | 265 | ||||
Olmos | February 9, 2004 | Lewis Energy Group | 344 | ||||
Pandura-Anáhuac | December 9, 2004 | A consortium comprised by Industrial Perforadora de Campeche, S.A. de C.V. and Compañia de Desarrollo de Servicios Petroleros, S.A. de C.V. | 900 | ||||
Pirineo | March 23, 2005 | A consortium comprised by Contructora Industrial Monclova, Materiales la Gloria, Alianz Petroleum, Steel Serv., Suelopetrol, NCT, Estudios y Proyectos and Petrotesting Colombia | 645 | ||||
| Total | $ | 5,887 | |||||
Source: Pemex-Exploration and Production.
By the end of 2004, through the MSC program, among other works, 20 wells had been drilled, 14 of those wells were completed, five major workovers were performed and 754 square kilometers of three-dimensional seismic information was acquired. These works represent an investment of approximately U.S. $69 million. As a consequence of these works, natural gas production increased by 25 million cubic feet per day, from 69 million cubic feet per day in 2003 to 94 million of cubic feet per day in April 2004.
On February 8, 2005, we announced that the companies that had acquired bidding documents for the Ricos block chose not to submit final proposals. The contract for the Monclova block was awarded on February 17, 2005 to a consortium comprised by Hullera Mexicana, Energy Milenium, Andrews Technologies de México, Yuma Exploration and Production Inc., and Aries Operating L.P.; however, the contract was not signed due to several disagreements among the members of the consortium.
During 2005, theAuditoría Superior de la Federación (the Supreme Auditor of the Federation, which we refer to as the ASF), an entity of the Mexican Congress, recommended that before proceeding with future MSC bidding rounds for non associated natural gas projects in the Burgos basin, the terms “exploration” and “exploitation” be redefined under the Regulatory Law. While we believe that the MSCs are fully consistent with the Regulatory Law, we have prepared a proposed amendment to the Regulatory Law redefining such terms in a manner that we believe will provide clearer and more precise definitions of such terms. This proposal has been
32
Table of Contents
passed to the executive branch, which is the branch of the Mexican Government that has the power to present such amendments to Mexican Congress.
As a result of the recommendation of the ASF described above, it is possible that there will be no further invitations to bid for MSCs in the Burgos basin this year. However, we plan to review and evaluate the MSC program in order to carry out further MSCs rounds in the near future.
There are several pending claims related to this MSC program. See “Item 8—Financial Information—Legal Proceedings––Civil Actions.”
Crude Oil Production
In 2004, we produced an average of 3,383 thousand barrels per day of crude oil, 0.4% greater than our average daily production in 2003 of 3,371 thousand barrels per day of crude oil. The increase was mainly due to our ongoing investments in the Cantarell project, which led to an increase in the production of the Cantarell reservoirs of approximately 21 thousand barrels per day, 1.0% greater than the average daily production from this area in 2003, and our investments in the Northern region, which led to an increase in production of approximately 7 thousand barrels per day, 10.3% greater than its average daily production from this region in 2003. This increase in average daily production was partially offset by a decrease in light crude oil production in the Southwestern Marine and Southern regions.
Crude oil can be classified by sulphur content. “Sour” crudes contain 3.4% or greater sulphur content by weight and “sweet” crudes contain less than 1.0% sulphur content by weight. Most of our production is classified as sour crudes.
Pemex-Exploration and Production produces four types of crude oil:
| • | Altamira, a heavy crude oil; |
| • | Maya, a heavy crude oil; |
| • | Isthmus, a light crude oil; and |
| • | Olmeca, a very light crude oil. |
Most of Pemex-Exploration and Production’s production consists of Isthmus and Maya crude oil. In 2004, 72.7% of Pemex-Exploration and Production’s total production of crude oil consisted of heavy crudes and 27.3% consisted of light and very light crudes. The Marine region yields mostly heavy crude oil (85.3% of this region’s production in 2004), although significant volumes of light crude oil are also produced (14.7% of this region’s production). The Southern region yields mainly light and very light crudes (together, 98.5% of this region’s production), and the Northern region yields a mixture of both heavy crude oil (47.5% of this region’s production in 2004) and light and very light crudes (52.5% of this region’s production in 2004).
33
Table of Contents
The following table sets forth our annual crude oil production rates for the five years ended December 31, 2004.
| Year Ended December 31, | 2004 vs. 2003 | ||||||||||||
| 2000 | 2001 | 2002(1) | 2003 | 2004 | |||||||||
| (in thousands of barrels per day) | (%) | ||||||||||||
Marine region | |||||||||||||
Heavy crude oil | 1,730.5 | 1,953.7 | 2,127.1 | 2,380.9 | 2,412.3 | 1.3 | |||||||
Light crude oil | 654.4 | 586.2 | 476.7 | 433.0 | 416.7 | (3.8 | ) | ||||||
Total | 2,384.9 | 2,539.9 | 2,603.8 | 2,813.9 | 2,829.0 | 0.5 | |||||||
Southern region(1) | |||||||||||||
Heavy crude oil | — | — | 6.2 | 6.4 | 7.1 | 10.9 | |||||||
Light crude oil | 549.6 | 508.7 | 492.2 | 476.9 | 465.6 | (2.4 | ) | ||||||
Total | 549.6 | 508.7 | 498.4 | 483.3 | 472.7 | (2.2 | ) | ||||||
Northern region | |||||||||||||
Heavy crude oil | 43.7 | 43.3 | 40.3 | 38.0 | 38.6 | 1.5 | |||||||
Light crude oil | 33.7 | 35.2 | 34.6 | 35.6 | 42.6 | 19.6 | |||||||
Total | 77.5 | 78.5 | 74.9 | 73.6 | 81.2 | 10.3 | |||||||
Total heavy crude oil | 1,774.3 | 1,997.0 | 2,173.7 | 2,425.4 | 2,458.0 | 1.3 | |||||||
Total light crude oil | 1,237.7 | 1,130.1 | 1,003.5 | 945.5 | 924.9 | (2.2 | ) | ||||||
Total crude oil | 3,012.0 | 3,127.0 | 3,177.1 | 3,370.9 | 3,382.9 | 0.4 | |||||||
Note: Numbers may not total due to rounding.
| (1) | As of year 2002, certain crude oil types previously classified as very light crude oil were reclassified as light crude oil in the Southern region. |
Source: Pemex-Exploration and Production.
In 2004, the Marine region’s offshore facilities, which are located in the Campeche Sound in the Gulf of Mexico, produced 83.6% of Mexico’s crude oil. Approximately 14.0% of crude oil production came from onshore facilities in the Southern region. Inland facilities in the Northern region accounted for the remaining 2.4% of total crude oil production. Due to the high productivity of certain wells, 12 fields accounted for 80.0% of Mexico’s crude oil production in 2004.
The Marine region is an area of approximately 21,000 square kilometers in the Campeche Sound in the Gulf of Mexico. Our production area covers 9,000 square kilometers of the Marine region. We began geophysical operations in this region in 1972, commenced drilling in 1974 and began production in June 1979. In 2004, the average production level for this region was 2,829 thousand barrels per day. The Marine region’s production area includes 23 oil fields that are less than 100 meters below sea level and have an average well depth of 3,500 meters.
The Southern region covers an area of approximately 23,000 square kilometers, with our production area in this region comprising 9,000 square kilometers in the states of Chiapas and Tabasco. In 2004, production in the Southern region totaled 473 thousand barrels per day. This production area included 93 oil fields with an average well depth of 5,500 meters.
The Northern region, including the continental shelf area in the Gulf of Mexico, covers an area of approximately 2 million square kilometers. Our production area in this region is located in the states of Veracruz, Tamaulipas, Nuevo León, Coahuila, San Luis Potosí and the continental platform in the Gulf of Mexico. In 2004, production in the Northern region totaled 81 thousand barrels of crude oil per day and 1,529 million cubic feet of natural gas per day. This production area included 201 oil fields with an average well depth of 2,100 meters.
34
Table of Contents
Production by Fields
We conduct exploration, production and development activities in fields throughout Mexico. Mexico’s main fields are described below.
Cantarell Complex.Cantarell is located on the continental shelf of the Gulf of Mexico. It consists of the Akal, Chac, Kutz, Nohoch and Sihil fields, which extend over an area of 162 square kilometers. The Akal field is considered one of the last giant oil fields in the world discovered in the past 20 years. As of December 31, 2004, there were a total of 384 wells drilled, 207 of which were producing. During 2004, the complex was most important producer of crude oil in Mexico, averaging 2.1 million barrels per day of crude oil and 773.4 million cubic feet per day of natural gas. As of December 31, 2004, cumulative production was 10.8 billion barrels of crude oil and 4.4 trillion cubic feet of natural gas. Proved hydrocarbon reserves totaled 6,092.0 million barrels of crude oil and 3.3 trillion cubic feet of natural gas as of December 31, 2004. Total proved reserves were 7.0 billion barrels of crude oil equivalent as of December 31, 2004, of which 5.5 billion were developed.
Ku-Maloob-Zaap Complex.This complex of fields is located off the coast of Campeche in Mexican territorial waters in the Gulf of Mexico. This is Mexico’s third most important complex of fields in terms of total remaining hydrocarbon reserves. It is composed of the Ku, Maloob and Zaap fields, and extends over an area of 121 square kilometers. As of December 31, 2004, there were a total of 66 wells drilled, 49 of which were producing. During 2004, this complex produced an average of 301.2 thousand barrels of crude oil and 157.5 million cubic feet of natural gas per day. As of December 31, 2004, cumulative production was 1.9 billion barrels of crude oil and 1.0 trillion cubic feet of natural gas. Proved hydrocarbon reserves totaled 1.4 billion barrels of crude oil and 930.8 billion cubic feet of natural gas as of December 31, 2004. Total proved reserves were 1.6 billion barrels of crude oil equivalent as of December 31, 2004, of which 870.9 million were developed.
Abkatún-Pol-Chuc Complex. This area is made up of three fields in the Southwestern offshore region which extend over an area of 198 square kilometers. As of December 31, 2004, there were a total of 194 wells drilled, 6 of which were injectors. Currently, there are 44 producing wells. During 2004, the complex was the third most important crude oil producer, averaging 173.1 thousand barrels of crude oil and 168.8 million cubic feet of natural gas per day. As of December 31, 2004, cumulative production was 3.8 billion barrels of crude oil and 3.4 trillion cubic feet of natural gas. Proved hydrocarbon reserves totaled 226.6 million barrels of crude oil and 212.3 billion cubic feet of natural gas as of December 31, 2004. Total proved reserves were 273.3 million barrels of crude oil equivalent as of December 31, 2004, all of which were developed.
Antonio J. Bermúdez Complex.This complex of fields is the largest crude oil producer in the Southern region and the fourth largest in Mexico. It consists of the Samaria, Cunduacán, Oxiacaque, Iride, Platanal and Carrizo fields and covers an area of 192 square kilometers. As of December 31, 2004, there were a total of 396 wells drilled, 86 of which were producing. During 2004, the complex produced an average of 141.4 thousand barrels of crude oil and 263.1 million cubic feet of natural gas per day. As of December 31, 2004, cumulative production was 2.6 billion barrels of crude oil and 3.5 trillion cubic feet of natural gas, and proved hydrocarbon reserves totaled 1.4 billion barrels of crude oil and 3.0 trillion cubic feet of natural gas. Total proved reserves were 2.2 billion barrels of crude oil equivalent as of December 31, 2004, of which 1.1 billion were developed.
Caan Field.This field is located in the Southwestern offshore region and covers an area of 46 square kilometers. As of December 31, 2004, there were a total of 42 wells drilled, 25 of which were producing. During 2004, the field was the fifth most important crude oil producer, averaging 107.8 thousand barrels of crude oil and 216.7 million cubic feet of natural gas per day. As of December 31, 2004, cumulative production was 714.7 million barrels of crude oil and 1.2 trillion cubic feet of natural gas. Proved hydrocarbon reserves totaled 105.6 million barrels of crude oil and 307.5 billion cubic feet of natural gas as of December 31, 2004. Total proved reserves were 173.5 million barrels of crude oil equivalent as of December 31, 2004, all of which were developed.
Puerto Ceiba Field.This field was the first crude oil producer in the Southern region and the sixth largest producer in Mexico, covering an area of 41.2 square kilometers. As of December 31, 2004, there were 33 wells
35
Table of Contents
drilled in the field, 12 of which were producing. During 2004, this field produced an average of 77.0 thousand barrels of crude oil and 52.8 million cubic feet of natural gas per day. As of December 31, 2004, cumulative production was 87.1 million barrels of crude oil and 56.6 billion cubic feet of natural gas. Moreover, the proved hydrocarbon reserves totaled 158.1 million barrels of crude oil and 110.6 billion cubic feet of natural gas as of December 31, 2004. Total proved reserves were 183.7 million barrels of crude oil equivalent, of which 114.8 million were developed as of December 31, 2004.
Jujo-Tecominoacán Field.This field is the third largest crude oil producer in the Southern region and the seventh largest producer in Mexico and covers an area of 74 square kilometers. As of December 31, 2004, there were a total of 110 wells drilled, 44 of which were producing. During 2004, the field produced an average of 64.0 thousand barrels of crude oil and 76.1 million cubic feet of natural gas per day. As of December 31, 2004, cumulative production was 991.3 million barrels of crude oil and 1.1 trillion cubic feet of natural gas, and proved hydrocarbon reserves totaled 539.3 million barrels of crude oil and 1.3 trillion cubic feet of natural gas. Total proved reserves were 888.5 million barrels of crude oil equivalent as of December 31, 2004, of which 488.0 million were developed.
Delta del Grijalva Project.In terms of production, this project is the fourth most important in the Southern region and the eighth most important in Mexico. It includes the fields of Caparroso-Pijije-Escuintle, Escarbado, Luna-Palapa, Sen and Tizón. During 2004, the fields produced an average of 40.2 thousand barrels of crude oil and 149.8 million cubic feet of natural gas per day. The most important producers are Sen, Luna-Palapa and Caparroso-Pijije-Escuintle.
| • | Sen. This field covers an area of 41 square kilometers. As of December 31, 2004, there were a total of 30 wells drilled, 11 of which were producing. During 2004, the field produced an average of 12.7 thousand barrels of crude oil and 32.9 million cubic feet of natural gas per day. As of December 31, 2004, cumulative production was 177.4 million barrels of crude oil and 489.2 billion cubic feet of natural gas, and proved hydrocarbon reserves totaled 33.1 million barrels of crude oil and 95.5 billion cubic feet of natural gas. Total proved reserves were 56.3 million barrels of crude oil equivalent as of December 31, 2004, of which 38.4 million were developed. |
| • | Luna-Palapa. This field covers an area of 17 square kilometers. As of December 31, 2004, there were a total of 36 wells drilled, eight of which were producing. During 2004, the field produced an average of 4.8 thousand barrels of crude oil and 33.3 million cubic feet of natural gas per day. As of December 31, 2004, cumulative production was 114.6 million barrels of crude oil and 639.3 billion cubic feet of natural gas, and proved hydrocarbon reserves totaled 3.7 million barrels of crude oil and 16.1 billion cubic feet of natural gas. Total proved reserves were 7.6 million barrels of crude oil equivalent as of December 31, 2004, all of which are developed. |
| • | Caparroso-Pijije-Escuintle. This field covers an area of 16.6 square kilometers. As of December 31, 2004, there were a total of 32 wells drilled, 10 of which were producing. During 2004, the field produced an average of 17.7 thousand barrels of crude oil and 54.7 million cubic feet of natural gas per day. As of December 31, 2004, cumulative production was 110.5 million barrels of crude oil and 320.7 billion cubic feet of natural gas, and proved hydrocarbon reserves totaled 37.4 million barrels of crude oil and 121.2 billion cubic feet of natural gas. Total proved reserves were 66.9 million barrels of crude oil equivalent as of December 31, 2004, 54.8 million of which were developed. |
Ek and Balam Fields.This complex of fields is located off the coast of Campeche, in Mexican territorial waters in the Gulf of Mexico. It is made up of two fields extending over an area of 43 square kilometers. As of December 31, 2004, there were a total of 35 wells drilled, 5 of which were producing. During 2004, the fields were the ninth most important crude oil producers, averaging 11.7 thousand barrels of crude oil and 2.8 million cubic feet of natural gas per day. As of December 31, 2004, cumulative production was 117.8 million barrels of crude oil and 28.9 billion cubic feet of natural gas. Proved hydrocarbon reserves totaled 116.1 million barrels of crude oil and 28.8 billion cubic feet of natural gas as of December 31, 2004. Total proved reserves were 123.5 million barrels of crude oil equivalent as of December 31, 2004, all of which were developed.
36
Table of Contents
Paleocanal de Chicontepec.This complex of fields (which we refer to as Chicontepec) is part of the Northern region of our operations and is divided into 29 areas, which extend over an area of 3,731 square kilometers. As of December 31, 2004, there were a total of 1,343 wells drilled, 479 of which were producing. During 2004, Chicontepec produced an average of 20.6 thousand barrels of crude oil and 30.5 million cubic feet of natural gas per day. As of December 31, 2004, cumulative production was 124.4 million barrels of crude oil and 221.8 billion cubic feet of natural gas. Proved hydrocarbon reserves totaled 564.7 million barrels of crude oil and 1.2 trillion cubic feet of natural gas as of December 31, 2004. Total proved reserves were 776.6 million barrels of crude oil equivalent as of December 31, 2004, of which 92.5 million were developed.
Burgos Project. The Burgos fields of northern Mexico produced an average of 1.1 billion cubic feet of natural gas per day in 2004. This complex of fields is the largest producer of non-associated gas in Mexico. The most important producers are the Arcabuz-Culebra, Cuitláhuac and Arcos fields.
| • | Arcabuz-Culebra. This field covers an area of 380 square kilometers. As of December 31, 2004, there were a total of 653 wells drilled in this area, 473 of which were producing. During 2004, the field produced an average of 210.5 million cubic feet of natural gas per day. As of December 31, 2004, cumulative production was 1,238.1 billion cubic feet of natural gas, and proved hydrocarbon reserves totaled 371.8 billion cubic feet of natural gas, of which 311.0 billion were developed. |
| • | Cuitláhuac. This field covers an area of 190 square kilometers. As of December 31, 2004, there were a total of 302 wells drilled in this area, 200 of which were producing. During 2004, the field produced an average of 113.3 million cubic feet of natural gas per day. As of December 31, 2004, cumulative production was 394.1 billion cubic feet of natural gas, and proved hydrocarbon reserves totaled 157.2 billion cubic feet of natural gas, of which 132.9 billion were developed. |
| • | Arcos. This field covers an area of 45 square kilometers. As of December 31, 2004, there were a total of 157 wells drilled in this area, 131 of which were producing. During 2004, the field produced an average of 105.5 million cubic feet of natural gas per day. As of December 31, 2004, cumulative production was 481.2 billion cubic feet of natural gas, and proved hydrocarbon reserves totaled 66.8 billion cubic feet of natural gas, of which 63.9 billion were developed. |
Muspac Field. Muspac is the most important gas producer in the Southern region and the fourth most important in the country, covering an area of 17 square kilometers. As of December 31, 2004, there were a total of 30 wells drilled, 20 of which were producing. During 2004, the field produced an average of 3.4 thousand barrels of crude oil and 144.6 million cubic feet of natural gas per day. As of December 31, 2004, cumulative production was 72.5 million barrels of crude oil and 1.4 trillion cubic feet of natural gas. Proved hydrocarbon reserves totaled 12.4 million barrels of crude oil and 0.6 trillion cubic feet of natural gas as of December 31, 2004. Total proved reserves were 149.1 million barrels of crude oil equivalent as of December 31, 2004, all of which were developed.
Pipelines
The crude oil and natural gas pipeline network owned by Pemex-Exploration and Production connects crude oil and natural gas producing centers with refineries and petrochemical plants. At the end of 2004, this pipeline network consisted of approximately 34,131 kilometers of pipe, of which 3,085 kilometers were located in the Marine region, 12,032 kilometers were located in the Southern region and 19,013 kilometers were located in the Northern region. For a description of products transported by the pipeline network, see “—Transportation and Distribution” below.
Crude Oil Sales
During 2004, domestic consumption of crude oil amounted to approximately 1,489 thousand barrels per day, which represented 44.0% of our total crude oil production. Through PMI’s activities, we sold the remainder of our crude oil production abroad. See “—International Trading” below. Maya crude oil accounted for 86% of exported crude oil volume sold by PMI in 2004, but only 48% of domestic consumption.
37
Table of Contents
The following table sets forth crude oil distribution for the past five years.
Crude Oil Distribution
| At December 31, | 2004 vs. | ||||||||||||
| 2000 | 2001 | 2002 | 2003 | 2004 | |||||||||
| (in thousands of barrels per day) | (%) | ||||||||||||
Production | 3,012.0 | 3,127.0 | 3,177.1 | 3,370.9 | 3,382.9 | 0.4 | |||||||
Distribution | |||||||||||||
Refineries | 1,126.9 | 1,140.4 | 1,171.9 | 1,246.4 | 1,257.9 | 0.9 | |||||||
Products under processing agreements(1) | 103.7 | 62.3 | 130.4 | 112.5 | 97.4 | (13.4 | ) | ||||||
Petrochemicals | 136.0 | 146.2 | 144.5 | 150.4 | 133.8 | (11.0 | ) | ||||||
Exports | 1,619.8 | 1,756.6 | 1,716.2 | 1,848.3 | 1,873.6 | 1.4 | |||||||
Total | 2,986.4 | 3,105.6 | 3,163.1 | 3,357.6 | 3,362.7 | 0.2 | |||||||
Stock changes, statistical differences | 25.6 | 21.4 | 14.0 | 13.3 | 20.3 | 52.6 | |||||||
Note: Numbers may not total due to rounding.
| (1) | Represents exports to third-party processors for re-import into Mexico. |
Source: Pemex-Exploration and Production
Because of its higher sulphur content, Maya crude oil requires extra processing and has lower refining yields than do more valuable sweet crudes, and thus requires extra investment by the purchaser to refine. Because of this, we receive a lower price for Maya crude oil than we do for sweeter crude oils that cost less to refine. In addition, because of this price difference, we must continue to support the export value of sour crude oil such as Maya crude oil in relation to other grades of crude oil by creating incentives for refiners to invest in high-conversion refineries capable of upgrading the relatively large proportion of residue produced from processing sour crude oil in less efficient refining complex configurations. We may do this by entering into long-term Maya crude oil supply agreements pursuant to which purchasers agree to undertake projects to expand the capacity of their respective refineries to upgrade residue from Maya crude oil. See “International Trading—Geographic Distribution of Export Sales” below.
Gas Flaring
The flaring of produced gas, which is the process of burning off surplus combustible vapors from a well, either as a means of disposal or as a safety measure to relieve well pressure, is considered to be one of the most significant sources of air emissions from offshore oil and gas installations. In 2004, gas flaring represented 3.3% of our total natural gas production, which is a decrease from 2003, when gas flaring represented 5.6% of total natural gas production. This decrease was a result of the commencement of a new offshore gas treatment facility on the Akal-C platform within the Cantarell complex.
Refining
Refining Processes and Capacity
Pemex-Refining’s production processes include the following:
| • | Atmospheric distillation. This process heats crude oil in a tube furnace at atmospheric pressure to distill refined products. The primary products produced are gasoline, kerosene, jet fuel, diesel, atmospheric gas oil and atmospheric reduced crude oil. |
| • | Vacuum distillation. This process heats crude oil or other feedstock in a vacuum distillation column, which is operated at low pressures. The objective of this process is to maximize production of heavy vacuum gas oil, which is produced by boiling crude oil. |
38
Table of Contents
| • | Cracking. This process uses either heat and pressure or a catalytic agent to increase gasoline yields from crude oil. |
| • | Visbreaking. This is a thermal cracking process, which uses a horizontal-tube heater fired to a high temperature. Visbreaking reduces flasher bottom viscosity and produces some heavy gas oil. |
| • | Reforming processes. These processes use heat and catalysts to transform smaller or unstable hydrocarbon molecules into larger, more useful refining or blending products. For example, Pemex-Refining uses reforming processes to convert low-octane gasoline into higher-octane stocks that are suitable for blending into finished gasoline and to convert naphthas into more volatile, higher-octane products. |
| • | Hydrotreatment or resid hydrocracking. This process uses a catalyst and hydrogen at high temperature and pressure to remove sulphur, nitrogen and some aromatic compounds. Hydrotreatment also processes some lighter liquid product off-take. |
| • | Alkylation and isomerization. This polymerization process unites olefins and isoparaffins. Butylenes and isobutanes are combined with sulphuric acid or hydrofluoric acid to rearrange straight-chain hydrocarbon molecules into branched-chain products. Pentanes and hexanes, which are difficult to reform, are isomerized through the use of aluminum chloride and other precious-metal catalysts. Normal butane may be isomerized to provide a portion of the isobutane feed needed for the alkylation process. The process produces a high octane, low sensitivity blending agent for gasoline. |
| • | Coking. This process is a severe method of thermal cracking used to upgrade heavy residuals into lighter products or distillates. Coking produces straight-run gasoline (coker naptha) and various middle-distillate fractions used as catalytic feedstock, thus generating a concentrated solid material called coke of petroleum. |
These production processes together constitute Pemex-Refining’s production capacity as set forth in the table below.
Refining Capacity by Production Process
| At December 31, | ||||||||||
| 2000 | 2001 | 2002 | 2003 | 2004 | ||||||
| (in thousands of barrels per day) | ||||||||||
Production Process | ||||||||||
Atmospheric distillation | 1,559.0 | 1,559.0 | 1,540.0 | 1,540.0 | 1,540.0 | |||||
Vacuum distillation | 774.8 | 773.8 | 768.4 | 768.4 | 768.4 | |||||
Cracking | 375.0 | 375.0 | 395.5 | 395.5 | 374.5 | |||||
Visbreaking | 141.0 | 141.0 | 141.0 | 141.0 | 141.0 | |||||
Reforming | 268.8 | 268.8 | 301.3 | 301.3 | 301.3 | |||||
Hydrotreatment | 808.0 | 848.0 | 987.1 | 987.1 | 987.1 | |||||
Alkylation and isomerization | 138.8 | 138.8 | 143.9 | 143.9 | 143.9 | |||||
Coking | — | — | — | 100.0 | 100.0 | |||||
Source: Base de Datos Institucional (Pemex BDI).
At the end of 2004, Pemex-Refining owned and operated six refineries: Cadereyta, Madero, Minatitlán, Salamanca, Salina Cruz and Tula, and one topping unit located in the petrochemical complex of La Cangrejera.Our refineries are comprised of atmospheric and vacuum distillation units, where the bulk of crude oil input is processed. Secondary processing facilities include desulphurization units and facilities for catalytic cracking, reforming and hydrotreating. During 2004, our refineries processed 1,303 thousand barrels per day of crude oil (213 thousand barrels at Cadereyta, 145 thousand barrels at Madero, 167 thousand barrels at Minatitlán, 199 thousand barrels at Salamanca, 288 thousand barrels at Salina Cruz and 292 thousand barrels at Tula), which consisted of 765 thousand barrels per day of Olmeca and Isthmus crude oil and 538 thousand barrels per day of Maya crude oil.
39
Table of Contents
Since 1993, through our subsidiary company, P.M.I. Norteamérica, S.A. de C.V., we have participated in a limited partnership with Shell Oil Company in a refinery located in Deer Park, Texas. Under the Deer Park Limited Partnership agreement, P.M.I. Norteamérica, S.A. de C.V. and Shell Oil Company each provides 50% of the refinery’s crude oil input and owns 50% of the refinery’s output. The partnership completed a substantial upgrading program in mid-1995 to enable it to process Maya crude oil. PEMEX and Shell Oil Company completed an expansion project at the refinery in Deer Park in April 2001, thereby increasing the capacity of the refinery by 60 thousand barrels per day to 340 thousand barrels per day. The expansion project included an expansion of the refinery’s existing coking unit, a new sulphur plant and upgrades to the crude distillation, distillates hydrotreating and hydrocracking units.
Production
Pemex-Refining produces a wide range of products derived from crude oil and natural gas, including liquefied petroleum gas, gasoline, jet fuel, diesel, fuel oil, asphalts, lubricants and other refined oil and natural gas products. Pemex-Refining produced 1,361 thousand barrels per day of refined products (including dry gas by-products of the refining process) in 2004, an increase of 1.4% from 2003 levels.
The following table sets forth, by category, Pemex-Refining’s production of refined products from 2000 through 2004.
Pemex-Refining Production
| Year Ended December 31, | 2004 vs. | ||||||||||||
| 2000 | 2001 | 2002 | 2003 | 2004 | |||||||||
| (in thousands of barrels per day) | (%) | ||||||||||||
Refinery crude oil runs | 1,227.4 | 1,251.9 | 1,245.4 | 1,285.9 | 1,303.4 | 1.4 | |||||||
Refined products | |||||||||||||
Liquefied petroleum gas | 24.9 | 27.8 | 31.3 | 33.8 | 28.0 | (17.2 | ) | ||||||
Gasoline | |||||||||||||
Nova (leaded)/Base | 27.9 | 22.4 | 16.4 | 10.5 | 3.9 | (62.9 | ) | ||||||
Pemex Magna | 346.0 | 349.4 | 359.4 | 396.5 | 418.5 | 5.5 | |||||||
Pemex Premium | 17.9 | 17.3 | 21.8 | 37.6 | 43.8 | 16.5 | |||||||
Others | 1.2 | 1.2 | 0.7 | 0.6 | 0.4 | (33.3 | ) | ||||||
Total | 393.0 | 390.3 | 398.2 | 445.2 | 466.7 | 4.8 | |||||||
Kerosenes | |||||||||||||
Jet fuel | 55.3 | 56.7 | 56.7 | 59.6 | 62.1 | 4.2 | |||||||
Other kerosenes | 0.3 | 0.3 | — | — | — | — | |||||||
Total | 55.6 | 57.0 | 56.7 | 59.6 | 62.1 | 4.2 | |||||||
Diesel | |||||||||||||
Pemex Diesel | 254.5 | 266.6 | 246.7 | 290.8 | 319.6 | 9.9 | |||||||
Low sulphur diesel | 1.2 | 1.1 | 0.7 | 0.6 | 0.0 | (100.0 | ) | ||||||
Others | 9.7 | 13.9 | 19.5 | 16.4 | 5.1 | (68.9 | ) | ||||||
Total | 265.4 | 281.6 | 266.9 | 307.8 | 324.7 | 5.5 | |||||||
Fuel oil | 422.6 | 435.9 | 449.6 | 396.5 | 368.0 | (7.2 | ) | ||||||
Other refined products | |||||||||||||
Industrial gas oil | 2.4 | — | — | — | — | — | |||||||
Asphalts | 31.1 | 28.7 | 28.8 | 25.6 | 27.2 | 6.3 | |||||||
Lubricants | 6.0 | 5.2 | 4.9 | 5.5 | 5.4 | (1.8 | ) | ||||||
Paraffins | 1.3 | 1.2 | 1.0 | 0.9 | 1.0 | 11.1 | |||||||
Still gas | 41.8 | 39.0 | 37.4 | 51.3 | 49.9 | (2.7 | ) | ||||||
Other refined products(1) | 1.9 | 0.6 | 1.1 | 16.7 | 28.2 | 68.9 | |||||||
Total | 84.5 | 74.7 | 73.3 | 100.1 | 111.7 | 11.6 | |||||||
Total refined products | 1,246.0 | 1,267.3 | 1,275.9 | 1,342.9 | 1,361.2 | 1.4 | |||||||
Note: Numbers may not total due to rounding.
| (1) | Includes aeroflex 1-2, coke and furfural extract. |
Source: Pemex BDI.
40
Table of Contents
Fuel oil, automotive gasoline and diesels represent the bulk of Pemex-Refining’s production. In 2004, fuel oil represented 27%, gasoline represented 34% and diesels represented 24% of total refined product production. Jet fuel represented 5% and liquefied petroleum gas represented 2% of total production of refined products in 2004. The remainder of Pemex-Refining’s production consisted of a variety of other refined products.
As a result of our strategy of investing in technology to improve the quality of our fuels, over the past several years Pemex-Refining has increased its production of unleaded gasoline (including Pemex Premium) in relation to leaded gasoline. All of our automotive gasoline production now consists of unleaded gasoline. We also introduced new environmentally sound products such as Pemex Diesel, with 0.05% sulphur content. The share of Pemex Diesel as a percentage of total diesel produced by Pemex-Refining has increased from 96% in 2000 to 98% in 2004.
Domestic Sales
We market a full range of refined products, including gasoline, jet fuel, diesel, fuel oil and petrochemicals. We are one of a few major producers of crude oil worldwide that experiences significant domestic demand for our refined products.
Over the five years ended December 31, 2004, the value of Pemex-Refining’s domestic sales of refined products was as follows:
Value of Domestic Sales(1)
| Year Ended December 31, | 2004 vs. | ||||||||||||
| 2000 | 2001 | 2002 | 2003 | 2004 | |||||||||
| (in millions of constant pesos at December 31, 2004)(2) | (%) | ||||||||||||
Oil Products | |||||||||||||
Gasoline | |||||||||||||
Pemex Magna | Ps. 78,858.5 | Ps. 71,760.7 | Ps. 64,487.9 | Ps. 86,752.6 | Ps. 117,390.9 | 35 | |||||||
Pemex Premium | 11,530.2 | 12,848.6 | 13,981.3 | 19,701.4 | 27,591.2 | 40 | |||||||
Aviation fuels | 136.4 | 132.6 | 141.0 | 139.6 | 119.7 | (14 | ) | ||||||
Others | 221.8 | 205.8 | 138.1 | 91.0 | 90.9 | — | |||||||
Total | 90,746.7 | 84,947.7 | 78,748.3 | 106,684.7 | 145,192.7 | 36 | |||||||
Kerosenes | |||||||||||||
Jet fuel | 8,064.7 | 6,713.1 | 5,842.7 | 7,755.4 | 10,951.1 | 41 | |||||||
Other kerosenes | 119.8 | 147.7 | 149.6 | 123.4 | 130.5 | 6 | |||||||
Total | 8,184.5 | 6,860.8 | 5,992.3 | 7,878.8 | 11,081.5 | 41 | |||||||
Diesel | |||||||||||||
Pemex Diesel | 36,676.1 | 32,597.9 | 28,600.6 | 39,199.8 | 51,675.9 | 32 | |||||||
Others | 9,089.9 | 7,329.8 | 5,422.0 | 8,762.8 | 9,797.3 | 12 | |||||||
Total | 45,766.0 | 39,927.9 | 34,022.5 | 47,962.6 | 61,473.2 | 28 | |||||||
Fuel oil | |||||||||||||
Total | 40,460.5 | 32,673.2 | 30,045.3 | 33,146.3 | 31,528.8 | (5 | ) | ||||||
Other refined products | |||||||||||||
Industrial gas oil | 383.1 | 10.9 | — | — | — | — | |||||||
Asphalts | 1,989.7 | 1,788.5 | 2,038.4 | 2,472.0 | 2,857.8 | 16 | |||||||
Lubricants | 1,205.8 | 1,191.2 | 962.1 | 1,208.7 | 1,245.0 | 3 | |||||||
Paraffins | 189.8 | 166.8 | 138.2 | 128.4 | 144.7 | 13 | |||||||
Others(3) | 2.4 | 0.6 | 1.2 | 25.8 | 32.6 | 26 | |||||||
Total | 3,770.8 | 3,158.1 | 3,139.7 | 3,834.6 | 4,280.1 | 12 | |||||||
Total oil products | Ps. 188,928.4 | Ps. 167,567.7 | Ps. 151,948.2 | Ps. 199,507.3 | Ps. 253,556.4 | 27 | |||||||
Petrochemicals(4) | Ps. 658.3 | Ps. 812.3 | Ps. 615.8 | Ps. 984.4 | Ps. 1,687.7 | 71 | |||||||
41
Table of Contents
Notes: Numbers may not total due to rounding.
| (1) | Excludes IEPS tax and value added tax. See “—Taxes and Duties” below. |
| (2) | Figures have been restated to constant pesos as of December 31, 2004, by applying the inflation factors, as measured by the NCPI, from the respective year through December 31, 2004. For the five years ended December 31, 2004, the inflation factor is the average inflation rate for each of these years. |
| (3) | Includes aeroflex 1-2, coke and furfural extract. Since 2003, figure also includes sales of coke from the coker at the Cadereyta refinery, which started operating in 2003. |
| (4) | These are petrochemical products produced at refineries operated by Pemex-Refining. |
Source: Pemex BDI.
The largest consumers of fuels in Mexico are the Federal Electricity Commission and our subsidiary entities. The Federal Electricity Commission consumed approximately 77% of our fuel oil production during 2004 pursuant to a fuel oil supply contract entered into in November 1995 under which we agreed to supply a minimum of 270,000 barrels of fuel oil per day to the Federal Electricity Commission. The price per cubic meter of the fuel oil supplied to the Federal Electricity Commission is based on the three-month average spot price per cubic meter of Fuel Oil No. 6 (3% sulphur) at Houston, Texas, as quoted in Platt’s U.S. Marketscan and adjusted for quality and transportation cost differentials. In addition, the price of the fuel oil is discounted by a commercial margin on each cubic meter of fuel oil. In 2004, this volume discount amounted to approximately 1.4% of total fuel oil sales to the Federal Electricity Commission. The contract can be terminated by either party upon six months’ notice. The total amount paid to us by the Federal Electricity Commission under this contract in 2004 was Ps. 24,120 million and represented 9.5% of our total revenues from domestic sales of refined products.
Our domestic sales of refined oil products increased by 27.1% in value, or Ps. 54,049 million, in 2004 from 2003 levels.This increase was due primarily to a 33.1% average increase in international prices of refined products, as well as a 2.4% increase in domestic sales volumes and increased sales of products with greater added value. For example, the average price of automotive gasoline increased by 37.9%, the average price of automotive diesel increased by 33.1% and the average price of jet fuel increased by 42.2%.
The volume of our domestic gasoline sales in 2004 increased by 5.9%, from 601.2 thousand barrels per day in 2003 to 636.7 thousand barrels per day in 2004. The volume of our domestic diesel sales increased by 2.7%, from 294.7 thousand barrels per day in 2003 to 302.7 thousand barrels per day in 2004. In contrast, the volume of our domestic sales of fuel oil decreased by 6.2%, from 354.6 thousand barrels per day in 2003 to 332.5 thousand barrels per day in 2004, primarily due to lesser demand from the Federal Electricity Commission, as a result of its program of substitution of fuel oil with natural gas.
42
Table of Contents
The volume of Pemex-Refining’s domestic sales of refined products for the five-year period ended December 31, 2004 was distributed as follows:
Volume of Domestic Sales
| Year Ended December 31, | 2004 vs. 2003 | ||||||||||||
| 2000 | 2001 | 2002 | 2003 | 2004 | |||||||||
| (in thousands of barrels per day, except where otherwise indicated) | (%) | ||||||||||||
Oil Products | |||||||||||||
Gasoline | |||||||||||||
Pemex Magna | 472.3 | 476.5 | 476.5 | 500.2 | 525.5 | 5.1 | |||||||
Pemex Premium | 58.9 | 73.9 | 88.5 | 100.1 | 110.4 | 10.3 | |||||||
Aviation fuels | 0.4 | 0.4 | 0.4 | 0.4 | 0.4 | 0.0 | |||||||
Others | 1.1 | 1.0 | 0.8 | 0.4 | 0.4 | 0.0 | |||||||
Total | 532.7 | 551.8 | 566.2 | 601.2 | 636.7 | 5.9 | |||||||
Kerosenes | |||||||||||||
Jet fuel | 55.5 | 55.3 | 53.3 | 54.2 | 57.8 | 6.6 | |||||||
Other kerosenes | 0.7 | 0.8 | 0.8 | 0.7 | 0.7 | 0.0 | |||||||
Total | 56.2 | 56.1 | 54.1 | 54.9 | 58.5 | 6.6 | |||||||
Diesel | |||||||||||||
Pemex Diesel | 228.6 | 226.4 | 228.0 | 240.7 | 255.4 | 6.1 | |||||||
Others | 56.1 | 49.4 | 42.7 | 54.0 | 47.3 | (12.4 | ) | ||||||
Total | 284.7 | 275.8 | 270.7 | 294.7 | 302.7 | 2.7 | |||||||
Fuel oil | |||||||||||||
Total | 492.4 | 474.9 | 406.2 | 354.6 | 332.5 | (6.2 | ) | ||||||
Other oil products | |||||||||||||
Industrial gas oil | 2.3 | 0.0 | — | — | — | — | |||||||
Asphalts | 20.6 | 20.9 | 21.6 | 22.2 | 24.5 | 10.4 | |||||||
Lubricants | 6.4 | 5.5 | 5.2 | 5.7 | 5.7 | 0.0 | |||||||
Paraffins | 1.3 | 1.2 | 1.1 | 1.0 | 1.1 | 10.0 | |||||||
Others(1) | 1.8 | 0.4 | 1.3 | 22.8 | 28.4 | 24.6 | |||||||
Total | 32.4 | 28.0 | 29.1 | 51.7 | 59.7 | 15.5 | |||||||
Total oil products | 1,398.4 | 1,386.7 | 1,326.2 | 1,357.1 | 1,390.0 | 2.4 | |||||||
Petrochemicals(2) | 201.1 | 301.6 | 235.3 | 272.3 | 286.0 | 5.0 | |||||||
Note: Numbers may not total due to rounding
| (1) | Includes aeroflex 1-2, coke and furfural extract. Since 2003, figure also includes sales of coke from the coker at the Cadereyta refinery, which started operating in 2003. |
| (2) | In thousands of metric tons. These are petrochemical by-products of the refining process produced and sold by Pemex-Refining. |
Source: Pemex BDI.
Since 1998, at the retail level, we have offered standard and premium grades of unleaded gasoline throughout the country. Our efforts to build and enhance our brands have also progressed during the past four years. All of Mexico’s independent gasoline service stations now participate in our franchise program, which provides financial assistance to upgrade equipment and facilities and technical assistance in the development of marketing and customer service programs. At the end of 2004, there were 6,732 retail service stations in Mexico, of which 6,677 were privately owned and operated as franchises.
43
Table of Contents
Investments
Over the last ten years, Pemex-Refining has focused its investment program on enhancing the quality of gasoline and diesel to meet new environmental standards in Mexico, improving its ability to process heavy crudes in order to optimize the crude oil blend in its refineries and increasing the production of unleaded gasoline and diesel to supply growing demand at low cost, as opposed to increasing its overall crude oil processing capacity.This focus is primarily the result of the abundance of heavy crudes in Mexico. In addition, due to the reduced availability of heavy crudes in the export markets, the lower cost of raw materials in Mexico leads to higher profit margins on the heavy crudes we do export. In the medium-term, Pemex-Refining will continue to import unleaded gasoline to satisfy domestic demand. During 2004, Pemex-Refining imported approximately 170.1 thousand barrels per day of unleaded gasoline, which represented 26.7% of total domestic demand for unleaded gasoline in that year.
Non-PIDIREGAS Investments.In nominal terms, in 2004, Pemex-Refining invested Ps. 4,647 million, excluding capital expenditures related to PIDIREGAS, as compared to Ps. 5,744 million in 2003, representing a 19% decrease.Pemex-Refining invested 33% of this total amount to expand and upgrade refineries, 12% in environmental and industrial safety projects, 33% in maintenance and rehabilitation projects and 22% in other projects and acquisitions.
Cadereyta Project. In November 1997, Pemex-Refining awarded a U.S. $1.6 billion contract to upgrade and revamp the Cadereyta refinery to Conproca, S.A. de C.V. (CONPROCA), a consortium formed by SK Engineering & Construction Co., Ltd., Siemens AG and Triturados Basálticos y Derivados, S.A. de C.V. We expect the project to increase clean fuel production substantially, specifically gasoline and diesel, which will enable Pemex-Refining to fulfill future demand requirements in northern Mexico and comply with future environmental regulations. In November 2003, the project was certified as 99.31% complete and formally concluded. Pemex-Refining makes semi-annual amortization payments on June 15 and December 15 of each year, the first of which was a payment of U.S. $53.2 million on December 15, 2000. During 2004, Pemex-Refining made amortization payments totaling U.S. $102.4 million. Semi-annual amortization payments will continue until June 15, 2010.
Madero Project. In February 1999, Pemex-Refining awarded a U.S. $1.2 billion contract for the Madero refinery upgrading project to another consortium, PEMOPRO, S.A. de C.V., led by SK Engineering & Construction Co., Ltd., Siemens AG and Triturados Basálticos y Derivados, S.A. de C.V. The total cost of the project was U.S. $1.8 billion and involved the construction of ten new plants and the upgrading of seven others at the Madero complex in the state of Tamaulipas in northeastern Mexico. Between 1999 and 2004, the project increased the Madero refinery’s processing capacity for heavy crude oil (Maya) by 63.0 thousand barrels per day, increased gasoline production by 11.2 thousand barrels per day, increased middle distillates (diesel and jet fuel) production by approximately 4.0 thousand barrels per day and reduced production of high sulphur fuel oil by 8.2 thousand barrels per day. The project was completed on October 25, 2002. Payments on this project are due in April, June, October and December of each year. The first amortization payments of U.S. $136.5 million were made in 2003. During 2004, Pemex-Refining made amortization payments totaling U.S. $136.5 million in respect of this project. Amortization payments will continue until 2022.
Tula and Salamanca Projects. On November 11, 1999, Pemex-Refining awarded the Tula and Salamanca projects to Samsung Ingeniería Tula, S.A. de C.V. / Siemens, S.A. de C.V. and to Samsung Ingeniería México, S.A. de C.V. / Siemens AG and Siemens S.A. de C.V., respectively, through an international bidding process. These projects are dedicated exclusively to increasing gasoline quality, whereas the Cadereyta and Madero projects are dedicated to increasing heavy crude oil processing capacities through residual conversion. The construction period for the Tula and Salamanca projects lasted 29 and 34 months, respectively. Total costs were U.S. $160.5 million for the Tula project and U.S. $257.0 million for the Salamanca project. The Tula project was completed on August 27, 2002, and the Salamanca project was completed on January 9, 2003. Payments on the Tula project are due in February, April and August of each year, and payments on the Salamanca project are due
44
Table of Contents
in April, June, October and December of each year. The first amortization payments of U.S. $22.0 million for the Tula project and U.S. $33.6 million for the Salamanca project were made in 2003. During 2004, Pemex-Refining made amortization payments aggregating U.S. $55.6 million in respect of both projects. The last payments under these two projects will be made in 2022.
Minatitlán Project. This refining project is intended to increase production of high quality gasoline and middle distillates and to improve the crude oil blend. The project consists of six bidding packages, each of which was published during 2003. Pemex-Refining awarded the first contract of Ps. 379 million to Tradeco Infraestructura S.A. de C.V. on December 8, 2003. The construction period for the first contract is expected to last approximately 19 months. The second contract of U.S. $684.4 million was awarded to ICA Fluor Daniel, S. de R.L. de C.V. in October 2004. The construction period for this contract is expected to last approximately 42 months. The third contract of U.S. $534.1 million was awarded to Dragados, Proyectos Industriales de México, S.A. de C.V. and Dragados Industrial, S.A., in October 2004. The construction period for this contract is expected to last approximately 37 months. The fourth contract of U.S. $317.0 million was awarded to Mina-Trico S. de R.L. de C.V. This contract was signed in February 2005 and the construction period is expected to last approximately 35 months. The fifth contract of U.S. $317.9 million was awarded to Proyectos Ebramex, S. de R.L. de C.V. The contract was signed in January 2005, and the construction period is expected to last approximately 37 months. The sixth contract of U.S. $154 million was granted to Samsung Engineering, Co. Ltd. The contract was executed in February 2005 and the construction period is expected to last approximately 33 months. The expected date for the completion of this project is October 2008.
2005 Refining Investment Budget. For 2005, Pemex-Refining has budgeted Ps. 7,079 million for investment in PIDIREGAS. In addition, Pemex-Refining has budgeted Ps. 7,116 million for investments in 2005, excluding expenditures related to PIDIREGAS. Pemex-Refining will invest 32% of the total amount to expand and upgrade refineries, 21% in environmental and industrial safety projects, 35% in maintenance and rehabilitation projects and 12% in other projects and acquisitions.
Gas and Basic Petrochemicals
Natural Gas and Condensates
Pemex-Exploration and Production’s average natural gas production increased by 1.7%, from 4,498 million cubic feet per day in 2003 to 4,573 million cubic feet per day in 2004, while the average wet natural gas processed by Pemex-Gas and Basic Petrochemicals increased by 2.9%, from 3,853 million cubic feet per day in 2003 to 3,963 million cubic feet per day in 2004. Natural gas production associated with crude oil production accounted for 65.8% of total natural gas production in 2004, with the remainder of natural gas production consisting of extraction from fields holding natural gas reserves. Although natural gas production is more geographically diverse than crude oil production, 105 fields (or 16.7% of the 628 producing fields) accounted for 85.7% of all production in 2004. Of the total production, 34% originated in the Marine region, 33% in the Southern region and the remainder, 33%, in the Northern region.
All wet natural gas production is directed to Pemex-Gas and Basic Petrochemical’s gas processing facilities. At the end of 2004, Pemex-Gas and Basic Petrochemicals owned 12 facilities.
The following facilities are located in the Southern region:
| • | Cactus: This facility contains 22 plants that together produced 680 million cubic feet per day of dry gas (which is natural gas with a methane content of more than 90%), 24 thousand barrels per day of ethane, 49 thousand barrels per day of liquefied gas, 23 thousand barrels per day of naphtha and 294 thousand tons of sulphur in 2004. |
| • | Ciudad Pemex: This facility contains eight plants that together produced 773 million cubic feet per day of dry gas and 236 thousand tons of sulphur in 2004. |
45
Table of Contents
| • | La Cangrejera: This facility contains two plants that together produced 34 thousand barrels per day of ethane, 43 thousand barrels per day of liquefied gas and 11 thousand barrels per day of naphtha in 2004. |
| • | Morelos: This facility contains one plant that produced 32 thousand barrels per day of ethane, 42 thousand barrels per day of liquefied gas and 9 thousand barrels per day of naphtha in 2004. |
| • | Nuevo Pemex: This facility contains 13 plants that together produced 913 million cubic feet per day of dry gas, 28 thousand barrels per day of ethane, 76 thousand barrels per day of liquefied gas, 37 thousand barrels per day of naphtha and 204 thousand tons of sulphur in 2004. |
| • | Pajaritos: This facility contains one plant that produced 9 thousand barrels per day of ethane in 2004. |
| • | La Venta: This facility contains two plants that together produced 161 million cubic feet per day of dry gas in 2004. |
| • | Matapionche: This facility contains five plants that together produced 72 million cubic feet per day of dry gas, 2 thousand barrels per day of liquefied gas, one thousand barrels per day of naphtha and 12 thousand tons of sulphur in 2004. |
The following facilities are located in the Northern region:
| • | Reynosa: This facility contains two plants that together produced 215 million cubic feet per day of dry gas, one thousand barrels per day of ethane, 5 thousand barrels per day of liquefied gas, 6 thousand barrels per day of naphtha and 2 thousand barrels per day of other products in 2004. |
| • | Poza Rica: This facility contains four plants that together produced 74 million cubic feet per day of dry gas, 4 thousand barrels per day of ethane, 2 thousand barrels per day of liquefied gas, one thousand barrels per day of naphtha and 9 thousand tons of sulphur in 2004. |
| • | Arenque: This facility contains three plants that together produced 32 million cubic feet per day of dry gas, one thousand barrels per day of carbon dioxide liquids and 4 thousand tons of sulphur in 2004. |
| • | Burgos: This facility contains three plants that together produced 224 million cubic feet per day of dry gas, 6 thousand barrels per day of liquefied gas and 3 thousand barrels per day of naphtha in 2004. |
The following tables set forth Pemex-Gas and Basic Petrochemicals’ total natural gas processing and production, as well as processing capacity, for the five years ended December 31, 2004.
Natural Gas and Condensates Processing and Production(1)
| Year Ended December 31, | 2004 vs. | ||||||||||||
| 2000 | 2001 | 2002 | 2003 | 2004 | |||||||||
| (in millions of cubic feet per day, except where otherwise indicated) | (%) | ||||||||||||
Processing | |||||||||||||
Wet gas | 3,691 | 3,677 | 3,770 | 3,853 | 3,963 | 2.9 | |||||||
Sour gas | 3,220 | 3,227 | 3,260 | 3,360 | 3,349 | (0.3 | ) | ||||||
Sweet gas(2) | 471 | 450 | 510 | 492 | 614 | 24.8 | |||||||
Condensates(3) | 101 | 105 | 94 | 95 | 107 | 12.6 | |||||||
Gas to natural gas liquids extraction | 3,710 | 3,693 | 3,746 | 3,829 | 3,925 | 2.5 | |||||||
Wet gas | 3,536 | 3,526 | 3,600 | 3,689 | 3,803 | 3.1 | |||||||
Reprocessing streams(4) | 174 | 166 | 146 | 141 | 123 | (12.8 | ) | ||||||
Production | |||||||||||||
Dry gas(5) | 2,791 | 2,804 | 2,916 | 3,029 | 3,144 | 3.8 | |||||||
Natural gas liquids(6)(7) | 445 | 443 | 418 | 428 | 451 | 5.4 | |||||||
Liquefied petroleum gas(6) | 204 | 206 | 205 | 212 | 225 | 6.1 | |||||||
Ethane(6) | 156 | 147 | 127 | 125 | 133 | 6.4 | |||||||
Naphtha(6) (8) | 85 | 88 | 84 | 86 | 90 | 4.7 | |||||||
Sulphur(9) | 661 | 684 | 703 | 757 | 759 | 0.3 | |||||||
46
Table of Contents
Note: Numbers may not total due to rounding
| (1) | Excludes operations of Pemex-Exploration and Production. Pemex-Exploration and Production produced a total of 4,573 million cubic feet per day of natural gas in 2004. |
| (2) | Includes sweet vapor from condensates. |
| (3) | Includes internal streams. |
| (4) | Reprocessing of pipeline dry gas at various cryogenic plants. |
| (5) | Does not include ethane reinjected into the natural gas stream. |
| (6) | In thousands of barrels per day. |
| (7) | Includes stabilized condensates, reprocessing streams from La Cangrejera petrochemical complex and other streams for fractionating. |
| (8) | Includes pentanes. |
| (9) | In thousands of tons. |
Source: Pemex BDI.
Processing Capacity
| Year Ended December 31, | ||||||||||
| 2000 | 2001 | 2002 | 2003 | 2004 | ||||||
(in millions of cubic feet per day, except where otherwise indicated) | ||||||||||
Sweetening plants | ||||||||||
Sour condensates(1)(2) | 192 | 144 | 144 | 144 | 144 | |||||
Sour natural gas(2)(3) | 3,753 | 3,923 | 4,173 | 4,503 | 4,503 | |||||
Natural gas liquids recovery plants | ||||||||||
Cryogenics(4) | 4,559 | 4,559 | 4,559 | 4,592 | 4,992 | |||||
Absorption(3)(5) | 475 | 475 | 475 | 554 | 554 | |||||
Total | 5,034 | 5,034 | 5,034 | 5,146 | 5,546 | |||||
Natural gas liquids fractionating(1)(3)(5) | 554 | 554 | 563 | 569 | 574 | |||||
Processing of hydrosulphuric acid(6) | 216 | 219 | 219 | 219 | 219 | |||||
| (1) | In thousands of barrels per day. |
| (2) | In 2001, two sour condensates sweetening plants at Ciudad Pemex were modified to process sour natural gas. In 2002, sour gas sweetening plants No. 1 and No. 2 at Ciudad Pemex increased production capacity from 400 to 525 million cubic feet per day. In 2003, a sour natural gas sweetening plant began operations at the Arenque complex, with a capacity of 34 million cubic feet per day. |
| (3) | In 2003, as a result of Pemex-Gas and Basic Petrochemicals’ processing capacity review, adjustments set forth above to the capacity of plants to process sour natural gas, absorb natural gas liquids and fractionate natural gas liquids were made. |
| (4) | Includes the cryogenic plant located in La Cangrejera. In 2003, a new cryogenic plant began operations at the Arenque complex, with a capacity of 33 million cubic feet per day. In 2004, two modular cryogenic plants started operations at the Burgos complex, each with a capacity of 200 million cubic feet per day. |
| (5) | In 2002, the La Cangrejera plant increased its liquids fractionating capacity from 104 thousand barrels per day to 113 thousand barrels per day. In 2004, a liquids fractionating plant began operations at the Burgos complex, with a capacity of 5.7 thousand barrels per day. |
| (6) | In 2003, one sulphur recovery plant began operations at the Arenque complex, with a capacity of 13 tons per day of sulphur production. This increase in capacity was offset by a decrease in capacity at Matapionche. |
Source: Pemex BDI.
Domestic consumption of dry gas totaled 4,813 million cubic feet per day in 2004, a 4.3% increase from the 2003 domestic consumption of 4,615 million cubic feet per day. The subsidiary entities consumed approximately 43% of the total domestic dry gas consumed in 2004, while the industrial-distributor sector consumed 25% and the electrical sector consumed 32%.
47
Table of Contents
We import dry gas to satisfy shortfalls in our production and to meet demand in areas of northern Mexico which, due to their distance from the fields, can be supplied more efficiently by importing natural gas from the United States. We imported 766 million cubic feet per day of dry gas in 2004, a 1.2% increase from the 757 million cubic feet per day imported in 2003.
Pemex-Gas and Basic Petrochemicals also produces liquid hydrocarbons obtained from sweet natural gas and recovered in surface separating facilities and liquid hydrocarbons condensed in natural gas pipelines. Our production of natural gas liquids, including stabilized condensates and reprocessing and other fractionating streams, increased by 5.4%, from 428 thousand barrels per day in 2003 to 451 thousand barrels per day in 2004, due to greater availability of wet gas from Pemex-Exploration and Production.
Pemex-Gas and Basic Petrochemicals processes sour condensates, which have a higher sulphur content, to produce stabilized sweet condensates. The volume of sour condensates we processed from Pemex-Exploration and Production and internal streams of Pemex-Gas and Basic Petrochemicals amounted to 100 thousand barrels per day in 2004, a 12.4% increase from 89 thousand barrels per day in 2003. Of these amounts, 87 thousand barrels per day (87%) resulted in stabilized condensates during 2004, and 76 thousand barrels per day (76%) resulted in stabilized condensates during 2003. Pemex-Gas and Basic Petrochemicals also processes sweet condensates at its Reynosa and Burgos facilities to produce solvents, naphta and heavy naphta.
In March and May of 2004, Pemex-Gas and Basic Petrochemicals started operations of two modular cryogenic plants and a liquid fractionating plant at the Burgos gas processing center in northern Mexico to recover the liquid hydrocarbons associated with the natural gas production in the Burgos basin and ensure an effective supply of natural gas in Mexico. Each cryogenic plant has a processing capacity of 200 million cubic feet per day of sweet wet gas, while the fractionating plant has a processing capacity of 6 thousand barrels per day.
In October 2004 and April 2005, Pemex-Gas and Basic Petrochemicals executed two contracts to build two new modular cryogenic plants. These plants will also be constructed at the Burgos gas processing center and will have the same processing capacity as the two modular cryogenic plants mentioned above.
The Regulatory Law limits basic petrochemicals to the following nine products that are used in the petrochemical production process: ethane, propane, butane, pentanes, hexane, heptane, carbon black, naphthas and methane, when obtained from hydrocarbon reservoirs in Mexico and used as raw material for petrochemical industrial processes. Pemex-Gas and Basic Petrochemicals produces methane, ethane, propane, butane and naptha. All other petrochemical products may be produced by Pemex-Petrochemicals, Pemex-Refining or by private sector companies. However, the Regulatory Law also allows companies that produce basic petrochemicals, as by-products of non-basic petrochemical production, to sell these basic petrochemicals internally within plants in the same unit or complex or to sell them to us.
48
Table of Contents
Over the five years ended December 31, 2004, the value of Pemex-Gas and Basic Petrochemicals’ domestic sales were distributed as follows:
Value of Domestic Sales of Pemex-Gas and Basic Petrochemicals(1)
| Year Ended December 31, | 2004 vs. 2003 | ||||||||||||
| 2000 | 2001 | 2002 | 2003 | 2004 | |||||||||
| (in millions of constant pesos at December 31, 2004) | (%) | ||||||||||||
Natural gas | Ps. 33,306.9 | Ps. 34,163.2 | Ps. 34,099.4 | Ps. 54,916.9 | Ps. 69,195.4 | 26.0 | |||||||
Liquefied petroleum gas | 34,362.2 | 34,651.3 | 29,402.2 | 39,539.5 | 42,662.9 | 7.9 | |||||||
Petrochemicals | |||||||||||||
Hexane | 139.0 | 168.5 | 150.7 | 233.4 | 286.0 | 22.5 | |||||||
Dissolving agents | 314.4 | 445.5 | 240.0 | 45.1 | 62.4 | 38.4 | |||||||
Sulphur | 157.7 | 86.0 | 124.3 | 208.4 | 189.0 | (9.3 | ) | ||||||
Carbon black | 253.8 | 141.9 | 152.6 | 294.4 | 371.0 | 26.0 | |||||||
Pentanes | 35.4 | 3.2 | 53.3 | 24.8 | 46.3 | 86.7 | |||||||
Heptane | 26.9 | 29.1 | 22.8 | 32.3 | 41.6 | 28.8 | |||||||
Butane | 42.6 | 46.3 | 41.0 | 58.7 | 69.7 | 18.7 | |||||||
Propane | 30.5 | 27.6 | 21.1 | 30.0 | 40.8 | 36.0 | |||||||
Isobutane | 9.0 | 7.5 | 2.8 | 0.4 | 0.0 | (100.0 | ) | ||||||
Others | 154.6 | 185.9 | 125.5 | 8.4 | 13.8 | 64.3 | |||||||
Total Petrochemicals | 1,164.0 | 1,141.3 | 934.6 | 935.8 | 1,120.6 | 19.7 | |||||||
Total | Ps. 68,833.1 | Ps. 69,956.0 | Ps. 64,436.2 | Ps.95,392.2 | Ps. 112,978.8 | 18.4 | |||||||
Note: Numbers may not total due to rounding
| (1) | Excludes value added tax. |
Sources: Pemex BDI.
Subsidiaries of Pemex-Gas and Basic Petrochemicals
Pemex-Gas and Basic Petrochemicals conducts certain management, real estate and distribution activities through its subsidiaries and through certain joint ventures The following table lists Pemex-Gas and Basic Petrochemicals’ subsidiaries, their principal operating activities and Pemex-Gas and Basic Petrochemicals’ ownership interest:
Subsidiaries of Pemex-Gas and Basic Petrochemicals(1)(2)
Subsidiary | Principal Activity | Ownership Interest | |||
Mex Gas International, Ltd. | Holding company | 100.00 | % | ||
Pasco Terminals, Inc. | Storage and distribution of liquid sulphur | 100.00 | |||
Pasco International, Ltd. | Holding company | 100.00 | |||
Pan American Sulphur, Ltd. | Storage and distribution of sulphuric acid and distillates | 99.87 | |||
Terrenos para Industrias, S.A. | Real estate holding company | 100.00 |
| (1) | As of December 31, 2004. |
| (2) | Mex Gas International, Ltd. is the only subsidiary of Pemex-Gas and Basic Petrochemicals that is a consolidated subsidiary company. See Note 2 (c) to our consolidated financial statements included herein. |
Source: Pemex-Gas and Basic Petrochemicals.
49
Table of Contents
The following table lists Pemex-Gas and Basic Petrochemicals’ joint ventures, their principal operating activities and Pemex-Gas and Basic Petrochemicals’ ownership interest:
Joint Ventures of Pemex-Gas and Basic Petrochemicals(1)
Subsidiary | Principal Activity | Ownership Interest | |||
Gasoductos de Chihuahua, S. de R.L. de C.V | Transport of gas | 50.00 | % | ||
CH4 Energía, S.A. de C.V. | Trading of gas | 50.00 |
| (1) | As of December 31, 2004. |
Source: Pemex-Gas and Basic Petrochemicals.
Private Sector Participation in Natural Gas Distribution
The Regulatory Law, as amended effective May 12, 1995, provides that private and “social sector” companies may, with governmental authorization, store, distribute or transport natural gas, and may construct, own and operate natural gas pipelines, facilities and equipment. The regulations implementing this amendment went into effect on November 9, 1995.
Since 1997, the Regulatory Law has required us to provide the private sector with open access to our transportation system for distribution, ending our prior exclusive rights over the lines of distribution. We continue to market natural gas and may develop natural gas storage systems.
In 1996, theComisión Reguladora de Energía (Energy Regulatory Commission) approved the Gradual Access Program for 1996-1997, which required that we open access to our natural gas distribution system to the private sector and prohibited vertical integration between transportation and distribution. As a result, Pemex-Gas and Basic Petrochemicals’ distribution assets located within the following official distribution zones have been privatized: Chihuahua, Toluca, Saltillo, Nuevo Laredo, Río Pánuco, Norte de Tamaulipas, Distrito Federal, Valle de Cuautitlán Texcoco, Querétaro, La Laguna, Bajío Norte, Puebla-Tlaxcala, Guadalajara, Piedras Negras and Ciudad Juárez. As of 1999, all of our natural gas distribution pipelines were opened to private sector use and there were no further distribution assets left to divest pursuant to the program, although a portion of these assets are still held in trust and the distribution assets located within Veracruz have not yet been divested.
LPG Pricing Program
On February 27, 2003, President Fox issued an executive decree establishing maximum prices on first-hand and end-user sales of liquefied petroleum gas as part of a Mexican Government program to stabilize LPG prices. The purpose of this program was to curtail seasonal price fluctuations that can adversely affect economic development. Pursuant to the decree, the maximum prices of first hand sales are adjusted periodically according to a formula determined by the Mexican Government, and theSecretaría de Economía (the Ministry of Economy) fixes the end-user’s purchase price. The decree expires in December 2005.
Natural Gas Hedging Operations
Pemex-Gas and Basic Petrochemicals offers its customers financial instruments as a value added service and we provide various hedging contracts to our customers in order to give them the option of protecting against fluctuations in the price of our products. On January 17, 2001, the Ministry of Finance and Public Credit, the Ministry of Economy, theSecretaría de Energía (the Ministry of Energy) and PEMEX announced a program that would stabilize natural gas prices for certain industrial consumers in Mexico who chose to join it. Most of the Mexican industrial consumers decided to participate through a 3-year contract with a fixed price of U.S. $4.00 per million British Thermal Units (BTUs) (from January 2001 through December 2003). This program
50
Table of Contents
represented a 1.6% cost savings to our customers on the sales price over that period. In 2001, we hedged approximately 91% of the total volume of natural gas sold under this program. This price represented a discount of approximately 58% from the spot prices for natural gas offered in the market as of January 17, 2001, and it was a price 14% greater than the spot prices offered in the market in September 2002. Over the whole period, this program represented a discount of 1.6% to our customers on the reference price. In 2001, we hedged approximately 91% of the total volume of natural gas sold under this program.
At the end of 2003, the Ministry of Energy published a bulletin announcing two hedging mechanisms that Pemex-Gas and Basic Petrochemicals would offer to its natural gas customers for the period from January 1, 2004 through December 31, 2006 to replace the program mentioned above. This program applies to approximately 20% of our total domestic sales of natural gas to industrial customers. These mechanisms provide two alternatives:
| • | Customers can purchase natural gas swaps from us at a fixed price equal to a maximum of U.S. $4.50 per million BTUs over the period from January 1, 2004 through December 31, 2006 for purchases of up to 10 million cubic feet per day. If the customer’s requirements are higher (up to 20 million cubic feet per day), the fixed price would be U.S. $4.55 per million BTUs; or |
| • | Customers can purchase natural gas swaps from us for the period between January 2004 through December 2004 at a lower fixed price of U.S. $4.425 per million BTUs, so long as the reference price in Reynosa does not exceed U.S. $6.00 per million BTUs. If the reference price does exceed that amount, the customer would also pay the difference between U.S. $6.00 per million BTUs and the average spot price. In June 2004, all the customers who had already entered the program agreed to renew their respective contracts for the period from 2005 through 2006. |
Pemex-Gas and Basic Petrochemicals modified its traditional risk profile for natural gas in order to mitigate the potential volatility in income resulting from the sale of this product. This strategy does not leave Pemex-Gas and Basic Petrochemicals with any exposure to basis risk (i.e., the risk arising from the price of a derivative being based on a different reference than that of the underlying commodity), due to the fact that the derivatives are now priced using the same market indices as the ones used to price Pemex-Gas and Basic Petrochemicals’ natural gas sales.
For more information on these fixed price sales, see “Item 11—Quantitative and Qualitative Disclosures About Market Risk—Commodity Price Risk.”
Investments
In nominal peso terms, Pemex-Gas and Basic Petrochemicals invested Ps. 2,498 million in 2004, as compared to Ps. 3,253 million in 2003, in projects primarily related to natural gas and condensates processing, transportation and storage. For 2005, the Mexican Government approved Ps. 1,524 million in nominal terms for capital expenditures for investment in new PIDIREGAS for Pemex-Gas and Basic Petrochemicals at the modular cryogenic plants in Reynosa. In addition to this, Ps. 2,884 million in nominal terms has been budgeted for Pemex-Gas and Basic Petrochemicals’ non-PIDIREGAS-related capital expenditures in 2005.
Petrochemicals
Capacity
At the end of 2004, Pemex-Petrochemicals operated seven petrochemical complexes and one petrochemical unit for the production of non-basic petrochemical products. Pemex-Petrochemicals also owns the Camargo petrochemical complex that stopped operating three years ago, and a petrochemical unit at Reynosa that stopped operating in August 1998. At the end of 2004, Pemex-Petrochemicals operated 51 plants, including those that were not producing. Pemex-Petrochemicals had a total installed capacity sufficient to produce 12.55 million tons
51
Table of Contents
of petrochemical products per year in 2004, 0.4% higher than its 2003 installed capacity of 12.50 million tons per year, due to the increased production capacity of low density polyethylene at La Cangrejera petrochemical complex. Pemex-Petrochemicals’ total production capacity for the last five years was distributed among its facilities as follows:
Pemex-Petrochemicals’ Total Capacity
| Year ended December 31, | |||||||||||
| 2000 | 2001 | 2002 | 2003 | 2004 | |||||||
| (In thousands of tons) | |||||||||||
Petrochemical Facility | |||||||||||
Cosoleacaque | 4,696 | 4,736 | 4,998 | 4,975 | 4,975 | ||||||
La Cangrejera | 2,873 | 2,297 | 2,427 | 3,205 | 3,255 | ||||||
Morelos | 2,031 | 2,134 | 2,107 | 2,263 | 2,263 | ||||||
Pajaritos | 1,066 | 1,066 | 1,021 | 1,021 | 1,021 | ||||||
Escolín | 333 | 337 | 337 | 337 | 337 | ||||||
San Martín Texmelucan | 246 | 260 | 268 | 288 | 288 | ||||||
Camargo | 297 | 297 | 333 | 333 | 333 | ||||||
Tula | 60 | 62 | 71 | 76 | 76 | ||||||
Others | 45 | 0 | (1) | 0 | 0 | 0 | |||||
Total | 11,647 | 11,189 | 11,561 | 12,496 | 12,546 | ||||||
Note: Numbers may not total due to rounding.
| (1) | Reflects the shutting down of two plants in our Reynosa unit in 2001. |
Source: Pemex BDI.
Production
Pemex-Petrochemicals manufactures different non-basic petrochemical products, including:
| • | methane derivatives, such as ammonia and methanol; |
| • | ethane derivatives, such as ethylene, polyethylenes, vinyl chloride monomer and ethylene oxide; |
| • | aromatics and their derivatives, such as styrene, toluene, xylenes and paraxylene; |
| • | propylene and its derivatives, such as acrylonitrile; and |
| • | other products, such as oxygen, nitrogen, pentane, hexane and heptane liquids. |
Our combined annual total petrochemical production increased by 4.2%, from 10,298 thousand tons in 2003 to 10,731 thousand tons in 2004. Of this amount, Pemex-Petrochemicals produced 6,223 thousand tons of petrochemicals in 2004, representing a 2.3% increase from its production of 6,085 thousand tons in 2003, partly due to an increase in ammonia production and resuming operations in the paraxylene plant in La Cangrejera petrochemical complex.The remainder was produced by Pemex-Gas and Basic Petrochemicals. For information on Pemex-Gas and Basic Petrochemicals’ petrochemical production, see “—Gas and Basic Petrochemicals” above.
Pemex-Petrochemicals has increased slightly its production in the last two years, but it still remains at a level under the aggregate production in 2000 due to adverse petrochemical market conditions in Mexico. The following table summarizes the annual production associated with the principal petrochemical activities of Pemex-Petrochemicals for the five years ended December 31, 2004.
52
Table of Contents
Pemex-Petrochemicals Production
| Year Ended December 31, | 2004 vs. 2003 | ||||||||||||
| 2000 | 2001 | 2002 | 2003 | 2004 | |||||||||
| (in thousands of tons per year) | (%) | ||||||||||||
Liquids | |||||||||||||
Hexanes | 54 | 62 | 57 | 70 | 66 | (5.7 | ) | ||||||
Heptanes | 15 | 13 | 8 | 18 | 11 | (38.9 | ) | ||||||
Total | 69 | 75 | 65 | 88 | 77 | (12.5 | ) | ||||||
Other inputs | |||||||||||||
Oxygen | 413 | 380 | 376 | 399 | 418 | 4.8 | |||||||
Nitrogen | 105 | 96 | 109 | 106 | 112 | 5.7 | |||||||
Hydrogen | 2 | — | — | 167 | 162 | (3.0 | ) | ||||||
Total | 520 | 476 | 485 | 672 | 692 | 3.0 | |||||||
Petrochemicals | |||||||||||||
Methane derivatives | 2,271 | 1,752 | 1,663 | 1,383 | 1,668 | 20.6 | |||||||
Ethane derivatives | 2,636 | 2,408 | 2,309 | 2,218 | 2,073 | (6.5 | ) | ||||||
Aromatics and derivatives | 667 | 642 | 670 | 795 | 1,222 | 53.7 | |||||||
Propylene and derivatives | 180 | 127 | 115 | 125 | 116 | (7.2 | ) | ||||||
Others | 359 | 396 | 467 | 723 | 328 | (54.6 | ) | ||||||
Total | 6,113 | 5,325 | 5,224 | 5,244 | 5,406 | 3.1 | |||||||
Other products | |||||||||||||
Hydrochloric acid | 107 | 87 | 92 | 66 | 38 | (42.4 | ) | ||||||
Muriatic acid | 27 | 31 | 24 | 14 | 11 | (21.4 | ) | ||||||
Total | 134 | 118 | 116 | 81 | 49 | (39.5 | ) | ||||||
Total | 6,836 | 5,994 | 5,889 | 6,085 | 6,223 | 2.3 | |||||||
Note: Numbers may not total due to rounding.
Source: Pemex BDI.
Investments
Pemex-Petrochemicals invested Ps. 1,598 million in 2004, as compared to Ps. 1,627 million in 2003, in nominal peso terms, in projects such as ethylene, polyethylene and vinyl chloride monomer revamps, transportation and storage. For 2005, Pemex-Petrochemicals expects to invest Ps. 2,227 million in non-PIDIREGAS-related capital expenditures and Ps. 266 million in PIDIREGAS on revamping aromatics and derivative plants at La Cangrejera petrochemical complex, the expansion of its high density polyethylene plant to produce linear high and low density polyethylene and the second phase of the ethylene cracker revamping process at the Morelos petrochemical facility.
In addition, Pemex-Petrochemicals is analyzing several options to develop the Phoenix Project with the participation of private investment. All of these options include the construction of some new facilities and revamps at La Cangrejera and Morelos petrochemical complexes. The definition of the final scope of the project is subject to negotiations with potential partners.
Domestic Sales
In 2004, the value of the domestic sales of petrochemical products by Pemex-Petrochemicals increased by 44%, from Ps. 11,411 million in 2003 to Ps. 16,413 million in 2004. This increase was primarily due to a significant increase in the prices of some of the products manufactured by Pemex-Petrochemicals, such as
53
Table of Contents
polyethylenes, ethylene oxide and monoethylene glycol. As part of its commercial strategy in 2004, Pemex-Petrochemicals resumed operations in its paraxylene plant in La Cangrejera petrochemical complex in order to take advantage of the high prices of these petrochemical products.
Over the five years ended December 31, 2004, the value of Pemex-Petrochemicals’ domestic sales was distributed as set forth in the table below. The sales of petrochemical products by Pemex-Gas and Basic Petrochemicals and Pemex-Refining are included under “—Gas and Basic Petrochemicals” and “—Refining” above.
Value of Domestic Sales(1)
| Year Ended December 31, | 2004 vs. 2003 | |||||||||||
| 2000 | 2001 | 2002 | 2003 | 2004 | ||||||||
| (in millions of constant pesos at December 31, 2004)(2) | (%) | |||||||||||
Petrochemical Product | ||||||||||||
Methane derivatives | Ps. 1,869.7 | Ps. 1,699.0 | Ps. 1,231.8 | Ps. 1,757.3 | Ps. 2,168.2 | 23.4 | ||||||
Ethane derivatives | 7,128.5 | 5,641.9 | 4,560.3 | 6,645.0 | 8,327.1 | 25.3 | ||||||
Aromatics and derivatives | 2,004.8 | 1,462.8 | 1,475.9 | 2,050.2 | 4,654.9 | 127.0 | ||||||
Propylene and derivatives | 972.8 | 541.1 | 591.7 | 816.4 | 1,116.9 | 36.8 | ||||||
Others | 38.6 | 46.1 | 97.8 | 141.6 | 145.8 | 3.0 | ||||||
Total | Ps. 12,014.4 | Ps.9,390.9 | Ps. 7,957.6 | Ps. 11,410.5 | Ps. 16,412.9 | 43.8 | ||||||
Note: Numbers may not total due to rounding.
| (1) | Excludes value added tax. |
| (2) | Figures have been restated to constant pesos as of December 31, 2004, by applying the inflation factors from the respective year through December 31, 2004. For the five years ended December 31, 2004, the inflation factor is the average inflation rate for each of these years. |
Source: Pemex BDI.
Private Sector Participation in Petrochemicals Sector
Pemex-Petrochemicals, Petróleos Mexicanos and, in some cases, Pemex-Refining are the sole shareholders and own the following seven subsidiaries that hold the assets and liabilities associated with the production of non-basic petrochemicals, as well as the real estate corresponding to each complex or plant:
| • | Petroquímica Cosoleacaque, S.A. de C.V.; |
| • | Petroquímica Escolín, S.A. de C.V.; |
| • | Petroquímica Tula, S.A. de C.V.; |
| • | Petroquímica Camargo, S.A. de C.V.; |
| • | Petroquímica La Cangrejera, S.A. de C.V.; |
| • | Petroquímica Morelos, S.A. de C.V.; and |
| • | Petroquímica Pajaritos, S.A. de C.V. |
On September 15, 2004, a resolution was published in the Official Gazette of the Federation (Diario Oficial de la Federación) authorizing the Ministry of Energy to carry out the merger of the seven subsidiaries of Pemex-Petrochemicals into Pemex-Petrochemicals. The Board of Directors of Petróleos Mexicanos has also approved the merger. Pursuant to this resolution, the merger process should be completed by September 15, 2005. As of the date of this report, the merger remained subject only to the actual transfer of ownership of the seven subsidiaries’ assets to Pemex-Petrochemicals. Pemex-Petrochemicals expects to complete this merger in June 2005 or in the following weeks.
54
Table of Contents
International Trading
The PMI Group
The PMI Group includes PMI and the other PEMEX subsidiaries and affiliates that conduct international commercial activities for our products, except for natural gas, which is marketed directly by Pemex-Gas and Basic Petrochemicals. The PMI Group’s main objective is to assist in maximizing our profitability and optimizing our operations through the use of international trade, facilitating the link between the international markets and us and pursuing new business opportunities in marketing our products. The PMI Group manages the international sales of our crude oil and petroleum products and acquires in the international markets those petroleum products that we import to satisfy domestic demand. Sales and purchases of petroleum products (refined products, petrochemical products and liquefied petroleum gas) in the international markets are carried out through P.M.I. Trading Ltd. P.M.I. Trading Ltd. also performs third-party trading, transportation and risk-management activities.
Exports and Imports
PMI purchases crude oil from Pemex-Exploration and Production and then sells it to PMI’s customers. PMI sold an average of 1,870 thousand barrels per day of crude oil in 2004, which constituted 55.3% of our total crude oil production.
The following tables set forth the composition and average prices of our crude oil exports for the periods indicated:
| Year Ended December 31, | ||||||||||||||||||||
| 2000 | 2001 | 2002 | 2003 | 2004 | ||||||||||||||||
| (tbpd) | (%) | (tbpd) | (%) | (tbpd) | (%) | (tbpd) | (%) | (tbpd) | (%) | |||||||||||
Crude oil exports (by volume) | ||||||||||||||||||||
Olmeca (API gravity of 38°-39°) | 398 | 25 | 317 | 18 | 245 | 14 | 216 | 12 | 221 | 12 | ||||||||||
Isthmus (API gravity of 32°-33°) | 110 | 7 | 87 | 5 | 46 | 3 | 25 | 1 | 27 | 1 | ||||||||||
Maya (API gravity of 21°-22°) | 1,086 | 68 | 1,332 | 76 | 1,398 | 82 | 1,590 | 86 | 1,608 | 86 | ||||||||||
Altamira (API gravity 15.0°-16.5°) | 11 | 1 | 20 | 1 | 17 | 1 | 14 | 1 | 13 | 1 | ||||||||||
Total | 1,604 | 100 | 1,756 | 100 | 1,705 | 100 | 1,844 | 100 | 1,870 | 100 | ||||||||||
Notes: Numbers may not total due to rounding.
tbpd = thousand barrels per day.
API gravity refers to the specific gravity, or density, of liquid petroleum products measured in degrees on the American Petroleum Institute scale. On the API scale, oil with the least specific gravity has the highest API gravity. In addition, if all other things are equal, the higher the API gravity, the greater the value of the crude oil.
Source: PMI operating statistics, which are based on information in bills of lading.
| Year Ended December 31, | |||||||||||||||
| 2000 | 2001 | 2002 | 2003 | 2004 | |||||||||||
| (U.S. dollars per barrel) | |||||||||||||||
Crude Oil Prices | |||||||||||||||
Olmeca | $ | 29.00 | $ | 23.96 | $ | 24.87 | $ | 29.32 | $ | 39.34 | |||||
Isthmus | 27.87 | 22.27 | 23.48 | 28.08 | 38.04 | ||||||||||
Maya | 22.99 | 17.19 | 20.89 | 24.13 | 29.82 | ||||||||||
Altamira | 19.67 | 12.75 | 19.41 | 22.81 | 28.12 | ||||||||||
Weighted average realized price | $ | 24.79 | $ | 18.61 | $ | 21.52 | $ | 24.78 | $ | 31.05 | |||||
Source: PMI operating statistics, which are based on information in bills of lading.
55
Table of Contents
Geographic Distribution of Export Sales
In 2004, 98% of PMI’s sales of our crude oil exports were to countries in the western hemisphere. As of December 31, 2004, PMI had 29 customers in 13 countries. Among these countries, the United States, Spain, the Netherlands Antilles and Canada have consistently been our largest customers.
The following table sets forth crude oil export sales by country.
Crude Oil Exports by Country
| Percentage of Exports | |||||||||||||||
| 2000 | 2001 | 2002 | 2003 | 2004 | |||||||||||
United States | 75.0 | % | 75.3 | % | 78.6 | % | 78.0 | % | 79.2 | % | |||||
Spain | 8.7 | 8.4 | 8.3 | 7.8 | 8.0 | ||||||||||
Netherlands Antilles | 6.7 | 7.6 | 5.3 | 5.7 | 6.2 | ||||||||||
Japan | 2.2 | 1.0 | 0.6 | 0.6 | 0.0 | ||||||||||
Canada | 1.7 | 1.6 | 1.2 | 1.6 | 1.5 | ||||||||||
Others | 5.7 | 6.2 | 6.1 | 6.4 | 5.0 | ||||||||||
Total | 100.0 | % | 100.0 | % | 100.0 | % | 100.0 | % | 100.0 | % | |||||
Note: Numbers may not total due to rounding.
Source: PMI operating statistics, which are based on information in bills of lading.
56
Table of Contents
The following table sets forth the geographic distribution of PMI’s sales of crude oil exports from January 1, 2000 through December 31, 2004. The table also presents the distribution of exports among PMI’s crude oil types for those years.
Composition and Geographic Distribution of Crude Oil Export Sales
| At December 31, | ||||||||||||||||||||
| 2000 | 2001 | 2002 | 2003 | 2004 | ||||||||||||||||
| (tbpd) | (%) | (tbpd) | (%) | (tbpd) | (%) | (tbpd) | (%) | (tbpd) | (%) | |||||||||||
PMI Crude Oil Export Sales to: | ||||||||||||||||||||
United States and Canada | 1,230 | 77 | 1,349 | 77 | 1,360 | 80 | 1,467 | 80 | 1,510 | 81 | ||||||||||
Europe | 185 | 12 | 184 | 10 | 181 | 11 | 176 | 10 | 178 | 10 | ||||||||||
Central and South America | 149 | 9 | 179 | 10 | 117 | 7 | 137 | 7 | 145 | 8 | ||||||||||
Far East | 40 | 2 | 37 | 2 | 47 | 3 | 63 | 3 | 36 | 2 | ||||||||||
Africa | — | — | 6 | 0 | — | — | 1 | 0 | 0 | 0 | ||||||||||
Total | 1,604 | 100 | 1,756 | 100 | 1,705 | 100 | 1,844 | 100 | 1,870 | 100 | ||||||||||
Olmeca (API gravity of 38°-39°) | ||||||||||||||||||||
United States and Canada | 378 | 24 | 292 | 17 | 225 | 13 | 195 | 11 | 208 | 11 | ||||||||||
Others | 19 | 1 | 25 | 1 | 20 | 1 | 21 | 1 | 14 | 1 | ||||||||||
Total | 398 | 25 | 317 | 18 | 245 | 14 | 216 | 12 | 221 | 12 | ||||||||||
Isthmus (API gravity of 32°-33°) | ||||||||||||||||||||
United States and Canada | 68 | 4 | 56 | 3 | 29 | 2 | 11 | 1 | 6 | 0 | ||||||||||
Others | 41 | 3 | 31 | 2 | 17 | 1 | 14 | 1 | 22 | 1 | ||||||||||
Total | 110 | 7 | 87 | 5 | 46 | 3 | 25 | 1 | 27 | 1 | ||||||||||
Maya (API gravity of 21°-22°) | ||||||||||||||||||||
United States and Canada | 773 | 48 | 982 | 56 | 1,090 | 64 | 1,247 | 68 | 1,283 | 69 | ||||||||||
Others | 313 | 19 | 350 | 20 | 308 | 18 | 342 | 19 | 325 | 17 | ||||||||||
Total | 1,086 | 68 | 1,331 | 76 | 1,398 | 82 | 1,590 | 86 | 1,608 | 86 | ||||||||||
Altamira (API gravity of 15.0°-16.5°) | ||||||||||||||||||||
United States and Canada | 11 | 1 | 20 | 1 | 17 | 1 | 14 | 1 | 13 | 1 | ||||||||||
Others | — | — | — | — | — | — | — | — | — | — | ||||||||||
Total | 11 | 1 | 20 | 1 | 17 | 1 | 14 | 1 | 13 | 1 | ||||||||||
Notes: Numbers may not total due to rounding.
tbpd = thousands barrels per day
API gravity refers to the specific gravity, or density, of liquid petroleum products measured in degrees on the American Petroleum Institute scale. On the API scale, oil with the least specific gravity has the highest API gravity. In addition, if all other things are equal, the higher the API gravity, the greater the value of the crude oil.
| Source: | PMI operating statistics, which are based on information in bills of lading. |
PMI makes a significant percentage of its crude oil sales under evergreen contracts, which can be terminated by either party pursuant to a three month phase-out clause. PMI sells most of its remaining exports to the same customers that purchase under evergreen contracts, but PMI makes these sales pursuant to separate supply contracts, which apply the pricing formulas included in the evergreen contracts. PMI generally sells crude
57
Table of Contents
oil on aFree On Board basis (at the shipping point). In practically all cases, PMI sells refined products onFree on Board andCost and Freight bases and buys refined products onDelivery Ex-ship orDelivery at Frontier andCost and Freight bases.
PMI has entered into several long-term Maya crude oil supply agreements pursuant to which the purchasers have agreed to undertake projects to expand the capacity of their respective refineries to upgrade residue from Maya crude oil. Under these agreements, PMI provides the purchasers with certain support mechanisms that will protect, under certain adverse market conditions, the investments that the purchasers undertake in accordance with the agreements. These agreements include:
| • | an agreement with Port Arthur Coker Co., signed on March 10, 1998, to supply its Port Arthur, Texas refinery with approximately 165 thousand barrels per day of Maya crude oil for a period of eight years following project completion, which occurred in March 2001; |
| • | an agreement with Coastal Aruba Refining Company N.V. (which was assigned to Valero Energy Corporation on March 5, 2004 following its acquisition of Coastal Aruba Refining Company N.V.), signed on July 30, 1998, to supply its refinery in Aruba with approximately 100 thousand barrels per day of Maya crude oil for a period of five years following project completion, which occurred in April 2000. The agreement was extended until July 2005, after which time PMI will continue to supply Maya crude oil for the refinery under an evergreen contract, as described above; |
| • | an agreement with Exxon Company U.S.A. and Exxon Trading Company International, signed on September 25, 1998, to supply its Baytown, Texas refinery with approximately 65 thousand barrels per day of Maya crude oil for a period of five years following project completion, which occurred in December 2001; |
| • | an agreement with Pecten Trading Company, which is a trading subsidiary of Shell Oil Company, signed on May 1, 1999, and an agreement with P.M.I. Norteamérica, S.A. de C.V., signed on the same date, to supply the Deer Park refinery joint venture with a total of approximately 50 thousand barrels per day of Maya crude oil for a period of seven years following project completion, which occurred in April, 2001, and up to 170 thousand barrels per day thereafter; |
| • | an agreement with Marathon Ashland Supply LLC, signed on May 19, 1999, to supply its Garyville, Louisiana refinery with approximately 100 thousand barrels per day of Maya crude oil for a period of five years following project completion, which occurred in December, 2001; |
| • | an agreement with Valero Marketing and Supply Company and Valero Refining–Texas, L.P., signed on December 17, 2001, to supply their Texas City, Texas refinery with approximately 90 thousand barrels per day of Maya crude oil for a period of five years following project completion, which occurred in February, 2004; and |
| • | an agreement with Chevron Products Company, a division of Chevron U.S.A. Inc., signed on March 6, 2002, to supply its Pascagoula, Mississippi refinery with approximately 130 thousand barrels per day of Maya crude oil for a period of five years following project completion, which occurred in May 2003. |
These long-term Maya crude oil supply agreements further our strategy of supporting the export value of Maya crude oil in relation to the value of other grades of crude oil by creating incentives for refiners to invest in new high-conversion refineries, which will be capable of upgrading the relatively large proportion of residue produced from processing Maya crude oil in less-efficient refining complex configurations.
The Ministry of Energy has entered into certain agreements to reduce or increase exports of crude oil as discussed below in “—Trade Regulations and Export Agreements.”
58
Table of Contents
The following table sets forth the average volume of our exports and imports of crude oil, natural gas and petroleum products for the five years ended December 31, 2004.
Volume of Exports and Imports
| Year Ended December 31, | 2004 vs. 2003 | ||||||||||||
| 2000 | 2001 | 2002 | 2003 | 2004 | |||||||||
| (in thousands barrels per day, except as noted) | (%) | ||||||||||||
Exports | |||||||||||||
Crude Oil | |||||||||||||
Olmeca | 397.6 | 317.4 | 244.8 | 215.6 | 221.4 | 2.7 | |||||||
Isthmus | 109.8 | 86.8 | 45.8 | 24.9 | 27.4 | 10.0 | |||||||
Altamira | 10.6 | 19.5 | 16.9 | 13.7 | 13.4 | (2.2 | ) | ||||||
Maya | 1,085.8 | 1,331.9 | 1,397.6 | 1,589.6 | 1,608.1 | 1.2 | |||||||
Total crude oil | 1,603.7 | 1,755.7 | 1,705.1 | 1,843.9 | 1,870.3 | 1.4 | |||||||
Natural gas(1) | 3.5 | 3.7 | 4.4 | — | — | — | |||||||
Refined products | 112.5 | 102.5 | 155.9 | 178.9 | 151.8 | (15.1 | ) | ||||||
Petrochemical products(2) | 1,123.9 | 794.0 | 801.7 | 834.8 | 915.7 | 9.7 | |||||||
Imports | |||||||||||||
Natural gas(3) | 231.4 | 292.2 | 592.5 | 756.9 | 766.0 | 1.2 | |||||||
Refined products | 445.5 | 382.0 | 349.9 | 287.2 | 310.5 | 8.1 | |||||||
Petrochemical products(2) | 444.4 | 280.3 | 295.3 | 532.4 | 276.6 | (48.0 | ) | ||||||
| Note: | Numbers are subject to adjustment because the volume of crude oil exports actually sold during December 2004 may be adjusted to reflect the percentage of water in each shipment. |
| (1) | Fuel oil equivalent. |
| (2) | Thousands of metric tons. |
| (3) | Millions of cubic feet per day. |
Source: PMI operating statistics, which are based on information in bills of lading.
Crude oil exports increased by 1.4% in 2004, from 1,843.9 thousand barrels per day in 2003 to 1,870.3 thousand barrels per day in 2004, partly as a result of an increase in production and greater availability due to decreased domestic consumption. Natural gas imports increased by 1.2% in 2004, from 756.9 million cubic feet per day in 2003 to 766.0 million cubic feet per day in 2004, primarily due to increased demand in Mexico. Due to this increased domestic demand, no natural gas was exported in 2004. In 2004, exports of petrochemical products by volume increased by 9.7%, from 834.8 thousand metric tons in 2003 to 915.7 thousand metric tons in 2004, while imports of petrochemical products by volume decreased by 48.0%, from 532.4 thousand metric tons in 2003 to 276.6 thousand metric tons in 2004. In 2004, exports of refined products by volume decreased by 15.2%, from 178.9 thousand barrels per day in 2003 to 151.8 thousand barrels per day in 2004, while imports of refined products by volume increased by 8.1%, from 287.2 thousand barrels per day in 2003 to 310.5 thousand barrels per day in 2004. During 2005, import volumes of refined products are likely to continue to fluctuate significantly as a result of the anticipated startup of new refining plants.
59
Table of Contents
The following table sets forth the value of exports and imports of crude oil, natural gas and petroleum products for the five years ended December 31, 2004.
Value of Exports and Imports(1)
| Year ended December 31, | 2004 vs. 2003 | ||||||||||||||||
| 2000 | 2001 | 2002 | 2003 | 2004 | |||||||||||||
| (in millions of nominal U.S. dollars) | (%) | ||||||||||||||||
Exports | |||||||||||||||||
Olmeca | $ | 4,219.9 | $ | 2,775.7 | $ | 2,222.9 | $ | 2,307.7 | $ | 3,187.9 | 38.1 | ||||||
Isthmus | 1,119.5 | 705.9 | 392.5 | 255.4 | 380.9 | 49.1 | |||||||||||
Altamira | 76.2 | 90.9 | 119.6 | 114.5 | 138.2 | 20.7 | |||||||||||
Maya | 9,137.2 | 8,355.1 | 10,657.2 | 13,998.7 | 17,550.8 | 25.4 | |||||||||||
Total crude oil(2) | $ | 14,552.9 | $ | 11,927.6 | $ | 13,392.2 | $ | 16,676.3 | $ | 21,257.8 | 27.5 | ||||||
Natural gas | 48.8 | 47.8 | 4.0 | — | — | — | |||||||||||
Refined products | 1,167.8 | 896.5 | 1,288.1 | 1,743.4 | 2,036.8 | 16.8 | |||||||||||
Petrochemical products | 280.3 | 145.2 | 145.3 | 186.0 | 250.8 | 34.8 | |||||||||||
Total products | $ | 1,496.9 | $ | 1,089.5 | $ | 1,437.4 | $ | 1,929.4 | $ | 2,287.6 | 18.6 | ||||||
Total exports | $ | 16,049.8 | $ | 13,017.1 | $ | 14,829.6 | $ | 18,605.6 | $ | 23,545.4 | 26.6 | ||||||
Imports | |||||||||||||||||
Natural gas | $ | 366.5 | $ | 423.8 | $ | 775.4 | $ | 1,526.2 | $ | 1,715.1 | 12.4 | ||||||
Refined products | 5,411.3 | 4,170.0 | 3,827.4 | 3,777.3 | 5,306.2 | 40.5 | |||||||||||
Petrochemical products | 125.2 | 83.9 | 70.5 | 105.5 | 145.9 | 38.3 | |||||||||||
Total imports | $ | 5,903.0 | $ | 4,677.7 | $ | 4,673.3 | $ | 5,409.0 | $ | 7,167.2 | 32.5 | ||||||
Net exports | $ | 10,146.8 | $ | 8,339.4 | $ | 10,156.3 | $ | 13,196.7 | $ | 16,378.2 | 24.1 | ||||||
Note: Numbers may not total due to rounding.
| (1) | Does not include crude oil, refined products, petrochemicals and natural gas purchased by P.M.I. Trading Ltd. or P.M.I. Norteamérica, S.A. de C.V. from third parties outside of Mexico and resold in the international markets. The figures expressed in this table differ from the amounts contained in the financial statements under “Net Sales” because of the differences in methodology associated with the calculation of the exchange rates and other minor adjustments. |
| (2) | Crude oil exports are subject to adjustment to reflect the percentage of water in each shipment. |
Sources: PMI operating statistics, which are based on information in bills of lading.
Imports of natural gas increased in value by 12.4% during 2004, as a result of increased domestic demand for natural gas and higher natural gas prices.
In 2004, we continued to be a net importer of refined products, with imports of refined products increasing in value by 40.5%, while exports of refined products increased in value by 16.8%. Our net imports of refined products for 2004 totaled U.S. $3,269.4 million, a 60.7% increase from the refined products trade deficit of U.S. $2,033.9 million in 2003.
60
Table of Contents
The following table describes the composition of our imports and exports of selected refined products in 2002, 2003 and 2004.
Imports and Exports of Selected Refined Products
| Year Ended December 31, | |||||||||||||||
| 2002 | 2003 | 2004 | |||||||||||||
| (tbpd) | (%) | (tbpd) | (%) | (tbpd) | (%) | ||||||||||
Imports | |||||||||||||||
Gasoline(1) | 179.6 | 51.3 | 145.2 | 50.6 | 192.6 | 62.0 | |||||||||
Fuel oil | 19.0 | 5.4 | 20.3 | 7.1 | 17.1 | 5.5 | |||||||||
Liquefied petroleum gas | 101.6 | 29.0 | 85.2 | 29.7 | 84.4 | 27.2 | |||||||||
Diesel | 26.7 | 7.6 | 9.9 | 3.5 | 3.6 | 1.2 | |||||||||
Others | 23.0 | 6.6 | 26.5 | 9.2 | 12.8 | 4.1 | |||||||||
Total | 349.9 | 100.0 | % | 287.2 | 100.0 | % | 310.5 | 100.0 | % | ||||||
Exports | |||||||||||||||
Gasoline(1) | 70.7 | 45.3 | 70.9 | 39.6 | 76.7 | 50.5 | |||||||||
Diesel | 5.5 | 3.5 | 2.5 | 1.4 | 7.7 | 5.1 | |||||||||
Liquefied petroleum gas | 0.4 | 0.2 | 0.3 | 0.2 | 0.2 | 0.2 | |||||||||
Jet fuel | 6.3 | 4.1 | 7.6 | 4.2 | 6.8 | 4.5 | |||||||||
Fuel oil | 25.7 | 16.5 | 23.6 | 13.2 | 3.5 | 2.3 | |||||||||
Others | 47.3 | 30.4 | 73.9 | 41.3 | 56.9 | 37.5 | |||||||||
Total | 155.9 | 100.0 | % | 178.9 | 100.0 | % | 151.8 | 100.0 | % | ||||||
Notes: tbpd = thousands of barrels per day.
Numbers may not total due to rounding.
| (1) | Includes methyl terbutyl ether (MTBE) and pentanes. |
Source: PMI operating statistics based on INCOTERMS (International Commercial Terms).
61
Table of Contents
For the three years ended December 31, 2004, our imports and exports of selected petrochemicals were as follows:
Imports and Exports of Selected Petrochemicals
| Year Ended December 31, | |||||||||||||||
| 2002 | 2003 | 2004 | |||||||||||||
| (tmt) | (%) | (tmt) | (%) | (tmt) | (%) | ||||||||||
Imports | |||||||||||||||
Xylenes | 5.0 | 1.7 | 2.0 | 0.4 | 18.5 | 6.7 | |||||||||
Propylene | 4.5 | 1.5 | 0.4 | 0.1 | 0.1 | 0.0 | |||||||||
Ammonia | 88.6 | 30.0 | 35.2 | 6.6 | 14.7 | 5.3 | |||||||||
Others | 197.2 | 66.8 | 494.8 | 92.9 | 243.4 | 88.0 | |||||||||
Total | 295.3 | 100.0 | % | 532.4 | 100.0 | % | 276.6 | 100.0 | % | ||||||
Exports | |||||||||||||||
Sulphur | 411.8 | 51.4 | 552.6 | 66.2 | 607.2 | 66.3 | |||||||||
Ammonia | 123.2 | 15.4 | 0.1 | 0.0 | 35.9 | 3.9 | |||||||||
Ethylene | 98.3 | 12.3 | 94.0 | 11.3 | 154.3 | 16.9 | |||||||||
Polyethylenes | 50.1 | 6.3 | 34.3 | 4.1 | 25.5 | 2.8 | |||||||||
Others | 118.4 | 14.8 | 153.8 | 18.4 | 92.9 | 10.1 | |||||||||
Total | 801.7 | 100.0 | % | 834.8 | 100.0 | % | 915.7 | 100.0 | % | ||||||
Notes: tmt = thousands of metric tons.
Numbers may not total due to rounding.
Source: PMI operating statistics based on INCOTERMS (International Commercial Terms).
Hedging Operations
P.M.I. Trading Ltd. engages in hedging operations to cover the variations in the purchase and sale prices for petroleum products. Our internal policies establish a limit on the maximum capital at risk. Capital at risk is calculated daily in order to compare the actual figures with the aforementioned limit. Internal controls include a risk comptroller responsible for ensuring compliance, an internal auditing department and a risk management committee. See “Item 11—Quantitative and Qualitative Disclosures About Market Risk—Commodity Price Risk.”
Transportation and Distribution
Our pipelines connect crude oil and natural gas producing centers with refineries and petrochemical plants, and the refineries and petrochemical plants with Mexico’s major cities. At the end of 2004, our pipeline network measured approximately 61,711 kilometers in length. Of the total network, approximately 9,927 kilometers of pipelines transport crude oil, approximately 14,228 kilometers transport petroleum products and petrochemicals, 16,481 kilometers transport natural gas, 1,734 kilometers transport liquefied petroleum gas, 1,448 kilometers transport basic petrochemicals and the remaining pipelines are crude oil and natural gas gathering pipelines. Ownership of the pipelines is distributed among our subsidiary entities according to the products they transport.
The transportation of crude oil, natural gas and other products through a pipeline network is subject to leaks and spills in soil. See “Item 3—Key Information—Risk Factors— Risk Factors Related to the Operations of PEMEX.” In 2005, as part of our Emergency Program for Strengthening Safety, Health and Environmental Protection, we decreased the capacity and operating pressure in two pipelines and we will inspect and repair 10,775 kilometers without suspending operations. In 2005, we have budgeted a total of Ps. 1.7 billion for the remediation and maintenance of 427 pipelines and we expect to invest up to a total of Ps. 8.3 billion in the
62
Table of Contents
remediation and maintenance of our pipeline network through 2008. For more information on recent problems with our pipeline network, see “Item 4—Information on the Company—Environmental Regulation—Environmental Liabilities.”
During 2004, we transported approximately 79.8 billion tons per kilometer of crude oil and petroleum products to be processed in the refining system and petroleum products to satisfy domestic demand, as compared to the 77.2 billion tons per kilometer carried in 2003. Of the total amount of tons per kilometer we transported in 2004, we carried 60.3% through pipelines, 35.5% by vessels and the remainder by train tank cars and tank trucks.
At the end of 2004, we owned twenty-three refined product tankers and leased another ten. We also owned 77 major wholesale storage centers.
PEMEX Corporate Matters
In addition to the operating activities that we undertake through the activities of our subsidiary entities and subsidiary companies, we have certain centralized corporate operations that coordinate general labor, safety, insurance and legal matters.
Industrial Safety and Environmental Protection
Petróleos Mexicanos’ Corporate Direction of Operations is responsible for planning, conducting and coordinating programs to:
| • | foster a company culture of safety and environmental protection; |
| • | improve the safety of our workers and facilities; |
| • | reduce risks to the residents surrounding our facilities; and |
| • | protect the environment. |
We intend to develop further the industrial safety and environmental programs for each subsidiary entity. The environmental and safety division of each subsidiary entity coordinates closely with the Corporate Direction of Operations.
Insurance
We maintain general and civil liability insurance coverage for our onshore real and personal property, such as refineries, process plants, pipelines and storage facilities, and our offshore properties such as drilling platforms, rigs, gas gathering systems, floating docks and production facilities. Our insurance covers risks of sudden and accidental physical destruction or loss or damage to our properties. Our offshore general and civil liability insurance also covers extraordinary costs related to the operation of offshore wells, such as control and repair costs, evacuation costs and costs associated with spills. We maintain additional coverage for offshore environmental liabilities. We also maintain protection and indemnity insurance, life insurance, as well as insurance for automobiles and heavy equipment, electronic equipment and cargo and hull insurance for our shipping fleet.
We contract all of our insurance policies through Mexican insurance carriers. These policies have limits of U.S. $1.3 billion for onshore and offshore property, U.S. $300 million for extraordinary costs related to the operation of offshore wells, U.S. $1.0 billion for protection and indemnification for marine-related liabilities and U.S. $500 million for civil liabilities. Since June 2003, we have stopped purchasing business interruption insurance that compensated us for loss of revenues due to damage to our facilities because factors related to the nature and operation of our facilities, such as the ability of any of our six refineries to compensate for the loss of any one refinery and the separation of plants within the refineries, as well as the available coverage and conditions in the international insurance and reinsurance markets led us to conclude that the benefits of this type
63
Table of Contents
of coverage were outweighed by the cost. Instead, we have purchased business interruption mitigation insurance that compensates us only for the expenses that are necessary for us to recover our production capabilities in the least time possible. Our insurance policies are reinsured through Kot Insurance Company AG, our wholly-owned subsidiary organized under the laws of Switzerland (previously organized under the laws of Bermuda as Kot Insurance Company Ltd.). The purpose of Kot Insurance Company AG, which we refer to as Kot AG, is to reinsure policies of the insurers of Petróleos Mexicanos, the subsidiary entities, the subsidiary companies and their affiliates. Kot AG reinsures 47.6% of its reinsurance policies with unaffiliated third party reinsurers.
Property, Plants and Equipment
General
Substantially all of our property, consisting of refineries, storage, production, manufacturing and transportation facilities and certain retail outlets, is located in Mexico, including Mexican waters in the Gulf of Mexico. The location, character, utilization and productive capacity of our exploration, drilling, refining, petrochemical production, transportation and storage facilities are described above. See “—Exploration and Production,” “—Refining,” “—Gas and Basic Petrochemicals,” “—Petrochemicals,” and “—Transportation and Distribution.”
Reserves
Under Mexican law, all oil and other hydrocarbon reserves within Mexico are owned by the Mexican nation and not by us. Petróleos Mexicanos and the subsidiary entities have the exclusive right to exploit those reserves under the Regulatory Law and related laws and regulations. Our estimates of Mexico’s hydrocarbon reserves are described in “—Exploration and Production—Reserves.”
GENERAL REGULATORY FRAMEWORK
The Mexican Government and its agencies closely regulate and supervise our operations. The Ministry of Energy monitors our activities and the Secretary of Energy acts as the chairman of the Board of Directors of Petróleos Mexicanos. The Ministry of Finance and Public Credit approves the annual budget and financing program of Petróleos Mexicanos and the subsidiary entities. The Mexican Government incorporates the annual budget and financing program of Petróleos Mexicanos and the subsidiary entities into its budget, which the Mexican Congress must approve each year. The Mexican Government is not, however, directly liable for the financial obligations that we incur. TheSecretaría de Medio Ambiente y Recursos Naturales(the Ministry of the Environment and Natural Resources), in conjunction with other federal and state authorities, regulates our activities that affect the environment. TheSecretaría de la Función Pública(the Ministry of the Public Function), which we refer to as SFP (formerly known as SECODAM), appoints the external auditors of Petróleos Mexicanos and the subsidiary entities.
The ASF reviews annually theCuenta Pública(public account) of the various federal government entities on an annual basis, including Petróleos Mexicanos and the subsidiary entities. This review focuses mainly on the entities’ compliance with budgetary benchmarks and budget and accounting laws. The ASF prepares reports of its observations based on this review. The reports are subject to our analysis and, if necessary, our clarification and explanation of any issues raised during the audit. Discrepancies in amounts spent may subject our officials to legal sanctions. However, in most instances the observed issues are explained and clarified. The financial information provided to the ASF is prepared in accordance with Mexican Financial Reporting Standards applicable to Mexican public sector entities, which differ in several aspects from Mexican GAAP. As a result, our financial statements reflect different financial data than that included in the public account.
64
Table of Contents
ENVIRONMENTAL REGULATION
Legal Framework
We are subject to various laws related to the environmental protection of natural resources, as well as the management of hazardous and non-hazardous wastes. In particular, we are subject to the provisions of theLey General del Equilibrio Ecológico y la Protección al Ambiente(General Law on Ecology and Environmental Protection, which we refer to as the Environmental Law), the regulations issued thereunder and several technical environmental norms issued by the Ministry of the Environment and Natural Resources, which is in charge of supervising and regulating environmental matters relating to the oil and gas industry in Mexico. TheSecretaría de Salud (the Ministry of Health), the Secretaría deComunicaciones y Transportes (the Ministry of Communications and Transportation), the Secretaría de Marina (Ministry of Navy) and the Ministry of Energy assist the Ministry of the Environment and Natural Resources in its functions. In addition, we are subject to the environmental laws and regulations issued by the governments of each of the states of Mexico where our facilities are located.
The Environmental Law and Regulations of the Ministry of the Environment and Natural Resources
The Environmental Law and related regulations require that we obtain certain authorizations from the Ministry of the Environment and Natural Resources before we can carry out any activity that may have an adverse effect on the environment. In particular, these environmental regulations apply to chemical, petrochemical, crude oil refining and extraction activities, as well as the construction of crude oil and natural gas pipelines. Before authorizing a new project, the Ministry of the Environment and Natural Resources requires the submission of an environmental impact analysis and any other information that it may request. The Ministry of the Environment and Natural Resources is entitled to grant or deny its authorization of any activity.
The environmental regulations that apply generally to Mexican industry apply to us. These regulations specify, among other matters, permissible levels of emissions, water discharges and hazardous substances discharges as well as atmospheric pollution level limits. The technical regulations for oil and petrochemical industries set forth maximum permissible levels of pollution in residual water discharges and natural gas emissions. These regulations also establish procedures for measuring pollution levels. Mexico generally updates and revises its environmental regulatory framework as necessary, and we participate with the Mexican Government in developing environmental regulations that are related to our activities.
In April 1997, the Ministry of the Environment and Natural Resources issued regulations governing the procedures for obtaining an environmental license, under which new industrial facilities can comply with all applicable environmental requirements by way of a single administrative procedure. Each environmental license integrates all of the different permits, licenses and authorizations related to environmental matters for a particular facility. Since these regulations went into effect, we have been required to obtain an environmental license for any new facility, while our facilities that existed prior to the effectiveness of these regulations are not subject to this obligation.
Federal and state authorities in Mexico may inspect any facility to determine compliance with the Environmental Law, local environmental laws, regulations and technical environmental regulations. Violations or non-compliance with the legal provisions may result in the application of substantial fines, temporary or permanent shutdown of a facility, required capital expenditures to minimize the effect of our operations on the environment, cleanup of contaminated land and water, cancellation of a concession or revocation of authorization to carry out certain activities and, in certain cases, criminal prosecution of employees and individuals.
On March 29, 2005, the Ministry of the Environment and Natural Resources issued aNorma Oficial Mexicana (Official Mexican Rule) identified as NOM-138-SEMARNAT/SS-2003, which establishes maximum permissible limits for hydrocarbons in soil and specifications for its characterization and remediation. We are currently evaluating whether this new regulation will have an impact on our environmental liabilities.
65
Table of Contents
PEMEX’s Internal Monitoring
We believe that we are currently in substantial compliance with current federal and state environmental laws as those laws have been historically interpreted and enforced. We maintain an organizational structure that permits us to implement and monitor our environmental program. The subsidiary entities have specialized departments, depending on the size and geographic distribution of their respective sites, which implement their own environmental programs and conduct internal environmental audits and inspections of their sites and their immediate surroundings based on the standards of the Ministry of the Environment and Natural Resources. When these internal audits reveal deficiencies, the subsidiary entities take the necessary remedial actions to eliminate these deficiencies. If soil or bodies of water are contaminated at levels that exceed the levels stipulated in the applicable regulation, the remediation requirements derived from these internal audits and inspections are recorded in our financial statements as environmental liabilities when they are known and estimable.
Our Corporate Direction of Operations has developed an integrated safety and environmental protection management system and is currently implementing strategies within PEMEX to create a company culture focused on improving industrial safety and environmental protection. This system is an administrative tool composed of diverse, interdependent and interrelated elements, focused on diagnosis, evaluation, implementation and continuing preventive improvements related to safety and environmental protection. The diagnosis and evaluation stages have been completed; the system is now in an advanced stage of implementation.
We maintain an internal structure to identify and solve environmental problems and retain external consultants to perform operational audits at our industrial plants, including cost estimates for remedying any shortfall in compliance with Mexican environmental laws. Such remedies can include improving the operating efficiency of plants, cleaning up contaminated land and water, and capital expenditures to minimize the effect of our operations on the environment.
In addition to our internal monitoring structure for identifying affected areas, areas of non-compliance and improvement opportunities, our environmental program is subject to the review of theProcuraduría Federal de Protección al Ambiente(the Office of the Federal Attorney for Environmental Protection, which we refer to as PROFEPA). PROFEPA administers the Mexican environmental regulatory rubric and establishes acceptable standards of environmental remediation. Although PROFEPA has the authority to review and inspect remediation works performed by us and compliance with permitted contamination levels established by laws and regulations, it does not determine our environmental liabilities. We maintain proper records of all of the studies, estimations, performed works and any other information that PROFEPA may request from time to time.
Since 1993, we have participated in a voluntary environmental audit program with PROFEPA. As each environmental audit is completed, we send the audit report (which includes the estimated costs for remedying environmental anomalies) to PROFEPA for its review and approval. After approval by PROFEPA, we review the audits and determine which findings can be resolved by changing current plant or drilling operations and implementing the current capital expenditures plan. If the audit report is approved by PROFEPA, we negotiate a corrective action plan with PROFEPA, stipulating the time period, amounts to be expended and the steps to be taken to bring each site into compliance. As of December 31, 2004, with respect to Petróleos Mexicanos and the subsidiary entities, 440 environmental audits, including the negotiation of a corrective action plan, had been concluded under the program with PROFEPA, and all main facilities had been covered. As of December 31, 2004, corrective action plans for 369 audits had been implemented and all of these sites have received “clean industry” certifications from PROFEPA (some of which had to be recertified).With respect to the remaining 71 audits, the corrective action plans have been agreed upon and are being implemented.
In 2004, two significant oil spills occurred in the state of Veracruz. In October 2004, the Nuevo Teapa-Venta de Carpio pipeline ruptured near Omealca, spilling approximately 10,000 barrels of crude oil. In December 2004, the Nuevo Teapa-Poza Rica pipeline ruptured, spilling approximately 5,000 barrels of crude oil near Nanchital. In each of these two incidents, the emergency action plan developed by us, in coordination with local authorities and private companies, permitted the recovery of substantially all of the spilled crude oil. In each
66
Table of Contents
case, PROFEPA requested that we initiate environmental impact evaluations. It is anticipated that during the second half of 2005, the results of these evaluations will provide estimates of the areas that have been impacted and recommend environmental remediation activities.
On April 29, 2005, the Board of Directors of Petróleos Mexicanos approved the Emergency Program for Strengthening Safety, Health and Environmental Protection, under which we will implement “international best practices” designed to strengthen operational discipline, establish guidelines for safety processes and improve the operation and quality of our facilities and pipeline system. Under this program, the Corporate Direction of Operations will supervise and coordinate all actions to be taken by us to ensure an effective response in areas related to industrial safety, environmental protection, maintenance, operation and automation, particularly in connection within our pipeline system, in order to operate within safety margins and reduce operational risks.
There are currently no material legal or administrative proceedings pending against us with respect to any environmental matters, and we do not believe that continued compliance with environmental laws will have a material adverse effect on our financial condition or results of operations.
Environmental Liabilities
At December 31, 2004, our estimated and accrued environmental liabilities totaled Ps. 1,809.0 million. Of this total, Ps. 830.8 million was attributable to Pemex-Exploration and Production, Ps. 712.4 million was attributable to Pemex-Refining, Ps. 226.8 million was attributable to Pemex-Gas and Basic Petrochemicals and Ps. 38.9 million was attributable to Pemex-Petrochemicals. There were no environmental liabilities at the subsidiary company level.The following charts detail our environmental liabilities by subsidiary entity and operating region at December 31, 2004.
Pemex-Exploration and Production
| Estimated Affected Area | Estimated Liability | |||
| (in hectares) | (in thousands of pesos) | |||
Northern region | 284.95 | Ps. 569,908 | ||
Southern region | 5.60 | 11,956 | ||
Southeastern Marine region | — | — | ||
Total(1) | 290.55 | Ps. 581,864 | ||
| Note: | Numbers may not total due to rounding. |
| (1) | During 2004, environmental remediation was completed on 53.15 hectares. There were 33.12 hectares of additional affected areas, including 14.02 hectares in the Northern region and 19.10 hectares in the Southern region, which were affected as a result of spills from pipelines. |
| Source: | PEMEX. |
| Holding Ponds Drainage | ||||
| Number of Holding Ponds | Estimated Liability | |||
| (in thousands of pesos) | ||||
Northern region(1) | 403 | Ps. 200,777 | ||
Southern region | 18 | 48,200 | ||
Total(2) | 421 | 248,977 | ||
Total estimated environmental liabilities of Pemex-Exploration and Production | Ps. 830,841 | |||
67
Table of Contents
| Note: | Numbers may not total due to rounding. |
| (1) | A total of 674 holding ponds, 668 in the Northern region and six in the Southern region, were restored and discharged as liabilities for 2004. In the Northern region two holding ponds were discharged as liabilities because they were redundant. A total of 467 holding ponds in the Northern region were classified as new liabilities. |
| Source: | PEMEX. |
Pemex-Refining
| Estimated affected area | Estimated Liability | |||
| (in hectares) | (in thousands of pesos) | |||
Pipelines(1) | 7.48 | Ps. 63,211 | ||
Refineries(2) | 182.31 | 221,181 | ||
Storage and Distribution Terminals(3)(4) | 121.47 | 277,494 | ||
Other affected areas(5) | 52.00 | 150,537 | ||
Total | 363.26 | Ps. 712,423 | ||
| (1) | PROFEPA has approved the environmental remediation of two pipelines; accordingly, the remaining estimated liabilities associated with these pipelines are considered discharged. |
| (2) | All six of Pemex-Refining’s refineries have been audited. In 2004, some restoration activities were initiated with an associated cost of Ps. 4.2 million. |
| (3) | All of Pemex-Refining’s storage and distribution terminals have been audited. Of the 26 terminals which required environmental remediation, the estimated affected area of 3 storage and distribution terminals has not yet been determined; however, the estimated liability includes the cost estimate for such areas based on available information. |
| (4) | Restoration activities with an associated cost of Ps. 27.6 million and recent information decreased the estimated liability of these sites. |
| (5) | Figure primarily represents estimated liability of the Santa Alejandrina swamp in Minatitlán, Veracruz. |
| Source: | PEMEX. |
Pemex-Gas and Basic Petrochemicals
| Estimated affected area | Estimated Liability | |||
| (in hectares) | (in thousands of pesos) | |||
Gas Complex Processors(1) | 25.80 | Ps. 220,587 | ||
Pipelines(2) | 0.11 | 6,218 | ||
Total | 25.91 | Ps. 226,805 | ||
| (1) | Seven gas complex processing plants and one gas processing plant have been audited and six complex gas processing plants were determined to require environmental remediation. The affected area at the gas complex processing plant of La Venta has been reduced, as a result of a characterization site study that demonstrated that an area of 25.1 hectares with an associated cost of Ps. 30.5 million was in compliance with the new limits established by environmental regulations. In the complex processing plants of Reynosa, new information regarding the area affected increased the restoration cost by Ps. 85.6 million. |
| (2) | Following an evaluation, the estimated costs of remediation activities were increased based on new information resulting from the evaluation in the pipeline sector of Minatitlán. |
| Source: | PEMEX. |
68
Table of Contents
Pemex-Petrochemicals
| Estimated affected area | Estimated Liability | |||
| (in hectares) | (in thousands of pesos) | |||
Petroquímica La Cangrejera, S.A. de C.V. | 0.30 | Ps. 1,780 | ||
Petroquímica Pajaritos, S.A. de C.V.(1) | 10.53 | 37,149 | ||
Total(2) | 10.83 | Ps. 38,929 | ||
| (1) | New information from evaluation and restoration activities at Petroquímica Pajaritos S.A. de C.V. resulted in an increase in the affected area. |
| (2) | All of Pemex-Petrochemicals’ plants have been audited and the table above reflects the only plants determined to require environmental remediation. |
| Source: | PEMEX. |
Our estimates of environmental liabilities include cost estimates for general and site-specific evaluation studies and the corresponding remediation. The remediation sites consist of sites identified in the audit process described above as well as those previously identified sites in more mature petroleum operating areas that were not cleaned up in the past. Our environmental liabilities also include the elimination of holding ponds created by abandoned petroleum wells. Additionally, our environmental liabilities include an accrual for information requested and received periodically from field managers as to probable environmental liabilities identified in their respective areas of responsibility. We accrue environmental liabilities when sufficient basic knowledge is available to form a preliminary estimation as to remediation cost. Although the full potential scope of the remediation cost may not be known with certainty, these accruals are made when the liability is probable and the amount is reasonably estimable, in accordance with Bulletin C-12 “Contingencies and Commitments” for Mexican GAAP purposes and with SFAS No. 5 “Accounting for Contingencies” for U.S. GAAP purposes. These estimated liabilities include assumptions resulting from an initial evaluation of damage, including land acreage to be remediated, depth of contamination and type of contamination. While the initial evaluation is extensive, there is a possibility that the actual scope of remediation could vary depending upon information gained during the remediation process. For a further discussion of our environmental liabilities, see Note 19 II (c) to our consolidated financial statements included herein.
Unasserted or additional claims are not reflected in our identified liabilities. We are not aware of any such claims that would be of such a magnitude as to materially affect our estimates of environmental liabilities.
At the end of 2004, we were not aware of uncertainties with respect to joint and several liabilities that could affect our assessment of environmental contingencies or otherwise result in a major environmental liability.We are responsible for all production, processing, storage and distribution of petroleum and its derivatives in Mexico. As a result, we believe we are positioned to know immediately of any claims and are therefore directly accountable for any claims that may be brought against us.
The timing of remediation or cleanup of the sites accounted for in these environmental liabilities is a function of the annual budget assigned to us by the Mexican Congress.
Environmental Projects and Expenditures
In 2004, we spent approximately Ps. 2,433 million in environmental projects and related expenditures, as compared to Ps. 3,659 million in 2003. For 2005, we have budgeted Ps. 1,864 million for development of basic environmental infrastructure. These environmental projects and expenditures are primarily directed to the modernization of installations, the implementation of systems and mechanisms to monitor and control atmospheric pollution, the acquisition of equipment to address the contingencies of hydrocarbon spills, the expansion of water effluent systems, the restoration and reforestation of affected areas, studies for environmental investigation and the conducting of environmental audits. In addition, we continue to conduct extensive research
69
Table of Contents
and development efforts to increase our capacity to produce gasoline, diesel and fuel oil with lower sulphur content. We are developing procedures to track the costs and expenses of our industrial safety measures and environmental compliance.
We do not believe that the cost of complying with environmental laws or environmental requirements related to the North American Free Trade Agreement (NAFTA) among the governments of Mexico, the United States and Canada, the Vienna Convention for the Protection of the Ozone Layer, the Agreement on Environmental Cooperation between the Governments of Mexico and Canada or Mexico’s membership in the Organization for Economic Cooperation and Development, has caused or will cause a significant increase in our environmental expenditures.
TRADE REGULATIONS AND EXPORT AGREEMENTS
Although it is not a member of OPEC, since 1998 Mexico has entered into agreements with OPEC and non-OPEC members to reduce its oil exports in order to stabilize international oil prices. Under three agreements, in 1998 and 1999, Mexico agreed to reduce our oil exports by 325 thousand barrels per day through most of 1999. These agreements were successful in stabilizing oil prices in 1999.
Since then, the Ministry of Energy of Mexico has periodically announced increases and decreases in crude oil exports in conjunction with production revisions by other oil producing countries in order to stabilize oil prices. During 2002, the Ministry of Energy announced a decrease in crude oil exports of 100 thousand barrels per day, to 1.66 million barrels per day, in line with OPEC announcements to reduce crude oil production levels that year.
During 2003, as a result of increasing market demand and the reduction by more than 2 million barrels per day of Venezuelan crude oil exports, Mexico announced increases in crude oil exports totaling 220 thousand barrels per day to a level of 1.88 million barrels per day.
In March 2004, OPEC announced that it would cut crude oil production by one million barrels per day beginning April 1, 2004. In June 2004, OPEC announced that it would increase crude oil production by 500 thousand barrels per day beginning August 1, 2004. In September 2004, OPEC announced that it would increase crude oil production by 1 million barrels per day beginning November 1, 2004. In March 2005, OPEC announced that it would raise its oil production ceiling from 27 million barrels per day to 27.5 million barrels per day with immediate effect, and authorized an additional increase in the oil production ceiling of 0.5 million barrels per day should oil prices remain at their current level or increase prior to the next extraordinary meeting of OPEC in June. As of the date of this report, Mexico has not announced any revisions to its current levels of crude oil exports as a result of these latest announcements by OPEC.
For more information on these agreements and announcements, see “Item 5—Operating and Financial Review and Prospects—Sales Volumes and Prices—Export Agreements.”
NAFTA did not affect the exclusive rights of Mexico, through PEMEX, to explore and produce crude oil and natural gas in Mexico, and to refine crude oil and to produce basic petrochemicals in Mexico. Since 2003, non-basic petrochemical products enjoy zero tariff under NAFTA and, subject to limited exceptions, exports of crude oil and petroleum products from Mexico to the United States and Canada are free or exempt from tariffs. Similarly, since 2003, imports of petroleum products from the United States and Canada that we import into Mexico are free or exempt from tariffs. In addition, in 2004, NAFTA phased in lower tariffs on certain materials and equipment that we import into Mexico. The zero tariff on imports of non-basic petrochemicals from the United States and Canada to Mexico could, over time, increase competition in the non-basic petrochemicals industry in Mexico. To the extent that domestic and international prices for our products remain constant, lower tariffs on the products, materials and equipment that we import from and export to the United States and Canada will decrease our expenses and increase our income.
70
Table of Contents
TAXES AND DUTIES
General
We must pay a number of special hydrocarbon taxes and duties to the Mexican Government, in addition to the other taxes and duties paid by some of the subsidiary companies, as described below under “—Other Taxes.” The rates at which the Mexican Congress assesses hydrocarbon taxes and duties may vary from year to year and are set after taking into consideration our operating budget, our capital expenditure program and our financing needs. The aggregate tax rate for all special hydrocarbon taxes and duties will not exceed 60.8% of the revenues of sales to third parties under the oil price set for the particular year.
If the indirect IEPS tax that we collect is taken into account, we contributed approximately 39% of the Mexican Government’s revenues in 2004 and 35% in 2003.
The most important taxes and duties that we are required to pay and their applicable rates are the following:
| Hydrocarbon Extraction Duty | Only Pemex-Exploration and Production pays this duty. A rate of 52.3% is applied to the net cash flow that results from deducting all cash expenditures (including operating expenses and capital expenditures) from the cash revenues generated by Pemex-Exploration and Production’s sales of goods and services. | |
| Extraordinary Hydrocarbon Extraction Duty | Only Pemex-Exploration and Production pays this duty, which is calculated on the same basis as the hydrocarbon extraction duty, using a tax rate of 25.5%. | |
| Additional Hydrocarbon Extraction Duty | Only Pemex-Exploration and Production pays this duty, which is calculated on the same basis as the hydrocarbon extraction duty, using a tax rate of 1.1%. | |
| Hydrocarbon Income Tax | Petróleos Mexicanos pays this direct tax on behalf of itself and its subsidiary entities. This tax is equivalent to the regular income tax applied to all Mexican corporations, a tax to which Petróleos Mexicanos and subsidiary entities are not subject. A tax rate of 35% is applied to net income (determined in accordance with the Income Tax Law) of each of Petróleos Mexicanos and the subsidiary entities, and may be determined on a consolidated basis. | |
| IEPS Tax | The Special Tax on Production and Services (which we refer to as the IEPS Tax) is an indirect tax on domestic sales of gasoline and diesel that Pemex-Refining collects on behalf of the Mexican Government. The IEPS Tax on the sale of gasoline and diesel is equivalent to the difference between the international reference price of each product (adjusted by freight costs and quality factors) and the retail price of the product to its customers (not including value added tax, the retailers’ margin and freight costs). Thus, the Mexican Government ensures that we retain an amount reflecting the international prices (adjusted as described above) of these products, while the Mexican Government collects the difference between the international prices and the prices at which these products are sold in Mexico. | |
71
Table of Contents
| Infrastructure Duty; Excess Gains Revenue Duty | The duty for exploration, gas, refining and petrochemical infrastructure (which we refer as the infrastructure duty) is a duty payable to the Mexican Government in addition to the hydrocarbon duty when our crude oil export prices exceed the per barrel threshold price established for that year. A portion of the money collected by Mexican Government is dedicated and reimbursed to us for investment in infrastructure works for exploration, gas, refining and petrochemical production that will be carried out by us and our subsidiary entities. This duty equals 39.2% of Pemex’s revenues from crude oil export sales in excess of the threshold crude oil price set for year, which in 2004 was U.S. $20.00 per barrel. The infrastructure duty replaced the excess gains revenue duty which we paid in prior years and was calculated in the same manner. For 2005, the excess gains revenue duty replaces the infrastructure duty, and the threshold price above which this duty must be paid for 2005 is U.S. $23.00. See “—Excess Gains Revenue Duty” below. |
We make advance payments to the Mexican Government in respect of our hydrocarbon extraction duties, extraordinary hydrocarbon extraction duties, hydrocarbon income tax, excess gains revenue duties and IEPS tax. These are credited against our liability under the foregoing duties and taxes.The sum of the hydrocarbon extraction duty, the extraordinary hydrocarbon extraction duty, the additional hydrocarbon extraction duty, the hydrocarbon income tax and the IEPS tax (which we refer to collectively as the Taxes and Duties) must equal the hydrocarbon duty. For 2005, the hydrocarbon duty is calculated by applying a rate of 60.8% to the sales revenues of Petróleos Mexicanos and subsidiary entities from the PMI Group and third parties, including the IEPS tax generated by Pemex-Refining, but excluding the value added tax.
In the event that the sum of the Taxes and Duties is not equal to the hydrocarbon duty, the rates of the hydrocarbon extraction duty, the extraordinary hydrocarbon extraction duty and the additional hydrocarbon extraction duty will be adjusted to ensure that the sum of the Taxes and Duties equals the hydrocarbon duty.
Excess Gains Revenue Duty
In 2002 and 2003, we paid an excess gains revenue duty in an amount equal to 39.2% of those revenues in excess of the threshold price set for that year. Thus, in 2002 and 2003, for every dollar exceeding the threshold price, we paid to the Mexican Government 60.8 cents in hydrocarbon duty and 39.2 cents in excess gains revenue duty so that all revenues above the threshold amount for those years of U.S. $15.50 per barrel and U.S. $18.35 per barrel, respectively, were payable to the Mexican Government. However, for the amount up to the threshold price, we paid only the hydrocarbon duty. We paid this duty in 2002 and 2003. In 2004, instead of paying the excess gains revenue duty to the Mexican Government, we were obligated to pay the infrastructure duty, the proceeds of which will be dedicated for investment in infrastructure works for exploration, gas, refining and petrochemicals that will be carried out by us and our subsidiary entities. Like the excess gains revenue duty, this duty equals 39.2% of our revenues from crude oil export sales in excess of the threshold crude oil price set for that year (which in 2004 was U.S. $20.00 per barrel). See also “Item 5—Operating and Financial Review and Prospects—General—IEPS Tax, Excess Gains Revenue Duty, Hydrocarbon Duties and Other Taxes.”
Beginning in 2005, we are obligated to pay the excess gains revenue duty to the Mexican Government instead of the infrastructure duty, in an amount equal to 39.2% of the revenues from crude oil export prices in excess of the threshold crude oil price set for the year (which in 2005 is U.S. $23.00 per barrel). Thus, for every dollar exceeding the threshold price, we must pay to the Mexican Government 60.8 cents in hydrocarbon duty and 39.2 cents in excess gains revenue duty so that all revenues above the threshold amount for that year is
72
Table of Contents
payable to the Mexican Government. However, for the amount up to the threshold price, we pay only the hydrocarbon duty. The excess gains duty generated for amounts in excess of U.S. $27.00 will be allocated as follows:
| • | 50% for capital expenditures in exploration, production, refining, gas and pretrochemical activities of Petróleos Mexicanos and the subsidiary entities; and |
| • | 50% for expenditures of infrastructure and equipment programs and investment projects carried out by the various Mexican states. |
Other Taxes
Since 1994, our interest payments on our external debt have been subject to Mexican withholding taxes. In 1994, the Mexican Government credited our withholding tax payments against our tax liability, but since the end of 1994, the Mexican Government has not allowed such a credit. Nevertheless, withholding taxes do not represent a substantial portion of our total tax liability.
Beginning in 1995, we have been subject to municipal and state taxes, such as real property and payroll taxes. However, because most of our facilities are located on federal property, which is not subject to municipal taxation, real property taxes are not a significant part of our overall taxes. Similarly, payroll taxes do not represent a substantial portion of our total tax liability.
Petróleos Mexicanos and the subsidiary entities are exempt from Mexican corporate income tax; however, some of our subsidiary companies are Mexican corporations and are subject to the tax regime applicable to all other Mexican corporations. Mexican companies are generally required to pay the higher of their income tax liability (determined at a rate of 35% for 2000 through 2002, 34% for 2003, 33% for 2004 and 32% thereafter) or their asset tax liability (determined at a rate of 1.8% of the average tax value of virtually all of their assets, less the average tax value of certain liabilities – basically liabilities with Mexican residents excluding debts with financial institutions or their intermediaries). To the extent a company is required to pay the asset tax in any year, the portion of that tax that exceeds the company’s income tax liability may be credited against the company’s income tax liability in subsequent years.
In addition, we have a number of non-Mexican subsidiary companies that may be subject to taxation in the jurisdiction of their incorporation or operations. The aggregate taxes paid by the subsidiary companies was Ps. 709 million in 2002, Ps. 752 million in 2003 and Ps. 1,315 million in 2004.
Future Fiscal Reform
Over the past few years, we have been discussing various proposals with the Mexican Government for reforming the Mexican federal tax regime applicable to us. The proposals have generally sought to change the current applicable tax law so that our fiscal burdens are similar to those of state-owned oil companies in other countries. In particular, we have presented alternative internal revenue strategies that allow the Mexican Government to recover income from hydrocarbon extraction while improving our ability to finance more efficiently our operations.
On April 27, 2005, the Chamber of Senators approved a proposal to modify the fiscal regime of PEMEX. This proposal was approved by the Chamber of Deputies on June 28, 2005 and was sent to the President for his approval. If approved, the new fiscal regime will go into effect on January 1, 2006.
73
Table of Contents
This proposal is designed to strengthen PEMEX’s competitiveness and improve its financial position. If adopted, the implementation of this new fiscal regime may have the effect of diminishing PEMEX’s net indebtedness incurred on an annual basis in future years, in amounts equal to the amount of taxes that would have been paid by PEMEX in such years if it continued to be subject to the prevailing fiscal regime. If the proposal is approved, we will assess its impact on our results of operations and financial condition.
74
Table of Contents
UNITED MEXICAN STATES
The information in this section with regard to Mexico has been included due to Petróleos Mexicanos’ and the subsidiary entities’ relationship with the Mexican Government and has been reviewed by the Ministry of Finance and Public Credit.
Form of Government
The President is the chief of the executive branch of the Mexican Government. The current President of Mexico is Vicente Fox Quesada, whose term expires on November 30, 2006. The Constitution limits the President to one six-year term and does not allow reelection for any additional terms.
In the Congressional election held on July 6, 2003, all of the seats in the Chamber of Deputies were up for election. The members of the Senate were elected on June 2, 2000. The following table provides the current distribution of Congressional seats, reflecting certain post-election changes in the party affiliations of certain senators and deputies:
Party Representation in Congress
| Senate | Chamber of Deputies | |||||||||
| Seats | % of Total | Seats | % of Total | |||||||
Institutional Revolutionary Party | 59 | 46.1 | % | 224 | 44.8 | % | ||||
National Action Party | 47 | 36.7 | 149 | 29.8 | ||||||
Democratic Revolution Party | 15 | 11.7 | 97 | 19.4 | ||||||
Ecological Green Party of Mexico | 5 | 3.9 | 17 | 3.4 | ||||||
Independent | 2 | 1.6 | 2 | 0.4 | ||||||
Labor Party | 0 | 0.0 | 6 | 1.2 | ||||||
Convergence for Democracy | 0 | 0.0 | 5 | 1.0 | ||||||
Total | 128 | 100.0 | % | 500 | 100.0 | % | ||||
| Note: | Totals may differ due to rounding. |
Source: Cámara de Diputados H. Congreso de la Unión y Cámara de Senadores.
Presidential and federal congressional elections in Mexico will be held in July 2006. Recent uncertainty regarding the impeachment and presidential candidacy of Andres Manuel Lopez Obrador has led to political unrest. If Lopez Obrador had been found guilty of contempt of court charges that were filed against him, he could have been prevented from running as a candidate for the presidency. Mexico’s new Attorney General appointed on April 27, 2005, Daniel Cabeza de Vaca, has announced that he will formally drop the contempt of court charges against Lopez Obrador, which were initiated by his predecessor. However, there can be no assurance that similar charges will not be brought again prior to the elections. The impeachment process also led to the filing by the Congress of Mexico City of a constitutional controversy with the Supreme Court contesting the impeachment process that was conducted by the Federal Chamber of Deputies, to which the Federal Chamber of Deputies responded with its own constitutional controversy filing. The Supreme Court dismissed both the case filed by the Congress of Mexico City and the filing by the Federal Chamber of Deputies.
The Economy
National Development Program
On June 11, 2002, the Mexican Government announced thePrograma Nacional de Financiamiento del Desarrollo 2002-2006 (National Development Financing Program 2002-2006, or PRONAFIDE 2002-2006). The goals of the PRONAFIDE 2002-2006 are to:
| • | generate the resources needed to finance social programs contemplated by the National Development Plan 2001-2006; |
75
Table of Contents
| • | increase the rate of economic growth; |
| • | generate jobs consistent with population dynamics; and |
| • | consolidate a stable macroeconomic environment. |
The basic strategies that the Mexican Government expects to employ in connection with the PRONAFIDE 2002-2006 are as follows:
| • | implementation of structural reforms aimed at fostering a legal and economic environment favorable to the competitive participation of the private sector in productive activities; |
| • | promotion of public sector savings in order to increase the availability of financial resources for the private sector; |
| • | promotion of private sector domestic savings, with an emphasis on both popular and long-term savings; |
| • | promotion of external savings only as a complement to domestic savings; and |
| • | strengthening of the financial system and modernization of development banks in order to foster economic growth in the medium term. |
Notwithstanding these initiatives, significant new investment in infrastructure, industrial and agricultural modernization, training and environmental protection will be required for continued growth and development. The Mexican economy is also likely to continue to be subject to the effects of adverse domestic and external factors such as declines in foreign direct and portfolio investment, high interest rates and low oil prices, which may lead to volatility in the foreign exchange and financial markets and may affect Mexico’s ability to service its foreign debt.
The PRONAFIDE 2002-2006 presents the medium-term strategy aimed at creating and strengthening domestic sources of financing within a stable macroeconomic environment and contemplates a medium-term fiscal stance that includes the following:
| • | maintaining the public sector debt within sustainable levels; |
| • | reducing the Mexican Government’s absorption of domestic financial resources, limiting the crowding-out effect of fiscal policy to private investment in the medium term; and |
| • | strengthening the capacity of the Mexican Government to fulfill its social mandate. |
The Role of the Government in the Economy; Privatization
On May 24, 2002, the Mexican Government completed its privatization ofAseguradora Hidalgo, S.A. (AHISA). TheComisión Intersecretarial de Desincorporación (CID) approved the sale of AHISA shares owned by the Mexican Government and by us to MetLife Inc. for Ps. 9,200 million.
On June 19, 2002, the Mexican Government and the Bank Savings Insurance Institute (IPAB), jointly carried out the sale of nearly all of their shares ofGrupo Financiero BBVA Bancomer, S.A. de C.V. (BBVA Bancomer) in the national and international markets. On July 3, 2002, the Mexican Government and IPAB sold additional shares pursuant to an over-allotment option. The Mexican Government had retained a minority interest in Bancomer, S.A. at the time of its privatization in 1991. IPAB had acquired the shares in connection with the purchase by BBVA Bancomer ofBanca Promex, S.A. in 2000. The net proceeds to the Mexican Government as a result of the sale totaled Ps. 6.5 billion for the shares sold internationally, Ps. 574.2 million for the shares sold in Mexico and U.S. $11.2 million for the shares sold in the United States in the form of ADSs. The proceeds to IPAB as a result of the sale totaled Ps. 1,004.6 million for the shares sold internationally, Ps. 88.1 million for the shares sold in Mexico and U.S. $1.7 million for the ADSs sold in the United States. From November 2002 through January 2003, the Mexican Government and IPAB sold their remaining shares of BBVA Bancomer in the Mexican stock market for total net proceeds of Ps. 444.4 million for the Mexican Government and Ps. 68.2 million for IPAB.
76
Table of Contents
On December 12, 2002, Congress approved the dissolution and liquidation ofBanco Nacional de Crédito Rural, S.N.C., a governmental development bank.
The Mexican Government believes that increased private investment in the generation, distribution and transmission of electrical energy is necessary in order to increase Mexico’s electrical capacity to ensure that Mexico will have a sufficient and reliable supply of adequately priced electricity in the long term. A 1992 law currently allows private companies to generate electricity only for their own use or for sale to the Federal Electricity Commission (CFE). The executive branch of the Government presented a proposal to opposing political parties in August 2002 for a constitutional amendment and amendments to the laws and regulations establishing CFE to achieve this objective. Past legislative initiatives to allow greater private sector participation in this sector have not succeeded. The August 2002 proposal is still under discussion and it remains unclear whether a formal bill enacting these types of reforms will be passed by the Congress.
Gross Domestic Product
According to preliminary figures, GDP increased by 1.4% in real terms during 2003. GDP increased by 2.5% in the first quarter of 2003, by 0.1% in the second quarter, by 1.0% in the third quarter and by 2.1% in the fourth quarter, each in real terms and as compared to the same period of 2002.
According to preliminary figures, GDP grew by 4.4% in real terms during 2004. This growth was led by the transportation, storage and communications sector, which grew by 9.7% in real terms. The construction sector grew by 5.3%, the commerce, hotels and restaurants sector grew by 4.9%, the financial services, insurance and real estate sector increased by 4.6%, and the agriculture, livestock, fishing and forestry sector grew by 4.0%, each in real terms. The manufacturing sector grew by 3.8%, the mining, petroleum and gas sector grew by 2.5%, the electricity, gas and water sector grew by 2.3% and the community, social and personal services sector grew by 1.7%, each in real terms.
According to preliminary figures, GDP grew by 2.4% in real terms during the first quarter of 2005, as compared with the same period of 2004. The transportation, storage and communications sector grew by 7.8%, the commerce, hotels and restaurants sector grew by 3.3%, the financial services, insurance and real estate sector grew by 5.1%, the community, social and personal services sector grew by 1.6% and the construction sector grew by 1.0%, each in real terms. The agriculture, livestock, fishing and forestry sector contracted by 1.5%, the manufacturing sector contracted by 0.2%, the mining, petroleum and gas sector contracted by 1.1% and the electricity, gas and water sector contracted by 1.2%, each in real terms.
The following table sets forth the change in Mexico’s real GDP growth by sector for the periods indicated.
Real GDP Growth by Sector
| 2000 | 2001 | 2002(1) | 2003(1) | 2004(1) | First quarter of 2005(1)(2) | |||||||||||||
GDP (constant 1993 prices) | 6.6 | % | (0.2 | )% | 0.8 | % | 1.4 | % | 4.4 | % | 2.4 | % | ||||||
Agriculture, livestock, fishing and forestry | 0.6 | 3.5 | 0.1 | 3.5 | 4.0 | (1.5 | ) | |||||||||||
Mining, petroleum and gas | 3.8 | 1.5 | 0.4 | 3.7 | 2.5 | (1.1 | ) | |||||||||||
Manufacturing | 6.9 | (3.8 | ) | (0.7 | ) | (1.3 | ) | 3.8 | (0.2 | ) | ||||||||
Construction | 4.2 | (5.7 | ) | 2.1 | 3.3 | 5.3 | 1.0 | |||||||||||
Electricity, gas and water | 3.0 | 2.3 | 1.0 | 1.6 | 2.3 | (1.2 | ) | |||||||||||
Transportation, storage and communications | 9.1 | 3.8 | 1.8 | 5.0 | 9.7 | 7.8 | ||||||||||||
Commerce, hotels and restaurants | 12.2 | (1.2 | ) | 0.0 | 1.6 | 4.9 | 3.3 | |||||||||||
Financial services, insurance and real estate | 5.5 | 4.5 | 4.2 | 3.9 | 4.6 | 5.1 | ||||||||||||
Community, social and personal services | 2.9 | (0.3 | ) | 0.9 | (0.6 | ) | 1.7 | 1.6 |
77
Table of Contents
| (1) | Preliminary. |
| (2) | First quarter 2005 results as compared to the same period of 2004. |
Source: National Institute of Statistics, Geography and Informatics.
Prices and Wages
Inflation during 2003 (as measured by the change in the NCPI) was 4.0%, 1.7 percentage points lower than during 2002. The decrease in inflation in 2003 was attributable to the relative stability of residential electricity prices, domestic gas prices and fruit and vegetable prices in 2003 compared with 2002. Inflation during 2004 was 5.2%, 2.2 percentage points higher than the official inflation target for the year. The increase in inflation in 2004 was attributable primarily to the increase in the international prices of the majority of the components of the NCPI. Inflation during the first five months of 2005 was 0.9%, 0.6 percentage points lower than during the same period of 2004.
Interest Rates
During 2003, interest rates on 28-dayCetes averaged 6.23% and interest rates on 91-dayCetes averaged 6.51%, as compared with average rates on 28-day and 91-dayCetes of 7.09% and 7.46%, respectively, during 2002. Domestic interest rates were at historically low levels during 2003, largely due to reduced inflationary expectations and favorable conditions in the financial markets.
During 2004, interest rates on 28-dayCetes averaged 6.82% and interest rates on 91-dayCetes averaged 7.10%, as compared with average rates on 28-dayCetes and 91-dayCetes of 6.23% and 6.51%, respectively, during 2003.
During the first five months of 2005, interest rates on 28-dayCetes averaged 9.31% and interest rates on 91-dayCetes averaged 9.54%, as compared with average rates on 28-dayCetes and 91-dayCetes of 5.87% and 6.00%, respectively, during the same period of 2004. On June 21, 2005, the 28-dayCetes rate was 9.62% and the 91-dayCetes rate was 9.78%.
Financial System
2004 Monetary Program
Mexico’s monetary program for 2004 had as its principal objective the achievement of an inflation rate not exceeding 3.0% by the end of 2004. Mexico’s monetary program for 2004 was made up of the following elements:
| • | inflation objectives; |
| • | a reference guideline for the analysis of the economic situation and inflationary pressures; |
| • | a framework for the monetary instruments to be used by the Central Bank to achieve its objectives; and |
| • | a plan for regular communications with the public that promotes the transparency, credibility and effectiveness of monetary policy. |
Banco de México uses a “short” mechanism to induce the necessary changes in interest rates to achieve inflation objectives. Under the mechanism, Banco de México sets a predetermined amount at which the daily average of the net total balance of all current accounts of banks accumulated during a certain period will close and controls that amount by restricting the amount of credit it auctions to banks on a daily basis. Prior to April 10, 2003, that amount was set based on a 28-day period. On April 10, 2003, the period was changed from 28 days to a daily average balance. When the predetermined amount is negative, or “short,” Banco de México exerts upward pressure on interest rates by leaving the market short of pesos and by increasing the interest rate on a
78
Table of Contents
portion of the credit it auctions on that day. This mechanism allows Banco de México to combat inflationary pressures and disorderly conditions in the money and foreign exchange markets and to ensure that changes in the monetary base follow a path consistent with the assumed inflation rate.
Using the daily average balance mechanism, Banco de México increased the “short” on nine occasions during 2004, from Ps. 25 million to Ps. 29 million on February 20, 2004, from Ps. 29 million to Ps. 33 million on March 12, 2004, from Ps. 33 million to Ps. 37 million on April 27, 2004, from Ps. 37 million to Ps. 41 million on July 23, 2004, from Ps. 41 million to Ps. 45 million on August 27, 2004, from Ps. 45 million to Ps. 51 million on September 24, 2004, from Ps. 51 million to Ps. 57 million on October 22, 2004, from Ps. 57 million to Ps. 63 million on November 26, 2004 and from Ps. 63 million to Ps. 69 million on December 10, 2004. These increases were made in response to internal and external factors that could have threatened the achievement of the 3.0% inflation target for 2004.
During 2004, the Ml money supply (defined as bills and coins held by the public, plus checking accounts denominated in local currency and foreign currency, plus interest-bearing deposits denominated in pesos and operated by debit cards) increased by 4.9% in real terms, as compared with 2003. Checking account deposits denominated in pesos decreased by 1.8% in real terms during 2004, as compared with 2003.
During 2004, financial savings increased by 8.2% in real terms, as compared with 2003. Savings generated by Mexican residents increased by 7.0% in real terms and savings generated by non-residents increased by 98.2% in real terms in 2004, in each case as compared with 2003.
At December 31, 2004, the monetary base totaled Ps. 340.2 billion, a 12.0% nominal increase from the level of Ps. 303.6 billion at December 31, 2003.
2005 Monetary Program
Mexico’s monetary program for 2005 has as its principal objective an inflation rate no higher than 3.0% by the end of 2005. Mexico’s monetary program for 2005 is made up of the following elements:
| • | inflation objectives; |
| • | a reference guideline for the analysis of the economic situation and inflationary pressures; |
| • | a framework for the monetary instruments to be used by the Central Bank to achieve its objectives; and |
| • | a plan for regular communication with the public that promotes the transparency, credibility and effectiveness of the monetary policy. |
Using the daily average balance mechanism, the Board of Governors of Banco de México increased the “short” on three occasions during the first five months of 2005, from Ps. 69 million to Ps. 75 million on January 28, 2005, from Ps. 75 million to Ps. 77 million on February 25, 2005 and from Ps. 77 million to Ps. 79 million on March 23, 2005. These increases in the “short” were made in response to internal and external factors that threatened the achievement of the inflation target for 2005.
During the first four months of 2005, the Ml money supply increased by 6.9% in real terms, as compared with the same period of 2004. In addition, checking account deposits denominated in pesos increased by 2.8% in real terms during first four months of 2005, as compared with the same period of 2004.
During the first four months of 2005, financial savings increased by 8.2% in real terms, as compared with the same period of 2004. Savings generated by Mexican residents increased by 6.7% in real terms and savings generated by non-residents increased by 104.3% in real terms during the first four months of 2005, each as compared with the same period of 2004.
79
Table of Contents
At June 23, 2005, the monetary base totaled Ps. 302.7 billion, an 11.0% nominal decrease from the level of Ps. 340.2 billion at December 31, 2004. Banco de México estimates that the monetary base will total approximately Ps. 374.4 billion at December 31, 2005.
Banking System
In connection with the implementation of NAFTA, amendments to several laws relating to financial services, including the Banking Law and theLey del Mercado de Valores (Securities Market Law), became effective on January 1, 1994. These measures permit non-Mexican financial groups and financial intermediaries, through Mexican subsidiaries, to engage in various activities in the Mexican financial system, including banking and securities activities. On April 20, 1994, the Ministry of Finance and Public Credit issued regulations that implemented these amendments, as well as provisions of NAFTA dealing with financial services and any future trade agreements incorporating similar provisions. These regulations set forth rules under which Canadian and U.S. financial institutions (and other foreign financial institutions acting through Canadian or U.S. affiliates) are permitted to establish or acquire Mexican financial institutions and financial holding companies. Pursuant to these rules, the aggregate net capital of Mexican commercial banks controlled by foreign financial institutions established pursuant to the North American Free Trade Agreement and other trade treaties, excluding Mexican banks acquired pursuant to a program approved by the Ministry of Finance and Public Credit, could not exceed 25% of the total net capitalization of all Mexican banks until January 1, 2000.
In December 1998, Congress approved legislation introducing a package of financial and banking reforms which supplemented reforms in place since 1995. The 1998 reforms did not affect the general foreign ownership restrictions under the Banking Law and NAFTA regulations discussed above. Under the 1998 reforms, all remaining restrictions on foreign ownership of the largest Mexican banks were removed. Foreign ownership was previously restricted in any Mexican bank whose net capital exceeded 6% of the aggregate net capital of all Mexican banks. In addition, the aggregate foreign shareholdings of Mexican-controlled banks was limited to 49% and no foreign shareholder was authorized to own, directly or indirectly, more than 5% of the equity of any Mexican bank (or 20%, with the approval of the Ministry of Finance and Public Credit). Those limits did not, however, apply to any foreign financial institution that acquired control (i.e., more than 51% of the common stock) of a smaller-sized Mexican bank (i.e., one whose net capital did not exceed 6% of the Mexican banking system’s aggregate net capital).
The Banking Law was amended on June 4, 2001 to:
| • | enhance corporate governance by (1) expanding minority shareholders’ rights, (2) introducing independent board members, and (3) requiring an audit committee of the board of directors; |
| • | improve the framework for banking operations by (1) providing adequate regulation regarding the provision of banking services using new technologies, (2) allowing banks to offer additional services, and (3) setting a new framework for related operations; and |
| • | strengthen regulation and surveillance while reducing their cost by (1) introducing prompt corrective actions based on banks’ capitalization levels, (2) defining responsibilities and activities of the various financial authorities, and (3) expanding the role of external auditors. |
Banking Supervision and Support
The 1994-95 peso devaluation and ensuing financial crisis created concerns about the stability of the Mexican banking system. The devaluation, higher domestic interest rates and contraction in real GDP combined to weaken the quality of the assets of Mexican banks, caused the capitalization of several banks to fall below the minimum required levels and created funding difficulties for many banks.
The weakening of the banking system prompted the Mexican Government to enact policies aimed at increasing the capitalization of Mexican banks. New reserve requirements were introduced by Banco de México to facilitate the regulation of liquidity. Pursuant to these requirements, which took effect on March 11, 1995, a bank that overdraws its account with Banco de México must subsequently deposit funds, and maintain amounts
80
Table of Contents
on deposit, at least equal to the amount of the overdraft. Substantial fines may be imposed if a bank fails to make and maintain such deposits. The new reserve requirements were intended to reduce Banco de México’s daily net extension of credit. In addition, effective January 1, 1997, Banking Circular 1343 issued by the National Banking and Securities Commission (CNBV) adopted significant changes in the accounting practices applicable to Mexican commercial banks and development banks, with the intent of making those practices more consistent with international accounting standards, including U.S. GAAP.
In response to the 1994-95 financial crisis, the Mexican Government took a number of additional steps to support the banking system, including broadening the scope for investment by foreign and domestic investors in the equity of Mexican financial institutions, enhancing the power of the CNBV to supervise and intervene in the activities of financial holding companies and creating a number of debtor support programs to restructure past-due loans caused by the crisis, then-rising interest rates and the ongoing recession. From 1994 to 1996, the CNBV exercised its authority to intervene in the management of a number of Mexican financial institutions, including the Cremi/Union financial group,Grupo Financiero Asemex Banpaís, S.A. de C.V. and its banking and insurance subsidiaries,Banco Capital, S.A. andBanco del Sureste, S.A.
In addition, the Government established the Temporary Capitalization Program (PROCAPTE), a voluntary program to assist viable but undercapitalized banks, under which the Banking Fund for the Protection of Savings (FOBAPROA) advanced funds to participating banks in exchange for five-year, mandatorily convertible bonds. By May 1995, the value of bonds issued through PROCAPTE reached Ps. 7,008 million. In February of 1997, the last bank participating in PROCAPTE liquidated its total participation, thus concluding the PROCAPTE program.
Through FOBAPROA, the Mexican Government made foreign exchange available through a foreign exchange credit window to help banks meet dollar liquidity needs. Outstanding drawings under this program reached their highest point of U.S. $3.8 billion in April 1995, and were completely repaid by August 31, 1995. No such drawings were made after that date.
In 1995 and 1996, the Ministry of Finance and Public Credit approved recapitalization plans for twelve of Mexico’s financial institutions, many of which involved strategic investments by foreign financial institutions and the purchase by FOBAPROA of large portions of the loan portfolios of the affected banks.
In 1998, the Mexican Government’s program to rescue troubled banks, which was first implemented in 1995, was restructured. Under the revised system, FOBAPROA was replaced by the Bank Savings Insurance Institute, or IPAB, which assumed FOBAPROA’s assets and liabilities, except for certain liabilities that were explicitly excluded under the financial reforms. IPAB also manages a deposit insurance program. During 1999, IPAB commenced a transition program under which deposit insurance limits are being introduced gradually. By 2005, deposit insurance will be limited to 400,000Unidades de Inversión (or UDIs, units of account whose value in pesos is indexed to inflation on a daily basis, as measured by the change in the national consumer price index), per person or entity, per institution. For June 25, 2005, one UDI was set at Ps. 3.566012.
The Congress allocates funds to IPAB on an annual basis to manage and service IPAB’s net liabilities, but those liabilities generally have not become public sector debt as had been originally proposed. In emergency situations, IPAB is permitted to contract additional financing in an amount not exceeding 6% of the total liabilities of banking institutions without congressional authorization. At March 31, 2005, IPAB’s debt totaled Ps. 784.9 billion.
In addition to Mexico’s auctions of debt securities in the domestic market, IPAB also sells peso-denominated debt securities in Mexico. IPAB uses the proceeds of these sales to service its maturing obligations, to improve the maturity profile of its indebtedness and to reduce its financing costs. IPAB’s securities are sold through auctions conducted by Banco de México. During 2000, IPAB conducted its first offering of these securities, placing Ps. 73,360 million of three- and five-year Savings Protection Bonds (BPAs) during that year.
81
Table of Contents
BPAs pay interest monthly at a rate (reset monthly) equal to the higher of the 28-dayCetes rate and the rate applicable to one-month bank notes (Pagarés con Rendimiento Liquidable al Vencimiento). IPAB placed a total of Ps. 62,600 million of these three- and five-year BPAs in the market in 2004, as compared to a total of Ps. 74,600 million in 2003.
In July 2002, IPAB conducted an offering of a new type of peso-denominated Savings Protection Bonds (BPATs). These five-year Savings Protection Bonds pay interest every 91 days at a rate (reset quarterly) equal to the 91-dayCetes rate. In total, IPAB placed Ps. 77,800 million of these BPAT instruments in 2004 and Ps. 77,400 million of BPAT instruments in 2003.
In May 2004, IPAB conducted an offering of a new type of peso-denominated Savings Protection Bonds (BPA182). These seven-year Savings Protection Bonds pay interest every 182 days at a rate (reset every six months) equal to the 182-dayCetes rate. In total, IPAB placed Ps. 10,400 million of these BPA182 instruments in 2004.
In addition to its other activities, IPAB is now in the process of disposing of the loan portfolios and other assets acquired by FOBAPROA during the 1994-1996 period. In May 2002, IPAB announced its intention to initiate a review of four banks that had transferred nonperforming loans to FOBAPROA following the 1994-1995 financial crisis, in order to determine whether all of the loans transferred by the banks were in fact eligible for transfer under the applicable guidelines. The four banks subsequently filed suit to challenge the reviews, which were suspended pending resolution of the suits by the applicable courts. In July 2004, the four banks reached an out-of-court settlement agreement with IPAB, pursuant to which they have agreed to exchange their FOBAPROA notes for new notes from IPAB with a face value of approximately 50% of the face value of the original FOBAPROA notes, subject to certain further audits regarding a portion of the transferred loans. On June 26, 2005, all audits were conducted and the banks agreed to accept a 52.9% reduction in the total face value of their FOBAPROA notes.
The Ministry of Finance and Public Credit issued new rules governing the capitalization requirements of Mexican commercial banks effective on January 1, 2000. These rules currently require Mexican commercial banks to:
| • | maintain at 20% the amount of deferred taxes arising from fiscal losses that may be included as Tier 1 capital; |
| • | include all new issuances of subordinated convertible debt as Tier 2 capital. Outstanding subordinated mandatorily convertible debt, subject to current limitations, will remain as Tier 1 capital until its maturity or conversion; |
| • | exclude investments in non-financial companies and companies whose shares are not traded on the Mexican Stock Exchange from Tier 1 capital, except where those investments result from the capitalization of restructured loans; and |
| • | exclude from Tier 2 capital certain specific assets, including credit card debt, mortgages and commercial loans, and establish general loan loss reserves for these types of assets. |
The new rules also allow Mexican commercial banks, as part of a capitalization program, to issue cumulative and noncumulative subordinated debt securities through a special purpose vehicle, providing them with a new financing alternative in international markets. These new instruments will have a minimum maturity of ten years, will be unsecured and deeply subordinated and will provide for the deferral (cumulative) or cancellation (noncumulative) of interest payments in certain circumstances and payment of the face value at the maturity date. Subject to limitations, noncumulative instruments may be included as Tier 1 capital.
During the second half of 2000, the Mexican Government continued to establish rules and criteria for the regulation of banking institutions in accordance with accepted international practices. In September 2000, the Mexican Government issued new rules for classifying the quality of loan portfolios of commercial banking
82
Table of Contents
institutions. At the same time, the rules governing the capitalization requirements of commercial banks were modified. In October 2000 and more recently in September 2003, the Mexican Government announced new rules for classifying the credit portfolios of development banks.
At December 31, 2004, calculated in accordance with the accounting criteria applicable to credit institutions since the beginning of 1998, the total amount of past-due loans of commercial banks (excluding banks under Government intervention and those in special situations) was Ps. 27.0 billion, as compared with Ps. 31.1 billion at December 31, 2003. The total loan portfolio of the banking system increased by 3.7% in real terms during 2004 as compared with 2003. The past-due loan ratio of commercial banks was 2.5% at December 31, 2004, as compared to 3.2% at December 31, 2003. The amount of loan loss reserves created by commercial banks (excluding banks under Government intervention and those in special situations) totaled Ps. 54.5 billion at the end of December 2004, as compared with Ps. 52.0 billion at December 31, 2003. At this level, commercial banks had reserves covering 202% of their past-due loans, exceeding the minimum reserve level of 45% required by the applicable accounting criteria.
At March 31, 2005, the total amount of past-due loans of commercial banks (excluding banks under Government intervention and those in special situations) was Ps. 26.7 billion, as compared with Ps. 27.0 billion at December 31, 2004. The total loan portfolio of the banking system decreased by 2.0% in real terms during the first quarter of 2005. The past-due loan ratio of commercial banks was 2.4% at March 31, 2005, as compared to 2.5% at December 31, 2004. The amount of loan loss reserves created by commercial banks (excluding banks under Government intervention and those in special situations) totaled Ps. 53.4 billion at March 2005, as compared with Ps. 54.5 billion at December 31, 2004. At this level, commercial banks had reserves covering 200% of their past-due loans, exceeding the minimum reserve level of 45% required by the applicable accounting criteria.
The Securities Market
The Mexican Stock Exchange is Mexico’s only stock exchange and is located in Mexico City. The Mexican Stock Exchange is organized as a corporation with shares owned by 30 brokerage firms, each of which is authorized to trade on the exchange floor. Both debt and equity securities are traded on the Mexican Stock Exchange, including stocks and bonds of private sector corporations, equity certificates or shares issued by banks, commercial paper, bankers’ acceptances, certificates of deposit, Mexican Government debt and special hedging instruments linked to the dollar. Currently, institutional investors are the most active participants in the Mexican Stock Exchange, although retail investors also play a role in the market. The Mexican equity market is one of Latin America’s largest in terms of market capitalization, but it remains relatively small and illiquid compared to major world markets.
Effective June 1, 2001, the Securities Market Law was amended to promote the securities market by making it more transparent, liquid and efficient and to include stricter corporate governance rules, which are intended to strengthen the rights of minority shareholders of public companies and brokerage houses, among other things. The amendments require issuers of securities to appoint an audit committee of the board which will have full access to the issuer’s information, appoint independent board members and limit the amount of non-voting and voting-restricted stock they issue. In addition, the reforms introduce provisions that are intended to regulate the duties of board members and the legal responsibility of board members when acting in violation of such duties. The amendments also broaden the scope of insider trading provisions and introduce more severe penalties for insider trading violations.
In March 2005, a draft bill was submitted to Mexico’s Federal Congress with the purpose of enacting a new federal statute that would amend, restate and repeal the existing Securities Market Law in its entirety. The Mexican Congress has initiated a formal review of the bill. In its current form, the draft securities law emphasizes corporate governance and disclosure requirements, and, among others, introduces concepts new to Mexico such as institutional investors and safe harbors from public offering requirements. Although there can be
83
Table of Contents
no assurance that the bill will be approved or on what terms it may be approved, the enactment of an amended and restated securities market law could materially change the legal regime applicable to and governing public issuers in Mexico.
The market capitalization of the Mexican Stock Exchange was U.S. $170.1 billion at the end of 2004, representing a 38.8% increase in dollar terms from its year-end 2003 level. The value of transactions on the Mexican Stock Exchange reached U.S. $50.0 billion in 2004, 58.2% more than in 2003. Fixed income securities (i.e., commercial paper, notes, bonds and ordinary participation certificates) accounted for 0.4% and equity securities (i.e., shares and certificates of patrimonial contribution) accounted for the remaining 99.6% of transactions in 2004.
At December 31, 2004, the Stock Market Index stood at 12,917.9 points, representing a 46.9% increase in nominal peso terms from the level of 8,795.3 points at December 31, 2003. At June 24, 2005, the Stock Market Index stood at 13,299.28 points, representing a 3.0% increase from the level at December 31, 2004.
Recent Commercial Legislation
On April 27, 2000, the Mexican Congress passed into law the Commercial Reorganization and Bankruptcy Act, a new framework for business reorganizations and for bankruptcy proceedings, which was intended to result in greater legal certainty and swifter case resolution for debtors and creditors involved in the insolvency process. The law replaced one that had been in place since 1943. Among its provisions, the new laws limited the period of time in which insolvent debtors may reach a reorganization agreement with their creditors before a liquidation of the debtor is imposed. The law also established a Federal Institute of Reorganization and Bankruptcy Specialists, which is intended to coordinate the provision of certain technical support in reorganization cases and to ensure that the professionals assigned to provide such support meet certain ethical and professional requirements.
On April 30, 2000, the Mexican Congress passed into law the Miscellany of Secured Lending, which amended the Commerce Code, the General Law of Negotiable Instruments and Credit Transactions and the Credit Institutions Law. The law was intended to promote the availability of credit to small- and medium-size businesses by allowing a wider range of assets to be used as collateral for new borrowing. It recognizes two new types of security interests, a pledge while the borrower retains possession of the collateral and a collateral trust where a trustee holds the collateral for the benefit of the lender. Under the law, if a debtor defaults on its obligation to a creditor who holds either type of security interest, the obligation may be satisfied by the transfer of the collateral to the creditor. In such a case, if the value of collateral exceeds the value of the obligation, the creditor will be obligated to compensate the debtor for the difference. The law also provides for an expedited procedure for creditors to execute judgments against security interests.
On June 13, 2003, a congressional decree was published amending the Commerce Code, the General Law of Negotiable Instruments and Credit Transactions, the Securities Market Law, the Banking Law, the Insurance Companies Law, the Bond Companies Law and the General Law of Ancillary Credit Organizations and Activities. Among its provisions, the decree eliminates a prior non-recourse provision applicable to non-possessory pledges and collateral trusts in order to allow creditors further recourse against debtors in the event that proceeds derived from the sale or foreclosure of collateral are insufficient to pay secured obligations. The decree also amends certain aspects of the collateral trust, including extending the period for which a trust may be created and changing certain aspects of the trustee’s role. Provisions of the Commerce Code governing judicial foreclosure proceedings of securities trusts are amended accordingly. Additionally, the new decree amends the Securities Market Law to redefine the provisions for creating and transferring the securities granted as collateral under a special pledge over securities deposited in an institution for deposit and clearance of securities.
External Sector of the Economy
Foreign Trade
During 2004, according to preliminary figures, Mexico registered a trade deficit of U.S. $8.8 billion, as compared with a trade deficit of U.S. $5.8 billion during 2003. Merchandise exports increased by 14.1% during
84
Table of Contents
2004, to U.S. $188.0 billion, as compared with U.S. $164.8 billion during 2003. During 2004, petroleum exports increased by 27.2%, while non-petroleum exports increased by 12.4%, each as compared with 2003.
During 2004, according to preliminary figures, total imports grew by 15.4% to U.S. $196.8 billion, as compared with U.S. $170.5 billion for 2003. During 2004, imports of intermediate goods increased by 15.5%, imports of capital goods increased by 11.8% and imports of consumer goods increased by 18.1%, each as compared with 2003.
During the first five months of 2005, according to preliminary figures, Mexico registered a trade deficit of U.S. $2.6 billion, as compared with a trade deficit of U.S. $1.1 billion during the first five months of 2004. Merchandise exports increased by 11.4% during the first five months of 2005, to U.S. $82.5 billion, as compared with U.S. $74.1 billion during the same period of 2004. During the first five months of 2005, petroleum exports increased by 29.6%, while non-petroleum exports increased by 8.9%, each as compared with the same period of 2004.
During the first five months of 2005, according to preliminary figures, total imports grew by 13.2% to U.S. $85.1 billion, as compared with U.S. $75.2 billion during the same period of 2004. During the first five months of 2005, imports of intermediate goods increased by 10.6%, imports of capital goods increased by 18.6% and imports of consumer goods increased by 25.1%, each as compared with the first four months of 2004.
A free trade agreement with Uruguay, signed in November 2003, went into effect on July 15, 2004. On September 17, 2004, Mexico signed a free trade agreement with Japan, which went into effect on April 1, 2005.
Balance of International Payments
According to preliminary figures, during 2004, Mexico’s current account registered a deficit of U.S. $7.4 billion, or 1.1% of GDP, a 12.5% decrease in nominal terms as compared with the current account deficit registered in 2003. The capital account surplus for 2004 totaled U.S. $12.3 billion, as compared with a surplus of U.S. $l8.0 billion in 2003. Net foreign investment in Mexico as recorded in the balance of payments totaled U.S. $22.7 billion in 2004, and was composed of direct foreign investment totaling U.S. $16.6 billion and net foreign portfolio investment (including securities placed abroad) inflows totaling U.S. $6.1 billion.
According to preliminary figures, during the first quarter of 2005, Mexico’s current account registered a deficit of 0.4% of GDP, or U.S. $2.6 billion, as compared to a deficit of U.S. $1.3 billion for the same period of 2004. The capital account surplus for the first quarter of 2005 totaled U.S. $3.6 billion, 34.0% less than the U.S. $5.5 billion surplus for the same period of 2004. Net foreign investment in Mexico as recorded in the balance of payments totaled U.S. $10.2 billion during the first quarter of 2005, and was composed of direct foreign investment totaling U.S. $3.8 billion and net foreign portfolio investment (including securities placed abroad) inflows totaling U.S. $6.5 billion.
In August 1996, the Foreign Exchange Commission, composed of members of the Ministry of Finance and Banco de México, announced a plan to increase Mexico’s reserves by conducting monthly auctions of options to sell U.S. dollars to Banco de México. The auctions took place among commercial banks, which could assign their rights arising therefrom. The auctions allowed Banco de México to accumulate international assets without creating distortions in the currency markets. At May 11, 2001, the net international assets of Banco de México totaled U.S. $40,732 million, a level sufficiently high to justify the suspension of the accumulation of reserves by this mechanism. Accordingly, on May 18, 2001, the Foreign Exchange Commission decided to suspend until further notice the sale of options after the auction held on June 29, 2001.
On March 20, 2003, the Foreign Exchange Commission announced that it had adopted a new mechanism to moderate the rate of accumulation of international reserves expected in 2003. Under the mechanism, Banco de México announced every quarter the total amount of dollars it would supply to the currency market in the following three-month period. The amount of dollars to be sold, which were sold exclusively to Mexican credit
85
Table of Contents
institutions, equaled 50% of the increase in net international reserves registered during the previous quarter less the sales of dollars made through this mechanism during the previous quarter. The total amount of dollars to be sold in a quarter was sold through daily auctions, each for an amount equal to the total for the quarter divided by the number of business days in the quarter.
On March 12, 2004, the Foreign Exchange Commission announced that it would adjust the existing mechanism to moderate the rate of accumulation of international reserves that it had adopted on March 20, 2003 and that commenced on May 2, 2003. Under the adjusted mechanism, which remains in effect, Banco de México continues to make quarterly announcements regarding the daily amounts of dollars to be supplied to the currency market pursuant to the same formula, but the total amount announced is divided into four equal portions to be sold in the following four quarters. The new mechanism commenced on May 3, 2004. The amount of dollars to be auctioned during the quarter from May through July 2004 (U.S. $22.0 million) was based retroactively on the accumulation of net international reserves registered in the four quarters from April 16, 2003 through April 16, 2004. The total to be auctioned for the quarter from May through July 2004 was therefore equal to the sum of one-fourth of each of the total amounts announced for the quarters ended in July 2003, October 2003, January 2004 and April 2004. On April 19, 2005, Banco de México announced that the daily amount of dollars to be auctioned pursuant to this procedure for the period from May 2, 2005 to July 29, 2005 would be U.S. $15.0 million.
At December 31, 2004, Mexico’s international reserves totaled U.S. $61.5 billion, an increase of U.S. $4.1 billion from the level at December 31, 2003. The net international assets of Banco de México totaled U.S. $64.2 billion at December 31, 2004, an increase of U.S. $5.2 billion from the level at December 31, 2003.
At June 17, 2005, Mexico’s international reserves totaled U.S. $60.4 billion, a decrease of U.S. $1.1 billion from the level at December 31, 2004. The net international assets of Banco de México totaled U.S. $63.4 billion at June 17, 2005, a decrease of U.S. $0.8 billion from the level at December 31, 2004.
Direct Foreign Investment in Mexico
During 2004, direct foreign investment in Mexico notified to the National Foreign Investment Commission totaled approximately U.S. $15.8 billion. Total accumulated direct foreign investment in Mexico during the 1999-2004 period amounted to approximately U.S. $100.0 billion. Of the total direct foreign investment during 2004, 52.0% has been channeled to manufacturing, 29.9% to financial services, 7.8% to transportation and communications and 5.6% to commerce.
According to preliminary figures, during 2004, net foreign investment in Mexico, as recorded in the balance of payments, totaled U.S. $22.7 billion and comprised direct foreign investment of U.S. $16.6 billion and net portfolio investment (including securities placed abroad) of U.S. $6.1 billion. Net foreign investment in Mexico totaled U.S. $10.2 billion during the first quarter of 2005, and was composed of direct foreign investment totaling U.S. $3.8 billion and net foreign portfolio investment (including securities placed abroad) inflows totaling U.S. $6.5 billion.
Exchange Controls and Foreign Exchange Rates
Since December 22, 1994, the Mexican Government has maintained a floating exchange rate policy, with Banco de México intervening in the foreign exchange market from time to time to minimize volatility and ensure an orderly market. The Mexican Government has also promoted market-based mechanisms for stabilizing the exchange rate, such as over-the-counter forward and options contracts between banks and their clients in Mexico, and authorization of peso futures trading on the Chicago Mercantile Exchange. In addition, since October 1996, Banco de México has permitted foreign financial institutions to open peso-denominated accounts and to borrow and lend pesos (subject to general restrictions on conducting banking activities in Mexico).
In February 1997, the Foreign Exchange Commission established a program enabling Banco de México to sell up to U.S. $200 million of dollars to Mexican commercial banks pursuant to an auction mechanism on any
86
Table of Contents
day in which the peso/dollar exchange rate applicable to the payment of obligations denominated in foreign currencies exceeded the corresponding rate on the preceding business day by more than 2%. This mechanism was adopted with the aim of moderating the volatility of the peso/dollar exchange rate, while maintaining the Mexican Government’s freely floating exchange rate regime. The only extraordinary intervention by Banco de México in the foreign currency market outside the auction mechanism took place on September 10, 1998, when Banco de México sold U.S. $200 million under the auction program and an additional U.S. $278 million through an extraordinary direct sale of dollars at market rates in an attempt to stabilize steep declines in the value of the peso.
The Foreign Exchange Commission resolved on May 18, 2001, as a result of the relative stability of the value of the peso, to suspend use of the auction mechanism for the contingent sale of dollars. The suspension took effect as of July 2, 2001.
The peso/dollar exchange rate closed at Ps. 11.2648 = U.S. $1.00 on December 31, 2004, a 0.26% depreciation in dollar terms as compared to the exchange rate at the end of 2003. During 2004, the average peso/U.S. dollar exchange rate was Ps. 11.2860= U.S. $1.00, as compared to Ps. 10.7890 = U.S. $1.00 in 2003. The peso/U.S. dollar exchange rate announced by Banco de México on June 24, 2005 (to take effect on the second business day thereafter) was Ps. 10.7642 = U.S. $1.00.
Public Finance
Fiscal Policy
The rationalization of public expenditure and the augmentation of revenue have been important components of the Mexican Government’s economic stabilization strategy. The Mexican Government’s fiscal policy has had two fundamental objectives: to establish the macroeconomic foundation for sustained growth and to focus the Mexican Government’s resources on those sectors in which the Mexican Government can have the greatest impact in supporting social development and the competitiveness of the Mexican economy.
At present, the Mexican Government’s principal short-term fiscal policy objectives, in addition to countering inflation, are:
| • | strengthening economic activity and exports; |
| • | maintaining an adequate surplus in the Mexican Government’s primary balance while incurring only a moderate public sector deficit; |
| • | continuing to promote fiscal federalism; and |
| • | increasing the efficiency and competitiveness of the economy and the effectiveness of the tax collection system. |
The Mexican Government’s principal fiscal policy objectives over the medium-term are:
| • | significantly reducing the inflation rate to levels approximating those of Mexico’s major trading partners; |
| • | consolidating the process of sustainable economic growth; |
| • | promoting private sector savings; |
| • | continuing to modernize the economy; and |
| • | strengthening social policy through increased real spending on social development. |
2004 Budget and Fiscal Results
In 2004, public sector budgetary revenues were less than public sector budgetary expenditures (excluding off-budget revenues and expenditures of the public sector) by approximately Ps. 23.3 billion in nominal terms.
87
Table of Contents
Budgetary revenues increased by 5.9% in real terms as compared to budgetary revenues for 2003. Within budgetary revenues, non-oil tax revenues increased by 1.6% in real terms, while oil related revenues increased at a real rate of 14.5%. Overall, public sector revenues were Ps. 166.2 billion higher than the total projected in the Federal Annual Revenue Law for 2004. This result was mainly attributable to the significant increase in oil revenues.
The overall public sector balance registered a deficit of Ps. 19.7 billion in nominal terms in 2004, reflecting a decrease of 55.6% in real terms as compared to the public sector deficit for 2003. The 2004 public sector deficit included a gross expenditures of Ps. 7.4 billion related to the costs associated with thePrograma de Separación Voluntaria (Voluntary Retirement Program, or PSV), which was implemented in late 2002 with the long-term goal of reducing the number of Government administrative personnel and which offers severance packages to certain persons who retire voluntarily. Excluding the gross expenditure related to the PSV, the public sector deficit for 2004 was Ps. 12.4 billion, equivalent to 0.2% of estimated GDP for 2004, which is equal to the public sector deficit target (as a percentage of GDP) approved by Congress for 2004. The primary surplus, defined as total public sector revenues less expenditures other than interest payments on public debt, was Ps. 189.9 billion in nominal terms in 2004, 26.1% higher in real terms than the surplus recorded for 2003.
2005 Budget and Fiscal Package
On November 13, 2004, the Congress approved the Federal Annual Revenue Law for 2005 and on November 18, 2004, the Chamber of Deputies approved the Federal Expenditure Decree for 2005 (as passed, together with the Federal Annual Revenue Law for 2005 as passed, the “2005 Budget”). The 2005 Budget maintains fiscal discipline as the cornerstone of the economic program, and contemplates a public sector deficit of 0.22% of GDP for 2005.
The 2005 Budget as originally proposed to Congress was based on an estimated weighted average price of Mexico’s oil exports of U.S. $23.00 per barrel. Congress’s upward revision to U.S. $27.00 per barrel and the 2005 Budget’s estimated volume of oil exports of 1,900 thousand barrels per day resulted in an additional Ps. 41.7 billion of projected revenues as compared to the original proposal. The 2005 Budget as originally proposed to Congress contemplated a public sector deficit as a percentage of GDP of 0.1%. Congress revised the proposal to provide for a public sector deficit of 0.22% of GDP.
Subsequent to the passing of the Federal Expenditure Decree for 2005 by the Chamber of Deputies, the President on December 21, 2004 submitted a filing to the Supreme Court of Mexico contesting the limitations of the powers of the Executive with respect to the budget approval process and the reallocation of certain expenditures set forth in the Federal Expenditure Decree for 2005, which represent amounts allocated by the President in the proposal to certain federal programs and entities and shifted by Congress to fund programs administered in certain cases by the states. The President’s filing with the Supreme Court requested that the court rule, among other things, that the President has the power to eliminate changes made by the Chamber of Deputies to the original Federal Expenditure Decree as proposed by the President and submitted to the Chamber of Deputies. On December 22, 2004, the Supreme Court granted an interim ruling suspending until a further ruling is issued by the Supreme Court the carrying out of specific works projects, services and transfers within the expenditures contested by the President and which account for up to Ps. 4.2 billion of expenditures. On May 17, 2005, the Supreme Court ruled that President Fox does have the power to veto changes made by the Chamber of Deputies to the original Federal Expenditure Decree, but also ruled that the Chamber of Deputies may override the President’s veto by a two-thirds vote. The Supreme Court ordered the Chamber of Deputies to reconsider the President’s original proposed changes to the Federal Expenditures Decree for 2005. This reconsideration is pending in the Chamber of Deputies and there can be no assurance as to whether the Federal Expenditures Decree for 2005 will be revised.
88
Table of Contents
The results for 2003 and 2004, the revised budget assumptions and targets for 2004 and the budget assumptions and targets for 2005, as set forth in the 2005 Budget passed by Congress, are set forth below:
2003 and 2004 Results;
2004 Revised Budget Assumptions and Targets;
2005 Budget Assumptions and Targets
| 2003 Results | 2004 Budget | 2004 Results | 2005 Budget | |||||
Real GDP growth (%) | 1.3(1) | 3.1 | 4.4(1) | 3.8 | ||||
Increase in the national consumer price index (%) | 4.0 | 3.0 | 5.2 | 3.0 | ||||
Average export price of Mexican oil mix (U.S.$/barrel) | 24.79 | 20.00 | 31.01 | 27.00 | ||||
Current account deficit as % of GDP | 1.3(1) | 2.6 | 1.1(1) | 2.1 | ||||
Average exchange rate (Ps./$1.00) | 10.8 | 11.2 | 11.29 | 11.6 | ||||
Average rate on 28-dayCetes (%) | 6.2 | 6.5 | 6.82 | 7.8 | ||||
Public sector balance as % of GDP | (0.7)(1) | (0.3) | (0.26)(1) | (0.2) | ||||
Primary balance as % of GDP | 2.2(1) | 2.7 | 2.49(1) | N/A |
N/A = Not available.
| (1) | Preliminary. |
Source: Ministry of Finance and Public Credit.
Under the 2005 Budget, the Government estimates that it will devote Ps. 313.2 billion (23.8% of total budgetary programmable expenditures) to education and Ps. 382.4 billion (29.0% of total budgetary programmable expenditures) to health and social security.
According to preliminary figures, during the first four months of 2005, the public sector overall balance registered a surplus of Ps. 52.5 billion, 32.9% lower in real terms than the surplus for the same period of 2004, and the primary balance registered a surplus of Ps. 123.7 billion, 17.8% lower in real terms than the surplus for the same period of 2004.
Public Debt
Internal Public Debt
Internal debt is presented herein on a “net” basis, and includes the internal debt of the Mexican Government, including Banco de México’s general account balance (which was positive at April 30, 2005, indicating monies owed to the Mexican Government) and the assets of theFondo del Sistema de Ahorro Para el Retiro(the Retirement Savings System Fund). In addition, net internal debt includesCetes and other securities sold to the public in primary auctions, but not such debt allocated to Banco de México for its use in regulating liquidity (Regulación Monetaria). See footnote 2 to the table “Net Internal Public Debt” below. Internal debt does not include the debt of IPAB or the debt of budget-controlled or administratively controlled agencies. See “—Financial System—Banking Supervision and Support.”
Over the last decade, the Mexican Government historically has pursued an internal debt strategy aimed at lengthening the average maturity of its debt in order to reduce its refinancing risk. To further this goal, the Mexican Government in 1999 offered for the first time 10-year UDI-denominated securities and guaranteed 30-year UDI- indexed bonds and subsequently began offering three-year, five-year, seven-year and ten-year fixed rate peso-denominated bonds.
On October 28, 2003, the Mexican Government issued its first twenty-year fixed rate peso-denominated bonds, placing Ps. 1.0 billion of these instruments in the market. The Mexican Government expects to continue to offer these instruments on a regular basis, along with the shorter-term fixed rate peso-denominated bonds mentioned above, pursuant to a securities auction calendar published by the Mexican Government each quarter.
89
Table of Contents
With the issuance of these securities, the Mexican Government intends to establish a long-dated benchmark yield curve and to begin to develop a long-term private domestic debt market. The Mexican Government anticipates that the issuance of these instruments has encouraged:
| • | increased use of long-term fixed rate contracts; |
| • | the issuance of long-term peso-denominated securities by Mexican companies; |
| • | the development of long-term financial hedging products; and |
| • | the potential to direct long-term savings toward the financing of long-term investment projects. |
At December 31, 2004, according to preliminary figures, the net internal debt of the Mexican Government totaled Ps. 1,030 billion, as compared with the Ps. 927.1 billion outstanding at December 31, 2003. At December 31, 2004, according to preliminary figures, the gross internal debt of the Government totaled Ps. 1,099.2 billion, as compared to Ps. 1,011.9 billion at December 31, 2003.
At March 31, 2005, according to preliminary figures, the net internal debt of the Mexican Government totaled Ps. 1,031.7 billion, as compared with the Ps. 1,030.0 billion outstanding at December 31, 2004. At March 31, 2005, according to preliminary figures, the gross internal debt of the Government totaled Ps. 1,127.7 billion, as compared to Ps. 1,099.2 billion at December 31, 2004.
At April 30, 2005, according to preliminary figures, the net internal debt of the Mexican Government was Ps. 1,018.9 billion and the gross internal debt of the Government totaled Ps. 1,138.3 billion.
The following table summarizes the net internal public debt of the Mexican Government at each of the dates indicated.
Net Internal Public Debt
| December 31, | March 31, | |||||||||||
| 2000 | 2001(1) | 2002(1) | 2003(1) | 2004(1) | 2005(1) | |||||||
| (in billions of Pesos) | ||||||||||||
Total net internal debt(2) | Ps. 606.2 | Ps. 691.0 | Ps. 821.3 | Ps. 927.1 | Ps. 1,030.0 | Ps. 1,031.7 | ||||||
Mexican Government | 606.2 | 691.0 | 821.3 | 927.1 | 1,030.0 | 1,031.7 | ||||||
Peso-denominated(2) | 606.2 | 691.0 | 821.3 | 927.1 | 1,030.0 | 1,031.7 | ||||||
Foreign currency-denominated (Tesobonos) | 0.0 | 0.0 | 0.0 | 0.0 | 0.0 | 0.0 | ||||||
| Note: | Totals may differ due to rounding. |
N.A. = Not available.
| (1) | Preliminary. |
| (2) | Does not include bonds sold by Banco de México in open-market operations pursuant toRegulación Monetaria, which amounted to approximately U.S. $20.7 billion at December 31, 2004.Regulación Monetaria does not increase the Mexican Government’s overall level of internal debt, because Banco de México must reimburse the Mexican Government for any allocated debt that Banco de México sells into the secondary market and that is presented to the Mexican Government for payment. If Banco de México undertakes extensive sales of allocated debt in the secondary market, however,Regulación Monetaria can result in a situation in which the level of outstanding internal debt is higher than the Mexican Government’s figure for net internal debt. |
Source: Ministry of Finance and Public Credit.
90
Table of Contents
External Public Debt
The total or gross external debt of the public sector consists of the external portion of the long-term indebtedness incurred directly by the Government, the external long-term indebtedness incurred by budget-controlled agencies, the external long-term indebtedness incurred directly or guaranteed by administratively controlled agencies (including but not limited to national development banks), and the short-term external debt of the public sector.
According to preliminary figures, outstanding gross external debt increased by approximately U.S. $0.2 billion during 2004, from U.S. $79.0 billion at December 31, 2003 to U.S. $79.2 billion at December 31, 2004. Of the total external debt at December 31, 2004, U.S. $77.1 billion represented long-term debt and U.S. $2.1 billion represented short-term debt.
According to preliminary figures, total public debt (gross external debt plus net internal debt) at December 31, 2004 represented approximately 23.3% of nominal GDP, 1.6 percentage points higher than at the end of 2003.
According to preliminary figures, outstanding public sector gross external debt increased by approximately U.S. $0.04 billion during the first quarter of 2005, from U.S. $79.2 billion at December 31, 2004 to U.S. $79.3 billion at March 31, 2005. Of this amount, U.S. $75.5 billion represented long-term debt and U.S. $3.8 billion represented short-term debt.
According to preliminary figures, at April 30, 2005, the total outstanding gross external debt of the Mexican public sector totaled U.S. $77.2 billion. Of this amount, U.S. $73.8 billion represented long-term debt and U.S. $3.4 billion represented short-term debt.
The following table sets forth a summary of the external public debt of Mexico, which includes the external debt of the Mexican Government, budget-controlled agencies and administratively controlled agencies, and a breakdown of such debt by currency. External public debt as used in this section does not include, among other things, repurchase obligations of Banco de México with the International Monetary Fund or the debt of IPAB. See “—Financial System—Banking Supervision and Support.” See footnote 1 to the table “Summary of External Public Debt” below.
Summary of External Public Debt(1)
By Type
| Long-Term Direct Debt of the Mexican Government | Long-Term Debt of Budget- Controlled Agencies | Other Long- Term Public Debt(2) | Total Long- Term Debt | Total Short-Term Debt | Total Long- and Short- Term Debt | |||||||
| (in millions of dollars) | ||||||||||||
December 31, | ||||||||||||
2000 | 46,065 | 10,853 | 23,386 | 80,304 | 3,754 | 84,058 | ||||||
2001 | 44,070 | 10,361 | 22,224 | 76,655 | 3,684 | 80,339 | ||||||
2002 | 43,554 | 10,630 | 21,845 | 76,029 | 2,789 | 78,818 | ||||||
2003 | 44,898 | 11,190 | 21,248 | 77,336 | 1,688 | 79,024 | ||||||
2004 | 48,561 | 10,636 | 17,952 | 77,149 | 2,077 | 79,226 | ||||||
March 31, 2005 | 49,418 | 8,859 | 17,189 | 75,466 | 3,802 | 79,268 | ||||||
91
Table of Contents
By Currency(3)
| December 31, | March 31, | |||||||||||||||||||||||
| 2000 | 2001 | 2002 | 2003 | 2004 | 2005 | |||||||||||||||||||
| (in millions of $) | (%) | (in millions of $) | (%) | (in millions of $) | (%) | (in millions of $) | (%) | (in millions of $) | (%) | (in millions of $) | (%) | |||||||||||||
U.S. Dollars | 71,065 | 84.0 | 69,933 | 87.0 | 69,804 | 88.6 | 70,519 | 89.2 | 71,220 | 89.9 | 71,624 | 90.4 | ||||||||||||
Japanese Yen | 5,878 | 7.0 | 4,708 | 5.9 | 3,849 | 4.9 | 4,013 | 5.1 | 2,937 | 3.7 | 2,837 | 3.6 | ||||||||||||
Deutsche Marks | 1,270 | 1.5 | 390 | 0.5 | 0 | 0.0 | 0 | 0.0 | 0 | 0.0 | 0 | 0.0 | ||||||||||||
Pounds Sterling | 144 | 0.2 | 140 | 0.2 | 156 | 0.2 | 173 | 0.2 | 186 | 0.2 | 183 | 0.2 | ||||||||||||
French Francs | 627 | 0.7 | 170 | 0.2 | 0 | 0.0 | 0 | 0.0 | 0 | 0.0 | 0 | 0.0 | ||||||||||||
Swiss Francs | 27 | 0.0 | 135 | 0.2 | 173 | 0.2 | 184 | 0.2 | 236 | 0.3 | 220 | 0.3 | ||||||||||||
Others | 5,588 | 6.6 | 4,863 | 6.0 | 4,836 | 6.1 | 4,135 | 5.3 | 4,647 | 5.9 | 4,404 | 5.6 | ||||||||||||
Total | 84,600 | 100.0 | 80,339 | 100.0 | 78,818 | 100.0 | 79,024 | 100.0 | 79,226 | 100.0 | 79,268 | 100.0 | ||||||||||||
| Note: | Totals may differ due to rounding. |
| (1) | External debt denominated in foreign currencies other than dollars has been translated into dollars at exchange rates as of each of the dates indicated. External public debt does not include (a) repurchase obligations of Banco de México with the IMF (none of these were outstanding at December 31, 2004), (b) external borrowings by the public sector after March 31, 2005, including approximately U.S. $2,605 billion in capital market financings and (c) loans from the Commodity Credit Corporation to public sector Mexican banks. External debt is presented herein on a “gross” basis, and includes external obligations of the public sector at their full outstanding face or principal amount. For certain informational and statistical purposes, Mexico sometimes reports its external public sector debt on a “net” or “economic” basis, which is calculated as the gross debt net of certain financial assets held abroad. These financial assets include the value of principal and interest collateral on restructured debt and Mexican public sector external debt that is held by public sector entities but that has not been canceled. |
| (2) | Includes debt of development banks and other administratively controlled agencies whose finances are consolidated with the Mexican Government. |
| (3) | Adjusted to reflect the effect of currency swaps. |
Source: Ministry of Finance and Public Credit.
Subsequent to December 31, 2004:
| • | Mexico issued U.S. $1,000,000,000 of its 6.625% Global Notes due 2015 on January 7, 2005. |
| • | Mexico issued CHF 250,000,000 of its 3.0% Global Notes due 2012 on June 14, 2005. |
| • | Mexico issued EUR 750,000,000 of its 4.25% Global Notes due 2015 on June 16, 2005. |
92
Table of Contents
| Item 5. | Operating and Financial Review and Prospects |
General
We earn income from:
| • | export sales, which consist primarily of sales of crude oil and refined products; |
| • | domestic sales, which consist of sales of natural gas, refined products (such as gasoline, diesel fuel and liquefied petroleum gas) and petrochemical products; and |
| • | other sources, including investment income. |
Our operating expenses include:
| • | costs of sales (which include labor expenses), costs of operating, maintaining and repairing plants and equipment, purchases of refined petroleum and other products, depreciation and amortization of fixed assets and, until December 31, 2003, costs of increasing the reserve for exploration and depletion of oil fields; |
| • | expenses for transportation and distribution of our products; |
| • | administrative expenses; and |
| • | interest expense. |
Our income is affected by a number of factors, including:
| • | changes in international prices of crude oil and refined petroleum products, which are denominated in U.S. dollars, and domestic prices of petroleum products, which are denominated in pesos; |
| • | the type and volume of crude oil produced and exported; |
| • | the type and volume of natural gas produced and sold; |
| • | the results of development and exploration activities; |
| • | the amount of taxes and duties that the Mexican Government imposes on us; |
| • | Mexican inflation; |
| • | fluctuations in the peso-U.S. dollar exchange rate; and |
| • | Mexican and global economic conditions, including the levels of international interest rates. |
Overview
Our principal objectives are to increase our operating efficiency, raise our crude oil and natural gas production levels, modernize our infrastructure and improve Mexico’s hydrocarbon reserves replacement rate, as well as maintaining health, safety and environmental standards. The recent accidents in some of our facilities attest to the need to redouble our efforts to improve facilities maintenance and safety procedures. See “Item 4—Information on the Company—Environmental Regulation—PEMEX’s Internal Monitoring” and “Item 4—Information on the Company—Business Overview—Transportation and Distribution.” We are committed to carrying out all our operations in a manner that ensures the safety of our installations and that respects neighboring communities and the environment.
Our consolidated financial statements included herein are presented in constant pesos, so all financial information is restated in constant pesos as of December 31, 2004. Unless otherwise indicated, all amounts included in “Item 5— Operating and Financial Review and Prospects” are presented in constant pesos as of December 31, 2004.
93
Table of Contents
We have reported losses in recent years and this trend continued in 2004 as we reported a loss of Ps. 25.5 billion.As described above, our loss is affected by a number of factors. Of principal importance in 2004, we remained subject to the heavy tax burden imposed on us by the Mexican Government. Approximately 65.6% of the sales revenues of Petróleos Mexicanos and the subsidiary entities were used to pay taxes to the Mexican Government. The rate at which we were taxed in 2004 did not change significantly from prior years; however, in addition to the payment of these taxes and duties, our costs and operating expenses increased due to an increase in import purchases, primarily of natural gas, an increase in maintenance and exploration expenses as well as an increase in costs associated with the labor reserve for pension obligations. The negative effects on our income of these factors were partially offset by an increase in total revenues due to increased prices and higher sales volumes of our principal products, particularly crude oil, which accounts for a substantial percentage of our total sales.
To reduce our losses in the future, we are undertaking a number of initiatives to increase our efficiency by introducing measures to reduce costs and expenses and increase our profitability. Moreover, in 2004 we paid to the Mexican Government the infrastructure duty, and in 2005 we are obligated to pay the excess gains revenue duty. During the year, we received a total of Ps. 33.0 billion as reimbursement of the infrastructure duty we paid in 2004 for investment in infrastructure works for exploration, gas, refining and petrochemicals that will be carried out by us. See “Item 4—Information on the Company—Taxes and Duties—Excess Gains Revenue Duty.” The enactment of additional changes to our tax regime and the implementation of measures to increase our profitability would enhance our financial performance. However, only the Mexican Congress has the power to enact further changes in federal tax law, and we cannot predict the extent or nature of future changes, if any, to the federal hydrocarbon tax laws applicable to us. We have increased our capital expenditures (both PIDIREGAS and non-PIDIREGAS), particularly in the area of exploration and production. In nominal peso terms, we increased our capital investment in this area by 28% in 2004, as compared to 2003. Our increased production goals for 2005 include producing, on average, 0.5% more crude oil and 6.5% more natural gas as compared to 2004.
Critical Accounting Policies
Our significant accounting policies are more fully described in Notes 2 and 19 to our consolidated financial statements included herein. Some of our accounting policies require the application of significant judgment by management in selecting the appropriate assumptions for calculating financial estimates. By their nature, these judgments are subject to a degree of uncertainty and are based on our historical experience, terms of existing contracts, management’s view of trends in the oil and gas industry, both internationally and within Mexico, economic factors in Mexico and information from outside sources. We believe the following critical accounting policies, among others, affect management’s more significant judgments and estimates used in the preparation of our consolidated financial statements and could potentially impact our financial results and future financial performance. Unless otherwise stated, the following critical accounting policies apply for both Mexican and U.S. GAAP purposes.
Exploration and Drilling Costs
Until December 31, 2003, under Mexican GAAP, we annually determined a budgeted exploration and drilling cost per barrel based upon internal engineering studies. To determine the cost per barrel, we took into consideration the budgeted exploration and drilling costs, the estimated annual production of oil and gas and the estimated percentage of non-successful wells. The resulting per barrel amount was charged as cost of sales in our consolidated statement of income against the equity reserve established for exploration and drilling costs. Changes in the budgeted exploration and drilling cost per barrel would have affected our recorded cost of sales expense. Under U.S. GAAP, the budgeted exploration and drilling cost recognized as part of the equity reserve was reversed and the successful efforts method of accounting was applied. Since January 1, 2004, we have applied the successful efforts method of oil and gas accounting, discussed below, for both Mexican and U.S. GAAP purposes.
94
Table of Contents
Successful Efforts Method of Oil and Gas Accounting
We apply the successful efforts method of oil and gas accounting. This accounting principle requires that capitalized costs for producing properties be amortized on the basis of crude oil and natural gas reserve quantities. Our reserve estimates are determined in accordance with earth science and petroleum engineering principles and practices in accordance with Rule 4-10 of Regulation S-X of the Securities Act and can vary as a result of changes in such factors as forecasted oil and gas prices, reservoir performance and oil field technology.
Downward revision of our reserve estimates can result in either: (a) higher depreciation and depletion expense per barrel in future periods, (b) an immediate write-down of an asset’s book value in accordance with accounting rules for the impairment of properties, or (c) changes in our accrual of the asset retirement obligation. An impairment of oil- and gas-producing fixed assets would result if the downward revisions were so significant that the estimated future cash flows from the remaining reserves in the field were insufficient to recover the unamortized capitalized costs. Conversely, if the oil and gas reserve quantities were revised upward, our per-barrel depreciation and depletion expense would be lower.
The application of successful efforts accounting can also cause material fluctuations between periods in exploration expense if drilling results are different than expected or if we change our exploration and development plans. The determination that exploratory drilling was unsuccessful in finding economically producible reserves requires the immediate expensing of previously capitalized drilling costs. We make semi-annual assessments of the amounts included within fixed assets to determine whether capitalization is initially appropriate and can continue. Exploration wells capitalized beyond 12 months are subject to additional judgment as to whether the facts and circumstances have changed and therefore whether the conditions described in clauses (a) and (b) below no longer apply. Exploration wells more than 12 months old are expensed unless (a) (i) they are in an area requiring major capital expenditure before production can begin, (ii) commercially productive quantities of reserves have been found, and (iii) they are subject to further exploration or appraisal activity in that either drilling of additional exploratory wells is under way or firmly planned for the near future, or (b) proved reserves are recorded within 12 months following the completion of exploratory drilling.
Environmental Remediation, Asset Retirement Obligations
We also make judgments and estimates in recording liabilities for environmental cleanup and asset retirement obligations. Estimated liabilities for environmental remediation and asset retirement obligations are subject to change because of matters such as changes in laws, regulations and their interpretation, the determination of additional information on the extent and nature of site contamination, the determination of additional works which need to be undertaken, improvements in technology, the nature and timing of expenditure, foreign currency exchange rates to the extent that some of these costs are incurred in U.S. dollars, and changes in discount rates. In addition, with respect to offshore properties, our historical dismantlement and plugging experiences have been very limited, and, therefore, our estimates of the expected cost or salvage value may vary from what will actually be incurred for many of these long-term properties when these activities are ultimately undertaken.
While we believe that our environmental remediation and asset retirement obligation provisions are adequate and that the interpretations applied of existing law are appropriate, the amounts estimated for future liabilities, which are based on discounted cash flows, may differ materially from the costs that will actually be incurred to remediate our properties. If we determine that an insufficient environmental remediation or asset retirement obligation provision has been created, earnings will be adjusted as appropriate in the period in which the determination is made.
Employee Benefit Plans
We provide a range of benefits to our current and retired employees, including pensions, post-retirement health care benefits and post-employment benefits (primarily health services and supplemental payments). We
95
Table of Contents
annually record amounts relating to these plans based on calculations specified by Mexican and U.S. GAAP, respectively, which include various actuarial assumptions, such as real discount rates, assumed rates of return, compensation increases, turnover rates and health care cost trend rates. We review our actuarial assumptions on an annual basis and make modifications to the assumptions based on current rates and trends when it is deemed appropriate to do so. As required by Mexican and U.S. GAAP, the effect of the modifications is generally recorded or amortized over future periods. We believe that the assumptions utilized in recording our obligations under our plans, which are presented in Notes 11 and 19 II (e) and (f) to our consolidated financial statements included herein, are reasonable based on our experience and advice from our independent actuaries.
Financial Instruments
Under Mexican GAAP, we apply Bulletin C-2, “Financial Instruments” (which we refer to as Bulletin C-2), which provides for the definition of financial instruments, including derivative financial instruments and requires that all financial instruments, with the exception of “held to maturity” investments and certain derivative instruments that qualify as hedges, to be recorded at fair value with the fair value adjustment recognized in earnings. Held to maturity investments are recorded at amortized cost subject to an impairment review. See “Item 5—Operating and Financial Review and Prospects—Recently Issued Accounting Standards—New Mexican GAAP Accounting Standards,” for a discussion of the recently issued Bulletin C-10, “Derivative Financial Instruments and Hedge Operations.”
Quoted market prices for certain derivatives used by us are not readily available. We have calculated the fair value of these derivatives using common market valuation methods and value-influencing market data at the relevant respective balance sheet dates.
The use of valuation models requires us to make assumptions and estimates regarding the volatility of derivative contracts at the balance sheet dates, and actual results could differ significantly due to fluctuations in value-influencing market data. The valuation models for our interest rate and currency derivatives are based on calculations and valuations using a group-wide financial reporting system, which provides consistent market data and valuation algorithms throughout our organization. The algorithms used to obtain valuations are those which are commonly used in the financial markets. In certain cases, the calculated fair value of derivatives is compared with results which are produced by other market participants, including banks, as well as those available through other internally available systems. The valuations of commodity instruments are also made utilizing common valuation techniques.
Through internal guidelines (i.e., group-wide financial guidelines), we ensure that the derivatives used for risk management purposes are only utilized to hedge booked, contracted or planned underlying transactions. We calculate and assess market risks in accordance with the policies outlined in “Item 11—Quantitative and Qualitative Disclosures About Market Risk.”
Contracts providing for physical delivery in Mexico are currently accounted for as contracts with no derivative components, because no sufficient natural gas market mechanism or spot market exists in Mexico so as to allow us to classify gas as readily convertible to cash. In the future, it is possible that a sufficient market mechanism or spot market for natural gas could emerge resulting in a need to reassess the Mexican contracts for derivatives under SFAS No. 133. If any such reassessment resulted in contracts being accounted for as derivatives under SFAS No. 133, the impact on future operating results could be significant.
Impairment of Long-Lived Assets
In addition to our oil and gas assets that could become impaired under the application of successful efforts accounting, other long-lived assets could become impaired and require write-down if circumstances warrant. Conditions that could cause our assets to become impaired include lower than forecasted commodity sales prices, changes in our business plans and plant modernizations, or a significant adverse change in the national or international business climate. The amount of an impairment charge would be based on estimates of an asset’s
96
Table of Contents
fair value compared with its book value. While we believe that our estimates of future cash flows are reasonable, different assumptions regarding projected commodity sales prices, production and overhead costs and foreign currency exchange rates and inflation could materially affect the anticipated cash flows to be generated by long-lived assets, thereby affecting the evaluations of the carrying values of those long-lived assets.
Sales Volumes and Prices
The profitability of our operations in any particular accounting period is directly related to the sales volume of, and average realized prices for, the crude oil and natural gas that we sell. The average realized prices for crude oil and natural gas fluctuate from one period to another due to world market conditions and other factors.
Export Volumes and Prices
Pemex-Exploration and Production sells crude oil to PMI, which then sells it to international clients. The volume of crude oil that we export is the volume delivered to international clients as adjusted for water content according to the bill of lading and standard market practice. We base our crude oil export price formulas on a basket of international reference prices and a constant set according to specific market conditions. We determine export prices of petroleum products and natural gas by reference to market conditions and direct negotiations with our clients.
Significant changes in international crude oil prices directly affect our financial results. The impact of changes in crude oil prices on our refining activities and petrochemicals business depends on:
| • | the magnitude of the change in crude oil prices; |
| • | how quickly petroleum and petrochemical product prices in international markets adjust to reflect changes in crude oil prices; and |
| • | the extent to which prices in Mexico, where we sell most of our petroleum products and petrochemicals, reflect international prices for those products. |
The following table sets forth the weighted average price per barrel of crude oil that PMI received from exports to international customers and the average price of its benchmark, West Texas Intermediate crude oil, for the years indicated. Note that the average prices of West Texas Intermediate crude oil are higher than the average prices of crude oil that we export. This is primarily due to the higher cost of refining sour crude oils, which make up a majority of our exports. See “Item 4—Information on the Company—Business Overview—International Trading.”
| Year Ended December 31, | |||||||||||||||
| 2000 | 2001 | 2002 | 2003 | 2004 | |||||||||||
| (in dollars per barrel) | |||||||||||||||
West Texas Intermediate crude oil average price | $ | 30.97 | $ | 25.93 | $ | 26.08 | $ | 31.10 | $ | 41.49 | |||||
PEMEX crude oil weighted average export price | 24.79 | 18.61 | 21.52 | 24.78 | 31.05 | ||||||||||
| Note: | The numbers in this table are average prices for the full year. Spot prices at year end are different. On June 27, 2005 the spot price for West Texas Intermediate crude oil was U.S. $60.40 per barrel and the spot price for the PEMEX crude oil basket was an estimated U.S. $46.90 per barrel. |
Sources: PMI operating statistics, which are based on information in bills of lading, and Platt’s U.S. Market Scan (McGraw-Hill Company).
Domestic Prices
Committees composed of officials of Petróleos Mexicanos and the subsidiary entities and representatives of various governmental agencies including, among others, the Ministry of Finance and Public Credit, the Ministry of Energy, SFP and the Ministry of Economy set the formulas that we use to determine prices for crude oil and
97
Table of Contents
petroleum products sold in the domestic market. Petróleos Mexicanos and the subsidiary entities, together with the Mexican Government, pursue a policy that keeps domestic wholesale prices generally in line with international prices. We determine wholesale prices by reference to international prices, but make adjustments to reflect opportunity costs, transportation expenses and differences in the quality of our products relative to international benchmarks. The retail price is comprised of the wholesale price plus the value added tax, the retailer’s margin and freight costs. The Ministry of Finance and Public Credit determines retail prices of gasoline and diesel before the beginning of each fiscal year in conjunction with the preparation of the Mexican Government’s budget for that year. The Ministry of Finance and Public Credit also adjusts gasoline and diesel prices so that they are consistent with the Mexican Government’s macroeconomic targets.
Our retail prices for gasoline and diesel reflect the addition of the IEPS tax as described below, as well as the value added tax. We charge the IEPS tax only on gasoline and diesel. See “—IEPS Tax, Excess Gains Duty, Hydrocarbon Duties and Other Taxes” below, for a further discussion of the IEPS tax. For financial statement purposes, the IEPS tax is presented as part of net domestic sales and then deducted after “Income before hydrocarbon extraction duties and other, special tax on production and services, and cumulative effect of adoption of new accounting standards.”
Natural gas prices for domestic sale are calculated according to the Energy Regulatory Commission directives published on March 20, 1996. These prices reflect natural gas opportunity costs and competitive conditions in international markets and at the point of sale.
The following table compares the average prices in nominal terms of petroleum products in Mexico and in the United States for the years indicated.
| 2000 | 2001 | 2002 | 2003 | 2004 | ||||||||||||||||||||||||||
| Mexico | U.S. | Mexico | U.S. | Mexico | U.S. | Mexico | U.S. | Mexico | U.S. | |||||||||||||||||||||
Oil Products | ||||||||||||||||||||||||||||||
Unleaded regular gasoline(1) | $ | 84.89 | $ | 60.83 | $ | 92.91 | $ | 56.69 | $ | 94.70 | $ | 53.92 | $ | 87.79 | $ | 60.94 | $ | 86.48 | $ | 72.39 | ||||||||||
Premium gasoline(1) | 94.36 | 68.07 | 104.29 | 64.53 | 106.32 | 61.68 | 98.55 | 68.78 | 101.17 | 80.38 | ||||||||||||||||||||
Jet fuel(2) | 37.44 | 35.69 | 32.47 | 30.32 | 30.11 | 28.96 | 36.30 | 34.87 | 47.92 | 48.49 | ||||||||||||||||||||
Kerosene(3) | 70.34 | 37.64 | 77.05 | 32.44 | 78.50 | 30.23 | 72.80 | 36.68 | 71.72 | 50.75 | ||||||||||||||||||||
Natural Gas(4) | ||||||||||||||||||||||||||||||
Industrial | 3.65 | 4.45 | 4.20 | 5.03 | 3.15 | 3.99 | 5.31 | 5.81 | 6.09 | 6.38 | ||||||||||||||||||||
Residential | 6.27 | 8.44 | 6.48 | 9.26 | 5.65 | 8.45 | 7.62 | 10.63 | 9.58 | 12.66 | ||||||||||||||||||||
Selected Petrochemicals | ||||||||||||||||||||||||||||||
Ammonia(5) | 153.84 | 173.93 | 157.41 | 160.55 | 133.74 | 127.47 | 237.03 | 205.36 | 272.48 | 250.68 | ||||||||||||||||||||
Polyethylene L.D.(6) | 1,034.70 | 1,298.66 | 877.90 | 1,059.74 | 735.36 | 1,013.47 | 948.07 | 1,286.82 | 1,221.15 | 1,504.37 | ||||||||||||||||||||
Polyethylene H.D.(7) | 1,082.79 | 1,183.66 | 961.44 | 1,004.63 | 699.51 | 947.90 | 824.85 | 1,187.97 | 978.44 | 1,364.33 | ||||||||||||||||||||
Styrene(8) | 916.42 | 888.92 | 641.56 | 690.15 | 757.67 | 701.30 | 885.89 | 873.94 | 1,297.79 | 1,231.44 | ||||||||||||||||||||
| (1) | In U.S. dollars per barrel. Prices to final consumers including taxes. Premium price in Mexico City. U.S. prices for Houston, Texas. |
Sources: Pemex-Refining and Lundberg Retail Price Survey (Lundberg Survey Inc.).
| (2) | In U.S. dollars per barrel. Mexican prices at the gate of the refineries. U.S. spot prices in Houston, Texas (Jet Fuel Gulf Coast Waterborne). |
Sources: Pemex-Refining and Platt’s U.S. Market Scan (McGraw-Hill Company).
| (3) | In U.S. dollars per barrel. In both countries, prices to final consumers. Mexico prices include taxes, while U.S. prices exclude them. |
Sources: Pemex-Refining and Petroleum Marketing Monthly published by the Energy Information Administration (DOE) (Kerosene Type Jet Fuel, end users).
| (4) | In U.S. dollars per thousand cubic feet. Prices exclude taxes. Prices are for Mexico City and surrounding areas. Industrial prices correspond to nomination of additional volumes under contract with notification to the supplier. Residential prices reflect the specific cost of transportation and distribution in that area. U.S. prices are national average industrial prices and Texas residential prices. |
| Sources: | Pemex-Gas and Basic Petrochemicals and Petroleum Marketing Monthly published by the Energy Information Administration (DOE) |
| (5) | In U.S. dollars per ton. Prices exclude taxes. Mexico prices to contract users at Cosoleacaque Petrochemical Plant. U.S. spot prices in Tampa, Florida. |
| Sources: | Pemex-Petrochemicals, Fertecon Weekly Ammonia Fax (Fertecon Limited) and Fertilizer Market Bulletin (FMB Consultants Ltd.). |
98
Table of Contents
| (6) | In U.S. dollars per ton. LPDE film quality. Prices exclude taxes. Mexico prices to spot consumers. U.S. prices are domestic contract average. |
| Sources: | Pemex-Petrochemicals and ICIS-LOR (Icis-Lor Group Ltd.). |
| (7) | In U.S. dollars per ton. Block molding quality. Prices exclude taxes. Mexico prices to spot consumers. U.S. prices are domestic contract average. |
| Sources: | Pemex-Petrochemicals and ICIS-LOR (Icis-Lor Group Ltd.). |
| (8) | In U.S. dollars per ton. Prices exclude taxes. Mexico prices to spot consumers. U.S. prices are average of contract and spot prices. |
| Sources: | Pemex-Petrochemicals and ICIS-LOR (Icis-Lor Group Ltd.). |
IEPS Tax, Excess Gains Duty, Hydrocarbon Duties and Other Taxes
The following table sets forth the taxes and duties that we recorded each of the past three years.
| Year ended December 31, | ||||||
| 2002 | 2003 | 2004 | ||||
(in millions of constant pesos as of December 31, 2004) | ||||||
Hydrocarbon extractions duties and other taxes | Ps. 201,470 | Ps.303,335 | Ps. 419,629 | |||
IEPS tax | 128,793 | 98,960 | 54,705 | |||
Total | Ps. 330,263 | Ps.402,295 | Ps. 474,334 | |||
| Note: | For a description of these taxes and duties, see “Item 4—Information on the Company—Taxes and Duties” above. |
Source: PEMEX’s financial statements.
The IEPS tax ensures that we retain the portion of our sales revenues that represents the adjusted international reference prices of our products, and it also gives the Mexican Government the difference between the domestic retail prices, which are prices that are set by the Mexican Government based on target rates of inflation, and adjusted international reference prices of diesel and gasoline.
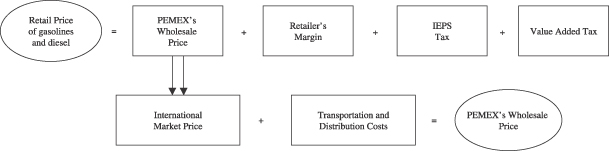
When international prices decrease, our wholesale price will decrease and, as a result, the IEPS tax that we collect from consumers and transfer to the Mexican Government will increase.
99
Table of Contents
For automotive fuels, the IEPS tax is equal to the retail price at which Pemex-Refining sells gasoline and automotive diesel to retailers less Pemex-Refining’s wholesale price, value added tax and distribution costs.
In addition to the IEPS tax, we are subject to a number of other federal taxes and duties. In 2004, the sum of these taxes and duties totaled Ps. 474,334 million, including the IEPS tax and the infrastructure duty discussed below. In 2005, the sum of these taxes and duties (other than the excess gains revenue duty) is expected to total approximately 60.8% of the sales revenues of Petróleos Mexicanos and the subsidiary entities from sales to the PMI Group and to third parties. In addition to these taxes and duties, we are subject to an additional 39.2% excess gains revenue duty, which applies to the portion of proceeds of our crude oil exports that are attributable to sales at prices in excess of a specific threshold price per barrel set by the Mexican Government. In 2004, this price was U.S. $20.00 per barrel, and this duty was called the infrastructure duty. The effect of the excess gains revenue duty, when combined with the regular duty rate, is that the Mexican Government, not PEMEX, realizes all of the benefits of increases in crude oil prices over the threshold, which is U.S. $23.00 per barrel in 2005. See also “Item 4—Information on the Company—Taxes and Duties—Excess Gains Revenue Duty.”
Hydrocarbon taxes and duties affect our income because they are recorded as expenses. However, the IEPS tax and the value added tax are indirect taxes that do not have an impact on our income because they are pass-through taxes that we collect from consumers and transfer to the Mexican Government.
Relation to the Mexican Government
Mexico is the sole owner of Petróleos Mexicanos and the subsidiary entities and the Mexican Government closely regulates and supervises our operations. Mexican Government ministers control key executive decisions at PEMEX. The Secretary of the Ministry of Energy of Mexico is the Chairman of the Board of Directors of Petróleos Mexicanos. SFP appoints Petróleos Mexicanos and the subsidiary entities’ external auditors.
The Mexican Government incorporates the annual budget and financing program of Petróleos Mexicanos and the subsidiary entities into its consolidated annual budget, which it submits to the Mexican Congress for its approval. The Mexican Congress also designates certain of our largest capital expenditures as PIDIREGAS. See “Item 4—Information on the Company—History and Development—Capital Expenditures and Investments.”
Inflation
Mexico experienced high inflation during the 1980s. The annual rate of inflation (as measured by the change in the NCPI) decreased from a high of 159.2% in 1987 to 11.9% in 1992, 8.0% in 1993 and 7.1% in 1994. However, the economic events that followed the devaluation of the peso against the U.S. dollar in late 1994 and 1995, and turbulence in international financial markets, caused inflation to increase to 52.0% in 1995, decrease to 27.7% in 1996 and 15.7% in 1997 and increase to 18.6% in 1998. The annual inflation rate decreased to 12.3% in 1999, 9.0% in 2000 and 4.4% in 2001, increased to 5.7% in 2002, decreased to 4.0% in 2003 and increased to 5.19% in 2004.
Mexican inflation has affected our consolidated financial statements in the following ways:
| • | Each year, we adjust the value of certain of our fixed assets, materials and spare parts on our balance sheet to reflect the effects of inflation. This revaluation will increase our assets in periods of high inflation. When we revalue fixed assets and inventories to reflect the effects of inflation, our subsequent depreciation and cost of sales charges will increase, reducing our income. The higher carrying value further exposes us to subsequent impairment charges. Through 2002, we revalued our fixed assets based on a hybrid of NCPI and specific-index items as determined by independent appraisers. The specific-index method takes into account usage, obsolescence, specific costs of operation and the remaining productive life of the revalued assets. Beginning in 2003, we revalue all of our fixed assets using the NCPI. See Note 2 (h) to our consolidated financial statements included herein. |
100
Table of Contents
| • | Mexican GAAP requires that financial statements recognize the effects of inflation in accordance with Bulletin B-10. A component of inflation accounting which is not reflected in historical based accounting is the recognition of a gain or loss on monetary position, which is included in the income statement as a component of comprehensive financing cost. The gain or loss on monetary position captures the impact of purchasing power fluctuations on monetary assets and liabilities. To the extent that we have a net monetary liability position, the income statement will reflect a monetary gain as measured by the change in the NCPI. To the extent that we have a net monetary asset position, the income statement will reflect a monetary loss as measured by the change in the NCPI. |
Consolidation
The financial statements, which are prepared in accordance with Mexican GAAP, consolidate the results of Petróleos Mexicanos, the subsidiary entities and the subsidiary companies. Certain non-material subsidiary companies, however, are not consolidated and are accounted for under either the cost method or the equity method. For a list of the consolidated subsidiary companies, see Note 2 (c) to our consolidated financial statements included herein. For U.S. GAAP purposes, we consolidate the results and financial condition of Pemex Finance, Ltd. For U.S. and Mexican GAAP purposes, beginning in 2003, we began consolidating the results and financial position of Fideicomiso F/163 and RepCon Lux S.A.
Export Agreements
On March 29, 2000, OPEC, excluding Iran, agreed to increase its crude oil production by 1,450 thousand barrels per day. Mexico, which is not a member of OPEC, announced on March 29, 2000, that it would increase its exports of crude oil by 150 thousand barrels per day, beginning in April 2000. On June 21, 2000, the Ministry of Energy announced an additional increase in crude oil exports of 75 thousand barrels per day, beginning in July 2000.
Following OPEC’s announcement in January 2001 that it would reduce crude oil production by 1.5 million barrels per day, Mexico announced it would decrease its crude oil exports by 75 thousand barrels per day, beginning on February 1, 2001. Following a March 2001 announcement by OPEC of an additional 1.0 million barrel per day reduction in crude oil production, on March 25, 2001, Mexico announced a further reduction in crude oil exports of 40 thousand barrels per day, beginning on April 1, 2001. On July 24, 2001, Mexico announced that it would reduce its crude oil exports by an additional 70 thousand barrels per day, beginning on September 1, 2001.
Following OPEC’s announcement that it would reduce crude oil production by 1.5 million barrels per day, on January 2, 2002, Mexico announced it would decrease its crude oil exports by 100 thousand barrels per day to 1.66 million barrels per day for six months beginning on January 1, 2002. Mexico maintained that level of exports throughout 2002.
In January 2003, as a result of increasing market demand, Mexico agreed to increase its crude oil exports by 100 thousand barrels per day to a level of 1.76 million barrels per day. In February 2003, in light of the loss of more than 2 million barrels per day of Venezuelan crude oil, Mexico announced a further 120 thousand barrel per day increase in its crude oil export to a level of 1.88 million barrels per day. In September 2003, OPEC announced that it would cut crude oil production by 900 thousand barrels per day beginning November 1, 2003. Following this announcement, Mexico announced that it expected to maintain its crude oil exports at their present levels. In March 2004, OPEC announced that it would cut crude oil production by one million barrels per day beginning April 1, 2004. In June 2004, OPEC announced that it would increase crude oil production by 500 thousand barrels per day beginning August 1, 2004. In September 2004, OPEC announced that it would increase crude oil production by 1 million barrels per day beginning November 1, 2004. In March 2005, OPEC announced an additional 500 thousand barrels per day increase in the ceiling to 27.5 million barrels per day in view of the expectation of another year of strong global oil demand. In June 2005, OPEC announced that it would increase crude oil production by 500 thousand barrels per day beginning July 1, 2005. OPEC will reconvene in September to review its production policy. As of the date of this report, Mexico has not announced any revisions to its current levels of crude oil exports as a result of these latest announcements by OPEC.
101
Table of Contents
Results of Operations of Petróleos Mexicanos, the Subsidiary Entities and the Subsidiary Companies—For the Year Ended December 31, 2004 Compared to the Year Ended December 31, 2003
Sales
Total sales, net of the IEPS tax, were Ps. 718.9 billion in 2004, an increase of 28.6% from total sales in 2003, net of the IEPS tax, of Ps. 558.9 billion. The increase in total sales from 2003 to 2004 resulted primarily from a 27.9% increase in domestic sales, net of the IEPS tax, in 2004, from Ps. 308.4 billion in 2003 to Ps. 394.3 billion in 2004 due to increased unit prices and higher sales volumes. In addition, total sales increased due to a 29.5% increase in export sales, from Ps. 250.6 billion in 2003 to Ps. 324.6 billion in 2004 due to an increase in crude oil export prices, a 1.4% increase in crude oil sales volumes and the depreciation of the peso against the dollar (which increased the peso value of sales denominated in dollars).
Domestic Sales
Domestic sales, net of the IEPS tax, increased by 27.9% in 2004, from Ps. 308.4 billion in 2003 to Ps. 394.3 billion in 2004, due to increases in prices and in the volume of domestic sales of certain products. Domestic sales of petroleum products other than natural gas increased by 26.8% in 2004, from Ps. 239.5 billion in 2003 to Ps. 303.9 billion in 2004, primarily due to increases in the average sales prices and volumes of our principal petroleum products. The 5.9% increase in the sales volumes of gasoline, from 601.2 thousand barrels per day in 2003 to 636.7 thousand barrels per day in 2004, was primarily due to the effectiveness of the actions taken to reduce the illicit market in fuels (see “Item 8—Financial Information—Legal Proceedings––Actions Against the Illicit Market in Fuels in Mexico”) and an increase in the number of vehicles in Mexico. Domestic petrochemical sales (including sales of certain by-products of the petrochemical production process) increased by 47.3%, from Ps. 13.1 billion in 2003 to Ps. 19.3 billion in 2004, due to an increase in the domestic prices of our principal petrochemical products, particularly polyethylenes, ethylene oxide and ammonia, and a change in commercial strategy to take advantage of the higher profit margins of certain products. Sales of natural gas increased by 27.6% in 2004, from Ps. 55.8 billion in 2003 to Ps. 71.1 billion in 2004, as a result of an increase in average prices and a 5.4% increase in volumes of natural gas sold. The higher demand for natural gas was primarily driven by an increase in demand in the electricity sector, while the industrial and distribution sectors maintained demand at levels consistent with the levels of demand in 2003.
Export Sales
In 2004, total consolidated export sales increased by 29.5% in peso terms from Ps. 250.6 billion in 2003 to Ps. 324.6 billion in 2004. Excluding the trading activities of the PMI Group, export sales by the subsidiary entities to the PMI Group and third parties increased by 27.2% in peso terms, from Ps. 213.7 billion in 2003 to Ps. 271.8 billion in 2004. In dollar terms, excluding the trading activities of the PMI Group, export sales (which are dollar-denominated) increased by 27.2% in 2004, from U.S. $18.4 billion in 2003 to U.S. $23.4 billion in 2004. This increase was a result of a 25.6% increase in crude oil export prices, and a 1.4% increase in crude oil sales volumes. The trading and export activities of the PMI Group generated additional marginal revenues of Ps. 52.8 billion in 2004, 43.5% higher in peso terms than the Ps. 36.8 billion of additional revenues generated in 2003, mainly due to the increased price of crude oil that we exported and the strengthening of the dollar against the peso. The weighted average price per barrel of crude oil that the PMI Group sold to third parties in 2004 was U.S. $31.05, 25.3% higher than the weighted average price of U.S. $24.78 in 2003.
Crude oil sales by Pemex-Exploration and Production to PMI for export accounted for 90.9% of export sales (excluding the trading activities of the PMI Group) in 2004, as compared to 90.4% in 2003. These crude oil sales increased in peso terms by 27.8% in 2004, from Ps. 193.1 billion in 2003 to Ps. 246.9 billion in 2004, and increased in dollar terms by 28.3% in 2004, from U.S. $16.6 billion in 2003 to U.S. $21.3 billion in 2004.The weighted average price per barrel of crude oil that Pemex-Exploration and Production sold to PMI for export in 2004 was U.S. $31.02, 25.3% higher than the weighted average price of U.S. $24.75 in 2003. The volume of crude oil exports increased by 1.4%, from 1,844 thousand barrels per day in 2003 to 1,870 thousand barrels per day in 2004, as a result of increased demand.
102
Table of Contents
Export sales of petroleum products by Pemex-Refining and Pemex-Gas and Basic Petrochemicals to the PMI Group and third parties, including natural gas liquids, decreased from 8.8% of export sales (excluding the trading activities of the PMI Group) in 2003 to 8.2% in 2004. Export sales of petroleum products, including natural gas liquids, increased by 19.1%, from Ps. 18.8 billion in 2003 to Ps. 22.4 billion in 2004, primarily due to an increase in the export prices of naphtas. In dollar terms, export sales of petroleum products, including natural gas liquids, increased by 18.8%, from U.S. $1.6 billion in 2003 to U.S. $1.9 billion in 2004.
Petrochemical products accounted for the remainder of export sales in 2003 and 2004. Export sales of petrochemical products (including certain by-products of the petrochemical process) increased by 47.1%, from Ps. 1.7 billion in 2003 to Ps. 2.5 billion in 2004, primarily due to a 64.1% increase in the volume of ethylene exports. In dollar terms, export sales of petrochemical products (including certain by-products of the petrochemical process) increased by 47.0% in 2004, from U.S. $147.7 million in 2003 to U.S. $217.1 million in 2004.
Other Revenues and Expenses
Other revenues, net, increased by Ps. 8.1 billion, from Ps. 3.1 billion in 2003 to Ps. 11.2 billion in 2004, primarily due to an increase in the value of our investment in the Deer Park refinery, which is accounted for under the equity method (see Note 6 to our consolidated financial statements included herein) and the recognition of a gain arising from the appreciation of the value of our shares in Repsol during 2004 (see “Item 5—Operating and Financial Review and Prospects—Liquidity and Capital Resources—2004 Financing Activities” and “Item 11—Quantitative and Qualitative Disclosure about Market Risk—Equity Swap”).
Costs and Operating Expenses
Costs of sales, transportation, distribution expenses and administrative expenses increased by 17.4%, from Ps. 271.2 billion in 2003 to Ps. 318.4 billion in 2004. This increase was mainly due to an increase in maintenance expenses of Ps. 15.9 billion in accordance with our maintenance program, an increase in product purchases of Ps. 16.9 billion due primarily to increased domestic demand for gasoline and natural gas, an increase in the cost of products purchased for sale abroad by P.M.I. Trading Ltd. of Ps. 14.6 billion and an increase in costs associated with the labor reserve for pension obligations of Ps. 5.0 billion resulting from the increase in the number of employees and changes in actuarial assumptions, which was partially offset by an increase in the value of crude oil and petroleum product inventories of Ps. 3.3 billion.
Comprehensive Financing Cost
Under Mexican GAAP, comprehensive financing cost reflects interest income (including gains and losses on certain derivative instruments), interest expense, foreign exchange gain or loss and the gain or loss attributable to the effects of inflation on monetary liabilities and assets. A substantial portion of our indebtedness (84.3% at December 31, 2004) is denominated in foreign currencies, so a depreciation of the peso results in foreign exchange loss and higher interest expense in peso terms.
In 2004, comprehensive financing cost decreased by Ps. 25.3 billion, or 78.3%, from Ps. 32.3 billion in 2003 to Ps. 7.0 billion in 2004, primarily as a result of the following:
| • | The peso depreciated at a lower rate against the U.S. dollar during 2004 in comparison to 2003, which resulted in a Ps. 23.3 billion decrease in net foreign exchange losses, from Ps. 26.8 billion in 2003 to Ps. 3.5 billion in 2004. |
| • | In 2003 and 2004, our average monetary liabilities exceeded our average monetary assets, resulting in a net gain in monetary position. The net gain in monetary position, which amounted to Ps. 19.5 billion in 2004, was 61.1% higher than the net gain in monetary position in 2003 of Ps. 12.1 billion, due to an increase in the inflation rate (from 4.0% in 2003 to 5.2% in 2004). This gain decreased our comprehensive financing cost. |
103
Table of Contents
| • | These decreases in comprehensive financing cost were partially offset by an increase in net interest expense of Ps. 5.5 billion, or 31.3%, from Ps. 17.6 billion in 2003 to Ps. 23.1 billion in 2004, as a result of the increase in interest expense in connection with debt financing obtained for, but not yet committed to, PIDIREGAS, which is not capitalized, and the financial costs generated by the appreciation of the Repsol shares underlying the exchangeable bonds issued by RepCon Lux, S.A. (gains or losses related to derivatives associated with borrowings are classified within interest expense). |
Duties and Taxes
Hydrocarbon extraction duties and other duties and taxes (including the IEPS tax) increased by 17.9%, from Ps. 402.3 billion in 2003 to Ps. 474.3 billion in 2004, largely due to the 28.6% increase in our net sales revenues, excluding the IEPS tax. We paid Ps. 34.4 billion in infrastructure duty in 2004, which represents the difference between the actual crude oil prices at which Pemex-Exploration and Production sold to PMI, which averaged U.S. $31.02 per barrel for the Mexican weighted crude oil mix, and the threshold crude oil price for 2004 of U.S. $20.00 per barrel. We paid Ps. 19.7 billion in excess gains revenue duties in 2003.
Cumulative Effect of Adoption of New Accounting Standards
Beginning January 1, 2003, we adopted Bulletin C-9, “Liabilities, Provisions, Contingent Assets and Liabilities and Commitments,” issued by the Mexican Institute of Public Accountants, which establishes rules relating to provisions for dismantlement and abandonment costs. The adoption of Bulletin C-9 resulted in the recognition of a benefit of Ps. 2.1 billion as of January 1, 2003 related to the provision for dismantlement and abandonment costs. For further information, see Note 2 (h) to our consolidated financial statements included herein.
In 2004, we adopted Bulletin C-15, “Impairment of the Value of Long-Lived Assets and their Disposal,” which resulted in a Ps. 2.0 billion charge at January 1, 2004 attributable to the cumulative effect of recognition of the impairment of the carrying value of fixed assets, primarily those of Pemex-Exploration and Production. For further information, see Notes 2 (i) and 5 (c) to our consolidated financial statements included herein. In 2004, we also adopted the amendments to Bulletin D-3, “Labor Obligations,” which resulted in the recognition of an initial liability related to prior service costs and a charge to income for 2004 in the amount of Ps. 8.4 billion. For further information, see Notes 2 (l) and 11 to our consolidated financial statements included herein.
Income/(Loss)
In 2004, we reported a loss of Ps. 25.5 billion on Ps. 730.0 billion in total revenues net of the IEPS tax, as compared with a loss of Ps. 42.8 billion on Ps. 562.1 billion in total revenues net of the IEPS tax in 2003. This 40.4% decrease in losses from 2003 to 2004 resulted from the various factors described above.
Results of Operations of Petróleos Mexicanos, the Subsidiary Entities and the Subsidiary Companies—For the Year Ended December 31, 2003 Compared to the Year Ended December 31, 2002
Sales
Total sales, net of the IEPS tax, were Ps. 558.9 billion in 2003, an increase of 35.4% from total sales in 2002, net of the IEPS tax, of Ps. 412.8 billion. The increase in total sales from 2002 to 2003 resulted primarily from a 37.3% increase in domestic sales in 2003, from Ps. 224.7 billion in 2002 to Ps. 308.4 billion in 2003 due to increased unit prices and higher sales volumes. In addition, total sales increased due to a 33.2% increase in export sales, from Ps. 188.1 billion in 2002 to Ps. 250.6 billion in 2003 due to an increase in crude oil export prices, higher sales volumes and the depreciation of the peso against the dollar (which increased the peso value of sales denominated in dollars).
104
Table of Contents
Domestic Sales
Domestic sales, net of the IEPS tax, increased by 37.3% in 2003, from Ps. 224.7 billion in 2002 to Ps. 308.4 billion in 2003. Domestic sales of petroleum products other than natural gas increased by 31.8% in 2003, from Ps. 181.7 billion in 2002 to Ps. 239.5 billion in 2003, primarily due to increases in the average sales prices and volumes of our principal petroleum products. The volume of gasoline sold increased by 6.2%, from 566.2 thousand barrels per day in 2002 to 601.2 thousand barrels per day in 2003, due to an increase in the number of vehicles in Mexico, increased demand along the northern border following the implementation of a program in January 2003 to bring prices along the northern border closer to the lower market prices in border communities in the United States, and a 13.0% increase in the volume of Pemex Premium gasoline sold as a result of changes in consumer preferences. Domestic petrochemical sales (including sales of certain by-products of the petrochemical production process) increased by 43.7%, from Ps. 9.2 billion in 2002 to Ps. 13.1 billion in 2003, due to an increase in the domestic prices of our principal petrochemical products, particularly polyethylenes, ethylene oxide and ammonia, and a change in commercial strategy to take advantage of the higher profit margins of certain products. Sales of natural gas increased by 64.6% in 2003, from Ps. 33.9 billion in 2002 to Ps. 55.8 billion in 2003, as a result of an increase in average prices and an 8.1% increase in volumes of natural gas sold. The higher demand for natural gas was primarily driven by a 14.7% increase in demand in the electricity sector, while the industrial and distribution sectors maintained demand at levels consistent with the levels of demand in 2002.
Export Sales
In 2003, total consolidated export sales increased by 33.2% in peso terms from Ps. 188.1 billion in 2002 to Ps. 250.6 billion in 2003. Excluding the trading activities of the PMI Group, export sales by the subsidiary entities to the PMI Group and third parties increased by 34.4% in peso terms, from Ps. 159.0 billion in 2002 to Ps. 213.7 billion in 2003. In dollar terms, excluding the trading activities of the PMI Group, export sales (which are dollar-denominated) increased by 26.0% in 2003, from U.S. $14.6 billion in 2002 to U.S. $18.4 billion in 2003. This increase was a result of an increase in crude oil export prices, an 8.3% increase in sales volumes and the depreciation of the peso against the dollar. The trading and export activities of the PMI Group generated additional marginal revenues of Ps. 36.8 billion in 2003, 26.8% higher in peso terms than in 2002, mainly due to the increased prices of crude oil that we exported and the strengthening of the dollar against the peso. The weighted average price per barrel of crude oil that the PMI Group sold to third parties in 2003 was U.S. $24.78, 15.1% higher than the weighted average price of U.S. $21.52 in 2002.
Crude oil sales by Pemex-Exploration and Production to PMI for export accounted for 90.4% of export sales (excluding the trading activities of the PMI Group) in 2003, as compared to 91.1% in 2002. These crude oil sales increased in peso terms by 33.3% in 2003, from Ps. 144.8 billion in 2002 to Ps. 193.1 billion in 2003, and increased in dollar terms by 24.8% in 2003, from U.S. $13.3 billion in 2002 to U.S. $16.6 billion in 2003.The weighted average price per barrel of crude oil that Pemex-Exploration and Production sold to PMI for export in 2003 was U.S. $24.75, 16.1% higher than the weighted average price of U.S. $21.31 in 2002. The volume of crude oil exports increased by 8.3%, from 1,705 thousand barrels per day in 2002 to 1,844 thousand barrels per day in 2003, partly as a result of increased demand caused by the two million barrel per day decrease in oil production in Venezuela due to the political crisis and strike by oil workers there.
Export sales of petroleum products by Pemex-Refining and Pemex-Gas and Basic Petrochemicals to the PMI Group and third parties, including natural gas liquids, increased from 8.2% of export sales (excluding the trading activities of the PMI Group) in 2002 to 8.8% in 2003. Export sales of petroleum products, including natural gas liquids, increased by 45.7%, from Ps. 12.9 billion in 2002 to Ps. 18.8 billion in 2003, due to a 14.7% increase in the volume of exports of petroleum products and higher prices. In dollar terms, export sales of petroleum products, including natural gas liquids, increased by 33.3%, from U.S. $1.2 billion in 2002 to U.S. $1.6 billion in 2003.
Petrochemical products accounted for the remainder of export sales in 2002 and 2003. Export sales of petrochemical products (including certain by-products of the petrochemical process) increased by 41.7%, from
105
Table of Contents
Ps. 1.2 billion in 2002 to Ps. 1.7 billion in 2003, primarily due to a 34.2% increase in the volume of sulphur sold. In dollar terms, export sales of petrochemical products (including certain by-products of the petrochemical process) increased by 30.8% in 2003, from U.S. $112.9 million in 2002 to U.S. $147.7 million in 2003.
Other Revenues and Expenses
Other revenues, net, increased by Ps. 3.2 billion, from other expenses, net, of Ps. 94.1 million in 2002 to other revenues, net, of Ps. 3.1 billion in 2003, primarily due to the favorable results of natural gas hedging operations.
Costs and Operating Expenses
Costs of sales, transportation, distribution expenses and administrative expenses increased by 17.7%, from Ps. 230.5 billion in 2002 to Ps. 271.2 billion in 2003. This increase was mainly due to an increase in import purchases of Ps. 9.2 billion as a result of a 27.7% increase in the volumes of natural gas purchased, an increase in depreciation and amortization expense from Ps. 35.6 billion in 2002 to Ps. 42.6 billion in 2003, a decrease of Ps. 5.3 billion in the valuation of crude oil and petroleum products (which is accounted for as an increase in costs of sales) and an increase in maintenance expenses of Ps. 11.8 billion.
Comprehensive Financing Cost
Under Mexican GAAP, comprehensive financing cost reflects interest income, interest expense, foreign exchange gain or loss and the gain or loss attributable to the effects of inflation on monetary liabilities and assets. A substantial portion of our indebtedness (92.9% at December 31, 2003) is denominated in foreign currencies, so a depreciation of the peso results in foreign exchange loss and higher interest expense in peso terms.
In 2003, comprehensive financing cost increased by Ps. 25.7 billion, or 389.4%, from Ps. 6.6 billion in 2002 to Ps. 32.3 billion in 2003, primarily as a result of foreign exchange losses. The changes in each component were as follows:
| • | Net interest expense increased by 13.6% in 2003 due to an increase in total debt, which was only partially offset by lower average interest rates on our liabilities; |
| • | The depreciation of the peso against the U.S. dollar by 8.96% resulted in a Ps. 22.2 billion increase in the net foreign exchange loss from 2002 to 2003; and |
| • | In 2002 and 2003, our average monetary liabilities exceeded our average monetary assets, resulting in a net gain from monetary position. The net gain in monetary position, which amounted to Ps. 12.1 billion in 2003, was 11.0% less than in 2002 due to a decline in the inflation rate from 5.7% in 2002 to 4.0% in 2003. The net gain in monetary position in 2002 amounted to Ps. 13.6 billion. |
Duties and Taxes
Hydrocarbon extraction duties and other duties and taxes (including the IEPS tax) increased by 21.8%, from Ps. 330.3 billion in 2002 to Ps. 402.3 billion in 2003, largely due to an increase in sales revenues (excluding the IEPS tax) of 35.4%. We paid Ps. 19.7 billion in excess gains duties in 2003, which represents the difference between the actual crude oil prices at which Pemex-Exploration and Production sold to PMI, which averaged U.S. $24.75 per barrel for the Mexican weighted crude oil mix, and the Mexican Government’s crude oil price budgetary assumption of U.S. $18.35 per barrel. We paid Ps. 15.0 billion in excess gains duties in 2002.
Cumulative Effect from the Adoption of New Accounting Pronouncement
Beginning January 1, 2003, we adopted the guidelines of Bulletin C-9, “Liabilities, Provisions, Contingent Assets and Liabilities and Commitments,” under Mexican GAAP, which establishes rules for quantifying the
106
Table of Contents
disclosure and presentation of liabilities, reserves and contingent assets and liabilities, as well as general guidelines for the disclosure of commitments by a company in the normal course of business. As a result of the adoption of Bulletin C-9, we recognized a benefit in our reserve for abandonment and dismantlement costs of Ps. 2.1 billion, as of the beginning of 2003. For further information, see Note 2 (h) to our consolidated financial statements included herein.
Income/(Loss)
In 2003, we reported a loss of Ps. 42.8 billion on Ps. 562.0 billion in total revenues net of the IEPS tax, as compared with a loss of Ps. 25.9 billion on Ps. 412.7 billion in total revenues net of the IEPS tax in 2002. This 65.3% increase in losses from 2002 to 2003 resulted from the various factors described above.
Liquidity and Capital Resources
Equity Structure and the Certificates of Contribution “A”
Our total equity as of December 31, 2004 was Ps. 33.3 billion, and our total capitalization (long-term debt plus equity) amounted to Ps. 427.9 billion.
In March 1990, the Mexican Government exchanged U.S. $7.58 billion worth of external debt of Petróleos Mexicanos with international commercial banks for 30-year Collateralized Fixed Rate Bonds Due 2019 and Collateralized Floating Rate Bonds Due 2019 (also called Brady Bonds) issued by the Mexican Government. In exchange for the cancellation of this external debt, Petróleos Mexicanos’ indebtedness to the Mexican Government increased by an amount equal to U.S. $7.58 billion. The new indebtedness was denominated in currencies other than pesos. In December 1990, the Mexican Government and Petróleos Mexicanos agreed to capitalize the indebtedness incurred in March 1990 into Petróleos Mexicanos’ equity as Certificates of Contribution “A.” As a condition to this capitalization, Petróleos Mexicanos agreed to pay a minimum guaranteed dividend to the Mexican Government equal to the debt service on the capitalized debt at the exchange rates in effect at the date the payments are made. The total dividend on the Certificates of Contribution “A” is approved annually by the Board of Directors of Petróleos Mexicanos after the close of each fiscal year. Each quarter, Petróleos Mexicanos makes advance payments to the Mexican Government that total a prorated portion of the minimum guaranteed dividend.
From 2000 to 2004, Petróleos Mexicanos made annual advance payments, which were declared as dividends to the Mexican Government, as follows.
| Year Ended December 31, | ||||||||||
| 2000 | 2001 | 2002 | 2003 | 2004 | ||||||
(in millions of constant pesos as of December 31, 2004) | ||||||||||
Total advance payments to the Mexican Government | Ps. 6,715 | Ps. 2,489 | Ps. 10,622 | Ps. 10,703 | Ps. 10,388 | |||||
Dividends declared in respect of Certificates of Contribution “A”(1) | 5,940 | 6,592 | 2,442 | 10,500 | 10,388 | |||||
| Note: |
| (1) | In each of the five years ended December 31, 2004, the dividends were approved by the Board of Directors of Petróleos Mexicanos. |
Source: PEMEX’s financial statements.
107
Table of Contents
In December 1997, Petróleos Mexicanos and the Mexican Government agreed to an equity reduction of the Certificates of Contribution “A” in exchange for a cash payment to the Mexican Government of Ps. 12.12 billion (U.S. $1.5 billion). Further to that agreement, the Ministry of Finance and Public Credit, acting on behalf of the Mexican Government, agreed to a reduction in the minimum guaranteed dividends that it would receive from Petróleos Mexicanos from 1998 through 2006. Since 1999, Petróleos Mexicanos has been scheduled to make a total of U.S. $4.9 billion in advance payments to the Mexican Government in respect of the principal amount of the Certificates of Contribution “A.” In 1999 and 2000, Petróleos Mexicanos paid U.S. $250 million in principal and interest under that arrangement. No advance payments of principal were made in 2001. In each of 2002, 2003 and 2004, Petróleos Mexicanos paid principal of U.S. $874 million to the Mexican Government. In addition, since 1999, Petróleos Mexicanos has paid minimum guaranteed dividends on the Certificates of Contribution “A” at the rate of the three-month London Interbank Offered Rate (LIBOR) plus 13/16% per year on the outstanding balance of the principal amount of the debt capitalized in December 1990. The following table sets forth the scheduled maturities on the original principal amount of the capitalized debt for each of 2005 and 2006.
| Year Ended December 31, | |||||||||
| 2005 | 2006 | Total | |||||||
| (in millions of U.S. dollars) | |||||||||
Future advance payments of minimum guaranteed dividends to the Mexican Government in respect of principal amount of the capitalized debt | $ | 874 | $ | 874 | $ | 1,748 | |||
| Note: | Numbers may not total due to rounding |
| Source: | PEMEX’s financial statements. |
On September 30, 2004, we received Ps. 12,549 million from the Ministry of Finance and Public Credit as an advance payment of the total amount of reimbursements that we were to receive from the infrastructure duty in 2004. This advance payment was temporarily recorded as a line item reflecting a future increase of equity. On November 4, 2004, the Board of Directors of Petróleos Mexicanos approved the increase of our equity by any amount that we receive from the Ministry of Finance and Public Credit in connection with the infrastructure duty, subject to the establishment of a trust or to the execution of an agreement with a financial institution to manage these funds. On December 15, 2004 and December 31, 2004, we received Ps. 8,000 million and Ps. 12,451 million, respectively, from the Ministry of Finance and Public Credit as payments that we were to receive from the infrastructure duty that we paid to the Mexican Government in 2004. As a result of these three payments and the execution of an agreement to manage these funds, our equity increased by Ps. 32,638 million in December 2004. In March 2005, after receiving the necessary approvals from the Ministry of Finance and Public Credit, our equity was increased by an additional Ps. 362 million to compensate for foreign exchange losses in 2004 in respect of the transfers made by the Ministry of Finance and Public Credit for reimbursements arising from the infrastructure duty that we paid to the Mexican Government in 2004. For further information regarding the infrastructure duty, see “Item 4—Information on the Company—Taxes and Duties—Excess Gains Revenue Duty.”
Cash Flow from Operating, Financing and Investing Activities
During 2004, net funds provided by operating activities were Ps. 6.0 billion, a 66.7% decrease from Ps. 18.0 billion provided in 2003. Funds from income (which was negative in 2004) plus items that did not require cash outlays totaled Ps. 69.5 billion, as compared to Ps. 50.2 billion in 2003. New debt financings provided an additional Ps. 61.8 billion of funds in 2004, as compared to Ps. 116.8 billion in 2003. During 2004, we applied net funds of Ps. 73.9 billion for net investments at cost in fixed assets (Ps. 75.1 billion of new investments and capitalized interest, less Ps. 1.2 billion in dispositions of fixed assets), as compared to Ps. 74.3 billion for net investments at cost in fixed assets (Ps. 71.4 billion of new investments and capitalized interest, less Ps. 10.1 billion in dispositions of fixed assets, plus Ps. 12.9 billion for the reclassification of abandonment and dismantlement costs, which had previously been registered under accumulated depreciation and amortization, as long-term liabilities under the reserve for abandonment and dismantlement activities, sundry creditors and others (which is a non-cash item)) in 2003.
108
Table of Contents
At December 31, 2004, our cash and cash equivalents totaled Ps. 84.9 billion, as compared to Ps. 77.1 billion at December 31, 2003. At that time, we did not have sufficient working capital generated exclusively from operations for our budgeted cash flow requirements for 2005. However, based on past experience, we expect to generate sufficient working capital through:
| • | cash flow generated from operations; |
| • | the issuance ofcertificados bursátiles (peso-denominated senior notes) in the domestic market; |
| • | the issuance of other debt securities in the international capital markets; |
| • | renewing existing and securing additional lines of credit from international and local commercial banks; and |
| • | other additional financing activities. |
On June 30, 2004, we established a new syndicated revolving credit facility to fund our working capital needs for an amount of U.S. $1.25 billion. This new facility will serve as a substitute for a U.S. $445 million U.S. commercial paper program that was established in December 2001 and backed by a letter of credit from Barclays Bank Plc., a U.S. $650 million acceptance credit facility with a group of international banks and a U.S. $135 million acceptance credit facility that we entered into with Japanese banks in 2001. This new credit facility will be used to fund Pemex’s working capital needs. Loans under this facility will be borrowed with interest periods ranging from 1 month up to 6 months, and may be prepaid on any interest payment date. The facility will mature in 2008 and 2010. In August, 2004, we established a program to issue up to Ps. 10 billion ofcertificados bursátiles de corto plazo (short-term publicly-traded notes), denominated in pesos in the Mexican market, of which Ps. 8 billion remains unused. As of December 31, 2004, we had U.S. $6.9 billion in lines of credit, of which U.S. $2.7 billion was unused. See also “—Commitments for Capital Expenditures and Sources of Funding” below.
We have met and expect to meet in the future our cash requirements for working capital, capital expenditures and investments with a combination of funds provided by operations and financing. See “—Financing Activities” below.
Commitments for Capital Expenditures and Sources of Funding
Our current aggregate commitments for capital expenditures, including both PIDIREGAS and non- PIDIREGAS expenditures, total approximately Ps. 136.5 billion for 2005. For general descriptions of our current commitments for capital expenditures, see “Item 4—Information on the Company—History and Development—Capital Expenditures and Investments.”
In 2004, in nominal peso terms, Pemex-Exploration and Production invested Ps. 109.6 billion in 27 PIDIREGAS and Ps. 3.7 billion in other general operating investments and strategic products for a total of Ps. 113.3 billion in capital expenditures in exploration and production. In 2005, Pemex-Exploration and Production again has 27 PIDIREGAS in its budget, for which Ps. 106.0 billion was budgeted. In addition, Pemex-Exploration and Production has budgeted Ps. 8.8 billion for non-PIDIREGAS capital expenditures for 2005. For more detail on the expenditures for and purpose of these investments, see “Item 4—Information on the Company—Business Overview—Exploration and Production—Investment in Exploration and Production.”
Pemex-Refining invested in one PIDIREGAS in 2004 and invested in other general operating projects, strategic planning, acquisition of equipment, research and development and complementary investments for a total of Ps. 5.1 billion in capital expenditures in nominal peso terms by Pemex-Refining in 2004. In 2005, Pemex-Refining expects to invest Ps. 14.2 billion in capital expenditures. Of this amount, Pemex-Refining has budgeted Ps. 7.1 billion for one PIDIREGAS and Ps. 7.1 billion for other non-PIDIREGAS capital expenditures. For more detail on the expenditures for and purpose of Pemex-Refining’s investments, see “Item 4—Information on the Company—Business Overview—Refining—Investments.”
109
Table of Contents
Both Pemex-Petrochemicals and Pemex-Gas and Basic Petrochemicals invest in projects primarily related to natural gas and condensates processing, transportation and storage. In 2005, Pemex-Gas and Basic Petrochemicals will invest Ps. 1.5 billion in capital expenditures for one PIDIREGAS, the modular cryogenic plants in Reynosa. The non-PIDIREGAS capital expenditures for Pemex-Gas and Basic Petrochemicals are expected to be Ps. 2.9 billion in 2005. For more detail on the expenditures for and purpose of Pemex-Gas and Basic Petrochemicals’s investments, see “Item 4—Information on the Company—Business Overview—Gas and Basic Petrochemicals—Investments.”
In 2005, Pemex-Petrochemicals will invest Ps. 266 million in capital expenditures for one PIDIREGAS, Aromatics Train 1 at Petroquímica La Cangrejera. The non-PIDIREGAS capital expenditures for Pemex-Petrochemicals are expected to be Ps. 2.2 billion in 2005.For more detail on the expenditures for and purpose of Pemex-Petrochemicals’s investments, see “Item 4—Information on the Company—Business Overview—Petrochemicals—Investments.”
Our current commitments for capital expenditures have increased in recent years compared to previous years. We plan to fund these expenditures through the financing activities in which we have engaged in the past as well as new sources. We have funded and we expect to continue to fund our commitments for PIDIREGAS capital expenditures primarily through the issuance of debt securities in capital markets transactions, commercial bank syndicated loans, bilateral loans from commercial banks and guaranteed loans from export credit agencies. To a lesser extent, we may decide to use Pemex Finance, Ltd. to fund some PIDIREGAS if we consider it advisable in light of market conditions. The securities that we or Pemex Finance, Ltd. issue vary in tenor, amount, currency and type of interest rate. We may issue debt securities in U.S. dollars, Japanese yen, euros, pounds sterling or Mexican pesos, among others; these securities may be issued with fixed or floating rates and with maturities of one or more years including perpetual debt securities, depending on market conditions and funding requirements. Commercial bank syndicated loans may be established with single or multiple tranches with maturities ranging between one and seven years. Bilateral loans vary in tenor and range between two and three or more years. See also “—Financing Activities” below.
As described in “—Financing Activities” below, we have thus far issued U.S. $2.6 billion in debt securities in the international capital markets in 2005 through our guarantee of securities by the Pemex Project Funding Master Trust, and we expect to issue additional securities over the rest of the year. In addition, we have thus far issued Ps. 31.0 billion ofcertificados bursátiles to date in 2005 in the domestic market through Fideicomiso F/163. Prior to 2003, Petróleos Mexicanos had never issued debt securities in the domestic market. Because the domestic market has demonstrated significant growth over the past few years, we believe that this market represents a good alternative source of PIDIREGAS funding, offering competitive conditions in terms of tenor, amount and type of interest rates, and as a result we plan to continue to issue such securities in the Mexican domestic market. Additionally, we fund some PIDIREGAS through commercial bank loans denominated in Mexican pesos.
Non-PIDIREGAS investments are funded mainly through our operating revenues, and, to a lesser degree, financing activities. These financing activities consist primarily of loans from export credit agencies. These loans are usually structured with maturities ranging between five and ten years.
In order to be able to carry out our planned capital expenditure program, we will need to seek financing from a variety of sources, and we cannot guarantee that we will be able to obtain financing on terms that would be acceptable to us. Our inability to obtain additional financing could have an adverse effect on our planned capital expenditure program and result in our being required to limit or defer this program.
Financing Activities
2005 Financing Activities. During the period from January 1 to May 31, 2005, the Pemex Project Funding Master Trust obtained U.S. $368.0 million in nominal terms in loans from financial institutions for use in financing PIDIREGAS. In addition, we participated in the following financing activities:
| • | Petróleos Mexicanos obtained loans from export credit agencies totaling U.S. $26.9 million; |
110
Table of Contents
| • | Petróleos Mexicanos issued, under its short-term peso-denominated publicly-traded notes program, a total of Ps. 10.5 billion in nominal terms of notes in the Mexican domestic market; as of the date of this report, Petróleos Mexicanos maintains an outstanding balance of Ps. 2.0 billion under this program, all of which become due on or prior to July 21, 2005; |
| • | the Pemex Project Funding Master Trust increased the size of its Medium-Term Note program, Series A, from U.S. $11 billion to U.S. $20 billion, and on February 24, 2005, it issued €1 billion of its 5.50% Notes due 2025, guaranteed by Petróleos Mexicanos, under the program; |
| • | the Pemex Project Funding Master Trust entered into a Credit Facility Agreement in the amount of U.S. $4.25 billion on March 22, 2005 with a group of international financial institutions to refinance outstanding amounts of certain syndicated facilities and for new PIDIREGAS financing; this agreement is guaranteed by Petróleos Mexicanos and consists of two separate tranches, which become due in 2010 and 2012, respectively; |
| • | Fideicomiso F/163 issued a total of Ps. 6 billion of its publicly-traded notes denominated inUnidades de Inversión(Units of Investment, or “UDIs”) in the Mexican domestic market on February 1, 2005, which were guaranteed by Petróleos Mexicanos and was a reopening of an earlier issuance. The value of UDIs are calculated daily by Banco de México based on the National Consumer Price Index; |
| • | Fideicomiso F/163 issued a total of Ps. 15 billion of its publicly-traded notes in the Mexican domestic market on February 11, 2005, guaranteed by Petróleos Mexicanos, consisting of two separate tranches: |
| • | Ps. 7.5 billion of its publicly-traded notes due February 11, 2010, bearing interest at the 91-dayCetes (Treasury bill) rate plus 51 basis points; and |
| • | Ps. 7.5 billion of its publicly-traded notes due February 11, 2013, bearing interest at the 182-dayCetes rate plus 57 basis points; and |
| • | Fideicomiso F/163 issued a total of Ps. 10 billion of its publicly-traded notes in the Mexican domestic market on May 13, 2005, which were guaranteed by Petróleos Mexicanos and were reopenings of previous issuances, consisting of two separate tranches: |
| • | Ps. 5,012.6 million of its publicly-traded notes due February 4, 2010, bearing interest at the 91-dayCetes (Treasury bill) rate plus 51 basis points; and |
| • | Ps. 4,987.4 million of its publicly-traded notes due January 31, 2013, bearing interest at the 182-dayCetes rate plus 57 basis points. |
In addition, on June 8, 2005, the Pemex Project Funding Master Trust issued U.S. $1 billion of its 5.75% Notes due 2015 and U.S. $500 million of its 6.625% Bonds due 2035; the securities were issued under the Master Trust’s Medium-Term Note program, Series A, and are guaranteed by Petróleos Mexicanos.
In the period from January 1 to May 31, 2005, Petróleos Mexicanos’ net payments on borrowings totaled U.S. $2.5 billion and were as follows:
| • | U.S. $10.6 million in respect of direct loans; |
| • | U.S. $73.0 million in respect of credit lines from export credit agencies; |
| • | U.S. $2.4 billion in respect of bond issues; |
| • | U.S. $9.6 million in respect of restructured debt; and |
| • | U.S. $42.1 million in respect of leases. |
In the period from January 1 to May 31, 2005, the Pemex Project Funding Master Trust’s net payments on borrowings totaled U.S. $4.2 billion and were as follows:
| • | U.S. $2.3 billion in respect of foreign trade financing; |
111
Table of Contents
| • | U.S. $189.7 million in respect of project financing; |
| • | U.S. $500 million in respect of bond issues; |
| • | U.S. $1.2 billion in respect of financing from commercial banks; and |
| • | U.S. $66.1 million in respect of theConvenio de Derivación de Fondos (Transfer of Funds Agreement) with the Mexican Government. |
In the period from January 1 to May 31, 2005, Fideicomiso F/163’s net payments on borrowings totaled U.S. $39.3 million and were in respect of direct loans.
2004 Financing Activities. During the period from January 1, 2004 to December 31, 2004, we participated in the following financing activities:
| • | Petróleos Mexicanos obtained loans from export credit agencies totaling U.S. $93.7 million; |
| • | Petróleos Mexicanos obtained direct loans denominated in Japanese yen in an amount equivalent to U.S. $120.1 million; |
| • | on August 16, 2004, theComisión Nacional Bancaria y de Valores(the National Banking and Securities Commission) of Mexico authorized Petróleos Mexicanos and Fideicomiso F/163’s Ps. 10 billion short-term peso-denominated publicly-traded notes (certificados bursátiles de corto plazo) program in the Mexican market. Under the program no more than Ps. 10 billion can be outstanding at any time. Petróleos Mexicanos issued a total of Ps. 9 billion in nominal terms of its notes in the Mexican domestic market in 18 tranches during 2004; these notes have matured; |
| • | the Pemex Project Funding Master Trust obtained U.S. $1.4 billion in credit lines from export credit agencies; |
| • | the Pemex Project Funding Master Trust obtained U.S. $25.0 million in commercial bank loans; |
| • | the Pemex Project Funding Master Trust issued U.S. $1.5 billion of its Guaranteed Floating Rate Notes due 2010 on June 15, 2004, guaranteed by Petróleos Mexicanos; |
| • | the Pemex Project Funding Master Trust issued €850,000,000 of its 6.375 per cent. Guaranteed Notes due 2016 on August 5, 2004, guaranteed by Petróleos Mexicanos; |
| • | the Pemex Project Funding Master Trust issued U.S. $1.75 billion of its 7.75 percent Guaranteed Perpetual Bonds on September 28, 2004, guaranteed by Petróleos Mexicanos; |
| • | the Pemex Project Funding Master Trust completed an exchange offer on December 30, 2004, pursuant to which the Pemex Project Funding Master Trust issued U.S. $158,353,000 of its 9.00% Guaranteed Notes due 2007, U.S. $399,619,000 of its 8.85% Guaranteed Notes due 2007, U.S. $439,011,000 of its 9 3/8% Guaranteed Notes due 2008, U.S. $324,220,000 of its 9¼% Guaranteed Bonds due 2018, U.S. $228,735,000 of its 8.625% Guaranteed Bonds due 2023, U.S. $354,477,000 of its 9.50% Guaranteed Bonds due 2027 and U.S. $403,746,000 of its 9.50% Guaranteed Puttable or Mandatory Exchangeable Securities (“POMESSM”) due 2027, in exchange for an equal principal amount of corresponding 9.00% Guaranteed Notes due 2007, 8.85% Global Guaranteed Notes due 2007, 9 3/8% Global Guaranteed Notes due 2008, 9¼% Global Guaranteed Bonds due 2018, 8.625% Bonds due 2023, 9.50% Global Guaranteed Bonds due 2027 and 9.50% POMESSM due 2027 (collectively, the “old securities”) issued by Petróleos Mexicanos, and pursuant to which the Pemex Project Funding Master Trust made early participation payments totaling U.S. $5,713,665. During the second quarter of 2005, the Pemex Project Funding Master Trust delivered to Petróleos Mexicanos a portion of the old securities acquired by it in the exchange offers in exchange for cash payments, a portion of which will be made over time, equal to the market value of the relevant old securities at the time of such delivery; |
| • | RepCon Lux S.A. issued approximately U.S. $1.37 billion of its 4.5 per cent. Guaranteed Exchangeable Bonds due 2011; these bonds are guaranteed by Petróleos Mexicanos, and are exchangeable for shares of common stock of Repsol or, at the option of RepCon Lux S.A., the cash equivalent thereof; |
112
Table of Contents
| • | Fideicomiso F/163 issued a total of Ps. 11.5 billion in nominal terms of its publicly-traded notes in the Mexican domestic market on January 30, 2004; the notes are guaranteed by Petróleos Mexicanos and were reopenings of earlier issuances, consisting of three separate tranches: |
| • | Ps. 4 billion in nominal terms of its publicly-traded notes due October 18, 2007, bearing interest at the 91-dayCetes (treasury bill) rate plus 67 basis points; |
| • | Ps. 5 billion in nominal terms of its publicly-traded notes due October 8, 2009, bearing interest at the 182-dayCetes rate plus 65 basis points; and |
| • | Ps. 2.5 billion in nominal terms of its 8.38% publicly-traded notes due October 14, 2010; |
| • | Fideicomiso F/163 issued a total of Ps. 14,672,000,000 in nominal terms of its publicly-traded notes in the Mexican market on March 26, 2004; the notes are guaranteed by Petróleos Mexicanos and were reopenings of earlier issuances, consisting of three separate tranches: |
| • | Ps. 6,000,000,000 in nominal terms of its publicly-traded notes due October 18, 2007, bearing interest at the 91-dayCetes rate plus 67 basis points; |
| • | Ps. 6,000,000,000 in nominal terms of its publicly-traded notes due October 8, 2009, bearing interest at the 182-dayCetes rate plus 65 basis points; and |
| • | Ps. 2,672,000,000 in nominal terms of its 8.38% publicly-traded notes due October 14, 2010; |
| • | Fideicomiso F/163 entered into a loan agreement in the amount of Ps. 4 billion in nominal terms on March 30, 2004, guaranteed by Petróleos Mexicanos, with a Mexican commercial bank for use in financing PIDIREGAS; |
| • | Fideicomiso F/163 entered into a loan agreement in the amount of Ps. 4 billion on November 4, 2004, guaranteed by Petróleos Mexicanos, with a Mexican commercial bank for use in financing PIDIREGAS; |
| • | Fideicomiso F/163 entered into a loan agreement in the amount of Ps. 3 billion on November 23, 2004, guaranteed by Petróleos Mexicanos, with a Mexican commercial bank for use in financing PIDIREGAS; |
| • | Fideicomiso F/163, entered into a loan agreement in the amount of Ps. 4 billion on December 20, 2004, guaranteed by Petróleos Mexicanos, with a Mexican commercial bank for use in financing PIDIREGAS; and |
| • | Fideicomiso F/163 issued a total of Ps. 5 billion ofcertificados bursátiles due December 5, 2019, which are denominated in UDIs, on December 23, 2004, guaranteed by Petróleos Mexicanos, in the Mexican market. |
In the period from January 1 to December 31, 2004, Petróleos Mexicanos’ net payments on borrowings totaled U.S. $2.2 billion and were as follows:
| • | U.S. $369.2 million in respect of direct loans; |
| • | U.S. $125 million in respect of foreign trade lines; |
| • | U.S. $540 million in respect of bankers’ acceptances; |
| • | U.S. $341.2 million in respect of credit lines from export credit agencies; |
| • | U.S. $432 million in respect of commercial paper; |
| • | U.S. $43.8 million in respect of the short-term peso-denominated notes (certificados bursátiles de corto plazo) program; |
| • | U.S. $218.2 million in respect of bond issues; |
| • | U.S. $76.1 million in respect of restructured debt; and |
| • | U.S. $57.3 million in respect of leases. |
113
Table of Contents
In the period from January 1 to December 31, 2004, the Pemex Project Funding Master Trust’s net payments on borrowings totaled U.S. $2.9 billion and were as follows:
| • | U.S. $789.2 million in respect of foreign trade financing; |
| • | U.S. $533.2 million in respect of project financing; |
| • | U.S. $1.3 billion in respect of financing from commercial banks; and |
| • | U.S. $267.2 million in respect of the Convenio de Derivación de Fondos (Transfer of Funds Agreement) with the Mexican Government. |
In the period from January 1 to December 31, 2004, Fideicomiso F/163’s net payments on borrowings totaled U.S. $24.7 million and were made in respect of direct loans.
At December 31, 2004, our total indebtedness, excluding accrued interest, was approximately U.S. $38.8 billion. Of this amount, U.S. $35.0 billion consisted of long-term debt, which was composed of approximately U.S. $21.5 billion in instruments with fixed annual interest rates ranging from 2.0% to 14.5% with maturities ranging from 2006 to 2027, approximately U.S. $13.5 billion at variable interest rates, of which U.S. $11.4 billion in drawings under lines of credit was based on LIBOR and other variable rates with maturities ranging from 2006 to 2019, and U.S. $2.1 billion in floating rate notes with maturities ranging from 2008 to 2010. Short-term debt totaled approximately U.S. $3.9 billion, consisting of U.S. $2.6 billion of variable interest rate borrowings under various lines of credit established under committed credit facilities with various international commercial banks and U.S. $1.3 billion of lines of credit with fixed interest rates.
The portion of our total debt at December 31, 2004 corresponding to borrowings of the Pemex Project Funding Master Trust and the Fideicomiso F/163 was U.S. $31.5 billion, of which U.S. $26.0 billion consisted of borrowings of the Pemex Project Funding Master Trust and U.S. $5.5 billion consisted of borrowings of the Fideicomiso F/163. The U.S. $31.5 billion corresponding to the borrowings of the Pemex Project Funding Master Trust and the Fideicomiso F/163 consisted of U.S. $16.1 billion in long-term debt at fixed interest rates with maturities ranging from 2006 to 2023, U.S. $12.9 billion in long-term debt with variable interest rates with maturities ranging from 2006 to 2019, and U.S. $2.5 billion in short-term debt, of which U.S. $2.3 billion consisted of variable interest rate borrowings under various lines of credit. The Pemex Project Funding Master Trust also has U.S. $3.5 billion in short-term and long-term debt consisting of an obligation to Pemex-Exploration and Production in respect of funds allocated to the Pemex Project Funding Master Trust arising from the sale of accounts receivables. This amount is not reflected in our consolidated financial statements due to the off-setting effects of the consolidation of the results of both Pemex-Exploration and Production and the Pemex Project Funding Master Trust (i.e., the effects of intercompany indebtedness are eliminated).
2003 Financing Activities. During the period from January 1, 2003 to December 31, 2003, Petróleos Mexicanos obtained direct credits in the amount of U.S. $440 million for use in financing our working capital requirements, and the Pemex Project Funding Master Trust obtained U.S. $2.9 billion in commercial bank loans for use in financing PIDIREGAS projects. In addition, we participated in the following financing activities:
| • | Petróleos Mexicanos obtained loans from export credit agencies totaling U.S. $152.3 million; |
| • | Petróleos Mexicanos obtained foreign trade financing in the amount of U.S. $125 million; |
| • | Petróleos Mexicanos obtained U.S. $432 million through its commercial paper program; |
| • | Petróleos Mexicanos re-utilized U.S. $540 million from two acceptance credit facilities; |
| • | the Pemex Project Funding Master Trust obtained U.S. $2.1 billion in project financing from various institutions; |
| • | the Pemex Project Funding Master Trust issued £250,000,000 of its 7.50% Notes due 2013 on January 27, 2003; the notes were issued under the Master Trust’s Medium-Term Note program, Series A and are guaranteed by Petróleos Mexicanos; |
114
Table of Contents
| • | the Pemex Project Funding Master Trust issued U.S. $750,000,000 of its 6.125% Notes due 2008 on February 6, 2003; the notes were issued under the Master Trust’s Medium-Term Note program, Series A and are guaranteed by Petróleos Mexicanos; |
| • | the Pemex Project Funding Master Trust issued U.S. $500,000,000 of its 8.625% Bonds due 2022 on March 21, 2003; the bonds were issued under the Master Trust’s Medium-Term Note program, Series A and are guaranteed by Petróleos Mexicanos; |
| • | the Pemex Project Funding Master Trust issued €750,000,000 of its 6.625 per cent. Guaranteed Notes due 2010 on April 4, 2003; the notes are guaranteed by Petróleos Mexicanos; |
| • | the Pemex Project Funding Master Trust issued U.S. $750,000,000 of its 7.375% Notes due 2014 on June 4, 2003; the notes were issued under the Master Trust’s Medium-Term Note program, Series A, and are guaranteed by Petróleos Mexicanos; |
| • | the Pemex Project Funding Master Trust issued €500,000,000 of its 6.25 per cent. Guaranteed Notes due 2013 on August 5, 2003; the notes are guaranteed by Petróleos Mexicanos; |
| • | the Pemex Project Funding Master Trust issued U.S. $500,000,000 of its Guaranteed Floating Rate Notes due 2009 on October 15, 2003; the notes bear interest at a rate per year, adjusted quarterly, equal to three-month LIBOR plus 1.80 per cent. and are guaranteed by Petróleos Mexicanos; |
| • | Fideicomiso F/163 issued a total of Ps. 6,500,000,000 in nominal terms of its publicly-traded notes in the Mexican domestic market on October 24, 2003; the notes are guaranteed by Petróleos Mexicanos, and consist of three separate issuances: |
| • | Ps. 3,000,000,000 in nominal terms of its publicly-traded notes due October 18, 2007, bearing interest at the 91-dayCetes (treasury bill) rate plus 67 basis points; |
| • | Ps. 2,500,000,000 in nominal terms of its publicly-traded notes due October 8, 2009, bearing interest at the 182-dayCetes rate plus 65 basis points; and |
| • | Ps. 1,000,000,000 in nominal terms of its publicly-traded 8.38% notes due October 14, 2010; |
| • | the Pemex Project Funding Master Trust issued £150,000,000 of its 7.50% Notes due 2013 on November 7, 2003; the notes were issued under the Master Trust’s Medium-Term Note program, Series A and are guaranteed by Petróleos Mexicanos; |
| • | Fideicomiso F/163 entered into a loan agreement in the amount of Ps. 2,500,000,000 in nominal terms on December 18, 2003, guaranteed by Petróleos Mexicanos, with a Mexican commercial bank for use in financing PIDIREGAS; and |
| • | Fideicomiso F/163 entered into syndicated loans in the amount of Ps. 7,000,000,000 in nominal terms on December 23, 2003 with a group of Mexican commercial banks for use in financing PIDIREGAS; the loans are guaranteed by Petróleos Mexicanos and consist of two separate tranches: Ps. 4,945,000,000 in nominal terms bearing interest at the 28-dayCetes rate plus 35 basis points, and Ps. 2,055,000,000 in nominal terms bearing interest at a fixed rate of 8.40%; the tranches become due in 2007 and 2008, respectively. |
In the period from January 1, 2003 to December 31, 2003, Petróleos Mexicanos’ net payments on borrowings totaled U.S. $3.0 billion and were allocated as follows:
| • | U.S. $963.6 million in respect of direct loans; |
| • | U.S. $187.7 million in respect of credit lines from export credit agencies in connection with project financing; |
| • | U.S. $432.5 million in respect of commercial paper; |
| • | U.S. $72.3 million in respect of restructured debt; |
115
Table of Contents
| • | U.S. $24.3 million in respect of leases; |
| • | U.S. $225 million in respect of foreign trade financing; |
| • | U.S. $785 million in respect of bankers’ acceptances; and |
| • | U.S. $330 million in respect of bond issues. |
In the period from January 1, 2003 to December 31, 2003, the Pemex Project Funding Master Trust’s net payments on borrowings totaled U.S. $1.8 billion and were allocated as follows:
| • | U.S. $426.7 million in respect of foreign trade financing; |
| • | U.S. $426.8 million in respect of project financing from commercial banks; |
| • | U.S. $731.9 million in respect of commercial bank loans; and |
| • | U.S. $260.8 million in respect of the Convenio de Derivación de Fondos (Transfer of Funds Agreement) with the Mexican Government. |
At December 31, 2003, our total indebtedness, excluding accrued interest, was approximately U.S. $31.7 billion. Of this amount, U.S. $27 billion consisted of total long-term debt, which was composed of approximately U.S. $17.4 billion of instruments with fixed annual interest rates ranging from 1.55% to 14.5% with maturities ranging from 2005 to 2027 and approximately U.S. $9.6 billion of instruments with variable interest rates, of which U.S. $8.0 billion consisted of drawings under lines of credit was based on LIBOR with maturities ranging from 2005 to 2014, and U.S. $1.6 billion consisted of floating rate notes with maturities ranging from 2005 to 2009. Short-term debt totaled approximately U.S. $4.7 billion, consisting of U.S. $4.3 billion of variable interest rate borrowings under various lines of credit established under committed credit facilities with various international commercial banks and U.S. $0.4 billion of lines of credit with fixed interest rates.
The portion of our total debt at December 31, 2003 corresponding to borrowings of the Pemex Project Funding Master Trust and the Fideicomiso F/163 was U.S. $23.9 billion, of which U.S. $22.5 billion consisted of borrowings of the Pemex Project Funding Master Trust and U.S. $1.4 billion consisted of borrowings of the Fideicomiso F/163. The U.S. $23.9 billion corresponding to the borrowings of the Pemex Project Funding Master Trust and the Fideicomiso F/163 consisted of U.S. $12.2 billion in long-term debt at fixed interest rates with maturities ranging from 2005 to 2023, U.S. $9.1 billion in long-term debt with variable interest rates with maturities ranging from 2005 to 2014, and U.S. $2.6 billion in short-term debt, of which U.S. $2.4 billion consisted of variable interest rate borrowings under various lines of credit. The Pemex Project Funding Master Trust also had U.S. $3.8 billion in short-term and long-term debt consisting of an obligation to Pemex-Exploration and Production in respect of funds allocated to the Pemex Project Funding Master Trust arising from the sale of accounts receivables. This amount is not reflected in our consolidated financial statements due to the offsetting effects of the consolidation of the results of both Pemex-Exploration and Production and the Pemex Project Funding Master Trust (i.e., the effects of intercompany indebtedness are eliminated).
116
Table of Contents
The table below sets forth our total indebtedness as of December 31 for each of the five years from 2000 to 2004.
Total Indebtedness of PEMEX
| Year Ended December 31,(1) | |||||||||||||||
| 2000(2) | 2001(2) | 2002(2) | 2003(2) | 2004(2) | |||||||||||
| (in millions of U.S. dollars)(3) | |||||||||||||||
Domestic Debt in Various Currencies(3) | $ | 923 | $ | 749 | $ | 694 | $ | 2,900 | $ | 6,530 | |||||
External Debt(4) | |||||||||||||||
MYRA(5) | $ | 351 | $ | 292 | $ | 224 | $ | 153 | $ | 77 | |||||
Other direct bank loans | 1,749 | 2,148 | 3,674 | 2,769 | 1,789 | ||||||||||
Securities | |||||||||||||||
Bonds(6) | 6,719 | 8,509 | 11,515 | 16,285 | 22,133 | ||||||||||
Commercial paper | 447 | 228 | 433 | 432 | 0 | ||||||||||
Total securities | 7,166 | 8,737 | 11,948 | 16,717 | 22,133 | ||||||||||
Trade financing(7) | |||||||||||||||
Acceptance lines | 880 | 785 | 785 | 540 | 0 | ||||||||||
Advances from commercial banks(8) | 1,395 | 1,490 | 2,150 | 3,323 | 2,409 | ||||||||||
Total trade financing | 2,275 | 2,275 | 2,935 | 3,863 | 2,409 | ||||||||||
Purchasing loans(9) | 355 | 351 | 380 | 387 | 366 | ||||||||||
Financial leases | 437 | 319 | 279 | 254 | 197 | ||||||||||
Export credit agency loans (project finance)(10) | 1,650 | 2,282 | 2,866 | 4,636 | 5,471 | ||||||||||
Total external debt | $ | 13,983 | $ | 16,404 | $ | 22,306 | $ | 28,779 | $ | 32,442 | |||||
Total Indebtedness(2)(11) | $ | 14,906 | $ | 17,153 | $ | 23,000 | $ | 31,679 | $ | 38,972 | |||||
| Note: | Numbers may not total due to rounding. |
| (1) | Figures do not include accrued interest. Accrued interest was U.S. $224 million, U.S. $284 million, U.S. $331 million, U.S. $459 million and U.S. $231 million at December 31, 2000, 2001, 2002, 2003 and 2004, respectively. |
| (2) | Includes U.S. $4.5 billion, U.S. $7.5 billion, U.S. $14.1 billion, U.S. $22.5 billion and U.S. $26.0 billion of indebtedness of the Pemex Project Funding Master Trust as of December 31, 2000, 2001, 2002, 2003 and 2004, respectively, and U.S. $1.4 billion and U.S. $5.5 billion of indebtedness of Fideicomiso F/163 as of December 31, 2003 and 2004, respectively. |
| (3) | Indebtedness payable in currencies other than U.S. dollars was first converted into pesos for accounting purposes at the exchange rates set by Banco de México and then converted from pesos to U.S. dollars at the following exchange rates: Ps. 9.5722 = U.S. $1.00 for 2000, Ps. 9.1423 = U.S. $1.00 for 2001, Ps. 10.3125 = U.S. $1.00 for 2002, Ps. 11.236 = U.S. $1.00 for 2003 and Ps.11.2648 = U.S. $1.00 for 2004. See Notes 9 and 14 to our consolidated financial statements included herein. |
| (4) | Indebtedness payable other than in pesos and owed to persons or institutions having its head office or chief place of business outside Mexico, and payable outside the territory of Mexico. |
| (5) | Multi-Year Restructuring Agreement. |
| (6) | Includes issuance by RepCon Lux S.A. of U.S. $1.37 billion of its 4.5 per cent. Guaranteed Exchangeable Bonds due 2011. See “Item 5—Operating and Financial Review and Prospects—Liquidity and Capital Resources—2004 Financing Activities.” |
| (7) | To finance external trade of crude oil and derivatives. |
| (8) | Includes indebtedness of the Pemex Project Funding Master Trust of U.S. $1.0 billion in trade financing advances from commercial banks as of December 31, 2000 and 2001, U.S. $1.9 billion as of December 31, 2002, U.S. $3.2 billion as of December 31, 2003 and U.S. $2.4 billion as of December 31, 2004. |
| (9) | To finance imports of equipment and spare parts. |
| (10) | Includes U.S. $1,450 million, U.S. $2,176 million, U.S. $2,771 million, U.S. $4,529 million and U.S. $5,428 million of indebtedness of the Pemex Project Funding Master Trust as of December 31, 2000, 2001, 2002, 2003 and 2004, respectively. |
| (11) | Does not include U.S. $1,565.1 million, U.S. $1,451.8 million, U.S. $1,330.4 million, U.S. $1,195.4 million and U.S. $1,186.1 million of indebtedness as of December 31, 2000, 2001, 2002, 2003 and 2004, respectively, incurred in connection with notes payable to contractors. See Note 8 to our consolidated financial statements included herein. |
Source: Petróleos Mexicanos.
117
Table of Contents
Financing Activities of Pemex Finance, Ltd.
Commencing December 1, 1998, Petróleos Mexicanos, Pemex-Exploration and Production, PMI and P.M.I. Services B.V. have entered into several agreements with Pemex Finance, Ltd., a limited liability company organized under the laws of the Cayman Islands. Under these contracts, Pemex Finance, Ltd. purchases certain existing PMI accounts receivable for crude oil as well as certain accounts receivable to be generated in the future by PMI related to crude oil. The receivables sold are those generated by the sale of Maya crude oil to designated customers in the United States, Canada and Aruba. The net proceeds obtained by Pemex-Exploration and Production from the sale of such receivables under the agreements are utilized for PIDIREGAS expenditures. Pemex Finance, Ltd. obtains resources for the acquisition of such accounts receivable through the placement of debt instruments in the international markets.
As of December 31, 2004, the outstanding debt of Pemex Finance, Ltd. was composed of U.S. $3.6 billion aggregate principal amount of notes with maturities ranging from 2005 to 2018 and interest rates ranging between 6.30% and 10.61%, as well as two series of floating rate notes.
2005 Financing Activities. On June 27, 2005, Pemex Finance, Ltd. redeemed the following series of its outstanding notes at a redemption price equal to the principal amount thereof plus accrued interest thereon and a make-whole premium:
Series | Outstanding Principal Amount | ||
6.55% Notes due 2008 | U.S.$ | 194,117,647.07 | |
6.30% Notes due 2010 | U.S.$ | 400,000,000.00 | |
7.33% Notes due 2012 | U.S.$ | 250,000,000.00 | |
7.80% Notes due 2013 | U.S.$ | 150,000,000.00 | |
As of May 31, 2005, Pemex Finance, Ltd. has made payments of U.S. $170.3 million in principal of its notes. On June 28, 2005, Pemex Finance, Ltd. paid U.S. $550 million plus accrued interest to Petróleos Mexicanos in connection with certain subordinated debt obligations. Pemex Finance, Ltd. has not incurred any additional indebtedness during 2005.
2004 Financing Activities. During 2004, Pemex Finance, Ltd. made payments of U.S. $344.8 million in principal of its notes. Pemex Finance, Ltd. did not incur any additional indebtedness during 2004.
2003 Financing Activities. During 2003, Pemex Finance, Ltd. made payments of U.S. $328.3 million in principal of its notes. Pemex Finance, Ltd. did not incur any additional indebtedness during 2003.
118
Table of Contents
Contractual Obligations and Off-balance Sheet Arrangements
Information about our long-term contractual obligations and off-balance sheet arrangements outstanding at December 31, 2004 from the notes to our consolidated financial statements included herein is set forth below. This information is important in understanding our financial position. In considering the economic viability of investment opportunities, we view any source of financing, for example, operating leases or sales of future accounts receivable, as being economically equivalent to consolidated debt.
Contractual Obligations as of December 31, 2004(1)
| Payment due by period | |||||||||||||||
| Total | Less than 1 year | 1-3 years | 4-5 years | After 5 years | |||||||||||
| (in millions of U.S. dollars) | |||||||||||||||
Contractual obligations recognized in balance sheet: | |||||||||||||||
Long-term debt(2) | $ | 38,774.8 | $ | 3,918.2 | $ | 13,079.9 | $ | 5,267.3 | $ | 16,509.4 | |||||
Capital lease obligations(3) | 197.0 | 28.7 | 93.3 | 41.6 | 33.4 | ||||||||||
Sales of future accounts receivable(4) | 3,252.2 | — | 722.0 | 940.0 | 1,590.2 | ||||||||||
Notes payable to contractors(5) | 1,050.4 | 157.4 | 558.0 | 335.0 | — | ||||||||||
Other Long-Term Liabilities: | |||||||||||||||
Dismantlement and abandonment costs obligations(6) | 1,211.6 | 14.5 | 66.6 | 52.5 | 1,078.0 | ||||||||||
Employee benefit plans(7) | 27,098.8 | 1,608.0 | 3,459.4 | 3,425.1 | 18,606.3 | ||||||||||
Total contractual obligations recognized in balance sheet | $ | 71,584.8 | $ | 5,726.8 | $ | 17,979.2 | $ | 10,061.5 | $ | 37,817.3 | |||||
Other contractual obligations not recognized in liabilities: | |||||||||||||||
PIDIREGAS commitments(8) | 19,136.4 | 9,698.3 | 6,799.5 | 1,302.2 | 1,336.4 | ||||||||||
Nitrogen supply contract(9) | 1,640.5 | 235.6 | 582.2 | 230.5 | 592.2 | ||||||||||
Minimum Guaranteed Dividends(10) | 1,747.6 | 873.8 | 873.8 | — | — | ||||||||||
Total contractual obligations not recognized in liabilities | $ | 22,524.5 | $ | 10,807.7 | $ | 8,255.5 | $ | 1,532.7 | $ | 1,928.6 | |||||
Total contractual obligations | $ | 94,109.3 | $ | 16,534.5 | $ | 26,234.7 | $ | 11,594.2 | $ | 39,745.9 | |||||
| Note: | These figures do not include accrued interest. |
| (1) | All amounts calculated in accordance with Mexican GAAP. |
| (2) | See Note 9 to our consolidated financial statements included herein. |
| (3) | See Note 19 II (g) to our consolidated financial statements included herein. |
| (4) | Under U.S. GAAP, we consolidate Pemex Finance, Ltd. and recognize on our balance sheet its outstanding debt as of December 31, 2004 of U.S. $3.6 billion. See Notes 7 and 19 II (a) to our consolidated financial statements included herein. |
| (5) | See Note 8 to our consolidated financial statements included herein. |
| (6) | See Notes 2(h) and 5 to our consolidated financial statements included herein. |
| (7) | See Note 11 to our consolidated financial statements included herein. |
| (8) | See Note 16 (b) to our consolidated financial statements included herein. |
| (9) | See Note 16 (a) to our consolidated financial statements included herein. |
| (10) | See Note 13 to our consolidated financial statements included herein. |
As of December 31, 2004, we did not have any off-balance sheet arrangements of the type that we are required to disclose under Item 5.E of Form 20-F.
119
Table of Contents
The following tables set forth information regarding the fair value of our derivative contracts in connection with natural gas trading activities as of December 31, 2004:
Fair Value of Natural Gas Derivative Contracts(1)
| (in thousands of U.S. dollars) | ||||
Fair value of contracts outstanding at the beginning of the period | $ | (105,629 | ) | |
Contracts realized or otherwise settled during the period | (116,533 | ) | ||
Fair value of new contracts when entered into during the period | 17,999 | |||
Other changes in fair values | (71,418 | ) | ||
Fair value of contracts outstanding at the end of the period | $ | (275,582 | ) | |
| (1) | As of December 31, 2004. |
Fair Value of Natural Gas Derivative Contracts at Period-End by Maturity(1)
| Maturity less than 1 year | Maturity 1-3 years | Maturity 4-5 years | Maturity in excess of 5 years | Total fair value | |||||||||
| (in thousands of U.S. dollars) | |||||||||||||
Source of Fair Value | |||||||||||||
Prices actively quoted | 1,632 | — | — | — | 1,632 | ||||||||
Prices provided by other external sources | (170,852 | ) | (106,362 | ) | — | — | (277,214 | ) | |||||
| (1) | As of December 31, 2004. |
120
Table of Contents
Results of Operations by Business Segment
This section presents results of our operations by business segment, including our central corporate operations and the operations of the consolidated subsidiary companies.
Revenue by Business Segment
The following table sets forth our trade and intersegment net sales revenues by business segment for the five fiscal years ended December 31, 2004 as well as the percentage change in sales revenues for the years 2002 to 2004.
| Year Ended December 31, | 2003 vs. 2002 | 2004 vs. 2003 | |||||||||||||||||
| 2000 | 2001 | 2002 | 2003 | 2004 | |||||||||||||||
| (in millions of constant pesos at December 31, 2004) | (%) | (%) | |||||||||||||||||
Exploration and Production | |||||||||||||||||||
Trade sales(1) | Ps. — | Ps. — | Ps. — | Ps. — | Ps. — | — | — | ||||||||||||
Intersegment sales | 376,833 | 313,115 | 316,852 | 448,780 | 560,997 | 41.6 | 25.0 | ||||||||||||
Total net sales | Ps. 376,833 | Ps. 313,115 | Ps. 316,852 | Ps. 448,780 | Ps. 560,997 | 41.6 | 25.0 | ||||||||||||
Refining | |||||||||||||||||||
Trade sales | Ps. 277,681 | Ps. 282,660 | Ps. 281,357 | Ps. 299,551 | Ps. 316,140 | 6.5 | 5.5 | ||||||||||||
Intersegment sales | 11,587 | 10,383 | 15,803 | 24,657 | 27,021 | 56.0 | 9.6 | ||||||||||||
Total net sales | Ps. 289,268 | Ps. 293,043 | Ps. 297,160 | Ps. 324,209 | Ps. 343,161 | 9.1 | 5.8 | ||||||||||||
Gas and Basic Petrochemicals | |||||||||||||||||||
Trade sales(1) | Ps. 77,195 | Ps. 77,134 | Ps. 64,395 | Ps. 96,313 | Ps. 116,049 | 49.6 | 20.5 | ||||||||||||
Intersegment sales | 31,260 | 32,512 | 29,155 | 53,442 | 67,187 | 83.3 | 25.7 | ||||||||||||
Total net sales | Ps. 108,455 | Ps. 109,646 | Ps. 93,551 | Ps. 149,755 | Ps. 183,236 | 60.1 | 22.4 | ||||||||||||
Petrochemicals | |||||||||||||||||||
Trade sales(1) | Ps. 14,706 | Ps. 10,651 | Ps. 8,168 | Ps. 11,473 | Ps. 16,824 | 40.5 | 46.6 | ||||||||||||
Intersegment sales | 3,283 | 3,302 | 4,409 | 6,375 | 7,366 | 44.6 | 15.5 | ||||||||||||
Total net sales | Ps. 17,989 | Ps. 13,953 | Ps. 12,577 | Ps. 17,848 | Ps. 24,190 | 41.9 | 35.5 | ||||||||||||
Corporate and Subsidiary Companies | |||||||||||||||||||
Trade sales | Ps. 195,616 | Ps. 155,732 | Ps. 187,654 | Ps. 250,556 | Ps. 324,574 | 33.5 | 29.5 | ||||||||||||
Intersegment sales and eliminations . . | (422,963 | ) | (359,313 | ) | (366,220 | ) | (533,253 | ) | (662,571 | ) | 45.6 | 24.3 | |||||||
Total net sales | Ps.(227,347 | ) | Ps.(203,581 | ) | Ps.(178,566 | ) | Ps.(282,697 | ) | Ps.(337,997 | ) | 58.3 | 19.6 | |||||||
Total Net Sales | Ps. 565,198 | Ps. 526,177 | Ps. 541,574 | Ps. 657,893 | Ps. 773,587 | 21.5 | 17.6 | ||||||||||||
| Notes: | Numbers may not total due to rounding. |
| (1) | These trade sales include sales by the subsidiary entities to the consolidated subsidiary companies, primarily to the PMI Group. These sales are treated as eliminations in this table. |
Source: PEMEX’s financial statements.
121
Table of Contents
Income by Business Segment
The following table sets forth our income (loss) by business segment for each year in the four-year period ended December 31, 2004, as well as the percentage change in income for the years 2002 to 2004.
| Year Ended December 31, | 2003 vs. 2002 | 2004 vs. 2003 | ||||||||||||||||
| 2001 | 2002 | 2003 | 2004 | |||||||||||||||
(in millions of constant pesos at December 31, 2004) | (%) | (%) | ||||||||||||||||
Business Segment | ||||||||||||||||||
Exploration and Production | Ps. 12,423 | Ps. 16,385 | Ps. 1,180 | Ps.(13,670 | ) | (92.8 | ) | (1,258.5 | ) | |||||||||
Refining | (32,471 | ) | (37,498 | ) | (38,099 | ) | (22,060 | ) | 1.6 | (42.1 | ) | |||||||
Gas and Basic Petrochemicals | 860 | 2,441 | 8,082 | 11,652 | 231.2 | 44.2 | ||||||||||||
Petrochemicals | (11,414 | ) | (12,856 | ) | (15,378 | ) | (12,315 | ) | 19.6 | (19.9 | ) | |||||||
Corporate and Subsidiary Companies(1) | (1,372 | ) | 5,679 | 1,460 | 10,897 | (74.3 | ) | 646.4 | ||||||||||
Total Income/(loss) | Ps.(31,974 | ) | Ps.(25,850 | ) | Ps.(42,754 | ) | Ps.(25,496 | ) | (65.4 | ) | 40.4 | |||||||
| Note: | Numbers may not total due to rounding. |
| (1) | Includes intersegment eliminations. |
Source: PEMEX’s financial statements.
2004 Compared to 2003
Exploration and Production
In 2004, Pemex-Exploration and Production’s sales of crude oil and natural gas to the PMI Group increased by 27.8% in peso terms and by 27.9% in U.S. dollar terms, mainly due to an increase in crude oil export prices. The weighted average price of crude oil sold by Pemex-Exploration and Production to the PMI Group for export was U.S. $31.02 in 2004, as compared to U.S. $24.75 in 2003. Intersegment sales increased by 25.0%, principally as a result of the increase in crude oil export prices. Income related to exploration and production activities decreased by 1,258.5% from Ps. 1,180 million in 2003 to a loss of Ps. 13,670 million in 2004, primarily as a result of an increase in taxes and duties, maintenance expenses and costs related to the labor reserve.
Refining
In 2004, trade sales related to refining activities increased by 5.5%, from Ps. 299,551 million in 2003 to Ps. 316,140 million in 2004, due to an increase in the average sales prices and volumes of our principal petroleum products. Export sales related to refining activities decreased by 9.3%, from Ps. 10,317 million in 2003 to Ps. 9,361 million in 2004, as a result of decrease in sales of fuel oil. Net of the IEPS tax, domestic sales related to refining activities increased by 30.3%, from Ps. 200,591 million in 2003 to Ps. 261,435 million in 2004, principally due to an increase in the average sales prices and volumes of our principal petroleum products. Intersegment sales increased by 9.6%, to Ps. 27,021 million, largely due to an increase in the sales volumes of liquefied petroleum gas and diesel. In 2004, the total loss related to refining activities was Ps. 22,060 million, 42.1% less than the loss of Ps. 38,099 million in 2003. The decreased loss was primarily due to increases in the average sales prices of our principal petroleum products.
Gas and Basic Petrochemicals
In 2004, trade sales related to the natural gas and basic petrochemical business segment increased by 20.5%, from Ps. 96,313 million in 2003 to Ps. 116,049 million in 2004. Liquefied petroleum gas sales increased by 10.0%, from Ps. 38,358 million in 2003 to Ps. 42,208 million in 2004, principally due to an increase in liquefied petroleum gas prices. The volume of domestic sales of basic petrochemicals increased by 17.3% in 2004, from 794 thousand tons per year in 2003 to 931 thousand tons per year in 2004. Natural gas sales increased by 27.0%,
122
Table of Contents
from Ps. 54,577 million in 2003 to Ps. 69,321 million in 2004, mainly due to an increase in natural gas prices. Income related to natural gas and basic petrochemicals increased by 44.2%, to Ps. 11,652 million, mainly due to increases in the prices of our principal products.
Petrochemicals
In 2004, trade sales related to the petrochemicals business segment increased by 46.6%, from Ps. 11,473 million in 2003 to Ps. 16,824 million in 2004. Prices and volumes for petrochemicals sold domestically increased for a majority of our petrochemical products. In 2004, the volume of petrochemical exports increased by 5.5%, from 292 thousand tons in 2003 to 308 thousand tons in 2004. Losses related to petrochemical activities decreased by 19.9%, from Ps. 15,378 million in 2003 to Ps. 12,315 million in 2004, mainly due to an increase in sales volumes of styrene and an increase in the sale prices of the majority of our principal petrochemical products.
Corporate and Subsidiary Companies
In 2004, additional marginal trade sales revenues relating to PMI’s exports of crude oil and petroleum products to third parties increased by 29.5% in peso terms, from Ps. 250,556 million in 2003 to Ps. 324,574 million in 2004, as a result of increased prices of the crude oil that we exported and the strengthening of the dollar against the peso. In 2004, the trade income related to corporate and subsidiary companies, which includes the international trading activities of the PMI Group, increased from Ps. 1,460 million in 2003 to Ps. 10,897 million in 2004, primarily due an increase in sales volumes to third parties and an increase in sale prices.
2003 Compared to 2002
Exploration and Production
In 2003, Pemex-Exploration and Production’s sales of crude oil and natural gas to the PMI Group increased by 33.4% in peso terms and by 24.8% in U.S. dollar terms, as a result of higher sales volumes and an increase in crude oil export prices. The weighted average price of crude oil sold by Pemex-Exploration and Production to the PMI Group for export was U.S. $24.75 in 2003, as compared to U.S. $21.31 in 2002. Intersegment sales increased by 41.6%, principally as a result of the increase in crude oil export prices. Income related to exploration and production activities decreased by 92.8% from Ps. 16,385 million in 2002 to Ps. 1,180 million in 2003, primarily as a result of an increase in product purchases and an increase in depreciation and maintenance expenses.
Refining
In 2003, trade sales related to refining activities increased by 6.5%, from Ps. 281,357 million in 2002 to Ps. 299,551 million in 2003, due to an increase in the average sales prices and volumes of our principal petroleum products. Export sales related to refining activities increased by 44.8%, from Ps. 7,125 million in 2002 to Ps. 10,317 million in 2003, as a result of increase in sales of virgin stock. Net of the IEPS tax, domestic sales related to refining activities increased by 31.7%, from Ps. 152,367 million in 2002 to Ps. 200,591 million in 2003, principally due to an increase in the average sales prices and volumes of our principal petroleum products. Intersegment sales increased by 56.0%, to Ps. 24,657 million, largely due to an increase in the sales volumes of liquefied petroleum gas and diesel. In 2003, the total loss related to refining activities was Ps. 38,099 million, 1.6% greater than the loss of Ps. 37,498 million in 2002. The increased loss was primarily due to increases in the purchases of products due to higher prices and higher volume of crude oil purchased, which was partially offset by an increase in trade sales by Pemex-Refining.
123
Table of Contents
Gas and Basic Petrochemicals
In 2003, trade sales related to the natural gas and basic petrochemical business segment increased by 49.6%, from Ps. 64,395 million in 2002 to Ps. 96,313 million in 2003. Liquefied petroleum gas sales increased by 34.2%, from Ps. 28,590 million in 2002 to Ps. 38,358 million in 2003, principally due to an increase in liquefied petroleum prices. The volume of domestic sales of basic petrochemicals decreased by 7.8% in 2003, from 861 thousand tons per year in 2002 to 794 thousand tons per year in 2003. Natural gas sales increased by 65.7%, from Ps. 32,946 million in 2002 to Ps. 54,577 million in 2003, mainly due to an increase in natural gas prices. Income related to natural gas and basic petrochemicals increased by 231.2%, to Ps. 8,082 million, mainly due to increases in the prices of our principal products.
Petrochemicals
In 2003, trade sales related to the petrochemicals business segment increased by 40.5%, from Ps. 8,168 million in 2002 to Ps. 11,473 million in 2003. Prices and volumes for petrochemicals sold domestically increased for a majority of our petrochemical products. In 2003, the volume of petrochemical exports decreased by 28.2%, from 387 thousand tons in 2002 to 278 thousand tons in 2003. Losses related to petrochemical activities increased by 19.6%, from Ps. 12,856 million in 2002 to Ps. 15,378 million in 2003, mainly due to an increase in cost of sales resulting from an increase in product purchases and losses resulting from the disposal of fixed assets.
Corporate and Subsidiary Companies
In 2003, additional marginal trade sales revenues relating to PMI’s exports of crude oil and petroleum products to third parties increased by 33.5% in peso terms, from Ps. 187,654 million in 2002 to Ps. 250,556 million in 2003, as a result of increased prices of the crude oil that we exported and the strengthening of the dollar against the peso. In 2003, the trade income related to corporate and subsidiary companies, which includes the international trading activities of the PMI Group, decreased from Ps. 5,679 million in 2002 to Ps. 1,460 million in 2003, primarily due to a lower net gain from monetary position in 2003.
U.S. GAAP Reconciliation
Net income (loss) under U.S. GAAP differ from net income (loss) under Mexican GAAP due to several factors, which are differences in methods of accounting for exploration and drilling costs, pension, seniority premiums and post-retirement benefit obligations, accrued vacation, capitalized interest, impairment of fixed assets, depreciation, derivatives, profit in inventory and our investment in Repsol shares. The amounts for such adjustments vary per year. For further information regarding these and other differences between Mexican and U.S. GAAP as they relate to our operating results, see Note 19 to our consolidated financial statements included herein.
Income and Equity (Deficit) under U.S. GAAP
For the year ended December 31, 2004, our net loss under U.S. GAAP was approximately Ps. 13.0 billion, representing a Ps. 12.5 billion decrease from the net loss recorded under Mexican GAAP. For the year ended December 31, 2003, our net loss under U.S. GAAP was approximately Ps. 69.8 billion, representing a Ps. 27.0 billion increase from the net loss recorded under Mexican GAAP. For the year ended December 31, 2002, our net loss under U.S. GAAP was approximately Ps. 34.4 billion, representing a Ps. 8.5 billion increase from the net loss recorded under Mexican GAAP. For further detail regarding the adjustments related to these amounts, see Note 19 to our consolidated financial statements included herein.
Our equity deficit under U.S. GAAP was approximately Ps. 48.9 billion at December 31, 2004, as compared to an equity deficit of Ps. 46.7 billion at December 31, 2003. For further detail regarding the adjustments related to these amounts, see Note 19 to our consolidated financial statements included herein.
124
Table of Contents
Exploration and Drilling Costs
As of January 1, 2004, we changed our Mexican GAAP accounting policy to the successful efforts method of accounting. Under Mexican GAAP, through 2003, we charged exploration and drilling costs to the equity reserve for exploration and depletion of oil fields. Exploration and drilling costs related to successful oil wells were credited to the equity reserve and recorded as fixed assets. Cost of sales was recognized by recording a charge for each barrel of crude oil extracted in the statement of operations and recording a credit to the equity reserve. Under U.S. GAAP, we initially capitalized the costs of drilling exploratory wells and exploratory-type stratigraphic test wells, which were subsequently charged to expense if proved reserves were not discovered. Development costs, including the costs of drilling development wells and development-type stratigraphic test wells, were capitalized.
Pensions and Post-retirement Benefits
Seniority premium and pension plan amounts under U.S. GAAP and Mexican GAAP differ because of the different implementation dates required by Bulletin D-3 and SFAS No. 87. Under Mexican GAAP, we account for supplemental payments under its Bulletin D-3 calculations. However, through 2003, we accounted for other health services benefits on a pay-as-you-go basis. Effective January 1, 2004, we have adopted revised Bulletin D-3 and begun to recognize a liability for post-retirement benefits. Under U.S. GAAP, we have historically followed the guidelines of SFAS No. 106, which uses the transitional recognition method in accounting for health service and other supplemental payments provided to retirees.
Fixed Asset Adjustments
| • | Capitalization of interest. For Mexican GAAP purposes, we capitalize interest to property, plant and equipment based on the total interest cost incurred on loans allocated to construction projects, regardless of whether or not the amounts borrowed have been spent on such projects. For purposes of the U.S. GAAP reconciliation, we capitalize interest pursuant to Statement of Financial Accounting Standards No. 34, “Capitalization of Interest.”. |
| • | Impairment. For Mexican GAAP purposes, effective as of January 1, 2004, we adopted Bulletin C-15, “Impairment and Disposal of Long-Lived Assets,” which provides specific criteria for determining when there is impairment in the value of long-lived assets for both tangible and intangible assets. Bulletin C-15 establishes a methodology for calculating and recording losses arising from the impairment of assets and their reversal, and provides guidance for accounting, presentation and disclosure for discontinued operations. Under U.S. GAAP, SFAS No. 144 requires that we evaluate our long-lived assets for impairment whenever events or circumstances indicate that the carrying amount of an asset may not be recoverable. SFAS No. 144 requires us to write-down impaired assets to the fair value, if available, or the discounted present value of expected future cash flows on related assets. We measure impairment of our oil and gas producing assets based on the undiscounted estimated future cash flows associated with estimated proved reserves on a field-by-field basis. See “Item 5—Operating and Financial Review and Prospects—Recently Issued Accounting Standards,” for a discussion of new impairment guidance under Mexican GAAP, which became effective as of January 1, 2004. |
Derivatives
For Mexican GAAP purposes, we apply Bulletin C-2, which provides guidance for the definition of financial instruments and requires all financial instruments, with the exception of “held to maturity” instruments, to be recorded at fair value with the related adjustment recognized in earnings. “Held to maturity” instruments and certain derivative instruments qualifying as hedges are to be recorded at amortized cost subject to impairment evaluation. For U.S. GAAP purposes, we apply SFAS No. 133 (as amended by SFAS No. 137, SFAS No. 138 and SFAS No. 149), which establishes accounting and reporting standards for derivative instruments and hedging activities. SFAS No. 133 requires that an entity recognize all derivatives as either assets or liabilities in the consolidated balance sheet and measure those instruments at fair value. SFAS No. 133 prescribes
125
Table of Contents
requirements for designation and documentation of hedging relationships and ongoing assessments of effectiveness in order to qualify for hedge accounting.
Profit in Inventory
Under Mexican GAAP, we value crude oil and derivatives for export at net realizable value with the difference between the net realizable value and cost recorded in earnings. By contrast, U.S. GAAP requires that inventories be recorded at net realizable cost, but not to exceed cost. For U.S. GAAP purposes, we have eliminated the effect of recognizing a profit within the inventory balance.
Other Differences
In addition to these differences between Mexican and U.S. GAAP, other significant differences that affect our net income relate to the accounting for accrued vacation, depreciation convention and our investment in Repsol shares. See Note 19 to our consolidated financial statements included herein.
Recently Issued Accounting Standards
New Mexican GAAP Accounting Standards
In May 2004, the MIPA, issued Bulletin B-7, “Business Acquisitions,” which provides guidance for the accounting of business acquisitions and investments in affiliated entities. Bulletin B-7 requires that all business acquisitions and investments in affiliates be accounted for by the purchase method of accounting. Upon adoption of Bulletin B-7, goodwill ceases to be amortized and is instead tested annually for impairment. Bulletin B-7 also provides guidelines for the acquisition of a minority interest, and for asset transfers and business acquisitions among entities under common control. Adoption of Bulletin B-7 is effective for periods beginning on January 1, 2005, with early adoption encouraged. Effective January 1, 2005, we adopted the provisions of Bulletin B-7. We believe that the adoption of Bulletin B-7 will not have a significant impact on our results of operations or financial position.
In April 2004, the MIPA issued Bulletin C-10, “Derivative Financial Instruments and Hedge Operations.” Bulletin C-10 establishes revised accounting and reporting standards and requires that all derivative instruments, including certain embedded derivative instruments, be recorded in the balance sheet as either an asset or a liability measured at its fair value. Bulletin C-10 also requires that changes in the derivative’s fair value be recognized currently in earnings unless hedge accounting criteria is met. Adoption of Bulletin C-10 is effective for periods beginning on January 1, 2005, with early adoption recommended. We have adopted Bulletin C-10 and the initial effects from the adoption of this bulletin resulted in a gain of Ps. 4.4 billion for the first three months of 2005.
In December 2003, the MIPA issued Bulletin D-3 “Labor Obligations,” which will provide accounting and disclosure guidance with respect to post-retirement benefits other than pensions. This would include medical benefits and employee indemnities paid upon termination of an employment relationship prior to retirement. Bulletin D-3 will require that such amounts be actuarially determined in a manner similar to that required for pension accounting. The provisions of the standard related to post-retirement medical and other benefits is effective in 2004, while certain provisions became effective as of January 1, 2005. These provisions provide additional valuation and disclosure requirements for recognizing severance payments paid to employees upon dismissal. The adoption of these provisions will result in the recognition of an initial liability related to prior service costs for an amount of approximately Ps. 1.2 billion and an estimated charge to income upon adoption of approximately Ps. 313 million.
126
Table of Contents
New U.S. GAAP Accounting Standards
In November 2004, the FASB issued Statement of Financial Accounting Standards No. 151, “Inventory Costs—an Amendment of ARB No. 43” (“SFAS No. 151”), which is the result of its efforts to converge U.S. accounting standards for inventories with International Accounting Standards. SFAS No. 151 requires idle facility expenses, freight, handling costs, and wasted material (spoilage) costs to be recognized as current-period charges. It also requires that allocation of fixed production overhead to the costs of conversion be based on the normal capacity of the production facilities. SFAS No. 151 will be effective for inventory costs incurred during fiscal years beginning after June 15, 2005. We are currently evaluating the impact that this standard may have on our financial position and results of operations.
In December 2004, the FASB issued Statement of Financial Accounting Standards No. 153, “Exchange of Non-Monetary Assets and Amendment of Accounting Principles Bulletin No. 29 (“APB No. 29”)” (“SFAS No. 153”), which is intended to improve comparability of U.S. accounting standards for non monetary transactions with International Accounting Standards. SFAS No. 153 eliminates the exception to fair value for exchanges of similar productive assets outlined in APB No. 29 and replaces it with a general exception for exchange transactions that do not have commercial substance—that is, transactions that are not expected to result in significant changes in the cash flows of the reporting entity. We do not expect that the adoption of SFAS No. 153 will have a material impact on our financial position and results of operations.
In March 2005, the FASB published FASB Interpretation No. 47 “Accounting for Conditional Asset Retirement Obligations” (“FIN 47”). FIN 47 clarifies that the term conditional asset retirement obligation as used in SFAS No. 143 refers to a legal obligation to perform an asset retirement activity in which the timing and/or method of settlement are conditional on a future event that may or may not be within the control of the entity. Accordingly, an entity is required to recognize a liability for the fair value of a conditional asset retirement obligation if the fair value of the liability can be reasonably estimated. Uncertainty about the timing and/or method of settlement of a conditional asset retirement obligation should be factored into the measurement of the liability when sufficient information exists. FIN 47 also clarifies when an entity would have sufficient information to reasonably estimate the fair value of an asset retirement obligation. FIN 47 is effective no later than the end of fiscal years ending after December 15, 2005 (December 31, 2005, for calendar-year enterprises such as PEMEX). Retrospective application for interim financial information is permitted but is not required. Early adoption of this interpretation is encouraged. We are currently evaluating the impact that this standard may have on our financial position and results of operations.
In April 2005, the FASB issued a FASB Staff Position No. FAS 19-1 “Accounting for Suspended Well Costs” (“FSP 19-1”). The FSP 19-1 addresses the issue related to the circumstances that would permit the continued capitalization of exploratory well costs beyond one year, other than when additional exploration wells are necessary to justify major capital expenditures and those wells are under way or firmly planned for the near future; FSP 19-1 also provides guidance on the accounting and disclosures for exploratory well costs and amends the FASB Statement No. 19, “Financial Accounting and Reporting by Oil and Gas Producing Companies” (“SFAS No. 19”). This guidance applies to enterprises that use the successful efforts method of accounting as described in SFAS No. 19. The FSP 19-1 will become effective in the first reporting period beginning after April 4, 2005; however early application of this guidance is permitted in periods for which financial statements have not yet been issued. We are currently evaluating the impact that FSP 19-1 may have on our financial position or results of operations, as well as the additional disclosures which may be required to our consolidated financial statements.
In June 2005, the FASB published SFAS No. 154, “Accounting Changes and Error Corrections a replacement of APB Opinion No. 20 and FASB Statement No. 3” (“SFAS No. 154”), which changes the requirements for the accounting for and reporting of a change in accounting principle and redefines restatement as the revising of previously issued financial statements to reflect the correction of an error. SFAS No. 154 requires retrospective application to prior periods’ financial statements of changes in accounting principle, unless
127
Table of Contents
it is impracticable to determine the period-specific effects of the cumulative effect of the change. This Statement also carries forward without change the guidance contained in Opinion 20 for reporting the correction of an error in previously issued financial statements and a change in accounting estimate. This Statement does not change the transition provisions of any existing accounting pronouncement. SFAS No. 154 will be effective for accounting changes and corrections of errors made in fiscal years beginning after December 15, 2005. We are currently evaluating the impact that this statement may have on our financial position and results of operations.
128
Table of Contents
| Item 6. | Directors, Senior Management and Employees |
An eleven-member Board of Directors governs Petróleos Mexicanos. The President of Mexico appoints six members, including the Chairman of the Board of Directors. An amendment to the Organic Law requires that the members of the Board of Directors of Petróleos Mexicanos include the Secretary of the Ministry of the Environment and Natural Resources. The President of Mexico also appoints the Director General of Petróleos Mexicanos. TheSindicato de Trabajadores Petroleros de la República Mexicana(the Petroleum Workers’ Union, which we refer to as the Union) selects the remaining five directors from among our employees. Alternate directors are authorized to serve on the Board of Directors in place of directors who are unable to attend meetings or otherwise participate in the activities of the Board. The members of the Board of Directors are not appointed for a specific term. The members of the Board of Directors, except for those members selected by the Union, serve subject to the discretion of the President of Mexico.
An eight-member board of directors governs each subsidiary entity. Each of these boards consists of the Director General of Petróleos Mexicanos, the Director General of each of the other three subsidiary entities and four additional directors, who are each appointed by the President of Mexico. The Director General of Petróleos Mexicanos serves as Chairman of the board of each subsidiary entity. Neither the members of the boards of directors of the subsidiary entities nor the executive officers are appointed for a specific term. The members of the boards of directors and the Directors General serve subject to the discretion of the President of Mexico.
At an extraordinary session of the Board of Directors, held on May 12, 2004, the board approved the dissolution of three executive offices: Corporate Direction of Strategic Planning, Corporate Direction for Competitiveness and Innovation and Corporate Direction for Industrial Safety and Environmental Protection.
On November 1, 2004, Mr. Raúl Muñoz Leos resigned from his position as Director General of Petróleos Mexicanos and Mr. Luis Ramírez Corzo y Hernández (former Director General of Pemex-Exploration and Production) was designated Director General of Petróleos Mexicanos.
The following tables set forth certain information with respect to directors and executive officers of Petróleos Mexicanos and each of the subsidiary entities as of June 17, 2005.
Petróleos Mexicanos—Directors and Executive Officers
Name | Position with Petróleos Mexicanos | Year Appointed | ||
Mr. Fernando Elizondo Barragán | Chairman of the Board of Directors of Petróleos Mexicanos and Secretary of Energy Born: 1949 Business experience: Presidential Liasion for the Tax Reform; Acting Governor of the State of Nuevo León; Secretary of Finance and General Treasurer of the State of Nuevo León. Other board memberships: Comisión Federal de Electricidad (Chairman); Luz y Fuerza del Centro (Chairman); Banco Nacional de Comercio Exterior, S.N.C.; Nacional Financiera, S.N.C.; and Comisión Nacional del Agua. | 2004 | ||
129
Table of Contents
Petróleos Mexicanos—Directors and Executive Officers
Name | Position with Petróleos Mexicanos | Year Appointed | ||
Mr. Fernando de Jesús Canales Clariond | Board Member of Petróleos Mexicanos and Secretary of Economy Born: 1946 Business experience: Governor of the State of Nuevo León; Federal Congressman of the LI Legislature; and Assistant Director General of Grupo IMSA, S.A. de C.V. Other board memberships: Banco Nacional de Comercio Exterior, S.N.C.; Banco del Ahorro Nacional y Servicios Financieros, S.N.C.; Centro Nacional de Metrología (Chairman); Comisión Federal de Electricidad; Comisión Intersecretarial de Desincorporación; Comisión Intersecretarial de Política Industrial; Comisión Intersecretarial de Gasto-Financiamiento; Comisión Intersecretarial de Precios y Tarifas de los Bienes y Servicios de la Administración Pública Federal; Comisión Intersecretarial para la Transparencia y el Combate a la Corrupción de la Administración Pública Federal; Fondo para la Micro, Pequeña y Mediana Empresa (Chairman); Consejo Nacional de Ciencia y Tecnología; and Nacional Financiera S.N.C. | 2003 | ||
Mr. Alberto Cárdenas Jiménez | Board Member of Petróleos Mexicanos and Secretary of the Environment and Natural Resources Born: 1958 Business experience: Director General of Comisión Nacional Forestal; Governor of the State of Jalisco and Mayor of Zapotlán El Grande, State of Jalisco. Other board memberships: Comisión Federal de Electricidad. | 2003 | ||
Mr. Luis Ernesto Derbez Bautista | Board Member of Petróleos Mexicanos and Secretary of Foreign Affairs Born: 1947 Business experience: Secretary of Economy; Independent Consultant of World Bank and Inter-American Development Bank; Responsible for regional areas of international interest of the World Bank (Chile, west and central regions of Africa, India, etc.); and Professor of Instituto Tecnológico de Estudios Superiores de Monterrey. Other board memberships: Banco de Desarrollo de América del Norte; Banco Nacional de Comercio Exterior, S.N.C.; Comisión de Comercio Exterior; Comisión Intersecretarial para la Transparencia y el Combate a la Corrupción de la Administración Pública Federal; Consejo General de Investigación Científica y Tecnológica; Aeropuertos y Servicios Auxiliares; Telecomunicaciones de México; and Servicio Postal Mexicano. | 2001 |
130
Table of Contents
Petróleos Mexicanos—Directors and Executive Officers
Name | Position with Petróleos Mexicanos | Year Appointed | ||
Mr. Pedro Cerisola y Weber | Board Member of Petróleos Mexicanos and Secretary of Communications and Transportation Born: 1949 Business experience: Advisor of President Vicente Fox; General Coordinator for Vicente Fox’s Presidential Campaign; Projects and Planning of Aeropuertos y Servicios Auxiliares; and Regional Director General and Planning Director of Teléfonos de México, S.A. de C.V. Other board memberships: Aeropuertos y Servicios Auxiliares (Chairman); Caminos y Puentes Federales de Ingresos y Servicios Conexos (Chairman); Telecomunicaciones de México (Chairman); Servicio Postal Mexicano (Chairman); and Banco Nacional de Obras y Servicios Públicos, S.N.C. | 2001 | ||
Mr. José Francisco Gil Díaz | Board Member of Petróleos Mexicanos and Secretary of Finance and Public Credit Born: 1943 Business experience: Director General of Avantel; Director General of Economic-Finance Studies of the Ministry of Finance and Public Credit; Manager of the Organization and Information Analysis Unit of Banco de México; Director General of Revenues Policy and Undersecretary of Revenues of the Ministry of Finance and Public Credit. Other board memberships: Banco del Ahorro Nacional y Servicios Financieros, S.N.C. (Chairman); Banco Nacional de Comercio Exterior, S.N.C. (Chairman); Financiera Rural (Chairman); Banco Nacional de Obras y Servicios Públicos, S.N.C. (Chairman); Casa de Moneda de México (Chairman); Nacional Financiera, S.N.C. (Chairman); Comisión Federal de Electricidad; Comisión Intersecretarial de Gasto Financiamiento (Chairman); Comisión Intersecretarial de Desincorporación (Chairman); Comisión Nacional Bancaria y de Valores; Comisión Nacional para la Protección y Defensa de los Usuarios de Servicios Financieros (Chairman); and Comisión Nacional de Seguros y Fianzas. | 2001 | ||
Mr. Ramón Hernández Toledo | Board Member of Petróleos Mexicanos and Union Representative Born: 1937 Business experience: Federal Congressman of the LVII Legislature; Supervisor “A” of Auxiliary Services; Chief of Cauldrons Custody and other positions in Petróleos Mexicanos. | 1992 | ||
131
Table of Contents
Petróleos Mexicanos—Directors and Executive Officers
Name | Position with Petróleos Mexicanos | Year Appointed | ||
Mr. Pablo Pavón Vinales | Board Member of Petróleos Mexicanos and Union Representative Born: 1945 Business experience: Federal Congressman of the LIX Legislature; Mayor of Minatitlán, State of Veracruz; Chief “A” of Refinería Gral. Lázaro Cárdenas del Río and other positions in Petróleos Mexicanos. | 1992 | ||
Mr. Luis Ricardo Aldana Prieto | Board Member of Petróleos Mexicanos; Union Representative Born: 1954 Business experience: Senator of the LIX Legislature; Treasury Secretary of the General Executive Committee of the Union; and General Secretary of Section 40 of the Union. | 2001 | ||
Mr. Alejandro Sánchez Narváez | Board Member of Petróleos Mexicanos and Union Representative Born: 1952 Business experience: Plant Supervisor and other positions in Petróleos Mexicanos. | 2001 | ||
Mr. Mario Martínez Aldana | Board Member of Petróleos Mexicanos and Union Representative Born: 1952 Business experience: Technician of Railroad Equipment; Geographic Information Uplifting, Treasury Secretary of the Union and other positions in Petróleos Mexicanos. | 2001 | ||
Mr. Luis Ramírez Corzo y Hernández | Director General Born: 1948 Business experience: Director General of Pemex-Exploration and Production; and Director General of Turbinas Solar, S.A. de C.V. Other board memberships: Desarrollos Inmobiliarios CUGA, S.A. de C.V. (Chairman). | 2004 | ||
Mr. Juan José Suárez Coppel | Chief Financial Officer Born: 1959 Business experience: Chief of Staff of the Secretary of Finance and Public Credit; Corporate Treasurer of Grupo Televisa; and Director of Derivatives Trading Desk of Banco Nacional de México S.A. Other board memberships: Deer Park Refining, L.P.; I.I.I. Servicios, S.A. de C.V.; I.I.I., S.A. de C.V.; Mexicana de Lubricantes, S.A. de C.V.; and Instituto Mexicano del Petróleo. | 2001 | ||
132
Table of Contents
Petróleos Mexicanos—Directors and Executive Officers
Name | Position with Petróleos Mexicanos | Year Appointed | ||
Ms. Martha Alicia Olvera Rodríguez | Deputy Director of Programming and Budget Born: 1954 Business experience: Associate Managing Director of Planning and Financial Programming of Petróleos Mexicanos; Associate Managing Director of Budget Control of Petróleos Mexicanos; and Deputy Manager of Programs Integration of Petróleos Mexicanos. | 2002 | ||
Mr. Victor Manuel Cámara Peón | Deputy Director of Financial Information Systems Born: 1943 Business experience: Director of Control and Operational Risk of Banco Nacional de México, S.A.; Director General of Human Resources of Banco Nacional de México, S.A.; and Administrative Director of Banco Nacional de México, S.A. Other board memberships: Intermarítima Maya, S.A. de C.V.; Grupo Roche, S.A. de C.V.; Comercial Salinera de Yucatán, S.A. de C.V.; Infraestructura Maya Peninsular, S.A. de C.V.; and Industria Salinera de Yucatán, S.A. de C.V. | 2003 | ||
Mr. Rigoberto Ariel Yépez García | Deputy Director of Economic Planning Born: 1965 Business experience: Professor and Researcher at the Economics Department of Instituto Tecnológico Autónomo de México; Director General of Prices, Tariffs, Duties and Products Policy of the Ministry of Finance and Public Credit; Associate Managing Director of Business Development of Pemex-Gas and Basic Petrochemicals; and Assistant Director General of Prices and Tariffs Policy of the Ministry of Finance and Public Credit Other board memberships: CH4 Energía, S.A. de C.V.; Gasoductos de Chihuahua, S. de R.L. de C.V.; I.I.I. Servicios, S.A. de C.V. (Alternate); and Instalaciones Inmobiliarias para Industrias, S.A. de C.V. (Alternate). | 2001 | ||
Mr. Esteban Levín Balcells | Acting Deputy Director of Finance and Treasury Born: 1972 Business experience: Coordinator of Advisors of the Corporate Financial Office of Petróleos Mexicanos; Acting Deputy Director of the Financial Information Systems of Petróleos Mexicanos; Advisor of the Corporate Financial Office of Petróleos Mexicanos; and Engagement Manager of McKinsey & Co. | 2005 | ||
133
Table of Contents
Petróleos Mexicanos—Directors and Executive Officers
Name | Position with Petróleos Mexicanos | Year Appointed | ||
Mr. José Manuel Carrera Panizzo | Deputy Director of Risk Management Born: 1969 Business experience: Manager of Foreign Exchange, Metals, Coins and International Agreements of Banco de México; Research Officer of Financial Markets Analysis of Banco de México; and Foreign Exchange Analyst of Banco de México Other board memberships: MGI Trading, Ltd. (Vice President); MGI Enterprises, Ltd. (Vice President); and MGI Supply Ltd. (Vice President). | 2001 | ||
Mr. Rosendo Villarreal Dávila | Corporate Director of Administration Born: 1942 Business experience: Head of the Internal Control Body of the SFP; Senator of the LVI and LVII Legislature; and Mayor of Saltillo, State of Coahuila. Other board memberships: Transportes Villarreal Berlanga, S.A. de C.V. | 2005 | ||
Mr. Lamberto Alonso Calderón | Deputy Director of Labor Relations Born: 1953 Business experience: Advisor “A” of Pemex-Refining; Chief of Commercial Performance and Control Procedures Unit of Pemex-Refining; and Chief of Management Unit of Pemex Refining. | 2005 | ||
Mr. José Néstor García Reza | Acting General Counsel of Petróleos Mexicanos Born: 1965 Business experience: Head of Legal Advising Office of Pemex-Exploration and Production; Chief of the Legal Unit of Pemex-Exploration and Production; Legal Director of Banca Quadrum, S.A.; and Legal Director General of Bancrecer, S.A. | 2004 | ||
Mr. José Salazar Ilarregui Ruffino | Deputy Director of Corporate Services Born: 1952 Business experience: Technical Director of Telecomunicaciones de México of the Ministry of Communications and Transportation; Vice President of Technology and Information of Corporación Novavisión S. de R.L.; and Director of Technology of Cablevisión, S.A. de C.V. | 2005 | ||
Mr. Víctor Manuel Vázquez Zárate | Deputy Director of Medical Services Born: 1943 Business experience: Associate Managing Director of Medical Services of Petróleos Mexicanos; Deputy Manager of Administrative Technical Support of Petróleos Mexicanos; and Medical Advisor of the Corporate Services Management of Petróleos Mexicanos. | 2000 | ||
134
Table of Contents
Petróleos Mexicanos—Directors and Executive Officers
Name | Position with Petróleos Mexicanos | Year Appointed | ||
Mr. Marco Antonio Murillo Soberanis | Deputy Director of Human Resources Born: 1959 Business experience: Corporate Manager of Human Resources of Petróleos Mexicanos; Chief of Planning and Evaluation Unit of Petróleos Mexicanos and Project Leader of Petróleos Mexicanos. | 2005 | ||
Mr. Jorge Collard de la Rocha | Acting Deputy Director of Supplies Born: 1951 Business experience: Director of Finance of Banco Nacional de Obras y Servicios Públicos, S.N.C.; Director General of Programming and Budget of Energy and Infrastructure of the Ministry of Finance and Public Credit; and Director General of Programming and Budget of Agriculture, Livestock, Fishing and Supply of the Ministry of Finance and Public Credit. | 2005 | ||
Mr. Emilio del Bosque González | Acting Deputy Director of Patrimony Management Born: 1947 Business experience: Strategy and Negotiations Consultant; Corporate Director of Supply of Grupo Industrial Saltillo, S.A. de C.V.; and Director of Purchases of CIFUNSA, S.A. de C.V. | 2005 | ||
Mr. Marco Ramírez Silva | Corporate Director of Operations Born: 1957 Business experience: Director General of Pemex-Gas and Basic Petrochemicals; Deputy Director of Liquefied Gas and Basic Petrochemicals of Pemex-Gas and Basic Petrochemicals; and Deputy Director of Planning and Operative Control of Pemex-Gas and Basic Petrochemicals. | 2005 | ||
Mr. Vicente Córdova Rayas | Deputy Director of Investment Projects Born: 1955 Business experience: Associate Managing Director of Competence Center of Petroleos Mexicanos; Head of Continuous Improvement of Pemex-Gas and Basic Petrochemicals; and Coordinator of Advisors of the Deputy Director of Natural Gas of Pemex-Gas and Basic Petrochemicals. | 2005 | ||
Mr. Guillermo Ruiz Gutiérrez | Deputy Director of Operation Evaluation Born: 1959 Business experience: Associate Managing Director; Manager; and Superintendent of Petróleos Mexicanos. | 2005 | ||
135
Table of Contents
Petróleos Mexicanos—Directors and Executive Officers
Name | Position with Petróleos Mexicanos | Year Appointed | ||
Mr. Alejandro Martínez Sibaja | Deputy Director of Operations Coordination Born: 1956 Business experience: Commercial Associate Managing Director of Pemex-Gas and Basic Petrochemicals; Associate Managing Director of PMI; and Deputy Manager of PMI. | 2005 | ||
Mr. Constantino Fernández Cabrera | Deputy Director of Industrial Safety and Environmental Protection Born: 1938 Business experience: Coordinator of Advisors of the Director General of Pemex-Gas and Basic Petrochemicals; Associate Managing Director of Liquified Gas Trading of Pemex-Gas and Basic Petrochemicals; and Associate Managing Director of Pipelines and Terminals of Pemex-Gas and Basic Petrochemicals. | 2005 | ||
Mr. Federico A. Martínez Salas | Corporate Director of Engineering and Project Development Born: 1943 Business experience: Deputy Director of Engineering and Strategic Works Development of Pemex-Exploration and Production; Executive Director of Cantarell Project; and Deputy Director of Primary Production Projects of Petróleos Mexicanos. | 2005 | ||
Mr. Ernesto Ríos Montero | Deputy Director of Engineering Born: 1936 Business experience: Director of Consultoría Empresarial Ejecutiva, S.A. de C.V.; Executive Vice President of Operations of Grupo Bufete Industrial, S.A.; Vice President of Engineering of Grupo Bufete Industrial, S.A. Other board memberships: Instituto Mexicano del Petróleo (Alternate). | 2001 | ||
Mr. Franciso Guillermo Iturbide Ruiz | Deputy Director of Contracting Born: 1951 Business experience: Associate Managing Director of Contracts of Pemex-Exploration and Production; Associate Managing Director of Management and Services of Pemex-Exploration and Production; and Deputy Manager of Biddings and Contracts for Cantarell Project of Pemex-Exploration and Production. | 2005 | ||
Mr. Genaro Ceballos Bravo | Deputy Director of Industrial Plants Projects Born: 1956 Business experience: Associate Managing Director of Projects “C” of Petróleos Mexicanos; Associate Managing Director of Projects and Construction of Pemex-Gas and Basic Petrochemicals and Vice President of Projects of P.M.I. Holdings North America, Inc. | 2005 | ||
136
Table of Contents
Petróleos Mexicanos—Directors and Executive Officers
Name | Position with Petróleos Mexicanos | Year Appointed | ||
Mr. Jorge Alberto Aguilar López | Acting Deputy Director of Quality Control Born: 1956 Business experience: Deputy Director of Contracting of Petróleos Mexicanos; Director of Projects of Grupo Mexico, S.A. de C.V.; and Associate Managing Director of Financial Planning of Comisión Federal de Electricidad. | 2005 | ||
Mr. Benigno Estrada Rodríguez | Head of the Internal Control Body Born: 1947 Business experience: Head of the Internal Control Body of Banco Nacional de Comercio Exterior, S.N.C.; Assistant Director General of Grupo Tek; and Recovery Director of Corporate Banking and Specialized Banking of Banca Cremi, S.A. | 2003 | ||
Mr. Federico Domínguez Zuloaga | Head of Liabilities Area and Head of Complaints Area Born: 1959 Business experience: Deputy Manager of Coercive Collection of the Ministry of Finance and Public Credit; Advisor of Political Parties of the Instituto Federal Electoral; and Chief of Loan Services for the Fondo para la Vivienda del Instituto de Seguridad y Servicios Sociales de los Trabajadores del Estado. | 2001 | ||
Mr. Aniceto del Río Chico | Head of Control and Evaluation Auditing Born: 1946 Business experience: Partner of Alger Consultores, S.C.; Director of Smiling Company, Director of Fit-Biz Executive Center; Director of Gecisa Internacional and Director of Producciones Patsa. Other board memberships: Smiling Company (Chairman). | 2003 | ||
Mr. Héctor Aguiñaga Pérez | Head of the Auditing Area Born: 1950 Business experience: National Director of Internal Auditing Services of KPMG Cárdenas Dosal, S.C.; General Auditor of Pan-American Beverages, Inc.; and General Auditor of Sears Roebuck de México, S.A. de C.V. | 2004 | ||
Mr. Jorge Andrés Ocejo Moreno | Coordinator of Advisors of the Director General Born: 1943 Business experience: Coordinator of Advisors of the Secretary of Labor and Social Security; Secretary General of the National Executive Committee of Partido Acción Nacional; and Liaisons Secretary of the National Executive Committee of Partido Acción Nacional. Other board memberships: Colegio de Alta Dirección de Empresas, A.C. (Chairman). | 2003 | ||
137
Table of Contents
Petróleos Mexicanos—Directors and Executive Officers
Name | Position with Petróleos Mexicanos | Year Appointed | ||
Mr. Luis Kaim Gebara | Executive Coordinator to the Director General Born: 1947 Business experience: General Coordinator of Social Communication of the State of Hidalgo; General Coordinator of Social Communication of Instituto de Seguridad y Servicios Sociales de los Trabajadores del Estado; and Corporate Director of Broadcast and Computing of Liconsa, S.A. de C.V. | 2005 | ||
Mr. Moisés Ithuriel Orozco García | Executive Advisor to the Director General Born: 1968 Business experience: Corporate Director of Administration of Petróleos Mexicanos; Associate Managing Director of Strategic Planning of Petróleos Mexicanos; and Coordinator of Advisors of the Director General of Pemex-Petrochemicals. | 2004 | ||
Mr. Raoul Capdevielle Orozco | Technical Secretary of the Director General Born: 1943 Business experience: Deputy Comptroller of Liabilities of Petróleos Mexicanos; Chief of the Legal Unit of Instalaciones Inmobiliarias para Industrias, S.A. and I.I.I. Servicios, S.A. de C.V.; and Legal Director of Concessions of Triturados Basálticos y Derivados, S.A. de C.V. | 2001 | ||
Pemex-Exploration and Production—Directors and Executive Officers
Name | Position with Pemex-Exploration and Production | Year Appointed | ||
Mr. Luis Ramírez Corzo y Hernández | Chairman of the Board of Pemex-Exploration and Production (refer to Petróleos Mexicanos) | 2004 | ||
Mr. Juan Bueno Torio | Board Member of Pemex-Exploration and Production (refer to Pemex-Refining) | 2003 | ||
Mr. Roberto Ramírez Soberón* | Board Member of Pemex-Exploration and Production (refer to Pemex-Gas and Basic Petrochemicals) | 2005 | ||
Mr. Rafael Beverido Lomelín | Board Member of Pemex-Exploration and Production (refer to Pemex-Petrochemicals) | 2001 | ||
Mr. Juan José Suárez Coppel | Board Member of Pemex-Exploration and Production (refer to Petróleos Mexicanos) | 2002 | ||
138
Table of Contents
Pemex-Exploration and Production—Directors and Executive Officers
Name | Position with Pemex-Exploration and Production | Year Appointed | ||
Mr. Carlos Hurtado López | Board Member of Pemex-Exploration and Production and Undersecretary of Disbursements of the Ministry of Finance and Public Credit Born: 1955 Business experience: Coordinator of Advisors for Political, Economic and Social Matters in the Presidency; Mexico’s Representative to the Organization for Economic Cooperation and Development; General Coordinator of Fondo Nacional de Apoyo a Empresas de Solidaridad; and Director General of Economic and Social Policy. Other board memberships: Aeropuertos y Servicios Auxiliares; Ferrocarriles Nacionales de México; Comisión Federal de Electricidad; and Luz y Fuerza del Centro. | 2001 | ||
Mr. Héctor Moreira Rodríguez | Board Member of Pemex-Exploration and Production and Undersecretary of Hydrocarbons of the Ministry of Energy Born: 1946 Business experience: Undersecretary of Energy Planning and Technology Development of the Ministry of Energy; Vice President for Innovation and Development of Instituto Tecnológico de Estudios Superiores de Monterrey; and Head of the Strategic Planning Unit of the Mexican Presidency. Other board memberships: Instalaciones Inmobiliarias para Industrias, S.A. de C.V.; Instituto Mexicano del Petróleo; Comisión Nacional para el Ahorro de Energía; Subcomité de Coberturas Petroleras of Instituto Mexicano de Transporte; Comité Técnico del Fideicomiso Patrimonial; and Centro de Investigación y Docencia Económica. | 2004 | ||
Mr. Salvador Rubén Ortiz Vértiz | Board Member of Pemex-Exploration and Production and General Coordinator of Mining of the Ministry of Economy Born: 1949 Business experience: Assistant Director and Deputy Director of Sectorial Studies for Grupo Financiero Banamex-Accival, S.A.; Senior Advisor to the Energy Sector and Basic Industries of Grupo Financiero Banamex-Accival, S.A.; and Advisor of the Crude Oil Sector for Banco Nacional de México, S.A. Other board memberships: Servicio Geológico Mexicano (Alternate Chairman); Fideicomiso de Fomento Minero (Alternate Chairman); Exportadora de Sal, S.A. de C.V. (Alternate Chairman); and Transportadora de Sal, S.A. de C.V. (Alternate Chairman). | 2002 | ||
139
Table of Contents
Pemex-Exploration and Production—Directors and Executive Officers
Name | Position with Pemex-Exploration and Production | Year Appointed | ||
Mr. Carlos A. Morales Gil | Acting Director General and Deputy Director of Planning and Evaluation Born: 1954 Business experience: Deputy Director (Southern region), Associate Managing Director of Planning, Associate Managing Director of Production and Deputy Manager of Oilfields Management of Pemex-Exploration and Production. | 2004 | ||
Mr. Sergio Aceves Borbolla | Deputy Director of Engineering and Strategic Works Development Born: 1959 Business experience: Associate Managing Director of Projects (Northeastern Marine region) of Petróleos Mexicanos; Associate Managing Director of Construction of Pemex-Exploration and Production; and Head of Transition Projects of Pemex-Exploration and Production. | 2005 | ||
Mr. J. Javier Hinojosa Puebla | Deputy Director (Northeastern Marine region) Born: 1958 Business experience: Coordinator of the Executive Commercial Operative Coordination of Pemex-Exploration and Production; Associate Managing Director of Analysis and Investment Evaluation in Exploration of Pemex-Exploration and Production; and Associate Managing Director of Technical Operative Coordination (Southern region) of Pemex-Exploration and Production. | 2003 | ||
Mr. Alfredo E. Guzmán Baldizán | Deputy Director (Northern region) Born: 1947 Business experience: Executive Coordinator of Exploration Strategies; Associate Managing Director of Planning (Northern region); and Associate Managing Director of Exploration (Northern region) of Pemex-Exploration and Production. | 2003 | ||
Mr. José Tomás Limón Hernández | Deputy Director of Operations and Trade Born: 1943 Business Experience: Deputy Director of Operations Coordination; Associate Managing Director of Programming and Evaluation; and Director of Cantarell Project. | 2003 | ||
Mr. Rogelio Bartolomé Morando Sedas | Deputy Director of Industrial Safety, Environmental Protection and Quality. Born: 1946 Business Experience: Advisor of the Director of Industrial Safety and Environmental Protection of Petróleos Mexicanos; Director General of Industrias Tecnos S.A. de C.V.; and Plant Manager of Dupont S.A. de C.V. | 2003 | ||
140
Table of Contents
Pemex-Exploration and Production—Directors and Executive Officers
Name | Position with Pemex-Exploration and Production | Year Appointed | ||
Mr. Teódulo Gutiérrez Acosta | Deputy Director (Southern region) Born: 1944 Business Experience: Deputy Director of Human Resources, Competitiveness and Innovation of Pemex-Exploration and Production; Associate Managing Director of Professional Development of Pemex-Exploration and Production; and Associate Managing Director of Technological Development of Production of Pemex-Exploration and Production. | 2005 | ||
Mr. Héctor Leyva Torres | Deputy Director of Marine Services Coordination Born: 1948 Business experience: Deputy Director (Southwestern Marine region); Deputy Director (Southern region); Associate Managing Director of Production (Southern region); and Associate Managing Director of Production (Marine region) of Pemex-Exploration and Production. Other board memberships: Administración Portuaria Integral de Dos Bocas. | 2003 | ||
Mr. Rafael J. Bracho Ransom | Deputy Director of Management and Finance Born: 1947 Business experience: Director of Instalaciones Inmobiliarias para Industrias, S.A. de C.V.; and Deputy Director of Finance of Pemex-Gas and Basic Petrochemicals. | 2002 | ||
Mr. Ricardo Palomo Martínez | Deputy Director of Drilling and Well Maintenance Unit Born: 1954 Business experience: Deputy Director (Southwestern Marine region) of Pemex-Exploration and Production, Manager of Burgos Production Asset of Pemex-Exploration and Production; Associate Managing Director of Integral Project of Burgos basin; and General Superintendent of Reynosa District. | 2005 | ||
Mr. Luis Sergio Guaso Montoya | Executive Director of New Models of Execution (formerly named Executive Director of MSCs) Born: 1963 Business Experience: Associate Managing Director of Economic Analysis of Pemex-Exploration and Production; Associate Managing Director of Investment Resources of Pemex-Exploration and Production; Economic Advisor of P.M.I. Holdings North America, Inc. | 2002 | ||
141
Table of Contents
Pemex-Exploration and Production—Directors and Executive Officers
Name | Position with Pemex-Exploration and Production | Year Appointed | ||
Mr. Francisco Javier Barraza Rodríguez | Deputy Director of Technology Information Coordination Born: 1943 Business experience: Technical Support on Documental Technology of ImaxServ; Director of Administrative Systems of Scotiabank Inverlat, S.A.; and External Consultant on Administrative Systems of Banco Nacional de México, S.A. | 2003 | ||
Mr. Pedro Silva López | Deputy Director (Southwestern Marine region) Born: 1953 Business experience: Deputy Director of Operations Coordination of Petróleos Mexicanos; Executive Director of Strategic Gas Program of Pemex-Exploration and Production; and Associate Managing Director of Strategic Planning of Pemex-Exploration and Production. | 2005 | ||
Mr. Héber Cinco Ley | Deputy Director of Technical Coordination of Exploitation Born: 1946 Business Experience: Director General of Asesoría y Servicios Petroleros S.A. de C.V.; Professor of Universidad Nacional Autónoma de México; and Reservoir Engineer of Standard Oil Company. | 2003 | ||
Mr. Adán Ernesto Oviedo Pérez | Deputy Director of Technical Coordination of Exploration Born: 1956 Business Experience: Associate Managing Director of Diagnosis and Risk Analysis of Pemex-Exploration and Production; Manager of Salina del Istmo Exploration Asset; and Assistant Well Geologist of Pemex-Exploration and Production. | 2003 | ||
Mr. Luis Ramos Martínez | Acting Deputy Director of Human Resources, Competitiveness and Innovation Born: 1957 Business experience: Associate Managing Director of Development and Compensation of Pemex-Exploration and Production; Deputy Manager of Onshore Exploitation Strategies of Pemex-Exploration and Production. | 2005 | ||
Mr. Jorge Javier Ramos Negrete | Head of the Internal Control Body Born: 1949 Business Experience: Head of the Internal Control Body in Procuraduría Federal del Consumidor; Treasurer of Ciudad Juárez, State of Chihuahua; and Partner and Director of Ramos Negrete y Asociados, S.C. | 2003 | ||
142
Table of Contents
Pemex-Refining—Directors and Executive Officers
Name | Position with Pemex-Refining | Year Appointed | ||
Mr. Luis Ramírez Corzo y Hernández | Chairman of the Board of Pemex-Refining (refer to Petróleos Mexicanos) | 2004 | ||
Mr. Roberto Ramírez Soberón* | Board Member of Pemex-Refining (refer to Pemex-Gas and Basic Petrochemicals) | 2005 | ||
Mr. Carlos A. Morales Gil* | Board Member of Pemex-Refining (refer to Pemex-Exploration and Production) | 2004 | ||
Mr. Rafael Beverido Lomelín | Board Member of Pemex-Refining (refer to Pemex Petrochemicals) | 2001 | ||
Mr. Carlos Hurtado López | Board Member of Pemex-Refining (refer to Pemex-Exploration and Production) | 2001 | ||
Mr. Héctor Moreira Rodríguez (Vacant) | Board Member of Pemex-Refining (refer to Pemex-Exploration and Production)
Board Member of Pemex-Refining | 2004 | ||
Mr. Sergio Alejandro García de Alba Zepeda | Board Member of Pemex-Refining and Undersecretary for Small and Medium Companies of the Ministry of Economy Born: 1955 Business experience: Partner and Director General of Recreación y Desarrollo Infantil de México, S.A. de C.V.; Vice President of Axtel, S.A. de C.V.; and Secretary of Economic Promotion of the State of Jalisco. Other board memberships: Banco Nacional de Comercio Exterior, S.N.C.; Centro de Investigación y Asistencia Tecnológica y Diseño del Estado de Jalisco, A.C.; Centro de Investigación y Asistencia Tecnológica en Cuero y Calzado, A.C.; Consejo Nacional de Ciencia y Tecnología; Comisión Mixta para la Promoción de las Exportaciones (Chairman); Exportadores Asociados, S.A. de C.V.; Instituto Nacional de Estadística, Geografía e Informática; and Nacional Financiera, S.N.C. | 2003 | ||
Mr. Juan Bueno Torio | Director General Born: 1953 Business experience: Undersecretary for Small and Medium Enterprise of the Ministry of Economy; Federal Congressman of the LVII Legislature; and Director General of Grupo Empresarial Bueno. | 2003 | ||
143
Table of Contents
Pemex-Refining—Directors and Executive Officers
Name | Position with Pemex-Refining | Year Appointed | ||
Mr. Miguel Tame Domínguez | Deputy Director of Production Born: 1946 Business experience: Associate Managing Director of Refinería Miguel Hidalgo; Associate Managing Director of Refinería Gral. Lázaro Cárdenas del Río; Associate Managing Director of Refinería Ing. Antonio M. Amor; and Associate Managing Director of Production Control of Pemex-Refining. | 2003 | ||
Mr. Carlos Xavier Pani Espinosa | Deputy Director of Trading Born: 1947 Business experience: Deputy Director of Trading of Pemex-Petrochemicals; Director General of CP Estrategia y Servicios, S.A. de C.V.; and Director General of Dermet, S.A. de C.V. | 2003 | ||
Mr. Pedro Carlos Gómez Flores | Deputy Director of Storage and Distribution Born: 1951 Business experience: Deputy Director of Organization Development of Petróleos Mexicanos; Deputy Director of Sectorial Relations of Petróleos Mexicanos, Deputy Director of Strategic Planning of Petróleos Mexicanos; and Deputy Director of Distribution of Pemex-Refining. | 2004 | ||
Mr. José Antonio Gómez Urquiza de la Macorra | Deputy Director of Finance and Management Born: 1951 Business experience: Director General of Cámara de la Industria del Hierro y del Acero; Deputy Delegate of Management of Delegación Benito Juárez; and Director General of Trichem de México, S.A. de C.V. | 2003 | ||
Mr. Manuel Betancourt García | Deputy Director of Planning, Coordination and Evaluation Born: 1947 Business experience: Director General of Industrial Development of Hydrocarbons of the Ministry of Energy; Director General of Policy and Energy Development of the Ministry of Energy; Coordinator of Advisors of the General Administrative Officer of the Ministry of Commerce and Industrial Development. | 2003 | ||
144
Table of Contents
Pemex-Refining—Directors and Executive Officers
Name | Position with Pemex-Refining | Year Appointed | ||
Mr. Juan Daniel Gómez Bilbao | Auditor of Industrial Safety and Environmental Protection Born: 1948 Business experience: Associate Managing Director of Program Evaluation of Petróleos Mexicanos; Deputy Director of Training and Technical Services of Instituto Mexicano del Petróleo; and Deputy Director of Research in Industrial Transformation of Instituto Mexicano del Petróleo. | 2001 | ||
Mr. José María Eugenio Núñez Murillo | Head of the Internal Control Body Born: 1948 Business experience: Federal Congressman of the LVIII Legislature; Chief Accountant of Finance of the LIV Legislature of the State of Jalisco; and Director Partner of Nuñez Asesores, S.C. Other board memberships: Nuñez Asesores, S.C. (Partner Director). | 2003 | ||
Pemex-Gas and Basic Petrochemicals—Directors and Executive Officers
Name | Position with Pemex-Gas and Basic Petrochemicals | Year Appointed | ||
Mr. Luis Ramírez Corzo y Hernández | Chairman of the Board of Pemex-Gas and Basic Petrochemicals (refer to Petróleos Mexicanos) | 2004 | ||
Mr. Carlos A. Morales Gil* | Board Member of Pemex-Gas and Basic Petrochemicals (refer to Pemex-Exploration and Production) | 2004 | ||
Mr. Juan Bueno Torio | Board Member of Pemex-Gas and Basic Petrochemicals (refer to Pemex-Refining) | 2003 | ||
Mr. Rafael Beverido Lomelín | Board Member of Pemex-Gas and Basic Petrochemicals (refer to Pemex-Petrochemicals) | 2001 | ||
Mr. Carlos Hurtado López | Board Member of Pemex-Gas and Basic Petrochemicals (refer to Pemex-Exploration and Production) | 2001 | ||
Mr. Héctor Moreira Rodríguez | Board Member of Pemex-Gas and Basic Petrochemicals (refer to Pemex-Exploration and Production) | 2004 | ||
Mr. Juan José Súarez Coppel | Board Member of Pemex-Gas and Basic Petrochemicals (refer to Petróleos Mexicanos) | 2002 | ||
(Vacant) | Board Member of Pemex-Gas and Basic Petrochemicals | |||
145
Table of Contents
Pemex-Gas and Basic Petrochemicals—Directors and Executive Officers
Name | Position with Pemex-Gas and Basic Petrochemicals | Year Appointed | ||
Mr. Roberto Ramírez Soberón | Acting Director General and Deputy Director of Planning Born: 1950 Business experience: Commercial Associate Managing Director, Associate Managing Director of Control and Measuring, Associate Managing Director of Marketing, and Deputy Manager of Solvents of Pemex-Gas and Basic Petrochemicals. | 2005 | ||
Mr. Salvador García-Luna Rodríguez | Deputy Director of Liquefied Gas and Basic Petrochemicals Born: 1959 Business experience: Commercial Director of Crude Oil of PMI; Commercial Associate Managing Director of Petroleum Products of PMI; and Commercial Deputy Manager of PMI. | 1996 | ||
Mr. Luis Felipe Luna Melo | Deputy Director of Natural Gas Born: 1956 Business experience: Commercial Representative in Tokyo and Deputy Manager of Analysis of PMI; and President of P.M.I. Holdings North America, Inc. | 1996 | ||
Mr. Claudio Enrique Trulín Espinosa | Deputy Director of Management and Finance Born: 1945 Business experience: Associate Managing Director of Internal Management and Corporate Support of Petróleos Mexicanos; and Technical Secretary of Industrial Safety and Environmental Protection Auditing of Petróleos Mexicanos. | 2001 | ||
Mr. Armando R. Arenas Briones | Deputy Director of Production Born: 1948 Business experience: Associate Managing Director; Coordinator; and Plant Manager of Petróleos Mexicanos. | 1996 | ||
Mr. Claudio F. Urencio Castro | Deputy Director of Pipelines Born: 1949 Business experience: Director General of Programming and Budget of the Federal District Department; Director of Economic Research of Bancomer S.N.C.; and Director General of Economic Analysis of the Ministry of Commerce and Industrial Promotion. | 1996 | ||
Mr. René Paredes Corral | Head of the Internal Control Body Born: 1966 Business experience: Head of the Governmental Auditing Unit of SFP; Head of the Internal Control Body of Comisión Federal de Electricidad; and Director of Finance of Toshiba America Consumer Products. | 2003 |
146
Table of Contents
Pemex- Petrochemicals—Directors and Executive Officers
Name | Position with Pemex-Petrochemicals | Year Appointed | ||
Mr. Luis Ramírez Corzo y Hernández | Chairman of the Board of Pemex-Petrochemicals (refer to Petróleos Mexicanos) | 2004 | ||
Mr. Roberto Ramírez Soberón* | Board Member of Pemex-Petrochemicals refer to Pemex-Gas and Basic Petrochemicals) | 2005 | ||
Mr. Juan Bueno Torio | Board Member of Pemex-Petrochemicals (refer to Pemex-Refining) | 2003 | ||
Mr. Carlos A. Morales Gil* | Board Member of Pemex-Petrochemicals (refer to Pemex-Exploration and Production) | 2004 | ||
Mr. Carlos Hurtado López | Board Member of Pemex-Petrochemicals refer to Pemex-Exploration and Production) | 2001 | ||
Mr. Héctor Moreira Rodríguez | Board Member of Pemex-Petrochemicals (refer to Pemex-Exploration and Production) | 2004 | ||
(Vacant) | Board Member of Pemex-Petrochemicals | |||
Mr. Juan Antonio García Villa | Board Member of Pemex-Petrochemicals and Undersecretary of Foreign Investment and International Trade Practices of the Ministry of Economy Born: 1945 Business experience: Senator and Local Congressman in Coahuila; Advisor of the Governor of the State of Coahuila; Editorial Contributor of Organización Editorial Mexicana; and Professor at Universidad Iberoamericana. Other board memberships: Luz y Fuerza del Centro; Centro de Investigación en Química Aplicada; Fondo de Información y Documentación para la Industria; Corporación Mexicana de Investigación en Materiales; Centro de Investigación y Desarrollo Tecnológico en Electroquímica; Fondo de Investigación y Desarrollo para la Modernización Tecnológica; Centro de Ingeniería y Desarrollo Industrial; Fondo para el Fortalecimiento de las Capacidades Científicas y Tecnológicas; Comisión Federal de Electricidad; Comisión Nacional de Normalización; and Coordinación de la Inversión Pública Federal. | 2003 | ||
Mr. Rafael Beverido Lomelín | Director General Born: 1942 Business experience: Director General and other positions in Industrias Negromex, S.A. de C.V. and Adviser to several companies of Grupo DESC. | 2001 | ||
147
Table of Contents
Pemex- Petrochemicals—Directors and Executive Officers
Name | Position with Pemex-Petrochemicals | Year Appointed | ||
Mr. Lorenzo Aldeco Ramírez | Deputy Director of Trading Born: 1955 Business experience: Deputy Director of Operations of Pemex-Petrochemicals; Deputy Director of Planning of Pemex-Petrochemicals; Manager of Operations of Servicios de Operaciones de Nitrógeno, S.A. de C.V.; Manager of Chemical Plant of Industrias Negromex, S.A. de C.V.; and Manager of Acquisitions of Industrias Negromex, S.A. de C.V. | 2005 | ||
Mr. Abraham Klip Moshinsky | Deputy Director of Planning Born: 1956 Business Experience: Director General of Blindajes Automundo, S.A. de C.V.; Director General of Carrocerías y Adaptaciones Automotrices, S.A. de C.V.; and Director of Operations of Industrias Negromex, S.A. de C.V. | 2002 | ||
Mr. Mario Hugo González Petrikowsky | Deputy Director of Management and Finance Born: 1937 Business experience: Associate Managing Director of Budgeting; Advisor to the Deputy Direction of Programming and Budgeting; and Deputy Director of Planning of Pemex-Petrochemicals. | 2001 | ||
Mr. Francisco Arturo Arellano Urbina | Deputy Director of Operations Born: 1946 Business experience: Director of Petroquímica La Cangrejera, S.A. de C.V.; Director General of Micosa División Construcciones, S.A. de C.V.; and Director General of RCR Ingenieros Asociados, S.A. de C.V. | 2005 | ||
Mr. Felipe de Jesús Barragán Alvídrez | Head of the Internal Control Body Born: 1950 Business experience: Head of the Internal Control Body of Petroquímica Morelos, S.A. de C.V.; Head of the Internal Control Body of Petroquímica Escolín, S.A. de C.V.; and Deputy Comptroller of Auditing of Pemex-Petrochemicals | 2003 | ||
| * | Under the Organic Law, Directors General of the subsidiary entities must be appointed by the President of Mexico. Until such appointment is made, an Acting Director General of a subsidiary entity is able to attend the meetings of the Board of Directors of a subsidiary entity but does not have the power to vote on any resolution proposed at such meetings. |
148
Table of Contents
Compensation of Directors and Officers
For the year ended December 31, 2004, the aggregate compensation of executive officers of Petróleos Mexicanos and the subsidiary entities (82 persons) paid or accrued in that year for services in all capacities was approximately Ps. 246.9 million. Members of the boards of directors of Petróleos Mexicanos and the subsidiary entities do not receive compensation for their services.
Board Practices
Neither the members of the boards of directors nor the executive officers are appointed for a specific term. The members of the boards of directors, except for those selected by the Union, and the Directors General of Petróleos Mexicanos and the subsidiary entities serve subject to the discretion of the President of Mexico.
Audit Committee
As we currently do not have an audit committee of the Board of Directors, the entire Board of Directors of Petróleos Mexicanos is presently acting as our audit committee within the meaning of Section 3(a)(58)(B) of the Exchange Act.
Employees
Excluding employees of the PMI Group and including those employed by us on a temporary basis, at December 31, 2004, Petróleos Mexicanos and the subsidiary entities had 137,722 employees, as compared with 138,215 at December 31, 2003. During 2004, Petróleos Mexicanos and the subsidiary entities employed an average of 16,735 temporary employees. The following table sets forth the number of employees of Petróleos Mexicanos, the subsidiary entities and the PMI Group at year-end for the past five years.
| At December 31, | ||||||||||||
| 2000 | 2001 | 2002 | 2003 | 2004 | 2004 % of Total | |||||||
Pemex-Refining | 47,717 | 47,710 | 47,341 | 46,692 | 44,899 | 32.6 | ||||||
Pemex-Exploration and Production | 46,215 | 43,208 | 44,658 | 46,322 | 47,975 | 34.8 | ||||||
Pemex-Petrochemicals | 13,526 | 14,578 | 14,360 | 14,203 | 13,895 | 10.1 | ||||||
Pemex-Gas and Basic Petrochemicals | 10,595 | 11,716 | 11,977 | 12,104 | 11,923 | 8.7 | ||||||
Petróleos Mexicanos | 17,038 | 17,640 | 18,798 | 18,894 | 19,030 | 13.8 | ||||||
Total | 135,091 | 134,852 | 137,134 | 138,215 | 137,722 | 100.0 | ||||||
PMI Group | 303 | 324 | 330 | 318 | 320 | — | ||||||
Source: Petróleos Mexicanos.
The Union represents approximately 80.9% of the work force of Petróleos Mexicanos and the subsidiary entities. The members of the Union are our employees and they elect their own leadership from among their ranks. Since the Union’s official establishment in 1938, we have experienced no labor strikes, and although we have experienced work stoppages for short periods of time, none of these stoppages has had a significant material adverse effect on our operations. However, there was an investigation and judicial proceeding relating to certain alleged improper diversions of federal monies by Union officials, which resulted in an offer by the Union to pay to us, over a period of years, Ps. 1,580 million in nominal terms for the amounts allegedly diverted from us. See “Item 8—Financial Information—Legal Proceedings––Mexican Government Audits and Other Investigations.”
Our relationship with our employees is regulated by theLey Federal del Trabajo(Federal Labor Law) and a collective bargaining agreement between Petróleos Mexicanos and the Union. The collective bargaining agreement regulates extensively all aspects of the relationship of Petróleos Mexicanos and the subsidiary entities with their employees. The collective bargaining agreement is subject to renegotiation every two years, although salaries are reviewed annually.
149
Table of Contents
Petróleos Mexicanos and the Union renewed the collective bargaining agreement effective August 1, 2003, which provided for a 4.3% increase in wages and several increases in benefits oriented to improve productivity. This renewed contract was set to expire on July 31, 2005. Subsequently, on July 26, 2004, Petróleos Mexicanos and the Union entered into a side agreement, effective August 1, 2004, which provides for a 4% increase in wages and other benefits, as well as an out-of-court settlement of a claim filed in August 2003 by the Union which is described under “Item 8—Financial Information—Legal Proceedings—Labor-related Proceedings.” Shortly after the occurrence of these events, in August 2004, the resignation of Mr. Juan Carlos Soriano from his position as General Counsel and Head of the Legal Department of Petróleos Mexicanos was requested and accepted. On September 20, 2004, Mr. José Nestor García Reza was designated Deputy General Counsel and Head of the Legal Department of Petróleos Mexicanos.
As of the date of this report, Petróleos Mexicanos and the Union are negotiating an amendment to this side agreement in order to make any adjustments required by applicable regulations and to establish a mechanism for the payment of benefits. This amendment would be subject to the approval of the Board of Directors of Petróleos Mexicanos and the Ministry of Finance and Public Credit. In addition, on June 15, 2005, Petróleos Mexicanos and the Union commenced negotiations regarding a new collective bargaining agreement that will be effective on August 1, 2005.
In accordance with the collective bargaining agreement and the Federal Labor Law, Petróleos Mexicanos and the subsidiary entities are under an obligation to pay seniority premiums to retiring employees and pension and death benefits to retired employees or their survivors. Retirees are entitled to receive increases in their pensions whenever salary increases are granted to current employees. We also provide health and medical benefits to employees, retired employees and their families and, subject to our overall budgetary constraints, we provide an interest-rate subsidy on employees’ mortgage loans.
On November 5, 1997, the Ministry of Finance and Public Credit and the Board of Directors of Petróleos Mexicanos authorized the formation of a trust called the Pemex Labor Fund. This fund is a vehicle to fund labor liabilities, current pension payments and seniority premiums. We have designed a contribution plan to increase the funds held in this trust and to continue to make payments on outstanding labor and pension liabilities. Our contributions to the Pemex Labor Fund amounted to Ps. 11,228 million in 2002, Ps. 18,077 million in 2003 and Ps. 1,897 million in 2004.
| Item 7. | Major Shareholders and Related Party Transactions |
Major Shareholders
Petróleos Mexicanos and the subsidiary entities have no shareholders because they are decentralized public entities of the Mexican Government. The Mexican Government closely regulates and supervises our operations; it incorporates the annual budget and financing programs of Petróleos Mexicanos and the subsidiary entities into its consolidated annual budget, which it submits to the Mexican Congress for its approval.
The Mexican Government also directs many executive decisions at us. Mexican Government ministers hold a majority of the seats on the Board of Directors of Petróleos Mexicanos, and the Secretary of Energy is the Chairman of the Board of Petróleos Mexicanos. The SFP appoints our external auditors and the Director General of Petróleos Mexicanos is a member of the President of Mexico’s cabinet. See also “Item 3—Key Information—Risk Factors—Risk Factors Related to the Relationship between PEMEX and the Mexican Government” and “Item 10—Additional Information—Share Capital.”
Related Party Transactions
Under Article 8, Section XI of theLey Federal de Responsabilidades Administrativas de los Servidores Públicos (Federal Law of Administrative Responsibilities of Public Officials), which is applicable to all of our employees, our employees are obligated to “recuse themselves from intervening in any way in the attention to,
150
Table of Contents
processing or resolution of matters in which they might have personal, family or business interest, including those where some benefit can result for themselves, their spouse, blood or affinity relatives up to the fourth degree, or civil relatives, or for third parties with which they have professional, labor, or business relations, or for partners or partnerships where the public officials or the persons referred above are or have been members of.”
As an employee benefit, we offer salary advances to all of our eligible Union and non-Union workers, including our executive officers, pursuant to the programs set forth in the collective bargaining agreement and in theReglamento de Trabajo del Personal de Confianza (Employment Regulation of White Collar Employees), respectively. The salary advances, which are non-interest bearing, are offered to each eligible employee in an amount up to a maximum of four months salary and are repaid through salary deductions in equal installments over a period of either one or two years, as elected by the employee. Most of our employees take advantage of this benefit. The largest amount of salary advances outstanding to executive officers during 2004 was Ps. 20.5 million. As of May 31, 2005, the aggregate amount of salary advances outstanding to our executive officers was Ps. 16 million.
| Item 8. | Financial Information |
Legal Proceedings
In the ordinary course of our business, we are named in a number of lawsuits of various types. We evaluate the merit of each claim and assess the likely outcome, accruing a contingent liability when an unfavorable decision is probable and the amount is reasonably estimable. We do not believe a materially unfavorable outcome is probable for any known or pending lawsuits or threatened litigation for which we have not made any accruals.
Labor-related Proceedings
We are a party to various legal actions involving labor claims of former and present employees. These labor disputes relate to severance payments, life insurance benefits, extensions of labor contracts, level of wages, improper termination and employee housing. We do not expect these lawsuits to have a material adverse effect on our financial condition or future results of operations.
In August 2003, the Union filed a claim against Petróleos Mexicanos before theJunta Federal de Conciliación y Arbitraje (Federal Council of Conciliation and Arbitration) arguing that certain benefit payments have not been made. In July, 2004, the Union and Petróleos Mexicanos agreed to settle this claim out of court and expressly waived any right to further pursue the claim pursuant to the side agreement referenced above under “Item 6—Directors, Senior Management and Employees—Employees.” On August 3, 2004, the Union withdrew its claim from the Federal Council of Conciliation and Arbitration.
Some Congressmen have questioned the benefits payments agreed between Petróleos Mexicanos and the Union under the side agreement described above. However, as of this date no formal charges have been commenced against Petróleos Mexicanos or its directors or officers in connection with the side agreement.
For information on our negotiations with the Union and collective bargaining agreements, see “Item 6—Directors, Senior Management and Employees—Employees.”
Mexican Government Audits and Other Investigations
In 2001, the SFP conducted an audit of our operations in 2000 and previous years. In the audit, SFP identified a series of transactions between PEMEX and the Union during 2000 which we believe involved illicit behavior. We describe the transactions, allegations and related proceedings below.
On January 21, 2002, SFP announced that it had submitted a criminal complaint to theProcuraduría General de la República (the Office of the Federal Attorney General) for the diversion of Ps. 1,580 million in federal monies from us to the Union from March 2000 to October 2000. SFP has alleged that the payments were not properly made under applicable Mexican laws and government regulations.
151
Table of Contents
In addition, the Federal Attorney General filed charges against certain of our former officers charging them with exceeding the scope of their corporate powers in executing the several transactions under investigation. On March 20, 2002, Petróleos Mexicanos filed three criminal complaints with the Federal Attorney General requesting prosecution principally of Rogelio Montemayor Seguy (former Director General), Carlos Juaristi Septién (former Corporate Management Director) and Juan José Domene Berlanga (former Chief Financial Officer) for acting illegally, outside the scope of their corporate powers and without the consent of the Board of Directors of Petróleos Mexicanos, our general counsel or the Mexican Government to illegally divert to the Union and certain of its representatives a total of Ps. 1,660 million (which includes the Ps. 1,580 million previously identified by SFP in its complaint). On that same date, the Federal Attorney General filed charges against Manuel Gómezperalta Damirón (also a former Corporate Management Director) for the alleged commission of the crime of embezzlement in connection with the aforementioned diversion of funds to the Union. The evidentiary stage in the case against Mr. Gómezperalta is in its final stages.
Mr. Montemayor resigned from PEMEX effective November 30, 2000, concurrent with President Fox’s appointment of Raúl Muñoz Leos as Director General. Messrs. Juaristi and Domene ended their affiliation with PEMEX in February 2001 as a result of the change in administration following the appointment of Mr. Muñoz Leos. In May 2002, a Mexican federal judge issued arrest warrants against these and certain other former officers of Petróleos Mexicanos for their embezzlement and unlawful use of their corporate powers and privileges. In 2002, Mr. Montemayor surrendered himself to U.S. federal authorities in Texas instead of federal authorities in Mexico.
At a hearing on July 20, 2004, a U.S. federal judge authorized the extradition of Rogelio Montemayor Seguy from the United States to Mexico. On August 5, 2004, Mr. Montemayor’s habeas corpus petition appealing the decision was denied, and on September 2, 2004, U.S. authorities turned him over to officials in Mexico to face charges for the alleged commission of the crimes of embezzlement and wrongful use of powers.
On September 10, 2002, the Federal Attorney General submitted a request to the Mexican Congress to remove the legislative immunity from prosecution of Senator Luis Ricardo Aldana Prieto, who is a member of the Board of Directors of Petróleos Mexicanos as a representative of the Union, for his participation in the illegal diversion of our funds. Senator Luis Ricardo Aldana Prieto will complete his term in 2006, and will continue to have legislative immunity unless the Congress strips him of it. If the Congress strips him of his legislative immunity, the Federal Attorney General will be able to proceed with the criminal prosecution.
In July 2003, the Federal Attorney General closed its investigation against Messrs. Montemayor, Juaristi and Domene with regard to the charges of money laundering and organized crime, on the grounds that it had insufficient proof to support these charges. The charges of electoral embezzlement, wrongful use of powers and, in the case of Messrs. Juaristi and Domene, improper exercise of a public service have been dismissed by the federal courts of Mexico for failure to provide sufficient proof to support these charges. Nevertheless, these former officers continue to be sought by the federal courts of Mexico for their alleged commission of the crime of embezzlement. The criminal trial against Mr. Montemayor is in the evidentiary stage. On May 10, 2005, the SFP announced it had fined the ex-Director General of Petróleos Mexicanos and other four ex-officers for a total of Ps. 2.8 billion and banned each of them plus a sixth ex-officer, who was not fined, from holding public office for varying periods of time.This decision has been appealed by some of these former officers and the final resolution is pending.
A Mexican judge issued two arrest warrants in September and October 2003 and issued formal imprisonment writs in October 2003 against Carlos Romero Deschamps (General Secretary of the Union), in connection with the investigation, commencing the criminal trial against him. This criminal trial is in the evidentiary stages.
The Union has offered to pay, over a period of years, Ps. 1,580 million to us for the amounts allegedly diverted from us through the transactions under investigation.This offer was accepted by the Board of Directors of Petróleos Mexicanos on September 1, 2003. The amounts that we have received as restitution have been
152
Table of Contents
appropriately recorded as a gain in the period in which cash was received, in accordance with both Mexican and U.S. GAAP.
Since learning from SFP about the illegal diversion of funds, we have been cooperating with SFP and the Office of the Federal Attorney General to prosecute the responsible persons. In addition, a number of initiatives and certain rules have been promoted and enacted in order to promote a culture of ethics and prevent corruption in our daily operations. On July 31, 2002, a code of ethics for federal public servants (Código de Ética de los Servidores Públicos de la Administración Pública Federal) was published in the Official Gazette of the Federation containing rules to promote legality, honesty, integrity, loyalty, impartiality and efficiency in the performance of public work by public officers. Prior to this, President Vicente Fox Quesada’s cabinet had committed to follow a code of ethics which embodies the conduct that the people of Mexico expect of their public servants. On October 3, 2003, we announced a corporate code of conduct for Petróleos Mexicanos and the subsidiary entities,el Código de Conducta de Petróleos Mexicanos y Organismos Subsidiarios(the Code of Conduct of Petróleos Mexicanos and the subsidiary entities) that defines the code of conduct expected from all workers in Petróleos Mexicanos and its subsidiary entities in the daily performance of their duties, and which is designed to promote transparency and prevent abuses. In addition, on May 12, 2004, the Board of Directors of Petróleos Mexicanos adopted a Code of Ethics for our chief executive officer, chief financial officer, chief accounting officer and all other employees performing similar functions in Petróleos Mexicanos, the subsidiary entities and the subsidiary companies. For more information on this Code of Ethics, see “Item 16B—Code of Ethics.” We expect that these efforts will result in a more effective system of internal controls.
In October 2000, in accordance with Article 73 of the Acquisitions, Leasing and Public Sector Services Law, Pemex-Refining settled a legal dispute with Productos Ecológicos S.A. de C.V. (Proesa) relating to the early termination of a long-term MTBE supply and services contract involving an MTBE plant that was never built before the Court for International Arbitration of the International Chamber of Commerce. Proesa’s initial claim against Pemex-Refining was for approximately U.S. $650 million. However, after discussion and negotiation in private arbitration proceedings, Pemex-Refining agreed to settle the dispute for a total amount of approximately U.S. $146.5 million (U.S. $127 million plus taxes). The settlement was formalized by an agreement between Pemex-Refining and Proesa, dated October 16, 2000, and fully paid on the same date; the full payment was recorded as an expense in 2000. Pemex-Refining submitted a criminal complaint to the Office of the Federal Attorney General against former officers of Pemex-Refining in connection with this matter.
The Office of the Federal Attorney General filed charges against these officers for unlawful use of their corporate powers and privileges. A federal judge subsequently issued formal imprisonment writs against former officers Mr. Mario Willars Andrade (former Director General of Pemex-Refining), Mr. Luis Ricardo Bouchot Guerrero and Mr. Cuauhtémoc Arce Herce. The evidentiary stage in the proceeding against Mr. Arce concluded and he was released on bail. In September 2004, Pemex-Refining appealed this decision, which is currently pending resolution.
Actions Against the Illicit Market in Fuels in Mexico
We are working with the Mexican Government’s Ministry of Finance and the Ministry of Energy to implement a number of measures to combat the illegal trade in fuels. This illegal trade is primarily the product of theft from pipelines, theft from our installations and the smuggling of products used to adulterate fuels. In connection with the implementation of these measures, the Federal Criminal Code was modified on April 29, 2004 to include as a high crime the theft or exploitation of hydrocarbons or its derivatives without consent or authorization. Since March 1, 2004, the Federal Preventive Police has guarded Pemex-Refining’s installations, which has helped to reduce the illicit market in fuels. Pemex-Refining is implementing several measures to prevent and fight the illicit market in fuels, including the development of an electronic control system in retail service stations that can detect irregularities, the installation of a system that allows us to detect and locate leaks from pipelines, the utilization of satellite monitoring of tankers and a system of mobile laboratories to analyze the quality of fuels. The illicit market in fuels impacts our results of operations due to the loss of revenue that
153
Table of Contents
would have been generated by the sale of such products, the production cost of which is already included in our cost of sales. We believe that the actions described above to combat the illegal trade in fuels have resulted in a reduction of this illegal trade and an increase in our sales volumes.
Civil Actions
In March 1999, Zapata Internacional, S.A. de C.V. (“Zapata”) filed a claim in a Mexican court against Pemex-Exploration and Production arguing that work under a construction agreement had been concluded but had not been paid for. Following a ruling in favor of Zapata, a judgment of approximately Ps. 9.2 million plus interest was entered against Pemex-Exploration and Production. In November 2003, Zapata filed a motion to execute this judgment, and in March 2004, Pemex-Exploration and Production was ordered to pay Ps. 1.6 billion. Pemex-Exploration and Production filed an appeal to contest the monetary sum awarded, and the judge overturned the ruling awarding interest payments to Zapata. After filing an appeal of such resolution, Zapata and Pemex-Exploration and Production agreed to an out-of-court settlement of this claim for a total of Ps. 60 million. On June 22, 2005, Zapata withdrew its appeal.
In March 2000, Construcciones Industriales del Golfo, S.A. de C.V. filed a claim for U.S. $79 million plus interest in a Mexican court against Pemex-Refining and Petróleos Mexicanos arguing that work under a construction agreement had been concluded but had not been paid for. In February 2004, following a ruling in favor of Construcciones Industriales del Golfo, S.A. de C.V., a judgment of approximately U.S. $4.5 million plus accrued interest was entered against Pemex-Refining; no judgment was entered into against Petróleos Mexicanos. Petróleos Mexicanos has filed an appeal, because a decision regarding expenses was not included in such judgment. In April 2005, Construcciones Industriales del Golfo, S.A. de C.V. filed a motion to determine the accrued interest to be paid by Pemex-Refining, which is currently pending resolution.
In September 2001, CONPROCA, the construction company performing construction and maintenance services for Pemex-Refining’s Cadereyta refinery, filed a claim for arbitration before the International Arbitration Court against Pemex-Refining and Petróleos Mexicanos related to expenses incurred by CONPROCA in providing those services. The parties filed their respective responses before the International Arbitration Court on November 18, 2003, and their respective rejoinders were filed before the deadline of May 7, 2004. In March 2005, the parties filed their respective rejoinders to the prior responses in connection with additional claims filed by each of them. The claim filed by CONPROCA is for U.S. $632.1 million, and Pemex-Refining and Petróleos Mexicanos filed a counterclaim in the amount of U.S. $907.7 million. In May 2005, the parties presented the evidence in support of these claims, which will be examined in June 2005.
In April 2004, Construcciones Industriales del Golfo, S.A. de C.V. filed a claim in a Mexican court for breach of contract against Pemex-Exploration and Production and Petróleos Mexicanos in connection with the removal of deposits in the Salamanca refinery. The claim seeks an award of approximately Ps. 15 million for works performed and not paid and approximately U.S. $219.6 million for damages. In May 2004, Pemex-Exploration and Production and Petróleos Mexicanos responded by arguing that the court did not have jurisdiction to hear the dispute, which motion was denied. Pemex-Exploration and Production and Petróleos Mexicanos answered the claim and the trial is in the evidentiary stage.
Two claims have been presented in connection with the MSC program (see “Item 4—Information on the Company—Business Overview—Pemex-Exploration and Production—Multiple Services Contracts”), one by theUnión Nacional de Trabajadores de Confianza de la Industria Petrolera (the National Alliance of Non-Union Petroleum Industry Workers) and the other by a group of Congressmen, led by Senator Manuel Barlett Díaz. In the first case, a civil claim was presented in April 2004 alleging that the MSC entered into between Pemex-Exploration and Production and Repsol Exploración México, S.A. de C.V. was void because it violated Article 27 of the Political Constitution of the United Mexican States. Pemex-Exploration and Production denied the validity of this argument and responded by asserting all applicable legal defenses. In June 2004, the judge issued a preliminary judgment declaring that the court did not have jurisdiction over the claim, and the claim was
154
Table of Contents
remitted to an administrative judge. In May 2005, the administrative judge also issued a preliminary judgment declaring that the court did not have jurisdiction over the claim. This decision was not appealed by the plaintiffs and since the plaintiffs did not file a claim at the relevant fiscal court it has been dismissed with prejudice.
In the second case, on May 6, 2004, prior to acknowledging receipt of the claim, the judge made a motion to require Pemex-Exploration and Production to fulfill certain requirements in connection with the aforementioned MSC. On July 27, 2004, Pemex-Exploration and Production provided the court with certain information that had been requested by the presiding judge, who subsequently acknowledged receipt of the claim. Pemex-Exploration and Production filed a motion arguing that the court lacks jurisdiction, which was denied, and a motion arguing that the plaintiffs failed to have capacity to be a party in this suit, which was granted by the judge on June 10, 2005.This decision has been appealed by the plaintiffs. Neither of these claims seek monetary damages as relief, rather they seek to prevent the performance of the MSC through a declaration that the MSCs are void. However, if the MSC is declared void, Repsol Exploración México, S.A. de C.V. may sue for damages. We believe we have sufficient elements to support these claims and, accordingly, we have not created a reserve to pay for any potential judgment.
In December 2003, Unión de Sistemas Industriales, S.A. de C.V. filed a claim in a Mexican civil court against Pemex-Refining seeking approximately U.S. $142 million for, among other things, works performed and not paid under a construction agreement. In January 2004, Pemex-Refining filed a motion arguing that the court lacked jurisdiction, and on June 4, 2004 the judge granted the motion and remitted the claim to an administrative judge. Following a successful appeal by Unión de Sistemas Industriales, S.A. de C.V., the judge pronounced that the claim had to be remitted again to the initial Mexican civil court. Pemex-Refining appealed this decision, which motion was denied. In October 2004, Pemex-Refining responded to this claim, which is currently in its evidentiary stages.
In July 2000, Petroquímica Cosoleacaque S.A. de C.V. (“PECOSA”) filed a claim against Afianzadora Insurgentes, S.A. de C.V. and Fianzas México Bital, S.A. The claim seeks an award of approximately U.S. $100 million for a surety bond granted in favor of Agronitrogenados, S.A. de C.V., an ammonia supplier of PECOSA. In June 2004, a judgment was entered in favor of PECOSA. In October 2004, Afianzadora Insurgentes, S.A. de C.V. and Fianza México Bital, S.A appealed this decision, which appeal is currently pending resolution.
In December 2004, Corporación Mexicana de Mantenimiento Integral S. de R.L. de C.V. (“COMMISA”) filed a claim before the International Court of Arbitration against Pemex-Exploration and Production seeking approximately U.S. $300 million for, among other things, the breach of a construction agreement in connection with two platforms in the Cantarell complex. In December 2004, the judge acknowledged receipt of the claim and Pemex-Exploration and Production designated its arbitrator. Such designation was appealed by COMMISA. In February 2005, Pemex-Exploration and Production responded to the claim and filed a counterclaim against COMMISA.In March 2005, COMMISA responded to the counterclaim. In April 2005, the court accepted the arbitrators proposed by the parties. After the appointment of its chairman, the arbitration court will summon the parties and determine the issues subject to this arbitration.
In January 2005, COMBISA S. de R.L. de C.V. (“COMBISA”) filed a claim before the International Court of Arbitration against Pemex-Exploration and Production seeking approximately U.S. $235 million plus interest accrued for, among other things, the breach of a construction agreement in connection with two platforms in the Cantarell complex. In April 2005, Pemex-Exploration and Production responded the claim and filed a counterclaim against COMBISA. In May 2005, COMBISA responded to the counterclaim. The acceptance by the court of the arbitrators proposed by the parties is still pending.
In February 2005, COMMISA filed a claim before the International Court of Arbitration against Pemex-Exploration and Production seeking approximately U.S. $147 million plus damages for, among other things, the breach of a construction agreement in connection with pipelines in the Cantarell complex. In April 2005, the court accepted the arbitrators proposed by the parties and appointed the chairman of the arbitration court. In May 2005, Pemex-Exploration and Production responded to the claim and filed a counterclaim against COMMISA.
155
Table of Contents
Dividends
In March 1990, as a result of the implementation of the 1989-92 Financing Package for Mexico, our commercial bank creditors exchanged U.S. $7.58 billion of Petróleos Mexicanos’ external indebtedness for Brady Bonds issued by the Mexican Government. At the same time, Petróleos Mexicanos’ indebtedness to the Mexican Government increased by the same amount; the new indebtedness was denominated in currencies other than pesos. In December 1990, the Mexican Government and Petróleos Mexicanos agreed to capitalize this indebtedness, converting it into Certificates of Contribution “A.” As a condition of this capitalization, Petróleos Mexicanos agreed to pay a minimum guaranteed dividend to the Mexican Government equal to the debt service on the capitalized debt. The Board of Directors of Petróleos Mexicanos approves the total dividend on the Certificates of Contribution “A” after the end of each fiscal year, although Petróleos Mexicanos pays an amount equal to the minimum guaranteed dividend to the Mexican Government in monthly advance payments during the year. During 2000, 2001, 2002, 2003 and 2004, Petróleos Mexicanos made advance payments to the Mexican Government in the aggregate of Ps. 6,715 million, Ps. 2,489 million, Ps. 10,622 million, Ps. 10,703 million and Ps 10,388 million, respectively, towards the minimum guaranteed dividends for those years See “Item 5—Operating and Financial Review and Prospects—Liquidity and Capital Resources—Equity Structure and the Certificates of Contribution ‘A.’”
156
Table of Contents
| Item 9. | The Offer and Listing |
Trading in the debt securities issued by Petróleos Mexicanos and the Pemex Project Funding Master Trust takes place primarily in the over-the-counter market. All the debt securities issued by Petróleos Mexicanos and the Pemex Project Funding Master Trust that are registered pursuant to the Securities Act are also listed on the Luxembourg Stock Exchange.
| Item 10. | Additional Information |
Memorandum and Articles of Association
The Mexican Congress established Petróleos Mexicanos by a decree dated June 7, 1938, effective July 20, 1938. None of Petróleos Mexicanos or the subsidiary entities has bylaws or articles of association. On July 17, 1992, the Mexican Congress created the subsidiary entities out of operations that had previously been directly managed by Petróleos Mexicanos. Petróleos Mexicanos and its four subsidiary entities, Pemex-Exploration and Production, Pemex-Refining, Pemex-Gas and Basic Petrochemicals and Pemex-Petrochemicals, are decentralized public entities of the Mexican Government, and each is a legal entity empowered to own property and carry on business in its own name. The activities of Petróleos Mexicanos and the subsidiary entities are regulated by the Political Constitution of the United Mexican States, the Regulatory Law, the Organic Law, regulations issued pursuant to the Regulatory Law and other federal laws and regulations. See “Item 4—Information on the Company—History and Development.” Six members of the Board of Directors of Petróleos Mexicanos, including the Chairman, are appointed by the President of Mexico. Our Union selects the remaining five directors from among employees of Petróleos Mexicanos and the subsidiary entities. An eight-member board of directors governs each subsidiary entity. Each of these boards consists of the Director General of Petróleos Mexicanos, the Director General of each of the other three subsidiary entities and four additional directors, who are each appointed by the President of Mexico. The members of the boards of directors of Petróleos Mexicanos and each of the subsidiary entities are not appointed for a specific term, and, except for those members selected by the Union, they serve subject to the discretion of the President of Mexico.
Under the Federal Law of Administrative Responsibilities of Public Officials, our directors are obligated to abstain from voting on a proposal, arrangement or contact in which they have a personal, family or business interest. Our directors do not receive compensation for their services as members of the boards of directors of Petróleos Mexicanos and the subsidiary entities, nor do they have the power to vote compensation to themselves or any other member of the board. Under the Federal Law of Administrative Responsibilities of Public Officials, our directors have to perform their duties without obtaining or attempt to obtain additional benefits to those granted by law. Therefore, our directors do not have borrowing powers exercisable by themselves. There is no requirement for early retirement for our directors.
Material Contracts
On November 10, 1998, Petróleos Mexicanos, The Bank of New York and The Bank of New York (Delaware) entered into a Trust Agreement, which created the Pemex Project Funding Master Trust and designated The Bank of New York as Managing Trustee and The Bank of New York (Delaware) as Delaware Trustee. On the same date, Petróleos Mexicanos, the subsidiary entities and the Pemex Project Funding Master Trust, acting through The Bank of New York, entered into an Assignment and Indemnity Agreement. This agreement provides for the assignment by the subsidiary entities to the Pemex Project Funding Master Trust of certain payment obligations relating to PIDIREGAS, the arrangement by Petróleos Mexicanos of financing on behalf of the Pemex Project Funding Master Trust to meet such payment obligations, the payment by Petróleos Mexicanos and the subsidiary entities to the Pemex Project Funding Master Trust of the amounts necessary to meet the Pemex Project Funding Master Trust’s obligations under such financings and the indemnification of the Pemex Project Funding Master Trust by Petróleos Mexicanos and the subsidiary entities. The Trust Agreement was amended on November 17, 2004 and December 22, 2004.
157
Table of Contents
On December 30, 2004, the Pemex Project Funding Master Trust and Petróleos Mexicanos entered into an Indenture with Deutsche Bank Trust Company Americas, as Trustee. This agreement provides for the issuance by the Pemex Project Funding Master Trust from time to time of unsecured debt securities. These issuances are unconditionally guaranteed by Petróleos Mexicanos. Pursuant to a Guaranty Agreement, dated as of July 29, 1996, Petróleos Mexicanos’ obligations are jointly and severally guaranteed by Pemex-Exploration and Production, Pemex-Refining and Pemex-Gas and Basic Petrochemicals.
On February 11, 2005, the Pemex Project Funding Master Trust increased the aggregate amount of debt securities issuable under its Medium-Term Notes program to U.S. $20,000,000,000. Following the increase and pursuant to the December 2004 Indenture referred to above, the Pemex Project Funding Master Trust issued the following securities
| • | €1,000,000,000 5.50% Notes due 2025, issued on February 24, 2005; |
| • | U.S. $1,000,000,000 5.75% Notes due 2015, issued on June 8, 2005; and |
| • | U.S. $500,000,000 6.625% Bonds due 2035, issued on June 8, 2005. |
As of December 31, 2003 and 2004, we have entered into contracts with various contractors for an approximate amount of Ps. 172,652 million and Ps. 215,567 million, respectively. These contracts are for the development of PIDIREGAS and are therefore subject to standards required in NIF-09-B, which is a Mexican accounting guideline that outlines specific accounting and budgetary treatment applicable to PIDIREGAS. For an explanation of NIF-09-B, see “Item 4—Information on the Company—History and Development—Capital Expenditures and Investment” and Note 2 (d) to our consolidated financial statements included herein.
Exchange Controls
Mexico has had a free market for foreign exchange since 1991, and the government has allowed the peso to float freely against the U.S. dollar since December 1994. There can be no assurance that the government will maintain its current foreign exchange policies. See “Item 3—Key Information—Exchange Rates” and “Item 3—Key Information—Risk Factors—Considerations Related to Mexico.”
Taxation
The 1997 Securities, the 1998 Securities, the 1999 Securities, the 2001 Securities, the 2003 Securities and the 2004 Securities.
Pursuant to a registration statement on Form F-4 (File No. 333-7796), which was declared effective by the SEC on October 17, 1997, Petróleos Mexicanos, Pemex-Exploration and Production, Pemex-Refining and Pemex-Gas and Basic Petrochemicals registered pursuant to the Securities Act of 1933 up to U.S. $600,000,000 of 8.85% Global Guaranteed Notes due 2007 and up to U.S. $400,000,000 of 9.50% Global Guaranteed Bonds due 2027. These securities are collectively referred to as the 1997 Securities.
Pursuant to a registration statement on Form F-4 (File No. 333-9310), which was declared effective by the SEC on August 24, 1998, Petróleos Mexicanos, Pemex-Exploration and Production, Pemex-Refining and Pemex-Gas and Basic Petrochemicals registered pursuant to the Securities Act of 1933 up to U.S. $350,000,000 of 8 3/8% Global Guaranteed Notes due 2005 and up to U.S. $350,000,000 of 9 ¼% Global Guaranteed Bonds due 2018. These securities are collectively referred to as the 1998 Securities.
Pursuant to a registration statement on Form F-4 (File No. 333-10906), which was declared effective by the SEC on October 1, 1999, Petróleos Mexicanos, Pemex-Exploration and Production, Pemex-Refining and Pemex-Gas and Basic Petrochemicals registered pursuant to the Securities Act of 1933 up to U.S. $600,000,000 of 9 3/8% Notes due December 2, 2008, Puttable at Par on December 2, 2001 (the Puttable Notes). Pursuant to a registration statement on Form F-4 (File No. 333-10706), which was declared effective by the SEC on October 1,
158
Table of Contents
1999, Petróleos Mexicanos, Pemex-Exploration and Production, Pemex-Refining and Pemex-Gas and Basic Petrochemicals registered pursuant to the Securities Act of 1933 up to U.S. $500,000,000 of 9.50% Puttable or Mandatorily Exchangeable Securities (POMESSM) due 2027. The securities registered in 1999 under these two registration statements are collectively referred to as the 1999 Securities.
Pursuant to a registration statement on Form F-4 (File No. 333-13812), which was declared effective by the SEC on August 29, 2001, the Pemex Project Funding Master Trust, Petróleos Mexicanos, Pemex-Exploration and Production, Pemex-Refining and Pemex-Gas and Basic Petrochemicals registered pursuant to the Securities Act of 1933 up to U.S. $1,000,000,000 of 8.50% Notes due 2008 and up to U.S. $1,000,000,000 of 9.125% Notes due 2010. These securities are collectively referred to as the 2001 Securities.
Pursuant to a registration statement on Form F-4 (File No. 333-102993) which was declared effective by the SEC on February 14, 2003, Petróleos Mexicanos, Pemex-Exploration and Production, Pemex-Refining and Pemex-Gas and Basis Petrochemicals registered pursuant to the Securities Act of 1933 up to U.S. $600,000,000 of 6.50% Notes due February 1, 2005. Pursuant to a registration statement on Form F-4 (File No. 333-103197), which was declared effective by the SEC on February 24, 2003, the Pemex Project Funding Master Trust, Petróleos Mexicanos, Pemex-Exploration and Production, Pemex-Refining and Pemex-Gas and Basic Petrochemicals registered pursuant to the Securities Act of 1933 up to U.S. $750,000,000 of 8.00% Notes due 2011, up to U.S. $1,000,000,000 of 7.875% Notes due 2009, up to U.S. $500,000,000 of 8.625% Bonds due 2022 and up to U.S. $1,000,000,000 of 7.375% Notes due 2014. Pursuant to a registration statement on Form F-4 (File No. 333-107905), which was declared effective by the SEC on August 21, 2003, the Pemex Project Funding Master Trust, Petróleos Mexicanos, Pemex-Exploration and Production, Pemex-Refining and Pemex-Gas and Basic Petrochemicals registered pursuant to the Securities Act of 1933 up to U.S. $750,000,000 of 6.125% Notes due 2008, up to U.S. $510,154,000 of 8.625% Bonds due 2022 and up to U.S. $757,265,000 of 7.375% Notes due 2014. Pursuant to a registration statement on Form F-4 (File No. 333-103197), which was declared effective by the SEC on August 21, 2003, the Pemex Project Funding Master Trust, Petróleos Mexicanos, Pemex-Exploration and Production, Pemex-Refining and Pemex-Gas and Basic Petrochemicals registered pursuant to the Securities Act of 1933 up to U.S. $36,977,000 of 8.00% Notes due 2011 and up to U.S. $24,692,000 of 7.875% Notes due 2009.Pursuant to a registration statement on Form F-4 (File No. 333-108257), which was declared effective by the SEC on August 28, 2003, the Pemex Project Funding Master Trust, Petróleos Mexicanos, Pemex-Exploration and Production, Pemex-Refining and Pemex-Gas and Basic Petrochemicals registered pursuant to the Securities Act of 1933 up to U.S. $9,841,000 of 9.125% Notes due 2010. The securities registered in 2003 under these registration statements are collectively referred to as the 2003 Securities.
Pursuant to a registration statement on Form F-4 (File No. 333-118373), which was declared effective by the SEC on August 31, 2004, the Pemex Project Funding Master Trust, Petróleos Mexicanos, Pemex-Exploration and Production, Pemex-Refining and Pemex-Gas and Basic Petrochemicals registered pursuant to the Securities Act of 1933 up to U.S. $36,296,000 of 8.50% Notes due 2008, U.S. $18,095,000 of 7.375% Notes due 2014 and up to U.S. $47,085,000 of 8.625% Bonds due 2022. These securities are collectively referred to as the 2004 Securities, and together with the 1997 Securities, the 1998 Securities, the 1999 Securities, the 2001 Securities and the 2003 Securities, are collectively referred as the “Registered Securities”).
Taxation Generally
The following summary contains a description of the principal Mexican and U.S. federal income tax consequences of the ownership and disposition of the Registered Securities, but it does not purport to be a comprehensive description of all of the tax considerations that may be relevant to a decision to invest in, or dispose of, the Registered Securities.
This summary is based on the federal tax laws of Mexico and the United States in force on the date of this Form 20-F, including the provisions of the income tax treaty between the United States and Mexico together with related protocols (the Tax Treaty) (which are subject to change), and does not describe any tax consequences
159
Table of Contents
arising under the laws of any state or municipality in Mexico, the United States or any other jurisdiction, or the laws of any taxing jurisdiction other than the federal laws of Mexico and the United States.
Mexico has also entered into, or is negotiating, tax treaties with various countries that may have effects on holders of Registered Securities. This summary does not discuss the consequences (if any) of such treaties.
Each holder or beneficial owner of Registered Securities should consult its tax advisor as to the Mexican, United States or other tax consequences of the ownership and disposition of those securities, including the effect of any foreign, state or municipal tax laws, and the consequences of the application of any tax treaty to which Mexico is a party.
Mexican Taxation
This summary of certain Mexican federal tax considerations refers only to holders of Registered Securities that are not residents of Mexico for Mexican tax purposes and that will not hold the Registered Securities or a beneficial interest therein through a permanent establishment for tax purposes (we refer to any such non-resident holder as a Foreign Holder). For purposes of Mexican taxation, an individual is a resident of Mexico if he/she has established his/her domicile in Mexico. When an individual also has a place of residence in another country, that individual will be considered a resident of Mexico for tax purposes, if such individual has his/her center of vital interest in Mexico. An individual would be deemed to have his/her center of vital interest in Mexico if, among other things, (a) more than 50% of his/her total income for the year derives from Mexican sources, or (b) his/her principal center of professional activities is located in Mexico.
A legal entity is a resident of Mexico if:
| • | it has been incorporated under the laws of Mexico; |
| • | maintains the principal administration of its business in Mexico; or |
| • | it has established its effective management in Mexico. |
A Mexican national is presumed to be a resident of Mexico unless such person can demonstrate to the contrary. If a legal entity or individual has a permanent establishment in Mexico, such permanent establishment shall be required to pay taxes in Mexico on income attributable to such permanent establishment in accordance with Mexican federal tax law.
Taxation of Interest. Under the MexicanLey del Impuesto Sobre la Renta(Income Tax Law) and rules issued by the Ministry of Finance and Public Credit applicable to PEMEX, payments of interest (which is deemed to include any amounts paid in excess of the original issue price of the securities), made by a Mexican issuer (including Petróleos Mexicanos and the Pemex Project Funding Master Trust) in respect of notes or bonds and other debt securities to a Foreign Holder will generally be subject to a Mexican withholding tax assessed at a rate of 4.9%, if the following requirements are met:
| • | the relevant notes or bonds are registered with the Special Section of the National Registry of Securities maintained by the National Banking and Securities Commission; |
| • | the notes or bonds are placed outside of Mexico through banks or brokerage houses in a country that has entered into a treaty to avoid double taxation with Mexico; and |
| • | the issuer duly complies with the information requirements established in the general rules issued by the Ministry of Finance and Public Credit for such purposes. |
If the effective beneficiaries, directly or indirectly, individually or jointly with related parties, receive more than 5% of the interest paid on the notes or bonds and are holders, directly or indirectly, individually or jointly, with related parties of more than 10% of the voting stock of the issuer or entities 20% or more of whose stock is
160
Table of Contents
owned directly or indirectly, individually or jointly, by parties related to the issuer, the withholding tax rate applicable to payment of interest on the notes or bonds may be significantly higher.
Payments of interest made by Petróleos Mexicanos, the Pemex Project Funding Master Trust (in the case of Registered Securities issued by it) or Pemex-Exploration and Production, Pemex-Refining, or Pemex-Gas and Basic Petrochemicals in respect of the Registered Securities, to non-Mexican pension or retirement funds will be exempt from Mexican withholding taxes, provided that:
| • | such fund is duly organized pursuant to the laws of its country of origin and is the effective beneficiary of the interest payment; |
| • | the income from such interest payment is exempt from income tax in such country of residence; and |
| • | such fund is registered with the Ministry of Finance and Public Credit for that purpose. |
Additional Amounts. Petróleos Mexicanos, the Pemex Project Funding Master Trust (in the case of Registered Securities issued by it), Pemex-Exploration and Production, Pemex-Refining and Pemex-Gas and Basic Petrochemicals have agreed, subject to specified exceptions and limitations, to:
| • | pay Additional Amounts (as defined in the Indenture dated September 18, 1997, between Petróleos Mexicanos and Deutsche Bank (the 1997 Indenture)) to the holders of the 1997 Securities in respect of the Mexican withholding taxes mentioned above; |
| • | pay Additional Amounts (as defined in the Indenture dated August 7, 1998, between Petróleos Mexicanos and Deutsche Bank (the 1998 Indenture)) to the holders of the 1998 Securities in respect of the Mexican withholding taxes mentioned above; |
| • | pay Additional Amounts (as defined in the Indenture dated as of July 31, 1999, between Petróleos Mexicanos and Deutsche Bank) to the holders of the Puttable Notes; |
| • | pay Additional Amounts (as defined in the Indenture dated as of July 15, 1999, between Petróleos Mexicanos and Deutsche Bank) to the holders of the POMESSM in respect of the Mexican withholding taxes described above; and |
| • | pay Additional Amounts (as defined in the Indenture dated as of July 31, 2000, among the Pemex Project Funding Master Trust, Petróleos Mexicanos and Deutsche Bank) to the holders of the 2001 Securities, the 2003 Securities and the 2004 Securities in respect of the Mexican withholding taxes described above. |
If Petróleos Mexicanos or the Pemex Project Funding Master Trust (in the case of Registered Securities issued by it) pays Additional Amounts in respect of such Mexican withholding taxes, any refunds received with respect to such Additional Amounts will be for the account of Petróleos Mexicanos or the Pemex Project Funding Master Trust, as applicable.
Holders or beneficial owners of the Registered Securities may be requested to provide certain information or documentation necessary to enable Petróleos Mexicanos, the Pemex Project Funding Master Trust (in the case of Registered Securities issued by it), Pemex-Exploration and Production, Pemex-Refining or Pemex-Gas and Basic Petrochemicals to establish the appropriate Mexican withholding tax rate applicable to such holders or beneficial owners. In the event that the specified information or documentation concerning the holder or beneficial owner, if requested, is not provided on a timely basis, the obligation of Petróleos Mexicanos, the Pemex Project Funding Master Trust (in the case of Registered Securities issued by it), Pemex-Exploration and Production, Pemex-Refining or Pemex-Gas and Basic Petrochemicals to pay Additional Amounts may be limited.
Taxation of Dispositions. Capital gains resulting from the sale or other disposition of the Registered Securities by a Foreign Holder will not be subject to Mexican income or withholding taxes.
161
Table of Contents
Other Mexican Tax Considerations. Under the Income Tax Law, any discount received by a non-resident upon purchase of the notes or bonds from a Mexican resident or a non-resident with a permanent establishment in Mexico, is deemed interest income, and therefore, subject to taxes in Mexico. Such interest income results from the difference between the face value (plus accrued interest not subject to withholding) and the purchase price of such notes or bonds.
Transfer and Other Taxes. There are no Mexican stamp, registration, or similar taxes payable by a Foreign Holder in connection with the purchase, ownership or disposition of the Registered Securities. A Foreign Holder of the Registered Securities will not be liable for Mexican estate, succession, gift, inheritance or similar tax with respect to such securities.
United States Taxation
This summary of certain U.S. federal income tax considerations deals principally with persons that will hold the Registered Securities as capital assets and whose functional currency is the United States dollar. As used in this section “Taxation,” the term “United States Holder” means an individual who is a citizen or resident of the United States, a U.S. domestic corporation or any other person that is subject to U.S. federal income taxation on a net income basis in respect of its investment in the Registered Securities.
This summary does not purport to be a comprehensive description of all the tax considerations that may be relevant to any particular investor, including tax considerations that arise from rules of general application or that are assumed to be known to investors. This summary generally does not address the tax treatment of holders that may be subject to special tax rules, such as banks, insurance companies, tax-exempt organizations, dealers in securities or currencies, certain short-term holders of Registered Securities, traders in securities electing to mark to market, or persons that hedge their exposure in the Registered Securities or hold the Registered Securities as a position in a “straddle” for tax purposes or as part of a “synthetic security” or a “conversion transaction” or other integrated investment comprised of such securities and one or more other investments, nor does it address the tax treatment of holders that do not acquire the Registered Securities at their issue price as part of the initial distribution. Investors who purchase the Registered Securities at a price other than the issue price should consult their tax advisor as to the possible applicability to them of the amortizable bond premium or market discount rules. United States Holders should be aware that the U.S. federal income tax consequences of holding the Registered Securities may be materially different for investors described in the prior sentence, including as a result of recent changes in law applicable to investors with short holding periods or that engage in hedging transactions.
Taxation of Interest and Additional Amounts. A United States Holder will treat the gross amount of interest and Additional Amounts (i.e., without reduction for Mexican withholding taxes) as ordinary interest income in respect of the Registered Securities. Mexican withholding taxes paid at the appropriate rate applicable to the United States Holder will be treated as foreign income taxes eligible for credit against such United States Holder’s U.S. federal income tax liability, subject to generally applicable limitations and conditions, or, at the election of such United States Holder, for deduction in computing such United States Holder’s taxable income. Interest and Additional Amounts will constitute income from sources without the United States for U.S. foreign tax credit purposes. Such income generally will constitute “passive income” for U.S. foreign tax credit purposes unless the Mexican withholding tax applicable to the United States Holder is imposed at a rate of at least 5%, in which case such income generally will constitute “high withholding tax interest.”
The calculation of foreign tax credits and, in the case of a United States Holder that elects to deduct foreign taxes, the availability of deductions, involves the application of rules that depend on a United States Holder’s particular circumstances. United States Holders should consult their own tax advisors regarding the availability of foreign tax credits and the treatment of Additional Amounts.
162
Table of Contents
Foreign tax credits may not be allowed for withholding taxes imposed in respect of certain short-term or hedged positions in securities or in respect of arrangements in which a United States Holder’s expected economic profits is insubstantial. United States Holders should consult their own advisors concerning the implications of these rules in light of their particular circumstances.
Taxation of Dispositions. Upon the sale, exchange or retirement of a Registered Security, a United States Holder will generally recognize a gain or loss equal to the difference between the amount realized (less any amounts attributable to accrued and unpaid interest not previously includible in gross income, which will be taxable as ordinary income) and the holder’s tax basis in such security. Gain or loss recognized by a United States Holder on the sale, redemption or other disposition of the Registered Securities generally will be long-term capital gain or loss if, at the time of disposition, the securities have been held for more than one year. Long-term capital gain realized by an individual United States Holder is generally taxed at lower rates than short-term capital gains or ordinary income.
Non-United States Holders. Holders of the Registered Securities that are, with respect to the United States, non-resident aliens or foreign corporations (Non-United States Holders) will not be subject to U.S. federal income taxes, including withholding taxes, on payments of interest on the securities so long as the requirements described under “Backup Withholding and Information Reporting” are satisfied, unless such income is effectively connected with the conduct by the Non-United States Holder of a trade or business in the United States.
The gain realized on any sale or exchange of the Registered Securities by a Non-United States Holder will not be subject to U.S. federal income tax, including withholding tax, unless (1) such gain is effectively connected with the conduct by the holder of a trade or business in the United States or (2) in the case of gain realized by an individual holder, the holder is present in the United States for 183 days or more in the taxable year of the sale and either (A) such gain or income is attributable to an office or other fixed place of business maintained in the United States by such holder or (B) such holder has a tax home in the United States.
A Registered Security held by an individual holder who at the time of death is a nonresident alien will not be subject to United States federal estate tax.
Backup Withholding and Information Reporting. The principal paying agent for each of the Registered Securities will be required to file information returns with the Internal Revenue Service with respect to payments made to certain United States Holders of those securities. In addition, certain United States Holders may be subject to a backup withholding tax in respect of such payments, unless they (1) provide their accurate taxpayer identification numbers to the principal paying agent and certify that they are not subject to backup withholding or (2) otherwise establish an exemption from the backup withholding tax. Non-United States Holders may be required to comply with applicable certification procedures to establish that they are not United States Holders in order to avoid the application of such information reporting requirements and backup withholding tax.
Documents on Display
We are subject to the information requirements of the Securities Exchange Act of 1934, as amended. In accordance with these requirements, we file reports, including annual reports on Form 20-F, and other information with the SEC. These materials, including this annual report, and the exhibits thereto, may be inspected and copied at the SEC’s public reference room at 450 Fifth Street, N.W., Washington, D.C. 20549. Please call the SEC at 1-800-SEC-0330 for further information on the public reference rooms. In addition, any filings we make electronically with the SEC will be available to the public over the Internet at the SEC’s web site at http://www.sec.gov.
163
Table of Contents
| Item 11. | Quantitative and Qualitative Disclosures About Market Risk |
Risk Management and Financial Instruments
We face significant market risks as part of our normal business operations as result of the fluctuation of the prices of the commodities we produce and trade, of the value of the foreign currency in which some of our liabilities are denominated and of the interest rates of our debt obligations. Managing risk exposure is a high priority for our senior management and risk management committee, which is composed of representatives of Petróleos Mexicanos and the subsidiary entities, Banco de México, the Ministry of Finance and Public Credit and PMI.
During 2001, the Board of Directors of Petróleos Mexicanos approved a restructuring of the risk management area and created the Risk Management Deputy Direction. The objectives of this area are to create value by aligning the supply of internal and external capital with the demand for funds for operations and investment projects, to develop the financial and operational risk management strategy for Petróleos Mexicanos and the subsidiary entities and to establish institutional regulations consistent with a consolidated risk management approach.
We also established a risk management corporate governance framework, by updating our Risk Management General Policies, modifying the operation rules of the Risk Management Committee and creating the Risk Management General Guidelines, in accordance with an integrated and consolidated risk management approach aimed at managing the volatility inherent in these normal business exposures. In accordance with these policies, we enter into various transactions using derivative financial and commodity instruments, including conventional exchange-traded derivative instruments such as futures and options, as well as over-the-counter instruments such as swaps, options and forward contracts.
Commodity Price Risk
Crude Oil
Our exports and domestic sales are related to international hydrocarbon prices, thus exposing us to fluctuations in international markets. We share this risk with the Mexican Government through our current fiscal regime. In order to mitigate this risk, since 1998, the Mexican Government, along with PEMEX, has actively participated with the major international oil producers to improve international oil prices by reducing crude oil exports volumes. See “Item 5—Operating and Financial Review and Prospects—Export Agreements.”
Over the past few years, PMI entered into several long-term Maya crude oil supply agreements. Under these agreements, PMI provides purchasers with certain support mechanisms to protect, under certain adverse market conditions, the investments the purchasers made in accordance with the agreements. Given the conditions of crude oil markets, placing additional volumes of crude oil in more refineries that are able to process the heavy crude oil that Pemex-Exploration and Production produces supports the overall average price of crude oil exports. We perceive the risk under these agreements as manageable, without the need for hedging instruments, since in the worst-case market scenario the expected additional value derived from crude oil exports should exceed the expected cost of the support mechanisms. Nonetheless, since December 2002, we implemented short-term oil price hedging strategies through the use of options to hedge against potential decreases in short-term prices of crude oil. The applicable strategy is designed taking into account, among other things, financial requirements established by the Mexican Government, our financial condition and cash flow, the annual budget and international market prices. From the end of 2002 through the beginning of 2003, we hedged approximately 20% of our total crude oil production for the year 2003. In September 2004, we entered into a short-term oil price hedging strategy through the use of options for approximately 7% of our total crude oil production for 2004; these options expired on December 31, 2004 and were not exercised. During February and March 2005, we entered into a new hedging strategy for approximately 7% of our total crude oil production for 2005.
164
Table of Contents
Petroleum Products
We balance our overall petroleum product supply and demand through P.M.I. Trading Ltd., managing only those exposures associated with our immediate operational program. To this end, we use the full range of conventional oil price-related financial and commodity derivatives available in the oil markets. Our benchmark for petroleum product commercial activities is the prevailing market price. As of December 31, 2004, the capital at risk as measured against the above-mentioned benchmark was U.S. $5.0 million.
Natural Gas
As described above under “Item 4—Information on the Company—Business Overview—Gas and Basic Petrochemicals—Hedging Operations” we entered into a number of three-year agreements with Mexican industrial consumers to sell natural gas at a fixed reference price of U.S. $4.00 per million BTUs for 2001 through 2003.As part of our risk management strategy at that moment, we also entered into a number of derivative instruments to hedge these fixed price sales under these agreements.
The risk management strategy used to hedge these fixed price sales left us with an exposure to basis risk arising from the difference between the index used to hedge the natural gas sales at a fixed price and the index used as reference to mark to market these fixed-price contracts. This basis risk was treated as an inefficiency of the transaction and affected our earnings in a period other than the one during which the transaction was realized.
During the fourth quarter of 2003, the Ministry of Energy announced a new natural gas hedging program for 2004 through 2006. This program, which represents approximately 20% of the total volume of natural gas sales to our industrial customers, was implemented in order to fix the price for the aforementioned period to the natural gas consumers. We decided to change our traditional risk profile with respect to natural gas, in order to mitigate the volatility of the revenues derived from the sales of this product. This strategy does not leave us with an exposure to basis risk, due to the fact that the derivatives are priced using the same market indices as the ones used to price the natural gas sales.For more information on this new program, see “Item 4—Information on the Company—Business Overview—Gas and Basic Petrochemicals—Hedging Operations.”
Exchange Rate and Interest Rate Risks
A significant amount of our revenues is derived from exports of crude oil and petroleum products, which are priced and payable in U.S. dollars. Moreover, our revenues net of the IEPS tax from domestic sales of petroleum products and petrochemicals are related to the international dollar-denominated prices of these products. By contrast, most of our costs of sales and other expenses, other than hydrocarbon duties, are payable in pesos and are not linked to the U.S. dollar. As a result, the peso’s depreciation against the U.S. dollar increases our income in peso terms. Appreciation of the peso relative to the U.S. dollar has the opposite effect. We perceive this risk as manageable, without the need for hedging instruments, because most of our investments and debt issuances are made in U.S. dollars and, therefore, the impact of the fluctuation in the exchange rate between the U.S. dollar and the peso on our revenues is offset by its impact on our obligations.
Most of our debt is denominated in U.S. dollars or pesos. However, we borrow in currencies other than pesos or the U.S. dollar. Therefore, fluctuations in non-dollar currencies (other than pesos) can increase our costs of funding. Since 1991, Petróleos Mexicanos has entered into currency swaps to hedge against movements in exchange rates when it borrows in currencies other than U.S. dollars or pesos. In 2002, Petróleos Mexicanos, and in 2002, 2003 and 2004, the Pemex Project Funding Master Trust, respectively, entered into various cross-currency swaps to hedge currency risk arising from debt obligations denominated in Euros, pounds sterling and Japanese yen issued by the Pemex Project Funding Master Trust. As of December 31, 2004, the aggregate notional amount of the swaps entered into in 2002, 2003 and 2004 was U.S. $1,201.1 million, U.S. $2,039.5 million and U.S. $1,078.6 million, respectively, for a total outstanding position on currency swaps at year-end of U.S. $5,575.3 million. During 2005, the Pemex Project Funding Master Trust has entered into cross-currency
165
Table of Contents
swaps to hedge currency risk arising from debt obligations denominated in Euros for a total notional amount of U.S. $1,322.8 million. As described above, most of our revenues are either in U.S. dollars or indexed to the U.S. dollar and our policy is to hedge against movements in exchange rates when we borrow in currencies other than U.S. dollars or pesos. As a result of this policy, we believe that our debt portfolio sensitivity to currencies other than the peso or U.S. dollar is negligible. In 2002, 2004 and 2005 the Pemex Project Funding Master Trust entered into cross-currency swaps to hedge its exposure in Japanese yen and Euro, with termination dates in 2023, 2016 and 2025, respectively. Given the long-term nature of these obligations, the swaps used to hedge these risks includes an option linked to a well-defined set of credit default events. In case such an event occurs, the swaps terminate without any payment obligation by either party. These swaps have a notional amount of U.S. $241.4 million, U.S. $1,028.5 million and U.S. $1,322.8 million, respectively.
In November 2004, the Pemex Project Funding Master Trust and in March 2005, Petróleos Mexicanos settled a portion of their positions with a positive mark to market in their cross-currency swaps, collecting U.S. $541.2 million and U.S. $303.8 million, respectively. Simultaneously, both the Pemex Project Funding Master Trust and Petróleos Mexicanos entered into a number of new cross-currency swaps at the then prevailing market conditions.
Effective January 1, 2003, due to the adoption of Bulletin B-10 we have ceased to capitalize our debt-related foreign exchange losses on our balance sheet.Prior to this date, we had capitalized our debt-related foreign exchange losses on our balance sheet, but only up to the increase in the restated value of our fixed assets in the same period. We recorded total net foreign exchange losses of Ps. 4,661 million in 2002, Ps. 26,830 million in 2003 and Ps. 3,471 million in 2004.
Interest Rate Risk
We are exposed to fluctuations in interest rates on short and long-term floating rate instruments. We are predominantly exposed to U.S. dollar LIBOR interest rates because our borrowings are primarily denominated in, or swapped into, U.S. dollars. We use derivative instruments as described below to achieve a desired mix of fixed and floating instruments in our debt portfolio. As of December 31, 2004, the proportion of floating rate debt was approximately 41.2% of total net debt outstanding.
Interest Rate Swaps
Under interest-rate swap agreements, we are obligated to make payments based on a fixed interest rate and are entitled to receive payments based on either the floating six-month LIBOR or the Mexican Interbank Interest Rate (TIIE) for peso-denominated swaps. As of December 31, 2004, Petróleos Mexicanos was a party to interest-rate swap agreements with a notional amount of U.S. $1,110.9 million, with an average fixed interest rate of approximately 4.94% in U.S. dollars and 10.21% in pesos and a weighted average term of approximately 4.47 years. In 2005, we have entered into peso-denominated interest-rate swap agreements with a total notional amount of Ps. 10,500.0 million.
The market value of Petróleos Mexicanos’ foreign exchange and interest rate derivatives position was positive Ps. 7,609.0 million as of December 31, 2003 and positive Ps. 8,101.0 million as of December 31, 2004.
The effects on the consolidated statements of income of entering into swap transactions designated as hedges are recorded as incurred and when the precise settlement amounts are known. The effects on the consolidated statements of income of derivative instruments not designated as hedges are recognized in earnings according to changes in their fair value. Such amounts are included in the consolidated statements of income within the “Interest, net” caption. See Note 10 to our consolidated financial statements included herein.
When derivative results are favorable to Petróleos Mexicanos, it faces the risk that counterparties will not pay their obligations. To minimize this risk, Petróleos Mexicanos monitors counterparties’ creditworthiness and
166
Table of Contents
exposure to derivative instruments. Petróleos Mexicanos also deals exclusively with major financial institutions and maintains a diversified portfolio.
Equity Swap
At December 31, 2003, Petróleos Mexicanos held two equity swaps with respect to shares of Repsol. In 1994, Petróleos Mexicanos entered into an equity swap, which was restructured in March 2000, resulting in a swap with respect to 26,427,781 Repsol shares divided in three tranches, having one-, two- and three-year maturities. In addition, in January 2000, Petróleos Mexicanos entered into a second equity swap with respect to 13,679,704 Repsol shares maturing in three years. These swaps matured in January 2004 and they were not renewed.
Instruments Entered into for Trading Purposes
As part of our client-based approach, we offer natural gas derivatives to our clients. As mentioned above, our benchmark is the market price; therefore, we enter into derivative transactions with the opposite position in order to offset the effect of the derivatives offered to our clients. Neither Bulletin C-2 nor SFAS No. 133 allows derivative positions to serve as hedges for other derivatives. Therefore, these operations are treated for accounting purposes as entered into for trading purposes. However, given that they have offsetting effects, we are only exposed to the basis risk arising from the difference between the index offered to clients and the underlying index related to the offsetting position.
The following tables set forth our portfolio of debt and derivative financial instruments as of December 31, 2004. It should be noted that:
| • | for debt obligations, this table presents principal cash flows and related weighted average interest rates for fixed and variable rate debt; |
| • | for interest-rate swaps and other derivatives, this table presents notional amounts and weighted average interest rates by expected (contractual) maturity dates; |
| • | weighted average variable rates are based on implied forward rates in the yield curve at the reporting date; |
| • | fair values are obtained from market quotes received from market sources such as Reuters, Telerate and Bloomberg; |
| • | where quotes are not available, fair value is calculated internally, discounting from the corresponding zero coupon yield curve in the original currency; |
| • | for all instruments, the tables show the contract terms in order to determine future cash flows categorized by expected maturity dates; |
| • | the information is presented in equivalents of the peso, which is our reporting currency; and |
| • | each instrument’s actual cash flows are denominated in U.S. dollars or other foreign currencies as indicated in parentheses. |
167
Table of Contents
Quantitative Disclosure of Market Risk (Interest Rate Sensitivity) as of December 31, 2004(1)
| Year of Expected Maturity Date | |||||||||||||||||
| 2005 | 2006 | 2007 | 2008 | 2009 | Thereafter | Total Carrying Value | Fair Value | ||||||||||
| (in thousands of nominal pesos) | |||||||||||||||||
Liabilities | |||||||||||||||||
Outstanding debt | |||||||||||||||||
Fixed rate (U.S. dollars) | 12,437,591 | 6,995,802 | 11,011,198 | 28,868,671 | 32,029,693 | 81,637,227 | 172,980,182 | (199,191,744 | ) | ||||||||
Average Interest Rate (%) | 7.66 | ||||||||||||||||
Fixed rate (Japanese yen) | 2,156,871 | 2,157,477 | 2,186,118 | 2,214,761 | 2,214,760 | 6,626,479 | 17,556,466 | (19,197,719 | ) | ||||||||
Average Interest Rate (%) | 1.62 | ||||||||||||||||
Fixed rate (British pounds) | — | 1,082,660 | — | — | — | 8,661,280 | 9,743,940 | (10,493,508 | ) | ||||||||
Average Interest Rate (%) | 8.28 | ||||||||||||||||
Fixed rate (Pesos) | — | — | 1,027,500 | 1,027,500 | — | 10,172,000 | 12,227,000 | (12,144,962 | ) | ||||||||
Average Interest Rate (%) | 9.39 | ||||||||||||||||
Fixed rate (Euro) | 811 | 811 | 13,594,989 | 811 | 811 | 32,175,938 | 45,774,171 | (49,495,515 | ) | ||||||||
Average Interest Rate (%) | 6.78 | ||||||||||||||||
Total fixed rate debt | 14,595,273 | 10,236,750 | 27,819,805 | 32,111,743 | 34,245,264 | 139,272,924 | 258,281,759 | (290,523,448 | ) | ||||||||
Variable rate (U.S. dollars) | 23,902,196 | 30,423,129 | 14,074,370 | 7,351,479 | 11,614,175 | 35,078,502 | 122,443,851 | (124,696,660 | ) | ||||||||
Variable rate (Swiss francs) | 1,132 | 1,131 | — | — | — | — | 2,263 | (2,285 | ) | ||||||||
| Variable rate (Euro) | 17,675 | 14,844 | — | 1,582,434 | — | — | 1,614,953 | (3,419,374 | ) | ||||||||
Variable rate (pesos) | 5,944,444 | 3,944,444 | 16,916,944 | 3,916,944 | 13,944,446 | 12,000,000 | 56,667,222 | (54,569,811 | ) | ||||||||
Total variable rate debt | 29,865,447 | 34,383,548 | 30,991,314 | 12,850,857 | 25,558,621 | 47,078,502 | 180,728,289 | (182,688,130 | ) | ||||||||
Total Debt | 44,460,720 | 44,620,298 | 58,811,119 | 44,962,600 | 59,803,885 | 186,351,426 | 439,010,048 | (473,211,577 | ) | ||||||||
| Note: | Numbers may not total due to rounding. |
| (1) | The information in this table has been calculated using exchange rates at December 31, 2004 of Ps. 11.2648 = U.S. $1.00; Ps. 0.1101 = 1.00 Japanese yen; Ps. 21.6532 = 1.00 British pound; Ps. 15.3201 = 1.00 Euro; and Ps. 9.9241 = 1.00 Swiss franc. |
| Source: | Petróleos Mexicanos. |
168
Table of Contents
Quantitative Disclosure of Market Risk (Interest Rate Risk) as of December 31, 2004(1)
Derivative financial instruments held or issued for purposes other than trading:
| Year of Expected Maturity Date | |||||||||||||||||
| 2005 | 2006 | 2007 | 2008 | 2009 | Thereafter | Total Notional Amount | Fair Value | ||||||||||
| (in thousands of nominal pesos) | |||||||||||||||||
Hedging Instruments | |||||||||||||||||
Interest Rate Swaps (U.S. Dollar) | |||||||||||||||||
Variable to Fixed | 428,146 | 428,146 | 428,146 | 428,146 | 428,146 | 428,146 | 2,568,876 | (102,057 | ) | ||||||||
Average pay rate | 4.94 | 4.94 | 4.94 | 4.94 | 4.94 | 4.94 | |||||||||||
Average receive rate | 2.66 | 3.55 | 3.98 | 4.32 | 4.61 | 4.86 | |||||||||||
Interest Rate Swaps (Mexican Pesos) | |||||||||||||||||
Variable to Fixed | — | — | 2,472,500 | 2,472,500 | 5,000,000 | — | 9,945,000 | (29,636 | ) | ||||||||
Average pay rate | 10.20 | 10.21 | 10.21 | 10.21 | 10.25 | ||||||||||||
Average receive rate | 9.14 | 9.34 | 9.97 | 10.46 | 11.23 | ||||||||||||
Cross Currency Swaps | |||||||||||||||||
Receive Euro / Pay U.S. dollars | — | — | 11,888,456 | 1,352,692 | — | 29,913,676 | 43,154,825 | 4,651,255 | |||||||||
Receive Japanese Yen/ Pay U.S. dollars | 1,579,469 | 1,579,469 | 1,607,685 | 1,635,901 | 1,635,887 | 5,366,733 | 13,405,145 | 2,292,394 | |||||||||
Receive British pounds/ Pay U.S. dollars | — | 807,968 | — | — | — | 7,689,240 | 8,497,208 | 1,289,069 | |||||||||
Non-Hedging Instruments | |||||||||||||||||
Interest Rate Swaps | |||||||||||||||||
Variable to fixed | — | — | — | — | — | — | — | — | |||||||||
Average pay rate (%) | |||||||||||||||||
Average receive rate (%) | |||||||||||||||||
Total | — | — | — | — | — | — | — | — | |||||||||
| Note: | Numbers may not total due to rounding. |
| (1) | The information in this table has been calculated using exchange rates at December 31, 2004 of Ps. 11.2648 = U.S. $1.00; Ps. 0.1101 = 1.00 Japanese yen; Ps. 21.6532 = 1.00 British pound; and Ps. 15.3201 = 1.00 Euro. |
| Item 12. | Description of Securities Other than Equity Securities |
Not applicable.
169
Table of Contents
PART II
| Item 13. | Defaults, Dividend Arrearages and Delinquencies |
Not applicable.
| Item 14. | Material Modifications to the Rights of Security Holders and Use of Proceeds |
Not applicable.
| Item 15. | Controls and Procedures |
We carried out an evaluation under the supervision and with the participation of our management, including our Director General and our Chief Financial Officer, of the effectiveness of the design and operation of our disclosure controls and procedures as of December 31, 2004. There are inherent limitations to the effectiveness of any system of the disclosure controls and procedures, including the possibility of human error and the procedures circumvention or overriding of the controls and procedures. Accordingly, even effective disclosures controls and procedures can only provide reasonable assurance of achieving their control objectives. Based upon, and as of the date of, our evaluation, our Director General and our Chief Financial Officer concluded in our annual report on Form 20-F for the fiscal year ended December 31, 2004 filed on June 30, 2005 (the “Annual Report”) that our disclosure controls and procedures as of December 31, 2004, were effective at that time. Subsequent to the filing of the Annual Report, we identified a material weakness in our internal control over financial reporting, as discussed below. Due to this material weakness, we reevaluated our disclosures controls and procedures and, based on that evaluation, our Director General and our Chief Financial Officer have concluded that our disclosures controls and procedures as of December 31, 2004 were not effective. We therefore performed additional analysis and other post-closing procedures to ensure our consolidated financial statements are prepared in accordance with Mexican GAAP. Accordingly, management believes that the financial statements included in this report fairly present in all material respects our financial condition, results of operations and cash flows for the periods presented.
There has been no change over our internal control over financial reporting during 2004 that has materially affected, or is reasonably likely to materially affect, our internal control over financial reporting.
Subsequent to the filing of the Annual Report, Petróleos Mexicanos identified and corrected certain amounts that had been previously reported under Mexican GAAP in the condensed consolidating financial information for the three years ended December 31, 2004, 2003 and 2002 as presented in Notes 20 and 21 to our consolidated financial statements. None of these corrections, which are described in greater detail in Notes 20 and 21, had an impact on the consolidated financial information presented in our consolidated financial statements. We recognize that the inadvertent errors that caused the need for the corrections described above represent a material weakness in our internal control over financial reporting, as defined under the Public Company Accounting Oversight Board’s Auditing Standard No. 2,An Audit of Internal Control Over Financial Reporting Performed in Conjunction with an Audit of Financial Statements. During 2005, we have made and continue to make changes in our internal control over financial reporting that have materially affected, or are reasonably likely to materially affect, our internal control over financial reporting, including the implementation of measures designed to prevent the inadvertent errors described above and measures to improve our internal control over financial reporting as part of our effort to comply with Section 404 of the Sarbanes-Oxley Act of 2002. We believe that certain of these measures, undertaken to ensure the quality of the information and modifications to our internal control processes, including upgrading our information technologies through automation of our consolidation system, will improve our ability to prepare the Mexican GAAP financial information presented in Notes 20 and 21 to our consolidated financial statements.
| Item 16A. | Audit Committee Financial Expert |
We do not currently have an audit committee of our Board of Directors. Thus, the entire Board of Directors of Pétroleos Mexicanos is presently acting as our audit committee as specified by Section 3(a)(58)(B) of the Exchange Act. We believe that the members of our Board of Directors have sufficient financial and other experience to perform their acting responsibilities as members of the audit committee. Notwithstanding the board members’ financial and other experience, the audit committee does not include a “financial expert” as that term is strictly defined in the rules promulgated under the Sarbanes-Oxley Act. Further, we do not have the power to
170
Table of Contents
appoint a financial expert to our board as the members of the boards of directors, except for those selected by the Union, serve subject to the discretion of the President of Mexico. See “Item 6—Directors, Senior Management and Employees.” Because we do not have securities listed or quoted on a U.S. exchange, we are not required to comply with the independence requirements established by Rule 10A-3 of the Exchange Act. However, we are voluntarily considering the establishment of an independent audit committee as part of our efforts to implement best practices in corporate governance.
| Item 16B. | Code of Ethics |
We have adopted a code of ethics, as defined in Item 16B of Form 20-F under the Exchange Act. Our Code of Ethics applies to our chief executive officer, chief financial officer, chief accounting officer and all other employees of Pétroleos Mexicanos, the subsidiary entities and the subsidiary companies. Our Code of Ethics is available on our website at http://www.pemex.com. If we amend the provisions of our Code of Ethics that apply to our chief executive officer, chief financial officer, chief accounting officer and persons performing similar functions, or if we grant any waiver of such provisions, we will disclose such amendment or waiver on our website at the same address.
In addition, all of our employees are currently also subject to theCódigo de Etica de los Servidores Públicos de la Administración Pública Federal (the Code of Ethics for Federal Public Officials of the Federal Public Administration), which was issued by SFP in July 2002 pursuant to the requirements of theLey Federal de Responsabilidades Administrativas de los Servidores Públicos(Federal Law of Administrative Responsibilities of Public Officials) in order to establish clear rules to promote and enforce legal and ethical standards of conduct and to prevent corruption and corporate abuses by Mexican public officials. See “Item 8—Financial Information—Legal Proceedings—Mexican Government Audits and Other Investigations” for more information.
| Item 16C. | Principal Accountant Fees and Services |
Audit and Non-Audit Fees
The following table sets forth the fees billed to us by our independent auditors, PricewaterhouseCoopers, S.C. during the fiscal years ended December 31, 2003 and 2004:
| Year ended December 31, | ||||
| 2003 | 2004 | |||
| (in thousands of nominal pesos) | ||||
Audit fees | Ps. 24,688 | Ps. 25,231 | ||
Audit-related fees | 1,192 | 670 | ||
Tax fees | 1,584 | 1,528 | ||
Other fees | 3,500 | 3,443 | ||
Total fees | Ps. 30,964 | Ps. 30,872 | ||
Audit fees in the above table are the aggregate fees billed by PricewaterhouseCoopers, S.C. in connection with the audit of our annual financial statements, the review of our interim financial statements, services provided in connection with statutory and regulatory filings, comfort letters, statutory audits and consents.
Audit-related fees in the above table are the aggregate fees billed by PricewaterhouseCoopers, S.C. for special purpose audits performed in accordance with the instructions of the SFP, which were performed pursuant to agreed upon procedures.
Tax fees in the above table are fees billed by PricewaterhouseCoopers, S.C. for tax compliance services, which generally involved the review of original and amended tax returns and claims for tax refunds.
171
Table of Contents
Other fees in the above table are fees billed by PricewaterhouseCoopers, S.C. primarily related to the review of the information technology services for safety, health and the environment.
Audit Committee Approval Policies and Procedures
The SFP appoints the external auditors of Petróleos Mexicanos and the subsidiary entities through a competitive bidding process on an annual basis to audit our financial statements in accordance with the Mexican Financial Reporting Standards applicable to Mexican public sector entities. The auditors selected by the SFP to audit these financial statements subsequently audit financial statements in accordance with Mexican GAAP and reconcile them to U.S. GAAP. The Board of Directors of Petróleos Mexicanos reviews and ratifies the engagement of the external auditors by the SFP.
Item 16D. Exemptions from the Listing Standards for Audit Committees.
Not applicable.
Item 16E. Purchases of Equity Securities by the Issuer and Affiliated Purchasers.
Not applicable.
172
Table of Contents
PART III
| Item 17. | Financial Statements. |
Not applicable.
| Item 18. | Financial Statements. |
See pages F-1 through F-92, incorporated herein by reference.
| Item 19. | Exhibits. |
Documents filed as exhibits to this Form 20-F:
| 1.1 | Ley Orgánica de Petróleos Mexicanos y Organismos Subsidiarios (the Organic Law of Petróleos Mexicanos and Subsidiary Entities), as amended effective January 1, 1994 (previously filed as Exhibit 3.1 to Petróleos Mexicanos’ Registration Statement on Form F-1 (File No. 33-86304) on November 14, 1994 and incorporated by reference herein). |
| 1.2 | Reglamento de la Ley Orgánica de Petróleos Mexicanos(Regulations to the Organic Law of Petróleos Mexicanos), together with an English translation (previously filed as Exhibit 3.2 to Petróleos Mexicanos’ Registration Statement on Form F-1 (File No. 33-86304) on November 14, 1994 and incorporated by reference herein). |
| 1.3 | Reglamento de Gas Natural (Natural Gas Regulation), effective November 9, 1995 together with an English translation (previously filed as Exhibit 1 to Petróleos Mexicanos’ annual report on Form 20-F (File No. 0-99) on June 28, 1996 and incorporated by reference herein). |
| 1.4 | Decreto por el que se Reforma la Ley Reglamentaria del Artículo 27 Constitucional en el Ramo del Petróleo (Decree that Amends the Regulatory Law to Article 27 of the Political Constitution of the United Mexican States Concerning Petroleum Affairs), effective November 14, 1996 (previously filed as Exhibit 1 to Petróleos Mexicanos’ annual report on Form 20-F (File No. 0-99) on June 30, 1997 and incorporated by reference herein). |
| 1.5 | Decreto por el que se adiciona el Reglamento de la Ley Orgánica de Petróleos Mexicanos(Decree that adds to the Regulations to the Organic Law of Petróleos Mexicanos), together with an English translation, effective April 30, 2001 (previously filed as Exhibit 1.5 to Petróleos Mexicanos’ annual report on Form 20-F (File No. 0-99) on June 28, 2001 and incorporated by reference herein). |
| 1.6 | Ley Orgánica de Petróleos Mexicanos y Organismos Subsidiarios (the Organic Law of Petróleos Mexicanos and Subsidiary Entities), as amended effective January 16, 2002 (English translation) (previously filed as Exhibit 1.6 to Amendment No. 1 to Petróleos Mexicanos’ annual report on Form 20-F/A (File No. 0-99) on November 15, 2002 and incorporated by reference herein). |
| 2.1 | Indenture, dated as of September 18, 1997, between Petróleos Mexicanos and Bankers Trust Company (previously filed as Exhibit 4.1 to Petróleos Mexicanos’ Registration Statement on Form F-4 (File No. 333-7796) on October 17, 1997 and incorporated by reference herein). |
| 2.2 | Indenture, dated August 7, 1998, between Petróleos Mexicanos and Bankers Trust Company (previously filed as Exhibit 4.1 to Petróleos Mexicanos’ Registration Statement on Form F-4 on August 11, 1998 and incorporated by reference herein). |
| 2.3 | Indenture, dated July 15, 1999, between Petróleos Mexicanos and Bankers Trust Company (previously filed as Exhibit 4.1 to Petróleos Mexicanos’ Registration Statement on Form F-4 (File No. 333-10706) on August 23, 1999 and incorporated by reference herein). |
173
Table of Contents
| 2.4 | Indenture, dated July 31, 1999, between Petróleos Mexicanos and Bankers Trust Company (previously filed as Exhibit 4.1 to Petróleos Mexicanos’ Registration Statement on Form F-4 (File No. 333-10706) on September 29, 1999 and incorporated by reference herein). |
| 2.5 | Indenture, dated as of July 31, 2000, among Pemex Project Funding Master Trust, Petróleos Mexicanos and Bankers Trust (previously filed as Exhibit 2.5 to Petróleos Mexicanos’ annual report on Form 20-F (File No. 0-99) on June 28, 2001 and incorporated by reference herein). |
| 2.6 | Indenture, dated as of February 3, 2003, between Petróleos Mexicanos and Deutsche Bank Trust Company Americas (previously filed as Exhibit 4.7 to Petróleos Mexicanos’ Registration Statement on Form F-4 (File No. 333-102993) on February 12, 2003 and incorporated by reference herein). |
| 2.7 | Indenture, dated as of December 30, 2004 among Pemex Project Funding Master Trust, Petróleos Mexicanos and Deutsche Bank Trust Company Americas (previously filed as Exhibit 2.7 to Petróleos Mexicanos’ Annual Report on Form 20-F (File No. 0-99) on June 30, 2005 and incorporated by reference herein). |
| 2.8 | Fiscal Agency Agreement between Petróleos Mexicanos and Bankers Trust, dated as of June 16, 1993, and amended and restated as of February 26, 1998 (previously filed as Exhibit 3.1 to Petróleos Mexicanos’ annual report on Form 20-F (File No. 0-99) on June 29, 2000 and incorporated by reference herein). |
| 2.9 | Trust Agreement, dated as of November 10, 1998, among The Bank of New York, The Bank of New York (Delaware) and Petróleos Mexicanos (previously filed as Exhibit 3.1 to Petróleos Mexicanos’ annual report on Form 20-F (File No. 0-99) on June 30, 1999 and incorporated by reference herein). |
| 2.10 | Amendment No. 1, dated as of November 14, 2004, to the Trust Agreement among The Bank of New York, The Bank of New York (Delaware) and Petróleos Mexicanos (previously filed as Exhibit 2.10 to Petróleos Mexicanos’ Annual Report on Form 20-F (File No. 0-99) on June 30, 2005 and incorporated by reference herein). |
| 2.11 | Amendment No. 2, dated as of December 22, 2004 to the Trust Agreement among The Bank of New York, The Bank of New York (Delaware) and Petróleos Mexicanos (previously filed as Exhibit 2.11 to Petróleos Mexicanos’ Annual Report on Form 20-F (File No. 0-99) on June 30, 2005 and incorporated by reference herein). |
| 2.12 | Assignment and Indemnity Agreement, dated as of November 10, 1998, among Petróleos Mexicanos, Pemex-Exploración y Producción, Pemex-Refinación, Pemex-Gas y Petroquímica Básica and Pemex Project Funding Master Trust, (previously filed as Exhibit 3.2 to Petróleos Mexicanos’ annual report on Form 20-F (File No. 0-99) on June 30, 1999 and incorporated by reference herein). |
| 2.13 | Guaranty Agreement, dated July 29, 1996, among Petróleos Mexicanos, Pemex-Exploración y Producción, Pemex-Refinación and Pemex-Gas y Petroquímica Básica (previously filed as Exhibit 4.4 to Petróleos Mexicanos’ Registration Statement on Form F-4 (File No. 333-7796) on October 17, 1997 and incorporated by reference herein). |
The registrant agrees to furnish to the Securities and Exchange Commission, upon request, copies of any instruments that define the rights of holders of long-term debt of the registrant that are not filed as exhibits to this annual report.
| 4.1 | Agreement for the Financial Strengthening of Petróleos Mexicanos between the Federal Government of Mexico and Petróleos Mexicanos, together with a summary in English (previously filed as Exhibit 10.1 to Petróleos Mexicanos’ Registration Statement on Form F-1 (File No. 33-86304) on November 14, 1994 and incorporated by reference herein). |
174
Table of Contents
| 4.2 | Amendment to the Agreement for the Financial Strengthening of Petróleos Mexicanos between the Federal Government of Mexico and Petróleos Mexicanos, dated December 18, 1997, together with an English translation (previously filed as Exhibit 10.1 to Amendment No. 1 to Petróleos Mexicanos’ annual report on Form 20-F/A (File No. 0-99) on July 20, 1998 and incorporated by reference herein). |
| 4.3 | Receivables Purchase Agreement, dated as of December 1, 1998, by and among Pemex Finance, Ltd., P.M.I. Comercio Internacional, S.A. de C.V., P.M.I. Services, B.V. and Pemex-Exploración y Producción. (previously filed as Exhibit 3.3 to Petróleos Mexicanos’ annual report on Form 20-F (File No. 0-99) on June 30, 1999 and incorporated by reference herein). |
| 4.4 | Transfer of Funds Agreement, dated as of November 24, 2000, among Pemex Project Funding Master Trust, Petróleos Mexicanos and the Federal Government (English translation) (previously filed as Exhibit 4.4 to Amendment No. 1 to Petróleos Mexicanos’ annual report on Form 20-F/A (File No. 0-99) on November 15, 2002 and incorporated by reference herein). |
| 7.1 | Computation of Ratio of Earnings to Fixed Charges (previously filed as Exhibit 7.1 to Petróleos Mexicanos’ Annual Report on Form 20-F (File No. 0-99) on June 30, 2005 and incorporated by reference herein). |
| 8.1 | For a list of subsidiaries, their jurisdiction of incorporation and the names under which they do business, see “Consolidated Structure of PEMEX” on page 3. |
| 12.1 | CEO Certification pursuant to Rule 13a-14(a)/15d-14(a). |
| 12.2 | CFO Certification pursuant to Rule 13a-14(a)/15d-14(a). |
| 13.1 | Certification pursuant to Rule 13a-14(b)/15d-14(b) and 18 U.S.C. § 1350. |
175
Table of Contents
SIGNATURE
Pursuant to the requirements of Section 12 of the Securities Exchange Act of 1934, as amended, the registrant certifies that it meets all of the requirements for filing on Form 20-F and has duly caused this annual report to be signed on its behalf by the undersigned, thereunto duly authorized.
| PETRÓLEOS MEXICANOS | ||
| By: | /S/ JUAN JOSÉ SUÁREZ COPPEL | |
Name: Juan José Suárez Coppel Title: Chief Financial Officer | ||
Date: November 23, 2005
176
Table of Contents
PETRÓLEOS MEXICANOS, SUBSIDIARY ENTITIES
AND SUBSIDIARY COMPANIES
CONSOLIDATED FINANCIAL STATEMENTS
DECEMBER 31, 2004, 2003 AND 2002
Table of Contents
Table of Contents
REPORT OF INDEPENDENT REGISTERED
PUBLIC ACCOUNTING FIRM
Mexico City, Mexico
April 22, 2005, except for Notes 15, 20 and 21, as to which the date is September 30, 2005
To the General Comptroller’s Office
and the Board of Directors of
Petróleos Mexicanos:
We have audited the accompanying consolidated balance sheets of Petróleos Mexicanos, Subsidiary Entities and Subsidiary Companies (collectively, “PEMEX”) as of December 31, 2004 and 2003, and the related consolidated statements of operations, changes in equity and changes in financial position for each of the three years in the period ended December 31, 2004. These financial statements are the responsibility of the management of PEMEX. Our responsibility is to express an opinion on these financial statements based on our audits.
We conducted our audits in accordance with auditing standards generally accepted in Mexico and with the Standards of the Public Company Accounting Oversight Board (United States of America). These standards require that we plan and perform the audit to obtain reasonable assurance about whether the financial statements are free of material misstatement and have been prepared on the basis of generally accepted accounting principles. An audit includes examining, on a test basis, evidence supporting the amounts and disclosures contained in the consolidated financial statements. An audit also includes assessing the accounting principles used and significant estimates made by management, as well as evaluating the overall financial statement presentation. We believe that our audits provide a reasonable basis for our opinion.
As described in Notes 2 (l) and 11 to the consolidated financial statements, effective January 1, 2004, PEMEX adopted the amendments to Bulletin D-3, “Labor Obligations”, issued by the Mexican Institute of Public Accountants (“MIPA”). These amendments set forth additional valuation and disclosure requirements for the recognition of post-retirement obligations. As of January 1, 2004, the adoption of these amendments resulted in the recognition of an initial liability related to prior service costs and a charge to income for 2004 in the amount of Ps. 8,444,988,000 which is presented as a cumulative effect of adoption of new accounting standards in the consolidated statement of operations.
As described in Note 2 (e) to the consolidated financial statements, effective January 1, 2004, the Board of Directors of PEMEX approved a change in the accounting policy for the recognition of well exploration and drilling expenses to the successful efforts method of accounting. As a result, the oil-field exploration and depletion reserve will be discontinued. The change in the accounting policy for recognizing exploration and drilling costs had no effect on the consolidated financial statements upon adoption, since at December 31, 2003, the specific oil-field exploration and depletion reserve had been entirely utilized.
As described in Note 2 (i) to the consolidated financial statements, Bulletin C-15, “Impairment of the Value of Long-Lived Assets and their Disposal”, issued by the MIPA, became effective January 1, 2004. PEMEX calculated an impairment of the value of long-lived assets at January 1 and December 31, 2004, and determined a cumulative effect of Ps. 2,024,132,000 and an impairment charge for the year of Ps. 1,652,570,000, respectively. The initial effect is presented in the consolidated statement of operations as a cumulative effect of adoption of new accounting standards and the impairment charge for the year is presented in the consolidated statement of operations under costs and operating expenses.
As discussed in Note 2 (h) to the consolidated financial statements, effective January 1, 2003, PEMEX adopted the guidelines of the Bulletin C-9, “Liabilities, Provisions, Contingent Assets and Liabilities and Commitments”, issued by the MIPA. As a result, an initial cumulative benefit totaling Ps. 2,117,261,000 was recognized in earnings as a cumulative effect of adoption of new accounting standards in the consolidated statement of operations.
F-1
Table of Contents
In our opinion, the consolidated financial statements referred to above present fairly, in all material respects, the consolidated financial position of PEMEX as of December 31, 2004 and 2003, and the consolidated results of their operations, changes in equity and changes in financial position for each of the three years in the period ended December 31, 2004, in conformity with accounting principles generally accepted in Mexico.
As discussed in Notes 20 and 21 to the consolidated financial statements, PEMEX has restated amounts that had been previously reported under Mexican GAAP in the condensed consolidating balance sheets at December 31, 2004 and 2003 and condensed consolidating results of operations and changes in financial position for the years ended December 31, 2004, 2003, and 2002.
Accounting principles generally accepted in Mexico vary in certain significant respects from accounting principles generally accepted in the United States of America. Information relating to the nature and effect of said differences is presented in Note 19 to the consolidated financial statements.
PricewaterhouseCoopers |
| /s/ FRANCISCO J. HERNÁNDEZ F. |
| Francisco J. Hernández F. |
F-2
Table of Contents
PETRÓLEOS MEXICANOS, SUBSIDIARY ENTITIES AND SUBSIDIARY COMPANIES
CONSOLIDATED BALANCE SHEETS
AS OF DECEMBER 31, 2004 AND 2003
(In thousands of Mexican pesos of December 31, 2004 purchasing power
and thousands of U.S. dollars)
(Notes 1, 2 and 14)
| 2004 | 2004 | 2003 | ||||||||||
| (Unaudited) | ||||||||||||
ASSETS: | ||||||||||||
Current assets: | ||||||||||||
Cash and cash equivalents | US$ | 7,534,287 | Ps. | 84,872,231 | Ps. | 77,143,143 | ||||||
Cash in trust fund (Note 13) | 2,903,348 | 32,705,633 | — | |||||||||
Accounts, notes receivable and other, net (Note 3) | 8,013,812 | 90,273,995 | 73,857,439 | |||||||||
Inventories, net (Note 4) | 3,174,821 | 35,763,728 | 28,903,964 | |||||||||
Total current assets | 21,626,268 | 243,615,587 | 179,904,546 | |||||||||
Properties and equipment, net (Note 5) | 52,781,135 | 594,568,925 | 567,209,192 | |||||||||
Intangible asset derived from the actuarial computation of labor obligations and other assets (Notes 6 and 11) | 9,706,593 | 109,342,825 | 142,244,817 | |||||||||
Total assets | US$ | 84,113,996 | Ps. | 947,527,337 | Ps. | 889,358,555 | ||||||
LIABILITIES: | ||||||||||||
Current liabilities: | ||||||||||||
Current portion of long-term debt (Note 9) | US$ | 4,178,067 | Ps. | 47,065,088 | Ps. | 60,488,366 | ||||||
Current portion of notes payable to contractors (Note 8) | 184,343 | 2,076,592 | 1,985,108 | |||||||||
Suppliers | 2,159,171 | 24,322,630 | 35,282,295 | |||||||||
Accounts and accrued expenses payable | 2,031,229 | 22,881,389 | 7,720,936 | |||||||||
Taxes payable | 3,918,117 | 44,136,805 | 38,546,112 | |||||||||
Total current liabilities | 12,470,927 | 140,482,504 | 144,022,817 | |||||||||
Long-term liabilities: | ||||||||||||
Long-term debt (Note 9) | 35,024,974 | 394,549,328 | 319,373,040 | |||||||||
Notes payable to contractors (Note 8) | 1,001,800 | 11,285,080 | 13,821,639 | |||||||||
Sale of future accounts receivable (Note 7) | 3,252,227 | 36,635,689 | 42,557,120 | |||||||||
Reserve for dismantlement and abandonment activities, sundry creditors and others (Notes 2(h) and 5) | 2,305,350 | 25,969,304 | 20,739,386 | |||||||||
Reserve for retirement payments, pensions and seniority premiums (Note 11) | 27,098,796 | 305,262,514 | 300,603,198 | |||||||||
Total long-term liabilities | 68,683,147 | 773,701,915 | 697,094,383 | |||||||||
Total liabilities | 81,154,074 | 914,184,419 | 841,117,200 | |||||||||
Commitments and contingencies (Notes 16 and 17) | ||||||||||||
EQUITY (Note 13): | ||||||||||||
Certificates of Contribution “A” | 7,715,085 | 86,908,890 | 86,908,890 | |||||||||
Surplus in restatement of equity | 11,748,280 | 132,342,011 | 137,018,937 | |||||||||
Mexican Government increase in equity of Subsidiary Entities | 2,897,302 | 32,637,530 | — | |||||||||
Effect on equity from labor obligations | (619,238 | ) | (6,975,592 | ) | — | |||||||
Accumulated losses: | ||||||||||||
From prior years | (16,518,208 | ) | (186,074,311 | ) | (132,932,341 | ) | ||||||
Net loss for the year | (2,263,299 | ) | (25,495,610 | ) | (42,754,131 | ) | ||||||
| (18,781,507 | ) | (211,569,921 | ) | (175,686,472 | ) | |||||||
Total equity | 2,959,922 | 33,342,918 | 48,241,355 | |||||||||
Total liabilities and equity | US$ | 84,113,996 | Ps. | 947,527,337 | Ps. | 889,358,555 | ||||||
The accompanying notes are an integral part of these consolidated financial statements.
F-3
Table of Contents
PETRÓLEOS MEXICANOS, SUBSIDIARY ENTITIES AND SUBSIDIARY COMPANIES
CONSOLIDATED STATEMENTS OF OPERATIONS
FOR THE YEARS ENDED DECEMBER 31, 2004, 2003 AND 2002
(In thousands of Mexican pesos of December 31, 2004 purchasing power
and thousands as of U.S. dollars)
(Notes 1, 2 and 14)
| 2004 | 2004 | 2003 | 2002 | |||||||||||||
| (Unaudited) | ||||||||||||||||
Net sales: | ||||||||||||||||
Domestic | US$ | 39,859,806 | Ps. | 449,012,740 | Ps. | 407,337,262 | Ps. | 353,526,447 | ||||||||
Export | 28,813,151 | 324,574,385 | 250,556,143 | 188,047,374 | ||||||||||||
| 68,672,957 | 773,587,125 | 657,893,405 | 541,573,821 | |||||||||||||
Other revenues (expenses), net | 990,198 | 11,154,377 | 3,114,711 | (94,065 | ) | |||||||||||
Total revenues | 69,663,155 | 784,741,502 | 661,008,116 | 541,479,756 | ||||||||||||
Costs and operating expenses: | ||||||||||||||||
Cost of sales | 23,445,200 | 264,105,487 | 217,869,140 | 177,513,719 | ||||||||||||
Transportation and distribution expenses | 1,560,108 | 17,574,308 | 16,356,086 | 16,831,378 | ||||||||||||
Administrative expenses | 3,258,472 | 36,706,034 | 37,021,765 | 36,158,166 | ||||||||||||
Total cost and operating expenses | 28,263,780 | 318,385,829 | 271,246,991 | 230,503,263 | ||||||||||||
Comprehensive financing cost: | ||||||||||||||||
Exchange loss, net | (308,106 | ) | (3,470,747 | ) | (26,830,343 | ) | (4,661,247 | ) | ||||||||
Interest paid, net | (2,052,737 | ) | (23,123,667 | ) | (17,598,848 | ) | (15,493,308 | ) | ||||||||
Gain on monetary position | 1,735,163 | 19,546,261 | 12,090,999 | 13,591,567 | ||||||||||||
| (625,680 | ) | (7,048,153 | ) | (32,338,192 | ) | (6,562,988 | ) | |||||||||
Income before hydrocarbon extraction duties and other, special tax on production and services, and cumulative effect of adoption of new accounting standards | 40,773,695 | 459,307,520 | 357,422,933 | 304,413,505 | ||||||||||||
Hydrocarbon extraction duties and other | 37,251,364 | 419,629,162 | 303,334,715 | 201,470,457 | ||||||||||||
Special tax on production and services (IEPS Tax) | 4,856,264 | 54,704,848 | 98,959,610 | 128,792,678 | ||||||||||||
| 42,107,628 | 474,334,010 | 402,294,325 | 330,263,135 | |||||||||||||
Cumulative effect of adoption of new accounting standards (Notes 2(e), 2(h) and 2(1)) | (929,366 | ) | (10,469,120 | ) | 2,117,261 | — | ||||||||||
Net loss for the year | (US$2,263,299 | ) | (Ps. 25,495,610 | ) | (Ps. 42,754,131 | ) | (Ps. 25,849,630 | ) | ||||||||
The accompanying notes are an integral part of these consolidated financial statements.
F-4
Table of Contents
PETRÓLEOS MEXICANOS, SUBSIDIARY ENTITIES AND SUBSIDIARY COMPANIES
CONSOLIDATED STATEMENTS OF CHANGES IN EQUITY
FOR THE YEARS ENDED DECEMBER 31, 2004, 2003 AND 2002
(In thousands of Mexican pesos of December 31, 2004 purchasing power
and thousands of U.S. dollars)
(Notes 1, 2 and 13)
| Certificates of Contribution “A” | Specific oil-field exploration and depletion reserve | Surplus in restatement of equity | Mexican Government increase in equity of Subsidiary Entities | Effect on equity from labor obligations | Accumulated losses | Total | ||||||||||||||||||||||
| From prior years | Net loss for the year | |||||||||||||||||||||||||||
Balances at December 31, 2001 | Ps. | 86,908,890 | Ps. | 21,145,734 | Ps. | 135,504,569 | Ps. | — | Ps. | — | (Ps. 65,089,279 | ) | (Ps. 38,421,987 | ) | Ps. | 140,047,927 | ||||||||||||
Transfer to prior years’ accumulated losses | (38,421,987 | ) | 38,421,987 | |||||||||||||||||||||||||
Minimum guaranteed dividends paid to the Mexican Government approved by the Board of Directors on April 24, 2002 | (2,441,738 | ) | (2,441,738 | ) | ||||||||||||||||||||||||
Transfer to prior years’ accumulated losses from the specific oil-field exploration and depletion reserve, approved by the Board of Directors on April 24, 2002 | (9,326,018 | ) | 9,326,018 | |||||||||||||||||||||||||
Comprehensive loss for the year (Note 12) | 1,911,708 | (4,413,521 | ) | 44,436 | (25,849,630 | ) | (28,307,007 | ) | ||||||||||||||||||||
Balances at December 31, 2002 | 86,908,890 | 13,731,424 | 131,091,048 | (96,582,550 | ) | (25,849,630 | ) | 109,299,182 | ||||||||||||||||||||
Transfer to prior years’ accumulated losses | (25,849,630 | ) | 25,849,630 | |||||||||||||||||||||||||
Minimum guaranteed dividends paid to the Mexican Government approved by the Board of Directors on May 28, 2003 | (10,500,161 | ) | (10,500,161 | ) | ||||||||||||||||||||||||
Comprehensive loss for the year (Note 12) | (13,731,424 | ) | 5,927,889 | (42,754,131 | ) | (50,557,666 | ) | |||||||||||||||||||||
Balances at December 31, 2003 | 86,908,890 | 137,018,937 | (132,932,341 | ) | (42,754,131 | ) | 48,241,355 | |||||||||||||||||||||
Transfer to prior years’ accumulated losses | (42,754,131 | ) | 42,754,131 | |||||||||||||||||||||||||
Minimum guaranteed dividends paid to the Mexican Government approved by the Board of Directors on May 12, 2004 | (10,387,839 | ) | (10,387,839 | ) | ||||||||||||||||||||||||
Increase in the equity of the Subsidiary Entities made by the Federal Government (Note 13) | 32,637,530 | 32,637,530 | ||||||||||||||||||||||||||
Comprehensive loss for the year (Note 12) | (4,676,926 | ) | (6,975,592 | ) | (25,495,610 | ) | (37,148,128 | ) | ||||||||||||||||||||
Balances at December 31, 2004 | Ps. | 86,908,890 | Ps. | — | Ps. | 132,342,011 | Ps. | 32,637,530 | (Ps. 6,975,592 | ) | (Ps. 186,074,311 | ) | (Ps. 25,495,610 | ) | Ps. | 33,342,918 | ||||||||||||
(Unaudited) | US$ | 7,715,085 | US$ | — | US$ | 11,748,280 | US$ | 2,897,302 | (US$619,238 | ) | (US$16,518,208 | ) | (US$2,263,299 | ) | US$ | 2,959,922 | ||||||||||||
The accompanying notes are an integral part of these consolidated financial statements.
F-5
Table of Contents
PETRÓLEOS MEXICANOS, SUBSIDIARY ENTITIES AND SUBSIDIARY COMPANIES
CONSOLIDATED STATEMENTS OF CHANGES IN FINANCIAL POSITION
FOR THE YEARS ENDED DECEMBER 31, 2004, 2003 AND 2002
(In thousands of Mexican pesos of December 31, 2004 purchasing power
and thousands as of U.S. dollars)
(Notes 1, 2 and 14)
| 2004 | 2004 | 2003 | 2002 | |||||||||||||
| (Unaudited) | ||||||||||||||||
Funds provided by (used in): | ||||||||||||||||
Operating activities: | ||||||||||||||||
Net loss for the year | (US$2,263,299 | ) | (Ps. 25,495,610 | ) | (Ps. 42,754,131 | ) | (Ps. 25,849,630 | ) | ||||||||
Charges to operations not requiring the use of funds: | ||||||||||||||||
Depreciation and amortization | 3,719,558 | 41,900,077 | 42,648,759 | 35,569,746 | ||||||||||||
Reserve for retirement payments, pensions and indemnities | 4,709,577 | 53,052,445 | 40,961,047 | 41,773,368 | ||||||||||||
Specific oil-field exploration and depletion reserve | — | — | 9,344,332 | 9,035,374 | ||||||||||||
| 6,165,836 | 69,456,912 | 50,200,007 | 60,528,858 | |||||||||||||
Variances in: | ||||||||||||||||
Accounts, notes receivable and other | (1,457,332 | ) | (16,416,556 | ) | (13,294,701 | ) | (8,689,691 | ) | ||||||||
Inventories | (608,956 | ) | (6,859,764 | ) | (2,183,199 | ) | (6,781,632 | ) | ||||||||
Intangible asset derived from the actuarial computation of labor obligations and other assets | 2,920,779 | 32,901,992 | 417,586 | (57,735,716 | ) | |||||||||||
Suppliers | (972,913 | ) | (10,959,665 | ) | 3,267,931 | 4,841,686 | ||||||||||
Accounts payable and accrued expenses | 1,345,825 | 15,160,453 | 357,467 | (2,379,021 | ) | |||||||||||
Taxes payable | 496,298 | 5,590,693 | 9,325,935 | 26,287,870 | ||||||||||||
Cash in trust fund | (2,903,348 | ) | (32,705,633 | ) | — | — | ||||||||||
Reserve for dismantlement and abandonment activities, sundry creditors and others | 464,271 | 5,229,918 | 12,330,413 | (304,610 | ) | |||||||||||
Effect on equity from labor obligations | (619,238 | ) | (6,975,592 | ) | — | — | ||||||||||
Reserve for retirement payments, pensions and indemnities and others | (4,295,960 | ) | (48,393,129 | ) | (19,303,921 | ) | 37,132,905 | |||||||||
Exploration and well-drilling expenses charged to the specific oil-field exploration and depletion reserve | — | — | (23,075,756 | ) | (7,123,667 | ) | ||||||||||
Funds provided by operating activities | 535,262 | 6,029,629 | 18,041,762 | 45,776,982 | ||||||||||||
Financing activities: | ||||||||||||||||
Minimum guaranteed dividends paid to the Mexican Government | (922,150 | ) | (10,387,839 | ) | (10,500,161 | ) | (2,441,738 | ) | ||||||||
Debt, net | 5,481,945 | 61,753,010 | 116,768,545 | 78,793,678 | ||||||||||||
Notes payable to contractors | (217,054 | ) | (2,445,075 | ) | (15,908,291 | ) | 14,488,431 | |||||||||
Sale of future accounts receivable | (525,658 | ) | (5,921,431 | ) | (4,953,601 | ) | (4,149,808 | ) | ||||||||
Increase in equity of Subsidiary Entities | 2,897,302 | 32,637,530 | — | — | ||||||||||||
Other | — | — | — | 44,436 | ||||||||||||
Funds provided by (used in) financing activities | 6,714,385 | 75,636,195 | 85,406,492 | 86,734,999 | ||||||||||||
Investing activities: | ||||||||||||||||
Increase in fixed assets, net | (6,563,519 | ) | (73,936,736 | ) | (74,294,409 | ) | (101,218,761 | ) | ||||||||
Funds used in investing activities | (6,563,519 | ) | (73,936,736 | ) | (74,294,409 | ) | (101,218,761 | ) | ||||||||
Net increase in cash and cash equivalents | 686,128 | 7,729,088 | 29,153,845 | 31,293,220 | ||||||||||||
Cash and cash equivalents at beginning of the year | 6,848,159 | 77,143,143 | 47,989,298 | 16,696,078 | ||||||||||||
Cash and cash equivalents at end of the year | US$ | 7,534,287 | Ps. | 84,872,231 | Ps. | 77,143,143 | Ps. | 47,989,298 | ||||||||
The accompanying notes are an integral part of these consolidated financial statements.
F-6
Table of Contents
PETRÓLEOS MEXICANOS, SUBSIDIARY ENTITIES AND SUBSIDIARY COMPANIES
NOTES TO THE CONSOLIDATED FINANCIAL STATEMENTS FOR THE YEARS
ENDED DECEMBER 31, 2004, 2003 AND 2002
(Figures stated in thousands of Mexican pesos of December 31, 2004 purchasing power
and in thousands of U.S. dollars or other currency units)
1. Structure and business operations of Petróleos Mexicanos, Subsidiary Entities and Subsidiary Companies
Following the nationalization of the foreign-owned oil companies then operating in the United Mexican States (“Mexico”), Petróleos Mexicanos was created by a decree of the Mexican Congress dated June 7, 1938 and effective July 20, 1938. Petróleos Mexicanos and its four Subsidiary Entities (as defined below) are decentralized public entities of the Federal Government of Mexico (the “Mexican Government”) and together comprise the Mexican state oil and gas company.
The operations of Petróleos Mexicanos and Subsidiary Entities are regulated by theConstitución Politica de los Estados Unidos Mexicanos(Political Constitution of the United Mexican States, or the “Mexican Constitution”), theLey Reglamentaria del Artículo 27 Constitucional en el Ramo del Petróleo(Regulation Law to Article 27 of the Political Constitution of the United Mexican States concerning Petroleum affairs, or the “Regulatory Law”), effective November 30, 1958, as amended effective May 12, 1995 and November 14, 1996, and theLey Orgánica de Petróleos Mexicanos y Organismos Subsidiarios(the Organic Law of Petróleos Mexicanos and Subsidiary Entities, or the “Organic Law”), effective July 17, 1992, as amended effective January 1, 1994 and January 16, 2002. Under the Organic Law and related regulations, Petróleos Mexicanos is entrusted with the central planning activities and the strategic management of Mexico’s petroleum industry. For purposes of these financial statements, capitalized words carry the meanings attributed to them herein or the meanings as defined in the Mexican Constitution or the Organic Law.
The Organic Law establishes a structure that consists of decentralized legal entities of a technical, industrial and commercial nature, with their own corporate identity and equity and with the legal authority to own property and conduct business in their own names. The Subsidiary Entities are controlled by and have characteristics of subsidiaries of Petróleos Mexicanos. The Subsidiary Entities are:
Pemex-Exploración y Producción (Pemex-Exploration and Production);
Pemex-Refinación (Pemex-Refining);
Pemex-Gas y Petroquímica Básica (Pemex-Gas and Basic Petrochemicals); and
Pemex-Petroquímica (Pemex-Petrochemicals) (including its seven subsidiaries).
The strategic activities entrusted to Petróleos Mexicanos and Subsidiary Entities by the Organic Law other than those entrusted to Pemex-Petrochemicals, can be performed only by Petróleos Mexicanos and Subsidiary Entities and cannot be delegated or subcontracted. Pemex-Petrochemicals is an exception and may delegate and/or subcontract certain work.
The principal objectives of the Subsidiary Entities are as follows:
| I. | Pemex-Exploration and Production explores for and produces crude oil and natural gas; additionally, this entity transports, stores and markets such products; |
| II. | Pemex-Refining refines petroleum products and derivatives thereof that may be used as basic industrial raw materials; additionally, this entity stores, transports, distributes and markets such products and derivatives; |
F-7
Table of Contents
PETRÓLEOS MEXICANOS, SUBSIDIARY ENTITIES AND SUBSIDIARY COMPANIES
NOTES TO THE CONSOLIDATED FINANCIAL STATEMENTS FOR THE YEARS
ENDED DECEMBER 31, 2004, 2003 AND 2002
(Figures stated in thousands of Mexican pesos of December 31, 2004 purchasing power
and in thousands of U.S. dollars or other currency units)—(Continued)
| III. | Pemex-Gas and Basic Petrochemicals processes natural gas, natural gas liquids and derivatives thereof that may be used as basic industrial raw materials, and stores, transports, distributes and markets such products; additionally, this entity stores, transports, distributes and markets Basic Petrochemicals; and |
| IV. | Pemex-Petrochemicals engages in industrial petrochemical processing and stores, distributes and markets Secondary Petrochemicals. |
At their formation, Petróleos Mexicanos assigned to the Subsidiary Entities all the assets and liabilities needed to carry out these activities, which assets and liabilities were incorporated into the Subsidiary Entities’ initial capital contribution. Additionally, Petróleos Mexicanos assigned to the Subsidiary Entities all the personnel needed for their operations, and the Subsidiary Entities assumed all the related labor liabilities. There was no change in the carrying value of assets and liabilities upon their contribution by Petróleos Mexicanos to the Subsidiary Entities.
The principal distinction between the Subsidiary Entities and the Subsidiary Companies (as defined below) is that the Subsidiary Entities are decentralized public entities created by Article 3 of the Organic Law, whereas the Subsidiary Companies are companies that have been formed in accordance with the general corporations law of each of the respective jurisdictions in which they are incorporated, and are managed as any other private corporations subject to the general corporations law, in their respective jurisdictions.
As used herein, “Subsidiary Companies” include those companies listed in Note 2(c) below, which are defined as (a) those companies which are not Subsidiary Entities but in which Petróleos Mexicanos has more than a 50% ownership investment, (b) the Pemex Project Funding Master Trust (the “Master Trust”), a Delaware statutory trust, (c) Fideicomiso Irrevocable de Administración No. F/163 (“Fideicomiso F/163”), a Mexican statutory trust incorporated in 2003 in Mexico (both the Master Trust and Fideicomiso F/163 are controlled by Petróleos Mexicanos) and (d) RepCon Lux, S.A., a Luxembourg finance vehicle whose debt in guaranteed by Petróleos Mexicanos (“RepCon Lux”). Petróleos Mexicanos also guarantees the debt of the Master Trust. The guarantee, when taken together with the Indentures pursuant to which the Master Trust has issued debt securities, the Trust Agreement constituting the Master Trust, and Petróleos Mexicanos’ obligations to pay all fees and expenses of the Master Trust, constitutes a full and unconditional guarantee by Petróleos Mexicanos of the Master Trust’s obligations under those securities. “Non-consolidated subsidiary companies”, as used herein, are defined as those companies (a) which are not Subsidiary Entities or Subsidiary Companies and (b) in which Petróleos Mexicanos has less than a 50% ownership interest. Petróleos Mexicanos, the Subsidiary Entities and the Subsidiary Companies are referred to as “PEMEX”.
2. Significant accounting policies
The principal accounting policies followed by PEMEX in the preparation of these consolidated financial statements, including the concepts, methods and criteria pertaining to the effects of inflation on the financial information, are summarized below:
(a) Accounting basis for the preparation of financial information
The accompanying consolidated financial statements have been prepared in conformity with accounting principles generally accepted in Mexico (“Mexican GAAP”) as issued by theInstituto Mexicano de Contadores Públicos (Mexican Institute of Public Accountants, or “MIPA”).
F-8
Table of Contents
PETRÓLEOS MEXICANOS, SUBSIDIARY ENTITIES AND SUBSIDIARY COMPANIES
NOTES TO THE CONSOLIDATED FINANCIAL STATEMENTS FOR THE YEARS
ENDED DECEMBER 31, 2004, 2003 AND 2002
(Figures stated in thousands of Mexican pesos of December 31, 2004 purchasing power
and in thousands of U.S. dollars or other currency units)—(Continued)
(b) Effects of inflation on the financial information
Beginning in January 1, 2003, PEMEX recognizes the effects of inflation in accordance with Financial Reporting Standard (“NIF”) 06-BIS “A” Section C, which establishes the obligation for PEMEX to adopt Bulletin B-10 of Mexican GAAP, “Recognition of the Effects of Inflation on Financial Information” (“Bulletin B-10”). All periods presented herein are presented in accordance with Bulletin B-10.
The recognition of the effects of inflation in accordance with Bulletin B-10 consists of, among other things, the restatement of non-monetary assets using inflation factors based on the Mexican National Consumer Price Index (“NCPI”) (including the restatement of fixed assets with consideration of value in use), the recognition in the consolidated statement of operations of comprehensive financing cost (including the determination of gains or losses in monetary position), the restatement of the equity accounts and the presentation of the financial statements for all periods in constant pesos with purchasing power at the latest balance sheet date. See Notes 2(h), 2(m), 2(n), 2(o) and 2(p). Consequently, the amounts shown in the accompanying financial statements and these notes are expressed in thousands of constant Mexican pesos as of December 31, 2004. The December 31, 2004 restatement factors applied to the consolidated financial statements at December 31, 2003 and 2002 were 5.2% and 9.4%, which correspond to inflation from January 1, 2004 and 2003 through December 31, 2004, respectively, based on the NCPI.
(c) Consolidation
The consolidated financial statements include the accounts of Petróleos Mexicanos, the Subsidiary Entities and the Subsidiary Companies. All significant intercompany transactions have been eliminated in the consolidation.
The consolidated Subsidiary Companies are as follows: P.M.I. Comercio Internacional, S.A. de C.V. (“PMI”); P.M.I. Trading Ltd.; P.M.I. Holdings North America, Inc.; P.M.I. Holdings N.V.; P.M.I. Holdings B.V.; P.M.I. Norteamérica, S.A. de C.V. (“PMI NASA”); Kot Insurance Company AG; Integrated Trade Systems, Inc.; P.M.I. Marine Limited; P.M.I. Services, B.V.; Pemex Internacional España, S.A.; Pemex Services Europe Ltd.; P.M.I. Services North America, Inc.; Mex Gas International, Ltd.; the Master Trust; Fideicomiso F/163; and RepCon Lux.
Through December 31, 2003, certain investments in Subsidiary Companies and other non-consolidated subsidiary companies, due to their immateriality in relation to PEMEX’s total assets and revenues, are accounted for under the cost method. Effective January 1, 2004, these investments are accounted for under the equity method; however, the effect of this change was not material for the consolidated financial statements.
(d) Long-term productive infrastructure projects (PIDIREGAS)
The investment in long-term productive infrastructure projects (“PIDIREGAS”) and related liabilities are initially recorded in accordance with NIF-09-B applicable toEntidades Paraestatales de la Administración Pública Federal (State-owned Entities of the Federal Public Administration), which provides for recording only liabilities maturing in less than two years.
For the purposes of these consolidated financial statements and in accordance with Mexican GAAP, all the accounts related to PIDIREGAS were incorporated into the consolidated financial statements for the years ended December 31, 2004, 2003 and 2002, i.e., all effects of NIF-09-B are excluded.
F-9
Table of Contents
PETRÓLEOS MEXICANOS, SUBSIDIARY ENTITIES AND SUBSIDIARY COMPANIES
NOTES TO THE CONSOLIDATED FINANCIAL STATEMENTS FOR THE YEARS
ENDED DECEMBER 31, 2004, 2003 AND 2002
(Figures stated in thousands of Mexican pesos of December 31, 2004 purchasing power
and in thousands of U.S. dollars or other currency units)—(Continued)
The main objective of the Master Trust and of Fideicomiso F/163 is to administer financial resources related to PIDIREGAS, such financial resources having been designated by PEMEX for that purpose.
(e) Exploration and drilling costs and specific oil-field exploration and depletion reserve
Effective January 1, 2004, the Board of Directors of PEMEX approved a change in the accounting policy for the recognition of well exploration and drilling expenses to the successful-efforts method of accounting. As a result, the oil-field exploration and depletion reserve will be discontinued. The change in accounting policy for recording well exploration and drilling costs had no effect on the consolidated financial statements, since at December 31, 2003, the specific oil-field exploration and depletion reserve had been entirely utilized.
Under the successful efforts method of accounting for oil and gas exploration costs, exploration costs are charged to income when incurred, except that exploratory drilling costs are included in fixed assets, pending determination of proven reserves. Exploration wells more than 12 months old are expensed unless (a) (i) they are in an area requiring major capital expenditure before production can begin, (ii) commercially productive quantities of reserves have been found, and (iii) they are subject to further exploration or appraisal activity in that either drilling of additional exploratory wells is under way or firmly planned for the near future, or (b) proved reserves are recorded within 12 months following the completion of exploratory drilling. Expenses pertaining to the drilling of development wells are capitalized whether or not successful.
Management makes semi-annual assessments of the amounts included within fixed assets to determine whether capitalization is initially appropriate and can continue. Exploration wells capitalized beyond 12 months are subject to additional judgment as to whether the facts and circumstances have changed and therefore whether the conditions described in clauses (a) and (b) of the preceding paragraph no longer apply. PEMEX management believes that this new methodology reflects the best practice for recognizing the capitalization of costs related to the exploration and drilling of wells.
Through December 31, 2003, a specific capital reserve was established to cover current and future exploration and drilling costs. As oil and gas was extracted from existing wells, the equity reserve was increased, and an amount equal to the increase was charged to cost of sales based upon a calculated quota of exploration and drilling cost per barrel. Accumulated drilling costs pertaining to successful wells were reclassified from that reserve and charged as an investment in fixed assets.
(f) Marketable securities
Marketable securities include investments in debt and equity securities and have been classified on the basis of their intended use at the date of acquisition as debt instruments to be held to maturity, financial instruments for trading and financial instruments available for sale. These financial instruments are initially recorded at acquisition cost, and are subsequently valued as follows (See Note 10):
| i. | Debt instruments to be held to maturity are valued at acquisition cost and are subsequently reduced by the amortization of any premiums or increased by the amortization of any discounts over the term of the debt instrument, in proportion to the outstanding balance. Any loss in value is recognized at the end of each period. |
| ii. | Financial instruments held for trading and available for sale are valued at fair value, which is similar to market value. The fair value is the value at which a financial asset can be exchanged or a financial |
F-10
Table of Contents
PETRÓLEOS MEXICANOS, SUBSIDIARY ENTITIES AND SUBSIDIARY COMPANIES
NOTES TO THE CONSOLIDATED FINANCIAL STATEMENTS FOR THE YEARS
ENDED DECEMBER 31, 2004, 2003 AND 2002
(Figures stated in thousands of Mexican pesos of December 31, 2004 purchasing power
and in thousands of U.S. dollars or other currency units)—(Continued)
liability can be liquidated between interested and willing parties in an arm’s-length transaction. The effect of the valuation of financial instruments is recorded in income for the year. |
(g) Inventory valuation
Inventories are valued as follows:
| I. | Crude oil and derivatives thereof for export: at net realizable value, determined on the basis of average export prices at December 31, 2004 and 2003, less a provision for distribution expenses and shrinkage. |
| II. | Crude oil and derivatives thereof for domestic sales: at cost, as calculated based on net realizable international market prices. |
| III. | Materials, spare parts and supplies: at the last purchase price. |
| IV. | Materials in transit: at acquisition cost. |
(h) Properties and equipment
PEMEX’s assets are initially recorded at acquisition or construction cost. Interest pertaining to fixed assets in the construction or installation phase are capitalized as part of the asset cost. As of December 31, 2004 and 2003, these assets are expressed at their inflation restated value, determined by applying factors computed from the National Consumer Price Index (“NCPI”).
Property, plant and equipment assets are depreciated using the straight-line method, based on the inflation restated value of the assets and applying depreciation rates according to their expected useful life, based on calculations from independent appraisals. Asset depreciation begins the month after the asset is placed into service. The depreciation rates used by PEMEX are as follows:
| % | Years | |||
Buildings | 3 | 33 | ||
Plants and drilling equipment | 3 – 5 | 20 – 33 | ||
Furniture and fixtures | 10 | 10 | ||
Offshore platforms | 4 | 25 | ||
Transportation equipment | 4 – 20 | 5 – 25 | ||
Pipelines | 4 | 25 | ||
Software/computers | 10 – 25 | 4 – 10 |
Related gains or losses from the sale or disposal of fixed assets are recognized in income for the period in which they are incurred. PEMEX amortizes its well assets using the units-of-production (“UOP”) method. The amount to be recognized as amortization expense is calculated based upon the number of equivalent barrels of crude oil extracted from each specific field as compared to the field’s proved developed reserves.
TheReglamento de Trabajos Petroleros (“Petroleum Works Law”) provides that once a well turns out to be dry, invaded with salt water or abandoned due to mechanical failure or when the well’s production has been depleted such that abandonment is necessary due to economic unfeasibility of production, it must be plugged to ensure the maintenance of sanitary and safe conditions and to prevent the seepage of hydrocarbons to the surface. All activities required for plugging a well are undertaken for the purpose of properly and definitively isolating
F-11
Table of Contents
PETRÓLEOS MEXICANOS, SUBSIDIARY ENTITIES AND SUBSIDIARY COMPANIES
NOTES TO THE CONSOLIDATED FINANCIAL STATEMENTS FOR THE YEARS
ENDED DECEMBER 31, 2004, 2003 AND 2002
(Figures stated in thousands of Mexican pesos of December 31, 2004 purchasing power
and in thousands of U.S. dollars or other currency units)—(Continued)
the cross formations in the perforation that contains oil, gas or water, in order to ensure that hydrocarbons do not seep to the surface. This law also requires that PEMEX obtain approval from the Ministry of Energy for the dismantlement of hydrocarbon installations, either for the purpose of replacing them with new installations or for permanent retirement.
Through December 31, 2002, estimated dismantlement and abandonment costs were taken into account in determining amortization and depreciation rates. PEMEX recognized the costs related to currently producing and temporarily closed wells based on the UOP method. In the case of non-producing wells subject to abandonment and dismantlement, the full dismantlement and abandonment cost was recognized at the end of each period. All estimates were based on the life of the field, and taking into consideration current cost estimates on an undiscounted basis. No salvage value was considered when determining such rates because salvage values have traditionally been zero. The estimated dismantlement and abandonment costs were reflected within accumulated depreciation and amortization.
Effective January 1, 2003, PEMEX adopted Bulletin C-9, “Liabilities, Provisions, Contingent Assets and Liabilities and Commitments” issued by the MIPA (“Bulletin C-9”). As a result, PEMEX changed the method of accruing the costs related to wells subject to abandonment and dismantlement. The present values of these costs are recorded as liabilities on a discounted basis when incurred, which is typically at the time the wells are put into service. The amounts recorded for these obligations are initially recorded by capitalizing the respective costs. Over time the liabilities will be accreted by the change in their present value during each period and the initial capitalized costs will be depreciated over the useful lives of the related assets based on the UOP method. In the case of the non-producing wells subject to abandonment and dismantlement, the full dismantlement and abandonment cost will be recognized at the end of each period.
The adoption of Bulletin C-9 resulted in the recognition of a benefit of Ps. 2,117,261 related to the provision for dismantlement and abandonment, as of January 1, 2003.
The carrying value of these long-lived assets is subject to an annual impairment assessment. See Notes 2(i) and 5.
(i) Impairment of the value of long-lived assets
Effective January 1, 2004, PEMEX adopted Bulletin C-15, “Impairment of the Value of Long-Lived Assets and their Disposal”, issued by the MIPA (“Bulletin C-15”). PEMEX recognized impairment in the value of long-lived assets as of January 1, 2004 and for the year ended December 31, 2004 with an initial effect of adoption and a subsequent impairment charge for the year of Ps. 2,024,132 and Ps. 1,652,570, respectively. The initial adoption effect is presented in the consolidated statement of operations as a cumulative effect of adoption of a new accounting standard, and the impairment for the year is also presented in the consolidated statement of operations within costs and operating expenses. See Note 5.
PEMEX evaluates the impairment of long-lived assets whenever there are events or circumstances indicating that the book value of a given asset may not be recoverable. In order to analyze impairment, PEMEX makes a comparison, for each of the cash-generating units, of the book value of the long-lived assets and the estimated future value (discounted) of cash flows generated by such long-lived assets. If the book value of the long-lived assets exceeds the estimated recoverable value, a charge is made to income for the period for an impairment loss.
F-12
Table of Contents
PETRÓLEOS MEXICANOS, SUBSIDIARY ENTITIES AND SUBSIDIARY COMPANIES
NOTES TO THE CONSOLIDATED FINANCIAL STATEMENTS FOR THE YEARS
ENDED DECEMBER 31, 2004, 2003 AND 2002
(Figures stated in thousands of Mexican pesos of December 31, 2004 purchasing power
and in thousands of U.S. dollars or other currency units)—(Continued)
This calculation is made at the end of each period, and in accordance with Bulletin C-15, the impairment recorded can be reversed in subsequent periods if the subsequent impairment analysis does not indicate a loss in such future periods.
(j) Liabilities, provisions, contingent assets and liabilities and commitments
PEMEX’s liabilities represent present obligations and the liability provisions recognized in the balance sheet represent present obligations whose settlement will probably require the use of an estimate of economic resources. These provisions have been recorded, based on management’s best estimate of the amount needed to settle present liability; however, actual results could differ from the provisions recognized.
Bulletin C-9 went into effect on January 1, 2003. This Bulletin establishes general rules for the valuation, presentation and disclosure of liabilities, provisions and contingent assets and liabilities, as well as for the disclosure of commitments entered into by a company as a part of its normal operations. See Note 2(h) for a discussion of the impact of Bulletin C-9 related to the provision for dismantlement and abandonment costs.
(k) Foreign currency balances and transactions
Transactions denominated in foreign currency are recorded at the respective exchange rates prevailing on the day that the transactions are entered into. Monetary assets and liabilities in foreign currencies are stated in pesos at the rates in effect at the balance sheet date and published by theSecretaría de Hacienda y Crédito Público (Ministry of Finance and Public Credit, or “SHCP”). Foreign exchange losses and gains are charged and credited, respectively, to income. This resulted in net exchange losses charged to income of Ps. 3,470,747, Ps. 26,830,343 and Ps. 4,661,247 in 2004, 2003 and 2002, respectively.
(l) Retirement benefits, pensions and seniority premiums
Seniority premiums to which PEMEX employees are entitled upon termination of their employment as well as the obligations under retirement plans established for the employees, to which the employees do not contribute, are recorded as a cost of the years in which the respective services are rendered, based on actuarial studies carried out using the projected unit credit method. PEMEX has recorded the results of the actuarial valuations in these consolidated financial statements in accordance with Mexican GAAP Bulletin D-3, “Labor Obligations”, issued by the MIPA (“Bulletin D-3”).
Payments for indemnities to dismissed personnel are charged to expense as they are incurred.
Effective January 1, 2004, PEMEX adopted the amendments to Bulletin D-3, issued by the MIPA, which include rules for valuation, presentation and recording for recognition of remuneration upon retirement. The plan for other post-retirement benefits includes support given in the form of cash to retired personnel and their dependents for gas, gasoline and basic supplies, as well as medical services. See Note 11.
(m) Equity
Certificates of Contribution “A”, the specific oil-field exploration and depletion reserve (until 2003) and accumulated losses represent the value of these items stated in terms of purchasing power of the most recent balance sheet date, and are determined by applying factors derived from the NCPI to the historical amounts.
F-13
Table of Contents
PETRÓLEOS MEXICANOS, SUBSIDIARY ENTITIES AND SUBSIDIARY COMPANIES
NOTES TO THE CONSOLIDATED FINANCIAL STATEMENTS FOR THE YEARS
ENDED DECEMBER 31, 2004, 2003 AND 2002
(Figures stated in thousands of Mexican pesos of December 31, 2004 purchasing power
and in thousands of U.S. dollars or other currency units)—(Continued)
(n) Surplus in the restatement of equity
The surplus in the restatement of equity at December 31, 2004 and 2003 is composed of cumulative results from the initial net monetary position and of results from holding non-monetary assets (mainly inventories and properties and equipment), restated in Mexican pesos of purchasing power as of the most recent balance sheet date.
(o) Result on monetary position
The gain on monetary position represents the gain or loss, measured in terms of the NCPI, on net monthly monetary assets and liabilities for the year, expressed in Mexican pesos of purchasing power as of the most recent balance sheet date. The inflation rates were 5.2%, 3.8% and 5.7%, in 2004, 2003 and 2002, respectively.
(p) Comprehensive financing cost
Comprehensive financing cost includes all types of financial gains or costs, such as interest income and expense, net foreign exchange gains or losses and effects on valuation of financial instruments, in addition to gains or losses on monetary position.
(q) Cost of sales
Cost of sales is determined by adding to inventories at the beginning of the year the operating cost of oil fields, refineries and plants (including internally-consumed products), the purchase cost of refined and other products, and deducting the value of inventories at the end of the year. The amount thus determined is restated to period end purchasing power based on NCPI factors. Cost of sales also includes the depreciation and amortization expense associated with assets used in operations as well as the expense associated with the reserve for future dismantlement and abandonment costs. Through December 31, 2003, cost of sales also included the increase in the specific oil-field exploration and depletion reserve for the year (a fixed charge per barrel extracted).
(r) Taxes and federal duties
Petróleos Mexicanos and the Subsidiary Entities are subject to special tax laws, which are based upon petroleum revenues and do not generate temporary differences or deferred income taxes. Petróleos Mexicanos and the Subsidiary Entities are not subject to theLey del Impuesto Sobre la Renta (“Income Tax Law”) or theLey del Impuesto al Activo (“Asset Tax Law”). Some of the Subsidiary Companies are subject to the Income Tax Law and Asset Tax Law; however, such Subsidiary Companies do not generate significant deferred income taxes.
Petróleos Mexicanos and the Subsidiary Entities are subject to the following duties and taxes: Hydrocarbon Extraction Duties, Hydrocarbon Income Tax and the Special Tax on Production and Services (“IEPS Tax”). Petróleos Mexicanos and the Subsidiary Entities are also subject to theImpuesto al Valor Agregado(Value Added Tax, or “VAT”).
Hydrocarbon extraction duties are calculated at a rate of 52.3% on the net cash flow difference between crude oil sales and extraction costs and expenses. Extraordinary and additional hydrocarbon extraction duties are
F-14
Table of Contents
PETRÓLEOS MEXICANOS, SUBSIDIARY ENTITIES AND SUBSIDIARY COMPANIES
NOTES TO THE CONSOLIDATED FINANCIAL STATEMENTS FOR THE YEARS
ENDED DECEMBER 31, 2004, 2003 AND 2002
(Figures stated in thousands of Mexican pesos of December 31, 2004 purchasing power
and in thousands of U.S. dollars or other currency units)—(Continued)
calculated at a rate of 25.5% and 1.1%, respectively, on the same basis. The hydrocarbon income tax is equivalent to the regular income tax applied to all Mexican corporations, a tax to which Petróleos Mexicanos and the Subsidiary Entities are not subject; the rate of this tax was 35% for all periods presented.
The sum of the above duties and taxes must equal 60.8% of Petróleos Mexicanos and the Subsidiary Entities’ annual sales revenues to third parties. In addition, PEMEX pays a 39.2% duty on excess gains revenues, i.e., the portion of revenues in respect of crude oil sales at prices in excess of a threshold price set by the Mexican Government annually of 20.00 U.S. dollars, 18.35 U.S. dollars and 15.50 U.S. dollars per barrel for 2004, 2003 and 2002, respectively. Therefore, to the extent that the sum of hydrocarbon extraction duties is less than 60.8% of sales to third parties, additional taxes are paid to reach that level.
(s) Special Tax on production and Services (IEPS Tax)
The IEPS Tax charged to customers is a tax on the domestic sales of gasoline and diesel. The applicable rates depend on, among other factors, the product, producer’s price, freight costs, commissions and the region in which the respective product is sold. For financial statement purposes, the IEPS Tax collected from customers is presented as part of “Net domestic sales”, and the payment to the Government is deducted after “Income before hydrocarbon extraction duties and other, special tax on production and services, and cumulative effect of adoption of new accounting standards”.
(t) Revenue recognition
For all export products, risk of loss and ownership title is transferred upon shipment, and thus PEMEX records sales revenue upon shipment to customers abroad. In the case of certain domestic sales in which the customer takes product delivery at a PEMEX facility, sales revenues are recorded at the time delivery is taken. For domestic sales in which PEMEX is responsible for product delivery, risk of loss and ownership is transferred at the delivery point, and PEMEX records sales revenue upon delivery.
(u) Financial instruments with characteristics of liability, equity or both
PEMEX enters into derivative financial instruments in order to reduce the risk of adverse movements in interest rates, in the price of oil and natural gas, in the value of foreign currencies and in the price of PEMEX’s investment portfolios. Derivative instruments contracted for hedging purposes are recorded in the balance sheet on the basis of the same criteria used to record the assets or liabilities covered by those instruments. Financial instruments not considered hedges are recorded at fair value, with the realized and unrealized results recorded in earnings.
Financial instruments issued by PEMEX with characteristics of equity, of liability or of both, are recorded at the time of issuance as a liability, as equity or as both, depending on the components involved. Initial costs incurred in the issuance of those instruments are assigned to liabilities and equity in the same proportion as the amounts of their components. Gains or losses pertaining to the components of financial instruments classified as liabilities are recorded as part of comprehensive financing cost. The distribution of profits to the owners of the components of financial instruments classified as equity is charged directly to an equity account.
F-15
Table of Contents
PETRÓLEOS MEXICANOS, SUBSIDIARY ENTITIES AND SUBSIDIARY COMPANIES
NOTES TO THE CONSOLIDATED FINANCIAL STATEMENTS FOR THE YEARS
ENDED DECEMBER 31, 2004, 2003 AND 2002
(Figures stated in thousands of Mexican pesos of December 31, 2004 purchasing power
and in thousands of U.S. dollars or other currency units)—(Continued)
(v) Use of estimates
The preparation of the financial statements in accordance with Mexican GAAP requires the use of estimates. PEMEX management makes estimates and assumptions that affect the amounts and the disclosures presented as of the date of the consolidated financial statements. Actual results could differ from those estimates.
(w) Comprehensive income (loss)
Comprehensive income (loss) is represented by the net loss for the period plus the effect of restatement, the net increase or decrease in the specific oil-field exploration and depletion reserve (through 2003), and items required by specific accounting standards to be reflected in equity but which do not constitute equity contributions, reductions or distributions, and is restated on the basis of NCPI factors. See Note 12.
(x) Convenience translation
United Stated dollar (“U.S. dollar”) amounts shown in the balance sheets, the statements of operations, the statements of changes in equity and statements of changes in financial position have been included solely for the convenience of the reader. Such amounts are translated from pesos, as a matter of arithmetic computation only, at an exchange rate for the settlement of obligations in foreign currencies provided byBanco de México and the SHCP at December 31, 2004. Translations herein should not be construed as a representation that the peso amounts have been or could be converted into U.S. dollars at the foregoing rate or any other rate.
(y) Reclassifications
Certain reclassifications have been made to 2003 and 2002 amounts presented in the consolidated financial statements and related notes to conform such amounts and disclosures to the current year presentation.
3. Accounts, notes receivable and other
At December 31, accounts, notes receivable and other receivables are as follows:
| 2004 | 2003 | |||||||
Sales-domestic | Ps. 30,635,446 | Ps. 23,322,587 | ||||||
Sales-export | 9,253,595 | 11,880,701 | ||||||
Pemex Finance, Ltd. | 8,051,516 | 8,570,007 | ||||||
Mexican Government advance payments | 10,387,839 | 10,703,189 | ||||||
Employees and officers | 2,450,763 | 2,426,868 | ||||||
Other accounts receivable | 31,414,785 | 19,155,183 | ||||||
Less: | ||||||||
Allowance for doubtful accounts | (1,919,949 | ) | (2,201,096 | ) | ||||
| Ps. 90,273,995 | Ps. 73,857,439 | |||||||
F-16
Table of Contents
PETRÓLEOS MEXICANOS, SUBSIDIARY ENTITIES AND SUBSIDIARY COMPANIES
NOTES TO THE CONSOLIDATED FINANCIAL STATEMENTS FOR THE YEARS
ENDED DECEMBER 31, 2004, 2003 AND 2002
(Figures stated in thousands of Mexican pesos of December 31, 2004 purchasing power
and in thousands of U.S. dollars or other currency units)—(Continued)
4. Inventories
At December 31, inventories are as follows:
| 2004 | 2003 | |||||||
Crude oil, refined products, derivatives and petrochemical products | Ps. 30,590,768 | Ps. 25,226,625 | ||||||
Materials and supplies in stock | 4,242,957 | 4,382,523 | ||||||
Materials and products in transit | 2,587,864 | 1,238,969 | ||||||
Less: | ||||||||
Allowance for slow-moving and obsolete inventory | (1,657,861 | ) | (1,944,153 | ) | ||||
| Ps. 35,763,728 | Ps. 28,903,964 | |||||||
5. Properties and equipment
At December 31, components of properties and equipment are as follows:
| 2004 | 2003 | |||||||
Plants | Ps. 302,162,096 | Ps. 292,399,170 | ||||||
Pipelines | 228,317,114 | 228,894,105 | ||||||
Wells | 263,238,565 | 224,075,520 | ||||||
Drilling equipment | 19,944,162 | 21,397,388 | ||||||
Buildings | 37,663,443 | 37,615,830 | ||||||
Offshore platforms | 97,065,643 | 72,944,546 | ||||||
Furniture and equipment | 27,171,179 | 24,064,588 | ||||||
Transportation equipment | 12,780,796 | 12,911,345 | ||||||
| 988,342,998 | 914,302,492 | |||||||
Less: | ||||||||
Accumulated depreciation and amortization | (515,710,572 | ) | (477,041,882 | ) | ||||
| 472,632,426 | 437,260,610 | |||||||
Land | 38,046,582 | 39,723,521 | ||||||
Construction in progress | 82,571,832 | 88,384,704 | ||||||
Fixed assets to be disposed of | 1,318,085 | 1,684,867 | ||||||
Construction spares | — | 155,490 | ||||||
Total | Ps. 594,568,925 | Ps. 567,209,192 | ||||||
| a) | For the years ended December 31, 2004, 2003 and 2002, interest costs associated with fixed assets in the construction or installation phase and that were capitalized as part of those assets totaled Ps. 4,339,933, Ps. 7,622,449 and Ps. 5,752,053, respectively. |
| b) | Depreciation of assets and amortization of wells for the periods ended December 31, 2004, 2003 and 2002 recorded in operating costs and expenses were Ps. 41,900,077, Ps. 42,648,759 and Ps. 35,569,746, respectively, which included Ps. 314,277, Ps. 479,596 and Ps. 1,473,535, respectively, related to dismantlement and abandonment costs. |
F-17
Table of Contents
PETRÓLEOS MEXICANOS, SUBSIDIARY ENTITIES AND SUBSIDIARY COMPANIES
NOTES TO THE CONSOLIDATED FINANCIAL STATEMENTS FOR THE YEARS
ENDED DECEMBER 31, 2004, 2003 AND 2002
(Figures stated in thousands of Mexican pesos of December 31, 2004 purchasing power
and in thousands of U.S. dollars or other currency units)—(Continued)
| c) | As of December 31, 2004 and 2003, PEMEX has recognized cumulative impairment charges in the value of the long-lived assets amounting to Ps. 11,166,694 and Ps. 7,489,992, respectively. Impairments recorded through December 31, 2003 were determined in accordance with the value in use concept in accordance with Bulletin B-10. With the adoption of Bulletin C-15, PEMEX determined a cumulative effect totaling Ps. 2,024,132 at January 1, 2004 and an effect for the year ended December 31, 2004 totaling Ps. 1,652,570 for the year. The cumulative effect at January 1, 2004 of the adoption of Bulletin C-15 is shown in the consolidated statement of operations under cumulative effect of adoption of new accounting standards, and the effect for the year is presented under costs and operating expenses. |
6. Intangible asset derived from the actuarial computation of labor obligations and other assets
At December 31, intangible and other assets consist of:
| 2004 | 2003 | |||||
Intangible asset derived from the actuarial computation of labor obligations (Note 11) | Ps. | 76,438,830 | Ps. | 125,502,324 | ||
Long-term investments and other assets | 32,903,995 | 16,742,493 | ||||
| Ps. | 109,342,825 | Ps. | 142,244,817 | |||
Included in long-term investments and other assets are 58,679,800 shares of Repsol YPF, S.A. with a carrying value of Ps. 17,224,496 at December 31, 2004 and 18,557,219 shares of the same company with a carrying value of Ps. 4,274,205 at December 31, 2003.
PMI NASA has a 50% joint venture with Shell Oil Company, in which it owns a 50% interest in a petroleum refinery located in Deer Park, Texas. The investment is accounted for under the equity method and amounts to Ps. 5,182,708 and Ps. 2,952,132, respectively, at December 31, 2004 and 2003. During 2004, 2003 and 2002, PEMEX recorded Ps. 3,232,074 and Ps. 935,910 of profits and Ps. 276,553 of losses, respectively, relative to its interest in the joint venture, which has been reflected in the line item “Other revenues” in the statements of operations. In 2004, 2003 and 2002, PEMEX paid the joint venture Ps. 7,638,459, Ps. 4,903,450 and Ps. 2,829,725, respectively, for the processing of crude oil.
7. Sale of future accounts receivable
On December 1, 1998, Petróleos Mexicanos, Pemex-Exploration and Production, PMI and P.M.I. Services B.V. entered into several agreements with Pemex Finance, Ltd. (“Pemex Finance”), a limited liability company which was organized under the laws of the Cayman Islands. Under these agreements, Pemex Finance purchases certain existing accounts receivable for crude oil from Pemex-Exploration and Production and PMI, either already existing or to arise in the future. The current and future accounts receivable sold are those generated from the sale of Maya crude oil to designated customers in the United States, Canada, and Aruba. The net resources obtained by Pemex-Exploration and Production from the sale of such receivables under the agreements are utilized for PIDIREGAS (see Note 2 (d)). For the year ended December 31, 2004, 2003 and 2002, the sales under these agreements were Ps. 170,160,778, Ps. 128,339,972 and Ps. 82,918,425, respectively.
The “Sale of future accounts receivable” is shown as a long-term liability in the consolidated financial statements at December 31, 2004 and 2003. Although the agreements between Petróleos Mexicanos, Pemex-Exploration and Production, PMI, P.M.I. Services, B.V. and Pemex Finance establish short-term payment obligations, it is not
F-18
Table of Contents
PETRÓLEOS MEXICANOS, SUBSIDIARY ENTITIES AND SUBSIDIARY COMPANIES
NOTES TO THE CONSOLIDATED FINANCIAL STATEMENTS FOR THE YEARS
ENDED DECEMBER 31, 2004, 2003 AND 2002
(Figures stated in thousands of Mexican pesos of December 31, 2004 purchasing power
and in thousands of U.S. dollars or other currency units)—(Continued)
expected that current receivables will have to be used in the short term to cover those obligations, because those receivables are constantly being regenerated. Additionally, Pemex Finance has a proven continuous ability to contract debt in the international market sufficient to sustain the acquisition of accounts receivable from PEMEX.
8. Notes payable to contractors
At December 31, the notes payable to contractors consisted of:
| 2004 | 2003 | |||||||
Total notes payable to contractors (a)(b)(c) | Ps. | 13,361,672 | Ps. | 15,806,747 | ||||
Less: Current portion of notes payable to contractors | (2,076,592 | ) | (1,985,108 | ) | ||||
Notes payable to contractors (long-term) | Ps. | 11,285,080 | Ps. | 13,821,639 | ||||
| (a) | On November 26, 1997, Petróleos Mexicanos and Pemex-Refining entered into a financed public works contract and a unit-price public works contract with Consorcio Proyecto Cadereyta Conproca, S.A. de C.V. The related contracts are for the reconfiguration and modernization of the “Ing. Héctor R. Lara Sosa” refinery in Cadereyta, N.L. |
The original amount of the financed public works contract was U.S. $1,618,352, plus a financing cost of U.S. $805,648, due in twenty semi-annual payments of U.S. $121,200. The original amount of the unit-price public works contract was U.S. $80,000, including a financing cost of U.S. $47,600 payable monthly based on the percentage of completion. At December 31, 2004 and 2003, the outstanding balances of the respective contracts were Ps. 11,832,618 and Ps. 14,180,314, respectively.
| (b) | On June 25, 1997, PEMEX entered into a 10-year service agreement, with a contractor for a daily fee of U.S. $82.50 for the storage and loading of stabilized petroleum by means of a floating system (“FSO”). At December 31, 2004 and 2003, the outstanding balances were Ps. 976,442 and Ps. 1,227,715, respectively. |
| (c) | In 2004 and 2003, PEMEX had liabilities of Ps. 552,612 and Ps. 398,718, respectively, for the upgrade of the refinery located in Minatitlán, Veracruz. Additionally, during 2004 and 2003, PEMEX paid Ps. 6,046,440 and Ps. 15,364,577, for the upgrading and modernization of the refineries located in Salamanca, Guanajuato and Ciudad Madero, Tamaulipas. |
9. Debt
In 2004, significant financing activities were as follows:
| a. | Petróleos Mexicanos issued short-term certificates totaling Ps. 9,000,000 (in nominal terms), bearing fixed interest rates ranging from 8.43% to 8.79%. Of that amount, Ps. 7,000,000 was repaid in 2004 and Ps. 2,000,000 is repayable in 2005. |
| b. | Petróleos Mexicanos obtained direct loans denominated in Japanese yen (¥) of ¥ 13,229,411, equivalent to U.S. $129,302 (Ps. 1,456,558), bearing interest at a fixed rate of 4.2%. Of this amount, ¥ 1,202,674 was paid in December 2004, and the remainder is payable on different dates up 2009. |
| c. | Petróleos Mexicanos obtained U.S. $93,666 (Ps. 1,055,129) for purchasing loans and project financing, granted by export credit agencies. These loans bear interest at LIBOR plus 0.0625% to 0.5% with various maturity dates through 2014. |
F-19
Table of Contents
PETRÓLEOS MEXICANOS, SUBSIDIARY ENTITIES AND SUBSIDIARY COMPANIES
NOTES TO THE CONSOLIDATED FINANCIAL STATEMENTS FOR THE YEARS
ENDED DECEMBER 31, 2004, 2003 AND 2002
(Figures stated in thousands of Mexican pesos of December 31, 2004 purchasing power
and in thousands of U.S. dollars or other currency units)—(Continued)
In 2004, the Master Trust undertook the following financing activities:
| a. | The Master Trust obtained credit lines from export credit agencies totaling U.S. $1,399,069 (Ps. 15,760,232) to finance foreign trade operations. These loans are repayable on various maturity dates through 2007 and are subject to interest at LIBOR plus 0.03% and 0.38%. |
| b. | On June 15, 2004, the Master Trust issued U.S. $1,500,000 (Ps. 16,897,200) of Guaranteed Floating Rate Notes due 2010. The notes bear interest at LIBOR plus 1.3% and are guaranteed by Petróleos Mexicanos. |
| c. | On August 5, 2004, the Master Trust issued € 850,000 (Ps. 13,022,085) of 6.375% Guaranteed Notes due 2016. The notes are guaranteed by Petróleos Mexicanos. |
| d. | On September 28, 2004, the Master Trust issued perpetual bonds with no fixed maturity date totaling U.S. $1,750,000 (Ps. 19,713,400), which bear a fixed interest rate of 7.75%. The bonds are guaranteed by Petróleos Mexicanos and may be redeemed at any time on or after the fifth anniversary from the date of issuance at the option of the issuer. |
| e. | On December 30, 2004, the Master Trust completed an exchange offer pursuant to which the Master Trust issued seven tranches of notes with a principal amount totaling U.S. $2,308,161 (Ps. 26,000,972) in exchange for an equal principal amount of notes previously issued by Petróleos Mexicanos. This amount represented 78.4% of the total principal amount of notes subject to the offer. |
| f. | At various dates in 2004, the Master Trust obtained bank loans to finance PIDIREGAS projects, which totaled U.S. $25,000 (Ps. 281,620), subject to an interest rate of LIBOR plus 0.55% to 0.7%. Such loans are due in 2006 and 2007. |
In 2004, Fideicomiso F/163 undertook the following financing activities:
| a. | On January 30, 2004, under its Ps. 20,000,000 peso-denominated publicly-traded notes (certificados bursátiles) program approved by theComisión Nacional Bancaria y de Valores(National Banking and Securities Commission, or “CNBV”), the Fideicomiso F/163, issued Ps. 11,500,000 (in nominal terms) of notes the Mexican domestic market which corresponded to a reopening of an earlier issuance and involved three separate tranches: Ps. 4,000,000 at a variable 91-day interest rateCertificados de la Tesorería de la Federación (Mexican Government Treasury Bonds, or “CETES”) plus 0.65% maturing in 2007; Ps. 5,000,000 at the 182-day CETES rate plus 0.67%, maturing in 2009; and Ps. 2,500,000 at a fixed rate of 8.38%, maturing in 2010. |
| b. | On March 26, 2004, under its peso-denominated publicly-traded notes (certificados bursátiles) program (which was increased to Ps. 40,000,000), the Fideicomiso F/163 issued Ps. 14,672,000 (in nominal terms) of the foregoing notes in a further reopening, also in three tranches, of Ps. 6,00,000 at the CETES rate plus 0.65%, maturing in 2007; Ps. 6,000,000 at the CETES rate plus 0.67% maturing in 2009; and Ps. 2,672,000 at a fixed rate of 8.38%, maturing in 2010. |
| c. | On March 30, 2004, Fideicomiso F/163 obtained a bank loan for Ps. 4,000,000 (in nominal terms), which is subject to a variable interest at theTasa de Interés Interbancaria de Equilibrio (Inter-banking interest rate, or “TIIE”) plus 0.40% and is repayable from 2005 to 2009. |
| d. | On November 4, 2004, Fideicomiso F/163 obtained a bank loan of Ps. 4,000,000 (in nominal terms), which is subject to interest at a fixed rate of 11% and matures in 2011 and 2012. |
F-20
Table of Contents
PETRÓLEOS MEXICANOS, SUBSIDIARY ENTITIES AND SUBSIDIARY COMPANIES
NOTES TO THE CONSOLIDATED FINANCIAL STATEMENTS FOR THE YEARS
ENDED DECEMBER 31, 2004, 2003 AND 2002
(Figures stated in thousands of Mexican pesos of December 31, 2004 purchasing power
and in thousands of U.S. dollars or other currency units)—(Continued)
| e. | On November 23, 2004, Fideicomiso F/163 obtained a bank loan of Ps. 3,000,000 (in nominal terms), which is subject to interest at TIIE plus 0.48% and is repayable in 2010 and 2012. |
| f. | On December 23, 2004, Fideicomiso F/163 issued zero coupon notes denominated inUnidades de Inversión (Units of Investment, or UDI) in an amount of UDI 1,415,800 (equivalent to Ps. 5,000,000 (in nominal terms)) with a maturity of 15 years. |
| g. | On December 20, 2004, Fideicomiso F/163 obtained a loan for Ps. 4,000,000 (in nominal terms) subject to an interest rate equal to the TIIE rate plus 0.425%, which was subsequently changed to a fixed rate of 10.55% and will mature from 2010 to 2012. |
Additionally, in 2004 the following financing activities were also undertaken:
| a. | On January 26, 2004, RepCon Lux issued U.S. $1,373,738 (Ps. 15,474,884) of 4.5% guaranteed exchangeable bonds due 2011, bearing interest at the fixed rate of 4.5%. These bonds are guaranteed by Petróleos Mexicanos and are exchangeable for shares of common stock of Repsol YPF, S.A. or the cash equivalent thereof. See Note 6. |
| b. | As of December 31, 2004, PMI Trading has signed a number of agreements with foreign banks pertaining to credit lines intended to support commercial transactions, totaling U.S. $60,000. At December 31, 2004, these credit lines remain unused. Additionally, PMI Trading obtained a bank loan of U.S. $25,000 (Ps. 281,620) at a fixed interest rate of 3.45%, payable in 2005. |
In 2003, significant financing operations were as follows:
| a. | Petróleos Mexicanos obtained loans to finance foreign trade operations totaling U.S. $125,000 (Ps. 1,477,405). The loans were payable (and paid) in 2004 and bore interest at LIBOR plus 0.585% to 0.65%. |
| b. | Petróleos Mexicanos obtained direct loans of U.S. $440,000 (Ps. 5,200,464) from a number of banks which bore interest at LIBOR plus 0.55% to 0.695% and matured and were paid in 2004. |
| c. | Petróleos Mexicanos reutilized U.S. $432,000 (Ps. 5,105,911) under its commercial paper program. This commercial paper matured and was paid in 2004 and bore interest at discount rates from 1.085% to 1.11%, which were the prevailing rates in the market at the date of each issuance. |
| d. | Petróleos Mexicanos utilized U.S. $540,000 (Ps. 6,382,389) of bank credit lines. Drawdowns under these loans bore interest payable at the close of the period at LIBOR plus 0.6%, and matured and were paid in 2004. |
| e. | Petróleos Mexicanos obtained U.S. $152,340 (Ps. 1,800,543) for purchasing goods and services through loans secured by various export credit agencies. The project financing credits bear interest at LIBOR plus 0.0625% to 1.5% and a fixed rate of 3.32% to 5.04%, payable on several dates ending in 2014. |
In 2003, the Master Trust undertook the following financing activities:
| a. | The Master Trust obtained commercial bank loans totaling U.S. $1,173,583 (Ps. 13,870,856). These loans bear fixed interest of 5.44%, LIBOR plus 0.6% to 1.9% and other variable rates plus 0.2% to 0.4%, and are repayable in installments until 2018. |
F-21
Table of Contents
PETRÓLEOS MEXICANOS, SUBSIDIARY ENTITIES AND SUBSIDIARY COMPANIES
NOTES TO THE CONSOLIDATED FINANCIAL STATEMENTS FOR THE YEARS
ENDED DECEMBER 31, 2004, 2003 AND 2002
(Figures stated in thousands of Mexican pesos of December 31, 2004 purchasing power
and in thousands of U.S. dollars or other currency units)—(Continued)
| b. | The Master Trust obtained loans to finance foreign trade operations totaling U.S. $1,700,000 (Ps. 20,092,705). These loans are repayable in 2004 and 2006 and bear interest at LIBOR plus 0.4% and 0.6%. |
| c. | On January 27, 2003, the Master Trust issued £250,000 (Ps. 5,283,786) of 7.50% Notes due 2013; the notes were issued under the Master Trust’s Medium-Term Note program, Series A, and are guaranteed by Petróleos Mexicanos. |
| d. | On February 6, 2003, the Master Trust issued U.S. $750,000 (Ps. 8,864,429) of 6.125% Notes due 2008; the notes were issued under the Master Trust’s Medium-Term Note program, Series A, and are guaranteed by Petróleos Mexicanos. |
| e. | On March 21, 2003, the Master Trust issued U.S. $500,000 (Ps. 5,909,619) of 8.625% Bonds due 2022; the bonds were issued under the Master Trust’s Medium-Term Note program, Series A, and are guaranteed by Petróleos Mexicanos. |
| f. | On April 4, 2003, the Master Trust issued €750,000 (Ps. 11,173,630) of 6.625% Notes due 2010; the notes are guaranteed by Petróleos Mexicanos. |
| g. | On June 4, 2003, the Master Trust issued U.S. $750,000 (Ps. 8,864,428) of 7.375% Notes due 2014; the notes were issued under the Master Trust’s Medium-Term Note program, Series A, and are guaranteed by Petróleos Mexicanos. |
| h. | On August 5, 2003, the Master Trust issued €500,000 (Ps. 7,449,086) of 6.25% Guaranteed Notes due 2013; the notes are guaranteed by Petróleos Mexicanos. |
| i. | On October 15, 2003, the Master Trust issued U.S. $500,000 (Ps. 5,909,619) of Guaranteed Floating Rate Notes due 2009; the notes bear interest at LIBOR plus 1.8% and are guaranteed by Petróleos Mexicanos. |
| j. | On November 5, 2003, the Master Trust issued £150,000 (Ps. 3,170,272) of 7.50% Notes due 2013. The notes were issued under the Master Trust’s Medium-Term Note program, Series A, and are guaranteed by Petróleos Mexicanos. |
| k. | At various dates during 2003, the Master Trust obtained project financings totaling U.S. $2,096,154 (Ps. 24,774,943) at fixed interest rates from 3.23% to 6.64% and at LIBOR plus 0.03% to 2.25% with various maturities until 2014. |
In 2003, Fideicomiso F/163 undertook the following financing activities:
| a. | On October 24, 2003, Fideicomiso F/163 issued Ps. 6,500,000 (in nominal terms) of publicly traded notes (certificados bursátiles), consisting of three tranches, bearing interest at a fixed rate of 8.38% and at the CETES rate plus 0.65% and 0.67%, with various maturities until 2010. |
| b. | On December 18, 2003, Fideicomiso F/163 obtained a bank loan of Ps. 2,500,000 (in nominal terms), which is subject to interest at the TIIE rate plus 0.36% payable on several dates through 2008. |
| c. | On December 23, 2003, Fideicomiso F/163 obtained a syndicated bank loan of Ps. 7,000,000 (in nominal terms), which is subject to the TIIE rate plus 0.35% and a fixed rate of 8.4% and is repayable in 2007 and 2008. |
F-22
Table of Contents
PETRÓLEOS MEXICANOS, SUBSIDIARY ENTITIES AND SUBSIDIARY COMPANIES
NOTES TO THE CONSOLIDATED FINANCIAL STATEMENTS FOR THE YEARS
ENDED DECEMBER 31, 2004, 2003 AND 2002
(Figures stated in thousands of Mexican pesos of December 31, 2004 purchasing power
and in thousands of U.S. dollars or other currency units)—(Continued)
In 1983, 1985, 1987, and 1990, Petróleos Mexicanos, together with the Mexican Government, entered into various covenants with the international banking community for restructuring its debt. As a result of the final agreement, the remaining balance of the restructured Mexican Government debt retained principally the same interest conditions as had been negotiated in 1987. The agreed-upon periods of amortization included a provision for division of the debt into two main portions with amortization over 52 and 48 quarters, respectively. The first amortization period began in 1994 and the second began in 1995, with both scheduled to end in December 2006.
Each year, the Ministry of Finance approves Petróleos Mexicanos and Subsidiary Entities’ annual budget and its annual financing program. The Mexican Government incorporates Petróleos Mexicanos and Subsidiary Entities’ annual budget and annual financing program into the budget of the Mexican Government, which the Mexican Congress must approve each year. PEMEX’s debt is not an obligation of, and is not guaranteed by, the Mexican Government. However, under theLey General de Deuda Pública (the “General Law of Public Debt”), Petróleos Mexicanos and Subsidiary Entities’ foreign debt obligations must be approved by and registered with the SHCP and are considered Mexican external public debt. Although Petróleos Mexicanos’ debt is not guaranteed by the Mexican Government, Petróleos Mexicanos’ external debt has received “pari passu” treatment in previous debt restructurings.
Various credit facilities require compliance with various operating covenants which, among other things, place restrictions on the following types of transactions:
| • | The sale of substantial assets essential for the continued operations of the business; |
| • | Liens against its assets; and |
| • | Transfers, sales or assignments of rights to payment under contracts for the sale of crude oil or gas not yet earned, accounts receivable or other negotiable instruments. |
F-23
Table of Contents
PETRÓLEOS MEXICANOS, SUBSIDIARY ENTITIES AND SUBSIDIARY COMPANIES
NOTES TO THE CONSOLIDATED FINANCIAL STATEMENTS FOR THE YEARS
ENDED DECEMBER 31, 2004, 2003 AND 2002
(Figures stated in thousands of Mexican pesos of December 31, 2004 purchasing power
and in thousands of U.S. dollars or other currency units)—(Continued)
As of December 31, 2004 and 2003, long-term debt was as follows:
| December 31, 2004 | December 31, 2003 | |||||||||||||
Rate of interest (3) | Maturity | Pesos (thousands) | Foreign (thousands) | Pesos (thousands) | Foreign (thousands) | |||||||||
U.S. dollars: | ||||||||||||||
Unsecured loans | Variable and LIBOR plus 0.8125% | 2005 and 2006 | Ps. | 2,760,153 | 245,025 | Ps. | 1,770,531 | 149,801 | ||||||
Unsecured loans | Variable and LIBOR plus 0.8125% | 2006 | 763,360 | 67,765 | 5,029,146 | 425,505 | ||||||||
Acceptance lines | LIBOR plus 0.6% | 2004 | — | — | 6,382,389 | 540,000 | ||||||||
Bonds | Fixed of 4.5% to 9.125% and LIBOR plus 1.3% to 1.8% | Various to 2023 | 188,932,978 | 16,771,978 | 143,582,944 | 12,148,240 | ||||||||
Financing assigned to PIDIREGAS | Fixed of 3.23% to 7.69% and LIBOR plus 0.03% to 2.25% | Various to 2014 | 52,109,773 | 4,625,894 | 43,516,471 | 3,681,834 | ||||||||
Purchasing loans and project financing | Fixed of 3.32% to 7.77% and LIBOR plus 0.0625% to 0.5% | Various to 2012 | 4,602,299 | 408,556 | 5,299,876 | 448,411 | ||||||||
Leasing contracts | Fixed of 8.05% to 10.04% | Various to 2012 | 2,219,489 | 197,029 | 3,006,217 | 254,350 | ||||||||
Commercial paper | Various from 1.085% to 1.11% | Various to 2004 | 5,105,911 | 432,000 | ||||||||||
External trade loans | LIBOR plus 0.6% to 1.125% | Various to 2007 | 27,138,781 | 2,409,167 | 39,279,268 | 3,323,333 | ||||||||
Bank loans | Fixed of 3.45% to 5.58% LIBOR plus 0.55% to 1.2% | Various to 2018 | 16,897,200 | 1,500,000 | 29,257,642 | 2,475,425 | ||||||||
Total financing in U.S. dollars | 295,424,033 | 26,225,414 | 282,230,395 | 23,878,899 | ||||||||||
Euros: | ||||||||||||||
Bonds | Fixed of 6.25% to 7.75%, and floating of 9.1065% | Various to 2016 | 47,348,823 | 3,090,634 | 36,074,346 | 2,421,394 | ||||||||
Unsecured loans, banks and project financing | Fixed of 2% and LIBOR plus 0.8125% | Various to 2016 | 40,301 | 2,631 | 79,759 | 5,354 | ||||||||
Total financing in Euros | 47,389,124 | 3,093,265 | 36,154,105 | 2,426,748 | ||||||||||
Pesos: | ||||||||||||||
Certificates | Fixed of 8.38% to 8.79% and CETES plus 0.65% to 0.67% | Various to 2019 | 39,672,000 | — | 6,837,402 | — | ||||||||
Project financing and syndicated bank loans | Fixed of 8.4% to 11%, TIIE plus 0.2% to 0.48% | Various to 2012 | 29,222,222 | — | 19,986,252 | — | ||||||||
Total financing in pesos | 68,894,222 | — | 26,823,654 | — | ||||||||||
Japanese yen: | ||||||||||||||
Directs loans | Fixed of 4.2% | 2009 | 1,324,144 | 12,026,738 | — | — | ||||||||
Bonds | Fixed of 3.5% | 2023 | 3,303,000 | 30,000,000 | 3,307,199 | 30,000,000 | ||||||||
Project financing | Fixed 2.9% to 2.9081% and PRIME in yen | Various to 2015 | 12,929,322 | 117,432,539 | 16,402,257 | 148,786,858 | ||||||||
Total financing in Yen | 17,556,466 | 159,459,277 | 19,709,456 | 178,786,858 | ||||||||||
Other currencies (1) | Fixed rate of 7.5% to 14.5% and LIBOR plus 0.8125% | Various to 2013 | 9,746,203 | Various | 9,515,174 | Various | ||||||||
Total principal in pesos (2) | 439,010,048 | — | 374,432,784 | |||||||||||
Plus: Accrued interest | 2,604,368 | — | 5,428,622 | — | ||||||||||
Total principal and interest | 441,614,416 | 379,861,406 | ||||||||||||
Less: Short-term maturities | 47,065,088 | — | 60,488,366 | — | ||||||||||
Long-term debt | Ps. | 394,549,328 | — | Ps. | 319,373,040 | — | ||||||||
F-24
Table of Contents
PETRÓLEOS MEXICANOS, SUBSIDIARY ENTITIES AND SUBSIDIARY COMPANIES
NOTES TO THE CONSOLIDATED FINANCIAL STATEMENTS FOR THE YEARS
ENDED DECEMBER 31, 2004, 2003 AND 2002
(Figures stated in thousands of Mexican pesos of December 31, 2004 purchasing power
and in thousands of U.S. dollars or other currency units)—(Continued)
| 2005 | 2006 | 2007 | 2008 | 2009 | thereafter | 2010 and Total | |||||||||||||||
Maturity of the principal In local currency | Ps. 44,460,720 | Ps. 44,620,298 | Ps. 58,811,119 | Ps. 44,962,600 | Ps. 59,803,885 | Ps. 186,351,426 | Ps. 439,010,048 | ||||||||||||||
Notes to table:
| (1) | Balance includes debt denominated in Pounds sterling and Swiss francs, carrying different interest rates. |
| (2) | Includes financing from foreign banks for Ps. 389,294,878 and Ps. 340,152,847 as of December 31, 2004 and 2003, respectively. |
| (3) | As of December 31, 2004 and 2003 the rates were as follows: LIBOR, 2.78% and 1.22%, respectively; the Prime rate in Japanese yen, 1.375% and 1.7%, respectively; the rate for bank acceptances was 0.75%; the CETES 8.81% for 91 days and 8.66% for 182 days and 6.17% for 91 days and 6.74% for 182 days, respectively; TIIE 8.95% and 6.2889%, respectively. |
10. Financial instruments
During the normal course of business, PEMEX is exposed to foreign currency risk, interest rate risk, the hydrocarbon price risk and credit risk. These risks create volatility in earnings, equity, and cash flows from period to period. PEMEX makes use of derivative instruments in various strategies to eliminate or limit many of these risks.
PEMEX has established general risk management guidelines for the use of financial derivative instruments. Each Subsidiary Entity using derivative financial instruments has also adopted specific guidelines and policies to manage their respective risk. The guidelines established by the Subsidiary Entities operate within the PEMEX risk management structure.
The Risk Management Committee of PEMEX, comprised of representatives of PEMEX, the Central Bank of Mexico, the Ministry of Finance and PMI, authorizes PEMEX’s hedging strategies and submits the risk management policies for the approval of the Board of Directors of Petróleos Mexicanos (the “Board of Directors”).
In 2001, the Board of Directors approved a restructuring of the risk management area and created the Risk Management Deputy Direction, whose objective is to develop the financial and catastrophic operational risk management strategy for PEMEX and to establish institutional regulations consistent with a consolidated risk management approach.
(i) Credit risk
PEMEX is subject to credit risk through trade receivables. The bulk of operations is carried out with domestic customers whose operations are industry related, although PEMEX also has customers located abroad (primarily in the United States). To monitor this risk, PEMEX has established an internal credit committee to monitor credit policies and procedures. However, PEMEX closely monitors extensions of credit and has never experienced significant credit losses.
PEMEX invests excess cash in low-risk, liquid instruments, which are placed with a wide array of institutions.
(ii) Counterparty risk from the use of derivative financial instruments
PEMEX is exposed to credit (or repayment) risk and market risk through the use of derivative financial instruments. When the fair value of the derivate is positive, PEMEX is exposed to the credit risk of the
F-25
Table of Contents
PETRÓLEOS MEXICANOS, SUBSIDIARY ENTITIES AND SUBSIDIARY COMPANIES
NOTES TO THE CONSOLIDATED FINANCIAL STATEMENTS FOR THE YEARS
ENDED DECEMBER 31, 2004, 2003 AND 2002
(Figures stated in thousands of Mexican pesos of December 31, 2004 purchasing power
and in thousands of U.S. dollars or other currency units)—(Continued)
counterparty, i.e., the risk that the counterparty fails to fulfill its performance obligations under the derivative contract. When the fair value of a derivative contract is negative, this indicates that PEMEX owes the counterparty, which means that it does not assume a credit risk.
In order to minimize the credit risk in derivative financial instruments, PEMEX enters into transactions with high quality counterparties, which include financial institutions and commodities exchanges that satisfy PEMEX’s established credit approval criteria. Normally, these counterparties have a higher credit rating than that of PEMEX.
Derivative transactions are generally executed on the basis of standard agreements. In general, collateral for debt-related financial derivative transactions is neither provided nor received.
(iii) Interest rate risk management
PEMEX’s interest rate risk hedging strategy reduces the volatility of the financial risk in the operating cash flows of PEMEX for the long-term debt commitments and minimum guaranteed dividends. Interest rate derivatives allow PEMEX to have an adequate mix of fixed and variable rates in its debt portfolio.
PEMEX’s interest rate derivative operations consist mainly of interest rate swaps under which PEMEX is entitled to receive payments based on six month LIBOR and Mexican Peso TIIE and makes payments at fixed rates.
(iv) Exchange rate risk management
As a currency exchange rate risk hedging policy, PEMEX contracts cross-currency swaps in order to hedge against adverse changes in currency exchange rates for currencies other than the U.S. dollar. Since a significant amount of PEMEX’s revenues is denominated in U.S. dollars, PEMEX generally contracts loans in U.S. dollars. However, PEMEX also contracts debt in currencies other than the U.S. dollar to take advantage of the financing terms available in these foreign currencies.
PEMEX has traditionally contracted currency swaps as a hedging strategy against exchange fluctuations to reduce the effects of exposure to the depreciation of the U.S. dollar. These foreign currency financial derivatives have been established to translate the amounts of various bonds issued in other currencies into U.S. dollars.
In 2002 and 2004, PEMEX entered into cross-currency swaps to hedge its exposure in Japanese yen and Euro, with termination dates in 2023 and 2016, respectively. Given the long-term nature of these obligations, the swaps used to hedge these risks include an option linked to a well-defined set of credit default events. In case such an event occurs, the swaps terminate without any payment obligation by either party. These swaps have an initial notional amount of U.S. $241,400 and U.S. $1,028,500, respectively.
(v) Commodity price risk management
Petroleum products:
PEMEX balances its overall petroleum product supply and demand through PMI Trading Ltd., managing only those exposures associated with the immediate operational program. To this end, PEMEX uses the full range of conventional oil price-related financial and commodity derivatives available in the oil markets. PEMEX’s benchmark for petroleum product commercial activities is the prevailing market price.
F-26
Table of Contents
PETRÓLEOS MEXICANOS, SUBSIDIARY ENTITIES AND SUBSIDIARY COMPANIES
NOTES TO THE CONSOLIDATED FINANCIAL STATEMENTS FOR THE YEARS
ENDED DECEMBER 31, 2004, 2003 AND 2002
(Figures stated in thousands of Mexican pesos of December 31, 2004 purchasing power
and in thousands of U.S. dollars or other currency units)—(Continued)
Natural gas:
PEMEX offers its customers financial instruments and hedging contracts in order to give them the option of protecting against fluctuations in the international price of natural gas. As part of the policies of the Mexican Government for promoting economic growth, on January 17, 2001, the Ministry of Finance, the Ministry of Energy and PEMEX announced a program for setting the price of natural gas for certain industrial natural gas customers in Mexico wishing to participate in the program. Most industrial customers in Mexico participated in the program by signing a three-year contract for the purchase of natural gas at a fixed reference price of 4.0 U.S. dollars per million British thermal units (BTUs). During the life of these agreements (January 2001 to December 2003), the price represented a 1.6% discount on the prevailing market sales price.
During the four quarter of 2003, the Ministry of Energy announced a new program for hedging natural gas prices in addition to those already in existence, to be offered by PEMEX to domestic customers for the years 2004 through 2006. The new program offers customers two options:
| • | A fixed reference price of 4.50 U.S. dollars per million BTUs for the period from 2004 to 2006 for consumption of up to 10 million cubic feet per day, and 4.55 U.S. dollars per million BTUs for consumption exceeding that amount up to 20 million cubic feet per day. |
| • | A fixed reference price of 4.425 U.S. dollars per million BTUs plus any excess of the reference index (the spot price for the Reynosa basket) over 6.00 U.S. dollars per million BTUs for the period from January to December 2004. |
PEMEX decided to modify its traditional risk profile for natural gas in order to mitigate the volatility of income arising from natural gas sales.
Sales under this program represent approximately 20% of all of PEMEX’s domestic industrial natural gas sales and 10% of overall natural gas sales and does not leave PEMEX with basis risk exposure, because the derivative is valued using the same market reference price used to price natural gas sales.
Crude oil:
PEMEX’s exports and domestic sales are related to international hydrocarbon prices, thus exposing PEMEX to fluctuations in international markets. PEMEX does not generally enter into any long-term hedges against fluctuations in crude oil prices due to the fiscal regime, in which it transfers, via taxes and duties, most of the risk in the price of this commodity to the federal government. However, in order to lessen the effect of a decline in hydrocarbon prices, since 1998, the Mexican Government, along with PEMEX, agreed to reduce the volume of crude oil exports in conjunction with the major international oil producers to improve international oil prices. Moreover, for the year 2004, PEMEX entered into a short-term oil price hedging strategy through the use of options to hedge against potential decreases in short-term prices of this commodity, in order to guarantee a minimum price for the volume being hedged, which represented approximately 7% of the total crude oil production for that year. These options expired on December 31, 2004, and were not exercised.
(vi) Investment portfolio risk management
At December 31, 2003, PEMEX held two equity swaps in respect of a total of 40,107,485 shares of Repsol YPF, S.A. (“Repsol”) whose market value at that date was 19.47 U.S. dollars per share. Those swaps matured in January of 2004 and were not renewed.
F-27
Table of Contents
PETRÓLEOS MEXICANOS, SUBSIDIARY ENTITIES AND SUBSIDIARY COMPANIES
NOTES TO THE CONSOLIDATED FINANCIAL STATEMENTS FOR THE YEARS
ENDED DECEMBER 31, 2004, 2003 AND 2002
(Figures stated in thousands of Mexican pesos of December 31, 2004 purchasing power
and in thousands of U.S. dollars or other currency units)—(Continued)
(vii) Fair value of derivative financial instruments
The fair value of derivative instruments is sensitive to movements in the underlying market rates and variables. PEMEX monitors the fair value of derivative financial instruments on a periodic basis. Fair values are calculated for each derivative financial instrument, which is the price at which one party would assume the rights and duties of another party. Fair values of financial derivatives have been calculated using common market valuation methods with reference to available market data as of the balance sheet date.
The following is a summary of the methods and assumptions for the valuation of the derivative financial instruments that PEMEX utilizes.
| • | Natural gas swaps are valued separately at future rates or market prices as of the balance sheet date. |
| • | Market prices for currency and commodity options are valued using standard option-pricing models commonly used in the international financial market. |
| • | The fair values of interest rate instruments were determined by discounting future cash flows using market interest rates over the remaining terms of the instruments. Discounted cash values for interest rate swaps and cross-currency swaps are determined for each individual transaction as of the balance sheet date. |
| • | Energy future contracts traded on recognized exchanges are valued individually at daily settlement prices determined on the futures markets that are published by their respective clearing houses. |
The following table indicates the types of interest rate swaps and equity swaps, their notional amount and fair value at December 31:
| 2004 | 2003 | |||||||||||
| Notional amount | Fair value | Notional amount | Fair value | |||||||||
Interest rate swaps | Ps. 12,513,876 | (Ps. 131,693 | ) | Ps. | 4,326,456 | (Ps. 237,453 | ) | |||||
Equity swaps | — | — | 8,597,444 | (629,047 | ) | |||||||
The following table indicates the types of cross-currency swaps, their notional amount and their respective fair values at December 31:
| 2004 | 2003 | |||||||||||
| Notional amount | Fair value | Notional amount | Fair value | |||||||||
Pounds sterling to U.S. dollars | Ps. 8,497,208 | Ps. 1,289,069 | Ps. 8,195,089 | Ps. | 830,026 | |||||||
Japanese yen to U.S. dollars | 13,405,145 | 2,292,394 | 14,825,716 | 1,844,856 | ||||||||
Euros to U.S. dollars | 43,154,825 | 4,651,225 | 29,116,726 | 5,171,162 | ||||||||
The following table indicates the commodity derivative instruments and their fair value at December 31.
| 2004 Fair value | 2003 Fair value | |||||
Swaps | (Ps. 3,122,776 | ) | (Ps. 1,278,657 | ) | ||
Options | 4,839 | 71,686 | ||||
Futures | 62,193 | 17,854 |
F-28
Table of Contents
PETRÓLEOS MEXICANOS, SUBSIDIARY ENTITIES AND SUBSIDIARY COMPANIES
NOTES TO THE CONSOLIDATED FINANCIAL STATEMENTS FOR THE YEARS
ENDED DECEMBER 31, 2004, 2003 AND 2002
(Figures stated in thousands of Mexican pesos of December 31, 2004 purchasing power
and in thousands of U.S. dollars or other currency units)—(Continued)
(viii) Fair value of financial instruments other than derivatives
The estimated fair value of financial instruments other than derivatives for which it is practicable to estimate their value, as of December 31, 2004 and 2003, is as follows:
| 2004 | 2003 | |||||||||||
| Carrying value | Fair value | Carrying value | Fair value | |||||||||
Assets: | ||||||||||||
Cash and cash equivalents | Ps. | 84,872,231 | Ps. | 84,872,231 | Ps. | 77,143,143 | Ps. | 77,143,143 | ||||
Accounts receivable, notes and other | 90,273,995 | 90,273,995 | 73,857,439 | 73,857,439 | ||||||||
Liabilities: | ||||||||||||
Suppliers | 24,322,630 | 24,322,630 | 35,282,295 | 35,282,295 | ||||||||
Accounts and accrued expenses payable | 22,881,389 | 22,881,389 | 7,720,936 | 7,720,936 | ||||||||
Sale of future accounts receivable | 36,685,689 | 36,685,689 | 42,557,120 | 42,557,120 | ||||||||
Taxes payable | 44,136,805 | 44,136,805 | 38,546,112 | 38,546,112 | ||||||||
Current portion of long-term debt | 47,065,088 | 47,065,088 | 60,488,366 | 60,488,366 | ||||||||
Current portion of notes payable to contractors | 2,076,592 | 2,076,592 | 1,985,108 | 1,985,108 | ||||||||
Long-term notes payable to contractors | 11,285,080 | 13,145,739 | 13,821,639 | 16,451,060 | ||||||||
Long-term debt | 394,549,238 | 426,146,489 | 319,373,040 | 342,226,441 | ||||||||
The nominal value of financial instruments such as cash equivalents, accounts receivable and payable, taxes payable and current portion of long-term debt approximate fair value because of their short maturities.
The fair value of long-term debt is determined by reference to market quotes, and, where quotes are not available, is based on discounted cash flow analyses. Because assumptions significantly affect the derived fair value and they are inherently subjective in nature, the estimated fair values may not necessarily be realized in a sale or settlement of the instrument.
11. Labor obligations
PEMEX has established employee non-contributory retirement plans in accordance with theLey Federal del Trabajo (“Federal Labor Law”) and under collective bargaining agreements. Benefits are determined depending on years of service and final salary at retirement. Liabilities and costs of such plans, including those related to the seniority premium benefit, to which every employee is entitled upon termination of employment, are recorded in accordance with an actuarial valuation performed by independent actuaries.
PEMEX has also established plans for other post retirement benefit obligations whose actuarial amounts are determined by independent actuaries.
For the years ended December 31, 2004 and 2003, PEMEX contributed Ps. 1,806,646 and Ps. 17,962,018, respectively, to the pension plan, seniority premium plan and other post-retirement benefits plan.
F-29
Table of Contents
PETRÓLEOS MEXICANOS, SUBSIDIARY ENTITIES AND SUBSIDIARY COMPANIES
NOTES TO THE CONSOLIDATED FINANCIAL STATEMENTS FOR THE YEARS
ENDED DECEMBER 31, 2004, 2003 AND 2002
(Figures stated in thousands of Mexican pesos of December 31, 2004 purchasing power
and in thousands of U.S. dollars or other currency units)—(Continued)
(i) Pensions and seniority premiums
The pension plan and seniority premium liabilities are as follows:
| December 31, 2004 | December 31, 2003 | |||||||||||||||
| Pensions | Seniority premiums | Total | Total | |||||||||||||
Vested benefit obligation | Ps. | 127,412,954 | Ps. | 2,646,718 | Ps. | 130,059,672 | Ps. | 115,655,154 | ||||||||
Nonvested benefit obligation | 85,732,940 | 8,871,727 | 94,604,667 | 100,932,081 | ||||||||||||
Current benefit obligation | 213,145,894 | 11,518,445 | 224,664,339 | 216,587,235 | ||||||||||||
Less: Plan assets | (2,484,870 | ) | (10,478 | ) | (2,495,348 | ) | (13,831,178 | ) | ||||||||
Net current liability | Ps. | 210,661,024 | Ps. | 11,507,967 | Ps. | 222,168,991 | Ps. | 202,756,057 | ||||||||
Additional liability arising from the excess of net current liability over the net projected liability | Ps. | 83,414,422 | — | Ps. | 83,414,422 | Ps. | 88,434,071 | |||||||||
Net liability portion arising from other post-retirement benefits for 2003 | — | — | — | 37,068,251 | ||||||||||||
Total additional minimum liability arising from the excess of net current liability over the net projected liability | Ps. | 83,414,422 | — | Ps. | 83,414,422 | Ps. | 125,502,322 | |||||||||
| December 31, 2004 | December 31, 2003 | |||||||||||||||
| Pensions | Seniority Premiums | Total | Total | |||||||||||||
Projected benefit obligation | Ps. | 219,514,314 | Ps. | 12,364,573 | Ps. | 231,878,887 | Ps. | 230,471,098 | ||||||||
Less: Plan assets | (2,484,870 | ) | (10,478 | ) | (2,495,348 | ) | (13,831,178 | ) | ||||||||
Items to be amortized over the following 14 and 15 years: | ||||||||||||||||
Transition obligation | (72,895,366 | ) | (3,751,149 | ) | (76,646,515 | ) | (85,295,839 | ) | ||||||||
Prior service costs and plan amendments | (4,134,368 | ) | (291,659 | ) | (4,426,027 | ) | (3,496,811 | ) | ||||||||
Variations in assumptions and adjustments for experience | (12,753,108 | ) | 5,449,112 | (7,303,996 | ) | (13,525,284 | ) | |||||||||
Total of unamortized items | (89,782,842 | ) | 1,406,304 | (88,376,538 | ) | (102,317,934 | ) | |||||||||
Net projected liability | Ps. | 127,246,602 | Ps. | 13,760,399 | Ps. | 141,007,001 | Ps. | 114,321,986 | ||||||||
F-30
Table of Contents
PETRÓLEOS MEXICANOS, SUBSIDIARY ENTITIES AND SUBSIDIARY COMPANIES
NOTES TO THE CONSOLIDATED FINANCIAL STATEMENTS FOR THE YEARS
ENDED DECEMBER 31, 2004, 2003 AND 2002
(Figures stated in thousands of Mexican pesos of December 31, 2004 purchasing power
and in thousands of U.S. dollars or other currency units)—(Continued)
Net cost for the period:
| December 31, 2004 | December 31, 2003 | December 31, 2002 | ||||||||||||||||||
| Pensions | Seniority Premiums | Total | Total | Total | ||||||||||||||||
Service cost | Ps. | 5,568,008 | Ps. | 794,684 | Ps. | 6,362,692 | Ps. | 5,663,238 | Ps. | 5,779,313 | ||||||||||
Financial cost | 16,790,888 | 1,115,091 | 17,905,979 | 16,561,294 | 20,408,930 | |||||||||||||||
Return on plan assets | (624,941 | ) | — | (624,941 | ) | (1,082,971 | ) | (752,449 | ) | |||||||||||
Transition obligation | 5,070,015 | 345,330 | 5,415,345 | 5,472,645 | 1,266,134 | |||||||||||||||
Prior services and plan amendments | 240,979 | 28,369 | 269,348 | 150,549 | 2,890,502 | |||||||||||||||
Variations in assumptions and adjustments for experience | 177,870 | (45,308 | ) | 132,562 | 53,659 | 1,790,075 | ||||||||||||||
Inflationary adjustment | 1,408,068 | 116,178 | 1,524,246 | 1,064,096 | — | |||||||||||||||
Total net cost for the year | Ps. | 28,630,887 | Ps. | 2,354,344 | Ps. | 30,985,231 | Ps. | 27,882,510 | Ps. | 31,382,505 | ||||||||||
Rates used in calculating benefit obligations and plan benefits:
| December 31, | ||||||
| 2004 | 2003 | |||||
Discount rate | 4.59 | % | 4.59 | % | ||
Rate of increase in compensation levels | 0.92 | % | 0.92 | % | ||
Rate of increase in costs of other post-retirement benefits | 0.92 | % | 0.92 | % | ||
Expected long term rate of the return on plan assets | 5.50 | % | 5.50 | % | ||
(ii) Other post-retirement benefits:
Net liability for other post-retirement benefits:
| December 31, | ||||||||
| 2004 | 2003 | |||||||
Obligations for other post-retirement benefits | Ps. | 167,845,931 | Ps. | 99,157,035 | ||||
Less: Items pending amortization related to other post-retirement benefits | (87,004,840 | ) | (38,378,145 | ) | ||||
Total net liability | Ps. | 80,841,091 | Ps. | 60,778,890 | ||||
F-31
Table of Contents
PETRÓLEOS MEXICANOS, SUBSIDIARY ENTITIES AND SUBSIDIARY COMPANIES
NOTES TO THE CONSOLIDATED FINANCIAL STATEMENTS FOR THE YEARS
ENDED DECEMBER 31, 2004, 2003 AND 2002
(Figures stated in thousands of Mexican pesos of December 31, 2004 purchasing power
and in thousands of U.S. dollars or other currency units)—(Continued)
Net cost for the period:
| December 31, 2004 | December 31, 2003 | December 31, 2002 | ||||||||||
Service cost | Ps. | 3,524,865 | Ps. | 2,219,742 | Ps. | 1,649,091 | ||||||
Financial cost | 11,722,692 | 7,694,822 | 6,723,796 | |||||||||
Transition obligation | 5,632,866 | 2,563,008 | 30,974 | |||||||||
Prior services and plan amendments | 202,893 | 212,251 | 2,737,505 | |||||||||
Variations in assumptions and adjustments for experience | (105,052 | ) | (111,463 | ) | (750,503 | ) | ||||||
Inflationary adjustment | 1,088,950 | 500,177 | — | |||||||||
Total net cost for the year | Ps. | 22,067,214 | Ps. | 13,078,537 | Ps. | 10,390,863 | ||||||
| December 31, | ||||||
| 2004 | 2003 | |||||
Expected obligations for other post-retirement benefits related to retired employees and active employees that have become vested | Ps. | 103,846,466 | Ps. | 56,184,702 | ||
Portion of the post retirement benefits for other employees based on years of service | 63,999,465 | 42,972,333 | ||||
Total accumulated obligation for other post-retirement benefits | Ps. | 167,845,931 | Ps. | 99,157,035 | ||
| The effect of increasing by one percent the rate used in estimating the increase in the cost of other post-retirement benefits, with no change in other assumptions, is a follows: | ||||||
Increase in total labor cost and financial cost | Ps. | 5,310,481 | ||||
Increase in accumulated post-retirement benefit obligation | Ps. | 49,131,237 | ||||
Since 1995, PEMEX has recognized the liability and cost for supplemental payments for gas, gasoline and basic food supplies, in accordance with guidelines of Bulletin D-3, “Labor Obligations”, in effect at that date. However, beginning in 2004 with the adoption of revised Bulletin D-3, PEMEX began to record the liability for post-retirement medical benefits and, in addition, reclassified the liability related to supplemental payments from “pensions and seniority premiums” obligations, where it had been presented in the past. Therefore, the additional minimum liability decreased as compared to 2003 due to the guidelines of the revised Bulletin D-3, which does not require that an additional liability be established for other post-retirement benefits.
F-32
Table of Contents
PETRÓLEOS MEXICANOS, SUBSIDIARY ENTITIES AND SUBSIDIARY COMPANIES
NOTES TO THE CONSOLIDATED FINANCIAL STATEMENTS FOR THE YEARS
ENDED DECEMBER 31, 2004, 2003 AND 2002
(Figures stated in thousands of Mexican pesos of December 31, 2004 purchasing power
and in thousands of U.S. dollars or other currency units)—(Continued)
12. Comprehensive loss
Comprehensive loss for the years ended December 31, 2004, 2003 and 2002 is as follows:
| 2004 | 2003 | 2002 | |||||||
Net loss for the year | (Ps. 25,495,610 | ) | (Ps. 42,754,131 | ) | (Ps. 25,849,630 | ) | |||
Surplus in restatement of equity, net | (4,676,926 | ) | 5,927,889 | (4,413,521 | ) | ||||
(Application) increase in specific oil-field exploration and depletion reserve, net | — | (13,731,424 | ) | 1,911,708 | |||||
Effect on equity from labor obligations | (6,975,592 | ) | — | — | |||||
Other | — | — | 44,436 | ||||||
Comprehensive loss for the year | (Ps. 37,148,128 | ) | (Ps. 50,557,666 | ) | (Ps. 28,307,007 | ) | |||
13. Equity
On December 31, 1990, certain debt owed by Petróleos Mexicanos to the Mexican Government was capitalized as equity. This capitalization amounted to Ps. 22,334,195 in nominal terms (U.S. $7,577,000) and was authorized by the Board of Directors. The capitalization agreement between Petróleos Mexicanos and the Mexican Government stipulates that the Certificates of Contribution “A” constitute permanent capital.
As a condition of this capitalization, Petróleos Mexicanos agreed to pay a minimum guaranteed dividend to the Mexican Government equal to the debt service for the capitalized debt. The minimum guaranteed dividend consists of the payment of principal and interest in the same terms and conditions as those originally agreed upon with international creditors until the year 2006, at the exchange rates in effect as of the date payments are made. Such payments must be approved annually by the Board of Directors.
In 2004, Petróleos Mexicanos paid Ps. 10,387,839 (Ps. 10,703,190 during 2003) to the Mexican Government in advance on account of the minimum guaranteed dividend. These payments will be applied to the final amount that the Board of Directors approves as the total annual dividend, which is usually in the following fiscal year.
In December 1997, the Board of Directors and the Mexican Government agreed to an equity reduction of the Certificates of Contribution “A” in exchange for a cash payment to the Mexican Government of Ps. 12,118,050 in nominal terms (U.S. $1,500,000). Petróleos Mexicanos and the Ministry of Finance agreed upon a corresponding reduction in the future payments of the minimum guaranteed dividend.
As a result, the Certificates of Contribution “A” are as follows:
Certificates of Contribution “A” (nominal value) | Ps. | 10,753,090 | |
Inflation restatement increase | 76,155,800 | ||
Certificates of Contribution “A” in Mexican pesos of December 31, 2004 purchasing power | Ps. | 86,908,890 | |
On various dates during 2004, the Mexican Government transferred amounts to Petróleos Mexicanos totaling Ps. 33,000,000 in respect of the duty for infrastructure paid by PEMEX during the year, which was
F-33
Table of Contents
PETRÓLEOS MEXICANOS, SUBSIDIARY ENTITIES AND SUBSIDIARY COMPANIES
NOTES TO THE CONSOLIDATED FINANCIAL STATEMENTS FOR THE YEARS
ENDED DECEMBER 31, 2004, 2003 AND 2002
(Figures stated in thousands of Mexican pesos of December 31, 2004 purchasing power
and in thousands of U.S. dollars or other currency units)—(Continued)
accounted for as an increase in the equity of the Subsidiary Entities. According to theLey de Ingresos de laFederación (“Federal Income Law”), these amounts are to be utilized for infrastructure works in exploration, refining, gas and petrochemicals. Pursuant to an agency agreement (comisión mercantil) signed with Banco Santander Serfín, S.A., as agent, cash totaling Ps. 32,637,530 was deposited with such agent, who will disburse the cash for infrastructure works in accordance with PEMEX’s instructions. This amount, together with interest accrued thereon, is reflected as cash in trust fund in the balance sheet.
14. Foreign currency position
At December 31, 2004 and 2003, PEMEX had the following assets and liabilities denominated in foreign currencies (which are translated into Mexican pesos at the 2004 and 2003 year-end exchange rates listed below):
| Amounts in foreign currency (Thousands) | ||||||||||||
| Assets | Liabilities | Net Asset (liability) position | Year-end Exchange rate | Amounts in pesos | ||||||||
2004: | ||||||||||||
U.S. dollars | 9,322,376 | 40,570,870 | (31,248,494 | ) | 11.2648 | (Ps. 352,008,035 | ) | |||||
Japanese yen | 90,415 | 163,009,706 | (162,919,291 | ) | 0.1101 | (17,937,414 | ) | |||||
Pounds sterling | 814 | 452,498 | (451,684 | ) | 21.6532 | (9,780,404 | ) | |||||
Euros | 14,393 | 3,280,525 | (3,266,132 | ) | 15.3201 | (50,037,469 | ) | |||||
Total net asset (liability) position, before foreign currency hedging (Note 10) | (Ps. 429,763,322 | ) | ||||||||||
2003: | ||||||||||||
U.S. dollars | 5,779,829 | 29,843,201 | (24,063,372 | ) | 11.2360 | (Ps. 270,376,048 | ) | |||||
Japanese yen | 194,226,518 | (194,226,518 | ) | 0.1048 | (20,354,939 | ) | ||||||
Pound sterling | 260 | 452,718 | (452,458 | ) | 20.0922 | (9,090,877 | ) | |||||
Euros | 279,441 | 2,670,519 | (2,391,078 | ) | 14.1630 | (33,864,838 | ) | |||||
Total net asset (liability) position, before foreign currency hedging (Note 10) | (Ps. 333,686,702 | ) | ||||||||||
15. Segment financial information
PEMEX’s primary business is the exploration for and production of crude oil and natural gas and the refining and marketing of petroleum products, conducted through four business segments: Pemex-Exploration and Production, Pemex-Refining, Pemex-Gas and Basic Petrochemicals and Pemex-Petrochemicals. Management makes decisions related to the operations of the consolidated business along these four strategic lines.
The primary sources of revenue for the segments are as described below:
| • | Pemex-Exploration and Production earns revenues from domestic crude oil sales, as well as from the export of crude oil, through PMI, to international markets. Export sales are made through PMI to |
F-34
Table of Contents
PETRÓLEOS MEXICANOS, SUBSIDIARY ENTITIES AND SUBSIDIARY COMPANIES
NOTES TO THE CONSOLIDATED FINANCIAL STATEMENTS FOR THE YEARS
ENDED DECEMBER 31, 2004, 2003 AND 2002
(Figures stated in thousands of Mexican pesos of December 31, 2004 purchasing power
and in thousands of U.S. dollars or other currency units)—(Continued)
approximately 25 major customers in various foreign markets. Less than half (approximately 45%) of PEMEX’s crude oil is sold domestically; however, these amounts are in large part sufficient to satisfy Mexican domestic demand. |
| • | Pemex-Refining earns revenues from sales of refined petroleum products and derivatives. Most of Refining’s sales are to third parties and occur within the domestic market. The entity supplies the Comisión Federal de Electricidad (“CFE”) with a significant portion of its fuel oil production. Pemex-Refining’s most profitable products are various types of gasoline. |
| • | Pemex-Gas and Basic Petrochemicals earns revenues primarily from domestic sources. Pemex-Gas and Basic Petrochemicals also consumes high levels of its own natural gas production. Most revenues for the entity are obtained through the sale of ethane and butane gas. |
| • | Pemex-Petrochemicals engages in the sale of petrochemical products to the domestic market. Pemex-Petrochemicals offers a wide range of products, with the higher revenue generating products being methane derivatives, ethane derivatives and aromatics and derivatives. |
In making performance analyses for the entities, PEMEX’s management focuses on sales volumes and gross revenues as the primary indicators.
Income (loss) and identifiable assets for each segment have been determined after intersegment adjustments. Sales between segments are made at internal transfer prices established by PEMEX which reflect international market prices.
Subsequent to the filing of its annual report on Form 20-F for the fiscal year ended December 31, 2004 (the “Form 20-F”) on June 30, 2005, Petróleos Mexicanos identified and corrected certain amounts that had been previously reported under Mexican GAAP in the condensed segment financial information for the years ended December 31, 2004 and 2003 to our consolidated financial statements in this Note 15. None of these corrections had an impact on the consolidated financial information for any segment for the years ended December 31, 2004 and 2003. These items have been restated in Notes 20 and 21 and the corresponding resulting changes to condensed segment financial information have been restated in this Note 15. The corrections are described in greater detail in Notes 20 and 21.
F-35
Table of Contents
PETRÓLEOS MEXICANOS, SUBSIDIARY ENTITIES AND SUBSIDIARY COMPANIES
NOTES TO THE CONSOLIDATED FINANCIAL STATEMENTS FOR THE YEARS
ENDED DECEMBER 31, 2004, 2003 AND 2002
(Figures stated in thousands of Mexican pesos of December 31, 2004 purchasing power
and in thousands of U.S. dollars or other currency units)—(Continued)
Following is the condensed financial information of these segments:
| Exploration and Production | Refining | Gas and Basic Petrochemicals | Petrochemicals | Corporate and Subsidiary Companies | Intersegment Eliminations | Total | ||||||||||||||||||||||
Year ended December 31, 2004: | ||||||||||||||||||||||||||||
Sales: | ||||||||||||||||||||||||||||
Trade (1) | Ps. | — | Ps. | 316,139,585 | Ps. | 116,049,305 | Ps. | 16,823,850 | Ps. | 324,574,385 | Ps. | — | Ps. | 773,587,125 | ||||||||||||||
Intersegment | 560,997,135 | 27,021,306 | 67,187,349 | 7,365,976 | 93,070,685 | (755,642,451 | ) | — | ||||||||||||||||||||
Total net sales | 560,997,135 | 343,160,891 | 183,236,654 | 24,189,826 | 417,645,070 | (755,642,451 | ) | 773,587,125 | ||||||||||||||||||||
Operating income (loss) (1) | 412,422,364 | 39,877,803 | 13,298,155 | (7,905,400 | ) | (628,631 | ) | (1,862,995 | ) | 455,201,296 | ||||||||||||||||||
Comprehensive financing cost (as restated)(4) | 7,589,872 | 5,296,769 | (156,854 | ) | 1,348,140 | (3,236,503 | ) | (10,266,257 | ) | 7,048,153 | ||||||||||||||||||
Net income (loss) | (13,669,930 | ) | (22,060,462 | ) | 11,652,271 | (12,315,100 | ) | (22,020,397 | ) | 32,918,008 | (25,495,610 | ) | ||||||||||||||||
Depreciation and amortization | 28,902,751 | 7,500,738 | 3,400,804 | 1,289,115 | 806,669 | — | 41,900,077 | |||||||||||||||||||||
Acquisition of fixed assets (2) | 66,849,314 | 4,653,156 | 1,636,351 | 1,592,677 | 330,970 | — | 75,062,468 | |||||||||||||||||||||
Total assets (as restated)(4) | 727,062,059 | 274,694,329 | 104,182,117 | 86,430,827 | 1,029,780,113 | (1,274,622,108 | ) | 947,527,337 | ||||||||||||||||||||
Year ended December 31, 2003: | ||||||||||||||||||||||||||||
Sales: | ||||||||||||||||||||||||||||
Trade (1) | Ps. | — | Ps. | 299,551,437 | Ps. | 96,312,823 | Ps. | 11,472,993 | Ps. | 250,556,152 | Ps. | — | Ps. | 657,893,405 | ||||||||||||||
Intersegment | 448,779,512 | 24,657,053 | 53,442,431 | 6,375,129 | 69,862,428 | (603,116,553 | ) | — | ||||||||||||||||||||
Total net sales | 448,779,512 | 324,208,490 | 149,755,254 | 17,848,122 | 320,418,580 | (603,116,553 | ) | 657,893,405 | ||||||||||||||||||||
Operating income (loss) (1) | 319,977,798 | 74,950,471 | 4,176,736 | (10,294,391 | ) | (21,364,403 | ) | 19,200,203 | 386,646,414 | |||||||||||||||||||
Comprehensive financing cost | 22,387,213 | 12,932,215 | (696,249 | ) | 1,082,210 | 11,804,864 | (15,172,061 | ) | 32,338,192 | |||||||||||||||||||
Net income (loss)(as restated)(4) | 1,180,484 | (38,098,735 | ) | 8,082,419 | (15,378,314 | ) | (38,997,568 | ) | 40,457,583 | (42,754,131 | ) | |||||||||||||||||
Depreciation and amortization | 29,177,389 | 8,009,797 | 3,513,544 | 1,056,697 | 891,332 | — | 42,648,759 | |||||||||||||||||||||
Acquisition of fixed assets (2) | 51,602,488 | 13,792,567 | �� | 3,716,279 | 1,710,828 | 564,640 | — | 71,386,802 | ||||||||||||||||||||
Total assets (as restated)(4) | 619,606,871 | 216,364,002 | 88,949,282 | 62,576,704 | 849,656,415 | (947,794,719 | ) | 889,358,555 | ||||||||||||||||||||
Year ended December 31, 2002: | ||||||||||||||||||||||||||||
Sales: | ||||||||||||||||||||||||||||
Trade (1) | Ps. | — | Ps. | 281,356,956 | Ps. | 64,395,399 | Ps. | 8,167,656 | Ps. | 187,653,810 | Ps. | — | Ps. | 541,573,821 | ||||||||||||||
Intersegment | 316,852,364 | 15,803,262 | 29,155,117 | 4,409,362 | 63,175,849 | (429,395,954 | ) | — | ||||||||||||||||||||
Total net sales | 316,852,364 | 297,160,218 | 93,550,516 | 12,577,018 | 250,829,659 | (429,395,954 | ) | 541,573,821 | ||||||||||||||||||||
Operating income (loss) (1) | 215,938,359 | 97,978,654 | 4,268,959 | (9,892,062 | ) | (18,371,914 | ) | 21,148,562 | 311,070,558 | |||||||||||||||||||
Comprehensive financing cost | 1,865,971 | 5,575,489 | 69,901 | 390,028 | 653,889 | (1,992,290 | ) | 6,562,988 | ||||||||||||||||||||
Net income (loss) (as restated)(4) | 16,384,685 | (37,498,442 | ) | 2,440,614 | (12,855,688 | ) | (20,463,969 | ) | 26,143,170 | (25,849,630 | ) | |||||||||||||||||
Depreciation and amortization | 22,611,578 | 7,193,072 | 3,632,643 | 1,296,963 | 835,490 | — | 35,569,746 | |||||||||||||||||||||
Acquisition of fixed assets (3) | 7,621,267 | 24,800,902 | 1,584,804 | 2,020,351 | 63,872,081 | — | 99,899,405 | |||||||||||||||||||||
Total assets | 452,032,357 | 215,759,226 | 72,215,196 | 34,866,588 | 783,048,290 | (750,350,802 | ) | 807,570,855 | ||||||||||||||||||||
| (1) | Trade sales and operating income (loss) of Pemex-Refining include the IEPS Tax as part of the sale prices of the products sold in amounts of Ps. 128,742,678 for 2002, Ps. 98,959,610 for 2003, and Ps. 54,704,848 for 2004. |
| (2) | Beginning in 2003, the acquisition of fixed assets related to the PIDIREGAS projects are presented in each of the Subsidiary Entities that will maintain and operate those fixed assets. |
| (3) | In 2002, the Subsidiary Companies segment acquired fixed assets in the amount of Ps. 65,682,376, of which Ps. 65,129,949 are related to the Master Trust and Ps. 1,810,295 of completed assets were transferred from the Master Trust to the Subsidiary Entities who will maintain and operate the fixed assets. |
| (4) | See Note 20—Subsidiary Guarantor Information. |
F-36
Table of Contents
PETRÓLEOS MEXICANOS, SUBSIDIARY ENTITIES AND SUBSIDIARY COMPANIES
NOTES TO THE CONSOLIDATED FINANCIAL STATEMENTS FOR THE YEARS
ENDED DECEMBER 31, 2004, 2003 AND 2002
(Figures stated in thousands of Mexican pesos of December 31, 2004 purchasing power
and in thousands of U.S. dollars or other currency units)—(Continued)
16. Commitments
| a. | PEMEX has entered into a nitrogen supply contract for the pressure maintenance program at the Cantarell field that expires in 2015. At December 31, 2004 and 2003, the value of the nitrogen to be supplied during the term of the contract is approximately Ps. 18,480,170 and Ps. 22,418,099, respectively. In the event of the annulment of the contract for causes attributable to PEMEX, PEMEX would be required to purchase the nitrogen production plant in accordance with the terms of the contract. |
| b. | At December 31, 2004, PEMEX has entered into contracts with various contractors for an approximate amount of Ps. 215,567,409. These contracts are for the development of PIDIREGAS. |
| c. | PEMEX, through its subsidiaries PMI and PMI-NASA, has executed several long-term purchase and sale contracts for crude oil with foreign companies in international markets. The terms and conditions of these contracts are specific for each customer and their duration in certain contracts have no expiration and in certain cases, the contracts contain minimum mandatory periods. |
17. Contingencies
| a. | In the normal course of business, PEMEX is named in a number of lawsuits of various types. PEMEX evaluates the merit of each claim and assesses the likely outcome, accruing a contingent liability when an unfavorable decision is probable and the amount is reasonably estimable. PEMEX does not believe a materially unfavorable outcome is probable for any known or pending lawsuits or threatened litigation for which PEMEX has not made any accruals. |
| b. | PEMEX is subject to theLey General de Equilibrio Ecológico y Protección al Ambiente (the General Law on Ecology and Protection of the Environment, or the “Environmental Law”). To comply with this law, PEMEX has contracted environmental audits for its larger operating, storage and transportation facilities. To date, audits of refineries, secondary petrochemical plants and certain other facilities have been concluded. Following the completion of such audits, PEMEX signed various agreements with theProcuraduría Federal de Protección al Ambiente(the Federal Attorney of Environmental Protection, or “PROFEPA”) to implement environmental remediation and improvement plans. Such plans consider remediation for environmental damages previously caused, as well as related investments for the improvement of equipment, maintenance, labor and materials. |
PEMEX has recorded a reserve for environmental remediation as of December 31, 2004 and 2003 of Ps. 1,808,998 and Ps. 2,026,438, respectively. That reserve is included in long-term liabilities in the balance sheet.
| c. | At December 31, 2004, PEMEX is involved in various civil, tax and administrative lawsuits with a total claim amount of Ps. 13,323,752. At December 31, 2004 and 2003, PEMEX has accrued Ps. 1,578,654 and Ps. 1,409,283, respectively, related to those contingencies. |
| d. | PEMEX is currently involved an arbitration with Conproca, S.A. de C.V. (“Conproca”) arising out of public works contracts signed with Conproca and accounted for as PIDIREGAS, pursuant to which Conproca seeks a payment of U.S. $632,801. PEMEX filed a counter-claim against Conproca for the non-fulfillment of contracts relating to the Cadereyta Project in an amount of U.S. $907,660. |
A number of stages of the arbitration hearings are still pending, such as presentation of evidence and expert opinions and other procedures. According to the trial schedule approved by the court, these actions are scheduled to take place in 2005 and 2006.
F-37
Table of Contents
PETRÓLEOS MEXICANOS, SUBSIDIARY ENTITIES AND SUBSIDIARY COMPANIES
NOTES TO THE CONSOLIDATED FINANCIAL STATEMENTS FOR THE YEARS
ENDED DECEMBER 31, 2004, 2003 AND 2002
(Figures stated in thousands of Mexican pesos of December 31, 2004 purchasing power
and in thousands of U.S. dollars or other currency units)—(Continued)
PEMEX management has evaluated this lawsuit and determined that a reserve for this lawsuit was not necessary as of December 31, 2004.
| e. | PEMEX has been sued by Construcciones Industriales del Golfo, S.A. de C.V. for late and non-payment of a total of U.S. $79,276 (Ps. 893,028). The first judgment handed down required PEMEX to pay U.S. $4,000 (Ps. 45,059), plus 6% interest on that amount as from the time the amount became overdue to the date on which full payment is made. An appeal was filed against that resolution, and the respective judgment is being awaited. Based on an analysis of the documentation provided by the supplier, PEMEX recorded a liability of U.S. $4,576 (Ps. 51,548). |
| f. | TheComisión Federal de Competencia (Federal Competition Commission) handed down a resolution against PEMEX for alleged monopolistic policies relating to exclusivity clauses for the sale of lubricants, grease, and oil. The resolution required the following measures be taken: |
| • | Amendment of the joint venture agreements, trademark license contract, franchise supply contract, as well as documents containing the exclusivity clause; |
| • | Amendment of contracts with franchise service stations to adjust franchise and supply contracts; and |
| • | Reporting of the resolution handed down by the Federal Competition Commission to the legal representatives of service stations. |
To date, PEMEX has filed two appeals for constitutional relief from this resolution. One appeal was resolved favorably in the first instance, but was challenged through an appeal for review. A ruling thereon has not yet been handed down. Consequently, PEMEX has not accrued any reserve for this claim.
18. Subsequent events
New accounting pronouncements:
Bulletin B-7, “Business Acquisitions”, and the amendments to Bulletin C-2, “Financial Instruments”, were issued by the MIPA and became effective January 1, 2005. Management believes that the adoption of these standards will not have a significant effect on PEMEX’s consolidated financial position or results of operations.
Additionally, on January 1, 2005, the provisions of Bulletin C-10, “Derivative Financial Instruments and Hedging Operations” (Bulletin C-10), became effective. This Bulletin provides expanded guidance for the recognition, valuation and disclosures applicable to all derivative financial instruments. PEMEX is currently evaluating the impact that the adoption of this Bulletin will have on its consolidated financial statements.
Certain provisions of revised Bulletin D-3, “Labor Obligations”, became effective January 1, 2005. These provisions provide additional valuation and disclosure requirements for recognizing severance payments paid to employees upon dismissal. The adoption of these provisions will result in the recognition of an initial liability related to prior service costs for an amount of approximately Ps. 1,222,561 and an estimated charge to income upon adoption of approximately Ps. 313,069.
F-38
Table of Contents
PETRÓLEOS MEXICANOS, SUBSIDIARY ENTITIES AND SUBSIDIARY COMPANIES
NOTES TO THE CONSOLIDATED FINANCIAL STATEMENTS FOR THE YEARS
ENDED DECEMBER 31, 2004, 2003 AND 2002
(Figures stated in thousands of Mexican pesos of December 31, 2004 purchasing power
and in thousands of U.S. dollars or other currency units)—(Continued)
19. Differences between Mexican GAAP and U.S. GAAP
PEMEX’s consolidated financial statements are prepared in accordance with Mexican GAAP, which differs in certain significant respects from accounting principles generally accepted in the United States (“U.S. GAAP”). In accordance with Bulletin B-10, as discussed in Note 2(b) to the financial statements, all of the related U.S. GAAP adjustments have also been restated to reflect the effects of inflation. The application of B-10 represents a comprehensive measure of the effects of price level changes and is considered to result in a more meaningful presentation than historical cost-based financial reporting in an environment such as Mexico. None of the adjustments to the financial statements for the effects of inflation required under Mexican GAAP have been eliminated in the U.S. GAAP reconciliation.
The differences between Mexican GAAP and U.S. GAAP, as they relate to PEMEX, are presented below together with explanations of certain adjustments that affect net income and shareholders’ equity as of and for the years ended December 31:
F-39
Table of Contents
PETRÓLEOS MEXICANOS, SUBSIDIARY ENTITIES AND SUBSIDIARY COMPANIES
NOTES TO THE CONSOLIDATED FINANCIAL STATEMENTS FOR THE YEARS
ENDED DECEMBER 31, 2004, 2003 AND 2002
(Figures stated in thousands of Mexican pesos of December 31, 2004 purchasing power
and in thousands of U.S. dollars or other currency units)—(Continued)
I. Differences in measurement methods:
Loss represents pre-tax loss, because PEMEX is not subject to Mexican income taxes, and is reconciled as follows:
| 2004 | 2003 | 2002 | |||||||
Net loss for the year under Mexican GAAP | (Ps. 25,495,610 | ) | (Ps. 42,754,131 | ) | (Ps. 25,849,629 | ) | |||
U.S. GAAP adjustments: | |||||||||
Exploration and drilling costs, net (a) | (1,419,459 | ) | (20,284,641 | ) | 3,397,002 | ||||
Pensions and seniority premiums (b) | 748,138 | 584,919 | (1,523,987 | ) | |||||
Post-retirement benefits (c) | (2,658,394 | ) | (9,092,420 | ) | (8,346,845 | ) | |||
Accrued vacation (d) | 126,884 | (27,220 | ) | (36,773 | ) | ||||
Fixed asset adjustments: | |||||||||
Capitalized gains (losses) of hedging financial instruments, net (e) | 1,094,896 | (187,133 | ) | (297,331 | ) | ||||
Capitalization of interest, net (f) | 1,949,866 | 1,809,307 | 1,628,470 | ||||||
Impairment, net (g) | 9,157,632 | (2,755,623 | ) | 2,170,206 | |||||
Depreciation convention (h) | 701,976 | 701,976 | (564,031 | ) | |||||
Derivative financial instruments (i) | 5,517,885 | 1,916,419 | (3,199,945 | ) | |||||
Sales of shares of Repsol (j) | 676,294 | (585,237 | ) | (703,399 | ) | ||||
Profit in inventory (k) | 1,039,355 | (109,315 | ) | (1,053,751 | ) | ||||
Available-for-sale investment securities (m) | (5,029,143 | ) | — | — | |||||
Effects of inflation accounting on U.S. GAAP | 578,498 | 1,031,722 | 17,634 | ||||||
Total U.S. GAAP adjustments, net | 12,484,428 | (26,997,246 | ) | (8,512,750 | ) | ||||
Net loss for the year under U.S. GAAP | (13,011,182 | ) | (Ps. 69,751,377 | ) | (Ps. 34,362,379 | ) | |||
Components of U.S. GAAP net loss: | |||||||||
Loss from continuing operations | (13,011,182 | ) | (Ps. 71,868,639 | ) | (Ps. 34,362,379 | ) | |||
Cumulative effect of adoption of new accounting standard (n) | — | 2,117,262 | — | ||||||
Net loss for the year | (13,011,182 | ) | (Ps. 69,751,377 | ) | (Ps. 34,362,379 | ) | |||
Comprehensive loss under U.S. GAAP: | |||||||||
Net loss for the year under U.S. GAAP | (13,011,182 | ) | (Ps. 69,751,377 | ) | (Ps. 34,362,379 | ) | |||
Other comprehensive income (loss): | |||||||||
Additional minimum pension liability (b) | (2,595,522 | ) | — | — | |||||
Derivative financial instruments (i) | (7,574,174 | ) | 5,283,556 | 934,032 | |||||
Unrealized gains on available-for-sale investment securities (m) | 3,706,556 | 4,770,466 | (286,572 | ) | |||||
(Deficit) surplus in restatement of equity | (4,676,926 | ) | 5,927,888 | (4,369,084 | ) | ||||
Comprehensive loss | (24,151,248 | ) | (Ps. 53,769,467 | ) | (Ps. 38,084,003 | ) | |||
F-40
Table of Contents
PETRÓLEOS MEXICANOS, SUBSIDIARY ENTITIES AND SUBSIDIARY COMPANIES
NOTES TO THE CONSOLIDATED FINANCIAL STATEMENTS FOR THE YEARS
ENDED DECEMBER 31, 2004, 2003 AND 2002
(Figures stated in thousands of Mexican pesos of December 31, 2004 purchasing power
and in thousands of U.S. dollars or other currency units)—(Continued)
| 2004 | 2003 | |||||
Components of accumulated other comprehensive income at December 31: | ||||||
Derivative financial instruments (i) | Ps. (1,887,395) | Ps. 5,686,779 | ||||
Additional minimum pension liability (b) | (2,595,522 | ) | — | |||
Unrealized gains on available-for-sale investment securities (m) | 8,190,450 | 4,483,894 | ||||
Surplus in restatement of equity | 132,342,011 | 137,692,710 | ||||
Accumulated other comprehensive income | Ps. 136,049,544 | Ps. 147,863,383 | ||||
| 2004 | 2003 | |||||
Equity is reconciled as follows: | ||||||
Equity under Mexican GAAP | Ps. 33,342,918 | Ps. 48,241,355 | ||||
U.S. GAAP adjustments: | ||||||
Exploration and drilling costs (a) | 15,182,401 | 16,601,860 | ||||
Pensions and seniority premiums: | ||||||
Pensions and seniority premiums (b) | (9,705,349 | ) | (10,453,487 | ) | ||
Additional minimum pension liability (b) | 4,380,070 | — | ||||
Post-retirement benefits (c) | (41,797,698 | ) | (39,139,304 | ) | ||
Accrued vacation (d) | (533,614 | ) | (694,783 | ) | ||
Fixed asset adjustments: | ||||||
Capitalized gains (losses) of hedging financial instruments, net (e) | 610,431 | (484,465 | ) | |||
Capitalization of interest, net (f) | (11,666,285 | ) | (13,616,151 | ) | ||
Impairment, net (g) | (35,974,639 | ) | (45,132,271 | ) | ||
Depreciation convention (h) | (2,105,926 | ) | (2,807,902 | ) | ||
Derivative financial instruments (i) | 10,609,623 | 12,665,912 | ||||
Sale of shares of Repsol (j) | — | (676,294 | ) | |||
Profit in inventory (k) | (810,144 | ) | (1,849,499 | ) | ||
Advanced payments on minimum guaranteed dividend (l) | (10,387,839 | ) | (10,703,189 | ) | ||
Available-for-sale investment securities (m) | — | 1,322,587 | ||||
Total U.S. GAAP adjustments, net | (82,198,969 | ) | (94,966,986 | ) | ||
(Deficit) equity under U.S. GAAP | (Ps. 48,856,051 | ) | (Ps. 46,725,631 | ) | ||
| 2004 | 2003 | |||||
Changes in U.S. GAAP equity for the year ended December 31: | ||||||
(Deficit) equity at January 1 | (Ps. 46,725,631 | ) | Ps. 18,020,285 | |||
Net loss for the period | (13,011,182 | ) | (69,751,377 | ) | ||
Mexican Government increase in equity of Subsidiary Entities | 32,637,530 | — | ||||
Minimum guaranteed dividends | (10,616,702 | ) | (10,976,449 | ) | ||
Other comprehensive income: | ||||||
Additional minimum pension liability (b) | (2,595,522 | ) | — | |||
Derivative financial instruments | (7,574,174 | ) | 5,283,556 | |||
Unrealized gains on available-for-sale investment securities | 3,706,556 | 4,770,466 | ||||
(Deficit) surplus in restatement of equity | (4,676,926 | ) | 5,927,888 | |||
(Deficit) equity at December 31 | (Ps. 48,856,051 | ) | (Ps. 46,725,631 | ) | ||
F-41
Table of Contents
PETRÓLEOS MEXICANOS, SUBSIDIARY ENTITIES AND SUBSIDIARY COMPANIES
NOTES TO THE CONSOLIDATED FINANCIAL STATEMENTS FOR THE YEARS
ENDED DECEMBER 31, 2004, 2003 AND 2002
(Figures stated in thousands of Mexican pesos of December 31, 2004 purchasing power
and in thousands of U.S. dollars or other currency units)—(Continued)
Explanation of reconciling items:
(a) Exploration and drilling costs
As discussed in Note 2(e), effective January 1, 2004, for Mexican GAAP purposes PEMEX approved a change in the accounting policy for the recognition of well exploration and drilling costs to the successful-efforts method of accounting.
Under the successful efforts method of accounting for oil and gas exploration costs, exploration costs are charged to income when incurred, except that exploratory drilling costs are included in fixed assets, pending determination of proven reserves. Exploration wells more than 12 months old are expensed unless (a) (i) they are in an area requiring major capital expenditure before production can begin, (ii) commercially productive quantities of reserves have been found, and (iii) they are subject to further exploration or appraisal activity in that either drilling of additional exploratory wells is under way or firmly planned for the near future, or (b) proved reserves are recorded within 12 months following the completion of exploratory drilling. Expenses pertaining to the drilling of development wells are capitalized whether or not successful.
Management makes semi-annual assessments of the amounts included within fixed assets to determine whether capitalization is initially appropriate and can continue. Exploration wells capitalized beyond 12 months are subject to additional judgment as to whether the facts and circumstances have changed and therefore whether the conditions described in clauses (a) and (b) of the preceding paragraph no longer apply.
Through December 31, 2003, under Mexican GAAP a specific equity account reserve was established to cover current and future exploration and drilling costs. As oil and gas was extracted from existing wells, the equity reserve was increased, and an amount equal to the increase was charged to cost of sales based upon a calculated quota of exploration and drilling cost per barrel. Accumulated drilling costs pertaining to successful wells were reclassified from that reserve and charged as an investment in fixed assets.
Under U.S. GAAP, costs of drilling exploratory wells and exploratory-type stratigraphic test wells are initially capitalized and are later charged to expense if proved reserves are not discovered. Such capitalized costs are amortized on a UOP basis over proved developed reserves. Development costs, including the costs of drilling development wells and development-type stratigraphic test wells, are capitalized. The capitalized costs of wells and related equipment are amortized on a UOP basis over proved developed reserves, as the related oil and gas reserves are extracted. Therefore, through December 31, 2003, PEMEX adjusted the results of operations and equity to reflect the impact of U.S. GAAP on exploration and drilling costs;i.e., the Mexican GAAP operations charge related to the cost per barrel has been reversed, the equity account related to the specific oil field exploration and drilling reserve has been reversed to zero, and costs related to properties in the exploration and development phase have been capitalized in accordance with U.S. GAAP. No such adjustment was required for the year ended December 31, 2004 due to the adoption of the successful efforts method of accounting for Mexican GAAP purposes.
At December 31, 2004, the U.S. GAAP equity adjustment represents the cumulative costs of capitalized unsuccessful wells on proven areas under U.S. GAAP, not capitalized under Mexican GAAP through December 31, 2003, net of the amortization of such capitalized amounts. The 2004 U.S. GAAP net income adjustment reflects the amortization of such capitalized costs on a UOP basis.
F-42
Table of Contents
PETRÓLEOS MEXICANOS, SUBSIDIARY ENTITIES AND SUBSIDIARY COMPANIES
NOTES TO THE CONSOLIDATED FINANCIAL STATEMENTS FOR THE YEARS
ENDED DECEMBER 31, 2004, 2003 AND 2002
(Figures stated in thousands of Mexican pesos of December 31, 2004 purchasing power
and in thousands of U.S. dollars or other currency units)—(Continued)
In April 2005, the FASB issued a FASB Staff Position No. FAS 19-1 “Accounting for Suspended Well Costs” (“FSP 19-1”). The FSP 19-1 addresses the circumstances that would permit the continued capitalization of exploratory well costs beyond one year, other than when additional exploration wells are necessary to justify major capital expenditures and those wells are under way or firmly planned for the near future. Under the provision of FSP 19-1, exploration costs would continue to be capitalized after the completion of drilling when (a) the well has found a sufficient quantity of reserves to justify completion as a producing well and (b) the enterprise is making sufficient progress assessing the reserves and the economic and operating viability of the project. If either condition is met or if an enterprise obtains information that raises substantial doubt about the economic or operational viability of the project the exploratory well would be assumed to be impaired, and its costs, net of any salvage value, would be charged to expenses. The FSP 19-1 provides a number of indicators that need to be present to demonstrate sufficient progress has been made in assessing the reserves and the economic viability of the project. Given that the FSP 19-1 was recently issued, we are evaluating the impact that this FASB Staff Position will have on our historical accounting policy and consolidated financial statements.
The following table provides an aging of capitalized well costs, based on the date the drilling was completed, and the number of projects for which exploratory well costs have been capitalized for a period greater than one year since the completion of drilling:
| At December 31, 2004 | ||
Exploratory well costs capitalized for a period of one year or less | Ps. 5,852,724 | |
Exploratory well costs capitalized for a period greater than one year but less than two years | 955,000 | |
Balance at December 31, 2004 | Ps. 6,807,724 | |
Number of projects with exploratory well costs that have been capitalized for a period greater than one year | 88 |
(b) Pensions and seniority premiums
Under Mexican GAAP, PEMEX follows the guidance in Bulletin D-3, which establishes the procedures for measuring the expenses and liabilities for pension plans and seniority premiums. The primary difference between PEMEX’s application of Bulletin D-3 and the U.S. GAAP guidance provided in Statement of Financial Accounting Standards (“SFAS”) No. 87, “Employers Accounting for Pensions” (“SFAS No. 87”), is the implementation dates.
In accordance with Bulletin D-3 and SFAS No. 87, PEMEX recognizes an additional minimum pension liability, which under SFAS No. 87 is equal to the excess of the accumulated benefit obligation over the fair value of plan assets and accrued pension liabilities (see Note 19II(e)).
(c) Post-retirement benefits
As described in Notes 2 (l) and 11, under Mexican GAAP, through December 31, 2003, PEMEX accounted for health service benefits on a pay-as-you-go basis. Effective January 1, 2004, PEMEX adopted the amendments to Bulletin D-3 that set forth additional valuation and disclosure requirements for the recognition of post-retirement obligations.
F-43
Table of Contents
PETRÓLEOS MEXICANOS, SUBSIDIARY ENTITIES AND SUBSIDIARY COMPANIES
NOTES TO THE CONSOLIDATED FINANCIAL STATEMENTS FOR THE YEARS
ENDED DECEMBER 31, 2004, 2003 AND 2002
(Figures stated in thousands of Mexican pesos of December 31, 2004 purchasing power
and in thousands of U.S. dollars or other currency units)—(Continued)
Under U.S. GAAP, PEMEX follows the guidelines of SFAS No. 106, “Employers’ Accounting for Post-Retirement Benefits Other Than Pensions,” (“SFAS No. 106”) in accounting for health service and other supplemental payments provided to retirees and other eligible family members. SFAS No. 106 requires the accrual of the expected cost of providing such benefits during the years that the employees render service.
After giving effect to the amendments to Bulletin D-3 on PEMEX’s Mexican GAAP financial statements, the U.S. GAAP adjustment represents the difference of the unrecognized prior service costs and transition obligation amounts under Mexican GAAP and U.S. GAAP due to the different adoption dates of the applicable Mexican and U.S. GAAP standards.
(d) Accrued vacation
Under Mexican GAAP, vacation expense is recognized when the vacation is utilized by the employee. Under U.S. GAAP, vacation expense is accrued for when earned by the employee.
(e) Fixed assets—Capitalized gains and losses of hedging financial instruments
Under Mexican GAAP, realized gains and losses arising from hedging instruments designated as cash flow hedges are capitalized as part of capitalized interest. Under U.S. GAAP, realized gains and losses arising from currency swap hedging instruments designated as cash flow hedges cannot be capitalized as part of the qualifying assets, but are recognized into earnings during the same period in which the forecasted transaction affects earnings. For the years ended December 31, 2004 and 2003, PEMEX capitalized a gain of Ps. 1,075,273 and loss of Ps. 193,249, respectively, arising from hedging instruments. The 2004 and 2003 net income adjustments also reverse depreciation of Ps. 19,623 and Ps. 6,116, respectively, related to amounts previously capitalized.
(f) Fixed assets—Capitalization of interest
Under Mexican GAAP, interest is capitalized to property, plant and equipment based upon total interest cost incurred on loans allocated to construction projects, regardless of whether or not the amounts borrowed have been spent on such projects.
Under U.S. GAAP, interest is capitalized by applying an average interest rate to the construction in progress balance without exceeding total interest expense. PEMEX has accordingly adjusted its results of operations and equity to reflect the U.S. GAAP requirements for capitalizing interest. The net income adjustment for capitalized interest presented herein also includes the effects of depreciation of Ps. 1,061,563, Ps. 1,084,278, and Ps. 1,121,529 for the years ended December 31, 2004, 2003 and 2002, respectively, related to the cumulative difference in amounts previously capitalized for such assets.
F-44
Table of Contents
PETRÓLEOS MEXICANOS, SUBSIDIARY ENTITIES AND SUBSIDIARY COMPANIES
NOTES TO THE CONSOLIDATED FINANCIAL STATEMENTS FOR THE YEARS
ENDED DECEMBER 31, 2004, 2003 AND 2002
(Figures stated in thousands of Mexican pesos of December 31, 2004 purchasing power
and in thousands of U.S. dollars or other currency units)—(Continued)
Interest costs for the years ended December 31, 2004, 2003 and 2002, for Mexican GAAP and U.S. GAAP purposes were allocated as follows:
| 2004 | 2003 | 2002 | ||||
Under Mexican GAAP: | ||||||
Interest capitalized | Ps. 4,339,933 | Ps. 7,622,449 | Ps. 5,752,053 | |||
Interest in the specific oil field exploration and depletion reserve | — | 20,029 | 52,638 | |||
Interest expense | 31,764,579 | 24,706,311 | 22,059,995 | |||
Total interest cost | Ps. 36,104,512 | Ps. 32,348,789 | Ps. 27,864,686 | |||
Under U.S. GAAP: | ||||||
Interest capitalized | Ps. 5,228,236 | Ps. 8,367,505 | Ps. 6,311,633 | |||
Interest expense | 30,876,276 | 23,981,284 | 21,553,053 | |||
Total interest cost | Ps. 36,104,512 | Ps. 32,348,789 | Ps. 27,864,686 | |||
(g) Fixed assets—Impairment
For Mexican GAAP purposes, as described in Note 2(i), effective January 1, 2004, PEMEX adopted Bulletin C-15, under which it evaluates the impairment of long-lived assets whenever there are events or circumstances indicating that the book value of a given asset may not be recoverable. For each of the cash-generating units, if the book value of the long-lived assets exceeds the estimated future value (discounted) of cash flows recoverable by such long-lived assets, a charge is made to income for the period for an impairment loss. This calculation is made at least annually, and in accordance with Bulletin C-15, the impairment recorded can be reversed in subsequent periods if the subsequent impairment analysis does not indicate a loss in such future periods. No such reversals were made in 2004.
In determining the estimated future cash flows for impairment purposes for all periods presented, hydrocarbon duties based on sales to third parties have not been included in the net cash flow calculation. Management believes that the hydrocarbon duties paid are similar in nature to income taxes or dividend distributions payable to its parent, and therefore are properly excluded from the net cash flow calculation.
Through December 31, 2003, under Mexican GAAP, PEMEX evaluated the recovery of its long-lived assets utilizing the “value in use” criteria of Bulletin B-10.
For U.S. GAAP purposes, an evaluation of impairment is undertaken whenever events or circumstances indicate that the carrying amount of an asset may not be recoverable, as is the case under Mexican GAAP. Under U.S. GAAP, the impairment criteria are met when the carrying value of assets exceeds the sum of expected future cash flows (undiscounted and without financing charges) of the related assets. The asset is written down to fair value as determined by using the present value of expected future cash flows. PEMEX measures impairment of its oil and gas producing assets based on the undiscounted estimated future cash flows associated with estimated proved reserves on a field by field basis following the guidance on SFAS No. 144, “Accounting for the Impairment or Disposal of Long-Lived Assets.”
F-45
Table of Contents
PETRÓLEOS MEXICANOS, SUBSIDIARY ENTITIES AND SUBSIDIARY COMPANIES
NOTES TO THE CONSOLIDATED FINANCIAL STATEMENTS FOR THE YEARS
ENDED DECEMBER 31, 2004, 2003 AND 2002
(Figures stated in thousands of Mexican pesos of December 31, 2004 purchasing power
and in thousands of U.S. dollars or other currency units)—(Continued)
In 2004, under U.S. GAAP, PEMEX did not record any impairment charge. The 2004 U.S. GAAP net income reconciliation includes a credit of Ps. 5,480,930 for depreciation due to the difference in carrying values of long-lived assets between Mexican GAAP and U.S. GAAP for the cumulative impairment charge differences, as well as the reversal of the 2004 impairment charge of Ps. 3,676,702 recorded under Mexican GAAP primarily related to petrochemical plants and certain oil and gas producing wells which were previously impaired under U.S. GAAP in prior years.
In 2003, under U.S. GAAP, PEMEX recorded an impairment charge of Ps. 4,913,273, which reflects an adjustment relating to certain oil and gas producing fields as well as certain refining assets. The 2003 U.S. GAAP net income reconciliation also includes a credit of Ps. 2,157,649 for depreciation due to the difference in carrying values of long-lived assets between Mexican GAAP and U.S. GAAP for the cumulative impairment charge differences and the reversal of write-off charges recorded under Mexican GAAP for assets previously impaired under U.S. GAAP, primarily in petrochemical plants.
In 2002, under U.S. GAAP, PEMEX recorded an impairment charge of Ps. 6,938,161, which reflects an adjustment relating to certain oil and gas producing fields. The 2002 U.S. GAAP net income reconciliation also includes a credit of Ps. 4,182,537 for depreciation due to the difference in carrying values of long-lived assets between Mexican GAAP and U.S. GAAP for the cumulative impairment charge differences and the reversal of write-off charges recorded under Mexican GAAP for assets previously impaired under U.S. GAAP, primarily in petrochemical plants.
(h) Fixed assets—Depreciation convention
Until 2002, under Mexican GAAP, PEMEX would begin to depreciate assets the year after which they were placed in service. For U.S. GAAP purposes, assets were depreciated from the date placed in service. For the year ended December 31, 2002, due to significant new capital expenditures, an adjustment for depreciation has been recognized in the U.S. GAAP reconciliation. Beginning in 2003, PEMEX changed its accounting under Mexican GAAP to require depreciation from the month after the asset was placed into service, therefore eliminating any new differences between Mexican GAAP and U.S. GAAP. In 2004 and 2003, the U.S. GAAP adjustments reflect a credit to income of Ps. 701,976 for the reversal of the depreciation expense previously recorded under U.S. GAAP.
(i) Accounting for derivative financial instruments
For U.S. GAAP purposes, PEMEX applies SFAS No. 133, “Accounting for Derivative Instruments and Hedging Activities,” as amended (“SFAS No. 133”), which requires that all derivative instruments (including certain derivative instruments embedded in other contracts) should be recognized in the balance sheet as assets or liabilities at their fair values and that changes to fair values be recognized immediately in earnings, unless the derivative qualifies as a “hedge” (as defined in SFAS No. 133), for which certain special accounting treatment is permitted.
In accordance with U.S. GAAP, hedge effectiveness is assessed consistently with the method and risk management strategy documented for each hedging relationship. On at least a quarterly basis, PEMEX assesses the effectiveness of each hedging relationship retrospectively and prospectively to ensure that hedge accounting was appropriate for the prior period and continues to be appropriate for future periods. PEMEX considers hedge accounting to be appropriate if the assessment of hedge effectiveness indicates that the change in fair value of the designated hedging instrument is highly effective at offsetting the change in fair value due to the hedged risk of the hedged item or transaction.
F-46
Table of Contents
PETRÓLEOS MEXICANOS, SUBSIDIARY ENTITIES AND SUBSIDIARY COMPANIES
NOTES TO THE CONSOLIDATED FINANCIAL STATEMENTS FOR THE YEARS
ENDED DECEMBER 31, 2004, 2003 AND 2002
(Figures stated in thousands of Mexican pesos of December 31, 2004 purchasing power
and in thousands of U.S. dollars or other currency units)—(Continued)
If a derivative instrument qualifies as a fair value hedge under the applicable guidance and is documented as such, the change in the fair value of the derivative and the change in the fair value of the hedged item that is due to the hedged risks is recorded in earnings based on the income classification of the item being hedged. These hedges also adjust the book values of the derivatives and hedged item. If a derivative instrument qualifies as a cash flow hedge under the applicable guidance and is documented as such, the effective portion of the hedging instrument’s gain or loss is reported in stockholders’ equity (as a component of accumulated other comprehensive income) and is reclassified into earnings in the period during which the transaction being hedged affects earnings. Gains or losses reclassified from stockholders’ equity to earnings are classified in accordance with the earnings treatment of the hedged transaction. The ineffective portion of a hedging derivative’s fair value change, where that derivative is used in a cash flow hedge, is recorded in current earnings. Classification in the statement of operations of the ineffective portion of the hedging instrument’s gain or loss is based on the income statement classification of the transaction being hedged. If a derivative instrument does not qualify as a hedge under the applicable guidance, the change in the fair value of the derivative is immediately recognized in the statement of operations.
PEMEX has entered into contracts for the purchase and/or sale of oil and gas. While some of these contracts meet the definition of a derivative under SFAS No. 133, PEMEX has determined that the normal purchase or normal sale exception applies to such contracts. Accordingly, such contracts are not accounted for as derivatives pursuant to SFAS No. 133.
PEMEX also evaluates contracts for “embedded” derivatives, and considers whether any embedded derivatives have to be bifurcated, or separated, from the host contracts in accordance with SFAS No. 133 requirements. Embedded derivatives may have terms that are not clearly and closely related to the terms of the host contract in which they are included. If embedded derivatives exist and are not clearly and closely related to the host contract, they are accounted for separately from the host contract as derivatives, with changes in their fair value recorded in current earnings, to the extent that the hybrid instrument is not already accounted at fair value.
When hedge accounting is discontinued due to PEMEX’s determination that the derivative no longer qualifies as an effective fair value hedge, PEMEX will continue to carry the derivative on the balance sheet at its fair value. The related hedged asset or liability will cease to be adjusted for changes in fair value that are due to the previously hedged risk. When PEMEX discontinues hedge accounting in a cash flow hedge because it is no longer probable that the forecasted transaction will occur in the originally expected period, the gain or loss on the derivative remains in accumulated other comprehensive income and is reclassified into earnings when the forecasted transaction affects earnings. However, if it is probable that a forecasted transaction will not occur by the end of the originally specified time period or within an additional two month period of time thereafter, the gains and losses that were accumulated in other comprehensive income will be recognized in current earnings. If a derivative instrument ceases to meet the criteria for hedge accounting, any subsequent gains and losses are recognized in current earnings.
An adjustment of the carrying amount of a hedged asset held for sale will remain part of the carrying amount of that asset until the asset is sold, at which point the entire carrying amount of the hedged asset would be recognized as the cost of the item sold in determining earnings. An adjustment of the carrying amount of a hedged interest-bearing financial instrument will be amortized to earnings; amortization will begin no later than when the hedged item ceases to be adjusted for changes in its fair value attributable to the risk being hedged.
F-47
Table of Contents
PETRÓLEOS MEXICANOS, SUBSIDIARY ENTITIES AND SUBSIDIARY COMPANIES
NOTES TO THE CONSOLIDATED FINANCIAL STATEMENTS FOR THE YEARS
ENDED DECEMBER 31, 2004, 2003 AND 2002
(Figures stated in thousands of Mexican pesos of December 31, 2004 purchasing power
and in thousands of U.S. dollars or other currency units)—(Continued)
The principal differences between derivative accounting under Mexican GAAP and U.S. GAAP relate to the following:
| • | As disclosed in Note 10, PEMEX has entered into cross currency swaps under which it swaps principal and interest payments on non-U.S. dollar-denominated obligations for U.S. dollar amounts. This limits PEMEX’s exposure to fluctuations in these currencies as they relate to the U.S. dollar. Under U.S. GAAP, foreign currency hedges can only be designated as such when hedging the risk to the entity’s functional currency, and therefore, contracts entered into by PEMEX entities whose functional currency is not U.S. dollars do not qualify for hedge accounting under U.S. GAAP although they do under Mexican GAAP Bulletin C-2, which has no similar requirement that foreign currency hedge transactions be carried out in the entity’s functional currency. |
| • | Given the need for specialized technology, PEMEX enters into infrastructure and supply contracts whose settlement terms are denominated in or linked to the U.S. dollar. Such contracts are generally entered into by entities whose functional currency is not the U.S. dollar, thus creating a foreign currency embedded derivative which is bifurcated and evaluated separately under U.S. GAAP. Such embedded derivatives are not required to be bifurcated under Mexican GAAP Bulletin C-2 since they are considered normal contractual provisions in Mexico. |
| • | Lastly, as of December 31, 2003 and 2002, under Mexican GAAP Bulletin C-2, PEMEX recognized a loss on the fair value of the equity swap and other contracts related to the Repsol shares described in Note 10. As more fully described in adjustment (j), under U.S. GAAP, the transfer of the Repsol shares did not meet the definition of a true sale. Thus, the swap would not have been fair valued under U.S. GAAP. During 2004, this equity swap was terminated, and as such there is no remaining adjustment for U.S. GAAP purposes. |
With the termination of the equity swap, during 2004, PEMEX exercised the option to purchase the Repsol shares and transferred those shares to RepCon Lux, which issued debt securities that are exchangeable into Repsol shares at the option of the bondholder. This embedded option to exchange debt securities of RepCon Lux for Repsol shares is bifurcated and accounted for separately at fair value under Mexican and U.S. GAAP, and changes in fair values are recorded in earnings. Thus, there is no U.S. GAAP adjustment related to this embedded option feature.
The following table indicates the duration and respective rates for the interest rate swaps at December 31:
| 2004 | 2003 | |||||
Weighted average (maturity years) | 4.47 | 5.00 | ||||
Average receive rate in U.S. dollars | 3.63 | % | 3.10 | % | ||
Average receive rate in Mexican pesos | 9.72 | % | — | |||
Average pay rate in U.S. dollars | 4.94 | % | 5.25 | % | ||
Average pay rate in Mexican pesos | 10.21 | % | — |
For the years ended December 31, 2004, 2003 and 2002, PEMEX recognized a net gain (loss) of Ps. 5,517,885, Ps. 2,389,382 and (Ps. 1,299,748), respectively, reported as a component of “interest, net” in the consolidated statements of operations, which included the ineffective portion of all fair-value hedges. All components of each derivative’s gain or loss were included in the assessment of hedge effectiveness, except for the time value of option contracts.
F-48
Table of Contents
PETRÓLEOS MEXICANOS, SUBSIDIARY ENTITIES AND SUBSIDIARY COMPANIES
NOTES TO THE CONSOLIDATED FINANCIAL STATEMENTS FOR THE YEARS
ENDED DECEMBER 31, 2004, 2003 AND 2002
(Figures stated in thousands of Mexican pesos of December 31, 2004 purchasing power
and in thousands of U.S. dollars or other currency units)—(Continued)
For the years ended December 31, 2004, 2003 and 2002, PEMEX recognized a net gain (loss) of (Ps. 7,574,174), Ps. 5,283,556 and Ps. 934,032, respectively, reported as “derivative financial instruments” in the consolidated other comprehensive loss statement. All components of each derivative’s gain or loss were included in the assessment of hedge effectiveness, except for the time value of option contracts.
For cash flow hedges, gains and losses on derivative contracts that are reclassified from accumulated other comprehensive income to current-period earnings are included in the line item in which the hedged item is recorded in the same period the forecasted transaction affects earnings. As of December 31, 2004, a net loss of Ps. 857,924 of the balance related to derivative instruments accumulated in other comprehensive income (loss) are expected to be reclassified during the next twelve months to the consolidated statement of operations.
(j) Sale of shares of Repsol
Under Mexican GAAP, PEMEX recorded gains in years prior to 2002 related to the transfer of its Repsol shares to a third party. For U.S. GAAP purposes, the transfer of the shares did not meet the criteria for sale recognition as the transaction included a repurchase feature at the option of PEMEX, and, accordingly, all gains were reversed and the transfer of the shares treated as a financing transaction. Therefore, under U.S. GAAP, the Repsol shares would be evaluated pursuant to SFAS No. 115, “Accounting for Certain Investments in Debt and Equity Securities” (“SFAS No. 115”) (adjustment (m)), and a liability resulting from these transactions would also be reflected on the balance sheet. During the years 2003 and 2002, PEMEX recognized Ps. 799,983 and Ps. 213,892, respectively, for purposes of the U.S. GAAP reconciliation, of monetary gains, included in adjustment (o), and (Ps. 585,237) and (Ps. 703,399), respectively, of foreign exchange losses on the U.S. dollar liability.
During 2004, PEMEX exercised the option to repurchase the Repsol shares, terminated the equity swap arrangements relating thereto and subsequently transferred the repurchased shares to RepCon Lux, a consolidated entity. Therefore, as described in adjustment (m), there is no adjustment in equity for U.S. GAAP purposes as of December 31, 2004. As such, the cumulative adjustment of Ps. 676,294 as of December 31, 2003, has been reversed as of December 31, 2004.
(k) Profit in inventory
Under Mexican GAAP, PEMEX values crude oil and derivatives for export at net realizable value with the difference between the net realizable value and cost recorded in earnings. In contrast, U.S. GAAP requires that inventories be recorded at net realizable value, but not to exceed cost. For U.S. GAAP equity reconciliation purposes, PEMEX has eliminated the effect of recognizing a profit within its ending inventory balance at each period end; and for net income reconciliation purposes, the adjustment reflects the reversal of the prior year’s equity adjustment as inventory is sold, as well as profit in inventory at the balance sheet date.
(l) Advance payments on minimum guaranteed dividend
Under Mexican GAAP, advance payments on the minimum guaranteed dividend owed to the Mexican Government derived from the capitalization of debt as described in Note 13 are recorded as an account receivable prior to approval of the total annual dividend amount by the Board of Directors, which is usually in the following fiscal year.
F-49
Table of Contents
PETRÓLEOS MEXICANOS, SUBSIDIARY ENTITIES AND SUBSIDIARY COMPANIES
NOTES TO THE CONSOLIDATED FINANCIAL STATEMENTS FOR THE YEARS
ENDED DECEMBER 31, 2004, 2003 AND 2002
(Figures stated in thousands of Mexican pesos of December 31, 2004 purchasing power
and in thousands of U.S. dollars or other currency units)—(Continued)
Under U.S. GAAP, such receivable balances are considered as a reduction in equity. PEMEX has accordingly adjusted equity to reflect the minimum guaranteed dividend payment as a reduction in equity.
The effective rate used to calculate the minimum guaranteed dividend is LIBOR plus 0.8125% (which ranged from 1.9225% to 2.7725% and from 1.9125% to 2.2125% for 2004 and 2003, respectively).
The scheduled maturities on the original principal amount of the capitalized debt over the remaining years is as follows:
Year | |||
2005 | U.S.$ | 873,848 | |
2006 | 873,848 | ||
Total | U.S.$ | 1,747,696 | |
(m) Accounting for available-for-sale securities (Repsol)
As described in adjustment (j), the transfer of PEMEX’s Repsol shares to a third party in prior years did not meet the criteria for sale recognition under U.S. GAAP and, accordingly, these shares continued to be reflected in PEMEX’s financial statements.
Pursuant to SFAS No. 115, PEMEX classifies its investment securities as “available-for-sale” and, accordingly, they are recorded at fair value with unrealized gains and losses excluded from the statement of operations and reported in other comprehensive income (loss). The fair value of the securities is determined by quoted market prices at December 31, 2004, 2003 and 2002. An impairment loss is recognized when the loss is considered other than temporary.
During 2004, PEMEX exercised the option to repurchase the Repsol shares and transferred those shares to RepCon Lux pursuant to a swap agreement, as described above, and RepCon Lux issued debt securities that are exchangeable into Repsol shares at the option of the bondholder. For Mexican GAAP and U.S. GAAP purposes, RepCon Lux is consolidated, and thus, at December 31, 2004, the shares are reflected on the balance sheet under Mexican GAAP and have been classified as “available-for-sale” and recorded at fair value. Nevertheless, under Mexican GAAP, the unrealized gains and losses are reflected in equity. Therefore, the adjustment in income for U.S. GAAP purposes as of December 31, 2004 reflects the reversal of the equity reconciliation item for December 31, 2003 and the reclassification of the unrealized gains under Mexican GAAP from the statement of operations to other comprehensive income (loss), and there is no adjustment in equity for U.S. GAAP purposes as of December 31, 2004.
The U.S. GAAP cost and fair value of PEMEX’s investments at December 31, 2004, 2003 and 2002, are as follows:
| Cost | Fair Value | Unrealized Gain (Loss) | |||||
2004 | Ps. 9,034,046 | Ps. 17,224,496 | Ps. 8,190,450 | ||||
2003 | Ps. 9,034,046 | Ps. 13,517,939 | Ps. 4,483,893 | ||||
2002 | Ps. 9,034,046 | Ps. 8,747,473 | (Ps. 286,573 | ) |
F-50
Table of Contents
PETRÓLEOS MEXICANOS, SUBSIDIARY ENTITIES AND SUBSIDIARY COMPANIES
NOTES TO THE CONSOLIDATED FINANCIAL STATEMENTS FOR THE YEARS
ENDED DECEMBER 31, 2004, 2003 AND 2002
(Figures stated in thousands of Mexican pesos of December 31, 2004 purchasing power
and in thousands of U.S. dollars or other currency units)—(Continued)
(n) Cumulative effect of adoption of new accounting standard (SFAS No. 143)
As discussed in Note 2(h), effective January 1, 2003, PEMEX adopted Bulletin C-9; for U.S. GAAP purposes, it also adopted SFAS No. 143 “Asset Retirement Obligations” (“SFAS No. 143”).
The cumulative effect of adopting SFAS No. 143 on PEMEX’s results of operations and financial condition at January 1, 2003 was a decrease in the reserve for dismantlement and abandonment costs of Ps. 1,563,444, and a benefit for the cumulative effect of adoption of Ps. 2,117,261. There is no U.S. GAAP adjustment for the adoption of SFAS No. 143 as the equivalent amounts were recorded under Mexican GAAP upon the adoption of Bulletin C-9 in 2003.
PEMEX’s liability provisions recognized in the balance sheet represent present obligations whose settlement will probably require the future use of estimated economic resources. These provisions have been recorded based on management’s best estimate of the amount needed to presently settle the liability; however, actual results could differ from the provisions recognized. No assets or trust funds have been established to satisfy these obligations.
PEMEX’s asset retirement obligation for the years ended December 31, 2003 and 2004, amounts to Ps. 12,911,118 and Ps. 13,647,966, respectively.
(o) Effects of inflation on the U.S. GAAP adjustments
Various U.S. GAAP adjustments included herein are adjustments to monetary assets and liabilities recorded under Mexican GAAP pursuant to Bulletin B-10 as described in Note 2(b) and, therefore, the adjustments to the respective balance would also result in adjustment to the monetary gain or loss as reported under Mexican GAAP for each of the three years presented.
II. Additional disclosure requirements:
(a) Consolidation of Pemex Finance
As more fully disclosed in Note 7, PEMEX and certain subsidiaries entered into several agreements with Pemex Finance under which Pemex Finance purchases existing accounts receivable and rights to future receivables from certain customers. Pemex Finance obtains resources for such purchases through the placement of debt instruments in the international markets as well as the recurring returns on its investments.
Under SFAS No. 140, “Accounting for the Transfers and Servicing of Financial Assets and Extinguishments of Liabilities,” PEMEX has evaluated the Pemex Finance structure in light of the permitted and non-permitted
F-51
Table of Contents
PETRÓLEOS MEXICANOS, SUBSIDIARY ENTITIES AND SUBSIDIARY COMPANIES
NOTES TO THE CONSOLIDATED FINANCIAL STATEMENTS FOR THE YEARS
ENDED DECEMBER 31, 2004, 2003 AND 2002
(Figures stated in thousands of Mexican pesos of December 31, 2004 purchasing power
and in thousands of U.S. dollars or other currency units)—(Continued)
activities of a Qualified Special Purpose Entity (“QSPE”) and determined that Pemex Finance does not qualify as a QSPE and should thus be consolidated for U.S. GAAP purposes. Consequently, as of December 31, 2004 and 2003, the U.S. GAAP consolidated total assets would have increased by Ps. 7,006,233 and Ps. 6,105,208, respectively, and total liabilities would have increased by Ps. 4,428,867 and Ps. 4,691,016, respectively. Had Pemex Finance been consolidated, there would not have been any effect on PEMEX’s equity or net income (loss) for each period. Pemex Finance has been consolidated in the accompanying condensed consolidated U.S. GAAP information included herein.
(b) Special Tax on Production and Services (“IEPS Tax”)
Under Mexican GAAP, the IEPS Tax is reflected as part of “Net domestic sales” when charged to customers and the amounts payable to the Mexican Government are then deducted from “Income before hydrocarbon extraction duties and other, special tax on production and services, and cumulative effect of adoption of new accounting standards.”
Under U.S. GAAP, this tax would have no net effect on revenues nor would it be deducted from “Income before hydrocarbon extraction duties and other, special tax on production and services, and cumulative effect of adoption of new accounting standards,” as both the amount charged to customers and the amount accrued as payable to the tax authorities would be excluded from revenues (i.e., no gross-up).
(c) Environmental, dismantlement and abandonment
Environmental:
PEMEX estimates its environmental liabilities on a site-by-site basis based on the best available information. After an affected area is identified, PEMEX establishes accruals for its environmental liabilities using costs of prior or current remediation works with similar characteristics. PEMEX establishes accruals using estimates based on costs of similar remediation works most recently contracted and in progress at that time.
In 1999, PEMEX implemented new internal guidelines for estimating and recording environmental liabilities. The guidelines,Pasivos Ambientales: Definición y Lineamientos para su Cuantificación y Registro Contable (Environmental Liabilities: Definition and Guidelines for their Quantification and Accounting Treatment), sought to standardize and improve upon PEMEX’s internal procedures for identifying necessary remediation works and estimating and monitoring environmental liabilities. These guidelines codified existing policy with respect to estimating environmental liabilities, and establish that an environmental liability exists when:
| • | As a result of the activities of PEMEX, an affected area is identified in a particular site, and PEMEX undertakes a formal commitment to correct the environmental deficiency, in accordance with the criteria, guidelines, standards and legal framework in force; and |
| • | A reasonable estimate of the costs of remediation or clean-up of the identified affected area has been made, including the costs of the assessment studies. |
As stated above, in accordance with past and present internal guidelines, PEMEX conducts site-by-site studies to identify environmental liabilities and develop a reasonable estimate of such liabilities. These guidelines consider many factors but are tailored to specific Mexican requirements. Each contaminated site must be characterized, quantified and assessed through a specific study. The contamination of the affected sites may extend to the soil,
F-52
Table of Contents
PETRÓLEOS MEXICANOS, SUBSIDIARY ENTITIES AND SUBSIDIARY COMPANIES
NOTES TO THE CONSOLIDATED FINANCIAL STATEMENTS FOR THE YEARS
ENDED DECEMBER 31, 2004, 2003 AND 2002
(Figures stated in thousands of Mexican pesos of December 31, 2004 purchasing power
and in thousands of U.S. dollars or other currency units)—(Continued)
subsoil and bodies of water, including water deposits, lagoons, swamps and others. These sites may be located inside PEMEX’s facilities, in surrounding areas, in abandoned areas where PEMEX had activity in the past or along the pipelines.
Once the corresponding contaminated site has been identified and evaluated, expenses for the cleanup of (i) hydrocarbon seepage and other spills that may cause pollution and that cannot be corrected in a short timeframe, (ii) water deposits and (iii) the concentration of hazardous residuals, will be included in the remediation or restoration of affected areas. Estimates are kept current based on best available information.
Based on reports from field managers and other available information, management prepares reports for identified affected areas on a periodic basis. When the contamination relates to a new incident, PEMEX informs PROFEPA and responds immediately to eliminate the cause of the incident or to minimize its effects. Subsequently, PEMEX and PROFEPA jointly determine whether the contamination has been eliminated or if additional actions are necessary for the remediation of the site.
PEMEX believes its environmental liabilities are probable when its initial studies reveal the existence of contamination in the inspected areas at levels above those permitted by Mexican law, indicating that PEMEX will have to perform remediation works necessary to bring the site into compliance. PEMEX believes the liability is reasonably estimable when (i) an assessment of the size of the affected area has been made, (ii) it has compared the affected area to other affected areas identified and addressed in the past, and (iii) based on PEMEX’s experience with current or recent works on similar sites, PEMEX can assess the estimated remediation costs in order to be able to calculate the corresponding environmental liability. Thus, PEMEX accrues for these environmental liabilities when it identifies affected areas with contamination levels above those permitted by Mexican law and PEMEX is able to make a reasonable estimate of the size of the affected area and the remediation cost. In addition, PEMEX periodically revises its estimates of environmental liabilities as it obtains new information during the course of the remediation works in order to ensure its estimates are based on the most accurate and updated information.
PROFEPA administers the Mexican environmental regulatory rubric and establishes acceptable standards of environmental remediation. Although PROFEPA has the authority to review and inspect remediation works performed by PEMEX and compliance with permitted contamination levels established by laws and regulations, it does not determine PEMEX’s environmental liabilities. PEMEX maintains proper records of all of the studies, estimations, performed works and any other information that PROFEPA may request from time to time.
During 2004, 2003 and 2002, PEMEX invested Ps. 2,433,010, Ps. 3,659,588 and Ps. 3,344,016, respectively, in various environmental projects and related expenditures. The most important of these projects have been directed to the modernization of installations, the implementation of systems and control mechanisms to monitor atmospheric pollution, the acquisition of equipment to clean hydrocarbon spills, the expansion of aquatic effluent systems, the restoration and reforestation of affected areas, studies for environmental investigation and the conducting of environmental audits. In addition, PEMEX has engaged in extensive research and development efforts to develop capacity for increased production of unleaded gasoline, diesel and fuel oil with lower sulfur content and alternative fuels, such as industrial oil gas and natural gas. Currently, PEMEX is developing a procedure (Procedimiento para la Determinación de Gastos Asociados a las Actividades de Seguridad Industrial y Protección Ambiental) to determine the costs and expenses related to the activities associated with integral safety and environmental management.
F-53
Table of Contents
PETRÓLEOS MEXICANOS, SUBSIDIARY ENTITIES AND SUBSIDIARY COMPANIES
NOTES TO THE CONSOLIDATED FINANCIAL STATEMENTS FOR THE YEARS
ENDED DECEMBER 31, 2004, 2003 AND 2002
(Figures stated in thousands of Mexican pesos of December 31, 2004 purchasing power
and in thousands of U.S. dollars or other currency units)—(Continued)
Management of PEMEX believes that its operations are in substantial compliance with the Environmental Law as such law has been historically interpreted and enforced.
Environmental expenditures are expensed or capitalized depending on their future economic benefit. Expenditures that relate to an existing condition caused by past operations and that have no future economic benefit are expensed. Liabilities for expenditures of a non-capital nature are recorded on an undiscounted basis when environmental assessment and/or remediation is probable and the costs can be reasonably estimated.
As PEMEX has exclusive rights to production and processing of crude oil, natural gas, and refined products within Mexico, there are no instances of joint liability; PEMEX is the sole responsible party in the event of environmental damage. PEMEX has contracted insurance policies to cover the cost of certain environmental contingencies. The liability accruals are not reflected net of any amounts forthcoming under such policies.
Environmental liabilities accrued in the consolidated financial statements, for both Mexican GAAP and U.S. GAAP purposes, as of December 31, are divided among the operating units as follows:
| 2004 | 2003 | |||
Pemex—Exploration and Production | Ps. 830,841 | Ps. 1,075,963 | ||
Pemex—Refining | 712,423 | 754,570 | ||
Pemex—Gas and Basic Petrochemicals | 226,805 | 172,187 | ||
Pemex—Petrochemicals | 38,929 | 23,717 | ||
Total Environmental Liability Accrual | Ps. 1,808,998 | Ps. 2,026,437 | ||
(d) Dismantlement and abandonment costs
Under current Mexican law, PEMEX’s legal obligation related to dismantlement and abandonment activities is governed by the following two federal laws: the Petroleum Works Law and the Environmental Law described above. Although PEMEX is subject to other laws and regulations established at a local level in areas where PEMEX undertakes petroleum extractive activities, these local laws and regulations do not contain any specific guidance on abandonment, restoration and removal of oil and gas facilities or otherwise impose a higher standard on PEMEX in this regard. The United Mexican States is not a party to any international treaty or convention that would affect PEMEX’s understanding of its obligation with regard to dismantlement and abandonment activities. Thus, the only relevant law for PEMEX as to abandonment and removal of facilities related to oil- and gas-producing activities is Mexican federal law.
The Petroleum Works Law provides that wells must be plugged, or in certain special cases capped, to ensure the maintenance of sanitary and safe conditions and to prevent the seepage of hydrocarbons to the surface. The Petroleum Works Law requires that PEMEX plug a well when it turns out to be dry, invaded with salt water or abandoned due to a mechanical accident, or once a well’s production has been depleted such that abandonment is necessary due to economic unfeasibility of production. All activities required for plugging a well are undertaken with the purpose of isolating, in a definitive and convenient manner, the cross formations in the perforation that contains oil, gas or water in order to ensure that hydrocarbons do not seep to the surface.
PEMEX must obtain authorization from the Ministry of Energy before performing any plugging activities. The Petroleum Works Law also states that the Ministry of Energy may also authorize temporary plugging of
F-54
Table of Contents
PETRÓLEOS MEXICANOS, SUBSIDIARY ENTITIES AND SUBSIDIARY COMPANIES
NOTES TO THE CONSOLIDATED FINANCIAL STATEMENTS FOR THE YEARS
ENDED DECEMBER 31, 2004, 2003 AND 2002
(Figures stated in thousands of Mexican pesos of December 31, 2004 purchasing power
and in thousands of U.S. dollars or other currency units)—(Continued)
exploratory wells where production of hydrocarbons is commercially feasible but for which there are no adequate means for its exploitation.
PEMEX monitors and reviews its own internal estimates of costs to undertake dismantlement and abandonment at levels consistent with Mexican legal requirements and guidelines for oil and gas industry extractive activities. Estimates as to aggregate costs consider PEMEX’s operational specifics such as its number of onshore and offshore wells, depth of wells, varying nature of offshore platforms, expected production lives, current expectations as to when the costs will be incurred based on present production rates and other operational specifics. The actual costs incurred in the dismantlement and retirement of wells are considered where practicable, as described above. The average cost for plugging and dismantlement varies from producing region to producing region and from platform to platform. For the offshore regions, to the extent that actual costs are not available due to limited plugging and dismantlement activity historically, PEMEX uses estimates based on services costs. The estimated costs are both peso- and U.S. dollar-denominated.
(e) Pensions and seniority premiums
The components of net seniority premium and pension plan cost, calculated in accordance with SFAS No. 87, using December 31 as a measurement date, consist of the following:
| 2004 | 2003 | 2002 | |||||||
Service cost | Ps. 6,362,696 | Ps. 5,638,931 | Ps. 5,292,814 | ||||||
Interest cost | 18,088,700 | 16,539,801 | 18,293,953 | ||||||
Return on plan assets | (801,426 | ) | (1,082,941 | ) | (451,689 | ) | |||
Net amortization and deferral | 39,689 | — | 153,969 | ||||||
Amortization of net transition obligation | 5,060,117 | 5,101,150 | 5,555,180 | ||||||
Adjustment to net periodic pension cost due to inflation | 1,487,317 | 1,100,650 | 1,629,723 | ||||||
Net cost under U.S. GAAP | 30,237,093 | 27,297,591 | 30,473,950 | ||||||
Net cost under Mexican GAAP | (30,985,231 | ) | (27,882,510 | ) | (28,949,963 | ) | |||
Additional (benefit) expense recognized under U.S. GAAP | (Ps. 748,138 | ) | (Ps. 584,919 | ) | Ps. 1,523,987 | ||||
Actuarial assumptions used in the calculation of benefit obligations, net seniority premium and pension plan cost under U.S. GAAP as of December 31 are:
| 2004 | 2003 | 2002 | |||||||
Discount rate | 4.59 | % | 4.59 | % | 4.59 | % | |||
Rates of increase in compensation levels | 0.92 | % | 0.92 | % | 0.92 | % | |||
Expected long-term rate of return on assets | 5.50 | % | 5.50 | % | 5.50 | % |
F-55
Table of Contents
PETRÓLEOS MEXICANOS, SUBSIDIARY ENTITIES AND SUBSIDIARY COMPANIES
NOTES TO THE CONSOLIDATED FINANCIAL STATEMENTS FOR THE YEARS
ENDED DECEMBER 31, 2004, 2003 AND 2002
(Figures stated in thousands of Mexican pesos of December 31, 2004 purchasing power
and in thousands of U.S. dollars or other currency units)—(Continued)
The combined seniority premium and pension plan liability as of December 31 under SFAS No. 87 is as follows:
| 2004 | 2003 | |||||
Accumulated benefit obligation | Ps. 225,821,439 | Ps. 217,479,353 | ||||
Projected benefit obligation | 231,878,881 | 230,005,639 | ||||
Plan assets at fair value | (2,495,349 | ) | (13,768,034 | ) | ||
Projected benefit obligation in excess of plan assets | 229,383,532 | 216,237,605 | ||||
Unrecognized net loss | (2,951,999 | ) | (11,659,771 | ) | ||
Unrecognized transition obligation | (72,982,560 | ) | (77,914,997 | ) | ||
Unrecognized prior service costs and plan amendments | (2,736,623 | ) | (1,887,364 | ) | ||
Accrued liability under U.S. GAAP | 150,712,350 | 124,775,473 | ||||
Accrued liability recognized under Mexican GAAP | (141,007,001 | ) | (114,321,986 | ) | ||
Net U.S. GAAP adjustment to seniority premium and pension plan liability | 9,705,349 | 10,453,487 | ||||
Additional minimum liability | Ps. 72,048,036 | Ps. 78,931,513 | ||||
The scheduled maturities on the benefits expected to be paid in each of the next five years, and through 2014, are as follows:
Year | Expected Benefit Payments | |
2005 | Ps. 10,088,507 | |
2006 | 10,900,360 | |
2007 | 10,938,353 | |
2008 | 11,066,065 | |
2009 | 11,018,957 | |
2010 to 2014 | 55,188,341 | |
Total | Ps. 109,200,583 | |
In accordance with the provisions of SFAS No. 87, PEMEX has reflected, for U.S. GAAP purposes, an additional minimum liability at the end of each year representing the excess of the accumulated benefit obligation over the fair value of plan assets and accrued pension liabilities. The additional minimum liability is offset by recording an intangible asset provided that the asset recognized does not exceed the sum of the unrecognized prior service cost and the unrecognized transition obligation for the year. As of December 31, 2004 and 2003, for U.S. GAAP purposes, PEMEX recognized an intangible asset of Ps. 69,452,514 and Ps. 78,931,513, respectively. In addition, in 2004 PEMEX recognized in other comprehensive loss the excess of the additional minimum pension liability over the sum of the unrecognized prior service cost and the unrecognized transition obligation of Ps. 2,595,522. The difference of Ps. 4,380,070 in the amount recognized in other comprehensive loss under Mexican GAAP of Ps. 6,975,592 and the amount unrecognized under U.S. GAAP of Ps. 2,595,522 has been reflected as a U.S. GAAP adjustment in the equity reconciliation for 2004.
The objective of PEMEX’s investment guidelines with respect to the labor fund is to grant the highest security together with an adequate rate of return of the fund, maintaining the purchasing power of the investment. The
F-56
Table of Contents
PETRÓLEOS MEXICANOS, SUBSIDIARY ENTITIES AND SUBSIDIARY COMPANIES
NOTES TO THE CONSOLIDATED FINANCIAL STATEMENTS FOR THE YEARS
ENDED DECEMBER 31, 2004, 2003 AND 2002
(Figures stated in thousands of Mexican pesos of December 31, 2004 purchasing power
and in thousands of U.S. dollars or other currency units)—(Continued)
comparative benchmark used by PEMEX is the monthly average of primary interest rates of Mexican 28-day T-bills (Cetes 28).
The investment guidelines list certain prohibited investments, such as securities of companies that are subject to intervention by a regulatory authority, subordinated securities, convertible securities, certain foreign exchange securities, derivatives other than the structured notes mentioned above, securities having terms with certain characteristics such as liquidity, risk, return, or maturity that do not comply with certain requirements set by PEMEX’s Financial Resources Committee and securities not listed on the Mexican Stock Exchange.
The expected long-term rate of return is based on the guidelines of the Mexican Society of Consulting Actuaries which annually issues recommendations for selecting financial assumptions based on a historical analysis conducted on economic variables such as inflation, risk-free interest rates and increases to the legal minimum wage and salaries in general.
At December 31, 2004 and 2003, all of PEMEX’s plan assets were invested in Federal Government bonds and bonds issued by financial institutions listed on the Mexican Stock Exchange. The following table shows PEMEX’s actual investment allocation at December 31 of each year.
Securities | 2004 | 2003 | ||||
Federal Government Bonds | 44 | % | 30 | % | ||
Bonds issued by financial institutions listed on the Mexican Stock Exchange | 56 | % | 70 | % | ||
Total | 100 | % | 100 | % | ||
The calculation of pension cost and benefit obligations under SFAS No. 87 requires considerable judgment with respect to choosing actuarial assumptions. Each significant assumption reflects PEMEX’s best estimate of the plan’s future experience solely with respect to that assumption. Assumed discount rates and compensation levels often have the greatest effect on pension cost and benefit obligations and are related because both are affected by some of the same economic factors. The discount rate is based upon the current prices for settling the pension obligation, referred to as the “settlement rate.” Assumed compensation levels reflect PEMEX’s estimate of actual future compensation levels for the individuals involved and is consistent with assumed discount rates to the extent that both incorporate expectations of the same future economic conditions, such as inflation.
(f) Other post-retirement benefits
PEMEX has implemented SFAS No. 106 effective January 1, 1995, using the transitional recognition method and December 31 as a measurement date.
PEMEX makes supplemental payments in respect of its obligation for gas, gasoline and basic food supplies and provides health care benefits, in each case to retired employees and immediate family members. PEMEX regularly determines the level of its supplemental payments considering inflationary conditions. Health care is provided through a regional network of PEMEX hospitals and medical centers, which also provide care to active PEMEX employees. No commitments have been made regarding the level of such contributions in the future.
Effective January 1, 2004, PEMEX adopted the amendments to Bulletin D-3 which established an obligation to recognize a reserve for post-retirement medical benefits and to include the supplemental payments as a part of
F-57
Table of Contents
PETRÓLEOS MEXICANOS, SUBSIDIARY ENTITIES AND SUBSIDIARY COMPANIES
NOTES TO THE CONSOLIDATED FINANCIAL STATEMENTS FOR THE YEARS
ENDED DECEMBER 31, 2004, 2003 AND 2002
(Figures stated in thousands of Mexican pesos of December 31, 2004 purchasing power
and in thousands of U.S. dollars or other currency units)—(Continued)
PEMEX’s other post-retirement benefits obligation. In prior years, the obligation for post-retirement medical benefits was recognized under U.S. GAAP, but not under Mexican GAAP. In prior years, the obligation for supplemental payments under Mexican GAAP was recognized as a part of PEMEX’s pensions and seniority premiums obligation and reclassified for U.S. GAAP purposes as a component of the SFAS No. 106 adjustment. In 2004, under Mexican GAAP, these benefits were reclassified to form part of the liability for other post-retirement benefits, which is now consistent with U.S. GAAP.
The scheduled maturities on the benefits expected to be paid in each of the next five years, and through 2014, are as follows:
Year | Expected Benefit Payments | |
2005 | Ps. 8,025,789 | |
2006 | 8,640,737 | |
2007 | 8,489,690 | |
2008 | 8,344,849 | |
2009 | 8,152,760 | |
2010 to 2014 | 38,029,720 | |
Total | Ps. 79,683,545 | |
In 2004, PEMEX reevaluated the estimated costs used in the calculation of its obligations for post-retirement benefits. As a result of the reevaluation, the estimated allocable cost per employee was reduced resulting in a reduction in PEMEX’s post-retirement benefits obligation. In accordance with SFAS No. 106, the gain resulting from this change in estimate has been recorded as an unrecognized actuarial gain and will be amortized over the related service period.
F-58
Table of Contents
PETRÓLEOS MEXICANOS, SUBSIDIARY ENTITIES AND SUBSIDIARY COMPANIES
NOTES TO THE CONSOLIDATED FINANCIAL STATEMENTS FOR THE YEARS
ENDED DECEMBER 31, 2004, 2003 AND 2002
(Figures stated in thousands of Mexican pesos of December 31, 2004 purchasing power
and in thousands of U.S. dollars or other currency units)—(Continued)
The components of other post-retirement benefits expense consist of the following for the years ended December 31, 2004, 2003 and 2002:
| 2004 | 2003 | 2002 | |||||||||||||||||||||||||
| Supplemental Payments | Health Services | Total | Supplemental Payments | Health Services | Total | Supplemental Payments | Health Services | Total | |||||||||||||||||||
Service cost | Ps. 2,370,506 | Ps. 1,920,957 | Ps. 4,291,463 | Ps. 2,219,742 | Ps. 2,378,867 | Ps. 4,598,609 | Ps. 1,510,799 | Ps. 1,293,005 | Ps. 2,803,804 | ||||||||||||||||||
Interest cost | 7,765,519 | 6,281,038 | 14,046,557 | 7,694,822 | 6,210,883 | 13,905,705 | 5,945,360 | 5,968,745 | 11,914,105 | ||||||||||||||||||
Amortization of actuarial (gains) and losses | 1,232 | (19,561 | ) | (18,329 | ) | (19,467 | ) | (19,467 | ) | ||||||||||||||||||
Amortization of prior service cost and plan amendments | (6,688 | ) | (6,688 | ) | (6,655 | ) | (6,655 | ) | |||||||||||||||||||
Amortization of transition obligation | 2,737,252 | 2,455,188 | 5,192,440 | 2,769,217 | 2,434,522 | 5,203,739 | 2,393,546 | 2,037,769 | 4,431,315 | ||||||||||||||||||
Adjustment to net periodic post- retirement benefit cost due to inflation | 667,983 | 552,182 | 1,220,165 | 504,368 | 440,344 | 944,712 | 561,054 | 528,964 | 1,090,018 | ||||||||||||||||||
Net expense under U.S. GAAP | 13,535,804 | 11,189,804 | 24,725,608 | 13,188,149 | 11,464,616 | 24,652,765 | 10,404,104 | 9,809,016 | 20,213,120 | ||||||||||||||||||
Expense under Mexican GAAP | (13,622,227 | ) | (8,444,987 | ) | (22,067,214 | ) | (13,078,537 | ) | (2,481,809 | ) | (15,560,346 | ) | (9,275,313 | ) | (2,590,961 | ) | (11,866,274 | ) | |||||||||
Additional expense (benefit) under U.S. GAAP | (Ps. 86,423 | ) | Ps. 2,744,817 | Ps. 2,658,394 | Ps. 109,612 | Ps. 8,982,807 | Ps. 9,092,419 | Ps. 1,128,791 | Ps. 7,218,055 | Ps. 8,346,846 | |||||||||||||||||
F-59
Table of Contents
PETRÓLEOS MEXICANOS, SUBSIDIARY ENTITIES AND SUBSIDIARY COMPANIES
NOTES TO THE CONSOLIDATED FINANCIAL STATEMENTS FOR THE YEARS
ENDED DECEMBER 31, 2004, 2003 AND 2002
(Figures stated in thousands of Mexican pesos of December 31, 2004 purchasing power
and in thousands of U.S. dollars or other currency units)—(Continued)
Actuarial assumptions used in the calculation of other post-retirement benefits and cost under U.S. GAAP as of December 31 were:
| 2004 | 2003 | 2002 | |||||||
Discount rate | 4.59 | % | 4.59 | % | 4.59 | % | |||
Health care cost trend rate | 0.92 | % | 0.92 | % | 0.92 | % |
Since the other post-retirement benefits are not based on levels of compensation, it is not necessary to use salary increase assumptions to determine expenses. The effect of a 1% increase in the health care cost trend rate is to increase net expense for other post-retirement benefits by Ps. 500,588 for 2004 (Ps. 591,793 for 2003 and Ps. 1,255,788 for 2002) and increase the accumulated post-retirement benefit obligation by Ps. 3,985,147 for 2004 (Ps. 5,420,874 for 2003 and Ps. 7,009,731 for 2002). The effect of a 1% decrease in the health care cost trend rate is to decrease net expense for other post-retirement benefits by Ps. 405,972 for 2004 (Ps. 667,343 for 2003 and Ps. 872,578 for 2002) and decrease the accumulated post-retirement benefit obligation by Ps. 3,241,511 (Ps. 4,664,623 for 2003 and Ps. 5,875,565 for 2002).
F-60
Table of Contents
PETRÓLEOS MEXICANOS, SUBSIDIARY ENTITIES AND SUBSIDIARY COMPANIES
NOTES TO THE CONSOLIDATED FINANCIAL STATEMENTS FOR THE YEARS
ENDED DECEMBER 31, 2004, 2003 AND 2002
(Figures stated in thousands of Mexican pesos of December 31, 2004 purchasing power
and in thousands of U.S. dollars or other currency units)—(Continued)
The other post-retirement benefits liability as of December 31, 2004 and 2003 is as follows:
| 2004 | 2003 | |||||||||||||||||
| Supplemental Payments | Health Services | Total | Supplemental Payments | Health Services | Total | |||||||||||||
Accumulated unfunded post retirement benefit obligation: | ||||||||||||||||||
Retirees | Ps. 60,612,487 | Ps. 38,266,481 | Ps. 98,878,968 | Ps. 53,508,704 | Ps. 45,836,860 | Ps. 99,345,564 | ||||||||||||
Fully eligible active participants | 2,379,934 | 2,587,564 | 4,967,498 | 2,675,997 | 4,167,565 | 6,843,562 | ||||||||||||
Other active plan participants | 43,509,071 | 20,490,393 | 63,999,464 | 42,972,334 | 30,577,635 | 73,549,968 | ||||||||||||
Total | 106,501,492 | 61,344,438 | 167,845,930 | 99,157,035 | 80,582,060 | 179,739,094 | ||||||||||||
Unrecognized actuarial gains (losses) | 1,981,174 | 26,952,367 | 28,933,541 | (1,488,202 | ) | 1,112,569 | (375,633 | ) | ||||||||||
Prior service cost and plan amendments | (94,711 | ) | — | (94,711 | ) | 62,650 | — | 62,650 | ||||||||||
Unamortized transition obligation | (39,481,902 | ) | (34,564,069 | ) | (74,045,971 | ) | (42,361,231 | ) | (37,146,687 | ) | (79,507,918 | ) | ||||||
Net post-retirement benefit liability | ||||||||||||||||||
U.S. GAAP | 68,906,053 | 53,732,736 | 122,638,789 | 55,370,251 | 44,547,942 | 99,918,193 | ||||||||||||
Mexican GAAP | (74,401,146 | ) | (6,439,945 | ) | (80,841,091 | ) | (60,778,890 | ) | — | (60,778,890 | ) | |||||||
Net U.S. GAAP adjustment | (Ps. 5,495,093 | ) | Ps. 47,292,791 | Ps. 41,797,698 | (Ps. 5,408,639 | ) | Ps. 44,547,942 | Ps. 39,139,303 | ||||||||||
F-61
Table of Contents
PETRÓLEOS MEXICANOS, SUBSIDIARY ENTITIES AND SUBSIDIARY COMPANIES
NOTES TO THE CONSOLIDATED FINANCIAL STATEMENTS FOR THE YEARS
ENDED DECEMBER 31, 2004, 2003 AND 2002
(Figures stated in thousands of Mexican pesos of December 31, 2004 purchasing power
and in thousands of U.S. dollars or other currency units)—(Continued)
Pursuant to the requirements of SFAS No. 132, the following tables present a reconciliation of the beginning and ending balances of plan assets’ fair value and the accumulated post-retirement benefit obligation.
Seniority Premiums and Pension Benefits | Supplemental Payments | Health Services | ||||||||||||||||||||||
| 2004 | 2003 | 2004 | 2003 | 2004 | 2003 | |||||||||||||||||||
Change in benefit obligation (PBO) | ||||||||||||||||||||||||
Benefits obligation at beginning of year | Ps. | 230,005,641 | Ps. | 202,776,525 | Ps. | 99,157,035 | Ps. | 91,072,966 | Ps. | 80,582,060 | Ps. | 75,294,446 | ||||||||||||
Effect of inflation on beginning balance | (10,729,266 | ) | (7,755,030 | ) | (4,893,054 | ) | (3,483,014 | ) | (3,976,444 | ) | (2,879,579 | ) | ||||||||||||
Service cost | 6,362,696 | 5,638,931 | 2,370,506 | 2,219,742 | ) | 1,920,957 | 2,378,867 | |||||||||||||||||
Interest cost | 18,088,700 | 16,539,801 | 7,765,519 | 7,694,822 | 6,281,038 | 6,210,883 | ||||||||||||||||||
Prior service costs and plan amendments | 2,736,623 | 1,883,030 | 94,711 | (62,650 | ) | — | — | |||||||||||||||||
Actuarial (gains)/losses | (2,951,999 | ) | 19,789,683 | 5,917,334 | 5,365,489 | (21,458,140 | ) | 2,059,252 | ||||||||||||||||
Benefits paid | (11,633,514 | ) | (8,867,299 | ) | (3,910,559 | ) | (3,650,320 | ) | (2,005,033 | ) | (2,481,809 | ) | ||||||||||||
Benefits obligation at end of year | Ps. | 231,878,881 | Ps. | 230,005,641 | Ps. | 106,501,492 | Ps. | 99,157,035 | Ps. | 61,344,438 | Ps. | 80,582,060 | ||||||||||||
Change in plan assets | ||||||||||||||||||||||||
Fair value of plan assets at beginning of year | Ps. | 13,768,034 | Ps. | 7,222,197 | Ps. | — | Ps. | — | Ps. | — | Ps. | — | ||||||||||||
Effect of inflation on beginning balance | (615,723 | ) | (276,204 | ) | — | — | — | — | ||||||||||||||||
Actual return on plan assets | 589,394 | 895,109 | — | — | — | — | ||||||||||||||||||
Company contributions | 1,896,757 | 14,489,251 | — | 3,587,272 | — | — | ||||||||||||||||||
Transfer of funds | (3,910,559 | ) | — | 3,910,559 | — | — | — | |||||||||||||||||
Benefits paid | (9,232,554 | ) | (8,562,319 | ) | (3,910,559 | ) | (3,587,272 | ) | — | — | ||||||||||||||
Fair value of plan assets at end of year | Ps. | 2,495,349 | Ps. | 13,768,034 | Ps. | — | Ps. | — | Ps. | — | Ps. | — | ||||||||||||
F-62
Table of Contents
PETRÓLEOS MEXICANOS, SUBSIDIARY ENTITIES AND SUBSIDIARY COMPANIES
NOTES TO THE CONSOLIDATED FINANCIAL STATEMENTS FOR THE YEARS
ENDED DECEMBER 31, 2004, 2003 AND 2002
(Figures stated in thousands of Mexican pesos of December 31, 2004 purchasing power
and in thousands of U.S. dollars or other currency units)—(Continued)
(g) Leases
During 2004, 2003 and 2002, PEMEX’s rent expense under operating leases was not significant. As of December 31, 2004, PEMEX did not have any significant operating lease arrangements.
PEMEX enters into non-cancelable lease arrangements for equipment used in the ordinary course of business. The following table shows the future minimum obligations under lease commitments in effect at December 31, 2004:
Capital Leases (1) | |||
2005 | Ps. | 704,357 | |
2006 | 450,954 | ||
2007 | 558,803 | ||
2008 | 429,421 | ||
2009 | 309,978 | ||
2010 and thereafter | 723,051 | ||
| Ps. | 3,176,564 | ||
| (1) | Includes a total of Ps. 1,962,986 of imputed interest and commissions. |
Assets acquired under capital leases, together with their related depreciation, are included in “Properties and equipment, net”.
(h) Supplemental geographical information
The majority of PEMEX’s operations are in Mexico. The following shows PEMEX’s domestic and export sales for the years ended December 31 (on a Mexican GAAP basis):
| 2004 | 2003 | 2002 | |||||||
Domestic sales | Ps. | 449,012,740 | Ps. | 407,337,262 | Ps. | 353,526,447 | |||
Export sales: | |||||||||
United States | 269,858,654 | 205,497,028 | 154,925,800 | ||||||
Canada, Central and South America | 27,126,189 | 19,460,523 | 12,102,654 | ||||||
Europe | 23,234,646 | 18,602,002 | 16,737,489 | ||||||
Far East | 4,354,896 | 6,996,590 | 4,281,431 | ||||||
Total export sales | 324,574,385 | 250,556,143 | 188,047,374 | ||||||
Total sales | Ps. | 773,587,125 | Ps. | 657,893,405 | Ps. | 541,573,821 | |||
PEMEX does not have significant long-lived assets outside of Mexico.
F-63
Table of Contents
PETRÓLEOS MEXICANOS, SUBSIDIARY ENTITIES AND SUBSIDIARY COMPANIES
NOTES TO THE CONSOLIDATED FINANCIAL STATEMENTS FOR THE YEARS
ENDED DECEMBER 31, 2004, 2003 AND 2002
(Figures stated in thousands of Mexican pesos of December 31, 2004 purchasing power
and in thousands of U.S. dollars or other currency units)—(Continued)
(i) Valuation and qualifying accounts
The valuation and qualifying accounts for PEMEX are as follows:
Description | Balance at beginning of period | Additions charged to costs and expenses | Deductions | Balance at end of period | ||||
For the year ended December 31, 2004: | ||||||||
Reserves deducted in the balance sheet from the assets to which they apply: | ||||||||
Allowance for uncollectible trade accounts | Ps. 2,201,096 | Ps. 1,025,018 | Ps. 1,306,165 | Ps. 1,919,949 | ||||
Allowance for slow-moving inventory and obsolescence | 1,944,153 | 96,511 | 382,803 | 1,657,861 | ||||
For the year ended December 31, 2003: | ||||||||
Reserves deducted in the balance sheet from the assets to which they apply: | ||||||||
Allowance for uncollectible trade accounts | 2,091,040 | 261,762 | 151,706 | 2,201,096 | ||||
Allowance for slow-moving inventory and obsolescence | 2,256,097 | 347,934 | 659,878 | 1,944,153 | ||||
For the year ended December 31, 2002: | ||||||||
Reserves deducted in the balance sheet from the assets to which they apply: | ||||||||
Allowance for uncollectible trade accounts | 1,454,702 | 912,622 | 276,284 | 2,091,040 | ||||
Allowance for slow-moving inventory and obsolescence | 2,292,032 | 552,002 | 587,937 | 2,256,097 |
Note: The above valuation and qualifying accounts are presented in accordance with U.S. GAAP. The Mexican GAAP accounts titled “reserve for dismantlement and abandonment activities, sundry creditors and others” and “reserve for retirement payments, pensions, and seniority premiums” are accrued liability accounts, and not valuation and qualifying accounts and have not been included in the table above.
(j) Significant risks and uncertainties
Environmental
The ultimate costs to be incurred in relation to PEMEX’s environmental contingencies may exceed the total amounts reserved. Additional liabilities may be accrued as the assessment work is completed and formal remedial plans are formulated. Numerous factors affect the reliability and precision of clean-up cost estimates, including the individual characteristics of the site, the lack of specific guidance as to permissible levels of pollution and type of technology available for the remediation as well as general economic factors such as inflation.
As discussed previously, PEMEX accrues an environmental liability when a reasonable estimate of the costs for remediation or clean-up of the identified affected area has been made. In some cases, investigations are not yet at
F-64
Table of Contents
PETRÓLEOS MEXICANOS, SUBSIDIARY ENTITIES AND SUBSIDIARY COMPANIES
NOTES TO THE CONSOLIDATED FINANCIAL STATEMENTS FOR THE YEARS
ENDED DECEMBER 31, 2004, 2003 AND 2002
(Figures stated in thousands of Mexican pesos of December 31, 2004 purchasing power
and in thousands of U.S. dollars or other currency units)—(Continued)
a stage where PEMEX is able to quantify the liability or estimate a range of possible exposure. In such cases, the amounts of PEMEX’s liabilities are indeterminate due to the unknown magnitude of possible contamination, the imprecise and conflicting engineering evaluations and estimates of proper cleanup methods and costs, the unknown timing and extent of the corrective actions that may be required, and the ambiguities in Mexican environmental laws and regulations.
PEMEX is not aware of any unasserted claims or assessments, which may give rise to an environmental liability, and therefore, no amounts related to such items have been reflected in the environmental accrual.
Mexican Government
The operations and earnings of PEMEX have been, and may in the future be, affected from time to time in varying degree by political developments and laws and regulations, such as forced divestiture of assets, budgetary adjustments, restrictions on production levels and capital expenditures, price controls, tax increases, cancellation of contract rights, refined product specifications, and environmental, health and safety regulations. Both the likelihood of such occurrences and their overall effect upon PEMEX are not predictable.
Labor
PEMEX employees belonging to the Petroleum Workers’ Union of the Mexican Republic represent approximately 80.9% of the workforce. They have a collective bargaining agreement which is renegotiated every two years and is set to expire on July 31, 2005.
Product prices
Because PEMEX’s major products are commodities, significant changes in the international prices of crude oil, natural gas and chemical products could have a significant impact on PEMEX’s results of operations in any particular year. Crude oil represents approximately 35% of PEMEX’s sales revenues net of the IEPS Tax, and prices of the products PEMEX produces can be influenced by changes in crude oil prices, which makes it reasonably possible that PEMEX is vulnerable to near-term severe impacts from fluctuations in prices.
(k) Capitalized software costs
Direct internal and external costs related to the development of internal use software are deferred and included in other assets. Capitalized software costs, net of amortization, as of December 31, 2004 and 2003 amounted to Ps. 630,386 and Ps. 376,982, respectively. Amortization expense for the years ended December 31, 2004, 2003 and 2002 amounted to Ps. 114,770, Ps. 91,499 and Ps. 390,082, respectively.
F-65
Table of Contents
PETRÓLEOS MEXICANOS, SUBSIDIARY ENTITIES AND SUBSIDIARY COMPANIES
NOTES TO THE CONSOLIDATED FINANCIAL STATEMENTS FOR THE YEARS
ENDED DECEMBER 31, 2004, 2003 AND 2002
(Figures stated in thousands of Mexican pesos of December 31, 2004 purchasing power
and in thousands of U.S. dollars or other currency units)—(Continued)
(l) Supplemental condensed information on a U.S. GAAP basis.
The following condensed consolidating information reflects the U.S. GAAP adjustments disclosed in this note.
CONDENSED CONSOLIDATED BALANCE SHEETS AS OF DECEMBER 31, 2004 AND 2003
| 2004 | 2003 | |||||||
ASSETS | ||||||||
Total current assets | Ps. | 240,067,936 | Ps. | 175,705,322 | ||||
Properties and equipment, net | 570,580,431 | 535,091,640 | ||||||
Intangible asset derived from the actuarial computation of labor obligations and other assets | 102,356,509 | 147,004,666 | ||||||
Total assets | Ps. | 913,004,876 | Ps. | 857,801,628 | ||||
LIABILITIES | ||||||||
Total current liabilities | Ps. | 145,295,582 | Ps. | 104,251,540 | ||||
Long-term debt | 442,619,500 | 426,820,683 | ||||||
Reserve for dismantlement and abandonment activities, sundry creditors and others | 25,969,304 | 20,786,389 | ||||||
Reserve for retirement payments, pensions and seniority premiums | 345,399,175 | 350,196,003 | ||||||
Total liabilities | 959,283,561 | 902,054,615 | ||||||
Minority interest | 2,577,366 | 2,472,643 | ||||||
TOTAL EQUITY (DEFICIT) | (48,856,051 | ) | (46,725,631 | ) | ||||
Total liabilities and equity | Ps. | 913,004,876 | Ps. | 857,801,628 | ||||
CONSOLIDATED STATEMENTS OF OPERATIONS
FOR THE YEARS ENDED DECEMBER 31, 2004, 2003 AND 2002
| 2004 | 2003 | 2002 | |||||||
Total revenues, net of IEPS Tax | Ps. 725,719,886 | Ps. 562,048,981 | Ps. 412,687,079 | ||||||
Total costs and operating expenses | (321,003,182 | ) | (302,375,950 | ) | (236,469,176 | ) | |||
Comprehensive financing cost | 2,083,033 | (28,204,243 | ) | (8,889,024 | ) | ||||
Income before hydrocarbon extraction duties and other, cumulative effect of adoption of new accounting standard and minority interest | 406,799,737 | 231,468,788 | 167,328,877 | ||||||
Hydrocarbon extraction duties and other | 419,629,162 | 303,334,715 | 201,470,457 | ||||||
Cumulative effect of adoption of new accounting standard | — | 2,117,261 | — | ||||||
Minority interest | (181,757 | ) | (2,713 | ) | (220,799 | ) | |||
Net loss | (Ps. 13,011,182 | ) | (Ps. 69,751,377 | ) | (Ps. 34,362,379 | ) | |||
F-66
Table of Contents
PETRÓLEOS MEXICANOS, SUBSIDIARY ENTITIES AND SUBSIDIARY COMPANIES
NOTES TO THE CONSOLIDATED FINANCIAL STATEMENTS FOR THE YEARS
ENDED DECEMBER 31, 2004, 2003 AND 2002
(Figures stated in thousands of Mexican pesos of December 31, 2004 purchasing power
and in thousands of U.S. dollars or other currency units)—(Continued)
CONSOLIDATED STATEMENTS OF CASH FLOWS FOR
THE YEARS ENDED DECEMBER 31, 2004, 2003 AND 2002
| 2004 | 2003 | 2002 | |||||||
Operating Activities | |||||||||
Net loss for the year | (Ps. 13,011,182 | ) | (Ps. 69,751,377 | ) | (Ps. 34,362,379 | ) | |||
Adjustments to reconcile net loss to cash provided by operating activities: | |||||||||
Depreciation and amortization | 36,055,444 | 39,789,133 | 29,138,259 | ||||||
Reserve for retirement payments, pensions and seniority premiums | 54,962,713 | 51,950,356 | 50,687,070 | ||||||
Impairment of fixed assets | 4,913,273 | 4,825,312 | |||||||
Loss on disposal of fixed assets | 3,618,250 | 11,678,608 | 14,366,148 | ||||||
Allowance for uncollectible trade accounts | 281,147 | 110,056 | 714,796 | ||||||
Allowance for slow-moving inventory and obsolescence | 286,292 | (311,944 | ) | 87,684 | |||||
Minority interest | 226,739 | 305,542 | 411,254 | ||||||
Foreign exchange loss (gain) | 5,630,835 | 35,835,068 | 6,512,183 | ||||||
Financial instruments | (5,517,885 | ) | (1,844,665 | ) | 3,644,793 | ||||
Loss on available for sale investment securities | 5,029,143 | ||||||||
Gain from monetary position | (22,127,589 | ) | (13,121,896 | ) | (13,547,435 | ) | |||
Changes in operating assets and liabilities: | |||||||||
Accounts and notes receivable | (91,859,200 | ) | (15,329,722 | ) | (2,851,602 | ) | |||
Inventories | (2,877,179 | ) | (1,767,069 | ) | (5,815,565 | ) | |||
Other assets | (17,676,192 | ) | 759,642 | (3,524,620 | ) | ||||
Accounts payable and accrued liabilities | 56,531,318 | (22,939,824 | ) | 19,702,752 | |||||
Cash flows provided by operating activities | 9,552,654 | 20,275,181 | 69,988,650 | ||||||
Investing Activities | |||||||||
Acquisition of fixed assets | (81,365,977 | ) | (61,262,032 | ) | (99,434,038 | ) | |||
Cash flows used in investing activities | (81,365,977 | ) | (61,262,032 | ) | (99,434,038 | ) | |||
Financing Activities | |||||||||
Proceeds from long term financing | Ps. 137,472,266 | Ps. 154,973,372 | Ps. 116,660,420 | ||||||
Financing payments | (76,224,729 | ) | (72,332,663 | ) | (43,241,066 | ) | |||
Increase in Equity of Subsidiary Entities | 32,637,530 | — | — | ||||||
Dividends paid to the Mexican Government | (10,387,839 | ) | (10,886,349 | ) | (10,575,338 | ) | |||
Cash flows provided by financing activities | 83,497,228 | 83,497,228 | 62,844,016 | ||||||
Effects of inflation on cash and cash equivalents | (3,936,289 | ) | (1,842,521 | ) | (1,084,065 | ) | |||
Increase (decrease) in cash and equivalents | 7,747,617 | 28,924,987 | 32,314,563 | ||||||
Cash and cash equivalents, beginning of period | 79,767,912 | 50,842,927 | 18,528,364 | ||||||
Cash and cash equivalents, end of period | Ps. 87,515,529 | Ps. 79,767,914 | Ps. 50,842,927 | ||||||
Supplemental cash disclosures: | |||||||||
Interest paid (net of amounts capitalized) | Ps. 36,028,174 | Ps. 31,764,466 | Ps. 24,317,346 | ||||||
Taxes paid | 447,666,965 | 386,475,466 | 293,400,704 | ||||||
Supplemental non-cash disclosures: | |||||||||
Acquisition of fixed assets via contractor financing | Ps. — | Ps. — | Ps. 15,658,287 | ||||||
Unrealized gains (losses) on available for sale securities | 3,706,556 | 4,770,466 | (286,572 | ) | |||||
Additional minimum pension liability | (6,975,592 | ) | 2,955,280 | 10,167,525 | |||||
Derivative financial instruments | (7,574,174 | ) | 5,283,556 | (934,032 | ) |
F-67
Table of Contents
PETRÓLEOS MEXICANOS, SUBSIDIARY ENTITIES AND SUBSIDIARY COMPANIES
NOTES TO THE CONSOLIDATED FINANCIAL STATEMENTS FOR THE YEARS
ENDED DECEMBER 31, 2004, 2003 AND 2002
(Figures stated in thousands of Mexican pesos of December 31, 2004 purchasing power
and in thousands of U.S. dollars or other currency units)—(Continued)
(n) Recently issued accounting standards
In November 2004, the FASB issued Statement of Financial Accounting Standards (SFAS) No. 151, “Inventory Costs—an Amendment of ARB No. 43” (“SFAS No. 151”), which is the result of its efforts to converge U.S. accounting standards for inventories with International Accounting Standards. SFAS No. 151 requires idle facility expenses, freight, handling costs, and wasted material (spoilage) costs to be recognized as current-period charges. It also requires that allocation of fixed production overhead to the costs of conversion be based on the normal capacity of the production facilities. SFAS No. 151 will be effective for inventory costs incurred during fiscal years beginning after June 15, 2005. PEMEX is evaluating the impact that this standard may have on its financial position and results of operations.
In December 2004, the FASB issued Statement of Financial Accounting Standards (SFAS) No. 153, “Exchange of Non-monetary Assets and Amendment of APB No. 29” (“SFAS No. 153”), which is intended to improve comparability of U.S. accounting standards for non monetary transactions with International Accounting Standards. SFAS No. 153 eliminates the exception to fair value for exchanges of similar productive assets outlined in APB No. 29 and replaces it with a general exception for exchange transactions that do not have commercial substance—that is, transactions that are not expected to result in significant changes in the cash flows of the reporting entity. SFAS No. 153 is not expected to have any impact on PEMEX’s financial position or results of operations.
In March 2005, the FASB published FASB Interpretation No. 47 “Accounting for Conditional Asset Retirement Obligations” (“FIN 47”). FIN 47 clarifies that the term conditional asset retirement obligation as used in SFAS No. 143 refers to a legal obligation to perform an asset retirement activity in which the timing and/or method of settlement are conditional on a future event that may or may not be within the control of the entity. Accordingly, an entity is required to recognize a liability for the fair value of a conditional asset retirement obligation if the fair value of the liability can be reasonably estimated. Uncertainty about the timing and/or method of settlement of a conditional asset retirement obligation should be factored into the measurement of the liability when sufficient information exists. FIN 47 also clarifies when an entity would have sufficient information to reasonably estimate the fair value of an asset retirement obligation. FIN 47 is effective no later than the end of fiscal years ending after December 15, 2005 (December 31, 2005, for calendar-year enterprises such as PEMEX). Retrospective application for interim financial information is permitted but is not required. Early adoption of this interpretation is encouraged. PEMEX is evaluating the impact that this standard may have on its financial position or results of operations.
In June 2005, the FASB published SFAS No. 154, “Accounting Changes and Error Corrections a replacement of APB Opinion No. 20 and FASB Statement No. 3” (“SFAS No. 154”), which changes the requirements for the accounting for and reporting of a change in accounting principle and redefines restatement as the revising of previously issued financial statements to reflect the correction of an error. SFAS No. 154 requires retrospective application to prior periods’ financial statements of changes in accounting principle, unless it is impracticable to determine the period-specific effects of the cumulative effect of the change. This Statement also carries forward without change the guidance contained in Opinion 20 for reporting the correction of an error in previously issued financial statements and a change in accounting estimate. This Statement does not change the transition provisions of any existing accounting pronouncement. SFAS No. 154 will be effective for accounting changes and corrections of errors made in fiscal years beginning after December 15, 2005. We are currently evaluating the impact that this statement may have on our financial position and results of operations.
F-68
Table of Contents
PETRÓLEOS MEXICANOS, SUBSIDIARY ENTITIES AND SUBSIDIARY COMPANIES
NOTES TO THE CONSOLIDATED FINANCIAL STATEMENTS FOR THE YEARS
ENDED DECEMBER 31, 2004, 2003 AND 2002
(Figures stated in thousands of Mexican pesos of December 31, 2004 purchasing power
and in thousands of U.S. dollars or other currency units)—(Continued)
20. Subsidiary guarantor information
The following consolidating information presents restated condensed balance sheets at December 31, 2004 and 2003 and condensed statements of operations and the restated changes in financial position for the years ended December 31, 2004, 2003 and 2002 of Petróleos Mexicanos, Pemex-Exploration and Production, Pemex-Refining, Pemex-Gas and Basic Petrochemicals, and Pemex-Petrochemicals and the consolidated Subsidiary Companies.
These statements are prepared in conformity with accounting principles generally accepted in Mexico, including the recognition of inflation, in accordance with Bulletin B-10, with one exception: for the purposes of the presentation of the subsidiary guarantor information, the Subsidiary Entities and Subsidiary Companies have been accounted for as investments under the equity method by Petróleos Mexicanos. Earnings of subsidiaries are therefore reflected in Petróleos Mexicanos’ investment account and earnings. The principal elimination entries eliminate Petróleos Mexicanos’ investment in subsidiaries and intercompany balances and transactions. Pemex-Exploration and Production, Pemex-Refining and Pemex-Gas and Basic Petrochemicals (collectively, the “Subsidiary Guarantors”) and Pemex-Petrochemicals are 100%-owned subsidiaries of Petróleos Mexicanos. Pemex-Petrochemicals and the Subsidiary Companies collectively comprise the non-guarantor subsidiaries (“Non-Guarantor Subsidiaries”).
The significant differences between Mexican and U.S. GAAP as they affect PEMEX are described in Note 19. The following also presents the reconciliation of equity to U.S. GAAP as of December 31, 2004 and 2003 and the reconciliation of income to U.S. GAAP for the three years ended December 31, 2004, 2003 and 2002 for each of Petróleos Mexicanos, the Subsidiary Guarantors and the Non-Guarantor Subsidiaries. The following reconciliation to U.S. GAAP does not include the reversal of Mexican GAAP inflation accounting adjustments, as these adjustments represent a comprehensive measure of the effects of price level changes in the inflationary Mexican economy, which is considered a more meaningful presentation than historical cost-based financial reporting for both Mexican and U.S. accounting purposes.
As of December 31, 2004, Petróleos Mexicanos, the Master Trust, Fideicomiso F/163 and RepCon Lux are the only entities of PEMEX authorized to contract debt with debt outstanding as of that date, and thus all guaranteed debt is held by these entities. The guarantees of the Subsidiary Guarantors are full and unconditional and joint and several. Management has not presented separate financial statements for the Subsidiary Guarantors because it has determined that such information is not material to investors.
Restatement
Subsequent to the filing of the Form 20-F on June 30, 2005, Petróleos Mexicanos identified and corrected certain amounts that had been previously reported under Mexican GAAP in the condensed consolidating balance sheets at December 31, 2004 and 2003 and condensed consolidating results of operations and changes in financial position for the years ended December 31, 2004, 2003 and 2002 in this Note 20. None of these corrections had an impact on the consolidated balance sheets at December 31, 2004 and 2003 and consolidated results of operations and changes in financial position for the years ended December 31, 2004, 2003 and 2002. The corrections are described in greater detail below:
(a) Corrections to Condensed Consolidating Balance Sheets
Separate financial statements for each of Petróleos Mexicanos, the Subsidiary Guarantors and certain of the Non-Guarantor Subsidiaries are, for statutory purposes, prepared in Spanish in accordance with the financial
F-69
Table of Contents
reporting standards (“Governmental Accounting Standards”), established bythe Secretaría de la Función Pública (General Comptroller’s Office of the Mexican Government) andthe Secretaría de Hacienda y Crédito Público(Ministry of Finance and Public Credit). These financial statements are not published or translated into English. The Mexican Governmental Accounting Standards differ in certain respects from Mexican GAAP and in order to prepare the consolidated financial statements of PEMEX in accordance with Mexican GAAP, certain adjustments are made to these statements. PEMEX has identified the following items which have been corrected in the restated condensed balance sheets and affected various columns as described below:
(i.)Misclassifications of inter-company balances within the condensed balance sheets.Previously, various inter-company balances were inconsistently classified within the condensed balance sheet captions and among several of the columns. These balances have now been appropriately classified between current and non-current and consistently allocated among the columns.
(ii.)Improper inclusion of certain adjustments to convert from Governmental Accounting Standards to Mexican GAAP, which were previously presented in the eliminations column.In the restated consolidating balance sheets, the columns appropriately represent the cumulative Mexican GAAP adjustments as they relate to the individual entities and the eliminations column has been adjusted accordingly.
(b) Corrections to Condensed Consolidating Results of Operations
The condensed consolidating results of operations, specifically, the information presented under the column captioned “Petróleos Mexicanos” and the column captioned “Eliminations,” were restated to properly reflect the recognition of the net results of operations of the Subsidiary Guarantors and the Non-Guarantor Subsidiaries pursuant to the equity method of accounting. In certain circumstances, Petróleos Mexicanos had previously presented the net results of operations reported by the Subsidiary Entities based on preliminary financial information. In the restated results of operations, the line item captioned “Equity participation in subsidiaries” within the Petróleos Mexicanos column has been revised to reflect the final financial information of all the Subsidiary Entities on a Mexican GAAP basis, with the corresponding offsets included in the line item captioned “Other (expenses) revenues, net” within the Petróleos Mexicanos column and the column captioned “Eliminations” where they were initially reported.
(c) Corrections to Condensed Consolidating Statements of Changes in Financial Position
As a result of the corrections to the condensed consolidating balance sheets and results of operations described above, the statements of changes in financial position of Petróleos Mexicanos, the Subsidiary Guarantors and the Non-Guarantor Subsidiaries, as well as the eliminations columns, were restated to reflect the impact of the corrected amounts.
In addition, PEMEX discovered certain errors had been made due to the misclassification of certain items among the categories of operating, financing and investing activities. Specifically, the column detailing the changes in financial position of Petróleos Mexicanos was restated to include equity in earnings of consolidated and unconsolidated subsidiaries in operating activities rather than financing activities and the column detailing the changes in financial position of the Subsidiary Guarantors was restated to include amounts related to specific oil-field exploration and depletion activities in operating activities rather than investing activities.
F-70
Table of Contents
PETRÓLEOS MEXICANOS, SUBSIDIARY ENTITIES AND SUBSIDIARY COMPANIES
NOTES TO THE CONSOLIDATED FINANCIAL STATEMENTS FOR THE YEARS
ENDED DECEMBER 31, 2004, 2003 AND 2002
(Figures stated in thousands of Mexican pesos of December 31, 2004 purchasing power
and in thousands of U.S. dollars or other currency units)—(Continued)
SUPPLEMENTAL CONDENSED CONSOLIDATING FINANCIAL INFORMATION
BALANCE SHEET
As of December 31, 2004
Petróleos Mexicanos | Subsidiary Guarantors | Non-Guarantor Subsidiaries | Eliminations | PEMEX Consolidated | ||||||||||||
| (As restated) | (As restated) | (As restated) | (As restated) | |||||||||||||
ASSETS | ||||||||||||||||
Current assets: | ||||||||||||||||
Cash and cash equivalents | Ps. | 43,857,404 | Ps. | 2,098,179 | Ps. | 38,916,648 | Ps. | — | Ps. | 84,872,231 | ||||||
Accounts, notes receivable and other, net | 77,631,254 | 51,192,582 | 64,656,477 | (70,500,685 | ) | 122,979,628 | ||||||||||
Accounts receivables—intercompany | 21,332,625 | 348,637,532 | 117,232,259 | (487,202,416 | ) | — | ||||||||||
Inventories, net | 324,828 | 30,508,546 | 4,930,354 | — | 35,763,728 | |||||||||||
Total current assets | 143,146,111 | 432,436,839 | 225,735,738 | (557,703,101 | ) | 243,615,587 | ||||||||||
Long-term receivable— intercompany | 69,677,470 | 1,825,516 | 344,348,220 | (415,851,206 | ) | — | ||||||||||
Investments in subsidiaries and equity investees | 257,753,140 | 2,472,396 | 23,110,634 | (257,753,139 | ) | 25,583,031 | ||||||||||
Properties and equipment, net | 8,348,906 | 569,382,388 | 16,837,631 | — | 594,568,925 | |||||||||||
Intangible asset derived from the actuarial computation of labor obligations | 11,647,168 | 58,347,177 | 6,444,485 | — | 76,438,830 | |||||||||||
Other assets | 1,888,289 | 41,474,202 | 7,273,168 | (43,314,695 | ) | 7,320,964 | ||||||||||
Total assets | Ps. | 492,461,084 | Ps 1,105,938,518 | Ps. | 623,749,876 | (Ps. | 1,274,622,141 | ) | Ps. | 947,527,337 | ||||||
LIABILITIES | ||||||||||||||||
Current liabilities: | ||||||||||||||||
Current portion of long-term debt | Ps. | 16,867,578 | Ps. | — | Ps. | 30,197,510 | Ps. | — | Ps. | 47,065,088 | ||||||
Accounts payable—intercompany | 288,866,655 | 152,187,987 | 46,147,775 | (487,202,417 | ) | — | ||||||||||
Other current liabilities | 24,367,785 | 66,054,808 | 104,853,388 | (101,858,565 | ) | 93,417,416 | ||||||||||
Total current liabilities | 330,102,018 | 218,242,795 | 181,198,673 | (589,060,982 | ) | 140,482,504 | ||||||||||
Long-term debt and notes payable to contractors | 26,362,578 | 11,285,080 | 368,186,750 | — | 405,834,408 | |||||||||||
Long-term liabilities—intercompany | 57,323,541 | 350,957,204 | 7,570,460 | (415,851,205 | ) | — | ||||||||||
Sale of future accounts receivable | — | 48,592,503 | — | (11,956,814 | ) | 36,635,689 | ||||||||||
Reserve for retirement payments, pensions, seniority premiums, dismantlement and abandonment activities, sundry creditors and others | 45,330,029 | 251,204,258 | 34,697,531 | — | 331,231,818 | |||||||||||
Total liabilities | 459,118,166 | 880,281,840 | 591,653,414 | (1,016,869,001 | ) | 914,184,419 | ||||||||||
EQUITY | 33,342,918 | 225,656,678 | 32,096,462 | (257,753,140 | ) | 33,342,918 | ||||||||||
Total liabilities and equity | Ps. | 492,461,084 | Ps. | 1,105,938,518 | Ps. | 623,749,876 | (Ps. | 1,274,622,141 | ) | Ps. | 947,527,337 | |||||
F-71
Table of Contents
PETRÓLEOS MEXICANOS, SUBSIDIARY ENTITIES AND SUBSIDIARY COMPANIES
NOTES TO THE CONSOLIDATED FINANCIAL STATEMENTS FOR THE YEARS
ENDED DECEMBER 31, 2004, 2003 AND 2002
(Figures stated in thousands of Mexican pesos of December 31, 2004 purchasing power
and in thousands of U.S. dollars or other currency units)—(Continued)
SUPPLEMENTAL CONDENSED CONSOLIDATING FINANCIAL INFORMATION
U.S. GAAP RECONCILIATION OF EQUITY
For the year ended December 31, 2004
Petróleos Mexicanos | Subsidiary Guarantors | Non-Guarantor Subsidiaries | Eliminations | PEMEX Consolidated | ||||||||||||||||
Equity under Mexican GAAP (as restated) | Ps. | 33,342,918 | Ps. | 225,656,678 | Ps. | 32,096,462 | (Ps. | 257,753,140 | ) | Ps. | 33,342,918 | |||||||||
U.S. GAAP adjustments: | ||||||||||||||||||||
Exploration and drilling costs | — | 15,182,401 | — | — | 15,182,401 | |||||||||||||||
Pensions and seniority premiums: | ||||||||||||||||||||
Pensions and seniority premiums | (848,295 | ) | (7,873,063 | ) | (983,991 | ) | — | (9,705,349 | ) | |||||||||||
Additional pension liability | 550,909 | 2,418,282 | 1,410,879 | — | 4,380,070 | |||||||||||||||
Post-retirement benefits | (5,879,475 | ) | (31,811,795 | ) | (4,106,428 | ) | — | (41,797,698 | ) | |||||||||||
Accrued vacation | (73,733 | ) | (406,044 | ) | (53,837 | ) | — | (533,614 | ) | |||||||||||
Fixed asset adjustments: | ||||||||||||||||||||
Capitalized gains and losses of hedging financial instruments | — | 610,431 | — | — | 610,431 | |||||||||||||||
Capitalization of interest, net | — | (11,287,810 | ) | (378,475 | ) | — | (11,666,285 | ) | ||||||||||||
Impairment, net | — | (26,096,625 | ) | (9,878,013 | ) | — | (35,974,638 | ) | ||||||||||||
Depreciation convention | (40,544 | ) | (2,000,590 | ) | (64,792 | ) | — | (2,105,926 | ) | |||||||||||
Derivative financial instruments | 935,533 | 6,440,526 | 3,084,742 | 148,822 | 10,609,623 | |||||||||||||||
Profit in inventory | — | (810,144 | ) | — | — | (810,144 | ) | |||||||||||||
Available-for-sale investment securities | — | — | — | — | — | |||||||||||||||
Advance payments of minimum guaranteed dividends | (10,387,839 | ) | — | — | — | (10,387,839 | ) | |||||||||||||
Total U.S. GAAP adjustments, net | (15,743,444 | ) | (55,634,431 | ) | (10,969,915 | ) | 148,822 | (82,198,968 | ) | |||||||||||
Equity (deficit) under U.S. GAAP | Ps. | 17,599,474 | Ps. | 170,022,247 | Ps. | 21,126,547 | (Ps. | 257,604,318 | ) | (Ps. | 48,856,050 | ) | ||||||||
F-72
Table of Contents
PETRÓLEOS MEXICANOS, SUBSIDIARY ENTITIES AND SUBSIDIARY COMPANIES
NOTES TO THE CONSOLIDATED FINANCIAL STATEMENTS FOR THE YEARS
ENDED DECEMBER 31, 2004, 2003 AND 2002
(Figures stated in thousands of Mexican pesos of December 31, 2004 purchasing power
and in thousands of U.S. dollars or other currency units)—(Continued)
SUPPLEMENTAL CONDENSED CONSOLIDATING FINANCIAL INFORMATION
BALANCE SHEET
As of December 31, 2003
Petróleos Mexicanos | Subsidiary Guarantors | Non-Guarantor Subsidiaries | Eliminations | PEMEX Consolidated | ||||||||||||
| (As restated) | (As restated) | (As restated) | (As restated) | |||||||||||||
ASSETS | ||||||||||||||||
Current assets: | ||||||||||||||||
Cash and cash equivalents | Ps. | 29,060,122 | Ps. | 1,034,659 | Ps. | 47,048,362 | Ps. | — | Ps. | 77,143,143 | ||||||
Accounts, notes receivable and other, net | 53,156,624 | 42,133,573 | 54,737,256 | (76,170,014 | ) | 73,857,439 | ||||||||||
Accounts receivables—intercompany | 16,792,686 | 174,200,480 | 64,592,400 | (255,585,566 | ) | — | ||||||||||
Inventories, net | 367,531 | 25,356,279 | 3,180,154 | — | 28,903,964 | |||||||||||
Total current assets | 99,376,963 | 242,724,991 | 169,558,172 | (331,755,580 | ) | 179,904,546 | ||||||||||
Long-term receivable—intercompany | 79,334,568 | — | 271,756,562 | (351,091,130 | ) | — | ||||||||||
Investments in subsidiaries and equity investees | 217,280,688 | 2,064,953 | 8,947,284 | (217,280,670 | ) | 11,012,255 | ||||||||||
Properties and equipment, net | 8,872,717 | 538,188,815 | 20,147,660 | — | 567,209,192 | |||||||||||
Intangible asset derived from the actuarial computation of labor obligations | 21,427,698 | 94,914,827 | 9,159,799 | — | 125,502,324 | |||||||||||
Other assets | 193,653 | 47,026,568 | 6,177,356 | (47,667,339 | ) | 5,730,238 | ||||||||||
Total assets | Ps. | 426,486,287 | Ps. | 924,920,154 | Ps. | 485,746,833 | (Ps. | 947,794,719 | ) | Ps. | 889,358,555 | |||||
LIABILITIES | ||||||||||||||||
Current liabilities: | ||||||||||||||||
Current portion of long-term debt | Ps. | 25,478,148 | Ps. | — | Ps. | 35,010,218 | (Ps. | — | ) | Ps. | 60,488,366 | |||||
Accounts payable—intercompany | 188,017,865 | 38,402,234 | 29,165,467 | (255,585,566 | ) | — | ||||||||||
Other current liabilities | 27,261,138 | 57,418,904 | 112,835,197 | (113,980,788 | ) | 83,534,451 | ||||||||||
Total current liabilities | 240,757,151 | 95,821,138 | 177,010,882 | (369,566,354 | ) | 144,022,817 | ||||||||||
Long-term debt and notes payable to contractors | 68,017,363 | 13,821,638 | 251,355,678 | — | 333,194,679 | |||||||||||
Long-term liabilities—intercompany | 26,325,197 | 320,556,693 | 4,209,239 | (351,091,129 | ) | — | ||||||||||
Sale of future accounts receivable | — | 52,413,689 | — | (9,856,569 | ) | 42,557,120 | ||||||||||
Reserve for retirement payments, pensions, seniority premiums, dismantlement and abandonment activities, sundry creditors and others | 43,145,221 | 248,103,328 | 30,094,035 | — | 321,342,584 | |||||||||||
Total liabilities | 378,244,932 | 730,716,486 | 462,669,834 | (730,514,052 | ) | 841,117,200 | ||||||||||
EQUITY | 48,241,355 | 194,203,668 | 23,076,999 | (217,280,667 | ) | 48,241,355 | ||||||||||
Total liabilities and equity | Ps. | 426,486,287 | Ps. | 924,920,154 | Ps. | 485,746,833 | (Ps. | 947,794,719 | ) | Ps. | 889,358,555 | |||||
F-73
Table of Contents
PETRÓLEOS MEXICANOS, SUBSIDIARY ENTITIES AND SUBSIDIARY COMPANIES
NOTES TO THE CONSOLIDATED FINANCIAL STATEMENTS FOR THE YEARS
ENDED DECEMBER 31, 2004, 2003 AND 2002
(Figures stated in thousands of Mexican pesos of December 31, 2004 purchasing power
and in thousands of U.S. dollars or other currency units)—(Continued)
SUPPLEMENTAL CONDENSED CONSOLIDATING FINANCIAL INFORMATION
U.S. GAAP RECONCILIATION OF EQUITY
For the year ended December 31, 2003
Petróleos Mexicanos | Subsidiary Guarantors | Non-Guarantor Subsidiaries | Eliminations | PEMEX Consolidated | ||||||||||||||||
Equity under Mexican GAAP (as restated) | Ps. | 48,241,355 | Ps. | 194,203,668 | Ps. | 23,076,999 | (Ps. | 217,280,667 | ) | Ps. | 48,241,355 | |||||||||
U.S. GAAP adjustments: | ||||||||||||||||||||
Exploration and drilling costs | — | 16,601,860 | — | — | 16,601,860 | |||||||||||||||
Pensions and seniority premiums | (860,191 | ) | (8,438,183 | ) | (1,155,113 | ) | — | (10,453,487 | ) | |||||||||||
Post-retirement benefits | (5,569,267 | ) | (29,735,138 | ) | (3,834,899 | ) | — | (39,139,304 | ) | |||||||||||
Accrued vacation | (94,977 | ) | (528,410 | ) | (71,396 | ) | — | (694,783 | ) | |||||||||||
Fixed asset adjustments: | ||||||||||||||||||||
Capitalized gains and losses of hedging financial instruments | — | (484,465 | ) | — | — | (484,465 | ) | |||||||||||||
Capitalization of interest, net | — | (13,197,362 | ) | (418,789 | ) | — | (13,616,151 | ) | ||||||||||||
Impairment, net | — | (33,065,398 | ) | (12,066,872 | ) | — | (45,132,270 | ) | ||||||||||||
Depreciation convention | (54,058 | ) | (2,667,455 | ) | (86,389 | ) | — | (2,807,902 | ) | |||||||||||
Derivative financial instruments | (1,541,333 | ) | 7,499,178 | 6,657,047 | 51,020 | 12,665,912 | ||||||||||||||
Sale of shares of Repsol | (676,294 | ) | — | — | — | (676,294 | ) | |||||||||||||
Profit in inventory | — | (1,849,499 | ) | — | — | (1,849,499 | ) | |||||||||||||
Available-for-sale investment securities | 1,322,587 | — | — | — | 1,322,587 | |||||||||||||||
Advance payments of minimum guaranteed dividends | (10,703,189 | ) | — | — | (10,703,189 | ) | ||||||||||||||
Total U.S. GAAP adjustments, net | (18,176,722 | ) | (65,864,872 | ) | (10,976,411 | ) | 51,020 | (94,966,985 | ) | |||||||||||
Equity (deficit) under U.S. GAAP | Ps. | 30,064,633 | Ps. | 128,338,796 | Ps. | 12,100,588 | (Ps. | 217,229,647 | ) | (Ps. | 46,725,630 | ) | ||||||||
F-74
Table of Contents
PETRÓLEOS MEXICANOS, SUBSIDIARY ENTITIES AND SUBSIDIARY COMPANIES
NOTES TO THE CONSOLIDATED FINANCIAL STATEMENTS FOR THE YEARS
ENDED DECEMBER 31, 2004, 2003 AND 2002
(Figures stated in thousands of Mexican pesos of December 31, 2004 purchasing power
and in thousands of U.S. dollars or other currency units)—(Continued)
SUPPLEMENTAL CONDENSED CONSOLIDATING FINANCIAL INFORMATION
STATEMENT OF INCOME
For the year ended December 31, 2004
Petróleos Mexicanos | Subsidiary Guarantors | Non-Guarantor Subsidiaries | Eliminations | PEMEX Consolidated | ||||||||||||||||
| (As restated) | (As restated) | |||||||||||||||||||
Net sales | Ps. | 18,409,161 | Ps. | 1,087,394,680 | Ps. | 423,425,735 | (Ps. | 755,642,451 | ) | Ps. | 773,587,125 | |||||||||
Other (expenses) revenues, net | 420,123 | 2,358,537 | 9,697,576 | (1,321,859 | ) | 11,154,377 | ||||||||||||||
Total revenues | 18,829,284 | 1,089,753,217 | 433,123,311 | (756,964,310 | ) | 784,741,502 | ||||||||||||||
Costs and operating expenses: | ||||||||||||||||||||
Cost of sales | 177,102 | 575,510,361 | 424,583,066 | (736,165,042 | ) | 264,105,487 | ||||||||||||||
Transportation and distribution expenses | — | 17,265,698 | 491,950 | (183,340 | ) | 17,574,308 | ||||||||||||||
Administrative expenses | 21,878,904 | 29,020,299 | 4,601,073 | (18,794,242 | ) | 36,706,034 | ||||||||||||||
Total costs and operating expenses | 22,056,006 | 621,796,358 | 429,676,089 | (755,142,624 | ) | 318,385,829 | ||||||||||||||
Comprehensive financing income (cost) | 8,924,544 | (12,729,787 | ) | (13,509,187 | ) | 10,266,277 | (7,048,153 | ) | ||||||||||||
Equity participation in subsidiaries | (30,103,097 | ) | — | — | 30,103,097 | — | ||||||||||||||
Capitalization of Master Trust operations and others | — | — | 8,430,243 | (8,430,243 | ) | |||||||||||||||
(Loss) income before hydrocarbon extraction duties and other, special tax on production and services and cumulative effect of adoption of new accounting standards | (24,405,275 | ) | 455,227,072 | (1,631,722 | ) | 30,117,445 | 459,307,520 | |||||||||||||
Hydrocarbon extraction duties and other | — | 418,045,215 | 1,569,599 | 14,348 | 419,629,162 | |||||||||||||||
Special tax on production and services (IEPS Tax) | — | 54,704,848 | — | — | 54,704,848 | |||||||||||||||
| — | 472,750,063 | 1,569,599 | 14,348 | 474,334,010 | ||||||||||||||||
Cumulative effect of adoption of new accounting standards | (1,090,580 | ) | (6,555,130 | ) | (2,823,410 | ) | — | (10,469,120 | ) | |||||||||||
Net (loss) income for the year | (Ps. | 25,495,855 | ) | (Ps. | 24,078,121 | ) | (Ps. | 6,024,731 | ) | Ps. | 30,103,097 | (Ps. | 25,495,610 | ) | ||||||
F-75
Table of Contents
PETRÓLEOS MEXICANOS, SUBSIDIARY ENTITIES AND SUBSIDIARY COMPANIES
NOTES TO THE CONSOLIDATED FINANCIAL STATEMENTS FOR THE YEARS
ENDED DECEMBER 31, 2004, 2003 AND 2002
(Figures stated in thousands of Mexican pesos of December 31, 2004 purchasing power
and in thousands of U.S. dollars or other currency units)—(Continued)
SUPPLEMENTAL CONDENSED CONSOLIDATING FINANCIAL INFORMATION
U.S. GAAP RECONCILIATION OF INCOME
For the year ended December 31, 2004
Petróleos Mexicanos | Subsidiary Guarantors | Non-Guarantor Subsidiaries | Eliminations | PEMEX Consolidated | ||||||||||
Net loss under Mexican GAAP (as restated) | (Ps..25,495,855 | ) | (Ps.24,078,121 | ) | (Ps.6,024,731 | ) | Ps.30,103,097 | (Ps.25,495,610 | ) | |||||
U.S. GAAP adjustments: | ||||||||||||||
Exploration and drilling costs | — | (1,419,459 | ) | — | — | (1,419,459 | ) | |||||||
Pensions and seniority premiums | 11,887 | 565,121 | 171,130 | — | 748,138 | |||||||||
Post-retirement benefits | (310,205 | ) | (2,076,643 | ) | (271,546 | ) | — | (2,658,394 | ) | |||||
Accrued vacation | 17,532 | 96,550 | 12,802 | — | 126,884 | |||||||||
Fixed asset adjustments: | ||||||||||||||
Capitalized gains and losses of hedging financial instruments | — | 1,094,896 | — | — | 1,094,896 | |||||||||
Capitalization of interest, net | — | 1,909,551 | 40,315 | — | 1,949,866 | |||||||||
Impairment, net | — | 6,968,773 | 2,188,859 | — | 9,157,632 | |||||||||
Depreciation convention | 13,515 | 666,864 | 21,597 | — | 701,976 | |||||||||
Derivative financial instruments | 2,476,866 | 799,104 | 2,144,113 | 97,802 | 5,517,885 | |||||||||
Sale of shares of Repsol | 676,294 | — | — | — | 676,294 | |||||||||
Profit in inventory | — | 1,039,355 | — | — | 1,039,355 | |||||||||
Available-for-sale investment securities . | (5,029,143 | ) | — | — | — | (5,029,143 | ) | |||||||
Effect of inflation accounting on U.S. GAAP adjustment | 544,138 | 21,508 | 2,852 | 578,498 | ||||||||||
Total U.S. GAAP adjustments, net | (1,589,116 | ) | 9,665,620 | 4,310,122 | 97,802 | 12,484,428 | ||||||||
Net (loss) income under U.S. GAAP | (Ps.27,084,971 | ) | (Ps.14,412,501 | ) | (Ps.1,714,609 | ) | Ps.30,200,899 | (Ps.13,011,182 | ) | |||||
F-76
Table of Contents
PETRÓLEOS MEXICANOS, SUBSIDIARY ENTITIES AND SUBSIDIARY COMPANIES
NOTES TO THE CONSOLIDATED FINANCIAL STATEMENTS FOR THE YEARS
ENDED DECEMBER 31, 2004, 2003 AND 2002
(Figures stated in thousands of Mexican pesos of December 31, 2004 purchasing power
and in thousands of U.S. dollars or other currency units)—(Continued)
SUPPLEMENTAL CONDENSED CONSOLIDATING FINANCIAL INFORMATION
STATEMENT OF INCOME
For the year ended December 31, 2003
| Petróleos Mexicanos | Subsidiary Guarantors | Non-Guarantor Subsidiaries | Eliminations | PEMEX Consolidated | ||||||||||||||||
| (As restated) | (As restated) | |||||||||||||||||||
Net sales | Ps. | 19,035,581 | Ps. | 922,743,256 | Ps. | 319,231,121 | (Ps. | 603,116,553 | ) | Ps. | 657,893,405 | |||||||||
Other (expenses) revenues, net | (3,572,239 | ) | 5,821,871 | 9,426,261 | (8,561,182 | ) | 3,114,711 | |||||||||||||
Total revenues | 15,463,342 | 928,565,127 | 328,657,382 | (611,677,735 | ) | 661,008,116 | ||||||||||||||
Costs and operating expenses: | ||||||||||||||||||||
Cost of sales | — | 477,292,036 | 324,872,038 | (584,294,934 | ) | 217,869,140 | ||||||||||||||
Transportation and distribution expenses | — | 16,442,914 | 345,751 | (432,579 | ) | 16,356,086 | ||||||||||||||
Administrative expenses | 21,063,576 | 29,903,301 | 4,608,551 | (18,553,663 | ) | 37,021,765 | ||||||||||||||
Total costs and operating expenses | 21,063,576 | 523,638,251 | 329,826,340 | (603,281,176 | ) | 271,246,991 | ||||||||||||||
Comprehensive financing income (cost) | 4,251,098 | (34,623,179 | ) | (17,138,172 | ) | 15,172,061 | (32,338,192 | ) | ||||||||||||
Equity participation in subsidiaries | (40,457,582 | ) | — | — | 40,457,582 | — | ||||||||||||||
Capitalization of Master Trust operations and others | — | — | 6,764,704 | (6,764,704 | ) | — | ||||||||||||||
(Loss) income before hydrocarbon extraction duties and other, special tax on production and services and cumulative effect of adoption of new accounting standards | (41,806,718 | ) | 370,303,697 | (12,177,703 | ) | 40,468,380 | 357,422,933 | |||||||||||||
Hydrocarbon extraction duties and other | 43,214 | 302,297,180 | 983,524 | 10,797 | 303,334,715 | |||||||||||||||
Special tax on production and services (IEPS Tax) | — | 98,959,610 | — | — | 98,959,610 | |||||||||||||||
| 43,214 | 401,256,790 | 983,524 | 10,797 | 402,294,325 | ||||||||||||||||
Cumulative effect of adoption of new accounting standards | — | 2,117,261 | — | — | 2,117,261 | |||||||||||||||
Net (loss) income for the year | (Ps. | 41,849,932 | ) | (Ps. | 28,835,832 | ) | (Ps. | 12,525,950 | ) | Ps. | 40,457,583 | (Ps. | 42,754,131 | ) | ||||||
F-77
Table of Contents
PETRÓLEOS MEXICANOS, SUBSIDIARY ENTITIES AND SUBSIDIARY COMPANIES
NOTES TO THE CONSOLIDATED FINANCIAL STATEMENTS FOR THE YEARS
ENDED DECEMBER 31, 2004, 2003 AND 2002
(Figures stated in thousands of Mexican pesos of December 31, 2004 purchasing power
and in thousands of U.S. dollars or other currency units)—(Continued)
SUPPLEMENTAL CONDENSED CONSOLIDATING FINANCIAL INFORMATION
U.S. GAAP RECONCILIATION OF INCOME
For the year ended December 31, 2003
Petróleos Mexicanos | Subsidiary Guarantors | Non-Guarantor Subsidiaries | Eliminations | PEMEX Consolidated | |||||||||||||||
Net loss under Mexican GAAP (as restated) | (Ps. | 41,849,932 | ) | (Ps. | 28,835,832 | ) | (Ps. | 12,525,950 | ) | Ps. | 40,457,583 | (Ps. | 42,754,131 | ) | |||||
U.S. GAAP adjustments: | |||||||||||||||||||
Exploration and drilling costs | — | (20,284,641 | ) | — | — | (20,284,641 | ) | ||||||||||||
Pensions and seniority premiums | (10,206 | ) | 456,452 | 138,673 | — | 584,919 | |||||||||||||
Post-retirement benefits | (1,206,075 | ) | (7,039,412 | ) | (846,933 | ) | — | (9,092,420 | ) | ||||||||||
Accrued vacation | (3,721 | ) | (20,702 | ) | (2,797 | ) | — | (27,220 | ) | ||||||||||
Fixed asset adjustments: | |||||||||||||||||||
Capitalized gains and losses of hedging financial instruments | — | (187,133 | ) | — | — | (187,133 | ) | ||||||||||||
Capitalization of interest, net | — | 1,767,988 | 41,319 | — | 1,809,307 | ||||||||||||||
Impairment, net | — | (730,735 | ) | (2,024,888 | ) | — | (2,755,623 | ) | |||||||||||
Depreciation convention | 13,515 | 666,864 | 21,597 | — | 701,976 | ||||||||||||||
Derivative financial instruments | (791,601 | ) | 1,683,054 | 973,946 | 51,020 | 1,916,419 | |||||||||||||
Sale of shares of Repsol | (585,237 | ) | — | — | — | (585,237 | ) | ||||||||||||
Profit in inventory | — | (109,315 | ) | — | — | (109,315 | ) | ||||||||||||
Available-for-sale investment securities | — | — | — | — | — | ||||||||||||||
Effect of inflation accounting on U.S. GAAP adjustment | 977,428 | 47,831 | 6,463 | 1,031,722 | |||||||||||||||
Total U.S. GAAP adjustments, net | (1,605,897 | ) | (23,749,749 | ) | (1,692,620 | ) | 51,020 | (26,997,246 | ) | ||||||||||
Net (loss) income under U.S. GAAP | (Ps. | 43,455,829 | ) | (Ps. | 52,585,581 | ) | (Ps. | 14,218,570 | ) | Ps. | 40,508,603 | (Ps. | 69,751,377 | ) | |||||
F-78
Table of Contents
PETRÓLEOS MEXICANOS, SUBSIDIARY ENTITIES AND SUBSIDIARY COMPANIES
NOTES TO THE CONSOLIDATED FINANCIAL STATEMENTS FOR THE YEARS
ENDED DECEMBER 31, 2004, 2003 AND 2002
(Figures stated in thousands of Mexican pesos of December 31, 2004 purchasing power
and in thousands of U.S. dollars or other currency units)—(Continued)
SUPPLEMENTAL CONDENSED CONSOLIDATING FINANCIAL INFORMATION
STATEMENT OF INCOME
For the year ended December 31, 2002
| Petróleos Mexicanos | Subsidiary Guarantors | Non-Guarantor Subsidiaries | Eliminations | PEMEX Consolidated | ||||||||||||||||
| (As restated) | (As restated) | |||||||||||||||||||
Net sales | Ps. | 19,509,512 | Ps. | 707,563,098 | Ps. | 243,897,165 | (Ps. | 429,395,954 | ) | Ps. | 541,573,821 | |||||||||
Other revenues (expenses), net | 1,760,544 | 41,471 | 4,266,101 | (6,162,181 | ) | (94,065 | ) | |||||||||||||
Total revenues | 21,270,056 | 707,604,569 | 248,163,266 | (435,558,135 | ) | 541,479,756 | ||||||||||||||
Costs and operating expenses: | ||||||||||||||||||||
Cost of sales | — | 340,954,015 | 247,178,016 | (410,618,312 | ) | 177,513,719 | ||||||||||||||
Transportation and distribution expenses | — | 16,130,564 | 977,831 | (277,017 | ) | 16,831,378 | ||||||||||||||
Administrative expenses | 18,943,481 | 32,292,547 | 5,061,813 | (20,139,675 | ) | 36,158,166 | ||||||||||||||
Total costs and operating expenses | 18,943,481 | 389,377,126 | 253,217,660 | (431,035,004 | ) | 230,503,263 | ||||||||||||||
Comprehensive financing (cost) income | (2,033,035 | ) | (7,511,361 | ) | 989,118 | 1,992,290 | (6,562,988 | ) | ||||||||||||
Equity participation in subsidiaries | (26,143,170 | ) | — | — | 26,143,170 | — | ||||||||||||||
Capitalization of Master Trust operations and others | — | — | (2,530,841 | ) | 2,530,841 | — | ||||||||||||||
(Loss) income before hydrocarbon extraction duties and other, special tax on production and services and cumulative effect of adoption of new accounting standards | (25,849,630 | ) | 310,716,082 | (6,596,117 | ) | 26,143,170 | 304,413,505 | |||||||||||||
Hydrocarbon extraction duties and other | — | 200,596,547 | 873,910 | — | 201,470,457 | |||||||||||||||
Special tax on production and services (IEPS Tax) | — | 128,792,678 | — | — | 128,792,678 | |||||||||||||||
| — | 329,389,225 | 873,910 | — | 330,263,135 | ||||||||||||||||
Cumulative effect of adoption of new accounting standards | — | — | — | — | — | |||||||||||||||
Net (loss) income for the year | (Ps. | 25,849,630 | ) | (Ps. | 18,673,143 | ) | (Ps. | 7,470,027 | ) | Ps. | 26,143,170 | (Ps. | 25,849,630 | ) | ||||||
F-79
Table of Contents
PETRÓLEOS MEXICANOS, SUBSIDIARY ENTITIES AND SUBSIDIARY COMPANIES
NOTES TO THE CONSOLIDATED FINANCIAL STATEMENTS FOR THE YEARS
ENDED DECEMBER 31, 2004, 2003 AND 2002
(Figures stated in thousands of Mexican pesos of December 31, 2004 purchasing power
and in thousands of U.S. dollars or other currency units)—(Continued)
U.S. GAAP RECONCILIATION OF INCOME
For the year ended December 31, 2002
Petróleos Mexicanos | Subsidiary Guarantors | Non-Guarantor Subsidiaries | Eliminations | PEMEX Consolidated | |||||||||||||||
Net loss under Mexican GAAP (as restated) | (Ps. | 25,849,630 | ) | (Ps. | 18,673,143 | ) | (Ps. | 7,470,027 | ) | Ps. | 26,143,170 | (Ps. | 25,849,630 | ) | |||||
U.S. GAAP adjustments: | |||||||||||||||||||
Exploration and drilling costs | — | 3,397,002 | — | — | 3,397,002 | ||||||||||||||
Pensions and seniority premiums | (49,407 | ) | (1,209,726 | ) | (264,854 | ) | — | (1,523,987 | ) | ||||||||||
Post-retirement benefits | (1,147,439 | ) | (6,401,748 | ) | (797,658 | ) | — | (8,346,845 | ) | ||||||||||
Accrued vacation | (5,040 | ) | (27,882 | ) | (3,851 | ) | — | (36,773 | ) | ||||||||||
Fixed asset adjustments: | |||||||||||||||||||
Capitalized gains and losses of hedging financial instruments | — | (297,331 | ) | — | — | (297,331 | ) | ||||||||||||
Capitalization of interest, net | — | 1,607,179 | 21,291 | — | 1,628,470 | ||||||||||||||
Impairment, net | — | (1,425,515 | ) | 3,595,721 | — | 2,170,206 | |||||||||||||
Depreciation convention | (13,248 | ) | (530,217 | ) | (20,566 | ) | — | (564,031 | ) | ||||||||||
Derivative financial instruments | 1,685,042 | (4,880,510 | ) | (4,477 | ) | — | (3,199,945 | ) | |||||||||||
Sale of shares of Repsol | (703,399 | ) | — | — | — | (703,399 | ) | ||||||||||||
Profit in inventory | — | (1,053,751 | ) | — | — | (1,053,751 | ) | ||||||||||||
Effect of inflation accounting on U.S. GAAP adjustment | 16,706 | 818 | 110 | — | 17,634 | ||||||||||||||
Total U.S. GAAP adjustments, net | (216,785 | ) | (10,821,681 | ) | 2,525,716 | — | (8,512,750 | ) | |||||||||||
Net (loss) income under U.S. GAAP | (Ps. | 26,066,415 | ) | (Ps. | 29,494,824 | ) | (Ps. | 4,944,311 | ) | Ps. | 26,143,170 | (Ps. | 34,362,380 | ) | |||||
F-80
Table of Contents
PETRÓLEOS MEXICANOS, SUBSIDIARY ENTITIES AND SUBSIDIARY COMPANIES
NOTES TO THE CONSOLIDATED FINANCIAL STATEMENTS FOR THE YEARS
ENDED DECEMBER 31, 2004, 2003 AND 2002
(Figures stated in thousands of Mexican pesos of December 31, 2004 purchasing power
and in thousands of U.S. dollars or other currency units)—(Continued)
SUPPLEMENTAL CONDENSED CONSOLIDATING FINANCIAL INFORMATION
STATEMENT OF CHANGES IN FINANCIAL POSITION
For the year ended December 31, 2004
Petróleos Mexicanos | Subsidiary Guarantors | Non-Guarantor Subsidiaries | Eliminations | PEMEX Consolidated | ||||||||||||||||
| (As restated) | (As restated) | (As restated) | (As restated) | |||||||||||||||||
Funds provided by (used in) operating activities | Ps. | 34,884,631 | Ps. | 60,573,697 | (Ps. | 89,428,699 | ) | — | Ps. | 6,029,629 | ||||||||||
Financing activities: | ||||||||||||||||||||
Sale of future accounts receivable | — | (5,921,431 | ) | — | — | (5,921,431 | ) | |||||||||||||
Long-term debt | (50,265,357 | ) | (2,445,075 | ) | 112,018,367 | — | 59,307,935 | |||||||||||||
Net (loss) income passed to Petróleos Mexicanos | — | — | — | — | — | |||||||||||||||
Inter-company charges and deductions | 32,452,809 | (8,341,482 | ) | (8,450 | ) | (24,102,877 | ) | — | ||||||||||||
Notes payable to contractors | — | — | — | — | — | |||||||||||||||
Other changes | (10,387,839 | ) | 30,709,168 | 1,928,362 | — | 22,249,691 | ||||||||||||||
Funds provided by (used in) financing activities | (28,200,387 | ) | 14,001,180 | 113,938,279 | (24,102,877 | ) | 75,636,195 | |||||||||||||
Investing activities: | ||||||||||||||||||||
Increase in fixed assets, net | (236,894 | ) | (73,511,357 | ) | (188,485 | ) | — | (73,936,736 | ) | |||||||||||
Inter-company charges and deductions | 8,349,932 | — | (32,452,809 | ) | 24,102,877 | — | ||||||||||||||
Investments in subsidiaries | — | — | — | — | — | |||||||||||||||
Funds (used in) provided by investing activities | 8,113,038 | (73,511,357 | ) | (32,641,294 | ) | 24,102,877 | (73,936,736 | ) | ||||||||||||
Increase (decrease) in cash and cash equivalents | 14,797,282 | 1,063,520 | (8,131,714 | ) | — | 7,729,088 | ||||||||||||||
Cash and cash equivalents at beginning of the year | 29,060,122 | 1,034,659 | 47,048,362 | — | 77,143,143 | |||||||||||||||
Cash and cash equivalents at the end of the year | Ps. | 43,857,404 | Ps. | 2,098,179 | Ps. | 38,916,648 | Ps. | — | Ps. | 84,872,231 | ||||||||||
F-81
Table of Contents
PETRÓLEOS MEXICANOS, SUBSIDIARY ENTITIES AND SUBSIDIARY COMPANIES
NOTES TO THE CONSOLIDATED FINANCIAL STATEMENTS FOR THE YEARS
ENDED DECEMBER 31, 2004, 2003 AND 2002
(Figures stated in thousands of Mexican pesos of December 31, 2004 purchasing power
and in thousands of U.S. dollars or other currency units)—(Continued)
SUPPLEMENTAL CONDENSED CONSOLIDATING FINANCIAL INFORMATION
STATEMENT OF CHANGES IN FINANCIAL POSITION
For the year ended December 31, 2003
Petróleos Mexicanos | Subsidiary Guarantors | Non-Guarantor Subsidiaries | Eliminations | PEMEX Consolidated | ||||||||||||||||
| (As restated) | (As restated) | (As restated) | (As restated) | |||||||||||||||||
Funds provided by (used in) operating activities | Ps. | 22,131,817 | Ps. | 81,037,847 | (Ps. | 85,127,902 | ) | Ps. | — | Ps. | 18,041,762 | |||||||||
Financing activities: | ||||||||||||||||||||
Sale of future accounts receivable | — | (4,953,601 | ) | — | — | (4,953,601 | ) | |||||||||||||
Long-term debt | (8,001,215 | ) | (15,908,290 | ) | 124,769,759 | — | 100,860,254 | |||||||||||||
Net (loss) income passed to Petróleos Mexicanos | — | — | — | — | — | |||||||||||||||
Inter-company charges and deductions | 14,133,444 | 13,337,361 | 6,525 | (27,477,330 | ) | — | ||||||||||||||
Notes payable to contractors | — | — | — | — | — | |||||||||||||||
Other changes | (10,500,161 | ) | — | — | — | (10,500,161 | ) | |||||||||||||
Funds provided by (used in) financing activities | (4,367,932 | ) | (7,524,530 | ) | 124,776,284 | (27,477,330 | ) | 85,406,492 | ||||||||||||
Investing activities: | ||||||||||||||||||||
Increase in fixed assets, net | 265,670 | (73,403,693 | ) | (1,156,386 | ) | — | (74,294,409 | ) | ||||||||||||
Inter-company charges and deductions | (13,344,186 | ) | — | (14,133,144 | ) | 27,477,330 | — | |||||||||||||
Investments in subsidiaries | — | — | — | — | — | |||||||||||||||
Funds (used in) provided by investing activities | (13,078,516 | ) | (73,403,693 | ) | (15,289,530 | ) | 27,477,330 | (74,294,409 | ) | |||||||||||
Increase in cash and cash equivalents | 4,685,369 | 109,624 | 24,358,852 | — | 29,153,845 | |||||||||||||||
Cash and cash equivalents at beginning of the year | 24,374,753 | 925,035 | 22,689,510 | — | 47,989,298 | |||||||||||||||
Cash and cash equivalents at the end of the year | Ps. | 29,060,122 | Ps. | 1,034,659 | Ps. | 47,048,362 | Ps. | — | Ps. | 77,143,143 | ||||||||||
F-82
Table of Contents
PETRÓLEOS MEXICANOS, SUBSIDIARY ENTITIES AND SUBSIDIARY COMPANIES
NOTES TO THE CONSOLIDATED FINANCIAL STATEMENTS FOR THE YEARS
ENDED DECEMBER 31, 2004, 2003 AND 2002
(Figures stated in thousands of Mexican pesos of December 31, 2004 purchasing power
and in thousands of U.S. dollars or other currency units)—(Continued)
SUPPLEMENTAL CONDENSED CONSOLIDATING FINANCIAL INFORMATION
STATEMENT OF CHANGES IN FINANCIAL POSITION
For the year ended December 31, 2002
Petróleos Mexicanos | Subsidiary Guarantors | Non-Guarantor Subsidiaries | Eliminations | PEMEX Consolidated | ||||||||||||||||
| (As restated) | (As restated) | (As restated) | (As restated) | |||||||||||||||||
Funds provided by (used in) operating activities | Ps. | 28,852,302 | Ps. | 84,259,212 | (Ps. | 67,334,532 | ) | Ps. | — | Ps. | 45,776,982 | |||||||||
Financing activities: | ||||||||||||||||||||
Sale of future accounts receivable | — | (4,149,808 | ) | — | — | (4,149,808 | ) | |||||||||||||
Long-term debt | (2,170,464 | ) | 14,602,113 | 80,850,460 | — | 93,282,109 | ||||||||||||||
Net income (loss) passed to Petróleos Mexicanos | — | — | — | — | — | |||||||||||||||
Inter-company charges and deductions | 6,329,773 | 12,586,609 | (121,576 | ) | (18,794,806 | ) | — | |||||||||||||
Notes payable to contractors | — | — | — | — | — | |||||||||||||||
Other changes | (2,397,302 | ) | — | — | — | (2,397,302 | ) | |||||||||||||
Funds provided by (used in) financing activities | 1,762,007 | 23,038,914 | 80,728,884 | (18,794,806 | ) | 86,734,999 | ||||||||||||||
Investing activities: | ||||||||||||||||||||
Increase in fixed assets, net | (159,038 | ) | (107,208,340 | ) | 6,148,617 | — | (101,218,761 | ) | ||||||||||||
Inter-company charges and deductions | (12,465,033 | ) | — | (6,329,773 | ) | 18,794,806 | — | |||||||||||||
Investments in subsidiaries | — | — | — | — | — | |||||||||||||||
Funds (used in) provided by investing activities | (12,624,071 | ) | (107,208,340 | ) | (181,156 | ) | 18,794,806 | (101,218,761 | ) | |||||||||||
Increase in cash and cash equivalents | 17,990,238 | 89,786 | 13,213,196 | — | 31,293,220 | |||||||||||||||
Cash and cash equivalents at beginning of the year | 6,384,514 | 835,249 | 9,476,315 | — | 16,696,078 | |||||||||||||||
Cash and cash equivalents at the end of the year | Ps. | 24,374,752 | Ps. | 925,035 | Ps. | 22,689,511 | Ps. | — | Ps. | 47,989,298 | ||||||||||
F-83
Table of Contents
PETRÓLEOS MEXICANOS, SUBSIDIARY ENTITIES AND SUBSIDIARY COMPANIES
NOTES TO THE CONSOLIDATED FINANCIAL STATEMENTS FOR THE YEARS
ENDED DECEMBER 31, 2004, 2003 AND 2002
(Figures stated in thousands of Mexican pesos of December 31, 2004 purchasing power
and in thousands of U.S. dollars or other currency units)—(Continued)
21. PIDIREGAS liabilities and the Pemex Project Funding Master Trust (“Master Trust”)
The Master Trust, a consolidated entity which is a Delaware statutory trust, was organized under the laws of Delaware on November 10, 1998. On December 31, 1998, PEMEX transferred all assets and liabilities related to PIDIREGAS for an amount equaling Ps. 12,104,010 (in nominal terms) to the Master Trust. The main objective of the Master Trust is to administer financial resources related to PIDIREGAS, such financial resources being designated by PEMEX for that purpose, by assuming payment obligations under contracts relating to PIDIREGAS and acting as the borrower under financing arrangements for PIDIREGAS.
Under an Assignment and Indemnity Agreement dated November 10, 1998, among Petróleos Mexicanos, the Master Trust and the Subsidiary Guarantors, Petróleos Mexicanos and the Subsidiary Guarantors have certain obligations to the Master Trust with respect to the liabilities incurred by the Master Trust in connection with PIDIREGAS. These obligations include:
| i | the obligation of Petróleos Mexicanos to guarantee the repayment of the debt obligations undertaken by the Master Trust to finance PIDIREGAS; |
| ii | the obligation of Petróleos Mexicanos and the Subsidiary Guarantor which is sponsoring the relevant PIDIREGAS to make such payments to the Master Trust as may be necessary for the Master Trust to fulfill its payment obligations in respect of any financing the Master Trust has entered into in connection with such project; and |
| iii | the joint and several obligation of Petróleos Mexicanos and each of the aforementioned Subsidiary Guarantors to indemnify the Master Trust with respect to any liability incurred by the Master Trust in connection with PIDIREGAS. |
The Master Trust is consolidated in the financial statements of PEMEX for each of the periods presented in accordance with consolidation principles detailed in Mexican GAAP Bulletin B-8 “Consolidated and Combined Financial Statements and Valuation of Permanent Investments in Stocks.” In accordance with U.S. accounting principles, the Master Trust is a special purpose entity requiring consolidation to the financial statements as it does not meet non-consolidation criteria as specified in U.S. accounting literature.
The following consolidating information presents restated condensed consolidating balance sheets at December 31, 2004 and 2003 and condensed consolidating statements of operations and the restated changes in financial position for the years ended December 31, 2004, 2003 and 2002 of Petróleos Mexicanos, the Master Trust, the Subsidiary Guarantors and the Non-Guarantor Subsidiaries (excluding the Master Trust). These financial statements are prepared in conformity with Mexican GAAP, including the recognition of inflation in accordance with Bulletin B-10, except that in the following condensed financial information, the Master Trust and the Subsidiary Entities are accounted for as investments under the equity method by Petróleos Mexicanos rather than being consolidated. Pemex-Petrochemicals and the Subsidiary Guarantors are 100%-owned subsidiaries of Petróleos Mexicanos. Petróleos Mexicanos’ guaranty of the indebtedness of the Master Trust is full and unconditional. The guaranties by the Subsidiary Guarantors of Petróleos Mexicanos’ guaranty of the Master Trust’s payment obligations are full and unconditional and joint and several.
F-84
Table of Contents
PETRÓLEOS MEXICANOS, SUBSIDIARY ENTITIES AND SUBSIDIARY COMPANIES
NOTES TO THE CONSOLIDATED FINANCIAL STATEMENTS FOR THE YEARS
ENDED DECEMBER 31, 2004, 2003 AND 2002
(Figures stated in thousands of Mexican pesos of December 31, 2004 purchasing power
and in thousands of U.S. dollars or other currency units)—(Continued)
The significant differences between Mexican and U.S. GAAP as they affect PEMEX are described in Note 19. The following also presents the reconciliation of equity to U.S. GAAP as of December 31, 2004 and 2003 and the reconciliation of income to U.S. GAAP for the three years ended December 31, 2004 for each of Petróleos Mexicanos, the Master Trust, the Subsidiary Guarantors and the Non-Guarantor Subsidiaries. The following reconciliation to U.S. GAAP does not include the reversal of Mexican GAAP inflation accounting adjustments, as these adjustments represent a comprehensive measure of the effects of price level changes in the inflationary Mexican economy, which is considered a more meaningful presentation than historical cost-based financial reporting for both Mexican and U.S. accounting purposes.
As of December 31, 2004, Petróleos Mexicanos, the Master Trust and Fideicomiso F/163 are the only entities of PEMEX authorized to contract debt for PIDIREGAS with debt outstanding as of that date, and thus all guaranteed PIDIREGAS debt is held by these entities.
Restatement
Subsequent to the filing of the Form 20-F on June 30, 2005, Petróleos Mexicanos identified and corrected certain amounts that had been previously reported under Mexican GAAP in the condensed consolidating balance sheets at December 31, 2004 and 2003 and condensed consolidating results of operations and changes in financial position for the years ended December 31, 2004, 2003 and 2002 in this Note 21. None of these corrections had an impact on the consolidated balance sheets at December 31, 2004 and 2003 and condensed results of operations and changes in financial position for the years ended December 31, 2004, 2003 and 2002. The corrections are described in greater detail below:
(a)Corrections to Condensed Consolidating Balance Sheets
Separate financial statements for each of Petróleos Mexicanos, the Subsidiary Guarantors and certain of the Non-Guarantor Subsidiaries are prepared in Spanish in accordance with Governmental Accounting Standards, as described in Note 20. The Mexican Governmental Accounting Standards differ in certain respects from Mexican GAAP and in order to prepare the consolidated financial statements of PEMEX in accordance with Mexican GAAP, certain adjustments are made to these statements. PEMEX has identified the following items which have been corrected in the restated condensed balance sheets and affected various columns as described below:
(i.)Misclassifications of inter-company balances within the condensed balance sheets.Previously, various inter-company balances were inconsistently classified within the condensed balance sheet captions and among several of the columns. These balances have now been appropriately classified between current and non-current and consistently allocated among the columns.
(ii.)Improper inclusion of certain adjustments to convert from Governmental Accounting Standards to Mexican GAAP, which were previously presented in the eliminations column.In the restated consolidating balance sheets, the columns appropriately represent the cumulative Mexican GAAP adjustments as they relate to the individual entities and the eliminations column has been adjusted accordingly.
(b) Corrections to Condensed Consolidating Results of Operations
The condensed consolidating results of operations, specifically, the information presented under the column captioned “Petróleos Mexicanos” and the column captioned “Eliminations”, were restated to properly reflect the
F-85
Table of Contents
PETRÓLEOS MEXICANOS, SUBSIDIARY ENTITIES AND SUBSIDIARY COMPANIES
NOTES TO THE CONSOLIDATED FINANCIAL STATEMENTS FOR THE YEARS
ENDED DECEMBER 31, 2004, 2003 AND 2002
(Figures stated in thousands of Mexican pesos of December 31, 2004 purchasing power
and in thousands of U.S. dollars or other currency units)—(Continued)
recognition of the net results of operations of the Subsidiary Guarantors and the Non-Guarantor Subsidiaries pursuant to the equity method of accounting. In certain circumstances, Petróleos Mexicanos had previously presented the net results of operations reported by the Subsidiary Entities based on preliminary financial information. In the restated results of operations, the line item captioned “Equity participation in subsidiaries” within the Petróleos Mexicanos column has been revised to reflect the final financial information of all the Subsidiary Entities on a Mexican GAAP basis, with the corresponding offsets included in the line item captioned “Other (expense) revenue, net” within the Petróleos Mexicanos column and the column captioned “Eliminations” where they were initially reported.
(c) Corrections to Condensed Consolidating Statements of Changes in Financial Position
As a result of the corrections to the condensed consolidating balance sheets and results of operations described above, the statements of changes in financial position of Petróleos Mexicanos, the Subsidiary Guarantors, the Master Trust and the Non-Guarantor Subsidiaries, as well as the eliminations columns, were restated to reflect the impact of the corrected amounts.
In addition, PEMEX discovered certain errors had been made due to the misclassification of certain items among the categories of operating, financing and investing activities. Specifically, the column detailing the changes in financial position of Petróleos Mexicanos was restated to include equity in earnings of consolidated and unconsolidated subsidiaries in operating activities rather than financing activities and the column detailing the changes in financial position of the Subsidiary Guarantors was restated to include amounts related to specific oil-field exploration and depletion activities in operating activities rather than investing activities
F-86
Table of Contents
PETRÓLEOS MEXICANOS, SUBSIDIARY ENTITIES AND SUBSIDIARY COMPANIES
NOTES TO THE CONSOLIDATED FINANCIAL STATEMENTS FOR THE YEARS
ENDED DECEMBER 31, 2004, 2003 AND 2002
(Figures stated in thousands of Mexican pesos of December 31, 2004 purchasing power
and in thousands of U.S. dollars or other currency units)—(Continued)
SUPPLEMENTAL CONDENSED CONSOLIDATING FINANCIAL INFORMATION
BALANCE SHEET
As of December 31, 2004
Petróleos Mexicanos | Master Trust | Subsidiary Guarantors | Non-Guarantor Subsidiaries | Eliminations | PEMEX Consolidated | ||||||||||||||
| (As restated) | (As restated) | (As restated) | (As restated) | (As restated) | |||||||||||||||
ASSETS | |||||||||||||||||||
Current assets: | |||||||||||||||||||
Cash and cash equivalents | Ps. | 43,857,404 | Ps. | 22,955,739 | Ps. | 2,098,179 | Ps. | 15,960,909 | Ps. — | Ps. | 84,872,231 | ||||||||
Accounts, notes receivable and other, net | 77,631,254 | 55,756,264 | 51,192,582 | 8,900,213 | (70,500,685 | ) | 122,979,628 | ||||||||||||
Accounts receivables-intercompany | 21,332,625 | 39,370,396 | 348,637,532 | 77,861,863 | (487,202,416 | ) | — | ||||||||||||
Inventories, net | 324,828 | — | 30,508,546 | 4,930,354 | — | 35,763,728 | |||||||||||||
Total current assets | 143,146,111 | 118,082,399 | 432,436,839 | 107,653,339 | (557,703,101 | ) | 243,615, 587 | ||||||||||||
Long-term receivables - intercompany | 69,677,470 | 296,904,884 | 1,825,516 | 47,443,336 | (415,851,206 | ) | — | ||||||||||||
Investments in subsidiaries | 257,753,140 | — | 2,472,396 | 23,110,634 | (257,753,139 | ) | 25,583,031 | ||||||||||||
Properties and equipment, net | 8,348,906 | — | 569,382,388 | 16,837,631 | — | 594,568,925 | |||||||||||||
Intangible asset derived from the actuarial computation of labor obligations | 11,647,168 | — | 58,347,177 | 6,444,485 | — | 76,438,830 | |||||||||||||
Other assets | 1,888,289 | 741,201 | 41,474,202 | 6,531,967 | (43,314,695 | ) | 7,320,964 | ||||||||||||
Total assets | Ps. | 492,461,084 | Ps. | 415,728,484 | Ps. | 1,105,938,518 | Ps. | 208,021,392 | (Ps. | 1,274,622,141 | ) | Ps. | 947,527,337 | ||||||
LIABILITIES | |||||||||||||||||||
Current liabilities: | |||||||||||||||||||
Current portion of long-term debt | Ps. | 16,867,578 | Ps. | 27,537,842 | Ps. | — | Ps. | 2,659,668 | Ps. | — | Ps. | 47,065,088 | |||||||
Accounts payable—intercompany | 288,866,655 | 432,832 | 152,187,987 | 45,714,943 | (487,202,417 | ) | — | ||||||||||||
Other current liabilities | 24,367,785 | 95,495,722 | 66,054,808 | 9,357,666 | (101,858,565 | ) | 93,417,416 | ||||||||||||
Total current liabilities | 330,102,018 | 123,466,396 | 218,242,795 | 57,732,277 | (589,060,982 | ) | 140,482,504 | ||||||||||||
Long-term debt | 26,362,578 | 292,262,088 | 11,285,080 | 75,924,662 | — | 405,834,408 | |||||||||||||
Long-term payables—intercompany | 57,323,541 | — | 350,957,204 | 7,570,460 | (415,851,205 | ) | — | ||||||||||||
Sale of future accounts receivable | — | — | 48,592,503 | — | (11,956,814 | ) | 36,635,689 | ||||||||||||
Reserve for retirement payments, pensions, seniority premiums, dismantlement and abandonment activities, sundry creditors, and others | 45,330,029 | — | 251,204,258 | 34,697,531 | — | 331,231,818 | |||||||||||||
Total liabilities | 459,118,166 | 415,728,484 | 880,281,840 | 175,924,930 | (1,016,869,001 | ) | 914,184,419 | ||||||||||||
EQUITY | 33,342,918 | — | 225,656,678 | 32,096,462 | (257,753,140 | ) | 33,342,918 | ||||||||||||
Total liabilities and equity | Ps. | 492,461,084 | Ps. | 415,728,484 | Ps. | 1,105,938,518 | Ps. | 208,021,392 | (Ps. | 1,274,622,141 | ) | Ps. | 947,527,337 | ||||||
F-87
Table of Contents
PETRÓLEOS MEXICANOS, SUBSIDIARY ENTITIES AND SUBSIDIARY COMPANIES
NOTES TO THE CONSOLIDATED FINANCIAL STATEMENTS FOR THE YEARS
ENDED DECEMBER 31, 2004, 2003 AND 2002
(Figures stated in thousands of Mexican pesos of December 31, 2004 purchasing power
and in thousands of U.S. dollars or other currency units)—(Continued)
SUPPLEMENTAL CONDENSED CONSOLIDATING FINANCIAL INFORMATION
U.S. GAAP RECONCILIATION OF EQUITY
For the year ended December 31, 2004
Petróleos Mexicanos | Master Trust | Subsidiary Guarantors | Non-Guarantor Subsidiaries | Eliminations | PEMEX Consolidated | ||||||||||||||||||
Equity under Mexican GAAP (as restated) | Ps. | 33,342,918 | Ps. | — | Ps. | 225,656,678 | Ps. | 32,096,462 | (Ps. | 257,753,140 | ) | Ps. | 33,342,918 | ||||||||||
U.S. GAAP adjustments: | |||||||||||||||||||||||
Exploration and drilling costs | — | 15,182,401 | — | — | 15,182,401 | ||||||||||||||||||
Pensions and seniority premiums: | |||||||||||||||||||||||
Pensions and seniority premiums | (848,295 | ) | (7,873,063 | ) | (983,991 | ) | — | (9,705,349 | ) | ||||||||||||||
Additional Pension liability | 550,909 | 2,418,282 | 1,410,879 | — | 4,380,070 | ||||||||||||||||||
Post-retirement benefits | (5,879,475 | ) | (31,811,795 | ) | (4,106,428 | ) | — | (41,797,698 | ) | ||||||||||||||
Accrued vacation | (73,733 | ) | — | (406,044 | ) | (53,837 | ) | — | (533,614 | ) | |||||||||||||
Fixed asset adjustments: | |||||||||||||||||||||||
Capitalized gains and losses of hedging financial instruments | — | 610,431 | — | — | 610,431 | ||||||||||||||||||
Capitalization of interests, net | — | (11,287,810 | ) | (378,475 | ) | — | (11,666,285 | ) | |||||||||||||||
Impairment, net | — | — | (26,096,625 | ) | (9,878,013 | ) | — | (35,974,638 | ) | ||||||||||||||
Depreciation convention | (40,544 | ) | — | (2,000,590 | ) | (64,792 | ) | — | (2,105,926 | ) | |||||||||||||
Derivative financial instruments | 935,533 | 3,777,959 | 6,440,526 | (693,217 | ) | 148,822 | 10,609,623 | ||||||||||||||||
Profit in inventory | — | (810,144 | ) | — | — | (810,144 | ) | ||||||||||||||||
Advance payment of minimum guaranteed dividends | (10,387,839 | ) | — | — | — | — | (10,387,839 | ) | |||||||||||||||
Total U.S. GAAP adjustments,net | (15,743,444 | ) | 3,777,959 | (55,634,431 | ) | (14,747,874 | ) | 148,822 | (82,198,968 | ) | |||||||||||||
Equity (deficit) under U.S. GAAP | Ps. | 17,599,474 | Ps. | 3,777,959 | Ps. | 170,022,247 | Ps. | 17,348,588 | (Ps. | 257,604,318 | ) | (Ps. | 48,856,050 | ) | |||||||||
F-88
Table of Contents
PETRÓLEOS MEXICANOS, SUBSIDIARY ENTITIES AND SUBSIDIARY COMPANIES
NOTES TO THE CONSOLIDATED FINANCIAL STATEMENTS FOR THE YEARS
ENDED DECEMBER 31, 2004, 2003 AND 2002
(Figures stated in thousands of Mexican pesos of December 31, 2004 purchasing power
and in thousands of U.S. dollars or other currency units)—(Continued)
SUPPLEMENTAL CONDENSED CONSOLIDATING FINANCIAL INFORMATION
BALANCE SHEET
As of December 31, 2003
Petróleos Mexicanos | Master Trust | Subsidiary Guarantors | Non-Guarantor Subsidiaries | Eliminations | PEMEX Consolidated | ||||||||||||||
| (As restated) | (As restated) | (As restated) | (As restated) | (As restated) | |||||||||||||||
ASSETS | |||||||||||||||||||
Current assets: | |||||||||||||||||||
Cash and cash equivalents | Ps. | 29,060,122 | Ps. | 25,590,855 | Ps. | 1,034,659 | Ps. | 21,457,507 | Ps. | — | Ps. | 77,143,143 | |||||||
Accounts, notes receivable and other, net | 53,156,624 | 42,040,541 | 42,133,573 | 12,696,715 | (76,170,014 | ) | 73,857,439 | ||||||||||||
Accounts receivable-intercompany | 16,792,686 | 32,066,087 | 174,200,480 | 32,526,313 | (255,585,566 | ) | — | ||||||||||||
Inventories, net | 367,531 | — | 25,356,279 | 3,180,154 | — | 28,903,964 | |||||||||||||
Total current assets | 99,376,963 | 99,697,483 | 242,724,991 | 69,860,689 | (331,755,580 | ) | 179,904,546 | ||||||||||||
Long-term receivables - intercompany | 79,334,568 | 271,756,562 | — | — | (351,091,130 | ) | — | ||||||||||||
Investments in subsidiaries | 217,280,688 | — | 2,064,953 | 8,947,284 | (217,280,670 | ) | 11,012,255 | ||||||||||||
Properties and equipment, net | 8,872,717 | — | 538,188,815 | 20,147,660 | — | 567,209,192 | |||||||||||||
Intangible asset derived from the actuarial computation of labor obligations | 21,427,698 | — | 94,914,827 | 9,159,799 | — | 125,502,324 | |||||||||||||
Other assets | 193,653 | — | 47,026,568 | 6,177,356 | (47,667,339 | ) | 5,730,238 | ||||||||||||
Total assets | Ps. | 426,486,287 | Ps. | 371,454,045 | Ps. | 924,920,154 | Ps. | 114,292,788 | (Ps. | 947,794,719 | ) | Ps. | 889,358,555 | ||||||
LIABILITIES | |||||||||||||||||||
Current liabilities: | |||||||||||||||||||
Current portion of long-term debt | Ps. | 25,478,148 | Ps. | 34,626,489 | Ps. | — | Ps. | 383,729 | Ps. | — | Ps. | 60,488,366 | |||||||
Accounts payable—intercompany | 188,017,865 | 491,132 | 38,402,234 | 28,674,335 | (255,585,566 | ) | — | ||||||||||||
Other current liabilities | 27,261,138 | 101,515,509 | 57,418,904 | 11,319,688 | (113,980,788 | ) | 83,534,451 | ||||||||||||
Total current liabilities | 240,757,151 | 136,633,130 | 95,821,138 | 40,377,752 | (369,566,354 | ) | 144,022,817 | ||||||||||||
Long-term debt | 68,017,363 | 234,820,915 | 13,821,638 | 16,534,763 | — | 333,194,679 | |||||||||||||
Long-term payables—intercompany | 26,325,197 | — | 320,556,693 | 4,209,239 | (351,091,129 | ) | — | ||||||||||||
Sale of future accounts receivable | — | — | 52,413,689 | — | (9,856,569 | ) | 42,557,120 | ||||||||||||
Reserve for retirement payments, pensions, seniority premiums, dismantlement and abandonment activities, sundry creditors, and others | 43,145,221 | — | 248,103,328 | 30,094,035 | — | 321,342,584 | |||||||||||||
Total liabilities | 378,244,932 | 371,454,045 | 730,716,486 | 91,215,789 | (730,514,052 | ) | 841,117,200 | ||||||||||||
EQUITY | 48,241,355 | — | 194,203,668 | 23,076,999 | (217,280,667 | ) | 48,241,355 | ||||||||||||
Total liabilities and equity | Ps. | 426,486,287 | Ps. | 371,454,045 | Ps. | 924,920,154 | Ps. | 114,292,788 | (Ps. | 947,794,719 | ) | Ps. | 889,358,555 | ||||||
F-89
Table of Contents
PETRÓLEOS MEXICANOS, SUBSIDIARY ENTITIES AND SUBSIDIARY COMPANIES
NOTES TO THE CONSOLIDATED FINANCIAL STATEMENTS FOR THE YEARS
ENDED DECEMBER 31, 2004, 2003 AND 2002
(Figures stated in thousands of Mexican pesos of December 31, 2004 purchasing power
and in thousands of U.S. dollars or other currency units)—(Continued)
SUPPLEMENTAL CONDENSED CONSOLIDATING FINANCIAL INFORMATION
U.S. GAAP RECONCILIATION OF EQUITY
For the year ended December 31, 2003
Petróleos Mexicanos | Master Trust | Subsidiary Guarantors | Non-Guarantor Subsidiaries | Eliminations | PEMEX Consolidated | ||||||||||||||||||
Equity under Mexican GAAP(as restated) | Ps. | 48,241,355 | Ps. | — | Ps. | 194,203,668 | Ps. | 23,076,999 | (Ps. | 217,280,667 | ) | Ps. | 48,241,355 | ||||||||||
U.S. GAAP adjustments: | |||||||||||||||||||||||
Exploration and drilling costs | — | 16,601,860 | — | — | 16,601,860 | ||||||||||||||||||
Pensions and seniority premiums | (860,191 | ) | (8,438,183 | ) | (1,155,113 | ) | — | (10,453,487 | ) | ||||||||||||||
Post-retirement benefits | (5,569,267 | ) | (29,735,138 | ) | (3,834,899 | ) | — | (39,139,304 | ) | ||||||||||||||
Accrued vacation | (94,977 | ) | — | (528,410 | ) | (71,396 | ) | — | (694,783 | ) | |||||||||||||
Fixed asset adjustments: | |||||||||||||||||||||||
Capitalized gains and losses of hedging financial instruments | — | (484,465 | ) | — | — | (484,465 | ) | ||||||||||||||||
Capitalization of interests, net | — | (13,197,362 | ) | (418,789 | ) | — | (13,616,151 | ) | |||||||||||||||
Impairment, net | — | — | (33,065,398 | ) | (12,066,872 | ) | — | (45,132,270 | ) | ||||||||||||||
Depreciation convention | (54,058 | ) | — | (2,667,455 | ) | (86,389 | ) | — | (2,807,902 | ) | |||||||||||||
Derivative financial instruments | (1,541,333 | ) | 5,752,803 | 7,499,178 | 904,244 | 51,020 | 12,665,912 | ||||||||||||||||
Sales of shares of Repsol | (676,294 | ) | — | — | — | (676,294 | ) | ||||||||||||||||
Profit in inventory | — | (1,849,499 | ) | — | — | (1,849,499 | ) | ||||||||||||||||
Available-for-sale investment securities | 1,322,587 | — | — | — | 1,322,587 | ||||||||||||||||||
Advance payment of minimum guaranteed dividends | (10,703,189 | ) | — | — | — | (10,703,189 | ) | ||||||||||||||||
Total U.S. GAAP adjustments, net | (18,176,722 | ) | 5,752,803 | (65,864,872 | ) | (16,729,214 | ) | 51,020 | (94,966,985 | ) | |||||||||||||
Equity (deficit) under U.S. GAAP | Ps. | 30,064,633 | Ps. | 5,752,803 | Ps. | 128,338,796 | Ps. | 6,347,785 | (Ps. | 217,229,647 | ) | (Ps. | 46,725,630 | ) | |||||||||
F-90
Table of Contents
PETRÓLEOS MEXICANOS, SUBSIDIARY ENTITIES AND SUBSIDIARY COMPANIES
NOTES TO THE CONSOLIDATED FINANCIAL STATEMENTS FOR THE YEARS
ENDED DECEMBER 31, 2004, 2003 AND 2002
(Figures stated in thousands of Mexican pesos of December 31, 2004 purchasing power
and in thousands of U.S. dollars or other currency units)—(Continued)
SUPPLEMENTAL CONDENSED CONSOLIDATING FINANCIAL INFORMATION
STATEMENT OF INCOME
For the year ended December 31, 2004
| Petróleos Mexicanos | Master Trust | Subsidiary Guarantors | Non-Guarantor Subsidiaries | Eliminations | PEMEX Consolidated | ||||||||||||||||||
| (As restated) | (As restated) | ||||||||||||||||||||||
Net sales | Ps. | 18,409,161 | Ps. | — | Ps. | 1,087,394,680 | Ps. | 423,425,735 | (Ps. | 755,642,451 | ) | Ps. | 773,587,125 | ||||||||||
Other (expenses) revenues, net | 420,123 | — | 2,358,537 | 9,697,576 | (1,321,859 | ) | 11,154,377 | ||||||||||||||||
Total revenues | 18,829,284 | — | 1,089,753,217 | 433,123,311 | (756,964,310 | ) | 784,741,502 | ||||||||||||||||
Costs and operating expenses: | |||||||||||||||||||||||
Cost of sales | 177,102 | — | 575,510,361 | 424,583,066 | (736,165,042 | ) | 264,105,487 | ||||||||||||||||
Transportation and distribution expenses | — | — | 17,265,698 | 491,950 | (183,340 | ) | 17,574,308 | ||||||||||||||||
Administrative expenses | 21,878,904 | 7,743 | 29,020,299 | 4,593,330 | (18,794,242 | ) | 36,706,034 | ||||||||||||||||
Total costs and operating expenses | 22,056,006 | 7,743 | 621,796,358 | 429,668,346 | (755,142,624 | ) | 318,385,829 | ||||||||||||||||
Comprehensive financing cost (income) | (8,924,544 | ) | 5,277,146 | 12,729,787 | 8,232,041 | (10,266,277 | ) | 7,048,153 | |||||||||||||||
Equity participation in subsidiaries | (30,103,097 | ) | — | — | — | 30,103,097 | — | ||||||||||||||||
Capitalization of Master Trust operations and others | — | 5,284,889 | — | 3,145,354 | (8,430,243 | ) | — | ||||||||||||||||
(Loss) income before hydrocarbon extraction duties and other, special tax on production and services and cumulative effect of adoption of new accounting standards | (24,405,275 | ) | — | 455,227,072 | (1,631,722 | ) | 30,117,445 | 459,307,520 | |||||||||||||||
Hydrocarbon extraction duties and other | — | — | 418,045,215 | 1,569,599 | 14,348 | 419,629,162 | |||||||||||||||||
Special tax on production and services (IEPS Tax) | — | — | 54,704,848 | — | — | 54,704,848 | |||||||||||||||||
| 472,750,063 | 1,569,599 | 14,348 | 474,334,010 | ||||||||||||||||||||
Cumulative effect of adoption of new accounting standards | (1,090,580 | ) | — | (6,555,130 | ) | (2,823,410 | ) | — | (10,469,120 | ) | |||||||||||||
Net (loss) income for the year | (Ps. | 25,495,855 | ) | Ps. | — | (Ps. | 24,078,121 | ) | (Ps. | 6,024,731 | ) | Ps. | 30,103,097 | (Ps. | 25,495,610 | ) | |||||||
F-91
Table of Contents
PETRÓLEOS MEXICANOS, SUBSIDIARY ENTITIES AND SUBSIDIARY COMPANIES
NOTES TO THE CONSOLIDATED FINANCIAL STATEMENTS FOR THE YEARS
ENDED DECEMBER 31, 2004, 2003 AND 2002
(Figures stated in thousands of Mexican pesos of December 31, 2004 purchasing power
and in thousands of U.S. dollars or other currency units)—(Continued)
SUPPLEMENTAL CONDENSED CONSOLIDATING FINANCIAL INFORMATION
U.S. GAAP RECONCILIATION OF INCOME
For the year ended December 31, 2004
Petróleos Mexicanos | Master Trust | Subsidiary Guarantors | Non-Guarantor Subsidiaries | Eliminations | PEMEX Consolidated | |||||||||||||||||
Net loss under Mexican GAAP(as restated) | (Ps. | 25,495,855 | ) | Ps. | — | (Ps. | 24,078,121 | ) | (Ps. | 6,024,731 | ) | Ps. | 30,103,097 | (Ps. | 25,495,610 | ) | ||||||
U.S. GAAP adjustments: | ||||||||||||||||||||||
Exploration and drilling costs | — | — | (1,419,459 | ) | — | — | (1,419,459 | ) | ||||||||||||||
Pensions and seniority premiums | 11,887 | — | 565,121 | 171,130 | — | 748,138 | ||||||||||||||||
Post-retirement benefits | (310,205 | ) | — | (2,076,643 | ) | (271,546 | ) | — | (2,658,394 | ) | ||||||||||||
Accrued vacation | 17,532 | — | 96,550 | 12,802 | — | 126,884 | ||||||||||||||||
Fixed asset adjustments: | ||||||||||||||||||||||
Capitalized gains and losses of hedging financial instruments | — | — | 1,094,896 | — | — | 1,094,896 | ||||||||||||||||
Capitalization of interests, net | — | — | 1,909,551 | 40,315 | — | 1,949,866 | ||||||||||||||||
Impairment, net | — | — | 6,968,773 | 2,188,859 | — | 9,157,632 | ||||||||||||||||
Depreciation convention | 13,515 | — | 666,864 | 21,597 | — | 701,976 | ||||||||||||||||
Derivative financial instruments | 2,476,866 | 3,711,939 | 799,104 | (1,567,826 | ) | 97,802 | 5,517,885 | |||||||||||||||
Sales of shares of Repsol | 676,294 | — | — | — | — | 676,294 | ||||||||||||||||
Profit in inventory | — | — | 1,039,355 | — | — | 1,039,355 | ||||||||||||||||
Available-for-sale securities (Repsol) | (5,029,143 | ) | — | — | — | — | (5,029,143 | ) | ||||||||||||||
Effect of inflation accounting on U.S. GAAP adjustment | 554,138 | — | 21,508 | 2,852 | — | 578,498 | ||||||||||||||||
Total U.S. GAAP adjustments, net | (1,589,116 | ) | 3,711,939 | 9,665,620 | 598,183 | 97,802 | 12,484,428 | |||||||||||||||
Net (loss) income under U.S. GAAP | (Ps. | 27,084,971 | ) | Ps. | 3,711,939 | (Ps. | 14,412,501 | ) | (Ps. | 5,426,548 | ) | Ps. | 30,200,899 | (Ps. | 13,011,182 | ) | ||||||
F-92
Table of Contents
PETRÓLEOS MEXICANOS, SUBSIDIARY ENTITIES AND SUBSIDIARY COMPANIES
NOTES TO THE CONSOLIDATED FINANCIAL STATEMENTS FOR THE YEARS
ENDED DECEMBER 31, 2004, 2003 AND 2002
(Figures stated in thousands of Mexican pesos of December 31, 2004 purchasing power
and in thousands of U.S. dollars or other currency units)—(Continued)
SUPPLEMENTAL CONDENSED CONSOLIDATING FINANCIAL INFORMATION
STATEMENT OF INCOME
For the year ended December 31, 2003
| Petróleos Mexicanos | Master Trust | Subsidiary Guarantors | Non-Guarantor Subsidiaries | Eliminations | PEMEX Consolidated | ||||||||||||||||||
| (As restated) | (As restated) | ||||||||||||||||||||||
Net sales | Ps. | 19,035,581 | Ps. | — | Ps. | 922,743,256 | Ps. | 319,231,121 | (Ps. | 603,116,553 | ) | Ps. | 657,893,405 | ||||||||||
Other (expenses) revenues, net | (3,572,239 | ) | — | 5,821,871 | 9,426,261 | (8,561,182 | ) | 3,114,711 | |||||||||||||||
Total revenues | 15,463,342 | — | 928,565,127 | 328,657,382 | (611,677,735 | ) | 661,008,116 | ||||||||||||||||
Costs and operating expenses: | |||||||||||||||||||||||
Cost of sales | — | — | 477,292,036 | 324,872,038 | (584,294,934 | ) | 217,869,140 | ||||||||||||||||
Transportation and distribution expenses | — | — | 16,442,914 | 345,751 | (432,579 | ) | 16,356,086 | ||||||||||||||||
Administrative expenses | 21,063,576 | 47,541 | 29,903,301 | 4,561,010 | (18,553,663 | ) | 37,021,765 | ||||||||||||||||
Total costs and operating expenses | 21,063,576 | 47,541 | 523,638,251 | 329,778,799 | (603,281,176 | ) | 271,246,991 | ||||||||||||||||
Comprehensive financing cost (income) | (4,251,098 | ) | 6,717,163 | 34,623,179 | 10,421,009 | (15,172,061 | ) | 32,338,192 | |||||||||||||||
Equity participation in subsidiaries | (40,457,582 | ) | — | — | — | 40,457,582 | — | ||||||||||||||||
Capitalization of Master Trust operations and others | — | 6,764,704 | — | — | (6,764,704 | ) | — | ||||||||||||||||
(Loss) income before hydrocarbon extraction duties and other, special tax on production and services and cumulative effect of adoption of new accounting standards | (41,806,718 | ) | — | 370,303,697 | (11,542,426 | ) | 40,468,380 | 357,422,933 | |||||||||||||||
Hydrocarbon extraction duties and other | 43,214 | — | 302,297,180 | 983,524 | 10,797 | 303,334,715 | |||||||||||||||||
Special tax on production and services (IEPS Tax) | — | — | 98,959,610 | — | — | 98,959,610 | |||||||||||||||||
| 43,214 | — | 401,256,790 | 983,524 | 10,797 | 402,294,325 | ||||||||||||||||||
Cumulative effect of adoption of new accounting standards | — | — | 2,117,261 | — | — | 2,117,261 | |||||||||||||||||
Net (loss) income for the year | (Ps. | 41,849,932 | ) | Ps. | — | (Ps. | 28,835,832 | ) | (Ps. | 12,525,950 | ) | Ps. | 40,457,583 | (Ps. | 42,754,131 | ) | |||||||
F-93
Table of Contents
PETRÓLEOS MEXICANOS, SUBSIDIARY ENTITIES AND SUBSIDIARY COMPANIES
NOTES TO THE CONSOLIDATED FINANCIAL STATEMENTS FOR THE YEARS
ENDED DECEMBER 31, 2004, 2003 AND 2002
(Figures stated in thousands of Mexican pesos of December 31, 2004 purchasing power
and in thousands of U.S. dollars or other currency units)—(Continued)
SUPPLEMENTAL CONDENSED CONSOLIDATING FINANCIAL INFORMATION
U.S. GAAP RECONCILIATION OF INCOME
For the year ended December 31, 2003
Petróleos Mexicanos | Master | Subsidiary Guarantors | Non-Guarantor Subsidiaries | Eliminations | PEMEX Consolidated | |||||||||||||||||
Net loss under Mexican GAAP (as restated) | (Ps. | 41,849,932 | ) | Ps. | — | (Ps. | 28,835,832 | ) | (Ps. | 12,525,950 | ) | Ps. | 40,457,583 | (Ps. | 42,754,131 | ) | ||||||
U.S. GAAP adjustments: | ||||||||||||||||||||||
Exploration and drilling costs | — | — | (20,284,641 | ) | — | — | (20,284,641 | ) | ||||||||||||||
Pensions and seniority premiums | (10,206 | ) | — | 456,452 | 138,673 | — | 584,919 | |||||||||||||||
Post-retirement benefits | (1,206,075 | ) | — | (7,039,412 | ) | (846,933 | ) | — | (9,092,420 | ) | ||||||||||||
Accrued vacation | (3,721 | ) | — | (20,702 | ) | (2,797 | ) | — | (27,220 | ) | ||||||||||||
Fixed asset adjustments: | ||||||||||||||||||||||
Capitalized gains and losses of hedging financial instruments | — | — | (187,133 | ) | — | — | (187,133 | ) | ||||||||||||||
Capitalization of interests, net | — | — | 1,767,988 | 41,319 | — | 1,809,307 | ||||||||||||||||
Impairment, net | — | — | (730,735 | ) | (2,024,888 | ) | — | (2,755,623 | ) | |||||||||||||
Depreciation convention | 13,515 | 666,864 | 21,597 | — | 701,976 | |||||||||||||||||
Derivative financial instruments | (791,601 | ) | 68,787 | 1,683,054 | 905,159 | 51,020 | 1,916,419 | |||||||||||||||
Sales of shares of Repsol | (585,237 | ) | — | — | — | — | (585,237 | ) | ||||||||||||||
Profit in inventory | — | — | (109,315 | ) | — | — | (109,315 | ) | ||||||||||||||
Available-for-sale investment securities | — | — | — | — | — | — | ||||||||||||||||
Effect of inflation accounting on U.S. GAAP adjustment | 977,428 | — | 47,831 | 6,463 | 1,031,722 | |||||||||||||||||
Total U.S. GAAP adjustments, net | (1,605,897 | ) | 68,787 | (23,749,749 | ) | (1,761,407 | ) | 51,020 | (26,997,246 | ) | ||||||||||||
Net (loss) income under U.S. GAAP | (Ps. | 43,455,829 | ) | Ps. | 68,787 | (Ps. | 52,585,581 | ) | (Ps. | 14,287,357 | ) | Ps. | 40,508,603 | (Ps. | 69,751,377 | ) | ||||||
F-94
Table of Contents
PETRÓLEOS MEXICANOS, SUBSIDIARY ENTITIES AND SUBSIDIARY COMPANIES
NOTES TO THE CONSOLIDATED FINANCIAL STATEMENTS FOR THE YEARS
ENDED DECEMBER 31, 2004, 2003 AND 2002
(Figures stated in thousands of Mexican pesos of December 31, 2004 purchasing power
and in thousands of U.S. dollars or other currency units)—(Continued)
SUPPLEMENTAL CONDENSED CONSOLIDATING FINANCIAL INFORMATION
STATEMENT OF INCOME
For the year ended December 31, 2002
| Petróleos Mexicanos | Master Trust | Subsidiary Guarantors | Non-Guarantor Subsidiaries | Eliminations | PEMEX Consolidated | |||||||||||||
| (As restated) | (As restated) | |||||||||||||||||
Net sales | Ps. 19,509,512 | Ps. — | Ps. 707,563,098 | Ps. 243,897,165 | (Ps. 429,395,954 | ) | Ps. 541,573,821 | |||||||||||
Other revenues (expenses), net | 1,760,544 | — | 41,471 | 4,266,101 | (6,162,181 | ) | (94,065 | ) | ||||||||||
Total revenues | 21,270,056 | — | 707,604,569 | 248,163,266 | (435,558,135 | ) | 541,479,756 | |||||||||||
Costs and operating expenses: | ||||||||||||||||||
Cost of sales | — | 340,954,015 | 247,178,016 | (410,618,312 | ) | 177,513,719 | ||||||||||||
Transportation and distribution expenses | — | 16,130,564 | 977,831 | (277,017 | ) | 16,831,378 | ||||||||||||
Administrative expenses | 18,943,481 | 37,591 | 32,292,547 | 5,024,222 | (20,139,675 | ) | 36,158,166 | |||||||||||
Total costs and operating expenses | 18,943,481 | 37,591 | 389,377,126 | 253,180,069 | (431,035,004 | ) | 230,503,263 | |||||||||||
Comprehensive financing cost (income) | 2,033,035 | (6,222,702 | ) | 7,511,361 | 5,233,584 | (1,992,290 | ) | 6,562,988 | ||||||||||
Equity participation in subsidiaries | (26,143,170 | ) | — | — | — | 26,143,170 | — | |||||||||||
Capitalization of Master Trust operations and others | — | (2,530,841 | ) | — | — | 2,530,841 | — | |||||||||||
(Loss) income before hydrocarbon extraction duties and other, special tax on production and services and cumulative effect of adoption of new accounting standards | (25,849,630 | ) | 3,654,270 | 310,716,082 | (10,250,387 | ) | 26,143,170 | 304,413,505 | ||||||||||
Hydrocarbon extraction duties and other | — | — | 200,596,547 | 873,910 | — | 201,470,457 | ||||||||||||
Special tax on production and services (IEPS Tax) | — | — | 128,792,678 | — | — | 128,792,678 | ||||||||||||
| — | — | 329,389,225 | 873,910 | — | 330,263,135 | |||||||||||||
Net (loss) income for the year | (Ps. 25,849,630 | ) | Ps. 3,654,270 | (Ps. 18,673,143 | ) | (Ps. 11,124,297 | ) | Ps. 26,143,170 | (Ps. 25,849,630 | ) | ||||||||
F-95
Table of Contents
PETRÓLEOS MEXICANOS, SUBSIDIARY ENTITIES AND SUBSIDIARY COMPANIES
NOTES TO THE CONSOLIDATED FINANCIAL STATEMENTS FOR THE YEARS
ENDED DECEMBER 31, 2004, 2003 AND 2002
(Figures stated in thousands of Mexican pesos of December 31, 2004 purchasing power
and in thousands of U.S. dollars or other currency units)—(Continued)
SUPPLEMENTAL CONDENSED CONSOLIDATING FINANCIAL INFORMATION
U.S. GAAP RECONCILIATION OF INCOME
For the year ended December 31, 2002
Petróleos Mexicanos | Master Trust | Subsidiary Guarantors | Non-Guarantor Subsidiaries | Eliminations | PEMEX Consolidated | ||||||||||||||||||
Net loss under Mexican GAAP(as restated) | (Ps. | 25,849,630 | ) | Ps. | 3,654,270 | (Ps. | 18,673,143 | ) | (Ps. | 11,124,297 | ) | Ps. | 26,143,170 | (Ps. | 25,849,630 | ) | |||||||
U.S. GAAP adjustments: | |||||||||||||||||||||||
Exploration and drilling costs | — | — | 3,397,002 | — | — | 3,397,002 | |||||||||||||||||
Pensions and seniority premiums | (49,407 | ) | — | (1,209,726 | ) | (264,854 | ) | — | (1,523,987 | ) | |||||||||||||
Post-retirement benefits | (1,147,439 | ) | — | (6,401,748 | ) | (797,658 | ) | — | (8,346,845 | ) | |||||||||||||
Accrued vacation | (5,040 | ) | — | (27,882 | ) | (3,851 | ) | — | (36,773 | ) | |||||||||||||
Fixed asset adjustments: | |||||||||||||||||||||||
Capitalized gains and losses of hedging financial instruments | — | — | (297,331 | ) | — | — | (297,331 | ) | |||||||||||||||
Capitalization of interests, net | — | — | 1,607,179 | 21,291 | — | 1,628,470 | |||||||||||||||||
Impairment, net | — | — | (1,425,515 | ) | 3,595,721 | — | 2,170,206 | ||||||||||||||||
Depreciation convention | (13,248 | ) | — | (530,217 | ) | (20,566 | ) | — | (564,031 | ) | |||||||||||||
Derivative financial instruments | 1,685,042 | (2,769 | ) | (4,880,510 | ) | (1,708 | ) | — | (3,199,945 | ) | |||||||||||||
Sales of shares of Repsol | (703,399 | ) | — | — | — | — | (703,399 | ) | |||||||||||||||
Profit in inventory | — | — | (1,053,751 | ) | — | — | (1,053,751 | ) | |||||||||||||||
Available-for-sale investment securities | — | — | — | — | — | — | |||||||||||||||||
Effect of inflation accounting on U.S. GAAP adjustment | 16,706 | — | 818 | 110 | — | 17,634 | |||||||||||||||||
Total U.S. GAAP adjustments, net | (216,785 | ) | (2,769 | ) | (10,821,681 | ) | 2,528,485 | — | (8,512,750 | ) | |||||||||||||
Net (loss) income under U.S. GAAP | (Ps. | 26,066,415 | ) | Ps. | 3,651,501 | (Ps. | 29,494,824 | ) | (Ps. | 8,595,812 | ) | Ps. | 26,143,170 | (Ps. | 34,362,380 | ) | |||||||
F-96
Table of Contents
PETRÓLEOS MEXICANOS, SUBSIDIARY ENTITIES AND SUBSIDIARY COMPANIES
NOTES TO THE CONSOLIDATED FINANCIAL STATEMENTS FOR THE YEARS
ENDED DECEMBER 31, 2004, 2003 AND 2002
(Figures stated in thousands of Mexican pesos of December 31, 2004 purchasing power
and in thousands of U.S. dollars or other currency units)—(Continued)
SUPPLEMENTAL CONDENSED CONSOLIDATING FINANCIAL INFORMATION
STATEMENT OF CHANGES IN FINANCIAL POSITION
For the year ended December 31, 2004
Petróleos Mexicanos | Master Trust | Subsidiary Guarantors | Non-Guarantor Subsidiaries | Eliminations | PEMEX Consolidated | |||||||||||||
| (As restated) | (As restated) | (As restated) | (As restated) | (As restated) | ||||||||||||||
Funds provided by (used in) operating activities | Ps. 34,884,631 | (Ps. 20,538,404 | ) | Ps. 60,573,697 | (Ps. 68,890,295 | ) | Ps. — | Ps. 6,029,629 | ||||||||||
Financing activities: | ||||||||||||||||||
Sale of future accounts receivable | — | — | (5,921,431 | ) | — | — | (5,921,431 | ) | ||||||||||
Long-term debt | (50,265,357 | ) | 50,356,097 | (2,445,075 | ) | 61,662,270 | — | 59,307,935 | ||||||||||
Net income passed to Petróleos Mexicanos | ||||||||||||||||||
Inter-company charges and deductions | 32,452,809 | — | (8,341,482 | ) | (8,450 | ) | (24,102,877 | ) | — | |||||||||
Notes payable to contractors | — | — | — | — | — | — | ||||||||||||
Other changes in equity and retained earnings | (10,387,839 | ) | — | 30,709,168 | 1,928,362 | — | 22,249,691 | |||||||||||
Funds provided by (used in) financing activities | (28,200,387 | ) | 50,356,097 | 14,001,180 | 63,582,182 | (24,102,877 | ) | 75,636, 195 | ||||||||||
Investing activities: | ||||||||||||||||||
Increase in fixed assets, net | (236,894 | ) | — | (73,511,357 | ) | (188,485 | ) | — | (73,936,736 | ) | ||||||||
Inter-company charges and deductions | 8,349,932 | (32,452,809 | ) | — | — | 24,102,877 | — | |||||||||||
Investments in subsidiaries | — | — | — | — | — | |||||||||||||
Funds (used in) provided by investing activities | 8,113,038 | (32,452,809 | ) | (73,511,357 | ) | (188,485 | ) | 24,102,877 | (73,936,736 | ) | ||||||||
Increase in cash and cash equivalents | 14,797,282 | �� | (2,635,116 | ) | 1,063,520 | (5,496,598 | ) | — | 7,729,088 | |||||||||
Cash and cash equivalents at beginning of the year | 29,060,122 | 25,590,855 | 1,034,659 | 21,457,507 | — | 77,143,143 | ||||||||||||
Cash and cash equivalents at the end of the year | Ps. 43,857,404 | Ps. 22,955,739 | Ps. 2,098,179 | Ps. 15,960,909 | Ps. — | Ps. 84,872,231 | ||||||||||||
F-97
Table of Contents
PETRÓLEOS MEXICANOS, SUBSIDIARY ENTITIES AND SUBSIDIARY COMPANIES
NOTES TO THE CONSOLIDATED FINANCIAL STATEMENTS FOR THE YEARS
ENDED DECEMBER 31, 2004, 2003 AND 2002
(Figures stated in thousands of Mexican pesos of December 31, 2004 purchasing power
and in thousands of U.S. dollars or other currency units)—(Continued)
SUPPLEMENTAL CONDENSED CONSOLIDATING FINANCIAL INFORMATION
STATEMENT OF CHANGES IN FINANCIAL POSITION
For the year ended December 31, 2003
Petróleos Mexicanos | Master Trust | Subsidiary Guarantors | Non-Guarantor Subsidiaries | Eliminations | PEMEX Consolidated | |||||||||||||
| (As restated) | (As restated) | (As restated) | (As restated) | (As restated) | ||||||||||||||
Funds provided by (used in) operating activities | Ps. 22,131,817 | (Ps. 85,347,926 | ) | Ps. 81,037,847 | Ps. 220,024 | Ps. — | Ps. 18,041,762 | |||||||||||
Financing activities: | ||||||||||||||||||
Sale of future accounts receivable | — | — | (4,953,601 | ) | — | — | (4,953,601 | ) | ||||||||||
Long-term debt | (8,001,215 | ) | 107,961,232 | (15,908,290 | ) | 16,808,527 | — | 100,860,254 | ||||||||||
Net income passed to Petróleos Mexicanos | ||||||||||||||||||
Inter-company charges and deductions | 14,133,444 | — | 13,337,361 | 6,525 | (27,477,330 | ) | — | |||||||||||
Notes payable to contractors | — | — | — | — | — | — | ||||||||||||
Other changes in equity and retained earnings | (10,500,161 | ) | — | — | — | — | (10,500,161 | ) | ||||||||||
Funds provided by (used in) financing activities | (4,367,932 | ) | 107,961,232 | (7,524,530 | ) | 16,815,052 | (27,477,330 | ) | 85,406,492 | |||||||||
Investing activities: | ||||||||||||||||||
Increase in fixed assets, net | 265,670 | — | (73,403,693 | ) | (1,156,386 | ) | — | (74,294,409 | ) | |||||||||
Inter-company charges and deductions | (13,344,186 | ) | (14,133,144 | ) | — | — | 27,477,330 | — | ||||||||||
Investments in subsidiaries | — | — | — | — | — | |||||||||||||
Funds (used in) provided by investing activities | (13,078,516 | ) | (14,133,144 | ) | 73,403,693 | ) | (1,156,386 | ) | 27,477,330 | (74,2 94,409 | ) | |||||||
Increase in cash and cash equivalents | 4,685,369 | 8,480,162 | 109,624 | 15,878,690 | — | 29,153,845 | ||||||||||||
Cash and cash equivalents at beginning of the year | 24,374,753 | 17,110,693 | 925,035 | 5,578,817 | — | 47,989,298 | ||||||||||||
Cash and cash equivalents at the end of the year | Ps. 29,060,122 | Ps. 25,590,855 | Ps. 1,034,659 | Ps. 21,457,507 | Ps. — | Ps. 77,143,143 | ||||||||||||
F-98
Table of Contents
PETRÓLEOS MEXICANOS, SUBSIDIARY ENTITIES AND SUBSIDIARY COMPANIES
NOTES TO THE CONSOLIDATED FINANCIAL STATEMENTS FOR THE YEARS
ENDED DECEMBER 31, 2004, 2003 AND 2002
(Figures stated in thousands of Mexican pesos of December 31, 2004 purchasing power
and in thousands of U.S. dollars or other currency units)—(Continued)
SUPPLEMENTAL CONDENSED CONSOLIDATING FINANCIAL INFORMATION
STATEMENT OF CHANGES IN FINANCIAL POSITION
For the year ended December 31, 2002
Petróleos Mexicanos | Master Trust | Subsidiary Guarantors | Non-Guarantor Subsidiaries | Eliminations | PEMEX Consolidated | |||||||||||||
| (As restated) | (As restated) | (As restated) | (As restated) | (As restated) | ||||||||||||||
Funds (used in) provided by operating activities | Ps. 28,852,302 | (Ps. 63,523,679 | ) | Ps. 84,259,212 | (Ps. 3,810,853 | ) | Ps. — | Ps. 45,776,982 | ||||||||||
Financing activities: | ||||||||||||||||||
Sale of future accounts receivable | — | — | (4,149,808 | ) | — | — | (4,149,808 | ) | ||||||||||
Long-term debt | (2,170,464 | ) | 80,850,460 | 14,602,113 | — | — | 93,282,109 | |||||||||||
Net (loss) income passed to Petróleos Mexicanos | ||||||||||||||||||
Inter-company charges and deductions | 6,329,773 | — | 12,586,609 | (121,576 | ) | (18,794,806 | ) | — | ||||||||||
Notes payable to contractors | — | — | — | — | — | — | ||||||||||||
Other changes in equity and retained earnings | (2,397,302 | ) | — | — | — | — | (2,397,302 | ) | ||||||||||
Funds provided by (used in) financing activities | 1,762,007 | 80,850,460 | 23,038,914 | (121,576 | ) | (18,794,806 | ) | 86,734,999 | ||||||||||
Investing activities: | ||||||||||||||||||
Increase in fixed assets, net | (159,038 | ) | — | (107,208,340 | ) | 6,148,617 | — | (101,218,761 | ) | |||||||||
Inter-company charges and deductions | (12,465,033 | ) | (6,329,773 | ) | — | — | 18,794,806 | — | ||||||||||
Investments in subsidiaries | — | — | — | — | — | — | ||||||||||||
Funds (used in) provided by investing activities | (12,624,071 | ) | (6,329,773 | ) | (107,208,340 | ) | 6,148,617 | 18,794,806 | (101,218,761 | ) | ||||||||
Increase in cash and cash equivalents | 17,990,238 | 10,997,008 | 89,786 | 2,216,188 | — | 31,293,220 | ||||||||||||
Cash and cash equivalents at beginning of the year | 6,384,514 | 6,113,687 | 835,249 | 3,362,628 | — | 16,696,078 | ||||||||||||
Cash and cash equivalents at the end of the year | Ps. 24,374,752 | Ps. 17,110,695 | Ps. 925,035 | Ps. 5,578,816 | Ps. — | Ps. 47,989,298 | ||||||||||||
F-99
Table of Contents
PETRÓLEOS MEXICANOS, SUBSIDIARY ENTITIES AND SUBSIDIARY COMPANIES
NOTES TO THE CONSOLIDATED FINANCIAL STATEMENTS FOR THE YEARS
ENDED DECEMBER 31, 2004, 2003 AND 2002
(Figures stated in thousands of Mexican pesos of December 31, 2004 purchasing power
and in thousands of U.S. dollars or other currency units)—(Continued)
22. Supplementary information on oil and gas exploration and production activities (unaudited)
The following tables provide supplementary information on the oil and gas exploration, development and producing activities of Pemex-Exploration and Production in compliance with SFAS No. 69, “Disclosures about Oil and Gas Producing Activities” (“SFAS No. 69”). All exploration and production activities of Pemex-Exploration and Production are located in Mexico.
The supplemental data presented herein reflects information for all of Pemex-Exploration and Production’s oil and gas producing activities. Capitalized costs and results of operations presented herein have been prepared in accordance with U.S. GAAP and have included the effects of adoption of SFAS No. 143 where appropriate. Under otherwise indicated, all information is presented in constant pesos as of December 31, 2004.
Capitalized costs for oil and gas producing activities (unaudited):
| As of December 31, | |||||||||
| 2004 | 2003 | 2002 | |||||||
Proved properties | Ps. 571,905,561 | Ps. 498,699,851 | Ps. 405,200,969 | ||||||
Construction in progress | 60,802,431 | 72,040,482 | 118,987,655 | ||||||
Accumulated depreciation and amortization | (255,037,215 | ) | (229,801,874 | ) | (240,142,934 | ) | |||
Net capitalized costs | Ps. 377,670,777 | Ps. 340,938,459 | Ps. 284,045,690 | ||||||
Costs incurred for oil and gas property exploration and development activities (unaudited):
| Year ended December 31, | ||||||
| 2004 | 2003 | 2002 | ||||
Exploration | Ps. 20,989,270 | Ps. 18,496,461 | Ps. 12,033,416 | |||
Development | 67,417,085 | 48,335,422 | 37,013,176 | |||
Total costs incurred | Ps. 88,406,355 | Ps. 66,831,883 | Ps. 49,046,592 | |||
There are no property acquisition costs because PEMEX exploits oil reserves owned by the Mexican nation.
Exploration costs include costs of geological and geophysical studies of fields amounting to Ps. 5,254,132, Ps. 12,125,770 and Ps. 5,887,408 for 2004, 2003 and 2002, respectively, that, in accordance with the successful efforts methods are accounted for as geological and geophysical exploration expenses.
Development costs include those incurred to obtain access to proved reserves and to provide facilities for extracting, treating, gathering and storing the oil and gas.
F-100
Table of Contents
PETRÓLEOS MEXICANOS, SUBSIDIARY ENTITIES AND SUBSIDIARY COMPANIES
NOTES TO THE CONSOLIDATED FINANCIAL STATEMENTS FOR THE YEARS
ENDED DECEMBER 31, 2004, 2003 AND 2002
(Figures stated in thousands of Mexican pesos of December 31, 2004 purchasing power
and in thousands of U.S. dollars or other currency units)—(Continued)
Results of operations for oil and gas producing activities (unaudited):
| Year Ended December 31, | ||||||
| 2004 | 2003 | 2002 | ||||
Revenues from sale of oil and gas | Ps. 560,997,135 | Ps. 448,779,513 | Ps. 316,852,364 | |||
Hydrocarbon duties | 380,951,624 | 279,532,764 | 182,478,348 | |||
Excess-gains taxes | 34,393,259 | 19,664,354 | 15,485,788 | |||
Production costs (excluding taxes) | 99,403,551 | 72,351,601 | 46,187,793 | |||
Exploration expenses | 5,254,132 | 6,256,541 | 5,094,100 | |||
Depreciation, depletion, amortization and accretion | 24,606,921 | 24,790,746 | 22,235,343 | |||
| 544,609,487 | 402,596,006 | 271,481,372 | ||||
Results of operations for oil and gas producing activities | Ps. 16,387,648 | Ps. 46,183,507 | Ps. 45,370,992 | |||
Crude oil and natural gas reserves:
Sales prices and production costs (unaudited)
The following table summarizes average sales prices (excluding production taxes) in U.S. dollars:
| 2004 | 2003 | 2002 | |||||||
December average sales price | $ | 30.00 | $ | 24.51 | $ | 24.53 | |||
Crude oil, per barrel | $ | 29.52 | $ | 25.83 | $ | 26.36 | |||
Natural gas, per thousand cubic feet | $ | 6.64 | $ | 4.10 | $ | 3.58 | |||
Crude oil and natural gas reserves (unaudited)
Under the Political Constitution of the United Mexican States and Mexican statutory law, all oil and other hydrocarbon reserves within Mexico are owned by the Mexican nation and not by PEMEX. Under the Organic Law, PEMEX has the exclusive right to produce these reserves and sells the production subject to a federal production tax currently assessed at the rate of 60.8% of revenue from production sales. Crude oil exports are subject to an additional “excess gains” tax. PEMEX’s exploration and development activities are limited to reserves located in Mexico.
Proved oil and gas reserves are those estimated quantities of crude oil, natural gas and natural gas liquids which geological and engineering data demonstrate with reasonable certainty to be recoverable in future years from known reservoirs under existing economic and operating conditions,i.e., prices and costs at the date the estimate is made. Mexico’s proved reserves are estimated by PEMEX’s petroleum engineers.
PEMEX estimates Mexico’s reserves using standard geological and engineering methods generally accepted by the petroleum industry. The choice of method or combinations of methods employed in the analysis of each reservoir is determined by experience in the area, the stage of development, quality and completeness of basic data and production and pressure history. The reserves data set forth herein represent only estimates. Reserves valuation is a subjective process of estimating underground accumulations of crude oil and natural gas that cannot be measured in an exact manner. The accuracy of any reserve estimate depends on the quality of available
F-101
Table of Contents
PETRÓLEOS MEXICANOS, SUBSIDIARY ENTITIES AND SUBSIDIARY COMPANIES
NOTES TO THE CONSOLIDATED FINANCIAL STATEMENTS FOR THE YEARS
ENDED DECEMBER 31, 2004, 2003 AND 2002
(Figures stated in thousands of Mexican pesos of December 31, 2004 purchasing power
and in thousands of U.S. dollars or other currency units)—(Continued)
data, the engineering and geological interpretation and judgment. As a result, estimates of different engineers may vary. In addition, results of drilling, testing and production subsequent to the date of an estimate are among the criteria which may be used to justify revision of such estimate.
The following two tables of oil and gas reserves set forth PEMEX’s estimates of Mexico’s proved reserves at December 31, 2004, 2003 and 2002 in accordance with the definition of proved reserves under Rule 4-10(a) Regulation S-X of the Securities Act of 1933.
Mexico’s total proved developed and undeveloped reserves of crude oil and condensates decreased by 7.7% in 2004, from 16.0 billion barrels of oil equivalent in 2003 to 14.8 billion barrels of oil equivalent in 2004. In 2004, proved developed reserves of crude oil and condensates decreased by 6.9%, from 10.5 billion barrels of oil equivalent in 2003 to 9.7 billion barrels in 2004. Mexico’s total proved developed and undeveloped dry gas reserves decreased by 0.3% in 2004, from 14.9 trillion cubic feet in 2003 to 14.8 trillion cubic feet in 2004. Mexico’s proved developed dry gas reserves decreased by 2.9% in 2004, from 8.1 trillion cubic feet in 2003 to 8.3 trillion cubic feet in 2004.
Crude oil and condensate reserves (including natural gas liquids) (a) (unaudited)
| (Millions of barrels) | |||||||||
| 2004 | 2003 | 2002 | |||||||
Proved developed and undeveloped reserves At January 1 | 16,041 | 17,196 | 18,767 | ||||||
Revisions | (109 | ) | 120 | (247 | ) | ||||
Extensions and discoveries (b) | 245 | 84 | (36 | ) | |||||
Production | (1,374 | ) | (1,359 | ) | (1,288 | ) | |||
At December 31 | 14,803 | 16,041 | 17,196 | ||||||
Proved developed reserves at December 31 | 9,745 | 10,473 | 11,725 | ||||||
Note: Table amounts may not total due to rounding.
| (a) | Crude oil and condensate reserves include the fraction of liquefiable hydrocarbons recoverable in natural gas processing plants. |
| (b) | Extensions include positive and negative changes due to new data gathered through drilling of extension wells. |
F-102
Table of Contents
PETRÓLEOS MEXICANOS, SUBSIDIARY ENTITIES AND SUBSIDIARY COMPANIES
NOTES TO THE CONSOLIDATED FINANCIAL STATEMENTS FOR THE YEARS
ENDED DECEMBER 31, 2004, 2003 AND 2002
(Figures stated in thousands of Mexican pesos of December 31, 2004 purchasing power
and in thousands of U.S. dollars or other currency units)—(Continued)
Dry gas reserves (unaudited)
| (Billions of cubic feet) | |||||||||
| 2004 | 2003 | 2002 | |||||||
Proved developed and undeveloped reserves At January 1 | 14,850 | 14,985 | 16,256 | ||||||
Revisions | 547 | 695 | (443 | ) | |||||
Extensions and discoveries (a) | 641 | 354 | 313 | ||||||
Production (b) | (1,231 | ) | (1,184 | ) | (1,141 | ) | |||
At December 31 | 14,807 | 14,850 | 14,985 | ||||||
Proved developed reserves at December 31 | 8,325 | 8,094 | 8,572 | ||||||
Note: Table amounts may not total due to rounding.
| (a) | Extensions include positive and negative changes due to new data gathered through drilling of extension wells. Negative changes are reported as revisions. |
| (b) | Natural gas production reported in other tables refer to wet, sour gas. There is a shrinkage in volume when natural gas liquids and impurities are extracted to obtain dry gas. Therefore, reported natural gas volumes are greater than dry gas volumes. |
Based on the reservoir performance, new information, and discoveries, proved reserves in accordance with the definition of proved reserves under Rule 4-10(a) of Regulation S-X for all regions as of December 31, 2004 are estimated to be 17,649.8 million barrels of oil equivalent (18,895 million barrels of oil equivalent at December 31, 2003).
Standardized measure of discounted future net cash flows related to proved oil and gas reserves (unaudited)
The standardized measure tables presented below relate to proved oil and gas reserves, excluding 1.39 billion barrels of oil equivalent of proved reserves scheduled to be produced after the year 2029.
Estimated future cash inflows from production are computed by applying average prices of oil and gas on December 31 to the year-end quantities. Future development and production costs are those estimated future expenditures needed to develop and produce the year-end estimated proved reserves, assuming constant year-end economic conditions.
Future tax expenses are computed by applying the appropriate year-end statutory tax rates—with consideration of the tax rates already legislated for 2005—to the future pre-tax net cash flows related to Mexico’s proved oil and gas reserves.
In addition to being subject to the payment of all taxes and contributions set forth by the SHCP (except as indicated below), PEMEX is presently subject to the following special duties: a hydrocarbon extraction duty, an extraordinary hydrocarbon extraction duty, an additional hydrocarbon extraction duty, a tax on hydrocarbon income and the IEPS Tax. These taxes and duties are to be credited against theDerecho Sobre Hidrocarburos
F-103
Table of Contents
PETRÓLEOS MEXICANOS, SUBSIDIARY ENTITIES AND SUBSIDIARY COMPANIES
NOTES TO THE CONSOLIDATED FINANCIAL STATEMENTS FOR THE YEARS
ENDED DECEMBER 31, 2004, 2003 AND 2002
(Figures stated in thousands of Mexican pesos of December 31, 2004 purchasing power
and in thousands of U.S. dollars or other currency units)—(Continued)
(“hydrocarbon duty”), which is calculated by applying a rate of 60.8% to the sales revenue of Petróleos Mexicanos and Subsidiary Entities to third parties (sales revenues are taken to include the IEPS Tax generated by the sale of refined products, but do not include VAT). In addition to the payment of the hydrocarbon duty, Petróleos Mexicanos and Subsidiary Entities must pay to the Mexican Government a duty for exploration, gas, refining and petrochemical infrastructure (replacing the prior years’ excess gains tax), which for 2004 was equal to 39.2% on the portion of Petróleos Mexicanos and Subsidiary Entities’ crude oil export sales revenues in excess of a threshold price of 20.00 U.S. dollars per barrel. Since the 2004 prices were higher than 20.00 U.S. dollars per barrel, Petróleos Mexicanos and Subsidiary Entities paid this duty. For 2005 this duty was replaced by an excess gains tax, which will apply to prices in excess of 23.00 U.S. dollars per barrel. Petróleos Mexicanos and the Subsidiary Entities are not subject to the Income Tax Law (Ley del Impuesto Sobre la Renta) or Asset Tax Law (Ley del Impuesto al Activo).
The standardized measure provided below represents a comparative benchmark value rather than an estimate of expected future cash flows or fair market value of PEMEX’s production rights. There are numerous uncertainties inherent in estimating quantities of proved reserves and in projecting future rates of production and timing of development expenditures, including many factors beyond the control of the producer. Accordingly, reserve estimates may be materially different from the quantities of crude oil and natural gas that are ultimately recovered.
Revised Standardized measure of discounted net cash flows (unaudited)
| As of December 31, | ||||||||||||
| 2004 | 2003 | 2002 | ||||||||||
Future cash inflows | U.S.$ | 493,971,000 | U.S.$ | 419,343,000 | U.S.$ | 426,218,000 | ||||||
Future production costs | (70,922,000 | ) | (60,515,000 | ) | (56,788,000 | ) | ||||||
Future development costs | (29,314,000 | ) | (29,834,000 | ) | (20,159,000 | ) | ||||||
Future production and income tax expenses | (311,919,000 | ) | (261,370,000 | ) | (272,450,000 | ) | ||||||
Future net cash flows | 81,817,000 | 67,624,000 | 76,821,000 | |||||||||
Effect of discounting net cash flows at 10% | (35,193,000 | ) | (29,974,000 | ) | (33,406,000 | ) | ||||||
Standardized measure of discounted future net cash flows | U.S.$ | 46,624,000 | U.S.$ | 37,650,000 | U.S.$ | 43,415,000 | ||||||
Note: Table amounts may not total due to rounding.
PEMEX notes that the future cash flows before tax were U.S.$ 387,749,000, U.S. $322,829,000 and U.S. $ 343,470,000 as of December 31, 2004, 2003 and 2002, respectively.
F-104
Table of Contents
PETRÓLEOS MEXICANOS, SUBSIDIARY ENTITIES AND SUBSIDIARY COMPANIES
NOTES TO THE CONSOLIDATED FINANCIAL STATEMENTS FOR THE YEARS
ENDED DECEMBER 31, 2004, 2003 AND 2002
(Figures stated in thousands of Mexican pesos of December 31, 2004 purchasing power
and in thousands of U.S. dollars or other currency units)—(Continued)
To comply with SFAS No. 69, the next table presents the aggregate standardized measure change for each year and significant sources of variance:
Changes in standardized measure of discounted net cash flows (unaudited)
| 2004 | 2003 | 2002 | ||||||||||
Sales of oil and gas produced, net of production costs | U.S.$ | (41,740,000 | ) | U.S.$ | (32,870,000 | ) | U.S.$ | (25,005,000 | ) | |||
Net changes in prices and production costs | 46,463,000 | 1,876,000 | 113,938,000 | |||||||||
Extensions and discoveries | 3,629,000 | 1,869,000 | 1,490,000 | |||||||||
Development cost incurred during the year | 8,998,000 | 7,709,000 | 6,355,000 | |||||||||
Changes in estimated development costs | (8,003,000 | ) | (12,702,000 | ) | (5,477,000 | ) | ||||||
Reserves revisions, extensions, discoveries and timing change | 9,082,000 | 11,440,000 | 506,000 | |||||||||
Accretion of discount of pre-tax net cash flows | 17,507,000 | 17,908,000 | 8,715,000 | |||||||||
Net changes in production-and excess-gains taxes | (26,962,000 | ) | (994,000 | ) | (78,814,000 | ) | ||||||
Other | 0 | 0 | 0 | |||||||||
Aggregate change in standardized measure | U.S.$ | 8,974,000 | U.S.$ | (5,765,000 | ) | U.S.$ | 21,708,000 | |||||
Standardized measure | ||||||||||||
As of January 1 | 37,650,000 | 43,415,000 | 21,707,000 | |||||||||
As of December 31 | 46,624,000 | 37,650,000 | 43,415,000 | |||||||||
Change | U.S.$ | 8,974,000 | U.S.$ | (5,765,000 | ) | U.S.$ | 21,708,000 | |||||
Note: Table amounts may not total due to rounding.
In computing the amounts under each factor of change, the effects of variances in prices and costs are computed before the effects of changes in quantities. Consequently, changes in reserves are calculated at December 31 prices and costs. The change in computed taxes includes taxes effectively incurred during the year and the change in future tax expense.
F-105