UNITED STATES
SECURITIES AND EXCHANGE COMMISSION
Washington, D.C. 20549
FORM 6-K
REPORT OF FOREIGN PRIVATE ISSUER
PURSUANT TO RULE 13a-16 OR 15d-16 UNDER
THE SECURITIES EXCHANGE ACT OF 1934
For the month of May, 2006
Commission File Number 0-99
PETROLEOS MEXICANOS
(Exact name of registrant as specified in its charter)
MEXICAN PETROLEUM
(Translation of registrant’s name into English)
United Mexican States
(Jurisdiction of incorporation or organization)
Avenida Marina Nacional No. 329
Colonia Huasteca
Mexico, D.F. 11311
Mexico
(Address of principal executive offices)
Indicate by check mark whether the registrant files or will file annual reports under cover of Form 20-F or Form 40-F.
Form 20-F X Form 40-F
Indicate by check mark if the registrant is submitting the Form 6-K in paper as permitted by Regulation S-T Rule 101(b)(1)
Yes No X
Indicate by check mark if the registrant is submitting the Form 6-K in paper as permitted by Regulation S-T Rule 101(b)(7)
Yes No X
Indicate by check mark whether the registrant by furnishing the information contained in this form is also thereby furnishing the information to the Commission pursuant to Rule 12g3-2(b) under the Securities Exchange Act of 1934.
Yes No X
 | Investor Relations (5255) 1944 9700 ri@dcf.pemex.com |
May 3, 2006
PEMEX unaudited financial results report
as of March 31, 2006
| Financial highlights | PEMEX, Mexico’s oil and gas company and the ninth largest integrated oil company in the world1, headed by Luis Ramírez Corzo, announced its unaudited consolidated financial results as of March 31, 2006.
• Total sales increased 19%, as compared to the first quarter of 2005, reaching Ps. 241.4 billion (US$22.2 billion)2
• Income before taxes and duties increased 21%, as compared to the first quarter of 2005, to Ps. 150.2 billion (US$13.8 billion)
• Net income was Ps. 7.8 billion (US$0.7 billion) |
Table 1
Petróleos Mexicanos, Subsidiary Entities and Subsidiary Companies
Financial results summary
| First quarter (January - March) | |||||||||||
| 2005 | 2006 | Change | 2006 | ||||||||
| (Ps. mm) | (US$mm) | ||||||||||
Total sales | 202,354 | 241,431 | 19 | % | 39,076 | 22,163 | |||||
Domestic sales(1) | 117,351 | 126,552 | 8 | % | 9,201 | 11,617 | |||||
Exports | 85,004 | 114,879 | 35 | % | 29,875 | 10,546 | |||||
Income before taxes and duties(1) | 124,554 | 150,239 | 21 | % | 25,686 | 13,792 | |||||
Taxes and duties | 123,817 | 142,487 | 15 | % | 18,670 | 13,080 | |||||
Net income (loss) | 5,312 | 7,752 | 46 | % | 2,440 | 712 | |||||
EBITDA(2) | 141,730 | 179,328 | 27 | % | 37,598 | 16,462 | |||||
EBITDA / Interest expense(3) | 13.0 | 14.4 | |||||||||
| * | Unaudited consolidated financial statements prepared in accordance with Mexican Generally Accepted Accounting Principles (Mexican GAAP) issued by the Instituto Mexicano de Contadores Públicos. Inflation recognition is also in accordance with Mexican GAAP. Accordingly, peso figures are presented in constant Mexican pesos as of March 31, 2006. |
| (1) | Includes the Special Tax on Production and Services (IEPS), which w as Ps. 11,933 million in the first quarter of 2005 and zero in the first quarter of 2006. |
| (2) | Excludes IEPS. |
| (3) | Excludes capitalized interest. |
Note: Numbers may not total due to rounding.
| 1 | Petroleum Intelligence Weekly Ranking, December 2005. |
| 2 | Amounts in US dollars are translated at the March 31, 2006 exchange rate of Ps.10.8935 per US dollar. |
PEMEX financial results report as of March 31, 2006 | 1/47 | |||
| www.pemex.com |
| PEMEX | Investor Relations |
| Operational highlights | • Total liquid hydrocarbons production totaled 3,784 Mbd, 1% more than the production in the first quarter of 2005:
• Crude oil production increased 29 Mbd, to 3,345 Mbd
• Natural gas liquids production increased by 0.3% to 439 Mbd
• Natural gas production rose 10% to 5,094 million cubic feet per day (MMcfd):
• Gas flaring represented 3.2% of total natural gas production
• Crude oil exports averaged 2,003 Mbd, 8% higher than the volume registered during the first quarter of 2005 |
Operating items
Exploration and production
| Crude oil production | During the first quarter of 2006 crude oil production averaged 3,345 Mbd, 1% higher than the 3,316 Mbd average for the first quarter of 2005. Despite the 1% decrease in heavy crude oil production, light and extra-light crude oil production increased 2% and 38%, respectively.
The production increase of light and extra-light crude oil production was due to the progress in the completion and workover of wells at the assets of Bellota-Jujo, Samaria-Luna and Litoral de Tabasco.
The decrease in heavy crude oil production was due mainly to wells planned shut-in’s in Cantarell as a result of the increasing gas-oil contact. |
Table 2
Petróleos Mexicanos, Subsidiary Entities and Subsidiary Companies
Production of liquid hydrocarbons
| First quarter (January - March) | ||||||||||
| 2005 | 2006 | Change | ||||||||
| (Mbd) | ||||||||||
Liquid hydrocarbons | 3,754 | 3,784 | 1 | % | 30 | |||||
Crude oil | 3,316 | 3,345 | 1 | % | 29 | |||||
Heavy | 2,410 | 2,376 | -1 | % | (34 | ) | ||||
Light | 784 | 800 | 2 | % | 17 | |||||
Extra-light | 123 | 169 | 38 | % | 46 | |||||
Natural gas liquids(1) | 438 | 439 | 0.3 | % | 1 | |||||
| (1) | Includes condensates. |
Note: Numbers may not total due to rounding.
PEMEX financial results report as of March 31, 2006 | 2/47 | |||
| www.pemex.com |
| PEMEX | Investor Relations |
| Natural gas production | In the first quarter of 2006, natural gas production increased 10% as compared to the first quarter of 2005. Non-associated gas production increased 19%, while associated gas production increased 4%.
The increase in non-associated natural gas production was due mainly to the addition of new development wells and infrastructure works at the Burgos and Veracruz basins. The growth in associated natural gas production was a result of the increase in lighter crude oils production, particularly in the Ixtal-Manik project.
| |
| Gas flaring | In the first quarter of 2006, gas flaring represented 3.2% of total natural gas production. The increase with respect to the first quarter of 2005 was due to maintenance works on a 48 inch natural gas pipeline that runs from the Dos Bocas Marine Terminal to the compression facilities in Cunduacán. These maintenance works began in the third quarter of 2005. |
Table 3
Petróleos Mexicanos, Subsidiary Entities and Subsidiary Companies
Production of natural gas and gas flaring
| First quarter (January - March) | |||||||||||
| 2005 | 2006 | Change | |||||||||
| (MMcfd) | |||||||||||
Total | 4,640 | 5,094 | 10 | % | 454 | ||||||
Associated | 2,900 | 3,025 | 4 | % | 125 | ||||||
Non-associated | 1,740 | 2,069 | 19 | % | 329 | ||||||
Natural gas flaring | 130 | 163 | 25 | % | 33 | ||||||
Gas flaring / total production | 2.8 | % | 3.2 | % | |||||||
Note: Numbers may not total due to rounding.
| Wells | During the first quarter of 2006, wells drilled decreased by 6 as compared to the first quarter of 2005. Exploration wells drilled decreased by 5 due to a reduction in activities at the Burgos project. Development wells drilled decreased by 1, as a result of reduced activity at the Ogarrio-Magallanes project. |
PEMEX financial results report as of March 31, 2006 | 3/47 | |||
| www.pemex.com |
| PEMEX | Investor Relations |
Table 4
Petróleos Mexicanos, Subsidiary Entities and Subsidiary Companies
Drilling activity and inventory of wells
| First quarter (January - March) | ||||||||||
| 2005 | 2006 | Change | ||||||||
| (Number of wells) | ||||||||||
Wells drilled | 176 | 170 | -3 | % | (6 | ) | ||||
Development | 155 | 154 | -1 | % | (1 | ) | ||||
Exploration | 21 | 16 | -24 | % | (5 | ) | ||||
Total operating wells(1) | 5,638 | 6,112 | 8 | % | 474 | |||||
Injection | 277 | 265 | -4 | % | (12 | ) | ||||
Production | 5,361 | 5,847 | 9 | % | 486 | |||||
Crude | 3,028 | 3,175 | 5 | % | 147 | |||||
Non-associated gas | 2,333 | 2,672 | 15 | % | 339 | |||||
| (1) | As of March 31, 2005. |
Note: Numbers may not total due to rounding.
| Seismic studies | During the first quarter of 2006, the area covered by new 2D seismic studies decreased by 73% as compared to the same quarter of 2005. This reduction was due mainly to decreased activity at the Burgos and Golfo de México B projects. The area covered by new 3D seismic studies decreased 77%. This reduction was due mainly to decreased activity at the Pandura – Anáhuac block which is part of the financed public works contracts.
The decrease in 2D and 3D seismic information studies is a result of the transition of the projects to the interpretation and analysis phases. |
Table 5
Petróleos Mexicanos, Subsidiary Entities and Subsidiary Companies
Seismic studies
| First quarter (January - March) | ||||||||||
| 2005 | 2006 | Change | ||||||||
Seismic | ||||||||||
2D (Km.) | 1,337 | 365 | -73 | % | (972 | ) | ||||
3D (Km2) | 3,138 | 722 | -77 | % | (2,416 | ) | ||||
__________ Note: Numbers may not total due to rounding. | ||||||||||
| Discoveries | Our main discoveries in the first quarter of 2006 were: |
Table 6
Petróleos Mexicanos, Subsidiary Entities and Subsidiary Companies
Main discoveries
Project | 1Q06 | Geologic age | Initial production | Type | ||||
Burgos | Rusco-1 | Oligocene | 4.0 MMcfd | Non-associated natural gas | ||||
Comalcalco | Cobra-1 | Cretaceous | 1.6 Mbd | Light crude oil | ||||
PEMEX financial results report as of March 31, 2006 | 4/47 | |||
| www.pemex.com |
| PEMEX | Investor Relations |
| Hydrocarbon reserves | Proved hydrocarbon reserves (1P), as of December 31, 2005 were 16,470 million barrels of crude oil equivalent. Of this amount:
• 72% are crude oil
• 11% are condensate and plant liquids
• 17% are dry gas
Out of total proved reserves, 69% are developed reserves:
• 76% are crude oil
• 9% are condensate and plant liquids
• 15% are dry gas
The remaining 31% are undeveloped reserves:
• 63% are crude oil
• 16% are condensate and plant liquids
• 21% are dry gas | |
| Reserves-production ratio | Considering 2005 annual production (1,604 million barrels), the reserves-production ratio in crude oil equivalent is 10 years for proved reserves. | |
| Replacement rate | As of December 31, 2005, proved reserves discoveries in Mexico, attributable to exploratory activity, were 137 million barrels of crude oil equivalent. These discoveries are comprised of reservoirs of non-associated gas and crude oil.
Considering discoveries only, PEMEX replaced 9% of its production taking into account proved reserves (1P). Considering the discoveries, developments and existing field revisions, the reserve replacement of proved reserves reached 26%.
For further detail on hydrocarbon reserves as of December 31, 2005, please refer to the hydrocarbon reserves report available at:
http://www.pemex.com/files/content/dcf_reservas_i_060316.pdf | |
PEMEX financial results report as of March 31, 2006 | 5/47 | |||
| www.pemex.com |
| PEMEX | Investor Relations |
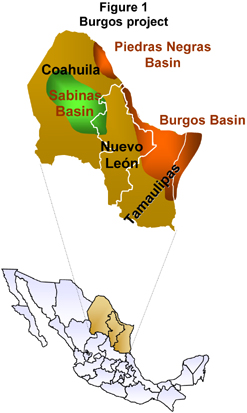
| Burgos project | The Burgos project is located in the Northern Region in the states of Tamaulipas, Nuevo León and Coahuila. The project comprises the Burgos, Sabinas and Piedras Negras Basins.
The objective of the Burgos project is to increase natural gas reserves and natural gas production. The project execution was approved in 1997, and in 2004 the financed public works contracts were added to the project.
During the 1997 – 2005 period, PEMEX completed the following activities:
• Drilling and completion of 219 exploratory wells and 2,345 development wells
• 815 workovers to development wells
• The acquisition of 19,451 km and 18,506 km2 of 2D and 3D seismic information
• The construction of 11,568 infrastructure works (pipelines and facilities)
Some of the most relevant achievements include an increase of 250% in natural gas production, from 487 MMcfd in 1997 to 1,217 in 2005. On December 30, 2005, natural gas production registered a record production of 1,306 MMcfd. In 2005, the incorporation of total natural gas reserves (3P) equaled 396,400 MMcf.
For 2006, the Burgos project targets are:
• Natural gas production of 1,264 MMcfd
• 3P natural gas reserves incorporation of 498,000 MMcf
In order to achieve these targets, the following activities will be undertaken:
• Drilling and completion of 38 exploratory wells and 321 development wells
• 215 workovers
• The acquisition of 1,460 km and 547 km2 of 2D and 3D seismic information
During the first quarter of 2006, natural gas production averaged 1,303 MMcfd. On March 18, 2006, natural gas production registered a new record production of 1,322 MMcfd.
During the 2007 – 2021 period, PEMEX expects to implement the following activities. These activities include the financed public works contracts:
• Drilling and completion of 578 exploratory wells and 1,520 development wells
• 1,786 workovers
• The acquisition of 4,700 km and 13,450 km2 of 2D and 3D seismic information
Based on the implementation of the abovementioned activities, the Burgos project is expected to reach around 1,330 MMcfd of natural gas production in 2007, and a peak production of 1,920 MMcfd in 2011.
During the period 2007 – 2021, total investment is estimated to be approximately US$14 billion. |
PEMEX financial results report as of March 31, 2006 | 6/47 | |||
| www.pemex.com |
| PEMEX | Investor Relations |
Gas and basic petrochemicals
| Gas processing and dry gas production | During the first quarter of 2006, total on-shore natural gas processing increased by 3%. This variation was attributable to:
• An increase of 67 MMcfd in on-shore natural gas processing due to the rise in non-associated natural gas production from the Burgos and the Veracruz Basins
• An increase of 54 MMcfd in sour wet gas processing as a result of a higher associated natural gas supply caused by an increase in lighter crude oils production
The increase in wet gas processing caused dry gas and natural gas liquids production to improve by 4% and 0.3% respectively, in the first quarter of 2006, as compared to the first quarter of 2005. |
PEMEX financial results report as of March 31, 2006 | 7/47 | |||
| www.pemex.com |
| PEMEX | Investor Relations |
Table 7
Petróleos Mexicanos, Subsidiary Entities and Subsidiary Companies
Natural gas processed and dry gas production
| First quarter (January - March) | |||||||||
| 2005 | 2006 | Change | |||||||
| (MMcfd) | |||||||||
On-shore gas processed | 3,895 | 4,017 | 3 | % | 121 | ||||
Sour wet gas | 3,199 | 3,253 | 2 | % | 54 | ||||
Sweet wet gas | 696 | 764 | 10 | % | 67 | ||||
Production | |||||||||
Dry gas | 3,148 | 3,284 | 4 | % | 136 | ||||
Natural gas liquids (Mbd)(1) | 438 | 439 | 0.3 | % | 1 | ||||
| (1) | Includes condensates. |
Note: Numbers may not total due to rounding.
| Infrastructure works | In March 2006, the cryogenic plant 3 started operating by processing 100 MMcfd of sweet wet gas. The construction of the cryogenic plant 4 continues on schedule and it is expected to start operating in the third quarter of 2006.
These two plants contribute to the sweet wet gas processing capacity expansion in Northern Mexico. The construction of the cryogenic plants 3 and 4 commenced in late 2004 and early 2005, respectively, and similar to the modular cryogenic plants 1 and 2, plants 3 and 4 will have a processing capacity of 200 MMcfd of sweet wet gas.
In February 2006, the engineering, procurement and construction (EPC) package execution for the liquefied petroleum gas (LPG) pipeline was signed. This pipeline will transport up to 30 Mbd of LPG from the Burgos Gas Processing Center to the city of Monterrey. This project includes a delivery terminal with two 20 Mb storage facilities and 8 dispensers. |
Refining
| Processing | During the first quarter of 2006, total crude oil processing decreased by 4%, resulting from a 5% reduction in the processing of heavy crude oil and 3% decrease in the processing of light crude oils. The decrease in total crude oil processing was due mainly to:
• Pipeline maintenance works due to the implementation of the Safety, Health and Environmental Protection Program (SSPA)
• An increase in plants maintenance works compared to those performed in the first quarter of 2005
• An increase in fuel oil inventories due to a reduction in the Comisión Federal de Electricidad (CFE) fuel oil demand |
PEMEX financial results report as of March 31, 2006 | 8/47 | |||
| www.pemex.com |
| PEMEX | Investor Relations |
Table 8
Petróleos Mexicanos, Subsidiary Entities and Subsidiary Companies
Crude oil processing
| First quarter (January - March) | ||||||||||
| 2005 | 2006 | Change | ||||||||
| (Mbd) | ||||||||||
Total processed | 1,317 | 1,265 | -4 | % | (52 | ) | ||||
Heavy Currents | 553 | 524 | -5 | % | (29 | ) | ||||
Light Currents | 764 | 741 | -3 | % | (23 | ) | ||||
Note: Numbers may not total due to rounding.
| Capacity utilization | During the first quarter of 2006, as a consequence of the reduction in total crude oil processing, the primary distillation capacity utilization rate decreased by 3%, as compared to the first quarter of 2005. The utilization rate decreased from 85% to 82%. | |
| Production | During the first quarter of 2006, total refined products production decreased by 4%. Gasoline and fuel oil productions decreased by 7% and 6%, respectively. The reduction in gasoline production was mainly due to lower crude oil processing and an increase in plants maintenance works, particularly the maintenance of the refining infrastructure in La Cangrejera which in turn reduced the elaboration of gasoline bases. The decrease in fuel oil production was also caused by lower crude oil processing and higher asphalt output. | |
Table 9
Petróleos Mexicanos, Subsidiary Entities and Subsidiary Companies
Refining production
| First quarter (January - March) | ||||||||||
| 2005 | 2006 | Change | ||||||||
| (Mbd) | ||||||||||
Total production | 1,597 | 1,540 | -4 | % | (57 | ) | ||||
Gasolines | 482 | 450 | -7 | % | (32 | ) | ||||
Fuel oil | 356 | 334 | -6 | % | (22 | ) | ||||
Diesel | 321 | 317 | -1 | % | (4 | ) | ||||
Liquefied petroleum gas (LPG) | 250 | 247 | -1 | % | (3 | ) | ||||
Jet Fuel | 67 | 62 | -7 | % | (5 | ) | ||||
Other(1) | 121 | 130 | 8 | % | 9 | |||||
| (1) | Includes mainly parafines, furfural extract and aeroflex. |
Note: Numbers may not total due to rounding.
PEMEX financial results report as of March 31, 2006 | 9/47 | |||
| www.pemex.com |
| PEMEX | Investor Relations |
| Variable refining margin | The variable refining margin is an estimate of the operating income per barrel of crude oil processed. The operating income is calculated as total revenues minus the cost of:
• Inputs
• Natural gas and fuel oil used to operate the refineries
• Electric power, water and catalysts (auxiliary services)
In the first quarter of 2006, PEMEX’s variable refining margin decreased by 4%, to US$4.84 per barrel, from US$5.05 per barrel in the first quarter of 2005. This decrease is primarily a result of a lower production of light refined products, mainly gasoline. | |
| Franchises | As of March 31, 2006, the number of franchised gas stations rose 6% to 7,268, from 6,826 as of March 31, 2005. | |
Petrochemicals
| Production | Total petrochemicals production for the first quarter of 2006 was 2,623 thousand tons (Mt), 1% lower than the total petrochemicals production in the same quarter of 2005. This reduction was mainly driven by lower production of aromatics, propylene and their derivatives. However, during the first quarter of 2006 a higher number of ammonia plants were operating and vinyl chloride production was more stable than in the first quarter of 2005. Methanol production decreased as a result of production shut-down caused by high natural gas prices and inventory management.
Aromatics and derivatives, as well as acrylonitrile production decreased due to maintenance works performed on the aromatics train in La Cangrejera Petrochemical Center. Moreover, acrylonitrile plants shut-down was due to lack of acrylonitrile demand caused by higher acrylonitrile prices. |
PEMEX financial results report as of March 31, 2006 | 10/47 | |||
| www.pemex.com |
| PEMEX | Investor Relations |
Table 10
Petróleos Mexicanos, Subsidiary Entities and Subsidiary Companies
Production of petrochemicals
| First quarter (January - March) | ||||||||||
| 2005 | 2006 | Change | ||||||||
| (Mt) | ||||||||||
Total production | 2,656 | 2,623 | -1 | % | (33 | ) | ||||
Methane derivatives | ||||||||||
Ammonia | 140 | 209 | 49 | % | 69 | |||||
Methanol | 35 | 23 | -35 | % | (12 | ) | ||||
Ethane derivatives | ||||||||||
Ethylene | 276 | 259 | -6 | % | (17 | ) | ||||
Ethylene oxide | 93 | 80 | -14 | % | (13 | ) | ||||
Low density polyethylene | 63 | 78 | 24 | % | 15 | |||||
High density polyethylene | 46 | 37 | -19 | % | (9 | ) | ||||
Vinyl chloride | 13 | 50 | 291 | % | 37 | |||||
Aromatics and derivatives | ||||||||||
Toluene | 59 | 25 | -57 | % | (34 | ) | ||||
Ethylbenzene | 42 | 30 | -29 | % | (12 | ) | ||||
Benzene | 38 | 16 | -57 | % | (22 | ) | ||||
Propylene and derivatives | ||||||||||
Acrylonitrile | 15 | — | — | — | ||||||
Polypropylene | 92 | 82 | -11 | % | (10 | ) | ||||
Others(1) | 1,744 | 1,734 | -1 | % | (10 | ) | ||||
| (1) | Includes glycols, heavy reformed, oxygen, hydrogen, nitrogen, clorhidric acid, muriatic acid, hexane, heptanes and others. |
Note: Numbers may not total due to rounding.
| New petrochemical plant | During the second quarter of 2006, PEMEX expects to begin operations of a “swing” plant at the Morelos Petrochemical Center in Coatzacoalcos, Veracruz. The plant will have a production capacity of 300 Mt per year of either low density linear polyethylene or high density polyethylene. |
International trade3
| Crude oil exports | In the first quarter of 2006, PEMEX’s crude oil exports averaged 2,003 Mbd, 8% higher than the volume registered during the first quarter of 2005. Approximately 80% of total crude oil exports were heavy crude oil (Maya), while the rest consisted of light and extra-light crude oil (Isthmus and Olmeca).
81% of the total crude oil exports were delivered to the United States, while the remaining 19% were distributed among Europe (8%), the rest of America (9%) and the Far East (2%).
In the first quarter of 2006, the weighted average export price of the Mexican crude oil basket was US$49.85 per barrel, as compared to US$34.65 per barrel in the first quarter of 2005. |
| 3 | Source: PMI. |
PEMEX financial results report as of March 31, 2006 | 11/47 | |||
| www.pemex.com |
| PEMEX | Investor Relations |
| Refined products and petrochemicals exports | Exports of refined products averaged 164 Mbd, 2% lower than in the first quarter of 2005. This was due to lower availability of long residue. The main refined products exported during the first quarter of 2006 were naphtha, coker gasoline and condensates.
Petrochemicals exports decreased by 6%, or 13 Mt, totaling 206 Mt for the quarter. This was attributable to higher availability of ethane derivatives, propane and aromatics. The main petrochemical products exported during the first quarter of 2006 were high and low-density polyethylene, ethylene, crude butadiene and sulphur. |
Table 11
Petróleos Mexicanos, Subsidiary Entities and Subsidiary Companies
Exports(1)
| First quarter (January - March) | ||||||||||
| 2005 | 2006 | Change | ||||||||
Crude oil exports (Mbd)(2) | ||||||||||
Total | 1,856 | 2,003 | 8 | % | 147 | |||||
Heavy | 1,613 | 1,598 | -1 | % | (15 | ) | ||||
Light | 21 | 138 | 565 | % | 117 | |||||
Extra-light | 222 | 267 | 20 | % | 45 | |||||
Average price (US$/b) | 34.65 | 49.85 | 44 | % | 15 | |||||
Refined products (Mbd) | 167 | 164 | -2 | % | (3 | ) | ||||
Petrochemicals (Mt) | 219 | 206 | -6 | % | (13 | ) | ||||
| (1) | Source: PMI. Does not consider third party operations by PMI. |
| (2) | Excludes the volume of crude oil under processing agreements. |
Note: Numbers may not total due to rounding.
| Imports | In the first quarter of 2006, natural gas imports averaged 369 MMcfd, 47% fewer than the imports registered during the first quarter of 2005. Imports decreased due to an increase in PEMEX’s production and lower domestic demand.
Imports of refined products increased by 22%, from 369 Mbd in the first quarter of 2005 to 450 Mbd. The increase was attributable mainly to higher gasoline and diesel imports.
Petrochemicals imports increased by 57%, to 138 Mt, due to higher imports of methanol, ammonia and isobutane. |
PEMEX financial results report as of March 31, 2006 | 12/47 | |||
| www.pemex.com |
| PEMEX | Investor Relations |
Table 12
Petróleos Mexicanos, Subsidiary Entities and Subsidiary Companies
Imports(1)
| First quarter (January - March) | ||||||||||
| 2005 | 2006 | Change | ||||||||
Natural gas (MMcfd) | 691 | 369 | -47 | % | (322 | ) | ||||
Refined products (Mbd)(2) | 369 | 450 | 22 | % | 80 | |||||
Petrochemicals (Mt) | 88 | 138 | 57 | % | 50 | |||||
| (1) | Source: PMI except natural gas imports. Does not consider third party operations by PMI. |
| (2) | Includes the volume of imported products under processing agreements. Also, 79 Mbd and 81 Mbd of |
LPG for the first quarter of 2005 and 2006, respectively.
Note: Numbers may not total due to rounding.
Financial results as of March 31, 2006
Total sales
| Total sales | During the first quarter of 2006, total sales (including the special tax on production and services, or IEPS) increased by 19% in constant pesos to Ps. 241.4 billion (US$22.2 billion), as compared to Ps. 202.4 billion in the first quarter of 2005. The growth was due mainly to higher prices. | |
| Domestic sales | During the first quarter of 2006, domestic sales, including IEPS, increased 8% to Ps. 126.6 billion (US$11.6 billion), from Ps. 117.4 billion. Domestic sales, net of IEPS, increased 20% to Ps. 126.6 billion (US$11.6 billion) from Ps. 105.4 billion. The increase in total domestic sales was attributable to the following:
• Natural gas sales increased 7% to Ps. 19.0 billion (US$1.7 billion) from Ps. 17.7 billion. Natural gas sales volume decreased 1% to 2,735 MMcfd from 2,772 MMcfd. During the first quarter of 2006, the average sales price of natural gas was US$6.91 per MMBtu, while in first quarter of 2005, the average price was US$6.35 MMBtu
• Sales of refined products, net of IEPS, grew 25% to Ps. 102.6 billion (US$9.4 billion) from Ps. 82.1 billion. Refined products sales volume increased 3% to 1,794 Mbd, from 1,750 Mbd. The IEPS generated by these sales was zero compared to Ps. 11.9 billion in the first quarter of 2005. Sales of refined products, including IEPS, increased 9% to Ps. 102.6 billion (US$9.4 billion) from Ps. 94.0 billion
• Petrochemical sales decreased 12% to Ps. 4.9 billion (US$0.5 billion) from Ps. 5.6 billion. Petrochemicals sales volume fell 3% to 918 Mt from 945 Mt | |
PEMEX financial results report as of March 31, 2006 | 13/47 | |||
| www.pemex.com |
| PEMEX | Investor Relations |
Table 13
Petróleos Mexicanos, Subsidiary Entities and Subsidiary Companies
Domestic sales
| First quarter (January - March) | ||||||||||||
| 2005 | 2006 | Change | 2006 | |||||||||
| (Ps. mm) | (US$mm) | |||||||||||
Domestic sales including IEPS | 117,351 | 126,552 | 8 | % | 9,201 | 11,617 | ||||||
Domestic sales without IEPS | 105,418 | 126,552 | 20 | % | 21,134 | 11,617 | ||||||
Natural gas | 17,727 | 19,026 | 7 | % | 1,300 | 1,747 | ||||||
Refined products including IEPS | 94,015 | 102,598 | 9 | % | 8,583 | 9,418 | ||||||
Refined products | 82,083 | 102,598 | 25 | % | 20,515 | 9,418 | ||||||
IEPS | 11,933 | — | (11,933 | ) | — | |||||||
Gasoline | 38,715 | 50,685 | 31 | % | 11,970 | 4,653 | ||||||
Diesel | 17,890 | 20,976 | 17 | % | 3,086 | 1,926 | ||||||
LPG | 12,364 | 13,407 | 8 | % | 1,043 | 1,231 | ||||||
Other | 13,114 | 17,531 | 34 | % | 4,417 | 1,609 | ||||||
Petrochemical products | 5,609 | 4,928 | -12 | % | (681 | ) | 452 | |||||
| * | Unaudited consolidated financial statements prepared in accordance with Mexican Generally Accepted Accounting Principles (Mexican GAAP) issued by the Instituto Mexicano de Contadores Públicos. Inflation recognition is also in accordance with Mexican GAAP. Accordingly, peso figures are presented in constant Mexican pesos as of March 31, 2006. |
Note: Numbers may not total due to rounding.
Table 14
Petróleos Mexicanos, Subsidiary Entities and Subsidiary Companies
Volume of domestic sales(1)
| First quarter (January - March) | ||||||||||
| 2005 | 2006 | Change | ||||||||
Natural gas (MMcfd) | 2,772 | 2,735 | -1 | % | (37 | ) | ||||
Refined products (Mbd) | 1,750 | 1,794 | 3 | % | 44 | |||||
Gasoline | 651 | 699 | 7 | % | 48 | |||||
Diesel | 301 | 335 | 12 | % | 35 | |||||
LPG | 332 | 321 | -3 | % | (11 | ) | ||||
Other | 467 | 439 | -6 | % | (28 | ) | ||||
Petrochemicals (Mt) | 945 | 918 | -3 | % | (27 | ) | ||||
Note: Numbers may not total due to rounding.
| Exports | During the first quarter of 2006, export sales totaled Ps. 114.9 billion (US$10.5 billion), 35% higher than the Ps. 85.0 billion registered in the first quarter of 2005.
• Crude oil and condensates export sales increased 38% to Ps. 105.5 billion (US$9.7 billion) from Ps. 76.4 billion. Crude oil exports volume rose 8% to 2,003 Mbd from 1,856 Mbd
• Refined products export sales rose 19% to Ps. 8.8 billion (US$0.8 billion) from Ps. 7.4 billion. Refined products exports volume fell 2% to 164 Mbd from 167 Mbd
• Petrochemical products export sales decreased 49% to Ps. 0.6 billion (US$0.06 billion) from Ps. 1.2 billion. Petrochemical products exports volume decreased 6% to 206 Mt from 219 Mt |
PEMEX financial results report as of March 31, 2006 | 14/47 | |||
| www.pemex.com |
| PEMEX | Investor Relations |
Table 15
Petróleos Mexicanos, Subsidiary Entities and Subsidiary Companies
Exports
First quarter (January - March) | ||||||||||||
| 2005 | 2006 | Change | 2006 | |||||||||
| (Ps. mm) | (US$mm) | |||||||||||
Total exports | 85,004 | 114,879 | 35 | % | 29,875 | 10,546 | ||||||
Crude oil and condensates | 76,386 | 105,463 | 38 | % | 29,077 | 9,681 | ||||||
Refined products | 7,374 | 8,778 | 19 | % | 1,404 | 806 | ||||||
Petrochemical products | 1,243 | 638 | -49 | % | (605 | ) | 59 | |||||
| * | Unaudited consolidated financial statements prepared in accordance with Mexican Generally Accepted Accounting Principles (Mexican GAAP) issued by the Instituto Mexicano de Contadores Públicos. Inflation recognition is also in accordance with Mexican GAAP. Accordingly, peso figures are presented in constant Mexican pesos as of March 31, 2006. |
| Note: | Numbers may not total due to rounding. |
Costs and operating expenses
| Costs and operating expenses | Costs and operating expenses grew 20%, or Ps. 15.7 billion compared to the first quarter of 2005, to Ps. 94.0 billion (US$8.6 billion). This variation was mainly due to:
• An increase of Ps. 5.9 billion, in operating expenses, primarily payroll and supplies and materials purchases
• An unfavorable effect of Ps 5.6 billion, in the variation of inventories
• An increase of Ps. 3.8 billion, in imports of products
• An increase of Ps. 1.8 billion in the reserve for retirement payments
• An unfavorable effect of Ps. 0.1 billion, in manufacturing expenses
• An increase of Ps. 0.1 billion, in exploration and non-successful drilling expenses
• An decrease of Ps. 1.9 billion, in depreciation and amortization
• An increase of Ps. 0.1 billion, in upkeep and maintenance (including operational maintenance)
The payroll increase was caused by the registration of salary compensations that were not observed in the first quarter of 2005. The salary compensations were derived from salaries paid for maintenance works, salary increases in real terms and the restructuring of Pemex Exploration and Production. |
PEMEX financial results report as of March 31, 2006 | 15/47 | |||
| www.pemex.com |
| PEMEX | Investor Relations |
| Cost of sales | Cost of sales increased 22%, or Ps. 13.6 billion, to Ps. 76.1 billion (US$7.0 billion). The increase was the result of the following:
• An unfavorable effect of Ps 5.6 billion, in the variation of inventories
• An increase of Ps. 3.8 billion, in imports of products
• An unfavorable effect of Ps. 3.7 billion, in operating expenses, primarily supplies and materials purchases
• An increase of Ps. 2.1 billion in the reserve for retirement payments
• An increase of Ps. 0.1 billion, in exploration and non-successful drilling expenses
• An unfavorable effect of Ps. 0.1 billion, in manufacturing expenses due to the increase in the difference between refined products prices – mainly gasoline – and crude oil price
• A decrease of Ps. 1.9 billion, in depreciation and amortization
• An increase of Ps. 0.1 billion, in upkeep and maintenance (including operational maintenance) | |
| Distribution expenses | During the first quarter of 2006, transportation expenses increased 14%, from Ps. 4.8 billion to Ps. 5.5 billion (US$0.5 billion). This increase was primarily due to a rise of 13%, or Ps. 0.4 billion in operating expenses, particularly in payroll; plus an increase of 13%, or Ps. 0.2 billion in the reserve for retirement payments. | |
| Administrative expenses | During the first quarter of 2006, administrative expenses increased 12%, from Ps. 11.0 billion to Ps. 12.3 billion (US$1.1 billion). This increase was for the most part a result of a rise of Ps. 1.8 billion in operating expenses, mainly payroll. This increase was offset by a decrease of Ps. 0.5 billion in the reserve for retirement payments. | |
| Cost of the reserve for retirement payments | The cost of the reserve for retirement payments, pensions and indemnities increased 13%, from Ps. 14.1 billion to Ps. 15.9 billion (US$1.5 billion). This cost is distributed among cost of sales, distribution expenses and administrative expenses. The increase in the cost of the reserve for retirement payments was the result of not only the natural evolution of the reserve, but also reclassifications in this cost distribution ratios. | |
Operating income
| Operating income increased 19% | Operating income in the first quarter of 2006 totaled Ps. 147.5 billion (US$13.5 billion), and was 19% higher than the comparable figure for the first quarter of 2005 of Ps. 124.1 billion.
Excluding IEPS, operating income grew 31%, or Ps. 35.3 billion, to Ps. 147.5 billion (US$13.5 billion) from Ps. 112.1 billion. | |
PEMEX financial results report as of March 31, 2006 | 16/47 | |||
| www.pemex.com |
| PEMEX | Investor Relations |
Comprehensive financing cost
| Increase of comprehensive financing cost | During the first quarter of 2006, the comprehensive financing cost increased by Ps. 0.07 billion, from a cost of Ps. 3.57 billion to a cost of Ps. 3.64 billion (US$0.3 billion). This increase was caused by:
• A decrease of Ps. 1.2 billion in net interest expense
• An increase of Ps. 7.4 billion in the net foreign exchange loss
• An increase of Ps. 6.1 billion in the monetary gain | |
| Net interest expense | Net interest expense –not including capitalized interests–, decreased 14%, from Ps. 8.7 billion to Ps. 7.5 billion (US$0.7 billion).
Interest expense increased Ps. 1.5 billion, while interest income increased Ps. 2.7 billion.
The reduction in interest expense is mostly a consequence of a decrease in the non-capitalized interests of the PIDIREGAS projects and a reduction in the interest of the documented debt. | |
| Foreign exchange loss | Net foreign exchange loss totaled Ps. 4.3 billion (US$0.4 billion) in the first quarter of 2006 as compared to a net foreign exchange gain of Ps. 3.1 billion in the first quarter of 2005.
This decrease was primarily a consequence of the depreciation of the Mexican peso against the US dollar by 1.07%, during the first quarter of 2006, as compared to an appreciation of 0.77% in the comparable period of 2005. | |
| Monetary gain | The monetary gain was Ps. 8.2 billion (US$0.7 billion), representing an increase of Ps.6.1 billion compared to the monetary gain for the first quarter of 2005.
The increase in the monetary gain was due to an increase in monetary assets and to a rise in inflation from 0.79% in the first quarter of 2005 to 0.87% in the same period of 2006. | |
PEMEX financial results report as of March 31, 2006 | 17/47 | |||
| www.pemex.com |
| PEMEX | Investor Relations |
Table 16
Petróleos Mexicanos, Subsidiary Entities and Subsidiary Companies
Comprehensive financing cost
| First quarter (January - March) | |||||||||||||||
| 2005 | 2006 | Change | 2006 | ||||||||||||
| (Ps. mm) | (US$mm) | ||||||||||||||
Comprehensive financing cost | 3,569 | 3,637 | 2 | % | 68 | 334 | |||||||||
Interest income | (2,213 | ) | (4,961 | ) | (2,748 | ) | (455 | ) | |||||||
Interest expense | 10,924 | 12,469 | 14 | % | 1,545 | 1,145 | |||||||||
Foreign exchange loss (gain) | (3,063 | ) | 4,299 | 7,362 | 395 | ||||||||||
Monetary loss (gain) | (2,080 | ) | (8,169 | ) | (6,090 | ) | (750 | ) | |||||||
| * | Unaudited consolidated financial statements prepared in accordance with Mexican Generally Accepted Accounting Principles (Mexican GAAP) issued by the Instituto Mexicano de Contadores Públicos. Inflation recognition is also in accordance with Mexican GAAP. Accordingly, peso figures are presented in constant Mexican pesos as of March 31, 2006. |
Note: Numbers may not total due to rounding.
Other revenues
Other net revenues | Other net revenues totaled Ps. 6.4 billion (US$0.6 billion). The corresponding figure for the first quarter of 2005 was a net revenue of Ps. 4.0 billion. The variation was mainly due to higher income generated by the negative IEPS tax rate. | |
Income before taxes and duties
| Income before taxes | During the first quarter of 2006, income before taxes and duties was Ps. 150.2 billion (US$13.8 billion), compared to Ps. 124.6 billion. The 21% increase was mainly the result of:
• An increase of Ps. 23.4 billion in operating income
• An increase of Ps. 2.4 billion in other net revenues
• An increase of Ps. 0.1 billion in comprehensive financing cost | |
PEMEX financial results report as of March 31, 2006 | 18/47 | |||
| www.pemex.com |
| PEMEX | Investor Relations |
Taxes and duties
| Taxes and duties | During the first quarter of 2006, taxes and duties paid increased 15%, from Ps. 123.8 billion to Ps. 142.5 billion (US$13.1 billion). It is important to note that as a percentage of total sales, taxes and duties equaled 59% and 61% in 2006 and 2005, respectively. | |
| Ordinary hydrocarbons duty and others | During 2005, Petróleos Mexicanos and its subsidiary entities paid taxes and duties equivalent to 60.8% of total sales4. Since January 1, 2006, PEMEX is subject to a new fiscal regime. Under the new tax regime, Pemex Exploration and Production is governed by theLey Federal de Derechos and the tax regime for the other subsidiary entities continues to be governed by theLey de Ingresos de la Federación.
The most important duty in the new fiscal regime is the ordinary hydrocarbons duty (OHD). This duty is paid by Pemex Exploration and Production. Under the new fiscal regime, the tax base is aquasi operating profit5 while in the previous regime the tax base was total sales.
In the first quarter of 2006, the amount of OHD and other taxes and duties paid increased Ps. 36.8 billion to Ps. 140.8 billion (US$12.9 billion). | |
| IEPS | Until December 31, 2005, Petróleos Mexicanos and its subsidiary entities paid taxes and duties equivalent to 60.8% of total sales. This included the special tax on production and services (IEPS) that applies to gasoline and automotive diesel. Under the new tax regime, IEPS continues to be governed by theLey de Ingresos de la Federación (Mexico’s Income Law).
IEPS is paid by the end consumer of gasoline and diesel, and PEMEX is an intermediary between the Ministry of Finance (SHCP) and the end consumer since PEMEX collects the IEPS and passes it on to the federal government. The difference between the retail price and the estimated production cost of gasoline and diesel is primarily IEPS.
The Ministry of Finance determines the retail price of gasoline and diesel.
Estimated production cost of gasoline and diesel is based on the production cost of an efficient refinery located in the Gulf of Mexico.
During the first quarters of 2005 and 2006, the estimated production cost of gasoline and diesel was higher than the retail price. In 2005, PEMEX could not incorporate the increase of the producer price of gasoline and diesel in their respective retail prices. In 2006, in accordance to Mexico’s Income Law, the difference was credited against the other taxes and duties paid by PEMEX.
During the first quarter of 2006, IEPS totaled zero. In the first quarter of 2005, IEPS equaled Ps. 11.9 billion. | |
| 4 | PEMEX’s subsidiary companies that are located in México pay corporate income tax on the same basis as private sector companies in México. |
| 5 | The new fiscal regime is explained in the “Other relevant topics” section. |
PEMEX financial results report as of March 31, 2006 | 19/47 | |||
| www.pemex.com |
| PEMEX | Investor Relations |
| Excess gains duty (ARE) | In 2005, the excess gains duty was equal to 39.2% of the revenues from crude oil export sales in excess of the threshold price set by the Mexican Government of US$23.00 per barrel. The proceeds of this duty paid in excess of US$27.00 per barrel would be allocated as follows:
• 50% to the investment in infrastructure in exploration, production, gas, refining and petrochemicals that Petróleos Mexicanos and its subsidiary entities undertake
• 50% to programs and investment projects in infrastructure of the Federal States of the Mexican Republic
In 2006, the excess gains duty is equal to 6.5% of the revenues from crude oil export sales in excess of US$36.50 per barrel. This tax is complemented by the extraordinary duty on crude oil exports which is equal to 13.1% of the revenues from crude oil export sales in excess of the threshold price. The combined tax rate resulting from these duties is equivalent to 19.6% which is 50% of the excess gains duty tax rate paid in 2005.
During the first quarter of 2006, the excess gains duty paid by PEMEX totaled Ps. 1.7 billion (US$0.2 billion) while in the same quarter of 2005, the excess gains duty totaled Ps. 7.9 billion.
The proceeds from the excess gains duty and the extraordinary duty on crude oil exports will be destined to the states. The former according to thePresupuesto de Egresos de la Federación (Federal Budget) and the latter through the stabilization fund of the states’ revenues. |
Table 17
Petróleos Mexicanos, Subsidiary Entities and Subsidiary Companies
Taxes and duties
| First quarter (January - March) | ||||||||||||
| 2005 | 2006 | Change | 2006 | |||||||||
| (Ps. mm) | (US$mm) | |||||||||||
Total taxes and duties | 123,817 | 142,487 | 15 | % | 18,670 | 13,080 | ||||||
Ordinary hydrocarbons dutyand others(1) | 103,958 | 140,784 | 35 | % | 36,826 | 12,924 | ||||||
Special Tax on Productionand Services (IEPS) | 11,933 | — | (11,933 | ) | — | |||||||
Excess gains duty | 7,927 | 1,703 | -79 | % | (6,224 | ) | 156 | |||||
| * | Unaudited consolidated financial statements prepared in accordance with Mexican Generally Accepted Accounting Principles (Mexican GAAP) issued by the Instituto Mexicano de Contadores Públicos. Inflation recognition is also in accordance with Mexican GAAP. Accordingly, peso figures are presented in constant Mexican pesos as of March 31, 2006. |
| (1) | For 2005, amount represents the hydrocarbon extraction duties and others |
Note: Numbers may not total due to rounding.
PEMEX financial results report as of March 31, 2006 | 20/47 | |||
| www.pemex.com |
| PEMEX | Investor Relations |
Net income
| Net income of Ps. 7.8 billion | During the first quarter of 2006, PEMEX registered a net income of Ps. 7.8 billion (US$0.7 billion), compared to a net income of Ps. 5.3 billion during the first quarter of 2005. The Ps. 2.4 billion increase in the net income is explained by:
• An increase of Ps. 23.4 billion in operating income
• An increase of Ps. 0.1 billion in the comprehensive financing cost
• An increase of Ps. 2.4 billion in other net revenues
• An increase of Ps. 18.7 in taxes and duties
• A decrease of Ps. 4.6 billion in the initial accumulated effect due to the adoption of new accounting principles |
EBITDA
| EBITDA increased 27% | During the first quarter of 2006, EBITDA increased 27%, from Ps. 141.7 billion to Ps. 179.3 billion (US$16.5 billion). |
Table 18
Petróleos Mexicanos, Subsidiary Entities and Subsidiary Companies
EBITDA reconciliation
| First quarter (January - March) | ||||||||||||
| 2005 | 2006 | Change | 2006 | |||||||||
| (Ps. mm) | (US$mm) | |||||||||||
Net income (loss) 5,312 | 5,312 | 7,752 | 46 | % | 2,440 | 712 | ||||||
+ Taxes and duties | 123,817 | 142,487 | 15 | % | 18,670 | 13,080 | ||||||
- Special Tax on Production and Services (IEPS) | 11,933 | — | (11,933 | ) | — | |||||||
+ Comprehensive financing cost | 3,569 | 3,637 | 2 | % | 68 | 334 | ||||||
+ Depreciation and amortization | 11,477 | 9,549 | -17 | % | (1,928 | ) | 877 | |||||
+ Cost of the reserve for retirement payments | 14,063 | 15,903 | 13 | % | 1,839 | 1,460 | ||||||
- Initial cummulative effect due to the adoption of new accounting standards | 4,576.2 | — | (4,576 | ) | — | |||||||
EBITDA 141,730 | 141,730 | 179,328 | 27 | % | 37,598 | 16,462 | ||||||
| * | Unaudited consolidated financial statements prepared in accordance with Mexican Generally Accepted Accounting Principles (Mexican GAAP) issued by the Instituto Mexicano de Contadores Públicos. Inflation recognition is also in accordance with Mexican GAAP. Accordingly, peso figures are presented in constant Mexican pesos as of March 31, 2006. |
Note: Numbers may not total due to rounding.
PEMEX financial results report as of March 31, 2006 | 21/47 | |||
| www.pemex.com |
| PEMEX | Investor Relations |
Total assets
| Total assets increased 7% | As of March 31, 2006, total assets were Ps. 1,114.1 billion (US$102.3 billion), representing a 7%, or Ps. 74.2 billion, increase as compared to total assets as of March 31, 2005. The changes in the components of total assets were as follows:
• Cash and cash equivalents increased by 16%, or Ps. 18.3 billion
• Accounts receivable increased by 20%, or Ps. 26.9 billion
• The value of inventories increased by 18%, or Ps. 7.5 billion, as a result of higher hydrocarbon prices
• Financial derivative instruments decreased by 83%, or Ps. 7.1 billion
• Properties and equipment increased by 6%, or Ps. 36.2 billion, reflecting new investments
• Other assets decreased by 7%, or Ps. 7.6 billion, mainly as a result of the application of the new Bulletin D-3 “Labor Obligations”, which separates benefits at retirement from benefits after retirement since the latter do not have an effect on the intangible asset |
Total liabilities
| Liabilities increased 13% | Total liabilities increased by 13% to Ps. 1,127.2 billion (US$103.5 billion).
• Short-term liabilities increased by 34%, or Ps. 47.2 billion, to Ps. 184.7 billion (US$17.0 billion), primarily as a result of the increase in taxes payable
• Long-term liabilities increased by 9%, or Ps. 79.8 billion, to Ps. 942.5 billion (US$86.5 billion), due to the increase in the reserve for retirement payments | |
| Reserve for retirement payments | The reserve for retirement payments, pensions and seniority premiums increased by 19%, to Ps. 390.6 billion (US$35.9 billion) from Ps. 329.0 billion. The Ps. 61.7 billion growth resulted from an increase in salary, pensions and benefits, changes in labor conditions, the seniority of temporary employees incorporated as base employees, anticipated retirement benefits concessions, the increase in the number of current and retired employees, changes in actuarial assumptions, and a decrease in the pension fund. | |
PEMEX financial results report as of March 31, 2006 | 22/47 | |||
| www.pemex.com |
| PEMEX | Investor Relations |
Equity
| Decrease of Ps. 55.1 billion | PEMEX’s equity decreased by Ps. 55.1 billion, from Ps. 39.8 billion to Ps. -15.4 billion (US$ -1.4 billion). The change in equity was due to:
• An increase of Ps. 82.7 billion in cumulative net losses
• A decrease of Ps. 20.2 billion attributable to the reserve for retirement payments, pensions and seniority premiums
• A decrease of Ps. 1.7 billion in comprehensive income due to the application of the Bulletin C-10 “Derivative Financial Instruments and Hedge Operations”
• An increase of Ps. 3.7 billion due to the restatement of equity
• An offsetting effect of Ps. 45.2 billion due to the reimbursement of the excess gains duty paid in 2005
Under Mexican Law, there are no legal consequences for decentralized public entities of the Federal Government with negative equity. As a result, there are no legal concerns regarding PEMEX´s current financial obligations nor on its capability to generate cash.
Current financing agreements do not include financial covenants, or events of default that could be triggered as a result of negative equity. It is important to note that PEMEX had reported negative equity in its US GAAP reconciliation for its year 2000, 20-F form. With the application of the Mexican accounting Bulletin B-10, which incorporates the effects of inflation on financial information, from 2001 to 2002 the reconciliation of PEMEX’s equity to US GAAP was positive, nevertheless, in 2003 it was negative again. |
Results by segment
| Operating income | Operating income in the first quarter of 2006 totaled Ps. 147.5 billion (US$13.5 billion), and was 19% higher than the comparable figure for the first quarter of 2005 of Ps. 124.1 billion.
• Pemex Exploration and Production operating net income totaled Ps. 161.0 billion (US$14.8 billion), Ps. 46.3 billion higher than the comparable figure in 2005
• Pemex Gas and Basic Petrochemicals operating net income totaled Ps. 2.2 billion (US$0.2 billion), Ps. 1.1 billion lower than the operating income registered in 2005
• The operating loss of Pemex Refining totaled Ps. 11.0 billion (US$1.0 billion), Ps. 18.4 billion lower than the operating income registered in 2005
• The operating loss of Pemex Petrochemicals totaled Ps. 5.1 billion (US$0.5 billion), Ps. 3.8 billion lower than the operating loss registered in 2005 |
PEMEX financial results report as of March 31, 2006 | 23/47 | |||
| www.pemex.com |
| PEMEX | Investor Relations |
Changes in financial position
| Funds provided by operating activities | Funds provided by operating activities totaled Ps. 14.4 billion (US$1.3 billion). The decrease of Ps. 6.8 billion is primarily due to the increase in accounts and notes receivable. | |
| Funds provided by financing activities | Funds provided by financing activities totaled Ps. 19.8 billion (US$1.8 billion). The decrease of Ps. 1.4 billion is mainly due to securities financing and the amortization of bank loans. | |
| Funds used in investing activities | Funds used in investing activities totaled to Ps. 21.0 billion (US$1.9 billion) as a result of an increase in fixed assets. | |
Financing activities
| Funds raised year to date | Year to date, US$1.9 billion were raised as follows:
• US$1.5 billion in foreign capital markets
• US$0.3 billion from export credit agencies (ECA’s)
The total amount has been raised in the international markets. | |
| Financing program for the remainder of 2006 | For the rest of 2006, PEMEX plans to raise approximately an additional US$0.8 billion. Additionally, and depending on market conditions, PEMEX may continue with pre-funding.
The additional amount to raise in 2006 is subject to the possibility of using cash flow from operations. This alternative is still under discussion with the Ministry of Finance (SHCP). | |
PEMEX financial results report as of March 31, 2006 | 24/47 | |||
| www.pemex.com |
| PEMEX | Investor Relations |
Capital markets
| Master Trust | In the first quarter of 2006, the Pemex Project Funding Master Trust, a Delaware trust controlled by, and whose debt is guaranteed by PEMEX, entered into the following financings:
• On February 2, 2006, it reopened two issuances of US$1,500 million issued in June, 2005, which are divided into two tranches:
• US$750 million with a 5.75% coupon due in 2015
• US$750 million with a 6.625% coupon due in 2035
• During the first semester of 2006, PEMEX expects to sign a US$5,500 million syndicated credit facility, which is currently in process of syndication. The syndicated credit is divided in a US$4,250 long-term credit and a US$1,250 revolving syndicated facility. The long-term credit will be used to refinance the syndicated credit signed on March 22, 2005 and will be divided into two tranches:
• Tranch A: US$1,500 million maturing in five years
• Tranch B: US$2,750 million to be paid in 7 years
The revolving syndicated facility will mature in three years and can be used indistinctively by the Pemex Project Funding Master Trust or by Petróleos Mexicanos, depending on their requirements. |
Total debt
| Total debt of US$51.0 billion | Total consolidated debt including accrued interest was Ps. 555.4 billion (US$51.0 billion). This figure represents an increase of 4%, or Ps.22.0 billion, compared to the figure recorded on March 31, 2005. In 2006, total debt equals documented debt which includes:
• Documented debt of Petróleos Mexicanos, the Pemex Project Funding Master Trust, Trust F/163, RepCon Lux S.A. and Pemex Finance, Ltd
• Notes payable to contractors. In the elaboration of the audited financial results as of December 31, 2005, the external auditors recommended that notes payable to contractors be consolidated in documented debt | |
| Net debt of US$38.6 billion | Net debt, or the difference between debt and cash equivalents, increased Ps. 3.7 billion, to Ps. 420.5 billion (US$ 38.6 billion) as of March 31, 2006, from Ps. 416.8 billion. | |
PEMEX financial results report as of March 31, 2006 | 25/47 | |||
| www.pemex.com |
| PEMEX | Investor Relations |
Table 19
Petróleos Mexicanos, Subsidiary Entities and Subsidiary Companies
Consolidated total debt
| As of March 31, | ||||||||||||
| 2005 | 2006 | Change | 2006 | |||||||||
| (Ps. mm) | (US$mm) | |||||||||||
Documented debt(1) | 501,450 | 557,692 | 11 | % | 56,242 | 51,195 | ||||||
Short-term | 27,246 | 30,676 | 13 | % | 3,430 | 2,816 | ||||||
Long-term | 474,204 | 527,016 | 11 | % | 52,812 | 48,379 | ||||||
Sale of future accounts receivable(2) | 31,958 | — | (31,958 | ) | — | |||||||
Long-term | 31,958 | — | (31,958 | ) | — | |||||||
Total debt | 533,408 | 557,692 | 5 | % | 24,284 | 51,195 | ||||||
Short-term | 27,246 | 30,676 | 13 | % | 3,430 | 2,816 | ||||||
Long-term | 506,162 | 527,016 | 4 | % | 20,854 | 48,379 | ||||||
Cash & cash equivalents | 116,580 | 134,891 | 16 | % | 18,311 | 12,383 | ||||||
Total net debt | 416,828 | 422,801 | 1 | % | 5,973 | 38,812 | ||||||
| * | Unaudited consolidated financial statements prepared in accordance with Mexican Generally Accepted Accounting Principles (Mexican GAAP) issued by the Instituto Mexicano de Contadores Públicos.Inflation recognition is also in accordance with Mexican GAAP. Accordingly, peso figures are presented in constant Mexican pesos as of March 31, 2006. |
| (1) | Consistent with debt figures presented in U.S. Securities and Exchange Commission filings. |
| (2) | Represents Pemex Finance debt for the first quarter of 2005. Since the third quarter of 2005, Pemex Finance debt is consolidated in documented debt. As of March 31, 2006, Pemex Finance debt totaled Ps. 24.7 billion |
Note: Numbers may not total due to rounding.
| Short-term debt | Total debt with a remaining maturity of less than twelve months was Ps. 30.7 billion (US$2.8 billion). | |
| Long-term debt | Total long-term debt was Ps. 527.0 billion (US$48.4 billion). | |
PEMEX financial results report as of March 31, 2006 | 26/47 | |||
| www.pemex.com |
| PEMEX | Investor Relations |
| Maturity profile | The following table shows the maturity profile of PEMEX’s total debt by currency: |
Table 20
Petróleos Mexicanos, Subsidiary Entities and Subsidiary Companies
Maturity profile
| As of March 31, | ||||||
| (Ps. mm) | US$mm | |||||
Documented debt in pesos | 104,585 | 9,601 | ||||
2006 | 3,500 | 321 | ||||
January - March 2007 | (3,476 | ) | (319 | ) | ||
April 2007 - March 2008 | 17,944 | 1,647 | ||||
April 2008 - March 2009 | 4,944 | 454 | ||||
April 2010 - March 2011 | 26,013 | 2,388 | ||||
April 2011 and beyond | 55,659 | 5,109 | ||||
Documented debt in other currencies | 453,107 | 41,594 | ||||
2006 | 26,214 | 2,406 | ||||
January - March 2007 | 4,438 | 407 | ||||
April 2007 - March 2008 | 51,442 | 4,722 | ||||
April 2008 - March 2009 | 50,491 | 4,635 | ||||
April 2010 - March 2011 | 71,754 | 6,587 | ||||
April 2011 and beyond | 248,769 | 22,836 | ||||
Total debt | 557,692 | 51,195 | ||||
| * | Unaudited consolidated financial statements prepared in accordance with Mexican Generally Accepted Accounting Principles (Mexican GAAP) issued by the Instituto Mexicano de Contadores Públicos. Inflation recognition is also in accordance with Mexican GAAP. Accordingly, peso figures are presented in constant Mexican pesos as of March 31, 2006. |
Note: Numbers may not total due to rounding.
| Duration | PEMEX plans to smooth its maturity profile regardless of the duration of its outstanding debt. The average duration of its debt exposure is presented in the following table. |
Table 21
Petróleos Mexicanos, Subsidiary Entities and Subsidiary Companies
Average duration of debt exposure
| As of March 31, | |||||||
| 2005 | 2006 | Change | |||||
| (Years) | |||||||
U.S. Dollars | 4.0 | 4.2 | 0.1 | ||||
Mexican pesos | 1.5 | 2.1 | 0.6 | ||||
Euros | 1.2 | 1.5 | 0.3 | ||||
Japanese yen | 2.6 | 2.1 | (0.5 | ) | |||
Swiss francs | 0.4 | 0.2 | (0.2 | ) | |||
Total | 3.6 | 3.8 | 0.2 | ||||
Note: Numbers may not total due to rounding.
PEMEX financial results report as of March 31, 2006 | 27/47 | |||
| www.pemex.com |
| PEMEX | Investor Relations |
| Interest rate risk | PEMEX’s policy is to maintain a balance between fixed and floating rate liabilities in order to mitigate the impact of fluctuations in interest rates. As of March 31, 2006, approximately 62% of PEMEX’s debt exposure carried a fixed interest rate, and 38% of its debt bore interest at floating rates. | |
| More financing in pesos | Although most of PEMEX’s debt is U.S. dollar denominated and at fixed rates, peso denominated financing has increased about 2 percentage points. | |
| Debt exposure | The following table sets forth PEMEX’s debt exposure to currency and interest rate risk: | |
Table 22
Petróleos Mexicanos, Subsidiary Entities and Subsidiary Companies
Debt exposure
(excluding accrued interest)
| As of March 31, | ||||||||||||||||||
| 2005 | 2006 | 2005 | 2006 | 2005 | 2006 | |||||||||||||
| By currency | Percentage At fixed rate | At floating rate | ||||||||||||||||
U.S. Dollars | 82.2 | % | 79.9 | % | 67.5 | % | 65.7 | % | 32.5 | % | 34.3 | % | ||||||
Mexican pesos | 17.6 | % | 20.0 | % | 40.4 | % | 49.0 | % | 59.6 | % | 51.0 | % | ||||||
Euros | 0.006 | % | 0.003 | % | 23.1 | % | 38.5 | % | 76.9 | % | 61.5 | % | ||||||
Japanese yen | 0.2 | % | 0.1 | % | 100.0 | % | 100.0 | % | 0.0 | % | 0.0 | % | ||||||
Swiss francs | 0.0004 | % | 0.0001 | % | 0 | % | 0.0 | % | 100.00 | % | 100.00 | % | ||||||
Total | 100.0 | % | 100.0 | % | 62.8 | % | 62.4 | % | 37.2 | % | 37.6 | % | ||||||
Note: Numbers may not total due to rounding.
PEMEX financial results report as of March 31, 2006 | 28/47 | |||
| www.pemex.com |
| PEMEX | Investor Relations |
Other relevant topics
| New fiscal regime | Starting January 1, 2006, PEMEX is subject to a new fiscal regime. Under the new tax regime, Pemex Exploration and Production is governed by theLey Federal de Derechos and the tax regime for the other subsidiary entities continues to be governed by theLey de Ingresos de la Federación. The new fiscal regime for Pemex Exploration and Production consists of the following duties:
• Ordinary duty on hydrocarbons.- From 2006 to 2009, a variable tax rate will apply, depending on the average Mexican crude oil export price and the specific year6. The rate would vary from 78.68% to 87.81% in 2006, and would become a uniform rate of 79% in 2010 and thereafter. This duty would apply to the value of extracted production minus certain permitted deductions (including specific investments, some costs and expenses and the other duties)7
• Duty on hydrocarbons for the oil revenues stabilization fund.- The rate will range from 1% to 10%, on the value of the extracted crude oil production, depending on the average Mexican crude oil export price, and only if the crude oil export price exceeds US$22 per barrel8
• Extraordinary duty on crude oil exports.- The rate will be 13.1% on the realized value of oil exports in excess of estimated value of oil exports budgeted by Congress. This duty is to be credited against the duty for hydrocarbons for the oil revenues stabilization fund. The proceeds from this duty will be destined to the states through the stabilization fund of the states’ revenues
• Duty on hydrocarbons fo the fund for scientific and technological research on energy.- The rate will be 0.05% on the value of extracted production. Based on the Federal Budget, the proceeds will be destined to the Mexican Petroleum Institute (IMP)
• Duty on hydrocarbons for fiscal monitoring of oil activities.- The rate will be 0.003% on the value of extracted production. Based on the Federal Budget, the proceeds will be destined to the Auditoría Superior de la Federación (Federal Auditing entity)
• Additional duty.- From 2006 to 2008, this duty will be applied if and only if the actual annual crude oil production is below the target production for a given year9 |
| 6 | See Table A9 |
| 7 | See Table A10 |
| 8 | See Table A11 |
| 9 | See Table A12 and methodology of calculation |
PEMEX financial results report as of March 31, 2006 | 29/47 | |||
| www.pemex.com |
| PEMEX | Investor Relations |
| End of the natural gas price subsidy | In accordance with a Presidential Decree issued on September 12, 2005, the natural gas price to industrial consumers and distributors was equivalent to:
• The price in Reynosa, Tamaulipas in August 2005 (7.253 US$/MMBtu), plus
• 21% of the difference between the price in Reynosa for a given month and 7.253 US$/MMBtu
The decree determined that this mechanism was in effect until natural gas production in the Gulf of Mexico was reestablished. The production was reestablished on January 10, 2006, when the 30 day average natural gas production reached 8,000 MMcfd. | |
| Incidents | During the first quarter of 2006, the following incidents occurred in the states of Morelos, Veracruz and Coahuila:
• On February 1, 2006, a Premium gasoline leak occurred in the Añil-Cuernavaca pipeline at the Montecristi station located at the kilometer 58 of the federal route Mexico-Cuernavaca. The leakage took place in a controlling valve
• On February 15, 2006 a leak of crude oil occurred in the compression station El Plan, in the municipality Las Chiapas, in the state of Veracruz. This incident was due to corrosion in the pipelines located in the surrounding area
• On February 28,2006, a crude oil leakage occurred in the 30 inch crude oil pipeline that runs from Nuevo Teapa to Poza Rica due to illegal tapping
• On March 8, 2006, a fire took place in the ten inch pipeline Satélite – Monclova – Sabinas due to illegal tapping. The incident was located next to the federal route Monterrey – Monclova in the municipality of Castaños in the state of Coahuila
• On March 31, 2006, a gasoline leakage occurred in the 16 inch pipeline that runs from Minatitlán to Salina Cruz due to illegal tapping. This incident took place in the Agraria neighborhood, in the municipality of Jaltipán in the state of Veracruz
In collaboration with the Governments of the states of Morelos, Veracruz and Coahuila, the Mexican Army and Navy, municipal authorities and Civil Protection, among others, PEMEX has implemented contingency plans to protect and reestablish the health and integrity of the population of the affected areas and counteract any negative environmental impact. | |
PEMEX financial results report as of March 31, 2006 | 30/47 | |||
| www.pemex.com |
| PEMEX | Investor Relations |
Annex
Table A1
Petróleos Mexicanos, Subsidiary Entities and Subsidiary Companies
Crude oil production by selected fields (quarterly)
| 2003 | 2004 | 2005 | 2006 | |||||||||||||||||||||||||||||
| 2000 | 2001 | 2002 | 1Q | 2Q | 3Q | 4Q | 1Q | 2Q | 3Q | 4Q | 1Q | 2Q | 3Q | 4Q | 1Q | |||||||||||||||||
| (Mbd) | ||||||||||||||||||||||||||||||||
Total | 3,012 | 3,127 | 3,177 | 3,324 | 3,332 | 3,415 | 3,411 | 3,382 | 3,422 | 3,382 | 3,346 | 3,316 | 3,425 | 3,286 | 3,306 | 3,345 | ||||||||||||||||
Northeast Marine Region | 1,763 | 1,986 | 2,152 | 2,346 | 2,376 | 2,467 | 2,474 | 2,440 | 2,479 | 2,436 | 2,408 | 2,375 | 2,450 | 2,305 | 2,300 | 2,334 | ||||||||||||||||
Akal and Nohoch | 1,420 | 1,673 | 1,851 | 1,995 | 2,023 | 2,096 | 2,101 | 2,085 | 2,110 | 2,074 | 2,047 | 2,067 | 2,041 | 1,905 | 1,883 | 1,882 | ||||||||||||||||
Ku | 205 | 176 | 185 | 202 | 196 | 197 | 195 | 185 | 194 | 197 | 189 | 159 | 213 | 213 | 225 | 244 | ||||||||||||||||
Zaap | 30 | 26 | 21 | 28 | 31 | 51 | 54 | 53 | 53 | 54 | 68 | 53 | 77 | 75 | 71 | 82 | ||||||||||||||||
Maloob | 50 | 45 | 35 | 51 | 53 | 48 | 46 | 51 | 55 | 55 | 50 | 38 | 51 | 48 | 50 | 57 | ||||||||||||||||
Chac | 18 | 22 | 17 | 19 | 20 | 21 | 22 | 23 | 23 | 11 | 11 | 10 | 13 | 12 | 12 | 13 | ||||||||||||||||
Kutz | — | 5 | 9 | 13 | 11 | 13 | 14 | 9 | 12 | 13 | 13 | 10 | 14 | 11 | 11 | 12 | ||||||||||||||||
Otros | 40 | 40 | 32 | 39 | 42 | 41 | 42 | 34 | 33 | 31 | 30 | 37 | 40 | 39 | 48 | 44 | ||||||||||||||||
Southwest Marine Region | 622 | 554 | 452 | 410 | 399 | 393 | 388 | 389 | 391 | 388 | 384 | 381 | 394 | 390 | 419 | 428 | ||||||||||||||||
Caan | 182 | 163 | 133 | 119 | 117 | 111 | 110 | 107 | 109 | 109 | 106 | 102 | 100 | 95 | 94 | 93 | ||||||||||||||||
Chuc | 140 | 118 | 107 | 98 | 101 | 99 | 96 | 92 | 93 | 93 | 94 | 98 | 103 | 99 | 112 | 111 | ||||||||||||||||
Abkatún | 108 | 103 | 80 | 75 | 72 | 67 | 63 | 59 | 57 | 52 | 50 | 49 | 47 | 41 | 38 | 34 | ||||||||||||||||
Taratunich | 50 | 43 | 39 | 36 | 34 | 38 | 37 | 35 | 33 | 33 | 32 | 27 | 24 | 17 | 19 | 24 | ||||||||||||||||
Pol | 74 | 62 | 42 | 38 | 36 | 34 | 32 | 30 | 28 | 23 | 21 | 19 | 18 | 16 | 14 | 14 | ||||||||||||||||
Otros | 69 | 64 | 51 | 43 | 40 | 44 | 51 | 67 | 72 | 78 | 81 | 86 | 102 | 122 | 142 | 152 | ||||||||||||||||
South Region | 550 | 509 | 498 | 496 | 485 | 480 | 472 | 474 | 471 | 475 | 471 | 479 | 495 | 508 | 504 | 499 | ||||||||||||||||
Puerto Ceiba | 17 | 21 | 38 | 37 | 43 | 51 | 55 | 70 | 79 | 82 | 77 | 77 | 81 | 81 | 70 | 63 | ||||||||||||||||
Samaria | 83 | 83 | 71 | 77 | 76 | 71 | 67 | 66 | 64 | 60 | 59 | 60 | 64 | 68 | 69 | 66 | ||||||||||||||||
Iride | 45 | 43 | 43 | 47 | 43 | 43 | 45 | 45 | 46 | 46 | 48 | 48 | 50 | 51 | 52 | 51 | ||||||||||||||||
Jujo | 61 | 56 | 56 | 54 | 54 | 49 | 48 | 47 | 45 | 45 | 41 | 45 | 52 | 51 | 51 | 54 | ||||||||||||||||
Cunduacán | 24 | 22 | 21 | 22 | 22 | 23 | 25 | 24 | 24 | 28 | 28 | 28 | 30 | 27 | 25 | 23 | ||||||||||||||||
Tecominoacán | 32 | 29 | 27 | 24 | 23 | 24 | 23 | 21 | 19 | 18 | 19 | 20 | 22 | 23 | 25 | 28 | ||||||||||||||||
Cárdenas | 23 | 20 | 16 | 15 | 14 | 14 | 14 | 14 | 14 | 13 | 11 | 11 | 14 | 18 | 18 | 19 | ||||||||||||||||
Sen | 30 | 33 | 31 | 25 | 24 | 21 | 16 | 9 | 11 | 15 | 16 | 17 | 18 | 19 | 21 | 22 | ||||||||||||||||
Pijije | 4 | 5 | 9 | 11 | 12 | 13 | 13 | 12 | 11 | 11 | 10 | 10 | 12 | 14 | 14 | 14 | ||||||||||||||||
Jolote | 20 | 16 | 15 | 13 | 12 | 11 | 11 | 12 | 11 | 11 | 10 | 9 | 10 | 10 | 9 | 9 | ||||||||||||||||
Cactus | 11 | 12 | 10 | 11 | 11 | 12 | 13 | 11 | 11 | 11 | 10 | 11 | 9 | 9 | 8 | 8 | ||||||||||||||||
Bellota | 10 | 9 | 10 | 9 | 8 | 9 | 8 | 10 | 10 | 9 | 9 | 10 | 9 | 9 | 8 | 8 | ||||||||||||||||
Chinchorro | 10 | 10 | 9 | 10 | 11 | 10 | 10 | 10 | 9 | 8 | 8 | 8 | 8 | 8 | 7 | 7 | ||||||||||||||||
Yagual | 4 | 4 | 4 | 4 | 3 | 4 | 4 | 4 | 5 | 7 | 10 | 11 | 11 | 13 | 12 | 11 | ||||||||||||||||
Rodador | 2 | 2 | 3 | 7 | 7 | 8 | 7 | 7 | 7 | 6 | 5 | 5 | 5 | 5 | 6 | 4 | ||||||||||||||||
Otros | 174 | 144 | 136 | 131 | 122 | 119 | 115 | 111 | 107 | 107 | 108 | 108 | 101 | 104 | 110 | 111 | ||||||||||||||||
North Region | 77 | 79 | 75 | 71 | 72 | 74 | 77 | 80 | 80 | 82 | 83 | 81 | 86 | 84 | 83 | 84 | ||||||||||||||||
Poza Rica | 10 | 11 | 10 | 9 | 9 | 10 | 11 | 10 | 11 | 12 | 11 | 10 | 10 | 10 | 9 | 10 | ||||||||||||||||
Arenque | 6 | 8 | 8 | 9 | 9 | 9 | 8 | 8 | 8 | 8 | 9 | 10 | 10 | 9 | 9 | 8 | ||||||||||||||||
Agua Fría | 3 | 2 | 2 | 2 | 2 | 2 | 3 | 6 | 6 | 6 | 8 | 6 | 6 | 5 | 6 | 7 | ||||||||||||||||
Taj��n | 2 | 1 | 1 | 2 | 2 | 4 | 6 | 6 | 6 | 6 | 5 | 6 | 6 | 6 | 6 | 6 | ||||||||||||||||
Tamaulipas | 8 | 8 | 7 | 5 | 5 | 5 | 5 | 5 | 5 | 5 | 5 | 5 | 5 | 5 | 5 | 5 | ||||||||||||||||
Constituciones | 7 | 7 | 6 | 5 | 5 | 5 | 5 | 5 | 5 | 5 | 5 | 5 | 5 | 5 | 5 | 5 | ||||||||||||||||
Otros | 42 | 41 | 40 | 39 | 39 | 39 | 39 | 39 | 38 | 40 | 38 | 39 | 43 | 43 | 43 | 43 | ||||||||||||||||
Note: Numbers may not total due to rounding.
| PEMEX financial results report as of March 31, 2006 | 31/47 | |||
| www.pemex.com |
| PEMEX | Investor Relations |
Table A2
Petróleos Mexicanos, Subsidiary Entities and Subsidiary Companies
Natural gas production by selected fields (quarterly)
| 2003 | 2004 | 2005 | 2006 | |||||||||||||||||||||||||||||
| 2000 | 2001 | 2002 | 1Q | 2Q | 3Q | 4Q | 1Q | 2Q | 3Q | 4Q | 1Q | 2Q | 3Q | 4Q | 1Q | |||||||||||||||||
| (MMcfd) | ||||||||||||||||||||||||||||||||
Total | 4,679 | 4,511 | 4,423 | 4,441 | 4,425 | 4,563 | 4,562 | 4,557 | 4,570 | 4,577 | 4,586 | 4,640 | 4,861 | 4,839 | 4,928 | 5,094 | ||||||||||||||||
Northeast Marine Region | 737 | 794 | 831 | 913 | 924 | 963 | 962 | 948 | 959 | 945 | 938 | 918 | 965 | 914 | 915 | 931 | ||||||||||||||||
Akal and Nohoch | 543 | 610 | 676 | 728 | 738 | 765 | 767 | 761 | 770 | 757 | 747 | 755 | 745 | 695 | 687 | 687 | ||||||||||||||||
Ku | 133 | 123 | 98 | 118 | 116 | 108 | 102 | 102 | 101 | 102 | 98 | 82 | 106 | 109 | 115 | 127 | ||||||||||||||||
Otros | 60 | 61 | 57 | 67 | 69 | 90 | 93 | 85 | 89 | 86 | 93 | 81 | 113 | 110 | 113 | 117 | ||||||||||||||||
Southwest Marine Region | 820 | 736 | 621 | 580 | 578 | 582 | 585 | 609 | 600 | 599 | 602 | 601 | 654 | 656 | 707 | 750 | ||||||||||||||||
Caan | 278 | 258 | 215 | 197 | 209 | 208 | 211 | 222 | 221 | 207 | 212 | 207 | 216 | 205 | 198 | 196 | ||||||||||||||||
Chuc | 177 | 148 | 131 | 119 | 121 | 120 | 116 | 105 | 92 | 92 | 92 | 97 | 108 | 117 | 130 | 118 | ||||||||||||||||
Taratunich | 75 | 67 | 65 | 64 | 61 | 71 | 71 | 69 | 65 | 67 | 62 | 54 | 49 | 32 | 37 | 57 | ||||||||||||||||
Sinan | — | — | — | — | — | — | 5 | 32 | 44 | 57 | 61 | 63 | 80 | 89 | 88 | 94 | ||||||||||||||||
Abkatún | 82 | 78 | 62 | 58 | 57 | 56 | 55 | 52 | 49 | 45 | 42 | 43 | 42 | 33 | 27 | 33 | ||||||||||||||||
Uech | 51 | 45 | 43 | 43 | 37 | 41 | 38 | 39 | 40 | 36 | 32 | 28 | 25 | 22 | 25 | 26 | ||||||||||||||||
Otros | 157 | 139 | 104 | 99 | 93 | 84 | 90 | 91 | 89 | 96 | 101 | 109 | 134 | 160 | 203 | 226 | ||||||||||||||||
South Region | 1,857 | 1,743 | 1,704 | 1,644 | 1,634 | 1,641 | 1,601 | 1,532 | 1,507 | 1,486 | 1,456 | 1,419 | 1,408 | 1,398 | 1,377 | 1,361 | ||||||||||||||||
Muspac | 216 | 212 | 235 | 245 | 216 | 204 | 196 | 171 | 146 | 133 | 128 | 124 | 116 | 117 | 104 | 92 | ||||||||||||||||
Samaria | 113 | 114 | 94 | 91 | 95 | 102 | 106 | 102 | 102 | 106 | 99 | 94 | 89 | 89 | 79 | 78 | ||||||||||||||||
Catedral | 134 | 123 | 124 | 134 | 133 | 125 | 120 | 111 | 104 | 95 | 92 | 82 | 75 | 71 | 68 | 66 | ||||||||||||||||
Giraldas | 96 | 102 | 103 | 95 | 95 | 98 | 95 | 91 | 90 | 87 | 87 | 83 | 78 | 69 | 67 | 64 | ||||||||||||||||
Copano | 79 | 86 | 80 | 76 | 79 | 86 | 84 | 84 | 84 | 74 | 72 | 70 | 68 | 64 | 59 | 60 | ||||||||||||||||
Cunduacán | 64 | 57 | 51 | 54 | 54 | 43 | 68 | 72 | 70 | 72 | 69 | 77 | 90 | 90 | 94 | 99 | ||||||||||||||||
Iride | 68 | 76 | 74 | 79 | 73 | 80 | 78 | 67 | 69 | 68 | 77 | 83 | 92 | 96 | 102 | 109 | ||||||||||||||||
Puerto Ceiba | 11 | 18 | 24 | 21 | 26 | 33 | 34 | 43 | 52 | 58 | 57 | 52 | 54 | 53 | 47 | 43 | ||||||||||||||||
Jujo | 82 | 81 | 71 | 65 | 62 | 55 | 50 | 47 | 46 | 48 | 41 | 46 | 53 | 59 | 59 | 64 | ||||||||||||||||
José Colomo | 63 | 60 | 47 | 39 | 38 | 36 | 35 | 37 | 35 | 35 | 35 | 35 | 35 | 36 | 35 | 32 | ||||||||||||||||
Sen | 86 | 92 | 91 | 75 | 71 | 63 | 47 | 25 | 30 | 38 | 39 | 41 | 45 | 47 | 53 | 56 | ||||||||||||||||
Pijije | 12 | 14 | 26 | 32 | 35 | 37 | 36 | 35 | 32 | 32 | 30 | 29 | 34 | 41 | 42 | 42 | ||||||||||||||||
Luna | 110 | 89 | 85 | 60 | 53 | 47 | 43 | 36 | 33 | 31 | 30 | 30 | 21 | 25 | 21 | 21 | ||||||||||||||||
Tecominoacán | 40 | 37 | 30 | 26 | 24 | 26 | 24 | 30 | 30 | 30 | 33 | 31 | 36 | 33 | 35 | 40 | ||||||||||||||||
Saramako | — | — | 2 | 9 | 9 | 18 | 21 | 21 | 23 | 32 | 36 | 29 | 28 | 25 | 22 | 20 | ||||||||||||||||
Cárdenas | 47 | 35 | 31 | 28 | 29 | 28 | 26 | 24 | 23 | 30 | 29 | 26 | 29 | 40 | 38 | 41 | ||||||||||||||||
Cactus | 21 | 22 | 19 | 22 | 25 | 24 | 29 | 26 | 25 | 27 | 23 | 25 | 23 | 22 | 22 | 20 | ||||||||||||||||
Bellota | 26 | 25 | 28 | 22 | 27 | 30 | 29 | 29 | 30 | 20 | 22 | 26 | 26 | 23 | 24 | 23 | ||||||||||||||||
Otros | 590 | 501 | 489 | 470 | 491 | 505 | 479 | 480 | 481 | 471 | 456 | 438 | 415 | 401 | 405 | 393 | ||||||||||||||||
North Region | 1,266 | 1,238 | 1,268 | 1,304 | 1,290 | 1,377 | 1,414 | 1,469 | 1,504 | 1,547 | 1,590 | 1,703 | 1,834 | 1,871 | 1,930 | 2,052 | ||||||||||||||||
Culebra | 320 | 274 | 219 | 208 | 201 | 200 | 196 | 179 | 164 | 153 | 182 | 182 | 185 | 167 | 153 | 157 | ||||||||||||||||
Cuitláhuac | 122 | 126 | 109 | 93 | 92 | 87 | 91 | 92 | 104 | 129 | 127 | 116 | 115 | 116 | 117 | 121 | ||||||||||||||||
Arcos | 199 | 175 | 148 | 149 | 155 | 134 | 125 | 128 | 115 | 90 | 82 | 76 | 81 | 101 | 109 | 104 | ||||||||||||||||
Cocuite | 18 | 27 | 45 | 65 | 79 | 105 | 110 | 112 | 99 | 102 | 92 | 84 | 77 | 71 | 65 | 57 | ||||||||||||||||
Vistoso | — | — | — | — | — | — | 32 | 59 | 79 | 85 | 95 | 111 | 118 | 119 | 120 | 120 | ||||||||||||||||
Santa Rosalia | 9 | 24 | 63 | 51 | 40 | 53 | 67 | 62 | 66 | 70 | 55 | 56 | 56 | 58 | 71 | 55 | ||||||||||||||||
Corindón | 26 | 40 | 59 | 54 | 63 | 63 | 56 | 62 | 49 | 44 | 44 | 45 | 41 | 36 | 49 | 48 | ||||||||||||||||
Arcabuz | 93 | 57 | 46 | 37 | 33 | 32 | 32 | 38 | 35 | 41 | 47 | 54 | 67 | 76 | 65 | 71 | ||||||||||||||||
Torrecillas | 1 | 5 | 21 | 30 | 32 | 38 | 36 | 36 | 46 | 38 | 36 | 36 | 41 | 41 | 43 | 43 | ||||||||||||||||
Velero | 2 | 9 | 13 | 17 | 19 | 22 | 29 | 41 | 36 | 38 | 38 | 50 | 50 | 49 | 51 | 54 | ||||||||||||||||
Arenque | 27 | 28 | 29 | 29 | 30 | 32 | 31 | 32 | 32 | 33 | 32 | 31 | 32 | 33 | 31 | 32 | ||||||||||||||||
Copite | 47 | 35 | 33 | 30 | 21 | 28 | 28 | 28 | 29 | 30 | 30 | 28 | 27 | 22 | 26 | 27 | ||||||||||||||||
Otros | 402 | 439 | 482 | 540 | 526 | 583 | 580 | 601 | 648 | 693 | 732 | 833 | 945 | 982 | 1,030 | 1,163 | ||||||||||||||||
Note: Numbers may not total due to rounding.
PEMEX financial results report as of March 31, 2006 | 32/47 | |||
| www.pemex.com |
| PEMEX | Investor Relations |
Table A3
Petróleos Mexicanos, Subsidiary Entities and Subsidiary Companies
Consolidated balance sheets
| As of March 31, | ||||||||||||||
| 2005 | 2006 | Change | 2006 | |||||||||||
| (Ps. mm) | (US$mm) | |||||||||||||
Current assets | 299,736 | 345,299 | 15 | % | 45,563 | 31,698 | ||||||||
Cash & cash equivalents | 116,580 | 134,891 | 16 | % | 18,311 | 12,383 | ||||||||
Accounts receivable | 132,297 | 159,190 | 20 | % | 26,893 | 14,613 | ||||||||
Inventories | 42,328 | 49,802 | 18 | % | 7,474 | 4,572 | ||||||||
Financial derivative instruments | 8,531 | 1,416 | -83 | % | (7,115 | ) | 130 | |||||||
Properties and equipment | 624,552 | 660,793 | 6 | % | 36,241 | 60,659 | ||||||||
Other assets | 115,593 | 107,971 | -7 | % | (7,621 | ) | 9,912 | |||||||
Total assets | 1,039,880 | 1,114,063 | 7 | % | 74,183 | 102,269 | ||||||||
Short-term liabilities | 137,437 | 184,893 | 35 | % | 47,457 | 16,973 | ||||||||
Short-term debt(1) | 27,246 | 30,676 | 13 | % | 3,430 | 2,816 | ||||||||
Suppliers | 24,584 | 22,056 | -10 | % | (2,528 | ) | 2,025 | |||||||
Accounts payable and accured expenses | 24,812 | 29,396 | 18 | % | 4,584 | 2,698 | ||||||||
Taxes payable | 49,500 | 89,808 | 81 | % | 40,308 | 8,244 | ||||||||
Financial derivative instruments | 11,294 | 12,958 | 15 | % | 1,664 | 1,189 | ||||||||
Long-term liabilities | 862,667 | 944,534 | 9 | % | 81,867 | 86,706 | ||||||||
Long-term debt(2) | 506,162 | 527,016 | 4 | % | 20,854 | 48,379 | ||||||||
Reserve for retirement payments, pensionsand seniority premiums | 328,972 | 390,631 | 19 | % | 61,659 | 35,859 | ||||||||
Other non-current liabilities(3) | 27,533 | 26,887 | -2 | % | (646 | ) | 2,468 | |||||||
Total liabilities | 1,000,103 | 1,129,427 | 13 | % | 129,324 | 103,679 | ||||||||
Total equity | 39,777 | (15,365 | ) | (55,141 | ) | (1,410 | ) | |||||||
Total liabilities & equity | 1,039,880 | 1,114,063 | 7 | % | 74,183 | 102,269 | ||||||||
| * | Unaudited consolidated financial statements prepared in accordance with Mexican Generally Accepted Accounting Principles (Mexican GAAP) issued by the Instituto Mexicano de Contadores Públicos.Inflation recognition is also in accordance with Mexican GAAP. Accordingly, peso figures are presented in constant Mexican pesos as of March 31, 2006. |
| (1) | Includes maturities shorter than twelve months of documented debt (Petróleos Mexicanos, the Pemex Project Funding Master Trust, the Mexican Trust F/163, and RepconLux) and notes payable to contractors. |
| (2) | Includes maturities longer than twelve months of documented debt (Petróleos Mexicanos, the Pemex Project Funding Master Trust, the Mexican Trust F/163, and Repcon Lux), notes payable to contractors and sale of future accounts receivable. |
| (3) | Corresponds to the balance of the reserve for dismantlement and abandonment activities, sundry creditors and others. |
Note: Numbers may not total due to rounding.
PEMEX financial results report as of March 31, 2006 | 33/47 | |||
| www.pemex.com |
| PEMEX | Investor Relations |
Table A4
Petróleos Mexicanos, Subsidiary Entities and Subsidiary Companies
Consolidated income statement
| First quarter (January - March) | |||||||||||||||
| 2005 | 2006 | Change | 2006 | ||||||||||||
| (Ps. mm) | (US$mm) | ||||||||||||||
Total sales | 202,354 | 241,431 | 19 | % | 39,076 | 22,163 | |||||||||
Domestic sales(1) | 117,351 | 126,552 | 8 | % | 9,201 | 11,617 | |||||||||
Exports | 85,004 | 114,879 | 35 | % | 29,875 | 10,546 | |||||||||
Costs and expenses(2) | 78,272 | 93,959 | 20 | % | 15,686 | 8,625 | |||||||||
Cost of sales | 62,501 | 76,148 | 22 | % | 13,647 | 6,990 | |||||||||
Distribution expenses | 4,819 | 5,496 | 14 | % | 677 | 505 | |||||||||
Administrative expenses | 10,952 | 12,315 | 12 | % | 1,362 | 1,130 | |||||||||
Operating income | 124,082 | 147,472 | 19 | % | 23,390 | 13,538 | |||||||||
Comprehensive financing cost | 3,569 | 3,637 | 2 | % | 68 | 334 | |||||||||
Other expenses (revenues) | (4,040 | ) | (6,404 | ) | (2,364 | ) | (588 | ) | |||||||
Income before taxes and duties | 124,554 | 150,239 | 21 | % | 25,686 | 13,792 | |||||||||
Taxes and duties | 123,817 | 142,487 | 15 | % | 18,670 | 13,080 | |||||||||
Hydrocarbon extraction duties and other | 111,885 | 142,487 | 27 | % | 30,602 | 13,080 | |||||||||
Special Tax on Production and | |||||||||||||||
Services (IEPS) | 11,933 | — | -100 | % | (11,933 | ) | — | ||||||||
Initial cumulative effect due tothe adoption of new accountingstandards | 4,576.2 | — | (4,576 | ) | — | ||||||||||
Net income (loss) | 5,312 | 7,752 | 46 | % | 2,440 | 712 | |||||||||
| * | Unaudited consolidated financial statements prepared in accordance with Mexican Generally Accepted Accounting Principles (Mexican GAAP) issued by the Instituto Mexicano de Contadores Públicos. Inflation recognition is also in accordance with Mexican GAAP. Accordingly, peso figures are presented in constant Mexican pesos as of March 31, 2006. |
| (1) | Includes the Special Tax on Production and Services (IEPS), which was Ps. 11,933 million in the first quarter of 2005 and zero in the first quarter of 2006. |
| (2) | Includes the cost of the reserve for retirment payments, pensions and indemnities. |
Note: Numbers may not total due to rounding.
PEMEX financial results report as of March 31, 2006 | 34/47 | |||
| www.pemex.com |
| PEMEX | Investor Relations |
Table A5
Petróleos Mexicanos, Subsidiary Entities and Subsidiary Companies
Equity
| As of March 31, | |||||||||||||||
| 2005 | 2006 | Change | 2006 | ||||||||||||
| (Ps. mm) | (US$mm) | ||||||||||||||
Total equity | 39,777 | (15,365 | ) | (55,141 | ) | (1,410 | ) | ||||||||
Certificates of contribution “A” | 89,872 | 90,499 | 1 | % | 628 | 8,308 | |||||||||
Capitalized proceeds | 34,336 | 79,527 | 132 | % | 45,191 | 7,300 | |||||||||
Effect of the reserve for retirement payments | (7,270 | ) | (27,492 | ) | (20,223 | ) | (2,524 | ) | |||||||
Comprehensive income | (1,671 | ) | (3,369 | ) | (1,698 | ) | (309 | ) | |||||||
Restatement of equity | 141,962 | 145,616 | 3 | % | 3,654 | 13,367 | |||||||||
Accumulated net income (losses) | (217,453 | ) | (300,146 | ) | (82,693 | ) | (27,553 | ) | |||||||
From prior years | (222,765 | ) | (307,898 | ) | (85,133 | ) | (28,264 | ) | |||||||
Net income (loss) for the period | 5,312 | 7,752 | 46 | % | 2,440 | 712 | |||||||||
| * | Unaudited consolidated financial statements prepared in accordance with Mexican Generally Accepted Accounting Principles (Mexican GAAP) issued by the Instituto Mexicano de Contadores Públicos. Inflation recognition is also in accordance with Mexican GAAP. Accordingly, peso figures are presented in constant Mexican pesos as of March 31, 2006. |
Note: Numbers may not total due to rounding.
PEMEX financial results report as of March 31, 2006 | 35/47 | |||
| www.pemex.com |
| PEMEX | Investor Relations |
Table A6
Petróleos Mexicanos, Subsidiary Entities and Subsidiary Companies
Consolidated statements of changes in financial position
As of March 31, | |||||||||||||||
| 2005 | 2006 | Change | 2006 | ||||||||||||
| (Ps. mm) | (US$mm) | ||||||||||||||
Operating activities | |||||||||||||||
Net income (loss) | 5,312 | 7,752 | 46 | % | 2,440 | 712 | |||||||||
Charges to operations not requiring the use of funds: | 25,540 | 25,452 | 0 | % | (88 | ) | 2,336 | ||||||||
Depreciation and amortization | 11,477 | 9,549 | -17 | % | (1,928 | ) | 877 | ||||||||
Other non-cash flow items | 14,063 | 15,903 | 13 | % | 1,840 | 1,460 | |||||||||
Funds from net income (loss) | 30,852 | 33,204 | 46 | % | 2,352 | 3,048 | |||||||||
Changes in working capital: | (9,711 | ) | (18,847 | ) | (9,136 | ) | (1,730 | ) | |||||||
Accounts, notes receivable and other | (15,886 | ) | (41,501 | ) | (25,615 | ) | (3,810 | ) | |||||||
Inventories | (5,087 | ) | 1,171 | 6,258 | 107 | ||||||||||
Intangible asset derived from actuarial computation of labor obligations and other assets | 1,049 | (587 | ) | (1,636 | ) | (54 | ) | ||||||||
Suppliers | (3,129 | ) | (9,143 | ) | (6,014 | ) | (839 | ) | |||||||
Other liabilities | 13,342 | 31,213 | 134 | % | 17,871 | 2,865 | |||||||||
Funds provided by (used) in operating activities | 21,141 | 14,357 | 32 | % | (6,784 | ) | 1,318 | ||||||||
Financing activities | |||||||||||||||
Bank loans financing | (23,925 | ) | 8,599 | 32,524 | 789 | ||||||||||
Securities financing | 45,415 | 18,391 | -60 | % | (27,024 | ) | 1,688 | ||||||||
Other financing | (250 | ) | 1,816 | 2,066 | 167 | ||||||||||
Amortization of bank loans | — | (11,970 | ) | (11,970 | ) | (1,099 | ) | ||||||||
Amortization of securities | — | (983 | ) | (983 | ) | (90 | ) | ||||||||
Amortization of other financing | — | 3,241 | 3,241 | 298 | |||||||||||
Minimum guaranteed dividends paid to the Mexican Government | — | 719 | 719 | 66 | |||||||||||
Future incresases in equity | — | — | — | — | |||||||||||
Funds provided by (used) in financing activities | 21,240 | 19,813 | -7 | % | (1,427 | ) | 1,819 | ||||||||
Investing activities | |||||||||||||||
Acquisition of property, plants and equipment | (14,180 | ) | (21,038 | ) | (6,858 | ) | (1,931 | ) | |||||||
Funds provided by (used) in investing activities | (14,180 | ) | (21,038 | ) | (6,858 | ) | (1,931 | ) | |||||||
Net increase in cash and cash equivalents | 28,202 | 13,132 | -53 | % | (15,069 | ) | 1,206 | ||||||||
Cash and cash equivalents at the beginning of the year | 88,378 | 121,759 | 38 | % | 33,381 | 11,177 | |||||||||
Cash and cash equivalents at the end of the year | 116,580 | 134,891 | 16 | % | 18,312 | 12,383 | |||||||||
Funds provided by (used) in operating activities | 21,141 | 14,357 | 32 | % | (6,784 | ) | 1,318 | ||||||||
Funds provided by (used) in investing activities | (14,180 | ) | (21,038 | ) | (6,858 | ) | (1,931 | ) | |||||||
Free cash-flow | 6,961 | (6,681 | ) | (13,642 | ) | (613 | ) | ||||||||
| * | Unaudited consolidated financial statements prepared in accordance with Mexican Generally Accepted Accounting Principles (Mexican GAAP) issued by the Instituto Mexicano de Contadores Públicos. Inflation recognition is also in accordance with Mexican GAAP. Accordingly, peso figures are presented in constant Mexican pesos as of March 31, 2006. |
Free cashflow and discretionary free cashflow are non Mexican GAAP measures and are reconciled to Mexican GAAP as set forth above.
Note: Numbers may not total due to rounding.
PEMEX financial results report as of March 31, 2006 | 36/47 | |||
| www.pemex.com |
| PEMEX | Investor Relations |
Table A7
Petróleos Mexicanos, Subsidiary Entities and Subsidiary Companies
Total sales, net income (loss) and total assets by segment
Figures in millions of constant pesos as of March 31, 2006
| Exploration and Production | Refining(1) | Gas and Basic Petrochemicals | Petrochemicals | Subsidiary Companies and | Intersegment Eliminations | Total | ||||||||||||
Three months ending March 31, 2006 | ||||||||||||||||||
Total sales | 195,654 | 97,821 | 52,665 | 6,103 | 157,260 | (268,072 | ) | 241,430 | ||||||||||
External clients | — | 89,755 | 32,073 | 4,516 | 115,086 | — | 241,430 | |||||||||||
Intersegment | 195,654 | 8,066 | 20,592 | 1,586 | 42,173 | (268,072 | ) | — | ||||||||||
Operating income (loss) | 161,033 | (10,976 | ) | 2,171 | (5,053 | ) | (3,683 | ) | 3,979 | 147,472 | ||||||||
Net income (loss) | 16,872 | (8,445 | ) | 1,706 | (5,804 | ) | 8,082 | (4,658 | ) | 7,752 | ||||||||
As of March 31, 2006 | ||||||||||||||||||
Assets | 900,029 | 308,984 | 115,150 | 51,093 | 1,595,219 | (1,856,413 | ) | 1,114,063 | ||||||||||
Three months ending March 31, 2005 | ||||||||||||||||||
Total sales | 146,242 | 88,951 | 47,014 | 7,597 | 119,333 | (206,782 | ) | 202,354 | ||||||||||
External clients | — | 81,652 | 30,496 | 5,203 | 85,003 | — | 202,354 | |||||||||||
Intersegment | 146,242 | 7,299 | 16,518 | 2,394 | 34,329 | (206,782 | ) | 0 | ||||||||||
Operating income (loss) | 114,736 | 7,384 | 3,248 | (1,245 | ) | 525 | (565 | ) | 124,082 | |||||||||
Net income (loss) | 5,644 | (4,714 | ) | 4,024 | (2,557 | ) | 10,136 | (7,221 | ) | 5,312 | ||||||||
As of March 31, 2005 | ||||||||||||||||||
Total assets | 828,017 | 304,789 | 109,758 | 52,930 | 1,105,932 | (1,361,546 | ) | 1,039,880 | ||||||||||
| * | Unaudited consolidated financial statements prepared in accordance with Mexican Generally Accepted Accounting Principles (Mexican GAAP) issued by the Instituto Mexicano de Contadores Públicos. Inflation recognition is also in accordance with Mexican GAAP. Accordingly, peso figures are presented in constant Mexican pesos as of March 31, 2006. |
| (1) | External clients sales of Refining are net of IEPS. |
Note: Numbers may not total due to rounding.
PEMEX financial results report as of March 31, 2006 | 37/47 | |||
| www.pemex.com |
| PEMEX | Investor Relations |
| Cash payment of taxes | The total cash payment of taxes during the first quarter of 2006 increased 15%. This was mainly because the cash payment of the ordinary hydrocarbons duty and others increased Ps. 32.9 billion, or 34%, compared to the first quarter of 2005. Nevertheless the cash payment of the Special Tax on Production and Services (IEPS) decreased Ps. 15.5 billion. |
Table A8
Petróleos Mexicanos, Subsidiary Entities and Subsidiary Companies
Cash payment of taxes (nominal figures)
| First quarter (January - March) | ||||||||||||
| 2005 | 2006 | Change | 2006 | |||||||||
| (Ps. mm) | (US$mm) | |||||||||||
Total taxes and duties | 115,242 | 132,755 | 15 | % | 17,513 | 12,187 | ||||||
Ordinary hydrocarbons duty and others(1) | 97,895 | 130,822 | 34 | % | 32,927 | 12,009 | ||||||
Excess gains duty | — | 51 | 51 | 5 | ||||||||
Special Tax on Production and Services (IEPS) | 17,347 | 1,882 | -89 | % | (15,465 | ) | 173 | |||||
| (1) | For 2005, amount represents the hydrocarbon extraction duties and others |
Note: Numbers may not total due to rounding.
PEMEX financial results report as of March 31, 2006 | 38/47 | |||
| www.pemex.com |
| PEMEX | Investor Relations |
Table A9
Tax rate for the calculation of the ordinary duty on hydrocarbons
Annual weighted average price range of the mexican exported crude oil (US$/b) | Applicable rate over the value of the production of the crude oil and natural gas extracted during the year minus the permitted deductions | |||||||||
| 2006 | 2007 | 2008 | 2009 | |||||||
0.00 | 19.99 | 87.81 | 85.61 | 83.40 | 81.20 | |||||
20.00 | 21.99 | 87.32 | 85.24 | 83.16 | 81.08 | |||||
22.00 | 23.99 | 83.14 | 82.10 | 81.07 | 80.03 | |||||
24.00 | 25.99 | 82.34 | 81.50 | 80.67 | 79.83 | |||||
26.00 | 27.99 | 81.53 | 80.90 | 80.27 | 79.63 | |||||
28.00 | and above | 78.68 | 78.76 | 78.84 | 78.92 | |||||
PEMEX financial results report as of March 31, 2006 | 39/47 | |||
| www.pemex.com |
| PEMEX | Investor Relations |
Table A10
Permitted deductions for the tax base calculation of the ordinary duty on hydrocarbons
Concept | Annual deduction | |
Investments(1) | ||
Book value of investments made before January 1, 2006 | According to Mexican GAAP | |
Exploration | ||
Enhanced recovery | 100% | |
Non-capitalized maintenance | ||
Development | 16.7% | |
Production | ||
Oil pipelines | ||
Gas pipelines | ||
Terminals | 5% | |
Transportation | ||
Storage | ||
Costs | ||
Production costs(2) | 100% | |
Expenses | ||
Exploration | 100% | |
Transportation |
| (1) | In any case, investments’ deductions will not exceed 100% of the original investments |
| (2) | According to Mexican GAAP and not including investments |
Note: Investments, costs and expenses will not exceed the following costcap
| Costcapt | = (6.5 US$/b * total crude oil and associated natural gas volume in year t) |
+(2.7 US$/Mcf * total net natural gas volume in year t)
The deductions that exceed the costcap may be deducted in the immediate following seven years according to the rules set by the SHCP
The costcap will cease to apply in 2010 should the Congress and the Federal Executive Power ammend the by-laws of PEMEX to implement corporate governance best practices
Concept | Annual deduction | ||
Duties | |||
Duty on hydrocarbons for the stabilization fund | |||
Extraordinary duty on crude oil exports | |||
Duty on hydrocarbons for the fund for scientific and technological research on energy | |||
Duty on hydrocarbons for fiscal monitoring of oil activities | |||
Others | |||
Non-associated natural gas extracted in excess of the volume extracted in 2006 | US$ | 0.50 / Mcf | |
PEMEX financial results report as of March 31, 2006 | 40/47 | |||
| www.pemex.com |
| PEMEX | Investor Relations |
Table A11
Tax rate for the calculation of the duty on hydrocarbons for the stabilization fund
Annual weighted average price | Applicable rate over the value of the total crude oil extracted during the year | |
22.01-23.00 | 1.0% | |
23.01-24.00 | 2.0% | |
24.01-25.00 | 3.0% | |
25.01-26.00 | 4.0% | |
26.01-27.00 | 5.0% | |
27.01-28.00 | 6.0% | |
28.01-29.00 | 7.0% | |
29.01-30.00 | 8.0% | |
30.01-31.00 | 9.0% | |
31.00 and above | 10.0% |
Table A12
Tax rate for the calculation of the additional duty
Year | Crude Oil Production Target (Mb) | |
2006 | 1,247,935 | |
2007 | 1,259,980 | |
2008 | 1,285,895 |
Calculation Methodology for the Additional Duty
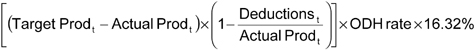
ODH: Ordinary duty on hydrocarbons
PEMEX financial results report as of March 31, 2006 | 41/47 | |||
| www.pemex.com |
| PEMEX | Investor Relations |
Table A13
Concepts for the calculation of the ordinary hydrocarbons duty
| Concept | ||||
| a) | Extracted production of crude oil in 2006 (MMbd) | 3.42 | ||
| b) | Weighted average Mexican crude oil price (US$/b) | 36.50 | ||
| c) | Value of extracted production of crude oil in 2006 (a x b) (MMUS$) | 45,563 | ||
| d) | Natural gas production in 2006 (MMMcfd) | 5.3 | ||
| e) | Natural gas volume used in hydrocarbon production (MMMcfd) | 0.6 | ||
| f) | Gas flaring (up to 2% of natural gas production) * (MMMcfd) | 0.1 | ||
| g) | Natural gas volume to deduct (e + f) (MMMcfd) | 0.7 | ||
| h) | Extracted production of natural gas in 2006 (d -g) (MMMcfd) | 4.6 | ||
| i) | Weighted average natural gas price (US$/Mcf) | 6.33 | ||
| j) | Value of extracted production of natural gas in 2006 (h x i) (MMUS$) | 10,612 | ||
| k) | Value of extracted production of crude oil and natural gas in 2006 (c + $ (MMUS$) | 56,175 | ||
| * | The 2% limit is effective in 2006. From 2007 and thereafter, natural gas flaring is not included in the volume to deduct |
| Deductions | ||
Concept | ||
Investments depreciation, costs and expenses (MMUS$) * | ||
Depreciation of investments made before 2006 | 2,746 | |
Depreciation of exploration, enhanced recovery and non-capitalized maintenance investments | 3,368 | |
Depreciation of development and production investments | 1,026 | |
Depreciation of oil pipelines, gas pipelines, terminals, transportation and storage investments | 53 | |
Costs and expenses | 3,693 | |
l) Total investments depreciation, costs and expenses | 10,886 |
| * | Exchange rate 11.40 $/US$ |
| Costcap | |||
a) Extracted production of crude oil in 2006 (MMbd) | 3.42 | ||
Extracted production of associated natural gas in 2006 (MMMcfd) | 2.7 | ||
m) Crude oil and associated natural gas costcap in 2006 (MMUS$) | 9,390 | ||
Extracted production of non-associated natural gas in 2006 (MMMcfd) | 1.9 | ||
n) Non-associated natural gas costcap in 2006 (MMUS$) | 1,875 | ||
o) Costcap (m + n) | 11,266 | ||
p) Investments depreciation, costs and expenses deductions [Min (l, o)] | 10,886 | ||
| Duties (MMUS$) | |||
Duty on hydrocarbons for the stabilization fund (DHSF) | 4,556 | ||
Extraordinary duty on crude oil exports (EDE) | 0 | ||
Excess gains duty (EGD) | 0 | ||
Duty on hydrocarbons for the fund for scientific and technological research on energy | 28 | ||
Duty on hydrocarbons for fiscal monitoring of oil activities | 2 | ||
Special tax on production and services (IEPS) | 0 | ||
q) Total duties | 4,586 | ||
r) Total OHD deductions (p + q) (MMUS$) | 15,472 | ||
s) OHD tax base (k - r) (MMUS$) | 40,703 | ||
t) OHD tax rate corresponding to a 36.50 US$/b weighted average Mexican crude oil price in 2006 (Refer to Table A10) | 78.68 | % | |
Ordinary Hydrocarbons Duty (OHD) (s x t) (MMUS$) | 32,025 |
| 1) | Calculations based on a weighted average Mexican crude oil price of 36.50 US$/b. This is the price used for the elaboration of the 2006 Federal Budget.Therefore, EDE and EGD are zero since realized value of crude oil exports equals budgeted value of crude oil exports |
| 2) | Crude oil, natural gas, associated natural gas and non-associated natural gas productions, natural gas volume used in hydrocarbon production, natural gas flaring, natural gas price, investments depreciation, costs and expenses figures are assumed for illustrative purposes |
| * | Since January 1, 2006, according to theLey de Ingresos de la Federación,the special tax on production services (IEPS) will be credited against a pre-existent positive balance, in the event that this amount is not sufficient, it will be credited against the value added tax (VAT), if the VAT is not sufficient, it will be credited against the DHSF. If the IEPS exceeds the DHSF, it will be credited against the OHD |
PEMEX financial results report as of March 31, 2006 | 42/47 | |||
| www.pemex.com |
| PEMEX | Investor Relations |
Table A14
Concepts for the calculation of the duty on hydrocarbons for the stabilization fund
Concept | |||||
a) | Extracted production of crude oil in 2006 (MMbd) | 3.42 | |||
b) | Weighted average Mexican crude oil price (US$/b) | 36.50 | |||
c) | Value of extracted production of crude oil in 2006 (a x b) (MMUS$) | 45,563 | |||
d) | DHSF tax rate corresponding to a 36.50 US$/b weighted average Mexican crude oil price (Refer to Table A12) | 10.0 | % | ||
| Deductions | |||||
Concept | |||||
| e) | Extraordinary duty on crude oil exports (EDE) | 0 | |||
f) | Excess gains duty (EGD) | 0 | |||
g) | Special tax on production and services (IEPS) * | ||||
Duty on hydrocarbons for the stabilization fund (DHSF) (c x d - (e + f)) (MMUS$) | 4,556 | ||||
| 1) | Calculations based on a weighted average Mexican crude oil price of 36.50 US$/b. This is the price used for the elaboration of the 2006 Federal Budget. Therefore, EDE and EGD are zero since realized value of crude oil exports equals budgeted value of crude oil exports |
| * | Since January 1, 2006, according to the Ley de Ingresos de la Federación, the special tax on production services (IEPS) will be credited against a pre-existent positive balance, in the event that this amount is not sufficient, it will be credited against the value added tax (VAT), if the VAT is not sufficient, it will be credited against the DHSF. If the IEPS exceeds the DHSF, it will be credited against the OHD |
PEMEX financial results report as of March 31, 2006 | 43/47 | |||
| www.pemex.com |
| PEMEX | Investor Relations |
Table A15
Concepts for the calculation of the extraordinary duty on crude oil exports
Concept | |||
a) Crude oil exports in 2006 (MMbd) | 1.87 | ||
b) Weighted average Mexican crude oil price (US$/b) | 40.00 | ||
c) Value of crude oil exports in 2006 (a x b) (MMUS$) | 27,277 | ||
d) Budgeted weighted average Mexican crude oil price (US$/b) | 36.50 | ||
e) Value of crude oil exports budgeted by Congress in 2006 (a x d) (MMUS$) | 24,890 | ||
f) Difference between value of realized and value of budgeted crude oil exports Max(c -e, 0) s.t. c - e >=0 (MMUS$) | 2,387 | ||
g) EDE tax rate | 13.1 | % | |
Extraordinary duty on crude oil exports (EDE) (f x g) | 313 |
| 1) | For this example, the weighted average Mexican crude oil price used is 40 US$/b. This price exceeds the 36.50 US$/b price used for the elaboration of the 2006 Federal Budget. |
| 2) | Crude oil exports figure is assumed for illustrative purposes |
Table A16
Concepts for the calculation of the excess gains duty
Concept | |||
a) Crude oil exports in 2006 (MMbd) | 1.87 | ||
b) Weighted average Mexican crude oil price (US$/b) | 40.00 | ||
c) Value of crude oil exports in 2006 (a x b) (MMUS$) | 27,277 | ||
d) Budgeted weighted average Mexican crude oil price (US$/b) | 36.50 | ||
e) Value of crude oil exports budgeted by Congress in 2006 (a x d) (MMUS$) | 24,890 | ||
f) Difference between value of realized and value of budgeted crude oil exports Max(c -e, 0) s.t. c - e >=0 (MMUS$) | 2,387 | ||
g) EGD tax rate | 6.5 | % | |
Excess Gains Duty (EGD) (f x g) | 155 |
| 1) | For this example, the weighted average Mexican crude oil price used is 40 US$/b. This price exceeds the 36.50 US$/b price used for the elaboration of the 2006 Federal Budget. |
| 2) | Crude oil exports figure is assumed for illustrative purposes |
PEMEX financial results report as of March 31, 2006 | 44/47 | |||
| www.pemex.com |
| PEMEX | Investor Relations |
Table A17
Concepts for the calculation of the duty on hydrocarbons for the fund for scientific and technological research on energy
and for fiscal monitoring of oil activities
Concept | ||||
a) | Extracted production of crude oil in 2006 (MMbd) | 3.42 | ||
b) | Weighted average Mexican crude oil price (US$/b) | 36.50 | ||
c) | Value of extracted production of crude oil in 2006 (a x b) (MMUS$) | 45,563 | ||
d) | Natural gas production in 2006 (MMMcfd) | 5.3 | ||
e) | Natural gas volume used in hydrocarbon production (MMMcfd) | 0.6 | ||
f) | Gas flaring (up to 2% of natural gas production) * (MMMcfd) | 0.1 | ||
g) | Natural gas volume to deduct (e + f) (MMMcfd) | 0.7 | ||
h) | Extracted production of natural gas in 2006 (d -g) (MMMcfd) | 4.6 | ||
i) | Weighted average natural gas price (US$/Mcf) | 6.33 | ||
j) | Value of extracted production of natural gas in 2006 (h x i) (MMUS $) | 10612.36 | ||
k) | Value of extracted production of crude oil and natural gas in 2006 (c + j) (MMUS$) | 56,175 | ||
| * | The 2% limit is effective in 2006. From 2007 and thereafter, natural gas flaring is not included in the volume to deduct |
l) Duty on hydrocarbons for the fund for scientific and technological research on energy tax rate | 0.05 | % | |
Duty on hydrocarbons for the fund for scientific and technological research on energy (MMUS$) (k x l) | 28 | ||
m) Duty on hydrocarbons for fiscal monitoring of oil activities tax rate | 0.003 | % | |
Duty on hydrocarbons for fiscal monitoring of oil activities (MMUS$ ) (k x m) | 2 | ||
| 1) | Crude oil and natural gas productions, natural gas volume used in hydrocarbon production, natural gas flaring and natural gas price are assumed for illustrative purposes |
PEMEX financial results report as of March 31, 2006 | 45/47 | |||
| www.pemex.com |
| PEMEX | Investor Relations |
Table A18
Concepts for the calculation of the additional duty
Concept | |||
a) Crude oil target production in 2006 (MMb) | 1,248 | ||
b) Weighted average Mexican crude oil price (US$/b) | 36.50 | ||
c) Value of crude oil target production in 2006 (a x b) (MMUS$) | 45,550 | ||
d) Actual crude oil production in 2006 (MMb) * | 1,095 | ||
e) Value of actual crude oil production in 2006 (a x b) (MMUS$) | 39,968 | ||
f) Total OHD deductions in 2006 (MMUS$) ** | 15,472 | ||
g) AD tax base (c - e) x (1 - (f / e) | 3,421 | ||
h) OHD tax rate corresponding to a 36.50 US$/b weighted average Mexican crude oil price in 2006 (Refer to Table A10) | 78.68 | % | |
i) AD tax rate | 16.32 | % | |
Additional duty (AD) (g x h x i) | 439 |
| * | For this example, actual crude oil production is 3 MMbd |
| ** | For this example, the OHD deductions are the one calculated in this Annex. However, in order to calculate de AD it is necessary to determine the deductions related to the actual crude oil production that is below the target production |
PEMEX financial results report as of March 31, 2006 | 46/47 | |||
| www.pemex.com |
| PEMEX | Investor Relations |
If you need to contact Investor Relations or to be included in the distribution list, please call or send an e-mail to:
| Telephone: | (52 55) 1944 9700 |
| Voice | mail: (52 55) 1944 2500 ext. 59412 |
ri@dcf.pemex.com
Celina Torres | Rolando Galindo | |
ctorresu@dcf.pemex.com | rgalindog@dcf.pemex.com | |
Alejandro Reyes | Armando Acosta | |
areyesv@dcf.pemex.com | aacosta@dcf.pemex.com | |
Elizabeth Osman eosman@dcf.pemex.com | ||
PEMEX is Mexico’s national oil and gas company. Created in 1938, it is the exclusive producer of Mexico’s oil and gas resources. The operating subsidiary entities are Pemex Exploration and Production, Pemex Refining, Pemex Gas and Basic Petrochemicals and Pemex Petrochemicals. The principal subsidiary company is PMI, its international trading arm.
Amounts in US dollars are translated at the March 31, 2006 exchange rate of Ps. 10.8935 per US dollar.
This report contains forward-looking statements. Statements that are not historical facts, including statements about our beliefs and expectations, are forward looking-statements. These are good faith statements based on current plans, estimates and projections and therefore you should not place undue reliance on them. Forward-looking statements speak only as of the date they were made, and we undertake no obligation to update publicly any of them in light of new information or future events. Forward-looking statements involve inherent risks and uncertainties. These risks and uncertainties include crude oil price volatility; production, equipment, and transportation risks inherent in the oil industry; environmental regulations in Mexico; actions of the Mexican government with respect to our operations, budget, taxation, commercial activities, control of hydrocarbon reserves, or debt service payments; any limitations on exports resulting from agreements of the Mexican government; and economic, political, and foreign exchange risks affecting Mexico. These risks and uncertainties are more fully detailed in PEMEX’s most recent Form 20-F filing with the US Securities and Exchange Commission (www.sec.gov) and the PEMEX Prospectus filed with the National Banking and Securities Commission (CNBV) and available through the Mexican Stock Exchange (kwww.bmv.com.mx). These factors could cause actual results to differ materially from those contained in any forward-looking statement.
The US Securities and Exchange Commission (SEC) permits oil and gas companies, in their filings with the SEC, to disclose only proved reserves that a company has demonstrated by actual production or conclusive formation tests to be economically and legally producible under existing economic and operating conditions. We use certain terms in this document, such as total reserves, probable reserves and possible reserves, that the SEC’s guidelines strictly prohibit us from including in filings with the SEC. Investors are urged to consider closely the disclosure in our Form 20-F, “File No. 0-99”, available from us atwww.pemex.com or Marina Nacional 329 Floor 38 Col. Huasteca, Mexico City 11311 or at (52 55) 1944 9700. You can also obtain this Form from the SEC by calling 1-800-SEC-0330.
EBITDA, free cash-flow and discretionary cash-flow are non-GAAP measures, which are calculated as described above. They are presented because PEMEX believes that they are widely accepted financial indicators of its ability to service or incur debt. EBITDA, free cash-flow and discretionary cash-flow should not be considered as indicators of financial performance, as an alternative to cash flow, as a measure of liquidity, or as being comparable to similarly named measures of other companies.
The total debt calculation includes, in addition to documented debt, the items that are usually considered as debt by the financial markets.
PEMEX financial results report as of March 31, 2006 | 47/47 | |||
| www.pemex.com |
SIGNATURES
Pursuant to the requirements of the Securities Exchange Act of 1934, the registrant has duly caused this report to be signed on its behalf by the undersigned, thereunto duly authorized.
| Petróleos Mexicanos | ||
| By: | /s/ Mauricio Alazraki Pfeffer | |
| Mauricio Alazraki Pfeffer | ||
| Associate Managing Director of Finance | ||
Date: May 23, 2006
FORWARD-LOOKING STATEMENTS
This report may contain forward-looking statements. These statements are statements that are not historical facts, and are based on management’s current view and estimates of future economic circumstances, industry conditions, company performance and financial results. The words “anticipates,” “believes,” “estimates,” “expects,” “plans” and similar expressions, as they relate to the company, are intended to identify forward-looking statements. Statements regarding the declaration or payment of dividends, the implementation of principal operating and financing strategies and capital expenditure plans, the direction of future operations and the factors or trends affecting financial condition, liquidity or results of operations are examples of forward-looking statements. Such statements reflect the current views of management and are subject to a number of risks and uncertainties. There is no guarantee that the expected events, trends or results will actually occur. The statements are based on many assumptions and factors, including general economic and market conditions, industry conditions, and operating factors. Any changes in such assumptions or factors could cause actual results to differ materially from current expectations.