3Q11 Earnings Conference Call 3Q11 Earnings Conference Call Supplemental Materials October 26, 2011 October 26, 2011 Exhibit 99.2 |
2 Safe Harbor Language Safe Harbor Language Statements contained in this presentation which are not historical facts and which pertain to future operating results of IBERIABANK Corporation and its subsidiaries constitute “forward-looking statements” within the meaning of the Private Securities Litigation Reform Act of 1995. These forward-looking statements involve significant risks and uncertainties. Actual results may differ materially from the results discussed in these forward-looking statements. Factors that might cause such a difference include, but are not limited to, those discussed in the Company’s periodic filings with the SEC. |
Introductory Comments 3 |
Introductory Comments Summary – Position • Favorable Balance Sheet Composition • Very Balanced; Core Funded; Low C&D Exposure • Continued Good Asset Quality; Extraordinary Capital • Favorable Interest Rate And Credit Risk Positioning • Some of the Highest Capital Ratios of Bank Holding Companies With More Than $5 Billion in Assets • Legacy Deposit Growth in 3Q11 And Improved Deposit Mix • Future Growth Engines in Multiple Markets • Strategic Recruiting Continued During The 3 rd Quarter • Fortunately, We Avoided What Ails The Banking Industry • Remain Well Positioned For Future Opportunities 4 |
IBKC Overview IBKC Overview Our Locations 5 Deposit Market Share as of June 30, 2011. Source: SNL Financial. Map Reflects Locations as of October 24,2011. *Other Mortgage Locations not shown = 9 Arkansas 34 Branches $1.0 bil deposits #12 Rank 32 Non-bank Offices Texas 4 Branches $185 mm deposits #227 Rank 3 Non-bank Offices Louisiana 78 Branches $5.1 bil deposits #5 Rank 31 Non-bank Offices Alabama 12 Branches $500 mm deposits #20 Rank 5 Non-bank Offices Florida 42 Branches $2.3 bil deposits #24 Rank 10 Non-bank Offices Tennessee 2 Branches $155 mm deposits #113 Rank 1 Non-bank Office |
Financial Overview 6 |
Financial Overview Summary – 3Q11 and 09/30/11 • T/E Net Interest Income Up $17mm (+21%) • Credit Quality Statistics Excluding FDIC Covered Assets And Acquired Assets Marked To Fair Value: • NPA/Assets = 0.95% (0.84% in 2Q11) • 30+ Days Past Due = 1.68% (1.40% in 2Q11) • Loan Loss Reserve/Loans = 1.33% (1.28% in 2Q11) • Net COs/Average Loans = 0.12% (0.13% in 2Q11) • Provision = $6mm ($10mm in 2Q11) • Reported EPS Of $0.58, Up 212% from 2Q11. Significant Items Impacting 3Q11 Results Include: • Merger And Conversion Costs = $6mm or $0.12 • Gains On Sale of Investments = $1mm or $0.03 7 |
Financial Overview Favorable Balance Sheet Growth 3Q11 Results 3Q11 Results •Loans +$26mm, +0.4% •Deposits +$117mm +1.3% •Loan/Deposits = 79% •Equity = -$35mm, -2% •Equity/Assets = 12.77% •Tier 1 Leverage = 10.55% •Div Payout = 57.7% •ROA = 0.59% •ROE = 4.56% •ROTE = 6.44% •Efficiency Ratio = 74% •Tang Eff. Ratio = 75% •BV/Share = $50.19 •Tang BV/Share = $37.12 8 $600 $1,000 $1,400 $1,800 $2,200 $2,600 $3,000 $3,400 $3,800 $4,200 $4,600 $5,000 $5,400 $5,800 $6,200 $6,600 $7,000 $7,400 $7,800 $8,200 $8,600 $9,000 Quarterly Averages Annual Average Balances |
Financial Overview Low Risk Balance Sheet At September 30, 2011 41% Of Balance Sheet In Very Low Risk Components 9 Cash and Equivalents, 4% Investment Securities, 18% Mortgage Loans Held For Sale, 1% Acquired Loans - Fair Value, 0.3% Loans - FDIC Covered, 12% FDIC Loss Share Receivable, 5% Loans - Noncovered, 49% Other Assets, 10% |
Financial Overview Trends - Mortgage Interest Rates • Conforming Rates Have Bounced Off Of Lows • Refi Activity Has Diminished • Sales Spreads Remain Favorable • Improved Competitive Dynamics In Mortgage Business Source: Bloomberg as of October 25, 2011 Mortgage Interest Rate Trend |
Financial Overview Mortgage Quarterly Revenues • In 3Q11 Closed $504mm (+43% Vs. 2Q11) • In 3Q11 Sold $447mm (+34% Vs. 2Q11) • 3Q11 Vs. 2Q11: 43% Increase In Mtg. Revenues • 3Q11 Vs. 3Q10: 1% Decrease In Mtg. Revenues • $225 mm Locked Pipeline on 10/21/11 11 |
Financial Overview Title Insurance Quarterly Revenues • Title & Mortgage Footprints Don’t Necessarily Overlap • 3Q11: $4.9mm In Revenues (+9% Vs. 2Q11) 12 $- $0.5 $1.0 $1.5 $2.0 $2.5 $3.0 $3.5 $4.0 $4.5 $5.0 $5.5 $6.0 $6.5 2003 2004 2005 2006 2007 2008 2009 2010 2011 Title Insurance Revenues * * Includes United Title in April 2007 ** ** Includes American Abstract in March 2008 1st Qtr 2nd Qtr 3rd Qtr 4th Qtr |
Financial Overview Service Charges/Revenues • Less Reliance On Service Charge Income And Consumer Fees Than Peers 13 0.0% 2.0% 4.0% 6.0% 8.0% 10.0% 12.0% 14.0% 16.0% 18.0% EBTX PBIB OZRK CSFL UCBI IBKC SBCF HOMB PFBX FSGI HBHC FMFC BXS TRMK TIBB SFNC RNST MSL SBSI CCBG IBKC = 6% Source: SNL Data as of most recent quarter Non- Interest Income Excludes Gains on Acquisitions and Investment Sales |
Financial Overview Quarterly Repricing Schedule 4Q11 1Q12 2Q12 3Q12 4Q12 Cash Equivalents 319.4 $ - $ - $ - $ - $ 0.64% 0.00% 0.00% 0.00% 0.00% Investments 330.7 $ 211.3 $ 209.1 $ 142.6 $ 93.5 $ 3.05% 3.45% 3.61% 3.79% 3.80% Loans 3,755.4 $ 386.5 $ 379.6 $ 358.5 $ 232.7 $ 3.65% 5.49% 5.28% 5.08% 5.62% Time Deposits 728.4 $ 485.8 $ 467.3 $ 405.9 $ 126.7 $ 1.32% 1.51% 1.50% 1.51% 1.49% Borrowed Funds 344.2 $ 22.3 $ 20.8 $ 1.5 $ 5.8 $ 1.25% 3.01% 2.90% 4.01% 2.19% 14 |
Financial Overview Interest Rate Simulations Source: Bancware model, as of September 30, 2011 • Fairly Balanced From An Interest Rate Risk Position • Degree Is A Function Of The Reaction Of Competitors To Changes In Deposit Pricing • Forward Curve Has A Small Positive Impact Over 12 Months Includes Cameron and OMNI acquisitions Base Blue Forward Change In: -200 bp -100 bp Case +100 bp +200 bp Chip Curve Net Interest Income 0.3% 0.3% 0.0% 2.0% 4.4% -0.1% 0.8% Economic Value of Equity 2.9% 2.0% 0.0% 5.4% 7.9% -0.1% -0.1% 15 |
Financial Overview Annual Change In Stock Price Source: Bloomberg as of October 25, 2011 16 -60% -20% 0% 20% 40% 60% 2000 2001 2002 2003 2004 2005 2006 2007 2008 2009 2010 2011 58% -40% |
Financial Overview 3 Years Price Change By Index Source: SNL Through October 25, 2011 17 -60% -50% -40% -30% -20% -10% 0% 10% 20% 30% 40% 50% 60% 70% 80% +14% Banks < $250M Southeast Banks Micro Cap Banks Banks < $500M Banks $1B-$5B Banks > $10B Banks $250M-$500M Banks Large Cap Banks Banks $5B-$10B Mid Cap Banks TARP Participants KBW Bank Banks $500M-$1B Small Cap Banks Mid-Atlantic Banks NASDAQ Bank Western Banks S&P Bank Midwest Banks Southwest Banks S&P Financials All Financial Institutions NASDAQ Finl New England Banks IBERIABANK Corporation NYSE S&P 500 Russell 3000 Russell 2000 S&P Small-Cap NASDAQ S&P Mid-Cap |
Asset Quality 18 |
Asset Quality Loan Portfolio Mix % based on gross portfolio – excluding discounts on loans acquired in FDIC-assisted transactions $000s % of CRE % Loans C&D-IBERIABANK 344,926 15% 4% CRE-Owner Occupied 932,169 41% 12% CRE-Non-Owner Occupied 1,006,017 44% 13% Total Commercial RE 2,283,111 $ 100% 29% Residential 4% Home Equity 10% Credit Card 1% Automobile 0% Indirect Automobile 4% Other Consumer 1% Business 22% Commercial RE 29% All Other Loans 4% CapitalSouth Gross Loans = 3%, Discount = 1% Orion Gross Loans = 10%, Discount = 4% Century Gross Loans = 4%, Discount = 2% Transparent slices indicate loan discounts Sterling Gross Loans = 2%, Discount = 1% 19 |
Asset Quality IBERIABANK Builder & Non-Builder C&D Loan Exposure Note: Excludes Covered Loans 20 |
Asset Quality 3Q11 Compared To Prior Quarters Note: Includes FDIC Assisted Acquisitions 21 ($thousands) 3Q10 4Q10 1Q11 2Q11 3Q11 Nonaccruals 871,353 $ 816,243 $ 800,265 $ 790,953 $ 805,247 $ OREO & Foreclosed 57,495 69,218 83,186 117,741 123,307 90+ Days Past Due 43,593 53,112 29,279 23,070 24,741 Nonperforming Assets 972,441 $ 938,573 $ 912,730 $ 931,765 $ 953,295 $ NPAs/Assets 9.21% 9.36% 9.18% 8.14% 8.27% NPAs/(Loans + OREO) 16.63% 15.37% 14.71% 12.73% 12.97% LLR/Loans 2.28% 2.26% 2.44% 2.36% 2.43% Net Charge-Offs/Loans 0.36% 0.72% -0.05% 0.10% 0.10% Past Dues: 30-89 Days Past Due 89,786 $ 111,345 $ 107,725 $ 86,880 $ 74,604 $ 90+ days Past Due 43,593 53,112 29,279 23,070 24,741 Nonaccual Loans 871,353 816,243 800,265 790,953 805,247 Total 30+ Past Dues 1,004,732 $ 980,700 $ 937,269 $ 900,903 $ 904,592 $ % Loans 17.35% 16.25% 15.31% 12.51% 12.52% Loan Mix: Commercial 66.2% 67.2% 67.5% 60.6% 61.4% Consumer 15.4% 15.4% 16.0% 16.2% 16.0% Mortgage 12.4% 11.5% 10.8% 8.9% 8.3% Business Banking 1.4% 1.4% 1.4% 10.5% 10.3% Indirect 4.0% 3.8% 3.7% 3.2% 3.4% Credit Cards 0.6% 0.7% 0.6% 0.6% 0.6% Total Loans 100.0% 100.0% 100.0% 100.0% 100.0% IBERIABANK Corporation |
9/30/10 12/31/10 3/31/11 6/30/11 9/30/11 Consolidated (Ex-FDIC Covered Assets and SOP 03-3) 30+ days past due 0.52% 0.33% 0.35% 0.41% 0.46% Non-accrual 0.96% 1.11% 1.30% 0.99% 1.22% Total Past Due 1.48% 1.44% 1.65% 1.40% 1.68% CapitalSouth Only 30+ days past due 7.94% 7.10% 7.85% 6.57% 6.09% Non-accrual 23.38% 21.12% 21.47% 21.05% 21.20% Total Past Due 31.32% 28.22% 29.32% 27.62% 27.29% Orion Only 30+ days past due 3.59% 6.11% 4.24% 3.31% 2.85% Non-accrual 36.26% 34.52% 36.07% 35.16% 37.56% Total Past Due 39.85% 40.63% 40.31% 38.47% 40.41% Century Only 30+ days past due 3.53% 5.44% 5.18% 3.82% 4.09% Non-accrual 40.57% 41.39% 42.15% 42.74% 43.95% Total Past Due 44.10% 46.83% 47.33% 46.56% 48.04% Sterling Only 30+ days past due 7.31% 10.68% 12.17% 3.83% 2.69% Non-accrual 20.08% 26.68% 28.59% 31.97% 34.68% Total Past Due 27.39% 37.36% 40.76% 35.80% 37.37% Consolidated (With FDIC Covered Assets) 30+ days past due 1.98% 2.44% 2.04% 1.41% 1.28% Non-accrual 12.95% 12.10% 11.89% 10.17% 10.36% Total Past Due 14.93% 14.54% 13.93% 11.58% 11.64% Asset Quality Loans Past Due + Non-Accruals ** Beginning in 2011, IBERIABANK fsb was merged with IBERIABANK 22 |
Asset Quality Trends – Entity NPAs & Past Dues Note: Includes FDIC Assisted Acquisitions 23 (Dollars in $000s) 3Q10 4Q10 1Q11* 2Q11 3Q11 $Chg 9/30/10 12/31/10 3/31/11 6/30/11 9/30/11 Last Qtr. Nonaccrual Loans 871,353 $ 816,244 $ 800,265 $ 790,953 $ 805,247 $ 14,294 $ OREO & Foreclosed Assets 57,495 $ 69,217 $ 83,186 $ 117,742 $ 123,307 $ 5,564 $ Accruing 90+ Days Past Due 43,593 $ 53,112 $ 29,279 $ 23,070 $ 24,741 $ 1,671 $ Total NPAs 972,441 $ 938,573 $ 912,730 $ 931,765 $ 953,295 $ 21,530 $ NPAs / Total Assets 9.21% 9.36% 9.18% 8.14% 8.27% 30-89 Days Past Due 89,786 $ 111,345 $ 107,725 $ 86,880 $ 74,604 $ (12,276) $ 30-89 Days PDs / Loans 1.55% 1.84% 1.76% 1.21% 1.03% |
Asset Quality Trends – Entity LLR & Net COs Note: Includes FDIC Assisted Acquisitions 24 (Dollars in $000s) 3Q10 4Q10 1Q11 2Q11 3Q11 $Chg 09/30/10 12/31/2010 3/31/2011 6/30/2011 9/30/2011 Last Qtr. Loan Loss Reserve* 131,954 $ 136,100 $ 149,119 $ 169,988 $ 175,320 $ 5,332 $ LLR / Total Loans 2.28% 2.26% 2.44% 2.36% 2.43% Net Charge-Offs 5,330 $ 10,506 $ (764) $ 1,718 $ 1,880 $ 161 $ Net COs/Avg Loans 0.36% 0.72% -0.05% 0.10% 0.10% LLR Coverage Of NPAs 14% 15% 16% 18% 18% * Does not include loan discounts associated with acquisitions. |
Asset Quality Loan Mix And 30 Days+ Past Due 25 3Q10 4Q10 1Q11 2Q11 3Q11 3Q11* 9/30/10 12/31/10 3/31/11 6/30/11 9/30/11 9/30/11 % of Outstandings Commercial 66.2% 67.3% 67.5% 60.6% 61.4% 61.0% Mortgage 12.4% 11.5% 10.8% 8.9% 8.3% 5.3% Consumer 15.4% 15.4% 16.0% 16.2% 16.0% 15.8% Indirect 4.0% 3.8% 3.7% 3.2% 3.4% 4.5% Business Banking 1.4% 1.4% 1.4% 10.5% 10.3% 12.7% Credit Cards 0.6% 0.6% 0.6% 0.6% 0.6% 0.7% Total Loans 100.0% 100.0% 100.0% 100.0% 100.0% 100.0% Past Due 30+ Days* Commercial 15.99% 15.55% 14.78% 12.97% 12.80% 1.71% Mortgage 14.28% 14.94% 15.21% 14.89% 15.84% 2.60% Consumer 16.22% 14.82% 14.71% 11.33% 10.52% 1.17% Indirect 0.78% 0.87% 0.74% 0.78% 0.96% 0.89% Business Banking 2.95% 2.57% 2.82% 4.91% 7.01% 2.07% Credit Cards 1.50% 1.57% 1.74% 1.56% 1.90% 1.73% Total Loans 14.93% 14.54% 13.93% 11.58% 11.64% 1.68% * Excludes FDIC assisted acquisitions and SOP 03-3 loans acquired from OMNI and Cameron |
Asset Quality Asset Quality Classified Assets • “Classified Assets” Are Loans That Exhibit Stress And Warrant Close Watching • At September 30, 2011 Classified Assets were $197 million • Our Classified Assets As A Percentage Of Total Assets Are Very Low, Particularly Compared To Our Local Peers 26 Source: SNL, Company Filings for 2010 IBKC Data as of September 30, 2011 -Excludes covered loans related to FDIC-Assisted Acquisitions 0% 1% 2% 3% 4% 5% 6% 7% 8% 9% 10% SBSI OZRK IBERIABANK SFNC RNST EBTX HOMB TRMK MSL BXS HBHC CSFL FMFC SBCF CCBG WTNY PFBX PBIB UCBI FSGI Classified Assets-to- Total Assets At December 31, 2010 |
$1.7 Million In Net Charge-Offs In 3Q11 Excluding FDIC Covered and SOP 03-3 Loans (0.12% Of Average Loans) Asset Quality Loan Loss Reserve • Legacy IBERIABANK Credits Performing Very Well • Classified Assets And NPAs Remain Favorable • $6.1 Million Loan Loss Provision In 3Q11 (2Q11 = $10.0 Million) • Acquired Builder Construction Portfolio Was Only $1.9 Million (0.03% of Total Loans) 27 3Q10 4Q10 1Q11 2Q11 3Q11 Net Charge-Offs - legacy 6,123 $ 10,473 $ (655) $ 1,895 $ 1,711 $ Loan Growth 683 5,501 2,043 4,737 615 Change In Asset Quality (3,548) (4,418) 2,313 719 3,976 Loan Loss Provision - legacy 3,258 $ 11,556 $ 3,701 $ 7,351 $ 6,302 $ Loan Loss Provision - FDIC Acqs. 1,870 (332) 1,770 2,639 (175) Total Loan Loss Provision 5,128 $ 11,224 $ 5,471 $ 9,990 $ 6,127 $ Net Charge-Offs/Avg. Loans 0.36% 0.72% -0.05% 0.10% 0.10% Loan Loss Reserve/Loans 2.28% 2.26% 2.44% 2.36% 2.43% |
• The Lowest Level Of C&D Loan Exposure Compared To Peers • One Of The Lowest Levels Of NPAs Compared To Peers Asset Quality C&D Loans And NPAs Compared To Peers Source: SNL, using most recent quarterly information * Excludes FDIC Covered Assets and acquired assets marked to fair value 28 |
Asset Quality Commercial Real Estate Loan Portfolio Excludes covered loans related to FDIC-Assisted Acquisitions 29 - 1,000,000 2,000,000 3,000,000 4,000,000 5,000,000 6,000,000 7,000,000 8,000,000 9,000,000 10,000,000 Non -Builder Portfolio CRE CRE Loans Outstanding At September 30, 2011 |
Asset Quality Commercial Real Estate Loan Portfolio Note: Includes commercial construction and land development loans Excludes covered loans related to FDIC-Assisted Acquisitions Sep 2010 Dec 2010 Mar 2011 Jun 2011 Sep 2011 Non-Owner Occupied Current 910.5 $ 895.0 $ 916.1 $ 1,215.2 $ 1,193.0 $ Past Due 1.5 2.5 6.8 10.8 16.2 Nonaccrual 18.4 22.7 31.9 50.7 57.1 Total 930.5 $ 920.2 $ 954.8 $ 1,276.7 $ 1,266.4 $ % Nonaccrual 1.98% 2.46% 3.34% 3.97% 4.51% Owner Occupied Current 605.2 $ 632.6 $ 691.2 $ 982.7 $ 1,009.0 $ Past Due 7.3 1.7 0.8 1.2 0.5 Nonaccrual 5.0 5.6 5.9 7.5 7.3 Total 617.5 $ 639.9 $ 697.9 $ 991.4 $ 1,016.7 $ % Nonaccrual 0.81% 0.88% 0.84% 0.75% 0.72% Total CRE 1,548.0 $ 1,560.1 $ 1,652.7 $ 2,268.1 $ 2,283.1 $ % Nonaccrual 1.52% 1.81% 2.29% 2.56% 2.82% Non-Owner Occup/Risk Based Cap. 78% 76% 100% 120% 100% 30 |
Asset Quality Commercial Loan Composition Note: At September 30, 2011; Includes commercial construction and land development loans – excludes Covered Assets 31 0% 5% 10% 15% 20% 25% 30% 35% Storage Agriculture Governmental Communications Energy Transport Financial/Insurance Education Households Religious Heavy/Civil Construction Wholesalers Manufacturing Construction Retail Other Hospitality RE-Owner Occupied Medical % Of Commercial Loan Portfolio At September 30, 2011 RE-Non-Owner Occupied |
Consumer Loan Portfolio 32 |
Consumer Loan Portfolio By Product – Score Distribution Note: Excludes Credit Cards Excludes Covered Loans from FDIC Acquisitions Score Intervals HELOC Home Equity Loans Unsecured Lines Unsecured Other Secured Indirect Auto 800 + 12% 14% 5% 8% 13% 12% 750 - 799 40% 35% 29% 31% 25% 28% 700 - 749 25% 24% 28% 25% 25% 23% 650 - 699 14% 15% 20% 17% 16% 18% 600 - 649 5% 5% 9% 8% 8% 8% 550 - 599 2% 4% 5% 5% 6% 5% 500 - 549 1% 2% 4% 3% 4% 3% 450 - 499 0% 1% 1% 1% 1% 1% 400 - 449 0% 0% 0% 0% 0% 0% Other 1% 1% 2% 2% 3% 1% Total 100% 100% 100% 100% 100% 100% Avg. Score 745 725 731 710 700 716 Consumer Portfolio - Score Distribution By Product 33 |
Consumer Loan Portfolio Past Dues By Product • Generally Good And Stable Asset Quality Across Consumer Products Excludes Covered Loans from FDIC Acquisitions 9/30/10 12/31/10 3/31/11 6/30/11 9/30/11 Home Equity Lines of Credit 30 to 59 Days Past Due 0.24% 0.21% 0.21% 0.13% 0.17% 60 to 89 Days Past Due 0.03% 0.28% 0.01% 0.04% 0.08% Over 90 Days Past Due 0.15% 0.00% 0.00% 0.00% 0.00% Total 30+ Days Past Due 0.42% 0.49% 0.22% 0.17% 0.25% Net Charge-Offs 0.87% 1.28% 0.90% 0.02% 0.38% Home Equity Term Loans 30 to 59 Days Past Due 0.28% 0.57% 0.29% 0.50% 0.59% 60 to 89 Days Past Due 0.16% 0.17% 0.01% 0.13% 0.21% Over 90 Days Past Due 0.31% 0.00% 0.00% 0.00% 0.01% Total 30+ Days Past Due 0.75% 0.75% 0.31% 0.63% 0.81% Net Charge-Offs 0.21% 0.65% 0.82% 0.34% 0.21% Indirect Loans 30 to 59 Days Past Due 0.34% 0.40% 0.34% 0.38% 0.46% 60 to 89 Days Past Due 0.09% 0.07% 0.02% 0.09% 0.11% Over 90 Days Past Due 0.03% 0.00% 0.00% 0.00% 0.00% Non Accrual 0.35% 0.42% 0.40% 0.33% 0.42% Total 30+ Days Past Due 0.81% 0.89% 0.76% 0.80% 0.99% Net Charge-Offs 0.13% 0.39% 0.17% 0.09% 0.30% Credit Card Loans 30 to 59 Days Past Due 0.35% 0.34% 0.26% 0.29% 0.37% 60 to 89 Days Past Due 0.21% 0.22% 0.32% 0.14% 0.25% Over 90 Days Past Due 0.00% 0.00% 0.00% 0.00% 0.00% Non Accrual 0.86% 0.88% 1.02% 1.01% 1.11% Total 30+ Days Past Due 1.41% 1.44% 1.60% 1.44% 1.73% Net Charge-Offs 2.16% 1.98% 1.76% 2.05% 1.69% Other Consumer Loans 30 to 59 Days Past Due 0.48% 0.36% 0.26% 0.30% 0.28% 60 to 89 Days Past Due 0.10% 0.10% 0.09% 0.30% 0.05% Over 90 Days Past Due 0.04% 0.00% 0.00% 0.00% 0.00% Total 30+ Days Past Due 0.62% 0.46% 0.35% 0.60% 0.33% Net Charge-Offs 2.11% 1.86% 0.74% 0.78% 1.81% Total Consumer Loans Total 30+ Days Past Due 0.57% 0.58% 0.31% 0.47% 0.56% Net Charge-Offs 0.60% 0.90% 0.71% 0.31% 0.48% Consumer Loan Portfolio - Quarterly Credit Statistics Loans Past Due As A % of Product Loans 34 |
Consumer Loan Portfolio By Product – Origination Mix 35 0% 10% 20% 30% 40% 50% 60% 70% 80% 90% 100% 1Q07 3Q07 1Q08 3Q08 1Q09 3Q09 1Q10 3Q10 1Q11 3Q11 35% 41% 19% 5% Quarter Originations - Product Total % |
Consumer Loan Portfolio By Product – Loan-To-Values 36 54% 77% 68% 79% 0% 10% 20% 30% 40% 50% 60% 70% 80% 90% 100% Loan-to-Values At Time Of Origination HELOC 1st HELOC 2nd Home Equity 1st Home Equity 2nd Quarter |
Consumer Loan Portfolio Indirect – 30+ Days Past Dues 37 Month .55% |
Consumer Loan Portfolio Indirect – Net Charge-Offs 0.00% 0.20% 0.40% 0.60% 0.80% 1.00% 1.20% 1.40% 1.60% 1.80% 2.00% 2.20% 2.40% .17% 38 Month |
FDIC Loss Share Performance 39 |
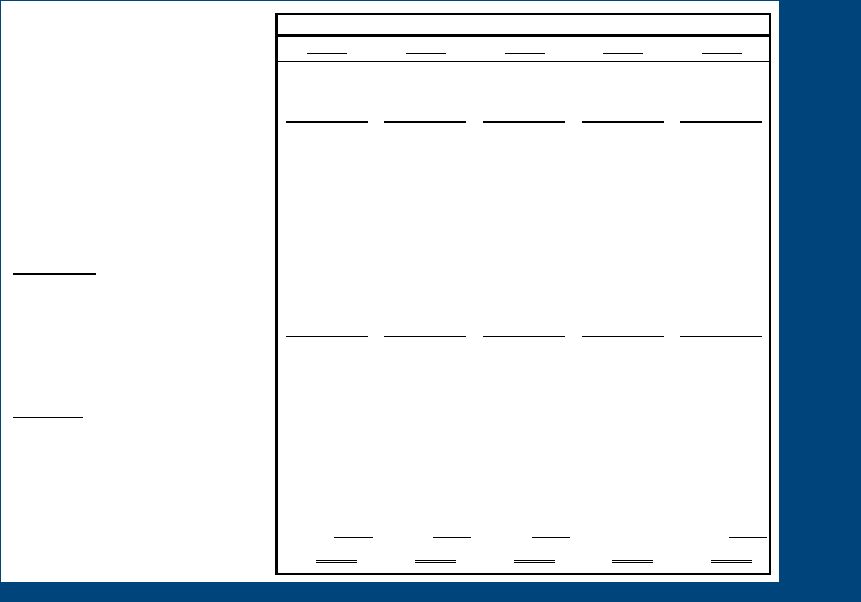
Loss Share Performance Covered Loan Portfolio Rollforward 40 Average Income / Expense Average Yield Average Income / Expense Average Yield Average Income / Expense Average Yield Average Income / Expense Average Yield Covered Loans 1,466,627 39,453 10.592% 1,545,551 54,118 14.049% 1,489,782 40,454 10.768% 1,421,784 28,201 7.819% Mortgage Loans 247,827 6,159 9.941% 253,360 6,865 10.839% 243,303 4,487 7.378% 229,678 5,209 9.072% Indirect Automobile - - 0.000% - - 0.000% - - 0.000% - - 0.000% Credit Card 1,154 20 6.934% 1,083 19 7.091% 1,026 17 6.721% 972 16 6.693% Consumer 213,082 3,225 6.005% 196,378 3,926 8.107% 189,022 (234) -0.497% 172,391 3,780 8.698% Line Of Credit-Consumer Loans 79,958 4,582 22.733% 79,580 7,391 37.664% 81,575 2,967 14.588% 80,650 2,372 11.669% Commercial & Business Banking 924,098 25,467 10.792% 1,015,204 35,917 14.155% 975,301 33,217 13.477% 938,554 16,824 7.018% Loans in Process 508 - 0.000% (54) - 0.000% (445) - 0.000% (460) - 0.000% Overdrafts 0 - 0.000% 0 - 0.000% 0 - 0.000% 0 - 0.000% FDIC Loss Share Receivable 899,558 (8,619) -3.749% 708,809 (21,913) -12.366% 666,159 (18,315) -10.877% 626,551 (2,602) -1.625% Net Covered Loan Portfolio 2,366,185 30,834 5.143% 2,254,360 32,205 5.744% 2,155,941 22,139 4.080% 2,048,335 25,599 4.930% Average Income / Expense Average Yield Average Income / Expense Average Yield Average Income / Expense Average Yield Average Income / Expense Average Yield Covered Loans 1,466,627 39,453 10.592% 1,545,551 54,118 14.049% 1,489,782 40,454 10.768% 1,421,784 28,201 7.819% CapitalSouth Bank 250,865 8,355 13.171% 251,762 10,188 16.262% 240,511 5,196 8.536% 227,549 (1,827) -3.080% Orion Bank 742,289 24,721 13.046% 823,081 32,651 16.025% 794,202 29,013 14.479% 759,860 24,875 12.861% Century Bank 332,360 3,878 4.610% 339,135 9,156 10.795% 323,681 4,105 5.072% 303,773 3,024 3.979% Sterling Bank 141,113 2,499 6.770% 131,574 2,123 6.472% 131,388 2,140 6.464% 130,602 2,130 6.405% FDIC Loss Share Receivable 899,558 (8,619) -3.749% 708,809 (21,913) -12.366% 666,159 (18,315) -10.877% 626,551 (2,602) -1.625% CapitalSouth Bank 79,553 (2,600) -12.788% 58,914 (1,877) -12.744% 58,676 (4,456) -30.041% 57,146 5,754 39.402% Orion Bank 555,610 (5,568) -3.921% 418,948 (18,861) -18.009% 392,880 (13,256) -13.348% 375,943 (11,021) -11.472% Century Bank 197,355 (593) -1.177% 163,829 (1,385) -3.383% 157,959 (756) -1.894% 145,807 2,505 6.723% Sterling Bank 67,040 142 0.830% 67,119 210 1.253% 56,644 152 1.065% 47,655 159 1.310% Net Covered Loan Portfolio 2,366,185 30,834 5.143% 2,254,360 32,205 5.744% 2,155,941 22,139 4.080% 2,048,335 25,599 4.930% CapitalSouth Bank 330,418 5,756 6.921% 310,676 8,311 10.762% 299,187 740 0.954% 284,696 3,927 5.448% Orion Bank 1,297,899 19,153 5.783% 1,242,029 13,790 4.546% 1,187,083 15,757 5.269% 1,135,803 13,853 4.807% Century Bank 529,715 3,285 2.457% 502,963 7,770 6.177% 481,639 3,349 2.787% 449,580 5,529 4.869% Sterling Bank 208,153 2,641 4.854% 198,692 2,333 4.709% 188,032 2,293 4.838% 178,257 2,290 5.043% 4Q2010 1Q2011 2Q2011 3Q2011 4Q2010 1Q2011 2Q2011 3Q2011 |
Markets 41 |
Markets – Local Economies Unemployment – vs. U.S. MSAs Source: U.S. Department of Labor, Bureau of Labor Statistics • Consistently Low Rates Of Unemploy-ment In Our Legacy MSAs • Many Of Our Legacy Markets Not Dependent On Housing For Growth • Assets In FDIC- Assisted Acquisition Markets Are Protected Under Loss-Share Agreements 42 |
Markets – Local Economies Freddie Mac – Regional Prices Source: Freddie Mac, FMHPI data series for 2Q2011 Last 5-Year Housing Price Last 12 2Q11 vs. Region States Included Change Months 1Q11 West South Central LA, AR, TX, OK -1.8% -2.3% 10.8% West North Central IA, KS, MN, MO, ND, NE, SD -6.0% -3.1% 16.0% East South Central TN, AL, MS, KY -9.2% -3.8% 9.3% South Atlantic NC, SC, FL, GA, VA, MD, WV, DC, DE -16.5% -4.0% 13.6% New England CT, MA, ME, NH, RI, VT -18.0% -4.6% 8.8% East North Central IL, IN, MI, OH, WI -20.2% -4.8% 26.2% Pacific CA, OR, WA, HI, AK -22.1% -5.8% 8.1% Middle Atlantic NY, NJ, PA -14.6% -5.9% 3.2% Mountain AZ, CO, ID, MT, NM, NV, UT, WY -25.3% -9.6% -0.6% United States -25.1% -7.0% 8.5% 43 |
Markets – Local Economies Housing Price Change Vs. U.S. MSAs Source: Freddie Mac, FMHPI data series for 2Q2011 44 -40.0% -35.0% -30.0% -25.0% -20.0% -15.0% -10.0% -5.0% 0.0% 5.0% 10.0% 15.0% Average of MSAs -5.4% |
-3% 8% 2% 7% -8% -60% -50% -40% -30% -20% -10% 0% 10% Louisiana MSAs Alexandria LA MSA Baton Rouge LA MSA Houma-Bayou Cane-Thibodaux LA MSA Lafayette LA MSA Lake Charles LA MSA Monroe LA MSA New Orleans-Metairie-Kenner LA MSA Shreveport-Bossier City LA MSA Markets – Local Economies Housing Price Trends – IBKC Markets 45 Source : Freddie Mac FHMPI Index – data indexed at 4Q2006 |
Markets – Local Economies Housing Price Trends – IBKC Markets -26% 0% -3% -60% -50% -40% -30% -20% -10% 0% 10% Arkansas MSAs Fayetteville-Springdale-Rogers AR-MO MSA Jonesboro AR MSA Little Rock-North Little Rock-Conway AR MSA 46 Source : Freddie Mac FHMPI Index – data indexed at 4Q2006 |
Markets – Local Economies Housing Price Trends – IBKC Markets -52% -32% -53% -46% -60% -50% -40% -30% -20% -10% 0% 10% Florida MSAs Cape Coral-Fort Myers FL MSA Jacksonville FL MSA Miami-Fort Lauderdale-Pompano Beach FL MSA Naples-Marco Island FL MSA North Port-Bradenton-Sarasota FL MSA 47 Source : Freddie Mac FHMPI Index – data indexed at 4Q2006 |
Markets – Local Economies Housing Price Trends – IBKC Markets -11% -4% -19% 6% -16% -60% -50% -40% -30% -20% -10% 0% 10% Other MSAs Birmingham-Hoover AL MSA Huntsville AL MSA Mobile AL MSA Montgomery AL MSA Houston-Sugar Land-Baytown TX MSA Memphis TN-MS-AR MSA 48 Source : Freddie Mac FHMPI Index – data indexed at 4Q2006 |
Markets – Local Economies House Price Decline Probability • Local Housing Prices Did Not Escalate Rapidly, So Little House Price “Snap-Back” • According To PMI, Our Legacy Markets Have Some Of The Lowest Probabilities To Exhibit Housing Price Declines Over Next 2 Years Source: PMI Economic Real Estate Trends as of 2Q11 49 Shreveport, LA 17.6% Jonesboro, AR 17.7% Lafayette, LA 18.1% Mobile, AL 39.4% Baton Rouge, LA 40.9% New Orleans, LA 45.9% Memphis, TN 46.0% Lake Charles, LA 47.8% Little Rock, AR 23.7% NW Arkansas, 25.0% W. Palm Beach, FL 90.0% Jacksonville, FL 92.6% Tampa, FL 93.2% Bradenton, FL 93.5% Cape Coral, FL 96.0% Naples, FL 96.8% Monroe, LA 31.3% Houston, TX 32.7% Birmingham, AL 33.3% Huntsville, AL 36.5% Montgomery, AL 36.8% |
Markets-Local Economies IBKC Market Demographics Source: SNL Financial 50 MSA IBKC Market Rank IBKC Offices IBKC Deposits IBKC Dep Mkt. Share (%) Percent of IBKC Franchise Market Population Population Change 2000-10 (%) Projected Population Change 2010-15 (%) Median HH Income 2010 ($) HH Income Change 2000-10 (%) Projected HH Income Change 2010-15 (%) FLORIDA North Port-Bradenton-Sarasota, FL 6 13 706,045 4.30 7.63 712,761 20.82 4.06 51,943 27.68 10.66 Naples-Marco Island, FL 5 7 623,371 6.25 6.74 332,156 32.13 5.99 62,368 28.82 11.33 Miami-Fort Lauderdale-Pompano Beach, FL 34 11 526,968 0.33 5.70 5,513,060 10.09 1.37 51,835 28.66 13.46 Key West, FL 5 5 185,312 8.21 2.00 73,868 (7.19) (4.68) 53,763 25.83 10.94 Cape Coral-Fort Myers, FL 18 4 158,839 1.39 1.72 628,829 42.63 8.17 51,699 28.21 10.86 Jacksonville, FL 30 3 53,557 0.11 0.58 1,389,042 23.72 7.08 54,392 27.54 11.94 LOUISIANA New Orleans-Metairie-Kenner, LA 5 24 1,404,895 4.82 15.18 1,187,772 (9.78) 8.77 42,621 20.67 6.36 Lafayette, LA 1 13 1,280,381 23.15 13.84 263,368 10.16 4.27 40,904 15.26 8.20 New Iberia, LA 1 4 786,474 45.05 8.50 75,402 2.92 0.17 35,185 13.27 7.36 Lake Charles, LA 3 17 508,287 15.17 5.49 194,964 0.72 (0.15) 40,423 14.49 9.42 Baton Rouge, LA 5 5 430,652 2.72 4.65 789,682 11.86 4.80 42,872 14.54 7.08 Monroe, LA 3 6 316,612 11.31 3.42 174,353 2.53 1.13 35,606 12.22 10.11 Shreveport-Bossier City, LA 7 2 189,816 2.85 2.05 394,961 5.05 1.61 37,988 14.48 8.83 Ruston, LA 4 2 89,832 7.88 0.97 57,874 (0.06) (0.30) 30,621 11.16 4.98 Crowley, LA 6 2 52,234 6.52 0.56 60,988 3.61 0.49 29,921 12.20 4.42 Abbeville, LA 9 2 46,760 5.12 0.51 56,867 5.69 1.46 31,930 8.45 6.64 Bastrop, LA 6 2 17,509 6.49 0.19 28,799 (7.16) (3.98) 27,955 11.26 5.29 Houma-Bayou Cane-Thibodaux, LA 14 1 13,291 0.31 0.14 204,128 4.96 0.46 39,560 12.74 9.36 ARKANSAS Little Rock-North Little Rock-Conway, AR 9 11 389,999 2.87 4.22 694,164 13.70 5.87 51,146 31.38 13.27 Jonesboro, AR 3 6 213,547 8.31 2.31 119,895 11.26 6.02 39,890 28.23 16.63 Fayetteville-Springdale-Rogers, AR-MO 17 8 118,343 1.44 1.28 461,723 33.04 10.17 48,929 35.01 9.83 Paragould, AR 9 2 7,324 0.98 0.08 41,398 10.89 4.05 39,063 26.62 15.16 TENNESSEE Memphis, TN-MS-AR 25 2 155,202 0.68 1.68 1,325,833 10.01 4.28 51,618 30.32 11.85 TEXAS Houston-Sugar Land-Baytown, TX 54 4 185,288 0.13 2.00 6,017,013 27.60 10.46 58,086 30.07 14.35 ALABAMA Birmingham-Hoover, AL 13 4 245,181 0.84 2.65 1,133,874 7.76 3.39 45,636 20.09 6.12 Montgomery, AL 12 2 104,538 1.45 1.13 372,902 7.61 3.06 44,338 19.12 8.45 Mobile, AL 9 2 99,878 1.65 1.08 410,234 2.60 1.01 39,492 17.15 9.17 Huntsville, AL 19 2 41,820 0.63 0.45 407,958 19.15 9.36 51,241 18.68 7.69 Daphne-Fairhope-Foley, AL 18 1 14,260 0.44 0.15 186,407 32.75 11.05 46,476 15.47 3.91 Aggregate: National 169 9,603,738 96.86 23,310,275 9.60 4.06 45,656 21.40 9.47 |
Markets – Local Economies IBKC Office Optimization • Entered 3 New Markets • Acquired 12 Offices (All) • Closed/Consolidated 18 Offices (All Types) • Opened 10 New Bank Offices • Opened 7 Mortgage Offices • Divested/Sold 1 Office • 5 Office Realignments 1999 Through 2005 Since 2005 • Entered 27 New Markets • Acquired 180 Offices (All) • Closed/Consolidated 54 Offices (All Types) • Opened 23 New Bank Offices • Opened 27 Mortgage Offices • Opened 2 Title Office • 13 Office Realignments 51 |
Markets – Local Economies Oil & Gas Impact Source: Bloomberg 52 Natural Gas Crude Oil $3.62 $92.99 $- $20.00 $40.00 $60.00 $80.00 $100.00 $120.00 $140.00 $160.00 $- $2.00 $4.00 $6.00 $8.00 $10.00 $12.00 $14.00 $16.00 |
Summary Of IBKC • Industry Operating Environment--Challenging • Housing • Credit Risk • Interest Rate Risk • Operations Risk • We Tend To Move “Ahead Of The Curve” • Focus On Long-Term Investments & Payback • Organic And External Growth • Expense Controls And Revenue Growth • EPS/Stock Price Linkage - Shareholder Focus • Favorable Risk/Return Compared To Peers 53 |