 IBERIABANK Corporation IBERIABANK Corporation Strategic Overview Strategic Overview October 26, 2011 October 26, 2011 Exhibit 99.4 |
 Safe Harbor Language Safe Harbor Language 2 To the extent that statements in this presentation relate to future plans, objectives, financial results or performance of IBERIABANK Corporation, these statements are deemed to be forward-looking statements within the meaning of the Private Securities Litigation Reform Act of 1995. Such statements, which are based on management’s current information, estimates and assumptions and the current economic environment, are generally identified by the use of the words “plan”, “believe”, “expect”, “intend”, “anticipate”, “estimate”, “project” or similar expressions. IBERIABANK Corporation’s actual strategies and results in future periods may differ materially from those currently expected due to various risks and uncertainties. Actual results could differ materially because of factors such as the current level of market volatility and our ability to execute our growth strategy, including the availability of future FDIC-assisted failed bank opportunities, unanticipated losses related to the integration of, and accounting for, acquired businesses and assets and assumed liabilities in FDIC-assisted transactions, adjustments of fair values of acquired assets and assumed liabilities and of deferred taxes in FDIC-assisted acquisitions, credit risk of our customers, effects of the on-going correction in residential real estate prices and reduced levels of home sales, sufficiency of our allowance for loan losses, changes in interest rates, access to funding sources, reliance on the services of executive management, competition for loans, deposits and investment dollars, reputational risk and social factors, changes in government regulations and legislation, increases in FDIC insurance assessments, geographic concentration of our markets and economic conditions in these markets, rapid changes in the financial services industry, dependence on our operational, technological, and organizational infrastructure, hurricanes and other adverse weather events, the volatility and low trading volume of our common stock, and valuation of intangible assets. These and other factors that may cause actual results to differ materially from these forward-looking statements are discussed in the Company’s Annual Report on Form 10-K and other filings with the Securities and Exchange Commission (the “SEC”), available at the SEC’s website, http://www.sec.gov, and the Company’s website, http://www.iberiabank.com, under the heading “Investor Information.” All information in this presentation is as of the date of this presentation. The Company undertakes no duty to update any forward-looking statement to conform the statement to actual results or changes in the Company’s expectations. |
 • Every 5-6 Years We Set Strategic Goals • Recently Refreshed Our Strategic Plan • Focus Our Company: Mission Statement Philosophies And Culture Economic And Industry Dynamics Risks And Opportunities Strengths And Areas Requiring Improvement Operating Parameters Areas Of Future Emphasis And Investment Strategic/Financial Goals Overview Strategic Overview Strategic Overview 3 |
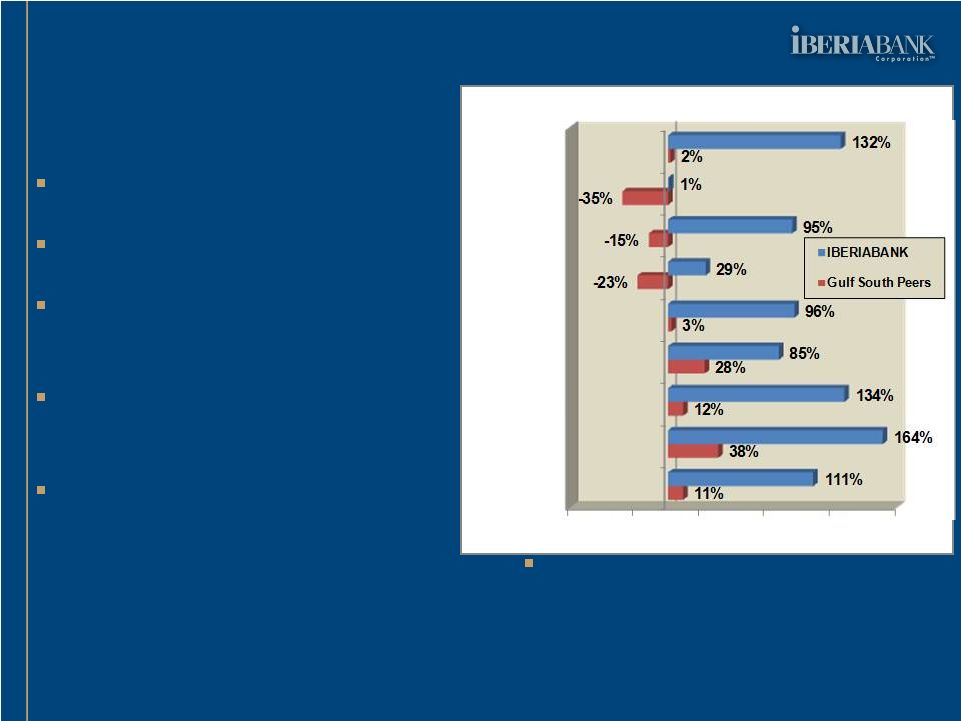 Strategic Overview Strategic Overview Over The Past Three Years… Over The Past Three Years… Total Revenues Of $1.5 Billion Earned $280 Million; $14.57 EPS Paid $105 Million In Dividends, Or $5.10 Per Share (38% Payout) Improved Asset Quality And Capital Strength Added: • +$6.6 Billion Assets • +120 New Locations • +1,247 Associates • +$18.06 In Tangible BVS • +$0.8 Billion Market Cap. At The End Of 3Q11: • Total Assets Of $11.5 Billion • 2,541 Associates • Operations In 12 States 4 -75% -25% 25% 75% 125% 175% Loans Deposits Assets Offices # FTE BVS TBVS Stock Price Market Cap % Change Since 2007 |
 Strategic Overview Strategic Overview Our Current Position 5 • Little Or No Loan Growth • Real Estate Dependence • Asset Quality Concerns • Unrecognized Collateral Values • Flat & Low Yield Curve Results In Margin Compression • Durbin Amendment Exposure • Capital Constrained • Dividends Slashed • Costly Access To Fresh Capital • Share Buyback Capability? • M&A Experience/Infrastructure? Industry Headwinds Our Positioning • $518mm YTD Organic Growth • 41% of Bal. Sheet Is Low Risk • Classified Assets = 1.7%/Assets • FDIC Loss Share Protection • Less Spread Dependent With Mtg/Title 12% Of Revenues • Service Chg/Revenues of 6% • $300mm+ In Excess Capital • Consistent Quarterly Dividends • Raised $603mm In Capital • Buyback Completed In 3Q11 • 5 FDIC And 7 Live Bank Deals |
 • Provide Exceptional Value-Based Client Service • Great Place To Work • Growth That Is Consistent With High Performance • Shareholder Focused • Strong Sense Of Community Mission Statement And Culture Strategic Overview Strategic Overview 6 • Teamwork • Client Focus • Financial Focus • Attention To Detail • Do What Is Right • High Performance Expectations • Self Starters • Respect For Others • Conservative & Methodical • Continuous Improvement Mission Statement Selected Philosophies And Culture |
 • Time Period: 5-Year Time Frame • Economic Growth Remains Tempered • Near-Term Inflation Is tempered As Well • Current Credit Cycle Is 5-6 Years Long (2/3 Complete) • Assume The Interest Rate Environment Imbedded In The Current Forward Curves Low, Flat Interest Rate Curves Initially Curves Begin to Steepen To More Historic Levels Impacted More On Short-End Of Curves (<5 Years) Major Economic Assumptions Strategic Overview Strategic Overview 7 |
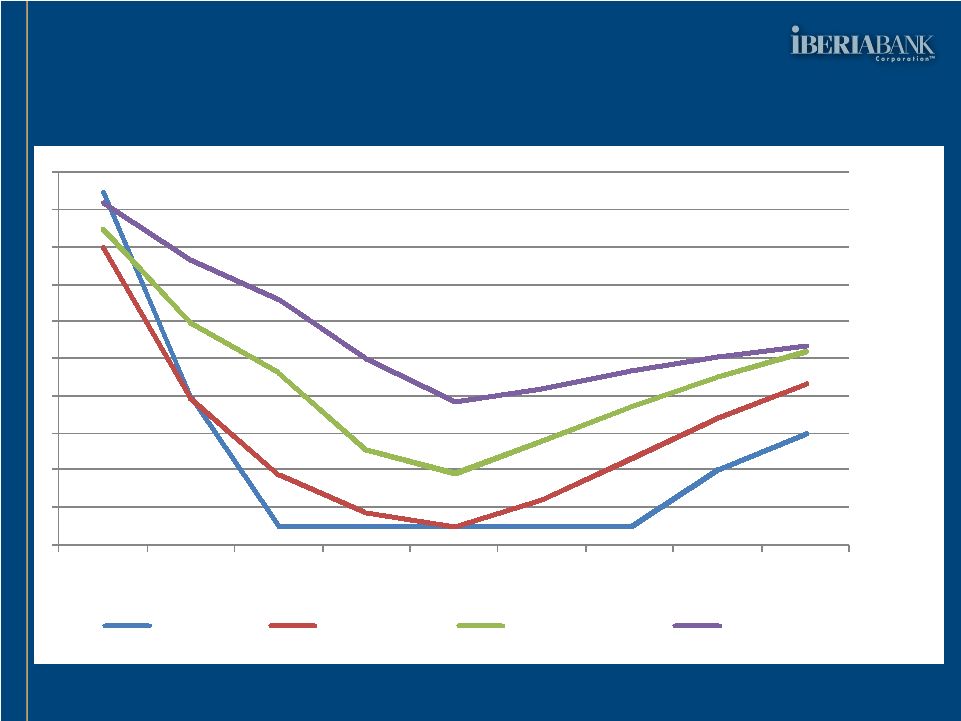 Forward Interest Rate Curves Strategic Overview Strategic Overview 8 0.00% 0.50% 1.00% 1.50% 2.00% 2.50% 3.00% 3.50% 4.00% 4.50% 5.00% Sep-07 Sep-08 Sep-09 Sep-10 Sep-11 Sep-12 Sep-13 Sep-14 Sep-15 Overnight 2yr Treasury 5 Year Treasury 10 Year Treasury |
 • Banking Industry Returns Will Remain Challenging Limited Balance Sheet Growth Spread Compression (Government & Industry Impacts) Legislative/Compliance Provide Revenue Pressure Regulatory Burdens Remain Elevated Lower Industry Returns On Tangible Equity • New Capital Will Remain Scarce And Fairly Targeted • Banking Industry Will Continue To Consolidate Up To An Additional 200 Failures in Southeast U.S. Live Banks - Board And Management Fatigue We Will Participate In Situations That Fit Organic Growth Story & Supplement With Acquisitions Industry Competitive Dynamics Strategic Overview Strategic Overview 9 |
 • Market-Focused, Not Size-Focused • Southeastern U.S. – Texas To Virginia • Focus On Metropolitan, Not Rural, Markets • Interest In Specific MSAs, Based On Opportunity: Risk/Return Perspective Consistent With Our Culture Connectivity To Recruits And Target Clients Competitive Dynamics (Current And Future) • Areas Of Emphasis: Small Business And Retail Trust, Wealth Management, Capital Markets Targeted Market/Branch Expansion Improve Operating Leverage And Profitability Strategic Focus Strategic Overview Strategic Overview 10 |
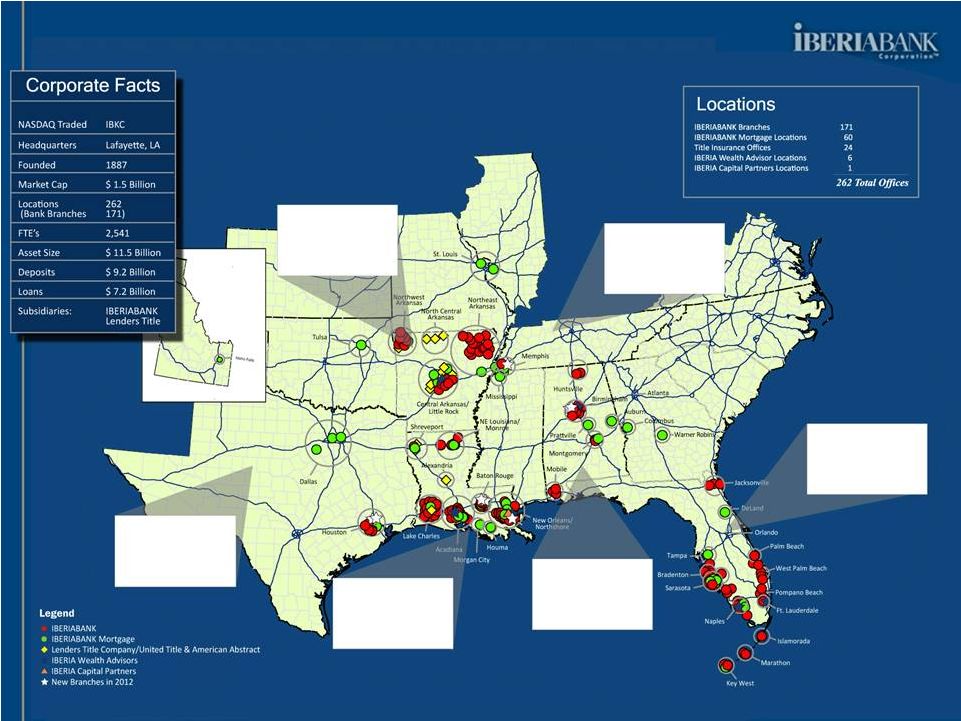 IBKC Overview IBKC Overview Our Locations 11 Deposit Market Share as of June 30, 2011. Source: SNL Financial. Map Reflects Locations as of October 24,2011. *Other Mortgage Locations not shown = 9 Arkansas 34 Branches $1.0 bil deposits #12 Rank 32 Non-bank Offices Texas 4 Branches $185 mm deposits #227 Rank 3 Non-bank Offices Louisiana 78 Branches $5.1 bil deposits #5 Rank 31 Non-bank Offices Alabama 12 Branches $500 mm deposits #20 Rank 5 Non-bank Offices Florida 42 Branches $2.3 bil deposits #24 Rank 10 Non-bank Offices Tennessee 2 Branches $155 mm deposits #113 Rank 1 Non-bank Office |
 Indicates cities in which our members of Senior Management (Market Presidents, Executive Vice Presidents, etc.) have resided/worked. IBKC Overview IBKC Overview Where We Lived & Worked Greensboro, NC Indianapolis, IN Las Vegas, NV Mansfield, PA Morris Plains, NJ New York, NJ Pittsburgh, PA Phoenix, AZ San Diego, CA Scottsdale, AZ Wilmington, DE Resides in New Orleans, LA Michael J. Brown, VC Chief Operating Officer Jefferson G. Parker, VC Manager of Brokerage, Trust, and Wealth and Management Anthony J. Restel, SEVP Chief Financial Officer Robert B. Worley General Counsel Daryl G. Byrd President and CEO Beth A. Ardoin, EVP Director of Communications George J. Becker III, EVP Director of Corporate Operations Barry F. Berthelot, EVP Director of Organizational Development Resides in Lafayette, LA Resides in Greensboro, NC Gregg Strader, EVP Chief Credit Officer Broad Experience Throughout Southeastern U.S. 12 Resides in Annapolis, MD Robert M. Kottler, EVP Director of Retail and Small Business Albuquerque, NM Annapolis, MD Boston, MA Buffalo, NY Charlotte, NC Charlottetown, PE, Canada Chennai, India Cleveland, OH Columbus, OH Detroit, MI Flint, MI Hartford, CT Resides in Raleigh, NC John R. Davis, SEVP Director of Financial Strategy and Mortgage Resides in Greensboro, GA James B. Gburek, EVP Chief Risk Officer Resides in Gastonia, NC H. Spurgeon Mackie, EVP Executive Credit Officer Experience in Additional Cities: Indicates cities in which our 11 members of Executive Management have resided/worked |
 • Combination of Organic Growth And Acquisitions • Include Bargain Purchase Gains (Present Value Benefit) • Exclude One-Time Costs • Full Deployment Of Capital During The Planning Period Organic Loan Growth Selected Acquisitions Share Repurchases Regulatory Capital Limits Subject To Change • Selective Branch Additions And Strategic Recruits • No New Businesses Assumed • Improve Operating Leverage From Prior Investments Other Assumptions Strategic Overview Strategic Overview 13 |
 • Return On Average Tangible Equity Excludes One-Time Costs By End Of Planning Period • Tangible Efficiency Ratio Entire Company, Not Just Bank By End Of Planning Period • Asset Quality Nonperforming Assets/Total Assets Exclude FDIC Covered Assets • Earnings Per Share Growth Annual Growth Throughout Period Excludes One-Time Costs 3-5 Year Strategic Goals Strategic Overview Strategic Overview 14 13% to 17% Target 60% or Less Peer Top 10% Double-Digit % |
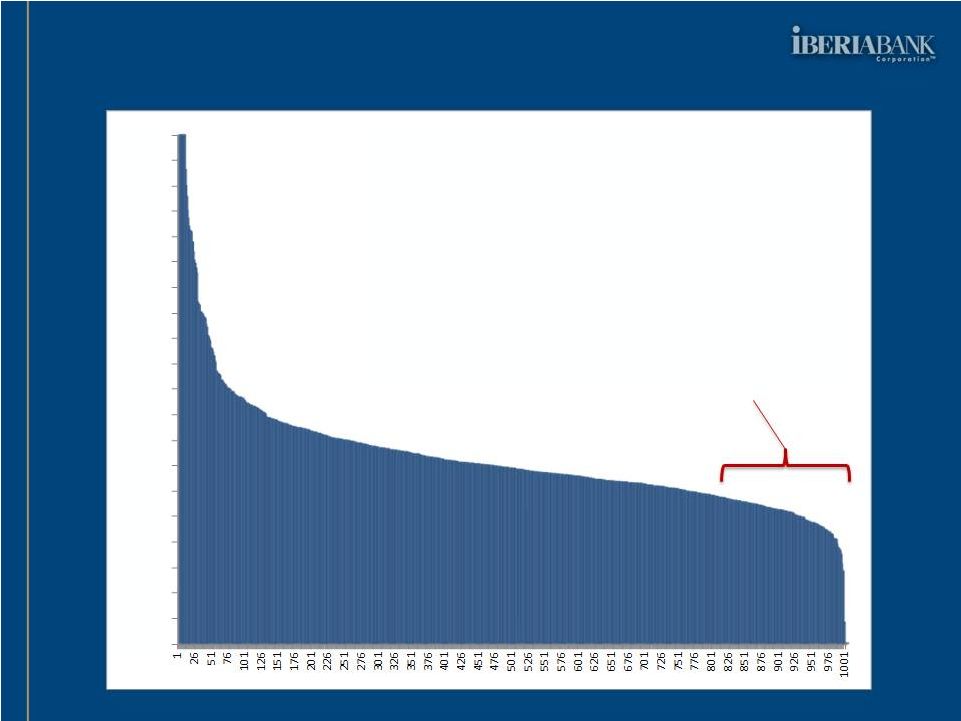
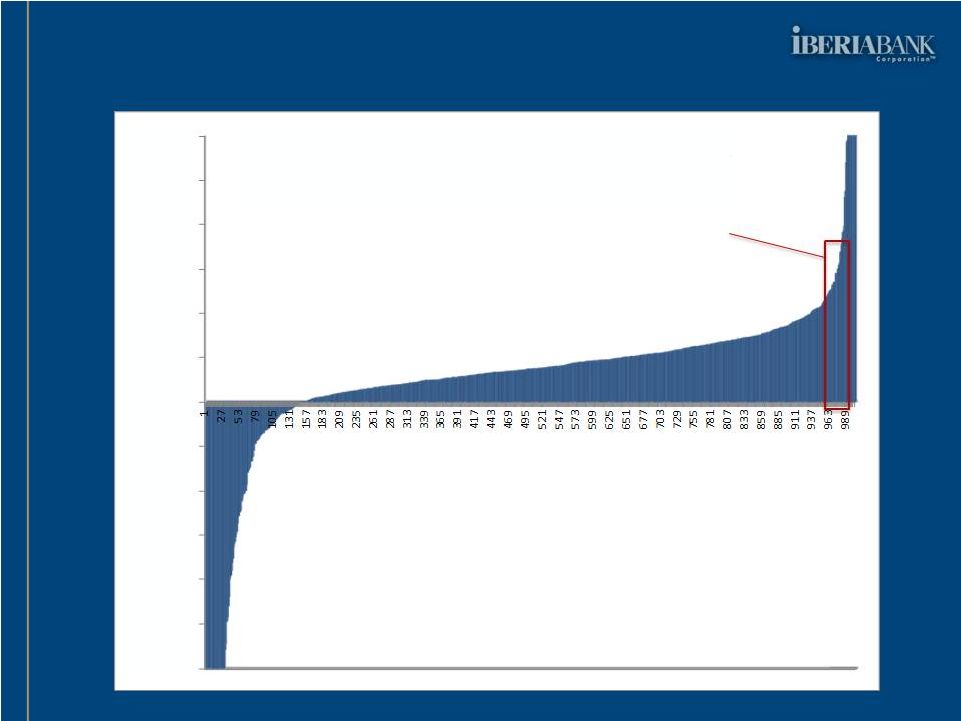 Strategic Overview Strategic Overview Return On Tangible Equity 15 Source: SNL; US Bank Holding Companies reporting as of June 30, 2011 -30.00% -25.00% -20.00% -15.00% -10.00% -5.00% 0.00% 5.00% 10.00% 15.00% 20.00% 25.00% 30.00% 2Q11 Return On Tangible Equity - US BHCs ROTEs 13%-17% |
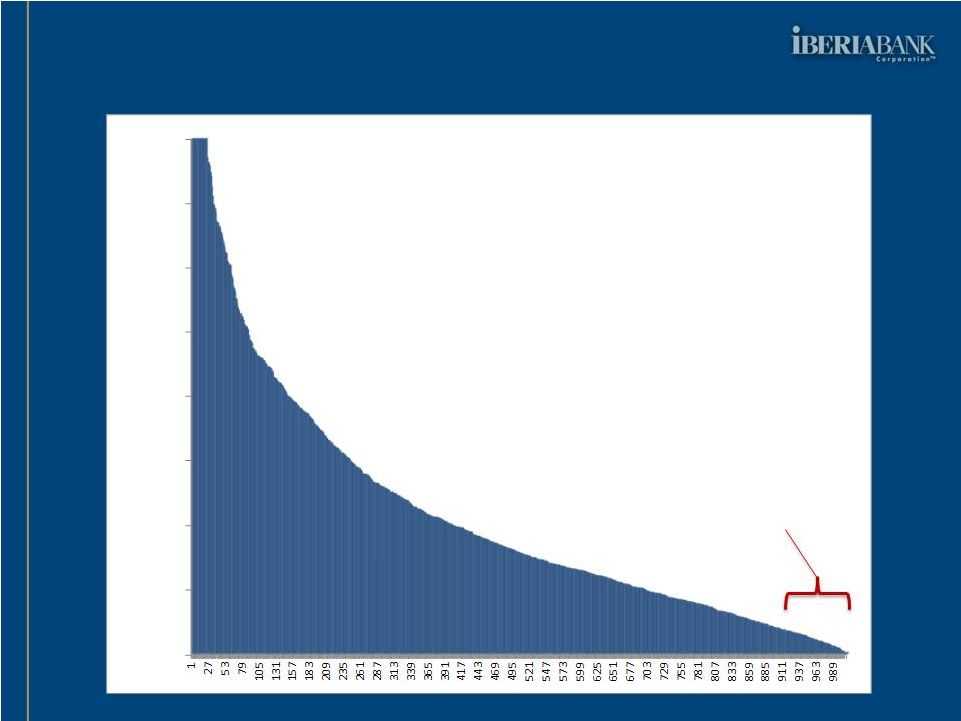
 Strategic Overview Strategic Overview Tangible Efficiency Ratio 16 Source: SNL; US Bank Holding Companies reporting as of June 30, 2011 0% 10% 20% 30% 40% 50% 60% 70% 80% 90% 100% 110% 120% 130% 140% 150% 160% 170% 180% 190% 200% 2Q11 Tangible Efficiency Ratio - US BHCs Tangible Efficiency Ratio Less Than 60% |
 Strategic Overview Strategic Overview Asset Quality (NPAs/Total Assets) 17 Top 10% Source: SNL; US Bank Holding Companies reporting as of June 30, 2011 0.00% 2.00% 4.00% 6.00% 8.00% 10.00% 12.00% 14.00% 16.00% |
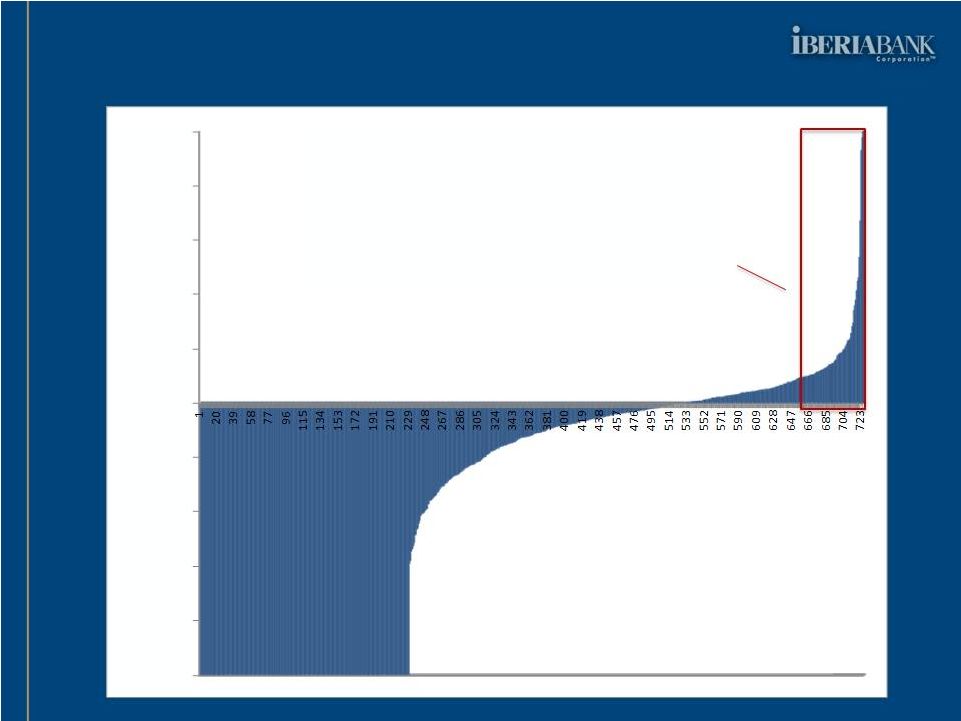 Strategic Overview Strategic Overview EPS Growth 18 Double Digit Growth Source: SNL; US Bank Holding Companies reporting as of June 30, 2011 -100.0% -80.0% -60.0% -40.0% -20.0% 0.0% 20.0% 40.0% 60.0% 80.0% 100.0% EPS Growth 5-Year CAGR - US BHCs |
 |