UNITED STATES SECURITIES AND EXCHANGE COMMISSION
Washington, D.C. 20549
Form 10-K
þ ANNUAL REPORT PURSUANT TO SECTION 13 OR 15(d) OF THE
SECURITIES EXCHANGE ACT OF 1934
For the fiscal year endedDecember 31, 2008
OR
o TRANSITION REPORT PURSUANT TO SECTION 13 OR 15(d) OF THE
SECURITIES EXCHANGE ACT OF 1934
For the transition period from to
Commission File Number 1-368-2
Chevron Corporation
(Exact name of registrant as specified in its charter)
| | | | | |
| Delaware | | 94-0890210 | | 6001 Bollinger Canyon Road,
San Ramon, California 94583-2324 |
| | | | |
(State or other jurisdiction of
incorporation or organization) | | (I.R.S. Employer
Identification Number) | | (Address of principal executive offices) (Zip Code) |
Registrant’s telephone number, including area code(925) 842-1000
Securities registered pursuant to Section 12(b) of the Act:
| | | |
Title of Each Class | | Name of Each Exchange
on Which Registered |
| Common stock, par value $.75 per share | | New York Stock Exchange, Inc. |
Indicate by check mark if the registrant is a well-known seasoned issuer, as defined in Rule 405 of the Securities Act. Yes þ No o
Indicate by check mark if the registrant is not required to file reports pursuant to Section 13 or Section 15(d) of the Act. Yes o No þ
Indicate by check mark whether the registrant (1) has filed all reports required to be filed by Section 13 or 15(d) of the Securities Exchange Act of 1934 during the preceding 12 months (or for such shorter period that the registrant was required to file such reports), and (2) has been subject to such filing requirements for the past 90 days. Yes þ No o
Indicate by check mark if disclosure of delinquent filers pursuant to Item 405 ofRegulation S-K (§ 229.405 of this chapter) is not contained herein, and will not be contained, to the best of registrant’s knowledge, in definitive proxy or information statements incorporated by reference in Part III of thisForm 10-K or any amendment to thisForm 10-K. o
Indicate by check mark whether the registrant is a large accelerated filer, an accelerated filer, a non-accelerated filer, or a smaller reporting company. See the definitions of “large accelerated filer,” “accelerated filer” and “smaller reporting company” inRule 12b-2 of the Exchange Act. (Check one):
| | | | | | | |
Large accelerated filer þ | | Accelerated filer o | | Non-accelerated filer o
(Do not check if a smaller
reporting company) | | Smaller reporting company o |
Indicate by check mark whether the registrant is a shell company (as defined inRule 12b-2 of the Act). Yes o No þ
Aggregate market value of the voting and non-voting common equity held by non-affiliates computed by reference to the price at which the common equity was last sold, or the average bid and asked price of such common equity, as of the last business day of the registrant’s most recently completed second fiscal quarter — $203,659,751,369 (As of June 30, 2008)
Number of Shares of Common Stock outstanding as of February 20, 2009 — 2,004,559,279
DOCUMENTS INCORPORATED BY REFERENCE
(To The Extent Indicated Herein)
Notice of the 2009 Annual Meeting and 2009 Proxy Statement, to be filed pursuant toRule 14a-6(b) under the Securities Exchange Act of 1934, in connection with the company’s 2009 Annual Meeting of Stockholders (in Part III)
CAUTIONARY STATEMENT RELEVANT TO FORWARD-LOOKING INFORMATION
FOR THE PURPOSE OF “SAFE HARBOR” PROVISIONS OF THE
PRIVATE SECURITIES LITIGATION REFORM ACT OF 1995
ThisAnnual Report onForm 10-Kof Chevron Corporation contains forward-looking statements relating to Chevron’s operations that are based on management’s current expectations, estimates and projections about the petroleum, chemicals and other energy-related industries. Words such as “anticipates,” “expects,” “intends,” “plans,” “targets,” “projects,” “believes,” “seeks,” “schedules,” “estimates,” “budgets” and similar expressions are intended to identify such forward-looking statements. These statements are not guarantees of future performance and are subject to certain risks, uncertainties and other factors, some of which are beyond the company’s control and are difficult to predict. Therefore, actual outcomes and results may differ materially from what is expressed or forecasted in such forward-looking statements. The reader should not place undue reliance on these forward-looking statements, which speak only as of the date of this report. Unless legally required, Chevron undertakes no obligation to update publicly any forward-looking statements, whether as a result of new information, future events or otherwise.
Among the important factors that could cause actual results to differ materially from those in the forward-looking statements are crude-oil and natural-gas prices; refining, marketing and chemical margins; actions of competitors or regulators; timing of exploration expenses; timing of crude-oil liftings; the competitiveness of alternate-energy sources or product substitutes; technological developments; the results of operations and financial condition of equity affiliates; the inability or failure of the company’s joint-venture partners to fund their share of operations and development activities; the potential failure to achieve expected net production from existing and future crude-oil and natural-gas development projects; potential delays in the development, construction orstart-up of planned projects; the potential disruption or interruption of the company’s net production or manufacturing facilities or delivery/transportation networks due to war, accidents, political events, civil unrest, severe weather or crude-oil production quotas that might be imposed by OPEC (Organization of Petroleum Exporting Countries); the potential liability for remedial actions or assessments under existing or future environmental regulations and litigation; significant investment or product changes under existing or future environmental statutes, regulations and litigation; the potential liability resulting from pending or future litigation; the company’s acquisition or disposition of assets; gains and losses from asset dispositions or impairments; government-mandated sales, divestitures, recapitalizations, industry-specific taxes, changes in fiscal terms or restrictions on scope of company operations; foreign currency movements compared with the U.S. dollar; the effects of changed accounting rules under generally accepted accounting principles promulgated by rule-setting bodies; and the factors set forth under the heading “Risk Factors” on pages 30 and 31 in this report. In addition, such statements could be affected by general domestic and international economic and political conditions. Unpredictable or unknown factors not discussed in this report could also have material adverse effects on forward-looking statements.
2
PART I
| |
| (a) | General Development of Business |
Summary Description of Chevron
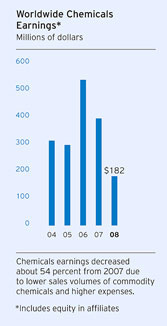
Chevron Corporation,1 a Delaware corporation, manages its investments in subsidiaries and affiliates and provides administrative, financial, management and technology support to U.S. and international subsidiaries that engage in fully integrated petroleum operations, chemicals operations, mining operations, power generation and energy services. Exploration and production (upstream) operations consist of exploring for, developing and producing crude oil and natural gas and also marketing natural gas. Refining, marketing and transportation (downstream) operations relate to refining crude oil into finished petroleum products; marketing crude oil and the many products derived from petroleum; and transporting crude oil, natural gas and petroleum products by pipeline, marine vessel, motor equipment and rail car. Chemical operations include the manufacture and marketing of commodity petrochemicals, plastics for industrial uses, and fuel and lubricant oil additives.
A list of the company’s major subsidiaries is presented on pagesE-125 andE-126. As of December 31, 2008, Chevron had approximately 67,000 employees (including about 5,000 service station employees). Approximately 32,000 employees (including about 4,000 service station employees), or 48 percent, were employed in U.S. operations.
Overview of Petroleum Industry
Petroleum industry operations and profitability are influenced by many factors, and individual petroleum companies have little control over some of them. Governmental policies, particularly in the areas of taxation, energy and the environment have a significant impact on petroleum activities, regulating how companies are structured and where and how companies conduct their operations and formulate their products and, in some cases, limiting their profits directly. Prices for crude oil and natural gas, petroleum products and petrochemicals are generally determined by supply and demand for these commodities. However, some governments impose price controls on refined products such as gasoline or diesel fuel. The members of the Organization of Petroleum Exporting Countries (OPEC) are typically the world’s swing producers of crude oil, and their production levels are a major factor in determining worldwide supply. Demand for crude oil and its products and for natural gas is largely driven by the conditions of local, national and global economies, although weather patterns and taxation relative to other energy sources also play a significant part. Seasonality is not a primary driver to changes in the company’s quarterly earnings during the year.
Strong competition exists in all sectors of the petroleum and petrochemical industries in supplying the energy, fuel and chemical needs of industry and individual consumers. Chevron competes with fully integrated major global petroleum companies, as well as independent and national petroleum companies, for the acquisition of crude oil and natural gas leases and other properties and for the equipment and labor required to develop and operate those properties. In its downstream business, Chevron also competes with fully integrated major petroleum companies and other independent refining, marketing and transportation entities in the sale or acquisition of various goods or services in many national and international markets.
Operating Environment
Refer to pages FS-2 through FS-8 of thisForm 10-K in Management’s Discussion and Analysis of Financial Condition and Results of Operations for a discussion of the company’s current business environment and outlook.
1 Incorporated in Delaware in 1926 as Standard Oil Company of California, the company adopted the name Chevron Corporation in 1984 and ChevronTexaco Corporation in 2001. In 2005, ChevronTexaco Corporation changed its name to Chevron Corporation. As used in this report, the term “Chevron” and such terms as “the company,” “the corporation,” “our,” “we” and “us” may refer to Chevron Corporation, one or more of its consolidated subsidiaries, or all of them taken as a whole, but unless stated otherwise, it does not include “affiliates” of Chevron — i.e., those companies accounted for by the equity method (generally owned 50 percent or less) or investments accounted for by the cost method. All of these terms are used for convenience only and are not intended as a precise description of any of the separate companies, each of which manages its own affairs.
3
Chevron Strategic Direction
Chevron’s primary objective is to create stockholder value and achieve sustained financial returns from its operations that will enable it to outperform its competitors. As a foundation for achieving this objective, the company has established the following strategies:
Strategies for Major Businesses
| | |
| | • | Upstream —grow profitably in core areas, build new legacy positions and commercialize the company’s equity natural-gas resource base while growing a high-impact global gas business |
| |
| | • | Downstream —improve returns and selectively grow, with a focus on integrated value creation |
The company also continues to invest in renewable-energy technologies, with an objective of capturing profitable positions.
Enabling Strategies Companywide
| | |
| | • | Invest in peopleto achieve the company’s strategies |
| |
| | • | Leverage technologyto deliver superior performance and growth |
| |
| | • | Build organizational capabilityto deliver world-class performance in operational excellence, cost management, capital stewardship and profitable growth |
(b) Description of Business and Properties
The upstream, downstream and chemicals activities of the company and its equity affiliates are widely dispersed geographically, with operations in North America, South America, Europe, Africa, the Middle East, Asia and Australia. Tabulations of segment sales and other operating revenues, earnings and income taxes for the three years ending December 31, 2008, and assets as of the end of 2008 and 2007 — for the United States and the company’s international geographic areas — are in Note 9 to the Consolidated Financial Statements beginning onpage FS-38. Similar comparative data for the company’s investments in and income from equity affiliates and property, plant and equipment are in Notes 12 and 13 on pages FS-41 to FS-43.
Capital and Exploratory Expenditures
Total expenditures for 2008 were $22.8 billion, including $2.3 billion for Chevron’s share of expenditures by affiliated companies, which did not require cash outlays by the company. In 2007 and 2006, expenditures were $20 billion and $16.6 billion, respectively, including the company’s share of affiliates’ expenditures of $2.3 billion and $1.9 billion in the corresponding periods.
Of the $22.8 billion in expenditures for 2008, about three-fourths, or $17.5 billion, was related to upstream activities. Approximately the same percentage was also expended for upstream operations in 2007 and 2006. International upstream accounted for about 70 percent of the worldwide upstream investment in each of the three years, reflecting the company’s continuing focus on opportunities that are available outside the United States.
In 2009, the company estimates capital and exploratory expenditures will be $22.8 billion, including $1.8 billion of spending by affiliates. About three-fourths of the total, or $17.5 billion, is budgeted for exploration and production activities, with $13.9 billion of that amount outside the United States.
Refer also to a discussion of the company’s capital and exploratory expenditures onpage FS-11 and FS-12.
Upstream — Exploration and Production
The table on the following page summarizes the net production of liquids and natural gas for 2008 and 2007 by the company and its affiliates.
4
Net Production of Crude Oil and Natural Gas Liquids and Natural Gas1
| | | | | | | | | | | | | | | | | | | | | | | | | |
| | | | | | | | | Components of Oil-Equivalent | |
| | | | | | Crude Oil & Natural Gas
| | | | |
| | | Oil-Equivalent (Thousands
| | | Liquids (Thousands of
| | | Natural Gas (Millions of
| |
| | | of Barrels per Day) | | | Barrels per Day) | | | Cubic Feet per Day) | |
| | | 2008 | | | 2007 | | | 2008 | | | 2007 | | | 2008 | | | 2007 | |
| |
United States: | | | | | | | | | | | | | | | | | | | | | | | | |
| California | | | 215 | | | | 221 | | | | 201 | | | | 205 | | | | 88 | | | | 97 | |
| Gulf of Mexico | | | 160 | | | | 214 | | | | 86 | | | | 118 | | | | 439 | | | | 576 | |
| Texas (Onshore) | | | 149 | | | | 153 | | | | 76 | | | | 77 | | | | 441 | | | | 457 | |
| Other States | | | 147 | | | | 155 | | | | 58 | | | | 60 | | | | 533 | | | | 569 | |
| | | | | | | | | | | | | | | | | | | | | | | | | |
| Total United States | | | 671 | | | | 743 | | | | 421 | | | | 460 | | | | 1,501 | | | | 1,699 | |
| | | | | | | | | | | | | | | | | | | | | | | | | |
Africa: | | | | | | | | | | | | | | | | | | | | | | | | |
| Angola | | | 154 | | | | 179 | | | | 145 | | | | 171 | | | | 52 | | | | 48 | |
| Nigeria | | | 154 | | | | 129 | | | | 142 | | | | 126 | | | | 72 | | | | 15 | |
| Chad | | | 29 | | | | 32 | | | | 28 | | | | 31 | | | | 5 | | | | 4 | |
| Republic of the Congo | | | 13 | | | | 8 | | | | 11 | | | | 7 | | | | 12 | | | | 7 | |
| Democratic Republic of the Congo | | | 2 | | | | 3 | | | | 2 | | | | 3 | | | | 1 | | | | 2 | |
| | | | | | | | | | | | | | | | | | | | | | | | | |
| Total Africa | | | 352 | | | | 351 | | | | 328 | | | | 338 | | | | 142 | | | | 76 | |
| | | | | | | | | | | | | | | | | | | | | | | | | |
Asia-Pacific: | | | | | | | | | | | | | | | | | | | | | | | | |
| Thailand | | | 217 | | | | 224 | | | | 67 | | | | 71 | | | | 894 | | | | 916 | |
Partitioned Neutral Zone (PNZ)2 | | | 106 | | | | 112 | | | | 103 | | | | 109 | | | | 20 | | | | 17 | |
| Australia | | | 96 | | | | 100 | | | | 34 | | | | 39 | | | | 376 | | | | 372 | |
| Bangladesh | | | 71 | | | | 47 | | | | 2 | | | | 2 | | | | 414 | | | | 275 | |
| Kazakhstan | | | 66 | | | | 66 | | | | 41 | | | | 41 | | | | 153 | | | | 149 | |
| Azerbaijan | | | 29 | | | | 61 | | | | 28 | | | | 60 | | | | 7 | | | | 5 | |
| Philippines | | | 26 | | | | 26 | | | | 5 | | | | 5 | | | | 128 | | | | 126 | |
| China | | | 22 | | | | 26 | | | | 19 | | | | 22 | | | | 22 | | | | 22 | |
| Myanmar | | | 15 | | | | 17 | | | | — | | | | — | | | | 89 | | | | 100 | |
| | | | | | | | | | | | | | | | | | | | | | | | | |
| Total Asia-Pacific | | | 648 | | | | 679 | | | | 299 | | | | 349 | | | | 2,103 | | | | 1,982 | |
| | | | | | | | | | | | | | | | | | | | | | | | | |
Indonesia | | | 235 | | | | 241 | | | | 182 | | | | 195 | | | | 319 | | | | 277 | |
Other International: | | | | | | | | | | | | | | | | | | | | | | | | |
| United Kingdom | | | 106 | | | | 115 | | | | 71 | | | | 78 | | | | 208 | | | | 220 | |
| Denmark | | | 61 | | | | 63 | | | | 37 | | | | 41 | | | | 142 | | | | 132 | |
| Argentina | | | 44 | | | | 47 | | | | 37 | | | | 39 | | | | 45 | | | | 50 | |
| Canada | | | 37 | | | | 36 | | | | 36 | | | | 35 | | | | 4 | | | | 5 | |
| Colombia | | | 35 | | | | 30 | | | | — | | | | — | | | | 209 | | | | 178 | |
| Trinidad and Tobago | | | 32 | | | | 29 | | | | — | | | | — | | | | 189 | | | | 174 | |
| Netherlands | | | 9 | | | | 4 | | | | 2 | | | | 3 | | | | 40 | | | | 5 | |
| Norway | | | 6 | | | | 6 | | | | 6 | | | | 6 | | | | 1 | | | | 1 | |
| | | | | | | | | | | | | | | | | | | | | | | | | |
| Total Other International | | | 330 | | | | 330 | | | | 189 | | | | 202 | | | | 838 | | | | 765 | |
| | | | | | | | | | | | | | | | | | | | | | | | | |
| Total International | | | 1,565 | | | | 1,601 | | | | 998 | | | | 1,084 | | | | 3,402 | | | | 3,100 | |
| | | | | | | | | | | | | | | | | | | | | | | | | |
| Total Consolidated Operations | | | 2,236 | | | | 2,344 | | | | 1,419 | | | | 1,544 | | | | 4,903 | | | | 4,799 | |
Equity Affiliates3 | | | 267 | | | | 248 | | | | 230 | | | | 212 | | | | 222 | | | | 220 | |
| | | | | | | | | | | | | | | | | | | | | | | | | |
Total Including Affiliates4 | | | 2,503 | | | | 2,592 | | | | 1,649 | | | | 1,756 | | | | 5,125 | | | | 5,019 | |
| | | | | | | | | | | | | | | | | | | | | | | | | |
| | | | | | | | | | | | | | | | | | | | | | | | | |
1 Excludes Athabasca oil sands
production, net: | | | 27 | | | | 27 | | | | 27 | | | | 27 | | | | — | | | | — | |
2 Located between Saudi Arabia and Kuwait. | | | | | | | | | | | | | | | | | | | | |
3 Volumes represent Chevron’s share of production by affiliates, including Tengizchevroil (TCO) in Kazakhstan and Petroboscan, Petroindependiente and Petropiar/Hamaca in Venezuela. |
4 Volumes include natural gas consumed in operations of 520 million and 498 million cubic feet per day in 2008 and 2007, respectively. |
Worldwide oil-equivalent production, including volumes from oil sands (refer to footnote 1 above), was 2.53 million barrels per day, down about 3 percent from 2007. The decline was mostly attributable to damages to facilities caused by September 2008 hurricanes in the U.S. Gulf of Mexico and the impact of higher prices on certain production-sharing and variable-royalty agreements outside the United States. Refer to the “Results of Operations” section beginning onpage FS-6 for a detailed discussion of the factors explaining the 2006 — 2008 changes in production for crude oil and natural gas liquids and natural gas.
5
The company estimates that its average worldwide oil-equivalent production in 2009 will be approximately 2.63 million barrels per day. This estimate is subject to many uncertainties, including quotas that may be imposed by OPEC, the price effect on production volumes calculated under cost-recovery and variable-royalty provisions of certain contracts, changes in fiscal terms or restrictions on the scope of company operations, delays in projectstart-ups, fluctuations in demand for natural gas in various markets, and production that may have to be shut in due to weather conditions, civil unrest, changing geopolitics or other disruptions to operations. Future production levels also are affected by the size and number of economic investment opportunities and, for new large-scale projects, the time lag between initial exploration and the beginning of production. Refer to the “Review of Ongoing Exploration and Production Activities in Key Areas,” beginning on page 9, for a discussion of the company’s major oil and gas development projects.
Average Sales Prices and Production Costs per Unit of Production
Refer to Table IV onpage FS-67 for the company’s average sales price per barrel of crude oil and natural gas liquids and per thousand cubic feet of natural gas produced and the average production cost per oil-equivalent barrel for 2008, 2007 and 2006.
Gross and Net Productive Wells
The following table summarizes gross and net productive wells at year-end 2008 for the company and its affiliates:
Productive Oil and Gas Wells1 at December 31, 2008
| | | | | | | | | | | | | | | | | |
| | | Productive2
| | | Productive2
| |
| | | Oil Wells | | | Gas Wells | |
| | | Gross | | | Net | | | Gross | | | Net | |
| |
| United States: | | | | | | | | | | | | | | | | |
| California | | | 25,726 | | | | 23,921 | | | | 188 | | | | 44 | |
| Gulf of Mexico | | | 1,489 | | | | 1,214 | | | | 922 | | | | 701 | |
| Other U.S. | | | 23,729 | | | | 8,460 | | | | 10,587 | | | | 4,824 | |
| | | | | | | | | | | | | | | | | |
| Total United States | | | 50,944 | | | | 33,595 | | | | 11,697 | | | | 5,569 | |
| | | | | | | | | | | | | | | | | |
| Africa | | | 2,126 | | | | 723 | | | | 17 | | | | 7 | |
| Asia-Pacific | | | 2,479 | | | | 1,150 | | | | 2,468 | | | | 1,560 | |
| Indonesia | | | 7,879 | | | | 7,737 | | | | 203 | | | | 165 | |
| Other International | | | 1,091 | | | | 680 | | | | 275 | | | | 105 | |
| | | | | | | | | | | | | | | | | |
| Total International | | | 13,575 | | | | 10,290 | | | | 2,963 | | | | 1,837 | |
| | | | | | | | | | | | | | | | | |
| Total Consolidated Companies | | | 64,519 | | | | 43,885 | | | | 14,660 | | | | 7,406 | |
| Equity in Affiliates | | | 1,174 | | | | 413 | | | | 7 | | | | 2 | |
| | | | | | | | | | | | | | | | | |
| Total Including Affiliates | | | 65,693 | | | | 44,298 | | | | 14,667 | | | | 7,408 | |
| | | | | | | | | | | | | | | | | |
| Multiple completion wells included above: | | | 881 | | | | 549 | | | | 411 | | | | 318 | |
| | |
| 1 | | Includes wells producing or capable of producing and injection wells temporarily functioning as producing wells. Wells that produce both oil and gas are classified as oil wells. |
| 2 | | Gross wells include the total number of wells in which the company has an interest. Net wells include wholly owned wells and the sum of the company’s fractional interests in gross wells. |
Reserves
Refer to Table V beginning onpage FS-67 for a tabulation of the company’s proved net oil and gas reserves by geographic area, at the beginning of 2006 and each year-end from 2006 through 2008, and an accompanying discussion of major changes to proved reserves by geographic area for the three-year period ending December 31, 2008. During 2008, the company provided oil and gas reserves estimates for 2007 to the Department of Energy, Energy Information Administration (EIA), that agree with the 2007 reserve volumes in Table V. This reporting fulfilled the requirement that such estimates are to be consistent with, and do not differ more than 5 percent from, the information furnished to the Securities and Exchange Commission in the company’s 2007 Annual Report onForm 10-K. During 2009, the company will file estimates of oil and gas reserves with the Department of Energy, EIA, consistent with the 2008 reserve data reported in Table V.
6
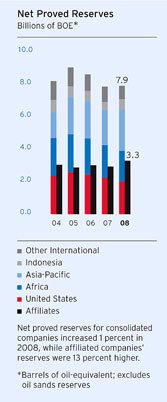
The net proved-reserve balances at the end of each of the three years 2006 through 2008 are shown in the table below:
Net Proved Reserves at December 31
| | | | | | | | | | | | | |
| | | 2008 | | | 2007 | | | 2006 | |
| |
| Liquids* — Millions of barrels | | | | | | | | | | | | |
| Consolidated Companies | | | 4,735 | | | | 4,665 | | | | 5,294 | |
| Affiliated Companies | | | 2,615 | | | | 2,422 | | | | 2,512 | |
| Natural Gas — Billions of cubic feet | | | | | | | | | | | | |
| Consolidated Companies | | | 19,022 | | | | 19,137 | | | | 19,910 | |
| Affiliated Companies | | | 4,053 | | | | 3,003 | | | | 2,974 | |
| Total Oil-Equivalent — Millions of barrels | | | | | | | | | | | | |
| Consolidated Companies | | | 7,905 | | | | 7,855 | | | | 8,612 | |
| Affiliated Companies | | | 3,291 | | | | 2,922 | | | | 3,008 | |
| | |
| * | | Crude oil, condensate and natural gas liquids |
Acreage
At December 31, 2008, the company owned or had under lease or similar agreements undeveloped and developed oil and gas properties located throughout the world. The geographical distribution of the company’s acreage is shown in the following table.
Acreage1 at December 31, 2008
(Thousands of Acres)
| | | | | | | | | | | | | | | | | | | | | | | | | |
| | | | | | | | | Developed and
| |
| | | Undeveloped2 | | | Developed2 | | | Undeveloped | |
| | | Gross | | | Net | | | Gross | | | Net | | | Gross | | | Net | |
| |
| United States: | | | | | | | | | | | | | | | | | | | | | | | | |
| California | | | 138 | | | | 122 | | | | 183 | | | | 176 | | | | 321 | | | | 298 | |
| Gulf of Mexico | | | 2,108 | | | | 1,500 | | | | 1,568 | | | | 1,141 | | | | 3,676 | | | | 2,641 | |
| Other U.S. | | | 3,441 | | | | 2,784 | | | | 4,461 | | | | 2,497 | | | | 7,902 | | | | 5,281 | |
| | | | | | | | | | | | | | | | | | | | | | | | | |
| Total United States | | | 5,687 | | | | 4,406 | | | | 6,212 | | | | 3,814 | | | | 11,899 | | | | 8,220 | |
| | | | | | | | | | | | | | | | | | | | | | | | | |
| Africa | | | 17,686 | | | | 7,710 | | | | 2,487 | | | | 921 | | | | 20,173 | | | | 8,631 | |
| Asia-Pacific | | | 45,429 | | | | 22,447 | | | | 5,937 | | | | 2,649 | | | | 51,366 | | | | 25,096 | |
| Indonesia | | | 8,031 | | | | 5,348 | | | | 383 | | | | 341 | | | | 8,414 | | | | 5,689 | |
| Other International | | | 35,236 | | | | 19,957 | | | | 1,924 | | | | 613 | | | | 37,160 | | | | 20,570 | |
| | | | | | | | | | | | | | | | | | | | | | | | | |
| Total International | | | 106,382 | | | | 55,462 | | | | 10,731 | | | | 4,524 | | | | 117,113 | | | | 59,986 | |
| | | | | | | | | | | | | | | | | | | | | | | | | |
| Total Consolidated Companies | | | 112,069 | | | | 59,868 | | | | 16,943 | | | | 8,338 | | | | 129,012 | | | | 68,206 | |
| Equity in Affiliates | | | 640 | | | | 300 | | | | 259 | | | | 104 | | | | 899 | | | | 404 | |
| | | | | | | | | | | | | | | | | | | | | | | | | |
| Total Including Affiliates | | | 112,709 | | | | 60,168 | | | | 17,202 | | | | 8,442 | | | | 129,911 | | | | 68,610 | |
| | | | | | | | | | | | | | | | | | | | | | | | | |
| | |
| 1 | | Gross acreage includes the total number of acres in all tracts in which the company has an interest. Net acreage includes wholly owned interests and the sum of the company’s fractional interests in gross acreage. |
| 2 | | Developed acreage is spaced or assignable to productive wells. Undeveloped acreage is acreage on which wells have not been drilled or completed to permit commercial production and that may contain undeveloped proved reserves. The gross undeveloped acres that will expire in 2009, 2010 and 2011 if production is not established by certain required dates are 5,707, 8,290 and 4,720, respectively. |
7
Delivery Commitments
The company sells crude oil and natural gas from its producing operations under a variety of contractual obligations. Most contracts generally commit the company to sell quantities based on production from specified properties, but some natural gas sales contracts specify delivery of fixed and determinable quantities, as discussed below.
In the United States, the company is contractually committed to deliver to third parties and affiliates 414 billion cubic feet of natural gas through 2011. The company believes it can satisfy these contracts from quantities available from production of the company’s proved developed U.S. reserves. These contracts include a variety of pricing terms, including both index and fixed-price contracts.
Outside the United States, the company is contractually committed to deliver to third parties a total of 865 billion cubic feet of natural gas from 2009 through 2011 from Argentina, Australia, Canada, Colombia, Denmark and the Philippines. The sales contracts contain variable pricing formulas that are generally referenced to the prevailing market price for crude oil, natural gas or other petroleum products at the time of delivery. The company believes it can satisfy these contracts from quantities available from production of the company’s proved developed reserves in Argentina, Australia, Colombia, Denmark and the Philippines. The company plans to meet its Canadian contractual delivery commitments of 28 billion cubic feet through third-party purchases.
Development Activities
Refer to Table I onpage FS-62 for details associated with the company’s development expenditures and costs of proved property acquisitions for 2008, 2007 and 2006.
The table below summarizes the company’s net interest in productive and dry development wells completed in each of the past three years and the status of the company’s development wells drilling at December 31, 2008. A “development well” is a well drilled within the proved area of a crude oil or natural gas reservoir to the depth of a stratigraphic horizon known to be productive.
Development Well Activity
| | | | | | | | | | | | | | | | | | | | | | | | | | | | | | | | | |
| | | Wells Drilling
| | | Net Wells Completed1 | |
| | | at 12/31/082 | | | 2008 | | | 2007 | | | 2006 | |
| | | Gross | | | Net | | | Prod. | | | Dry | | | Prod. | | | Dry | | | Prod. | | | Dry | |
| |
| United States: | | | | | | | | | | | | | | | | | | | | | | | | | | | | | | | | |
| California | | | 8 | | | | 1 | | | | 533 | | | | — | | | | 620 | | | | — | | | | 600 | | | | — | |
| Gulf of Mexico | | | 44 | | | | 25 | | | | 26 | | | | 3 | | | | 30 | | | | 1 | | | | 34 | | | | 5 | |
| Other U.S. | | | 9 | | | | 8 | | | | 287 | | | | 1 | | | | 225 | | | | 4 | | | | 317 | | | | 6 | |
| | | | | | | | | | | | | | | | | | | | | | | | | | | | | | | | | |
| Total United States | | | 61 | | | | 34 | | | | 846 | | | | 4 | | | | 875 | | | | 5 | | | | 951 | | | | 11 | |
| | | | | | | | | | | | | | | | | | | | | | | | | | | | | | | | | |
| Africa | | | 13 | | | | 8 | | | | 33 | | | | — | | | | 43 | | | | — | | | | 45 | | | | 2 | |
| Asia-Pacific | | | 13 | | | | 4 | | | | 203 | | | | 1 | | | | 223 | | | | — | | | | 235 | | | | 1 | |
| Indonesia | | | 2 | | | | 2 | | | | 462 | | | | — | | | | 374 | | | | — | | | | 258 | | | | — | |
| Other International | | | 7 | | | | 2 | | | | 41 | | | | — | | | | 52 | | | | — | | | | 43 | | | | — | |
| | | | | | | | | | | | | | | | | | | | | | | | | | | | | | | | | |
| Total International | | | 35 | | | | 16 | | | | 739 | | | | 1 | | | | 692 | | | | — | | | | 581 | | | | 3 | |
| | | | | | | | | | | | | | | | | | | | | | | | | | | | | | | | | |
| Total Consolidated Companies | | | 96 | | | | 50 | | | | 1,585 | | | | 5 | | | | 1,567 | | | | 5 | | | | 1,532 | | | | 14 | |
| Equity in Affiliates | | | 2 | | | | 1 | | | | 16 | | | | — | | | | 3 | | | | — | | | | 13 | | | | — | |
| | | | | | | | | | | | | | | | | | | | | | | | | | | | | | | | | |
| Total Including Affiliates | | | 98 | | | | 51 | | | | 1,601 | | | | 5 | | | | 1,570 | | | | 5 | | | | 1,545 | | | | 14 | |
| | | | | | | | | | | | | | | | | | | | | | | | | | | | | | | | | |
| | |
| 1 | | Indicates the fractional number of wells completed during the year, regardless of when drilling was initiated. Completion refers to the installation of permanent equipment for the production of crude oil or natural gas or, in the case of a dry well, the reporting of abandonment to the appropriate agency. |
| 2 | | Represents wells in the process of drilling, including wells for which drilling was not completed and which were temporarily suspended at the end of 2008. Gross wells include the total number of wells in which the company has an interest. Net wells include wholly owned wells and the sum of the company’s fractional interests in gross wells. |
8
Exploration Activities
The following table summarizes the company’s net interests in productive and dry exploratory wells completed in each of the last three years and the number of exploratory wells drilling at December 31, 2008. “Exploratory wells” are wells drilled to find and produce crude oil or natural gas in unproved areas and include delineation wells, which are wells drilled to find a new reservoir in a field previously found to be productive of crude oil or natural gas in another reservoir or to extend a known reservoir beyond the proved area.
Exploratory Well Activity
| | | | | | | | | | | | | | | | | | | | | | | | | | | | | | | | | |
| | | Wells Drilling
| | | Net Wells Completed1,2 | |
| | | at 12/31/083 | | | 2008 | | | 2007 | | | 2006 | |
| | | Gross | | | Net | | | Prod. | | | Dry | | | Prod. | | | Dry | | | Prod. | | | Dry | |
| |
| United States: | | | | | | | | | | | | | | | | | | | | | | | | | | | | | | | | |
| California | | | — | | | | — | | | | — | | | | — | | | | — | | | | — | | | | — | | | | — | |
| Gulf of Mexico | | | 9 | | | | 3 | | | | 8 | | | | 1 | | | | 4 | | | | 7 | | | | 9 | | | | 8 | |
| Other U.S. | | | — | | | | — | | | | — | | | | 1 | | | | — | | | | 1 | | | | 7 | | | | — | |
| | | | | | | | | | | | | | | | | | | | | | | | | | | | | | | | | |
| Total United States | | | 9 | | | | 3 | | | | 8 | | | | 2 | | | | 4 | | | | 8 | | | | 16 | | | | 8 | |
| | | | | | | | | | | | | | | | | | | | | | | | | | | | | | | | | |
| Africa | | | 8 | | | | 3 | | | | 2 | | | | 1 | | | | 6 | | | | 2 | | | | 1 | | | | — | |
| Asia-Pacific | | | 4 | | | | 2 | | | | 10 | | | | 1 | | | | 14 | | | | 9 | | | | 18 | | | | 7 | |
| Indonesia | | | — | | | | — | | | | 4 | | | | 1 | | | | 1 | | | | — | | | | 2 | | | | — | |
| Other International | | | 2 | | | | — | | | | 39 | | | | 2 | | | | 41 | | | | 6 | | | | 6 | | | | 3 | |
| | | | | | | | | | | | | | | | | | | | | | | | | | | | | | | | | |
| Total International | | | 14 | | | | 5 | | | | 55 | | | | 5 | | | | 62 | | | | 17 | | | | 27 | | | | 10 | |
| | | | | | | | | | | | | | | | | | | | | | | | | | | | | | | | | |
| Total Consolidated Companies | | | 23 | | | | 8 | | | | 63 | | | | 7 | | | | 66 | | | | 25 | | | | 43 | | | | 18 | |
| Equity in Affiliates | | | — | | | | — | | | | — | | | | — | | | | — | | | | — | | | | 1 | | | | — | |
| | | | | | | | | | | | | | | | | | | | | | | | | | | | | | | | | |
| Total Including Affiliates | | | 23 | | | | 8 | | | | 63 | | | | 7 | | | | 66 | | | | 25 | | | | 44 | | | | 18 | |
| | | | | | | | | | | | | | | | | | | | | | | | | | | | | | | | | |
| | |
| 1 | | 2007 conformed to 2008 presentation. |
| 2 | | Indicates the fractional number of wells completed during the year, regardless of when drilling was initiated. Completion refers to the installation of permanent equipment for the production of crude oil or natural gas or, in the case of a dry well, the reporting of abandonment to the appropriate agency. Some exploratory wells are not drilled with the intention of producing from the well bore. In such cases, “completion” refers to the completion of drilling. Further categorization of productive or dry is based on the determination as to whether hydrocarbons in a sufficient quantity were found to justify completion as a producing well, whether or not the well is actually going to be completed as a producer. |
| 3 | | Represents wells that are in the process of drilling but have been neither abandoned nor completed as of the last day of the year, including wells for which drilling was not completed and which were temporarily suspended at the end of 2008. Does not include wells for which drilling was completed at year-end 2008 and that were reported as suspended wells in Note 20 beginning onpage FS-48. Gross wells include the total number of wells in which the company has an interest. Net wells include wholly owned wells and the sum of the company’s fractional interests in gross wells. |
Refer to Table I onpage FS-62 for detail of the company’s exploration expenditures and costs of unproved property acquisitions for 2008, 2007 and 2006.
Review of Ongoing Exploration and Production Activities in Key Areas
Chevron’s 2008 key upstream activities, some of which are also discussed in Management’s Discussion and Analysis of Financial Condition and Results of Operations beginning onpage FS-2, are presented below. The comments include references to “total production” and “net production,” which are defined under “Production” in Exhibit 99.1 onpage E-146.
The discussion that follows references the status of proved reserves recognition for significant long-lead-time projects not yet on production and for projects recently placed on production. Reserves are not discussed for recent discoveries that have yet to advance to a project stage or for mature areas of production that do not have individual projects requiring significant levels of capital or exploratory investment. Amounts indicated for project costs represent total project costs, not the company’s share of costs for projects that are less than wholly owned.
9
Consolidated Operations
| | | | | |
 | | | |
Chevron has production and exploration activities in most of the world’s major hydrocarbon basins. The company’s upstream strategy is to grow profitably in core areas, build new legacy positions and commercialize the company’s equity natural-gas resource base while growing a high-impact global gas business. The map at left indicates Chevron’s primary areas of production and exploration. |
Upstream activities in the United States are concentrated in California, the Gulf of Mexico, Louisiana, Texas, New Mexico, the Rocky Mountains and Alaska. Average net oil-equivalent production in the United States during 2008 was 671,000 barrels per day, composed of 421,000 barrels of crude oil and natural gas liquids and 1.5 billion cubic feet of natural gas. Refer to Table V beginning onpage FS-67 for a discussion of the net proved reserves and different hydrocarbon characteristics for the company’s major U.S. producing areas.
| | | | | |
 | | | | California: The company has significant production in the San Joaquin Valley. In 2008, average net oil-equivalent production was 215,000 barrels per day, composed of 196,000 barrels of crude oil, 88 million cubic feet of natural gas and 5,000 barrels of natural gas liquids. Approximately 84 percent of the crude-oil production is considered heavy oil (typically with API gravity lower than 22 degrees). |
| | | | | |
 | | | | Gulf of Mexico: Average net oil-equivalent production during 2008 for the company’s combined interests in the Gulf of Mexico shelf and deepwater areas, and the onshore fields in the region was 160,000 barrels per day. The daily oil-equivalent production comprised 76,000 barrels of crude oil, 439 million cubic feet of natural gas and 10,000 barrels of natural gas liquids.
Production levels in 2008 were adversely affected by damage to facilities caused by hurricanes Gustav and Ike in September. At the end of 2008, approximately 50,000 barrels per day of oil-equivalent production remained offline, with restoration of the volumes to occur as repairs to third-party pipelines and producing facilities are completed. |
10
During 2008, Chevron was engaged in various development and exploration activities in the deepwater Gulf of Mexico. Productionstart-up occurred in fourth quarter 2008 at the 75 percent-owned and operated Blind Faith project. The project was designed for daily production capacity of 65,000 barrels of crude oil and 55 million cubic feet of natural gas from subsea wells tied back to a semisubmersible hull. Proved undeveloped reserves were initially recorded in 2005, and a portion was transferred to the proved-developed category in 2008 coincident with projectstart-up. The production life of the field is estimated to be approximately 20 years.
At Caesar/Tonga, the company participated in a successful appraisal well in 2008. The Tonga and Caesar partnerships have formed a unit agreement for the area, with Chevron having a 20 percent nonoperated working interest. First oil is expected by 2011. Development plans include a subsea tie-back to a nearby third-party production facility.
The company is also participating in the ultra-deep Perdido Regional Development. The project encompasses the installation of a producing host facility to service multiple fields, including Chevron’s 33 percent-owned Great White, 60 percent-owned Silvertip and 58 percent-owned Tobago. Chevron has a 38 percent interest in the Perdido Regional Host. All of these fields and the production facility are partner-operated. Activities during 2008 included facility construction, development drilling and spar installation. First oil is expected in early 2010, with the facility capable of handling 130,000 barrels of oil-equivalent per day. The project has an expected life of approximately 25 years. Proved undeveloped reserves related to the project were first recorded in 2006, and the phased reclassification of these reserves to the proved-developed category is anticipated near the time of productionstart-up.
At the 58 percent-owned and operated Tahiti Field, development work continued following a delay in 2007 due to metallurgical problems with the facility’s mooring shackles, which problems have been resolved. The project is designed as a subsea development, with the wells tied back to a truss-spar floating production facility. Productionstart-up is expected in mid-2009. Initial booking of proved undeveloped reserves occurred in 2003 for the project, with the transfer of a portion of these reserves into the proved-developed category anticipated near the time of productionstart-up. With an estimated production life of 30 years, Tahiti is designed to have a maximum total daily production of 125,000 barrels of crude oil and 70 million cubic feet of natural gas. In early 2009, a possible second phase of field development was under evaluation.
Deepwater exploration activities in 2008 and early 2009 included participation in 12 exploratory wells — four wildcat and eight appraisal. Exploratory work included the following:
| | |
| | • | Big Foot — 60 percent-owned and operated. A successful appraisal well was completed in first quarter 2008. A final appraisal well began drilling in November 2008, and was completed in January 2009. As of late February 2009, evaluation of the drilling results was under way. |
| |
| | • | Buckskin — 55 percent-owned and operated. A successful wildcat well was completed in early 2009. |
| |
| | • | Jack & St. Malo — 50 percent- and 41 percent-owned and operated interests, respectively. The prospects are being evaluated together due to their relative proximity. Successful appraisal wells were drilled during 2008 at both Jack and St. Malo, bringing the total wells drilled to three at Jack and four at St. Malo. |
| |
| | • | Knotty Head — 25 percent-owned and nonoperated working interest. Subsurface studies continued during 2008 at this 2005 discovery, with an appraisal well planned for third quarter 2009. |
| |
| | • | Puma — 22 percent-owned and nonoperated working interest. An appraisal well began drilling in late 2008 and was scheduled for completion in second quarter 2009. |
| |
| | • | Tubular Bells — 30 percent-owned and nonoperated working interest. An appraisal well was completed in 2008. |
At the end of 2008, the company had not yet recognized proved reserves for any of the exploration projects discussed above.
Besides the activities connected with the development and exploration projects in the Gulf of Mexico, the company also has access to liquefied natural gas (LNG) for the North America natural gas market through the Sabine Pass LNG terminal in Louisiana. The terminal was completed in mid-2008, and Chevron has contracted for 1 billion cubic feet per day of regasification capacity at the facility beginning in July 2009. The company also has completed the permitting process to develop the Casotte Landing regasification facility adjacent to the company’s Pascagoula refinery in Mississippi. Casotte Landing remains a development option for Chevron to bring LNG into the United States.
Also in the Sabine Pass area of Louisiana, the company has a binding agreement to be one of the anchor shippers in a 3.2 billion-cubic-feet-per-day third-party-owned natural gas pipeline. Chevron has contracted to have 1.6 billion cubic
11
feet per day of capacity in the pipeline, of which 1 billion cubic feet per day is in a new pipeline and 600 million cubic feet per day is interconnecting capacity to an existing pipeline. The new pipeline system, expected to be completed in second quarter 2009, will provide access to Chevron’s Sabine and Bridgeline pipelines, which connect to the Henry Hub. The Henry Hub interconnects to nine interstate and four intrastate pipelines and is the pricing point for natural gas futures contracts traded on the NYMEX (New York Mercantile Exchange).
Other U.S. Areas: Outside California and the Gulf of Mexico, the company manages operations across the mid-continental United States and Alaska. During 2008, the company’s U.S. production outside California and the Gulf of Mexico averaged 296,000 net oil-equivalent barrels per day, composed of 101,000 barrels of crude oil, 974 million cubic feet of natural gas and 33,000 barrels of natural gas liquids.
In the Piceance Basin in northwestern Colorado, the company is continuing a natural-gas development in which it holds a 100 percent operated working interest. A pipeline to transport the gas to a gathering system was completed in 2008 and facilities to produce 60 million cubic feet of natural gas per day are expected to be completed in mid-2009. Development drilling began in 2007, and reserves will be recognized over the life of the project based upon drilling results.
b) Africa
In Africa, the company is engaged in exploration and production activities in Angola, Chad, Democratic Republic of the Congo, Libya, Nigeria and Republic of the Congo.
| | | | | |
 | | | | Angola: Chevron holds company-operated working interests in offshore Blocks 0 and 14 and nonoperated working interests in offshore Block 2 and the onshore Fina Sonangol Texaco (FST) area. Net production from these operations in 2008 averaged 154,000 barrels of oil-equivalent per day.
The company operates in areas A and B of the 39 percent-owned Block 0, which averaged 109,000 barrels per day of net liquids production in 2008. The Block 0 concession extends through 2030.
Start-up of the Mafumeira Field in Area A of Block 0 is expected in third quarter 2009, with crude-oil production ramping up to the expected maximum total of 35,000 barrels per day in 2011.
Two delineation wells were drilled in Area A. One well found commercial quantities of hydrocarbons and was placed into production during the year. The acquisition of seismic data started in late 2008 and is expected to be finalized in 2010.
Also in Area A are three gas management projects that are expected to eliminate routine flaring of natural gas by injecting excess natural gas into various reservoirs. |
The Takula gas-processing platform started production in December 2008. The Cabinda Gas Plant is scheduled forstart-up in the second half of 2009. The Takula and Malongo Flare and Relief project is scheduled forstart-up in stages beginning in the second half of 2009 and continuing into 2011. In Area B, development drilling occurred during 2008 at the Nemba and Kokongo fields. Front-end engineering and development (FEED) continued on the South N’Dola field development.
In 31 percent-owned Block 14, net production in 2008 averaged 33,000 barrels of liquids per day. Activities in 2008 included development drilling at the Benguela Belize-Lobito Tomboco (BBLT) project and the ongoing evaluation of the Negage project. Development and production rights for the various fields in Block 14 expire between 2027 and 2029.
Also in Block 14, development of the Tombua and Landana fields continued. Installation of producing facilities was completed in late 2008, with expectedstart-up in the second half of 2009. Production from the Landana North reservoir is expected to continue to utilize the BBLT infrastructure afterstart-up. The maximum total production from Tombua and Landana of 100,000 barrels of crude oil per day is expected to occur in 2011. Proved undeveloped reserves were recognized for Tombua and Landana in 2001 and 2002, respectively. Reclassification from proved undeveloped to proved developed for Landana occurred in 2006 and 2007. Further reclassification is expected between 2009 and 2012 as theTombua-Landana facilities and the drilling program are completed.
12
During 2008, in the Lucapa provisional development area of Block 14, exploratory drilling included an appraisal well that was the second successful appraisal of the 2006 Lucapa discovery. Studies to evaluate development alternatives at Lucapa began in second quarter 2008. At the end of 2008, proved reserves had not been recognized. At the 20 percent-owned Block 2 and the 16 percent-owned FST area, combined production during 2008 averaged 3,000 barrels of net liquids per day.
Refer also to page 22 for a discussion of affiliate operations in Angola.
Angola-Republic of the Congo Joint Development Area: Chevron operates and holds a 31 percent interest in the Lianzi Development Area located between Angola and Republic of the Congo. In 2006, the development of the Lianzi area was approved by a committee of representatives from the two countries, and a conceptual field development plan was also submitted to this committee. In late 2008, the project entered FEED, and further development planning is scheduled in 2009.
Republic of the Congo: Chevron has a 32 percent nonoperated working interest in the Nkossa, Nsoko and Moho-Bilondo exploitation permits and a 29 percent nonoperated working interest in the Kitina exploitation permit, all of which are offshore. Net production from the Republic of the Congo fields averaged 13,000 barrels of oil-equivalent per day in 2008.
Production at the Moho-Bilondo subsea development project started in April 2008. Maximum total production of 90,000 barrels of crude oil per day is expected in 2010. Proved undeveloped reserves were initially recognized in 2001. Transfer to the proved-developed category occurred in 2008. Chevron’s development and production rights for Moho-Bilondo expire in 2030. One appraisal well was drilled in the Moho-Bilondo permit area during 2008. Drilling began on an exploration well in early 2009.
Chad/Cameroon: Chevron participates in a project to develop crude-oil fields in southern Chad and transport the produced volumes by pipeline to the coast of Cameroon for export. Chevron has a 25 percent nonoperated working interest in the producing operations and a 21 percent interest in two affiliates that own the pipeline.
Average daily net production in 2008 was 29,000 barrels of oil-equivalent. In late 2008, the development application for the Timbre Field in the Doba area was approved. The Chad producing operations are conducted under a concession that expires in 2030. Partners relinquished rights to exploration acreage not covered by field-development rights in February 2009.
Libya: Chevron is the operator and holds a 100 percent interest in the onshore Block 177 exploration license. A two-well exploration program is scheduled for 2009.
| | | | | |
 | | | | Nigeria: Chevron holds a 40 percent interest in 13 concessions predominantly in the onshore and near-offshore region of the Niger Delta. The company operates under a joint-venture arrangement in this region with the Nigerian National Petroleum Corporation (NNPC), which owns a 60 percent interest. The company also owns varying interests in deepwater offshore blocks. In 2008, the company’s net oil-equivalent production in Nigeria averaged 154,000 barrels per day, composed of 142,000 barrels of liquids and 72 million cubic feet of natural gas.
In deepwater offshore, initial production occurred in July 2008 at the 68 percent-owned and operated Agbami Field in OML 127 and OML 128. The project is a subsea design, with wells tied back to a floating production, storage and offloading (FPSO) vessel. By year-end 2008, total crude-oil production was averaging approximately 130,000 barrels per day. Maximum total production of crude oil and natural gas liquids of 250,000 barrels per day is expected to be achieved by year-end 2009. The company initially recognized proved undeveloped reserves for Agbami in 2002. A portion of the proved undeveloped reserves was reclassified to proved developed in 2008 at productionstart-up. The total cost for the first phase of |
13
this project was $7 billion. Additional development drilling is being evaluated. The leases that contain the Agbami Field expire in 2023 and 2024.
Also in the deepwater area, the Aparo Field in OML 132 and OML 140 and the Bonga SW Field in offshore OML 118 share a common geologic structure and are planned to be jointly developed under a proposed unitization agreement. Work continued in early 2009 on agreements between Chevron and partners in OML 118. At the end of 2008, the company had not recognized proved reserves for this project.
Chevron operates and holds a 95 percent interest in the deepwater Nsiko discovery on OML 140. Development activities continued in 2008, with FEED expected to commence after commercial terms are resolved. At the end of 2008, the company had not recognized proved reserves for this project.
The company also holds a 30 percent nonoperated working interest in the deepwater Usan project in OML 138. The development plans involve subsea wells producing to an FPSO vessel. Major construction contracts were awarded in 2008, and development drilling is scheduled to begin in the second half of 2009. Productionstart-up is scheduled for 2012. Maximum total production of 180,000 barrels of crude oil per day is expected to be achieved within one year ofstart-up. The company recognized proved undeveloped reserves for the project in 2004, and a portion is expected to be reclassified to the proved-developed category near productionstart-up.
Chevron participated in three successful deepwater exploration wells during 2008. Hydrocarbons were confirmed in two wells in OPL 214 and one well in OML 113. Additional reservoir studies are scheduled for 2009, and one exploration well is planned later in the year. The company has 20 percent and 18 percent nonoperated working interests in the two leases, respectively. At the end of 2008, proved reserves had not been recognized for these activities.
In the Niger Delta, construction is under way on the Phase 3A expansion of the Escravos Gas Plant (EGP), which is expected to be installed in late 2009 and start up production in 2010. Phase 3A scope includes offshore natural-gas gathering and compression infrastructure and a second gas processing facility, which potentially would increase processing capacity from 285 million to 680 million cubic feet of natural gas per day and increase LPG and condensate export capacity from 15,000 to 58,000 barrels per day. EGP Phase 3A is designed to process natural gas from the Meji, Delta South, Okan and Mefa fields. Proved undeveloped reserves associated with EGP Phase 3A were recognized in 2002. These reserves are expected to be reclassified to proved developed as various project milestones are reached and related projects are completed. The anticipated life of EGP Phase 3A is 25 years. Phase 3B of the EGP project is designed to gather natural gas from eight offshore fields and to compress and transport natural gas to onshore facilities beginning in 2013.
Engineering and procurement activities continued during 2008 for certain onshore fields that had been shut in since 2003 due to civil unrest. The 40 percent-owned and operated Onshore Asset Gas Management project is designed to restore approximately 125 million cubic feet of natural gas per day to the Nigerian domestic gas market. A major construction contract is expected to be awarded in 2010.
Refer to page 23 for a discussion of affiliate operations in Nigeria and to page 25 for a discussion of the plannedgas-to-liquids facility at Escravos. Refer also to “Pipelines” under “Transportation Operations” beginning on page 26 for a discussion of the West African Gas Pipeline operations.
14
c) Asia-Pacific
Major producing countries in the Asia-Pacific region include Australia, Azerbaijan, Bangladesh, Kazakhstan, the Partitioned Neutral Zone located between Saudi Arabia and Kuwait, and Thailand.
| | | | | |
 | | | | Australia: During 2008, the average net oil-equivalent production from Chevron’s interests in Australia was 96,000 barrels per day, composed of 34,000 barrels of liquids and 376 million cubic feet of natural gas.
Chevron has a 17 percent nonoperated working interest in the North West Shelf (NWS) Venture offshore Western Australia. Daily net production from the project during 2008 averaged 25,000 barrels of crude oil and condensate, 374 million cubic feet of natural gas, and 4,000 barrels of LPG. Approximately 70 percent of the natural gas was sold in the form of LNG to major utilities in Japan, South Korea and China, primarily under long-term contracts. The remaining natural gas was sold to the Western Australia domestic market.
In September 2008, a fifth LNG train increased processing and export capacity from approximately 12 million metric tons per year to more than 16 million. Part of the natural gas for these expanded facilities is being supplied from the Angel natural-gas field, which started production in October 2008. Additional supply will be provided by the North Rankin 2 project, for which an investment decision was made in March 2008. The project is scheduled to start production in 2013.Proved undeveloped reserves were booked in prior years and will be reclassified to proved developed upon completion of the project. |
The NWS Venture is also advancing plans to extend the period of crude-oil production. The NWS Oil Redevelopment Project is designed to replace an FPSO and a portion of existing subsea infrastructure that services production from the Cossack, Hermes, Lambert and Wanaea offshore fields. A final investment decision was made in November 2008 andstart-up is expected early 2011. The project is expected to extend production past 2020. The concession for the NWS Venture expires in 2034.
On Barrow and Thevenard islands off the northwest coast of Australia, Chevron operates crude-oil producing facilities that had combined net production of 5,000 barrels per day in 2008. Chevron’s interests in these operations are 57 percent for Barrow and 51 percent for Thevenard.
Also off the northwest coast of Australia, Chevron is the operator of the Gorgon development and has a 50 percent ownership interest across most of the Greater Gorgon Area. Chevron and two joint-venture participants are planning for the combined development of Gorgon and nearby natural-gas fields as one large-scale project. Environmental approvals were in process and a final investment decision is expected to be made in the second half of 2009 for a three-train, 15 million-metric-ton-per-year LNG facility. Natural gas for the project is expected to be supplied from the Gorgon and Io/Jansz fields. The Gorgon project has an expected economic life of at least 40 years.
At the end of 2008, the company had not recognized proved reserves for any of the Greater Gorgon Area fields. Recognition is contingent on securing sufficient LNG sales agreements and achieving other key project milestones, including receipt of environmental permits. In 2008, negotiations continued to finalize sales agreements with three utility customers in Japan and GS Caltex, a Chevron affiliated company. Purchases by each of these customers are expected to range from 250,000 metric tons per year to 1.5 million metric tons per year over 25 years.
15
In 2008, the company also announced plans for a multi-train LNG plant to process natural gas from its wholly owned Wheatstone discovery located on the northwest cost of mainland Australia. The project is expected to begin FEED during the second half of 2009. During 2008, Chevron conducted appraisal drilling in the Wheatstone and Iago fields. During 2009, the company plans to drill multiple exploration and appraisal wells in its operated acreage. At the end of 2008, the company had not recognized proved reserves for this project.
In the Browse Basin, the company conducted successful appraisal drilling programs in the Calliance and Torosa fields. A commitment well was also drilled to test the northern extension of the Ichthys Field in the eastern Browse Basin. At the end of 2008, proved reserves had not been recognized.
| | | |
 | | Azerbaijan: Chevron holds a 10 percent nonoperated working interest in the Azerbaijan International Operating Company (AIOC), which produces crude oil in the Caspian Sea from the Azeri-Chirag-Gunashli (ACG) project. Chevron also has a 9 percent interest in the Baku-Tbilisi-Ceyhan (BTC) affiliate, which transports AIOC production by pipeline from Baku, Azerbaijan, through Georgia to Mediterranean deepwater port facilities in Ceyhan, Turkey. (Refer to “Pipelines” under “Transportation Operations” beginning on page 26 for a discussion of the BTC operations.)
In 2008, the company’s daily net production from AIOC averaged 29,000 barrels of oil-equivalent. First oil from Phase III of ACG development occurred during the second quarter 2008. Reserves were reclassified to proved developed shortly beforestart-up. In early 2009, total production was averaging about 670,000 barrels per day. The AIOC operations are conducted under a30-year production-sharing contract (PSC) that expires in 2024.
Kazakhstan: Chevron holds a 20 percent nonoperated working interest in the Karachaganak project, which is being developed in phases. During 2008, Karachaganak net oil-equivalent production averaged 66,000 barrels per day, composed of 41,000 barrels of liquids and 153 million cubic feet of natural gas. In 2008, access to the Caspian Pipeline Consortium (CPC) and Atyrau-Samara (Russia) pipelines enabled Karachaganak sales of |
approximately 163,000 barrels per day (30,000 net barrels) of processed liquids at world-market prices. The remaining liquids were sold into Russian markets. During 2008, work continued on a fourth train that is designed to increase the export of processed liquids by 56,000 barrels per day (11,000 net barrels). The fourth train is expected to start up in 2011.
During 2008, partners continued to evaluate alternatives for a Phase III development of Karachaganak. Timing for the recognition of Phase III proved reserves is uncertain and depends on finalizing a Phase III project design and achievement of project milestones. Karachaganak operations are conducted under a40-year PSC that expires in 2038.
Refer also to page 23 for a discussion of Tengizchevroil, a 50 percent-owned affiliate with operations in Kazakhstan, and to page 26 in “Pipelines” under “Transportation Operations” for a discussion of CPC operations.
Bangladesh: Chevron operates and has 98 percent interests in three PSCs in onshore Blocks 12, 13 and 14 and an 88 percent interest in Block 7. Net oil-equivalent production from these operations in 2008 averaged 71,000 barrels per day, composed of 414 million cubic feet of natural gas and 2,000 barrels of liquids.
Cambodia: Chevron operates and holds a 55 percent interest in the1.2 million-acre (4,709 sq-km) Block A, located offshore in the Gulf of Thailand. During 2008 and early 2009, evaluation continued of the exploratory and appraisal drilling programs that occurred in 2007. Proved reserves had not been recognized as of the end of 2008.
16
Myanmar: Chevron has a 28 percent nonoperated working interest in a PSC for the production of natural gas from the Yadana and Sein fields offshore in the Andaman Sea. The company also has a 28 percent interest in a pipeline company that transports the natural gas from Yadana to the Myanmar-Thailand border for delivery to power plants in Thailand. Most of the natural gas is purchased by Thailand’s PTT Public Company Limited (PTT). The company’s average net natural gas production in 2008 was 89 million cubic feet per day.
| | | |
 | | Thailand: Chevron has operated and nonoperated working interests in several different offshore blocks. The company’s net oil-equivalent production in 2008 averaged 217,000 barrels per day, composed of 67,000 barrels of crude oil and condensate and 894 million cubic feet of natural gas. All of the company’s natural gas production is sold to PTT under long-term sales contracts.
Operated interests are in Pattani and other fields with ownership interests ranging from 35 percent to 80 percent in Blocks 10 through 13, B12/27, B8/32, 9A, G4/43 and G4/48. Blocks B8/32 and 9A produce crude oil and natural gas from six operating areas, and Blocks 10 through 13 and B12/27 produce crude oil, condensate and natural gas from 16 operating areas. First production from Block G4/43 occurred in first quarter 2008. |
For Blocks 10 through 13, a final investment decision was made in March 2008 for the construction of a second central natural-gas processing facility in the Platong area. The 70 percent-owned and operated Platong Gas II project is designed to add 420 million cubic feet per day of processing capacity in 2011. The company expects to reclassify proved undeveloped reserves to proved developed throughout the project’s life as the wellhead platforms are installed. Concessions for Blocks 10 through 13 expire in 2022.
Chevron has a 16 percent nonoperated working interest in Blocks 14A, 15A, 16A, G9/48 and G8/50, known collectively as the Arthit Field. First production from Arthit occurred in 2008 and averaged 10,000 net oil-equivalent barrels per day through the end of the year.
During 2008, 13 exploration wells were drilled in the Gulf of Thailand, and all were successful. In Block G4/50, an exploratory joint operating agreement was signed in late 2008. A3-D seismic survey and geological studies are scheduled for 2009. Three exploratory wells are planned for 2010. At the end of 2008, proved reserves had not been recognized for these activities. In addition, Chevron holds exploration interests in a number of blocks that are currently inactive, pending resolution of border issues between Thailand and Cambodia.
Vietnam: The company operates off the southwest coast and has a 42 percent interest in a PSC that includes Blocks B and 48/95, and a 43 percent interest in another PSC for Block 52/97. Chevron also has a third PSC with a 50 percent-owned and operated interest in Block B122 offshore eastern Vietnam. No production occurred in these areas during 2008.
In the blocks off the southwest coast, the Vietnam Gas Project is aimed at developing an area in the Malay Basin to supply natural gas to state-owned PetroVietnam. The project includes installation of wellhead and hub platforms, an FSO vessel, field pipelines and a central processing platform. The timing of first natural-gas production is dependent upon the outcome of commercial negotiations. Maximum total production of approximately 500 million cubic feet of natural gas per day is projected within five years ofstart-up. At the end of 2008, proved reserves had not been recognized for this project.
During the year, two exploratory wells confirmed hydrocarbons in Block B and Block 52/97. In Block 122,2-D seismic information was purchased in late 2008, with processing scheduled for 2009. Proved reserves had not been recognized as of the end of 2008. Future activity in Block 122 may be affected by an ongoing territorial dispute between Vietnam and China.
17
| | | | | |
 | | | | China: Chevron has one operated and three nonoperated working interests in several areas. Net oil-equivalent production from the nonoperated areas in 2008 averaged 22,000 barrels per day, composed of 19,000 barrels of crude oil and condensate and 22 million cubic feet of natural gas.
The company holds a 49 percent operated interest in the Chuandongbei area in the onshore Sichuan Basin, where the company entered into a30-year PSC effective February 2008 to develop natural gas resources. Project plans included two sour-gas purification plants with an aggregate design capacity of 740 million cubic feet per day. A final investment decision was made for the first stage of the project in December 2008, and proved undeveloped reserves were recognized at that time.
In the South China Sea, the company has nonoperated working interests of 33 percent in Blocks 16/08 and 16/19 located in the Pearl River Delta Mouth Basin, 25 percent in the QHD-32-6 Field in Bohai Bay and 16 percent in the unitized and producing BZ25-1 Field in Bohai Bay Block 11/19. Chevron also holds a 50 percent nonoperated working interest in one prospective onshore natural-gas block in the Ordos Basin. |
The joint development of the HZ 25-3 and HZ 25-1 crude-oil fields in Block 16/19 is expected to achieve first production in the third quarter 2009. The maximum total production of approximately 11,000 barrels of crude oil per day is anticipated by early 2011.
| | | | | |
 | | | | Partitioned Neutral Zone (PNZ): During 2008, the company negotiated a30-year extension to its agreement with the Kingdom of Saudi Arabia to operate on behalf of the Saudi government its 50 percent interest in the petroleum resources of the onshore area of the PNZ between Saudi Arabia and Kuwait. Under the extension, Chevron has rights to this 50 percent interest in the hydrocarbon resource and pays a royalty and other taxes on the associated volumes produced until 2039. As a result of the contract extension, the company recognized additional proved reserves.
During 2008, the company’s average net oil-equivalent production was 106,000 barrels per |
| day, composed of 103,000 barrels of crude oil and 20 million cubic feet of natural gas. Steam injection for the second phase of a steamflood pilot project is anticipated to begin in mid-2009. This pilot is a unique application of steam injection into a carbonate reservoir and, if successful, could significantly increase heavy oil recovery. |
Philippines: The company holds a 45 percent nonoperated working interest in the Malampaya natural-gas field located 50 miles (80 km) offshore Palawan Island. Net oil-equivalent production in 2008 averaged 26,000 barrels per day, composed of 128 million cubic feet of natural gas and 5,000 barrels of condensate. Chevron also develops and produces geothermal resources under an agreement with the National Power Corporation, a Philippine government-owned company. The combined generating capacity of the facilities is 637 megawatts.
18
d) Indonesia
| | | | | |
 | | | | Chevron’s operated interests in Indonesia are managed by several wholly owned subsidiaries, including PT. Chevron Pacific Indonesia (CPI). CPI holds operated interests of 100 percent in the Rokan and Siak PSCs. Other subsidiaries operate four PSCs in the Kutei Basin, located offshore East Kalimantan, and one PSC in the East Ambalat Block, located offshore northeast Kalimantan. These interests range from 80 percent to 100 percent. Chevron also has nonoperated working interests in a joint venture in Block B in the South Natuna Sea and in the NE Madura III Block in the East Java Sea Basin. Chevron’s interests in these PSCs range from 25 percent to 40 percent. |
The company’s net oil-equivalent production in 2008 from all of its interests in Indonesia averaged 235,000 barrels per day. The daily oil-equivalent rate comprised 182,000 barrels of crude oil and 319 million cubic feet of natural gas. The largest producing field is Duri, located in the Rokan PSC. Duri has been under steamflood operation since 1985 and is one of the world’s largest steamflood developments. The North Duri Development is located in the northern area of the Duri Field and is divided into multiple expansion areas. The Area 12 expansion area started production November 2008. Maximum total daily production from Area 12 is estimated at 34,000 barrels of crude oil in 2012. Proved undeveloped reserves for the North Duri development were recognized in previous years, and reclassification from proved undeveloped to proved developed is scheduled to occur during various stages of sequential completion. The Rokan PSC expires in 2021.
Chevron has plans to develop the Gendalo and Gehem deepwater natural-gas fields located in the Kutei Basin as a single project with one development concept. In October 2008, the company received approval from the government of Indonesia for the final development plans. The Bangka natural-gas project remained under evaluation in 2008 and, based on the evaluation results, may be developed in parallel with Gendalo and Gehem. The development timing is dependent on government approvals, market conditions and the achievement of key project milestones. At the end of 2008, the company had not recognized proved reserves for either of these projects. The company holds an 80 percent operated interest in both.
Also in the Kutei Basin, first production is expected in March 2009 at the Seturian Field, which is providing natural gas to a state-owned refinery. During 2008, the development concept for the 50 percent-owned and operated Sadewa project in the Kutei Basin remained under evaluation. A development decision for Sadewa is expected by year-end 2009.
A drilling campaign continued through 2008 in South Natuna Sea Block B to provide additional supply for long-term gas sales contracts. Additional development drilling in the North Belut Field began in November 2008, with first production expected in fourth quarter 2009. In November 2008, Chevron was awarded 100 percent interests in two exploration blocks in western Papua. Geological studies are planned for 2009 in preparation for2-D seismic acquisition.
In West Java, Chevron operates the wholly owned Salak geothermal field with a total capacity of 377 megawatts. Also in West Java, Chevron holds a 95 percent interest in a power generation company that operates the Darajat geothermal contract area in Garut with a total capacity of 259 megawatts. Chevron also operates a 95 percent-owned 300-megawatt cogeneration facility in support of CPI’s operation in North Duri, Sumatra.
19
| |
| e) | Other International Areas |
The “Other International” region is composed of Latin America, Canada and Europe.
| | | | | |
 | | | | Argentina: Chevron holds operated interests in several concessions and one exploratory block in the Neuquen and Austral basins. Working interests range from 19 percent to 100 percent. Net oil-equivalent production in 2008 averaged 44,000 barrels per day, composed of 37,000 barrels of crude oil and natural gas liquids and 45 million cubic feet of natural gas. The company also holds a 14 percent interest in the Oleoductos del Valle S.A. pipeline.
Brazil: Chevron holds working interests ranging from 30 percent to 52 percent in three deepwater blocks in the Campos Basin. Chevron also holds a 20 percent nonoperated working interest in one block in the Santos Basin. None of these blocks had production in 2008.
In Block BC-4, located in the Campos Basin, the company is the operator and has a 52 percent interest in the Frade Field, which is under development as a subsea production design. Proved undeveloped reserves were recorded for the first time in 2005. Partial reclassification to the proved-developed category is scheduled upon productionstart-up in 2009. Estimated maximum total production of 87,000 oil-equivalent barrels per day is anticipated in 2011. The concession that includes the Frade project expires in 2025.
In the partner-operated Campos Basin Block BC-20, two areas — 38 percent-owned Papa-Terra and 30 percent-owned Maromba — were retained for development following the end of the exploration phase of this block. Evaluation of design options continued into |
2009. At the end of 2008, proved reserves had not been recognized for these projects.
In the Santos basin, evaluation of investment options continued into 2009 for the 20 percent-owned and partner-operated Atlanta and Oliva fields. At the end of 2008, proved reserves had not been recognized.
Colombia: The company operates the offshore Chuchupa and the onshore Ballena and Riohacha natural gas fields as part of the Guajira Association contract. In exchange, Chevron receives 43 percent of the production for the remaining life of each field and a variable production volume from a fixed-fee Build-Operate-Maintain-Transfer agreement based on prior Chuchupa capital contributions. Daily net production averaged 209 million cubic feet of natural gas in 2008.
Trinidad and Tobago: Company interests include 50 percent ownership in four partner-operated blocks in the East Coast Marine Area offshore Trinidad, which includes the Dolphin and Dolphin Deep producing natural-gas fields and the Starfish discovery. Chevron also holds a 50 percent operated interest in the Manatee area of Block 6d. Net production in 2008 averaged 189 million cubic feet of natural gas per day. Incremental production associated with a new domestic sales agreement is scheduled to commence at Dolphin in third quarter 2009.
Venezuela: The company operates in two exploratory blocks offshore Plataforma Deltana, with working interests of 60 percent in Block 2 and 100 percent in Block 3. Chevron also holds a 100 percent operated interest in the Cardon III exploratory block, located north of Lake Maracaibo in the Gulf of Venezuela. Petróleos de Venezuela, S.A. (PDVSA), Venezuela’s national crude-oil and natural-gas company, has the option to increase its ownership in each of the three company-operated blocks up to 35 percent upon declaration of commerciality.
A conceptual development plan has been completed for the Loran Field in Block 2. Loran is projected to provide the initial supply of natural gas for Delta Caribe LNG (DCLNG) Train 1, Venezuela’s first LNG train. A DCLNG framework agreement was signed in September 2008, which provides Chevron with a 10 percent nonoperated interest in the first train and the associated offshore pipeline. An exploration well is planned in the Cardon III block in 2009. At the end of 2008, proved reserves had not been recognized in these exploratory blocks.
Chevron also holds interest in two affiliates located in western Venezuela and in one affiliate in the Orinoco Belt. Refer to page 23 for a discussion of affiliate operations in Venezuela.
20
| | | | | |
 | | | | Canada: Company activities in Canada include nonoperated working interests of 27 percent in the Hibernia and Hebron fields offshore eastern Canada and 20 percent in the Athabasca Oil Sands Project (AOSP), and operated interests of 60 percent in the Ells River “In Situ” Oil Sands Project. Excluding volumes mined at AOSP, average net oil-equivalent production during 2008 was 37,000 barrels per day, composed of 36,000 barrels of crude oil and natural gas liquids and 4 million cubic feet of natural gas. Substantially all of this production was from the Hibernia Field, where a development plan is being formulated for a proposed Hibernia South Extension. At AOSP, the company’s share of mined bitumen (for upgrading into synthetic crude oil) averaged 27,000 barrels per day during 2008.
For Hebron, agreements were reached during
|
| 2008 with the provincial government of Newfoundland and Labrador that allow development activities to begin. As of the end of 2008, the company had not recognized proved reserves for this project. |
At AOSP, the first phase of an expansion project is under way that is designed to produce an additional 100,000 barrels per day of mined bitumen. The expansion would increase total AOSP design capacity to more than 255,000 barrels per day in late 2010. The projected cost of this expansion is $13.7 billion.
The Ells River project consists of heavy oil leases of more than 85,000 acres (344 sq km). The area contains significant volumes with potential for recovery by using Steam Assisted Gravity Drainage, an industry-proven technology that employs steam and horizontal drilling to extract the bitumen through wells rather than through mining operations. During 2008, the company completed an appraisal drilling program and a seismic survey. An additional seismic program started in late 2008 and is expected to be completed in March 2009. At the end of 2008, proved reserves had not been recognized.
The company also holds exploration leases in the Mackenzie Delta and Beaufort Sea region, including a 33 percent nonoperated working interest in the offshore Amauligak discovery. Three exploration wells were drilled on company leases in the Mackenzie Delta region in 2008. Drilling on three additional wells in the Mackenzie Delta is expected to be completed in second quarter 2009 and assessment of development concept alternatives for Amauligak continued. The company holds additional exploration acreage in eastern Labrador and the Orphan Basin. At the end of 2008, proved reserves had not been recognized for any of these areas.
Greenland: Chevron has a 29 percent nonoperated working interest in an exploration license in Block 4 offshore West Greenland in the Baffin Basin. A2-D seismic survey was completed in 2008, and interpretation of the data is expected to occur in 2009.
21
| | | | | |
 | | | | Denmark: Chevron has a 15 percent working interest in the partner-operated Danish Underground Consortium (DUC), which produces crude oil and natural gas from 15 fields in the Danish North Sea. Net oil-equivalent production in 2008 from DUC averaged 61,000 barrels per day, composed of 37,000 barrels of crude oil and 142 million cubic feet of natural gas.
Faroe Islands: Chevron operates and holds a 40 percent interest in five offshore exploratory blocks. During 2008, the company acquired additional2-D seismic data for an area located near the Rosebank/Lochnagar discovery offshore the United Kingdom. Engineering and geological evaluation of the seismic data continued into early 2009. As of the end of 2008, proved reserves had not been recognized.
Netherlands: Chevron is the operator and holds interests ranging from 34 percent to 80 percent in nine blocks in the Dutch sector of the North Sea. In 2008, the company’s net oil-equivalent production from the five producing blocks was 9,000 barrels per day, composed of 2,000 barrels of crude oil and 40 million cubic feet of natural gas. |
Norway: The company holds an 8 percent interest in the partner-operated Draugen Field. The company’s net production averaged 6,000 barrels of oil-equivalent per day during 2008. In the 40 percent-owned and partner-operated PL397 area in the Barents Sea, additional3-D seismic information was obtained in 2008, with evaluation of the data continuing into 2009.
United Kingdom: The company’s average net oil-equivalent production in 2008 from 11 offshore fields was 106,000 barrels per day, composed of 71,000 barrels of crude oil and natural gas liquids and 208 million cubic feet of natural gas. Most of the production was from the 85 percent-owned and operated Captain Field and the 32 percent-owned and jointly operated Britannia Field.
Two partner-operated satellite fields of Britannia commenced production in 2008 — the 17 percent-owned Callanish Field in the second quarter and the 25 percent-owned Brodgar Field in the third quarter.
At the 40 percent-owned and operated Rosebank/Lochnagar area northwest of the Shetland Islands, an exploration well in an adjacent structure is expected to be completed in second-quarter 2009 and an appraisal well is planned for later in the year. Evaluation of development alternatives continued during 2008 for the 19 percent-owned and partner-operated Clair Phase 2 and 10 percent-owned and partner-operated Laggan/Tormore projects. As of the end of 2008, proved reserves had not been recognized for any of these three exploration areas.
Equity Affiliate Operations
Angola: In addition to the exploration and producing activities in Angola, Chevron has a 36 percent ownership interest in the Angola LNG affiliate that began construction in early 2008 of an onshore natural gas liquefaction plant located in the northern part of the country. The plant is designed to process more than 1 billion cubic feet of natural gas per day. Plantstart-up is scheduled for 2012. Chevron made an initial booking of proved undeveloped natural-gas reserves in 2007 for the producing operations associated with this LNG project. The life of the LNG plant is estimated to be in excess of 20 years.
22
Kazakhstan: The company holds a 50 percent interest in Tengizchevroil (TCO), which operates and is developing the Tengiz and Korolev crude-oil fields, located in western Kazakhstan, under a40-year concession that expires in 2033. Chevron’s net oil-equivalent production in 2008 from these fields averaged 201,000 barrels per day, composed of 168,000 barrels of crude oil and natural gas liquids and 195 million cubic feet of natural gas.
In 2008, TCO completed a significant expansion composed of two integrated projects referred to as Second Generation Plant (SGP) and Sour Gas Injection (SGI). Total cost of the project was $7.4 billion. The projects increased TCO’s daily production capacity to 540,000 barrels of crude oil, 760 million cubic feet of natural gas and 46,000 barrels of natural gas liquids. The SGI facility injects approximately one-third of the sour gas separated from the crude oil back into the reservoir. The injected gas maintains higher reservoir pressure and displaces oil towards producing wells. The company recognized additional proved reserves associated with SGI in 2008. TCO is evaluating options for another expansion project based on SGI/SGP technologies.
During 2008, the majority of TCO’s production was exported through the Caspian Pipeline Consortium (CPC) pipeline that runs from Tengiz in Kazakhstan to tanker-loading facilities at Novorossiysk on the Russian coast of the Black Sea. The majority of the incremental production from SGI/SGP was moved by rail to Black Sea ports. Other export routes included shipment via tanker to Baku for transport by the BTC pipeline to Ceyhan or by rail to Black Sea ports. (Refer to “Pipelines” under “Transportation Operations” beginning on page 26 for a discussion of CPC operations.)
Nigeria: Chevron holds a 19 percent interest in the OKLNG Free Zone Enterprise (OKLNG) affiliate, which will operate the Olokola LNG project. OKLNG plans to build a multitrain natural gas liquefaction facility and marine terminal located northwest of Escravos. The project is expected to be implemented in phases, starting with two 6.3 million-ton-per-year trains. Approximately 50 percent of the gas supplied to the plant is expected to be provided from the producing areas associated with Chevron’s joint-venture arrangement with Nigerian National Petroleum Corporation. At the end of 2008, a final investment decision had not been reached, and the company had not recognized proved reserves associated with this project.
Venezuela: Chevron has a 30 percent interest in the Petropiar affiliate that operates the Hamaca heavy-oil production and upgrading project located in Venezuela’s Orinoco Belt, a 39 percent interest in the Petroboscan affiliate that operates the Boscan Field in the western part of the country, and a 25 percent interest in the Petroindependiente affiliate that operates the LL-652 Field in Lake Maracaibo. The company’s share of average net oil-equivalent production during 2008 from these operations was 66,000 barrels per day, composed of 62,000 barrels of crude oil and natural gas liquids and 27 million cubic feet of natural gas.
Sales of Natural Gas and Natural Gas Liquids
The company sells natural gas and natural gas liquids from its producing operations under a variety of contractual arrangements. Outside the United States, substantially all of the natural gas sales are from the company’s producing interests in Australia, Bangladesh, Kazakhstan, Indonesia, Latin America, the Philippines, Thailand and the United Kingdom. The company also makes third-party purchases and sales of natural gas in connection with its trading activities. Substantially all of the sales of natural gas liquids are from company operations in Africa, Australia and Indonesia.
Refer to “Selected Operating Data,” onpage FS-10 in Management’s Discussion and Analysis of Financial Condition and Results of Operations, for further information on the company’s sales volumes of natural gas and natural gas liquids. Refer also to “Delivery Commitments” on page 8 for information related to the company’s delivery commitments for the sale of crude oil and natural gas.
23
Downstream — Refining, Marketing and Transportation
Refining Operations
At the end of 2008, the company had a refining network capable of processing 2.1 million barrels of crude oil per day. Daily refinery inputs for 2006 through 2008 for the company and affiliate refineries were as follows:
Petroleum Refineries: Locations, Capacities and Inputs
(Crude-unit capacities and crude-oil inputs in thousands of barrels per day; includes equity share in affiliates)
| | | | | | | | | | | | | | | | | | | | | | | |
| | | | | December 31, 2008 | | | | | | | | | | |
| | | | | | Operable
| | | Refinery Inputs | |
| Locations | | Number | | | Capacity | | | 2008 | | | 2007 | | | 2006 | |
| |
| Pascagoula | | Mississippi | | | 1 | | | | 330 | | | | 299 | | | | 285 | | | | 337 | |
| El Segundo | | California | | | 1 | | | | 265 | | | | 263 | | | | 222 | | | | 258 | |
| Richmond | | California | | | 1 | | | | 243 | | | | 237 | | | | 192 | | | | 224 | |
| Kapolei | | Hawaii | | | 1 | | | | 54 | | | | 46 | | | | 51 | | | | 50 | |
| Salt Lake City | | Utah | | | 1 | | | | 45 | | | | 38 | | | | 42 | | | | 39 | |
Other1 | | | | | 1 | | | | 80 | | | | 8 | | | | 20 | | | | 31 | |
| | | | | | | | | | | | | | | | | | | | | | | |
Total Consolidated Companies —United States | | | 6 | | | | 1,017 | | | | 891 | | | | 812 | | | | 939 | |
| | | | | | | | | | | | | | | | | | | | | |
| Pembroke | | United Kingdom | | | 1 | | | | 210 | | | | 203 | | | | 212 | | | | 165 | |
Cape Town2 | | South Africa | | | 1 | | | | 110 | | | | 75 | | | | 72 | | | | 71 | |
| Burnaby, B.C. | | Canada | | | 1 | | | | 55 | | | | 36 | | | | 49 | | | | 49 | |
| | | | | | | | | | | | | | | | | | | | | | | |
Total Consolidated Companies —International | | | 3 | | | | 375 | | | | 314 | | | | 333 | | | | 285 | |
Affiliates3 | | Various Locations | | | 9 | | | | 747 | | | | 653 | | | | 688 | | | | 765 | |
| | | | | | | | | | | | | | | | | | | | | | | |
Total Including Affiliates— International | | | 12 | | | | 1,122 | | | | 967 | | | | 1,021 | | | | 1,050 | |
| | | | | | | | | | | | | | | | | | | | | |
Total Including Affiliates —Worldwide | | | 18 | | | | 2,139 | | | | 1,858 | | | | 1,833 | | | | 1,989 | |
| | | | | | | | | | | | | | | | | | | | | |
| | |
| 1 | | Asphalt plant in Perth Amboy, New Jersey. Plant was idled during 2008. |
| 2 | | Chevron holds 100 percent of the common stock issued by Chevron South Africa (Pty) Limited, which owns the Cape Town Refinery. A consortium of South African partners owns preferred shares ultimately convertible to a 25 percent equity interest in Chevron South Africa (Pty) Limited. None of the preferred shares had been converted as of February 2009. |
| 3 | | Chevron sold its 31 percent interest in the Nerefco Refinery in the Netherlands in March 2007. During 2008, the company sold its 4 percent ownership interest in a refinery in Abidjan, Côte d’Ivoire, and its 8 percent ownership interest in a refinery in Cameroon, decreasing the company’s combined share of operable capacity by about 5,000 barrels per day. |
Average crude oil distillation capacity utilization during 2008 was 87 percent, compared with 85 percent in 2007. This increase generally resulted from an improvement in utilization at the refineries in Richmond and El Segundo, California. At the U.S. fuel refineries, crude oil distillation capacity utilization averaged 95 percent in 2008, compared with 85 percent in 2007, and cracking and coking capacity utilization averaged 86 percent and 78 percent in 2008 and 2007, respectively. Cracking and coking units are the primary facilities used in fuel refineries to convert heavier feedstocks into gasoline and other light products.
The company’s refineries in the United States, the United Kingdom, Canada, South Africa and Australia produce low-sulfur fuels. GS Caltex, the company’s 50 percent-owned affiliate, completed construction in 2008 on projects to produce low-sulfur fuels at the700,000 barrel-per-day Yeosu refining complex in South Korea. Other projects completed during the year at Yeosu included a new hydrocracker complex and distillation unit that increases high-value product yield and lowers feedstock costs. In 2009, construction continues at the Yeosu complex on projects designed to further improve processing of higher-sulfur crude oils and reduce fuel-oil production. At the company’s 50 percent-owned Singapore Refining Company, construction continued during 2008 and into early 2009 to enable the refinery to meet regional specifications for clean diesel fuels.
At the Pascagoula refinery, various projects were completed during 2008 that enhanced the ability to process heavier, higher-sulfur crudes, resulting in lower crude-acquisition costs. In addition, construction progressed on a continuous catalytic reformer that is expected to improve refinery reliability and increase daily gasoline production at the refinery by 10 percent, or 600,000 gallons per day, by mid-2010. At the Richmond and El Segundo refineries, construction continued and design and engineering work advanced during 2008 to further increase the ability to process high-sulfur crude oils and improve high-value product yields.
24
In August 2008, Chevron submitted an environmental permit application to the Mississippi Department of Environmental Quality for the construction of a premium base oil facility at the company’s Pascagoula Refinery. The facility is expected to have daily production of approximately 25,000 barrels of premium base oil for use in manufacturing high-performance lubricants, such as motor oils for consumer and commercial uses.
Chevron holds a 5 percent interest in Reliance Petroleum Limited, a company formed by Reliance Industries Limited to construct a new refinery in Jamnagar, India. Chevron has rights to increase its equity ownership to 29 percent or to sell back its investment to Reliance Industries Limited. These rights expire the later of July 27, 2009, or three months after the plant is fully commissioned.
Chevron processes imported and domestic crude oil in its U.S. refining operations. Imported crude oil accounted for about 88 percent and 87 percent of Chevron’s U.S. refinery inputs in 2008 and 2007, respectively.
Gas-to-Liquids
In Nigeria, Chevron and the Nigerian National Petroleum Corporation are developing a34,000 barrel-per-daygas-to-liquids facility at Escravos designed to process natural gas supplied from the Phase 3A expansion of the Escravos Gas Plant (EGP). At the end of 2008, engineering was essentially complete and facility construction was under way. Chevron has a 75 percent interest in the plant, which is expected to be operational by 2012. The estimated cost of the plant is $5.9 billion. Refer also to page 14 for a discussion on the EGP Phase 3A expansion.
Marketing Operations
The company markets petroleum products under the principal brands of “Chevron,” “Texaco” and “Caltex” throughout much of the world. The table below identifies the company’s and affiliates’ refined products sales volumes, excluding intercompany sales, for the three years ending December 31, 2008.
Refined Products Sales Volumes1
(Thousands of Barrels per Day)
| | | | | | | | | | | | | |
| | | 2008 | | | 2007 | | | 2006 | |
| |
| United States | | | | | | | | | | | | |
| Gasolines | | | 692 | | | | 728 | | | | 712 | |
| Jet Fuel | | | 274 | | | | 271 | | | | 280 | |
| Gas Oils and Kerosene | | | 229 | | | | 221 | | | | 252 | |
| Residual Fuel Oil | | | 127 | | | | 138 | | | | 128 | |
Other Petroleum Products2 | | | 91 | | | | 99 | | | | 122 | |
| | | | | | | | | | | | | |
Total United States | | | 1,413 | | | | 1,457 | | | | 1,494 | |
| | | | | | | | | | | | | |
International3 | | | | | | | | | | | | |
| Gasolines | | | 589 | | | | 581 | | | | 595 | |
| Jet Fuel | | | 278 | | | | 274 | | | | 266 | |
| Gas Oils and Kerosene | | | 710 | | | | 730 | | | | 776 | |
| Residual Fuel Oil | | | 257 | | | | 271 | | | | 324 | |
Other Petroleum Products2 | | | 182 | | | | 171 | | | | 166 | |
| | | | | | | | | | | | | |
Total International | | | 2,016 | | | | 2,027 | | | | 2,127 | |
| | | | | | | | | | | | | |
Total Worldwide3 | | | 3,429 | | | | 3,484 | | | | 3,621 | |
| | | | | | | | | | | | | |
| | | | | | | | | | | | | | | |
1 | | Includes buy/sell arrangements. Refer to Note 14 on page FS-43. | | | — | | | | — | | | | 50 | |
2 | | Principally naphtha, lubricants, asphalt and coke. | | | | | | | | | | | | |
3 | | Includes share of equity affiliates’ sales: | | | 512 | | | | 492 | | | | 492 | |
In the United States, the company markets under the Chevron and Texaco brands. The company supplies directly or through retailers and marketers approximately 9,700 Chevron- and Texaco-branded motor vehicle retail outlets, primarily in the mid-Atlantic, southern and western states. Approximately 500 of these outlets are company-owned or -leased stations.
25
Outside the United States, Chevron supplies directly or through retailers and marketers approximately 15,300 branded service stations, including affiliates. In British Columbia, Canada, the company markets under the Chevron brand. The company markets in the United Kingdom, Ireland, Latin America and the Caribbean using the Texaco brand. In the Asia-Pacific region, southern Africa, Egypt and Pakistan, the company uses the Caltex brand.
The company also operates through affiliates under various brand names. In South Korea, the company operates through its 50 percent-owned affiliate, GS Caltex, using the GS Caltex brand. The company’s 50 percent-owned affiliate in Australia, Caltex Australia Limited, operates using the Caltex and Ampol brands.
In 2008, the company announced agreements to sell marketing-related businesses in Brazil, Nigeria, Kenya, Uganda, Benin, Cameroon, Republic of the Congo, Côte d’Ivoire and Togo. The company will retain its lubricants business in Brazil. The company also completed the sale of its heating-oil business in the United Kingdom. In addition, the company sold its interest in about 350 individual service-station sites. The majority of these sites will continue to market company-branded gasoline through new supply agreements.
The company also manages other marketing businesses globally. Chevron markets aviation fuel at more than 1,000 airports. The company also markets an extensive line of lubricant and coolant products under brand names that include Havoline, Delo, Ursa, Meropa and Taro.
Transportation Operations
Pipelines: Chevron owns and operates an extensive system of crude oil, refined products, chemicals, natural gas liquids and natural gas pipelines in the United States. The company also has direct or indirect interests in other U.S. and international pipelines. The company’s ownership interests in pipelines are summarized in the following table.
Pipeline Mileage at December 31, 2008
| | | | | |
| | | Net Mileage1 | |
| United States: | | | | |
Crude Oil2 | | | 2,886 | |
| Natural Gas | | | 2,263 | |
Petroleum Products3 | | | 6,030 | |
| | | | | |
Total United States | | | 11,179 | |
| International: | | | | |
Crude Oil2 | | | 700 | |
| Natural Gas | | | 576 | |
Petroleum Products3 | | | 433 | |
| | | | | |
| Total International | | | 1,709 | |
| | | | | |
Worldwide | | | 12,888 | |
| | | | | |
| | | |
1 | | Partially owned pipelines are included at the company’s equity percentage. |
2 | | Includes gathering lines related to the transportation function. Excludes gathering lines related to U.S. and international production activities. |
3 | | Includes refined products, chemicals and natural gas liquids. |
During 2008, the company completed the construction of a natural gas gathering pipeline serving the Piceance Basin in northwest Colorado; participated in the successful installation of the Amberjack-Tahiti lateral pipeline on the seafloor of the U.S. Gulf of Mexico; and led the expansion of the West Texas LPG pipeline system. Chevron also continued with a project during 2008 to expand capacity by about 2 billion cubic feet at the Keystone natural-gas storage facility. The project is expected to be completed in late 2009.
Chevron has a 15 percent interest in the Caspian Pipeline Consortium (CPC) affiliate. CPC operates a crude oil export pipeline from the Tengiz Field in Kazakhstan to the Russian Black Sea port of Novorossiysk. During 2008, CPC transported an average of approximately 675,000 barrels of crude oil per day, including 557,000 barrels per day from Kazakhstan and 118,000 barrels per day from Russia. In late 2008, the CPC partners signed a Memorandum of Understanding to expand the design capacity to 1.4 million barrels per day. A final investment decision is expected after commercial terms have been agreed upon and required government approvals have been received.
26
The company has a 9 percent interest in the Baku-Tbilisi-Ceyhan (BTC) affiliate that owns and operates a pipeline that transports primarily the crude oil produced by Azerbaijan International Operating Company (AIOC) (owned 10 percent by Chevron) from Baku, Azerbaijan, through Georgia to deepwater port facilities in Ceyhan, Turkey. The BTC pipeline has a crude-oil capacity of 1.2 million barrels per day and transports the majority of the AIOC production. Another production export route for crude oil is the Western Route Export Pipeline, wholly owned by AIOC, with capacity to transport 145,000 barrels per day from Baku, Azerbaijan, to the marine terminal at Supsa, Georgia.
Chevron is the largest shareholder, with a 37 percent interest, in the West African Gas Pipeline Company Limited affiliate, which constructed, owns and operates the421-mile(678-km) West African Gas Pipeline. The pipeline is designed to supply Nigerian natural gas to customers in Benin, Ghana and Togo for industrial applications and power generation and is expected to have capacity of 170 million cubic feet of natural gas per day by 2010. First gas was shipped in December 2008.
Tankers: All tankers in Chevron’s controlled seagoing fleet were utilized during 2008. In addition, at any given time during 2008 the company had approximately 40 deep-sea vessels chartered on a voyage basis, or for a period of less than one year. Additionally, the following table summarizes the capacity of the company’s controlled fleet.
Controlled Tankers at December 31, 2008
| | | | | | | | | | | | | | | | | |
| | | U.S. Flag | | | Foreign Flag | |
| | | | | | Cargo Capacity
| | | | | | Cargo Capacity
| |
| | | Number | | | (Millions of Barrels) | | | Number | | | (Millions of Barrels) | |
| |
| Owned | | | 3 | | | | 0.8 | | | | 1 | | | | 1.1 | |
| Bareboat Chartered | | | 2 | | | | 0.7 | | | | 18 | | | | 27.1 | |
| Time Chartered* | | | — | | | | — | | | | 17 | | | | 14.6 | |
| | | | | | | | | | | | | | | | | |
Total | | | 5 | | | | 1.5 | | | | 36 | | | | 42.8 | |
Federal law requires that cargo transported between U.S. ports be carried in ships built and registered in the United States, owned and operated by U.S. entities, and manned by U.S. crews. In 2008, the company’s U.S. flag fleet was engaged primarily in transporting refined products between the Gulf Coast and the East Coast and from California refineries to terminals on the West Coast and in Alaska and Hawaii. OneU.S.-flagged product tanker, capable of carrying 300,000 barrels of cargo, was delivered in 2008 and two additionalU.S.-flagged product tankers are scheduled for delivery in 2010.
The foreign-flagged vessels were engaged primarily in transporting crude oil from the Middle East, Asia, the Black Sea, Mexico and West Africa to ports in the United States, Europe, Australia and Asia. Refined products were also transported by tanker worldwide.
In addition to the vessels described above, the company owns a one-sixth interest in each of seven LNG tankers transporting cargoes for the North West Shelf (NWS) Venture in Australia. The NWS project also has two LNG tankers under long-term time charter. In 2008, the company sold its two LNG shipbuilding contracts with Samsung Heavy Industries, but retained the option to purchase two new LNG vessels.
The Federal Oil Pollution Act of 1990 requires the phase-out by year-end 2010 of all single-hull tankers trading to U.S. ports or transferring cargo in waters within the U.S. Exclusive Economic Zone. As of the end of 2008, the company’s owned and bareboat-chartered fleet was completely double-hulled. The company is a member of many oil-spill-response cooperatives in areas in which it operates around the world.
Chemicals
Chevron Phillips Chemical Company LLC (CPChem) is equally owned with ConocoPhillips Corporation. At the end of 2008, CPChem owned or had joint venture interests in 35 manufacturing facilities and five research and technical centers in Belgium, Brazil, China, Colombia, Qatar, Saudi Arabia, Singapore, South Korea and the United States.
Americas Styrenics LLC, a50-50 joint venture between CPChem and Dow Chemical Company, began commercial operations in 2008. This joint venture combined CPChem’s U.S. styrene and polystyrene operations with Dow’s U.S. and Latin America polystyrene operations. Also, construction continued on the new 22 million-pound-per-year Ryton® polyphenylene-sulfide (PPS) manufacturing facility at Borger, Texas. Completion of this plant is expected in second quarter 2009.
27
Outside the United States, CPChem’s 50 percent-owned Jubail Chevron Phillips Company began commercial production at its world-scale styrene facility at Al Jubail, Saudi Arabia. The styrene facility is located adjacent to an existing aromatics complex in Al Jubail that is jointly owned by CPChem and the Saudi Industrial Investment Group. Also during 2008, construction commenced by Saudi Polymers Company, a joint venture company formed to build a third petrochemical project in Al Jubail. Project completion is expected in 2011.
CPChem continued construction during 2008 on the 49 percent-owned Q-Chem II project in Mesaieed, Qatar. The project includes a 350,000-metric-ton-per-year polyethylene plant and a 345,000-metric-ton-per-year normal alpha olefins plant — each utilizing CPChem proprietary technology — and is located adjacent to the existing Q-Chem I complex. Q-Chem II also includes a separate joint venture to develop a 1.3 million-metric-ton-per-year ethylene cracker at Qatar’s Ras Laffan Industrial City, in which Q-Chem II owns 54 percent of the capacity rights.Start-up is anticipated in late 2009.
Chevron’s Oronite brand lubricant and fuel additives business is a leading developer, manufacturer and marketer of performance additives for lubricating oils and fuels. The company owns and operates facilities in Brazil, France, Japan, the Netherlands, Singapore and the United States and has equity interests in facilities in India and Mexico. Oronite provides additives for lubricating oil in most engine applications, such as passenger car, heavy-duty diesel, marine, locomotive and motorcycle engines, and additives for fuels to improve engine performance and extend engine life. Oronite completed construction and started up the hydrofluoric acid replacement alkylation units in Gonfreville, France, during 2008. Commercial production commenced in January 2009. Also during 2008, the Gonfreville facility began full commercial production of new sulfur-free detergent components for marine engine applications and low-sulfur components for automotive engine oil applications.
Other Businesses
Mining
Chevron’sU.S.-based mining company produces and markets coal and molybdenum. Sales occur in both U.S. and international markets.
The company owns and operates two surface coal mines, McKinley, in New Mexico, and Kemmerer, in Wyoming, and one underground coal mine, North River, in Alabama. The company also owns a 50 percent interest in Youngs Creek Mining Company LLC, a joint venture to develop a coal mine in northern Wyoming. Coal sales from wholly owned mines were 11 million tons, down about 1 million tons from 2007.
At year-end 2008, Chevron controlled approximately 200 million tons of proven and probable coal reserves in the United States, including reserves of environmentally desirable low-sulfur coal. The company is contractually committed to deliver between 8 million and 11 million tons of coal per year through the end of 2010 and believes it will satisfy these contracts from existing coal reserves.
In addition to the coal operations, Chevron owns and operates the Questa molybdenum mine in New Mexico. At year-end 2008, Chevron controlled approximately 53 million pounds of proven molybdenum reserves at Questa.
In 2008, the company sold the petroleum coke calciner assets of Chicago Carbon Company, a wholly owned subsidiary in Illinois. The company also sold its lanthanides processing facilities and rare-earth mineral mine in Mountain Pass, California, and its 33 percent interest in Sumikin Molycorp, a manufacturer and marketer of neodymium compounds in Japan. In early 2009, the company was actively marketing its coal reserves at the North River Mine and elsewhere in Alabama for sale.
Power Generation
Chevron’s power generation business develops and operates commercial power projects and has interests in 13 power assets through joint ventures in the United States and Asia. The company manages the production of more than 2,300 megawatts of electricity at 11 facilities it owns through joint ventures. The company operates gas-fired cogeneration facilities that use waste heat recovery to produce additional electricity or to support industrial thermal hosts. A number of the facilities produce steam for use in upstream operations to facilitate production of heavy oil.
The company has major geothermal operations in Indonesia and the Philippines and is investigating several advanced solar technologies for use in oil field operations as part of its renewable energy strategy. For additional information on the company’s geothermal operations and renewable energy projects, refer to page 19 and “Research and Technology”, on page 29.
28
Chevron Energy Solutions
Chevron Energy Solutions (CES) is a wholly owned subsidiary that provides public institutions and businesses with sustainable energy projects designed to increase energy efficiency and reliability, reduce energy costs, and utilize renewable and alternative-power technologies. Since 2000, CES has developed hundreds of projects that will help government, education and other customers reduce their energy costs and carbon footprint. Major projects completed by CES in 2008 included several large solar panel installations in California.
Research and Technology
The company’s energy technology organization supports Chevron’s upstream and downstream businesses by providing technology, services and competency development in earth sciences; reservoir and production engineering; drilling and completions; facilities engineering; manufacturing; process technology; catalysis; technical computing; and health, environment and safety. The information technology organization integrates computing, telecommunications, data management, security and network technology to provide a standardized digital infrastructure and enable Chevron’s global operations and business processes.
Chevron Technology Ventures (CTV) manages investments and projects in emerging energy technologies and their integration into Chevron’s core businesses. As of the end of 2008, CTV was investigating technologies such as next-generation biofuels, advanced solar power and enhanced geothermal.
Chevron’s research and development expenses were $835 million, $562 million and $468 million for the years 2008, 2007 and 2006, respectively.
Some of the investments the company makes in the areas described above are in new or unproven technologies and business processes, and ultimate successes are not certain. Although not all initiatives may prove to be economically viable, the company’s overall investment in this area is not significant to the company’s consolidated financial position.
Environmental Protection
Virtually all aspects of the company’s businesses are subject to various U.S. federal, state and local environmental, health and safety laws and regulations and to similar laws and regulations in other countries. These regulatory requirements continue to change and increase in both number and complexity and to govern not only the manner in which the company conducts its operations, but also the products it sells. Chevron expects more environment-related regulations in the countries where it has operations. Most of the costs of complying with the many laws and regulations pertaining to its operations are embedded in the normal costs of conducting business.
In 2008, the company’s U.S. capitalized environmental expenditures were approximately $780 million, representing approximately 9 percent of the company’s total consolidated U.S. capital and exploratory expenditures. These environmental expenditures include capital outlays to retrofit existing facilities as well as those associated with new facilities. The expenditures relate mostly to air- and water-quality projects and activities at the company’s refineries, oil and gas producing facilities, and marketing facilities. For 2009, the company estimates U.S. capital expenditures for environmental control facilities will be approximately $1 billion. The future annual capital costs are uncertain and will be governed by several factors, including future changes to regulatory requirements.
Refer to Management’s Discussion and Analysis of Financial Condition and Results of Operations on pages FS-16 through FS-18 for additional information on environmental matters and their impact on Chevron and on the company’s 2008 environmental expenditures, remediation provisions and year-end environmental reserves.
Web Site Access to SEC Reports
The company’s Internet Web site is atwww.chevron.com. Information contained on the company’s Internet Web site is not part of this Annual Report onForm 10-K. The company’s Annual Reports onForm 10-K, Quarterly Reports onForm 10-Q, Current Reports onForm 8-K and any amendments to these reports filed or furnished pursuant to Section 13(a) or 15(d) of the Securities Exchange Act of 1934 are available on the company’s Web site soon after such reports are filed with or furnished to the Securities and Exchange Commission (SEC). The reports are also available at the SEC’s Web site atwww.sec.gov.
29
Chevron is a major fully integrated petroleum company with a diversified business portfolio, a strong balance sheet, and a history of generating sufficient cash to fund capital and exploratory expenditures and to pay dividends. Nevertheless, some inherent risks could materially impact the company’s financial results of operations or financial condition.
Chevron is exposed to the effects of changing commodity prices.
Chevron is primarily in a commodities business with a history of price volatility. The single largest variable that affects the company’s results of operations is the price of crude oil, which can be influenced by general economic conditions and geopolitical risk.
During extended periods of historically low prices for crude oil, the company’s upstream earnings and capital and exploratory expenditure programs will be negatively affected. Upstream assets may also become impaired. The impact on downstream earnings is dependent upon the supply and demand for refined products and the associated margins on refined-product sales.
The scope of Chevron’s business will decline if the company does not successfully develop resources.
The company is in an extractive business; therefore, if Chevron is not successful in replacing the crude oil and natural gas it produces with good prospects for future production, the company’s business will decline. Creating and maintaining an inventory of projects depends on many factors, including obtaining and renewing rights to explore, develop and produce hydrocarbons; drilling success; ability to bring long-lead-time, capital-intensive projects to completion on budget and schedule; and efficient and profitable operation of mature properties.
The company’s operations could be disrupted by natural or human factors.
Chevron operates in both urban areas and remote and sometimes inhospitable regions. The company’s operations and facilities are therefore subject to disruption from either natural or human causes, including hurricanes, floods and other forms of severe weather, war, civil unrest and other political events, fires, earthquakes, and explosions, any of which could result in suspension of operations or harm to people or the natural environment.
Chevron’s business subjects the company to liability risks.
The company produces, transports, refines and markets materials with potential toxicity, and it purchases, handles and disposes of other potentially toxic materials in the course of the company’s business. Chevron operations also produce byproducts, which may be considered pollutants. Any of these activities could result in liability, either as a result of an accidental, unlawful discharge or as a result of new conclusions on the effects of the company’s operations on human health or the environment.
Political instability could harm Chevron’s business.
The company’s operations, particularly exploration and production, can be affected by changing economic, regulatory and political environments in the various countries in which it operates. As has occurred in the past, actions could be taken by governments to increase public ownership of the company’s partially or wholly owned businessesand/or to impose additional taxes or royalties.
In certain locations, governments have imposed restrictions, controls and taxes, and in others, political conditions have existed that may threaten the safety of employees and the company’s continued presence in those countries. Internal unrest, acts of violence or strained relations between a government and the company or other governments may affect the company’s operations. Those developments have, at times, significantly affected the company’s related operations and results and are carefully considered by management when evaluating the level of current and future activity in such countries. At December 31, 2008, 29 percent of the company’s net proved reserves were located in Kazakhstan. The company also has significant interests in Organization of Petroleum Exporting Countries (OPEC)-member countries including Angola, Nigeria and Venezuela and in the Partitioned Neutral Zone between Saudi Arabia and Kuwait. Twenty-three percent of the company’s net proved reserves, including affiliates, were located in OPEC countries at December 31, 2008 (excluding reserves in Indonesia, which relinquished its OPEC membership at the end of 2008).
30
Regulation of greenhouse gas emissions could increase Chevron’s operational costs and reduce demand for Chevron’s products.
Management expects continued political attention to issues concerning climate change, and the role of human activity in it and potential remediation or mitigation through regulation that could materially affect the company’s operations.
International agreements and national or regional legislation and regulatory measures to limit greenhouse emissions are currently in various phases of discussion or implementation. The Kyoto Protocol, California’s Global Warming Solutions Act and Australia’s proposed Carbon Pollution Reduction Scheme, along with other actual or pending federal, state and provincial regulations, envision a reduction of greenhouse gas emissions through market-based trading schemes. The company is currently complying with greenhouse gas emissions limits within the European Union.
As a result of these and other environmental regulations, the company expects to incur substantial capital, compliance, operating, maintenance and remediation costs. The level of expenditure required to comply with these laws and regulations is uncertain and may vary by jurisdiction depending on the laws enacted in each jurisdiction and the company’s activities in it. The company’s production and processing operations (e.g., the production of crude oil at offshore platforms and the processing of natural gas at liquefied natural gas facilities) typically result in emission of greenhouse gases. Likewise, emissions arise from power and downstream operations, including crude oil transportation and refining. Finally, although beyond the control of the company, the use of passenger vehicle fuels and related products by consumers also results in greenhouse gas emissions that may be regulated.
The company’s financial performance will depend on a number of factors, including, among others, the greenhouse gas emissions reductions required by law, the price and availability of emission allowances and credits, the extent to which Chevron would be entitled to receive emission allowances or need to purchase them in the open market or through auctions and the impact of legislation on the company’s ability to recover the costs incurred through the pricing of the company’s products. Material cost increases or incentives to conserve or use alternative energy sources could reduce demand for products the company currently sells. To the extent these costs are not ultimately reflected in the price of the company’s products, the company’s operating results will be adversely affected.
| |
| Item 1B. | Unresolved Staff Comments |
None.
The location and character of the company’s crude oil, natural gas and mining properties and its refining, marketing, transportation and chemicals facilities are described on page 3 under Item 1. Business. Information required by the Securities Exchange Act Industry Guide No. 2 (“Disclosure of Oil and Gas Operations”) is also contained in Item 1 and in Tables I through VII on pages FS-62 to FS-74. Note 13, “Properties, Plant and Equipment,” to the company’s financial statements is onpage FS-43.
| |
| Item 3. | Legal Proceedings |
Ecuador Chevron is a defendant in a civil lawsuit before the Superior Court of Nueva Loja in Lago Agrio, Ecuador, brought in May 2003 by plaintiffs who claim to be representatives of certain residents of an area where an oil production consortium formerly had operations. The lawsuit alleges damage to the environment from the oil exploration and production operations, and seeks unspecified damages to fund environmental remediation and restoration of the alleged environmental harm, plus a health monitoring program. Until 1992, Texaco Petroleum Company (Texpet), a subsidiary of Texaco Inc., was a minority member of this consortium with Petroecuador, the Ecuadorian state-owned oil company, as the majority partner; since 1990, the operations have been conducted solely by Petroecuador. At the conclusion of the consortium and following an independent third-party environmental audit of the concession area, Texpet entered into a formal agreement with the Republic of Ecuador and Petroecuador for Texpet to remediate specific sites assigned by the government in proportion to Texpet’s ownership share of the consortium. Pursuant to that agreement, Texpet conducted a three-year remediation program at a cost of $40 million. After certifying that the sites were properly remediated, the government granted Texpet and all related corporate entities a full release from any and all environmental liability arising from the consortium operations.
Based on the history described above, Chevron believes that this lawsuit lacks legal or factual merit. As to matters of law, the company believes first, that the court lacks jurisdiction over Chevron; second, that the law under which plaintiffs bring the action, enacted in 1999, cannot be applied retroactively to Chevron; third, that the claims are barred by the
31
statute of limitations in Ecuador; and, fourth, that the lawsuit is also barred by the releases from liability previously given to Texpet by the Republic of Ecuador and Petroecuador. With regard to the facts, the company believes that the evidence confirms that Texpet’s remediation was properly conducted and that the remaining environmental damage reflects Petroecuador’s failure to timely fulfill its legal obligations and Petroecuador’s further conduct since assuming full control over the operations.
In April 2008, a mining engineer appointed by the court to identify and determine the cause of environmental damage, and to specify steps needed to remediate it, issued a report recommending that the court assess $8 billion, which would, according to the engineer, provide financial compensation for purported damages, including wrongful death claims, and pay for, among other items, environmental remediation, health care systems, and additional infrastructure for Petroecuador. The engineer’s report also asserted that an additional $8.3 billion could be assessed against Chevron for unjust enrichment. The engineer’s report is not binding on the court. Chevron also believes that the engineer’s work was performed and his report prepared in a manner contrary to law and in violation of the court’s orders. Chevron submitted a rebuttal to the report in which it asked the court to strike the report in its entirety. In November 2008, the engineer revised the report and, without additional evidence, recommended an increase in the financial compensation for purported damages to a total of $18.9 billion and an increase in the assessment for purported unjust enrichment to a total of $8.4 billion. Chevron submitted a rebuttal to the revised report, and Chevron will continue a vigorous defense of any attempted imposition of liability.
Management does not believe an estimate of a reasonably possible loss (or a range of loss) can be made in this case. Due to the defects associated with the engineer’s report, management does not believe the report itself has any utility in calculating a reasonably possible loss (or a range of loss). Moreover, the highly uncertain legal environment surrounding the case provides no basis for management to estimate a reasonably possible loss (or a range of loss).
| |
| Item 4. | Submission of Matters to a Vote of Security Holders |
None.
32
PART II
| |
| Item 5. | Market for the Registrant’s Common Equity, Related Stockholder Matters and Issuer Purchases of Equity Securities |
The information on Chevron’s common stock market prices, dividends, principal exchanges on which the stock is traded and number of stockholders of record is contained in the Quarterly Results and Stock Market Data tabulations, onpage FS-24.
CHEVRON CORPORATION
ISSUER PURCHASES OF EQUITY SECURITIES
| | | | | | | | | | | | | | | | | |
| | | | | | | | | | | | Maximum
| |
| | | | | | | | | Total Number of
| | | Number of Shares
| |
| | | Total Number
| | | Average
| | | Shares Purchased as
| | | that May Yet be
| |
| | | of Shares
| | | Price Paid
| | | Part of Publicly
| | | Purchased Under
| |
Period | | Purchased(1)(2) | | | per Share | | | Announced Program | | | the Program | |
| |
| Oct. 1 – Oct. 31, 2008 | | | 14,185,681 | | | | 67.71 | | | | 14,184,858 | | | | — | |
| Nov. 1 – Nov. 30, 2008 | | | 7,687,933 | | | | 72.46 | | | | 7,665,000 | | | | — | |
| Dec. 1 – Dec. 31, 2008 | | | 6,373,015 | | | | 76.05 | | | | 6,367,989 | | | | — | |
| | | | | | | | | | | | | | | | | |
Total Oct. 1 – Dec. 31, 2008 | | | 28,246,629 | | | | 70.88 | | | | 28,217,847 | | | | (2 | ) |
| | | | | | | | | | | | | | | | | |
| |
| (1) | Includes 14,339 common shares repurchased during the three-month period ended December 31, 2008, from company employees for required personal income tax withholdings on the exercise of the stock options issued to management and employees under the company’s broad-based employee stock options, long-term incentive plans and former Texaco Inc. stock option plans. Also includes 14,443 shares delivered or attested to in satisfaction of the exercise price by holders of certain former Texaco Inc. employee stock options exercised during the three-month period ended December 31, 2008. The October purchases also include approximately 14.2 million shares acquired in an exchange transaction for a U.S. upstream property and cash. |
| |
| (2) | In September 2007, the company authorized stock repurchases of up to $15 billion that may be made from time to time at prevailing prices as permitted by securities laws and other requirements and subject to market conditions and other factors. The program will occur over a period of up to three years and may be discontinued at any time. As of December 31, 2008, 118,996,749 shares had been acquired under this program for $10.1 billion. |
| |
| Item 6. | Selected Financial Data |
The selected financial data for years 2004 through 2008 are presented onpage FS-61.
| |
| Item 7. | Management’s Discussion and Analysis of Financial Condition and Results of Operations |
The index to Management’s Discussion and Analysis of Financial Condition and Results of Operations, Consolidated Financial Statements and Supplementary Data is presented onpage FS-1.
| |
| Item 7A. | Quantitative and Qualitative Disclosures About Market Risk |
The company’s discussion of interest rate, foreign currency and commodity price market risk is contained in Management’s Discussion and Analysis of Financial Condition and Results of Operations — “Financial and Derivative Instruments,” beginning onpage FS-13 and in Note 7 to the Consolidated Financial Statements, “Financial and Derivative Instruments,” beginning onpage FS-36.
| |
| Item 8. | Financial Statements and Supplementary Data |
The index to Management’s Discussion and Analysis, Consolidated Financial Statements and Supplementary Data is presented onpage FS-1.
33
| |
| Item 9. | Changes in and Disagreements With Accountants on Accounting and Financial Disclosure |
None.
| |
| Item 9A. | Controls and Procedures |
| |
| (a) | Evaluation of Disclosure Controls and Procedures |
The company’s management has evaluated, with the participation of the Chief Executive Officer and Chief Financial Officer, the effectiveness of the company’s disclosure controls and procedures (as defined inRule 13a-15(e) and15d-15(e) under the Securities Exchange Act of 1934 (the “Exchange Act”) as of the end of the period covered by this report. Based on this evaluation, the Chief Executive Officer and Chief Financial Officer concluded that the company’s disclosure controls and procedures were effective as of December 31, 2008.
| |
| (b) | Management’s Report on Internal Control Over Financial Reporting |
The company’s management is responsible for establishing and maintaining adequate internal control over financial reporting, as such term is defined in Exchange ActRule 13a-15(f). The company’s management, including the Chief Executive Officer and Chief Financial Officer, conducted an evaluation of the effectiveness of the company’s internal control over financial reporting based on theInternal Control — Integrated Frameworkissued by the Committee of Sponsoring Organizations of the Treadway Commission. Based on the results of this evaluation, the company’s management concluded that internal control over financial reporting was effective as of December 31, 2008.
The effectiveness of the company’s internal control over financial reporting as of December 31, 2008, has been audited by PricewaterhouseCoopers LLP, an independent registered public accounting firm, as stated in its report included onpage FS-26.
| |
| (c) | Changes in Internal Control Over Financial Reporting |
During the quarter ended December 31, 2008, there were no changes in the company’s internal control over financial reporting that have materially affected, or are reasonably likely to materially affect, the company’s internal control over financial reporting.
| |
| Item 9B. | Other Information |
None.
34
PART III
Item 10. Directors, Executive Officers and Corporate Governance
Executive Officers of the Registrant at February 26, 2009
The Executive Officers of the Corporation consist of the Chairman of the Board, the Vice Chairman of the Board and such other officers of the Corporation who are members of the Executive Committee.
| | | | | | | |
| Name and Age | | Current and Prior Positions (up to five years) | | Current Areas of Responsibility |
| |
| D.J. O’Reilly | | 62 | | Chairman of the Board and Chief Executive Officer (since 2000) | | Chief Executive Officer |
| P.J. Robertson | | 62 | | Vice Chairman of the Board (since 2002) | | Policy, Government and Public Affairs; Human Resources |
| J.E. Bethancourt | | 57 | | Executive Vice President (since 2003) | | Technology; Chemicals; Mining; Health, Environment and Safety |
| G.L. Kirkland | | 58 | | Executive Vice President (since 2005) President of Chevron Overseas
Petroleum Inc. (2002 to 2004)
| | Worldwide Exploration and Production Activities and Global Gas Activities, including Natural Gas Trading |
| J.S. Watson | | 52 | | Executive Vice President (since 2008)
Vice President and President of Chevron
International Exploration and Production Company
(2005 through 2007)
Vice President and Chief Financial
Officer (2000 through 2004) | | Business Development, Mergers and Acquisitions, Strategic Planning, Project Resources Company, Procurement |
| M.K. Wirth | | 48 | | Executive Vice President (since 2006) President of Global Supply and Trading
(2004 to 2006)
President of Marketing, Asia, Middle East and Africa Marketing
Business Unit (2001 to 2004) | | Global Refining, Marketing, Lubricants, and Supply and Trading, excluding Natural Gas Trading |
| P.E. Yarrington | | 52 | | Vice President and Chief Financial
Officer (since 2009)
Vice President and Treasurer
(2007 through 2008)
Vice President, Policy, Government and
Public Affairs (2002 to 2007) | | Finance |
| C.A. James | | 54 | | Vice President and General Counsel
(since 2002) | | Law |
The information required by Item 401(b) and (e) ofRegulation S-K and contained under the heading “Election of Directors” in the Notice of the 2009 Annual Meeting and 2009 Proxy Statement, to be filed pursuant toRule 14a-6(b) under the Securities Exchange Act of 1934 (the “Exchange Act”), in connection with the company’s 2009 Annual Meeting of Stockholders (the “2009 Proxy Statement”), is incorporated by reference into this Annual Report onForm 10-K.
The information required by Item 405 ofRegulation S-K and contained under the heading “Stock Ownership Information — Section 16(a) Beneficial Ownership Reporting Compliance” in the 2009 Proxy Statement is incorporated by reference into this Annual Report onForm 10-K.
The information required by Item 406 ofRegulation S-K and contained under the heading “Board Operations — Business Conduct and Ethics Code” in the 2009 Proxy Statement is incorporated by reference into this Annual Report onForm 10-K.
The information required byItem 407(d)(4)-(5) ofRegulation S-K and contained under the heading “Board Operations — Board Committee Membership and Functions” in the 2009 Proxy Statement is incorporated by reference into this Annual Report onForm 10-K.
35
There were no changes to the process by which stockholders may recommend nominees to the Board of Directors during the last fiscal year.
Item 11. Executive Compensation
The information required by Item 402 ofRegulation S-K and contained under the headings “Executive Compensation” and “Directors’ Compensation” in the 2009 Proxy Statement is incorporated by reference into this Annual Report onForm 10-K.
The information required by Item 407(e)(4) ofRegulation S-K and contained under the heading “Board Operations — Board Committee Membership and Functions” in the 2009 Proxy Statement is incorporated by reference into this Annual Report onForm 10-K.
The information required by Item 407(e)(5) ofRegulation S-K and contained under the heading “Board Operations — Management Compensation Committee Report” in the 2009 Proxy Statement is incorporated herein by reference into this Annual Report onForm 10-K. Pursuant to the rules and regulations of the SEC under the Exchange Act, the information under such caption incorporated by reference from the 2009 Proxy Statement shall not be deemed “filed” for purposes of Section 18 of the Exchange Act nor shall it be deemed incorporated by reference into any filing under the Securities Act of 1933.
Item 12. Security Ownership of Certain Beneficial Owners and Management and Related Stockholder Matters
The information required by Item 403 ofRegulation S-K and contained under the heading “Stock Ownership Information — Security Ownership of Certain Beneficial Owners and Management” in the 2009 Proxy Statement is incorporated by reference into this Annual Report onForm 10-K.
The information required by Item 201(d) ofRegulation S-K and contained under the heading “Equity Compensation Plan Information” in the 2009 Proxy Statement is incorporated by reference into this Annual Report onForm 10-K.
Item 13. Certain Relationships and Related Transactions, and Director Independence
The information required by Item 404 ofRegulation S-K and contained under the heading “Board Operations — Transactions with Related Persons” in the 2009 Proxy Statement is incorporated by reference into this Annual Report onForm 10-K.
The information required by Item 407(a) ofRegulation S-K and contained under the heading “Board Operations — Independence of Directors” in the 2009 Proxy Statement is incorporated by reference into this Annual Report onForm 10-K.
Item 14. Principal Accounting Fees and Services
The information required by Item 9(e) of Schedule 14A and contained under the heading “Ratification of Independent Registered Public Accounting Firm” in the 2009 Proxy Statement is incorporated by reference into this Annual Report onForm 10-K.
36
PART IV
| |
| Item 15. | Exhibits, Financial Statement Schedules |
(a) The following documents are filed as part of this report:
(1) Financial Statements:
| | | |
| | | Page(s) |
| |
| | FS-26 |
| | FS-27 |
| | FS-28 |
| | FS-29 |
| | FS-30 |
| | FS-31 |
| | FS-32 to FS-59 |
(2) Financial Statement Schedules:
| | |
| | | Included on page 38 is Schedule II — Valuation and Qualifying Accounts. |
(3) Exhibits:
| | |
| | | The Exhibit Index on pagesE-1 andE-2 lists the exhibits that are filed as part of this report. |
37
SCHEDULE II — VALUATION AND QUALIFYING ACCOUNTS
Millions of Dollars
| | | | | | | | | | | | | |
| | | Year Ended December 31 | |
| | | 2008 | | | 2007 | | | 2006 | |
| |
Employee Termination Benefits: | | | | | | | | | | | | |
| Balance at January 1 | | $ | 117 | | | $ | 28 | | | $ | 91 | |
| Additions (deductions) charged (credited) to expense | | | (13 | ) | | | 106 | | | | (21 | ) |
| Payments | | | (60 | ) | | | (17 | ) | | | (42 | ) |
| | | | | | | | | | | | | |
Balance at December 31 | | $ | 44 | | | $ | 117 | | | $ | 28 | |
| | | | | | | | | | | | | |
Allowance for Doubtful Accounts: | | | | | | | | | | | | |
| Balance at January 1 | | $ | 200 | | | $ | 217 | | | $ | 198 | |
| Additions charged to expense | | | 105 | | | | 29 | | | | 61 | |
| Bad debt write-offs | | | (30 | ) | | | (46 | ) | | | (42 | ) |
| | | | | | | | | | | | | |
Balance at December 31 | | $ | 275 | | | $ | 200 | | | $ | 217 | |
| | | | | | | | | | | | | |
Deferred Income Tax Valuation Allowance:* | | | | | | | | | | | | |
| Balance at January 1 | | $ | 5,949 | | | $ | 4,391 | | | $ | 3,249 | |
| Additions charged to deferred income tax expense | | | 2,599 | | | | 1,894 | | | | 1,700 | |
| Deductions credited to goodwill | | | — | | | | — | | | | (77 | ) |
| Deductions credited to deferred income tax expense | | | (1,013 | ) | | | (336 | ) | | | (481 | ) |
| | | | | | | | | | | | | |
Balance at December 31 | | $ | 7,535 | | | $ | 5,949 | | | $ | 4,391 | |
| | | | | | | | | | | | | |
| |
| * | See also Note 16 to the Consolidated Financial Statements beginning onpage FS-45. |
38
SIGNATURES
Pursuant to the requirements of Section 13 or 15(d) of the Securities Exchange Act of 1934, the Registrant has duly caused this report to be signed on its behalf by the undersigned, thereunto duly authorized, on the 26th day of February, 2009.
Chevron Corporation
David J. O’Reilly, Chairman of the Board
and Chief Executive Officer
Pursuant to the requirements of the Securities Exchange Act of 1934, this report has been signed below by the following persons on behalf of the Registrant and in the capacities indicated on the 26th day of February, 2009.
| | | |
Principal Executive Officers
| | |
| (and Directors) | | Directors |
| |
/s/David J. O’Reilly
David J. O’Reilly, Chairman of the
Board and Chief Executive Officer | | Samuel H. Armacost*
Samuel H. Armacost |
| | | |
/s/Peter J. Robertson
Peter J. Robertson, Vice Chairman of the Board | | Linnet F. Deily*
Linnet F. Deily |
| | | |
| | | Robert E. Denham*
Robert E. Denham |
| | | |
| | | Robert J. Eaton*
Robert J. Eaton |
| | | |
Principal Financial Officer
/s/Patricia E. Yarrington
Patricia E. Yarrington, Vice President and
Chief Financial Officer
Principal Accounting Officer
/s/Mark A. Humphrey
Mark A. Humphrey, Vice President and Comptroller | | Sam Ginn*
Sam Ginn
Enrique Hernandez, Jr.*
Enrique Hernandez, Jr.
Franklyn G. Jenifer*
Franklyn G. Jenifer
Sam Nunn*
Sam Nunn |
| | | |
| | | Donald B. Rice*
Donald B. Rice |
| | | |
*By: /s/Lydia I. Beebe
Lydia I. Beebe,
Attorney-in-Fact
| | Kevin W. Sharer*
Kevin W. Sharer |
| | | Charles R. Shoemate*
Charles R. Shoemate |
| | | |
| | | Ronald D. Sugar*
Ronald D. Sugar |
| | | |
| | | Carl Ware*
Carl Ware |
39
Financial Table of Contents
FS-2
| | | |
| | |
| | FS-2 |
| | FS-2 |
| | FS-2 |
| | FS-5 |
| | FS-6 |
| | FS-8 |
| | FS-10 |
| | FS-10 |
| | FS-12 |
| | FS-12 |
| | FS-13 |
| | FS-15 |
| | FS-15 |
| | FS-17 |
| | FS-18 |
| | FS-21 |
| | FS-24 |
FS-25
| | | |
Consolidated Financial Statements | | |
| | FS-25 |
| | FS-26 |
| | FS-27 |
| | FS-28 |
| | FS-29 |
| | FS-30 |
| | FS-31 |
FS-32
FS-1
| | | | | | | | | | |
Management’s Discussion and Analysis of
Financial Condition and Results of Operations
| | | | | | | | | |
| | | | | | | | | | |
Key Financial Results
| | | | | | | | | | | | | | |
| Millions of dollars, except per-share amounts | | 2008 | | | | 2007 | | | 2006 | |
| Net Income | | $ | 23,931 | | | | $ | 18,688 | | | $ | 17,138 | |
| Per Share Amounts: | | | | | | | | | | | | | |
| Net Income – Basic | | $ | 11.74 | | | | $ | 8.83 | | | $ | 7.84 | |
| – Diluted | | $ | 11.67 | | | | $ | 8.77 | | | $ | 7.80 | |
| Dividends | | $ | 2.53 | | | | $ | 2.26 | | | $ | 2.01 | |
| Sales and Other | | | | | | | | | | | | | |
| Operating Revenues | | $ | 264,958 | | | | $ | 214,091 | | | $ | 204,892 | |
| Return on: | | | | | | | | | | | | | |
| Average Capital Employed | | | 26.6 | % | | | | 23.1 | % | | | 22.6 | % |
| Average Stockholders’ Equity | | | 29.2 | % | | | | 25.6 | % | | | 26.0 | % |
| | | | | |
Income by Major Operating Area
| | | | | | | | | | | | | | |
| Millions of dollars | | 2008 | | | | 2007 | | | 2006 | |
| Upstream – Exploration and Production | | | | | | | | | | | | | |
| United States | | $ | 7,126 | | | | $ | 4,532 | | | $ | 4,270 | |
| International | | | 14,584 | | | | | 10,284 | | | | 8,872 | |
| | | | | |
| Total Upstream | | | 21,710 | | | | | 14,816 | | | | 13,142 | |
| | | | | |
| Downstream – Refining, Marketing and Transportation | | | | | | | | | | | | | |
| United States | | | 1,369 | | | | | 966 | | | | 1,938 | |
| International | | | 2,060 | | | | | 2,536 | | | | 2,035 | |
| | | | | |
| Total Downstream | | | 3,429 | | | | | 3,502 | | | | 3,973 | |
| | | | | |
| Chemicals | | | 182 | | | | | 396 | | | | 539 | |
| All Other | | | (1,390 | ) | | | | (26 | ) | | | (516 | ) |
| | | | | |
| Net Income* | | $ | 23,931 | | | | $ | 18,688 | | | $ | 17,138 | |
| | | | | |
| |
| *Includes Foreign Currency Effects: | | | $ 862 | | | | | $(352 | ) | | | $(219 | ) |
Refer to the “Results of Operations” section beginning on page FS-6 for a discussion of financial results by major operating area for the three years ending December 31, 2008.
Business Environment and Outlook
Chevron is a global energy company with significant business activities in the following countries: Angola, Argentina, Australia, Azerbaijan, Bangladesh, Brazil, Cambodia, Canada, Chad, China, Colombia, Democratic Republic of the Congo, Denmark, France, India, Indonesia, Kazakhstan, Myanmar, the Netherlands, Nigeria, Norway, the Partitioned Neutral Zone between Saudi Arabia and Kuwait, the Philippines, Qatar, Republic of the Congo, Singapore, South Africa, South Korea, Thailand, Trinidad and Tobago, the United Kingdom, the United States, Venezuela, and Vietnam.
Earnings of the company depend largely on the profitability of its upstream (exploration and production) and downstream (refining, marketing and transportation) business segments. The single biggest factor that affects the results of operations for both segments is movement in the price of crude oil. In the downstream business, crude oil is the largest cost component of refined products. The overall trend in earnings is typically less affected by results from the company’s chemicals business and other activities and invest-
ments. Earnings for the company in any period may also be influenced by events or transactions that are infrequent and/ or unusual in nature.
In recent years and through most of 2008, Chevron and the oil and gas industry at large experienced an increase in certain costs that exceeded the general trend of inflation in many areas of the world. This increase in costs affected the company’s operating expenses and capital programs for all business segments, but particularly for upstream. These cost pressures began to soften somewhat in late 2008. As the price of crude oil dropped precipitously from a record high in mid-year, the demand for some goods and services in the industry began to slacken. This cost trend is expected to continue during 2009 if crude-oil prices do not significantly rebound. (Refer to the “Upstream” section on next page for a discussion of the trend in crude-oil prices.)
The company’s operations, especially upstream, can also be affected by changing economic, regulatory and political environments in the various countries in which it operates, including the United States. Civil unrest, acts of violence or strained relations between a government and the company or other governments may impact the company’s operations or investments. Those developments have at times significantly affected the company’s operations and results and are carefully considered by management when evaluating the level of current and future activity in such countries.
To sustain its long-term competitive position in the upstream business, the company must develop and replenish an inventory of projects that offer adequate financial returns for the investment required. Identifying promising areas for exploration, acquiring the necessary rights to explore for and to produce crude oil and natural gas, drilling successfully, and handling the many technical and operational details in a safe and cost-effective manner are all important factors in this effort. Projects often require long lead times and large capital commitments. From time to time, certain governments have sought to renegotiate contracts or impose additional costs on the company. Governments may attempt to do so in the future. The company will continue to monitor these developments, take them into account in evaluating future investment opportunities, and otherwise seek to mitigate any risks to the company’s current operations or future prospects.
The company also continually evaluates opportunities to dispose of assets that are not expected to provide sufficient long-term value or to acquire assets or operations complementary to its asset base to help augment the company’s growth. Refer to the “Results of Operations” section beginning on page FS-6 for discussions of net gains on asset sales during 2008. Asset dispositions and restructurings may occur in future periods and could result in significant gains or losses.
FS-2
The company has been closely monitoring the ongoing uncertainty in financial and credit markets, the rapid decline in crude-oil prices that began in the second half of 2008, and the general contraction of worldwide economic activity. Management is taking these developments into account in the conduct of daily operations and for business planning. The company remains confident of its underlying financial strength to deal with potential problems presented in this environment.
Comments related to earnings trends for the company’s major business areas are as follows:
Upstream Earnings for the upstream segment are closely aligned with industry price levels for crude oil and natural gas. Crude-oil and natural-gas prices are subject to external
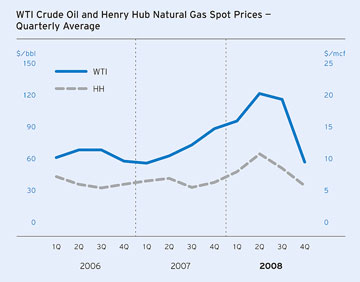
factors over which the company has no control, including product demand connected with global economic conditions, industry inventory levels, production quotas imposed by the Organization of Petroleum Exporting Countries (OPEC), weather-related damage and disruptions, competing fuel prices, and regional supply interruptions or fears thereof that may be caused by military conflicts, civil unrest or political uncertainty. Moreover, any of these factors could also inhibit the company’s production capacity in an affected region. The company monitors developments closely in the countries in which it operates and holds investments, and attempts to manage risks in operating its facilities and business.
Price levels for capital and exploratory costs and operating expenses associated with the efficient production of crude oil and natural gas can also be subject to external factors beyond the company’s control. External factors include not only the general level of inflation but also prices charged by the industry’s material- and service-providers, which can be affected by the volatility of the industry’s own supply and demand conditions for such materials and services. Capital and exploratory expenditures and operating expenses also can be affected by damages to production facilities caused by severe weather or civil unrest.
Industry price levels for crude oil were volatile during 2008. The spot price for West Texas Intermediate (WTI) crude oil, a benchmark crude, started 2008 at $96 per barrel and peaked at $147 in early July. At the end of the year, the WTI price had fallen to $45 per barrel. As of mid-February 2009, the WTI price was $38 per barrel. The collapse in price during the second half of 2008 was largely driven by a decline in the demand for crude oil that was associated with a significant weakening in world economies. The WTI price averaged $100 per barrel for the full-year 2008, compared with $72 in 2007.
As in 2007, a wide differential in prices existed in 2008 between high-quality (i.e., high-gravity, low-sulfur) crude oils and those of lower quality (i.e., low-gravity, high-sulfur crude). The relatively lower price for the high-sulfur crudes has been associated with an ample supply and relatively lower demand due to the limited number of refineries that are able to process this lower-quality feedstock into light products (i.e., motor gasoline, jet fuel, aviation gasoline and diesel fuel). Chevron produces or shares in the production of heavy crude oil in California, Chad, Indonesia, the Partitioned Neutral Zone between Saudi Arabia and Kuwait, Venezuela and certain fields in Angola, China and the United Kingdom North Sea. (Refer to page FS-10 for the company’s average U.S. and international crude oil realizations.)
In contrast to price movements in the global market for crude oil, price changes for natural gas in many regional markets are more closely aligned with supply-and-demand conditions in those markets. In the United States during 2008, benchmark prices at Henry Hub averaged about $9 per thousand cubic feet (MCF), compared with about $7 in 2007. At December 31, 2008, and as of mid-February 2009,
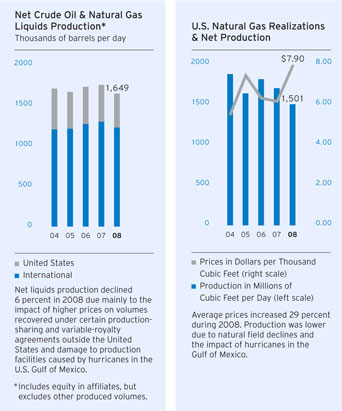
FS-3
| | | | | | | | | | |
Management’s Discussion and Analysis of
Financial Condition and Results of Operations
|
| | | | | | | | | | |
the Henry Hub price was about $5.60 and $4.70 per MCF, respectively. Fluctuations in the price for natural gas in the United States are closely associated with the volumes produced in North America and the inventory in underground storage relative to customer demand. U.S. natural gas prices are also typically higher during the winter period when demand for heating is greatest.
Certain other regions of the world in which the company operates have different supply, demand and regulatory circumstances, typically resulting in lower average sales prices for the company’s production of natural gas. (Refer to page FS-10 for the company’s average natural gas realizations for the U.S. and international regions.) Additionally, excess-supply conditions that exist in certain parts of the world cannot easily serve to mitigate the relatively higher-price conditions in the United States and other markets because of the lack of infrastructure to transport and receive liquefied natural gas.
To help address this regional imbalance between supply and demand for natural gas, Chevron continues to invest in long-term projects in areas of excess supply to install infrastructure to produce and liquefy natural gas for transport by tanker, along with investments and commitments to regasify the product in markets where demand is strong and supplies are not as plentiful. Due to the significance of the overall investment in these long-term projects, the natural gas sales prices in the areas of excess supply (before the natural gas is transferred to a processing facility) are expected to remain below sales prices for natural gas that is produced much nearer to areas of high demand and can be transported in existing natural gas pipeline networks (as in the United States or Thailand).
Besides the impact of the fluctuation in price for crude oil and natural gas, the longer-term trend in earnings for the upstream segment is also a function of other factors, including the company’s ability to find or acquire and efficiently produce crude oil and natural gas, changes in fiscal terms of contracts, changes in tax rates on income, and the cost of goods and services.
Chevron’s worldwide net oil-equivalent production in 2008, including volumes produced from oil sands, averaged 2.53 million barrels per day, a decline of about 90,000 barrels per day from 2007 due mainly to the impact of higher prices on volumes recovered under certain production-sharing and variable-royalty agreements outside the United States and damage to production facilities in September 2008 caused by hurricanes Gustav and Ike in the U.S. Gulf of Mexico. (Refer to the discussion of U.S. upstream production trends in the “Results of Operations” section on page
FS-6. Refer also to the “Selected Operating Data” table on page
FS-10 for a listing of production volumes for each of the three years ending December 31, 2008.)
The company estimates that oil-equivalent production in 2009 will average approximately 2.63 million barrels per day. This estimate is subject to many uncertainties, including quotas that may be imposed by OPEC, price effects on production volumes calculated under cost-recovery and variable-royalty provisions of certain contracts, changes in fiscal terms or restrictions on the scope of company operations, delays in project startups, fluctuations in demand for natural gas in various markets, weather conditions that may shut in production, civil unrest, changing geopolitics, or other disruptions to operations. Future production levels also are affected by the size and number of economic investment opportunities and, for new large-scale projects, the time lag between initial exploration and the beginning of production. Most of Chevron’s upstream investment is currently being made outside the United States. Investments in upstream projects generally are made well in advance of the start of the associated production of crude oil and natural gas.
Approximately 20 percent of the company’s net oil-equivalent production in 2008 occurred in the OPEC-member countries of Angola, Nigeria and Venezuela and in the Partitioned Neutral Zone between Saudi Arabia and Kuwait. (This production statistic excludes volumes produced in Indonesia, which relinquished its OPEC membership at the end of 2008.) At a meeting on December 17, 2008, OPEC announced a reduction of 4.2 million barrels per day, or 14 percent, from actual September 2008 production of 29 million barrels per day. The reduction became effective January 1, 2009. OPEC quotas did not significantly affect Chevron’s production level in 2007 or in 2008. The company’s current and future production levels could be affected by the cutbacks announced by OPEC in December 2008.
Refer to the “Results of Operations” section on pages FS-6 through FS-7 for additional discussion of the company’s upstream operations.
Downstream Earnings for the downstream segment are closely tied to margins on the refining and marketing of products that include gasoline, diesel, jet fuel, lubricants, fuel oil and feedstocks for chemical manufacturing. Industry margins are sometimes volatile and can be affected by the global and regional supply-and-demand balance for refined products and by changes in the price of crude oil used for refinery feedstock. Industry margins can also be influenced by refined-product inventory levels, geopolitical events, refinery maintenance programs and disruptions at refineries resulting from unplanned outages that may be due to severe weather or other operational events.
Other factors affecting profitability for downstream operations include the reliability and efficiency of the company’s refining and marketing network, the effectiveness of
FS-4
the crude-oil and product-supply functions and the economic returns on invested capital. Profitability can also be affected by the volatility of tanker-charter rates for the company’s shipping operations, which are driven by the industry’s demand for crude oil and product tankers. Other factors beyond the company’s control include the general level of inflation and energy costs to operate the company’s refinery and distribution network.
The company’s most significant marketing areas are the West Coast of North America, the U.S. Gulf Coast, Latin America, Asia, southern Africa and the United Kingdom. Chevron operates or has ownership interests in refineries in each of these areas except Latin America. Downstream earnings, especially in the United States, were weak from mid-2007 through mid-2008 due mainly to increasing prices of crude oil used in the refining process that were not always fully recovered through sales prices of refined products. Margins significantly improved in the second half of 2008 as the price of crude oil declined. As part of its downstream strategy to focus on areas of market strength, the company announced plans to sell marketing businesses in several countries. Refer to the discussion in “Operating Developments” below.
Industry margins in the future may be volatile and are influenced by changes in the price of crude oil used for refinery feedstock and by changes in the supply and demand for crude oil and refined products. The industry supply-and-demand balance can be affected by disruptions at refineries resulting from maintenance programs and unplanned outages, including weather-related disruptions; refined-product inventory levels; and geopolitical events.
Refer to pages FS-7 through FS-8 for additional discussion of the company’s downstream operations.
Chemicals Earnings in the petrochemicals business are closely tied to global chemical demand, industry inventory levels and plant capacity utilization. Feedstock and fuel costs, which tend to follow crude oil and natural gas price movements, also influence earnings in this segment.
Refer to the “Results of Operations” section on page FS-8 for additional discussion of chemicals earnings.
Operating Developments
Key operating developments and other events during 2008 and early 2009 included the following:
Upstream
Australia Started production from Train 5 of the 17 percent-owned North West Shelf Venture onshore liquefied-natural-gas (LNG) facility in West Australia, increasing export capacity from about 12 million metric tons annually to more than 16 million. The company also announced plans for an LNG project that initially will have a capacity of 5 million tons per year and process natural gas from Chevron’s 100 percent-owned Wheatstone discovery located on the northwest coast of mainland Australia.
Canada Finalized agreements with the government of Newfoundland and Labrador to develop the 27 percent-owned Hebron heavy-oil project off the eastern coast.
Indonesia Achieved first oil at North Duri Field Area 12, which Chevron operates with a 100 percent interest. Maximum total crude-oil production of 34,000 barrels per day is expected in 2012.
Kazakhstan Completed the second phase of a major expansion of production operations and processing facilities at the 50 percent-owned Tengizchevroil affiliate, increasing
total crude-oil production capacity from 400,000 to 540,000 barrels per day.
Middle East Signed an agreement with the Kingdom of Saudi Arabia to extend to 2039 the company’s operation of the Kingdom’s 50 percent interest in oil and gas resources of the onshore area of the Partitioned Neutral Zone between the Kingdom and the state of Kuwait.
Nigeria Started production offshore at the 68 percent-owned and operated Agbami Field, with total oil production expected to reach a maximum of 250,000 barrels per day by the end of 2009. The company and partners also announced plans to develop the 30 percent-owned and partner-operated offshore Usan Field, which is expected to have maximum total production of 180,000 barrels of crude oil per day within one year of start-up in 2012.
Republic of the Congo Confirmed startup of the 32 percent-owned, partner-operated Moho-Bilondo deepwater project, which is expected to reach maximum total crude-oil production of 90,000 barrels per day in 2010.
Thailand Approved construction in the Gulf of Thailand of the 70 percent-owned and operated Platong Gas II project, which is designed to have processing capacity of 420 million cubic feet of natural gas per day.
United States Began production at the 75 percent-owned and operated Blind Faith project in the deepwater Gulf of Mexico. Total volumes are expected to ramp up during 2009 to approximately 65,000 barrels of crude oil and 55 million cubic feet of natural gas per day.
Downstream
The company announced plans to sell marketing-related businesses in Brazil, Nigeria, Benin, Cameroon, Republic of the Congo, Côte d’Ivoire, Togo, Kenya, and Uganda.
FS-5
| | | | | | | | | | |
Management’s Discussion and Analysis of
Financial Condition and Results of Operations
|
| | | | | | | | | | |
Other
Common Stock Dividends Increased the quarterly common stock dividend by 12.1 percent in April 2008 to $0.65 per share. 2008 was the 21st consecutive year that the company increased its annual dividend payment.
Common Stock Repurchase Program Acquired $8.0 billion of common shares in 2008 as part of a $15 billion repurchase program initiated in 2007.
Results of Operations
Major Operating Areas The following section presents the results of operations for the company’s business segments – upstream, downstream and chemicals – as well as for “all other,” which includes mining, power generation businesses, the various companies and departments that are managed at the corporate level, and the company’s investment in Dynegy prior to its sale in May 2007. Income is also presented for the U.S. and international geographic areas of the upstream and downstream business segments. (Refer to Note 9, beginning on page FS-38, for a discussion of the company’s “reportable segments,” as defined in Financial Accounting Standards Board (FASB) Statement No. 131,Disclosures About Segments of an Enterprise and Related Information.) This section should also be read in conjunction with the discussion in “Business Environment and Outlook” on pages FS-2 through FS-5.
U.S. Upstream – Exploration and Production
| | | | | | | | | | | | | | |
| Millions of dollars | | 2008 | | | | 2007 | | | 2006 | |
| | | | | |
Income | | $ | 7,126 | | | | $ | 4,532 | | | $ | 4,270 | |
| | | | | |
U.S upstream income of $7.1 billion in 2008 increased $2.6 billion from 2007. Higher average prices for crude oil and natural gas increased earnings by $3.1 billion between periods. Also contributing to the higher earnings were gains of approximately $1 billion on asset sales, including a $600 million gain on an asset-exchange transaction. Partially offsetting these benefits were adverse effects of about $1.6 billion associated with lower oil-equivalent production and higher operating expenses, which included approximately $400 million of expenses resulting from damage to facilities in the Gulf of Mexico caused by hurricanes Gustav and Ike in September.
Income of $4.5 billion in 2007 increased approximately $260 million from 2006. Results in 2007 benefited approximately $700 million from higher prices for crude oil and natural gas liquids. This benefit to income was partially offset by the effects of a decline in oil-equivalent production and an increase in depreciation, operating and exploration expenses.
The company’s average realization for crude oil and natural gas liquids in 2008 was $88.43 per barrel, compared with $63.16 in 2007 and $56.66 in 2006. The average natural gas realization was $7.90 per thousand cubic feet in 2008, compared with $6.12 and $6.29 in 2007 and 2006, respectively.
Net oil-equivalent production in 2008 averaged 671,000 barrels per day, down 9.7 percent and 12.1 percent from 2007 and 2006, respectively. The decrease between 2007 and 2008 was mainly due to normal field declines and the adverse impact of the hurricanes. The decline in 2007 from 2006 was due primarily to normal field declines. The net liquids component of oil-equivalent production for 2008 averaged 421,000 barrels per day, down approximately 8 percent from 2007 and down 9 percent compared with 2006. Net natural gas production averaged 1.5 billion cubic feet per day in 2008, down 12 percent from 2007 and down 17 percent from 2006.
Refer to the “Selected Operating Data” table on page FS-10 for the three-year comparative production volumes in the United States.
International Upstream – Exploration and Production
| | | | | | | | | | | | | | |
| Millions of dollars | | 2008 | | | | 2007 | | | 2006 | |
| | | | | |
Income* | | $ | 14,584 | | | | $ | 10,284 | | | $ | 8,872 | |
| | | | | |
| *Includes Foreign Currency Effects: | | | $ 873 | | | | | $ (417 | ) | | | $ (371 | ) |
International upstream income of $14.6 billion in 2008 increased $4.3 billion from 2007. Higher prices for crude oil and natural gas increased earnings by $4.9 billion. Partially offsetting the benefit of higher prices was an impact of about $1.8 billion associated with a reduction of crude-oil sales volumes due to timing of certain cargo liftings and higher depreciation and operating expenses. Foreign currency effects benefited earnings by $873 million in 2008, compared with reductions to earnings of $417 million in 2007 and $371 million in 2006.
FS-6
Income in 2007 of $10.3 billion increased $1.4 billion from 2006. Earnings in 2007 benefited approximately $1.6 billion from higher prices, primarily for crude oil, and $300 million from increased liftings. Non-recurring income-tax items also benefited earnings between periods. These benefits to income were partially offset by the impact of higher operating and depreciation expenses.
The company’s average realization for crude oil and natural gas liquids in 2008 was $86.51 per barrel, compared with $65.01 in 2007 and $57.65 in 2006. The average natural gas realization was $5.19 per thousand cubic feet in 2008, compared with $3.90 and $3.73 in 2007 and 2006, respectively.
Net oil-equivalent production of 1.86 million barrels per day in 2008 declined about 1 percent and 2 percent from 2007 and 2006, respectively. The volumes for each year included production from oil sands in Canada. Volumes in 2006 also included production under an operating service agreement in Venezuela until its conversion to a joint-stock company in October of that year. Absent the impact of higher prices on certain production-sharing and variable-royalty agreements, net oil-equivalent production increased between 2007 and 2008. The decline in 2007 from 2006 was associated with the impact of the contract conversion in Venezuela and the impact of higher prices on production-sharing agreements.
The net liquids component of oil-equivalent production was 1.3 million barrels per day in 2008, a decrease of 5 percent from 2007 and 9 percent from 2006. Net natural gas production of 3.6 billion cubic feet per day in 2008 was up 9 percent and 15 percent from 2007 and 2006, respectively.
Refer to the “Selected Operating Data” table, on page FS-10, for the three-year comparative of international production volumes.
U.S. Downstream – Refining, Marketing and Transportation
| | | | | | | | | | | | | | |
| Millions of dollars | | 2008 | | | | 2007 | | | 2006 | |
| | | | | |
Income | | $ | 1,369 | | | | $ | 966 | | | $ | 1,938 | |
| | | | | |
U.S downstream earnings of $1.4 billion in 2008 increased about $400 million from 2007 due mainly to improved margins on the sale of refined products and gains on derivative commodity instruments. Operating expenses were higher between periods. Income of $966 million in 2007 decreased nearly $1 billion from 2006. The decline was associated mainly with lower refined-product margins and higher planned and unplanned refinery downtime than a year earlier. Operating expenses were also higher in 2007 than in 2006.
Sales volumes of refined products were 1.41 million barrels per day in 2008, a decrease of 3 percent from 2007. The decline was associated with reduced sales of gasoline and fuel oil. Sales volumes of refined products were 1.46 million barrels per day in 2007, a decrease of 3 percent from 2006. The reported sales volume for 2007 was on a different basis than 2006 due to a change in accounting rules that became effective April 1, 2006, for certain purchase-and-sale (buy/ sell) contracts with the same counterparty. Excluding the
impact of this accounting standard, refined-product sales in 2007 decreased 1 percent from 2006. Branded gasoline sales volumes of 601,000 barrels per day in 2008 was down about 4 percent and 2 percent from 2007 and 2006, respectively.
Refer to the “Selected Operating Data” table on page FS-10 for a three-year comparative of sales volumes of gasoline and other refined products and refinery-input volumes. Refer also to Note 14, “Accounting for Buy/Sell Contracts,” on page FS-43 for a discussion of the accounting for purchase-and-sale contracts with the same counterparty.
International Downstream – Refining, Marketing and Transportation
| | | | | | | | | | | | | | |
| Millions of dollars | | 2008 | | | | 2007 | | | 2006 | |
| | | | | |
Income* | | $ | 2,060 | | | | $ | 2,536 | | | $ | 2,035 | |
| | | | | |
| *Includes Foreign Currency Effects: | | | $ 193 | | | | | $ 62 | | | | $ 98 | |
International downstream income of $2.1 billion in 2008 decreased nearly $500 million from 2007. Earnings in 2007 included gains of approximately $1 billion on the sale of assets, which included an interest in a refinery and marketing assets in the Benelux region of Europe. The $500 million improvement otherwise between years was associated primarily with a benefit from gains on derivative commodity instruments that was only partially offset by the impact of lower margins on the sale of refined products. Foreign currency effects increased earnings by $193 million in 2008, compared with $62 million in 2007. Income in 2007 of $2.5 billion increased $500 million from 2006, largely due to the gains on asset sales. Margins on the sale of refined products in 2007 were up slightly from 2006. Operating expenses were higher, and earnings from the company’s shipping operations were lower.
FS-7
| | | | | | | | | | |
Management’s Discussion and Analysis of
Financial Condition and Results of Operations
|
| | | | | | | | | | |
Refined-product sales volumes were 2.02 million barrels per day in 2008, about 1 percent lower than 2007 due mainly to reduced sales of gas oil and fuel oil. Refined product sales volumes were 2.03 million barrels per day in 2007, about 5 percent lower than 2006. The decline in 2007 was largely due to the impact of asset sales and the accounting-standard change for buy/sell contracts. Excluding the accounting change, sales decreased about 4 percent.
Refer to the “Selected Operating Data” table, on page FS-10, for a three-year comparative of sales volumes of gasoline and other refined products and refinery-input volumes. Refer also to Note 14, “Accounting for Buy/Sell Contracts,” on page FS-43 for a discussion of the accounting for purchase-and-sale contracts with the same counterparty.
Chemicals
| | | | | | | | | | | | | | |
| Millions of dollars | | 2008 | | | | 2007 | | | 2006 | |
| | | | | |
Income* | | $ | 182 | | | | $ | 396 | | | $ | 539 | |
| | | | | |
| *Includes Foreign Currency Effects: | | | $ (18 | ) | | | | $ (3 | ) | | | $ (8 | ) |
The chemicals segment includes the company’s Oronite subsidiary and the 50 percent-owned Chevron Phillips Chemical Company LLC (CPChem). In 2008, earnings were $182 million, compared with $396 million and $539 million in 2007 and 2006, respectively. Earnings declined in 2008 due to lower sales volumes of commodity chemicals by CPChem. Higher expenses for planned maintenance activities also contributed to the earnings decline. Earnings also declined for the company’s Oronite subsidiary due to lower volumes and higher operating expenses. In 2007, earnings of $396 million decreased $143 million from 2006 due to the impact of lower margins on the sale of commodity chemicals by CPChem that were only partially offset by improved margins on Oronite’s sales of additives for lubricants and fuel.
All Other
| | | | | | | | | | | | | | |
| Millions of dollars | | 2008 | | | | 2007 | | | 2006 | |
| | | | | |
Net Charges* | | $ | (1,390 | ) | | | $ | (26 | ) | | $ | (516 | ) |
| | | | | |
| *Includes Foreign Currency Effects: | | | $ (186 | ) | | | | $ 6 | | | | $ 62 | |
All Other includes mining operations, power generation businesses, worldwide cash management and debt financing activities, corporate administrative functions, insurance operations, real estate activities, alternative fuels and technology companies, and the company’s interest in Dynegy prior to its sale in May 2007.
Net charges in 2008 increased $1.4 billion from 2007. Results in 2007 included a $680 million gain on the sale of the company’s investment in Dynegy common stock and a loss of approximately $175 million associated with the early redemption of Texaco Capital Inc. bonds. Results in 2008 included net unfavorable
corporate tax items and increased costs of environmental remediation for sites that previously had been closed or sold. Foreign exchange effects also contributed to the increase in net charges between years. Net charges of $26 million in 2007 decreased $490 million from 2006 due mainly to the Dynegy-related gain in 2007.
Consolidated Statement of Income
Comparative amounts for certain income statement categories are shown below:
| | | | | | | | | | | | | | |
| Millions of dollars | | 2008 | | | | 2007 | | | 2006 | |
| | | | | |
Sales and other operating revenues | | $ | 264,958 | | | | $ | 214,091 | | | $ | 204,892 | |
| | | | | |
Sales and other operating revenues increased in the comparative periods due mainly to higher prices for crude oil, natural gas and refined products.
| | | | | | | | | | | | | | |
| Millions of dollars | | 2008 | | | | 2007 | | | 2006 | |
| | | | | |
Income from equity affiliates | | $ | 5,366 | | | | $ | 4,144 | | | $ | 4,255 | |
| | | | | |
FS-8
Income from equity affiliates increased in 2008 from 2007 on improved upstream-related earnings at Tengizchevroil (TCO) due to higher prices for crude oil. Lower income from equity affiliates between 2006 and 2007 was mainly due to a decline in earnings from CPChem, Dynegy (sold in May 2007) and downstream affiliates in the Asia-Pacific area. Partially offsetting these declines were improved results for TCO and income for a full year from Petroboscan, which was converted from an operating service agreement to a joint-stock company in October 2006. Refer to Note 12, beginning on page FS-41, for a discussion of Chevron’s investments in affiliated companies.
| | | | | | | | | | | | | | |
| Millions of dollars | | 2008 | | | | 2007 | | | 2006 | |
| | | | |
Other income | | $ | 2,681 | | | | $ | 2,669 | | | $ | 971 | |
| | | | |
Other income of $2.7 billion in 2008 included gains of approximately $1.3 billion on asset sales. Other income of $2.7 billion in 2007 included net gains of $1.7 billion from asset sales and a loss of $245 million on the early redemption of debt. Interest income was approximately $340 million in 2008 and $600 million in both 2007 and 2006. Foreign currency effects benefited other income by $355 million in 2008 while reducing other income by $352 million and $260 million in 2007 and 2006, respectively.
| | | | | | | | | | | | | | |
| Millions of dollars | | 2008 | | | | 2007 | | | 2006 | |
| | | | |
Purchased crude oil and products | | $ | 171,397 | | | | $ | 133,309 | | | $ | 128,151 | |
| | | | |
Crude oil and product purchases in 2008 increased $38.1 billion from 2007 due to higher prices for crude oil, natural gas and refined products. Crude oil and product purchases in 2007 increased more than $5 billion from 2006 due to these same factors.
| | | | | | | | | | | | | | |
| Millions of dollars | | 2008 | | | | 2007 | | | 2006 | |
| | | | |
Operating, selling, general and administrative expenses | | $ | 26,551 | | | | $ | 22,858 | | | $ | 19,717 | |
| | | | |
Operating, selling, general and administrative expenses in 2008 increased approximately $3.7 billion from 2007 primarily due to $1.2 billion of higher costs for employee and contract labor; $800 million of increased costs for materials, services and equipment; $700 million of uninsured losses associated with hurricanes in the Gulf of Mexico in 2008; and an increase of about $300 million for environmental remediation activities. Total expenses were about $3.1 billion higher in 2007 than in 2006. Increases were recorded in a number of categories, including $1.5 billion of higher costs for employee and contract labor.
| | | | | | | | | | | | | | |
| Millions of dollars | | 2008 | | | | 2007 | | | 2006 | |
| | | | |
Exploration expense | | $ | 1,169 | | | | $ | 1,323 | | | $ | 1,364 | |
| | | | |
Exploration expenses in 2008 declined from 2007 due mainly to lower amounts for well write-offs for operations in the United States. Expenses in 2007 were essentially unchanged from 2006.
| | | | | | | | | | | | | | |
| Millions of dollars | | 2008 | | | | 2007 | | | 2006 | |
| | | | |
Depreciation, depletion and amortization | | $ | 9,528 | | | | $ | 8,708 | | | $ | 7,506 | |
| | | | |
Depreciation, depletion and amortization expenses increased in 2008 from 2007 largely due to higher depreciation rates for certain crude oil and natural gas producing fields, reflecting completion of higher-cost development projects and asset-retirement obligations. The increase between 2006 and 2007 reflects an increase in charges related to asset write-downs and higher depreciation rates for certain crude oil and natural gas producing fields worldwide.
| | | | | | | | | | | | | | |
| Millions of dollars | | 2008 | | | | 2007 | | | 2006 | |
| | | | |
Taxes other than on income | | $ | 21,303 | | | | $ | 22,266 | | | $ | 20,883 | |
| | | | |
Taxes other than on income decreased between 2007 and 2008 periods mainly due to lower import duties as a result of the effects of the 2007 sales of the company’s Benelux refining and marketing businesses and a decline in import volumes in the United Kingdom. Taxes other than on income increased between 2006 and 2007 due to higher import duties in the company’s U.K. downstream operations in 2007.
| | | | | | | | | | | | | | |
| Millions of dollars | | 2008 | | | | 2007 | | | 2006 | |
| | | | |
Interest and debt expense | | $ | – | | | | $ | 166 | | | $ | 451 | |
| | | | |
Interest and debt expense decreased significantly in 2008 because all interest-related amounts were being capitalized. Interest and debt expense in 2007 decreased from 2006 primarily due to lower average debt balances and higher amounts of interest capitalized.
| | | | | | | | | | | | | | |
| Millions of dollars | | 2008 | | | | 2007 | | | 2006 | |
| | | | |
Income tax expense | | $ | 19,026 | | | | $ | 13,479 | | | $ | 14,838 | |
| | | | |
Effective income tax rates were 44 percent in 2008, 42 percent in 2007 and 46 percent in 2006. Rates were higher between 2007 and 2008 primarily due to a greater proportion of income earned in tax jurisdictions with higher income tax rates. In addition, the 2007 period included a relatively low effective tax rate on the sale of the company’s investment in Dynegy common stock and the sale of downstream assets in Europe. Rates were lower in 2007 compared with 2006 due mainly to the impact of nonrecurring items in 2007 mentioned above and the absence of 2006 charges related to a tax-law change that increased tax rates on upstream operations in the U.K. North Sea and the settlement of a tax claim in Venezuela. Refer also to the discussion of income taxes in Note 16 beginning on page FS-45.
FS-9
| | | | | | | | | | |
Management’s Discussion and Analysis of
Financial Condition and Results of Operations
| | | | | | | | | |
| | | | | | | | | | |
Selected Operating Data1,2
| | | | | | | | | | | | | | |
| | | 2008 | | | | 2007 | | | 2006 | |
| | | | |
U.S. Upstream | | | | | | | | | | | | | |
| Net Crude Oil and Natural Gas Liquids Production (MBPD) | | | 421 | | | | | 460 | | | | 462 | |
Net Natural Gas Production (MMCFPD)3 | | | 1,501 | | | | | 1,699 | | | | 1,810 | |
| Net Oil-Equivalent Production (MBOEPD) | | | 671 | | | | | 743 | | | | 763 | |
| Sales of Natural Gas (MMCFPD) | | | 7,226 | | | | | 7,624 | | | | 7,051 | |
| Sales of Natural Gas Liquids (MBPD) | | | 159 | | | | | 160 | | | | 124 | |
| Revenues From Net Production | | | | | | | | | | | | | |
| Liquids ($/Bbl) | | $ | 88.43 | | | | $ | 63.16 | | | $ | 56.66 | |
| Natural Gas ($/MCF) | | $ | 7.90 | | | | $ | 6.12 | | | $ | 6.29 | |
| | | | | | | | | | | | | | |
International Upstream | | | | | | | | | | | | | |
| Net Crude Oil and Natural Gas Liquids Production (MBPD) | | | 1,228 | | | | | 1,296 | | | | 1,270 | |
Net Natural Gas Production (MMCFPD)3 | | | 3,624 | | | | | 3,320 | | | | 3,146 | |
Net Oil-Equivalent Production (MBOEPD)4 | | | 1,859 | | | | | 1,876 | | | | 1,904 | |
| Sales Natural Gas (MMCFPD) | | | 4,215 | | | | | 3,792 | | | | 3,478 | |
| Sales Natural Gas Liquids (MBPD) | | | 114 | | | | | 118 | | | | 102 | |
| Revenues From Liftings | | | | | | | | | | | | | |
| Liquids ($/Bbl) | | $ | 86.51 | | | | $ | 65.01 | | | $ | 57.65 | |
| Natural Gas ($/MCF) | | $ | 5.19 | | | | $ | 3.90 | | | $ | 3.73 | |
| | | | | | | | | | | | | | |
Worldwide Upstream | | | | | | | | | | | | | |
Net Oil-Equivalent Production (MBOEPD)3,4 | | | | | | | | | | | | | |
| United States | | | 671 | | | | | 743 | | | | 763 | |
| International | | | 1,859 | | | | | 1,876 | | | | 1,904 | |
| | | | | | |
| Total | | | 2,530 | | | | | 2,619 | | | | 2,667 | |
| | | | | | | | | | | | | | |
U.S. Downstream | | | | | | | | | | | | | |
Gasoline Sales (MBPD)5 | | | 692 | | | | | 728 | | | | 712 | |
| Other Refined-Product Sales (MBPD) | | | 721 | | | | | 729 | | | | 782 | |
| | | | | | |
Total (MBPD)6 | | | 1,413 | | | | | 1,457 | | | | 1,494 | |
| Refinery Input (MBPD) | | | 891 | | | | | 812 | | | | 939 | |
| | | | | | | | | | | | | | |
International Downstream | | | | | | | | | | | | | |
Gasoline Sales (MBPD)5 | | | 589 | | | | | 581 | | | | 595 | |
| Other Refined-Product Sales (MBPD) | | | 1,427 | | | | | 1,446 | | | | 1,532 | |
| | | | | | |
Total (MBPD)6, 7 | | | 2,016 | | | | | 2,027 | | | | 2,127 | |
| Refinery Input (MBPD) | | | 967 | | | | | 1,021 | | | | 1,050 | |
| | | | |
| | | | | | | | | | | | | |
1 Includes interest in affiliates.
|
| 2 MBPD = Thousands of barrels per day; MMCFPD = Millions of cubic feet per day; |
| MBOEPD = Thousands of barrels of oil-equivalents per day; Bbl = Barrel; |
| MCF = Thousands of cubic feet. Oil-equivalent gas (OEG) conversion ratio is 6,000 cubic feet |
| of gas = 1 barrel of oil. |
| 3 Includes natural gas consumed in operations (MMCFPD): |
| United States | | | 70 | | | | 65 | | | | 56 | |
| International | | | 450 | | | | 433 | | | | 419 | |
4 Includes other produced volumes (MBPD): | | | | | | | | | | | | |
| Athabasca Oil Sands – Net | | | 27 | | | | 27 | | | | 27 | |
| Boscan Operating Service Agreement | | | – | | | | – | | | | 82 | |
| | | |
| | | | 27 | | | | 27 | | | | 109 | |
| 5 Includes branded and unbranded gasoline. |
| 6 Includes volumes for buy/sell contracts (MBPD): |
| United States | | | – | | | | – | | | | 26 | |
| International | | | – | | | | – | | | | 24 | |
| 7 Includes sales of affiliates (MBPD): | | | 512 | | | | 492 | | | | 492 | |
Liquidity and Capital Resources
Cash, cash equivalents and marketable securities Total balances were $9.6 billion and $8.1 billion at December 31, 2008 and 2007, respectively. Cash provided by operating activities in 2008 was $29.6 billion, compared with $25.0 billion in 2007 and $24.3 billion in 2006.
Cash provided by operating activities was net of contributions to employee pension plans of approximately $800 million, $300 million and $400 million in 2008, 2007 and 2006, respectively. Cash provided by investing activities included proceeds from asset sales of $1.5 billion in 2008, $3.3 billion in 2007 and $1.0 billion in 2006.
At December 31, 2008, restricted cash of $367 million associated with capital-investment projects at the company’s Pascagoula, Mississippi, refinery and Angola liquefied natural gas project was invested in short-term marketable securities and reclassified from cash equivalents to a long-term asset on the Consolidated Balance Sheet.
Dividends The company paid dividends of approximately $5.2 billion in 2008, $4.8 billion in 2007 and $4.4 billion in 2006. In April 2008, the company increased its quarterly common stock dividend by 12.1 percent to $0.65 per share.
Debt, capital lease and minority interest obligations Total debt and capital lease balances were $8.9 billion at December 31, 2008, up from $7.2 billion at year-end 2007. The company also had minority interest obligations of $469 million and $204 million at December 31, 2008 and 2007, respectively.
The $1.7 billion increase in total debt and capital lease obligations during 2008 included the net effect of an approximate $2.7 billion increase in commercial paper and $749 million of Chevron Canada Funding Company bonds that matured. The company’s debt and capital lease obligations due within one year, consisting primarily of commercial paper and the current portion of long-term debt, totaled $7.8 billion at December 31, 2008, up from $5.5 billion at year-end 2007. Of these amounts, $5.0 billion and $4.4 billion were reclassified to long-term at the end of each period, respectively. At year-end 2008, settlement of these obligations was not expected to require the use of working capital within one year, as the company had the intent and the ability, as evidenced by committed credit facilities, to refinance them on a long-term basis.
At year-end 2008, the company had $5 billion in committed credit facilities with various major banks, which permit the refinancing of short-term obligations on a long-term basis. These facilities support commercial-paper borrowing and also can be used for general corporate purposes. The company’s practice has been to continually
FS-10
replace expiring commitments with new commitments on substantially the same terms, maintaining levels management believes appropriate. Terms of new commitments in the future will be subject to market conditions at the time of renewal. Any borrowings under the facilities would be
unsecured indebtedness at interest rates based on London Interbank Offered Rate or an average of base lending rates published by specified banks and on terms reflecting the company’s strong credit rating. No borrowings were outstanding under these facilities at December 31, 2008. In addition, the company has an automatic shelf registration statement that expires in March 2010 for an unspecified amount of nonconvertible debt securities issued or guaranteed by the company. In January 2009, the company’s Board of Directors authorized the issuance of one or more series of notes or debentures in an aggregate amount up to $5 billion for a term not to exceed ten years.
At December 31, 2008, the company had outstanding public bonds issued by Chevron Corporation Profit Sharing/Savings Plan Trust Fund, Texaco Capital Inc. and Union Oil Company of California. All of these securities are guaranteed by Chevron Corporation and are rated AA by Standard and Poor’s Corporation and Aa1 by Moody’s Investors Service. The company’s U.S. commercial paper is rated A-1+ by Standard and Poor’s and P-1 by Moody’s. All of these ratings denote high-quality, investment-grade securities.
The company’s future debt level is dependent primarily on results of operations, the capital-spending program and cash that may be generated from asset dispositions. During periods of low prices for crude oil and natural gas and narrow margins for refined products and commodity chemicals, the company has the flexibility to increase borrowings and/or modify capital-spending plans to continue paying the common stock dividend and maintain the company’s high-quality debt ratings.
Common stock repurchase program In September 2007, the company authorized the acquisition of up to $15 billion of additional common shares from time to time at prevailing prices, as permitted by securities laws and other legal requirements and subject to market conditions and other factors. The program is for a period of up to three years and may be discontinued at any time. Through December 31, 2008, 119 million shares had been acquired under the program for $10.1 billion, including $8.0 billion in 2008. These amounts include shares acquired in October 2008 as part of an asset-exchange transaction described in Note 2 beginning on page FS-34. The company did not acquire any shares in early 2009 and does not plan to acquire any shares in the 2009 first quarter.
Capital and exploratory expenditures Total reported expenditures for 2008 were $22.8 billion, including $2.3 billion for the company’s share of affiliates’ expenditures, which did not require cash outlays by the company. In 2007 and 2006, expenditures were $20.0 billion and $16.6 billion, respectively, including the company’s share of affiliates’ expenditures of $2.3 billion and $1.9 billion in the corresponding periods.
Of the $22.8 billion in expenditures for 2008, about three-fourths, or $17.5 billion, related to upstream activities. Approximately the same percentage was also expended for upstream operations in 2007 and 2006. International upstream accounted for about 70 percent of the worldwide
upstream investment in each of the three years, reflecting the company’s continuing focus on opportunities that are available outside the United States.
The company estimates that in 2009, capital and exploratory expenditures will be $22.8 billion, including $1.8 billion of spending by affiliates. About three-fourths of the total, or $17.5 billion, is budgeted for exploration and production activities, with $13.9 billion of this amount outside the United States. Spending in 2009 is primarily targeted for exploratory prospects in the deepwater U.S. Gulf of Mexico, western Africa, and the Gulf of Thailand and major development projects in Angola, Australia, Brazil, Indonesia, Nigeria, Thailand and the deepwater U.S. Gulf of Mexico. Also included are one-time payments associated with upstream operating agreements in China and the Partitioned Neutral Zone between Saudi Arabia and Kuwait.
FS-11
| | | | | | | | | | |
Management’s Discussion and Analysis of
Financial Condition and Results of Operations
|
| | | | | | | | | | |
Capital and Exploratory Expenditures
| | | | | | | | | | | | | | | | | | | | | | | | | | | | | | | | | | | | | | | |
| | | 2008 | | | | 2007 | | | | 2006 | |
| Millions of dollars | | U.S. | | | Int’l. | | | Total | | | | U.S. | | | Int’l. | | | Total | | | | U.S. | | | Int’l. | | | Total | |
| | | | | | | | |
| Upstream – Exploration and Production | | $ | 5,516 | | | $ | 11,944 | | | $ | 17,460 | | | | $ | 4,558 | | | $ | 10,980 | | | $ | 15,538 | | | | $ | 4,123 | | | $ | 8,696 | | | $ | 12,819 | |
| Downstream – Refining, Marketing and Transportation | | | 2,182 | | | | 2,023 | | | | 4,205 | | | | | 1,576 | | | | 1,867 | | | | 3,443 | | | | | 1,176 | | | | 1,999 | | | | 3,175 | |
| Chemicals | | | 407 | | | | 78 | | | | 485 | | | | | 218 | | | | 53 | | | | 271 | | | | | 146 | | | | 54 | | | | 200 | |
| All Other | | | 618 | | | | 7 | | | | 625 | | | | | 768 | | | | 6 | | | | 774 | | | | | 403 | | | | 14 | | | | 417 | |
| | | | | | | | |
| Total | | $ | 8,723 | | | $ | 14,052 | | | $ | 22,775 | | | | $ | 7,120 | | | $ | 12,906 | | | $ | 20,026 | | | | $ | 5,848 | | | $ | 10,763 | | | $ | 16,611 | |
| | | | | | | | |
| Total, Excluding Equity in Affiliates | | $ | 8,241 | | | $ | 12,228 | | | $ | 20,469 | | | | $ | 6,900 | | | $ | 10,790 | | | $ | 17,690 | | | | $ | 5,642 | | | $ | 9,050 | | | $ | 14,692 | |
| | | | | | | | |
Worldwide downstream spending in 2009 is estimated at $4.3 billion, with about $2.0 billion for projects in the United States. Capital projects include upgrades to refineries in the United States and South Korea and construction of a gas-to-liquids facility in support of associated upstream projects.
Investments in chemicals, technology and other corporate businesses in 2009 are budgeted at $1.0 billion. Technology investments include projects related to unconventional hydrocarbon technologies, oil and gas reservoir management, and gas-fired and renewable power generation.
Pension Obligations In 2008, the company’s pension plan contributions were $839 million (including $577 million to the U.S. plans). The company estimates contributions in 2009 will be approximately $800 million. Actual contribution amounts are dependent upon plan-investment results, changes in pension obligations, regulatory requirements and other economic factors. Additional funding may be required if investment returns are insufficient to offset increases in plan obligations. Refer also to the discussion of pension accounting in “Critical Accounting Estimates and Assumptions,” beginning on page FS-18.
Financial Ratios
Financial Ratios
| | | | | | | | | | | | | | |
| | | At December 31 | |
| | | 2008 | | | | 2007 | | | 2006 | |
| | | | | |
| Current Ratio | | | 1.1 | | | | | 1.2 | | | | 1.3 | |
| Interest Coverage Ratio | | | 166.9 | | | | | 69.2 | | | | 53.5 | |
| Debt Ratio | | | 9.3 | % | | | | 8.6 | % | | | 12.5 | % |
| | | | | |
Current Ratio – current assets divided by current liabilities. The current ratio in all periods was adversely affected by the fact that Chevron’s inventories are valued on a Last-In, First-Out basis. At year-end 2008, the book value of inventory was lower than replacement costs, based on average acquisition costs during the year, by approximately $9 billion.
Interest Coverage Ratio – income before income tax expense, plus interest and debt expense and amortization of capitalized interest, divided by before-tax interest costs. The company’s interest coverage ratio was higher between 2007 and 2008 and between 2006 and 2007, primarily due to higher before-tax income and lower average debt balances in each of the subsequent years.
Debt Ratio – total debt as a percentage of total debt plus equity. The increase between 2007 and 2008 was primarily due to higher debt. The decrease between 2006 and 2007 was due to lower debt and higher stockholders’ equity balance.
Guarantees, Off-Balance-Sheet Arrangements and Contractual Obligations, and Other Contingencies
Direct Guarantee
| | | | | | | | | | | | | | | | | | | | | |
| Millions of dollars | | Commitment Expiration by Period | |
| | | | | | | | | | | 2010– | | | 2012– | | | After | |
| | | Total | | | 2009 | | | 2011 | | | 2013 | | | 2013 | |
| |
| Guarantee of non-consolidated affiliate or joint-venture obligation | | $ | 613 | | | $ | – | | | $ | – | | | $ | 76 | | | $ | 537 | |
| |
The company’s guarantee of approximately $600 million is associated with certain payments under a terminal-use agreement entered into by a company affiliate. The terminal is expected to be operational by 2012. Over the approximate 16-year term of the guarantee, the maximum guarantee amount will be reduced as certain fees are paid by the affiliate.
FS-12
There are numerous cross-indemnity agreements with the affiliate and the other partners to permit recovery of any amounts paid under the guarantee. Chevron has recorded no liability for its obligation under this guarantee.
Indemnifications The company provided certain indemnities of contingent liabilities of Equilon and Motiva to Shell and Saudi Refining, Inc., in connection with the February 2002 sale of the company’s interests in those investments. The company would be required to perform if the indemnified liabilities become actual losses. Were that to occur, the company could be required to make future payments up to $300 million. Through the end of 2008, the company had paid $48 million under these indemnities and continues to be obligated for possible additional indemnification payments in the future.
The company has also provided indemnities relating to contingent environmental liabilities related to assets originally contributed by Texaco to the Equilon and Motiva joint ventures and environmental conditions that existed prior to the formation of Equilon and Motiva or that occurred during the period of Texaco’s ownership interest in the joint ventures. In general, the environmental conditions or events that are subject to these indemnities must have arisen prior to December 2001. Claims must be asserted no later than February 2009 for Equilon indemnities and no later than February 2012 for Motiva indemnities. Under the terms of these indemnities, there is no maximum limit on the amount of potential future payments. In February 2009, Shell delivered a letter to the company purporting to preserve unmatured claims for certain Equilon indemnities. The letter itself provides no estimate of the ultimate claim amount, and management does not believe the letter provides a basis to estimate the amount, if any, of a range of loss or potential range of loss with respect to Equilon or the Motiva indemnities. The company posts no assets as collateral and has made no payments under the indemnities.
The amounts payable for the indemnities described above are to be net of amounts recovered from insurance carriers and others and net of liabilities recorded by Equilon or Motiva prior to September 30, 2001, for any applicable incident.
In the acquisition of Unocal, the company assumed certain indemnities relating to contingent environmental liabilities associated with assets that were sold in 1997. Under the indemnification agreement, the company’s liability is unlimited until April 2022, when the indemnification expires. The acquirer shares in certain environmental remediation costs up to a maximum obligation of $200 million, which had not been reached as of December 31, 2008.
Securitization During 2008, the company terminated the program used to securitize downstream-related trade accounts receivable. At year-end 2007, the balance of securitized receivables was $675 million. As of December 31, 2008, the company had no other securitization arrangements in place.
Minority Interests The company has commitments of $469 million related to minority interests in subsidiary companies.
Long-Term Unconditional Purchase Obligations and Commitments, Including Throughput and Take-or-Pay Agreements The company and its subsidiaries have certain other contingent liabilities relating to long-term unconditional purchase obligations and commitments, including throughput and take-or-pay agreements, some of which relate to suppliers’ financing arrangements. The agreements typically provide goods and services, such as pipeline and storage capacity, drilling rigs, utilities, and petroleum products, to be used or sold in the ordinary course of the company’s business. The aggregate approximate amounts of required payments under these various commitments are: 2009 – $6.4 billion; 2010 – $4.0 billion; 2011 – $3.6 billion; 2012 – $1.5 billion; 2013 – $1.3 billion; 2014 and after – $4.3 billion. A portion of these commitments may ultimately be shared with project partners. Total payments under the agreements were approximately $5.1 billion in 2008, $3.7 billion in 2007 and $3.0 billion in 2006.
The following table summarizes the company’s significant contractual obligations:
Contractual Obligations1
| | | | | | | | | | | | | | | | | | | | | |
| Millions of dollars | | Payments Due by Period | |
| | | | | | | | | | | 2010– | | | 2012– | | | After | |
| | | Total | | | 2009 | | | 2011 | | | 2013 | | | 2013 | |
| | |
On Balance Sheet:2 | | | | | | | | | | | | | | | | | | | | |
Short-Term Debt3 | | $ | 2,818 | | | $ | 2,818 | | | $ | – | | | $ | – | | | $ | – | |
Long-Term Debt3 | | | 5,742 | | | | – | | | | 5,061 | | | | 74 | | | | 607 | |
| Noncancelable Capital Lease Obligations | | | 548 | | | | 97 | | | | 154 | | | | 143 | | | | 154 | |
| Interest | | | 2,133 | | | | 174 | | | | 322 | | | | 312 | | | | 1,325 | |
| Off-Balance-Sheet: | | | | | | | | | | | | | | | | | | | | |
| Noncancelable Operating Lease Obligations | | | 2,888 | | | | 503 | | | | 835 | | | | 603 | | | | 947 | |
| Throughput and Take-or-Pay Agreements | | | 15,726 | | | | 5,063 | | | | 5,383 | | | | 1,261 | | | | 4,019 | |
Other Unconditional Purchase Obligations4 | | | 5,356 | | | | 1,342 | | | | 2,159 | | | | 1,541 | | | | 314 | |
| | |
| 1 | | Excludes contributions for pensions and other postretirement benefit plans. Information on employee benefit plans is contained in Note 22 beginning on page FS-51. |
| |
| 2 | | Does not include amounts related to the company’s income tax liabilities associated with uncertain tax positions. The company is unable to make reasonable estimates for the periods in which these liabilities may become payable. The company does not expect settlement of such liabilities will have a material effect on its results of operations, consolidated financial position or liquidity in any single period. |
| |
| 3 | | $5.0 billion of short-term debt that the company expects to refinance is included in long-term debt. The repayment schedule above reflects the projected repayment of the entire amounts in the 2010–2011 period. |
| |
| 4 | | Does not include obligations to purchase the company’s share of natural gas liquids and regasified natural gas associated with operations of the 36.4 percent-owned Angola LNG affiliate. The LNG plant is expected to commence operations in 2012 and is designed to produce 5.2 million metric tons of liquefied natural gas and related natural gas liquids per year. Volumes and prices associated with these purchase obligations are neither fixed nor determinable. |
Financial and Derivative Instruments
The market risk associated with the company’s portfolio of financial and derivative instruments is discussed below. The estimates of financial exposure to market risk discussed below do not represent the company’s projection of future market changes. The actual impact of future market changes could differ materially due to factors discussed elsewhere in this report, including those set forth under the heading “Risk
FS-13
| | | | | | | | | | |
Management’s Discussion and Analysis of
Financial Condition and Results of Operations
|
| | | | | | | | | | |
Factors” in Part I, Item 1A, of the company’s 2008 Annual Report on Form 10-K.
Derivative Commodity Instruments Chevron is exposed to market risks related to the price volatility of crude oil, refined products, natural gas, natural gas liquids, liquefied natural gas and refinery feedstocks.
The company uses derivative commodity instruments to manage these exposures on a portion of its activity, including firm commitments and anticipated transactions for the purchase, sale and storage of crude oil, refined products, natural gas, natural gas liquids and feedstock for company refineries. The company also uses derivative commodity instruments for limited trading purposes. The results of this activity were not material to the company’s financial position, net income or cash flows in 2008.
The company’s market exposure positions are monitored and managed on a daily basis by an internal Risk Control group to ensure compliance with the company’s risk management policies that have been approved by the Audit Committee of the company’s Board of Directors.
The derivative instruments used in the company’s risk management and trading activities consist mainly of futures, options and swap contracts traded on the NYMEX (New York Mercantile Exchange) and on electronic platforms of ICE (Inter-Continental Exchange) and GLOBEX (Chicago Mercantile Exchange). In addition, crude oil, natural gas and refined-product swap contracts and option contracts are entered into principally with major financial institutions and other oil and gas companies in the “over-the-counter” markets.
Virtually all derivatives beyond those designated as normal purchase and normal sale contracts are recorded at fair value on the Consolidated Balance Sheet with resulting gains and losses reflected in income. Fair values are derived principally from published market quotes and other independent third-party quotes. The change in fair value from Chevron’s derivative commodity instruments in 2008 was a quarterly average increase of $160 million in total assets and a quarterly average decrease of $1 million in total liabilities.
The company uses a Value-at-Risk (VaR) model to estimate the potential loss in fair value on a single day from the effect of adverse changes in market conditions on derivative instruments held or issued, which are recorded on the balance sheet at December 31, 2008, as derivative instruments in accordance with FAS Statement No. 133, “Accounting for Derivative Instruments and Hedging Activities,” as amended (FAS 133). VaR is the maximum loss not to be exceeded within a given probability or confidence level over a given period of time. The company’s VaR model uses the Monte Carlo simulation method that involves generating hypothetical scenarios from the specified probability distribution and constructing a full distribution of a portfolio’s potential values.
The VaR model utilizes an exponentially weighted moving average for computing historical volatilities and correlations, a 95 percent confidence level, and a one-day holding period. That is, the company’s 95 percent, one-day VaR corresponds to the unrealized loss in portfolio value that would not be exceeded on average more than one in every 20 trading days, if the portfolio were held constant for one day.
The one-day holding period is based on the assumption that market-risk positions can be liquidated or hedged within one day. For hedging and risk management, the company uses conventional exchange-traded instruments such as futures and options as well as non-exchange-traded swaps, most of which can be liquidated or hedged effectively within one day. The table below presents the 95 percent/one-day VaR for each of the company’s primary risk exposures in the area of derivative commodity instruments at December 31, 2008 and 2007. The higher amounts in 2008 were associated with an increase in price volatility for these commodities during the year.
| | | | | | | | | | |
| Millions of dollars | | 2008 | | | | 2007 | |
| | | | |
| Crude Oil | | $ | 39 | | | | $ | 29 | |
| Natural Gas | | | 5 | | | | | 3 | |
| Refined Products | | | 45 | | | | | 23 | |
| | | | |
Foreign Currency The company enters into forward exchange contracts, generally with terms of 180 days or less, to manage some of its foreign currency exposures. These exposures include revenue and anticipated purchase transactions, including foreign currency capital expenditures and lease commitments, forecasted to occur within 180 days. The forward exchange contracts are recorded at fair value on the balance sheet with resulting gains and losses reflected in income.
The aggregate effect of a hypothetical 10 percent increase in the value of the U.S. dollar at year-end 2008 would be a reduction in the fair value of the foreign exchange contracts of approximately $100 million. The effect would be the opposite for a hypothetical 10 percent decrease in the value of the U.S. dollar at year-end 2008.
Interest RatesThe company enters into interest-rate swaps from time to time as part of its overall strategy to manage the interest rate risk on its debt. Under the terms of the swaps, net cash settlements are based on the difference between fixed-rate and floating-rate interest amounts calculated by reference to agreed notional principal amounts. Interest rate swaps related to a portion of the company’s fixed-rate debt are accounted for as fair value hedges. Interest rate swaps related to floating-rate debt are recorded at fair value on the balance sheet with resulting gains and losses reflected in income. At year-end 2008, the company had no interest-rate swaps on floating-rate debt. The company’s only interest-rate swaps on fixed-rate debt matured in January 2009.
FS-14
Transactions With Related Parties
Chevron enters into a number of business arrangements with related parties, principally its equity affiliates. These arrangements include long-term supply or offtake agreements and long-term purchase agreements. Refer to Other Information in Note 12 of the Consolidated Financial Statements, page FS-42, for further discussion. Management believes these agreements have been negotiated on terms consistent with those that would have been negotiated with an unrelated party.
Litigation and Other Contingencies
MTBE Chevron and many other companies in the petroleum industry have used methyl tertiary butyl ether (MTBE) as a gasoline additive. In October 2008, 59 cases were settled in which the company was a party and which related to the use of MTBE in certain oxygenated gasolines and the alleged seepage of MTBE into groundwater. The terms of this agreement are confidential and not material to the company’s results of operations, liquidity or financial position. Chevron is a party to 37 other pending lawsuits and claims, the majority of which involve numerous other petroleum marketers and refiners. Resolution of these lawsuits and claims may ultimately require the company to correct or ameliorate the alleged effects on the environment of prior release of MTBE by the company or other parties. Additional lawsuits and claims related to the use of MTBE, including personal-injury claims, may be filed in the future. The settlement of the 59 lawsuits did not set any precedents related to standards of liability to be used to judge the merits of the claims, corrective measures required or monetary damages to be assessed for the remaining lawsuits and claims or future lawsuits and claims. As a result, the company’s ultimate exposure related to pending lawsuits and claims is not currently determinable, but could be material to net income in any one period. The company no longer uses MTBE in the manufacture of gasoline in the United States.
RFG Patent Fourteen purported class actions were brought by consumers who purchased reformulated gasoline (RFG) from January 1995 through August 2005, alleging that Unocal misled the California Air Resources Board into adopting standards for composition of RFG that overlapped with Unocal’s undisclosed and pending patents. The parties agreed to a settlement that calls for, among other things, Unocal to pay $48 million and for the establishment of acy presfund to administer payout of the award. The court approved the final settlement in November 2008.
Ecuador Chevron is a defendant in a civil lawsuit before the Superior Court of Nueva Loja in Lago Agrio, Ecuador, brought in May 2003 by plaintiffs who claim to be representatives of certain residents of an area where an oil production consortium formerly had operations. The lawsuit alleges damage to the environment from the oil exploration and production operations, and seeks unspecified damages to fund environmental remediation and restoration of the alleged environmental harm, plus a health monitoring program. Until 1992, Texaco Petroleum Company (Texpet), a subsidiary of Texaco Inc., was a minority member of this consortium with Petroecuador, the Ecuadorian state-owned
oil company, as the majority partner; since 1990, the operations have been conducted solely by Petroecuador. At the conclusion of the consortium and following an independent third-party environmental audit of the concession area, Texpet entered into a formal agreement with the Republic of Ecuador and Petroecuador for Texpet to remediate specific sites assigned by the government in proportion to Texpet’s ownership share of the consortium. Pursuant to that agreement, Texpet conducted a three-year remediation program at a cost of $40 million. After certifying that the sites were properly remediated, the government granted Texpet and all related corporate entities a full release from any and all environmental liability arising from the consortium operations.
Based on the history described above, Chevron believes that this lawsuit lacks legal or factual merit. As to matters of law, the company believes first, that the court lacks jurisdiction over Chevron; second, that the law under which plaintiffs bring the action, enacted in 1999, cannot be applied retroactively to Chevron; third, that the claims are barred by the statute of limitations in Ecuador; and, fourth, that the lawsuit is also barred by the releases from liability previously given to Texpet by the Republic of Ecuador and Petroecuador. With regard to the facts, the company believes that the evidence confirms that Texpet’s remediation was properly conducted and that the remaining environmental damage reflects Petroecuador’s failure to timely fulfill its legal obligations and Petroecuador’s further conduct since assuming full control over the operations.
In April 2008, a mining engineer appointed by the court to identify and determine the cause of environmental damage, and to specify steps needed to remediate it, issued a report recommending that the court assess $8 billion, which would, according to the engineer, provide financial compensation for purported damages, including wrongful death claims, and pay for, among other items, environmental remediation, health care systems, and additional infrastructure for Petroecuador. The engineer’s report also asserted that an additional $8.3 billion could be assessed against Chevron for unjust enrichment. The engineer’s report is not binding on the court. Chevron also believes that the engineer’s work was performed and his report prepared in a manner contrary to law and in violation of the court’s orders. Chevron submitted a rebuttal to the report in which it asked the court to strike the report in its entirety. In November 2008, the engineer revised the report and, without additional evidence, recommended an increase in the financial compensation for purported damages to a total of $18.9 billion and an increase in the assessment for purported unjust enrichment to a total of $8.4 billion. Chevron submitted a rebuttal to the revised report, and Chevron will continue a vigorous defense of any attempted imposition of liability.
Management does not believe an estimate of a reasonably possible loss (or a range of loss) can be made in this case. Due to the defects associated with the engineer’s report, management does not believe the report itself has any utility in calculating a reasonably possible loss (or a range of loss). Moreover, the highly uncertain legal environment surrounding the case provides no basis for management to
FS-15
| | | | | | | | | | |
Management’s Discussion and Analysis of
Financial Condition and Results of Operations
|
| | | | | | | | | | |
estimate a reasonable possible loss (or a range of loss).
Environmental The company is subject to loss contingencies pursuant to environmental laws and regulations that in the future may require the company to take action to correct or ameliorate the effects on the environment of prior release of chemicals or petroleum substances, including MTBE, by the company or other parties. Such contingencies may exist for various sites, including, but not limited to, federal Superfund sites and analogous sites under state laws, refineries, crude oil fields, service stations, terminals, land development areas, and mining operations, whether operating, closed or divested. These future costs are not fully determinable due to such factors as the unknown magnitude of possible contamination, the unknown timing and extent of the corrective actions that may be required, the determination of the company’s liability in proportion to other responsible parties, and the extent to which such costs are recoverable from third parties.
Although the company has provided for known environmental obligations that are probable and reasonably estimable, the amount of additional future costs may be material to results of operations in the period in which they are recognized. The company does not expect these costs will have a material effect on its consolidated financial position or liquidity. Also, the company does not believe its obligations to make such expenditures have had, or will have, any significant impact on the company’s competitive position relative to other U.S. or international petroleum or chemical companies.
The following table displays the annual changes to the company’s before-tax environmental remediation reserves, including those for federal Superfund sites and analogous sites under state laws.
| | | | | | | | | | | | | | |
| Millions of dollars | | 2008 | | | | 2007 | | | 2006 | |
| | | | | |
| Balance at January 1 | | $ | 1,539 | | | | $ | 1,441 | | | $ | 1,469 | |
| Net Additions | | | 784 | | | | | 562 | | | | 366 | |
| Expenditures | | | (505 | ) | | | | (464 | ) | | | (394 | ) |
| | | | | |
Balance at December 31 | | $ | 1,818 | | | | $ | 1,539 | | | $ | 1,441 | |
| | | | | |
Included in the $1,818 million year-end 2008 reserve balance were remediation activities of 248 sites for which
the company had been identified as a potentially responsible party or otherwise involved in the remediation by the U.S. Environmental Protection Agency (EPA) or other regulatory agencies under the provisions of the federal Superfund law or analogous state laws. The company’s remediation reserve for these sites at year-end 2008 was $120 million. The federal Superfund law and analogous state laws provide for joint and several liability for all responsible parties. Any future actions by the EPA or other regulatory agencies to require Chevron to assume other potentially responsible parties’ costs at designated hazardous waste sites are not expected to have a material effect on the company’s consolidated financial position or liquidity.
Of the remaining year-end 2008 environmental reserves balance of $1,698 million, $968 million related to current and former sites for the company’s U.S. downstream operations, including refineries and other plants, marketing locations (i.e., service stations and terminals), and pipelines. The remaining $730 million was associated with various sites in international downstream ($117 million), upstream ($390 million), chemicals ($154 million) and other ($69 million). Liabilities at all sites, whether operating, closed or divested, were primarily associated with the company’s plans and activities to remediate soil or groundwater contamination or both. These and other activities include one or more of the following: site assessment; soil excavation; offsite disposal of contaminants; onsite containment, remediation and/or extraction of petroleum hydrocarbon liquid and vapor from soil; groundwater extraction and treatment; and monitoring of the natural attenuation of the contaminants.
The company manages environmental liabilities under specific sets of regulatory requirements, which in the United States include the Resource Conservation and Recovery Act and various state or local regulations. No single remediation site at year-end 2008 had a recorded liability that was material to the company’s financial position, results of operations or liquidity.
It is likely that the company will continue to incur additional liabilities, beyond those recorded, for environmental remediation relating to past operations. These future costs are not fully determinable due to such factors as the unknown magnitude of possible contamination, the unknown timing and extent of the corrective actions that may be required, the determination of the company’s liability in proportion to other responsible parties, and the extent to which such costs are recoverable from third parties.
The company accounts for asset retirement obligations in accordance with FASB Statement No. 143,Accounting for Asset Retirement Obligations(FAS 143). Under FAS 143, the fair value of a liability for an asset retirement obligation is recorded when there is a legal obligation associated with the retirement of long-lived assets and the liability can be
FS-16
reasonably estimated. The liability balance of approximately $9.4 billion for asset retirement obligations at year-end 2008 related primarily to upstream properties.
For the company’s other ongoing operating assets, such as refineries and chemicals facilities, no provisions are made for exit or cleanup costs that may be required when such assets reach the end of their useful lives unless a decision to sell or otherwise abandon the facility has been made, as the indeterminate settlement dates for the asset retirements prevent estimation of the fair value of the asset retirement obligation.
Refer also to Note 24, beginning on page FS-58, related to FAS 143 and the company’s adoption in 2005 of FASB Interpretation No. (FIN) 47,Accounting for Conditional Asset Retirement Obligations – An Interpretation of FASB Statement No. 143(FIN 47), and the discussion of “Environmental Matters” below.
Income Taxes The company calculates its income tax expense and liabilities quarterly. These liabilities generally are subject to audit and are not finalized with the individual taxing authorities until several years after the end of the annual period for which income taxes have been calculated. Refer to Note 16 beginning on page FS-45 for a discussion of the periods for which tax returns have been audited for the company’s major tax jurisdictions and a discussion for all tax jurisdictions of the differences between the amount of tax benefits recognized in the financial statements and the amount taken or expected to be taken in a tax return. The company does not expect that settlement of income tax liabilities associated with uncertain tax positions will have a material effect on its results of operations, consolidated financial position or liquidity.
The Emergency Economic Stabilization Act of 2008, which contained a number of energy and tax-related provisions, known as the Energy Improvement and Extension Act of 2008 (the Act), was signed into U.S. law in October 2008. The Act includes two provisions that affect Chevron’s tax liability, beginning in the fourth quarter of 2008. The Act freezes at 6 percent the domestic manufacturer’s deduction on income from U.S. oil and gas operations that was scheduled to increase to 9 percent in 2010. Effective in 2009, the Act expands the current foreign tax credit (FTC) limitation for Foreign Oil and Gas Extraction Income to also include foreign downstream income, known as Foreign Oil Related Income. This change is expected to impact Chevron’s utilization of FTCs.
Suspended Wells The company suspends the costs of exploratory wells pending a final determination of the commercial potential of the related crude oil and natural gas fields. The ultimate disposition of these well costs is dependent on the results of future drilling activity or development decisions or both. At December 31, 2008, the company had approximately $2.1 billion of suspended exploratory wells included in properties, plant and equipment, an increase of $458 million from 2007. The 2007 balance reflected an increase of $421 million from 2006.
The future trend of the company’s exploration expenses can be affected by amounts associated with well write-offs, including wells that had been previously suspended pending determination as to whether the well had found reserves
that could be classified as proved. The effect on exploration expenses in future periods of the $2.1 billion of suspended wells at year-end 2008 is uncertain pending future activities, including normal project evaluation and additional drilling.
Refer to Note 20, beginning on page FS-48, for additional discussion of suspended wells.
Equity Redetermination For oil and gas producing operations, ownership agreements may provide for periodic reassessments of equity interests in estimated crude oil and natural gas reserves. These activities, individually or together, may result in gains or losses that could be material to earnings in any given period. One such equity redetermination process has been under way since 1996 for Chevron’s interests in four producing zones at the Naval Petroleum Reserve at Elk Hills, California, for the time when the remaining interests in these zones were owned by the U.S. Department of Energy. A wide range remains for a possible net settlement amount for the four zones. For this range of settlement, Chevron estimates its maximum possible net before-tax liability at approximately $200 million, and the possible maximum net amount that could be owed to Chevron is estimated at about $150 million. The timing of the settlement and the exact amount within this range of estimates are uncertain.
Other Contingencies Chevron receives claims from and submits claims to customers; trading partners; U.S. federal, state and local regulatory bodies; governments; contractors; insurers; and suppliers. The amounts of these claims, individually and in the aggregate, may be significant and take lengthy periods to resolve.
The company and its affiliates also continue to review and analyze their operations and may close, abandon, sell, exchange, acquire or restructure assets to achieve operational or strategic benefits and to improve competitiveness and profitability. These activities, individually or together, may result in gains or losses in future periods.
Environmental Matters
Virtually all aspects of the businesses in which the company engages are subject to various federal, state and local environmental, health and safety laws and regulations. These regulatory requirements continue to increase in both number and complexity over time and govern not only the manner in which the company conducts its operations, but also the products it sells. Most of the costs of complying with laws and regulations pertaining to company operations and products are embedded in the normal costs of doing business.
Accidental leaks and spills requiring cleanup may occur in the ordinary course of business. In addition to the costs for environmental protection associated with its ongoing operations and products, the company may incur expenses for corrective actions at various owned and previously owned facilities and at third-party-owned waste-disposal sites used by the company. An obligation may arise when operations are closed or sold or at non-Chevron sites where company products have been handled or disposed of. Most of the expenditures to fulfill these obligations relate to facilities and sites where past operations followed practices and procedures that were con-
FS-17
| | | | | | | | | | |
Management’s Discussion and Analysis of
Financial Condition and Results of Operations
|
| | | | | | | | | | |
sidered acceptable at the time but now require investigative or remedial work or both to meet current standards.
Using definitions and guidelines established by the American Petroleum Institute, Chevron estimated its worldwide environmental spending in 2008 at approximately $3.1 billion for its consolidated companies. Included in these expenditures were approximately $1.3 billion of environmental capital expenditures and $1.8 billion of costs associated with the prevention, control, abatement or elimination of hazardous substances and pollutants from operating, closed or divested sites, and the abandonment and restoration of sites.
For 2009, total worldwide environmental capital expenditures are estimated at $2.2 billion. These capital costs are in addition to the ongoing costs of complying with environmental regulations and the costs to remediate previously contaminated sites.
It is not possible to predict with certainty the amount of additional investments in new or existing facilities or amounts of incremental operating costs to be incurred in the future to: prevent, control, reduce or eliminate releases of hazardous materials into the environment; comply with existing and new environmental laws or regulations; or remediate and restore areas damaged by prior releases of hazardous materials. Although these costs may be significant to the results of operations in any single period, the company does not expect them to have a material effect on the company’s liquidity or financial position.
Critical Accounting Estimates and Assumptions
Management makes many estimates and assumptions in the application of generally accepted accounting principles (GAAP) that may have a material impact on the company’s consolidated financial statements and related disclosures and on the comparability of such information over different reporting periods. All such estimates and assumptions affect reported amounts of assets, liabilities, revenues and expenses, as well as disclosures of contingent assets and liabilities. Estimates and assumptions are based on management’s experience and other information available prior to the issuance of the financial statements. Materially different results can occur as circumstances change and additional information becomes known.
The discussion in this section of “critical” accounting estimates or assumptions is according to the disclosure guidelines of the Securities and Exchange Commission (SEC), wherein:
| | 1. | | the nature of the estimates or assumptions is material due to the levels of subjectivity and judgment neces- |
| | | | sary to account for highly uncertain matters or the susceptibility of such matters to change; and |
| | 2. | | the impact of the estimates and assumptions on the company’s financial condition or operating performance is material. |
Besides those meeting these “critical” criteria, the company makes many other accounting estimates and assumptions in preparing its financial statements and related disclosures. Although not associated with “highly uncertain matters,” these estimates and assumptions are also subject to revision as circumstances warrant, and materially different results may sometimes occur.
For example, the recording of deferred tax assets requires an assessment under the accounting rules that the future realization of the associated tax benefits be “more likely than not.” Another example is the estimation of crude oil and natural gas reserves under SEC rules that require “... geological and engineering data (that) demonstrate with reasonable certainty (reserves) to be recoverable in future years from known reservoirs under existing economic and operating conditions, i.e., prices and costs as of the date the estimate is made.” Refer to Table V, “Reserve Quantity Information,” beginning on page FS-67, for the changes in these estimates for the three years ending December 31, 2008, and to Table VII, “Changes in the Standardized Measure of Discounted Future Net Cash Flows From Proved Reserves” on page FS-74 for estimates of proved-reserve values for each of the three years ended December 31, 2008, which were based on year-end prices at the time. Note 1 to the Consolidated Financial Statements, beginning on page FS-32, includes a description of the “successful efforts” method of accounting for oil and gas exploration and production activities. The estimates of crude oil and natural gas reserves are important to the timing of expense recognition for costs incurred.
The discussion of the critical accounting policy for “Impairment of Properties, Plant and Equipment and Investments in Affiliates,” beginning on page FS-20, includes reference to conditions under which downward revisions of proved-reserve quantities could result in impairments of oil and gas properties. This commentary should be read in conjunction with disclosures elsewhere in this discussion and in the Notes to the Consolidated Financial Statements related to estimates, uncertainties, contingencies and new accounting standards. Significant accounting policies are discussed in Note 1 to the Consolidated Financial Statements, beginning on page FS-32. The development and selection of accounting estimates
FS-18
and assumptions, including those deemed “critical,” and the associated disclosures in this discussion have been discussed by management with the Audit Committee of the Board of Directors.
The areas of accounting and the associated “critical” estimates and assumptions made by the company are as follows:
Pension and Other Postretirement Benefit Plans The determination of pension-plan obligations and expense is based on a number of actuarial assumptions. Two critical assumptions are the expected long-term rate of return on plan assets and the discount rate applied to pension plan obligations. For other postretirement benefit (OPEB) plans, which provide for certain health care and life insurance benefits for qualifying retired employees and which are not funded, critical assumptions in determining OPEB obligations and expense are the discount rate and the assumed health care cost-trend rates.
Note 22, beginning on page FS-51, includes information on the funded status of the company’s pension and OPEB plans at the end of 2008 and 2007; the components of pension and OPEB expense for the three years ending December 31, 2008; and the underlying assumptions for those periods.
Pension and OPEB expense is recorded on the Consolidated Statement of Income in “Operating expenses” or “Selling, general and administrative expenses” and applies to all business segments. The year-end 2008 and 2007 funded status, measured as the difference between plan assets and obligations, of each of the company’s pension and OPEB plans is recognized on the Consolidated Balance Sheet. The funded status of overfunded pension plans is recorded as a long-term asset in “Deferred charges and other assets.” The funded status of underfunded or unfunded pension and OPEB plans is recorded in “Accrued liabilities” or “Reserves for employee benefit plans.” Amounts yet to be recognized as components of pension or OPEB expense are recorded in “Accumulated other comprehensive loss.”
To estimate the long-term rate of return on pension assets, the company uses a process that incorporates actual historical asset-class returns and an assessment of expected future performance and takes into consideration external actuarial advice and asset-class factors. Asset allocations are periodically updated using pension plan asset/liability studies, and the determination of the company’s estimates of long-term rates of return are consistent with these studies. The expected long-term rate of return on U.S. pension plan assets, which account for 68 percent of the company’s pension plan assets, has remained at 7.8 percent since 2002. For the 10 years ending December 31, 2008, actual asset returns averaged 3.7 percent for this plan. The actual asset returns for the 10 years ending December 31, 2007, averaged 8.7 percent. The actual return for 2008 was negative and was associated with the broad decline in the financial markets in the second half of the year.
The year-end market-related value of assets of the major U.S. pension plan used in the determination of pension expense was based on the market value in the preceding three months, as opposed to the maximum allowable period of five years under U.S. accounting rules. Management considers the three-month period long enough to minimize the effects of distortions from day-to-day market volatility and still be contemporaneous to the end of the year. For other plans, market value of assets as of year-end is used in calculating the pension expense.
The discount rate assumptions used to determine U.S. and international pension and postretirement benefit plan obligations and expense reflect the prevailing rates available on high-quality fixed-income debt instruments. At December 31, 2008, the company selected a 6.3 percent discount rate for the major U.S. pension and postretirement plans. This rate was selected based on a cash flow analysis that matched estimated future benefit payments to the Citigroup Pension Discount Yield Curve as of year-end 2008. The discount rates at the end of 2007 and 2006 were 6.3 percent and 5.8 percent, respectively.
An increase in the expected long-term return on plan assets or the discount rate would reduce pension plan expense, and vice versa. Total pension expense for 2008 was $770 million. As an indication of the sensitivity of pension expense to the long-term rate of return assumption, a 1 percent increase in the expected rate of return on assets of the company’s primary U.S. pension plan would have reduced total pension plan expense for 2008 by approximately $70 million. A 1 percent increase in the discount rate for this same plan, which accounted for about 61 percent of the companywide pension obligation, would have reduced total pension plan expense for 2008 by approximately $140 million.
An increase in the discount rate would decrease the pension obligation, thus changing the funded status of a plan recorded on the Consolidated Balance Sheet. The total pension liability on the Consolidated Balance Sheet at December 31, 2008, for underfunded plans was approximately $4.0 billion. As an indication of the sensitivity of pension liabilities to the discount rate assumption, a 0.25 percent increase in the discount rate applied to the company’s primary U.S. pension plan would have reduced the plan obligation by approximately $250 million, which would have decreased the plan’s underfunded status from approximately $2.0 billion to $1.8 billion. Other plans would be less under-funded as discount rates increase. The actual rates of return on plan assets and discount rates may vary significantly from estimates because of unanticipated changes in the world’s financial markets.
In 2008, the company’s pension plan contributions were $839 million (including $577 million to the U.S. plans). In 2009, the company estimates contributions will be approximately $800 million. Actual contribution amounts are
FS-19
| | | | | | | | | | |
Management’s Discussion and Analysis of
Financial Condition and Results of Operations
|
| | | | | | | | | | |
dependent upon plan-investment results, changes in pension obligations, regulatory requirements and other economic factors. Additional funding may be required if investment returns are insufficient to offset increases in plan obligations.
��For the company’s OPEB plans, expense for 2008 was $179 million and the total liability, which reflected the unfunded status of the plans at the end of 2008, was $2.9 billion.
As an indication of discount rate sensitivity to the determination of OPEB expense in 2008, a 1 percent increase in the discount rate for the company’s primary U.S. OPEB plan, which accounted for about 67 percent of the companywide OPEB expense, would have decreased OPEB expense by approximately $20 million. A 0.25 percent increase in the discount rate for the same plan, which accounted for about 86 percent of the companywide OPEB liabilities, would have decreased total OPEB liabilities at the end of 2008 by approximately $56 million.
For the main U.S. postretirement medical plan, the annual increase to company contributions is limited to 4 percent per year. For active employees and retirees under age 65 whose claims experiences are combined for rating purposes, the assumed health care cost-trend rates start with 7 percent in 2009 and gradually drop to 5 percent for 2017 and beyond. As an indication of the health care cost-trend rate sensitivity to the determination of OPEB expense in 2008, a 1 percent increase in the rates for the main U.S. OPEB plan, which accounted for 86 percent of the companywide OPEB liabilities, would have increased OPEB expense $8 million.
Differences between the various assumptions used to determine expense and the funded status of each plan and actual experience are not included in benefit plan costs in the year the difference occurs. Instead, the differences are included in actuarial gain/loss and unamortized amounts have been reflected in “Accumulated other comprehensive loss” on the Consolidated Balance Sheet. Refer to Note 22, beginning on page FS-51, for information on the $6.0 billion of before-tax actuarial losses recorded by the company as of December 31, 2008; a description of the method used to amortize those costs; and an estimate of the costs to be recognized in expense during 2009.
Impairment of Properties, Plant and Equipment and Investments in Affiliates The company assesses its properties, plant and equipment (PP&E) for possible impairment whenever events or changes in circumstances indicate that the carrying value of the assets may not be recoverable. Such indicators include changes in the company’s business plans, changes in commodity prices and, for crude oil and natural gas properties, significant downward revisions of estimated
proved-reserve quantities. If the carrying value of an asset exceeds the future undiscounted cash flows expected from the asset, an impairment charge is recorded for the excess of carrying value of the asset over its estimated fair value.
Determination as to whether and how much an asset is impaired involves management estimates on highly uncertain matters, such as future commodity prices, the effects of inflation and technology improvements on operating expenses, production profiles, and the outlook for global or regional market supply-and-demand conditions for crude oil, natural gas, commodity chemicals and refined products. However, the impairment reviews and calculations are based on assumptions that are consistent with the company’s business plans and long-term investment decisions.
No major individual impairments of PP&E were recorded for the three years ending December 31, 2008. An estimate as to the sensitivity to earnings for these periods if other assumptions had been used in impairment reviews and impairment calculations is not practicable, given the broad range of the company’s PP&E and the number of assumptions involved in the estimates. That is, favorable changes to some assumptions might have avoided the need to impair any assets in these periods, whereas unfavorable changes might have caused an additional unknown number of other assets to become impaired.
Investments in common stock of affiliates that are accounted for under the equity method, as well as investments in other securities of these equity investees, are reviewed for impairment when the fair value of the investment falls below the company’s carrying value. When such a decline is deemed to be other than temporary, an impairment charge is recorded to the income statement for the difference between the investment’s carrying value and its estimated fair value at the time. In making the determination as to whether a decline is other than temporary, the company considers such factors as the duration and extent of the decline, the investee’s financial performance, and the company’s ability and intention to retain its investment for a period that will be sufficient to allow for any anticipated recovery in the investment’s market value. Differing assumptions could affect whether an investment is impaired in any period or the amount of the impairment, and are not subject to sensitivity analysis.
From time to time, the company performs impairment reviews and determines whether any write-down in the carrying value of an asset or asset group is required. For example, when significant downward revisions to crude oil and natural gas reserves are made for any single field or concession, an impairment review is performed to determine if the carrying value of the asset remains recoverable. Also, if the expectation
FS-20
of sale of a particular asset or asset group in any period has been deemed more likely than not, an impairment review is performed, and if the estimated net proceeds exceed the carrying value of the asset or asset group, no impairment charge is required. Such calculations are reviewed each period until the asset or asset group is disposed of. Assets that are not impaired on a held-and-used basis could possibly become impaired if a decision is made to sell such assets. That is, the assets would be impaired if they are classified as held-for-sale and the estimated proceeds from the sale, less costs to sell, are less than the assets’ associated carrying values.
Business Combinations – Purchase-Price Allocation Accounting for business combinations requires the allocation of the company’s purchase price to the various assets and liabilities of the acquired business at their respective fair values. The company uses all available information to make these fair value determinations, and for major acquisitions, may hire an independent appraisal firm to assist in making fair value estimates. In some instances, assumptions with respect to the timing and amount of future revenues and expenses associated with an asset might have to be used in determining its fair value. Actual timing and amount of net cash flows from revenues and expenses related to that asset over time may differ materially from those initial estimates, and if the timing is delayed significantly or if the net cash flows decline significantly, the asset could become impaired. Effective January 1, 2009, the accounting for business combinations will change. Refer to Note 19 on page FS-48.
Goodwill Goodwill resulting from a business combination is not subject to amortization. As required by FASB Statement No. 142,Goodwill and Other Intangible Assets,the company tests such goodwill at the reporting unit level for impairment on an annual basis and between annual tests if an event occurs or circumstances change that would more likely than not reduce the fair value of a reporting unit below its carrying amount.
Contingent Losses Management also makes judgments and estimates in recording liabilities for claims, litigation, tax matters and environmental remediation. Actual costs can frequently vary from estimates for a variety of reasons. For example, the costs from settlement of claims and litigation can vary from estimates based on differing interpretations of laws, opinions on culpability and assessments on the amount of damages. Similarly, liabilities for environmental remediation are subject to change because of changes in laws, regulations and their interpretation, the determination of additional information on the extent and nature of site contamination, and improvements in technology.
Under the accounting rules, a liability is generally recorded for these types of contingencies if management determines the loss to be both probable and estimable. The company generally records these losses as “Operating expenses” or “Selling, general and administrative expenses” on the Consolidated Statement of Income. An exception to this handling is for income tax matters, for which ben-
efits are recognized only if management determines the tax position is “more likely than not” (i.e., likelihood greater than 50 percent) to be allowed by the tax jurisdiction. For additional discussion of income tax uncertainties, refer to Note 16 beginning on page FS-45. Refer also to the business segment discussions elsewhere in this section for the effect on earnings from losses associated with certain litigation, and environmental remediation and tax matters for the three years ended December 31, 2008.
An estimate as to the sensitivity to earnings for these periods if other assumptions had been used in recording these liabilities is not practicable because of the number of contingencies that must be assessed, the number of underlying assumptions and the wide range of reasonably possible outcomes, both in terms of the probability of loss and the estimates of such loss.
New Accounting Standards
FASB Statement No. 141 (revised 2007), Business
Combinations (FAS 141-R) In December 2007, the FASB issued FAS 141-R, which became effective for business combination transactions having an acquisition date on or after January 1, 2009. This standard requires the acquiring entity in a business combination to recognize the assets acquired, the liabilities assumed, and any noncontrolling interest in the acquiree at the acquisition date to be measured at their respective fair values. It also requires acquisition-related costs, as well as restructuring costs the acquirer expects to incur for which it is not obligated at acquisition date, to be recorded against income rather than included in purchase-price determination. Finally, the standard requires recognition of contingent arrangements at their acquisition-date fair values, with subsequent changes in fair value generally reflected in income.
FASB Staff Position FAS 141(R)-a Accounting for Assets Acquired and Liabilities Assumed in a Business Combination (FSP FAS 141(R)-a) In February 2009, the FASB approved for issuance FSP FAS 141(R)-a, which became effective for business combinations having an acquisition date on or after January 1, 2009. This standard requires an asset or liability arising from a contingency in a business combination to be recognized at fair value if fair value can be reasonably determined. If it cannot be reasonably determined then the asset or liability will need to be recognized in accordance with FASB Statement No. 5,Accounting for Contingencies, and FASB Interpretation No. 14,Reasonable Estimation of the Amount of the Loss.
FASB Statement No. 160, Noncontrolling Interests in Consolidated Financial Statements, an amendment of ARB No. 51 (FAS 160) The FASB issued FAS 160 in December 2007, which became effective for the company January 1, 2009, with retroactive adoption of the Standard’s presentation and disclosure requirements for existing minority interests. This standard requires ownership interests in subsidiaries held by parties other than the parent to be presented within the
FS-21
| | | | | | | | | | |
Management’s Discussion and Analysis of
Financial Condition and Results of Operations
|
| | | | | | | | | | |
equity section of the Consolidated Balance Sheet but separate from the parent’s equity. It also requires the amount of consolidated net income attributable to the parent and the noncontrolling interest to be clearly identified and presented on the face of the Consolidated Statement of Income. Certain changes in a parent’s ownership interest are to be accounted for as equity transactions and when a subsidiary is deconsolidated, any noncontrolling equity investment in the former subsidiary is to be initially measured at fair value. Implementation of FAS 160 will not significantly change the presentation of the company’s Consolidated Statement of Income or Consolidated Balance Sheet.
FASB Statement No. 161, Disclosures about Derivative Instruments and Hedging Activities (FAS 161) In March 2008, the FASB issued FAS 161, which became effective for the company on January 1, 2009. This standard amends and expands the disclosure requirements of FASB Statement No. 133,Accounting for Derivative Instruments and Hedging Activities.FAS 161 requires disclosures related to objectives and strategies for using derivatives; the fair-value amounts of, and gains and losses on, derivative instruments; and credit-risk-related contingent features in derivative agreements. The company’s disclosures for derivative instruments will
be expanded to include a tabular representation of the location and fair value amounts of derivative instruments on the balance sheet, fair value gains and losses on the income statement and gains and losses associated with cash flow hedges recognized in earnings and other comprehensive income.
FASB Staff Position FAS 132(R)-1, Employer’s Disclosures about Postretirement Benefit Plan Assets (FSP FAS 132(R)-1) In December 2008, the FASB issued FSP FAS 132(R)-1, which becomes effective with the company’s reporting at December 31, 2009. This standard amends and expands the disclosure requirements on the plan assets of defined benefit pension and other postretirement plans to provide users of financial statements with an understanding of: how investment allocation decisions are made; the major categories of plan assets; the inputs and valuation techniques used to measure the fair value of plan assets; the effect of fair-value measurements using significant unobservable inputs on changes in plan assets for the period; and significant concentrations of risk within plan assets. The company does not prefund its other postretirement plan obligations, and the effect on the company’s disclosures for its pension plan assets as a result of the adoption of FSP FAS 132(R)-1 will depend on the company’s plan assets at that time.
FS-22
THIS PAGE INTENTIONALLY LEFT BLANK
FS-23
Quarterly Results and Stock Market Data
Unaudited
| | | | | | | | | | | | | | | | | | | | | | | | | | | | | | | | | | |
| | | 2008 | | | | 2007 | |
| Millions of dollars, except per-share amounts | | 4th Q | | | 3rd Q | | | 2nd Q | | | 1st Q | | | | 4th Q | | | 3rd Q | | | 2nd Q | | | 1st Q | |
| | | | | |
Revenues and Other Income | | | | | | | | | | | | | | | | | | | | | | | | | | | | | | | | | |
Sales and other operating revenues1 | | $ | 43,145 | | | $ | 76,192 | | | $ | 80,962 | | | $ | 64,659 | | | | $ | 59,900 | | | $ | 53,545 | | | $ | 54,344 | | | $ | 46,302 | |
| Income from equity affiliates | | | 886 | | | | 1,673 | | | | 1,563 | | | | 1,244 | | | | | 1,153 | | | | 1,160 | | | | 894 | | | | 937 | |
| Other income | | | 1,172 | | | | 1,002 | | | | 464 | | | | 43 | | | | | 357 | | | | 468 | | | | 856 | | | | 988 | |
| | | | | |
Total Revenues and Other Income | | | 45,203 | | | | 78,867 | | | | 82,989 | | | | 65,946 | | | | | 61,410 | | | | 55,173 | | | | 56,094 | | | | 48,227 | |
| | | | | |
Costs and Other Deductions | | | | | | | | | | | | | | | | | | | | | | | | | | | | | | | | | |
| Purchased crude oil and products | | | 23,575 | | | | 49,238 | | | | 56,056 | | | | 42,528 | | | | | 38,056 | | | | 33,988 | | | | 33,138 | | | | 28,127 | |
| Operating expenses | | | 5,416 | | | | 5,676 | | | | 5,248 | | | | 4,455 | | | | | 4,798 | | | | 4,397 | | | | 4,124 | | | | 3,613 | |
| Selling, general and administrative expenses | | | 1,492 | | | | 1,278 | | | | 1,639 | | | | 1,347 | | | | | 1,833 | | | | 1,446 | | | | 1,516 | | | | 1,131 | |
| Exploration expenses | | | 338 | | | | 271 | | | | 307 | | | | 253 | | | | | 449 | | | | 295 | | | | 273 | | | | 306 | |
| Depreciation, depletion and amortization | | | 2,589 | | | | 2,449 | | | | 2,275 | | | | 2,215 | | | | | 2,094 | | | | 2,495 | | | | 2,156 | | | | 1,963 | |
Taxes other than on income1 | | | 4,547 | | | | 5,614 | | | | 5,699 | | | | 5,443 | | | | | 5,560 | | | | 5,538 | | | | 5,743 | | | | 5,425 | |
| Interest and debt expense | | | – | | | | – | | | | – | | | | – | | | | | 7 | | | | 22 | | | | 63 | | | | 74 | |
| Minority interests | | | 6 | | | | 32 | | | | 34 | | | | 28 | | | | | 35 | | | | 25 | | | | 19 | | | | 28 | |
| | | | | |
Total Costs and Other Deductions | | | 37,963 | | | | 64,558 | | | | 71,258 | | | | 56,269 | | | | | 52,832 | | | | 48,206 | | | | 47,032 | | | | 40,667 | |
| | | | | |
Income Before Income Tax Expense | | | 7,240 | | | | 14,309 | | | | 11,731 | | | | 9,677 | | | | | 8,578 | | | | 6,967 | | | | 9,062 | | | | 7,560 | |
Income Tax Expense | | | 2,345 | | | | 6,416 | | | | 5,756 | | | | 4,509 | | | | | 3,703 | | | | 3,249 | | | | 3,682 | | | | 2,845 | |
| | | | | |
Net Income | | $ | 4,895 | | | $ | 7,893 | | | $ | 5,975 | | | $ | 5,168 | | | | $ | 4,875 | | | $ | 3,718 | | | $ | 5,380 | | | $ | 4,715 | |
| | | | | |
Per-Share of Common Stock | | | | | | | | | | | | | | | | | | | | | | | | | | | | | | | | | |
Net Income | | | | | | | | | | | | | | | | | | | | | | | | | | | | | | | | | |
– Basic | | $ | 2.45 | | | $ | 3.88 | | | $ | 2.91 | | | $ | 2.50 | | | | $ | 2.34 | | | $ | 1.77 | | | $ | 2.52 | | | $ | 2.20 | |
– Diluted | | $ | 2.44 | | | $ | 3.85 | | | $ | 2.90 | | | $ | 2.48 | | | | $ | 2.32 | | | $ | 1.75 | | | $ | 2.52 | | | $ | 2.18 | |
| | | | | |
Dividends | | $ | 0.65 | | | $ | 0.65 | | | $ | 0.65 | | | $ | 0.58 | | | | $ | 0.58 | | | $ | 0.58 | | | $ | 0.58 | | | $ | 0.52 | |
Common Stock Price Range – High2 | | $ | 82.20 | | | $ | 99.08 | | | $ | 103.09 | | | $ | 94.61 | | | | $ | 94.86 | | | $ | 94.84 | | | $ | 84.24 | | | $ | 74.95 | |
– Low2 | | $ | 57.83 | | | $ | 77.50 | | | $ | 86.74 | | | $ | 77.51 | | | | $ | 83.79 | | | $ | 80.76 | | | $ | 74.83 | | | $ | 66.43 | |
| | | | | |
1 Includes excise, value-added and similar taxes: | | $ | 2,080 | | | $ | 2,577 | | | $ | 2,652 | | | $ | 2,537 | | | | $ | 2,548 | | | $ | 2,550 | | | $ | 2,609 | | | $ | 2,414 | |
2 End of day price. | | | | | | | | | | | | | | | | | | | | | | | | | | | | | | | | | |
The company’s common stock is listed on the New York Stock Exchange (trading symbol: CVX). As of February 20, 2009, stockholders of record numbered approximately 205,000. There are no restrictions on the company’s ability to pay dividends.
FS-24
Management’s Responsibility for Financial Statements
To the Stockholders of Chevron Corporation
Management of Chevron is responsible for preparing the accompanying consolidated financial statements and the related information appearing in this report. The statements were prepared in accordance with accounting principles generally accepted in the United States of America and fairly represent the transactions and financial position of the company. The financial statements include amounts that are based on management’s best estimates and judgment.
As stated in its report included herein, the independent registered public accounting firm of PricewaterhouseCoopers LLP has audited the company’s consolidated financial statements in accordance with the standards of the Public Company Accounting Oversight Board (United States).
The Board of Directors of Chevron has an Audit Committee composed of directors who are not officers or employees of the company. The Audit Committee meets regularly with members of management, the internal auditors and the independent registered public accounting firm to review accounting, internal control, auditing and financial reporting matters. Both the internal auditors and the independent registered public accounting firm have free and direct access to the Audit Committee without the presence of management.
Management’s Report on Internal Control Over Financial Reporting
The company’s management is responsible for establishing and maintaining adequate internal control over financial reporting, as such term is defined in Exchange Act Rule 13a-15(f). The company’s management, including the Chief Executive Officer and Chief Financial Officer, conducted an evaluation of the effectiveness of the company’s internal control over financial reporting based on theInternal Control – Integrated Frameworkissued by the Committee of Sponsoring Organizations of the Treadway Commission. Based on the results of this evaluation, the company’s management concluded that internal control over financial reporting was effective as of December 31, 2008.
The effectiveness of the company’s internal control over financial reporting as of December 31, 2008, has been audited by PricewaterhouseCoopers LLP, an independent registered public accounting firm, as stated in its report included herein.
| | | | | |
| |  | |  |
David J. O’Reilly | | Patricia E. Yarrington | | Mark A. Humphrey |
| Chairman of the Board | | Vice President | | Vice President |
| and Chief Executive Officer | | and Chief Financial Officer | | and Comptroller |
February 26, 2009
FS-25
Report of Independent Registered Public Accounting Firm
To the Stockholders and the Board of Directors of Chevron Corporation:
In our opinion, the accompanying consolidated balance sheets and the related consolidated statements of income, comprehensive income, stockholders’ equity and cash flows present fairly, in all material respects, the financial position of Chevron Corporation and its subsidiaries at December 31, 2008 and December 31, 2007 and the results of their operations and their cash flows for each of the three years in the period ended December 31, 2008 in conformity with accounting principles generally accepted in the United States of America. In addition, in our opinion, the financial statement schedule listed in the index appearing under Item 15(a)(2) presents fairly, in all material respects, the information set forth therein when read in conjunction with the related consolidated financial statements. Also in our opinion, the Company maintained, in all material respects, effective internal control over financial reporting as of December 31, 2008 based on criteria established inInternal Control – Integrated Frameworkissued by the Committee of Sponsoring Organizations of the Treadway Commission (COSO). The Company’s management is responsible for these financial statements and financial statement schedule, for maintaining effective internal control over financial reporting and for its assessment of the effectiveness of internal control over financial reporting, included in the accompanying Management’s Report on Internal Control Over Financial Reporting. Our responsibility is to express opinions on these financial statements, on the financial statement schedule, and on the Company’s internal control over financial reporting based on our integrated audits. We conducted our audits in accordance with the standards of the Public Company Accounting Oversight Board (United States). Those standards require that we plan and perform the audits to obtain reasonable assurance about whether the financial statements are free of material misstatement and whether effective internal control over financial reporting was maintained in all material respects. Our audits of the financial statements included examining, on a test basis, evidence supporting the amounts and disclosures in the financial statements, assessing the accounting principles used and significant estimates made by management, and evaluating the overall financial statement presentation. Our audit of internal control over financial reporting included obtaining an understanding of internal control over financial reporting, assessing the risk that a material weakness exists, and
testing and evaluating the design and operating effectiveness of internal control based on the assessed risk. Our audits also included performing such other procedures as we considered necessary in the circumstances. We believe that our audits provide a reasonable basis for our opinions.
As discussed in Note 14 to the Consolidated Financial Statements, the Company changed its method of accounting for buy/sell contracts on April 1, 2006.
As discussed in Note 16 to the Consolidated Financial Statements, the Company changed its method of accounting for uncertain income tax positions on January 1, 2007.
A company’s internal control over financial reporting is a process designed to provide reasonable assurance regarding the reliability of financial reporting and the preparation of financial statements for external purposes in accordance with generally accepted accounting principles. A company’s internal control over financial reporting includes those policies and procedures that (i) pertain to the maintenance of records that, in reasonable detail, accurately and fairly reflect the transactions and dispositions of the assets of the company; (ii) provide reasonable assurance that transactions are recorded as necessary to permit preparation of financial statements in accordance with generally accepted accounting principles, and that receipts and expenditures of the company are being made only in accordance with authorizations of management and directors of the company; and (iii) provide reasonable assurance regarding prevention or timely detection of unauthorized acquisition, use, or disposition of the company’s assets that could have a material effect on the financial statements.
Because of its inherent limitations, internal control over financial reporting may not prevent or detect misstatements. Also, projections of any evaluation of effectiveness to future periods are subject to the risk that controls may become inadequate because of changes in conditions, or that the degree of compliance with the policies or procedures may deteriorate.
/s/PricewaterhouseCoopers LLP
San Francisco, California
February 26, 2009
FS-26
Consolidated Statement of Income
Millions of dollars, except per-share amounts
| | | | | | | | | | | | | | |
| | | Year ended December 31 | |
| | | 2008 | | | | 2007 | | | 2006 | |
| | | | | |
Revenues and Other Income | | | | | | | | | | | | | |
Sales and other operating revenues1,2 | | $ | 264,958 | | | | $ | 214,091 | | | $ | 204,892 | |
| Income from equity affiliates | | | 5,366 | | | | | 4,144 | | | | 4,255 | |
| Other income | | | 2,681 | | | | | 2,669 | | | | 971 | |
| | | | | |
Total Revenues and Other Income | | | 273,005 | | | | | 220,904 | | | | 210,118 | |
| | | | | |
Costs and Other Deductions | | | | | | | | | | | | | |
Purchased crude oil and products2 | | | 171,397 | | | | | 133,309 | | | | 128,151 | |
| Operating expenses | | | 20,795 | | | | | 16,932 | | | | 14,624 | |
| Selling, general and administrative expenses | | | 5,756 | | | | | 5,926 | | | | 5,093 | |
| Exploration expenses | | | 1,169 | | | | | 1,323 | | | | 1,364 | |
| Depreciation, depletion and amortization | | | 9,528 | | | | | 8,708 | | | | 7,506 | |
Taxes other than on income1 | | | 21,303 | | | | | 22,266 | | | | 20,883 | |
| Interest and debt expense | | | – | | | | | 166 | | | | 451 | |
| Minority interests | | | 100 | | | | | 107 | | | | 70 | |
| | | | | |
Total Costs and Other Deductions | | | 230,048 | | | | | 188,737 | | | | 178,142 | |
| | | | | |
Income Before Income Tax Expense | | | 42,957 | | | | | 32,167 | | | | 31,976 | |
Income Tax Expense | | | 19,026 | | | | | 13,479 | | | | 14,838 | |
| | | | | |
Net Income | | $ | 23,931 | | | | $ | 18,688 | | | $ | 17,138 | |
| | | | | |
Per-Share of Common Stock | | | | | | | | | | | | | |
Net Income | | | | | | | | | | | | | |
– Basic | | $ | 11.74 | | | | $ | 8.83 | | | $ | 7.84 | |
– Diluted | | $ | 11.67 | | | | $ | 8.77 | | | $ | 7.80 | |
| | | | | |
| | | | |
1 Includes excise, value-added and similar taxes. | | $ | 9,846 | | | | $ | 10,121 | | | $ | 9,551 | |
2 Includes amounts in revenues for buy/sell contracts; associated costs are in “Purchased crude oil and products.”
Refer also to Note 14, on page FS-43. | | $ | – | | | | $ | – | | | $ | 6,725 | |
See accompanying Notes to the Consolidated Financial Statements.
FS-27
Consolidated Statement of Comprehensive Income
Millions of dollars
| | | | | | | | | | | | | | |
| | | Year ended December 31 | |
| | | 2008 | | | | 2007 | | | 2006 | |
| | | | | |
Net Income | | $ | 23,931 | | | | $ | 18,688 | | | $ | 17,138 | |
| | | | | |
| Currency translation adjustment | | | | | | | | | | | | | |
| Unrealized net change arising during period | | | (112 | ) | | | | 31 | | | | 55 | |
| | | | | |
| Unrealized holding (loss) gain on securities | | | | | | | | | | | | | |
| Net (loss) gain arising during period | | | (6 | ) | | | | 17 | | | | (88 | ) |
| Reclassification to net income of net realized loss | | | – | | | | | 2 | | | | – | |
| | | | | |
| Total | | | (6 | ) | | | | 19 | | | | (88 | ) |
| | | | | |
| Derivatives | | | | | | | | | | | | | |
| Net derivatives gain (loss) on hedge transactions | | | 139 | | | | | (10 | ) | | | 2 | |
| Reclassification to net income of net realized loss | | | 32 | | | | | 7 | | | | 95 | |
| Income taxes on derivatives transactions | | | (61 | ) | | | | (3 | ) | | | (30 | ) |
| | | | | |
| Total | | | 110 | | | | | (6 | ) | | | 67 | |
| | | | | |
| Defined benefit plans | | | | | | | | | | | | | |
| Minimum pension liability adjustment | | | – | | | | | – | | | | (88 | ) |
| Actuarial loss | | | | | | | | | | | | | |
| Amortization to net income of net actuarial loss | | | 483 | | | | | 356 | | | | – | |
| Actuarial (loss) gain arising during period | | | (3,228 | ) | | | | 530 | | | | – | |
| Prior service cost | | | | | | | | | | | | | |
| Amortization to net income of net prior service credits | | | (64 | ) | | | | (15 | ) | | | – | |
| Prior service (credit) cost arising during period | | | (32 | ) | | | | 204 | | | | – | |
| Defined benefit plans sponsored by equity affiliates | | | (97 | ) | | | | 19 | | | | – | |
| Income taxes on defined benefit plans | | | 1,037 | | | | | (409 | ) | | | 50 | |
| | | | | |
| Total | | | (1,901 | ) | | | | 685 | | | | (38 | ) |
| | | | | |
Other Comprehensive (Loss) Gain, Net of Tax | | | (1,909 | ) | | | | 729 | | | | (4 | ) |
| | | | | |
Comprehensive Income | | $ | 22,022 | | | | $ | 19,417 | | | $ | 17,134 | |
| | | | | |
See accompanying Notes to the Consolidated Financial Statements.
FS-28
Consolidated Balance Sheet
Millions of dollars, except per-share amounts
| | | | | | | | | | |
| | | At December 31 | |
| | | 2008 | | | | 2007 | |
| | | | | |
Assets | | | | | | | | | |
| Cash and cash equivalents | | $ | 9,347 | | | | $ | 7,362 | |
| Marketable securities | | | 213 | | | | | 732 | |
| Accounts and notes receivable (less allowance: 2008 – $246; 2007 – $165) | | | 15,856 | | | | | 22,446 | |
| Inventories: | | | | | | | | | |
| Crude oil and petroleum products | | | 5,175 | | | | | 4,003 | |
| Chemicals | | | 459 | | | | | 290 | |
| Materials, supplies and other | | | 1,220 | | | | | 1,017 | |
| | | | | | | |
| Total inventories | | | 6,854 | | | | | 5,310 | |
| Prepaid expenses and other current assets | | | 4,200 | | | | | 3,527 | |
| | | | | |
Total Current Assets | | | 36,470 | | | | | 39,377 | |
| Long-term receivables, net | | | 2,413 | | | | | 2,194 | |
| Investments and advances | | | 20,920 | | | | | 20,477 | |
| Properties, plant and equipment, at cost | | | 173,299 | | | | | 154,084 | |
| Less: Accumulated depreciation, depletion and amortization | | | 81,519 | | | | | 75,474 | |
| | | | | | | |
| Properties, plant and equipment, net | | | 91,780 | | | | | 78,610 | |
| Deferred charges and other assets | | | 4,711 | | | | | 3,491 | |
| Goodwill | | | 4,619 | | | | | 4,637 | |
| Assets held for sale | | | 252 | | | | | – | |
| | | | | |
Total Assets | | $ | 161,165 | | | | $ | 148,786 | |
| | | | | |
Liabilities and Stockholders’ Equity | | | | | | | | | |
| Short-term debt | | $ | 2,818 | | | | $ | 1,162 | |
| Accounts payable | | | 16,580 | | | | | 21,756 | |
| Accrued liabilities | | | 8,077 | | | | | 5,275 | |
| Federal and other taxes on income | | | 3,079 | | | | | 3,972 | |
| Other taxes payable | | | 1,469 | | | | | 1,633 | |
| | | | | |
Total Current Liabilities | | | 32,023 | | | | | 33,798 | |
| Long-term debt | | | 5,742 | | | | | 5,664 | |
| Capital lease obligations | | | 341 | | | | | 406 | |
| Deferred credits and other noncurrent obligations | | | 17,678 | | | | | 15,007 | |
| Noncurrent deferred income taxes | | | 11,539 | | | | | 12,170 | |
| Reserves for employee benefit plans | | | 6,725 | | | | | 4,449 | |
| Minority interests | | | 469 | | | | | 204 | |
| | | | | |
Total Liabilities | | | 74,517 | | | | | 71,698 | |
| | | | | |
| Preferred stock (authorized 100,000,000 shares, $1.00 par value; none issued) | | | – | | | | | – | |
| Common stock (authorized 6,000,000,000 shares at December 31, 2008, and 4,000,000,000 at December 31, 2007; $0.75 par value; 2,442,676,580 shares issued at December 31, 2008 and 2007) | | | 1,832 | | | | | 1,832 | |
| Capital in excess of par value | | | 14,448 | | | | | 14,289 | |
| Retained earnings | | | 101,102 | | | | | 82,329 | |
| Notes receivable – key employees | | | – | | | | | (1 | ) |
| Accumulated other comprehensive loss | | | (3,924 | ) | | | | (2,015 | ) |
| Deferred compensation and benefit plan trust | | | (434 | ) | | | | (454 | ) |
| Treasury stock, at cost (2008 – 438,444,795 shares; 2007 – 352,242,618 shares) | | | (26,376 | ) | | | | (18,892 | ) |
| | | | | |
Total Stockholders’ Equity | | | 86,648 | | | | | 77,088 | |
| | | | | |
Total Liabilities and Stockholders’ Equity | | $ | 161,165 | | | | $ | 148,786 | |
| | | | | |
See accompanying Notes to the Consolidated Financial Statements.
FS-29
Consolidated Statement of Cash Flows
Millions of dollars
| | | | | | | | | | | | | | |
| | | Year ended December 31 | |
| | | 2008 | | | | 2007 | | | 2006 | |
| | | | | |
Operating Activities | | | | | | | | | | | | | |
| Net income | | $ | 23,931 | | | | $ | 18,688 | | | $ | 17,138 | |
| Adjustments | | | | | | | | | | | | | |
| Depreciation, depletion and amortization | | | 9,528 | | | | | 8,708 | | | | 7,506 | |
| Dry hole expense | | | 375 | | | | | 507 | | | | 520 | |
| Distributions less than income from equity affiliates | | | (440 | ) | | | | (1,439 | ) | | | (979 | ) |
| Net before-tax gains on asset retirements and sales | | | (1,358 | ) | | | | (2,315 | ) | | | (229 | ) |
| Net foreign currency effects | | | (355 | ) | | | | 378 | | | | 259 | |
| Deferred income tax provision | | | 598 | | | | | 261 | | | | 614 | |
| Net (increase) decrease in operating working capital | | | (1,673 | ) | | | | 685 | | | | 1,044 | |
| Minority interest in net income | | | 100 | | | | | 107 | | | | 70 | |
| Increase in long-term receivables | | | (161 | ) | | | | (82 | ) | | | (900 | ) |
| (Increase) decrease in other deferred charges | | | (84 | ) | | | | (530 | ) | | | 232 | |
| Cash contributions to employee pension plans | | | (839 | ) | | | | (317 | ) | | | (449 | ) |
| Other | | | 10 | | | | | 326 | | | | (503 | ) |
| | | | | |
Net Cash Provided by Operating Activities | | | 29,632 | | | | | 24,977 | | | | 24,323 | |
| | | | | |
Investing Activities | | | | | | | | | | | | | |
| Capital expenditures | | | (19,666 | ) | | | | (16,678 | ) | | | (13,813 | ) |
| Repayment of loans by equity affiliates | | | 179 | | | | | 21 | | | | 463 | |
| Proceeds from asset sales | | | 1,491 | | | | | 3,338 | | | | 989 | |
| Net sales of marketable securities | | | 483 | | | | | 185 | | | | 142 | |
| Net sales (purchases) of other short-term investments | | | 432 | | | | | (799 | ) | | | – | |
| | | | | |
Net Cash Used for Investing Activities | | | (17,081 | ) | | | | (13,933 | ) | | | (12,219 | ) |
| | | | | |
Financing Activities | | | | | | | | | | | | | |
| Net borrowings (payments) of short-term obligations | | | 2,647 | | | | | (345 | ) | | | (677 | ) |
| Repayments of long-term debt and other financing obligations | | | (965 | ) | | | | (3,343 | ) | | | (2,224 | ) |
| Proceeds from issuances of long-term debt | | | – | | | | | 650 | | | | – | |
| Cash dividends – common stock | | | (5,162 | ) | | | | (4,791 | ) | | | (4,396 | ) |
| Dividends paid to minority interests | | | (99 | ) | | | | (77 | ) | | | (60 | ) |
| Net purchases of treasury shares | | | (6,821 | ) | | | | (6,389 | ) | | | (4,491 | ) |
| | | | | |
Net Cash Used for Financing Activities | | | (10,400 | ) | | | | (14,295 | ) | | | (11,848 | ) |
| | | | | |
Effect of Exchange Rate Changes on Cash and Cash Equivalents | | | (166 | ) | | | | 120 | | | | 194 | |
| | | | | |
Net Change in Cash and Cash Equivalents | | | 1,985 | | | | | (3,131 | ) | | | 450 | |
Cash and Cash Equivalents at January 1 | | | 7,362 | | | | | 10,493 | | | | 10,043 | |
| | | | | |
Cash and Cash Equivalents at December 31 | | $ | 9,347 | | | | $ | 7,362 | | | $ | 10,493 | |
| | | | | |
See accompanying Notes to the Consolidated Financial Statements.
FS-30
Consolidated Statement of Stockholders’ Equity
Shares in thousands; amounts in millions of dollars
| | | | | | | | | | | | | | | | | | | | | | | | | | |
| | | 2008 | | | | 2007 | | | 2006 | |
| | | Shares | | | Amount | | | | Shares | | | Amount | | | Shares | | | Amount | |
| | | | | |
Preferred Stock | | | – | | | $ | – | | | | | – | | | $ | – | | | | – | | | $ | – | |
| | | | | |
Common Stock | | | | | | | | | | | | | | | | | | | | | | | | | |
| Balance at January 1 | | | 2,442,677 | | | $ | 1,832 | | | | | 2,442,677 | | | $ | 1,832 | | | | 2,442,677 | | | $ | 1,832 | |
Balance at December 31 | | | 2,442,677 | | | $ | 1,832 | | | | | 2,442,677 | | | $ | 1,832 | | | | 2,442,677 | | | $ | 1,832 | |
| | | | | |
Capital in Excess of Par | | | | | | | | | | | | | | | | | | | | | | | | | |
| Balance at January 1 | | | | | | $ | 14,289 | | | | | | | | $ | 14,126 | | | | | | | $ | 13,894 | |
| Treasury stock transactions | | | | | | | 159 | | | | | | | | | 163 | | | | | | | | 232 | |
| | | | | | | | | | | |
Balance at December 31 | | | | | | $ | 14,448 | | | | | | | | $ | 14,289 | | | | | | | $ | 14,126 | |
| | | | | |
Retained Earnings | | | | | | | | | | | | | | | | | | | | | | | | | |
| Balance at January 1 | | | | | | $ | 82,329 | | | | | | | | $ | 68,464 | | | | | | | $ | 55,738 | |
| Net income | | | | | | | 23,931 | | | | | | | | | 18,688 | | | | | | | | 17,138 | |
| Cash dividends on common stock | | | | | | | (5,162 | ) | | | | | | | | (4,791 | ) | | | | | | | (4,396 | ) |
| Adoption of EITF 04-6, “Accounting for Stripping Costs Incurred during Production in the Mining Industry” | | | | | | | – | | | | | | | | | – | | | | | | | | (19 | ) |
| Adoption of FIN 48, “Accounting for Uncertainty in Income Taxes” | | | | | | | – | | | | | | | | | (35 | ) | | | | | | | – | |
| Tax benefit from dividends paid on unallocated ESOP shares and other | | | | | | | 4 | | | | | | | | | 3 | | | | | | | | 3 | |
| | | | | | | | | | | |
Balance at December 31 | | | | | | $ | 101,102 | | | | | | | | $ | 82,329 | | | | | | | $ | 68,464 | |
| | | | | |
Notes Receivable – Key Employees | | | | | | $ | – | | | | | | | | $ | (1 | ) | | | | | | $ | (2 | ) |
| | | | | |
Accumulated Other Comprehensive Loss | | | | | | | | | | | | | | | | | | | | | | | | | |
Currency translation adjustment
Balance at January 1 | | | | | | $ | (59 | ) | | | | | | | $ | (90 | ) | | | | | | $ | (145 | ) |
| Change during year | | | | | | | (112 | ) | | | | | | | | 31 | | | | | | | | 55 | |
| | | | | | | | | | | |
| Balance at December 31 | | | | | | $ | (171 | ) | | | | | | | $ | (59 | ) | | | | | | $ | (90 | ) |
Pension and other postretirement benefit plans
Balance at January 1 | | | | | | $ | (2,008 | ) | | | | | | | $ | (2,585 | ) | | | | | | $ | (344 | ) |
| Change to defined benefit plans during year | | | | | | | (1,901 | ) | | | | | | | | 685 | | | | | | | | (38 | ) |
| Adoption of FAS 158, “Employers’ Accounting for Defined Benefit Pension and Other Postretirement Plans” | | | | | | | – | | | | | | | | | (108 | ) | | | | | | | (2,203 | ) |
| | | | | | | | | | | |
| Balance at December 31 | | | | | | $ | (3,909 | ) | | | | | | | $ | (2,008 | ) | | | | | | $ | (2,585 | ) |
| Unrealized net holding gain on securities Balance at January 1 | | | | | | $ | 19 | | | | | | | | $ | – | | | | | | | $ | 88 | |
| Change during year | | | | | | | (6 | ) | | | | | | | | 19 | | | | | | | | (88 | ) |
| | | | | | | | | | | |
| Balance at December 31 | | | | | | $ | 13 | | | | | | | | $ | 19 | | | | | | | $ | – | |
| Net derivatives gain (loss) on hedge transactions | | | | | | | | | | | | | | |
| Balance at January 1 | | | | | | $ | 33 | | | | | | | | $ | 39 | | | | | | | $ | (28 | ) |
| Change during year | | | | | | | 110 | | | | | | | | | (6 | ) | | | | | | | 67 | |
| | | | | | | | | | | |
| Balance at December 31 | | | | | | $ | 143 | | | | | | | | $ | 33 | | | | | | | $ | 39 | |
| | | | | | | | | | | |
Balance at December 31 | | | | | | $ | (3,924 | ) | | | | | | | $ | (2,015 | ) | | | | | | $ | (2,636 | ) |
| | | | | |
Deferred Compensation and Benefit Plan Trust Deferred Compensation | | | | | | | | | | | | | | | | | | | | | | | | | |
| Balance at January 1 | | | | | | $ | (214 | ) | | | | | | | $ | (214 | ) | | | | | | $ | (246 | ) |
| Net reduction of ESOP debt and other | | | | | | | 20 | | | | | | | | | – | | | | | | | | 32 | |
| | | | | | | | | | | |
Balance at December 31 | | | | | | | (194 | ) | | | | | | | | (214 | ) | | | | | | | (214 | ) |
Benefit Plan Trust (Common Stock) | | | 14,168 | | | | (240 | ) | | | | 14,168 | | | | (240 | ) | | | 14,168 | | | | (240 | ) |
| | | | | | | |
Balance at December 31 | | | 14,168 | | | $ | (434 | ) | | | | 14,168 | | | $ | (454 | ) | | | 14,168 | | | $ | (454 | ) |
| | | | | |
Treasury Stock at Cost | | | | | | | | | | | | | | | | | | | | | | | | | |
| Balance at January 1 | | | 352,243 | | | $ | (18,892 | ) | | | | 278,118 | | | $ | (12,395 | ) | | | 209,990 | | | $ | (7,870 | ) |
| Purchases | | | 95,631 | | | | (8,011 | ) | | | | 85,429 | | | | (7,036 | ) | | | 80,369 | | | | (5,033 | ) |
| Issuances – mainly employee benefit plans | | | (9,429 | ) | | | 527 | | | | | (11,304 | ) | | | 539 | | | | (12,241 | ) | | | 508 | |
| | | | | | | |
Balance at December 31 | | | 438,445 | | | $ | (26,376 | ) | | | | 352,243 | | | $ | (18,892 | ) | | | 278,118 | | | $ | (12,395 | ) |
| | | | | |
Total Stockholders’ Equity at December 31 | | | | | | $ | 86,648 | | | | | | | | $ | 77,088 | | | | | | | $ | 68,935 | |
| | | | | |
See accompanying Notes to the Consolidated Financial Statements.
FS-31
| | | | | | | | | | |
Notes to the Consolidated Financial Statements
Millions of dollars, except per-share amounts
|
| | | | | | | | | | |
Note 1
Summary of Significant Accounting Policies
General Exploration and production (upstream) operations consist of exploring for, developing and producing crude oil and natural gas and marketing natural gas. Refining, marketing and transportation (downstream) operations relate to refining crude oil into finished petroleum products; marketing crude oil and the many products derived from petroleum; and transporting crude oil, natural gas and petroleum products by pipeline, marine vessel, motor equipment and rail car. Chemical operations include the manufacture and marketing of commodity petrochemicals, plastics for industrial uses, and fuel and lubricant oil additives.
The company’s Consolidated Financial Statements are prepared in accordance with accounting principles generally accepted in the United States of America. These require the use of estimates and assumptions that affect the assets, liabilities, revenues and expenses reported in the financial statements, as well as amounts included in the notes thereto, including discussion and disclosure of contingent liabilities. Although the company uses its best estimates and judgments, actual results could differ from these estimates as future confirming events occur.
The nature of the company’s operations and the many countries in which it operates subject the company to changing economic, regulatory and political conditions. The company does not believe it is vulnerable to the risk of near-term severe impact as a result of any concentration of its activities.
Subsidiary and Affiliated Companies The Consolidated Financial Statements include the accounts of controlled subsidiary companies more than 50 percent-owned and variable-interest entities in which the company is the primary beneficiary. Undivided interests in oil and gas joint ventures and certain other assets are consolidated on a proportionate basis. Investments in and advances to affiliates in which the company has a substantial ownership interest of approximately 20 percent to 50 percent or for which the company exercises significant influence but not control over policy decisions are accounted for by the equity method. As part of that accounting, the company recognizes gains and losses that arise from the issuance of stock by an affiliate that results in changes in the company’s proportionate share of the dollar amount of the affiliate’s equity currently in income.
Investments are assessed for possible impairment when events indicate that the fair value of the investment may be below the company’s carrying value. When such a condition is deemed to be other than temporary, the carrying value of the investment is written down to its fair value, and the amount of the write-down is included in net income. In making the determination as to whether a decline is other than temporary, the company considers such factors as the duration and extent of the decline, the investee’s financial
performance, and the company’s ability and intention to retain its investment for a period that will be sufficient to allow for any anticipated recovery in the investment’s market value. The new cost basis of investments in these equity investees is not changed for subsequent recoveries in fair value.
Differences between the company’s carrying value of an equity investment and its underlying equity in the net assets of the affiliate are assigned to the extent practicable to specific assets and liabilities based on the company’s analysis of the various factors giving rise to the difference. When appropriate, the company’s share of the affiliate’s reported earnings is adjusted quarterly to reflect the difference between these allocated values and the affiliate’s historical book values.
Derivatives The majority of the company’s activity in derivative commodity instruments is intended to manage the financial risk posed by physical transactions. For some of this derivative activity, generally limited to large, discrete or infrequently occurring transactions, the company may elect to apply fair value or cash flow hedge accounting. For other similar derivative instruments, generally because of the short-term nature of the contracts or their limited use, the company does not apply hedge accounting, and changes in the fair value of those contracts are reflected in current income. For the company’s commodity trading activity and foreign currency exposures, gains and losses from derivative instruments are reported in current income. Interest rate swaps – hedging a portion of the company’s fixed-rate debt – are accounted for as fair value hedges, whereas interest rate swaps relating to a portion of the company’s floating-rate debt are recorded at fair value on the Consolidated Balance Sheet, with resulting gains and losses reflected in income. Where Chevron is a party to master netting arrangements, fair value receivable and payable amounts recognized for derivative instruments executed with the same counterparty are offset on the balance sheet.
Short-Term Investments All short-term investments are classified as available for sale and are in highly liquid debt securities. Those investments that are part of the company’s cash management portfolio and have original maturities of three months or less are reported as “Cash equivalents.” The balance of the short-term investments is reported as “Marketable securities” and is marked-to-market, with any unrealized gains or losses included in “Other comprehensive income.”
Inventories Crude oil, petroleum products and chemicals are generally stated at cost, using a Last-In, First-Out (LIFO) method. In the aggregate, these costs are below market. “Materials, supplies and other” inventories generally are stated at average cost.
FS-32
| | | | | | | | | | |
| | |
Note 1Summary of Significant Accounting Policies - Continued
| | |
Properties, Plant and Equipment The successful efforts method is used for crude oil and natural gas exploration and production activities. All costs for development wells, related plant and equipment, proved mineral interests in crude oil and natural gas properties, and related asset retirement obligation (ARO) assets are capitalized. Costs of exploratory wells are capitalized pending determination of whether the wells found proved reserves. Costs of wells that are assigned proved reserves remain capitalized. Costs also are capitalized for exploratory wells that have found crude oil and natural gas reserves even if the reserves cannot be classified as proved when the drilling is completed, provided the exploratory well has found a sufficient quantity of reserves to justify its completion as a producing well and the company is making sufficient progress assessing the reserves and the economic and operating viability of the project. All other exploratory wells and costs are expensed. Refer to Note 20, beginning on page FS-48, for additional discussion of accounting for suspended exploratory well costs.
Long-lived assets to be held and used, including proved crude oil and natural gas properties, are assessed for possible impairment by comparing their carrying values with their associated undiscounted future net before-tax cash flows. Events that can trigger assessments for possible impairments include write-downs of proved reserves based on field performance, significant decreases in the market value of an asset, significant change in the extent or manner of use of or a physical change in an asset, and a more-likely-than-not expectation that a long-lived asset or asset group will be sold or otherwise disposed of significantly sooner than the end of its previously estimated useful life. Impaired assets are written down to their estimated fair values, generally their discounted future net before-tax cash flows. For proved crude oil and natural gas properties in the United States, the company generally performs the impairment review on an individual field basis. Outside the United States, reviews are performed on a country, concession, development area or field basis, as appropriate. In the refining, marketing, transportation and chemical areas, impairment reviews are generally done on the basis of a refinery, a plant, a marketing area or marketing assets by country. Impairment amounts are recorded as incremental “Depreciation, depletion and amortization” expense.
Long-lived assets that are held for sale are evaluated for possible impairment by comparing the carrying value of the asset with its fair value less the cost to sell. If the net book value exceeds the fair value less cost to sell, the asset is considered impaired and adjusted to the lower value.
As required under Financial Accounting Standards Board (FASB) Statement No. 143,Accounting for Asset Retirement Obligations(FAS 143), the fair value of a liability for an ARO is recorded as an asset and a liability when there is a
legal obligation associated with the retirement of a long-lived asset and the amount can be reasonably estimated. Refer also to Note 24, beginning on page FS-58, relating to AROs.
Depreciation and depletion of all capitalized costs of proved crude oil and natural gas producing properties, except mineral interests, are expensed using the unit-of-production method generally by individual field, as the proved developed reserves are produced. Depletion expenses for capitalized costs of proved mineral interests are recognized using the unit-of-production method by individual field as the related proved reserves are produced. Periodic valuation provisions for impairment of capitalized costs of unproved mineral interests are expensed.
Depreciation and depletion expenses for mining assets are determined using the unit-of-production method as the proved reserves are produced. The capitalized costs of all other plant and equipment are depreciated or amortized over their estimated useful lives. In general, the declining-balance method is used to depreciate plant and equipment in the United States; the straight-line method generally is used to depreciate international plant and equipment and to amortize all capitalized leased assets.
Gains or losses are not recognized for normal retirements of properties, plant and equipment subject to composite group amortization or depreciation. Gains or losses from abnormal retirements are recorded as expenses and from sales as “Other income.”
Expenditures for maintenance (including those for planned major maintenance projects), repairs and minor renewals to maintain facilities in operating condition are generally expensed as incurred. Major replacements and renewals are capitalized.
Goodwill Goodwill resulting from a business combination is not subject to amortization. As required by FASB Statement No. 142,Goodwill and Other Intangible Assets, the company tests such goodwill at the reporting unit level for impairment on an annual basis and between annual tests if an event occurs or circumstances change that would more likely than not reduce the fair value of a reporting unit below its carrying amount.
Environmental Expenditures Environmental expenditures that relate to ongoing operations or to conditions caused by past operations are expensed. Expenditures that create future benefits or contribute to future revenue generation are capitalized.
Liabilities related to future remediation costs are recorded when environmental assessments or cleanups or both are probable and the costs can be reasonably estimated. For the company’s U.S. and Canadian marketing facilities, the accrual is based in part on the probability that a future remediation commitment will be required. For crude oil, natural gas and
FS-33
| | | | | | | | | | |
Notes to the Consolidated Financial Statements Millions of dollars, except per-share amounts | |
Note 1Summary of Significant Accounting Policies - Continued
|
| | | | | | | | | | |
mineral producing properties, a liability for an ARO is made, following FAS 143. Refer to Note 24, beginning on page FS-58, for a discussion of FAS 143.
For federal Superfund sites and analogous sites under state laws, the company records a liability for its designated share of the probable and estimable costs and probable amounts for other potentially responsible parties when mandated by the regulatory agencies because the other parties are not able to pay their respective shares.
The gross amount of environmental liabilities is based on the company’s best estimate of future costs using currently available technology and applying current regulations and the company’s own internal environmental policies. Future amounts are not discounted. Recoveries or reimbursements are recorded as assets when receipt is reasonably assured.
Currency Translation The U.S. dollar is the functional currency for substantially all of the company’s consolidated operations and those of its equity affiliates. For those operations, all gains and losses from currency translations are currently included in income. The cumulative translation effects for those few entities, both consolidated and affiliated, using functional currencies other than the U.S. dollar are included in the currency translation adjustment in “Stockholders’ Equity.”
Revenue Recognition Revenues associated with sales of crude oil, natural gas, coal, petroleum and chemicals products, and all other sources are recorded when title passes to the customer, net of royalties, discounts and allowances, as applicable. Revenues from natural gas production from properties in which Chevron has an interest with other producers are generally recognized on the basis of the company’s net working interest (entitlement method). Excise, value-added and similar taxes assessed by a governmental authority on a revenue-producing transaction between a seller and a customer are presented on a gross basis. The associated amounts are shown as a footnote to the Consolidated Statement of Income on page FS-27. Refer to Note 14, on page FS-43, for a discussion of the accounting for buy/sell arrangements.
Stock Options and Other Share-Based Compensation The company issues stock options and other share-based compensation to its employees and accounts for these transactions under the provisions of FASB Statement No. 123R,Share-Based Payment(FAS 123R). For equity awards, such as stock options, total compensation cost is based on the grant date fair value and for liability awards, such as stock appreciation rights, total compensation cost is based on the settlement
value. The company recognizes stock-based compensation expense for all awards over the service period required to earn the award, which is the shorter of the vesting period or the time period an employee becomes eligible to retain the award at retirement. Stock options and stock appreciation rights granted under the company’s Long-Term Incentive Plan have graded vesting provisions by which one-third of each award vests on the first, second and third anniversaries of the date of grant. The company amortizes these newly issued graded awards on a straight-line basis.
Tax benefits of deductions from the exercise of stock options are presented as financing cash inflows in the Consolidated Statement of Cash Flows. Refer to Note 21, beginning on page FS-49 for a description of the company’s share-based compensation plans and information related to awards granted under those plans and Note 2, which follows, for information on excess tax benefits reported on the company’s Statement of Cash Flows.
Note 2
Information Relating to the Consolidated Statement of Cash Flows
| | | | | | | | | | | | | | |
| | | Year ended December 31 | |
| | | 2008 | | | | 2007 | | | 2006 | |
| | | | | |
| Net (increase) decrease in operating working capital was composed of the following: | | | | | | | | | | | | | |
| Decrease (increase) in accounts and notes receivable | | $ | 6,030 | | | | $ | (3,867 | ) | | $ | 17 | |
| Increase in inventories | | | (1,545 | ) | | | | (749 | ) | | | (536 | ) |
| Increase in prepaid expenses and other current assets | | | (621 | ) | | | | (370 | ) | | | (31 | ) |
| (Decrease) increase in accounts payable and accrued liabilities | | | (4,628 | ) | | | | 4,930 | | | | 1,246 | |
| (Decrease) increase in income and other taxes payable | | | (909 | ) | | | | 741 | | | | 348 | |
| | | | | |
| Net (increase) decrease in operating working capital | | $ | (1,673 | ) | | | $ | 685 | | | $ | 1,044 | |
| | | | | |
| Net cash provided by operating activities includes the following cash payments for interest and income taxes: | | | | | | | | | | | | | |
| Interest paid on debt (net of capitalized interest) | | $ | – | | | | $ | 203 | | | $ | 470 | |
| Income taxes | | $ | 19,130 | | | | $ | 12,340 | | | $ | 13,806 | |
| | | | | |
| Net sales of marketable securities consisted of the following gross amounts: | | | | | | | | | | | | | |
| Marketable securities sold | | $ | 3,719 | | | | $ | 2,160 | | | $ | 1,413 | |
| Marketable securities purchased | | | (3,236 | ) | | | | (1,975 | ) | | | (1,271 | ) |
| | | | | |
| Net sales of marketable securities | | $ | 483 | | | | $ | 185 | | | $ | 142 | |
| | | | | |
FS-34
| | | | | | | | | | | |
| | |
Note 2Information Relating to the Consolidated Statement of
Cash Flows - Continued
| | |
In accordance with the cash-flow classification requirements of FAS 123R,Share-Based Payment, the “Net decrease in operating working capital” includes reductions of $106, $96 and $94 for excess income tax benefits associated with stock options exercised during 2008, 2007 and 2006, respectively. These amounts are offset by “Net purchases of treasury shares.”
In 2008, “Net purchases of other short-term investments” consist of $367 in restricted cash associated with capital-investment projects at the company’s Pascagoula, Mississippi refinery and the Angola liquefied natural gas project that was invested in short-term marketable securities and reclassified from “Cash and cash equivalents” to “Deferred charges and other assets” in the Consolidated Balance Sheet. In 2007, the company issued a $650 tax exempt Mississippi Gulf Opportunity Zone Bond as a source of funds for the Pascagoula Refinery project.
The “Net purchases of treasury shares” represents the cost of common shares less the cost of shares issued for share-based compensation plans. Purchases totaled $8,011, $7,036 and $5,033 in 2008, 2007 and 2006, respectively.
The Consolidated Statement of Cash Flows for 2008 excludes changes to the Consolidated Balance Sheet that did not affect cash. “Net purchases of treasury shares” excludes $680 of treasury shares acquired in exchange for a U.S. upstream property and $280 in cash. The carrying value of this property in “Properties, plant and equipment” on the Consolidated Balance Sheet was not significant. The “Increase in accounts payable and accrued liabilities” excludes a $2,450 increase in “Accrued liabilities” that was offset to “Properties, plant and equipment” on the Consolidated Balance Sheet. This amount related to accruals associated with upstream operating agreements outside the United States. “Capital expenditures” excludes a $1,400 increase in “Properties, plant and equipment” (PPE) related to the acquisition of an additional interest in an equity affiliate that required a change to the consolidated method of accounting for the investment during 2008. This addition to PPE was offset primarily by reductions in “Investments and advances” and working capital and an increase in “Noncurrent deferred income tax” liabilities. Refer also to Note 24 beginning on page FS-58 for a discussion of revisions to the company’s AROs that also did not involve cash receipts or payments for the three years ending December 31, 2008.
The major components of “Capital expenditures” and the reconciliation of this amount to the reported capital and exploratory expenditures, including equity affiliates, are presented in the following table:
| | | | | | | | | | | | | | |
| | | Year ended December 31 | |
| | | 2008 | | | | 2007 | | | 2006 | |
| | | | | |
| Additions to properties, plant and equipment* | | $ | 18,495 | | | | $ | 16,127 | | | $ | 12,800 | |
| Additions to investments | | | 1,051 | | | | | 881 | | | | 880 | |
| Current-year dry hole expenditures | | | 320 | | | | | 418 | | | | 400 | |
| Payments for other liabilities and assets, net | | | (200 | ) | | | | (748 | ) | | | (267 | ) |
| | | | | |
| Capital expenditures | | | 19,666 | | | | | 16,678 | | | | 13,813 | |
| Expensed exploration expenditures | | | 794 | | | | | 816 | | | | 844 | |
| Assets acquired through capital lease obligations and other financing obligations | | | 9 | | | | | 196 | | | | 35 | |
| | | | | |
| Capital and exploratory expenditures, excluding equity affiliates | | | 20,469 | | | | | 17,690 | | | | 14,692 | |
| Equity in affiliates’ expenditures | | | 2,306 | | | | | 2,336 | | | | 1,919 | |
| | | | | |
| Capital and exploratory expenditures, including equity affiliates | | $ | 22,775 | | | | $ | 20,026 | | | $ | 16,611 | |
| | | | | |
* Net of noncash additions of $5,153 in 2008, $3,560 in 2007 and $440 in 2006.
Note 3
Stockholders’ Equity
Retained earnings at December 31, 2008 and 2007, included approximately $7,951 and $7,284, respectively, for the company’s share of undistributed earnings of equity affiliates.
At December 31, 2008, about 109 million shares of Chevron’s common stock remained available for issuance from the 160 million shares that were reserved for issuance under the Chevron Corporation Long-Term Incentive Plan (LTIP). In addition, approximately 409,000 shares remain available for issuance from the 800,000 shares of the company’s common stock that were reserved for awards under the Chevron Corporation Non-Employee Directors’ Equity Compensation and Deferral Plan (Non-Employee Directors’ Plan).
Note 4
Summarized Financial Data – Chevron U.S.A. Inc.
Chevron U.S.A. Inc. (CUSA) is a major subsidiary of Chevron Corporation. CUSA and its subsidiaries manage and operate most of Chevron’s U.S. businesses. Assets include those related to the exploration and production of crude oil, natural gas and natural gas liquids and those associated with the refining, marketing, supply and distribution of products derived from petroleum, excluding most of the regulated pipeline operations of Chevron. CUSA also holds the company’s investment in the Chevron Phillips Chemical Company LLC joint venture, which is accounted for using the equity method.
FS-35
| | | | | | | | | | |
Notes to the Consolidated Financial Statements Millions of dollars, except per-share amounts | |
Note 4Summarized Financial Data – Chevron U.S.A. Inc. - Continued
|
| | | | | | | | | | |
During 2008, Chevron implemented legal reorganizations in which certain Chevron subsidiaries transferred assets to or under CUSA. The summarized financial information for CUSA and its consolidated subsidiaries presented in the table below gives retroactive effect to the reorganizations as if they had occurred on January 1, 2006. However, the financial information in the following table may not reflect the financial position and operating results in the periods presented if the reorganization actually had occurred on that date.
| | | | | | | | | | | | | | |
| | | Year ended December 31 | |
| | | 2008 | | | | 2007 | | | 2006 | |
| | | | | |
| Sales and other operating revenues | | $ | 195,593 | | | | $ | 153,574 | | | $ | 145,774 | |
| Total costs and other deductions | | | 185,788 | | | | | 147,510 | | | | 137,765 | |
| Net income | | | 7,237 | | | | | 5,203 | | | | 5,668 | |
| | | | | |
| | | | | | | | | | |
| | | At December 31 | |
| | | 2008 | | | | 2007 | |
| | | | | |
| Current assets | | $ | 32,760 | | | | $ | 32,801 | |
| Other assets | | | 31,806 | | | | | 27,400 | |
| Current liabilities | | | 14,322 | | | | | 20,050 | |
| Other liabilities | | | 14,805 | | | | | 11,447 | |
| | | | | |
| Net equity | | | 35,439 | | | | | 28,704 | |
| | | | | |
| Memo: Total debt | | $ | 6,813 | | | | $ | 4,433 | |
Note 5
Summarized Financial Data – Chevron Transport Corporation Ltd.
Chevron Transport Corporation Ltd. (CTC), incorporated in Bermuda, is an indirect, wholly owned subsidiary of Chevron Corporation. CTC is the principal operator of Chevron’s international tanker fleet and is engaged in the marine transportation of crude oil and refined petroleum products. Most of CTC’s shipping revenue is derived from providing transportation services to other Chevron companies. Chevron Corporation has fully and unconditionally guaranteed this subsidiary’s obligations in connection with certain debt securities issued by a third party. Summarized financial information for CTC and its consolidated subsidiaries is presented in the following table:
| | | | | | | | | | | | | | |
| | | Year ended December 31 | |
| | | 2008 | | | | 2007 | | | 2006 | |
| | | | | |
| Sales and other operating revenues | | $ | 1,022 | | | | $ | 667 | | | $ | 692 | |
| Total costs and other deductions | | | 947 | | | | | 713 | | | | 602 | |
| Net income | | | 120 | | | | | (39 | ) | | | 119 | |
| | | | | |
| | | | | | | | | | |
| | | At December 31 | |
| | | 2008 | | | | 2007 | |
| | | | | |
| Current assets | | $ | 482 | | | | $ | 335 | |
| Other assets | | | 172 | | | | | 337 | |
| Current liabilities | | | 98 | | | | | 107 | |
| Other liabilities | | | 88 | | | | | 188 | |
| | | | | |
| Net equity | | | 468 | | | | | 377 | |
| | | | | |
There were no restrictions on CTC’s ability to pay dividends or make loans or advances at December 31, 2008.
Note 6
Summarized Financial Data – Tengizchevroil LLP.
Chevron has a 50 percent equity ownership interest in Tengizchevroil LLP (TCO). Refer to Note 12 on page FS-41 for a discussion of TCO operations.
Summarized financial information for 100 percent of TCO is presented in the table below:
| | | | | | | | | | | | | | |
| | | Year ended December 31 | |
| | | 2008 | | | | 2007 | | | 2006 | |
| | | | | |
| Sales and other operating revenues | | $ | 14,329 | | | | $ | 8,919 | | | $ | 7,654 | |
| Costs and other deductions | | | 5,621 | | | | | 3,387 | | | | 2,967 | |
| Net income | | | 6,134 | | | | | 3,952 | | | | 3,315 | |
| | | | | |
| | | | | | | | | | |
| | | At December 31 | |
| | | 2008 | | | | 2007 | �� |
| | | | | |
| Current assets | | $ | 2,740 | | | | $ | 2,784 | |
| Other assets | | | 12,240 | | | | | 11,446 | |
| Current liabilities | | | 1,867 | | | | | 1,534 | |
| Other liabilities | | | 4,759 | | | | | 4,927 | |
| | | | | |
| Net equity | | | 8,354 | | | | | 7,769 | |
| | | | | |
Note 7
Financial and Derivative Instruments
Derivative Commodity Instruments Chevron is exposed to market risks related to price volatility of crude oil, refined products, natural gas, natural gas liquids, liquefied natural gas and refinery feedstocks.
The company uses derivative commodity instruments to manage these exposures on a portion of its activity, including firm commitments and anticipated transactions for the purchase, sale and storage of crude oil, refined products, natural gas, natural gas liquids and feedstock for company refineries. From time to time, the company also uses derivative commodity instruments for limited trading purposes.
The company uses International Swaps and Derivatives Association agreements to govern derivative contracts with certain counterparties to mitigate credit risk. Depending on the nature of the derivative transactions, bilateral collateral arrangements may also be required. When the company is engaged in more than one outstanding derivative transaction with the same counterparty and also has a legally enforceable netting agreement with that counterparty, the net mark-to-market exposure represents the netting of the positive and negative exposures with that counterparty and is a reasonable measure of the company’s credit risk exposure. The company also uses other netting agreements with certain counterparties with which it conducts significant transactions to mitigate credit risk.
The fair values of the outstanding contracts are reported on the Consolidated Balance Sheet as “Accounts and notes receivable,” “Accounts payable,” “Long-term receivables – net” and “Deferred credits and other noncurrent obligations.” Gains and losses on the company’s risk management activities
FS-36
| | | | | | | | | | | |
| |
Note 7Financial and Derivative Instruments - Continued
| | |
are reported as either “Sales and other operating revenues” or “Purchased crude oil and products,” whereas trading gains and losses are reported as “Other income.”
Foreign Currency The company enters into forward exchange contracts, generally with terms of 180 days or less, to manage some of its foreign currency exposures. These exposures include revenue and anticipated purchase transactions, including foreign currency capital expenditures and lease commitments, forecasted to occur within 180 days. The forward exchange contracts are recorded at fair value on the balance sheet with resulting gains and losses reflected in income.
The fair values of the outstanding contracts are reported on the Consolidated Balance Sheet as “Accounts and notes receivable” or “Accounts payable,” with gains and losses reported as “Other income.”
Interest Rates The company enters into interest rate swaps from time to time as part of its overall strategy to manage the interest rate risk on its debt. Under the terms of the swaps, net cash settlements are based on the difference between fixed-rate and floating-rate interest amounts calculated by reference to agreed notional principal amounts. Interest rate swaps related to a portion of the company’s fixed-rate debt are accounted for as fair value hedges.
Fair values of the interest rate swaps are reported on the Consolidated Balance Sheet as “Accounts and notes receivable” or “Accounts payable.” Interest rate swaps related to floating-rate debt are recorded at fair value on the balance sheet with resulting gains and losses reflected in income. At year-end 2008, the company had no interest-rate swaps on floating-rate debt.
Fair Value Fair values are derived from quoted market prices, other independent third-party quotes or, if not available, the present value of the expected cash flows. The fair values reflect the cash that would have been received or paid if the instruments were settled at year-end.
Long-term debt of $1,221 and $2,132 had estimated fair values of $1,414 and $2,354 at December 31, 2008 and 2007, respectively.
The company holds cash equivalents and marketable securities in U.S. and non-U.S. portfolios. The instruments held are primarily time deposits, money market funds and fixed rate bonds. Cash equivalents and marketable securities had carrying/fair values of $7,271 and $5,427 at December 31, 2008 and 2007, respectively. Of these balances, $7,058 and $4,695 at the respective year-ends were classified as cash equivalents that had average maturities under 90 days. The remainder, classified as marketable securities, had average maturities of approximately one year. At December 31, 2008,
restricted cash with a carrying/fair value of $367 that is related to capital-investment projects at the company’s Pascagoula, Mississippi refinery and Angola liquefied natural gas project was reclassified from “Cash and cash equivalents” to “Deferred charges and other assets” on the Consolidated Balance Sheet. This restricted cash was invested in short-term marketable securities.
Fair values of other financial and derivative instruments at the end of 2008 and 2007 were not material.
Concentrations of Credit Risk The company’s financial instruments that are exposed to concentrations of credit risk consist primarily of its cash equivalents, marketable securities, derivative financial instruments and trade receivables. The company’s short-term investments are placed with a wide array of financial institutions with high credit ratings. This diversified investment policy limits the company’s exposure both to credit risk and to concentrations of credit risk. Similar standards of diversity and creditworthiness are applied to the company’s counterparties in derivative instruments.
The trade receivable balances, reflecting the company’s diversified sources of revenue, are dispersed among the company’s broad customer base worldwide. As a consequence, the company believes concentrations of credit risk are limited. The company routinely assesses the financial strength of its customers. When the financial strength of a customer is not considered sufficient, requiring Letters of Credit is a principal method used to support sales to customers.
Note 8
Fair Value Measurements
The company implemented FASB Statement No. 157,Fair Value Measurements(FAS 157), as of January 1, 2008. FAS 157 was amended in February 2008 by FASB Staff Position (FSP) FAS No. 157-1,Application of FASB Statement No. 157 to FASB Statement No. 13 and Its Related Interpretive Accounting Pronouncements That Address Leasing Transactions,and by FSP FAS 157-2,Effective Date of FASB Statement No. 157,which delayed the company’s application of FAS 157 for nonrecurring nonfinancial assets and liabilities until January 1, 2009. FAS 157 was further amended in October 2008 by FSP FAS 157-3,Determining the Fair Value of a Financial Asset When the Market for That Asset Is Not Active,which clarifies the application of FAS 157 to assets participating in inactive markets.
Implementation of FAS 157 did not have a material effect on the company’s results of operations or consolidated financial position and had no effect on the company’s existing fair-value measurement practices. However, FAS 157 requires disclosure of a fair-value hierarchy of inputs the
FS-37
| | | | | | | | | | |
Notes to the Consolidated Financial Statements Millions of dollars, except per-share amounts | |
Note 8Fair Value Measurements - Continued
|
| | | | | | | | | | |
company uses to value an asset or a liability. The three levels of the fair-value hierarchy are described as follows:
Level 1: Quoted prices (unadjusted) in active markets for identical assets and liabilities. For the company, Level 1 inputs include exchange-traded futures contracts for which the parties are willing to transact at the exchange-quoted price and marketable securities that are actively traded.
Level 2: Inputs other than Level 1 that are observable, either directly or indirectly. For the company, Level 2 inputs include quoted prices for similar assets or liabilities, prices obtained through third-party broker quotes, and prices that can be corroborated with other observable inputs for substantially the complete term of a contract.
Level 3: Unobservable inputs. The company does not use Level 3 inputs for any of its recurring fair-value measurements. Beginning January 1, 2009, Level 3 inputs may be required for the determination of fair value associated with certain nonrecurring measurements of nonfinancial assets and liabilities.
The fair-value hierarchy for assets and liabilities measured at fair value at December 31, 2008, is as follows:
Assets and Liabilities Measured at
Fair Value on a Recurring Basis
| | | | | | | | | | | | | | | | | |
| | | | | | | Prices in Active | | | | | | | |
| | | | | | | Markets for | | | Other | | | | |
| | | | | | | Identical | | | Observable | | | Unobservable | |
| | | At December 31 | | | Assets/Liabilities | | | Inputs | | | Inputs | |
| | | 2008 | | | (Level 1) | | | (Level 2) | | | (Level 3) | |
| |
| Marketable Securities | | $ | 213 | | | $ | 213 | | | $ | – | | | $ | – | |
| Derivatives | | | 805 | | | | 529 | | | | 276 | | | | – | |
| |
Total Assets at Fair Value | | $ | 1,018 | | | $ | 742 | | | $ | 276 | | | $ | – | |
| |
| Derivatives | | $ | 516 | | | $ | 98 | | | $ | 418 | | | $ | – | |
| |
Total Liabilities at Fair Value | | $ | 516 | | | $ | 98 | | | $ | 418 | | | $ | – | |
| |
Marketable securities The company calculates fair value for its marketable securities based on quoted market prices for identical assets and liabilities.
Derivatives The company records its derivative instruments – other than any commodity derivative contracts that are designated as normal purchase and normal sale – on the Consolidated Balance Sheet at fair value, with virtually all the offsetting amount to income. For derivatives with identical or similar provisions as contracts that are publicly traded on a regular basis, the company uses the market values of the publicly traded instruments as an input for fair-value calculations.
The company’s derivative instruments principally include crude oil, natural gas and refined-product futures, swaps, options and forward contracts, as well as interest-rate swaps and foreign currency forward contracts. Derivatives
classified as Level 1 include futures, swaps and options contracts traded in active markets such as the NYMEX (New York Mercantile Exchange).
Derivatives classified as Level 2 include swaps (including interest rate), options, and forward (including foreign currency) contracts principally with financial institutions and other oil and gas companies, the fair values for which are obtained from third-party broker quotes, industry pricing services and exchanges. The company obtains multiple sources of pricing information for the Level 2 instruments. Since this pricing information is generated from observable market data, it has historically been very consistent. The company does not materially adjust this information. The company incorporates internal review, evaluation and assessment procedures, including a comparison of Level 2 fair values derived from the company’s internally developed forward curves (on a sample basis) with the pricing information to document reasonable, logical and supportable fair-value determinations and proper level of classification.
Note 9
Operating Segments and Geographic Data
Although each subsidiary of Chevron is responsible for its own affairs, Chevron Corporation manages its investments in these subsidiaries and their affiliates. For this purpose, the investments are grouped as follows: upstream – exploration and production; downstream – refining, marketing and transportation; chemicals; and all other. The first three of these groupings represent the company’s “reportable segments” and “operating segments” as defined in Financial Accounting Standards Board (FASB) Statement No. 131,Disclosures About Segments of an Enterprise and Related Information(FAS 131).
The segments are separately managed for investment purposes under a structure that includes “segment managers” who report to the company’s “chief operating decision maker” (CODM) (terms as defined in FAS 131). The CODM is the company’s Executive Committee, a committee of senior officers that includes the Chief Executive Officer and that, in turn, reports to the Board of Directors of Chevron Corporation.
The operating segments represent components of the company as described in FAS 131 terms that engage in activities (a) from which revenues are earned and expenses are incurred; (b) whose operating results are regularly reviewed by the CODM, which makes decisions about resources to be allocated to the segments and to assess their performance; and (c) for which discrete financial information is available.
Segment managers for the reportable segments are accountable directly to and maintain regular contact with the company’s CODM to discuss the segment’s operating activities and financial performance. The CODM approves annual capital and exploratory budgets at the reportable segment level, as well as reviews capital and exploratory funding for major
FS-38
| | | | | | | | | | | |
| | |
Note 9Operating Segments and Geographic Data - Continued
| | |
projects and approves major changes to the annual capital and exploratory budgets. However, business-unit managers within the operating segments are directly responsible for decisions relating to project implementation and all other matters connected with daily operations. Company officers who are members of the Executive Committee also have individual management responsibilities and participate in other committees for purposes other than acting as the CODM.
“All Other” activities include the company’s interest in Dynegy (through May 2007, when Chevron sold its interest), mining operations, power generation businesses, worldwide cash management and debt financing activities, corporate administrative functions, insurance operations, real estate activities, alternative fuels, and technology companies.
The company’s primary country of operation is the United States of America, its country of domicile. Other components of the company’s operations are reported as “International” (outside the United States).
Segment Earnings The company evaluates the performance of its operating segments on an after-tax basis, without considering the effects of debt financing interest expense or investment interest income, both of which are managed by the company on a worldwide basis. Corporate administrative costs and assets are not allocated to the operating segments. However, operating segments are billed for the direct use of corporate services. Nonbillable costs remain at the corporate level in “All Other.” After-tax segment income by major operating area is presented in the following table:
| | | | | | | | | | | | | | |
| | | Year ended December 31 | |
| | | 2008 | | | | 2007 | | | 2006 | |
| | | | | |
Income by Major Operating Area | | | | | | | | | | | | | |
Upstream | | | | | | | | | | | | | |
| United States | | $ | 7,126 | | | | $ | 4,532 | | | $ | 4,270 | |
| International | | | 14,584 | | | | | 10,284 | | | | 8,872 | |
| | | | | |
Total Upstream | | | 21,710 | | | | | 14,816 | | | | 13,142 | |
| | | | | |
Downstream | | | | | | | | | | | | | |
| United States | | | 1,369 | | | | | 966 | | | | 1,938 | |
| International | | | 2,060 | | | | | 2,536 | | | | 2,035 | |
| | | | | |
Total Downstream | | | 3,429 | | | | | 3,502 | | | | 3,973 | |
| | | | | |
Chemicals | | | | | | | | | | | | | |
| United States | | | 22 | | | | | 253 | | | | 430 | |
| International | | | 160 | | | | | 143 | | | | 109 | |
| | | | | |
Total Chemicals | | | 182 | | | | | 396 | | | | 539 | |
| | | | | |
Total Segment Income | | | 25,321 | | | | | 18,714 | | | | 17,654 | |
All Other | | | | | | | | | | | | | |
| Interest expense | | | – | | | | | (107 | ) | | | (312 | ) |
| Interest income | | | 192 | | | | | 385 | | | | 380 | |
| Other | | | (1,582 | ) | | | | (304 | ) | | | (584 | ) |
| | | | | |
Net Income | | $ | 23,931 | | | | $ | 18,688 | | | $ | 17,138 | |
| | | | | |
Segment Assets Segment assets do not include intercompany investments or intercompany receivables. Segment assets at year-end 2008 and 2007 are as follows:
| | | | | | | | | | |
| | | At December 31 | |
| | | 2008 | | | | 2007 | |
| | | | | |
Upstream | | | | | | | | | |
| United States | | $ | 26,071 | | | | $ | 23,535 | |
| International | | | 72,530 | | | | | 61,049 | |
| Goodwill | | | 4,619 | | | | | 4,637 | |
| | | | | |
Total Upstream | | | 103,220 | | | | | 89,221 | |
| | | | | |
Downstream | | | | | | | | | |
| United States | | | 15,869 | | | | | 16,790 | |
| International | | | 23,572 | | | | | 26,075 | |
| | | | | |
Total Downstream | | | 39,441 | | | | | 42,865 | |
| | | | | |
Chemicals | | | | | | | | | |
| United States | | | 2,535 | | | | | 2,484 | |
| International | | | 1,086 | | | | | 870 | |
| | | | | |
Total Chemicals | | | 3,621 | | | | | 3,354 | |
| | | | | |
Total Segment Assets | | | 146,282 | | | | | 135,440 | |
| | | | | |
All Other* | | | | | | | | | |
| United States | | | 8,984 | | | | | 6,847 | |
| International | | | 5,899 | | | | | 6,499 | |
| | | | | |
Total All Other | | | 14,883 | | | | | 13,346 | |
| | | | | |
Total Assets – United States | | | 53,459 | | | | | 49,656 | |
Total Assets – International | | | 103,087 | | | | | 94,493 | |
Goodwill | | | 4,619 | | | | | 4,637 | |
| | | | | |
Total Assets | | $ | 161,165 | | | | $ | 148,786 | |
| | | | | |
| * | | “All Other” assets consist primarily of worldwide cash, cash equivalents and marketable securities, real estate, information systems, mining operations, power generation businesses, technology companies, and assets of the corporate administrative functions. |
Segment Sales and Other Operating Revenues Operating segment sales and other operating revenues, including internal transfers, for the years 2008, 2007 and 2006 are presented in the table on the following page. Products are transferred between operating segments at internal product values that approximate market prices.
Revenues for the upstream segment are derived primarily from the production and sale of crude oil and natural gas, as well as the sale of third-party production of natural gas. Revenues for the downstream segment are derived from the refining and marketing of petroleum products, such as gasoline, jet fuel, gas oils, kerosene, lubricants, residual fuel oils and other products derived from crude oil. This segment also generates revenues from the transportation and trading of crude oil and refined products. Revenues for the chemicals segment are derived primarily from the manufacture and sale of additives for lubricants and fuel. “All Other” activities include revenues from mining operations of coal and other minerals, power generation businesses, insurance operations, real estate activities, and technology companies.
FS-39
| | | | | | | | | | |
Notes to the Consolidated Financial Statements Millions of dollars, except per-share amounts | |
Note 9Operating Segments and Geographic Data - Continued
|
| | | | | | | | | | |
Other than the United States, no single country accounted for 10 percent or more of the company’s total sales and other operating revenues in 2008.
| | | | | | | | | | | | | | |
| | | Year ended December 31 | |
| | | 2008 | | | | 2007 | | | 2006 | |
| | | | | |
Upstream | | | | | | | | | | | | | |
| United States | | $ | 23,503 | | | | $ | 18,736 | | | $ | 18,061 | |
| Intersegment | | | 15,142 | | | | | 11,625 | | | | 10,069 | |
| | | | | |
| Total United States | | | 38,645 | | | | | 30,361 | | | | 28,130 | |
| | | | | |
| International | | | 19,469 | | | | | 15,213 | | | | 14,560 | |
| Intersegment | | | 24,204 | | | | | 19,647 | | | | 17,139 | |
| | | | | |
| Total International | | | 43,673 | | | | | 34,860 | | | | 31,699 | |
| | | | | |
Total Upstream | | | 82,318 | | | | | 65,221 | | | | 59,829 | |
| | | | | |
Downstream | | | | | | | | | | | | | |
| United States | | | 87,515 | | | | | 70,535 | | | | 69,367 | |
| Excise and similar taxes | | | 4,746 | | | | | 4,990 | | | | 4,829 | |
| Intersegment | | | 447 | | | | | 491 | | | | 533 | |
| | | | | |
| Total United States | | | 92,708 | | | | | 76,016 | | | | 74,729 | |
| | | | | |
| International | | | 122,064 | | | | | 97,178 | | | | 91,325 | |
| Excise and similar taxes | | | 5,044 | | | | | 5,042 | | | | 4,657 | |
| Intersegment | | | 122 | | | | | 38 | | | | 37 | |
| | | | | |
| Total International | | | 127,230 | | | | | 102,258 | | | | 96,019 | |
| | | | | |
Total Downstream | | | 219,938 | | | | | 178,274 | | | | 170,748 | |
| | | | | |
Chemicals | | | | | | | | | | | | | |
| United States | | | 305 | | | | | 351 | | | | 372 | |
| Excise and similar taxes | | | 2 | | | | | 2 | | | | 2 | |
| Intersegment | | | 266 | | | | | 235 | | | | 243 | |
| | | | | |
| Total United States | | | 573 | | | | | 588 | | | | 617 | |
| | | | | |
| International | | | 1,388 | | | | | 1,143 | | | | 959 | |
| Excise and similar taxes | | | 55 | | | | | 86 | | | | 63 | |
| Intersegment | | | 154 | | | | | 142 | | | | 160 | |
| | | | | |
| Total International | | | 1,597 | | | | | 1,371 | | | | 1,182 | |
| | | | | |
Total Chemicals | | | 2,170 | | | | | 1,959 | | | | 1,799 | |
| | | | | |
All Other | | | | | | | | | | | | | |
| United States | | | 815 | | | | | 757 | | | | 653 | |
| Intersegment | | | 917 | | | | | 760 | | | | 584 | |
| | | | | |
| Total United States | | | 1,732 | | | | | 1,517 | | | | 1,237 | |
| | | | | |
| International | | | 52 | | | | | 58 | | | | 44 | |
| Intersegment | | | 33 | | | | | 31 | | | | 23 | |
| | | | | |
| Total International | | | 85 | | | | | 89 | | | | 67 | |
| | | | | |
Total All Other | | | 1,817 | | | | | 1,606 | | | | 1,304 | |
| | | | | |
Segment Sales and Other Operating Revenues | | | | | | | | | | | | | |
| United States | | | 133,658 | | | | | 108,482 | | | | 104,713 | |
| International | | | 172,585 | | | | | 138,578 | | | | 128,967 | |
| | | | | |
Total Segment Sales and Other Operating Revenues | | | 306,243 | | | | | 247,060 | | | | 233,680 | |
| Elimination of intersegment sales | | | (41,285 | ) | | | | (32,969 | ) | | | (28,788 | ) |
| | | | | |
Total Sales and Other Operating Revenues* | | $ | 264,958 | | | | $ | 214,091 | | | $ | 204,892 | |
| | | | | |
| * | | Includes buy/sell contracts of $6,725 in 2006. Substantially all of the amounts relate to the downstream segment. Refer to Note 14, on page FS-43, for a discussion of the company’s accounting for buy/sell contracts. |
Segment Income Taxes Segment income tax expense for the years 2008, 2007 and 2006 are as follows:
| | | | | | | | | | | | | | |
| | | Year ended December 31 | |
| | | 2008 | | | | 2007 | | | 2006 | |
| | | | | |
Upstream | | | | | | | | | | | | | |
| United States | | $ | 3,693 | | | | $ | 2,541 | | | $ | 2,668 | |
| International | | | 15,132 | | | | | 11,307 | | | | 10,987 | |
| | | | | |
Total Upstream | | | 18,825 | | | | | 13,848 | | | | 13,655 | |
| | | | | |
Downstream | | | | | | | | | | | | | |
| United States | | | 815 | | | | | 520 | | | | 1,162 | |
| International | | | 813 | | | | | 400 | | | | 586 | |
| | | | | |
Total Downstream | | | 1,628 | | | | | 920 | | | | 1,748 | |
| | | | | |
Chemicals | | | | | | | | | | | | | |
| United States | | | (22 | ) | | | | 6 | | | | 213 | |
| International | | | 47 | | | | | 36 | | | | 30 | |
| | | | | |
Total Chemicals | | | 25 | | | | | 42 | | | | 243 | |
| | | | | |
All Other | | | (1,452 | ) | | | | (1,331 | ) | | | (808 | ) |
| | | | | |
Total Income Tax Expense | | $ | 19,026 | | | | $ | 13,479 | | | $ | 14,838 | |
| | | | | |
Other Segment Information Additional information for the segmentation of major equity affiliates is contained in Note 12, beginning on page FS-41. Information related to properties, plant and equipment by segment is contained in Note 13, on page FS-43.
Note 10
Lease Commitments
Certain noncancelable leases are classified as capital leases, and the leased assets are included as part of “Properties, plant and equipment, at cost.” Such leasing arrangements involve tanker charters, crude oil production and processing equipment, service stations, office buildings, and other facilities. Other leases are classified as operating leases and are not capitalized. The payments on such leases are recorded as expense. Details of the capitalized leased assets are as follows:
| | | | | | | | | | |
| | | At December 31 | |
| | | 2008 | | | | 2007 | |
| | | | | |
| Upstream | | $ | 491 | | | | $ | 482 | |
| Downstream | | $ | 399 | | | | $ | 551 | |
| Chemical and all other | | | 171 | | | | | 171 | |
| | | | | |
| Total | | | 1,061 | | | | | 1,204 | |
| Less: Accumulated amortization | | | 522 | | | | | 628 | |
| | | | | |
| Net capitalized leased assets | | $ | 539 | | | | $ | 576 | |
| | | | | |
Rental expenses incurred for operating leases during 2008, 2007 and 2006 were as follows:
| | | | | | | | | | | | | | |
| | | Year ended December 31 | |
| | | 2008 | | | | 2007 | | | 2006 | |
| | | | | |
| Minimum rentals | | $ | 2,984 | | | | $ | 2,419 | | | $ | 2,326 | |
| Contingent rentals | | | 6 | | | | | 6 | | | | 6 | |
| | | | | |
| Total | | | 2,990 | | | | | 2,425 | | | | 2,332 | |
| Less: Sublease rental income | | | 41 | | | | | 30 | | | | 33 | |
| | | | | |
| Net rental expense | | $ | 2,949 | | | | $ | 2,395 | | | $ | 2,299 | |
| | | | | |
FS-40
| | | | | | | | | | | |
| | |
Note 10Lease Commitments - Continued
| | |
Contingent rentals are based on factors other than the passage of time, principally sales volumes at leased service stations. Certain leases include escalation clauses for adjusting rentals to reflect changes in price indices, renewal options ranging up to 25 years, and options to purchase the leased property during or at the end of the initial or renewal lease period for the fair market value or other specified amount at that time.
At December 31, 2008, the estimated future minimum lease payments (net of noncancelable sublease rentals) under operating and capital leases, which at inception had a non-cancelable term of more than one year, were as follows:
| | | | | | | | | | |
| | | At December 31 | |
| | | Operating | | | | Capital | |
| | | Leases | | | | Leases | |
| Year: 2009 | | $ | 503 | | | | $ | 97 | |
| 2010 | | | 463 | | | | | 77 | |
| 2011 | | | 372 | | | | | 77 | |
| 2012 | | | 315 | | | | | 84 | |
| 2013 | | | 288 | | | | | 59 | |
| Thereafter | | | 947 | | | | | 154 | |
| | | | |
| Total | | $ | 2,888 | | | | $ | 548 | |
| | | | |
| Less: Amounts representing interest and executory costs | | | | | | | | (110 | ) |
| | | | |
| Net present values | | | | | | | | 438 | |
| Less: Capital lease obligations included in short-term debt | | | | | | | | (97 | ) |
| | | | |
| Long-term capital lease obligations | | | | | | | $ | 341 | |
| | | | |
Note 11
Restructuring and Reorganization Costs
In 2007, the company implemented a restructuring and reorganization program in its downstream operations. Approximately 900 employees were eligible for severance payments. As of December 31, 2008, approximately 700 employees have been terminated under the program. Most of the associated positions are located outside the United States. The program is expected to be completed by the end of 2009.
Shown in the table below is the activity for the company’s liability related to the downstream reorganization. The associated charges against income were categorized as “Operating expenses” or “Selling, general and administrative expenses” on the Consolidated Statement of Income.
| | | | | | | | | | |
| Amounts before tax | | 2008 | | | | 2007 | |
| Balance at January 1 | | $ | 85 | | | | $ | – | |
| Accruals/adjustments | | | (11 | ) | | | | 85 | |
| Payments | | | (52 | ) | | | | – | |
| | | | |
| Balance at December 31 | | $ | 22 | | | | $ | 85 | |
| | | | |
Note 12
Investments and Advances
Equity in earnings, together with investments in and advances to companies accounted for using the equity method and other investments accounted for at or below cost, is shown in the table below. For certain equity affiliates, Chevron pays its share of some income taxes directly. For such affiliates, the equity in earnings does not include these taxes, which are reported on the Consolidated Statement of Income as “Income tax expense.”
| | | | | | | | | | | | | | | | | | | | | | |
| | | Investments and Advances | | | | Equity in Earnings | |
| | | At December 31 | | | | Year ended December 31 | |
| | | 2008 | | | 2007 | | | | 2008 | | | 2007 | | | 2006 | |
Upstream | | | | | | | | | | | | | | | | | | | | | |
| Tengizchevroil | | $ | 6,290 | | | $ | 6,321 | | | | $ | 3,220 | | | $ | 2,135 | | | $ | 1,817 | |
| Petropiar/Hamaca | | | 1,130 | | | | 1,168 | | | | | 317 | | | | 327 | | | | 319 | |
| Petroboscan | | | 816 | | | | 762 | | | | | 244 | | | | 185 | | | | 31 | |
| Angola LNG Limited | | | 1,191 | | | | 574 | | | | | (8 | ) | | | 21 | | | | – | |
| Other | | | 725 | | | | 765 | | | | | 206 | | | | 204 | | | | 123 | |
| | | | |
| Total Upstream | | | 10,152 | | | | 9,590 | | | | | 3,979 | | | | 2,872 | | | | 2,290 | |
| | | | |
Downstream | | | | | | | | | | | | | | | | | | | | | |
| GS Caltex Corporation | | | 2,601 | | | | 2,276 | | | | | 444 | | | | 217 | | | | 316 | |
| Caspian Pipeline Consortium | | | 749 | | | | 951 | | | | | 103 | | | | 102 | | | | 117 | |
| Star Petroleum Refining Company Ltd. | | | 877 | | | | 944 | | | | | 22 | | | | 157 | | | | 116 | |
| Escravos Gas-to-Liquids | | | – | | | | 628 | | | | | 86 | | | | 103 | | | | 146 | |
| Caltex Australia Ltd. | | | 723 | | | | 580 | | | | | 250 | | | | 129 | | | | 186 | |
| Colonial Pipeline Company | | | 536 | | | | 546 | | | | | 32 | | | | 39 | | | | 34 | |
| Other | | | 1,664 | | | | 1,501 | | | | | 268 | | | | 215 | | | | 212 | |
| | | | |
| Total Downstream | | | 7,150 | | | | 7,426 | | | | | 1,205 | | | | 962 | | | | 1,127 | |
| | | | |
Chemicals | | | | | | | | | | | | | | | | | | | | | |
| Chevron Phillips Chemical Company LLC | | | 2,037 | | | | 2,024 | | | | | 158 | | | | 380 | | | | 697 | |
| Other | | | 25 | | | | 24 | | | | | 4 | | | | 6 | | | | 5 | |
| | | | |
| Total Chemicals | | | 2,062 | | | | 2,048 | | | | | 162 | | | | 386 | | | | 702 | |
| | | | |
All Other | | | | | | | | | | | | | | | | | | | | | |
| Other | | | 567 | | | | 449 | | | | | 20 | | | | (76 | ) | | | 136 | |
| | | | |
| Total equity method | | $ | 19,931 | | | $ | 19,513 | | | | $ | 5,366 | | | $ | 4,144 | | | $ | 4,255 | |
| Other at or below cost | | | 989 | | | | 964 | | | | | | | | | | | | | | |
| | | | | | | | | | | | | | |
| Total investments and advances | | $ | 20,920 | | | $ | 20,477 | | | | | | | | | | | | | | |
| | | | |
| Total United States | | $ | 4,002 | | | $ | 3,889 | | | | $ | 307 | | | $ | 478 | | | $ | 955 | |
| Total International | | $ | 16,918 | | | $ | 16,588 | | | | $ | 5,059 | | | $ | 3,666 | | | $ | 3,300 | |
| | | | |
Descriptions of major affiliates, including significant differences between the company’s carrying value of its investments and its underlying equity in the net assets of the affiliates, are as follows:
Tengizchevroil Chevron has a 50 percent equity ownership interest in Tengizchevroil (TCO), a joint venture formed in 1993 to develop the Tengiz and Korolev crude oil fields in Kazakhstan over a
40-year period. At December 31, 2008, the company’s carrying value of its investment in TCO was about $210 higher than the amount of underlying equity in TCO net assets. This difference results from Chevron acquiring a portion of its interest in TCO at a value greater than the underlying equity for that portion of TCO’s assets.
FS-41
| | | | | | | | | | |
Notes to the Consolidated Financial Statements Millions of dollars, except per-share amounts | |
Note 12Investments and Advances - Continued
|
| | | | | | | | | | |
Petropiar Chevron has a 30 percent interest in Petropiar, a joint stock company formed in 2008 to operate the Hamaca heavy oil production and upgrading project. The project, located in Venezuela’s Orinoco Belt, has a 25-year contract term. Prior to the formation of Petropiar, Chevron had a 30 percent interest in the Hamaca project. At December 31, 2008, the company’s carrying value of its investment in Petropiar was approximately $250 less than the amount of underlying equity in Petropiar net assets. The difference represents the excess of Chevron’s underlying equity in Petropiar’s net assets over the net book value of the assets contributed to the venture.
Petroboscan Chevron has a 39 percent interest in Petroboscan, a joint stock company formed in 2006 to operate the Boscan Field in Venezuela until 2026. Chevron previously operated the field under an operating service agreement. At December 31, 2008, the company’s carrying value of its investment in Petroboscan was approximately $290 higher than the amount of underlying equity in Petroboscan net assets. The difference reflects the excess of the net book value of the assets contributed by Chevron over its underlying equity in Petroboscan’s net assets.
Angola LNG Ltd. Chevron has a 36 percent interest in Angola LNG Ltd., which will process and liquefy natural gas produced in Angola for delivery to international markets.
GS Caltex Corporation Chevron owns 50 percent of GS Caltex Corporation, a joint venture with GS Holdings. The joint venture imports, refines and markets petroleum products and petrochemicals, predominantly in South Korea.
Caspian Pipeline Consortium Chevron has a 15 percent interest in the Caspian Pipeline Consortium, which provides the critical export route for crude oil from both TCO and Karachaganak.
Star Petroleum Refining Company Ltd. Chevron has a 64 percent equity ownership interest in Star Petroleum Refining Company Ltd. (SPRC), which owns the Star Refinery in Thailand. The Petroleum Authority of Thailand owns the remaining 36 percent of SPRC.
Escravos Gas-to-Liquids Chevron Nigeria Limited (CNL) has a 75 percent interest in Escravos Gas-to-Liquids (EGTL) with the other 25 percent of the joint venture owned by Nigeria National Petroleum Company. Until December 1, 2008, Sasol Ltd. provided 50 percent of CNL’s funding require-
ments for the venture as risk-based financing (returns are based on project performance). Effective December 1, 2008, Chevron acquired an additional 37 percent of the obligation from Sasol, with Sasol retaining 13 percent of the funding obligation. On that date, Chevron changed its method of accounting for its EGTL investment from equity to consolidated. This venture was formed to convert natural gas produced from Chevron’s Nigerian operations into liquid products for sale in international markets.
Caltex Australia Ltd. Chevron has a 50 percent equity ownership interest in Caltex Australia Ltd. (CAL). The remaining 50 percent of CAL is publicly owned. At December 31, 2008, the fair value of Chevron’s share of CAL common stock was approximately $670. The decline in value below the company’s carrying value of $723 million at the end of 2008 was deemed temporary.
Colonial Pipeline Company Chevron owns an approximate 23 percent equity interest in the Colonial Pipeline Company. The Colonial Pipeline system runs from Texas to New Jersey and transports petroleum products in a 13-state market. At December 31, 2008, the company’s carrying value of its investment in Colonial Pipeline was approximately $560 higher than the amount of underlying equity in Colonial Pipeline net assets. This difference primarily relates to purchase price adjustments from the acquisition of Unocal Corporation.
Chevron Phillips Chemical Company LLC Chevron owns 50 percent of Chevron Phillips Chemical Company LLC (CPChem), with the other half owned by ConocoPhillips Corporation.
Dynegy Inc. In 2007, Chevron sold its 19 percent common stock investment in Dynegy Inc., for approximately $940, resulting in a gain of $680.
Other Information “Sales and other operating revenues” on the Consolidated Statement of Income includes $15,390, $11,555 and $9,582 with affiliated companies for 2008, 2007 and 2006, respectively. “Purchased crude oil and products” includes $6,850, $5,464 and $4,222 with affiliated companies for 2008, 2007 and 2006, respectively.
“Accounts and notes receivable” on the Consolidated Balance Sheet includes $701 and $1,722 due from affiliated companies at December 31, 2008 and 2007, respectively. “Accounts payable” includes $289 and $374 due to affiliated companies at December 31, 2008 and 2007, respectively.
FS-42
| | | | | | | | | | | |
| | |
Note 12Investments and Advances - Continued
| | |
The following table provides summarized financial information on a 100 percent basis for all equity affiliates as well as Chevron’s total share, which includes Chevron loans to affiliates of $2,820 at December 31, 2008.
| | | | | | | | | | | | | | | | | | | | | | | | | | |
| | | Affiliates | | | | Chevron Share | |
| Year ended December 31 | | 2008 | | | 2007 | | | 2006 | | | | 2008 | | | 2007 | | | 2006 | |
| | | | |
| Total revenues | | $ | 112,707 | | | $ | 94,864 | | | $ | 73,746 | | | | $ | 54,055 | | | $ | 46,579 | | | $ | 35,695 | |
| Income before income tax expense | | | 17,500 | | | | 12,510 | | | | 10,973 | | | | | 7,532 | | | | 5,836 | | | | 5,295 | |
| Net income | | | 12,705 | | | | 9,743 | | | | 7,905 | | | | | 5,524 | | | | 4,550 | | | | 4,072 | |
| | | | |
At December 31 | | | | | | | | | | | | | | | | | | | | | | | | | |
| | | | |
| Current assets | | $ | 25,194 | | | $ | 26,360 | | | $ | 19,769 | | | | $ | 10,804 | | | $ | 11,914 | | | $ | 8,944 | |
| Noncurrent assets | | | 51,878 | | | | 48,440 | | | | 49,896 | | | | | 20,129 | | | | 19,045 | | | | 18,575 | |
| Current liabilities | | | 17,727 | | | | 19,033 | | | | 15,254 | | | | | 7,474 | | | | 9,009 | | | | 6,818 | |
| Noncurrent liabilities | | | 21,049 | | | | 22,757 | | | | 24,059 | | | | | 4,533 | | | | 3,745 | | | | 3,902 | |
| | | | |
| Net equity | | $ | 38,296 | | | $ | 33,010 | | | $ | 30,352 | | | | $ | 18,926 | | | $ | 18,205 | | | $ | 16,799 | |
| | | | |
Note 13
Properties, Plant and Equipment
| | | | | | | | | | | | | | | | | | | | | | | | | | | | | | | | | | | | | | | | | | | | | | | | | | | | |
| | | At December 31 | | | | Year ended December 31 | |
| | | Gross Investment at Cost | | | | Net Investment | | | | Additions at Cost1 | | | | Depreciation Expense2 | |
| | | 2008 | | | 2007 | | | 2006 | | | | 2008 | | | 2007 | | | 2006 | | | | 2008 | | | 2007 | | | 2006 | | | | 2008 | | | 2007 | | | 2006 | |
| | | | | | | | | | |
Upstream | | | | | | | | | | | | | | | | | | | | | | | | | | | | | | | | | | | | | | | | | | | | | | | | | | | |
| United States | | $ | 54,156 | | | $ | 50,991 | | | $ | 46,191 | | | | $ | 22,294 | | | $ | 19,850 | | | $ | 16,706 | | | | $ | 5,374 | | | $ | 5,725 | | | $ | 3,739 | | | | $ | 2,683 | | | $ | 2,700 | | | $ | 2,374 | |
| International | | | 84,282 | | | | 71,408 | | | | 61,281 | | | | | 51,140 | | | | 43,431 | | | | 37,730 | | | | | 13,177 | | | | 10,512 | | | | 7,290 | | | | | 5,441 | | | | 4,605 | | | | 3,888 | |
| | | | | | | | | | |
| Total Upstream | | | 138,438 | | | | 122,399 | | | | 107,472 | | | | | 73,434 | | | | 63,281 | | | | 54,436 | | | | | 18,551 | | | | 16,237 | | | | 11,029 | | | | | 8,124 | | | | 7,305 | | | | 6,262 | |
| | | | | | | | | | |
Downstream | | | | | | | | | | | | | | | | | | | | | | | | | | | | | | | | | | | | | | | | | | | | | | | | | | | |
| United States | | | 17,394 | | | | 15,807 | | | | 14,553 | | | | | 8,977 | | | | 7,685 | | | | 6,741 | | | | | 2,032 | | | | 1,514 | | | | 1,109 | | | | | 629 | | | | 509 | | | | 474 | |
| International | | | 11,587 | | | | 10,471 | | | | 11,036 | | | | | 6,001 | | | | 4,690 | | | | 5,233 | | | | | 2,285 | | | | 519 | | | | 532 | | | | | 469 | | | | 633 | | | | 551 | |
| | | | | | | | | | |
| Total Downstream | | | 28,981 | | | | 26,278 | | | | 25,589 | | | | | 14,978 | | | | 12,375 | | | | 11,974 | | | | | 4,317 | | | | 2,033 | | | | 1,641 | | | | | 1,098 | | | | 1,142 | | | | 1,025 | |
| | | | | | | | | | |
Chemicals | | | | | | | | | | | | | | | | | | | | | | | | | | | | | | | | | | | | | | | | | | | | | | | | | | | |
| United States | | | 725 | | | | 678 | | | | 645 | | | | | 338 | | | | 308 | | | | 289 | | | | | 50 | | | | 40 | | | | 25 | | | | | 19 | | | | 19 | | | | 19 | |
| International | | | 828 | | | | 815 | | | | 771 | | | | | 496 | | | | 453 | | | | 431 | | | | | 72 | | | | 53 | | | | 54 | | | | | 33 | | | | 26 | | | | 24 | |
| | | | | | | | | | |
| Total Chemicals | | | 1,553 | | | | 1,493 | | | | 1,416 | | | | | 834 | | | | 761 | | | | 720 | | | | | 122 | | | | 93 | | | | 79 | | | | | 52 | | | | 45 | | | | 43 | |
| | | | | | | | | | |
All Other3 | | | | | | | | | | | | | | | | | | | | | | | | | | | | | | | | | | | | | | | | | | | | | | | | | | | |
| United States | | | 4,310 | | | | 3,873 | | | | 3,243 | | | | | 2,523 | | | | 2,179 | | | | 1,709 | | | | | 598 | | | | 680 | | | | 270 | | | | | 250 | | | | 215 | | | | 171 | |
| International | | | 17 | | | | 41 | | | | 27 | | | | | 11 | | | | 14 | | | | 19 | | | | | 5 | | | | 5 | | | | 8 | | | | | 4 | | | | 1 | | | | 5 | |
| | | | | | | | | | |
| Total All Other | | | 4,327 | | | | 3,914 | | | | 3,270 | | | | | 2,534 | | | | 2,193 | | | | 1,728 | | | | | 603 | | | | 685 | | | | 278 | | | | | 254 | | | | 216 | | | | 176 | |
| | | | | | | | | | |
| Total United States | | | 76,585 | | | | 71,349 | | | | 64,632 | | | | | 34,132 | | | | 30,022 | | | | 25,445 | | | | | 8,054 | | | | 7,959 | | | | 5,143 | | | | | 3,581 | | | | 3,443 | | | | 3,038 | |
| Total International | | | 96,714 | | | | 82,735 | | | | 73,115 | | | | | 57,648 | | | | 48,588 | | | | 43,413 | | | | | 15,539 | | | | 11,089 | | | | 7,884 | | | | | 5,947 | | | | 5,265 | | | | 4,468 | |
| | | | | | | | | | |
Total | | $ | 173,299 | | | $ | 154,084 | | | $ | 137,747 | | | | $ | 91,780 | | | $ | 78,610 | | | $ | 68,858 | | | | $ | 23,593 | | | $ | 19,048 | | | $ | 13,027 | | | | $ | 9,528 | | | $ | 8,708 | | | $ | 7,506 | |
| | | | | | | | | | |
1 Net of dry hole expense related to prior years’ expenditures of $55, $89 and $120 in 2008, 2007 and 2006, respectively.
2 Depreciation expense includes accretion expense of $430, $399 and $275 in 2008, 2007 and 2006, respectively.
3 Primarily mining operations, power generation businesses, real estate assets and management information systems.
Note 14
Accounting for Buy/Sell Contracts
The company adopted the accounting prescribed by Emerging Issues Task Force (EITF) Issue No. 04-13,Accounting for Purchases and Sales of Inventory with the Same Counterparty(Issue 04-13), on a prospective basis from April 1, 2006. Issue 04-13 requires that two or more legally separate exchange transactions with the same counterparty, including buy/sell transactions, be combined and considered as a single arrangement for purposes of applying the provisions of Accounting Principles Board Opinion No. 29,Accounting for Nonmonetary Transactions,when the transactions are entered into “in
contemplation” of one another. In prior periods, the company accounted for buy/sell transactions in the Consolidated Statement of Income as a monetary transaction – purchases were reported as “Purchased crude oil and products”; sales were reported as “Sales and other operating revenues.”
With the company’s adoption of Issue 04-13, buy/sell transactions beginning in the second quarter 2006 are netted against each other on the Consolidated Statement of Income, with no effect on net income. The amount associated with buy/sell transactions in the first quarter 2006 is shown as a footnote to the Consolidated Statement of Income on page FS-27.
FS-43
| | | | | | | | | | |
Notes to the Consolidated Financial Statements Millions of dollars, except per-share amounts | |
|
| | | | | | | | | | |
Note 15
Litigation
MTBE Chevron and many other companies in the petroleum industry have used methyl tertiary butyl ether (MTBE) as a gasoline additive. In October 2008, 59 cases were settled in which the company was a party and which related to the use of MTBE in certain oxygenated gasolines and the alleged seepage of MTBE into groundwater. The terms of this agreement are confidential and not material to the company’s results of operations, liquidity or financial position.
Chevron is a party to 37 other pending lawsuits and claims, the majority of which involve numerous other petroleum marketers and refiners. Resolution of these lawsuits and claims may ultimately require the company to correct or ameliorate the alleged effects on the environment of prior release of MTBE by the company or other parties. Additional lawsuits and claims related to the use of MTBE, including personal-injury claims, may be filed in the future. The settlement of the 59 lawsuits did not set any precedents related to standards of liability to be used to judge the merits of the claims, corrective measures required or monetary damages to be assessed for the remaining lawsuits and claims or future lawsuits and claims. As a result, the company’s ultimate exposure related to pending lawsuits and claims is not currently determinable, but could be material to net income in any one period. The company no longer uses MTBE in the manufacture of gasoline in the United States.
RFG Patent Fourteen purported class actions were brought by consumers who purchased reformulated gasoline (RFG) from January 1995 through August 2005, alleging that Unocal misled the California Air Resources Board into adopting standards for composition of RFG that overlapped with Unocal’s undisclosed and pending patents. The parties agreed to a settlement that calls for, among other things, Unocal to pay $48 and for the establishment of acy presfund to administer payout of the award. The court approved the final settlement in November 2008.
Ecuador Chevron is a defendant in a civil lawsuit before the Superior Court of Nueva Loja in Lago Agrio, Ecuador, brought in May 2003 by plaintiffs who claim to be representatives of certain residents of an area where an oil production consortium formerly had operations. The lawsuit alleges damage to the environment from the oil exploration and production operations, and seeks unspecified damages to fund environmental remediation and restoration of the alleged environmental harm, plus a health monitoring program. Until 1992, Texaco Petroleum Company (Texpet), a subsidiary of Texaco Inc., was a minority member of this consortium with Petroecuador, the Ecuadorian state-owned
oil company, as the majority partner; since 1990, the operations have been conducted solely by Petroecuador. At the conclusion of the consortium and following an independent third-party environmental audit of the concession area, Texpet entered into a formal agreement with the Republic of Ecuador and Petroecuador for Texpet to remediate specific sites assigned by the government in proportion to Texpet’s ownership share of the consortium. Pursuant to that agreement, Texpet conducted a three-year remediation program at a cost of $40. After certifying that the sites were properly remediated, the government granted Texpet and all related corporate entities a full release from any and all environmental liability arising from the consortium operations.
Based on the history described above, Chevron believes that this lawsuit lacks legal or factual merit. As to matters of law, the company believes first, that the court lacks jurisdiction over Chevron; second, that the law under which plaintiffs bring the action, enacted in 1999, cannot be applied retroactively to Chevron; third, that the claims are barred by the statute of limitations in Ecuador; and, fourth, that the lawsuit is also barred by the releases from liability previously given to Texpet by the Republic of Ecuador and Petroecuador. With regard to the facts, the company believes that the evidence confirms that Texpet’s remediation was properly conducted and that the remaining environmental damage reflects Petroecuador’s failure to timely fulfill its legal obligations and Petroecuador’s further conduct since assuming full control over the operations.
In April 2008, a mining engineer appointed by the court to identify and determine the cause of environmental damage, and to specify steps needed to remediate it, issued a report recommending that the court assess $8,000, which would, according to the engineer, provide financial compensation for purported damages, including wrongful death claims, and pay for, among other items, environmental remediation, health care systems, and additional infrastructure for Petroecuador. The engineer’s report also asserted that an additional $8,300 could be assessed against Chevron for unjust enrichment. The engineer’s report is not binding on the court. Chevron also believes that the engineer’s work was performed and his report prepared in a manner contrary to law and in violation of the court’s orders. Chevron submitted a rebuttal to the report in which it asked the court to strike the report in its entirety. In November 2008, the engineer revised the report and, without additional evidence, recommended an increase in the financial compensation for purported damages to a total of $18,900 and an increase in the assessment for purported unjust enrichment to a
FS-44
| | | | | | | | | | | |
| | |
Note 15Litigation - Continued
| | |
total of $8,400. Chevron submitted a rebuttal to the revised report, and Chevron will continue a vigorous defense of any attempted imposition of liability.
Management does not believe an estimate of a reasonably possible loss (or a range of loss) can be made in this case. Due to the defects associated with the engineer’s report, management does not believe the report itself has any utility in calculating a reasonably possible loss (or a range of loss). Moreover, the highly uncertain legal environment surrounding the case provides no basis for management to estimate a reasonably possible loss (or a range of loss).
Note 16
Taxes
Income Taxes
| | | | | | | | | | | | | | |
| | | Year ended December 31 | |
| | | 2008 | | | | 2007 | | | 2006 | |
| | | | |
| Taxes on income | | | | | | | | | | | | | |
| U.S. Federal | | | | | | | | | | | | | |
| Current | | $ | 2,879 | | | | $ | 1,446 | | | $ | 2,828 | |
| Deferred | | | 274 | | | | | 225 | | | | 200 | |
| State and local | | | 669 | | | | | 338 | | | | 581 | |
| | | | |
| Total United States | | | 3,822 | | | | | 2,009 | | | | 3,609 | |
| | | | |
| International | | | | | | | | | | | | | |
| Current | | | 15,021 | | | | | 11,416 | | | | 11,030 | |
| Deferred | | | 183 | | | | | 54 | | | | 199 | |
| | | | |
| Total International | | | 15,204 | | | | | 11,470 | | | | 11,229 | |
| | | | |
| Total taxes on income | | $ | 19,026 | | | | $ | 13,479 | | | $ | 14,838 | |
| | | | |
In 2008, before-tax income for U.S. operations, including related corporate and other charges, was $10,682, compared with before-tax income of $7,794 and $9,131 in 2007 and 2006, respectively. For international operations, before-tax income was $32,275, $24,373 and $22,845 in 2008, 2007 and 2006, respectively. U.S. federal income tax expense was reduced by $198, $132 and $116 in 2008, 2007 and 2006, respectively, for business tax credits.
The reconciliation between the U.S. statutory federal income tax rate and the company’s effective income tax rate is explained in the table below:
| | | | | | | | | | | | | | |
| | | Year ended December 31 | |
| | | 2008 | | | | 2007 | | | 2006 | |
| | | | |
| U.S. statutory federal income tax rate | | | 35.0 | % | | | | 35.0 | % | | | 35.0 | % |
| Effect of income taxes from international operations at rates different from the U.S. statutory rate | | | 10.2 | | | | | 8.3 | | | | 10.3 | |
| State and local taxes on income, net of U.S. federal income tax benefit | | | 1.0 | | | | | 0.8 | | | | 1.0 | |
| Prior-year tax adjustments | | | (0.1 | ) | | | | 0.3 | | | | 0.9 | |
| Tax credits | | | (0.5 | ) | | | | (0.4 | ) | | | (0.4 | ) |
| Effects of enacted changes in tax laws | | | (0.6 | ) | | | | (0.3 | ) | | | 0.3 | |
| Other | | | (0.7 | ) | | | | (1.8 | ) | | | (0.7 | ) |
| | | | |
| Effective tax rate | | | 44.3 | % | | | | 41.9 | % | | | 46.4 | % |
| | | | |
The company’s effective tax rate increased from 41.9 percent in 2007 to 44.3 percent in 2008. The increase in the “Effect of income taxes from international operations at rates different from the U.S. statutory rate” from 8.3 percent in 2007 to 10.2 percent in 2008 was mainly due to a greater proportion of income being earned in 2008 in tax jurisdictions with higher tax rates. In addition, the 2007 period included a relatively low tax rate on the sale of downstream assets in Europe. The change in “Other” from a negative 1.8 percent to a negative 0.7 percent primarily related to a lower effective tax rate on the sale of the company’s investment in Dynegy common stock in 2007.
The company records its deferred taxes on a tax-jurisdiction basis and classifies those net amounts as current or noncurrent based on the balance sheet classification of the related assets or liabilities. The reported deferred tax balances are composed of the following:
| | | | | | | | | | |
| | | At December 31 | |
| | | 2008 | | | | 2007 | |
| | | | |
| Deferred tax liabilities | | | | | | | | | |
| Properties, plant and equipment | | $ | 18,271 | | | | $ | 17,310 | |
| Investments and other | | | 2,225 | | | | | 1,837 | |
| | | | |
| Total deferred tax liabilities | | | 20,496 | | | | | 19,147 | |
| | | | |
| Deferred tax assets | | | | | | | | | |
| Abandonment/environmental reserves | | | (4,338 | ) | | | | (3,587 | ) |
| Employee benefits | | | (3,488 | ) | | | | (2,148 | ) |
| Tax loss carryforwards | | | (1,139 | ) | | | | (1,603 | ) |
| Deferred credits | | | (3,933 | ) | | | | (1,689 | ) |
| Foreign tax credits | | | (4,784 | ) | | | | (3,138 | ) |
| Inventory | | | (260 | ) | | | | (608 | ) |
| Other accrued liabilities | | | (445 | ) | | | | (477 | ) |
| Miscellaneous | | | (1,732 | ) | | | | (1,528 | ) |
| | | | |
| Total deferred tax assets | | | (20,119 | ) | | | | (14,778 | ) |
| | | | |
| Deferred tax assets valuation allowance | | | 7,535 | | | | | 5,949 | |
| | | | |
| Total deferred taxes, net | | $ | 7,912 | | | | $ | 10,318 | |
| | | | |
Deferred tax liabilities at the end of 2008 increased by approximately $1,300 from year-end 2007. The increase was primarily related to increased temporary differences for properties, plant and equipment.
Deferred tax assets increased by approximately $5,300 in 2008. The increase related primarily to deferred credits recorded for future tax benefits earned from a new field in Africa ($2,200); increased deferred tax benefits for pension-related obligations ($1,300); and additional foreign tax credits arising from earnings in high-tax-rate international jurisdictions ($1,600), which were substantially offset by valuation allowances.
The overall valuation allowance relates to foreign tax credit carryforwards, tax loss carryforwards and temporary differences for which no benefit is expected to be realized. Tax loss carryforwards exist in many international jurisdictions. Whereas some of these tax loss carryforwards do not have an expiration date, others expire at various times from
FS-45
| | | | | | | | | | |
Notes to the Consolidated Financial Statements Millions of dollars, except per-share amounts | |
|
| | | | | | | | | | |
2009 through 2032. Foreign tax credit carryforwards of $4,784 will expire between 2009 and 2018.
At December 31, 2008 and 2007, deferred taxes were classified in the Consolidated Balance Sheet as follows:
| | | | | | | | | | |
| | | At December 31 | |
| | | 2008 | | | | 2007 | |
| | | | |
| Prepaid expenses and other current assets | | $ | (1,130 | ) | | | $ | (1,234 | ) |
| Deferred charges and other assets | | | (2,686 | ) | | | | (812 | ) |
| Federal and other taxes on income | | | 189 | | | | | 194 | |
| Noncurrent deferred income taxes | | | 11,539 | | | | | 12,170 | |
| | | | |
| Total deferred income taxes, net | | $ | 7,912 | | | | $ | 10,318 | |
| | | | |
Income taxes are not accrued for unremitted earnings of international operations that have been or are intended to be reinvested indefinitely. Undistributed earnings of international consolidated subsidiaries and affiliates for which no deferred income tax provision has been made for possible future remittances totaled $22,428 at December 31, 2008. This amount represents earnings reinvested as part of the company’s ongoing international business. It is not practicable to estimate the amount of taxes that might be payable on the eventual remittance of earnings that are intended to be reinvested indefinitely. At the end of 2008, deferred income taxes were recorded for the undistributed earnings of certain international operations for which the company no longer intends to indefinitely reinvest the earnings. The company does not anticipate incurring significant additional taxes on remittances of earnings that are not indefinitely reinvested.
Uncertain Income Tax Positions Financial Accounting Standards Board (FASB) Interpretation No. 48,Accounting for Uncertainty in Income Taxes – An Interpretation of FASB Statement No. 109(FIN 48), provides the accounting guidance for income tax benefits that are uncertain in nature. Under FIN 48, a company recognizes a tax benefit in the financial statements for an uncertain tax position only if management’s assessment is that the position is “more likely than not” (i.e., a likelihood greater than 50 percent) to be allowed by the tax jurisdiction based solely on the technical merits of the position. The term “tax position” in FIN 48 refers to a position in a previously filed tax return or a position expected to be taken in a future tax return that is reflected in measuring current or deferred income tax assets and liabilities for interim or annual periods.
The following table indicates the changes to the company’s unrecognized tax benefits for the year ended December 31, 2008. The term “unrecognized tax benefits” in FIN 48 refers to the differences between a tax position taken or expected to be taken in a tax return and the benefit measured and recognized in the financial statements in accordance with the guidelines of FIN 48. Interest and penalties are not included.
| | | | | | | | | | |
| | | 2008 | | | | 2007 | |
| | | | |
| Balance at January 1 | | $ | 2,199 | | | | $ | 2,296 | |
| Foreign currency effects | | | (1 | ) | | | | 19 | |
| Additions based on tax positions taken in current year | | | 522 | | | | | 418 | |
| Reductions based on tax positions taken in current year | | | (17 | ) | | | | – | |
| Additions/reductions resulting from current year asset acquisitions/sales | | | 175 | | | | | – | |
| Additions for tax positions taken in prior years | | | 337 | | | | | 120 | |
| Reductions for tax positions taken in prior years | | | (246 | ) | | | | (225 | ) |
| Settlements with taxing authorities in current year | | | (215 | ) | | | | (255 | ) |
| Reductions as a result of a lapse of the applicable statute of limitations | | | (58 | ) | | | | – | |
| Reductions due to tax positions previously expected to be taken but subsequently not taken on prior year tax returns | | | – | | | | | (174 | ) |
| | | | |
| Balance at December 31 | | $ | 2,696 | | | | $ | 2,199 | |
| | | | |
Although unrecognized tax benefits for individual tax positions may increase or decrease during 2009, the company believes that no change will be individually significant during 2009. Approximately 85 percent of the $2,696 of unrecognized tax benefits at December 31, 2008, would have an impact on the effective tax rate if subsequently recognized.
Tax positions for Chevron and its subsidiaries and affiliates are subject to income tax audits by many tax jurisdictions throughout the world. For the company’s major tax jurisdictions, examinations of tax returns for certain prior tax years had not been completed as of December 31, 2008. For these jurisdictions, the latest years for which income tax examinations had been finalized were as follows: United States – 2003, Nigeria – 1994, Angola – 2001 and Saudi Arabia – 2003.
On the Consolidated Statement of Income, the company reports interest and penalties related to liabilities for uncertain tax positions as “Income tax expense.” As of December 31, 2008, accruals of $276 for anticipated interest and penalty obligations were included on the Consolidated Balance Sheet, compared with accruals of $198 as of year-end 2007. Income tax expense associated with interest and penalties was $79 and $70 in 2008 and 2007, respectively.
FS-46
Taxes Other Than on Income
| | | | | | | | | | | | | | |
| | | Year ended December 31 | |
| | | 2008 | | | | 2007 | | | 2006 | |
| | | | | |
| United States | | | | | | | | | | | | | |
| Excise and similar taxes on products and merchandise | | $ | 4,748 | | | | $ | 4,992 | | | $ | 4,831 | |
| Import duties and other levies | | | 1 | | | | | 12 | | | | 32 | |
| Property and other miscellaneous taxes | | | 588 | | | | | 491 | | | | 475 | |
| Payroll taxes | | | 204 | | | | | 185 | | | | 155 | |
| Taxes on production | | | 431 | | | | | 288 | | | | 360 | |
| | | | | |
| Total United States | | | 5,972 | | | | | 5,968 | | | | 5,853 | |
| | | | | |
| International | | | | | | | | | | | | | |
| Excise and similar taxes on products and merchandise | | | 5,098 | | | | | 5,129 | | | | 4,720 | |
| Import duties and other levies | | | 8,368 | | | | | 10,404 | | | | 9,618 | |
| Property and other miscellaneous taxes | | | 1,557 | | | | | 528 | | | | 491 | |
| Payroll taxes | | | 106 | | | | | 89 | | | | 75 | |
| Taxes on production | | | 202 | | | | | 148 | | | | 126 | |
| | | | | |
| Total International | | | 15,331 | | | | | 16,298 | | | | 15,030 | |
| | | | | |
| Total taxes other than on income | | $ | 21,303 | | | | $ | 22,266 | | | $ | 20,883 | |
| | | | | |
Note 17
Short-Term Debt
| | | | | | | | | | |
| | | At December 31 | |
| | | 2008 | | | | 2007 | |
| | | | | |
| Commercial paper* | | $ | 5,742 | | | | $ | 3,030 | |
| Notes payable to banks and others with originating terms of one year or less | | | 149 | | | | | 219 | |
| Current maturities of long-term debt | | | 429 | | | | | 850 | |
| Current maturities of long-term capital leases | | | 78 | | | | | 73 | |
| Redeemable long-term obligations | | | | | | | | | |
| Long-term debt | | | 1,351 | | | | | 1,351 | |
| Capital leases | | | 19 | | | | | 21 | |
| | | | | |
| Subtotal | | | 7,768 | | | | | 5,544 | |
| Reclassified to long-term debt | | | (4,950 | ) | | | | (4,382 | ) |
| | | | | |
| Total short-term debt | | $ | 2,818 | | | | $ | 1,162 | |
| | | | | |
* Weighted-average interest rates at December 31, 2008 and 2007, were 0.67 percent and 4.35 percent, respectively.
Redeemable long-term obligations consist primarily of tax-exempt variable-rate put bonds that are included as current liabilities because they become redeemable at the option of the bondholders within one year following the balance sheet date.
The company periodically enters into interest rate swaps on a portion of its short-term debt. See Note 7, beginning on page FS-36, for information concerning the company’s debt-related derivative activities.
At December 31, 2008, the company had $4,950 of committed credit facilities with banks worldwide, which permit
the company to refinance short-term obligations on a long-term basis. The facilities support the company’s commercial paper borrowings. Interest on borrowings under the terms of specific agreements may be based on the London Interbank Offered Rate or bank prime rate. No amounts were outstanding under these credit agreements during 2008 or at year-end.
At December 31, 2008 and 2007, the company classified $4,950 and $4,382, respectively, of short-term debt as long-term. Settlement of these obligations is not expected to require the use of working capital in 2009, as the company has both the intent and the ability to refinance this debt on a long-term basis.
Note 18
Long-Term Debt
Total long-term debt, excluding capital leases, at December 31, 2008, was $5,742. The company’s long-term debt outstanding at year-end 2008 and 2007 was as follows:
| | | | | | | | | | |
| | | At December 31 | |
| | | 2008 | | | | 2007 | |
| | | | | |
| 3.375% notes due 2008 | | $ | – | | | | $ | 749 | |
| 5.5% notes due 2009 | | | 400 | | | | | 405 | |
7.327% amortizing notes due 20141 | | | 194 | | | | | 213 | |
| 8.625% debentures due 2032 | | | 147 | | | | | 161 | |
| 8.625% debentures due 2031 | | | 108 | | | | | 108 | |
| 7.5% debentures due 2043 | | | 85 | | | | | 85 | |
| 8% debentures due 2032 | | | 74 | | | | | 81 | |
| 9.75% debentures due 2020 | | | 56 | | | | | 57 | |
| 8.875% debentures due 2021 | | | 40 | | | | | 46 | |
| 8.625% debentures due 2010 | | | 30 | | | | | 30 | |
| 3.85% notes due 2008 | | | – | | | | | 30 | |
Medium-term notes, maturing from 2021 to 2038 (6.2%)2 | | | 38 | | | | | 64 | |
Fixed interest rate notes, maturing 2011 (9.378%)2 | | | 21 | | | | | 27 | |
Other foreign currency obligations (0.5%)2 | | | 13 | | | | | 17 | |
Other long-term debt (9.1%)2 | | | 15 | | | | | 59 | |
| | | | | |
| Total including debt due within one year | | | 1,221 | | | | | 2,132 | |
| Debt due within one year | | | (429 | ) | | | | (850 | ) |
| Reclassified from short-term debt | | | 4,950 | | | | | 4,382 | |
| | | | | |
| Total long-term debt | | $ | 5,742 | | | | $ | 5,664 | |
| | | | | |
1 Guarantee of ESOP debt.
2 Weighted-average interest rate at December 31, 2008.
Long-term debt of $1,221 matures as follows: 2009 – $429; 2010 – $64; 2011 – $47; 2012 – $33; 2013 – $41; and after 2013 – $607.
In 2008, debt totaling $822 matured, including $749 of Chevron Canada Funding Company notes. In 2007, $2,000 of Chevron Canada Funding Company bonds matured. The company also redeemed early $874 of Texaco Capital Inc. bonds, at an after-tax loss of approximately $175.
FS-47
| | | | | | | | | | |
Notes to the Consolidated Financial Statements Millions of dollars, except per-share amounts | |
Note 19New Accounting Standards
|
| | | | | | | | | | |
Note 19
New Accounting Standards
FASB Statement No. 141 (revised 2007), Business Combinations (FAS 141-R)In December 2007, the FASB issued FAS 141-R, which became effective for business combination transactions having an acquisition date on or after January 1, 2009. This standard requires the acquiring entity in a business combination to recognize the assets acquired, the liabilities assumed, and any noncontrolling interest in the acquiree at the acquisition date to be measured at their respective fair values. It also requires acquisition-related costs, as well as restructuring costs the acquirer expects to incur for which it is not obligated at acquisition date, to be recorded against income rather than included in purchase-price determination. Finally, the standard requires recognition of contingent arrangements at their acquisition-date fair values, with subsequent changes in fair value generally reflected in income.
FASB Staff Position FAS 141(R)-a Accounting for Assets Acquired and Liabilities Assumed in a Business Combination (FSP FAS 141(R)-a) In February 2009, the FASB approved for issuance FSP FAS 141(R)-a, which became effective for business combinations having an acquisition date on or after January 1, 2009. This standard requires an asset or liability arising from a contingency in a business combination to be recognized at fair value if fair value can be reasonably determined. If it cannot be reasonably determined then the asset or liability will need to be recognized in accordance with FASB Statement No. 5,Accounting for Contingencies, and FASB Interpretation No. 14,Reasonable Estimation of the Amount of the Loss.
FASB Statement No. 160, Noncontrolling Interests in Consolidated Financial Statements, an amendment of ARB No. 51 (FAS 160)The FASB issued FAS 160 in December 2007, which became effective for the company January 1, 2009, with retroactive adoption of the Standard’s presentation and disclosure requirements for existing minority interests. This standard requires ownership interests in subsidiaries held by parties other than the parent to be presented within the equity section of the Consolidated Balance Sheet but separate from the parent’s equity. It also requires the amount of consolidated net income attributable to the parent and the noncontrolling interest to be clearly identified and presented on the face of the Consolidated Statement of Income. Certain changes in a parent’s ownership interest are to be accounted for as equity transactions and when a subsidiary is deconsolidated, any noncontrolling equity investment in the former subsidiary is to be initially measured at fair value. Implementation of FAS 160 will not significantly change the presentation of the company’s Consolidated Statement of Income or Consolidated Balance Sheet.
FASB Statement No. 161, Disclosures about Derivative Instruments and Hedging Activities (FAS 161)In March 2008, the FASB issued FAS 161, which became effective for the company on January 1, 2009. This standard amends and expands the disclosure requirements of FASB Statement No. 133,Accounting for Derivative Instruments and Hedging Activities.FAS 161 requires disclosures related to objectives and strategies for using derivatives; the fair-value amounts of, and gains and losses on, derivative instruments; and credit-risk-related contingent features in derivative agreements. The company’s disclosures for derivative instruments will be expanded to include a tabular representation of the location and fair value amounts of derivative instruments on the balance sheet, fair value gains and losses on the income statement and gains and losses associated with cash flow hedges recognized in earnings and other comprehensive income.
FASB Staff Position FAS 132(R)-1, Employer’s Disclosures about Postretirement Benefit Plan Assets (FSP FAS 132(R)-1)In December 2008, the FASB issued FSP FAS 132(R)-1, which becomes effective with the company’s reporting at December 31, 2009. This standard amends and expands the disclosure requirements on the plan assets of defined benefit pension and other postretirement plans to provide users of financial statements with an understanding of: how investment allocation decisions are made; the major categories of plan assets; the inputs and valuation techniques used to measure the fair value of plan assets; the effect of fair-value measurements using significant unobservable inputs on changes in plan assets for the period; and significant concentrations of risk within plan assets. The company does not prefund its other postretirement plan obligations, and the effect on the company’s disclosures for its pension plan assets as a result of the adoption of FSP FAS 132(R)-1 will depend on the company’s plan assets at that time.
Note 20
Accounting for Suspended Exploratory Wells
The company accounts for the cost of exploratory wells in accordance with FASB Statement No. 19,Financial and Reporting by Oil and Gas Producing Companies(FAS 19), as amended by FASB Staff Position (FSP) FAS 19-1,Accounting for Suspended Well Costs, which provides that exploratory well costs continue to be capitalized after the completion of drilling when (a) the well has found a sufficient quantity of reserves to justify completion as a producing well and (b) the enterprise is making sufficient progress assessing the reserves and the economic and operating viability of the project. If either condition is not met or if an enterprise obtains information that raises substantial doubt about the economic or operational viability of the project, the exploratory well would be assumed to be impaired, and its costs, net of any salvage value, would be charged to expense.
FS-48
| | | | | | | | | | |
| |
Note 20Accounting for Suspended Exploratory Wells - Continued
|
| | | | | | | | | | |
FAS 19 provides a number of indicators that can assist an entity to demonstrate sufficient progress is being made in assessing the reserves and economic viability of the project.
The following table indicates the changes to the company’s suspended exploratory well costs for the three years ended December 31, 2008:
| | | | | | | | | | | | | | |
| | | 2008 | | | | 2007 | | | 2006 | |
| | | | | |
| Beginning balance at January 1 | | $ | 1,660 | | | | $ | 1,239 | | | $ | 1,109 | |
| Additions to capitalized exploratory well costs pending the determination of proved reserves | | | 643 | | | | | 486 | | | | 446 | |
| Reclassifications to wells, facilities and equipment based on the determination of proved reserves | | | (49 | ) | | | | (23 | ) | | | (171 | ) |
| Capitalized exploratory well costs charged to expense | | | (136 | ) | | | | (42 | ) | | | (121 | ) |
| Other reductions* | | | – | | | | | – | | | | (24 | ) |
| | | | | |
| Ending balance at December 31 | | $ | 2,118 | | | | $ | 1,660 | | | $ | 1,239 | |
| | | | | |
* Represent property sales and exchanges.
The following table provides an aging of capitalized well costs and the number of projects for which exploratory well costs have been capitalized for a period greater than one year since the completion of drilling.
| | | | | | | | | | | | | | |
| | | At December 31 | |
| | | 2008 | | | | 2007 | | | 2006 | |
| | | | | |
| Exploratory well costs capitalized for a period of one year or less | | $ | 559 | | | | $ | 449 | | | $ | 332 | |
| Exploratory well costs capitalized for a period greater than one year | | | 1,559 | | | | | 1,211 | | | | 907 | |
| | | | | |
| Balance at December 31 | | $ | 2,118 | | | | $ | 1,660 | | | $ | 1,239 | |
| | | | | |
| Number of projects with exploratory well costs that have been capitalized for a period greater than one year* | | | 50 | | | | | 54 | | | | 44 | |
| | | | | |
* Certain projects have multiple wells or fields or both.
Of the $1,559 of exploratory well costs capitalized for more than one year at December 31, 2008, $874 (27 projects) is related to projects that had drilling activities under way or firmly planned for the near future. An additional $279 (four projects) is related to projects that had drilling activity during 2008. The $406 balance is related to 19 projects in areas requiring a major capital expenditure before production could begin and for which additional drilling efforts were not under way or firmly planned for the near future. Additional drilling was not deemed necessary because the presence of hydrocarbons had already been established, and other activities were in process to enable a future decision on project development.
The projects for the $406 referenced above had the following activities associated with assessing the reserves and the projects’ economic viability: (a) $107 (two projects) –
government approval of the plan of development received in fourth quarter 2008; (b) $73 (two projects) – continued unitization efforts on adjacent discoveries that span inter-national boundaries; (c) $49 (one project) – alignment of project stakeholders regarding scope and commercial strategy; (d) $46 (one project) – subsurface and facilities engineering studies ongoing with front-end-engineering and design expected in late 2009; (e) $40 (one project) continued review of development options; (f) $91 – miscellaneous activities for 12 projects with smaller amounts suspended. While progress was being made on all 50 projects, the decision on the recognition of proved reserves under SEC rules in some cases may not occur for several years because of the complexity, scale and negotiations connected with the projects. The majority of these decisions are expected to occur in the next three years.
The $1,559 of suspended well costs capitalized for a period greater than one year as of December 31, 2008, represents 195 exploratory wells in 50 projects. The tables below contain the aging of these costs on a well and project basis:
| | | | | | | | | |
| | | | | | | Number | |
| Aging based on drilling completion date of individual wells: | | Amount | | | of wells | |
| |
| 1992 | | $ | 7 | | | | 3 | |
| 1994–1997 | | | 31 | | | | 4 | |
| 1998–2002 | | | 176 | | | | 34 | |
| 2003–2007 | | | 1,345 | | | | 154 | |
| |
| Total | | $ | 1,559 | | | | 195 | |
| |
| | | | | | | | | |
| Aging based on drilling completion date of last | | | | | | Number | |
| suspended well in project: | | Amount | | | of projects | |
| |
| 1992 | | $ | 7 | | | | 1 | |
| 1999 | | | 8 | | | | 1 | |
| 2003 | | | 69 | | | | 3 | |
| 2004–2008 | | | 1,475 | | | | 45 | |
| |
| Total | | $ | 1,559 | | | | 50 | |
| |
Note 21
Stock Options and Other Share-Based Compensation
Compensation expense for stock options for 2008, 2007 and 2006 was $168 ($109 after tax), $146 ($95 after tax) and $125 ($81 after tax), respectively. In addition, compensation expense for stock appreciation rights, performance units and restricted stock units was $132 ($86 after tax), $205 ($133 after tax) and $113 ($73 after tax) for 2008, 2007 and 2006, respectively. No significant stock-based compensation cost was capitalized at December 31, 2008 and 2007.
Cash received in payment for option exercises under all share-based payment arrangements for 2008, 2007 and 2006 was $404, $445 and $444, respectively. Actual tax benefits realized for the tax deductions from option exercises were $103, $94 and $91 for 2008, 2007 and 2006, respectively.
FS-49
| | | | | | | | | | |
Notes to the Consolidated Financial Statements Millions of dollars, except per-share amounts | |
Note 21Stock Options and Other Share-Based Compensation - Continued
|
| | | | | | | | | | |
Cash paid to settle performance units and stock appreciation rights was $136, $88 and $68 for 2008, 2007 and 2006, respectively.
Chevron Long-Term Incentive Plan (LTIP)Awards under the LTIP may take the form of, but are not limited to, stock options, restricted stock, restricted stock units, stock appreciation rights, performance units and nonstock grants. From April 2004 through January 2014, no more than 160 million shares may be issued under the LTIP, and no more than 64 million of those shares may be in a form other than a stock option, stock appreciation right or award requiring full payment for shares by the award recipient.
Texaco Stock Incentive Plan (Texaco SIP) On the closing of the acquisition of Texaco in October 2001, outstanding options granted under the Texaco SIP were converted to Chevron options. These options, which have 10-year contractual lives extending into 2011, retained a provision for being restored. This provision enables a participant who exercises a stock option to receive new options equal to the number of shares exchanged or who has shares withheld to satisfy tax withholding obligations to receive new options equal to the number of shares exchanged or withheld. The restored options are fully exercisable six months after the date of grant, and the exercise price is the market value of the common stock on the day the restored option is granted. Beginning in 2007, restored options were granted under the LTIP. No further awards may be granted under the former Texaco plans.
Unocal Share-Based Plans (Unocal Plans) When Chevron acquired Unocal in August 2005, outstanding stock options and stock appreciation rights granted under various Unocal Plans were exchanged for fully vested Chevron options and appreciation rights. These awards retained the same provisions as the original Unocal Plans. If not exercised, these awards will expire between early 2009 and early 2015.
The fair market values of stock options and stock appreciation rights granted in 2008, 2007 and 2006 were measured on the date of grant using the Black-Scholes option-pricing model, with the following weighted-average assumptions:
| | | | | | | | | | | | | | |
| | | Year ended December 31 | |
| | | 2008 | | | | 2007 | | | 2006 | |
| | | | | |
Stock Options | | | | | | | | | | | | | |
Expected term in years1 | | | 6.1 | | | | | 6.3 | | | | 6.4 | |
Volatility2 | | | 22.0 | % | | | | 22.0 | % | | | 23.7 | % |
| Risk-free interest rate based on zero coupon U.S. treasury note | | | 3.0 | % | | | | 4.5 | % | | | 4.7 | % |
| Dividend yield | | | 2.7 | % | | | | 3.2 | % | | | 3.1 | % |
| Weighted-average fair value per option granted | | $ | 15.97 | | | | $ | 15.27 | | | $ | 12.74 | |
| | | | | | | | | | | | | | |
Restored Options | | | | | | | | | | | | | |
Expected term in years1 | | | 1.2 | | | | | 1.6 | | | | 2.2 | |
Volatility2 | | | 23.1 | % | | | | 21.2 | % | | | 19.6 | % |
| Risk-free interest rate based on zero coupon U.S. treasury note | | | 1.9 | % | | | | 4.5 | % | | | 4.8 | % |
| Dividend yield | | | 2.7 | % | | | | 3.2 | % | | | 3.3 | % |
| Weighted-average fair value per option granted | | $ | 10.01 | | | | $ | 8.61 | | | $ | 7.72 | |
| | | | | |
| 1 | | Expected term is based on historical exercise and post-vesting cancellation data. |
| |
| 2 | | Volatility rate is based on historical stock prices over an appropriate period, generally equal to the expected term. |
A summary of option activity during 2008 is presented below:
| | | | | | | | | | | | | | | | | |
| | | | | | | | | | | Weighted- | | | | |
| | | | | | | Weighted- | | | Average | | | | |
| | | | | | | Average | | | Remaining | | | Aggregate | |
| | | Shares | | | Exercise | | | Contractual | | | Intrinsic | |
| | | (Thousands) | | | Price | | | Term | | | Value | |
| | |
| | | | | | | | | | | | | | | | | |
Outstanding at
January 1, 2008 | | | 57,357 | | | $ | 54.50 | | | | | | | | | |
| Granted | | | 12,391 | | | $ | 84.98 | | | | | | | | | |
| Exercised | | | (10,758 | ) | | $ | 53.69 | | | | | | | | | |
| Restored | | | 1,196 | | | $ | 94.53 | | | | | | | | | |
| Forfeited | | | (1,173 | ) | | $ | 79.53 | | | | | | | | | |
Outstanding at
December 31, 2008 | | | 59,013 | | | $ | 61.36 | | | 6.5 yrs. | | $ | 883 | |
| |
Exercisable at
December 31, 2008 | | | 36,934 | | | $ | 51.51 | | | 5.2 yrs. | | $ | 838 | |
| |
The total intrinsic value (i.e., the difference between the exercise price and the market price) of options exercised during 2008, 2007 and 2006 was $433, $423 and $281, respectively. During this period, the company continued its practice of issuing treasury shares upon exercise of these awards.
FS-50
| | | | | | | | | | | |
| | |
Note 21 Stock Options and Other Share-Based Compensation - Continued
| | |
As of December 31, 2008, there was $179 of total unrecognized before-tax compensation cost related to nonvested share-based compensation arrangements granted or restored under the plans. That cost is expected to be recognized over a weighted-average period of 1.9 years.
At January 1, 2008, the number of LTIP performance units outstanding was equivalent to 2,225,015 shares. During 2008, 888,300 units were granted, 652,897 units vested with cash proceeds distributed to recipients and 59,863 units were forfeited. At December 31, 2008, units outstanding were 2,400,555, and the fair value of the liability recorded for these instruments was $201. In addition, outstanding stock appreciation rights and other awards that were granted under various LTIP and former Texaco and Unocal programs totaled approximately 1.4 million equivalent shares as of December 31, 2008. A liability of $35 was recorded for these awards.
Broad-Based Employee Stock Options In addition to the plans described above, Chevron granted all eligible employees stock options or equivalents in 1998. The options vested in February 2000 and expired in February 2008. A total of 9,641,600 options were awarded with an exercise price of $38.16 per share.
The fair value of each option on the date of grant was estimated at $9.54 using the Black-Scholes model for the preceding 10 years. The assumptions used in the model, based on a 10-year average, were: a risk-free interest rate of 7 percent, a dividend yield of 4.2 percent, an expected life of seven years and a volatility of 24.7 percent.
At January 1, 2008, the number of broad-based employee stock options outstanding was 652,715. Through the conclusion of the program in February 2008, 396,875 shares were exercised and 255,840 shares were forfeited. The total intrinsic value of these options exercised during 2008, 2007 and 2006 was $18, $30, and $10, respectively.
Note 22
Employee Benefit Plans
The company has defined-benefit pension plans for many employees. The company typically prefunds defined-benefit plans as required by local regulations or in certain situations where prefunding provides economic advantages. In the United States, all qualified plans are subject to the Employee Retirement Income Security Act (ERISA) minimum funding standard. The company does not typically fund U.S. nonqualified pension plans that are not subject to funding requirements under laws and regulations because contributions to these pension plans may be less economic and investment returns may be less attractive than the company’s other investment alternatives.
The company also sponsors other postretirement (OPEB) plans that provide medical and dental benefits, as well as life insurance for some active and qualifying retired employees. The plans are unfunded, and the company and retirees share the costs. Medical coverage for Medicare-eligible retirees in the company’s main U.S. medical plan is secondary to Medicare (including Part D), and the increase to the company contribution for retiree medical coverage is limited to no more than 4 percent per year. Certain life insurance benefits are paid by the company.
Effective December 31, 2006, the company implemented the recognition and measurement provisions of Financial Accounting Standards Board (FASB) Statement No. 158,Employers’ Accounting for Defined Benefit Pension and Other Postretirement Plans, an amendment of FASB Statements No. 87, 88, 106 and 132(R), which requires the recognition of the overfunded or underfunded status of each of its defined benefit pension and OPEB as an asset or liability, with the offset to “Accumulated other comprehensive loss.”
The funded status of the company’s pension and other postretirement benefit plans for 2008 and 2007 is on the following page:
FS-51
| | | | | | | | | | |
Notes to the Consolidated Financial Statements Millions of dollars, except per-share amounts | |
Note 22Employee Benefit Plans - Continued
|
| | | | | | | | | | |
| | | | | | | | | | | | | | | | | | | | | | | | | | | |
| | | Pension Benefits | | | | |
| | | 2008 | | | | 2007 | | | Other Benefits | |
| | | U.S. | | | Int’l. | | | | U.S. | | | Int’l. | | | 2008 | | | | 2007 | |
| | | | | | | | | | | |
Change in Benefit Obligation | | | | | | | | | | | | | | | | | | | | | | | | | | |
| Benefit obligation at January 1 | | $ | 8,395 | | | $ | 4,633 | | | | $ | 8,792 | | | $ | 4,207 | | | $ | 2,939 | | | | $ | 3,257 | |
| Service cost | | | 250 | | | | 132 | | | | | 260 | | | | 125 | | | | 44 | | | | | 49 | |
| Interest cost | | | 499 | | | | 292 | | | | | 483 | | | | 255 | | | | 178 | | | | | 184 | |
| Plan participants’ contributions | | | – | | | | 9 | | | | | – | | | | 7 | | | | 152 | | | | | 122 | |
| Plan amendments | | | – | | | | 32 | | | | | (301 | ) | | | 97 | | | | – | | | | | – | |
| Curtailments | | | – | | | | – | | | | | – | | | | (12 | ) | | | – | | | | | – | |
| Actuarial gain | | | (62 | ) | | | (104 | ) | | | | (131 | ) | | | (40 | ) | | | (14 | ) | | | | (413 | ) |
| Foreign currency exchange rate changes | | | – | | | | (858 | ) | | | | – | | | | 219 | | | | (28 | ) | | | | 12 | |
| Benefits paid | | | (955 | ) | | | (246 | ) | | | | (708 | ) | | | (225 | ) | | | (340 | ) | | | | (272 | ) |
| Special termination benefits | | | – | | | | 1 | | | | | – | | | | – | | | | – | | | | | – | |
| | | | | | | | | | | |
| Benefit obligation at December 31 | | | 8,127 | | | | 3,891 | | | | | 8,395 | | | | 4,633 | | | | 2,931 | | | | | 2,939 | |
| | | | | | | | | | | |
Change in Plan Assets | | | | | | | | | | | | | | | | | | | | | | | | | | |
| Fair value of plan assets at January 1 | | | 7,918 | | | | 3,892 | | | | | 7,941 | | | | 3,456 | | | | – | | | | | – | |
| Actual return on plan assets | | | (2,092 | ) | | | (655 | ) | | | | 607 | | | | 232 | | | | – | | | | | – | |
| Foreign currency exchange rate changes | | | – | | | | (662 | ) | | | | – | | | | 183 | | | | – | | | | | – | |
| Employer contributions | | | 577 | | | | 262 | | | | | 78 | | | | 239 | | | | 188 | | | | | 150 | |
| Plan participants’ contributions | | | – | | | | 9 | | | | | – | | | | 7 | | | | 152 | | | | | 122 | |
| Benefits paid | | | (955 | ) | | | (246 | ) | | | | (708 | ) | | | (225 | ) | | | (340 | ) | | | | (272 | ) |
| | | | | | | | | | | |
| Fair value of plan assets at December 31 | | | 5,448 | | | | 2,600 | | | | | 7,918 | | | | 3,892 | | | | – | | | | | – | |
| | | | | | | | | | | |
Funded Status at December 31 | | $ | (2,679 | ) | | $ | (1,291 | ) | | | $ | (477 | ) | | $ | (741 | ) | | $ | (2,931 | ) | | | $ | (2,939 | ) |
| | | | | | | | | | |
Amounts recognized on the Consolidated Balance Sheet for the company’s pension and other postretirement benefit plans at December 31, 2008 and 2007, include:
| | | | | | | | | | | | | | | | | | | | | | | | | | | |
| | | Pension Benefits | | | | |
| | | 2008 | | | | 2007 | | | Other Benefits | |
| | | U.S. | | | Int’l. | | | | U.S. | | | Int’l. | | | 2008 | | | | 2007 | |
| | | | | | | | | | | |
| Deferred charges and other assets | | $ | 6 | | | $ | 31 | | | | $ | 181 | | | $ | 279 | | | $ | – | | | | $ | – | |
| Accrued liabilities | | | (72 | ) | | | (61 | ) | | | | (68 | ) | | | (55 | ) | | | (209 | ) | | | | (207 | ) |
| Reserves for employee benefit plans | | | (2,613 | ) | | | (1,261 | ) | | | | (590 | ) | | | (965 | ) | | | (2,722 | ) | | | | (2,732 | ) |
| | | | | | | | | | | |
Net amount recognized at December 31 | | $ | (2,679 | ) | | $ | (1,291 | ) | | | $ | (477 | ) | | $ | (741 | ) | | $ | (2,931 | ) | | | $ | (2,939 | ) |
| | | | | | | | | | |
Amounts recognized on a before-tax basis in “Accumulated other comprehensive loss” for the company’s pension and OPEB postretirement plans were $5,831 and $2,990 at the end of 2008 and 2007. These amounts consisted of:
| | | | | | | | | | | | | | | | | | | | | | | | | | | |
| | | Pension Benefits | | | | |
| | | 2008 | | | | 2007 | | | Other Benefits | |
| | | U.S. | | | Int’l. | | | | U.S. | | | Int’l. | | | 2008 | | | | 2007 | |
| | | | | | | | | | | |
| Net actuarial loss | | $ | 3,797 | | | $ | 1,804 | | | | $ | 1,539 | | | $ | 1,237 | | | $ | 410 | | | | $ | 490 | |
| Prior-service (credit) costs | | | (68 | ) | | | 211 | | | | | (75 | ) | | | 203 | | | | (323 | ) | | | | (404 | ) |
| | | | | | | | | | | |
Total recognized at December 31 | | $ | 3,729 | | | $ | 2,015 | | | | $ | 1,464 | | | $ | 1,440 | | | $ | 87 | | | | $ | 86 | |
| | | | | | | | | |
The accumulated benefit obligations for all U.S. and international pension plans were $7,376 and $3,273, respectively, at December 31, 2008, and $7,712 and $4,000, respectively, at December 31, 2007.
Information for U.S. and international pension plans with an accumulated benefit obligation in excess of plan assets at December 31, 2008 and 2007, was:
| | | | | | | | | | | | | | | | | | |
| | | Pension Benefits | |
| | | 2008 | | | | 2007 | |
| | | U.S. | | | Int’l. | | | | U.S. | | | Int’l. | |
| | | | | |
| Projected benefit obligations | | $ | 8,121 | | | $ | 2,906 | | | | $ | 678 | | | $ | 1,089 | |
| Accumulated benefit obligations | | | 7,371 | | | | 2,539 | | | | | 638 | | | | 926 | |
| Fair value of plan assets | | | 5,436 | | | | 1,698 | | | | | 20 | | | | 271 | |
| | | | | |
FS-52
| | | | | | | | | | | |
| | |
Note 22Employee Benefit Plans - Continued
| | |
The components of net periodic benefit cost for 2008, 2007 and 2006 and amounts recognized in other comprehensive income for 2008 and 2007 are shown in the table below. For 2008 and 2007, changes in pension plan assets and benefit obligations were recognized as changes in other comprehensive income.
| | | | | | | | | | | | | | | | | | | | | | | | | | | | | | | | | | | | | | | |
| | | Pension Benefits | | | | |
| | | 2008 | | | | 2007 | | | 2006 | | | Other Benefits | |
| | | U.S. | | | Int’l. | | | | U.S. | | | Int’l. | | | U.S. | | | Int’l. | | | 2008 | | | | 2007 | | | 2006 | |
| | | | | | | | | | | |
Net Periodic Benefit Cost | | | | | | | | | | | | | | | | | | | | | | | | | | | | | | | | | | | | | | |
| Service cost | | $ | 250 | | | $ | 132 | | | | $ | 260 | | | $ | 125 | | | $ | 234 | | | $ | 98 | | | $ | 44 | | | | $ | 49 | | | $ | 35 | |
| Interest cost | | | 499 | | | | 292 | | | | | 483 | | | | 255 | | | | 468 | | | | 214 | | | | 178 | | | | | 184 | | | | 181 | |
| Expected return on plan assets | | | (593 | ) | | | (273 | ) | | | | (578 | ) | | | (266 | ) | | | (550 | ) | | | (227 | ) | | | – | | | | | – | | | | – | |
| Amortization of transitional assets | | | – | | | | – | | | | | – | | | | – | | | | – | | | | 1 | | | | – | | | | | – | | | | – | |
| Amortization of prior-service (credits) costs | | | (7 | ) | | | 24 | | | | | 46 | | | | 17 | | | | 46 | | | | 14 | | | | (81 | ) | | | | (81 | ) | | | (86 | ) |
| Recognized actuarial losses | | | 60 | | | | 77 | | | | | 128 | | | | 82 | | | | 149 | | | | 69 | | | | 38 | | | | | 81 | | | | 97 | |
| Settlement losses | | | 306 | | | | 2 | | | | | 65 | | | | – | | | | 70 | | | | – | | | | – | | | | | – | | | | – | |
| Curtailment losses | | | – | | | | – | | | | | – | | | | 3 | | | | – | | | | – | | | | – | | | | | – | | | | – | |
| Special termination benefit recognition | | | – | | | | 1 | | | | | – | | | | – | | | | – | | | | – | | | | – | | | | | – | | | | – | |
| | | | | | | | | | | |
| Net periodic benefit cost | | | 515 | | | | 255 | | | | | 404 | | | | 216 | | | | 417 | | | | 169 | | | | 179 | | | | | 233 | | | | 227 | |
| | | | | | | | | | | |
Changes Recognized in Other Comprehensive Income | | | | | | | | | | | | | | | | | | | | | | | | | | | | | | | | | | | | | | |
| Net actuarial loss (gain) during period | | | 2,624 | | | | 646 | | | | | (160 | ) | | | 31 | | | | – | | | | – | | | | (42 | ) | | | | (401 | ) | | | – | |
| Amortization of actuarial loss | | | (366 | ) | | | (79 | ) | | | | (193 | ) | | | (82 | ) | | | – | | | | – | | | | (38 | ) | | | | (81 | ) | | | – | |
| Prior service cost (credit) during period | | | – | | | | 32 | | | | | (301 | ) | | | 97 | | | | – | | | | – | | | | – | | | | | – | | | | – | |
| Amortization of prior-service credits (costs) | | | 7 | | | | (24 | ) | | | | (46 | ) | | | (20 | ) | | | – | | | | – | | | | 81 | | | | | 81 | | | | – | |
| | | | | | | | | | | |
| Total changes recognized in other comprehensive income | | | 2,265 | | | | 575 | | | | | (700 | ) | | | 26 | | | | – | | | | – | | | | 1 | | | | | (401 | ) | | | – | |
| | | | | | | | | | | |
Recognized in Net Periodic Benefit Cost and Other Comprehensive Income | | $ | 2,780 | | | $ | 830 | | | | $ | (296 | ) | | $ | 242 | | | $ | 417 | | | $ | 169 | | | $ | 180 | | | | $ | (168 | ) | | $ | 227 | |
| | | | | | | | | | | |
Net actuarial losses recorded in “Accumulated other comprehensive loss” at December 31, 2008, for the company’s U.S. pension, international pension and OPEB plans are being amortized on a straight-line basis over approximately 10, 13 and 10 years, respectively. These amortization periods represent the estimated average remaining service of employees expected to receive benefits under the plans. These losses are amortized to the extent they exceed 10 percent of the higher of the projected benefit obligation or market-related value of plan assets. The amount subject to amortization is determined on a plan-by-plan basis. During 2009, the company estimates actuarial losses of $298, $103 and $28 will be amortized from “Accumulated other comprehensive loss” for U.S. pension, international pension and OPEB plans, respectively. In
addition, the company estimates an additional $201 will be recognized from “Accumulated other comprehensive loss” during 2009 related to lump-sum settlement costs from U.S. pension plans.
The weighted average amortization period for recognizing prior service costs (credits) recorded in “Accumulated other comprehensive loss” at December 31, 2008, was approximately nine and 13 years for U.S. and international pension plans, respectively, and eight years for other postretirement benefit plans. During 2009, the company estimates prior service (credits) costs of $(7), $25 and $(81) will be amortized from “Accumulated other comprehensive loss” for U.S. pension, international pension and OPEB plans, respectively.
FS-53
| | | | | | | | | | |
Notes to the Consolidated Financial Statements Millions of dollars, except per-share amounts | |
Note 22Employee Benefit Plans - Continued
|
| | | | | | | | | | |
AssumptionsThe following weighted-average assumptions were used to determine benefit obligations and net periodic benefit costs for years ended December 31:
| | | | | | | | | | | | | | | | | | | | | | | | | | | | | | | | | | | | | | | |
| | | Pension Benefits | | | | |
| | | 2008 | | | | 2007 | | | 2006 | | | Other Benefits | |
| | | U.S. | | | Int’l. | | | | U.S. | | | Int’l. | | | U.S. | | | Int’l. | | | 2008 | | | | 2007 | | | 2006 | |
| | | | | | | | | | | |
| Assumptions used to determine benefit obligations | | | | | | | | | | | | | | | | | | | | | | | | | | | | | | | | | | | | | | |
| Discount rate | | | 6.3 | % | | | 7.5 | % | | | | 6.3 | % | | | 6.7 | % | | | 5.8 | % | | | 6.0 | % | | | 6.3 | % | | | | 6.3 | % | | | 5.8 | % |
| Rate of compensation increase | | | 4.5 | % | | | 6.8 | % | | | | 4.5 | % | | | 6.4 | % | | | 4.5 | % | | | 6.1 | % | | | 4.0 | % | | | | 4.5 | % | | | 4.5 | % |
| Assumptions used to determine net periodic benefit cost | | | | | | | | | | | | | | | | | | | | | | | | | | | | | | | | | | | | | | |
Discount rate1 | | | 6.3 | % | | | 6.7 | % | | | | 5.8 | % | | | 6.0 | % | | | 5.8 | % | | | 5.9 | % | | | 6.3 | % | | | | 5.8 | % | | | 5.9 | % |
| Expected return on plan assets | | | 7.8 | % | | | 7.4 | % | | | | 7.8 | % | | | 7.5 | % | | | 7.8 | % | | | 7.4 | % | | | N/A | | | | | N/A | | | | N/A | |
| Rate of compensation increase | | | 4.5 | % | | | 6.4 | % | | | | 4.5 | % | | | 6.1 | % | | | 4.2 | % | | | 5.1 | % | | | 4.5 | % | | | | 4.5 | % | | | 4.2 | % |
| | | | | | | | | | | |
1 The 2006 U.S. discount rate reflects remeasurement on July 1, 2006, due to plan combinations and changes, primarily several Unocal plans into related Chevron plans.
Expected Return on Plan AssetsThe company’s estimated long-term rate of return on pension assets is driven primarily by actual historical asset-class returns, an assessment of expected future performance, advice from external actuarial firms and the incorporation of specific asset-class risk factors. Asset allocations are periodically updated using pension plan asset/liability studies, and the company’s estimated long-term rates of return are consistent with these studies.
There have been no changes in the expected long-term rate of return on plan assets since 2002 for U.S. plans, which account for 68 percent of the company’s pension plan assets. At December 31, 2008, the estimated long-term rate of return on U.S. pension plan assets was 7.8 percent.
The market-related value of assets of the major U.S. pension plan used in the determination of pension expense was based on the market values in the three months preceding the year-end measurement date, as opposed to the maximum allowable period of five years under U.S. accounting rules. Management considers the three-month time period long enough to minimize the effects of distortions from day-to-day market volatility and still be contemporaneous to the end of the year. For other plans, market value of assets as of year-end is used in calculating the pension expense.
Discount Rate The discount rate assumptions used to determine U.S. and international pension and postretirement benefit plan obligations and expense reflect the prevailing rates available on high-quality, fixed-income debt instruments. At December 31, 2008, the company selected a 6.3 percent discount rate for the major U.S. pension and postretirement plans. This rate was based on a cash flow analysis that matched estimated future benefit payments to the Citigroup Pension Discount Yield Curve as of year-end 2008. The discount rates at the end of 2007 and 2006 were 6.3 percent and 5.8 percent, respectively.
Other Benefit Assumptions For the measurement of accumulated postretirement benefit obligation at December 31, 2008, for the main U.S. postretirement medical plan, the assumed health care cost-trend rates start with 7 percent in 2009 and gradually decline to 5 percent for 2017 and beyond. For this measurement at December 31, 2007, the assumed health care cost-trend rates started with 8 percent in 2008 and gradually declined to 5 percent for 2014 and beyond. In both measurements, the annual increase to company contributions was capped at 4 percent.
Assumed health care cost-trend rates can have a significant effect on the amounts reported for retiree health care costs. The impact is mitigated by the 4 percent cap on the company’s medical contributions for the primary U.S. plan. A one-percentage-point change in the assumed health care cost-trend rates would have the following effects:
| | | | | | | | | |
| | | 1 Percent | | | 1 Percent | |
| | | Increase | | | Decrease | |
| | |
| Effect on total service and interest cost components | | $ | 9 | | | $ | (8 | ) |
| Effect on postretirement benefit obligation | | $ | 88 | | | $ | (75 | ) |
| | |
Plan Assets and Investment Strategy The company’s pension plan weighted-average asset allocations at December 31 by asset category are as follows:
| | | | | | | | | | | | | | | | | | |
| | | U.S. | | | | International | |
| Asset Category | | 2008 | | | 2007 | | | | 2008 | | | 2007 | |
| | | | | |
| Equities | | | 52 | % | | | 64 | % | | | | 47 | % | | | 56 | % |
| Fixed Income | | | 34 | % | | | 23 | % | | | | 50 | % | | | 43 | % |
| Real Estate | | | 13 | % | | | 12 | % | | | | 2 | % | | | 1 | % |
| Other | | | 1 | % | | | 1 | % | | | | 1 | % | | | – | |
| | | | | |
| Total | | | 100 | % | | | 100 | % | | | | 100 | % | | | 100 | % |
| | | | | |
FS-54
| | | | | | | | | | | |
| | |
Note 22Employee Benefit Plans - Continued
| | |
The pension plans invest primarily in asset categories with sufficient size, liquidity and cost efficiency to permit investments of reasonable size. The pension plans invest in asset categories that provide diversification benefits and are easily measured. To assess the plans’ investment performance, long-term asset allocation policy benchmarks have been established.
For the primary U.S. pension plan, the Chevron Board of Directors has approved the following percentage asset-allocation ranges: equities 40–70, fixed income/cash 20–60, real estate 0–15 and other 0–5. The significant international pension plans also have established maximum and minimum asset allocation ranges that vary by each plan. Actual asset allocation, within approved ranges, is based on a variety of current economic and market conditions and consideration of specific asset category risk.
Equities include investments in the company’s common stock in the amount of $22 and $36 at December 31, 2008 and 2007, respectively. The “Other” asset category includes minimal investments in private-equity limited partnerships.
Cash Contributions and Benefit Payments In 2008, the company contributed $577 and $262 to its U.S. and international pension plans, respectively. In 2009, the company expects contributions to be approximately $550 and $250 to its U.S. and international pension plans, respectively. Actual contribution amounts are dependent upon plan-investment returns, changes in pension obligations, regulatory environments and other economic factors. Additional funding may ultimately be required if investment returns are insufficient to offset increases in plan obligations.
The company anticipates paying other postretirement benefits of approximately $209 in 2009, as compared with $188 paid in 2008.
The following benefit payments, which include estimated future service, are expected to be paid in the next 10 years:
| | | | | | | | | | | | | |
| | | Pension Benefits | | | Other | |
| | | U.S. | | | Int’l. | | | Benefits | |
| | | | |
| 2009 | | $ | 853 | | | $ | 226 | | | $ | 209 | |
| 2010 | | $ | 841 | | | $ | 249 | | | $ | 216 | |
| 2011 | | $ | 849 | | | $ | 240 | | | $ | 222 | |
| 2012 | | $ | 863 | | | $ | 265 | | | $ | 225 | |
| 2013 | | $ | 874 | | | $ | 277 | | | $ | 230 | |
| 2014–2018 | | $ | 4,379 | | | $ | 1,746 | | | $ | 1,205 | |
| | |
Employee Savings Investment Plan Eligible employees of Chevron and certain of its subsidiaries participate in the Chevron Employee Savings Investment Plan (ESIP).
Charges to expense for the ESIP represent the company’s contributions to the plan, which are funded either through the purchase of shares of common stock on the open market or through the release of common stock held in the leveraged employee stock ownership plan (LESOP), which follows. Total company matching contributions to employee accounts within the ESIP were $231, $206 and $169 in 2008, 2007 and 2006, respectively. This cost was reduced by the value of shares released from the LESOP totaling $40, $33 and $6 in 2008, 2007 and 2006, respectively. The remaining amounts, totaling $191, $173 and $163 in 2008, 2007 and 2006, respectively, represent open market purchases.
Employee Stock Ownership Plan Within the Chevron ESIP is an employee stock ownership plan (ESOP). In 1989, Chevron established a LESOP as a constituent part of the ESOP. The LESOP provides partial prefunding of the company’s future commitments to the ESIP.
As permitted by American Institute of Certified Public Accountants (AICPA) Statement of Position 93-6,Employers’ Accounting for Employee Stock Ownership Plans, the company has elected to continue its practices, which are based on AICPA Statement of Position 76-3,Accounting Practices for Certain Employee Stock Ownership Plans, and subsequent consensus of the EITF of the FASB. The debt of the LESOP is recorded as debt, and shares pledged as collateral are reported as “Deferred compensation and benefit plan trust” on the Consolidated Balance Sheet and the Consolidated Statement of Stockholders’ Equity.
The company reports compensation expense equal to LESOP debt principal repayments less dividends received and used by the LESOP for debt service. Interest accrued on LESOP debt is recorded as interest expense. Dividends paid on LESOP shares are reflected as a reduction of retained earnings. All LESOP shares are considered outstanding for earnings-per-share computations.
A net credit to expense of $1 was recorded for the LESOP each year in 2008, 2007 and 2006. The net credit for the respective years was composed of credits to compensation expense of $15, $17 and $18 and charges to interest expense for LESOP debt of $14, $16 and $17.
Of the dividends paid on the LESOP shares, $35, $8 and $59 were used in 2008, 2007 and 2006, respectively, to service LESOP debt. The amount in 2006 included $28 of LESOP debt service that was scheduled for payment on the first business day of January 2007 and was paid in late December 2006. No contributions were required in 2008, 2007 or 2006 as dividends received by the LESOP were sufficient to satisfy LESOP debt service.
FS-55
| | | | | | | | | | |
Notes to the Consolidated Financial Statements Millions of dollars, except per-share amounts | |
Note 22Employee Benefit Plans - Continued
|
| | | | | | | | | | |
Shares held in the LESOP are released and allocated to the accounts of plan participants based on debt service deemed to be paid in the year in proportion to the total of current year and remaining debt service. LESOP shares as of December 31, 2008 and 2007, were as follows:
| | | | | | | | | |
| Thousands | | 2008 | | | 2007 |
| | | | | | | | | |
| Allocated shares | | | 19,651 | | | | 20,506 |
| Unallocated shares | | | 6,366 | | | | 7,365 |
| | | | | | | | | |
| Total LESOP shares | | | 26,017 | | | | 27,871 |
| |
Benefit Plan Trusts Prior to its acquisition by Chevron, Texaco established a benefit plan trust for funding obligations under some of its benefit plans. At year-end 2008, the trust contained 14.2 million shares of Chevron treasury stock. The trust will sell the shares or use the dividends from the shares to pay benefits only to the extent that the company does not pay such benefits. The company intends to continue to pay its obligations under the benefit plans. The trustee will vote the shares held in the trust as instructed by the trust’s beneficiaries. The shares held in the trust are not considered outstanding for earnings-per-share purposes until distributed or sold by the trust in payment of benefit obligations.
Prior to its acquisition by Chevron, Unocal established various grantor trusts to fund obligations under some of its benefit plans, including the deferred compensation and supplemental retirement plans. At December 31, 2008 and 2007, trust assets of $60 and $69, respectively, were invested primarily in interest-earning accounts.
Employee Incentive Plans Effective January 2008, the company established the Chevron Incentive Plan (CIP), a single annual cash bonus plan for eligible employees that links awards to corporate, unit and individual performance in the prior year. This plan replaced other cash bonus programs, which primarily included the Management Incentive Plan (MIP) and the Chevron Success Sharing program. In 2008, charges to expense for cash bonuses were $757. Charges to expense for MIP were $184 and $180 in 2007 and 2006, respectively. Charges for other cash bonus programs were $431 and $329 in 2007 and 2006, respectively. Chevron also has a Long-Term Incentive Plan (LTIP) for officers and other regular salaried employees of the company and its subsidiaries who hold positions of significant responsibility. Awards under LTIP consist of stock options and other share-based compensation that are described in Note 21 on page FS-49.
Note 23
Other Contingencies and Commitments
Income Taxes The company calculates its income tax expense and liabilities quarterly. These liabilities generally are subject to audit and are not finalized with the individual taxing authorities until several years after the end of the annual
period for which income taxes have been calculated. Refer to Note 16 beginning on page FS-45 for a discussion of the periods for which tax returns have been audited for the company’s major tax jurisdictions and a discussion for all tax jurisdictions of the differences between the amount of tax benefits recognized in the financial statements and the amount taken or expected to be taken in a tax return. The company does not expect settlement of income tax liabilities associated with uncertain tax positions will have a material effect on its results of operations, consolidated financial position or liquidity.
Guarantees The company has issued a guarantee of approximately $600 associated with certain payments under a terminal use agreement entered into by a company affiliate. The terminal is expected to be operational by 2012. Over the approximate 16-year term of the guarantee, the maximum guarantee amount will reduce over time as certain fees are paid by the affiliate. There are numerous cross-indemnity agreements with the affiliate and the other partners to permit recovery of any amounts paid under the guarantee. Chevron carries no liability for its obligation under this guarantee.
Indemnifications The company provided certain indemnities of contingent liabilities of Equilon and Motiva to Shell and Saudi Refining, Inc., in connection with the February 2002 sale of the company’s interests in those investments. The company would be required to perform if the indemnified liabilities become actual losses. Were that to occur, the company could be required to make future payments up to $300. Through the end of 2008, the company paid $48 under these indemnities and continues to be obligated for possible additional indemnification payments in the future.
The company has also provided indemnities relating to contingent environmental liabilities related to assets originally contributed by Texaco to the Equilon and Motiva joint ventures and environmental conditions that existed prior to the formation of Equilon and Motiva or that occurred during the period of Texaco’s ownership interest in the joint ventures. In general, the environmental conditions or events that are subject to these indemnities must have arisen prior to December 2001. Claims must be asserted no later than February 2009 for Equilon indemnities and no later than February 2012 for Motiva indemnities. Under the terms of these indemnities, there is no maximum limit on the amount of potential future payments. In February 2009, Shell delivered a letter to the company purporting to preserve unmatured claims for certain Equilon indemnities. The letter itself provides no estimate of the ultimate claim amount, and management does not believe the letter provides a basis to estimate the amount, if any, of a range of loss or potential range of loss with respect to the Equilon or the Motiva indemnities. The company posts no assets as collateral and has made no payments under the indemnities.
FS-56
| | | | | | | | | | | |
| | |
Note 23 Other Contingencies and Commitments - Continued
| | |
The amounts payable for the indemnities described on the previous page are to be net of amounts recovered from insurance carriers and others and net of liabilities recorded by Equilon or Motiva prior to September 30, 2001, for any applicable incident.
In the acquisition of Unocal, the company assumed certain indemnities relating to contingent environmental liabilities associated with assets that were sold in 1997. Under the indemnification agreement, the company’s liability is unlimited until April 2022, when the indemnification expires. The acquirer shares in certain environmental remediation costs up to a maximum obligation of $200, which had not been reached as of December 31, 2008.
Securitization During 2008, the company terminated the program used to securitize downstream-related trade accounts receivable. At year-end 2007, the balance of securitized receivables was $675 million. As of December 31, 2008, the company had no other securitization arrangements in place.
Long-Term Unconditional Purchase Obligations and Commitments, Including Throughput and Take-or-Pay Agreements The company and its subsidiaries have certain other contingent liabilities relating to long-term unconditional purchase obligations and commitments, including throughput and take-or-pay agreements, some of which relate to suppliers’ financing arrangements. The agreements typically provide goods and services, such as pipeline and storage capacity, drilling rigs, utilities, and petroleum products, to be used or sold in the ordinary course of the company’s business. The aggregate approximate amounts of required payments under these various commitments are: 2009 – $6,405; 2010 – $3,964; 2011 – $3,578; 2012 – $1,473; 2013 – $1,329; 2014 and after – $4,333. A portion of these commitments may ultimately be shared with project partners. Total payments under the agreements were approximately $5,100 in 2008 $3,700 in 2007 and $3,000 in 2006.
Minority Interests The company has commitments of $469 related to minority interests in subsidiary companies.
Environmental The company is subject to loss contingencies pursuant to environmental laws and regulations that in the future may require the company to take action to correct or ameliorate the effects on the environment of prior release of chemicals or petroleum substances, including MTBE, by the company or other parties. Such contingencies may exist for various sites, including, but not limited to, federal Superfund sites and analogous sites under state laws, refineries, crude oil fields, service stations, terminals, land development areas, and mining operations, whether operating, closed or divested. These future costs are not fully determinable due to such factors as the unknown magnitude of possible contamination,
the unknown timing and extent of the corrective actions that may be required, the determination of the company’s liability in proportion to other responsible parties, and the extent to which such costs are recoverable from third parties.
Although the company has provided for known environmental obligations that are probable and reasonably estimable, the amount of additional future costs may be material to results of operations in the period in which they are recognized. The company does not expect these costs will have a material effect on its consolidated financial position or liquidity. Also, the company does not believe its obligations to make such expenditures have had, or will have, any significant impact on the company’s competitive position relative to other U.S. or international petroleum or chemical companies.
Chevron’s environmental reserve as of December 31, 2008, was $1,818. Included in this balance were remediation activities of 248 sites for which the company had been identified as a potentially responsible party or otherwise involved in the remediation by the U.S. Environmental Protection Agency (EPA) or other regulatory agencies under the provisions of the federal Superfund law or analogous state laws. The company’s remediation reserve for these sites at year-end 2008 was $120. The federal Superfund law and analogous state laws provide for joint and several liability for all responsible parties. Any future actions by the EPA or other regulatory agencies to require Chevron to assume other potentially responsible parties’ costs at designated hazardous waste sites are not expected to have a material effect on the company’s results of operations, consolidated financial position or liquidity.
Of the remaining year-end 2008 environmental reserves balance of $1,698, $968 related to the company’s U.S. downstream operations, including refineries and other plants, marketing locations (i.e., service stations and terminals), and pipelines. The remaining $730 was associated with various sites in international downstream ($117), upstream ($390), chemicals ($154) and other businesses ($69). Liabilities at all sites, whether operating, closed or divested, were primarily associated with the company’s plans and activities to remediate soil or groundwater contamination or both. These and other activities include one or more of the following: site assessment; soil excavation; offsite disposal of contaminants; onsite containment, remediation and/or extraction of petroleum hydrocarbon liquid and vapor from soil; groundwater extraction and treatment; and monitoring of the natural attenuation of the contaminants.
The company manages environmental liabilities under specific sets of regulatory requirements, which in the United States include the Resource Conservation and Recovery Act and various state or local regulations. No single remediation site at year-end 2008 had a recorded liability that was material to the company’s results of operations, consolidated financial position or liquidity.
FS-57
| | | | | | | | | | |
Notes to the Consolidated Financial Statements Millions of dollars, except per-share amounts | |
Note 23Other Contingencies and Commitments - Continued
|
| | | | | | | | | | |
It is likely that the company will continue to incur additional liabilities, beyond those recorded, for environmental remediation relating to past operations. These future costs are not fully determinable due to such factors as the unknown magnitude of possible contamination, the unknown timing and extent of the corrective actions that may be required, the determination of the company’s liability in proportion to other responsible parties, and the extent to which such costs are recoverable from third parties.
Refer to Note 24 below for a discussion of the company’s Asset Retirement Obligations.
Equity Redetermination For oil and gas producing operations, ownership agreements may provide for periodic reassessments of equity interests in estimated crude oil and natural gas reserves. These activities, individually or together, may result in gains or losses that could be material to earnings in any given period. One such equity redetermination process has been under way since 1996 for Chevron’s interests in four producing zones at the Naval Petroleum Reserve at Elk Hills, California, for the time when the remaining interests in these zones were owned by the U.S. Department of Energy. A wide range remains for a possible net settlement amount for the four zones. For this range of settlement, Chevron estimates its maximum possible net before-tax liability at approximately $200, and the possible maximum net amount that could be owed to Chevron is estimated at about $150. The timing of the settlement and the exact amount within this range of estimates are uncertain.
Other Contingencies Chevron receives claims from and submits claims to customers; trading partners; U.S. federal, state and local regulatory bodies; governments; contractors; insurers; and suppliers. The amounts of these claims, individually and in the aggregate, may be significant and take lengthy periods to resolve.
The company and its affiliates also continue to review and analyze their operations and may close, abandon, sell, exchange, acquire or restructure assets to achieve operational or strategic benefits and to improve competitiveness and profitability. These activities, individually or together, may result in gains or losses in future periods.
Note 24
Asset Retirement Obligations
The company accounts for asset retirement obligations (ARO) in accordance with Financial Accounting Standards Board (FASB) Statement No. 143,Accounting for Asset Retirement Obligations(FAS 143) and FASB Interpretation No. 47,Accounting for Conditional Asset Retirement Obligations – An Interpretation of FASB Statement No. 143(FIN 47). FAS 143 applies to the fair
value of a liability for an ARO that is recorded when there is a legal obligation associated with the retirement of a tangible long-lived asset and the liability can be reasonably estimated. Obligations associated with the retirement of these assets require recognition in certain circumstances: (1) the present value of a liability and offsetting asset for an ARO, (2) the subsequent accretion of that liability and depreciation of the asset, and (3) the periodic review of the ARO liability estimates and discount rates. FIN 47 clarifies that the phrase “conditional asset retirement obligation,” as used in FAS 143, refers to a legal obligation to perform asset retirement activity for which the timing and/or method of settlement are conditional on a future event that may or may not be within the control of the company. The obligation to perform the asset retirement activity is unconditional even though uncertainty exists about the timing and/or method of settlement. Uncertainty about the timing and/or method of settlement of a conditional ARO should be factored into the measurement of the liability when sufficient information exists. FAS 143 acknowledges that in some cases, sufficient information may not be available to reasonably estimate the fair value of an ARO. FIN 47 also clarifies when an entity would have sufficient information to reasonably estimate the fair value of an ARO.
FAS 143 and FIN 47 primarily affect the company’s accounting for crude oil and natural gas producing assets. No significant AROs associated with any legal obligations to retire refining, marketing and transportation (downstream) and chemical long-lived assets have been recognized, as indeterminate settlement dates for the asset retirements prevent estimation of the fair value of the associated ARO. The company performs periodic reviews of its downstream and chemical long-lived assets for any changes in facts and circumstances that might require recognition of a retirement obligation.
The following table indicates the changes to the company’s before-tax asset retirement obligations in 2008, 2007 and 2006:
| | | | | | | | | | | | | | |
| | | 2008 | | | | 2007 | | | 2006 | |
| | | | | | | | | | | | | | |
| Balance at January 1 | | $ | 8,253 | | | | $ | 5,773 | | | $ | 4,304 | |
| Liabilities incurred | | | 308 | | | | | 178 | | | | 153 | |
| Liabilities settled | | | (973 | ) | | | | (818 | ) | | | (387 | ) |
| Accretion expense | | | 430 | | | | | 399 | * | | | 275 | |
| Revisions in estimated cash flows | | | 1,377 | | | | | 2,721 | | | | 1,428 | |
| | | | | | | | | | | | | | |
| Balance at December 31 | | $ | 9,395 | | | | $ | 8,253 | | | $ | 5,773 | |
| | | | | | | | | | | | | | |
*Includes $175 for revision to the ARO liability retained on properties that had been sold.
In the table above, the amounts associated with “Revisions in estimated cash flows” reflect increasing costs to abandon onshore and offshore wells, equipment and facilities, including an aggregate of $1,804 for 2006 through 2008 for the estimated costs to dismantle and abandon wells and facilities damaged by hurricanes in the U.S. Gulf of Mexico in 2005 and 2008. The long-term portion of the $9,395 balance at the end of 2008 was $8,588.
FS-58
| | | | | | | | | | |
| | |
Note 25Other Financial Information
| | |
Note 25
Other Financial Information
Net income in 2008 included gains of approximately $1,200 relating to the sale of nonstrategic properties. Of this amount, approximately $1,000 related to upstream assets. Net income in 2007 included gains of approximately $2,000 relating to the sale of nonstrategic properties. Of this amount, approximately $1,100 related to downstream assets and $680 related to the sale of the company’s investment in Dynegy Inc.
Other financial information is as follows:
| | | | | | | | | | | | | | |
| | | Year ended December 31 | |
| | | 2008 | | | | 2007 | | | 2006 | |
| | | | | |
| Total financing interest and debt costs | | $ | 256 | | | | $ | 468 | | | $ | 608 | |
| Less: Capitalized interest | | | 256 | | | | | 302 | | | | 157 | |
| | | | | | | |
| Interest and debt expense | | $ | – | | | | $ | 166 | | | $ | 451 | |
| | | | | |
| Research and development expenses | | $ | 835 | | | | $ | 562 | | | $ | 468 | |
| Foreign currency effects* | | $ | 862 | | | | $ | (352 | ) | | $ | (219 | ) |
| | | | | |
| * | | Includes $420, $18 and $15 in 2008, 2007 and 2006, respectively, for the company’s share of equity affiliates’ foreign currency effects. |
The excess of replacement cost over the carrying value of inventories for which the Last-In, First-Out (LIFO) method is used was $9,368 and $6,958 at December 31, 2008 and 2007, respectively. Replacement cost is generally based on average acquisition costs for the year. LIFO profits of $210, $113 and $82 were included in net income for the years 2008, 2007 and 2006, respectively.
Note 26
Assets Held for Sale
At December 31, 2008, the company classified $252 of net properties, plant and equipment as “Assets held for sale” on the Consolidated Balance Sheet. Assets in this category related to groups of service stations, aviation facilities, lubricants blending plants, and commercial and industrial fuels business. These assets are anticipated to be sold in 2009.
Note 27
Earnings Per Share
Basic earnings per share (EPS) is based upon net income less preferred stock dividend requirements and includes the effects of deferrals of salary and other compensation awards that are invested in Chevron stock units by certain officers and employees of the company and the company’s share of stock transactions of affiliates, which, under the applicable accounting rules, may be recorded directly to the company’s retained earnings instead of net income. Diluted EPS includes the effects of these items as well as the dilutive effects of outstanding stock options awarded under the company’s stock option programs (refer to Note 21, “Stock Options and Other Share-Based Compensation” beginning on page FS-49). The table below sets forth the computation of basic and diluted EPS:
| | | | | | | | | | | | | | |
| | | Year ended December 31 | |
| | | 2008 | | | | 2007 | | | 2006 | |
| | | | | |
Basic EPS Calculation | | | | | | | | | | | | | |
| Income from operations | | $ | 23,931 | | | | $ | 18,688 | | | $ | 17,138 | |
| Add: Dividend equivalents paid on stock units | | | – | | | | | – | | | | 1 | |
| | | | | |
| Net income available to common stockholders – Basic | | $ | 23,931 | | | | $ | 18,688 | | | $ | 17,139 | |
| | | | | |
| Weighted-average number of common shares outstanding | | | 2,037 | | | | | 2,117 | | | | 2,185 | |
| Add: Deferred awards held as stock units | | | 1 | | | | | 1 | | | | 1 | |
| | | | | |
| Total weighted-average number of common shares outstanding | | | 2,038 | | | | | 2,118 | | | | 2,186 | |
| | | | | |
| Per share of common stock | | | | | | | | | | | | | |
| Net income – Basic | | $ | 11.74 | | | | $ | 8.83 | | | $ | 7.84 | |
| | | | | |
| | | | | | | | | | | | | | |
Diluted EPS Calculation | | | | | | | | | | | | | |
| Income from operations | | $ | 23,931 | | | | $ | 18,688 | | | $ | 17,138 | |
| Add: Dividend equivalents paid on stock units | | | – | | | | | – | | | | 1 | |
| Add: Dilutive effects of employee stock-based awards | | | – | | | | | – | | | | – | |
| | | | | |
| Net income available to common stockholders – Diluted | | $ | 23,931 | | | | $ | 18,688 | | | $ | 17,139 | |
| | | | | |
| Weighted-average number of common shares outstanding | | | 2,037 | | | | | 2,117 | | | | 2,185 | |
| Add: Deferred awards held as stock units | | | 1 | | | | | 1 | | | | 1 | |
| Add: Dilutive effect of employee stock-based awards | | | 12 | | | | | 14 | | | | 11 | |
| | | | | |
| Total weighted-average number of common shares outstanding | | | 2,050 | | | | | 2,132 | | | | 2,197 | |
| | | | | |
| Per share of common stock | | | | | | | | | | | | | |
| Net income – Diluted | | $ | 11.67 | | | | $ | 8.77 | | | $ | 7.80 | |
| | | | | |
FS-59
THIS PAGE INTENTIONALLY LEFT BLANK
FS-60
Five-Year Financial Summary
Unaudited
| | | | | | | | | | | | | | | | | | | | | | |
| Millions of dollars, except per-share amounts | | 2008 | | | | 2007 | | | 2006 | | | 2005 | | | 2004 | |
| | | | | |
Statement of Income Data | | | | | | | | | | | | | | | | | | | | | |
Revenues and Other Income | | | | | | | | | | | | | | | | | | | | | |
Total sales and other operating revenues1,2 | | $ | 264,958 | | | | $ | 214,091 | | | $ | 204,892 | | | $ | 193,641 | | | $ | 150,865 | |
| Income from equity affiliates and other income | | | 8,047 | | | | | 6,813 | | | | 5,226 | | | | 4,559 | | | | 4,435 | |
| | | | | |
Total Revenues and Other Income | | | 273,005 | | | | | 220,904 | | | | 210,118 | | | | 198,200 | | | | 155,300 | |
Total Costs and Other Deductions | | | 230,048 | | | | | 188,737 | | | | 178,142 | | | | 173,003 | | | | 134,749 | |
| | | | | |
Income From Continuing Operations Before Income Taxes | | | 42,957 | | | | | 32,167 | | | | 31,976 | | | | 25,197 | | | | 20,551 | |
Income Tax Expense | | | 19,026 | | | | | 13,479 | | | | 14,838 | | | | 11,098 | | | | 7,517 | |
| | | | | |
Income From Continuing Operations | | | 23,931 | | | | | 18,688 | | | | 17,138 | | | | 14,099 | | | | 13,034 | |
Income From Discontinued Operations | | | – | | | | | – | | | | – | | | | – | | | | 294 | |
| | | | | |
Net Income | | $ | 23,931 | | | | $ | 18,688 | | | $ | 17,138 | | | $ | 14,099 | | | $ | 13,328 | |
| | | | | |
Per Share of Common Stock3 | | | | | | | | | | | | | | | | | | | | | |
Income From Continuing Operations | | | | | | | | | | | | | | | | | | | | | |
| – Basic | | $ | 11.74 | | | | $ | 8.83 | | | $ | 7.84 | | | $ | 6.58 | | | $ | 6.16 | |
| – Diluted | | $ | 11.67 | | | | $ | 8.77 | | | $ | 7.80 | | | $ | 6.54 | | | $ | 6.14 | |
Income From Discontinued Operations | | | | | | | | | | | | | | | | | | | | | |
| – Basic | | $ | – | | | | $ | – | | | $ | – | | | $ | – | | | $ | 0.14 | |
| – Diluted | | $ | – | | | | $ | – | | | $ | – | | | $ | – | | | $ | 0.14 | |
Net Income2 | | | | | | | | | | | | | | | | | | | | | |
| – Basic | | $ | 11.74 | | | | $ | 8.83 | | | $ | 7.84 | | | $ | 6.58 | | | $ | 6.30 | |
| – Diluted | | $ | 11.67 | | | | $ | 8.77 | | | $ | 7.80 | | | $ | 6.54 | | | $ | 6.28 | |
| | | | | |
Cash Dividends Per Share | | $ | 2.53 | | | | $ | 2.26 | | | $ | 2.01 | | | $ | 1.75 | | | $ | 1.53 | |
| | | | | |
Balance Sheet Data (at December 31) | | | | | | | | | | | | | | | | | | | | | |
| Current assets | | $ | 36,470 | | | | $ | 39,377 | | | $ | 36,304 | | | $ | 34,336 | | | $ | 28,503 | |
| Noncurrent assets | | | 124,695 | | | | | 109,409 | | | | 96,324 | | | | 91,497 | | | | 64,705 | |
| | | | | |
Total Assets | | | 161,165 | | | | | 148,786 | | | | 132,628 | | | | 125,833 | | | | 93,208 | |
| | | | | |
| Short-term debt | | | 2,818 | | | | | 1,162 | | | | 2,159 | | | | 739 | | | | 816 | |
| Other current liabilities | | | 29,205 | | | | | 32,636 | | | | 26,250 | | | | 24,272 | | | | 17,979 | |
| Long-term debt and capital lease obligations | | | 6,083 | | | | | 6,070 | | | | 7,679 | | | | 12,131 | | | | 10,456 | |
| Other noncurrent liabilities | | | 36,411 | | | | | 31,830 | | | | 27,605 | | | | 26,015 | | | | 18,727 | |
| | | | | |
Total Liabilities | | | 74,517 | | | | | 71,698 | | | | 63,693 | | | | 63,157 | | | | 47,978 | |
| | | | | |
Stockholders’ Equity | | $ | 86,648 | | | | $ | 77,088 | | | $ | 68,935 | | | $ | 62,676 | | | $ | 45,230 | |
| | | | | |
1 Includes excise, value-added and similar taxes: | | $ | 9,846 | | | | $ | 10,121 | | | $ | 9,551 | | | $ | 8,719 | | | $ | 7,968 | |
2 Includes amounts in revenues for buy/sell contracts; associated costs are in “Total Costs and Other Deductions.” Refer also to Note 14, on page FS-43. | | $ | – | | | | $ | – | | | $ | 6,725 | | | $ | 23,822 | | | $ | 18,650 | |
| 3 Per-share amounts in all periods reflect a two-for-one stock split effected as a 100 percent stock dividend in September 2004. |
FS-61
| | | | | | | | | | |
Supplemental Information on Oil and Gas Producing Activities
Unaudited
|
| | | | | | | | | | |
In accordance with FAS 69,Disclosures About Oil and Gas Producing Activities, this section provides supplemental information on oil and gas exploration and producing activities of the company in seven separate tables. Tables I through IV provide historical cost information pertaining to costs incurred in exploration, property acquisitions and development; capitalized costs; and results of operations. Tables V
through VII present information on the company’s estimated net proved reserve quantities, standardized measure of estimated discounted future net cash flows related to proved reserves, and changes in estimated discounted future net cash flows. The Africa geographic area includes activities principally in Nigeria, Angola, Chad, Republic of the Congo and Democratic Republic of the Congo. The Asia-Pacific
Table I – Costs Incurred in Exploration, Property Acquisitions and Development1
| | | | | | | | | | | | | | | | | | | | | | | | | | | | | | | | | | | | | | | | | | | | | | | | | |
| | | Consolidated Companies | | | | |
| | | United States | | | International | | | | | | | | |
| | | | | | | Gulf of | | | | | | | Total | | | | | | | Asia- | | | | | | | | | | | Total | | | | | | | Affiliated Companies | |
| Millions of dollars | | Calif. | | | Mexico | | | Other | | | U.S. | | | Africa | | | Pacific | | | Indonesia | | | Other | | | Int’l. | | | Total | | | TCO | | | Other | |
| | | | | |
Year Ended Dec. 31, 2008 | | | | | | | | | | | | | | | | | | | | | | | | | | | | | | | | | | | | | | | | | | | | | | | | |
| Exploration | | | | | | | | | | | | | | | | | | | | | | | | | | | | | | | | | | | | | | | | | | | | | | | | |
| Wells | | $ | – | | | $ | 477 | | | $ | 42 | | | $ | 519 | | | $ | 197 | | | $ | 312 | | | $ | 20 | | | $ | 67 | | | $ | 596 | | | $ | 1,115 | | | $ | – | | | $ | – | |
| Geological and geophysical | | | – | | | | 65 | | | | 1 | | | | 66 | | | | 90 | | | | 56 | | | | 11 | | | | 106 | | | | 263 | | | | 329 | | | | – | | | | – | |
| Rentals and other | | | – | | | | 140 | | | | 3 | | | | 143 | | | | 60 | | | | 148 | | | | 37 | | | | 97 | | | | 342 | | | | 485 | | | | – | | | | – | |
| |
| Total exploration | | | – | | | | 682 | | | | 46 | | | | 728 | | | | 347 | | | | 516 | | | | 68 | | | | 270 | | | | 1,201 | | | | 1,929 | | | | – | | | | – | |
| |
Property acquisitions2 | | | | | | | | | | | | | | | | | | | | | | | | | | | | | | | | | | | | | | | | | | | | | | | | |
| Proved | | | (1 | ) | | | 2 | | | | 87 | | | | 88 | | | | – | | | | 169 | | | | – | | | | – | | | | 169 | | | | 257 | | | | – | | | | – | |
| Unproved | | | 1 | | | | 576 | | | | 2 | | | | 579 | | | | – | | | | 280 | | | | – | | | | – | | | | 280 | | | | 859 | | | | – | | | | – | |
| |
| Total property acquisitions | | | – | | | | 578 | | | | 89 | | | | 667 | | | | – | | | | 449 | | | | – | | | | – | | | | 449 | | | | 1,116 | | | | – | | | | – | |
| |
Development3 | | | 928 | | | | 1,923 | | | | 1,497 | | | | 4,348 | | | | 3,723 | | | | 4,484 | | | | 753 | | | | 1,879 | | | | 10,839 | | | | 15,187 | | | | 643 | | | | 120 | |
| |
Total Costs Incurred | | $ | 928 | | | $ | 3,183 | | | $ | 1,632 | | | $ | 5,743 | | | $ | 4,070 | | | $ | 5,449 | | | $ | 821 | | | $ | 2,149 | | | $ | 12,489 | | | $ | 18,232 | | | $ | 643 | | | $ | 120 | |
| |
Year Ended Dec. 31, 2007 | | | | | | | | | | | | | | | | | | | | | | | | | | | | | | | | | | | | | | | | | | | | | | | | |
| Exploration | | | | | | | | | | | | | | | | | | | | | | | | | | | | | | | | | | | | | | | | | | | | | | | | |
| Wells | | $ | 4 | | | $ | 430 | | | $ | 18 | | | $ | 452 | | | $ | 202 | | | $ | 156 | | | $ | 3 | | | $ | 195 | | | $ | 556 | | | $ | 1,008 | | | $ | – | | | $ | 7 | |
| Geological and geophysical | | | – | | | | 59 | | | | 14 | | | | 73 | | | | 136 | | | | 48 | | | | 11 | | | | 98 | | | | 293 | | | | 366 | | | | – | | | | – | |
| Rentals and other | | | – | | | | 128 | | | | 5 | | | | 133 | | | | 70 | | | | 120 | | | | 50 | | | | 79 | | | | 319 | | | | 452 | | | | – | | | | – | |
| |
| Total exploration | | | 4 | | | | 617 | | | | 37 | | | | 658 | | | | 408 | | | | 324 | | | | 64 | | | | 372 | | | | 1,168 | | | | 1,826 | | | | – | | | | 7 | |
| |
Property acquisitions2 | | | | | | | | | | | | | | | | | | | | | | | | | | | | | | | | | | | | | | | | | | | | | | | | |
| Proved | | | 10 | | | | 220 | | | | 13 | | | | 243 | | | | 5 | | | | 92 | | | | – | | | | (2 | ) | | | 95 | | | | 338 | | | | – | | | | – | |
| Unproved | | | 35 | | | | 75 | | | | 3 | | | | 113 | | | | 8 | | | | 35 | | | | – | | | | 24 | | | | 67 | | | | 180 | | | | – | | | | – | |
| |
| Total property acquisitions | | | 45 | | | | 295 | | | | 16 | | | | 356 | | | | 13 | | | | 127 | | | | – | | | | 22 | | | | 162 | | | | 518 | | | | – | | | | – | |
| |
Development3 | | | 1,198 | | | | 2,237 | | | | 1,775 | | | | 5,210 | | | | 4,176 | | | | 1,897 | | | | 620 | | | | 1,504 | | | | 8,197 | | | | 13,407 | | | | 832 | | | | 64 | |
| |
Total Costs Incurred | | $ | 1,247 | | | $ | 3,149 | | | $ | 1,828 | | | $ | 6,224 | | | $ | 4,597 | | | $ | 2,348 | | | $ | 684 | | | $ | 1,898 | | | $ | 9,527 | | | $ | 15,751 | | | $ | 832 | | | $ | 71 | |
| |
Year Ended Dec. 31, 2006 | | | | | | | | | | | | | | | | | | | | | | | | | | | | | | | | | | | | | | | | | | | | | | | | |
| Exploration | | | | | | | | | | | | | | | | | | | | | | | | | | | | | | | | | | | | | | | | | | | | | | | | |
| Wells | | $ | – | | | $ | 493 | | | $ | 22 | | | $ | 515 | | | $ | 151 | | | $ | 121 | | | $ | 20 | | | $ | 246 | | | $ | 538 | | | $ | 1,053 | | | $ | 25 | | | $ | – | |
| Geological and geophysical | | | – | | | | 96 | | | | 8 | | | | 104 | | | | 180 | | | | 53 | | | | 12 | | | | 92 | | | | 337 | | | | 441 | | | | – | | | | – | |
| Rentals and other | | | – | | | | 116 | | | | 16 | | | | 132 | | | | 48 | | | | 140 | | | | 58 | | | | 50 | | | | 296 | | | | 428 | | | | – | | | | – | |
| |
| Total exploration | | | – | | | | 705 | | | | 46 | | | | 751 | | | | 379 | | | | 314 | | | | 90 | | | | 388 | | | | 1,171 | | | | 1,922 | | | | 25 | | | | – | |
| |
Property acquisitions2 | | | | | | | | | | | | | | | | | | | | | | | | | | | | | | | | | | | | | | | | | | | | | | | | |
| Proved | | | 6 | | | | 152 | | | | – | | | | 158 | | | | 1 | | | | 10 | | | | – | | | | 15 | | | | 26 | | | | 184 | | | | – | | | | 581 | |
| Unproved | | | 1 | | | | 47 | | | | 10 | | | | 58 | | | | – | | | | 1 | | | | – | | | | 135 | | | | 136 | | | | 194 | | | | – | | | | – | |
| |
| Total property acquisitions | | | 7 | | | | 199 | | | | 10 | | | | 216 | | | | 1 | | | | 11 | | | | – | | | | 150 | | | | 162 | | | | 378 | | | | – | | | | 581 | |
| |
Development3 | | | 686 | | | | 1,632 | | | | 868 | | | | 3,186 | | | | 2,890 | | | | 1,788 | | | | 460 | | | | 1,019 | | | | 6,157 | | | | 9,343 | | | | 671 | | | | 25 | |
| |
Total Costs Incurred | | $ | 693 | | | $ | 2,536 | | | $ | 924 | | | $ | 4,153 | | | $ | 3,270 | | | $ | 2,113 | | | $ | 550 | | | $ | 1,557 | | | $ | 7,490 | | | $ | 11,643 | | | $ | 696 | | | $ | 606 | |
| |
| 1 | | Includes costs incurred whether capitalized or expensed. Excludes general support equipment expenditures. Includes capitalized amounts related to asset retirement obligations. See Note 24, “Asset Retirement Obligations,” beginning on page FS-58. |
| |
| 2 | | Includes wells, equipment and facilities associated with proved reserves. Does not include properties acquired in nonmonetary transactions. |
| |
| 3 | | Includes $224, $99 and $160 costs incurred prior to assignment of proved reserves in 2008, 2007 and 2006, respectively. |
FS-62
| | | | | | | | | | | |
| | |
Table II Capitalized Costs Related to Oil and
Gas Producing Activities
| | |
geographic area includes activities principally in Australia, Azerbaijan, Bangladesh, China, Kazakhstan, Myanmar, the Partitioned Neutral Zone between Kuwait and Saudi Arabia, the Philippines, and Thailand. The international “Other” geographic category includes activities in Argentina, Brazil, Canada, Colombia, Denmark, the Netherlands, Norway, Trinidad and Tobago, Venezuela, the United Kingdom, and
other countries. Amounts for TCO represent Chevron’s 50 percent equity share of Tengizchevroil, an exploration and production partnership in the Republic of Kazakhstan. The affiliated companies “Other” amounts are composed of the company’s equity interests in Venezuela, Angola and Russia. Refer to Note 12 beginning on page FS-41 for a discussion of the company’s major equity affiliates.
Table II - Capitalized Costs Related to Oil and Gas Producing Activities
| | | | | | | | | | | | | | | | | | | | | | | | | | | | | | | | | | | | | | | | | | | | | | | | | |
| | | Consolidated Companies | | | | |
| | | United States | | | International | | | | | | | | |
| | | | | | | Gulf of | | | | | | | Total | | | | | | | Asia- | | | | | | | | | | | Total | | | | | | | Affiliated Companies | |
| Millions of dollars | | Calif. | | | Mexico | | | Other | | | U.S. | | | Africa | | | Pacific | | | Indonesia | | | Other | | | Int’l. | | | Total | | | TCO | | | Other | |
| | | | | |
At Dec. 31, 2008 | | | | | | | | | | | | | | | | | | | | | | | | | | | | | | | | | | | | | | | | | | | | | | | | |
| Unproved properties | | $ | 810 | | | $ | 1,357 | | | $ | 328 | | | $ | 2,495 | | | $ | 294 | | | $ | 2,788 | | | $ | 651 | | | $ | 912 | | | $ | 4,645 | | | $ | 7,140 | | | $ | 113 | | | $ | – | |
| Proved properties and related producing assets | | | 12,048 | | | | 19,318 | | | | 14,914 | | | | 46,280 | | | | 17,495 | | | | 21,726 | | | | 8,117 | | | | 13,041 | | | | 60,379 | | | | 106,659 | | | | 5,991 | | | | 841 | |
| Support equipment | | | 239 | | | | 226 | | | | 252 | | | | 717 | | | | 967 | | | | 266 | | | | 1,150 | | | | 475 | | | | 2,858 | | | | 3,575 | | | | 888 | | | | – | |
| Deferred exploratory wells | | | – | | | | 602 | | | | – | | | | 602 | | | | 499 | | | | 495 | | | | 107 | | | | 415 | | | | 1,516 | | | | 2,118 | | | | – | | | | – | |
| Other uncompleted projects | | | 405 | | | | 3,812 | | | | 58 | | | | 4,275 | | | | 4,226 | | | | 2,490 | | | | 875 | | | | 1,739 | | | | 9,330 | | | | 13,605 | | | | 501 | | | | 81 | |
| |
Gross Cap. Costs | | | 13,502 | | | | 25,315 | | | | 15,552 | | | | 54,369 | | | | 23,481 | | | | 27,765 | | | | 10,900 | | | | 16,582 | | | | 78,728 | | | | 133,097 | | | | 7,493 | | | | 922 | |
| |
| Unproved properties valuation | | | 744 | | | | 80 | | | | 21 | | | | 845 | | | | 202 | | | | 223 | | | | 64 | | | | 439 | | | | 928 | | | | 1,773 | | | | 29 | | | | – | |
| Proved producing properties – Depreciation and depletion | | | 7,802 | | | | 14,546 | | | | 8,432 | | | | 30,780 | | | | 6,602 | | | | 8,692 | | | | 6,214 | | | | 8,360 | | | | 29,868 | | | | 60,648 | | | | 831 | | | | 212 | |
| Support equipment depreciation | | | 145 | | | | 99 | | | | 138 | | | | 382 | | | | 523 | | | | 128 | | | | 611 | | | | 307 | | | | 1,569 | | | | 1,951 | | | | 307 | | | | – | |
| |
| Accumulated provisions | | | 8,691 | | | | 14,725 | | | | 8,591 | | | | 32,007 | | | | 7,327 | | | | 9,043 | | | | 6,889 | | | | 9,106 | | | | 32,365 | | | | 64,372 | | | | 1,167 | | | | 212 | |
| |
Net Capitalized Costs | | $ | 4,811 | | | $ | 10,590 | | | $ | 6,961 | | | $ | 22,362 | | | $ | 16,154 | | | $ | 18,722 | | | $ | 4,011 | | | $ | 7,476 | | | $ | 46,363 | | | $ | 68,725 | | | $ | 6,326 | | | $ | 710 | |
| |
At Dec. 31, 2007 | | | | | | | | | | | | | | | | | | | | | | | | | | | | | | | | | | | | | | | | | | | | | | | | |
| Unproved properties | | $ | 805 | | | $ | 892 | | | $ | 353 | | | $ | 2,050 | | | $ | 314 | | | $ | 2,639 | | | $ | 630 | | | $ | 1,015 | | | $ | 4,598 | | | $ | 6,648 | | | $ | 112 | | | $ | – | |
| Proved properties and related producing assets | | | 11,260 | | | | 19,110 | | | | 13,718 | | | | 44,088 | | | | 11,894 | | | | 17,321 | | | | 7,705 | | | | 11,360 | | | | 48,280 | | | | 92,368 | | | | 4,247 | | | | 858 | |
| Support equipment | | | 201 | | | | 206 | | | | 230 | | | | 637 | | | | 850 | | | | 284 | | | | 1,123 | | | | 439 | | | | 2,696 | | | | 3,333 | | | | 758 | | | | – | |
| Deferred exploratory wells | | | – | | | | 406 | | | | 7 | | | | 413 | | | | 368 | | | | 293 | | | | 148 | | | | 438 | | | | 1,247 | | | | 1,660 | | | | – | | | | – | |
| Other uncompleted projects | | | 308 | | | | 3,128 | | | | 573 | | | | 4,009 | | | | 6,430 | | | | 2,049 | | | | 593 | | | | 1,421 | | | | 10,493 | | | | 14,502 | | | | 1,633 | | | | 55 | |
| |
Gross Cap. Costs | | | 12,574 | | | | 23,742 | | | | 14,881 | | | | 51,197 | | | | 19,856 | | | | 22,586 | | | | 10,199 | | | | 14,673 | | | | 67,314 | | | | 118,511 | | | | 6,750 | | | | 913 | |
| |
| Unproved properties valuation | | | 741 | | | | 57 | | | | 35 | | | | 833 | | | | 201 | | | | 221 | | | | 39 | | | | 427 | | | | 888 | | | | 1,721 | | | | 23 | | | | – | |
| Proved producing properties – Depreciation and depletion | | | 7,383 | | | | 15,074 | | | | 7,640 | | | | 30,097 | | | | 5,427 | | | | 6,912 | | | | 5,592 | | | | 7,062 | | | | 24,993 | | | | 55,090 | | | | 644 | | | | 167 | |
| Support equipment depreciation | | | 133 | | | | 92 | | | | 124 | | | | 349 | | | | 464 | | | | 144 | | | | 571 | | | | 261 | | | | 1,440 | | | | 1,789 | | | | 267 | | | | – | |
| |
| Accumulated provisions | | | 8,257 | | | | 15,223 | | | | 7,799 | | | | 31,279 | | | | 6,092 | | | | 7,277 | | | | 6,202 | | | | 7,750 | | | | 27,321 | | | | 58,600 | | | | 934 | | | | 167 | |
| |
Net Capitalized Costs | | $ | 4,317 | | | $ | 8,519 | | | $ | 7,082 | | | $ | 19,918 | | | $ | 13,764 | | | $ | 15,309 | | | $ | 3,997 | | | $ | 6,923 | | | $ | 39,993 | | | $ | 59,911 | | | $ | 5,816 | | | $ | 746 | |
| |
FS-63
| | | | | | | | | | |
Supplemental Information on Oil and Gas Producing Activities
Table IICapitalized Costs Related to Oil and
Gas Producing Activities - Continued
|
| |
| | | | | | | | | | | | | | | | | | | | | | | | | | | | | | | | | | | | | | | | | | | | | | | | | |
| | | Consolidated Companies | | | | |
| | | United States | | | International | | | | | | | | |
| | | | | | | Gulf of | | | | | | | Total | | | | | | | Asia- | | | | | | | | | | | Total | | | | | | | Affiliated Companies | |
| Millions of dollars | | Calif. | | | Mexico | | | Other | | | U.S. | | | Africa | | | Pacific | | | Indonesia | | | Other | | | Int’l. | | | Total | | | TCO | | | Other | |
| | | | | |
At Dec. 31, 2006 | | | | | | | | | | | | | | | | | | | | | | | | | | | | | | | | | | | | | | | | | | | | | | | | |
| Unproved properties | | $ | 770 | | | $ | 1,007 | | | $ | 370 | | | $ | 2,147 | | | $ | 342 | | | $ | 2,373 | | | $ | 707 | | | $ | 1,082 | | | $ | 4,504 | | | $ | 6,651 | | | $ | 112 | | | $ | – | |
| Proved properties and related producing assets | | | 9,960 | | | | 18,464 | | | | 12,284 | | | | 40,708 | | | | 9,943 | | | | 15,486 | | | | 7,110 | | | | 10,461 | | | | 43,000 | | | | 83,708 | | | | 2,701 | | | | 1,096 | |
| Support equipment | | | 189 | | | | 212 | | | | 226 | | | | 627 | | | | 745 | | | | 240 | | | | 1,093 | | | | 364 | | | | 2,442 | | | | 3,069 | | | | 611 | | | | – | |
| Deferred exploratory wells | | | – | | | | 343 | | | | 7 | | | | 350 | | | | 231 | | | | 217 | | | | 149 | | | | 292 | | | | 889 | | | | 1,239 | | | | – | | | | – | |
| Other uncompleted projects | | | 370 | | | | 2,188 | | | | – | | | | 2,558 | | | | 4,299 | | | | 1,546 | | | | 493 | | | | 917 | | | | 7,255 | | | | 9,813 | | | | 2,493 | | | | 40 | |
| |
Gross Cap. Costs | | | 11,289 | | | | 22,214 | | | | 12,887 | | | | 46,390 | | | | 15,560 | | | | 19,862 | | | | 9,552 | | | | 13,116 | | | | 58,090 | | | | 104,480 | | | | 5,917 | | | | 1,136 | |
| |
| Unproved properties valuation | | | 738 | | | | 52 | | | | 29 | | | | 819 | | | | 189 | | | | 74 | | | | 14 | | | | 337 | | | | 614 | | | | 1,433 | | | | 22 | | | | – | |
| Proved producing properties – Depreciation and depletion | | | 7,082 | | | | 14,468 | | | | 6,880 | | | | 28,430 | | | | 4,794 | | | | 5,273 | | | | 4,971 | | | | 6,087 | | | | 21,125 | | | | 49,555 | | | | 541 | | | | 109 | |
| Support equipment depreciation | | | 125 | | | | 111 | | | | 130 | | | | 366 | | | | 400 | | | | 102 | | | | 522 | | | | 238 | | | | 1,262 | | | | 1,628 | | | | 242 | | | | – | |
| |
| Accumulated provisions | | | 7,945 | | | | 14,631 | | | | 7,039 | | | | 29,615 | | | | 5,383 | | | | 5,449 | | | | 5,507 | | | | 6,662 | | | | 23,001 | | | | 52,616 | | | | 805 | | | | 109 | |
| |
Net Capitalized Costs | | $ | 3,344 | | | $ | 7,583 | | | $ | 5,848 | | | $ | 16,775 | | | $ | 10,177 | | | $ | 14,413 | | | $ | 4,045 | | | $ | 6,454 | | | $ | 35,089 | | | $ | 51,864 | | | $ | 5,112 | | | $ | 1,027 | |
| |
FS-64
| | | | | | | | | | | |
| | |
Table III Results of Operations for Oil and
Gas Producing Activities1
| |
The company’s results of operations from oil and gas producing activities for the years 2008, 2007 and 2006 are shown in the following table. Net income from exploration and production activities as reported on page FS-39 reflects income taxes computed on an effective rate basis.
In accordance with FAS 69, income taxes in Table III are based on statutory tax rates, reflecting allowable deductions and tax credits. Interest income and expense are excluded from the results reported in Table III and from the net income amounts on page FS-39.
| | | | | | | | | | | | | | | | | | | | | | | | | | | | | | | | | | | | | | | | | | | | | | | | | |
| | | Consolidated Companies | | | | |
| | | United States | | | International | | | | | | | | |
| | | | | | | Gulf of | | | | | | | Total | | | | | | | Asia- | | | | | | | | | | | Total | | | | | | | Affiliated Companies | |
| Millions of dollars | | Calif. | | | Mexico | | | Other | | | U.S. | | | Africa | | | Pacific | | | Indonesia | | | Other | | | Int’l. | | | Total | | | TCO | | | Other | |
| | | | | |
Year Ended Dec. 31, 2008 | | | | | | | | | | | | | | | | | | | | | | | | | | | | | | | | | | | | | | | | | | | | | | | | |
| Revenues from net production | | | | | | | | | | | | | | | | | | | | | | | | | | | | | | | | | | | | | | | | | | | | | | | | |
| Sales | | $ | 226 | | | $ | 1,543 | | | $ | 3,113 | | | $ | 4,882 | | | $ | 2,578 | | | $ | 7,030 | | | $ | 1,447 | | | $ | 4,026 | | | $ | 15,081 | | | $ | 19,963 | | | $ | 4,971 | | | $ | 1,599 | |
| Transfers | | | 6,405 | | | | 2,839 | | | | 3,624 | | | | 12,868 | | | | 8,373 | | | | 5,703 | | | | 2,975 | | | | 3,651 | | | | 20,702 | | | | 33,570 | | | | – | | | | – | |
| |
| Total | | | 6,631 | | | | 4,382 | | | | 6,737 | | | | 17,750 | | | | 10,951 | | | | 12,733 | | | | 4,422 | | | | 7,677 | | | | 35,783 | | | | 53,533 | | | | 4,971 | | | | 1,599 | |
| Production expenses excluding taxes | | | (1,385 | ) | | | (914 | ) | | | (1,523 | ) | | | (3,822 | ) | | | (1,228 | ) | | | (1,182 | ) | | | (1,009 | ) | | | (874 | ) | | | (4,293 | ) | | | (8,115 | ) | | | (376 | ) | | | (125 | ) |
| Taxes other than on income | | | (107 | ) | | | (55 | ) | | | (554 | ) | | | (716 | ) | | | (163 | ) | | | (585 | ) | | | (1 | ) | | | (47 | ) | | | (796 | ) | | | (1,512 | ) | | | (41 | ) | | | (278 | ) |
| Proved producing properties: Depreciation and depletion | | | (415 | ) | | | (926 | ) | | | (945 | ) | | | (2,286 | ) | | | (1,176 | ) | | | (1,804 | ) | | | (617 | ) | | | (1,330 | ) | | | (4,927 | ) | | | (7,213 | ) | | | (237 | ) | | | (77 | ) |
Accretion expense2 | | | (29 | ) | | | (119 | ) | | | (94 | ) | | | (242 | ) | | | (60 | ) | | | (31 | ) | | | (22 | ) | | | (54 | ) | | | (167 | ) | | | (409 | ) | | | (2 | ) | | | (1 | ) |
| Exploration expenses | | | – | | | | (330 | ) | | | (40 | ) | | | (370 | ) | | | (223 | ) | | | (243 | ) | | | (83 | ) | | | (250 | ) | | | (799 | ) | | | (1,169 | ) | | | – | | | | – | |
| Unproved properties valuation | | | (3 | ) | | | (91 | ) | | | (20 | ) | | | (114 | ) | | | (13 | ) | | | (12 | ) | | | (25 | ) | | | (7 | ) | | | (57 | ) | | | (171 | ) | | | – | | | | – | |
Other income (expense)3 | | | (20 | ) | | | (383 | ) | | | 1,110 | | | | 707 | | | | (350 | ) | | | 298 | | | | (64 | ) | | | 282 | | | | 166 | | | | 873 | | | | 184 | | | | 105 | |
| |
| Results before income taxes | | | 4,672 | | | | 1,564 | | | | 4,671 | | | | 10,907 | | | | 7,738 | | | | 9,174 | | | | 2,601 | | | | 5,397 | | | | 24,910 | | | | 35,817 | | | | 4,499 | | | | 1,223 | |
| Income tax expense | | | (1,652 | ) | | | (553 | ) | | | (1,651 | ) | | | (3,856 | ) | | | (6,051 | ) | | | (4,865 | ) | | | (1,257 | ) | | | (3,016 | ) | | | (15,189 | ) | | | (19,045 | ) | | | (1,357 | ) | | | (612 | ) |
| |
Results of ProducingOperations | | $ | 3,020 | | | $ | 1,011 | | | $ | 3,020 | | | $ | 7,051 | | | $ | 1,687 | | | $ | 4,309 | | | $ | 1,344 | | | $ | 2,381 | | | $ | 9,721 | | | $ | 16,772 | | | $ | 3,142 | | | $ | 611 | |
| |
Year Ended Dec. 31, 2007 | | | | | | | | | | | | | | | | | | | | | | | | | | | | | | | | | | | | | | | | | | | | | | | | |
| Revenues from net production | | | | | | | | | | | | | | | | | | | | | | | | | | | | | | | | | | | | | | | | | | | | | | | | |
| Sales | | $ | 202 | | | $ | 1,555 | | | $ | 2,476 | | | $ | 4,233 | | | $ | 1,810 | | | $ | 6,192 | | | $ | 1,045 | | | $ | 3,012 | | | $ | 12,059 | | | $ | 16,292 | | | $ | 3,327 | | | $ | 1,290 | |
| Transfers | | | 4,671 | | | | 2,630 | | | | 2,707 | | | | 10,008 | | | | 6,778 | | | | 4,440 | | | | 2,590 | | | | 2,744 | | | | 16,552 | | | | 26,560 | | | | – | | | | – | |
| |
| Total | | | 4,873 | | | | 4,185 | | | | 5,183 | | | | 14,241 | | | | 8,588 | | | | 10,632 | | | | 3,635 | | | | 5,756 | | | | 28,611 | | | | 42,852 | | | | 3,327 | | | | 1,290 | |
Production expenses4 excluding taxes | | | (1,063 | ) | | | (936 | ) | | | (1,400 | ) | | | (3,399 | ) | | | (892 | ) | | | (953 | ) | | | (892 | ) | | | (828 | ) | | | (3,565 | ) | | | (6,964 | ) | | | (248 | ) | | | (92 | ) |
| Taxes other than on income | | | (91 | ) | | | (53 | ) | | | (378 | ) | | | (522 | ) | | | (49 | ) | | | (292 | ) | | | (2 | ) | | | (58 | ) | | | (401 | ) | | | (923 | ) | | | (31 | ) | | | (163 | ) |
| Proved producing properties: Depreciation and depletion | | | (300 | ) | | | (1,143 | ) | | | (833 | ) | | | (2,276 | ) | | | (646 | ) | | | (1,668 | ) | | | (623 | ) | | | (980 | ) | | | (3,917 | ) | | | (6,193 | ) | | | (127 | ) | | | (94 | ) |
Accretion expense2 | | | (92 | ) | | | 1 | | | | (167 | ) | | | (258 | ) | | | (33 | ) | | | (36 | ) | | | (21 | ) | | | (27 | ) | | | (117 | ) | | | (375 | ) | | | (1 | ) | | | (2 | ) |
| Exploration expenses | | | – | | | | (486 | ) | | | (25 | ) | | | (511 | ) | | | (267 | ) | | | (225 | ) | | | (61 | ) | | | (259 | ) | | | (812 | ) | | | (1,323 | ) | | | – | | | | – | |
| Unproved properties valuation | | | (3 | ) | | | (102 | ) | | | (27 | ) | | | (132 | ) | | | (12 | ) | | | (150 | ) | | | (30 | ) | | | (120 | ) | | | (312 | ) | | | (444 | ) | | | – | | | | – | |
Other income (expense)3 | | | 3 | | | | 2 | | | | 31 | | | | 36 | | | | (447 | ) | | | (302 | ) | | | (197 | ) | | | 33 | | | | (913 | ) | | | (877 | ) | | | 18 | | | | 7 | |
| |
| Results before income taxes | | | 3,327 | | | | 1,468 | | | | 2,384 | | | | 7,179 | | | | 6,242 | | | | 7,006 | | | | 1,809 | | | | 3,517 | | | | 18,574 | | | | 25,753 | | | | 2,938 | | | | 946 | |
| Income tax expense | | | (1,204 | ) | | | (531 | ) | | | (864 | ) | | | (2,599 | ) | | | (4,907 | ) | | | (3,456 | ) | | | (841 | ) | | | (1,830 | ) | | | (11,034 | ) | | | (13,633 | ) | | | (887 | ) | | | (462 | ) |
| |
Results of ProducingOperations | | $ | 2,123 | | | $ | 937 | | | $ | 1,520 | | | $ | 4,580 | | | $ | 1,335 | | | $ | 3,550 | | | $ | 968 | | | $ | 1,687 | | | $ | 7,540 | | | $ | 12,120 | | | $ | 2,051 | | | $ | 484 | |
| |
| 1 | | The value of owned production consumed in operations as fuel has been eliminated from revenues and production expenses, and the related volumes have been deducted from net production in calculating the unit average sales price and production cost. This has no effect on the results of producing operations. |
| |
| 2 | | Represents accretion of ARO liability. Refer to Note 24, “Asset Retirement Obligations,” beginning on page FS-58. |
| |
| 3 | | Includes foreign currency gains and losses, gains and losses on property dispositions, and income from operating and technical service agreements. |
| |
| 4 | | Includes $10 costs incurred prior to assignment of proved reserves in 2007. |
FS-65
| | | | | | | | | | | |
Supplemental Information on Oil and Gas Producing Activities
| | | | | | | | | | |
Table III Results of Operations for Oil and
Gas Producing Activities1 - Continued
| | | | | | | | | |
| | | | | | | | | | | | | | | | | | | | | | | | | | | | | | | | | | | | | | | | | | | | | | | | | |
| | | Consolidated Companies | | | | |
| | | United States | | | International | | | | | | | | |
| | | | | | | Gulf of | | | | | | | Total | | | | | | | Asia- | | | | | | | | | | | Total | | | | | | | Affiliated Companies | |
| Millions of dollars | | Calif. | | | Mexico | | | Other | | | U.S. | | | Africa | | | Pacific | | | Indonesia | | | Other | | | Int’l. | | | Total | | | TCO | | | Other | |
| | | | | |
Year Ended Dec. 31, 2006 | | | | | | | | | | | | | | | | | | | | | | | | | | | | | | | | | | | | | | | | | | | | | | | | |
| Revenues from net production | | | | | | | | | | | | | | | | | | | | | | | | | | | | | | | | | | | | | | | | | | | | | | | | |
| Sales | | $ | 308 | | | $ | 1,845 | | | $ | 2,976 | | | $ | 5,129 | | | $ | 2,377 | | | $ | 4,938 | | | $ | 1,001 | | | $ | 2,814 | | | $ | 11,130 | | | $ | 16,259 | | | $ | 2,861 | | | $ | 598 | |
| Transfers | | | 4,072 | | | | 2,317 | | | | 2,046 | | | | 8,435 | | | | 5,264 | | | | 4,084 | | | | 2,211 | | | | 2,848 | | | | 14,407 | | | | 22,842 | | | | – | | | | – | |
| |
| Total | | | 4,380 | | | | 4,162 | | | | 5,022 | | | | 13,564 | | | | 7,641 | | | | 9,022 | | | | 3,212 | | | | 5,662 | | | | 25,537 | | | | 39,101 | | | | 2,861 | | | | 598 | |
| Production expenses excluding taxes | | | (889 | ) | | | (765 | ) | | | (1,057 | ) | | | (2,711 | ) | | | (640 | ) | | | (740 | ) | | | (728 | ) | | | (664 | ) | | | (2,772 | ) | | | (5,483 | ) | | | (202 | ) | | | (42 | ) |
| Taxes other than on income | | | (84 | ) | | | (57 | ) | | | (442 | ) | | | (583 | ) | | | (57 | ) | | | (231 | ) | | | (1 | ) | | | (60 | ) | | | (349 | ) | | | (932 | ) | | | (28 | ) | | | (6 | ) |
| Proved producing properties: | | | | | | | | | | | | | | | | | | | | | | | | | | | | | | | | | | | | | | | | | | | | | | | | |
| Depreciation and depletion | | | (275 | ) | | | (1,096 | ) | | | (763 | ) | | | (2,134 | ) | | | (579 | ) | | | (1,475 | ) | | | (666 | ) | | | (703 | ) | | | (3,423 | ) | | | (5,557 | ) | | | (114 | ) | | | (33 | ) |
Accretion expense2 | | | (11 | ) | | | (80 | ) | | | (39 | ) | | | (130 | ) | | | (26 | ) | | | (30 | ) | | | (23 | ) | | | (49 | ) | | | (128 | ) | | | (258 | ) | | | (1 | ) | | | – | |
| Exploration expenses | | | – | | | | (407 | ) | | | (24 | ) | | | (431 | ) | | | (296 | ) | | | (209 | ) | | | (110 | ) | | | (318 | ) | | | (933 | ) | | | (1,364 | ) | | | (25 | ) | | | – | |
| Unproved properties valuation | | | (3 | ) | | | (73 | ) | | | (8 | ) | | | (84 | ) | | | (28 | ) | | | (15 | ) | | | (14 | ) | | | (27 | ) | | | (84 | ) | | | (168 | ) | | | – | | | | – | |
Other income (expense)3 | | | 1 | | | | (732 | ) | | | 254 | | | | (477 | ) | | | (435 | ) | | | (475 | ) | | | 50 | | | | 385 | | | | (475 | ) | | | (952 | ) | | | 8 | | | | (50 | ) |
| |
| Results before income taxes | | | 3,119 | | | | 952 | | | | 2,943 | | | | 7,014 | | | | 5,580 | | | | 5,847 | | | | 1,720 | | | | 4,226 | | | | 17,373 | | | | 24,387 | | | | 2,499 | | | | 467 | |
| Income tax expense | | | (1,169 | ) | | | (357 | ) | | | (1,103 | ) | | | (2,629 | ) | | | (4,740 | ) | | | (3,224 | ) | | | (793 | ) | | | (2,151 | ) | | | (10,908 | ) | | | (13,537 | ) | | | (750 | ) | | | (174 | ) |
| |
Results of Producing Operations | | $ | 1,950 | | | $ | 595 | | | $ | 1,840 | | | $ | 4,385 | | | $ | 840 | | | $ | 2,623 | | | $ | 927 | | | $ | 2,075 | | | $ | 6,465 | | | $ | 10,850 | | | $ | 1,749 | | | $ | 293 | |
| |
| 1 | | The value of owned production consumed in operations as fuel has been eliminated from revenues and production expenses, and the related volumes have been deducted from net production in calculating the unit average sales price and production cost. This has no effect on the results of producing operations. |
| |
| 2 | | Represents accretion of ARO liability. Refer to Note 24, “Asset Retirement Obligations,” beginning on page FS-58. |
| |
| 3 | | Includes foreign currency gains and losses, gains and losses on property dispositions, and income from operating and technical service agreements. |
FS-66
| | | | | | | | | | | |
| | |
Table IVResults of Operations for Oil and
Gas Producing Activities - Unit Prices and Costs1,2
| | |
| | | | | | | | | | | | | | | | | | | | | | | | | | | | | | | | | | | | | | | | | | | | | | | | | |
| | | Consolidated Companies | | | | |
| | | United States | | | International | | | | | | | | |
| | | | | | | Gulf of | | | | | | | Total | | | | | | | Asia- | | | | | | | | | | | Total | | | | | | | Affiliated Companies | |
| | | Calif. | | | Mexico | | | Other | | | U.S. | | | Africa | | | Pacific | | | Indonesia | | | Other | | | Int’l. | | | Total | | | TCO | | | Other | |
| | | | | |
Year Ended Dec. 31, 2008 | | | | | | | | | | | | | | | | | | | | | | | | | | | | | | | | | | | | | | | | | | | | | | | | |
| Average sales prices Liquids, per barrel | | $ | 87.43 | | | $ | 95.62 | | | $ | 85.30 | | | $ | 88.43 | | | $ | 91.71 | | | $ | 86.38 | | | $ | 79.14 | | | $ | 85.14 | | | $ | 86.99 | | | $ | 87.44 | | | $ | 79.11 | | | $ | 69.65 | |
| Natural gas, per thousand cubic feet | | | 7.19 | | | | 9.17 | | | | 7.43 | | | | 7.90 | | | | – | | | | 4.56 | | | | 8.25 | | | | 6.00 | | | | 5.14 | | | | 6.02 | | | | 1.56 | | | | 3.98 | |
| Average production costs, per barrel | | | 17.67 | | | | 16.22 | | | | 14.31 | | | | 15.85 | | | | 10.00 | | | | 5.14 | | | | 16.46 | | | | 7.36 | | | | 8.06 | | | | 10.49 | | | | 5.24 | | | | 5.32 | |
| |
Year Ended Dec. 31, 2007 | | | | | | | | | | | | | | | | | | | | | | | | | | | | | | | | | | | | | | | | | | | | | | | | |
| Average sales prices Liquids, per barrel | | $ | 62.61 | | | $ | 65.07 | | | $ | 62.35 | | | $ | 63.16 | | | $ | 69.90 | | | $ | 64.20 | | | $ | 61.05 | | | $ | 62.97 | | | $ | 65.40 | | | $ | 64.71 | | | $ | 62.47 | | | $ | 51.98 | |
| Natural gas, per thousand cubic feet | | | 5.77 | | | | 7.01 | | | | 5.65 | | | | 6.12 | | | | – | | | | 3.60 | | | | 7.61 | | | | 4.13 | | | | 4.02 | | | | 4.79 | | | | 0.89 | | | | 0.44 | |
| Average production costs, per barrel | | | 13.23 | | | | 12.32 | | | | 12.62 | | | | 12.72 | | | | 7.26 | | | | 3.96 | | | | 14.28 | | | | 6.96 | | | | 6.54 | | | | 8.58 | | | | 3.98 | | | | 3.56 | |
| |
Year Ended Dec. 31, 2006 | | | | | | | | | | | | | | | | | | | | | | | | | | | | | | | | | | | | | | | | | | | | | | | | |
| Average sales prices Liquids, per barrel | | $ | 55.20 | | | $ | 60.35 | | | $ | 55.80 | | | $ | 56.66 | | | $ | 61.53 | | | $ | 57.05 | | | $ | 52.23 | | | $ | 57.31 | | | $ | 57.92 | | | $ | 57.53 | | | $ | 56.80 | | | $ | 37.26 | |
| Natural gas, per thousand cubic feet | | | 6.08 | | | | 7.20 | | | | 5.73 | | | | 6.29 | | | | 0.06 | | | | 3.44 | | | | 7.12 | | | | 4.03 | | | | 3.88 | | | | 4.85 | | | | 0.77 | | | | 0.36 | |
| Average production costs, per barrel | | | 10.94 | | | | 9.59 | | | | 9.26 | | | | 9.85 | | | | 5.13 | | | | 3.36 | | | | 11.44 | | | | 5.23 | | | | 5.17 | | | | 6.76 | | | | 3.31 | | | | 2.51 | |
| |
| 1 | | The value of owned production consumed in operations as fuel has been eliminated from revenues and production expenses, and the related volumes have been deducted from net production in calculating the unit average sales price and production cost. This has no effect on the results of producing operations. |
| |
| 2 | | Natural gas converted to oil-equivalent gas (OEG) barrels at a rate of 6 MCF = 1 OEG barrel. |
Table V – Reserve Quantity Information
Reserves Governance The company has adopted a comprehensive reserves and resource classification system modeled after a system developed and approved by the Society of Petroleum Engineers, the World Petroleum Congress and the American Association of Petroleum Geologists. The system classifies recoverable hydrocarbons into six categories based on their status at the time of reporting – three deemed commercial and three noncommercial. Within the commercial classification are proved reserves and two categories of unproved: probable and possible. The noncommercial categories are also referred to as contingent resources. For reserves estimates to be classified as proved, they must meet all SEC and company standards.
Proved reserves are the estimated quantities that geologic and engineering data demonstrate with reasonable certainty to be recoverable in future years from known reservoirs under existing economic and operating conditions. Net proved reserves exclude royalties and interests owned by others and reflect contractual arrangements and royalty obligations in effect at the time of the estimate.
Proved reserves are classified as either developed or undeveloped. Proved developed reserves are the quantities expected to be recovered through existing wells with existing equipment and operating methods.
Due to the inherent uncertainties and the limited nature of reservoir data, estimates of reserves are subject to change as additional information becomes available.
Proved reserves are estimated by company asset teams composed of earth scientists and engineers. As part of the internal control process related to reserves estimation, the company maintains a Reserves Advisory Committee (RAC) that is chaired by the corporate reserves manager, who is a member of a corporate department that reports directly to the executive vice president responsible for the company’s worldwide exploration and production activities. All of the RAC members are knowledgeable in SEC guidelines for proved reserves classification. The RAC coordinates its activities through two operating company-level reserves managers. These two reserves managers are not members of the RAC so as to preserve the corporate-level independence.
The RAC has the following primary responsibilities: provide independent reviews of the business units’ recommended reserve changes; confirm that proved reserves are recognized in accordance with SEC guidelines; determine that reserve volumes are calculated using consistent and appropriate standards, procedures and technology; and maintain theCorporate Reserves Manual,which provides standardized procedures used corporatewide for classifying and reporting hydrocarbon reserves.
FS-67
| | | | | | | | | | | |
Supplemental Information on Oil and Gas Producing Activities
| | | | | | | | | | |
Table V Reserve Quantity Information - Continued
|
During the year, the RAC is represented in meetings with each of the company’s upstream business units to review and discuss reserve changes recommended by the various asset teams. Major changes are also reviewed with the company’s Strategy and Planning Committee and the Executive Committee, whose members include the Chief Executive Officer and the Chief Financial Officer. The company’s annual reserve activity is also reviewed with the Board of Directors. If major changes to reserves were to occur between the annual reviews, those matters would also be discussed with the Board.
RAC subteams also conduct in-depth reviews during the year of many of the fields that have the largest proved reserves quantities. These reviews include an examination of the proved-reserve records and documentation of their alignment with theCorporate Reserves Manual.
Modernization of Oil and Gas Reporting In December 2008, the SEC issued its final rule, Modernization of Oil and Gas Reporting (Release Nos. 33-8995; 34-59192; FR-78). The disclosure requirements under the final rule will become effective for the company in its Form 10-K filing for the year ending December 31, 2009. The final rule changes a number of oil and gas reserve estimation and disclosure requirements under SEC Regulations S-K and S-X.
Among the principal changes in the final rule are requirements to use a price based on a 12-month average for reserve estimation and disclosure instead of a single end-of-year price; expanding the definition of oil and gas producing activities to include nontraditional sources such as bitumen extracted from oil sands; permitting the use of new reliable technologies to establish reasonable certainty of proved reserves; allowing optional disclosure of probable and possible reserves; modifying the definition of geographic area for disclosure of reserve estimates and production; amending disclosures of proved reserve quantities to include separate disclosures of synthetic oil and gas; expanding proved, undeveloped reserve disclosures (PUDs), including discussion of PUDs five years old or more; and disclosure of the qualifications of the chief technical person who oversees the company’s overall reserves estimation process.
Reserve Quantities At December 31, 2008, oil-equivalent reserves for the company’s consolidated operations were 7.9 billion barrels. (Refer to the term “Reserves” on page E-147 for the definition of oil-equivalent reserves.) Approximately 25 percent of the total reserves were in the United States. For the company’s interests in equity affiliates, oil-equivalent reserves were 3.3 billion barrels, 82 percent of which were associated with the company’s 50 percent ownership in TCO.
Aside from the Tengiz Field in the TCO affiliate, no single property accounted for more than 5 percent of the company’s total oil-equivalent proved reserves. About 20 other individual properties in the company’s portfolio of assets
each contained between 1 percent and 5 percent of the company’s oil-equivalent proved reserves, which in the aggregate accounted for approximately 40 percent of the company’s total proved reserves. These properties were geographically dispersed, located in the United States, South America, West Africa, the Middle East and the Asia-Pacific region.
In the United States, total oil-equivalent reserves at year-end 2008 were 2.0 billion barrels. Of this amount, 43 percent, 22 percent and 35 percent were located in California, the Gulf of Mexico and other U.S. areas, respectively.
In California, liquids reserves represented 94 percent of the total, with most classified as heavy oil. Because of heavy oil’s high viscosity and the need to employ enhanced recovery methods, the producing operations are capital intensive in nature. Most of the company’s heavy-oil fields in California employ a continuous steamflooding process.
In the Gulf of Mexico region, liquids represented approximately 66 percent of total oil-equivalent reserves. Production operations are mostly offshore and, as a result, are also capital intensive. Costs include investments in wells, production platforms and other facilities, such as gathering lines and storage facilities.
In other U.S. areas, the reserves were split about equally between liquids and natural gas. For production of crude oil, some fields utilize enhanced recovery methods, including water-flood and CO2 injection.
The pattern of net reserve changes shown in the following tables, for the three years ending December 31, 2008, is not necessarily indicative of future trends. Apart from acquisitions, the company’s ability to add proved reserves is affected by, among other things, events and circumstances that are outside the company’s control, such as delays in government permitting, partner approvals of development plans, declines in oil and gas prices, OPEC constraints, geopolitical uncertainties and civil unrest.
The upward revision in Thailand reflected additional drilling and development activity during the year. These upward revisions were partially offset by reductions in reservoir performance in Nigeria and the United Kingdom, which decreased reserves by 43 million barrels and by 32 million barrels, respectively. Most of the upward revision for affiliated companies was related to a 60 million-barrel increase in TCO as a result of improved reservoir performance.
In 2007, net revisions decreased reserves by 146 million barrels for worldwide consolidated companies and increased reserves by 103 million barrels for equity affiliates. For consolidated companies, the largest downward net revisions were 89 million barrels in Africa and 66 million barrels in Indonesia. The company’s estimated net proved oil and natural gas reserves and changes thereto for the years 2006, 2007 and 2008 are shown in the tables on pages FS-69 and FS-71.
FS-68
| | | | | | | | | | | |
| | |
Table VReserve Quantity Information - Continued
| | |
Net Proved Reserves of Crude Oil, Condensate and Natural Gas Liquids
| | | | | | | | | | | | | | | | | | | | | | | | | | | | | | | | | | | | | | | | | | | | | | | | | |
| | | Consolidated Companies | | | | |
| | | United States | | | International | | | | | | | | |
| | | | | | | Gulf of | | | | | | | Total | | | | | | | Asia- | | | | | | | | | | | Total | | | | | | | Affiliated Companies | |
| Millions of barrels | | Calif. | | | Mexico | | | Other | | | U.S. | | | Africa | | | Pacific | | | Indonesia | | | Other | | | Int’l. | | | Total | | | TCO | | | Other | |
| | | | | | |
Reserves at Jan. 1, 20061 | | | 965 | | | | 333 | | | | 533 | | | | 1,831 | | | | 1,814 | | | | 829 | | | | 579 | | | | 573 | | | | 3,795 | | | | 5,626 | | | | 1,939 | | | | 435 | |
| Changes attributable to: | | | | | | | | | | | | | | | | | | | | | | | | | | | | | | | | | | | | | | | | | | | | | | | | |
| Revisions | | | (14 | ) | | | 7 | | | | 7 | | | | – | | | | (49 | ) | | | 72 | | | | 61 | | | | (45 | ) | | | 39 | | | | 39 | | | | 60 | | | | 24 | |
| Improved recovery | | | 49 | | | | – | | | | 3 | | | | 52 | | | | 13 | | | | 1 | | | | 6 | | | | 11 | | | | 31 | | | | 83 | | | | – | | | | – | |
| Extensions and discoveries | | | – | | | | 25 | | | | 8 | | | | 33 | | | | 30 | | | | 6 | | | | 2 | | | | 36 | | | | 74 | | | | 107 | | | | – | | | | – | |
Purchases2 | | | 2 | | | | 2 | | | | – | | | | 4 | | | | 15 | | | | – | | | | – | | | | 2 | | | | 17 | | | | 21 | | | | – | | | | 119 | |
Sales3 | | | – | | | | – | | | | – | | | | – | | | | – | | | | – | | | | – | | | | (15 | ) | | | (15 | ) | | | (15 | ) | | | – | | | | – | |
| Production | | | (76 | ) | | | (42 | ) | | | (51 | ) | | | (169 | ) | | | (125 | ) | | | (123 | ) | | | (72 | ) | | | (78 | ) | | | (398 | ) | | | (567 | ) | | | (49 | ) | | | (16 | ) |
| |
Reserves at Dec. 31, 20061 | | | 926 | | | | 325 | | | | 500 | | | | 1,751 | | | | 1,698 | | | | 785 | | | | 576 | | | | 484 | | | | 3,543 | | | | 5,294 | | | | 1,950 | | | | 562 | |
| Changes attributable to: | | | | | | | | | | | | | | | | | | | | | | | | | | | | | | | | | | | | | | | | | | | | | | | | |
| Revisions | | | 1 | | | | (1 | ) | | | (5 | ) | | | (5 | ) | | | (89 | ) | | | 7 | | | | (66 | ) | | | 7 | | | | (141 | ) | | | (146 | ) | | | 92 | | | | 11 | |
| Improved recovery | | | 6 | | | | – | | | | 3 | | | | 9 | | | | 7 | | | | 3 | | | | 1 | | | | – | | | | 11 | | | | 20 | | | | – | | | | – | |
| Extensions and discoveries | | | 1 | | | | 25 | | | | 10 | | | | 36 | | | | 6 | | | | 1 | | | | – | | | | 17 | | | | 24 | | | | 60 | | | | – | | | | – | |
Purchases2 | | | 1 | | | | 9 | | | | – | | | | 10 | | | | – | | | | – | | | | – | | | | – | | | | – | | | | 10 | | | | – | | | | 316 | |
Sales3 | | | – | | | | (8 | ) | | | (1 | ) | | | (9 | ) | | | – | | | | – | | | | – | | | | – | | | | – | | | | (9 | ) | | | – | | | | (432 | ) |
| Production | | | (75 | ) | | | (43 | ) | | | (50 | ) | | | (168 | ) | | | (122 | ) | | | (128 | ) | | | (72 | ) | | | (74 | ) | | | (396 | ) | | | (564 | ) | | | (53 | ) | | | (24 | ) |
| |
Reserves at Dec. 31, 20071 | | | 860 | | | | 307 | | | | 457 | | | | 1,624 | | | | 1,500 | | | | 668 | | | | 439 | | | | 434 | | | | 3,041 | | | | 4,665 | | | | 1,989 | | | | 433 | |
| Changes attributable to: | | | | | | | | | | | | | | | | | | | | | | | | | | | | | | | | | | | | | | | | | | | | | | | | |
| Revisions | | | 10 | | | | 4 | | | | (30 | ) | | | (16 | ) | | | 2 | | | | 384 | | | | 191 | | | | (25 | ) | | | 552 | | | | 536 | | | | 249 | | | | 18 | |
| Improved recovery | | | 4 | | | | – | | | | 1 | | | | 5 | | | | 1 | | | | 17 | | | | 1 | | | | 3 | | | | 22 | | | | 27 | | | | – | | | | 10 | |
| Extensions and discoveries | | | 1 | | | | 13 | | | | 3 | | | | 17 | | | | 3 | | | | 3 | | | | 2 | | | | 8 | | | | 16 | | | | 33 | | | | – | | | | – | |
| Purchases | | | – | | | | – | | | | 1 | | | | 1 | | | | – | | | | – | | | | – | | | | – | | | | – | | | | 1 | | | | – | | | | – | |
Sales3 | | | – | | | | (6 | ) | | | (1 | ) | | | (7 | ) | | | – | | | | – | | | | – | | | | – | | | | – | | | | (7 | ) | | | – | | | | – | |
| Production | | | (73 | ) | | | (32 | ) | | | (49 | ) | | | (154 | ) | | | (121 | ) | | | (110 | ) | | | (66 | ) | | | (69 | ) | | | (366 | ) | | | (520 | ) | | | (62 | ) | | | (22 | ) |
| |
Reserves at Dec. 31, 20081,4 | | | 802 | | | | 286 | | | | 382 | | | | 1,470 | | | | 1,385 | | | | 962 | | | | 567 | | | | 351 | | | | 3,265 | | | | 4,735 | | | | 2,176 | | | | 439 | |
| |
Developed Reserves5 | | | | | | | | | | | | | | | | | | | | | | | | | | | | | | | | | | | | | | | | | | | | | | | | |
| |
| At Jan. 1, 2006 | | | 809 | | | | 177 | | | | 474 | | | | 1,460 | | | | 945 | | | | 534 | | | | 439 | | | | 416 | | | | 2,334 | | | | 3,794 | | | | 1,611 | | | | 196 | |
| At Dec. 31, 2006 | | | 749 | | | | 163 | | | | 443 | | | | 1,355 | | | | 893 | | | | 530 | | | | 426 | | | | 349 | | | | 2,198 | | | | 3,553 | | | | 1,003 | | | | 311 | |
| At Dec. 31, 2007 | | | 701 | | | | 136 | | | | 401 | | | | 1,238 | | | | 758 | | | | 422 | | | | 363 | | | | 305 | | | | 1,848 | | | | 3,086 | | | | 1,273 | | | | 263 | |
At Dec. 31, 2008 | | | 679 | | | | 140 | | | | 339 | | | | 1,158 | | | | 789 | | | | 666 | | | | 474 | | | | 249 | | | | 2,178 | | | | 3,336 | | | | 1,369 | | | | 263 | |
| |
| 1 | | Included are year-end reserve quantities related to production-sharing contracts (PSC) (refer to page E-146 for the definition of a PSC). PSC-related reserve quantities are 32 percent, 26 percent and 30 percent for consolidated companies for 2008, 2007 and 2006, respectively. |
| |
| 2 | | Includes reserves acquired through nonmonetary transactions. |
| |
| 3 | | Includes reserves disposed of through nonmonetary transactions. |
| |
| 4 | | Net reserve changes (excluding production) in 2008 consist of 770 million barrels of developed reserves and (180) million barrels of undeveloped reserves for consolidated companies and 180 million barrels of developed reserves and 97 million barrels of undeveloped reserves for affiliated companies. |
| |
| 5 | | During 2008, the percentages of undeveloped reserves at December 31, 2007, transferred to developed reserves were 18 percent and 2 percent for consolidated companies and affiliated companies, respectively. |
Information on Canadian Oil Sands Net Proved Reserves Not Included Above:
In addition to conventional liquids and natural gas proved reserves, Chevron has a 20 percent nonoperated working interest in the Athabasca oil-sands project in Canada. As of year-end 2008, SEC regulations defined oil-sands reserves as mining-related and not a part of conventional oil and gas reserves. Net proved oil-sands reserves were 436 million and 443 million as of December 31, 2007 and 2006, respectively. The oil-sands quantities were not classified as proved reserves at the end of 2008 because under the provisions of SEC Industry Guide 7,Description of Property by Issuers Engaged or to Be Engaged in Significant Mining Operations,a mineral deposit must be economically producible at the time of the reserve determination in order to be classified as proved. Due to the decline in crude-oil prices at the end of 2008, the operating costs of the Athabasca project exceeded the revenues from crude-oil sales at that time. The inability to classify the oil-sands volumes as proved at the end of 2008 did not affect the daily operations of the Athabasca project nor the activities under way to expand those operations. During 2008, bitumen production for the project averaged 126,000 barrels per day (27,000 net). The expansion project is designed to increase production capacity to 255,000 barrels per day in late 2010. The oil-sands proved reserves for 2007 and 2006 are not included in the standardized measure of discounted future net cash flows for conventional oil and gas reserves on page FS-73.
Noteworthy amounts in the categories of liquids proved-reserve changes for 2006 through 2008 are discussed below:
Revisions In 2006, net revisions increased reserves by 39 million and 84 million barrels for worldwide consolidated companies and equity affiliates, respectively. International consolidated companies accounted for the net increase of 39 million barrels. The largest upward net revisions were 61 mil-
lion barrels in Indonesia and 27 million barrels in Thailand. In Indonesia, the increase was the result of infill drilling and improved steamflood and waterflood performance.
In Africa, the decrease was mainly based on field performance data for fields in Nigeria and the effect of higher year-end prices in Angola and Republic of the Congo. In Indonesia, the decline also reflected the impact of higher
FS-69
| | | | | | | | | | | |
Supplemental Information on Oil and Gas Producing Activities
| | | | | | | | | | |
Table V Reserve Quantity Information - Continued
|
year-end prices. Higher prices also resulted in downward revisions in Karachaganak and Azerbaijan. For equity affiliates, most of the upward revision was related to a 92 million-barrel increase for TCO’s Tengiz Field and an 11 million-barrel increase for Petroboscan in Venezuela, both as a result of improved reservoir performance. At TCO, the upward revision was tempered by the negative impact of higher year-end prices.
In 2008, net revisions increased reserves by 536 million barrels for worldwide consolidated companies and increased reserves by 267 million barrels for equity affiliates. For consolidated companies, international areas added 552 million barrels. The largest increase was in the Asia-Pacific region, which added 384 million barrels. The majority of the increase was in the Partitioned Neutral Zone as a result of a concession extension. Upward revisions were also recorded in Kazakhstan and Azerbaijan and were mainly associated with the effect of lower year-end prices on the calculation of reserves associated with production-sharing and variable-royalty contracts. In Indonesia, reserves increased 191 million barrels due mainly to the impact of lower year-end prices on the reserve calculations for production-sharing contracts, as well as a result of development drilling and improved waterflood and steamflood performance. For affiliate companies, the 249 million-barrel increase for TCO was due to the effect of lower year-end prices on the royalty determination and facility optimization at the Tengiz and Korolev fields.
Improved Recovery In 2006, improved recovery increased liquids volumes worldwide by 83 million barrels for consolidated companies. Reserves in the United States increased 52 million barrels, with California representing 49 million barrels of the total increase due to steamflood expansion and revised modeling activities. Internationally, improved recovery increased reserves by 31 million barrels, with no single country accounting for an increase of more than 10 million barrels.
In 2007, improved recovery increased liquids volumes by 20 million barrels worldwide. No addition was individually significant.
In 2008, improved recovery increased worldwide liquids volumes by 37 million barrels. International consolidated companies accounted for 22 million barrels and the United States accounted for 5 million barrels. The largest addition
was related to gas reinjection in Kazakhstan. Affiliated companies increased reserves 10 million barrels due to improved secondary recovery at Boscan.
Extensions and Discoveries In 2006, extensions and discoveries increased liquids volumes worldwide by 107 million barrels for consolidated companies. Reserves in Nigeria increased by 27 million barrels due in part to the initial booking of reserves for the Aparo Field. Additional drilling activities contributed 19 million barrels in the United Kingdom and 14 million barrels in Argentina. In the United States, the Gulf of Mexico added 25 million barrels, mainly the result of the initial booking of the Great White Field in the deepwater Perdido Fold Belt area.
In 2007, extensions and discoveries increased liquids volumes by 60 million barrels worldwide. The largest additions were 25 million barrels in the U.S. Gulf of Mexico, mainly for the deepwater Tahiti and Mad Dog fields.
In 2008, extensions and discoveries increased consolidated company reserves 33 million barrels worldwide. The United States increased reserves 17 million barrels, primarily in the Gulf of Mexico. International companies increased reserves 16 million barrels with no one country resulting in additions greater than 5 million barrels.
Purchases In 2006, acquisitions increased liquids volumes worldwide by 21 million barrels for consolidated companies and 119 million barrels for equity affiliates. For consolidated companies, the amount was mainly the result of new agreements in Nigeria, which added 13 million barrels of reserves. The other-equity-affiliates quantity reflects the result of the conversion of Boscan and LL-652 operations to joint stock companies in Venezuela.
In 2007, acquisitions of 316 million barrels for equity affiliates related to the formation of a new Hamaca equity affiliate in Venezuela.
Sales In 2006, sales decreased reserves by 15 million barrels due to the conversion of the LL-652 risked service agreement to a joint stock company in Venezuela.
In 2007, affiliated company sales of 432 million barrels related to the dissolution of a Hamaca equity affiliate in Venezuela.
FS-70
| | | | | | | | | | | |
| | |
Table V Reserve Quantity Information - Continued
| | |
Net Proved Reserves of Natural Gas
| | | | | | | | | | | | | | | | | | | | | | | | | | | | | | | | | | | | | | | | | | | | | | | | | |
| | | Consolidated Companies | | | | |
| | | United States | | | International | | | | | | | | |
| | | | | | | Gulf of | | | | | | | Total | | | | | | | Asia- | | | | | | | | | | | Total | | | | | | | Affiliated Companies | |
| Billions of cubic feet | | Calif. | | | Mexico | | | Other | | | U.S. | | | Africa | | | Pacific | | | Indonesia | | | Other | | | Int’l. | | | Total | | | TCO | | | Other | |
| | | | | | |
Reserves at Jan. 1, 20061 | | | 304 | | | | 1,171 | | | | 2,953 | | | | 4,428 | | | | 3,191 | | | | 8,623 | | | | 646 | | | | 3,578 | | | | 16,038 | | | | 20,466 | | | | 2,787 | | | | 181 | |
| Changes attributable to: | | | | | | | | | | | | | | | | | | | | | | | | | | | | | | | | | | | | | | | | | | | | | | | | |
| Revisions | | | 32 | | | | 40 | | | | (102 | ) | | | (30 | ) | | | 34 | | | | 400 | | | | 38 | | | | 39 | | | | 511 | | | | 481 | | | | 26 | | | | – | |
| Improved recovery | | | 5 | | | | – | | | | – | | | | 5 | | | | 3 | | | | – | | | | – | | | | 5 | | | | 8 | | | | 13 | | | | – | | | | – | |
| Extensions and discoveries | | | – | | | | 111 | | | | 157 | | | | 268 | | | | 11 | | | | 510 | | | | – | | | | 10 | | | | 531 | | | | 799 | | | | – | | | | – | |
Purchases2 | | | 6 | | | | 13 | | | | – | | | | 19 | | | | – | | | | 16 | | | | – | | | | – | | | | 16 | | | | 35 | | | | – | | | | 54 | |
Sales3 | | | – | | | | – | | | | (1 | ) | | | (1 | ) | | | – | | | | – | | | | – | | | | (148 | ) | | | (148 | ) | | | (149 | ) | | | – | | | | – | |
| Production | | | (37 | ) | | | (241 | ) | | | (383 | ) | | | (661 | ) | | | (33 | ) | | | (629 | ) | | | (110 | ) | | | (302 | ) | | | (1,074 | ) | | | (1,735 | ) | | | (70 | ) | | | (4 | ) |
| | |
Reserves at Dec. 31, 20061 | | | 310 | | | | 1,094 | | | �� | 2,624 | | | | 4,028 | | | | 3,206 | | | | 8,920 | | | | 574 | | | | 3,182 | | | | 15,882 | | | | 19,910 | | | | 2,743 | | | | 231 | |
| Changes attributable to: | | | | | | | | | | | | | | | | | | | | | | | | | | | | | | | | | | | | | | | | | | | | | | | | |
| Revisions | | | 40 | | | | 39 | | | | 130 | | | | 209 | | | | (141 | ) | | | 149 | | | | 12 | | | | 166 | | | | 186 | | | | 395 | | | | 75 | | | | (2 | ) |
| Improved recovery | | | – | | | | – | | | | – | | | | – | | | | – | | | | – | | | | – | | | | 1 | | | | 1 | | | | 1 | | | | – | | | | – | |
| Extensions and discoveries | | | – | | | | 40 | | | | 46 | | | | 86 | | | | 11 | | | | 392 | | | | – | | | | 29 | | | | 432 | | | | 518 | | | | – | | | | – | |
Purchases2 | | | 2 | | | | 19 | | | | 29 | | | | 50 | | | | – | | | | 91 | | | | – | | | | – | | | | 91 | | | | 141 | | | | – | | | | 211 | |
Sales3 | | | – | | | | (39 | ) | | | (37 | ) | | | (76 | ) | | | – | | | | – | | | | – | | | | – | | | | – | | | | (76 | ) | | | – | | | | (175 | ) |
| Production | | | (35 | ) | | | (210 | ) | | | (375 | ) | | | (620 | ) | | | (27 | ) | | | (725 | ) | | | (101 | ) | | | (279 | ) | | | (1,132 | ) | | | (1,752 | ) | | | (70 | ) | | | (10 | ) |
| | |
Reserves at Dec. 31, 20071 | | | 317 | | | | 943 | | | | 2,417 | | | | 3,677 | | | | 3,049 | | | | 8,827 | | | | 485 | | | | 3,099 | | | | 15,460 | | | | 19,137 | | | | 2,748 | | | | 255 | |
| Changes attributable to: | | | | | | | | | | | | | | | | | | | | | | | | | | | | | | | | | | | | | | | | | | | | | | | | |
| Revisions | | | 8 | | | | 21 | | | | (57 | ) | | | (28 | ) | | | 60 | | | | 961 | | | | 107 | | | | 66 | | | | 1,194 | | | | 1,166 | | | | 498 | | | | 632 | |
| Improved recovery | | | – | | | | – | | | | – | | | | – | | | | – | | | | – | | | | – | | | | – | | | | – | | | | – | | | | – | | | | – | |
| Extensions and discoveries | | | – | | | | 95 | | | | 13 | | | | 108 | | | | – | | | | 23 | | | | – | | | | 1 | | | | 24 | | | | 132 | | | | – | | | | – | |
| Purchases | | | – | | | | – | | | | 66 | | | | 66 | | | | – | | | | 441 | | | | – | | | | – | | | | 441 | | | | 507 | | | | – | | | | – | |
Sales3 | | | – | | | | (27 | ) | | | (97 | ) | | | (124 | ) | | | – | | | | – | | | | – | | | | – | | | | – | | | | (124 | ) | | | – | | | | – | |
| Production | | | (32 | ) | | | (161 | ) | | | (356 | ) | | | (549 | ) | | | (53 | ) | | | (769 | ) | | | (117 | ) | | | (308 | ) | | | (1,247 | ) | | | (1,796 | ) | | | (71 | ) | | | (9 | ) |
| | |
Reserves at Dec. 31, 20081,4 | | | 293 | | | | 871 | | | | 1,986 | | | | 3,150 | | | | 3,056 | | | | 9,483 | | | | 475 | | | | 2,858 | | | | 15,872 | | | | 19,022 | | | | 3,175 | | | | 878 | |
| | |
Developed Reserves5 | | | | | | | | | | | | | | | | | | | | | | | | | | | | | | | | | | | | | | | | | | | | | | | | |
| At Jan. 1, 2006 | | | 251 | | | | 977 | | | | 2,794 | | | | 4,022 | | | | 1,346 | | | | 4,819 | | | | 449 | | | | 2,453 | | | | 9,067 | | | | 13,089 | | | | 2,314 | | | | 85 | |
| At Dec. 31, 2006 | | | 250 | | | | 873 | | | | 2,434 | | | | 3,557 | | | | 1,306 | | | | 4,751 | | | | 377 | | | | 1,912 | | | | 8,346 | | | | 11,903 | | | | 1,412 | | | | 144 | |
| At Dec. 31, 2007 | | | 261 | | | | 727 | | | | 2,238 | | | | 3,226 | | | | 1,151 | | | | 5,081 | | | | 326 | | | | 1,915 | | | | 8,473 | | | | 11,699 | | | | 1,762 | | | | 117 | |
At Dec. 31, 2008 | | | 247 | | | | 669 | | | | 1,793 | | | | 2,709 | | | | 1,209 | | | | 5,374 | | | | 302 | | | | 2,245 | | | | 9,130 | | | | 11,839 | | | | 1,999 | | | | 124 | |
| | |
| 1 | Includes year-end reserve quantities related to production-sharing contracts (PSC) (refer to page E-146 for the definition of a PSC). PSC-related reserve quantities are 40 percent, 37 percent and 47 percent for consolidated companies for 2008, 2007 and 2006, respectively. |
| |
| 2 | Includes reserves acquired through nonmonetary transactions. |
| |
| 3 | Includes reserves disposed of through nonmonetary transactions. |
| |
| 4 | Net reserve changes (excluding production) in 2008 consist of 1,936 billion cubic feet of developed reserves and (255) billion cubic feet of undeveloped reserves for consolidated companies and 324 billion cubic feet of developed reserves and 806 billion cubic feet of undeveloped reserves for affiliated companies. |
| 5 | During 2008, the percentages of undeveloped reserves at December 31, 2007, transferred to developed reserves were 12 percent and 0 percent for consolidated companies and affiliated companies, respectively. |
Noteworthy amounts in the categories of natural gas proved-reserve changes for 2006 through 2008 are discussed below:
RevisionsIn 2006, revisions accounted for a net increase of 481 billion cubic feet (BCF) for consolidated companies and 26 BCF for affiliates. For consolidated companies, net increases of 511 BCF internationally were partially offset by a 30 BCF downward revision in the United States. Drilling and development activities added 337 BCF of reserves in Thailand, while Kazakhstan added 200 BCF, largely due to development activity. Trinidad and Tobago increased 185 BCF, attributable to improved reservoir performance and a
new contract for sales of natural gas. These additions were partially offset by downward revisions of 224 BCF in the United Kingdom and 130 BCF in Australia due to drilling results and reservoir performance. U.S. “Other” had a downward revision of 102 BCF due to reservoir performance, which was partially offset by upward revisions of 72 BCF in the Gulf of Mexico and California related to reservoir performance and development drilling. TCO had an upward revision of 26 BCF associated with additional development activity and updated reservoir performance.
In 2007, revisions increased reserves for consolidated companies by a net 395 BCF and increased reserves for affili-
FS-71
| | | | | | | | | | | |
Supplemental Information on Oil and Gas Producing Activities
| | | | | | | | | | |
Table V Reserve Quantity Information - Continued
| |
ated companies by a net 73 BCF. For consolidated companies, net increases were 209 BCF in the United States and 186 BCF internationally. Improved reservoir performance for many fields in the United States contributed 130 BCF in the “Other” region, 40 BCF in California and 39 BCF in the Gulf of Mexico. Drilling activities added 360 BCF in Thailand and improved reservoir performance added 188 BCF in Trinidad and Tobago. These additions were partially offset by downward revisions of 185 BCF in Australia due to drilling results and 136 BCF in Nigeria due to field performance. Negative revisions due to the impact of higher prices were recorded in Azerbaijan and Kazakhstan. TCO had an upward revision of 75 BCF associated with improved reservoir performance and development activities. This upward revision was net of a negative impact due to higher year-end prices.
In 2008, revisions increased reserves for consolidated companies by a net 1,166 BCF and increased reserves for affiliated companies by 1,130 BCF. In the Asia-Pacific region, positive revisions totaled 961 BCF for consolidated companies. Almost half of the increase was attributed to the Karachaganak Field in Kazakhstan, due mainly to the effects of low year-end prices on the production-sharing contract and the results of development drilling and improved recovery. Other large upward revisions were recorded for the Pattani Field in Thailand due to a successful drilling campaign. For the TCO affiliate in Kazakhstan, an increase of 498 BCF reflected the impacts of lower year-end prices on the royalty determination and facility optimization. Reserves associated with the Angola LNG project accounted for a majority of the 632 BCF increase in “Other” affiliated companies.
Extensions and Discoveries In 2006, extensions and discoveries accounted for an increase of 799 BCF for consolidated companies, reflecting a 531 BCF increase outside the United States and a U.S. increase of 268 BCF. Bangladesh added 451 BCF, the result of development activity and field extensions, and Thailand added 59 BCF, the result of drilling activities. U.S. “Other” contributed 157 BCF, approximately half of which was related to South Texas and the Piceance Basin, and the Gulf of Mexico added 111 BCF, partly due to the initial booking of reserves at the Great White Field in the deepwater Perdido Fold Belt area.
In 2007, extensions and discoveries accounted for an increase of 518 BCF worldwide. The largest addition was 330 BCF in Bangladesh, the result of drilling activities. Other additions were not individually significant.
Purchases In 2006, purchases of natural gas reserves were 35 BCF for consolidated companies, about evenly divided between the company’s U.S. and international operations. Affiliated companies added 54 BCF of reserves, the result of conversion of an operating service agreement to a joint stock company in Venezuela.
In 2007, purchases of natural gas reserves were 141 BCF for consolidated companies, which include the acquisition of an additional interest in the Bibiyana Field in Bangladesh. Affiliated company purchases of 211 BCF related to the formation of a new Hamaca equity affiliate in Venezuela and an initial booking related to the Angola LNG project.
Sales In 2006, sales for consolidated companies totaled 149 BCF, mostly associated with the conversion of a risked service agreement to a joint stock company in Venezuela.
In 2007, sales were 76 BCF and 175 BCF for consolidated companies and equity affiliates, respectively. The affiliated company sales related to the dissolution of a Hamaca equity affiliate in Venezuela.
Table VI – Standardized Measure of Discounted Future
Net Cash Flows Related to Proved Oil
and Gas Reserves
The standardized measure of discounted future net cash flows, related to the preceding proved oil and gas reserves, is calculated in accordance with the requirements of FAS 69. Estimated future cash inflows from production are computed by applying year-end prices for oil and gas to year-end quantities of estimated net proved reserves. Future price changes are limited to those provided by contractual arrangements in existence at the end of each reporting year. Future development and production costs are those estimated future expenditures necessary to develop and produce year-end estimated proved reserves based on year-end cost indices, assuming continuation of year-end economic conditions, and include estimated costs for asset retirement obligations. Estimated future income taxes are calculated by applying appropriate year-end statutory tax rates. These rates reflect allowable deductions and tax credits and are applied to estimated future pretax net cash flows, less the tax basis of related assets. Discounted future net cash flows are calculated using 10 percent midperiod discount factors. Discounting requires a year-by-year estimate of when future expenditures will be incurred and when reserves will be produced.
The information provided does not represent management’s estimate of the company’s expected future cash flows or value of proved oil and gas reserves. Estimates of proved-reserve quantities are imprecise and change over time as new information becomes available. Moreover, probable and possible reserves, which may become proved in the future, are excluded from the calculations. The arbitrary valuation prescribed under FAS 69 requires assumptions as to the timing and amount of future development and production costs. The calculations are made as of December 31 each year and should not be relied upon as an indication of the company’s future cash flows or value of its oil and gas reserves. In the following table, “Standardized Measure Net Cash Flows” refers to the standardized measure of discounted future net cash flows.
FS-72
| | | | | | | | | | | |
| | |
Table VIStandardized Measure of Discounted Future Net Cash
Flows Related to Proved Oil and Gas Reserves
| | |
| | | | | | | | | | | | | | | | | | | | | | | | | | | | | | | | | | | | | | | | | | | | | | | | | |
| | | Consolidated Companies | | | | |
| | | United States | | | International | | | | | | | | |
| | | | | | | Gulf of | | | | | | | Total | | | | | | | Asia- | | | | | | | | | | | Total | | | | | | | Affiliated Companies | |
| Millions of dollars | | Calif. | | | Mexico | | | Other | | | U.S. | | | Africa | | | Pacific | | | Indonesia | | | Other | | | Int’l. | | | Total | | | TCO | | | Other | |
| | | | | | | | |
At December 31, 2008 | | | | | | | | | | | | | | | | | | | | | | | | | | | | | | | | | | | | | | | | | | | | | | | | |
| Future cash inflows from production | | $ | 27,223 | | | $ | 16,407 | | | $ | 22,544 | | | $ | 66,174 | | | $ | 52,344 | | | $ | 67,386 | | | $ | 22,836 | | | $ | 23,041 | | | $ | 165,607 | | | $ | 231,781 | | | $ | 51,252 | | | $ | 13,968 | |
| Future production costs | | | (20,554 | ) | | | (8,311 | ) | | | (16,873 | ) | | | (45,738 | ) | | | (20,302 | ) | | | (21,949 | ) | | | (17,857 | ) | | | (9,374 | ) | | | (69,482 | ) | | | (115,220 | ) | | | (14,502 | ) | | | (2,319 | ) |
| Future devel. costs | | | (3,087 | ) | | | (1,650 | ) | | | (1,362 | ) | | | (6,099 | ) | | | (19,001 | ) | | | (12,575 | ) | | | (3,632 | ) | | | (2,499 | ) | | | (37,707 | ) | | | (43,806 | ) | | | (10,140 | ) | | | (1,551 | ) |
| Future income taxes | | | (1,272 | ) | | | (2,289 | ) | | | (1,530 | ) | | | (5,091 | ) | | | (9,581 | ) | | | (11,906 | ) | | | (613 | ) | | | (5,352 | ) | | | (27,452 | ) | | | (32,543 | ) | | | (7,517 | ) | | | (5,223 | ) |
| | |
| Undiscounted future net cash flows | | | 2,310 | | | | 4,157 | | | | 2,779 | | | | 9,246 | | | | 3,460 | | | | 20,956 | | | | 734 | | | | 5,816 | | | | 30,966 | | | | 40,212 | | | | 19,093 | | | | 4,875 | |
| 10 percent midyear annual discount for timing of estimated cash flows | | | (1,118 | ) | | | (583 | ) | | | (617 | ) | | | (2,318 | ) | | | (1,139 | ) | | | (9,145 | ) | | | (352 | ) | | | (1,597 | ) | | | (12,233 | ) | | | (14,551 | ) | | | (11,261 | ) | | | (2,966 | ) |
| | |
Standardized Measure | | | | | | | | | | | | | | | | | | | | | | | | | | | | | | | | | | | | | | | | | | | | | | | | |
Net Cash Flows | | $ | 1,192 | | | $ | 3,574 | | | $ | 2,162 | | | $ | 6,928 | | | $ | 2,321 | | | $ | 11,811 | | | $ | 382 | | | $ | 4,219 | | | $ | 18,733 | | | $ | 25,661 | | | $ | 7,832 | | | $ | 1,909 | |
| | |
At December 31, 2007 | | | | | | | | | | | | | | | | | | | | | | | | | | | | | | | | | | | | | | | | | | | | | | | | |
| Future cash inflows from production | | $ | 75,201 | | | $ | 34,162 | | | $ | 52,775 | | | $ | 162,138 | | | $ | 132,450 | | | $ | 93,046 | | | $ | 35,020 | | | $ | 45,566 | | | $ | 306,082 | | | $ | 468,220 | | | $ | 159,078 | | | $ | 29,845 | |
| Future production costs | | | (17,888 | ) | | | (7,193 | ) | | | (16,780 | ) | | | (41,861 | ) | | | (15,707 | ) | | | (16,022 | ) | | | (18,270 | ) | | | (11,990 | ) | | | (61,989 | ) | | | (103,850 | ) | | | (10,408 | ) | | | (1,529 | ) |
| Future devel. costs | | | (3,491 | ) | | | (3,011 | ) | | | (1,578 | ) | | | (8,080 | ) | | | (11,516 | ) | | | (8,263 | ) | | | (4,012 | ) | | | (3,468 | ) | | | (27,259 | ) | | | (35,339 | ) | | | (8,580 | ) | | | (1,175 | ) |
| Future income taxes | | | (19,112 | ) | | | (8,507 | ) | | | (12,221 | ) | | | (39,840 | ) | | | (74,172 | ) | | | (26,838 | ) | | | (5,796 | ) | | | (15,524 | ) | | | (122,330 | ) | | | (162,170 | ) | | | (39,575 | ) | | | (13,600 | ) |
| | |
| Undiscounted future net cash flows | | | 34,710 | | | | 15,451 | | | | 22,196 | | | | 72,357 | | | | 31,055 | | | | 41,923 | | | | 6,942 | | | | 14,584 | | | | 94,504 | | | | 166,861 | | | | 100,515 | | | | 13,541 | |
| 10 percent midyear annual discount for timing of estimated cash flows | | | (17,204 | ) | | | (4,438 | ) | | | (9,491 | ) | | | (31,133 | ) | | | (14,171 | ) | | | (17,117 | ) | | | (2,702 | ) | | | (4,689 | ) | | | (38,679 | ) | | | (69,812 | ) | | | (64,519 | ) | | | (7,779 | ) |
| | |
Standardized Measure Net Cash Flows | | $ | 17,506 | | | $ | 11,013 | | | $ | 12,705 | | | $ | 41,224 | | | $ | 16,884 | | | $ | 24,806 | | | $ | 4,240 | | | $ | 9,895 | | | $ | 55,825 | | | $ | 97,049 | | | $ | 35,996 | | | $ | 5,762 | |
| | |
At December 31, 2006 | | | | | | | | | | | | | | | | | | | | | | | | | | | | | | | | | | | | | | | | | | | | | | | | |
| Future cash inflows from production | | $ | 48,828 | | | $ | 23,768 | | | $ | 38,727 | | | $ | 111,323 | | | $ | 97,571 | | | $ | 70,288 | | | $ | 30,538 | | | $ | 36,272 | | | $ | 234,669 | | | $ | 345,992 | | | $ | 104,069 | | | $ | 20,644 | |
| Future production costs | | | (14,791 | ) | | | (6,750 | ) | | | (12,845 | ) | | | (34,386 | ) | | | (12,523 | ) | | | (13,398 | ) | | | (16,281 | ) | | | (10,777 | ) | | | (52,979 | ) | | | (87,365 | ) | | | (7,796 | ) | | | (2,348 | ) |
| Future devel. costs | | | (3,999 | ) | | | (2,947 | ) | | | (1,399 | ) | | | (8,345 | ) | | | (9,648 | ) | | | (6,963 | ) | | | (2,284 | ) | | | (3,082 | ) | | | (21,977 | ) | | | (30,322 | ) | | | (7,026 | ) | | | (1,732 | ) |
| Future income taxes | | | (10,171 | ) | | | (4,764 | ) | | | (8,290 | ) | | | (23,225 | ) | | | (53,214 | ) | | | (20,633 | ) | | | (5,448 | ) | | | (11,164 | ) | | | (90,459 | ) | | | (113,684 | ) | | | (25,212 | ) | | | (8,282 | ) |
| | |
| Undiscounted future net cash flows | | | 19,867 | | | | 9,307 | | | | 16,193 | | | | 45,367 | | | | 22,186 | | | | 29,294 | | | | 6,525 | | | | 11,249 | | | | 69,254 | | | | 114,621 | | | | 64,035 | | | | 8,282 | |
| 10 percent midyear annual discount for timing of estimated cash flows | | | (9,779 | ) | | | (3,256 | ) | | | (7,210 | ) | | | (20,245 | ) | | | (10,065 | ) | | | (12,457 | ) | | | (2,426 | ) | | | (3,608 | ) | | | (28,556 | ) | | | (48,801 | ) | | | (40,597 | ) | | | (5,185 | ) |
| | |
Standardized Measure Net Cash Flows | | $ | 10,088 | | | $ | 6,051 | | | $ | 8,983 | | | $ | 25,122 | | | $ | 12,121 | | | $ | 16,837 | | | $ | 4,099 | | | $ | 7,641 | | | $ | 40,698 | | | $ | 65,820 | | | $ | 23,438 | | | $ | 3,097 | |
| | |
FS-73
| | | | | | | | | | | |
Supplemental Information on Oil and Gas Producing Activities
| | | | | | | | | | |
Table VII Changes in the Standardized Measure of Discounted
Future Net Cash Flows From Proved Reserves
| |
The changes in present values between years, which can be significant, reflect changes in estimated proved-reserve quantities and prices and assumptions used in forecasting
production volumes and costs. Changes in the timing of production are included with “Revisions of previous quantity estimates.”
| | | | | | | | | | | | | | | | | | | | | | | | | | | |
| | | Consolidated Companies | | | Affiliated Companies | |
| Millions of dollars | | 2008 | | | | 2007 | | | 2006 | | | 2008 | | | | 2007 | | | 2006 | |
| | | | | | | | |
Present Value at January 1 | | $ | 97,049 | | | | $ | 65,820 | | | $ | 84,287 | | | $ | 41,758 | | | | $ | 26,535 | | | $ | 26,769 | |
| | | | | | | | |
| Sales and transfers of oil and gas produced net of production costs | | | (43,906 | ) | | | | (34,957 | ) | | | (32,690 | ) | | | (5,750 | ) | | | | (4,084 | ) | | | (3,180 | ) |
| Development costs incurred | | | 13,682 | | | | | 10,468 | | | | 8,875 | | | | 763 | | | | | 889 | | | | 721 | |
| Purchases of reserves | | | 233 | | | | | 780 | | | | 580 | | | | – | | | | | 7,711 | | | | 1,767 | |
| Sales of reserves | | | (542 | ) | | | | (425 | ) | | | (306 | ) | | | – | | | | | (7,767 | ) | | | – | |
| Extensions, discoveries and improved recovery less related costs | | | 646 | | | | | 3,664 | | | | 4,067 | | | | 83 | | | | | – | | | | – | |
| Revisions of previous quantity estimates | | | 37,853 | | | | | (7,801 | ) | | | 7,277 | | | | 3,718 | | | | | (1,333 | ) | | | (967 | ) |
| Net changes in prices, development and production costs | | | (169,046 | ) | | | | 74,900 | | | | (24,725 | ) | | | (51,696 | ) | | | | 23,616 | | | | (837 | ) |
| Accretion of discount | | | 17,458 | | | | | 12,196 | | | | 14,218 | | | | 5,976 | | | | | 3,745 | | | | 3,673 | |
| Net change in income tax | | | 72,234 | | | | | (27,596 | ) | | | 4,237 | | | | 14,889 | | | | | (7,554 | ) | | | (1,411 | ) |
| | | | | | | | |
| Net change for the year | | | (71,388 | ) | | | | 31,229 | | | | (18,467 | ) | | | (32,017 | ) | | | | 15,223 | | | | (234 | ) |
| | | | | | | | |
Present Value at December 31 | | $ | 25,661 | | | | $ | 97,049 | | | $ | 65,820 | | | $ | 9,741 | | | | $ | 41,758 | | | $ | 26,535 | |
| | | | | | | | |
FS-74
EXHIBIT INDEX
| | | | | |
Exhibit No. | | Description |
| |
| | 3 | .1 | | Restated Certificate of Incorporation of Chevron Corporation, dated May 30, 2008, filed as Exhibit 3.1 to Chevron Corporation’s Quarterly Report onForm 10-Q for the quarterly period ended June 30, 2008, and incorporated herein by reference. |
| | 3 | .2 | | By-Laws of Chevron Corporation, as amended January 30, 2008, filed as Exhibit 3.1 to Chevron Corporation’s Current Report onForm 8-K dated February 1, 2008, and incorporated herein by reference. |
| | 4 | .1 | | Pursuant to the Instructions to Exhibits, certain instruments defining the rights of holders of long-term debt securities of the company and its consolidated subsidiaries are not filed because the total amount of securities authorized under any such instrument does not exceed 10 percent of the total assets of the corporation and its subsidiaries on a consolidated basis. A copy of such instrument will be furnished to the Commission upon request. |
| | 4 | .2* | | Confidential Stockholder Voting Policy of Chevron Corporation (page E-3). |
| | 10 | .1* | | Chevron Corporation Non-Employee Directors’ Equity Compensation and Deferral Plan (pages E-4 to E-16). |
| | 10 | .2* | | Chevron Incentive Plan (pages E-17 to E-30). |
| | 10 | .3* | | Long-Term Incentive Plan of Chevron Corporation (pages E-31 to E-57). |
| | 10 | .4 | | Chevron Corporation Deferred Compensation Plan for Management Employees, as amended and restated on December 7, 2005, filed as Exhibit 10.5 to Chevron Corporation’s Current Report onForm 8-K dated December 7, 2005, and incorporated herein by reference. |
| | 10 | .5* | | Chevron Corporation Deferred Compensation Plan for Management Employees II (pages E-58 to E-71). |
| | 10 | .6* | | Chevron Corporation Retirement Restoration Plan (pages E-72 to E-98). |
| | 10 | .7* | | Chevron Corporation ESIP Restoration Plan (pages E-99 to E-120). |
| | 10 | .8 | | Texaco Inc. Stock Incentive Plan, adopted May 9, 1989, as amended May 13, 1993, and May 13, 1997, filed as Exhibit 10.13 to Chevron Corporation’s Annual Report onForm 10-K for the year ended December 31, 2001, and incorporated herein by reference. |
| | 10 | .9 | | Supplemental Pension Plan of Texaco Inc., dated June 26, 1975, filed as Exhibit 10.14 to Chevron Corporation’s Annual Report onForm 10-K for the year ended December 31, 2001, and incorporated herein by reference. |
| | 10 | .10 | | Supplemental Bonus Retirement Plan of Texaco Inc., dated May 1, 1981, filed as Exhibit 10.15 to Chevron Corporation’s Annual Report onForm 10-K for the year ended December 31, 2001, and incorporated herein by reference. |
| | 10 | .11 | | Texaco Inc. Director and Employee Deferral Plan approved March 28, 1997, filed as Exhibit 10.16 to Chevron Corporation’s Annual Report onForm 10-K for the year ended December 31, 2001, and incorporated herein by reference. |
| | 10 | .12 | | Chevron Corporation 1998 Stock Option Program for U.S. Dollar Payroll Employees, filed as Exhibit 10.12 to Chevron Corporation’s Annual Report onForm 10-K for the year ended December 31, 2002, and incorporated herein by reference. |
| | 10 | .13* | | Summary of Chevron Incentive Plan Award Criteria (pages E-121 to E-122). |
| | 10 | .14 | | Chevron Corporation Change in Control Surplus Employee Severance Program for Salary Grades 41 through 43, filed as Exhibit 10.1 to Chevron Corporation’s Current Report onForm 8-K dated December 6, 2006, and incorporated herein by reference. |
| | 10 | .15 | | Chevron Corporation Benefit Protection Program, filed as Exhibit 10.2 to Chevron Corporation’s Current Report onForm 8-K dated December 6, 2006, and incorporated herein by reference. |
| | 10 | .16 | | Form of Notice of Grant under the Chevron Corporation Long-Term Incentive Plan, filed as Exhibit 10.1 to Chevron’s Current Report onForm 8-K dated June 29, 2005, and incorporated herein by reference. |
| | 10 | .17 | | Form of Restricted Stock Unit Grant Agreement under the Chevron Corporation Long-Term Incentive Plan, filed as Exhibit 10.20 to Chevron Corporation’s Quarterly Report onForm 10-Q for the quarterly period ended June 30, 2006, and incorporated herein by reference. |
| | 10 | .18 | | Form of Retainer Stock Option Agreement under the Chevron Corporation Non-Employee Directors’ Equity Compensation and Deferral Plan, filed as Exhibit 10.2 to Chevron’s Current Report onForm 8-K dated June 29, 2005, and incorporated herein by reference. |
| | 10 | .19* | | Form of Stock Units Agreement under Chevron Corporation Non-Employee Directors’ Equity Compensation and Deferral Plan (page E-123). |
| | 12 | .1* | | Computation of Ratio of Earnings to Fixed Charges(page E-124). |
E-1
| | | | | |
Exhibit No. | | Description |
| |
| | 21 | .1* | | Subsidiaries of Chevron Corporation (pagesE-125 toE-127). |
| | 23 | .1* | | Consent of PricewaterhouseCoopers LLP(page E-128). |
| | 24 | .1 to 24.13* | | Powers of Attorney for directors and certain officers of Chevron Corporation, authorizing the signing of the Annual Report onForm 10-K on their behalf (pages E-129 to E-141). |
| | 31 | .1* | | Rule 13a-14(a)/15d-14(a) Certification of the company’s Chief Executive Officer(page E-142). |
| | 31 | .2* | | Rule 13a-14(a)/15d-14(a) Certification of the company’s Chief Financial Officer(page E-143). |
| | 32 | .1* | | Section 1350 Certification of the company’s Chief Executive Officer(page E-144). |
| | 32 | .2* | | Section 1350 Certification of the company’s Chief Financial Officer(page E-145). |
| | 99 | .1* | | Definitions of Selected Energy and Financial Terms (pagesE-146 toE-148). |
| | 100 | .INS* | | XBRL Instance Document |
| | 100 | .SCH* | | XBRL Schema Document |
| | 100 | .CAL* | | XBRL Calculation Linkbase Document |
| | 100 | .LAB* | | XBRL Label Linkbase Document |
| | 100 | .PRE* | | XBRL Presentation Linkbase Document |
| | 100 | .DEF* | | XBRL Definition Linkbase Document |
Copies of above exhibits not contained herein are available to any security holder upon written request to the Corporate Governance Department, Chevron Corporation, 6001 Bollinger Canyon Road, San Ramon, California94583-2324.
E-2