Table of Contents
| Delaware | 94-0890210 | 6001 Bollinger Canyon Road, San Ramon, California 94583-2324 | ||
| (State or other jurisdiction of incorporation or organization) | (I.R.S. Employer Identification Number) | (Address of principal executive offices) (Zip Code) |
Title of Each Class | Name of Each Exchange on Which Registered | |
| Common stock, par value $.75 per share | New York Stock Exchange, Inc. |
1
Table of Contents
FOR THE PURPOSE OF “SAFE HARBOR” PROVISIONS OF THE
PRIVATE SECURITIES LITIGATION REFORM ACT OF 1995
2
Table of Contents
| Item 1. | Business |
| (a) | General Development of Business |
3
Table of Contents
| • | Upstream — grow profitably in core areas, build new legacy positions and commercialize the company’s natural gas equity resource base while growing a high-impact global gas business | |
| • | Downstream — improve base-business returns and selectively grow, with a focus on integrated value creation |
| • | Invest in people to achieve the company’s strategies | |
| • | Leverage technology to deliver superior performance and growth | |
| • | Build organizational capability to deliver world-class performance in operational excellence, cost reduction, capital stewardship and profitable growth |
| (b) | Description of Business and Properties |
4
Table of Contents
Components of Oil-Equivalent | ||||||||||||||||||||||||
| Crude Oil & Natural Gas | ||||||||||||||||||||||||
| Oil-Equivalent (Thousands | Liquids (Thousands of | Natural Gas (Millions of | ||||||||||||||||||||||
| of Barrels per Day) | Barrels per Day) | Cubic Feet per Day) | ||||||||||||||||||||||
| 2007 | 2006 | 2007 | 2006 | 2007 | 2006 | |||||||||||||||||||
United States: | ||||||||||||||||||||||||
| California | 221 | 224 | 205 | 207 | 97 | 101 | ||||||||||||||||||
| Gulf of Mexico | 214 | 224 | 118 | 114 | 576 | 661 | ||||||||||||||||||
| Texas (Onshore) | 153 | 150 | 77 | 79 | 457 | 425 | ||||||||||||||||||
| Other States | 155 | 165 | 60 | 62 | 569 | 623 | ||||||||||||||||||
| Total United States | 743 | 763 | 460 | 462 | 1,699 | 1,810 | ||||||||||||||||||
Africa: | ||||||||||||||||||||||||
| Angola | 179 | 164 | 171 | 156 | 48 | 47 | ||||||||||||||||||
| Nigeria | 129 | 144 | 126 | 139 | 15 | 29 | ||||||||||||||||||
| Chad | 32 | 35 | 31 | 34 | 4 | 4 | ||||||||||||||||||
| Republic of the Congo | 8 | 12 | 7 | 11 | 7 | 8 | ||||||||||||||||||
| Democratic Republic of the Congo | 3 | 3 | 3 | 3 | 2 | 2 | ||||||||||||||||||
| Total Africa | 351 | 358 | 338 | 343 | 76 | 90 | ||||||||||||||||||
Asia-Pacific: | ||||||||||||||||||||||||
| Thailand | 224 | 216 | 71 | 73 | 916 | 856 | ||||||||||||||||||
Partitioned Neutral Zone (PNZ)1 | 112 | 114 | 109 | 111 | 17 | 19 | ||||||||||||||||||
| Australia | 100 | 99 | 39 | 39 | 372 | 360 | ||||||||||||||||||
| Kazakhstan | 66 | 62 | 41 | 38 | 149 | 143 | ||||||||||||||||||
| Azerbaijan | 61 | 47 | 60 | 46 | 5 | 4 | ||||||||||||||||||
| Bangladesh | 47 | 21 | 2 | — | 275 | 126 | ||||||||||||||||||
| China | 26 | 26 | 22 | 23 | 22 | 18 | ||||||||||||||||||
| Philippines | 26 | 24 | 5 | 6 | 126 | 108 | ||||||||||||||||||
| Myanmar | 17 | 15 | — | — | 100 | 89 | ||||||||||||||||||
| Total Asia-Pacific | 679 | 624 | 349 | 336 | 1,982 | 1,723 | ||||||||||||||||||
Indonesia | 241 | 248 | 195 | 198 | 277 | 302 | ||||||||||||||||||
Other International: | ||||||||||||||||||||||||
| United Kingdom | 115 | 115 | 78 | 75 | 220 | 242 | ||||||||||||||||||
| Denmark | 63 | 68 | 41 | 44 | 132 | 146 | ||||||||||||||||||
| Argentina | 47 | 47 | 39 | 38 | 50 | 54 | ||||||||||||||||||
| Canada | 36 | 47 | 35 | 46 | 5 | 6 | ||||||||||||||||||
| Colombia | 30 | 29 | — | — | 178 | 174 | ||||||||||||||||||
| Trinidad and Tobago | 29 | 29 | — | — | 174 | 174 | ||||||||||||||||||
| Norway | 6 | 6 | 6 | 6 | 1 | 1 | ||||||||||||||||||
| Netherlands | 4 | 4 | 3 | 3 | 5 | 7 | ||||||||||||||||||
Venezuela2 | — | 7 | — | 3 | — | 21 | ||||||||||||||||||
| Total Other International | 330 | 352 | 202 | 215 | 765 | 825 | ||||||||||||||||||
| Total International | 1,601 | 1,582 | 1,084 | 1,092 | 3,100 | 2,940 | ||||||||||||||||||
| Total Consolidated Operations | 2,344 | 2,345 | 1,544 | 1,554 | 4,799 | 4,750 | ||||||||||||||||||
Equity Affiliates3 | 248 | 213 | 212 | 178 | 220 | 206 | ||||||||||||||||||
Total Including Affiliates4,5 | 2,592 | 2,558 | 1,756 | 1,732 | 5,019 | 4,956 | ||||||||||||||||||
| 1 | Located between Saudi Arabia and Kuwait. | |
| 2 | Through September 2006, LL-652 was reported as part of Venezuela consolidated operations. As of October 2006, LL-652 is reported under Equity Affiliates. See footnote 3 below. | |
| 3 | Equity Affiliates represent Chevron’s share of production by affiliates, including Tengizchevroil (TCO) in Kazakhstan and Hamaca in Venezuela. Effective October 2006, the company converted its interests in Boscan and LL-652 operating service agreements in Venezuela to Empresas Mixtas (i.e., joint stock contractual structures), and these interests are accounted for as equity affiliates.LL-652 was previously reported as part of Venezuela consolidated operations, and Boscan was included in “other produced volumes.” See footnote 5 below. | |
| 4 | Includes natural gas consumed in operations of 498 million and 475 million cubic feet per day in 2007 and 2006, respectively. | |
| 5 | Does not include other produced volumes: |
| Athabasca Oil Sands — net | 27 | 27 | 27 | 27 | — | — | ||||||||||||||||||
Boscan Operating Service Agreement3 | — | 82 | — | 82 | — | — |
5
Table of Contents
| Productive2 | Productive2 | |||||||||||||||
| Oil Wells | Gas Wells | |||||||||||||||
| Gross | Net | Gross | Net | |||||||||||||
| United States: | ||||||||||||||||
| California | 25,029 | 23,305 | 176 | 44 | ||||||||||||
| Gulf of Mexico | 1,600 | 1,375 | 1,104 | 893 | ||||||||||||
| Other U.S. | 23,628 | 8,537 | 10,929 | 5,106 | ||||||||||||
| Total United States | 50,257 | 33,217 | 12,209 | 6,043 | ||||||||||||
| Africa | 2,190 | 748 | 8 | 3 | ||||||||||||
| Asia-Pacific | 2,405 | 1,139 | 2,308 | 1,451 | ||||||||||||
| Indonesia | 8,150 | 7,991 | 211 | 170 | ||||||||||||
| Other International | 1,042 | 660 | 256 | 106 | ||||||||||||
| Total International | 13,787 | 10,538 | 2,783 | 1,730 | ||||||||||||
| Total Consolidated Companies | 64,044 | 43,755 | 14,992 | 7,773 | ||||||||||||
| Equity in Affiliates | 1,072 | 375 | — | — | ||||||||||||
| Total Including Affiliates | 65,116 | 44,130 | 14,992 | 7,773 | ||||||||||||
| Multiple completion wells included above: | 967 | 587 | 456 | 340 | ||||||||||||
| 1 | Includes wells producing or capable of producing and injection wells temporarily functioning as producing wells. Wells that produce both oil and gas are classified as oil wells. | |
| 2 | Gross wells include the total number of wells in which the company has an interest. Net wells include wholly owned wells and the sum of the company’s fractional interests in gross wells. |
6
Table of Contents
| 2007 | 2006 | 2005 | ||||||||||
| Liquids* — Millions of barrels | ||||||||||||
| Consolidated Companies | 4,665 | 5,294 | 5,626 | |||||||||
| Affiliated Companies | 2,422 | 2,512 | 2,374 | |||||||||
| Natural Gas — Billions of cubic feet | ||||||||||||
| Consolidated Companies | 19,137 | 19,910 | 20,466 | |||||||||
| Affiliated Companies | 3,003 | 2,974 | 2,968 | |||||||||
| Total Oil-Equivalent — Millions of barrels | ||||||||||||
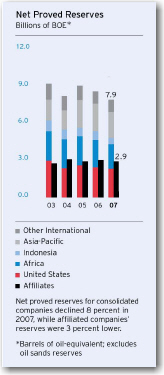
| Consolidated Companies | 7,855 | 8,612 | 9,037 | |||||||||
| Affiliated Companies | 2,922 | 3,008 | 2,869 | |||||||||
| * | Crude oil, condensate and natural gas liquids |
(Thousands of Acres)
| Developed and | ||||||||||||||||||||||||
| Undeveloped2 | Developed2 | Undeveloped | ||||||||||||||||||||||
| Gross | Net | Gross | Net | Gross | Net | |||||||||||||||||||
| United States: | ||||||||||||||||||||||||
| California | 139 | 122 | 185 | 178 | 324 | 300 | ||||||||||||||||||
| Gulf of Mexico | 2,482 | 1,828 | 1,621 | 1,178 | 4,103 | 3,006 | ||||||||||||||||||
| Other U.S. | 3,800 | 3,012 | 5,884 | 2,588 | 9,684 | 5,600 | ||||||||||||||||||
| Total United States | 6,421 | 4,962 | 7,690 | 3,944 | 14,111 | 8,906 | ||||||||||||||||||
| Africa | 17,391 | 7,619 | 2,520 | 922 | 19,911 | 8,541 | ||||||||||||||||||
| Asia-Pacific | 52,006 | 23,660 | 5,847 | 2,630 | 57,853 | 26,290 | ||||||||||||||||||
| Indonesia | 9,109 | 5,894 | 382 | 340 | 9,491 | 6,234 | ||||||||||||||||||
| Other International | 35,688 | 20,022 | 2,397 | 664 | 38,085 | 20,686 | ||||||||||||||||||
| Total International | 114,194 | 57,195 | 11,146 | 4,556 | 125,340 | 61,751 | ||||||||||||||||||
| �� | ||||||||||||||||||||||||
| Total Consolidated Companies | 120,615 | 62,157 | 18,836 | 8,500 | 139,451 | 70,657 | ||||||||||||||||||
| Equity in Affiliates | 647 | 302 | 252 | 103 | 899 | 405 | ||||||||||||||||||
| Total Including Affiliates | 121,262 | 62,459 | 19,088 | 8,603 | 140,350 | 71,062 | ||||||||||||||||||
| 1 | Gross acreage includes the total number of acres in all tracts in which the company has an interest. Net acreage includes wholly owned interests and the sum of the company’s fractional interests in gross acreage. | |
| 2 | Developed acreage is spaced or assignable to productive wells. Undeveloped acreage is acreage on which wells have not been drilled or completed to permit commercial production and that may contain undeveloped proved reserves. The gross undeveloped acres that will expire in 2008, 2009 and 2010 if production is not established by certain required dates are 7,770, 10,860 and 4,288, respectively. |
7
Table of Contents
| Wells Drilling | Net Wells Completed1,2 | |||||||||||||||||||||||||||||||
| at 12/31/073 | 2007 | 2006 | 2005 | |||||||||||||||||||||||||||||
| Gross | Net | Prod. | Dry | Prod. | Dry | Prod. | Dry | |||||||||||||||||||||||||
| United States: | ||||||||||||||||||||||||||||||||
| California | 5 | 1 | 620 | — | 600 | — | 661 | — | ||||||||||||||||||||||||
| Gulf of Mexico | 39 | 18 | 30 | 1 | 34 | 5 | 29 | 3 | ||||||||||||||||||||||||
| Other U.S. | 11 | 10 | 225 | 4 | 317 | 6 | 256 | 4 | ||||||||||||||||||||||||
| Total United States | 55 | 29 | 875 | 5 | 951 | 11 | 946 | 7 | ||||||||||||||||||||||||
| Africa | 8 | 3 | 43 | — | 45 | 2 | 38 | — | ||||||||||||||||||||||||
| Asia-Pacific | 13 | 4 | 223 | — | 235 | 1 | 150 | — | ||||||||||||||||||||||||
| Indonesia | — | — | 374 | — | 258 | — | 107 | — | ||||||||||||||||||||||||
| Other International | 4 | — | 52 | — | 43 | — | 79 | — | ||||||||||||||||||||||||
| Total International | 25 | 7 | 692 | — | 581 | 3 | 374 | — | ||||||||||||||||||||||||
| Total Consolidated Companies | 80 | 36 | 1,567 | 5 | 1,532 | 14 | 1,320 | 7 | ||||||||||||||||||||||||
| Equity in Affiliates | — | — | 3 | — | 13 | — | 23 | — | ||||||||||||||||||||||||
| Total Including Affiliates | 80 | 36 | 1,570 | 5 | 1,545 | 14 | 1,343 | 7 | ||||||||||||||||||||||||
| 1 | Indicates the fractional number of wells completed during the year, regardless of when drilling was initiated. Completion refers to the installation of permanent equipment for the production of crude oil or natural gas or, in the case of a dry well, the reporting of abandonment to the appropriate agency. | |
| 2 | Includes completion of wells beginning August 2005 related to the former Unocal operations. | |
| 3 | Represents wells in the process of drilling, including wells for which drilling was not completed and which were temporarily suspended at the end of 2007. Gross wells include the total number of wells in which the company has an interest. Net wells include wholly owned wells and the sum of the company’s fractional interests in gross wells. |
8
Table of Contents
| Wells | ||||||||||||||||||||||||||||||||
| Drilling | Net Wells Completed1,2 | |||||||||||||||||||||||||||||||
| at 12/31/073 | 2007 | 2006 | 2005 | |||||||||||||||||||||||||||||
| Gross | Net | Prod. | Dry | Prod. | Dry | Prod. | Dry | |||||||||||||||||||||||||
| United States: | ||||||||||||||||||||||||||||||||
| California | — | — | — | — | — | — | — | — | ||||||||||||||||||||||||
| Gulf of Mexico | 12 | 5 | 4 | 7 | 9 | 8 | 14 | 8 | ||||||||||||||||||||||||
| Other U.S. | — | — | — | 1 | 7 | — | 5 | 6 | ||||||||||||||||||||||||
| Total United States | 12 | 5 | 4 | 8 | 16 | 8 | 19 | 14 | ||||||||||||||||||||||||
| Africa | 35 | 15 | 6 | 2 | 1 | — | 4 | 1 | ||||||||||||||||||||||||
| Asia-Pacific | 1 | 1 | 14 | 10 | 18 | 7 | 10 | — | ||||||||||||||||||||||||
| Indonesia | — | — | 1 | — | 2 | — | 5 | — | ||||||||||||||||||||||||
| Other International | 3 | 1 | 5 | 2 | 6 | 3 | 7 | 4 | ||||||||||||||||||||||||
| Total International | 39 | 17 | 26 | 14 | 27 | 10 | 26 | 5 | ||||||||||||||||||||||||
| Total Consolidated Companies | 51 | 22 | 30 | 22 | 43 | 18 | 45 | 19 | ||||||||||||||||||||||||
| Equity in Affiliates | — | — | 41 | — | 1 | — | 8 | — | ||||||||||||||||||||||||
| Total Including Affiliates | 51 | 22 | 71 | 22 | 44 | 18 | 53 | 19 | ||||||||||||||||||||||||
| 1 | Indicates the fractional number of wells completed during the year, regardless of when drilling was initiated. Completion refers to the installation of permanent equipment for the production of crude oil or natural gas or, in the case of a dry well, the reporting of abandonment to the appropriate agency. Some exploratory wells are not drilled with the intention of producing from the well bore. In such cases, “completion” refers to the completion of drilling. Further categorization of productive or dry is based on the determination as to whether hydrocarbons in a sufficient quantity were found to justify completion as a producing well, whether or not the well is actually going to be completed as a producer. | |
| 2 | Includes completion of wells beginning August 2005 related to the former Unocal operations. | |
| 3 | Represents wells that are in the process of drilling but have been neither abandoned nor completed as of the last day of the year, including wells for which drilling was not completed and which were temporarily suspended at the end of 2007. Does not include wells for which drilling was completed at year-end 2007 and that were reported as suspended wells in Note 19 beginning onpage FS-47. Gross wells include the total number of wells in which the company has an interest. Net wells include wholly owned wells and the sum of the company’s fractional interests in gross wells. |
9
Table of Contents
 | Chevron has production and exploration activities in most of the world’s major hydrocarbon basins. The company’s upstream strategy is to grow profitably in core areas, build new legacy positions and commercialize the company’s natural gas equity resource base while growing a high-impact global gas business. The map on the left indicates Chevron’s primary areas of production and exploration as well as the potential target markets for the company’s natural gas resources. |
| a) | United States |
 | California: The company has significant production in the San Joaquin Valley. In 2007, average netoil-equivalent production was 221,000 barrels per day, composed of 200,000 barrels of crude oil, 97 million cubic feet of natural gas and 5,000 barrels of natural gas liquids. Approximately 80 percent of thecrude-oil production is considered heavy oil (typically with API gravity lower than 22 degrees). |
10
Table of Contents
 | Gulf of Mexico: Average net oil-equivalent production during 2007 for the company’s combined interests in the Gulf of Mexico shelf and deepwater areas, and the onshore fields in the region was 214,000 barrels per day. The daily oil-equivalent production comprised 105,000 barrels of crude oil, 576 million cubic feet of natural gas and 13,000 barrels of natural gas liquids. During 2007, Chevron was engaged in various development and exploration activities in the deepwater Gulf of Mexico. Development work continued at the 58 percent-owned and operated Tahiti Field, where productionstart-up is expected in the third quarter 2009. Construction of | |
| the spar hull and topsides was completed in 2007; however, installation of the spar hull was delayed for about one year when testing revealed a metallurgical problem with the mooring shackles. Six development wells were drilled in 2007, and flow-back tests for five of the six were completed during the year. Initial booking of proved undeveloped reserves occurred in 2003, and the transfer of these reserves into the proved developed category is anticipated near the time of productionstart-up. With an estimated production life of 30 years, Tahiti is designed to have a maximum total daily production of 125,000 barrels of crude oil and 70 million cubic feet of natural gas. The total cost for this project is estimated at $4.7 billion and includes a planned second phase of field development afterstart-up that involves additional wells and facility upgrades. | ||
| • | Big Foot — 60 percent-owned and operated. A successful appraisal well was completed in January 2008. | |
| • | Jack — 50 percent-owned and operated. A second appraisal well is scheduled for completion in the second quarter 2008. | |
| • | Saint Malo — 41 percent-owned and operated. Located near the Jack discovery, a second appraisal well drilled in 2007 is scheduled for completion by the end of the first quarter 2008. | |
| • | Tubular Bells — 30 percent-owned and nonoperated working interest. The second appraisal well began drilling in 2007 and is scheduled for completion in the first quarter 2008. | |
| • | Knotty Head — 25 percent-owned and nonoperated working interest. Discovered in 2005, subsurface studies were in progress in early 2008. | |
| • | Puma — 22 percent-owned and nonoperated working interest. Two appraisal wells were drilled in 2007. |
11
Table of Contents
| • | West Tonga — 21 percent-owned and nonoperated working interest. A successful discovery well was drilled in 2007. |
12
Table of Contents
| b) | Africa |
 | Angola: Chevron holds company-operated working interests in Blocks 0 and 14 and nonoperated working interests in Block 2 and the Fina Sonangol Texaco (FST) area. In 2007, daily net production was 179,000 barrels of oil-equivalent. The 39 percent-owned Block 0 and 31 percent-owned Block 14 are off the west coast, north of the Congo River. In Block 0, the company operates in two areas — A and B — composed of 21 fields that produced 120,000 barrels per day of net liquids in 2007. The Block 0 concession extends through 2030. Area A of Block 0 comprises 15 producing fields and averaged daily net production of approximately 65,000 barrels of crude oil and 1,000 barrels of liquefied petroleum gas (LPG) in 2007. This production includes volumes from the Banzala Field that produced first oil in June 2007. The development of the Mafumeira Field in Area A continued in 2007 and will target the northern portion of the field. Initial booking of proved | |
| undeveloped reserves for this development occurred in 2003, and reclassification of proved undeveloped reserves into the proved developed category is anticipated near the time of first production expected in 2009. Maximum total daily production is expected to be approximately 30,000 barrels of crude oil in 2011. | ||
13
Table of Contents
14
Table of Contents
 | Nigeria: Chevron holds a 40 percent interest in 13 concessions predominantly in the onshore and near-offshore regions of the Niger Delta and varying interests in deepwater offshore blocks. In the Niger Delta, the company operates under a joint-venture arrangement with the Nigerian National Petroleum Corporation (NNPC), which owns a 60 percent interest. In 2007, net oil- equivalent production from 32 fields averaged 129,000 barrels per day. The daily oil-equivalent rate comprised 126,000 barrels of liquids and 15 million cubic feet of natural gas. In the Niger Delta, Chevron has a 40 percent operated interest in the South Offshore Water Injection Project (SOWIP), an enhancedcrude-oil recovery project in Oil Mining License (OML) 90 aimed at increasing production through water injection, natural-gas lift and production debottlenecking in the Okan and Delta fields. The upgraded Delta South Water Injection Platform (DSWIP), which is part of SOWIP, began water injection in March 2007 at a total daily rate of 100,000 barrels. The total maximum daily water injection rate | |
| is expected to increase to 240,000 barrels in 2009 upon the laying of water injection pipelines. Crude-oil production at year-end 2007 was approximately 5,000 barrels per day, and maximum total production is expected to be 35,000 barrels per day in 2010. Initial recognition of proved reserves was made in 2005. Reclassification of additional proved undeveloped reserves to the developed category is expected to occur after the evaluation of the water injection performance. The estimated life of the project is 25 years. | ||
15
Table of Contents
| c) | Asia-Pacific |
 | Australia: During 2007, the average net oil-equivalent production from Chevron’s interests in Australia was 100,000 barrels per day, composed of 39,000 barrels of liquids and 372 million cubic feet of natural gas. Chevron has a 17 percent nonoperated working interest in the North West Shelf (NWS) Venture offshore Western Australia. Daily net production from the project during 2007 averaged 29,000 barrels of crude oil and condensate, 369 million cubic feet of natural gas, and 5,000 barrels of LPG. Approximately 75 percent of the natural gas was sold in the form of LNG to major utilities in Japan, South Korea and China, primarily under long-term contracts. The remaining natural gas was sold to the Western Australia domestic | |
| market. A fifth LNG train, which is intended to increase export capacity by more than 4 million metric tons per year, to more than 16 million, is expected to be commissioned in late 2008. The Angel natural gas field, where development is under way, and the North Rankin Redevelopment project will supply the fifth LNG train.Start-up of the fifth train is projected to accelerate production from the NWS fields. An investment decision by the company and its partners on the North Rankin Redevelopment project is expected in late 2008. The end of the NWS Venture concession period is 2034. | ||
16
Table of Contents
 | Azerbaijan: Chevron holds a 10 percent nonoperated working interest in the Azerbaijan International Operating Company (AIOC), which produces crude oil in the Caspian Sea from the Azeri-Chirag-Gunashli (ACG) project. Chevron also has a 9 percent interest in the Baku-Tbilisi-Ceyhan (BTC) affiliate, which transports AIOC production by pipeline from Baku, Azerbaijan, through Georgia to Mediterranean deepwater port facilities in Ceyhan, Turkey. (Refer to “Pipelines” under “Transportation Operations” on page 28 for a discussion of the BTC operations.) In 2007, the company’s daily net production from AIOC averaged 61,000 barrels of oil-equivalent. First production from Phase III of ACG development is targeted for the second quarter 2008. Total crude-oil production from the ACG project is expected to increase to about 940,000 barrels per day by the end of 2008 and to more than 1 million barrels per day in 2009. Proved undeveloped reserves for ACG are expected to be reclassified to proved developed reserves as wells are drilled and completed. The AIOC operations are conducted under a30-year PSC that expires in 2024. |
17
Table of Contents
 | Cambodia: Chevron operates and holds a 55 percent interest in the1.2 million-acre Block A, located offshore in the Gulf of Thailand. A four-well exploration and appraisal program was completed in 2007. As of early 2008, the results and prospects for further drilling were being evaluated. Myanmar: Chevron has a 28 percent nonoperated working interest in a PSC for the production of natural gas from the Yadana and Sein fields offshore in the Andaman Sea. The company also has a 28 percent interest in a pipeline company that transports the natural gas from Yadana to the Myanmar-Thailand border for delivery to power plants in Thailand. Most of the natural gas is purchased by | |
| Thailand’s PTT Public Company Limited (PTT). The company’s average net natural gas production in 2007 was 100 million cubic feet per day, or 17,000 barrels of oil-equivalent. | ||
18
Table of Contents
19
Table of Contents
| d) | Indonesia |
 | Chevron’s operated interests in Indonesia are managed by several wholly owned subsidiaries, including PT. Chevron Pacific Indonesia (CPI). CPI holds operated interests of 100 percent in the Rokan and Siak PSCs and 90 percent in the Mountain Front Kuantan PSC. Other subsidiaries operate four PSCs in the Kutei Basin, East Kalimantan and one PSC in the Tarakan Basin, Northeast Kalimantan. These interests range from 80 percent to 100 percent. Chevron also has nonoperated working interests in a joint venture in South Natuna Sea Block B and in the NE Madura III block in the East Java Sea Basin. Chevron’s interests in these PSCs range from 25 percent to 40 percent. In January 2008, Chevron relinquished its 35 percent nonoperated working interest | |
| in the Donggala PSC in the Kutei Basin. In West Java, Chevron wholly owns a power generation company that operates the Darajat geothermal contract area in Garut, West Java, with a total capacity of 259 megawatts. This includes the Darajat III 110-megawatt unit that was placed online in July 2007. Chevron also operates a 95 percent-owned300-megawatt cogeneration facility in support of CPI’s operation in North Duri and the wholly owned Salak geothermal field, located in West Java, with a total capacity of 377 megawatts. | ||
20
Table of Contents
| e) | Other International Areas |
 | Argentina: Chevron holds an operated interest in 17 concessions and one exploratory block in the Neuquen and Austral basins. Working interests range from 19 percent to 100 percent. Net oil-equivalent production in 2007 averaged 47,000 barrels per day, composed of 39,000 barrels of crude oil and 50 million cubic feet of natural gas. Chevron also holds a 14 percent interest in the Oleoductos del Valle S.A. pipeline. In 2007, three exploratory wells were drilled in the Austral Basin, and two were successful. Brazil: Chevron holds working interests ranging from 20 percent to 52 percent in three deepwater blocks. None of the blocks had production in 2007. In Block BC-4, located in the Campos Basin, the company is the operator and has a 52 percent interest in the Frade Field. In 2007, major construction activities included work to convert a crude-oil tanker to an FPSO vessel and the manufacture of subsea systems and flowlines for the project. Subsea installation activities began in early 2008. Proved undeveloped reserves were recorded for | |
| the first time in 2005. Partial reclassification of proved undeveloped reserves to the proved developed category is anticipated upon productionstart-up in early 2009. Estimated maximum total production of 90,000oil-equivalent barrels per day is anticipated in 2011. The concession that involves the Frade project expires in 2025. | ||
21
Table of Contents
 | Denmark: Chevron holds a 15 percent nonoperated working interest in the Danish Underground Consortium (DUC), which produces crude oil and natural gas from 15 fields in the Danish North Sea and has a 12 percent interest in each of four exploration licenses. Net oil-equivalent production in 2007 from DUC averaged 63,000 barrels per day, composed of 41,000 barrels of crude oil and 132 million cubic feet of natural gas. Faroe Islands: Chevron has a 40 percent interest in five offshore blocks and is the operator. During 2007, the company acquired a2-D seismic survey over License 008, located near the Rosebank/Lochnagar discovery in the United Kingdom. Greenland: In October 2007, Chevron was awarded a 29 percent nonoperated working interest in an exploration license in Block 4 offshore West Greenland in the Baffin Basin. The planned four-year work program includes seismic acquisition, and geologic, engineering and environmental studies. |
22
Table of Contents
23
Table of Contents
24
Table of Contents
(Capacities and inputs in thousands of barrels per day; includes equity share in affiliates)
| December 31, 2007 | ||||||||||||||||||||||
| Operable | Refinery Inputs | |||||||||||||||||||||
| Locations | Number | Capacity | 2007 | 2006 | 2005 | |||||||||||||||||
| Pascagoula | Mississippi | 1 | 330 | 285 | 337 | 263 | ||||||||||||||||
| El Segundo | California | 1 | 260 | 222 | 258 | 230 | ||||||||||||||||
| Richmond | California | 1 | 243 | 192 | 224 | 233 | ||||||||||||||||
| Kapolei | Hawaii | 1 | 54 | 51 | 50 | 50 | ||||||||||||||||
| Salt Lake City | Utah | 1 | 45 | 42 | 39 | 41 | ||||||||||||||||
Other1 | 1 | 80 | 20 | 31 | 28 | |||||||||||||||||
Total Consolidated Companies —United States | 6 | 1,012 | 812 | 939 | 845 | |||||||||||||||||
| Pembroke | United Kingdom | 1 | 210 | 212 | 165 | 186 | ||||||||||||||||
Cape Town2 | South Africa | 1 | 110 | 72 | 71 | 61 | ||||||||||||||||
| Burnaby, B.C. | Canada | 1 | 55 | 49 | 49 | 45 | ||||||||||||||||
Total Consolidated Companies —International | 3 | 375 | 333 | 285 | 292 | |||||||||||||||||
Affiliates3 | Various Locations | 11 | 728 | 688 | 765 | 746 | ||||||||||||||||
Total Including Affiliates —International | 14 | 1,103 | 1,021 | 1,050 | 1,038 | |||||||||||||||||
Total Including Affiliates —Worldwide | 20 | 2,115 | 1,833 | 1,989 | 1,883 | |||||||||||||||||
| 1 | Asphalt plants in Perth Amboy, New Jersey, and Portland, Oregon. The Portland plant was sold in February 2005. | |
| 2 | Chevron holds 100 percent of the common stock issued by Chevron South Africa (Pty) Limited, which owns the Cape Town Refinery. A consortium of South African partners owns preferred shares ultimately convertible to a 25 percent equity interest in Chevron South Africa (Pty) Limited. None of the preferred shares had been converted as of February 2008. | |
| 3 | Chevron sold its 31 percent interest in the Nerefco Refinery in the Netherlands in March 2007. This decreased the company’s share of operable capacity by about 124,000 barrels per day. |
25
Table of Contents
26
Table of Contents
(Thousands of Barrels per Day)
| 2007 | 2006 | 2005 | |||||||
| United States | |||||||||
| Gasolines | 728 | 712 | 709 | ||||||
| Jet Fuel | 271 | 280 | 291 | ||||||
| Gas Oils and Kerosene | 221 | 252 | 231 | ||||||
| Residual Fuel Oil | 138 | 128 | 122 | ||||||
Other Petroleum Products2 | 99 | 122 | 120 | ||||||
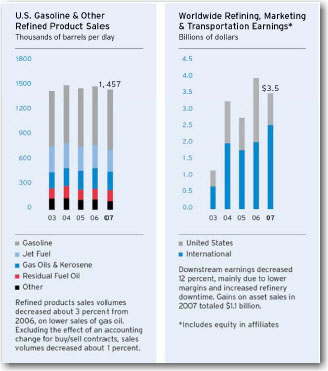
Total United States | 1,457 | 1,494 | 1,473 | ||||||
International3 | |||||||||
| Gasolines | 581 | 595 | 662 | ||||||
| Jet Fuel | 274 | 266 | 258 | ||||||
| Gas Oils and Kerosene | 730 | 776 | 781 | ||||||
| Residual Fuel Oil | 271 | 324 | 404 | ||||||
Other Petroleum Products2 | 171 | 166 | 147 | ||||||
Total International | 2,027 | 2,127 | 2,252 | ||||||
Total Worldwide3 | 3,484 | 3,621 | 3,725 | ||||||
1 | Includes buy/sell arrangements. Refer to Note 13 onpage FS-42. | — | 50 | 217 | ||||||||||
2 | Principally naphtha, lubricants, asphalt and coke. | |||||||||||||
3 | Includes share of equity affiliates’ sales: | 492 | 492 | 498 |
27
Table of Contents
| Net Mileage1 | ||||
| United States: | ||||
Crude Oil2 | 2,853 | |||
| Natural Gas | 2,275 | |||
Petroleum Products3 | 7,053 | |||
Total United States | 12,181 | |||
| International: | ||||
Crude Oil2 | 700 | |||
| Natural Gas | 768 | |||
Petroleum Products3 | 426 | |||
Total International | 1,894 | |||
Worldwide | 14,075 | |||
1 | Partially owned pipelines are included at the company’s equity percentage. | |
2 | Includes gathering lines related to the transportation function. Excludes gathering lines related to U.S. and international production activities. | |
3 | Includes refined products, chemicals and natural gas liquids. |
28
Table of Contents
| U.S. Flag | Foreign Flag | |||||||||||||||
| Cargo Capacity | Cargo Capacity | |||||||||||||||
| Number | (Millions of Barrels) | Number | (Millions of Barrels) | |||||||||||||
| Owned | 3 | 0.8 | 1 | 1.1 | ||||||||||||
| Bareboat Chartered | 1 | 0.3 | 19 | 28.1 | ||||||||||||
| Time Chartered* | — | — | 24 | 14.3 | ||||||||||||
Total | 4 | 1.1 | 44 | 43.5 | ||||||||||||
| * | One year or more. |
29
Table of Contents
30
Table of Contents
31
Table of Contents
32
Table of Contents
| Item 1B. | Unresolved Staff Comments |
| Item 2. | Properties |
| Item 3. | Legal Proceedings |
| Item 4. | Submission of Matters to a Vote of Security Holders |
33
Table of Contents
| Maximum | ||||||||||||||||
| Total Number of | Number of Shares | |||||||||||||||
| Total Number | Average | Shares Purchased as | that May Yet be | |||||||||||||
| of Shares | Price Paid | Part of Publicly | Purchased Under | |||||||||||||
Period | Purchased(1)(2) | per Share | Announced Program | the Program | ||||||||||||
| Oct. 1 – Oct. 31, 2007 | 4,225,293 | 92.09 | 4,038,000 | — | ||||||||||||
| Nov. 1 – Nov. 30, 2007 | 10,455,696 | 86.46 | 10,200,000 | — | ||||||||||||
| Dec. 1 – Dec. 31, 2007 | 8,375,829 | 90.82 | 8,221,763 | — | ||||||||||||
Total Oct. 1 – Dec. 31, 2007 | 23,056,818 | 89.08 | 22,459,763 | (2 | ) | |||||||||||
| (1) | Includes 42,494 common shares repurchased during the three-month period ended December 31, 2007, from company employees for required personal income tax withholdings on the exercise of the stock options issued to management and employees under the company’s broad-based employee stock options, long-term incentive plans and former Texaco Inc. stock option plans. Also includes 554,561 shares delivered or attested to in satisfaction of the exercise price by holders of certain former Texaco Inc. employee stock options exercised during the three-month period ended December 31, 2007. |
| (2) | In September 2007, the company authorized stock repurchases of up to $15 billion that may be made from time to time at prevailing prices as permitted by securities laws and other requirements and subject to market conditions and other factors. The program will occur over a period of up to three years and may be discontinued at any time. As of December 31, 2007, 23,530,209 shares had been acquired under this program for $2.1 billion. |
34
Table of Contents
35
Table of Contents
| Item 10. | Directors, Executive Officers and Corporate Governance |
| Name and Age | Current and Prior Positions (up to five years) | Current Areas of Responsibility | ||||
| D.J. O’Reilly | 61 | Chairman of the Board and Chief Executive Officer (since 2000) | Chief Executive Officer | |||
| P.J. Robertson | 61 | Vice Chairman of the Board (since 2002) President of Chevron Overseas Petroleum Inc. (2000 to 2002) | Policy, Government and Public Affairs; Human Resources | |||
| J.E. Bethancourt | 56 | Executive Vice President (since 2003) Vice President of Human Resources (2001 to 2003) | Technology; Chemicals; Mining; Health, Environment and Safety | |||
| G.L. Kirkland | 57 | Executive Vice President (since 2005) President of Chevron Overseas Petroleum Inc. (2002 to 2004) President of Chevron U.S.A. Production Company (2000 to 2002) | Worldwide Exploration and Production Activities and Global Gas Activities, including Natural Gas Trading | |||
| J.S. Watson | 51 | Executive Vice President (since 2008) Vice President and President of Chevron International Exploration and Production Company (2005 through 2007) Vice President and Chief Financial Officer (2000 through 2004) | Business Development; Mergers and Acquisitions; Strategic Planning; Project Resources Company | |||
| M.K. Wirth | 47 | Executive Vice President (since 2006) President of Global Supply and Trading (2004 to 2006) President of Marketing, Asia, Middle East and Africa Marketing Business Unit (2001 to 2004) | Global Refining, Marketing, Lubricants, and Supply and Trading, excluding Natural Gas Trading | |||
| S.J. Crowe | 60 | Vice President and Chief Financial Officer (since 2005) Vice President and Comptroller (from 2000 through 2004) | Finance | |||
| C.A. James | 53 | Vice President and General Counsel (since 2002) | Law | |||
36
Table of Contents
37
| Item 15. | Exhibits, Financial Statement Schedules |
| Page(s) | ||
| Report of Independent Registered Public Accounting Firm — PricewaterhouseCoopers LLP | FS-26 | |
| Consolidated Statement of Income for the three years ended December 31, 2007 | FS-27 | |
| Consolidated Statement of Comprehensive Income for the three years ended December 31, 2007 | FS-28 | |
| Consolidated Balance Sheet at December 31, 2007 and 2006 | FS-29 | |
| Consolidated Statement of Cash Flows for the three years ended December 31, 2007 | FS-30 | |
| Consolidated Statement of Stockholders’ Equity for the three years ended December 31, 2007 | FS-31 | |
| Notes to the Consolidated Financial Statements | FS-32 to FS-58 |
| We have included, on page 39, Schedule II — Valuation and Qualifying Accounts. |
| The Exhibit Index on pagesE-1 andE-2 lists the exhibits that are filed as part of this report. |
38
Table of Contents
Millions of Dollars
| Year Ended December 31 | ||||||||||||
| 2007 | 2006 | 2005 | ||||||||||
Employee Termination Benefits: | ||||||||||||
| Balance at January 1 | $ | 28 | $ | 91 | $ | 137 | ||||||
| Additions (deductions) charged (credited) to expense | 106 | (21 | ) | (21 | ) | |||||||
| Additions related to Unocal acquisition | — | — | 106 | |||||||||
| Payments | (17 | ) | (42 | ) | (131 | ) | ||||||
Balance at December 31 | $ | 117 | $ | 28 | $ | 91 | ||||||
Allowance for Doubtful Accounts: | ||||||||||||
| Balance at January 1 | $ | 217 | $ | 198 | $ | 219 | ||||||
| Additions charged to expense | 29 | 61 | 3 | |||||||||
| Additions related to Unocal acquisition | — | — | 6 | |||||||||
| Bad debt write-offs | (46 | ) | (42 | ) | (30 | ) | ||||||
Balance at December 31 | $ | 200 | $ | 217 | $ | 198 | ||||||
Deferred Income Tax Valuation Allowance:* | ||||||||||||
| Balance at January 1 | $ | 4,391 | $ | 3,249 | $ | 1,661 | ||||||
| Additions charged to deferred income tax expense | 1,894 | 1,700 | 1,593 | |||||||||
| Additions related to Unocal acquisition | — | — | 400 | |||||||||
| Deductions credited to goodwill | — | (77 | ) | (60 | ) | |||||||
| Deductions credited to deferred income tax expense | (336 | ) | (481 | ) | (345 | ) | ||||||
Balance at December 31 | $ | 5,949 | $ | 4,391 | $ | 3,249 | ||||||
| * | See also Note 15 to the Consolidated Financial Statements beginning onpage FS-43. |
39
Table of Contents
| By | /s/ David J. O’Reilly |
| Principal Executive Officers | ||
| (and Directors) | Directors | |
| /s/David J. O’Reilly David J. O’Reilly, Chairman of the Board and Chief Executive Officer | Samuel H. Armacost* Samuel H. Armacost | |
| /s/Peter J. Robertson Peter J. Robertson, Vice Chairman of the Board | Linnet F. Deily* Linnet F. Deily | |
| Robert E. Denham* Robert E. Denham | ||
| Robert J. Eaton* Robert J. Eaton | ||
Principal Financial Officer | Sam Ginn* Sam Ginn | |
| /s/Stephen J. Crowe Stephen J. Crowe, Vice President and Chief Financial Officer | Franklyn G. Jenifer* Franklyn G. Jenifer | |
Principal Accounting Officer | ||
| /s/Mark A. Humphrey Mark A. Humphrey, Vice President and Comptroller | Sam Nunn* Sam Nunn | |
| Donald B. Rice* Donald B. Rice | ||
*By: /s/Lydia I. Beebe Lydia I. Beebe, Attorney-in-Fact | Kevin W. Sharer* Kevin W. Sharer | |
| Charles R. Shoemate* Charles R. Shoemate | ||
| Ronald D. Sugar* Ronald D. Sugar | ||
| Carl Ware* Carl Ware |
40
Table of Contents
INDEX TO MANAGEMENT’S DISCUSSION AND ANALYSIS,
CONSOLIDATED FINANCIAL STATEMENTS AND SUPPLEMENTARY DATA
FS-1
Table of Contents
| Management’s Discussion and Analysis of Financial Condition and Results of Operations |
Key Financial Results
| Millions of dollars, except per-share amounts | 2007 | 2006 | 2005 | ||||||||||
| Net Income | $ | 18,688 | $ | 17,138 | $ | 14,099 | |||||||
| Per Share Amounts: | |||||||||||||
| Net Income – Basic | $ | 8.83 | $ | 7.84 | $ | 6.58 | |||||||
| – Diluted | $ | 8.77 | $ | 7.80 | $ | 6.54 | |||||||
| Dividends | $ | 2.26 | $ | 2.01 | $ | 1.75 | |||||||
| Sales and Other Operating Revenues | $ | 214,091 | $ | 204,892 | $ | 193,641 | |||||||
| Return on: | |||||||||||||
| Average Capital Employed | 23.1 | % | 22.6 | % | 21.9 | % | |||||||
| Average Stockholders’ Equity | 25.6 | % | 26.0 | % | 26.1 | % | |||||||
Income by Major Operating Area
| Millions of dollars | 2007 | 2006 | 2005 | ||||||||||
| Upstream – Exploration and Production | |||||||||||||
| United States | $ | 4,532 | $ | 4,270 | $ | 4,168 | |||||||
| International | 10,284 | 8,872 | 7,556 | ||||||||||
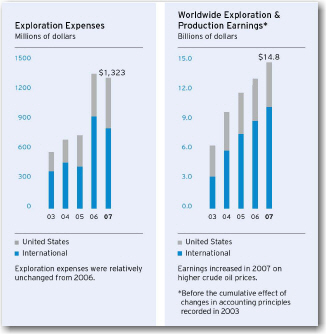
| Total Upstream | 14,816 | 13,142 | 11,724 | ||||||||||
| Downstream – Refining, Marketing and Transportation | |||||||||||||
| United States | 966 | 1,938 | 980 | ||||||||||
| International | 2,536 | 2,035 | 1,786 | ||||||||||
| Total Downstream | 3,502 | 3,973 | 2,766 | ||||||||||
| Chemicals | 396 | 539 | 298 | ||||||||||
| All Other | (26 | ) | (516 | ) | (689 | ) | |||||||
| Net Income* | $ | 18,688 | $ | 17,138 | $ | 14,099 | |||||||
| *Includes Foreign Currency Effects: | $ (352) | $ (219) | $ (61) | ||||||||||
Refer to the “Results of Operations” section beginning on page FS-6 for a detailed discussion of financial results by major operating area for the three years ending December 31, 2007.
Business Environment and Outlook
FS-2
Table of Contents
may be caused by military conflicts, civil unrest or political uncertainty. Moreover, any of these factors could also inhibit the company’s production capacity in an affected region. The company monitors developments closely in the countries in which it operates and holds investments, and attempts to manage risks in operating its facilities and business.
FS-3
Table of Contents
| Management’s Discussion and Analysis of Financial Condition and Results of Operations |
Downstream Earnings for the downstream segment are closely tied to margins on the refining and marketing of products that include gasoline, diesel, jet fuel, lubricants, fuel oil and feedstocks for chemical manufacturing. Industry margins are sometimes volatile and can be affected by the global and regional supply-and-demand balance for refined products and by changes in the price of crude oil used for refinery feedstock. Industry margins can also be influenced by refined-product inventory levels, geopolitical events, refinery maintenance programs and disruptions at refineries resulting from unplanned outages that may be due to severe weather, fires or other operational events.
FS-4
Table of Contents
Chemicals Earnings in the petrochemicals business are closely tied to global chemical demand, industry inventory levels and plant capacity utilization. Feedstock and fuel costs, which tend to follow crude oil and natural gas price movements, also influence earnings in this segment.
Operating Developments
Upstream
Downstream
FS-5
Table of Contents
| Management’s Discussion and Analysis of Financial Condition and Results of Operations |
Other
Results of Operations
U.S. Upstream–Exploration and Production
| Millions of dollars | 2007 | 2006 | 2005 | ||||||||||
Income | $ | 4,532 | $ | 4,270 | $ | 4,168 | |||||||
U.S. upstream income of $4.5 billion in 2007 increased approximately $260 million from 2006. Results in 2007 benefited approximately $700 million from higher prices for crude oil and natural gas liquids. This benefit to income was partially offset by the
Net oil-equivalent production in 2007 averaged 743,000 barrels per day, down 2.6 percent from 2006 and up 2 percent from 2005, which included only five months of production from the Unocal properties acquired in August of that year. The net liquids component of oil-equivalent production for 2007 averaged 460,000 barrels a day, which was essentially flat compared with 2006, and an increase of 1 percent from 2005. Net natural gas production averaged 1.7 billion cubic feet per day in 2007, down 6 percent from 2006 and up 4 percent from 2005.
FS-6
Table of Contents
International Upstream-Exploration and Production
| Millions of dollars | 2007 | 2006 | 2005 | ||||||||||
Income* | $ | 10,284 | $ | 8,872 | $ | 7,556 | |||||||
| *Includes Foreign Currency Effects: | $ (417) | $ (371) | $ 14 | ||||||||||
International upstream income of $10.3 billion in 2007 increased $1.4 billion from 2006. Earnings in 2007 benefited approximately $1.6 billion from higher prices, primarily for crude oil, and $300 million from increased liftings. Non-recurring income tax items also benefited earnings between periods. These benefits to income were partially offset by the impact of higher operating and depreciation expenses.
US. Downstream-Refining, Marketing and Transportation
| Millions of dollars | 2007 | 2006 | 2005 | ||||||||||
Income | $ | 966 | $ | 1,938 | $ | 980 | |||||||
U.S. downstream earnings of $966 million in 2007 declined nearly $1 billion from 2006 and were essentially the same as 2005. The decline in 2007 from 2006 was associated mainly with weaker refined-product margins due to the effects of higher crude oil prices and the negative impacts of higher planned and unplanned downtime on refinery production volumes at the company’s three major refineries. Operating expenses were also higher in 2007. The improvement in 2006 earnings from 2005 was primarily associated with higher average refined-product margins in 2006 and the adverse effect of downtime in 2005 at refining, marketing and pipeline operations that was caused by hurricanes in the Gulf of Mexico.
FS-7
Table of Contents
| Management’s Discussion and Analysis of Financial Condition and Results of Operations |
International Downstream–Refining, Marketing and Transportation
| Millions of dollars | 2007 | 2006 | 2005 | ||||||||||
Income* | $ | 2,536 | $ | 2,035 | $ | 1,786 | |||||||
| *Includes Foreign Currency Effects: | $ 62 | $ 98 | $(24 | ) | |||||||||
International downstream income of $2.5 billion in 2007 increased about $500 million from 2006 and $750 million from 2005. Results for 2007 included gains of approximately $1 billion on the sale of assets, including an interest in a refinery and marketing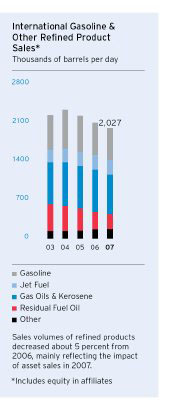 assets in the Benelux region of Europe. Margins on the sale of refined products in 2007 were up slightly from the prior year. Operating expenses were higher, and earnings from the company’s shipping operations were lower. The increase in earnings in 2006 compared with 2005 was associated mainly with the benefit of higher refined-product sales margins in the Asia-Pacific area and Canada and improved results from crude-oil and refined-product trading activities.
Chemicals
| Millions of dollars | 2007 | 2006 | 2005 | ||||||||||
Income* | $ | 396 | $ | 539 | $ | 298 | |||||||
| *Includes Foreign Currency Effects: | $ (3) | $ (8) | $ – | ||||||||||
The chemicals segment includes the company’s Oronite subsidiary and the 50 percent-owned Chevron Phillips Chemical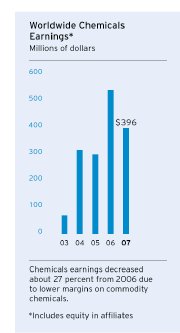 Company LLC (CPChem). In 2007, earnings were $396 million, compared with $539 million and $298 million in 2006 and 2005, respectively. Between 2006 and 2007, the benefit of improved margins on sales of lubricants and fuel additives by Oronite was more than offset by the effect of lower margins on the sale of commodity chemicals by CPChem. In 2006, earnings of $539 million increased about $240 million from 2005 due to higher margins for commodity chemicals at CPChem and for fuel and lubricant additives at Oronite.
All Other
| Millions of dollars | 2007 | 2006 | 2005 | ||||||||||
Net Charges* | $ | (26 | ) | $ | (516 | ) | $ | (689 | ) | ||||
| *Includes Foreign Currency Effects: | $ 6 | $ 62 | (51 | ) | |||||||||
All Other includes mining operations, power generation businesses, worldwide cash management and debt financing activities, corporate administrative functions, insurance operations, real estate activities, alternative fuels and technology companies, and the company’s interest in Dynegy prior to its sale in May 2007.
FS-8
Table of Contents
Consolidated Statement of Income
| Millions of dollars | 2007 | 2006 | 2005 | ||||||||||
Sales and other operating revenues | $ | 214,091 | $ | 204,892 | $ | 193,641 | |||||||
Sales and other operating revenues in 2007 increased over 2006 due primarily to higher prices for crude oil, natural gas, natural gas liquids and refined products, partially offset by lower sales volumes. The increase in 2006 from 2005 was primarily due to higher prices for refined products. The higher revenues in 2006 were net of an impact from a change in the accounting for buy/sell contracts, as described in Note 13 on page FS-42.
| Millions of dollars | 2007 | 2006 | 2005 | ||||||||||
Income from equity affiliates | $ | 4,144 | $ | 4,255 | $ | 3,731 | |||||||
Lower income from equity affiliates in 2007 was mainly due to a decline in earnings from CPChem, Dynegy (sold in May 2007) and downstream affiliates in the Asia-Pacific area. Partially offsetting these declines were improved results for Tengizchevroil (TCO) and income for a full year from Petroboscan, which was converted from an operating service agreement to a joint-stock company in October 2006. The increase between 2005 and 2006 was primarily due to improved results for TCO and CPChem. Refer to Note 11, beginning on page FS-40, for a discussion of Chevron’s investment in affiliated companies.
| Millions of dollars | 2007 | 2006 | 2005 | ||||||||||
Other income | $ | 2,669 | $ | 971 | $ | 828 | |||||||
Other income of nearly $2.7 billion in 2007 included the net of gains totaling $1.7 billion from the sale of downstream assets in the Benelux countries and the company’s investment in Dynegy and a loss of approximately $245 million on the early redemption of Texaco debt. Interest income was approximately $600 million, $600 million and $400 million in 2007, 2006 and 2005, respectively. Foreign currency losses were $352 million, $260 million and $60 million in the corresponding years.
| Millions of dollars | 2007 | 2006 | 2005 | ||||||||||
Purchased crude oil and products | $ | 133,309 | $ | 128,151 | $ | 127,968 | |||||||
Crude oil and product purchases in 2007 increased from 2006 due to higher prices for crude oil, natural gas, natural gas liquids and refined products. Crude oil and product purchases in 2006 increased from 2005 on higher prices for crude oil and refined products and the inclusion of Unocal-related amounts for the full year 2006 vs. five months in 2005. The increase was mitigated by the effect of the accounting change in April 2006 for buy/sell contracts.
| Millions of dollars | 2007 | 2006 | 2005 | ||||||||||
Operating, selling, general and administrative expenses | $ | 22,858 | $ | 19,717 | $ | 17,019 | |||||||
Operating, selling, general and administrative expenses in 2007 increased 16 percent from a year earlier. Expenses were higher in a number of categories, with the largest increases recorded for the cost of employee payroll and contract labor. Total expenses increased in 2006 from 2005 due mainly to the inclusion of former-Unocal expenses for the full year 2006. Besides this effect, expenses were higher in 2006 for labor, transportation, and uninsured costs associated with the hurricanes in 2005.
| Millions of dollars | 2007 | 2006 | 2005 | ||||||||||
Exploration expense | $ | 1,323 | $ | 1,364 | $ | 743 | |||||||
Exploration expenses in 2007 declined from 2006 mainly due to lower amounts for well write-offs and geological and geophysical costs for operations outside the United States. Expenses increased in 2006 from 2005 due to higher amounts for well write-offs and geological and geophysical costs for operations outside the United States, as well as the inclusion of Unocal-related amounts for the full year 2006.
| Millions of dollars | 2007 | 2006 | 2005 | ||||||||||
Depreciation, depletion and amortization | $ | 8,708 | $ | 7,506 | $ | 5,913 | |||||||
Depreciation, depletion and amortization expenses increased from 2005 through 2007, reflecting an increase in charges related to asset write-downs and higher depreciation rates for certain crude oil and natural gas producing fields worldwide and the inclusion of Unocal-related amounts beginning in August 2005.
| Millions of dollars | 2007 | 2006 | 2005 | ||||||||||
Taxes other than on income | $ | 22,266 | $ | 20,883 | $ | 20,782 | |||||||
Taxes other than on income increased in 2007 from a year earlier due to higher duties in the company’s U.K. downstream operations. Taxes other than on income were essentially unchanged in 2006 from 2005, with the effect of higher U.S. refined product sales being offset by lower sales volumes subject to duties in the company’s European downstream operations.
| Millions of dollars | 2007 | 2006 | 2005 | ||||||||||
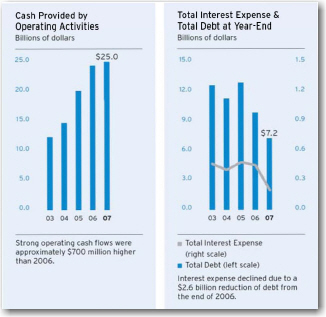
Interest and debt expense | $ | 166 | $ | 451 | $ | 482 | |||||||
Interest and debt expense in 2007 decreased from 2006 primarily due to lower average debt balances and higher amounts of interest capitalized. The decrease in 2006 vs. 2005 was mainly due to lower average debt balances and an increase in the amount of interest capitalized, partially offset by higher average interest rates on commercial paper and other variable-rate debt.
FS-9
Table of Contents
| Management’s Discussion and Analysis of Financial Condition and Results of Operations |
| Millions of dollars | 2007 | 2006 | 2005 | ||||||||||
Income tax expense | $ | 13,479 | $ | 14,838 | $ | 11,098 | |||||||
Effective income tax rates were 42 percent in 2007, 46 percent in 2006 and 44 percent in 2005. Rates were lower in 2007 compared with the prior year due mainly to the impact of nonrecurring items, including asset sales in 2007 and the absence of 2006 charges related to a tax-law change that increased tax rates on upstream operations in the U.K. North Sea and the settlement of a tax claim in Venezuela. The higher tax rate in 2006 compared with 2005 also reflected these nonrecurring charges in 2006. Refer also to the discussion of income taxes in Note 15 beginning on page FS-43.
Selected Operating Data1,2
| 2007 | 2006 | 2005 | |||||||||||
U.S. Upstream3 | |||||||||||||
| Net Crude Oil and Natural Gas Liquids Production (MBPD) | 460 | 462 | 455 | ||||||||||
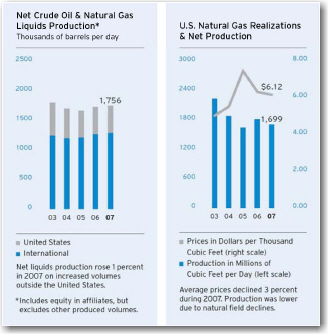
Net Natural Gas Production (MMCFPD)4 | 1,699 | 1,810 | 1,634 | ||||||||||
| Net Oil-Equivalent Production (MBOEPD) | 743 | 763 | 727 | ||||||||||
| Sales of Natural Gas (MMCFPD) | 7,624 | 7,051 | 5,449 | ||||||||||
| Sales of Natural Gas Liquids (MBPD) | 160 | 124 | 151 | ||||||||||
| Revenues From Net Production | |||||||||||||
| Liquids ($/Bbl) | $ | 63.16 | $ | 56.66 | $ | 46.97 | |||||||
| Natural Gas ($/MCF) | $ | 6.12 | $ | 6.29 | $ | 7.43 | |||||||
International Upstream3 | |||||||||||||
| Net Crude Oil and Natural Gas Liquids Production (MBPD) | 1,296 | 1,270 | 1,214 | ||||||||||
Net Natural Gas Production (MMCFPD)4 | 3,320 | 3,146 | 2,599 | ||||||||||
Net Oil-Equivalent Production (MBOEPD)5 | 1,876 | 1,904 | 1,790 | ||||||||||
| Sales Natural Gas (MMCFPD) | 3,792 | 3,478 | 2,450 | ||||||||||
| Sales Natural Gas Liquids (MBPD) | 118 | 102 | 120 | ||||||||||
| Revenues From Liftings | |||||||||||||
| Liquids ($/Bbl) | $ | 65.01 | $ | 57.65 | $ | 47.59 | |||||||
| Natural Gas ($/MCF) | $ | 3.90 | $ | 3.73 | $ | 3.19 | |||||||
U.S. and International Upstream3 | |||||||||||||
Net Oil-Equivalent Production Including Other Produced Volumes (MBOEPD)4,5 | |||||||||||||
| United States | 743 | 763 | 727 | ||||||||||
| International | 1,876 | 1,904 | 1,790 | ||||||||||
| Total | 2,619 | 2,667 | 2,517 | ||||||||||
U.S. Downstream | �� | ||||||||||||
Gasoline Sales (MBPD)6 | 728 | 712 | 709 | ||||||||||
| Other Refined Product Sales (MBPD) | 729 | 782 | 764 | ||||||||||
Total (MBPD)7 | 1,457 | 1,494 | 1,473 | ||||||||||
| Refinery Input (MBPD) | 812 | 939 | 845 | ||||||||||
International Downstream | |||||||||||||
Gasoline Sales (MBPD)6 | 581 | 595 | 662 | ||||||||||
| Other Refined Product Sales (MBPD) | 1,446 | 1,532 | 1,590 | ||||||||||
Total (MBPD)7,8 | 2,027 | 2,127 | 2,252 | ||||||||||
| Refinery Input (MBPD) | 1,021 | 1,050 | 1,038 | ||||||||||
| 1 Includes equity in affiliates. | ||||||||||||
| 2 MBPD = Thousands of barrels per day; MMCFPD = Millions of cubic feet per day; | ||||||||||||
| MBOEPD = Thousands of barrels of oil equivalents per day; Bbl = Barrel; | ||||||||||||
| MCF = Thousands of cubic feet. Oil-equivalent gas (OEG) conversion ratio is 6,000 cubic feet | ||||||||||||
| of gas = 1 barrel of oil. | ||||||||||||
| 3 Includes net production beginning August 2005, for properties associated with acquisition | ||||||||||||
| of Unocal. | ||||||||||||
| 4 Includes natural gas consumed in operations (MMCFPD): | ||||||||||||
| United States | 65 | 56 | 48 | |||||||||
| International | 433 | 419 | 356 | |||||||||
| 5 Includes other produced volumes (MBPD): | ||||||||||||
| Athabasca Oil Sands – Net | 27 | 27 | 32 | |||||||||
| Boscan Operating Service Agreement | – | 82 | 111 | |||||||||
| 27 | 109 | 143 | ||||||||||
| 6 Includes branded and unbranded gasoline. | ||||||||||||
| 7 Includes volumes for buy/sell contracts (MBPD): | ||||||||||||
| United States | – | 26 | 88 | |||||||||
| International | – | 24 | 129 | |||||||||
8 Includes sales of affiliates (MBPD): | 492 | 492 | 498 | |||||||||
FS-10
Table of Contents
Liquidity and Capital Resources
FS-11
Table of Contents
| Management’s Discussion and Analysis of Financial Condition and Results of Operations |
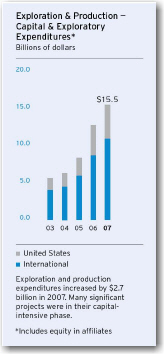
Capital and Exploratory Expenditures
| 2007 | 2006 | 2005 | ||||||||||||||||||||||||||||||||||||
| Millions of dollars | U.S. | Int'l. | Total | U.S. | Int'l. | Total | U.S. | Int'l. | Total | |||||||||||||||||||||||||||||
| Upstream – Exploration and Production | $ | 4,558 | $ | 10,980 | $ | 15,538 | $ | 4,123 | $ | 8,696 | $ | 12,819 | $ | 2,450 | $ | 5,939 | $ | 8,389 | ||||||||||||||||||||
| Downstream – Refining, Marketing and Transportation | 1,576 | 1,867 | 3,443 | 1,176 | 1,999 | 3,175 | 818 | 1,332 | 2,150 | |||||||||||||||||||||||||||||
| Chemicals | 218 | 53 | 271 | 146 | 54 | 200 | 108 | 43 | 151 | |||||||||||||||||||||||||||||
| All Other | 768 | 6 | 774 | 403 | 14 | 417 | 329 | 44 | 373 | |||||||||||||||||||||||||||||
| Total | $ | 7,120 | $ | 12,906 | $ | 20,026 | $ | 5,848 | $ | 10,763 | $ | 16,611 | $ | 3,705 | $ | 7,358 | $ | 11,063 | ||||||||||||||||||||
| Total, Excluding Equity in Affiliates | $ | 6,900 | $ | 10,790 | $ | 17,690 | $ | 5,642 | $ | 9,050 | $ | 14,692 | $ | 3,522 | $ | 5,860 | $ | 9,382 | ||||||||||||||||||||
FS-12
Table of Contents
Financial Ratios
Financial Ratios
| At December 31 | |||||||||||||
| 2007 | 2006 | 2005 | |||||||||||
| Current Ratio | 1.2 | 1.3 | 1.4 | ||||||||||
| Interest Coverage Ratio | 69.2 | 53.5 | 47.5 | ||||||||||
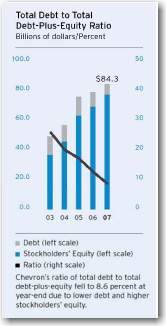
| Total Debt/Total Debt-Plus-Equity | 8.6 | % | 12.5 | % | 17.0 | % | |||||||
Current Ratio – current assets divided by current liabilities. The current ratio in all periods was adversely affected by the fact that Chevron’s inventories are valued on a Last-In-First-Out basis. At year-end 2007, the book value of inventory was lower than replacement costs, based on average acquisition costs during the year, by approximately $7 billion.
Guarantees, Off-Balance-Sheet Arrangements and Contractual Obligations, and Other Contingencies
Direct Guarantee
| Millions of dollars | Commitment Expiration by Period | |||||||||||||||||||
| Total | 2008 | 2009- 2011 | 2012 | After 2012 | ||||||||||||||||
| Guarantee of non-consolidated affiliate or joint-venture obligation | $ | 613 | $ | – | $ | – | $ | 38 | $ | 575 | ||||||||||
The company’s guarantee of approximately $600 million is associated with certain payments under a terminal use agreement entered into by a company affiliate. The terminal is expected to be operational by 2012. Over the approximate 16-year term of the guarantee, the maximum guarantee amount will reduce over time as certain fees are paid by the affiliate. There are numerous cross-indemnity agreements with the affiliate and the other partners to permit recovery of any amounts paid under the guarantee. Chevron carries no liability for its obligation under this guarantee.
FS-13
Table of Contents
| Management’s Discussion and Analysis of Financial Condition and Results of Operations |
Contractual Obligations
| Millions of dollars | Payments Due by Period | |||||||||||||||||||
| 2009- | After | |||||||||||||||||||
| Total | 2008 | 2011 | 2012 | 2012 | ||||||||||||||||
On Balance Sheet:1 | ||||||||||||||||||||
Short-Term Debt2 | $ | 1,162 | $ | 1,162 | $ | – | $ | – | $ | – | ||||||||||
Long-Term Debt2 | 5,664 | – | 4,926 | 33 | 705 | |||||||||||||||
| Noncancelable Capital Lease Obligations | 406 | – | 193 | 61 | 152 | |||||||||||||||
| Interest | 3,950 | 360 | 899 | 292 | 2,399 | |||||||||||||||
| Off-Balance-Sheet: | ||||||||||||||||||||
| Noncancelable Operating Lease Obligations | 3,167 | 513 | 1,255 | 293 | 1,106 | |||||||||||||||
| Throughput and Take-or-Pay Agreements | 13,118 | 3,699 | 4,783 | 618 | 4,018 | |||||||||||||||
Other Unconditional Purchase Obligations3 | 6,300 | 988 | 3,779 | 653 | 880 | |||||||||||||||
| 1 | Does not include amounts related to the company’s income tax liabilities associated with uncertain tax positions. The company is unable to make reasonable estimates for the periods in which these liabilities may become due. The company does not expect settlement of such liabilities will have a material effect on its results of operations, consolidated financial position or liquidity in any single period. | |
| 2 | $4.4. billion of short-term debt that the company expects to refinance is included in long-term debt. The repayment schedule above reflects the projected repayment of the entire amounts in the 2009-2011 period. | |
| 3 | Does not include obligations to purchase the company’s share of natural gas liquids and regasified natural gas associated with operations of the 36.4 percent-owned Angola LNG affiliate. The LNG plant is expected to commence operations in 2012 and is designed to produce 5.2 million metric tons of liquefied natural gas and related natural gas liquids per year. Volumes and prices associated with these purchase obligations are neither fixed nor determinable. |
Financial and Derivative Instruments
FS-14
Table of Contents
| Millions of dollars | 2007 | |||
| Crude Oil | $ | 29 | ||
| Natural Gas | 3 | |||
| Refined Products | 23 | |||
Incremental Increase (Decrease) in Fair Value of Open Commodity
Derivative Contracts Assuming a Hypothetical Increase in
Year-End Commodity Prices of 10 Percent
| Millions of dollars | 2007 | 2006 | |||||||
| Crude Oil | $ | (113 | ) | $ | 4 | ||||
| Natural Gas | 14 | 10 | |||||||
| Refined Products | (96 | ) | (30 | ) | |||||
The same hypothetical decrease in prices of these commodities would result in approximately the same opposite effects on the fair values of the contracts. The hypothetical effect on these contracts was estimated by calculating the fair value of the contracts as the difference between the hypothetical and current market prices multiplied by the contract amounts.
Transactions With Related Parties
FS-15
Table of Contents
| Management’s Discussion and Analysis of Financial Condition and Results of Operations |
Litigation and Other Contingencies
FS-16
Table of Contents
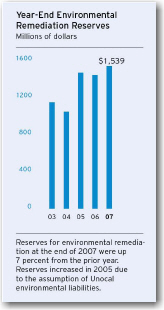
| Millions of dollars | 2007 | 2006 | 2005 | ||||||||||
| Balance at January 1 | $ | 1,441 | $ | 1,469 | $ | 1,047 | |||||||
| Net Additions | 562 | 366 | 731 | ||||||||||
| Expenditures | (464 | ) | (394 | ) | (309 | ) | |||||||
Balance at December 31 | $ | 1,539 | $ | 1,441 | $ | 1,469 | |||||||
Included in the $1,539 million year-end 2007 reserve balance were remediation activities of 240 sites for which the company had been identified as a potentially responsible party or otherwise involved in the remediation by the U.S. Environmental Protection Agency (EPA) or other regulatory agencies under the provisions of the federal Superfund law or analogous state laws. The company’s remediation reserve for these sites at year-end 2007 was $123 million. The federal Superfund law and analogous state laws provide for joint and several liability for all responsible parties. Any future actions by the EPA or other regulatory agencies to require Chevron to assume other potentially responsible parties’ costs at designated hazardous waste sites are not expected to have a material effect on the company’s consolidated financial position or liquidity.
FS-17
Table of Contents
| Management’s Discussion and Analysis of Financial Condition and Results of Operations |
Environmental Matters
Critical Accounting Estimates and Assumptions
| 1. | the nature of the estimates or assumptions is material due to the levels of subjectivity and judgment necessary to account for highly uncertain matters or the susceptibility of such matters to change; and | ||
| 2. | the impact of the estimates and assumptions on the company’s financial condition or operating performance is material. |
FS-18
Table of Contents
FS-19
Table of Contents
| Management’s Discussion and Analysis of Financial Condition and Results of Operations |
FS-20
Table of Contents
New Accounting Standards
FS-21
Table of Contents
| Management’s Discussion and Analysis of Financial Condition and Results of Operations |
FS-22
Table of Contents
THIS PAGE INTENTIONALLY LEFT BLANK
FS-23
Table of Contents
| 2007 | 2006 | ||||||||||||||||||||||||||||||||
| Millions of dollars, except per-share amounts | 4th Q | 3rd Q | 2nd Q | 1st Q | 4th Q | 3rd Q | 2nd Q | 1st Q | |||||||||||||||||||||||||
Revenues and Other Income | |||||||||||||||||||||||||||||||||
Sales and other operating revenues1,2 | $ | 59,900 | $ | 53,545 | $ | 54,344 | $ | 46,302 | $ | 46,238 | $ | 52,977 | $ | 52,153 | $ | 53,524 | |||||||||||||||||
| Income from equity affiliates | 1,153 | 1,160 | 894 | 937 | 1,079 | 1,080 | 1,113 | 983 | |||||||||||||||||||||||||
| Other income | 357 | 468 | 856 | 988 | 429 | 155 | 270 | 117 | |||||||||||||||||||||||||
Total Revenues and Other Income | 61,410 | 55,173 | 56,094 | 48,227 | 47,746 | 54,212 | 53,536 | 54,624 | |||||||||||||||||||||||||
Costs and Other Deductions | |||||||||||||||||||||||||||||||||
Purchased crude oil and products2 | 38,056 | 33,988 | 33,138 | 28,127 | 27,658 | 32,076 | 32,747 | 35,670 | |||||||||||||||||||||||||
| Operating expenses | 4,798 | 4,397 | 4,124 | 3,613 | 4,092 | 3,650 | 3,835 | 3,047 | |||||||||||||||||||||||||
| Selling, general and administrative expenses | 1,833 | 1,446 | 1,516 | 1,131 | 1,203 | 1,428 | 1,207 | 1,255 | |||||||||||||||||||||||||
| Exploration expenses | 449 | 295 | 273 | 306 | 547 | 284 | 265 | 268 | |||||||||||||||||||||||||
| Depreciation, depletion and amortization | 2,094 | 2,495 | 2,156 | 1,963 | 1,988 | 1,923 | 1,807 | 1,788 | |||||||||||||||||||||||||
Taxes other than on income1 | 5,560 | 5,538 | 5,743 | 5,425 | 5,533 | 5,403 | 5,153 | 4,794 | |||||||||||||||||||||||||
| Interest and debt expense | 7 | 22 | 63 | 74 | 92 | 104 | 121 | 134 | |||||||||||||||||||||||||
| Minority interests | 35 | 25 | 19 | 28 | 2 | 20 | 22 | 26 | |||||||||||||||||||||||||
Total Costs and Other Deductions | 52,832 | 48,206 | 47,032 | 40,667 | 41,115 | 44,888 | 45,157 | 46,982 | |||||||||||||||||||||||||
Income Before Income Tax Expense | 8,578 | 6,967 | 9,062 | 7,560 | 6,631 | 9,324 | 8,379 | 7,642 | |||||||||||||||||||||||||
Income Tax Expense | 3,703 | 3,249 | 3,682 | 2,845 | 2,859 | 4,307 | 4,026 | 3,646 | |||||||||||||||||||||||||
Net Income | $ | 4,875 | $ | 3,718 | $ | 5,380 | $ | 4,715 | $ | 3,772 | $ | 5,017 | $ | 4,353 | $ | 3,996 | |||||||||||||||||
Per-Share of Common Stock | |||||||||||||||||||||||||||||||||
Net Income | |||||||||||||||||||||||||||||||||
– Basic | $ | 2.34 | $ | 1.77 | $ | 2.52 | $ | 2.20 | $ | 1.75 | $ | 2.30 | $ | 1.98 | $ | 1.81 | |||||||||||||||||
– Diluted | $ | 2.32 | $ | 1.75 | $ | 2.52 | $ | 2.18 | $ | 1.74 | $ | 2.29 | $ | 1.97 | $ | 1.80 | |||||||||||||||||
Dividends | $ | 0.58 | $ | 0.58 | $ | 0.58 | $ | 0.52 | $ | 0.52 | $ | 0.52 | $ | 0.52 | $ | 0.45 | |||||||||||||||||
Common Stock Price Range – High3 | $ | 94.86 | $ | 94.84 | $ | 84.24 | $ | 74.95 | $ | 75.97 | $ | 67.85 | $ | 62.88 | $ | 62.21 | |||||||||||||||||
– Low3 | $ | 83.79 | $ | 80.76 | $ | 74.83 | $ | 66.43 | $ | 62.94 | $ | 60.88 | $ | 56.78 | $ | 54.08 | |||||||||||||||||
1 Includes excise, value-added and similar taxes: | $2,548 | $2,550 | $2,609 | $2,414 | $2,498 | $2,522 | $2,416 | $2,115 | |||||||||||||||||||||||||
2 Includes amounts for buy/sell contracts: | $ – | $ – | $ – | $ – | $ – | $ – | $ – | $6,725 | |||||||||||||||||||||||||
3 End of day price. | |||||||||||||||||||||||||||||||||
The company’s common stock is listed on the New York Stock Exchange (trading symbol: CVX). As of February 22, 2008, stockholders of record numbered approximately 214,000. There are no restrictions on the company’s ability to pay dividends.
FS-24
Table of Contents
Management’s Responsibility for Financial Statements
To the Stockholders of Chevron Corporation
Management’s Report on Internal Control Over Financial Reporting
The company’s management is responsible for establishing and maintaining adequate internal control over financial reporting, as such term is defined in Exchange Act Rule 13a–15(f). The company’s management, including the Chief Executive Officer and Chief Financial Officer, conducted an evaluation of the effectiveness of the company’s internal control over financial reporting based on theInternal Control – Integrated Frameworkissued by the Committee of Sponsoring Organizations of the Treadway Commission. Based on the results of this evaluation, the company’s management concluded that internal control over financial reporting was effective as of December 31, 2007.
 |  |  | ||
| David J. O’Reilly | Stephen J. Crowe | Mark A. Humphrey | ||
| Chairman of the Board | Vice President | Vice President | ||
| and Chief Executive Officer | and Chief Financial Officer | and Comptroller | ||
| February 28, 2008 |
FS-25
Table of Contents
Report of Independent Registered Public Accounting Firm
To the Stockholders and the Board of Directors of Chevron Corporation:
In our opinion, the accompanying consolidated balance sheets and the related consolidated statements of income, comprehensive income, shareholders’ equity and cash flows present fairly, in all material respects, the financial position of Chevron Corporation and its subsidiaries at December 31, 2007, and December 31, 2006, and the results of their operations and their cash flows for each of the three years in the period ended December 31, 2007, in conformity with accounting principles generally accepted in the United States of America. In addition, in our opinion, the financial statement schedule listed in the index appearing under Item 15(a)(2) presents fairly, in all material respects, the information set forth therein when read in conjunction with the related consolidated financial statements. Also, in our opinion, the Company maintained, in all material respects, effective internal control over financial reporting as of December 31, 2007, based on criteria established inInternal Control – Integrated Frameworkissued by the Committee of Sponsoring Organizations of the Treadway Commission (COSO). The Company’s management is responsible for these financial statements and financial statement schedule; for maintaining effective internal control over financial reporting and for its assessment of the effectiveness of internal control over financial reporting, included in the accompanying Management’s Report on Internal Controls Over Financial Reporting. Our responsibility is to express opinions on these financial statements, on the financial statement schedule, and on the Company’s internal control over financial reporting based on our integrated audits. We conducted our audits in accordance with the standards of the Public Company Accounting Oversight Board (United States). Those standards require that we plan and perform the audits to obtain reasonable assurance about whether the financial statements are free of material misstatements and whether effective internal control over financial reporting was maintained in all material respects. Our audits of the financial statements included examining, on a test basis, evidence supporting the amounts and disclosures in the financial statements, assessing the accounting principles used and significant estimates made by management, and evaluating the overall financial statement presentation. Our audit of internal control over financial reporting included obtaining an understanding of internal control over financial reporting, assessing the risk that a material weakness exists, and testing and evaluating the design and operating effectiveness of internal control, based on the assessed risk. Our audits also included performing such other procedures as we considered necessary in
the circumstances. We believe that our audits provide a reasonable basis for our opinions.
/s/PricewaterhouseCoopers LLP
San Francisco, California
February 28, 2008
FS-26
Table of Contents
| Year ended December 31 | |||||||||||||
| 2007 | 2006 | 2005 | |||||||||||
Revenues and Other Income | |||||||||||||
Sales and other operating revenues1,2 | $ | 214,091 | $ | 204,892 | $ | 193,641 | |||||||
| Income from equity affiliates | 4,144 | 4,255 | 3,731 | ||||||||||
| Other income | 2,669 | 971 | 828 | ||||||||||
Total Revenues and Other Income | 220,904 | 210,118 | 198,200 | ||||||||||
Costs and Other Deductions | |||||||||||||
Purchased crude oil and products2 | 133,309 | 128,151 | 127,968 | ||||||||||
| Operating expenses | 16,932 | 14,624 | 12,191 | ||||||||||
| Selling, general and administrative expenses | 5,926 | 5,093 | 4,828 | ||||||||||
| Exploration expenses | 1,323 | 1,364 | 743 | ||||||||||
| Depreciation, depletion and amortization | 8,708 | 7,506 | 5,913 | ||||||||||
Taxes other than on income1 | 22,266 | 20,883 | 20,782 | ||||||||||
| Interest and debt expense | 166 | 451 | 482 | ||||||||||
| Minority interests | 107 | 70 | 96 | ||||||||||
Total Costs and Other Deductions | 188,737 | 178,142 | 173,003 | ||||||||||
Income Before Income Tax Expense | 32,167 | 31,976 | 25,197 | ||||||||||
Income Tax Expense | 13,479 | 14,838 | 11,098 | ||||||||||
Net Income | $ | 18,688 | $ | 17,138 | $ | 14,099 | |||||||
Per-Share of Common Stock | |||||||||||||
Net Income | |||||||||||||
– Basic | $ | 8.83 | $ | 7.84 | $ | 6.58 | |||||||
– Diluted | $ | 8.77 | $ | 7.80 | $ | 6.54 | |||||||
1 Includes excise, value-added and similar taxes. | $ | 10,121 | $ | 9,551 | $ | 8,719 | |||||||
2 Includes amounts in revenues for buy/sell contracts; associated costs are in “Purchased crude oil and products.” | |||||||||||||
| Refer also to Note 13, on page FS-42. | $ | – | $ | 6,725 | $ | 23,822 | |||||||
See accompanying Notes to the Consolidated Financial Statements.
FS-27
Table of Contents
| Year ended December 31 | |||||||||||||
| 2007 | 2006 | 2005 | |||||||||||
Net Income | $ | 18,688 | $ | 17,138 | $ | 14,099 | |||||||
| Currency translation adjustment | |||||||||||||
| Unrealized net change arising during period | 31 | 55 | (5 | ) | |||||||||
| Unrealized holding gain (loss) on securities | |||||||||||||
| Net gain (loss) arising during period | 17 | (88 | ) | (32 | ) | ||||||||
| Reclassification to net income of net realized loss | 2 | – | – | ||||||||||
| Total | 19 | (88 | ) | (32 | ) | ||||||||
| Derivatives | |||||||||||||
| Net derivatives (loss) gain on hedge transactions | (10 | ) | 2 | (242 | ) | ||||||||
| Reclassification to net income of net realized loss | 7 | 95 | 34 | ||||||||||
| Income taxes on derivatives transactions | (3 | ) | (30 | ) | 77 | ||||||||
| Total | (6 | ) | 67 | (131 | ) | ||||||||
| Defined benefit plans | |||||||||||||
| Minimum pension liability adjustment | – | (88 | ) | 89 | |||||||||
| Actuarial loss | |||||||||||||
| Amortization to net income of net actuarial loss | 356 | – | – | ||||||||||
| Actuarial gain arising during period | 530 | – | – | ||||||||||
| Prior service cost | |||||||||||||
| Amortization to net income of net prior service credits | (15 | ) | – | – | |||||||||
| Prior service cost arising during period | 204 | – | – | ||||||||||
| Non-sponsored defined benefit plans | 19 | – | – | ||||||||||
| Income taxes on defined benefit plans | (409 | ) | 50 | (31 | ) | ||||||||
| Total | 685 | (38 | ) | 58 | |||||||||
Other Comprehensive Gain (Loss), Net of Tax | 729 | (4 | ) | (110 | ) | ||||||||
Comprehensive Income | $ | 19,417 | $ | 17,134 | $ | 13,989 | |||||||
FS-28
Table of Contents
| At December 31 | |||||||||
| 2007 | 2006 | ||||||||
Assets | |||||||||
| Cash and cash equivalents | $ | 7,362 | $ | 10,493 | |||||
| Marketable securities | 732 | 953 | |||||||
| Accounts and notes receivable (less allowance: 2007 – $165; 2006 – $175) | 22,446 | 17,628 | |||||||
| Inventories: | |||||||||
| Crude oil and petroleum products | 4,003 | 3,586 | |||||||
| Chemicals | 290 | 258 | |||||||
| Materials, supplies and other | 1,017 | 812 | |||||||
| Total inventories | 5,310 | 4,656 | |||||||
| Prepaid expenses and other current assets | 3,527 | 2,574 | |||||||
Total Current Assets | 39,377 | 36,304 | |||||||
| Long-term receivables, net | 2,194 | 2,203 | |||||||
| Investments and advances | 20,477 | 18,552 | |||||||
| Properties, plant and equipment, at cost | 154,084 | 137,747 | |||||||
| Less: Accumulated depreciation, depletion and amortization | 75,474 | 68,889 | |||||||
| Properties, plant and equipment, net | 78,610 | 68,858 | |||||||
| Deferred charges and other assets | 3,491 | 2,088 | |||||||
| Goodwill | 4,637 | 4,623 | |||||||
Total Assets | $ | 148,786 | $ | 132,628 | |||||
Liabilities and Stockholders’ Equity | |||||||||
| Short-term debt | $ | 1,162 | $ | 2,159 | |||||
| Accounts payable | 21,756 | 16,675 | |||||||
| Accrued liabilities | 5,275 | 4,546 | |||||||
| Federal and other taxes on income | 3,972 | 3,626 | |||||||
| Other taxes payable | 1,633 | 1,403 | |||||||
Total Current Liabilities | 33,798 | 28,409 | |||||||
| Long-term debt | 5,664 | 7,405 | |||||||
| Capital lease obligations | 406 | 274 | |||||||
| Deferred credits and other noncurrent obligations | 15,007 | 11,000 | |||||||
| Noncurrent deferred income taxes | 12,170 | 11,647 | |||||||
| Reserves for employee benefit plans | 4,449 | 4,749 | |||||||
| Minority interests | 204 | 209 | |||||||
Total Liabilities | 71,698 | 63,693 | |||||||
| Preferred stock (authorized 100,000,000 shares, $1.00 par value; none issued) | – | – | |||||||
| Common stock (authorized 4,000,000,000 shares, $0.75 par value; 2,442,676,580 shares issued at December 31, 2007 and 2006) | 1,832 | 1,832 | |||||||
| Capital in excess of par value | 14,289 | 14,126 | |||||||
| Retained earnings | 82,329 | 68,464 | |||||||
| Notes receivable – key employees | (1 | ) | (2 | ) | |||||
| Accumulated other comprehensive loss | (2,015 | ) | (2,636 | ) | |||||
| Deferred compensation and benefit plan trust | (454 | ) | (454 | ) | |||||
| Treasury stock, at cost (2007 – 352,242,618 shares; 2006 – 278,118,341 shares) | (18,892 | ) | (12,395 | ) | |||||
Total Stockholders’ Equity | 77,088 | 68,935 | |||||||
Total Liabilities and Stockholders’ Equity | $ | 148,786 | $ | 132,628 | |||||
FS-29
Table of Contents
| Year ended December 31 | |||||||||||||
| 2007 | 2006 | 2005 | |||||||||||
Operating Activities | |||||||||||||
| Net income | $ | 18,688 | $ | 17,138 | $ | 14,099 | |||||||
| Adjustments | |||||||||||||
| Depreciation, depletion and amortization | 8,708 | 7,506 | 5,913 | ||||||||||
| Dry hole expense | 507 | 520 | 226 | ||||||||||
| Distributions less than income from equity affiliates | (1,439 | ) | (979 | ) | (1,304 | ) | |||||||
| Net before-tax gains on asset retirements and sales | (2,315 | ) | (229 | ) | (134 | ) | |||||||
| Net foreign currency effects | 378 | 259 | 62 | ||||||||||
| Deferred income tax provision | 261 | 614 | 1,393 | ||||||||||
| Net decrease (increase) in operating working capital | 685 | 1,044 | (54 | ) | |||||||||
| Minority interest in net income | 107 | 70 | 96 | ||||||||||
| (Increase) in long-term receivables | (82 | ) | (900 | ) | (191 | ) | |||||||
| (Increase) decrease in other deferred charges | (530 | ) | 232 | 668 | |||||||||
| Cash contributions to employee pension plans | (317 | ) | (449 | ) | (1,022 | ) | |||||||
| Other | 326 | (503 | ) | 353 | |||||||||
Net Cash Provided by Operating Activities | 24,977 | 24,323 | 20,105 | ||||||||||
Investing Activities | |||||||||||||
| Cash portion of Unocal acquisition, net of Unocal cash received | – | – | (5,934 | ) | |||||||||
| Capital expenditures | (16,678 | ) | (13,813 | ) | (8,701 | ) | |||||||
| Repayment of loans by equity affiliates | 21 | 463 | 57 | ||||||||||
| Proceeds from asset sales | 3,338 | 989 | 2,681 | ||||||||||
| Net sales of marketable securities | 185 | 142 | 336 | ||||||||||
| Net purchases of other short-term investments | (799 | ) | – | – | |||||||||
Net Cash Used for Investing Activities | (13,933 | ) | (12,219 | ) | (11,561 | ) | |||||||
Financing Activities | |||||||||||||
| Net payments of short-term obligations | (345 | ) | (677 | ) | (109 | ) | |||||||
| Repayments of long-term debt and other financing obligations | (3,343 | ) | (2,224 | ) | (966 | ) | |||||||
| Proceeds from issuances of long-term debt | 650 | – | 20 | ||||||||||
| Cash dividends – common stock | (4,791 | ) | (4,396 | ) | (3,778 | ) | |||||||
| Dividends paid to minority interests | (77 | ) | (60 | ) | (98 | ) | |||||||
| Net purchases of treasury shares | (6,389 | ) | (4,491 | ) | (2,597 | ) | |||||||
| Redemption of preferred stock of subsidiaries | – | – | (140 | ) | |||||||||
Net Cash Used for Financing Activities | (14,295 | ) | (11,848 | ) | (7,668 | ) | |||||||
Effect of Exchange Rate Changes On Cash and Cash Equivalents | 120 | 194 | (124 | ) | |||||||||
Net Change in Cash and Cash Equivalents | (3,131 | ) | 450 | 752 | |||||||||
Cash and Cash Equivalents at January 1 | 10,493 | 10,043 | 9,291 | ||||||||||
Cash and Cash Equivalents at December 31 | $ | 7,362 | $ | 10,493 | $ | 10,043 | |||||||
FS-30
Table of Contents
| 2007 | 2006 | 2005 | |||||||||||||||||||||||
| Shares | Amount | Shares | Amount | Shares | Amount | ||||||||||||||||||||
Preferred Stock | – | $ | – | – | $ | – | – | $ | – | ||||||||||||||||
Common Stock | |||||||||||||||||||||||||
| Balance at January 1 | 2,442,677 | $ | 1,832 | 2,442,677 | $ | 1,832 | 2,274,032 | $ | 1,706 | ||||||||||||||||
| Shares issued for Unocal acquisition | – | – | – | – | 168,645 | 126 | |||||||||||||||||||
Balance at December 31 | 2,442,677 | $ | 1,832 | 2,442,677 | $ | 1,832 | 2,442,677 | $ | 1,832 | ||||||||||||||||
Capital in Excess of Par | |||||||||||||||||||||||||
| Balance at January 1 | $ | 14,126 | $ | 13,894 | $ | 4,160 | |||||||||||||||||||
| Shares issued for Unocal acquisition | – | – | 9,585 | ||||||||||||||||||||||
| Treasury stock transactions | 163 | 232 | 149 | ||||||||||||||||||||||
Balance at December 31 | $ | 14,289 | $ | 14,126 | $ | 13,894 | |||||||||||||||||||
Retained Earnings | |||||||||||||||||||||||||
| Balance at January 1 | $ | 68,464 | $ | 55,738 | $ | 45,414 | |||||||||||||||||||
| Net income | 18,688 | 17,138 | 14,099 | ||||||||||||||||||||||
| Cash dividends on common stock | (4,791 | ) | (4,396 | ) | (3,778 | ) | |||||||||||||||||||
| Adoption of EITF 04–6, “Accounting for Stripping Costs Incurred during Production in the Mining Industry” | – | (19 | ) | – | |||||||||||||||||||||
| Adoption of FIN 48, “Accounting for Uncertainty in Income Taxes” | (35 | ) | – | – | |||||||||||||||||||||
| Tax benefit from dividends paid on unallocated ESOP shares and other | 3 | 3 | 3 | ||||||||||||||||||||||
Balance at December 31 | $ | 82,329 | $ | 68,464 | $ | 55,738 | |||||||||||||||||||
Notes Receivable – Key Employees | $ | (1 | ) | $ | (2 | ) | $ | (3 | ) | ||||||||||||||||
Accumulated Other Comprehensive Loss | |||||||||||||||||||||||||
| Currency translation adjustment | |||||||||||||||||||||||||
| Balance at January 1 | $ | (90 | ) | $ | (145 | ) | $ | (140 | ) | ||||||||||||||||
| Change during year | 31 | 55 | (5 | ) | |||||||||||||||||||||
| Balance at December 31 | $ | (59 | ) | $ | (90 | ) | $ | (145 | ) | ||||||||||||||||
| Pension and other postretirement benefit plans | |||||||||||||||||||||||||
| Balance at January 1 | $ | (2,585 | ) | $ | (344 | ) | $ | (402 | ) | ||||||||||||||||
| Change to defined benefit plans during year | 685 | (38 | ) | 58 | |||||||||||||||||||||
| Adoption of FAS 158, “Employers’ Accounting for Defined Benefit Pension and Other Postretirement Plans” | (108 | ) | (2,203 | ) | – | ||||||||||||||||||||
| Balance at December 31 | $ | (2,008 | ) | $ | (2,585 | ) | $ | (344 | ) | ||||||||||||||||
| Unrealized net holding gain on securities | |||||||||||||||||||||||||
| Balance at January 1 | $ | – | $ | 88 | $ | 120 | |||||||||||||||||||
| Change during year | 19 | (88 | ) | (32 | ) | ||||||||||||||||||||
| Balance at December 31 | $ | 19 | $ | – | $ | 88 | |||||||||||||||||||
| Net derivatives gain (loss) on hedge transactions | |||||||||||||||||||||||||
| Balance at January 1 | $ | 39 | $ | (28 | ) | $ | 103 | ||||||||||||||||||
| Change during year | (6 | ) | 67 | (131 | ) | ||||||||||||||||||||
| Balance at December 31 | $ | 33 | $ | 39 | $ | (28 | ) | ||||||||||||||||||
Balance at December 31 | $ | (2,015 | ) | $ | (2,636 | ) | $ | (429 | ) | ||||||||||||||||
Deferred Compensation and Benefit Plan Trust Deferred Compensation | |||||||||||||||||||||||||
| Balance at January 1 | $ | (214 | ) | $ | (246 | ) | $ | (367 | ) | ||||||||||||||||
| Net reduction of ESOP debt and other | – | 32 | 121 | ||||||||||||||||||||||
Balance at December 31 | (214 | ) | (214 | ) | (246 | ) | |||||||||||||||||||
Benefit Plan Trust (Common Stock) | 14,168 | (240 | ) | 14,168 | (240 | ) | 14,168 | (240 | ) | ||||||||||||||||
Balance at December 31 | 14,168 | $ | (454 | ) | 14,168 | $ | (454 | ) | 14,168 | $ | (486 | ) | |||||||||||||
Treasury Stock at Cost | |||||||||||||||||||||||||
| Balance at January 1 | 278,118 | $ | (12,395 | ) | 209,990 | $ | (7,870 | ) | 166,912 | $ | (5,124 | ) | |||||||||||||
| Purchases | 85,429 | (7,036 | ) | 80,369 | (5,033 | ) | 52,013 | (3,029 | ) | ||||||||||||||||
| Issuances – mainly employee benefit plans | (11,304 | ) | 539 | (12,241 | ) | 508 | (8,935 | ) | 283 | ||||||||||||||||
Balance at December 31 | 352,243 | $ | (18,892 | ) | 278,118 | $ | (12,395 | ) | 209,990 | $ | (7,870 | ) | |||||||||||||
Total Stockholders’ Equity at December 31 | $ | 77,088 | $ | 68,935 | $ | 62,676 | |||||||||||||||||||
FS-31
Table of Contents
Notes to the Consolidated Financial Statements Millions of dollars, except per-share amounts |
Note 1
Subsidiary and Affiliated Companies The Consolidated Financial Statements include the accounts of controlled subsidiary companies more than 50 percent-owned and variable-interest entities in which the company is the primary beneficiary. Undivided interests in oil and gas joint ventures and certain other assets are consolidated on a proportionate basis. Investments in and advances to affiliates in which the company has a substantial ownership interest of approximately 20 percent to 50 percent or for which the company exercises significant influence but not control over policy decisions are accounted for by the equity method. As part of that accounting, the company recognizes gains and losses that arise from the issuance of stock by an affiliate that results in changes in the company’s proportionate share of the dollar amount of the affiliate’s equity currently in income.
Derivatives The majority of the company’s activity in commodity derivative instruments is intended to manage the financial risk posed by physical transactions. For some of this derivative activity, generally limited to large, discrete or infrequently occurring transactions, the company may elect to apply fair value or cash flow hedge accounting. For other similar derivative instruments, generally because of the short-term nature of the contracts or their limited use, the company does not apply hedge accounting, and changes in the fair value of those contracts are reflected in current income. For the company’s commodity trading activity, gains and losses from the derivative instruments are reported in current income. For derivative instruments relating to foreign currency exposures, gains and losses are reported in current income. Interest rate swaps – hedging a portion of the company’s fixed-rate debt – are accounted for as fair value hedges, whereas interest rate swaps relating to a portion of the company’s floating-rate debt are recorded at fair value on the Consolidated Balance Sheet, with resulting gains and losses reflected in income. Where Chevron is a party to master netting arrangements, fair value receivable and payable amounts recognized for derivative instruments executed with the same counterparty are offset on the balance sheet.
Short-Term Investments All short-term investments are classified as available for sale and are in highly liquid debt securities. Those investments that are part of the company’s cash management portfolio and have original maturities of three months or less are reported as “Cash equivalents.” The balance of the short-term investments is reported as “Marketable securities” and are marked-to-market, with any unrealized gains or losses included in “Other comprehensive income.”
Inventories Crude oil, petroleum products and chemicals are generally stated at cost, using a Last-In, First-Out (LIFO) method. In the aggregate, these costs are below market. “Materials, supplies and other” inventories generally are stated at average cost.
FS-32
Table of Contents
Note 1Summary of Significant Accounting Policies – Continued |
Goodwill Goodwill resulting from a business combination is not subject to amortization. As required by FASB Statement No. 142,Goodwill and Other Intangible Assets, the company tests such goodwill at the reporting unit level for impairment on an annual basis and between annual tests if an event occurs or circumstances change that would more likely than not reduce the fair value of a reporting unit below its carrying amount.
Environmental Expenditures Environmental expenditures that relate to ongoing operations or to conditions caused by past operations are expensed. Expenditures that create future benefits or contribute to future revenue generation are capitalized.
FS-33
Table of Contents
Notes to the Consolidated Financial Statements Millions of dollars, except per-share amounts | ||||||||||
Note 1Summary of Significant Accounting Policies – Continued |
Currency Translation The U.S. dollar is the functional currency for substantially all of the company’s consolidated operations and those of its equity affiliates. For those operations, all gains and losses from currency translations are currently included in income. The cumulative translation effects for those few entities, both consolidated and affiliated, using functional currencies other than the U.S. dollar are included in the currency translation adjustment in “Stockholders’ Equity.”
Revenue Recognition Revenues associated with sales of crude oil, natural gas, coal, petroleum and chemicals products, and all other sources are recorded when title passes to the customer, net of royalties, discounts and allowances, as applicable. Revenues from natural gas production from properties in which Chevron has an interest with other producers are generally recognized on the basis of the company’s net working interest (entitlement method). Excise, value-added and similar taxes assessed by a governmental authority on a revenue-producing transaction between a seller and a customer are presented on a gross basis. The associated amounts are shown as a footnote to the Consolidated Statement of Income on page FS-27. Refer to Note 13, on page FS-42, for a discussion of the accounting for buy/sell arrangements.
Stock Options and Other Share-Based Compensation Effective July 1, 2005, the company adopted the provisions of FASB Statement No. 123R,Share-Based Payment(FAS 123R), for its share-based compensation plans. The company previously accounted for these plans under the recognition and measurement principles of Accounting Principles Board (APB) Opinion No. 25,Accounting for Stock Issued to Employees(APB 25), and related interpretations and disclosure requirements established by FASB Statement No. 123,Accounting for Stock-Based Compensation(FAS 123).
| Year ended December 31 | ||||||||
| 2005 | ||||||||
Net income, as reported | $ | 14,099 | ||||||
| Add: Stock-based employee compensation expense included in reported net income, net of related tax effects | 81 | |||||||
| Deduct: Total stock-based employee compensation expense determined under fair-valued-based method for awards, net of related tax effects* | (108 | ) | ||||||
Pro forma net income | $ | 14,072 | ||||||
Net income per share: | ||||||||
| Basic – as reported | $ | 6.58 | ||||||
| Basic – pro forma | $ | 6.56 | ||||||
| Diluted – as reported | $ | 6.54 | ||||||
| Diluted – pro forma | $ | 6.53 | ||||||
Note 2
| Year ended December 31 | ||||||||
| 2005 | ||||||||
| Sales and other operating revenues | $ | 198,762 | ||||||
| Net income | 14,967 | |||||||
| Net income per share of common stock | ||||||||
| Basic | $ | 6.68 | ||||||
| Diluted | $ | 6.64 | ||||||
FS-34
Table of Contents
| |
Note 3
| Year ended December 31 | |||||||||||||
| 2007 | 2006 | 2005 | |||||||||||
| Net decrease (increase) in operating working capital was composed of the following: | |||||||||||||
| (Increase) decrease in accounts and notes receivable | $ | (3,867 | ) | $ | 17 | $ | (3,164 | ) | |||||
| Increase in inventories | (749 | ) | (536 | ) | (968 | ) | |||||||
| Increase in prepaid expenses and other current assets | (370 | ) | (31 | ) | (54 | ) | |||||||
| Increase in accounts payable and accrued liabilities | 4,930 | 1,246 | 3,851 | ||||||||||
| Increase in income and other taxes payable | 741 | 348 | 281 | ||||||||||
| Net decrease (increase) in operating working capital | $ | 685 | $ | 1,044 | $ | (54 | ) | ||||||
| Net cash provided by operating activities includes the following cash payments for interest and income taxes: | |||||||||||||
| Interest paid on debt (net of capitalized interest) | $ | 203 | $ | 470 | $ | 455 | |||||||
| Income taxes | $ | 12,340 | $ | 13,806 | $ | 8,875 | |||||||
| Net (purchases) sales of marketable securities consisted of the following gross amounts: | |||||||||||||
| Marketable securities purchased | $ | (1,975 | ) | $ | (1,271 | ) | $ | (918 | ) | ||||
| Marketable securities sold | 2,160 | 1,413 | 1,254 | ||||||||||
| Net sales (purchases) of marketable securities | $ | 185 | $ | 142 | $ | 336 | |||||||
| Year ended December 31 | |||||||||||||
| 2007 | 2006 | 2005 | |||||||||||
| Additions to properties, plant and equipment* | $ | 16,127 | $ | 12,800 | $ | 8,154 | |||||||
| Additions to investments | 881 | 880 | 459 | ||||||||||
| Current-year dry hole expenditures | 418 | 400 | 198 | ||||||||||
| Payments for other liabilities and assets, net | (748 | ) | (267 | ) | (110 | ) | |||||||
| Capital expenditures | 16,678 | 13,813 | 8,701 | ||||||||||
| Expensed exploration expenditures | 816 | 844 | 517 | ||||||||||
| Assets acquired through capital lease obligations and other financing obligations | 196 | 35 | 164 | ||||||||||
| Capital and exploratory expenditures, excluding equity affiliates | 17,690 | 14,692 | 9,382 | ||||||||||
| Equity in affiliates’ expenditures | 2,336 | 1,919 | 1,681 | ||||||||||
| Capital and exploratory expenditures, including equity affiliates | $ | 20,026 | $ | 16,611 | $ | 11,063 | |||||||
Note 4
FS-35
Table of Contents
Notes to the Consolidated Financial Statements Millions of dollars, except per-share amounts | ||||||||||
Note 4Summarized Financial Data Chevron U.S.A. Inc. – Continued |
| Year ended December 31 | |||||||||||||
| 2007 | 2006 | 2005 | |||||||||||
| Sales and other operating revenues | $ | 153,574 | $ | 145,774 | $ | 137,866 | |||||||
| Total costs and other deductions | 147,510 | 137,765 | 131,809 | ||||||||||
| Net income | 5,203 | 5,668 | 4,775 | ||||||||||
| At December 31 | |||||||||||||
| 2007 | 2006 | ||||||||||||
| Current assets | $ | 32,803 | $ | 26,066 | |||||||||
| Other assets | 27,401 | 23,538 | |||||||||||
| Current liabilities | 20,050 | 16,917 | |||||||||||
| Other liabilities | 11,447 | 9,037 | |||||||||||
| Net equity | 28,707 | 23,650 | |||||||||||
| Memo: Total debt | $ | 4,433 | $ | 3,465 | |||||||||
Note 5
| Year ended December 31 | |||||||||||||
| 2007 | 2006 | 2005 | |||||||||||
| Sales and other operating revenues | $ | 667 | $ | 692 | $ | 640 | |||||||
| Total costs and other deductions | 713 | 602 | 509 | ||||||||||
| Net income | (39 | ) | 119 | 113 | |||||||||
| At December 31 | |||||||||||||
| 2007 | 2006 | ||||||||||||
| Current assets | $ | 335 | $ | 413 | |||||||||
| Other assets | 337 | 345 | |||||||||||
| Current liabilities | 107 | 92 | |||||||||||
| Other liabilities | 188 | 250 | |||||||||||
| Net equity | 377 | 416 | |||||||||||
Note 6
Note 7
Commodity Derivative Instruments Chevron is exposed to market risks related to price volatility of crude oil, refined products, natural gas, natural gas liquids, liquefied natural gas and refinery feedstocks.
Foreign Currency The company enters into forward exchange contracts, generally with terms of 180 days or less, to manage some of its foreign currency exposures. These exposures include revenue and anticipated purchase transactions, including foreign currency capital expenditures and lease commitments, forecasted to occur within 180 days. The forward exchange contracts are recorded at fair value on the balance sheet with resulting gains and losses reflected in income.
FS-36
Table of Contents
Note 7Financial and Derivative Instruments – Continued |
Interest Rates The company enters into interest rate swaps as part of its overall strategy to manage the interest rate risk on its debt. Under the terms of the swaps, net cash settlements are based on the difference between fixed-rate and floating-rate interest amounts calculated by reference to agreed notional principal amounts. Interest rate swaps related to a portion of the company’s fixed-rate debt are accounted for as fair value hedges.
Fair Value Fair values are derived from quoted market prices, other independent third-party quotes or, if not available, the present value of the expected cash flows. The fair values reflect the cash that would have been received or paid if the instruments were settled at year-end.
Concentrations of Credit Risk The company’s financial instruments that are exposed to concentrations of credit risk consist primarily of its cash equivalents, marketable securities, derivative financial instruments and trade receivables. The company’s short-term investments are placed with a wide array of financial institutions with high credit ratings. This diversified investment policy limits the company’s exposure both to credit risk and to concentrations of credit risk. Similar standards of diversity and creditworthiness are applied to the company’s counterparties in derivative instruments.
Note 8
FS-37
Table of Contents
Notes to the Consolidated Financial Statements Millions of dollars, except per-share amounts | ||||||||||
Note 8Operating Segments and Geographic Data – Continued |
Segment Earnings The company evaluates the performance of its operating segments on an after-tax basis, without considering the effects of debt financing interest expense or investment interest income, both of which are managed by the company on a worldwide basis. Corporate administrative costs and assets are not allocated to the operating segments. However, operating segments are billed for the direct use of corporate services. Nonbillable costs remain at the corporate level in “All Other.” After-tax segment income by major operating area is presented in the following table:
| Year ended December 31 | |||||||||||||
| 2007 | 2006 | 2005 | |||||||||||
Income by Major Operating Area | |||||||||||||
Upstream | |||||||||||||
| United States | $ | 4,532 | $ | 4,270 | $ | 4,168 | |||||||
| International | 10,284 | 8,872 | 7,556 | ||||||||||
Total Upstream | 14,816 | 13,142 | 11,724 | ||||||||||
Downstream | |||||||||||||
| United States | 966 | 1,938 | 980 | ||||||||||
| International | 2,536 | 2,035 | 1,786 | ||||||||||
Total Downstream | 3,502 | 3,973 | 2,766 | ||||||||||
Chemicals | |||||||||||||
| United States | 253 | 430 | 240 | ||||||||||
| International | 143 | 109 | 58 | ||||||||||
Total Chemicals | 396 | 539 | 298 | ||||||||||
Total Segment Income | 18,714 | 17,654 | 14,788 | ||||||||||
All Other | |||||||||||||
| Interest expense | (107 | ) | (312 | ) | (337 | ) | |||||||
| Interest income | 385 | 380 | 266 | ||||||||||
| Other | (304 | ) | (584 | ) | (618 | ) | |||||||
Net Income | $ | 18,688 | $ | 17,138 | $ | 14,099 | |||||||
| At December 31 | |||||||||||||
| 2007 | 2006 | ||||||||||||
Upstream | |||||||||||||
| United States | $ | 23,535 | $ | 20,727 | |||||||||
| International | 61,049 | 51,844 | |||||||||||
| Goodwill | 4,637 | 4,623 | |||||||||||
Total Upstream | 89,221 | 77,194 | |||||||||||
Downstream | |||||||||||||
| United States | 16,790 | 13,482 | |||||||||||
| International | 26,075 | 22,892 | |||||||||||
Total Downstream | 42,865 | 36,374 | |||||||||||
Chemicals | |||||||||||||
| United States | 2,484 | 2,568 | |||||||||||
| International | 870 | 832 | |||||||||||
Total Chemicals | 3,354 | 3,400 | |||||||||||
Total Segment Assets | 135,440 | 116,968 | |||||||||||
All Other* | |||||||||||||
| United States | 6,847 | 8,481 | |||||||||||
| International | 6,499 | 7,179 | |||||||||||
Total All Other | 13,346 | 15,660 | |||||||||||
Total Assets – United States | 49,656 | 45,258 | |||||||||||
Total Assets – International | 94,493 | 82,747 | |||||||||||
Goodwill | 4,637 | 4,623 | |||||||||||
Total Assets | $ | 148,786 | $ | 132,628 | |||||||||
Segment Sales and Other Operating Revenues Operating segment sales and other operating revenues, including internal transfers, for the years 2007, 2006 and 2005 are presented in the following table. Products are transferred between operating segments at internal product values that approximate market prices.
FS-38
Table of Contents
Note 8Operating Segments and Geographic Data – Continued |
| Year ended December 31 | |||||||||||||
| 2007 | 2006 | 2005 | |||||||||||
Upstream | |||||||||||||
| United States | $ | 18,736 | $ | 18,061 | $ | 16,044 | |||||||
| Intersegment | 11,625 | 10,069 | 8,651 | ||||||||||
| Total United States | 30,361 | 28,130 | 24,695 | ||||||||||
| International | 15,213 | 14,560 | 10,190 | ||||||||||
| Intersegment | 19,647 | 17,139 | 13,652 | ||||||||||
| Total International | 34,860 | 31,699 | 23,842 | ||||||||||
Total Upstream | 65,221 | 59,829 | 48,537 | ||||||||||
Downstream | |||||||||||||
| United States | 70,535 | 69,367 | 73,721 | ||||||||||
| Excise and similar taxes | 4,990 | 4,829 | 4,521 | ||||||||||
| Intersegment | 491 | 533 | 535 | ||||||||||
| Total United States | 76,016 | 74,729 | 78,777 | ||||||||||
| International | 97,178 | 91,325 | 83,223 | ||||||||||
| Excise and similar taxes | 5,042 | 4,657 | 4,184 | ||||||||||
| Intersegment | 38 | 37 | 14 | ||||||||||
| Total International | 102,258 | 96,019 | 87,421 | ||||||||||
Total Downstream | 178,274 | 170,748 | 166,198 | ||||||||||
Chemicals | |||||||||||||
| United States | 351 | 372 | 343 | ||||||||||
| Excise and similar taxes | 2 | 2 | – | ||||||||||
| Intersegment | 235 | 243 | 241 | ||||||||||
| Total United States | 588 | 617 | 584 | ||||||||||
| International | 1,143 | 959 | 760 | ||||||||||
| Excise and similar taxes | 86 | 63 | 14 | ||||||||||
| Intersegment | 142 | 160 | 131 | ||||||||||
| Total International | 1,371 | 1,182 | 905 | ||||||||||
Total Chemicals | 1,959 | 1,799 | 1,489 | ||||||||||
All Other | |||||||||||||
| United States | 757 | 653 | 597 | ||||||||||
| Intersegment | 760 | 584 | 514 | ||||||||||
| Total United States | 1,517 | 1,237 | 1,111 | ||||||||||
| International | 58 | 44 | 44 | ||||||||||
| Intersegment | 31 | 23 | 26 | ||||||||||
| Total International | 89 | 67 | 70 | ||||||||||
Total All Other | 1,606 | 1,304 | 1,181 | ||||||||||
Segment Sales and Other Operating Revenues | |||||||||||||
| United States | 108,482 | 104,713 | 105,167 | ||||||||||
| International | 138,578 | 128,967 | 112,238 | ||||||||||
| �� | |||||||||||||
Total Segment Sales and Other Operating Revenues | 247,060 | 233,680 | 217,405 | ||||||||||
| Elimination of intersegment sales | (32,969 | ) | (28,788 | ) | (23,764 | ) | |||||||
Total Sales and Other Operating Revenues* | $ | 214,091 | $ | 204,892 | $ | 193,641 | |||||||
Segment Income Taxes Segment income tax expense for the years 2007, 2006 and 2005 are as follows:
| Year ended December 31 | |||||||||||||
| 2007 | 2006 | 2005 | |||||||||||
Upstream | |||||||||||||
| United States | $ | 2,541 | $ | 2,668 | $ | 2,330 | |||||||
| International | 11,307 | 10,987 | 8,440 | ||||||||||
Total Upstream | 13,848 | 13,655 | 10,770 | ||||||||||
Downstream | |||||||||||||
| United States | 520 | 1,162 | 575 | ||||||||||
| International | 400 | 586 | 576 | ||||||||||
Total Downstream | 920 | 1,748 | 1,151 | ||||||||||
Chemicals | |||||||||||||
| United States | 6 | 213 | 99 | ||||||||||
| International | 36 | 30 | 25 | ||||||||||
Total Chemicals | 42 | 243 | 124 | ||||||||||
All Other | (1,331 | ) | (808 | ) | (947 | ) | |||||||
Total Income Tax Expense | $ | 13,479 | $ | 14,838 | $ | 11,098 | |||||||
Other Segment Information Additional information for the segmentation of major equity affiliates is contained in Note 11, beginning on page FS-40. Information related to properties, plant and equipment by segment is contained in Note 12, on page FS-42.
Note 9
| At December 31 | |||||||||||||
| 2007 | 2006* | ||||||||||||
| Upstream | $ | 482 | $ | 461 | |||||||||
| Downstream | $ | 551 | $ | 550 | |||||||||
| Chemical and all other | 171 | 2 | |||||||||||
| Total | 1,204 | 1,013 | |||||||||||
| Less: Accumulated amortization | 628 | 548 | |||||||||||
| Net capitalized leased assets | $ | 576 | $ | 465 | |||||||||
| Year ended December 31 | |||||||||||||
| 2007 | 2006 | 2005 | |||||||||||
| Minimum rentals | $ | 2,419 | $ | 2,326 | $ | 2,102 | |||||||
| Contingent rentals | 6 | 6 | 6 | ||||||||||
| Total | 2,425 | 2,332 | 2,108 | ||||||||||
| Less: Sublease rental income | 30 | 33 | 43 | ||||||||||
| Net rental expense | $ | 2,395 | $ | 2,299 | $ | 2,065 | |||||||
FS-39
Table of Contents
Notes to the Consolidated Financial Statements Millions of dollars, except per-share amounts | ||||||||||
Note 9Lease Commitments – Continued |
| At December 31 | |||||||||
| Operating | Capital | ||||||||
| Leases | Leases | ||||||||
| Year: 2008 | $ | 513 | $ | 103 | |||||
| 2009 | 478 | 106 | |||||||
| 2010 | 430 | 83 | |||||||
| 2011 | 347 | 85 | |||||||
| 2012 | 293 | 91 | |||||||
| Thereafter | 1,106 | 347 | |||||||
| Total | $ | 3,167 | $ | 815 | |||||
| Less: Amounts representing interest and executory costs | (315 | ) | |||||||
| Net present values | 500 | ||||||||
| Less: Capital lease obligations included in short-term debt | (94 | ) | |||||||
| Long-term capital lease obligations | $ | 406 | |||||||
Note 10
| Amounts before tax | 2007 | |||
| Balance at January 1 | $ | – | ||
| Additions | 85 | |||
| Payments | – | |||
| Balance at December 31 | $ | 85 | ||
Note 11
| Investments and Advances | Equity in Earnings | ||||||||||||||||||||
| At December 31 | Year ended December 31 | ||||||||||||||||||||
| 2007 | 2006 | 2007 | 2006 | 2005 | |||||||||||||||||
Upstream | |||||||||||||||||||||
| Tengizchevroil | $ | 6,321 | $ | 5,507 | $ | 2,135 | $ | 1,817 | $ | 1,514 | |||||||||||
| Hamaca | 1,168 | 928 | 327 | 319 | 390 | ||||||||||||||||
| Petroboscan | 762 | 712 | 185 | 31 | – | ||||||||||||||||
| Angola LNG Limited | 574 | – | 21 | – | – | ||||||||||||||||
| Other | 765 | 682 | 204 | 123 | 139 | ||||||||||||||||
| Total Upstream | 9,590 | 7,829 | 2,872 | 2,290 | 2,043 | ||||||||||||||||
Downstream | |||||||||||||||||||||
| GS Caltex Corporation | 2,276 | 2,176 | 217 | 316 | 320 | ||||||||||||||||
| Caspian Pipeline Consortium | 951 | 990 | 102 | 117 | 101 | ||||||||||||||||
| Star Petroleum Refining Company Ltd. | 944 | 787 | 157 | 116 | 81 | ||||||||||||||||
| Escravos Gas-to-Liquids | 628 | 432 | 103 | 146 | 95 | ||||||||||||||||
| Caltex Australia Ltd. | 580 | 559 | 129 | 186 | 214 | ||||||||||||||||
| Colonial Pipeline Company | 546 | 555 | 39 | 34 | 13 | ||||||||||||||||
| Other | 1,501 | 1,407 | 215 | 212 | 178 | ||||||||||||||||
| Total Downstream | 7,426 | 6,906 | 962 | 1,127 | 1,002 | ||||||||||||||||
Chemicals | |||||||||||||||||||||
| Chevron Phillips Chemical Company LLC | 2,024 | 2,044 | 380 | 697 | 449 | ||||||||||||||||
| Other | 24 | 22 | 6 | 5 | 3 | ||||||||||||||||
| Total Chemicals | 2,048 | 2,066 | 386 | 702 | 452 | ||||||||||||||||
All Other | |||||||||||||||||||||
| Dynegy Inc. | – | 254 | 8 | 68 | 189 | ||||||||||||||||
| Other | 449 | 586 | (84 | ) | 68 | 45 | |||||||||||||||
| Total equity method | $ | 19,513 | $ | 17,641 | $ | 4,144 | $ | 4,255 | $ | 3,731 | |||||||||||
| Other at or below cost | 964 | 911 | |||||||||||||||||||
| Total investments and advances | $ | 20,477 | $ | 18,552 | |||||||||||||||||
| Total United States | $ | 3,889 | $ | 4,191 | $ | 478 | $ | 955 | $ | 833 | |||||||||||
| Total International | $ | 16,588 | $ | 14,361 | $ | 3,666 | $ | 3,300 | $ | 2,898 | |||||||||||
Hamaca Chevron’s 30 percent interest in the Hamaca heavy oil production and upgrading project located in Venezuela’s Orinoco Belt was converted to a 30 percent share-holding in a joint stock company in January 2008, with a 25-year contract term.
FS-40
Table of Contents
Note 11Investments and Advances – Continued |
Angola LNG Ltd. Chevron has a 36 percent interest in Angola LNG, which will process and liquefy natural gas produced in Angola for delivery to international markets.
GS Caltex Corporation Chevron owns 50 percent of GS Caltex, a joint venture with GS Holdings. The joint venture, originally formed in 1967 between the LG Group and Caltex, imports, refines and markets petroleum products and petrochemicals predominantly in South Korea.
Caspian Pipeline Consortium Chevron has a 15 percent interest in the Caspian Pipeline Consortium (CPC), which provides the critical export route for crude oil from both TCO and Karachaganak. At December 31, 2007, the company’s carrying value of its investment in CPC was about $50 higher than the amount of underlying equity in CPC net assets.
Star Petroleum Refining Company Ltd. Chevron has a 64 percent equity ownership interest in Star Petroleum Refining Company Limited (SPRC), which owns the Star Refinery in Thailand. The Petroleum Authority of Thailand owns the remaining 36 percent of SPRC.
Escravos Gas-to-Liquids Chevron Nigeria Limited (CNL) has a 75 percent interest in Escravos Gas-to-Liquids (EGTL) with the other 25 percent of the joint venture owned by Nigeria National Petroleum Company. Sasol Ltd provides 50 percent of the venture capital required by CNL as risk-based financing (returns are based on project performance). This venture was formed to convert natural gas produced from Chevron’s Nigerian operations into liquid products for sale in international markets. At December 31, 2007, the company’s carrying value of its investment in EGTL was about $25 lower than the amount of underlying equity in EGTL net assets.
Caltex Australia Ltd. Chevron has a 50 percent equity ownership interest in Caltex Australia Limited (CAL). The remaining 50 percent of CAL is publicly owned. At December 31, 2007, the fair value of Chevron’s share of CAL common stock was approximately $2,294. The aggregate carrying value of the company’s investment in CAL was approximately $50 lower than the amount of underlying equity in CAL net assets.
Chevron Phillips Chemical Company LLC Chevron owns 50 percent of Chevron Phillips Chemical Company LLC (CPChem), with the other half owned by ConocoPhillips Corporation. At December 31, 2007, the company’s carrying value of its investment in CPChem was approximately $60 lower than the amount of underlying equity in CPChem net assets.
Dynegy Inc. In May 2007, Chevron sold its 19 percent common stock investment in Dynegy Inc., a provider of electricity to markets and customers throughout the United States, for approximately $940, resulting in a gain of $680.
Other Information “Sales and other operating revenues” on the Consolidated Statement of Income includes $11,555, $9,582 and $8,824 with affiliated companies for 2007, 2006 and 2005, respectively. “Purchased crude oil and products” includes $5,464, $4,222 and $3,219 with affiliated companies for 2007, 2006 and 2005, respectively.
FS-41
Table of Contents
Notes to the Consolidated Financial Statements Millions of dollars, except per-share amounts | ||||||||||
Note 11Investments and Advances – Continued |
| Affiliates | Chevron Share | ||||||||||||||||||||||||
| Year ended December 31 | 2007 | 2006 | 2005 | 2007 | 2006 | 2005 | |||||||||||||||||||
| Total revenues | $ | 94,864 | $ | 73,746 | $ | 64,642 | $ | 46,579 | $ | 35,695 | $ | 31,252 | |||||||||||||
| Income before income tax expense | 12,510 | 10,973 | 7,883 | 5,836 | 5,295 | 4,165 | |||||||||||||||||||
| Net income | 9,743 | 7,905 | 6,645 | 4,550 | 4,072 | 3,534 | |||||||||||||||||||
At December 31 | |||||||||||||||||||||||||
| Current assets | $ | 26,360 | $ | 19,769 | $ | 19,903 | $ | 11,914 | $ | 8,944 | $ | 8,537 | |||||||||||||
| Noncurrent assets | 48,440 | 49,896 | 46,925 | 19,045 | 18,575 | 17,747 | |||||||||||||||||||
| Current liabilities | 19,033 | 15,254 | 13,427 | 9,009 | 6,818 | 6,034 | |||||||||||||||||||
| Noncurrent liabilities | 22,757 | 24,059 | 26,579 | 3,745 | 3,902 | 4,906 | |||||||||||||||||||
Net equity | $ | 33,010 | $ | 30,352 | $ | 26,822 | $ | 18,205 | $ | 16,799 | $ | 15,344 | |||||||||||||
Note 12
| At December 31 | Year ended December 31 | ||||||||||||||||||||||||||||||||||||||||||||||||||
| Gross Investment at Cost | Net Investment | Additions at Cost1 | Depreciation Expense2 | ||||||||||||||||||||||||||||||||||||||||||||||||
| 2007 | 2006 | 2005 | 2007 | 2006 | 2005 | 2007 | 2006 | 2005 | 2007 | 2006 | 2005 | ||||||||||||||||||||||||||||||||||||||||
Upstream | |||||||||||||||||||||||||||||||||||||||||||||||||||
| United States | $ | 50,991 | $ | 46,191 | $ | 43,390 | $ | 19,850 | $ | 16,706 | $ | 15,327 | $ | 5,725 | $ | 3,739 | $ | 2,160 | $ | 2,700 | $ | 2,374 | $ | 1,869 | |||||||||||||||||||||||||||
| International | 71,408 | 61,281 | 54,497 | 43,431 | 37,730 | 34,311 | 10,512 | 7,290 | 4,897 | 4,605 | 3,888 | 2,804 | |||||||||||||||||||||||||||||||||||||||
| Total Upstream | 122,399 | 107,472 | 97,887 | 63,281 | 54,436 | 49,638 | 16,237 | 11,029 | 7,057 | 7,305 | 6,262 | 4,673 | |||||||||||||||||||||||||||||||||||||||
Downstream | |||||||||||||||||||||||||||||||||||||||||||||||||||
| United States | 15,807 | 14,553 | 13,832 | 7,685 | 6,741 | 6,169 | 1,514 | 1,109 | 793 | 509 | 474 | 461 | |||||||||||||||||||||||||||||||||||||||
| International | 10,471 | 11,036 | 11,235 | 4,690 | 5,233 | 5,529 | 519 | 532 | 453 | 633 | 551 | 550 | |||||||||||||||||||||||||||||||||||||||
| Total Downstream | 26,278 | 25,589 | 25,067 | 12,375 | 11,974 | 11,698 | 2,033 | 1,641 | 1,246 | 1,142 | 1,025 | 1,011 | |||||||||||||||||||||||||||||||||||||||
Chemicals | |||||||||||||||||||||||||||||||||||||||||||||||||||
| United States | 678 | 645 | 624 | 308 | 289 | 282 | 40 | 25 | 12 | 19 | 19 | 19 | |||||||||||||||||||||||||||||||||||||||
| International | 815 | 771 | 721 | 453 | 431 | 402 | 53 | 54 | 43 | 26 | 24 | 23 | |||||||||||||||||||||||||||||||||||||||
| Total Chemicals | 1,493 | 1,416 | 1,345 | 761 | 720 | 684 | 93 | 79 | 55 | 45 | 43 | 42 | |||||||||||||||||||||||||||||||||||||||
All Other3 | |||||||||||||||||||||||||||||||||||||||||||||||||||
| United States | 3,873 | 3,243 | 3,127 | 2,179 | 1,709 | 1,655 | 680 | 270 | 199 | 215 | 171 | 186 | |||||||||||||||||||||||||||||||||||||||
| International | 41 | 27 | 20 | 14 | 19 | 15 | 5 | 8 | 4 | 1 | 5 | 1 | |||||||||||||||||||||||||||||||||||||||
| Total All Other | 3,914 | 3,270 | 3,147 | 2,193 | 1,728 | 1,670 | 685 | 278 | 203 | 216 | 176 | 187 | |||||||||||||||||||||||||||||||||||||||
| Total United States | 71,349 | 64,632 | 60,973 | 30,022 | 25,445 | 23,433 | 7,959 | 5,143 | 3,164 | 3,443 | 3,038 | 2,535 | |||||||||||||||||||||||||||||||||||||||
| Total International | 82,735 | 73,115 | 66,473 | 48,588 | 43,413 | 40,257 | 11,089 | 7,884 | 5,397 | 5,265 | 4,468 | 3,378 | |||||||||||||||||||||||||||||||||||||||
| Total | $ | 154,084 | $ | 137,747 | $ | 127,446 | $ | 78,610 | $ | 68,858 | $ | 63,690 | $ | 19,048 | $ | 13,027 | $ | 8,561 | $ | 8,708 | $ | 7,506 | $ | 5,913 | |||||||||||||||||||||||||||
| 1 | Net of dry hole expense related to prior years’ expenditures of $89, $120 and $28 in 2007, 2006 and 2005, respectively. | |
| 2 | Depreciation expense includes accretion expense of $399, $275 and $187 in 2007, 2006 and 2005, respectively. | |
| 3 | Primarily mining operations, power generation businesses, real estate assets and management information systems. |
Note 13
FS-42
Table of Contents
| |
Note 14
RFG Patent Fourteen purported class actions were brought by consumers of reformulated gasoline (RFG) alleging that Unocal misled the California Air Resources Board into adopting standards for composition of RFG that overlapped with Unocal’s undisclosed and pending patents. Eleven lawsuits were consolidated in U.S. District Court for the Central District of California, where a class action has been certified, and three were consolidated in a state court action. Unocal is alleged to have monopolized, conspired and engaged in unfair methods of competition, resulting in injury to consumers of RFG. Plaintiffs in both consolidated actions seek unspecified actual and punitive damages, attorneys’ fees, and interest on behalf of an alleged class of consumers who purchased “summertime” RFG in California from January 1995 through August 2005. The parties have reached a tentative agreement to resolve all of the above matters in an amount that is not material to the company’s results of operations, liquidity or
Note 15
| Year ended December 31 | |||||||||||||
| 2007 | 2006 | 2005 | |||||||||||
| Taxes on income | |||||||||||||
| U.S. Federal | |||||||||||||
| Current | $ | 1,446 | $ | 2,828 | $ | 1,459 | |||||||
| Deferred | 225 | 200 | 567 | ||||||||||
| State and local | 338 | 581 | 409 | ||||||||||
| Total United States | 2,009 | 3,609 | 2,435 | ||||||||||
| International | |||||||||||||
| Current | 11,416 | 11,030 | 7,837 | ||||||||||
| Deferred | 54 | 199 | 826 | ||||||||||
| Total International | 11,470 | 11,229 | 8,663 | ||||||||||
| Total taxes on income | $ | 13,479 | $ | 14,838 | $ | 11,098 | |||||||
In 2007, before-tax income for U.S. operations, including related corporate and other charges, was $7,794, compared with before-tax income of $9,131 and $6,733 in 2006 and 2005, respectively. For international operations, before-tax income was $24,373, $22,845 and $18,464 in 2007, 2006 and 2005, respectively. U.S. federal income tax expense was reduced by $132, $116 and $289 in 2007, 2006 and 2005, respectively, for business tax credits.
| Year ended December 31 | |||||||||||||
| 2007 | 2006 | 2005 | |||||||||||
| U.S. statutory federal income tax rate | 35.0 | % | 35.0 | % | 35.0 | % | |||||||
| Effect of income taxes from international operations at rates different from the U.S. statutory rate | 8.3 | 10.3 | 9.2 | ||||||||||
| State and local taxes on income, net of U.S. federal income tax benefit | 0.8 | 1.0 | 1.0 | ||||||||||
| Prior-year tax adjustments | 0.3 | 0.9 | 0.1 | ||||||||||
| Tax credits | (0.4 | ) | (0.4 | ) | (1.1 | ) | |||||||
| Effects of enacted changes in tax laws | (0.3 | ) | 0.3 | – | |||||||||
| Other | (1.8 | ) | (0.7 | ) | (0.1 | ) | |||||||
| Effective tax rate | 41.9 | % | 46.4 | % | 44.1 | % | |||||||
FS-43
Table of Contents
Notes to the Consolidated Financial Statements Millions of dollars, except per-share amounts | ||||||||||
Note 15 Taxes – Continued |
| At December 31 | |||||||||
| 2007 | 2006 | ||||||||
| Deferred tax liabilities | |||||||||
| Properties, plant and equipment | $ | 17,310 | $ | 16,054 | |||||
| Investments and other | 1,837 | 2,137 | |||||||
| Total deferred tax liabilities | 19,147 | 18,191 | |||||||
| Deferred tax assets | |||||||||
| Abandonment/environmental reserves | (3,587 | ) | (2,925 | ) | |||||
| Employee benefits | (2,148 | ) | (2,707 | ) | |||||
| Tax loss carryforwards | (1,603 | ) | (1,509 | ) | |||||
| Capital losses | – | (246 | ) | ||||||
| Deferred credits | (1,689 | ) | (1,670 | ) | |||||
| Foreign tax credits | (3,138 | ) | (1,916 | ) | |||||
| Inventory | (608 | ) | (378 | ) | |||||
| Other accrued liabilities | (477 | ) | (375 | ) | |||||
| Miscellaneous | (1,528 | ) | (1,144 | ) | |||||
| Total deferred tax assets | (14,778 | ) | (12,870 | ) | |||||
| Deferred tax assets valuation allowance | 5,949 | 4,391 | |||||||
| Total deferred taxes, net | $ | 10,318 | $ | 9,712 | |||||
| At December 31 | |||||||||
| 2007 | 2006 | ||||||||
| Prepaid expenses and other current assets | $ | (1,234 | ) | $ | (1,167 | ) | |||
| Deferred charges and other assets | (812 | ) | (844 | ) | |||||
| Federal and other taxes on income | 194 | 76 | |||||||
| Noncurrent deferred income taxes | 12,170 | 11,647 | |||||||
| Total deferred income taxes, net | $ | 10,318 | $ | 9,712 | |||||
Uncertain Income Tax Positions Effective January 1, 2007, the company implemented Financial Accounting Standards Board (FASB) Interpretation No. 48,Accounting for Uncertainty in Income Taxes – An Interpretation of FASB Statement No. 109 (FIN 48), which clarifies the accounting for income tax benefits that are uncertain in nature. This interpretation was intended by the standard-setters to address the diversity in practice that existed in this area of accounting for income taxes.
FS-44
Table of Contents
Note 15 Taxes – Continued |
| Balance at January 1, 2007 (date of FIN 48 adoption) | $ | 2,296 | ||
| Foreign currency effects | 19 | |||
| Additions based on tax positions taken in 2007 | 418 | |||
| Additions for tax positions taken in prior years | 120 | |||
| Reductions for tax positions taken in prior years | (225 | ) | ||
| Settlements with taxing authorities in 2007 | (255 | ) | ||
| Reductions due to tax positions previously expected to be taken but subsequently not taken on 2006 tax returns | (174 | ) | ||
| Balance at December 31, 2007 | $ | 2,199 | ||
| Year ended December 31 | |||||||||||||
| 2007 | 2006 | 2005 | |||||||||||
| United States | |||||||||||||
| Excise and similar taxes on products and merchandise | $ | 4,992 | $ | 4,831 | $ | 4,521 | |||||||
| Import duties and other levies | 12 | 32 | 8 | ||||||||||
| Property and other miscellaneous taxes | 491 | 475 | 392 | ||||||||||
| Payroll taxes | 185 | 155 | 149 | ||||||||||
| Taxes on production | 288 | 360 | 323 | ||||||||||
| Total United States | 5,968 | 5,853 | 5,393 | ||||||||||
| International | |||||||||||||
| Excise and similar taxes on products and merchandise | 5,129 | 4,720 | 4,198 | ||||||||||
| Import duties and other levies | 10,404 | 9,618 | 10,466 | ||||||||||
| Property and other miscellaneous taxes | 528 | 491 | 535 | ||||||||||
| Payroll taxes | 89 | 75 | 52 | ||||||||||
| Taxes on production | 148 | 126 | 138 | ||||||||||
| Total International | 16,298 | 15,030 | 15,389 | ||||||||||
| Total taxes other than on income | $ | 22,266 | $ | 20,883 | $ | 20,782 | |||||||
Note 16
| At December 31 | |||||||||
| 2007 | 2006 | ||||||||
| Commercial paper* | $ | 3,030 | $ | 3,472 | |||||
| Notes payable to banks and others with originating terms of one year or less | 219 | 122 | |||||||
| Current maturities of long-term debt | 850 | 2,176 | |||||||
| Current maturities of long-term capital leases | 73 | 57 | |||||||
| Redeemable long-term obligations | |||||||||
| Long-term debt | 1,351 | 487 | |||||||
| Capital leases | 21 | 295 | |||||||
| Subtotal | 5,544 | 6,609 | |||||||
| Reclassified to long-term debt | (4,382 | ) | (4,450 | ) | |||||
| Total short-term debt | $ | 1,162 | $ | 2,159 | |||||
FS-45
Table of Contents
Notes to the Consolidated Financial Statements Millions of dollars, except per-share amounts | ||||||||||
Note 16Short-Term Debt – Continued |
Note 17
| At December 31 | |||||||||
| 2007 | 2006 | ||||||||
| 3.375% notes due 2008 | $ | 749 | $ | 738 | |||||
| 5.5% notes due 2009 | 405 | 401 | |||||||
7.327% amortizing notes due 20141 | 213 | 213 | |||||||
| 8.625% debentures due 2032 | 161 | 199 | |||||||
| 8.625% debentures due 2031 | 108 | 199 | |||||||
| 7.5% debentures due 2043 | 85 | 198 | |||||||
| 8% debentures due 2032 | 81 | 148 | |||||||
| 9.75% debentures due 2020 | 57 | 250 | |||||||
| 8.875% debentures due 2021 | 46 | 150 | |||||||
| 8.625% debentures due 2010 | 30 | 150 | |||||||
| 3.85% notes due 2008 | 30 | – | |||||||
| 3.5% notes due 2007 | – | 1,996 | |||||||
| 7.09% notes due 2007 | – | 144 | |||||||
Medium-term notes, maturing from 2021 to 2038 (6.2%)2 | 64 | 210 | |||||||
Fixed interest rate notes, maturing from 2008 to 2011 (8.2%)2 | 27 | 46 | |||||||
Other foreign currency obligations (0.5%)2 | 17 | 23 | |||||||
Other long-term debt (7.4%)2 | 59 | 66 | |||||||
| Total including debt due within one year | 2,132 | 5,131 | |||||||
| Debt due within one year | (850 | ) | (2,176 | ) | |||||
| Reclassified from short-term debt | 4,382 | 4,450 | |||||||
| Total long-term debt | $ | 5,664 | $ | 7,405 | |||||
| 1 | Guarantee of ESOP debt. | |
| 2 | Weighted-average interest rate at December 31, 2007. |
Note 18
FASB Staff Position FAS No. 157-1, Application of FASB Statement No. 157 to FASB Statement No. 13 and Its Related Interpretive Accounting Pronouncements That Address Leasing Transactions (FSP 157-1) In February 2008, the FASB issued FSP 157-1, which became effective for the company on January 1, 2008. This FSP excludes FASB Statement No. 13, Accounting for Leases, and its related interpretive accounting pronouncements from the provisions of FAS 157. Implementation of this standard did not have a material effect on the company’s results of operations or consolidated financial position.
FASB Staff Position FAS No. 157-2, Effective Date of FASB Statement No. 157 (FSP 157-2) In February 2008, the FASB issued FSP 157-2, which delays the company’s January 1, 2008 effective date of FAS 157 for all nonfinancial assets and nonfinancial liabilities, except those recognized or disclosed at fair value in the financial statements on a recurring basis (at least annually), until January 1, 2009. Implementation of this standard did not have a material effect on the company’s results of operations or consolidated financial position.
FASB Statement No. 159, The Fair Value Option for Financial Assets and Financial Liabilities - Including an amendment of FASB Statement No. 115 (FAS 159) In February 2007, the FASB issued FAS 159, which became effective for the company on January 1, 2008. This standard permits companies to choose to measure many financial instruments and certain other items at fair value and report unrealized gains and losses in earnings. Such accounting is optional and is generally to be applied instrument by instrument. The implementation of FAS 159 did not have a material effect on the company’s results of operations or consolidated financial position.
FASB Statement No. 141 (revised 2007), Business Combinations (FAS 141-R) In December 2007, the FASB issued FAS 141-R, which will become effective for business combination transactions having an acquisition date on or after January 1, 2009. This standard requires the acquiring entity in a business combination to
FS-46
Table of Contents
Note 18New Accounting Standards – Continued |
FASB Statement No. 160, Noncontrolling Interests in Consolidated Financial Statements, an amendment of ARB No. 51 (FAS 160) The FASB issued FAS 160 in December 2007, which will become effective for the company January 1, 2009, with retroactive adoption of the Statement’s presentation and disclosure requirements for existing minority interests. This standard will require ownership interests in subsidiaries held by parties other than the parent to be presented within the equity section of the consolidated statement of financial position but separate from the parent’s equity. It will also require the amount of consolidated net income attributable to the parent and the noncontrolling interest to be clearly identified and presented on the face of the consolidated income statement. Certain changes in a parent’s ownership interest are to be accounted for as equity transactions and when a subsidiary is deconsolidated, any noncontrolling equity investment in the former subsidiary is to be initially measured at fair value. The company does not anticipate the implementation of FAS 160 will significantly change the presentation of its consolidated income statement or consolidated balance sheet.
Note 19
| 2007 | 2006 | 2005 | |||||||||||
| Beginning balance at January 1 | $ | 1,239 | $ | 1,109 | $ | 671 | |||||||
| Additions associated with the acquisition of Unocal | – | – | 317 | ||||||||||
| Additions to capitalized exploratory well costs pending the determination of proved reserves | 486 | 446 | 290 | ||||||||||
| Reclassifications to wells, facilities and equipment based on the determination of proved reserves | (23 | ) | (171 | ) | (140 | ) | |||||||
| Capitalized exploratory well costs charged to expense | (42 | ) | (121 | ) | (6 | ) | |||||||
| Other reductions* | – | (24 | ) | (23 | ) | ||||||||
| Ending balance at December 31 | $ | 1,660 | $ | 1,239 | $ | 1,109 | |||||||
| At December 31 | |||||||||||||
| 2007 | 2006 | 2005 | |||||||||||
| Exploratory well costs capitalized for a period of one year or less | $ | 449 | $ | 332 | $ | 259 | |||||||
| Exploratory well costs capitalized for a period greater than one year | 1,211 | 907 | 850 | ||||||||||
| Balance at December 31 | $ | 1,660 | $ | 1,239 | $ | 1,109 | |||||||
| Number of projects with exploratory well costs that have been capitalized for a period greater than one year* | 54 | 44 | 40 | ||||||||||
FS-47
Table of Contents
Notes to the Consolidated Financial Statements Millions of dollars, except per-share amounts | ||||||||||
Note 19 Accounting For Suspended Exploratory Wells – Continued |
| Number | ||||||||
| Aging based on drilling completion date of individual wells: | Amount | of wells | ||||||
| 1994–1996 | $ | 27 | 3 | |||||
| 1997–2001 | 128 | 32 | ||||||
| 2002–2006 | 1,056 | 92 | ||||||
| Total | $ | 1,211 | 127 | |||||
| Aging based on drilling completion date of last | Number | |||||||
| suspended well in project: | Amount | of projects | ||||||
| 1999 | $ | 8 | 1 | |||||
| 2003–2007 | 1,203 | 53 | ||||||
| Total | $ | 1,211 | 54 | |||||
Note 20
FS-48
Table of Contents
Note 20 Employee Benefit Plans – Continued |
| Pension Benefits | ||||||||||||||||||||||||||
| 2007 | 2006 | Other Benefits | ||||||||||||||||||||||||
| U.S. | Int’l. | U.S. | Int’l. | 2007 | 2006 | |||||||||||||||||||||
Change in Benefit Obligation | ||||||||||||||||||||||||||
| Benefit obligation at January 1 | $ | 8,792 | $ | 4,207 | $ | 8,594 | $ | 3,611 | $ | 3,257 | $ | 3,252 | ||||||||||||||
| Service cost | 260 | 125 | 234 | 98 | 49 | 35 | ||||||||||||||||||||
| Interest cost | 483 | 255 | 468 | 214 | 184 | 181 | ||||||||||||||||||||
| Plan participants’ contributions | – | 7 | – | 7 | 122 | 134 | ||||||||||||||||||||
| Plan amendments | (301 | ) | 97 | 14 | 37 | – | 107 | |||||||||||||||||||
| Curtailments | – | (12 | ) | – | – | – | – | |||||||||||||||||||
| Actuarial (gain) loss | (131 | ) | (40 | ) | 297 | 97 | (413 | ) | (102 | ) | ||||||||||||||||
| Foreign currency exchange rate changes | – | 219 | – | 355 | 12 | (5 | ) | |||||||||||||||||||
| Benefits paid | (708 | ) | (225 | ) | (815 | ) | (212 | ) | (272 | ) | (345 | ) | ||||||||||||||
| Benefit obligation at December 31 | 8,395 | 4,633 | 8,792 | 4,207 | 2,939 | 3,257 | ||||||||||||||||||||
Change in Plan Assets | ||||||||||||||||||||||||||
| Fair value of plan assets at January 1 | 7,941 | 3,456 | 7,463 | 2,890 | – | – | ||||||||||||||||||||
| Actual return on plan assets | 607 | 232 | 1,069 | 225 | – | – | ||||||||||||||||||||
| Foreign currency exchange rate changes | – | 183 | – | 321 | – | – | ||||||||||||||||||||
| Employer contributions | 78 | 239 | 224 | 225 | 150 | 211 | ||||||||||||||||||||
| Plan participants’ contributions | – | 7 | – | 7 | 122 | 134 | ||||||||||||||||||||
| Benefits paid | (708 | ) | (225 | ) | (815 | ) | (212 | ) | (272 | ) | (345 | ) | ||||||||||||||
| Fair value of plan assets at December 31 | 7,918 | 3,892 | 7,941 | 3,456 | – | – | ||||||||||||||||||||
Funded Status at December 31 | $ | (477 | ) | $ | (741 | ) | $ | (851 | ) | $ | (751 | ) | $ | (2,939 | ) | $ | (3,257 | ) | ||||||||
| Pension Benefits | ||||||||||||||||||||||||||
| 2007 | 2006 | Other Benefits | ||||||||||||||||||||||||
| U.S. | Int’l. | U.S. | Int’l. | 2007 | 2006 | |||||||||||||||||||||
| Deferred charges and other assets | $ | 181 | $ | 279 | $ | 18 | $ | 96 | $ | – | $ | – | ||||||||||||||
| Accrued liabilities | (68 | ) | (55 | ) | (53 | ) | (47 | ) | (207 | ) | (223 | ) | ||||||||||||||
| Reserves for employee benefit plans | (590 | ) | (965 | ) | (816 | ) | (800 | ) | (2,732 | ) | (3,034 | ) | ||||||||||||||
| Net amount recognized at December 31 | $ | (477 | ) | $ | (741 | ) | $ | (851 | ) | $ | (751 | ) | $ | (2,939 | ) | $ | (3,257 | ) | ||||||||
| Pension Benefits | ||||||||||||||||||||||||||
| 2007 | 2006 | Other Benefits | ||||||||||||||||||||||||
| U.S. | Int’l. | U.S. | Int’l. | 2007 | 2006 | |||||||||||||||||||||
| Net actuarial loss | $ | 1,539 | $ | 1,237 | $ | 1,892 | $ | 1,288 | $ | 490 | $ | 972 | ||||||||||||||
| Prior-service costs (credit) | (75 | ) | 203 | 272 | 126 | (404 | ) | (485 | ) | |||||||||||||||||
| Total recognized at December 31 | $ | 1,464 | $ | 1,440 | $ | 2,164 | $ | 1,414 | $ | 86 | $ | 487 | ||||||||||||||
| Pension Benefits | |||||||||||||||||
| 2007 | 2006 | ||||||||||||||||
| U.S. | Int’l. | U.S. | Int’l. | ||||||||||||||
| Projected benefit obligations | $ | 678 | $ | 1,089 | $ | 848 | $ | 849 | |||||||||
| Accumulated benefit obligations | 638 | 926 | 806 | 741 | |||||||||||||
| Fair value of plan assets | 20 | 271 | 12 | 172 | |||||||||||||
FS-49
Table of Contents
Notes to the Consolidated Financial Statements Millions of dollars, except per-share amounts | ||||||||||
Note 20 Employee Benefit Plans – Continued |
| Pension Benefits | ||||||||||||||||||||||||||||||||||||||
| 2007 | 2006 | 2005 | Other Benefits | |||||||||||||||||||||||||||||||||||
| U.S. | Int’l. | U.S. | Int’l. | U.S. | Int’l. | 2007 | 2006 | 2005 | ||||||||||||||||||||||||||||||
Net Periodic Benefit Cost | ||||||||||||||||||||||||||||||||||||||
| Service cost | $ | 260 | $ | 125 | $ | 234 | $ | 98 | $ | 208 | $ | 84 | $ | 49 | $ | 35 | $ | 30 | ||||||||||||||||||||
| Interest cost | 483 | 255 | 468 | 214 | 395 | 199 | 184 | 181 | 164 | |||||||||||||||||||||||||||||
| Expected return on plan assets | (578 | ) | (266 | ) | (550 | ) | (227 | ) | (449 | ) | (208 | ) | – | – | – | |||||||||||||||||||||||
| Amortization of transitional assets | – | – | – | 1 | – | 2 | – | – | – | |||||||||||||||||||||||||||||
| Amortization of prior-service costs (credits) | 46 | 17 | 46 | 14 | 45 | 16 | (81 | ) | (86 | ) | (91 | ) | ||||||||||||||||||||||||||
| Recognized actuarial losses | 128 | 82 | 149 | 69 | 177 | 51 | 81 | 97 | 93 | |||||||||||||||||||||||||||||
| Settlement losses | 65 | – | 70 | – | 86 | – | – | – | – | |||||||||||||||||||||||||||||
| Curtailment losses | – | 3 | – | – | – | – | – | – | – | |||||||||||||||||||||||||||||
| Net periodic benefit cost | 404 | 216 | 417 | 169 | 462 | 144 | 233 | 227 | 196 | |||||||||||||||||||||||||||||
Changes Recognized in Other Comprehensive Income | ||||||||||||||||||||||||||||||||||||||
| Net actuarial (gain) loss during period | (160 | ) | 31 | – | – | – | – | (401 | ) | – | – | |||||||||||||||||||||||||||
| Amortization of actuarial (loss) | (193 | ) | (82 | ) | – | – | – | – | (81 | ) | – | – | ||||||||||||||||||||||||||
| Prior service (credit) cost during period | (301 | ) | 97 | – | – | – | – | – | – | – | ||||||||||||||||||||||||||||
| Amortization of prior-service (costs) credits | (46 | ) | (20 | ) | – | – | – | – | 81 | – | – | |||||||||||||||||||||||||||
| Total changes recognized in other comprehensive income | (700 | ) | 26 | – | – | – | – | (401 | ) | – | – | |||||||||||||||||||||||||||
Recognized in Net Periodic Benefit Cost and Other Comprehensive Income | $ | (296 | ) | $ | 242 | $ | 417 | $ | 169 | $ | 462 | $ | 144 | $ | (168 | ) | $ | 227 | $ | 196 | ||||||||||||||||||
FS-50
Table of Contents
Note 20Employee Benefit Plans – Continued |
| Pension Benefits | ||||||||||||||||||||||||||||||||||||||
| 2007 | 2006 | 2005 | Other Benefits | |||||||||||||||||||||||||||||||||||
| U.S. | Int’l. | U.S. | Int’l. | U.S. | Int’l. | 2007 | 2006 | 2005 | ||||||||||||||||||||||||||||||
| Assumptions used to determine benefit obligations | ||||||||||||||||||||||||||||||||||||||
| Discount rate | 6.3 | % | 6.7 | % | 5.8 | % | 6.0 | % | 5.5 | % | 5.9 | % | 6.3 | % | 5.8 | % | 5.6 | % | ||||||||||||||||||||
| Rate of compensation increase | 4.5 | % | 6.4 | % | 4.5 | % | 6.1 | % | 4.0 | % | 5.1 | % | 4.5 | % | 4.5 | % | 4.0 | % | ||||||||||||||||||||
| Assumptions used to determine net periodic benefit cost | ||||||||||||||||||||||||||||||||||||||
Discount rate1,2 | 5.8 | % | 6.0 | % | 5.8 | % | 5.9 | % | 5.5 | % | 6.4 | % | 5.8 | % | 5.9 | % | 5.8 | % | ||||||||||||||||||||
Expected return on plan assets1 | 7.8 | % | 7.5 | % | 7.8 | % | 7.4 | % | 7.8 | % | 7.9 | % | N/A | N/A | N/A | |||||||||||||||||||||||
Rate of compensation increase1 | 4.5 | % | 6.1 | % | 4.2 | % | 5.1 | % | 4.0 | % | 5.0 | % | 4.5 | % | 4.2 | % | 4.0 | % | ||||||||||||||||||||
| 1 | The 2005 discount rate, expected return on plan assets and rate of compensation increase reflect the remeasurement of the acquired Unocal benefit plans at July 31, 2005. | |
| 2 | The 2006 U.S. discount rate reflects remeasurement on July 1, 2006, due to plan combinations and changes, primarily several Unocal plans into related Chevron plans. |
Discount Rate The discount rate assumptions used to determine U.S. and international pension and postretirement benefit plan obligations and expense reflect the prevailing rates available on high-quality, fixed-income debt instruments. At December 31, 2007, the company selected a 6.3 percent discount rate for the major U.S. pension and postretirement plans. This rate was based on a cash flow analysis that matched estimated future benefit payments to the Citigroup Pension Discount Yield Curve as of year-end 2007. The discount rates at the end of 2006 and 2005 were 5.8 percent and 5.5 percent, respectively.
| 1 Percent | 1 Percent | |||||||
| Increase | Decrease | |||||||
| Effect on total service and interest cost components | $ | 9 | $ | (8 | ) | |||
| Effect on postretirement benefit obligation | $ | 86 | $ | (75 | ) | |||
Plan Assets and Investment Strategy The company’s pension plan weighted-average asset allocations at December 31 by asset category are as follows:
| U.S. | International | ||||||||||||||||
| Asset Category | 2007 | 2006 | 2007 | 2006 | |||||||||||||
| Equities | 64 | % | 68 | % | 56 | % | 62 | % | |||||||||
| Fixed Income | 23 | % | 21 | % | 43 | % | 37 | % | |||||||||
| Real Estate | 12 | % | 10 | % | 1 | % | 1 | % | |||||||||
| Other | 1 | % | 1 | % | – | – | |||||||||||
| Total | 100 | % | 100 | % | 100 | % | 100 | % | |||||||||
FS-51
Table of Contents
Notes to the Consolidated Financial Statements Millions of dollars, except per-share amounts | ||||||||||
Note 20Employee Benefit Plans – Continued |
Cash Contributions and Benefit Payments In 2007, the company contributed $78 and $239 to its U.S. and international pension plans, respectively. In 2008, the company expects contributions to be approximately $300 and $200 to its U.S. and international pension plans, respectively. Actual contribution amounts are dependent upon plan-investment returns, changes in pension obligations, regulatory environments and other economic factors. Additional funding may ultimately be required if investment returns are insufficient to offset increases in plan obligations.
| Pension Benefits | Other | |||||||||||
| U.S. | Int’l. | Benefits | ||||||||||
| 2008 | $ | 832 | $ | 238 | $ | 207 | ||||||
| 2009 | $ | 841 | $ | 272 | $ | 213 | ||||||
| 2010 | $ | 849 | $ | 282 | $ | 219 | ||||||
| 2011 | $ | 856 | $ | 279 | $ | 225 | ||||||
| 2012 | $ | 863 | $ | 296 | $ | 228 | ||||||
| 2013–2017 | $ | 4,338 | $ | 1,819 | $ | 1,195 | ||||||
Employee Savings Investment Plan Eligible employees of Chevron and certain of its subsidiaries participate in the Chevron Employee Savings Investment Plan (ESIP).
Employee Stock Ownership Plan Within the Chevron ESIP is an employee stock ownership plan (ESOP). In 1989, Chevron established a LESOP as a constituent part of the ESOP. The LESOP provides partial prefunding of the company’s future commitments to the ESIP.
| Thousands | 2007 | 2006 | |||||||
| Allocated shares | 20,506 | 21,827 | |||||||
| Unallocated shares | 7,365 | 8,316 | |||||||
| Total LESOP shares | 27,871 | 30,143 | |||||||
FS-52
Table of Contents
Note 20Employee Benefit Plans – Continued |
Employee Incentive Plans Chevron has two incentive plans, the Management Incentive Plan (MIP) and the Long-Term Incentive Plan (LTIP), for officers and other regular salaried employees of the company and its subsidiaries who hold positions of significant responsibility. MIP is an annual cash incentive plan that links awards to performance results of the prior year. The cash awards may be deferred by the recipients by conversion to stock units or other investment fund alternatives. Aggregate charges to expense for MIP were $184, $180 and $155 in 2007, 2006 and 2005, respectively. Awards under LTIP consist of stock options and other share-based compensation that are described in Note 21 below.
Note 21
Chevron Long-Term Incentive Plan (LTIP) Awards under the LTIP may take the form of, but are not limited to, stock options, restricted stock, restricted stock units, stock appreciation rights, performance units and nonstock grants. From April 2004 through January 2014, no more than 160 million shares may be issued under the LTIP, and no more than 64 million of those shares may be in a form other than a stock option, stock appreciation right or award requiring full payment for shares by the award recipient.
FS-53
Table of Contents
Notes to the Consolidated Financial Statements Millions of dollars, except per-share amounts | ||||||||||
Note 21Stock Options and Other Share-Based Compensation – Continued |
Texaco Stock Incentive Plan (Texaco SIP) On the closing of the acquisition of Texaco in October 2001, outstanding options granted under the Texaco SIP were converted to Chevron options. These options, which have 10-year contractual lives extending into 2011, retained a provision for being restored. This provision enables a participant who exercises a stock option to receive new options equal to the number of shares exchanged or who has shares withheld to satisfy tax withholding obligations to receive new options equal to the number of shares exchanged or withheld. The restored options are fully exercisable six months after the date of grant, and the exercise price is the market value of the common stock on the day the restored option is granted. Beginning in 2007, restored options were granted under the LTIP. No further awards may be granted under the former Texaco plans.
Unocal Share-Based Plans (Unocal Plans) When Chevron acquired Unocal in August 2005, outstanding stock options and stock appreciation rights granted under various Unocal Plans were exchanged for fully vested Chevron options and appreciation rights. These awards retained the same provisions as the original Unocal Plans. Awards issued prior to 2004 generally may be exercised for up to three years after termination of employment (depending upon the terms of the individual award agreements) or the original expiration date, whichever is earlier. Awards issued since 2004 generally remained exercisable until the end of the normal option term if termination of employment occurred prior to August 10, 2007. Other awards issued under the Unocal Plans, including restricted stock, stock units, restricted stock units and performance shares, became vested at the acquisition date, and shares or cash were issued to recipients in accordance with change-in-control provisions of the plans.
| Year ended December 31 | |||||||||||||
| 2007 | 2006 | 2005 | |||||||||||
Stock Options | |||||||||||||
Expected term in years1 | 6.3 | 6.4 | 6.4 | ||||||||||
Volatility2 | 22.0 | % | 23.7 | % | 24.5 | % | |||||||
| Risk-free interest rate based on zero coupon U.S. treasury note | 4.5 | % | 4.7 | % | 3.8 | % | |||||||
| Dividend yield | 3.2 | % | 3.1 | % | 3.4 | % | |||||||
| Weighted-average fair value per option granted | $ | 15.27 | $ | 12.74 | $ | 11.66 | |||||||
Restored Options | |||||||||||||
Expected term in years1 | 1.6 | 2.2 | 2.1 | ||||||||||
Volatility2 | 21.2 | % | 19.6 | % | 18.6 | % | |||||||
| Risk-free interest rate based on zero coupon U.S. treasury note | 4.5 | % | 4.8 | % | 3.8 | % | |||||||
| Dividend yield | 3.2 | % | 3.3 | % | 3.4 | % | |||||||
| Weighted-average fair value per option granted | $ | 8.61 | $ | 7.72 | $ | 6.09 | |||||||
Unocal Plans3 | |||||||||||||
Expected term in years1 | – | – | 4.2 | ||||||||||
Volatility2 | – | – | 21.6 | % | |||||||||
| Risk-free interest rate based on zero coupon U.S. treasury note | – | – | 3.9 | % | |||||||||
| Dividend yield | – | – | 3.4 | % | |||||||||
| Weighted-average fair value per option granted | – | – | $ | 21.48 | |||||||||
| 1 | Expected term is based on historical exercise and post-vesting cancellation data. | |
| 2 | Volatility rate is based on historical stock prices over an appropriate period, generally equal to the expected term. | |
| 3 | Represent options converted at the acquisition date. |
| Weighted- | ||||||||||||||||
| Weighted- | Average | |||||||||||||||
| Average | Remaining | Aggregate | ||||||||||||||
| Shares | Exercise | Contractual | Intrinsic | |||||||||||||
| (Thousands) | Price | Term | Value | |||||||||||||
Outstanding at January 1, 2007 | 55,945 | $ | 47.91 | |||||||||||||
| Granted | 12,848 | $ | 74.08 | |||||||||||||
| Exercised | (14,340 | ) | $ | 51.92 | ||||||||||||
| Restored | 3,458 | $ | 80.45 | |||||||||||||
| Forfeited | (554 | ) | $ | 72.36 | ||||||||||||
Outstanding at December 31, 2007 | 57,357 | $ | 54.50 | 6.3 yrs. | $ | 2,227 | ||||||||||
Exercisable at December 31, 2007 | 35,540 | $ | 45.93 | 5.1 yrs. | $ | 1,685 | ||||||||||
FS-54
Table of Contents
Note 21Stock Options and Other Share-Based Compensation – Continued |
Broad-Based Employee Stock Options In addition to the plans described above, Chevron granted all eligible employees stock options or equivalents in 1998. The options vested in February 2000 and expired in February 2008. A total of 9,641,600 options were awarded with an exercise price of $38.16 per share.
Note 22
Guarantees The company’s guarantee of approximately $600 is associated with certain payments under a terminal use agreement entered into by a company affiliate. The terminal is expected to be operational by 2012. Over the approximate 16-year term of the guarantee, the maximum guarantee amount will reduce over time as certain fees are paid by the affiliate. There are numerous cross-indemnity agreements with the affiliate and the other partners to permit recovery of any amounts paid under the guarantee. Chevron carries no liability for its obligation under this guarantee.
Indemnifications The company provided certain indemnities of contingent liabilities of Equilon and Motiva to Shell and Saudi Refining, Inc., in connection with the February 2002 sale of the company’s interests in those investments. The company would be required to perform if the indemnified liabilities become actual losses. Were that to occur, the company could be required to make future payments up to $300. Through the end of 2007, the company paid $48 under these indemnities and continues to be obligated for possible additional indemnification payments in the future.
FS-55
Table of Contents
Notes to the Consolidated Financial Statements Millions of dollars, except per-share amounts | ||||||||||
Note 22Other Contingencies and Commitments – Continued |
Long-Term Unconditional Purchase Obligations and Commitments, Including Throughput and Take-or-Pay Agreements The company and its subsidiaries have certain other contingent liabilities relating to long-term unconditional purchase obligations and commitments, including throughput and take-or-pay agreements, some of which relate to suppliers’ financing arrangements. The agreements typically provide goods and services, such as pipeline and storage capacity, drilling rigs, utilities, and petroleum products, to be used or sold in the ordinary course of the company’s business. The aggregate approximate amounts of required payments under these various commitments are: 2008 – $4,700; 2009 – $3,300; 2010 – $3,300; 2011 – $1,900; 2012 – $1,300; 2013 and after – $4,900. A portion of these commitments may ultimately be shared with project partners. Total payments under the agreements were approximately $3,700 in 2007, $3,000 in 2006 and $2,100 in 2005.
Minority Interests The company has commitments of $204 related to minority interests in subsidiary companies.
Environmental The company is subject to loss contingencies pursuant to environmental laws and regulations that in the future may require the company to take action to correct or ameliorate the effects on the environment of prior release of chemicals or petroleum substances, including MTBE, by the company or other parties. Such contingencies may exist for various sites, including, but not limited to, federal Superfund sites and analogous sites under state laws, refineries, crude oil fields, service stations, terminals, land development areas, and mining operations, whether operating, closed or divested. These future costs are not fully determinable due to such factors as the unknown magnitude of possible contamination, the unknown timing and extent of the corrective actions that may be required, the determination of the company’s liability in proportion to other responsible parties, and the extent to which such costs are recoverable from third parties.
FS-56
Table of Contents
Note 22Other Contingencies and Commitments – Continued |
Equity RedeterminationFor oil and gas producing operations, ownership agreements may provide for periodic reassessments of equity interests in estimated crude oil and natural gas reserves. These activities, individually or together, may result in gains or losses that could be material to earnings in any given period. One such equity redetermination process has been under way since 1996 for Chevron’s interests in four producing zones at the Naval Petroleum Reserve at Elk Hills, California, for the time when the remaining interests in these zones were owned by the U.S. Department of Energy. A wide range remains for a possible net settlement amount for the four zones. For this range of settlement, Chevron estimates its maximum possible net before-tax liability at approximately $200, and the possible maximum net amount that could be owed to Chevron is estimated at about $150. The timing of the settlement and the exact amount within this range of estimates are uncertain.
Other ContingenciesChevron receives claims from and submits claims to customers; trading partners; U.S. federal, state and local regulatory bodies; governments; contractors; insurers; and suppliers. The amounts of these claims, individually and in the aggregate, may be significant and take lengthy periods to resolve.
Note 23
| 2007 | 2006 | 2005 | |||||||||||
| Balance at January 1 | $ | 5,773 | $ | 4,304 | $ | 2,878 | |||||||
| Liabilities assumed in the Unocal acquisition | – | – | 1,216 | ||||||||||
| Liabilities incurred | 178 | 153 | 90 | ||||||||||
| Liabilities settled | (818 | ) | (387 | ) | (172 | ) | |||||||
| Accretion expense | 399 | * | 275 | 187 | |||||||||
| Revisions in estimated cash flows | 2,721 | 1,428 | 105 | ||||||||||
| Balance at December 31 | $ | 8,253 | $ | 5,773 | $ | 4,304 | |||||||
FS-57
Table of Contents
Notes to the Consolidated Financial Statements Millions of dollars, except per-share amounts | ||||||||||
Note 23Asset Retirement Obligations – Continued |
Note 24
| Year ended December 31 | |||||||||||||
| 2007 | 2006 | 2005 | |||||||||||
| Total financing interest and debt costs | $ | 468 | $ | 608 | $ | 542 | |||||||
| Less: Capitalized interest | 302 | 157 | 60 | ||||||||||
| Interest and debt expense | $ | 166 | $ | 451 | $ | 482 | |||||||
| Research and development expenses | $ | 562 | $ | 468 | $ | 316 | |||||||
| Foreign currency effects* | $ | (352 | ) | $ | (219 | ) | $ | (61 | ) | ||||
Note 25
| Year ended December 31 | |||||||||||||
| 2007 | 2006 | 2005 | |||||||||||
Basic EPS Calculation | |||||||||||||
| Income from operations | $ | 18,688 | $ | 17,138 | $ | 14,099 | |||||||
| Add: Dividend equivalents paid on stock units | – | 1 | 2 | ||||||||||
| Net income available to common stockholders – Basic | $ | 18,688 | $ | 17,139 | $ | 14,101 | |||||||
| Weighted-average number of common shares outstanding | 2,117 | 2,185 | 2,143 | ||||||||||
| Add: Deferred awards held as stock units | 1 | 1 | 1 | ||||||||||
| Total weighted-average number of common shares outstanding | 2,118 | 2,186 | 2,144 | ||||||||||
| Per share of common stock | |||||||||||||
| Net income – Basic | $ | 8.83 | $ | 7.84 | $ | 6.58 | |||||||
Diluted EPS Calculation | |||||||||||||
| Income from operations | $ | 18,688 | $ | 17,138 | $ | 14,099 | |||||||
| Add: Dividend equivalents paid on stock units | – | 1 | 2 | ||||||||||
| Add: Dilutive effects of employee stock-based awards | – | – | 2 | ||||||||||
| Net income available to common stockholders – Diluted | $ | 18,688 | $ | 17,139 | $ | 14,103 | |||||||
| Weighted-average number of common shares outstanding | 2,117 | 2,185 | 2,143 | ||||||||||
| Add: Deferred awards held as stock units | 1 | 1 | 1 | ||||||||||
| Add: Dilutive effect of employee stock-based awards | 14 | 11 | 11 | ||||||||||
| Total weighted-average number of common shares outstanding | 2,132 | 2,197 | 2,155 | ||||||||||
| Per share of common stock | |||||||||||||
| Net income – Diluted | $ | 8.77 | $ | 7.80 | $ | 6.54 | |||||||
FS-58
Table of Contents
THIS PAGE INTENTIONALLY LEFT BLANK
FS-59
Table of Contents
Five-Year Financial Summary
| Millions of dollars, except per-share amounts | 2007 | 2006 | 2005 | 2004 | 2003 | ||||||||||||||||
Statement of Income Data | |||||||||||||||||||||
Revenues and Other Income | |||||||||||||||||||||
Total sales and other operating revenues1,2 | $ | 214,091 | $ | 204,892 | $ | 193,641 | $ | 150,865 | $ | 119,575 | |||||||||||
| Income from equity affiliates and other income | 6,813 | 5,226 | 4,559 | 4,435 | 1,702 | ||||||||||||||||
Total Revenues and Other Income | 220,904 | 210,118 | 198,200 | 155,300 | 121,277 | ||||||||||||||||
Total Costs and Other Deductions | 188,737 | 178,142 | 173,003 | 134,749 | 108,601 | ||||||||||||||||
Income From Continuing Operations Before Income Taxes | 32,167 | 31,976 | 25,197 | 20,551 | 12,676 | ||||||||||||||||
Income Tax Expense | 13,479 | 14,838 | 11,098 | 7,517 | 5,294 | ||||||||||||||||
Income From Continuing Operations | 18,688 | 17,138 | 14,099 | 13,034 | 7,382 | ||||||||||||||||
Income From Discontinued Operations | – | – | – | 294 | 44 | ||||||||||||||||
Income Before | |||||||||||||||||||||
Cumulative Effect of Changes in Accounting Principles | 18,688 | 17,138 | 14,099 | 13,328 | 7,426 | ||||||||||||||||
| Cumulative effect of changes in accounting principles | – | – | – | – | (196 | ) | |||||||||||||||
Net Income | $ | 18,688 | $ | 17,138 | $ | 14,099 | $ | 13,328 | $ | 7,230 | |||||||||||
Per Share of Common Stock3 | |||||||||||||||||||||
Income From Continuing Operations4 | |||||||||||||||||||||
| – Basic | $ | 8.83 | $ | 7.84 | $ | 6.58 | $ | 6.16 | $ | 3.55 | |||||||||||
| – Diluted | $ | 8.77 | $ | 7.80 | $ | 6.54 | $ | 6.14 | $ | 3.55 | |||||||||||
Income From Discontinued Operations | |||||||||||||||||||||
| – Basic | $ | – | $ | – | $ | – | $ | 0.14 | $ | 0.02 | |||||||||||
| – Diluted | $ | – | $ | – | $ | – | $ | 0.14 | $ | 0.02 | |||||||||||
Cumulative Effect of Changes in Accounting Principles | |||||||||||||||||||||
| – Basic | $ | – | $ | – | $ | – | $ | – | $ | (0.09 | ) | ||||||||||
| – Diluted | $ | – | $ | – | $ | – | $ | – | $ | (0.09 | ) | ||||||||||
Net Income2 | |||||||||||||||||||||
| – Basic | $ | 8.83 | $ | 7.84 | $ | 6.58 | $ | 6.30 | $ | 3.48 | |||||||||||
| – Diluted | $ | 8.77 | $ | 7.80 | $ | 6.54 | $ | 6.28 | $ | 3.48 | |||||||||||
Cash Dividends Per Share | $ | 2.26 | $ | 2.01 | $ | 1.75 | $ | 1.53 | $ | 1.43 | |||||||||||
Balance Sheet Data (at December 31) | |||||||||||||||||||||
| Current assets | $ | 39,377 | $ | 36,304 | $ | 34,336 | $ | 28,503 | $ | 19,426 | |||||||||||
| Noncurrent assets | 109,409 | 96,324 | 91,497 | 64,705 | 62,044 | ||||||||||||||||
Total Assets | 148,786 | 132,628 | 125,833 | 93,208 | 81,470 | ||||||||||||||||
| Short-term debt | 1,162 | 2,159 | 739 | 816 | 1,703 | ||||||||||||||||
| Other current liabilities | 32,636 | 26,250 | 24,272 | 17,979 | 14,408 | ||||||||||||||||
| Long-term debt and capital lease obligations | 6,070 | 7,679 | 12,131 | 10,456 | 10,894 | ||||||||||||||||
| Other noncurrent liabilities | 31,830 | 27,605 | 26,015 | 18,727 | 18,170 | ||||||||||||||||
Total Liabilities | 71,698 | 63,693 | 63,157 | 47,978 | 45,175 | ||||||||||||||||
Stockholders’ Equity | $ | 77,088 | $ | 68,935 | $ | 62,676 | $ | 45,230 | $ | 36,295 | |||||||||||
1 Includes excise, value-added and similar taxes: | $ | 10,121 | $ | 9,551 | $ | 8,719 | $ | 7,968 | $ | 7,095 | |||||||||||
2 Includes amounts in revenues for buy/sell contracts; associated costs are in “Total Costs and Other Deductions.” Refer also to Note 13, on page FS-42. | $ | – | $ | 6,725 | $ | 23,822 | $ | 18,650 | $ | 14,246 | |||||||||||
3 Per-share amounts in all periods reflect a two-for-one stock split effected as a 100 percent stock dividend in September 2004. | |||||||||||||||||||||
4 The amount in 2003 includes a benefit of $0.08 for the company’s share of a capital stock transaction of its Dynegy affiliate, which, under the applicable accounting rules, was recorded directly to retained earnings and not included in net income for the period. | |||||||||||||||||||||
FS-60
Table of Contents
Supplemental Information on Oil and Gas Producing Activities Unaudited |
Table I – Costs Incurred in Exploration, Property Acquisitions and Development1
| Consolidated Companies | ||||||||||||||||||||||||||||||||||||||||||||||||
| United States | International | |||||||||||||||||||||||||||||||||||||||||||||||
| Gulf of | Total | Asia- | Total | Affiliated Companies | ||||||||||||||||||||||||||||||||||||||||||||
| Millions of dollars | Calif. | Mexico | Other | U.S. | Africa | Pacific | Indonesia | Other | Int’l | Total | TCO | Other | ||||||||||||||||||||||||||||||||||||
Year Ended Dec. 31, 2007 | ||||||||||||||||||||||||||||||||||||||||||||||||
| Exploration | ||||||||||||||||||||||||||||||||||||||||||||||||
| Wells | $ | 4 | $ | 430 | $ | 18 | $ | 452 | $ | 202 | $ | 156 | $ | 3 | $ | 195 | $ | 556 | $ | 1,008 | $ | – | $ | 7 | ||||||||||||||||||||||||
| Geological and geophysical | – | 59 | 14 | 73 | 136 | 48 | 11 | 98 | 293 | 366 | – | – | ||||||||||||||||||||||||||||||||||||
| Rentals and other | – | 128 | 5 | 133 | 70 | 120 | 50 | 79 | 319 | 452 | – | – | ||||||||||||||||||||||||||||||||||||
| Total exploration | 4 | 617 | 37 | 658 | 408 | 324 | 64 | 372 | 1,168 | 1,826 | – | 7 | ||||||||||||||||||||||||||||||||||||
Property acquisitions2 | ||||||||||||||||||||||||||||||||||||||||||||||||
| Proved | 10 | 220 | 13 | 243 | 5 | 92 | – | (2 | ) | 95 | 338 | – | – | |||||||||||||||||||||||||||||||||||
| Unproved | 35 | 75 | 3 | 113 | 8 | 35 | – | 24 | 67 | 180 | – | – | ||||||||||||||||||||||||||||||||||||
| Total property acquisitions | 45 | 295 | 16 | 356 | 13 | 127 | – | 22 | 162 | 518 | – | – | ||||||||||||||||||||||||||||||||||||
Development3 | 1,198 | 2,237 | 1,775 | 5,210 | 4,176 | 1,897 | 620 | 1,504 | 8,197 | 13,407 | 832 | 64 | ||||||||||||||||||||||||||||||||||||
Total Costs Incurred | $ | 1,247 | $ | 3,149 | $ | 1,828 | $ | 6,224 | $ | 4,597 | $ | 2,348 | $ | 684 | $ | 1,898 | $ | 9,527 | $ | 15,751 | $ | 832 | $ | 71 | ||||||||||||||||||||||||
Year Ended Dec. 31, 2006 | ||||||||||||||||||||||||||||||||||||||||||||||||
| Exploration | ||||||||||||||||||||||||||||||||||||||||||||||||
| Wells | $ | – | $ | 493 | $ | 22 | $ | 515 | $ | 151 | $ | 121 | $ | 20 | $ | 246 | $ | 538 | $ | 1,053 | $ | 25 | $ | – | ||||||||||||||||||||||||
| Geological and geophysical | – | 96 | 8 | 104 | 180 | 53 | 12 | 92 | 337 | 441 | – | – | ||||||||||||||||||||||||||||||||||||
| Rentals and other | – | 116 | 16 | 132 | 48 | 140 | 58 | 50 | 296 | 428 | – | – | ||||||||||||||||||||||||||||||||||||
| Total exploration | – | 705 | 46 | 751 | 379 | 314 | 90 | 388 | 1,171 | 1,922 | 25 | – | ||||||||||||||||||||||||||||||||||||
Property acquisitions2 | ||||||||||||||||||||||||||||||||||||||||||||||||
| Proved | 6 | 152 | – | 158 | 1 | 10 | – | 15 | 26 | 184 | – | 581 | ||||||||||||||||||||||||||||||||||||
| Unproved | 1 | 47 | 10 | 58 | – | 1 | – | 135 | 136 | 194 | – | – | ||||||||||||||||||||||||||||||||||||
| Total property acquisitions | 7 | 199 | 10 | 216 | 1 | 11 | – | 150 | 162 | 378 | – | 581 | ||||||||||||||||||||||||||||||||||||
Development3 | 686 | 1,632 | 868 | 3,186 | 2,890 | 1,788 | 460 | 1,019 | 6,157 | 9,343 | 671 | 25 | ||||||||||||||||||||||||||||||||||||
Total Costs Incurred | $ | 693 | $ | 2,536 | $ | 924 | $ | 4,153 | $ | 3,270 | $ | 2,113 | $ | 550 | $ | 1,557 | $ | 7,490 | $ | 11,643 | $ | 696 | $ | 606 | ||||||||||||||||||||||||
Year Ended Dec. 31, 2005 | ||||||||||||||||||||||||||||||||||||||||||||||||
| Exploration | ||||||||||||||||||||||||||||||||||||||||||||||||
| Wells | $ | – | $ | 452 | $ | 24 | $ | 476 | $ | 105 | $ | 38 | $ | 9 | $ | 201 | $ | 353 | $ | 829 | $ | – | $ | – | ||||||||||||||||||||||||
| Geological and geophysical | – | 67 | – | 67 | 96 | 28 | 10 | 68 | 202 | 269 | – | – | ||||||||||||||||||||||||||||||||||||
| Rentals and other | – | 93 | 8 | �� | 101 | 24 | 58 | 12 | 72 | 166 | 267 | – | – | |||||||||||||||||||||||||||||||||||
| Total exploration | – | 612 | 32 | 644 | 225 | 124 | 31 | 341 | 721 | 1,365 | – | – | ||||||||||||||||||||||||||||||||||||
Property acquisitions2 | ||||||||||||||||||||||||||||||||||||||||||||||||
| Proved – Unocal | – | 1,608 | 2,388 | 3,996 | 30 | 6,609 | 637 | 1,790 | 9,066 | 13,062 | – | – | ||||||||||||||||||||||||||||||||||||
| Proved – Other | – | 6 | 10 | 16 | 2 | 2 | – | 12 | 16 | 32 | – | – | ||||||||||||||||||||||||||||||||||||
| Unproved – Unocal | – | 819 | 295 | 1,114 | 11 | 2,209 | 821 | 38 | 3,079 | 4,193 | – | – | ||||||||||||||||||||||||||||||||||||
| Unproved – Other | – | 17 | 6 | 23 | 67 | – | – | 28 | 95 | 118 | – | – | ||||||||||||||||||||||||||||||||||||
| Total property acquisitions | – | 2,450 | 2,699 | 5,149 | 110 | 8,820 | 1,458 | 1,868 | 12,256 | 17,405 | – | – | ||||||||||||||||||||||||||||||||||||
Development3 | 507 | 680 | 601 | 1,788 | 1,892 | 1,088 | 382 | 726 | 4,088 | 5,876 | 767 | 43 | ||||||||||||||||||||||||||||||||||||
Total Costs Incurred | $ | 507 | $ | 3,742 | $ | 3,332 | $ | 7,581 | $ | 2,227 | $ | 10,032 | $ | 1,871 | $ | 2,935 | $ | 17,065 | $ | 24,646 | $ | 767 | $ | 43 | ||||||||||||||||||||||||
| 1 | Includes costs incurred whether capitalized or expensed. Excludes general support equipment expenditures. Includes capitalized amounts related to asset retirement obligations. See Note 23, “Asset Retirement Obligations,” beginning on page FS-57. |
| 2 | Includes wells, equipment and facilities associated with proved reserves. Does not include properties acquired in nonmonetary transactions. |
| 3 | Includes $99, $160 and $160 costs incurred prior to assignment of proved reserves in 2007, 2006 and 2005, respectively. |
FS-61
Table of Contents
Supplemental Information on Oil and Gas Producing Activities – Continued |
Table II – Capitalized Costs Related to Oil and Gas Producing Activities
| Consolidated Companies | ||||||||||||||||||||||||||||||||||||||||||||||||
| United States | International | |||||||||||||||||||||||||||||||||||||||||||||||
| Gulf of | Total | Asia- | Total | Affiliated Companies | ||||||||||||||||||||||||||||||||||||||||||||
| Millions of dollars | Calif. | Mexico | Other | U.S. | Africa | Pacific | Indonesia | Other | Int’l. | Total | TCO | Other | ||||||||||||||||||||||||||||||||||||
At Dec. 31, 2007 | ||||||||||||||||||||||||||||||||||||||||||||||||
| Unproved properties | $ | 805 | $ | 892 | $ | 353 | $ | 2,050 | $ | 314 | $ | 2,639 | $ | 630 | $ | 1,015 | $ | 4,598 | $ | 6,648 | $ | 112 | $ | – | ||||||||||||||||||||||||
| Proved properties and related producing assets | 11,260 | 19,110 | 13,718 | 44,088 | 11,894 | 17,321 | 7,705 | 11,360 | 48,280 | 92,368 | 4,247 | 858 | ||||||||||||||||||||||||||||||||||||
| Support equipment | 201 | 206 | 230 | 637 | 850 | 284 | 1,123 | 439 | 2,696 | 3,333 | 758 | – | ||||||||||||||||||||||||||||||||||||
| Deferred exploratory wells | – | 406 | 7 | 413 | 368 | 293 | 148 | 438 | 1,247 | 1,660 | – | – | ||||||||||||||||||||||||||||||||||||
| Other uncompleted projects | 308 | 3,128 | 573 | 4,009 | 6,430 | 2,049 | 593 | 1,421 | 10,493 | 14,502 | 1,633 | 55 | ||||||||||||||||||||||||||||||||||||
Gross Cap. Costs | 12,574 | 23,742 | 14,881 | 51,197 | 19,856 | 22,586 | 10,199 | 14,673 | 67,314 | 118,511 | 6,750 | 913 | ||||||||||||||||||||||||||||||||||||
| Unproved properties valuation | 741 | 57 | 35 | 833 | 201 | 221 | 39 | 427 | 888 | 1,721 | 23 | – | ||||||||||||||||||||||||||||||||||||
| Proved producing properties – | ||||||||||||||||||||||||||||||||||||||||||||||||
| Depreciation and depletion | 7,383 | 15,074 | 7,640 | 30,097 | 5,427 | 6,912 | 5,592 | 7,062 | 24,993 | 55,090 | 644 | 167 | ||||||||||||||||||||||||||||||||||||
| Support equipment depreciation | 133 | 92 | 124 | 349 | 464 | 144 | 571 | 261 | 1,440 | 1,789 | 267 | – | ||||||||||||||||||||||||||||||||||||
| Accumulated provisions | 8,257 | 15,223 | 7,799 | 31,279 | 6,092 | 7,277 | 6,202 | 7,750 | 27,321 | 58,600 | 934 | 167 | ||||||||||||||||||||||||||||||||||||
Net Capitalized Costs | $ | 4,317 | $ | 8,519 | $ | 7,082 | $ | 19,918 | $ | 13,764 | $ | 15,309 | $ | 3,997 | $ | 6,923 | $ | 39,993 | $ | 59,911 | $ | 5,816 | $ | 746 | ||||||||||||||||||||||||
At Dec. 31, 2006 | ||||||||||||||||||||||||||||||||||||||||||||||||
| Unproved properties | $ | 770 | $ | 1,007 | $ | 370 | $ | 2,147 | $ | 342 | $ | 2,373 | $ | 707 | $ | 1,082 | $ | 4,504 | $ | 6,651 | $ | 112 | $ | – | ||||||||||||||||||||||||
| Proved properties and related producing assets | 9,960 | 18,464 | 12,284 | 40,708 | 9,943 | 15,486 | 7,110 | 10,461 | 43,000 | 83,708 | 2,701 | 1,096 | ||||||||||||||||||||||||||||||||||||
| Support equipment | 189 | 212 | 226 | 627 | 745 | 240 | 1,093 | 364 | 2,442 | 3,069 | 611 | – | ||||||||||||||||||||||||||||||||||||
| Deferred exploratory wells | – | 343 | 7 | 350 | 231 | 217 | 149 | 292 | 889 | 1,239 | – | – | ||||||||||||||||||||||||||||||||||||
| Other uncompleted projects | 370 | 2,188 | – | 2,558 | 4,299 | 1,546 | 493 | 917 | 7,255 | 9,813 | 2,493 | 40 | ||||||||||||||||||||||||||||||||||||
Gross Cap. Costs | 11,289 | 22,214 | 12,887 | 46,390 | 15,560 | 19,862 | 9,552 | 13,116 | 58,090 | 104,480 | 5,917 | 1,136 | ||||||||||||||||||||||||||||||||||||
| Unproved properties valuation | 738 | 52 | 29 | 819 | 189 | 74 | 14 | 337 | 614 | 1,433 | 22 | – | ||||||||||||||||||||||||||||||||||||
| Proved producing properties – | ||||||||||||||||||||||||||||||||||||||||||||||||
| Depreciation and depletion | 7,082 | 14,468 | 6,880 | 28,430 | 4,794 | 5,273 | 4,971 | �� | 6,087 | 21,125 | 49,555 | 541 | 109 | |||||||||||||||||||||||||||||||||||
| Support equipment depreciation | 125 | 111 | 130 | 366 | 400 | 102 | 522 | 238 | 1,262 | 1,628 | 242 | – | ||||||||||||||||||||||||||||||||||||
| Accumulated provisions | 7,945 | 14,631 | 7,039 | 29,615 | 5,383 | 5,449 | 5,507 | 6,662 | 23,001 | 52,616 | 805 | 109 | ||||||||||||||||||||||||||||||||||||
Net Capitalized Costs | $ | 3,344 | $ | 7,583 | $ | 5,848 | $ | 16,775 | $ | 10,177 | $ | 14,413 | $ | 4,045 | $ | 6,454 | $ | 35,089 | $ | 51,864 | $ | 5,112 | $ | 1,027 | ||||||||||||||||||||||||
FS-62
Table of Contents
Table II Capitalized Costs Related to Oil and Gas Producing Activities – Continued |
| Consolidated Companies | ||||||||||||||||||||||||||||||||||||||||||||||||
| United States | International | |||||||||||||||||||||||||||||||||||||||||||||||
| Gulf of | Total | Asia- | Total | Affiliated Companies | ||||||||||||||||||||||||||||||||||||||||||||
| Millions of dollars | Calif. | Mexico | Other | U.S. | Africa | Pacific | Indonesia | Other | Int’l. | Total | TCO | Other | ||||||||||||||||||||||||||||||||||||
At Dec. 31, 2005 | ||||||||||||||||||||||||||||||||||||||||||||||||
| Unproved properties | $ | 769 | $ | 1,077 | $ | 397 | $ | 2,243 | $ | 407 | $ | 2,287 | $ | 645 | $ | 983 | $ | 4,322 | $ | 6,565 | $ | 108 | $ | – | ||||||||||||||||||||||||
| Proved properties and related producing assets | 9,546 | 18,283 | 11,467 | 39,296 | 8,404 | 14,928 | 6,613 | 9,627 | 39,572 | 78,868 | 2,264 | 1,213 | ||||||||||||||||||||||||||||||||||||
| Support equipment | 204 | 193 | 230 | 627 | 715 | 426 | 1,217 | 356 | 2,714 | 3,341 | 549 | – | ||||||||||||||||||||||||||||||||||||
| Deferred exploratory wells | – | 284 | 5 | 289 | 245 | 154 | 173 | 248 | 820 | 1,109 | – | – | ||||||||||||||||||||||||||||||||||||
| Other uncompleted projects | 149 | 782 | 209 | 1,140 | 2,878 | 790 | 427 | 946 | 5,041 | 6,181 | 2,332 | – | ||||||||||||||||||||||||||||||||||||
Gross Cap. Costs | 10,668 | 20,619 | 12,308 | 43,595 | 12,649 | 18,585 | 9,075 | 12,160 | 52,469 | 96,064 | 5,253 | 1,213 | ||||||||||||||||||||||||||||||||||||
| Unproved properties valuation | 736 | 90 | 22 | 848 | 162 | 69 | – | 318 | 549 | 1,397 | 17 | – | ||||||||||||||||||||||||||||||||||||
| Proved producing properties – | ||||||||||||||||||||||||||||||||||||||||||||||||
| Depreciation and depletion | 6,818 | 14,067 | 6,049 | 26,934 | 4,266 | 4,016 | 4,105 | 5,720 | 18,107 | 45,041 | 460 | 90 | ||||||||||||||||||||||||||||||||||||
| Support equipment depreciation | 140 | 119 | 149 | 408 | 317 | 88 | 680 | 222 | 1,307 | 1,715 | 213 | – | ||||||||||||||||||||||||||||||||||||
| Accumulated provisions | 7,694 | 14,276 | 6,220 | 28,190 | 4,745 | 4,173 | 4,785 | 6,260 | 19,963 | 48,153 | 690 | 90 | ||||||||||||||||||||||||||||||||||||
Net Capitalized Costs | $ | 2,974 | $ | 6,343 | $ | 6,088 | $ | 15,405 | $ | 7,904 | $ | 14,412 | $ | 4,290 | $ | 5,900 | $ | 32,506 | $ | 47,911 | $ | 4,563 | $ | 1,123 | ||||||||||||||||||||||||
FS-63
Table of Contents
Supplemental Information on Oil and Gas Producing Activities –Continued | ||||||||||
Table III Results of Operations for Oil and Gas Producing Activities1 | ||||||||||
| Consolidated Companies | ||||||||||||||||||||||||||||||||||||||||||||||||
| United States | International | |||||||||||||||||||||||||||||||||||||||||||||||
| Gulf of | Total | Asia- | Total | Affiliated Companies | ||||||||||||||||||||||||||||||||||||||||||||
| Millions of dollars | Calif. | Mexico | Other | U.S. | Africa | Pacific | Indonesia | Other | Int’l. | Total | TCO | Other | ||||||||||||||||||||||||||||||||||||
Year Ended Dec. 31, 2007 | ||||||||||||||||||||||||||||||||||||||||||||||||
| Revenues from net production | ||||||||||||||||||||||||||||||||||||||||||||||||
| Sales | $ | 202 | $ | 1,555 | $ | 2,476 | $ | 4,233 | $ | 1,810 | $ | 6,192 | $ | 1,045 | $ | 3,012 | $ | 12,059 | $ | 16,292 | $ | 3,327 | $ | 1,290 | ||||||||||||||||||||||||
| Transfers | 4,671 | 2,630 | 2,707 | 10,008 | 6,778 | 4,440 | 2,590 | 2,744 | 16,552 | 26,560 | – | – | ||||||||||||||||||||||||||||||||||||
| Total | 4,873 | 4,185 | 5,183 | 14,241 | 8,588 | 10,632 | 3,635 | 5,756 | 28,611 | 42,852 | 3,327 | 1,290 | ||||||||||||||||||||||||||||||||||||
Production expenses excluding taxes2 | (1,063 | ) | (936 | ) | (1,400 | ) | (3,399 | ) | (892 | ) | (953 | ) | (892 | ) | (828 | ) | (3,565 | ) | (6,964 | ) | (248 | ) | (92 | ) | ||||||||||||||||||||||||
| Taxes other than on income | (91 | ) | (53 | ) | (378 | ) | (522 | ) | (49 | ) | (292 | ) | (2 | ) | (58 | ) | (401 | ) | (923 | ) | (31 | ) | (163 | ) | ||||||||||||||||||||||||
| Proved producing properties: Depreciation and depletion | (300 | ) | (1,143 | ) | (833 | ) | (2,276 | ) | (646 | ) | (1,668 | ) | (623 | ) | (980 | ) | (3,917 | ) | (6,193 | ) | (127 | ) | (94 | ) | ||||||||||||||||||||||||
Accretion expense3 | (92 | ) | 1 | (167 | ) | (258 | ) | (33 | ) | (36 | ) | (21 | ) | (27 | ) | (117 | ) | (375 | ) | (1 | ) | (2 | ) | |||||||||||||||||||||||||
| Exploration expenses | – | (486 | ) | (25 | ) | (511 | ) | (267 | ) | (225 | ) | (61 | ) | (259 | ) | (812 | ) | (1,323 | ) | – | – | |||||||||||||||||||||||||||
| Unproved properties valuation | (3 | ) | (102 | ) | (27 | ) | (132 | ) | (12 | ) | (150 | ) | (30 | ) | (120 | ) | (312 | ) | (444 | ) | – | – | ||||||||||||||||||||||||||
Other income (expense)4 | 3 | 2 | 31 | 36 | (447 | ) | (302 | ) | (197 | ) | (722 | ) | (1,668 | ) | (1,632 | ) | 18 | (7 | ) | |||||||||||||||||||||||||||||
| Results before income taxes | 3,327 | 1,468 | 2,384 | 7,179 | 6,242 | 7,006 | 1,809 | 2,762 | 17,819 | 24,998 | 2,938 | 946 | ||||||||||||||||||||||||||||||||||||
| Income tax expense | (1,204 | ) | (531 | ) | (864 | ) | (2,599 | ) | (4,907 | ) | (3,456 | ) | (841 | ) | (1,624 | ) | (10,828 | ) | (13,427 | ) | (887 | ) | (462 | ) | ||||||||||||||||||||||||
Results of Producing Operations | $ | 2,123 | $ | 937 | $ | 1,520 | $ | 4,580 | $ | 1,335 | $ | 3,550 | $ | 968 | $ | 1,138 | $ | 6,991 | $ | 11,571 | $ | 2,051 | $ | 484 | ||||||||||||||||||||||||
Year Ended Dec. 31, 2006 | ||||||||||||||||||||||||||||||||||||||||||||||||
| Revenues from net production Sales | $ | 308 | $ | 1,845 | $ | 2,976 | $ | 5,129 | $ | 2,377 | $ | 4,938 | $ | 1,001 | $ | 2,814 | $ | 11,130 | $ | 16,259 | $ | 2,861 | $ | 598 | ||||||||||||||||||||||||
| Transfers | 4,072 | 2,317 | 2,046 | 8,435 | 5,264 | 4,084 | 2,211 | 2,848 | 14,407 | 22,842 | – | – | ||||||||||||||||||||||||||||||||||||
| Total | 4,380 | 4,162 | 5,022 | 13,564 | 7,641 | 9,022 | 3,212 | 5,662 | 25,537 | 39,101 | 2,861 | 598 | ||||||||||||||||||||||||||||||||||||
| Production expenses excluding taxes | (889 | ) | (765 | ) | (1,057 | ) | (2,711 | ) | (640 | ) | (740 | ) | (728 | ) | (664 | ) | (2,772 | ) | (5,483 | ) | (202 | ) | (42 | ) | ||||||||||||||||||||||||
| Taxes other than on income | (84 | ) | (57 | ) | (442 | ) | (583 | ) | (57 | ) | (231 | ) | (1 | ) | (60 | ) | (349 | ) | (932 | ) | (28 | ) | (6 | ) | ||||||||||||||||||||||||
| Proved producing properties: Depreciation and depletion | (275 | ) | (1,096 | ) | (763 | ) | (2,134 | ) | (579 | ) | (1,475 | ) | (666 | ) | (703 | ) | (3,423 | ) | (5,557 | ) | (114 | ) | (33 | ) | ||||||||||||||||||||||||
Accretion expense3 | (11 | ) | (80 | ) | (39 | ) | (130 | ) | (26 | ) | (30 | ) | (23 | ) | (49 | ) | (128 | ) | (258 | ) | (1 | ) | – | |||||||||||||||||||||||||
| Exploration expenses | – | (407 | ) | (24 | ) | (431 | ) | (296 | ) | (209 | ) | (110 | ) | (318 | ) | (933 | ) | (1,364 | ) | (25 | ) | – | ||||||||||||||||||||||||||
| Unproved properties valuation | (3 | ) | (73 | ) | (8 | ) | (84 | ) | (28 | ) | (15 | ) | (14 | ) | (27 | ) | (84 | ) | (168 | ) | – | – | ||||||||||||||||||||||||||
Other income (expense)4 | 1 | (732 | ) | 254 | (477 | ) | (435 | ) | (475 | ) | 50 | 385 | (475 | ) | (952 | ) | 8 | (50 | ) | |||||||||||||||||||||||||||||
| Results before income taxes | 3,119 | 952 | 2,943 | 7,014 | 5,580 | 5,847 | 1,720 | 4,226 | 17,373 | 24,387 | 2,499 | 467 | ||||||||||||||||||||||||||||||||||||
| Income tax expense | (1,169 | ) | (357 | ) | (1,103 | ) | (2,629 | ) | (4,740 | ) | (3,224 | ) | (793 | ) | (2,151 | ) | (10,908 | ) | (13,537 | ) | (750 | ) | (174 | ) | ||||||||||||||||||||||||
Results of Producing Operations | $ | 1,950 | $ | 595 | $ | 1,840 | $ | 4,385 | $ | 840 | $ | 2,623 | $ | 927 | $ | 2,075 | $ | 6,465 | $ | 10,850 | $ | 1,749 | $ | 293 | ||||||||||||||||||||||||
| 1 | The value of owned production consumed in operations as fuel has been eliminated from revenues and production expenses, and the related volumes have been deducted from net production in calculating the unit average sales price and production cost. This has no effect on the results of producing operations. |
| 2 | Includes $10 costs incurred prior to assignment of proved reserves in 2007. |
| 3 | Represents accretion of ARO liability. Refer to Note 23, “Asset Retirement Obligations,” beginning on page FS-57. |
| 4 | Includes foreign currency gains and losses, gains and losses on property dispositions, and income from operating and technical service agreements. |
FS-64
Table of Contents
Table III Results of Operations for Oil and Gas Producing Activities1 – Continued | ||||||||||
| Consolidated Companies | ||||||||||||||||||||||||||||||||||||||||||||||||
| United States | International | |||||||||||||||||||||||||||||||||||||||||||||||
| Gulf of | Total | Asia- | Total | Affiliated Companies | ||||||||||||||||||||||||||||||||||||||||||||
| Millions of dollars | Calif. | Mexico | Other | U.S. | Africa | Pacific | Indonesia | Other | Int’l. | Total | TCO | Other | ||||||||||||||||||||||||||||||||||||
Year Ended Dec. 31, 2005 | ||||||||||||||||||||||||||||||||||||||||||||||||
| Revenues from net production | ||||||||||||||||||||||||||||||||||||||||||||||||
| Sales | $ | 337 | $ | 1,576 | $ | 3,174 | $ | 5,087 | $ | 2,142 | $ | 2,941 | $ | 539 | $ | 2,668 | $ | 8,290 | $ | 13,377 | $ | 2,307 | $ | 666 | ||||||||||||||||||||||||
| Transfers | 3,497 | 2,127 | 1,395 | 7,019 | 3,615 | 3,179 | 1,986 | 2,607 | 11,387 | 18,406 | – | – | ||||||||||||||||||||||||||||||||||||
| Total | 3,834 | 3,703 | 4,569 | 12,106 | 5,757 | 6,120 | 2,525 | 5,275 | 19,677 | 31,783 | 2,307 | 666 | ||||||||||||||||||||||||||||||||||||
| Production expenses excluding taxes | (916 | ) | (638 | ) | (777 | ) | (2,331 | ) | (558 | ) | (570 | ) | (660 | ) | (596 | ) | (2,384 | ) | (4,715 | ) | (152 | ) | (82 | ) | ||||||||||||||||||||||||
| Taxes other than on income | (65 | ) | (41 | ) | (384 | ) | (490 | ) | (48 | ) | (189 | ) | (1 | ) | (195 | ) | (433 | ) | (923 | ) | (27 | ) | – | |||||||||||||||||||||||||
| Proved producing properties: | ||||||||||||||||||||||||||||||||||||||||||||||||
| Depreciation and depletion | (253 | ) | (936 | ) | (520 | ) | (1,709 | ) | (414 | ) | (852 | ) | (550 | ) | (672 | ) | (2,488 | ) | (4,197 | ) | (83 | ) | (46 | ) | ||||||||||||||||||||||||
Accretion expense2 | (13 | ) | (35 | ) | (46 | ) | (94 | ) | (22 | ) | (20 | ) | (15 | ) | (25 | ) | (82 | ) | (176 | ) | (1 | ) | – | |||||||||||||||||||||||||
| Exploration expenses | – | (307 | ) | (13 | ) | (320 | ) | (117 | ) | (90 | ) | (26 | ) | (190 | ) | (423 | ) | (743 | ) | – | – | |||||||||||||||||||||||||||
| Unproved properties valuation | (3 | ) | (32 | ) | (4 | ) | (39 | ) | (50 | ) | (8 | ) | – | (24 | ) | (82 | ) | (121 | ) | – | – | |||||||||||||||||||||||||||
Other income (expense)3 | 2 | (354 | ) | (140 | ) | (492 | ) | (243 | ) | (182 | ) | 182 | 280 | 37 | (455 | ) | (9 | ) | 8 | |||||||||||||||||||||||||||||
| Results before income taxes | 2,586 | 1,360 | 2,685 | 6,631 | 4,305 | 4,209 | 1,455 | 3,853 | 13,822 | 20,453 | 2,035 | 546 | ||||||||||||||||||||||||||||||||||||
| Income tax expense | (913 | ) | (482 | ) | (953 | ) | (2,348 | ) | (3,430 | ) | (2,264 | ) | (644 | ) | (1,938 | ) | (8,276 | ) | (10,624 | ) | (611 | ) | (186 | ) | ||||||||||||||||||||||||
Results of Producing Operations | $ | 1,673 | $ | 878 | $ | 1,732 | $ | 4,283 | $ | 875 | $ | 1,945 | $ | 811 | $ | 1,915 | $ | 5,546 | $ | 9,829 | $ | 1,424 | $ | 360 | ||||||||||||||||||||||||
| 1 | The value of owned production consumed in operations as fuel has been eliminated from revenues and production expenses, and the related volumes have been deducted from net production in calculating the unit average sales price and production cost. This has no effect on the results of producing operations. | |
| 2 | Represents accretion of ARO liability. Refer to Note 23, “Asset Retirement Obligations,” beginning on page FS-57. | |
| 3 | Includes foreign currency gains and losses, gains and losses on property dispositions, and income from operating and technical service agreements. |
FS-65
Table of Contents
Supplemental Information on Oil and Gas Producing Activities –Continued | ||||||||||
Table IV Results of Operations for Oil and Gas Producing Activities – Unit Prices and Costs1,2 | ||||||||||
| Consolidated Companies | ||||||||||||||||||||||||||||||||||||||||||||||||
| United States | International | |||||||||||||||||||||||||||||||||||||||||||||||
| Gulf of | Total | Asia- | Total | Affiliated Companies | ||||||||||||||||||||||||||||||||||||||||||||
| Calif. | Mexico | Other | U.S. | Africa | Pacific | Indonesia | Other | Int’l. | Total | TCO | Other | |||||||||||||||||||||||||||||||||||||
Year Ended Dec. 31, 2007 | ||||||||||||||||||||||||||||||||||||||||||||||||
| Average sales prices | ||||||||||||||||||||||||||||||||||||||||||||||||
| Liquids, per barrel | $ | 62.61 | $ | 65.07 | $ | 62.35 | $ | 63.16 | $ | 69.90 | $ | 64.20 | $ | 61.05 | $ | 62.97 | $ | 65.40 | $ | 64.71 | $ | 62.47 | $ | 51.98 | ||||||||||||||||||||||||
| Natural gas, per thousand cubic feet | 5.77 | 7.01 | 5.65 | 6.12 | – | 3.60 | 7.61 | 4.13 | 4.02 | 4.79 | 0.89 | 0.44 | ||||||||||||||||||||||||||||||||||||
| Average production costs, per barrel | 13.23 | 12.32 | 12.62 | 12.72 | 7.26 | 3.96 | 14.28 | 6.96 | 6.54 | 8.58 | 3.98 | 3.56 | ||||||||||||||||||||||||||||||||||||
Year Ended Dec. 31, 2006 | ||||||||||||||||||||||||||||||||||||||||||||||||
| Average sales prices | ||||||||||||||||||||||||||||||||||||||||||||||||
| Liquids, per barrel | $ | 55.20 | $ | 60.35 | $ | 55.80 | $ | 56.66 | $ | 61.53 | $ | 57.05 | $ | 52.23 | $ | 57.31 | $ | 57.92 | $ | 57.53 | $ | 56.80 | $ | 37.26 | ||||||||||||||||||||||||
| Natural gas, per thousand cubic feet | 6.08 | 7.20 | 5.73 | 6.29 | 0.06 | 3.44 | 7.12 | 4.03 | 3.88 | 4.85 | 0.77 | 0.36 | ||||||||||||||||||||||||||||||||||||
| Average production costs, per barrel | 10.94 | 9.59 | 9.26 | 9.85 | 5.13 | 3.36 | 11.44 | 5.23 | 5.17 | 6.76 | 3.31 | 2.51 | ||||||||||||||||||||||||||||||||||||
Year Ended Dec. 31, 2005 | ||||||||||||||||||||||||||||||||||||||||||||||||
| Average sales prices | ||||||||||||||||||||||||||||||||||||||||||||||||
| Liquids, per barrel | $ | 45.24 | $ | 48.80 | $ | 48.29 | $ | 46.97 | $ | 50.54 | $ | 45.88 | $ | 44.40 | $ | 48.61 | $ | 47.83 | $ | 47.56 | $ | 45.59 | $ | 45.89 | ||||||||||||||||||||||||
| Natural gas, per thousand cubic feet | 6.94 | 8.43 | 6.90 | 7.43 | 0.04 | 3.59 | 5.74 | 3.31 | 3.48 | 5.18 | 0.61 | 0.26 | ||||||||||||||||||||||||||||||||||||
| Average production costs, per barrel | 10.74 | 8.55 | 7.57 | 8.88 | 4.72 | 3.38 | 11.28 | 4.32 | 4.93 | 6.32 | 2.45 | 5.53 | ||||||||||||||||||||||||||||||||||||
| 1 | The value of owned production consumed in operations as fuel has been eliminated from revenues and production expenses, and the related volumes have been deducted from net production in calculating the unit average sales price and production cost. This has no effect on the results of producing operations. |
| 2 | Natural gas converted to oil-equivalent gas (OEG) barrels at a rate of 6 MCF = 1 OEG barrel. |
Table V – Reserve Quantity Information
FS-66
Table of Contents
Table V Reserve Quantity Information – Continued |
FS-67
Table of Contents
Supplemental Information on Oil and Gas Producing Activities –Continued | ||||||||||
Table V Reserve Quantity Information – Continued | ||||||||||
Net Proved Reserves of Crude Oil, Condensate and Natural Gas Liquids
| Consolidated Companies | ||||||||||||||||||||||||||||||||||||||||||||||||
| United States | International | |||||||||||||||||||||||||||||||||||||||||||||||
| Gulf of | Total | Asia- | Total | Affiliated Companies | ||||||||||||||||||||||||||||||||||||||||||||
| Millions of barrels | Calif. | Mexico | Other | U.S. | Africa | Pacific | Indonesia | Other | Int'l. | Total | TCO | Other | ||||||||||||||||||||||||||||||||||||
Reserves at Jan. 1, 2005 | 1,011 | 294 | 432 | 1,737 | 1,833 | 676 | 698 | 567 | 3,774 | 5,511 | 1,994 | 468 | ||||||||||||||||||||||||||||||||||||
| Changes attributable to: | ||||||||||||||||||||||||||||||||||||||||||||||||
| Revisions | (23 | ) | (6 | ) | (11 | ) | (40 | ) | (29 | ) | (56 | ) | (108 | ) | (6 | ) | (199 | ) | (239 | ) | (5 | ) | (19 | ) | ||||||||||||||||||||||||
| Improved recovery | 57 | – | 4 | 61 | 67 | 4 | 42 | 29 | 142 | 203 | – | – | ||||||||||||||||||||||||||||||||||||
| Extensions and discoveries | – | 37 | 7 | 44 | 53 | 21 | 1 | 65 | 140 | 184 | – | – | ||||||||||||||||||||||||||||||||||||
Purchases1 | – | 49 | 147 | 196 | 4 | 287 | 20 | 65 | 376 | 572 | – | – | ||||||||||||||||||||||||||||||||||||
Sales2 | (1 | ) | – | (1 | ) | (2 | ) | – | – | – | (58 | ) | (58 | ) | (60 | ) | – | – | ||||||||||||||||||||||||||||||
| Production | (79 | ) | (41 | ) | (45 | ) | (165 | ) | (114 | ) | (103 | ) | (74 | ) | (89 | ) | (380 | ) | (545 | ) | (50 | ) | (14 | ) | ||||||||||||||||||||||||
Reserves at Dec. 31, 20053 | 965 | 333 | 533 | 1,831 | 1,814 | 829 | 579 | 573 | 3,795 | 5,626 | 1,939 | 435 | ||||||||||||||||||||||||||||||||||||
| Changes attributable to: | ||||||||||||||||||||||||||||||||||||||||||||||||
| Revisions | (14 | ) | 7 | 7 | – | (49 | ) | 72 | 61 | (45 | ) | 39 | 39 | 60 | 24 | |||||||||||||||||||||||||||||||||
| Improved recovery | 49 | – | 3 | 52 | 13 | 1 | 6 | 11 | 31 | 83 | – | – | ||||||||||||||||||||||||||||||||||||
| Extensions and discoveries | – | 25 | 8 | 33 | 30 | 6 | 2 | 36 | 74 | 107 | – | – | ||||||||||||||||||||||||||||||||||||
Purchases1 | 2 | 2 | – | 4 | 15 | – | – | 2 | 17 | 21 | – | 119 | ||||||||||||||||||||||||||||||||||||
Sales2 | – | – | – | – | – | – | – | (15 | ) | (15 | ) | (15 | ) | – | – | |||||||||||||||||||||||||||||||||
| Production | (76 | ) | (42 | ) | (51 | ) | (169 | ) | (125 | ) | (123 | ) | (72 | ) | (78 | ) | (398 | ) | (567 | ) | (49 | ) | (16 | ) | ||||||||||||||||||||||||
Reserves at Dec. 31, 20063 | 926 | 325 | 500 | 1,751 | 1,698 | 785 | 576 | 484 | 3,543 | 5,294 | 1,950 | 562 | ||||||||||||||||||||||||||||||||||||
| Changes attributable to: | ||||||||||||||||||||||||||||||||||||||||||||||||
| Revisions | 1 | (1 | ) | (5 | ) | (5 | ) | (89 | ) | 7 | (66 | ) | 7 | (141 | ) | (146 | ) | 92 | 11 | |||||||||||||||||||||||||||||
| Improved recovery | 6 | – | 3 | 9 | 7 | 3 | 1 | – | 11 | 20 | – | – | ||||||||||||||||||||||||||||||||||||
| Extensions and discoveries | 1 | 25 | 10 | 36 | 6 | 1 | – | 17 | 24 | 60 | – | – | ||||||||||||||||||||||||||||||||||||
Purchases1 | 1 | 9 | – | 10 | – | – | – | – | – | 10 | – | 316 | ||||||||||||||||||||||||||||||||||||
Sales2 | – | (8 | ) | (1 | ) | (9 | ) | – | – | – | – | – | (9 | ) | – | (432 | ) | |||||||||||||||||||||||||||||||
| Production | (75 | ) | (43 | ) | (50 | ) | (168 | ) | (122 | ) | (128 | ) | (72 | ) | (74 | ) | (396 | ) | (564 | ) | (53 | ) | (24 | ) | ||||||||||||||||||||||||
Reserves at Dec. 31, 20073,4 | 860 | 307 | 457 | 1,624 | 1,500 | 668 | 439 | 434 | 3,041 | 4,665 | 1,989 | 433 | ||||||||||||||||||||||||||||||||||||
Developed Reserves5 | ||||||||||||||||||||||||||||||||||||||||||||||||
| At Jan. 1, 2005 | 832 | 192 | 386 | 1,410 | 990 | 543 | 490 | 469 | 2,492 | 3,902 | 1,510 | 188 | ||||||||||||||||||||||||||||||||||||
| At Dec. 31, 2005 | 809 | 177 | 474 | 1,460 | 945 | 534 | 439 | 416 | 2,334 | 3,794 | 1,611 | 196 | ||||||||||||||||||||||||||||||||||||
| At Dec. 31, 2006 | 749 | 163 | 443 | 1,355 | 893 | 530 | 426 | 349 | 2,198 | 3,553 | 1,003 | 311 | ||||||||||||||||||||||||||||||||||||
At Dec. 31, 2007 | 701 | 136 | 401 | 1,238 | 758 | 422 | 363 | 305 | 1,848 | 3,086 | 1,273 | 263 | ||||||||||||||||||||||||||||||||||||
| 1 | Includes reserves acquired through nonmonetary transactions. |
| 2 | Includes reserves disposed of through nonmonetary transactions. |
| 3 | Included are year-end reserve quantities related to production-sharing contracts (PSC) (refer to page E-23 for the definition of a PSC). PSC-related reserve quantities are 26 percent, 30 percent and 29 percent for consolidated companies for 2007, 2006 and 2005, respectively. |
| 4 | Net reserve changes (excluding production) in 2007 consist of 97 million barrels of developed reserves and (162) million barrels of undeveloped reserves for consolidated companies and 299 million barrels of developed reserves and (312) million barrels of undeveloped reserves for affiliated companies. |
| 5 | During 2007, the percentages of undeveloped reserves at December 31, 2006, transferred to developed reserves were 8 percent and 24 percent for consolidated companies and affiliated companies, respectively. |
Information on Canadian Oil Sands Net Proved Reserves Not Included Above:
FS-68
Table of Contents
Table V Reserve Quantity Information – Continued |
FS-69
Table of Contents
Supplemental Information on Oil and Gas Producing Activities –Continued | ||||||||||
Table V Reserve Quantity Information – Continued | ||||||||||
Net Proved Reserves of Natural Gas
| Consolidated Companies | ||||||||||||||||||||||||||||||||||||||||||||||||
| United States | International | |||||||||||||||||||||||||||||||||||||||||||||||
| Gulf of | Total | Asia- | Total | Affiliated Companies | ||||||||||||||||||||||||||||||||||||||||||||
| Billions of cubic feet | Calif. | Mexico | Other | U.S. | Africa | Pacific | Indonesia | Other | Int'l. | Total | TCO | Other | ||||||||||||||||||||||||||||||||||||
Reserves at Jan. 1, 2005 | 314 | 1,064 | 2,326 | 3,704 | 2,979 | 5,405 | 502 | 3,538 | 12,424 | 16,128 | 3,413 | 134 | ||||||||||||||||||||||||||||||||||||
| Changes attributable to: | ||||||||||||||||||||||||||||||||||||||||||||||||
| Revisions | 21 | (15 | ) | (15 | ) | (9 | ) | 211 | (428 | ) | (31 | ) | 243 | (5 | ) | (14 | ) | (547 | ) | 49 | ||||||||||||||||||||||||||||
| Improved recovery | 8 | – | – | 8 | 13 | – | – | 31 | 44 | 52 | – | – | ||||||||||||||||||||||||||||||||||||
| Extensions and discoveries | – | 68 | 99 | 167 | 25 | 118 | 5 | 55 | 203 | 370 | – | – | ||||||||||||||||||||||||||||||||||||
Purchases1 | – | 269 | 899 | 1,168 | 5 | 3,962 | 247 | 274 | 4,488 | 5,656 | – | – | ||||||||||||||||||||||||||||||||||||
Sales2 | – | – | (6 | ) | (6 | ) | – | – | – | (248 | ) | (248 | ) | (254 | ) | – | – | |||||||||||||||||||||||||||||||
| Production | (39 | ) | (215 | ) | (350 | ) | (604 | ) | (42 | ) | (434 | ) | (77 | ) | (315 | ) | (868 | ) | (1,472 | ) | (79 | ) | (2 | ) | ||||||||||||||||||||||||
Reserves at Dec. 31, 20053 | 304 | 1,171 | 2,953 | 4,428 | 3,191 | 8,623 | 646 | 3,578 | 16,038 | 20,466 | 2,787 | 181 | ||||||||||||||||||||||||||||||||||||
| Changes attributable to: | ||||||||||||||||||||||||||||||||||||||||||||||||
| Revisions | 32 | 40 | (102 | ) | (30 | ) | 34 | 400 | 38 | 39 | 511 | 481 | 26 | – | ||||||||||||||||||||||||||||||||||
| Improved recovery | 5 | – | – | 5 | 3 | – | – | 5 | 8 | 13 | – | – | ||||||||||||||||||||||||||||||||||||
| Extensions and discoveries | – | 111 | 157 | 268 | 11 | 510 | – | 10 | 531 | 799 | – | – | ||||||||||||||||||||||||||||||||||||
Purchases1 | 6 | 13 | – | 19 | – | 16 | – | – | 16 | 35 | – | 54 | ||||||||||||||||||||||||||||||||||||
Sales2 | – | – | (1 | ) | (1 | ) | – | – | – | (148 | ) | (148 | ) | (149 | ) | – | – | |||||||||||||||||||||||||||||||
| Production | (37 | ) | (241 | ) | (383 | ) | (661 | ) | (33 | ) | (629 | ) | (110 | ) | (302 | ) | (1,074 | ) | (1,735 | ) | (70 | ) | (4 | ) | ||||||||||||||||||||||||
Reserves at Dec. 31, 20063 | 310 | 1,094 | 2,624 | 4,028 | 3,206 | 8,920 | 574 | 3,182 | 15,882 | 19,910 | 2,743 | 231 | ||||||||||||||||||||||||||||||||||||
| Changes attributable to: | ||||||||||||||||||||||||||||||||||||||||||||||||
| Revisions | 40 | 39 | 130 | 209 | (141 | ) | 149 | 12 | 166 | 186 | 395 | 75 | (2 | ) | ||||||||||||||||||||||||||||||||||
| Improved recovery | – | – | – | – | – | – | – | 1 | 1 | 1 | – | – | ||||||||||||||||||||||||||||||||||||
| Extensions and discoveries | – | 40 | 46 | 86 | 11 | 392 | – | 29 | 432 | 518 | – | – | ||||||||||||||||||||||||||||||||||||
Purchases1 | 2 | 19 | 29 | 50 | – | 91 | – | – | 91 | 141 | – | 211 | ||||||||||||||||||||||||||||||||||||
Sales2 | – | (39 | ) | (37 | ) | (76 | ) | – | – | – | – | – | (76 | ) | – | (175 | ) | |||||||||||||||||||||||||||||||
| Production | (35 | ) | (210 | ) | (375 | ) | (620 | ) | (27 | ) | (725 | ) | (101 | ) | (279 | ) | (1,132 | ) | (1,752 | ) | (70 | ) | (10 | ) | ||||||||||||||||||||||||
Reserves at Dec. 31, 20073,4 | 317 | 943 | 2,417 | 3,677 | 3,049 | 8,827 | 485 | 3,099 | 15,460 | 19,137 | 2,748 | 255 | ||||||||||||||||||||||||||||||||||||
Developed Reserves5 | ||||||||||||||||||||||||||||||||||||||||||||||||
| At Jan. 1, 2005 | 252 | 937 | 2,191 | 3,380 | 1,108 | 3,701 | 271 | 2,273 | 7,353 | 10,733 | 2,584 | 63 | ||||||||||||||||||||||||||||||||||||
| At Dec. 31, 2005 | 251 | 977 | 2,794 | 4,022 | 1,346 | 4,819 | 449 | 2,453 | 9,067 | 13,089 | 2,314 | 85 | ||||||||||||||||||||||||||||||||||||
| At Dec. 31, 2006 | 250 | 873 | 2,434 | 3,557 | 1,306 | 4,751 | 377 | 1,912 | 8,346 | 11,903 | 1,412 | 144 | ||||||||||||||||||||||||||||||||||||
At Dec. 31, 2007 | 261 | 727 | 2,238 | 3,226 | 1,151 | 5,081 | 326 | 1,915 | 8,473 | 11,699 | 1,762 | 117 | ||||||||||||||||||||||||||||||||||||
| 1 | Includes reserves acquired through nonmonetary transactions. |
| 2 | Includes reserves disposed of through nonmonetary transactions. |
| 3 | Includes year-end reserve quantities related to production-sharing contracts (PSC) (refer to page E-23 for the definition of a PSC). PSC-related reserve quantities are 37 percent, 47 percent and 44 percent for consolidated companies for 2007, 2006 and 2005, respectively. |
| 4 | Net reserve changes (excluding production) in 2007 consist of 1,548 billion cubic feet of developed reserves and (569) billion cubic feet of undeveloped reserves for consolidated companies and 403 billion cubic feet of developed reserves and (294) billion cubic feet of undeveloped reserves for affiliated companies. |
| 5 | During 2007, the percentages of undeveloped reserves at December 31, 2006, transferred to developed reserves were 10 percent and 27 percent for consolidated companies and affiliated companies, respectively. |
FS-70
Table of Contents
Table V Reserve Quantity Information – Continued |
FS-71
Table of Contents
Supplemental Information on Oil and Gas Producing Activities –Continued | ||||||||||
Table VI Standardized Measure of Discounted Future Net Cash Flows Related to Proved Oil and Gas Reserves | ||||||||||
FS-72
Table of Contents
Table VI Standardized Measure of Discounted Future Net Cash Flows Related to Proved Oil and Gas Reserves – Continued |
| Consolidated Companies | ||||||||||||||||||||||||||||||||||||||||||||||||
| United States | International | |||||||||||||||||||||||||||||||||||||||||||||||
| Gulf of | Total | Asia- | Total | Affiliated Companies | ||||||||||||||||||||||||||||||||||||||||||||
| Millions of dollars | Calif. | Mexico | Other | U.S. | Africa | Pacific | Indonesia | Other | Int'l. | Total | TCO | Other | ||||||||||||||||||||||||||||||||||||
At December 31, 2007 | ||||||||||||||||||||||||||||||||||||||||||||||||
| Future cash inflows from production | $ | 75,201 | $ | 34,162 | $ | 52,775 | $ | 162,138 | $ | 132,450 | $ | 93,046 | $ | 35,020 | $ | 45,566 | $ | 306,082 | $ | 468,220 | 159,078 | $ | 29,845 | |||||||||||||||||||||||||
| Future production costs | (17,888 | ) | (7,193 | ) | (16,780 | ) | (41,861 | ) | (15,707 | ) | (16,022 | ) | (18,270 | ) | (11,990 | ) | (61,989 | ) | (103,850 | ) | (10,408 | ) | (1,529 | ) | ||||||||||||||||||||||||
| Future devel. costs | (3,491 | ) | (3,011 | ) | (1,578 | ) | (8,080 | ) | (11,516 | ) | (8,263 | ) | (4,012 | ) | (3,468 | ) | (27,259 | ) | (35,339 | ) | (8,580 | ) | (1,175 | ) | ||||||||||||||||||||||||
| Future income taxes | (19,112 | ) | (8,507 | ) | (12,221 | ) | (39,840 | ) | (74,172 | ) | (26,838 | ) | (5,796 | ) | (15,524 | ) | (122,330 | ) | (162,170 | ) | (39,575 | ) | (13,600 | ) | ||||||||||||||||||||||||
| Undiscounted future net cash flows | 34,710 | 15,451 | 22,196 | 72,357 | 31,055 | 41,923 | 6,942 | 14,584 | 94,504 | 166,861 | 100,515 | 13,541 | ||||||||||||||||||||||||||||||||||||
| 10 percent midyear annual discount for timing of estimated cash flows | (17,204 | ) | (4,438 | ) | (9,491 | ) | (31,133 | ) | (14,171 | ) | (17,117 | ) | (2,702 | ) | (4,689 | ) | (38,679 | ) | (69,812 | ) | (64,519 | ) | (7,779 | ) | ||||||||||||||||||||||||
Standardized Measure Net Cash Flows | $ | 17,506 | $ | 11,013 | $ | 12,705 | $ | 41,224 | $ | 16,884 | $ | 24,806 | $ | 4,240 | $ | 9,895 | $ | 55,825 | $ | 97,049 | $ | 35,996 | $ | 5,762 | ||||||||||||||||||||||||
At December 31, 2006 | ||||||||||||||||||||||||||||||||||||||||||||||||
| Future cash inflows from production | $ | 48,828 | $ | 23,768 | $ | 38,727 | $ | 111,323 | $ | 97,571 | $ | 70,288 | $ | 30,538 | $ | 36,272 | $ | 234,669 | $ | 345,992 | $ | 104,069 | $ | 20,644 | ||||||||||||||||||||||||
| Future production costs | (14,791 | ) | (6,750 | ) | (12,845 | ) | (34,386 | ) | (12,523 | ) | (13,398 | ) | (16,281 | ) | (10,777 | ) | (52,979 | ) | (87,365 | ) | (7,796 | ) | (2,348 | ) | ||||||||||||||||||||||||
| Future devel. costs | (3,999 | ) | (2,947 | ) | (1,399 | ) | (8,345 | ) | (9,648 | ) | (6,963 | ) | (2,284 | ) | (3,082 | ) | (21,977 | ) | (30,322 | ) | (7,026 | ) | (1,732 | ) | ||||||||||||||||||||||||
| Future income taxes | (10,171 | ) | (4,764 | ) | (8,290 | ) | (23,225 | ) | (53,214 | ) | (20,633 | ) | (5,448 | ) | (11,164 | ) | (90,459 | ) | (113,684 | ) | (25,212 | ) | (8,282 | ) | ||||||||||||||||||||||||
| Undiscounted future net cash flows | 19,867 | 9,307 | 16,193 | 45,367 | 22,186 | 29,294 | 6,525 | 11,249 | 69,254 | 114,621 | 64,035 | 8,282 | ||||||||||||||||||||||||||||||||||||
| 10 percent midyear annual discount for timing of estimated cash flows | (9,779 | ) | (3,256 | ) | (7,210 | ) | (20,245 | ) | (10,065 | ) | (12,457 | ) | (2,426 | ) | (3,608 | ) | (28,556 | ) | (48,801 | ) | (40,597 | ) | (5,185 | ) | ||||||||||||||||||||||||
Standardized Measure Net Cash Flows | $ | 10,088 | $ | 6,051 | $ | 8,983 | $ | 25,122 | $ | 12,121 | $ | 16,837 | $ | 4,099 | $ | 7,641 | $ | 40,698 | $ | 65,820 | $ | 23,438 | $ | 3,097 | ||||||||||||||||||||||||
At December 31, 2005 | ||||||||||||||||||||||||||||||||||||||||||||||||
| Future cash inflows from production | $ | 50,771 | $ | 29,422 | $ | 50,039 | $ | 130,232 | $ | 101,912 | $ | 73,612 | $ | 32,538 | $ | 44,680 | $ | 252,742 | $ | 382,974 | $ | 97,707 | $ | 20,616 | ||||||||||||||||||||||||
| Future production costs | (15,719 | ) | (5,758 | ) | (12,767 | ) | (34,244 | ) | (11,366 | ) | (12,459 | ) | (18,260 | ) | (11,908 | ) | (53,993 | ) | (88,237 | ) | (7,399 | ) | (2,101 | ) | ||||||||||||||||||||||||
| Future devel. costs | (2,274 | ) | (2,467 | ) | (873 | ) | (5,614 | ) | (8,197 | ) | (5,840 | ) | (1,730 | ) | (2,439 | ) | (18,206 | ) | (23,820 | ) | (5,996 | ) | (762 | ) | ||||||||||||||||||||||||
| Future income taxes | (11,092 | ) | (7,173 | ) | (12,317 | ) | (30,582 | ) | (50,894 | ) | (21,509 | ) | (5,709 | ) | (13,917 | ) | (92,029 | ) | (122,611 | ) | (23,818 | ) | (6,036 | ) | ||||||||||||||||||||||||
| Undiscounted future net cash flows | 21,686 | 14,024 | 24,082 | 59,792 | 31,455 | 33,804 | 6,839 | 16,416 | 88,514 | 148,306 | 60,494 | 11,717 | ||||||||||||||||||||||||||||||||||||
| 10 percent midyear annual discount for timing of estimated cash flows | (10,947 | ) | (4,520 | ) | (10,838 | ) | (26,305 | ) | (14,881 | ) | (14,929 | ) | (2,269 | ) | (5,635 | ) | (37,714 | ) | (64,019 | ) | (37,674 | ) | (7,768 | ) | ||||||||||||||||||||||||
Standardized Measure Net Cash Flows | $ | 10,739 | $ | 9,504 | $ | 13,244 | $ | 33,487 | $ | 16,574 | $ | 18,875 | $ | 4,570 | $ | 10,781 | $ | 50,800 | $ | 84,287 | $ | 22,820 | $ | 3,949 | ||||||||||||||||||||||||
FS-73
Table of Contents
Supplemental Information on Oil and Gas Producing Activities –Continued | ||||||||||
Table VII Changes in the Standardized Measure of Discounted Future Net Cash Flows From Proved Reserves | ||||||||||
| Consolidated Companies | Affiliated Companies | |||||||||||||||||||||||||
| Millions of dollars | 2007 | 2006 | 2005 | 2007 | 2006 | 2005 | ||||||||||||||||||||
| Present Value at January 1 | $ | 65,820 | $ | 84,287 | $ | 48,134 | $ | 26,535 | $ | 26,769 | $ | 14,920 | ||||||||||||||
| Sales and transfers of oil and gas produced net of production costs | (34,957 | ) | (32,690 | ) | (26,145 | ) | (4,084 | ) | (3,180 | ) | (2,712 | ) | ||||||||||||||
| Development costs incurred | 10,468 | 8,875 | 5,504 | 889 | 721 | 810 | ||||||||||||||||||||
| Purchases of reserves | 780 | 580 | 25,307 | 7,711 | 1,767 | – | ||||||||||||||||||||
| Sales of reserves | (425 | ) | (306 | ) | (2,006 | ) | (7,767 | ) | – | – | ||||||||||||||||
| Extensions, discoveries and improved recovery less related costs | 3,664 | 4,067 | 7,446 | – | – | – | ||||||||||||||||||||
| Revisions of previous quantity estimates | (7,801 | ) | 7,277 | (13,564 | ) | (1,333 | ) | (967 | ) | (2,598 | ) | |||||||||||||||
| Net changes in prices, development and production costs | 74,900 | (24,725 | ) | 61,370 | 23,616 | (837 | ) | 19,205 | ||||||||||||||||||
| Accretion of discount | 12,196 | 14,218 | 8,160 | 3,745 | 3,673 | 2,055 | ||||||||||||||||||||
| Net change in income tax | (27,596 | ) | 4,237 | (29,919 | ) | (7,554 | ) | (1,411 | ) | (4,911 | ) | |||||||||||||||
| Net change for the year | 31,229 | (18,467 | ) | 36,153 | 15,223 | (234 | ) | 11,849 | ||||||||||||||||||
| Present Value at December 31 | $ | 97,049 | $ | 65,820 | $ | 84,287 | $ | 41,758 | $ | 26,535 | $ | 26,769 | ||||||||||||||
FS-74
Table of Contents
Exhibit No. | Description | |||
| 3 | .1 | Restated Certificate of Incorporation of Chevron Corporation, dated May 1, 2007, filed as Exhibit 3.1 to Chevron Corporation’s Quarterly Report onForm 10-Q for the quarterly period ended March 31, 2007, and incorporated herein by reference. | ||
| 3 | .2 | By-Laws of Chevron Corporation, as amended January 30, 2008, filed as Exhibit 3.1 to Chevron Corporation’s Current Report onForm 8-K dated February 1, 2008, and incorporated herein by reference. | ||
| 4 | Pursuant to the Instructions to Exhibits, certain instruments defining the rights of holders of long-term debt securities of the company and its consolidated subsidiaries are not filed because the total amount of securities authorized under any such instrument does not exceed 10 percent of the total assets of the corporation and its subsidiaries on a consolidated basis. A copy of such instrument will be furnished to the Commission upon request. | |||
| 10 | .1 | Chevron Corporation Non-Employee Directors’ Equity Compensation and Deferral Plan filed as Exhibit 10.1 to Chevron Corporation’s Quarterly Report onForm 10-Q for the quarterly period ended March 31, 2007, and incorporated herein by reference. | ||
| 10 | .2 | Management Incentive Plan of Chevron Corporation filed as Exhibit 10.3 to Chevron Corporation’s Current Report onForm 8-K dated December 6, 2006, and incorporated herein by reference. | ||
| 10 | .4 | Chevron Corporation Long-Term Incentive Plan filed as Exhibit 10.4 to Chevron Corporation’s Current Report onForm 8-K dated December 6, 2006, and incorporated herein by reference. | ||
| 10 | .6 | Chevron Corporation Deferred Compensation Plan for Management Employees, as amended and restated on December 7, 2005, filed as Exhibit 10.5 to Chevron Corporation’s Current Report onForm 8-K dated December 7, 2005, and incorporated herein by reference. | ||
| 10 | .7 | Chevron Corporation Deferred Compensation Plan for Management Employees II filed as Exhibit 10.5 to Chevron Corporation’s Current Report onForm 8-K dated December 6, 2006, and incorporated herein by reference. | ||
| 10 | .8 | Texaco Inc. Stock Incentive Plan, adopted May 9, 1989, as amended May 13, 1993, and May 13, 1997, filed as Exhibit 10.13 to Chevron Corporation’s Annual Report onForm 10-K for the year ended December 31, 2001, and incorporated herein by reference. | ||
| 10 | .9 | Supplemental Pension Plan of Texaco Inc., dated June 26, 1975, filed as Exhibit 10.14 to Chevron Corporation’s Annual Report onForm 10-K for the year ended December 31, 2001, and incorporated herein by reference. | ||
| 10 | .10 | Supplemental Bonus Retirement Plan of Texaco Inc., dated May 1, 1981, filed as Exhibit 10.15 to Chevron Corporation’s Annual Report onForm 10-K for the year ended December 31, 2001, and incorporated herein by reference. | ||
| 10 | .11 | Texaco Inc. Director and Employee Deferral Plan approved March 28, 1997, filed as Exhibit 10.16 to Chevron Corporation’s Annual Report onForm 10-K for the year ended December 31, 2001, and incorporated herein by reference. | ||
| 10 | .12 | Chevron Corporation 1998 Stock Option Program for U.S. Dollar Payroll Employees, filed as Exhibit 10.12 to Chevron Corporation’s Annual Report onForm 10-K for the year ended December 31, 2002, and incorporated herein by reference. | ||
| 10 | .13 | Summary of Chevron’s Management and Incentive Plan Awards and Criteria, filed as Exhibit 10.13 to Chevron Corporation’s Quarterly Report onForm 10-Q for the quarterly period ended March 31, 2005, and incorporated herein by reference. | ||
| 10 | .14 | Chevron Corporation Change in Control Surplus Employee Severance Program for Salary Grades 41 through 43 filed as Exhibit 10.1 to Chevron Corporation’s Current Report onForm 8-K dated December 6, 2006, and incorporated herein by reference. | ||
E-1
Table of Contents
Exhibit No. | Description | |||
| 10 | .15 | Chevron Corporation Benefit Protection Program, filed as Exhibit 10.2 to Chevron Corporation’s Current Report onForm 8-K dated December 6, 2006, and incorporated herein by reference. | ||
| 10 | .16 | Form of Notice of Grant under the Chevron Corporation Long-Term Incentive Plan, filed as Exhibit 10.1 to Chevron’s Current Report onForm 8-K dated June 29, 2005, and incorporated herein by reference. | ||
| 10 | .17 | Form of Retainer Stock Option Agreement under the Chevron Corporation Non-Employee Directors’ Equity Compensation and Deferral Plan, filed as Exhibit 10.2 to Chevron’s Current Report onForm 8-K dated June 29, 2005, and incorporated herein by reference. | ||
| 10 | .18 | Chevron Corporation Retirement Restoration Plan, filed as Exhibit 10.18 to Chevron Corporation’s Quarterly Report onForm 10-Q for the quarterly period ended June 30, 2006, and incorporated herein by reference. | ||
| 10 | .19 | Chevron Corporation ESIP Restoration Plan, filed as Exhibit 10.19 to Chevron Corporation’s Quarterly Report onForm 10-Q for the quarterly period ended June 30, 2006, and incorporated herein by reference. | ||
| 10 | .20 | Form of Restricted Stock Unit Grant Agreement under the Chevron Corporation Long-Term Incentive Plan, filed as Exhibit 10.20 to Chevron Corporation’s Quarterly Report onForm 10-Q for the quarterly period ended June 30, 2006, and incorporated herein by reference. | ||
| 12 | .1* | Computation of Ratio of Earnings to Fixed Charges(page E-3). | ||
| 21 | .1* | Subsidiaries of Chevron Corporation (pagesE-4 toE-5). | ||
| 23 | .1* | Consent of PricewaterhouseCoopers LLP(page E-6). | ||
| 24 | .1 to 24.12* | Powers of Attorney for directors and certain officers of Chevron Corporation, authorizing the signing of the Annual Report onForm 10-K on their behalf. | ||
| 31 | .1* | Rule 13a-14(a)/15d-14(a) Certification of the company’s Chief Executive Officer(page E-19). | ||
| 31 | .2* | Rule 13a-14(a)/15d-14(a) Certification of the company’s Chief Financial Officer(page E-20). | ||
| 32 | .1* | Section 1350 Certification of the company’s Chief Executive Officer(page E-21). | ||
| 32 | .2* | Section 1350 Certification of the company’s Chief Financial Officer(page E-22). | ||
| 99 | .1* | Definitions of Selected Energy and Financial Terms (pagesE-23 toE-25). | ||
| * | Filed herewith. |
E-2