UNITED STATES
SECURITIES AND EXCHANGE COMMISSION
Washington, D.C. 20549
FORM N-CSR
CERTIFIED SHAREHOLDER REPORT OF REGISTERED
MANAGEMENT INVESTMENT COMPANIES
Investment Company Act file number 811-08918
HC Capital Trust
(Exact name of registrant as specified in charter)
|
| Five Tower Bridge, 300 Barr Harbor Drive, Suite 500, West Conshohocken, PA 19428 |
| (Address of principal executive offices) (Zip code) |
Citi Fund Services Ohio, Inc., 3435 Stelzer Road, Columbus, OH 43219
(Name and address of agent for service)
Registrant’s telephone number, including area code: 800-242-9596
Date of fiscal year end: June 30
Date of reporting period: June 30, 2015
Item 1. Reports to Stockholders.

Annual Report
The Value Equity Portfolio
The Institutional Value Equity Portfolio
The Growth Equity Portfolio
The Institutional Growth Equity Portfolio
The Small Capitalization–Mid Capitalization Equity Portfolio
The Institutional Small Capitalization–Mid Capitalization Equity Portfolio
The Real Estate Securities Portfolio
The Commodity Returns Strategy Portfolio
The International Equity Portfolio
The Institutional International Equity Portfolio
The Emerging Markets Portfolio
The Core Fixed Income Portfolio
The Fixed Income Opportunity Portfolio
The U.S. Government Fixed Income Securities Portfolio
The Inflation Protected Securities Portfolio
The U.S. Corporate Fixed Income Securities Portfolio
The U.S. Mortgage/Asset Backed Fixed Income Securities Portfolio
The Short-Term Municipal Bond Portfolio
The Intermediate Term Municipal Bond Portfolio
The Intermediate Term Municipal Bond II Portfolio
June 30, 2015
June 30, 2015
We are pleased to present the June 30, 2015 Annual Report for the HC Capital Trust (the “Trust”).
The Trust is an open-end management investment company. As of June 30, 2015, the Trust consisted of twenty separate investment portfolios (the “Portfolios”). Day-to-day portfolio management services are provided to each of the Trust’s Portfolios by one or more independent money management organizations (“Specialist Managers”). Each Specialist Manager is subject to the supervision of HC Capital Solutions, an operating division of Hirtle Callaghan & Co., LLC, which serves as the Trust’s primary investment adviser and to the general oversight of the Trust’s Board of Trustees.
The Value Equity Portfolio, seeks total return by investing in a diversified portfolio of equity securities of large companies with relatively low price-earnings ratios and high dividend yields.
The Institutional Value Equity Portfolio, seeks total return by investing in a diversified portfolio of equity securities of large companies with relatively low price-earnings ratios and high dividend yields.
The Growth Equity Portfolio, seeks capital appreciation by investing in a diversified portfolio of equity securities of large and mid-capitalization companies with superior prospects for earnings growth.
The Institutional Growth Equity Portfolio, seeks capital appreciation by investing in a diversified portfolio of equity securities of large and mid-capitalization companies with superior prospects for earnings growth.
The Small Capitalization–Mid Capitalization Equity Portfolio, seeks long-term capital appreciation by investing in a diversified portfolio of equity securities of small-capitalization companies.
The Institutional Small Capitalization–Mid Capitalization Equity Portfolio, seeks long-term capital appreciation by investing in a diversified portfolio of equity securities of small-capitalization companies.
The Real Estate Securities Portfolio, seeks to provide a total return consisting of both capital appreciation and current income.
The Commodity Returns Strategy Portfolio, seeks capital appreciation by investing in a diversified portfolio of commodity-related instruments.
The International Equity Portfolio, seeks total return by investing in a diversified portfolio of equity securities of companies based in countries other than the United States of America.
The Institutional International Equity Portfolio, seeks total return by investing in a diversified portfolio of equity securities of companies based in countries other than the United States of America.
The Emerging Markets Portfolio, seeks total return by investing in a diversified portfolio of securities issued by companies domiciled, or doing a substantial portion of their business, in countries with a developing or emerging economy or securities market.
The Core Fixed Income Portfolio, seeks current income, consistent with the preservation of capital, by investing in a diversified portfolio of debt securities, including U.S. and non-U.S. government securities, corporate debt securities, and asset-backed issues.
The Fixed Income Opportunity Portfolio, seeks to achieve above-average total return by investing in high yield securities (commonly referred to as “junk bonds”).
The U.S. Government Fixed Income Securities Portfolio, seeks to provide a moderate and sustainable level of current income, consistent with the preservation of capital by investing primarily in a diversified portfolio of U.S. Treasury and government related fixed income securities.
The Inflation Protected Securities Portfolio, seeks to provide inflation protection and income consistent with investment in inflation-indexed securities.
The U.S. Corporate Fixed Income Securities Portfolio, seeks to provide a moderate and sustainable level of current income, consistent with the preservation of capital by investing primarily in a diversified portfolio of investment grade fixed income securities issued by U.S. corporations.
The U.S. Mortgage/Asset Backed Fixed Income Securities Portfolio, seeks to provide a moderate and sustainable level of current income, consistent with the preservation of capital by investing primarily in a diversified portfolio of publicly issued mortgage and asset backed securities.
The Short-Term Municipal Bond Portfolio, seeks current income exempt from Federal income tax, consistent with preservation of capital, by investing primarily in securities issued by municipalities and related securities.
The Intermediate Term Municipal Bond Portfolio, seeks current income, consistent with the preservation of capital, exempt from Federal income tax by investing in securities issued by municipalities and related entities.
The Intermediate Term Municipal Bond II Portfolio, seeks current income, consistent with the preservation of capital, exempt from Federal income tax by investing in securities issued by municipalities and related entities.
[THIS PAGE INTENTIONALLY LEFT BLANK]
| | | | |
| HC CAPITAL TRUST | | | | Annual Report |
June 30, 2015
Table of Contents
[THIS PAGE INTENTIONALLY LEFT BLANK]
Fiscal Year 2015 Summary
General Market
(Unaudited — June 30, 2015)
The several portfolios of the HC Capital Trust provide clients with distinct, broadly diversified, cost-effective exposure to multiple asset class funds (for both taxable and institutional investors). The Portfolios are structured as multi-manager, multi strategy vehicles that may be used by or clients of Hirtle Callaghan & Co., LLC. The Portfolios enable HC Capital Solutions (the advisor) to construct independent, custom asset allocation portfolios to best meet such clients’ overall investment policies and objectives. The absolute performance of each Portfolio over the period is designed to reflect the absolute performance of the asset class as reflected by the portfolio benchmark. Depending upon the objective, each Portfolio will generally seek to deliver performance that exceeds, or is in-line with the benchmark for the Portfolio as well as a peer universe of mutual funds with similar investment strategies.
Financial returns in the overall markets were broadly positive during the Trust’s fiscal year ended June 30, 2015, but were punctuated by bouts of volatility. The turbulence stemmed from a series of exogenous shocks related to the U.S. Dollar, the oil market, the U.S. Federal Reserve’s posture and the geopolitical tensions. The surprising strength of the U.S. Dollar (U.S. Federal Reserve’s trade weighted Dollar index +15.51%) impaired returns on foreign holdings for U.S. dollar-based investors. The U.S. Dollar’s strength was a consequence of (1) heightened geo-political concerns and (2) the perception of differential monetary policy between the U.S. and the rest of the world. Russia’s annexation of Crimea and interference in Ukraine, the territorial gains of ISIS in Syria and Iraq and China’s belligerence in the South China Sea heightened risk aversion in financial markets. The most impactful exogenous event was the decision by the Saudis in November to continue crude oil production in spite of the rising global inventories caused by the influx of North American shale oil. The Saudi refusal to cede market share caused a massive dislocation in the oil market. Prices fell from a high of $105 per barrel of West Texas Intermediate to a low of $43 per barrel in March. The industry adjusted rapidly to curtail supply – straining the more leveraged balance sheets of producers and oil service companies. The relief of lower oil prices to consumers failed to manifest itself. So the first order impact of lower employment and capital expenditure in the oil fields seems to outweigh the positive impact on consumption.
During this period, real activity generally accelerated around the world. The U.S. economy continued to gain strength – despite a severe winter that disrupted activity. Employment in the U.S. steadily improved as the housing and auto sectors rebounded. The European economy – particularly in the most troubled peripheral economies – appeared to have reached the inflection point in activity. The stronger U.S. Dollar and the European Central Bank’s commitment to quantitative easing appeared to have a positive influence on European corporate earnings and consumer confidence. Chinese growth continued to slow marginally, but the People’s Bank of China (“PBOC”) took steps to lower interest rates to stimulate lending activity, and the decline in real estate activity seen in the first half of the year appeared to level off.
U.S. equities appreciated modestly over the twelve months ended June 30, 2015 (7.43% for the S&P 500). Growth stocks outperformed value stocks (Russell 1000® Value Index 7.42% versus Russell 1000® Growth Index 10.47%). International developed market equities rose (MSCI EAFE 12.30%) in local currency terms, but declined 4.18% in U.S. Dollar terms. The MSCI Emerging Markets index lagged the developed markets, falling 5.19% in U.S. Dollar terms. Fixed income asset classes rebounded from the selloff related to the Federal Reserve’s tapering of quantitative easing. The U.S. 10 year Treasury yield decreased from 2.53% to 2.36% over the year. Interest sensitive sectors like real estate securities (REITs) and utilities outperformed as rates declined.
Each of the Portfolios provided results consistent with their stated objectives over the fiscal year ended June 30, 2015. The performance of each Portfolio is listed in the table below and detailed summaries of the objectives, managers, and results are contained in the subsequent sections.
1
The table below summarizes the performance of each Portfolio in the HC Capital Trust. Note that benchmark performance is shown for comparison purposes only; it is not possible to invest directly in a securities index. All of the referenced benchmark indices are unmanaged, which means that the indices results do not reflect the impact of expenses associated with investing in securities, such as fees, brokerage commission and transactions costs.
| | | | |
HC Capital Trust Portfolios | | Fiscal Year
2015 Return | |
The Value Equity Portfolio | | | 5.27%(a) | |
Russell 1000® Value Index1 | | | 4.12% | |
The Institutional Value Equity Portfolio | | | 5.05%(a) | |
Russell 1000® Value Index1 | | | 4.12% | |
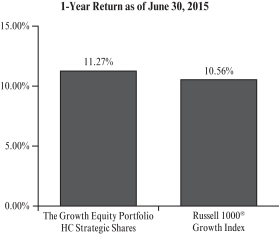
The Growth Equity Portfolio | | | 11.27%(a) | |
Russell 1000® Growth Index1 | | | 10.56% | |
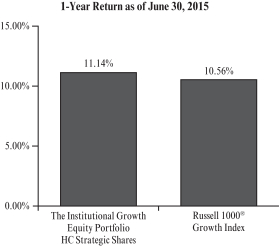
The Institutional Growth Equity Portfolio | | | 11.14%(a) | |
Russell 1000® Growth Index1 | | | 10.56% | |
The Small Capitalization–Mid Capitalization Equity Portfolio | | | 6.91%(a) | |
Russell 2000® Index1 | | | 6.49% | |
The Institutional Small Capitalization–Mid Capitalization Equity Portfolio | | | 7.43%(a) | |
Russell 2000® Index1 | | | 6.49% | |
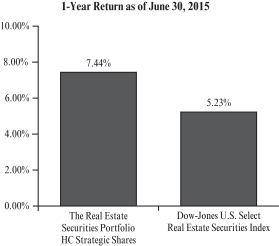
The Real Estate Securities Portfolio | | | 7.44%(a) | |
Dow-Jones U.S. Select Real Estate Securities Index2 | | | 5.23% | |
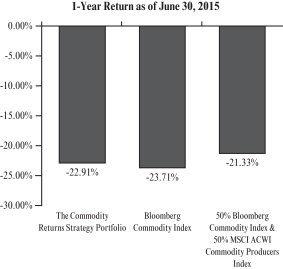
The Commodity Returns Strategy Portfolio | | | -22.91%(a) | |
Bloomberg Commodity Index3 | | | -23.71% | |
HC Commodities Benchmark4 | | | -21.33% | |
The International Equity Portfolio | | | -4.50%(a) | |
MSCI EAFE Index5 | | | -3.82% | |
The Institutional International Equity Portfolio | | | -4.38%(a) | |
MSCI EAFE Index5 | | | -3.82% | |
The Emerging Markets Portfolio | | | -8.48%(a) | |
MSCI EM Index6 | | | -4.77% | |
The Core Fixed Income Portfolio | | | 1.16%(a) | |
Barclays Capital U.S. Aggregate Bond Index7 | | | 1.85% | |
The Fixed Income Opportunity Portfolio | | | 0.06%(a) | |
Barclays Capital U.S. High Yield Ba/B 2% Issuer Capped Index8 | | | 0.72% | |
The U.S. Government Fixed Income Securities Portfolio | | | 2.03% | |
Barclays Capital U.S. Government Bond Index9 | | | 2.27% | |
The Inflation Protected Securities Portfolio | | | -1.72%(a) | |
Barclays Capital U.S. Treasury Inflation Protected Securities Index10 | | | -1.72% | |
The U.S. Corporate Fixed Income Securities Portfolio | | | -0.01% | |
Barclays Capital U.S. Corporate Index11 | | | 0.75% | |
The U.S. Mortgage/Asset Backed Fixed Income Securities Portfolio | | | 1.97% | |
Barclays Capital U.S. Securitized Index12 | | | 2.25% | |
The Short-Term Municipal Bond Portfolio | | | 0.19% | |
BofA Merrill Lynch 1-3 Year Municipal Index13 | | | 0.40% | |
The Intermediate Term Municipal Bond Portfolio | | | 1.54% | |
Barclays Capital 3-15 Year Blend Muni Index14 | | | 2.40% | |
The Intermediate Term Municipal Bond II Portfolio | | | 1.31% | |
Barclays Capital 5-Year General Obligation Muni Index15 | | | 1.31% | |
In reviewing the table above and the remainder of this report, note that past performance does not guarantee future results. The remainder of this report contains more specific details about the performance, strategy and managers in each of the portfolios.
2
| (a) | The return shown is that of HC Strategic Shares and has not been adjusted to reflect HC Advisors Shares expenses, which may be higher. |
| 1 | Each of the Russell indices is a market cap-weighted index of common stocks domiciled in the U.S. Unlike the S&P 500 Stock Index however, the basket of securities included in the various Russell indices is reconstituted each year. The Russell 3000® Index is constructed by ranking U.S. common stocks from largest to smallest market capitalization, and including in the index the top 3,000 stocks. The largest 1,000 stocks become the Russell 1000® Index and the next 2,000 stocks are included in the Russell 2000® Index. The Russell 1000® Growth Index is designed to measure the performance of those companies included in the Russell 1000 Index that have relatively higher price-to-book ratios and higher forecasted growth values. The Russell 1000 Value® Index is designed to measure the performance of those companies included in the Russell 1000® Index that have relatively lower price-to-book ratios and lower forecasted growth values. |
| 2 | Dow-Jones U.S. Select Real Estate Securities Index – is a broad measure of the performance of publicly traded global real estate securities, such as Real Estate Investment Trusts (“REITs”) and Real Estate Operating Companies (“REOCs”). The index is capitalization-weighted. The global index is an expansion of the original U.S. index, developed in 1991. |
| 3 | The Bloomberg Commodity Index is a broadly diversified index that allows investors to track commodity futures through a single, simple measure. The index is designed to minimize concentration in one commodity or sector. It currently includes 19 commodity futures in five groups. No one commodity can comprise less than 2% or more than 15% of the index, and no group can represent more than 33% of the index (as of the annual re-weightings of the components). |
| 4 | The HC Commodities Benchmark is comprised 50% of the Bloomberg Commodity Index and 50% of the MSCI ACWI Commodity Producers Index. The MSCI ACWI Commodity Producers Index captures the global opportunity set of commodity produces in the energy, metal and agricultural sectors. Constituents are selected from the equity universe of MSCI ACWI, the parent index, which covers mid and large cap securities across 24 Developed Markets (DM) and 21 Emerging Markets (EM) countries. All index constituents are categorized in one of twelve sub industries according to the Global Industry Classification Standard (GICS), including: integrated oil & gas, oil & gas exploration & production, gold, steel, aluminum, precious metals & minerals, agricultural products, paper products, and forest products. |
| 5 | The Morgan Stanley Capital International Europe, Australasia, and Far East Index (“MSCI EAFE Index”). The MSCI EAFE Index (Europe, Australasia, Far East) is an unmanaged, free float-adjusted market capitalization index that is designed to measure the equity market performance of developed markets, excluding the U.S. & Canada. As of June 2015, the MSCI EAFE Index consisted of the following 21 developed market country indices: Australia, Austria, Belgium, Denmark, Finland, France, Germany, Hong Kong, Ireland, Israel, Italy, Japan, the Netherlands, New Zealand, Norway, Portugal, Singapore, Spain, Sweden, Switzerland, and the United Kingdom. |
| 6 | MSCI Emerging Markets Index (“MSCI EM Index”) – is an unmanaged free float-adjusted market capitalization index that is designed to measure equity market performance of emerging markets. As of June 2015, the MSCI EM Index consisted of the following 22 emerging market country indices: Brazil, Chile, China, Colombia, Czech Republic, Egypt, Greece, Hungary, India, Indonesia, Korea, Malaysia, Mexico, Peru, Philippines, Poland, Russia, South Africa, Taiwan, Thailand, Turkey and United Arab Emirates. |
| 7 | The Barclays Capital U.S. Aggregate Bond Index is an unmanaged index that includes more than 5,000 taxable government, investment-grade corporate and mortgage backed securities. |
| 8 | Barclays Capital U.S. High Yield Ba/B 2% Issuer Capped Index is an unmanaged index designed to mirror the investable universe of the U.S. dollar denominated high yield debt market. |
| 9 | The Barclays Capital U.S. Government Index is a broad-based index that represents the general performance of U.S. Treasury and U.S. Government agency and debt securities. |
| 10 | The Barclays Capital U.S. Treasury Inflation Protected Securities Index consists of Inflation-Protection securities issued by the U.S. Treasury. |
| 11 | The Barclays Capital U.S. Corporate Index is an unmanaged index that covers USD-denominated, investment-grade, fixed-rate and taxable securities sold by industrial, utility and financial issuers. It includes publicly issued U.S. corporate and foreign debentures and secured notes that meet specified maturity, liquidity and quality requirements. |
| 12 | The Barclays Capital U.S. Securitized Index is an unmanaged index that tracks the performance of mortgage-backed pass-through securities issued by Ginnie Mae, Fannie Mae and Freddie Mac, investment-grade bonds and asset-backed securities. |
| 13 | The Bank of America (“BofA”) Merrill Lynch 1-3 Year Municipal Index is an equal-weighted index that tracks the total return performance of the domestic U.S. municipal market. The index consists of investment-grade, publicly traded, fixed-rate and coupon bearing municipal securities with a maturity of one to three years. |
| 14 | Barclays Capital 3-15 Year Blend Muni Index is an index composed of tax-exempt bonds with maturities ranging between 2 and 17 years. |
| 15 | Barclays Capital 5-Year General Obligations Muni Index is an unmanaged index generally representative of investment grade fixed rate debt obligations issued by state and local government entities, with maturities of no more than six years. |
3
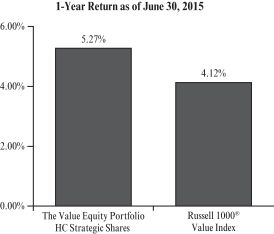
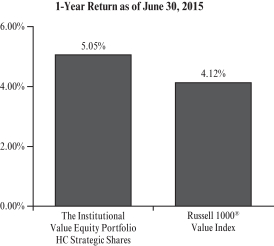
The Value Equity Portfolio
The Institutional Value Equity Portfolio
(Unaudited)
The Value Equity Portfolio (the “Portfolio”) managed by AllianceBernstein, L.P., Cadence Capital Management, LLC and Parametric Portfolio Associates, LLC returned 5.27% for the fiscal year compared to 4.12% for the Russell 1000® Value Index1 and 4.27% for the average manager in the Lipper2 universe of Large Cap Value Funds.3
The Institutional Value Equity Portfolio (the “Institutional Portfolio”) managed by AllianceBernstein, L.P., Cadence Capital Management LLC and Parametric Portfolio Associates, LLC returned 5.05% for the fiscal year compared to 4.12% for the Russell 1000® Value Index1 and 4.27% for the average manager in the Lipper2 universe of Large Cap Value Funds.3
The Portfolio outperformed both its benchmark and peer group over the period. The Portfolio benefited from its allocation to traditional value strategies employed by Alliance Bernstein. The Traditional value managers tend to have higher beta relative to benchmark and tend to select stocks with price/book, price/earnings, and price/cash flow measures at a substantial discount to the overall market. The Portfolio also benefited from overweights to the health services and retail trade sectors which outperformed the index. This style tended to outperform the Russell 1000® Value Index, as the market gained confidence in the traction of the U.S. recovery and valuations for cyclical stocks and financials rose.
The Portfolio’s cash positions, however, detracted as markets rallied. The Portfolio’s cash position serves two purposes. First, it is intended to provide protection in the event of a market correction. Second, it allows the portfolio to take overweight positions in more volatile strategies without increasing the Portfolio’s overall sensitivity to the market, or beta.
Both Portfolios are diversified across multiple managers and strategies to ensure proper portfolio diversification, with the goal of providing superior long-term returns in as stable and consistent a manner as possible. As a result, it is expected that some managers and styles will be leading at times, while others are lagging and vice versa. The Portfolios expect to capitalize on this cyclicality of manager styles by reducing exposure to investment managers whose strategy and style realize exceptional excess returns and allocating to good long-term managers whose investment strategy and style have been out of favor in the short-term. An example of this during the period is the termination of Institutional Capital, LLC., a relative value manager, and reallocation of those assets to Quality Value style managers.
| 1 | The Russell 1000® Value Index measures the performance of those companies included in the Russell 1000® Stock Index with lower price-to-book ratios and lower forecasted growth rates. This index is unmanaged, thus the index results do not reflect the impact of expenses associated with any investment in securities, such as brokerage commission or other transaction costs. Benchmark performance is shown for comparison purposes only, as it is not possible to invest directly in a securities index. |
| 2 | Lipper, Inc. is an independent statistical monitoring organization that compiles performance on mutual funds and further categorizes them by investment objective. |
| 3 | During the fiscal year, Mellon Capital Management Corporation and Pacific Investment Management Company, LLC (Institutional Portfolio only) were also under contract to manage the Portfolios but did not have assets allocated to them. |
4
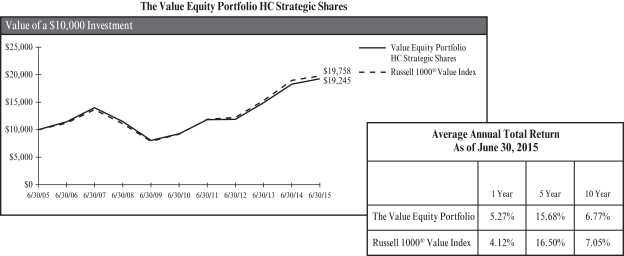
The chart represents historical performance of a hypothetical investment of $10,000 in The Value Equity Portfolio for the 10-year period ended 6/30/15, and represents the reinvestment of dividends and capital gains in the Portfolio.
Past performance does not guarantee future results. The performance data quoted represents past performance and current returns may be lower or higher. The investment return and principal value will fluctuate so that an investor’s shares, when redeemed, may be worth more or less than the original cost. To obtain performance information current to the most recent month end, please call (800) 242-9596.
The Portfolio’s performance above is compared to the Russell 1000® Value Index. The index is unmanaged and does not reflect the deduction of fees associated with a mutual fund, such as investment management and fund accounting fees, or the deduction of taxes. An investor cannot invest directly in an index. The performance of The Value Equity Portfolio reflects the deduction of fees for these value-added services, but does not reflect the deduction of taxes that a shareholder would pay on the Portfolio’s distributions or redemptions of the Portfolio’s shares.
Expense Ratio
HC Strategic Shares 0.33%
HC Advisors Shares 0.58%
This information is included in the most current prospectus available to current and prospective shareholders of the Portfolio. Additional information pertaining to the June 30, 2015, expense ratios can be found in the financial highlights.
5
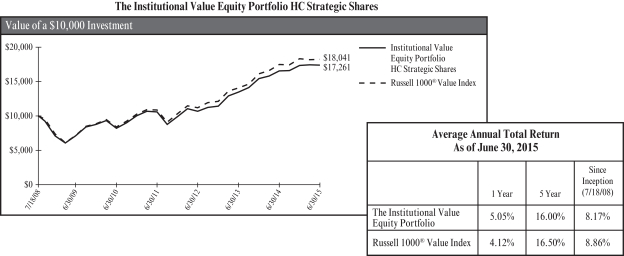
The chart represents historical performance of a hypothetical investment of $10,000 in The Institutional Value Equity Portfolio from 7/18/08 to 6/30/15, and represents the reinvestment of dividends and capital gains in the Portfolio.
Past performance does not guarantee future results. The performance data quoted represents past performance and current returns may be lower or higher. The investment return and principal value will fluctuate so that an investor’s shares, when redeemed, may be worth more or less than the original cost. To obtain performance information current to the most recent month end, please call (800) 242-9596.
The Portfolio’s performance above is compared to the Russell 1000® Value Index. The index is unmanaged and does not reflect the deduction of fees associated with a mutual fund, such as investment management and fund accounting fees, or the deduction of taxes. An investor cannot invest directly in an index. The performance of The Institutional Value Equity Portfolio reflects the deduction of fees for these value-added services, but does not reflect the deduction of taxes that a shareholder would pay on the Portfolio’s distributions or redemptions of the Portfolio’s shares.
Expense Ratio
HC Strategic Shares 0.32%
HC Advisors Shares 0.57%
This information is included in the most current prospectus available to current and prospective shareholders of the Portfolio. Additional information pertaining to the June 30, 2015, expense ratios can be found in the financial highlights.
6
The Growth Equity Portfolio
The Institutional Growth Equity Portfolio
(Unaudited)
The Growth Equity Portfolio (the “Portfolio”) managed by Jennison Associates LLC, Mellon Capital Management Corporation, Sustainable Growth Advisers, LP and Parametric Portfolio Associates LLC, returned 11.27% for the fiscal year compared to 10.56% for the Russell 1000® Growth Index1 and 10.60% for the average manager in the Lipper2 universe of Large Cap Growth Funds.3
The Institutional Growth Equity Portfolio (the “Institutional Portfolio”) managed by Jennison Associates LLC, Mellon Capital Management Corporation, Sustainable Growth Advisers, LP and Parametric Portfolio Associates LLC returned 11.14% for the fiscal year compared to 10.56% for the Russell 1000® Growth Index1 and 10.60% for the average manager in the Lipper2 universe of Large Cap Growth Funds.3
The Portfolios outperformed their benchmark and peer group because of higher allocations to earnings momentum growth style strategies. Momentum growth managers favor companies with current or near-term superior earnings growth potential on both an absolute and relative basis, which are also reasonably priced. The resulting portfolio includes relatively large companies with dominant market positions and, frequently, multinational exposure. Over the period higher quality stocks posted weaker performance as investors bid up stocks with more cyclical or momentum characteristics. As valuations in domestic markets have risen, the Portfolios have been intentionally positioned more defensively.
Both Portfolios are diversified across multiple managers and strategies to ensure proper portfolio diversification, with the goal of providing superior long-term returns in as stable and consistent a manner as possible. As a result, it is expected that some managers and styles will be leading at times, while others are lagging and vice versa. The Portfolios expect to capitalize on this cyclicality of manager styles by reducing exposure to investment managers whose strategy and style realize extraordinary excess returns and allocating to good long-term managers whose investment strategy and style have been out of favor in the short-term. An example of this is the elimination of the previous allocation in the Institutional Portfolio to Pacific Investment Management Company, LLC during the period and the reallocation of those assets to Quality Growth style managers.
| 1 | The Russell 1000® Growth Index measures the performance of those companies included in the Russell 1000® Index with higher price-to-book ratios and higher forecasted growth rates. This index is unmanaged, thus the index results do not reflect the impact of expenses associated with any investment in securities, such as brokerage commission or other transaction costs. Benchmark performance is shown for comparison purposes only, as it is not possible to invest directly in a securities index. |
| 2 | Lipper, Inc. is an independent statistical monitoring organization that compiles performance on mutual funds and further categorizes them by investment objective. |
| 3 | During the fiscal year, Cadence Capital Management was also under contract to manage the Portfolios but did not have assets allocated to it. |
7
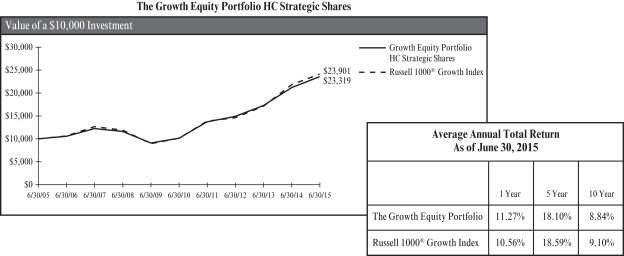
The chart represents historical performance of a hypothetical investment of $10,000 in The Growth Equity Portfolio for the 10-year period ended 6/30/15, and represents the reinvestment of dividends and capital gains in the Portfolio.
Past performance does not guarantee future results. The performance data quoted represents past performance and current returns may be lower or higher. The investment return and principal value will fluctuate so that an investor’s shares, when redeemed, may be worth more or less than the original cost. To obtain performance information current to the most recent month end, please call (800) 242-9596.
The Portfolio’s performance above is compared to the Russell 1000® Growth Index. The index is unmanaged and does not reflect the deduction of fees associated with a mutual fund, such as investment management and fund accounting fees, or the deduction of taxes. An investor cannot invest directly in an index. The performance of The Growth Equity Portfolio reflects the deduction of fees for these value-added services, but does not reflect the deduction of taxes that a shareholder would pay on the Portfolio’s distributions or redemptions of the Portfolio’s shares.
Expense Ratio
HC Strategic Shares 0.31%
HC Advisors Shares 0.56%
This information is included in the most current prospectus available to current and prospective shareholders of the Portfolio. Additional information pertaining to the June 30, 2015, expense ratios can be found in the financial highlights.
8
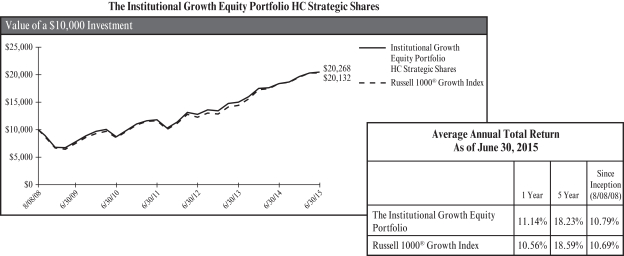
The chart represents historical performance of a hypothetical investment of $10,000 in The Institutional Growth Equity Portfolio from 8/8/08 to 6/30/15, and represents the reinvestment of dividends and capital gains in the Portfolio.
Past performance does not guarantee future results. The performance data quoted represents past performance and current returns may be lower or higher. The investment return and principal value will fluctuate so that an investor’s shares, when redeemed, may be worth more or less than the original cost. To obtain performance information current to the most recent month end, please call (800) 242-9596.
The Portfolio’s performance above is compared to the Russell 1000® Growth Index. The index is unmanaged and does not reflect the deduction of fees associated with a mutual fund, such as investment management and fund accounting fees, or the deduction of taxes. An investor cannot invest directly in an index. The performance of The Institutional Growth Equity Portfolio reflects the deduction of fees for these value-added services, but does not reflect the deduction of taxes that a shareholder would pay on the Portfolio’s distributions or redemptions of the Portfolio’s shares.
Expense Ratio
HC Strategic Shares 0.30%
HC Advisors Shares 0.55%
This information is included in the most current prospectus available to current and prospective shareholders of the Portfolio. Additional information pertaining to the June 30, 2015, expense ratios can be found in the financial highlights.
9
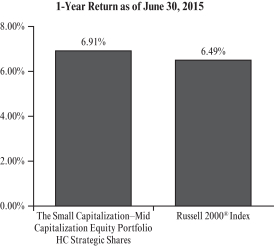
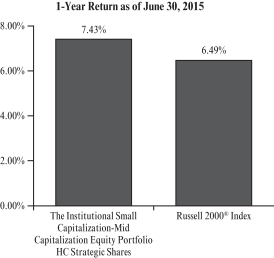
The Small Capitalization–Mid Capitalization Equity Portfolio
The Institutional Small Capitalization–Mid Capitalization Equity Portfolio
(Unaudited)
The Small Capitalization–Mid Capitalization Equity Portfolio (the “Portfolio”) managed by Ariel Investments, LLC, Frontier Capital Management Company, LLC, IronBridge Capital Management LP, Mellon Capital Management Corporation, Pzena Investment Management, LLC (“Pzena”), Cupps Capital Management, LLC and Parametric Portfolio Associates, LLC returned 6.91% for the period compared to 6.49% return for the Russell 2000® Index1 and 5.26% for the average manager in the Lipper2 universe of Small Cap Core Funds.3
The Portfolio outperformed its peer group and the benchmark for the period. The Portfolio benefited from allocations to (1) a Growth at a Reasonable Price or “GARP” style managed by Frontier and (2) a traditional value style particularly managed by Pzena (3) a core growth style managed by Ironbridge. Small capitalization equities performed well as investor confidence in the U.S. economy improved.
The Institutional Small Capitalization–Mid Capitalization Equity Portfolio (the “Institutional Portfolio”) managed by Cupps Capital Management, LLC, Frontier Capital Management Company, LLC, IronBridge Capital Management LP, Mellon Capital Management Corporation and Pzena Investment Management, LLC returned 7.43% for the period compared to a 6.49% return for the Russell 2000® Index1 and 5.26% for the average manager in the Lipper2 universe of Small Cap Core Funds.3
The Institutional Portfolio benefited from allocations to (1) a Growth at a Reasonable Price or “GARP” style managed by Frontier and (2) a traditional value style particularly managed by Pzena (3) a core growth style managed by Ironbridge. Small capitalization equities performed well as investor confidence in the U.S. economy improved. The performance difference between the Institutional Portfolio and the Portfolio was primarily driven by the inclusion of Ariels’s deep value style which HC Capital Solution (“the Adviser”) deemed inappropriate for tax-sensitive investors. Ariel uses the market’s short-term focus to uncover mispriced companies whose true value will be realized over time. Cupps Capital Management was added to the portfolio during the period.
Both Portfolios are diversified across multiple managers and strategies to ensure proper portfolio diversification, with the goal of providing superior long-term returns in as stable and consistent a manner as possible. As a result, it is expected that some managers and styles will be leading at times, while others are lagging and vice versa. The Portfolios expect to capitalize on this cyclicality of manager styles by reducing exposure to investment managers whose strategy and style realize extraordinary excess returns and allocating to good long-term managers whose investment strategy and style have been out of favor in the short-term.
| 1 | Russell 2000® Index measures the performance of smaller capitalization U.S. companies. The largest 1,000 stocks become the Russell 1000® Index and the next 2,000 stocks become the Russell 2000® Index. This index is unmanaged, thus the index results do not reflect the impact of expenses associated with any investment in securities, such as brokerage commission or other transaction costs. Benchmark performance is shown for comparison purposes only, as it is not possible to invest directly in a securities index. |
| 2 | Lipper, Inc. is an independent statistical monitoring organization that compiles performance on mutual funds and further categorizes them by investment objective. |
| 3 | During the fiscal year, Cadence Capital Management was also under contract to manage the Portfolios but did not have assets allocated to it. |
10
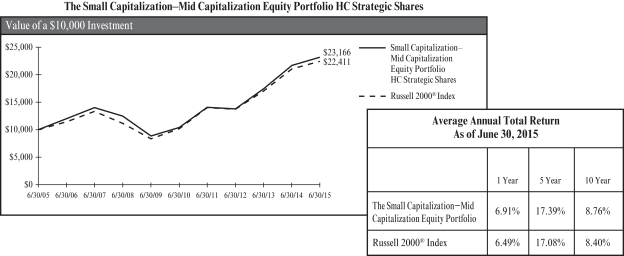
The chart represents historical performance of a hypothetical investment of $10,000 in The Small Capitalization–Mid Capitalization Equity Portfolio for the 10-year period ended 6/30/15, and represents the reinvestment of dividends and capital gains in the Portfolio.
Past performance does not guarantee future results. The performance data quoted represents past performance and current returns may be lower or higher. The investment return and principal value will fluctuate so that an investor’s shares, when redeemed, may be worth more or less than the original cost. To obtain performance information current to the most recent month end, please call (800) 242-9596.
The Portfolio’s performance above is compared to the Russell 2000® Index, which represents the performance of domestically traded common stocks of small to mid-sized companies. The index is unmanaged and does not reflect the deduction of fees associated with a mutual fund, such as investment management and fund accounting fees, or the deduction of taxes. An investor cannot invest directly in an index. The performance of The Small Capitalization–Mid Capitalization Equity Portfolio reflects the deduction of fees for these value-added services, but does not reflect the deduction of taxes that a shareholder would pay on the Portfolio’s distributions or redemptions of the Portfolio’s shares.
Expense Ratio
HC Strategic Shares 0.76%
HC Advisors Shares 1.01%
This information is included in the most current prospectus available to current and prospective shareholders of the Portfolio. Additional information pertaining to the June 30, 2015, expense ratios can be found in the financial highlights.
11
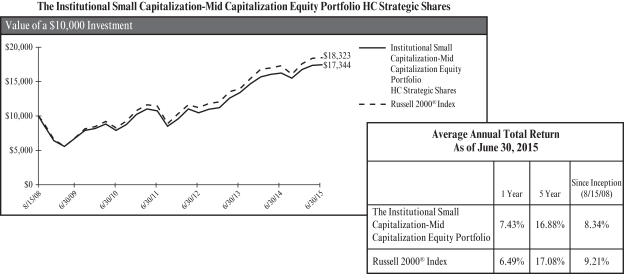
The chart represents historical performance of a hypothetical investment of $10,000 in The Institutional Small Capitalization–Mid Capitalization Equity Portfolio from 8/15/08 to 6/30/15, and represents the reinvestment of dividends and capital gains in the Portfolio.
Past performance does not guarantee future results. The performance data quoted represents past performance and current returns may be lower or higher. The investment return and principal value will fluctuate so that an investor’s shares, when redeemed, may be worth more or less than the original cost. To obtain performance information current to the most recent month end, please call (800) 242-9596.
The Portfolio’s performance above is compared to the Russell 2000® Index, which represents the performance of domestically traded common stocks of small to mid-sized companies. The index is unmanaged and does not reflect the deduction of fees associated with a mutual fund, such as investment management and fund accounting fees, or the deduction of taxes. An investor cannot invest directly in an index. The performance of The Institutional Small Capitalization–Mid Capitalization Equity Portfolio reflects the deduction of fees for these value-added services, but does not reflect the deduction of taxes that a shareholder would pay on the Portfolio’s distributions or redemptions of the Portfolio’s shares.
Expense Ratio
HC Strategic Shares 0.80%
HC Advisors Shares 1.05%
This information is included in the most current prospectus available to current and prospective shareholders of the Portfolio. Additional information pertaining to the June 30, 2015, expense ratios can be found in the financial highlights.
12
The Real Estate Securities Portfolio
(Unaudited)
The Real Estate Securities Portfolio (the “Portfolio”) was managed by Wellington Management Company LLP (“Wellington”) and Parametric Portfolio Associates LLC (“Parametric”) returned 7.44% for the year compared to 5.23% for the Dow-Jones U.S. Select Real Estate Securities Index1 and 4.34% for the average manager in the Lipper2 universe of Real Estate funds.3 The U.S. Real Estate Market benefitted from improving fundamentals in most sectors-declining vacancies, rent growth and constrained supply.
The Portfolio outperformed its peer group and the benchmark for the period. The Portfolio benefited from relative allocations to the warehouse, real estate technology and specialty finance sectors. The outperformance was also driven by strong security selection in healthcare, lodging and retail centers.
| 1 | The Dow-Jones U.S. Select Real Estate Securities Index is a broad measure of the performance of publicly traded global real estate securities, such as Real Estate Investment Trust (REITs) and Real Estate Operating Companies (REOCs). The index is capitalization-weighted. The global index is an expansion of the original U.S. index, developed in 1991. This index is unmanaged, thus the index results do not reflect the impact of expenses associated with any investment in securities, such as brokerage commission or other transaction costs. Benchmark performance is shown for comparison purposes only as it is not possible to invest directly in a securities index. |
| 2 | Lipper, Inc. is an independent statistical monitoring organization that compiles performance on mutual funds and further categorizes them by investment objective. |
| 3 | During the fiscal year, Mellon Capital Management Corporation and Cadence Capital Management were also under contract to manage the Portfolio but did not have assets allocated to them. |
13
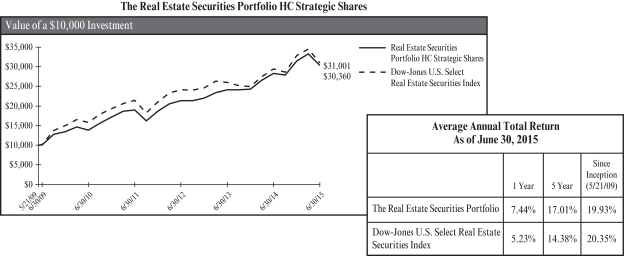
The chart represents historical performance of a hypothetical investment of $10,000 in The Real Estate Securities Portfolio from 5/21/09 to 6/30/15, and represents the reinvestment of dividends and capital gains in the Portfolio. The Real Estate Securities Portfolio was redeemed in full on June 30, 2013 and recommenced operations on September 12, 2013.
Past performance does not guarantee future results. The performance data quoted represents past performance and current returns may be lower or higher. The investment return and principal value will fluctuate so that an investor’s shares, when redeemed, may be worth more or less than the original cost. To obtain performance information current to the most recent month end, please call (800) 242-9596.
The Portfolio’s performance above is compared to the Dow-Jones U.S. Select Real Estate Securities Index. The index is unmanaged and does not reflect the deduction of fees associated with a mutual fund, such as investment management and fund accounting fees, or the deduction of taxes. An investor cannot invest directly in an index. The performance of The Real Estate Securities Portfolio reflects the deduction of fees for these value-added services, but does not reflect the deduction of taxes that a shareholder would pay on the Portfolio’s distributions or redemptions of the Portfolio’s shares.
Expense Ratio
HC Strategic Shares 0.78%
This information is included in the most current prospectus available to current and prospective shareholders of the Portfolio. Additional information pertaining to the June 30, 2015, expense ratios can be found in the financial highlights.
14
The Commodity Returns Strategy Portfolio
(Unaudited)
The Commodity Returns Strategy Portfolio (the “Portfolio”) managed by Wellington Management Company, LLP, Pacific Investment Management Company, LLC, Mellon Capital Management Corporation and Parametric Portfolio Associates LLC returned -22.91% for the year compared to -21.33% for the HC Commodities Benchmark1, -23.71% for the Bloomberg Commodity Index2 and -24.95% for the average manager in the Lipper3 universe of Natural Resources Funds.4
The portfolio slightly underperformed the HC Commodities Benchmark but outperformed both the Bloomberg Commodity Index and the peer group. The modest underperformance was primarily due to the fund’s overweight in commodity-linked equities, which typically exhibit slightly higher sensitivity to the commodity spot markets that sold off during the latter half of 2014. We continue to hold more commodity-linked equities than futures in the fund to capture better risk/return characteristics and high cash flow yields.
The managers of the futures strategies use derivatives – including futures, options, forwards, and swaps – to gain exposure to the underlying physical commodities. The returns generated by those strategies are predominantly a function of the change in the value of the derivatives held. To a lesser extent, the performance of the strategies reflects the change in the value of investments – primarily short dated fixed income – required to collateralize the derivative strategies.
The Portfolio is diversified across multiple managers and strategies, with the goal of providing superior long-term returns in as stable and consistent a manner as possible. As a result, it is expected that some managers and styles will be leading at times, while others are lagging and vice versa. Over the period the Portfolio outperformed the Bloomberg Commodity Index, driven primarily by an over-weight to commodities equities rather than futures.
| 1 | The HC Commodities Benchmark is composed of 50% of the Bloomberg Commodity Index2 and 50% of the MSCI ACWI Commodity Producers Index.5 |
| 2 | The Bloomberg Commodity Index is a broadly diversified index that allows investors to track commodity futures through a single, simple measure. The index is designed to minimize concentration in one commodity or sector. It currently includes 19 commodity futures in five groups. No one commodity can comprise less than 2% or more than 15% of the index, and no group can represent more than 33% of the index (as of the annual re-weightings of the components). This index is unmanaged, thus the index results do not reflect the impact of expenses associated with any investment in securities, such as brokerage commission or other transaction costs. Benchmark performance is shown for comparison purposes only, as it is not possible to invest directly in a securities index. |
| 3 | Lipper, Inc. is an independent statistical monitoring organization that compiles performance on mutual funds and further categorizes them by investment objective. |
| 4 | During the fiscal year, Cadence Capital Management was also under contract to the Portfolio but did not have any assets allocated to it. |
| 5 | The MSCI Commodity Producers Index captures the global opportunity set of commodity producers in the energy, metal and agricultural sectors. Constituents are selected from the equity universe of MSCI, the parent index, which covers mid and large cap securities across 24 Developed Markets (DM) and 21 Emerging Markets (EM) countries. All index constituents are categorized in one of twelve sub industries according to the Global Industry Classification Standard (GICS), including: integrated oil & gas, oil & gas exploration & production, gold, steel, aluminum, precious metals & minerals, agricultural products, paper products, and forest products. This index is unmanaged, thus the index results do not reflect the impact of expenses associated with any investment in securities, such as brokerage commission or other transaction costs. Benchmark performance is shown for comparison purposes only, as it is not possible to invest directly in a securities index. |
15
The Commodity Returns Strategy Portfolio HC Strategic Shares
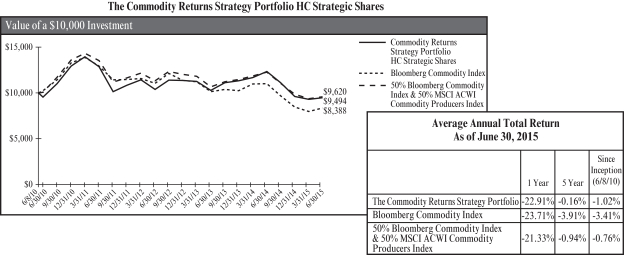
The chart represents historical performance of a hypothetical investment of $10,000 in The Commodity Returns Strategy Portfolio from 6/8/10 to 6/30/15, and represents the reinvestment of dividends and capital gains in the Portfolio.
Past performance does not guarantee future results. The performance data quoted represents past performance and current returns may be lower or higher. The investment return and principal value will fluctuate so that an investor’s shares, when redeemed, may be worth more or less than the original cost. To obtain performance information current to the most recent month end, please call (800) 242-9596.
The Portfolio’s performance above is compared to the Bloomberg Commodity Index and the 50% Bloomberg Commodity Index & 50% MSCI ACWI Commodity Producers Index. The Dow-Jones UBS Commodity Index is unmanaged and does not reflect the deduction of fees associated with a mutual fund, such as investment management and fund accounting fees, or the deduction of taxes. The MSCI ACWI Commodity Producers Index is unmanaged, thus the index results do not reflect the impact of expenses associated with any investment in securities, such as brokerage commission or other transaction costs. An investor cannot invest directly in an index. The performance of The Commodity Returns Strategy Portfolio reflects the deduction of fees for these value-added services, but does not reflect the deduction of taxes that a shareholder would pay on the Portfolio’s distributions or redemptions of the Portfolio’s shares.
Expense Ratio
HC Strategic Shares 0.60%
HC Advisors Shares 0.85%
This information is included in the most current prospectus available to current and prospective shareholders of the Portfolio. Additional information pertaining to the June 30, 2015, expense ratios can be found in the financial highlights.
16
The International Equity Portfolio
The Institutional International Equity Portfolio
(Unaudited)
The International Equity Portfolio (the “Portfolio”) managed by Artisan Partners Limited Partnership, Capital Guardian Trust Company, Causeway Capital Management LLC, Cadence Capital Management, LLC, Mellon Capital Management Corporation and Parametric Portfolio Associates, LLC returned -4.50% for the period compared to -3.82% for the MSCI EAFE Index1 and -3.53% for the average manager in the Lipper2 universe of International Large-Cap Core Funds.3
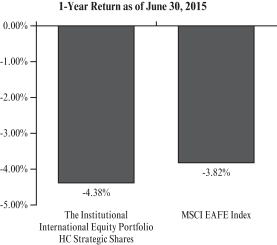
The Institutional International Equity Portfolio (the “Institutional Portfolio”) managed by Artisan Partners Limited Partnership, Capital Guardian Trust Company, Causeway Capital Management LLC, Lazard Asset Management LLC and Cadence Capital Management, LLC and Mellon Capital Management Corporation returned -4.38% for the fiscal year compared to -3.82% for the MSCI EAFE Index1 and -3.53% for the average manager in the Lipper2 universe of International Large-Cap Core Funds.3
The strength of the U.S. Dollar was a headwind for the performance of the benchmark and the Portfolios. In local currency terms, the MSCI EAFE benchmark returned 11.73% for the period versus -4.21% in U.S. Dollar terms.
In February 2015, the Portfolios were shifted slightly to emphasize the value-oriented strategies managed by Cadence Capital and Causeway Capital, and de-emphasize the better-performing growth strategies. The shift was intended to focus on companies that have strong balance sheets, good value characteristics, and high relative dividend yields. This orientation was mildly discounted by the marketplace during the second half of the fiscal year and it, along with a relatively small exposure to Emerging Markets, drove the Portfolio’s modest underperformance.
Both Portfolios are diversified across multiple managers and strategies to ensure proper portfolio diversification, with the goal of providing superior long-term returns in as stable and consistent a manner as possible. As a result, it is expected that some managers and styles will be leading at times, while others are lagging and vice versa. The Portfolios expect to capitalize on this cyclicality of manager styles by reducing exposure to investment managers whose strategy and style realize extraordinary excess returns and allocating to good long-term managers whose investment strategy and style have been out of favor in the short-term.
| 1 | The Morgan Stanley Capital International Europe, Australasia, and Far East Index (“MSCI EAFE Index”), which covers Europe, Australia, and the Far East, is an unmanaged, market value weighted index designed to measure the overall condition of developed overseas equities markets. This index is unmanaged, thus the index results do not reflect the impact of expenses associated with any investment in securities, such as brokerage commission or other transaction costs. Benchmark performance is shown for comparison purposes only, as it is not possible to invest directly in a securities index. |
| 2 | Lipper, Inc. is an independent statistical monitoring organization that compiles performance on mutual funds and further categorizes them by investment objective. |
| 3 | During the fiscal year, City of London Investment Management Company Ltd was also under contract to manage the Portfolios but did not have assets allocated to them. |
17

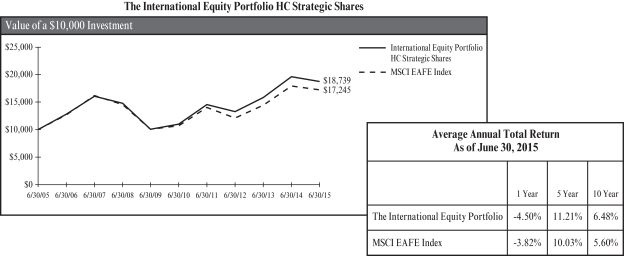
The chart represents historical performance of a hypothetical investment of $10,000 in The International Equity Portfolio for the 10-year period ended 6/30/15, and represents the reinvestment of dividends and capital gains in the Portfolio.
Past performance does not guarantee future results. The performance data quoted represents past performance and current returns may be lower or higher. The investment return and principal value will fluctuate so that an investor’s shares, when redeemed, may be worth more or less than the original cost. To obtain performance information current to the most recent month end, please call (800) 242-9596.
The Portfolio’s performance above is compared to the MSCI EAFE Index, which represents the performance of the major stock markets in those regions. The index is unmanaged and does not reflect the deduction of fees associated with a mutual fund, such as investment management and fund accounting fees, or the deduction of taxes. An investor cannot invest directly in an index. The performance of The International Equity Portfolio reflects the deduction of fees for these value-added services, but does not reflect the deduction of taxes that a shareholder would pay on the Portfolio’s distributions or redemptions of the Portfolio’s shares.
Expense Ratio
HC Strategic Shares 0.41%
HC Advisors Shares 0.66%
This information is included in the most current prospectus available to current and prospective shareholders of the Portfolio. Additional information pertaining to the June 30, 2015, expense ratios can be found in the financial highlights.
18
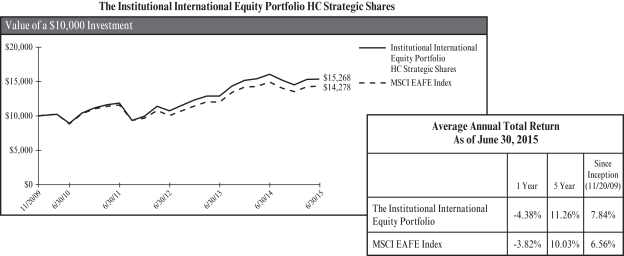
The chart represents historical performance of a hypothetical investment of $10,000 in The Institutional International Equity Portfolio from 11/20/09 to 6/30/15, and represents the reinvestment of dividends and capital gains in the Portfolio.
Past performance does not guarantee future results. The performance data quoted represents past performance and current returns may be lower or higher. The investment return and principal value will fluctuate so that an investor’s shares, when redeemed, may be worth more or less than the original cost. To obtain performance information current to the most recent month end, please call (800) 242-9596.
The Portfolio’s performance above is compared to the MSCI EAFE Index, which represents the performance of the major stock markets in those regions. The index is unmanaged and does not reflect the deduction of fees associated with a mutual fund, such as investment management and fund accounting fees, or the deduction of taxes. An investor cannot invest directly in an index. The performance of The Institutional International Equity Portfolio reflects the deduction of fees for these value-added services, but does not reflect the deduction of taxes that a shareholder would pay on the Portfolio’s distributions or redemptions of the Portfolio’s shares.
Expense Ratio
HC Strategic Shares 0.38%
HC Advisors Shares 0.63%
This information is included in the most current prospectus available to current and prospective shareholders of the Portfolio. Additional information pertaining to the June 30, 2015, expense ratios can be found in the financial highlights.
19
The Emerging Markets Portfolio
(Unaudited)
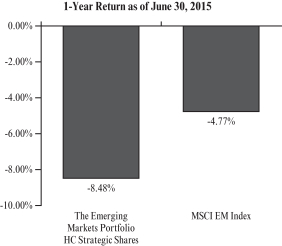
The Emerging Markets Portfolio (the “Portfolio”) managed by Mellon Capital Management Corporation, Boston Company Asset Management, LLC and Parametric Portfolio Associates, LLC returned -8.48% compared to -4.77% for the MSCI EM Index1 and -6.80% for the average manager in the Lipper2 universe of Emerging Markets Funds.3
For the period, the Portfolio underperformed the benchmark and the average manager in the industry universe. The underperformance is primarily due to the Portfolio’s value bias. Over this period traditional valuation metrics like low price/book and low price/cash flow were ineffective, and the Portfolio’s high exposure to those types of companies drove underperformance. During the fiscal year, strong-performing companies in the Emerging Markets were characterized by high growth and momentum, two factors to which the fund is relatively under-exposed.
The Emerging Markets have exhibited a good deal of dispersion of late. High growth industries such as biotechnology and internet/software services have been the drivers of performance and have reached lofty valuations. On the other hand, energy, industrials, and utilities flagged and are priced quite cheaply. Throughout the fiscal year, the Fund maintained its allocation to the better-valued companies with higher prospective returns, and remains well-positioned to capture the rewards of a valuation-driven rally.
The Portfolio provides broad access to international emerging markets equity. The Portfolio is managed with multiple managers to provide diversification of manager style as well as diversification of firm specific risks. Mellon Capital Management Corporation employs a quantitatively driven investment process that seeks to identify companies paying high dividends relative to the benchmark while maintaining quality balance sheets. The portfolio diversifies amongst a large number of names and across geographies and sectors to capture its specified factor. Boston Company Asset Management, LLC employs a fundamentally driven investment process to identify attractive value companies within the international emerging markets equity universe and then constructs a diversified portfolio of those companies in accordance with industry and individual company allocation guidelines.
| 1 | The Morgan Stanley Capital International Emerging Markets Index (“MSCI EM Index”) is a free float-adjusted market capitalization index that is designed to measure equity market performance in the global emerging markets. As of June 30, 2015 the MSCI EM Index consisted of the following 21 emerging market country indices: Brazil, Chile, China, Colombia, Czech Republic, Egypt, Hungary, India, Indonesia, Korea, Malaysia, Mexico, Morocco, Peru, Philippines, Poland, Russia, South Africa, Taiwan, Thailand and Turkey. This index is unmanaged, thus the index results do not reflect the impact of expenses associated with any investment in securities, such as brokerage commission or other transaction costs. Benchmark performance is shown for comparison purposes only as it is not possible to invest directly in a securities index. |
| 2 | Lipper, Inc. is an independent statistical monitoring organization that compiles performance on mutual funds and further categorizes them by investment objective. |
| 3 | During the fiscal year, City of London Investment Management Company Ltd and Cadence Capital Management were also under contract to manage the Portfolio but did not have assets allocated to them. |
20
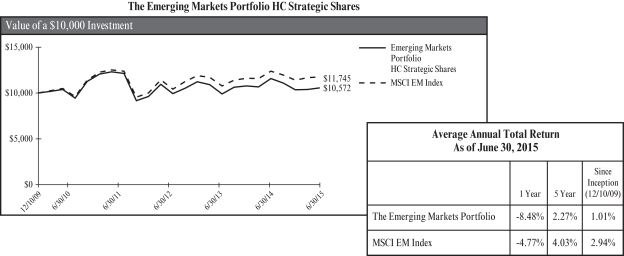
The chart represents historical performance of a hypothetical investment of $10,000 in The Emerging Markets Portfolio from 12/10/09 to 6/30/15, and represents the reinvestment of dividends and capital gains in the Portfolio.
Past performance does not guarantee future results. The performance data quoted represents past performance and current returns may be lower or higher. The investment return and principal value will fluctuate so that an investor’s shares, when redeemed, may be worth more or less than the original cost. To obtain performance information current to the most recent month end, please call (800) 242-9596.
The Portfolio’s performance above is compared to the MSCI EM Index, which represents the performance of the major stock markets in those regions. The index is unmanaged and does not reflect the deduction of fees associated with a mutual fund, such as investment management and fund accounting fees, or the deduction of taxes. An investor cannot invest directly in an index. The performance of The Emerging Markets Portfolio reflects the deduction of fees for these value-added services, but does not reflect the deduction of taxes that a shareholder would pay on the Portfolio’s distributions or redemptions of the Portfolio’s shares.
Expense Ratio
HC Strategic Shares 0.62%
HC Advisors Shares 0.87%
This information is included in the most current prospectus available to current and prospective shareholders of the Portfolio. Additional information pertaining to the June 30, 2015, expense ratios can be found in the financial highlights.
21
The Core Fixed Income Portfolio
(Unaudited)
The Core Fixed Income Portfolio (the “Portfolio”) managed by Mellon Capital Management Corporation (“Mellon”) and Agincourt Capital Management, LLC returned 1.16% for the fiscal year compared to 1.85% for the Barclays Capital U.S. Aggregate Bond Index1 (“BarCap”) and 1.11% for the average fixed income manager in the Lipper2 universe of Core Bond Funds.
Within the U.S. Fixed Income markets, longer-duration fixed income indices tended to outperform shorter duration indices as the curve flattened during the first half of the fiscal year. The major U.S. indices representing government, securitized and corporate securities generated positive returns. Fixed income returns were meager during the second half of the fiscal year as investors tried to determine when the Federal Reserve may start to raise rates. The short-end of the curve remained relatively unchanged while the long-end moved higher in May and June contributing to losses. Lower-quality credits delivered positive results as investors continued to reach for yield. The BarCap Index, a broad measure of the U.S. bond market, gained 1.85% for the fiscal year end.
The Portfolio is allocated across the three major sectors of the BarCap Index: governments, credit, and asset backed securities. The government and asset backed sectors are passively managed to provide performance in-line with their respective benchmarks. Actual results may vary marginally from the underlying benchmarks because of cash flows and because for practical purposes, the portfolios hold a representative group of the securities in the benchmarks and do not seek to fully replicate all of the individual holdings. The credit portfolio has a bit more flexibility to vary from the index by avoiding credits that the manager feels have adverse price risk. The allocations across the three sectors will vary over time based upon the relative attractiveness of the sectors. In general, the portfolio maintains aggregate characteristics – duration, weighted average yield-to-maturity, and average credit quality comparable to the benchmark.
During the second half of the fiscal year we terminated Seix Investment Advisors LLC. Agincourt Capital Management, LLC assumed investment management responsibilities of those assets. Agincourt’s investment process yields a higher quality portfolio at a more favorable fee rate, relative to Seix.
For the fiscal year the corporate strategy negatively contributed to overall portfolio performance relative to the benchmark. Prior to termination in March of 2015, Seix’s underperformance relative to their benchmark was primarily due to sector selection. Over weights in Metals & Mining, Oil Field Services and an underweight to Integrated Energy sectors negatively impacted performance. Since it assumed management responsibility for the corporate strategy, Agincourt has performed in line with the Portfolio’s benchmark.
| 1 | The Barclays Capital U.S. Aggregate Bond Index includes more than 8,000 taxable government, investment-grade corporate and mortgage backed securities. This index is unmanaged, thus the index results do not reflect the impact of expenses associated with any investment in securities, such as brokerage commission or other transaction costs. Benchmark performance is shown for comparison purposes only, as it is not possible to invest directly in a securities index. |
| 2 | Lipper, Inc. is an independent statistical monitoring organization that compiles performance on mutual funds and further categorizes them by investment objective. |
22
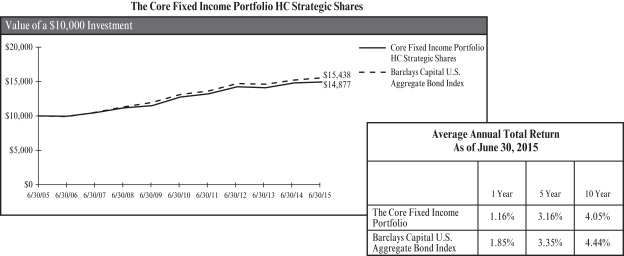
The chart represents historical performance of a hypothetical investment of $10,000 in The Core Fixed Income Portfolio for the 10-year period ended 6/30/15, and represents the reinvestment of dividends and capital gains in the Portfolio.
Past performance does not guarantee future results. The performance data quoted represents past performance and current returns may be lower or higher. The investment return and principal value will fluctuate so that an investor’s shares, when redeemed, may be worth more or less than the original cost. To obtain performance information current to the most recent month end, please call (800) 242-9596.
The Portfolio’s performance above is compared to the Barclays Capital U.S. Aggregate Bond Index. The index is unmanaged and does not reflect the deduction of fees associated with a mutual fund, such as investment management and fund accounting fees, or the deduction of taxes. An investor cannot invest directly in an index. The performance of The Core Fixed Income Portfolio reflects the deduction of fees for these value-added services, but does not reflect the deduction of taxes that a shareholder would pay on the Portfolio’s distributions or redemptions of the Portfolio’s shares.
Expense Ratio
HC Strategic Shares 0.23%
HC Advisors Shares 0.48%
This information is included in the most current prospectus available to current and prospective shareholders of the Portfolio. Additional information pertaining to the June 30, 2015, expense ratios can be found in the financial highlights.
23
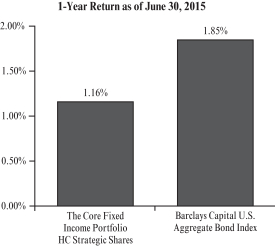
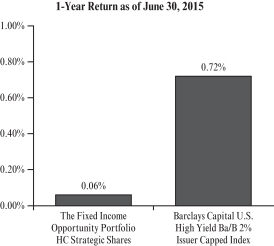
The Fixed Income Opportunity Portfolio
(Unaudited)
For the fiscal year, the Fixed Income Opportunity Portfolio (the “Portfolio”), managed by Fort Washington Investment Advisors, Inc., Western Management Company, City of London Investment Management Company Ltd. and Parametric Portfolio Associates, LLC had a return of 0.06% compared to 0.72% for the Barclays Capital U.S. High Yield Ba/B 2% Issuer Capped Index1 and -1.29% for the average manager in the Lipper2 High Current Yield Fund universe.
The Portfolio is designed to provide investors with higher returns over time than traditional fixed income investments primarily through investment in a diversified portfolio of high yield bonds. The Portfolio may also opportunistically invest in international bonds, convertible bonds, preferred stocks, treasury inflation bonds, loan participations and fixed and floating rate loans.
Within the U.S. Fixed Income markets, longer-duration fixed income indices tended to outperform shorter duration indices as the curve flattened during the first half of the fiscal year. The major U.S. indices representing government, securitized and corporate securities generated positive returns. The sharp drop in oil prices was a notable contributor to the sell-off in high yield market indices, where nearly 15% of the high yield market is comprised of Energy issues. During the second half of the fiscal year fixed income returns were meager as investors tried to determine when the Federal Reserve may start to raise rates. The short-end of the curve remained relatively unchanged while the long-end moved higher in May and June contributing to losses. Lower-quality credits delivered positive results as investors continued to reach for yield. As a result, high yield markets managed to post positive results for fiscal year end.
During the first half of the fiscal year we opportunistically added two strategies to the portfolio. Western Asset Management Company’s opportunistic mortgage strategy seeks to add incremental value by exploiting inefficiencies across the structured product market. City of London’s strategy seeks to provide a high-level of current income by investing in high-yield fixed income securities via closed-end funds at a discount to published net asset value.
During the fiscal year ended June 30, 2015, The Fort Washington Investment Advisors high yield strategy underperformed its benchmark. The strategy largely underperformed due to negative attribution from sector allocation, primarily due to an overweight to Energy. The sharp drop in the price of crude oil caused significant spread widening in Energy. The overweight allocation to Energy detracted from returns with the price of oil falling from $105/barrel to $60/barrel.
City of London’s exposure contributed negatively to overall Portfolio performance for the fiscal year. The strategy gave back initial gains as closed-end fund discounts in the taxable bond space widened sharply in the last six weeks of the fiscal year end.
Western Asset’s opportunistic mortgage strategy performed in line with their stated benchmark. Exposure over the fiscal year was neither a contributor nor a detractor to overall portfolio performance.
| 1 | The Barclays Capital U.S. High Yield Ba/B 2% Issuer Capped Index is a market capitalization-weighted index that measures fixed rate non-investment grade debt securities of U.S. and non-U.S. corporations. No single issuer accounts for more than 2% of market cap. The index is calculated on a total return basis. This index is unmanaged, thus the index results do not reflect the impact of expenses associated with any investment in securities, such as brokerage commission or other transaction costs. Benchmark performance is shown for comparison purposes only, as it is not possible to invest directly in a securities index. |
| 2 | Lipper, Inc. is an independent statistical monitoring organization that compiles performance on mutual funds and further categorizes them by investment objective. |
24
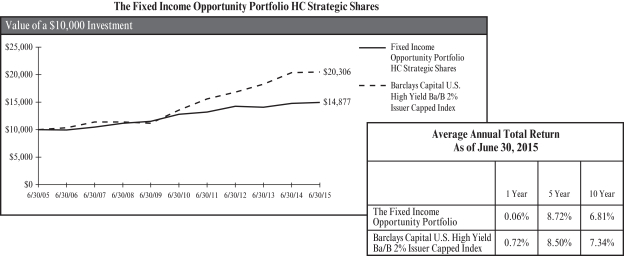
The chart represents historical performance of a hypothetical investment of $10,000 in The Fixed Income Opportunity Portfolio for the 10-year period ended 6/30/15, and represents the reinvestment of dividends and capital gains in the Portfolio.
Past performance does not guarantee future results. The performance data quoted represents past performance and current returns may be lower or higher. The investment return and principal value will fluctuate so that an investor’s shares, when redeemed, may be worth more or less than the original cost. To obtain performance information current to the most recent month end, please call (800) 242-9596.
The Portfolio’s performance above is compared to the Barclays Capital U.S. High Yield Ba/B 2% Issuer Capped Index. The index is unmanaged and does not reflect the deduction of fees associated with a mutual fund, such as investment management and fund accounting fees, or the deduction of taxes. An investor cannot invest directly in an index. The performance of The Fixed Income Opportunity Portfolio reflects the deduction of fees for these value-added services, but does not reflect the deduction of taxes that a shareholder would pay on the Portfolio’s distributions or redemptions of the Portfolio’s shares.
Expense Ratio
HC Strategic Shares 0.37%
HC Advisors Shares 0.62%
This information is included in the most current prospectus available to current and prospective shareholders of the Portfolio. Additional information pertaining to the June 30, 2015, expense ratios can be found in the financial highlights.
25
The U.S. Government Fixed Income Securities Portfolio
(Unaudited)
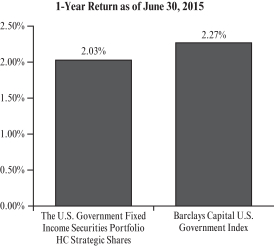
The U.S. Government Fixed Income Securities Portfolio (the “Portfolio”) managed by Mellon Capital Management Corporation returned 2.03% compared to 2.27% for the Barclays Capital U.S. Government Bond Index1 and 1.45% for the average fixed income manager in the Lipper2 universe of General U.S. Government Funds.
Within the U.S. Fixed Income markets, longer-duration fixed income indices tended to outperform shorter duration indices as the curve flattened during the first half of the fiscal year. The major U.S. indices representing government, securitized and corporate securities generated positive returns. Fixed income returns were meager during the second half of the fiscal year as investors tried to determine when the Federal Reserve may start to raise rates. The short-end of the curve remained relatively unchanged while the long-end moved higher in May and June contributing to losses. Lower-quality credits delivered positive results as investors continued to reach for yield. The BarCap Index, a broad measure of the U.S. bond market, gained 1.85% for the fiscal year end.
The Portfolio is structured to perform similarly to the benchmark. As such it uses a sampling methodology to select a subset of the index universe that maintains aggregate characteristics – duration, weighted average yield-to-maturity, and average credit quality in line with the benchmark. Since the Portfolio owns a subset of securities of the Index, there will necessarily be some tracking error.
| 1 | The Barclays Capital U.S. Government Bond Index is a broad-based unmanaged index that represents the general performance of U.S. Treasury and U.S. Government Agency debt securities. |
| 2 | Lipper, Inc. is an independent statistical monitoring organization that compiles performance on mutual funds and further categorizes them by investment objective. |
26
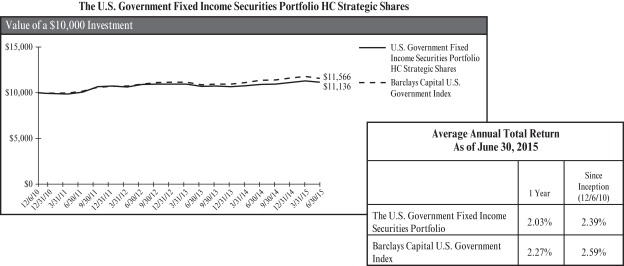
The chart represents historical performance of a hypothetical investment of $10,000 in The U.S. Government Fixed Income Securities Portfolio from 12/6/10 to 6/30/15, and represents the reinvestment of dividends and capital gains in the Portfolio.
Past performance does not guarantee future results. The performance data quoted represents past performance and current returns may be lower or higher. The investment return and principal value will fluctuate so that an investor’s shares, when redeemed, may be worth more or less than the original cost. To obtain performance information current to the most recent month end, please call (800) 242-9596.
The Portfolio’s performance above is compared to the Barclays Capital U.S. Government Index. The index is unmanaged and does not reflect the deduction of fees associated with a mutual fund, such as investment management and fund accounting fees, or the deduction of taxes. An investor cannot invest directly in an index. The performance of The U.S. Government Fixed Income Securities Portfolio reflects the deduction of fees for these value-added services, but does not reflect the deduction of taxes that a shareholder would pay on the Portfolio’s distributions or redemptions of the Portfolio’s shares.
Expense Ratio
HC Strategic Shares 0.18%
This information is included in the most current prospectus available to current and prospective shareholders of the Portfolio. Additional information pertaining to the June 30, 2015, expense ratios can be found in the financial highlights.
27
The Inflation Protected Securities Portfolio
(Unaudited)
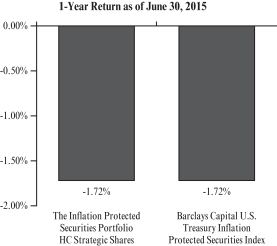
The Inflation Protected Securities Portfolio (the “Portfolio”) managed by Mellon Capital Management Corporation returned -1.72% compared to -1.72% for the Barclays Capital U.S. Treasury Inflation Protected Securities Index1 and -2.92% for the average fixed income manager in the Lipper2 universe of Inflation Protected Bond Funds.
Within the U.S. Fixed Income markets, longer-duration fixed income indices tended to outperform shorter duration indices as the curve flattened during the first half of the fiscal year. The major U.S. indices representing government, securitized and corporate securities generated positive returns. Fixed income returns were meager during the second half of the fiscal year as investors tried to determine when the Federal Reserve may start to raise rates. The short-end of the curve remained relatively unchanged while the long-end moved higher in May and June contributing to losses. Lower-quality credits delivered positive results as investors continued to reach for yield. The BarCap Index, a broad measure of the U.S. bond market, gained 1.85% for the fiscal year end.
The Portfolio is currently structured to perform similarly to the benchmark. As such it utilizes a full replication approach to duplicate the fundamental characteristics and performance of the Barclays Capital U.S. Treasury Inflation Protected Securities Index.
| 1 | The Barclays Capital U.S. Treasury Inflation Protected Securities Index is an unmanaged index generally consisting of all inflation-protection securities issued by the U.S. Treasury. |
| 2 | Lipper, Inc. is an independent statistical monitoring organization that compiles performance on mutual funds and further categorizes them by investment objective. |
28
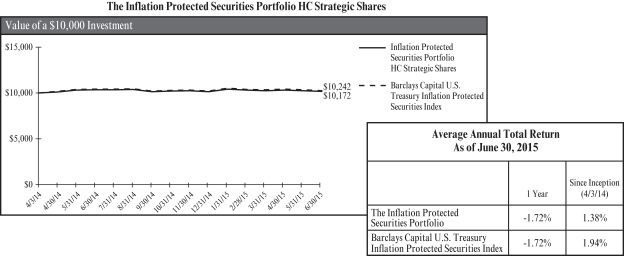
The chart represents historical performance of a hypothetical investment of $10,000 in The U.S. Inflation Protected Securities Portfolio from 4/3/14 to 6/30/15, and represents the reinvestment of dividends and capital gains in the Portfolio.
Past performance does not guarantee future results. The performance data quoted represents past performance and current returns may be lower or higher. The investment return and principal value will fluctuate so that an investor’s shares, when redeemed, may be worth more or less than the original cost. To obtain performance information current to the most recent month end, please call (800) 242-9596.
The Portfolio’s performance above is compared to the Barclays Capital U.S. Treasury Inflation Protected Securities Index. The index is unmanaged and does not reflect the deduction of fees associated with a mutual fund, such as investment management and fund accounting fees, or the deduction of taxes. An investor cannot invest directly in an index. The performance of The Inflation Protected Securities Portfolio reflects the deduction of fees for these value-added services, but does not reflect the deduction of taxes that a shareholder would pay on the Portfolio’s distributions or redemptions of the Portfolio’s shares.
Expense Ratio
HC Strategic Shares 0.16%
HC Advisor Shares 0.41%
This information is included in the most current prospectus available to current and prospective shareholders of the Portfolio. Additional information pertaining to the June 30, 2015, expense ratios can be found in the financial highlights.
29
The U.S. Corporate Fixed Income Securities Portfolio
(Unaudited)
The U.S. Corporate Fixed Income Securities Portfolio (the “Portfolio”) managed by Agincourt Capital Management, LLC returned -0.01% compared to 0.75% for the Barclays Capital U.S. Corporate Index1 and 0.54% for the average fixed income manager in the Lipper2 universe of Corporate Debt Funds BBB-Rated Funds.3
During the second half of the fiscal year we terminated Seix Investment Advisors LLC. Agincourt Capital Management, LLC assumed investment management responsibilities of those assets. Agincourt’s investment process yields a higher quality portfolio at a more favorable fee rate, relative to Seix.
Within the U.S. Fixed Income markets, longer-duration fixed income indices tended to outperform shorter duration indices as the curve flattened during the first half of the fiscal year. The major U.S. indices representing government, securitized and corporate securities generated positive returns. Fixed income returns were meager during the second half of the fiscal year as investors tried to determine when the Federal Reserve may start to raise rates. The short-end of the curve remained relatively unchanged while the long-end moved higher in May and June contributing to losses. Lower-quality credits delivered positive results as investors continued to reach for yield. The BarCap Index, a broad measure of the U.S. bond market, gained 1.85% for the fiscal year end.
For the fiscal year the corporate strategy underperformed their benchmark. Prior to termination in March of 2015, Seix’s underperformance relative to their benchmark was primarily due to sector selection. Over weights in Metals & Mining, Oil Field Services and an underweight to Integrated Energy sectors negatively impacted performance. Since Agincourt assumed management responsibility for the corporate strategy they have performed in line with their benchmark.
| 1 | The Barclays Capital U.S. Corporate Index covers USD denominated, investment-grade, fixed-rate, taxable securities sold by industrial, utility and financial issuers. It includes publicly issued U.S. corporate and foreign debentures and secured notes that meet specified maturity, liquidity and quality requirements. Securities in the index roll up to the U.S. Credit and U.S. Aggregate indices. |
| 2 | Lipper, Inc. is an independent statistical monitoring organization that compiles performance on mutual funds and further categorizes them by investment objective. |
| 3 | During the fiscal year, there were other Specialist Managers that were under contract to the Portfolio but did not have any assets allocated to them. |
30
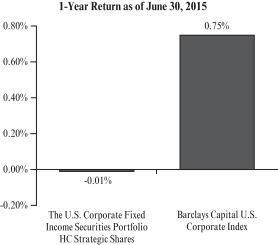
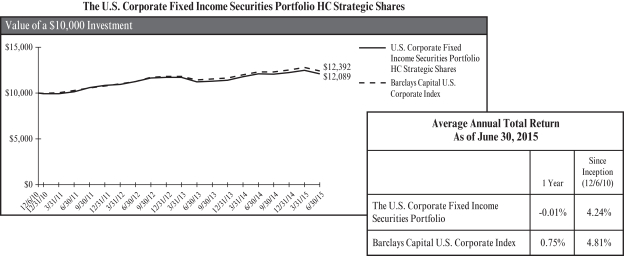
The chart represents historical performance of a hypothetical investment of $10,000 in The U.S. Corporate Fixed Income Securities Portfolio from 12/6/10 to 6/30/15, and represents the reinvestment of dividends and capital gains in the Portfolio.
Past performance does not guarantee future results. The performance data quoted represents past performance and current returns may be lower or higher. The investment return and principal value will fluctuate so that an investor’s shares, when redeemed, may be worth more or less than the original cost. To obtain performance information current to the most recent month end, please call (800) 242-9596.
The Portfolio’s performance above is compared to the Barclays Capital U.S. Corporate Index. The index is unmanaged and does not reflect the deduction of fees associated with a mutual fund, such as investment management and fund accounting fees, or the deduction of taxes. An investor cannot invest directly in an index. The performance of The U.S. Corporate Fixed Income Securities Portfolio reflects the deduction of fees for these value-added services, but does not reflect the deduction of taxes that a shareholder would pay on the Portfolio’s distributions or redemptions of the Portfolio’s shares.
Expense Ratio
HC Strategic Shares 0.22%
This information is included in the most current prospectus available to current and prospective shareholders of the Portfolio. Additional information pertaining to the June 30, 2015, expense ratios can be found in the financial highlights.
31
The U.S. Mortgage/Asset Backed Fixed Income Securities Portfolio
(Unaudited)
The U.S. Mortgage/Asset Backed Fixed Income Securities Portfolio (the “Portfolio”) managed by Mellon Capital Management Corporation returned 1.97% compared to 2.25% or the Barclays Capital U.S. Securitized Index1 and 2.27% for the average fixed income manager in the Lipper2 universe of U.S. Mortgage Funds.
Within the U.S. Fixed Income markets, longer-duration fixed income indices tended to outperform shorter duration indices as the curve flattened during the first half of the fiscal year. The major U.S. indices representing government, securitized and corporate securities generated positive returns. Fixed income returns were meager during the second half of the fiscal year as investors tried to determine when the Federal Reserve may start to raise rates. The short-end of the curve remained relatively unchanged while the long-end moved higher in May and June contributing to losses. Lower-quality credits delivered positive results as investors continued to reach for yield. The BarCap Index, a broad measure of the U.S. bond market, gained 1.85% for the fiscal year end.
The Portfolio is structured to simulate the performance of the benchmark. As such the Portfolio maintains aggregate characteristics – duration, weighted average yield-to-maturity, and average credit quality in line with the benchmark. Since the Portfolio holds a subset of the securities represented in the benchmark, it is expected to generate a small amount of tracking error.
| 1 | The Barclays Capital U.S. Securitized Index is an unmanaged index that tracks the performance of mortgage-backed pass through securities issued by Ginnie Mae, Fannie Mae and Freddie Mac, investment-grade bonds and asset-backed securities. |
| 2 | Lipper, Inc. is an independent statistical monitoring organization that compiles performance on mutual funds and further categorizes them by investment objective. |
32
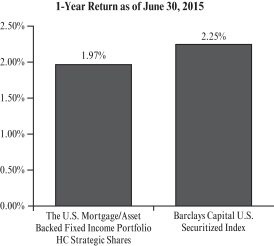
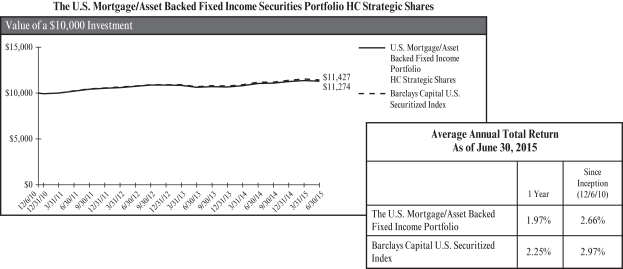
The chart represents historical performance of a hypothetical investment of $10,000 in The U.S. Mortgage/Asset Backed Fixed Income Portfolio from 12/6/10 to 6/30/15, and represents the reinvestment of dividends and capital gains in the Portfolio.
Past performance does not guarantee future results. The performance data quoted represents past performance and current returns may be lower or higher. The investment return and principal value will fluctuate so that an investor’s shares, when redeemed, may be worth more or less than the original cost. To obtain performance information current to the most recent month end, please call (800) 242-9596.
The Portfolio’s performance above is compared to the Barclays Capital U.S. Securitized Index. The index is unmanaged and does not reflect the deduction of fees associated with a mutual fund, such as investment management and fund accounting fees, or the deduction of taxes. An investor cannot invest directly in an index. The performance of The U.S. Mortgage/Asset Backed Fixed Income Portfolio reflects the deduction of fees for these value-added services, but does not reflect the deduction of taxes that a shareholder would pay on the Portfolio’s distributions or redemptions of the Portfolio’s shares.
Expense Ratio
HC Strategic Shares 0.21%
This information is included in the most current prospectus available to current and prospective shareholders of the Portfolio. Additional information pertaining to the June 30, 2015, expense ratios can be found in the financial highlights.
33
The Short-Term Municipal Bond Portfolio
(Unaudited)
The Short-Term Municipal Bond Portfolio (the “Portfolio”) managed by Breckinridge Capital Advisors, Inc. gained 0.19% for the fiscal year compared to 0.40% for the BofA Merrill Lynch 1-3 Year Municipal Index1 and 0.19% for the average manager in the Lipper2 universe of Short Duration Municipal Bond Funds.
During the first half of the fiscal year, municipal bonds generated positive results. Returns were the strongest in longer maturities, as the yield curve flattened along with Treasuries. Despite higher rates and a number of negative credit headlines related to Puerto Rico, Illinois, Chicago and New Jersey, munis posted modest positive returns during the second half of the fiscal year.
The Breckinridge strategy modestly outperformed the benchmark and peer universe gross of fees. The main driver of performance over the past year was the portfolio’s exposure to bonds beyond 3 years. Although the yield curve steepened in the first half of 2015 the outperformance from the last half of 2014 helped the Breckenridge strategy outperform the BofA Merrill Lynch 1-3 Year Muni Index for the fiscal year end. The portfolio’s Local Government Obligation bonds outperformed the benchmark but the lack of exposure to BBB rated bonds mostly offset those gains. The modest underperformance of the Portfolio is attributable to fees and expenses.
| 1 | The BofA Merrill Lynch 1-3 Year Muni Index is an unmanaged, equal-weighted index that tracks the total return performance of the domestic U.S. municipal market. The index consists of investment grade, publicly traded, fixed-rate and coupon bearing municipal securities with a maturity of one to three years. This index is unmanaged, thus the index results do not reflect the impact of expenses associated with any investment in securities, such as brokerage commission or other transaction costs. Benchmark performance is shown for comparison purposes only, as it is not possible to invest directly in a securities index. |
| 2 | Lipper, Inc. is an independent statistical monitoring organization that organization compiles performance on mutual funds and further categorizes them by investment objective. |
34
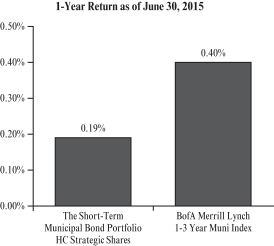
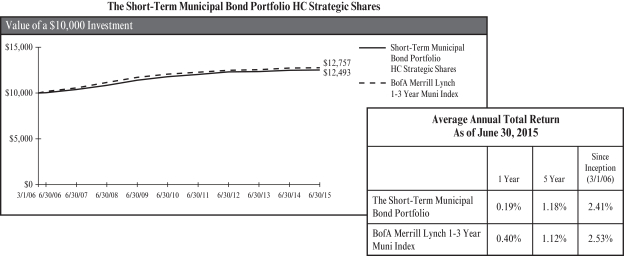
The chart represents historical performance of a hypothetical investment of $10,000 in The Short-Term Municipal Bond Portfolio from 3/1/06 to 6/30/15, and represents the reinvestment of dividends and capital gains in the Portfolio.
Past performance does not guarantee future results. The performance data quoted represents past performance and current returns may be lower or higher. The investment return and principal value will fluctuate so that an investor’s shares, when redeemed, may be worth more or less than the original cost. To obtain performance information current to the most recent month end, please call (800) 242-9596.
The Portfolio’s performance above is compared to the BofA Merrill Lynch 1-3 Year Muni Index. The index is unmanaged and does not reflect the deduction of fees associated with a mutual fund, such as investment management and fund accounting fees, or the deduction of taxes. An investor cannot invest directly in an index. The performance of The Short-Term Municipal Bond Portfolio reflects the deduction of fees for these value-added services, but does not reflect the deduction of taxes that a shareholder would pay on the Portfolio’s distributions or redemptions of the Portfolio’s shares.
Expense Ratio
HC Strategic Shares 0.29%
This information is included in the most current prospectus available to current and prospective shareholders of the Portfolio. Additional information pertaining to the June 30, 2015, expense ratios can be found in the financial highlights.
35
The Intermediate Term Municipal Bond Portfolio
(Unaudited)
The Intermediate Term Municipal Bond Portfolio (the “Portfolio”) managed by Standish Mellon Asset Management Company LLC (“Standish”) returned 1.54% for the fiscal year compared to 2.40% for the Barclays Capital 3-15 Year Blend Muni Index1 and 1.26% for average manager in the Lipper2 Intermediate Municipal Debt Funds universe.
Municipal bonds during the first half of the fiscal year generated positive results. Returns were the strongest in longer maturities, as the yield curve flattened along with Treasuries. Despite higher rates and a number of negative credit headlines related to Puerto Rico, Illinois, Chicago and New Jersey, munis posted modest positive returns during the second half of the fiscal year.
The Standish strategy underperformed the Barclays Capital Municipal 3-15 year benchmark during the twelve-month reporting period.
Interest rate positioning was the primary detractor to relative results led by being underweight longer maturity 8-to-15 year bonds which outperformed shorter duration assets. The benefit from a shorter duration posture maintained by the portfolio amidst the rising interest rate environment was not enough to offset the negative impact from yield curve positioning. Both sector and security allocations, particularly among revenue issuers, were positive drivers to relative performance. Favorable security selection was seen among education and hospital revenue bonds.
From a sector standpoint, emphasis toward revenue bonds contributed positively amidst steady investor demand for higher yielding securities. Within the revenue sector the fund benefited from being overweight hospital, tobacco and airport bonds which offered attractive yields and were in strong demand from income-seeking investors. Amidst an environment of relatively low volatility and tightening credit spreads, tactical sector positioning toward a more defensive stance proved to be a modest detractor to relative performance. In particular, emphasis on some of the more liquid, higher grade revenue sectors such as essential service water, power as well as special tax bonds detracted as these bonds lagged higher yielding alternatives.
From a quality perspective, maintaining a higher quality bias was a negative led by underweight exposure to A-rated and BBB-rated bonds, which performed well versus the highest grade AAA-rated bonds.
| 1 | Barclays Capital 3-15 Year Blend Muni Index is an index of government bonds. This index is unmanaged, thus the index results do not reflect the impact of expenses associated with any investment in securities, such as brokerage commission or other transaction costs. Benchmark performance is shown for comparison purposes only, as it is not possible to invest directly in a securities index. |
| 2 | Lipper, Inc. is an independent statistical monitoring organization that compiles performance on mutual funds and further categorizes them by investment objective. |
36
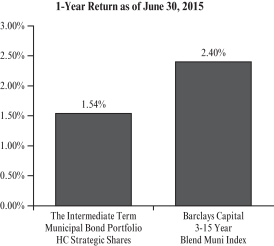
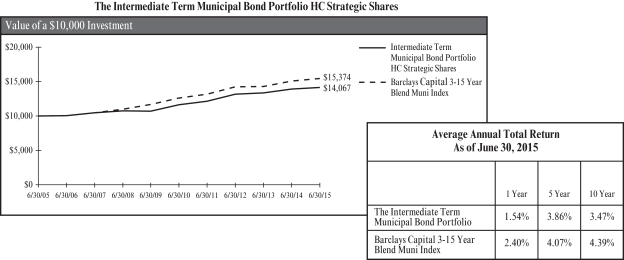
The chart represents historical performance of a hypothetical investment of $10,000 in The Intermediate Term Municipal Bond Portfolio for the 10-year period ended 6/30/15, and represents the reinvestment of dividends and capital gains in the Portfolio.
Past performance does not guarantee future results. The performance data quoted represents past performance and current returns may be lower or higher. The investment return and principal value will fluctuate so that an investor’s shares, when redeemed, may be worth more or less than the original cost. To obtain performance information current to the most recent month end, please call (800) 242-9596.
The Portfolio’s performance above is compared to the Barclays Capital 3-15 Year Blend Muni Index. The index is unmanaged and does not reflect the deduction of fees associated with a mutual fund, such as investment management and fund accounting fees, or the deduction of taxes. An investor cannot invest directly in an index. The performance of The Intermediate Term Municipal Bond Portfolio reflects the deduction of fees for these value-added services, but does not reflect the deduction of taxes that a shareholder would pay on the Portfolio’s distributions or redemptions of the Portfolio’s shares.
Expense Ratio
HC Strategic Shares 0.28%
HC Advisors Shares 0.53%
This information is included in the most current prospectus available to current and prospective shareholders of the Portfolio. Additional information pertaining to the June 30, 2015, expense ratios can be found in the financial highlights.
37
The Intermediate Term Municipal Bond II Portfolio
(Unaudited)
The Intermediate Term Municipal Bond II Portfolio (the “Portfolio”) managed by Breckinridge Capital Advisors, Inc. returned 1.31% compared to 1.31% for the Barclays Capital 5-Year General Obligation Muni Index1 and 1.26% for average manager in the Lipper2 Intermediate Municipal Debt Funds universe.
Municipal bonds during the first half of the fiscal year generated positive results. Returns were the strongest in longer maturities, as the yield curve flattened along with Treasuries. Despite higher rates and a number of negative credit headlines related to Puerto Rico, Illinois, Chicago and New Jersey, munis posted modest positive returns during the second half of the fiscal year.
The Breckinridge strategy outperformed the benchmark and peer universe gross of fees for the fiscal year end. The main driver of performance over the past year was the portfolio’s exposure to longer bonds beyond 5 years. Although the yield curve steepened in the first half of 2015 the outperformance from the last half of 2014 in the longer end helped the portfolio outperform the Barclays Capital 5 Year General Obligation Index. The portfolio’s exposure to sectors not held by the index such as Water & Sewer and Transportation added slightly to performance. The underweight to lower quality A rated bonds detracted slightly but not in a material way.
| 1 | The Barclays Capital 5-Year General Obligation Muni Index is an unmanaged index generally representative of investment grade fixed rate debt obligations issued by state and local government entities, with maturities of no more than six years. |
| 2 | Lipper, Inc. is an independent statistical monitoring organization that compiles performance on mutual funds and further categorizes them by investment objective. |
38
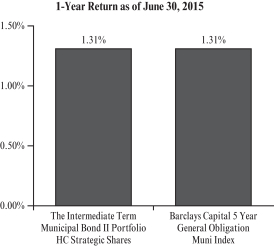
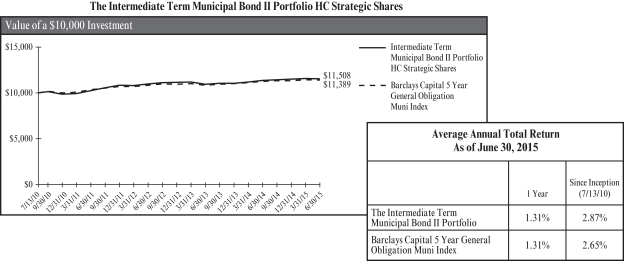
The chart represents historical performance of a hypothetical investment of $10,000 in The Intermediate Term Municipal Bond II Portfolio from 7/13/10 to 6/30/15, and represents the reinvestment of dividends and capital gains in the Portfolio.
Past performance does not guarantee future results. The performance data quoted represents past performance and current returns may be lower or higher. The investment return and principal value will fluctuate so that an investor’s shares, when redeemed, may be worth more or less than the original cost. To obtain performance information current to the most recent month end, please call (800) 242-9596.
The Portfolio’s performance above is compared to the Barclays Capital 5 Year General Obligation Muni Index. The index is unmanaged and does not reflect the deduction of fees associated with a mutual fund, such as investment management and fund accounting fees, or the deduction of taxes. An investor cannot invest directly in an index. The performance of The Intermediate Term Municipal Bond II Portfolio reflects the deduction of fees for these value-added services, but does not reflect the deduction of taxes that a shareholder would pay on the Portfolio’s distributions or redemptions of the Portfolio’s shares.
Expense Ratio
HC Strategic Shares 0.25%
HC Advisors Shares 0.50%
This information is included in the most current prospectus available to current and prospective shareholders of the Portfolio. Additional information pertaining to the June 30, 2015, expense ratios can be found in the financial highlights.
39
Conclusion
The performance of the Portfolios for the fiscal year was consistent with our expectations. Our valuation work based on normalized earnings currently assesses the broad US equity markets to be in the expensive part of its distribution. As a result, we have deliberately emphasized quality and yield characteristics in our US large cap equity Portfolios. This bias should reduce the sensitivity of the Portfolios to the market. If markets continue their upward momentum, we would expect our Portfolios to lag. If downside volatility picks up, we expect the Portfolios to behave more defensively. This positioning will increase the tracking error of the Portfolios relative to their benchmarks, but we believe that protecting investors from a valuation impairment is more important than keeping up with an advancing bull market.
We continue to add new strategies to broaden the return sources to investors. For example we added a structured commercial real estate mortgage strategy to our Fixed Income Opportunities portfolio. The strategy is designed to diversify away from corporate credit with a wider margin of safety relative to corporate credit. The strategy owns floating rate securities that minimize the exposure to duration.
We are continuing to refine the exposures of our custom defined style portfolios to capture the characteristics that are priced to deliver excess returns. In the US, we prefer quality and yield. In International Developed markets, we find yield attractive. In Emerging Markets equities, our preference is own traditional value and yield. Our goal is to identify the best rewarded subset of risk in each market.
We appreciate your continued trust and support.
HC Capital Solutions
40
HC CAPITAL TRUST
The Value Equity Portfolio
Portfolio of Investments — June 30, 2015
| | | | | | | | |
| Shares | | | Security Description | | Value
(000) | |
| | | | Common Stocks — 82.89% | | | | |
| | | | Aerospace & Defense — 1.91% | | | | |
| | 33,926 | | | L-3 Communications Holdings, Inc. | | $ | 3,847 | |
| | 13,594 | | | Lockheed Martin Corp. | | | 2,527 | |
| | 15,719 | | | Raytheon Co. | | | 1,504 | |
| | 28,856 | | | The Boeing Co. | | | 4,003 | |
| | | | | | | | |
| | | | | | | 11,881 | |
| | | | | | | | |
| | | | Air Freight & Logistics — 0.60% | | | | |
| | 7,123 | | | C.H. Robinson Worldwide, Inc. | | | 444 | |
| | 34,190 | | | United Parcel Service, Inc., Class – B | | | 3,314 | |
| | | | | | | | |
| | | | | | | 3,758 | |
| | | | | | | | |
| | | | Airlines — 1.22% | | | | |
| | 10,522 | | | Copa Holdings SA, Class – A^ | | | 869 | |
| | 91,600 | | | Delta Air Lines, Inc. | | | 3,763 | |
| | 142,012 | | | JetBlue Airways Corp. (a) | | | 2,948 | |
| | | | | | | | |
| | | | | | | 7,580 | |
| | | | | | | | |
| | | | Auto Components — 0.69% | | | | |
| | 17,030 | | | Lear Corp. | | | 1,912 | |
| | 41,778 | | | Magna International, Inc., ADR | | | 2,343 | |
| | | | | | | | |
| | | | | | | 4,255 | |
| | | | | | | | |
| | | | Automobiles — 1.74% | | | | |
| | 558,991 | | | Ford Motor Co. | | | 8,390 | |
| | 74,396 | | | General Motors Co. | | | 2,480 | |
| | | | | | | | |
| | | | | | | 10,870 | |
| | | | | | | | |
| | | | Banks — 5.58% | | | | |
| | 440,657 | | | Bank of America Corp. | | | 7,500 | |
| | 1,620 | | | Bank of Hawaii Corp. | | | 108 | |
| | 4,346 | | | BankUnited, Inc. | | | 156 | |
| | 34,267 | | | BB&T Corp. | | | 1,381 | |
| | 1,468 | | | BOK Financial Corp. | | | 102 | |
| | 170,327 | | | Citizens Financial Group, Inc. | | | 4,652 | |
| | 2,415 | | | Cullen/Frost Bankers, Inc. | | | 190 | |
| | 44,536 | | | Fifth Third Bancorp | | | 927 | |
| | 14,331 | | | First Niagara Financial Group, Inc. | | | 135 | |
| | 60,751 | | | JPMorgan Chase & Co. | | | 4,116 | |
| | 5,459 | | | M&T Bank Corp. | | | 682 | |
| | 4,668 | | | PacWest Bancorp | | | 218 | |
| | 65,172 | | | Regions Financial Corp. | | | 675 | |
| | 81,384 | | | U.S. BanCorp | | | 3,532 | |
| | 185,038 | | | Wells Fargo & Co. | | | 10,408 | |
| | | | | | | | |
| | | | | | | 34,782 | |
| | | | | | | | |
| | | | Beverages — 1.57% | | | | |
| | 12,974 | | | Coca-Cola Enterprises, Inc. | | | 564 | |
| | 9,009 | | | Dr. Pepper Snapple Group, Inc. | | | 657 | |
| | 6,298 | | | Molson Coors Brewing Co., Class – B | | | 440 | |
| | 43,964 | | | PepsiCo, Inc. | | | 4,103 | |
| | 103,068 | | | The Coca-Cola Co. | | | 4,043 | |
| | | | | | | | |
| | | | | | | 9,807 | |
| | | | | | | | |
| | | | Biotechnology — 0.49% | | | | |
| | 25,984 | | | Gilead Sciences, Inc. | | | 3,042 | |
| | | | | | | | |
| | | | Capital Markets — 0.87% | | | | |
| | 1,665 | | | Artisan Partners Asset Management, Inc. | | | 77 | |
| | 6,137 | | | BlackRock, Inc., Class – A | | | 2,124 | |
| | 5,754 | | | Eaton Vance Corp. | | | 225 | |
| | | | | | | | |
| Shares | | | Security Description | | Value
(000) | |
| | | | Capital Markets (continued) | | | | |
| | 4,036 | | | Federated Investors, Inc., Class – B | | $ | 135 | |
| | 22,944 | | | Invesco Ltd. | | | 861 | |
| | 6,151 | | | Lazard Ltd., Class – A | | | 346 | |
| | 17,974 | | | T. Rowe Price Group, Inc. | | | 1,397 | |
| | 4,079 | | | Waddell & Reed Financial, Inc., Class – A | | | 193 | |
| | | | | | | | |
| | | | | | | 5,358 | |
| | | | | | | | |
| | | | Chemicals — 3.75% | | | | |
| | 10,503 | | | Air Products & Chemicals, Inc. | | | 1,437 | |
| | 3,650 | | | Airgas, Inc. | | | 386 | |
| | 77,115 | | | CF Industries Holdings, Inc. | | | 4,958 | |
| | 42,080 | | | E.I. du Pont de Nemours & Co. | | | 2,691 | |
| | 9,334 | | | Huntsman Corp. | | | 206 | |
| | 74,934 | | | LyondellBasell Industries NV, Class – A | | | 7,757 | |
| | 14,775 | | | Praxair, Inc. | | | 1,766 | |
| | 61,585 | | | The Dow Chemical Co. | | | 3,151 | |
| | 19,546 | | | The Mosaic Co. | | | 916 | |
| | 2,452 | | | The Scotts Miracle-Gro Co. | | | 145 | |
| | | | | | | | |
| | | | | | | 23,413 | |
| | | | | | | | |
| | | | Commercial Services & Supplies — 0.41% | | | | |
| | 5,560 | | | Covanta Holding Corp. | | | 118 | |
| | 6,861 | | | KAR Auction Services, Inc. | | | 257 | |
| | 9,163 | | | Pitney Bowes, Inc. | | | 191 | |
| | 9,416 | | | R.R. Donnelley & Sons Co. | | | 164 | |
| | 11,974 | | | Republic Services, Inc., Class – A | | | 469 | |
| | 8,004 | | | The ADT Corp. | | | 269 | |
| | 23,498 | | | Waste Management, Inc. | | | 1,088 | |
| | | | | | | | |
| | | | | | | 2,556 | |
| | | | | | | | |
| | | | Communications Equipment — 1.90% | | | | |
| | 117,622 | | | Brocade Communications Systems, Inc. | | | 1,397 | |
| | 144,785 | | | Cisco Systems, Inc. | | | 3,976 | |
| | 70,340 | | | Corning, Inc. | | | 1,388 | |
| | 6,832 | | | Harris Corp. | | | 525 | |
| | 11,240 | | | Motorola Solutions, Inc. | | | 645 | |
| | 62,389 | | | Qualcomm, Inc. | | | 3,907 | |
| | | | | | | | |
| | | | | | | 11,838 | |
| | | | | | | | |
| | | | Consumer Finance — 1.93% | | | | |
| | 81,038 | | | Capital One Financial Corp. | | | 7,129 | |
| | 33,017 | | | Discover Financial Services | | | 1,902 | |
| | 21,602 | | | Navient Corp. | | | 393 | |
| | 74,262 | | | SLM Corp. (a) | | | 733 | |
| | 40,639 | | | Springleaf Holdings, Inc. (a) | | | 1,866 | |
| | | | | | | | |
| | | | | | | 12,023 | |
| | | | | | | | |
| | | | Containers & Packaging — 0.16% | | | | |
| | 4,688 | | | Avery Dennison Corp. | | | 286 | |
| | 4,318 | | | Bemis Co., Inc. | | | 194 | |
| | 5,171 | | | Packaging Corp. of America | | | 323 | |
| | 4,786 | | | Sonoco Products Co. | | | 205 | |
| | | | | | | | |
| | | | | | | 1,008 | |
| | | | | | | | |
| | | | Distributors — 0.11% | | | | |
| | 7,753 | | | Genuine Parts Co. | | | 694 | |
| | | | | | | | |
| | | | Diversified Consumer Services — 0.06% | | | | |
| | 12,682 | | | H&R Block, Inc. | | | 376 | |
| | | | | | | | |
See accompanying notes to financial statements.
41
HC CAPITAL TRUST
The Value Equity Portfolio
Portfolio of Investments (continued) — June 30, 2015
| | | | | | | | |
| Shares | | | Security Description | | Value
(000) | |
| | | | Common Stocks (continued) | | | | |
| | | | Diversified Telecommunication Services — 1.51% | |
| | 119,720 | | | AT&T, Inc. | | $ | 4,251 | |
| | 27,835 | | | CenturyLink, Inc. | | | 818 | |
| | 49,832 | | | Frontier Communications Corp. | | | 247 | |
| | 88,426 | | | Verizon Communications, Inc. | | | 4,122 | |
| | | | | | | | |
| | | | | | | 9,438 | |
| | | | | | | | |
| | | | Electric Utilities — 2.02% | | | | |
| | 14,648 | | | American Electric Power, Inc. | | | 776 | |
| | 21,463 | | | Duke Energy Corp. | | | 1,516 | |
| | 66,073 | | | Edison International | | | 3,672 | |
| | 5,371 | | | Entergy Corp. | | | 379 | |
| | 10,720 | | | Eversource Energy | | | 487 | |
| | 23,265 | | | Exelon Corp. | | | 731 | |
| | 12,218 | | | FirstEnergy Corp. | | | 398 | |
| | 4,580 | | | Great Plains Energy, Inc. | | | 111 | |
| | 2,864 | | | Hawaiian Electric Industries, Inc. | | | 85 | |
| | 13,609 | | | NextEra Energy, Inc. | | | 1,334 | |
| | 6,827 | | | OGE Energy Corp. | | | 195 | |
| | 6,498 | | | Pepco Holdings, Inc. | | | 175 | |
| | 3,251 | | | Pinnacle West Capital Corp. | | | 185 | |
| | 20,843 | | | PPL Corp. | | | 614 | |
| | 30,723 | | | The Southern Co. | | | 1,287 | |
| | 4,210 | | | Westar Energy, Inc. | | | 144 | |
| | 16,412 | | | Xcel Energy, Inc. | | | 528 | |
| | | | | | | | |
| | | | | | | 12,617 | |
| | | | | | | | |
| | | | Electrical Equipment — 0.90% | | | | |
| | 23,765 | | | Eaton Corp. PLC | | | 1,604 | |
| | 71,872 | | | Emerson Electric Co. | | | 3,984 | |
| | | | | | | | |
| | | | | | | 5,588 | |
| | | | | | | | |
| | | | Electronic Equipment, Instruments & Components — 0.32% | |
| | 58,665 | | | Keysight Technologies, Inc. (a) | | | 1,830 | |
| | 5,223 | | | National Instruments Corp. | | | 154 | |
| | | | | | | | |
| | | | | | | 1,984 | |
| | | | | | | | |
| | | | Energy Equipment & Services — 1.98% | | | | |
| | 15,038 | | | Ensco PLC, ADR | | | 335 | |
| | 1,714 | | | Franks International NV | | | 32 | |
| | 46,966 | | | Helmerich & Payne, Inc. | | | 3,307 | |
| | 85,795 | | | National Oilwell Varco, Inc. | | | 4,142 | |
| | 7,204 | | | Oceaneering International, Inc. | | | 336 | |
| | 48,398 | | | Schlumberger Ltd. | | | 4,171 | |
| | | | | | | | |
| | | | | | | 12,323 | |
| | | | | | | | |
| | | | Food & Staples Retailing — 0.83% | | | | |
| | 11,130 | | | Safeway, Inc. | | | 1 | |
| | 11,130 | | | Safeway, Inc. | | | 11 | |
| | 28,917 | | | Sysco Corp. | | | 1,044 | |
| | 57,739 | | | Wal-Mart Stores, Inc. | | | 4,095 | |
| | | | | | | | |
| | | | | | | 5,151 | |
| | | | | | | | |
| | | | Food Products — 1.63% | | | | |
| | 34,927 | | | Archer-Daniels-Midland Co. | | | 1,685 | |
| | 6,954 | | | Campbell Soup Co. | | | 331 | |
| | 15,976 | | | ConAgra Foods, Inc. | | | 698 | |
| | 9,237 | | | Flowers Foods, Inc. | | | 195 | |
| | | | | | | | |
| Shares | | | Security Description | | Value
(000) | |
| | | | Food Products (continued) | | | | |
| | 29,266 | | | General Mills, Inc. | | $ | 1,631 | |
| | 10,280 | | | Hershey Co. | | | 913 | |
| | 11,741 | | | Ingredion, Inc. | | | 937 | |
| | 12,858 | | | Kellogg Co. | | | 806 | |
| | 27,593 | | | Kraft Foods Group, Inc. | | | 2,350 | |
| | 5,842 | | | The J.M. Smucker Co. | | | 633 | |
| | | | | | | | |
| | | | | | | 10,179 | |
| | | | | | | | |
| | | | Gas Utilities — 0.55% | | | | |
| | 3,764 | | | AGL Resources, Inc. | | | 175 | |
| | 3,040 | | | Atmos Energy Corp. | | | 156 | |
| | 2,588 | | | National Fuel Gas Co. | | | 152 | |
| | 5,139 | | | Questar Corp. | | | 107 | |
| | 83,200 | | | UGI Corp. | | | 2,867 | |
| | | | | | | | |
| | | | | | | 3,457 | |
| | | | | | | | |
| | | | Health Care Equipment & Supplies — 0.31% | | | | |
| | 27,662 | | | Baxter International, Inc. | | | 1,934 | |
| | | | | | | | |
| | | | Health Care Providers & Services — 1.89% | | | | |
| | 32,954 | | | Aetna, Inc. | | | 4,200 | |
| | 46,269 | | | Anthem, Inc. | | | 7,595 | |
| | | | | | | | |
| | | | | | | 11,795 | |
| | | | | | | | |
| | | | Hotels, Restaurants & Leisure — 1.43% | | | | |
| | 5,883 | | | Darden Restaurants, Inc. | | | 418 | |
| | 2,741 | | | Extended Stay America, Inc. | | | 51 | |
| | 1 | | | International Game Technology PLC (a) | | | — | |
| | 79,454 | | | Las Vegas Sands Corp. | | | 4,178 | |
| | 43,358 | | | McDonald’s Corp. | | | 4,122 | |
| | 3,259 | | | Six Flags Entertainment Corp. | | | 146 | |
| | | | | | | | |
| | | | | | | 8,915 | |
| | | | | | | | |
| | | | Household Durables — 0.11% | | | | |
| | 5,555 | | | Garmin Ltd. | | | 244 | |
| | 5,984 | | | Leggett & Platt, Inc. | | | 291 | |
| | 2,427 | | | Tupperware Brands Corp. | | | 157 | |
| | | | | | | | |
| | | | | | | 692 | |
| | | | | | | | |
| | | | Household Products — 1.56% | | | | |
| | 46,145 | | | Colgate-Palmolive Co. | | | 3,018 | |
| | 18,824 | | | Kimberly-Clark Corp. | | | 1,995 | |
| | 6,246 | | | The Clorox Co. | | | 650 | |
| | 52,243 | | | The Procter & Gamble Co. | | | 4,087 | |
| | | | | | | | |
| | | | | | | 9,750 | |
| | | | | | | | |
| | | | Independent Power and Renewable Electricity Producers — 0.56% | |
| | 168,827 | | | Calpine Corp. (a) | | | 3,037 | |
| | 9,213 | | | NRG Energy, Inc. | | | 211 | |
| | 19,931 | | | The AES Corp. | | | 264 | |
| | | | | | | | |
| | | | | | | 3,512 | |
| | | | | | | | |
| | | | Industrial Conglomerates — 1.30% | | | | |
| | 26,322 | | | 3M Co. | | | 4,061 | |
| | 152,896 | | | General Electric Co. | | | 4,063 | |
| | | | | | | | |
| | | | | | | 8,124 | |
| | | | | | | | |
| | | | Insurance — 5.28% | | | | |
| | 17,486 | | | ACE Ltd. | | | 1,778 | |
| | 25,161 | | | Aflac, Inc. | | | 1,565 | |
| | 4,899 | | | Allied World Assurance Co. Holdings AG | | | 212 | |
See accompanying notes to financial statements.
42
HC CAPITAL TRUST
The Value Equity Portfolio
Portfolio of Investments (continued) — June 30, 2015
| | | | | | | | |
| Shares | | | Security Description | | Value
(000) | |
| | | | Common Stocks (continued) | | | | |
| | | | Insurance (continued) | | | | |
| | 108,227 | | | Allstate Corp. | | $ | 7,022 | |
| | 37,780 | | | American Financial Group, Inc. | | | 2,457 | |
| | 58,449 | | | American International Group, Inc. | | | 3,613 | |
| | 43,568 | | | Aon PLC | | | 4,343 | |
| | 7,398 | | | Arthur J. Gallagher & Co. | | | 350 | |
| | 8,312 | | | Cincinnati Financial Corp. | | | 417 | |
| | 1,913 | | | Endurance Specialty Holdings Ltd. | | | 126 | |
| | 26,985 | | | First American Financial Corp. | | | 1,004 | |
| | 2,036 | | | Hanover Insurance Group, Inc. | | | 151 | |
| | 1,213 | | | Mercury General Corp. | | | 68 | |
| | 45,067 | | | MetLife, Inc. | | | 2,523 | |
| | 10,598 | | | Old Republic International Corp. | | | 166 | |
| | 2,384 | | | PartnerRe Ltd. | | | 306 | |
| | 15,606 | | | Principal Financial Group, Inc. | | | 800 | |
| | 2,950 | | | ProAssurance Corp. | | | 136 | |
| | 21,861 | | | Prudential Financial, Inc. | | | 1,913 | |
| | 13,349 | | | The Chubb Corp. | | | 1,270 | |
| | 28,525 | | | The Progressive Corp. | | | 794 | |
| | 17,703 | | | The Travelers Cos., Inc. | | | 1,711 | |
| | 3,646 | | | Validus Holdings Ltd. | | | 160 | |
| | | | | | | | |
| | | | | | | 32,885 | |
| | | | | | | | |
| | | | Internet Software & Services — 0.11% | | | | |
| | 2,665 | | | Equinix, Inc. | | | 677 | |
| | | | | | | | |
| | | | IT Services — 1.87% | | | | |
| | 23,416 | | | Automatic Data Processing, Inc. | | | 1,879 | |
| | 38,600 | | | Booz Allen Hamilton Holding Corp. | | | 974 | |
| | 25,002 | | | International Business Machines Corp. | | | 4,067 | |
| | 3,097 | | | Leidos Holdings, Inc. | | | 125 | |
| | 14,356 | | | Paychex, Inc. | | | 673 | |
| | 28,771 | | | Western Union Co. | | | 585 | |
| | 313,453 | | | Xerox Corp. | | | 3,335 | |
| | | | | | | | |
| | | | | | | 11,638 | |
| | | | | | | | |
| | | | Leisure Products — 0.70% | | | | |
| | 4,845 | | | Hasbro, Inc. | | | 362 | |
| | 156,445 | | | Mattel, Inc. | | | 4,019 | |
| | | | | | | | |
| | | | | | | 4,381 | |
| | | | | | | | |
| | | | Machinery — 2.27% | | | | |
| | 47,615 | | | Caterpillar, Inc. | | | 4,039 | |
| | 2,678 | | | Crane Co. | | | 157 | |
| | 30,972 | | | Cummins, Inc. | | | 4,064 | |
| | 18,478 | | | Deere & Co. | | | 1,793 | |
| | 10,174 | | | Dover Corp. | | | 714 | |
| | 67,764 | | | ITT Corp. | | | 2,835 | |
| | 14,494 | | | The Timken Co. | | | 530 | |
| | | | | | | | |
| | | | | | | 14,132 | |
| | | | | | | | |
| | | | Media — 1.50% | | | | |
| | 9,607 | | | Cablevision Systems Corp., Class – A | | | 230 | |
| | 4,728 | | | Cinemark Holdings, Inc. | | | 190 | |
| | 21,846 | | | Omnicom Group, Inc. | | | 1,518 | |
| | 3,701 | | | Regal Entertainment Group, Class – A | | | 77 | |
| | 21,095 | | | The Interpublic Group of Cos., Inc. | | | 407 | |
| | 17,012 | | | Thomson Reuters Corp. | | | 648 | |
| | 57,526 | | | Time Warner, Inc. | | | 5,028 | |
| | | | | | | | |
| Shares | | | Security Description | | Value
(000) | |
| | | | Media (continued) | | | | |
| | 19,239 | | | Viacom, Inc., Class – B | | $ | 1,244 | |
| | | | | | | | |
| | | | | | | 9,342 | |
| | | | | | | | |
| | | | Metals & Mining — 0.25% | | | | |
| | 5,146 | | | Allegheny Technologies, Inc. | | | 155 | |
| | 2,527 | | | Compass Minerals International, Inc. | | | 208 | |
| | 16,178 | | | Nucor Corp. | | | 713 | |
| | 4,329 | | | Reliance Steel & Aluminum Co. | | | 262 | |
| | 11,627 | | | Steel Dynamics, Inc. | | | 241 | |
| | | | | | | | |
| | | | | | | 1,579 | |
| | | | | | | | |
| | | | Multi-line Insurance — 0.01% | | | | |
| | 380 | | | American National Insurance Co. | | | 39 | |
| | | | | | | | |
| | | | Multiline Retail – 1.88% | | | | |
| | 8,527 | | | Dillard’s, Inc., Class – A | | | 897 | |
| | 47,192 | | | Dollar General Corp. | | | 3,669 | |
| | 69,529 | | | Kohl’s Corp. | | | 4,353 | |
| | 34,097 | | | Target Corp. | | | 2,783 | |
| | | | | | | | |
| | | | | | | 11,702 | |
| | | | | | | | |
| | | | Multi-Utilities — 1.05% | | | | |
| | 3,624 | | | Alliant Energy Corp. | | | 209 | |
| | 7,168 | | | Ameren Corp. | | | 270 | |
| | 14,492 | | | CenterPoint Energy, Inc. | | | 276 | |
| | 8,312 | | | CMS Energy Corp. | �� | | 265 | |
| | 9,616 | | | Consolidated Edison, Inc. | | | 557 | |
| | 19,544 | | | Dominion Resources, Inc. | | | 1,308 | |
| | 5,534 | | | DTE Energy Co. | | | 413 | |
| | 6,730 | | | MDU Resources Group, Inc. | | | 131 | |
| | 7,301 | | | NiSource, Inc. | | | 333 | |
| | 12,672 | | | PG&E Corp. | | | 622 | |
| | 13,682 | | | Public Service Enterprise Group, Inc. | | | 537 | |
| | 4,644 | | | SCANA Corp. | | | 235 | |
| | 7,368 | | | Sempra Energy | | | 729 | |
| | 6,917 | | | TECO Energy, Inc. | | | 122 | |
| | 2,593 | | | Vectren Corp. | | | 100 | |
| | 10,127 | | | WEC Energy Group, Inc. | | | 455 | |
| | | | | | | | |
| | | | | | | 6,562 | |
| | | | | | | | |
| | | | Oil, Gas & Consumable Fuels — 8.93% | | | | |
| | 33,144 | | | Chesapeake Energy Corp.^ | | | 370 | |
| | 41,931 | | | Chevron Corp. | | | 4,045 | |
| | 67,161 | | | ConocoPhillips | | | 4,124 | |
| | 661 | | | CVR Energy, Inc. | | | 25 | |
| | 33,177 | | | EOG Resources, Inc. | | | 2,905 | |
| | 49,347 | | | Exxon Mobil Corp. | | | 4,106 | |
| | 3,770 | | | Golar LNG Ltd. | | | 176 | |
| | 115,110 | | | Hess Corp. | | | 7,700 | |
| | 10,111 | | | HollyFrontier Corp. | | | 432 | |
| | 106,000 | | | Kinder Morgan, Inc. | | | 4,069 | |
| | 93,759 | | | Marathon Oil Corp. | | | 2,488 | |
| | 18,228 | | | Marathon Petroleum Corp. | | | 954 | |
| | 100,633 | | | Murphy Oil Corp. | | | 4,183 | |
| | 53,468 | | | Occidental Petroleum Corp. | | | 4,158 | |
| | 60,998 | | | ONEOK, Inc. | | | 2,408 | |
| | 3,663 | | | PBF Energy, Inc., Class – A | | | 104 | |
| | 31,956 | | | Phillips 66 | | | 2,574 | |
| | 57,988 | | | Spectra Energy Corp. | | | 1,890 | |
See accompanying notes to financial statements.
43
HC CAPITAL TRUST
The Value Equity Portfolio
Portfolio of Investments (continued) — June 30, 2015
| | | | | | | | |
| Shares | | | Security Description | | Value
(000) | |
| | | | Common Stocks (continued) | | | | |
| | | | Oil, Gas & Consumable Fuels (continued) | |
| | 3,851 | | | Targa Resources Corp. | | $ | 344 | |
| | 2,206 | | | Teekay Shipping Corp. | | | 94 | |
| | 41,334 | | | The Williams Cos., Inc. | | | 2,372 | |
| | 96,662 | | | Valero Energy Corp. | | | 6,051 | |
| | | | | | | | |
| | | | | | | 55,572 | |
| | | | | | | | |
| | | | Paper & Forest Products — 0.18% | | | | |
| | 3,543 | | | Domtar Corp. | | | 147 | |
| | 20,526 | | | International Paper Co. | | | 977 | |
| | | | | | | | |
| | | | | | | 1,124 | |
| | | | | | | | |
| | | | Personal Products — 0.04% | | | | |
| | 20,392 | | | Avon Products, Inc. | | | 128 | |
| | 3,075 | | | Nu Skin Enterprises, Inc., Class – A | | | 145 | |
| | | | | | | | |
| | | | | | | 273 | |
| | | | | | | | |
| | | | Pharmaceuticals — 4.76% | | | | |
| | 59,636 | | | AbbVie, Inc. | | | 4,007 | |
| | 62,674 | | | Bristol-Myers Squibb Co. | | | 4,170 | |
| | 37,534 | | | Eli Lilly & Co. | | | 3,134 | |
| | 41,991 | | | Johnson & Johnson | | | 4,092 | |
| | 71,096 | | | Merck & Co., Inc. | | | 4,047 | |
| | 303,977 | | | Pfizer, Inc. | | | 10,193 | |
| | | | | | | | |
| | | | | | | 29,643 | |
| | | | | | | | |
| | | | Professional Services — 0.12% | | | | |
| | 16,992 | | | Nielsen Holdings NV | | | 761 | |
| | | | | | | | |
| | | | Real Estate Investment Trusts — 2.15% | |
| | 1,777 | | | Alexandria Real Estate Equities, Inc. | | | 155 | |
| | 2,626 | | | American Campus Communities, Inc. | | | 99 | |
| | 3,853 | | | Apartment Investment & Management Co., Class – A | | | 142 | |
| | 2,943 | | | AvalonBay Communities, Inc. | | | 470 | |
| | 5,487 | | | BioMed Realty Trust, Inc. | | | 106 | |
| | 4,230 | | | Brandywine Realty Trust | | | 56 | |
| | 3,877 | | | Brixmor Property Group, Inc. | | | 90 | |
| | 1,974 | | | Camden Property Trust | | | 147 | |
| | 4,522 | | | CBL & Associates Properties, Inc. | | | 73 | |
| | 2,764 | | | Columbia Property Trust, Inc. | | | 68 | |
| | 2,260 | | | Corporate Office Properties Trust | | | 53 | |
| | 2,647 | | | Corrections Corp. of America | | | 88 | |
| | 7,480 | | | Crown Castle International Corp. | | | 601 | |
| | 7,513 | | | DDR Corp. | | | 116 | |
| | 3,224 | | | Digital Realty Trust, Inc. | | | 215 | |
| | 3,575 | | | Douglas Emmett, Inc. | | | 96 | |
| | 7,690 | | | Duke Realty Corp. | | | 143 | |
| | 1,983 | | | Equity Lifestyle Properties, Inc. | | | 104 | |
| | 8,195 | | | Equity Residential | | | 575 | |
| | 1,491 | | | Essex Property Trust, Inc. | | | 317 | |
| | 2,822 | | | Extra Space Storage, Inc. | | | 184 | |
| | 1,605 | | | Federal Realty Investment Trust | | | 206 | |
| | 2,008 | | | Gaming And Leisure Properties, Inc. | | | 74 | |
| | 13,618 | | | General Growth Properties, Inc. | | | 349 | |
| | 13,028 | | | HCP, Inc. | | | 475 | |
| | 8,533 | | | Health Care REIT, Inc. | | | 560 | |
| | 2,790 | | | Healthcare Trust of America, Inc., Class – A | | | 67 | |
| | | | | | | | |
| Shares | | | Security Description | | Value
(000) | |
| | | | Real Estate Investment Trusts (continued) | | | | |
| | 1,260 | | | Home Properties, Inc. | | $ | 92 | |
| | 3,367 | | | Hospitality Properties Trust | | | 97 | |
| | 18,617 | | | Host Hotels & Resorts, Inc. | | | 369 | |
| | 4,936 | | | Iron Mountain, Inc. | | | 153 | |
| | 10,120 | | | Kimco Realty Corp. | | | 228 | |
| | 1,818 | | | Lamar Advertising Co., Class – A | | | 104 | |
| | 3,519 | | | Liberty Property Trust | | | 113 | |
| | 1,757 | | | Mid-America Apartment Communities, Inc. | | | 128 | |
| | 3,466 | | | National Retail Properties, Inc. | | | 121 | |
| | 9,112 | | | NorthStar Realty Finance Corp. | | | 145 | |
| | 4,675 | | | OMEGA Healthcare Investors, Inc. | | | 160 | |
| | 3,498 | | | Outfront Media, Inc. | | | 88 | |
| | 3,461 | | | Piedmont Office Realty Trust, Inc., Class – A | | | 61 | |
| | 4,015 | | | Plum Creek Timber Co., Inc. | | | 163 | |
| | 1,294 | | | Post Properties, Inc. | | | 70 | |
| | 12,876 | | | Prologis, Inc. | | | 478 | |
| | 3,521 | | | Public Storage | | | 650 | |
| | 2,917 | | | Rayonier, Inc. | | | 75 | |
| | 5,875 | | | Realty Income Corp. | | | 261 | |
| | 2,069 | | | Regency Centers Corp. | | | 122 | |
| | 5,547 | | | Retail Properties of America, Inc., Class – A | | | 77 | |
| | 6,325 | | | Senior Housing Properties Trust | | | 111 | |
| | 7,953 | | | Simon Property Group, Inc. | | | 1,377 | |
| | 10,963 | | | Spirit Realty Capital, Inc. | | | 106 | |
| | 5,867 | | | Starwood Property Trust, Inc. | | | 127 | |
| | 2,371 | | | Tanger Factory Outlet Centers, Inc. | | | 75 | |
| | 1,525 | | | Taubman Centers, Inc. | | | 106 | |
| | 3,745 | | | The Macerich Co. | | | 279 | |
| | 5,733 | | | UDR, Inc. | | | 184 | |
| | 8,717 | | | Ventas, Inc. | | | 541 | |
| | 4,010 | | | Vornado Realty Trust | | | 381 | |
| | 2,920 | | | Weingarten Realty Investors | | | 95 | |
| | 13,385 | | | Weyerhaeuser Co. | | | 422 | |
| | 2,921 | | | WP Carey, Inc. | | | 172 | |
| | 4,166 | | | WP GLIMCHER, Inc. | | | 56 | |
| | | | | | | | |
| | | | | | | 13,416 | |
| | | | | | | | |
| | | | Road & Rail — 0.37% | | | | |
| | 26,056 | | | Norfolk Southern Corp. | | | 2,276 | |
| | | | | | | | |
| | | | Semiconductors & Semiconductor Equipment — 2.63% | |
| | 13,156 | | | Analog Devices, Inc. | | | 844 | |
| | 120,448 | | | Applied Materials, Inc. | | | 2,315 | |
| | 16,272 | | | Cypress Semiconductor Corp. | | | 191 | |
| | 229,272 | | | Intel Corp. | | | 6,974 | |
| | 21,500 | | | KLA-Tencor Corp. | | | 1,209 | |
| | 11,259 | | | Linear Technology Corp. | | | 498 | |
| | 12,553 | | | Maxim Integrated Products, Inc. | | | 434 | |
| | 8,867 | | | Microchip Technology, Inc. | | | 421 | |
| | 55,295 | | | Texas Instruments, Inc. | | | 2,848 | |
| | 14,565 | | | Xilinx, Inc. | | | 643 | |
| | | | | | | | |
| | | | | | | 16,377 | |
| | | | | | | | |
| | | | Software — 2.75% | | | | |
| | 15,336 | | | CA, Inc. | | | 449 | |
| | 46,114 | | | Electronic Arts, Inc. (a) | | | 3,067 | |
| | 234,886 | | | Microsoft Corp. | | | 10,370 | |
See accompanying notes to financial statements.
44
HC CAPITAL TRUST
The Value Equity Portfolio
Portfolio of Investments (continued) — June 30, 2015
| | | | | | | | |
| Shares | | | Security Description | | Value
(000) | |
| | | | Common Stocks (continued) | | | | |
| | | | Software (continued) | | | | |
| | 44,650 | | | Oracle Corp. | | $ | 1,799 | |
| | 62,706 | | | Symantec Corp. | | | 1,458 | |
| | | | | | | | |
| | | | | | | 17,143 | |
| | | | | | | | |
| | | | Specialty Retail — 2.08% | | | | |
| | 14,876 | | | Best Buy Co., Inc. | | | 485 | |
| | 3,594 | | | DSW, Inc., Class – A | | | 120 | |
| | 53,951 | | | Foot Locker, Inc. | | | 3,616 | |
| | 84,273 | | | GameStop Corp., Class – A^ | | | 3,621 | |
| | 13,862 | | | Gap, Inc. | | | 529 | |
| | 11,387 | | | L Brands, Inc. | | | 976 | |
| | 209,157 | | | Office Depot, Inc. (a) | | | 1,811 | |
| | 119,022 | | | Staples, Inc. | | | 1,822 | |
| | | | | | | | |
| | | | | | | 12,980 | |
| | | | | | | | |
| | | | Technology Hardware, Storage & Peripherals — 1.42% | |
| | 290,426 | | | Hewlett-Packard Co. | | | 8,716 | |
| | 3,146 | | | Lexmark International, Inc., Class – A | | | 139 | |
| | | | | | | | |
| | | | | | | 8,855 | |
| | | | | | | | |
| | | | Textiles, Apparel & Luxury Goods — 0.10% | | | | |
| | 18,500 | | | Coach, Inc. | | | 640 | |
| | | | | | | | |
| | | | Thrifts & Mortgage Finance — 0.08% | | | | |
| | 16,619 | | | New York Community Bancorp, Inc. | | | 306 | |
| | 12,800 | | | People’s United Financial, Inc. | | | 207 | |
| | | | | | | | |
| | | | | | | 513 | |
| | | | | | | | |
| | | | Tobacco — 1.88% | | | | |
| | 101,670 | | | Altria Group, Inc. | | | 4,972 | |
| | 50,482 | | | Philip Morris International, Inc. | | | 4,047 | |
| | 36,452 | | | Reynolds American, Inc. | | | 2,722 | |
| | | | | | | | |
| | | | | | | 11,741 | |
| | | | | | | | |
| | | | Trading Companies & Distributors — 0.18% | | | | |
| | 14,342 | | | Fastenal Co. | | | 605 | |
| | 2,360 | | | GATX Corp. | | | 125 | |
| | 3,263 | | | MSC Industrial Direct Co., Inc., Class – A | | | 228 | |
| | 1,224 | | | Watsco, Inc. | | | 151 | |
| | | | | | | | |
| | | | | | | 1,109 | |
| | | | | | | | |
| | | | Transportation Infrastructure — 0.05% | | | | |
| | 3,410 | | | Macquarie Infrastructure Corp. | | | 282 | |
| | | | | | | | |
| | | | Water Utilities — 0.07% | | | | |
| | 5,705 | | | American Water Works Co., Inc. | | | 277 | |
| | 5,874 | | | Aqua America, Inc. | | | 144 | |
| | | | | | | | |
| | | | | | | 421 | |
| | | | | | | | |
| | | | Wireless Telecommunication Services — 0.29% | |
| | 50,007 | | | Vodafone Group PLC, ADR | | | 1,823 | |
| | | | | | | | |
| | | | Total Common Stocks | | | 516,586 | |
| | | | | | | | |
| | | | | | | | |
Shares or
Principal
Amount
(000) | | | Security
Description | | Value
(000) | |
| | | | Time Deposit — 0.58% | | | | |
| $ | 3,610 | | | State Street Liquidity Management Control System Eurodollar Time Deposit, 0.01%, 7/1/15 | | $ | 3,610 | |
| | | | | | | | |
| | | | Total Time Deposit | | | 3,610 | |
| | | | | | | | |
| | | | Mutual Funds —15.53% | | | | |
| | 1,329,373 | | | Dreyfus Treasury Prime Cash Management Fund, 0.00% (b) | | | 1,329 | |
| | 64,668,219 | | | Federated U.S. Treasury Cash Reserve Fund, Institutional Shares, 0.00% (b) | | | 64,668 | |
| | 412,427 | | | Vanguard REIT ETF | | | 30,805 | |
| | | | | | | | |
| | | | Total Mutual Funds | | | 96,802 | |
| | | | | | | | |
| | | | Repurchase Agreement — 0.39% | | | | |
| $ | 2,411 | | | Jefferies LLC, 0.23%, 7/1/15
(Purchased on 6/30/15, proceeds at maturity $2,411,365 collateralized by U.S. Treasury Obligations, 0.00% – 3.28%, 8/15/15 – 8/15/44 fair value $2,411,350)^^ | | | 2,411 | |
| | | | | | | | |
| | | | Total Repurchase Agreement | | | 2,411 | |
| | | | | | | | |
| | | | Total Investments
(cost $542,033) — 99.39% | | | 619,409 | |
| | | | Other assets in excess of
liabilities — 0.61% | | | 3,776 | |
| | | | | | | | |
| | | | Net Assets — 100.00% | | $ | 623,185 | |
| | | | | | | | |
Amounts designated as “—” are $0 or have been rounded to $0.
| ^ | All or part of this security was on loan as of June 30, 2015. The total value of securities on loan as of June 30, 2015, was $2,948 (amount in thousands). |
| ^^ | Purchased with cash collateral held from securities lending. The value of the collateral could include collateral held for securities that were sold on or before June 30, 2015. |
| (a) | Represents non-income producing security. |
| (b) | The rate disclosed is the rate in effect on June 30, 2015. |
ADR — American Depositary Receipt
ETF — Exchange Traded Fund
REIT — Real Estate Investment Trust
See accompanying notes to financial statements.
45
HC CAPITAL TRUST
The Value Equity Portfolio
Portfolio of Investments (concluded) — June 30, 2015
The following table reflects the percentage of total net assets of the Portfolio attributable to each Specialist Manager, see Note 3 in the Notes to Financial Statements.
| | | | | | | | | | | | | | | | | | | | |
The Value Equity Portfolio | | Alliance
Bernstein L.P. | | | Cadence Capital
Management, LLC | | | Parametric
Portfolio
Associates, LLC | | | HC Capital
Solutions | | | Total | |
Common Stocks | | | 30.58 | % | | | 52.31 | % | | | — | | | | — | | | | 82.89 | % |
Time Deposit | | | 0.58 | % | | | — | | | | — | | | | — | | | | 0.58 | % |
Mutual Funds | | | — | | | | 0.21 | % | | | 4.94 | % | | | 10.38 | % | | | 15.53 | % |
Repurchase Agreement | | | 0.29 | % | | | 0.10 | % | | | — | | | | — | | | | 0.39 | % |
Other Assets (Liabilities) | | | -0.74 | % | | | -0.01 | % | | | 1.37 | % | | | -0.01 | % | | | 0.61 | % |
| | | | | | | | | | | | | | | | | | | | |
Total Net Assets | | | 30.71 | % | | | 52.61 | % | | | 6.31 | % | | | 10.37 | % | | | 100.00 | % |
| | | | | | | | | | | | | | | | | | | | |
The following table reflects the open derivative positions held by the Portfolio as of June 30, 2015.
Long Futures
| | | | | | | | | | | | | | | | |
Number of
Contracts | | | Futures Contracts Positions^ | | Value
(000) | | | Expiration | | | Unrealized
Appreciation/
(Depreciation)
(000) | |
| | 149 | | | E-Mini S&P 500 Future | | $ | 15,305 | | | | 9/18/15 | | | $ | (345 | ) |
| | 21 | | | E-Mini S&P Midcap 400 Future | | | 3,146 | | | | 9/18/15 | | | | (60 | ) |
| | | | | | | | | | | | | | | | |
| | | | Net Unrealized Appreciation/(Depreciation) | | | | | | | | | | $ | (405 | ) |
| | | | | | | | | | | | | | | | |
Amounts designated as “—” are $0 or have been rounded to $0.
| ^ | Cash has been pledged as collateral for futures contracts held by the Portfolio. |
See accompanying notes to financial statements.
46
HC CAPITAL TRUST
The Institutional Value Equity Portfolio
Portfolio of Investments — June 30, 2015
| | | | | | | | |
| Shares | | | Security
Description | | Value
(000) | |
| | | | Common Stocks — 82.13% | | | | |
| | | | Aerospace & Defense — 1.89% | | | | |
| | 49,691 | | | L-3 Communications Holdings, Inc. | | $ | 5,634 | |
| | 19,832 | | | Lockheed Martin Corp. | | | 3,687 | |
| | 22,932 | | | Raytheon Co. | | | 2,194 | |
| | 42,097 | | | The Boeing Co. | | | 5,840 | |
| | | | | | | | |
| | | | | | | 17,355 | |
| | | | | | | | |
| | | | Air Freight & Logistics — 0.60% | | | | |
| | 10,390 | | | C.H. Robinson Worldwide, Inc. | | | 648 | |
| | 49,880 | | | United Parcel Service, Inc., Class – B | | | 4,834 | |
| | | | | | | | |
| | | | | | | 5,482 | |
| | | | | | | | |
| | | | Airlines — 1.21% | | | | |
| | 15,351 | | | Copa Holdings SA, Class – A^ | | | 1,268 | |
| | 134,986 | | | Delta Air Lines, Inc. | | | 5,545 | |
| | 204,914 | | | JetBlue Airways Corp. (a) | | | 4,254 | |
| | | | | | | | |
| | | | | | | 11,067 | |
| | | | | | | | |
| | | | Auto Components — 0.69% | | | | |
| | 24,756 | | | Lear Corp. | | | 2,779 | |
| | 62,442 | | | Magna International, Inc., ADR | | | 3,502 | |
| | | | | | | | |
| | | | | | | 6,281 | |
| | | | | | | | |
| | | | Automobiles — 1.74% | | | | |
| | 821,940 | | | Ford Motor Co. | | | 12,337 | |
| | 108,537 | | | General Motors Co. | | | 3,618 | |
| | | | | | | | |
| | | | | | | 15,955 | |
| | | | | | | | |
| | | | Banks — 5.58% | | | | |
| | 651,724 | | | Bank of America Corp. | | | 11,092 | |
| | 2,363 | | | Bank of Hawaii Corp. | | | 158 | |
| | 6,341 | | | BankUnited, Inc. | | | 228 | |
| | 49,992 | | | BB&T Corp. | | | 2,015 | |
| | 2,141 | | | BOK Financial Corp. | | | 149 | |
| | 251,820 | | | Citizens Financial Group, Inc. | | | 6,877 | |
| | 3,523 | | | Cullen/Frost Bankers, Inc. | | | 277 | |
| | 64,974 | | | Fifth Third Bancorp | | | 1,353 | |
| | 20,908 | | | First Niagara Financial Group, Inc. | | | 197 | |
| | 88,630 | | | JPMorgan Chase & Co. | | | 6,006 | |
| | 7,964 | | | M&T Bank Corp. | | | 995 | |
| | 6,811 | | | PacWest Bancorp | | | 318 | |
| | 95,081 | | | Regions Financial Corp. | | | 985 | |
| | 118,731 | | | U.S. BanCorp | | | 5,153 | |
| | 272,421 | | | Wells Fargo & Co. | | | 15,320 | |
| | | | | | | | |
| | | | | | | 51,123 | |
| | | | | | | | |
| | | | Beverages — 1.56% | | | | |
| | 18,928 | | | Coca-Cola Enterprises, Inc. | | | 822 | |
| | 13,143 | | | Dr. Pepper Snapple Group, Inc. | | | 958 | |
| | 9,187 | | | Molson Coors Brewing Co., Class – B | | | 641 | |
| | 64,139 | | | PepsiCo, Inc. | | | 5,987 | |
| | 150,365 | | | The Coca-Cola Co. | | | 5,899 | |
| | | | | | | | |
| | | | | | | 14,307 | |
| | | | | | | | |
| | | | Biotechnology — 0.49% | | | | |
| | 38,227 | | | Gilead Sciences, Inc. | | | 4,476 | |
| | | | | | | | |
| | | | Capital Markets — 0.85% | | | | |
| | 2,429 | | | Artisan Partners Asset Management, Inc. | | | 113 | |
| | 8,953 | | | BlackRock, Inc., Class – A | | | 3,098 | |
| | 8,394 | | | Eaton Vance Corp. | | | 328 | |
| | | | | | | | |
| Shares | | | Security
Description | | Value
(000) | |
| | | | Capital Markets (continued) | | | | |
| | 5,888 | | | Federated Investors, Inc., Class – B | | $ | 197 | |
| | 33,473 | | | Invesco Ltd. | | | 1,255 | |
| | 8,975 | | | Lazard Ltd., Class – A | | | 505 | |
| | 26,222 | | | T. Rowe Price Group, Inc. | | | 2,038 | |
| | 5,951 | | | Waddell & Reed Financial, Inc., Class – A | | | 282 | |
| | | | | | | | |
| | | | | | | 7,816 | |
| | | | | | | | |
| | | | Chemicals — 3.46% | | | | |
| | 15,322 | | | Air Products & Chemicals, Inc. | | | 2,097 | |
| | 5,324 | | | Airgas, Inc. | | | 563 | |
| | 1 | | | Albemarle Corp. | | | — | |
| | 113,565 | | | CF Industries Holdings, Inc. | | | 7,299 | |
| | 61,391 | | | E.I. du Pont de Nemours & Co. | | | 3,926 | |
| | 13,617 | | | Huntsman Corp. | | | 301 | |
| | 85,335 | | | LyondellBasell Industries NV, Class – A | | | 8,834 | |
| | 21,556 | | | Praxair, Inc. | | | 2,577 | |
| | 89,846 | | | The Dow Chemical Co. | | | 4,597 | |
| | 28,514 | | | The Mosaic Co. | | | 1,336 | |
| | 3,578 | | | The Scotts Miracle-Gro Co. | | | 212 | |
| | | | | | | | |
| | | | | | | 31,742 | |
| | | | | | | | |
| | | | Commercial Services & Supplies — 0.41% | | | | |
| | 8,112 | | | Covanta Holding Corp. | | | 172 | |
| | 10,011 | | | KAR Auction Services, Inc. | | | 374 | |
| | 13,368 | | | Pitney Bowes, Inc. | | | 278 | |
| | 13,737 | | | R.R. Donnelley & Sons Co. | | | 239 | |
| | 17,468 | | | Republic Services, Inc., Class – A | | | 684 | |
| | 11,677 | | | The ADT Corp. | | | 392 | |
| | 34,282 | | | Waste Management, Inc. | | | 1,590 | |
| | | | | | | | |
| | | | | | | 3,729 | |
| | | | | | | | |
| | | | Communications Equipment — 1.89% | | | | |
| | 174,484 | | | Brocade Communications Systems, Inc. | | | 2,073 | |
| | 211,226 | | | Cisco Systems, Inc. | | | 5,799 | |
| | 102,619 | | | Corning, Inc. | | | 2,025 | |
| | 9,967 | | | Harris Corp. | | | 767 | |
| | 16,399 | | | Motorola Solutions, Inc. | | | 940 | |
| | 91,020 | | | Qualcomm, Inc. | | | 5,701 | |
| | | | | | | | |
| | | | | | | 17,305 | |
| | | | | | | | |
| | | | Consumer Finance — 1.83% | | | | |
| | 120,336 | | | Capital One Financial Corp. | | | 10,586 | |
| | 49,427 | | | Discover Financial Services | | | 2,848 | |
| | 31,515 | | | Navient Corp. | | | 574 | |
| | 60,373 | | | Springleaf Holdings, Inc. (a) | | | 2,772 | |
| | | | | | | | |
| | | | | | | 16,780 | |
| | | | | | | | |
| | | | Containers & Packaging — 0.16% | | | | |
| | 6,840 | | | Avery Dennison Corp. | | | 417 | |
| | 6,299 | | | Bemis Co., Inc. | | | 284 | |
| | 7,545 | | | Packaging Corp. of America | | | 471 | |
| | 6,982 | | | Sonoco Products Co. | | | 299 | |
| | | | | | | | |
| | | | | | | 1,471 | |
| | | | | | | | |
| | | | Distributors — 0.11% | | | | |
| | 11,311 | | | Genuine Parts Co. | | | 1,013 | |
| | | | | | | | |
| | | | Diversified Consumer Services — 0.06% | | | | |
| | 18,503 | | | H&R Block, Inc. | | | 549 | |
| | | | | | | | |
See accompanying notes to financial statements.
47
HC CAPITAL TRUST
The Institutional Value Equity Portfolio
Portfolio of Investments (continued) — June 30, 2015
| | | | | | | | |
| Shares | | | Security
Description | | Value
(000) | |
| | | | Common Stocks (continued) | | | | |
| | | | Diversified Telecommunication Services — 1.50% | |
| | 174,659 | | | AT&T, Inc. | | $ | 6,204 | |
| | 40,609 | | | CenturyLink, Inc. | | | 1,193 | |
| | 72,703 | | | Frontier Communications Corp. | | | 360 | |
| | 129,005 | | | Verizon Communications, Inc. | | | 6,013 | |
| | | | | | | | |
| | | | | | | 13,770 | |
| | | | | | | | |
| | | | Electric Utilities — 2.02% | | | | |
| | 21,371 | | | American Electric Power, Inc. | | | 1,132 | |
| | 31,312 | | | Duke Energy Corp. | | | 2,212 | |
| | 98,016 | | | Edison International | | | 5,449 | |
| | 7,837 | | | Entergy Corp. | | | 553 | |
| | 15,639 | | | Eversource Energy | | | 710 | |
| | 33,940 | | | Exelon Corp. | | | 1,066 | |
| | 17,825 | | | FirstEnergy Corp. | | | 580 | |
| | 6,681 | | | Great Plains Energy, Inc. | | | 161 | |
| | 4,178 | | | Hawaiian Electric Industries, Inc. | | | 124 | |
| | 19,854 | | | NextEra Energy, Inc. | | | 1,946 | |
| | 9,961 | | | OGE Energy Corp. | | | 285 | |
| | 9,479 | | | Pepco Holdings, Inc. | | | 255 | |
| | 4,742 | | | Pinnacle West Capital Corp. | | | 270 | |
| | 30,408 | | | PPL Corp. | | | 896 | |
| | 44,821 | | | The Southern Co. | | | 1,878 | |
| | 6,143 | | | Westar Energy, Inc. | | | 210 | |
| | 23,943 | | | Xcel Energy, Inc. | | | 770 | |
| | | | | | | | |
| | | | | | | 18,497 | |
| | | | | | | | |
| | | | Electrical Equipment — 0.89% | | | | |
| | 34,670 | | | Eaton Corp. PLC | | | 2,340 | |
| | 104,855 | | | Emerson Electric Co. | | | 5,812 | |
| | | | | | | | |
| | | | | | | 8,152 | |
| | | | | | | | |
| | | | Electronic Equipment, Instruments & Components — 0.32% | |
| | 87,269 | | | Keysight Technologies, Inc. (a) | | | 2,722 | |
| | 7,619 | | | National Instruments Corp. | | | 224 | |
| | | | | | | | |
| | | | | | | 2,946 | |
| | | | | | | | |
| | | | Energy Equipment & Services — 1.96% | | | | |
| | 21,939 | | | Ensco PLC, ADR | | | 489 | |
| | 2,501 | | | Franks International NV | | | 47 | |
| | 68,518 | | | Helmerich & Payne, Inc. | | | 4,825 | |
| | 125,166 | | | National Oilwell Varco, Inc. | | | 6,043 | |
| | 10,511 | | | Oceaneering International, Inc. | | | 490 | |
| | 70,608 | | | Schlumberger Ltd. | | | 6,086 | |
| | | | | | | | |
| | | | | | | 17,980 | |
| | | | | | | | |
| | | | Food & Staples Retailing — 0.82% | | | | |
| | 18,568 | | | Safeway, Inc. | | | 1 | |
| | 18,568 | | | Safeway, Inc. | | | 19 | |
| | 42,186 | | | Sysco Corp. | | | 1,523 | |
| | 84,236 | | | Wal-Mart Stores, Inc. | | | 5,975 | |
| | | | | | | | |
| | | | | | | 7,518 | |
| | | | | | | | |
| | | | Food Products — 1.62% | | | | |
| | 50,955 | | | Archer-Daniels-Midland Co. | | | 2,457 | |
| | 10,146 | | | Campbell Soup Co. | | | 483 | |
| | 23,308 | | | ConAgra Foods, Inc. | | | 1,019 | |
| | 13,476 | | | Flowers Foods, Inc. | | | 285 | |
| | | | | | | | |
| Shares | | | Security
Description | | Value
(000) | |
| | | | Food Products (continued) | | | | |
| | 42,696 | | | General Mills, Inc. | | $ | 2,379 | |
| | 14,998 | | | Hershey Co. | | | 1,332 | |
| | 17,463 | | | Ingredion, Inc. | | | 1,394 | |
| | 18,760 | | | Kellogg Co. | | | 1,176 | |
| | 40,255 | | | Kraft Foods Group, Inc. | | | 3,428 | |
| | 8,521 | | | The J.M. Smucker Co. | | | 924 | |
| | | | | | | | |
| | | | | | | 14,877 | |
| | | | | | | | |
| | | | Gas Utilities — 0.55% | | | | |
| | 5,492 | | | AGL Resources, Inc. | | | 256 | |
| | 4,436 | | | Atmos Energy Corp. | | | 227 | |
| | 3,776 | | | National Fuel Gas Co. | | | 222 | |
| | 7,497 | | | Questar Corp. | | | 157 | |
| | 122,482 | | | UGI Corp. | | | 4,220 | |
| | | | | | | | |
| | | | | | | 5,082 | |
| | | | | | | | |
| | | | Health Care Equipment & Supplies — 0.31% | |
| | 40,356 | | | Baxter International, Inc. | | | 2,822 | |
| | | | | | | | |
| | | | Health Care Providers & Services — 1.80% | |
| | 41,245 | | | Aetna, Inc. | | | 5,257 | |
| | 68,455 | | | Anthem, Inc. | | | 11,236 | |
| | | | | | | | |
| | | | | | | 16,493 | |
| | | | | | | | |
| | | | Hotels, Restaurants & Leisure — 1.42% | | | | |
| | 8,583 | | | Darden Restaurants, Inc. | | | 610 | |
| | 4,000 | | | Extended Stay America, Inc. | | | 75 | |
| | 115,915 | | | Las Vegas Sands Corp. | | | 6,094 | |
| | 63,255 | | | McDonald’s Corp. | | | 6,014 | |
| | 4,754 | | | Six Flags Entertainment Corp. | | | 213 | |
| | | | | | | | |
| | | | | | | 13,006 | |
| | | | | | | | |
| | | | Household Durables — 0.11% | | | | |
| | 8,104 | | | Garmin Ltd. | | | 356 | |
| | 8,730 | | | Leggett & Platt, Inc. | | | 425 | |
| | 3,541 | | | Tupperware Brands Corp. | | | 229 | |
| | | | | | | | |
| | | | | | | 1,010 | |
| | | | | | | | |
| | | | Household Products — 1.55% | | | | |
| | 67,320 | | | Colgate-Palmolive Co. | | | 4,403 | |
| | 27,463 | | | Kimberly-Clark Corp. | | | 2,910 | |
| | 9,111 | | | The Clorox Co. | | | 948 | |
| | 76,218 | | | The Procter & Gamble Co. | | | 5,964 | |
| | | | | | | | |
| | | | | | | 14,225 | |
| | | | | | | | |
| | | | Independent Power and Renewable Electricity Producers — 0.57% | |
| | 249,532 | | | Calpine Corp. (a) | | | 4,488 | |
| | 13,440 | | | NRG Energy, Inc. | | | 308 | |
| | 29,077 | | | The AES Corp. | | | 386 | |
| | | | | | | | |
| | | | | | | 5,182 | |
| | | | | | | | |
| | | | Industrial Conglomerates — 1.29% | | | | |
| | 38,401 | | | 3M Co. | | | 5,925 | |
| | 223,059 | | | General Electric Co. | | | 5,927 | |
| | | | | | | | |
| | | | | | | 11,852 | |
| | | | | | | | |
| | | | Insurance — 4.69% | | | | |
| | 25,510 | | | ACE Ltd. | | | 2,594 | |
| | 36,707 | | | Aflac, Inc. | | | 2,283 | |
| | 7,147 | | | Allied World Assurance Co. Holdings AG | | | 309 | |
| | 159,978 | | | Allstate Corp. | | | 10,378 | |
See accompanying notes to financial statements.
48
HC CAPITAL TRUST
The Institutional Value Equity Portfolio
Portfolio of Investments (continued) — June 30, 2015
| | | | | | | | |
| Shares | | | Security
Description | | Value
(000) | |
| | | | Common Stocks (continued) | | | | |
| | | | Insurance (continued) | | | | |
| | 56,596 | | | American Financial Group, Inc. | | $ | 3,681 | |
| | 63,657 | | | Aon PLC | | | 6,345 | |
| | 10,793 | | | Arthur J. Gallagher & Co. | | | 511 | |
| | 12,126 | | | Cincinnati Financial Corp. | | | 608 | |
| | 2,790 | | | Endurance Specialty Holdings Ltd. | | | 183 | |
| | 40,108 | | | First American Financial Corp. | | | 1,492 | |
| | 2,970 | | | Hanover Insurance Group, Inc. | | | 220 | |
| | 1,769 | | | Mercury General Corp. | | | 98 | |
| | 65,748 | | | MetLife, Inc. | | | 3,681 | |
| | 15,462 | | | Old Republic International Corp. | | | 242 | |
| | 3,478 | | | PartnerRe Ltd. | | | 447 | |
| | 22,767 | | | Principal Financial Group, Inc. | | | 1,168 | |
| | 4,304 | | | ProAssurance Corp. | | | 199 | |
| | 31,894 | | | Prudential Financial, Inc. | | | 2,791 | |
| | 19,475 | | | The Chubb Corp. | | | 1,853 | |
| | 41,615 | | | The Progressive Corp. | | | 1,158 | |
| | 25,825 | | | The Travelers Cos., Inc. | | | 2,496 | |
| | 5,318 | | | Validus Holdings Ltd. | | | 234 | |
| | | | | | | | |
| | | | | | | 42,971 | |
| | | | | | | | |
| | | | Internet Software & Services — 0.11% | | | | |
| | 3,888 | | | Equinix, Inc. | | | 988 | |
| | | | | | | | |
| | | | IT Services — 1.86% | | | | |
| | 34,164 | | | Automatic Data Processing, Inc. | | | 2,741 | |
| | 56,899 | | | Booz Allen Hamilton Holding Corp. | | | 1,436 | |
| | 36,475 | | | International Business Machines Corp. | | | 5,934 | |
| | 4,519 | | | Leidos Holdings, Inc. | | | 182 | |
| | 20,944 | | | Paychex, Inc. | | | 982 | |
| | 41,973 | | | Western Union Co. | | | 853 | |
| | 462,506 | | | Xerox Corp. | | | 4,921 | |
| | | | | | | | |
| | | | | | | 17,049 | |
| | | | | | | | |
| | | | Leisure Products — 0.70% | | | | |
| | 7,069 | | | Hasbro, Inc. | | | 529 | |
| | 228,238 | | | Mattel, Inc. | | | 5,863 | |
| | | | | | | | |
| | | | | | | 6,392 | |
| | | | | | | | |
| | | | Machinery — 2.26% | | | | |
| | 69,466 | | | Caterpillar, Inc. | | | 5,892 | |
| | 3,907 | | | Crane Co. | | | 229 | |
| | 45,185 | | | Cummins, Inc. | | | 5,928 | |
| | 26,958 | | | Deere & Co. | | | 2,616 | |
| | 14,843 | | | Dover Corp. | | | 1,042 | |
| | 100,921 | | | ITT Corp. | | | 4,223 | |
| | 21,145 | | | The Timken Co. | | | 773 | |
| | | | | | | | |
| | | | | | | 20,703 | |
| | | | | | | | |
| | | | Media — 1.49% | | | | |
| | 14,017 | | | Cablevision Systems Corp., Class – A | | | 336 | |
| | 6,899 | | | Cinemark Holdings, Inc. | | | 277 | |
| | 31,871 | | | Omnicom Group, Inc. | | | 2,215 | |
| | 5,400 | | | Regal Entertainment Group, Class – A | | | 113 | |
| | 30,775 | | | The Interpublic Group of Cos., Inc. | | | 593 | |
| | 24,819 | | | Thomson Reuters Corp. | | | 945 | |
| | 84,800 | | | Time Warner, Inc. | | | 7,412 | |
| | 28,068 | | | Viacom, Inc., Class – B | | | 1,814 | |
| | | | | | | | |
| | | | | | | 13,705 | |
| | | | | | | | |
| | | | | | | | |
| Shares | | | Security
Description | | Value
(000) | |
| | | | Metals & Mining — 0.25% | | | | |
| | 7,508 | | | Allegheny Technologies, Inc. | | $ | 227 | |
| | 3,686 | | | Compass Minerals International, Inc. | | | 303 | |
| | 23,604 | | | Nucor Corp. | | | 1,040 | |
| | 6,316 | | | Reliance Steel & Aluminum Co. | | | 382 | |
| | 16,963 | | | Steel Dynamics, Inc. | | | 351 | |
| | | | | | | | |
| | | | | | | 2,303 | |
| | | | | | | | |
| | | | Multi-line Insurance — 0.01% | | | | |
| | 554 | | | American National Insurance Co. | | | 57 | |
| | | | | | | | |
| | | | Multiline Retail — 1.88% | | | | |
| | 12,607 | | | Dillard’s, Inc., Class – A | | | 1,326 | |
| | 69,319 | | | Dollar General Corp. | | | 5,389 | |
| | 102,785 | | | Kohl’s Corp. | | | 6,435 | |
| | 49,744 | | | Target Corp. | | | 4,061 | |
| | | | | | | | |
| | | | | | | 17,211 | |
| | | | | | | | |
| | | | Multi-Utilities — 1.04% | | | | |
| | 5,287 | | | Alliant Energy Corp. | | | 305 | |
| | 10,457 | | | Ameren Corp. | | | 394 | |
| | 21,142 | | | CenterPoint Energy, Inc. | | | 402 | |
| | 12,126 | | | CMS Energy Corp. | | | 386 | |
| | 14,027 | | | Consolidated Edison, Inc. | | | 812 | |
| | 28,512 | | | Dominion Resources, Inc. | | | 1,906 | |
| | 8,074 | | | DTE Energy Co. | | | 603 | |
| | 9,819 | | | MDU Resources Group, Inc. | | | 192 | |
| | 10,652 | | | NiSource, Inc. | | | 486 | |
| | 18,486 | | | PG&E Corp. | | | 908 | |
| | 19,961 | | | Public Service Enterprise Group, Inc. | | | 784 | |
| | 6,774 | | | SCANA Corp. | | | 343 | |
| | 10,749 | | | Sempra Energy | | | 1,064 | |
| | 10,091 | | | TECO Energy, Inc. | | | 178 | |
| | 3,783 | | | Vectren Corp. | | | 146 | |
| | 14,774 | | | WEC Energy Group, Inc. | | | 664 | |
| | | | | | | | |
| | | | | | | 9,573 | |
| | | | | | | | |
| | | | Oil, Gas & Consumable Fuels — 9.36% | | | | |
| | 48,355 | | | Chesapeake Energy Corp.^ | | | 540 | |
| | 61,172 | | | Chevron Corp. | | | 5,901 | |
| | 97,981 | | | ConocoPhillips | | | 6,017 | |
| | 965 | | | CVR Energy, Inc. | | | 36 | |
| | 49,022 | | | EOG Resources, Inc. | | | 4,292 | |
| | 71,992 | | | Exxon Mobil Corp. | | | 5,990 | |
| | 5,499 | | | Golar LNG Ltd. | | | 257 | |
| | 169,836 | | | Hess Corp. | | | 11,358 | |
| | 14,752 | | | HollyFrontier Corp. | | | 630 | |
| | 154,643 | | | Kinder Morgan, Inc. | | | 5,937 | |
| | 136,785 | | | Marathon Oil Corp. | | | 3,630 | |
| | 27,600 | | | Marathon Petroleum Corp. | | | 1,444 | |
| | 148,247 | | | Murphy Oil Corp. | | | 6,163 | |
| | 78,004 | | | Occidental Petroleum Corp. | | | 6,066 | |
| | 88,989 | | | ONEOK, Inc. | | | 3,513 | |
| | 5,344 | | | PBF Energy, Inc., Class – A | | | 152 | |
| | 46,623 | | | Phillips 66 | | | 3,756 | |
| | 94,669 | | | SM Energy Co. | | | 4,366 | |
| | 84,599 | | | Spectra Energy Corp. | | | 2,758 | |
| | 5,618 | | | Targa Resources Corp. | | | 501 | |
| | 3,219 | | | Teekay Shipping Corp. | | | 138 | |
See accompanying notes to financial statements.
49
HC CAPITAL TRUST
The Institutional Value Equity Portfolio
Portfolio of Investments (continued) — June 30, 2015
| | | | | | | | |
| Shares | | | Security
Description | | Value
(000) | |
| | | | Common Stocks (continued) | | | | |
| | | | Oil, Gas & Consumable Fuels (continued) | | | | |
| | 60,307 | | | The Williams Cos., Inc. | | $ | 3,461 | |
| | 142,004 | | | Valero Energy Corp. | | | 8,889 | |
| | | | | | | | |
| | | | | | | 85,795 | |
| | | | | | | | |
| | | | Paper & Forest Products — 0.18% | | | | |
| | 5,170 | | | Domtar Corp. | | | 214 | |
| | 29,946 | | | International Paper Co. | | | 1,425 | |
| | | | | | | | |
| | | | | | | 1,639 | |
| | | | | | | | |
| | | | Personal Products — 0.04% | | | | |
| | 29,752 | | | Avon Products, Inc. | | | 186 | |
| | 4,486 | | | Nu Skin Enterprises, Inc., Class – A | | | 212 | |
| | | | | | | | |
| | | | | | | 398 | |
| | | | | | | | |
| | | | Pharmaceuticals — 4.73% | | | | |
| | 87,002 | | | AbbVie, Inc. | | | 5,846 | |
| | 91,435 | | | Bristol-Myers Squibb Co. | | | 6,084 | |
| | 54,759 | | | Eli Lilly & Co. | | | 4,572 | |
| | 61,260 | | | Johnson & Johnson | | | 5,970 | |
| | 103,729 | | | Merck & Co., Inc. | | | 5,905 | |
| | 446,736 | | | Pfizer, Inc. | | | 14,978 | |
| | | | | | | | |
| | | | | | | 43,355 | |
| | | | | | | | |
| | | | Professional Services — 0.12% | | | | |
| | 24,789 | | | Nielsen Holdings NV | | | 1,110 | |
| | | | | | | | |
| | | | Real Estate Investment Trusts — 2.14% | | | | |
| | 2,593 | | | Alexandria Real Estate Equities, Inc. | | | 227 | |
| | 3,831 | | | American Campus Communities, Inc. | | | 144 | |
| | 5,621 | | | Apartment Investment & Management Co., Class – A | | | 208 | |
| | 4,294 | | | AvalonBay Communities, Inc. | | | 686 | |
| | 8,005 | | | BioMed Realty Trust, Inc. | | | 155 | |
| | 6,171 | | | Brandywine Realty Trust | | | 82 | |
| | 5,656 | | | Brixmor Property Group, Inc. | | | 131 | |
| | 2,880 | | | Camden Property Trust | | | 214 | |
| | 6,599 | | | CBL & Associates Properties, Inc. | | | 107 | |
| | 4,031 | | | Columbia Property Trust, Inc. | | | 99 | |
| | 3,298 | | | Corporate Office Properties Trust | | | 78 | |
| | 3,862 | | | Corrections Corp. of America | | | 128 | |
| | 10,912 | | | Crown Castle International Corp. | | | 876 | |
| | 10,961 | | | DDR Corp. | | | 169 | |
| | 4,703 | | | Digital Realty Trust, Inc. | | | 314 | |
| | 5,217 | | | Douglas Emmett, Inc. | | | 141 | |
| | 11,220 | | | Duke Realty Corp. | | | 208 | |
| | 2,892 | | | Equity Lifestyle Properties, Inc. | | | 152 | |
| | 11,955 | | | Equity Residential | | | 839 | |
| | 2,174 | | | Essex Property Trust, Inc. | | | 462 | |
| | 4,117 | | | Extra Space Storage, Inc. | | | 269 | |
| | 2,342 | | | Federal Realty Investment Trust | | | 300 | |
| | 2,929 | | | Gaming And Leisure Properties, Inc. | | | 107 | |
| | 19,868 | | | General Growth Properties, Inc. | | | 510 | |
| | 19,007 | | | HCP, Inc. | | | 693 | |
| | 12,449 | | | Health Care REIT, Inc. | | | 817 | |
| | 4,070 | | | Healthcare Trust of America, Inc., Class – A | | | 97 | |
| | 1,838 | | | Home Properties, Inc. | | | 134 | |
| | 4,912 | | | Hospitality Properties Trust | | | 142 | |
| | 27,160 | | | Host Hotels & Resorts, Inc. | | | 539 | |
| | | | | | | | |
| Shares | | | Security
Description | | Value
(000) | |
| | | | Real Estate Investment Trusts (continued) | | | | |
| | 7,201 | | | Iron Mountain, Inc. | | $ | 223 | |
| | 14,764 | | | Kimco Realty Corp. | | | 333 | |
| | 2,653 | | | Lamar Advertising Co., Class – A | | | 152 | |
| | 5,135 | | | Liberty Property Trust | | | 165 | |
| | 2,564 | | | Mid-America Apartment Communities, Inc. | | | 187 | |
| | 5,058 | | | National Retail Properties, Inc. | | | 177 | |
| | 13,295 | | | NorthStar Realty Finance Corp. | | | 211 | |
| | 6,821 | | | OMEGA Healthcare Investors, Inc. | | | 234 | |
| | 5,104 | | | Outfront Media, Inc. | | | 129 | |
| | 5,049 | | | Piedmont Office Realty Trust, Inc., Class – A | | | 89 | |
| | 5,857 | | | Plum Creek Timber Co., Inc. | | | 238 | |
| | 1,888 | | | Post Properties, Inc. | | | 103 | |
| | 18,786 | | | Prologis, Inc. | | | 697 | |
| | 5,138 | | | Public Storage | | | 946 | |
| | 4,255 | | | Rayonier, Inc. | | | 109 | |
| | 8,570 | | | Realty Income Corp. | | | 380 | |
| | 3,018 | | | Regency Centers Corp. | | | 178 | |
| | 8,092 | | | Retail Properties of America, Inc., Class – A | | | 113 | |
| | 9,227 | | | Senior Housing Properties Trust | | | 162 | |
| | 11,603 | | | Simon Property Group, Inc. | | | 2,007 | |
| | 15,996 | | | Spirit Realty Capital, Inc. | | | 155 | |
| | 8,560 | | | Starwood Property Trust, Inc. | | | 185 | |
| | 3,459 | | | Tanger Factory Outlet Centers, Inc. | | | 110 | |
| | 2,223 | | | Taubman Centers, Inc. | | | 154 | |
| | 5,463 | | | The Macerich Co. | | | 408 | |
| | 8,364 | | | UDR, Inc. | | | 268 | |
| | 12,717 | | | Ventas, Inc. | | | 790 | |
| | 5,850 | | | Vornado Realty Trust | | | 555 | |
| | 4,261 | | | Weingarten Realty Investors | | | 139 | |
| | 19,528 | | | Weyerhaeuser Co. | | | 615 | |
| | 4,261 | | | WP Carey, Inc. | | | 251 | |
| | 6,080 | | | WP GLIMCHER, Inc. | | | 82 | |
| | | | | | | | |
| | | | | | | 19,573 | |
| | | | | | | | |
| | | | Road & Rail — 0.36% | | | | |
| | 38,013 | | | Norfolk Southern Corp. | | | 3,321 | |
| | | | | | | | |
| | | | Semiconductors & Semiconductor Equipment — 2.62% | |
| | 19,193 | | | Analog Devices, Inc. | | | 1,232 | |
| | 178,658 | | | Applied Materials, Inc. | | | 3,434 | |
| | 23,741 | | | Cypress Semiconductor Corp. | | | 279 | |
| | 335,746 | | | Intel Corp. | | | 10,212 | |
| | 31,366 | | | KLA-Tencor Corp. | | | 1,763 | |
| | 16,426 | | | Linear Technology Corp. | | | 727 | |
| | 18,313 | | | Maxim Integrated Products, Inc. | | | 633 | |
| | 12,935 | | | Microchip Technology, Inc. | | | 613 | |
| | 80,669 | | | Texas Instruments, Inc. | | | 4,155 | |
| | 21,249 | | | Xilinx, Inc. | | | 938 | |
| | | | | | | | |
| | | | | | | 23,986 | |
| | | | | | | | |
| | | | Software — 2.76% | | | | |
| | 22,373 | | | CA, Inc. | | | 655 | |
| | 68,428 | | | Electronic Arts, Inc. (a) | | | 4,550 | |
| | 345,903 | | | Microsoft Corp. | | | 15,272 | |
| | 65,940 | | | Oracle Corp. | | | 2,657 | |
| | 91,482 | | | Symantec Corp. | | | 2,127 | |
| | | | | | | | |
| | | | | | | 25,261 | |
| | | | | | | | |
See accompanying notes to financial statements.
50
HC CAPITAL TRUST
The Institutional Value Equity Portfolio
Portfolio of Investments (continued) — June 30, 2015
| | | | | | | | |
| Shares | | | Security
Description | | Value
(000) | |
| | | | Common Stocks (continued) | | | | |
| | | | Specialty Retail — 2.08% | | | | |
| | 21,702 | | | Best Buy Co., Inc. | | $ | 708 | |
| | 5,244 | | | DSW, Inc., Class – A | | | 175 | |
| | 79,267 | | | Foot Locker, Inc. | | | 5,312 | |
| | 123,747 | | | GameStop Corp., Class – A^ | | | 5,316 | |
| | 20,223 | | | Gap, Inc. | | | 772 | |
| | 16,611 | | | L Brands, Inc. | | | 1,424 | |
| | 309,443 | | | Office Depot, Inc. (a) | | | 2,680 | |
| | 175,788 | | | Staples, Inc. | | | 2,691 | |
| | | | | | | | |
| | | | | | | 19,078 | |
| | | | | | | | |
| | | | Technology Hardware, Storage & Peripherals — 1.56% | |
| | 470,210 | | | Hewlett-Packard Co. | | | 14,111 | |
| | 4,590 | | | Lexmark International, Inc., Class – A | | | 203 | |
| | | | | | | | |
| | | | | | | 14,314 | |
| | | | | | | | |
| | | | Textiles, Apparel & Luxury Goods — 0.10% | |
| | 26,989 | | | Coach, Inc. | | | 934 | |
| | | | | | | | |
| | | | Thrifts & Mortgage Finance — 0.08% | | | | |
| | 24,246 | | | New York Community Bancorp, Inc. | | | 445 | |
| | 18,675 | | | People’s United Financial, Inc. | | | 303 | |
| | | | | | | | |
| | | | | | | 748 | |
| | | | | | | | |
| | | | Tobacco — 1.87% | | | | |
| | 193,685 | | | Altria Group, Inc. | | | 9,474 | |
| | 73,647 | | | Philip Morris International, Inc. | | | 5,904 | |
| | 24,221 | | | Reynolds American, Inc. | | | 1,808 | |
| | | | | | | | |
| | | | | | | 17,186 | |
| | | | | | | | |
| | | | Trading Companies & Distributors — 0.18% | |
| | 20,923 | | | Fastenal Co. | | | 883 | |
| | 3,443 | | | GATX Corp. | | | 183 | |
| | 4,759 | | | MSC Industrial Direct Co., Inc., Class – A | | | 332 | |
| | 1,786 | | | Watsco, Inc. | | | 221 | |
| | | | | | | | |
| | | | | | | 1,619 | |
| | | | | | | | |
| | | | Transportation Infrastructure — 0.04% | | | | |
| | 4,974 | | | Macquarie Infrastructure Corp. | | | 411 | |
| | | | | | | | |
| | | | Water Utilities — 0.07% | | | | |
| | 8,322 | | | American Water Works Co., Inc. | | | 405 | |
| | 8,568 | | | Aqua America, Inc. | | | 210 | |
| | | | | | | | |
| | | | | | | 615 | |
| | | | | | | | |
| | | | Wireless Telecommunication Services — 0.29% | |
| | 73,840 | | | Vodafone Group PLC, ADR | | | 2,691 | |
| | | | | | | | |
| | | | Total Common Stocks | | | 752,849 | |
| | | | | | | | |
| | | | | | | | |
Shares or
Principal
Amount
(000) | | | Security
Description | | Value
(000) | |
| | | | Time Deposit — 1.19% | | | | |
| $ | 10,943 | | | State Street Liquidity Management Control System Eurodollar Time Deposit, 0.01%, 7/1/15 | | $ | 10,943 | |
| | | | | | | | |
| | | | Total Time Deposit | | | 10,943 | |
| | | | | | | | |
| | | | Mutual Funds —15.10% | | | | |
| | 1,940,079 | | | Dreyfus Treasury Prime Cash Management Fund, 0.00% (b) | | | 1,940 | |
| | 92,179,976 | | | Federated U.S. Treasury Cash Reserve Fund, Institutional Shares, 0.00% (b) | | | 92,180 | |
| | 592,862 | | | Vanguard REIT ETF | | | 44,281 | |
| | | | | | | | |
| | | | Total Mutual Funds | | | 138,401 | |
| | | | | | | | |
| | | | Repurchase Agreement — 0.41% | | | | |
| $ | 3,770 | | | Jefferies LLC,0.23%, 7/1/15
(Purchased on 6/30/15, proceeds at maturity $3,769,921 collateralized by U.S. Treasury Obligations, 0.00% – 3.28%, 8/15/15 – 8/15/44 fair value $3,845,295)^^ | | | 3,770 | |
| | | | | | | | |
| | | | Total Repurchase Agreement | | | 3,770 | |
| | | | | | | | |
| | | | Total Investments
(cost $798,124) — 98.83% | | | 905,963 | |
| | | | Other assets in excess of
liabilities — 1.17% | | | 10,717 | |
| | | | | | | | |
| | | | Net Assets — 100.00% | | $ | 916,680 | |
| | | | | | | | |
Amounts designated as “—” are $0 or have been rounded to $0.
| ^ | All or part of this security was on loan as of June 30, 2015. The total value of securities on loan as of June 30, 2015, was $6,379 (amount in thousands). |
| ^^ | Purchased with cash collateral held from securities lending. The value of the collateral could include collateral held for securities that were sold on or before June 30, 2015. |
| (a) | Represents non-income producing security. |
| (b) | The rate disclosed is the rate in effect on June 30, 2015. |
ADR — American Depositary Receipt
ETF — Exchange Traded Fund
REIT — Real Estate Investment Trust
See accompanying notes to financial statements.
51
HC CAPITAL TRUST
The Institutional Value Equity Portfolio
Portfolio of Investments (concluded) — June 30, 2015
The following table reflects the percentage of total net assets of the Portfolio attributable to each Specialist Manager, see Note 3 in the Notes to Financial Statements.
| | | | | | | | | | | | | | | | | | | | |
The Institutional Value Equity Portfolio | | Alliance
Bernstein L.P. | | | Cadence Capital
Management, LLC | | | Parametric
Portfolio
Associates, LLC | | | HC Capital
Solutions | | | Total | |
Common Stocks | | | 30.25 | % | | | 51.88 | % | | | — | | | | — | | | | 82.13 | % |
Time Deposit | | | 1.19 | % | | | — | | | | — | | | | — | | | | 1.19 | % |
Mutual Funds | | | — | | | | 0.22 | % | | | 4.83 | % | | | 10.05 | % | | | 15.10 | % |
Repurchase Agreement | | | 0.32 | % | | | 0.09 | % | | | — | | | | — | | | | 0.41 | % |
Other Assets (Liabilities) | | | -0.91 | % | | | -0.01 | % | | | 2.09 | % | | | — | | | | 1.17 | % |
| | | | | | | | | | | | | | | | | | | | |
Total Net Assets | | | 30.85 | % | | | 52.18 | % | | | 6.92 | % | | | 10.05 | % | | | 100.00 | % |
| | | | | | | | | | | | | | | | | | | | |
The following table reflects the open derivative positions held by the Portfolio as of June 30, 2015.
Long Futures
| | | | | | | | | | | | | | | | |
Number of
Contracts | | | Futures Contracts Positions^ | | Value
(000) | | | Expiration | | | Unrealized
Appreciation/
(Depreciation)
(000) | |
| | 148 | | | E-Mini S&P 500 Future | | $ | 15,203 | | | | 9/18/15 | | | $ | (346 | ) |
| | 21 | | | E-Mini S&P Midcap 400 Future | | | 3,146 | | | | 9/18/15 | | | | (60 | ) |
| | | | | | | | | | | | | | | | |
| | | | Net Unrealized Appreciation/(Depreciation) | | | | | | | | | | $ | (406 | ) |
| | | | | | | | | | | | | | | | |
Amounts designated as “—” are $0 or have been rounded to $0.
| ^ | Cash has been pledged as collateral for futures contracts held by the Portfolio. |
See accompanying notes to financial statements.
52
HC CAPITAL TRUST
The Growth Equity Portfolio
Portfolio of Investments — June 30, 2015
| | | | | | | | |
| Shares | | | Security Description | | Value
(000) | |
| | | | Common Stocks — 82.03% | | | | |
| | | | Aerospace & Defense — 1.32% | | | | |
| | 11,980 | | | General Dynamics Corp. | | $ | 1,697 | |
| | 3,361 | | | L-3 Communications Holdings, Inc. | | | 381 | |
| | 5,669 | | | Precision Castparts Corp. | | | 1,133 | |
| | 12,269 | | | Raytheon Co. | | | 1,174 | |
| | 5,291 | | | Rockwell Collins, Inc. | | | 489 | |
| | 19,092 | | | The Boeing Co. | | | 2,648 | |
| | 35,945 | | | United Technologies Corp. | | | 3,988 | |
| | | | | | | | |
| | | | | | | 11,510 | |
| | | | | | | | |
| | | | Air Freight & Logistics — 0.08% | | | | |
| | 5,820 | | | C.H. Robinson Worldwide, Inc. | | | 363 | |
| | 7,723 | | | Expeditors International of Washington, Inc. | | | 356 | |
| | | | | | | | |
| | | | | | | 719 | |
| | | | | | | | |
| | | | Airlines — 0.02% | | | | |
| | 2,831 | | | Spirit Airlines, Inc. (a) | | | 176 | |
| | | | | | | | |
| | | | Automobiles — 0.33% | | | | |
| | 10,638 | | | Tesla Motors, Inc. (a) | | | 2,854 | |
| | | | | | | | |
| | | | Banks — 0.06% | | | | |
| | 2,102 | | | Cullen/Frost Bankers, Inc. | | | 165 | |
| | 5,378 | | | First Republic Bank | | | 339 | |
| | | | | | | | |
| | | | | | | 504 | |
| | | | | | | | |
| | | | Beverages — 1.67% | | | | |
| | 6,049 | | | Brown-Forman Corp., Class – B | | | 606 | |
| | 7,683 | | | Dr. Pepper Snapple Group, Inc. | | | 560 | |
| | 13,190 | | | Monster Beverage Corp. (a) | | | 1,768 | |
| | 59,437 | | | PepsiCo, Inc. | | | 5,548 | |
| | 155,705 | | | The Coca-Cola Co. | | | 6,108 | |
| | | | | | | | |
| | | | | | | 14,590 | |
| | | | | | | | |
| | | | Biotechnology — 4.51% | | | | |
| | 15,335 | | | Alexion Pharmaceuticals, Inc. (a) | | | 2,772 | |
| | 102,163 | | | Amgen, Inc. | | | 15,684 | |
| | 11,278 | | | Biogen Idec, Inc. (a) | | | 4,556 | |
| | 19,482 | | | Celgene Corp. (a) | | | 2,255 | |
| | 24,489 | | | Gilead Sciences, Inc. | | | 2,867 | |
| | 19,048 | | | Regeneron Pharmaceuticals, Inc. (a) | | | 9,717 | |
| | 12,764 | | | Vertex Pharmaceuticals, Inc. (a) | | | 1,576 | |
| | | | | | | | |
| | | | | | | 39,427 | |
| | | | | | | | |
| | | | Capital Markets — 1.90% | | | | |
| | 3,632 | | | Federated Investors, Inc., Class – B | | | 122 | |
| | 15,548 | | | Franklin Resources, Inc. | | | 762 | |
| | 8,936 | | | Goldman Sachs Group, Inc. | | | 1,866 | |
| | 57,156 | | | Morgan Stanley | | | 2,217 | |
| | 5,176 | | | SEI Investments Co. | | | 254 | |
| | 130,516 | | | State Street Corp. | | | 10,050 | |
| | 10,071 | | | T. Rowe Price Group, Inc. | | | 783 | |
| | 10,573 | | | TD Ameritrade Holdg Corp. | | | 389 | |
| | 3,328 | | | Waddell & Reed Financial, Inc., Class – A | | | 157 | |
| | | | | | | | |
| | | | | | | 16,600 | |
| | | | | | | | |
| | | | Chemicals — 3.24% | | | | |
| | 8,303 | | | Air Products & Chemicals, Inc. | | | 1,136 | |
| | 109,509 | | | Ecolab, Inc. | | | 12,382 | |
| | 3,163 | | | International Flavors & Fragrances, Inc. | | | 346 | |
| | | | | | | | |
| Shares | | | Security Description | | Value
(000) | |
| | | | Chemicals (continued) | | | | |
| | 94,095 | | | Monsanto Co. | | $ | 10,030 | |
| | 11,476 | | | Praxair, Inc. | | | 1,372 | |
| | 4,624 | | | Sigma-Aldrich Corp. | | | 644 | |
| | 8,796 | | | The Sherwin-Williams Co. | | | 2,419 | |
| | | | | | | | |
| | | | | | | 28,329 | |
| | | | | | | | |
| | | | Commercial Services & Supplies — 0.14% | | | | |
| | 3,918 | | | Cintas Corp. | | | 331 | |
| | 4,407 | | | Copart, Inc. (a) | | | 156 | |
| | 3,687 | | | Rollins, Inc. | | | 105 | |
| | 3,305 | | | Stericycle, Inc. (a) | | | 444 | |
| | 4,827 | | | Waste Connections, Inc. | | | 227 | |
| | | | | | | | |
| | | | | | | 1,263 | |
| | | | | | | | |
| | | | Communications Equipment — 1.69% | | | | |
| | 200,890 | | | Cisco Systems, Inc. | | | 5,516 | |
| | 2,946 | | | F5 Networks, Inc. (a) | | | 355 | |
| | 4,152 | | | Harris Corp. | | | 319 | |
| | 137,309 | | | Qualcomm, Inc. | | | 8,600 | |
| | | | | | | | |
| | | | | | | 14,790 | |
| | | | | | | | |
| | | | Construction & Engineering — 0.06% | | | | |
| | 5,809 | | | Fluor Corp. | | | 308 | |
| | 5,148 | | | Jacobs Engineering Group, Inc. (a) | | | 209 | |
| | | | | | | | |
| | | | | | | 517 | |
| | | | | | | | |
| | | | Consumer Finance — 1.26% | | | | |
| | 141,110 | | | American Express Co. | | | 10,967 | |
| | | | | | | | |
| | | | Containers & Packaging — 0.04% | | | | |
| | 2,539 | | | AptarGroup, Inc. | | | 162 | |
| | 3,971 | | | Sonoco Products Co. | | | 170 | |
| | | | | | | | |
| | | | | | | 332 | |
| | | | | | | | |
| | | | Distributors — 0.06% | | | | |
| | 6,042 | | | Genuine Parts Co. | | | 541 | |
| | | | | | | | |
| | | | Diversified Consumer Services — 0.01% | | | | |
| | 3,777 | | | Apollo Group, Inc., Class – A (a) | | | 49 | |
| | | | | | | | |
| | | | Diversified Financial Services — 0.48% | | | | |
| | 3,353 | | | CBOE Holdings, Inc. | | | 192 | |
| | 12,487 | | | CME Group, Inc. | | | 1,162 | |
| | 27,926 | | | The McGraw-Hill Cos., Inc. | | | 2,805 | |
| | | | | | | | |
| | | | | | | 4,159 | |
| | | | | | | | |
| | | | Electrical Equipment — 0.26% | | | | |
| | 9,591 | | | AMETEK, Inc. | | | 525 | |
| | 27,495 | | | Emerson Electric Co. | | | 1,524 | |
| | 2,308 | | | Hubbell, Inc., Class – B | | | 250 | |
| | | | | | | | |
| | | | | | | 2,299 | |
| | | | | | | | |
| | | | Electronic Equipment, Instruments & Components — 0.17% | |
| | 12,329 | | | Amphenol Corp., Class – A | | | 715 | |
| | 1,901 | | | Dolby Laboratories, Inc., Class – A | | | 75 | |
| | 5,557 | | | FLIR Systems, Inc. | | | 171 | |
| | 6,086 | | | Ingram Micro, Inc. (a) | | | 152 | |
| | 3,864 | | | National Instruments Corp. | | | 114 | |
| | 2,006 | | | Zebra Technologies Corp. (a) | | | 223 | |
| | | | | | | | |
| | | | | | | 1,450 | |
| | | | | | | | |
See accompanying notes to financial statements.
53
HC CAPITAL TRUST
The Growth Equity Portfolio
Portfolio of Investments (continued) — June 30, 2015
| | | | | | | | |
| Shares | | | Security Description | | Value
(000) | |
| | | | Common Stocks (continued) | | | | |
| | | | Energy Equipment & Services — 1.88% | | | | |
| | 21,867 | | | Core Laboratories NV | | $ | 2,494 | |
| | 1,600 | | | Dril-Quip, Inc. (a) | | | 120 | |
| | 9,197 | | | FMC Technologies, Inc. (a) | | | 382 | |
| | 3,760 | | | Helmerich & Payne, Inc. | | | 265 | |
| | 16,803 | | | National Oilwell Varco, Inc. | | | 811 | |
| | 3,878 | | | Oceaneering International, Inc. | | | 181 | |
| | 140,997 | | | Schlumberger Ltd. | | | 12,152 | |
| | | | | | | | |
| | | | | | | 16,405 | |
| | | | | | | | |
| | | | Food & Staples Retailing — 3.40% | | | | |
| | 36,329 | | | Costco Wholesale Corp. | | | 4,907 | |
| | 45,872 | | | CVS Caremark Corp. | | | 4,811 | |
| | 22,890 | | | Sysco Corp. | | | 826 | |
| | 25,163 | | | The Kroger Co. | | | 1,825 | |
| | 37,426 | | | Walgreens Boots Alliance, Inc. | | | 3,160 | |
| | 62,481 | | | Wal-Mart Stores, Inc. | | | 4,432 | |
| | 248,039 | | | Whole Foods Market, Inc. | | | 9,782 | |
| | | | | | | | |
| | | | | | | 29,743 | |
| | | | | | | | |
| | | | Food Products — 2.85% | | | | |
| | 6,839 | | | Campbell Soup Co. | | | 326 | |
| | 6,750 | | | Flowers Foods, Inc. | | | 143 | |
| | 110,498 | | | Hershey Co. | | | 9,816 | |
| | 5,206 | | | Hormel Foods Corp. | | | 293 | |
| | 5,075 | | | McCormick & Co., Inc. | | | 411 | |
| | 7,927 | | | Mead Johnson Nutrition Co. | | | 715 | |
| | 310,906 | | | Mondelez International, Inc., Class – A | | | 12,791 | |
| | 4,053 | | | The J.M. Smucker Co. | | | 439 | |
| | | | | | | | |
| | | | | | | 24,934 | |
| | | | | | | | |
| | | | Health Care Equipment & Supplies — 2.08% | | | | |
| | 116,279 | | | Abbott Laboratories | | | 5,707 | |
| | 21,238 | | | Baxter International, Inc. | | | 1,485 | |
| | 7,575 | | | Becton, Dickinson & Co. | | | 1,073 | |
| | 2,960 | | | C.R. Bard, Inc. | | | 505 | |
| | 5,552 | | | Dentsply International, Inc. | | | 286 | |
| | 4,122 | | | Edwards Lifesciences Corp. (a) | | | 587 | |
| | 3,760 | | | IDEXX Laboratories, Inc. (a) | | | 241 | |
| | 1,403 | | | Intuitive Surgical, Inc. (a) | | | 680 | |
| | 56,105 | | | Medtronic PLC | | | 4,157 | |
| | 5,494 | | | ResMed, Inc. | | | 310 | |
| | 11,106 | | | St. Jude Medical, Inc. | | | 812 | |
| | 13,184 | | | Stryker Corp. | | | 1,260 | |
| | 4,059 | | | Varian Medical Systems, Inc. (a) | | | 342 | |
| | 6,582 | | | Zimmer Holdings, Inc. | | | 719 | |
| | | | | | | | |
| | | | | | | 18,164 | |
| | | | | | | | |
| | | | Health Care Providers & Services — 1.70% | | | | |
| | 13,972 | | | Aetna, Inc. | | | 1,781 | |
| | 10,952 | | | Anthem, Inc. | | | 1,798 | |
| | 28,787 | | | Express Scripts Holding Co. (a) | | | 2,560 | |
| | 3,334 | | | Henry Schein, Inc. (a) | | | 474 | |
| | 3,906 | | | Laboratory Corp. of America Holdings (a) | | | 473 | |
| | 9,008 | | | McKesson Corp. | | | 2,025 | |
| | 3,890 | | | MEDNAX, Inc. (a) | | | 288 | |
| | 3,351 | | | Patterson Cos., Inc. | | | 163 | |
| | | | | | | | |
| Shares | | | Security Description | | Value
(000) | |
| | | | Health Care Providers & Services (continued) | | | | |
| | 5,659 | | | Quest Diagnostics, Inc. | | $ | 410 | |
| | 38,435 | | | UnitedHealth Group, Inc. | | | 4,690 | |
| | 3,451 | | | VCA Antech, Inc. (a) | | | 188 | |
| | | | | | | | |
| | | | | | | 14,850 | |
| | | | | | | | |
| | | | Health Care Technology — 1.42% | | | | |
| | 179,562 | | | Cerner Corp. (a) | | | 12,400 | |
| | 1,487 | | | Veeva Systems, Inc. (a) | | | 42 | |
| | | | | | | | |
| | | | | | | 12,442 | |
| | | | | | | | |
| | | | Hotels, Restaurants & Leisure — 3.04% | | | | |
| | 4,200 | | | Chipotle Mexican Grill, Inc. (a) | | | 2,541 | |
| | 34,854 | | | Marriott International, Inc. | | | 2,593 | |
| | 38,777 | | | McDonald’s Corp. | | | 3,687 | |
| | 989 | | | Panera Bread Co., Class – A (a) | | | 173 | |
| | 299,111 | | | Starbucks Corp. | | | 16,036 | |
| | 17,290 | | | YUM! Brands, Inc. | | | 1,557 | |
| | | | | | | | |
| | | | | | | 26,587 | |
| | | | | | | | |
| | | | Household Durables — 0.02% | | | | |
| | 4,761 | | | Garmin Ltd. | | | 209 | |
| | | | | | | | |
| | | | Household Products — 2.40% | | | | |
| | 5,298 | | | Church & Dwight Co., Inc. | | | 430 | |
| | 181,507 | | | Colgate-Palmolive Co. | | | 11,873 | |
| | 14,762 | | | Kimberly-Clark Corp. | | | 1,564 | |
| | 5,016 | | | The Clorox Co. | | | 522 | |
| | 83,849 | | | The Procter & Gamble Co. | | | 6,560 | |
| | | | | | | | |
| | | | | | | 20,949 | |
| | | | | | | | |
| | | | Industrial Conglomerates — 0.79% | | | | |
| | 25,629 | | | 3M Co. | | | 3,955 | |
| | 2,507 | | | Carlisle Cos., Inc. | | | 251 | |
| | 23,816 | | | Danaher Corp. | | | 2,038 | |
| | 3,883 | | | Roper Industries, Inc. | | | 670 | |
| | | | | | | | |
| | | | | | | 6,914 | |
| | | | | | | | |
| | | | Insurance — 1.03% | | | | |
| | 86,140 | | | Aon PLC | | | 8,586 | |
| | 4,695 | | | Brown & Brown, Inc. | | | 154 | |
| | 5,118 | | | Torchmark Corp. | | | 298 | |
| | | | | | | | |
| | | | | | | 9,038 | |
| | | | | | | | |
| | | | Internet & Catalog Retail — 4.32% | | | | |
| | 36,725 | | | Amazon.com, Inc. (a) | | | 15,942 | |
| | 61,078 | | | JD.com, Inc., ADR (a) | | | 2,083 | |
| | 6,366 | | | Netflix, Inc. (a) | | | 4,182 | |
| | 12,017 | | | Priceline.com, Inc. (a) | | | 13,836 | |
| | 15,162 | | | TripAdvisor, Inc. (a) | | | 1,321 | |
| | 15,336 | | | Vipshop Holdings Ltd., ADR (a) | | | 341 | |
| | | | | | | | |
| | | | | | | 37,705 | |
| | | | | | | | |
| | | | Internet Software & Services — 7.37% | | | | |
| | 23,407 | | | Alibaba Group Holding Ltd., ADR (a) | | | 1,926 | |
| | 49,688 | | | eBay, Inc. (a) | | | 2,993 | |
| | 32,875 | | | Equinix, Inc. | | | 8,350 | |
| | 75,305 | | | Facebook, Inc., Class – A (a) | | | 6,459 | |
| | 37,734 | | | Google, Inc. (a) | | | 19,641 | |
| | 16,263 | | | Google, Inc., Class – A (a) | | | 8,783 | |
| | 50,271 | | | LinkedIn Corp., Class – A (a) | | | 10,387 | |
| | 4,565 | | | Rackspace Hosting, Inc. (a) | | | 170 | |
See accompanying notes to financial statements.
54
HC CAPITAL TRUST
The Growth Equity Portfolio
Portfolio of Investments (continued) — June 30, 2015
| | | | | | | | |
| Shares | | | Security Description | | Value
(000) | |
| | | | Common Stocks (continued) | | | | |
| | | | Internet Software & Services (continued) | | | | |
| | 142,371 | | | Tencent Holdings Ltd., ADR | | $ | 2,855 | |
| | 35,262 | | | Twitter, Inc. (a) | | | 1,277 | |
| | 37,136 | | | Yahoo!, Inc. (a) | | | 1,459 | |
| | | | | | | | |
| | | | | | | 64,300 | |
| | | | | | | | |
| | | | IT Services — 6.34% | | | | |
| | 24,818 | | | Accenture PLC, Class – A | | | 2,402 | |
| | 6,277 | | | Amdocs Ltd. | | | 343 | |
| | 133,424 | | | Automatic Data Processing, Inc. | | | 10,705 | |
| | 4,705 | | | Broadridge Financial Solutions, Inc. | | | 235 | |
| | 23,846 | | | Cognizant Technology Solutions Corp. (a) | | | 1,457 | |
| | 3,237 | | | FleetCor Technologies, Inc. (a) | | | 505 | |
| | 2,649 | | | Global Payments, Inc. | | | 274 | |
| | 37,079 | | | International Business Machines Corp. | | | 6,031 | |
| | 3,304 | | | Jack Henry & Associates, Inc. | | | 214 | |
| | 102,482 | | | MasterCard, Inc., Class – A | | | 9,580 | |
| | 12,764 | | | Paychex, Inc. | | | 598 | |
| | 6,171 | | | Teradata Corp. (a) | | | 228 | |
| | 6,581 | | | Total System Services, Inc. | | | 275 | |
| | 328,807 | | | Visa, Inc., Class – A | | | 22,080 | |
| | 21,148 | | | Western Union Co. | | | 430 | |
| | | | | | | | |
| | | | | | | 55,357 | |
| | | | | | | | |
| | | | Leisure Products — 0.04% | | | | |
| | 2,548 | | | Polaris Industries, Inc. | | | 377 | |
| | | | | | | | |
| | | | Life Sciences Tools & Services — 0.69% | | | | |
| | 1,451 | | | Bio-Techne Corp. | | | 143 | |
| | 13,782 | | | Illumina, Inc. (a) | | | 3,010 | |
| | 1,164 | | | Mettler-Toledo International, Inc. (a) | | | 397 | |
| | 15,655 | | | Thermo Electron Corp. | | | 2,031 | |
| | 3,310 | | | Waters Corp. (a) | | | 425 | |
| | | | | | | | |
| | | | | | | 6,006 | |
| | | | | | | | |
| | | | Machinery — 0.36% | | | | |
| | 1,919 | | | Crane Co. | | | 113 | |
| | 5,587 | | | Donaldson Co., Inc. | | | 200 | |
| | 3,134 | | | IDEX Corp. | | | 246 | |
| | 12,679 | | | Illinois Tool Works, Inc. | | | 1,164 | |
| | 4,274 | | | Pall Corp. | | | 532 | |
| | 2,241 | | | The Middleby Corp. (a) | | | 252 | |
| | 3,760 | | | Wabtec Corp. | | | 354 | |
| | 7,209 | | | Xylem, Inc. | | | 267 | |
| | | | | | | | |
| | | | | | | 3,128 | |
| | | | | | | | |
| | | | Marine — 0.02% | | | | |
| | 2,249 | | | Kirby Corp. (a) | | | 172 | |
| | | | | | | | |
| | | | Media — 2.00% | | | | |
| | 1,722 | | | John Wiley & Sons, Inc., Class – A | | | 94 | |
| | 785 | | | Morningstar, Inc. | | | 62 | |
| | 10,137 | | | Omnicom Group, Inc. | | | 704 | |
| | 4,126 | | | Scripps Networks Interactive, Class – A | | | 270 | |
| | 126,993 | | | The Walt Disney Co. | | | 14,495 | |
| | 20,761 | | | Time Warner, Inc. | | | 1,815 | |
| | | | | | | | |
| | | | | | | 17,440 | |
| | | | | | | | |
| | | | Multiline Retail — 0.35% | | | | |
| | 20,591 | | | Dollar General Corp. | | | 1,601 | |
| | 8,098 | | | Dollar Tree, Inc. (a) | | | 640 | |
| | | | | | | | |
| Shares | | | Security Description | | Value
(000) | |
| | | | Multiline Retail (continued) | | | | |
| | 3,718 | | | Family Dollar Stores, Inc. | | $ | 293 | |
| | 8,147 | | | Kohl’s Corp. | | | 510 | |
| | | | | | | | |
| | | | | | | 3,044 | |
| | | | | | | | |
| | | | Oil, Gas & Consumable Fuels — 1.95% | | | | |
| | 66,913 | | | Chevron Corp. | | | 6,455 | |
| | 17,806 | | | Concho Resources, Inc. (a) | | | 2,027 | |
| | 19,196 | | | EOG Resources, Inc. | | | 1,681 | |
| | 80,899 | | | Exxon Mobil Corp. | | | 6,731 | |
| | 2,784 | | | World Fuel Services Corp. | | | 133 | |
| | | | | | | | |
| | | | | | | 17,027 | |
| | | | | | | | |
| | | | Personal Products — 0.10% | | | | |
| | 2,310 | | | Nu Skin Enterprises, Inc., Class – A | | | 109 | |
| | 8,973 | | | The Estee Lauder Cos., Inc., Class – A | | | 777 | |
| | | | | | | | |
| | | | | | | 886 | |
| | | | | | | | |
| | | | Pharmaceuticals — 4.51% | | | | |
| | 17,863 | | | Allergan PLC (a) | | | 5,421 | |
| | 60,104 | | | Bristol-Myers Squibb Co. | | | 3,999 | |
| | 38,594 | | | Eli Lilly & Co. | | | 3,222 | |
| | 69,236 | | | Johnson & Johnson | | | 6,748 | |
| | 150,126 | | | Merck & Co., Inc. | | | 8,547 | |
| | 49,782 | | | Novo Nordisk A/S, Class – B, ADR | | | 2,726 | |
| | 112,358 | | | Sanofi-Aventis, ADR | | | 5,565 | |
| | 12,849 | | | Shire PLC, ADR | | | 3,103 | |
| | | | | | | | |
| | | | | | | 39,331 | |
| | | | | | | | |
| | | | Professional Services — 0.66% | | | | |
| | 4,760 | | | Equifax, Inc. | | | 462 | |
| | 2,649 | | | IHS, Inc. (a) | | | 341 | |
| | 2,512 | | | Towers Watson & Co., Class – A | | | 316 | |
| | 64,376 | | | Versik Analytics, Inc., Class – A (a) | | | 4,684 | |
| | | | | | | | |
| | | | | | | 5,803 | |
| | | | | | | | |
| | | | Real Estate Investment Trusts — 0.23% | | | | |
| | 21,152 | | | American Tower Corp. | | | 1,973 | |
| | | | | | | | |
| | | | Road & Rail — 0.20% | | | | |
| | 10,537 | | | Canadian Pacific Railway Ltd. | | | 1,688 | |
| | 1,756 | | | Landstar System, Inc. | | | 117 | |
| | | | | | | | |
| | | | | | | 1,805 | |
| | | | | | | | |
| | | | Semiconductors & Semiconductor Equipment — 1.22% | |
| | 12,325 | | | Analog Devices, Inc. | | | 791 | |
| | 38,669 | | | ARM Holdings PLC, ADR | | | 1,905 | |
| | 195,214 | | | Intel Corp. | | | 5,937 | |
| | 9,237 | | | Linear Technology Corp. | | | 409 | |
| | 16,191 | | | NXP Semiconductors NV (a) | | | 1,590 | |
| | | | | | | | |
| | | | | | | 10,632 | |
| | | | | | | | |
| | | | Software — 5.92% | | | | |
| | 39,297 | | | Adobe Systems, Inc. (a) | | | 3,183 | |
| | 3,599 | | | ANSYS, Inc. (a) | | | 328 | |
| | 6,428 | | | Citrix Systems, Inc. (a) | | | 451 | |
| | 1,644 | | | FactSet Research Systems, Inc. | | | 267 | |
| | 22,566 | | | FireEye, Inc. (a) | | | 1,104 | |
| | 11,100 | | | Intuit, Inc. | | | 1,119 | |
| | 163,628 | | | Microsoft Corp. | | | 7,224 | |
| | 128,811 | | | Oracle Corp. | | | 5,191 | |
See accompanying notes to financial statements.
55
HC CAPITAL TRUST
The Growth Equity Portfolio
Portfolio of Investments (continued) — June 30, 2015
| | | | | | | | |
| Shares | | | Security Description | | Value
(000) | |
| | | | Common Stocks (continued) | | | | |
| | | | Software (continued) | | | | |
| | 128,414 | | | Red Hat, Inc. (a) | | $ | 9,751 | |
| | 126,275 | | | Salesforce.com, Inc. (a) | | | 8,793 | |
| | 129,740 | | | SAP AG, ADR | | | 9,112 | |
| | 2,545 | | | SolarWinds, Inc. (a) | | | 117 | |
| | 27,310 | | | Splunk, Inc. (a) | | | 1,901 | |
| | 17,823 | | | VMware, Inc., Class – A (a) | | | 1,528 | |
| | 22,490 | | | Workday, Inc., Class – A (a) | | | 1,718 | |
| | | | | | | | |
| | | | | | | 51,787 | |
| | | | | | | | |
| | | | Specialty Retail — 3.37% | | | | |
| | 2,510 | | | Aaron’s, Inc. | | | 91 | |
| | 2,813 | | | Abercrombie & Fitch Co., Class – A | | | 61 | |
| | 2,835 | | | Advance Auto Parts, Inc. | | | 452 | |
| | 1,289 | | | AutoZone, Inc. (a) | | | 860 | |
| | 7,271 | | | Bed Bath & Beyond, Inc. (a) | | | 502 | |
| | 11,080 | | | Best Buy Co., Inc. | | | 361 | |
| | 3,749 | | | Dick’s Sporting Goods, Inc. | | | 194 | |
| | 4,243 | | | GameStop Corp., Class – A^ | | | 182 | |
| | 9,839 | | | Gap, Inc. | | | 376 | |
| | 183,005 | | | Industria de Diseno Textil SA, ADR | | | 2,970 | |
| | 201,530 | | | Lowe’s Cos., Inc. | | | 13,495 | |
| | 14,235 | | | O’Reilly Automotive, Inc. (a) | | | 3,217 | |
| | 16,630 | | | Ross Stores, Inc. | | | 808 | |
| | 25,409 | | | Staples, Inc. | | | 389 | |
| | 54,903 | | | The TJX Cos., Inc. | | | 3,632 | |
| | 14,636 | | | Tiffany & Co. | | | 1,344 | |
| | 2,504 | | | Ulta Salon, Cosmetics & Fragrance, Inc. (a) | | | 387 | |
| | 4,170 | | | Urban Outfitters, Inc. (a) | | | 146 | |
| | | | | | | | |
| | | | | | | 29,467 | |
| | | | | | | | |
| | | | Technology Hardware, Storage & Peripherals — 2.27% | |
| | 140,645 | | | Apple, Inc. | | | 17,641 | |
| | 80,337 | | | EMC Corp. | | | 2,120 | |
| | 2,451 | | | Lexmark International, Inc., Class – A | | | 108 | |
| | | | | | | | |
| | | | | | | 19,869 | |
| | | | | | | | |
| | | | Textiles, Apparel & Luxury Goods — 1.46% | |
| | 10,756 | | | Coach, Inc. | | | 372 | |
| | 1,369 | | | Deckers Outdoor Corp. (a) | | | 99 | |
| | 1,727 | | | Fossil Group, Inc. (a) | | | 120 | |
| | 8,006 | | | Michael Kors Holdings Ltd. (a) | | | 337 | |
| | 70,005 | | | NIKE, Inc., Class – B | | | 7,562 | |
| | 2,316 | | | Ralph Lauren Corp. | | | 307 | |
| | 36,305 | | | Under Armour, Inc., Class – A (a) | | | 3,029 | |
| | 13,554 | | | V.F. Corp. | | | 945 | |
| | | | | | | | |
| | | | | | | 12,771 | |
| | | | | | | | |
| | | | Tobacco — 0.60% | | | | |
| | 61,696 | | | Philip Morris International, Inc. | | | 4,946 | |
| | 4,122 | | | Reynolds American, Inc. | | | 308 | |
| | | | | | | | |
| | | | | | | 5,254 | |
| | | | | | | | |
| | | | Trading Companies & Distributors — 0.14% | |
| | 11,605 | | | Fastenal Co. | | | 489 | |
| | 1,871 | | | MSC Industrial Direct Co., Inc., Class – A | | | 131 | |
| | | | | | | | |
Shares or
Principal
Amount
(000) | | | Security Description | | Value
(000) | |
| | | | Trading Companies & Distributors (continued) | |
| | 4,204 | | | NOW, Inc. (a) | | $ | 84 | |
| | 2,282 | | | W.W. Grainger, Inc. | | | 540 | |
| | | | | | | | |
| | | | | | | 1,244 | |
| | | | | | | | |
| | | | Total Common Stocks | | | 716,689 | |
| | | | | | | | |
| | | | Time Deposit — 0.96% | | | | |
| $ | 8,379 | | | State Street Liquidity Management Control System Eurodollar Time Deposit, 0.01%, 7/1/15 | | | 8,379 | |
| | | | | | | | |
| | | | Total Time Deposit | | | 8,379 | |
| | | | | | | | |
| | | | Mutual Funds — 10.70% | | | | |
| | 90,761,674 | | | Federated U.S. Treasury Cash Reserve Fund, Institutional Shares, 0.00% (b) | | | 90,762 | |
| | 2,701,833 | | | SSgA Treasury Money Market Fund, 0.00% (b) | | | 2,702 | |
| | | | | | | | |
| | | | Total Mutual Funds | | | 93,464 | |
| | | | | | | | |
| | | | Total Investments (cost $599,230) — 93.69% | | | 818,532 | |
| | | | Other assets in excess of liabilities — 6.31% | | | 55,095 | |
| | | | | | | | |
| | | | Net Assets — 100.00% | | $ | 873,627 | |
| | | | | | | | |
| ^ | All or part of this security was on loan as of June 30, 2015. The total value of securities on loan as of June 30, 2015, was $118 (amount in thousands). |
| (a) | Represents non-income producing security. |
| (b) | The rate disclosed is the rate in effect on June 30, 2015. |
ADR — American Depositary Receipt
See accompanying notes to financial statements.
56
HC CAPITAL TRUST
The Growth Equity Portfolio
Portfolio of Investments (concluded) — June 30, 2015
The following table reflects the percentage of total net assets of the Portfolio attributable to each Specialist Manager, see Note 3 in the Notes to Financial Statements.
| | | | | | | | | | | | | | | | | | | | | | | | | | | | | | |
The Growth Equity Portfolio | | Jennison
Associates, LLC | | Mellon Capital
Management
Corporation | | Parametric
Portfolio
Associates, LLC | | Sustainable
Growth Advisers, LP | | HC Capital
Solutions | | Total |
Common Stocks | | | | 20.17 | % | | | | 30.94 | % | | | | — | | | | | 30.92 | % | | | | — | | | | | 82.03 | % |
Time Deposit | | | | 0.11 | % | | | | — | | | | | — | | | | | 0.85 | % | | | | — | | | | | 0.96 | % |
Mutual Funds | | | | — | | | | | 0.31 | % | | | | — | | | | | — | | | | | 10.39 | % | | | | 10.70 | % |
Other Assets (Liabilities) | | | | 0.05 | % | | | | 0.03 | % | | | | 6.20 | % | | | | 0.03 | % | | | | — | | | | | 6.31 | % |
| | | | | | | | | | | | | | | | | | | | | | | | | | | | | | |
Total Net Assets | | | | 20.33 | % | | | | 31.28 | % | | | | 6.20 | % | | | | 31.80 | % | | | | 10.39 | % | | | | 100.00 | % |
| | | | | | | | | | | | | | | | | | | | | | | | | | | | | | |
The following table reflects the open derivative positions held by the Portfolio as of June 30, 2015.
Long Futures
| | | | | | | | | | | | | | | | | | | | |
Number of
Contracts | | Futures Contracts Positions^ | | Value
(000) | | Expiration | | Unrealized
Appreciation/
(Depreciation)
(000) |
| | | 230 | | | E-Mini NASDAQ 100 Future | | | $ | 20,195 | | | | | 9/18/15 | | | | $ | (420 | ) |
| | | 378 | | | E-Mini S&P 500 Future | | | | 38,828 | | | | | 9/18/15 | | | | | (831 | ) |
| | | 66 | | | E-Mini S&P Midcap 400 Future | | | | 9,887 | | | | | 9/18/15 | | | | | (187 | ) |
| | | | | | | | | | | | | | | | | | | | | |
| | | | | | Net Unrealized Appreciation/(Depreciation) | | | | | | | | | | | | | $ | (1,438 | ) |
| | | | | | | | | | | | | | | | | | | | | |
Amounts designated as “—” are $0 or have been rounded to $0.
| ^ | Cash has been pledged as collateral for futures contracts held by the Portfolio. |
See accompanying notes to financial statements.
57
HC CAPITAL TRUST
The Institutional Growth Equity Portfolio
Portfolio of Investments — June 30, 2015
| | | | | | | | |
| Shares | | | Security Description | | Value
(000) | |
| | | | Common Stocks — 82.40% | | | | |
| | | | Aerospace & Defense — 1.48% | | | | |
| | 21,014 | | | General Dynamics Corp. | | $ | 2,977 | |
| | 5,942 | | | L-3 Communications Holdings, Inc. | | | 674 | |
| | 9,943 | | | Precision Castparts Corp. | | | 1,987 | |
| | 21,520 | | | Raytheon Co. | | | 2,059 | |
| | 9,311 | | | Rockwell Collins, Inc. | | | 860 | |
| | 28,300 | | | The Boeing Co. | | | 3,926 | |
| | 63,005 | | | United Technologies Corp. | | | 6,989 | |
| | | | | | | | |
| | | | | | | 19,472 | |
| | | | | | | | |
| | | | Air Freight & Logistics — 0.10% | | | | |
| | 10,213 | | | C.H. Robinson Worldwide, Inc. | | | 637 | |
| | 13,570 | | | Expeditors International of Washington, Inc. | | | 626 | |
| | | | | | | | |
| | | | | | | 1,263 | |
| | | | | | | | |
| | | | Airlines — 0.02% | | | | |
| | 5,003 | | | Spirit Airlines, Inc. (a) | | | 311 | |
| | | | | | | | |
| | | | Automobiles — 0.32% | | | | |
| | 15,836 | | | Tesla Motors, Inc. (a) | | | 4,248 | |
| | | | | | | | |
| | | | Banks — 0.07% | | | | |
| | 3,631 | | | Cullen/Frost Bankers, Inc. | | | 285 | |
| | 9,453 | | | First Republic Bank | | | 596 | |
| | | | | | | | |
| | | | | | | 881 | |
| | | | | | | | |
| | | | Beverages — 1.92% | | | | |
| | 10,569 | | | Brown-Forman Corp., Class – B | | | 1,059 | |
| | 13,507 | | | Dr. Pepper Snapple Group, Inc. | | | 985 | |
| | 21,773 | | | Monster Beverage Corp. (a) | | | 2,918 | |
| | 104,198 | | | PepsiCo, Inc. | | | 9,726 | |
| | 272,866 | | | The Coca-Cola Co. | | | 10,704 | |
| | | | | | | | |
| | | | | | | 25,392 | |
| | | | | | | | |
| | | | Biotechnology — 4.26% | | | | |
| | 22,987 | | | Alexion Pharmaceuticals, Inc. (a) | | | 4,155 | |
| | 145,815 | | | Amgen, Inc. | | | 22,386 | |
| | 16,749 | | | Biogen Idec, Inc. (a) | | | 6,766 | |
| | 29,198 | | | Celgene Corp. (a) | | | 3,379 | |
| | 36,339 | | | Gilead Sciences, Inc. | | | 4,255 | |
| | 25,457 | | | Regeneron Pharmaceuticals, Inc. (a) | | | 12,986 | |
| | 19,131 | | | Vertex Pharmaceuticals, Inc. (a) | | | 2,362 | |
| | | | | | | | |
| | | | | | | 56,289 | |
| | | | | | | | |
| | | | Capital Markets — 1.77% | | | | |
| | 6,421 | | | Federated Investors, Inc., Class – B | | | 215 | |
| | 27,252 | | | Franklin Resources, Inc. | | | 1,336 | |
| | 13,289 | | | Goldman Sachs Group, Inc. | | | 2,775 | |
| | 84,721 | | | Morgan Stanley | | | 3,286 | |
| | 9,136 | | | SEI Investments Co. | | | 448 | |
| | 168,663 | | | State Street Corp. | | | 12,987 | |
| | 18,061 | | | T. Rowe Price Group, Inc. | | | 1,404 | |
| | 18,489 | | | TD Ameritrade Holdg Corp. | | | 681 | |
| | 5,881 | | | Waddell & Reed Financial, Inc., Class – A | | | 278 | |
| | | | | | | | |
| | | | | | | 23,410 | |
| | | | | | | | |
| | | | Chemicals — 3.05% | | | | |
| | 14,572 | | | Air Products & Chemicals, Inc. | | | 1,994 | |
| | 146,557 | | | Ecolab, Inc. | | | 16,571 | |
| | 5,596 | | | International Flavors & Fragrances, Inc. | | | 612 | |
| | 128,058 | | | Monsanto Co. | | | 13,650 | |
| | | | | | | | |
| Shares | | | Security Description | | Value
(000) | |
| | | | Chemicals (continued) | | | | |
| | 20,111 | | | Praxair, Inc. | | $ | 2,404 | |
| | 8,058 | | | Sigma-Aldrich Corp. | | | 1,123 | |
| | 14,102 | | | The Sherwin-Williams Co. | | | 3,878 | |
| | | | | | | | |
| | | | | | | 40,232 | |
| | | | | | | | |
| | | | Commercial Services & Supplies — 0.17% | | | | |
| | 6,921 | | | Cintas Corp. | | | 585 | |
| | 7,748 | | | Copart, Inc. (a) | | | 275 | |
| | 6,504 | | | Rollins, Inc. | | | 186 | |
| | 5,841 | | | Stericycle, Inc. (a) | | | 782 | |
| | 8,493 | | | Waste Connections, Inc. | | | 400 | |
| | | | | | | | |
| | | | | | | 2,228 | |
| | | | | | | | |
| | | | Communications Equipment — 1.76% | | | | |
| | 352,135 | | | Cisco Systems, Inc. | | | 9,670 | |
| | 5,215 | | | F5 Networks, Inc. (a) | | | 628 | |
| | 7,304 | | | Harris Corp. | | | 562 | |
| | 198,011 | | | Qualcomm, Inc. | | | 12,400 | |
| | | | | | | | |
| | | | | | | 23,260 | |
| | | | | | | | |
| | | | Construction & Engineering — 0.07% | | | | |
| | 10,185 | | | Fluor Corp. | | | 540 | |
| | 9,084 | | | Jacobs Engineering Group, Inc. (a) | | | 369 | |
| | | | | | | | |
| | | | | | | 909 | |
| | | | | | | | |
| | | | Consumer Finance — 1.08% | | | | |
| | 182,630 | | | American Express Co. | | | 14,194 | |
| | | | | | | | |
| | | | Containers & Packaging – 0.04% | | | | |
| | 4,510 | | | AptarGroup, Inc. | | | 288 | |
| | 6,991 | | | Sonoco Products Co. | | | 299 | |
| | | | | | | | |
| | | | | | | 587 | |
| | | | | | | | |
| | | | Distributors — 0.07% | | | | |
| | 10,556 | | | Genuine Parts Co. | | | 945 | |
| | | | | | | | |
| | | | Diversified Consumer Services — 0.01% | | | | |
| | 6,681 | | | Apollo Group, Inc., Class – A (a) | | | 86 | |
| | | | | | | | |
| | | | Diversified Financial Services — 0.52% | | | | |
| | 5,928 | | | CBOE Holdings, Inc. | | | 339 | |
| | 21,920 | | | CME Group, Inc. | | | 2,040 | |
| | 44,308 | | | The McGraw-Hill Cos., Inc. | | | 4,451 | |
| | | | | | | | |
| | | | | | | 6,830 | |
| | | | | | | | |
| | | | Electrical Equipment — 0.31% | | | | |
| | 16,843 | | | AMETEK, Inc. | | | 923 | |
| | 48,215 | | | Emerson Electric Co. | | | 2,673 | |
| | 4,057 | | | Hubbell, Inc., Class – B | | | 439 | |
| | | | | | | | |
| | | | | | | 4,035 | |
| | | | | | | | |
| | | | Electronic Equipment, Instruments & Components — 0.19% | |
| | 21,610 | | | Amphenol Corp., Class – A | | | 1,253 | |
| | 3,289 | | | Dolby Laboratories, Inc., Class – A | | | 131 | |
| | 9,747 | | | FLIR Systems, Inc. | | | 300 | |
| | 10,638 | | | Ingram Micro, Inc. (a) | | | 266 | |
| | 6,821 | | | National Instruments Corp. | | | 201 | |
| | 3,483 | | | Zebra Technologies Corp. (a) | | | 387 | |
| | | | | | | | |
| | | | | | | 2,538 | |
| | | | | | | | |
See accompanying notes to financial statements.
58
HC CAPITAL TRUST
The Institutional Growth Equity Portfolio
Portfolio of Investments (continued) — June 30, 2015
| | | | | | | | |
| Shares | | | Security Description | | Value
(000) | |
| | | | Common Stocks (continued) | | | | |
| | | | Energy Equipment & Services — 1.70% | | | | |
| | 28,317 | | | Core Laboratories NV | | $ | 3,230 | |
| | 2,788 | | | Dril-Quip, Inc. (a) | | | 210 | |
| | 16,154 | | | FMC Technologies, Inc. (a) | | | 670 | |
| | 6,620 | | | Helmerich & Payne, Inc. | | | 466 | |
| | 29,502 | | | National Oilwell Varco, Inc. | | | 1,424 | |
| | 6,838 | | | Oceaneering International, Inc. | | | 319 | |
| | 186,576 | | | Schlumberger Ltd. | | | 16,081 | |
| | | | | | | | |
| | | | | | | 22,400 | |
| | | | | | | | |
| | | | Food & Staples Retailing — 3.54% | | | | |
| | 58,781 | | | Costco Wholesale Corp. | | | 7,939 | |
| | 80,357 | | | CVS Caremark Corp. | | | 8,428 | |
| | 40,168 | | | Sysco Corp. | | | 1,450 | |
| | 37,322 | | | The Kroger Co. | | | 2,706 | |
| | 65,594 | | | Walgreens Boots Alliance, Inc. | | | 5,539 | |
| | 109,490 | | | Wal-Mart Stores, Inc. | | | 7,766 | |
| | 327,590 | | | Whole Foods Market, Inc. | | | 12,920 | |
| | | | | | | | |
| | | | | | | 46,748 | |
| | | | | | | | |
| | | | Food Products — 2.56% | | | | |
| | 11,931 | | | Campbell Soup Co. | | | 569 | |
| | 11,786 | | | Flowers Foods, Inc. | | | 249 | |
| | 145,807 | | | Hershey Co. | | | 12,952 | |
| | 9,173 | | | Hormel Foods Corp. | | | 517 | |
| | 8,949 | | | McCormick & Co., Inc. | | | 724 | |
| | 13,890 | | | Mead Johnson Nutrition Co. | | | 1,253 | |
| | 407,429 | | | Mondelez International, Inc., Class – A | | | 16,762 | |
| | 7,123 | | | The J.M. Smucker Co. | | | 772 | |
| | | | | | | | |
| | | | | | | 33,798 | |
| | | | | | | | |
| | | | Health Care Equipment & Supplies — 2.35% | | | | |
| | 188,130 | | | Abbott Laboratories | | | 9,233 | |
| | 37,282 | | | Baxter International, Inc. | | | 2,607 | |
| | 13,288 | | | Becton, Dickinson & Co. | | | 1,882 | |
| | 5,249 | | | C.R. Bard, Inc. | | | 896 | |
| | 9,737 | | | Dentsply International, Inc. | | | 502 | |
| | 7,242 | | | Edwards Lifesciences Corp. (a) | | | 1,031 | |
| | 6,536 | | | IDEXX Laboratories, Inc. (a) | | | 419 | |
| | 2,464 | | | Intuitive Surgical, Inc. (a) | | | 1,194 | |
| | 98,292 | | | Medtronic PLC | | | 7,283 | |
| | 9,649 | | | ResMed, Inc. | | | 544 | |
| | 19,505 | | | St. Jude Medical, Inc. | | | 1,425 | |
| | 23,112 | | | Stryker Corp. | | | 2,209 | |
| | 7,134 | | | Varian Medical Systems, Inc. (a) | | | 602 | |
| | 11,522 | | | Zimmer Holdings, Inc. | | | 1,259 | |
| | | | | | | | |
| | | | | | | 31,086 | |
| | | | | | | | |
| | | | Health Care Providers & Services — 1.98% | | | | |
| | 24,553 | | | Aetna, Inc. | | | 3,130 | |
| | 19,202 | | | Anthem, Inc. | | | 3,152 | |
| | 50,457 | | | Express Scripts Holding Co. (a) | | | 4,488 | |
| | 5,875 | | | Henry Schein, Inc. (a) | | | 835 | |
| | 6,890 | | | Laboratory Corp. of America Holdings (a) | | | 835 | |
| | 15,844 | | | McKesson Corp. | | | 3,562 | |
| | 6,870 | | | MEDNAX, Inc. (a) | | | 509 | |
| | 5,915 | | | Patterson Cos., Inc. | | | 288 | |
| | 9,935 | | | Quest Diagnostics, Inc. | | | 720 | |
| | 67,351 | | | UnitedHealth Group, Inc. | | | 8,216 | |
| | 6,099 | | | VCA Antech, Inc. (a) | | | 332 | |
| | | | | | | | |
| | | | | | | 26,067 | |
| | | | | | | | |
| | | | | | | | |
| Shares | | | Security Description | | Value
(000) | |
| | | | Health Care Technology — 1.25% | | | | |
| | 238,162 | | | Cerner Corp. (a) | | $ | 16,448 | |
| | 2,580 | | | Veeva Systems, Inc. (a) | | | 72 | |
| | | | | | | | |
| | | | | | | 16,520 | |
| | | | | | | | |
| | | | Hotels, Restaurants & Leisure — 3.06% | | | | |
| | 6,576 | | | Chipotle Mexican Grill, Inc. (a) | | | 3,978 | |
| | 52,100 | | | Marriott International, Inc. | | | 3,876 | |
| | 67,924 | | | McDonald’s Corp. | | | 6,458 | |
| | 1,694 | | | Panera Bread Co., Class – A (a) | | | 296 | |
| | 428,617 | | | Starbucks Corp. | | | 22,980 | |
| | 30,332 | | | YUM! Brands, Inc. | | | 2,732 | |
| | | | | | | | |
| | | | | | | 40,320 | |
| | | | | | | | |
| | | | Household Durables — 0.03% | | | | |
| | 8,380 | | | Garmin Ltd. | | | 368 | |
| | | | | | | | |
| | | | Household Products — 2.45% | | | | |
| | 9,334 | | | Church & Dwight Co., Inc. | | | 757 | |
| | 251,261 | | | Colgate-Palmolive Co. | | | 16,436 | |
| | 25,897 | | | Kimberly-Clark Corp. | | | 2,744 | |
| | 8,852 | | | The Clorox Co. | | | 921 | |
| | 146,938 | | | The Procter & Gamble Co. | | | 11,496 | |
| | | | | | | | |
| | | | | | | 32,354 | |
| | | | | | | | |
| | | | Industrial Conglomerates — 0.92% | | | | |
| | 44,972 | | | 3M Co. | | | 6,939 | |
| | 4,406 | | | Carlisle Cos., Inc. | | | 441 | |
| | 41,762 | | | Danaher Corp. | | | 3,574 | |
| | 6,846 | | | Roper Industries, Inc. | | | 1,181 | |
| | | | | | | | |
| | | | | | | 12,135 | |
| | | | | | | | |
| | | | Insurance — 0.90% | | | | |
| | 111,570 | | | Aon PLC | | | 11,121 | |
| | 8,268 | | | Brown & Brown, Inc. | | | 272 | |
| | 9,029 | | | Torchmark Corp. | | | 525 | |
| | | | | | | | |
| | | | | | | 11,918 | |
| | | | | | | | |
| | | | Internet & Catalog Retail — 3.97% | | | | |
| | 50,247 | | | Amazon.com, Inc. (a) | | | 21,812 | |
| | 94,405 | | | JD.com, Inc., ADR (a) | | | 3,219 | |
| | 9,543 | | | Netflix, Inc. (a) | | | 6,269 | |
| | 16,065 | | | Priceline.com, Inc. (a) | | | 18,497 | |
| | 23,800 | | | TripAdvisor, Inc. (a) | | | 2,074 | |
| | 24,268 | | | Vipshop Holdings Ltd., ADR (a) | | | 540 | |
| | | | | | | | |
| | | | | | | 52,411 | |
| | | | | | | | |
| | | | Internet Software & Services — 7.16% | | | | |
| | 35,053 | | | Alibaba Group Holding Ltd., ADR (a) | | | 2,884 | |
| | 87,079 | | | eBay, Inc. (a) | | | 5,246 | |
| | 42,539 | | | Equinix, Inc. | | | 10,805 | |
| | 110,925 | | | Facebook, Inc., Class – A (a) | | | 9,513 | |
| | 54,922 | | | Google, Inc. (a) | | | 28,586 | |
| | 27,016 | | | Google, Inc., Class – A (a) | | | 14,590 | |
| | 67,787 | | | LinkedIn Corp., Class – A (a) | | | 14,007 | |
| | 8,056 | | | Rackspace Hosting, Inc. (a) | | | 300 | |
| | 211,444 | | | Tencent Holdings Ltd., ADR | | | 4,239 | |
| | 52,689 | | | Twitter, Inc. (a) | | | 1,908 | |
| | 65,087 | | | Yahoo!, Inc. (a) | | | 2,557 | |
| | | | | | | | |
| | | | | | | 94,635 | |
| | | | | | | | |
| | | | IT Services — 6.40% | | | | |
| | 43,470 | | | Accenture PLC, Class – A | | | 4,207 | |
| | 10,989 | | | Amdocs Ltd. | | | 600 | |
See accompanying notes to financial statements.
59
HC CAPITAL TRUST
The Institutional Growth Equity Portfolio
Portfolio of Investments (continued) — June 30, 2015
| | | | | | | | |
| Shares | | | Security Description | | Value
(000) | |
| | | | Common Stocks (continued) | | | | |
| | | | IT Services (continued) | | | | |
| | 181,439 | | | Automatic Data Processing, Inc. | | $ | 14,557 | |
| | 8,297 | | | Broadridge Financial Solutions, Inc. | | | 415 | |
| | 41,818 | | | Cognizant Technology Solutions Corp. (a) | | | 2,555 | |
| | 5,715 | | | FleetCor Technologies, Inc. (a) | | | 892 | |
| | 4,676 | | | Global Payments, Inc. | | | 484 | |
| | 65,020 | | | International Business Machines Corp. | | | 10,576 | |
| | 5,828 | | | Jack Henry & Associates, Inc. | | | 377 | |
| | 163,491 | | | MasterCard, Inc., Class – A | | | 15,283 | |
| | 22,375 | | | Paychex, Inc. | | | 1,049 | |
| | 10,822 | | | Teradata Corp. (a) | | | 400 | |
| | 11,520 | | | Total System Services, Inc. | | | 481 | |
| | 474,048 | | | Visa, Inc., Class – A | | | 31,833 | |
| | 37,060 | | | Western Union Co. | | | 753 | |
| | | | | | | | |
| | | | | | | 84,462 | |
| | | | | | | | |
| | | | Leisure Products — 0.05% | | | | |
| | 4,537 | | | Polaris Industries, Inc. | | | 672 | |
| | | | | | | | |
| | | | Life Sciences Tools & Services — 0.74% | | | | |
| | 2,525 | | | Bio-Techne Corp. | | | 249 | |
| | 20,465 | | | Illumina, Inc. (a) | | | 4,469 | |
| | 2,015 | | | Mettler-Toledo International, Inc. (a) | | | 688 | |
| | 27,423 | | | Thermo Electron Corp. | | | 3,558 | |
| | 5,849 | | | Waters Corp. (a) | | | 751 | |
| | | | | | | | |
| | | | | | | 9,715 | |
| | | | | | | | |
| | | | Machinery — 0.42% | | | | |
| | 3,341 | | | Crane Co. | | | 196 | |
| | 9,819 | | | Donaldson Co., Inc. | | | 352 | |
| | 5,562 | | | IDEX Corp. | | | 437 | |
| | 22,236 | | | Illinois Tool Works, Inc. | | | 2,042 | |
| | 7,549 | | | Pall Corp. | | | 939 | |
| | 3,915 | | | The Middleby Corp. (a) | | | 439 | |
| | 6,620 | | | Wabtec Corp. | | | 624 | |
| | 12,632 | | | Xylem, Inc. | | | 468 | |
| | | | | | | | |
| | | | | | | 5,497 | |
| | | | | | | | |
| | | | Marine — 0.02% | | | | |
| | 3,910 | | | Kirby Corp. (a) | | | 300 | |
| | | | | | | | |
| | | | Media — 1.85% | | | | |
| | 3,014 | | | John Wiley & Sons, Inc., Class – A | | | 164 | |
| | 1,336 | | | Morningstar, Inc. | | | 106 | |
| | 17,777 | | | Omnicom Group, Inc. | | | 1,235 | |
| | 7,247 | | | Scripps Networks Interactive, Class – A | | | 474 | |
| | 171,676 | | | The Walt Disney Co. | | | 19,596 | |
| | 32,163 | | | Time Warner, Inc. | | | 2,811 | |
| | | | | | | | |
| | | | | | | 24,386 | |
| | | | | | | | |
| | | | Multiline Retail — 0.37% | | | | |
| | 30,767 | | | Dollar General Corp. | | | 2,392 | |
| | 14,225 | | | Dollar Tree, Inc. (a) | | | 1,124 | |
| | 6,497 | | | Family Dollar Stores, Inc. | | | 512 | |
| | 14,332 | | | Kohl’s Corp. | | | 897 | |
| | | | | | | | |
| | | | | | | 4,925 | |
| | | | | | | | |
| | | | Oil, Gas & Consumable Fuels — 2.19% | | | | |
| | 117,303 | | | Chevron Corp. | | | 11,316 | |
| | 26,459 | | | Concho Resources, Inc. (a) | | | 3,013 | |
| | 28,454 | | | EOG Resources, Inc. | | | 2,491 | |
| | 141,856 | | | Exxon Mobil Corp. | | | 11,802 | |
| | | | | | | | |
| Shares | | | Security Description | | Value
(000) | |
| | | | Oil, Gas & Consumable Fuels (continued) | | | | |
| | 4,934 | | | World Fuel Services Corp. | | $ | 237 | |
| | | | | | | | |
| | | | | | | 28,859 | |
| | | | | | | | |
| | | | Personal Products — 0.12% | | | | |
| | 4,033 | | | Nu Skin Enterprises, Inc., Class – A | | | 190 | |
| | 15,752 | | | The Estee Lauder Cos., Inc., Class – A | | | 1,365 | |
| | | | | | | | |
| | | | | | | 1,555 | |
| | | | | | | | |
| | | | Pharmaceuticals — 4.72% | | | | |
| | 27,714 | | | Allergan PLC (a) | | | 8,410 | |
| | 88,816 | | | Bristol-Myers Squibb Co. | | | 5,910 | |
| | 67,626 | | | Eli Lilly & Co. | | | 5,646 | |
| | 121,332 | | | Johnson & Johnson | | | 11,825 | |
| | 254,021 | | | Merck & Co., Inc. | | | 14,461 | |
| | 73,933 | | | Novo Nordisk A/S, Class – B, ADR | | | 4,049 | |
| | 145,508 | | | Sanofi-Aventis, ADR | | | 7,207 | |
| | 19,226 | | | Shire PLC, ADR | | | 4,643 | |
| | | | | | | | |
| | | | | | | 62,151 | |
| | | | | | | | |
| | | | Professional Services — 0.63% | | | | |
| | 8,380 | | | Equifax, Inc. | | | 814 | |
| | 4,676 | | | IHS, Inc. (a) | | | 601 | |
| | 4,459 | | | Towers Watson & Co., Class – A | | | 561 | |
| | 86,239 | | | Versik Analytics, Inc., Class – A (a) | | | 6,275 | |
| | | | | | | | |
| | | | | | | 8,251 | |
| | | | | | | | |
| | | | Real Estate Investment Trusts — 0.22% | | | | |
| | 31,204 | | | American Tower Corp. | | | 2,911 | |
| | | | | | | | |
| | | | Road & Rail — 0.21% | | | | |
| | 15,573 | | | Canadian Pacific Railway Ltd. | | | 2,495 | |
| | 3,086 | | | Landstar System, Inc. | | | 206 | |
| | | | | | | | |
| | | | | | | 2,701 | |
| | | | | | | | |
| | | | Semiconductors & Semiconductor Equipment — 1.35% | |
| | 21,604 | | | Analog Devices, Inc. | | | 1,387 | |
| | 58,303 | | | ARM Holdings PLC, ADR | | | 2,873 | |
| | 342,094 | | | Intel Corp. | | | 10,405 | |
| | 16,267 | | | Linear Technology Corp. | | | 719 | |
| | 24,271 | | | NXP Semiconductors NV (a) | | | 2,383 | |
| | | | | | | | |
| | | | | | | 17,767 | |
| | | | | | | | |
| | | | Software — 5.82% | | | | |
| | 60,945 | | | Adobe Systems, Inc. (a) | | | 4,937 | |
| | 6,352 | | | ANSYS, Inc. (a) | | | 580 | |
| | 11,249 | | | Citrix Systems, Inc. (a) | | | 789 | |
| | 2,897 | | | FactSet Research Systems, Inc. | | | 471 | |
| | 32,785 | | | FireEye, Inc. (a) | | | 1,604 | |
| | 19,483 | | | Intuit, Inc. | | | 1,963 | |
| | 286,750 | | | Microsoft Corp. | | | 12,659 | |
| | 225,730 | | | Oracle Corp. | | | 9,097 | |
| | 172,207 | | | Red Hat, Inc. (a) | | | 13,075 | |
| | 173,356 | | | Salesforce.com, Inc. (a) | | | 12,071 | |
| | 168,055 | | | SAP AG, ADR | | | 11,803 | |
| | 4,521 | | | SolarWinds, Inc. (a) | | | 209 | |
| | 40,294 | | | Splunk, Inc. (a) | | | 2,805 | |
| | 27,136 | | | VMware, Inc., Class – A (a) | | | 2,327 | |
| | 33,692 | | | Workday, Inc., Class – A (a) | | | 2,574 | |
| | | | | | | | |
| | | | | | | 76,964 | |
| | | | | | | | |
| | | | Specialty Retail — 3.29% | | | | |
| | 4,400 | | | Aaron’s, Inc. | | | 159 | |
| | 4,977 | | | Abercrombie & Fitch Co., Class – A | | | 107 | |
See accompanying notes to financial statements.
60
HC CAPITAL TRUST
The Institutional Growth Equity Portfolio
Portfolio of Investments (continued) — June 30, 2015
| | | | | | | | |
| Shares | | | Security Description | | Value
(000) | |
| | | | Common Stocks (continued) | | | | |
| | | | Specialty Retail (continued) | | | | |
| | 5,019 | | | Advance Auto Parts, Inc. | | $ | 799 | |
| | 2,235 | | | AutoZone, Inc. (a) | | | 1,491 | |
| | 12,727 | | | Bed Bath & Beyond, Inc. (a) | | | 878 | |
| | 19,705 | | | Best Buy Co., Inc. | | | 643 | |
| | 6,618 | | | Dick’s Sporting Goods, Inc. | | | 343 | |
| | 7,464 | | | GameStop Corp., Class – A^ | | | 321 | |
| | 17,235 | | | Gap, Inc. | | | 658 | |
| | 272,504 | | | Industria de Diseno Textil SA, ADR | | | 4,423 | |
| | 260,710 | | | Lowe’s Cos., Inc. | | | 17,459 | |
| | 22,243 | | | O’Reilly Automotive, Inc. (a) | | | 5,026 | |
| | 29,187 | | | Ross Stores, Inc. | | | 1,419 | |
| | 44,475 | | | Staples, Inc. | | | 681 | |
| | 88,916 | | | The TJX Cos., Inc. | | | 5,884 | |
| | 23,028 | | | Tiffany & Co. | | | 2,114 | |
| | 4,408 | | | Ulta Salon, Cosmetics & Fragrance, Inc. (a) | | | 681 | |
| | 7,328 | | | Urban Outfitters, Inc. (a) | | | 256 | |
| | | | | | | | |
| | | | | | | 43,342 | |
| | | | | | | | |
| | | | Technology Hardware, Storage & Peripherals — 2.50% | |
| | 232,304 | | | Apple, Inc. | | | 29,137 | |
| | 140,719 | | | EMC Corp. | | | 3,714 | |
| | 4,264 | | | Lexmark International, Inc., Class – A | | | 188 | |
| | | | | | | | |
| | | | | | | 33,039 | |
| | | | | | | | |
| | | | Textiles, Apparel & Luxury Goods — 1.55% | |
| | 18,832 | | | Coach, Inc. | | | 652 | |
| | 2,392 | | | Deckers Outdoor Corp. (a) | | | 172 | |
| | 3,004 | | | Fossil Group, Inc. (a) | | | 208 | |
| | 14,046 | | | Michael Kors Holdings Ltd. (a) | | | 591 | |
| | 111,003 | | | NIKE, Inc., Class – B | | | 11,991 | |
| | 4,052 | | | Ralph Lauren Corp. | | | 536 | |
| | 55,943 | | | Under Armour, Inc., Class – A (a) | | | 4,668 | |
| | 23,710 | | | V.F. Corp. | | | 1,654 | |
| | | | | | | | |
| | | | | | | 20,472 | |
| | | | | | | | |
| | | | Tobacco — 0.70% | | | | |
| | 108,101 | | | Philip Morris International, Inc. | | | 8,666 | |
| | 7,242 | | | Reynolds American, Inc. | | | 541 | |
| | | | | | | | |
| | | | | | | 9,207 | |
| | | | | | | | |
| | | | Trading Companies & Distributors — 0.17% | |
| | 20,386 | | | Fastenal Co. | | | 860 | |
| | 3,260 | | | MSC Industrial Direct Co., Inc., Class – A | | | 227 | |
| | 7,402 | | | NOW, Inc. (a) | | | 147 | |
| | 4,000 | | | W.W. Grainger, Inc. | | | 947 | |
| | | | | | | | |
| | | | | | | 2,181 | |
| | | | | | | | |
| | | | Total Common Stocks | | | 1,087,227 | |
| | | | | | | | |
| | | | | | | | |
Shares or
Principal
Amount
(000) | | | Security Description | | Value
(000) | |
| | | | Time Deposit — 0.86% | | | | |
| $ | 11,297 | | | State Street Liquidity Management Control System Eurodollar Time Deposit, 0.01%, 7/1/15 | | $ | 11,297 | |
| | | | | | | | |
| | | | Total Time Deposit | | | 11,297 | |
| | | | | | | | |
| | | | Mutual Funds — 10.90% | | | | |
| | 139,782,932 | | | Federated U.S. Treasury Cash Reserve Fund, Institutional Shares, 0.00% (b) | | | 139,783 | |
| | 3,971,598 | | | SSgA Treasury Money Market Fund, 0.00% (b) | | | 3,972 | |
| | | | | | | | |
| | | | Total Mutual Funds | | | 143,755 | |
| | | | | | | | |
| | | | Total Investments
(cost $973,369) — 94.16% | | | 1,242,279 | |
| | | | Other assets in excess of liabilities — 5.84% | | | 77,040 | |
| | | | | | | | |
| | | | Net Assets — 100.00% | | $ | 1,319,319 | |
| | | | | | | | |
| ^ | All or part of this security was on loan as of June 30, 2015. The total value of securities on loan as of June 30, 2015, was $295 (amount in thousands). |
| (a) | Represents non-income producing security. |
| (b) | The rate disclosed is the rate in effect on June 30, 2015. |
ADR — American Depositary Receipt
See accompanying notes to financial statements.
61
HC CAPITAL TRUST
The Institutional Growth Equity Portfolio
Portfolio of Investments (concluded) — June 30, 2015
The following table reflects the percentage of total net assets of the Portfolio attributable to each Specialist Manager, see Note 3 in the Notes to Financial Statements.
| | | | | | | | | | | | | | | | | | | | | | | | |
The Institutional Growth Equity Portfolio | | Jennison
Associates, LLC | | | Mellon Capital
Management
Corporation | | | Parametric
Portfolio
Associates, LLC | | | Sustainable
Growth Advisers, LP | | | HC Capital
Solutions | | | Total | |
Common Stocks | | | 20.01 | % | | | 35.93 | % | | | — | | | | 26.46 | % | | | — | | | | 82.40 | % |
Time Deposit | | | 0.10 | % | | | — | | | | — | | | | 0.76 | % | | | — | | | | 0.86 | % |
Mutual Funds | | | — | | | | 0.31 | % | | | — | | | | — | | | | 10.59 | % | | | 10.90 | % |
Other Assets (Liabilities) | | | 0.05 | % | | | 0.03 | % | | | 5.74 | % | | | 0.02 | % | | | — | | | | 5.84 | % |
| | | | | | | | | | | | | | | | | | | | | | | | |
Total Net Assets | | | 20.16 | % | | | 36.27 | % | | | 5.74 | % | | | 27.24 | % | | | 10.59 | % | | | 100.00 | % |
| | | | | | | | | | | | | | | | | | | | | | | | |
The following table reflects the open derivative positions held by the Portfolio as of June 30, 2015.
Long Futures
| | | | | | | | | | | | | | | | |
Number of
Contracts | | | Futures Contracts Positions^ | | Value
(000) | | | Expiration | | | Unrealized
Appreciation/
(Depreciation)
(000) | |
| | 284 | | | E-Mini NASDAQ 100 Future | | $ | 24,937 | | | | 9/18/15 | | | $ | (530 | ) |
| | 452 | | | E-Mini S&P 500 Future | | | 46,429 | | | | 9/18/15 | | | | (1,057 | ) |
| | 84 | | | E-Mini S&P Midcap 400 Future | | | 12,584 | | | | 9/18/15 | | | | (238 | ) |
| | | | | | | | | | | | | | | | |
| | | | Net Unrealized Appreciation/(Depreciation) | | | | | | | | | | $ | (1,825 | ) |
| | | | | | | | | | | | | | | | |
Amounts designated as “—” are $0 or have been rounded to $0.
| ^ | Cash has been pledged as collateral for futures contracts held by the portfolio. |
See accompanying notes to financial statements.
62
HC CAPITAL TRUST
The Small Capitalization–Mid Capitalization Equity Portfolio
Portfolio of Investments — June 30, 2015
| | | | | | | | |
| Shares | | | Security
Description | | Value
(000) | |
| | | | Common Stocks — 85.12% | | | | |
| | | | Aerospace & Defense — 0.98% | | | | |
| | 59 | | | AAR Corp. | | $ | 2 | |
| | 5 | | | Aerojet Rocketdyne Holdings, Inc. (a) | | | — | |
| | 3 | | | Astronics Corp. (a) | | | — | |
| | 2,600 | | | Cubic Corp. | | | 124 | |
| | 6,080 | | | Curtiss-Wright Corp. | | | 441 | |
| | 68 | | | Ducommun, Inc. (a) | | | 2 | |
| | 35 | | | Engility Holdings, Inc. (a) | | | 1 | |
| | 18,000 | | | Erickson Air-Crane, Inc. (a) | | | 78 | |
| | 3,179 | | | Esterline Technologies Corp. (a) | | | 303 | |
| | 3 | | | HEICO Corp. | | | — | |
| | 5 | | | HEICO Corp., Class – A | | | — | |
| | 24 | | | National Presto Industries, Inc. | | | 2 | |
| | 13 | | | Orbital ATK, Inc. | | | 1 | |
| | 1 | | | Sparton Corp. (a) | | | — | |
| | 5,193 | | | TASER International, Inc. (a) | | | 173 | |
| | 1 | | | Teledyne Technologies, Inc. (a) | | | — | |
| | 20 | | | Triumph Group, Inc. | | | 1 | |
| | 1 | | | Vectrus, Inc. (a) | | | — | |
| | | | | | | | |
| | | | | | | 1,128 | |
| | | | | | | | |
| | | | Air Freight & Logistics — 0.46% | | | | |
| | 202 | | | Air Transport Services Group, Inc. (a) | | | 2 | |
| | 39 | | | Atlas Air Worldwide Holdings, Inc. (a) | | | 2 | |
| | 4 | | | Echo Global Logistics, Inc. (a) | | | — | |
| | 4 | | | Forward Air Corp. | | | — | |
| | 4 | | | Hub Group, Inc., Class – A (a) | | | — | |
| | 1 | | | Park-Ohio Holdings Corp. | | | — | |
| | 3 | | | Radiant Logistics, Inc. (a) | | | — | |
| | 23,035 | | | UTI Worldwide, Inc. (a) | | | 230 | |
| | 6,519 | | | XPO Logistics, Inc. (a) | | | 295 | |
| | | | | | | | |
| | | | | | | 529 | |
| | | | | | | | |
| | | | Airlines — 1.92% | | | | |
| | 2 | | | Allegiant Travel Co. | | | — | |
| | 4,920 | | | American Airlines Group, Inc. | | | 196 | |
| | 20 | | | Copa Holdings SA, Class – A | | | 2 | |
| | 572 | | | Hawaiian Holdings, Inc. (a) | | | 14 | |
| | 26,944 | | | JetBlue Airways Corp. (a) | | | 559 | |
| | 128 | | | Republic Airways Holdings, Inc. (a) | | | 1 | |
| | 140 | | | SkyWest, Inc. | | | 2 | |
| | 26,991 | | | United Continental Holdings, Inc. (a) | | | 1,432 | |
| | 3 | | | Virgin America, Inc. (a) | | | — | |
| | | | | | | | |
| | | | | | | 2,206 | |
| | | | | | | | |
| | | | Apparel, Accessories & Luxury Goods — 0.00% | |
| | 1 | | | Cherokee, Inc. | | | — | |
| | | | | | | | |
| | | | Auto Components — 1.65% | |
| | 10 | | | American Axle & Manufacturing Holdings, Inc. (a) | | | — | |
| | 1,635 | | | Autoliv, Inc. | | | 191 | |
| | 75 | | | Cooper Tire & Rubber Co. | | | 3 | |
| | 10,459 | | | Dana Holding Corp. | | | 215 | |
| | 4 | | | Dorman Products, Inc. (a) | | | — | |
| | 3 | | | Drew Industries, Inc. | | | — | |
| | 12,834 | | | Fox Factory Holding Corp. (a) | | | 206 | |
| | 6,695 | | | Gentherm, Inc. (a) | | | 368 | |
| | | | | | | | |
| Shares | | | Security
Description | | Value
(000) | |
| | | | Auto Components (continued) | | | | |
| | 1 | | | Metaldyne Performance Group, Inc. | | $ | — | |
| | 8,590 | | | Modine Manufacturing Co. (a) | | | 92 | |
| | 2 | | | Motorcar Parts of America, Inc. (a) | | | — | |
| | 127 | | | Remy International, Inc. | | | 3 | |
| | 28,100 | | | Spartan Motors, Inc. | | | 129 | |
| | 12,630 | | | Stoneridge, Inc. (a) | | | 148 | |
| | 5,900 | | | Superior Industries, Inc. | | | 108 | |
| | 7,448 | | | Tenneco, Inc. (a) | | | 427 | |
| | 102 | | | Tower International, Inc. (a) | | | 3 | |
| | | | | | | | |
| | | | | | | 1,893 | |
| | | | | | | | |
| | | | Automobiles — 0.00% | | | | |
| | 3 | | | Winnebago Industries, Inc. | | | — | |
| | | | | | | | |
| | | | Banks — 4.80% | | | | |
| | 40 | | | 1st Source, Inc. | | | 1 | |
| | 66 | | | American National Bankshares, Inc. | | | 2 | |
| | 8,775 | | | Associated Banc-Corp. | | | 178 | |
| | 40 | | | Banco Latinoamericano de Comercio Exterior SA, Class – E | | | 1 | |
| | 5,840 | | | Bank of the Ozarks, Inc. | | | 267 | |
| | 13,590 | | | BankUnited, Inc. | | | 488 | |
| | 7,720 | | | Banner Corp. | | | 370 | |
| | 9,966 | | | BBCN Bancorp, Inc. | | | 147 | |
| | 40 | | | Camden National Corp. | | | 2 | |
| | 77 | | | CNB Financial Corp. | | | 1 | |
| | 21,657 | | | Columbia Banking System, Inc. | | | 705 | |
| | 7,915 | | | Cullen/Frost Bankers, Inc. | | | 622 | |
| | 3 | | | Eagle BanCorp, Inc. (a) | | | — | |
| | 71 | | | Fidelity Southern Corp. | | | 1 | |
| | 60 | | | Financial Institutions, Inc. | | | 1 | |
| | 260 | | | First Bancorp (a) | | | 1 | |
| | 84 | | | First Bancorp | | | 1 | |
| | 80 | | | First Community Bancshares, Inc. | | | 1 | |
| | 5 | | | First Financial Bankshares, Inc. | | | — | |
| | 45 | | | First Financial Corp. | | | 2 | |
| | 50 | | | First Interstate BancSystem, Inc. | | | 1 | |
| | 8,225 | | | First Midwest BanCorp, Inc. | | | 156 | |
| | 165 | | | First Niagara Financial Group, Inc. | | | 2 | |
| | 40 | | | Great Southern Bancorp, Inc. | | | 2 | |
| | 50 | | | Hancock Holding Co. | | | 2 | |
| | 60 | | | Heartland Financial USA, Inc. | | | 2 | |
| | 6 | | | Home Bancshares, Inc. | | | — | |
| | 59 | | | Horizon Bancorp | | | 1 | |
| | 115 | | | Independent Bank Corp. | | | 2 | |
| | 60 | | | International Bancshares Corp. | | | 2 | |
| | 70 | | | MainSource Financial Group, Inc. | | | 2 | |
| | 2,500 | | | MB Financial, Inc. | | | 86 | |
| | 90 | | | MidSouth Bancorp, Inc. | | | 1 | |
| | 13,549 | | | National Penn Bancshares, Inc. | | | 153 | |
| | 60 | | | NBT Bancorp, Inc. | | | 2 | |
| | 50 | | | Northrim BanCorp, Inc. | | | 1 | |
| | 85 | | | OFG Bancorp | | | 1 | |
| | 11,854 | | | PacWest Bancorp | | | 554 | |
| | 50 | | | Peoples Bancorp, Inc. | | | 1 | |
| | 8,380 | | | Popular, Inc. (a) | | | 242 | |
| | 14,178 | | | Square 1 Financial, Inc., Class – A (a) | | | 388 | |
See accompanying notes to financial statements.
63
HC CAPITAL TRUST
The Small Capitalization–Mid Capitalization Equity Portfolio
Portfolio of Investments (continued) — June 30, 2015
| | | | | | | | |
| Shares | | | Security
Description | | Value
(000) | |
| | | | Common Stocks (continued) | | | | |
| | | | Banks (continued) | | | | |
| | 109 | | | Susquehanna Bancshares, Inc. | | $ | 2 | |
| | 4,430 | | | SVB Financial Group (a) | | | 638 | |
| | 5,592 | | | Synovus Financial Corp. | | | 172 | |
| | 7,572 | | | TCF Financial Corp. | | | 126 | |
| | 93 | | | TowneBank | | | 2 | |
| | 61 | | | Trustmark Corp. | | | 2 | |
| | 71 | | | Univest Corp. of Pennsylvania | | | 1 | |
| | 4,703 | | | Webster Financial Corp. | | | 186 | |
| | 40 | | | WesBanco, Inc. | | | 1 | |
| | 6 | | | Western Alliance Bancorp (a) | | | — | |
| | 30 | | | Wintrust Financial Corp. | �� | | 2 | |
| | | | | | | | |
| | | | | | | 5,524 | |
| | | | | | | | |
| | | | Beverages — 0.00% | | | | |
| | 9 | | | Castle Brands, Inc. (a) | | | — | |
| | 21 | | | Coca-Cola Bottling Co. Consolidated | | | 3 | |
| | 1 | | | MGP Ingredients, Inc. | | | — | |
| | 1 | | | National Beverage Corp. (a) | | | — | |
| | 1 | | | The Boston Beer Co., Inc., Class – A (a) | | | — | |
| | | | | | | | |
| | | | | | | 3 | |
| | | | | | | | |
| | | | Biotechnology — 2.80% | | | | |
| | 1 | | | Abeona Therapeutics, Inc. (a) | | | — | |
| | 10 | | | Acadia Pharmaceuticals, Inc. (a) | | | — | |
| | 3 | | | Acceleron Pharma, Inc. (a) | | | — | |
| | 14 | | | Achillion Pharmaceuticals, Inc. (a) | | | — | |
| | 73 | | | Acorda Therapeutics, Inc. (a) | | | 2 | |
| | 1 | | | Aduro Biotech, Inc. (a) | | | — | |
| | 4 | | | Advaxis, Inc. (a) | | | — | |
| | 3 | | | Aegerion Pharmaceuticals, Inc. (a) | | | — | |
| | 2 | | | Affimed Therapeutics BV (a) | | | — | |
| | 8 | | | Agenus, Inc. (a) | | | — | |
| | 385 | | | Agios Pharmaceuticals, Inc. (a) | | | 43 | |
| | 3 | | | Alder Biopharmaceuticals, Inc. (a) | | | — | |
| | 4 | | | AMAG Pharmaceuticals, Inc. (a) | | | — | |
| | 12 | | | Amicus Therapeutics, Inc. (a) | | | — | |
| | 1,695 | | | Anacor Pharmaceuticals, Inc. (a) | | | 132 | |
| | 5 | | | Anthera Pharmaceuticals, Inc. (a) | | | — | |
| | 1 | | | Applied Genetic Technologies Corp. (a) | | | — | |
| | 2 | | | Ardelyx, Inc. (a) | | | — | |
| | 32 | | | Arena Pharmaceuticals, Inc. (a) | | | — | |
| | 22 | | | ARIAD Pharmaceuticals, Inc. (a) | | | — | |
| | 15 | | | Array BioPharma, Inc. (a) | | | — | |
| | 5 | | | Arrowhead Research Corp. (a) | | | — | |
| | 1 | | | Asterias Biotherapeutics, Inc. (a) | | | — | |
| | 1,922 | | | Atara Biotherapeutics, Inc. (a) | | | 101 | |
| | 1 | | | aTyr Pharma, Inc. (a) | | | — | |
| | 3 | | | Avalanche Biotechnologies, Inc. (a) | | | — | |
| | 1 | | | Bellicum Pharmaceuticals, Inc. (a) | | | — | |
| | 8 | | | BioCryst Pharmaceuticals, Inc. (a) | | | — | |
| | 974 | | | BioMarin Pharmaceutical, Inc. (a) | | | 134 | |
| | 1 | | | BioSpecifics Technologies Corp. (a) | | | — | |
| | 7 | | | BioTime, Inc. (a) | | | — | |
| | 1 | | | Blueprint Medicines Corp. (a) | | | — | |
| | 2 | | | Cara Therapeutics, Inc. (a) | | | — | |
| | 9 | | | Catalyst Pharmaceuticals, Inc. (a) | | | — | |
| | | | | | | | |
| Shares | | | Security
Description | | Value
(000) | |
| | | | Biotechnology (continued) | | | | |
| | 12 | | | Celldex Therapeutics, Inc. (a) | | $ | — | |
| | 1 | | | Cellular Biomedicine Group, Inc. (a) | | | — | |
| | 8,979 | | | Cepheid, Inc. (a) | | | 550 | |
| | 4 | | | ChemoCentryx, Inc. (a) | | | — | |
| | 5 | | | Chimerix, Inc. (a) | | | — | |
| | 1 | | | Cidara Therapeutics, Inc. (a) | | | — | |
| | 3 | | | Clovis Oncology, Inc. (a) | | | — | |
| | 3 | | | Coherus Biosciences, Inc. (a) | | | — | |
| | 2 | | | Concert Pharmaceuticals, Inc. (a) | | | — | |
| | 4 | | | CorMedix, Inc. (a) | | | — | |
| | 22 | | | CTI BioPharma Corp. (a) | | | — | |
| | 14 | | | Curis, Inc. (a) | | | — | |
| | 2 | | | Cytokinetics, Inc. (a) | | | — | |
| | 7 | | | CytRx Corp. (a) | | | — | |
| | 2 | | | Dicerna Pharmaceuticals, Inc. (a) | | | — | |
| | 6,340 | | | Dyax Corp. (a) | | | 169 | |
| | 4 | | | Dynavax Technologies Corp. (a) | | | — | |
| | 1 | | | Eagle Pharmaceuticals, Inc. (a) | | | — | |
| | 94 | | | Emergent BioSolutions, Inc. (a) | | | 3 | |
| | 2 | | | Enanta Pharmaceuticals, Inc. (a) | | | — | |
| | 4 | | | Epizyme, Inc. (a) | | | — | |
| | 2 | | | Esperion Therapeutics, Inc. (a) | | | — | |
| | 22,047 | | | Exact Sciences Corp. (a) | | | 657 | |
| | 26 | | | Exelixis, Inc. (a) | | | — | |
| | 3 | | | Fibrocell Science, Inc. (a) | | | — | |
| | 6 | | | Fibrogen, Inc. (a) | | | — | |
| | 3 | | | Five Prime Therapeutics, Inc. (a) | | | — | |
| | 2 | | | Flexion Therapeutics, Inc. (a) | | | — | |
| | 2 | | | Foundation Medicine, Inc. (a) | | | — | |
| | 21 | | | Galena Biopharma, Inc. (a) | | | — | |
| | 2 | | | Genocea Biosciences, Inc. (a) | | | — | |
| | 6,262 | | | Genomic Health, Inc. (a) | | | 175 | |
| | 19 | | | Geron Corp. (a) | | | — | |
| | 14 | | | Halozyme Therapeutics, Inc. (a) | | | — | |
| | 3 | | | Heron Therapeutics, Inc. (a) | | | — | |
| | 10 | | | Idera Pharmaceuticals, Inc. (a) | | | — | |
| | 1 | | | Ignyta, Inc. (a) | | | — | |
| | 1 | | | Immune Design Corp. (a) | | | — | |
| | 11 | | | ImmunoGen, Inc. (a) | | | — | |
| | 12 | | | Immunomedics, Inc. (a) | | | — | |
| | 6 | | | Infinity Pharmaceuticals, Inc. (a) | | | — | |
| | 8 | | | Inovio Pharmaceuticals, Inc. (a) | | | — | |
| | 8 | | | Insmed, Inc. (a) | | | — | |
| | 3 | | | Insys Therapeutics, Inc. (a) | | | — | |
| | 4,110 | | | Intrexon Corp.^ | | | 202 | |
| | 1 | | | Invitae Corp. (a) | | | — | |
| | 17 | | | Ironwood Pharmaceuticals, Inc. (a) | | | — | |
| | 2,695 | | | Isis Pharmaceuticals, Inc. (a) | | | 156 | |
| | 3 | | | Karyopharm Therapeutics, Inc. (a) | | | — | |
| | 14 | | | Keryx Biopharmaceuticals, Inc. (a) | | | — | |
| | 12,100 | | | Kindred Biosciences, Inc. (a) | | | 83 | |
| | 4 | | | Kite Pharma, Inc. (a) | | | — | |
| | 3 | | | KYTHERA Biopharmaceuticals, Inc. (a) | | | — | |
| | 2 | | | La Jolla Pharmaceutical Co. (a) | | | — | |
| | 3 | | | Lexicon Pharmaceuticals, Inc. (a) | | | — | |
See accompanying notes to financial statements.
64
HC CAPITAL TRUST
The Small Capitalization–Mid Capitalization Equity Portfolio
Portfolio of Investments (continued) — June 30, 2015
| | | | | | | | |
| Shares | | | Security
Description | | Value
(000) | |
| | | | Common Stocks (continued) | | | | |
| | | | Biotechnology (continued) | | | | |
| | 2 | | | Ligand Pharmaceuticals, Inc., Class – B (a) | | $ | — | |
| | 6 | | | Lion Biotechnologies, Inc. (a) | | | — | |
| | 4 | | | MacroGenics, Inc. (a) | | | — | |
| | 32 | | | MannKind Corp. (a) | | | — | |
| | 2 | | | Medgenics, Inc. (a) | | | — | |
| | 14 | | | Merrimack Pharmaceuticals, Inc. (a) | | | — | |
| | 14 | | | MiMedx Group, Inc. (a) | | | — | |
| | 1 | | | Mirati Therapeutics, Inc. (a) | | | — | |
| | 8 | | | Momenta Pharmaceuticals, Inc. (a) | | | — | |
| | 5,619 | | | Myriad Genetics, Inc.^(a) | | | 192 | |
| | 19 | | | Navidea Biopharmaceuticals, Inc. (a) | | | — | |
| | 11 | | | Neurocrine Biosciences, Inc. (a) | | | 1 | |
| | 3 | | | NewLink Genetics Corp. (a) | | | — | |
| | 6 | | | Northwest Biotherapeutics, Inc. (a) | | | — | |
| | 35 | | | Novavax, Inc. (a) | | | — | |
| | 4 | | | Ocata Therapeutics, Inc. (a) | | | — | |
| | 7,882 | | | OncoMed Pharmaceuticals, Inc. (a) | | | 178 | |
| | 15 | | | Oncothyreon, Inc. (a) | | | — | |
| | 3 | | | Ophthotech Corp. (a) | | | — | |
| | 14 | | | Orexigen Therapeutics, Inc. (a) | | | — | |
| | 11 | | | Organovo Holdings, Inc. (a) | | | — | |
| | 2 | | | Osiris Therapeutics, Inc. (a) | | | — | |
| | 2 | | | Otonomy, Inc. (a) | | | — | |
| | 3 | | | OvaScience, Inc. (a) | | | — | |
| | 300 | | | PDL BioPharma, Inc. | | | 2 | |
| | 26 | | | Peregrine Pharmaceuticals, Inc. (a) | | | — | |
| | 2 | | | Pfenex, Inc. (a) | | | — | |
| | 6 | | | Portola Pharmaceuticals, Inc. (a) | | | — | |
| | 9 | | | Progenics Pharmaceuticals, Inc. (a) | | | — | |
| | 1 | | | Proteon Therapeutics, Inc. (a) | | | — | |
| | 4 | | | Prothena Corp. PLC (a) | | | — | |
| | 4 | | | PTC Therapeutics, Inc. (a) | | | — | |
| | 4 | | | Radius Health, Inc. (a) | | | — | |
| | 11 | | | Raptor Pharmaceuticals Corp. (a) | | | — | |
| | 4 | | | Regulus Therapeutics, Inc. (a) | | | — | |
| | 102 | | | Repligen Corp. (a) | | | 4 | |
| | 5 | | | Retrophin, Inc. (a) | | | — | |
| | 9 | | | Rigel Pharmaceuticals, Inc. (a) | | | — | |
| | 2 | | | Sage Therapeutics, Inc. (a) | | | — | |
| | 6,574 | | | Sangamo BioSciences, Inc. (a) | | | 73 | |
| | 5 | | | Sarepta Therapeutics, Inc. (a) | | | — | |
| | 3,975 | | | Seattle Genetics, Inc. (a) | | | 193 | |
| | 4 | | | Sorrento Therapeutics, Inc. (a) | | | — | |
| | 1 | | | Spark Therapeutics, Inc. (a) | | | — | |
| | 2 | | | Spectrum Pharmaceuticals, Inc. (a) | | | — | |
| | 1 | | | Stemline Therapeutics, Inc. (a) | | | — | |
| | 13 | | | Synergy Pharmaceuticals, Inc. (a) | | | — | |
| | 12 | | | Synta Pharmaceuticals Corp. (a) | | | — | |
| | 1 | | | T2 Biosystems, Inc. (a) | | | — | |
| | 3 | | | Tesaro, Inc. (a) | | | — | |
| | 5 | | | TG Therapeutics, Inc. (a) | | | — | |
| | 9 | | | Threshold Pharmaceuticals, Inc. (a) | | | — | |
| | 1 | | | Tokai Pharmaceuticals, Inc. (a) | | | — | |
| | 3 | | | Trevena, Inc. (a) | | | — | |
| | | | | | | | |
| Shares | | | Security
Description | | Value
(000) | |
| | | | Biotechnology (continued) | | | | |
| | 3 | | | Trovagene, Inc. (a) | | $ | — | |
| | 1,280 | | | Ultragenyx Pharmaceutical, Inc. (a) | | | 132 | |
| | 4 | | | Vanda Pharmaceuticals, Inc. (a) | | | — | |
| | 1 | | | Verastem, Inc. (a) | | | — | |
| | 56,700 | | | Vical, Inc. (a) | | | 40 | |
| | 2 | | | Vitae Pharmaceuticals, Inc. (a) | | | — | |
| | 2 | | | Vital Therapies, Inc. (a) | | | — | |
| | 1 | | | XBiotech, Inc. (a) | | | — | |
| | 4 | | | Xencor, Inc. (a) | | | — | |
| | 10 | | | XOMA Corp. (a) | | | — | |
| | 2 | | | Zafgen, Inc. (a) | | | — | |
| | 16 | | | ZIOPHARM Oncology, Inc. (a) | | | — | |
| | | | | | | | |
| | | | | | | 3,222 | |
| | | | | | | | |
| | | | Building Products — 2.11% | | | | |
| | 5 | | | AAON, Inc. | | | — | |
| | 4 | | | Advanced Drainage Systems, Inc. | | | — | |
| | 2 | | | American Woodmark Corp. (a) | | | — | |
| | 4 | | | Apogee Enterprises, Inc. | | | — | |
| | 3,387 | | | Armstrong World Industries, Inc. (a) | | | 180 | |
| | 6 | | | Builders FirstSource, Inc. (a) | | | — | |
| | 10,124 | | | CaesarStone Sdot Yam Ltd. | | | 694 | |
| | 4 | | | Continental Building Products, Inc. (a) | | | — | |
| | 9,991 | | | Gibraltar Industries, Inc. (a) | | | 204 | |
| | 3,448 | | | Griffon Corp. | | | 55 | |
| | 2 | | | Insteel Industries, Inc. | | | — | |
| | 4,387 | | | Lennox International, Inc. | | | 473 | |
| | 2,705 | | | Masonite International Corp. (a) | | | 190 | |
| | 4 | | | NCI Building Systems, Inc. (a) | | | — | |
| | 1 | | | Nortek, Inc. (a) | | | — | |
| | 2 | | | Patrick Industries, Inc. (a) | | | — | |
| | 6 | | | PGT, Inc. (a) | | | — | |
| | 3 | | | Ply Gem Holdings, Inc. (a) | | | — | |
| | 2,200 | | | Simpson Manufacturing Co., Inc. | | | 75 | |
| | 4,324 | | | Trex Co., Inc. (a) | | | 214 | |
| | 6,493 | | | Universal Forest Products, Inc. | | | 338 | |
| | | | | | | | |
| | | | | | | 2,423 | |
| | | | | | | | |
| | | | Capital Markets — 2.08% | | | | |
| | 36 | | | Arlington Asset Investment Corp. | | | 1 | |
| | 2,389 | | | Artisan Partners Asset Management, Inc. | | | 111 | |
| | 23 | | | BGC Partners, Inc., Class – A | | | — | |
| | 74 | | | Calamos Asset Management, Inc., Class – A | | | 1 | |
| | 4,400 | | | Capital Southwest Corp. | | | 220 | |
| | 3 | | | Cohen & Steers, Inc. | | | — | |
| | 50,201 | | | Cowen Group, Inc. (a) | | | 321 | |
| | 6,200 | | | E*Trade Financial Corp. (a) | | | 186 | |
| | 5 | | | Evercore Partners, Inc., Class – A | | | — | |
| | 40 | | | FBR & Co. (a) | | | 1 | |
| | 1 | | | Fifth Street Asset Management, Inc. | | | — | |
| | 7 | | | Financial Engines, Inc. | | | — | |
| | 12 | | | GAMCO Investors, Inc., Class – A | | | 1 | |
| | 4 | | | Greenhill & Co., Inc. | | | — | |
| | 5 | | | HFF, Inc., Class – A | | | — | |
| | 8,896 | | | Interactive Brokers Group, Inc., Class – A | | | 370 | |
| | 1 | | | International Fcstone, Inc. (a) | | | — | |
| | 1 | | | Investment Technology Group, Inc. | | | — | |
See accompanying notes to financial statements.
65
HC CAPITAL TRUST
The Small Capitalization–Mid Capitalization Equity Portfolio
Portfolio of Investments (continued) — June 30, 2015
| | | | | | | | |
| Shares | | | Security
Description | | Value
(000) | |
| | | | Common Stocks (continued) | | | | |
| | | | Capital Markets (continued) | | | | |
| | 2 | | | Janus Capital Group, Inc. | | $ | — | |
| | 1 | | | KCG Holdings, Inc. (a) | | | — | |
| | 4 | | | Ladenburg Thalmann Financial Services, Inc. (a) | | | — | |
| | 3,000 | | | LPL Financial Holdings, Inc. | | | 139 | |
| | 57 | | | Manning & Napier, Inc. | | | 1 | |
| | 1 | | | Medley Management, Inc., Class – A | | | — | |
| | 2 | | | Moelis & Co., Class – A | | | — | |
| | 3 | | | Om Asset Management PLC | | | — | |
| | 41 | | | Oppenheimer Holdings, Inc., Class – A | | | 1 | |
| | 2 | | | Pzena Investment Management, Inc. | | | — | |
| | 4,315 | | | Raymond James Financial, Inc. | | | 257 | |
| | 8,224 | | | Stifel Financial Corp. (a) | | | 476 | |
| | 2 | | | Virtu Financial, Inc., Class – A (a) | | | — | |
| | 1,759 | | | Waddell & Reed Financial, Inc., Class – A | | | 83 | |
| | 1 | | | Westwood Holdings Group, Inc. | | | — | |
| | 10,108 | | | WisdomTree Investments, Inc. | | | 222 | |
| | | | | | | | |
| | | | | | | 2,391 | |
| | | | | | | | |
| | | | Chemicals — 2.19% | | | | |
| | 47 | | | A. Schulman, Inc. | | | 2 | |
| | 3,013 | | | Albemarle Corp. | | | 167 | |
| | 40 | | | Axiall Corp. | | | 1 | |
| | 4 | | | Balchem Corp. | | | — | |
| | 3,958 | | | Cabot Corp. | | | 148 | |
| | 4 | | | Calgon Carbon Corp. | | | — | |
| | 59 | | | Chase Corp. | | | 2 | |
| | 9 | | | Chemtura Corp. (a) | | | — | |
| | 1 | | | Core Molding Technologies, Inc. (a) | | | — | |
| | 10 | | | Ferro Corp. (a) | | | — | |
| | 3,122 | | | FMC Corp. | | | 164 | |
| | 131 | | | FutureFuel Corp. | | | 2 | |
| | 7 | | | H.B. Fuller Co. | | | — | |
| | 1 | | | KMG Chemicals, Inc. | | | — | |
| | 64 | | | Koppers Holdings, Inc. | | | 2 | |
| | 15,372 | | | Kraton Performance Polymers, Inc. (a) | | | 367 | |
| | 1 | | | LSB Industries, Inc. (a) | | | — | |
| | 3,208 | | | Methanex Corp. | | | 179 | |
| | 4 | | | Minerals Technologies, Inc. | | | — | |
| | 1,006 | | | NewMarket Corp. | | | 447 | |
| | 77 | | | Olin Corp. | | | 2 | |
| | 4 | | | Omnova Solutions, Inc. (a) | | | — | |
| | 7,112 | | | PolyOne Corp. | | | 279 | |
| | 1 | | | Quaker Chemical Corp. | | | — | |
| | 172,930 | | | Rentech, Inc. (a) | | | 185 | |
| | 6 | | | Senomyx, Inc. (a) | | | — | |
| | 5,454 | | | Sensient Technologies Corp. | | | 373 | |
| | 41 | | | Stepan Co. | | | 2 | |
| | 3 | | | Trecora Resources (a) | | | — | |
| | 1 | | | Tredegar Industries, Inc. | | | — | |
| | 2 | | | Trinseo SA (a) | | | — | |
| | 12,861 | | | Tronox Ltd., Class – A | | | 188 | |
| | 1 | | | Valhi, Inc. | | | — | |
| | | | | | | | |
| | | | | | | 2,510 | |
| | | | | | | | |
| | | | Commercial Services & Supplies — 1.17% | | | | |
| | 51 | | | ABM Industries, Inc. | | | 2 | |
| | | | | | | | |
| Shares | | | Security
Description | | Value
(000) | |
| | | | Commercial Services & Supplies (continued) | | | | |
| | 160 | | | ACCO Brands Corp. (a) | | $ | 1 | |
| | 2,753 | | | ARC Document Solutions, Inc. (a) | | | 21 | |
| | 5,725 | | | Brady Corp. | | | 142 | |
| | 2 | | | Casella Waste Systems, Inc. (a) | | | — | |
| | 24 | | | Deluxe Corp. | | | 1 | |
| | 107 | | | Ennis, Inc. | | | 2 | |
| | 3,515 | | | Essendant, Inc. | | | 138 | |
| | 2 | | | G & K Services, Inc., Class – A | | | — | |
| | 9 | | | Healthcare Services Group, Inc. | | | — | |
| | 8 | | | Herman Miller, Inc. | | | — | |
| | 6 | | | HNI Corp. | | | — | |
| | 2 | | | InnerWorkings, Inc. (a) | | | — | |
| | 9 | | | Interface, Inc. | | | — | |
| | 5,190 | | | KAR Auction Services, Inc. | | | 195 | |
| | 160 | | | Kimball International, Inc., Class – B | | | 2 | |
| | 6 | | | Knoll, Inc. | | | — | |
| | 2,400 | | | Matthews International Corp., Class – A | | | 128 | |
| | 7,121 | | | Mobile Mini, Inc. | | | 300 | |
| | 2 | | | MSA Safety, Inc. | | | — | |
| | 2 | | | Multi-Color Corp. | | | — | |
| | 70 | | | Quad Graphics, Inc. | | | 1 | |
| | 80 | | | R.R. Donnelley & Sons Co. | | | 1 | |
| | 2,331 | | | Ritchie Bros. Auctioneers, Inc. | | | 65 | |
| | 2 | | | SP Plus Corp. (a) | | | — | |
| | 94 | | | Steelcase, Inc., Class – A | | | 2 | |
| | 2,803 | | | Team, Inc. (a) | | | 113 | |
| | 5,780 | | | Tetra Tech, Inc. | | | 149 | |
| | 2,453 | | | The Brink’s Co. | | | 72 | |
| | 10 | | | UniFirst Corp. | | | 1 | |
| | 3 | | | US Ecology, Inc. | | | — | |
| | 41 | | | West Corp. | | | 1 | |
| | | | | | | | |
| | | | | | | 1,337 | |
| | | | | | | | |
| | | | Communications Equipment — 0.72% | | | | |
| | 2,375 | | | ADTRAN, Inc. | | | 39 | |
| | 3 | | | Aerohive Networks, Inc. (a) | | | — | |
| | 2 | | | Alliance Fiber Optic Products, Inc. | | | — | |
| | 2 | | | Applied Optoelectronics, Inc. (a) | | | — | |
| | 65 | | | BEL Fuse, Inc., Class – B | | | 1 | |
| | 57 | | | Black Box Corp. | | | 1 | |
| | 5 | | | CalAmp Corp. (a) | | | — | |
| | 15 | | | Ciena Corp. (a) | | | — | |
| | 1 | | | Clearfield, Inc. (a) | | | — | |
| | 3 | | | Extreme Networks, Inc. (a) | | | — | |
| | 2 | | | Harmonic, Inc. (a) | | | — | |
| | 9 | | | Harris Corp. | | | 1 | |
| | 13,348 | | | Infinera Corp. (a) | | | 281 | |
| | 4 | | | InterDigital, Inc. | | | — | |
| | 7 | | | Ixia (a) | | | — | |
| | 2 | | | KVH Industries, Inc. (a) | | | — | |
| | 23,000 | | | PC-Telephone, Inc. | | | 165 | |
| | 5 | | �� | Plantronics, Inc. | | | — | |
| | 10 | | | Ruckus Wireless, Inc. (a) | | | — | |
| | 32,037 | | | ShoreTel, Inc. (a) | | | 218 | |
| | 4,450 | | | Sierra Wireless, Inc.^(a) | | | 111 | |
| | 58 | | | TESSCO Technologies, Inc. | | | 1 | |
See accompanying notes to financial statements.
66
HC CAPITAL TRUST
The Small Capitalization–Mid Capitalization Equity Portfolio
Portfolio of Investments (continued) — June 30, 2015
| | | | | | | | |
| Shares | | | Security
Description | | Value
(000) | |
| | | | Common Stocks (continued) | | | | |
| | | | Communications Equipment (continued) | | | | |
| | 4 | | | Ubiquiti Networks, Inc. | | $ | — | |
| | 5 | | | ViaSat, Inc. (a) | | | — | |
| | | | | | | | |
| | | | | | | 818 | |
| | | | | | | | |
| | | | Construction & Engineering — 0.55% | | | | |
| | 2 | | | Argan, Inc. | | | — | |
| | 40 | | | Chicago Bridge & Iron Co. | | | 2 | |
| | 5 | | | Comfort Systems USA, Inc. | | | — | |
| | 4 | | | Dycom Industries, Inc. (a) | | | — | |
| | 19,605 | | | Furmanite Corp. (a) | | | 159 | |
| | 1 | | | Great Lakes Dredge & Dock Co. (a) | | | — | |
| | 2 | | | HC2 Holdings, Inc. (a) | | | — | |
| | 2,820 | | | KBR, Inc. | | | 55 | |
| | 5,333 | | | MasTec, Inc. (a) | | | 106 | |
| | 60 | | | MYR Group, Inc. (a) | | | 2 | |
| | 1 | | | NV5 Holdings, Inc. (a) | | | — | |
| | 2,991 | | | Primoris Services Corp. | | | 59 | |
| | 6,147 | | | Quanta Services, Inc. (a) | | | 178 | |
| | 3,403 | | | Tutor Perini Corp. (a) | | | 73 | |
| | | | | | | | |
| | | | | | | 634 | |
| | | | | | | | |
| | | | Construction Materials — 0.59% | | | | |
| | 5,100 | | | Eagle Materials, Inc. | | | 390 | |
| | 6,422 | | | Headwaters, Inc. (a) | | | 117 | |
| | 1,190 | | | Martin Marietta Materials, Inc. | | | 168 | |
| | 3 | | | Summit Materials, Inc., Class – A (a) | | | — | |
| | 2 | | | US Concrete, Inc. (a) | | | — | |
| | | | | | | | |
| | | | | | | 675 | |
| | | | | | | | |
| | | | Consumer Finance — 0.38% | | | | |
| | 1 | | | Encore Capital Group, Inc. (a) | | | — | |
| | 53 | | | Enova International, Inc. (a) | | | 1 | |
| | 87 | | | EZCORP, Inc., Class – A (a) | | | 1 | |
| | 3 | | | First Cash Financial Services, Inc. (a) | | | — | |
| | 6,259 | | | Green Dot Corp., Class – A (a) | | | 119 | |
| | 23 | | | Nelnet, Inc., Class – A | | | 1 | |
| | 72 | | | Nicholas Financial, Inc. (a) | | | 1 | |
| | 4,921 | | | PRA Group, Inc. (a) | | | 306 | |
| | 60 | | | Santander Consumer USA Holdings, Inc. (a) | | | 2 | |
| | 14 | | | World Acceptance Corp.^(a) | | | 1 | |
| | | | | | | | |
| | | | | | | 432 | |
| | | | | | | | |
| | | | Containers & Packaging — 0.74% | | | | |
| | 1 | | | AEP Industries, Inc. (a) | | | — | |
| | 6,711 | | | AptarGroup, Inc. | | | 428 | |
| | 12,919 | | | Berry Plastics Group, Inc. (a) | | | 419 | |
| | 34 | | | Greif, Inc., Class – A | | | 1 | |
| | 3 | | | Myers Industries, Inc. | | | — | |
| | | | | | | | |
| | | | | | | 848 | |
| | | | | | | | |
| | | | Distributors — 0.00% | | | | |
| | 2 | | | Core-Mark Holding Co., Inc. | | | — | |
| | 1 | | | Fenix Parts, Inc. (a) | | | — | |
| | 6 | | | Pool Corp. | | | 1 | |
| | | | | | | | |
| | | | | | | 1 | |
| | | | | | | | |
| | | | Diversified Consumer Services — 0.25% | | | | |
| | 5,963 | | | 2U, Inc. (a) | | | 193 | |
| | 54 | | | Apollo Group, Inc., Class – A (a) | | | 1 | |
| | | | | | | | |
| Shares | | | Security
Description | | Value
(000) | |
| | | | Diversified Consumer Services (continued) | | | | |
| | 5 | | | Bright Horizons Family Solutions, Inc. (a) | | $ | — | |
| | 2 | | | Capella Education Co. | | | — | |
| | 27,983 | | | Career Education Corp. (a) | | | 92 | |
| | 1 | | | Collectors Universe, Inc. | | | — | |
| | 6 | | | Grand Canyon Education, Inc. (a) | | | — | |
| | 1 | | | Houghton Mifflin Harcourt Co. (a) | | | — | |
| | 160 | | | K12, Inc. (a) | | | 2 | |
| | 1 | | | Liberty Tax, Inc. | | | — | |
| | 12 | | | LifeLock, Inc. (a) | | | — | |
| | 8 | | | Sotheby’s | | | — | |
| | 43 | | | Steiner Leisure Ltd. (a) | | | 2 | |
| | 1 | | | Strayer Education, Inc. (a) | | | — | |
| | 3 | | | Weight Watchers International, Inc. (a) | | | — | |
| | | | | | | | |
| | | | | | | 290 | |
| | | | | | | | |
| | | | Diversified Financial Services — 0.25% | | | | |
| | 6,775 | | | Leucadia National Corp. | | | 165 | |
| | 5 | | | MarketAxess Holdings, Inc. | | | — | |
| | 2 | | | On Deck Capital, Inc. (a) | | | — | |
| | 4,809 | | | PHH Corp. (a) | | | 125 | |
| | | | | | | | |
| | | | | | | 290 | |
| | | | | | | | |
| | | | Diversified Telecommunication Services — 0.86% | | | | |
| | 4 | | | 8x8, Inc. (a) | | | — | |
| | 13,666 | | | Cogent Communications Group, Inc. | | | 463 | |
| | 4 | | | Consolidated Communications Holdings, Inc. | | | — | |
| | 3 | | | FairPoint Communications, Inc. (a) | | | — | |
| | 5 | | | General Communication, Inc., Class – A (a) | | | — | |
| | 52 | | | Hawaiian Telcom Holdco, Inc. (a) | | | 1 | |
| | 81 | | | IDT Corp. | | | 1 | |
| | 7 | | | inContact, Inc. (a) | | | — | |
| | 2 | | | Inteliquent, Inc. | | | — | |
| | 1 | | | Intelsat SA (a) | | | — | |
| | 3 | | | Lumos Networks Corp. | | | — | |
| | 44,400 | | | ORBCOMM, Inc. (a) | | | 301 | |
| | 1 | | | Pacific DataVision, Inc. (a) | | | — | |
| | 21,706 | | | Premiere Global Services, Inc. (a) | | | 223 | |
| | 1 | | | Straight Path Communications, Inc., Class – B (a) | | | — | |
| | 3 | | | Vonage Holdings Corp. (a) | | | — | |
| | 11 | | | Windstream Holdings, Inc. | | | — | |
| | | | | | | | |
| | | | | | | 989 | |
| | | | | | | | |
| | | | Electric Utilities — 0.32% | | | | |
| | 10,214 | | | El Paso Electric Co. | | | 354 | |
| | 93 | | | PNM Resources, Inc. | | | 2 | |
| | 66 | | | Portland General Electric Co. | | | 2 | |
| | 170 | | | Spark Energy, Inc., Class – A | | | 3 | |
| | 92 | | | The Empire District Electric Co. | | | 2 | |
| | 57 | | | UIL Holdings Corp. | | | 3 | |
| | 70 | | | Unitil Corp. | | | 2 | |
| | | | | | | | |
| | | | | | | 368 | |
| | | | | | | | |
| | | | Electrical Equipment — 0.95% | | | | |
| | 2,410 | | | Acuity Brands, Inc. | | | 435 | |
| | 1 | | | Allied Motion Technologies, Inc. | | | — | |
| | 3 | | | AZZ, Inc. | | | — | |
| | 1,402 | | | Encore Wire Corp. | | | 62 | |
| | 4,275 | | | EnerSys | | | 301 | |
See accompanying notes to financial statements.
67
HC CAPITAL TRUST
The Small Capitalization–Mid Capitalization Equity Portfolio
Portfolio of Investments (continued) — June 30, 2015
| | | | | | | | |
| Shares | | | Security
Description | | Value
(000) | |
| | | | Common Stocks (continued) | | | | |
| | | | Electrical Equipment (continued) | | | | |
| | 4 | | | Enphase Energy, Inc. (a) | | $ | — | |
| | 6 | | | Franklin Electric Co., Inc. | | | — | |
| | 15 | | | FuelCell Energy, Inc. (a) | | | — | |
| | 37 | | | Generac Holdings, Inc. (a) | | | 1 | |
| | 10,606 | | | General Cable Corp. | | | 209 | |
| | 33,900 | | | Orion Energy Systems, Inc. (a) | | | 85 | |
| | 13 | | | Plug Power, Inc. (a) | | | — | |
| | 6 | | | Polypore International, Inc. (a) | | | — | |
| | 1 | | | Power Solutions International, Inc. (a) | | | — | |
| | 1 | | | PowerSecure International, Inc. (a) | | | — | |
| | 30 | | | Preformed Line Products Co. | | | 1 | |
| | 25 | | | Regal-Beloit Corp. | | | 2 | |
| | 2 | | | Thermon Group Holdings, Inc. (a) | | | — | |
| | 2 | | | Vicor Corp. (a) | | | — | |
| | | | | | | | |
| | | | | | | 1,096 | |
| | | | | | | | |
| | | | Electronic Equipment, Instruments & Components — 3.71% | |
| | 2 | | | Badger Meter, Inc. | | | — | |
| | 8,588 | | | Belden, Inc. | | | 699 | |
| | 61 | | | Benchmark Electronics, Inc. (a) | | | 1 | |
| | 7,795 | | | Cognex Corp. | | | 376 | |
| | 15,262 | | | Control4 Corp.^(a) | | | 136 | |
| | 2 | | | Daktronics, Inc. | | | — | |
| | 35 | | | Dolby Laboratories, Inc., Class – A | | | 1 | |
| | 8,834 | | | DTS, Inc. (a) | | | 269 | |
| | 6,014 | | | Electro Rent Corp. | | | 65 | |
| | 100 | | | Fabrinet (a) | | | 2 | |
| | 1 | | | FARO Technologies, Inc. (a) | | | — | |
| | 5 | | | FEI Co. | | | — | |
| | 25,791 | | | Flextronics International Ltd. (a) | | | 292 | |
| | 5,788 | | | Insight Enterprises, Inc. (a) | | | 173 | |
| | 7,113 | | | InvenSense, Inc.^(a) | | | 107 | |
| | 3,695 | | | IPG Photonics Corp. (a) | | | 315 | |
| | 6,838 | | | Itron, Inc. (a) | | | 236 | |
| | 10,717 | | | Jabil Circuit, Inc. | | | 228 | |
| | 138 | | | Kimball Electronics, Inc. (a) | | | 2 | |
| | 3,039 | | | Littelfuse, Inc. | | | 288 | |
| | 5 | | | Methode Electronics, Inc. | | | — | |
| | 2 | | | MTS Systems Corp. | | | — | |
| | 3 | | | Newport Corp. (a) | | | — | |
| | 1 | | | OSI Systems, Inc. (a) | | | — | |
| | 70 | | | PC Connection, Inc. | | | 2 | |
| | 48 | | | Plexus Corp. (a) | | | 2 | |
| | 5 | | | RealD, Inc. (a) | | | — | |
| | 5,497 | | | Rogers Corp. (a) | | | 365 | |
| | 66 | | | Sanmina Corp. (a) | | | 1 | |
| | 23 | | | SYNNEX Corp. | | | 2 | |
| | 3,173 | | | Tech Data Corp. (a) | | | 183 | |
| | 11,359 | | | Trimble Navigation Ltd. (a) | | | 266 | |
| | 224 | | | TTM Technologies, Inc. (a) | | | 2 | |
| | 4,995 | | | Universal Display Corp. (a) | | | 258 | |
| | 119 | | | Vishay Intertechnology, Inc. | | | 1 | |
| | | | | | | | |
| | | | | | | 4,272 | |
| | | | | | | | |
| | | | | | | | |
| Shares | | | Security
Description | | Value
(000) | |
| | | | Energy Equipment & Services — 1.49% | | | | |
| | 6,296 | | | Atwood Oceanics, Inc. | | $ | 166 | |
| | 177 | | | Dawson Geophysical Co. (a) | | | 1 | |
| | 33 | | | Diamond Offshore Drilling, Inc. | | | 1 | |
| | 2,481 | | | Dril-Quip, Inc. (a) | | | 187 | |
| | 8 | | | FMSA Holdings, Inc. (a) | | | — | |
| | 10,200 | | | Gulf Island Fabrication, Inc. | | | 114 | |
| | 39 | | | GulfMark Offshore, Inc. | | | — | |
| | 11,057 | | | Helix Energy Solutions Group, Inc. (a) | | | 140 | |
| | 3 | | | ION Geophysical Corp. (a) | | | — | |
| | 8,600 | | | Key Energy Services, Inc. (a) | | | 15 | |
| | 71,782 | | | McDermott International, Inc. (a) | | | 383 | |
| | 11,300 | | | Mitcham Industries, Inc. (a) | | | 47 | |
| | 110 | | | Nabors Industries Ltd. | | | 2 | |
| | 26,570 | | | Newpark Resources, Inc. (a) | | | 217 | |
| | 410 | | | Parker Drilling Co. (a) | | | 1 | |
| | 30 | | | PHI, Inc. (a) | | | 1 | |
| | 2 | | | RigNet, Inc. (a) | | | — | |
| | 20,318 | | | Superior Energy Services, Inc. | | | 428 | |
| | 80 | | | Tesco Corp. | | | 1 | |
| | 34 | | | Unit Corp. (a) | | | 1 | |
| | 7 | | | US Silica Holdings, Inc. | | | — | |
| | 1,891 | | | Vantage Drilling Co. (a) | | | — | |
| | | | | | | | |
| | | | | | | 1,705 | |
| | | | | | | | |
| | | | Food & Staples Retailing — 1.11% | | | | |
| | 9,692 | | | Casey’s General Stores, Inc. | | | 929 | |
| | 2 | | | Chefs’ Warehouse Holdings LLC (a) | | | — | |
| | 7,525 | | | Diplomat Pharmacy, Inc. (a) | | | 337 | |
| | 2 | | | Fairway Group Holdings Corp. (a) | | | — | |
| | 92 | | | Ingles Markets, Inc., Class – A | | | 4 | |
| | 1 | | | Natural Grocers by Vitamin Cottage, Inc. (a) | | | — | |
| | 3 | | | PriceSmart, Inc. | | | — | |
| | 6 | | | The Fresh Market, Inc. (a) | | | — | |
| | 6 | | | United Natural Foods, Inc. (a) | | | — | |
| | 119 | | | Village Super Market, Inc., Class – A | | | 4 | |
| | | | | | | | |
| | | | | | | 1,274 | |
| | | | | | | | |
| | | | Food Products — 0.15% | | | | |
| | 7 | | | B&G Foods, Inc., Class – A | | | — | |
| | 7 | | | Boulder Brands, Inc. (a) | | | — | |
| | 2 | | | Calavo Growers, Inc. | | | — | |
| | 34 | | | Cal-Maine Foods, Inc. | | | 2 | |
| | 6 | | | Dean Foods Co. | | | — | |
| | 3 | | | Diamond Foods, Inc. (a) | | | — | |
| | 1 | | | Farmer Brothers Co. (a) | | | — | |
| | 42 | | | Fresh Del Monte Produce, Inc. | | | 2 | |
| | 3 | | | Freshpet, Inc. (a) | | | — | |
| | 3 | | | Inventure Foods, Inc. (a) | | | — | |
| | 2 | | | J&J Snack Foods Corp. | | | — | |
| | 30 | | | John B Sanfilippo & Son, Inc. | | | 2 | |
| | 2 | | | Lancaster Colony Corp. | | | — | |
| | 10,901 | | | Landec Corp. (a) | | | 158 | |
| | 1 | | | Lifeway Foods, Inc. (a) | | | — | |
| | 2 | | | Limoneira Co. | | | — | |
| | 150 | | | Omega Protein Corp. (a) | | | 2 | |
| | 15 | | | Sanderson Farms, Inc. | | | 1 | |
| | 1 | | | Seaboard Corp. (a) | | | 4 | |
See accompanying notes to financial statements.
68
HC CAPITAL TRUST
The Small Capitalization–Mid Capitalization Equity Portfolio
Portfolio of Investments (continued) — June 30, 2015
| | | | | | | | |
| Shares | | | Security
Description | | Value
(000) | |
| | | | Common Stocks (continued) | | | | |
| | | | Food Products (continued) | | | | |
| | 1 | | | Tootsie Roll Industries, Inc. | | $ | — | |
| | | | | | | | |
| | | | | | | 171 | |
| | | | | | | | |
| | | | Gas Utilities — 0.70% | | | | |
| | 44 | | | Southwest Gas Corp. | | | 2 | |
| | 23,197 | | | UGI Corp. | | | 799 | |
| | | | | | | | |
| | | | | | | 801 | |
| | | | | | | | |
| | | | Health Care Equipment — 0.00% | | | | |
| | 3 | | | Tornier NV (a) | | | — | |
| | | | | | | | |
| | | | Health Care Equipment & Supplies — 5.49% | | | | |
| | 3 | | | Abaxis, Inc. | | | — | |
| | 8,465 | | | Abiomed, Inc. (a) | | | 557 | |
| | 10 | | | Accuray, Inc. (a) | | | — | |
| | 2 | | | Anika Therapeutics, Inc. (a) | | | — | |
| | 20 | | | Antares Pharma, Inc. (a) | | | — | |
| | 3 | | | AtriCure, Inc. (a) | | | — | |
| | 5 | | | Cantel Medical Corp. | | | — | |
| | 4 | | | Cardiovascular Systems, Inc. (a) | | | — | |
| | 11 | | | Cerus Corp. (a) | | | — | |
| | 3 | | | Corindus Vascular Robotics, Inc., Class – I (a) | | | — | |
| | 1 | | | Cutera, Inc. (a) | | | — | |
| | 4 | | | Cyberonics, Inc. (a) | | | — | |
| | 3 | | | Cynosure, Inc. (a) | | | — | |
| | 17,343 | | | DexCom, Inc. (a) | | | 1,388 | |
| | 1,770 | | | Edwards Lifesciences Corp. (a) | | | 252 | |
| | 9 | | | Endologix, Inc. (a) | | | — | |
| | 1 | | | Entellus Medical, Inc. (a) | | | — | |
| | 80 | | | Exactech, Inc. (a) | | | 2 | |
| | 6 | | | GenMark Diagnostics, Inc. (a) | | | — | |
| | 9 | | | Globus Medical, Inc. (a) | | | — | |
| | 40 | | | Greatbatch, Inc. (a) | | | 2 | |
| | 3 | | | Haemonetics Corp. (a) | | | — | |
| | 50 | | | Halyard Health, Inc. (a) | | | 2 | |
| | 1,502 | | | HeartWare International, Inc. (a) | | | 109 | |
| | 1 | | | ICU Medical, Inc. (a) | | | — | |
| | 2 | | | Inogen, Inc. (a) | | | — | |
| | 14,862 | | | Insulet Corp. (a) | | | 461 | |
| | 1 | | | Integra LifeSciences Holdings Corp. (a) | | | — | |
| | 3 | | | InVivo Therapeutics Holdings Corp. (a) | | | — | |
| | 2 | | | K2M Group Holdings, Inc. (a) | | | — | |
| | 7,683 | | | LDR Holding Corp. (a) | | | 332 | |
| | 1 | | | LeMaitre Vascular, Inc. | | | — | |
| | 6 | | | Masimo Corp. (a) | | | — | |
| | 5 | | | Meridian Bioscience, Inc. | | | — | |
| | 4 | | | Natus Medical, Inc. (a) | | | — | |
| | 6,814 | | | Neogen Corp. (a) | | | 323 | |
| | 7,582 | | | Nevro Corp. (a) | | | 408 | |
| | 6 | | | NuVasive, Inc. (a) | | | — | |
| | 8 | | | NxStage Medical, Inc. (a) | | | — | |
| | 2 | | | Ocular Therapeutix, Inc. (a) | | | — | |
| | 1 | | | OraSure Technologies, Inc. (a) | | | — | |
| | 3 | | | Oxford Immunotec Global PLC (a) | | | — | |
| | 2 | | | Quidel Corp. (a) | | | — | |
| | 6 | | | Rockwell Medical Technologies, Inc. (a) | | | — | |
| | | | | | | | |
| Shares | | | Security
Description | | Value
(000) | |
| | | | Health Care Equipment & Supplies (continued) | | | | |
| | 6 | | | RTI Surgical, Inc. (a) | | $ | — | |
| | 2 | | | Second Sight Medical Products, Inc. (a) | | | — | |
| | 1 | | | Sientra, Inc. (a) | | | — | |
| | 5 | | | STAAR Surgical Co. (a) | | | — | |
| | 6,967 | | | STERIS Corp. | | | 449 | |
| | 21,881 | | | Tandem Diabetes Care, Inc. (a) | | | 237 | |
| | 3,761 | | | The Cooper Cos., Inc. | | | 670 | |
| | 6 | | | The Spectranetics Corp. (a) | | | — | |
| | 7 | | | Thoratec Corp. (a) | | | — | |
| | 35,523 | | | Unilife Corp.^(a) | | | 76 | |
| | 2 | | | Vascular Solutions, Inc. (a) | | | — | |
| | 2 | | | Veracyte, Inc. (a) | | | — | |
| | 13,114 | | | West Pharmaceutical Services, Inc. | | | 763 | |
| | 3 | | | Wright Medical Group, Inc. (a) | | | — | |
| | 9,669 | | | Zeltiq Aesthetics, Inc. (a) | | | 285 | |
| | | | | | | | |
| | | | | | | 6,316 | |
| | | | | | | | |
| | | | Health Care Providers & Services — 3.04% | | | | |
| | 5,497 | | | AAC Holdings, Inc. (a) | | | 239 | |
| | 15,392 | | | Acadia Healthcare Co., Inc. (a) | | | 1,207 | |
| | 3 | | | Aceto Corp. | | | — | |
| | 576 | | | Adeptus Health, Inc., Class – A (a) | | | 55 | |
| | 5 | | | Air Methods Corp. (a) | | | — | |
| | 65 | | | Almost Family, Inc. (a) | | | 3 | |
| | 3 | | | Amedisys, Inc. (a) | | | — | |
| | 6 | | | AMN Healthcare Services, Inc. (a) | | | — | |
| | 34 | | | AmSurg Corp. (a) | | | 2 | |
| | 3 | | | Bio-Reference Laboratories, Inc. (a) | | | — | |
| | 4 | | | Biotelemetry, Inc. (a) | | | — | |
| | 4 | | | Capital Senior Living Corp. (a) | | | — | |
| | 3,194 | | | Catamaran Corp. (a) | | | 195 | |
| | 18 | | | Chemed Corp. | | | 2 | |
| | 2 | | | Civitas Solutions, Inc. (a) | | | — | |
| | 1 | | | CorVel Corp. (a) | | | — | |
| | 3 | | | Cross Country Healthcare, Inc. (a) | | | — | |
| | 5 | | | ExamWorks Group, Inc. (a) | | | — | |
| | 390 | | | Five Star Quality Care, Inc. (a) | | | 2 | |
| | 250 | | | Genesis Healthcare, Inc. (a) | | | 2 | |
| | 81 | | | Hanger, Inc. (a) | | | 2 | |
| | 5 | | | HealthEquity, Inc. (a) | | | — | |
| | 62 | | | HealthSouth Corp. | | | 3 | |
| | 1 | | | IPC The Hospitalist Co., Inc. (a) | | | — | |
| | 94 | | | Kindred Healthcare, Inc. | | | 2 | |
| | 1 | | | Landauer, Inc. | | | — | |
| | 60 | | | LHC Group, Inc. (a) | | | 2 | |
| | 9,595 | | | LifePoint Hospitals, Inc. (a) | | | 835 | |
| | 30 | | | Magellan Health Services, Inc. (a) | | | 2 | |
| | 4,450 | | | MEDNAX, Inc. (a) | | | 330 | |
| | 39 | | | Molina Heathcare, Inc. (a) | | | 3 | |
| | 26 | | | National Healthcare Corp. | | | 2 | |
| | 1 | | | National Research Corp., Class – A | | | — | |
| | 4 | | | Nobilis Health Corp. (a) | | | — | |
| | 5,204 | | | Owens & Minor, Inc. | | | 177 | |
| | 2 | | | Providence Service Corp. (a) | | | — | |
| | 5 | | | RadNet, Inc. (a) | | | — | |
| | 141 | | | Select Medical Holdings Corp. | | | 2 | |
See accompanying notes to financial statements.
69
HC CAPITAL TRUST
The Small Capitalization–Mid Capitalization Equity Portfolio
Portfolio of Investments (continued) — June 30, 2015
| | | | | | | | |
| Shares | | | Security
Description | | Value
(000) | |
| | | | Common Stocks (continued) | | | | |
| | | | Health Care Providers & Services (continued) | | | | |
| | 3 | | | Surgical Care Affiliates, Inc. (a) | | $ | — | |
| | 2,219 | | | Team Health Holdings, Inc. (a) | | | 145 | |
| | 40 | | | The Ensign Group, Inc. | | | 2 | |
| | 5,688 | | | Triple-S Management Corp., Class – A (a) | | | 146 | |
| | 2 | | | Trupanion, Inc. (a) | | | — | |
| | 2 | | | U.S. Physical Therapy, Inc. | | | — | |
| | 1,526 | | | WellCare Health Plans, Inc. (a) | | | 129 | |
| | | | | | | | |
| | | | | | | 3,489 | |
| | | | | | | | |
| | | | Health Care Technology — 1.02% | | | | |
| | 9,200 | | | Allscripts Healthcare Solutions, Inc. (a) | | | 126 | |
| | 4 | | | Castlight Health, Inc., Class – B (a) | | | — | |
| | 1 | | | Computer Programs & Systems, Inc. | | | — | |
| | 1 | | | Connecture, Inc. (a) | | | — | |
| | 3 | | | HealthStream, Inc. (a) | | | — | |
| | 12 | | | HMS Holdings Corp. (a) | | | — | |
| | 1 | | | Imprivata, Inc. (a) | | | — | |
| | 7 | | | MedAssets, Inc. (a) | | | — | |
| | 12,174 | | | Medidata Solutions, Inc. (a) | | | 662 | |
| | 9 | | | Merge Healthcare, Inc. (a) | | | — | |
| | 10,309 | | | Omnicell, Inc. (a) | | | 389 | |
| | 1 | | | Press Ganey Holdings, Inc. (a) | | | — | |
| | 7 | | | Quality Systems, Inc. | | | — | |
| | 2 | | | Vocera Communications, Inc. (a) | | | — | |
| | | | | | | | |
| | | | | | | 1,177 | |
| | | | | | | | |
| | | | Hotels, Restaurants & Leisure — 2.60% | | | | |
| | 3 | | | BJ’s Restaurant, Inc. (a) | | | — | |
| | 16 | | | Bloomin’ Brands, Inc. | | | — | |
| | 1 | | | Bojangles’, Inc. (a) | | | — | |
| | 10 | | | Boyd Gaming Corp. (a) | | | — | |
| | 2 | | | Bravo Brio Restaurant Group, Inc. (a) | | | — | |
| | 4,324 | | | Buffalo Wild Wings, Inc. (a) | | | 679 | |
| | 210 | | | Caesars Acquisition Co., Class – A (a) | | | 1 | |
| | 31,600 | | | Century Casinos, Inc. (a) | | | 200 | |
| | 2 | | | Churchill Downs, Inc. | | | — | |
| | 2 | | | Chuy’s Holdings, Inc. (a) | | | — | |
| | 7,766 | | | ClubCorp Holdings, Inc. | | | 185 | |
| | 2 | | | Cracker Barrel Old Country Store, Inc. | | | — | |
| | 3 | | | Dave & Buster’s Entertainment, Inc. (a) | | | — | |
| | 1 | | | Del Frisco’s Restaurant Group, Inc. (a) | | | — | |
| | 8 | | | Denny’s Corp. (a) | | | — | |
| | 8,645 | | | Diamond Resorts International, Inc. (a) | | | 274 | |
| | 2 | | | DineEquity, Inc. | | | — | |
| | 2 | | | El Pollo Loco Holdings, Inc. (a) | | | — | |
| | 2 | | | Eldorado Resorts, Inc. (a) | | | — | |
| | 2 | | | Empire Resorts, Inc. (a) | | | — | |
| | 2,384 | | | Fiesta Restaurant Group, Inc. (a) | | | 119 | |
| | 30 | | | Hyatt Hotels Corp., Class – A (a) | | | 2 | |
| | 4,066 | | | International Speedway Corp., Class – A | | | 149 | |
| | 95 | | | Interval Leisure Group, Inc. | | | 2 | |
| | 3 | | | Isle of Capri Casino (a) | | | — | |
| | 5 | | | Jack in the Box, Inc. | | | — | |
| | 2 | | | Jamba, Inc. (a) | | | — | |
| | 1 | | | Kona Grill, Inc. (a) | | | — | |
| | 9 | | | Krispy Kreme Doughnuts, Inc. (a) | | | — | |
| | | | | | | | |
| Shares | | | Security
Description | | Value
(000) | |
| | | | Hotels, Restaurants & Leisure (continued) | | | | |
| | 7,907 | | | La Quinta Holdings, Inc. (a) | | $ | 181 | |
| | 123 | | | Marcus Corp. | | | 2 | |
| | 2 | | | Marriott Vacations Worldwide Corp. | | | — | |
| | 114 | | | Monarch Casino & Resort, Inc. (a) | | | 2 | |
| | 1 | | | Morgans Hotel Group Co. (a) | | | — | |
| | 1 | | | Noodles & Co. (a) | | | — | |
| | 4 | | | Papa John’s International, Inc. | | | — | |
| | 1 | | | Papa Murphy’s Holdings, Inc. (a) | | | — | |
| | 1 | | | Penn National Gaming, Inc. (a) | | | — | |
| | 8 | | | Pinnacle Entertainment, Inc. (a) | | | — | |
| | 3 | | | Popeyes Louisiana Kitchen, Inc. (a) | | | — | |
| | 3 | | | Potbelly Corp. (a) | | | — | |
| | 2,836 | | | Red Robin Gourmet Burgers, Inc. (a) | | | 244 | |
| | 30,490 | | | Ruby Tuesday, Inc. (a) | | | 191 | |
| | 149 | | | Ruth’s Hospitality Group, Inc. | | | 2 | |
| | 7 | | | Scientific Games Corp., Class – A (a) | | | — | |
| | 129 | | | SeaWorld Entertainment, Inc. | | | 2 | |
| | 1 | | | Shake Shack, Inc., Class – A (a) | | | — | |
| | 5 | | | Sonic Corp. | | | — | |
| | 90 | | | Speedway Motorsports, Inc. | | | 2 | |
| | 7,044 | | | Texas Roadhouse, Inc., Class – A | | | 265 | |
| | 6 | | | The Cheesecake Factory, Inc. | | | — | |
| | 2 | | | The Habit Restaurants, Inc. (a) | | | — | |
| | 4,419 | | | Vail Resorts, Inc. | | | 484 | |
| | 3 | | | Zoe’s Kitchen, Inc. (a) | | | — | |
| | | | | | | | |
| | | | | | | 2,986 | |
| | | | | | | | |
| | | | Household Durables — 0.95% | | | | |
| | 1 | | | Bassett Furniture Industries, Inc. | | | — | |
| | 1 | | | Cavco Industries, Inc. (a) | | | — | |
| | 61 | | | CSS Industries, Inc. | | | 2 | |
| | 50 | | | Flexsteel Industries, Inc. | | | 2 | |
| | 3,128 | | | Harman International Industries, Inc. | | | 372 | |
| | 2,072 | | | Helen of Troy Ltd. (a) | | | 202 | |
| | 3 | | | Installed Building Products, Inc. (a) | | | — | |
| | 2 | | | iRobot Corp. (a) | | | — | |
| | 4 | | | La-Z-Boy, Inc. | | | — | |
| | 8,009 | | | Libbey, Inc. | | | 331 | |
| | 118 | | | Lifetime Brands, Inc. | | | 2 | |
| | 1 | | | M/I Homes, Inc. (a) | | | — | |
| | 2 | | | MDC Holdings, Inc. | | | — | |
| | 28 | | | NACCO Industries, Inc., Class – A | | | 2 | |
| | 1 | | | Skullcandy, Inc. (a) | | | — | |
| | 3,672 | | | The Ryland Group, Inc. | | | 170 | |
| | 1 | | | TRI Pointe Homes, Inc. (a) | | | — | |
| | 2 | | | Universal Electronics, Inc. (a) | | | — | |
| | 4 | | | Zagg, Inc. (a) | | | — | |
| | | | | | | | |
| | | | | | | 1,083 | |
| | | | | | | | |
| | | | Household Products — 0.00% | | | | |
| | 1 | | | Central Garden & Pet Co., Class – A (a) | | | — | |
| | 5 | | | HRG Group, Inc. (a) | | | — | |
| | 22 | | | Oil-Dri Corp. of America | | | 1 | |
| | 2 | | | WD-40 Co. | | | — | |
| | | | | | | | |
| | | | | | | 1 | |
| | | | | | | | |
See accompanying notes to financial statements.
70
HC CAPITAL TRUST
The Small Capitalization–Mid Capitalization Equity Portfolio
Portfolio of Investments (continued) — June 30, 2015
| | | | | | | | |
| Shares | | | Security
Description | | Value
(000) | |
| | | | Common Stocks (continued) | | | | |
| | | | Independent Power and Renewable Electricity Producers — 0.00% | |
| | 2 | | | Ormat Technologies, Inc. | | $ | — | |
| | 2 | | | Vivint Solar, Inc. (a) | | | — | |
| | | | | | | | |
| | | | | | | 0 | |
| | | | | | | | |
| | | | Industrial Conglomerates — 0.14% | | | | |
| | 1,648 | | | Carlisle Cos., Inc. | | | 165 | |
| | 2 | | | Raven Industries, Inc. | | | — | |
| | | | | | | | |
| | | | | | | 165 | |
| | | | | | | | |
| | | | Industrials — 0.34% | | | | |
| | 33,000 | | | Volaris Aviation Holding Company, ADR (a) | | | 394 | |
| | | | | | | | |
| | | | Insurance — 3.22% | | | | |
| | 937 | | | Alleghany Corp. (a) | | | 440 | |
| | 1 | | | Ambac Financial Group, Inc. (a) | | | — | |
| | 59 | | | American Equity Investment Life Holding Co. | | | 2 | |
| | 12,859 | | | American Financial Group, Inc. | | | 837 | |
| | 9,509 | | | Argo Group International Holdings Ltd. | | | 529 | |
| | 2,567 | | | Aspen Insurance Holdings Ltd. | | | 123 | |
| | 1 | | | Atlas Financial Holdings, Inc. (a) | | | — | |
| | 167 | | | Crawford & Co. | | | 1 | |
| | 2 | | | eHealth, Inc. (a) | | | — | |
| | 3 | | | Employers Holdings, Inc. | | | — | |
| | 6,395 | | | Endurance Specialty Holdings Ltd. | | | 420 | |
| | 1,649 | | | Everest Re Group Ltd. | | | 300 | |
| | 4,200 | | | First American Financial Corp. | | | 156 | |
| | 7,325 | | | Genworth Financial, Inc., Class – A (a) | | | 55 | |
| | 2,980 | | | HCC Insurance Holdings, Inc. | | | 229 | |
| | 2 | | | Heritage Insurance Holdings, Inc. (a) | | | — | |
| | 4 | | | Hilltop Holdings, Inc. (a) | | | — | |
| | 138 | | | Maiden Holdings Ltd. | | | 2 | |
| | 190 | | | MBIA, Inc. (a) | | | 1 | |
| | 110 | | | OneBeacon Insurance Group Ltd. | | | 2 | |
| | 1 | | | Patriot National, Inc. (a) | | | — | |
| | 30 | | | Phoenix Cos., Inc. (a) | | | 1 | |
| | 1,081 | | | Primerica, Inc. | | | 49 | |
| | 4,870 | | | Stewart Information Services Corp. | | | 194 | |
| | 3,806 | | | Symetra Financial Corp. | | | 92 | |
| | 1 | | | Third Point Reinsurance Ltd. (a) | | | — | |
| | 94 | | | Universal Insurance Holdings, Inc. | | | 2 | |
| | 5,046 | | | W.R. Berkley Corp. | | | 262 | |
| | | | | | | | |
| | | | | | | 3,697 | |
| | | | | | | | |
| | | | Internet & Catalog Retail — 0.22% | | | | |
| | 188 | | | 1-800-FLOWERS.COM, Inc., Class – A (a) | | | 2 | |
| | 2 | | | Blue Nile, Inc. (a) | | | — | |
| | 3 | | | Etsy, Inc. (a) | | | — | |
| | 4 | | | HSN, Inc. | | | — | |
| | 3 | | | Liberty TripAdvisor Holdings, Inc., Class – A (a) | | | — | |
| | 4 | | | NutriSystem, Inc. | | | — | |
| | 14 | | | Orbitz Worldwide, Inc. (a) | | | — | |
| | 2 | | | Overstock.com, Inc. (a) | | | — | |
| | 3 | | | PetMed Express, Inc. | | | — | |
| | 3 | | | Shutterfly, Inc. (a) | | | — | |
| | 10 | | | Travelport Worldwide Ltd. | | | — | |
| | 6,742 | | | Wayfair, Inc., Class – A (a) | | | 255 | |
| | | | | | | | |
| Shares | | | Security
Description | | Value
(000) | |
| | | | Internet & Catalog Retail (continued) | | | | |
| | 9 | | | Zulily, Inc., Class – A (a) | | $ | — | |
| | | | | | | | |
| | | | | | | 257 | |
| | | | | | | | |
| | | | Internet Software & Services — 2.80% | | | | |
| | 3,660 | | | Akamai Technologies, Inc. (a) | | | 256 | |
| | 2 | | | Amber Road, Inc. (a) | | | — | |
| | 6 | | | Angie’s List, Inc. (a) | | | — | |
| | 1 | | | Apigee Corp. (a) | | | — | |
| | 4 | | | Bazaarvoice, Inc. (a) | | | — | |
| | 6,296 | | | Benefitfocus, Inc. (a) | | | 276 | |
| | 129 | | | Blucora, Inc. (a) | | | 2 | |
| | 2 | | | Box, Inc., Class – A (a) | | | — | |
| | 29,934 | | | Brightcove, Inc. (a) | | | 205 | |
| | 2 | | | Carbonite, Inc. (a) | | | — | |
| | 3 | | | ChannelAdvisor Corp. (a) | | | — | |
| | 4 | | | Chegg, Inc. (a) | | | — | |
| | 4 | | | Cimpress NV (a) | | | — | |
| | 4,720 | | | comScore, Inc. (a) | | | 251 | |
| | 4 | | | Constant Contact, Inc. (a) | | | — | |
| | 7 | | | Cornerstone OnDemand, Inc. (a) | | | — | |
| | 8 | | | Coupons.com, Inc. (a) | | | — | |
| | 3 | | | Cvent, Inc. (a) | | | — | |
| | 2 | | | DealerTrack Holdings, Inc. (a) | | | — | |
| | 6,216 | | | Demandware, Inc. (a) | | | 443 | |
| | 169 | | | DHI Group, Inc. (a) | | | 2 | |
| | 383 | | | EarthLink Holdings Corp. | | | 3 | |
| | 8 | | | Endurance International Group Holdings, Inc. (a) | | | — | |
| | 6,966 | | | Envestnet, Inc. (a) | | | 282 | |
| | 3 | | | Everyday Health, Inc. (a) | | | — | |
| | 3 | | | Five9, Inc. (a) | | | — | |
| | 19,366 | | | Gogo, Inc. (a) | | | 416 | |
| | 10 | | | GrubHub, Inc. (a) | | | — | |
| | 3 | | | GTT Communications, Inc. (a) | | | — | |
| | 12,316 | | | Hortonworks, Inc. (a) | | | 312 | |
| | 7 | | | Internap Network Services Corp. (a) | | | — | |
| | 3 | | | Intralinks Holdings, Inc. (a) | | | — | |
| | 38 | | | j2 Global, Inc. | | | 3 | |
| | 7 | | | LivePerson, Inc. (a) | | | — | |
| | 1,783 | | | LogMeln, Inc. (a) | | | 115 | |
| | 2 | | | Marin Software, Inc. (a) | | | — | |
| | 5 | | | Marketo, Inc. (a) | | | — | |
| | 1 | | | MaxPoint Interactive, Inc. (a) | | | — | |
| | 9,825 | | | Monster Worldwide, Inc. (a) | | | 64 | |
| | 1 | | | New Relic, Inc. (a) | | | — | |
| | 9 | | | NIC, Inc. | | | — | |
| | 3 | | | Opower, Inc. (a) | | | — | |
| | 3 | | | Perficient, Inc. (a) | | | — | |
| | 3 | | | Q2 Holdings, Inc. (a) | | | — | |
| | 12,926 | | | QuinStreet, Inc. (a) | | | 83 | |
| | 43,300 | | | RealNetworks, Inc. (a) | | | 234 | |
| | 1 | | | Reis, Inc. | | | — | |
| | 1 | | | RetailMeNot, Inc. (a) | | | — | |
| | 2 | | | SciQuest, Inc. (a) | | | — | |
| | 3 | | | Shutterstock, Inc. (a) | | | — | |
| | 2 | | | SPS Commerce, Inc. (a) | | | — | |
| | 2 | | | Stamps.com, Inc. (a) | | | — | |
See accompanying notes to financial statements.
71
HC CAPITAL TRUST
The Small Capitalization–Mid Capitalization Equity Portfolio
Portfolio of Investments (continued) — June 30, 2015
| | | | | | | | |
| Shares | | | Security
Description | | Value
(000) | |
| | | | Common Stocks (continued) | | | | |
| | | | Internet Software & Services (continued) | | | | |
| | 1 | | | TechTarget (a) | | $ | — | |
| | 3 | | | Textura Corp. (a) | | | — | |
| | 1 | | | Travelzoo, Inc. (a) | | | — | |
| | 6 | | | TrueCar, Inc. (a) | | | — | |
| | 4,026 | | | Web.com Group, Inc. (a) | | | 98 | |
| | 5 | | | WebMD Health Corp. (a) | | | — | |
| | 2 | | | Wix.com Ltd. (a) | | | — | |
| | 10,503 | | | XO Group, Inc. (a) | | | 172 | |
| | 4 | | | Xoom Corp. (a) | | | — | |
| | | | | | | | |
| | | | | | | 3,217 | |
| | | | | | | | |
| | | | IT Services — 1.48% | | | | |
| | 1 | | | 6D Global Technologies, Inc. (a) | | | — | |
| | 4 | | | Alliance Data Systems Corp. (a) | | | 1 | |
| | 62 | | | Blackhawk Network Holdings, Inc. (a) | | | 3 | |
| | 63 | | | Booz Allen Hamilton Holding Corp. | | | 2 | |
| | 22 | | | CACI International, Inc., Class – A (a) | | | 2 | |
| | 6 | | | Cardtronics, Inc. (a) | | | — | |
| | 33 | | | Cass Information Systems, Inc. | | | 2 | |
| | 201 | | | Computer Task Group, Inc. | | | 2 | |
| | 84 | | | Convergys Corp. | | | 2 | |
| | 52 | | | CoreLogic, Inc. (a) | | | 2 | |
| | 70 | | | CSG Systems International, Inc. | | | 2 | |
| | 17 | | | DST Systems, Inc. | | | 2 | |
| | 6 | | | EPAM Systems, Inc. (a) | | | — | |
| | 7 | | | Euronet Worldwide, Inc. (a) | | | — | |
| | 9 | | | EVERTEC, Inc. | | | — | |
| | 4 | | | Exlservice Holdings, Inc. (a) | | | — | |
| | 1 | | | Forrester Research, Inc. | | | — | |
| | 250 | | | Global Cash Access Holdings, Inc. (a) | | | 2 | |
| | 4,244 | | | Global Payments, Inc. | | | 439 | |
| | 5 | | | Heartland Payment Systems, Inc. | | | — | |
| | 55 | | | iGATE Corp. (a) | | | 3 | |
| | 10,894 | | | Jack Henry & Associates, Inc. | | | 704 | |
| | 40 | | | Leidos Holdings, Inc. | | | 2 | |
| | 8 | | | Lionbridge Technologies, Inc. (a) | | | — | |
| | 4,056 | | | Luxoft Holding, Inc. (a) | | | 229 | |
| | 53 | | | ManTech International Corp., Class – A | | | 2 | |
| | 9 | | | MAXIMUS, Inc. | | | 1 | |
| | 200 | | | MoneyGram International, Inc. (a) | | | 2 | |
| | 69 | | | NeuStar, Inc., Class – A (a) | | | 2 | |
| | 1 | | | PFSweb, Inc. (a) | | | — | |
| | 41 | | | Science Applications International Corp. | | | 2 | |
| | 5 | | | ServiceSource International, Inc. (a) | | | — | |
| | 74 | | | Sykes Enterprises, Inc. (a) | | | 2 | |
| | 4 | | | Syntel, Inc. (a) | | | — | |
| | 74 | | | TeleTech Holdings, Inc. | | | 2 | |
| | 197 | | | The Hackett Group, Inc. | | | 3 | |
| | 66 | | | Unisys Corp. (a) | | | 1 | |
| | 3,010 | | | VeriFone Systems, Inc. (a) | | | 102 | |
| | 4 | | | Virtusa Corp. (a) | | | — | |
| | 1,569 | | | WEX, Inc. (a) | | | 179 | |
| | | | | | | | |
| | | | | | | 1,697 | |
| | | | | | | | |
| | | | Leisure Products — 0.06% | | | | |
| | 53 | | | Arctic Cat, Inc. | | | 2 | |
| | | | | | | | |
| Shares | | | Security
Description | | Value
(000) | |
| | | | Leisure Products (continued) | | | | |
| | 66 | | | Johnson Outdoors, Inc., Class – A | | $ | 2 | |
| | 40,200 | | | LeapFrog Enterprises, Inc. (a) | | | 56 | |
| | 2 | | | Malibu Boats, Inc., Class – A (a) | | | — | |
| | 1 | | | Marine Products Corp. | | | — | |
| | 4 | | | Nautilus, Inc. (a) | | | — | |
| | 7 | | | Smith & Wesson Holding Corp. (a) | | | — | |
| | 52 | | | Sturm, Ruger & Co., Inc. | | | 3 | |
| | 26 | | | Vista Outdoor, Inc. (a) | | | 1 | |
| | | | | | | | |
| | | | | | | 64 | |
| | | | | | | | |
| | | | Life & Health Insurance — 0.14% | | | | |
| | 2,150 | | | StanCorp Financial Group, Inc. | | | 163 | |
| | | | | | | | |
| | | | Life Sciences Tools & Services — 1.08% | | | | |
| | 2,723 | | | Accelerate Diagnostics, Inc. (a) | | | 70 | |
| | 253 | | | Affymetrix, Inc. (a) | | | 3 | |
| | 145 | | | Albany Molecular Research, Inc. (a) | | | 3 | |
| | 15 | | | Bio-Rad Laboratories, Inc., Class – A (a) | | | 2 | |
| | 20 | | | Bio-Techne Corp. | | | 2 | |
| | 118 | | | Bruker Biosciences Corp. (a) | | | 2 | |
| | 2,897 | | | Cambrex Corp. (a) | | | 127 | |
| | 39 | | | Charles River Laboratories International, Inc. (a) | | | 3 | |
| | 7,044 | | | Fluidigm Corp. (a) | | | 171 | |
| | 107 | | | Furiex Pharmaceuticals, Inc.*(a) | | | — | |
| | 2,550 | | | Illumina, Inc. (a) | | | 558 | |
| | 4,222 | | | INC Research Holdings, Inc., Class – A (a) | | | 169 | |
| | 131 | | | Luminex Corp. (a) | | | 2 | |
| | 2 | | | NanoString Technologies, Inc. (a) | | | — | |
| | 7 | | | NeoGenomics, Inc. (a) | | | — | |
| | 8 | | | Pacific Boisciences of California, Inc. (a) | | | — | |
| | 45 | | | PAREXEL International Corp. (a) | | | 3 | |
| | 3 | | | PRA Health Sciences, Inc. (a) | | | — | |
| | 4,777 | | | QIAGEN NV (a) | | | 119 | |
| | 16 | | | Sequenom, Inc. (a) | | | — | |
| | | | | | | | |
| | | | | | | 1,234 | |
| | | | | | | | |
| | | | Machinery — 2.98% | | | | |
| | 6 | | | Accuride Corp. (a) | | | — | |
| | 7,055 | | | Actuant Corp., Class – A | | | 163 | |
| | 40 | | | AGCO Corp. | | | 2 | |
| | 1 | | | Albany International Corp., Class – A | | | — | |
| | 3 | | | Altra Holdings, Inc. | | | — | |
| | 35 | | | American Railcar Industries | | | 2 | |
| | 6 | | | Blount International, Inc. (a) | | | — | |
| | 1 | | | Blue Bird Corp. (a) | | | — | |
| | 75 | | | Briggs & Stratton Corp. | | | 1 | |
| | 2,375 | | | Chart Industries, Inc. (a) | | | 85 | |
| | 6 | | | CLARCOR, Inc. | | | — | |
| | 4,940 | | | Columbus McKinnon Corp. | | | 124 | |
| | 4 | | | Commercial Vehicle Group, Inc. (a) | | | — | |
| | 1 | | | Douglas Dynamics, Inc. | | | — | |
| | 2 | | | ENPRO Industries, Inc. | | | — | |
| | 1 | | | Freightcar America, Inc. | | | — | |
| | 133 | | | Global Brass & Copper Holdings, Inc. | | | 2 | |
| | 10,741 | | | Harsco Corp. | | | 177 | |
| | 8 | | | Hillenbrand, Inc. | | | — | |
| | 19 | | | Hyster-Yale Materials Handling, Inc. | | | 1 | |
See accompanying notes to financial statements.
72
HC CAPITAL TRUST
The Small Capitalization–Mid Capitalization Equity Portfolio
Portfolio of Investments (continued) — June 30, 2015
| | | | | | | | |
| Shares | | | Security
Description | | Value
(000) | |
| | | | Common Stocks (continued) | | | | |
| | | | Machinery (continued) | | | | |
| | 4,940 | | | IDEX Corp. | | $ | 389 | |
| | 9,090 | | | ITT Corp. | | | 381 | |
| | 4 | | | John Bean Technologies Corp. | | | — | |
| | 5,221 | | | Lincoln Electric Holdings, Inc. | | | 318 | |
| | 1 | | | Lindsay Corp. | | | — | |
| | 1 | | | Lydall, Inc. (a) | | | — | |
| | 18,177 | | | Meritor, Inc. (a) | | | 238 | |
| | 83 | | | Miller Industries, Inc. | | | 2 | |
| | 5 | | | Mueller Industries, Inc. | | | — | |
| | 21 | | | Mueller Water Products, Inc., Class – A | | | — | |
| | 3 | | | Nn, Inc. | | | — | |
| | 1,684 | | | Pall Corp. | | | 210 | |
| | 3 | | | Proto Labs, Inc. (a) | | | — | |
| | 3 | | | RBC Bearings, Inc. (a) | | | — | |
| | 13 | | | Rexnord Corp. (a) | | | — | |
| | 4,785 | | | Snap-on, Inc. | | | 763 | |
| | 1 | | | Standex International Corp. | | | — | |
| | 3 | | | Sun Hydraulics Corp. | | | — | |
| | 2 | | | Tennant Co. | | | — | |
| | 5,410 | | | Terex Corp. | | | 126 | |
| | 1 | | | The Gorman-Rupp Co. | | | — | |
| | 33 | | | The Greenbrier Cos., Inc. | | | 2 | |
| | 35 | | | The Timken Co. | | | 1 | |
| | 4,251 | | | TriMas Corp. (a) | | | 126 | |
| | 6,519 | | | Wabash National Corp. (a) | | | 82 | |
| | 1,892 | | | WABCO Holdings, Inc. (a) | | | 234 | |
| | 6 | | | Woodward, Inc. | | | — | |
| | 1 | | | Xerium Technologies, Inc. (a) | | | — | |
| | | | | | | | |
| | | | | | | 3,429 | |
| | | | | | | | |
| | | | Marine — 0.23% | | | | |
| | 1,361 | | | Kirby Corp. (a) | | | 105 | |
| | 5 | | | Matson, Inc. | | | — | |
| | 44,235 | | | Navios Maritime Holdings, Inc.^ | | | 165 | |
| | | | | | | | |
| | | | | | | 270 | |
| | | | | | | | |
| | | | Media — 0.99% | | | | |
| | 40 | | | AMC Entertainment Holdings, Inc., Class – A | | | 1 | |
| | 1 | | | Carmike Cinemas, Inc. (a) | | | — | |
| | 7 | | | Central Eurpoean Media Enterprises Ltd. (a) | | | — | |
| | 5 | | | Crown Media Holdings, Inc., Class – A (a) | | | — | |
| | 90 | | | Entercom Communications Corp. (a) | | | 1 | |
| | 8 | | | Entravision Communications Corp., Class – A | | | — | |
| | 23,847 | | | Global Eagle Entertainment, Inc. (a) | | | 311 | |
| | 8 | | | Gray Television, Inc. (a) | | | — | |
| | 36,786 | | | Harte-Hanks, Inc. | | | 220 | |
| | 6,398 | | | Imax Corp. (a) | | | 258 | |
| | 19 | | | Journal Media Group, Inc. | | | — | |
| | 9,460 | | | Lions Gate Entertainment Corp. | | | 349 | |
| | 2 | | | Loral Space & Communications, Inc. (a) | | | — | |
| | 3 | | | Martha Stewart Living Omnimedia, Inc. (a) | | | — | |
| | 2 | | | MDC Partners, Inc., Class – A | | | — | |
| | 2 | | | National CineMedia, Inc. | | | — | |
| | 4 | | | Nexstar Broadcasting Group, Inc., Class – A | | | — | |
| | 2 | | | Rentrak Corp. (a) | | | — | |
| | 129 | | | Salem Communications Corp., Class – A | | | 1 | |
| | | | | | | | |
| Shares | | | Security
Description | | Value
(000) | |
| | | | Media (continued) | | | | |
| | 26 | | | Scholastic Corp. | | $ | 1 | |
| | 3 | | | SFX Entertainment, Inc. (a) | | | — | |
| | 9 | | | Sinclair Broadcast Group, Inc. | | | — | |
| | 56 | | | The E.W. Scripps Co., Class – A | | | 2 | |
| | 4 | | | The New York Times Co., Class – A | | | — | |
| | 40 | | | Time, Inc. | | | 1 | |
| | 80 | | | Townsquare Media, Inc., Class – A (a) | | | 1 | |
| | 2 | | | Tribune Publishing Co. | | | — | |
| | 4 | | | World Wrestling Entertainment, Inc., Class – A | | | — | |
| | | | | | | | |
| | | | | | | 1,146 | |
| | | | | | | | |
| | | | Metals & Mining — 1.05% | | | | |
| | 6,780 | | | Agnico-Eagle Mines Ltd. | | | 192 | |
| | 9,236 | | | Allegheny Technologies, Inc. | | | 279 | |
| | 86 | | | Ampco-Pittsburgh Corp. | | | 1 | |
| | 4,362 | | | Carpenter Technology Corp. | | | 169 | |
| | 18,786 | | | Coeur d’Alene Mines Corp. (a) | | | 107 | |
| | 100 | | | Commercial Metals Co. | | | 2 | |
| | 17,409 | | | Globe Specialty Metals, Inc. | | | 308 | |
| | 4,334 | | | Horsehead Holding Corp. (a) | | | 51 | |
| | 26 | | | Kaiser Aluminum Corp. | | | 2 | |
| | 99 | | | Olympic Steel, Inc. | | | 2 | |
| | 2 | | | Real Industry, Inc. (a) | | | — | |
| | 4,900 | | | Schnitzer Steel Industries, Inc., Class – A | | | 86 | |
| | 7 | | | Stillwater Mining Co. (a) | | | — | |
| | 6 | | | SunCoke Energy, Inc. | | | — | |
| | 60 | | | United States Steel Corp. | | | 1 | |
| | 2 | | | Worthington Industries, Inc. | | | — | |
| | | | | | | | |
| | | | | | | 1,200 | |
| | | | | | | | |
| | | | Multiline Retail — 0.00% | | | | |
| | 46 | | | Big Lots, Inc. | | | 3 | |
| | 9 | | | Burlington Stores, Inc. (a) | | | — | |
| | 11 | | | Dillard’s, Inc., Class – A | | | 1 | |
| | 5 | | | Tuesday Morning Corp. (a) | | | — | |
| | | | | | | | |
| | | | | | | 4 | |
| | | | | | | | |
| | | | Multi-Utilities — 0.30% | | | | |
| | 80 | | | Avista Corp. | | | 2 | |
| | 7,882 | | | Black Hills Corp. | | | 345 | |
| | | | | | | | |
| | | | | | | 347 | |
| | | | | | | | |
| | | | Oil & Gas Exploration & Production — 0.00% | | | | |
| | 10 | | | Ultra Petroleum Corp. (a) | | | — | |
| | | | | | | | |
| | | | Oil, Gas & Consumable Fuels — 2.01% | | | | |
| | 23 | | | Adams Resources & Energy, Inc. | | | 1 | |
| | 5,712 | | | Cabot Oil & Gas Corp. | | | 180 | |
| | 22,961 | | | Carrizo Oil & Gas, Inc. (a) | | | 1,132 | |
| | 2,330 | | | CONSOL Energy, Inc. | | | 51 | |
| | 9,200 | | | Contango Oil & Gas Co. (a) | | | 113 | |
| | 3,550 | | | Continental Resources, Inc. (a) | | | 150 | |
| | 42 | | | Delek US Holdings, Inc. | | | 2 | |
| | 160 | | | Denbury Resources, Inc. | | | 1 | |
| | 930 | | | Diamondback Energy, Inc. (a) | | | 70 | |
| | 136,440 | | | Enbridge Energy Management LLC (a)(b) | | | — | |
| | 3 | | | Energy Fuels, Inc. (a) | | | — | |
| | 3 | | | Evolution Petroleum Corp. | | | — | |
| | 44 | | | Green Plains Renewable Energy, Inc. | | | 1 | |
See accompanying notes to financial statements.
73
HC CAPITAL TRUST
The Small Capitalization–Mid Capitalization Equity Portfolio
Portfolio of Investments (continued) — June 30, 2015
| | | | | | | | |
| Shares | | | Security
Description | | Value
(000) | |
| | | | Common Stocks (continued) | | | | |
| | | | Oil, Gas & Consumable Fuels (continued) | | | | |
| | 5,458 | | | Interoil Corp. (a) | | $ | 329 | |
| | 110 | | | Jones Energy, Inc., Class – A (a) | | | 1 | |
| | 27 | | | Magnum Hunter Resources Corp. (a) | | | — | |
| | 1,496 | | | Matador Resources Co. (a) | | | 37 | |
| | 1 | | | Panhandle Oil & Gas, Inc., Class – A | | | — | |
| | 2 | | | Par Petroleum Corp. (a) | | | — | |
| | 5 | | | Parsley Energy, Inc., Class – A (a) | | | — | |
| | 41 | | | PBF Energy, Inc., Class – A | | | 1 | |
| | 6 | | | Semgroup Corp. | | | — | |
| | 30 | | | SM Energy Co. | | | 1 | |
| | 11 | | | Solazyme, Inc. (a) | | | — | |
| | 9,300 | | | Synergy Resources Corp. (a) | | | 106 | |
| | 11 | | | Uranium Energy Corp. (a) | | | — | |
| | 40 | | | Western Refining, Inc. | | | 2 | |
| | 11,722 | | | WPX Energy, Inc. (a) | | | 144 | |
| | | | | | | | |
| | | | | | | 2,322 | |
| | | | | | | | |
| | | | Paper & Forest Products — 0.51% | | | | |
| | 5,504 | | | Boise Cascade Co. (a) | | | 202 | |
| | 3 | | | Clearwater Paper Corp. (a) | | | — | |
| | 1 | | | Deltic Timber Corp. | | | — | |
| | 40 | | | Domtar Corp. | | | 2 | |
| | 11 | | | KapStone Paper & Packaging Corp. | | | — | |
| | 22,016 | | | Louisiana-Pacific Corp. (a) | | | 376 | |
| | 1 | | | Neenah Paper, Inc. | | | — | |
| | 60 | | | P.H. Glatfelter Co. | | | 1 | |
| | 35 | | | Schweitzer-Mauduit International, Inc. | | | 1 | |
| | 5 | | | Wausau Paper Corp. | | | — | |
| | | | | | | | |
| | | | | | | 582 | |
| | | | | | | | |
| | | | Personal Products — 0.00% | | | | |
| | 1 | | | Inter Parfums, Inc. | | | — | |
| | 1 | | | Medifast, Inc. (a) | | | — | |
| | 1 | | | Natural Health Trends Corp. | | | — | |
| | 20 | | | Nature’s Sunshine Products, Inc. | | | — | |
| | 30 | | | Nutraceutical International Corp. (a) | | | 1 | |
| | 2 | | | Synutra International, Inc. (a) | | | — | |
| | 1 | | | USANA Health Sciences, Inc. (a) | | | — | |
| | | | | | | | |
| | | | | | | 1 | |
| | | | | | | | |
| | | | Pharmaceuticals — 0.05% | | | | |
| | 3 | | | Aerie Pharmaceuticals, Inc. (a) | | | — | |
| | 1 | | | Agile Therapeutics, Inc. (a) | | | — | |
| | 4 | | | Alimera Sciences, Inc. (a) | | | — | |
| | 3 | | | Amphastar Pharmaceuticals, Inc. (a) | | | — | |
| | 1 | | | ANI Pharmaceuticals, Inc. (a) | | | — | |
| | 4 | | | Aratana Therapeutics, Inc. (a) | | | — | |
| | 2 | | | Assembly Biosciences, Inc. (a) | | | — | |
| | 6 | | | BioDelivery Sciences International, Inc. (a) | | | — | |
| | 2 | | | Carbylan Therapeutics, Inc. (a) | | | — | |
| | 11 | | | Catalent, Inc. (a) | | | — | |
| | 4 | | | Cempra Holdings LLC (a) | | | — | |
| | 1 | | | Collegium Pharmaceutical, Inc. (a) | | | — | |
| | 8 | | | Corcept Therapeutics, Inc. (a) | | | — | |
| | 1 | | | Corium International, Inc. (a) | | | — | |
| | 8 | | | DepoMed, Inc. (a) | | | — | |
| | | | | | | | |
| Shares | | | Security
Description | | Value
(000) | |
| | | | Pharmaceuticals (continued) | | | | |
| | 1 | | | Dermira, Inc. (a) | | $ | — | |
| | 14 | | | Durect Corp. (a) | | | — | |
| | 1 | | | Flex Pharma, Inc. (a) | | | — | |
| | 3 | | | Foamix Pharmaceuticals Ltd. (a) | | | — | |
| | 1 | | | Heska Corp. (a) | | | — | |
| | 5 | | | IGI Laboratories, Inc. (a) | | | — | |
| | 80 | | | Impax Laboratories, Inc. (a) | | | 5 | |
| | 1,242 | | | Intersect ENT, Inc. (a) | | | 37 | |
| | 3 | | | Intra-Cellular Therapies, Inc. (a) | | | — | |
| | 3 | | | Lannett Co., Inc. (a) | | | — | |
| | 17 | | | Nektar Therapeutics (a) | | | — | |
| | 5 | | | Omeros Corp. (a) | | | — | |
| | 200 | | | Omthera Pharmaceutical, Inc.*(a) | | | — | |
| | 5 | | | Pacira Pharmaceuticals, Inc. (a) | | | — | |
| | 2 | | | Paratek Pharmaceuticals, Inc. | | | — | |
| | 6 | | | Pernix Therapeutics Holdings, Inc. (a) | | | — | |
| | 72 | | | Phibro Animal Health Corp., Class – A | | | 3 | |
| | 4 | | | POZEN, Inc. (a) | | | — | |
| | 70 | | | Prestige Brands Holdings, Inc. (a) | | | 3 | |
| | 4 | | | Relypsa, Inc. (a) | | | — | |
| | 2 | | | Revance Therapeutics, Inc. (a) | | | — | |
| | 81 | | | Sagent Pharmaceuticals, Inc. (a) | | | 2 | |
| | 277 | | | SciClone Pharmaceuticals, Inc. (a) | | | 3 | |
| | 162 | | | Sucampo Pharmaceuticals, Inc., Class – A (a) | | | 3 | |
| | 5 | | | Supernus Pharmaceuticals, Inc. (a) | | | — | |
| | 5 | | | Tetraphase Pharmaceuticals, Inc. (a) | | | — | |
| | 91 | | | The Medicines Co. (a) | | | 3 | |
| | 17 | | | TherapeuticsMD, Inc. (a) | | | — | |
| | 10 | | | Theravance, Inc. | | | — | |
| | 15 | | | VIVUS, Inc. (a) | | | — | |
| | 8 | | | XenoPort, Inc. (a) | | | — | |
| | 22 | | | Zogenix, Inc. (a) | | | — | |
| | 2 | | | ZS Pharma, Inc. (a) | | | — | |
| | | | | | | | |
| | | | | | | 59 | |
| | | | | | | | |
| | | | Professional Services — 0.26% | | | | |
| | 1 | | | Barrett Business Services, Inc. | | | — | |
| | 130 | | | CBIZ, Inc. (a) | | | 1 | |
| | 4 | | | CEB, Inc. | | | — | |
| | 3 | | | Exponent, Inc. | | | — | |
| | 2 | | | GP Strategies Corp. (a) | | | — | |
| | 3 | | | Insperity, Inc. | | | — | |
| | 78 | | | Kelly Services, Inc., Class – A | | | 1 | |
| | 3 | | | Kforce, Inc. | | | — | |
| | 4 | | | Korn/Ferry International | | | — | |
| | 1 | | | Mistras Group, Inc. (a) | | | — | |
| | 7 | | | On Assignment, Inc. (a) | | | — | |
| | 2 | | | Paylocity Holding Corp. (a) | | | — | |
| | 215,100 | | | Pendrell Corp. (a) | | | 296 | |
| | 1 | | | Resources Connections, Inc. | | | — | |
| | 1 | | | RPX Corp. (a) | | | — | |
| | 6 | | | The Advisory Board Co. (a) | | | — | |
| | 5 | | | TriNet Group, Inc. (a) | | | — | |
| | 6 | | | TrueBlue, Inc. (a) | | | — | |
| | 1 | | | Volt Information Sciences, Inc. (a) | | | — | |
| | 29 | | | VSE Corp. | | | 3 | |
See accompanying notes to financial statements.
74
HC CAPITAL TRUST
The Small Capitalization–Mid Capitalization Equity Portfolio
Portfolio of Investments (continued) — June 30, 2015
| | | | | | | | |
| Shares | | | Security
Description | | Value
(000) | |
| | | | Common Stocks (continued) | | | | |
| | | | Professional Services (continued) | | | | |
| | 5 | | | WageWorks, Inc. (a) | | $ | — | |
| | | | | | | | |
| | | | | | | 301 | |
| | | | | | | | |
| | | | Real Estate Investment Trusts — 1.89% | | | | |
| | 12,050 | | | Acadia Realty Trust | | | 352 | |
| | 132 | | | AG Mortgage Investment Trust, Inc. | | | 2 | |
| | 6,271 | | | Alexandria Real Estate Equities, Inc. | | | 549 | |
| | 4 | | | American Assets Trust, Inc. | | | — | |
| | 127 | | | American Capital Mortgage Investment Corp. | | | 2 | |
| | 480 | | | Anworth Mortgage Asset Corp. | | | 2 | |
| | 159 | | | Apollo Residential Mortgage, Inc. | | | 2 | |
| | 694 | | | Armour Residential REIT, Inc. | | | 2 | |
| | 250 | | | Ashford Hospitality Trust | | | 2 | |
| | 204 | | | Capstead Mortgage Corp. | | | 2 | |
| | 4 | | | CareTrust REIT, Inc. | | | — | |
| | 136 | | | CBL & Associates Properties, Inc. | | | 2 | |
| | 376 | | | Cedar Realty Trust, Inc. | | | 2 | |
| | 72 | | | Coresite Realty Corp. | | | 3 | |
| | 106 | | | CyrusOne, Inc. | | | 3 | |
| | 277 | | | CYS Investments, Inc. | | | 2 | |
| | 3,859 | | | DiamondRock Hospitality Co. | | | 49 | |
| | 3 | | | DuPont Fabros Technology, Inc. | | | — | |
| | 303 | | | Dynex Capital, Inc. | | | 2 | |
| | 5,282 | | | EastGroup Properties, Inc. | | | 298 | |
| | 2 | | | Excel Trust, Inc. | | | — | |
| | 137 | | | Hatteras Financial Corp. | | | 2 | |
| | 4 | | | Inland Real Estate Corp. | | | — | |
| | 164 | | | Invesco Mortgage Capital | | | 2 | |
| | 235 | | | Lexington Realty Trust | | | 2 | |
| | 5,021 | | | Mid-America Apartment Communities, Inc. | | | 367 | |
| | 2 | | | National Health Investors, Inc. | | | — | |
| | 120 | | | Pennsylvania Real Estate Investment Trust | | | 3 | |
| | 4 | | | Potlatch Corp. | | | — | |
| | 37 | | | PS Business Parks, Inc. | | | 3 | |
| | 3 | | | QTS Realty Trust, Inc., Class – L | | | — | |
| | 346 | | | Rait Financial Trust | | | 2 | |
| | 32,830 | | | Redwood Trust, Inc. | | | 516 | |
| | 6 | | | RLJ Lodging Trust | | | — | |
| | 6 | | | Ryman Hospitality Properties, Inc. | | | — | |
| | 1 | | | Sabra Healthcare REIT, Inc. | | | — | |
| | 1 | | | Saul Centers, Inc. | | | — | |
| | 4 | | | Sovran Self Storage, Inc. | | | — | |
| | 1 | | | Sun Communities, Inc. | | | — | |
| | 2 | | | Universal Health Realty Income Trust | | | — | |
| | 176 | | | Western Asset Mortgage Capital Corp. | | | 3 | |
| | | | | | | | |
| | | | | | | 2,176 | |
| | | | | | | | |
| | | | Real Estate Investment Trusts (REITs) — 0.00% | |
| | 2 | | | Easterly Government Properties, Inc. | | | — | |
| | 1 | | | Equity One, Inc. | | | — | |
| | 3 | | | National Storage Affiliates | | | — | |
| | 12 | | | Urban Edge Properties | | | — | |
| | | | | | | | |
| | | | | | | 0 | |
| | | | | | | | |
| | | | Real Estate Management & Development — 0.10% | |
| | 2 | | | Altisource Portfolio Solutions SA (a) | | | — | |
| | | | | | | | |
| Shares | | | Security
Description | | Value
(000) | |
| | | | Real Estate Management & Development (continued) | |
| | 7,300 | | | AV Homes, Inc. (a) | | $ | 105 | |
| | 1 | | | Kennedy-Wilson Holdings, Inc. | | | — | |
| | 2 | | | Marcus & Millichap, Inc. (a) | | | — | |
| | 81 | | | RE/MAX Holdings, Inc., Class – A | | | 3 | |
| | 140 | | | St. Joe Corp. (a) | | | 2 | |
| | | | | | | | |
| | | | | | | 110 | |
| | | | | | | | |
| | | | Restaurants — 0.00% | | | | |
| | 4 | | | Carrols Restaurant Group, Inc. (a) | | | — | |
| | | | | | | | |
| | | | Road & Rail — 0.14% | | | | |
| | 7 | | | AMERCO, Inc. | | | 2 | |
| | 1 | | | ArcBest Corp. | | | — | |
| | 2 | | | Celadon Group, Inc. | | | — | |
| | 1,753 | | | Con-way, Inc. | | | 67 | |
| | 1 | | | Covenant Transportation Group, Inc., Class – A (a) | | | — | |
| | 7 | | | Heartland Express, Inc. | | | — | |
| | 961 | | | Kansas City Southern Industries | | | 89 | |
| | 8 | | | Knight Transportation, Inc. | | | — | |
| | 1 | | | Marten Transport Ltd. | | | — | |
| | 1 | | | Quality Distribution, Inc. (a) | | | — | |
| | 1 | | | Roadrunner Transportation Systems, Inc. (a) | | | — | |
| | 3 | | | Saia, Inc. (a) | | | — | |
| | 12 | | | Swift Transportation Co. (a) | | | — | |
| | 1 | | | Universal Truckload Services, Inc. | | | — | |
| | 1 | | | Werner Enterprises, Inc. | | | — | |
| | 1 | | | YRC Worldwide, Inc. (a) | | | — | |
| | | | | | | | |
| | | | | | | 158 | |
| | | | | | | | |
| | | | Semiconductors — 0.00% | | | | |
| | 1 | | | CEVA, Inc. (a) | | | — | |
| | | | | | | | |
| | | | Semiconductors & Semiconductor Equipment — 6.94% | |
| | 3 | | | Advanced Energy Industries, Inc. (a) | | | — | |
| | 35 | | | Advanced Micro Devices, Inc. (a) | | | — | |
| | 220 | | | Alpha & Omega Semiconductor Ltd. (a) | | | 2 | |
| | 3,895 | | | Altera Corp. | | | 199 | |
| | 1,068 | | | Ambarella, Inc. (a) | | | 110 | |
| | 307 | | | Amkor Technology, Inc. (a) | | | 2 | |
| | 5 | | | Applied Micro Circuits Corp. (a) | | | — | |
| | 11,928 | | | Atmel Corp. | | | 118 | |
| | 10,400 | | | Brooks Automation, Inc. | | | 119 | |
| | 3 | | | Cabot Microelectronics Corp. (a) | | | — | |
| | 2,930 | | | Canadian Solar, Inc. (a) | | | 84 | |
| | 1 | | | Cascade Microtech, Inc. (a) | | | — | |
| | 9,022 | | | Cavium, Inc. (a) | | | 621 | |
| | 113 | | | Cirrus Logic, Inc. (a) | | | 4 | |
| | 6,216 | | | Cree, Inc. (a) | | | 162 | |
| | 53,899 | | | Cypress Semiconductor Corp. | | | 634 | |
| | 5,422 | | | Diodes, Inc. (a) | | | 131 | |
| | 158 | | | Entegris, Inc. (a) | | | 2 | |
| | 1 | | | Exar Corp. (a) | | | — | |
| | 13,341 | | | Fairchild Semiconductor International, Inc. (a) | | | 232 | |
| | 4 | | | FormFactor, Inc. (a) | | | — | |
| | 5 | | | Inphi Corp. (a) | | | — | |
| | 22,567 | | | Integrated Device Technology, Inc. (a) | | | 490 | |
See accompanying notes to financial statements.
75
HC CAPITAL TRUST
The Small Capitalization–Mid Capitalization Equity Portfolio
Portfolio of Investments (continued) — June 30, 2015
| | | | | | | | |
| Shares | | | Security Description | | Value
(000) | |
| | | | Common Stocks (continued) | | | | |
| | | | Semiconductors & Semiconductor Equipment (continued) | |
| | 127 | | | Integrated Silicon Solution, Inc. | | $ | 3 | |
| | 148 | | | IXYS Corp. | | | 2 | |
| | 7 | | | Lattice Semiconductor Corp. (a) | | | — | |
| | 3 | | | MA-COM Technology Solutions Holdings, Inc. (a) | | | — | |
| | 24,523 | | | Mattson Technology, Inc. (a) | | | 82 | |
| | 6,576 | | | Maxim Integrated Products, Inc. | | | 227 | |
| | 7 | | | MaxLinear, Inc. (a) | | | — | |
| | 4,968 | | | Mellanox Technologies Ltd. (a) | | | 242 | |
| | 6 | | | Micrel, Inc. | | | — | |
| | 12 | | | Microsemi Corp. (a) | | | — | |
| | 8,079 | | | Monolithic Power Systems, Inc. | | | 410 | |
| | 72 | | | OmniVision Technologies, Inc. (a) | | | 2 | |
| | 25,592 | | | ON Semiconductor Corp. (a) | | | 299 | |
| | 3 | | | PDF Solutions, Inc. (a) | | | — | |
| | 237 | | | Photronics, Inc. (a) | | | 2 | |
| | 8 | | | PMC – Sierra, Inc. (a) | | | — | |
| | 6,293 | | | Power Integrations, Inc. | | | 284 | |
| | 9,569 | | | Qorvo, Inc. (a) | | | 768 | |
| | 66,086 | | | QuickLogic Corp.^(a) | | | 105 | |
| | 15 | | | Rambus, Inc. (a) | | | — | |
| | 37,600 | | | Rubicon Technology, Inc. (a) | | | 91 | |
| | 1 | | | Rudolph Technologies, Inc. (a) | | | — | |
| | 3,403 | | | Semtech Corp. (a) | | | 68 | |
| | 1,911 | | | Silicon Laboratories, Inc. (a) | | | 103 | |
| | 7,940 | | | Skyworks Solutions, Inc. | | | 827 | |
| | 3,644 | | | SolarEdge Technologies, Inc. (a) | | | 132 | |
| | 9,700 | | | SunEdison, Inc. (a) | | | 290 | |
| | 3,435 | | | Synaptics, Inc. (a) | | | 298 | |
| | 103 | | | Teradyne, Inc. | | | 2 | |
| | 9,094 | | | Tessera Technologies, Inc. | | | 345 | |
| | 11,350 | | | Tower Semiconductor Ltd. (a) | | | 175 | |
| | 220 | | | Ultra Clean Holdings, Inc. (a) | | | 1 | |
| | 17,015 | | | Ultratech, Inc. (a) | | | 316 | |
| | 3 | | | Xcerra Corp. (a) | | | — | |
| | | | | | | | |
| | | | | | | 7,984 | |
| | | | | | | | |
| | | | Software — 6.27% | | | | |
| | 4 | | | A10 Networks, Inc. (a) | | | — | |
| | 15 | | | ACI Worldwide, Inc. (a) | | | — | |
| | 3,256 | | | Advent Software, Inc. | | | 144 | |
| | 1 | | | American Software, Inc., Class – A | | | — | |
| | 11,450 | | | Aspen Technology, Inc. (a) | | | 523 | |
| | 5 | | | AVG Technologies NV (a) | | | — | |
| | 1 | | | Barracuda Networks, Inc. (a) | | | — | |
| | 6 | | | Blackbaud, Inc. | | | — | |
| | 5 | | | Bottomline Technologies, Inc. (a) | | | — | |
| | 4 | | | BroadSoft, Inc. (a) | | | — | |
| | 7 | | | Callidus Software, Inc. (a) | | | — | |
| | 6 | | | CommVault Systems, Inc. (a) | | | — | |
| | 3 | | | Comverse, Inc. (a) | | | — | |
| | 2 | | | Cyan, Inc. (a) | | | — | |
| | 9,322 | | | CyberArk Software Ltd. (a) | | | 586 | |
| | 1 | | | Digimarc Corp. (a) | | | — | |
| | | | | | | | |
| Shares | | | Security Description | | Value
(000) | |
| | | | Software (continued) | | | | |
| | 6 | | | Digital Turbine, Inc. (a) | | $ | — | |
| | 125 | | | Ebix, Inc. | | | 4 | |
| | 6,430 | | | Electronic Arts, Inc. (a) | | | 428 | |
| | 5,114 | | | Ellie Mae, Inc. (a) | | | 357 | |
| | 93 | | | EPIQ Systems, Inc. | | | 2 | |
| | 27 | | | ePlus, Inc. (a) | | | 2 | |
| | 29 | | | Fair Isaac Corp. | | | 3 | |
| | 7,405 | | | Fleetmatics Group Ltd. (a) | | | 347 | |
| | 7,700 | | | Fortinet, Inc. (a) | | | 318 | |
| | 4 | | | Gigamon, Inc. (a) | | | — | |
| | 2 | | | Globant SA (a) | | | — | |
| | 9 | | | Glu Mobile, Inc. (a) | | | — | |
| | 2 | | | Guidance Software, Inc. (a) | | | — | |
| | 3,958 | | | Guidewire Software, Inc. (a) | | | 209 | |
| | 2 | | | HubSpot, Inc. (a) | | | — | |
| | 3 | | | Imperva, Inc. (a) | | | — | |
| | 7 | | | Infoblox, Inc. (a) | | | — | |
| | 2 | | | Interactive Intelligence Group (a) | | | — | |
| | 6 | | | Jive Software, Inc. (a) | | | — | |
| | 7,680 | | | Manhattan Associates, Inc. (a) | | | 459 | |
| | 73 | | | Mentor Graphics Corp. | | | 2 | |
| | 1 | | | MicroStrategy, Inc. (a) | | | — | |
| | 5 | | | MobileIron, Inc. (a) | | | — | |
| | 3 | | | Model N, Inc. (a) | | | — | |
| | 5 | | | Monotype Imaging Holdings, Inc. | | | — | |
| | 5 | | | NetScout Systems, Inc. (a) | | | — | |
| | 1,215 | | | NetSuite, Inc. (a) | | | 111 | |
| | 5,121 | | | Nuance Communications, Inc. (a) | | | 90 | |
| | 1 | | | Park City Group, Inc. (a) | | | — | |
| | 4,214 | | | Paycom Software, Inc. (a) | | | 144 | |
| | 5 | | | Pegasystems, Inc. | | | — | |
| | 8,295 | | | Proofpoint, Inc. (a) | | | 529 | |
| | 3 | | | PROS Holdings, Inc. (a) | | | — | |
| | 12,471 | | | PTC, Inc. (a) | | | 513 | |
| | 12 | | | QLIK Technologies, Inc. (a) | | | — | |
| | 5,283 | | | Qualys, Inc. (a) | | | 213 | |
| | 3 | | | Rally Software Development Corp. (a) | | | — | |
| | 7 | | | RealPage, Inc. (a) | | | — | |
| | 22,600 | | | Rosetta Stone, Inc. (a) | | | 180 | |
| | 28,815 | | | Rovi Corp. (a) | | | 461 | |
| | 2 | | | Sapiens International Corp. NV | | | — | |
| | 36,623 | | | SeaChange International, Inc. (a) | | | 257 | |
| | 15,820 | | | Silver Spring Networks, Inc. (a) | | | 196 | |
| | 5 | | | Synchronoss Technologies, Inc. (a) | | | — | |
| | 62 | | | Take-Two Interactive Software, Inc. (a) | | | 2 | |
| | 10,805 | | | Tangoe, Inc. (a) | | | 136 | |
| | 466 | | | Telecommunication Systems, Inc. (a) | | | 2 | |
| | 12,200 | | | Telenav, Inc. (a) | | | 98 | |
| | 3 | | | The Rubicon Project, Inc. (a) | | | — | |
| | 1,086 | | | The Ultimate Software Group, Inc. (a) | | | 178 | |
| | 19,770 | | | TiVo, Inc. (a) | | | 200 | |
| | 2 | | | TubeMogul, Inc. (a) | | | — | |
| | 2,304 | | | Tyler Technologies, Inc. (a) | | | 298 | |
| | 1 | | | Varonis Systems, Inc. (a) | | | — | |
| | 4 | | | VASCO Data Security International, Inc. (a) | | | — | |
See accompanying notes to financial statements.
76
HC CAPITAL TRUST
The Small Capitalization–Mid Capitalization Equity Portfolio
Portfolio of Investments (continued) — June 30, 2015
| | | | | | | | |
| Shares | | | Security Description | | Value
(000) | |
| | | | Common Stocks (continued) | | | | |
| | | | Software (continued) | | | | |
| | 8 | | | Verint Systems, Inc. (a) | | $ | — | |
| | 6 | | | VirnetX Holding Corp. (a) | | | — | |
| | 1 | | | Workiva, Inc. (a) | | | — | |
| | 2 | | | Yodlee, Inc. (a) | | | — | |
| | 7 | | | Zendesk, Inc. (a) | | | — | |
| | 8 | | | Zix Corp. (a) | | | — | |
| | 77,000 | | | Zynga, Inc. (a) | | | 220 | |
| | | | | | | | |
| | | | | | | 7,212 | |
| | | | | | | | |
| | | | Specialized Finance — 0.00% | | | | |
| | 1 | | | Gain Capital Holdings, Inc. | | | — | |
| | | | | | | | |
| | | | Specialized Real Estate Investment Trusts — 0.00% | |
| | 16 | | | CubeSmart | | | — | |
| | | | | | | | |
| | | | Specialty Retail — 1.69% | | | | |
| | 52 | | | Abercrombie & Fitch Co., Class – A | | | 1 | |
| | 22 | | | American Eagle Outfitters, Inc. | | | — | |
| | 6 | | | Ann, Inc. (a) | | | — | |
| | 4 | | | Asbury Automotive Group, Inc. (a) | | | — | |
| | 110 | | | Ascena Retail Group, Inc. (a) | | | 2 | |
| | 103 | | | Big 5 Sporting Goods Corp. | | | 1 | |
| | 2 | | | Boot Barn Holdings, Inc. (a) | | | — | |
| | 1 | | | Build-A-Bear Workshop, Inc. (a) | | | — | |
| | 1 | | | Caleres, Inc. | | | — | |
| | 6,980 | | | Chico’s FAS, Inc. | | | 117 | |
| | 58 | | | Destination Maternity Corp. | | | 1 | |
| | 1 | | | Destination XL Group, Inc. (a) | | | — | |
| | 10 | | | Express, Inc. (a) | | | — | |
| | 7 | | | Five Below, Inc. (a) | | | — | |
| | 6 | | | Francesca’s Holdings Corp. (a) | | | — | |
| | 40 | | | GameStop Corp., Class – A | | | 2 | |
| | 17 | | | Group 1 Automotive, Inc. | | | 2 | |
| | 55 | | | Haverty Furniture Cos., Inc. | | | 1 | |
| | 3 | | | Hibbett Sports, Inc. (a) | | | — | |
| | 2 | | | Kirkland’s, Inc. | | | — | |
| | 3 | | | Lithia Motors, Inc. | | | — | |
| | 7,202 | | | MarineMax, Inc. (a) | | | 170 | |
| | 3 | | | Mattress Firm Holding Corp. (a) | | | — | |
| | 4 | | | Monro Muffler Brake, Inc. | | | — | |
| | 17 | | | Murphy USA, Inc. (a) | | | 1 | |
| | 18 | | | Outerwall, Inc. | | | 1 | |
| | 3 | | | Party City Holdco, Inc. (a) | | | — | |
| | 12 | | | Pier 1 Imports, Inc. | | | — | |
| | 4,406 | | | Rent-A-Center, Inc. | | | 126 | |
| | 5,161 | | | Restoration Hardware Holdings, Inc. (a) | | | 505 | |
| | 7 | | | Select Comfort Corp. (a) | | | — | |
| | 50 | | | Shoe Carnival, Inc. | | | 1 | |
| | 49 | | | Sonic Automotive, Inc., Class – A | | | 1 | |
| | 1 | | | Sportsman’s Warehouse Holdings, Inc. (a) | | | — | |
| | 97 | | | Stein Mart, Inc. | | | 1 | |
| | 4 | | | The Buckle, Inc. | | | — | |
| | 31 | | | The Cato Corp. | | | 1 | |
| | 1 | | | The Children’s Place Retail Stores, Inc. | | | — | |
| | 2 | | | The Container Store Group, Inc. (a) | | | — | |
| | | | | | | | |
| Shares | | | Security Description | | Value
(000) | |
| | | | Specialty Retail (continued) | | | | |
| | 2 | | | The Finish Line, Inc., Class – A | | $ | — | |
| | 6 | | | The Men’s Wearhouse, Inc. | | | — | |
| | 9,536 | | | Tile Shop Holdings, Inc. (a) | | | 136 | |
| | 150 | | | Tilly’s, Inc., Class – A (a) | | | 1 | |
| | 9,711 | | | Tractor Supply Co. | | | 874 | |
| | 2 | | | Zumiez, Inc. (a) | | | — | |
| | | | | | | | |
| | | | | | | 1,945 | |
| | | | | | | | |
| | | | Technology Hardware, Storage & Peripherals — 0.46% | |
| | 1,085 | | | 3D Systems Corp. (a) | | | 21 | |
| | 3 | | | Avid Technology, Inc. (a) | | | — | |
| | 5 | | | Cray, Inc. (a) | | | — | |
| | 9 | | | Diebold, Inc. | | | — | |
| | 8 | | | Dot Hill Systems Corp. (a) | | | — | |
| | 2 | | | Eastman Kodak Co. (a) | | | — | |
| | 6 | | | Electronics for Imaging, Inc. (a) | | | — | |
| | 42,800 | | | Imation Corp. (a) | | | 174 | |
| | 4 | | | Immersion Corp. (a) | | | — | |
| | 42 | | | Lexmark International, Inc., Class – A | | | 2 | |
| | 3,407 | | | Nimble Storage, Inc. (a) | | | 96 | |
| | 4 | | | Novatel Wireless, Inc. (a) | | | — | |
| | 16,800 | | | QLogic Corp. (a) | | | 239 | |
| | 5 | | | Silicon Graphics International Corp. (a) | | | — | |
| | 5 | | | Super Micro Computer, Inc. (a) | | | — | |
| | 12 | | | Violin Memory, Inc. (a) | | | — | |
| | | | | | | | |
| | | | | | | 532 | |
| | | | | | | | |
| | | | Textiles, Apparel & Luxury Goods — 2.38% | | | | |
| | 3 | | | Columbia Sportswear Co. | | | — | |
| | 8 | | | Crocs, Inc. (a) | | | — | |
| | 80 | | | Culp, Inc. | | | 2 | |
| | 3 | | | Deckers Outdoor Corp. (a) | | | — | |
| | 17,583 | | | G-III Apparel Group Ltd. (a) | | | 1,238 | |
| | 60 | | | Movado Group, Inc. | | | 2 | |
| | 1,637 | | | Oxford Industries, Inc. | | | 143 | |
| | 11 | | | Quiksilver, Inc. (a) | | | — | |
| | 3 | | | Sequential Brands Group, Inc. (a) | | | — | |
| | 2,705 | | | Skechers USA, Inc., Class – A (a) | | | 297 | |
| | 7 | | | Steven Madden Ltd. (a) | | | — | |
| | 1 | | | Superior Uniform Group, Inc. | | | — | |
| | 7 | | | Tumi Holdings, Inc. (a) | | | — | |
| | 7,784 | | | Under Armour, Inc., Class – A (a) | | | 650 | |
| | 2 | | | Vince Holding Corp. (a) | | | — | |
| | 14,148 | | | Wolverine World Wide, Inc. | | | 403 | |
| | | | | | | | |
| | | | | | | 2,735 | |
| | | | | | | | |
| | | | Thirfts & Mortgage Finance — 0.21% | | | | |
| | 1 | | | Impac Mortgage Holdings, Inc. (a) | | | — | |
| | 3,100 | | | LendingTree, Inc. (a) | | | 244 | |
| | | | | | | | |
| | | | | | | 244 | |
| | | | | | | | |
| | | | Thrifts & Mortgage Finance — 0.06% | | | | |
| | 2 | | | Bofl Holding, Inc. (a) | | | — | |
| | 7 | | | Essent Group Ltd. (a) | | | — | |
| | 60 | | | Federal Agricultural Mortgage Corp., Class – C | | | 2 | |
| | 40 | | | First Defiance Financial Corp. | | | 2 | |
| | 70 | | | Home Loan Servicing Solutions Ltd. | | | — | |
See accompanying notes to financial statements.
77
HC CAPITAL TRUST
The Small Capitalization–Mid Capitalization Equity Portfolio
Portfolio of Investments (continued) — June 30, 2015
| | | | | | | | |
| | |
| Shares | | | Security Description | | Value
(000) | |
| | | | Common Stocks (continued) | | | | |
| | | | Thrifts & Mortgage Finance (continued) | | | | |
| | 80 | | | HomeStreet, Inc. (a) | | $ | 2 | |
| | 1 | | | Meridian Bancorp, Inc. (a) | | | — | |
| | 40 | | | Meta Financial Group, Inc. | | | 2 | |
| | 20 | | | MGIC Investment Corp. (a) | | | — | |
| | 1 | | | United Financial Bancorp, Inc. | | | — | |
| | 94 | | | Walker & Dunlop, Inc. (a) | | | 3 | |
| | 2,154 | | | WSFS Financial Corp. | | | 58 | |
| | | | | | | | |
| | | | | | | 69 | |
| | | | | | | | |
| | | | Tobacco — 0.00% | | | | |
| | 38 | | | Universal Corp. | | | 2 | |
| | 11 | | | Vector Group Ltd. | | | — | |
| | | | | | | | |
| | | | | | | 2 | |
| | | | | | | | |
| | | | Trading Companies & Distributors — 1.09% | | | | |
| | 76 | | | Aircastle Ltd. | | | 2 | |
| | 7,544 | | | Applied Industrial Technologies, Inc. | | | 300 | |
| | 3,918 | | | Beacon Roofing Supply, Inc. (a) | | | 130 | |
| | 70 | | | CAI International, Inc. (a) | | | 1 | |
| | 1 | | | DXP Enterprises, Inc. (a) | | | — | |
| | 3,073 | | | GATX Corp. | | | 163 | |
| | 4 | | | H&E Equipment Services, Inc. | | | — | |
| | 130 | | | Houston Wire & Cable Co. | | | 1 | |
| | 1 | | | Lawson Products, Inc. (a) | | | — | |
| | 9,957 | | | MRC Global, Inc. (a) | | | 154 | |
| | 1 | | | Neff Corp., Class – A (a) | | | — | |
| | 11,002 | | | Stock Building Supply Holdings, Inc. (a) | | | 215 | |
| | 41 | | | TAL International Group, Inc. | | | 1 | |
| | 43 | | | Textainer Group Holdings Ltd. | | | 1 | |
| | 2,322 | | | Watsco, Inc. | | | 288 | |
| | | | | | | | |
| | | | | | | 1,256 | |
| | | | | | | | |
| | | | Wireless Telecommunication Services — 0.00% | | | | |
| | 3 | | | Boingo Wireless, Inc. (a) | | | — | |
| | 7 | | | RingCentral, Inc., Class – A (a) | | | — | |
| | 3 | | | Shenandoah Telecommunications Co. | | | — | |
| | 88 | | | Spok Holdings, Inc. | | | 2 | |
| | | | | | | | |
| | | | | | | 2 | |
| | | | | | | | |
| | | | Total Common Stocks | | | 97,856 | |
| | | | | | | | |
| | | | Contingent Rights — 0.00% | | | | |
| | | | Biotechnology — 0.00% | | | | |
| | 500 | | | Clinical Data, Inc.*(a)(b)(c) | | | — | |
| | | | | | | | |
| | | | Machinery — 0.00% | | | | |
| | 1,000 | | | Gerber Scientific, Inc.*(a)(b)(d) | | | — | |
| | | | | | | | |
| | | | Wireless Telecommunication Services — 0.00% | | | | |
| | 260 | | | Leap Wireless International, Inc.*(a)(b)(d) | | | — | |
| | | | | | | | |
| | | | Total Contingent Rights | | | — | |
| | | | | | | | |
| | | | Warrant — 0.00% | | | | |
| | | | Oil, Gas & Consumable Fuels — 0.00% | | | | |
| | 160 | | | Magnum Hunter Resources Corp. (a) | | | — | |
| | | | | | | | |
| | | | Total Warrant | | | — | |
| | | | | | | | |
| | | | | | | | |
Shares or
Principal
Amount
(000) | | | Security Description | | Value
(000) | |
| | | | Time Deposit — 3.02% | | | | |
| $ | 3,469 | | | State Street Liquidity Management Control System Eurodollar Time Deposit,
0.01%, 7/1/15 | | $ | 3,469 | |
| | | | | | | | |
| | | | Total Time Deposit | | | 3,469 | |
| | | | | | | | |
| | | | Mutual Funds — 10.37% | | | | |
| | 11,773,888 | | | Federated U.S. Treasury Cash Reserve Fund, Institutional Shares, 0.00% (e) | | | 11,773 | |
| | 25,797 | | | SSgA Prime Money Market Fund, 0.03% (e) | | | 26 | |
| | 120,804 | | | SSgA Treasury Money Market Fund, 0.00% (e) | | | 121 | |
| | | | | | | | |
| | | | Total Mutual Funds | | | 11,920 | |
| | | | | | | | |
| | | | Repurchase Agreement — 0.50% | | | | |
| $ | 570 | | | Jefferies LLC, 0.23%, 7/1/15
(Purchased on 6/30/15, proceeds at maturity $569,848 collateralized by U.S. Treasury Obligations, 0.00% – 3.28%, 8/15/15 – 8/15/44 fair value $581,241)^^ | | | 570 | |
| | | | | | | | |
| | | | Total Repurchase Agreement | | | 570 | |
| | | | | | | | |
| | | | Total Investments (cost $86,703) — 99.01% | | | 113,815 | |
| | | | Other assets in excess of liabilities — 0.99% | | | 1,134 | |
| | | | | | | | |
| | | | Net Assets — 100.00% | | $ | 114,949 | |
| | | | | | | | |
Amounts designated as “—” are $0 or have been rounded to $0.
| * | Security was fair valued on June 30, 2015 and represents a Level 2 security. Refer to Note 2 in the Notes to Financial Statements. |
| ^ | All or part of this security was on loan as of June 30, 2015. The total value of securities on loan as of June 30, 2015, was $924 (amount in thousands). |
| ^^ | Purchases with cash collateral held from securities lending. The value of the collateral could include collateral held for securities that were sold on or before June 30, 2015. |
| (a) | Represents non-income producing security. |
| (b) | These securities have been deemed illiquid by the Specialist Manager and represent 0.00% of the Portfolio. |
| (c) | Rights entitle the Portfolio to cash based on the company’s achievement of milestones in connection with a pharmaceutical drug that was brought to market. |
| (d) | Rights entitle the Portfolio to cash based on any net recoveries obtained by the company in connection with certain claims of patent infringement. |
| (e) | The rate disclosed is the rate in effect on June 30, 2015. |
ADR — American Depositary Receipt
REIT — Real Estate Investment Trust
See accompanying notes to financial statements.
78
HC CAPITAL TRUST
The Small Capitalization–Mid Capitalization Equity Portfolio
Portfolio of Investments (concluded) — June 30, 2015
The following table reflects the percentage of total net assets of the Portfolio attributable to each Specialist Manager, see Note 3 in the Notes to Financial Statements.
| | | | | | | | | | | | | | | | | | | | | | | | | | | | | | | | | | | | |
The Small
Capitalization-Mid
Capitalization
Equity Portfolio | | Ariel
Investments,
LLC | | | Cupps Capital
Management,
LLC | | | Frontier
Capital
Management
Company,
LLC | | | IronBridge
Capital
Management
LP | | | Mellon
Capital
Management
Corporation | | | Parametric
Portfolio
Associates,
LLC | | | Pzena
Investment
Management,
LLC | | | HC Capital
Solutions | | | Total | |
Common Stocks | | | 4.24 | % | | | 14.66 | % | | | 30.01 | % | | | 30.40 | % | | | 0.64 | % | | | — | | | | 5.17 | % | | | — | | | | 85.12 | % |
Contingent Rights | | | — | | | | — | | | | — | | | | — | | | | — | | | | — | | | | — | | | | — | | | | 0.00 | % |
Warrant | | | — | | | | — | | | | — | | | | — | | | | — | | | | — | | | | — | | | | — | | | | 0.00 | % |
Time Deposit | | | 0.39 | % | | | — | | | | 0.95 | % | | | 1.54 | % | | | — | | | | — | | | | 0.14 | % | | | — | | | | 3.02 | % |
Mutual Funds | | | — | | | | 0.02 | % | | | — | | | | — | | | | 0.11 | % | | | — | | | | — | | | | 10.24 | % | | | 10.37 | % |
Repurchase Agreement | | | — | | | | — | | | | 0.33 | % | | | 0.17 | % | | | — | | | | — | | | | — | | | | — | | | | 0.50 | % |
Other Assets (Liabilities) | | | -0.03 | % | | | 0.01 | % | | | -0.63 | % | | | -0.24 | % | | | — | | | | 1.94 | % | | | -0.06 | % | | | — | | | | 0.99 | % |
| | | | | | | | | | | | | | | | | | | | | | | | | | | | | | | | | | | | |
Total Net Assets | | | 4.60 | % | | | 14.69 | % | | | 30.66 | % | | | 31.87 | % | | | 0.75 | % | | | 1.94 | % | | | 5.25 | % | | | 10.24 | % | | | 100.00 | % |
| | | | | | | | | | | | | | | | | | | | | | | | | | | | | | | | | | | | |
The following table reflects the open derivative positions held by the Portfolio as of June 30, 2015.
Short Futures
| | | | | | | | | | | | | | | | |
Number of
Contracts | | | Futures Contracts Positions^ | | Value
(000) | | | Expiration | | | Unrealized
Appreciation/
(Depreciation)
(000) | |
| | (37) | | | Russell 2000 Mini Index Future | | $ | (4,626 | ) | | | 9/18/15 | | | $ | 36 | |
| | | | | | | | | | | | | | | | |
| | | | Net Unrealized Appreciation/(Depreciation) | | | | | | | | | | $ | 36 | |
| | | | | | | | | | | | | | | | |
Amounts designated as “—” are $0 or have been rounded to $0.
See accompanying notes to financial statements.
79
HC CAPITAL TRUST
The Institutional Small Capitalization–Mid Capitalization Equity Portfolio
Portfolio of Investments — June 30, 2015
| | | | | | | | |
| Shares | | | Security Description | | Value
(000) | |
| | | | Common Stocks — 85.89% | | | | |
| | | | Aerospace & Defense — 1.01% | | | | |
| | 153 | | | AAR Corp. | | $ | 5 | |
| | 4,700 | | | Cubic Corp. | | | 224 | |
| | 11,575 | | | Curtiss-Wright Corp. | | | 837 | |
| | 180 | | | Ducommun, Inc. (a) | | | 5 | |
| | 110 | | | Engility Holdings, Inc. (a) | | | 3 | |
| | 6,045 | | | Esterline Technologies Corp. (a) | | | 576 | |
| | 70 | | | National Presto Industries, Inc. | | | 6 | |
| | 36 | | | Orbital ATK, Inc. | | | 3 | |
| | 10,656 | | | TASER International, Inc. (a) | | | 355 | |
| | 70 | | | Triumph Group, Inc. | | | 5 | |
| | | | | | | | |
| | | | | | | 2,019 | |
| | | | | | | | |
| | | | Air Freight & Logistics — 0.51% | | | | |
| | 540 | | | Air Transport Services Group, Inc. (a) | | | 6 | |
| | 95 | | | Atlas Air Worldwide Holdings, Inc. (a) | | | 5 | |
| | 39,683 | | | UTI Worldwide, Inc. (a) | | | 396 | |
| | 13,367 | | | XPO Logistics, Inc. (a) | | | 604 | |
| | | | | | | | |
| | | | | | | 1,011 | |
| | | | | | | | |
| | | | Airlines — 1.95% | | | | |
| | 8,306 | | | American Airlines Group, Inc. | | | 332 | |
| | 50 | | | Copa Holdings SA, Class – A | | | 4 | |
| | 1,033 | | | Hawaiian Holdings, Inc. (a) | | | 25 | |
| | 49,153 | | | JetBlue Airways Corp. (a) | | | 1,020 | |
| | 340 | | | Republic Airways Holdings, Inc. (a) | | | 3 | |
| | 370 | | | SkyWest, Inc. | | | 6 | |
| | 47,581 | | | United Continental Holdings, Inc. (a) | | | 2,522 | |
| | | | | | | | |
| | | | | | | 3,912 | |
| | | | | | | | |
| | | | Auto Components — 1.52% | | | | |
| | 2,817 | | | Autoliv, Inc. | | | 329 | |
| | 200 | | | Cooper Tire & Rubber Co. | | | 7 | |
| | 18,126 | | | Dana Holding Corp. | | | 373 | |
| | 22,686 | | | Fox Factory Holding Corp. (a) | | | 365 | |
| | 13,745 | | | Gentherm, Inc. (a) | | | 755 | |
| | 14,441 | | | Modine Manufacturing Co. (a) | | | 155 | |
| | 330 | | | Remy International, Inc. | | | 7 | |
| | 21,898 | | | Stoneridge, Inc. (a) | | | 256 | |
| | 13,882 | | | Tenneco, Inc. (a) | | | 797 | |
| | 260 | | | Tower International, Inc. (a) | | | 7 | |
| | | | | | | | |
| | | | | | | 3,051 | |
| | | | | | | | |
| | | | Banks — 5.02% | | | | |
| | 120 | | | 1st Source, Inc. | | | 4 | |
| | 180 | | | American National Bankshares, Inc. | | | 4 | |
| | 15,250 | | | Associated Banc-Corp. | | | 309 | |
| | 120 | | | Banco Latinoamericano de Comercio Exterior SA, Class – E | | | 4 | |
| | 11,980 | | | Bank of the Ozarks, Inc. | | | 548 | |
| | 25,840 | | | BankUnited, Inc. | | | 928 | |
| | 14,700 | | | Banner Corp. | | | 705 | |
| | 17,407 | | | BBCN Bancorp, Inc. | | | 257 | |
| | 110 | | | Camden National Corp. | | | 4 | |
| | 230 | | | CNB Financial Corp. | | | 4 | |
| | 41,188 | | | Columbia Banking System, Inc. | | | 1,341 | |
| | 15,041 | | | Cullen/Frost Bankers, Inc. | | | 1,182 | |
| | 241 | | | Fidelity Southern Corp. | | | 4 | |
| | | | | | | | |
| Shares | | | Security Description | | Value
(000) | |
| | | | Banks (continued) | | | | |
| | 170 | | | Financial Institutions, Inc. | | $ | 4 | |
| | 220 | | | First Bancorp | | | 4 | |
| | 700 | | | First Bancorp (a) | | | 3 | |
| | 260 | | | First Community Bancshares, Inc. | | | 5 | |
| | 120 | | | First Financial Corp. | | | 4 | |
| | 140 | | | First Interstate BancSystem, Inc. | | | 4 | |
| | 14,315 | | | First Midwest BanCorp, Inc. | | | 272 | |
| | 490 | | | First Niagara Financial Group, Inc. | | | 5 | |
| | 105 | | | Great Southern Bancorp, Inc. | | | 4 | |
| | 130 | | | Hancock Holding Co. | | | 4 | |
| | 160 | | | Heartland Financial USA, Inc. | | | 6 | |
| | 160 | | | Horizon Bancorp | | | 4 | |
| | 310 | | | Independent Bank Corp. | | | 4 | |
| | 170 | | | International Bancshares Corp. | | | 5 | |
| | 210 | | | MainSource Financial Group, Inc. | | | 5 | |
| | 230 | | | MidSouth Bancorp, Inc. | | | 4 | |
| | 23,550 | | | National Penn Bancshares, Inc. | | | 266 | |
| | 170 | | | NBT Bancorp, Inc. | | | 4 | |
| | 150 | | | Northrim BanCorp, Inc. | | | 4 | |
| | 240 | | | OFG Bancorp | | | 3 | |
| | 20,299 | | | PacWest Bancorp | | | 949 | |
| | 160 | | | Peoples Bancorp, Inc. | | | 4 | |
| | 14,228 | | | Popular, Inc. (a) | | | 410 | |
| | 27,297 | | | Square 1 Financial, Inc., Class – A (a) | | | 747 | |
| | 290 | | | Susquehanna Bancshares, Inc. | | | 4 | |
| | 8,420 | | | SVB Financial Group (a) | | | 1,212 | |
| | 10,275 | | | Synovus Financial Corp. | | | 317 | |
| | 13,152 | | | TCF Financial Corp. | | | 218 | |
| | 270 | | | TowneBank | | | 4 | |
| | 170 | | | Trustmark Corp. | | | 4 | |
| | 200 | | | Univest Corp. of Pennsylvania | | | 4 | |
| | 7,647 | | | Webster Financial Corp. | | | 302 | |
| | 120 | | | WesBanco, Inc. | | | 4 | |
| | 90 | | | Wintrust Financial Corp. | | | 5 | |
| | | | | | | | |
| | | | | | | 10,092 | |
| | | | | | | | |
| | | | Beverages — 0.00% | | | | |
| | 43 | | | Coca-Cola Bottling Co. Consolidated | | | 6 | |
| | | | | | | | |
| | | | Biotechnology — 3.05% | | | | |
| | 140 | | | Acorda Therapeutics, Inc. (a) | | | 5 | |
| | 795 | | | Agios Pharmaceuticals, Inc. (a) | | | 88 | |
| | 3,470 | | | Anacor Pharmaceuticals, Inc. (a) | | | 269 | |
| | 3,940 | | | Atara Biotherapeutics, Inc. (a) | | | 208 | |
| | 1,632 | | | BioMarin Pharmaceutical, Inc. (a) | | | 223 | |
| | 17,699 | | | Cepheid, Inc. (a) | | | 1,082 | |
| | 12,985 | | | Dyax Corp. (a) | | | 344 | |
| | 228 | | | Emergent BioSolutions, Inc. (a) | | | 8 | |
| | 45,252 | | | Exact Sciences Corp. (a) | | | 1,345 | |
| | 13,920 | | | Genomic Health, Inc. (a) | | | 387 | |
| | 8,190 | | | Intrexon Corp.^ | | | 400 | |
| | 5,475 | | | Isis Pharmaceuticals, Inc. (a) | | | 315 | |
| | 9,613 | | | Myriad Genetics, Inc.^(a) | | | 327 | |
| | 15,230 | | | OncoMed Pharmaceuticals, Inc. (a) | | | 343 | |
| | 800 | | | PDL BioPharma, Inc. | | | 5 | |
| | 270 | | | Repligen Corp. (a) | | | 11 | |
| | 11,596 | | | Sangamo BioSciences, Inc. (a) | | | 129 | |
See accompanying notes to financial statements.
80
HC CAPITAL TRUST
The Institutional Small Capitalization–Mid Capitalization Equity Portfolio
Portfolio of Investments (continued) — June 30, 2015
| | | | | | | | |
| Shares | | | Security Description | | Value
(000) | |
| | | | Common Stocks (continued) | | | | |
| | | | Biotechnology (continued) | | | | |
| | 7,550 | | | Seattle Genetics, Inc. (a) | | $ | 365 | |
| | 2,620 | | | Ultragenyx Pharmaceutical, Inc. (a) | | | 268 | |
| | | | | | | | |
| | | | | | | 6,122 | |
| | | | | | | | |
| | | | Building Products — 2.10% | | | | |
| | 5,988 | | | Armstrong World Industries, Inc. (a) | | | 319 | |
| | 18,319 | | | CaesarStone Sdot Yam Ltd. | | | 1,256 | |
| | 17,526 | | | Gibraltar Industries, Inc. (a) | | | 357 | |
| | 5,991 | | | Griffon Corp. | | | 95 | |
| | 7,733 | | | Lennox International, Inc. | | | 833 | |
| | 4,680 | | | Masonite International Corp. (a) | | | 328 | |
| | 7,272 | | | Trex Co., Inc. (a) | | | 359 | |
| | 12,373 | | | Universal Forest Products, Inc. | | | 644 | |
| | | | | | | | |
| | | | | | | 4,191 | |
| | | | | | | | |
| | | | Capital Markets — 1.72% | | | | |
| | 110 | | | Arlington Asset Investment Corp. | | | 2 | |
| | 4,114 | | | Artisan Partners Asset Management, Inc. | | | 191 | |
| | 240 | | | Calamos Asset Management, Inc., Class – A | | | 3 | |
| | 10,344 | | | E*Trade Financial Corp. (a) | | | 310 | |
| | 120 | | | FBR & Co. (a) | | | 3 | |
| | 40 | | | GAMCO Investors, Inc., Class – A | | | 3 | |
| | 18,272 | | | Interactive Brokers Group, Inc., Class – A | | | 759 | |
| | 5,316 | | | LPL Financial Holdings, Inc. | | | 247 | |
| | 210 | | | Manning & Napier, Inc. | | | 2 | |
| | 140 | | | Oppenheimer Holdings, Inc., Class – A | | | 4 | |
| | 7,270 | | | Raymond James Financial, Inc. | | | 433 | |
| | 15,656 | | | Stifel Financial Corp. (a) | | | 904 | |
| | 2,973 | | | Waddell & Reed Financial, Inc., Class – A | | | 141 | |
| | 20,729 | | | WisdomTree Investments, Inc. | | | 455 | |
| | | | | | | | |
| | | | | | | 3,457 | |
| | | | | | | | |
| | | | Chemicals — 2.11% | | | | |
| | 109 | | | A. Schulman, Inc. | | | 5 | |
| | 5,092 | | | Albemarle Corp. | | | 281 | |
| | 100 | | | Axiall Corp. | | | 4 | |
| | 6,715 | | | Cabot Corp. | | | 250 | |
| | 108 | | | Chase Corp. | | | 4 | |
| | 5,270 | | | FMC Corp. | | | 277 | |
| | 330 | | | FutureFuel Corp. | | | 4 | |
| | 170 | | | Koppers Holdings, Inc. | | | 4 | |
| | 27,103 | | | Kraton Performance Polymers, Inc. (a) | | | 647 | |
| | 6,088 | | | Methanex Corp. | | | 339 | |
| | 1,903 | | | NewMarket Corp. | | | 846 | |
| | 176 | | | Olin Corp. | | | 5 | |
| | 13,500 | | | PolyOne Corp. | | | 529 | |
| | 10,360 | | | Sensient Technologies Corp. | | | 708 | |
| | 111 | | | Stepan Co. | | | 6 | |
| | 22,158 | | | Tronox Ltd., Class – A | | | 324 | |
| | | | | | | | |
| | | | | | | 4,233 | |
| | | | | | | | |
| | | | Commercial Services & Supplies — 1.02% | | | | |
| | 130 | | | ABM Industries, Inc. | | | 4 | |
| | 410 | | | ACCO Brands Corp. (a) | | | 3 | |
| | 5,079 | | | ARC Document Solutions, Inc. (a) | | | 39 | |
| | 9,934 | | | Brady Corp. | | | 246 | |
| | 60 | | | Deluxe Corp. | | | 4 | |
| | | | | | | | |
| Shares | | | Security Description | | Value
(000) | |
| | | | Commercial Services & Supplies (continued) | | | | |
| | 300 | | | Ennis, Inc. | | $ | 6 | |
| | 6,147 | | | Essendant, Inc. | | | 241 | |
| | 8,757 | | | KAR Auction Services, Inc. | | | 328 | |
| | 430 | | | Kimball International, Inc., Class – B | | | 5 | |
| | 4,160 | | | Matthews International Corp., Class – A | | | 221 | |
| | 13,540 | | | Mobile Mini, Inc. | | | 569 | |
| | 180 | | | Quad Graphics, Inc. | | | 3 | |
| | 240 | | | R.R. Donnelley & Sons Co. | | | 4 | |
| | 3,943 | | | Ritchie Bros. Auctioneers, Inc. | | | 110 | |
| | 230 | | | Steelcase, Inc., Class – A | | | 4 | |
| | 10,025 | | | Tetra Tech, Inc. | | | 257 | |
| | 160 | | | The Brink’s Co. | | | 5 | |
| | 36 | | | UniFirst Corp. | | | 4 | |
| | 120 | | | West Corp. | | | 4 | |
| | | | | | | | |
| | | | | | | 2,057 | |
| | | | | | | | |
| | | | Communications Equipment — 0.67% | | | | |
| | 3,998 | | | ADTRAN, Inc. | | | 65 | |
| | 160 | | | BEL Fuse, Inc., Class – B | | | 3 | |
| | 175 | | | Black Box Corp. | | | 4 | |
| | 23 | | | Harris Corp. | | | 2 | |
| | 27,383 | | | Infinera Corp. (a) | | | 574 | |
| | 71,080 | | | ShoreTel, Inc. (a) | | | 482 | |
| | 8,475 | | | Sierra Wireless, Inc.^(a) | | | 211 | |
| | 140 | | | TESSCO Technologies, Inc. | | | 3 | |
| | | | | | | | |
| | | | | | | 1,344 | |
| | | | | | | | |
| | | | Construction & Engineering — 0.41% | | | | |
| | 110 | | | Chicago Bridge & Iron Co. | | | 6 | |
| | 4,814 | | | KBR, Inc. | | | 94 | |
| | 9,512 | | | MasTec, Inc. (a) | | | 189 | |
| | 166 | | | MYR Group, Inc. (a) | | | 5 | |
| | 5,284 | | | Primoris Services Corp. | | | 105 | |
| | 10,390 | | | Quanta Services, Inc. (a) | | | 299 | |
| | 5,967 | | | Tutor Perini Corp. (a) | | | 129 | |
| | | | | | | | |
| | | | | | | 827 | |
| | | | | | | | |
| | | | Construction Materials — 0.59% | | | | |
| | 8,603 | | | Eagle Materials, Inc. | | | 656 | |
| | 13,166 | | | Headwaters, Inc. (a) | | | 240 | |
| | 1,997 | | | Martin Marietta Materials, Inc. | | | 283 | |
| | | | | | | | |
| | | | | | | 1,179 | |
| | | | | | | | |
| | | | Consumer Finance — 0.40% | | | | |
| | 130 | | | Enova International, Inc. (a) | | | 2 | |
| | 270 | | | EZCORP, Inc., Class – A (a) | | | 2 | |
| | 11,034 | | | Green Dot Corp., Class – A (a) | | | 211 | |
| | 70 | | | Nelnet, Inc., Class – A | | | 3 | |
| | 240 | | | Nicholas Financial, Inc. (a) | | | 3 | |
| | 9,335 | | | PRA Group, Inc. (a) | | | 583 | |
| | 170 | | | Santander Consumer USA Holdings, Inc. (a) | | | 4 | |
| | 35 | | | World Acceptance Corp.^(a) | | | 2 | |
| | | | | | | | |
| | | | | | | 810 | |
| | | | | | | | |
| | | | Containers & Packaging — 0.77% | | | | |
| | 12,761 | | | AptarGroup, Inc. | | | 814 | |
| | 22,760 | | | Berry Plastics Group, Inc. (a) | | | 737 | |
| | 90 | | | Greif, Inc., Class – A | | | 3 | |
| | | | | | | | |
| | | | | | | 1,554 | |
| | | | | | | | |
See accompanying notes to financial statements.
81
HC CAPITAL TRUST
The Institutional Small Capitalization–Mid Capitalization Equity Portfolio
Portfolio of Investments (continued) — June 30, 2015
| | | | | | | | |
| Shares | | | Security Description | | Value
(000) | |
| | | | Common Stocks (continued) | | | | |
| | | | Diversified Consumer Services — 0.25% | | | | |
| | 10,129 | | | 2U, Inc. (a) | | $ | 325 | |
| | 150 | | | Apollo Group, Inc., Class – A (a) | | | 2 | |
| | 49,308 | | | Career Education Corp. (a) | | | 163 | |
| | 440 | | | K12, Inc. (a) | | | 6 | |
| | 115 | | | Steiner Leisure Ltd. (a) | | | 6 | |
| | | | | | | | |
| | | | | | | 502 | |
| | | | | | | | |
| | | | Diversified Financial Services — 0.25% | | | | |
| | 11,441 | | | Leucadia National Corp. | | | 277 | |
| | 8,402 | | | PHH Corp. (a) | | | 219 | |
| | | | | | | | |
| | | | | | | 496 | |
| | | | | | | | |
| | | | Diversified Telecommunication Services — 0.60% | |
| | 24,161 | | | Cogent Communications Group, Inc. | | | 818 | |
| | 150 | | | Hawaiian Telcom Holdco, Inc. (a) | | | 4 | |
| | 210 | | | IDT Corp. | | | 4 | |
| | 37,355 | | | Premiere Global Services, Inc. (a) | | | 384 | |
| | | | | | | | |
| | | | | | | 1,210 | |
| | | | | | | | |
| | | | Electric Utilities — 0.35% | | | | |
| | 19,418 | | | El Paso Electric Co. | | | 674 | |
| | 237 | | | PNM Resources, Inc. | | | 6 | |
| | 181 | | | Portland General Electric Co. | | | 6 | |
| | 460 | | | Spark Energy, Inc., Class – A | | | 7 | |
| | 239 | | | The Empire District Electric Co. | | | 5 | |
| | 160 | | | UIL Holdings Corp. | | | 7 | |
| | 190 | | | Unitil Corp. | | | 6 | |
| | | | | | | | |
| | | | | | | 711 | |
| | | | | | | | |
| | | | Electrical Equipment — 0.93% | | | | |
| | 4,575 | | | Acuity Brands, Inc. | | | 824 | |
| | 2,471 | | | Encore Wire Corp. | | | 109 | |
| | 8,121 | | | EnerSys | | | 571 | |
| | 49 | | | Generac Holdings, Inc. (a) | | | 2 | |
| | 18,400 | | | General Cable Corp. | | | 363 | |
| | 90 | | | Preformed Line Products Co. | | | 3 | |
| | 55 | | | Regal-Beloit Corp. | | | 4 | |
| | | | | | | | |
| | | | | | | 1,876 | |
| | | | | | | | |
| | | | Electronic Equipment, Instruments & Components — 3.76% | |
| | 14,961 | | | Belden, Inc. | | | 1,214 | |
| | 170 | | | Benchmark Electronics, Inc. (a) | | | 4 | |
| | 14,810 | | | Cognex Corp. | | | 712 | |
| | 26,904 | | | Control4 Corp.^(a) | | | 239 | |
| | 100 | | | Dolby Laboratories, Inc., Class – A | | | 4 | |
| | 15,217 | | | DTS, Inc. (a) | | | 464 | |
| | 280 | | | Electro Rent Corp. | | | 3 | |
| | 260 | | | Fabrinet (a) | | | 5 | |
| | 43,523 | | | Flextronics International Ltd. (a) | | | 492 | |
| | 10,109 | | | Insight Enterprises, Inc. (a) | | | 302 | |
| | 12,226 | | | InvenSense, Inc.^(a) | | | 185 | |
| | 7,383 | | | IPG Photonics Corp. (a) | | | 629 | |
| | 12,065 | | | Itron, Inc. (a) | | | 416 | |
| | 18,211 | | | Jabil Circuit, Inc. | | | 388 | |
| | 375 | | | Kimball Electronics, Inc. (a) | | | 5 | |
| | 5,743 | | | Littelfuse, Inc. | | | 545 | |
| | 170 | | | PC Connection, Inc. | | | 4 | |
| | | | | | | | |
| Shares | | | Security Description | | Value
(000) | |
| | | | Electronic Equipment, Instruments & Components (continued) | |
| | 110 | | | Plexus Corp. (a) | | $ | 5 | |
| | 9,686 | | | Rogers Corp. (a) | | | 641 | |
| | 180 | | | Sanmina Corp. (a) | | | 4 | |
| | 60 | | | SYNNEX Corp. | | | 4 | |
| | 5,543 | | | Tech Data Corp. (a) | | | 319 | |
| | 21,606 | | | Trimble Navigation Ltd. (a) | | | 507 | |
| | 605 | | | TTM Technologies, Inc. (a) | | | 6 | |
| | 8,368 | | | Universal Display Corp. (a) | | | 433 | |
| | 300 | | | Vishay Intertechnology, Inc. | | | 4 | |
| | | | | | | | |
| | | | | | | 7,534 | |
| | | | | | | | |
| | | | Energy Equipment & Services — 1.40% | | | | |
| | 12,153 | | | Atwood Oceanics, Inc. | | | 321 | |
| | 404 | | | Dawson Geophysical Co. (a) | | | 2 | |
| | 80 | | | Diamond Offshore Drilling, Inc. | | | 2 | |
| | 4,098 | | | Dril-Quip, Inc. (a) | | | 308 | |
| | 140 | | | GulfMark Offshore, Inc. | | | 2 | |
| | 21,025 | | | Helix Energy Solutions Group, Inc. (a) | | | 266 | |
| | 14,925 | | | Key Energy Services, Inc. (a) | | | 27 | |
| | 123,522 | | | McDermott International, Inc. (a) | | | 660 | |
| | 280 | | | Nabors Industries Ltd. | | | 4 | |
| | 50,535 | | | Newpark Resources, Inc. (a) | | | 411 | |
| | 1,080 | | | Parker Drilling Co. (a) | | | 4 | |
| | 80 | | | PHI, Inc. (a) | | | 2 | |
| | 37,839 | | | Superior Energy Services, Inc. | | | 796 | |
| | 250 | | | Tesco Corp. | | | 3 | |
| | 90 | | | Unit Corp. (a) | | | 2 | |
| | 4,180 | | | Vantage Drilling Co. (a) | | | 1 | |
| | | | | | | | |
| | | | | | | 2,811 | |
| | | | | | | | |
| | | | Food & Staples Retailing — 1.23% | | | | |
| | 18,414 | | | Casey’s General Stores, Inc. | | | 1,763 | |
| | 15,445 | | | Diplomat Pharmacy, Inc. (a) | | | 691 | |
| | 250 | | | Ingles Markets, Inc., Class – A | | | 12 | |
| | 320 | | | Village Super Market, Inc., Class – A | | | 10 | |
| | | | | | | | |
| | | | | | | 2,476 | |
| | | | | | | | |
| | | | Food Products — 0.01% | | | | |
| | 90 | | | Cal-Maine Foods, Inc. | | | 5 | |
| | 123 | | | Fresh Del Monte Produce, Inc. | | | 5 | |
| | 85 | | | John B Sanfilippo & Son, Inc. | | | 4 | |
| | 400 | | | Omega Protein Corp. (a) | | | 5 | |
| | 40 | | | Sanderson Farms, Inc. | | | 3 | |
| | 1 | | | Seaboard Corp. (a) | | | 4 | |
| | | | | | | | |
| | | | | | | 26 | |
| | | | | | | | |
| | | | Gas Utilities — 0.65% | | | | |
| | 120 | | | Southwest Gas Corp. | | | 6 | |
| | 37,728 | | | UGI Corp. | | | 1,300 | |
| | | | | | | | |
| | | | | | | 1,306 | |
| | | | | | | | |
| | | | Health Care Equipment & Supplies — 5.93% | | | | |
| | 17,380 | | | Abiomed, Inc. (a) | | | 1,142 | |
| | 31,789 | | | DexCom, Inc. (a) | | | 2,543 | |
| | 3,001 | | | Edwards Lifesciences Corp. (a) | | | 427 | |
| | 210 | | | Exactech, Inc. (a) | | | 4 | |
| | 90 | | | Greatbatch, Inc. (a) | | | 5 | |
| | 120 | | | Halyard Health, Inc. (a) | | | 5 | |
See accompanying notes to financial statements.
82
HC CAPITAL TRUST
The Institutional Small Capitalization–Mid Capitalization Equity Portfolio
Portfolio of Investments (continued) — June 30, 2015
| | | | | | | | |
| Shares | | | Security Description | | Value
(000) | |
| | | | Common Stocks (continued) | | | | |
| | | | Health Care Equipment & Supplies (continued) | | | | |
| �� | 2,663 | | | HeartWare International, Inc. (a) | | $ | 194 | |
| | 26,264 | | | Insulet Corp. (a) | | | 814 | |
| | 15,771 | | | LDR Holding Corp. (a) | | | 682 | |
| | 13,222 | | | Neogen Corp. (a) | | | 627 | |
| | 15,568 | | | Nevro Corp. (a) | | | 837 | |
| | 13,255 | | | STERIS Corp. | | | 854 | |
| | 37,650 | | | Tandem Diabetes Care, Inc. (a) | | | 408 | |
| | 6,572 | | | The Cooper Cos., Inc. | | | 1,170 | |
| | 60,007 | | | Unilife Corp.^(a) | | | 129 | |
| | 24,910 | | | West Pharmaceutical Services, Inc. | | | 1,447 | |
| | 19,850 | | | Zeltiq Aesthetics, Inc. (a) | | | 585 | |
| | | | | | | | |
| | | | | | | 11,873 | |
| | | | | | | | |
| | | | Health Care Providers & Services — 3.29% | | | | |
| | 11,286 | | | AAC Holdings, Inc.^(a) | | | 492 | |
| | 30,041 | | | Acadia Healthcare Co., Inc. (a) | | | 2,352 | |
| | 1,185 | | | Adeptus Health, Inc., Class – A (a) | | | 113 | |
| | 160 | | | Almost Family, Inc. (a) | | | 6 | |
| | 100 | | | AmSurg Corp. (a) | | | 7 | |
| | 5,260 | | | Catamaran Corp. (a) | | | 321 | |
| | 47 | | | Chemed Corp. | | | 6 | |
| | 990 | | | Five Star Quality Care, Inc. (a) | | | 5 | |
| | 640 | | | Genesis Healthcare, Inc. (a) | | | 4 | |
| | 210 | | | Hanger, Inc. (a) | | | 5 | |
| | 125 | | | HealthSouth Corp. | | | 6 | |
| | 220 | | | Kindred Healthcare, Inc. | | | 4 | |
| | 160 | | | LHC Group, Inc. (a) | | | 6 | |
| | 18,262 | | | LifePoint Hospitals, Inc. (a) | | | 1,588 | |
| | 70 | | | Magellan Health Services, Inc. (a) | | | 5 | |
| | 7,518 | | | MEDNAX, Inc. (a) | | | 557 | |
| | 80 | | | Molina Heathcare, Inc. (a) | | | 6 | |
| | 71 | | | National Healthcare Corp. | | | 5 | |
| | 9,048 | | | Owens & Minor, Inc. | | | 308 | |
| | 330 | | | Select Medical Holdings Corp. | | | 5 | |
| | 4,540 | | | Team Health Holdings, Inc. (a) | | | 297 | |
| | 105 | | | The Ensign Group, Inc. | | | 5 | |
| | 9,932 | | | Triple-S Management Corp., Class – A (a) | | | 255 | |
| | 2,765 | | | WellCare Health Plans, Inc. (a) | | | 235 | |
| | | | | | | | |
| | | | | | | 6,593 | |
| | | | | | | | |
| | | | Health Care Technology — 1.15% | | | | |
| | 15,465 | | | Allscripts Healthcare Solutions, Inc. (a) | | | 212 | |
| | 24,868 | | | Medidata Solutions, Inc. (a) | | | 1,351 | |
| | 19,583 | | | Omnicell, Inc. (a) | | | 738 | |
| | | | | | | | |
| | | | | | | 2,301 | |
| | | | | | | | |
| | | | Hotels, Restaurants & Leisure — 2.62% | | | | |
| | 8,212 | | | Buffalo Wild Wings, Inc. (a) | | | 1,288 | |
| | 550 | | | Caesars Acquisition Co., Class – A (a) | | | 4 | |
| | 15,932 | | | ClubCorp Holdings, Inc. | | | 380 | |
| | 17,735 | | | Diamond Resorts International, Inc. (a) | | | 560 | |
| | 4,885 | | | Fiesta Restaurant Group, Inc. (a) | | | 244 | |
| | 90 | | | Hyatt Hotels Corp., Class – A (a) | | | 5 | |
| | 170 | | | International Speedway Corp., Class – A | | | 6 | |
| | 240 | | | Interval Leisure Group, Inc. | | | 5 | |
| | | | | | | | |
| Shares | | | Security Description | | Value
(000) | |
| | | | Hotels, Restaurants & Leisure (continued) | | | | |
| | 16,205 | | | La Quinta Holdings, Inc. (a) | | $ | 370 | |
| | 270 | | | Marcus Corp. | | | 5 | |
| | 310 | | | Monarch Casino & Resort, Inc. (a) | | | 6 | |
| | 5,816 | | | Red Robin Gourmet Burgers, Inc. (a) | | | 499 | |
| | 57,980 | | | Ruby Tuesday, Inc. (a) | | | 364 | |
| | 380 | | | Ruth’s Hospitality Group, Inc. | | | 6 | |
| | 320 | | | SeaWorld Entertainment, Inc. | | | 6 | |
| | 240 | | | Speedway Motorsports, Inc. | | | 5 | |
| | 14,440 | | | Texas Roadhouse, Inc., Class – A | | | 540 | |
| | 8,922 | | | Vail Resorts, Inc. | | | 975 | |
| | | | | | | | |
| | | | | | | 5,268 | |
| | | | | | | | |
| | | | Household Durables — 0.99% | | | | |
| | 150 | | | CSS Industries, Inc. | | | 5 | |
| | 140 | | | Flexsteel Industries, Inc. | | | 6 | |
| | 5,268 | | | Harman International Industries, Inc. | | | 627 | |
| | 3,930 | | | Helen of Troy Ltd. (a) | | | 383 | |
| | 14,807 | | | Libbey, Inc. | | | 612 | |
| | 290 | | | Lifetime Brands, Inc. | | | 4 | |
| | 80 | | | NACCO Industries, Inc., Class – A | | | 5 | |
| | 7,535 | | | The Ryland Group, Inc. | | | 349 | |
| | | | | | | | |
| | | | | | | 1,991 | |
| | | | | | | | |
| | | | Household Products — 0.00% | | | | |
| | 60 | | | Oil-Dri Corp. of America | | | 2 | |
| | | | | | | | |
| | | | Industrial Conglomerates — 0.14% | | | | |
| | 2,791 | | | Carlisle Cos., Inc. | | | 279 | |
| | | | | | | | |
| | | | Industrials — 0.33% | | | | |
| | 55,716 | | | Volaris Aviation Holding Company, ADR (a) | | | 665 | |
| | | | | | | | |
| | | | Insurance — 3.29% | | | | |
| | 2,122 | | | Alleghany Corp. (a) | | | 995 | |
| | 160 | | | American Equity Investment Life Holding Co. | | | 4 | |
| | 24,450 | | | American Financial Group, Inc. | | | 1,591 | |
| | 17,710 | | | Argo Group International Holdings Ltd. | | | 987 | |
| | 3,175 | | | Aspen Insurance Holdings Ltd. | | | 152 | |
| | 460 | | | Crawford & Co. | | | 4 | |
| | 12,185 | | | Endurance Specialty Holdings Ltd. | | | 801 | |
| | 2,790 | | | Everest Re Group Ltd. | | | 508 | |
| | 12,725 | | | Genworth Financial, Inc., Class – A (a) | | | 96 | |
| | 5,029 | | | HCC Insurance Holdings, Inc. | | | 386 | |
| | 323 | | | Maiden Holdings Ltd. | | | 5 | |
| | 500 | | | MBIA, Inc. (a) | | | 3 | |
| | 300 | | | OneBeacon Insurance Group Ltd. | | | 4 | |
| | 70 | | | Phoenix Cos., Inc. (a) | | | 1 | |
| | 1,890 | | | Primerica, Inc. | | | 86 | |
| | 9,270 | | | Stewart Information Services Corp. | | | 369 | |
| | 6,660 | | | Symetra Financial Corp. | | | 161 | |
| | 230 | | | Universal Insurance Holdings, Inc. | | | 6 | |
| | 8,420 | | | W.R. Berkley Corp. | | | 437 | |
| | | | | | | | |
| | | | | | | 6,596 | |
| | | | | | | | |
| | | | Internet & Catalog Retail — 0.26% | | | | |
| | 490 | | | 1-800-FLOWERS.COM, Inc., Class – A (a) | | | 5 | |
| | 13,844 | | | Wayfair, Inc., Class – A^(a) | | | 521 | |
| | | | | | | | |
| | | | | | | 526 | |
| | | | | | | | |
See accompanying notes to financial statements.
83
HC CAPITAL TRUST
The Institutional Small Capitalization–Mid Capitalization Equity Portfolio
Portfolio of Investments (continued) — June 30, 2015
| | | | | | | | |
| Shares | | | Security Description | | Value
(000) | |
| | | | Common Stocks (continued) | | | | |
| | | | Internet Software & Services — 2.70% | | | | |
| | 6,186 | | | Akamai Technologies, Inc. (a) | | $ | 432 | |
| | 12,922 | | | Benefitfocus, Inc.^(a) | | | 567 | |
| | 330 | | | Blucora, Inc. (a) | | | 5 | |
| | 52,451 | | | Brightcove, Inc. (a) | | | 360 | |
| | 9,680 | | | comScore, Inc. (a) | | | 516 | |
| | 12,757 | | | Demandware, Inc. (a) | | | 906 | |
| | 400 | | | DHI Group, Inc. (a) | | | 4 | |
| | 1,050 | | | EarthLink Holdings Corp. | | | 8 | |
| | 14,292 | | | Envestnet, Inc. (a) | | | 578 | |
| | 34,216 | | | Gogo, Inc. (a) | | | 733 | |
| | 25,288 | | | Hortonworks, Inc.^(a) | | | 640 | |
| | 75 | | | j2 Global, Inc. | | | 5 | |
| | 3,655 | | | LogMeln, Inc. (a) | | | 236 | |
| | 17,075 | | | Monster Worldwide, Inc. (a) | | | 112 | |
| | 22,826 | | | QuinStreet, Inc. (a) | | | 147 | |
| | 6,698 | | | Web.com Group, Inc. (a) | | | 162 | |
| | | | | | | | |
| | | | | | | 5,411 | |
| | | | | | | | |
| | | | IT Services — 1.62% | | | | |
| | 8 | | | Alliance Data Systems Corp. (a) | | | 2 | |
| | 110 | | | Blackhawk Network Holdings, Inc. (a) | | | 5 | |
| | 160 | | | Booz Allen Hamilton Holding Corp. | | | 4 | |
| | 49 | | | CACI International, Inc., Class – A (a) | | | 4 | |
| | 93 | | | Cass Information Systems, Inc. | | | 5 | |
| | 520 | | | Computer Task Group, Inc. | | | 4 | |
| | 192 | | | Convergys Corp. | | | 5 | |
| | 141 | | | CoreLogic, Inc. (a) | | | 6 | |
| | 172 | | | CSG Systems International, Inc. | | | 5 | |
| | 50 | | | DST Systems, Inc. | | | 6 | |
| | 600 | | | Global Cash Access Holdings, Inc. (a) | | | 5 | |
| | 7,769 | | | Global Payments, Inc. | | | 804 | |
| | 120 | | | iGATE Corp. (a) | | | 6 | |
| | 20,716 | | | Jack Henry & Associates, Inc. | | | 1,340 | |
| | 110 | | | Leidos Holdings, Inc. | | | 4 | |
| | 8,331 | | | Luxoft Holding, Inc. (a) | | | 471 | |
| | 143 | | | ManTech International Corp., Class – A | | | 4 | |
| | 530 | | | MoneyGram International, Inc. (a) | | | 5 | |
| | 160 | | | NeuStar, Inc., Class – A (a) | | | 5 | |
| | 90 | | | Science Applications International Corp. | | | 5 | |
| | 190 | | | Sykes Enterprises, Inc. (a) | | | 5 | |
| | 180 | | | TeleTech Holdings, Inc. | | | 5 | |
| | 540 | | | The Hackett Group, Inc. | | | 7 | |
| | 160 | | | Unisys Corp. (a) | | | 3 | |
| | 5,090 | | | VeriFone Systems, Inc. (a) | | | 173 | |
| | 3,222 | | | WEX, Inc. (a) | | | 367 | |
| | | | | | | | |
| | | | | | | 3,255 | |
| | | | | | | | |
| | | | Leisure Products — 0.01% | | | | |
| | 140 | | | Arctic Cat, Inc. | | | 5 | |
| | 170 | | | Johnson Outdoors, Inc., Class – A | | | 4 | |
| | 130 | | | Sturm, Ruger & Co., Inc. | | | 7 | |
| | 72 | | | Vista Outdoor, Inc. (a) | | | 3 | |
| | | | | | | | |
| | | | | | | 19 | |
| | | | | | | | |
| | | | Life & Health Insurance — 0.14% | | | | |
| | 3,700 | | | StanCorp Financial Group, Inc. | | | 280 | |
| | | | | | | | |
| | | | | | | | |
| Shares | | | Security Description | | Value
(000) | |
| | | | Life Sciences Tools & Services — 1.12% | | | | |
| | 5,590 | | | Accelerate Diagnostics, Inc. (a) | | $ | 144 | |
| | 670 | | | Affymetrix, Inc. (a) | | | 7 | |
| | 380 | | | Albany Molecular Research, Inc. (a) | | | 8 | |
| | 48 | | | Bio-Rad Laboratories, Inc., Class – A (a) | | | 7 | |
| | 60 | | | Bio-Techne Corp. | | | 6 | |
| | 320 | | | Bruker Biosciences Corp. (a) | | | 7 | |
| | 5,550 | | | Cambrex Corp. (a) | | | 244 | |
| | 100 | | | Charles River Laboratories International, Inc. (a) | | | 7 | |
| | 13,400 | | | Fluidigm Corp. (a) | | | 324 | |
| | 4,304 | | | Illumina, Inc. (a) | | | 940 | |
| | 8,670 | | | INC Research Holdings, Inc., Class – A (a) | | | 348 | |
| | 330 | | | Luminex Corp. (a) | | | 6 | |
| | 110 | | | PAREXEL International Corp. (a) | | | 7 | |
| | 8,063 | | | QIAGEN NV (a) | | | 199 | |
| | | | | | | | |
| | | | | | | 2,254 | |
| | | | | | | | |
| | | | Machinery — 3.14% | | | | |
| | 12,235 | | | Actuant Corp., Class – A | | | 283 | |
| | 100 | | | AGCO Corp. | | | 6 | |
| | 90 | | | American Railcar Industries | | | 4 | |
| | 198 | | | Briggs & Stratton Corp. | | | 4 | |
| | 4,125 | | | Chart Industries, Inc. (a) | | | 147 | |
| | 8,610 | | | Columbus McKinnon Corp. | | | 215 | |
| | 350 | | | Global Brass & Copper Holdings, Inc. | | | 6 | |
| | 18,464 | | | Harsco Corp. | | | 305 | |
| | 55 | | | Hyster-Yale Materials Handling, Inc. | | | 4 | |
| | 10,080 | | | IDEX Corp. | | | 792 | |
| | 17,290 | | | ITT Corp. | | | 723 | |
| | 9,902 | | | Lincoln Electric Holdings, Inc. | | | 603 | |
| | 30,664 | | | Meritor, Inc. (a) | | | 402 | |
| | 221 | | | Miller Industries, Inc. | | | 4 | |
| | 2,905 | | | Pall Corp. | | | 362 | |
| | 9,103 | | | Snap-on, Inc. | | | 1,450 | |
| | 9,460 | | | Terex Corp. | | | 220 | |
| | 90 | | | The Greenbrier Cos., Inc. | | | 4 | |
| | 100 | | | The Timken Co. | | | 4 | |
| | 7,325 | | | TriMas Corp. (a) | | | 217 | |
| | 11,348 | | | Wabash National Corp. (a) | | | 142 | |
| | 3,334 | | | WABCO Holdings, Inc. (a) | | | 412 | |
| | | | | | | | |
| | | | | | | 6,309 | |
| | | | | | | | |
| | | | Marine — 0.26% | | | | |
| | 2,308 | | | Kirby Corp. (a) | | | 177 | |
| | 89,325 | | | Navios Maritime Holdings, Inc.^ | | | 332 | |
| | | | | | | | |
| | | | | | | 509 | |
| | | | | | | | |
| | | | Media — 1.00% | | | | |
| | 110 | | | AMC Entertainment Holdings, Inc., Class – A | | | 3 | |
| | 240 | | | Entercom Communications Corp. (a) | | | 3 | |
| | 41,545 | | | Global Eagle Entertainment, Inc. (a) | | | 541 | |
| | 70,068 | | | Harte-Hanks, Inc. | | | 418 | |
| | 10,785 | | | Imax Corp. (a) | | | 434 | |
| | 50 | | | Journal Media Group, Inc. | | | — | |
| | 15,947 | | | Lions Gate Entertainment Corp. | | | 590 | |
| | 350 | | | Salem Communications Corp., Class – A | | | 2 | |
| | 77 | | | Scholastic Corp. | | | 3 | |
| | 134 | | | The E.W. Scripps Co., Class – A | | | 3 | |
See accompanying notes to financial statements.
84
HC CAPITAL TRUST
The Institutional Small Capitalization–Mid Capitalization Equity Portfolio
Portfolio of Investments (continued) — June 30, 2015
| | | | | | | | |
| Shares | | | Security Description | | Value
(000) | |
| | | | Common Stocks (continued) | | | | |
| | | | Media (continued) | | | | |
| | 110 | | | Time, Inc. | | $ | 3 | |
| | 220 | | | Townsquare Media, Inc., Class – A (a) | | | 3 | |
| | | | | | | | |
| | | | | | | 2,003 | |
| | | | | | | | |
| | | | Metals & Mining — 1.07% | | | | |
| | 11,901 | | | Agnico-Eagle Mines Ltd. | | | 338 | |
| | 16,319 | | | Allegheny Technologies, Inc. | | | 493 | |
| | 220 | | | Ampco-Pittsburgh Corp. | | | 3 | |
| | 8,306 | | | Carpenter Technology Corp. | | | 321 | |
| | 32,365 | | | Coeur d’Alene Mines Corp. (a) | | | 185 | |
| | 260 | | | Commercial Metals Co. | | | 4 | |
| | 30,722 | | | Globe Specialty Metals, Inc. | | | 544 | |
| | 7,481 | | | Horsehead Holding Corp. (a) | | | 88 | |
| | 60 | | | Kaiser Aluminum Corp. | | | 5 | |
| | 251 | | | Olympic Steel, Inc. | | | 4 | |
| | 8,740 | | | Schnitzer Steel Industries, Inc., Class – A | | | 153 | |
| | 150 | | | United States Steel Corp. | | | 3 | |
| | | | | | | | |
| | | | | | | 2,141 | |
| | | | | | | | |
| | | | Multiline Retail — 0.00% | | | | |
| | 85 | | | Big Lots, Inc. | | | 4 | |
| | 37 | | | Dillard’s, Inc., Class – A | | | 4 | |
| | | | | | | | |
| | | | | | | 8 | |
| | | | | | | | |
| | | | Multi-Utilities — 0.33% | | | | |
| | 196 | | | Avista Corp. | | | 6 | |
| | 14,978 | | | Black Hills Corp. | | | 654 | |
| | | | | | | | |
| | | | | | | 660 | |
| | | | | | | | |
| | | | Oil, Gas & Consumable Fuels — 1.85% | | | | |
| | 70 | | | Adams Resources & Energy, Inc. | | | 3 | |
| | 9,681 | | | Cabot Oil & Gas Corp. | | | 305 | |
| | 35,820 | | | Carrizo Oil & Gas, Inc. (a) | | | 1,763 | |
| | 3,943 | | | CONSOL Energy, Inc. | | | 86 | |
| | 6,260 | | | Continental Resources, Inc. (a) | | | 265 | |
| | 100 | | | Delek US Holdings, Inc. | | | 4 | |
| | 440 | | | Denbury Resources, Inc. | | | 3 | |
| | 1,905 | | | Diamondback Energy, Inc. (a) | | | 144 | |
| | 120 | | | Green Plains Renewable Energy, Inc. | | | 3 | |
| | 9,647 | | | Interoil Corp. (a) | | | 581 | |
| | 280 | | | Jones Energy, Inc., Class – A (a) | | | 3 | |
| | 3,060 | | | Matador Resources Co. (a) | | | 77 | |
| | 100 | | | PBF Energy, Inc., Class – A | | | 3 | |
| | 90 | | | SM Energy Co. | | | 4 | |
| | 19,092 | | | Synergy Resources Corp. (a) | | | 218 | |
| | 80 | | | Western Refining, Inc. | | | 3 | |
| | 20,753 | | | WPX Energy, Inc. (a) | | | 255 | |
| | | | | | | | |
| | | | | | | 3,720 | |
| | | | | | | | |
| | | | Paper & Forest Products — 0.49% | | | | |
| | 9,218 | | | Boise Cascade Co. (a) | | | 338 | |
| | 100 | | | Domtar Corp. | | | 4 | |
| | 37,178 | | | Louisiana-Pacific Corp. (a) | | | 633 | |
| | 170 | | | P.H. Glatfelter Co. | | | 4 | |
| | 100 | | | Schweitzer-Mauduit International, Inc. | | | 4 | |
| | | | | | | | |
| | | | | | | 983 | |
| | | | | | | | |
| | | | | | | | |
| Shares | | | Security Description | | Value
(000) | |
| | | | Personal Products — 0.00% | | | | |
| | 130 | | | Nature’s Sunshine Products, Inc. | | $ | 2 | |
| | 90 | | | Nutraceutical International Corp. (a) | | | 2 | |
| | | | | | | | |
| | | | | | | 4 | |
| | | | | | | | |
| | | | Pharmaceuticals — 0.05% | | | | |
| | 187 | | | Impax Laboratories, Inc. (a) | | | 9 | |
| | 2,050 | | | Intersect ENT, Inc. (a) | | | 59 | |
| | 190 | | | Phibro Animal Health Corp., Class – A | | | 7 | |
| | 180 | | | Prestige Brands Holdings, Inc. (a) | | | 8 | |
| | 210 | | | Sagent Pharmaceuticals, Inc. (a) | | | 5 | |
| | 720 | | | SciClone Pharmaceuticals, Inc. (a) | | | 7 | |
| | 430 | | | Sucampo Pharmaceuticals, Inc., Class – A (a) | | | 7 | |
| | 232 | | | The Medicines Co. (a) | | | 7 | |
| | | | | | | | |
| | | | | | | 109 | |
| | | | | | | | |
| | | | Professional Services — 0.01% | | | | |
| | 440 | | | CBIZ, Inc. (a) | | | 4 | |
| | 230 | | | Kelly Services, Inc., Class – A | | | 4 | |
| | 70 | | | VSE Corp. | | | 4 | |
| | | | | | | | |
| | | | | | | 12 | |
| | | | | | | | |
| | | | Real Estate Investment Trusts — 2.07% | | | | |
| | 22,950 | | | Acadia Realty Trust | | | 668 | |
| | 348 | | | AG Mortgage Investment Trust, Inc. | | | 6 | |
| | 11,927 | | | Alexandria Real Estate Equities, Inc. | | | 1,043 | |
| | 350 | | | American Capital Mortgage Investment Corp. | | | 6 | |
| | 1,290 | | | Anworth Mortgage Asset Corp. | | | 6 | |
| | 430 | | | Apollo Residential Mortgage, Inc. | | | 6 | |
| | 1,850 | | | Armour Residential REIT, Inc. | | | 5 | |
| | 670 | | | Ashford Hospitality Trust | | | 6 | |
| | 532 | | | Capstead Mortgage Corp. | | | 6 | |
| | 350 | | | CBL & Associates Properties, Inc. | | | 6 | |
| | 990 | | | Cedar Realty Trust, Inc. | | | 6 | |
| | 177 | | | Coresite Realty Corp. | | | 8 | |
| | 260 | | | CyrusOne, Inc. | | | 8 | |
| | 740 | | | CYS Investments, Inc. | | | 6 | |
| | 6,724 | | | DiamondRock Hospitality Co. | | | 86 | |
| | 810 | | | Dynex Capital, Inc. | | | 6 | |
| | 10,041 | | | EastGroup Properties, Inc. | | | 565 | |
| | 360 | | | Hatteras Financial Corp. | | | 6 | |
| | 433 | | | Invesco Mortgage Capital | | | 6 | |
| | 620 | | | Lexington Realty Trust | | | 5 | |
| | 9,543 | | | Mid-America Apartment Communities, Inc. | | | 695 | |
| | 282 | | | Pennsylvania Real Estate Investment Trust | | | 6 | |
| | 90 | | | PS Business Parks, Inc. | | | 6 | |
| | 920 | | | Rait Financial Trust | | | 6 | |
| | 62,415 | | | Redwood Trust, Inc. | | | 980 | |
| | 454 | | | Western Asset Mortgage Capital Corp. | | | 7 | |
| | | | | | | | |
| | | | | | | 4,160 | |
| | | | | | | | |
| | | | Real Estate Management & Development — 0.01% | |
| | 200 | | | RE/MAX Holdings, Inc., Class – A | | | 7 | |
| | 380 | | | St. Joe Corp. (a) | | | 6 | |
| | | | | | | | |
| | | | | | | 13 | |
| | | | | | | | |
See accompanying notes to financial statements.
85
HC CAPITAL TRUST
The Institutional Small Capitalization–Mid Capitalization Equity Portfolio
Portfolio of Investments (continued) — June 30, 2015
| | | | | | | | |
| Shares | | | Security Description | | Value
(000) | |
| | | | Common Stocks (continued) | | | | |
| | | | Road & Rail — 0.14% | | | | |
| | 15 | | | AMERCO, Inc. | | $ | 5 | |
| | 3,057 | | | Con-way, Inc. | | | 117 | |
| | 1,708 | | | Kansas City Southern Industries | | | 156 | |
| | | | | | | | |
| | | | | | | 278 | |
| | | | | | | | |
| | | | Semiconductors & Semiconductor Equipment — 7.06% | |
| | 570 | | | Alpha & Omega Semiconductor Ltd. (a) | | | 5 | |
| | 6,497 | | | Altera Corp. | | | 333 | |
| | 2,181 | | | Ambarella, Inc. (a) | | | 224 | |
| | 810 | | | Amkor Technology, Inc. (a) | | | 5 | |
| | 21,032 | | | Atmel Corp. | | | 207 | |
| | 6,014 | | | Canadian Solar, Inc. (a) | | | 172 | |
| | 18,510 | | | Cavium, Inc. (a) | | | 1,274 | |
| | 270 | | | Cirrus Logic, Inc. (a) | | | 9 | |
| | 10,708 | | | Cree, Inc. (a) | | | 279 | |
| | 98,405 | | | Cypress Semiconductor Corp. | | | 1,157 | |
| | 9,511 | | | Diodes, Inc. (a) | | | 229 | |
| | 389 | | | Entegris, Inc. (a) | | | 6 | |
| | 22,603 | | | Fairchild Semiconductor International, Inc. (a) | | | 393 | |
| | 42,663 | | | Integrated Device Technology, Inc. (a) | | | 926 | |
| | 293 | | | Integrated Silicon Solution, Inc. | | | 6 | |
| | 390 | | | IXYS Corp. | | | 6 | |
| | 43,215 | | | Mattson Technology, Inc. (a) | | | 145 | |
| | 11,094 | | | Maxim Integrated Products, Inc. | | | 384 | |
| | 10,202 | | | Mellanox Technologies Ltd. (a) | | | 496 | |
| | 14,236 | | | Monolithic Power Systems, Inc. | | | 722 | |
| | 190 | | | OmniVision Technologies, Inc. (a) | | | 5 | |
| | 47,098 | | | ON Semiconductor Corp. (a) | | | 551 | |
| | 620 | | | Photronics, Inc. (a) | | | 6 | |
| | 11,970 | | | Power Integrations, Inc. | | | 541 | |
| | 16,868 | | | Qorvo, Inc. (a) | | | 1,354 | |
| | 116,590 | | | QuickLogic Corp. (a) | | | 185 | |
| | 5,838 | | | Semtech Corp. (a) | | | 116 | |
| | 3,209 | | | Silicon Laboratories, Inc. (a) | | | 173 | |
| | 14,048 | | | Skyworks Solutions, Inc. | | | 1,461 | |
| | 7,488 | | | SolarEdge Technologies, Inc. (a) | | | 272 | |
| | 16,367 | | | SunEdison, Inc. (a) | | | 490 | |
| | 5,869 | | | Synaptics, Inc. (a) | | | 509 | |
| | 261 | | | Teradyne, Inc. | | | 5 | |
| | 15,404 | | | Tessera Technologies, Inc. | | | 585 | |
| | 23,305 | | | Tower Semiconductor Ltd.^(a) | | | 360 | |
| | 590 | | | Ultra Clean Holdings, Inc. (a) | | | 4 | |
| | 30,085 | | | Ultratech, Inc. (a) | | | 558 | |
| | | | | | | | |
| | | | | | | 14,153 | |
| | | | | | | | |
| | | | Software — 6.33% | | | | |
| | 5,591 | | | Advent Software, Inc. | | | 247 | |
| | 23,953 | | | Aspen Technology, Inc. (a) | | | 1,092 | |
| | 19,142 | | | CyberArk Software Ltd.^(a) | | | 1,203 | |
| | 250 | | | Ebix, Inc. | | | 8 | |
| | 10,846 | | | Electronic Arts, Inc. (a) | | | 721 | |
| | 9,358 | | | Ellie Mae, Inc. (a) | | | 653 | |
| | 280 | | | EPIQ Systems, Inc. | | | 5 | |
| | 60 | | | ePlus, Inc. (a) | | | 5 | |
| | 60 | | | Fair Isaac Corp. | | | 5 | |
| | | | | | | | |
| Shares | | | Security Description | | Value
(000) | |
| | | | Software (continued) | | | | |
| | 12,598 | | | Fleetmatics Group Ltd. (a) | | $ | 590 | |
| | 12,905 | | | Fortinet, Inc. (a) | | | 533 | |
| | 8,533 | | | Guidewire Software, Inc. (a) | | | 452 | |
| | 14,590 | | | Manhattan Associates, Inc. (a) | | | 870 | |
| | 191 | | | Mentor Graphics Corp. | | | 5 | |
| | 2,493 | | | NetSuite, Inc. (a) | | | 229 | |
| | 8,811 | | | Nuance Communications, Inc. (a) | | | 154 | |
| | 8,640 | | | Paycom Software, Inc. (a) | | | 295 | |
| | 15,035 | | | Proofpoint, Inc. (a) | | | 957 | |
| | 23,708 | | | PTC, Inc. (a) | | | 973 | |
| | 10,841 | | | Qualys, Inc. (a) | | | 437 | |
| | 49,587 | | | Rovi Corp. (a) | | | 791 | |
| | 30,328 | | | SeaChange International, Inc. (a) | | | 213 | |
| | 27,964 | | | Silver Spring Networks, Inc. (a) | | | 347 | |
| | 150 | | | Take-Two Interactive Software, Inc. (a) | | | 4 | |
| | 19,152 | | | Tangoe, Inc. (a) | | | 241 | |
| | 1,550 | | | Telecommunication Systems, Inc. (a) | | | 5 | |
| | 2,237 | | | The Ultimate Software Group, Inc. (a) | | | 368 | |
| | 34,038 | | | TiVo, Inc. (a) | | | 345 | |
| | 4,370 | | | Tyler Technologies, Inc. (a) | | | 565 | |
| | 130,072 | | | Zynga, Inc. (a) | | | 372 | |
| | | | | | | | |
| | | | | | | 12,685 | |
| | | | | | | | |
| | | | Specialty Retail — 1.81% | | | | |
| | 140 | | | Abercrombie & Fitch Co., Class – A | | | 3 | |
| | 320 | | | Ascena Retail Group, Inc. (a) | | | 5 | |
| | 280 | | | Big 5 Sporting Goods Corp. | | | 4 | |
| | 11,994 | | | Chico’s FAS, Inc. | | | 199 | |
| | 240 | | | Destination Maternity Corp. | | | 3 | |
| | 110 | | | GameStop Corp., Class – A^ | | | 5 | |
| | 40 | | | Group 1 Automotive, Inc. | | | 4 | |
| | 170 | | | Haverty Furniture Cos., Inc. | | | 4 | |
| | 12,085 | | | MarineMax, Inc. (a) | | | 284 | |
| | 60 | | | Murphy USA, Inc. (a) | | | 3 | |
| | 50 | | | Outerwall, Inc. | | | 4 | |
| | 7,687 | | | Rent-A-Center, Inc. | | | 218 | |
| | 10,592 | | | Restoration Hardware Holdings, Inc. (a) | | | 1,034 | |
| | 150 | | | Shoe Carnival, Inc. | | | 4 | |
| | 140 | | | Sonic Automotive, Inc., Class – A | | | 3 | |
| | 250 | | | Stein Mart, Inc. | | | 3 | |
| | 90 | | | The Cato Corp. | | | 3 | |
| | 19,568 | | | Tile Shop Holdings, Inc. (a) | | | 278 | |
| | 410 | | | Tilly’s, Inc., Class – A (a) | | | 4 | |
| | 17,508 | | | Tractor Supply Co. | | | 1,575 | |
| | | | | | | | |
| | | | | | | 3,640 | |
| | | | | | | | |
| | | | Technology Hardware, Storage & Peripherals — 0.32% | |
| | 1,871 | | | 3D Systems Corp. (a) | | | 37 | |
| | 101 | | | Lexmark International, Inc., Class – A | | | 4 | |
| | 6,980 | | | Nimble Storage, Inc. (a) | | | 196 | |
| | 28,268 | | | QLogic Corp. (a) | | | 401 | |
| | | | | | | | |
| | | | | | | 638 | |
| | | | | | | | |
| | | | Textiles, Apparel & Luxury Goods — 2.66% | |
| | 220 | | | Culp, Inc. | | | 7 | |
| | 34,298 | | | G-III Apparel Group Ltd. (a) | | | 2,412 | |
| | 170 | | | Movado Group, Inc. | | | 5 | |
See accompanying notes to financial statements.
86
HC CAPITAL TRUST
The Institutional Small Capitalization–Mid Capitalization Equity Portfolio
Portfolio of Investments (continued) — June 30, 2015
| | | | | | | | |
Shares or
Principal
Amount
(000) | | | Security Description | | Value
(000) | |
| | | | Common Stocks (continued) | | | | |
| | | | Textiles, Apparel & Luxury Goods (continued) | |
| | 3,360 | | | Oxford Industries, Inc. | | $ | 294 | |
| | 5,560 | | | Skechers USA, Inc., Class – A (a) | | | 610 | |
| | 14,823 | | | Under Armour, Inc., Class – A (a) | | | 1,237 | |
| | 26,858 | | | Wolverine World Wide, Inc. | | | 765 | |
| | | | | | | | |
| | | | | | | 5,330 | |
| | | | | | | | |
| | | | Thirfts & Mortgage Finance — 0.25% | | | | |
| | 6,373 | | | LendingTree, Inc. (a) | | | 501 | |
| | | | | | | | |
| | | | Thrifts & Mortgage Finance — 0.06% | | | | |
| | 140 | | | Federal Agricultural Mortgage Corp., Class – C | | | 4 | |
| | 120 | | | First Defiance Financial Corp. | | | 5 | |
| | 190 | | | Home Loan Servicing Solutions Ltd. | | | — | |
| | 250 | | | HomeStreet, Inc. (a) | | | 6 | |
| | 110 | | | Meta Financial Group, Inc. | | | 5 | |
| | 234 | | | Walker & Dunlop, Inc. (a) | | | 6 | |
| | 3,810 | | | WSFS Financial Corp. | | | 103 | |
| | | | | | | | |
| | | | | | | 129 | |
| | | | | | | | |
| | | | Tobacco — 0.00% | | | | |
| | 90 | | | Universal Corp. | | | 5 | |
| | | | | | | | |
| | | | Trading Companies & Distributors — 1.11% | |
| | 194 | | | Aircastle Ltd. | | | 4 | |
| | 13,245 | | | Applied Industrial Technologies, Inc. | | | 526 | |
| | 6,903 | | | Beacon Roofing Supply, Inc. (a) | | | 229 | |
| | 200 | | | CAI International, Inc. (a) | | | 4 | |
| | 6,412 | | | GATX Corp. | | | 341 | |
| | 340 | | | Houston Wire & Cable Co. | | | 3 | |
| | 16,913 | | | MRC Global, Inc. (a) | | | 261 | |
| | 18,538 | | | Stock Building Supply Holdings, Inc. (a) | | | 362 | |
| | 97 | | | TAL International Group, Inc. | | | 3 | |
| | 130 | | | Textainer Group Holdings Ltd. | | | 3 | |
| | 4,001 | | | Watsco, Inc. | | | 496 | |
| | | | | | | | |
| | | | | | | 2,232 | |
| | | | | | | | |
| | | | Wireless Telecommunication Services — 0.00% | |
| | 250 | | | Spok Holdings, Inc. | | | 4 | |
| | | | | | | | |
| | | | Total Common Stocks | | | 172,352 | |
| | | | | | | | |
| | | | Contingent Rights — 0.00% | | | | |
| | | | Biotechnology — 0.00% | | | | |
| | 700 | | | Clinical Data, Inc.*(a)(b)(c) | | | — | |
| | | | | | | | |
| | | | Machinery — 0.00% | | | | |
| | 1,400 | | | Gerber Scientific, Inc.*(a)(c)(d) | | | — | |
| | | | | | | | |
| | | | Total Contingent Rights | | | — | |
| | | | | | | | |
| | | | Time Deposit — 2.81% | | | | |
| $ | 5,644 | | | State Street Liquidity Management Control System Eurodollar Time Deposit, 0.01%, 7/1/15 | | | 5,644 | |
| | | | | | | | |
| | | | Total Time Deposit | | | 5,644 | |
| | | | | | | | |
| | | | | | | | |
Shares or
Principal
Amount
(000) | | | Security Description | | Value
(000) | |
| | | | Mutual Funds — 10.23% | | | | |
| | 20,413,940 | | | Federated U.S. Treasury Cash Reserve Fund, Institutional Shares, 0.00% (e) | | $ | 20,414 | |
| | 59,351 | | | SSgA Prime Money Market Fund, 0.03% (e) | | | 59 | |
| | 60,039 | | | SSgA Treasury Money Market Fund, 0.00% (e) | | | 60 | |
| | | | | | | | |
| | | | Total Mutual Funds | | | 20,533 | |
| | | | | | | | |
| | | | Repurchase Agreement — 1.66% | | | | |
| $ | 3,337 | | | Jefferies LLC, 0.23%, 7/1/15
(Purchased on 6/30/15, proceeds at maturity $3,336,704 collateralized by U.S. Treasury Obligations, 0.00% – 3.28%, 8/15/15 – 8/15/44 fair value $3,403,417)^^ | | | 3,337 | |
| | | | | | | | |
| | | | Total Repurchase Agreement | | | 3,337 | |
| | | | | | | | |
| | | | Total Investments
(cost $150,572) — 100.59% | | | 201,866 | |
| | | | Liabilities in excess of
other assets — (0.59)% | | | (1,178 | ) |
| | | | | | | | |
| | | | Net Assets — 100.00% | | $ | 200,688 | |
| | | | | | | | |
Amounts designated as “—” are $0 or have been rounded to $0.
| * | Security was fair valued on June 30, 2015 and represents a Level 2 security. Refer to Note 2 in the Notes to Financial Statements. |
| ^ | All or part of this security was on loan as of June 30, 2015. The total value of securities on loan as of June 30, 2015, was $4,315 (amount in thousands). |
| ^^ | Purchases with cash collateral held from securities lending. The value of the collateral could include collateral held for securities that were sold on or before June 30, 2015. |
| (a) | Represents non-income producing security. |
| (b) | Rights entitle the Portfolio to cash based on the company’s achievement of milestones in connection with a pharmaceutical drug that was brought to market. |
| (c) | These securities have been deemed illiquid by the Specialist Manager and represent 0.00% of the Portfolio. |
| (d) | Rights entitle the Portfolio to cash based on any net recoveries obtained by the company in connection with certain claims of patent infringement. |
| (e) | The rate disclosed is the rate in effect on June 30, 2015. |
ADR — American Depositary Receipt
REIT — Real Estate Investment Trust
See accompanying notes to financial statements.
87
HC CAPITAL TRUST
The Institutional Small Capitalization–Mid Capitalization Equity Portfolio
Portfolio of Investments (concluded) — June 30, 2015
The following table reflects the percentage of total net assets of the Portfolio attributable to each Specialist Manager, see Note 3 in the Notes to Financial Statements.
| | | | | | | | | | | | | | | | | | | | | | | | | | | | | | | | |
The Institutional Small
Capitalization-Mid
Capitalization Equity
Portfolio | | Cupps Capital
Management,
LLC | | | Frontier
Capital
Management
Company,
LLC | | | IronBridge
Capital
Management
LP | | | Mellon
Capital
Management
Corporation | | | Parametric
Portfolio
Associates,
LLC | | | Pzena
Investment
Management,
LLC | | | HC Capital
Solutions | | | Total | |
Common Stocks | | | 17.25 | % | | | 29.59 | % | | | 33.10 | % | | | 0.81 | % | | | — | | | | 5.14 | % | | | — | | | | 85.89 | % |
Contingent Rights | | | — | | | | — | | | | — | | | | — | | | | — | | | | — | | | | — | | | | 0.00 | % |
Time Deposit | | | — | | | | 0.96 | % | | | 1.74 | % | | | — | | | | — | | | | 0.11 | % | | | — | | | | 2.81 | % |
Mutual Funds | | | 0.03 | % | | | — | | | | — | | | | 0.03 | % | | | — | | | | — | | | | 10.17 | % | | | 10.23 | % |
Repurchase Agreement | | | 1.16 | % | | | 0.31 | % | | | 0.19 | % | | | — | | | | — | | | | — | | | | — | | | | 1.66 | % |
Other Assets (Liabilities) | | | -1.15 | % | | | -0.61 | % | | | -0.26 | % | | | — | | | | 1.47 | % | | | -0.04 | % | | | — | | | | -0.59 | % |
| | | | | | | | | | | | | | | | | | | | | | | | | | | | | | | | |
Total Net Assets | | | 17.29 | % | | | 30.25 | % | | | 34.77 | % | | | 0.84 | % | | | 1.47 | % | | | 5.21 | % | | | 10.17 | % | | | 100.00 | % |
| | | | | | | | | | | | | | | | | | | | | | | | | | | | | | | | |
The following table reflects the open derivative positions held by the Portfolio as of June 30, 2015.
Short Futures
| | | | | | | | | | | | | | | | |
Number of
Contracts | | | Futures Contracts Positions^ | | Value
(000) | | | Expiration | | | Unrealized
Appreciation/
(Depreciation)
(000) | |
| | (65) | | | Russell 2000 Mini Index Future | | $ | (8,128 | ) | | | 9/18/15 | | | $ | 64 | |
| | | | | | | | | | | | | | | | |
| | | | Net Unrealized Appreciation/(Depreciation) | | | | | | | | | | $ | 64 | |
| | | | | | | | | | | | | | | | |
Amounts designated as “—” are $0 or have been rounded to $0.
See accompanying notes to financial statements.
88
HC CAPITAL TRUST
The Real Estate Securities Portfolio
Portfolio of Investments — June 30, 2015
| | | | | | | | |
| Shares | | | Security
Description | | Value
(000) | |
| | | | Common Stocks — 91.59% | | | | |
| | | | Food & Staples Retailing — 1.57% | | | | |
| | 19,839 | | | CVS Caremark Corp. | | $ | 2,081 | |
| | | | | | | | |
| | | | Health Care Providers & Services — 1.01% | | | | |
| | 14,795 | | | HCA Holdings, Inc. (a) | | | 1,342 | |
| | | | | | | | |
| | | | Hotels, Restaurants & Leisure — 3.92% | | | | |
| | 98,182 | | | Hilton Worldwide Holdings, Inc. (a) | | | 2,705 | |
| | 30,541 | | | Wyndham Worldwide Corp. | | | 2,502 | |
| | | | | | | | |
| | | | | | | 5,207 | |
| | | | | | | | |
| | | | Household Durables — 1.37% | | | | |
| | 66,511 | | | D.R. Horton, Inc. | | | 1,820 | |
| | | | | | | | |
| | | | Real Estate Investment Trusts — 77.78% | | | | |
| | 41,652 | | | Acadia Realty Trust | | | 1,212 | |
| | 44,415 | | | American Tower Corp. | | | 4,143 | |
| | 57,687 | | | AvalonBay Communities, Inc. | | | 9,222 | |
| | 205,422 | | | Big Yellow Group PLC | | | 2,057 | |
| | 48,851 | | | Boston Properties, Inc. | | | 5,913 | |
| | 22,898 | | | Chatham Lodging Trust | | | 606 | |
| | 21,500 | | | CyrusOne, Inc. | | | 633 | |
| | 141,058 | | | Douglas Emmett, Inc. | | | 3,800 | |
| | 157,488 | | | Duke Realty Corp. | | | 2,925 | |
| | 59,405 | | | Equity Lifestyle Properties, Inc. | | | 3,124 | |
| | 82,230 | | | Equity Residential | | | 5,770 | |
| | 33,864 | | | Essex Property Trust, Inc. | | | 7,196 | |
| | 37,731 | | | Extra Space Storage, Inc. | | | 2,461 | |
| | 28,318 | | | Federal Realty Investment Trust | | | 3,627 | |
| | 293,226 | | | General Growth Properties, Inc. | | | 7,524 | |
| | 129,227 | | | Health Care REIT, Inc. | | | 8,481 | |
| | 104,620 | | | Healthcare Trust of America, Inc., Class – A | | | 2,506 | |
| | 71,373 | | | Kite Realty Group Trust | | | 1,746 | |
| | 103,458 | | | Paramount Group, Inc. | | | 1,775 | |
| | 57,755 | | | Pebblebrook Hotel Trust | | | 2,477 | |
| | 101,722 | | | Physicians Realty Trust | | | 1,562 | |
| | 37,268 | | | Public Storage | | | 6,871 | |
| | 48,403 | | | Simon Property Group, Inc. | | | 8,375 | |
| | 53,390 | | | SL Green Realty Corp. | | | 5,867 | |
| | 14,281 | | | The Macerich Co. | | | 1,065 | |
| | 17,709 | | | Ventas, Inc. | | | 1,100 | |
| | 38,905 | | | Weyerhaeuser Co. | | | 1,226 | |
| | | | | | | | |
| | | | | | | 103,264 | |
| | | | | | | | |
| | | | Real Estate Management & Development — 4.63% | |
| | 220,612 | | | Forest City Enterprises, Inc., Class – A (a) | | | 4,876 | |
| | 51,488 | | | Kennedy-Wilson Holdings, Inc. | | | 1,266 | |
| | | | | | | | |
| | | | | | | 6,142 | |
| | | | | | | | |
| | | | Real Estate Services — 1.18% | | | | |
| | 9,177 | | | Jones Lang LaSalle, Inc. | | | 1,569 | |
| | | | | | | | |
| | | | Wireless Telecommunication Services — 0.13% | |
| | 1,516 | | | SBA Communications Corp., Class – A (a) | | | 174 | |
| | | | | | | | |
| | | | Total Common Stocks | | | 121,599 | |
| | | | | | | | |
| | | | | | | | |
| Shares | | | Security
Description | | Value
(000) | |
| | | | Mutual Funds — 7.35% | | | | |
| | 758,072 | | | DWS Government Cash Money Market Fund, 0.04% (b) | | $ | 758 | |
| | 8,998,631 | | | Federated U.S. Treasury Cash Reserve Fund, Institutional Shares, 0.00% (b) | | | 8,999 | |
| | | | | | | | |
| | | | Total Mutual Funds | | | 9,757 | |
| | | | | | | | |
| | | | Total Investments
(cost $114,219) — 98.94% | | | 131,356 | |
| | | | Other assets in excess of
liabilities — 1.06% | | | 1,402 | |
| | | | | | | | |
| | | | Net Assets — 100.00% | | $ | 132,758 | |
| | | | | | | | |
| (a) | Represents non-income producing security. |
| (b) | The rate disclosed is the rate in effect on June 30, 2015. |
REIT — Real Estate Investment Trust
The following table reflects the percentage of total net assets of the Portfolio attributable to each Specialist Manager, see Note 3 in the Notes to Financial Statements.
| | | | | | | | | | | | | | | | |
The Real Estate
Securities Portfolio | | Wellington
Management
Company
LLP | | | Parametric
Portfolio
Associates
LLC | | | HC
Capital
Solutions | | | Total | |
Common Stocks | | | 91.59 | % | | | — | | | | — | | | | 91.59 | % |
Mutual Funds | | | 0.57 | % | | | — | | | | 6.78 | % | | | 7.35 | % |
Other Assets (Liabilities) | | | 0.18 | % | | | 0.88 | % | | | — | | | | 1.06 | % |
| | | | | | | | | | | | | | | | |
Total Net Assets | | | 92.34 | % | | | 0.88 | % | | | 6.78 | % | | | 100.00 | % |
| | | | | | | | | | | | | | | | |
See accompanying notes to financial statements.
89
HC CAPITAL TRUST
The Real Estate Securities Portfolio
Portfolio of Investments (concluded) — June 30, 2015
The following table reflects the open derivative positions held by the Portfolio as of June 30, 2015.
Long Futures
| | | | | | | | | | | | | | | | |
Number of
Contracts | | | Futures Contracts Positions^ | | Value
(000) | | | Expiration | | | Unrealized
Appreciation/
(Depreciation)
(000) | |
| | 100 | | | Dow Jones U.S. Real Estate Future | | $ | 2,782 | | | | 9/18/15 | | | $ | (70 | ) |
| | | | | | | | | | | | | | | | |
| | | | Net Unrealized Appreciation/(Depreciation) | | | | | | | | | | $ | (70 | ) |
| | | | | | | | | | | | | | | | |
Amounts designated as “—” are $0 or have been rounded to $0.
See accompanying notes to financial statements.
90
HC CAPITAL TRUST
The Commodity Returns Strategy Portfolio
Portfolio of Investments — June 30, 2015
| | | | | | | | |
| Shares | | | Security Description | | Value
(000) | |
| | | | Common Stocks — 61.81% | | | | |
| | | | Australia — 2.20% | | | | |
| | 234,732 | | | Alumina Ltd. (Metals & Mining) | | $ | 277 | |
| | 109,659 | | | Amcor Ltd. (Containers & Packaging) | | | 1,161 | |
| | 291,866 | | | BHP Billiton Ltd. (Metals & Mining) | | | 6,089 | |
| | 74,658 | | | Boral Ltd. (Construction Materials) | | | 337 | |
| | 24,537 | | | Caltex Australia Ltd. (Oil, Gas & Consumable Fuels) | | | 603 | |
| | 1,376,996 | | | Fortescue Metals Group Ltd. (Metals & Mining)^ | | | 2,029 | |
| | 40,636 | | | Iluka Resources Ltd. (Metals & Mining) | | | 241 | |
| | 152,761 | | | Incitec Pivot Ltd. (Chemicals) | | | 454 | |
| | 2,262,156 | | | Medusa Mining Ltd. (Metals & Mining) (a) | | | 1,457 | |
| | 6,500,000 | | | Minmetals Resources Ltd. (Metals & Mining)^(a) | | | 2,298 | |
| | 69,658 | | | Newcrest Mining Ltd. (Metals & Mining) (a) | | | 700 | |
| | 34,239 | | | Orica Ltd. (Chemicals) | | | 562 | |
| | 100,538 | | | Origin Energy Ltd. (Oil, Gas & Consumable Fuels) | | | 928 | |
| | 39,496 | | | Rio Tinto Ltd. (Metals & Mining) | | | 1,638 | |
| | 817,815 | | | Santos Ltd. (Oil, Gas & Consumable Fuels) | | | 4,940 | |
| | 483,803 | | | South32 Ltd. (Metals & Mining) (a) | | | 668 | |
| | 67,235 | | | Woodside Petroleum Ltd. (Oil, Gas & Consumable Fuels) | | | 1,775 | |
| | 17,839 | | | WorleyParsons Ltd. (Energy Equipment & Services) | | | 143 | |
| | | | | | | | |
| | | | | | | 26,300 | |
| | | | | | | | |
| | | | Austria — 0.31% | | | | |
| | 13,704 | | | OMV AG (Oil, Gas & Consumable Fuels) | | | 377 | |
| 477,601
|
| | Schoeller-Bleckmann Oilfield Equipment AG, ADR (Oil, Gas & Consumable Fuels) | | | 2,885 | |
| | 10,418 | | | Voestalpine AG (Metals & Mining) | | | 434 | |
| | | | | | | | |
| | | | | | | 3,696 | |
| | | | | | | | |
| | | | Belgium — 0.52% | | | | |
| | 5,388 | | | Solvay SA (Chemicals) | | | 741 | |
| | 114,394 | | | Umicore SA (Chemicals) | | | 5,423 | |
| | | | | | | | |
| | | | | | | 6,164 | |
| | | | | | | | |
| | | | Bermuda — 0.10% | | | | |
| | 310,000 | | | Kunlun Energy Co. Ltd. (Oil, Gas & Consumable Fuels) | | | 316 | |
| | 25,900 | | | Nabors Industries Ltd. (Energy Equipment & Services) | | | 374 | |
| | 142,000 | | | Nine Dragons Paper Holdings Ltd. (Paper & Forest Products) | | | 124 | |
| | 33,585 | | | Seadrill Ltd. (Energy Equipment & Services) | | | 350 | |
| | | | | | | | |
| | | | | | | 1,164 | |
| | | | | | | | |
| | | | Brazil — 0.27% | | | | |
| | 56,700 | | | Companhia Siderurgica Nacional SA (CSN) (Metals & Mining) | | | 94 | |
| | 9,513 | | | Cosan SA Industria e Comercio (Oil, Gas & Consumable Fuels) | | | 77 | |
| | 20,577 | | | Duratex SA (Paper & Forest Products) | | | 48 | |
| | 23,900 | | | Fibria Celulose SA (Paper & Forest Products) | | | 328 | |
| | 270,512 | | | Petroleo Brasileiro SA (Oil, Gas & Consumable Fuels) (a) | | | 1,224 | |
| | 32,903 | | | Ultrapar Participacoes SA (Oil, Gas & Consumable Fuels) | | | 695 | |
| | | | | | | | |
| Shares | | | Security Description | | Value
(000) | |
| | | | Brazil (continued) | | | | |
| | 116,910 | | | Vale SA (Metals & Mining) | | $ | 691 | |
| | | | | | | | |
| | | | | | | 3,157 | |
| | | | | | | | |
| | | | Canada — 5.85% | | | | |
| | 19,500 | | | Agnico-Eagle Mines Ltd. (Metals & Mining) | | | 554 | |
| | 12,387 | | | Agrium, Inc. (Chemicals)^ | | | 1,313 | |
| | 12,500 | | | AltaGas Ltd. (Oil, Gas & Consumable Fuels)^ | | | 381 | |
| | 30,700 | | | ARC Resources Ltd. (Oil, Gas & Consumable Fuels)^ | | | 526 | |
| | 105,829 | | | Barrick Gold Corp. (Metals & Mining) | | | 1,131 | |
| | 18,700 | | | Baytex Energy Corp. (Oil, Gas & Consumable Fuels)^ | | | 291 | |
| | 190,717 | | | Cameco Corp. (Oil, Gas & Consumable Fuels) | �� | | 2,723 | |
| | 36,300 | | | Cameco Corp. (Oil, Gas & Consumable Fuels)^ | | | 519 | |
| | 234,169 | | | Canadian Natural Resources Ltd. (Oil, Gas & Consumable Fuels) | | | 6,361 | |
| | 45,000 | | | Canadian Oil Sands Ltd. (Oil, Gas & Consumable Fuels) | | | 364 | |
| | 74,914 | | | Cenovus Energy, Inc. (Oil, Gas & Consumable Fuels) | | | 1,198 | |
| | 38,277 | | | Crescent Point Energy Corp. (Oil, Gas & Consumable Fuels)^ | | | 786 | |
| | 688,604 | | | Eldorado Gold Corp. (Metals & Mining) | | | 2,856 | |
| | 77,111 | | | Enbridge, Inc. (Oil, Gas & Consumable Fuels) | | | 3,607 | |
| | 75,167 | | | Encana Corp. (Oil, Gas & Consumable Fuels) | | | 829 | |
| | 16,800 | | | Enerplus Corp. (Oil, Gas & Consumable Fuels)^ | | | 147 | |
| | 274,871 | | | First Quantum Minerals Ltd. (Metals & Mining) | | | 3,594 | |
| | 14,140 | | | Franco-Nevada Corp. (Metals & Mining) | | | 675 | |
| | 378,682 | | | Goldcorp, Inc. (Metals & Mining) | | | 6,135 | |
| | 73,953 | | | Goldcorp, Inc. (Metals & Mining) | | | 1,200 | |
| | 31,615 | | | Husky Energy, Inc. (Oil, Gas & Consumable Fuels)^ | | | 605 | |
| | 105,898 | | | Imperial Oil Ltd. (Oil, Gas & Consumable Fuels) | | | 4,090 | |
| | 26,960 | | | Imperial Oil Ltd. (Oil, Gas & Consumable Fuels) | | | 1,042 | |
| | 30,900 | | | Inter Pipeline Ltd. (Oil, Gas & Consumable Fuels) | | | 710 | |
| | 15,400 | | | Keyera Corp. (Oil, Gas & Consumable Fuels) | | | 514 | |
| | 110,021 | | | Kinross Gold Corp. (Metals & Mining) (a) | | | 256 | |
| | 15,300 | | | Meg Energy Corp. (Oil, Gas & Consumable Fuels) (a) | | | 250 | |
| | 76,400 | | | Methanex Corp. (Chemicals) | | | 4,265 | |
| | 799,191 | | | New Gold, Inc. (Metals & Mining) (a) | | | 2,150 | |
| | 5,000 | | | Paramount Resources Ltd., Class A (Oil, Gas & Consumable Fuels) (a) | | | 115 | |
| | 31,069 | | | Pembina Pipelines Corp. (Oil, Gas & Consumable Fuels) | | | 1,004 | |
| | 13,600 | | | Peyto Exploration & Development Corp. (Oil, Gas & Consumable Fuels)^ | | | 332 | |
| | 75,346 | | | Potash Corp. of Saskatchewan, Inc. (Chemicals) | | | 2,334 | |
| | 12,500 | | | PrairieSky Royalty Ltd. (Oil, Gas & Consumable Fuels) | | | 315 | |
| | 36,651 | | | Silver Wheaton Corp. (Metals & Mining) | | | 635 | |
| | 131,298 | | | Suncor Energy, Inc. (Oil, Gas & Consumable Fuels) | | | 3,617 | |
| | 51,497 | | | Teck Cominco Ltd., Class B (Metals & Mining) | | | 511 | |
| | 15,751 | | | Tourmaline Oil Corp. (Oil, Gas & Consumable Fuels) (a) | | | 473 | |
| | 216,600 | | | TransCanada Corp. (Oil, Gas & Consumable Fuels)^ | | | 8,804 | |
See accompanying notes to financial statements.
91
HC CAPITAL TRUST
The Commodity Returns Strategy Portfolio
Portfolio of Investments (continued) — June 30, 2015
| | | | | | | | |
| Shares | | | Security Description | | Value
(000) | |
| | | | Common Stocks (continued) | | | | |
| | | | Canada (continued) | | | | |
| | 91,406 | | | Turquoise Hill Resources Ltd. (Metals & Mining) (a) | | $ | 348 | |
| | 235,148 | | | Uranium Participation Corp. (Capital Markets)^(a) | | | 985 | |
| | 26,100 | | | Veresen, Inc. (Oil, Gas & Consumable Fuels) | | | 353 | |
| | 9,300 | | | Vermilion Energy, Inc. (Oil, Gas & Consumable Fuels) | | | 402 | |
| | 6,300 | | | West Fraser Timber Co. Ltd. (Paper & Forest Products) | | | 346 | |
| | 83,800 | | | Yamana Gold, Inc. (Metals & Mining) | | | 252 | |
| | | | | | | | |
| | | | | | | 69,898 | |
| | | | | | | | |
| | | | Cayman Islands — 0.01% | | | | |
| | 171,000 | | | China Resources Cement Holdings Ltd. (Construction Materials) | | | 96 | |
| | | | | | | | |
| | | | Chile — 0.07% | | | | |
| | 119,996 | | | Empresas CMPC SA (Paper & Forest Products) | | | 327 | |
| | 42,812 | | | Empresas Copec SA (Oil, Gas & Consumable Fuels) | | | 454 | |
| | | | | | | | |
| | | | | | | 781 | |
| | | | | | | | |
| | | | China — 1.49% | | | | |
| | 358,000 | | | Aluminum Corp. of China Ltd., H Shares (Metals & Mining) (a) | | | 181 | |
| | 812,700 | | | Anhui Conch Cement Co. Ltd., H Shares (Construction Materials) | | | 2,851 | |
| | 106,300 | | | BBMG Corp., H Shares (Construction Materials) | | | 108 | |
| | 243,000 | | | China Coal Energy Co. Ltd., H Shares (Oil, Gas & Consumable Fuels)^ | | | 145 | |
| | 279,000 | | | China National Building Material Co. Ltd., H Shares (Construction Materials) | | | 264 | |
| | 165,000 | | | China Oilfield Services Ltd., H Shares (Energy Equipment & Services) | | | 263 | |
| | 5,652,869 | | | China Petroleum & Chemical Corp., H Shares (Oil, Gas & Consumable Fuels) | | | 4,880 | |
| | 1,158,800 | | | China Shenhua Energy Co. Ltd., H Shares (Oil, Gas & Consumable Fuels) | | | 2,643 | |
| | 1,624,302 | | | CNOOC Ltd. (Oil, Gas & Consumable Fuels) | | | 2,305 | |
| | 90,300 | | | Inner Mongolia Yitai Coal Co. Ltd., B Shares (Oil, Gas & Consumable Fuels) | | | 130 | |
| | 120,000 | | | Jiangxi Copper Co. Ltd., H Shares (Metals & Mining) | | | 200 | |
| | 1,916,729 | | | PetroChina Co. Ltd., H Shares (Oil, Gas & Consumable Fuels) | | | 2,139 | |
| | 308,000 | | | Sinopec Shanghai Petrochemical Co. Ltd., H Shares (Chemicals) (a) | | | 167 | |
| | 158,000 | | | Yanzhou Coal Mining Co. Ltd., H Shares (Oil, Gas & Consumable Fuels)^ | | | 124 | |
| | 4,015,000 | | | Zijin Mining Group Co. Ltd., H Shares (Metals & Mining) | | | 1,414 | |
| | | | | | | | |
| | | | | | | 17,814 | |
| | | | | | | | |
| | | | Colombia — 0.05% | | | | |
| | 41,270 | | | Cementos Argos SA (Construction Materials) | | | 147 | |
| | 469,600 | | | Ecopetrol SA (Oil, Gas & Consumable Fuels) | | | 312 | |
| | 28,932 | | | Grupo Argos SA (Construction Materials) | | | 188 | |
| | | | | | | | |
| | | | | | | 647 | |
| | | | | | | | |
| | | | | | | | |
| Shares | | | Security Description | | Value
(000) | |
| | | | Curaçao — 1.91% | | | | |
| | 264,397 | | | Schlumberger Ltd. (Energy Equipment & Services) | | $ | 22,788 | |
| | | | | | | | |
| | | | Denmark — 0.09% | | | | |
| | 21,752 | | | Novozymes A/S, B Shares (Chemicals) | | | 1,034 | |
| | | | | | | | |
| | | | Finland — 0.14% | | | | |
| | 12,288 | | | Neste Oil Oyj (Oil, Gas & Consumable Fuels) | | | 313 | |
| | 50,683 | | | Stora Enso Oyj, R Shares (Paper & Forest Products) | | | 522 | |
| | 48,504 | | | UPM-Kymmene Oyj (Paper & Forest Products) | | | 858 | |
| | | | | | | | |
| | | | | | | 1,693 | |
| | | | | | | | |
| | | | France — 1.43% | | | | |
| | 31,397 | | | Air Liquide SA (Chemicals) | | | 3,971 | |
| | 6,164 | | | Arkema SA (Chemicals) | | | 444 | |
| | 3,341 | | | Imerys SA (Construction Materials) | | | 255 | |
| | 16,985 | | | Lafarge SA (Construction Materials) | | | 1,122 | |
| | 59,311 | | | Technip SA (Energy Equipment & Services)^ | | | 3,671 | |
| | 156,507 | | | Total SA (Oil, Gas & Consumable Fuels) | | | 7,601 | |
| | | | | | | | |
| | | | | | | 17,064 | |
| | | | | | | | |
| | | | Germany — 1.62% | | | | |
| | 79,101 | | | Aurubis AG (Metals & Mining) | | | 4,646 | |
| | 83,468 | | | BASF SE (Chemicals) | | | 7,334 | |
| | 8,470 | | | Evonik Industries AG (Chemicals) | | | 323 | |
| | 12,808 | | | HeidelbergCement AG (Construction Materials) | | | 1,016 | |
| | 17,394 | | | K+S AG – Registered (Chemicals) | | | 733 | |
| | 8,463 | | | Lanxess AG (Chemicals) | | | 499 | |
| | 16,908 | | | Linde AG (Chemicals) | | | 3,202 | |
| | 11,207 | | | Symrise AG (Chemicals) | | | 695 | |
| | 33,430 | | | ThyssenKrupp AG (Metals & Mining) | | | 870 | |
| | | | | | | | |
| | | | | | | 19,318 | |
| | | | | | | | |
| | | | Greece — 0.01% | | | | |
| | 4,828 | | | Titan Cement Co. SA (Construction Materials)* | | | 110 | |
| | | | | | | | |
| | | | Hong Kong — 0.03% | | | | |
| | 167,500 | | | Fosun International Ltd. (Metals & Mining) | | | 394 | |
| | | | | | | | |
| | | | Hungary — 0.01% | | | | |
| | 3,452 | | | MOL Hungarian Oil & Gas PLC (Oil, Gas & Consumable Fuels) | | | 177 | |
| | | | | | | | |
| | | | India — 0.18% | | | | |
| | 58,698 | | | Reliance Industries Ltd., GDR (Oil, Gas & Consumable Fuels) (b) | | | 1,828 | |
| | 26,650 | | | Tata Steel Ltd., Registered Shares, GDR (Metals & Mining) | | | 130 | |
| | 20,160 | | | Vedanta Ltd., ADR (Metals & Mining) | | | 218 | |
| | | | | | | | |
| | | | | | | 2,176 | |
| | | | | | | | |
| | | | Indonesia — 0.05% | | | | |
| | 1,254,300 | | | PT Adaro Energy Tbk (Oil, Gas & Consumable Fuels) | | | 71 | |
| | 142,800 | | | PT Indocement Tunggal Prakarsa Tbk (Construction Materials) | | | 224 | |
| | 284,100 | | | PT Semen Gresik (Persero) Tbk (Construction Materials) | | | 256 | |
| | 74,100 | | | PT Tambang Batubara Bukit Asam Tbk (Oil, Gas & Consumable Fuels) | | | 47 | |
| | | | | | | | |
| | | | | | | 598 | |
| | | | | | | | |
See accompanying notes to financial statements.
92
HC CAPITAL TRUST
The Commodity Returns Strategy Portfolio
Portfolio of Investments (continued) — June 30, 2015
| | | | | | | | |
| Shares | | | Security Description | | Value
(000) | |
| | | | Common Stocks (continued) | | | | |
| | | | Ireland — 0.09% | | | | |
| | 36,868 | | | CRH PLC (Construction Materials) | | $ | 1,041 | |
| | | | | | | | |
| | | | Israel — 0.05% | | | | |
| | 411 | | | Delek Group Ltd. (Oil, Gas & Consumable Fuels) | | | 121 | |
| | 46,217 | | | Israel Chemicals Ltd. (Chemicals) | | | 324 | |
| | 318 | | | The Israel Corp. Ltd. (Chemicals) | | | 112 | |
| | | | | | | | |
| | | | | | | 557 | |
| | | | | | | | |
| | | | Italy — 1.02% | | | | |
| | 674,941 | | | Eni SpA (Oil, Gas & Consumable Fuels) | | | 11,978 | |
| | 24,062 | | | Saipem SpA (Energy Equipment &
Services)^(a) | | | 254 | |
| | | | | | | | |
| | | | | | | 12,232 | |
| | | | | | | | |
| | | | Japan — 2.67% | | | | |
| | 15,000 | | | Air Water, Inc. (Chemicals) | | | 275 | |
| | 114,000 | | | Asahi Kasei Corp. (Chemicals) | | | 937 | |
| | 26,000 | | | Daicel Corp. (Chemicals) | | | 334 | |
| | 8,800 | | | Hitachi Chemical Co. Ltd. (Chemicals) | | | 159 | |
| | 19,000 | | | Hitachi Metals Ltd. (Metals & Mining) | | | 292 | |
| | 7,500 | | | Idemitsu Kosan Co. Ltd. (Oil, Gas & Consumable Fuels) | | | 147 | �� |
| | 623,600 | | | INPEX Corp. (Oil, Gas & Consumable Fuels) | | | 7,091 | |
| | 44,700 | | | JFE Holdings, Inc. (Metals & Mining) | | | 992 | |
| | 143,000 | | | JGC Corp. (Construction & Engineering) | | | 2,702 | |
| | 17,100 | | | JSR Corp. (Chemicals) | | | 302 | |
| | 204,144 | | | JX Holdings, Inc. (Oil, Gas & Consumable Fuels) | | | 881 | |
| | 23,000 | | | Kaneka Corp. (Chemicals) | | | 168 | |
| | 20,000 | | | Kansai Paint Co. Ltd. (Chemicals) | | | 310 | |
| | 285,000 | | | Kobe Steel Ltd. (Metals & Mining) | | | 480 | |
| | 230,200 | | | Komatsu Ltd. (Machinery) | | | 4,622 | |
| | 31,900 | | | Kuraray Co. Ltd. (Chemicals) | | | 390 | |
| | 4,100 | | | Maruichi Steel Tube Ltd. (Metals & Mining) | | | 102 | |
| | 123,200 | | | Mitsubishi Chemical Holdings Corp. (Chemicals) | | | 776 | |
| | 33,000 | | | Mitsubishi Gas Chemical Co., Inc. (Chemicals) | | | 185 | |
| | 106,000 | | | Mitsubishi Materials Corp. (Metals & Mining) | | | 407 | |
| | 74,000 | | | Mitsui Chemicals, Inc. (Chemicals) | | | 275 | |
| | 13,300 | | | Nippon Paint Holdings Co. Ltd. (Chemicals) | | | 376 | |
| | 689,210 | | | Nippon Steel & Sumitomo Metal Corp. (Metals & Mining) | | | 1,788 | |
| | 14,800 | | | Nitto Denko Corp. (Chemicals) | | | 1,217 | |
| | 77,000 | | | Oji Paper Co. Ltd. (Paper & Forest Products) | | | 335 | |
| | 37,315 | | | Shin-Etsu Chemical Co. Ltd. (Chemicals) | | | 2,316 | |
| | 15,800 | | | Showa Shell Sekiyu K.K. (Oil, Gas & Consumable Fuels) | | | 138 | |
| | 135,000 | | | Sumitomo Chemical Co. Ltd. (Chemicals) | | | 812 | |
| | 45,000 | | | Sumitomo Metal Mining Co. Ltd. (Metals & Mining) | | | 685 | |
| | 112,000 | | | Taiheiyo Cement Corp. (Construction Materials) | | | 328 | |
| | 15,000 | | | Taiyo Nippon Sanso Corp. (Chemicals) | | | 182 | |
| | 90,000 | | | Teijin Ltd. (Chemicals) | | | 349 | |
| | 27,000 | | | TonenGeneral Sekiyu K.K. (Oil, Gas & Consumable Fuels) | | | 251 | |
| | 133,000 | | | Toray Industries, Inc. (Chemicals) | | | 1,125 | |
| | | | | | | | |
| Shares | | | Security Description | | Value
(000) | |
| | | | Japan (continued) | | | | |
| | 13,700 | | | Toyo Seikan Kaisha Ltd. (Containers & Packaging) | | $ | 220 | |
| | | | | | | | |
| | | | | | | 31,949 | |
| | | | | | | | |
| | | | Jersey — 1.56% | | | | |
| | 4,429,670 | | | Glencore International PLC (Metals & Mining) | | | 17,766 | |
| | 24,817 | | | Petrofac Ltd. (Energy Equipment & Services) | | | 361 | |
| | 8,437 | | | Randgold Resources Ltd. (Metals & Mining) | | | 568 | |
| | | | | | | | |
| | | | | | | 18,695 | |
| | | | | | | | |
| | | | Luxembourg — 0.14% | | | | |
| | 90,807 | | | ArcelorMittal (Metals & Mining) | | | 884 | |
| | 24,149 | | | Subsea 7 SA (Energy Equipment & Services) (a) | | | 237 | |
| | 43,098 | | | Tenaris SA (Energy Equipment & Services) | | | 580 | |
| | | | | | | | |
| | | | | | | 1,701 | |
| | | | | | | | |
| | | | Malaysia — 0.07% | | | | |
| | 167,350 | | | Bumi Armada Berhad (Energy Equipment & Services) | | | 51 | |
| | 36,000 | | | Lafarge Malayan Cement Berhad (Construction Materials) | | | 81 | |
| | 259,900 | | | Petronas Chemicals Group Berhad (Chemicals) | | | 436 | |
| | 21,100 | | | Petronas Dagangan Berhad (Oil, Gas & Consumable Fuels) | | | 115 | |
| | 299,500 | | | SapuraKencana Petroleum Berhad (Energy Equipment & Services) | | | 187 | |
| | | | | | | | |
| | | | | �� | | 870 | |
| | | | | | | | |
| | | | Mexico — 0.22% | | | | |
| | 1,160,967 | | | Cemex SAB de CV (Construction Materials) (a) | | | 1,065 | |
| | 346,634 | | | Grupo Mexico SAB de CV, Series B (Metals & Mining) | | | 1,044 | |
| | 13,454 | | | Industrias Penoles SAB de CV (Metals & Mining) | | | 220 | |
| | 91,832 | | | Mexichem SAB de CV (Chemicals) | | | 265 | |
| | | | | | | | |
| | | | | | | 2,594 | |
| | | | | | | | |
| | | | Mongolia — 0.11% | | | | |
| | 27,091,800 | | | Mongolian Mining Corp. (Metals & Mining) (a) | | | 1,311 | |
| | | | | | | | |
| | | | Netherlands — 0.95% | | | | |
| | 22,304 | | | Akzo Nobel NV (Chemicals) | | | 1,623 | |
| | 3,889 | | | Core Laboratories NV (Energy Equipment & Services) | | | 444 | |
| | 16,364 | | | Koninklijke DSM NV (Chemicals) | | | 949 | |
| | 6,538 | | | Koninklijke Vopak NV (Oil, Gas & Consumable Fuels) | | | 330 | |
| | 75,360 | | | LyondellBasell Industries NV, Class – A (Chemicals) | | | 7,800 | |
| | 7,659 | | | OCI N.V. (Chemicals) | | | 216 | |
| | | | | | | | |
| | | | | | | 11,362 | |
| | | | | | | | |
| | | | New Zealand — 0.03% | | | | |
| | 65,110 | | | Fletcher Building Ltd. (Construction Materials) | | | 358 | |
| | | | | | | | |
| | | | Norway — 1.35% | | | | |
| | 1,252,849 | | | Norsk Hydro ASA (Metals & Mining) | | | 5,284 | |
| | 452,826 | | | Statoil ASA (Oil, Gas & Consumable Fuels) | | | 8,095 | |
See accompanying notes to financial statements.
93
HC CAPITAL TRUST
The Commodity Returns Strategy Portfolio
Portfolio of Investments (continued) — June 30, 2015
| | | | | | | | |
| Shares | | | Security Description | | Value
(000) | |
| | | | Common Stocks (continued) | | | | |
| | | | Norway (continued) | | | | |
| | 83,546 | | | TGS Nopec Geophysical Co. ASA (Energy Equipment & Services)^ | | $ | 1,952 | |
| | 16,317 | | | Yara International ASA (Chemicals) | | | 850 | |
| | | | | | | | |
| | | | | | | 16,181 | |
| | | | | | | | |
| | | | Peru — 0.01% | | | | |
| | 15,800 | | | Compania de Minas Buenaventura SA, ADR (Metals & Mining) | | | 164 | |
| | | | | | | | |
| | | | Poland — 0.12% | | | | |
| | 4,057 | | | Grupa Azoty SA (Chemicals) (a) | | | 89 | |
| | 6,354 | | | Grupa Lotos SA (Oil, Gas & Consumable Fuels) (a) | | | 51 | |
| | 12,978 | | | KGHM Polska Miedz SA (Metals & Mining) | | | 368 | |
| | 29,151 | | | Polski Koncern Naftowy Orlen SA (Oil, Gas & Consumable Fuels) | | | 573 | |
| | 160,851 | | | Polskie Gornictwo Naftowe i Gazownictwo SA (Oil, Gas & Consumable Fuels) | | | 282 | |
| | 50,853 | | | Synthos SA (Chemicals) (a) | | | 63 | |
| | | | | | | | |
| | | | | | | 1,426 | |
| | | | | | | | |
| | | | Portugal — 0.04% | | | | |
| | 35,704 | | | Galp Energia SGPS SA, B Shares (Oil, Gas & Consumable Fuels) | | | 419 | |
| | | | | | | | |
| | | | Qatar — 0.01% | | | | |
| | 4,860 | | | Gulf International Services QSC (Energy Equipment & Services) | | | 107 | |
| | | | | | | | |
| | | | Russia — 0.74% | | | | |
| | 495,577 | | | Gazprom OAO, GDR (Oil, Gas & Consumable Fuels) | | | 2,612 | |
| | 44,038 | | | Gazprom OAO – Sponsored ADR (Oil, Gas & Consumable Fuels) | | | 227 | |
| | 46,131 | | | LUKOIL, ADR (Oil, Gas & Consumable Fuels) | | | 2,030 | |
| | 51,212 | | | Mining & Metallurgical Co. Norilsk Nickel OJSC, ADR (Metals & Mining) | | | 868 | |
| | 8,326 | | | NovaTek OAO, Registered Shares, GDR (Oil, Gas & Consumable Fuels) | | | 848 | |
| | 105,841 | | | Rosneft Oil Co. OJSC, Registered Shares, GDR (Oil, Gas & Consumable Fuels) (b) | | | 436 | |
| | 18,883 | | | Severstal, Registered Shares, GDR (Metals & Mining) | | | 200 | |
| | 141,966 | | | Surgutneftegas, ADR (Oil, Gas & Consumable Fuels) | | | 836 | |
| | 21,053 | | | Tatneft OAO, ADR (Oil, Gas & Consumable Fuels) | | | 673 | |
| | 12,712 | | | Uralkali, Registered Shares, GDR (Chemicals) | | | 163 | |
| | | | | | | | |
| | | | | | | 8,893 | |
| | | | | | | | |
| | | | South Africa — 0.30% | | | | |
| | 9,409 | | | African Rainbow Minerals Ltd. (Metals & Mining) | | | 64 | |
| | 4,534 | | | Anglo Platinum Ltd. (Metals & Mining) (a) | | | 102 | |
| | 37,180 | | | AngloGold Ashanti Ltd. (Metals & Mining) (a) | | | 335 | |
| | 12,320 | | | Exxaro Resources Ltd. (Oil, Gas & Consumable Fuels) | | | 88 | |
| | 74,139 | | | Gold Fields Ltd. (Metals & Mining) | | | 238 | |
| | 51,617 | | | Impala Platinum Holdings Ltd. (Metals & Mining) (a) | | | 231 | |
| | 6,710 | | | Kumba Iron Ore Ltd. (Metals & Mining) | | | 83 | |
| | 10,752 | | | Mondi Ltd. (Paper & Forest Products) | | | 236 | |
| | | | | | | | |
| Shares | | | Security Description | | Value
(000) | |
| | | | South Africa (continued) | | | | |
| | 49,690 | | | Nampak Ltd. (Containers & Packaging) | | $ | 138 | |
| | 44,991 | | | Sappi Ltd. (Paper & Forest Products) (a) | | | 160 | |
| | 50,178 | | | Sasol Ltd. (Oil, Gas & Consumable Fuels) | | | 1,858 | |
| | | | | | | | |
| | | | | | | 3,533 | |
| | | | | | | | |
| | | | South Korea — 0.45% | | | | |
| | 4,286 | | | GS Holdings Corp. (Oil, Gas & Consumable Fuels) | | | 191 | |
| | 9,566 | | | Hanwha Chemical Corp. (Chemicals) | | | 160 | |
| | 3,913 | | | Hanwha Corp. (Chemicals) | | | 166 | |
| | 1,402 | | | Honam Petrochemical Corp. (Chemicals) | | | 363 | |
| | 1,943 | | | Hyosung Corp. (Chemicals) | | | 251 | |
| | 6,478 | | | Hyundai Steel Co. (Metals & Mining) | | | 393 | |
| | 1,172 | | | Korea Kumho Petrochemical Co. Ltd. (Chemicals) | | | 74 | |
| | 772 | | | Korea Zinc Co. Ltd. (Metals & Mining) | | | 377 | |
| | 4,216 | | | LG Chem Ltd. (Chemicals) | | | 1,053 | |
| | 1,457 | | | OCI Co. Ltd. (Chemicals)^ | | | 118 | |
| | 6,339 | | | POSCO (Metals & Mining) | | | 1,274 | |
| | 5,882 | | | SK Innovation Co. Ltd. (Oil, Gas & Consumable Fuels) (a) | | | 643 | |
| | 4,364 | | | S-Oil Corp. (Oil, Gas & Consumable Fuels) | | | 265 | |
| | | | | | | | |
| | | | | | | 5,328 | |
| | | | | | | | |
| | | | Spain — 0.14% | | | | |
| | 93,695 | | | Repsol YPF SA (Oil, Gas & Consumable Fuels) | | | 1,645 | |
| | | | | | | | |
| | | | Sweden — 0.32% | | | | |
| | 189,892 | | | Boliden AB (Metals & Mining) | | | 3,463 | |
| | 20,941 | | | Lundin Petroleum AB (Oil, Gas & Consumable Fuels) (a) | | | 359 | |
| | | | | | | | |
| | | | | | | 3,822 | |
| | | | | | | | |
| | | | Switzerland — 0.74% | | | | |
| | 782 | | | EMS-Chemie Holding AG – Registered (Chemicals) | | | 330 | |
| | 839 | | | Givaudan SA (Chemicals) | | | 1,452 | |
| | 20,807 | | | Holcim Ltd., Registered Shares (Construction Materials) | | | 1,536 | |
| | 195 | | | Sika AG (Chemicals) | | | 688 | |
| | 8,455 | | | Syngenta AG, Registered Shares (Chemicals) | | | 3,438 | |
| | 33,137 | | | Transocean Ltd. (Energy Equipment & Services)^ | | | 536 | |
| | 70,400 | | | Weatherford International PLC (Energy Equipment & Services) (a) | | | 864 | |
| | | | | | | | |
| | | | | | | 8,844 | |
| | | | | | | | |
| | | | Taiwan — 0.38% | | | | |
| | 212,082 | | | Asia Cement Corp. (Construction Materials) | | | 251 | |
| | 1,072,376 | | | China Steel Corp. (Metals & Mining) | | | 857 | |
| | 293,000 | | | Formosa Chemicals & Fibre Corp. (Chemicals) | | | 705 | |
| | 112,000 | | | Formosa Petrochemical Corp. (Oil, Gas & Consumable Fuels) | | | 288 | |
| | 376,160 | | | Formosa Plastics Corp. (Chemicals) | | | 885 | |
| | 431,010 | | | Nan Ya Plastics Corp. (Chemicals) | | | 1,011 | |
| | 314,000 | | | Taiwan Cement Corp. (Construction Materials) | | | 396 | |
| | 67,000 | | | Taiwan Fertilizer Co. Ltd. (Chemicals) | | | 111 | |
| | | | | | | | |
| | | | | | | 4,504 | |
| | | | | | | | |
See accompanying notes to financial statements.
94
HC CAPITAL TRUST
The Commodity Returns Strategy Portfolio
Portfolio of Investments (continued) — June 30, 2015
| | | | | | | | |
| Shares | | | Security Description | | Value
(000) | |
| | | | Common Stocks (continued) | | | | |
| | | | Thailand — 0.22% | | | | |
| | 107,500 | | | Banpu Public Co. Ltd., Registered Shares (Oil, Gas & Consumable Fuels) | | $ | 81 | |
| | 101,000 | | | Energy Absolute Public Co. Ltd. (Energy Equipment & Services) | | | 70 | |
| | 60,900 | | | Indorama Ventures Public Co. Ltd. (Chemicals) | | | 50 | |
| | 847,600 | | | IRPC Public Co. Ltd. – NVDR (Oil, Gas & Consumable Fuels) | | | 112 | |
| | 117,504 | | | PTT Exploration & Production Public Co. Ltd. (Oil, Gas & Consumable Fuels) | | | 379 | |
| | 150,455 | | | PTT Global Chemical Public Co. Ltd. (Chemicals) | | | 309 | |
| | 90,000 | | | PTT Public Co. Ltd. (Oil, Gas & Consumable Fuels) | | | 958 | |
| | 74,500 | | | Thai Oil Public Co. Ltd. (Oil, Gas & Consumable Fuels) | | | 121 | |
| | 33,200 | | | The Siam Cement Public Co. Ltd. (Construction Materials) | | | 509 | |
| | 3,800 | | | The Siam Cement Public Co. Ltd. (Construction Materials) | | | 59 | |
| | | | | | | | |
| | | | | | | 2,648 | |
| | | | | | | | |
| | | | Turkey — 0.05% | | | | |
| | 137,143 | | | Eregli Demir ve Celik Fabrikalari TAS (Metals & Mining) | | | 222 | |
| | 37,285 | | | Petkim Petrokimya Holding AS (Chemicals)^(a) | | | 56 | |
| | 12,162 | | | Tupras-Turkiye Petrol Rafinerileri A/S (Oil, Gas & Consumable Fuels) (a) | | | 309 | |
| | | | | | | | |
| | | | | | | 587 | |
| | | | | | | | |
| | | | United Kingdom — 8.33% | | | | |
| | 36,476 | | | AMEC PLC (Energy Equipment & Services) | | | 468 | |
| | 126,753 | | | Anglo American PLC (Metals & Mining) | | | 1,829 | |
| | 36,595 | | | Antofagasta PLC (Metals & Mining) | | | 396 | |
| | 602,730 | | | BG Group PLC (Oil, Gas & Consumable Fuels) | | | 10,032 | |
| | 879,723 | | | BHP Billiton PLC (Metals & Mining) | | | 17,262 | |
| | 1,186,896 | | | BP PLC (Oil, Gas & Consumable Fuels) | | | 7,834 | |
| | 12,481 | | | Croda International PLC (Chemicals) | | | 540 | |
| | 21,377 | | | Ensco PLC, ADR (Energy Equipment & Services) | | | 477 | |
| | 21,427 | | | Fresnillo PLC (Metals & Mining) | | | 234 | |
| | 18,622 | | | Johnson Matthey PLC (Chemicals) | | | 888 | |
| | 33,373 | | | Mondi PLC (Paper & Forest Products) | | | 719 | |
| | 65,001 | | | Rexam PLC (Containers & Packaging) | | | 564 | |
| | 567,301 | | | Rio Tinto PLC (Metals & Mining) | | | 23,296 | |
| | 924,200 | | | Royal Dutch Shell PLC, A Shares (Oil, Gas & Consumable Fuels) | | | 25,937 | |
| | 221,775 | | | Royal Dutch Shell PLC, B Shares (Oil, Gas & Consumable Fuels) | | | 6,296 | |
| | 513,944 | | | Tullow Oil PLC (Oil, Gas & Consumable Fuels) | | | 2,743 | |
| | | | | | | | |
| | | | | | | 99,515 | |
| | | | | | | | |
| | | | United States — 25.36% | | | | |
| | 18,536 | | | Air Products & Chemicals, Inc. (Chemicals) | | | 2,536 | |
| | 6,125 | | | Airgas, Inc. (Chemicals) | | | 648 | |
| | 10,178 | | | Albemarle Corp. (Chemicals) | | | 563 | |
| | | | | | | | |
| Shares | | | Security Description | | Value
(000) | |
| | | | United States (continued) | | | | |
| | 485,345 | | | Alcoa, Inc. (Metals & Mining) | | $ | 5,412 | |
| | 87,109 | | | Anadarko Petroleum Corp. (Oil, Gas & Consumable Fuels) | | | 6,800 | |
| | 6,000 | | | Antero Resources Corp. (Oil, Gas & Consumable Fuels) (a) | | | 206 | |
| | 117,019 | | | Apache Corp. (Oil, Gas & Consumable Fuels) | | | 6,744 | |
| | 6,000 | | | Ashland, Inc. (Chemicals) | | | 731 | |
| | 8,200 | | | Avery Dennison Corp. (Containers & Packaging) | | | 500 | |
| | 10,400 | | | Axalta Coating Systems Ltd. (Chemicals) (a) | | | 344 | |
| | 39,525 | | | Baker Hughes, Inc. (Energy Equipment & Services) | | | 2,439 | |
| | 11,900 | | | Ball Corp. (Containers & Packaging) | | | 835 | |
| | 135,472 | | | Cabot Oil & Gas Corp. (Oil, Gas & Consumable Fuels) | | | 4,273 | |
| | 65,698 | | | Cameron International Corp. (Energy Equipment & Services) (a) | | | 3,441 | |
| | 84,604 | | | Caterpillar, Inc. (Machinery) | | | 7,176 | |
| | 13,900 | | | Celanese Corp., Series A (Chemicals) | | | 999 | |
| | 21,725 | | | CF Industries Holdings, Inc. (Chemicals) | | | 1,396 | |
| | 54,346 | | | Chesapeake Energy Corp. (Oil, Gas & Consumable Fuels)^ | | | 607 | |
| | 251,907 | | | Chevron Corp. (Oil, Gas & Consumable Fuels) | | | 24,300 | |
| | 36,540 | | | Cimarex Energy Co. (Oil, Gas & Consumable Fuels) | | | 4,031 | |
| | 229,746 | | | Cobalt International Energy, Inc. (Oil, Gas & Consumable Fuels) (a) | | | 2,231 | |
| | 10,700 | | | Concho Resources, Inc. (Oil, Gas & Consumable Fuels) (a) | | | 1,218 | |
| | 313,517 | | | ConocoPhillips (Oil, Gas & Consumable Fuels) | | | 19,253 | |
| | 21,000 | | | CONSOL Energy, Inc. (Oil, Gas & Consumable Fuels) | | | 457 | |
| | 8,838 | | | Continental Resources, Inc. (Oil, Gas & Consumable Fuels) (a) | | | 375 | |
| | 12,600 | | | Crown Holdings, Inc. (Containers & Packaging) (a) | | | 667 | |
| | 35,291 | | | Devon Energy Corp. (Oil, Gas & Consumable Fuels) | | | 2,099 | |
| | 5,730 | | | Diamond Offshore Drilling, Inc. (Energy Equipment & Services)^ | | | 148 | |
| | 82,286 | | | E.I. du Pont de Nemours & Co. (Chemicals) | | | 5,262 | |
| | 13,556 | | | Eastman Chemical Co. (Chemicals) | | | 1,109 | |
| | 24,536 | | | Ecolab, Inc. (Chemicals) | | | 2,774 | |
| | 43,917 | | | Energen Corp. (Oil, Gas & Consumable Fuels) | | | 3,000 | |
| | 112,129 | | | EOG Resources, Inc. (Oil, Gas & Consumable Fuels) | | | 9,817 | |
| | 13,838 | | | EQT Corp. (Oil, Gas & Consumable Fuels) | | | 1,126 | |
| | 452,917 | | | Exxon Mobil Corp. (Oil, Gas & Consumable Fuels) | | | 37,682 | |
| | 77,670 | | | First Solar, Inc. (Semiconductors & Semiconductor Equipment) (a) | | | 3,649 | |
| | 12,162 | | | FMC Corp. (Chemicals) | | | 639 | |
| | 21,000 | | | FMC Technologies, Inc. (Energy Equipment & Services) (a) | | | 871 | |
| | 94,217 | | | Freeport-McMoRan Copper & Gold, Inc. (Metals & Mining) | | | 1,754 | |
| | 231,769 | | | Halliburton Co. (Energy Equipment & Services) | | | 9,982 | |
| | 9,800 | | | Helmerich & Payne, Inc. (Energy Equipment & Services) | | | 690 | |
See accompanying notes to financial statements.
95
HC CAPITAL TRUST
The Commodity Returns Strategy Portfolio
Portfolio of Investments (continued) — June 30, 2015
| | | | | | | | |
| Shares | | | Security Description | | Value
(000) | |
| | | | Common Stocks (continued) | | | | |
| | | | United States (continued) | | | | |
| | 82,584 | | | Hess Corp. (Oil, Gas & Consumable Fuels) | | $ | 5,523 | |
| | 16,872 | | | HollyFrontier Corp. (Oil, Gas & Consumable Fuels) | | | 720 | |
| | 7,400 | | | International Flavors & Fragrances, Inc. (Chemicals) | | | 809 | |
| | 36,500 | | | International Paper Co. (Paper & Forest Products) | | | 1,737 | |
| | 359,094 | | | Kinder Morgan, Inc. (Oil, Gas & Consumable Fuels) | | | 13,786 | |
| | 207,686 | | | Marathon Oil Corp. (Oil, Gas & Consumable Fuels) | | | 5,512 | |
| | 49,566 | | | Marathon Petroleum Corp. (Oil, Gas & Consumable Fuels) | | | 2,593 | |
| | 5,228 | | | Martin Marietta Materials, Inc. (Construction Materials) | | | 740 | |
| | 14,500 | | | MeadWestvaco Corp. (Containers & Packaging) | | | 684 | |
| | 43,970 | | | Monsanto Co. (Chemicals) | | | 4,687 | |
| | 15,300 | | | Murphy Oil Corp. (Oil, Gas & Consumable Fuels) | | | 636 | |
| | 114,480 | | | National Oilwell Varco, Inc. (Energy Equipment & Services) | | | 5,527 | |
| | 45,375 | | | Newmont Mining Corp. (Metals & Mining) | | | 1,060 | |
| | 35,120 | | | Noble Energy, Inc. (Oil, Gas & Consumable Fuels) | | | 1,499 | |
| | 157,291 | | | Nucor Corp. (Metals & Mining) | | | 6,931 | |
| | 70,010 | | | Occidental Petroleum Corp. (Oil, Gas & Consumable Fuels) | | | 5,445 | |
| | 9,058 | | | Oceaneering International, Inc. (Energy Equipment & Services) | | | 422 | |
| | 18,900 | | | ONEOK, Inc. (Oil, Gas & Consumable Fuels) | | | 746 | |
| | 8,900 | | | Packaging Corp. of America (Containers & Packaging) | | | 556 | |
| | 166,986 | | | Phillips 66 (Oil, Gas & Consumable Fuels) | | | 13,452 | |
| | 37,429 | | | Pioneer Natural Resources Co. (Oil, Gas & Consumable Fuels) | | | 5,191 | |
| | 24,836 | | | PPG Industries, Inc. (Chemicals) | | | 2,849 | |
| | 26,250 | | | Praxair, Inc. (Chemicals) | | | 3,138 | |
| | 15,329 | | | Range Resources Corp. (Oil, Gas & Consumable Fuels) | | | 757 | |
| | 12,700 | | | Rock-Tenn Co., Class A (Containers & Packaging) | | | 765 | |
| | 19,100 | | | Sealed Air Corp. (Containers & Packaging) | | | 980 | |
| | 10,900 | | | Sigma-Aldrich Corp. (Chemicals) | | | 1,519 | |
| | 15,660 | | | Southern Copper Corp. (Metals & Mining) | | | 461 | |
| | 34,969 | | | Southwestern Energy Co. (Oil, Gas & Consumable Fuels) (a) | | | 795 | |
| | 60,978 | | | Spectra Energy Corp. (Oil, Gas & Consumable Fuels) | | | 1,988 | |
| | 11,400 | | | Tesoro Corp. (Oil, Gas & Consumable Fuels) | | | 962 | |
| | 105,233 | | | The Dow Chemical Co. (Chemicals) | | | 5,385 | |
| | 147,400 | | | The Mosaic Co. (Chemicals) | | | 6,907 | |
| | 7,351 | | | The Sherwin-Williams Co. (Chemicals) | | | 2,022 | |
| | 64,678 | | | The Williams Cos., Inc. (Oil, Gas & Consumable Fuels) (a) | | | 3,712 | |
| | 156,137 | | | Valero Energy Corp. (Oil, Gas & Consumable Fuels) | | | 9,774 | |
| | | | | | | | |
Shares or
Principal
Amount
(000) | | | Security Description | | Value
(000) | |
| | | | United States (continued) | | | | |
| | 12,000 | | | Vulcan Materials Co. (Construction Materials) | | $ | 1,007 | |
| | 4,200 | | | Westlake Chemical Corp. (Chemicals) | | | 288 | |
| | 79,798 | | | Whiting Petroleum Corp. (Oil, Gas & Consumable Fuels) (a) | | | 2,681 | |
| | | | | | | | |
| | | | | | | 303,030 | |
| | | | | | | | |
| | | | Total Common Stocks | | | 738,385 | |
| | | | | | | | |
| | | | Preferred Stocks — 0.33% | | | | |
| | | | Brazil — 0.27% | | | | |
| | 10,700 | | | Braskem SA – Preferred, Class – A (Chemicals) | | | 47 | |
| | 83,000 | | | Gerdau SA – Preferred (Metals & Mining) | | | 199 | |
| | 253,000 | | | Klabin SA – Preferred (Containers & Packaging) | | | 308 | |
| | 356,375 | | | Petroleo Brasileiro SA – Preferred (Oil, Gas & Consumable Fuels) (a) | | | 1,461 | |
| | 33,900 | | | Suzano Papel e Celulose SA – Preferred, Class – A (Paper & Forest Products) | | | 181 | |
| | 26,187 | | | Usinas Siderurgicas de Minas Gerais SA – Preferred, Class – A (Metals & Mining) | | | 35 | |
| | 175,004 | | | Vale SA – Preferred (Metals & Mining) | | | 881 | |
| | | | | | | | |
| | | | | | | 3,112 | |
| | | | | | | | |
| | | | Chile — 0.01% | | | | |
| | 8,250 | | | Sociedad Quimica y Minera de Chile SA – Preferred, B Shares (Chemicals) | | | 134 | |
| | | | | | | | |
| | | | Germany — 0.02% | | | | |
| | 6,718 | | | Fuchs Petrolub AG – Preferred (Chemicals) | | | 284 | |
| | | | | | | | |
| | | | Russia — 0.02% | | | | |
| | 98 | | | AK Transneft OAO – Preferred (Oil, Gas & Consumable Fuels) (d) | | | 240 | |
| | | | | | | | |
| | | | South Korea – 0.01% | | | | |
| | 678 | | | LG Chem Ltd. – Preferred (Chemicals) | | | 114 | |
| | | | | | | | |
| | | | Total Preferred Stocks | | | 3,884 | |
| | | | | | | | |
| | | | Right — 0.00% | | | | |
| | | | Spain — 0.00% | | | | |
| | 93,695 | | | Repsol SA (a) | | | 49 | |
| | | | | | | | |
| | | | Total Right | | | 49 | |
| | | | | | | | |
| | | | Commercial Paper — 0.11% | | | | |
| | | | United Kingdom — 0.11% | | | | |
| $ | 1,300 | | | Tesco Treasury Services PLC,
1.00%, 8/18/15 (e) | | | 1,296 | |
| | | | | | | | |
| | | | Total Commercial Paper | | | 1,296 | |
| | | | | | | | |
| | | | Corporate Bonds — 1.53% | | | | |
| | 2,100 | | | AT&T, Inc., 0.70%, 3/30/17 (Diversified Telecommunication Services) (f) | | | 2,092 | |
| | 400 | | | Bank of America Corp., 4.10%, 7/24/23 (Banks) | | | 412 | |
| | 200 | | | Baxalta, Inc., 2.00%, 6/22/18 (Biotechnology) (b) | | | 200 | |
| | 300 | | | Baxalta, Inc., 2.88%, 6/23/20, Callable 5/23/20 @ 100 (Biotechnology) (b) | | | 300 | |
| | 100 | | | Baxalta, Inc., 3.60%, 6/23/22, Callable 4/23/22 @ 100 (Biotechnology) (b) | | | 100 | |
| | 400 | | | Baxalta, Inc., 4.00%, 6/23/25, Callable 3/23/25 @ 100 (Biotechnology) (b) | | | 396 | |
See accompanying notes to financial statements.
96
HC CAPITAL TRUST
The Commodity Returns Strategy Portfolio
Portfolio of Investments (continued) — June 30, 2015
| | | | | | | | |
Principal
Amount
(000) | | | Security Description | | Value
(000) | |
| | | | Corporate Bonds (continued) | | | | |
| $ | 400 | | | BellSouth Corp., 4.82%, 4/26/16, Callable 4/26/16 @ 100 (Media) (b)(f) | | $ | 411 | |
| | 2,100 | | | Citigroup, Inc., 0.80%, 5/1/17 (Banks) (f) | | | 2,093 | |
| | 1,500 | | | eBay, Inc., 1.35%, 7/15/17 (Internet Software & Services) | | | 1,498 | |
| | 3,000 | | | Ford Motor Credit Co. LLC, 0.80%, 9/8/17 (Consumer Finance) (f) | | | 2,982 | |
| | 2,100 | | | Goldman Sachs Group, Inc., 0.90%, 6/4/17 (Capital Markets) (f) | | | 2,097 | |
| | 2,100 | | | International Lease Finance Corp., 5.75%, 5/15/16 (Trading Companies & Distributors) | | | 2,153 | |
| | 2,000 | | | Oracle Corp., 0.78%, 10/8/19 (Software) (f) | | | 2,016 | |
| | 176 | | | Overseas Private Investment Corp., 4.73%, 3/15/22 (Commercial Services & Supplies) | | | 193 | |
| | 92 | | | SLM Corp., 6.25%, 1/25/16 (Consumer Finance) | | | 94 | |
| | 1,200 | | | Verizon Communications, Inc., 1.82%, 9/15/16 (Diversified Telecommunication Services) (f) | | | 1,215 | |
| | | | | | | | |
| | | | Total Corporate Bonds | | | 18,252 | |
| | | | | | | | |
| | | | Asset Backed Securities — 0.65% | | | | |
| | 563 | | | Atrium CDO Corp., Series 5A, Class A1, 0.53%, 7/20/20 (b)(f) | | | 560 | |
| | 271 | | | Commercial Industrial Finance Corp., Series 2007-1AL, Class A1L, 0.54%, 5/10/21 (b)(f) | | | 269 | |
| | 235 | | | Fore CLO Ltd., Series 2007-1AB, Class A1B, 0.52%, 7/20/19 (b)(f) | | | 233 | |
| | 450 | | | Fortess Credit Investments Ltd., Series 2015-4A, Class A, 1.53%, 7/17/23 (b)(f) | | | 450 | |
| | 200 | | | Four Corners CLO Ltd., Series 2006-2A, Class A, 0.55%, 1/26/20 (b)(f) | | | 197 | |
| | 288 | | | First Franklin Mortgage Loan Asset Backed Certificates, Series 2005-FF11D, Class A2D, 0.87%, 11/25/35 (f) | | | 286 | |
| | 250 | | | First Franklin Mortgage Loan Asset Backed Certificates, Series 2005-FF2, Class M3, 0.91%, 3/25/35 (f) | | | 248 | |
| | 1,100 | | | Household Home Equity Loan Trust, Series 2007-1, Class M2, 0.66%, 3/20/36 (f) | | | 1,034 | |
| | 784 | | | LCM Ltd. Partnership, Series 9A, Class A, 1.48%, 7/14/22 (b)(f) | | | 784 | |
| | 900 | | | LCM Ltd. Partnership, Series 12A, Class AR, 1.54%, 10/19/22 (b)(f) | | | 900 | |
| | 400 | | | New Century Home Equity Loan Trust, Series 2005-3, Class M2, 0.68%, 7/25/35 (f) | | | 386 | |
| | 200 | | | Park Place Securities, Inc., Series 2005-WCW2, Class M1, 0.69%, 7/25/35 (f) | | | 198 | |
| | 447 | | | Race Point CLO Ltd., Series 2006-3, Class A, 0.54%, 4/15/20 (b)(f) | | | 446 | |
| | 348 | | | Structured Asset Investment Loan Trust, Series 2003-BC11, Class M1, 1.16%, 10/25/33 (f) | | | 336 | |
| | 400 | | | Voya CLO Ltd., Series 2012-2RA, Class AR, 1.57%, 10/15/22 (b)(f) | | | 400 | |
| | | | | | | | |
Principal
Amount
(000) | | | Security Description | | Value
(000) | |
| | | | Asset Backed Securities (continued) | | | | |
| $ | 938 | | | Highlander Euro CDO, Series 2007-3X, Class A, 0.22%, 5/1/23 (f) | | $ | 1,027 | |
| | | | | | | | |
| | | | Total Asset Backed Securities | | | 7,754 | |
| | | | | | | | |
| | | | Collateralized Mortgage Obligations — 0.71% | | | | |
| | 300 | | | Ameriquest Mortgage Securities, Inc., Series 2005-R11, Class M1, 0.64%, 1/25/36 (f) | | | 274 | |
| | 53 | | | BCAP LLC Trust, Series 2011-R11, Class 30A5, 2.40%, 1/26/34 (b)(f) | | | 53 | |
| | 400 | | | Banc of America Commercial Mortgage, Inc., Series 2007-2, Class A4, 5.61%, 4/10/49 (f) | | | 418 | |
| | 1,124 | | | Banc of America Funding Corp., Series 2012-R5, Class A, 0.44%, 10/3/39 (b)(f) | | | 1,112 | |
| | 502 | | | Bear Stearns ALT-A Trust, Series 2007-8, Class 1A, 0.89%, 9/25/34 (f) | | | 487 | |
| | 224 | | | Countrywide Alternative Loan Trust, Series 2004-J7, Class 2A1, 0.96%, 9/25/34 (f) | | | 219 | |
| | 667 | | | Freddie Mac, Series 2781, Class F1, 0.64%, 9/15/42 (f) | | | 671 | |
| | 2,540 | | | Fannie Mae, Series 2013-M4, Class X1, 3.92%, 2/25/18 (f) | | | 197 | |
| | 471 | | | Freddie Mac, Series 3096, Class FX, 0.64%, 5/15/32 (f) | | | 476 | |
| | 445 | | | Fannie Mae, Series 2006-98, Class FA, 0.62%, 10/25/36 (f) | | | 447 | |
| | 150 | | | Freddie Mac, Series 3179, Class FP, 0.57%, 7/15/36 (f) | | | 150 | |
| | 200 | | | First Franklin Mortgage Loan Trust Asset Backed Certificates, Series 2005-FF6, Class M2, 0.63%, 5/25/36 (f) | | | 181 | |
| | 20 | | | GMAC Mortgage Corp. Loan Trust, Series 2004-AR1, Class 12A, 3.03%, 6/25/34 (f) | | | 20 | |
| | 200 | | | Long Beach Mortgage Loan Trust, Series 2005-2, Class M4, 1.12%, 4/25/35 (f) | | | 194 | |
| | 400 | | | Structured Asset Securities Corp., Series 2005-NC1, Class M2, 0.68%, 2/25/35 (f) | | | 374 | |
| | 219 | | | WaMu Mortgage Pass-Through Certificates, Series 2004-AR10, Class A3, 0.74%, 7/25/44 (f) | | | 204 | |
| | 313 | | | WaMu Mortgage Pass-Through Certificates, Series 2004-AR14, Class A1, 2.39%, 1/25/35 (f) | | | 315 | |
| | 44 | | | Granite Mortgages PLC, Series 2004-2, Class 2A1, 0.27%, 6/20/44 (f) | | | 49 | |
| | 233 | | | Hercules (Eclipse 2006-4) PLC, Series 2006-4, Class A, 0.81%, 10/25/18 (f) | | | 360 | |
| | 149 | | | Marche Mutui Srl, Series 4, Class A, 0.42%, 2/25/55 (f) | | | 164 | |
| | 1,433 | | | Grecale SRL, Series 2011-1, Class A2, 0.50%, 1/27/61 (f) | | | 1,578 | |
| | 96 | | | Marche Mutui Srl, Series 5, Class A, 0.40%, 10/27/65 (f) | | | 107 | |
| | 338 | | | Marche Mutui Srl, Series 6, Class A1, 2.25%, 1/27/64 (f) | | | 383 | |
| | | | | | | | |
| | | | Total Collateralized Mortgage Obligations | | | 8,433 | |
| | | | | | | | |
See accompanying notes to financial statements.
97
HC CAPITAL TRUST
The Commodity Returns Strategy Portfolio
Portfolio of Investments (continued) — June 30, 2015
| | | | | | | | |
Principal
Amount
(000) | | | Security Description | | Value
(000) | |
| | | | Certificate of Deposit — 0.12% | | | | |
| $ | 1,400 | | | Intesa Sanpaolo NY, 1.66%, 4/11/16 (f) | | $ | 1,403 | |
| | | | | | | | |
| | | | Total Certificate of Deposit | | | 1,403 | |
| | | | | | | | |
| | | | Global Bonds — 1.80% | | | | |
| | | | Italy — 0.44% | | | | |
| | 601 | | | Buoni del Tesoro Poliennali, Series ICPI, 2.15%, 11/12/17 (g) | | | 694 | |
| | 400 | | | Buoni Poliennali del Tesoro, Series ICPI, 5.50%, 11/1/22 (g) | | | 552 | |
| | 2,014 | | | Buoni Poliennali del Tesoro, 2.35%, 9/15/24 (g) | | | 2,472 | |
| | 80 | | | Italy Buoni Poliennali del Tesoro, Series ICPI, 2.55%, 10/22/16 (g) | | | 92 | |
| | 1,305 | | | Italy Buoni Poliennali del Tesoro, Series ICPI, 2.25%, 4/22/17 (g) | | | 1,496 | |
| | | | | | | | |
| | | | | | | 5,306 | |
| | | | | | | | |
| | | | Mexico — 0.38% | | | | |
| | 46,839 | | | Mexican Udibonos, Series S, 4.50%, 12/4/25 (f)(g) | | | 3,407 | |
| | 9,921 | | | Mexican Udibonos, Series S, 4.00%, 11/15/40 (f)(g) | | | 678 | |
| | 3,764 | | | Mexican Udibonos, Series S, 4.00%, 11/8/46 (f)(g) | | | 260 | |
| | 3,166 | | | Mexican Unibonos, 4.00%, 11/8/46 (f)(g) | | | 218 | |
| | | | | | | | |
| | | | | | | 4,563 | |
| | | | | | | | |
| | | | New Zealand — 0.08% | | | | |
| | 1,400 | | | New Zealand Index Linked Bond, 2.00%, 9/20/25 (g) | | | 971 | |
| | | | | | | | |
| | | | Spain — 0.71% | | | | |
| | 100 | | | Bankia SA, 3.50%, 12/14/15 (g) | | | 113 | |
| | 100 | | | Bankia SA, 0.20%, 1/25/16 (f)(g) | | | 111 | |
| | 3,500 | | | Bonos y Obligaciones del Estado, 5.85%, 1/31/22 (c)(g) | | | 4,899 | |
| | 1,300 | | | Generalitat de Catalunya, 4.95%, 2/11/20 (g) | | | 1,588 | |
| | 1,400 | | | Generalitat de Valencia, Series E, 4.90%, 3/17/20 (g) | | | 1,770 | |
| | | | | | | | |
| | | | | | | 8,481 | |
| | | | | | | | |
| | | | United Kingdom — 0.04% | | | | |
| | 190 | | | LBG Capital No.2 PLC, Series 21, 15.00%, 12/21/19 (g) | | | 424 | |
| | | | | | | | |
| | | | United States — 0.15% | | | | |
| | 1,000 | | | JPMorgan Chase Bank NA, 5.38%, 9/28/16 (g)(i) | | | 1,643 | |
| | 100 | | | JPMorgan Chase Bank NA, 4.37%, 11/30/21, Callable 11/14/16 @ 100 (f) | | | 117 | |
| | | | | | | | |
| | | | | | | 1,760 | |
| | | | | | | | |
| | | | Total Global Bonds | | | 21,505 | |
| | | | | | | | |
| | | | U.S. Government Agency Securities — 0.99% | | | | |
| | 1,100 | | | Federal Home Loan Bank, 0.04%,��7/15/15 (e) | | | 1,100 | |
| | 700 | | | Federal Home Loan Bank, 0.04%, 7/10/15 (e) | | | 700 | |
| | 100 | | | Federal Home Loan Bank, 0.07%, 8/19/15 (e) | | | 100 | |
| | 300 | | | Federal Home Loan Bank, 0.07%, 8/14/15 (e) | | | 300 | |
| | 4,100 | | | Federal Home Loan Bank, 0.09%, 9/9/15 (e) | | | 4,100 | |
| | 200 | | | Federal Home Loan Bank, 0.06%, 8/28/15 (e) | | | 200 | |
| | 200 | | | Federal Home Loan Bank, 0.04%, 7/8/15 (e) | | | 200 | |
| | | | | | | | |
Principal
Amount
(000) | | | Security Description | | Value
(000) | |
| | | | U.S. Government Agency Securities (continued) | | | | |
| $ | 2,800 | | | Federal Home Loan Bank, 0.13%, 9/2/15 | | $ | 2,800 | |
| | 2,378 | | | Freddie Mac, 0.42%, 9/18/15 (h) | | | 2,379 | |
| | | | | | | | |
| | | | Total U.S. Government Agency Securities | | | 11,879 | |
| | | | | | | | |
| | | | U.S. Treasury Obligations — 4.26% | | | | |
| | 1,095 | | | U.S. Treasury Inflation Index Note, 1.88%, 7/15/15 | | | 1,098 | |
| | 882 | | | U.S. Treasury Bill, 0.02%, 7/23/15 (e) | | | 882 | |
| | 3,953 | | | U.S. Treasury Bill, 0.02%, 8/20/15 (e)(h) | | | 3,953 | |
| | 3,036 | | | U.S. Treasury Bill, 0.01%, 8/27/15 (e) | | | 3,036 | |
| | 2,002 | | | U.S. Treasury Bill, 0.02%, 9/3/15 (e) | | | 2,002 | |
| | 35 | | | U.S. Treasury Bill, 0.02%, 9/10/15 (e) | | | 35 | |
| | 15,114 | | | U.S. Treasury Inflation Index Note, 0.13%, 4/15/16 | | | 15,184 | |
| | 2,976 | | | U.S. Treasury Inflation Index Note, 2.50%, 7/15/16 | | | 3,086 | |
| | 202 | | | U.S. Treasury Inflation Index Note, 0.13%, 4/15/19 | | | 205 | |
| | 1,253 | | | U.S. Treasury Inflation Index Note, 0.13%, 4/15/20 | | | 1,263 | |
| | 5,000 | | | U.S. Treasury Note, 1.50%, 5/31/20 | | | 4,972 | |
| | 309 | | | U.S. Treasury Inflation Index Note, 0.13%, 7/15/22 | | | 306 | |
| | 103 | | | U.S. Treasury Inflation Index Note, 0.13%, 1/15/23 | | | 101 | |
| | 787 | | | U.S. Treasury Inflation Index Note, 0.13%, 7/15/24 | | | 768 | |
| | 577 | | | U.S. Treasury Inflation Index Bond, 2.38%, 1/15/25 | | | 679 | |
| | 441 | | | U.S. Treasury Inflation Index Bond, 2.00%, 1/15/26 (h) | | | 506 | |
| | 223 | | | U.S. Treasury Inflation Index Bond, 2.38%, 1/15/27 (h) | | | 267 | |
| | 529 | | | U.S. Treasury Inflation Index Bond, 2.50%, 1/15/29 | | | 1,182 | |
| | 115 | | | U.S. Treasury Inflation Index Bond, 3.88%, 4/15/29 | | | 163 | |
| | 108 | | | U.S. Treasury Inflation Index Bond, 2.13%, 2/15/41 | | | 134 | |
| | 733 | | | U.S. Treasury Inflation Index Bond, 0.75%, 2/15/42 | | | 674 | |
| | 10 | | | U.S. Treasury Inflation Index Bond, 1.38%, 2/15/44 | | | 1,539 | |
| | 3,637 | | | U.S. Treasury Inflation Index Bond, 0.75%, 2/15/45 | | | 3,322 | |
| | 3,710 | | | U.S. Treasury Bond, 2.50%, 2/15/45 | | | 3,265 | |
| | 2,360 | | | U.S. Treasury Bond, 3.00%, 5/15/45 | | | 2,313 | |
| | | | | | | | |
| | | | Total U.S.Treasury Obligations | | | 50,935 | |
| | | | | | | | |
| | | | Yankee Dollars — 1.95% | | | | |
| | | | Australia — 0.23% | | | | |
| | 2,100 | | | Westpac Banking Corp., 0.61%, 5/19/17 (Banks) (f) | | | 2,101 | |
| | 700 | | | Westpac Banking Corp., Series E, 1.85%, 11/26/18 (Banks) (b) | | | 703 | |
| | | | | | | | |
| | | | | | | 2,804 | |
| | | | | | | | |
See accompanying notes to financial statements.
98
HC CAPITAL TRUST
The Commodity Returns Strategy Portfolio
Portfolio of Investments (continued) — June 30, 2015
| | | | | | | | |
Principal
Amount
(000) | | | Security Description | | Value
(000) | |
| | | | Yankee Dollars (continued) | | | | |
| | | | Canada — 0.03% | | | | |
| $ | 400 | | | Canadian Natural Resources Ltd., 0.66%, 3/30/16 (Oil, Gas & Consumable Fuels) (f) | | $ | 399 | |
| | | | | | | | |
| | | | Cayman Islands — 0.02% | | | | |
| | 200 | | | Petrobras International Finance Co., 5.38%, 1/27/21 (Oil, Gas & Consumable Fuels) | | | 192 | |
| | | | | | | | |
| | | | France — 0.32% | | | | |
| | 2,800 | | | BPCE SA, 0.91%, 6/17/17 (Banks) (f) | | | 2,801 | |
| | 1,000 | | | Dexia Credit Local SA NY, 1.25%, 10/18/16 (Diversified Financial Services) (b) | | | 1,005 | |
| | | | | | | | |
| | | | | | | 3,806 | |
| | | | | | | | |
| | | | Guernsey — 0.08% | | | | |
| | 1,000 | | | Credit Suisse Group Funding Ltd., 4.88%, 5/15/45 (Capital Markets) (b) | | | 962 | |
| | | | | | | | |
| | | | Italy — 0.06% | | | | |
| | 700 | | | Intesa Sanpaolo SpA, 3.13%, 1/15/16 (Banks) | | | 705 | |
| | | | | | | | |
| | | | Korea, Republic Of — 0.03% | | | | |
| | 300 | | | Export-Import Bank of Korea, 1.13%, 9/17/16 (Diversified Financial Services) (f) | | | 301 | |
| | | | | | | | |
| | | | Luxembourg — 0.16% | | | | |
| | 1,900 | | | Actavis Funding SCS, 3.80%, 3/15/25, Callable 12/15/24 @ 100 (Pharmaceuticals) | | | 1,866 | |
| | | | | | | | |
| | | | Netherlands — 0.44% | | | | |
| | 1,400 | | | Deutsche Annington Finance BV, 3.20%, 10/2/17 (Real Estate Management & Development) (b) | | | 1,432 | |
| | 800 | | | Petrobras Global Finance, 2.64%, 3/17/17 (Oil, Gas & Consumable Fuels) (f) | | | 786 | |
| | 300 | | | Petrobras Global Finance, 3.25%, 3/17/17 (Oil, Gas & Consumable Fuels) | | | 296 | |
| | 800 | | | Petrobras Global Finance, 2.42%, 1/15/19 (Oil, Gas & Consumable Fuels) (f) | | | 740 | |
| | 2,000 | | | Rabobank Nederland NY, 0.61%, 4/28/17 (Banks) (f) | | | 2,001 | |
| | | | | | | | |
| | | | | | | 5,255 | |
| | | | | | | | |
| | | | Norway — 0.08% | | | | |
| | 500 | | | Kommunalbanken AS, 0.66%, 3/27/17 (Capital Markets) (b)(f) | | | 503 | |
| | 400 | | | Nordea Eiendomskreditt AS, 2.13%, 9/22/16 (Thrifts & Mortgage Finance) (b) | | | 406 | |
| | 100 | | | Statoil ASA, 0.56%, 5/15/18 (Oil, Gas & Consumable Fuels) (f) | | | 100 | |
| | | | | | | | |
| | | | | | | 1,009 | |
| | | | | | | | |
| | | | Slovenia — 0.10% | | | | |
| | 200 | | | Republic of Slovenia – Registered Shares, 5.85%, 5/10/23 (Sovereign) | | | 226 | |
| | 900 | | | Republic of Slovenia – Registered Shares, 5.25%, 2/18/24 (Sovereign) | | | 981 | |
| | | | | | | | |
| | | | | | | 1,207 | |
| | | | | | | | |
| | | | Switzerland — 0.06% | | | | |
| | 600 | | | UBS AG Stamford Connecticut, 7.63%, 8/17/22 (Capital Markets) | | | 703 | |
| | | | | | | | |
| | | | | | | | |
Shares or
Contracts or
Principal
Amount
(000) | | | Security Description | | Value
(000) | |
| | | | United Kingdom — 0.33% | | | | |
| $ | 2,000 | | | BP Capital Markets PLC, 0.70%, 11/7/16 (Oil, Gas & Consumable Fuels) (f) | | $ | 1,999 | |
| | 600 | | | HBOS PLC, Series E, 0.98%, 9/30/16, Callable 3/30/15 @ 100 (Banks) (f) | | | 597 | |
| | 350 | | | Lloyds Bank PLC, 1.75%, 5/14/18 (Banks) | | | 350 | |
| | 50 | | | Lloyds Bank PLC, 3.50%, 5/14/25 (Banks) | | | 49 | |
| | 800 | | | Mbarclays Bank PLC, 7.63%, 11/21/22 (Banks) | | | 911 | |
| | | | | | | | |
| | | | | | | 3,906 | |
| | | | | | | | |
| | | | United States — 0.01% | | | | |
| | 2,100 | | | Navient LLC, Series E, 8.78%, 9/15/16 (Consumer Finance) | | | 135 | |
| | | | | | | | |
| | | | Total Yankee Dollars | | | 23,250 | |
| | | | | | | | |
| | | | Time Deposit — 0.95% | | | | |
| | 11,347 | | | State Street Liquidity Management Control System Eurodollar Time Deposit, 0.01%, 7/1/15 | | | 11,347 | |
| | | | | | | | |
| | | | Total Time Deposit | | | 11,347 | |
| | | | | | | | |
| | | | Mutual Funds — 0.60% | | | | |
| | 4,100 | | | ETFS Platinum Trust | | | 427 | |
| | 6,713,000 | | | SSgA Treasury Money Market Fund, 0.00% | | | 6,713 | |
| | | | | | | | |
| | | | Total Mutual Funds | | | 7,140 | |
| | | | | | | | |
| | | | Purchased Options — 0.0% | | | | |
| | | | Total Purchased Options | | | 269 | |
| | | | | | | | |
| | | | Repurchase Agreements — 19.85% | | | | |
| $ | 46,100 | | | Bank of America Corp.,
0.11%, 7/1/15 (Purchased on 6/30/15, proceeds at maturity $46,100,141 collateralized by U.S. Treasury Obligations, 2.13% – 4.50%, 12/31/21 –8/15/39 fair value $47,022,101) | | | 46,100 | |
| | 2,700 | | | Barclays,
0.25%, 7/1/15 (Purchased on 6/30/15, proceeds at maturity $2,700,019 collateralized by U.S. Treasury Note, 2.13%, 9/30/21 fair value $2,759,295) | | | 2,700 | |
| | 7,100 | | | BNP Paribas,
0.22%, 7/1/15, (Purchased on 6/30/15, proceeds at maturity $7,100,043 collateralized by U.S. Treasury Note, 1.50%, 11/30/19 fair value $7,252,510) | | | 7,100 | |
| | 46,200 | | | BNP Paribas,
0.08%, 7/1/15, (Purchased on 6/30/15, proceeds at maturity $46,200,103 collateralized by U.S. Treasury Obligations, 0.00% – 9.25%, 7/23/15 –8/15/43 fair value $47,124,150) | | | 46,200 | |
| | 46,300 | | | Deutsche Bank Securities, Inc.,
0.12%, 7/1/15 (Purchased on 6/30/15, proceeds at maturity $46,300,154 collateralized by U.S. Treasury Note, 2.13%, 6/30/22 fair value $47,226,110) | | | 46,300 | |
| | 3,000 | | | Goldman Sachs & Co.,
0.35%, 7/1/15 (Purchased on 6/30/15, proceeds at maturity $3,000,029 collateralized by Freddie Mac, 4.00%, 3/1/43 fair value $3,098,094) | | | 3,000 | |
See accompanying notes to financial statements.
99
HC CAPITAL TRUST
The Commodity Returns Strategy Portfolio
Portfolio of Investments (continued) — June 30, 2015
| | | | | | | | |
Principal
Amount
(000) | | | Security Description | | Value
(000) | |
| | | | Repurchase Agreements (continued) | | | | |
| $ | 11,859 | | | Jefferies LLC,
0.23%, 7/1/15 (Purchased on 6/30/15, proceeds at maturity $11,859,269 collateralized by U.S. Treasury Obligations, 0.00% - 3.28%, 8/15/15 – 8/15/44 fair value $12,096,378)^^ | | $ | 11,859 | |
| | 7,100 | | | JPMorgan Securities,
0.25%, 7/1/15 (Purchased on 6/30/15, proceeds at maturity $7,100,049 collateralized by U.S. Treasury Note 0.63%, 6/30/17 fair value $7,260,000) | | | 7,100 | |
| | 7,100 | | | Merrill Lynch Pierce Fenner & Smith, Inc.,
0.25%, 7/1/15 (Purchased on 6/30/15, proceeds at maturity $7,100,049 collateralized by U.S. Treasury Bond, 3.75%, 11/15/43 fair value $7,318,974) | | | 7,100 | |
| | 46,200 | | | Morgan Stanley & Co. LLC, 0.08%, 7/1/15 (Purchased on 6/30/15, proceeds at maturity $46,200,103 collateralized by U.S. Treasury Note, 0.00% – 1.25%, 1/31/20 fair value $47,124,088) | | | 46,200 | |
| | 6,300 | | | Royal Bank of Canada,
0.25%, 7/1/15 (Purchased on 6/30/15, proceeds at maturity $6,300,044 collateralized by U.S. Treasury Note, 2.25%, 11/15/24 fair value $6,445,942) | | | 6,300 | |
| | 7,100 | | | Toronto Dominion Bank NY, 0.25%, 7/1/15 (Purchased on 6/30/15, proceeds at maturity $7,100,049 collateralized by U.S. Treasury Note, 1.50%, 11/30/19 fair value $7,261,832) | | | 7,100 | |
| | | | | | | | |
| | | | Total Repurchase Agreements | | | 237,059 | |
| | | | | | | | |
| | | | Total Investments
(cost $1,168,489) — 95.66% | | | 1,142,840 | |
| | | | Other assets in excess of liabilities — 4.35% | | | 51,798 | |
| | | | | | | | |
| | | | Net Assets — 100.00% | | $ | 1,194,638 | |
| | | | | | | | |
Amounts designated as “—” are $0 or have been rounded to $0.
| * | Security was fair valued on June 30, 2015 and represents a Level 2 security. Refer to Note 2 in the Notes to Financial Statements. |
| ^ | All or part of this security was on loan as of June 30, 2015. The total value of securities on loan as of June 30, 2015, was $19,745 (amount in thousands). |
| ^^ | Purchased with cash collateral held from securities lending. The value of the collateral could include collateral held for securities that were sold on or before June 30, 2015. |
| (a) | Represents non-income producing security. |
| (b) | Represents a security purchased under Rule 144A or Section 4(2) and is exempt from registration under the Securities Act of 1933, as amended, or is otherwise restricted to resale. Certain of these securities may be resold in transactions exempt from registration, normally to qualified institutional buyers. These securities have been deemed liquid by the Specialist Manager. |
| (c) | Represents a security purchased under Rule 144A or Section 4(2) and is exempt from registration under the Securities Act of 1933, as amended, or is otherwise restricted to resale. This security may be resold in transactions exempt from registration, normally to qualified institutional buyers. This security has been deemed illiquid by the Specialist Manager and represents 0.41% of the Portfolio’s net assets. |
| (d) | This security has been deemed illiquid by the Specialist Manager and represent 0.02% of the Portfolio. |
| (e) | Rate disclosed represents effective yield at purchase. |
| (f) | Variable Rate Security. The rate reflected is the rate in effect on June 30, 2015. |
| (g) | The principal amount is disclosed in local currency and the value is disclosed in U.S. Dollars. |
| (h) | All or part of this security has been pledged as collateral for derivative instruments held by the Portfolio. |
| (i) | Principal amount is disclosed in British Pound Sterling. |
ADR — American Depositary Receipt
GDR — Global Depositary Receipt
LIBOR — Represents the London InterBank Offered Rate
MTN — Medium Term Note
NVDR — Non-Voting Depository Receipt
See accompanying notes to financial statements.
100
HC CAPITAL TRUST
The Commodity Returns Strategy Portfolio
Portfolio of Investments (continued) — June 30, 2015
The following table reflects the percentage of total net assets of the Portfolio attributable to each Specialist Manager, see Note 3 in the Notes to Financial Statements.
| | | | | | | | | | | | | | | | | | | | |
The Commodity Returns Strategy Portfolio | | Mellon Capital
Management
Corporation | | | Parametric
Portfolio
Associates, LLC | | | Pacific
Investment
Management
Company, LLC | | | Wellington
Management
Company, LLP | | | Total | |
Common Stocks | | | 31.94 | % | | | — | | | | — | | | | 29.87 | % | | | 61.81 | % |
Preferred Stocks | | | 0.33 | % | | | — | | | | — | | | | — | | | | 0.33 | % |
Rights | | | — | | | | — | | | | — | | | | — | | | | 0.00 | % |
Commercial Papers | | | — | | | | — | | | | 0.11 | % | | | — | | | | 0.11 | % |
Corporate Bonds | | | — | | | | — | | | | 1.53 | % | | | — | | | | 1.53 | % |
Asset Backed Securities | | | — | | | | — | | | | 0.65 | % | | | — | | | | 0.65 | % |
Collateralized Mortgage Obligations | | | — | | | | — | | | | 0.71 | % | | | — | | | | 0.71 | % |
Certificates of Deposit | | | — | | | | — | | | | 0.12 | % | | | — | | | | 0.12 | % |
Global Bonds | | | — | | | | — | | | | 1.80 | % | | | — | | | | 1.80 | % |
U.S. Government Agency Securities | | | — | | | | — | | | | 0.99 | % | | | — | | | | 0.99 | % |
U.S. Treasury Obligations | | | — | | | | — | | | | 4.26 | % | | | — | | | | 4.26 | % |
Yankee Dollars | | | — | | | | — | | | | 1.95 | % | | | — | | | | 1.95 | % |
Time Deposits | | | — | | | | — | | | | 0.08 | % | | | 0.87 | % | | | 0.95 | % |
Mutual Funds | | | 0.56 | % | | | — | | | | — | | | | 0.04 | % | | | 0.60 | % |
Purchased Options | | | — | | | | — | | | | 0.00 | % | | | — | | | | 0.00 | % |
Repurchase Agreements | | | 0.44 | % | | | — | | | | 3.38 | % | | | 16.02 | % | | | 19.84 | % |
Other Assets | | | -0.23 | % | | | 3.05 | % | | | 0.79 | % | | | 0.74 | % | | | 4.35 | % |
| | | | | | | | | | | | | | | | | | | | |
Total Net Assets | | | 33.04 | % | | | 3.05 | % | | | 16.37 | % | | | 47.54 | % | | | 100.00 | % |
| | | | | | | | | | | | | | | | | | | | |
The following tables reflect the open derivative positions held by the Portfolio as of June 30, 2015.
Long/(Short) Futures
| | | | | | | | | | | | | | | | |
Number of
Contracts | | | Futures Contracts Positions^ | | Value
(000) | | | Expiration | | | Unrealized
Appreciation/
(Depreciation)
(000) | |
| | (23 | ) | | 10-Year U.S. Treasury Note Future | | $ | (2,902 | ) | | | 9/21/15 | | | $ | 3 | |
| | (19 | ) | | 30-Year U.S. Treasury Bond Future | | | (2,866 | ) | | | 9/21/15 | | | | 3 | |
| | (74 | ) | | 90-day Eurodollar Future | | | (18,401 | ) | | | 12/14/15 | | | | (8 | ) |
| | (37 | ) | | 90-day Eurodollar Future | | | (9,183 | ) | | | 3/14/16 | | | | (8 | ) |
| | (21 | ) | | 90-day Eurodollar Future | | | (5,201 | ) | | | 6/13/16 | | | | (5 | ) |
| | (2 | ) | | 90-day Eurodollar Future | | | (494 | ) | | | 9/19/16 | | | | — | |
| | (3 | ) | | 90-day Eurodollar Future | | | (740 | ) | | | 12/19/16 | | | | — | |
| | (10 | ) | | 90-day Eurodollar Future | | | (2,461 | ) | | | 3/13/17 | | | | (1 | ) |
| | 276 | | | Brent Crude Future* | | | 17,551 | | | | 7/16/15 | | | | (520 | ) |
| | 53 | | | Brent Crude Future* | | | 3,399 | | | | 8/14/15 | | | | (104 | ) |
| | 62 | | | Brent Crude Future* | | | 4,010 | | | | 9/15/15 | | | | 21 | |
| | 3 | | | Brent Crude Future* | | | 196 | | | | 10/15/15 | | | | (3 | ) |
| | 79 | | | Brent Crude Future* | | | 5,194 | | | | 11/13/15 | | | | 372 | |
| | (14 | ) | | Brent Crude Future* | | | (935 | ) | | | 1/29/16 | | | | (1 | ) |
| | 2 | | | Brent Crude Future* | | | 135 | | | | 4/29/16 | | | | — | |
| | (3 | ) | | Brent Crude Future* | | | (205 | ) | | | 7/29/16 | | | | 2 | |
| | 6 | | | Brent Crude Future* | | | 413 | | | | 10/31/16 | | | | (4 | ) |
| | (3 | ) | | Brent Crude Future* | | | (208 | ) | | | 1/31/17 | | | | 2 | |
| | (3 | ) | | Brent Crude Future* | | | (210 | ) | | | 4/28/17 | | | | 5 | |
| | (55 | ) | | Brent Crude Future* | | | (3,877 | ) | | | 10/31/17 | | | | (87 | ) |
| | (3 | ) | | Brent Crude Future* | | | (214 | ) | | | 4/30/18 | | | | 2 | |
| | 135 | | | Canadian Dollar Future | | | 10,797 | | | | 9/15/15 | | | | (149 | ) |
| | (11 | ) | | Cocoa Future* | | | (360 | ) | | | 9/15/15 | | | | (20 | ) |
See accompanying notes to financial statements.
101
HC CAPITAL TRUST
The Commodity Returns Strategy Portfolio
Portfolio of Investments (continued) — June 30, 2015
| | | | | | | | | | | | | | | | |
Number of
Contracts | | | Futures Contracts Positions^ | | Value
(000) | | | Expiration | | | Unrealized
Appreciation/
(Depreciation)
(000) | |
| | 11 | | | Cocoa Future* | | $ | 359 | | | | 12/15/15 | | | $ | 51 | |
| | 38 | | | Coffee ‘C’ Future* | | | 1,887 | | | | 9/18/15 | | | | (100 | ) |
| | 21 | | | Copper Future* | | | 1,373 | | | | 9/28/15 | | | | (33 | ) |
| | 70 | | | Corn Future* | | | 1,477 | | | | 9/14/15 | | | | 196 | |
| | 243 | | | Corn Future* | | | 5,243 | | | | 12/14/15 | | | | 332 | |
| | 65 | | | Cotton No.2 Future* | | | 2,207 | | | | 12/8/15 | | | | 76 | |
| | (17 | ) | | Crude Oil Option Future* | | | (28 | ) | | | 11/10/15 | | | | 47 | |
| | (17 | ) | | Crude Oil Option Future* | | | (156 | ) | | | 10/26/17 | | | | 49 | |
| | (1 | ) | | EIA Flat Tax On-Highway Diesel Swap Future* | | | (123 | ) | | | 7/31/15 | | | | (7 | ) |
| | (1 | ) | | EIA Flat Tax On-Highway Diesel Swap Future* | | | (124 | ) | | | 8/31/15 | | | | (8 | ) |
| | (1 | ) | | EIA Flat Tax On-Highway Diesel Swap Future* | | | (126 | ) | | | 9/30/15 | | | | (10 | ) |
| | (1 | ) | | EIA Flat Tax On-Highway Diesel Swap Future* | | | (125 | ) | | | 10/30/15 | | | | (10 | ) |
| | (1 | ) | | EIA Flat Tax On-Highway Diesel Swap Future* | | | (124 | ) | | | 11/30/15 | | | | (8 | ) |
| | (1 | ) | | EIA Flat Tax On-Highway Diesel Swap Future* | | | (124 | ) | | | 12/31/15 | | | | (8 | ) |
| | 160 | | | Electrolytic Copper Future* | | | 23,053 | | | | 9/14/15 | | | | (2,372 | ) |
| | 33 | | | E-Mini S&P 500 Future | | | 3,390 | | | | 9/18/15 | | | | (80 | ) |
| | (5 | ) | | Euro-Bund Future | | | (847 | ) | | | 9/8/15 | | | | (6 | ) |
| | 106 | | | Gas Oil Future* | | | 6,143 | | | | 9/10/15 | | | | 33 | |
| | (1 | ) | | Gas Oil Future* | | | (60 | ) | | | 6/10/16 | | | | 2 | |
| | 2 | | | Gas Oil Future* | | | 124 | | | | 12/12/16 | | | | (4 | ) |
| | (1 | ) | | Gas Oil Future* | | | (63 | ) | | | 6/12/17 | | | | 3 | |
| | 62 | | | Gasoline RBOB Future* | | | 5,337 | | | | 7/31/15 | | | | 159 | |
| | (14 | ) | | Gasoline RBOB Future* | | | (1,176 | ) | | | 8/31/15 | | | | (28 | ) |
| | (3 | ) | | Gasoline RBOB Future* | | | (223 | ) | | | 10/30/15 | | | | 2 | |
| | (25 | ) | | Gasoline RBOB Future* | | | (1,822 | ) | | | 11/30/15 | | | | (62 | ) |
| | 9 | | | Gasoline RBOB Future* | | | 659 | | | | 2/29/16 | | | | (2 | ) |
| | 337 | | | Gold 100 Oz Future* | | | 39,490 | | | | 8/27/15 | | | | (1,305 | ) |
| | (11 | ) | | Gold 100 Oz Future* | | | (1,291 | ) | | | 12/29/15 | | | | 14 | |
| | 1 | | | Gulf Coast Ultra Low Sulfur Diesel CS Future* | | | 76 | | | | 7/31/15 | | | | 9 | |
| | 1 | | | Gulf Coast Ultra Low Sulfur Diesel CS Future* | | | 77 | | | | 8/31/15 | | | | 10 | |
| | 1 | | | Gulf Coast Ultra Low Sulfur Diesel CS Future* | | | 79 | | | | 9/30/15 | | | | 11 | |
| | 1 | | | Gulf Coast Ultra Low Sulfur Diesel CS Future* | | | 79 | | | | 10/30/15 | | | | 11 | |
| | 1 | | | Gulf Coast Ultra Low Sulfur Diesel CS Future* | | | 77 | | | | 11/30/15 | | | | 10 | |
| | 1 | | | Gulf Coast Ultra Low Sulfur Diesel CS Future* | | | 78 | | | | 12/31/15 | | | | 10 | |
| | 169 | | | Hard Red Winter Wheat Future* | | | 5,157 | | | | 9/14/15 | | | | 532 | |
| | 7 | | | Henry Hub Natural Gas Swap Future* | | | 57 | | | | 12/29/15 | | | | (16 | ) |
| | 7 | | | Henry Hub Natural Gas Swap Future* | | | 57 | | | | 1/27/16 | | | | (16 | ) |
| | 7 | | | Henry Hub Natural Gas Swap Future* | | | 56 | | | | 2/25/16 | | | | (17 | ) |
| | 7 | | | Henry Hub Natural Gas Swap Future* | | | 53 | | | | 3/29/16 | | | | (20 | ) |
| | 7 | | | Henry Hub Natural Gas Swap Future* | | | 53 | | | | 4/27/16 | | | | (20 | ) |
| | 7 | | | Henry Hub Natural Gas Swap Future* | | | 54 | | | | 5/26/16 | | | | (19 | ) |
| | 7 | | | Henry Hub Natural Gas Swap Future* | | | 55 | | | | 6/28/16 | | | | (18 | ) |
| | 7 | | | Henry Hub Natural Gas Swap Future* | | | 55 | | | | 7/27/16 | | | | (18 | ) |
| | 7 | | | Henry Hub Natural Gas Swap Future* | | | 55 | | | | 8/29/16 | | | | (18 | ) |
| | 7 | | | Henry Hub Natural Gas Swap Future* | | | 55 | | | | 9/28/16 | | | | (18 | ) |
| | 7 | | | Henry Hub Natural Gas Swap Future* | | | 57 | | | | 10/27/16 | | | | (16 | ) |
| | 7 | | | Henry Hub Natural Gas Swap Future* | | | 60 | | | | 11/28/16 | | | | (13 | ) |
| | 8 | | | Henry Hub Natural Gas Swap Future* | | | 71 | | | | 12/28/16 | | | | (15 | ) |
See accompanying notes to financial statements.
102
HC CAPITAL TRUST
The Commodity Returns Strategy Portfolio
Portfolio of Investments (continued) — June 30, 2015
| | | | | | | | | | | | | | | | |
Number of
Contracts | | | Futures Contracts Positions^ | | Value
(000) | | | Expiration | | | Unrealized
Appreciation/
(Depreciation)
(000) | |
| | 8 | | | Henry Hub Natural Gas Swap Future* | | $ | 70 | | | | 1/27/17 | | | $ | (16 | ) |
| | 8 | | | Henry Hub Natural Gas Swap Future* | | | 69 | | | | 2/24/17 | | | | (17 | ) |
| | 8 | | | Henry Hub Natural Gas Swap Future* | | | 64 | | | | 3/29/17 | | | | (21 | ) |
| | 8 | | | Henry Hub Natural Gas Swap Future* | | | 64 | | | | 4/26/17 | | | | (22 | ) |
| | 8 | | | Henry Hub Natural Gas Swap Future* | | | 65 | | | | 5/26/17 | | | | (21 | ) |
| | 8 | | | Henry Hub Natural Gas Swap Future* | | | 66 | | | | 6/28/17 | | | | (20 | ) |
| | 8 | | | Henry Hub Natural Gas Swap Future* | | | 66 | | | | 7/27/17 | | | | (20 | ) |
| | 8 | | | Henry Hub Natural Gas Swap Future* | | | 66 | | | | 8/29/17 | | | | (20 | ) |
| | 8 | | | Henry Hub Natural Gas Swap Future* | | | 66 | | | | 9/27/17 | | | | (20 | ) |
| | 8 | | | Henry Hub Natural Gas Swap Future* | | | 68 | | | | 10/27/17 | | | | (18 | ) |
| | 8 | | | Henry Hub Natural Gas Swap Future* | | | 71 | | | | 11/28/17 | | | | (15 | ) |
| | 7 | | | Henry Hub Natural Gas Swap Future* | | | 64 | | | | 12/27/17 | | | | (13 | ) |
| | 7 | | | Henry Hub Natural Gas Swap Future* | | | 64 | | | | 1/29/18 | | | | (14 | ) |
| | 7 | | | Henry Hub Natural Gas Swap Future* | | | 63 | | | | 2/26/18 | | | | (15 | ) |
| | 7 | | | Henry Hub Natural Gas Swap Future* | | | 57 | | | | 3/27/18 | | | | (20 | ) |
| | 7 | | | Henry Hub Natural Gas Swap Future* | | | 57 | | | | 4/26/18 | | | | (20 | ) |
| | 7 | | | Henry Hub Natural Gas Swap Future* | | | 58 | | | | 5/29/18 | | | | (20 | ) |
| | 7 | | | Henry Hub Natural Gas Swap Future* | | | 59 | | | | 6/27/18 | | | | (19 | ) |
| | 7 | | | Henry Hub Natural Gas Swap Future* | | | 59 | | | | 7/27/18 | | | | (19 | ) |
| | 7 | | | Henry Hub Natural Gas Swap Future* | | | 59 | | | | 8/29/18 | | | | (19 | ) |
| | 7 | | | Henry Hub Natural Gas Swap Future* | | | 59 | | | | 9/26/18 | | | | (19 | ) |
| | 7 | | | Henry Hub Natural Gas Swap Future* | | | 60 | | | | 10/29/18 | | | | (17 | ) |
| | 7 | | | Henry Hub Natural Gas Swap Future* | | | 63 | | | | 11/28/18 | | | | (15 | ) |
| | (27 | ) | | ICE WTI Crude Future* | | | (1,641 | ) | | | 11/19/15 | | | | 26 | |
| | 27 | | | ICE WTI Crude Future* | | | 1,672 | | | | 5/19/16 | | | | (12 | ) |
| | 12 | | | Lean Hogs Future* | | | 357 | | | | 8/14/15 | | | | (22 | ) |
| | 45 | | | Live Cattle Future* | | | 2,665 | | | | 8/31/15 | | | | (55 | ) |
| | 1 | | | LLS (Argus) VS WTI Spread Calendar Swap Future* | | | 3 | | | | 7/31/15 | | | | — | |
| | 1 | | | LLS (Argus) VS WTI Spread Calendar Swap Future* | | | 3 | | | | 8/31/15 | | | | — | |
| | 1 | | | LLS (Argus) VS WTI Spread Calendar Swap Future* | | | 3 | | | | 9/30/15 | | | | — | |
| | 3 | | | LLS (Argus) VS WTI Spread Calendar Swap Future* | | | 8 | | | | 10/30/15 | | | | — | |
| | 3 | | | LLS (Argus) VS WTI Spread Calendar Swap Future* | | | 8 | | | | 11/30/15 | | | | — | |
| | 3 | | | LLS (Argus) VS WTI Spread Calendar Swap Future* | | | 8 | | | | 12/31/15 | | | | — | |
| | 1 | | | LLS (Argus) VS WTI Spread Calendar Swap Future* | | | 3 | | | | 1/29/16 | | | | 1 | |
| | 1 | | | LLS (Argus) VS WTI Spread Calendar Swap Future* | | | 3 | | | | 2/29/16 | | | | 1 | |
| | 1 | | | LLS (Argus) VS WTI Spread Calendar Swap Future* | | | 3 | | | | 3/31/16 | | | | — | |
| | 1 | | | LLS (Argus) VS WTI Spread Calendar Swap Future* | | | 2 | | | | 4/29/16 | | | | — | |
| | 1 | | | LLS (Argus) VS WTI Spread Calendar Swap Future* | | | 2 | | | | 5/31/16 | | | | — | |
| | 1 | | | LLS (Argus) VS WTI Spread Calendar Swap Future* | | | 2 | | | | 6/30/16 | | | | — | |
| | 1 | | | LLS (Argus) VS WTI Spread Calendar Swap Future* | | | 3 | | | | 7/29/16 | | | | — | |
| | 1 | | | LLS (Argus) VS WTI Spread Calendar Swap Future* | | | 3 | | | | 8/31/16 | | | | — | |
| | 1 | | | LLS (Argus) VS WTI Spread Calendar Swap Future* | | | 3 | | | | 9/30/16 | | | | — | |
| | 1 | | | LLS (Argus) VS WTI Spread Calendar Swap Future* | | | 3 | | | | 10/31/16 | | | | 1 | |
| | 1 | | | LLS (Argus) VS WTI Spread Calendar Swap Future* | | | 3 | | | | 11/30/16 | | | | 1 | |
| | 1 | | | LLS (Argus) VS WTI Spread Calendar Swap Future* | | | 3 | | | | 12/30/16 | | | | 1 | |
| | 58 | | | LME Lead Future* | | | 2,549 | | | | 9/14/15 | | | | (368 | ) |
| | 27 | | | Mill Wheat Euro Future* | | | 312 | | | | 9/10/15 | | | | 34 | |
| | 49 | | | Mill Wheat Euro Future* | | | 570 | | | | 12/10/15 | | | | 45 | |
See accompanying notes to financial statements.
103
HC CAPITAL TRUST
The Commodity Returns Strategy Portfolio
Portfolio of Investments (continued) — June 30, 2015
| | | | | | | | | | | | | | | | |
Number of
Contracts | | | Futures Contracts Positions^ | | Value
(000) | | | Expiration | | | Unrealized
Appreciation/
(Depreciation)
(000) | |
| | 16 | | | Mill Wheat Euro Future* | | $ | 187 | | | | 3/10/16 | | | $ | 23 | |
| | 19 | | | Mini MSCI Emerging Markets Index Future* | | | 911 | | | | 9/18/15 | | | | (7 | ) |
| | 42 | | | Mini MSCI Emerging Markets Index Future* | | | 3,851 | | | | 9/18/15 | | | | (75 | ) |
| | 115 | | | Natural Gas Future* | | | 3,257 | | | | 7/29/15 | | | | (76 | ) |
| | 14 | | | Natural Gas Future* | | | 398 | | | | 8/27/15 | | | | 89 | |
| | (35 | ) | | Natural Gas Future* | | | (1,004 | ) | | | 9/28/15 | | | | 18 | |
| | (12 | ) | | Natural Gas Future* | | | (376 | ) | | | 11/25/15 | | | | (11 | ) |
| | 86 | | | Natural Gas Future* | | | 2,787 | | | | 12/29/15 | | | | (41 | ) |
| | (18 | ) | | Natural Gas Future* | | | (575 | ) | | | 2/25/16 | | | | 5 | |
| | 34 | | | Natural Gas Future* | | | 1,037 | | | | 3/29/16 | | | | (7 | ) |
| | (4 | ) | | Natural Gas Future* | | | (138 | ) | | | 2/24/17 | | | | (4 | ) |
| | 4 | | | Natural Gas Future* | | | 129 | | | | 3/29/17 | | | | 4 | |
| | 45 | | | New York Harbor USLD Future* | | | 3,572 | | | | 7/31/15 | | | | (119 | ) |
| | 10 | | | New York Harbor USLD Future* | | | 800 | | | | 8/31/15 | | | | 11 | |
| | 19 | | | New York Harbor USLD Future* | | | 1,562 | | | | 11/30/15 | | | | 52 | |
| | 2 | | | New York Harbor USLD Future* | | | 166 | | | | 2/29/16 | | | | (3 | ) |
| | (2 | ) | | New York Harbor USLD Future* | | | (165 | ) | | | 5/31/16 | | | | 3 | |
| | 48 | | | NYMEX Palladium Future* | | | 3,229 | | | | 9/28/15 | | | | (515 | ) |
| | 252 | | | NYMEX WTI Crude Future* | | | 14,986 | | | | 7/21/15 | | | | (366 | ) |
| | 100 | | | NYMEX WTI Crude Future* | | | 5,983 | | | | 8/20/15 | | | | 454 | |
| | (50 | ) | | NYMEX WTI Crude Future* | | | (3,005 | ) | | | 9/22/15 | | | | (44 | ) |
| | (6 | ) | | NYMEX WTI Crude Future* | | | (363 | ) | | | 10/20/15 | | | | (5 | ) |
| | 87 | | | NYMEX WTI Crude Future* | | | 5,288 | | | | 11/20/15 | | | | 331 | |
| | 4 | | | NYMEX WTI Crude Future* | | | 246 | | | | 2/22/16 | | | | 2 | |
| | 35 | | | NYMEX WTI Crude Future* | | | 2,167 | | | | 5/20/16 | | | | 2 | |
| | 4 | | | NYMEX WTI Crude Future* | | | 249 | | | | 8/22/16 | | | | 8 | |
| | 11 | | | NYMEX WTI Crude Future* | | | 689 | | | | 11/21/16 | | | | 3 | |
| | 3 | | | NYMEX WTI Crude Future* | | | 190 | | | | 5/22/17 | | | | (3 | ) |
| | 10 | | | NYMEX WTI Crude Future* | | | 643 | | | | 11/20/17 | | | | 4 | |
| | (11 | ) | | NYMEX WTI Crude Future* | | | (724 | ) | | | 11/19/18 | | | | (4 | ) |
| | 190 | | | Platinum Future* | | | 10,255 | | | | 10/28/15 | | | | 48 | |
| | 20 | | | Primary Aluminum Future* | | | 842 | | | | 9/14/15 | | | | (27 | ) |
| | 257 | | | Primary Aluminum Future* | | | 10,990 | | | | 12/14/15 | | | | (1,800 | ) |
| | (90 | ) | | Primary Aluminum Future* | | | (3,972 | ) | | | 12/19/16 | | | | 174 | |
| | 48 | | | Primary Nickel Future* | | | 3,443 | | | | 8/17/15 | | | | (228 | ) |
| | 17 | | | Primary Nickel Future* | | | 1,221 | | | | 9/14/15 | | | | (17 | ) |
| | 48 | | | Primary Nickel Future* | | | 3,461 | | | | 12/14/15 | | | | 73 | |
| | 6 | | | Red Spring Wheat Future* | | | 191 | | | | 9/14/15 | | | | 22 | |
| | 78 | | | S&P Toronto Stock Exchange 60 Index Future | | | 10,542 | | | | 9/17/15 | | | | (306 | ) |
| | 104 | | | Silver Future* | | | 8,102 | | | | 9/28/15 | | | | (310 | ) |
| | (6 | ) | | Soybean Future* | | | (311 | ) | | | 11/13/15 | | | | (5 | ) |
| | (9 | ) | | Soybean Future* | | | (469 | ) | | | 1/14/16 | | | | (23 | ) |
| | 24 | | | Soybean Future* | | | 1,240 | | | | 3/14/16 | | | | 80 | |
| | 9 | | | Soybean Future* | | | 456 | | | | 5/13/16 | | | | 13 | |
| | 15 | | | Soybean Meal Future* | | | 518 | | | | 12/14/15 | | | | 76 | |
| | 24 | | | Soybean Oil Future* | | | 491 | | | | 12/14/15 | | | | (6 | ) |
| | 3 | | | Soybean Oil Future* | | | 62 | | | | 3/14/16 | | | | 1 | |
| | 385 | | | Sugar #11 Future* | | | 5,377 | | | | 9/30/15 | | | | 116 | |
See accompanying notes to financial statements.
104
HC CAPITAL TRUST
The Commodity Returns Strategy Portfolio
Portfolio of Investments (continued) — June 30, 2015
| | | | | | | | | | | | | | | | |
Number of
Contracts | | | Futures Contracts Positions^ | | Value
(000) | | | Expiration | | | Unrealized
Appreciation/
(Depreciation)
(000) | |
| | (14 | ) | | Sugar #11 Future* | | $ | (216 | ) | | | 2/29/16 | | | $ | (6 | ) |
| | 95 | | | Wheat Future* | | | 2,925 | | | | 9/14/15 | | | | 570 | |
| | (18 | ) | | Wheat Future* | | | (560 | ) | | | 12/14/15 | | | | (89 | ) |
| | (6 | ) | | Wheat Future* | | | (188 | ) | | | 3/14/16 | | | | (30 | ) |
| | 6 | | | White Sugar Future* | | | 109 | | | | 9/15/15 | | | | 6 | |
| | 4 | | | White Sugar Future* | | | 73 | | | | 2/12/16 | | | | 2 | |
| | 18 | | | Zinc Future* | | | 896 | | | | 7/13/15 | | | | (69 | ) |
| | 131 | | | Zinc Future* | | | 6,545 | | | | 9/14/15 | | | | (291 | ) |
| | | | | | | | | | | | | | | | |
| | | | Net Unrealized Appreciation/(Depreciation) | | | | | | | | | | $ | (6,274 | ) |
| | | | | | | | | | | | | | | | |
Amounts designated as “—” are $0 or have been rounded to $0.
| ^ | Cash has been pledged as collateral for futures contracts held by the Portfolio. |
| * | All or a portion of these futures contracts are held by the wholly-owned subsidiaries of the Portfolio. See Note 2O in the Notes to Financial Statements for the basis of consolidation. |
Forward Currency Contracts
| | | | | | | | | | | | | | | | | | | | | | |
Contract
Amount
(Local Currency) | | | Currency | | Counterparty | | Settlement
Date | | | Settlement
Value
(000) | | | Value on
06/30/15
(000) | | | Unrealized
Appreciation/
(Depreciation)
(000) | |
| | | | Currencies Purchased | | | | | | | | | | | | | | | | | | |
| | 10,929,488 | | | Brazilian Real | | Deutsche Bank | | | 7/2/15 | | | $ | 3,537 | | | $ | 3,516 | | | $ | (21 | ) |
| | 2,744,526 | | | Brazilian Real | | Goldman Sachs | | | 7/2/15 | | | | 868 | | | | 883 | | | | 15 | |
| | 10,149,013 | | | Brazilian Real | | BNP Paribas | | | 8/4/15 | | | | 3,233 | | | | 3,223 | | | | (10 | ) |
| | 1,551,276 | | | Brazilian Real | | BNP Paribas | | | 7/2/15 | | | | 492 | | | | 499 | | | | 7 | |
| | 1,603,440 | | | Brazilian Real | | Deutsche Bank | | | 7/2/15 | | | | 510 | | | | 516 | | | | 6 | |
| | 125,000 | | | British Pound Sterling | | JPMorgan Chase | | | 8/4/15 | | | | 196 | | | | 196 | | | | — | |
| | 142,000 | * | | Canadian Dollar | | Goldman Sachs | | | 7/2/15 | | | | 114 | | | | 114 | | | | — | |
| | 1,983,000 | | | Euro | | Goldman Sachs | | | 7/2/15 | | | | 2,159 | | | | 2,210 | | | | 51 | |
| | 1,650,000 | | | Euro | | Goldman Sachs | | | 7/2/15 | | | | 1,870 | | | | 1,839 | | | | (31 | ) |
| | 117,000 | | | Euro | | Deutsche Bank | | | 7/2/15 | | | | 133 | | | | 130 | | | | (3 | ) |
| | 62,000 | * | | Euro | | BNP Paribas | | | 8/4/15 | | | | 69 | | | | 69 | | | | — | |
| | 35,000 | * | | Euro | | Standard Chartered | | | 7/2/15 | | | | 39 | | | | 39 | | | | — | |
| | 840,000 | * | | Euro | | Deutsche Bank | | | 8/4/15 | | | | 938 | | | | 937 | | | | (1 | ) |
| | 1,918,000 | | | Euro | | JPMorgan Chase | | | 7/2/15 | | | | 2,106 | | | | 2,138 | | | | 32 | |
| | 831,000 | * | | Euro | | Goldman Sachs | | | 7/2/15 | | | | 907 | | | | 926 | | | | 19 | |
| | 75,440,409 | | | Indian Rupee | | JPMorgan Chase | | | 7/24/15 | | | | 1,170 | | | | 1,179 | | | | 9 | |
| | 94,547,645 | | | Indian Rupee | | Barclays Bank | | | 7/24/15 | | | | 1,490 | | | | 1,478 | | | | (12 | ) |
| | 3,811,000 | | | Indian Rupee | | Goldman Sachs | | | 8/24/15 | | | | 59 | | | | 59 | | | | — | |
| | | | | | | | | | | | | | | | | | | | | | |
| | | | Total Currencies Purchased | | | | | | $ | 19,890 | | | $ | 19,951 | | | $ | 61 | |
| | | | | | | | | | | | | | | | | | | | | | |
| | | | Currencies Sold | | | | | | | | | | | | | | | | | | |
| | 2,060,250 | | | Brazilian Real | | Deutsche Bank | | | 7/2/15 | | | $ | 670 | | | $ | 663 | | | $ | 7 | |
| | 1,431,086 | | | Brazilian Real | | Deutsche Bank | | | 7/2/15 | | | | 467 | | | | 460 | | | | 7 | |
| | 304,465 | | | Brazilian Real | | Credit Suisse | | | 7/2/15 | | | | 99 | | | | 98 | | | | 1 | |
| | 2,274,147 | | | Brazilian Real | | Goldman Sachs | | | 7/2/15 | | | | 738 | | | | 732 | | | | 6 | |
| | 11,036,140 | | | Brazilian Real | | JPMorgan Chase | | | 4/4/16 | | | | 3,371 | | | | 3,235 | | | | 136 | |
| | 10,758,783 | | | Brazilian Real | | BNP Paribas | | | 7/2/15 | | | | 3,470 | | | | 3,461 | | | | 9 | |
| | 1,959,000 | | | British Pound Sterling | | JPMorgan Chase | | | 7/2/15 | | | | 3,008 | | | | 3,078 | | | | (70 | ) |
| | 1,959,000 | | | British Pound Sterling | | Deutsche Bank | | | 8/4/15 | | | | 3,081 | | | | 3,077 | | | | 4 | |
See accompanying notes to financial statements.
105
HC CAPITAL TRUST
The Commodity Returns Strategy Portfolio
Portfolio of Investments (continued) — June 30, 2015
| | | | | | | | | | | | | | | | | | | | | | |
Contract
Amount
(Local Currency) | | | Currency | | Counterparty | | Settlement
Date | | | Settlement
Value
(000) | | | Value on
06/30/15
(000) | | | Unrealized
Appreciation/
(Depreciation)
(000) | |
| | 177,000 | * | | Canadian Dollar | | Goldman Sachs | | | 7/2/15 | | | $ | 142 | | | $ | 142 | | | $ | — | |
| | 735,000 | | | Euro | | JPMorgan Chase | | | 8/4/15 | | | | 823 | | | | 820 | | | | 3 | |
| | 22,739,000 | | | Euro | | Goldman Sachs | | | 7/2/15 | | | | 24,859 | | | | 25,348 | | | | (489 | ) |
| | 584,000 | * | | Euro | | BNP Paribas | | | 7/2/15 | | | | 663 | | | | 651 | | | | 12 | |
| | 17,655,000 | | | Euro | | Goldman Sachs | | | 8/4/15 | | | | 19,611 | | | | 19,690 | | | | (79 | ) |
| | 1,530,000 | | | Euro | | Goldman Sachs | | | 8/4/15 | | | | 1,714 | | | | 1,706 | | | | 8 | |
| | 26,000 | * | | Euro | | Goldman Sachs | | | 7/2/15 | | | | 29 | | | | 29 | | | | — | |
| | 5,883,000 | | | Mexican Peso | | Barclays Bank | | | 7/7/15 | | | | 382 | | | | 374 | | | | 8 | |
| | 9,889,000 | | | Mexican Peso | | JPMorgan Chase | | | 7/7/15 | | | | 648 | | | | 629 | | | | 19 | |
| | 54,792,628 | | | Mexican Peso | | Barclays Bank | | | 9/30/15 | | | | 3,491 | | | | 3,464 | | | | 27 | |
| | 5,633,867 | | | Mexican Peso | | BNP Paribas | | | 7/7/15 | | | | 363 | | | | 358 | | | | 5 | |
| | 847,000 | | | Mexican Peso | | Deutsche Bank | | | 7/7/15 | | | | 56 | | | | 54 | | | | 2 | |
| | 2,660,000 | | | New Zealand Dollar | | BNP Paribas | | | 7/2/15 | | | | 1,895 | | | | 1,802 | | | | 93 | |
| | | | | | | | | | | | | | | | | | | | | | |
| | | | Total Currencies Sold | | | | | | $ | 69,580 | | | $ | 69,871 | | | $ | (291 | ) |
| | | | | | | | | | | | | | | | | | | | | | |
| | | | Net Unrealized/Appreciation(Depreciation) | | | | | | | | | | | | | | $ | (230 | ) |
| | | | | | | | | | | | | | | | | | | | | | |
Amounts designated as “—” are $0 or has been rounded to $0.
| * | All or a portion of these forward currency contracts are held by the wholly-owned subsidiaries of the Portfolio. See Note 2O in the Notes to Financial Statements for the basis of consolidation. |
Option Contracts
Over-the-counter options purchased as of June 30, 2015 were as follows:
| | | | | | | | | | | | | | | | | | | | | | | | | | | | |
Description | | Counterparty | | Put/
Call | | Exercise
Price | | | Expiration
Date | | | Number of
Contracts | | | Cost
(000) | | | Value
(000) | | | Unrealized
Appreciation/
(Depreciation)
(000) | |
Crude Oil Future* | | Goldman Sachs | | Put | | $ | 48 | | | | 11/17/15 | | | | 5 | | | $ | 18 | | | $ | 6 | | | $ | (12 | ) |
Natural Gas Future* | | BNP Paribas | | Put | | | 45 | | | | 12/30/15 | | | | 2,110 | | | | 5 | | | | 4 | | | | (1 | ) |
Natural Gas Future* | | BNP Paribas | | Put | | | 45 | | | | 10/29/15 | | | | 1,914 | | | | 5 | | | | 5 | | | | — | |
Natural Gas Future* | | BNP Paribas | | Put | | | 45 | | | | 11/27/15 | | | | 1,855 | | | | 3 | | | | 3 | | | | — | |
Live Cattle Option* | | Goldman Sachs | | Put | | | 140 | | | | 12/4/15 | | | | 2 | | | | 2 | | | | 1 | | | | (1 | ) |
| | | | | | | | | | | | | | | | | | | | | | | | | | | | |
Total | | | | | | | | | | | | | | | | | | $ | 33 | | | $ | 19 | | | $ | (14 | ) |
| | | | | | | | | | | | | | | | | | | | | | | | | | | | |
Over-the-counter options written as of June 30, 2015 were as follows:
| | | | | | | | | | | | | | | | | | | | | | | | | | | | |
Description | | Counterparty | | Put/
Call | | Exercise
Price | | | Expiration
Date | | | Number of
Contracts | | | Premium
(000) | | | Value
(000) | | | Unrealized
Appreciation/
(Depreciation)
(000) | |
EURUSD | | BNP Paribas | | Call | | $ | 1 | | | | 7/2/15 | | | | (620,000 | ) | | $ | (2 | ) | | $ | — | | | $ | 2 | |
EURUSD | | Barclays Bank | | Call | | | 1 | | | | 7/15/15 | | | | (940,000 | ) | | | (7 | ) | | | (2 | ) | | | 5 | |
EURUSD | | BNP Paribas | | Call | | | 1 | | | | 7/20/15 | | | | (1,606,000 | ) | | | (9 | ) | | | (2 | ) | | | 7 | |
Inflation Capital US Dollar US CPI Urban Consumers NSA Index Option | | Deutsche Bank | | Call | | | 3 | | | | 6/1/16 | | | | (50 | ) | | | — | | | | 1 | | | | 1 | |
Inflation Capital EUR Consumer NSA Index Option | | Goldman Sachs | | Call | | | 3 | | | | 6/22/35 | | | | (60 | ) | | | (27 | ) | | | (63 | ) | | | (36 | ) |
Crude Oil Brent* | | BNP Paribas | | Put | | | 59 | | | | 12/30/15 | | | | (2,000 | ) | | | (4 | ) | | | (6 | ) | | | (2 | ) |
Crude Oil Brent* | | BNP Paribas | | Put | | | 59 | | | | 10/29/15 | | | | (2,000 | ) | | | (4 | ) | | | (4 | ) | | | — | |
Crude Oil Brent* | | BNP Paribas | | Put | | | 59 | | | | 11/27/15 | | | | (2,000 | ) | | | (4 | ) | | | (5 | ) | | | (1 | ) |
Crude Oil Future* | | Goldman Sachs | | Put | | | 55 | | | | 11/10/15 | | | | (3 | ) | | | (13 | ) | | | (5 | ) | | | 8 | |
Crude Oil Option* | | Goldman Sachs | | Put | | | 54 | | | | 11/10/15 | | | | (2 | ) | | | (7 | ) | | | (3 | ) | | | 4 | |
EURUSD | | BNP Paribas | | Put | | | 1 | | | | 7/20/15 | | | | (1,606,000 | ) | | | (8 | ) | | | (22 | ) | | | (14 | ) |
See accompanying notes to financial statements.
106
HC CAPITAL TRUST
The Commodity Returns Strategy Portfolio
Portfolio of Investments (continued) — June 30, 2015
| | | | | | | | | | | | | | | | | | | | | | | | | | | | |
Description | | Counterparty | | Put/
Call | | Exercise
Price | | | Expiration
Date | | | Number of
Contracts | | | Premium
(000) | | | Value
(000) | | | Unrealized
Appreciation/
(Depreciation)
(000) | |
Inflation Capital US Dollar US CPI Urban Consumers NSA Index Option | | Deutsche Bank | | Put | | $ | — | | | | 1/11/18 | | | | (50 | ) | | $ | (5 | ) | | $ | (1 | ) | | $ | 4 | |
Inflation Capital US Dollar US CPI Urban Consumers NSA Index Option | | Deutsche Bank | | Put | | | — | | | | 1/22/18 | | | | (50 | ) | | | (5 | ) | | | (1 | ) | | | 4 | |
Inflation Capital US Dollar US CPI Urban Consumers NSA Index Option | | JPMorgan Chase | | Put | | | 4 | | | | 4/22/24 | | | | (60 | ) | | | (4 | ) | | | (2 | ) | | | 2 | |
Inflation Floor US Dollar US CPI Urban Consumers NSA Index Option | | JPMorgan Chase | | Put | | | — | | | | 3/24/20 | | | | (210 | ) | | | (24 | ) | | | (25 | ) | | | (1 | ) |
Inflation Capital US Dollar US CPI Urban Consumers NSA Index Option | | JPMorgan Chase | | Put | | | 4 | | | | 5/16/24 | | | | (20 | ) | | | (1 | ) | | | (1 | ) | | | — | |
Lean Hogs Option* | | Goldman Sachs | | Put | | | 56 | | | | 12/14/15 | | | | (5 | ) | | | (4 | ) | | | (3 | ) | | | 1 | |
Platgold* | | BNP Paribas | | Put | | | — | | | | 9/14/15 | | | | (100 | ) | | | (1 | ) | | | (1 | ) | | | — | |
Platgold Spread* | | Goldman Sachs | | Put | | | — | | | | 7/13/15 | | | | (300 | ) | | | (5 | ) | | | (9 | ) | | | (4 | ) |
| | | | | | | | | | | | | | | | | | | | | | | | | | | | |
Total | | | | | | | | | | | | | | | | | | $ | (134 | ) | | $ | (154 | ) | | $ | (20 | ) |
| | | | | | | | | | | | | | | | | | | | | | | | | | | | |
Exchange-traded options purchased as of June 30, 2015 were as follows:
| | | | | | | | | | | | | | | | | | | | | | | | | | |
Description | | Put/
Call | | Exercise
Price | | | Expiration
Date | | | Number of
Contracts | | | Cost
(000) | | | Value
(000) | | | Unrealized
Appreciation/
(Depreciation)
(000) | |
Brent Average Price Option* | | Call | | $ | 72 | | | | 1/29/16 | | | | 1 | | | $ | 3 | | | $ | 4 | | | $ | 1 | |
Brent Average Price Option* | | Call | | | 87 | | | | 1/29/16 | | | | 2 | | | | 3 | | | | 2 | | | | (1 | ) |
Brent Average Price Option* | | Call | | | 87 | | | | 2/29/16 | | | | 2 | | | | 3 | | | | 3 | | | | — | |
Brent Average Price Option* | | Call | | | 72 | | | | 2/29/16 | | | | 1 | | | | 3 | | | | 5 | | | | 2 | |
Brent Average Price Option* | | Call | | | 72 | | | | 3/31/16 | | | | 1 | | | | 3 | | | | 5 | | | | 2 | |
Brent Average Price Option* | | Call | | | 87 | | | | 3/31/16 | | | | 2 | | | | 3 | | | | 3 | | | | — | |
Crude Oil Future* | | Call | | | 145 | | | | 11/17/15 | | | | 5 | | | | 30 | | | | — | | | | (30 | ) |
Crude Oil Future* | | Call | | | 83 | | | | 12/15/15 | | | | 5 | | | | 6 | | | | 5 | | | | (1 | ) |
Euro-Bund Future | | Call | | | 154.50 | | | | 8/20/15 | | | | 12 | | | | 12 | | | | 12 | | | | — | |
Gold Future Option* | | Call | | | 2,000 | | | | 11/22/16 | | | | 19 | | | | 102 | | | | 7 | | | | (95 | ) |
Natural Gas Euro Option* | | Call | | | 4 | | | | 4/26/16 | | | | 22 | | | | 35 | | | | 38 | | | | 3 | |
Copper LME Option* | | Put | | | 5,800 | | | | 9/2/15 | | | | 16 | | | | 48 | | | | 86 | | | | 38 | |
Corn Future Option* | | Put | | | 350 | | | | 8/21/15 | | | | 202 | | | | 29 | | | | 14 | | | | (15 | ) |
Corn Future Option* | | Put | | | 340 | | | | 11/20/15 | | | | 20 | | | | 8 | | | | 3 | | | | (5 | ) |
Corn Future Option* | | Put | | | 350 | | | | 11/20/15 | | | | 94 | | | | 27 | | | | 16 | | | | (11 | ) |
Crude Oil Future* | | Put | | | 50 | | | | 9/17/15 | | | | 35 | | | | 68 | | | | 26 | | | | (42 | ) |
Crude Oil Future* | | Put | | | 48 | | | | 11/17/15 | | | | 17 | | | | 56 | | | | 20 | | | | (36 | ) |
IMM EUR Future Option | | Put | | | 99 | | | | 12/14/15 | | | | 10 | | | | 1 | | | | 1 | | | | — | |
Wheat Future Option* | | Put | | | 495 | | | | 7/24/15 | | | | 8 | | | | 1 | | | | — | | | | (1 | ) |
| | | | | | | | | | | | | | | | | | | | | | | | | | |
Total | | | | | | | | | | | | | | | | $ | 441 | | | $ | 250 | | | $ | (191 | ) |
| | | | | | | | | | | | | | | | | | | | | | | | | | |
See accompanying notes to financial statements.
107
HC CAPITAL TRUST
The Commodity Returns Strategy Portfolio
Portfolio of Investments (continued) — June 30, 2015
Exchange-traded options written as of June 30, 2015 were as follows:
| | | | | | | | | | | | | | | | | | | | | | | | | | |
Description | | Put/
Call | | Exercise
Price | | | Expiration
Date | | | Number of
Contracts | | | Premium
(000) | | | Value
(000) | | | Unrealized
Appreciation/
(Depreciation)
(000) | |
10-Year USD Future Option | | Call | | $ | 127 | | | | 8/21/15 | | | | (12 | ) | | $ | (8 | ) | | $ | (10 | ) | | $ | (2 | ) |
Crude Oil Future* | | Call | | | — | | | | 7/20/15 | | | | (7 | ) | | | (1 | ) | | | — | | | | 1 | |
Crude Oil Future* | | Call | | | — | | | | 7/20/15 | | | | (3 | ) | | | (1 | ) | | | — | | | | 1 | |
Crude Oil Future* | | Call | | | — | | | | 8/19/15 | | | | (7 | ) | | | (1 | ) | | | (1 | ) | | | — | |
Crude Oil Future* | | Call | | | — | | | | 8/19/15 | | | | (3 | ) | | | (1 | ) | | | — | | | | 1 | |
Crude Oil Future* | | Call | | | — | | | | 9/17/15 | | | | (35 | ) | | | (53 | ) | | | (21 | ) | | | 32 | |
Crude Oil Future* | | Call | | | — | | | | 9/21/15 | | | | (3 | ) | | | — | | | | — | | | | — | |
Crude Oil Future* | | Call | | | — | | | | 9/21/15 | | | | (3 | ) | | | (1 | ) | | | — | | | | 1 | |
Crude Oil Future* | | Call | | | — | | | | 9/21/15 | | | | (7 | ) | | | (1 | ) | | | (1 | ) | | | — | |
Crude Oil Future* | | Call | | | — | | | | 10/19/15 | | | | (3 | ) | | | — | | | | — | | | | — | |
Crude Oil Future* | | Call | | | — | | | | 10/19/15 | | | | (3 | ) | | | (1 | ) | | | (1 | ) | | | — | |
Crude Oil Future* | | Call | | | — | | | | 10/19/15 | | | | (7 | ) | | | (1 | ) | | | (1 | ) | | | — | |
Crude Oil Future* | | Call | | | — | | | | 11/19/15 | | | | (7 | ) | | | (1 | ) | | | (2 | ) | | | (1 | ) |
Crude Oil Future* | | Call | | | — | | | | 11/19/15 | | | | (3 | ) | | | — | | | | — | | | | — | |
Crude Oil Future* | | Call | | | — | | | | 11/19/15 | | | | (3 | ) | | | (1 | ) | | | (1 | ) | | | — | |
Euro-Bund Future | | Call | | | 147 | | | | 8/20/15 | | | | (12 | ) | | | (8 | ) | | | (5 | ) | | | 3 | |
Gasoline RBOB Option* | | Call | | | 215 | | | | 11/24/15 | | | | (5 | ) | | | (8 | ) | | | (8 | ) | | | — | |
Natural Gas Euro Option* | | Call | | | 3 | | | | 10/27/15 | | | | (22 | ) | | | (25 | ) | | | (25 | ) | | | — | |
Natural Gas Option* | | Call | | | 3 | | | | 7/28/15 | | | | (6 | ) | | | (2 | ) | | | (3 | ) | | | (1 | ) |
NY Harbour ULSD Asia Option* | | Call | | | 2 | | | | 1/29/16 | | | | (1 | ) | | | (4 | ) | | | (5 | ) | | | (1 | ) |
NY Harbour ULSD Asia Option* | | Call | | | 3 | | | | 1/29/16 | | | | (2 | ) | | | (4 | ) | | | (3 | ) | | | 1 | |
NY Harbour ULSD Asia Option* | | Call | | | 3 | | | | 2/29/16 | | | | (2 | ) | | | (4 | ) | | | (3 | ) | | | 1 | |
NY Harbour ULSD Asia Option* | | Call | | | 2 | | | | 2/29/16 | | | | (1 | ) | | | (5 | ) | | | (5 | ) | | | — | |
NY Harbour ULSD Asia Option* | | Call | | | 2 | | | | 3/31/16 | | | | (1 | ) | | | (4 | ) | | | (6 | ) | | | (2 | ) |
NY Harbour ULSD Asia Option* | | Call | | | 3 | | | | 3/31/16 | | | | (2 | ) | | | (4 | ) | | | (4 | ) | | | — | |
Soybean Future* | | Call | | | 980 | | | | 7/24/15 | | | | (9 | ) | | | (4 | ) | | | (33 | ) | | | (29 | ) |
WTI Brent Future* | | Call | | | — | | | | 7/15/15 | | | | (6 | ) | | | (2 | ) | | | (3 | ) | | | (1 | ) |
10-Year USD Future Option | | Put | | | 124 | | | | 8/21/15 | | | | (12 | ) | | | (10 | ) | | | (5 | ) | | | 5 | |
Crude Oil Brent Option* | | Put | | | 58 | | | | 12/31/15 | | | | (333 | ) | | | (1 | ) | | | (1 | ) | | | — | |
Crude Oil Brent Option* | | Put | | | 58 | | | | 10/30/15 | | | | (333 | ) | | | (1 | ) | | | (1 | ) | | | — | |
Crude Oil Brent Option* | | Put | | | 58 | | | | 11/30/15 | | | | (333 | ) | | | (1 | ) | | | (1 | ) | | | — | |
Crude Oil Future* | | Put | | | — | | | | 7/20/15 | | | | (7 | ) | | | (1 | ) | | | (1 | ) | | | — | |
Crude Oil Future* | | Put | | | — | | | | 7/20/15 | | | | (3 | ) | | | — | | | | — | | | | — | |
Crude Oil Future* | | Put | | | — | | | | 8/19/15 | | | | (7 | ) | | | (1 | ) | | | (1 | ) | | | — | |
Crude Oil Future* | | Put | | | — | | | | 8/19/15 | | | | (3 | ) | | | — | | | | — | | | | — | |
Crude Oil Future* | | Put | | | — | | | | 9/21/15 | | | | (7 | ) | | | (1 | ) | | | (1 | ) | | | — | |
Crude Oil Future* | | Put | | | — | | | | 9/21/15 | | | | (3 | ) | | | — | | | | — | | | | — | |
Crude Oil Future* | | Put | | | — | | | | 9/21/15 | | | | (3 | ) | | | — | | | | — | | | | — | |
Crude Oil Future* | | Put | | | — | | | | 10/19/15 | | | | (3 | ) | | | — | | | | — | | | | — | |
Crude Oil Future* | | Put | | | — | | | | 10/19/15 | | | | (3 | ) | | | — | | | | — | | | | — | |
Crude Oil Future* | | Put | | | — | | | | 10/19/15 | | | | (2 | ) | | | — | | | | — | | | | — | |
Crude Oil Future* | | Put | | | 70 | | | | 11/17/15 | | | | (5 | ) | | | (37 | ) | | | (54 | ) | | | (17 | ) |
Crude Oil Future* | | Put | | | — | | | | 11/19/15 | | | | (3 | ) | | | — | | | | — | | | | — | |
Crude Oil Future* | | Put | | | — | | | | 11/19/15 | | | | (12 | ) | | | (2 | ) | | | (1 | ) | | | 1 | |
Crude Oil Future* | | Put | | | — | | | | 11/19/15 | | | | (3 | ) | | | — | | | | — | | | | — | |
Euro-Bund Fund | | Put | | | 157.50 | | | | 8/21/15 | | | | (12 | ) | | | (4 | ) | | | (4 | ) | | | — | |
Natural Gas Option* | | Put | | | 3 | | | | 7/28/15 | | | | (4 | ) | | | (2 | ) | | | (1 | ) | | | 1 | |
Soybean Future* | | Put | | | 880 | | | | 7/24/15 | | | | (9 | ) | | | (4 | ) | | | — | | | | 4 | |
Wheat Future Option* | | Put | | | 475 | | | | 7/24/15 | | | | (8 | ) | | | (3 | ) | | | — | | | | 3 | |
Wheat Future Option* | | Put | | | 460 | | | | 11/20/15 | | | | (15 | ) | | | (8 | ) | | | (2 | ) | | | 6 | |
WTI Brent Future* | | Put | | | — | | | | 7/15/15 | | | | (6 | ) | | | (3 | ) | | | — | | | | 3 | |
| | | | | | | | | | | | | | | | | | | | | | | | | | |
Total | | | | | | | | | | | | | | | | $ | (224 | ) | | $ | (214 | ) | | $ | 10 | |
| | | | | | | | | | | | | | | | | | | | | | | | | | |
| * | All or a portion of these forward currency contracts are held by the wholly-owned subsidiaries of the Portfolio. See Note 2O in the Notes to Financial Statements for the basis of consolidation. |
See accompanying notes to financial statements.
108
HC CAPITAL TRUST
The Commodity Returns Strategy Portfolio
Portfolio of Investments (continued) — June 30, 2015
Over-the-counter swaptions written as of June 30, 2015 were as follows:
| | | | | | | | | | | | | | | | | | | | | | | | | | | | |
Description | | Counterparty | | Put/
Call | | Exercise
Price | | | Expiration
Date | | | Notional
Amount
(000) | | | Premium
(000) | | | Value
(000) | | | Unrealized
Appreciation/
(Depreciation)
(000) | |
10-Year Interest Rate, Pay 6-Month GBP LIBOR | | JPMorgan Chase | | Call | | $ | 1.9000 | | | | 9/9/15 | | | $ | 80 | | | $ | (8 | ) | | $ | (6 | ) | | $ | 2 | |
10-Year Interest Rate, Pay 6-Month GBP LIBOR | | Goldman Sachs | | Call | | | 1.7500 | | | | 8/20/25 | | | | 70 | | | | (6 | ) | | | (2 | ) | | | 4 | |
10-Year Interest Rate, Pay 6-Month USD LIBOR | | Goldman Sachs | | Call | | | 2.9100 | | | | 9/14/15 | | | | 510 | | | | (20 | ) | | | (18 | ) | | | 2 | |
5-Year Interest Rate, Pay 6-Month USD LIBOR | | JPMorgan Chase | | Call | | | 2.9100 | | | | 9/14/15 | | | | 330 | | | | (10 | ) | | | (10 | ) | | | — | |
S&P GSCI Natural Gas Official Close Index* | | Goldman Sachs | | Call | | | 1.1025 | | | | 8/6/15 | | | | 600 | | | | (1 | ) | | | (1 | ) | | | — | |
S&P GSCI Copper Official Close Index* | | Goldman Sachs | | Call | | | 0.3600 | | | | 7/9/15 | | | | 600 | | | | (2 | ) | | | — | | | | 2 | |
10-Year Interest Rate, Pay 6-Month GBP LIBOR | | Goldman Sachs | | Put | | | 2.4000 | | | | 8/20/25 | | | | 70 | | | | (6 | ) | | | (6 | ) | | | — | |
10-Year Interest Rate, Pay 6-Month USD LIBOR | | Goldman Sachs | | Put | | | 2.4000 | | | | 7/15/15 | | | | 430 | | | | (15 | ) | | | (47 | ) | | | (32 | ) |
5-Year Interest Rate, Pay 6-Month USD LIBOR | | Deutsche Bank | | Put | | | 1.9500 | | | | 7/13/15 | | | | 1,060 | | | | (37 | ) | | | (10 | ) | | | 27 | |
| | | | | | | | | | | | | | | | | | | | | | | | | | | | |
Total | | | | | | | | | | | | | | | | | | $ | (105 | ) | | $ | (100 | ) | | $ | 5 | |
| | | | | | | | | | | | | | | | | | | | | | | | | | | | |
| * | All or a portion of these forward currency contracts are held by the wholly-owned subsidiaries of the Portfolio. See Note 2O in the Notes to Financial Statements for the basis of consolidation. |
Total Return Swap Agreements
| | | | | | | | | | | | | | | | |
Underlying Reference | | Counterparty | | Expiration
Date | | Notional
Amount
(000) | | | Amount at
Value
(000) | | | Unrealized
Appreciation/
(Depreciation)
(000) | |
S&P GSCI Agricultural Index* | | Goldman Sachs | | 2/26/16 | | $ | 1,378 | | | $ | (68 | ) | | $ | (68 | ) |
S&P GSCI Agricultural Index* | | Goldman Sachs | | 5/31/16 | | | 707 | | | | (35 | ) | | | (35 | ) |
S&P GSCI Grains Index* | | Barclays Bank | | 2/26/16 | | | 1,713 | | | | 341 | | | | 341 | |
S&P GSCI Grains Index* | | Barclays Bank | | 5/31/16 | | | 194 | | | | 39 | | | | 39 | |
| | | | | | | | | | | | | | | | |
| | | | | | | | | | $ | 277 | | | $ | 277 | |
| | | | | | | | | | | | | | | | |
Interest Rate Swap Agreements
| | | | | | | | | | | | | | | | | | | | | | | | |
Pay/
Receive
Floating
Rate | | Floating Rate Index | | Fixed
Rate | | Expiration
Date | | | Counterparty | | Notional
Amount
(000) | | Swap
Premiums
Paid/
(Received) | | | Amount at
Value
(000) | | | Unrealized
Appreciation/
(Depreciation)
(000) | |
| Pay | | Brazil CETIP | | 13.03% | | | 1/2/18 | | | BNP Paribas | | 11,500 BRL | | | — | | | | (2 | ) | | | (2 | ) |
| Pay | | Brazil CETIP | | 13.03% | | | 1/2/18 | | | Deutsche Bank | | 9,700 BRL | | | (5 | ) | | | (2 | ) | | | 3 | |
| Pay | | Brazil CETIP | | 13.03% | | | 1/2/18 | | | Barclays Bank | | 3,799 BRL | | | (1 | ) | | | (1 | ) | | | — | |
| Pay | | Brazil CETIP | | 13.03% | | | 1/2/18 | | | JPMorgan Chase Bank | | 6,000 BRL | | | (8 | ) | | | (1 | ) | | | 7 | |
Pay
| | U.S. CPI Urban Consumers NSA | | 2.50% | | | 7/15/22 | | | Deutsche Bank | | 500 USD | | | 3 | | | | (43 | ) | | | (46 | ) |
| Pay | | United Kingdom RPI Index | | 3.32% | | | 5/15/30 | | | Goldman Sachs | | 300 GBP | | | — | | | | (2 | ) | | | (2 | ) |
| Pay | | United Kingdom RPI Index | | 3.40% | | | 6/15/30 | | | JPMorgan Chase Bank | | 4,000 GBP | | | (2 | ) | | | 26 | | | | 28 | |
| Pay | | United Kingdom RPI Index | | 3.55% | | | 12/11/44 | | | Deutsche Bank | | 1,000 GBP | | | 3 | | | | 66 | | | | 63 | |
| Pay | | United Kingdom RPI Index | | 3.53% | | | 12/15/44 | | | JPMorgan Chase Bank | | 100 GBP | | | — | | | | 5 | | | | 5 | |
| | | | | | | | | | | | | | | | | | | | | | | | |
| | | | | | | | | | | | | | $ | (10 | ) | | $ | 46 | | | $ | 56 | |
| | | | | | | | | | | | | | | | | | | | | | | | |
See accompanying notes to financial statements.
109
HC CAPITAL TRUST
The Commodity Returns Strategy Portfolio
Portfolio of Investments (continued) — June 30, 2015
Centrally Cleared Interest Rate Swap Agreements
| | | | | | | | | | | | | | | | | | | | | | |
Pay/
Receive
Floating
Rate | | Floating Rate Index | | Fixed
Rate | | Expiration
Date | | | Notional
Amount
(000) | | Swap
Premiums
Paid/
(Received) | | | Amount at
Value
(000) | | | Unrealized
Appreciation/
(Depreciation)
(000) | |
| Receive | | 3-Month U.S. Dollar LIBOR BBA | | 0.75% | | | 6/18/16 | | | 10,300 USD | | | (9 | ) | | | (25 | ) | | | (16 | ) |
| Receive | | MXN INTERBANK TIIE 28 DAY | | 4.04% | | | 2/3/17 | | | 30,000 MXN | | | 8 | | | | (2 | ) | | | (10 | ) |
| Receive | | 6-Month GBP LIBOR BBA | | 1.25% | | | 6/17/17 | | | 2,500 GBP | | | (7 | ) | | | (11 | ) | | | (4 | ) |
| Receive | | 3-Month U.S. Dollar LIBOR BBA | | 1.50% | | | 12/16/17 | | | 9,600 USD | | | (35 | ) | | | (51 | ) | | | (16 | ) |
| Pay | | MXN INTERBANK TIIE 28 DAY | | 6.35% | | | 9/1/23 | | | 5,000 MXN | | | (8 | ) | | | 7 | | | | 15 | |
| Pay | | MXN INTERBANK TIIE 28 DAY | | 6.35% | | | 9/1/23 | | | 12,000 MXN | | | 44 | | | | 12 | | | | (32 | ) |
| Receive | | 6-Month EUR EURIBOR BBA | | 0.75% | | | 9/16/25 | | | 3,200 EUR | | | (15 | ) | | | 159 | | | | 174 | |
| Receive | | 6-Month GBP LIBOR BBA | | 2.00% | | | 9/16/25 | | | 2,040 GBP | | | 80 | | | | 62 | | | | (18 | ) |
| Receive | | 3-Month U.S. Dollar LIBOR BBA | | 2.50% | | | 12/16/25 | | | 8,580 USD | | | 104 | | | | 67 | | | | (37 | ) |
| Receive | | 3-Month U.S. Dollar LIBOR BBA | | 2.50% | | | 12/16/25 | | | 4,800 USD | | | 65 | | | | 44 | | | | (21 | ) |
| Receive | | 6-Month GBP LIBOR BBA | | 2.00% | | | 9/16/45 | | | 1,460 GBP | | | 139 | | | | 192 | | | | 53 | |
| Receive | | 3-Month U.S. Dollar LIBOR BBA | | 2.75% | | | 12/16/45 | | | 9,700 USD | | | 732 | | | | 499 | | | | (233 | ) |
| Receive | | 3-Month U.S. Dollar LIBOR BBA | | 2.75% | | | 12/16/45 | | | 600 USD | | | 25 | | | | 29 | | | | 4 | |
| Receive | | 6-Month EUR EURIBOR BBA | | 1.50% | | | 3/16/46 | | | 900 EUR | | | (166 | ) | | | 62 | | | | 228 | |
| | | | | | | | | | | | | | | | | | | | | | |
| | | | | | | | | | | | $ | 957 | | | $ | 1,044 | | | $ | 87 | |
| | | | | | | | | | | | | | | | | | | | | | |
Commodity Forward Swap Agreements
| | | | | | | | | | | | | | | | | | | | | | |
Reference Entity | | Counterparty | | Strike
Price | | | Expiration
Date | | | Notional
Amount
(000) | | | Amount at
Value
(000) | | | Unrealized
Appreciation/
(Depreciation)
(000) | |
Eurobobco* | | BNP Paribas | | $ | 9.00 | | | | 9/30/16 | | | $ | 12 | | | $ | 3 | | | $ | 3 | |
Eurtop* | | BNP Paribas | | | 2.07 | | | | 12/31/15 | | | | 12 | | | | 3 | | | | 3 | |
Eurtop* | | BNP Paribas | | | 2.07 | | | | 3/31/16 | | | | 12 | | | | 1 | | | | 1 | |
Eurtop* | | Goldman Sachs | | | 1.94 | | | | 12/31/15 | | | | 3 | | | | 1 | | | | 1 | |
Eurtop* | | Goldman Sachs | | | 2.21 | | | | 12/31/15 | | | | 6 | | | | 1 | | | | 1 | |
Eurtop* | | Goldman Sachs | | | 2.15 | | | | 12/31/15 | | | | 3 | | | | 1 | | | | 1 | |
Eurtop* | | Goldman Sachs | | | 2.13 | | | | 12/31/15 | | | | 3 | | | | 1 | | | | 1 | |
Eurtop* | | Goldman Sachs | | | 2.10 | | | | 12/31/15 | | | | 3 | | | | 1 | | | | 1 | |
Eurtop* | | Goldman Sachs | | | 2.21 | | | | 3/31/16 | | | | 6 | | | | — | | | | — | |
Eurtop* | | Goldman Sachs | | | 2.15 | | | | 3/31/16 | | | | 3 | | | | — | | | | — | |
Eurtop* | | Goldman Sachs | | | 1.94 | | | | 3/31/16 | | | | 3 | | | | 1 | | | | 1 | |
Eurtop* | | Goldman Sachs | | | 2.13 | | | | 3/31/16 | | | | 3 | | | | — | | | | — | |
Eurtop* | | Goldman Sachs | | | 2.10 | | | | 3/31/16 | | | | 3 | | | | — | | | | — | |
LLSBRT* | | Goldman Sachs | | | — | | | | 12/31/15 | | | | 6 | | | | 39 | | | | 39 | |
LLSBRT* | | Goldman Sachs | | | 3.35 | | | | 12/31/15 | | | | 5 | | | | (6 | ) | | | (6 | ) |
LLSBRT* | | Goldman Sachs | | | — | | | | 12/31/15 | | | | 12 | | | | 83 | | | | 83 | |
LLSBRT* | | Goldman Sachs | | | 3.00 | | | | 12/31/15 | | | | 6 | | | | (5 | ) | | | (5 | ) |
LLSBRT* | | Goldman Sachs | | | — | | | | 12/31/15 | | | | 2 | | | | — | | | | — | |
LLSBRT* | | JPMorgan Chase | | | — | | | | 12/31/15 | | | | 5 | | | | (1 | ) | | | (1 | ) |
Gold Index* | | Goldman Sachs | | | 289.26 | | | | 1/29/16 | | | | 1 | | | | (155 | ) | | | (155 | ) |
Platinum Index* | | Goldman Sachs | | | 271.60 | | | | 10/30/15 | | | | 1 | | | | (157 | ) | | | (157 | ) |
| | | | | | | | | | | | | | | | | | | | | | |
| | | | | | | | | | | | | | | | $ | (189 | ) | | $ | (189 | ) |
| | | | | | | | | | | | | | | | | | | | | | |
See accompanying notes to financial statements.
110
HC CAPITAL TRUST
The Commodity Returns Strategy Portfolio
Portfolio of Investments (concluded) — June 30, 2015
Commodity Swap Agreements
| | | | | | | | | | | | | | | | | | | | | | |
Reference Entity | | Counterparty | | Expiration
Date | | | Notional
Amount
(000) | | | Swap
Premiums
Paid/
(Received)
(000) | | | Amount at
Value
(000) | | | Unrealized
Appreciation/
(Depreciation)
(000) | |
JPMorgan FNJ 1 Index* | | JPMorgan Chase | | | 8/17/15 | | | $ | 2,246 | | | $ | 16 | | | $ | (64 | ) | | $ | (80 | ) |
Bloomberg Brent Crude Subindex 1 Month Forward* | | JPMorgan Chase | | | 8/17/15 | | | | 593 | | | | — | | | | (3 | ) | | | (3 | ) |
Bloomberg Brent Crude Subindex* | | JPMorgan Chase | | | 8/17/15 | | | | 596 | | | | — | | | | 5 | | | | 5 | |
Bloomberg Commodity Index 1 Month Forward* | | Goldman Sachs | | | 8/17/15 | | | | 3,345 | | | | (1 | ) | | | 82 | | | | 83 | |
Bloomberg Commodity Index 1 Month Forward* | | JPMorgan Chase | | | 8/17/15 | | | | 6,704 | | | | — | | | | 164 | | | | 164 | |
Bloomberg Commodity Index* | | BNP Paribas | | | 8/17/15 | | | | 2,979 | | | | 64 | | | | 72 | | | | 8 | |
Bloomberg Commodity Index* | | BNP Paribas | | | 8/17/15 | | | | 29,019 | | | | (204 | ) | | | 699 | | | | 903 | |
Bloomberg Commodity Index* | | Canadian Imperial Bank of Commerce | | | 8/17/15 | | | | 21,654 | | | | — | | | | 521 | | | | 521 | |
Bloomberg Commodity Index* | | Goldman Sachs | | | 8/17/15 | | | | 8,838 | | | | — | | | | 213 | | | | 213 | |
Bloomberg Commodity Index* | | Goldman Sachs | | | 8/17/15 | | | | 2,608 | | | | (63 | ) | | | 62 | | | | 125 | |
Bloomberg Commodity Index* | | JPMorgan Chase | | | 8/17/15 | | | | 64,710 | | | | (35 | ) | | | 1,558 | | | | 1,593 | |
Bloomberg Commodity Index* | | Goldman Sachs | | | 8/17/15 | | | | 48,072 | | | | 35 | | | | 1,146 | | | | 1,111 | |
JPMorgan NIC P Index* | | JPMorgan Chase | | | 8/17/15 | | | | 3,588 | | | | — | | | | 75 | | | | 75 | |
| | | | | | | | | | | | | | | | | | | | | | |
| | | | | | | | | | | | $ | (188 | ) | | $ | 4,530 | | | $ | 4,718 | |
| | | | | | | | | | | | | | | | | | | | | | |
Variance Swap Agreements
| | | | | | | | | | | | | | | | | | | | | | |
Reference Entity | | Counterparty | | Strike
Price | | | Expiration
Date | | | Notional
Amount
(000) | | | Amount at
Value
(000) | | | Unrealized
Appreciation/
(Depreciation)
(000) | |
Crude Oil December 2015 Future* | | Deutsche Bank | | $ | 0.0420 | | | | 11/17/15 | | | $ | 120 | | | $ | 10 | | | $ | 10 | |
London Gold Market Fixing Ltd. Index* | | Goldman Sachs | | | 0.1089 | | | | 4/29/20 | | | | 455 | | | | 14 | | | | 14 | |
London Gold Market Fixing Ltd. Index* | | Goldman Sachs | | | 0.0784 | | | | 4/09/20 | | | | 179 | | | | 1 | | | | 1 | |
London Gold Market Fixing Ltd. Index* | | Goldman Sachs | | | 0.0778 | | | | 3/24/20 | | | | 538 | | | | 10 | | | | 10 | |
London Gold Market Fixing Ltd. Index* | | Goldman Sachs | | | 0.0784 | | | | 4/6/20 | | | | 179 | | | | 1 | | | | 1 | |
London Gold Market Fixing Ltd. Index* | | Goldman Sachs | | | 0.0789 | | | | 4/14/20 | | | | 178 | | | | 1 | | | | 1 | |
London Gold Market Fixing Ltd. Index* | | Goldman Sachs | | | 0.0613 | | | | 11/25/15 | | | | 160 | | | | 6 | | | | 6 | |
London Gold Market Fixing Ltd. Index* | | Goldman Sachs | | | 0.1089 | | | | 11/25/15 | | | | 120 | | | | (5 | ) | | | (5 | ) |
London Gold Market Fixing Ltd. Index* | | Goldman Sachs | | | 0.0870 | | | | 4/28/20 | | | | 339 | | | | 4 | | | | 4 | |
London Gold Market Fixing Ltd. Index* | | Goldman Sachs | | | 0.0858 | | | | 4/27/20 | | | | 341 | | | | 4 | | | | 4 | |
Natural Gas* | | Goldman Sachs | | | 0.1806 | | | | 7/28/15 | | | | 118 | | | | (1 | ) | | | (1 | ) |
S&P GSCI Crude Oil* | | Deutsche Bank | | | 0.0638 | | | | 11/17/15 | | | | 100 | | | | (13 | ) | | | (13 | ) |
| | | | | | | | | | | | | | | | | | | | | | |
| | | | | | | | | | | | | | | | $ | 32 | | | $ | 32 | |
| | | | | | | | | | | | | | | | | | | | | | |
| * | All or a portion of these swap agreements are held by the wholly-owned subsidiaries of the Portfolio. See Note 2O in the Notes to Financial Statements for the basis of consolidation. |
See accompanying notes to financial statements.
111
HC CAPITAL TRUST
The International Equity Portfolio
Portfolio of Investments — June 30, 2015
| | | | | | | | |
| Shares | | | Security
Description | | Value
(000) | |
| | | | Common Stocks — 95.26% | | | | |
| | | | Australia — 5.25% | | | | |
| | 6,500 | | | Ansell Ltd. (Health Care Equipment & Supplies) | | $ | 121 | |
| | 213,666 | | | AusNet Services (Electric Utilities) | | | 230 | |
| | 270,437 | | | Australia & New Zealand Banking Group Ltd. (Banks) | | | 6,717 | |
| | 35,661 | | | Bank of Queensland Ltd. (Banks) | | | 351 | |
| | 45,109 | | | Bendigo & Adelaide Bank Ltd. (Banks) | | | 427 | |
| | 634,900 | | | BHP Billiton Ltd. (Metals & Mining) | | | 13,248 | |
| | 27,299 | | | CIMIC Group Ltd. (Engineering & Construction) | | | 458 | |
| | 166,701 | | | Commonwealth Bank of Australia (Banks) | | | 10,948 | |
| | 129,067 | | | Dexus Property Group (Real Estate Investment Trusts) | | | 727 | |
| | 655,490 | | | Federation Centres (Real Estate Investment Trusts) | | | 1,476 | |
| | 331,649 | | | GPT Group (Real Estate Investment Trusts) | | | 1,095 | |
| | 56,341 | | | Iluka Resources Ltd. (Metals & Mining) | | | 334 | |
| | 230,381 | | | Insurance Australia Group Ltd. (Insurance) | | | 992 | |
| | 74,013 | | | Lend Lease Group Ltd. (Real Estate Management & Development) | | | 858 | |
| | 726,541 | | | Mirvac Group (Real Estate Investment Trusts) | | | 1,037 | |
| | 233,076 | | | National Australia Bank Ltd. (Banks) | | | 5,989 | |
| | 16,516 | | | Newcrest Mining Ltd. (Metals & Mining) (a) | | | 166 | |
| | 1,064,834 | | | Scentre Group (Real Estate Investment Trusts) | | | 3,081 | |
| | 51,262 | | | Seek Ltd. (Human Resource & Employment Services) | | | 556 | |
| | 457,884 | | | Stockland Trust Group (Real Estate Investment Trusts) | | | 1,448 | |
| | 126,581 | | | Suncorp Group Ltd. (Insurance) | | | 1,311 | |
| | 26,392 | | | Sydney Airport (Transportation Infrastructure) | | | 101 | |
| | 873,209 | | | Telstra Corp. Ltd. (Diversified Telecommunication Services) | | | 4,136 | |
| | 388,463 | | | Westfield Corp. (Real Estate Investment Trusts) | | | 2,733 | |
| | 318,997 | | | Westpac Banking Corp. (Banks) | | | 7,911 | |
| | 212,737 | | | Woodside Petroleum Ltd. (Oil, Gas & Consumable Fuels) | | | 5,617 | |
| | 351,074 | | | Woolworths Ltd. (Food & Staples Retailing) | | | 7,301 | |
| | 81,444 | | | WorleyParsons Ltd. (Energy Equipment & Services) | | | 654 | |
| | | | | | | | |
| | | | | | | 80,023 | |
| | | | | | | | |
| | | | Austria — 0.11% | | | | |
| | 62,391 | | | Immofinanz AG (Real Estate Management & Development) (a) | | | 147 | |
| | 37,623 | | | OMV AG (Oil, Gas & Consumable Fuels) | | | 1,036 | |
| | 11,235 | | | Raiffeisen Bank International AG (Banks) (a) | | | 163 | |
| | 3,383 | | | Vienna Insurance Group Wiener Staedtische Versicherung AG (Insurance) | | | 116 | |
| | 7,003 | | | Voestalpine AG (Metals & Mining) | | | 291 | |
| | | | | | | | |
| | | | | | | 1,753 | |
| | | | | | | | |
| | | | Belgium — 1.13% | | | | |
| | 18,400 | | | Ageas (Insurance) | | | 709 | |
| | 79,784 | | | Anheuser-Busch InBev NV (Beverages) | | | 9,560 | |
| | 21,783 | | | Belgacom SA (Diversified Telecommunication Services) | | | 769 | |
| | | | | | | | |
| Shares | | | Security
Description | | Value
(000) | |
| | | | Belgium (continued) | | | | |
| | 6,284 | | | Groupe Bruxelles Lambert SA (Diversified Financial Services) | | $ | 506 | |
| | 27,164 | | | KBC Groep NV (Banks) | | | 1,815 | |
| | 14,929 | | | Solvay SA (Chemicals) | | | 2,053 | |
| | 17,022 | | | Telenet Group Holding NV (Media) (a) | | | 926 | |
| | 13,022 | | | UCB SA (Pharmaceuticals) | | | 935 | |
| | | | | | | | |
| | | | | | | 17,273 | |
| | | | | | | | |
| | | | Bermuda — 0.12% | | | | |
| | 74,000 | | | Alibaba Health Information Technology Ltd. (Diversified Telecommunication Services) (a) | �� | | 77 | |
| | 188,000 | | | Beijing Enterprises Water Group Ltd. (Water Utilities) | | | 154 | |
| | 14,600 | | | Golar LNG Ltd. (Oil, Gas & Consumable Fuels) | | | 684 | |
| | 76,000 | | | Kunlun Energy Co. Ltd. (Oil, Gas & Consumable Fuels) | | | 77 | |
| | 52,000 | | | Nine Dragons Paper Holdings Ltd. (Paper & Forest Products) | | | 45 | |
| | 27,901 | | | Seadrill Ltd. (Energy Equipment & Services) | | | 291 | |
| | 122,000 | | | Sihuan Pharmaceutical Holdings Group Ltd. (Pharmaceuticals) | | | 69 | |
| | 147,167 | | | Yue Yuen Industrial Holdings Ltd. (Textiles, Apparel & Luxury Goods) | | | 493 | |
| | | | | | | | |
| | | | | | | 1,890 | |
| | | | | | | | |
| | | | Brazil — 0.51% | | | | |
| | 18,541 | | | Ambev SA, ADR (Beverages) | | | 113 | |
| | 126,400 | | | Ambev SA (Beverages) | | | 774 | |
| | 3,100 | | | B2W CIA Digital (Internet & Catalog Retail) (a) | | | 20 | |
| | 49,380 | | | Banco Bradesco SA, ADR (Banks) | | | 452 | |
| | 21,440 | | | Banco Bradesco SA (Banks) | | | 192 | |
| | 22,900 | | | Banco do Brasil SA (Banks) | | | 178 | |
| | 9,900 | | | Banco Santander Brasil SA (Banks) | | | 54 | |
| | 19,200 | | | BB Seguridade Participacoes SA (Insurance) | | | 211 | |
| | 47,200 | | | BM&FBOVESPA SA (Diversified Financial Services) | | | 178 | |
| | 12,100 | | | BR Malls Participacoes SA (Real Estate Management & Development) | | | 57 | |
| | 17,800 | | | BRF SA (Food Products) | | | 376 | |
| | 24,300 | | | CCR SA (Transportation Infrastructure) | | | 117 | |
| | 5,905 | | | CETIP SA (Capital Markets) | | | 65 | |
| | 9,000 | | | Cia de Saneamento Basico do Estado de Sao Paulo (Water Utilities) | | | 47 | |
| | 65,600 | | | Cia Vale Do Rio, ADR (Materials) | | | 331 | |
| | 22,200 | | | Cielo SA (IT Services) | | | 314 | |
| | 3,900 | | | Companhia Brasileira de Destribuicao Grupo PAO de (Food & Staples Retailing) | | | 92 | |
| | 19,400 | | | Companhia Siderurgica Nacional SA (CSN) (Metals & Mining) | | | 32 | |
| | 3,200 | | | Cosan SA Industria e Comercio (Oil, Gas & Consumable Fuels) | | | 26 | |
| | 4,392 | | | CPFL Energia SA (Electric Utilities) | | | 27 | |
| | 7,000 | | | Cyrela Brazil Realty SA Empreendimentos (Household Durables) | | | 22 | |
| | 9,130 | | | Duratex SA (Paper & Forest Products) | | | 21 | |
| | 5,400 | | | Ecorodovias Infraestrutura E Logistica SA (Transportation Infrastructure) | | | 14 | |
| | 7,300 | | | EDP – Energias do Brasil SA (Electric Utilities) | | | 27 | |
See accompanying notes to financial statements.
112
HC CAPITAL TRUST
The International Equity Portfolio
Portfolio of Investments (continued) — June 30, 2015
| | | | | | | | |
| Shares | | | Security
Description | | Value
(000) | |
| | | | Common Stocks (continued) | | | | |
| | | | Brazil (continued) | | | | |
| | 17,400 | | | Embraer SA (Aerospace & Defense) | | $ | 132 | |
| | 8,000 | | | Estacio Participacoes SA (Diversified Consumer Services) | | | 46 | |
| | 7,400 | | | Fibria Celulose SA (Paper & Forest Products) | | | 102 | |
| | 39,400 | | | Hypermarcas SA (Personal Products) (a) | | | 288 | |
| | 39,400 | | | Itau Unibanco Holding SA, ADR (Banks) | | | 431 | |
| | 74,750 | | | Itau Unibanco Holding SA (Banks) | | | 823 | |
| | 18,200 | | | JBS SA (Food Products) | | | 96 | |
| | 14,300 | | | Klabin SA (Containers & Packaging) | | | 88 | |
| | 37,140 | | | Kroton Educacional SA (Diversified Consumer Services) | | | 142 | |
| | 4,200 | | | Localiza Rent A Car SA (Road & Rail) | | | 42 | |
| | 3,550 | | | Lojas Americanas SA (Multiline Retail) | | | 15 | |
| | 3,400 | | | Lojas Renner SA (Multiline Retail) | | | 125 | |
| | 1,000 | | | M Dias Branco SA (Food Products) | | | 26 | |
| | 2,300 | | | Multiplan Empreendimentos Imobiliarios SA (Real Estate Management & Development) | | | 36 | |
| | 4,600 | | | Natura Cosmeticos SA (Personal Products) | | | 41 | |
| | 7,700 | | | OdontoPrev SA (Health Care Providers & Services) | | | 27 | |
| | 80,000 | | | Petroleo Brasileiro SA (Oil, Gas & Consumable Fuels) (a) | | | 362 | |
| | 3,300 | | | Porto Seguro SA (Insurance) | | | 44 | |
| | 6,000 | | | Qualicorp SA (Health Care Providers & Services) | | | 38 | |
| | 5,400 | | | Raia Drogasil SA (Food & Staples Retailing) | | | 70 | |
| | 9,700 | | | Souza Cruz SA (Tobacco) | | | 77 | |
| | 4,200 | | | Sul America SA (Insurance) | | | 21 | |
| | 23,000 | | | Tim Participacoes SA (Wireless Telecommunication Services) | | | 76 | |
| | 2,400 | | | Totvs SA (Software) | | | 30 | |
| | 4,700 | | | Tractebel Energia SA (Independent Power and Renewable Electricity Producers) | | | 51 | |
| | 3,100 | | | Transmissora Alianca de Energia Eletrica SA (Electric Utilities) | | | 21 | |
| | 9,800 | | | Ultrapar Participacoes SA (Oil, Gas & Consumable Fuels) | | | 207 | |
| | 54,500 | | | Vale SA, ADR (Metals & Mining)^ | | | 321 | |
| | 35,200 | | | Vale SA (Metals & Mining) | | | 208 | |
| | 3,100 | | | Via Varejo SA (Specialty Retail) | | | 11 | |
| | 16,380 | | | WEG SA (Machinery) | | | 101 | |
| | | | | | | | |
| | | | | | | 7,838 | |
| | | | | | | | |
| | | | Canada — 0.58% | | | | |
| | 7,900 | | | Alimentation Couche-Tard, Inc., Class – B (Food & Staples Retailing) | | | 338 | |
| | 153,158 | | | Baytex Energy Corp. (Oil, Gas & Consumable Fuels)^ | | | 2,383 | |
| | 3,300 | | | Canadian National Railway Co. (Road & Rail) | | | 190 | |
| | 22,300 | | | Cenovus Energy, Inc. (Oil, Gas & Consumable Fuels)^ | | | 357 | |
| | 60,100 | | | Centerra Gold, Inc. (Metals & Mining) | | | 342 | |
| | 16,900 | | | Enbridge, Inc. (Oil, Gas & Consumable Fuels) | | | 790 | |
| | 73,784 | | | First Quantum Minerals Ltd. (Metals & Mining) | | | 965 | |
| | 75,680 | | | Imperial Oil Ltd. (Oil, Gas & Consumable Fuels)^ | | | 2,925 | |
| | 22,900 | | | Labrador Iron Ore Royalty Corp. (Metals & Mining)^ | | | 261 | |
| | | | | | | | |
| Shares | | | Security
Description | | Value
(000) | |
| | | | Canada (continued) | | | | |
| | 9,700 | | | Potash Corp. of Saskatchewan, Inc. (Chemicals) | | $ | 300 | |
| | | | | | | | |
| | | | | | | 8,851 | |
| | | | | | | | |
| | | | Cayman Islands — 0.11% | | | | |
| | 20,000 | | | AAC Technologies Holdings, Inc. (Electronic Equipment, Instruments & Components) | | | 113 | |
| | 26,000 | | | Anta Sports Products Ltd. (Textiles, Apparel & Luxury Goods) | | | 63 | |
| | 25,300 | | | Chailease Holding Co. Ltd. (Diversified Financial Services) | | | 61 | |
| | 147,900 | | | China Huishan Dairy Holdings Co. Ltd. (Food Products) | | | 34 | |
| | 38,000 | | | China Mengniu Dairy Co. Ltd. (Food Products) | | | 189 | |
| | 60,000 | | | China Resources Cement Holdings Ltd. (Construction Materials) | | | 34 | |
| | 7,200 | | | Ctrip.com International, ADR (Internet & Catalog Retail) (a) | | | 522 | |
| | 268,000 | | | GCL-Poly Energy Holdings Ltd. (Semiconductors & Semiconductor Equipment) (a) | | | 62 | |
| | 140,000 | | | Geely Automobile Holdings Ltd. (Automobiles) | | | 75 | |
| | 24,000 | | | Kingsoft Corp. Ltd. (Software) | | | 81 | |
| | 78,000 | | | New World China Land Ltd. (Real Estate Management & Development) | | | 46 | |
| | 669,000 | | | Semiconductor Manufacturing International Corp. (Semiconductors & Semiconductor Equipment) (a) | | | 73 | |
| | 16,000 | | | Shenzhou International Group Holdings Ltd. (Textiles, Apparel & Luxury Goods) | | | 78 | |
| | 69,500 | | | Stella International Holdings Ltd. (Textiles, Apparel & Luxury Goods) | | | 166 | |
| | 9,000 | | | Zhen Ding Technology Holding Ltd. (Electronic Equipment, Instruments & Components) | | | 32 | |
| | | | | | | | |
| | | | | | | 1,629 | �� |
| | | | | | | | |
| | | | Chile — 0.08% | | | | |
| | 72,544 | | | AES Gener SA (Independent Power and Renewable Electricity Producers) | | | 41 | |
| | 68,483 | | | Aguas Andinas SA, Class – A (Water Utilities) | | | 39 | |
| | 578,487 | | | Banco de Chile SA (Banks) | | | 63 | |
| | 881 | | | Banco de Credito e Inversiones SA (Banks) | | | 39 | |
| | 1,810,634 | | | Banco Santander Chile (Banks) | | | 92 | |
| | 33,567 | | | Cencosud SA (Food & Staples Retailing) | | | 81 | |
| | 225,977 | | | Colbun SA (Independent Power and Renewable Electricity Producers) | | | 64 | |
| | 4,236 | | | Compania Cervecerias Unidas SA (Beverages) | | | 45 | |
| | 3,540,169 | | | CorpBanca SA (Banks) | | | 39 | |
| | 86,054 | | | Empresa Nacional de Electricidad SA (Independent Power and Renewable Electricity Producers) | | | 120 | |
| | 2,621 | | | Empresa Nacional de Telecomunicaciones SA (Wireless Telecommunication Services) | | | 29 | |
| | 37,407 | | | Empresas CMPC SA (Paper & Forest Products) | | | 102 | |
| | 12,338 | | | Empresas Copec SA (Oil, Gas & Consumable Fuels) | | | 131 | |
| | 498,562 | | | Enersis SA (Electric Utilities) | | | 159 | |
| | 7,969 | | | LATAM Airlines Group SA (Airlines) (a) | | | 57 | |
| | 14,509 | | | S.A.C.I. Falabella (Multiline Retail) | | | 101 | |
See accompanying notes to financial statements.
113
HC CAPITAL TRUST
The International Equity Portfolio
Portfolio of Investments (continued) — June 30, 2015
| | | | | | | | |
| Shares | | | Security
Description | | Value
(000) | |
| | | | Common Stocks (continued) | | | | |
| | | | Chile (continued) | | | | |
| | 11,609 | | | Sonda SA (IT Services) | | $ | 24 | |
| | 14,053 | | | Vina Concha y Toro SA (Beverages) | | | 24 | |
| | | | | | | | |
| | | | | | | 1,250 | |
| | | | | | | | |
| | | | China — 2.70% | | | | |
| | 613,000 | | | Agricultural Bank of China Ltd., H Shares (Banks) (a) | | | 330 | |
| | 54,000 | | | Air China Ltd. (Airlines) | | | 61 | |
| | 98,000 | | | Aluminum Corp. of China Ltd., H Shares (Metals & Mining) (a) | | | 49 | |
| | 33,500 | | | Anhui Conch Cement Co. Ltd., H Shares (Construction Materials) | | | 118 | |
| | 60,000 | | | AviChina Industry & Technology Co. Ltd., H Shares (Aerospace & Defense) | | | 59 | |
| | 16,018 | | | Baidu, Inc., ADR (Internet Software & Services) (a) | | | 3,189 | |
| | 3,197,613 | | | Bank of China Ltd., H Shares (Banks) | | | 2,079 | |
| | 232,000 | | | Bank of Communications Co. Ltd., H Shares (Banks) | | | 242 | |
| | 38,000 | | | BBMG Corp., H Shares (Construction Materials) | | | 38 | |
| | 46,000 | | | Beijing Capital International Airport Co. Ltd., H Shares (Transportation Infrastructure) | | | 53 | |
| | 16,500 | | | Byd Co. Ltd., H Shares (Automobiles) | | | 99 | |
| | 161,000 | | | CGN Power Co. Ltd., H Shares (Independent Power and Renewable Electricity Producers) (b) | | | 84 | |
| | 1,310,926 | | | China Cinda Asset Management Co. Ltd., H Shares (Capital Markets) (a)(b) | | | 731 | |
| | 214,000 | | | China CITIC Bank Corp. Ltd., H Shares (Banks) (a) | | | 171 | |
| | 87,000 | | | China Coal Energy Co. Ltd., H Shares (Oil, Gas & Consumable Fuels) | | | 52 | |
| | 118,000 | | | China Communications Construction Co. Ltd. (Construction & Engineering) | | | 177 | |
| | 76,000 | | | China Communications Services Corp. Ltd., H Shares (Diversified Telecommunication Services) | | | 38 | |
| | 17,800 | | | China Conch Venture Holdings Ltd. (Commercial Services) | | | 41 | |
| | 2,240,000 | | | China Construction Bank Corp., H Shares (Banks) | | | 2,046 | |
| | 68,000 | | | China COSCO Holdings Co. Ltd., H Shares (Marine) (a) | | | 44 | |
| | 85,700 | | | China Everbright Bank Co. Ltd., H Shares (Banks) | | | 51 | |
| | 83,000 | | | China Galaxy Securities Co., H Shares (Capital Markets) (a) | | | 108 | |
| | 14,900 | | | China International Marine Containers Group Co. Ltd., H Shares (Machinery) | | | 38 | |
| | 200,000 | | | China Life Insurance Co. Ltd., H Shares (Insurance) | | | 871 | |
| | 81,000 | | | China Longyuan Power Group Corp. (Independent Power and Renewable Electricity Producers) | | | 90 | |
| | 32,000 | | | China Medical System Holdings Ltd. (Pharmaceuticals) | | | 45 | |
| | 123,500 | | | China Merchants Bank Co. Ltd., H Shares (Banks) | | | 360 | |
| | 164,100 | | | China Minsheng Banking Corp. Ltd., H Shares (Banks) | | | 215 | |
| | | | | | | | |
| Shares | | | Security
Description | | Value
(000) | |
| | | | China (continued) | | | | |
| | 646,110 | | | China Mobile Ltd. (Wireless Telecommunication Services) | | $ | 8,273 | |
| | 80,000 | | | China National Building Material Co. Ltd., H Shares (Construction Materials) | | | 76 | |
| | 50,000 | | | China Oilfield Services Ltd., H Shares (Energy Equipment & Services) | | | 80 | |
| | 190,400 | | | China Pacific Insurance Group Co. Ltd. (Insurance) | | | 914 | |
| | 670,000 | | | China Petroleum & Chemical Corp., H Shares (Oil, Gas & Consumable Fuels) | | | 578 | |
| | 69,000 | | | China Power International Development Ltd. (Independent Power and Renewable Electricity Producers) | | | 53 | |
| | 58,500 | | | China Railway Construction Corp. Ltd., H Shares (Construction & Engineering) | | | 90 | |
| | 101,000 | | | China Railway Group Ltd., H Shares (Construction & Engineering) | | | 109 | |
| | 74,000 | | | China Resources Land Ltd. (Real Estate Management & Development) | | | 240 | |
| | 86,500 | | | China Shenhua Energy Co. Ltd., H Shares (Oil, Gas & Consumable Fuels) | | | 197 | |
| | 95,000 | | | China Shipping Container Lines Co. Ltd., H Shares (Marine) (a) | | | 37 | |
| | 38,000 | | | China Southern Airlines Co. Ltd., H Shares (Airlines) (a) | | | 45 | |
| | 386,000 | | | China Telecom Corp. Ltd. (Diversified Telecommunication Services) | | | 227 | |
| | 38,300 | | | China Vanke Co. Ltd., H Shares (Real Estate Management & Development) | | | 94 | |
| | 25,400 | | | Chongqing Changan Automobile Co. Ltd., Class – A (Automobiles) | | | 65 | |
| | 77,000 | | | Chongqing Rural Commercial Bank Co. Ltd., H Shares (Banks) | | | 62 | |
| | 57,000 | | | CITIC Securities Co. Ltd., H Shares (Capital Markets) | | | 206 | |
| | 2,836,382 | | | CNOOC Ltd. (Oil, Gas & Consumable Fuels) | | | 4,026 | |
| | 46,000 | | | Cosco Pacific Ltd. (Transportation Infrastructure) | | | 63 | |
| | 136,000 | | | Country Garden Holdings Co. (Real Estate Management & Development) | | | 60 | |
| | 111,100 | | | CSR Corp. Ltd., H Shares (Machinery) (a) | | | 170 | |
| | 8,800 | | | Dalian Wanda Commercial Properties Co. Ltd., Class – H (Real Estate Investment Trusts) (b) | | | 71 | |
| | 72,000 | | | Datang International Power Generation Co. Ltd., H Shares (Independent Power and Renewable Electricity Producers) | | | 37 | |
| | 72,000 | | | Dongfeng Motor Group Co. Ltd., H Shares (Automobiles) | | | 97 | |
| | 20,000 | | | ENN Energy Holdings Ltd. (Gas Utilities) | | | 121 | |
| | 28,600 | | | GF Securities Co. Ltd., Class – H (Diversified Financial Services) (a) | | | 73 | |
| | 300,000 | | | GOME Electrical Appliances Holding Ltd. (Specialty Retail) | | | 66 | |
| | 93,000 | | | Great Wall Motor Co. Ltd., H Shares (Automobiles) | | | 455 | |
| | 58,000 | | | Guangzhou Automobile Group Co. Ltd., H Shares (Automobiles) | | | 54 | |
| | 19,000 | | | Haitian International Holdings Ltd. (Machinery) | | | 45 | |
See accompanying notes to financial statements.
114
HC CAPITAL TRUST
The International Equity Portfolio
Portfolio of Investments (continued) — June 30, 2015
| | | | | | | | |
| Shares | | | Security
Description | | Value
(000) | |
| | | | Common Stocks (continued) | | | | |
| | | | China (continued) | | | | |
| | 65,200 | | | Haitong Securities Co. Ltd., H Shares (Capital Markets) | | $ | 172 | |
| | 44,000 | | | Huadian Power International Corp. Ltd., H Shares (Independent Power and Renewable Electricity Producers) | | | 49 | |
| | 88,000 | | | Huaneng Power International, Inc., H Shares (Independent Power and Renewable Electricity Producers) | | | 122 | |
| | 82,000 | | | Huaneng Renewables Corp. Ltd., Class – H (Electric Utilities) | | | 33 | |
| | 22,600 | | | Huatai Securities Co. Ltd., Class – H (Diversified Financial Services) (a)(b) | | | 64 | |
| | 2,276,808 | | | Industrial & Commercial Bank of China Ltd., H Shares (Banks) | | | 1,809 | |
| | 25,900 | | | Inner Mongolia Yitai Coal Co. Ltd., B Shares (Oil, Gas & Consumable Fuels) | | | 37 | |
| | 8,700 | | | Jardine Matheson Holdings Ltd. (Industrial Conglomerates) | | | 494 | |
| | 2,411 | | | JD.com, Inc., ADR (Internet & Catalog Retail) (a) | | | 82 | |
| | 36,000 | | | Jiangsu Expressway Co. Ltd., H Shares (Transportation Infrastructure) | | | 47 | |
| | 34,000 | | | Jiangxi Copper Co. Ltd., H Shares (Metals & Mining) | | | 57 | |
| | 40,500 | | | Longfor Properties (Real Estate Management & Development) | | | 64 | |
| | 26,200 | | | Luye Pharma Group Ltd. (Pharmaceuticals) (a) | | | 28 | |
| | 22,000 | | | New China Life Insurance Co. Ltd., H Shares (Insurance) | | | 131 | |
| | 163,000 | | | People’s Insurance Co. Group of China Ltd., H Shares (Insurance) | | | 104 | |
| | 572,000 | | | PetroChina Co. Ltd., H Shares (Oil, Gas & Consumable Fuels) | | | 638 | |
| | 308,500 | | | PICC Property & Casualty Co. Ltd., H Shares (Insurance) | | | 703 | |
| | 183,739 | | | Ping An Insurance Group Co. of China (Insurance) | | | 2,482 | |
| | 48,000 | | | Shandong Weigao Group Medical Polymer Co. Ltd. (Health Care Equipment & Supplies) | | | 36 | |
| | 78,000 | | | Shanghai Electric Group Co. Ltd., H Shares (Electrical Equipment) | | | 64 | |
| | 77,000 | | | Shanghai Fosun Pharmaceutical (Group) Co. Ltd., H Shares (Pharmaceuticals) | | | 285 | |
| | 15,000 | | | Shanghai Industrial Holdings Ltd. (Industrial Conglomerates) | | | 51 | |
| | 19,700 | | | Shanghai Pharmaceuticals Holding Co. Ltd., H Shares (Health Care Providers & Services) | | | 55 | |
| | 36,500 | | | Shimao Property Holdings Ltd. (Real Estate Management & Development) | | | 72 | |
| | 112,500 | | | Shui On Land Ltd. (Real Estate Management & Development) | | | 32 | |
| | 32,000 | | | Sinopec Engineering Group Co. Ltd., H Shares (Construction & Engineering) | | | 30 | |
| | 106,000 | | | Sinopec Shanghai Petrochemical Co. Ltd., H Shares (Chemicals) (a) | | | 58 | |
| | 31,200 | | | Sinopharm Group Co. (Health Care Providers & Services) | | | 139 | |
| | 41,000 | | | Sinotrans Ltd., H Shares (Air Freight & Logistics) | | | 27 | |
| | | | | | | | |
| Shares | | | Security
Description | | Value
(000) | |
| | | | China (continued) | | | | |
| | 53,000 | | | Soho China Ltd. (Real Estate Management & Development) | | $ | 35 | |
| | 51,000 | | | Sun Art Retail Group Ltd. (Food & Staples Retailing) | | | 46 | |
| | 41,000 | | | Sunac China Holdings Ltd. (Real Estate Investment Trusts) | | | 45 | |
| | 220,535 | | | Tencent Holdings Ltd. (Internet Software & Services) | | | 4,401 | |
| | 10,000 | | | Tsingtao Brewery Co. Ltd. (Beverages) | | | 61 | |
| | 156,000 | | | Want Want China Holdings Ltd. (Food Products) | | | 165 | |
| | 14,000 | | | Weichai Power Co. Ltd. (Machinery) | | | 47 | |
| | 48,000 | | | Yanzhou Coal Mining Co. Ltd., H Shares (Oil, Gas & Consumable Fuels) | | | 38 | |
| | 42,000 | | | Zhejiang Expressway Co. Ltd., H Shares (Transportation Infrastructure) | | | 58 | |
| | 14,500 | | | Zhuzhou CSR Times Electric Co. Ltd. (Electrical Equipment) | | | 108 | |
| | 174,000 | | | Zijin Mining Group Co. Ltd., H Shares (Metals & Mining) | | | 61 | |
| | 18,240 | | | ZTE Corp., H Shares (Communications Equipment) | | | 46 | |
| | | | | | | | |
| | | | | | | 41,239 | |
| | | | | | | | |
| | | | Colombia — 0.03% | | | | |
| | 5,141 | | | Almacenes Exito SA (Food & Staples Retailing) | | | 45 | |
| | 2,681 | | | Banco Davivienda SA (Banks) | | | 28 | |
| | 10,169 | | | Cementos Argos SA (Construction Materials) | | | 36 | |
| | 2,210 | | | Corporacion Financiera Colombiana SA (Diversified Financial Services) | | | 31 | |
| | 123,608 | | | Ecopetrol SA (Oil, Gas & Consumable Fuels) | | | 82 | |
| | 7,583 | | | Grupo Argos SA (Construction Materials) | | | 49 | |
| | 6,252 | | | Grupo de Inversiones Suramericana (Diversified Financial Services) | | | 88 | |
| | 9,604 | | | Interconexion Electrica SA (Electric Utilities) | | | 28 | |
| | 23,886 | | | ISAGEN SA ESP (Electric Utilities) | | | 25 | |
| | | | | | | | |
| | | | | | | 412 | |
| | | | | | | | |
| | | | Czech Republic — 0.01% | | | | |
| | 4,336 | | | CEZ A/S (Electric Utilities) | | | 101 | |
| | 450 | | | Komercni Banka A/S (Banks) | | | 100 | |
| | | | | | | | |
| | | | | | | 201 | |
| | | | | | | | |
| | | | Denmark — 1.29% | | | | |
| | 1,129 | | | A.P. Moller – Maersk A/S, Class – A (Marine) | | | 1,983 | |
| | 3,828 | | | A.P. Moller – Maersk A/S, Class – B (Marine) | | | 6,934 | |
| | 115,441 | | | Danske Bank A/S (Banks) | | | 3,396 | |
| | 14,713 | | | Genmab A/S (Biotechnology) (a) | | | 1,280 | |
| | 65,101 | | | ISS A/S (Commercial Services & Supplies) | | | 2,148 | |
| | 31,987 | | | Novo Nordisk A/S, Class – B (Pharmaceuticals) | | | 1,743 | |
| | 248,110 | | | TDC A/S (Diversified Telecommunication Services) | | | 1,820 | |
| | 18,393 | | | Tryg A/S (Insurance) | | | 383 | |
| | | | | | | | |
| | | | | | | 19,687 | |
| | | | | | | | |
| | | | Egypt — 0.01% | | | | |
| | 20,933 | | | Commercial International Bank Egypt SAE (Banks) | | | 155 | |
| | 65,910 | | | Orascom Telecom Holding SAE (Wireless Telecommunication Services) (a) | | | 22 | |
See accompanying notes to financial statements.
115
HC CAPITAL TRUST
The International Equity Portfolio
Portfolio of Investments (continued) — June 30, 2015
| | | | | | | | |
| Shares | | | Security
Description | | Value
(000) | |
| | | | Common Stocks (continued) | | | | |
| | | | Egypt (continued) | | | | |
| | 25,953 | | | Talaat Moustafa Group (Real Estate Management & Development) | | $ | 30 | |
| | | | | | | | |
| | | | | | | 207 | |
| | | | | | | | |
| | | | Finland — 0.53% | | | | |
| | 16,474 | | | Elisa Oyj (Diversified Telecommunication Services) | | | 522 | |
| | 50,234 | | | Fortum Oyj (Electric Utilities) | | | 893 | |
| | 27,107 | | | Metso Oyj (Machinery) | | | 745 | |
| | 26,281 | | | Nokian Renkaat Oyj (Auto Components) | | | 823 | |
| | 23,314 | | | Orion Oyj, Class – B (Pharmaceuticals) | | | 816 | |
| | 43,662 | | | Sampo Oyj, A Shares (Insurance) | | | 2,056 | |
| | 124,861 | | | UPM-Kymmene Oyj (Paper & Forest Products) | | | 2,208 | |
| | | | | | | | |
| | | | | | | 8,063 | |
| | | | | | | | |
| | | | France — 8.02% | | | | |
| | 213,446 | | | AXA SA (Insurance) | | | 5,385 | |
| | 73,995 | | | BNP Paribas (Banks) | | | 4,467 | |
| | 57,391 | | | Bouygues SA (Construction & Engineering) | | | 2,145 | |
| | 16,459 | | | Casino Guichard-Perrachon SA (Food & Staples Retailing) | | | 1,247 | |
| | 13,301 | | | CNP Assurances (Insurance) | | | 222 | |
| | 106,546 | | | Compagnie de Saint-Gobain (Building Products) | | | 4,783 | |
| | 10,327 | | | Danone SA (Food Products) | | | 668 | |
| | 45,838 | | | Edenred (Commercial Services & Supplies) | | | 1,133 | |
| | 17,329 | | | Electricite de France SA (Electric Utilities) | | | 386 | |
| | 2,378 | | | Essilor International SA (Health Care Equipment & Supplies) | | | 284 | |
| | 41,055 | | | Eutelsat Communications (Media) | | | 1,325 | |
| | 3,431 | | | Fonciere des Regions (Real Estate Investment Trusts) | | | 292 | |
| | 295,308 | | | GDF Suez (Multi-Utilities) | | | 5,477 | |
| | 3,340 | | | Gecina SA (Real Estate Investment Trusts) | | | 412 | |
| | 4,406 | | | Icade (Real Estate Investment Trusts) | | | 315 | |
| | 7,066 | | | JC Decaux SA (Media) | | | 295 | |
| | 19,238 | | | Klepierre (Real Estate Investment Trusts) | | | 846 | |
| | 30,819 | | | Lagardere SCA (Media) | | | 899 | |
| | 69,595 | | | Legrand SA (Electrical Equipment) | | | 3,907 | |
| | 10,625 | | | L’Oreal SA (Personal Products) | | | 1,895 | |
| | 11,359 | | | LVMH Moet Hennessy Louis Vuitton SA (Textiles, Apparel & Luxury Goods) | | | 1,990 | |
| | 52,042 | | | Natixism SA (Banks) | | | 374 | |
| | 19,134 | | | Numericable – SFR (Media) (a) | | | 1,014 | |
| | 276,761 | | | Orange (Diversified Telecommunication Services) | | | 4,260 | |
| | 19,571 | | | Pernod Ricard SA (Beverages)^ | | | 2,260 | |
| | 7,465 | | | Renault SA (Automobiles) | | | 777 | |
| | 63,103 | | | Rexel SA (Trading Companies & Distributors) | | | 1,017 | |
| | 11,748 | | | Safran SA (Aerospace & Defense) | | | 796 | |
| | 223,128 | | | Sanofi-Aventis (Pharmaceuticals) | | | 21,947 | |
| | 82,295 | | | Schneider Electric SA (Electrical Equipment) | | | 5,681 | |
| | 11,200 | | | SCOR SE (Insurance) | | | 395 | |
| | 9,500 | | | Societe Generale (Banks) | | | 443 | |
| | 19,419 | | | Suez Environnement Co. (Multi-Utilities) | | | 361 | |
| | 70,922 | | | Technip SA (Energy Equipment & Services) | | | 4,389 | |
| | 391,098 | | | Total SA (Oil, Gas & Consumable Fuels) | | | 18,995 | |
| | | | | | | | |
| Shares | | | Security
Description | | Value
(000) | |
| | | | France (continued) | | | | |
| | 11,958 | | | Unibail-Rodamco SE (Real Estate Investment Trusts) | | $ | 3,021 | |
| | 24,851 | | | Veolia Environnement (Multi-Utilities) | | | 507 | |
| | 136,447 | | | Vinci SA (Construction & Engineering) | | | 7,891 | |
| | 271,385 | | | Vivendi (Media) | | | 6,844 | |
| | 92,607 | | | Zodiac Aerospace (Aerospace & Defense) | | | 3,014 | |
| | | | | | | | |
| | | | | | | 122,359 | |
| | | | | | | | |
| | | | Germany — 6.88% | | | | |
| | 30,749 | | | Allianz SE (Insurance) | | | 4,788 | |
| | 7,982 | | | Axel Springer AG (Media) | | | 419 | |
| | 130,273 | | | BASF SE (Chemicals) | | | 11,446 | |
| | 60,642 | | | Bayer AG (Pharmaceuticals) | | | 8,487 | |
| | 90,042 | | | Bayerische Motoren Werke AG (Automobiles) | | | 9,854 | |
| | 17,466 | | | Beiersdorf AG (Personal Products) | | | 1,463 | |
| | 5,590 | | | Brenntag AG (Trading Companies & Distributors) | | | 320 | |
| | 222,428 | | | Daimler AG (Automobiles) | | | 20,243 | |
| | 61,974 | | | Deutsche Bank AG (Capital Markets) | | | 1,862 | |
| | 9,674 | | | Deutsche Boerse AG (Diversified Financial Services) | | | 801 | |
| | 208,292 | | | Deutsche Post AG (Air Freight & Logistics) | | | 6,084 | |
| | 309,536 | | | Deutsche Telekom AG (Diversified Telecommunication Services) | | | 5,331 | |
| | 38,304 | | | Deutsche Wohnen AG (Real Estate Management & Development) | | | 878 | |
| | 90,607 | | | E.ON AG (Multi-Utilities) | | | 1,207 | |
| | 9,000 | | | ElringKlinger AG (Auto Components) | | | 242 | |
| | 5,598 | | | Freenet AG (Wireless Telecommunication Services) | | | 189 | |
| | 3,264 | | | Hannover Rueckversicherung AG (Insurance) | | | 316 | |
| | 11,822 | | | Hugo Boss AG (Textiles, Apparel & Luxury Goods) | | | 1,321 | |
| | 15,107 | | | Lanxess AG (Chemicals) | | | 891 | |
| | 36,010 | | | Linde AG (Chemicals) | | | 6,820 | |
| | 6,041 | | | MAN SE (Machinery) | | | 622 | |
| | 28,649 | | | Metro AG (Hypermarkets & Super Centers) | | | 903 | |
| | 11,017 | | | GEA Group AG (Machinery) | | | 491 | |
| | 5,070 | | | MTU Aero Engines Holding AG (Aerospace & Defense) | | | 477 | |
| | 9,203 | | | Muenchener Rueckversicherungs-Gesellschaft AG (Insurance) | | | 1,631 | |
| | 49,462 | | | ProSiebenSat.1 Media AG (Media) | | | 2,442 | |
| | 24,572 | | | RWE AG (Multi-Utilities) | | | 528 | |
| | 43,583 | | | SAP AG (Software) | | | 3,041 | |
| | 111,420 | | | Siemens AG (Industrial Conglomerates) | | | 11,221 | |
| | 28,306 | | | TAG Immobilien AG (Real Estate Management & Development) | | | 331 | |
| | 52,773 | | | Telefonica Deutschland Holding AG (Diversified Telecommunication Services) | | | 304 | |
| | | | | | | | |
| | | | | | | 104,953 | |
| | | | | | | | |
| | | | Greece — 0.02% | | | | |
| | 107,214 | | | Alpha Bank AE (Banks) (a)* | | | 32 | |
| | 217,770 | | | Eurobank Ergasias SA (Banks) (a)* | | | 29 | |
| | 878 | | | Folli Follie SA (Specialty Retail)* | | | 22 | |
| | 7,230 | | | Hellenic Telecommunication Organization SA (Diversified Telecommunication Services)* | | | 61 | |
| | 2,958 | | | JUMBO SA (Specialty Retail)* | | | 22 | |
See accompanying notes to financial statements.
116
HC CAPITAL TRUST
The International Equity Portfolio
Portfolio of Investments (continued) — June 30, 2015
| | | | | | | | |
| Shares | | | Security
Description | | Value
(000) | |
| | | | Common Stocks (continued) | | | | |
| | | | Greece (continued) | | | | |
| | 40,545 | | | National Bank of Greece SA (Banks) (a)* | | $ | 45 | |
| | 6,479 | | | Opap SA (Hotels, Restaurants & Leisure)* | | | 52 | |
| | 58,688 | | | Piraeus Bank SA (Banks) (a)* | | | 22 | |
| | 1,466 | | | Titan Cement Co. SA (Construction Materials)* | | | 33 | |
| | | | | | | | |
| | | | | | | 318 | |
| | | | | | | | |
| | | | Hong Kong — 2.86% | | | | |
| | 1,062,980 | | | AIA Group Ltd. (Insurance) (b) | | | 6,959 | |
| | 270,000 | | | Alibaba Pictures Group Ltd. (Media) (a) | | | 105 | |
| | 95,500 | | | Beijing Enterprises Holdings Ltd. (Industrial Conglomerates) | | | 719 | |
| | 126,000 | | | Belle International Holdings Ltd. (Textiles, Apparel & Luxury Goods) | | | 145 | |
| | 454,055 | | | BOC Hong Kong (Holdings) Ltd. (Banks) | | | 1,893 | |
| | 84,000 | | | Brilliance China Automotive Holdings Ltd. (Automobiles) | | | 131 | |
| | 113,759 | | | Cheung Kong Infrastructure Holdings Ltd. (Electric Utilities) | | | 884 | |
| | 68,000 | | | China Agri-Industries Holdings Ltd. (Food Products) (a) | | | 39 | |
| | 285,000 | | | China Everbright International Ltd. (Commercial Services & Supplies) | | | 511 | |
| | 26,000 | | | China Everbright Ltd. (Capital Markets) | | | 90 | |
| | 40,000 | | | China Gas Holdings Ltd. (Gas Utilities) | | | 64 | |
| | 588,330 | | | China Merchants Holdings (International) Co. Ltd. (Transportation Infrastructure) | | | 2,524 | |
| | 112,000 | | | China Overseas Land & Investment Ltd. (Real Estate Management & Development) | | | 395 | |
| | 32,000 | | | China Resources Enterprises Ltd. (Food & Staples Retailing) | | | 103 | |
| | 26,000 | | | China Resources Gas Group Ltd. (Gas Utilities) | | | 77 | |
| | 48,000 | | | China Resources Power Holdings Co. Ltd. (Independent Power and Renewable Electricity Producers) | | | 134 | |
| | 46,000 | | | China State Construction International Holdings Ltd. (Construction & Engineering) | | | 83 | |
| | 41,600 | | | China Taiping Insurance Holdings Co. Ltd. (Insurance) (a) | | | 149 | |
| | 158,000 | | | China Unicom (Hong Kong) Ltd. (Diversified Telecommunication Services) | | | 249 | |
| | 58,000 | | | CITIC Pacific Ltd. (Industrial Conglomerates) | | | 104 | |
| | 175,593 | | | CLP Holdings Ltd. (Electric Utilities) | | | 1,492 | |
| | 110,000 | | | CSPC Pharmaceutical Group Ltd. (Pharmaceuticals) | | | 109 | |
| | 124,000 | | | Evergrande Real Estate Group Ltd. (Real Estate Management & Development) | | | 74 | |
| | 46,000 | | | Far East Horizon Ltd. (Diversified Financial Services) | | | 44 | |
| | 194,000 | | | First Pacific Co. Ltd. (Food & Staples Retailing) | | | 164 | |
| | 48,500 | | | Fosun International Ltd. (Metals & Mining) | | | 114 | |
| | 114,000 | | | Franshion Properties China Ltd. (Real Estate Management & Development) (a) | | | 41 | |
| | 34,000 | | | Goldin Properties Holdings Ltd. (Holding Companies – Diversified) (a) | | | 36 | |
| | 74,000 | | | Guangdong Investment Ltd. (Water Utilities) | | | 104 | |
| | 28,400 | | | Guangzhou R&F Properties Co. Ltd., H Shares (Real Estate Management & Development) (a) | | | 35 | |
| | | | | | | | |
| Shares | | | Security
Description | | Value
(000) | |
| | | | Hong Kong (continued) | | | | |
| | 30,000 | | | Haier Electronics Group Co. Ltd. (Household Durables) (a) | | $ | 81 | |
| | 334,000 | | | Hanergy Thin Film Power Group Ltd. (Semiconductors & Semiconductor Equipment) (a) | | | 168 | |
| | 448,675 | | | Hang Lung Properties Ltd. (Real Estate Management & Development) | | | 1,334 | |
| | 76,806 | | | Hang Seng Bank Ltd. (Banks) | | | 1,501 | |
| | 19,500 | | | Hengan International Group Co. Ltd. (Personal Products) | | | 232 | |
| | 798,680 | | | HKT Trust & HKT Ltd. (Diversified Telecommunication Services) | | | 940 | |
| | 105,000 | | | Hysan Development Co. (Real Estate Management & Development) | | | 455 | |
| | 128,500 | | | Kerry Properties Ltd. (Real Estate Management & Development) | | | 504 | |
| | 174,000 | | | Lenovo Group Ltd. (Technology Hardware, Storage & Peripherals) | | | 241 | |
| | 1,956,000 | | | Li & Fung Ltd. (Textiles, Apparel & Luxury Goods) | | | 1,552 | |
| | 7,900 | | | Melco Crown Entertainment Ltd., ADR (Hotels, Restaurants & Leisure) | | | 155 | |
| | 253,374 | | | MTR Corp. Ltd. (Road & Rail) | | | 1,180 | |
| | 1,030,483 | | | New World Development Co. Ltd. (Real Estate Management & Development) | | | 1,348 | |
| | 806,000 | | | PCCW Ltd. (Diversified Telecommunication Services) | | | 481 | |
| | 138,224 | | | Power Assets Holdings Ltd. (Electric Utilities) | | | 1,261 | |
| | 88,000 | | | Sino Biopharmaceutiical Ltd. (Pharmaceuticals) | | | 102 | |
| | 507,205 | | | Sino Land Co. Ltd. (Real Estate Management & Development) | | | 848 | |
| | 100,000 | | | Sino-Ocean Land Holdings Ltd. (Real Estate Management & Development) | | | 76 | |
| | 789,483 | | | SJM Holdings Ltd. (Hotels, Restaurants & Leisure)^ | | | 856 | |
| | 327,256 | | | Sun Hung Kai Properties Ltd. (Real Estate Management & Development) | | | 5,302 | |
| | 138,208 | | | Swire Pacific Ltd., Class – A (Real Estate Management & Development) | | | 1,738 | |
| | 125,604 | | | The Bank of East Asia Ltd. (Banks) | | | 549 | |
| | 509,908 | | | The Link Real Estate Investment Trust (Real Estate Investment Trusts) | | | 2,987 | |
| | 303,970 | | | The Wharf (Holdings) Ltd. (Real Estate Management & Development) | | | 2,023 | |
| | 48,000 | | | Tingyi (Cayman Islands) Holding Corp. (Food Products) | | | 98 | |
| | 166,000 | | | Yuexiu Property Co. Ltd. (Real Estate Management & Development) | | | 36 | |
| | | | | | | | |
| | | | | | | 43,619 | |
| | | | | | | | |
| | | | Hungary — 0.02% | | | | |
| | 867 | | | MOL Hungarian Oil & Gas PLC (Oil, Gas & Consumable Fuels) | | | 44 | |
| | 6,307 | | | OTP Bank Nyrt PLC (Banks) | | | 126 | |
| | 4,016 | | | Richter Gedeon Nyrt (Pharmaceuticals) | | | 60 | |
| | | | | | | | |
| | | | | | | 230 | |
| | | | | | | | |
| | | | India — 0.02% | | | | |
| | 15,080 | | | Infosys Ltd., ADR (IT Services) | | | 239 | |
| | | | | | | | |
See accompanying notes to financial statements.
117
HC CAPITAL TRUST
The International Equity Portfolio
Portfolio of Investments (continued) — June 30, 2015
| | | | | | | | |
| Shares | | | Security
Description | | Value
(000) | |
| | | | Common Stocks (continued) | | | | |
| | | | Indonesia — 0.16% | | | | |
| | 124,800 | | | Media Nusantara Citra (Media) | | $ | 18 | |
| | 356,700 | | | PT Adaro Energy Tbk (Oil, Gas & Consumable Fuels) | | | 20 | |
| | 11,700 | | | PT Astra Agro Lestari Tbk (Food Products) | | | 20 | |
| | 521,600 | | | PT Astra International Tbk (Automobiles) | | | 277 | |
| | 340,200 | | | PT Bank Central Asia Tbk (Banks) | | | 346 | |
| | 80,700 | | | PT Bank Danamon Indonesia Tbk (Banks) | | | 26 | |
| | 258,800 | | | PT Bank Mandiri Tbk (Banks) | | | 195 | |
| | 194,400 | | | PT Bank Negara Indonesia Persero Tbk (Banks) | | | 77 | |
| | 308,600 | | | PT Bank Rakyat Indonesia Persero Tbk (Banks) | | | 240 | |
| | 206,500 | | | PT Bumi Serpong Damai (Real Estate Management & Development) | | | 26 | |
| | 218,400 | | | PT Charoen Pokphand Indonesia Tbk (Food Products) | | | 45 | |
| | 210,300 | | | PT Global MediaCom Tbk (Media) | | | 18 | |
| | 14,000 | | | PT Gudang Garam Tbk (Tobacco) | | | 47 | |
| | 37,800 | | | PT Indocement Tunggal Prakarsa Tbk (Construction Materials) | | | 59 | |
| | 34,100 | | | PT Indofood CBP Sukses Makmur Tbk (Food Products) | | | 32 | |
| | 130,600 | | | PT Indofood Sukses Makmur Tbk (Food Products) | | | 65 | |
| | 40,800 | | | PT Jasa Marga Persero Tbk (Transportation Infrastructure) | | | 17 | |
| | 668,300 | | | PT Kalbe Farma Tbk (Pharmaceuticals) | | | 84 | |
| | 590,300 | | | PT Lippo Karawaci Tbk (Real Estate Management & Development) | | | 52 | |
| | 54,000 | | | PT Matahari Department Store Tbk (Multiline Retail) | | | 67 | |
| | 299,500 | | | PT Perusahaan Gas Negara Tbk (Gas Utilities) | | | 97 | |
| | 78,900 | | | PT Semen Gresik (Persero) Tbk (Construction Materials) | | | 71 | |
| | 195,600 | | | PT Summarecon Agung Tbk (Real Estate Investment Trusts) | | | 24 | |
| | 128,800 | | | PT Surya Citra Media Tbk (Media) | | | 28 | |
| | 24,700 | | | PT Tambang Batubara Bukit Asam Tbk (Oil, Gas & Consumable Fuels) | | | 16 | |
| | 1,339,600 | | | PT Telekomunikasi Indonesia Persero Tbk (Diversified Telecommunication Services) | | | 295 | |
| | 55,400 | | | PT Tower Bersama Infrastructure Tbk (Wireless Telecommunication Services) (a) | | | 38 | |
| | 40,300 | | | PT Unilever Indonesia Tbk (Household Products) | | | 119 | |
| | 42,800 | | | PT United Tractors Tbk (Machinery) | | | 65 | |
| | 80,800 | | | PT XL Axiata Tbk (Diversified Telecommunication Services) (a) | | | 22 | |
| | | | | | | | |
| | | | | | | 2,506 | |
| | | | | | | | |
| | | | Ireland — 0.28% | | | | |
| | 1,410,696 | | | Bank of Ireland (Banks) (a) | | | 570 | |
| | 87,371 | | | CRH PLC (Construction Materials) | | | 2,466 | |
| | 17,057 | | | Ryanair Holdings PLC, ADR (Airlines) | | | 1,217 | |
| | | | | | | | |
| | | | | | | 4,253 | |
| | | | | | | | |
| | | | Ireland (Republic of) — 0.33% | | | | |
| | 67,402 | | | Medtronic PLC (Health Care Equipment & Supplies) | | | 4,994 | |
| | | | | | | | |
| | | | | | | | |
| Shares | | | Security
Description | | Value
(000) | |
| | | | Israel — 0.44% | | | | |
| | 73,834 | | | Bank Leumi Le-Israel (Banks) (a) | | $ | 312 | |
| | 285,326 | | | Bezeq The Israeli Telecommunication Corp. Ltd. (Diversified Telecommunication Services) | | | 486 | |
| | 1,259 | | | Delek Group Ltd. (Oil, Gas & Consumable Fuels) | | | 372 | |
| | 141,413 | | | Israel Chemicals Ltd. (Chemicals) | | | 989 | |
| | 73,805 | | | Teva Pharmaceutical Industries Ltd. (Pharmaceuticals) | | | 4,368 | |
| | 595 | | | The Israel Corp. Ltd. (Chemicals) | | | 210 | |
| | | | | | | | |
| | | | | | | 6,737 | |
| | | | | | | | |
| | | | Italy — 0.82% | | | | |
| | 62,344 | | | Atlantia SpA (Transportation Infrastructure) | | | 1,540 | |
| | 248,385 | | | Enel SpA (Electric Utilities) | | | 1,125 | |
| | 386,911 | | | Eni SpA (Oil, Gas & Consumable Fuels) | | | 6,867 | |
| | 54,186 | | | Intesa Sanpaolo SpA (Banks) | | | 173 | |
| | 156,653 | | | Mediaset SpA (Media) | | | 753 | |
| | 80,969 | | | Snam Rete Gas SpA (Gas Utilities) | | | 385 | |
| | 712,326 | | | Telecom Italia SpA (Diversified Telecommunication Services) (a) | | | 903 | |
| | 480,977 | | | Telecom Italia SpA (Diversified Telecommunication Services) | | | 491 | |
| | 60,159 | | | Terna – Rete Elettrica Nationale SpA (Electric Utilities) | | | 266 | |
| | | | | | | | |
| | | | | | | 12,503 | |
| | | | | | | | |
| | | | Japan — 18.74% | | | | |
| | 149,486 | | | Aeon Co. Ltd. (Food & Staples Retailing) | | | 2,123 | |
| | 6,861 | | | Aeon Credit Service Co. Ltd. (Consumer Finance) | | | 191 | |
| | 46,724 | | | Aisin Seiki Co. Ltd. (Auto Components) | | | 1,989 | |
| | 69,162 | | | Aozora Bank Ltd. (Banks) | | | 261 | |
| | 248,229 | | | Asahi Glass Co. Ltd. (Building Products) | | | 1,491 | |
| | 17,880 | | | Benesse Holdings, Inc. (Diversified Consumer Services) | | | 449 | |
| | 144,711 | | | Bridgestone Corp. (Auto Components) | | | 5,354 | |
| | 52,500 | | | Brother Industries Ltd. (Technology Hardware, Storage & Peripherals) | | | 744 | |
| | 278,810 | | | Canon, Inc. (Technology Hardware, Storage & Peripherals) | | | 9,074 | |
| | 1,100 | | | COSMOS Pharmaceutical Corp. (Food & Staples Retailing) | | | 149 | |
| | 139,577 | | | Dai Nippon Printing Co. Ltd. (Commercial Services & Supplies) | | | 1,442 | |
| | 46,163 | | | Daihatsu Motor Co. Ltd. (Automobiles) | | | 658 | |
| | 163,678 | | | Daiichi Sankyo Co. Ltd. (Pharmaceuticals) | | | 3,028 | |
| | 8,079 | | | Daito Trust Construction Co. Ltd. (Real Estate Management & Development) | | | 837 | |
| | 67,450 | | | Daiwa House Industry Co. Ltd. (Real Estate Management & Development) | | | 1,573 | |
| | 93,000 | | | Daiwa Securities Group, Inc. (Investment Banking & Brokerage) | | | 697 | |
| | 132,000 | | | Denso Corp. (Auto Components) | | | 6,576 | |
| | 50,000 | | | East Japan Railway Co. (Road & Rail) | | | 4,498 | |
| | 63,857 | | | Eisai Co. Ltd. (Pharmaceuticals) | | | 4,287 | |
| | 5,600 | | | EXEDY Corp. (Auto Components) | | | 140 | |
| | 14,559 | | | FamilyMart Co. Ltd. (Food & Staples Retailing) | | | 670 | |
| | 47,800 | | | Fanuc Ltd. (Machinery) | | | 9,796 | |
| | 48,886 | | | Fukuoka Financial Group, Inc. (Banks) | | | 254 | |
See accompanying notes to financial statements.
118
HC CAPITAL TRUST
The International Equity Portfolio
Portfolio of Investments (continued) — June 30, 2015
| | | | | | | | |
| Shares | | | Security
Description | | Value
(000) | |
| | | | Common Stocks (continued) | | | | |
| | | | Japan (continued) | | | | |
| | 52,200 | | | Hamamatsu Photonics K.K. (Electronic Equipment, Instruments & Components) | | $ | 1,540 | |
| | 3,896 | | | Hikari Tsushin, Inc. (Specialty Retail) | | | 263 | |
| | 25,141 | | | Hitachi Construction Machinery Co. Ltd. (Machinery) | | | 440 | |
| | 1,912,000 | | | Hitachi Ltd. (Electronic Equipment, Instruments & Components) | | | 12,607 | |
| | 10,541 | | | Hokuriku Electric Power Co. (Electric Utilities) | | | 157 | |
| | 381,736 | | | Honda Motor Co. Ltd. (Automobiles) | | | 12,357 | |
| | 2,300 | | | Hoshizaki Electric Co. Ltd. (Machinery) | | | 135 | |
| | 26,800 | | | IBIDEN Co. Ltd. (Electronic Equipment, Instruments & Components) | | | 453 | |
| | 20,698 | | | Idemitsu Kosan Co. Ltd. (Oil, Gas & Consumable Fuels) | | | 406 | |
| | 518,000 | | | IHI Corp. (Machinery) | | | 2,413 | |
| | 37,830 | | | Iida Group Holdings Co. Ltd. (Household Durables) | | | 603 | |
| | 394,217 | | | ITOCHU Corp. (Trading Companies & Distributors) | | | 5,209 | |
| | 12,000 | | | ITOCHU Techno-Solutions Corp. (IT Services) | | | 299 | |
| | 99 | | | Japan Prime Realty Investment Corp. (Real Estate Investment Trusts)^ | | | 308 | |
| | 140 | | | Japan Real Estate Investment Corp. (Real Estate Investment Trusts) | | | 636 | |
| | 289 | | | Japan Retail Fund Investment Corp. (Real Estate Investment Trusts) | | | 578 | |
| | 282,209 | | | Japan Tobacco, Inc. (Tobacco) | | | 10,056 | |
| | 109,500 | | | JFE Holdings, Inc. (Metals & Mining) | | | 2,431 | |
| | 112,000 | | | JGC Corp. (Construction & Engineering) | | | 2,116 | |
| | 63,379 | | | JS Group Corp. (Building Products) | | | 1,259 | |
| | 44,254 | | | JSR Corp. (Chemicals) | | | 783 | |
| | 565,106 | | | JX Holdings, Inc. (Oil, Gas & Consumable Fuels) | | | 2,440 | |
| | 73,570 | | | Kaneka Corp. (Chemicals) | | | 538 | |
| | 408,000 | | | Kawasaki Heavy Industries Ltd. (Machinery) | | | 1,904 | |
| | 501,600 | | | KDDI Corp. (Wireless Telecommunication Services) | | | 12,108 | |
| | 3,820 | | | Keyence Corp. (Electronic Equipment, Instruments & Components) | | | 2,062 | |
| | 210,963 | | | Kirin Holdings Co. Ltd. (Beverages) | | | 2,907 | |
| | 688,986 | | | Kobe Steel Ltd. (Metals & Mining) | | | 1,160 | |
| | 367,445 | | | Komatsu Ltd. (Machinery) | | | 7,377 | |
| | 23,447 | | | Konami Corp. (Software) | | | 436 | |
| | 27,000 | | | Kubota Corp. (Machinery) | | | 428 | |
| | 83,284 | | | Kuraray Co. Ltd. (Chemicals) | | | 1,019 | |
| | 28,221 | | | Kurita Water Industries Ltd. (Machinery) | | | 658 | |
| | 15,494 | | | Lawson, Inc. (Food & Staples Retailing) | | | 1,061 | |
| | 442,216 | | | Marubeni Corp. (Trading Companies & Distributors) | | | 2,538 | |
| | 12,287 | | | Maruichi Steel Tube Ltd. (Metals & Mining) | | | 305 | |
| | 371,445 | | | Mitsubishi Corp. (Trading Companies & Distributors) | | | 8,171 | |
| | 90,018 | | | Mitsubishi Gas Chemical Co., Inc. (Chemicals) | | | 505 | |
| | 249,204 | | | Mitsubishi Materials Corp. (Metals & Mining) | | | 957 | |
| | | | | | | | |
| Shares | | | Security
Description | | Value
(000) | |
| | | | Japan (continued) | | | | |
| | 54,226 | | | Mitsubishi Tanabe Pharma Corp. (Pharmaceuticals) | | $ | 813 | |
| | 877,205 | | | Mitsubishi UFJ Financial Group, Inc. (Banks) | | | 6,307 | |
| | 429,088 | | | Mitsui & Co. Ltd. (Trading Companies & Distributors) | | | 5,830 | |
| | 1,285,877 | | | Mizuho Financial Group, Inc. (Banks) | | | 2,785 | |
| | 9,400 | | | Murata Manufacturing Co. Ltd. (Electronic Equipment, Instruments & Components) | | | 1,641 | |
| | 81,167 | | | NGK Insulators Ltd. (Machinery) | | | 2,093 | |
| | 2,000 | | | Nidec Corp. (Electronic Equipment, Instruments & Components) | | | 150 | |
| | 299,699 | | | Nikon Corp. (Household Durables) | | | 3,467 | |
| | 158 | | | Nippon Building Fund, Inc. (Real Estate Investment Trusts) | | | 693 | |
| | 93,423 | | | Nippon Electric Glass Co. Ltd. (Electronic Equipment, Instruments & Components) | | | 473 | |
| | 171 | | | Nippon Prologis REIT, Inc. (Real Estate Investment Trusts) | | | 315 | |
| | 105,962 | | | Nippon Telegraph & Telephone Corp. (Diversified Telecommunication Services) | | | 3,839 | |
| | 361,000 | | | Nippon Yusen Kabushiki Kaisha (Marine) | | | 1,006 | |
| | 670,254 | | | Nissan Motor Co. Ltd. (Automobiles) | | | 6,984 | |
| | 202,200 | | | Nomura Holdings, Inc. (Investment Banking & Brokerage) | | | 1,373 | |
| | 13,911 | | | Nomura Real Estate Holdings, Inc. (Real Estate Management & Development) | | | 292 | |
| | 6,900 | | | NSK Ltd. (Machinery) | | | 107 | |
| | 211,425 | | | NTT DoCoMo, Inc. (Wireless Telecommunication Services) | | | 4,050 | |
| | 200,822 | | | Oji Paper Co. Ltd. (Paper & Forest Products) | | | 873 | |
| | 83,000 | | | Olympus Corp. (Health Care Equipment & Supplies) | | | 2,869 | |
| | 600 | | | Ono Pharmaceutical Co. Ltd. (Pharmaceuticals) | | | 66 | |
| | 17,282 | | | Oracle Corp. Japan (Software) | | | 723 | |
| | 116,712 | | | Osaka Gas Co. Ltd. (Gas Utilities) | | | 461 | |
| | 90,915 | | | Otsuka Holdings Co. Ltd. (Pharmaceuticals) | | | 2,900 | |
| | 24,684 | | | Park24 Co. Ltd. (Commercial Services & Supplies) | | | 423 | |
| | 7,800 | | | Recruit Holdings Co. Ltd. (Professional Services) | | | 238 | |
| | 126,138 | | | Resona Holdings, Inc. (Banks) | | | 689 | |
| | 212,283 | | | Ricoh Co. Ltd. (Technology Hardware, Storage & Peripherals) | | | 2,203 | |
| | 4,600 | | | Rinnai Corp. (Household Durables) | | | 363 | |
| | 700 | | | Rohm Co. Ltd. (Semiconductors) | | | 47 | |
| | 3,600 | | | Ryohin Keikaku Co. (Multiline Retail) | | | 698 | |
| | 13,315 | | | Sankyo Co. Ltd. (Leisure Products) | | | 472 | |
| | 41,400 | | | Sega Sammy Holdings, Inc. (Leisure Products) | | | 541 | |
| | 102,793 | | | Sekisui Chemical Co. Ltd. (Household Durables) | | | 1,263 | |
| | 131,552 | | | Sekisui House Ltd. (Household Durables) | | | 2,090 | |
| | 4,100 | | | Shimano, Inc. (Leisure Products) | | | 560 | |
| | 37,100 | | | Shin-Etsu Chemical Co. Ltd. (Chemicals) | | | 2,303 | |
| | 43,894 | | | Showa Shell Sekiyu K.K. (Oil, Gas & Consumable Fuels) | | | 384 | |
| | 2,800 | | | SMC Corp. (Machinery) | | | 844 | |
| | 28,500 | | | SoftBank Corp. (Wireless Telecommunication Services) | | | 1,679 | |
See accompanying notes to financial statements.
119
HC CAPITAL TRUST
The International Equity Portfolio
Portfolio of Investments (continued) — June 30, 2015
| | | | | | | | |
| Shares | | | Security
Description | | Value
(000) | |
| | | | Common Stocks (continued) | | | | |
| | | | Japan (continued) | | | | |
| | 10,208 | | | Sony Financial Holdings, Inc. (Insurance) | | $ | 179 | |
| | 279,986 | | | Sumitomo Corp. (Trading Companies & Distributors) | | | 3,258 | |
| | 119,226 | | | Sumitomo Metal Mining Co. Ltd. (Metals & Mining) | | | 1,816 | |
| | 180,348 | | | Sumitomo Mitsui Financial Group, Inc. (Banks) | | | 8,045 | |
| | 184,832 | | | Sumitomo Mitsui Trust Holdings, Inc. (Banks) | | | 847 | |
| | 42,291 | | | Sumitomo Rubber Industries Ltd. (Auto Components) | | | 656 | |
| | 7,900 | | | Sysmex Corp. (Health Care Equipment & Supplies) | | | 471 | |
| | 194,811 | | | Takeda Pharmaceutical Co. Ltd. (Pharmaceuticals) | | | 9,411 | |
| | 17,342 | | | The Chugoku Electric Power Co., Inc. (Electric Utilities) | | | 253 | |
| | 25,210 | | | The Yokohama Rubber Co. Ltd. (Auto Components) | | | 506 | |
| | 69,981 | | | TonenGeneral Sekiyu K.K. (Oil, Gas & Consumable Fuels) | | | 651 | |
| | 9,100 | | | Topcon Corp. (Electronic Equipment, Instruments & Components) | | | 219 | |
| | 134,522 | | | Toppan Printing Co. Ltd. (Commercial Services & Supplies) | | | 1,126 | |
| | 15,562 | | | Toyoda Gosei Co. Ltd. (Auto Components) | | | 376 | |
| | 423,903 | | | Toyota Motor Corp. (Automobiles) | | | 28,415 | |
| | 48,370 | | | Toyota Tsusho Corp. (Trading Companies & Distributors) | | | 1,298 | |
| | 37,627 | | | Trend Micro, Inc. (Software) | | | 1,289 | |
| | 278 | | | United Urban Investment Corp. (Real Estate Investment Trusts) | | | 393 | |
| | 42,119 | | | West Japan Railway Co. (Road & Rail) | | | 2,697 | |
| | 227,200 | | | Yahoo Japan Corp. (Internet Software & Services) | | | 917 | |
| | 5,700 | | | Yamato Holdings Co. Ltd. (Air Freight & Logistics) | | | 110 | |
| | | | | | | | |
| | | | | | | 285,744 | |
| | | | | | | | |
| | | | Jersey — 0.18% | | | | |
| | 176,893 | | | Glencore International PLC (Metals & Mining) | | | 709 | |
| | 90,235 | | | WPP PLC (Media) | | | 2,022 | |
| | | | | | | | |
| | | | | | | 2,731 | |
| | | | | | | | |
| | | | Korea, Republic Of — 0.02% | | | | |
| | 700 | | | Cheil Industries, Inc. (Industrial Conglomerates) (a) | | | 111 | |
| | 109 | | | Hanmi Pharm Co. Ltd. (Pharmaceuticals) (a) | | | 46 | |
| | 225 | | | Hanssem Co. Ltd. (Household Durables) | | | 57 | |
| | 588 | | | KEPCO Plant Service & Engineering Co. Ltd. (Commercial Services & Supplies) | | | 62 | |
| | | | | | | | |
| | | | | | | 276 | |
| | | | | | | | |
| | | | Liberia — 0.04% | | | | |
| | 7,652 | | | Royal Caribbean Cruises Ltd. (Hotels, Resorts & Cruise Lines) | | | 602 | |
| | | | | | | | |
| | | | Luxembourg — 0.33% | | | | |
| | 6,840 | | | RTL Group (Media) | | | 618 | |
| | 104,204 | | | SES – FDR, Class – A (Media) | | | 3,500 | |
| | | | | | | | |
| Shares | | | Security
Description | | Value
(000) | |
| | | | Luxembourg (continued) | | | | |
| | 67,423 | | | Tenaris SA (Energy Equipment & Services) | | $ | 908 | |
| | | | | | | | |
| | | | | | | 5,026 | |
| | | | | | | | |
| | | | Malaysia — 0.22% | | | | |
| | 40,200 | | | Airasia Berhad (Airlines) | | | 16 | |
| | 30,000 | | | Alliance Financial Group Berhad (Banks) | | | 35 | |
| | 48,300 | | | AMMB Holdings Berhad (Banks) | | | 77 | |
| | 46,300 | | | Astro Malaysia Holdings Berhad (Media) | | | 38 | |
| | 70,200 | | | Axiata Group Berhad (Wireless Telecommunication Services) | | | 119 | |
| | 21,897 | | | Berjaya Sports Toto Berhard (Hotels, Restaurants & Leisure) | | | 19 | |
| | 3,800 | | | British American Tobacco Malaysia Berhad (Tobacco) | | | 62 | |
| | 49,800 | | | Bumi Armada Berhad (Energy Equipment & Services) | | | 15 | |
| | 142,200 | | | CIMB Group Holdings Berhad (Banks) | | | 206 | |
| | 92,736 | | | Dialog Group Berhad (Construction & Engineering) | | | 39 | |
| | 89,200 | | | DiGi.Com Berhad (Wireless Telecommunication Services) | | | 128 | |
| | 25,500 | | | Felda Global Ventures Holdings Berhad (Food Products) | | | 11 | |
| | 40,000 | | | Gamuda Berhad (Construction & Engineering) | | | 50 | |
| | 59,500 | | | Genting Berhad (Hotels, Restaurants & Leisure) | | | 127 | |
| | 85,400 | | | Genting Malaysia Berhad (Hotels, Restaurants & Leisure) | | | 95 | |
| | 7,800 | | | Genting Plantations Berhad (Food Products) | | | 20 | |
| | 14,500 | | | Hong Leong Bank Berhad (Banks) | | | 52 | |
| | 6,900 | | | Hong Leong Financial Group Berhad (Banks) | | | 28 | |
| | 67,200 | | | Ihh Healthcare Berhad (Health Care Providers & Services) (a) | | | 101 | |
| | 38,300 | | | IJM Corp. Berhad (Construction & Engineering) | | | 66 | |
| | 70,400 | | | IOI Corp. Berhad (Food Products) | | | 76 | |
| | 39,800 | | | IOI Properties Group Berhad (Real Estate Management & Development) | | | 20 | |
| | 10,700 | | | Kuala Lumpur Kepong Berhad (Food Products) | | | 61 | |
| | 11,600 | | | Lafarge Malayan Cement Berhad (Construction Materials) | | | 26 | |
| | 122,900 | | | Malayan Banking Berhad (Banks) | | | 298 | |
| | 15,900 | | | Malaysia Airports holdings Berhad (Transportation Infrastructure) | | | 26 | |
| | 55,600 | | | Maxis Berhad (Wireless Telecommunication Services) | | | 94 | |
| | 31,700 | | | MISC Berhad (Marine) | | | 65 | |
| | 76,600 | | | Petronas Chemicals Group Berhad (Chemicals) | | | 128 | |
| | 7,000 | | | Petronas Dagangan Berhad (Oil, Gas & Consumable Fuels) | | | 38 | |
| | 18,000 | | | Petronas Gas Berhad (Gas Utilities) | | | 101 | |
| | 13,300 | | | PPB Group Berhad (Food Products) | | | 53 | |
| | 71,600 | | | Public Bank Berhad (Banks) | | | 356 | |
| | 18,900 | | | RHB Capital Berhad (Banks) | | | 37 | |
| | 97,700 | | | SapuraKencana Petroleum Berhad (Energy Equipment & Services) | | | 61 | |
| | 81,000 | | | Sime Darby Berhad (Industrial Conglomerates) | | | 183 | |
| | 29,200 | | | Telekom Malaysia Berhad (Diversified Telecommunication Services) | | | 51 | |
| | 90,100 | | | Tenega Nasional Berhad (Electric Utilities) | | | 302 | |
| | 16,100 | | | UMW Holdings Berhad (Automobiles) | | | 43 | |
See accompanying notes to financial statements.
120
HC CAPITAL TRUST
The International Equity Portfolio
Portfolio of Investments (continued) — June 30, 2015
| | | | | | | | |
| Shares | | | Security
Description | | Value
(000) | |
| | | | Common Stocks (continued) | | | | |
| | | | Malaysia (continued) | | | | |
| | 17,900 | | | Westports Holding Berhad (Commercial Services) | | $ | 20 | |
| | 128,000 | | | YTL Corp. Berhad (Multi-Utilities) | | | 52 | |
| | 49,200 | | | YTL Power International Berhad (Multi-Utilities) | | | 21 | |
| | | | | | | | |
| | | | | | | 3,416 | |
| | | | | | | | |
| | | | Malta — 0.01% | | | | |
| | 8,581 | | | Brait SE (Capital Markets) | | | 87 | |
| | | | | | | | |
| | | | Mexico — 0.47% | | | | |
| | 78,900 | | | Alfa SAB de CV, Class – A (Industrial Conglomerates) | | | 151 | |
| | 873,900 | | | America Movil SAB de CV (Wireless Telecommunication Services) | | | 934 | |
| | 9,700 | | | Arca Continental SAB de CV (Beverages) | | | 55 | |
| | 21,112 | | | Cemex SAB de CV, ADR (Construction Materials) (a) | | | 193 | |
| | 340,667 | | | Cemex SAB de CV (Construction Materials) (a) | | | 313 | |
| | 11,900 | | | Coca-Cola FEMSA SAB de CV, Series L (Beverages) | | | 95 | |
| | 33,200 | | | Compartamos SAB de CV (Consumer Finance) | | | 59 | |
| | 12,400 | | | Controladora Comercial Mexicana SAB de CV (Food & Staples Retailing) | | | 39 | |
| | 5,400 | | | El Puerto de Liverpool SAB de CV, Class – C1 (Multiline Retail) | | | 62 | |
| | 61,200 | | | Fibra Uno Amdinistracion SA (Real Estate Investment Trusts) | | | 146 | |
| | 47,900 | | | Fomento Economico Mexicano SAB de CV (Beverages) | | | 427 | |
| | 4,800 | | | Gruma, S.A.B de CV, Class – B (Food Products) | | | 62 | |
| | 9,100 | | | Grupo Aeroportuario del Pacifico SAB de CV, B Shares (Transportation Infrastructure) | | | 62 | |
| | 6,200 | | | Grupo Aeroportuario del Sureste SAB de CV, Class – B (Transportation Infrastructure) | | | 89 | |
| | 45,900 | | | Grupo Bimbo SAB de CV (Food Products) (a) | | | 118 | |
| | 16,100 | | | Grupo Carso SAB de CV, Series A1 (Industrial Conglomerates) | | | 67 | |
| | 10,900 | | | Grupo Comercial Chedraui SAB de CV (Food & Staples Retailing) | | | 31 | |
| | 68,700 | | | Grupo Financiero Banorte SAB de CV (Banks) | | | 378 | |
| | 67,200 | | | Grupo Financiero Inbursa, SAB de CV, Class – O (Banks) | | | 152 | |
| | 43,800 | | | Grupo Financiero Santander Mexico SAB de CV, B Shares (Banks) | | | 81 | |
| | 14,800 | | | Grupo Lala SAB de CV (Food Products) | | | 31 | |
| | 102,700 | | | Grupo Mexico SAB de CV, Series B (Metals & Mining) | | | 309 | |
| | 56,639 | | | Grupo Televisa SA, ADR (Media) | | | 2,199 | |
| | 65,900 | | | Grupo Televisa SAB de CV (Media) | | | 512 | |
| | 3,610 | | | Industrias Penoles SAB de CV (Metals & Mining) | | | 59 | |
| | 35,800 | | | Kimberly-Clark de Mexico SAB de CV, A Shares (Household Products) | | | 77 | |
| | 26,900 | | | Mexichem SAB de CV (Chemicals) | | | 78 | |
| | 17,300 | | | Ohl Mexico SAB de CV (Transportation Infrastructure) (a) | | | 22 | |
| | 7,200 | | | Promotora y Operadora de Infraestructura SAB de CV (Construction & Engineering) (a) | | | 77 | |
| | | | | | | | |
| Shares | | | Security
Description | | Value
(000) | |
| | | | Mexico (continued) | | | | |
| | 135,800 | | | Wal-Mart de Mexico SAB de CV (Food & Staples Retailing) | | $ | 332 | |
| | | | | | | | |
| | | | | | | 7,210 | |
| | | | | | | | |
| | | | Netherlands — 2.70% | | | | |
| | 39,032 | | | AEGON NV (Insurance) | | | 286 | |
| | 14,459 | | | Airbus Group NV (Aerospace & Defense) | | | 938 | |
| | 119,483 | | | Akzo Nobel NV (Chemicals) | | | 8,694 | |
| | 50,711 | | | ASML Holding NV (Semiconductors & Semiconductor Equipment) | | | 5,240 | |
| | 5,261 | | | ASML Holding NV, NYS (Semiconductors & Semiconductor Equipment) | | | 548 | |
| | 5,279 | | | Delta Lloyd NV (Insurance) | | | 87 | |
| | 13,447 | | | Gemalto NV (Software) | | | 1,197 | |
| | 1,387 | | | Heineken NV (Beverages) | | | 105 | |
| | 16,608 | | | ING Groep NV (Banks) | | | 274 | |
| | 85,306 | | | Koninklijke Ahold NV (Food & Staples Retailing) | | | 1,598 | |
| | 6,617 | | | Koninklijke Boskalis Westminster NV (Construction & Engineering) | | | 324 | |
| | 31,142 | | | Koninklijke DSM NV (Chemicals) | | | 1,805 | |
| | 87,126 | | | Koninklijke Philips Electronics NV (Industrial Conglomerates) | | | 2,216 | |
| | 4,933 | | | Koninklijke Vopak NV (Oil, Gas & Consumable Fuels) | | | 249 | |
| | 2,760 | | | NN Group NV (Insurance) | | | 78 | |
| | 8,845 | | | Randstad Holding NV (Professional Services) | | | 576 | |
| | 296,863 | | | Reed Elsevier NV (Media) | | | 7,040 | |
| | 4,300 | | | Sensata Technologies Holding NV (Electrical Equipment) (a) | | | 227 | |
| | 266,410 | | | TNT NV (Air Freight & Logistics) (a) | | | 1,184 | |
| | 184,852 | | | Unilever NV (Food Products) | | | 7,697 | |
| | 25,863 | | | Wolters Kluwer NV (Media) | | | 768 | |
| | | | | | | | |
| | | | | | | 41,131 | |
| | | | | | | | |
| | | | New Zealand — 0.03% | | | | |
| | 55,400 | | | Infratil Ltd. (Electric Utilities) | | | 119 | |
| | 41,981 | | | Meridian Energy Ltd. (Electric Utilities) (a) | | | 61 | |
| | 180,824 | | | Telecom Corp. of New Zealand Ltd. (Diversified Telecommunication Services) | | | 342 | |
| | | | | | | | |
| | | | | | | 522 | |
| | | | | | | | |
| | | | Norway — 0.57% | | | | |
| | 30,391 | | | DNB ASA (Banks) | | | 507 | |
| | 10,983 | | | Gjensidige Forsikring ASA (Insurance) | | | 177 | |
| | 181,084 | | | Orkla ASA (Food Products) | | | 1,426 | |
| | 258,968 | | | Statoil ASA (Oil, Gas & Consumable Fuels) | | | 4,630 | |
| | 86,078 | | | Telenor ASA (Diversified Telecommunication Services) | | | 1,887 | |
| | | | | | | | |
| | | | | | | 8,627 | |
| | | | | | | | |
| | | | Papua New Guinea — 0.04% | | | | |
| | 104,432 | | | Oil Search Ltd. (Oil, Gas & Consumable Fuels) | | | 574 | |
| | | | | | | | |
| | | | Peru — 0.02% | | | | |
| | 5,500 | | | Compania de Minas Buenaventura SA, ADR (Metals & Mining) | | | 57 | |
| | 1,800 | | | Credicorp Ltd. (Banks) | | | 250 | |
| | | | | | | | |
| | | | | | | 307 | |
| | | | | | | | |
| | | | Philippines — 0.10% | | | | |
| | 56,900 | | | Aboitiz Equity Ventures, Inc. (Industrial Conglomerates) | | | 73 | |
See accompanying notes to financial statements.
121
HC CAPITAL TRUST
The International Equity Portfolio
Portfolio of Investments (continued) — June 30, 2015
| | | | | | | | |
| Shares | | | Security
Description | | Value
(000) | |
| | | | Common Stocks (continued) | | | | |
| | | | Philippines (continued) | | | | |
| | 38,300 | | | Aboitiz Power Corp. (Independent Power and Renewable Electricity Producers) | | $ | 39 | |
| | 60,300 | | | Alliance Global Group, Inc. (Industrial Conglomerates) | | | 29 | |
| | 5,390 | | | Ayala Corp. (Diversified Financial Services) | | | 94 | |
| | 194,900 | | | Ayala Land, Inc. (Real Estate Management & Development) | | | 161 | |
| | 22,490 | | | Bank of the Philippine Islands (Banks) | | | 47 | |
| | 39,960 | | | BDO Unibank, Inc. (Banks) | | | 97 | |
| | 115,800 | | | DMCI Holdings, Inc. (Industrial Conglomerates) | | | 34 | |
| | 248,700 | | | Energy Development Corp. (Independent Power and Renewable Electricity Producers) | | | 41 | |
| | 1,060 | | | Globe Telecom, Inc. (Wireless Telecommunication Services) | | | 59 | |
| | 1,745 | | | GT Capital Holdings, Inc. (Investment Companies) | | | 53 | |
| | 15,140 | | | International Container Terminal Services, Inc. (Transportation Infrastructure) | | | 37 | |
| | 70,900 | | | JG Summit Holdings, Inc. (Industrial Conglomerates) | | | 114 | |
| | 12,380 | | | Jollibee Foods Corp. (Hotels, Restaurants & Leisure) | | | 54 | |
| | 346,000 | | | Megaworld Corp. (Real Estate Management & Development) | | | 37 | |
| | 324,000 | | | Metro Pacific Investments Corp. (Diversified Financial Services) | | | 34 | |
| | 4,480 | | | Metropolitan Bank & Trust Co. (Banks) | | | 9 | |
| | 2,425 | | | Philippine Long Distance Telephone Co. (Wireless Telecommunication Services) | | | 151 | |
| | 4,130 | | | SM Investments Corp. (Industrial Conglomerates) | | | 82 | |
| | 224,100 | | | SM Prime Holdings, Inc. (Real Estate Management & Development) | | | 99 | |
| | 25,390 | | | Universal Robina Corp. (Food Products) | | | 109 | |
| | | | | | | | |
| | | | | | | 1,453 | |
| | | | | | | | |
| | | | Poland — 0.10% | | | | |
| | 1,346 | | | Alior Bank SA (Banks) (a) | | | 32 | |
| | 971 | | | Bank Handlowy w Warszawie SA (Banks) | | | 26 | |
| | 13,300 | | | Bank Millennium SA (Banks) (a) | | | 23 | |
| | 3,397 | | | Bank Pekao SA (Banks) | | | 163 | |
| | 969 | | | Bank Zachodni WBK SA (Banks) (a) | | | 88 | |
| | 483 | | | CCC SA (Textiles, Apparel & Luxury Goods) | | | 22 | |
| | 5,459 | | | Cyfrowy Polsat SA (Media) (a) | | | 34 | |
| | 6,568 | | | Enea SA (Electric Utilities) | | | 28 | |
| | 8,072 | | | Energa SA (Electric Utilities) | | | 49 | |
| | 1,813 | | | Eurocash SA (Food & Staples Retailing) | | | 18 | |
| | 22,044 | | | Getin Nobel Bank SA (Banks) (a) | | | 8 | |
| | 1,261 | | | Grupa Azoty SA (Chemicals) (a) | | | 28 | |
| | 2,309 | | | Grupa Lotos SA (Oil, Gas & Consumable Fuels) (a) | | | 18 | |
| | 3,832 | | | KGHM Polska Miedz SA (Metals & Mining) | | | 109 | |
| | 29 | | | LPP SA (Textiles, Apparel & Luxury Goods) | | | 52 | |
| | 439 | | | MBank SA (Banks) (a) | | | 48 | |
| | 21,551 | | | PGE SA (Electric Utilities) | | | 106 | |
| | 8,827 | | | Polski Koncern Naftowy Orlen SA (Oil, Gas & Consumable Fuels) | | | 174 | |
| | 52,480 | | | Polskie Gornictwo Naftowe i Gazownictwo SA (Oil, Gas & Consumable Fuels) | | | 92 | |
| | | | | | | | |
| Shares | | | Security
Description | | Value
(000) | |
| | | | Poland (continued) | | | | |
| | 22,842 | | | Powszechna Kasa Oszczednosci Bank Polski SA (Banks) | | $ | 188 | |
| | 1,552 | | | Powszechny Zaklad Ubezpieczen SA (Insurance) | | | 179 | |
| | 16,485 | | | Synthos SA (Chemicals) (a) | | | 20 | |
| | 23,349 | | | Tauron Polska Energia SA (Electric Utilities) | | | 27 | |
| | 19,720 | | | Telekomunikacja Polska SA (Diversified Telecommunication Services) | | | 43 | |
| | | | | | | | |
| | | | | | | 1,575 | |
| | | | | | | | |
| | | | Portugal — 0.07% | | | | |
| | 283,815 | | | EDP – Energias de Portugal SA (Electric Utilities) | | | 1,077 | |
| | | | | | | | |
| | | | Qatar — 0.07% | | | | |
| | 2,648 | | | Barwa Real Estate Co. (Real Estate Management & Development) | | | 39 | |
| | 4,072 | | | Doha Bank Qsc (Banks) | | | 59 | |
| | 15,787 | | | Ezdan Real Estate Co. QSC (Real Estate Investment Trusts) | | | 78 | |
| | 1,472 | | | Gulf International Services QSC (Energy Equipment & Services) | | | 32 | |
| | 4,122 | | | Industries Qatar Q.S.C. (Industrial Conglomerates) | | | 163 | |
| | 10,143 | | | Masraf Al Rayan (Banks) | | | 130 | |
| | 2,222 | | | Ooredoo Qsc (Diversified Telecommunication Services) | | | 53 | |
| | 760 | | | Qatar Electricity & Water Co. (Multi-Utilities) | | | 48 | |
| | 1,997 | | | Qatar Insurance Co. (Insurance) | | | 53 | |
| | 1,950 | | | Qatar Islamic Bank (Banks) | | | 58 | |
| | 4,543 | | | Qatar National Bank (Banks) | | | 240 | |
| | 1,584 | | | The Commercial Bank of Qatar QSC (Banks) | | | 24 | |
| | 11,887 | | | Vodafone Qatar (Wireless Telecommunication Services) (a) | | | 54 | |
| | | | | | | | |
| | | | | | | 1,031 | |
| | | | | | | | |
| | | | Russia — 0.28% | | | | |
| | 47,400 | | | ALROSA AO (Metals & Mining) | | | 54 | |
| | 3,371,000 | | | Federal Hydrogenerating Co. (Electric Utilities) | | | 34 | |
| | 312,687 | | | Gazprom OAO (Oil, Gas & Consumable Fuels) | | | 829 | |
| | 10,545 | | | LUKOIL OAO, ADR (Oil, Gas & Consumable Fuels) | | | 474 | |
| | 13,424 | | | LUKOIL OAO (Oil, Gas & Consumable Fuels) | | | 602 | |
| | 7,098 | | | Magnit OJSC,, Registered Shares, GDR (Food & Staples Retailing) | | | 395 | |
| | 2,606 | | | MegaFon OAO, GDR (Wireless Telecommunication Services) | | | 36 | |
| | 1,420 | | | MMC Norilsk Nickel PJSC (Metals & Mining) | | | 245 | |
| | 14,600 | | | Mobile TeleSystems OJSC, ADR (Wireless Telecommunication Services) | | | 143 | |
| | 2,433 | | | NovaTek OAO, Registered Shares, GDR (Oil, Gas & Consumable Fuels) | | | 248 | |
| | 32,700 | | | Rosneft Oil (Oil, Gas & Consumable Fuels) | | | 138 | |
| | 18,370 | | | Rostelecom OJSC (Diversified Telecommunication Services) | | | 30 | |
| | 283,390 | | | Sberbank of Russia (Banks) | | | 373 | |
| | 5,750 | | | Severstal (Metals & Mining) | | | 62 | |
| | 5,220 | | | Sistema JSFC, GDR (Wireless Telecommunication Services) | | | 46 | |
See accompanying notes to financial statements.
122
HC CAPITAL TRUST
The International Equity Portfolio
Portfolio of Investments (continued) — June 30, 2015
| | | | | | | | |
| Shares | | | Security
Description | | Value
(000) | |
| | | | Common Stocks (continued) | | | | |
| | | | Russia (continued) | | | | |
| | 174,100 | | | Surgutneftegas (Oil, Gas & Consumable Fuels) | | $ | 105 | |
| | 37,900 | | | Tatneft, Class – S (Oil, Gas & Consumable Fuels) | | | 204 | |
| | 23,110 | | | Uralkali OJSC (Chemicals) | | | 61 | |
| | 135,270,000 | | | VTB Bank OJSC (Banks) (a) | | | 194 | |
| | | | | | | | |
| | | | | | | 4,273 | |
| | | | | | | | |
| | | | Singapore — 1.27% | | | | |
| | 441,572 | | | Ascendas Real Estate Investment Trust (Real Estate Investment Trusts) | | | 807 | |
| | 425,744 | | | CapitaCommercial Trust (Real Estate Investment Trusts) | | | 493 | |
| | 506,115 | | | CapitaMall Trust (Real Estate Investment Trusts) | | | 808 | |
| | 20,298 | | | DBS Group Holdings Ltd. (Banks) | | | 312 | |
| | 1,843,341 | | | Hutchison Port Holdings Trust (Transportation Infrastructure) | | | 1,161 | |
| | 608,099 | | | Keppel Corp. Ltd. (Industrial Conglomerates) | | | 3,712 | |
| | 93,508 | | | Olam International Ltd. (Food & Staples Retailing) | | | 131 | |
| | 384,800 | | | SembCorp Industries Ltd. (Industrial Conglomerates) | | | 1,112 | |
| | 349,217 | | | SembCorp Marine Ltd. (Machinery)^ | | | 737 | |
| | 514,181 | | | Singapore Press Holdings Ltd. (Media) | | | 1,558 | |
| | 417,527 | | | Singapore Tech Engineering (Aerospace & Defense) | | | 1,023 | |
| | 1,835,079 | | | Singapore Telecommunications Ltd. (Diversified Telecommunication Services) | | | 5,737 | |
| | 126,126 | | | StarHub Ltd. (Wireless Telecommunication Services) | | | 370 | |
| | 494,880 | | | Suntec REIT (Real Estate Investment Trusts) | | | 634 | |
| | 765,036 | | | Yangzijiang Shipbuilding Holdings Ltd. (Machinery) | | | 804 | |
| | | | | | | | |
| | | | | | | 19,399 | |
| | | | | | | | |
| | | | South Africa — 0.58% | | | | |
| | 43,895 | | | African Bank Investments Ltd. (Diversified Financial Services) (a) | | | — | |
| | 1,865 | | | African Rainbow Minerals Ltd. (Metals & Mining) | | | 13 | |
| | 1,170 | | | Anglo Platinum Ltd. (Metals & Mining) (a) | | | 26 | |
| | 10,095 | | | AngloGold Ashanti Ltd. (Metals & Mining) (a) | | | 92 | |
| | 8,929 | | | Aspen Pharmacare Holdings Ltd. (Pharmaceuticals) | | | 264 | |
| | 9,306 | | | Barclays Africa Group Ltd. (Banks) | | | 140 | |
| | 5,507 | | | Barloworld Ltd. (Trading Companies & Distributors) | | | 44 | |
| | 8,487 | | | Bidvest Group Ltd. (Industrial Conglomerates) | | | 215 | |
| | 673 | | | Capitec Bank Holdings Ltd. (Diversified Financial Services) | | | 27 | |
| | 6,365 | | | Coronation Fund Managers Ltd. (Capital Markets) | | | 43 | |
| | 9,742 | | | Discovery Ltd. (Insurance) | | | 101 | |
| | 3,474 | | | Exxaro Resources Ltd. (Oil, Gas & Consumable Fuels) | | | 25 | |
| | | | | | | | |
| Shares | | | Security
Description | | Value
(000) | |
| | | | South Africa (continued) | | | | |
| | 90,045 | | | FirstRand Ltd. (Diversified Financial Services) | | $ | 395 | |
| | 23,078 | | | Gold Fields Ltd. (Metals & Mining) | | | 74 | |
| | 60,718 | | | Growthpoint Properties Ltd. (Real Estate Investment Trusts) | | | 132 | |
| | 5,395 | | | Hyprop Investments Ltd. (Real Estate Management & Development) | | | 54 | |
| | 14,854 | | | Impala Platinum Holdings Ltd. (Metals & Mining) (a) | | | 66 | |
| | 5,145 | | | Imperial Holdings Ltd. (Distributors) | | | 79 | |
| | 6,725 | | | Investec Ltd. (Capital Markets) | | | 61 | |
| | 1,805 | | | Kumba Iron Ore Ltd. (Metals & Mining) | | | 22 | |
| | 3,592 | | | Liberty Holdings Ltd. (Insurance) | | | 43 | |
| | 27,750 | | | Life Healthcare Group Holdings Ltd. (Health Care Providers & Services) | | | 86 | |
| | 2,604 | | | Massmart Holdings Ltd. (Food & Staples Retailing) | | | 32 | |
| | 11,339 | | | Mediclinic International Ltd. (Health Care Providers & Services) | | | 96 | |
| | 28,315 | | | MMI Holdings Ltd. (Insurance) | | | 70 | |
| | 2,678 | | | Mondi Ltd. (Paper & Forest Products) | | | 59 | |
| | 15,582 | | | Mr. Price Group Ltd. (Specialty Retail) | | | 322 | |
| | 45,545 | | | MTN Group Ltd. (Wireless Telecommunication Services) | | | 856 | |
| | 17,884 | | | Nampak Ltd. (Containers & Packaging) | | | 50 | |
| | 11,985 | | | Naspers Ltd. (Media) | | | 1,867 | |
| | 5,040 | | | Nedbank Group Ltd. (Banks) | | | 100 | |
| | 29,026 | | | Netcare Ltd. (Health Care Providers & Services) | | | 91 | |
| | 6,007 | | | Pick n Pay Stores Ltd. (Food & Staples Retailing) | | | 28 | |
| | 1,720 | | | PSG Group Ltd. (Diversified Financial Services) | | | 29 | |
| | 91,563 | | | Redefine Properties Ltd. (Real Estate Investment Trusts) | | | 77 | |
| | 13,249 | | | Remgro Ltd. (Diversified Financial Services) | | | 279 | |
| | 8,032 | | | Resilient Property Income Fund Ltd. (Real Estate Investment Trusts) | | | 64 | |
| | 20,460 | | | RMB Holdings Ltd. (Diversified Financial Services) | | | 112 | |
| | 17,162 | | | RMI Holdings Ltd. (Insurance) | | | 60 | |
| | 4,340 | | | Samsung Heavy Industries Co. Ltd. (Machinery) | | | 66 | |
| | 47,757 | | | Sanlam Ltd. (Insurance) | | | 261 | |
| | 14,462 | | | Sappi Ltd. (Paper & Forest Products) (a) | | | 51 | |
| | 14,937 | | | Sasol Ltd. (Oil, Gas & Consumable Fuels) | | | 553 | |
| | 11,947 | | | Shoprite Holdings Ltd. (Food & Staples Retailing) | | | 171 | |
| | 32,447 | | | Standard Bank Group Ltd. (Banks) | | | 428 | |
| | 59,781 | | | Steinhoff International Holdings Ltd. (Household Durables) | | | 379 | |
| | 5,590 | | | Telkom SA SOC Ltd. (Diversified Telecommunication Services) (a) | | | 29 | |
| | 5,896 | | | The Foschini Group Ltd. (Specialty Retail) | | | 77 | |
| | 4,499 | | | The Spar Group Ltd. (Food & Staples Retailing) | | | 70 | |
| | 4,444 | | | Tiger Brands Ltd. (Food Products) | | | 104 | |
| | 10,682 | | | Truworths International Ltd. (Specialty Retail) | | | 75 | |
| | 5,067 | | | Tsogo Sun Holdings Ltd. (Hotels, Restaurants & Leisure) | | | 10 | |
| | 10,004 | | | Vodacom Group Ltd. (Wireless Telecommunication Services) | | | 114 | |
| | 25,278 | | | Woolworths Holdings Ltd. (Multiline Retail) | | | 205 | |
| | | | | | | | |
| | | | | | | 8,787 | |
| | | | | | | | |
See accompanying notes to financial statements.
123
HC CAPITAL TRUST
The International Equity Portfolio
Portfolio of Investments (continued) — June 30, 2015
| | | | | | | | |
| Shares | | | Security
Description | | Value
(000) | |
| | | | Common Stocks (continued) | | | | |
| | | | South Korea — 1.76% | | | | |
| | 830 | | | Amorepacific Corp. (Personal Products) | | $ | 311 | |
| | 830 | | | Amorepacific Group (Personal Products) | | | 139 | |
| | 5,701 | | | BS Financial Group, Inc. (Banks) | | | 73 | |
| | 1,726 | | | Celltrion, Inc. (Pharmaceuticals) (a) | | | 121 | |
| | 2,220 | | | Cheil Worldwide, Inc. (Media) (a) | | | 34 | |
| | 211 | | | CJ Cheiljedang Corp. (Food Products) | | | 83 | |
| | 374 | | | CJ Corp. (Industrial Conglomerates) | | | 99 | |
| | 206 | | | CJ Korea Express Co. Ltd. (Road & Rail) (a) | | | 36 | |
| | 1,313 | | | Coway Co. Ltd. (Household Durables) | | | 108 | |
| | 651 | | | Daelim Industrial Co. Ltd. (Construction & Engineering) | | | 48 | |
| | 3,090 | | | Daewoo Engineering & Construction Co. Ltd. (Construction & Engineering) (a) | | | 17 | |
| | 1,370 | | | Daewoo International Corp. (Trading Companies & Distributors) | | | 32 | |
| | 5,070 | | | Daewoo Securities Co. Ltd. (Capital Markets) | | | 69 | |
| | 2,810 | | | Daewoo Shipbuilding & Marine Engineering Co. Ltd. (Machinery) | | | 34 | |
| | 658 | | | Daum Kakao Corp. (Internet Software & Services) | | | 74 | |
| | 4,533 | | | DGB Financial Group, Inc. (Banks) | | | 48 | |
| | 1,262 | | | Dongbu Insurance Co. Ltd. (Insurance) | | | 64 | |
| | 180 | | | Doosan Corp. (Industrial Conglomerates) | | | 18 | |
| | 1,410 | | | Doosan Heavy Industries & Construction Co. Ltd. (Electrical Equipment) | | | 30 | |
| | 3,320 | | | Doosan Infracore Co. Ltd. (Machinery) (a) | | | 29 | |
| | 576 | | | E-Mart Co. Ltd. (Food & Staples Retailing) | | | 119 | |
| | 1,415 | | | GS Engineering & Construction Corp. (Construction & Engineering) (a) | | | 34 | |
| | 1,324 | | | GS Holdings Corp. (Oil, Gas & Consumable Fuels) | | | 59 | |
| | 1,110 | | | Halla Climate Control Corp. (Auto Components) | | | 38 | |
| | 7,528 | | | Hana Financial Group, Inc. (Banks) | | | 196 | |
| | 2,008 | | | Hankook Tire Co. Ltd. (Auto Components) | | | 76 | |
| | 2,680 | | | Hanwha Chemical Corp. (Chemicals) | | | 45 | |
| | 1,430 | | | Hanwha Corp. (Chemicals) | | | 61 | |
| | 439 | | | Honam Petrochemical Corp. (Chemicals) | | | 114 | |
| | 958 | | | Hotel Shilla Co. Ltd. (Specialty Retail) | | | 96 | |
| | 15,482 | | | Hynix Semiconductor, Inc. (Semiconductors & Semiconductor Equipment) | | | 587 | |
| | 627 | | | Hyosung Corp. (Chemicals) | | | 81 | |
| | 371 | | | Hyundai Department Store (Multiline Retail) | | | 49 | |
| | 1,690 | | | Hyundai Development Co. (Construction & Engineering) | | | 100 | |
| | 1,892 | | | Hyundai Engineering & Construction Co. Ltd. (Construction & Engineering) | | | 70 | |
| | 504 | | | Hyundai Glovis Co. Ltd. (Air Freight & Logistics) | | | 91 | |
| | 1,058 | | | Hyundai Heavy Industries Co. Ltd. (Machinery) (a) | | | 105 | |
| | 1,900 | | | Hyundai Marine & Fire Insurance Co. Ltd. (Insurance) | | | 50 | |
| | 2,319 | | | Hyundai Merchant Marine Co. Ltd. (Marine) (a) | | | 14 | |
| | 318 | | | Hyundai Mipo Dockyard Co. (Machinery) (a) | | | 18 | |
| | 1,836 | | | Hyundai Mobis Co. Ltd. (Auto Components) | | | 349 | |
| | 28,520 | | | Hyundai Motor Co. Ltd. (Automobiles) | | | 3,478 | |
| | 1,918 | | | Hyundai Steel Co. (Metals & Mining) | | | 116 | |
| | | | | | | | |
| Shares | | | Security
Description | | Value
(000) | |
| | | | South Korea (continued) | | | | |
| | 464 | | | Hyundai Wia Corp. (Auto Components) | | $ | 43 | |
| | 6,747 | | | Industrial Bank of Korea (Banks) | | | 87 | |
| | 3,070 | | | Kangwon Land, Inc. (Hotels, Restaurants & Leisure) | | | 102 | |
| | 10,454 | | | KB Financial Group, Inc. (Banks) | | | 346 | |
| | 135 | | | KCC Corp. (Building Products) | | | 59 | |
| | 6,787 | | | Kia Motors Corp. (Automobiles) | | | 276 | |
| | 1,180 | | | Korea Aerospace Industries Ltd. (Aerospace & Defense) | | | 84 | |
| | 6,896 | | | Korea Electric Power Corp. (Electric Utilities) | | | 283 | |
| | 589 | | | Korea Gas Corp. (Gas Utilities) | | | 23 | |
| | 990 | | | Korea Investment Holdings Co. Ltd. (Capital Markets) | | | 57 | |
| | 307 | | | Korea Kumho Petrochemical Co. Ltd. (Chemicals) | | | 19 | |
| | 6,430 | | | Korea Life Insurance Co. Ltd. (Insurance) | | | 46 | |
| | 249 | | | Korea Zinc Co. Ltd. (Metals & Mining) | | | 122 | |
| | 1,071 | | | Korean Air Lines Co. Ltd. (Airlines) (a) | | | 39 | |
| | 493 | | | KT Corp. (Diversified Telecommunication Services) (a) | | | 13 | |
| | 49,538 | | | KT&G Corp. (Tobacco) | | | 4,216 | |
| | 1,247 | | | LG Chem Ltd. (Chemicals) | | | 311 | |
| | 2,656 | | | LG Corp. (Industrial Conglomerates) | | | 147 | |
| | 5,808 | | | LG Display Co. Ltd. (Electronic Equipment, Instruments & Components) | | | 135 | |
| | 2,725 | | | LG Electronics, Inc. (Information Technology) | | | 115 | |
| | 256 | | | LG Household & Health Care Ltd. (Household Products) | | | 178 | |
| | 362 | | | LG Innotek Co. Ltd. (Electronic Equipment, Instruments & Components) | | | 33 | |
| | 5,540 | | | LG UPlus Corp. (Diversified Telecommunication Services) | | | 49 | |
| | 21 | | | Lotte Confectionery Co. Ltd. (Food Products) | | | 37 | |
| | 279 | | | Lotte Shopping Co. Ltd. (Multiline Retail) | | | 59 | |
| | 425 | | | LS Corp. (Electrical Equipment) | | | 17 | |
| | 491 | | | LS Industrial Systems Co. Ltd. (Electrical Equipment) | | | 20 | |
| | 808 | | | Mirae Asset Securities Co. Ltd. (Capital Markets) | | | 37 | |
| | 729 | | | Naver Corp. (Internet Software & Services) | | | 415 | |
| | 396 | | | NCsoft Corp. (Software) | | | 70 | |
| | 3,690 | | | NH Investment & Securities Co. Ltd. (Capital Markets) | | | 40 | |
| | 435 | | | OCI Co. Ltd. (Chemicals) | | | 35 | |
| | 104 | | | Orion Corp. (Food Products) | | | 98 | |
| | 2,050 | | | Paradise Co. Ltd. (Hotels, Restaurants & Leisure) | | | 44 | |
| | 1,872 | | | POSCO (Metals & Mining) | | | 376 | |
| | 498 | | | S1 Corp. (Commercial Services & Supplies) | | | 35 | |
| | 3,479 | | | Samsung C&T Corp. (Trading Companies & Distributors) | | | 206 | |
| | 890 | | | Samsung Card Co. Ltd. (Consumer Finance) | | | 30 | |
| | 1,598 | | | Samsung Electro-Mechanics Co. Ltd. (Electronic Equipment, Instruments & Components) | | | 73 | |
| | 3,134 | | | Samsung Electronics Co. Ltd. (Technology Hardware, Storage & Peripherals) | | | 3,563 | |
| | 927 | | | Samsung Fire & Marine Insurance Co. Ltd. (Insurance) | | | 245 | |
| | 2,142 | | | Samsung Life Insurance Co. Ltd. (Insurance) | | | 206 | |
See accompanying notes to financial statements.
124
HC CAPITAL TRUST
The International Equity Portfolio
Portfolio of Investments (continued) — June 30, 2015
| | | | | | | | |
| Shares | | | Security
Description | | Value
(000) | |
| | | | Common Stocks (continued) | | | | |
| | | | South Korea (continued) | | | | |
| | 1,485 | | | Samsung SDI Co. Ltd. (Electronic Equipment, Instruments & Components) | | $ | 147 | |
| | 784 | | | Samsung SDS Co. Ltd. (IT Services) | | | 183 | |
| | 1,570 | | | Samsung Securities Co. Ltd. (Capital Markets) | | | 77 | |
| | 11,314 | | | Shinhan Financial Group Co. Ltd. (Banks) | | | 422 | |
| | 150 | | | Shinsegae Co. Ltd. (Multiline Retail) | | | 36 | |
| | 538 | | | SK C&C Co. Ltd. (IT Services) | | | 133 | |
| | 646 | | | SK Holdings Co. Ltd. (Industrial Conglomerates) | | | 115 | |
| | 1,674 | | | SK Innovation Co. Ltd. (Oil, Gas & Consumable Fuels) (a) | | | 183 | |
| | 2,630 | | | SK Networks Co. Ltd. (Trading Companies & Distributors) | | | 21 | |
| | 24,907 | | | SK Telecom Co. Ltd. (Wireless Telecommunication Services) | | | 5,583 | |
| | 1,131 | | | S-Oil Corp. (Oil, Gas & Consumable Fuels) | | | 69 | |
| | 8,243 | | | Woori Bank (Banks) | | | 72 | |
| | 229 | | | Yuhan Corp. (Pharmaceuticals) | | | 56 | |
| | | | | | | | |
| | | | | | | 26,899 | |
| | | | | | | | |
| | | | Spain — 2.53% | | | | |
| | 114,196 | | | Abertis Infraestructuras SA (Transportation Infrastructure) | | | 1,873 | |
| | 49,614 | | | ACS Actividades de Construccion y Servicios SA (Construction & Engineering) | | | 1,596 | |
| | 446,486 | | | Banco Bilbao Vizcaya Argentaria SA (Banks) | | | 4,376 | |
| | 1,037,158 | | | Banco Santander SA (Banks) | | | 7,241 | |
| | 487,773 | | | CaixaBank SA (Banks) (b) | | | 2,260 | |
| | 65,347 | | | Corporacion Mapfre (Insurance) | | | 225 | |
| | 14,334 | | | Enagas (Gas Utilities)^ | | | 390 | |
| | 24,738 | | | Gas Natural SDG SA (Gas Utilities) | | | 561 | |
| | 15,272 | | | Grifols SA, ADR (Biotechnology) | | | 473 | |
| | 15,717 | | | Grifols SA (Biotechnology) | | | 633 | |
| | 5,938 | | | Grifols SA, Class – B (Biotechnology) | | | 184 | |
| | 364,159 | | | Iberdrola SA (Electric Utilities) | | | 2,453 | |
| | 7,643 | | | Red Electrica Corporacion SA (Electric Utilities)^ | | | 612 | |
| | 298,031 | | | Repsol YPF SA (Oil, Gas & Consumable Fuels) | | | 5,232 | |
| | 30,536 | | | Tecnicas Reunidas SA (Energy Equipment & Services) | | | 1,569 | |
| | 632,227 | | | Telefonica SA (Diversified Telecommunication Services) | | | 8,986 | |
| | | | | | | | |
| | | | | | | 38,664 | |
| | | | | | | | |
| | | | Sweden — 2.46% | | | | |
| | 55,840 | | | Assa Abloy AB, Class – B (Metals & Mining) | | | 1,052 | |
| | 10,735 | | | Autoliv, Inc. (Auto Components) | | | 1,254 | |
| | 19,836 | | | Electrolux AB, Series B (Household Durables) | | | 622 | |
| | 16,445 | | | Industrivarden AB, C Shares (Diversified Financial Services) | | | 310 | |
| | 7,657 | | | Modern Times Group, B Shares (Media) | | | 206 | |
| | 327,629 | | | Nordea Bank AB (Banks) | | | 4,088 | |
| | 461,826 | | | Sandvik AB (Machinery) | | | 5,108 | |
| | 162,585 | | | Skandinaviska Enskilda Banken AB, Class – A (Banks) | | | 2,080 | |
| | | | | | | | |
| Shares | | | Security
Description | | Value
(000) | |
| | | | Sweden (continued) | | | | |
| | 128,121 | | | Skanska AB, B Shares (Construction & Engineering) | | $ | 2,598 | |
| | 73,323 | | | Svenska Handelsbanken AB, A Shares (Banks) | | | 1,071 | |
| | 144,359 | | | Swedbank AB, A Shares (Banks) | | | 3,368 | |
| | 68,319 | | | Tele2 AB, B Shares (Wireless Telecommunication Services) | | | 795 | |
| | 1,155,401 | | | Telefonaktiebolaget LM Ericsson, B Shares (Communications Equipment) | | | 11,978 | |
| | 516,681 | | | TeliaSonera AB (Diversified Telecommunication Services) | | | 3,044 | |
| | | | | | | | |
| | | | | | | 37,574 | |
| | | | | | | | |
| | | | Switzerland — 10.15% | | | | |
| | 848,891 | | | ABB Ltd. – Registered (Electrical Equipment) | | | 17,782 | |
| | 13,179 | | | Actelion Ltd. (Biotechnology) | | | 1,929 | |
| | 109,377 | | | Adecco SA, Registered Shares (Professional Services) | | | 8,881 | |
| | 47,182 | | | Aryzta AG (Food Products) | | | 2,327 | |
| | 5,851 | | | Baloise Holding AG, Registered Shares (Insurance) | | | 714 | |
| | 112,575 | | | Clariant AG (Chemicals) | | | 2,308 | |
| | 44,006 | | | Compagnie Financiere Richemont SA, Registered Shares (Textiles, Apparel & Luxury Goods) | | $ | 3,580 | |
| | 98,175 | | | Credit Suisse Group AG (Capital Markets) | | | 2,699 | |
| | 5,558 | | | DKSH Holding Ltd. (Professional Services) | | | 402 | |
| | 3,599 | | | Givaudan SA (Chemicals) | | | 6,229 | |
| | 11,552 | | | Holcim Ltd., Registered Shares (Construction Materials) | | | 853 | |
| | 10,374 | | | Julius Baer Group Ltd. (Capital Markets) | | | 582 | |
| | 18,110 | | | Kuehne & Nagel International (Marine) | | | 2,404 | |
| | 361,834 | | | Nestle SA (Food Products) | | | 26,131 | |
| | 74,841 | | | Novartis AG, Registered Shares (Pharmaceuticals) | | | 7,378 | |
| | 4,040 | | | Pargesa Holding SA (Diversified Financial Services) | | | 272 | |
| | 3,555 | | | Partners Group Holding AG (Capital Markets) | | | 1,063 | |
| | 113,968 | | | Roche Holding AG – Genusscheine (Pharmaceuticals) | | | 31,947 | |
| | 2,021 | | | SGS SA – Registered (Professional Services) | | | 3,689 | |
| | 8,534 | | | Sulzer AG (Machinery) | | | 878 | |
| | 13,783 | | | Swiss Prime Site AG (Real Estate Management & Development) | | | 1,046 | |
| | 43,376 | | | Swiss Re AG (Insurance) | | | 3,840 | |
| | 5,778 | | | Swisscom AG (Diversified Telecommunication Services) | | | 3,239 | |
| | 7,556 | | | Syngenta AG, Registered Shares (Chemicals) | | | 3,072 | |
| | 1,692 | | | The Swatch Group AG (Textiles, Apparel & Luxury Goods) | | | 659 | |
| | 1,144 | | | The Swatch Group AG (Textiles, Apparel & Luxury Goods) | | | 86 | |
| | 138,532 | | | Transocean Ltd. (Energy Equipment & Services)^ | | | 2,241 | |
| | 322,995 | | | UBS Group AG (Capital Markets) | | | 6,853 | |
| | 38,288 | | | Zurich Financial Services AG (Insurance) | | | 11,658 | |
| | | | | | | | |
| | | | | | | 154,742 | |
| | | | | | | | |
See accompanying notes to financial statements.
125
HC CAPITAL TRUST
The International Equity Portfolio
Portfolio of Investments (continued) — June 30, 2015
| | | | | | | | |
| Shares | | | Security
Description | | Value
(000) | |
| | | | Common Stocks (continued) | | | | |
| | | | Taiwan — 0.92% | | | | |
| | 60,450 | | | Acer, Inc. (Technology Hardware, Storage & Peripherals) (a) | | $ | 29 | |
| | 172,000 | | | Advanced Semiconductor Engineering, Inc. (Semiconductors & Semiconductor Equipment) | | | 233 | |
| | 8,795 | | | Advantech Co. Ltd. (Technology Hardware, Storage & Peripherals) | | | 60 | |
| | 57,120 | | | Asia Cement Corp. (Construction Materials) | | | 68 | |
| | 52,000 | | | Asia Pacific Telecom Co. Ltd. (Diversified Telecommunication Services) | | | 21 | |
| | 18,000 | | | Asustek Computer, Inc. (Technology Hardware, Storage & Peripherals) | | | 176 | |
| | 234,000 | | | AU Optronics Corp. (Electronic Equipment, Instruments & Components) | | | 104 | |
| | 18,000 | | | Catcher Technology Co. Ltd. (Technology Hardware, Storage & Peripherals) | | | 226 | |
| | 226,800 | | | Cathay Financial Holding Co. Ltd. (Insurance) | | | 396 | |
| | 120,720 | | | Chang Hwa Commercial Bank Ltd. (Banks) | | | 69 | |
| | 38,000 | | | Cheng Shin Rubber Industry Co. Ltd. (Auto Components) | | | 84 | |
| | 9,075 | | | Chicony Electronics Co. Ltd. (Technology Hardware, Storage & Peripherals) | | | 24 | |
| | 52,000 | | | China Airlines Ltd. (Airlines) (a) | | | 22 | |
| | 370,000 | | | China Development Financial Holding Corp. (Banks) | | | 140 | |
| | 77,900 | | �� | China Life Insurance Co. Ltd. (Insurance) | | | 80 | |
| | 21,000 | | | China Motor Corp. (Automobiles) | | | 16 | |
| | 315,440 | | | China Steel Corp. (Metals & Mining) | | | 252 | |
| | 373,318 | | | Chinatrust Financial Holding Co. Ltd. (Banks) | | | 294 | |
| | 99,000 | | | Chunghwa Telecom Co. Ltd. (Diversified Telecommunication Services) | | | 316 | |
| | 99,000 | | | Compal Electronics, Inc. (Technology Hardware, Storage & Peripherals) | | | 75 | |
| | 18,000 | | | CTCI Corp. (Construction & Engineering) | | | 29 | |
| | 47,000 | | | Delta Electronics, Inc. (Electronic Equipment, Instruments & Components) | | | 241 | |
| | 179,445 | | | E.Sun Financial Holding Co. Ltd. (Banks) | | | 120 | |
| | 5,200 | | | ECLAT Textile Co. Ltd. (Textiles, Apparel & Luxury Goods) | | | 85 | |
| | 25,000 | | | Epistar Corp. (Semiconductors & Semiconductor Equipment) | | | 33 | |
| | 42,449 | | | EVA Airways Corp. (Airlines) (a) | | | 29 | |
| | 42,000 | | | Evergreen Marine Corp. Ltd. (Marine) (a) | | | 21 | |
| | 76,720 | | | Far Eastern New Century Corp. (Industrial Conglomerates) | | | 81 | |
| | 40,000 | | | Far EasTone Telecommunications Co. Ltd. (Wireless Telecommunication Services) | | | 97 | |
| | 197,070 | | | First Financial Holdings Co. Ltd. (Banks) | | | 121 | |
| | 87,000 | | | Formosa Chemicals & Fibre Corp. (Chemicals) | | | 209 | |
| | 31,000 | | | Formosa Petrochemical Corp. (Oil, Gas & Consumable Fuels) | | | 80 | |
| | 115,000 | | | Formosa Plastics Corp. (Chemicals) | | | 271 | |
| | 23,000 | | | Formosa Taffeta Co. Ltd. (Textiles, Apparel & Luxury Goods) | | | 24 | |
| | 20,200 | | | Foxconn Technology Co. Ltd. (Technology Hardware, Storage & Peripherals) | | | 73 | |
| | 180,000 | | | Fubon Financial Holding Co. Ltd. (Diversified Financial Services) | | | 358 | |
| | 8,000 | | | Giant Manufacturing Co. Ltd. (Leisure Products) | | | 68 | |
| | | | | | | | |
| Shares | | | Security
Description | | Value
(000) | |
| | | | Taiwan (continued) | | | | |
| | 1,000 | | | Hermes Microvision, Inc. (Semiconductors & Semiconductor Equipment) | | $ | 65 | |
| | 13,500 | | | Highwealth Construction Corp. (Real Estate Management & Development) | | | 32 | |
| | 5,150 | | | Hiwin Technologies Corp. (Machinery) | | | 34 | |
| | 359,200 | | | Hon Hai Precision Industry Co. Ltd. (Electronic Equipment, Instruments & Components) | | | 1,129 | |
| | 7,000 | | | Hotai Motor Co. Ltd. (Specialty Retail) | | | 99 | |
| | 15,000 | | | HTC Corp. (Technology Hardware, Storage & Peripherals) (a) | | | 35 | |
| | 158,620 | | | Hua Nan Financial Holdings Co. Ltd., Class – C (Banks) | | | 91 | |
| | 222,553 | | | Innolux Corp. (Electronic Equipment, Instruments & Components) | | | 116 | |
| | 59,000 | | | Inotera Memories, Inc. (Semiconductors & Semiconductor Equipment) (a) | | | 47 | |
| | 68,000 | | | Inventec Corp. (Technology Hardware, Storage & Peripherals) | | | 47 | |
| | 9,000 | | | Kinsus Interconnect Technology Corp. (Semiconductors & Semiconductor Equipment) | | | 25 | |
| | 3,000 | | | Largan Precision Co. Ltd. (Electronic Equipment, Instruments & Components) | | | 343 | |
| | 55,275 | | | Lite-On Technology Corp. (Technology Hardware, Storage & Peripherals) | | | 65 | |
| | 40,000 | | | MediaTek, Inc. (Semiconductors & Semiconductor Equipment) | | | 547 | |
| | 276,000 | | | Mega Financial Holding Co. Ltd. (Banks) | | | 249 | |
| | 6,300 | | | Merida Industry Co. Ltd. (Leisure Products) | | | 41 | |
| | 133,000 | | | Nan Ya Plastics Corp. (Chemicals) | | | 312 | |
| | 16,000 | | | Novatek Microelectronics Corp. (Semiconductors & Semiconductor Equipment) | | | 77 | |
| | 43,000 | | | Pegatron Corp. (Technology Hardware, Storage & Peripherals) | | | 126 | |
| | 4,000 | | | Phison Electronics Corp. (Semiconductors & Semiconductor Equipment) | | | 35 | |
| | 60,000 | | | Pou Chen Corp. (Textiles, Apparel & Luxury Goods) | | | 87 | |
| | 12,000 | | | Powertech Technology, Inc. (Semiconductors & Semiconductor Equipment) | | | 26 | |
| | 16,000 | | | President Chain Store Corp. (Food & Staples Retailing) | | | 113 | |
| | 122,320 | | | President Enterprises Corp. (Food Products) | | | 217 | |
| | 72,000 | | | Quanta Computer, Inc. (Technology Hardware, Storage & Peripherals) | | | 171 | |
| | 9,000 | | | Radiant Opto-Electronics Corp. (Semiconductors & Semiconductor Equipment) | | | 33 | |
| | 14,000 | | | Realtek Semiconductor Corp. (Semiconductors & Semiconductor Equipment) | | | 36 | |
| | 19,000 | | | Ruentex Development Co. Ltd. (Real Estate Management & Development) | | | 30 | |
| | 15,000 | | | Ruentex Industries Ltd. (Textiles, Apparel & Luxury Goods) | | | 34 | |
| | 212,955 | | | Shin Kong Financial Holding Co. Ltd. (Insurance) | | | 65 | |
| | 77,000 | | | Siliconware Precision Industries Co. (Semiconductors & Semiconductor Equipment) | | | 118 | |
| | 8,000 | | | Simplo Technology Co. Ltd. (Electronic Equipment, Instruments & Components) | | | 37 | |
See accompanying notes to financial statements.
126
HC CAPITAL TRUST
The International Equity Portfolio
Portfolio of Investments (continued) — June 30, 2015
| | | | | | | | |
| Shares | | | Security
Description | | Value
(000) | |
| | | | Common Stocks (continued) | | | | |
| | | | Taiwan (continued) | | | | |
| | 280,311 | | | SinoPac Financial Holdings Co. Ltd. (Banks) | | $ | 124 | |
| | 9,810 | | | Standard Foods Corp. (Food Products) | | | 29 | |
| | 30,000 | | | Synnex Technology International Corp. (Electronic Equipment, Instruments & Components) | | | 44 | |
| | 226,462 | | | Taishin Financial Holding Co. Ltd. (Banks) | | | 94 | |
| | 118,560 | | | Taiwan Business Bank (Banks) (a) | | | 37 | |
| | 91,000 | | | Taiwan Cement Corp. (Construction Materials) | | | 114 | |
| | 181,854 | | | Taiwan Cooperative Financial Holding Co. Ltd. (Banks) | | | 95 | |
| | 18,000 | | | Taiwan Fertilizer Co. Ltd. (Chemicals) | | | 30 | |
| | 33,000 | | | Taiwan Glass Industry Corp. (Building Products) | | | 16 | |
| | 45,000 | | | Taiwan Mobile Co. Ltd. (Wireless Telecommunication Services) | | | 150 | |
| | 29,300 | | | Taiwan Semiconductor Manufacturing Co. Ltd., ADR (Semiconductors & Semiconductor Equipment) | | | 665 | |
| | 662,000 | | | Taiwan Semiconductor Manufacturing Co. Ltd. (Semiconductors & Semiconductor Equipment) | | | 3,016 | |
| | 42,000 | | | Teco Electric & Machinery Co. Ltd. (Electrical Equipment) | | | 33 | |
| | 7,000 | | | TPK Holding Co. Ltd. (Electronic Equipment, Instruments & Components) | | | 40 | |
| | 7,000 | | | Transcend Information, Inc. (Semiconductors & Semiconductor Equipment) | | | 26 | |
| | 8,000 | | | U-Ming Marine Transport Corp. (Marine) | | | 11 | |
| | 327,000 | | | United Microelectronics Corp. (Semiconductors & Semiconductor Equipment) | | | 138 | |
| | 22,000 | | | Vanguard International Semiconductor Corp. (Semiconductors & Semiconductor Equipment) | | | 35 | |
| | 23,000 | | | Wan Hai Lines Ltd. (Marine) | | | 18 | |
| | 57,121 | | | Wistron Corp. (Technology Hardware, Storage & Peripherals) | | | 43 | |
| | 43,000 | | | WPG Holdings Ltd. (Electronic Equipment, Instruments & Components) | | | 54 | |
| | 33,000 | | | Yang Ming Marine Transport (Marine) (a) | | | 12 | |
| | 219,900 | | | Yuanta Financial Holding Co. Ltd. (Capital Markets) | | | 119 | |
| | 24,000 | | | Yulon Motor Co. Ltd. (Automobiles) | | | 28 | |
| | | | | | | | |
| | | | | | | 14,078 | |
| | | | | | | | |
| | | | Taiwan, Province Of China — 0.00% | | | | |
| | 2,000 | | | Casetek Holdings Ltd. (Electronic Equipment, Instruments & Components) | | | 12 | |
| | 6,000 | | | Feng Tay Enterprise Co. Ltd. (Apparel) | | | 35 | |
| | | | | | | | |
| | | | | | | 47 | |
| | | | | | | | |
| | | | Thailand — 0.16% | | | | |
| | 29,200 | | | Advanced INFO Service Public Co. Ltd. (Wireless Telecommunication Services) | | | 208 | |
| | 12,600 | | | Airports of Thailand Public Co. Ltd., Registered Shares (Transportation Infrastructure) | | | 113 | |
| | 13,300 | | | Bangkok Bank Public Co. Ltd. – NVDR (Banks) | | | 70 | |
| | 162,100 | | | Bangkok Dusit Medical Service Public Co. Ltd., Class – F (Health Care Providers & Services) | | | 94 | |
| | 25,500 | | | Banpu Public Co. Ltd., Registered Shares (Oil, Gas & Consumable Fuels) | | | 19 | |
| | | | | | | | |
| Shares | | | Security
Description | | Value
(000) | |
| | | | Thailand (continued) | | | | |
| | 30,400 | | | BEC World Public Co. Ltd., Registered Shares (Media) | | $ | 34 | |
| | 175,800 | | | BTS Group Holdings Public Co. Ltd. (Road & Rail) | | | 52 | |
| | 8,100 | | | Bumrungrad Hospital Public Co. Ltd. (Health Care Providers & Services) | | | 45 | |
| | 40,000 | | | Central Pattana Public Co. Ltd., Registered Shares (Real Estate Management & Development) | | | 56 | |
| | 81,600 | | | Charoen Pokphand Foods Public Co. Ltd. (Food Products) | | | 58 | |
| | 123,100 | | | CP ALL Public Co. Ltd. (Food & Staples Retailing) | | | 169 | |
| | 9,200 | | | Delta Electronics (Thailand) PLC (Electronic Equipment, Instruments & Components) | | | 25 | |
| | 26,800 | | | Energy Absolute Public Co. Ltd. (Energy Equipment & Services) | | | 19 | |
| | 17,300 | | | Glow Energy Public Co. Ltd. (Independent Power and Renewable Electricity Producers) | | | 44 | |
| | 128,776 | | | Home Product Center Public Co. Ltd., Registered Shares (Specialty Retail) | | | 26 | |
| | 33,200 | | | Indorama Ventures Public Co. Ltd. (Chemicals) | | | 27 | |
| | 248,200 | | | IRPC Public Co. Ltd. – NVDR (Oil, Gas & Consumable Fuels) | | | 33 | |
| | 49,400 | | | Kasikornbank Public Co. Ltd. (Banks) | | | 276 | |
| | 86,800 | | | Krung Thai Bank Public Co. Ltd., Registered Shares (Banks) | | | 44 | |
| | 51,040 | | | Minor International Public Co. Ltd., Registered Shares (Hotels, Restaurants & Leisure) | | | 45 | |
| | 35,100 | | | PTT Exploration & Production Public Co. Ltd. (Oil, Gas & Consumable Fuels) | | | 113 | |
| | 44,800 | | | PTT Global Chemical Public Co. Ltd. (Chemicals) | | | 92 | |
| | 25,800 | | | PTT Public Co. Ltd. (Oil, Gas & Consumable Fuels) | | | 274 | |
| | 41,400 | | | Siam Commercial Bank Public Co. Ltd. (Banks) | | | 191 | |
| | 26,700 | | | Thai Oil Public Co. Ltd. (Oil, Gas & Consumable Fuels) | | | 43 | |
| | 38,400 | | | Thai Union Frozen Products Public Co. Ltd. (Diversified Consumer Services) | | | 25 | |
| | 8,800 | | | The Siam Cement Public Co. Ltd. (Construction Materials) | | | 135 | |
| | 436,800 | | | TMB Bank Public Co. Ltd. (Banks) | | | 30 | |
| | 238,619 | | | True Corp. Public Co. Ltd. (Diversified Telecommunication Services) (a) | | | 81 | |
| | | | | | | | |
| | | | | | | 2,441 | |
| | | | | | | | |
| | | | Turkey — 0.10% | | | | |
| | 62,278 | | | Akbank TAS (Banks) | | | 180 | |
| | 4,655 | | | Anadolu EFES Biracilik VE Malt Sanayii A/S (Beverages) | | | 42 | |
| | 6,942 | | | Arcelik A/S (Household Durables) | | | 38 | |
| | 5,766 | | | Bim Birlesik Magazalar A/S (Food & Staples Retailing) | | | 103 | |
| | 1,899 | | | Coca-Cola Icecek A/S (Beverages) | | | 32 | |
| | 50,826 | | | Emlak Konut Gayrimenkul Yatirim (Real Estate Investment Trusts) | | | 52 | |
| | 13,048 | | | Enka Insaat ve Sanayi A/S (Industrial Conglomerates) | | | 25 | |
| | 42,091 | | | Eregli Demir ve Celik Fabrikalari TAS (Metals & Mining) | | | 68 | |
| | 2,121 | | | Ford Otomotiv Sanayi A/S (Automobiles) | | | 29 | |
See accompanying notes to financial statements.
127
HC CAPITAL TRUST
The International Equity Portfolio
Portfolio of Investments (continued) — June 30, 2015
| | | | | | | | |
| Shares | | | Security
Description | | Value
(000) | |
| | | | Common Stocks (continued) | | | | |
| | | | Turkey (continued) | | | | |
| | 23,989 | | | Haci OMER Sabanci Holding (Diversified Financial Services) | | $ | 90 | |
| | 18,402 | | | KOC Holdings A/S (Industrial Conglomerates) | | | 85 | |
| | 6,398 | | | Petkim Petrokimya Holding AS (Chemicals) (a) | | | 10 | |
| | 5,049 | | | TAV Havalimanlari Holding A/S (Transportation Infrastructure) | | | 43 | |
| | 3,854 | | | Tofas Turk Otomobil Fabrikasi A/S (Automobiles) | | | 26 | |
| | 3,307 | | | Tupras-Turkiye Petrol Rafinerileri A/S (Oil, Gas & Consumable Fuels) (a) | | | 84 | |
| | 16,289 | | | Turk Hava Yollari Anonim Ortakligi (Airlines) (a) | | | 53 | |
| | 12,992 | | | Turk Telekomunikasyon A/S (Diversified Telecommunication Services) | | | 34 | |
| | 22,309 | | | Turkcell Iletisim Hizmetleri A/S (Wireless Telecommunication Services) | | | 103 | |
| | 65,039 | | | Turkiye Garanti Bankasi A/S (Banks) | | | 203 | |
| | 17,024 | | | Turkiye Halk Bankasi A/S (Banks) | | | 78 | |
| | 42,821 | | | Turkiye Is Bankasi A/S, C Shares (Banks) | | | 90 | |
| | 17,675 | | | Turkiye Sise ve Cam Fabrikalari A/S (Industrial Conglomerates) | | | 24 | |
| | 16,682 | | | Turkiye Vakiflar Bankasi TAO, Class – D (Banks) | | | 27 | |
| | 4,274 | | | Ulker Biskuvi Sanayi A/S (Food Products) | | | 30 | |
| | 22,134 | | | Yapi ve Kredi Bankasi AS (Banks) | | | 33 | |
| | | | | | | | |
| | | | | | | 1,582 | |
| | | | | | | | |
| | | | United Arab Emirates — 0.05% | | | | |
| | 57,361 | | | Abu Dhabi Commercial Bank PJSC (Banks) | | | 120 | |
| | 79,115 | | | Aldar Properties PJSC (Real Estate Management & Development) | | | 59 | |
| | 64,730 | | | Arabtec Holding Co. (Construction & Engineering) (a) | | | 46 | |
| | 4,821 | | | DP World Ltd. (Transportation Infrastructure) | | | 103 | |
| | 57,373 | | | Dubai Financial Market (Diversified Financial Services) | | | 31 | |
| | 27,945 | | | Dubai Islamic Bank (Banks) | | | 52 | |
| | 39,689 | | | Emaar Malls Group PJSC (Real Estate Investment Trusts) (a) | | | 36 | |
| | 97,033 | | | Emaar Properties PJSC (Real Estate Management & Development) | | | 208 | |
| | 22,493 | | | First Gulf Bank PJSC (Media) | | | 93 | |
| | 17,612 | | | National Bank of Abu Dhabi (Media) | | | 53 | |
| | | | | | | | |
| | | | | | | 801 | |
| | | | | | | | |
| | | | United Kingdom — 18.81% | | | | |
| | 178,565 | | | AA PLC (Commercial Services & Supplies) (a) | | | 1,039 | |
| | 69,346 | | | Aberdeen Asset Management PLC (Capital Markets) | | | 441 | |
| | 11,416 | | | Admiral Group PLC (Insurance) | | | 249 | |
| | 96,208 | | | AMEC PLC (Energy Equipment & Services) | | | 1,235 | |
| | 356,621 | | | Anglo American PLC (Metals & Mining) | | | 5,146 | |
| | 12,600 | | | ARM Holdings PLC (Semiconductors & Semiconductor Equipment) | | | 205 | |
| | 4,100 | | | Associated British Foods PLC (Food Products) | | | 185 | |
| | 289,305 | | | AstraZeneca PLC (Pharmaceuticals) | | | 18,266 | |
| | 648,648 | | | Aviva PLC (Insurance) | | | 5,019 | |
| | 39,347 | | | Babcock International Group PLC (Commercial Services & Supplies) | | | 668 | |
| | | | | | | | |
| Shares | | | Security
Description | | Value
(000) | |
| | | | United Kingdom (continued) | | | | |
| | 801,319 | | | BAE Systems PLC (Aerospace & Defense) | | $ | 5,680 | |
| | 484,323 | | | Balfour Beatty PLC (Construction & Engineering) | | | 1,841 | |
| | 1,246,342 | | | Barclays PLC (Banks) | | | 5,101 | |
| | 369,500 | | | BCA Marketplace PLC, Registered Shares (Specialty Retail) (a) | | | 917 | |
| | 480,744 | | | BHP Billiton PLC (Metals & Mining) | | | 9,433 | |
| | 2,426,474 | | | BP PLC (Oil, Gas & Consumable Fuels) | | | 16,016 | |
| | 411,395 | | | British American Tobacco PLC (Tobacco) | | | 22,071 | |
| | 177,869 | | | BT Group PLC (Diversified Telecommunication Services) | | $ | 1,258 | |
| | 115,645 | | | Capital Shopping Centres Group PLC (Real Estate Investment Trusts) | | | 559 | |
| | 94,555 | | | Carnival PLC (Hotels, Restaurants & Leisure) | | | 4,826 | |
| | 318,848 | | | Centrica PLC (Multi-Utilities) | | | 1,321 | |
| | 39,788 | | | Croda International PLC (Chemicals) | | | 1,720 | |
| | 21,212 | | | Delphi Automotive PLC (Auto Components) | | | 1,805 | |
| | 9,153 | | | Diageo PLC (Beverages) | | | 265 | |
| | 86,147 | | | Direct Line Insurance Group PLC (Insurance) | | | 454 | |
| | 6,400 | | | Ensco PLC, ADR (Energy Equipment & Services) | | | 143 | |
| | 10,900 | | | Fidessa Group PLC (Software) | | | 390 | |
| | 1,000,296 | | | GlaxoSmithKline PLC (Pharmaceuticals) | | | 20,783 | |
| | 70,254 | | | Grainger PLC (Real Estate Management & Development) | | | 252 | |
| | 20,255 | | | Greene King PLC (Hotels, Restaurants & Leisure)^ | | | 269 | |
| | 7,900 | | | Halma PLC (Electronic Equipment, Instruments & Components) | | | 95 | |
| | 40,100 | | | Henderson Group PLC (Capital Markets) | | | 164 | |
| | 96,587 | | | Home Retail Group PLC (Internet & Catalog Retail) | | | 256 | |
| | 1,208,890 | | | HSBC Holdings PLC (Banks) | | | 10,826 | |
| | 563,266 | | | HSBC Holdings PLC (HK) (Banks) | | | 5,098 | |
| | 47,725 | | | ICAP PLC (Capital Markets) | | | 397 | |
| | 254,897 | | | Imperial Tobacco Group PLC (Tobacco) | | | 12,282 | |
| | 27,730 | | | InterContinental Hotels Group PLC (Hotels, Restaurants & Leisure) | | | 1,118 | |
| | 604,555 | | | International Consolidated Airlines Group SA (Airlines) (a) | | | 4,698 | |
| | 960,736 | | | ITV PLC (Media) | | | 3,973 | |
| | 319,682 | | | J Sainsbury PLC (Food & Staples Retailing) | | | 1,332 | |
| | 12,058 | | | John Wood Group PLC (Energy Equipment & Services) | | | 122 | |
| | 57,647 | | | Johnson Matthey PLC (Chemicals) | | | 2,751 | |
| | 231,737 | | | Kingfisher PLC (Specialty Retail) | | | 1,264 | |
| | 378,097 | | | Legal & General Group PLC (Insurance) | | | 1,478 | |
| | 51,092 | | | Liberty Global PLC, Class – A (Media) (a) | | | 2,763 | |
| | 75,146 | | | Liberty Global PLC, Series C (Media) (a) | | | 3,805 | |
| | 5,472,050 | | | Lloyds Banking Group PLC (Banks) | | | 7,328 | |
| | 73,248 | | | Lonmin PLC (Metals & Mining) (a) | | | 129 | |
| | 39,607 | | | Marks & Spencer Group PLC (Multiline Retail) | | | 334 | |
| | 82,673 | | | Meggitt PLC (Aerospace & Defense) | | | 606 | |
| | 35,641 | | | Merlin Entertainments PLC (Hotels, Restaurants & Leisure) | | | 239 | |
| | 204,694 | | | Michael Page International PLC (Professional Services) | | | 1,753 | |
See accompanying notes to financial statements.
128
HC CAPITAL TRUST
The International Equity Portfolio
Portfolio of Investments (continued) — June 30, 2015
| | | | | | | | |
| Shares | | | Security
Description | | Value
(000) | |
| | | | Common Stocks (continued) | | | | |
| | | | United Kingdom (continued) | | | | |
| | 235,997 | | | National Grid PLC (Multi-Utilities) | | $ | 3,030 | |
| | 189,616 | | | Ocado Group PLC (Internet & Catalog Retail) (a) | | | 1,329 | |
| | 320,702 | | | Old Mutual PLC (Insurance) | | | 1,015 | |
| | 209,551 | | | Pearson PLC (Media) | | | 3,967 | |
| | 76,754 | | | Persimmon PLC (Household Durables) (a) | | | 2,381 | |
| | 129,993 | | | Prudential PLC (Insurance) | | | 3,130 | |
| | 346,297 | | | Rio Tinto PLC (Metals & Mining) | | | 14,221 | |
| | 410,195 | | | Royal Dutch Shell PLC, A Shares (Oil, Gas & Consumable Fuels) | | | 11,512 | |
| | 404,322 | | | Royal Dutch Shell PLC, B Shares (Oil, Gas & Consumable Fuels) | | | 11,478 | |
| | 35,340 | | | SABMiller PLC (Beverages) | | | 1,834 | |
| | 15,029 | | | Severn Trent PLC (Water Utilities) | | | 491 | |
| | 3,000 | | | Spirax-Sarco Engineering PLC (Machinery) | | | 160 | |
| | 40,200 | | | Sports Direct International (Specialty Retail) (a) | | | 454 | |
| | 267,430 | | | SSE PLC (Electric Utilities) | | | 6,453 | |
| | 157,282 | | | Standard Chartered PLC (Banks) | | | 2,518 | |
| | 121,061 | | | Tate & Lyle PLC (Food Products) | | | 988 | |
| | 2,096,463 | | | Tesco PLC (Food & Staples Retailing) | | | 7,000 | |
| | 571,055 | | | Thomas Cook Group PLC (Hotels, Restaurants & Leisure) (a) | | | 1,227 | |
| | 82,398 | | | Tullow Oil PLC (Oil, Gas & Consumable Fuels) | | | 440 | |
| | 3,453 | | | Unilever PLC (Food Products) | | | 148 | |
| | 41,376 | | | United Utilities Group PLC (Water Utilities) | | | 580 | |
| | 5,663,892 | | | Vodafone Group PLC (Wireless Telecommunication Services) | | | 20,452 | |
| | 567,393 | | | William Morrison Supermarkets PLC (Food & Staples Retailing) | | | 1,612 | |
| | | | | | | | |
| | | | | | | 286,788 | |
| | | | | | | | |
| | | | United States — 0.17% | | | | |
| | 29,065 | | | Cognizant Technology Solutions Corp. (IT Services) (a) | | | 1,776 | |
| | 21,300 | | | Samsonite International SA (Household Products) | | | 74 | |
| | 4,400 | | | Southern Copper Corp. (Metals & Mining) | | | 129 | |
| | 4,817 | | | WABCO Holdings, Inc. (Machinery) (a) | | | 596 | |
| | | | | | | | |
| | | | | | | 2,575 | |
| | | | | | | | |
| | | | Total Common Stocks | | | 1,453,066 | |
| | | | | | | | |
| | | | Preferred Stocks — 0.88% | | | | |
| | | | Brazil — 0.14% | | | | |
| | 3,000 | | | AES Tiete SA – Preferred (Independent Power and Renewable Electricity Producers) | | | 17 | |
| | 68,640 | | | Banco Bradesco SA – Preferred (Banks) | | | 629 | |
| | 4,500 | | | Banco do Estado do Rio Grande do Sul SA – Preferred, B Shares (Banks) | | | 13 | |
| | 5,000 | | | Braskem SA – Preferred, Class – A (Chemicals) | | | 22 | |
| | 6,800 | | | Centrais Eletricas Brasileiras SA – Preferred, B Shares (Electric Utilities) | | | 19 | |
| | 20,900 | | | Companhia Energetica de Minas Gerais SA – Preferred, ADR (Electric Utilities) | | | 79 | |
| | | | | | | | |
| Shares | | | Security
Description | | Value
(000) | |
| | | | Brazil (continued) | | | | |
| | 4,900 | | | Companhia Energetica de Sao Paulo – Preferred, B Shares (Independent Power and Renewable Electricity Producers) | | $ | 31 | |
| | 2,900 | | | Companhia Paranaense de Energia-COPEL – Preferred, B Shares (Electric Utilities) | | | 32 | |
| | 23,600 | | | Gerdau SA – Preferred (Metals & Mining) | | | 57 | |
| | 95,358 | | | Itausa – Investimentos Itau SA – Preferred (Banks) | | | 274 | |
| | 11,200 | | | Lojas Americanas SA – Preferred (Multiline Retail) | | | 63 | |
| | 8,170 | | | Oi SA – Preferred (Diversified Telecommunication Services) (a) | | | 16 | |
| | 103,000 | | | Petroleo Brasileiro SA – Preferred (Oil, Gas & Consumable Fuels) (a) | | | 422 | |
| | 8,900 | | | Suzano Papel e Celulose SA – Preferred,
Class – A (Paper & Forest Products) | | | 47 | |
| | 9,200 | | | Telefonica Brasil SA – Preferred (Diversified Telecommunication Services) | | | 128 | |
| | 11,200 | | | Usinas Siderurgicas de Minas Gerais SA – Preferred, Class – A (Metals & Mining) | | | 15 | |
| | 50,200 | | | Vale SA – Preferred (Metals & Mining) | | | 252 | |
| | | | | | | | |
| | | | | | | 2,116 | |
| | | | | | | | |
| | | | Chile — 0.00% | | | | |
| | 7,534 | | | Embotelladora Andina SA – Preferred, B Shares (Beverages) | | | 25 | |
| | 2,526 | | | Sociedad Quimica y Minera de Chile SA – Preferred, B Shares (Chemicals) | | | 41 | |
| | | | | | | | |
| | | | | | | 66 | |
| | | | | | | | |
| | | | Colombia — 0.01% | | | | |
| | 10,877 | | | Bancolombia SA – Preferred (Banks) | | | 116 | |
| | 91,081 | | | Grupo Aval Acciones y Valores SA – Preferred (Banks) | | | 45 | |
| | 2,721 | | | Grupo de Inversiones Suramericana – Preferred (Diversified Financial Services) | | | 38 | |
| | | | | | | | |
| | | | | | | 199 | |
| | | | | | | | |
| | | | Germany — 0.67% | | | | |
| | 9,591 | | | Bayerische Motoren Werke AG – Preferred (Automobiles) | | | 812 | |
| | 8,805 | | | Henkel AG & Co. KGaA – Preferred (Household Products) | | | 987 | |
| | 20,147 | | | Porsche Automobil Holding SE – Preferred (Automobiles) | | | 1,697 | |
| | 28,013 | | | Volkswagen AG – Preferred (Automobile Manufacturers) | | | 6,496 | |
| | | | | | | | |
| | | | | | | 9,992 | |
| | | | | | | | |
| | | | Korea, Republic Of — 0.00% | | | | |
| | 362 | | | Amorepacific Corp. – Preferred (Cosmetics/Personal Care) | | | 67 | |
| | | | | | | | |
| | | | Russia — 0.02% | | | | |
| | 42 | | | AK Transneft OAO – Preferred (Oil, Gas & Consumable Fuels) | | $ | 103 | |
| | 190,100 | | | Surgutneftegas – Preferred (Oil, Gas & Consumable Fuels) | | | 147 | |
| | | | | | | | |
| | | | | | | 250 | |
| | | | | | | | |
| | | | South Korea — 0.04% | | | | |
| | 899 | | | Hyundai Motor Co. Ltd. – Preferred (Automobiles) | | | 85 | |
See accompanying notes to financial statements.
129
HC CAPITAL TRUST
The International Equity Portfolio
Portfolio of Investments (continued) — June 30, 2015
| | | | | | | | |
Shares or
Principal
Amount
(000) | | | Security
Description | | Value
(000) | |
| | | | Preferred Stocks (continued) | | | | |
| | | | South Korea (continued) | | | | |
| | 693 | | | Hyundai Motor Co. Ltd. – Preferred (Automobiles) | | $ | 63 | |
| | 217 | | | LG Chem Ltd. – Preferred (Chemicals) | | | 37 | |
| | 538 | | | Samsung Electronics Co. Ltd. – Preferred (Technology Hardware, Storage & Peripherals) | | | 479 | |
| | | | | | | | |
| | | | | | | 664 | |
| | | | | | | | |
| | | | Total Preferred Stocks | | | 13,354 | |
| | | | | | | | |
| | | | Right — 0.00% | | | | |
| | | | Russia — 0.00% | | | | |
| | 31,900 | | | The Moscow Exchange MICEX (Diversified Financial Services) (a) | | | 40 | |
| | | | | | | | |
| | | | Total Right | | | 40 | |
| | | | | | | | |
| | | | U.S. Treasury Obligations — 0.00% | | | | |
| $ | 11 | | | U.S. Treasury Bill, 0.07%, 9/17/15 (c) | | | 11 | |
| | 17 | | | U.S. Treasury Bill,
0.04%, 12/10/15 (c)(d) | | | 17 | |
| | | | | | | | |
| | | | Total U.S.Treasury Obligations | | | 28 | |
| | | | | | | | |
| | | | Time Deposit — 0.52% | | | | |
| | 7,923 | | | State Street Liquidity Management Control System Eurodollar Time Deposit,
0.01%, 7/1/15 | | | 7,923 | |
| | | | | | | | |
| | | | Total Time Deposit | | | 7,923 | |
| | | | | | | | |
| | | | Mutual Funds — 0.77% | | | | |
| | 3,469,000 | | | Dreyfus Treasury Prime Cash Management Fund, 0.00% | | | 3,469 | |
| | 271,813 | | | iShares MSCI India ETF | | | 8,225 | |
| | 51,000 | | | SSgA Treasury Money Market
Fund, 0.00% | | | 51 | |
| | | | | | | | |
| | | | Total Mutual Funds | | | 11,745 | |
| | | | | | | | |
| | | | Repurchase Agreement — 0.58% | | | | |
| $ | 8,884 | | | Jefferies LLC, 0.23%, 7/1/15
(Purchased on 6/30/15, proceeds at maturity $8,883,806 collateralized by U.S. Treasury Obligations, 0.00% – 3.28%, 8/15/15 – 8/15/44 fair value $9,061,425)^^ | | | 8,884 | |
| | | | | | | | |
| | | | Total Repurchase Agreement | | | 8,884 | |
| | | | | | | | |
| | | | Total Investments
(cost $1,390,037) — 98.01% | | | 1,495,040 | |
| | | | Other assets in excess of
liabilities — 1.99% | | | 30,376 | |
| | | | | | | | |
| | | | Net Assets — 100.00% | | $ | 1,525,416 | |
| | | | | | | | |
Amounts designated as “—” are $0 or have been rounded to $0.
| * | Security was fair valued on June 30, 2015 and represents a Level 2 security. Refer to Note 2 in the Notes to Financial Statements. |
| ^ | All or part of this security was on loan as of June 30, 2015. The total value of securities on loan as of June 30, 2015, was $11,669 (amount in thousands). |
| ^^ | Purchased with cash collateral held from securities lending. The value of the collateral could include collateral held for securities that were sold on or before June 30, 2015. |
| (a) | Represents non-income producing security. |
| (b) | Represents a security purchased under Rule 144A or Section 4(2) and is exempt from registration under the Securities Act of 1933, as amended, or is otherwise restricted to resale. Certain of these securities may be resold in transactions exempt from registration, normally to qualified institutional buyers. These securities have been deemed liquid by the Specialist Manager. |
| (c) | Rate disclosed represents effective yield at purchase. |
| (d) | Zero Coupon Security. Effective rate shown is as of June 30, 2015. |
ADR — American Depositary Receipt
ETF — Exchange Traded Fund
FDR — Fiduciary Depositary Receipt
GDR — Global Depositary Receipt
NVDR — Non-Voting Depository Receipt
REIT — Real Estate Investment Trust
See accompanying notes to financial statements.
130
HC CAPITAL TRUST
The International Equity Portfolio
Portfolio of Investments (concluded) — June 30, 2015
The following table reflects the percentage of total net assets of the Portfolio attributable to each Specialist Manager, see Note 3 in the Notes to Financial Statements.
| | | | | | | | | | | | | | | | | | | | | | | | | | | | |
The International Equity Portfolio | | Artisan
Partners LP | | | Cadence
Capital
Management,
LLC | | | Capital
Guardian
Trust Co. | | | Causeway
Capital
Management
LLC | | | Mellon Capital
Management
Corporation | | | Parametric
Portfolio
Associates,
LLC | | | Total | |
Common Stocks | | | 6.88 | % | | | 61.53 | % | | | 6.75 | % | | | 13.82 | % | | | 6.28 | % | | | — | | | | 95.26 | % |
Preferred Stocks | | | 0.25 | % | | | 0.05 | % | | | — | | | | 0.36 | % | | | 0.22 | % | | | — | | | | 0.88 | % |
Right | | | — | | | | — | | | | — | | | | — | | | | — | | | | — | | | | 0.00 | % |
U.S. Treasury Obligations | | | — | | | | — | | | | — | | | | — | | | | — | | | | — | | | | 0.00 | % |
Time Deposit | | | 0.10 | % | | | — | | | | 0.21 | % | | | 0.21 | % | | | — | | | | — | | | | 0.52 | % |
Mutual Funds | | | — | | | | 0.23 | % | | | — | | | | — | | | | 0.54 | % | | | — | | | | 0.77 | % |
Repurchase Agreement | | | 0.03 | % | | | 0.28 | % | | | 0.10 | % | | | 0.17 | % | | | — | | | | — | | | | 0.58 | % |
Other Assets (Liabilities) | | | -0.01 | % | | | 0.01 | % | | | -0.05 | % | | | -0.11 | % | | | 0.04 | % | | | 2.11 | % | | | 1.99 | % |
| | | | | | | | | | | | | | | | | | | | | | | | | | | | |
Total Net Assets | | | 7.25 | % | | | 62.10 | % | | | 7.01 | % | | | 14.45 | % | | | 7.08 | % | | | 2.11 | % | | | 100.00 | % |
| | | | | | | | | | | | | | | | | | | | | | | | | | | | |
The following tables reflect the open derivative positions held by the Portfolio as of June 30, 2015.
Long Futures
| | | | | | | | | | | | | | | | |
Number of
Contracts | | | Futures Contracts Positions^ | | Value
(000) | | | Expiration | | | Unrealized
Appreciation/
(Depreciation)
(000) | |
| | 375 | | | Euro FX Currency Future | | $ | 52,294 | | | | 9/14/15 | | | $ | (12 | ) |
| | 170 | | | DAX Index Future | | | 52,119 | | | | 9/18/15 | | | | 78 | |
| | 14 | | | Mini MSCI Emerging Markets Index Future | | | 672 | | | | 9/18/15 | | | | (5 | ) |
| | 12 | | | Mini MSCI Emerging Markets Index Future | | | 1,100 | | | | 9/18/15 | | | | (16 | ) |
| | | | | | | | | | | | | | | | |
| | | | Net Unrealized Appreciation/(Depreciation) | | | | | | | | | | $ | 45 | |
| | | | | | | | | | | | | | | | |
Amounts designated as “—” are $0 or have been rounded to $0.
| ^ | Cash has been pledged as collateral for futures contracts held by the Portfolio. |
Forward Currency Contracts
| | | | | | | | | | | | | | | | | | | | | | |
Contract
Amount (Local Currency) | | | Currency | | Counterparty | | Settlement
Date | | | Settlement
Value
(000) | | | Value on
06/30/15
(000) | | | Unrealized
Appreciation/
(Depreciation)
(000) | |
| | | | Currencies Sold | | | | | | | | | | | | | | | | | | |
| | 863,513 | | | South African Rand | | UBS Warburg | | | 7/1/15 | | | $ | 71 | | | $ | 71 | | | $ | — | |
| | 617,276 | | | South African Rand | | UBS Warburg | | | 7/2/15 | | | | 51 | | | | 51 | | | | — | |
| | | | | | | | | | | | | | | | | | | | | | |
| | | | Total Currencies Sold | | | | | | $ | 122 | | | $ | 122 | | | $ | — | |
| | | | | | | | | | | | | | | | | | | | | | |
| | | | Net Unrealized/Appreciation (Depreciation) | | | | | | | | | | | | | | $ | — | |
| | | | | | | | | | | | | | | | | | | | | | |
Amounts designated as “—” are $0 or has been rounded to $0.
See accompanying notes to financial statements.
131
HC CAPITAL TRUST
The Institutional International Equity Portfolio
Portfolio of Investments — June 30, 2015
| | | | | | | | |
| Shares | | | Security Description | | Value
(000) | |
| | | | Common Stocks — 95.72% | | | | |
| | | | Australia — 5.76% | | | | |
| | 4,000 | | | Ansell Ltd. (Health Care Equipment & Supplies) | | $ | 74 | |
| | 152,504 | | | Aurizon Holdings Ltd. (Road & Rail) | | | 604 | |
| | 366,023 | | | AusNet Services (Electric Utilities) | | | 394 | |
| | 562,194 | | | Australia & New Zealand Banking Group Ltd. (Banks) | | | 13,964 | |
| | 66,535 | | | Bank of Queensland Ltd. (Banks) | | | 655 | |
| | 84,160 | | | Bendigo & Adelaide Bank Ltd. (Banks) | | | 796 | |
| | 1,278,600 | | | BHP Billiton Ltd. (Metals & Mining) | | | 26,679 | |
| | 50,177 | | | CIMIC Group Ltd. (Engineering & Construction) | | | 842 | |
| | 300,421 | | | Commonwealth Bank of Australia (Banks) | | | 19,729 | |
| | 50,231 | | | CSL Ltd. (Biotechnology) | | | 3,351 | |
| | 237,742 | | | Dexus Property Group (Real Estate Investment Trusts) | | | 1,339 | |
| | 277,860 | | | Downer EDI Ltd. (Commercial Services & Supplies) | | | 1,025 | |
| | 1,230,498 | | | Federation Centres (Real Estate Investment Trusts) | | | 2,772 | |
| | 1,392,416 | | | GPT Group (Real Estate Investment Trusts) | | | 4,597 | |
| | 35,802 | | | Iluka Resources Ltd. (Metals & Mining) | | | 212 | |
| | 272,303 | | | Independence Group NL (Metals & Mining) | | | 876 | |
| | 429,832 | | | Insurance Australia Group Ltd. (Insurance) | | | 1,850 | |
| | 136,305 | | | Lend Lease Group Ltd. (Real Estate Management & Development) | | | 1,580 | |
| | 1,355,542 | | | Mirvac Group (Real Estate Investment Trusts) | | | 1,934 | |
| | 432,898 | | | National Australia Bank Ltd. (Banks) | | | 11,123 | |
| | 10,495 | | | Newcrest Mining Ltd. (Metals & Mining) (a) | | | 105 | |
| | 239,801 | | | Platinum Asset Management Ltd. (Capital Markets) | | | 1,384 | |
| | 303,552 | | | Qantas Airways Ltd. (Airlines) (a) | | | 740 | |
| | 1,987,653 | | | Scentre Group (Real Estate Investment Trusts) | | | 5,750 | |
| | 32,048 | | | Seek Ltd. (Human Resource & Employment Services) | | | 348 | |
| | 854,293 | | | Stockland Trust Group (Real Estate Investment Trusts) | | | 2,702 | |
| | 236,171 | | | Suncorp Group Ltd. (Insurance) | | | 2,447 | |
| | 16,829 | | | Sydney Airport (Transportation Infrastructure) | | | 65 | |
| | 2,736,316 | | | Telstra Corp. Ltd. (Diversified Telecommunication Services) | | | 12,960 | |
| | 720,986 | | | Westfield Corp. (Real Estate Investment Trusts) | | | 5,072 | |
| | 581,323 | | | Westpac Banking Corp. (Banks) | | | 14,417 | |
| | 396,613 | | | Woodside Petroleum Ltd. (Oil, Gas & Consumable Fuels) | | | 10,473 | |
| | 653,122 | | | Woolworths Ltd. (Food & Staples Retailing) | | | 13,583 | |
| | 151,954 | | | WorleyParsons Ltd. (Energy Equipment & Services) | | | 1,220 | |
| | | | | | | | |
| | | | | | | 165,662 | |
| | | | | | | | |
| | | | Austria — 0.12% | | | | |
| | 33,701 | | | Immofinanz AG (Real Estate Management & Development) (a) | | | 79 | |
| | 70,475 | | | OMV AG (Oil, Gas & Consumable Fuels) | | | 1,939 | |
| | | | | | | | |
| Shares | | | Security Description | | Value
(000) | |
| | | | Austria (continued) | | | | |
| | 18,666 | | | Raiffeisen Bank International AG (Banks) (a) | | $ | 272 | |
| | 2,420 | | | Vienna Insurance Group Wiener Staedtische Versicherung AG (Insurance) | | | 83 | |
| | 25,433 | | | Voestalpine AG (Metals & Mining) | | | 1,058 | |
| | | | | | | | |
| | | | | | | 3,431 | |
| | | | | | | | |
| | | | Belgium — 1.13% | | | | |
| | 34,331 | | | Ageas (Insurance) | | | 1,322 | |
| | 152,373 | | | Anheuser-Busch InBev NV (Beverages) | | | 18,259 | |
| | 40,640 | | | Belgacom SA (Diversified Telecommunication Services) | | | 1,435 | |
| | 11,647 | | | Groupe Bruxelles Lambert SA (Diversified Financial Services) | | | 937 | |
| | 34,707 | | | KBC Groep NV (Banks) | | | 2,319 | |
| | 27,856 | | | Solvay SA (Chemicals) | | | 3,832 | |
| | 46,778 | | | Telenet Group Holding NV (Media) (a) | | | 2,544 | |
| | 26,956 | | | UCB SA (Pharmaceuticals) | | | 1,935 | |
| | | | | | | | |
| | | | | | | 32,583 | |
| | | | | | | | |
| | | | Bermuda — 0.08% | | | | |
| | 115,100 | | | Alibaba Health Information Technology Ltd. (Diversified Telecommunication Services) (a) | | | 120 | |
| | 340,000 | | | Beijing Enterprises Water Group Ltd. (Water Utilities) | | | 279 | |
| | 9,300 | | | Golar LNG Ltd. (Oil, Gas & Consumable Fuels) | | | 435 | |
| | 140,000 | | | Kunlun Energy Co. Ltd. (Oil, Gas & Consumable Fuels) | | | 143 | |
| | 91,000 | | | Nine Dragons Paper Holdings Ltd. (Paper & Forest Products) | | | 80 | |
| | 17,685 | | | Seadrill Ltd. (Energy Equipment & Services) | | | 184 | |
| | 216,000 | | | Sihuan Pharmaceutical Holdings Group Ltd. (Pharmaceuticals) | | | 123 | |
| | 277,000 | | | Yue Yuen Industrial Holdings Ltd. (Textiles, Apparel & Luxury Goods) | | | 927 | |
| | | | | | | | |
| | | | | | | 2,291 | |
| | | | | | | | |
| | | | Brazil — 0.41% | | | | |
| | 34,406 | | | Ambev SA, ADR (Beverages) | | | 210 | |
| | 222,400 | | | Ambev SA (Beverages) | | | 1,364 | |
| | 5,600 | | | B2W CIA Digital (Internet & Catalog Retail) (a) | | | 37 | |
| | 34,120 | | | Banco Bradesco SA, ADR (Banks) | | | 313 | |
| | 33,820 | | | Banco Bradesco SA (Banks) | | | 303 | |
| | 42,100 | | | Banco do Brasil SA (Banks) | | | 327 | |
| | 17,700 | | | Banco Santander Brasil SA (Banks) | | | 96 | |
| | 33,700 | | | BB Seguridade Participacoes SA (Insurance) | | | 370 | |
| | 83,200 | | | BM&FBOVESPA SA (Diversified Financial Services) | | | 314 | |
| | 21,500 | | | BR Malls Participacoes SA (Real Estate Management & Development) | | | 102 | |
| | 31,500 | | | BRF SA (Food Products) | | | 666 | |
| | 38,700 | | | CCR SA (Transportation Infrastructure) | | | 186 | |
| | 10,309 | | | CETIP SA (Capital Markets) | | | 113 | |
| | 15,900 | | | Cia de Saneamento Basico do Estado de Sao Paulo (Water Utilities) | | | 84 | |
| | 37,900 | | | Cia Vale Do Rio, ADR (Materials) | | | 191 | |
| | 39,360 | | | Cielo SA (IT Services) | | | 557 | |
See accompanying notes to financial statements.
132
HC CAPITAL TRUST
The Institutional International Equity Portfolio
Portfolio of Investments (continued) — June 30, 2015
| | | | | | | | |
| Shares | | | Security Description | | Value
(000) | |
| | | | Common Stocks (continued) | | | | |
| | | | Brazil (continued) | | | | |
| | 7,000 | | | Companhia Brasileira de Destribuicao Grupo PAO de (Food & Staples Retailing) | | $ | 165 | |
| | 34,200 | | | Companhia Siderurgica Nacional SA (CSN) (Metals & Mining) | | | 57 | |
| | 5,600 | | | Cosan SA Industria e Comercio (Oil, Gas & Consumable Fuels) | | | 45 | |
| | 10,939 | | | CPFL Energia SA (Electric Utilities) | | | 67 | |
| | 12,300 | | | Cyrela Brazil Realty SA Empreendimentos (Household Durables) | | | 39 | |
| | 16,170 | | | Duratex SA (Paper & Forest Products) | | | 38 | |
| | 9,100 | | | Ecorodovias Infraestrutura E Logistica SA (Transportation Infrastructure) | | | 23 | |
| | 12,900 | | | EDP – Energias do Brasil SA (Electric Utilities) | | | 48 | |
| | 30,800 | | | Embraer SA (Aerospace & Defense) | | | 233 | |
| | 14,100 | | | Estacio Participacoes SA (Diversified Consumer Services) | | | 81 | |
| | 11,500 | | | Fibria Celulose SA (Paper & Forest Products) | | | 157 | |
| | 37,500 | | | Hypermarcas SA (Personal Products) (a) | | | 273 | |
| | 27,200 | | | Itau Unibanco Holding SA, ADR (Banks) | | | 298 | |
| | 130,990 | | | Itau Unibanco Holding SA (Banks) | | | 1,443 | |
| | 34,900 | | | JBS SA (Food Products) | | | 184 | |
| | 25,200 | | | Klabin SA (Containers & Packaging) | | | 154 | |
| | 65,088 | | | Kroton Educacional SA (Diversified Consumer Services) | | | 249 | |
| | 7,400 | | | Localiza Rent A Car SA (Road & Rail) | | | 73 | |
| | 9,125 | | | Lojas Americanas SA (Multiline Retail) | | | 39 | |
| | 6,000 | | | Lojas Renner SA (Multiline Retail) | | | 220 | |
| | 1,800 | | | M Dias Branco SA (Food Products) | | | 47 | |
| | 4,100 | | | Multiplan Empreendimentos Imobiliarios SA (Real Estate Management & Development) | | | 63 | |
| | 8,100 | | | Natura Cosmeticos SA (Personal Products) | | | 73 | |
| | 9,000 | | | OdontoPrev SA (Health Care Providers & Services) | | | 31 | |
| | 141,100 | | | Petroleo Brasileiro SA (Oil, Gas & Consumable Fuels) (a) | | | 639 | |
| | 5,900 | | | Porto Seguro SA (Insurance) | | | 79 | |
| | 10,500 | | | Qualicorp SA (Health Care Providers & Services) | | | 67 | |
| | 9,500 | | | Raia Drogasil SA (Food & Staples Retailing) | | | 123 | |
| | 17,200 | | | Souza Cruz SA (Tobacco) | | | 136 | |
| | 7,500 | | | Sul America SA (Insurance) | | | 37 | |
| | 40,600 | | | Tim Participacoes SA (Wireless Telecommunication Services) | | | 133 | |
| | 5,100 | | | Totvs SA (Software) | | | 64 | |
| | 8,400 | | | Tractebel Energia SA (Independent Power and Renewable Electricity Producers) | | | 92 | |
| | 5,400 | | | Transmissora Alianca de Energia Eletrica SA (Electric Utilities) | | | 36 | |
| | 17,200 | | | Ultrapar Participacoes SA (Oil, Gas & Consumable Fuels) | | | 364 | |
| | 38,200 | | | Vale SA, ADR (Metals & Mining)^ | | | 225 | |
| | 63,400 | | | Vale SA (Metals & Mining) | | | 374 | |
| | 4,400 | | | Via Varejo SA (Specialty Retail) | | | 16 | |
| | 29,120 | | | WEG SA (Machinery) | | | 179 | |
| | | | | | | | |
| | | | | | | 11,897 | |
| | | | | | | | |
| | | | | | | | |
| Shares | | | Security Description | | Value
(000) | |
| | | | Canada — 0.31% | | | | |
| | 5,000 | | | Alimentation Couche-Tard, Inc., Class – B (Food & Staples Retailing) | | $ | 214 | |
| | 195,635 | | | Baytex Energy Corp. (Oil, Gas & Consumable Fuels)^ | | | 3,044 | |
| | 2,700 | | | Canadian National Railway Co. (Road & Rail) | | | 156 | |
| | 14,100 | | | Cenovus Energy, Inc. (Oil, Gas & Consumable Fuels)^ | | | 225 | |
| | 38,700 | | | Centerra Gold, Inc. (Metals & Mining) | | | 220 | |
| | 10,700 | | | Enbridge, Inc. (Oil, Gas & Consumable Fuels) | | | 500 | |
| | 46,439 | | | First Quantum Minerals Ltd. (Metals & Mining) | | | 607 | |
| | 96,630 | | | Imperial Oil Ltd. (Oil, Gas & Consumable Fuels)^ | | | 3,735 | |
| | 14,100 | | | Labrador Iron Ore Royalty Corp. (Metals & Mining)^ | | | 161 | |
| | 4,300 | | | Potash Corp. of Saskatchewan, Inc. (Chemicals) | | | 133 | |
| | | | | | | | |
| | | | | | | 8,995 | |
| | | | | | | | |
| | | | Cayman Islands — 0.08% | | | | |
| | 35,500 | | | AAC Technologies Holdings, Inc. (Electronic Equipment, Instruments & Components)^ | | | 201 | |
| | 46,000 | | | Anta Sports Products Ltd. (Textiles, Apparel & Luxury Goods) | | | 112 | |
| | 45,100 | | | Chailease Holding Co. Ltd. (Diversified Financial Services) | | | 109 | |
| | 288,900 | | | China Huishan Dairy Holdings Co. Ltd. (Food Products)^ | | | 66 | |
| | 68,000 | | | China Mengniu Dairy Co. Ltd. (Food Products) | | | 338 | |
| | 108,000 | | | China Resources Cement Holdings Ltd. (Construction Materials) | | | 60 | |
| | 4,600 | | | Ctrip.com International, ADR (Internet & Catalog Retail) (a) | | | 334 | |
| | 602,000 | | | GCL-Poly Energy Holdings Ltd. (Semiconductors & Semiconductor Equipment) (a) | | | 139 | |
| | 250,000 | | | Geely Automobile Holdings Ltd. (Automobiles) | | | 134 | |
| | 43,000 | | | Kingsoft Corp. Ltd. (Software) | | | 145 | |
| | 138,000 | | | New World China Land Ltd. (Real Estate Management & Development) | | | 82 | |
| | 1,029,000 | | | Semiconductor Manufacturing International Corp. (Semiconductors & Semiconductor Equipment) (a) | | | 113 | |
| | 29,000 | | | Shenzhou International Group Holdings Ltd. (Textiles, Apparel & Luxury Goods) | | | 141 | |
| | 63,500 | | | Stella International Holdings Ltd. (Textiles, Apparel & Luxury Goods) | | | 151 | |
| | 14,000 | | | Zhen Ding Technology Holding Ltd. (Electronic Equipment, Instruments & Components) | | | 49 | |
| | | | | | | | |
| | | | | | | 2,174 | |
| | | | | | | | |
| | | | Chile — 0.08% | | | | |
| | 129,207 | | | AES Gener SA (Independent Power and Renewable Electricity Producers) | | | 74 | |
| | 120,344 | | | Aguas Andinas SA, Class – A (Water Utilities) | | | 69 | |
| | 978,968 | | | Banco de Chile SA (Banks) | | | 107 | |
| | 1,449 | | | Banco de Credito e Inversiones SA (Banks) | | | 64 | |
| | 3,194,411 | | | Banco Santander Chile (Banks) | | | 161 | |
| | 59,288 | | | Cencosud SA (Food & Staples Retailing) | | | 143 | |
| | 402,342 | | | Colbun SA (Independent Power and Renewable Electricity Producers) | | | 115 | |
See accompanying notes to financial statements.
133
HC CAPITAL TRUST
The Institutional International Equity Portfolio
Portfolio of Investments (continued) — June 30, 2015
| | | | | | | | |
| Shares | | | Security Description | | Value
(000) | |
| | | | Common Stocks (continued) | | | | |
| | | | Chile (continued) | | | | |
| | 7,499 | | | Compania Cervecerias Unidas SA (Beverages) | | $ | 79 | |
| | 7,680,939 | | | CorpBanca SA (Banks) | | | 85 | |
| | 144,995 | | | Empresa Nacional de Electricidad SA (Independent Power and Renewable Electricity Producers) | | | 200 | |
| | 6,439 | | | Empresa Nacional de Telecomunicaciones SA (Wireless Telecommunication Services) | | | 71 | |
| | 58,680 | | | Empresas CMPC SA (Paper & Forest Products) | | | 160 | |
| | 22,070 | | | Empresas Copec SA (Oil, Gas & Consumable Fuels) | | | 234 | |
| | 947,070 | | | Enersis SA (Electric Utilities) | | | 301 | |
| | 13,283 | | | LATAM Airlines Group SA (Airlines) (a) | | | 95 | |
| | 23,118 | | | S.A.C.I. Falabella (Multiline Retail) | | | 162 | |
| | 14,975 | | | Sonda SA (IT Services) | | | 31 | |
| | 24,405 | | | Vina Concha y Toro SA (Beverages) | | | 43 | |
| | | | | | | | |
| | | | | | | 2,194 | |
| | | | | | | | |
| | | | China — 2.26% | | | | |
| | 1,087,000 | | | Agricultural Bank of China Ltd., H Shares (Banks) (a) | | | 585 | |
| | 96,000 | | | Air China Ltd. (Airlines) | | | 108 | |
| | 190,000 | | | Aluminum Corp. of China Ltd., H Shares (Metals & Mining) (a) | | | 96 | |
| | 59,000 | | | Anhui Conch Cement Co. Ltd., H Shares (Construction Materials) | | | 207 | |
| | 104,000 | | | AviChina Industry & Technology Co. Ltd., H Shares (Aerospace & Defense) | | | 102 | |
| | 32,849 | | | Baidu, Inc., ADR (Internet Software & Services) (a) | | | 6,540 | |
| | 4,481,335 | | | Bank of China Ltd., H Shares (Banks) | | | 2,914 | |
| | 412,000 | | | Bank of Communications Co. Ltd., H Shares (Banks) | | | 429 | |
| | 67,000 | | | BBMG Corp., H Shares (Construction Materials) | | | 68 | |
| | 82,000 | | | Beijing Capital International Airport Co. Ltd., H Shares (Transportation Infrastructure) | | | 95 | |
| | 30,500 | | | Byd Co. Ltd., H Shares (Automobiles)^ | | | 183 | |
| | 286,000 | | | CGN Power Co. Ltd., H Shares (Independent Power and Renewable Electricity Producers) (b) | | | 150 | |
| | 2,626,915 | | | China Cinda Asset Management Co. Ltd., H Shares (Capital Markets) (a)(b) | | | 1,463 | |
| | 366,000 | | | China CITIC Bank Corp. Ltd., H Shares (Banks) (a) | | | 292 | |
| | 120,000 | | | China Coal Energy Co. Ltd., H Shares (Oil, Gas & Consumable Fuels)^ | | | 72 | |
| | 207,000 | | | China Communications Construction Co. Ltd. (Construction & Engineering) | | | 310 | |
| | 132,000 | | | China Communications Services Corp. Ltd., H Shares (Diversified Telecommunication Services) | | | 67 | |
| | 28,000 | | | China Conch Venture Holdings Ltd. (Commercial Services) | | | 64 | |
| | 3,968,000 | | | China Construction Bank Corp., H Shares (Banks) | | | 3,624 | |
| | 118,500 | | | China COSCO Holdings Co. Ltd., H Shares (Marine)^(a) | | | 77 | |
| | | | | | | | |
| Shares | | | Security Description | | Value
(000) | |
| | | | China (continued) | | | | |
| | 155,900 | | | China Everbright Bank Co. Ltd., H Shares (Banks) | | $ | 94 | |
| | 147,000 | | | China Galaxy Securities Co., H Shares (Capital Markets) (a) | | | 192 | |
| | 26,300 | | | China International Marine Containers Group Co. Ltd., H Shares (Machinery) | | | 68 | |
| | 355,000 | | | China Life Insurance Co. Ltd., H Shares (Insurance) | | | 1,546 | |
| | 142,000 | | | China Longyuan Power Group Corp. (Independent Power and Renewable Electricity Producers) | | | 158 | |
| | 47,000 | | | China Medical System Holdings Ltd. (Pharmaceuticals) | | | 66 | |
| | 218,000 | | | China Merchants Bank Co. Ltd., H Shares (Banks) | | | 636 | |
| | 288,000 | | | China Minsheng Banking Corp. Ltd., H Shares (Banks) | | | 377 | |
| | 831,482 | | | China Mobile Ltd. (Wireless Telecommunication Services) | | | 10,647 | |
| | 140,000 | | | China National Building Material Co. Ltd., H Shares (Construction Materials) | | | 132 | |
| | 88,000 | | | China Oilfield Services Ltd., H Shares (Energy Equipment & Services) | | | 140 | |
| | 202,200 | | | China Pacific Insurance Group Co. Ltd. (Insurance) | | | 970 | |
| | 1,196,000 | | | China Petroleum & Chemical Corp., H Shares (Oil, Gas & Consumable Fuels) | | | 1,032 | |
| | 123,000 | | | China Power International Development Ltd. (Independent Power and Renewable Electricity Producers) | | | 94 | |
| | 103,500 | | | China Railway Construction Corp. Ltd., H Shares (Construction & Engineering) | | | 160 | |
| | 177,000 | | | China Railway Group Ltd., H Shares (Construction & Engineering) | | | 191 | |
| | 131,333 | | | China Resources Land Ltd. (Real Estate Management & Development) | | | 427 | |
| | 157,500 | | | China Shenhua Energy Co. Ltd., H Shares (Oil, Gas & Consumable Fuels) | | | 359 | |
| | 206,000 | | | China Shipping Container Lines Co. Ltd., H Shares (Marine) (a) | | | 80 | |
| | 96,000 | | | China Southern Airlines Co. Ltd., H Shares (Airlines) (a) | | | 114 | |
| | 682,000 | | | China Telecom Corp. Ltd. (Diversified Telecommunication Services) | | | 400 | |
| | 68,000 | | | China Vanke Co. Ltd., H Shares (Real Estate Management & Development)^ | | | 167 | |
| | 44,900 | | | Chongqing Changan Automobile Co. Ltd., Class – A (Automobiles) | | | 115 | |
| | 135,000 | | | Chongqing Rural Commercial Bank Co. Ltd., H Shares (Banks) | | | 108 | |
| | 102,000 | | | CITIC Securities Co. Ltd., H Shares (Capital Markets) | | | 368 | |
| | 3,865,771 | | | CNOOC Ltd. (Oil, Gas & Consumable Fuels) | | | 5,486 | |
| | 80,000 | | | Cosco Pacific Ltd. (Transportation Infrastructure) | | | 108 | |
| | 241,000 | | | Country Garden Holdings Co. (Real Estate Management & Development) | | | 106 | |
| | 196,000 | | | CSR Corp. Ltd., H Shares (Machinery) (a) | | | 301 | |
| | 15,400 | | | Dalian Wanda Commercial Properties Co. Ltd., Class – H (Real Estate Investment Trusts) (b) | | | 124 | |
See accompanying notes to financial statements.
134
HC CAPITAL TRUST
The Institutional International Equity Portfolio
Portfolio of Investments (continued) — June 30, 2015
| | | | | | | | |
| Shares | | | Security Description | | Value
(000) | |
| | | | Common Stocks (continued) | | | | |
| | | | China (continued) | | | | |
| | 122,000 | | | Datang International Power Generation Co. Ltd., H Shares (Independent Power and Renewable Electricity Producers) | | $ | 62 | |
| | 128,000 | | | Dongfeng Motor Group Co. Ltd., H Shares (Automobiles) | | | 172 | |
| | 36,000 | | | ENN Energy Holdings Ltd. (Gas Utilities) | | | 217 | |
| | 38,500 | | | GF Securities Co. Ltd., Class – H (Diversified Financial Services) (a) | | | 99 | |
| | 530,000 | | | GOME Electrical Appliances Holding Ltd. (Specialty Retail) | | | 117 | |
| | 95,000 | | | Great Wall Motor Co. Ltd., H Shares (Automobiles) | | | 466 | |
| | 118,000 | | | Guangzhou Automobile Group Co. Ltd., H Shares (Automobiles) | | | 109 | |
| | 33,000 | | | Haitian International Holdings Ltd. (Machinery) | | | 78 | |
| | 115,600 | | | Haitong Securities Co. Ltd., H Shares (Capital Markets) | | | 306 | |
| | 86,000 | | | Huadian Power International Corp. Ltd., H Shares (Independent Power and Renewable Electricity Producers) | | | 95 | |
| | 170,000 | | | Huaneng Power International, Inc., H Shares (Independent Power and Renewable Electricity Producers) | | | 237 | |
| | 146,000 | | | Huaneng Renewables Corp. Ltd., Class – H (Electric Utilities) | | | 59 | |
| | 40,100 | | | Huatai Securities Co. Ltd., Class – H (Diversified Financial Services) (a)(b) | | | 113 | |
| | 3,657,277 | | | Industrial & Commercial Bank of China Ltd., H Shares (Banks) | | | 2,906 | |
| | 45,300 | | | Inner Mongolia Yitai Coal Co. Ltd., B Shares (Oil, Gas & Consumable Fuels) | | | 65 | |
| | 5,700 | | | Jardine Matheson Holdings Ltd. (Industrial Conglomerates) | | | 324 | |
| | 4,943 | | | JD.com, Inc., ADR (Internet & Catalog Retail) (a) | | | 169 | |
| | 62,000 | | | Jiangsu Expressway Co. Ltd., H Shares (Transportation Infrastructure) | | | 81 | |
| | 61,000 | | | Jiangxi Copper Co. Ltd., H Shares (Metals & Mining) | | | 102 | |
| | 72,000 | | | Longfor Properties (Real Estate Management & Development) | | | 115 | |
| | 65,900 | | | Luye Pharma Group Ltd. (Pharmaceuticals) (a) | | | 71 | |
| | 38,600 | | | New China Life Insurance Co. Ltd., H Shares (Insurance) | | | 231 | |
| | 314,000 | | | People’s Insurance Co. Group of China Ltd., H Shares (Insurance) | | | 201 | |
| | 994,000 | | | PetroChina Co. Ltd., H Shares (Oil, Gas & Consumable Fuels) | | | 1,109 | |
| | 296,260 | | | PICC Property & Casualty Co. Ltd., H Shares (Insurance) | | | 675 | |
| | 293,356 | | | Ping An Insurance Group Co. of China (Insurance) | | | 3,962 | |
| | 88,000 | | | Shandong Weigao Group Medical Polymer Co. Ltd. (Health Care Equipment & Supplies) | | | 66 | |
| | 138,000 | | | Shanghai Electric Group Co. Ltd., H Shares (Electrical Equipment)^ | | | 113 | |
| | 56,000 | | | Shanghai Fosun Pharmaceutical (Group) Co. Ltd., H Shares (Pharmaceuticals) | | | 207 | |
| | | | | | | | |
| Shares | | | Security Description | | Value
(000) | |
| | | | China (continued) | | | | |
| | 21,000 | | | Shanghai Industrial Holdings Ltd. (Industrial Conglomerates) | | $ | 71 | |
| | 34,800 | | | Shanghai Pharmaceuticals Holding Co. Ltd., H Shares (Health Care Providers & Services) | | | 97 | |
| | 57,500 | | | Shimao Property Holdings Ltd. (Real Estate Management & Development) | | | 113 | |
| | 199,500 | | | Shui On Land Ltd. (Real Estate Management & Development) | | | 57 | |
| | 56,500 | | | Sinopec Engineering Group Co. Ltd., H Shares (Construction & Engineering) | | | 52 | |
| | 186,000 | | | Sinopec Shanghai Petrochemical Co. Ltd., H Shares (Chemicals) (a) | | | 101 | |
| | 57,200 | | | Sinopharm Group Co. (Health Care Providers & Services) | | | 254 | |
| | 70,000 | | | Sinotrans Ltd., H Shares (Air Freight & Logistics) | | | 47 | |
| | 94,000 | | | Soho China Ltd. (Real Estate Management & Development) | | | 61 | |
| | 102,500 | | | Sun Art Retail Group Ltd. (Food & Staples Retailing)^ | | | 92 | |
| | 93,000 | | | Sunac China Holdings Ltd. (Real Estate Investment Trusts) | | | 102 | |
| | 412,165 | | | Tencent Holdings Ltd. (Internet Software & Services) | | | 8,226 | |
| | 18,000 | | | Tsingtao Brewery Co. Ltd. (Beverages) | | | 109 | |
| | 276,000 | | | Want Want China Holdings Ltd. (Food Products) | | | 292 | |
| | 25,000 | | | Weichai Power Co. Ltd. (Machinery) | | | 83 | |
| | 84,000 | | | Yanzhou Coal Mining Co. Ltd., H Shares (Oil, Gas & Consumable Fuels)^ | | | 66 | |
| | 74,000 | | | Zhejiang Expressway Co. Ltd., H Shares (Transportation Infrastructure) | | | 103 | |
| | 26,000 | | | Zhuzhou CSR Times Electric Co. Ltd. (Electrical Equipment) | | | 195 | |
| | 308,000 | | | Zijin Mining Group Co. Ltd., H Shares (Metals & Mining) | | | 108 | |
| | 38,880 | | | ZTE Corp., H Shares (Communications Equipment) | | | 99 | |
| | | | | | | | |
| | | | | | | 65,067 | |
| | | | | | | | |
| | | | Colombia — 0.03% | | | | |
| | 9,084 | | | Almacenes Exito SA (Food & Staples Retailing) | | | 79 | |
| | 4,528 | | | Banco Davivienda SA (Banks) | | | 46 | |
| | 17,948 | | | Cementos Argos SA (Construction Materials) | | | 64 | |
| | 3,958 | | | Corporacion Financiera Colombiana SA (Diversified Financial Services) | | | 56 | |
| | 206,952 | | | Ecopetrol SA (Oil, Gas & Consumable Fuels) | | | 137 | |
| | 13,496 | | | Grupo Argos SA (Construction Materials) | | | 88 | |
| | 11,140 | | | Grupo de Inversiones Suramericana (Diversified Financial Services) | | | 159 | |
| | 16,956 | | | Interconexion Electrica SA (Electric Utilities) | | | 48 | |
| | 42,239 | | | ISAGEN SA ESP (Electric Utilities) | | | 45 | |
| | | | | | | | |
| | | | | | | 722 | |
| | | | | | | | |
| | | | Czech Republic — 0.01% | | | | |
| | 7,953 | | | CEZ A/S (Electric Utilities) | | | 185 | |
| | 708 | | | Komercni Banka A/S (Banks) | | | 157 | |
| | | | | | | | |
| | | | | | | 342 | |
| | | | | | | | |
See accompanying notes to financial statements.
135
HC CAPITAL TRUST
The Institutional International Equity Portfolio
Portfolio of Investments (continued) — June 30, 2015
| | | | | | | | |
| Shares | | | Security Description | | Value
(000) | |
| | | | Common Stocks (continued) | | | | |
| | | | Denmark — 1.47% | | | | |
| | 2,049 | | | A.P. Moller – Maersk A/S, Class – A (Marine) | | $ | 3,598 | |
| | 7,000 | | | A.P. Moller – Maersk A/S, Class – B (Marine) | | | 12,680 | |
| | 22,315 | | | Coloplast A/S, Class – B (Health Care Equipment & Supplies) | | | 1,464 | |
| | 212,966 | | | Danske Bank A/S (Banks) | | | 6,264 | |
| | 9,262 | | | Genmab A/S (Biotechnology) (a) | | | 806 | |
| | 121,432 | | | ISS A/S (Commercial Services & Supplies) | | | 4,007 | |
| | 174,520 | | | Novo Nordisk A/S, Class – B (Pharmaceuticals) | | | 9,510 | |
| | 441,318 | | | TDC A/S (Diversified Telecommunication Services) | | | 3,237 | |
| | 34,320 | | | Tryg A/S (Insurance) | | | 716 | |
| | | | | | | | |
| | | | | | | 42,282 | |
| | | | | | | | |
| | | | Egypt — 0.01% | | | | |
| | 39,698 | | | Commercial International Bank Egypt SAE (Banks) | | | 294 | |
| | 142,421 | | | Orascom Telecom Holding SAE (Wireless Telecommunication Services) (a) | | | 47 | |
| | 45,523 | | | Talaat Moustafa Group (Real Estate Management & Development) | | | 53 | |
| | | | | | | | |
| | | | | | | 394 | |
| | | | | | | | |
| | | | Faroe Islands — 0.04% | | | | |
| | 47,438 | | | Bakkafrost P/F (Food Products) | | | 1,268 | |
| | | | | | | | |
| | | | Finland — 0.63% | | | | |
| | 29,745 | | | Elisa Oyj (Diversified Telecommunication Services) | | | 943 | |
| | 63,578 | | | Fortum Oyj (Electric Utilities) | | | 1,130 | |
| | 115,776 | | | Kone Oyj (Machinery) | | | 4,698 | |
| | 50,500 | | | Metso Oyj (Machinery) | | | 1,387 | |
| | 49,034 | | | Nokian Renkaat Oyj (Auto Components) | | | 1,536 | |
| | 42,835 | | | Orion Oyj, Class – B (Pharmaceuticals) | | | 1,498 | |
| | 59,645 | | | Sampo Oyj, A Shares (Insurance) | | | 2,809 | |
| | 230,694 | | | UPM-Kymmene Oyj (Paper & Forest Products) | | | 4,081 | |
| | | | | | | | |
| | | | | | | 18,082 | |
| | | | | | | | |
| | | | France — 7.60% | | | | |
| | 487,412 | | | AXA SA (Insurance) | | | 12,296 | |
| | 162,097 | | | BNP Paribas (Banks) | | | 9,784 | |
| | 107,054 | | | Bouygues SA (Construction & Engineering) | | | 4,002 | |
| | 30,709 | | | Casino Guichard-Perrachon SA (Food & Staples Retailing) | | | 2,326 | |
| | 24,016 | | | CNP Assurances (Insurance) | | | 401 | |
| | 198,564 | | | Compagnie de Saint-Gobain (Building Products) | | | 8,913 | |
| | 6,545 | | | Danone SA (Food Products) | | | 423 | |
| | 85,523 | | | Edenred (Commercial Services & Supplies) | | | 2,113 | |
| | 32,334 | | | Electricite de France SA (Electric Utilities) | | | 721 | |
| | 28,922 | | | Elis SA (Commercial Services) | | | 568 | |
| | 721 | | | Essilor International SA (Health Care Equipment & Supplies) | | | 86 | |
| | 76,110 | | | Eutelsat Communications (Media) | | | 2,456 | |
| | 6,404 | | | Fonciere des Regions (Real Estate Investment Trusts) | | | 544 | |
| | 433,685 | | | GDF Suez (Multi-Utilities) | | | 8,044 | |
| | 6,089 | | | Gecina SA (Real Estate Investment Trusts) | | | 750 | |
| | | | | | | | |
| Shares | | | Security Description | | Value
(000) | |
| | | | France (continued) | | | | |
| | 8,175 | | | Icade (Real Estate Investment Trusts) | | $ | 584 | |
| | 4,099 | | | JC Decaux SA (Media) | | | 171 | |
| | 35,895 | | | Klepierre (Real Estate Investment Trusts) | | | 1,579 | |
| | 57,503 | | | Lagardere SCA (Media) | | | 1,677 | |
| | 89,942 | | | Legrand SA (Electrical Equipment) | | | 5,049 | |
| | 18,278 | | | L’Oreal SA (Personal Products) | | | 3,260 | |
| | 14,861 | | | LVMH Moet Hennessy Louis Vuitton SA (Textiles, Apparel & Luxury Goods) | | | 2,603 | |
| | 96,523 | | | Natixism SA (Banks) | | | 695 | |
| | 12,235 | | | Numericable – SFR (Media) (a) | | | 648 | |
| | 522,840 | | | Orange (Diversified Telecommunication Services) | | | 8,049 | |
| | 23,145 | | | Pernod Ricard SA (Beverages) | | | 2,673 | |
| | 4,715 | | | Renault SA (Automobiles) | | | 491 | |
| | 115,607 | | | Rexel SA (Trading Companies & Distributors) | | | 1,863 | |
| | 7,475 | | | Safran SA (Aerospace & Defense) | | | 507 | |
| | 391,349 | | | Sanofi-Aventis (Pharmaceuticals) | | | 38,493 | |
| | 114,374 | | | Schneider Electric SA (Electrical Equipment) | | | 7,896 | |
| | 20,898 | | | SCOR SE (Insurance) | | | 737 | |
| | 42,111 | | | Societe Generale (Banks) | | | 1,965 | |
| | 36,233 | | | Suez Environnement Co. (Multi-Utilities) | | | 674 | |
| | 104,283 | | | Technip SA (Energy Equipment & Services) | | | 6,454 | |
| | 773,732 | | | Total SA (Oil, Gas & Consumable Fuels) | | | 37,578 | |
| | 22,282 | | | Unibail-Rodamco SE (Real Estate Investment Trusts) | | | 5,631 | |
| | 17,072 | | | Valeo SA (Auto Components) | | | 2,690 | |
| | 46,250 | | | Veolia Environnement (Multi-Utilities) | | | 943 | |
| | 254,335 | | | Vinci SA (Construction & Engineering) | | | 14,708 | |
| | 503,938 | | | Vivendi (Media) | | | 12,710 | |
| | 139,698 | | | Zodiac Aerospace (Aerospace & Defense) | | | 4,547 | |
| | | | | | | | |
| | | | | | | 218,302 | |
| | | | | | | | |
| | | | Germany — 7.19% | | | | |
| | 90,788 | | | Allianz SE (Insurance) | | | 14,138 | |
| | 14,894 | | | Axel Springer AG (Media) | | | 782 | |
| | 299,061 | | | BASF SE (Chemicals) | | | 26,275 | |
| | 101,928 | | | Bayer AG (Pharmaceuticals) | | | 14,265 | |
| | 162,748 | | | Bayerische Motoren Werke AG (Automobiles) | | | 17,811 | |
| | 36,192 | | | Beiersdorf AG (Personal Products) | | | 3,031 | |
| | 3,554 | | | Brenntag AG (Trading Companies & Distributors) | | | 204 | |
| | 9,074 | | | Continental AG (Auto Components) | | | 2,147 | |
| | 402,437 | | | Daimler AG (Automobiles) | | | 36,623 | |
| | 135,052 | | | Deutsche Bank AG (Capital Markets) | | | 4,057 | |
| | 17,964 | | | Deutsche Boerse AG (Diversified Financial Services) | | | 1,487 | |
| | 412,114 | | | Deutsche Post AG (Air Freight & Logistics) | | | 12,038 | |
| | 552,441 | | | Deutsche Telekom AG (Diversified Telecommunication Services) | | | 9,514 | |
| | 24,352 | | | Deutsche Wohnen AG (Real Estate Management & Development) | | | 558 | |
| | 15,604 | | | Dialog Semiconductor PLC (Semiconductors & Semiconductor Equipment) (a) | | | 843 | |
| | 169,049 | | | E.ON AG (Multi-Utilities) | | | 2,251 | |
| | 5,719 | | | ElringKlinger AG (Auto Components) | | | 154 | |
See accompanying notes to financial statements.
136
HC CAPITAL TRUST
The Institutional International Equity Portfolio
Portfolio of Investments (continued) — June 30, 2015
| | | | | | | | |
| Shares | | | Security Description | | Value
(000) | |
| | | | Common Stocks (continued) | | | | |
| | | | Germany (continued) | | | | |
| | 6,997 | | | Freenet AG (Wireless Telecommunication Services) | | $ | 236 | |
| | 5,842 | | | Hannover Rueckversicherung AG (Insurance) | | | 565 | |
| | 31,215 | | | Hugo Boss AG (Textiles, Apparel & Luxury Goods) | | | 3,488 | |
| | 14,442 | | | Indus Holding AG (Industrial Conglomerates) | | | 727 | |
| | 9,712 | | | Lanxess AG (Chemicals) | | | 573 | |
| | 57,275 | | | Linde AG (Chemicals) | | | 10,847 | |
| | 11,192 | | | MAN SE (Machinery) | | | 1,153 | |
| | 52,966 | | | Metro AG (Hypermarkets & Super Centers) | | | 1,670 | |
| | 7,001 | | | GEA Group AG (Machinery) | | | 312 | |
| | 3,536 | | | MTU Aero Engines Holding AG (Aerospace & Defense) | | | 333 | |
| | 37,891 | | | Muenchener Rueckversicherungs-Gesellschaft AG (Insurance) | | | 6,716 | |
| | 92,178 | | | ProSiebenSat.1 Media AG (Media) | | | 4,552 | |
| | 45,845 | | | RWE AG (Multi-Utilities) | | | 986 | |
| | 57,345 | | | SAP AG (Software) | | | 4,002 | |
| | 233,139 | | | Siemens AG (Industrial Conglomerates) | | | 23,481 | |
| | 20,598 | | | TAG Immobilien AG (Real Estate Management & Development) | | | 241 | |
| | 98,317 | | | Telefonica Deutschland Holding AG (Diversified Telecommunication Services) | | | 567 | |
| | | | | | | | |
| | | | | | | 206,627 | |
| | | | | | | | |
| | | | Greece — 0.02% | | | | |
| | 188,889 | | | Alpha Bank AE (Banks) (a)* | | | 57 | |
| | 409,594 | | | Eurobank Ergasias SA (Banks) (a)* | | | 55 | |
| | 1,552 | | | Folli Follie SA (Specialty Retail)* | | | 39 | |
| | 12,314 | | | Hellenic Telecommunication Organization SA (Diversified Telecommunication Services)* | | | 104 | |
| | 5,223 | | | JUMBO SA (Specialty Retail)* | | | 39 | |
| | 75,427 | | | National Bank of Greece SA (Banks) (a)* | | | 83 | |
| | 11,466 | | | Opap SA (Hotels, Restaurants & Leisure)* | | | 91 | |
| | 99,254 | | | Piraeus Bank SA (Banks) (a)* | | | 37 | |
| | 1,998 | | | Titan Cement Co. SA (Construction Materials)* | | | 45 | |
| | | | | | | | |
| | | | | | | 550 | |
| | | | | | | | |
| | | | Hong Kong — 2.94% | | | | |
| | 1,698,118 | | | AIA Group Ltd. (Insurance) (b) | | | 11,117 | |
| | 478,000 | | | Alibaba Pictures Group Ltd. (Media)^(a) | | | 186 | |
| | 171,000 | | | Beijing Enterprises Holdings Ltd. (Industrial Conglomerates) | | | 1,287 | |
| | 223,000 | | | Belle International Holdings Ltd. (Textiles, Apparel & Luxury Goods) | | | 257 | |
| | 977,505 | | | BOC Hong Kong (Holdings) Ltd. (Banks) | | | 4,073 | |
| | 146,000 | | | Brilliance China Automotive Holdings Ltd. (Automobiles) | | | 228 | |
| | 148,534 | | | Cheung Kong Infrastructure Holdings Ltd. (Electric Utilities) | | | 1,154 | |
| | 117,096 | | | Cheung Kong Property Holdings, Ltd. (Real Estate Management & Development) (a) | | | 971 | |
| | 119,000 | | | China Agri-Industries Holdings Ltd. (Food Products) (a) | | | 68 | |
| | | | | | | | |
| Shares | | | Security Description | | Value
(000) | |
| | | | Hong Kong (continued) | | | | |
| | 256,000 | | | China Everbright International Ltd. (Commercial Services & Supplies) | | $ | 459 | |
| | 44,000 | | | China Everbright Ltd. (Capital Markets) | | | 153 | |
| | 82,000 | | | China Gas Holdings Ltd. (Gas Utilities) | | | 131 | |
| | 683,889 | | | China Merchants Holdings (International) Co. Ltd. (Transportation Infrastructure) | | | 2,934 | |
| | 192,000 | | | China Overseas Land & Investment Ltd. (Real Estate Management & Development) | | | 677 | |
| | 58,000 | | | China Resources Enterprises Ltd. (Food & Staples Retailing) | | | 187 | |
| | 42,000 | | | China Resources Gas Group Ltd. (Gas Utilities) | | | 125 | |
| | 88,000 | | | China Resources Power Holdings Co. Ltd. (Independent Power and Renewable Electricity Producers) | | | 246 | |
| | 80,000 | | | China State Construction International Holdings Ltd. (Construction & Engineering) | | | 144 | |
| | 73,200 | | | China Taiping Insurance Holdings Co. Ltd. (Insurance) (a) | | | 263 | |
| | 278,000 | | | China Unicom (Hong Kong) Ltd. (Diversified Telecommunication Services) | | | 438 | |
| | 101,000 | | | CITIC Pacific Ltd. (Industrial Conglomerates) | | | 181 | |
| | 117,096 | | | Ck Hutchison Holdings Ltd. (Real Estate Management & Development) | | | 1,721 | |
| | 326,919 | | | CLP Holdings Ltd. (Electric Utilities) | | | 2,779 | |
| | 200,000 | | | CSPC Pharmaceutical Group Ltd. (Pharmaceuticals) | | | 198 | |
| | 266,000 | | | Evergrande Real Estate Group Ltd. (Real Estate Management & Development)^ | | | 159 | |
| | 80,000 | | | Far East Horizon Ltd. (Diversified Financial Services) | | | 76 | |
| | 360,000 | | | First Pacific Co. Ltd. (Food & Staples Retailing) | | | 304 | |
| | 85,500 | | | Fosun International Ltd. (Metals & Mining) | | | 201 | |
| | 202,000 | | | Franshion Properties China Ltd. (Real Estate Management & Development) (a) | | | 72 | |
| | 60,000 | | | Goldin Properties Holdings Ltd. (Holding Companies – Diversified)^(a) | | | 63 | |
| | 130,000 | | | Guangdong Investment Ltd. (Water Utilities) | | | 182 | |
| | 50,000 | | | Guangzhou R&F Properties Co. Ltd., H Shares (Real Estate Management & Development) (a) | | | 61 | |
| | 54,000 | | | Haier Electronics Group Co. Ltd. (Household Durables) (a) | | | 146 | |
| | 588,000 | | | Hanergy Thin Film Power Group Ltd. (Semiconductors & Semiconductor Equipment)^(a) | | | 297 | |
| | 846,000 | | | Hang Lung Properties Ltd. (Real Estate Management & Development) | | | 2,516 | |
| | 143,809 | | | Hang Seng Bank Ltd. (Banks) | | | 2,811 | |
| | 35,000 | | | Hengan International Group Co. Ltd. (Personal Products) | | | 416 | |
| | 1,044,180 | | | HKT Trust & HKT Ltd. (Diversified Telecommunication Services) | | | 1,229 | |
| | 42,700 | | | Hong Kong Exchanges & Clearing Ltd. (Specialized Finance) | | | 1,507 | |
| | 196,000 | | | Hysan Development Co. (Real Estate Management & Development) | | | 850 | |
See accompanying notes to financial statements.
137
HC CAPITAL TRUST
The Institutional International Equity Portfolio
Portfolio of Investments (continued) — June 30, 2015
| | | | | | | | |
| Shares | | | Security Description | | Value
(000) | |
| | | | Common Stocks (continued) | | | | |
| | | | Hong Kong (continued) | | | | |
| | 239,500 | | | Kerry Properties Ltd. (Real Estate Management & Development) | | $ | 939 | |
| | 306,000 | | | Lenovo Group Ltd. (Technology Hardware, Storage & Peripherals) | | | 424 | |
| | 3,654,000 | | | Li & Fung Ltd. (Textiles, Apparel & Luxury Goods) | | | 2,899 | |
| | 4,100 | | | Melco Crown Entertainment Ltd., ADR (Hotels, Restaurants & Leisure) | | | 80 | |
| | 472,500 | | | MTR Corp. Ltd. (Road & Rail) | | | 2,201 | |
| | 1,931,000 | | | New World Development Co. Ltd. (Real Estate Management & Development) | | | 2,526 | |
| | 2,594,000 | | | PCCW Ltd. (Diversified Telecommunication Services) | | | 1,549 | |
| | 257,538 | | | Power Assets Holdings Ltd. (Electric Utilities) | | | 2,349 | |
| | 144,000 | | | Sino Biopharmaceutiical Ltd. (Pharmaceuticals) | | | 167 | |
| | 953,839 | | | Sino Land Co. Ltd. (Real Estate Management & Development) | | | 1,595 | |
| | 177,000 | | | Sino-Ocean Land Holdings Ltd. (Real Estate Management & Development) | | | 134 | |
| | 1,437,899 | | | SJM Holdings Ltd. (Hotels, Restaurants & Leisure)^ | | | 1,559 | |
| | 613,040 | | | Sun Hung Kai Properties Ltd. (Real Estate Management & Development) | | | 9,933 | |
| | 257,826 | | | Swire Pacific Ltd., Class – A (Real Estate Management & Development) | | | 3,241 | |
| | 234,541 | | | The Bank of East Asia Ltd. (Banks) | | | 1,026 | |
| | 904,618 | | | The Link Real Estate Investment Trust (Real Estate Investment Trusts) | | | 5,298 | |
| | 1,131,000 | | | The Wharf (Holdings) Ltd. (Real Estate Management & Development) | | | 7,529 | |
| | 88,000 | | | Tingyi (Cayman Islands) Holding Corp. (Food Products) | | | 180 | |
| | 292,000 | | | Yuexiu Property Co. Ltd. (Real Estate Management & Development) | | | 64 | |
| | | | | | | | |
| | | | | | | 84,560 | |
| | | | | | | | |
| | | | Hungary — 0.01% | | | | |
| | 1,602 | | | MOL Hungarian Oil & Gas PLC (Oil, Gas & Consumable Fuels) | | | 82 | |
| | 9,970 | | | OTP Bank Nyrt PLC (Banks) | | | 197 | |
| | 7,107 | | | Richter Gedeon Nyrt (Pharmaceuticals) | | | 107 | |
| | | | | | | | |
| | | | | | | 386 | |
| | | | | | | | |
| | | | India — 0.02% | | | | |
| | 30,926 | | | Infosys Ltd., ADR (IT Services) | | | 490 | |
| | | | | | | | |
| | | | Indonesia — 0.15% | | | | |
| | 220,600 | | | Media Nusantara Citra (Media) | | | 32 | |
| | 621,300 | | | PT Adaro Energy Tbk (Oil, Gas & Consumable Fuels) | | | 36 | |
| | 20,600 | | | PT Astra Agro Lestari Tbk (Food Products) | | | 35 | |
| | 985,700 | | | PT Astra International Tbk (Automobiles) | | | 523 | |
| | 598,800 | | | PT Bank Central Asia Tbk (Banks) | | | 606 | |
| | 201,700 | | | PT Bank Danamon Indonesia Tbk (Banks) | | | 65 | |
| | 431,900 | | | PT Bank Mandiri Tbk (Banks) | | | 326 | |
| | 343,100 | | | PT Bank Negara Indonesia Persero Tbk (Banks) | | | 136 | |
| | | | | | | | |
| Shares | | | Security Description | | Value
(000) | |
| | | | Indonesia (continued) | | | | |
| | 540,500 | | | PT Bank Rakyat Indonesia Persero Tbk (Banks) | | $ | 420 | |
| | 365,000 | | | PT Bumi Serpong Damai (Real Estate Management & Development) | | | 46 | |
| | 385,800 | | | PT Charoen Pokphand Indonesia Tbk (Food Products) | | | 80 | |
| | 371,000 | | | PT Global MediaCom Tbk (Media) | | | 33 | |
| | 24,900 | | | PT Gudang Garam Tbk (Tobacco) | | | 84 | |
| | 67,100 | | | PT Indocement Tunggal Prakarsa Tbk (Construction Materials) | | | 105 | |
| | 60,200 | | | PT Indofood CBP Sukses Makmur Tbk (Food Products) | | | 56 | |
| | 195,500 | | | PT Indofood Sukses Makmur Tbk (Food Products) | | | 97 | |
| | 108,500 | | | PT Jasa Marga Persero Tbk (Transportation Infrastructure) | | | 45 | |
| | 1,027,600 | | | PT Kalbe Farma Tbk (Pharmaceuticals) | | | 129 | |
| | 1,039,100 | | | PT Lippo Karawaci Tbk (Real Estate Management & Development) | | | 92 | |
| | 108,300 | | | PT Matahari Department Store Tbk (Multiline Retail) | | | 134 | |
| | 465,500 | | | PT Perusahaan Gas Negara Tbk (Gas Utilities) | | | 151 | |
| | 139,600 | | | PT Semen Gresik (Persero) Tbk (Construction Materials) | | | 126 | |
| | 346,500 | | | PT Summarecon Agung Tbk (Real Estate Investment Trusts) | | | 43 | |
| | 227,600 | | | PT Surya Citra Media Tbk (Media) | | | 49 | |
| | 43,400 | | | PT Tambang Batubara Bukit Asam Tbk (Oil, Gas & Consumable Fuels) | | | 27 | |
| | 2,366,400 | | | PT Telekomunikasi Indonesia Persero Tbk (Diversified Telecommunication Services) | | | 520 | |
| | 95,800 | | | PT Tower Bersama Infrastructure Tbk (Wireless Telecommunication Services) (a) | | | 66 | |
| | 71,300 | | | PT Unilever Indonesia Tbk (Household Products) | | | 211 | |
| | 76,000 | | | PT United Tractors Tbk (Machinery) | | | 116 | |
| | 141,100 | | | PT XL Axiata Tbk (Diversified Telecommunication Services) (a) | | | 39 | |
| | | | | | | | |
| | | | | | | 4,428 | |
| | | | | | | | |
| | | | Ireland — 0.34% | | | | |
| | 890,761 | | | Bank of Ireland (Banks) (a) | | | 360 | |
| | 159,563 | | | CRH PLC (Construction Materials) | | | 4,503 | |
| | 90,439 | | | Experian PLC (Professional Services) | | | 1,647 | |
| | 16,895 | | | ICON PLC (Life Sciences Tools & Services) (a) | | | 1,137 | |
| | 21,889 | | | Ryanair Holdings PLC, ADR (Airlines) | | | 1,562 | |
| | 15,477 | | | Smurfit Kappa Group PLC (Containers & Packaging) | | | 426 | |
| | | | | | | | |
| | | | | | | 9,635 | |
| | | | | | | | |
| | | | Ireland (Republic of) — 0.32% | | | | |
| | 124,752 | | | Medtronic PLC (Health Care Equipment & Supplies) | | | 9,244 | |
| | | | | | | | |
| | | | Israel — 0.47% | | | | |
| | 191,032 | | | Bank Leumi Le-Israel (Banks) (a) | | | 808 | |
| | 533,301 | | | Bezeq The Israeli Telecommunication Corp. Ltd. (Diversified Telecommunication Services) | | | 909 | |
See accompanying notes to financial statements.
138
HC CAPITAL TRUST
The Institutional International Equity Portfolio
Portfolio of Investments (continued) — June 30, 2015
| | | | | | | | |
| Shares | | | Security Description | | Value
(000) | |
| | | | Common Stocks (continued) | | | | |
| | | | Israel (continued) | | | | |
| | 2,359 | | | Delek Group Ltd. (Oil, Gas & Consumable Fuels) | | $ | 696 | |
| | 263,451 | | | Israel Chemicals Ltd. (Chemicals) | | | 1,842 | |
| | 341,503 | | | Israel Discount Bank, Class – A (Banks) (a) | | | 656 | |
| | 136,798 | | | Teva Pharmaceutical Industries Ltd. (Pharmaceuticals) | | | 8,096 | |
| | 1,111 | | | The Israel Corp. Ltd. (Chemicals) | | | 392 | |
| | | | | | | | |
| | | | | | | 13,399 | |
| | | | | | | | |
| | | | Italy — 0.91% | | | | |
| | 114,583 | | | Atlantia SpA (Transportation Infrastructure) | | | 2,830 | |
| | 453,953 | | | Enel SpA (Electric Utilities) | | | 2,056 | |
| | 885,717 | | | Eni SpA (Oil, Gas & Consumable Fuels) | | | 15,719 | |
| | 15,602 | | | Intesa Sanpaolo SpA (Banks) | | | 50 | |
| | 321,275 | | | Mediaset SpA (Media) | | | 1,544 | |
| | 139,833 | | | Snam Rete Gas SpA (Gas Utilities) | | | 665 | |
| | 1,464,492 | | | Telecom Italia SpA (Diversified Telecommunication Services) (a) | | | 1,858 | |
| | 835,192 | | | Telecom Italia SpA (Diversified Telecommunication Services) | | | 852 | |
| | 104,073 | | | Terna – Rete Elettrica Nationale SpA (Electric Utilities) | | | 460 | |
| | | | | | | | |
| | | | | | | 26,034 | |
| | | | | | | | |
| | | | Japan — 19.21% | | | | |
| | 279,225 | | | Aeon Co. Ltd. (Food & Staples Retailing) | | | 3,965 | |
| | 12,200 | | | Aeon Credit Service Co. Ltd. (Consumer Finance) | | | 339 | |
| | 83,732 | | | Aisin Seiki Co. Ltd. (Auto Components) | | | 3,565 | |
| | 66,600 | | | ALPS ELECTRIC Co. Ltd. (Electronic Equipment, Instruments & Components) | | | 2,055 | |
| | 122,000 | | | Aozora Bank Ltd. (Banks) | | | 461 | |
| | 462,575 | | | Asahi Glass Co. Ltd. (Building Products) | | | 2,778 | |
| | 231,000 | | | Asahi Kasei Corp. (Chemicals) | | | 1,898 | |
| | 90,200 | | | Astellas Pharma, Inc. (Pharmaceuticals) | | | 1,287 | |
| | 33,349 | | | Benesse Holdings, Inc. (Diversified Consumer Services) | | | 837 | |
| | 270,000 | | | Bridgestone Corp. (Auto Components) | | | 9,990 | |
| | 98,100 | | | Brother Industries Ltd. (Technology Hardware, Storage & Peripherals) | | | 1,390 | |
| | 573,867 | | | Canon, Inc. (Technology Hardware, Storage & Peripherals) | | | 18,677 | |
| | 700 | | | COSMOS Pharmaceutical Corp. (Food & Staples Retailing) | | | 95 | |
| | 257,079 | | | Dai Nippon Printing Co. Ltd. (Commercial Services & Supplies) | | | 2,656 | |
| | 86,212 | | | Daihatsu Motor Co. Ltd. (Automobiles) | | | 1,228 | |
| | 305,491 | | | Daiichi Sankyo Co. Ltd. (Pharmaceuticals) | | | 5,652 | |
| | 22,067 | | | Daito Trust Construction Co. Ltd. (Real Estate Management & Development) | | | 2,287 | |
| | 217,200 | | | Daiwa House Industry Co. Ltd. (Real Estate Management & Development) | | | 5,064 | |
| | 173,000 | | | Daiwa Securities Group, Inc. (Investment Banking & Brokerage) | | | 1,297 | |
| | 213,700 | | | Denso Corp. (Auto Components) | | | 10,646 | |
| | 63,900 | | | East Japan Railway Co. (Road & Rail) | | | 5,749 | |
| | 119,871 | | | Eisai Co. Ltd. (Pharmaceuticals) | | | 8,048 | |
| | 4,600 | | | EXEDY Corp. (Auto Components) | | | 115 | |
| | | | | | | | |
| Shares | | | Security Description | | Value
(000) | |
| | | | Japan (continued) | | | | |
| | 27,257 | | | FamilyMart Co. Ltd. (Food & Staples Retailing) | | $ | 1,254 | |
| | 79,600 | | | Fanuc Ltd. (Machinery) | | | 16,314 | |
| | 110,000 | | | Fujitsu Ltd. (Computer Hardware – DO NOT USE) | | | 615 | |
| | 86,000 | | | Fukuoka Financial Group, Inc. (Banks) | | | 446 | |
| | 33,100 | | | Hamamatsu Photonics K.K. (Electronic Equipment, Instruments & Components) | | | 976 | |
| | 100,200 | | | HASEKO Corp. (Household Durables) | | | 1,182 | |
| | 7,100 | | | Hikari Tsushin, Inc. (Specialty Retail) | | | 479 | |
| | 44,800 | | | Hitachi Construction Machinery Co. Ltd. (Machinery) | | | 785 | |
| | 3,005,000 | | | Hitachi Ltd. (Electronic Equipment, Instruments & Components) | | | 19,812 | |
| | 18,400 | | | Hokuriku Electric Power Co. (Electric Utilities) | | | 274 | |
| | 706,224 | | | Honda Motor Co. Ltd. (Automobiles) | | | 22,862 | |
| | 1,500 | | | Hoshizaki Electric Co. Ltd. (Machinery) | | | 88 | |
| | 50,000 | | | IBIDEN Co. Ltd. (Electronic Equipment, Instruments & Components) | | | 846 | |
| | 38,400 | | | Idemitsu Kosan Co. Ltd. (Oil, Gas & Consumable Fuels) | | | 754 | |
| | 910,000 | | | IHI Corp. (Machinery) | | | 4,239 | |
| | 66,100 | | | Iida Group Holdings Co. Ltd. (Household Durables) | | | 1,053 | |
| | 759,668 | | | ITOCHU Corp. (Trading Companies & Distributors) | | | 10,038 | |
| | 23,200 | | | ITOCHU Techno-Solutions Corp. (IT Services) | | | 578 | |
| | 42,000 | | | Japan Airlines Co. Ltd. (Airlines) | | | 1,466 | |
| | 25,000 | | | Japan Aviation Electronics Industry Ltd. (Electronic Equipment, Instruments & Components) | | | 680 | |
| | 187 | | | Japan Prime Realty Investment Corp. (Real Estate Investment Trusts)^ | | | 581 | |
| | 261 | | | Japan Real Estate Investment Corp. (Real Estate Investment Trusts) | | | 1,186 | |
| | 545 | | | Japan Retail Fund Investment Corp. (Real Estate Investment Trusts) | | | 1,091 | |
| | 525,197 | | | Japan Tobacco, Inc. (Tobacco) | | | 18,715 | |
| | 204,500 | | | JFE Holdings, Inc. (Metals & Mining) | | | 4,540 | |
| | 139,000 | | | JGC Corp. (Construction & Engineering) | | | 2,626 | |
| | 118,445 | | | JS Group Corp. (Building Products) | | | 2,352 | |
| | 81,683 | | | JSR Corp. (Chemicals) | | | 1,444 | |
| | 177,300 | | | JVC KENWOOD Corp. (Household Durables) | | | 484 | |
| | 1,054,324 | | | JX Holdings, Inc. (Oil, Gas & Consumable Fuels) | | | 4,551 | |
| | 40,700 | | | Kanamoto Co. Ltd. (Trading Companies & Distributors) | | | 1,033 | |
| | 137,602 | | | Kaneka Corp. (Chemicals) | | | 1,006 | |
| | 882,000 | | | Kawasaki Heavy Industries Ltd. (Machinery) | | | 4,116 | |
| | 810,700 | | | KDDI Corp. (Wireless Telecommunication Services) | | | 19,571 | |
| | 2,450 | | | Keyence Corp. (Electronic Equipment, Instruments & Components) | | | 1,323 | |
| | 387,032 | | | Kirin Holdings Co. Ltd. (Beverages) | | | 5,332 | |
| | 1,288,000 | | | Kobe Steel Ltd. (Metals & Mining) | | | 2,168 | |
See accompanying notes to financial statements.
139
HC CAPITAL TRUST
The Institutional International Equity Portfolio
Portfolio of Investments (continued) — June 30, 2015
| | | | | | | | |
| Shares | | | Security Description | | Value
(000) | |
| | | | Common Stocks (continued) | | | | |
| | | | Japan (continued) | | | | |
| | 592,300 | | | Komatsu Ltd. (Machinery) | | $ | 11,892 | |
| | 40,800 | | | Konami Corp. (Software) | | | 759 | |
| | 17,000 | | | Kubota Corp. (Machinery) | | | 270 | |
| | 155,529 | | | Kuraray Co. Ltd. (Chemicals) | | | 1,904 | |
| | 52,100 | | | Kurita Water Industries Ltd. (Machinery) | | | 1,215 | |
| | 28,926 | | | Lawson, Inc. (Food & Staples Retailing) | | | 1,981 | |
| | 793,231 | | | Marubeni Corp. (Trading Companies & Distributors) | | | 4,552 | |
| | 19,977 | | | Maruichi Steel Tube Ltd. (Metals & Mining) | | | 496 | |
| | 669,640 | | | Mitsubishi Corp. (Trading Companies & Distributors) | | | 14,731 | |
| | 263,000 | | | Mitsubishi Electric Corp. (Electrical Equipment) | | | 3,400 | |
| | 159,000 | | | Mitsubishi Gas Chemical Co., Inc. (Chemicals) | | | 891 | |
| | 454,000 | | | Mitsubishi Materials Corp. (Metals & Mining) | | | 1,744 | |
| | 101,343 | | | Mitsubishi Tanabe Pharma Corp. (Pharmaceuticals) | | | 1,520 | |
| | 2,081,282 | | | Mitsubishi UFJ Financial Group, Inc. (Banks) | | | 14,964 | |
| | 795,526 | | | Mitsui & Co. Ltd. (Trading Companies & Distributors) | | | 10,808 | |
| | 548,000 | | | Mitsui Mining & Smelting Co. Ltd. (Metals & Mining) | | | 1,482 | |
| | 2,399,092 | | | Mizuho Financial Group, Inc. (Banks) | | | 5,195 | |
| | 33,000 | | | Murata Manufacturing Co. Ltd. (Electronic Equipment, Instruments & Components) | | | 5,760 | |
| | 168,327 | | | NGK Insulators Ltd. (Machinery) | | | 4,340 | |
| | 1,300 | | | Nidec Corp. (Electronic Equipment, Instruments & Components) | | | 97 | |
| | 63,900 | | | Nihon Nohyaku Co. Ltd. (Chemicals) | | | 620 | |
| | 427,400 | | | Nikon Corp. (Household Durables) | | | 4,946 | |
| | 294 | | | Nippon Building Fund, Inc. (Real Estate Investment Trusts) | | | 1,287 | |
| | 164,000 | | | Nippon Electric Glass Co. Ltd. (Electronic Equipment, Instruments & Components) | | | 831 | |
| | 319 | | | Nippon Prologis REIT, Inc. (Real Estate Investment Trusts) | | | 588 | |
| | 310,178 | | | Nippon Telegraph & Telephone Corp. (Diversified Telecommunication Services) | | | 11,238 | |
| | 672,000 | | | Nippon Yusen Kabushiki Kaisha (Marine) | | | 1,873 | |
| | 175,200 | | | Nipro Corp. (Health Care Equipment & Supplies) | | | 1,794 | |
| | 1,585,679 | | | Nissan Motor Co. Ltd. (Automobiles) | | | 16,522 | |
| | 377,300 | | | Nomura Holdings, Inc. (Investment Banking & Brokerage) | | | 2,561 | |
| | 26,100 | | | Nomura Real Estate Holdings, Inc. (Real Estate Management & Development) | | | 548 | |
| | 4,400 | | | NSK Ltd. (Machinery) | | | 68 | |
| | 13,658 | | | NTT Data Corp. (IT Services) | | | 597 | |
| | 364,300 | | | NTT DoCoMo, Inc. (Wireless Telecommunication Services) | | | 6,978 | |
| | 366,090 | | | Oji Paper Co. Ltd. (Paper & Forest Products) | | | 1,592 | |
| | 171,400 | | | Olympus Corp. (Health Care Equipment & Supplies) | | | 5,925 | |
| | 1,300 | | | Ono Pharmaceutical Co. Ltd. (Pharmaceuticals) | | | 142 | |
| | 22,600 | | | Oracle Corp. Japan (Software) | | | 946 | |
| | 31,700 | | | ORIX Corp. (Diversified Financial Services) | | | 472 | |
| | | | | | | | |
| Shares | | | Security Description | | Value
(000) | |
| | | | Japan (continued) | | | | |
| | 217,477 | | | Osaka Gas Co. Ltd. (Gas Utilities) | | $ | 859 | |
| | 169,681 | | | Otsuka Holdings Co. Ltd. (Pharmaceuticals) | | | 5,413 | |
| | 46,200 | | | Park24 Co. Ltd. (Commercial Services & Supplies) | | | 792 | |
| | 5,000 | | | Recruit Holdings Co. Ltd. (Professional Services) | | | 153 | |
| | 488,085 | | | Resona Holdings, Inc. (Banks) | | | 2,666 | |
| | 325,600 | | | Ricoh Co. Ltd. (Technology Hardware, Storage & Peripherals) | | | 3,379 | |
| | 3,400 | | | Rinnai Corp. (Household Durables) | | | 268 | |
| | 200 | | | Rohm Co. Ltd. (Semiconductors) | | | 13 | |
| | 2,300 | | | Ryohin Keikaku Co. (Multiline Retail) | | | 446 | |
| | 111,000 | | | Sanden Holdings Corp. (Auto Components) | | | 517 | |
| | 24,904 | | | Sankyo Co. Ltd. (Leisure Products) | | | 882 | |
| | 77,400 | | | Sega Sammy Holdings, Inc. (Leisure Products) | | | 1,012 | |
| | 192,457 | | | Sekisui Chemical Co. Ltd. (Household Durables) | | | 2,364 | |
| | 242,465 | | | Sekisui House Ltd. (Household Durables) | | | 3,852 | |
| | 213,500 | | | Senshu Ikeda Holdings, Inc. (Banks) | | | 968 | |
| | 2,600 | | | Shimano, Inc. (Leisure Products) | | | 355 | |
| | 47,300 | | | Shin-Etsu Chemical Co. Ltd. (Chemicals) | | | 2,938 | |
| | 82,000 | | | Showa Shell Sekiyu K.K. (Oil, Gas & Consumable Fuels) | | | 717 | |
| | 1,800 | | | SMC Corp. (Machinery) | | | 542 | |
| | 18,100 | | | SoftBank Corp. (Wireless Telecommunication Services) | | | 1,066 | |
| | 18,000 | | | Sony Financial Holdings, Inc. (Insurance) | | | 316 | |
| | 522,200 | | | Sumitomo Corp. (Trading Companies & Distributors) | | | 6,077 | |
| | 402,000 | | | Sumitomo Heavy Industries Ltd. (Industrial Machinery) | | | 2,346 | |
| | 223,000 | | | Sumitomo Metal Mining Co. Ltd. (Metals & Mining) | | | 3,396 | |
| | 426,723 | | | Sumitomo Mitsui Financial Group, Inc. (Banks) | | | 19,035 | |
| | 340,000 | | | Sumitomo Mitsui Trust Holdings, Inc. (Banks) | | | 1,558 | |
| | 278,631 | | | Sumitomo Rubber Industries Ltd. (Auto Components) | | | 4,319 | |
| | 5,000 | | | Sysmex Corp. (Health Care Equipment & Supplies) | | | 298 | |
| | 107,000 | | | Taisei Corp. (Construction & Engineering) | | | 615 | |
| | 362,585 | | | Takeda Pharmaceutical Co. Ltd. (Pharmaceuticals) | | | 17,514 | |
| | 95,000 | | | The Bank of Yokohama Ltd. (Banks) | | | 583 | |
| | 71,100 | | | The Chugoku Electric Power Co., Inc. (Electric Utilities) | | | 1,038 | |
| | 110,000 | | | The San-in Godo Bank Ltd. (Banks) | | | 1,062 | |
| | 47,000 | | | The Yokohama Rubber Co. Ltd. (Auto Components) | | | 944 | |
| | 130,135 | | | TonenGeneral Sekiyu K.K. (Oil, Gas & Consumable Fuels) | | | 1,211 | |
| | 5,000 | | | Topcon Corp. (Electronic Equipment, Instruments & Components) | | | 121 | |
| | 251,545 | | | Toppan Printing Co. Ltd. (Commercial Services & Supplies) | | | 2,105 | |
| | 28,881 | | | Toyoda Gosei Co. Ltd. (Auto Components) | | | 697 | |
| | 746,500 | | | Toyota Motor Corp. (Automobiles) | | | 50,040 | |
| | 90,200 | | | Toyota Tsusho Corp. (Trading Companies & Distributors) | | | 2,421 | |
See accompanying notes to financial statements.
140
HC CAPITAL TRUST
The Institutional International Equity Portfolio
Portfolio of Investments (continued) — June 30, 2015
| | | | | | | | |
| Shares | | | Security Description | | Value
(000) | |
| | | | Common Stocks (continued) | | | | |
| | | | Japan (continued) | | | | |
| | 54,600 | | | Trend Micro, Inc. (Software) | | $ | 1,869 | |
| | 521 | | | United Urban Investment Corp. (Real Estate Investment Trusts) | | | 737 | |
| | 144,068 | | | West Japan Railway Co. (Road & Rail) | | | 9,225 | |
| | 144,500 | | | Yahoo Japan Corp. (Internet Software & Services) | | | 583 | |
| | 4,200 | | | Yamato Holdings Co. Ltd. (Air Freight & Logistics) | | | 81 | |
| | | | | | | | |
| | | | | | | 551,861 | |
| | | | | | | | |
| | | | Jersey — 0.41% | | | | |
| | 639,710 | | | Glencore International PLC (Metals & Mining) | | | 2,566 | |
| | 63,874 | | | Shire PLC (Pharmaceuticals) | | | 5,112 | |
| | 186,976 | | | WPP PLC (Media) | | | 4,189 | |
| | | | | | | | |
| | | | | | | 11,867 | |
| | | | | | | | |
| | | | Korea, Republic Of — 0.02% | | | | |
| | 1,200 | | | Cheil Industries, Inc. (Industrial Conglomerates) (a) | | | 191 | |
| | 247 | | | Hanmi Pharm Co. Ltd. (Pharmaceuticals) (a) | | | 103 | |
| | 372 | | | Hanssem Co. Ltd. (Household Durables) | | | 94 | |
| | 1,004 | | | KEPCO Plant Service & Engineering Co. Ltd. (Commercial Services & Supplies) | | | 106 | |
| | | | | | | | |
| | | | | | | 494 | |
| | | | | | | | |
| | | | Liberia — 0.04% | | | | |
| | 15,693 | | | Royal Caribbean Cruises Ltd. (Hotels, Resorts & Cruise Lines) | | | 1,235 | |
| | | | | | | | |
| | | | Luxembourg — 0.30% | | | | |
| | 12,761 | | | RTL Group (Media) | | | 1,153 | |
| | 174,995 | | | SES – FDR, Class – A (Media) | | | 5,878 | |
| | 125,794 | | | Tenaris SA (Energy Equipment & Services) | | | 1,694 | |
| | | | | | | | |
| | | | | | | 8,725 | |
| | | | | | | | |
| | | | Malaysia — 0.21% | | | | |
| | 71,000 | | | Airasia Berhad (Airlines) | | | 29 | |
| | 51,700 | | | Alliance Financial Group Berhad (Banks) | | | 60 | |
| | 85,400 | | | AMMB Holdings Berhad (Banks) | | | 137 | |
| | 82,100 | | | Astro Malaysia Holdings Berhad (Media) | | | 67 | |
| | 123,700 | | | Axiata Group Berhad (Wireless Telecommunication Services) | | | 210 | |
| | 38,372 | | | Berjaya Sports Toto Berhard (Hotels, Restaurants & Leisure) | | | 33 | |
| | 6,700 | | | British American Tobacco Malaysia Berhad (Tobacco) | | | 110 | |
| | 86,400 | | | Bumi Armada Berhad (Energy Equipment & Services) | | | 26 | |
| | 233,000 | | | CIMB Group Holdings Berhad (Banks) | | | 338 | |
| | 162,488 | | | Dialog Group Berhad (Construction & Engineering) | | | 69 | |
| | 159,100 | | | DiGi.Com Berhad (Wireless Telecommunication Services) | | | 226 | |
| | 70,200 | | | Felda Global Ventures Holdings Berhad (Food Products) | | | 30 | |
| | 90,300 | | | Gamuda Berhad (Construction & Engineering) | | | 112 | |
| | 105,600 | | | Genting Berhad (Hotels, Restaurants & Leisure) | | | 226 | |
| | | | | | | | |
| Shares | | | Security Description | | Value
(000) | |
| | | | Malaysia (continued) | | | | |
| | 134,500 | | | Genting Malaysia Berhad (Hotels, Restaurants & Leisure) | | $ | 150 | |
| | 13,800 | | | Genting Plantations Berhad (Food Products) | | | 36 | |
| | 26,200 | | | Hong Leong Bank Berhad (Banks) | | | 93 | |
| | 11,700 | | | Hong Leong Financial Group Berhad (Banks) | | | 47 | |
| | 120,100 | | | Ihh Healthcare Berhad (Health Care Providers & Services) (a) | | | 180 | |
| | 65,900 | | | IJM Corp. Berhad (Construction & Engineering) | | | 113 | |
| | 137,300 | | | IOI Corp. Berhad (Food Products) | | | 149 | |
| | 71,600 | | | IOI Properties Group Berhad (Real Estate Management & Development) | | | 35 | |
| | 19,400 | | | Kuala Lumpur Kepong Berhad (Food Products) | | | 110 | |
| | 20,800 | | | Lafarge Malayan Cement Berhad (Construction Materials) | | | 47 | |
| | 220,100 | | | Malayan Banking Berhad (Banks) | | | 533 | |
| | 41,500 | | | Malaysia Airports holdings Berhad (Transportation Infrastructure) | | | 68 | |
| | 100,000 | | | Maxis Berhad (Wireless Telecommunication Services) | | | 169 | |
| | 56,300 | | | MISC Berhad (Marine) | | | 115 | |
| | 137,400 | | | Petronas Chemicals Group Berhad (Chemicals) | | | 230 | |
| | 12,400 | | | Petronas Dagangan Berhad (Oil, Gas & Consumable Fuels) | | | 68 | |
| | 32,400 | | | Petronas Gas Berhad (Gas Utilities) | | | 183 | |
| | 23,800 | | | PPB Group Berhad (Food Products) | | | 95 | |
| | 117,440 | | | Public Bank Berhad (Banks) | | | 583 | |
| | 20,800 | | | RHB Capital Berhad (Banks) | | | 41 | |
| | 172,300 | | | SapuraKencana Petroleum Berhad (Energy Equipment & Services) | | | 108 | |
| | 138,800 | | | Sime Darby Berhad (Industrial Conglomerates) | | | 314 | |
| | 50,300 | | | Telekom Malaysia Berhad (Diversified Telecommunication Services) | | | 87 | |
| | 159,500 | | | Tenega Nasional Berhad (Electric Utilities) | | | 535 | |
| | 28,500 | | | UMW Holdings Berhad (Automobiles) | | | 77 | |
| | 31,600 | | | Westports Holding Berhad (Commercial Services) | | | 35 | |
| | 216,100 | | | YTL Corp. Berhad (Multi-Utilities) | | | 89 | |
| | 75,600 | | | YTL Power International Berhad (Multi-Utilities) | | | 32 | |
| | | | | | | | |
| | | | | | | 5,995 | |
| | | | | | | | |
| | | | Malta — 0.01% | | | | |
| | 16,382 | | | Brait SE (Capital Markets) | | | 166 | |
| | | | | | | | |
| | | | Mexico — 0.46% | | | | |
| | 130,800 | | | Alfa SAB de CV, Class – A (Industrial Conglomerates) | | | 251 | |
| | 1,560,900 | | | America Movil SAB de CV (Wireless Telecommunication Services) | | | 1,669 | |
| | 17,100 | | | Arca Continental SAB de CV (Beverages) | | | 97 | |
| | 12,224 | | | Cemex SAB de CV, ADR (Construction Materials) (a) | | | 112 | |
| | 601,511 | | | Cemex SAB de CV (Construction Materials) (a) | | | 552 | |
| | 22,300 | | | Coca-Cola FEMSA SAB de CV, Series L (Beverages) | | | 177 | |
| | 58,100 | | | Compartamos SAB de CV (Consumer Finance) | | | 103 | |
See accompanying notes to financial statements.
141
HC CAPITAL TRUST
The Institutional International Equity Portfolio
Portfolio of Investments (continued) — June 30, 2015
| | | | | | | | |
| Shares | | | Security Description | | Value
(000) | |
| | | | Common Stocks (continued) | | | | |
| | | | Mexico (continued) | | | | |
| | 21,700 | | | Controladora Comercial Mexicana SAB de CV (Food & Staples Retailing) | | $ | 68 | |
| | 9,600 | | | El Puerto de Liverpool SAB de CV, Class – C1 (Multiline Retail) | | | 111 | |
| | 108,500 | | | Fibra Uno Amdinistracion SA (Real Estate Investment Trusts) | | | 258 | |
| | 85,800 | | | Fomento Economico Mexicano SAB de CV (Beverages) | | | 765 | |
| | 7,900 | | | Gruma, S.A.B de CV, Class – B (Food Products) | | | 102 | |
| | 16,100 | | | Grupo Aeroportuario del Pacifico SAB de CV, B Shares (Transportation Infrastructure) | | | 110 | |
| | 10,800 | | | Grupo Aeroportuario del Sureste SAB de CV, Class – B (Transportation Infrastructure) | | | 154 | |
| | 80,900 | | | Grupo Bimbo SAB de CV (Food Products) (a) | | | 209 | |
| | 28,800 | | | Grupo Carso SAB de CV, Series A1 (Industrial Conglomerates) | | | 120 | |
| | 19,100 | | | Grupo Comercial Chedraui SAB de CV (Food & Staples Retailing) | | | 54 | |
| | 122,700 | | | Grupo Financiero Banorte SAB de CV (Banks) | | | 674 | |
| | 105,800 | | | Grupo Financiero Inbursa, SAB de CV, Class – O (Banks) | | | 240 | |
| | 86,500 | | | Grupo Financiero Santander Mexico SAB de CV, B Shares (Banks) | | | 160 | |
| | 26,000 | | | Grupo Lala SAB de CV (Food Products) | | | 54 | |
| | 182,500 | | | Grupo Mexico SAB de CV, Series B (Metals & Mining) | | | 550 | |
| | 116,152 | | | Grupo Televisa SA, ADR (Media) | | | 4,508 | |
| | 117,400 | | | Grupo Televisa SAB de CV (Media) | | | 912 | |
| | 6,380 | | | Industrias Penoles SAB de CV (Metals & Mining) | | | 104 | |
| | 66,100 | | | Kimberly-Clark de Mexico SAB de CV, A Shares (Household Products) | | | 143 | |
| | 47,200 | | | Mexichem SAB de CV (Chemicals) | | | 136 | |
| | 30,200 | | | Ohl Mexico SAB de CV (Transportation Infrastructure) (a) | | | 39 | |
| | 12,700 | | | Promotora y Operadora de Infraestructura SAB de CV (Construction & Engineering) (a) | | | 136 | |
| | 243,700 | | | Wal-Mart de Mexico SAB de CV (Food & Staples Retailing) | | | 596 | |
| | | | | | | | |
| | | | | | | 13,164 | |
| | | | | | | | |
| | | | Netherlands — 2.68% | | | | |
| | 230,339 | | | AEGON NV (Insurance) | | | 1,693 | |
| | 80,115 | | | Airbus Group NV (Aerospace & Defense) | | | 5,198 | |
| | 163,463 | | | Akzo Nobel NV (Chemicals) | | | 11,894 | |
| | 78,264 | | | ASML Holding NV (Semiconductors & Semiconductor Equipment) | | | 8,087 | |
| | 7,119 | | | ASML Holding NV, NYS (Semiconductors & Semiconductor Equipment) | | | 741 | |
| | 9,219 | | | Delta Lloyd NV (Insurance) | | | 151 | |
| | 33,689 | | | Euronext NV (Diversified Financial Services) | | | 1,326 | |
| | 8,555 | | | Gemalto NV (Software)^ | | | 762 | |
| | 884 | | | Heineken NV (Beverages) | | | 67 | |
| | 10,554 | | | ING Groep NV (Banks) | | | 174 | |
| | 265,678 | | | Koninklijke Ahold NV (Food & Staples Retailing) | | | 4,975 | |
| | 12,347 | | | Koninklijke Boskalis Westminster NV (Construction & Engineering) | | | 604 | |
| | | | | | | | |
| Shares | | | Security Description | | Value
(000) | |
| | | | Netherlands (continued) | | | | |
| | 36,540 | | | Koninklijke DSM NV (Chemicals) | | $ | 2,118 | |
| | 162,555 | | | Koninklijke Philips Electronics NV (Industrial Conglomerates) | | | 4,135 | |
| | 8,707 | | | Koninklijke Vopak NV (Oil, Gas & Consumable Fuels) | | | 439 | |
| | 5,150 | | | NN Group NV (Insurance) | | | 145 | |
| | 15,107 | | | NXP Semiconductors NV (Semiconductors & Semiconductor Equipment) (a) | | | 1,484 | |
| | 16,502 | | | Randstad Holding NV (Professional Services) | | | 1,074 | |
| | 428,969 | | | Reed Elsevier NV (Media) | | | 10,173 | |
| | 2,800 | | | Sensata Technologies Holding NV (Electrical Equipment) (a) | | | 148 | |
| | 419,058 | | | TNT NV (Air Freight & Logistics) (a) | | | 1,862 | |
| | 438,260 | | | Unilever NV (Food Products) | | | 18,250 | |
| | 48,257 | | | Wolters Kluwer NV (Media) | | | 1,433 | |
| | | | | | | | |
| | | | | | | 76,933 | |
| | | | | | | | |
| | | | New Zealand — 0.03% | | | | |
| | 35,000 | | | Infratil Ltd. (Electric Utilities) | | | 75 | |
| | 78,329 | | | Meridian Energy Ltd. (Electric Utilities) (a) | | | 114 | |
| | 337,375 | | | Telecom Corp. of New Zealand Ltd. (Diversified Telecommunication Services) | | | 639 | |
| | | | | | | | |
| | | | | | | 828 | |
| | | | | | | | |
| | | | Norway — 0.76% | | | | |
| | 85,424 | | | DNB ASA (Banks) | | | 1,426 | |
| | 20,460 | | | Gjensidige Forsikring ASA (Insurance) | | | 330 | |
| | 335,764 | | | Orkla ASA (Food Products) | | | 2,644 | |
| | 679,690 | | | Statoil ASA (Oil, Gas & Consumable Fuels) | | | 12,150 | |
| | 247,136 | | | Telenor ASA (Diversified Telecommunication Services) | | | 5,418 | |
| | | | | | | | |
| | | | | | | 21,968 | |
| | | | | | | | |
| | | | Papua New Guinea — 0.01% | | | | |
| | 66,408 | | | Oil Search Ltd. (Oil, Gas & Consumable Fuels) | | | 365 | |
| | | | | | | | |
| | | | Peru — 0.02% | | | | |
| | 9,800 | | | Compania de Minas Buenaventura SA, ADR (Metals & Mining) | | | 102 | |
| | 3,200 | | | Credicorp Ltd. (Banks) | | | 444 | |
| | | | | | | | |
| | | | | | | 546 | |
| | | | | | | | |
| | | | Philippines — 0.09% | | | | |
| | 100,830 | | | Aboitiz Equity Ventures, Inc. (Industrial Conglomerates) | | | 130 | |
| | 68,900 | | | Aboitiz Power Corp. (Independent Power and Renewable Electricity Producers) | | | 70 | |
| | 106,000 | | | Alliance Global Group, Inc. (Industrial Conglomerates) | | | 51 | |
| | 9,380 | | | Ayala Corp. (Diversified Financial Services) | | | 164 | |
| | 337,100 | | | Ayala Land, Inc. (Real Estate Management & Development) | | | 278 | |
| | 40,520 | | | Bank of the Philippine Islands (Banks) | | | 85 | |
| | 74,180 | | | BDO Unibank, Inc. (Banks) | | | 179 | |
| | 205,000 | | | DMCI Holdings, Inc. (Industrial Conglomerates) | | | 60 | |
| | 433,700 | | | Energy Development Corp. (Independent Power and Renewable Electricity Producers) | | | 72 | |
| | 1,850 | | | Globe Telecom, Inc. (Wireless Telecommunication Services) | | | 103 | |
| | 3,090 | | | GT Capital Holdings, Inc. (Investment Companies) | | | 94 | |
See accompanying notes to financial statements.
142
HC CAPITAL TRUST
The Institutional International Equity Portfolio
Portfolio of Investments (continued) — June 30, 2015
| | | | | | | | |
| Shares | | | Security Description | | Value
(000) | |
| | | | Common Stocks (continued) | | | | |
| | | | Philippines (continued) | | | | |
| | 26,590 | | | International Container Terminal Services, Inc. (Transportation Infrastructure) | | $ | 65 | |
| | 125,900 | | | JG Summit Holdings, Inc. (Industrial Conglomerates) | | | 199 | |
| | 21,880 | | | Jollibee Foods Corp. (Hotels, Restaurants & Leisure) | | | 96 | |
| | 356,000 | | | Megaworld Corp. (Real Estate Management & Development) | | | 38 | |
| | 569,000 | | | Metro Pacific Investments Corp. (Diversified Financial Services) | | | 60 | |
| | 20,290 | | | Metropolitan Bank & Trust Co. (Banks) | | | 42 | |
| | 4,365 | | | Philippine Long Distance Telephone Co. (Wireless Telecommunication Services) | | | 272 | |
| | 7,340 | | | SM Investments Corp. (Industrial Conglomerates) | | | 146 | |
| | 427,600 | | | SM Prime Holdings, Inc. (Real Estate Management & Development) | | | 190 | |
| | 44,920 | | | Universal Robina Corp. (Food Products) | | | 193 | |
| | | | | | | | |
| | | | | | | 2,587 | |
| | | | | | | | |
| | | | Poland — 0.10% | | | | |
| | 1,871 | | | Alior Bank SA (Banks) (a) | | | 44 | |
| | 1,729 | | | Bank Handlowy w Warszawie SA (Banks) | | | 46 | |
| | 23,377 | | | Bank Millennium SA (Banks) (a) | | | 41 | |
| | 6,324 | | | Bank Pekao SA (Banks)^ | | | 303 | |
| | 1,447 | | | Bank Zachodni WBK SA (Banks) (a) | | | 131 | |
| | 1,239 | | | CCC SA (Textiles, Apparel & Luxury Goods) | | | 57 | |
| | 9,564 | | | Cyfrowy Polsat SA (Media) (a) | | | 60 | |
| | 11,685 | | | Enea SA (Electric Utilities) | | | 50 | |
| | 9,208 | | | Energa SA (Electric Utilities) | | | 56 | |
| | 3,916 | | | Eurocash SA (Food & Staples Retailing) | | | 39 | |
| | 65,374 | | | Getin Nobel Bank SA (Banks) (a) | | | 24 | |
| | 2,212 | | | Grupa Azoty SA (Chemicals) (a) | | | 49 | |
| | 3,961 | | | Grupa Lotos SA (Oil, Gas & Consumable Fuels) (a) | | | 32 | |
| | 6,736 | | | KGHM Polska Miedz SA (Metals & Mining) | | | 191 | |
| | 51 | | | LPP SA (Textiles, Apparel & Luxury Goods) | | | 91 | |
| | 776 | | | MBank SA (Banks) (a) | | | 85 | |
| | 38,252 | | | PGE SA (Electric Utilities) | | | 187 | |
| | 15,509 | | | Polski Koncern Naftowy Orlen SA (Oil, Gas & Consumable Fuels) | | | 304 | |
| | 92,662 | | | Polskie Gornictwo Naftowe i Gazownictwo SA (Oil, Gas & Consumable Fuels) | | | 163 | |
| | 41,327 | | | Powszechna Kasa Oszczednosci Bank Polski SA (Banks) | | | 342 | |
| | 2,718 | | | Powszechny Zaklad Ubezpieczen SA (Insurance) | | | 313 | |
| | 29,075 | | | Synthos SA (Chemicals) (a) | | | 36 | |
| | 40,517 | | | Tauron Polska Energia SA (Electric Utilities) | | | 47 | |
| | 34,745 | | | Telekomunikacja Polska SA (Diversified Telecommunication Services)^ | | | 75 | |
| | | | | | | | |
| | | | | | | 2,766 | |
| | | | | | | | |
| | | | Portugal — 0.07% | | | | |
| | 520,142 | | | EDP – Energias de Portugal SA (Electric Utilities) | | | 1,974 | |
| | | | | | | | |
| | | | | | | | |
| Shares | | | Security Description | | Value
(000) | |
| | | | Qatar — 0.06% | | | | |
| | 4,735 | | | Barwa Real Estate Co. (Real Estate Management & Development) | | $ | 69 | |
| | 4,696 | | | Doha Bank Qsc (Banks) | | | 69 | |
| | 27,967 | | | Ezdan Real Estate Co. QSC (Real Estate Investment Trusts) | | | 138 | |
| | 2,608 | | | Gulf International Services QSC (Energy Equipment & Services) | | | 57 | |
| | 7,744 | | | Industries Qatar Q.S.C. (Industrial Conglomerates) | | | 306 | |
| | 19,085 | | | Masraf Al Rayan (Banks) | | | 244 | |
| | 3,897 | | | Ooredoo Qsc (Diversified Telecommunication Services) | | | 93 | |
| | 1,310 | | | Qatar Electricity & Water Co. (Multi-Utilities) | | | 82 | |
| | 3,537 | | | Qatar Insurance Co. (Insurance) | | | 94 | |
| | 2,191 | | | Qatar Islamic Bank (Banks) | | | 65 | |
| | 8,598 | | | Qatar National Bank (Banks) | | | 455 | |
| | 2,789 | | | The Commercial Bank of Qatar QSC (Banks) | | | 42 | |
| | 16,753 | | | Vodafone Qatar (Wireless Telecommunication Services) (a) | | | 76 | |
| | | | | | | | |
| | | | | | | 1,790 | |
| | | | | | | | |
| | | | Russia — 0.25% | | | | |
| | 86,500 | | | ALROSA AO (Metals & Mining) | | | 99 | |
| | 5,977,000 | | | Federal Hydrogenerating Co. (Electric Utilities) | | | 60 | |
| | 555,452 | | | Gazprom OAO (Oil, Gas & Consumable Fuels) | | | 1,472 | |
| | 6,621 | | | LUKOIL OAO, ADR (Oil, Gas & Consumable Fuels) | | | 297 | |
| | 24,192 | | | LUKOIL OAO (Oil, Gas & Consumable Fuels) | | | 1,086 | |
| | 12,525 | | | Magnit OJSC,, Registered Shares, GDR (Food & Staples Retailing) | | | 697 | |
| | 4,602 | | | MegaFon OAO, GDR (Wireless Telecommunication Services) | | | 64 | |
| | 2,654 | | | MMC Norilsk Nickel PJSC (Metals & Mining) | | | 458 | |
| | 25,700 | | | Mobile TeleSystems OJSC, ADR (Wireless Telecommunication Services) | | | 252 | |
| | 4,309 | | | NovaTek OAO, Registered Shares, GDR (Oil, Gas & Consumable Fuels) | | | 439 | |
| | 52,180 | | | Rosneft Oil (Oil, Gas & Consumable Fuels) | | | 220 | |
| | 40,080 | | | Rostelecom OJSC (Diversified Telecommunication Services) | | | 66 | |
| | 501,990 | | | Sberbank of Russia (Banks) | | | 659 | |
| | 10,170 | | | Severstal (Metals & Mining) | | | 110 | |
| | 6,696 | | | Sistema JSFC, GDR (Wireless Telecommunication Services) | | | 59 | |
| | 344,600 | | | Surgutneftegas (Oil, Gas & Consumable Fuels) | | | 207 | |
| | 64,920 | | | Tatneft, Class – S (Oil, Gas & Consumable Fuels) | | | 350 | |
| | 39,810 | | | Uralkali OJSC (Chemicals) | | | 106 | |
| | 244,890,000 | | | VTB Bank OJSC (Banks) (a) | | | 352 | |
| | | | | | | | |
| | | | | | | 7,053 | |
| | | | | | | | |
See accompanying notes to financial statements.
143
HC CAPITAL TRUST
The Institutional International Equity Portfolio
Portfolio of Investments (continued) — June 30, 2015
| | | | | | | | |
| Shares | | | Security Description | | Value
(000) | |
| | | | Common Stocks (continued) | | | | |
| | | | Singapore — 1.41% | | | | |
| | 827,800 | | | Ascendas Real Estate Investment Trust (Real Estate Investment Trusts) | | $ | 1,512 | |
| | 793,109 | | | CapitaCommercial Trust (Real Estate Investment Trusts) | | | 919 | |
| | 942,900 | | | CapitaMall Trust (Real Estate Investment Trusts) | | | 1,506 | |
| | 1,058,100 | | | ComfortDelGro Corp. Ltd. (Road & Rail) | | | 2,460 | |
| | 79,621 | | | DBS Group Holdings Ltd. (Banks) | | | 1,223 | |
| | 3,434,007 | | | Hutchison Port Holdings Trust (Transportation Infrastructure) | | | 2,163 | |
| | 1,131,191 | | | Keppel Corp. Ltd. (Industrial Conglomerates) | | | 6,906 | |
| | 75,797 | | | Olam International Ltd. (Food & Staples Retailing) | | | 106 | |
| | 717,900 | | | SembCorp Industries Ltd. (Industrial Conglomerates) | | | 2,074 | |
| | 644,900 | | | SembCorp Marine Ltd. (Machinery)^ | | | 1,360 | |
| | 166,100 | | | Singapore Exchange Ltd. (Diversified Financial Services) | | | 966 | |
| | 952,647 | | | Singapore Press Holdings Ltd. (Media)^ | | | 2,887 | |
| | 780,300 | | | Singapore Tech Engineering (Aerospace & Defense) | | | 1,912 | |
| | 3,268,310 | | | Singapore Telecommunications Ltd. (Diversified Telecommunication Services) | | | 10,218 | |
| | 234,900 | | | StarHub Ltd. (Wireless Telecommunication Services) | | | 689 | |
| | 921,980 | | | Suntec REIT (Real Estate Investment Trusts) | | | 1,181 | |
| | 52,100 | | | United Overseas Bank (Banks) | | | 893 | |
| | 1,425,011 | | | Yangzijiang Shipbuilding Holdings Ltd. (Machinery) | | | 1,498 | |
| | | | | | | | |
| | | | | | | 40,473 | |
| | | | | | | | |
| | | | South Africa — 0.52% | | | | |
| | 76,767 | | | African Bank Investments Ltd. (Diversified Financial Services) (a) | | | — | |
| | 5,764 | | | African Rainbow Minerals Ltd. (Metals & Mining) | | | 39 | |
| | 2,458 | | | Anglo Platinum Ltd. (Metals & Mining) (a) | | | 55 | |
| | 17,813 | | | AngloGold Ashanti Ltd. (Metals & Mining) (a) | | | 162 | |
| | 16,639 | | | Aspen Pharmacare Holdings Ltd. (Pharmaceuticals) | | | 493 | |
| | 16,448 | | | Barclays Africa Group Ltd. (Banks) | | | 248 | |
| | 9,687 | | | Barloworld Ltd. (Trading Companies & Distributors) | | | 77 | |
| | 15,019 | | | Bidvest Group Ltd. (Industrial Conglomerates) | | | 381 | |
| | 1,193 | | | Capitec Bank Holdings Ltd. (Diversified Financial Services) | | | 48 | |
| | 10,023 | | | Coronation Fund Managers Ltd. (Capital Markets) | | | 68 | |
| | 17,187 | | | Discovery Ltd. (Insurance) | | | 179 | |
| | 6,121 | | | Exxaro Resources Ltd. (Oil, Gas & Consumable Fuels) | | | 44 | |
| | 160,332 | | | FirstRand Ltd. (Diversified Financial Services) | | | 703 | |
| | 34,749 | | | Gold Fields Ltd. (Metals & Mining) | | | 111 | |
| | 107,581 | | | Growthpoint Properties Ltd. (Real Estate Investment Trusts) | | | 234 | |
| | | | | | | | |
| Shares | | | Security Description | | Value
(000) | |
| | | | South Africa (continued) | | | | |
| | 9,558 | | | Hyprop Investments Ltd. (Real Estate Management & Development) | | $ | 95 | |
| | 26,246 | | | Impala Platinum Holdings Ltd. (Metals & Mining) (a) | | | 117 | |
| | 9,054 | | | Imperial Holdings Ltd. (Distributors) | | | 138 | |
| | 12,100 | | | Investec Ltd. (Capital Markets) | | | 109 | |
| | 3,081 | | | Kumba Iron Ore Ltd. (Metals & Mining) | | | 38 | |
| | 6,319 | | | Liberty Holdings Ltd. (Insurance) | | | 75 | |
| | 48,976 | | | Life Healthcare Group Holdings Ltd. (Health Care Providers & Services) | | | 151 | |
| | 4,562 | | | Massmart Holdings Ltd. (Food & Staples Retailing) | | | 56 | |
| | 22,157 | | | Mediclinic International Ltd. (Health Care Providers & Services) | | | 187 | |
| | 50,183 | | | MMI Holdings Ltd. (Insurance) | | | 124 | |
| | 4,744 | | | Mondi Ltd. (Paper & Forest Products) | | | 104 | |
| | 15,495 | | | Mr. Price Group Ltd. (Specialty Retail) | | | 319 | |
| | 78,838 | | | MTN Group Ltd. (Wireless Telecommunication Services) | | | 1,485 | |
| | 26,423 | | | Nampak Ltd. (Containers & Packaging) | | | 73 | |
| | 19,765 | | | Naspers Ltd. (Media) | | | 3,082 | |
| | 8,887 | | | Nedbank Group Ltd. (Banks) | | | 177 | |
| | 49,622 | | | Netcare Ltd. (Health Care Providers & Services) | | | 156 | |
| | 10,672 | | | Pick n Pay Stores Ltd. (Food & Staples Retailing) | | | 50 | |
| | 3,047 | | | PSG Group Ltd. (Diversified Financial Services) | | | 51 | |
| | 165,091 | | | Redefine Properties Ltd. (Real Estate Investment Trusts) | | | 139 | |
| | 23,613 | | | Remgro Ltd. (Diversified Financial Services) | | | 497 | |
| | 11,026 | | | Resilient Property Income Fund Ltd. (Real Estate Investment Trusts) | | | 87 | |
| | 32,328 | | | RMB Holdings Ltd. (Diversified Financial Services) | | | 177 | |
| | 36,650 | | | RMI Holdings Ltd. (Insurance) | | | 128 | |
| | 7,680 | | | Samsung Heavy Industries Co. Ltd. (Machinery) | | | 117 | |
| | 84,676 | | | Sanlam Ltd. (Insurance) | | | 463 | |
| | 25,158 | | | Sappi Ltd. (Paper & Forest Products) (a) | | | 89 | |
| | 25,782 | | | Sasol Ltd. (Oil, Gas & Consumable Fuels) | | | 954 | |
| | 22,545 | | | Shoprite Holdings Ltd. (Food & Staples Retailing) | | | 322 | |
| | 57,857 | | | Standard Bank Group Ltd. (Banks) | | | 762 | |
| | 105,905 | | | Steinhoff International Holdings Ltd. (Household Durables) | | | 671 | |
| | 10,894 | | | Telkom SA SOC Ltd. (Diversified Telecommunication Services) (a) | | | 57 | |
| | 10,349 | | | The Foschini Group Ltd. (Specialty Retail) | | | 135 | |
| | 7,858 | | | The Spar Group Ltd. (Food & Staples Retailing) | | | 123 | |
| | 7,849 | | | Tiger Brands Ltd. (Food Products) | | | 183 | |
| | 18,810 | | | Truworths International Ltd. (Specialty Retail) | | | 133 | |
| | 8,980 | | | Tsogo Sun Holdings Ltd. (Hotels, Restaurants & Leisure) | | | 18 | |
| | 17,719 | | | Vodacom Group Ltd. (Wireless Telecommunication Services) | | | 202 | |
| | 44,639 | | | Woolworths Holdings Ltd. (Multiline Retail) | | | 362 | |
| | | | | | | | |
| | | | | | | 15,048 | |
| | | | | | | | |
See accompanying notes to financial statements.
144
HC CAPITAL TRUST
The Institutional International Equity Portfolio
Portfolio of Investments (continued) — June 30, 2015
| | | | | | | | |
| Shares | | | Security Description | | Value
(000) | |
| | | | Common Stocks (continued) | | | | |
| | | | South Korea — 1.44% | | | | |
| | 1,580 | | | Amorepacific Corp. (Personal Products) | | $ | 592 | |
| | 1,212 | | | Amorepacific Group (Personal Products) | | | 203 | |
| | 10,068 | | | BS Financial Group, Inc. (Banks) | | | 128 | |
| | 2,903 | | | Celltrion, Inc. (Pharmaceuticals)^(a) | | | 203 | |
| | 3,920 | | | Cheil Worldwide, Inc. (Media) (a) | | | 61 | |
| | 369 | | | CJ Cheiljedang Corp. (Food Products) | | | 146 | |
| | 653 | | | CJ Corp. (Industrial Conglomerates) | | | 173 | |
| | 269 | | | CJ Korea Express Co. Ltd. (Road & Rail) (a) | | | 47 | |
| | 2,577 | | | Coway Co. Ltd. (Household Durables) | | | 211 | |
| | 1,105 | | | Daelim Industrial Co. Ltd. (Construction & Engineering) | | | 81 | |
| | 5,480 | | | Daewoo Engineering & Construction Co. Ltd. (Construction & Engineering) (a) | | | 30 | |
| | 2,410 | | | Daewoo International Corp. (Trading Companies & Distributors) | | | 56 | |
| | 8,960 | | | Daewoo Securities Co. Ltd. (Capital Markets) | | | 122 | |
| | 4,980 | | | Daewoo Shipbuilding & Marine Engineering Co. Ltd. (Machinery) | | | 59 | |
| | 1,171 | | | Daum Kakao Corp. (Internet Software & Services) | | | 133 | |
| | 7,846 | | | DGB Financial Group, Inc. (Banks) | | | 82 | |
| | 2,223 | | | Dongbu Insurance Co. Ltd. (Insurance) | | | 113 | |
| | 338 | | | Doosan Corp. (Industrial Conglomerates) | | | 33 | |
| | 2,510 | | | Doosan Heavy Industries & Construction Co. Ltd. (Electrical Equipment) | | | 53 | |
| | 5,820 | | | Doosan Infracore Co. Ltd. (Machinery) (a) | | | 51 | |
| | 1,015 | | | E-Mart Co. Ltd. (Food & Staples Retailing) | | | 210 | |
| | 2,500 | | | GS Engineering & Construction Corp. (Construction & Engineering) (a) | | | 60 | |
| | 2,319 | | | GS Holdings Corp. (Oil, Gas & Consumable Fuels) | | | 103 | |
| | 1,960 | | | Halla Climate Control Corp. (Auto Components) | | | 68 | |
| | 13,289 | | | Hana Financial Group, Inc. (Banks) | | | 346 | |
| | 3,548 | | | Hankook Tire Co. Ltd. (Auto Components) | | | 134 | |
| | 4,700 | | | Hanwha Chemical Corp. (Chemicals) | | | 79 | |
| | 2,510 | | | Hanwha Corp. (Chemicals) | | | 106 | |
| | 758 | | | Honam Petrochemical Corp. (Chemicals) | | | 196 | |
| | 1,696 | | | Hotel Shilla Co. Ltd. (Specialty Retail) | | | 170 | |
| | 27,810 | | | Hynix Semiconductor, Inc. (Semiconductors & Semiconductor Equipment) | | | 1,055 | |
| | 1,093 | | | Hyosung Corp. (Chemicals) | | | 141 | |
| | 798 | | | Hyundai Department Store (Multiline Retail) | | | 105 | |
| | 2,980 | | | Hyundai Development Co. (Construction & Engineering) | | | 178 | |
| | 3,354 | | | Hyundai Engineering & Construction Co. Ltd. (Construction & Engineering) | | | 123 | |
| | 853 | | | Hyundai Glovis Co. Ltd. (Air Freight & Logistics) | | | 155 | |
| | 1,883 | | | Hyundai Heavy Industries Co. Ltd. (Machinery) (a) | | | 188 | |
| | 3,340 | | | Hyundai Marine & Fire Insurance Co. Ltd. (Insurance) | | | 88 | |
| | 4,257 | | | Hyundai Merchant Marine Co. Ltd. (Marine) (a) | | | 26 | |
| | 565 | | | Hyundai Mipo Dockyard Co. (Machinery) (a) | | | 33 | |
| | 3,211 | | | Hyundai Mobis Co. Ltd. (Auto Components) | | | 609 | |
| | 38,501 | | | Hyundai Motor Co. Ltd. (Automobiles) | | | 4,695 | |
| | 3,384 | | | Hyundai Steel Co. (Metals & Mining) | | | 205 | |
| | | | | | | | |
| Shares | | | Security Description | | Value
(000) | |
| | | | South Korea (continued) | | | | |
| | 818 | | | Hyundai Wia Corp. (Auto Components) | | $ | 76 | |
| | 13,300 | | | Industrial Bank of Korea (Banks) | | | 172 | |
| | 5,432 | | | Kangwon Land, Inc. (Hotels, Restaurants & Leisure) | | | 181 | |
| | 18,608 | | | KB Financial Group, Inc. (Banks) | | | 616 | |
| | 239 | | | KCC Corp. (Building Products) | | | 105 | |
| | 12,323 | | | Kia Motors Corp. (Automobiles) | | | 501 | |
| | 2,060 | | | Korea Aerospace Industries Ltd. (Aerospace & Defense) | | | 147 | |
| | 11,980 | | | Korea Electric Power Corp. (Electric Utilities) | | | 492 | |
| | 1,089 | | | Korea Gas Corp. (Gas Utilities) | | | 42 | |
| | 1,710 | | | Korea Investment Holdings Co. Ltd. (Capital Markets) | | | 98 | |
| | 772 | | | Korea Kumho Petrochemical Co. Ltd. (Chemicals) | | | 49 | |
| | 11,210 | | | Korea Life Insurance Co. Ltd. (Insurance) | | | 80 | |
| | 441 | | | Korea Zinc Co. Ltd. (Metals & Mining) | | | 216 | |
| | 1,879 | | | Korean Air Lines Co. Ltd. (Airlines) (a) | | | 68 | |
| | 1,080 | | | KT Corp. (Diversified Telecommunication Services) (a) | | | 28 | |
| | 64,771 | | | KT&G Corp. (Tobacco) | | | 5,512 | |
| | 2,163 | | | LG Chem Ltd. (Chemicals) | | | 541 | |
| | 4,744 | | | LG Corp. (Industrial Conglomerates) | | | 264 | |
| | 10,708 | | | LG Display Co. Ltd. (Electronic Equipment, Instruments & Components) | | | 248 | |
| | 4,830 | | | LG Electronics, Inc. (Information Technology) | | | 204 | |
| | 451 | | | LG Household & Health Care Ltd. (Household Products) | | | 313 | |
| | 632 | | | LG Innotek Co. Ltd. (Electronic Equipment, Instruments & Components) | | | 57 | |
| | 9,660 | | | LG UPlus Corp. (Diversified Telecommunication Services) | | | 85 | |
| | 37 | | | Lotte Confectionery Co. Ltd. (Food Products) | | | 64 | |
| | 491 | | | Lotte Shopping Co. Ltd. (Multiline Retail) | | | 103 | |
| | 732 | | | LS Corp. (Electrical Equipment) | | | 29 | |
| | 827 | | | LS Industrial Systems Co. Ltd. (Electrical Equipment) | | | 34 | |
| | 1,428 | | | Mirae Asset Securities Co. Ltd. (Capital Markets) | | | 65 | |
| | 1,337 | | | Naver Corp. (Internet Software & Services) | | | 760 | |
| | 705 | | | NCsoft Corp. (Software) | | | 125 | |
| | 6,560 | | | NH Investment & Securities Co. Ltd. (Capital Markets) | | | 72 | |
| | 769 | | | OCI Co. Ltd. (Chemicals) | | | 62 | |
| | 183 | | | Orion Corp. (Food Products) | | | 172 | |
| | 2,434 | | | Paradise Co. Ltd. (Hotels, Restaurants & Leisure) | | | 52 | |
| | 3,228 | | | POSCO (Metals & Mining) | | | 648 | |
| | 880 | | | S1 Corp. (Commercial Services & Supplies) | | | 62 | |
| | 6,166 | | | Samsung C&T Corp. (Trading Companies & Distributors) | | | 366 | |
| | 1,530 | | | Samsung Card Co. Ltd. (Consumer Finance) | | | 51 | |
| | 2,826 | | | Samsung Electro-Mechanics Co. Ltd. (Electronic Equipment, Instruments & Components) | | | 129 | |
| | 5,339 | | | Samsung Electronics Co. Ltd. (Technology Hardware, Storage & Peripherals) | | | 6,071 | |
| | 1,654 | | | Samsung Fire & Marine Insurance Co. Ltd. (Insurance) | | | 436 | |
| | 3,833 | | | Samsung Life Insurance Co. Ltd. (Insurance) | | | 369 | |
See accompanying notes to financial statements.
145
HC CAPITAL TRUST
The Institutional International Equity Portfolio
Portfolio of Investments (continued) — June 30, 2015
| | | | | | | | |
| Shares | | | Security Description | | Value
(000) | |
| | | | Common Stocks (continued) | | | | |
| | | | South Korea (continued) | | | | |
| | 2,624 | | | Samsung SDI Co. Ltd. (Electronic Equipment, Instruments & Components) | | $ | 262 | |
| | 1,389 | | | Samsung SDS Co. Ltd. (IT Services) | | | 323 | |
| | 2,770 | | | Samsung Securities Co. Ltd. (Capital Markets) | | | 135 | |
| | 20,190 | | | Shinhan Financial Group Co. Ltd. (Banks) | | | 753 | |
| | 291 | | | Shinsegae Co. Ltd. (Multiline Retail) | | | 70 | |
| | 938 | | | SK C&C Co. Ltd. (IT Services) | | | 233 | |
| | 1,128 | | | SK Holdings Co. Ltd. (Industrial Conglomerates) | | | 200 | |
| | 3,064 | | | SK Innovation Co. Ltd. (Oil, Gas & Consumable Fuels) (a) | | | 336 | |
| | 4,620 | | | SK Networks Co. Ltd. (Trading Companies & Distributors) | | | 37 | |
| | 32,172 | | | SK Telecom Co. Ltd. (Wireless Telecommunication Services) | | | 7,212 | |
| | 2,395 | | | S-Oil Corp. (Oil, Gas & Consumable Fuels) | | | 145 | |
| | 14,550 | | | Woori Bank (Banks) | | | 128 | |
| | 403 | | | Yuhan Corp. (Pharmaceuticals) | | | 99 | |
| | | | | | | | |
| | | | | | | 41,348 | |
| | | | | | | | |
| | | | Spain — 2.87% | | | | |
| | 210,310 | | | Abertis Infraestructuras SA (Transportation Infrastructure) | | | 3,449 | |
| | 92,520 | | | ACS Actividades de Construccion y Servicios SA (Construction & Engineering) | | | 2,976 | |
| | 1,161,642 | | | Banco Bilbao Vizcaya Argentaria SA (Banks) | | | 11,385 | |
| | 289,970 | | | Banco de Sabadell SA (Banks) | | | 700 | |
| | 2,064,586 | | | Banco Santander SA (Banks) | | | 14,416 | |
| | 45,792 | | | Bolsas y Mercados Espanoles (Diversified Financial Services) | | | 1,852 | |
| | 590,835 | | | CaixaBank SA (Banks) (b) | | | 2,737 | |
| | 120,331 | | | Corporacion Mapfre (Insurance) | | | 414 | |
| | 302,435 | | | Distribuidora Internacional de Alimentacion SA (Software) | | | 2,309 | |
| | 26,577 | | | Enagas (Gas Utilities)^ | | | 723 | |
| | 37,665 | | | Gamesa Corporacion Tecnologica SA (Electrical Equipment) (a) | | | 586 | |
| | 45,453 | | | Gas Natural SDG SA (Gas Utilities) | | | 1,030 | |
| | 31,324 | | | Grifols SA, ADR (Biotechnology) | | | 970 | |
| | 32,567 | | | Grifols SA (Biotechnology) | | | 1,312 | |
| | 3,907 | | | Grifols SA, Class – B (Biotechnology) | | | 121 | |
| | 1,069,395 | | | Iberdrola SA (Electric Utilities) | | | 7,202 | |
| | 24,197 | | | Red Electrica Corporacion SA (Electric Utilities)^ | | | 1,939 | |
| | 555,677 | | | Repsol YPF SA (Oil, Gas & Consumable Fuels) | | | 9,756 | |
| | 39,020 | | | Tecnicas Reunidas SA (Energy Equipment & Services) | | | 2,005 | |
| | 1,178,070 | | | Telefonica SA (Diversified Telecommunication Services) | | | 16,743 | |
| | | | | | | | |
| | | | | | | 82,625 | |
| | | | | | | | |
| | | | Sweden — 2.47% | | | | |
| | 35,529 | | | Assa Abloy AB, Class – B (Metals & Mining) | | | 669 | |
| | 22,014 | | | Autoliv, Inc. (Auto Components) | | | 2,572 | |
| | 106,139 | | | Boliden AB (Metals & Mining) | | | 1,936 | |
| | 12,620 | | | Electrolux AB, Series B (Household Durables) | | | 396 | |
| | | | | | | | |
| Shares | | | Security Description | | Value
(000) | |
| | | | Sweden (continued) | | | | |
| | 30,246 | | | Hennes & Mauritz AB, B Shares (Specialty Retail) | | $ | 1,165 | |
| | 29,461 | | | Industrivarden AB, C Shares (Diversified Financial Services) | | | 555 | |
| | 4,782 | | | Modern Times Group, B Shares (Media) | | | 128 | |
| | 610,194 | | | Nordea Bank AB (Banks) | | | 7,616 | |
| | 857,775 | | | Sandvik AB (Machinery) | | | 9,488 | |
| | 301,978 | | | Skandinaviska Enskilda Banken AB, Class – A (Banks) | | | 3,863 | |
| | 239,042 | | | Skanska AB, B Shares (Construction & Engineering) | | | 4,847 | |
| | 48,042 | | | Svenska Cellusoa AB, B Shares (Banks) | | | 1,222 | |
| | 46,593 | | | Svenska Handelsbanken AB, A Shares (Banks) | | | 680 | |
| | 275,093 | | | Swedbank AB, A Shares (Banks) | | | 6,418 | |
| | 123,253 | | | Tele2 AB, B Shares (Wireless Telecommunication Services) | | | 1,434 | |
| | 2,149,464 | | | Telefonaktiebolaget LM Ericsson, B Shares (Communications Equipment) | | | 22,285 | |
| | 963,735 | | | TeliaSonera AB (Diversified Telecommunication Services) | | | 5,677 | |
| | | | | | | | |
| | | | | | | 70,951 | |
| | | | | | | | |
| | | | Switzerland — 9.90% | | | | |
| | 1,568,219 | | | ABB Ltd. – Registered (Electrical Equipment) | | | 32,851 | |
| | 26,373 | | | Actelion Ltd. (Biotechnology) | | | 3,860 | |
| | 199,593 | | | Adecco SA, Registered Shares (Professional Services) | | | 16,208 | |
| | 60,316 | | | Aryzta AG (Food Products) | | | 2,975 | |
| | 10,918 | | | Baloise Holding AG, Registered Shares (Insurance) | | | 1,332 | |
| | 145,109 | | | Clariant AG (Chemicals) | | | 2,975 | |
| | 44,295 | | | Compagnie Financiere Richemont SA, Registered Shares (Textiles, Apparel & Luxury Goods) | | | 3,605 | |
| | 118,897 | | | Credit Suisse Group AG (Capital Markets) | | | 3,269 | |
| | 3,275 | | | DKSH Holding Ltd. (Professional Services) | | | 237 | |
| | 4,343 | | | Geberit AG (Building Products) | | | 1,448 | |
| | 6,408 | | | Givaudan SA (Chemicals) | | | 11,092 | |
| | 7,350 | | | Holcim Ltd., Registered Shares (Construction Materials) | | | 543 | |
| | 6,579 | | | Julius Baer Group Ltd. (Capital Markets) | | | 369 | |
| | 33,788 | | | Kuehne & Nagel International (Marine) | | | 4,486 | |
| | 787,320 | | | Nestle SA (Food Products) | | | 56,857 | |
| | 118,047 | | | Novartis AG, Registered Shares (Pharmaceuticals) | | | 11,638 | |
| | 7,037 | | | Pargesa Holding SA (Diversified Financial Services) | | | 474 | |
| | 4,117 | | | Partners Group Holding AG (Capital Markets) | | | 1,231 | |
| | 232,865 | | | Roche Holding AG – Genusscheine (Pharmaceuticals) | | | 65,272 | |
| | 3,756 | | | SGS SA – Registered (Professional Services) | | | 6,855 | |
| | 15,981 | | | Sulzer AG (Machinery) | | | 1,644 | |
| | 4,008 | | | Swiss Life Holding (Insurance) | | | 918 | |
| | 25,667 | | | Swiss Prime Site AG (Real Estate Management & Development) | | | 1,948 | |
| | 80,682 | | | Swiss Re AG (Insurance) | | | 7,143 | |
| | 10,707 | | | Swisscom AG (Diversified Telecommunication Services) | | | 6,002 | |
See accompanying notes to financial statements.
146
HC CAPITAL TRUST
The Institutional International Equity Portfolio
Portfolio of Investments (continued) — June 30, 2015
| | | | | | | | |
| Shares | | | Security Description | | Value
(000) | |
| | | | Common Stocks (continued) | | | | |
| | | | Switzerland (continued) | | | | |
| | 15,495 | | | Syngenta AG, Registered Shares (Chemicals) | | $ | 6,299 | |
| | 1,063 | | | The Swatch Group AG (Textiles, Apparel & Luxury Goods) | | | 414 | |
| | 699 | | | The Swatch Group AG (Textiles, Apparel & Luxury Goods) | | | 52 | |
| | 258,523 | | | Transocean Ltd.
(Energy Equipment & Services)^ | | | 4,182 | |
| | 29,273 | | | UBS AG – Registered (Capital Markets) | | | 622 | |
| | 388,573 | | | UBS Group AG (Capital Markets) | | | 8,244 | |
| | 64,359 | | | Zurich Financial Services AG (Insurance) | | | 19,596 | |
| | | | | | | | |
| | | | | | | 284,641 | |
| | | | | | | | |
| | | | Taiwan — 0.84% | | | | |
| | 112,524 | | | Acer, Inc. (Technology Hardware, Storage & Peripherals) (a) | | | 55 | |
| | 303,000 | | | Advanced Semiconductor Engineering, Inc. (Semiconductors & Semiconductor Equipment) | | | 411 | |
| | 16,491 | | | Advantech Co. Ltd. (Technology Hardware, Storage & Peripherals) | | | 113 | |
| | 100,980 | | | Asia Cement Corp. (Construction Materials) | | | 119 | |
| | 90,000 | | | Asia Pacific Telecom Co. Ltd. (Diversified Telecommunication Services) | | | 36 | |
| | 32,000 | | | Asustek Computer, Inc. (Technology Hardware, Storage & Peripherals) | | | 312 | |
| | 412,000 | | | AU Optronics Corp. (Electronic Equipment, Instruments & Components) | | | 182 | |
| | 32,000 | | | Catcher Technology Co. Ltd. (Technology Hardware, Storage & Peripherals) | | | 401 | |
| | 389,100 | | | Cathay Financial Holding Co. Ltd. (Insurance) | | | 679 | |
| | 210,780 | | | Chang Hwa Commercial Bank Ltd. (Banks) | | | 121 | |
| | 73,000 | | | Cheng Shin Rubber Industry Co. Ltd. (Auto Components) | | | 162 | |
| | 20,135 | | | Chicony Electronics Co. Ltd. (Technology Hardware, Storage & Peripherals) | | | 54 | |
| | 168,000 | | | China Airlines Ltd. (Airlines) (a) | | | 71 | |
| | 660,000 | | | China Development Financial Holding Corp. (Banks) | | | 250 | |
| | 140,600 | | | China Life Insurance Co. Ltd. (Insurance) | | | 144 | |
| | 35,000 | | | China Motor Corp. (Automobiles) | | | 27 | |
| | 583,440 | | | China Steel Corp. (Metals & Mining) | | | 466 | |
| | 662,640 | | | Chinatrust Financial Holding Co. Ltd. (Banks) | | | 521 | |
| | 185,000 | | | Chunghwa Telecom Co. Ltd. (Diversified Telecommunication Services) | | | 590 | |
| | 176,000 | | | Compal Electronics, Inc. (Technology Hardware, Storage & Peripherals) | | | 134 | |
| | 32,000 | | | CTCI Corp. (Construction & Engineering) | | | 52 | |
| | 85,000 | | | Delta Electronics, Inc. (Electronic Equipment, Instruments & Components) | | | 435 | |
| | 312,544 | | | E.Sun Financial Holding Co. Ltd. (Banks) | | | 209 | |
| | 8,320 | | | ECLAT Textile Co. Ltd. (Textiles, Apparel & Luxury Goods) | | | 136 | |
| | 44,000 | | | Epistar Corp. (Semiconductors & Semiconductor Equipment) | | | 59 | |
| | 69,984 | | | EVA Airways Corp. (Airlines) (a) | | | 48 | |
| | 68,000 | | | Evergreen Marine Corp. Ltd. (Marine) (a) | | | 35 | |
| | 136,680 | | | Far Eastern New Century Corp. (Industrial Conglomerates) | | | 145 | |
| | | | | | | | |
| Shares | | | Security Description | | Value
(000) | |
| | | | Taiwan (continued) | | | | |
| | 81,000 | | | Far EasTone Telecommunications Co. Ltd. (Wireless Telecommunication Services) | | $ | 196 | |
| | 349,920 | | | First Financial Holdings Co. Ltd. (Banks) | | | 214 | |
| | 156,000 | | | Formosa Chemicals & Fibre Corp. (Chemicals) | | | 375 | |
| | 48,000 | | | Formosa Petrochemical Corp. (Oil, Gas & Consumable Fuels) | | | 123 | |
| | 195,000 | | | Formosa Plastics Corp. (Chemicals) | | | 459 | |
| | 41,000 | | | Formosa Taffeta Co. Ltd. (Textiles, Apparel & Luxury Goods) | | | 44 | |
| | 39,150 | | | Foxconn Technology Co. Ltd. (Technology Hardware, Storage & Peripherals) | | | 142 | |
| | 319,000 | | | Fubon Financial Holding Co. Ltd. (Diversified Financial Services) | | | 635 | |
| | 14,000 | | | Giant Manufacturing Co. Ltd. (Leisure Products) | | | 119 | |
| | 2,000 | | | Hermes Microvision, Inc. (Semiconductors & Semiconductor Equipment) | | | 130 | |
| | 24,000 | | | Highwealth Construction Corp. (Real Estate Management & Development) | | | 57 | |
| | 9,270 | | | Hiwin Technologies Corp. (Machinery) | | | 61 | |
| | 635,760 | | | Hon Hai Precision Industry Co. Ltd. (Electronic Equipment, Instruments & Components) | | | 1,999 | |
| | 13,000 | | | Hotai Motor Co. Ltd. (Specialty Retail) | | | 184 | |
| | 31,000 | | | HTC Corp. (Technology Hardware, Storage & Peripherals) (a) | | | 72 | |
| | 283,220 | | | Hua Nan Financial Holdings Co. Ltd., Class – C (Banks) | | | 163 | |
| | 396,500 | | | Innolux Corp. (Electronic Equipment, Instruments & Components) | | | 207 | |
| | 113,000 | | | Inotera Memories, Inc. (Semiconductors & Semiconductor Equipment) (a) | | | 90 | |
| | 120,000 | | | Inventec Corp. (Technology Hardware, Storage & Peripherals) | | | 83 | |
| | 15,000 | | | Kinsus Interconnect Technology Corp. (Semiconductors & Semiconductor Equipment) | | | 41 | |
| | 5,000 | | | Largan Precision Co. Ltd. (Electronic Equipment, Instruments & Components) | | | 571 | |
| | 98,490 | | | Lite-On Technology Corp. (Technology Hardware, Storage & Peripherals) | | | 116 | |
| | 70,000 | | | MediaTek, Inc. (Semiconductors & Semiconductor Equipment) | | | 957 | |
| | 469,000 | | | Mega Financial Holding Co. Ltd. (Banks) | | | 423 | |
| | 10,500 | | | Merida Industry Co. Ltd. (Leisure Products) | | | 68 | |
| | 227,000 | | | Nan Ya Plastics Corp. (Chemicals) | | | 533 | |
| | 28,000 | | | Novatek Microelectronics Corp. (Semiconductors & Semiconductor Equipment) | | | 135 | |
| | 76,000 | | | Pegatron Corp. (Technology Hardware, Storage & Peripherals) | | | 222 | |
| | 7,000 | | | Phison Electronics Corp. (Semiconductors & Semiconductor Equipment) | | | 61 | |
| | 106,000 | | | Pou Chen Corp. (Textiles, Apparel & Luxury Goods) | | | 151 | |
| | 28,000 | | | Powertech Technology, Inc. (Semiconductors & Semiconductor Equipment) | | | 61 | |
| | 29,000 | | | President Chain Store Corp. (Food & Staples Retailing) | | | 204 | |
| | 216,960 | | | President Enterprises Corp. (Food Products) | | | 385 | |
| | 128,000 | | | Quanta Computer, Inc. (Technology Hardware, Storage & Peripherals) | | | 303 | |
See accompanying notes to financial statements.
147
HC CAPITAL TRUST
The Institutional International Equity Portfolio
Portfolio of Investments (continued) — June 30, 2015
| | | | | | | | |
| Shares | | | Security Description | | Value
(000) | |
| | | | Common Stocks (continued) | | | | |
| | | | Taiwan (continued) | | | | |
| | 19,000 | | | Radiant Opto-Electronics Corp. (Semiconductors & Semiconductor Equipment) | | $ | 71 | |
| | 24,000 | | | Realtek Semiconductor Corp. (Semiconductors & Semiconductor Equipment) | | | 62 | |
| | 33,000 | | | Ruentex Development Co. Ltd. (Real Estate Management & Development) | | | 52 | |
| | 27,000 | | | Ruentex Industries Ltd. (Textiles, Apparel & Luxury Goods) | | | 62 | |
| | 372,144 | | | Shin Kong Financial Holding Co. Ltd. (Insurance) | | | 114 | |
| | 141,000 | | | Siliconware Precision Industries Co. (Semiconductors & Semiconductor Equipment) | | | 216 | |
| | 15,000 | | | Simplo Technology Co. Ltd. (Electronic Equipment, Instruments & Components) | | | 70 | |
| | 383,218 | | | SinoPac Financial Holdings Co. Ltd. (Banks) | | | 170 | |
| | 17,440 | | | Standard Foods Corp. (Food Products) | | | 52 | |
| | 53,000 | | | Synnex Technology International Corp. (Electronic Equipment, Instruments & Components) | | | 79 | |
| | 386,965 | | | Taishin Financial Holding Co. Ltd. (Banks) | | | 161 | |
| | 235,760 | | | Taiwan Business Bank (Banks) (a) | | | 73 | |
| | 160,000 | | | Taiwan Cement Corp. (Construction Materials) | | | 202 | |
| | 336,492 | | | Taiwan Cooperative Financial Holding Co. Ltd. (Banks) | | | 176 | |
| | 31,000 | | | Taiwan Fertilizer Co. Ltd. (Chemicals) | | | 51 | |
| | 48,000 | | | Taiwan Glass Industry Corp. (Building Products) | | | 23 | |
| | 79,000 | | | Taiwan Mobile Co. Ltd. (Wireless Telecommunication Services) | | | 264 | |
| | 18,600 | | | Taiwan Semiconductor Manufacturing Co. Ltd., ADR (Semiconductors & Semiconductor Equipment) | | | 422 | |
| | 1,173,000 | | | Taiwan Semiconductor Manufacturing Co. Ltd. (Semiconductors & Semiconductor Equipment) | | | 5,342 | |
| | 96,000 | | | Teco Electric & Machinery Co. Ltd. (Electrical Equipment) | | | 75 | |
| | 12,000 | | | TPK Holding Co. Ltd. (Electronic Equipment, Instruments & Components) | | | 69 | |
| | 10,000 | | | Transcend Information, Inc. (Semiconductors & Semiconductor Equipment) | | | 37 | |
| | 18,000 | | | U-Ming Marine Transport Corp. (Marine) | | | 24 | |
| | 579,000 | | | United Microelectronics Corp. (Semiconductors & Semiconductor Equipment) | | | 245 | |
| | 38,000 | | | Vanguard International Semiconductor Corp. (Semiconductors & Semiconductor Equipment) | | | 61 | |
| | 35,000 | | | Wan Hai Lines Ltd. (Marine) | | | 28 | |
| | 99,423 | | | Wistron Corp. (Technology Hardware, Storage & Peripherals) | | | 75 | |
| | 60,000 | | | WPG Holdings Ltd. (Electronic Equipment, Instruments & Components) | | | 75 | |
| | 53,000 | | | Yang Ming Marine Transport (Marine) (a) | | | 19 | |
| | 392,525 | | | Yuanta Financial Holding Co. Ltd. (Capital Markets) | | | 212 | |
| | 42,000 | | | Yulon Motor Co. Ltd. (Automobiles) | | | 49 | |
| | | | | | | | |
| | | | | | | 24,182 | |
| | | | | | | | |
| | | | | | | | |
| Shares | | | Security Description | | Value
(000) | |
| | | | Taiwan, Province Of China — 0.00% | | | | |
| | 8,258 | | | Casetek Holdings Ltd. (Electronic Equipment, Instruments & Components) | | $ | 51 | |
| | 10,000 | | | Feng Tay Enterprise Co. Ltd. (Apparel) | | | 58 | |
| | | | | | | | |
| | | | | | | 109 | |
| | | | | | | | |
| | | | Thailand — 0.15% | | | | |
| | 51,200 | | | Advanced INFO Service Public Co. Ltd. (Wireless Telecommunication Services) | | | 364 | |
| | 22,300 | | | Airports of Thailand Public Co. Ltd., Registered Shares (Transportation Infrastructure) | | | 200 | |
| | 23,600 | | | Bangkok Bank Public Co. Ltd. – NVDR (Banks) | | | 124 | |
| | 197,300 | | | Bangkok Dusit Medical Service Public Co. Ltd., Class – F (Health Care Providers & Services) | | | 115 | |
| | 43,700 | | | Banpu Public Co. Ltd., Registered Shares (Oil, Gas & Consumable Fuels) | | | 33 | |
| | 44,200 | | | BEC World Public Co. Ltd., Registered Shares (Media) | | | 49 | |
| | 309,900 | | | BTS Group Holdings Public Co. Ltd. (Road & Rail) | | | 92 | |
| | 17,700 | | | Bumrungrad Hospital Public Co. Ltd. (Health Care Providers & Services) | | | 98 | |
| | 71,200 | | | Central Pattana Public Co. Ltd., Registered Shares (Real Estate Management & Development) | | | 100 | |
| | 118,400 | | | Charoen Pokphand Foods Public Co. Ltd. (Food Products) | | | 84 | |
| | 217,400 | | | CP ALL Public Co. Ltd. (Food & Staples Retailing) | | | 298 | |
| | 18,500 | | | Delta Electronics (Thailand) PLC (Electronic Equipment, Instruments & Components) | | | 50 | |
| | 47,500 | | | Energy Absolute Public Co. Ltd. (Energy Equipment & Services) | | | 33 | |
| | 30,200 | | | Glow Energy Public Co. Ltd. (Independent Power and Renewable Electricity Producers) | | | 76 | |
| | 161,508 | | | Home Product Center Public Co. Ltd., Registered Shares (Specialty Retail) | | | 32 | |
| | 58,000 | | | Indorama Ventures Public Co. Ltd. (Chemicals) | | | 48 | |
| | 615,300 | | | IRPC Public Co. Ltd. – NVDR (Oil, Gas & Consumable Fuels) | | | 82 | |
| | 86,900 | | | Kasikornbank Public Co. Ltd. (Banks) | | | 486 | |
| | 153,600 | | | Krung Thai Bank Public Co. Ltd., Registered Shares (Banks) | | | 78 | |
| | 76,560 | | | Minor International Public Co. Ltd., Registered Shares (Hotels, Restaurants & Leisure) | | | 68 | |
| | 62,500 | | | PTT Exploration & Production Public Co. Ltd. (Oil, Gas & Consumable Fuels) | | | 202 | |
| | 79,200 | | | PTT Global Chemical Public Co. Ltd. (Chemicals) | | | 162 | |
| | 47,800 | | | PTT Public Co. Ltd. (Oil, Gas & Consumable Fuels) | | | 508 | |
| | 72,400 | | | Siam Commercial Bank Public Co. Ltd. (Banks) | | | 333 | |
| | 46,700 | | | Thai Oil Public Co. Ltd. (Oil, Gas & Consumable Fuels) | | | 76 | |
| | 75,600 | | | Thai Union Frozen Products Public Co. Ltd. (Diversified Consumer Services) | | | 49 | |
| | 18,300 | | | The Siam Cement Public Co. Ltd. (Construction Materials) | | | 281 | |
| | 764,400 | | | TMB Bank Public Co. Ltd. (Banks) | | | 53 | |
| | 392,510 | | | True Corp. Public Co. Ltd. (Diversified Telecommunication Services) (a) | | | 133 | |
| | | | | | | | |
| | | | | | | 4,307 | |
| | | | | | | | |
See accompanying notes to financial statements.
148
HC CAPITAL TRUST
The Institutional International Equity Portfolio
Portfolio of Investments (continued) — June 30, 2015
| | | | | | | | |
| Shares | | | Security Description | | Value
(000) | |
| | | | Common Stocks (continued) | | | | |
| | | | Turkey — 0.10% | | | | |
| | 98,953 | | | Akbank TAS (Banks) | | $ | 286 | |
| | 8,523 | | | Anadolu EFES Biracilik VE Malt Sanayii A/S (Beverages) | | | 77 | |
| | 12,316 | | | Arcelik A/S (Household Durables) | | | 67 | |
| | 10,187 | | | Bim Birlesik Magazalar A/S (Food & Staples Retailing) | | | 182 | |
| | 3,350 | | | Coca-Cola Icecek A/S (Beverages) | | | 56 | |
| | 90,465 | | | Emlak Konut Gayrimenkul Yatirim (Real Estate Investment Trusts) | | | 93 | |
| | 23,708 | | | Enka Insaat ve Sanayi A/S (Industrial Conglomerates) | | | 45 | |
| | 73,718 | | | Eregli Demir ve Celik Fabrikalari TAS (Metals & Mining) | | | 119 | |
| | 3,776 | | | Ford Otomotiv Sanayi A/S (Automobiles) | | | 50 | |
| | 42,541 | | | Haci OMER Sabanci Holding (Diversified Financial Services) | | | 160 | |
| | 32,650 | | | KOC Holdings A/S (Industrial Conglomerates) | | | 151 | |
| | 11,340 | | | Petkim Petrokimya Holding AS (Chemicals) (a) | | | 17 | |
| | 8,803 | | | TAV Havalimanlari Holding A/S (Transportation Infrastructure) | | | 75 | |
| | 6,835 | | | Tofas Turk Otomobil Fabrikasi A/S (Automobiles) | | | 47 | |
| | 5,823 | | | Tupras-Turkiye Petrol Rafinerileri A/S (Oil, Gas & Consumable Fuels) (a) | | | 148 | |
| | 28,677 | | | Turk Hava Yollari Anonim Ortakligi (Airlines) (a) | | | 94 | |
| | 23,244 | | | Turk Telekomunikasyon A/S (Diversified Telecommunication Services) | | | 61 | |
| | 42,451 | | | Turkcell Iletisim Hizmetleri A/S (Wireless Telecommunication Services) | | | 196 | |
| | 106,058 | | | Turkiye Garanti Bankasi A/S (Banks) | | | 332 | |
| | 30,116 | | | Turkiye Halk Bankasi A/S (Banks) | | | 139 | |
| | 75,852 | | | Turkiye Is Bankasi A/S, C Shares (Banks) | | | 160 | |
| | 28,042 | | | Turkiye Sise ve Cam Fabrikalari A/S (Industrial Conglomerates) | | | 38 | |
| | 29,391 | | | Turkiye Vakiflar Bankasi TAO, Class – D (Banks) | | | 47 | |
| | 7,460 | | | Ulker Biskuvi Sanayi A/S (Food Products) | | | 52 | |
| | 39,061 | | | Yapi ve Kredi Bankasi AS (Banks) | | | 57 | |
| | | | | | | | |
| | | | | | | 2,749 | |
| | | | | | | | |
| | | | United Arab Emirates — 0.05% | | | | |
| | 83,648 | | | Abu Dhabi Commercial Bank PJSC (Banks) | | | 175 | |
| | 125,205 | | | Aldar Properties PJSC (Real Estate Management & Development) | | | 93 | |
| | 102,770 | | | Arabtec Holding Co. (Construction & Engineering) (a) | | | 74 | |
| | 9,352 | | | DP World Ltd. (Transportation Infrastructure) | | | 200 | |
| | 63,397 | | | Dubai Financial Market (Diversified Financial Services) | | | 34 | |
| | 64,200 | | | Dubai Islamic Bank (Banks) | | | 120 | |
| | 70,311 | | | Emaar Malls Group PJSC (Real Estate Investment Trusts) (a) | | | 64 | |
| | 176,775 | | | Emaar Properties PJSC (Real Estate Management & Development) | | | 379 | |
| | 39,267 | | | First Gulf Bank PJSC (Media) | | | 162 | |
| | 28,337 | | | National Bank of Abu Dhabi (Media) | | | 85 | |
| | | | | | | | |
| | | | | | | 1,386 | |
| | | | | | | | |
| | | | | | | | |
Shares | | | Security Description | | Value
(000) | |
| | | | United Kingdom — 18.67% | | | | |
| | 118,200 | | | AA PLC (Commercial Services & Supplies) (a) | | $ | 688 | |
| | 114,952 | | | Aberdeen Asset Management PLC (Capital Markets) | | | 730 | |
| | 21,445 | | | Admiral Group PLC (Insurance) | | | 467 | |
| | 179,500 | | | AMEC PLC (Energy Equipment & Services) | | | 2,305 | |
| | 665,976 | | | Anglo American PLC (Metals & Mining) | | | 9,610 | |
| | 8,000 | | | ARM Holdings PLC (Semiconductors & Semiconductor Equipment) | | | 130 | |
| | 1,700 | | | Associated British Foods PLC (Food Products) | | | 77 | |
| | 516,482 | | | AstraZeneca PLC (Pharmaceuticals) | | | 32,610 | |
| | 172,410 | | | Auto Trader Group PLC (Internet Software & Services) (a) | | | 826 | |
| | 826,167 | | | Aviva PLC (Insurance) | | | 6,393 | |
| | 80,691 | | | Babcock International Group PLC (Commercial Services & Supplies) | | | 1,369 | |
| | 1,493,535 | | | BAE Systems PLC (Aerospace & Defense) | | | 10,587 | |
| | 578,719 | | | Balfour Beatty PLC (Construction & Engineering) | | | 2,199 | |
| | 1,730,748 | | | Barclays PLC (Banks) | | | 7,083 | |
| | 243,700 | | | BCA Marketplace PLC, Registered Shares (Specialty Retail) (a) | | | 605 | |
| | 118,100 | | | Bellway PLC (Household Durables) | | | 4,401 | |
| | 901,070 | | | BHP Billiton PLC (Metals & Mining) | | | 17,681 | |
| | 4,514,123 | | | BP PLC (Oil, Gas & Consumable Fuels) | | | 29,796 | |
| | 677,870 | | | British American Tobacco PLC (Tobacco) | | | 36,368 | |
| | 903,302 | | | BT Group PLC (Diversified Telecommunication Services) | | | 6,389 | |
| | 215,765 | | | Capital Shopping Centres Group PLC (Real Estate Investment Trusts) | | | 1,043 | |
| | 132,157 | | | Carnival PLC (Hotels, Restaurants & Leisure) | | | 6,746 | |
| | 1,507,580 | | | Centrica PLC (Multi-Utilities) | | | 6,247 | |
| | 321,821 | | | Compass Group PLC (Hotels Restaurants & Leisure) | | | 5,324 | |
| | 79,311 | | | Croda International PLC (Chemicals) | | | 3,429 | |
| | 43,913 | | | Delphi Automotive PLC (Auto Components) | | | 3,737 | |
| | 7,595 | | | Diageo PLC (Beverages) | | | 220 | |
| | 159,656 | | | Direct Line Insurance Group PLC (Insurance) | | | 842 | |
| | 4,000 | | | Ensco PLC, ADR (Energy Equipment & Services) | | | 89 | |
| | 6,900 | | | Fidessa Group PLC (Software) | | | 247 | |
| | 1,715,501 | | | GlaxoSmithKline PLC (Pharmaceuticals) | | | 35,642 | |
| | 44,330 | | | Grainger PLC (Real Estate Management & Development) | | | 159 | |
| | 7,268 | | | Greene King PLC (Hotels, Restaurants & Leisure) | | | 96 | |
| | 4,800 | | | Halma PLC (Electronic Equipment, Instruments & Components) | | | 57 | |
| | 25,500 | | | Henderson Group PLC (Capital Markets) | | | 105 | |
| | 83,691 | | | Home Retail Group PLC (Internet & Catalog Retail) | | | 222 | |
| | 259,383 | | | Howden Joinery Group PLC (Specialty Retail) | | | 2,108 | |
| | 2,326,626 | | | HSBC Holdings PLC (Banks) | | | 20,838 | |
| | 678,678 | | | HSBC Holdings PLC (HK) (Banks) | | | 6,142 | |
| | 89,611 | | | ICAP PLC (Capital Markets) | | | 745 | |
| | 26,831 | | | IMI PLC (Machinery) | | | 474 | |
See accompanying notes to financial statements.
149
HC CAPITAL TRUST
The Institutional International Equity Portfolio
Portfolio of Investments (continued) — June 30, 2015
| | | | | | | | |
Shares | | | Security Description | | Value
(000) | |
| | | | Common Stocks (continued) | | | | |
| | | | United Kingdom (continued) | | | | |
| | 495,398 | | | Imperial Tobacco Group PLC (Tobacco) | | $ | 23,869 | |
| | 57,459 | | | InterContinental Hotels Group PLC (Hotels, Restaurants & Leisure) | | | 2,316 | |
| | 941,512 | | | International Consolidated Airlines Group SA (Airlines) (a) | | | 7,317 | |
| | 3,359,155 | | | ITV PLC (Media) | | | 13,895 | |
| | 911,041 | | | J Sainsbury PLC (Food & Staples Retailing) | | | 3,797 | |
| | 8,564 | | | John Wood Group PLC (Energy Equipment & Services) | | | 87 | |
| | 118,215 | | | Johnson Matthey PLC (Chemicals) | | | 5,642 | |
| | 275,238 | | | Kingfisher PLC (Specialty Retail) | | | 1,502 | |
| | 705,768 | | | Legal & General Group PLC (Insurance) | | | 2,760 | |
| | 93,032 | | | Liberty Global PLC, Class – A (Media) (a) | | | 5,030 | |
| | 142,954 | | | Liberty Global PLC, Series C (Media) (a) | | | 7,238 | |
| | 7,982,412 | | | Lloyds Banking Group PLC (Banks) | | | 10,689 | |
| | 47,356 | | | Lonmin PLC (Metals & Mining) (a) | | | 83 | |
| | 16,555 | | | Marks & Spencer Group PLC (Multiline Retail) | | | 139 | |
| | 52,538 | | | Meggitt PLC (Aerospace & Defense) | | | 385 | |
| | 22,665 | | | Merlin Entertainments PLC (Hotels, Restaurants & Leisure) | | | 152 | |
| | 363,186 | | | Michael Page International PLC (Professional Services) | | | 3,110 | |
| | 70,231 | | | Micro Focus International PLC (Software) | | | 1,501 | |
| | 76,428 | | | Mondi PLC (Paper & Forest Products) | | | 1,646 | |
| | 432,193 | | | National Grid PLC (Multi-Utilities) | | | 5,549 | |
| | 126,444 | | | Ocado Group PLC (Internet & Catalog Retail) (a) | | | 886 | |
| | 602,468 | | | Old Mutual PLC (Insurance) | | | 1,907 | |
| | 391,381 | | | Pearson PLC (Media) | | | 7,409 | |
| | 142,546 | | | Persimmon PLC (Household Durables) (a) | | | 4,423 | |
| | 71,168 | | | Provident Financial PLC (Consumer Finance) | | | 3,273 | |
| | 168,019 | | | Prudential PLC (Insurance) | | | 4,045 | |
| | 28,154 | | | RecKitt Benckiser Group PLC (Household Products) | | | 2,427 | |
| | 537,416 | | | Rentokil Initial PLC (Commercial Services & Supplies) | | | 1,250 | |
| | 623,950 | | | Rio Tinto PLC (Metals & Mining) | | | 25,623 | |
| | 920,198 | | | Royal Dutch Shell PLC, A Shares (Oil, Gas & Consumable Fuels) | | | 25,826 | |
| | 775,941 | | | Royal Dutch Shell PLC, B Shares (Oil, Gas & Consumable Fuels) | | | 22,027 | |
| | 72,473 | | | SABMiller PLC (Beverages) | | | 3,761 | |
| | 27,659 | | | Severn Trent PLC (Water Utilities) | | | 904 | |
| | 1,900 | | | Spirax-Sarco Engineering PLC (Machinery) | | | 101 | |
| | 25,600 | | | Sports Direct International (Specialty Retail) (a) | | | 289 | |
| | 378,235 | | | SSE PLC (Electric Utilities) | | | 9,127 | |
| | 293,455 | | | Standard Chartered PLC (Banks) | | | 4,698 | |
| | 226,887 | | | Tate & Lyle PLC (Food Products) | | | 1,852 | |
| | 3,900,183 | | | Tesco PLC (Food & Staples Retailing) | | | 13,023 | |
| | 421,644 | | | Thomas Cook Group PLC (Hotels, Restaurants & Leisure) (a) | | | 906 | |
| | 52,348 | | | Tullow Oil PLC (Oil, Gas & Consumable Fuels) | | | 279 | |
| | | | | | | | |
Shares | | | Security Description | | Value
(000) | |
| | | | United Kingdom (continued) | | | | |
| | 66,403 | | | Unilever PLC (Food Products) | | $ | 2,847 | |
| | 77,304 | | | United Utilities Group PLC (Water Utilities) | | | 1,084 | |
| | 9,442,732 | | | Vodafone Group PLC (Wireless Telecommunication Services) | | | 34,097 | |
| | 1,064,139 | | | William Morrison Supermarkets PLC (Food & Staples Retailing) | | | 3,023 | |
| | | | | | | | |
| | | | | | | 536,620 | |
| | | | | | | | |
| | | | United States — 0.18% | | | | |
| | 59,074 | | | Cognizant Technology Solutions Corp. (IT Services) (a) | | | 3,609 | |
| | 12,600 | | | Samsonite International SA (Household Products) | | | 44 | |
| | 7,800 | | | Southern Copper Corp. (Metals & Mining) | | | 229 | |
| | 9,877 | | | WABCO Holdings, Inc. (Machinery) (a) | | | 1,222 | |
| | | | | | | | |
| | | | | | | 5,104 | |
| | | | | | | | |
| | | | Total Common Stocks | | | 2,750,899 | |
| | | | | | | | |
| | | | Preferred Stocks — 0.77% | | | | |
| | | | Brazil — 0.13% | | | | |
| | 5,300 | | | AES Tiete SA – Preferred (Independent Power and Renewable Electricity Producers) | | | 30 | |
| | 121,520 | | | Banco Bradesco SA – Preferred (Banks) | | | 1,114 | |
| | 10,100 | | | Banco do Estado do Rio Grande do Sul SA – Preferred, B Shares (Banks) | | | 29 | |
| | 8,800 | | | Braskem SA – Preferred, Class – A (Chemicals) | | | 38 | |
| | 11,900 | | | Centrais Eletricas Brasileiras SA – Preferred, B Shares (Electric Utilities) | | | 32 | |
| | 36,900 | | | Companhia Energetica de Minas Gerais SA – Preferred, ADR (Electric Utilities) | | | 140 | |
| | 8,700 | | | Companhia Energetica de Sao Paulo – Preferred, B Shares (Independent Power and Renewable Electricity Producers) | | | 54 | |
| | 5,100 | | | Companhia Paranaense de Energia-COPEL – Preferred, B Shares (Electric Utilities) | | | 57 | |
| | 41,600 | | | Gerdau SA – Preferred (Metals & Mining) | | | 100 | |
| | 167,237 | | | Itausa – Investimentos Itau SA – Preferred (Banks) | | | 480 | |
| | 23,825 | | | Lojas Americanas SA – Preferred (Multiline Retail) | | | 134 | |
| | 13,640 | | | Oi SA – Preferred (Diversified Telecommunication Services) (a) | | | 26 | |
| | 183,500 | | | Petroleo Brasileiro SA – Preferred (Oil, Gas & Consumable Fuels) (a) | | | 752 | |
| | 15,700 | | | Suzano Papel e Celulose SA – Preferred, Class – A (Paper & Forest Products) | | | 84 | |
| | 16,000 | | | Telefonica Brasil SA – Preferred (Diversified Telecommunication Services) | | | 224 | |
| | 20,000 | | | Usinas Siderurgicas de Minas Gerais SA – Preferred, Class – A (Metals & Mining) | | | 27 | |
| | 87,900 | | | Vale SA – Preferred (Metals & Mining) | | | 442 | |
| | | | | | | | |
| | | | | | | 3,763 | |
| | | | | | | | |
| | | | Chile — 0.00% | | | | |
| | 13,354 | | | Embotelladora Andina SA – Preferred, B Shares (Beverages) | | | 45 | |
| | 4,452 | | | Sociedad Quimica y Minera de Chile SA – Preferred, B Shares (Chemicals) | | | 72 | |
| | | | | | | | |
| | | | | | | 117 | |
| | | | | | | | |
See accompanying notes to financial statements.
150
HC CAPITAL TRUST
The Institutional International Equity Portfolio
Portfolio of Investments (continued) — June 30, 2015
| | | | | | | | |
Shares or
Principal
Amount
(000) | | | Security Description | | Value (000) | |
| | | | Preferred Stocks (continued) | | | | |
| | | | Colombia — 0.01% | | | | |
| | 21,339 | | | Bancolombia SA – Preferred (Banks) | | $ | 228 | |
| | 161,668 | | | Grupo Aval Acciones y Valores SA – Preferred (Banks) | | | 79 | |
| | 4,778 | | | Grupo de Inversiones Suramericana – Preferred (Diversified Financial Services) | | | 67 | |
| | | | | | | | |
| | | | | | | 374 | |
| | | | | | | | |
| | | | Germany — 0.57% | | | | |
| | 17,889 | | | Bayerische Motoren Werke AG – Preferred (Automobiles) | | | 1,514 | |
| | 18,226 | | | Henkel AG & Co. KGaA – Preferred (Household Products) | | | 2,044 | |
| | 41,709 | | | Porsche Automobil Holding SE – Preferred (Automobiles) | | | 3,514 | |
| | 39,390 | | | Volkswagen AG – Preferred (Automobile Manufacturers) | | | 9,133 | |
| | | | | | | | |
| | | | | | | 16,205 | |
| | | | | | | | |
| | | | Korea, Republic Of — 0.00% | | | | |
| | 489 | | | Amorepacific Corp. – Preferred (Cosmetics/Personal Care) | | | 90 | |
| | | | | | | | |
| | | | Russia — 0.02% | | | | |
| | 75 | | | AK Transneft OAO – Preferred (Oil, Gas & Consumable Fuels) | | | 184 | |
| | 335,200 | | | Surgutneftegas – Preferred (Oil, Gas & Consumable Fuels) | | | 259 | |
| | | | | | | | |
| | | | | | | 443 | |
| | | | | | | | |
| | | | South Korea — 0.04% | | | | |
| | 1,755 | | | Hyundai Motor Co. Ltd. – Preferred (Automobiles) | | | 166 | |
| | 1,033 | | | Hyundai Motor Co. Ltd. – Preferred (Automobiles) | | | 94 | |
| | 386 | | | LG Chem Ltd. – Preferred (Chemicals) | | | 65 | |
| | 978 | | | Samsung Electronics Co. Ltd. – Preferred (Technology Hardware, Storage & Peripherals) | | | 871 | |
| | | | | | | | |
| | | | | | | 1,196 | |
| | | | | | | | |
| | | | Total Preferred Stocks | | | 22,188 | |
| | | | | | | | |
| | | | Right — 0.00% | | | | |
| | | | Russia — 0.00% | | | | |
| | 56,600 | | | The Moscow Exchange MICEX (Diversified Financial Services) (a) | | | 72 | |
| | | | | | | | |
| | | | Total Right | | | 72 | |
| | | | | | | | |
| | | | U.S. Treasury Obligations — 0.00% | | | | |
| $ | 10 | | | U.S. Treasury Bill, 0.08%, 9/17/15 (c) | | | 10 | |
| | 50 | | | U.S. Treasury Bill, 0.05%, 12/10/15 (c)(d) | | | 50 | |
| | | | | | | | |
| | | | Total U.S. Treasury Obligations | | | 60 | |
| | | | | | | | |
| | | | Time Deposit — 0.37% | | | | |
| | 10,551 | | | State Street Liquidity Management Control System Eurodollar Time Deposit, 0.01%, 7/1/15 | | | 10,551 | |
| | | | | | | | |
| | | | Total Time Deposit | | | 10,551 | |
| | | | | | | | |
| | | | | | | | |
Shares or
Principal
Amount
(000) | | | Security Description | | Value (000) | |
| | | | Mutual Funds — 0.79% | | | | |
| | 4,977,000 | | | Dreyfus Treasury Prime Cash Management Fund, 0.00% | | $ | 4,977 | |
| | 39,000 | | | Federated U.S. Treasury Cash Reserve Fund, Institutional Shares, 0.00% | | | 39 | |
| | 479,469 | | | iShares MSCI India ETF | | | 14,509 | |
| | 142,000 | | | SSgA Treasury Money Market Fund, 0.00% | | | 142 | |
| | 3,120,000 | | | SSgA U.S. Government Money Market Fund, 0.00% | | | 3,120 | |
| | | | | | | | |
| | | | Total Mutual Funds | | | 22,787 | |
| | | | | | | | |
| | | | Repurchase Agreement — 0.52% | | | | |
| $ | 15,040 | | | Jefferies LLC, 0.23%, 7/1/15
(Purchased on 6/30/15, proceeds at maturity $15,039,912 collateralized by U.S. Treasury Obligations, 0.00% – 3.28%, 8/15/15 – 8/15/44 fair value $15,340,613)^^ | | | 15,040 | |
| | | | | | | | |
| | | | Total Repurchase Agreement | | | 15,040 | |
| | | | | | | | |
| | | | Total Investments
(cost $2,686,351) — 98.17% | | | 2,821,597 | |
| | | | Other assets in excess of liabilities — 1.83% | | | 52,496 | |
| | | | | | | | |
| | | | Net Assets — 100.00% | | $ | 2,874,093 | |
| | | | | | | | |
Amounts designated as “—” are $0 or have been rounded to $0.
| * | Security was fair valued on June 30, 2015 and represents a Level 2 security. Refer to Note 2 in the Notes to Financial Statements. |
| ^ | All or part of this security was on loan as of June 30, 2015. The total value of securities on loan as of June 30, 2015, was $19,393 (amount in thousands). |
| ^^ | Purchased with cash collateral held from securities lending. The value of the collateral could include collateral held for securities that were sold on or before June 30, 2015. |
| (a) | Represents non-income producing security. |
| (b) | Represents a security purchased under Rule 144A or Section 4(2) and is exempt from registration under the Securities Act of 1933, as amended, or is otherwise restricted to resale. Certain of these securities may be resold in transactions exempt from registration, normally to qualified institutional buyers. These securities have been deemed liquid by the Specialist Manager. |
| (c) | Rate disclosed represents effective yield at purchase. |
| (d) | Zero Coupon Security. Effective rate shown is as of June 30, 2015. |
ADR — American Depositary Receipt
ETF — Exchange Traded Fund
FDR — Fiduciary Depositary Receipt
GDR — Global Depositary Receipt
NVDR — Non-Voting Depository Receipt
REIT — Real Estate Investment Trust
See accompanying notes to financial statements.
151
HC CAPITAL TRUST
The Institutional International Equity Portfolio
Portfolio of Investments (concluded) — June 30, 2015
The following table reflects the percentage of total net assets of the Portfolio attributable to each Specialist Manager, see Note 3 in the Notes to Financial Statements.
| | | | | | | | | | | | | | | | | | | | | | | | | | | | | | | | |
The Institutional
International Equity
Portfolio | | Artisan
Partners LP | | | Cadence Capital
Management, LLC | | | Capital
Guardian
Trust Co. | | | Causeway
Capital
Management
LLC | | | Lazard Asset
Management
LLC | | | Mellon Capital
Management
Corporation | | | Parametric
Portfolio
Associates, LLC | | | Total | |
Common Stocks | | | 7.49 | % | | | 60.64 | % | | | 2.28 | % | | | 9.33 | % | | | 10.09 | % | | | 5.89 | % | | | — | | | | 95.72 | % |
Preferred Stocks | | | 0.27 | % | | | 0.05 | % | | | — | | | | 0.24 | % | | | — | | | | 0.21 | % | | | — | | | | 0.77 | % |
Right | | | — | | | | — | | | | — | | | | — | | | | — | | | | — | | | | — | | | | 0.00 | % |
U.S. Treasury Obligations | | | — | | | | — | | | | — | | | | — | | | | — | | | | — | | | | — | | | | 0.00 | % |
Time Deposit | | | 0.10 | % | | | — | | | | 0.07 | % | | | 0.20 | % | | | — | | | | — | | | | — | | | | 0.37 | % |
Mutual Funds | | | — | | | | 0.18 | % | | | — | | | | — | | | | 0.11 | % | | | 0.50 | % | | | — | | | | 0.79 | % |
Repurchase Agreement | | | 0.03 | % | | | 0.31 | % | | | 0.03 | % | | | 0.10 | % | | | 0.01 | % | | | 0.04 | % | | | — | | | | 0.52 | % |
Other Assets (Liabilities) | | | (0.01 | )% | | | 0.04 | % | | | — | | | | (0.06 | )% | | | (0.04 | )% | | | 0.01 | % | | | 1.89 | % | | | 1.83 | % |
| | | | | | | | | | | | | | | | | | | | | | | | | | | | | | | | |
Total Net Assets | | | 7.88 | % | | | 61.22 | % | | | 2.38 | % | | | 9.81 | % | | | 10.17 | % | | | 6.65 | % | | | 1.89 | % | | | 100.00 | % |
| | | | | | | | | | | | | | | | | | | | | | | | | | | | | | | | |
The following tables reflect the open derivative positions held by the Portfolio as of June 30, 2015.
Long Futures
| | | | | | | | | | | | | | | | |
Number of
Contracts | | | Futures Contracts Positions^ | | Value
(000) | | | Expiration | | | Unrealized
Appreciation/
(Depreciation)
(000) | |
| | 383 | | | Euro FX Currency Future | | $ | 53,409 | | | | 9/14/15 | | | $ | (13 | ) |
| | 174 | | | DAX Index Future | | | 53,346 | | | | 9/18/15 | | | | 81 | |
| | 29 | | | Mini MSCI Emerging Markets Index Future | | | 1,391 | | | | 9/18/15 | | | | (9 | ) |
| | | | | | | | | | | | | | | | |
| | | | Net Unrealized Appreciation/(Depreciation) | | | | | | | | | | $ | 59 | |
| | | | | | | | | | | | | | | | |
Amounts designated as “—” are $0 or have been rounded to $0.
| ^ | Cash has been pledged as collateral for futures contracts held by the Portfolio. |
Forward Currency Contracts
| | | | | | | | | | | | | | | | | | | | | | |
Contract
Amount
(Local Currency) | | | Currency | | Counterparty | | Settlement
Date | | | Settlement
Value
(000) | | | Value on
06/30/15
(000) | | | Unrealized
Appreciation/
(Depreciation)
(000) | |
| | | | Currencies Sold | | | | | | | | | | | | | | | | | | |
| | 437,520 | | | South African Rand | | UBS Warburg | | | 7/1/15 | | | $ | 36 | | | $ | 36 | | | $ | — | |
| | 312,866 | | | South African Rand | | UBS Warburg | | | 7/2/15 | | | | 26 | | | | 26 | | | | — | |
| | | | | | | | | | | | | | | | | | | | | | |
| | | | Total Currencies Sold | | | | | | $ | 62 | | | $ | 62 | | | $ | — | |
| | | | | | | | | | | | | | | | | | | | | | |
| | | | Net Unrealized/Appreciation(Depreciation) | | | | | | | | | | | | | | $ | — | |
| | | | | | | | | | | | | | | | | | | | | | |
Amounts designated as “—” are $0 or has been rounded to $0.
See accompanying notes to financial statements.
152
HC CAPITAL TRUST
The Emerging Markets Portfolio
Portfolio of Investments — June 30, 2015
| | | | | | | | |
| Shares | | | Security Description | | Value
(000) | |
| | | | Common Stocks — 90.55% | | | | |
| | | | Brazil — 7.46% | | | | |
| | 3,821,600 | | | Ambev SA (Beverages) | | $ | 23,436 | |
| | 1,120,500 | | | BB Seguridade Participacoes SA (Insurance) | | | 12,343 | |
| | 2,197,600 | | | BM&FBOVESPA SA (Diversified Financial Services) | | | 8,293 | |
| | 967,500 | | | Brasil Insurance Participacoes e Adminstracao SA (Insurance) | | | 402 | |
| | 1,340,694 | | | Cia de Saneamento Basico do Estado de Sao Paulo SABESP, ADR (Water Utilities) | | | 6,945 | |
| | 874,300 | | | Cia Hering (Specialty Retail) | | | 3,392 | |
| | 1,468,995 | | | Cia Vale Do Rio, ADR (Materials) | | | 7,418 | |
| | 401,700 | | | CPFL Energia SA (Electric Utilities) | | | 2,474 | |
| | 810,300 | | | Cyrela Brazil Realty SA Empreendimentos (Household Durables) | | | 2,591 | |
| | 2,092,100 | | | Duratex SA (Paper & Forest Products) | | | 4,900 | |
| | 1,596,600 | | | EDP – Energias do Brasil SA (Electric Utilities) | | | 5,887 | |
| | 1,587,665 | | | Gerdau SA, ADR (Metals & Mining) | | | 3,826 | |
| | 713,626 | | | Itau Unibanco Holding SA, ADR (Banks) | | | 7,814 | |
| | 364,823 | | | Itau Unibanco Holding SA (Banks) | | | 4,020 | |
| | 5,069,226 | | | Magnesita Refratarios SA (Construction Materials) (b)(c) | | | 4,567 | |
| | 538,700 | | | Natura Cosmeticos SA (Personal Products) | | | 4,823 | |
| | 384,774 | | | Oi SA, ADR (Diversified Telecommunication Services)^(b) | | | 735 | |
| | 1,885,274 | | | Petroleo Brasileiro SA, ADR (Oil, Gas & Consumable Fuels) (b) | | | 17,062 | |
| | 1,323,400 | | | Souza Cruz SA (Tobacco) | | | 10,453 | |
| | 922,800 | | | Sul America SA (Insurance) | | | 4,513 | |
| | 340,550 | | | Telefonica Brasil SA, ADR (Diversified Telecommunication Services) | | | 4,744 | |
| | 133,000 | | | Transmissora Alianca de Energia Eletrica SA (Electric Utilities) | | | 881 | |
| | | | | | | | |
| | | | | | | 141,519 | |
| | | | | | | | |
| | | | Chile — 1.44% | | | | |
| | 27,280 | | | Banco de Credito e Inversiones SA (Banks) | | | 1,200 | |
| | 3,104,896 | | | Cencosud SA (Food & Staples Retailing) | | | 7,474 | |
| | 66,663,426 | | | CorpBanca SA (Banks) | | | 736 | |
| | 2,846,900 | | | Empresa Nacional de Electricidad SA (Independent Power and Renewable Electricity Producers) | | | 3,944 | |
| | 663,769 | | | Empresa Nacional de Telecomunicaciones SA (Wireless Telecommunication Services) (c) | | | 7,351 | |
| | 16,545,744 | | | Enersis SA (Electric Utilities) | | | 5,262 | |
| | 764,500 | | | Vina Concha y Toro SA (Beverages) | | | 1,333 | |
| | | | | | | | |
| | | | | | | 27,300 | |
| | | | | | | | |
| | | | China — 22.81% | | | | |
| | 22,526,000 | | | Agricultural Bank of China Ltd., H Shares (Banks) (b) | | | 12,118 | |
| | 1,768,500 | | | Anhui Conch Cement Co. Ltd., H Shares (Construction Materials) | | | 6,206 | |
| | 32,824,100 | | | Bank of China Ltd., H Shares (Banks) | | | 21,343 | |
| | 9,912,000 | | | Bank of Communications Co. Ltd., H Shares (Banks) | | | 10,332 | |
| | 4,227,000 | | | Baoxin Auto Group Ltd. (Specialty Retail) (b) | | | 2,688 | |
| | | | | | | | |
| Shares | | | Security Description | | Value
(000) | |
| | | | China (continued) | | | | |
| | 1,712,000 | | | Beijing Capital International Airport Co. Ltd., H Shares (Transportation Infrastructure) | | $ | 1,975 | |
| | 28,478,000 | | | China Communications Services Corp. Ltd., H Shares (Diversified Telecommunication Services) | | | 14,402 | |
| | 56,125,350 | | | China Construction Bank Corp., H Shares (Banks) | | | 51,264 | |
| | 2,879,000 | | | China Everbright Bank Co. Ltd., H Shares (Banks) | | | 1,727 | |
| | 1,626,000 | | | China Life Insurance Co. Ltd., H Shares (Insurance) | | | 7,080 | |
| | 4,788,500 | | | China Merchants Bank Co. Ltd., H Shares (Banks) | | | 13,962 | |
| | 120,398 | | | China Mobile Ltd., ADR (Wireless Telecommunication Services) | | | 7,716 | |
| | 2,113,000 | | | China Mobile Ltd. (Wireless Telecommunication Services) | | | 27,056 | |
| | 9,933,400 | | | China Petroleum & Chemical Corp., H Shares (Oil, Gas & Consumable Fuels) | | | 8,573 | |
| | 1,109,000 | | | China Railway Construction Corp. Ltd., H Shares (Construction & Engineering) | | | 1,714 | |
| | 6,368,000 | | | China Resources Cement Holdings Ltd. (Construction Materials) | | | 3,557 | |
| | 7,192,000 | | | China Resources Power Holdings Co. Ltd. (Independent Power and Renewable Electricity Producers) | | | 20,087 | |
| | 4,691,500 | | | China Shenhua Energy Co. Ltd., H Shares (Oil, Gas & Consumable Fuels) | | | 10,701 | |
| | 1,458,800 | | | China Vanke Co. Ltd., H Shares (Real Estate Management & Development)^ | | | 3,592 | |
| | 4,877,500 | | | China Zhentong Auto Services Holdings Ltd. (Specialty Retail) | | | 3,178 | |
| | 2,612,000 | | | Chongqing Rural Commercial Bank Co. Ltd., H Shares (Banks) | | | 2,093 | |
| | 14,589,000 | | | CNOOC Ltd. (Oil, Gas & Consumable Fuels) | | | 20,704 | |
| | 12,440,113 | | | Cosco Pacific Ltd. (Transportation Infrastructure) | | | 16,883 | |
| | 6,294,000 | | | Country Garden Holdings Co. (Real Estate Management & Development) | | | 2,769 | |
| | 3,290,000 | | | Dongfeng Motor Group Co. Ltd., H Shares (Automobiles) | | | 4,414 | |
| | 1,325,000 | | | Galaxy Entertainment Group Ltd. (Hotels, Restaurants & Leisure) | | | 5,282 | |
| | 8,119,324 | | | Guangzhou Automobile Group Co. Ltd., H Shares (Automobiles) | | | 7,521 | |
| | 55,664,440 | | | Industrial & Commercial Bank of China Ltd., H Shares (Banks) | | | 44,236 | |
| | 2,704,000 | | | Jiangsu Expressway Co. Ltd., H Shares (Transportation Infrastructure) | | | 3,551 | |
| | 5,647,000 | | | Lee & Man Paper Manufacturing Ltd. (Paper & Forest Products)^ | | | 3,599 | |
| | 14,055,000 | | | Lianhua Supermarket Holdings Ltd., H Shares (Food & Staples Retailing)^(b)(c) | | | 9,629 | |
| | 47,057,500 | | | Parkson Retail Group Ltd. (Multiline Retail) (c) | | | 9,835 | |
| | 7,418,000 | | | PetroChina Co. Ltd., H Shares (Oil, Gas & Consumable Fuels) | | | 8,278 | |
| | 555,500 | | | Ping An Insurance Group Co. of China (Insurance) | | | 7,503 | |
See accompanying notes to portfolio of investments.
153
HC CAPITAL TRUST
The Emerging Markets Portfolio
Portfolio of Investments (continued) — June 30, 2015
| | | | | | | | |
| Shares | | | Security Description | | Value
(000) | |
| | | | Common Stocks (continued) | | | | |
| | | | China (continued) | | | | |
| | 6,611,000 | | | Shanghai Industrial Holdings Ltd. (Industrial Conglomerates) (c) | | $ | 22,431 | |
| | 1,550,500 | | | Shimao Property Holdings Ltd. (Real Estate Management & Development) | | | 3,060 | |
| | 2,005,000 | | | Soho China Ltd. (Real Estate Management & Development) | | | 1,306 | |
| | 3,745,000 | | | Weichai Power Co. Ltd. (Machinery) | | | 12,489 | |
| | 20,574,000 | | | West China Cement Ltd. (Construction Materials) | | | 3,981 | |
| | 12,518,000 | | | Wumart Stores, Inc., H Shares (Food & Staples Retailing) (c) | | | 8,882 | |
| | 3,230,000 | | | Zhejiang Expressway Co. Ltd., H Shares (Transportation Infrastructure) | | | 4,484 | |
| | | | | | | | |
| | | | | | | 432,201 | |
| | | | | | | | |
| | | | Colombia — 0.30% | | | | |
| | 8,455,436 | | | Ecopetrol SA (Oil, Gas & Consumable Fuels) | | | 5,616 | |
| | | | | | | | |
| | | | Egypt — 0.29% | | | | |
| | 738,500 | | | Commercial International Bank Egypt SAE (Banks) | | | 5,464 | |
| | | | | | | | |
| | | | Greece — 0.16% | | | | |
| | 2,789,679 | | | National Bank of Greece SA (Banks) (b)* | | | 3,071 | |
| | | | | | | | |
| | | | Hong Kong — 1.37% | | | | |
| | 10,006,000 | | | Belle International Holdings Ltd. (Textiles, Apparel & Luxury Goods) | | | 11,528 | |
| | 6,537,337 | | | Evergrande Real Estate Group Ltd. (Real Estate Management & Development)^ | | | 3,904 | |
| | 2,038,000 | | | Far East Horizon Ltd. (Diversified Financial Services) | | | 1,940 | |
| | 4,256,000 | | | Franshion Properties China Ltd. (Real Estate Management & Development) (b) | | | 1,521 | |
| | 1,110,800 | | | Guangzhou R&F Properties Co. Ltd., H Shares (Real Estate Management & Development) (b) | | | 1,363 | |
| | 830,768 | | | NWS Holdings Ltd. (Industrial Conglomerates) | | | 1,203 | |
| | 3,881,000 | | | Sino-Ocean Land Holdings Ltd. (Real Estate Management & Development) | | | 2,934 | |
| | 7,956,000 | | | Yuexiu Property Co. Ltd. (Real Estate Management & Development) | | | 1,735 | |
| | | | | | | | |
| | | | | | | 26,128 | |
| | | | | | | | |
| | | | Hungary — 1.08% | | | | |
| | 70,440 | | | MOL Hungarian Oil & Gas PLC (Oil, Gas & Consumable Fuels) | | | 3,607 | |
| | 438,607 | | | OTP Bank Nyrt PLC (Banks) | | | 8,687 | |
| | 540,530 | | | Richter Gedeon Nyrt (Pharmaceuticals) | | | 8,125 | |
| | | | | | | | |
| | | | | | | 20,419 | |
| | | | | | | | |
| | | | India — 9.20% | | | | |
| | 35,800 | | | ACC Ltd. (Construction Materials) | | | 812 | |
| | 547,500 | | | Ambuja Cements Ltd. (Construction Materials) | | | 1,977 | |
| | 131,700 | | | Bajaj Auto Ltd. (Motorcycle Manufacturers) | | | 5,258 | |
| | 3,202,013 | | | Bank of India (Banks) (b) | | | 8,619 | |
| | 638,348 | | | Bharat Heavy Electricals Ltd. (Electrical Equipment) | | | 2,485 | |
| | | | | | | | |
| Shares | | | Security Description | | Value
(000) | |
| | | | India (continued) | | | | |
| | 273,500 | | | Bharat Pertoleum Corp. Ltd. (Oil Gas & Consumable Fuels) | | $ | 3,777 | |
| | 687,070 | | | Cairn India Ltd. (Oil, Gas & Consumable Fuels) | | | 1,959 | |
| | 1,043,800 | | | Coal India Ltd. (Oil, Gas & Consumable Fuels) | | | 6,905 | |
| | 242,800 | | | GAIL India Ltd. (Gas Utilities) | | | 1,496 | |
| | 3,363,522 | | | ICICI Bank Ltd. (Banks) | | | 16,269 | |
| | 547,710 | | | IDFC Ltd. (Diversified Financial Services) | | | 1,270 | |
| | 8,737,038 | | | India Cements Ltd. (Construction Materials) (b)(c) | | | 12,932 | |
| | 301,888 | | | Infosys Ltd. (IT Services) | | | 4,667 | |
| | 1,542,165 | | | ITC Ltd. (Tobacco) | | | 7,633 | |
| | 3,356,691 | | | NMDC Ltd. (Metals & Mining) | | | 6,257 | |
| | 4,530,313 | | | NTPC Ltd. (Independent Power and Renewable Electricity Producers) | | | 9,793 | |
| | 1,176,490 | | | Oil & Natural Gas Corp. Ltd. (Oil, Gas & Consumable Fuels) | | | 5,720 | |
| | 186,800 | | | Oil India Ltd. (Oil Gas & Consumable Fuels) | | | 1,311 | |
| | 631,632 | | | Oriental Bank of Commerce (Banks) | | | 1,665 | |
| | 2,282,476 | | | Power Grid Corp. of India Ltd. (Electric Utilities) | | | 4,987 | |
| | 2,120,259 | | | Punjab National Bank (Banks) | | | 4,622 | |
| | 1,387,980 | | | Reliance Industries Ltd. (Oil, Gas & Consumable Fuels) (a) | | | 21,800 | |
| | 11,540 | | | Reliance Industries Ltd., GDR (Oil, Gas & Consumable Fuels) (c) | | | 362 | |
| | 1,487,246 | | | Rolta India Ltd. (IT Services) | | | 2,356 | |
| | 228,304 | | | Rural Electrification Corp. Ltd. (Diversified Financial Services) | | | 987 | |
| | 999,100 | | | Sesa Sterlite Ltd. (Metals & Mining) | | | 2,733 | |
| | 1,691,480 | | | South Indian Bank Ltd. (Banks) | | | 628 | |
| | 3,197,750 | | | State Bank of India (Banks) | | | 13,195 | |
| | 5,802,442 | | | Steel Authority of India Ltd. (Metals & Mining) | | | 5,600 | |
| | 156,024 | | | Tata Consultancy Services Ltd. (IT Services) | | | 6,251 | |
| | 852,200 | | | Tata Power Co. Ltd. (Electric Utilities) | | | 992 | |
| | 91,938 | | | Vedanta Ltd., ADR (Metals & Mining) | | | 993 | |
| | 953,300 | | | Wipro Ltd. (IT Services) | | | 8,184 | |
| | | | | | | | |
| | | | | | | 174,495 | |
| | | | | | | | |
| | | | Indonesia — 1.10% | | | | |
| | 2,858,000 | | | PT Astra International Tbk (Automobiles) | | | 1,517 | |
| | 5,715,800 | | | PT Bank Rakyat Indonesia Persero Tbk (Banks) | | | 4,438 | |
| | 772,200 | | | PT Indocement Tunggal Prakarsa Tbk (Construction Materials) | | | 1,209 | |
| | 4,449,600 | | | PT Indofood Sukses Makmur Tbk (Food Products) | | | 2,195 | |
| | 5,648,000 | | | PT Perusahaan Gas Negara Tbk (Gas Utilities) | | | 1,828 | |
| | 1,554,700 | | | PT Semen Gresik (Persero) Tbk (Construction Materials) | | | 1,400 | |
| | 26,009,350 | | | PT Telekomunikasi Indonesia Persero Tbk (Diversified Telecommunication Services) | | | 5,717 | |
| | 1,724,700 | | | PT United Tractors Tbk (Machinery) | | | 2,636 | |
| | | | | | | | |
| | | | | | | 20,940 | |
| | | | | | | | |
See accompanying notes to portfolio of investments.
154
HC CAPITAL TRUST
The Emerging Markets Portfolio
Portfolio of Investments (continued) — June 30, 2015
| | | | | | | | |
| Shares | | | Security Description | | Value
(000) | |
| | | | Common Stocks (continued) | | | | |
| | | | Korea, Republic Of — 0.19% | | | | |
| | 33,400 | | | KEPCO Plant Service & Engineering Co. Ltd. (Commercial Services & Supplies) | | $ | 3,534 | |
| | | | | | | | |
| | | | Malaysia — 1.89% | | | | |
| | 1,277,400 | | | AMMB Holdings Berhad (Banks) | | | 2,043 | |
| | 936,200 | | | Berjaya Sports Toto Berhard (Hotels, Restaurants & Leisure) | | | 814 | |
| | 5,280,575 | | | CIMB Group Holdings Berhad (Banks) | | | 7,659 | |
| | 1,724,100 | | | Felda Global Ventures Holdings Berhad (Food Products) | | | 745 | |
| | 4,013,800 | | | IOI Corp. Berhad (Food Products) | | | 4,322 | |
| | 298,700 | | | Lafarge Malayan Cement Berhad (Construction Materials) | | | 670 | |
| | 2,894,514 | | | Malayan Banking Berhad (Banks) | | | 7,015 | |
| | 1,310,400 | | | Maxis Berhad (Wireless Telecommunication Services) | | | 2,214 | |
| | 2,991,600 | | | Sime Darby Berhad (Industrial Conglomerates) | | | 6,759 | |
| | 813,900 | | | UMW Holdings Berhad (Automobiles) | | | 2,189 | |
| | 2,695,600 | | | YTL Corp. Berhad (Multi-Utilities) | | | 1,108 | |
| | 879,500 | | | YTL Power International Berhad (Multi-Utilities) | | | 373 | |
| | | | | | | | |
| | | | | | | 35,911 | |
| | | | | | | | |
| | | | Mexico — 3.38% | | | | |
| | 2,871,129 | | | Alpek SA de CV (Chemicals) | | | 4,193 | |
| | 8,998,100 | | | America Movil SAB de CV (Wireless Telecommunication Services) | | | 9,619 | |
| | 716,700 | | | Coca-Cola FEMSA SAB de CV, Series L (Beverages) | | | 5,696 | |
| | 921,600 | | | Compartamos SAB de CV (Consumer Finance) | | | 1,639 | |
| | 2,632,900 | | | Consorcio ARA SAB de CV (Household Durables)^(b)(c) | | | 1,010 | |
| | 1,984,200 | | | Fibra Uno Amdinistracion SA (Real Estate Investment Trusts) | | | 4,720 | |
| | 357,705 | | | Grupo Aeroportuario del Sureste SAB de CV, Class – B (Transportation Infrastructure) | | | 5,083 | |
| | 1,179,000 | | | Grupo Financiero Banorte SAB de CV (Banks) | | | 6,483 | |
| | 368,971 | | | Grupo Financiero Santander Mexico SAB de CV – Sponsored ADR, Class – B (Diversified Banks – DO NOT USE) | | | 3,376 | |
| | 3,012,445 | | | Grupo Mexico SAB de CV, Series B (Metals & Mining) | | | 9,065 | |
| | 2,692,700 | | | Kimberly-Clark de Mexico SAB de CV, A Shares (Household Products) | | | 5,824 | |
| | 614,630 | | | Volaris Aviation Holding Company, ADR (Industrials) (b)(c) | | | 7,339 | |
| | | | | | | | |
| | | | | | | 64,047 | |
| | | | | | | | |
| | | | Peru — 0.43% | | | | |
| | 58,100 | | | Credicorp Ltd. (Banks) | | | 8,071 | |
| | | | | | | | |
| | | | Philippines — 0.68% | | | | |
| | 2,091,820 | | | Aboitiz Equity Ventures, Inc. (Industrial Conglomerates) | | | 2,694 | |
| | 1,280,500 | | | Aboitiz Power Corp. (Independent Power and Renewable Electricity Producers) | | | 1,292 | |
| | 3,545,200 | | | Alliance Global Group, Inc. (Industrial Conglomerates) | | | 1,707 | |
| | | | | | | | |
| Shares | | | Security Description | | Value
(000) | |
| | | | Philippines (continued) | | | | |
| | 6,948,000 | | | DMCI Holdings, Inc. (Industrial Conglomerates) | | $ | 2,034 | |
| | 84,400 | | | Philippine Long Distance Telephone Co. (Wireless Telecommunication Services) | | | 5,261 | |
| | | | | | | | |
| | | | | | | 12,988 | |
| | | | | | | | |
| | | | Poland — 1.47% | | | | |
| | 28,500 | | | Bank Handlowy w Warszawie SA (Banks)^ | | | 758 | |
| | 115,600 | | | Bank Pekao SA (Banks)^ | | | 5,535 | |
| | 177,500 | | | Energa SA (Electric Utilities) | | | 1,074 | |
| | 1,335,667 | | | Powszechna Kasa Oszczednosci Bank Polski SA (Banks) | | | 11,059 | |
| | 68,330 | | | Powszechny Zaklad Ubezpieczen SA (Insurance) | | | 7,866 | |
| | 461,400 | | | Synthos SA (Chemicals)^(b) | | | 571 | |
| | 484,500 | | | Telekomunikacja Polska SA (Diversified Telecommunication Services)^ | | | 1,052 | |
| | | | | | | | |
| | | | | | | 27,915 | |
| | | | | | | | |
| | | | Qatar — 0.79% | | | | |
| | 50,800 | | | Doha Bank Qsc (Banks) | | | 742 | |
| | 238,055 | | | Industries Qatar Q.S.C. (Industrial Conglomerates) | | | 9,415 | |
| | 325,774 | | | The Commercial Bank of Qatar QSC (Banks) | | | 4,912 | |
| | | | | | | | |
| | | | | | | 15,069 | |
| | | | | | | | |
| | | | Russia — 3.03% | | | | |
| | 3,117,261 | | | Gazprom OAO, GDR (Oil, Gas & Consumable Fuels) (c) | | | 16,429 | |
| | 314,719 | | | LUKOIL OAO, ADR (Oil, Gas & Consumable Fuels) | | | 14,134 | |
| | 289,460 | | | MegaFon OAO, GDR (Wireless Telecommunication Services) (a) | | | 4,023 | |
| | 1,415,282 | | | Rosneft Oil Co. OJSC, Registered Shares, GDR (Oil, Gas & Consumable Fuels) (a) | | | 5,831 | |
| | 1,633,848 | | | Sberbank of Russia, ADR (Banks) | | | 8,529 | |
| | 202,664 | | | Severstal, Registered Shares, GDR (Metals & Mining) | | | 2,144 | |
| | 5,032,401 | | | The Moscow Exchange (Diversified Financial Services) | | | 6,384 | |
| | | | | | | | |
| | | | | | | 57,474 | |
| | | | | | | | |
| | | | South Africa — 4.88% | | | | |
| | 92,300 | | | African Rainbow Minerals Ltd. (Metals & Mining) | | | 628 | |
| | 2,613,266 | | | Aveng Ltd. (Construction & Engineering) (b) | | | 1,236 | |
| | 655,813 | | | Barclays Africa Group Ltd. (Banks) | | | 9,871 | |
| | 195,200 | | | Coronation Fund Managers Ltd. (Capital Markets) | | | 1,323 | |
| | 249,400 | | | Exxaro Resources Ltd. (Oil, Gas & Consumable Fuels) | | | 1,783 | |
| | 2,149,263 | | | FirstRand Ltd. (Diversified Financial Services) | | | 9,427 | |
| | 1,972,966 | | | Growthpoint Properties Ltd. (Real Estate Investment Trusts) | | | 4,295 | |
| | 423,000 | | | Hyprop Investments Ltd. (Real Estate Management & Development) | | | 4,211 | |
| | 436,850 | | | Imperial Holdings Ltd. (Distributors) | | | 6,666 | |
| | 88,443 | | | Liberty Holdings Ltd. (Insurance) | | | 1,056 | |
| | 1,590,900 | | | Life Healthcare Group Holdings Ltd. (Health Care Providers & Services) | | | 4,912 | |
| | 949,100 | | | MMI Holdings Ltd. (Insurance) | | | 2,354 | |
See accompanying notes to portfolio of investments.
155
HC CAPITAL TRUST
The Emerging Markets Portfolio
Portfolio of Investments (continued) — June 30, 2015
| | | | | | | | |
| Shares | | | Security Description | | Value
(000) | |
| | | | Common Stocks (continued) | | | | |
| | | | South Africa (continued) | | | | |
| | 508,130 | | | MTN Group Ltd. (Wireless Telecommunication Services) | | $ | 9,562 | |
| | 528,100 | | | Nampak Ltd. (Containers & Packaging) | | | 1,468 | |
| | 5,894,906 | | | Redefine Properties Ltd. (Real Estate Investment Trusts) | | | 4,951 | |
| | 450,500 | | | Resilient Property Income Fund Ltd. (Real Estate Investment Trusts) | | | 3,574 | |
| | 253,319 | | | Sasol Ltd. (Oil, Gas & Consumable Fuels) | | | 9,378 | |
| | 680,358 | | | Standard Bank Group Ltd. (Banks) | | | 8,965 | |
| | 91,549 | | | Tiger Brands Ltd. (Food Products) | | | 2,135 | |
| | 677,100 | | | Truworths International Ltd. (Specialty Retail) | | | 4,774 | |
| | | | | | | | |
| | | | | | | 92,569 | |
| | | | | | | | |
| | | | South Korea — 14.69% | | | | |
| | 90,800 | | | Coway Co. Ltd. (Household Durables) | | | 7,442 | |
| | 78,600 | | | Daewoo International Corp. (Trading Companies & Distributors) | | | 1,818 | |
| | 153,300 | | | Daewoo Securities Co. Ltd. (Capital Markets) | | | 2,096 | |
| | 111,493 | | | DGB Financial Group, Inc. (Banks) | | | 1,170 | |
| | 36,300 | | | Dongbu Insurance Co. Ltd. (Insurance) | | | 1,840 | |
| | 10,440 | | | Doosan Corp. (Industrial Conglomerates) | | | 1,020 | |
| | 28,272 | | | E-Mart Co. Ltd. (Food & Staples Retailing) | | | 5,856 | |
| | 86,700 | | | GS Holdings Corp. (Oil, Gas & Consumable Fuels) | | | 3,868 | |
| | 64,100 | | | Halla Climate Control Corp. (Auto Components) | | | 2,216 | |
| | 236,389 | | | Hana Financial Group, Inc. (Banks) | | | 6,158 | |
| | 18,600 | | | Hyosung Corp. (Chemicals) | | | 2,402 | |
| | 151,633 | | | Hyundai Engineering & Construction Co. Ltd. (Construction & Engineering) | | | 5,582 | |
| | 51,541 | | | Hyundai Marine & Fire Insurance Co. Ltd. (Insurance) | | | 1,363 | |
| | 46,251 | | | Hyundai Mobis Co. Ltd. (Auto Components) | | | 8,792 | |
| | 161,445 | | | Hyundai Motor Co. Ltd. (Automobiles) | | | 19,689 | |
| | 215,300 | | | Industrial Bank of Korea (Banks) | | | 2,790 | |
| | 16,547 | | | Jinro Ltd. (Beverages) | | | 336 | |
| | 192,700 | | | Kangwon Land, Inc. (Hotels, Restaurants & Leisure) | | | 6,393 | |
| | 318,511 | | | KB Financial Group, Inc., ADR (Banks) (c) | | | 10,469 | |
| | 564,531 | | | KB Financial Group, Inc. (Banks) | | | 18,680 | |
| | 202,981 | | | Kia Motors Corp. (Automobiles) | | | 8,245 | |
| | 610,384 | | | Korea Electric Power Corp., ADR (Electric Utilities) | | | 12,427 | |
| | 11,400 | | | Korea Kumho Petrochemical Co. Ltd. (Chemicals) | | | 724 | |
| | 181,700 | | | Korea Life Insurance Co. Ltd. (Insurance) | | | 1,292 | |
| | 139,084 | | | Korean Reinsurance Co. (Insurance) | | | 1,534 | |
| | 243,230 | | | KT Corp., ADR (Diversified Telecommunication Services) (b) | | | 3,082 | |
| | 355,931 | | | KT Corp. (Diversified Telecommunication Services) (b) | | | 9,080 | |
| | 94,964 | | | KT&G Corp. (Tobacco) | | | 8,081 | |
| | 27,852 | | | LG Chem Ltd. (Chemicals) | | | 6,955 | |
| | 344,700 | | | LG Display Co. Ltd. (Electronic Equipment, Instruments & Components) | | | 7,990 | |
| | 161,756 | | | LG Electronics, Inc. (Information Technology) | | | 6,846 | |
| | | | | | | | |
| Shares | | | Security Description | | Value
(000) | |
| | | | South Korea (continued) | | | | |
| | 46,928 | | | Lotte Shopping Co. Ltd. (Multiline Retail) | | $ | 9,868 | |
| | 25,271 | | | LS Corp. (Electrical Equipment) | | | 985 | |
| | 24,900 | | | LS Industrial Systems Co. Ltd. (Electrical Equipment) | | | 1,020 | |
| | 21,133 | | | Nong Shim Co. Ltd. (Food Products) | | | 5,505 | |
| | 72,428 | | | POSCO (Metals & Mining) | | | 14,548 | |
| | 67,298 | | | POSCO, ADR (Metals & Mining) | | | 3,304 | |
| | 28,900 | | | Samsung Card Co. Ltd. (Consumer Finance) | | | 959 | |
| | 33,983 | | | Samsung Electronics Co. Ltd. (Technology Hardware, Storage & Peripherals) | | | 38,639 | |
| | 447,389 | | | Shinhan Financial Group Co. Ltd. (Banks) | | | 16,669 | |
| | 19,855 | | | Shinsegae Co. Ltd. (Multiline Retail) | | | 4,771 | |
| | 7,928 | | | SK Telecom Co. Ltd. (Wireless Telecommunication Services) | | | 1,777 | |
| | 492,954 | | | Woori Bank (Banks) | | | 4,332 | |
| | | | | | | | |
| | | | | | | 278,613 | |
| | | | | | | | |
| | | | Taiwan — 10.02% | | | | |
| | 6,221,000 | | | Advanced Semiconductor Engineering, Inc. (Semiconductors & Semiconductor Equipment) | | | 8,429 | |
| | 1,405,971 | | | Asia Cement Corp. (Construction Materials) | | | 1,663 | |
| | 602,000 | | | Asustek Computer, Inc. (Technology Hardware, Storage & Peripherals) | | | 5,864 | |
| | 2,122,000 | | | Cheng Shin Rubber Industry Co. Ltd. (Auto Components) | | | 4,698 | |
| | 584,000 | | | Chicony Electronics Co. Ltd. (Technology Hardware, Storage & Peripherals) | | | 1,567 | |
| | 8,985,000 | | | China Development Financial Holding Corp. (Banks) | | | 3,407 | |
| | 701,000 | | | China Motor Corp. (Automobiles) | | | 546 | |
| | 2,140,000 | | | Chunghwa Telecom Co. Ltd. (Diversified Telecommunication Services) | | | 6,825 | |
| | 13,487,000 | | | Compal Electronics, Inc. (Technology Hardware, Storage & Peripherals) | | | 10,273 | |
| | 778,000 | | | CTCI Corp. (Construction & Engineering) | | | 1,258 | |
| | 1,036,000 | | | Far EasTone Telecommunications Co. Ltd. (Wireless Telecommunication Services) | | | 2,505 | |
| | 979,000 | | | Formosa Taffeta Co. Ltd. (Textiles, Apparel & Luxury Goods) | | | 1,039 | |
| | 3,085,996 | | | Fubon Financial Holding Co. Ltd. (Diversified Financial Services) | | | 6,142 | |
| | 1,000 | | | Grand Pacific Petrochemical Corp. (Chemicals) | | | 1 | |
| | 379,000 | | | Highwealth Construction Corp. (Real Estate Management & Development) | | | 904 | |
| | 5,117,108 | | | Hon Hai Precision Industry Co. Ltd. (Electronic Equipment, Instruments & Components) | | | 16,089 | |
| | 874,000 | | | HTC Corp. (Technology Hardware, Storage & Peripherals) (b) | | | 2,040 | |
| | 3,022,000 | | | Inventec Corp. (Technology Hardware, Storage & Peripherals) | | | 2,091 | |
| | 362,000 | | | Kinsus Interconnect Technology Corp. (Semiconductors & Semiconductor Equipment) | | | 993 | |
| | 2,645,552 | | | Lite-On Technology Corp. (Technology Hardware, Storage & Peripherals) | | | 3,104 | |
See accompanying notes to portfolio of investments.
156
HC CAPITAL TRUST
The Emerging Markets Portfolio
Portfolio of Investments (continued) — June 30, 2015
| | | | | | | | |
| Shares | | | Security Description | | Value
(000) | |
| | | | Common Stocks (continued) | | | | |
| | | | Taiwan (continued) | | | | |
| | 763,962 | | | MediaTek, Inc. (Semiconductors & Semiconductor Equipment) | | $ | 10,450 | |
| | 6,290,477 | | | Mega Financial Holding Co. Ltd. (Banks) | | | 5,669 | |
| | 2,340,740 | | | Nan Ya Printed Circuit Board Corp. (Electronic Equipment, Instruments & Components) (b) | | | 3,084 | |
| | 746,000 | | | Novatek Microelectronics Corp. (Semiconductors & Semiconductor Equipment) | | | 3,603 | |
| | 2,076,000 | | | Pegatron Corp. (Technology Hardware, Storage & Peripherals) | | | 6,076 | |
| | 1,620 | | | Pou Chen Corp. (Textiles, Apparel & Luxury Goods) | | | 2 | |
| | 867,000 | | | Powertech Technology, Inc. (Semiconductors & Semiconductor Equipment) | | | 1,877 | |
| | 2,426,000 | | | Quanta Computer, Inc. (Technology Hardware, Storage & Peripherals) | | | 5,740 | |
| | 3,385,150 | | | Radiant Opto-Electronics Corp. (Semiconductors & Semiconductor Equipment) | | | 12,562 | |
| | 542,000 | | | Realtek Semiconductor Corp. (Semiconductors & Semiconductor Equipment) | | | 1,390 | |
| | 449,000 | | | Ruentex Development Co. Ltd. (Real Estate Management & Development) | | | 710 | |
| | 691,000 | | | Ruentex Industries Ltd. (Textiles, Apparel & Luxury Goods) | | | 1,582 | |
| | 31,286,550 | | | Shin Kong Financial Holding Co. Ltd. (Insurance) | | | 9,553 | |
| | 3,855,000 | | | Siliconware Precision Industries Co. (Semiconductors & Semiconductor Equipment) | | | 5,904 | |
| | 1,459,000 | | | Simplo Technology Co. Ltd. (Electronic Equipment, Instruments & Components) | | | 6,763 | |
| | 1,585,000 | | | Synnex Technology International Corp. (Electronic Equipment, Instruments & Components) | | | 2,350 | |
| | 2,126,000 | | | Taiwan Cement Corp. (Construction Materials) | | | 2,684 | |
| | 522,000 | | | Taiwan Fertilizer Co. Ltd. (Chemicals) | | | 863 | |
| | 1,096,000 | | | Taiwan Mobile Co. Ltd. (Wireless Telecommunication Services) | | | 3,659 | |
| | 1,864,000 | | | Taiwan Semiconductor Manufacturing Co. Ltd. (Semiconductors & Semiconductor Equipment) | | | 8,489 | |
| | 127,230 | | | Taiwan Semiconductor Manufacturing Co. Ltd., ADR (Semiconductors & Semiconductor Equipment) | | | 2,889 | |
| | 252,000 | | | Transcend Information, Inc. (Semiconductors & Semiconductor Equipment) | | | 927 | |
| | 559,000 | | | U-Ming Marine Transport Corp. (Marine) | | | 759 | |
| | 3,076,981 | | | United Microelectronics Corp., ADR (Semiconductors & Semiconductor Equipment) (c) | | | 6,308 | |
| | 1,012,000 | | | Vanguard International Semiconductor Corp. (Semiconductors & Semiconductor Equipment) | | | 1,620 | |
| | 698,000 | | | Wan Hai Lines Ltd. (Marine) | | | 554 | |
| | 3,007,408 | | | Wistron Corp. (Technology Hardware, Storage & Peripherals) | | | 2,281 | |
| | | | | | | | |
| Shares | | | Security Description | | Value
(000) | |
| | | | Taiwan (continued) | | | | |
| | 1,765,000 | | | WPG Holdings Ltd. (Electronic Equipment, Instruments & Components) | | $ | 2,211 | |
| | | | | | | | |
| | | | | | | 189,997 | |
| | | | | | | | |
| | | | Taiwan, Province Of China — 0.24% | | | | |
| | 747,000 | | | Casetek Holdings Ltd. (Electronic Equipment, Instruments & Components) | | | 4,625 | |
| | | | | | | | |
| | | | Thailand — 2.26% | | | | |
| | 488,300 | | | Advanced Info Service Public Co. Ltd. (Wireless Telecommunication Services) | | | 3,471 | |
| | 2,677,500 | | | Bangkok Bank Public Co. Ltd. – Foreign Registered Shares (Banks) | | | 14,153 | |
| | 252,800 | | | Bangkok Bank Public Co. Ltd. – NVDR (Banks) | | | 1,333 | |
| | 1,107,000 | | | Banpu Public Co. Ltd., Registered Shares (Oil, Gas & Consumable Fuels) | | | 836 | |
| | 927,700 | | | BEC World Public Co. Ltd. (Media) | | | 1,030 | |
| | 5,442,800 | | | BTS Group Holdings PCL (Road & Rail) | | | 1,612 | |
| | 464,500 | | | Delta Electronics (Thailand) PLC (Electronic Equipment, Instruments & Components) | | | 1,245 | |
| | 246,600 | | | Glow Energy Public Co. Ltd. (Independent Power Producers & Energy Traders) | | | 623 | |
| | 1,644,700 | | | Krung Thai Bank Public Co. Ltd. – NVDR (Banks) | | | 833 | |
| | 1,195,775 | | | PTT Exploration & Production Public Co. Ltd. (Oil, Gas & Consumable Fuels) | | | 3,860 | |
| | 2,978,642 | | | PTT Global Chemical Public Co. Ltd. (Chemicals) | | | 6,109 | |
| | 727,600 | | | Siam Commercial Bank Public Co. Ltd. – NVDR (Banks) | | | 3,351 | |
| | 2,679,600 | | | Thai Oil Public Co. Ltd. (Oil, Gas & Consumable Fuels) | | | 4,365 | |
| | | | | | | | |
| | | | | | | 42,821 | |
| | | | | | | | |
| | | | Turkey — 0.74% | | | | |
| | 1,233,900 | | | Eregli Demir ve Celik Fabrikalari TAS (Metals & Mining) | | | 1,999 | |
| | 1 | | | Kardemir Karabuk Demir Celik Sanayi ve Ticaret AS, Class – D (Metals & Mining) | | | — | |
| | 280,000 | | | TAV Havalimanlari Holding A/S (Transportation Infrastructure) | | | 2,377 | |
| | 215,200 | | | Tofas Turk Otomobil Fabrikasi A/S (Automobiles) | | | 1,470 | |
| | 442,600 | | | Turk Telekomunikasyon A/S (Diversified Telecommunication Services) | | | 1,165 | |
| | 1,533,753 | | | Turkiye Halk Bankasi A/S (Banks) | | | 7,068 | |
| | | | | | | | |
| | | | | | | 14,079 | |
| | | | | | | | |
| | | | United Arab Emirates — 0.65% | | | | |
| | 926,500 | | | Abu Dhabi Commercial Bank PJSC (Banks) | | | 1,940 | |
| | 845,900 | | | Dubai Islamic Bank (Banks) | | | 1,575 | |
| | 2,583,709 | | | Emaar Properties PJSC (Real Estate Management & Development) | | | 5,544 | |
| | 770,200 | | | First Gulf Bank PJSC (Media) | | | 3,187 | |
| | | | | | | | |
| | | | | | | 12,246 | |
| | | | | | | | |
| | | | Total Common Stocks | | | 1,717,112 | |
| | | | | | | | |
See accompanying notes to portfolio of investments.
157
HC CAPITAL TRUST
The Emerging Markets Portfolio
Portfolio of Investments (continued) — June 30, 2015
| | | | | | | | |
Shares or
Principal
Amount
(000) | | | Security Description | | Value
(000) | |
| | | | Preferred Stocks — 2.22% | | | | |
| | | | Brazil — 1.27% | | | | |
| | 2,001,300 | | | Banco do Estado do Rio Grande do Sul SA – Preferred, B Shares (Banks) | | $ | 5,776 | |
| | 1,176,212 | | | Companhia Energetica de Minas Gerais SA – Preferred, ADR (Electric Utilities) | | | 4,461 | |
| | 153,100 | | | Companhia Paranaense de Energia-COPEL – Preferred, B Shares (Electric Utilities) | | | 1,698 | |
| | 1,387,200 | | | Gerdau SA – Preferred (Metals & Mining) | | | 3,325 | |
| | 984,114 | | | Itausa – Investimentos Itau SA – Preferred (Banks) | | | 2,824 | |
| | 2,250,000 | | | Marcopolo SA – Preferred (Machinery) | | | 1,665 | |
| | 155,300 | | | Metalurgica Gerdau SA – Preferred (Metals & Mining) | | | 316 | |
| | 2,382,500 | | | Randon Participacoes SA – Preferred (Machinery) | | | 2,476 | |
| | 104,700 | | | Telefonica Brasil SA – Preferred (Diversified Telecommunication Services) | | | 1,464 | |
| | | | | | | | |
| | | | | | | 24,005 | |
| | | | | | | | |
| | | | Colombia — 0.07% | | | | |
| | 2,865,700 | | | Grupo Aval Acciones y Valores SA – Preferred (Banks) | | | 1,403 | |
| | | | | | | | |
| | | | South Korea — 0.88% | | | | |
| | 62,900 | | | Hyundai Motor Co. Ltd. – Preferred (Automobiles) | | | 5,922 | |
| | 40,300 | | | Hyundai Motor Co. Ltd. – Preferred (Automobiles) | | | 3,686 | |
| | 8,007 | | | Samsung Electronics Co. Ltd. – Preferred (Technology Hardware, Storage & Peripherals) | | | 7,130 | |
| | | | | | | | |
| | | | | | | 16,738 | |
| | | | | | | | |
| | | | Total Preferred Stocks | | | 42,146 | |
| | | | | | | | |
| | | | Global Bond — 0.00% | | | | |
| | | | India — 0.00% | | | | |
| $ | 2,864 | | | NTPC Ltd., 8.49%, 3/25/25 (d) | | | 6 | |
| | | | | | | | |
| | | | Total Global Bond | | | 6 | |
| | | | | | | | |
| | | | Time Deposit — 0.54% | | | | |
| | 10,162 | | | State Street Liquidity Management Control System Eurodollar Time Deposit, 0.01%, 7/1/15 | | | 10,162 | |
| | | | | | | | |
| | | | Total Time Deposit | | | 10,162 | |
| | | | | | | | |
| | | | Mutual Funds — 1.15% | | | | |
| | 19,000 | | | Federated U.S. Treasury Cash Reserve Fund, Institutional Shares, 0.00% | | | 19 | |
| | 423,004 | | | iShares MSCI Emerging Markets Index Fund ETF | | | 16,759 | |
| | 18,480 | | | iShares MSCI Taiwan Index Fund ETF | | | 292 | |
| | 2,966,000 | | | SSgA Treasury Money Market Fund, 0.00% | | | 2,966 | |
| | 77,652 | | | WisdomTree India Earnings Fund ETF | | | 1,683 | |
| | | | | | | | |
| | | | Total Mutual Funds | | | 21,719 | |
| | | | | | | | |
| | | | | | | | |
Principal
Amount
(000) | | | Security Description | | Value
(000) | |
| | | | Repurchase Agreement — 0.41% | | | | |
| $ | 7,723 | | | Jefferies LLC, 0.23%, 7/1/15
(Purchased on 6/30/15, proceeds at maturity $7,723,414 collateralized by U.S. Treasury Obligations, 0.00% – 3.28%, 8/15/15 – 8/15/44 fair value
$7,877,833)^^ | | $ | 7,723 | |
| | | | | | | | |
| | | | Total Repurchase Agreement | | | 7,723 | |
| | | | | | | | |
| | | | Total Investments
(cost $1,865,631) — 94.87% | | | 1,798,868 | |
| | | | Other assets in excess of
liabilities — 5.13% | | | 97,196 | |
| | | | | | | | |
| | | | Net Assets — 100.00% | | $ | 1,896,064 | |
| | | | | | | | |
Amounts designated as “—” are $0 or have been rounded to $0.
| * | Security was fair valued on June 30, 2015 and represents a Level 2 security. Refer to Note 2 in the Notes to Financial Statements. |
| ^ | All or part of this security was on loan as of June 30, 2015. The total value of securities on loan as of June 30, 2015, was $12,908 (amount in thousands). |
| ^^ | Purchased with cash collateral held from securities lending. The value of the collateral could include collateral held for securities that were sold on or before June 30, 2015. |
| (a) | Represents a security purchased under Rule 144A or Section 4(2) and is exempt from registration under the Securities Act of 1933, as amended, or is otherwise restricted to resale. Certain of these securities may be resold in transactions exempt from registration, normally to qualified institutional buyers. These securities have been deemed liquid by the Specialist Manager. |
| (b) | Represents non-income producing security. |
| (c) | These securities has been deemed illiquid by the Specialist Manager and represents 6.20% of the Portfolio’s net assets. |
| (d) | The principal amount is disclosed in local currency and the value is disclosed in U.S. Dollars. |
ADR — American Depositary Receipt
ETF — Exchange Traded Fund
GDR — Global Depositary Receipt
NVDR — Non-Voting Depository Receipt
See accompanying notes to portfolio of investments.
158
HC CAPITAL TRUST
The Emerging Markets Portfolio
Portfolio of Investments (concluded) — June 30, 2015
The following table reflects the percentage of total net assets of the Portfolio attributable to each Specialist Manager, see Note 3 in the Notes to Financial Statements.
| | | | | | | | | | | | | | | | |
The Emerging Markets Portfolio | | Boston Company
Asset
Management,
LLC | | | Mellon Capital
Management
Corporation | | | Parametric
Portfolio
Associates,
LLC | | | Total | |
Common Stocks | | | 45.53 | % | | | 45.02 | % | | | — | | | | 90.55 | % |
Preferred Stocks | | | 0.94 | % | | | 1.28 | % | | | — | | | | 2.22 | % |
Global Bond | | | — | | | | — | | | | — | | | | 0.00 | % |
Time Deposit | | | 0.54 | % | | | — | | | | — | | | | 0.54 | % |
Mutual Funds | | | 0.99 | % | | | 0.16 | % | | | — | | | | 1.15 | % |
Repurchase Agreement | | | 0.05 | % | | | 0.36 | % | | | — | | | | 0.41 | % |
Other Assets (Liabilities) | | | 0.42 | % | | | 0.77 | % | | | 3.94 | % | | | 5.13 | % |
| | | | | | | | | | | | | | | | |
Total Net Assets | | | 48.47 | % | | | 47.59 | % | | | 3.94 | % | | | 100.00 | % |
| | | | | | | | | | | | | | | | |
The following table reflects the open derivative positions held by the Portfolio as of June 30, 2015.
Long Futures
| | | | | | | | | | | | | | | | |
Number of
Contracts | | | Futures Contracts Positions^ | | Value
(000) | | | Expiration | | | Unrealized
Appreciation/
(Depreciation)
(000) | |
| | 1,602 | | | Mini MSCI Emerging Markets Index Future | | $ | 76,848 | | | | 9/18/15 | | | $ | (775 | ) |
| | | | | | | | | | | | | | | | |
| | | | Net Unrealized Appreciation/(Depreciation) | | | | | | | | | | $ | (775 | ) |
| | | | | | | | | | | | | | | | |
Amounts designated as “—” are $0 or have been rounded to $0.
See accompanying notes to portfolio of investments.
159
HC CAPITAL TRUST
The Core Fixed Income Portfolio
Portfolio of Investments — June 30, 2015
| | | | | | | | | | | | | | | | |
Principal
Amount
(000) | | | | | Rate % | | | Maturity
Date | | | Value
(000) | |
| | | | Asset Backed Securities — 0.54% | | | | | | | | | | | | |
| $ | 25 | | | American Express Credit Account Master Trust, Series 2012-5, Class A | | | 0.59 | | | | 5/15/18 | | | $ | 25 | |
| | 25 | | | AmeriCredit Automobile Receivables Trust, Series 2013-5, Class A3 | | | 0.90 | | | | 9/8/18 | | | | 25 | |
| | 25 | | | AmeriCredit Automobile Receivables Trust, Series 2014-4, Class A3 | | | 1.27 | | | | 7/8/19 | | | | 25 | |
| | 110 | | | Capital One Multi-Asset Execution Trust, Series 2006-A3, Class A3 | | | 5.05 | | | | 12/17/18 | | | | 114 | |
| | 20 | | | CarMax Auto Owner Trust, Series 2014-2, Class A3 | | | 0.98 | | | | 1/15/19 | | | | 20 | |
| | 20 | | | CarMax Auto Owner Trust, Series 2012-2, Class A4 | | | 1.16 | | | | 12/15/17 | | | | 20 | |
| | 100 | | | Citibank Credit Card Issuance Trust, Series 2014-A4, Class A4 | | | 1.23 | | | | 4/24/19 | | | | 100 | |
| | 20 | | | Fifth Third Auto Trust, Series 2014-3, Class A4 | | | 1.47 | | | | 5/17/21 | | | | 20 | |
| | 50 | | | Ford Credit Auto Lease Trust, Series 2014-B, Class A3 | | | 0.89 | | | | 9/15/17 | | | | 50 | |
| | 50 | | | Ford Credit Auto Owner Trust, Series 2013-C, Class A4 | | | 1.25 | | | | 10/15/18 | | | | 50 | |
| | 25 | | | Honda Auto Receivables Owner Trust, Series 2014-4, Class A3 | | | 0.99 | | | | 9/17/18 | | | | 25 | |
| | 20 | | | Mercedes-Benz Auto Lease Trust, Series 2015-A, Class A4 | | | 1.21 | | | | 10/15/20 | | | | 20 | |
| | 25 | | | Santander Drive Auto Receivables Trust, Series 2014-3, Class C | | | 2.13 | | | | 8/17/20 | | | | 25 | |
| | 20 | | | World Omni Auto Receivables Trust, Series 2014-A, Class A3 | | | 0.94 | | | | 4/15/19 | | | | 20 | |
| | | | | | | | | | | | | | | | |
| | | | Total Asset Backed Securities | | | | | | | | | | | 539 | |
| | | | | | | | | | | | | | | | |
| | | | Collateralized Mortgage Obligations — 2.47% | | | | | | | | | | | | |
| | 140 | | | Banc of America Commercial Mortgage, Inc., Series 2006-2, Class AJ (a) | | | 5.76 | | | | 5/10/45 | | | | 144 | |
| | 100 | | | Chase Issuance Trust, Series 2014-A7, Class A | | | 1.38 | | | | 11/15/19 | | | | 101 | |
| | 50 | | | Citigroup Commercial Mortgage Trust, Series 2015-GC27, Class A4 | | | 2.88 | | | | 2/10/48 | | | | 48 | |
| | 20 | | | Citigroup Commercial Mortgage Trust, Series 2015-GC27, Class A5 | | | 3.14 | | | | 2/10/48 | | | | 20 | |
| | 25 | | | Citigroup Commercial Mortgage Trust, Series 2014-GC23, Class A4 | | | 3.62 | | | | 7/10/47 | | | | 26 | |
| | 46 | | | Citigroup Commercial Mortgage Trust, Series 2008-C7, Class A4 (a) | | | 6.14 | | | | 9/10/17 | | | | 49 | |
| | 34 | | | Commercial Mortgage Trust, Series 2013-CR8, Class A1 | | | 1.02 | | | | 6/10/46 | | | | 34 | |
| | 20 | | | Commercial Mortgage Trust, Series 2014-LC15, Class A2 | | | 2.84 | | | | 4/10/47 | | | | 21 | |
| | 20 | | | Commercial Mortgage Trust, Series 2014-CR15, Class A2 | | | 2.93 | | | | 2/10/47 | | | | 21 | |
| | 50 | | | Commercial Mortgage Trust, Series 2015-LC19, Class A4 | | | 3.18 | | | | 2/10/48 | | | | 50 | |
| | 20 | | | Commercial Mortgage Trust, Series 2015-DC1, Class A5 | | | 3.35 | | | | 2/10/48 | | | | 20 | |
| | 50 | | | Commercial Mortgage Trust, Series 2013-CR8, Class A5 (a) | | | 3.61 | | | | 6/10/46 | | | | 52 | |
| | 25 | | | Commercial Mortgage Trust, Series 2014-UBS3, Class A4 | | | 3.82 | | | | 6/10/47 | | | | 26 | |
| | 30 | | | Commercial Mortgage Trust, Series 2014-CR15, Class A4 (a) | | | 4.07 | | | | 2/10/47 | | | | 32 | |
| | 50 | | | Commercial Mortgage Trust, Series 2014-CR14, Class A4 (a) | | | 4.24 | | | | 2/10/47 | | | | 54 | |
| | 25 | | | Commercial Mortgage Trust, Series 2013-CR11, Class B (a) | | | 5.16 | | | | 10/10/46 | | | | 28 | |
| | 66 | | | Fannie Mae, Series 2013-M14, Class APT (a) | | | 2.50 | | | | 4/25/23 | | | | 66 | |
| | 26 | | | Fannie Mae, Series 2014-M3, Class AB2 (a) | | | 3.46 | | | | 1/25/24 | | | | 27 | |
| | 25 | | | Fannie Mae-ACES, Series 2012-M4, Class 1A2 | | | 2.98 | | | | 4/25/22 | | | | 26 | |
| | 25 | | | Freddie Mac Multifamily Structured Pass-Through Certificates, Series K714, Class A1 | | | 2.08 | | | | 12/25/19 | | | | 25 | |
| | 70 | | | Freddie Mac Multifamily Structured Pass-Through Certificates, Series K027, Class A2 | | | 2.64 | | | | 1/25/23 | | | | 70 | |
| | 25 | | | Freddie Mac Multifamily Structured Pass-Through Certificates, Series K017, Class A2 | | | 2.87 | | | | 12/25/21 | | | | 26 | |
| | 18 | | | Freddie Mac Multifamily Structured Pass-Through Certificates, Series K032, Class A1 | | | 3.02 | | | | 2/25/23 | | | | 19 | |
| | 30 | | | Freddie Mac Multifamily Structured Pass-Through Certificates, Series K033, Class A2 (a) | | | 3.06 | | | | 7/25/23 | | | | 31 | |
| | 35 | | | Freddie Mac Multifamily Structured Pass-Through Certificates, Series K032, Class A2 (a) | | | 3.31 | | | | 5/25/23 | | | | 37 | |
| | 60 | | | Freddie Mac Multifamily Structured Pass-Through Certificates, Series K014, Class A2 | | | 3.87 | | | | 4/25/21 | | | | 65 | |
| | 35 | | | Freddie Mac Multifamily Structured Pass-Through Certificates, Series K012, Class A2 | | | 4.19 | | | | 12/25/20 | | | | 38 | |
| | 45 | | | Freddie Mac Multifamily Structured Pass-Through Certificates, Series K006, Class A2 | | | 4.25 | | | | 1/25/20 | | | | 49 | |
| | 15 | | | Greenwich Capital Commercial Funding Corp., Series 2005-GG5, Class AM (a) | | | 5.28 | | | | 4/10/37 | | | | 15 | |
| | 20 | | | GS Mortgage Securities Trust, Series 2014-GC20, Class A3 | | | 3.68 | | | | 4/10/47 | | | | 21 | |
| | 25 | | | GS Mortgage Securities Trust, Series 2013-GC14, Class A5 | | | 4.24 | | | | 8/10/46 | | | | 27 | |
| | 25 | | | Hyundai Auto Receivables Trust, Series 2014-A, Class A3 | | | 0.79 | | | | 7/16/18 | | | | 25 | |
| | 25 | | | JPMBB Commercial Mortgage Securities Trust, Series 2014-C24, Class A5 | | | 3.64 | | | | 11/15/47 | | | | 26 | |
| | 20 | | | JPMBB Commercial Mortgage Securities Trust, Series 2014-C21, Class A5 | | | 3.77 | | | | 8/15/47 | | | | 21 | |
| | 25 | | | JPMBB Commercial Mortgage Securities Trust, Series 2014-C22, Class A4 | | | 3.80 | | | | 9/15/47 | | | | 26 | |
| | 50 | | | JPMBB Commercial Mortgage Securities Trust, Series 2013-C15, Class A5 | | | 4.13 | | | | 11/15/45 | | | | 54 | |
| | 150 | | | JPMorgan Chase Commercial Mortgage Securities Corp., Series 2012-C8, Class A3 | | | 2.83 | | | | 10/15/45 | | | | 149 | |
| | 28 | | | Merrill Lynch Mortgage Trust, Series 2007-C1, Class A3 (a) | | | 5.84 | | | | 11/12/16 | | | | 28 | |
See accompanying notes to portfolio of investments.
160
HC CAPITAL TRUST
The Core Fixed Income Portfolio
Portfolio of Investments (continued) — June 30, 2015
| | | | | | | | | | | | | | | | |
Principal
Amount
(000) | | | | | Rate % | | | Maturity
Date | | | Value
(000) | |
| | | | Collateralized Mortgage Obligations (continued) | | | | | | | | | | | | |
| $ | 16 | | | Morgan Stanley BAML Trust, Series 2013-C9, Class A1 | | | 0.83 | | | | 5/15/46 | | | $ | 16 | |
| | 50 | | | Morgan Stanley BAML Trust, Series 2013-C11, Class A2 | | | 3.09 | | | | 8/15/46 | | | | 52 | |
| | 20 | | | Morgan Stanley BAML Trust, Series 2015-C20, Class A4 | | | 3.25 | | | | 2/15/48 | | | | 20 | |
| | 50 | | | Morgan Stanley BAML Trust, Series 2013-C9, Class AS | | | 3.46 | | | | 5/15/46 | | | | 50 | |
| | 25 | | | Morgan Stanley BAML Trust, Series 2014-C17, Class A5 | | | 3.74 | | | | 8/15/47 | | | | 26 | |
| | 205 | | | Morgan Stanley Capital I, Series 2007-HQ11, Class A4 (a) | | | 5.45 | | | | 2/12/44 | | | | 214 | |
| | 142 | | | Morgan Stanley Capital I, Series 2006-HQ9, Class A4 (a) | | | 5.73 | | | | 7/12/44 | | | | 145 | |
| | 180 | | | Morgan Stanley Capital I, Series 2007-IQ15, Class A4 (a) | | | 5.91 | | | | 7/11/17 | | | | 191 | |
| | 25 | | | UBS Commercial Mortgage Trust, Series 2012-C1, Class AAB | | | 3.00 | | | | 5/10/45 | | | | 26 | |
| | 20 | | | UBS-Barclays Commercial Mortgage Trust, Series 2012-C2, Class A2 | | | 2.11 | | | | 5/10/63 | | | | 20 | |
| | 30 | | | UBS-Barclays Commercial Mortgage Trust, Series 2012-C4, Class A5 | | | 2.85 | | | | 12/10/45 | | | | 30 | |
| | 21 | | | WF-RBS Commercial Mortgage Trust, Series 2012-C7, Class A1 | | | 2.30 | | | | 6/15/45 | | | | 21 | |
| | 50 | | | WF-Rbs Commercial Mortgage Trust, Series 2014-C24, Class A2 | | | 2.86 | | | | 11/15/47 | | | | 51 | |
| | | | | | | | | | | | | | | | |
| | | | Total Collateralized Mortgage Obligations | | | | | | | | | | | 2,459 | |
| | | | | | | | | | | | | | | | |
| | | | U.S. Government Agency Mortgages — 34.48% | | | | | | | | | | | | |
| | 23 | | | Fannie Mae, Pool #AT7281 | | | 2.00 | | | | 9/1/28 | | | | 23 | |
| | 94 | | | Fannie Mae, Pool #AS2673 | | | 2.00 | | | | 5/1/29 | | | | 93 | |
| | 136 | | | Fannie Mae, Pool #AP4742 | | | 2.50 | | | | 8/1/27 | | | | 139 | |
| | 67 | | | Fannie Mae, Pool #AB7391 | | | 2.50 | | | | 12/1/42 | | | | 64 | |
| | 140 | | | Fannie Mae, Pool #MA1277 | | | 2.50 | | | | 12/1/27 | | | | 142 | |
| | 83 | | | Fannie Mae, Pool #AU1660 | | | 2.50 | | | | 7/1/28 | | | | 85 | |
| | 87 | | | Fannie Mae, Pool #AU0293 | | | 2.50 | | | | 8/1/28 | | | | 88 | |
| | 98 | | | Fannie Mae, Pool #AS4660 | | | 2.50 | | | | 3/1/30 | | | | 99 | |
| | 82 | | | Fannie Mae, Pool #AO3019 | | | 2.50 | | | | 5/1/27 | | | | 84 | |
| | 138 | | | Fannie Mae, Pool #MA1210 | | | 2.50 | | | | 9/1/49 | | | | 141 | |
| | 83 | | | Fannie Mae, Pool #AU6677 | | | 2.50 | | | | 9/1/28 | | | | 85 | |
| | 58 | | | Fannie Mae, Pool #AY1861 (a) | | | 2.72 | | | | 1/1/45 | | | | 59 | |
| | 87 | | | Fannie Mae, Pool #AT0682 | | | 3.00 | | | | 4/1/43 | | | | 87 | |
| | 149 | | | Fannie Mae, Pool #AP2465 | | | 3.00 | | | | 8/1/42 | | | | 150 | |
| | 86 | | | Fannie Mae, Pool #AT2127 | | | 3.00 | | | | 4/1/43 | | | | 86 | |
| | 100 | | | Fannie Mae, Pool #AY4829 | | | 3.00 | | | | 5/1/45 | | | | 99 | |
| | 97 | | | Fannie Mae, Pool #MA2246 | | | 3.00 | | | | 4/1/30 | | | | 100 | |
| | 49 | | | Fannie Mae, Pool #MA2230 | | | 3.00 | | | | 4/1/35 | | | | 50 | |
| | 203 | | | Fannie Mae, Pool #MA1307 | | | 3.00 | | | | 1/1/33 | | | | 207 | |
| | 75 | | | Fannie Mae, Pool #AY2961 | | | 3.00 | | | | 5/1/45 | | | | 75 | |
| | 219 | | | Fannie Mae, Pool #AJ3079 | | | 3.00 | | | | 11/1/26 | | | | 227 | |
| | 22 | | | Fannie Mae, Pool #AO7628 | | | 3.00 | | | | 6/1/27 | | | | 23 | |
| | 146 | | | Fannie Mae, Pool #AO0752 | | | 3.00 | | | | 4/1/42 | | | | 146 | |
| | 244 | | | Fannie Mae, Pool #AB7099 | | | 3.00 | | | | 11/1/42 | | | | 244 | |
| | 91 | | | Fannie Mae, Pool #AS0302 | | | 3.00 | | | | 8/1/43 | | | | 91 | |
| | 323 | | | Fannie Mae, Pool #AP6375 | | | 3.00 | | | | 9/1/42 | | | | 324 | |
| | 45 | | | Fannie Mae, Pool #AU3353 | | | 3.00 | | | | 8/1/43 | | | | 45 | |
| | 125 | | | Fannie Mae, Pool #AK0006 | | | 3.00 | | | | 1/1/27 | | | | 130 | |
| | 59 | | | Fannie Mae, Pool #AW4057 | | | 3.00 | | | | 8/1/29 | | | | 61 | |
| | 44 | | | Fannie Mae, Pool #AW6710 | | | 3.00 | | | | 6/1/29 | | | | 45 | |
| | 127 | | | Fannie Mae, Pool #AP6493 | | | 3.00 | | | | 9/1/42 | | | | 127 | |
| | 86 | | | Fannie Mae, Pool #AB8897 | | | 3.00 | | | | 4/1/43 | | | | 86 | |
| | 101 | | | Fannie Mae, Pool #AU3735 | | | 3.00 | | | | 8/1/43 | | | | 102 | |
| | 84 | | | Fannie Mae, Pool #AT7311 | | | 3.00 | | | | 7/1/43 | | | | 84 | |
| | 78 | | | Fannie Mae, Pool #AU8932 | | | 3.00 | | | | 11/1/28 | | | | 81 | |
| | 102 | | | Fannie Mae, Pool #AB4483 | | | 3.00 | | | | 2/1/27 | �� | | | 106 | |
| | 320 | | | Fannie Mae, Pool #AQ7920 | | | 3.00 | | | | 12/1/42 | | | | 320 | |
| | 30 | | | Fannie Mae, Series 2014-M9, Class A2 (a) | | | 3.10 | | | | 7/25/24 | | | | 31 | |
| | 86 | | | Fannie Mae, Pool #MA1059 | | | 3.50 | | | | 5/1/32 | | | | 90 | |
See accompanying notes to portfolio of investments.
161
HC CAPITAL TRUST
The Core Fixed Income Portfolio
Portfolio of Investments (continued) — June 30, 2015
| | | | | | | | | | | | | | | | |
Principal
Amount
(000) | | | | | Rate % | | | Maturity
Date | | | Value
(000) | |
| | | | U.S. Government Agency Mortgages (continued) | | | | | | | | | | | | |
| $ | 337 | | | Fannie Mae, Pool #AB6017 | | | 3.50 | | | | 8/1/42 | | | $ | 349 | |
| | 253 | | | Fannie Mae, Pool #AO8137 | | | 3.50 | | | | 8/1/42 | | | | 262 | |
| | 254 | | | Fannie Mae, Pool #AL1717 | | | 3.50 | | | | 5/1/27 | | | | 268 | |
| | 75 | | | Fannie Mae, Pool #MA1982 | | | 3.50 | | | | 8/1/34 | | | | 79 | |
| | 97 | | | Fannie Mae, Pool #AB2052 | | | 3.50 | | | | 1/1/26 | | | | 102 | |
| | 157 | | | Fannie Mae, Pool #AO3760 | | | 3.50 | | | | 5/1/42 | | | | 163 | |
| | 44 | | | Fannie Mae, Pool #AJ4867 | | | 3.50 | | | | 1/1/42 | | | | 46 | |
| | 218 | | | Fannie Mae, Pool #AB4689 | | | 3.50 | | | | 3/1/42 | | | | 225 | |
| | 413 | | | Fannie Mae, Pool #AO2548 | | | 3.50 | | | | 4/1/42 | | | | 426 | |
| | 98 | | | Fannie Mae, Pool #AS4771 | | | 3.50 | | | | 4/1/45 | | | | 101 | |
| | 42 | | | Fannie Mae, Pool #AT2673 | | | 3.50 | | | | 4/1/43 | | | | 43 | |
| | 122 | | | Fannie Mae, Pool #AX9530 | | | 3.50 | | | | 2/1/45 | | | | 126 | |
| | 81 | | | Fannie Mae, Pool #AS4772 | | | 3.50 | | | | 4/1/45 | | | | 84 | |
| | 152 | | | Fannie Mae, Pool #AP9390 | | | 3.50 | | | | 10/1/42 | | | | 158 | |
| | 153 | | | Fannie Mae, Pool #AQ0546 | | | 3.50 | | | | 11/1/42 | | | | 158 | |
| | 99 | | | Fannie Mae, Pool #AS4773 | | | 3.50 | | | | 4/1/45 | | | | 102 | |
| | 100 | | | Fannie Mae, Pool #MA2292 | | | 3.50 | | | | 6/1/45 | | | | 103 | |
| | 94 | | | Fannie Mae, Pool #MA2125 | | | 3.50 | | | | 12/1/44 | | | | 97 | |
| | 42 | | | Fannie Mae, Pool #MA1921 | | | 3.50 | | | | 6/1/34 | | | | 44 | |
| | 99 | | | Fannie Mae, Pool #AY1306 | | | 3.50 | | | | 3/1/45 | | | | 102 | |
| | 98 | | | Fannie Mae, Pool #AY4300 | | | 3.50 | | | | 1/1/45 | | | | 101 | |
| | 87 | | | Fannie Mae, Pool #MA1107 | | | 3.50 | | | | 7/1/32 | | | | 91 | |
| | 24 | | | Fannie Mae, Pool #AJ1886 | | | 3.50 | | | | 3/1/42 | | | | 25 | |
| | 89 | | | Fannie Mae, Pool #AX0841 | | | 4.00 | | | | 9/1/44 | | | | 94 | |
| | 25 | | | Fannie Mae, Pool #AZ1210 | | | 4.00 | | | | 5/1/45 | | | | 27 | |
| | 86 | | | Fannie Mae, Pool #AX7289 | | | 4.00 | | | | 12/1/44 | | | | 91 | |
| | 30 | | | Fannie Mae, Pool #AV0606 | | | 4.00 | | | | 11/1/43 | | | | 32 | |
| | 47 | | | Fannie Mae, Pool #AU8849 | | | 4.00 | | | | 11/1/43 | | | | 50 | |
| | 377 | | | Fannie Mae, Pool #190405 | | | 4.00 | | | | 10/1/40 | | | | 400 | |
| | 250 | | | Fannie Mae, Pool #AI8534 | | | 4.00 | | | | 8/1/41 | | | | 266 | |
| | 84 | | | Fannie Mae, Pool #AH5859 | | | 4.00 | | | | 2/1/41 | | | | 89 | |
| | 82 | | | Fannie Mae, Pool #AO2959 | | | 4.00 | | | | 5/1/42 | | | | 87 | |
| | 192 | | | Fannie Mae, Pool #AH6242 | | | 4.00 | | | | 4/1/26 | | | | 205 | |
| | 99 | | | Fannie Mae, Pool #AS3467 | | | 4.00 | | | | 10/1/44 | | | | 105 | |
| | 89 | | | Fannie Mae, Pool #AS3468 | | | 4.00 | | | | 10/1/44 | | | | 95 | |
| | 92 | | | Fannie Mae, Pool #AS3903 | | | 4.00 | | | | 11/1/44 | | | | 97 | |
| | 125 | | | Fannie Mae, Pool #AI1186 | | | 4.00 | | | | 4/1/41 | | | | 133 | |
| | 30 | | | Fannie Mae, Pool #AS3638 | | | 4.00 | | | | 10/1/44 | | | | 32 | |
| | 260 | | | Fannie Mae, Pool #AJ7689 | | | 4.00 | | | | 12/1/41 | | | | 276 | |
| | 123 | | | Fannie Mae, Pool #AJ5303 | | | 4.00 | | | | 11/1/41 | | | | 131 | |
| | 42 | | | Fannie Mae, Pool #AJ6153 | | | 4.00 | | | | 11/1/41 | | | | 45 | |
| | 88 | | | Fannie Mae, Pool #AS3293 | | | 4.00 | | | | 9/1/44 | | | | 93 | |
| | 133 | | | Fannie Mae, Pool #MA0534 | | | 4.00 | | | | 10/1/30 | | | | 142 | |
| | 98 | | | Fannie Mae, Pool #AC7328 | | | 4.00 | | | | 12/1/39 | | | | 104 | |
| | 29 | | | Fannie Mae, Pool #AB0388 | | | 4.50 | | | | 4/1/19 | | | | 30 | |
| | 247 | | | Fannie Mae, Pool #AH7521 | | | 4.50 | | | | 3/1/41 | | | | 268 | |
| | 93 | | | Fannie Mae, Pool #AI1888 | | | 4.50 | | | | 5/1/41 | | | | 101 | |
| | 17 | | | Fannie Mae, Pool #MA0481 | | | 4.50 | | | | 8/1/30 | | | | 19 | |
| | 60 | | | Fannie Mae, Pool #AB3192 | | | 4.50 | | | | 6/1/41 | | | | 65 | |
| | 97 | | | Fannie Mae, Pool #AS2337 | | | 4.50 | | | | 5/1/44 | | | | 105 | |
| | 27 | | | Fannie Mae, Pool #AI8104 | | | 4.50 | | | | 6/1/41 | | | | 30 | |
| | 46 | | | Fannie Mae, Pool #AU5665 | | | 4.50 | | | | 9/1/43 | | | | 49 | |
| | 41 | | | Fannie Mae, Pool #AU9017 | | | 4.50 | | | | 9/1/43 | | | | 45 | |
| | 258 | | | Fannie Mae, Pool #AL1107 | | | 4.50 | | | | 11/1/41 | | | | 280 | |
See accompanying notes to portfolio of investments.
162
HC CAPITAL TRUST
The Core Fixed Income Portfolio
Portfolio of Investments (continued) — June 30, 2015
| | | | | | | | | | | | | | | | |
Principal
Amount
(000) | | | | | Rate % | | | Maturity
Date | | | Value
(000) | |
| | | | U.S. Government Agency Mortgages (continued) | | | | | | | | | | | | |
| $ | 100 | | | Fannie Mae, Pool #AS2751 | | | 4.50 | | | | 6/1/44 | | | $ | 108 | |
| | 28 | | | Fannie Mae, Pool #745278 | | | 4.50 | | | | 6/1/19 | | | | 29 | |
| | 40 | | | Fannie Mae, Pool #AE4314 | | | 4.50 | | | | 9/1/40 | | | | 43 | |
| | 117 | | | Fannie Mae, Pool #AE0954 | | | 4.50 | | | | 2/1/41 | | | | 126 | |
| | 31 | | | Fannie Mae, Pool #829106 | | | 4.50 | | | | 10/1/20 | | | | 32 | |
| | 63 | | | Fannie Mae, Pool #AA9781 | | | 4.50 | | | | 7/1/24 | | | | 68 | |
| | 272 | | | Fannie Mae, Pool #AE0217 | | | 4.50 | | | | 8/1/40 | | | | 295 | |
| | 18 | | | Fannie Mae, Pool #735646 | | | 4.50 | | | | 7/1/20 | | | | 18 | |
| | 31 | | | Fannie Mae, Pool #930998 | | | 4.50 | | | | 4/1/29 | | | | 33 | |
| | 22 | | | Fannie Mae, Pool #890603 | | | 5.00 | | | | 8/1/41 | | | | 24 | |
| | 95 | | | Fannie Mae, Pool #890621 | | | 5.00 | | | | 5/1/42 | | | | 105 | |
| | 267 | | | Fannie Mae, Pool #889117 | | | 5.00 | | | | 10/1/35 | | | | 296 | |
| | 23 | | | Fannie Mae, Pool #AA8753 | | | 5.00 | | | | 6/1/39 | | | | 26 | |
| | 58 | | | Fannie Mae, Pool #725238 | | | 5.00 | | | | 3/1/34 | | | | 65 | |
| | 34 | | | Fannie Mae, Pool #AE0945 | | | 5.00 | | | | 12/1/20 | | | | 35 | |
| | 146 | | | Fannie Mae, Pool #AH5988 | | | 5.00 | | | | 3/1/41 | | | | 163 | |
| | 64 | | | Fannie Mae, Pool #AD5477 | | | 5.00 | | | | 5/1/40 | | | | 71 | |
| | 47 | | | Fannie Mae, Pool #AJ1263 | | | 5.00 | | | | 9/1/26 | | | | 49 | |
| | 63 | | | Fannie Mae, Pool #725027 | | | 5.00 | | | | 11/1/33 | | | | 70 | |
| | 47 | | | Fannie Mae, Pool #603083 | | | 5.50 | | | | 1/1/17 | | | | 49 | |
| | 43 | | | Fannie Mae, Pool #AD0527 | | | 5.50 | | | | 6/1/39 | | | | 49 | |
| | 401 | | | Fannie Mae, Pool #890221 | | | 5.50 | | | | 12/1/33 | | | | 452 | |
| | 75 | | | Fannie Mae, Pool #257161 | | | 5.50 | | | | 4/1/38 | | | | 84 | |
| | 130 | | | Fannie Mae, Pool #725228 | | | 6.00 | | | | 3/1/34 | | | | 150 | |
| | 70 | | | Fannie Mae, Pool #959451 | | | 6.00 | | | | 12/1/37 | | | | 80 | |
| | 51 | | | Fannie Mae, Pool #AL0583 | | | 6.50 | | | | 10/1/39 | | | | 59 | |
| | 14 | | | Fannie Mae, Pool #888596 | | | 6.50 | | | | 7/1/37 | | | | 17 | |
| | 61 | | | Fannie Mae, Pool #889984 | | | 6.50 | | | | 10/1/38 | | | | 70 | |
| | 80 | | | Fannie Mae, Pool #AE0442 | | | 6.50 | | | | 1/1/39 | | | | 92 | |
| | 75 | | | Fannie Mae, 15 YR TBA | | | 2.50 | | | | 7/25/30 | | | | 76 | |
| | 25 | | | Fannie Mae, 15 YR TBA | | | 3.00 | | | | 8/25/30 | | | | 26 | |
| | 75 | | | Fannie Mae, 15 YR TBA | | | 3.00 | | | | 7/25/30 | | | | 78 | |
| | 25 | | | Fannie Mae, 15 YR TBA | | | 3.50 | | | | 7/25/30 | | | | 26 | |
| | 25 | | | Fannie Mae, 15 YR TBA | | | 3.50 | | | | 8/17/30 | | | | 26 | |
| | 25 | | | Fannie Mae, 30 YR TBA | | | 3.00 | | | | 8/25/45 | | | | 25 | |
| | 300 | | | Fannie Mae, 30 YR TBA | | | 3.00 | | | | 7/25/45 | | | | 299 | |
| | 350 | | | Fannie Mae, 30 YR TBA | | | 3.50 | | | | 7/25/45 | | | | 361 | |
| | 75 | | | Fannie Mae, 30 YR TBA | | | 3.50 | | | | 8/25/45 | | | | 77 | |
| | 635 | | | Fannie Mae, 30 YR TBA | | | 4.00 | | | | 7/25/45 | | | | 672 | |
| | 25 | | | Freddie Mac, Pool #J30345 | | | 2.00 | | | | 1/1/30 | | | | 25 | |
| | 72 | | | Freddie Mac, Pool #J25686 | | | 2.00 | | | | 9/1/28 | | | | 71 | |
| | 79 | | | Freddie Mac, Pool #849138 (a) | | | 2.43 | | | | 10/1/43 | | | | 81 | |
| | 75 | | | Freddie Mac, Pool #849578 (a) | | | 2.44 | | | | 12/1/44 | | | | 77 | |
| | 233 | | | Freddie Mac, Pool #G18459 | | | 2.50 | | | | 3/1/28 | | | | 238 | |
| | 84 | | | Freddie Mac, Pool #G18470 | | | 2.50 | | | | 6/1/28 | | | | 86 | |
| | 83 | | | Freddie Mac, Pool #G18475 | | | 2.50 | | | | 8/1/28 | | | | 85 | |
| | 84 | | | Freddie Mac, Pool #G18485 | | | 2.50 | | | | 10/1/28 | | | | 86 | |
| | 44 | | | Freddie Mac, Pool #J24626 | | | 2.50 | | | | 7/1/28 | | | | 45 | |
| | 24 | | | Freddie Mac, Pool #G07445 | | | 2.50 | | | | 7/1/43 | | | | 23 | |
| | 180 | | | Freddie Mac, Pool #G08537 | | | 3.00 | | | | 7/1/43 | | | | 179 | |
| | 228 | | | Freddie Mac, Pool #G08524 | | | 3.00 | | | | 3/1/43 | | | | 227 | |
| | 88 | | | Freddie Mac, Pool #G08525 | | | 3.00 | | | | 5/1/43 | | | | 87 | |
| | 45 | | | Freddie Mac, Pool #Q20542 | | | 3.00 | | | | 7/1/43 | | | | 45 | |
| | 87 | | | Freddie Mac, Pool #E09004 | | | 3.00 | | | | 7/1/27 | | | | 91 | |
See accompanying notes to portfolio of investments.
163
HC CAPITAL TRUST
The Core Fixed Income Portfolio
Portfolio of Investments (continued) — June 30, 2015
| | | | | | | | | | | | | | | | |
Principal
Amount
(000) | | | | | Rate % | | | Maturity
Date | | | Value
(000) | |
| | | | U.S. Government Agency Mortgages (continued) | | | | | | | | | | | | |
| $ | 64 | | | Freddie Mac, Pool #G15145 | | | 3.00 | | | | 7/1/29 | | | $ | 67 | |
| | 46 | | | Freddie Mac, Pool #Q20138 | | | 3.00 | | | | 7/1/43 | | | | 45 | |
| | 83 | | | Freddie Mac, Pool #C04446 | | | 3.00 | | | | 1/1/43 | | | | 82 | |
| | 100 | | | Freddie Mac, Pool #G08635 | | | 3.00 | | | | 4/1/45 | | | | 99 | |
| | 210 | | | Freddie Mac, Pool #C09035 | | | 3.00 | | | | 4/1/43 | | | | 210 | |
| | 83 | | | Freddie Mac, Pool #K90311 | | | 3.00 | | | | 4/1/33 | | | | 85 | |
| | 66 | | | Freddie Mac, Pool #G08556 | | | 3.00 | | | | 11/1/43 | | | | 66 | |
| | 89 | | | Freddie Mac, Pool #G08528 | | | 3.00 | | | | 4/1/43 | | | | 89 | |
| | 80 | | | Freddie Mac, Pool #J15438 | | | 3.00 | | | | 5/1/21 | | | | 83 | |
| | 130 | | | Freddie Mac, Pool #G18518 | | | 3.00 | | | | 7/1/29 | | | | 134 | |
| | 62 | | | Freddie Mac, Pool #C91709 | | | 3.00 | | | | 6/1/33 | | | | 63 | |
| | 46 | | | Freddie Mac, Pool #G18531 | | | 3.00 | | | | 11/1/29 | | | | 48 | |
| | 99 | | | Freddie Mac, Pool #J30284 | | | 3.50 | | | | 11/1/29 | | | | 104 | |
| | 42 | | | Freddie Mac, Pool #G07283 | | | 3.50 | | | | 7/1/42 | | | | 44 | |
| | 81 | | | Freddie Mac, Pool #Q18101 | | | 3.50 | | | | 5/1/43 | | | | 84 | |
| | 99 | | | Freddie Mac, Pool #Q31999 | | | 3.50 | | | | 3/1/45 | | | | 102 | |
| | 85 | | | Freddie Mac, Pool #Q09896 | | | 3.50 | | | | 8/1/42 | | | | 88 | |
| | 200 | | | Freddie Mac, Pool #G08641 | | | 3.50 | | | | 5/1/45 | | | | 205 | |
| | 83 | | | Freddie Mac, Pool #G08591 | | | 3.50 | | | | 6/1/44 | | | | 86 | |
| | 79 | | | Freddie Mac, Pool #J13919 | | | 3.50 | | | | 12/1/20 | | | | 83 | |
| | 103 | | | Freddie Mac, Pool #G08554 | | | 3.50 | | | | 10/1/43 | | | | 106 | |
| | 85 | | | Freddie Mac, Pool #C03759 | | | 3.50 | | | | 2/1/42 | | | | 88 | |
| | 199 | | | Freddie Mac, Pool #G08636 | | | 3.50 | | | | 4/1/45 | | | | 205 | |
| | 438 | | | Freddie Mac, Pool #G08495 | | | 3.50 | | | | 6/1/42 | | | | 451 | |
| | 48 | | | Freddie Mac, Pool #J14069 | | | 3.50 | | | | 1/1/26 | | | | 51 | |
| | 49 | | | Freddie Mac, Pool #Q17596 | | | 3.50 | | | | 4/1/43 | | | | 50 | |
| | 110 | | | Freddie Mac, Pool #C91456 | | | 3.50 | | | | 6/1/32 | | | | 115 | |
| | 87 | | | Freddie Mac, Pool #G08605 | | | 3.50 | | | | 9/1/44 | | | | 90 | |
| | 307 | | | Freddie Mac, Pool #A96286 | | | 4.00 | | | | 1/1/41 | | | | 326 | |
| | 100 | | | Freddie Mac, Pool #Q27459 | | | 4.00 | | | | 7/1/44 | | | | 106 | |
| | 53 | | | Freddie Mac, Pool #Q25809 | | | 4.00 | | | | 4/1/44 | | | | 56 | |
| | 20 | | | Freddie Mac, Pool #Q25548 | | | 4.00 | | | | 4/1/44 | | | | 21 | |
| | 87 | | | Freddie Mac, Pool #Q24955 | | | 4.00 | | | | 2/1/44 | | | | 93 | |
| | 25 | | | Freddie Mac, Pool #J14924 | | | 4.00 | | | | 4/1/26 | | | | 27 | |
| | 21 | | | Freddie Mac, Pool #B18694 | | | 4.00 | | | | 1/1/20 | | | | 22 | |
| | 29 | | | Freddie Mac, Pool #B19631 | | | 4.00 | | | | 7/1/20 | | | | 30 | |
| | 20 | | | Freddie Mac, Pool #J06163 | | | 4.00 | | | | 1/1/20 | | | | 21 | |
| | 77 | | | Freddie Mac, Pool #G08567 | | | 4.00 | | | | 1/1/44 | | | | 82 | |
| | 2 | | | Freddie Mac, Pool #G14786 | | | 4.00 | | | | 4/1/19 | | | | 3 | |
| | 56 | | | Freddie Mac, Pool #G08563 | | | 4.00 | | | | 1/1/44 | | | | 59 | |
| | 50 | | | Freddie Mac, Pool #G11690 | | | 4.00 | | | | 2/1/20 | | | | 52 | |
| | 98 | | | Freddie Mac, Pool #G08606 | | | 4.00 | | | | 9/1/44 | | | | 104 | |
| | 72 | | | Freddie Mac, Pool #Q26974 | | | 4.00 | | | | 7/1/44 | | | | 76 | |
| | 30 | | | Freddie Mac, Pool #C91377 | | | 4.50 | | | | 6/1/31 | | | | 33 | |
| | 19 | | | Freddie Mac, Pool #A97658 | | | 4.50 | | | | 3/1/41 | | | | 21 | |
| | 96 | | | Freddie Mac, Pool #G18303 | | | 4.50 | | | | 3/1/24 | | | | 102 | |
| | 21 | | | Freddie Mac, Pool #C90686 | | | 4.50 | | | | 6/1/23 | | | | 23 | |
| | 17 | | | Freddie Mac, Pool #J10406 | | | 4.50 | | | | 8/1/24 | | | | 19 | |
| | 39 | | | Freddie Mac, Pool #C09059 | | | 4.50 | | | | 3/1/44 | | | | 43 | |
| | 346 | | | Freddie Mac, Pool #A97692 | | | 4.50 | | | | 3/1/41 | | | | 373 | |
| | 21 | | | Freddie Mac, Pool #Q01065 | | | 4.50 | | | | 6/1/41 | | | | 23 | |
| | 97 | | | Freddie Mac, Pool #G01890 | | | 4.50 | | | | 10/1/35 | | | | 105 | |
| | 50 | | | Freddie Mac, Pool #Q03305 | | | 4.50 | | | | 9/1/41 | | | | 54 | |
| | 48 | | | Freddie Mac, Pool #Q04294 | | | 4.50 | | | | 11/1/41 | | | | 52 | |
See accompanying notes to portfolio of investments.
164
HC CAPITAL TRUST
The Core Fixed Income Portfolio
Portfolio of Investments (continued) — June 30, 2015
| | | | | | | | | | | | | | | | |
Principal
Amount
(000) | | | | | Rate % | | | Maturity
Date | | | Value
(000) | |
| | | | U.S. Government Agency Mortgages (continued) | | | | | | | | | | | | |
| $ | 60 | | | Freddie Mac, Pool #Q28202 | | | 4.50 | | | | 12/1/43 | | | $ | 65 | |
| | 72 | | | Freddie Mac, Pool #Q22671 | | | 4.50 | | | | 11/1/43 | | | | 78 | |
| | 91 | | | Freddie Mac, Pool #A97186 | | | 4.50 | | | | 3/1/41 | | | | 99 | |
| | 25 | | | Freddie Mac, Pool #Q24817 | | | 4.50 | | | | 2/1/44 | | | | 27 | |
| | 135 | | | Freddie Mac, Pool #G04913 | | | 5.00 | | | | 3/1/38 | | | | 148 | |
| | 119 | | | Freddie Mac, Pool #C01598 | | | 5.00 | | | | 8/1/33 | | | | 132 | |
| | 57 | | | Freddie Mac, Pool #G04817 | | | 5.00 | | | | 9/1/38 | | | | 63 | |
| | 47 | | | Freddie Mac, Pool #G08341 | | | 5.00 | | | | 4/1/39 | | | | 52 | |
| | 63 | | | Freddie Mac, Pool #G05904 | | | 5.00 | | | | 9/1/39 | | | | 69 | |
| | 40 | | | Freddie Mac, Pool #A14640 | | | 5.00 | | | | 10/1/33 | | | | 45 | |
| | 58 | | | Freddie Mac, Pool #G01962 | | | 5.00 | | | | 12/1/35 | | | | 64 | |
| | 94 | | | Freddie Mac, Pool #G04688 | | | 5.50 | | | | 9/1/38 | | | | 105 | |
| | 27 | | | Freddie Mac, Pool #G30432 | | | 5.50 | | | | 11/1/28 | | | | 31 | |
| | 261 | | | Freddie Mac, Pool #G01665 | | | 5.50 | | | | 3/1/34 | | | | 293 | |
| | 7 | | | Freddie Mac, Pool #1G1537 (a) | | | 5.70 | | | | 2/1/37 | | | | 7 | |
| | 11 | | | Freddie Mac, Pool #C90989 | | | 6.00 | | | | 9/1/26 | | | | 12 | |
| | 121 | | | Freddie Mac, Pool #G02794 | | | 6.00 | | | | 5/1/37 | | | | 137 | |
| | 35 | | | Freddie Mac, Pool #G03616 | | | 6.00 | | | | 12/1/37 | | | | 39 | |
| | 125 | | | Freddie Mac, Gold 15 YR TBA | | | 2.50 | | | | 7/15/30 | | | | 126 | |
| | 25 | | | Freddie Mac, Gold 15 YR TBA | | | 2.50 | | | | 8/15/30 | | | | 25 | |
| | 75 | | | Freddie Mac, Gold 15 YR TBA | | | 3.00 | | | | 7/15/30 | | | | 78 | |
| | 50 | | | Freddie Mac, Gold 15 YR TBA | | | 3.00 | | | | 8/15/30 | | | | 52 | |
| | 50 | | | Freddie Mac, Gold 30 YR TBA | | | 3.00 | | | | 8/15/45 | | | | 50 | |
| | 200 | | | Freddie Mac, Gold 30 YR TBA | | | 3.00 | | | | 7/15/45 | | | | 199 | |
| | 200 | | | Freddie Mac, Gold 30 YR TBA | | | 3.50 | | | | 7/15/45 | | | | 206 | |
| | 100 | | | Freddie Mac, Gold 30 YR TBA | | | 3.50 | | | | 8/15/45 | | | | 103 | |
| | 745 | | | Freddie Mac, Gold 30 YR TBA | | | 4.00 | | | | 7/15/45 | | | | 787 | |
| | 50 | | | Freddie Mac, Gold 30 YR TBA | | | 5.00 | | | | 7/15/45 | | | | 55 | |
| | 0 | | | Government National Mortgage Association, Pool #MA0719 (a) | | | 2.00 | | | | 1/20/43 | | | | 0 | |
| | 28 | | | Government National Mortgage Association, Pool #MA0712 (a) | | | 2.50 | | | | 1/20/43 | | | | 29 | |
| | 50 | | | Government National Mortgage Association, Pool #MA2767 (a) | | | 2.50 | | | | 4/20/45 | | | | 51 | |
| | 18 | | | Government National Mortgage Association, Pool #MA1155 | | | 2.50 | | | | 7/20/43 | | | | 18 | |
| | 76 | | | Government National Mortgage Association, Pool #AA8341 | | | 2.50 | | | | 2/15/28 | | | | 78 | |
| | 68 | | | Government National Mortgage Association, Pool #AA2654 | | | 3.00 | | | | 6/15/43 | | | | 68 | |
| | 44 | | | Government National Mortgage Association, Pool #MA1374 | | | 3.00 | | | | 10/20/43 | | | | 45 | |
| | 60 | | | Government National Mortgage Association, Pool #AF2664 | | | 3.00 | | | | 7/15/43 | | | | 60 | |
| | 86 | | | Government National Mortgage Association, Pool #AA6149 | | | 3.00 | | | | 3/20/43 | | | | 87 | |
| | 91 | | | Government National Mortgage Association, Pool #AA5897 | | | 3.00 | | | | 12/15/42 | | | | 92 | |
| | 92 | | | Government National Mortgage Association, Pool #MA0153 | | | 3.00 | | | | 6/20/42 | | | | 94 | |
| | 82 | | | Government National Mortgage Association, Pool #MA1011 | | | 3.00 | | | | 5/20/43 | | | | 83 | |
| | 88 | | | Government National Mortgage Association, Pool #MA1447 | | | 3.00 | | | | 11/20/43 | | | | 89 | |
| | 48 | | | Government National Mortgage Association, Pool #MA2444 | | | 3.00 | | | | 12/20/44 | | | | 49 | |
| | 81 | | | Government National Mortgage Association, Pool #MA0851 | | | 3.00 | | | | 3/20/43 | | | | 82 | |
| | 391 | | | Government National Mortgage Association, Pool #MA0624 | | | 3.00 | | | | 12/20/42 | | | | 396 | |
| | 91 | | | Government National Mortgage Association, Pool #MA2147 | | | 3.00 | | | | 8/20/44 | | | | 92 | |
| | 85 | | | Government National Mortgage Association, Pool #MA0461 | | | 3.00 | | | | 10/20/42 | | | | 86 | |
| | 62 | | | Government National Mortgage Association, Pool #MA0205 | | | 3.00 | | | | 7/20/27 | | | | 65 | |
| | 76 | | | Government National Mortgage Association, Pool #MA0391 | | | 3.00 | | | | 9/20/42 | | | | 78 | |
| | 36 | | | Government National Mortgage Association, Pool #AC3938 | | | 3.50 | | | | 1/15/43 | | | | 37 | |
| | 72 | | | Government National Mortgage Association, Pool #MA0852 | | | 3.50 | | | | 3/20/43 | | | | 75 | |
| | 252 | | | Government National Mortgage Association, Pool #MA0088 | | | 3.50 | | | | 5/20/42 | | | | 262 | |
| | 88 | | | Government National Mortgage Association, Pool #AJ0411 | | | 3.50 | | | | 9/15/44 | | | | 91 | |
| | 267 | | | Government National Mortgage Association, Pool #MA0220 | | | 3.50 | | | | 7/20/42 | | | | 277 | |
| | 79 | | | Government National Mortgage Association, Pool #MA0154 | | | 3.50 | | | | 6/20/42 | | | | 82 | |
See accompanying notes to portfolio of investments.
165
HC CAPITAL TRUST
The Core Fixed Income Portfolio
Portfolio of Investments (continued) — June 30, 2015
| | | | | | | | | | | | | | | | |
Principal
Amount
(000) | | | | | Rate % | | | Maturity
Date | | | Value
(000) | |
| | | | U.S. Government Agency Mortgages (continued) | | | | | | | | | | | | |
| $ | 24 | | | Government National Mortgage Association, Pool #778157 | | | 3.50 | | | | 3/15/42 | | | $ | 25 | |
| | 64 | | | Government National Mortgage Association, Pool #AB9211 | | | 3.50 | | | | 11/15/42 | | | | 67 | |
| | 139 | | | Government National Mortgage Association, Pool #MA0462 | | | 3.50 | | | | 10/20/42 | | | | 144 | |
| | 73 | | | Government National Mortgage Association, Pool #MA2371 | | | 3.50 | | | | 11/20/44 | | | | 76 | |
| | 20 | | | Government National Mortgage Association, Pool #MA1600 | | | 3.50 | | | | 1/20/44 | | | | 21 | |
| | 41 | | | Government National Mortgage Association, Pool #MA1012 | | | 3.50 | | | | 5/20/43 | | | | 43 | |
| | 79 | | | Government National Mortgage Association, Pool #MA0318 | | | 3.50 | | | | 8/20/42 | | | | 82 | |
| | 83 | | | Government National Mortgage Association, Pool #MA2148 | | | 3.50 | | | | 8/20/44 | | | | 86 | |
| | 79 | | | Government National Mortgage Association, Pool #MA0699 | | | 3.50 | | | | 1/20/43 | | | | 82 | |
| | 94 | | | Government National Mortgage Association, Pool #MA2445 | | | 3.50 | | | | 12/20/44 | | | | 98 | |
| | 64 | | | Government National Mortgage Association, Pool #MA2223 | | | 3.50 | | | | 9/20/44 | | | | 66 | |
| | 97 | | | Government National Mortgage Association, Pool #MA1838 | | | 3.50 | | | | 4/20/44 | | | | 101 | |
| | 74 | | | Government National Mortgage Association, Pool #MA0934 | | | 3.50 | | | | 4/20/43 | | | | 78 | |
| | 70 | | | Government National Mortgage Association, Pool #MA1574 | | | 3.50 | | | | 1/20/29 | | | | 73 | |
| | 81 | | | Government National Mortgage Association, Pool #MA2073 | | | 3.50 | | | | 7/20/44 | | | | 84 | |
| | 53 | | | Government National Mortgage Association, Pool #MA1761 | | | 4.00 | | | | 3/20/44 | | | | 56 | |
| | 21 | | | Government National Mortgage Association, Pool #774767 | | | 4.00 | | | | 12/15/41 | | | | 22 | |
| | 72 | | | Government National Mortgage Association, Pool #770602 | | | 4.00 | | | | 9/15/41 | | | | 76 | |
| | 143 | | | Government National Mortgage Association, Pool #MA1091 | | | 4.00 | | | | 6/20/43 | | | | 153 | |
| | 58 | | | Government National Mortgage Association, Pool #766495 | | | 4.00 | | | | 10/15/41 | | | | 62 | |
| | 54 | | | Government National Mortgage Association, Pool #MA1996 | | | 4.00 | | | | 6/20/44 | | | | 57 | |
| | 67 | | | Government National Mortgage Association, Pool #MA1286 | | | 4.00 | | | | 9/20/43 | | | | 71 | |
| | 22 | | | Government National Mortgage Association, Pool #AD2781 | | | 4.00 | | | | 10/15/43 | | | | 24 | |
| | 65 | | | Government National Mortgage Association, Pool #738710 | | | 4.00 | | | | 9/15/41 | | | | 69 | |
| | 66 | | | Government National Mortgage Association, Pool #741682 | | | 4.00 | | | | 7/15/41 | | | | 70 | |
| | 193 | | | Government National Mortgage Association, Pool #MA1839 | | | 4.00 | | | | 4/20/44 | | | | 205 | |
| | 108 | | | Government National Mortgage Association, Pool #MA2074 | | | 4.00 | | | | 7/20/44 | | | | 115 | |
| | 96 | | | Government National Mortgage Association, Pool #MA2522 | | | 4.00 | | | | 1/20/45 | | | | 102 | |
| | 58 | | | Government National Mortgage Association, Pool #MA2224 | | | 4.00 | | | | 9/20/44 | | | | 62 | |
| | 112 | | | Government National Mortgage Association, Pool #MA2149 | | | 4.00 | | | | 8/20/44 | | | | 119 | |
| | 25 | | | Government National Mortgage Association, Pool #MA2372 | | | 4.00 | | | | 11/20/44 | | | | 26 | |
| | 134 | | | Government National Mortgage Association, Pool #MA2304 | | | 4.00 | | | | 10/20/44 | | | | 142 | |
| | 273 | | | Government National Mortgage Association, Pool #005139 | | | 4.00 | | | | 8/20/41 | | | | 293 | |
| | 142 | | | Government National Mortgage Association, Pool #MA1762 | | | 4.50 | | | | 3/20/44 | | | | 153 | |
| | 50 | | | Government National Mortgage Association, Pool #MA1014 | | | 4.50 | | | | 5/20/43 | | | | 55 | |
| | 75 | | | Government National Mortgage Association, Pool #MA2756 | | | 4.50 | | | | 4/20/45 | | | | 81 | |
| | 46 | | | Government National Mortgage Association, Pool #748119 | | | 4.50 | | | | 6/15/41 | | | | 50 | |
| | 171 | | | Government National Mortgage Association, Pool #737310 | | | 4.50 | | | | 8/15/40 | | | | 188 | |
| | 91 | | | Government National Mortgage Association, Pool #721760 | | | 4.50 | | | | 8/15/40 | | | | 99 | |
| | 116 | | | Government National Mortgage Association, Pool #MA1092 | | | 4.50 | | | | 6/20/43 | | | | 127 | |
| | 25 | | | Government National Mortgage Association, Pool #727455 | | | 4.50 | | | | 8/15/41 | | | | 27 | |
| | 24 | | | Government National Mortgage Association, Pool #732249 | | | 4.50 | | | | 5/15/40 | | | | 26 | |
| | 66 | | | Government National Mortgage Association, Pool #738906 | | | 4.50 | | | | 10/15/41 | | | | 72 | |
| | 352 | | | Government National Mortgage Association, Pool #004801 | | | 4.50 | | | | 9/20/40 | | | | 384 | |
| | 29 | | | Government National Mortgage Association, Pool #MA1451 | | | 5.00 | | | | 11/20/43 | | | | 32 | |
| | 334 | | | Government National Mortgage Association, Pool #004559 | | | 5.00 | | | | 10/20/39 | | | | 372 | |
| | 104 | | | Government National Mortgage Association, Pool #697946 | | | 5.00 | | | | 3/15/39 | | | | 115 | |
| | 77 | | | Government National Mortgage Association, Pool #782523 | | | 5.00 | | | | 11/15/35 | | | | 86 | |
| | 44 | | | Government National Mortgage Association, Pool #MA0466 | | | 5.50 | | | | 10/20/42 | | | | 50 | |
| | 73 | | | Government National Mortgage Association, Pool #510835 | | | 5.50 | | | | 2/15/35 | | | | 83 | |
| | 29 | | | Government National Mortgage Association, Pool #704170 | | | 5.50 | | | | 1/15/39 | | | | 32 | |
| | 18 | | | Government National Mortgage Association, Pool #658181 | | | 5.50 | | | | 11/15/36 | | | | 20 | |
| | 44 | | | Government National Mortgage Association, Pool #MA0538 | | | 5.50 | | | | 11/20/42 | | | | 50 | |
| | 64 | | | Government National Mortgage Association, Pool #781959 | | | 6.00 | | | | 7/15/35 | | | | 75 | |
See accompanying notes to portfolio of investments.
166
HC CAPITAL TRUST
The Core Fixed Income Portfolio
Portfolio of Investments (continued) — June 30, 2015
| | | | | | | | | | | | | | | | |
Principal
Amount
(000) | | | | | Rate % | | | Maturity
Date | | | Value
(000) | |
| | | | U.S. Government Agency Mortgages (continued) | | | | | | | | | | | | |
| $ | 49 | | | Government National Mortgage Association, Pool #004222 | | | 6.00 | | | | 8/20/38 | | | $ | 56 | |
| | 4 | | | Government National Mortgage Association, Pool #582199 | | | 6.50 | | | | 1/15/32 | | | | 5 | |
| | 25 | | | Government National Mortgage Association, 30 YR TBA | | | 2.50 | | | | 7/15/45 | | | | 24 | |
| | 50 | | | Government National Mortgage Association, 30 YR TBA | | | 3.00 | | | | 8/20/45 | | | | 50 | |
| | 250 | | | Government National Mortgage Association, 30 YR TBA | | | 3.00 | | | | 7/20/45 | | | | 252 | |
| | 50 | | | Government National Mortgage Association, 30 YR TBA | | | 3.00 | | | | 7/15/45 | | | | 50 | |
| | 125 | | | Government National Mortgage Association, 30 YR TBA | | | 3.50 | | | | 8/20/45 | | | | 129 | |
| | 700 | | | Government National Mortgage Association, 30 YR TBA | | | 3.50 | | | | 7/20/45 | | | | 725 | |
| | 50 | | | Government National Mortgage Association, 30 YR TBA | | | 3.50 | | | | 7/15/45 | | | | 52 | |
| | 50 | | | Government National Mortgage Association, 30 YR TBA | | | 4.00 | | | | 7/15/45 | | | | 53 | |
| | 50 | | | Government National Mortgage Association, 30 YR TBA | | | 4.00 | | | | 8/20/45 | | | | 53 | |
| | 125 | | | Government National Mortgage Association, 30 YR TBA | | | 4.00 | | | | 7/20/45 | | | | 132 | |
| | 25 | | | Government National Mortgage Association, 30 YR TBA | | | 4.50 | | | | 7/15/45 | | | | 27 | |
| | 50 | | | Government National Mortgage Association, 30 YR TBA | | | 4.50 | | | | 8/20/45 | | | | 54 | |
| | 100 | | | Government National Mortgage Association, 30 YR TBA | | | 5.00 | | | | 7/15/45 | | | | 111 | |
| | | | | | | | | | | | | | | | |
| | | | Total U.S. Government Agency Mortgages | | | | | | | | | | | 34,392 | |
| | | | | | | | | | | | | | | | |
| | | | U.S. Government Agency Securities — 2.01% | | | | | | | | | | | | |
| | 50 | | | Fannie Mae | | | 0.75 | | | | 4/20/17 | | | | 50 | |
| | 80 | | | Fannie Mae | | | 0.88 | | | | 12/20/17 | | | | 80 | |
| | 60 | | | Fannie Mae | | | 0.88 | | | | 5/21/18 | | | | 60 | |
| | 25 | | | Fannie Mae | | | 0.88 | | | | 10/26/17 | | | | 25 | |
| | 60 | | | Fannie Mae, Callable 5/23/15 @ 100.00 | | | 0.95 | | | | 8/23/17 | | | | 60 | |
| | 25 | | | Fannie Mae, Callable 7/28/16 @ 100.00 | | | 1.07 | | | | 7/28/17 | | | | 25 | |
| | 145 | | | Fannie Mae, Callable 9/27/15 @ 100.00 | | | 1.07 | | | | 9/27/17 | | | | 146 | |
| | 45 | | | Fannie Mae | | | 1.13 | | | | 4/27/17 | | | | 45 | |
| | 30 | | | Fannie Mae | | | 1.25 | | | | 1/30/17 | | | | 30 | |
| | 30 | | | Fannie Mae | | | 1.63 | | | | 11/27/18 | | | | 30 | |
| | 55 | | | Fannie Mae | | | 1.75 | | | | 9/12/19 | | | | 55 | |
| | 25 | | | Fannie Mae | | | 1.88 | | | | 9/18/18 | | | | 26 | |
| | 55 | | | Fannie Mae (b) | | | 2.19 | | | | 10/9/19 | | | | 50 | |
| | 20 | | | Fannie Mae | | | 5.63 | | | | 7/15/37 | | | | 26 | |
| | 20 | | | Fannie Mae, Callable 4/18/16 @ 100.00 | | | 6.00 | | | | 4/18/36 | | | | 21 | |
| | 20 | | | Fannie Mae | | | 6.25 | | | | 5/15/29 | | | | 27 | |
| | 25 | | | Fannie Mae | | | 7.13 | | | | 1/15/30 | | | | 37 | |
| | 20 | | | Fannie Mae | | | 7.25 | | | | 5/15/30 | | | | 30 | |
| | 10 | | | Federal Farm Credit Bank, Callable 7/20/15 @ 100.00 | | | 0.54 | | | | 11/7/16 | | | | 10 | |
| | 20 | | | Federal Farm Credit Bank | | | 4.88 | | | | 1/17/17 | | | | 21 | |
| | 20 | | | Federal Farm Credit Bank | | | 5.13 | | | | 8/25/16 | | | | 21 | |
| | 80 | | | Federal Home Loan Bank | | | 0.63 | | | | 11/23/16 | | | | 80 | |
| | 35 | | | Federal Home Loan Bank, Series 1 | | | 1.00 | | | | 6/21/17 | | | | 35 | |
| | 50 | | | Federal Home Loan Bank | | | 1.75 | | | | 12/14/18 | | | | 51 | |
| | 25 | | | Federal Home Loan Bank | | | 2.13 | | | | 3/10/23 | | | | 24 | |
| | 25 | | | Federal Home Loan Bank | | | 3.63 | | | | 3/12/21 | | | | 27 | |
| | 20 | | | Federal Home Loan Bank | | | 4.13 | | | | 3/13/20 | | | | 22 | |
| | 95 | | | Federal Home Loan Bank | | | 4.75 | | | | 12/16/16 | | | | 101 | |
| | 70 | | | Federal Home Loan Bank, Series 1069 | | | 5.00 | | | | 11/17/17 | | | | 77 | |
| | 15 | | | Federal Home Loan Bank | | | 5.63 | | | | 6/11/21 | | | | 18 | |
| | 50 | | | Freddie Mac | | | 0.42 | | | | 9/18/15 | | | | 50 | |
| | 70 | | | Freddie Mac | | | 0.75 | | | | 1/12/18 | | | | 70 | |
| | 50 | | | Freddie Mac | | | 1.00 | | | | 9/29/17 | | | | 50 | |
| | 50 | | | Freddie Mac | | | 1.00 | | | | 3/8/17 | | | | 50 | |
| | 65 | | | Freddie Mac | | | 1.00 | | | | 7/28/17 | | | | 65 | |
| | 25 | | | Freddie Mac, Callable 7/30/15 @ 100.00 | | | 1.02 | | | | 4/30/18 | | | | 25 | |
| | 25 | | | Freddie Mac, Callable 5/28/15 @ 100.00 | | | 1.03 | | | | 11/28/17 | | | | 25 | |
See accompanying notes to portfolio of investments.
167
HC CAPITAL TRUST
The Core Fixed Income Portfolio
Portfolio of Investments (continued) — June 30, 2015
| | | | | | | | | | | | | | | | |
Principal
Amount
(000) | | | | | Rate % | | | Maturity
Date | | | Value
(000) | |
| | | | U.S. Government Agency Securities (continued) | | | | | | | | | | | | |
| $ | 20 | | | Freddie Mac | | | 1.20 | | | | 6/12/18 | | | $ | 20 | |
| | 20 | | | Freddie Mac | | | 1.25 | | | | 10/2/19 | | | | 20 | |
| | 25 | | | Freddie Mac | | | 1.38 | | | | 5/1/20 | | | | 25 | |
| | 20 | | | Freddie Mac | | | 1.40 | | | | 8/22/19 | | | | 20 | |
| | 25 | | | Freddie Mac | | | 1.75 | | | | 5/30/19 | | | | 25 | |
| | 50 | | | Freddie Mac | | | 2.00 | | | | 8/25/16 | | | | 51 | |
| | 65 | | | Freddie Mac | | | 2.38 | | | | 1/13/22 | | | | 66 | |
| | 30 | | | Freddie Mac | | | 3.75 | | | | 3/27/19 | | | | 33 | |
| | 25 | | | Freddie Mac | | | 6.25 | | | | 7/15/32 | | | | 35 | |
| | 5 | | | Tennessee Valley Authority | | | 3.50 | | | | 12/15/42 | | | | 5 | |
| | 5 | | | Tennessee Valley Authority | | | 5.25 | | | | 9/15/39 | | | | 6 | |
| | 20 | | | Tennessee Valley Authority | | | 5.88 | | | | 4/1/36 | | | | 26 | |
| | 20 | | | Tennessee Valley Authority, Series E (Independent Power and Renewable Electricity Producers) | | | 6.75 | | | | 11/1/25 | | | | 27 | |
| | | | | | | | | | | | | | | | |
| | | | Total U.S. Government Agency Securities | | | | | | | | | | | 2,004 | |
| | | | | | | | | | | | | | | | |
| | | | Corporate Bonds — 27.37% | | | | | | | | | | | | |
| | 300 | | | AbbVie, Inc. (Pharmaceuticals) | | | 1.75 | | | | 11/6/17 | | | | 300 | |
| | 75 | | | AbbVie, Inc. (Pharmaceuticals) | | | 4.40 | | | | 11/6/42 | | | | 71 | |
| | 240 | | | American Express Co. (Consumer Finance) | | | 2.65 | | | | 12/2/22 | | | | 231 | |
| | 45 | | | American Express Co. (Consumer Finance) | | | 7.00 | | | | 3/19/18 | | | | 51 | |
| | 312 | | | American International Group, MTN (Insurance) | | | 5.85 | | | | 1/16/18 | | | | 344 | |
| | 300 | | | Ameriprise Financial, Inc. (Capital Markets) | | | 4.00 | | | | 10/15/23 | | | | 313 | |
| | 230 | | | Amgen, Inc. (Biotechnology) | | | 2.13 | | | | 5/15/17 | | | | 233 | |
| | 115 | | | Amgen, Inc. (Biotechnology), Callable 5/15/41 @ 100.00 | | | 5.15 | | | | 11/15/41 | | | | 118 | |
| | 93 | | | Analog Devices, Inc. (Semiconductors & Semiconductor Equipment) | | | 3.00 | | | | 4/15/16 | | | | 94 | |
| | 240 | | | Anheuser-Busch InBev NV (Beverages) | | | 2.50 | | | | 7/15/22 | | | | 231 | |
| | 255 | | | Anthem, Inc. (Health Care Providers & Services), Callable 5/15/21 @ 100.00 | | | 3.70 | | | | 8/15/21 | | | | 261 | |
| | 100 | | | Anthem, Inc. (Health Care Providers & Services) | | | 4.63 | | | | 5/15/42 | | | | 91 | |
| | 155 | | | Archer-Daniels-Midland Co. (Food Products) | | | 4.02 | | | | 4/16/43 | | | | 145 | |
| | 225 | | | Associates Corp. North America (Diversified Financial Services) | | | 6.95 | | | | 11/1/18 | | | | 259 | |
| | 230 | | | AT&T, Inc. (Diversified Telecommunication Services), Callable 11/15/34 @ 100.00 | | | 4.50 | | | | 5/15/35 | | | | 211 | |
| | 340 | | | AT&T, Inc. (Diversified Telecommunication Services) | | | 5.50 | | | | 2/1/18 | | | | 372 | |
| | 80 | | | AT&T, Inc. (Diversified Telecommunication Services) | | | 5.55 | | | | 8/15/41 | | | | 82 | |
| | 25 | | | Atmos Energy Corp. (Gas Utilities), Callable 4/15/44 @ 100.00 | | | 4.13 | | | | 10/15/44 | | | | 24 | |
| | 708 | | | Bank of America Corp. (Banks) | | | 2.60 | | | | 1/15/19 | | | | 716 | |
| | 340 | | | Bank of America Corp., MTN (Banks) | | | 3.30 | | | | 1/11/23 | | | | 335 | |
| | 115 | | | Bank of America Corp., Series L, MTN (Diversified Financial Services) | | | 5.65 | | | | 5/1/18 | | | | 126 | |
| | 110 | | | Bank One Corp. (Banks) | | | 8.00 | | | | 4/29/27 | | | | 146 | |
| | 160 | | | Bear Stearns Co. LLC (Capital Markets) | | | 6.40 | | | | 10/2/17 | | | | 176 | |
| | 100 | | | Berkshire Hathaway, Inc. (Diversified Financial Services) | | | 4.40 | | | | 5/15/42 | | | | 98 | |
| | 65 | | | Bunge Limited Finance Co. (Food Products) | | | 8.50 | | | | 6/15/19 | | | | 79 | |
| | 85 | | | Burlington Northern Santa Fe LLC (Road & Rail), Callable 3/1/44 @ 100.00 | | | 4.55 | | | | 9/1/44 | | | | 84 | |
| | 450 | | | Capital One Bank USA, Series BKNT (Diversified Financial Services),
Callable 1/13/19 @ 100.00 | | | 2.25 | | | | 2/13/19 | | | | 447 | |
| | 205 | | | Capital One Financial Corp. (Consumer Finance) | | | 6.75 | | | | 9/15/17 | | | | 227 | |
| | 50 | | | Caterpillar Financial Services Corp., MTN (Consumer Finance) | | | 7.05 | | | | 10/1/18 | | | | 58 | |
| | 270 | | | Cisco Systems, Inc. (Communications Equipment) | | | 2.13 | | | | 3/1/19 | | | | 272 | |
| | 95 | | | Cisco Systems, Inc. (Communications Equipment) | | | 5.50 | | | | 1/15/40 | | | | 108 | |
| | 295 | | | Citigroup, Inc. (Banks) | | | 2.55 | | | | 4/8/19 | | | | 297 | |
| | 78 | | | Citigroup, Inc. (Banks) | | | 4.95 | | | | 11/7/43 | | | | 81 | |
| | 250 | | | Coca-Cola Enterprises, Inc. (Beverages) | | | 3.50 | | | | 9/15/20 | | | | 262 | |
| | 230 | | | Comcast Corp. (Media) | | | 2.85 | | | | 1/15/23 | | | | 224 | |
| | 80 | | | Comcast Corp. (Media) | | | 3.13 | | | | 7/15/22 | | | | 80 | |
| | 184 | | | Comcast Corp. (Media) | | | 4.65 | | | | 7/15/42 | | | | 184 | |
| | 210 | | | ConocoPhillips (Oil, Gas & Consumable Fuels) | | | 6.50 | | | | 2/1/39 | | | | 261 | |
See accompanying notes to portfolio of investments.
168
HC CAPITAL TRUST
The Core Fixed Income Portfolio
Portfolio of Investments (continued) — June 30, 2015
| | | | | | | | | | | | | | | | |
Principal
Amount
(000) | | | | | Rate % | | | Maturity
Date | | | Value
(000) | |
| | | | Corporate Bonds (continued) | | | | | | | | | | | | |
| $ | 15 | | | Consolidated Edison Co. of New York, Inc., Series 08-B (Multi-Utilities) | | | 6.75 | | | | 4/1/38 | | | $ | 19 | |
| | 395 | | | CSX Corp. (Road & Rail), Callable 5/1/24 @ 100.00 | | | 3.40 | | | | 8/1/24 | | | | 395 | |
| | 230 | | | CVS Caremark Corp. (Food & Staples Retailing), Callable 9/1/22 @ 100.00 | | | 2.75 | | | | 12/1/22 | | | | 222 | |
| | 185 | | | CVS Health Corp. (Food & Staples Retailing), Callable 2/15/21 @ 100.00 | | | 4.13 | | | | 5/15/21 | | | | 198 | |
| | 225 | | | Delphi Corp. (Auto Components), Callable 12/15/23 @ 100.00 | | | 4.15 | | | | 3/15/24 | | | | 233 | |
| | 30 | | | Delphi Corp. (Auto Components), Callable 2/15/18 @ 103.00 | | | 5.00 | | | | 2/15/23 | | | | 32 | |
| | 250 | | | Devon Energy Corp. (Oil, Gas & Consumable Fuels), Callable 4/15/21 @ 100.00 | | | 4.00 | | | | 7/15/21 | | | | 262 | |
| | 215 | | | Devon Energy Corp. (Oil, Gas & Consumable Fuels), Callable 1/15/41 @ 100.00 | | | 5.60 | | | | 7/15/41 | | | | 225 | |
| | 395 | | | Dominion Resources, Inc. (Multi-Utilities) | | | 5.20 | | | | 8/15/19 | | | | 437 | |
| | 130 | | | Dominion Resources, Inc. (Multi-Utilities) | | | 6.40 | | | | 6/15/18 | | | | 147 | |
| | 150 | | | Duke Energy Carolinas LLC (Electric Utilities) | | | 5.30 | | | | 2/15/40 | | | | 171 | |
| | 50 | | | Duke Energy Corp. (Electric Utilities), Callable 1/15/24 @ 100.00 | | | 3.75 | | | | 4/15/24 | | | | 51 | |
| | 220 | | | Eaton Corp. (Electrical Equipment) | | | 2.75 | | | | 11/2/22 | | | | 215 | |
| | 100 | | | Eaton Corp. (Electrical Equipment) | | | 4.15 | | | | 11/2/42 | | | | 92 | |
| | 200 | | | Ecolab, Inc. (Chemicals) | | | 3.00 | | | | 12/8/16 | | | | 205 | |
| | 130 | | | Ecolab, Inc. (Chemicals) | | | 4.35 | | | | 12/8/21 | | | | 140 | |
| | 25 | | | Ecolab, Inc. (Chemicals) | | | 5.50 | | | | 12/8/41 | | | | 27 | |
| | 46 | | | Enterprise Products Operating LLC (Oil, Gas & Consumable Fuels),
Callable 12/15/22 @ 100.00 | | | 3.35 | | | | 3/15/23 | | | | 45 | |
| | 164 | | | Enterprise Products Operating LLC (Oil, Gas & Consumable Fuels),
Callable 9/15/43 @ 100.00 | | | 4.85 | | | | 3/15/44 | | | | 154 | |
| | 250 | | | Enterprise Products Partners LP (Oil, Gas & Consumable Fuels),
Callable 9/15/19 @ 100.00 | | | 2.55 | | | | 10/15/19 | | | | 250 | |
| | 20 | | | Enterprise Products Partners LP (Oil, Gas & Consumable Fuels),
Callable 12/15/45 @ 100.00 | | | 4.90 | | | | 5/15/46 | | | | 19 | |
| | 300 | | | Exxon Mobil Corp. (Oil, Gas & Consumable Fuels), Callable 2/6/20 @ 100.00 | | | 1.91 | | | | 3/6/20 | | | | 298 | |
| | 95 | | | FedEx Corp. (Air Freight & Logistics) | | | 3.90 | | | | 2/1/35 | | | | 88 | |
| | 45 | | | FedEx Corp. (Air Freight & Logistics) | | | 4.10 | | | | 2/1/45 | | | | 40 | |
| | 30 | | | FedEx Corp. (Air Freight & Logistics) | | | 8.00 | | | | 1/15/19 | | | | 36 | |
| | 230 | | | Fiserv, Inc. (IT Services), Callable 5/1/20 @ 100.00 | | | 2.70 | | | | 6/1/20 | | | | 230 | |
| | 75 | | | Fiserv, Inc. (IT Services), Callable 3/1/25 @ 100.00 | | | 3.85 | | | | 6/1/25 | | | | 75 | |
| | 260 | | | General Electric Co., Series G, MTN (Industrial Conglomerates) | | | 3.10 | | | | 1/9/23 | | | | 260 | |
| | 184 | | | General Electric Co. (Industrial Conglomerates) | | | 4.13 | | | | 10/9/42 | | | | 177 | |
| | 162 | | | General Electric Co. (Industrial Conglomerates) | | | 5.25 | | | | 12/6/17 | | | | 176 | |
| | 495 | | | General Motors Co. (Automobiles) | | | 3.50 | | | | 10/2/18 | | | | 511 | |
| | 111 | | | Gilead Sciences, Inc. (Biotechnology), Callable 8/1/44 @ 100.00 | | | 4.50 | | | | 2/1/45 | | | | 111 | |
| | 130 | | | GlaxoSmithKline PLC (Pharmaceuticals) | | | 6.38 | | | | 5/15/38 | | | | 164 | |
| | 291 | | | Goldman Sachs Group, Inc. (Capital Markets) | | | 2.63 | | | | 1/31/19 | | | | 295 | |
| | 325 | | | Goldman Sachs Group, Inc. (Capital Markets) | | | 4.00 | | | | 3/3/24 | | | | 331 | |
| | 180 | | | Goldman Sachs Group, Inc. (Capital Markets) | | | 6.15 | | | | 4/1/18 | | | | 200 | |
| | 320 | | | Hewlett-Packard Co. (Technology Hardware, Storage & Peripherals) | | | 3.00 | | | | 9/15/16 | | | | 327 | |
| | 305 | | | International Business Machines Corp. (IT Services) | | | 3.63 | | | | 2/12/24 | | | | 308 | |
| | 270 | | | International Paper Co. (Paper Products), Callable 3/15/24 @ 100.00 | | | 3.65 | | | | 6/15/24 | | | | 266 | |
| | 75 | | | Intuit, Inc. (Software) | | | 5.75 | | | | 3/15/17 | | | | 80 | |
| | 50 | | | Johnson & Johnson (Pharmaceuticals), Callable 6/5/33 @ 100.00 | | | 4.38 | | | | 12/5/33 | | | | 53 | |
| | 50 | | | Johnson & Johnson (Pharmaceuticals) | | | 4.85 | | | | 5/15/41 | | | | 56 | |
| | 515 | | | JPMorgan Chase & Co. (Banks) | | | 4.25 | | | | 10/15/20 | | | | 551 | |
| | 50 | | | JPMorgan Chase & Co. (Banks) | | | 4.35 | | | | 8/15/21 | | | | 54 | |
| | 95 | | | Lincoln National Corp. (Insurance) | | | 7.00 | | | | 6/15/40 | | | | 119 | |
| | 120 | | | Lockheed Martin Corp. (Aerospace & Defense), Callable 12/1/24 @ 100.00 | | | 2.90 | | | | 3/1/25 | | | | 116 | |
| | 75 | | | Lockheed Martin Corp. (Aerospace & Defense), Callable 9/1/34 @ 100.00 | | | 3.60 | | | | 3/1/35 | | | | 69 | |
| | 195 | | | Medtronic, Inc. (Health Care Equipment & Supplies), Callable 1/1/23 @ 100.00 | | | 2.75 | | | | 4/1/23 | | | | 188 | |
| | 50 | | | MetLife, Inc. (Life & Health Insurance) | | | 4.05 | | | | 3/1/45 | | | | 46 | |
| | 185 | | | MetLife, Inc. (Life & Health Insurance) | | | 7.72 | | | | 2/15/19 | | | | 221 | |
| | 191 | | | MidAmerican Energy Holdings Co. (Electric Utilities) | | | 6.13 | | | | 4/1/36 | | | | 225 | |
| | 135 | | | Monsanto Co. (Chemicals) | | | 2.75 | | | | 7/15/21 | | | | 133 | |
See accompanying notes to portfolio of investments.
169
HC CAPITAL TRUST
The Core Fixed Income Portfolio
Portfolio of Investments (continued) — June 30, 2015
| | | | | | | | | | | | | | | | |
Principal
Amount
(000) | | | | | Rate % | | | Maturity
Date | | | Value
(000) | |
| | | | Corporate Bonds (continued) | | | | | | | | | | | | |
| $ | 495 | | | National Rural Utilities Cooperative Finance Corp. (Diversified Financial Services),
Callable 8/15/23 @ 100.00 | | | 3.40 | | | | 11/15/23 | | | $ | 507 | |
| | 200 | | | Nucor Corp. (Metals & Mining), Callable 5/1/23 @ 100.00 | | | 4.00 | | | | 8/1/23 | | | | 202 | |
| | 110 | | | Nucor Corp. (Metals & Mining), Callable 2/1/43 @ 100.00 | | | 5.20 | | | | 8/1/43 | | | | 113 | |
| | 85 | | | Oklahoma Gas & Electric Co. (Electric Utilities), Callable 11/15/40 @ 100.00 | | | 5.25 | | | | 5/15/41 | | | | 96 | |
| | 365 | | | Oracle Corp. (Software) | | | 2.50 | | | | 10/15/22 | | | | 352 | |
| | 100 | | | Oracle Corp. (Software) | | | 6.50 | | | | 4/15/38 | | | | 125 | |
| | 210 | | | Philip Morris International, Inc. (Tobacco) | | | 3.60 | | | | 11/15/23 | | | | 213 | |
| | 26 | | | Private Export Funding Corp. (Diversified Financial Services) | | | 2.13 | | | | 7/15/16 | | | | 26 | |
| | 114 | | | Procter & Gamble Co.(The) (Household Products) | | | 9.36 | | | | 1/1/21 | | | | 139 | |
| | 110 | | | Prudential Financial, Inc. (Insurance) | | | 6.20 | | | | 11/15/40 | | | | 129 | |
| | 50 | | | Puget Energy, Inc. (Technology Hardware, Storage & Peripherals),
Callable 4/15/22 @ 100.00 | | | 5.63 | | | | 7/15/22 | | | | 56 | |
| | 110 | | | Puget Energy, Inc. (Technology Hardware, Storage & Peripherals) | | | 6.00 | | | | 9/1/21 | | | | 126 | |
| | 100 | | | Puget Energy, Inc. (Electric Utilities) | | | 6.50 | | | | 12/15/20 | | | | 117 | |
| | 135 | | | Reed Elsevier NV (Beverages), Callable 7/15/22 @ 100.00 | | | 3.13 | | | | 10/15/22 | | | | 132 | |
| | 30 | | | Reed Elsevier NV (Beverages) | | | 8.63 | | | | 1/15/19 | | | | 36 | |
| | 220 | | | Rock-Tenn Co. (Containers & Packaging) | | | 3.50 | | | | 3/1/20 | | | | 227 | |
| | 210 | | | Roper Industries, Inc. (Electrical Equipment) | | | 2.05 | | | | 10/1/18 | | | | 209 | |
| | 35 | | | Roper Industries, Inc. (Electrical Equipment), Callable 8/15/22 @ 100.00 | | | 3.13 | | | | 11/15/22 | | | | 34 | |
| | 105 | | | San Diego Gas & Electric Co. (Electric Utilities), Callable 10/1/41 @ 100.00 | | | 4.30 | | | | 4/1/42 | | | | 105 | |
| | 335 | | | Southern California Gas Co. (Gas Utilities), Callable 6/15/24 @ 100.00 | | | 3.15 | | | | 9/15/24 | | | | 334 | |
| | 204 | | | Southwest Airlines Co 2007-1 Trust (Airlines) | | | 6.15 | | | | 8/1/22 | | | | 234 | |
| | 245 | | | Sunoco Logistics Partners LP (Oil, Gas & Consumable Fuels),
Callable 10/15/22 @ 100.00 | | | 3.45 | | | | 1/15/23 | | | | 232 | |
| | 160 | | | Sunoco Logistics Partners LP (Oil, Gas & Consumable Fuels), Callable 7/15/42 @ 100.00 | | | 4.95 | | | | 1/15/43 | | | | 140 | |
| | 45 | | | SunTrust Banks, Inc. (Banks), Callable 10/1/18 @ 100.00 | | | 2.35 | | | | 11/1/18 | | | | 45 | |
| | 240 | | | SunTrust Banks, Inc. (Banks), Callable 4/1/19 @ 100.00 | | | 2.50 | | | | 5/1/19 | | | | 241 | |
| | 320 | | | TC Pipelines, LP (Oil, Gas & Consumable Fuels), Callable 12/13/24 @ 100.00 | | | 4.38 | | | | 3/13/25 | | | | 316 | |
| | 240 | | | The Dow Chemical Co. (Chemicals), Callable 8/15/22 @ 100.00 | | | 3.00 | | | | 11/15/22 | | | | 230 | |
| | 80 | | | The Dow Chemical Co. (Chemicals) | | | 8.55 | | | | 5/15/19 | | | | 98 | |
| | 190 | | | The Home Depot, Inc. (Specialty Retail) | | | 5.88 | | | | 12/16/36 | | | | 229 | |
| | 250 | | | The Kroger Co. (Food & Staples Retailing), Callable 5/1/23 @ 100.00 | | | 3.85 | | | | 8/1/23 | | | | 256 | |
| | 70 | | | The Travelers Cos., Inc., MTN (Insurance) | | | 6.25 | | | | 6/15/37 | | | | 88 | |
| | 70 | | | Thermo Fisher Scientific, Inc (Life Sciences Tools & Services) | | | 3.20 | | | | 3/1/16 | | | | 71 | |
| | 195 | | | Thermo Fisher Scientific, Inc. (Life Sciences Tools & Services),
Callable 5/15/21 @ 100.00 | | | 3.60 | | | | 8/15/21 | | | | 199 | |
| | 130 | | | Time Warner, Inc. (Media) | | | 5.38 | | | | 10/15/41 | | | | 133 | |
| | 240 | | | Time Warner, Inc. (Media) | | | 6.88 | | | | 6/15/18 | | | | 274 | |
| | 140 | | | Toyota Motor Credit Corp., MTN (Diversified Financial Services) | | | 3.30 | | | | 1/12/22 | | | | 145 | |
| | 100 | | | Twenty-First Century Fox, Inc. (Media) | | | 3.00 | | | | 9/15/22 | | | | 98 | |
| | 80 | | | Twenty-First Century Fox, Inc. (Media) | | | 5.65 | | | | 8/15/20 | | | | 91 | |
| | 120 | | | Twenty-First Century Fox, Inc. (Media) | | | 6.20 | | | | 12/15/34 | | | | 139 | |
| | 50 | | | Twenty-First Century Fox, Inc. (Media) | | | 6.90 | | | | 3/1/19 | | | | 58 | |
| | 75 | | | United Parcel Service, Inc. (Air Freight & Logistics) | | | 6.20 | | | | 1/15/38 | | | | 94 | |
| | 85 | | | UnitedHealth Group, Inc. (Health Care Providers & Services) | | | 6.88 | | | | 2/15/38 | | | | 112 | |
| | 150 | | | Valero Energy Corp. (Oil, Gas & Consumable Fuels) | | | 3.65 | | | | 3/15/25 | | | | 146 | |
| | 40 | | | Ventas Realty, LP (Real Estate Investment Trusts (REITs)), Callable 5/15/22 @ 100.00 | | | 3.25 | | | | 8/15/22 | | | | 38 | |
| | 30 | | | Ventas, Inc. (Real Estate Investment Trusts (REITs)), Callable 11/1/24 @ 100.00 | | | 3.50 | | | | 2/1/25 | | | | 29 | |
| | 215 | | | Verizon Communications, Inc. (Diversified Telecommunication Services) | | | 5.15 | | | | 9/15/23 | | | | 235 | |
| | 480 | | | Verizon Communications, Inc. (Diversified Telecommunication Services) | | | 6.55 | | | | 9/15/43 | | | | 562 | |
| | 160 | | | Viacom, Inc. (Media), Callable 12/15/42 @ 100.00 | | | 4.88 | | | | 6/15/43 | | | | 143 | |
| | 355 | | | Virginia Elec & Power Co. (Oil, Gas & Consumable Fuels), Callable 12/15/22 @ 100.00 | | | 2.75 | | | | 3/15/23 | | | | 347 | |
| | 35 | | | Virginia Elec & Power Co. (Oil, Gas & Consumable Fuels), Callable 10/15/21 @ 100.00 | | | 2.95 | | | | 1/15/22 | | | | 35 | |
| | 375 | | | Wachovia Corp. (Diversified Financial Services) | | | 5.75 | | | | 2/1/18 | | | | 414 | |
See accompanying notes to portfolio of investments.
170
HC CAPITAL TRUST
The Core Fixed Income Portfolio
Portfolio of Investments (continued) — June 30, 2015
| | | | | | | | | | | | | | | | |
Principal
Amount
(000) | | | | | Rate % | | | Maturity
Date | | | Value
(000) | |
| | | | Corporate Bonds (continued) | | | | | | | | | | | | |
| $ | 312 | | | Wal-Mart Stores, Inc. (Food & Staples Retailing) | | | 1.95 | | | | 12/15/18 | | | $ | 317 | |
| | 250 | | | Wal-Mart Stores, Inc. (Food & Staples Retailing) | | | 5.63 | | | | 4/1/40 | | | | 292 | |
| | 70 | | | Wal-Mart Stores, Inc. (Food & Staples Retailing) | | | 6.50 | | | | 8/15/37 | | | | 90 | |
| | 160 | | | Waste Management, Inc. (Commercial Services & Supplies), Callable 12/1/24 @ 100.00 | | | 3.13 | | | | 3/1/25 | | | | 155 | |
| | 65 | | | Wells Fargo & Co. (Banks) | | | 3.00 | | | | 2/19/25 | | | | 62 | |
| | 105 | | | Western Gas Partners, LP (Oil, Gas & Consumable Fuels), Callable 3/1/25 @ 100.00 | | | 3.95 | | | | 6/1/25 | | | | 101 | |
| | 75 | | | Wyeth, Inc. (Pharmaceuticals) | | | 6.45 | | | | 2/1/24 | | | | 93 | |
| | 100 | | | Xerox Corp. (IT Services) | | | 6.40 | | | | 3/15/16 | | | | 104 | |
| | 220 | | | YUM! Brands, Inc. (Hotels, Restaurants & Leisure) | | | 6.25 | | | | 3/15/18 | | | | 243 | |
| | 50 | | | YUM! Brands, Inc. (Hotels, Restaurants & Leisure) | | | 6.88 | | | | 11/15/37 | | | | 58 | |
| | | | | | | | | | | | | | | | |
| | | | Total Corporate Bonds | | | | | | | | | | | 27,300 | |
| | | | | | | | | | | | | | | | |
| | | | U.S. Treasury Obligations — 22.45% | | | | | | | | | | | | |
| | 17 | | | U.S. Treasury Bond | | | 1.00 | | | | 8/31/19 | | | | 17 | |
| | 190 | | | U.S. Treasury Bond | | | 2.50 | | | | 2/15/45 | | | | 167 | |
| | 114 | | | U.S. Treasury Bond | | | 2.75 | | | | 11/15/42 | | | | 106 | |
| | 68 | | | U.S. Treasury Bond | | | 2.75 | | | | 8/15/42 | | | | 63 | |
| | 150 | | | U.S. Treasury Bond | | | 2.88 | | | | 5/15/43 | | | | 143 | |
| | 19 | | | U.S. Treasury Bond | | | 3.00 | | | | 5/15/42 | | | | 19 | |
| | 55 | | | U.S. Treasury Bond | | | 3.00 | | | | 5/15/45 | | | | 54 | |
| | 185 | | | U.S. Treasury Bond | | | 3.00 | | | | 11/15/44 | | | | 181 | |
| | 94 | | | U.S. Treasury Bond | | | 3.13 | | | | 11/15/41 | | | | 95 | |
| | 150 | | | U.S. Treasury Bond | | | 3.13 | | | | 8/15/44 | | | | 150 | |
| | 112 | | | U.S. Treasury Bond | | | 3.13 | | | | 2/15/42 | | | | 113 | |
| | 120 | | | U.S. Treasury Bond | | | 3.13 | | | | 2/15/43 | | | | 120 | |
| | 30 | | | U.S. Treasury Bond | | | 3.13 | | | | 5/15/21 | | | | 32 | |
| | 120 | | | U.S. Treasury Bond | | | 3.38 | | | | 5/15/44 | | | | 126 | |
| | 40 | | | U.S. Treasury Bond | | | 3.50 | | | | 2/15/39 | | | | 43 | |
| | 120 | | | U.S. Treasury Bond | | | 3.63 | | | | 8/15/43 | | | | 132 | |
| | 125 | | | U.S. Treasury Bond | | | 3.63 | | | | 2/15/44 | | | | 137 | |
| | 63 | | | U.S. Treasury Bond | | | 3.75 | | | | 8/15/41 | | | | 71 | |
| | 85 | | | U.S. Treasury Bond | | | 3.75 | | | | 11/15/43 | | | | 96 | |
| | 70 | | | U.S. Treasury Bond | | | 3.88 | | | | 8/15/40 | | | | 80 | |
| | 60 | | | U.S. Treasury Bond | | | 4.25 | | | | 11/15/40 | | | | 73 | |
| | 75 | | | U.S. Treasury Bond | | | 4.38 | | | | 5/15/40 | | | | 92 | |
| | 25 | | | U.S. Treasury Bond | | | 4.38 | | | | 11/15/39 | | | | 31 | |
| | 60 | | | U.S. Treasury Bond | | | 4.38 | | | | 5/15/41 | | | | 74 | |
| | 55 | | | U.S. Treasury Bond | | | 4.50 | | | | 8/15/39 | | | | 69 | |
| | 15 | | | U.S. Treasury Bond | | | 4.50 | | | | 5/15/38 | | | | 19 | |
| | 40 | | | U.S. Treasury Bond | | | 4.50 | | | | 2/15/36 | | | | 50 | |
| | 95 | | | U.S. Treasury Bond | | | 4.63 | | | | 2/15/40 | | | | 121 | |
| | 70 | | | U.S. Treasury Bond | | | 4.75 | | | | 2/15/41 | | | | 91 | |
| | 50 | | | U.S. Treasury Bond | | | 5.00 | | | | 5/15/37 | | | | 67 | |
| | 30 | | | U.S. Treasury Bond | | | 5.25 | | | | 11/15/28 | | | | 39 | |
| | 30 | | | U.S. Treasury Bond | | | 5.25 | | | | 2/15/29 | | | | 39 | |
| | 40 | | | U.S. Treasury Bond | | | 5.38 | | | | 2/15/31 | | | | 54 | |
| | 61 | | | U.S. Treasury Bond | | | 6.00 | | | | 2/15/26 | | | | 82 | |
| | 35 | | | U.S. Treasury Bond | | | 6.13 | | | | 11/15/27 | | | | 49 | |
| | 35 | | | U.S. Treasury Bond | | | 6.25 | | | | 8/15/23 | | | | 46 | |
| | 25 | | | U.S. Treasury Bond | | | 6.25 | | | | 5/15/30 | | | | 36 | |
| | 40 | | | U.S. Treasury Bond | | | 6.50 | | | | 11/15/26 | | | | 56 | |
| | 40 | | | U.S. Treasury Bond | | | 6.75 | | | | 8/15/26 | | | | 57 | |
| | 50 | | | U.S. Treasury Bond | | | 7.25 | | | | 8/15/22 | | | | 67 | |
| | 17 | | | U.S. Treasury Bond | | | 7.50 | | | | 11/15/24 | | | | 25 | |
| | 25 | | | U.S. Treasury Bond | | | 7.50 | | | | 11/15/16 | | | | 27 | |
See accompanying notes to portfolio of investments.
171
HC CAPITAL TRUST
The Core Fixed Income Portfolio
Portfolio of Investments (continued) — June 30, 2015
| | | | | | | | | | | | | | | | |
Principal
Amount
(000) | | | | | Rate % | | | Maturity
Date | | | Value
(000) | |
| | | | U.S. Treasury Obligations (continued) | | | | | | | | | | | | |
| $ | 15 | | | U.S. Treasury Bond | | | 7.63 | | | | 2/15/25 | | | $ | 22 | |
| | 40 | | | U.S. Treasury Bond | | | 8.00 | | | | 11/15/21 | | | | 55 | |
| | 35 | | | U.S. Treasury Bond | | | 8.13 | | | | 8/15/19 | | | | 44 | |
| | 50 | | | U.S. Treasury Bond | | | 8.13 | | | | 8/15/21 | | | | 68 | |
| | 50 | | | U.S. Treasury Bond | | | 8.75 | | | | 8/15/20 | | | | 67 | |
| | 150 | | | U.S. Treasury Note | | | 0.38 | | | | 10/31/16 | | | | 150 | |
| | 50 | | | U.S. Treasury Note | | | 0.50 | | | | 2/28/17 | | | | 50 | |
| | 100 | | | U.S. Treasury Note | | | 0.50 | | | | 11/30/16 | | | | 100 | |
| | 10 | | | U.S. Treasury Note | | | 0.50 | | | | 4/30/17 | | | | 10 | |
| | 165 | | | U.S. Treasury Note | | | 0.50 | | | | 8/31/16 | | | | 165 | |
| | 120 | | | U.S. Treasury Note | | | 0.50 | | | | 7/31/16 | | | | 120 | |
| | 75 | | | U.S. Treasury Note | | | 0.50 | | | | 7/31/17 | | | | 75 | |
| | 85 | | | U.S. Treasury Note | | | 0.50 | | | | 3/31/17 | | | | 85 | |
| | 100 | | | U.S. Treasury Note | | | 0.50 | | | | 9/30/16 | | | | 100 | |
| | 85 | | | U.S. Treasury Note | | | 0.50 | | | | 1/31/17 | | | | 85 | |
| | 108 | | | U.S. Treasury Note | | | 0.63 | | | | 12/15/16 | | | | 108 | |
| | 150 | | | U.S. Treasury Note | | | 0.63 | | | | 2/15/17 | | | | 150 | |
| | 70 | | | U.S. Treasury Note | | | 0.63 | | | | 8/15/16 | | | | 70 | |
| | 150 | | | U.S. Treasury Note | | | 0.63 | | | | 9/30/17 | | | | 150 | |
| | 108 | | | U.S. Treasury Note | | | 0.63 | | | | 11/15/16 | | | | 108 | |
| | 165 | | | U.S. Treasury Note | | | 0.63 | | | | 11/30/17 | | | | 164 | |
| | 215 | | | U.S. Treasury Note | | | 0.63 | | | | 5/31/17 | | | | 215 | |
| | 160 | | | U.S. Treasury Note | | | 0.63 | | | | 8/31/17 | | | | 160 | |
| | 82 | | | U.S. Treasury Note | | | 0.63 | | | | 10/15/16 | | | | 82 | |
| | 51 | | | U.S. Treasury Note | | | 0.63 | | | | 7/15/16 | | | | 51 | |
| | 120 | | | U.S. Treasury Note | | | 0.63 | | | | 4/30/18 | | | | 119 | |
| | 45 | | | U.S. Treasury Note | | | 0.63 | | | | 12/31/16 | | | | 45 | |
| | 90 | | | U.S. Treasury Note | | | 0.63 | | | | 6/30/17 | | | | 90 | |
| | 80 | | | U.S. Treasury Note | | | 0.75 | | | | 4/15/18 | | | | 80 | |
| | 112 | | | U.S. Treasury Note | | | 0.75 | | | | 3/15/17 | | | | 112 | |
| | 78 | | | U.S. Treasury Note | | | 0.75 | | | | 12/31/17 | | | | 78 | |
| | 50 | | | U.S. Treasury Note | | | 0.75 | | | | 3/31/18 | | | | 50 | |
| | 115 | | | U.S. Treasury Note | | | 0.75 | | | | 10/31/17 | | | | 115 | |
| | 68 | | | U.S. Treasury Note | | | 0.75 | | | | 6/30/17 | | | | 68 | |
| | 65 | | | U.S. Treasury Note | | | 0.75 | | | | 1/15/17 | | | | 65 | |
| | 140 | | | U.S. Treasury Note | | | 0.75 | | | | 2/28/18 | | | | 139 | |
| | 155 | | | U.S. Treasury Note | | | 0.88 | | | | 5/15/17 | | | | 156 | |
| | 80 | | | U.S. Treasury Note | | | 0.88 | | | | 1/15/18 | | | | 80 | |
| | 45 | | | U.S. Treasury Note | | | 0.88 | | | | 7/31/19 | | | | 44 | |
| | 85 | | | U.S. Treasury Note | | | 0.88 | | | | 9/15/16 | | | | 85 | |
| | 135 | | | U.S. Treasury Note | | | 0.88 | | | | 4/30/17 | | | | 136 | |
| | 130 | | | U.S. Treasury Note | | | 0.88 | | | | 11/15/17 | | | | 130 | |
| | 70 | | | U.S. Treasury Note | | | 0.88 | | | | 2/28/17 | | | | 70 | |
| | 72 | | | U.S. Treasury Note | | | 0.88 | | | | 12/31/16 | | | | 72 | |
| | 100 | | | U.S. Treasury Note | | | 0.88 | | | | 4/15/17 | | | | 101 | |
| | 77 | | | U.S. Treasury Note | | | 0.88 | | | | 11/30/16 | | | | 77 | |
| | 150 | | | U.S. Treasury Note | | | 0.88 | | | | 1/31/17 | | | | 151 | |
| | 95 | | | U.S. Treasury Note | | | 0.88 | | | | 7/15/17 | | | | 95 | |
| | 90 | | | U.S. Treasury Note | | | 0.88 | | | | 6/15/17 | | | | 90 | |
| | 90 | | | U.S. Treasury Note | | | 0.88 | | | | 8/15/17 | | | | 90 | |
| | 91 | | | U.S. Treasury Note | | | 0.88 | | | | 1/31/18 | | | | 91 | |
| | 135 | | | U.S. Treasury Note | | | 0.88 | | | | 10/15/17 | | | | 135 | |
| | 75 | | | U.S. Treasury Note | | | 1.00 | | | | 2/15/18 | | | | 75 | |
| | 20 | | | U.S. Treasury Note | | | 1.00 | | | | 6/30/19 | | | | 20 | |
See accompanying notes to portfolio of investments.
172
HC CAPITAL TRUST
The Core Fixed Income Portfolio
Portfolio of Investments (continued) — June 30, 2015
| | | | | | | | | | | | | | | | |
Principal
Amount
(000) | | | | | Rate % | | | Maturity
Date | | | Value
(000) | |
| | | | U.S. Treasury Obligations (continued) | | | | | | | | | | | | |
| $ | 85 | | | U.S. Treasury Note | | | 1.00 | | | | 12/15/17 | | | $ | 85 | |
| | 80 | | | U.S. Treasury Note | | | 1.00 | | | | 3/15/18 | | | | 80 | |
| | 95 | | | U.S. Treasury Note | | | 1.00 | | | | 9/15/17 | | | | 96 | |
| | 135 | | | U.S. Treasury Note | | | 1.00 | | | | 3/31/17 | | | | 136 | |
| | 85 | | | U.S. Treasury Note | | | 1.00 | | | | 11/30/19 | | | | 83 | |
| | 100 | | | U.S. Treasury Note | | | 1.00 | | | | 5/15/18 | | | | 100 | |
| | 100 | | | U.S. Treasury Note | | | 1.00 | | | | 9/30/19 | | | | 98 | |
| | 144 | | | U.S. Treasury Note | | | 1.00 | | | | 5/31/18 | | | | 144 | |
| | 154 | | | U.S. Treasury Note | | | 1.00 | | | | 8/31/16 | | | | 155 | |
| | 132 | | | U.S. Treasury Note | | | 1.00 | | | | 10/31/16 | | | | 133 | |
| | 130 | | | U.S. Treasury Note | | | 1.00 | | | | 9/30/16 | | | | 131 | |
| | 50 | | | U.S. Treasury Note | | | 1.13 | | | | 5/31/19 | | | | 50 | |
| | 85 | | | U.S. Treasury Note | | | 1.13 | | | | 6/15/18 | | | | 85 | |
| | 5 | | | U.S. Treasury Note | | | 1.13 | | | | 3/31/20 | | | | 5 | |
| | 60 | | | U.S. Treasury Note | | | 1.13 | | | | 12/31/19 | | | | 59 | |
| | 60 | | | U.S. Treasury Note | | | 1.13 | | | | 4/30/20 | | | | 59 | |
| | 100 | | | U.S. Treasury Note | | | 1.25 | | | | 2/29/20 | | | | 99 | |
| | 50 | | | U.S. Treasury Note | | | 1.25 | | | | 10/31/19 | | | | 50 | |
| | 65 | | | U.S. Treasury Note | | | 1.25 | | | | 1/31/19 | | | | 65 | |
| | 110 | | | U.S. Treasury Note | | | 1.25 | | | | 11/30/18 | | | | 110 | |
| | 54 | | | U.S. Treasury Note | | | 1.25 | | | | 4/30/19 | | | | 54 | |
| | 160 | | | U.S. Treasury Note | | | 1.25 | | | | 1/31/20 | | | | 158 | |
| | 120 | | | U.S. Treasury Note | | | 1.25 | | | | 10/31/18 | | | | 120 | |
| | 75 | | | U.S. Treasury Note | | | 1.38 | | | | 11/30/18 | | | | 76 | |
| | 165 | | | U.S. Treasury Note | | | 1.38 | | | | 4/30/20 | | | | 163 | |
| | 110 | | | U.S. Treasury Note | | | 1.38 | | | | 2/29/20 | | | | 109 | |
| | 51 | | | U.S. Treasury Note | | | 1.38 | | | | 12/31/18 | | | | 51 | |
| | 40 | | | U.S. Treasury Note | | | 1.38 | | | | 1/31/20 | | | | 40 | |
| | 150 | | | U.S. Treasury Note | | | 1.38 | | | | 7/31/18 | | | | 152 | |
| | 100 | | | U.S. Treasury Note | | | 1.38 | | | | 2/28/19 | | | | 100 | |
| | 30 | | | U.S. Treasury Note | | | 1.38 | | | | 5/31/20 | | | | 30 | |
| | 115 | | | U.S. Treasury Note | | | 1.38 | | | | 3/31/20 | | | | 114 | |
| | 135 | | | U.S. Treasury Note | | | 1.38 | | | | 9/30/18 | | | | 136 | |
| | 130 | | | U.S. Treasury Note | | | 1.38 | | | | 6/30/18 | | | | 131 | |
| | 131 | | | U.S. Treasury Note | | | 1.50 | | | | 2/28/19 | | | | 132 | |
| | 115 | | | U.S. Treasury Note | | | 1.50 | | | | 1/31/19 | | | | 116 | |
| | 59 | | | U.S. Treasury Note | | | 1.50 | | | | 6/30/16 | | | | 60 | |
| | 120 | | | U.S. Treasury Note | | | 1.50 | | | | 5/31/20 | | | | 119 | |
| | 160 | | | U.S. Treasury Note | | | 1.50 | | | | 10/31/19 | | | | 160 | |
| | 130 | | | U.S. Treasury Note | | | 1.50 | | | | 8/31/18 | | | | 132 | |
| | 20 | | | U.S. Treasury Note | | | 1.50 | | | | 3/31/19 | | | | 20 | |
| | 115 | | | U.S. Treasury Note | | | 1.50 | | | | 1/31/22 | | | | 111 | |
| | 80 | | | U.S. Treasury Note | | | 1.50 | | | | 11/30/19 | | | | 80 | |
| | 120 | | | U.S. Treasury Note | | | 1.50 | | | | 5/31/19 | | | | 121 | |
| | 155 | | | U.S. Treasury Note | | | 1.50 | | | | 7/31/16 | | | | 157 | |
| | 110 | | | U.S. Treasury Note | | | 1.50 | | | | 12/31/18 | | | | 111 | |
| | 120 | | | U.S. Treasury Note | | | 1.63 | | | | 8/31/19 | | | | 121 | |
| | 130 | | | U.S. Treasury Note | | | 1.63 | | | | 4/30/19 | | | | 131 | |
| | 125 | | | U.S. Treasury Note | | | 1.63 | | | | 7/31/19 | | | | 126 | |
| | 130 | | | U.S. Treasury Note | | | 1.63 | | | | 3/31/19 | | | | 132 | |
| | 85 | | | U.S. Treasury Note | | | 1.63 | | | | 6/30/19 | | | | 86 | |
| | 160 | | | U.S. Treasury Note | | | 1.63 | | | | 12/31/19 | | | | 161 | |
| | 81 | | | U.S. Treasury Note | | | 1.63 | | | | 8/15/22 | | | | 79 | |
| | 130 | | | U.S. Treasury Note | | | 1.63 | | | | 6/30/20 | | | | 130 | |
See accompanying notes to portfolio of investments.
173
HC CAPITAL TRUST
The Core Fixed Income Portfolio
Portfolio of Investments (continued) — June 30, 2015
| | | | | | | | | | | | | | | | |
Principal
Amount
(000) | | | | | Rate % | | | Maturity
Date | | | Value
(000) | |
| | | | U.S. Treasury Obligations (continued) | | | | | | | | | | | | |
| $ | 117 | | | U.S. Treasury Note | | | 1.63 | | | | 11/15/22 | | | $ | 113 | |
| | 95 | | | U.S. Treasury Note | | | 1.75 | | | | 4/30/22 | | | | 93 | |
| | 40 | | | U.S. Treasury Note | | | 1.75 | | | | 10/31/18 | | | | 41 | |
| | 174 | | | U.S. Treasury Note | | | 1.75 | | | | 5/15/23 | | | | 168 | |
| | 95 | | | U.S. Treasury Note | | | 1.75 | | | | 2/28/22 | | | | 93 | |
| | 95 | | | U.S. Treasury Note | | | 1.75 | | | | 3/31/22 | | | | 93 | |
| | 110 | | | U.S. Treasury Note | | | 1.75 | | | | 5/15/22 | | | | 108 | |
| | 135 | | | U.S. Treasury Note | | | 1.75 | | | | 10/31/20 | | | | 135 | |
| | 120 | | | U.S. Treasury Note | | | 1.75 | | | | 9/30/19 | | | | 121 | |
| | 100 | | | U.S. Treasury Note | | | 1.88 | | | | 5/31/22 | | | | 99 | |
| | 100 | | | U.S. Treasury Note | | | 1.88 | | | | 10/31/17 | | | | 103 | |
| | 100 | | | U.S. Treasury Note | | | 1.88 | | | | 11/30/21 | | | | 99 | |
| | 94 | | | U.S. Treasury Note | | | 1.88 | | | | 6/30/20 | | | | 95 | |
| | 55 | | | U.S. Treasury Note | | | 1.88 | | | | 9/30/17 | | | | 56 | |
| | 75 | | | U.S. Treasury Note | | | 1.88 | | | | 8/31/17 | | | | 77 | |
| | 130 | | | U.S. Treasury Note | | | 2.00 | | | | 11/15/21 | | | | 130 | |
| | 60 | | | U.S. Treasury Note | | | 2.00 | | | | 11/30/20 | | | | 61 | |
| | 265 | | | U.S. Treasury Note | | | 2.00 | | | | 2/15/25 | | | | 257 | |
| | 155 | | | U.S. Treasury Note | | | 2.00 | | | | 2/15/23 | | | | 153 | |
| | 95 | | | U.S. Treasury Note | | | 2.00 | | | | 10/31/21 | | | | 95 | |
| | 110 | | | U.S. Treasury Note | | | 2.00 | | | | 9/30/20 | | | | 112 | |
| | 120 | | | U.S. Treasury Note | | | 2.00 | | | | 7/31/20 | | | | 122 | |
| | 120 | | | U.S. Treasury Note | | | 2.00 | | | | 2/15/22 | | | | 120 | |
| | 130 | | | U.S. Treasury Note | | | 2.00 | | | | 2/28/21 | | | | 131 | |
| | 100 | | | U.S. Treasury Note | | | 2.00 | | | | 5/31/21 | | | | 101 | |
| | 95 | | | U.S. Treasury Note | | | 2.00 | | | | 8/31/21 | | | | 95 | |
| | 100 | | | U.S. Treasury Note | | | 2.13 | | | | 9/30/21 | | | | 101 | |
| | 100 | | | U.S. Treasury Note | | | 2.13 | | | | 6/30/22 | | | | 100 | |
| | 125 | | | U.S. Treasury Note | | | 2.13 | | | | 6/30/21 | | | | 127 | |
| | 80 | | | U.S. Treasury Note | | | 2.13 | | | | 8/31/20 | | | | 82 | |
| | 95 | | | U.S. Treasury Note | | | 2.13 | | | | 12/31/21 | | | | 96 | |
| | 160 | | | U.S. Treasury Note | | | 2.13 | | | | 5/15/25 | | | | 157 | |
| | 134 | | | U.S. Treasury Note | | | 2.13 | | | | 8/15/21 | | | | 136 | |
| | 100 | | | U.S. Treasury Note | | | 2.25 | | | | 7/31/21 | | | | 102 | |
| | 30 | | | U.S. Treasury Note | | | 2.25 | | | | 7/31/18 | | | | 31 | |
| | 180 | | | U.S. Treasury Note | | | 2.25 | | | | 11/15/24 | | | | 179 | |
| | 5 | | | U.S. Treasury Note | | | 2.25 | | | | 11/30/17 | | | | 5 | |
| | 118 | | | U.S. Treasury Note | | | 2.25 | | | | 3/31/21 | | | | 121 | |
| | 105 | | | U.S. Treasury Note | | | 2.25 | | | | 4/30/21 | | | | 107 | |
| | 215 | | | U.S. Treasury Note | | | 2.38 | | | | 8/15/24 | | | | 216 | |
| | 25 | | | U.S. Treasury Note | | | 2.38 | | | | 12/31/20 | | | | 26 | |
| | 30 | | | U.S. Treasury Note | | | 2.38 | | | | 6/30/18 | | | | 31 | |
| | 50 | | | U.S. Treasury Note | | | 2.50 | | | | 6/30/17 | | | | 52 | |
| | 215 | | | U.S. Treasury Note | | | 2.50 | | | | 5/15/24 | | | | 219 | |
| | 145 | | | U.S. Treasury Note | | | 2.50 | | | | 8/15/23 | | | | 148 | |
| | 174 | | | U.S. Treasury Note | | | 2.63 | | | | 11/15/20 | | | | 182 | |
| | 50 | | | U.S. Treasury Note | | | 2.63 | | | | 1/31/18 | | | | 52 | |
| | 65 | | | U.S. Treasury Note | | | 2.63 | | | | 4/30/18 | | | | 68 | |
| | 115 | | | U.S. Treasury Note | | | 2.63 | | | | 8/15/20 | | | | 120 | |
| | 99 | | | U.S. Treasury Note | | | 2.75 | | | | 5/31/17 | | | | 103 | |
| | 85 | | | U.S. Treasury Note | | | 2.75 | | | | 2/15/19 | | | | 90 | |
| | 226 | | | U.S. Treasury Note | | | 2.75 | | | | 11/15/23 | | | | 235 | |
| | 160 | | | U.S. Treasury Note | | | 2.75 | | | | 2/15/24 | | | | 166 | |
| | 72 | | | U.S. Treasury Note | | | 2.75 | | | | 12/31/17 | | | | 75 | |
See accompanying notes to portfolio of investments.
174
HC CAPITAL TRUST
The Core Fixed Income Portfolio
Portfolio of Investments (continued) — June 30, 2015
| | | | | | | | | | | | | | | | |
Principal
Amount
(000) | | | | | Rate % | | | Maturity
Date | | | Value
(000) | |
| | | | U.S. Treasury Obligations (continued) | | | | | | | | | | | | |
| $ | 60 | | | U.S. Treasury Note | | | 2.75 | | | | 11/30/16 | | | $ | 62 | |
| | 30 | | | U.S. Treasury Note | | | 2.88 | | | | 3/31/18 | | | | 32 | |
| | 123 | | | U.S. Treasury Note | | | 3.00 | | | | 9/30/16 | | | | 127 | |
| | 50 | | | U.S. Treasury Note | | | 3.00 | | | | 2/28/17 | | | | 52 | |
| | 89 | | | U.S. Treasury Note | | | 3.00 | | | | 8/31/16 | | | | 92 | |
| | 113 | | | U.S. Treasury Note | | | 3.13 | | | | 4/30/17 | | | | 118 | |
| | 100 | | | U.S. Treasury Note | | | 3.13 | | | | 1/31/17 | | | | 104 | |
| | 100 | | | U.S. Treasury Note | | | 3.13 | | | | 10/31/16 | | | | 104 | |
| | 111 | | | U.S. Treasury Note | | | 3.13 | | | | 5/15/19 | | | | 118 | |
| | 85 | | | U.S. Treasury Note | | | 3.25 | | | | 12/31/16 | | | | 89 | |
| | 38 | | | U.S. Treasury Note | | | 3.25 | | | | 7/31/16 | | | | 39 | |
| | 62 | | | U.S. Treasury Note | | | 3.25 | | | | 3/31/17 | | | | 65 | |
| | 121 | | | U.S. Treasury Note | | | 3.38 | | | | 11/15/19 | | | | 131 | |
| | 100 | | | U.S. Treasury Note | | | 3.50 | | | | 2/15/18 | | | | 107 | |
| | 120 | | | U.S. Treasury Note | | | 3.50 | | | | 5/15/20 | | | | 131 | |
| | 180 | | | U.S. Treasury Note | | | 3.63 | | | | 2/15/20 | | | | 197 | |
| | 100 | | | U.S. Treasury Note | | | 3.63 | | | | 8/15/19 | | | | 109 | |
| | 135 | | | U.S. Treasury Note | | | 3.63 | | | | 2/15/21 | | | | 148 | |
| | 150 | | | U.S. Treasury Note | | | 3.75 | | | | 11/15/18 | | | | 163 | |
| | 50 | | | U.S. Treasury Note | | | 3.88 | | | | 5/15/18 | | | | 54 | |
| | 30 | | | U.S. Treasury Note | | | 4.00 | | | | 8/15/18 | | | | 33 | |
| | 24 | | | U.S. Treasury Note | | | 4.25 | | | | 5/15/39 | | | | 29 | |
| | 75 | | | U.S. Treasury Note | | | 4.25 | | | | 11/15/17 | | | | 81 | |
| | 100 | | | U.S. Treasury Note | | | 4.63 | | | | 11/15/16 | | | | 106 | |
| | 50 | | | U.S. Treasury Note | | | 4.63 | | | | 2/15/17 | | | | 53 | |
| | 70 | | | U.S. Treasury Note | | | 4.75 | | | | 8/15/17 | | | | 76 | |
| | 70 | | | U.S. Treasury Note | | | 4.88 | | | | 8/15/16 | | | | 74 | |
| | 30 | | | U.S. Treasury Note | | | 5.50 | | | | 8/15/28 | | | | 40 | |
| | | | | | | | | | | | | | | | |
| | | | Total U.S. Treasury Obligations | | | | | | | | | | | 22,396 | |
| | | | | | | | | | | | | | | | |
| | | | Yankee Dollars — 4.69% | | | | | | | | | | | | |
| | 200 | | | America Movil SAB de CV (Wireless Telecommunication Services) | | | 6.13 | | | | 3/30/40 | | | | 232 | |
| | 25 | | | Bank of Nova Scotia (Banks) | | | 1.85 | | | | 4/14/20 | | | | 25 | |
| | 25 | | | Bank of Nova Scotia (Banks) | | | 2.13 | | | | 9/11/19 | | | | 25 | |
| | 200 | | | BHP Billiton Ltd. (Metals & Mining) | | | 3.85 | | | | 9/30/23 | | | | 206 | |
| | 115 | | | BHP Billiton Ltd. (Metals & Mining) | | | 5.00 | | | | 9/30/43 | | | | 119 | |
| | 80 | | | British Telecommunications PLC (Diversified Telecommunication Services) | | | 9.63 | | | | 12/15/30 | | | | 119 | |
| | 210 | | | Canadian Natural Resources (Oil, Gas & Consumable Fuels) | | | 5.70 | | | | 5/15/17 | | | | 226 | |
| | 65 | | | Canadian Natural Resources (Oil, Gas & Consumable Fuels) | | | 5.90 | | | | 2/1/18 | | | | 71 | |
| | 100 | | | Canadian Pacific Railway Co. (Road & Rail), Callable 11/1/24 @ 100.00 | | | 2.90 | | | | 2/1/25 | | | | 94 | |
| | 320 | | | Canadian Pacific Railway Co. (Road & Rail), Callable 12/15/22 @ 100.00 | | | 4.45 | | | | 3/15/23 | | | | 343 | |
| | 25 | | | Canadian Pacific Railway Co. (Road & Rail) | | | 7.25 | | | | 5/15/19 | | | | 30 | |
| | 100 | | | Deutsche Telekom International Finance (Diversified Telecommunication Services) (a)(c) | | | 8.75 | | | | 6/15/30 | | | | 141 | |
| | 120 | | | Diageo Capital PLC (Beverages) | | | 5.88 | | | | 9/30/36 | | | | 138 | |
| | 120 | | | HSBC Holdings PLC (Banks) | | | 6.80 | | | | 6/1/38 | | | | 149 | |
| | 105 | | | Iberdrola International BV (Electric Utilities) | | | 5.81 | | | | 3/15/25 | | | | 120 | |
| | 165 | | | Iberdrola International BV (Electric Utilities) | | | 6.75 | | | | 7/15/36 | | | | 202 | |
| | 125 | | | LyondellBasell Industries NV (Chemicals) | | | 4.00 | | | | 7/15/23 | | | | 128 | |
| | 300 | | | LyondellBasell Industries NV (Chemicals), Callable 1/15/19 @ 100.00 | | | 5.00 | | | | 4/15/19 | | | | 325 | |
| | 70 | | | Orange SA (Diversified Financial Services) | | | 9.00 | | | | 3/1/31 | | | | 99 | |
| | 200 | | | Petroleos Mexicanos (Oil, Gas & Consumable Fuels) | | | 5.75 | | | | 3/1/18 | | | | 217 | |
| | 175 | | | Petroleos Mexicanos (Oil, Gas & Consumable Fuels) | | | 6.63 | | | | 6/15/35 | | | | 187 | |
| | 100 | | | Rio Tinto Finance USA Ltd. (Metals & Mining) | | | 5.20 | | | | 11/2/40 | | | | 102 | |
| | 225 | | | Rio Tinto Finance USA PLC (Metals & Mining), Callable 12/22/21 @ 100.00 | | | 3.50 | | | | 3/22/22 | | | | 227 | |
| | 25 | | | Royal Bank of Canada (Banks) | | | 1.20 | | | | 9/19/17 | | | | 25 | |
See accompanying notes to portfolio of investments.
175
HC CAPITAL TRUST
The Core Fixed Income Portfolio
Portfolio of Investments (continued) — June 30, 2015
| | | | | | | | | | | | | | | | |
Shares or
Principal
Amount
(000) | | | | | Rate % | | | Maturity
Date | | | Value
(000) | |
| | | | Yankee Dollars (continued) | | | | | | | | | | | | |
| $ | 25 | | | Royal Bank of Canada (Banks) | | | 1.88 | | | | 2/5/20 | | | $ | 25 | |
| | 25 | | | Royal Bank of Canada (Banks) | | | 2.20 | | | | 9/23/19 | | | | 25 | |
| | 180 | | | Shell International Finance BV (Integrated Oil & Gas) | | | 6.38 | | | | 12/15/38 | | | | 226 | |
| | 300 | | | Statoil ASA (Oil, Gas & Consumable Fuels) | | | 3.25 | | | | 11/10/24 | | | | 300 | |
| | 30 | | | Statoil ASA (Oil, Gas & Consumable Fuels) | | | 5.10 | | | | 8/17/40 | | | | 32 | |
| | 80 | | | Telefonica Emisiones (Diversified Telecommunication Services) | | | 7.05 | | | | 6/20/36 | | | | 98 | |
| | 175 | | | Telefonica Emisiones SAU (Wireless Telecommunication Services) | | | 6.22 | | | | 7/3/17 | | | | 190 | |
| | 160 | | | Vodafone Group PLC (Wireless Telecommunication Services) | | | 2.50 | | | | 9/26/22 | | | | 147 | |
| | 80 | | | Vodafone Group PLC (Wireless Telecommunication Services) | | | 6.15 | | | | 2/27/37 | | | | 85 | |
| | | | | | | | | | | | | | | | |
| | | | Total Yankee Dollars | | | | | | | | | | | 4,678 | |
| | | | | | | | | | | | | | | | |
| | | | Time Deposit — 0.08% | | | | | | | | | | | | |
| | 75 | | | State Street Liquidity Management Control System Eurodollar Time Deposit | | | 0.01 | | | | 7/1/15 | | | | 75 | |
| | | | | | | | | | | | | | | | |
| | | | Total Time Deposit | | | | | | | | | | | 75 | |
| | | | | | | | | | | | | | | | |
| | | | Mutual Funds — 10.63% | | | | | | | | | | | | |
| | 4,959,405 | | | Federated U.S. Treasury Cash Reserve Fund, Institutional Shares (d) | | | 0.00 | | | | | | | | 4,960 | |
| | 4,889,209 | | | SSgA Treasury Money Market Fund (d) | | | 0.00 | | | | | | | | 4,889 | |
| | 759,452 | | | SSgA U.S. Government Money Market Fund (d) | | | 0.00 | | | | | | | | 759 | |
| | | | | | | | | | | | | | | | |
| | | | Total Mutual Funds | | | | | | | | | | | 10,608 | |
| | | | | | | | | | | | | | | | |
| | | | Total Investments Before TBA Sale Commitments (cost $105,088) — 104.72% | | | | | | | | | | | 104,451 | |
| | | | TBA Sale Commitments (e) — (0.29)% | | | | | | | | | | | | |
| $ | (65 | ) | | Fannie Mae, 15 YR TBA | | | 4.50 | | | | 7/25/30 | | | | (68 | ) |
| | (50 | ) | | Freddie Mac, Gold 15 YR TBA | | | 4.50 | | | | 7/15/30 | | | | (52 | ) |
| | (100 | ) | | Freddie Mac, Gold 30 YR TBA | | | 5.50 | | | | 7/15/45 | | | | (112 | ) |
| | (50 | ) | | Government National Mortgage Association | | | 5.50 | | | | 7/15/45 | | | | (56 | ) |
| | | | | | | | | | | | | | | | |
| | | | Total TBA Sale Commitments | | | | | | | | | | | (288 | ) |
| | | | | | | | | | | | | | | | |
| | | | Liabilities in excess of other assets — (4.43)% | | | | | | | | | | | (4,415 | ) |
| | | | | | | | | | | | | | | | |
| | | | Net Assets — 100.00% | | | | | | | | | | $ | 99,748 | |
| | | | | | | | | | | | | | | | |
Amounts designated as “—” are $0 or have been rounded to $0.
| (a) | Variable Rate Security. The rate reflected is the rate in effect on June 30, 2015. |
| (b) | Rate disclosed represents effective yield at purchase. |
| (c) | Step Bond: Coupon rate is set for an initial period and then increased to a higher coupon rate at a specified date. The rate shown is the rate in effect at June 30, 2015. |
| (d) | The rate disclosed is the rate in effect on June 30, 2015. |
| (e) | Represents a “to be announced” transaction. The Portfolio has committed to sell securities for which all specific information is not available at this time. (See Note 2 in the Notes to Financial Statements.) |
MTN—Medium Term Note
TBA—To Be Announced purchase or sale commitment. Security is subject to delayed delivery.
See accompanying notes to portfolio of investments.
176
HC CAPITAL TRUST
The Core Fixed Income Portfolio
Portfolio of Investments (concluded) — June 30, 2015
The following table reflects the percentage of total net assets of the Portfolio attributable to each Specialist Manager, see Note 3 in the Notes to Financial Statements.
| | | | | | | | | | | | | | | | |
The Core Fixed Income Portfolio | | Mellon Capital
Management
Corporation | | | Agincourt Capital
Management, LLC | | | HC Capital
Solutions | | | Total | |
Asset Backed Securities | | | 0.54 | % | | | — | | | | — | | | | 0.54 | % |
Collateralized Mortgage Obligations | | | 2.47 | % | | | — | | | | — | | | | 2.47 | % |
U.S. Government Agency Mortgages | | | 34.48 | % | | | — | | | | — | | | | 34.48 | % |
U.S. Government Agency Securities | | | 2.01 | % | | | — | | | | — | | | | 2.01 | % |
Corporate Bonds | | | 0.02 | % | | | 27.35 | % | | | — | | | | 27.37 | % |
U.S. Treasury Obligations | | | 22.45 | % | | | — | | | | — | | | | 22.45 | % |
Yankee Dollars | | | 0.13 | % | | | 4.56 | % | | | — | | | | 4.69 | % |
Time Deposit | | | 0.05 | % | | | 0.03 | % | | | — | | | | 0.08 | % |
Mutual Funds | | | 4.90 | % | | | 0.76 | % | | | 4.97 | % | | | 10.63 | % |
TBA Sale Commitments | | | -0.29 | % | | | — | | | | — | | | | -0.29 | % |
Other Assets (Liabilities) | | | -4.70 | % | | | 0.28 | % | | | -0.01 | % | | | -4.43 | % |
| | | | | | | | | | | | | | | | |
Total Net Assets | | | 62.06 | % | | | 32.98 | % | | | 4.96 | % | | | 100.00 | % |
| | | | | | | | | | | | | | | | |
See accompanying notes to portfolio of investments.
177
HC CAPITAL TRUST
The Fixed Income Opportunity Portfolio
Portfolio of Investments — June 30, 2015
| | | | | | | | | | | | | | | | |
Principal
Amount
(000) | | | | | Rate % | | | Maturity
Date | | | Value
(000) | |
| | | | Asset Backed Security — 0.66% | | | | | | | | | | | | |
| $ | 4,653 | | | Magnus-Relda Holding Vier GmbH, Series 1A, Class JNR ( c) | | | 7.00 | | | | 10/28/24 | | | $ | 5,334 | |
| | | | | | | | | | | | | | | | |
| | | | Total Asset Backed Security | | | | | | | | | | | 5,334 | |
| | | | | | | | | | | | | | | | |
| | | | Collateralized Mortgage Obligations — 6.59% | | | | | | | | | | | | |
| | 6,000 | | | Banc of America Merrill Lynch Mezzanine Securities Trust, Series 2014-INMZ,
Class MZB (a)(b)(c) | | | 8.67 | | | | 12/15/19 | | | | 6,000 | |
| | 5,000 | | | BLCP Hotel Trust, Series 2014-CLMZ, Class M (a)(c) | | | 5.91 | | | | 8/15/29 | | | | 4,988 | |
| | 2,000 | | | Carefree Portfolio Trust, Series 2014-CMZA, Class MZA (a)(b)(c) | | | 6.16 | | | | 11/15/29 | | | | 2,007 | |
| | 6,000 | | | Carefree Portfolio Trust, Series 2014-CMZB, Class MZB (a)(b)(c) | | | 7.91 | | | | 11/15/29 | | | | 6,038 | |
| | 2,700 | | | Citigroup Commercial Mortgage Trust, Series 2015-GC29, Class E (a)(c) | | | 4.29 | | | | 4/10/48 | | | | 1,879 | |
| | 1,300 | | | Citigroup Commercial Mortgage Trust, Series 2015-GC29, Class F (a)(c) | | | 4.29 | | | | 4/10/48 | | | | 727 | |
| | 6,000 | | | Commercial Mortgage Trust, Series 2014-CR21, Class F | | | 3.00 | | | | 12/10/47 | | | | 3,904 | |
| | 2,900 | | | Commercial Mortgage Trust, Series 2013-CR7, Class G (a)(c) | | | 4.35 | | | | 3/10/46 | | | | 2,156 | |
| | 778 | | | Commercial Mortgage Trust, Series 2013-CR13, Class E (a)(c) | | | 4.75 | | | | 12/10/23 | | | | 660 | |
| | 420 | | | Commercial Mortgage Trust, Series 2013-CR12, Class E (a)(c) | | | 5.08 | | | | 10/10/46 | | | | 364 | |
| | 2,985 | | | Credit Suisse European Mortgage Capital Trust, Series 2014-1MGN, Class B (a)(c) | | | 7.16 | | | | 7/20/22 | | | | 3,327 | |
| | 5,000 | | | CSMC 2015-Town Mezzanine Securities Trust, Series 2015, Class MZ (a)(c) | | | 9.17 | | | | 3/1/28 | | | | 4,962 | |
| | 2,100 | | | Dbubs Mortgage Trust, Series 2011-LC3A, Class G(c) | | | 3.75 | | | | 8/10/44 | | | | 1,284 | |
| | 600 | | | Goldman Sachs Mortgage Securities Trust, Series 2013-GC14, Class F (a)(c) | | | 4.77 | | | | 8/10/46 | | | | 504 | |
| | 700 | | | JPMBB Commercial Mortgage Securities Trust, Series 2014-C23, Class E (a)(c) | | | 3.36 | | | | 9/15/47 | | | | 493 | |
| | 6,900 | | | JP Morgan Chase Commercial Mortgage Securities Corp, Series 2014-CBMZ, Class M (a)(c) | | | 6.41 | | | | 10/15/29 | | | | 6,920 | |
| | 1,110 | | | Morgan Stanley BAMLTrust, Series 2015-C21, Class E(c) | | | 3.01 | | | | 3/15/48 | | | | 668 | |
| | 8,192 | | | UBS – Barclays Commercial Mortgage Trust, Series 2012-C2, Class H (a)(c) | | | 4.89 | | | | 5/10/63 | | | | 3,019 | |
| | 4,726 | | | UBS – Barclays Commercial Mortgage Trust, Series 2012-C2, Class G (a)(c) | | | 4.89 | | | | 5/10/63 | | | | 3,185 | |
| | 510 | | | Wells Fargo Commercial Mortgage Trust, Series 2013-LC12, Class E(c) | | | 3.50 | | | | 7/15/46 | | | | 394 | |
| | | | | | | | | | | | | | | | |
| | | | Total Collateralized Mortgage Obligations | | | | | | | | | | | 53,479 | |
| | | | | | | | | | | | | | | | |
| | | | Corporate Bonds — 60.12% | | | | | | | | | | | | |
| | 1,219 | | | A Schulman, Inc. (Chemicals), Callable 6/1/18 @ 105.16 (c) | | | 6.88 | | | | 6/1/23 | | | | 1,243 | |
| | 1,731 | | | Acadia Healthcare Co., Inc. (Health Care Providers & Services), Callable 7/1/17 @ 103.84 | | | 5.13 | | | | 7/1/22 | | | | 1,718 | |
| | 3,432 | | | Aleris International, Inc. (Metals & Mining), Callable 8/10/15 @ 103.81 | | | 7.63 | | | | 2/15/18 | | | | 3,518 | |
| | 571 | | | Aleris International, Inc. (Metals & Mining), Callable 11/1/15 @ 106.00 | | | 7.88 | | | | 11/1/20 | | | | 592 | |
| | 1,184 | | | Allegion US Holding Co., Inc. (Building Products), Callable 10/1/16 @ 104.31 | | | 5.75 | | | | 10/1/21 | | | | 1,223 | |
| | 2,069 | | | Alliant Techsystems, Inc. (Aerospace & Defense), Callable 10/1/16 @ 103.94 (c) | | | 5.25 | | | | 10/1/21 | | | | 2,110 | |
| | 80 | | | Ally Financial, Inc. (Consumer Finance) | | | 5.50 | | | | 2/15/17 | | | | 83 | |
| | 75 | | | Ally Financial, Inc. (Consumer Finance) | | | 6.25 | | | | 12/1/17 | | | | 80 | |
| | 248 | | | Ally Financial, Inc. (Consumer Finance) | | | 7.50 | | | | 9/15/20 | | | | 289 | |
| | 1,900 | | | Ally Financial, Inc. (Consumer Finance) | | | 8.00 | | | | 12/31/18 | | | | 2,121 | |
| | 2,624 | | | Ally Financial, Inc. (Consumer Finance) | | | 8.00 | | | | 11/1/31 | | | | 3,346 | |
| | 1,233 | | | Altice US Finance I Corp. (Wireless Telecommunication Services),
Callable 7/15/18 @ 104.03 (c) | | | 5.38 | | | | 7/15/23 | | | | 1,202 | |
| | 886 | | | AMC Networks, Inc. (Media), Callable 7/15/16 @ 104.00 | | | 7.75 | | | | 7/15/21 | | | | 957 | |
| | 500 | | | AmerenEnergy Generating Co., Series H (Electric Utilities)^ | | | 7.00 | | | | 4/15/18 | | | | 486 | |
| | 2,684 | | | American Airlines Pass-Through Trust, Series 2013-2, Class B (Airlines) | | | 5.60 | | | | 7/15/20 | | | | 2,764 | |
| | 739 | | | American Airlines Pass-Through Trust, Class B (Airlines) | | | 5.63 | | | | 1/15/21 | | | | 769 | |
| | 4,082 | | | American Axle & Manufacturing, Inc. (Auto Components), Callable 3/15/16 @ 105.00 | | | 6.25 | | | | 3/15/21 | | | | 4,286 | |
| | 4,079 | | | Amsted Industries, Inc. (Machinery), Callable 3/15/18 @ 103.00 (c) | | | 5.00 | | | | 3/15/22 | | | | 4,074 | |
| | 464 | | | Amsted Industries, Inc. (Machinery), Callable 9/15/19 @ 102.69 | | | 5.38 | | | | 9/15/24 | | | | 461 | |
| | 1,765 | | | Anixter International, Inc. (Electronic Equipment, Instruments & Components) | | | 5.13 | | | | 10/1/21 | | | | 1,796 | |
| | 2,169 | | | Audatex North America, Inc. (Software), Callable 6/15/17 @ 103.00 (c) | | | 6.00 | | | | 6/15/21 | | | | 2,229 | |
| | 50 | | | Audatex North America, Inc. (Software), Callable 11/1/18 @ 103.06 | | | 6.13 | | | | 11/1/23 | | | | 51 | |
| | 1,508 | | | B&G Foods, Inc. (Food Products), Callable 6/1/16 @ 103.47 | | | 4.63 | | | | 6/1/21 | | | | 1,485 | |
| | 247 | | | Basic Energy Services, Inc. (Energy Equipment & Services), Callable 10/15/17 @ 104.00^ | | | 7.75 | | | | 10/15/22 | | | | 195 | |
| | 1,612 | | | Belo Corp. (Media) | | | 7.25 | | | | 9/15/27 | | | | 1,693 | |
| | 200 | | | Berry Petroleum Co. (Oil, Gas & Consumable Fuels), Callable 3/15/17 @ 103.00 | | | 6.38 | | | | 9/15/22 | | | | 156 | |
See accompanying notes to portfolio of investments.
178
HC CAPITAL TRUST
The Fixed Income Opportunity Portfolio
Portfolio of Investments (continued) — June 30, 2015
| | | | | | | | | | | | | | | | |
Principal
Amount
(000) | | | | | Rate % | | | Maturity
Date | | | Value
(000) | |
| | | | Corporate Bonds (continued) | | | | | | | | | | | | |
| $ | 1,575 | | | Berry Petroleum Co. (Oil, Gas & Consumable Fuels), Callable 11/1/15 @ 103.00 | | | 6.75 | | | | 11/1/20 | | | $ | 1,244 | |
| | 6,500 | | | Bill Barrett Corp. (Oil, Gas & Consumable Fuels), Callable 10/15/17 @ 103.50 | | | 7.00 | | | | 10/15/22 | | | | 5,883 | |
| | 345 | | | BI-LO LLC/BI-LO Finance Corp. (Food & Staples Retailing), Callable 8/10/15 @ 104.63 (c) | | | 9.25 | | | | 2/15/19 | | | | 348 | |
| | 2,736 | | | Blue Racer Mid LLC/Finan (Oil, Gas & Consumable Fuels), Callable 11/15/17 @ 104.60 (c) | | | 6.13 | | | | 11/15/22 | | | | 2,818 | |
| | 114 | | | Building Materials Corp. of America (Building Products), Callable 11/15/19 @ 102.39 (c) | | | 5.38 | | | | 11/15/24 | | | | 112 | |
| | 430 | | | Building Materials Corp. of America (Building Products), Callable 5/1/16 @ 103.00 | | | 6.75 | | | | 5/1/21 | | | | 448 | |
| | 731 | | | Cable One, Inc. (Media), Callable 6/15/18 @ 102.88 (c) | | | 5.75 | | | | 6/15/22 | | | | 740 | |
| | 1,495 | | | Cablevision Systems Corp. (Media) | | | 5.88 | | | | 9/15/22 | | | | 1,450 | |
| | 220 | | | Cablevision Systems Corp. (Media) | | | 8.00 | | | | 4/15/20 | | | | 239 | |
| | 4,240 | | | Calfrac Holdings LP (Energy Equipment & Services), Callable 12/1/15 @ 104.00 (c) | | | 7.50 | | | | 12/1/20 | | | | 3,915 | |
| | 7,055 | | | California Resources Corp. (Oil, Gas & Consumable Fuels), Callable 6/15/21 @ 100.00^ | | | 5.50 | | | | 9/15/21 | | | | 6,138 | |
| | 3,257 | | | Calpine Corp. (Independent Power and Renewable Electricity Producers),
Callable 1/15/17 @ 103.94 (c) | | | 7.88 | | | | 1/15/23 | | | | 3,518 | |
| | 3,036 | | | Cardtronics, Inc. (IT Services), Callable 8/1/17 @ 103.84 | | | 5.13 | | | | 8/1/22 | | | | 2,968 | |
| | 3,399 | | | Carrizo Oil & Gas, Inc. (Oil, Gas & Consumable Fuels), Callable 9/15/16 @ 103.75 | | | 7.50 | | | | 9/15/20 | | | | 3,577 | |
| | 1,206 | | | CBRE Services, Inc. (Real Estate Management & Development), Callable 12/15/24 @ 100.00 | | | 5.25 | | | | 3/15/25 | | | | 1,248 | |
| | 1,475 | | | CCO Holdings LLC/CCO Holdings Capital Corp. (Diversified Telecommunication Services), Callable 2/15/18 @ 103.00 | | | 5.13 | | | | 2/15/23 | | | | 1,438 | |
| | 831 | | | CCO Holdings LLC/CCO Holdings Capital Corp. (Diversified Telecommunication Services), Callable 9/30/17 @ 103.00 | | | 5.25 | | | | 9/30/22 | | | | 819 | |
| | 1,085 | | | CCO Holdings LLC/CCO Holdings Capital Corp. (Diversified Telecommunication Services), Callable 3/15/16 @ 104.00 | | | 5.25 | | | | 3/15/21 | | | | 1,082 | |
| | 3,563 | | | CCO Holdings LLC/CCO Holdings Capital Corp. (Diversified Telecommunication Services), Callable 5/1/20 @ 102.68 (c) | | | 5.38 | | | | 5/1/25 | | | | 3,468 | |
| | 2,420 | | | CCO Holdings LLC/CCO Holdings Capital Corp. (Diversified Telecommunication Services), Callable 3/1/18 @ 103.00 | | | 5.75 | | | | 9/1/23 | | | | 2,425 | |
| | 1,259 | | | CCO Holdings LLC/CCO Holdings Capital Corp. (Diversified Telecommunication Services), Callable 7/15/18 @ 102.88^ | | | 5.75 | | | | 1/15/24 | | | | 1,265 | |
| | 773 | | | CCO Holdings LLC/CCO Holdings Capital Corp. (Diversified Telecommunication Services), Callable 1/31/17 @ 103.00 | | | 6.63 | | | | 1/31/22 | | | | 806 | |
| | 941 | | | CDW LLC/CDW Finance (Trading Companies & Distributors), Callable 3/1/18 @ 103.75 | | | 5.00 | | | | 9/1/23 | | | | 925 | |
| | 234 | | | CDW LLC/CDW Finance (Trading Companies & Distributors), Callable 8/15/17 @ 104.50 | | | 6.00 | | | | 8/15/22 | | | | 242 | |
| | 3,614 | | | CenturyLink, Inc. (Diversified Telecommunication Services) | | | 5.63 | | | | 4/1/20 | | | | 3,618 | |
| | 2,118 | | | CenturyLink, Inc., Series T (Diversified Telecommunication Services) | | | 5.80 | | | | 3/15/22 | | | | 2,023 | |
| | 245 | | | CenturyLink, Inc. (Diversified Telecommunication Services) | | | 6.45 | | | | 6/15/21 | | | | 247 | |
| | 3,120 | | | Cenveo Corp. (Commercial Services & Supplies), Callable 2/1/19 @ 100.00 (c) | | | 6.00 | | | | 8/1/19 | | | | 2,934 | |
| | 1,530 | | | Cenveo Corp. (Commercial Services & Supplies), Callable 8/10/15 @ 105.75^ | | | 11.50 | | | | 5/15/17 | | | | 1,561 | |
| | 5,768 | | | Cequel Communications Holdings I LLC/Cequel Capital Corp. (Media),
Callable 9/15/15 @ 105.00 (c) | | | 6.38 | | | | 9/15/20 | | | | 5,729 | |
| | 3,012 | | | Chemours Co. (Chemicals), Callable 5/15/20 @ 103.50 (c) | | | 6.63 | | | | 5/15/23 | | | | 2,918 | |
| | 1,506 | | | Chemours Co. (Chemicals), Callable 5/15/20 @ 103.50 (c) | | | 7.00 | | | | 5/15/25 | | | | 1,461 | |
| | 2,752 | | | Chemtura Corp. (Chemicals), Callable 7/15/16 @ 104.00 | | | 5.75 | | | | 7/15/21 | | | | 2,793 | |
| | 648 | | | Chesapeake Energy Corp. (Oil, Gas & Consumable Fuels), Callable 4/15/17 @ 104.00 | | | 4.88 | | | | 4/15/22 | | | | 562 | |
| | 1,000 | | | Chesapeake Energy Corp. (Oil, Gas & Consumable Fuels) | | | 5.75 | | | | 3/15/23 | | | | 905 | |
| | 220 | | | Chesapeake Energy Corp. (Oil, Gas & Consumable Fuels) | | | 6.13 | | | | 2/15/21 | | | | 207 | |
| | 95 | | | Chesapeake Energy Corp. (Oil, Gas & Consumable Fuels) | | | 6.50 | | | | 8/15/17 | | | | 97 | |
| | 600 | | | Chesapeake Energy Corp. (Oil, Gas & Consumable Fuels) | | | 6.63 | | | | 8/15/20 | | | | 585 | |
| | 1,415 | | | Chesapeake Energy Corp. (Oil, Gas & Consumable Fuels) | | | 6.88 | | | | 11/15/20 | | | | 1,380 | |
| | 5,920 | | | CHS/Community Health Systems, Inc. (Health Care Providers & Services),
Callable 7/15/16 @ 104.00 | | | 7.13 | | | | 7/15/20 | | | | 6,272 | |
| | 2,158 | | | CIT Group, Inc. (Banks) | | | 5.00 | | | | 8/15/22 | | | | 2,136 | |
| | 115 | | | CIT Group, Inc. (Banks) | | | 5.00 | | | | 5/15/17 | | | | 119 | |
| | 1,165 | | | CIT Group, Inc. (Banks) | | | 5.25 | | | | 3/15/18 | | | | 1,204 | |
| | 1,760 | | | CIT Group, Inc. (Banks) (c) | | | 6.63 | | | | 4/1/18 | | | | 1,868 | |
| | 3,081 | | | Clayton Williams Energy, Inc. (Oil, Gas & Consumable Fuels), Callable 8/10/15 @ 103.88^ | | | 7.75 | | | | 4/1/19 | | | | 2,927 | |
| | 65 | | | Clean Harbors, Inc. (Commercial Services & Supplies), Callable 12/1/16 @ 102.56 | | | 5.13 | | | | 6/1/21 | | | | 64 | |
See accompanying notes to portfolio of investments.
179
HC CAPITAL TRUST
The Fixed Income Opportunity Portfolio
Portfolio of Investments (continued) — June 30, 2015
| | | | | | | | | | | | | | | | |
Principal
Amount
(000) | | | | | Rate % | | | Maturity
Date | | | Value
(000) | |
| | | | Corporate Bonds (continued) | | | | | | | | | | | | |
| $ | 40 | | | Clean Harbors, Inc. (Commercial Services & Supplies), Callable 8/1/16 @ 102.63 | | | 5.25 | | | | 8/1/20 | | | $ | 41 | |
| | 4,204 | | | Clear Channel Worldwide Holdings, Inc., Series B (Media), Callable 11/15/17 @ 103.00 | | | 6.50 | | | | 11/15/22 | | | | 4,377 | |
| | 145 | | | Clear Channel Worldwide Holdings, Inc., Series A (Media), Callable 11/15/17 @ 103.25 | | | 6.50 | | | | 11/15/22 | | | | 149 | |
| | 406 | | | Cloud Peak Energy Resources LLC/Cloud Peak Energy Finance Corp. (Oil, Gas & Consumable Fuels), Callable 3/15/19 @ 103.00 | | | 6.38 | | | | 3/15/24 | | | | 288 | |
| | 710 | | | Cloud Peak Energy Resources LLC/Cloud Peak Energy Finance Corp. (Oil, Gas & Consumable Fuels), Callable 8/10/15 @ 104.25 | | | 8.50 | | | | 12/15/19 | | | | 602 | |
| | 1,418 | | | Commercial Metals Co. (Metals & Mining), Callable 2/15/23 @ 100.00 | | | 4.88 | | | | 5/15/23 | | | | 1,333 | |
| | 676 | | | Commscope, Inc. (Wireless Telecommunication Services), Callable 6/15/17 @ 102.19 (c) | | | 4.38 | | | | 6/15/20 | | | | 683 | |
| | 1,583 | | | Commscope, Inc. (Wireless Telecommunication Services), Callable 6/15/17 @ 102.50 (c) | | | 5.00 | | | | 6/15/21 | | | | 1,543 | |
| | 1,698 | | | Consol Energy, Inc. (Oil, Gas & Consumable Fuels), Callable 4/15/17 @ 104.41 | | | 5.88 | | | | 4/15/22 | | | | 1,443 | |
| | 3,473 | | | Cott Beverages, Inc. (Consumer Finance), Callable 7/1/17 @ 104.03 | | | 5.38 | | | | 7/1/22 | | | | 3,369 | |
| | 430 | | | Cott Beverages, Inc. (Consumer Finance), Callable 1/1/17 @ 103.38 (c) | | | 6.75 | | | | 1/1/20 | | | | 446 | |
| | 59 | | | Credit Acceptance Corp. (Consumer Finance), Callable 2/15/17 @ 103.06 | | | 6.13 | | | | 2/15/21 | | | | 59 | |
| | 3,205 | | | Credit Acceptance Corp. (Consumer Finance), Callable 3/15/18 @ 105.53 (c) | | | 7.38 | | | | 3/15/23 | | | | 3,309 | |
| | 2,868 | | | Crown Castle International Corp. (Real Estate Investment Trusts) | | | 5.25 | | | | 1/15/23 | | | | 2,889 | |
| | 2,000 | | | CTR Partnership LP/CareTrust Capital Corp. (Capital Markets), Callable 6/1/17 @ 102.94 | | | 5.88 | | | | 6/1/21 | | | | 2,035 | |
| | 1,989 | | | D.R. Horton, Inc. (Household Durables), Callable 12/1/18 @ 100.00 | | | 3.75 | | | | 3/1/19 | | | | 2,004 | |
| | 799 | | | D.R. Horton, Inc. (Household Durables), Callable 6/15/22 @ 100.00 | | | 4.38 | | | | 9/15/22 | | | | 775 | |
| | 1,784 | | | Darling Ingredients, Inc. (Food Products), Callable 1/15/17 @ 104.03 | | | 5.38 | | | | 1/15/22 | | | | 1,784 | |
| | 1,444 | | | DCP Midstream LLC (Oil, Gas & Consumable Fuels) (c) | | | 5.35 | | | | 3/15/20 | | | | 1,484 | |
| | 574 | | | DigitalGlobe, Inc. (Aerospace & Defense), Callable 2/1/17 @ 103.00 | | | 5.25 | | | | 2/1/21 | | | | 562 | |
| | 2,060 | | | DISH DBS Corp. (Media) | | | 5.13 | | | | 5/1/20 | | | | 2,083 | |
| | 1,428 | | | DISH DBS Corp. (Media) | | | 5.88 | | | | 7/15/22 | | | | 1,399 | |
| | 1,425 | | | DISH DBS Corp. (Media) | | | 6.75 | | | | 6/1/21 | | | | 1,486 | |
| | 1,315 | | | DISH DBS Corp. (Media) | | | 7.88 | | | | 9/1/19 | | | | 1,458 | |
| | 61 | | | Dynegy, Inc. (Independent Power and Renewable Electricity Producers),
Callable 5/1/17 @ 103.38 | | | 6.75 | | | | 11/1/19 | | | | 63 | |
| | 34 | | | Dynegy, Inc. (Independent Power and Renewable Electricity Producers),
Callable 11/1/19 @ 103.81 | | | 7.63 | | | | 11/1/24 | | | | 36 | |
| | 145 | | | EchoStar DBS Corp. (Media) | | | 7.13 | | | | 2/1/16 | | | | 149 | |
| | 2,604 | | | Equinix, Inc. (Internet Software & Services), Callable 4/1/17 @ 102.44 | | | 4.88 | | | | 4/1/20 | | | | 2,630 | |
| | 581 | | | Equinix, Inc. (Internet Software & Services), Callable 4/1/18 @ 103.00 | | | 5.38 | | | | 4/1/23 | | | | 581 | |
| | 329 | | | Family Tree Escrow LLC (Machinery), Callable 3/19/17 @ 102.63 (c) | | | 5.25 | | | | 3/1/20 | | | | 344 | |
| | 822 | | | Family Tree Escrow LLC (Machinery), Callable 3/1/18 @ 104.31 (c) | | | 5.75 | | | | 3/1/23 | | | | 859 | |
| | 3,347 | | | First Cash Financial Services, Inc. (Consumer Finance), Callable 4/1/17 @ 105.06 | | | 6.75 | | | | 4/1/21 | | | | 3,523 | |
| | 2,281 | | | Frontier Communications Corp. (Diversified Telecommunication Services),
Callable 6/15/21 @ 100.00 | | | 6.25 | | | | 9/15/21 | | | | 2,076 | |
| | 900 | | | Frontier Communications Corp. (Diversified Telecommunication Services) | | | 7.13 | | | | 1/15/23 | | | | 799 | |
| | 1,758 | | | Frontier Communications Corp. (Diversified Telecommunication Services) | | | 8.13 | | | | 10/1/18 | | | | 1,895 | |
| | 4,564 | | | Frontier Communications Corp. (Diversified Telecommunication Services) | | | 8.50 | | | | 4/15/20 | | | | 4,771 | |
| | 3,861 | | | FTS International, Inc. (Oil, Gas & Consumable Fuels), Callable 5/1/17 @ 104.69 | | | 6.25 | | | | 5/1/22 | | | | 2,838 | |
| | 666 | | | Gannett Co., Inc. (Media), Callable 9/15/17 @ 102.44 | | | 4.88 | | | | 9/15/21 | | | | 661 | |
| | 210 | | | GCI, Inc. (Diversified Telecommunication Services), Callable 6/1/16 @ 103.00 | | | 6.75 | | | | 6/1/21 | | | | 213 | |
| | 749 | | | General Motors Financial Co. (Consumer Finance) | | | 4.25 | | | | 5/15/23 | | | | 758 | |
| | 4,331 | | | Genesis Energy, LP (Oil, Gas & Consumable Fuels), Callable 2/15/17 @ 103.00 | | | 5.75 | | | | 2/15/21 | | | | 4,277 | |
| | 603 | | | Genesis Energy, LP (Oil, Gas & Consumable Fuels), Callable 5/15/18 @ 104.50 | | | 6.00 | | | | 5/15/23 | | | | 603 | |
| | 2,655 | | | GenOn Energy, Inc. (Independent Power and Renewable Electricity Producers) | | | 9.50 | | | | 10/15/18 | | | | 2,708 | |
| | 40 | | | GenOn Energy, Inc. (Independent Power and Renewable Electricity Producers),
Callable 10/15/20 @ 104.94 | | | 9.88 | | | | 10/15/20 | | | | 41 | |
| | 1,425 | | | GMAC, Inc. (Consumer Finance) | | | 8.00 | | | | 11/1/31 | | | | 1,706 | |
| | 3,107 | | | Goldman Sachs Group, Inc., Series M (Capital Markets), Callable 5/10/20 @ 100.00,
Perpetual Bond (a)(d) | | | 5.37 | | | | 12/31/49 | | | | 3,064 | |
| | 1,994 | | | Harland Clarke Holdings Corp. (Commercial Services & Supplies),
Callable 3/1/17 @ 103.00 (c) | | | 6.88 | | | | 3/1/20 | | | | 1,914 | |
See accompanying notes to portfolio of investments.
180
HC CAPITAL TRUST
The Fixed Income Opportunity Portfolio
Portfolio of Investments (continued) — June 30, 2015
| | | | | | | | | | | | | | | | |
Principal
Amount
(000) | | | | | Rate % | | | Maturity
Date | | | Value
(000) | |
| | | | Corporate Bonds (continued) | | | | | | | | | | | | |
| $ | 2,032 | | | Harland Clarke Holdings Corp. (Commercial Services & Supplies),
Callable 8/1/15 @ 105.00 (c) | | | 9.75 | | | | 8/1/18 | | | $ | 2,123 | |
| | 3,875 | | | HCA, Inc. (Health Care Providers & Services) | | | 5.38 | | | | 2/1/25 | | | | 3,938 | |
| | 1,787 | | | HCA, Inc. (Health Care Providers & Services) | | | 5.88 | | | | 3/15/22 | | | | 1,943 | |
| | 2,555 | | | HCA, Inc. (Health Care Providers & Services) | | | 6.50 | | | | 2/15/20 | | | | 2,855 | |
| | 900 | | | Hilcorp Energy, Inc./Hilcorp Energy Co. (Oil, Gas & Consumable Fuels),
Callable 10/1/15 @ 104.00 (c) | | | 7.63 | | | | 4/15/21 | | | | 936 | |
| | 4,302 | | | Hornbeck Offshore Services, Inc. (Energy Equipment & Services), Callable 3/1/16 @ 104.00 | | | 5.00 | | | | 3/1/21 | | | | 3,700 | |
| | 716 | | | Hughes Satellite Systems Corp. (Diversified Telecommunication Services) | | | 6.50 | | | | 6/15/19 | | | | 777 | |
| | 1,395 | | | Hughes Satellite Systems Corp. (Diversified Telecommunication Services) | | | 7.63 | | | | 6/15/21 | | | | 1,535 | |
| | 3,047 | | | Huntsman International LLC (Chemicals), Callable 8/15/20 @ 100.00 | | | 4.88 | | | | 11/15/20 | | | | 3,040 | |
| | 111 | | | Huntsman International Ltd. (Chemicals), Callable 8/15/22 @ 100.00 (c) | | | 5.13 | | | | 11/15/22 | | | | 109 | |
| | 3,093 | | | Ingles Markets, Inc. (Food & Staples Retailing), Callable 6/15/18 @ 103.00 | | | 5.75 | | | | 6/15/23 | | | | 3,144 | |
| | 1,055 | | | International Lease Finance Corp. (Trading Companies & Distributors) | | | 5.88 | | | | 4/1/19 | | | | 1,125 | |
| | 1,321 | | | International Lease Finance Corp. (Trading Companies & Distributors) | | | 5.88 | | | | 8/15/22 | | | | 1,427 | |
| | 1,330 | | | International Lease Finance Corp. (Trading Companies & Distributors) | | | 6.25 | | | | 5/15/19 | | | | 1,438 | |
| | 90 | | | International Lease Finance Corp. (Diversified Financial Services) | | | 8.25 | | | | 12/15/20 | | | | 107 | |
| | 1,000 | | | Iron Mountain, Inc. (Real Estate Investment Trusts), Callable 8/15/17 @ 103.00 | | | 5.75 | | | | 8/15/24 | | | | 1,001 | |
| | 1,100 | | | J.B. Poindexter & Co., Inc. (Auto Components), Callable 4/1/17 @ 105.00 (c) | | | 9.00 | | | | 4/1/22 | | | | 1,177 | |
| | 1,148 | | | JBS USA LLC/JBS USA Finance, Inc. (Food Products), Callable 6/15/20 @ 102.88 (c) | | | 5.75 | | | | 6/15/25 | | | | 1,135 | |
| | 3,906 | | | JBS USA LLC/JBS USA Finance, Inc. (Food Products), Callable 8/10/15 @ 105.44 (c) | | | 7.25 | | | | 6/1/21 | | | | 4,116 | |
| | 2,622 | | | JMC Steel Group, Inc. (Metals & Mining), Callable 8/10/15 @ 104.13^ (c) | | | 8.25 | | | | 3/15/18 | | | | 2,399 | |
| | 1,606 | | | JPMorgan Chase & Co. (Banks), Callable 5/1/20 @ 100.00, Perpetual Bond (a)(d) | | | 5.30 | | | | 12/31/49 | | | | 1,594 | |
| | 8,988 | | | Key Energy Services, Inc. (Energy Equipment & Services), Callable 3/1/16 @ 103.00 | | | 6.75 | | | | 3/1/21 | | | | 5,303 | |
| | 3,556 | | | Kindred Healthcare, Inc. (Health Care Providers & Services), Callable 4/15/17 @ 104.78 | | | 6.38 | | | | 4/15/22 | | | | 3,552 | |
| | 2,047 | | | KLX, Inc. (Aerospace & Defense), Callable 12/1/17 @ 104.41 (c) | | | 5.88 | | | | 12/1/22 | | | | 2,067 | |
| | 2,956 | | | Lamar Media Corp. (Media), Callable 2/1/17 @ 102.94 | | | 5.88 | | | | 2/1/22 | | | | 3,059 | |
| | 2,350 | | | Lennar Corp. (Household Durables), Callable 2/28/25 @ 100.00 | | | 4.75 | | | | 5/30/25 | | | | 2,279 | |
| | 396 | | | Lennar Corp. (Household Durables), Callable 8/15/22 @ 100.00 (a) | | | 4.75 | | | | 11/15/22 | | | | 389 | |
| | 2,411 | | | LifePoint Hospitals, Inc. (Health Care Providers & Services), Callable 12/1/16 @ 104.13 | | | 5.50 | | | | 12/1/21 | | | | 2,489 | |
| | 3,287 | | | Limited Brands, Inc. (Specialty Retail) | | | 5.63 | | | | 2/15/22 | | | | 3,460 | |
| | 4,104 | | | Lin Television Corp. (Media), Callable 1/15/17 @ 103.00 | | | 6.38 | | | | 1/15/21 | | | | 4,196 | |
| | 7,043 | | | Linn Energy LLC/Linn Energy Finance Corp. (Oil, Gas & Consumable Fuels),
Callable 8/10/15 @ 104.31 | | | 8.63 | | | | 4/15/20 | | | | 5,777 | |
| | 64 | | | LKQ Corp. (Distributors), Callable 5/15/18 @ 102.38 | | | 4.75 | | | | 5/15/23 | | | | 61 | |
| | 470 | | | Lynx I Corp. (Media), Callable 4/15/17 @ 103.00 (c) | | | 5.38 | | | | 4/15/21 | | | | 484 | |
| | 986 | | | Markwest Energy Part/Finance (Oil, Gas & Consumable Fuels), Callable 9/1/24 @ 100.00 | | | 4.88 | | | | 12/1/24 | | | | 964 | |
| | 1,500 | | | Markwest Energy Part/Finance (Oil, Gas & Consumable Fuels), Callable 2/15/17 @ 103.63 | | | 4.88 | | | | 6/1/25 | | | | 1,466 | |
| | 4,475 | | | Martin Midstream Partners LP/Martin Midstream Finance Corp. (Oil, Gas & Consumable Fuels), Callable 2/15/17 @ 104.00 | | | 7.25 | | | | 2/15/21 | | | | 4,397 | |
| | 1,178 | | | Masco Corp. (Building Products), Callable 1/1/25 @ 100.00 | | | 4.45 | | | | 4/1/25 | | | | 1,181 | |
| | 1,812 | | | Meritage Homes Corp. (Household Durables) | | | 7.15 | | | | 4/15/20 | | | | 1,957 | |
| | 1,538 | | | MetLife, Inc., Series C (Life & Health Insurance), Callable 6/15/20 @ 100.00,
Perpetual Bond (a)(d) | | | 5.25 | | | | 12/31/49 | | | | 1,525 | |
| | 6,361 | | | MGM Resorts International (Hotels, Restaurants & Leisure) | | | 5.25 | | | | 3/31/20 | | | | 6,409 | |
| | 150 | | | MidContinent Express Pipeline LLC (Oil, Gas & Consumable Fuels) | | | 6.70 | | | | 9/15/19 | | | | 163 | |
| | 3,427 | | | MPT Operating Partnership LP/MPT Finance Corp. (Real Estate Investment Trusts),
Callable 2/15/17 @ 103.00 | | | 6.38 | | | | 2/15/22 | | | | 3,653 | |
| | 1,629 | | | MPT Operating Partnership LP/MPT Finance Corp. (Real Estate Investment Trusts),
Callable 5/1/16 @ 103.00 | | | 6.88 | | | | 5/1/21 | | | | 1,721 | |
| | 1,843 | | | Multi-Color Corp. (Commercial Services & Supplies), Callable 12/1/17 @ 104.60 (c) | | | 6.13 | | | | 12/1/22 | | | | 1,884 | |
| | 5,023 | | | Navient LLC (Consumer Finance) | | | 6.13 | | | | 3/25/24 | | | | 4,809 | |
| | 936 | | | NCR Corp. (Technology Hardware, Storage & Peripherals), Callable 2/15/17 @ 102.31 | | | 4.63 | | | | 2/15/21 | | | | 938 | |
| | 3,482 | | | NCR Corp. (Technology Hardware, Storage & Peripherals), Callable 12/15/17 @ 102.94 | | | 5.88 | | | | 12/15/21 | | | | 3,587 | |
| | 300 | | | Netflix, Inc. (Internet & Catalog Retail) (c) | | | 5.50 | | | | 2/15/22 | | | | 310 | |
See accompanying notes to portfolio of investments.
181
HC CAPITAL TRUST
The Fixed Income Opportunity Portfolio
Portfolio of Investments (continued) — June 30, 2015
| | | | | | | | | | | | | | | | |
Principal
Amount
(000) | | | | | Rate % | | | Maturity
Date | | | Value
(000) | |
| | | | Corporate Bonds (continued) | | | | | | | | | | | | |
| $ | 2,024 | | | Netflix, Inc. (Internet & Catalog Retail) | | | 5.75 | | | | 3/1/24 | | | $ | 2,080 | |
| | 3,287 | | | Netflix, Inc. (Internet & Catalog Retail) (c) | | | 5.88 | | | | 2/15/25 | | | | 3,402 | |
| | 3,214 | | | NGL Energy Partners LP/Finance Co. (Oil, Gas & Consumable Fuels),
Callable 10/15/16 @ 105.16 | | | 6.88 | | | | 10/15/21 | | | | 3,343 | |
| | 2,350 | | | Nielsen Finance LLC/Nielsen Finance Co. (Diversified Financial Services),
Callable 10/1/16 @ 102.00 | | | 4.50 | | | | 10/1/20 | | | | 2,338 | |
| | 1,743 | | | Nielsen Finance LLC/Nielsen Finance Co. (Diversified Financial Services),
Callable 4/15/17 @ 104.00 (c) | | | 5.00 | | | | 4/15/22 | | | | 1,708 | |
| | 634 | | | NRG Energy, Inc. (Independent Power and Renewable Electricity Producers),
Callable 7/15/18 @ 103.12 | | | 6.25 | | | | 7/15/22 | | | | 644 | |
| | 3,157 | | | NRG Energy, Inc. (Independent Power and Renewable Electricity Producers),
Callable 5/15/16 @ 104.00 | | | 7.88 | | | | 5/15/21 | | | | 3,362 | |
| | 1,825 | | | NRG Energy, Inc. (Independent Power and Renewable Electricity Producers),
Callable 9/1/15 @ 104.00 | | | 8.25 | | | | 9/1/20 | | | | 1,912 | |
| | 1,759 | | | Nuance Communications, Inc. (Software), Callable 8/15/16 @ 103.00 (c) | | | 5.38 | | | | 8/15/20 | | | | 1,768 | |
| | 1,534 | | | NuStar Logistics LP (Oil, Gas & Consumable Fuels) | | | 4.80 | | | | 9/1/20 | | | | 1,549 | |
| | 370 | | | NuStar Logistics LP (Oil, Gas & Consumable Fuels) | | | 6.75 | | | | 2/1/21 | | | | 399 | |
| | 3,627 | | | Oasis Petroleum, Inc. (Oil, Gas & Consumable Fuels), Callable 9/15/17 @ 103.44^ | | | 6.88 | | | | 3/15/22 | | | | 3,681 | |
| | 115 | | | Oasis Petroleum, Inc. (Oil, Gas & Consumable Fuels), Callable 7/15/17 @ 103.44 | | | 6.88 | | | | 1/15/23 | | | | 114 | |
| | 3,453 | | | Penske Automotive Group (Specialty Retail), Callable 12/1/19 @ 102.69 | | | 5.38 | | | | 12/1/24 | | | | 3,496 | |
| | 609 | | | PHH Corp. (Diversified Financial Services), Callable 8/15/17 @ 103.00 | | | 6.38 | | | | 8/15/21 | | | | 598 | |
| | 3,415 | | | PHH Corp. (Diversified Financial Services) | | | 7.38 | | | | 9/1/19 | | | | 3,612 | |
| | 1,748 | | | PolyOne Corp. (Chemicals) | | | 5.25 | | | | 3/15/23 | | | | 1,731 | |
| | 7,395 | | | Post Holdings, Inc. (Food Products), Callable 2/15/17 @ 103.69 | | | 7.38 | | | | 2/15/22 | | | | 7,524 | |
| | 2,030 | | | QEP Resources, Inc. (Oil, Gas & Consumable Fuels) | | | 6.80 | | | | 3/1/20 | | | | 2,093 | |
| | 1,440 | | | Quad Graphics, Inc. (Commercial Services & Supplies) | | | 7.00 | | | | 5/1/22 | | | | 1,400 | |
| | 1,503 | | | Quicken Loans, Inc. (Diversified Consumer Services), Callable 5/1/20 @ 102.88 (c) | | | 5.75 | | | | 5/1/25 | | | | 1,439 | |
| | 200 | | | Quintiles Transnational (Pharmaceuticals), Callable 5/15/18 @ 103.66 (c) | | | 4.88 | | | | 5/15/23 | | | | 201 | |
| | 42 | | | Resolute Forest Products (Paper & Forest Products), Callable 5/15/17 @ 104.41 | | | 5.88 | | | | 5/15/23 | | | | 38 | |
| | 938 | | | Rose Rock Midstream, LP (Oil, Gas & Consumable Fuels), Callable 7/15/17 @ 104.22 | | | 5.63 | | | | 7/15/22 | | | | 917 | |
| | 1,550 | | | Rose Rock Midstream, LP (Oil, Gas & Consumable Fuels), Callable 5/15/19 @ 102.81 (c) | | | 5.63 | | | | 11/15/23 | | | | 1,500 | |
| | 750 | | | RRI Energy, Inc. (Independent Power and Renewable Electricity Producers) | | | 7.88 | | | | 6/15/17 | | | | 759 | |
| | 4,717 | | | Sabine Pass Liquefaction (Oil, Gas & Consumable Fuels), Callable 1/1/22 @ 100.00 (c) | | | 5.63 | | | | 3/1/25 | | | | 4,670 | |
| | 35 | | | Sabine Pass LNG LP (Oil, Gas & Consumable Fuels), Callable 11/1/16 @ 103.25 | | | 6.50 | | | | 11/1/20 | | | | 36 | |
| | 1,863 | | | Sabre Holdings Corp. (Software), Callable 4/15/18 @ 104.03 (c) | | | 5.38 | | | | 4/15/23 | | | | 1,835 | |
| | 1,147 | | | Sanchez Energy Corp. (Oil, Gas & Consumable Fuels), Callable 7/15/18 @ 103.06^ | | | 6.13 | | | | 1/15/23 | | | | 1,027 | |
| | 2,930 | | | SandRidge Energy, Inc. (Oil, Gas & Consumable Fuels), Callable 3/15/16 @ 103.75 | | | 7.50 | | | | 3/15/21 | | | | 1,282 | |
| | 1,215 | | | SandRidge Energy, Inc. (Oil, Gas & Consumable Fuels), Callable 4/15/17 @ 104.00 | | | 8.13 | | | | 10/15/22 | | | | 519 | |
| | 1,680 | | | SandRidge Energy, Inc. (Oil, Gas & Consumable Fuels), Callable 8/10/15 @ 104.38 | | | 8.75 | | | | 1/15/20 | | | | 907 | |
| | 290 | | | SBA Telecommunications LLC (Wireless Telecommunication Services),
Callable 7/15/16 @ 102.88 | | | 5.75 | | | | 7/15/20 | | | | 301 | |
| | 6,625 | | | Select Medical Corp. (Health Care Providers & Services), Callable 6/1/16 @ 105.00 | | | 6.38 | | | | 6/1/21 | | | | 6,691 | |
| | 2,341 | | | SemGroup Corp. (Oil, Gas & Consumable Fuels), Callable 6/15/16 @ 106.00 | | | 7.50 | | | | 6/15/21 | | | | 2,446 | |
| | 72 | | | Service Corp. International (Diversified Consumer Services), Callable 5/15/19 @ 102.69 | | | 5.38 | | | | 5/15/24 | | | | 75 | |
| | 700 | | | Service Corp. International (Diversified Consumer Services) | | | 8.00 | | | | 11/15/21 | | | | 816 | |
| | 11 | | | Seventy Seven Energy, Inc. (Energy Equipment & Services), Callable 7/15/17 @ 104.88 | | | 6.50 | | | | 7/15/22 | | | | 7 | |
| | 792 | | | Shea Homes LP/Funding Corp. (Real Estate Investment Trusts), Callable 4/1/18 @ 104.41 (c) | | | 5.88 | | | | 4/1/23 | | | | 802 | |
| | 792 | | | Shea Homes LP/Funding Corp. (Real Estate Investment Trusts),
Callable 6/15/21 @ 100.00 (c) | | | 6.13 | | | | 4/1/25 | | | | 798 | |
| | 2,246 | | | Sinclair Television Group, Inc. (Media), Callable 4/1/16 @ 104.00 | | | 5.38 | | | | 4/1/21 | | | | 2,263 | |
| | 300 | | | Sinclair Television Group, Inc. (Media), Callable 10/1/17 @ 103.00 | | | 6.13 | | | | 10/1/22 | | | | 308 | |
| | 368 | | | Sinclair Television Group, Inc. (Media), Callable 11/1/16 @ 105.00 | | | 6.38 | | | | 11/1/21 | | | | 380 | |
| | 1,817 | | | Sirius XM Radio, Inc. (Media), Callable 4/15/20 @ 102.69 (c) | | | 5.38 | | | | 4/15/25 | | | | 1,753 | |
| | 1,182 | | | Sirius XM Radio, Inc. (Media), Callable 10/1/16 @ 103.00 (c) | | | 5.88 | | | | 10/1/20 | | | | 1,212 | |
| | 619 | | | Sirius XM Radio, Inc. (Media), Callable 7/15/19 @ 103.00 (c) | | | 6.00 | | | | 7/15/24 | | | | 625 | |
| | 2,396 | | | SLM Corp. (Consumer Finance) | | | 5.50 | | | | 1/15/19 | | | | 2,443 | |
See accompanying notes to portfolio of investments.
182
HC CAPITAL TRUST
The Fixed Income Opportunity Portfolio
Portfolio of Investments (continued) — June 30, 2015
| | | | | | | | | | | | | | | | |
Principal
Amount
(000) | | | | | Rate % | | | Maturity
Date | | | Value
(000) | |
| | | | Corporate Bonds (continued) | | | | | | | | | | | | |
| $ | 130 | | | Sonic Automotive, Inc. (Specialty Retail), Callable 7/15/17 @ 103.50 | | | 7.00 | | | | 7/15/22 | | | $ | 141 | |
| | 1,131 | | | Spectrum Brands, Inc. (Household Products), Callable 7/15/20 @ 102.88 (c) | | | 5.75 | | | | 7/15/25 | | | | 1,148 | |
| | 2,525 | | | Sprint Capital Corp. (Wireless Telecommunication Services) | | | 6.90 | | | | 5/1/19 | | | | 2,576 | |
| | 630 | | | Sprint Corp. (Wireless Telecommunication Services), Callable 11/15/24 @ 100.00 | | | 7.63 | | | | 2/15/25 | | | | 594 | |
| | 2,687 | | | Sprint Nextel Corp. (Wireless Telecommunication Services) | | | 6.00 | | | | 11/15/22 | | | | 2,455 | |
| | 960 | | | Sprint Nextel Corp. (Wireless Telecommunication Services) (c) | | | 7.00 | | | | 3/1/20 | | | | 1,044 | |
| | 590 | | | Sprint Nextel Corp. (Wireless Telecommunication Services) | | | 7.00 | | | | 8/15/20 | | | | 586 | |
| | 770 | | | Sprint Nextel Corp. (Wireless Telecommunication Services) | | | 11.50 | | | | 11/15/21 | | | | 907 | |
| | 2,023 | | | Standard Pacific Corp. (Household Durables), Callable 5/15/24 @ 100.00 | | | 5.88 | | | | 11/15/24 | | | | 2,084 | |
| | 66 | | | Standard Pacific Corp. (Household Durables), Callable 6/15/21 @ 100.00 | | | 6.25 | | | | 12/15/21 | | | | 70 | |
| | 59 | | | Standard Pacific Corp. (Household Durables) | | | 8.38 | | | | 1/15/21 | | | | 68 | |
| | 281 | | | Steel Dynamics, Inc. (Metals & Mining), Callable 10/1/17 @ 102.56 | | | 5.13 | | | | 10/1/21 | | | | 282 | |
| | 461 | | | Steel Dynamics, Inc. (Metals & Mining), Callable 4/15/18 @ 103.00 | | | 5.25 | | | | 4/15/23 | | | | 458 | |
| | 1,000 | | | Steel Dynamics, Inc. (Metals & Mining), Callable 8/15/17 @ 103.00 | | | 6.38 | | | | 8/15/22 | | | | 1,046 | |
| | 1,127 | | | Targa Resources Partners LP (Oil, Gas & Consumable Fuels), Callable 2/1/17 @ 103.00 | | | 6.38 | | | | 8/1/22 | | | | 1,172 | |
| | 300 | | | Taylor Morrison Communities, Inc. (Household Durables), Callable 4/15/16 @ 103.94 | | | 5.25 | | | | 4/15/21 | | | | 296 | |
| | 1,403 | | | Taylor Morrison Communities, Inc. (Household Durables), Callable 1/15/23 @ 100.00 (c) | | | 5.88 | | | | 4/15/23 | | | | 1,389 | |
| | 335 | | | Tenet Healthcare Corp. (Oil, Gas & Consumable Fuels) | | | 4.75 | | | | 6/1/20 | | | | 340 | |
| | 6,281 | | | Tenet Healthcare Corp. (Health Care Providers & Services) | | | 6.00 | | | | 10/1/20 | | | | 6,697 | |
| | 1,510 | | | Tesoro Logistics LP/Tesoro Logistics Corp. (Oil, Gas & Consumable Fuels),
Callable 10/1/16 @ 103.00 | | | 5.88 | | | | 10/1/20 | | | | 1,552 | |
| | 75 | | | Tesoro Logistics LP/Tesoro Logistics Corp. (Oil, Gas & Consumable Fuels),
Callable 10/15/16 @ 104.59 | | | 6.13 | | | | 10/15/21 | | | | 78 | |
| | 519 | | | Tesoro Logistics LP/Tesoro Logistics Corp. (Oil, Gas & Consumable Fuels),
Callable 10/15/18 @ 103.13 (c) | | | 6.25 | | | | 10/15/22 | | | | 537 | |
| | 2,440 | | | The ADT Corp. (Commercial Services & Supplies) | | | 3.50 | | | | 7/15/22 | | | | 2,208 | |
| | 1,703 | | | The ADT Corp. (Commercial Services & Supplies)^ | | | 6.25 | | | | 10/15/21 | | | | 1,788 | |
| | 7 | | | The AES Corp. (Independent Power and Renewable Electricity Producers),
Callable 3/15/19 @ 102.75 (a) | | | 3.28 | | | | 6/1/19 | | | | 7 | |
| | 61 | | | The AES Corp. (Independent Power and Renewable Electricity Producers),
Callable 4/15/20 @ 102.75 | | | 5.50 | | | | 4/15/25 | | | | 58 | |
| | 4,400 | | | The AES Corp. (Independent Power and Renewable Electricity Producers),
Callable 6/1/21 @ 100.00 | | | 7.38 | | | | 7/1/21 | | | | 4,828 | |
| | 250 | | | The AES Corp. (Independent Power and Renewable Electricity Producers) | | | 8.00 | | | | 6/1/20 | | | | 289 | |
| | 2,196 | | | The Goodyear Tire & Rubber Co. (Auto Components), Callable 3/1/16 @ 104.88 | | | 6.50 | | | | 3/1/21 | | | | 2,325 | |
| | 3,300 | | | The Goodyear Tire & Rubber Co. (Auto Components) | | | 8.75 | | | | 8/15/20 | | | | 3,944 | |
| | 1,264 | | | The Men’s Wearhouse, Inc. (Specialty Retail), Callable 7/1/17 @ 105.25 | | | 7.00 | | | | 7/1/22 | | | | 1,352 | |
| | 1,582 | | | The Ryland Group, Inc. (Household Durables) | | | 5.38 | | | | 10/1/22 | | | | 1,598 | |
| | 713 | | | T-Mobile USA, Inc. (Wireless Telecommunication Services), Callable 9/1/18 @ 103.00 | | | 6.00 | | | | 3/1/23 | | | | 730 | |
| | 692 | | | T-Mobile USA, Inc. (Wireless Telecommunication Services), Callable 1/15/18 @ 103.00 | | | 6.13 | | | | 1/15/22 | | | | 714 | |
| | 2,633 | | | T-Mobile USA, Inc. (Wireless Telecommunication Services), Callable 4/1/17 @ 103.00 | | | 6.25 | | | | 4/1/21 | | | | 2,699 | |
| | 4,806 | | | T-Mobile USA, Inc. (Wireless Telecommunication Services), Callable 4/28/16 @ 103.27 | | | 6.54 | | | | 4/28/20 | | | | 5,032 | |
| | 1,605 | | | T-Mobile USA, Inc. (Wireless Telecommunication Services), Callable 4/1/18 @ 103.00 | | | 6.63 | | | | 4/1/23 | | | | 1,667 | |
| | 162 | | | T-Mobile USA, Inc. (Wireless Telecommunication Services), Callable 4/28/18 @ 103.00 | | | 6.84 | | | | 4/28/23 | | | | 170 | |
| | 2,081 | | | Toll Brothers Finance Corp. (Household Durables) | | | 5.88 | | | | 2/15/22 | | | | 2,232 | |
| | 1,523 | | | Tribune Media Co. (Media), Callable 7/15/18 @ 102.94 (c) | | | 5.88 | | | | 7/15/22 | | | | 1,534 | |
| | 916 | | | United Airlines Pass Through Trust, Class B (Airlines) | | | 4.63 | | | | 9/3/22 | | | | 923 | |
| | 1,218 | | | United Rentals NA, Inc. (Commercial Services & Supplies), Callable 7/15/18 @ 103.47 | | | 4.63 | | | | 7/15/23 | | | | 1,194 | |
| | 177 | | | United Rentals NA, Inc. (Commercial Services & Supplies), Callable 5/15/19 @ 102.88 | | | 5.75 | | | | 11/15/24 | | | | 174 | |
| | 2,620 | | | United Rentals NA, Inc. (Trading Companies & Distributors), Callable 4/15/17 @ 104.00 | | | 7.63 | | | | 4/15/22 | | | | 2,835 | |
| | 3,325 | | | Universal Hospital Services, Inc. (Health Care Providers & Services),
Callable 8/15/15 @ 106.00 | | | 7.63 | | | | 8/15/20 | | | | 3,076 | |
| | 167 | | | Univision Communications, Inc. (Media), Callable 5/15/18 @ 102.56 (c) | | | 5.13 | | | | 5/15/23 | | | | 162 | |
| | 209 | | | Univision Communications, Inc. (Media), Callable 2/15/20 @ 102.56 (c) | | | 5.13 | | | | 2/15/25 | | | | 202 | |
| | 5,729 | | | URS Corp. (Construction & Engineering), Callable 1/1/22 @ 100.00 | | | 5.00 | | | | 4/1/22 | | | | 5,514 | |
See accompanying notes to portfolio of investments.
183
HC CAPITAL TRUST
The Fixed Income Opportunity Portfolio
Portfolio of Investments (continued) — June 30, 2015
| | | | | | | | | | | | | | | | |
Principal
Amount
(000) | | | | | Rate % | | | Maturity
Date | | | Value
(000) | |
| | | | Corporate Bonds (continued) | | | | | | | | | | | | |
| $ | 1,038 | | | Valeant Pharmaceuticals International, Inc. (Pharmaceuticals),
Callable 10/15/16 @ 103.00 (c) | | | 6.38 | | | | 10/15/20 | | | $ | 1,093 | |
| | 3,828 | | | ViaSat, Inc. (Communications Equipment), Callable 6/15/16 @ 103.00 | | | 6.88 | | | | 6/15/20 | | | | 4,039 | |
| | 3,010 | | | Vulcan Materials Co. (Construction Materials) | | | 7.50 | | | | 6/15/21 | | | | 3,462 | |
| | 2,452 | | | West Corp. (Commercial Services & Supplies), Callable 7/15/17 @ 104.00 (c) | | | 5.38 | | | | 7/15/22 | | | | 2,294 | |
| | 2,210 | | | Whiting Petroleum Corp. (Oil, Gas & Consumable Fuels), Callable 12/15/18 @ 100.00 | | | 5.00 | | | | 3/15/19 | | | | 2,166 | |
| | 3,781 | | | Whiting Petroleum Corp. (Oil, Gas & Consumable Fuels), Callable 12/15/20 @ 100.00 | | | 5.75 | | | | 3/15/21 | | | | 3,721 | |
| | 170 | | | Windstream Corp. (Diversified Telecommunication Services), Callable 2/1/18 @ 103.00 | | | 6.38 | | | | 8/1/23 | | | | 138 | |
| | 533 | | | Windstream Corp. (Diversified Telecommunication Services), Callable 4/1/16 @ 104.00 | | | 7.50 | | | | 4/1/23 | | | | 465 | |
| | 655 | | | Windstream Corp. (Diversified Telecommunication Services), Callable 6/1/17 @ 104.00 | | | 7.50 | | | | 6/1/22 | | | | 576 | |
| | 600 | | | Windstream Corp. (Diversified Telecommunication Services), Callable 10/15/15 @ 104.00 | | | 7.75 | | | | 10/15/20 | | | | 587 | |
| | 3,250 | | | Windstream Corp. (Diversified Telecommunication Services) | | | 7.88 | | | | 11/1/17 | | | | 3,453 | |
| | 1,416 | | | ZF North Amercia Capital (Auto Components) (c) | | | 4.50 | | | | 4/29/22 | | | | 1,387 | |
| | 1,596 | | | ZF North Amercia Capital (Auto Components) (c) | | | 4.75 | | | | 4/29/25 | | | | 1,545 | |
| | | | | | | | | | | | | | | | |
| | | | Total Corporate Bonds | | | | | | | | | | | 487,967 | |
| | | | | | | | | | | | | | | | |
| | | | Yankee Dollars — 15.67% | | | | | | | | | | | | |
| | 1,547 | | | 1011778 B.C. ULC / New Red Finance, Inc. (Hotels, Restaurants & Leisure),
Callable 10/1/17 @ 102.31 (c) | | | 4.63 | | | | 1/15/22 | | | | 1,524 | |
| | 28 | | | Aercap Ireland Capital Ltd./AerCap Global Aviation Trust (Diversified Financial Services) | | | 4.63 | | | | 7/1/22 | | | | 28 | |
| | 298 | | | Aercap Ireland Capital Ltd./AerCap Global Aviation Trust (Diversified Financial Services) | | | 5.00 | | | | 10/1/21 | | | | 307 | |
| | 1,882 | | | AerCap Ireland Capital Ltd./AerCap Global Aviation Trust (Diversified Financial Services) (c) | | | 3.75 | | | | 5/15/19 | | | | 1,861 | |
| | 2,294 | | | AerCap Ireland Capital Ltd./AerCap Global Aviation Trust (Diversified Financial Services) (c) | | | 4.50 | | | | 5/15/21 | | | | 2,305 | |
| | 292 | | | Aircastle Ltd. (Trading Companies & Distributors) | | | 6.25 | | | | 12/1/19 | | | | 316 | |
| | 865 | | | Aircastle Ltd. (Trading Companies & Distributors) | | | 7.63 | | | | 4/15/20 | | | | 979 | |
| | 1,940 | | | Albea Beauty Holdings SA (Containers & Packaging), Callable 11/1/15 @ 106.00 (c) | | | 8.38 | | | | 11/1/19 | | | | 2,076 | |
| | 4,700 | | | Altice Financing SA (Consumer Finance), Callable 4/1/16 @ 103.75 (c) | | | 6.63 | | | | 2/15/23 | | | | 4,666 | |
| | 1,884 | | | Arcelormittal (Metals & Mining) | | | 7.00 | | | | 2/25/22 | | | | 2,030 | |
| | 3,721 | | | ArcelorMittal (Metals & Mining) | | | 6.00 | | | | 8/5/20 | | | | 3,888 | |
| | 100 | | | ArcelorMittal (Metals & Mining) | | | 6.13 | | | | 6/1/18 | | | | 107 | |
| | 1,971 | | | Barry Callebaut Services NV (Food Products) (c) | | | 5.50 | | | | 6/15/23 | | | | 2,099 | |
| | 786 | | | Baytex Energy Corp. (Oil, Gas & Consumable Fuels), Callable 6/1/17 @ 103.00 (c) | | | 5.13 | | | | 6/1/21 | | | | 737 | |
| | 1,180 | | | Bombardier, Inc. (Aerospace & Defense) (c) | | | 5.75 | | | | 3/15/22 | | | | 1,050 | |
| | 172 | | | Bombardier, Inc. (Aerospace & Defense) (c) | | | 6.13 | | | | 1/15/23 | | | | 153 | |
| | 1,389 | | | Bombardier, Inc. (Aerospace & Defense), Callable 3/15/20 @ 103.75 (c) | | | 7.50 | | | | 3/15/25 | | | | 1,260 | |
| | 358 | | | Cascades, Inc. (Containers & Packaging), Callable 7/15/17 @ 104.13 | | | 5.50 | | | | 7/15/22 | | | | 346 | |
| | 1,800 | | | Cascades, Inc. (Containers & Packaging), Callable 7/15/18 @ 104.31 (c) | | | 5.75 | | | | 7/15/23 | | | | 1,742 | |
| | 3,323 | | | Cimpress NV (Internet Software & Services), Callable 4/1/18 @ 105.25 (c) | | | 7.00 | | | | 4/1/22 | | | | 3,414 | |
| | 2,207 | | | Cogeco Cable, Inc. (Media), Callable 5/1/16 @ 104.00 (c) | | | 4.88 | | | | 5/1/20 | | | | 2,240 | |
| | 6,102 | | | Drill Rigs Holdings, Inc. (Energy Equipment & Services), Callable 10/1/15 @ 103.00 (c) | | | 6.50 | | | | 10/1/17 | | | | 5,355 | |
| | 6,109 | | | First Quantum Minerals Ltd. (Metals & Mining), Callable 2/15/18 @ 103.50 (c) | | | 7.00 | | | | 2/15/21 | | | | 5,841 | |
| | 73 | | | First Quantum Minerals Ltd. (Metals & Mining), Callable 10/15/15 @ 105.44 | | | 7.25 | | | | 10/15/19 | | | | 73 | |
| | 1,439 | | | First Quantum Minerals Ltd. (Metals & Mining), Callable 5/15/17 @ 105.00 (c) | | | 7.25 | | | | 5/15/22 | | | | 1,376 | |
| | 531 | | | FMG Resources (August 2006) Pty Ltd. (Metals & Mining), Callable 4/1/17 @ 103.44^ (c) | | | 6.88 | | | | 4/1/22 | | | | 372 | |
| | 1,045 | | | FMG Resources (August 2006) Pty Ltd. (Metals & Mining),
Callable 11/1/15 @ 104.00^ (c) | | | 8.25 | | | | 11/1/19 | | | | 882 | |
| | 325 | | | FMG Resources (August 2006) Pty Ltd. (Metals & Mining), Callable 3/1/18 @ 109.75 (c) | | | 9.75 | | | | 3/1/22 | | | | 336 | |
| | 2,596 | | | Gibson Energy, Inc. (Oil, Gas & Consumable Fuels), Callable 7/15/16 @ 105.00 (c) | | | 6.75 | | | | 7/15/21 | | | | 2,680 | |
| | 2,314 | | | Grifols Worldwide Operations Ltd. (Biotechnology), Callable 4/1/17 @ 103.94 | | | 5.25 | | | | 4/1/22 | | | | 2,320 | |
| | 3,663 | | | HudBay Minerals, Inc. (Metals & Mining), Callable 10/1/16 @ 105.00 | | | 9.50 | | | | 10/1/20 | | | | 3,883 | |
| | 1,090 | | | Intelsat Jackson Holdings SA (Diversified Telecommunication Services),
Callable 8/1/18 @ 102.75 | | | 5.50 | | | | 8/1/23 | | | | 965 | |
| | 3,206 | | | Intelsat Jackson Holdings SA (Diversified Telecommunication Services),
Callable 10/15/15 @ 103.63 | | | 7.25 | | | | 10/15/20 | | | | 3,170 | |
See accompanying notes to portfolio of investments.
184
HC CAPITAL TRUST
The Fixed Income Opportunity Portfolio
Portfolio of Investments (continued) — June 30, 2015
| | | | | | | | | | | | | | | | |
Shares or
Principal
Amount
(000) | | | | | Rate % | | | Maturity
Date | | | Value
(000) | |
| | | | Yankee Dollars (continued) | | | | | | | | | | | | |
| $ | 2,810 | | | Intelsat Jackson Holdings SA (Diversified Telecommunication Services),
Callable 4/1/16 @ 103.75 | | | 7.50 | | | | 4/1/21 | | | $ | 2,778 | |
| | 3,440 | | | Intergen NV (Electric Utilities), Callable 6/30/18 @ 103.50 (c) | | | 7.00 | | | | 6/30/23 | | | | 3,062 | |
| | 1,126 | | | International Game Technology (Hotels, Restaurants & Leisure),
Callable 11/15/19 @ 100.00 | | | 5.63 | | | | 2/15/20 | | | | 1,101 | |
| | 644 | | | International Game Technology (Hotels, Restaurants & Leisure),
Callable 8/15/21 @ 100.00 | | | 6.25 | | | | 2/15/22 | | | | 615 | |
| | 3,259 | | | Lundin Mining Corp. (Metals & Mining), Callable 11/1/17 @ 103.75 (c) | | | 7.50 | | | | 11/1/20 | | | | 3,512 | |
| | 905 | | | Lundin Mining Corp. (Metals & Mining), Callable 11/1/18 @ 103.94 (c) | | | 7.88 | | | | 11/1/22 | | | | 968 | |
| | 796 | | | Mallinckrodt Finance/SB (Pharmaceuticals), Callable 4/15/20 @ 102.75 (c) | | | 5.50 | | | | 4/15/25 | | | | 772 | |
| | 4,191 | | | MEG Energy Corp. (Oil, Gas & Consumable Fuels), Callable 7/30/17 @ 103.00 (c) | | | 6.38 | | | | 1/30/23 | | | | 3,876 | |
| | 751 | | | MEG Energy Corp. (Oil, Gas & Consumable Fuels), Callable 8/10/15 @ 104.88 (c) | | | 6.50 | | | | 3/15/21 | | | | 723 | |
| | 3,573 | | | Navios Maritime Holdings, Inc. (Marine), Callable 1/15/17 @ 106.00 (c) | | | 7.38 | | | | 1/15/22 | | | | 3,095 | |
| | 1,093 | | | NCL Corp. Ltd. (Hotels, Restaurants & Leisure), Callable 11/15/16 @ 102.63 (c) | | | 5.25 | | | | 11/15/19 | | | | 1,119 | |
| | 1,279 | | | Norbord, Inc. (Paper & Forest Products) (c) | | | 5.38 | | | | 12/1/20 | | | | 1,272 | |
| | 176 | | | Norbord, Inc. (Paper & Forest Products) (c) | | | 6.25 | | | | 4/15/23 | | | | 179 | |
| | 2,337 | | | Northern Blizzard Resources, Inc. (Oil, Gas & Consumable Fuels),
Callable 2/1/17 @ 105.00 (c) | | | 7.25 | | | | 2/1/22 | | | | 2,232 | |
| | 1,555 | | | Novelis, Inc. (Metals & Mining), Callable 8/10/15 @ 104.19 | | | 8.38 | | | | 12/15/17 | | | | 1,611 | |
| | 3,145 | | | NXP BV/NXP Funding LLC (Technology Hardware, Storage & Peripherals) (c) | | | 4.13 | | | | 6/15/20 | | | | 3,169 | |
| | 4,870 | | | Pacific Drilling SA (Energy Equipment & Services), Callable 6/1/16 @ 104.00 (c) | | | 5.38 | | | | 6/1/20 | | | | 3,689 | |
| | 2,521 | | | Pacific Drilling V Ltd. (Energy Equipment & Services), Callable 12/1/15 @ 104.00 (c) | | | 7.25 | | | | 12/1/17 | | | | 2,168 | |
| | 3,405 | | | Quebecor Media, Inc. (Media) | | | 5.75 | | | | 1/15/23 | | | | 3,397 | |
| | 1,672 | | | Royal Caribbean Cruises Ltd. (Hotels, Restaurants & Leisure) | | | 5.25 | | | | 11/15/22 | | | | 1,729 | |
| | 1,782 | | | SoftBank Corp. (Wireless Telecommunication Services) (c) | | | 4.50 | | | | 4/15/20 | | | | 1,789 | |
| | 2,158 | | | Stena AB (Marine) (c) | | | 7.00 | | | | 2/1/24 | | | | 2,082 | |
| | 2,836 | | | Telecom Italia Capital (Diversified Telecommunication Services) | | | 7.00 | | | | 6/4/18 | | | | 3,123 | |
| | 3,220 | | | The Nielsen Co. (Luxembourg) Sarl (Diversified Financial Services),
Callable 10/1/16 @ 104.00 (c) | | | 5.50 | | | | 10/1/21 | | | | 3,252 | |
| | 3,751 | | | Tullow Oil PLC (Oil, Gas & Consumable Fuels), Callable 11/1/16 @ 103.00 (c) | | | 6.00 | | | | 11/1/20 | | | | 3,399 | |
| | 794 | | | Tullow Oil PLC (Oil, Gas & Consumable Fuels), Callable 4/15/17 @ 105.00 (c) | | | 6.25 | | | | 4/15/22 | | | | 703 | |
| | 1,098 | | | UPCB Finance IV Ltd. (Media) (c) | | | 5.38 | | | | 1/15/25 | | | | 1,048 | |
| | 3,461 | | | UPCB Finance V Ltd. (Media), Callable 11/15/16 @ 103.63 (c) | | | 7.25 | | | | 11/15/21 | | | | 3,739 | |
| | 1,102 | | | UPCB Finance VI Ltd. (Media), Callable 1/15/17 @ 103.44 (c) | | | 6.88 | | | | 1/15/22 | | | | 1,173 | |
| | 951 | | | Valeant Pharmaceuticals (Pharmaceuticals), Callable 3/1/18 @ 102.75 (c) | | | 5.50 | | | | 3/1/23 | | | | 961 | |
| | 836 | | | Videotron Ltee (Media) | | | 5.00 | | | | 7/15/22 | | | | 834 | |
| | 3,430 | | | VPII Escrow Corp. (Pharmaceuticals), Callable 8/15/15 @ 105.00 (c) | | | 6.75 | | | | 8/15/18 | | | | 3,597 | |
| | | | | | | | | | | | | | | | |
| | | | Total Yankee Dollars | | | | | | | | | | | 127,148 | |
| | | | | | | | | | | | | | | | |
| | | | Preferred Stock — 0.02% | | | | | | | | | | | | |
| | 7,070 | | | GMAC Capital Trust I, Series 2 (Consumer Finance) Callable 2/15/16 @ 25.00 | | | | | | | | | | | 184 | |
| | | | | | | | | | | | | | | | |
| | | | Total Preferred Stock | | | | | | | | | | | 184 | |
| | | | | | | | | | | | | | | | |
| | | | Time Deposit — 0.67% | | | | | | | | | | | | |
| $ | 5,430 | | | State Street Liquidity Management Control System Eurodollar Time Deposit | | | 0.01 | | | | 7/1/15 | | | | 5,430 | |
| | | | | | | | | | | | | | | | |
| | | | Total Time Deposit | | | | | | | | | | | 5,430 | |
| | | | | | | | | | | | | | | | |
| | | | Mutual Funds — 13.46% | | | | | | | | | | | | |
| | 440,900 | | | BlackRock Corporate High Yield Fund, Inc. | | | | | | | | | | | 4,758 | |
| | 1,382,677 | | | BlackRock Debt Strategies Fund, Inc. | | | | | | | | | | | 5,006 | |
| | 684,714 | | | Credit Suisse Asset Management Income Fund, Inc. | | | | | | | | | | | 2,191 | |
| | 282,052 | | | Deutsche High Income Opportunities Fund, Inc. | | | | | | | | | | | 4,118 | |
| | 187,570 | | | Deutsche High Income Trust | | | | | | | | | | | 1,598 | |
| | 58,432,535 | | | Federated U.S. Treasury Cash Reserve Fund, Institutional Shares (e) | | | 0.00 | | | | | | | | 58,433 | |
| | 296,898 | | | First Trust High Income Long/Short Fund | | | | | | | | | | | 4,643 | |
| | 169,526 | | | Ivy High Income Opportunity Fund | | | | | | | | | | | 2,533 | |
| | 267,646 | | | MFS Intermediate High Income Fund | | | | | | | | | | | 712 | |
| | 386,608 | | | Neuberger Berman High Yield Strategies Fund, Inc. | | | | | | | | | | | 4,554 | |
See accompanying notes to portfolio of investments.
185
HC CAPITAL TRUST
The Fixed Income Opportunity Portfolio
Portfolio of Investments (continued) — June 30, 2015
| | | | | | | | | | | | | | | | |
Shares or
Principal
Amount
(000) | | | | | Rate % | | | Maturity
Date | | | Value
(000) | |
| | | | Mutual Funds (continued) | | | | | | | | | | | | |
| | 541,547 | | | New America High Income Fund, Inc. | | | | | | | | | | $ | 4,749 | |
| | 3,516,070 | | | SSgA Treasury Money Market Fund (e) | | | 0.00 | | | | | | | | 3,516 | |
| | 989,551 | | | SSgA U.S. Government Money Market Fund (e) | | | 0.00 | | | | | | | | 990 | |
| | 429,009 | | | Wells Fargo Advantage Income Opportunities Fund | | | | | | | | | | | 3,548 | |
| | 844,538 | | | Western Asset High Income Opportunity Fund, Inc. | | | | | | | | | | | 4,349 | |
| | 719,690 | | | Western Asset Managed High Income Fund, Inc. | | | | | | | | | | | 3,555 | |
| | | | | | | | | | | | | | | | |
| | | | Total Mutual Funds | | | | | | | | | | | 109,253 | |
| | | | | | | | | | | | | | | | |
| | | | Repurchase Agreement — 1.41% | | | | | | | | | | | | |
| $ | 11,406 | | | Jefferies LLC (Purchased on 6/30/15, proceeds at maturity $11,406,176 collateralized by U.S. Treasury Obligations, 0.00% – 3.28%, 8/15/15 – 8/15/44 fair value $11,634,226)^^ | | | 0.23 | | | | 07/01/2015 | | | | 11,406 | |
| | | | | | | | | | | | | | | | |
| | | | Total Repurchase Agreement | | | | | | | | | | | 11,406 | |
| | | | | | | | | | | | | | | | |
| | | | Total Investments (cost $816,915) — 98.60% | | | | | | | | | | | 800,201 | |
| | | | Other assets in excess of liabilities — 1.40% | | | | | | | | | | | 11,359 | |
| | | | | | | | | | | | | | | | |
| | | | Net Assets — 100.00% | | | | | | | | | | $ | 811,560 | |
| | | | | | | | | | | | | | | | |
| ^ | All or part of this security was on loan as of June 30, 2015. The total value of securities on loan as of June 30, 2015, was $17,715 (amount in thousands). |
| ^^ | Purchased with cash collateral held from securities lending. The value of the collateral could include collateral held for securities that were sold on or before June 30, 2015. |
| (a) | Variable Rate Security. The rate reflected is the rate in effect on June 30, 2015. |
| (b) | Step Bond: Coupon rate is set for an initial period and then increased to a higher coupon rate at a specified date. The rate shown is the rate in effect at June 30, 2015. |
| (c) | Represents a security purchased under Rule 144A or Section 4(2) and is exempt from registration under the Securities Act of 1933, as amended, or is otherwise restricted to resale. Certain of these securities may be resold in transactions exempt from registration, normally to qualified institutional buyers. These securities have been deemed liquid by the Specialist Manager. |
| (d) | A perpetual bond is one with no maturity date that pays a fixed interest rate until the bond insurance is terminated. |
| (e) | The rate disclosed is the rate in effect on June 30, 2015. |
ULC—Unlimited Liability Co.
See accompanying notes to portfolio of investments.
186
HC CAPITAL TRUST
The Fixed Income Opportunity Portfolio
Portfolio of Investments (concluded) — June 30, 2015
The following table reflects the percentage of total net assets of the Portfolio attributable to each Specialist Manager, see Note 3 in the Notes to Financial Statements.
| | | | | | | | | | | | | | | | | | | | | | | | |
The Fixed Income Opportunity Portfolio | | City of
London
Investment
Management
Company | | | Fort
Washington
Investment
Advisors,
Inc. | | | Parametric
Portfolio
Associates,
LLC | | | Western Asset
Management
Company | | | HC Capital
Solutions | | | Total | |
Asset Backed Security | | | — | | | | — | | | | — | | | | 0.66 | % | | | — | | | | 0.66 | % |
Collateralized Mortgage Obligations | | | — | | | | — | | | | — | | | | 6.59 | % | | | — | | | | 6.59 | % |
Corporate Bonds | | | — | | | | 60.12 | % | | | — | | | | — | | | | — | | | | 60.12 | % |
Yankee Dollars | | | — | | | | 15.67 | % | | | — | | | | — | | | | — | | | | 15.67 | % |
Preferred Stock | | | — | | | | 0.02 | % | | | — | | | | — | | | | — | | | | 0.02 | % |
Time Deposits | | | — | | | | 0.67 | % | | | — | | | | — | | | | — | | | | 0.67 | % |
Mutual Funds | | | 5.83 | % | | | — | | | | — | | | | 0.38 | % | | | 7.25 | % | | | 13.46 | % |
Repurchase Agreement | | | — | | | | 1.41 | % | | | — | | | | — | | | | — | | | | 1.41 | % |
Other Assets (Liablities) | | | 0.01 | % | | | -0.21 | % | | | 1.44 | % | | | 0.14 | % | | | 0.02 | % | | | 1.40 | % |
| | | | | | | | | | | | | | | | | | | | | | | | |
Total Net Assets | | | 5.84 | % | | | 77.68 | % | | | 1.44 | % | | | 7.77 | % | | | 7.27 | % | | | 100.00 | % |
| | | | | | | | | | | | | | | | | | | | | | | | |
The following tables reflect the open derivative positions held by the Portfolio as of June 30, 2015.
Long/(Short) Futures
| | | | | | | | | | | | | | | | |
Number of
Contracts | | | Futures Contracts Positions^ | | Value
(000) | | | Expiration | | | Unrealized
Appreciation/
(Depreciation)
(000) | |
| | (154) | | | 10-Year U.S. Treasury Note Future | | $ | (19,430 | ) | | | 9/21/15 | | | $ | 56 | |
| | 142 | | | 5-Year U.S. Treasury Note Future | | | 16,935 | | | | 9/30/15 | | | | (22 | ) |
| | (37) | | | Euro FX Currency Future | | | (5,160 | ) | | | 9/14/15 | | | | (11 | ) |
| | (26) | | | Euro-Bund Future | | | (4,405 | ) | | | 9/8/15 | | | | (46 | ) |
| | | | | | | | | | | | | | | | |
| | | | Net Unrealized Appreciation/(Depreciation) | | | | | | | | | | $ | (23 | ) |
| | | | | | | | | | | | | | | | |
Amounts designated as “—” are $0 or have been rounded to $0.
| ^ | Cash has been pledged as collateral for Futures Contracts held by the Portfolio. |
Forward Currency Contracts
| | | | | | | | | | | | | | | | | | | | | | |
Contract
Amount
(Local Currency) | | | Currency | | Counterparty | | Settlement
Date | | | Settlement
Value
(000) | | | Value on
06/30/15
(000) | | | Unrealized
Appreciation/
(Depreciation)
(000) | |
| | | | Currencies Sold | | | | | | | | | | | | | | | | | | |
| | 2,976,118 | | | Euro | | Citibank | | | 7/16/15 | | | $ | 3,154 | | | $ | 3,318 | | | $ | (164 | ) |
| | | | | | | | | | | | | | | | | | | | | | |
| | | | Total Currencies Sold | | | | | | $ | 3,154 | | | $ | 3,318 | | | $ | (164 | ) |
| | | | | | | | | | | | | | | | | | | | | | |
| | | | Net Unrealized/Appreciation(Depreciation) | | | | | | | | | | | | | | $ | (164 | ) |
| | | | | | | | | | | | | | | | | | | | | | |
See accompanying notes to portfolio of investments.
187
HC CAPITAL TRUST
The U.S. Government Fixed Income Securities Portfolio
Portfolio of Investments — June 30, 2015
| | | | | | | | | | | | | | | | |
Principal
Amount
(000) | | | | | Rate % | | | Maturity
Date | | | Value
(000) | |
| | | | U.S. Government Agency Securities — 7.63% | | | | | | | | | | | | |
| $ | 350 | | | Fannie Mae | | | 0.88 | | | | 12/20/17 | | | $ | 350 | |
| | 100 | | | Fannie Mae, Callable 9/27/15 @ 100.00 | | | 0.88 | | | | 12/27/17 | | | | 100 | |
| | 200 | | | Fannie Mae | | | 0.88 | | | | 5/21/18 | | | | 199 | |
| | 385 | | | Fannie Mae | | | 0.88 | | | | 10/26/17 | | | | 385 | |
| | 300 | | | Fannie Mae | | | 0.88 | | | | 8/28/17 | | | | 301 | |
| | 300 | | | Fannie Mae, Series 0001, Callable 7/30/15 @ 100.00 | | | 1.00 | | | | 4/30/18 | | | | 298 | |
| | 50 | | | Fannie Mae, Callable 8/15/15 @ 100.00 | | | 1.00 | | | | 2/15/18 | | | | 50 | |
| | 300 | | | Fannie Mae, Callable 9/28/15 @ 100.00 | | | 1.00 | | | | 12/28/17 | | | | 299 | |
| | 125 | | | Fannie Mae, Callable 7/28/16 @ 100.00 | | | 1.07 | | | | 7/28/17 | | | | 125 | |
| | 500 | | | Fannie Mae, Callable 10/30/15 @ 100.00 | | | 1.13 | | | | 4/30/18 | | | | 499 | |
| | 75 | | | Fannie Mae, Callable 9/28/15 @ 100.00 | | | 1.13 | | | | 3/28/18 | | | | 75 | |
| | 250 | | | Fannie Mae, Callable 8/28/15 @ 100.00 | | | 1.15 | | | | 2/28/18 | | | | 250 | |
| | 400 | | | Fannie Mae | | | 1.25 | | | | 1/30/17 | | | | 404 | |
| | 350 | | | Fannie Mae | | | 1.25 | | | | 9/28/16 | | | | 353 | |
| | 150 | | | Fannie Mae, Callable 7/29/15 @ 100.00 | | | 1.55 | | | | 10/29/19 | | | | 149 | |
| | 200 | | | Fannie Mae | | | 1.75 | | | | 11/26/19 | | | | 201 | |
| | 350 | | | Fannie Mae | | | 1.88 | | | | 9/18/18 | | | | 358 | |
| | 100 | | | Fannie Mae, Callable 8/22/15 @ 100.00 | | | 2.50 | | | | 2/22/23 | | | | 96 | |
| | 500 | | | Fannie Mae | | | 2.63 | | | | 9/6/24 | | | | 500 | |
| | 430 | | | Fannie Mae (a) | | | 2.86 | | | | 10/9/19 | | | | 393 | |
| | 260 | | | Fannie Mae | | | 5.00 | | | | 2/13/17 | | | | 278 | |
| | 400 | | | Fannie Mae | | | 5.25 | | | | 9/15/16 | | | | 423 | |
| | 200 | | | Fannie Mae | | | 5.38 | | | | 6/12/17 | | | | 218 | |
| | 150 | | | Fannie Mae, Callable 4/18/16 @ 100.00 | | | 6.00 | | | | 4/18/36 | | | | 156 | |
| | 85 | | | Fannie Mae | | | 6.21 | | | | 8/6/38 | | | | 121 | |
| | 95 | | | Fannie Mae | | | 6.25 | | | | 5/15/29 | | | | 130 | |
| | 160 | | | Fannie Mae | | | 6.63 | | | | 11/15/30 | | | | 226 | |
| | 180 | | | Fannie Mae | | | 7.25 | | | | 5/15/30 | | | | 268 | |
| | 150 | | | Federal Farm Credit Bank, Callable 7/20/15 @ 100.00 | | | 0.54 | | | | 11/7/16 | | | | 150 | |
| | 250 | | | Federal Farm Credit Bank | | | 1.13 | | | | 12/18/17 | | | | 251 | |
| | 250 | | | Federal Farm Credit Bank | | | 5.13 | | | | 8/25/16 | | | | 263 | |
| | 600 | | | Federal Home Loan Bank, Series 3823 | | | 0.50 | | | | 9/28/16 | | | | 600 | |
| | 250 | | | Federal Home Loan Bank | | | 0.63 | | | | 11/23/16 | | | | 250 | |
| | 200 | | | Federal Home Loan Bank, Series 1 | | | 0.88 | | | | 5/24/17 | | | | 201 | |
| | 500 | | | Federal Home Loan Bank, Series 1 | | | 1.00 | | | | 6/21/17 | | | | 503 | |
| | 200 | | | Federal Home Loan Bank | | | 1.25 | | | | 6/8/18 | | | | 201 | |
| | 200 | | | Federal Home Loan Bank, Callable 8/28/15 @ 100.00 | | | 1.50 | | | | 2/28/17 | | | | 200 | |
| | 500 | | | Federal Home Loan Bank | | | 1.63 | | | | 12/9/16 | | | | 508 | |
| | 200 | | | Federal Home Loan Bank | | | 1.75 | | | | 12/14/18 | | | | 203 | |
| | 400 | | | Federal Home Loan Bank | | | 2.00 | | | | 9/14/18 | | | | 409 | |
| | 300 | | | Federal Home Loan Bank | | | 2.13 | | | | 3/10/23 | | | | 293 | |
| | 160 | | | Federal Home Loan Bank | | | 2.88 | | | | 9/11/20 | | | | 168 | |
| | 200 | | | Federal Home Loan Bank | | | 4.13 | | | | 3/13/20 | | | | 222 | |
| | 550 | | | Federal Home Loan Bank | | | 4.75 | | | | 12/16/16 | | | | 583 | |
| | 250 | | | Federal Home Loan Bank, Series 1069 | | | 5.00 | | | | 11/17/17 | | | | 274 | |
| | 180 | | | Federal Home Loan Bank | | | 5.25 | | | | 12/11/20 | | | | 212 | |
| | 65 | | | Federal Home Loan Bank | | | 5.50 | | | | 7/15/36 | | | | 84 | |
| | 200 | | | Freddie Mac | | | 0.42 | | | | 9/18/15 | | | | 200 | |
| | 450 | | | Freddie Mac | | | 0.75 | | | | 1/12/18 | | | | 448 | |
| | 500 | | | Freddie Mac | | | 0.88 | | | | 10/14/16 | | | | 503 | |
| | 400 | | | Freddie Mac | | | 0.88 | | | | 2/22/17 | | | | 402 | |
| | 300 | | | Freddie Mac | | | 0.88 | | | | 3/7/18 | | | | 299 | |
| | 500 | | | Freddie Mac | | | 1.00 | | | | 3/8/17 | | | | 503 | |
| | 500 | | | Freddie Mac | | | 1.00 | | | | 9/29/17 | | | | 501 | |
See accompanying notes to portfolio of investments.
188
HC CAPITAL TRUST
The U.S. Government Fixed Income Securities Portfolio
Portfolio of Investments (continued) — June 30, 2015
| | | | | | | | | | | | | | | | |
Principal
Amount
(000) | | | | | Rate % | | | Maturity
Date | | | Value
(000) | |
| | | | U.S. Government Agency Securities (continued) | | | | | | | | | | | | |
| $ | 125 | | | Freddie Mac, Callable 7/30/15 @ 100.00 | | | 1.02 | | | | 4/30/18 | | | $ | 124 | |
| | 245 | | | Freddie Mac | | | 1.20 | | | | 6/12/18 | | | | 244 | |
| | 100 | | | Freddie Mac | | | 1.25 | | | | 10/2/19 | | | | 99 | |
| | 200 | | | Freddie Mac | | | 1.25 | | | | 8/1/19 | | | | 198 | |
| | 200 | | | Freddie Mac | | | 1.38 | | | | 5/1/20 | | | | 197 | |
| | 250 | | | Freddie Mac | | | 1.40 | | | | 8/22/19 | | | | 249 | |
| | 450 | | | Freddie Mac | | | 1.75 | | | | 5/30/19 | | | | 455 | |
| | 300 | | | Freddie Mac | | | 2.00 | | | | 8/25/16 | | | | 305 | |
| | 450 | | | Freddie Mac | | | 2.38 | | | | 1/13/22 | | | | 456 | |
| | 100 | | | Freddie Mac, Callable 10/17/15 @ 100.00 | | | 2.50 | | | | 4/17/23 | | | | 98 | |
| | 600 | | | Freddie Mac | | | 4.88 | | | | 6/13/18 | | | | 666 | |
| | 250 | | | Freddie Mac | | | 6.25 | | | | 7/15/32 | | | | 347 | |
| | 80 | | | Freddie Mac | | | 6.75 | | | | 3/15/31 | | | | 115 | |
| | 310 | | | Tennessee Valley Authority | | | 4.70 | | | | 7/15/33 | | | | 351 | |
| | 135 | | | Tennessee Valley Authority | | | 5.25 | | | | 9/15/39 | | | | 164 | |
| | 100 | | | Tennessee Valley Authority | | | 5.50 | | | | 7/18/17 | | | | 109 | |
| | 190 | | | Tennessee Valley Authority | | | 6.15 | | | | 1/15/38 | | | | 258 | |
| | | | | | | | | | | | | | | | |
| | | | Total U.S. Government Agency Securities | | | | | | | | | | | 20,071 | |
| | | | | | | | | | | | | | | | |
| | | | Corporate Bond — 0.10% | | | | | | | | | | | | |
| | 250 | | | Private Export Funding Corp. (Diversified Financial Services) | | | 4.38 | | | | 3/15/19 | | | | 275 | |
| | | | | | | | | | | | | | | | |
| | | | Total Corporate Bond | | | | | | | | | | | 275 | |
| | | | | | | | | | | | | | | | |
| | | | U.S. Treasury Obligations — 87.64% | | | | | | | | | | | | |
| | 600 | | | U.S. Treasury Bond | | | 1.00 | | | | 8/31/19 | | | | 590 | |
| | 2,075 | | | U.S. Treasury Bond | | | 2.50 | | | | 2/15/45 | | | | 1,825 | |
| | 1,171 | | | U.S. Treasury Bond | | | 2.75 | | | | 11/15/42 | | | | 1,089 | |
| | 837 | | | U.S. Treasury Bond | | | 2.75 | | | | 8/15/42 | | | | 779 | |
| | 1,416 | | | U.S. Treasury Bond | | | 2.88 | | | | 5/15/43 | | | | 1,349 | |
| | 660 | | | U.S. Treasury Bond | | | 3.00 | | | | 5/15/45 | | | | 647 | |
| | 439 | | | U.S. Treasury Bond | | | 3.00 | | | | 5/15/42 | | | | 430 | |
| | 1,815 | | | U.S. Treasury Bond | | | 3.00 | | | | 11/15/44 | | | | 1,775 | |
| | 666 | | | U.S. Treasury Bond | | | 3.13 | | | | 11/15/41 | | | | 671 | |
| | 1,560 | | | U.S. Treasury Bond | | | 3.13 | | | | 8/15/44 | | | | 1,563 | |
| | 500 | | | U.S. Treasury Bond | | | 3.13 | | | | 5/15/21 | | | | 535 | |
| | 1,000 | | | U.S. Treasury Bond | | | 3.13 | | | | 2/15/42 | | | | 1,005 | |
| | 1,147 | | | U.S. Treasury Bond | | | 3.13 | | | | 2/15/43 | | | | 1,149 | |
| | 1,405 | | | U.S. Treasury Bond | | | 3.38 | | | | 5/15/44 | | | | 1,476 | |
| | 400 | | | U.S. Treasury Bond | | | 3.50 | | | | 2/15/39 | | | | 431 | |
| | 1,280 | | | U.S. Treasury Bond | | | 3.63 | | | | 2/15/44 | | | | 1,407 | |
| | 900 | | | U.S. Treasury Bond | | | 3.63 | | | | 8/15/43 | | | | 990 | |
| | 630 | | | U.S. Treasury Bond | | | 3.75 | | | | 8/15/41 | | | | 707 | |
| | 1,245 | | | U.S. Treasury Bond | | | 3.75 | | | | 11/15/43 | | | | 1,400 | |
| | 185 | | | U.S. Treasury Bond | | | 3.88 | | | | 8/15/40 | | | | 211 | |
| | 690 | | | U.S. Treasury Bond | | | 4.25 | | | | 11/15/40 | | | | 835 | |
| | 363 | | | U.S. Treasury Bond | | | 4.38 | | | | 5/15/40 | | | | 447 | |
| | 846 | | | U.S. Treasury Bond | | | 4.38 | | | | 5/15/41 | | | | 1,046 | |
| | 455 | | | U.S. Treasury Bond | | | 4.38 | | | | 2/15/38 | | | | 560 | |
| | 682 | | | U.S. Treasury Bond | | | 4.38 | | | | 11/15/39 | | | | 839 | |
| | 400 | | | U.S. Treasury Bond | | | 4.50 | | | | 2/15/36 | | | | 503 | |
| | 400 | | | U.S. Treasury Bond | | | 4.50 | | | | 8/15/39 | | | | 501 | |
| | 673 | | | U.S. Treasury Bond | | | 4.63 | | | | 2/15/40 | | | | 858 | |
| | 410 | | | U.S. Treasury Bond | | | 4.75 | | | | 2/15/37 | | | | 531 | |
| | 775 | | | U.S. Treasury Bond | | | 4.75 | | | | 2/15/41 | | | | 1,009 | |
| | 230 | | | U.S. Treasury Bond | | | 5.25 | | | | 2/15/29 | | | | 300 | |
See accompanying notes to portfolio of investments.
189
HC CAPITAL TRUST
The U.S. Government Fixed Income Securities Portfolio
Portfolio of Investments (continued) — June 30, 2015
| | | | | | | | | | | | | | | | |
Principal
Amount
(000) | | | | | Rate % | | | Maturity
Date | | | Value
(000) | |
| | | | U.S. Treasury Obligations (continued) | | | | | | | | | | | | |
| $ | 282 | | | U.S. Treasury Bond | | | 5.25 | | | | 11/15/28 | | | $ | 368 | |
| | 359 | | | U.S. Treasury Bond | | | 5.38 | | | | 2/15/31 | | | | 483 | |
| | 485 | | | U.S. Treasury Bond | | | 6.00 | | | | 2/15/26 | | | | 651 | |
| | 235 | | | U.S. Treasury Bond | | | 6.13 | | | | 11/15/27 | | | | 326 | |
| | 150 | | | U.S. Treasury Bond | | | 6.13 | | | | 8/15/29 | | | | 212 | |
| | 465 | | | U.S. Treasury Bond | | | 6.25 | | | | 5/15/30 | | | | 671 | |
| | 122 | | | U.S. Treasury Bond | | | 6.25 | | | | 8/15/23 | | | | 159 | |
| | 400 | | | U.S. Treasury Bond | | | 6.38 | | | | 8/15/27 | | | | 564 | |
| | 368 | | | U.S. Treasury Bond | | | 6.50 | | | | 11/15/26 | | | | 518 | |
| | 350 | | | U.S. Treasury Bond | | | 6.88 | | | | 8/15/25 | | | | 495 | |
| | 500 | | | U.S. Treasury Bond | | | 7.13 | | | | 2/15/23 | | | | 678 | |
| | 300 | | | U.S. Treasury Bond | | | 7.25 | | | | 8/15/22 | | | | 405 | |
| | 570 | | | U.S. Treasury Bond | | | 7.50 | | | | 11/15/24 | | | | 824 | |
| | 400 | | | U.S. Treasury Bond | | | 7.50 | | | | 11/15/16 | | | | 439 | |
| | 7 | | | U.S. Treasury Bond | | | 7.88 | | | | 2/15/21 | | | | 9 | |
| | 700 | | | U.S. Treasury Bond | | | 8.00 | | | | 11/15/21 | | | | 956 | |
| | 110 | | | U.S. Treasury Bond | | | 8.13 | | | | 8/15/21 | | | | 150 | |
| | 350 | | | U.S. Treasury Bond | | | 8.13 | | | | 8/15/19 | | | | 445 | |
| | 400 | | | U.S. Treasury Bond | | | 8.75 | | | | 8/15/20 | | | | 540 | |
| | 620 | | | U.S. Treasury Bond | | | 8.75 | | | | 5/15/17 | | | | 714 | |
| | 980 | | | U.S. Treasury Note | | | 0.38 | | | | 10/31/16 | | | | 979 | |
| | 870 | | | U.S. Treasury Note | | | 0.50 | | | | 8/31/16 | | | | 871 | |
| | 1,315 | | | U.S. Treasury Note | | | 0.50 | | | | 4/30/17 | | | | 1,313 | |
| | 935 | | | U.S. Treasury Note | | | 0.50 | | | | 9/30/16 | | | | 936 | |
| | 970 | | | U.S. Treasury Note | | | 0.50 | | | | 11/30/16 | | | | 971 | |
| | 1,050 | | | U.S. Treasury Note | | | 0.50 | | | | 7/31/16 | | | | 1,052 | |
| | 800 | | | U.S. Treasury Note | | | 0.50 | | | | 1/31/17 | | | | 800 | |
| | 1,520 | | | U.S. Treasury Note | | | 0.50 | | | | 2/28/17 | | | | 1,519 | |
| | 820 | | | U.S. Treasury Note | | | 0.50 | | | | 3/31/17 | | | | 819 | |
| | 1,000 | | | U.S. Treasury Note | | | 0.50 | | | | 7/31/17 | | | | 996 | |
| | 1,100 | | | U.S. Treasury Note | | | 0.63 | | | | 10/15/16 | | | | 1,103 | |
| | 1,000 | | | U.S. Treasury Note | | | 0.63 | | | | 12/31/16 | | | | 1,002 | |
| | 1,440 | | | U.S. Treasury Note | | | 0.63 | | | | 9/30/17 | | | | 1,436 | |
| | 1,120 | | | U.S. Treasury Note | | | 0.63 | | | | 12/15/16 | | | | 1,122 | |
| | 930 | | | U.S. Treasury Note | | | 0.63 | | | | 6/30/17 | | | | 930 | |
| | 800 | | | U.S. Treasury Note | | | 0.63 | | | | 4/30/18 | | | | 793 | |
| | 1,300 | | | U.S. Treasury Note | | | 0.63 | | | | 8/15/16 | | | | 1,304 | |
| | 1,000 | | | U.S. Treasury Note | | | 0.63 | | | | 2/15/17 | | | | 1,001 | |
| | 925 | | | U.S. Treasury Note | | | 0.63 | | | | 11/15/16 | | | | 927 | |
| | 250 | | | U.S. Treasury Note | | | 0.63 | | | | 7/15/16 | | | | 251 | |
| | 2,500 | | | U.S. Treasury Note | | | 0.63 | | | | 5/31/17 | | | | 2,499 | |
| | 575 | | | U.S. Treasury Note | | | 0.63 | | | | 8/31/17 | | | | 574 | |
| | 1,780 | | | U.S. Treasury Note | | | 0.63 | | | | 11/30/17 | | | | 1,772 | |
| | 1,150 | | | U.S. Treasury Note | | | 0.75 | | | | 2/28/18 | | | | 1,145 | |
| | 1,600 | | | U.S. Treasury Note | | | 0.75 | | | | 10/31/17 | | | | 1,599 | |
| | 1,200 | | | U.S. Treasury Note | | | 0.75 | | | | 6/30/17 | | | | 1,202 | |
| | 513 | | | U.S. Treasury Note | | | 0.75 | | | | 3/31/18 | | | | 510 | |
| | 1,100 | | | U.S. Treasury Note | | | 0.75 | | | | 1/15/17 | | | | 1,104 | |
| | 755 | | | U.S. Treasury Note | | | 0.75 | | | | 4/15/18 | | | | 751 | |
| | 1,046 | | | U.S. Treasury Note | | | 0.75 | | | | 3/15/17 | | | | 1,050 | |
| | 1,236 | | | U.S. Treasury Note | | | 0.75 | | | | 12/31/17 | | | | 1,233 | |
| | 895 | | | U.S. Treasury Note | | | 0.88 | | | | 7/15/17 | | | | 899 | |
| | 830 | | | U.S. Treasury Note | | | 0.88 | | | | 6/15/17 | | | | 834 | |
| | 1,690 | | | U.S. Treasury Note | | | 0.88 | | | | 12/31/16 | | | | 1,700 | |
See accompanying notes to portfolio of investments.
190
HC CAPITAL TRUST
The U.S. Government Fixed Income Securities Portfolio
Portfolio of Investments (continued) — June 30, 2015
| | | | | | | | | | | | | | | | |
Principal
Amount
(000) | | | | | Rate % | | | Maturity
Date | | | Value
(000) | |
| | | | U.S. Treasury Obligations (continued) | | | | | | | | | | | | |
| $ | 1,022 | | | U.S. Treasury Note | | | 0.88 | | | | 11/30/16 | | | $ | 1,028 | |
| | 799 | | | U.S. Treasury Note | | | 0.88 | | | | 1/31/18 | | | | 799 | |
| | 680 | | | U.S. Treasury Note | | | 0.88 | | | | 4/15/17 | | | | 684 | |
| | 1,475 | | | U.S. Treasury Note | | | 0.88 | | | | 11/15/17 | | | | 1,478 | |
| | 495 | | | U.S. Treasury Note | | | 0.88 | | | | 8/15/17 | | | | 497 | |
| | 1,440 | | | U.S. Treasury Note | | | 0.88 | | | | 5/15/17 | | | | 1,447 | |
| | 380 | | | U.S. Treasury Note | | | 0.88 | | | | 7/31/19 | | | | 372 | |
| | 1,092 | | | U.S. Treasury Note | | | 0.88 | | | | 4/30/17 | | | | 1,098 | |
| | 1,305 | | | U.S. Treasury Note | | | 0.88 | | | | 10/15/17 | | | | 1,308 | |
| | 1,000 | | | U.S. Treasury Note | | | 0.88 | | | | 1/31/17 | | | | 1,006 | |
| | 655 | | | U.S. Treasury Note | | | 0.88 | | | | 2/28/17 | | | | 659 | |
| | 1,281 | | | U.S. Treasury Note | | | 0.88 | | | | 9/15/16 | | | | 1,288 | |
| | 740 | | | U.S. Treasury Note | | | 0.88 | | | | 1/15/18 | | | | 740 | |
| | 1,210 | | | U.S. Treasury Note | | | 1.00 | | | | 9/15/17 | | | | 1,217 | |
| | 927 | | | U.S. Treasury Note | | | 1.00 | | | | 9/30/16 | | | | 934 | |
| | 1,000 | | | U.S. Treasury Note | | | 1.00 | | | | 5/31/18 | | | | 1,000 | |
| | 1,600 | | | U.S. Treasury Note | | | 1.00 | | | | 8/31/16 | | | | 1,612 | |
| | 1,200 | | | U.S. Treasury Note | | | 1.00 | | | | 3/31/17 | | | | 1,209 | |
| | 800 | | | U.S. Treasury Note | | | 1.00 | | | | 5/15/18 | | | | 801 | |
| | 416 | | | U.S. Treasury Note | | | 1.00 | | | | 9/30/19 | | | | 408 | |
| | 1,165 | | | U.S. Treasury Note | | | 1.00 | | | | 10/31/16 | | | | 1,174 | |
| | 755 | | | U.S. Treasury Note | | | 1.00 | | | | 3/15/18 | | | | 757 | |
| | 700 | | | U.S. Treasury Note | | | 1.00 | | | | 6/30/19 | | | | 690 | |
| | 515 | | | U.S. Treasury Note | | | 1.00 | | | | 11/30/19 | | | | 504 | |
| | 700 | | | U.S. Treasury Note | | | 1.00 | | | | 2/15/18 | | | | 702 | |
| | 860 | | | U.S. Treasury Note | | | 1.00 | | | | 12/15/17 | | | | 864 | |
| | 550 | | | U.S. Treasury Note | | | 1.13 | | | | 3/31/20 | | | | 538 | |
| | 975 | | | U.S. Treasury Note | | | 1.13 | | | | 12/31/19 | | | | 958 | |
| | 855 | | | U.S. Treasury Note | | | 1.13 | | | | 6/15/18 | | | | 858 | |
| | 600 | | | U.S. Treasury Note | | | 1.13 | | | | 5/31/19 | | | | 595 | |
| | 300 | | | U.S. Treasury Note | | | 1.13 | | | | 4/30/20 | | | | 293 | |
| | 490 | | | U.S. Treasury Note | | | 1.25 | | | | 2/29/20 | | | | 483 | |
| | 1,195 | | | U.S. Treasury Note | | | 1.25 | | | | 10/31/18 | | | | 1,199 | |
| | 475 | | | U.S. Treasury Note | | | 1.25 | | | | 10/31/19 | | | | 471 | |
| | 300 | | | U.S. Treasury Note | | | 1.25 | | | | 4/30/19 | | | | 299 | |
| | 835 | | | U.S. Treasury Note | | | 1.25 | | | | 1/31/19 | | | | 835 | |
| | 1,075 | | | U.S. Treasury Note | | | 1.25 | | | | 1/31/20 | | | | 1,061 | |
| | 1,150 | | | U.S. Treasury Note | | | 1.25 | | | | 11/30/18 | | | | 1,153 | |
| | 500 | | | U.S. Treasury Note | | | 1.38 | | | | 1/31/20 | | | | 496 | |
| | 1,340 | | | U.S. Treasury Note | | | 1.38 | | | | 4/30/20 | | | | 1,325 | |
| | 1,105 | | | U.S. Treasury Note | | | 1.38 | | | | 3/31/20 | | | | 1,094 | |
| | 657 | | | U.S. Treasury Note | | | 1.38 | | | | 6/30/18 | | | | 664 | |
| | 1,600 | | | U.S. Treasury Note | | | 1.38 | | | | 9/30/18 | | | | 1,613 | |
| | 1,510 | | | U.S. Treasury Note | | | 1.38 | | | | 5/31/20 | | | | 1,492 | |
| | 900 | | | U.S. Treasury Note | | | 1.38 | | | | 2/29/20 | | | | 892 | |
| | 800 | | | U.S. Treasury Note | | | 1.38 | | | | 7/31/18 | | | | 808 | |
| | 493 | | | U.S. Treasury Note | | | 1.38 | | | | 12/31/18 | | | | 496 | |
| | 668 | | | U.S. Treasury Note | | | 1.38 | | | | 2/28/19 | | | | 670 | |
| | 585 | | | U.S. Treasury Note | | | 1.38 | | | | 11/30/18 | | | | 590 | |
| | 1,210 | | | U.S. Treasury Note | | | 1.50 | | | | 11/30/19 | | | | 1,210 | |
| | 1,340 | | | U.S. Treasury Note | | | 1.50 | | | | 12/31/18 | | | | 1,353 | |
| | 1,176 | | | U.S. Treasury Note | | | 1.50 | | | | 2/28/19 | | | | 1,186 | |
| | 1,250 | | | U.S. Treasury Note | | | 1.50 | | | | 10/31/19 | | | | 1,251 | |
| | 1,895 | | | U.S. Treasury Note | | | 1.50 | | | | 5/31/20 | | | | 1,884 | |
See accompanying notes to portfolio of investments.
191
HC CAPITAL TRUST
The U.S. Government Fixed Income Securities Portfolio
Portfolio of Investments (continued) — June 30, 2015
| | | | | | | | | | | | | | | | |
Principal
Amount
(000) | | | | | Rate % | | | Maturity
Date | | | Value
(000) | |
| | | | U.S. Treasury Obligations (continued) | | | | | | | | | | | | |
| $ | 1,414 | | | U.S. Treasury Note | | | 1.50 | | | | 7/31/16 | | | $ | 1,431 | |
| | 890 | | | U.S. Treasury Note | | | 1.50 | | | | 1/31/22 | | | | 862 | |
| | 1,233 | | | U.S. Treasury Note | | | 1.50 | | | | 1/31/19 | | | | 1,244 | |
| | 1,600 | | | U.S. Treasury Note | | | 1.50 | | | | 8/31/18 | | | | 1,621 | |
| | 1,135 | | | U.S. Treasury Note | | | 1.50 | | | | 5/31/19 | | | | 1,141 | |
| | 500 | | | U.S. Treasury Note | | | 1.50 | | | | 3/31/19 | | | | 504 | |
| | 1,230 | | | U.S. Treasury Note | | | 1.63 | | | | 4/30/19 | | | | 1,244 | |
| | 1,160 | | | U.S. Treasury Note | | | 1.63 | | | | 6/30/19 | | | | 1,171 | |
| | 1,160 | | | U.S. Treasury Note | | | 1.63 | | | | 7/31/19 | | | | 1,170 | |
| | 1,250 | | | U.S. Treasury Note | | | 1.63 | | | | 6/30/20 | | | | 1,250 | |
| | 570 | | | U.S. Treasury Note | | | 1.63 | | | | 8/15/22 | | | | 553 | |
| | 1,220 | | | U.S. Treasury Note | | | 1.63 | | | | 3/31/19 | | | | 1,235 | |
| | 1,257 | | | U.S. Treasury Note | | | 1.63 | | | | 11/15/22 | | | | 1,215 | |
| | 1,360 | | | U.S. Treasury Note | | | 1.63 | | | | 8/31/19 | | | | 1,371 | |
| | 1,205 | | | U.S. Treasury Note | | | 1.63 | | | | 12/31/19 | | | | 1,210 | |
| | 640 | | | U.S. Treasury Note | | | 1.75 | | | | 10/31/18 | | | | 653 | |
| | 1,140 | | | U.S. Treasury Note | | | 1.75 | | | | 5/15/22 | | | | 1,118 | |
| | 1,165 | | | U.S. Treasury Note | | | 1.75 | | | | 3/31/22 | | | | 1,144 | |
| | 910 | | | U.S. Treasury Note | | | 1.75 | | | | 4/30/22 | | | | 893 | |
| | 1,698 | | | U.S. Treasury Note | | | 1.75 | | | | 5/15/23 | | | | 1,642 | |
| | 1,215 | | | U.S. Treasury Note | | | 1.75 | | | | 10/31/20 | | | | 1,216 | |
| | 1,420 | | | U.S. Treasury Note | | | 1.75 | | | | 9/30/19 | | | | 1,437 | |
| | 950 | | | U.S. Treasury Note | | | 1.75 | | | | 2/28/22 | | | | 933 | |
| | 1,000 | | | U.S. Treasury Note | | | 1.88 | | | | 8/31/17 | | | | 1,025 | |
| | 920 | | | U.S. Treasury Note | | | 1.88 | | | | 6/30/20 | | | | 931 | |
| | 1,100 | | | U.S. Treasury Note | | | 1.88 | | | | 10/31/17 | | | | 1,128 | |
| | 816 | | | U.S. Treasury Note | | | 1.88 | | | | 9/30/17 | | | | 837 | |
| | 965 | | | U.S. Treasury Note | | | 1.88 | | | | 5/31/22 | | | | 954 | |
| | 1,000 | | | U.S. Treasury Note | | | 1.88 | | | | 11/30/21 | | | | 994 | |
| | 766 | | | U.S. Treasury Note | | | 2.00 | | | | 2/28/21 | | | | 773 | |
| | 870 | | | U.S. Treasury Note | | | 2.00 | | | | 8/31/21 | | | | 873 | |
| | 2,425 | | | U.S. Treasury Note | | | 2.00 | | | | 2/15/25 | | | | 2,355 | |
| | 950 | | | U.S. Treasury Note | | | 2.00 | | | | 11/30/20 | | | | 962 | |
| | 1,160 | | | U.S. Treasury Note | | | 2.00 | | | | 7/31/20 | | | | 1,179 | |
| | 1,538 | | | U.S. Treasury Note | | | 2.00 | | | | 2/15/23 | | | | 1,521 | |
| | 980 | | | U.S. Treasury Note | | | 2.00 | | | | 10/31/21 | | | | 982 | |
| | 1,043 | | | U.S. Treasury Note | | | 2.00 | | | | 2/15/22 | | | | 1,043 | |
| | 1,500 | | | U.S. Treasury Note | | | 2.00 | | | | 11/15/21 | | | | 1,503 | |
| | 800 | | | U.S. Treasury Note | | | 2.00 | | | | 9/30/20 | | | | 812 | |
| | 940 | | | U.S. Treasury Note | | | 2.00 | | | | 5/31/21 | | | | 946 | |
| | 1,035 | | | U.S. Treasury Note | | | 2.13 | | | | 6/30/22 | | | | 1,039 | |
| | 1,265 | | | U.S. Treasury Note | | | 2.13 | | | | 5/15/25 | | | | 1,242 | |
| | 1,265 | | | U.S. Treasury Note | | | 2.13 | | | | 8/31/20 | | | | 1,292 | |
| | 960 | | | U.S. Treasury Note | | | 2.13 | | | | 6/30/21 | | | | 972 | |
| | 935 | | | U.S. Treasury Note | | | 2.13 | | | | 9/30/21 | | | | 944 | |
| | 1,000 | | | U.S. Treasury Note | | | 2.13 | | | | 12/31/21 | | | | 1,008 | |
| | 1,000 | | | U.S. Treasury Note | | | 2.13 | | | | 1/31/21 | | | | 1,017 | |
| | 1,500 | | | U.S. Treasury Note | | | 2.13 | | | | 8/15/21 | | | | 1,517 | |
| | 500 | | | U.S. Treasury Note | | | 2.25 | | | | 7/31/18 | | | | 518 | |
| | 1,065 | | | U.S. Treasury Note | | | 2.25 | | | | 7/31/21 | | | | 1,085 | |
| | 850 | | | U.S. Treasury Note | | | 2.25 | | | | 4/30/21 | | | | 868 | |
| | 374 | | | U.S. Treasury Note | | | 2.25 | | | | 11/30/17 | | | | 387 | |
| | 1,510 | | | U.S. Treasury Note | | | 2.25 | | | | 3/31/21 | | | | 1,543 | |
| | 2,655 | | | U.S. Treasury Note | | | 2.25 | | | | 11/15/24 | | | | 2,638 | |
See accompanying notes to portfolio of investments.
192
HC CAPITAL TRUST
The U.S. Government Fixed Income Securities Portfolio
Portfolio of Investments (continued) — June 30, 2015
| | | | | | | | | | | | | | | | |
Principal
Amount
(000) | | | | | Rate % | | | Maturity
Date | | | Value
(000) | |
| | | | U.S. Treasury Obligations (continued) | | | | | | | | | | | | |
| $ | 2,120 | | | U.S. Treasury Note | | | 2.38 | | | | 8/15/24 | | | $ | 2,130 | |
| | 450 | | | U.S. Treasury Note | | | 2.38 | | | | 6/30/18 | | | | 468 | |
| | 970 | | | U.S. Treasury Note | | | 2.38 | | | | 7/31/17 | | | | 1,004 | |
| | 700 | | | U.S. Treasury Note | | | 2.38 | | | | 12/31/20 | | | | 722 | |
| | 200 | | | U.S. Treasury Note | | | 2.38 | | | | 5/31/18 | | | | 208 | |
| | 1,290 | | | U.S. Treasury Note | | | 2.50 | | | | 8/15/23 | | | | 1,318 | |
| | 750 | | | U.S. Treasury Note | | | 2.50 | | | | 6/30/17 | | | | 778 | |
| | 1,890 | | | U.S. Treasury Note | | | 2.50 | | | | 5/15/24 | | | | 1,921 | |
| | 406 | | | U.S. Treasury Note | | | 2.63 | | | | 1/31/18 | | | | 424 | |
| | 2,053 | | | U.S. Treasury Note | | | 2.63 | | | | 11/15/20 | | | | 2,143 | |
| | 550 | | | U.S. Treasury Note | | | 2.63 | | | | 4/30/18 | | | | 576 | |
| | 1,277 | | | U.S. Treasury Note | | | 2.63 | | | | 8/15/20 | | | | 1,335 | |
| | 1,029 | | | U.S. Treasury Note | | | 2.75 | | | | 2/15/19 | | | | 1,084 | |
| | 1,937 | | | U.S. Treasury Note | | | 2.75 | | | | 11/15/23 | | | | 2,013 | |
| | 648 | | | U.S. Treasury Note | | | 2.75 | | | | 12/31/17 | | | | 679 | |
| | 300 | | | U.S. Treasury Note | | | 2.75 | | | | 2/28/18 | | | | 315 | |
| | 1,000 | | | U.S. Treasury Note | | | 2.75 | | | | 11/30/16 | | | | 1,032 | |
| | 800 | | | U.S. Treasury Note | | | 2.75 | | | | 5/31/17 | | | | 833 | |
| | 1,915 | | | U.S. Treasury Note | | | 2.75 | | | | 2/15/24 | | | | 1,987 | |
| | 400 | | | U.S. Treasury Note | | | 2.88 | | | | 3/31/18 | | | | 421 | |
| | 1,015 | | | U.S. Treasury Note | | | 3.00 | | | | 9/30/16 | | | | 1,048 | |
| | 900 | | | U.S. Treasury Note | | | 3.00 | | | | 2/28/17 | | | | 937 | |
| | 767 | | | U.S. Treasury Note | | | 3.00 | | | | 8/31/16 | | | | 790 | |
| | 482 | | | U.S. Treasury Note | | | 3.13 | | | | 4/30/17 | | | | 504 | |
| | 1,230 | | | U.S. Treasury Note | | | 3.13 | | | | 5/15/19 | | | | 1,313 | |
| | 1,000 | | | U.S. Treasury Note | | | 3.13 | | | | 10/31/16 | | | | 1,036 | |
| | 1,035 | | | U.S. Treasury Note | | | 3.13 | | | | 1/31/17 | | | | 1,078 | |
| | 1,042 | | | U.S. Treasury Note | | | 3.25 | | | | 12/31/16 | | | | 1,085 | |
| | 349 | | | U.S. Treasury Note | | | 3.25 | | | | 7/31/16 | | | | 360 | |
| | 710 | | | U.S. Treasury Note | | | 3.25 | | | | 3/31/17 | | | | 743 | |
| | 1,082 | | | U.S. Treasury Note | | | 3.38 | | | | 11/15/19 | | | | 1,168 | |
| | 799 | | | U.S. Treasury Note | | | 3.50 | | | | 2/15/18 | | | | 853 | |
| | 1,325 | | | U.S. Treasury Note | | | 3.50 | | | | 5/15/20 | | | | 1,441 | |
| | 1,000 | | | U.S. Treasury Note | | | 3.63 | | | | 8/15/19 | | | | 1,089 | |
| | 1,652 | | | U.S. Treasury Note | | | 3.63 | | | | 2/15/21 | | | | 1,812 | |
| | 1,260 | | | U.S. Treasury Note | | | 3.63 | | | | 2/15/20 | | | | 1,376 | |
| | 1,000 | | | U.S. Treasury Note | | | 3.75 | | | | 11/15/18 | | | | 1,086 | |
| | 665 | | | U.S. Treasury Note | | | 3.88 | | | | 5/15/18 | | | | 720 | |
| | 300 | | | U.S. Treasury Note | | | 4.00 | | | | 8/15/18 | | | | 328 | |
| | 400 | | | U.S. Treasury Note | | | 4.25 | | | | 5/15/39 | | | | 483 | |
| | 500 | | | U.S. Treasury Note | | | 4.25 | | | | 11/15/17 | | | | 541 | |
| | 648 | | | U.S. Treasury Note | | | 4.50 | | | | 5/15/17 | | | | 695 | |
| | 500 | | | U.S. Treasury Note | | | 4.63 | | | | 11/15/16 | | | | 529 | |
| | 580 | | | U.S. Treasury Note | | | 4.63 | | | | 2/15/17 | | | | 618 | |
| | 800 | | | U.S. Treasury Note | | | 4.75 | | | | 8/15/17 | | | | 869 | |
| | 850 | | | U.S. Treasury Note | | | 4.88 | | | | 8/15/16 | | | | 893 | |
| | 313 | | | U.S. Treasury Note | | | 5.50 | | | | 8/15/28 | | | | 416 | |
| | | | | | | | | | | | | | | | |
| | | | Total U.S. Treasury Obligations | | | | | | | | | | | 230,453 | |
| | | | | | | | | | | | | | | | |
| | | | Yankee Dollar — 0.05% | | | | | | | | | | | | |
| | 115 | | | AID-Israel (Sovereign Bond) | | | 5.50 | | | | 9/18/23 | | | | 139 | |
| | | | | | | | | | | | | | | | |
| | | | Total Yankee Dollar | | | | | | | | | | | 139 | |
| | | | | | | | | | | | | | | | |
| | | | Time Deposit — 0.33% | | | | | | | | | | | | |
| | 872 | | | State Street Liquidity Management Control System Eurodollar Time Deposit | | | 0.01 | | | | 7/1/15 | | | | 872 | |
| | | | | | | | | | | | | | | | |
| | | | Total Time Deposit | | | | | | | | | | | 872 | |
| | | | | | | | | | | | | | | | |
See accompanying notes to portfolio of investments.
193
HC CAPITAL TRUST
The U.S. Government Fixed Income Securities Portfolio
Portfolio of Investments (concluded) — June 30, 2015
| | | | | | | | | | | | | | |
| Shares | | | | | Rate % | | | Maturity
Date | | Value
(000) | |
| | | | Mutual Fund — 4.93% | | | | | | | | | | |
| | 12,974,609 | | | Federated U.S. Treasury Cash Reserve Fund, Institutional Shares (b) | | | 0.00 | | | | | | 12,975 | |
| | | | | | | | | | | | | | |
| | | | Total Mutual Fund | | | | | | | | | 12,975 | |
| | | | | | | | | | | | | | |
| | | | Total Investments (cost $262,501) — 100.68% | | | | | | | | | 264,785 | |
| | | | Liabilities in excess of other assets — (0.68)% | | | | | | | | | (1,787 | ) |
| | | | | | | | | | | | | | |
| | | | Net Assets — 100.00% | | | | | | | | $ | 262,998 | |
| | | | | | | | | | | | | | |
| (a) | Rate disclosed represents effective yield at purchase. |
| (b) | The rate disclosed is the rate in effect on June 30, 2015. |
The following table reflects the percentage of total net assets of the Portfolio attributable to each Specialist Manager, see Note 3 in the Notes to Financial Statements.
| | | | | | | | | | | | |
The U.S. Government Fixed Income Securities Portfolio | | Mellon Capital
Management
Corporation | | | HC Capital
Solutions | | | Total | |
U.S. Government Agency Securities | | | 7.63 | % | | | — | | | | 7.63 | % |
Corporate Bond | | | 0.10 | % | | | — | | | | 0.10 | % |
U.S. Treasury Obligations | | | 87.64 | % | | | — | | | | 87.64 | % |
Yankee Dollar | | | 0.05 | % | | | — | | | | 0.05 | % |
Time Deposit | | | 0.33 | % | | | — | | | | 0.33 | % |
Mutual Funds | | | — | | | | 4.93 | % | | | 4.93 | % |
Other Assets (Liabilities) | | | -0.68 | % | | | — | | | | -0.68 | % |
| | | | | | | | | | | | |
Total Net Assets | | | 95.07 | % | | | 4.93 | % | | | 100.00 | % |
| | | | | | | | | | | | |
See accompanying notes to portfolio of investments.
194
HC CAPITAL TRUST
The Inflation Protected Securities Portfolio
Portfolio of Investments — June 30, 2015
| | | | | | | | | | | | | | | | |
Shares or
Principal
Amount
(000) | | | | | Rate % | | | Maturity
Date | | | Value
(000) | |
| | | | U.S. Treasury Obligations — 94.87% | | | | | | | | | | | | |
| $ | 6,981 | | | U.S. Treasury Inflation Index Bond | | | 0.63 | | | | 2/15/43 | | | $ | 6,189 | |
| | 9,472 | | | U.S. Treasury Inflation Index Bond | | | 0.75 | | | | 2/15/42 | | | | 8,705 | |
| | 8,178 | | | U.S. Treasury Inflation Index Bond | | | 0.75 | | | | 2/15/45 | | | | 7,470 | |
| | 10,582 | | | U.S. Treasury Inflation Index Bond | | | 1.38 | | | | 2/15/44 | | | | 11,297 | |
| | 7,996 | | | U.S. Treasury Inflation Index Bond | | | 1.75 | | | | 1/15/28 | | | | 9,058 | |
| | 9,965 | | | U.S. Treasury Inflation Index Bond | | | 2.00 | | | | 1/15/26 | | | | 11,439 | |
| | 4,234 | | | U.S. Treasury Inflation Index Bond | | | 2.13 | | | | 2/15/40 | | | | 5,214 | |
| | 5,386 | | | U.S. Treasury Inflation Index Bond | | | 2.13 | | | | 2/15/41 | | | | 6,681 | |
| | 13,682 | | | U.S. Treasury Inflation Index Bond | | | 2.38 | | | | 1/15/25 | | | | 16,095 | |
| | 8,017 | | | U.S. Treasury Inflation Index Bond | | | 2.38 | | | | 1/15/27 | | | | 9,592 | |
| | 7,745 | | | U.S. Treasury Inflation Index Bond | | | 2.50 | | | | 1/15/29 | | | | 9,545 | |
| | 3,122 | | | U.S. Treasury Inflation Index Bond | | | 3.38 | | | | 4/15/32 | | | | 4,401 | |
| | 6,757 | | | U.S. Treasury Inflation Index Bond | | | 3.63 | | | | 4/15/28 | | | | 9,206 | |
| | 8,221 | | | U.S. Treasury Inflation Index Bond | | | 3.88 | | | | 4/15/29 | | | | 11,644 | |
| | 20,781 | | | U.S. Treasury Inflation Index Note | | | 0.13 | | | | 7/15/24 | | | | 20,266 | |
| | 23,276 | | | U.S. Treasury Inflation Index Note | | | 0.13 | | | | 4/15/17 | | | | 23,592 | |
| | 21,272 | | | U.S. Treasury Inflation Index Note | | | 0.13 | | | | 7/15/22 | | | | 21,110 | |
| | 25,921 | | | U.S. Treasury Inflation Index Note | | | 0.13 | | | | 4/15/18 | | | | 26,328 | |
| | 25,676 | | | U.S. Treasury Inflation Index Note | | | 0.13 | | | | 4/15/19 | | | | 26,009 | |
| | 20,623 | | | U.S. Treasury Inflation Index Note | | | 0.13 | | | | 1/15/22 | | | | 20,437 | |
| | 21,370 | | | U.S. Treasury Inflation Index Note | | | 0.13 | | | | 1/15/23 | | | | 20,993 | |
| | 9,250 | | | U.S. Treasury Inflation Index Note | | | 0.13 | | | | 4/15/20 | | | | 9,324 | |
| | 20,832 | | | U.S. Treasury Inflation Index Note | | | 0.25 | | | | 1/15/25 | | | | 20,434 | |
| | 21,197 | | | U.S. Treasury Inflation Index Note | | | 0.38 | | | | 7/15/23 | | | | 21,273 | |
| | 21,147 | | | U.S. Treasury Inflation Index Note | | | 0.63 | | | | 1/15/24 | | | | 21,507 | |
| | 18,686 | | | U.S. Treasury Inflation Index Note | | | 0.63 | | | | 7/15/21 | | | | 19,287 | |
| | 17,604 | | | U.S. Treasury Inflation Index Note | | | 1.13 | | | | 1/15/21 | | | | 18,620 | |
| | 15,391 | | | U.S. Treasury Inflation Index Note | | | 1.25 | | | | 7/15/20 | | | | 16,469 | |
| | 7,814 | | | U.S. Treasury Inflation Index Note | | | 1.38 | | | | 7/15/18 | | | | 8,287 | |
| | 10,014 | | | U.S. Treasury Inflation Index Note | | | 1.38 | | | | 1/15/20 | | | | 10,706 | |
| | 7,923 | | | U.S. Treasury Inflation Index Note | | | 1.63 | | | | 1/15/18 | | | | 8,371 | |
| | 8,260 | | | U.S. Treasury Inflation Index Note | | | 1.88 | | | | 7/15/19 | | | | 9,001 | |
| | 7,268 | | | U.S. Treasury Inflation Index Note | | | 2.13 | | | | 1/15/19 | | | | 7,913 | |
| | 8,703 | | | U.S. Treasury Inflation Index Note | | | 2.38 | | | | 1/15/17 | | | | 9,128 | |
| | 10,025 | | | U.S. Treasury Inflation Index Note | | | 2.50 | | | | 7/15/16 | | | | 10,397 | |
| | 7,499 | | | U.S. Treasury Inflation Index Note | | | 2.63 | | | | 7/15/17 | | | | 8,047 | |
| | | | | | | | | | | | | | | | |
| | | | Total U.S. Treasury Obligations | | | | | | | | | | | 484,035 | |
| | | | | | | | | | | | | | | | |
| | | | Mutual Funds — 5.10% | | | | | | | | | | | | |
| | 25,960,652 | | | Federated U.S. Treasury Cash Reserve Fund, Institutional Shares (a) | | | 0.00 | | | | | | | | 25,961 | |
| | 35,954 | | | SSgA Treasury Money Market Fund (a) | | | 0.00 | | | | | | | | 36 | |
| | | | | | | | | | | | | | | | |
| | | | Total Mutual Funds | | | | | | | | | | | 25,997 | |
| | | | | | | | | | | | | | | | |
| | | | Total Investments (cost $507,672) — 99.97% | | | | | | | | | | | 510,032 | |
| | | | Other assets in excess of liabilities — 0.03% | | | | | | | | | | | 145 | |
| | | | | | | | | | | | | | | | |
| | | | Net Assets — 100.00% | | | | | | | | | | $ | 510,177 | |
| | | | | | | | | | | | | | | | |
| (a) | The rate disclosed is the rate in effect on June 30, 2015. |
As of June 30, 2015, 100% of the Portfolio’s net assets were managed by Mellon Capital Management Corporation.
See accompanying notes to portfolio of investments.
195
HC CAPITAL TRUST
The U.S. Corporate Fixed Income Securities Portfolio
Portfolio of Investments — June 30, 2015
| | | | | | | | | | | | | | | | |
Principal
Amount
(000) | | | | | Rate % | | | Maturity
Date | | | Value
(000) | |
| | | | Corporate Bonds — 79.73% | | | | | | | | | | | | |
| $ | 1,905 | | | AbbVie, Inc. (Pharmaceuticals) | | | 1.75 | | | | 11/6/17 | | | $ | 1,910 | |
| | 570 | | | AbbVie, Inc. (Pharmaceuticals) | | | 4.40 | | | | 11/6/42 | | | | 539 | |
| | 1,490 | | | American Express Co. (Consumer Finance) | | | 2.65 | | | | 12/2/22 | | | | 1,434 | |
| | 435 | | | American Express Co. (Consumer Finance) | | | 7.00 | | | | 3/19/18 | | | | 493 | |
| | 2,230 | | | Ameriprise Financial, Inc. (Capital Markets) | | | 4.00 | | | | 10/15/23 | | | | 2,329 | |
| | 1,740 | | | Amgen, Inc. (Biotechnology) | | | 2.13 | | | | 5/15/17 | | | | 1,767 | |
| | 750 | | | Amgen, Inc. (Biotechnology), Callable 5/15/41 @ 100.00 | | | 5.15 | | | | 11/15/41 | | | | 770 | |
| | 699 | | | Analog Devices, Inc. (Semiconductors & Semiconductor Equipment) | | | 3.00 | | | | 4/15/16 | | | | 709 | |
| | 1,490 | | | Anheuser-Busch InBev NV (Beverages) | | | 2.50 | | | | 7/15/22 | | | | 1,433 | |
| | 1,670 | | | Anthem, Inc. (Health Care Providers & Services), Callable 5/15/21 @ 100.00 | | | 3.70 | | | | 8/15/21 | | | | 1,709 | |
| | 625 | | | Anthem, Inc. (Health Care Providers & Services) | | | 4.63 | | | | 5/15/42 | | | | 571 | |
| | 965 | | | Archer-Daniels-Midland Co. (Food Products) | | | 4.02 | | | | 4/16/43 | | | | 908 | |
| | 1,425 | | | Associates Corp. North America (Diversified Financial Services) | | | 6.95 | | | | 11/1/18 | | | | 1,639 | |
| | 1,515 | | | AT&T, Inc. (Diversified Telecommunication Services),
Callable 11/15/34 @ 100.00 | | | 4.50 | | | | 5/15/35 | | | | 1,393 | |
| | 2,175 | | | AT&T, Inc. (Diversified Telecommunication Services) | | | 5.50 | | | | 2/1/18 | | | | 2,377 | |
| | 495 | | | AT&T, Inc. (Diversified Telecommunication Services) | | | 5.55 | | | | 8/15/41 | | | | 507 | |
| | 155 | | | Atmos Energy Corp. (Gas Utilities), Callable 4/15/44 @ 100.00 | | | 4.13 | | | | 10/15/44 | | | | 148 | |
| | 4,516 | | | Bank of America Corp. (Banks) | | | 2.60 | | | | 1/15/19 | | | | 4,566 | |
| | 2,160 | | | Bank of America Corp., MTN (Banks) | | | 3.30 | | | | 1/11/23 | | | | 2,127 | |
| | 900 | | | Bank of America Corp., Series L, MTN (Diversified Financial Services) | | | 5.65 | | | | 5/1/18 | | | | 989 | |
| | 683 | | | Bank One Corp. (Banks) | | | 8.00 | | | | 4/29/27 | | | | 908 | |
| | 990 | | | Bear Stearns Co. LLC (Capital Markets) | | | 6.40 | | | | 10/2/17 | | | | 1,090 | |
| | 620 | | | Berkshire Hathaway, Inc. (Diversified Financial Services) | | | 4.40 | | | | 5/15/42 | | | | 611 | |
| | 405 | | | Bunge Limited Finance Co. (Food Products) | | | 8.50 | | | | 6/15/19 | | | | 490 | |
| | 530 | | | Burlington Northern Santa Fe LLC (Road & Rail), Callable 3/1/44 @ 100.00 | | | 4.55 | | | | 9/1/44 | | | | 522 | |
| | 2,775 | | | Capital One Bank USA, Series BKNT (Diversified Financial Services),
Callable 1/13/19 @ 100.00 | | | 2.25 | | | | 2/13/19 | | | | 2,759 | |
| | 1,270 | | | Capital One Financial Corp. (Consumer Finance) | | | 6.75 | | | | 9/15/17 | | | | 1,406 | |
| | 310 | | | Caterpillar Financial Services Corp., MTN (Consumer Finance) | | | 7.05 | | | | 10/1/18 | | | | 362 | |
| | 695 | | | Cisco Systems, Inc. (Communications Equipment) | | | 2.13 | | | | 3/1/19 | | | | 700 | |
| | 595 | | | Cisco Systems, Inc. (Communications Equipment) | | | 5.50 | | | | 1/15/40 | | | | 678 | |
| | 2,170 | | | Citigroup, Inc. (Banks) | | | 2.55 | | | | 4/8/19 | | | | 2,188 | |
| | 496 | | | Citigroup, Inc. (Banks) | | | 4.95 | | | | 11/7/43 | | | | 514 | |
| | 1,565 | | | Coca-Cola Enterprises, Inc. (Beverages) | | | 3.50 | | | | 9/15/20 | | | | 1,640 | |
| | 1,170 | | | Comcast Corp. (Media) | | | 2.85 | | | | 1/15/23 | | | | 1,137 | |
| | 795 | | | Comcast Corp. (Media) | | | 3.13 | | | | 7/15/22 | | | | 791 | |
| | 1,211 | | | Comcast Corp. (Media) | | | 4.65 | | | | 7/15/42 | | | | 1,214 | |
| | 1,350 | | | ConocoPhillips (Oil, Gas & Consumable Fuels) | | | 6.50 | | | | 2/1/39 | | | | 1,675 | |
| | 95 | | | Consolidated Edison Co. of New York, Inc., Series 08-B (Multi-Utilities) | | | 6.75 | | | | 4/1/38 | | | | 123 | |
| | 2,485 | | | CSX Corp. (Road & Rail), Callable 5/1/24 @ 100.00 | | | 3.40 | | | | 8/1/24 | | | | 2,486 | |
| | 1,415 | | | CVS Caremark Corp. (Food & Staples Retailing), Callable 9/1/22 @ 100.00 | | | 2.75 | | | | 12/1/22 | | | | 1,364 | |
| | 1,150 | | | CVS Health Corp. (Food & Staples Retailing), Callable 2/15/21 @ 100.00 | | | 4.13 | | | | 5/15/21 | | | | 1,230 | |
| | 1,484 | | | Delphi Corp. (Auto Components), Callable 12/15/23 @ 100.00 | | | 4.15 | | | | 3/15/24 | | | | 1,534 | |
| | 185 | | | Delphi Corp. (Auto Components), Callable 2/15/18 @ 103.00 | | | 5.00 | | | | 2/15/23 | | | | 197 | |
| | 1,550 | | | Devon Energy Corp. (Oil, Gas & Consumable Fuels), Callable 4/15/21 @ 100.00 | | | 4.00 | | | | 7/15/21 | | | | 1,625 | |
| | 1,820 | | | Devon Energy Corp. (Oil, Gas & Consumable Fuels), Callable 1/15/41 @ 100.00 | | | 5.60 | | | | 7/15/41 | | | | 1,905 | |
| | 2,480 | | | Dominion Resources, Inc. (Multi-Utilities) | | | 5.20 | | | | 8/15/19 | | | | 2,744 | |
| | 800 | | | Dominion Resources, Inc. (Multi-Utilities) | | | 6.40 | | | | 6/15/18 | | | | 902 | |
| | 963 | | | Duke Energy Carolinas LLC (Electric Utilities) | | | 5.30 | | | | 2/15/40 | | | | 1,096 | |
| | 310 | | | Duke Energy Corp. (Electric Utilities), Callable 1/15/24 @ 100.00 | | | 3.75 | | | | 4/15/24 | | | | 316 | |
| | 1,380 | | | Eaton Corp. (Electrical Equipment) | | | 2.75 | | | | 11/2/22 | | | | 1,342 | |
| | 620 | | | Eaton Corp. (Electrical Equipment) | | | 4.15 | | | | 11/2/42 | | | | 572 | |
| | 800 | | | Ecolab, Inc. (Chemicals) | | | 3.00 | | | | 12/8/16 | | | | 819 | |
| | 1,100 | | | Ecolab, Inc. (Chemicals) | | | 4.35 | | | | 12/8/21 | | | | 1,186 | |
| | 161 | | | Ecolab, Inc. (Chemicals) | | | 5.50 | | | | 12/8/41 | | | | 176 | |
See accompanying notes to portfolio of investments.
196
HC CAPITAL TRUST
The U.S. Corporate Fixed Income Securities Portfolio
Portfolio of Investments (continued) — June 30, 2015
| | | | | | | | | | | | | | | | |
Principal
Amount
(000) | | | | | Rate % | | | Maturity
Date | | | Value
(000) | |
| | | | Corporate Bonds (continued) | | | | | | | | | | | | |
| $ | 299 | | | Enterprise Products Operating LLC (Oil, Gas & Consumable Fuels),
Callable 12/15/22 @ 100.00 | | | 3.35 | | | | 3/15/23 | | | $ | 292 | |
| | 1,012 | | | Enterprise Products Operating LLC (Oil, Gas & Consumable Fuels),
Callable 9/15/43 @ 100.00 | | | 4.85 | | | | 3/15/44 | | | | 952 | |
| | 1,750 | | | Enterprise Products Partners LP (Oil, Gas & Consumable Fuels),
Callable 9/15/19 @ 100.00 | | | 2.55 | | | | 10/15/19 | | | | 1,749 | |
| | 120 | | | Enterprise Products Partners LP (Oil, Gas & Consumable Fuels),
Callable 12/15/45 @ 100.00 | | | 4.90 | | | | 5/15/46 | | | | 113 | |
| | 2,940 | | | Exxon Mobil Corp. (Oil, Gas & Consumable Fuels), Callable 2/6/20 @ 100.00 | | | 1.91 | | | | 3/6/20 | | | | 2,923 | |
| | 755 | | | FedEx Corp. (Air Freight & Logistics) | | | 3.90 | | | | 2/1/35 | | | | 698 | |
| | 260 | | | FedEx Corp. (Air Freight & Logistics) | | | 4.10 | | | | 2/1/45 | | | | 234 | |
| | 180 | | | FedEx Corp. (Air Freight & Logistics) | | | 8.00 | | | | 1/15/19 | | | | 215 | |
| | 1,470 | | | Fiserv, Inc. (IT Services), Callable 5/1/20 @ 100.00 | | | 2.70 | | | | 6/1/20 | | | | 1,467 | |
| | 480 | | | Fiserv, Inc. (IT Services), Callable 3/1/25 @ 100.00 | | | 3.85 | | | | 6/1/25 | | | | 481 | |
| | 1,271 | | | Ford Motor Credit Co. LLC (Consumer Finance) | | | 5.00 | | | | 5/15/18 | | | | 1,366 | |
| | 1,610 | | | General Electric Co., Series G, MTN (Industrial Conglomerates) | | | 3.10 | | | | 1/9/23 | | | | 1,605 | |
| | 1,144 | | | General Electric Co. (Industrial Conglomerates) | | | 4.13 | | | | 10/9/42 | | | | 1,101 | |
| | 993 | | | General Electric Co. (Industrial Conglomerates) | | | 5.25 | | | | 12/6/17 | | | | 1,082 | |
| | 3,165 | | | General Motors Co. (Automobiles) | | | 3.50 | | | | 10/2/18 | | | | 3,268 | |
| | 830 | | | Gilead Sciences, Inc. (Biotechnology), Callable 8/1/44 @ 100.00 | | | 4.50 | | | | 2/1/45 | | | | 827 | |
| | 795 | | | GlaxoSmithKline PLC (Pharmaceuticals) | | | 6.38 | | | | 5/15/38 | | | | 1,001 | |
| | 1,956 | | | Goldman Sachs Group, Inc. (Capital Markets) | | | 2.63 | | | | 1/31/19 | | | | 1,980 | |
| | 2,030 | | | Goldman Sachs Group, Inc. (Capital Markets) | | | 4.00 | | | | 3/3/24 | | | | 2,065 | |
| | 1,250 | | | Goldman Sachs Group, Inc. (Capital Markets) | | | 6.15 | | | | 4/1/18 | | | | 1,390 | |
| | 2,025 | | | Hewlett-Packard Co. (Technology Hardware, Storage & Peripherals) | | | 3.00 | | | | 9/15/16 | | | | 2,066 | |
| | 1,875 | | | International Business Machines Corp. (IT Services) | | | 3.63 | | | | 2/12/24 | | | | 1,899 | |
| | 1,760 | | | International Paper Co. (Paper Products), Callable 3/15/24 @ 100.00 | | | 3.65 | | | | 6/15/24 | | | | 1,735 | |
| | 473 | | | Intuit, Inc. (Software) | | | 5.75 | | | | 3/15/17 | | | | 506 | |
| | 310 | | | Johnson & Johnson (Pharmaceuticals), Callable 6/5/33 @ 100.00 | | | 4.38 | | | | 12/5/33 | | | | 328 | |
| | 305 | | | Johnson & Johnson (Pharmaceuticals) | | | 4.85 | | | | 5/15/41 | | | | 341 | |
| | 3,545 | | | JPMorgan Chase & Co. (Banks) | | | 4.25 | | | | 10/15/20 | | | | 3,792 | |
| | 310 | | | JPMorgan Chase & Co. (Banks) | | | 4.35 | | | | 8/15/21 | | | | 332 | |
| | 595 | | | Lincoln National Corp. (Insurance) | | | 7.00 | | | | 6/15/40 | | | | 746 | |
| | 880 | | | Lockheed Martin Corp. (Aerospace & Defense), Callable 12/1/24 @ 100.00 | | | 2.90 | | | | 3/1/25 | | | | 845 | |
| | 465 | | | Lockheed Martin Corp. (Aerospace & Defense), Callable 9/1/34 @ 100.00 | | | 3.60 | | | | 3/1/35 | | | | 430 | |
| | 1,250 | | | Medtronic, Inc. (Health Care Equipment & Supplies), Callable 1/1/23 @ 100.00 | | | 2.75 | | | | 4/1/23 | | | | 1,208 | |
| | 350 | | | Medtronic, Inc. (Health Care Equipment & Supplies), Callable 9/15/43 @ 100.00 | | | 4.63 | | | | 3/15/44 | | | | 353 | |
| | 310 | | | MetLife, Inc. (Life & Health Insurance) | | | 4.05 | | | | 3/1/45 | | | | 285 | |
| | 1,733 | | | MetLife, Inc. (Life & Health Insurance) | | | 7.72 | | | | 2/15/19 | | | | 2,067 | |
| | 1,475 | | | MidAmerican Energy Holdings Co. (Electric Utilities) | | | 6.13 | | | | 4/1/36 | | | | 1,737 | |
| | 870 | | | Monsanto Co. (Chemicals) | | | 2.75 | | | | 7/15/21 | | | | 854 | |
| | 3,370 | | | National Rural Utilities Cooperative Finance Corp. (Diversified Financial Services),
Callable 8/15/23 @ 100.00 | | | 3.40 | | | | 11/15/23 | | | | 3,441 | |
| | 1,725 | | | Nucor Corp. (Metals & Mining), Callable 5/1/23 @ 100.00 | | | 4.00 | | | | 8/1/23 | | | | 1,750 | |
| | 690 | | | Nucor Corp. (Metals & Mining), Callable 2/1/43 @ 100.00 | | | 5.20 | | | | 8/1/43 | | | | 706 | |
| | 535 | | | Oklahoma Gas & Electric Co. (Electric Utilities), Callable 11/15/40 @ 100.00 | | | 5.25 | | | | 5/15/41 | | | | 604 | |
| | 2,320 | | | Oracle Corp. (Software) | | | 2.50 | | | | 10/15/22 | | | | 2,235 | |
| | 620 | | | Oracle Corp. (Software) | | | 6.50 | | | | 4/15/38 | | | | 778 | |
| | 1,300 | | | Philip Morris International, Inc. (Tobacco) | | | 3.60 | | | | 11/15/23 | | | | 1,320 | |
| | 572 | | | Procter & Gamble Co.(The) (Household Products) | | | 9.36 | | | | 1/1/21 | | | | 696 | |
| | 695 | | | Prudential Financial, Inc. (Insurance) | | | 6.20 | | | | 11/15/40 | | | | 815 | |
| | 385 | | | Puget Energy, Inc. (Technology Hardware, Storage & Peripherals),
Callable 4/15/22 @ 100.00 | | | 5.63 | | | | 7/15/22 | | | | 433 | |
| | 688 | | | Puget Energy, Inc. (Technology Hardware, Storage & Peripherals) | | | 6.00 | | | | 9/1/21 | | | | 788 | |
| | 620 | | | Puget Energy, Inc. (Electric Utilities) | | | 6.50 | | | | 12/15/20 | | | | 726 | |
| | 850 | | | Reed Elsevier NV (Beverages), Callable 7/15/22 @ 100.00 | | | 3.13 | | | | 10/15/22 | | | | 829 | |
| | 203 | | | Reed Elsevier NV (Beverages) | | | 8.63 | | | | 1/15/19 | | | | 244 | |
See accompanying notes to portfolio of investments.
197
HC CAPITAL TRUST
The U.S. Corporate Fixed Income Securities Portfolio
Portfolio of Investments (continued) — June 30, 2015
| | | | | | | | | | | | | | | | |
Principal
Amount
(000) | | | | | Rate % | | | Maturity
Date | | | Value
(000) | |
| | | | Corporate Bonds (continued) | | | | | | | | | | | | |
| $ | 1,375 | | | Rock-Tenn Co. (Containers & Packaging) | | | 3.50 | | | | 3/1/20 | | | $ | 1,416 | |
| | 1,345 | | | Roper Industries, Inc. (Electrical Equipment) | | | 2.05 | | | | 10/1/18 | | | | 1,342 | |
| | 215 | | | Roper Industries, Inc. (Electrical Equipment), Callable 8/15/22 @ 100.00 | | | 3.13 | | | | 11/15/22 | | | | 208 | |
| | 640 | | | San Diego Gas & Electric Co. (Electric Utilities), Callable 10/1/41 @ 100.00 | | | 4.30 | | | | 4/1/42 | | | | 643 | |
| | 2,110 | | | Southern California Gas Co. (Gas Utilities), Callable 6/15/24 @ 100.00 | | | 3.15 | | | | 9/15/24 | | | | 2,107 | |
| | 1,323 | | | Southwest Airlines Co 2007-1 Trust (Airlines) | | | 6.15 | | | | 8/1/22 | | | | 1,514 | |
| | 1,530 | | | Sunoco Logistics Partners LP (Oil, Gas & Consumable Fuels), Callable 10/15/22 @ 100.00 | | | 3.45 | | | | 1/15/23 | | | | 1,448 | |
| | 995 | | | Sunoco Logistics Partners LP (Oil, Gas & Consumable Fuels), Callable 7/15/42 @ 100.00 | | | 4.95 | | | | 1/15/43 | | | | 872 | |
| | 320 | | | SunTrust Banks, Inc. (Banks), Callable 10/1/18 @ 100.00 | | | 2.35 | | | | 11/1/18 | | | | 322 | |
| | 1,500 | | | SunTrust Banks, Inc. (Banks), Callable 4/1/19 @ 100.00 | | | 2.50 | | | | 5/1/19 | | | | 1,508 | |
| | 2,091 | | | TC Pipelines, LP (Oil, Gas & Consumable Fuels), Callable 12/13/24 @ 100.00 | | | 4.38 | | | | 3/13/25 | | | | 2,066 | |
| | 1,485 | | | The Dow Chemical Co. (Chemicals), Callable 8/15/22 @ 100.00 | | | 3.00 | | | | 11/15/22 | | | | 1,428 | |
| | 495 | | | The Dow Chemical Co. (Chemicals) | | | 8.55 | | | | 5/15/19 | | | | 604 | |
| | 1,160 | | | The Home Depot, Inc. (Specialty Retail) | | | 5.88 | | | | 12/16/36 | | | | 1,396 | |
| | 1,550 | | | The Kroger Co. (Food & Staples Retailing), Callable 5/1/23 @ 100.00 | | | 3.85 | | | | 8/1/23 | | | | 1,590 | |
| | 435 | | | The Travelers Cos., Inc., MTN (Insurance) | | | 6.25 | | | | 6/15/37 | | | | 546 | |
| | 435 | | | Thermo Fisher Scientific, Inc (Life Sciences Tools & Services) | | | 3.20 | | | | 3/1/16 | | | | 442 | |
| | 1,220 | | | Thermo Fisher Scientific, Inc. (Life Sciences Tools & Services), Callable 5/15/21 @ 100.00 | | | 3.60 | | | | 8/15/21 | | | | 1,242 | |
| | 795 | | | Time Warner, Inc. (Media) | | | 5.38 | | | | 10/15/41 | | | | 816 | |
| | 1,835 | | | Time Warner, Inc. (Media) | | | 6.88 | | | | 6/15/18 | | | | 2,093 | |
| | 875 | | | Toyota Motor Credit Corp., MTN (Diversified Financial Services) | | | 3.30 | | | | 1/12/22 | | | | 906 | |
| | 639 | | | Twenty-First Century Fox, Inc. (Media) | | | 3.00 | | | | 9/15/22 | | | | 624 | |
| | 500 | | | Twenty-First Century Fox, Inc. (Media) | | | 5.65 | | | | 8/15/20 | | | | 571 | |
| | 765 | | | Twenty-First Century Fox, Inc. (Media) | | | 6.20 | | | | 12/15/34 | | | | 888 | |
| | 315 | | | Twenty-First Century Fox, Inc. (Media) | | | 6.90 | | | | 3/1/19 | | | | 366 | |
| | 500 | | | United Parcel Service, Inc. (Air Freight & Logistics) | | | 6.20 | | | | 1/15/38 | | | | 625 | |
| | 540 | | | UnitedHealth Group, Inc. (Health Care Providers & Services) | | | 6.88 | | | | 2/15/38 | | | | 710 | |
| | 1,175 | | | Valero Energy Corp. (Oil, Gas & Consumable Fuels) | | | 3.65 | | | | 3/15/25 | | | | 1,143 | |
| | 270 | | | Ventas Realty, LP (Real Estate Investment Trusts (REITs)), Callable 5/15/22 @ 100.00 | | | 3.25 | | | | 8/15/22 | | | | 261 | |
| | 200 | | | Ventas, Inc. (Real Estate Investment Trusts (REITs)), Callable 11/1/24 @ 100.00 | | | 3.50 | | | | 2/1/25 | | | | 192 | |
| | 1,470 | | | Verizon Communications, Inc. (Diversified Telecommunication Services) | | | 5.15 | | | | 9/15/23 | | | | 1,609 | |
| | 3,119 | | | Verizon Communications, Inc. (Diversified Telecommunication Services) | | | 6.55 | | | | 9/15/43 | | | | 3,649 | |
| | 990 | | | Viacom, Inc. (Media), Callable 12/15/42 @ 100.00 | | | 4.88 | | | | 6/15/43 | | | | 886 | |
| | 2,290 | | | Virginia Elec & Power Co. (Oil, Gas & Consumable Fuels), Callable 12/15/22 @ 100.00 | | | 2.75 | | | | 3/15/23 | | | | 2,236 | |
| | 215 | | | Virginia Elec & Power Co. (Oil, Gas & Consumable Fuels), Callable 10/15/21 @ 100.00 | | | 2.95 | | | | 1/15/22 | | | | 214 | |
| | 2,430 | | | Wachovia Corp. (Diversified Financial Services) | | | 5.75 | | | | 2/1/18 | | | | 2,684 | |
| | 1,939 | | | Wal-Mart Stores, Inc. (Food & Staples Retailing) | | | 1.95 | | | | 12/15/18 | | | | 1,969 | |
| | 1,850 | | | Wal-Mart Stores, Inc. (Food & Staples Retailing) | | | 5.63 | | | | 4/1/40 | | | | 2,164 | |
| | 450 | | | Wal-Mart Stores, Inc. (Food & Staples Retailing) | | | 6.50 | | | | 8/15/37 | | | | 578 | |
| | 1,000 | | | Waste Management, Inc. (Commercial Services & Supplies), Callable 12/1/24 @ 100.00 | | | 3.13 | | | | 3/1/25 | | | | 970 | |
| | 1,155 | | | Wells Fargo & Co. (Banks) | | | 3.00 | | | | 2/19/25 | | | | 1,106 | |
| | 675 | | | Western Gas Partners, LP (Oil, Gas & Consumable Fuels), Callable 3/1/25 @ 100.00 | | | 3.95 | | | | 6/1/25 | | | | 649 | |
| | 470 | | | Wyeth, Inc. (Pharmaceuticals) | | | 6.45 | | | | 2/1/24 | | | | 580 | |
| | 620 | | | Xerox Corp. (IT Services) | | | 6.40 | | | | 3/15/16 | | | | 643 | |
| | 1,391 | | | YUM! Brands, Inc. (Hotels, Restaurants & Leisure) | | | 6.25 | | | | 3/15/18 | | | | 1,537 | |
| | 310 | | | YUM! Brands, Inc. (Hotels, Restaurants & Leisure) | | | 6.88 | | | | 11/15/37 | | | | 359 | |
| | | | | | | | | | | | | | | | |
| | | | Total Corporate Bonds | | | | | | | | | | | 178,040 | |
| | | | | | | | | | | | | | | | |
| | | | Yankee Dollars — 13.15% | | | | | | | | | | | | |
| | 1,220 | | | America Movil SAB de CV (Wireless Telecommunication Services) | | | 6.13 | | | | 3/30/40 | | | | 1,413 | |
| | 1,255 | | | BHP Billiton Ltd. (Metals & Mining) | | | 3.85 | | | | 9/30/23 | | | | 1,289 | |
| | 730 | | | BHP Billiton Ltd. (Metals & Mining) | | | 5.00 | | | | 9/30/43 | | | | 758 | |
| | 595 | | | British Telecommunications PLC (Diversified Telecommunication Services) | | | 9.63 | | | | 12/15/30 | | | | 883 | |
| | 1,309 | | | Canadian Natural Resources (Oil, Gas & Consumable Fuels) | | | 5.70 | | | | 5/15/17 | | | | 1,409 | |
| | 388 | | | Canadian Natural Resources (Oil, Gas & Consumable Fuels) | | | 5.90 | | | | 2/1/18 | | | | 423 | |
| | 640 | | | Canadian Pacific Railway Co. (Road & Rail), Callable 11/1/24 @ 100.00 | | | 2.90 | | | | 2/1/25 | | | | 602 | |
See accompanying notes to portfolio of investments.
198
HC CAPITAL TRUST
The U.S. Corporate Fixed Income Securities Portfolio
Portfolio of Investments (concluded) — June 30, 2015
| | | | | | | | | | | | | | | | |
Shares or
Principal
Amount
(000) | | | | | Rate % | | | Maturity
Date | | | Value
(000) | |
| | | | Yankee Dollars (continued) | | | | | | | | | | | | |
| $ | 1,990 | | | Canadian Pacific Railway Co. (Road & Rail), Callable 12/15/22 @ 100.00 | | | 4.45 | | | | 3/15/23 | | | $ | 2,137 | |
| | 165 | | | Canadian Pacific Railway Co. (Road & Rail) | | | 7.25 | | | | 5/15/19 | | | | 195 | |
| | 665 | | | Deutsche Telekom International Finance (Diversified Telecommunication Services) (a)(b) | | | 8.75 | | | | 6/15/30 | | | | 936 | |
| | 750 | | | Diageo Capital PLC (Beverages) | | | 5.88 | | | | 9/30/36 | | | | 863 | |
| | 745 | | | HSBC Holdings PLC (Banks) | | | 6.80 | | | | 6/1/38 | | | | 925 | |
| | 645 | | | Iberdrola International BV (Electric Utilities) | | | 5.81 | | | | 3/15/25 | | | | 737 | |
| | 1,045 | | | Iberdrola International BV (Electric Utilities) | | | 6.75 | | | | 7/15/36 | | | | 1,281 | |
| | 725 | | | LyondellBasell Industries NV (Chemicals) | | | 4.00 | | | | 7/15/23 | | | | 741 | |
| | 1,880 | | | LyondellBasell Industries NV (Chemicals), Callable 1/15/19 @ 100.00 | | | 5.00 | | | | 4/15/19 | | | | 2,036 | |
| | 250 | | | LyondellBasell Industries NV (Chemicals), Callable 1/15/24 @ 100.00 | | | 5.75 | | | | 4/15/24 | | | | 285 | |
| | 418 | | | Orange SA (Diversified Financial Services) | | | 9.00 | | | | 3/1/31 | | | | 590 | |
| | 1,242 | | | Petroleos Mexicanos (Oil, Gas & Consumable Fuels) | | | 5.75 | | | | 3/1/18 | | | | 1,351 | |
| | 1,150 | | | Petroleos Mexicanos (Oil, Gas & Consumable Fuels) | | | 6.63 | | | | 6/15/35 | | | | 1,228 | |
| | 625 | | | Rio Tinto Finance USA Ltd. (Metals & Mining) | | | 5.20 | | | | 11/2/40 | | | | 637 | |
| | 1,400 | | | Rio Tinto Finance USA PLC (Metals & Mining), Callable 12/22/21 @ 100.00 | | | 3.50 | | | | 3/22/22 | | | | 1,412 | |
| | 1,115 | | | Shell International Finance BV (Integrated Oil & Gas) | | | 6.38 | | | | 12/15/38 | | | | 1,402 | |
| | 1,860 | | | Statoil ASA (Oil, Gas & Consumable Fuels) | | | 3.25 | | | | 11/10/24 | | | | 1,850 | |
| | 185 | | | Statoil ASA (Oil, Gas & Consumable Fuels) | | | 5.10 | | | | 8/17/40 | | | | 199 | |
| | 495 | | | Telefonica Emisiones (Diversified Telecommunication Services) | | | 7.05 | | | | 6/20/36 | | | | 608 | |
| | 1,605 | | | Telefonica Emisiones SAU (Wireless Telecommunication Services) | | | 6.22 | | | | 7/3/17 | | | | 1,744 | |
| | 990 | | | Vodafone Group PLC (Wireless Telecommunication Services) | | | 2.50 | | | | 9/26/22 | | | | 907 | |
| | 495 | | | Vodafone Group PLC (Wireless Telecommunication Services) | | | 6.15 | | | | 2/27/37 | | | | 529 | |
| | | | | | | | | | | | | | | | |
| | | | Total Yankee Dollars | | | | | | | | | | | 29,370 | |
| | | | | | | | | | | | | | | | |
| | | | Mutual Funds — 7.06% | | | | | | | | | | | | |
| | 11,241,018 | | | Federated U.S. Treasury Cash Reserve Fund, Institutional Shares (c) | | | 0.00 | | | | | | | | 11,241 | |
| | 4,537,472 | | | SSgA U.S. Government Money Market Fund (c) | | | 0.00 | | | | | | | | 4,537 | |
| | | | | | | | | | | | | | | | |
| | | | Total Mutual Funds | | | | | | | | | | | 15,778 | |
| | | | | | | | | | | | | | | | |
| | | | Total Investments (cost $229,882) — 99.94% | | | | | | | | | | | 223,188 | |
| | | | |
| | | | Other assets in excess of liabilities — 0.06% | | | | | | | | | | | 141 | |
| | | | | | | | | | | | | | | | |
| | | | Net Assets — 100.00% | | | | | | | | | | $ | 223,329 | |
| | | | | | | | | | | | | | | | |
| (a) | Variable Rate Security. The rate reflected is the rate in effect on June 30, 2015. |
| (b) | Step Bond: Coupon rate is set for an initial period and then increased to a higher coupon rate at a specified date. The rate shown is the rate in effect at June 30, 2015. |
| (c) | The rate disclosed is the rate in effect on June 30, 2015. |
MTN — Medium Term Note
The following table reflects the percentage of total net assets of the Portfolio attributable to each Specialist Manager, see Note 3 in the Notes to Financial Statements.
| | | | | | | | | | | | |
The U.S. Corporate Fixed Income Securities Portfolio | | Agincourt
Capital
Management,
LLC | | | HC Capital
Solutions | | | Total | |
Corporate Bonds | | | 79.73 | % | | | — | | | | 79.73 | % |
Yankee Dollar | | | 13.15 | % | | | — | | | | 13.15 | % |
Mutual Funds | | | 2.04 | % | | | 5.02 | % | | | 7.06 | % |
Other Assets (Liabilities) | | | 0.06 | % | | | — | | | | 0.06 | % |
| | | | | | | | | | | | |
Total Net Assets | | | 94.98 | % | | | 5.02 | % | | | 100.00 | % |
| | | | | | | | | | | | |
See accompanying notes to portfolio of investments.
199
HC CAPITAL TRUST
The U.S. Mortgage/Asset Backed Fixed Income Securities Portfolio
Portfolio of Investments — June 30, 2015
| | | | | | | | | | | | | | | | |
Principal
Amount
(000) | | | | | Rate % | | | Maturity
Date | | | Value
(000) | |
| | | | Asset Backed Securities — 1.72% | | | | | | | | | | | | |
| $ | 200 | | | American Express Credit Account Master Trust, Series 2014-3, Class A | | | 1.49 | | | | 4/15/20 | | | $ | 201 | |
| | 100 | | | AmeriCredit Automobile Receivables Trust, Series 2013-5, Class A3 | | | 0.90 | | | | 9/8/18 | | | | 100 | |
| | 70 | | | Capital Auto Receivables Asset Trust, Series 2014-2, Class A3 | | | 1.26 | | | | 5/21/18 | | | | 70 | |
| | 250 | | | Capital One Multi-Asset Execution Trust, Series 2007-A7, Class A7 | | | 5.75 | | | | 7/15/20 | | | | 274 | |
| | 195 | | | CarMax Auto Owner Trust, Series 2014-1, Class A3 | | | 0.79 | | | | 10/15/18 | | | | 195 | |
| | 100 | | | CarMax Auto Owner Trust, Series 2012-2, Class A4 | | | 1.16 | | | | 12/15/17 | | | | 100 | |
| | 300 | | | Chase Issuance Trust (CHAIT), Series 2014-A1, Class A1 | | | 1.15 | | | | 1/15/19 | | | | 301 | |
| | 300 | | | Chase Issuance Trust (CHAIT), Series 2015-A2, Class A2 | | | 1.59 | | | | 2/18/20 | | | | 302 | |
| | 250 | | | Chase Issuance Trust (CHAIT), Series 2012-A7, Class A7 | | | 2.16 | | | | 9/16/24 | | | | 243 | |
| | 300 | | | Citibank Credit Card Issuance Trust, Series 2014-A2, Class A2 | | | 1.02 | | | | 2/22/19 | | | | 300 | |
| | 100 | | | Citibank Credit Card Issuance Trust, Series 2014-A1, Class A1 | | | 2.88 | | | | 1/23/23 | | | | 103 | |
| | 250 | | | Discover Card Execution Note Trust, Series 2013-A2, Class A2 | | | 0.69 | | | | 8/15/18 | | | | 250 | |
| | 200 | | | Discover Card Execution Note Trust, Series 2014-A4, Class A4 | | | 2.12 | | | | 12/15/21 | | | | 202 | |
| | 195 | | | Fifth Third Auto Trust, Series 2014-3, Class A3 | | | 0.96 | | | | 3/15/19 | | | | 195 | |
| | 187 | | | Fifth Third Auto Trust, Series 2014-3, Class A4 | | | 1.47 | | | | 5/17/21 | | | | 187 | |
| | 225 | | | Ford Credit Auto Owner Trust, Series 2013-C, Class A4 | | | 1.25 | | | | 10/15/18 | | | | 226 | |
| | 85 | | | Ford Credit Auto Owner Trust, Series 2015-A, Class A3 | | | 1.28 | | | | 9/15/19 | | | | 85 | |
| | 160 | | | Ford Credit Auto Owner Trust, Series 2015-A, Class A4 | | | 1.64 | | | | 6/15/20 | | | | 160 | |
| | 300 | | | Honda Auto Receivables Owner Trust, Series 2014-3, Class A3 | | | 0.88 | | | | 6/15/18 | | | | 300 | |
| | 100 | | | Honda Auto Receivables Owner Trust, Series 2014-4, Class A3 | | | 0.99 | | | | 9/17/18 | | | | 100 | |
| | 40 | | | Mercedes-Benz Auto Lease Trust, Series 2015-A, Class A4 | | | 1.21 | | | | 10/15/20 | | | | 40 | |
| | 200 | | | Nissan Auto Receivables Owner Trust, Series 2013-B, Class A4 | | | 1.31 | | | | 10/15/19 | | | | 200 | |
| | 200 | | | Santander Drive Auto Receivables Trust, Series 2014-3, Class C | | | 2.13 | | | | 8/17/20 | | | | 202 | |
| | | | | | | | | | | | | | | | |
| | | | Total Asset Backed Securities | | | | | | | | | | | 4,336 | |
| | | | | | | | | | | | | | | | |
| | | | Collateralized Mortgage Obligations — 6.03% | | | | | | | | | | | | |
| | 50 | | | CD Commercial Mortgage Trust, Series 2007-CD5, Class AM (a) | | | 6.12 | | | | 11/15/44 | | | | 54 | |
| | 250 | | | Citigroup Commercial Mortgage Trust, Series 2014-GC19, Class A2 | | | 2.79 | | | | 3/10/47 | | | | 257 | |
| | 250 | | | Citigroup Commercial Mortgage Trust, Series 2015-GC27, Class A4 | | | 2.88 | | | | 2/10/48 | | | | 241 | |
| | 200 | | | Citigroup Commercial Mortgage Trust, Series 2015-GC27, Class A5 | | | 3.14 | | | | 2/10/48 | | | | 196 | |
| | 250 | | | Citigroup Commercial Mortgage Trust, Series 2014-GC23, Class A4 | | | 3.62 | | | | 7/10/47 | | | | 257 | |
| | 138 | | | Citigroup Commercial Mortgage Trust, Series 2008-C7, Class A4 (a) | | | 6.14 | | | | 9/10/17 | | | | 148 | |
| | 290 | | | Commercial Mortgage Trust, Series 2012-CR1, Class A2 | | | 2.35 | | | | 5/15/45 | | | | 295 | |
| | 100 | | | Commercial Mortgage Trust, Series 2014-LC15, Class A2 | | | 2.84 | | | | 4/10/47 | | | | 103 | |
| | 200 | | | Commercial Mortgage Trust, Series 2015-LC19, Class A4 | | | 3.18 | | | | 2/10/48 | | | | 198 | |
| | 80 | | | Commercial Mortgage Trust, Series 2015-DC1, Class A5 | | | 3.35 | | | | 2/10/48 | | | | 80 | |
| | 500 | | | Commercial Mortgage Trust, Series 2013-CR8, Class A5 (a) | | | 3.61 | | | | 6/10/46 | | | | 521 | |
| | 250 | | | Commercial Mortgage Trust, Series 2014-UBS3, Class A4 | | | 3.82 | | | | 6/10/47 | | | | 261 | |
| | 100 | | | Commercial Mortgage Trust, Series 2014-UBS4, Class AM | | | 3.97 | | | | 8/10/47 | | | | 101 | |
| | 100 | | | Commercial Mortgage Trust, Series 2013-CR11, Class B (a) | | | 5.16 | | | | 10/10/46 | | | | 111 | |
| | 38 | | | Fannie Mae, Series 2013-M14, Class APT (a) | | | 2.50 | | | | 4/25/23 | | | | 38 | |
| | 300 | | | Fannie Mae, Series 2012-M1, Class A2 | | | 2.73 | | | | 10/25/21 | | | | 306 | |
| | 160 | | | Fannie Mae, Series 2014-M3, Class AB2 (a) | | | 3.46 | | | | 1/25/24 | | | | 167 | |
| | 75 | | | Fannie Mae-ACES, Series 2012-M4, Class 1A2 | | | 2.98 | | | | 4/25/22 | | | | 77 | |
| | 142 | | | Freddie Mac Multifamily Structured Pass-Through Certificates, Series K714, Class A1 | | | 2.08 | | | | 12/25/19 | | | | 144 | |
| | 400 | | | Freddie Mac Multifamily Structured Pass-Through Certificates, Series K027, Class A2 | | | 2.64 | | | | 1/25/23 | | | | 401 | |
| | 91 | | | Freddie Mac Multifamily Structured Pass-Through Certificates, Series K009, Class A1 | | | 2.76 | | | | 5/25/20 | | | | 94 | |
| | 150 | | | Freddie Mac Multifamily Structured Pass-Through Certificates, Series K017, Class A2 | | | 2.87 | | | | 12/25/21 | | | | 154 | |
| | 109 | | | Freddie Mac Multifamily Structured Pass-Through Certificates, Series K032, Class A1 | | | 3.02 | | | | 2/25/23 | | | | 114 | |
| | 200 | | | Freddie Mac Multifamily Structured Pass-Through Certificates, Series K033, Class A2 (a) | | | 3.06 | | | | 7/25/23 | | | | 205 | |
| | 200 | | | Freddie Mac Multifamily Structured Pass-Through Certificates, Series K032, Class A2 (a) | | | 3.31 | | | | 5/25/23 | | | | 209 | |
| | 200 | | | Freddie Mac Multifamily Structured Pass-Through Certificates, Series K029, Class A2 | | | 3.32 | | | | 2/25/23 | | | | 210 | |
| | 360 | | | Freddie Mac Multifamily Structured Pass-Through Certificates, Series K014, Class A2 | | | 3.87 | | | | 4/25/21 | | | | 390 | |
| | 225 | | | Freddie Mac Multifamily Structured Pass-Through Certificates, Series K012, Class A2 | | | 4.19 | | | | 12/25/20 | | | | 247 | |
| | 200 | | | Freddie Mac Multifamily Structured Pass-Through Certificates, Series K006, Class A2 | | | 4.25 | | | | 1/25/20 | | | | 219 | |
| | 320 | | | Freddie Mac Multifamily Structured Pass-Through Certificates, Series K010, Class A2 | | | 4.33 | | | | 10/25/20 | | | | 353 | |
| | 190 | | | Greenwich Capital Commercial Funding Corp., Series 2006-GG7, Class A4 (a) | | | 5.82 | | | | 7/10/38 | | | | 195 | |
| | 125 | | | GS Mortgage Securities Trust, Series 2014-GC20, Class A3 | | | 3.68 | | | | 4/10/47 | | | | 131 | |
| | 300 | | | GS Mortgage Securities Trust, Series 2013-GC14, Class A5 | | | 4.24 | | | | 8/10/46 | | | | 325 | |
| | 150 | | | JPMBB Commercial Mortgage Securities Trust, Series 2014-C24, Class A5 | | | 3.64 | | | | 11/15/47 | | | | 154 | |
| | 200 | | | JPMBB Commercial Mortgage Securities Trust, Series 2014-C21, Class A5 | | | 3.77 | | | | 8/15/47 | | | | 207 | |
See accompanying notes to portfolio of investments.
200
HC CAPITAL TRUST
The U.S. Mortgage/Asset Backed Fixed Income Securities Portfolio
Portfolio of Investments (continued) — June 30, 2015
| | | | | | | | | | | | | | | | |
Principal
Amount
(000) | | | | | Rate % | | | Maturity
Date | | | Value
(000) | |
| | | | Collateralized Mortgage Obligations (continued) | | | | | | | | | | | | |
| $ | 200 | | | JPMBB Commercial Mortgage Securities Trust, Series 2014-C22, Class A4 | | | 3.80 | | | | 9/15/47 | | | $ | 207 | |
| | 200 | | | JPMBB Commercial Mortgage Securities Trust, Series 2013-C15, Class A5 | | | 4.13 | | | | 11/15/45 | | | | 214 | |
| | 193 | | | JPMorgan Chase Commercial Mortgage Securities Corp., Series 2013-LC11, Class A2 | | | 1.85 | | | | 4/15/46 | | | | 194 | |
| | 1,000 | | | JPMorgan Chase Commercial Mortgage Securities Corp., Series 2012-C8, Class A3 | | | 2.83 | | | | 10/15/45 | | | | 1,000 | |
| | 220 | | | JPMorgan Chase Commercial Mortgage Securities Corp., Series 2014-C18, Class A5 | | | 4.08 | | | | 2/15/47 | | | | 234 | |
| | 169 | | | Merrill Lynch Mortgage Trust, Series 2007-C1, Class A3 (a) | | | 5.84 | | | | 11/12/16 | | | | 170 | |
| | 200 | | | Morgan Stanley BAML Trust, Series 2013-C12, Class A2 | | | 3.00 | | | | 10/15/46 | | | | 207 | |
| | 250 | | | Morgan Stanley BAML Trust, Series 2013-C11, Class A2 | | | 3.09 | | | | 8/15/46 | | | | 259 | |
| | 100 | | | Morgan Stanley BAML Trust, Series 2015-C20, Class A4 | | | 3.25 | | | | 2/15/48 | | | | 99 | |
| | 100 | | | Morgan Stanley BAML Trust, Series 2014-C17, Class A5 | | | 3.74 | | | | 8/15/47 | | | | 103 | |
| | 100 | | | Morgan Stanley BAML Trust, Series 2014-C15, Class A4 | | | 4.05 | | | | 4/15/47 | | | | 106 | |
| | 1,000 | | | Morgan Stanley Capital I, Series 2007-HQ11, Class A4 (a) | | | 5.45 | | | | 2/12/44 | | | | 1,050 | |
| | 608 | | | Morgan Stanley Capital I, Series 2006-HQ9, Class A4 (a) | | | 5.73 | | | | 7/12/44 | | | | 623 | |
| | 1,241 | | | Morgan Stanley Capital I, Series 2007-IQ15, Class A4 (a) | | | 5.91 | | | | 7/11/17 | | | | 1,325 | |
| | 250 | | | UBS Commercial Mortgage Trust, Series 2012-C1, Class AAB | | | 3.00 | | | | 5/10/45 | | | | 258 | |
| | 155 | | | UBS-Barclays Commercial Mortgage Trust, Series 2012-C2, Class A4 | | | 3.53 | | | | 5/10/63 | | | | 161 | |
| | 225 | | | Wachovia Bank Commercial Mortgage Trust, Series 2007-C31, Class A5 | | | 5.50 | | | | 4/15/47 | | | | 239 | |
| | 550 | | | Wachovia Bank Commercial Mortgage Trust, Series 2006-C26, Class A3 (a) | | | 6.01 | | | | 6/15/45 | | | | 565 | |
| | 185 | | | Wells Fargo Commercial Mortgage Trust, Series 2014-LC16, Class A5 | | | 3.82 | | | | 8/15/50 | | | | 193 | |
| | 156 | | | Wells Fargo Commercial Mortgage Trust, Series 2015-C26, Class C | | | 4.07 | | | | 2/15/48 | | | | 147 | |
| | 119 | | | WF-RBS Commercial Mortgage Trust, Series 2014-LC14, Class A1 | | | 1.19 | | | | 3/15/47 | | | | 118 | |
| | 250 | | | WF-RBS Commercial Mortgage Trust, Serie 2014-C21, Class A1 | | | 1.41 | | | | 8/15/47 | | | | 250 | |
| | 300 | | | WF-RBS Commercial Mortgage Trust, Series 2013-C14, Class ASB | | | 2.98 | | | | 6/15/46 | | | | 308 | |
| | | | | | | | | | | | | | | | |
| | | | Total Collateralized Mortgage Obligations | | | | | | | | | | | 15,193 | |
| | | | | | | | | | | | | | | | |
| | | | U.S. Government Agency Mortgages — 88.14% | | | | | | | | | | | | |
| | 475 | | | Fannie Mae, Pool #AS1058 | | | 2.00 | | | | 11/1/28 | | | | 472 | |
| | 90 | | | Fannie Mae, Pool #AS0001 | | | 2.00 | | | | 7/1/28 | | | | 89 | |
| | 300 | | | Fannie Mae, Pool #AY4232 | | | 2.00 | | | | 5/1/30 | | | | 296 | |
| | 413 | | | Fannie Mae, Pool #AU2619 | | | 2.50 | | | | 8/1/28 | | | | 421 | |
| | 487 | | | Fannie Mae, Pool #AX2403 | | | 2.50 | | | | 9/1/29 | | | | 495 | |
| | 272 | | | Fannie Mae, Pool #AB7391 | | | 2.50 | | | | 12/1/42 | | | | 261 | |
| | 39 | | | Fannie Mae, Pool #MA1511 | | | 2.50 | | | | 7/1/33 | | | | 38 | |
| | 830 | | | Fannie Mae, Pool #MA1210 | | | 2.50 | | | | 9/1/49 | | | | 847 | |
| | 488 | | | Fannie Mae, Pool #AS4660 | | | 2.50 | | | | 3/1/30 | | | | 495 | |
| | 284 | | | Fannie Mae, Pool #AU5334 | | | 2.50 | | | | 11/1/28 | | | | 289 | |
| | 322 | | | Fannie Mae, Pool #AU4798 | | | 2.50 | | | | 9/1/28 | | | | 327 | |
| | 641 | | | Fannie Mae, Pool #AO3019 | | | 2.50 | | | | 5/1/27 | | | | 653 | |
| | 196 | | | Fannie Mae, Pool #AU6387 | | | 2.50 | | | | 11/1/28 | | | | 199 | |
| | 85 | | | Fannie Mae, Pool #MA1270 | | | 2.50 | | | | 11/1/32 | | | | 84 | |
| | 767 | | | Fannie Mae, Pool #MA1277 | | | 2.50 | | | | 12/1/27 | | | | 782 | |
| | 185 | | | Fannie Mae, Pool #AS0513 | | | 2.50 | | | | 8/1/43 | | | | 177 | |
| | 682 | | | Fannie Mae, Pool #AP4742 | | | 2.50 | | | | 8/1/27 | | | | 696 | |
| | 152 | | | Fannie Mae, Pool #AL5800 (a) | | | 2.69 | | | | 2/1/44 | | | | 156 | |
| | 72 | | | Fannie Mae, Pool #AL4360 (a) | | | 2.71 | | | | 11/1/43 | | | | 74 | |
| | 231 | | | Fannie Mae, Pool #AY1861 (a) | | | 2.72 | | | | 1/1/45 | | | | 237 | |
| | 1,166 | | | Fannie Mae, Pool #AO0752 | | | 3.00 | | | | 4/1/42 | | | | 1,168 | |
| | 163 | | | Fannie Mae, Pool #AW8295 | | | 3.00 | | | | 8/1/29 | | | | 169 | |
| | 330 | | | Fannie Mae, Pool #AK8522 | | | 3.00 | | | | 3/1/27 | | | | 343 | |
| | 116 | | | Fannie Mae, Pool #MA1338 | | | 3.00 | | | | 2/1/33 | | | | 118 | |
| | 277 | | | Fannie Mae, Pool #AW7383 | | | 3.00 | | | | 8/1/29 | | | | 288 | |
| | 198 | | | Fannie Mae, Pool #MA2230 | | | 3.00 | | | | 4/1/35 | | | | 201 | |
| | 156 | | | Fannie Mae, Pool #AU7890 | | | 3.00 | | | | 9/1/28 | | | | 162 | |
| | 713 | | | Fannie Mae, Pool #MA1307 | | | 3.00 | | | | 1/1/33 | | | | 727 | |
| | 511 | | | Fannie Mae, Pool #AB4483 | | | 3.00 | | | | 2/1/27 | | | | 531 | |
See accompanying notes to portfolio of investments.
201
HC CAPITAL TRUST
The U.S. Mortgage/Asset Backed Fixed Income Securities Portfolio
Portfolio of Investments (continued) — June 30, 2015
| | | | | | | | | | | | | | | | |
Principal
Amount
(000) | | | | | Rate % | | | Maturity
Date | | | Value
(000) | |
| | | | U.S. Government Agency Mortgages (continued) | | | | | | | | | | | | |
| $ | 190 | | | Fannie Mae, Pool #MA2149 | | | 3.00 | | | | 1/1/30 | | | $ | 197 | |
| | 91 | | | Fannie Mae, Pool #MA2087 | | | 3.00 | | | | 11/1/34 | | | | 93 | |
| | 483 | | | Fannie Mae, Pool #MA2246 | | | 3.00 | | | | 4/1/30 | | | | 501 | |
| | 224 | | | Fannie Mae, Pool #MA1527 | | | 3.00 | | | | 8/1/33 | | | | 228 | |
| | 250 | | | Fannie Mae, Pool #MA1401 | | | 3.00 | | | | 4/1/33 | | | | 255 | |
| | 499 | | | Fannie Mae, Pool #AY2961 | | | 3.00 | | | | 5/1/45 | | | | 498 | |
| | 668 | | | Fannie Mae, Pool #AK0006 | | | 3.00 | | | | 1/1/27 | | | | 693 | |
| | 1,112 | | | Fannie Mae, Pool #AK3302 | | | 3.00 | | | | 3/1/27 | | | | 1,155 | |
| | 201 | | | Fannie Mae, Pool #MA2065 | | | 3.00 | | | | 10/1/34 | | | | 205 | |
| | 1,942 | | | Fannie Mae, Pool #AB7099 | | | 3.00 | | | | 11/1/42 | | | | 1,945 | |
| | 525 | | | Fannie Mae, Pool #AB8897 | | | 3.00 | | | | 4/1/43 | | | | 525 | |
| | 1,859 | | | Fannie Mae, Pool #AP6375 | | | 3.00 | | | | 9/1/42 | | | | 1,862 | |
| | 527 | | | Fannie Mae, Pool #AT2127 | | | 3.00 | | | | 4/1/43 | | | | 527 | |
| | 411 | | | Fannie Mae, Pool #AS1527 | | | 3.00 | | | | 1/1/29 | | | | 426 | |
| | 85 | | | Fannie Mae, Pool #AT1575 | | | 3.00 | | | | 5/1/43 | | | | 85 | |
| | 258 | | | Fannie Mae, Pool #AS2312 | | | 3.00 | | | | 5/1/29 | | | | 267 | |
| | 280 | | | Fannie Mae, Pool #AQ3223 | | | 3.00 | | | | 11/1/27 | | | | 290 | |
| | 359 | | | Fannie Mae, Pool #AU3735 | | | 3.00 | | | | 8/1/43 | | | | 359 | |
| | 1,041 | | | Fannie Mae, Pool #AP6493 | | | 3.00 | | | | 9/1/42 | | | | 1,043 | |
| | 176 | | | Fannie Mae, Pool #AS3117 | | | 3.00 | | | | 8/1/29 | | | | 183 | |
| | 2,157 | | | Fannie Mae, Pool #AQ7920 | | | 3.00 | | | | 12/1/42 | | | | 2,160 | |
| | 534 | | | Fannie Mae, Pool #AP8746 | | | 3.00 | | | | 10/1/42 | | | | 535 | |
| | 896 | | | Fannie Mae, Pool #AP2465 | | | 3.00 | | | | 8/1/42 | | | | 897 | |
| | 498 | | | Fannie Mae, Pool #AY4829 | | | 3.00 | | | | 5/1/45 | | | | 496 | |
| | 64 | | | Fannie Mae, Pool #AR7426 | | | 3.00 | | | | 7/1/43 | | | | 64 | |
| | 531 | | | Fannie Mae, Pool #AT0682 | | | 3.00 | | | | 4/1/43 | | | | 531 | |
| | 250 | | | Fannie Mae, Series 2014-M9, Class A2 (a) | | | 3.10 | | | | 7/25/24 | | | | 255 | |
| | 345 | | | Fannie Mae, Pool #MA0521 | | | 3.50 | | | | 9/1/20 | | | | 364 | |
| | 54 | | | Fannie Mae, Pool #MA1021 | | | 3.50 | | | | 3/1/27 | | | | 57 | |
| | 2,023 | | | Fannie Mae, Pool #AB6017 | | | 3.50 | | | | 8/1/42 | | | | 2,091 | |
| | 144 | | | Fannie Mae, Pool #AK0706 | | | 3.50 | | | | 2/1/27 | | | | 152 | |
| | 277 | | | Fannie Mae, Pool #AU3742 | | | 3.50 | | | | 8/1/43 | | | | 286 | |
| | 79 | | | Fannie Mae, Pool #AP9390 | | | 3.50 | | | | 10/1/42 | | | | 82 | |
| | 2,994 | | | Fannie Mae, Pool #AK7497 | | | 3.50 | | | | 4/1/42 | | | | 3,097 | |
| | 492 | | | Fannie Mae, Pool #AS4771 | | | 3.50 | | | | 4/1/45 | | | | 507 | |
| | 576 | | | Fannie Mae, Pool #MA1059 | | | 3.50 | | | | 5/1/32 | | | | 602 | |
| | 580 | | | Fannie Mae, Pool #AS4772 | | | 3.50 | | | | 4/1/45 | | | | 598 | |
| | 1,601 | | | Fannie Mae, Pool #AL1717 | | | 3.50 | | | | 5/1/27 | | | | 1,693 | |
| | 495 | | | Fannie Mae, Pool #AS4773 | | | 3.50 | | | | 4/1/45 | | | | 511 | |
| | 300 | | | Fannie Mae, Pool #AX5201 | | | 3.50 | | | | 10/1/29 | | | | 317 | |
| | 1,947 | | | Fannie Mae, Pool #AO2548 | | | 3.50 | | | | 4/1/42 | | | | 2,013 | |
| | 205 | | | Fannie Mae, Pool #MA1889 | | | 3.50 | | | | 5/1/34 | | | | 214 | |
| | 491 | | | Fannie Mae, Pool #AY4300 | | | 3.50 | | | | 1/1/45 | | | | 507 | |
| | 470 | | | Fannie Mae, Pool #MA2125 | | | 3.50 | | | | 12/1/44 | | | | 485 | |
| | 2,550 | | | Fannie Mae, Pool #AO8137 | | | 3.50 | | | | 8/1/42 | | | | 2,636 | |
| | 498 | | | Fannie Mae, Pool #MA2292 | | | 3.50 | | | | 6/1/45 | | | | 513 | |
| | 92 | | | Fannie Mae, Pool #AV6407 | | | 3.50 | | | | 2/1/29 | | | | 97 | |
| | 212 | | | Fannie Mae, Pool #AO4647 | | | 3.50 | | | | 6/1/42 | | | | 220 | |
| | 42 | | | Fannie Mae, Pool #AJ6181 | | | 3.50 | | | | 12/1/26 | | | | 45 | |
| | 200 | | | Fannie Mae, Pool #310139 | | | 3.50 | | | | 11/1/25 | | | | 211 | |
| | 493 | | | Fannie Mae, Pool #AY1306 | | | 3.50 | | | | 3/1/45 | | | | 509 | |
| | 840 | | | Fannie Mae, Pool #AQ0546 | | | 3.50 | | | | 11/1/42 | | | | 868 | |
| | 487 | | | Fannie Mae, Pool #AX9530 | | | 3.50 | | | | 2/1/45 | | | | 503 | |
| | 708 | | | Fannie Mae, Pool #AO3760 | | | 3.50 | | | | 5/1/42 | | | | 732 | |
See accompanying notes to portfolio of investments.
202
HC CAPITAL TRUST
The U.S. Mortgage/Asset Backed Fixed Income Securities Portfolio
Portfolio of Investments (continued) — June 30, 2015
| | | | | | | | | | | | | | | | |
Principal
Amount
(000) | | | | | Rate % | | | Maturity
Date | | | Value
(000) | |
| | | | U.S. Government Agency Mortgages (continued) | | | | | | | | | | | | |
| $ | 387 | | | Fannie Mae, Pool #AO4385 | | | 3.50 | | | | 6/1/42 | | | $ | 400 | |
| | 235 | | | Fannie Mae, Pool #AO9140 | | | 3.50 | | | | 7/1/42 | | | | 243 | |
| | 489 | | | Fannie Mae, Pool #MA1107 | | | 3.50 | | | | 7/1/32 | | | | 511 | |
| | 129 | | | Fannie Mae, Pool #AS2081 | | | 3.50 | | | | 4/1/29 | | | | 136 | |
| | 468 | | | Fannie Mae, Pool #MA1982 | | | 3.50 | | | | 8/1/34 | | | | 490 | |
| | 870 | | | Fannie Mae, Pool #AS0531 | | | 4.00 | | | | 9/1/43 | | | | 927 | |
| | 487 | | | Fannie Mae, Pool #AX0841 | | | 4.00 | | | | 9/1/44 | | | | 516 | |
| | 660 | | | Fannie Mae, Pool #AH5859 | | | 4.00 | | | | 2/1/41 | | | | 703 | |
| | 75 | | | Fannie Mae, Pool #AH3394 | | | 4.00 | | | | 1/1/41 | | | | 80 | |
| | 482 | | | Fannie Mae, Pool #AS3293 | | | 4.00 | | | | 9/1/44 | | | | 511 | |
| | 368 | | | Fannie Mae, Pool #AS3903 | | | 4.00 | | | | 11/1/44 | | | | 390 | |
| | 90 | | | Fannie Mae, Pool #AS3448 | | | 4.00 | | | | 9/1/44 | | | | 96 | |
| | 2,117 | | | Fannie Mae, Pool #AH6242 | | | 4.00 | | | | 4/1/26 | | | | 2,262 | |
| | 1,107 | | | Fannie Mae, Pool #AJ5303 | | | 4.00 | | | | 11/1/41 | | | | 1,176 | |
| | 462 | | | Fannie Mae, Pool #AS3467 | | | 4.00 | | | | 10/1/44 | | | | 490 | |
| | 389 | | | Fannie Mae, Pool #AV2340 | | | 4.00 | | | | 12/1/43 | | | | 412 | |
| | 399 | | | Fannie Mae, Pool #AW5063 | | | 4.00 | | | | 7/1/44 | | | | 423 | |
| | 2,379 | | | Fannie Mae, Pool #190405 | | | 4.00 | | | | 10/1/40 | | | | 2,530 | |
| | 687 | | | Fannie Mae, Pool #AC7328 | | | 4.00 | | | | 12/1/39 | | | | 731 | |
| | 475 | | | Fannie Mae, Pool #AY1595 | | | 4.00 | | | | 1/1/45 | | | | 504 | |
| | 985 | | | Fannie Mae, Pool #AJ7857 | | | 4.00 | | | | 12/1/41 | | | | 1,044 | |
| | 227 | | | Fannie Mae, Pool #MA0493 | | | 4.00 | | | | 8/1/30 | | | | 241 | |
| | 468 | | | Fannie Mae, Pool #MA0641 | | | 4.00 | | | | 2/1/31 | | | | 500 | |
| | 72 | | | Fannie Mae, Pool #AW9041 | | | 4.00 | | | | 8/1/44 | | | | 77 | |
| | 1,471 | | | Fannie Mae, Pool #AJ7689 | | | 4.00 | | | | 12/1/41 | | | | 1,566 | |
| | 490 | | | Fannie Mae, Pool #AS3468 | | | 4.00 | | | | 10/1/44 | | | | 520 | |
| | 478 | | | Fannie Mae, Pool #AS3216 | | | 4.00 | | | | 9/1/44 | | | | 507 | |
| | 327 | | | Fannie Mae, Pool #AT3872 | | | 4.00 | | | | 6/1/43 | | | | 347 | |
| | 409 | | | Fannie Mae, Pool #AO2959 | | | 4.00 | | | | 5/1/42 | | | | 435 | |
| | 218 | | | Fannie Mae, Pool #AU5302 | | | 4.50 | | | | 10/1/43 | | | | 236 | |
| | 95 | | | Fannie Mae, Pool #982892 | | | 4.50 | | | | 5/1/23 | | | | 102 | |
| | 187 | | | Fannie Mae, Pool #678206 | | | 4.50 | | | | 6/1/18 | | | | 194 | |
| | 50 | | | Fannie Mae, Pool #AW7048 | | | 4.50 | | | | 6/1/44 | | | | 54 | |
| | 84 | | | Fannie Mae, Pool #AH6790 | | | 4.50 | | | | 3/1/41 | | | | 91 | |
| | 1,062 | | | Fannie Mae, Pool #AH9055 | | | 4.50 | | | | 4/1/41 | | | | 1,151 | |
| | 394 | | | Fannie Mae, Pool #AL4450 | | | 4.50 | | | | 12/1/43 | | | | 427 | |
| | 343 | | | Fannie Mae, Pool #AS0861 | | | 4.50 | | | | 10/1/43 | | | | 371 | |
| | 1,107 | | | Fannie Mae, Pool #AL1107 | | | 4.50 | | | | 11/1/41 | | | | 1,200 | |
| | 223 | | | Fannie Mae, Pool #254720 | | | 4.50 | | | | 5/1/18 | | | | 232 | |
| | 425 | | | Fannie Mae, Pool #AS1638 | | | 4.50 | | | | 2/1/44 | | | | 459 | |
| | 58 | | | Fannie Mae, Pool #310112 | | | 4.50 | | | | 6/1/19 | | | | 61 | |
| | 511 | | | Fannie Mae, Pool #AI4815 | | | 4.50 | | | | 6/1/41 | | | | 554 | |
| | 2,762 | | | Fannie Mae, Pool #AH7521 | | | 4.50 | | | | 3/1/41 | | | | 2,995 | |
| | 285 | | | Fannie Mae, Pool #MA0481 | | | 4.50 | | | | 8/1/30 | | | | 310 | |
| | 517 | | | Fannie Mae, Pool #AE0217 | | | 4.50 | | | | 8/1/40 | | | | 560 | |
| | 490 | | | Fannie Mae, Pool #AD8529 | | | 4.50 | | | | 8/1/40 | | | | 531 | |
| | 471 | | | Fannie Mae, Pool #AB3192 | | | 4.50 | | | | 6/1/41 | | | | 511 | |
| | 83 | | | Fannie Mae, Pool #AB1470 | | | 4.50 | | | | 9/1/40 | | | | 90 | |
| | 219 | | | Fannie Mae, Pool #AB1389 | | | 4.50 | | | | 8/1/40 | | | | 237 | |
| | 92 | | | Fannie Mae, Pool #AA0860 | | | 4.50 | | | | 1/1/39 | | | | 100 | |
| | 5 | | | Fannie Mae, Pool #AB0388 | | | 4.50 | | | | 4/1/19 | | | | 5 | |
| | 348 | | | Fannie Mae, Pool #AA9781 | | | 4.50 | | | | 7/1/24 | | | | 373 | |
| | 95 | | | Fannie Mae, Pool #890621 | | | 5.00 | | | | 5/1/42 | | | | 105 | |
| | 1,846 | | | Fannie Mae, Pool #889117 | | | 5.00 | | | | 10/1/35 | | | | 2,048 | |
See accompanying notes to portfolio of investments.
203
HC CAPITAL TRUST
The U.S. Mortgage/Asset Backed Fixed Income Securities Portfolio
Portfolio of Investments (continued) — June 30, 2015
| | | | | | | | | | | | | | | | |
Principal
Amount
(000) | | | | | Rate % | | | Maturity
Date | | | Value
(000) | |
| | | | U.S. Government Agency Mortgages (continued) | | | | | | | | | | | | |
| $ | 73 | | | Fannie Mae, Pool #725504 | | | 5.00 | | | | 1/1/19 | | | $ | 78 | |
| | 500 | | | Fannie Mae, Pool #AS0837 | | | 5.00 | | | | 10/1/43 | | | | 552 | |
| | 100 | | | Fannie Mae, Pool #725238 | | | 5.00 | | | | 3/1/34 | | | | 111 | |
| | 253 | | | Fannie Mae, Pool #796663 | | | 5.00 | | | | 9/1/19 | | | | 265 | |
| | 1 | | | Fannie Mae, Pool #650196 | | | 5.00 | | | | 11/1/17 | | | | 1 | |
| | 235 | | | Fannie Mae, Pool #AS0575 | | | 5.00 | | | | 9/1/43 | | | | 259 | |
| | 4 | | | Fannie Mae, Pool #868986 | | | 5.00 | | | | 5/1/21 | | | | 4 | |
| | 87 | | | Fannie Mae, Pool #890603 | | | 5.00 | | | | 8/1/41 | | | | 96 | |
| | 43 | | | Fannie Mae, Pool #AL3272 | | | 5.00 | | | | 2/1/25 | | | | 47 | |
| | 1,933 | | | Fannie Mae, Pool #AH5988 | | | 5.00 | | | | 3/1/41 | | | | 2,146 | |
| | 25 | | | Fannie Mae, Pool #545900 | | | 5.50 | | | | 7/1/17 | | | | 25 | |
| | 12 | | | Fannie Mae, Pool #625938 | | | 5.50 | | | | 3/1/17 | | | | 12 | |
| | 77 | | | Fannie Mae, Pool #545400 | | | 5.50 | | | | 1/1/17 | | | | 79 | |
| | 3 | | | Fannie Mae, Pool #630942 | | | 5.50 | | | | 2/1/17 | | | | 3 | |
| | 48 | | | Fannie Mae, Pool #627241 | | | 5.50 | | | | 9/1/17 | | | | 49 | |
| | 58 | | | Fannie Mae, Pool #909662 | | | 5.50 | | | | 2/1/22 | | | | 62 | |
| | 115 | | | Fannie Mae, Pool #976945 | | | 5.50 | | | | 2/1/23 | | | | 123 | |
| | 2,827 | | | Fannie Mae, Pool #890221 | | | 5.50 | | | | 12/1/33 | | | | 3,189 | |
| | 55 | | | Fannie Mae, Pool #AL0725 | | | 5.50 | | | | 6/1/24 | | | | 58 | |
| | 5 | | | Fannie Mae, Pool #A79636 | | | 5.50 | | | | 7/1/38 | | | | 5 | |
| | 49 | | | Fannie Mae, Pool #929451 | | | 5.50 | | | | 5/1/38 | | | | 55 | |
| | 8 | | | Fannie Mae, Pool #A69671 | | | 5.50 | | | | 12/1/37 | | | | 8 | |
| | 1,787 | | | Fannie Mae, Pool #725228 | | | 6.00 | | | | 3/1/34 | | | | 2,059 | |
| | 459 | | | Fannie Mae, Pool #889984 | | | 6.50 | | | | 10/1/38 | | | | 527 | |
| | 109 | | | Fannie Mae, Pool #888596 | | | 6.50 | | | | 7/1/37 | | | | 125 | |
| | 825 | | | Fannie Mae, 15 YR TBA | | | 2.50 | | | | 7/25/30 | | | | 835 | |
| | 375 | | | Fannie Mae, 15 YR TBA | | | 3.00 | | | | 7/25/30 | | | | 389 | |
| | 50 | | | Fannie Mae, 15 YR TBA | | | 3.50 | | | | 7/25/30 | | | | 53 | |
| | 100 | | | Fannie Mae, 30 YR TBA | | | 2.50 | | | | 7/25/45 | | | | 96 | |
| | 2,400 | | | Fannie Mae, 30 YR TBA | | | 3.00 | | | | 7/25/45 | | | | 2,391 | |
| | 400 | | | Fannie Mae, 30 YR TBA | | | 3.00 | | | | 8/25/45 | | | | 397 | |
| | 500 | | | Fannie Mae, 30 YR TBA | | | 3.50 | | | | 8/25/45 | | | | 514 | |
| | 2,750 | | | Fannie Mae, 30 YR TBA | | | 3.50 | | | | 7/25/45 | | | | 2,834 | |
| | 1,325 | | | Fannie Mae, 30 YR TBA | | | 4.00 | | | | 8/25/45 | | | | 1,401 | |
| | 3,225 | | | Fannie Mae, 30 YR TBA | | | 4.00 | | | | 7/25/45 | | | | 3,418 | |
| | 200 | | | Fannie Mae, 30 YR TBA | | | 4.50 | | | | 7/25/45 | | | | 216 | |
| | 800 | | | Fannie Mae, 30 YR TBA | | | 5.00 | | | | 7/25/45 | | | | 884 | |
| | 100 | | | Freddie Mac, Pool #G18547 | | | 2.00 | | | | 3/1/30 | | | | 99 | |
| | 93 | | | Freddie Mac, Pool #J25759 | | | 2.00 | | | | 8/1/28 | | | | 93 | |
| | 380 | | | Freddie Mac, Pool #J25777 | | | 2.00 | | | | 9/1/28 | | | | 378 | |
| | 395 | | | Freddie Mac, Pool #849138 (a) | | | 2.43 | | | | 10/1/43 | | | | 403 | |
| | 469 | | | Freddie Mac, Pool #849578 (a) | | | 2.44 | | | | 12/1/44 | | | | 482 | |
| | 58 | | | Freddie Mac, Pool #G18472 | | | 2.50 | | | | 7/1/28 | | | | 59 | |
| | 389 | | | Freddie Mac, Pool #G18459 | | | 2.50 | | | | 3/1/28 | | | | 397 | |
| | 421 | | | Freddie Mac, Pool #G18470 | | | 2.50 | | | | 6/1/28 | | | | 430 | |
| | 175 | | | Freddie Mac, Pool #J25585 | | | 2.50 | | | | 9/1/28 | | | | 178 | |
| | 464 | | | Freddie Mac, Pool #J26408 | | | 2.50 | | | | 11/1/28 | | | | 472 | |
| | 401 | | | Freddie Mac, Pool #J25016 | | | 2.50 | | | | 8/1/28 | | | | 409 | |
| | 386 | | | Freddie Mac, Pool #J23440 | | | 2.50 | | | | 4/1/28 | | | | 394 | |
| | 92 | | | Freddie Mac, Pool #Q20404 | | | 2.50 | | | | 7/1/43 | | | | 88 | |
| | 401 | | | Freddie Mac, Pool #J18954 | | | 2.50 | | | | 4/1/27 | | | | 410 | |
| | 377 | | | Freddie Mac, Pool #G18533 | | | 2.50 | | | | 12/1/29 | | | | 382 | |
| | 168 | | | Freddie Mac, Pool #G18485 | | | 2.50 | | | | 10/1/28 | | | | 171 | |
| | 287 | | | Freddie Mac, Pool #J22874 | | | 2.50 | | | | 3/1/28 | | | | 293 | |
See accompanying notes to portfolio of investments.
204
HC CAPITAL TRUST
The U.S. Mortgage/Asset Backed Fixed Income Securities Portfolio
Portfolio of Investments (continued) — June 30, 2015
| | | | | | | | | | | | | | | | |
Principal
Amount
(000) | | | | | Rate % | | | Maturity
Date | | | Value
(000) | |
| | | | U.S. Government Agency Mortgages (continued) | | | | | | | | | | | | |
| $ | 438 | | | Freddie Mac, Pool #G08525 | | | 3.00 | | | | 5/1/43 | | | $ | 436 | |
| | 530 | | | Freddie Mac, Pool #Q16222 | | | 3.00 | | | | 3/1/43 | | | | 528 | |
| | 86 | | | Freddie Mac, Pool #Q18599 | | | 3.00 | | | | 6/1/43 | | | | 86 | |
| | 275 | | | Freddie Mac, Pool #Q20067 | | | 3.00 | | | | 7/1/43 | | | | 274 | |
| | 325 | | | Freddie Mac, Pool #G08648 | | | 3.00 | | | | 6/1/45 | | | | 323 | |
| | 92 | | | Freddie Mac, Pool #Q19754 | | | 3.00 | | | | 7/1/43 | | | | 92 | |
| | 21 | | | Freddie Mac, Pool #Q13086 | | | 3.00 | | | | 11/1/42 | | | | 21 | |
| | 789 | | | Freddie Mac, Pool #G08534 | | | 3.00 | | | | 6/1/43 | | | | 787 | |
| | 467 | | | Freddie Mac, Pool #G15217 | | | 3.00 | | | | 11/1/29 | | | | 484 | |
| | 445 | | | Freddie Mac, Pool #C04619 | | | 3.00 | | | | 3/1/43 | | | | 444 | |
| | 789 | | | Freddie Mac, Pool #Q21065 | | | 3.00 | | | | 8/1/43 | | | | 786 | |
| | 92 | | | Freddie Mac, Pool #G08540 | | | 3.00 | | | | 8/1/43 | | | | 91 | |
| | 1,887 | | | Freddie Mac, Pool #G08537 | | | 3.00 | | | | 7/1/43 | | | | 1,880 | |
| | 28 | | | Freddie Mac, Pool #Q18882 | | | 3.00 | | | | 5/1/43 | | | | 28 | |
| | 396 | | | Freddie Mac, Pool #C91581 | | | 3.00 | | | | 11/1/32 | | | | 403 | |
| | 428 | | | Freddie Mac, Pool #G18518 | | | 3.00 | | | | 7/1/29 | | | | 443 | |
| | 530 | | | Freddie Mac, Pool #G18514 | | | 3.00 | | | | 6/1/29 | | | | 549 | |
| | 94 | | | Freddie Mac, Pool #G18534 | | | 3.00 | | | | 12/1/29 | | | | 97 | |
| | 367 | | | Freddie Mac, Pool #G18531 | | | 3.00 | | | | 11/1/29 | | | | 381 | |
| | 264 | | | Freddie Mac, Pool #C91724 | | | 3.00 | | | | 9/1/33 | | | | 268 | |
| | 179 | | | Freddie Mac, Pool #C91707 | | | 3.00 | | | | 6/1/33 | | | | 182 | |
| | 523 | | | Freddie Mac, Pool #G08635 | | | 3.00 | | | | 4/1/45 | | | | 521 | |
| | 430 | | | Freddie Mac, Pool #G15145 | | | 3.00 | | | | 7/1/29 | | | | 446 | |
| | 200 | | | Freddie Mac, Pool #G08640 | | | 3.00 | | | | 5/1/45 | | | | 199 | |
| | 317 | | | Freddie Mac, Pool #C04422 | | | 3.00 | | | | 12/1/42 | | | | 316 | |
| | 417 | | | Freddie Mac, Pool #C04446 | | | 3.00 | | | | 1/1/43 | | | | 416 | |
| | 445 | | | Freddie Mac, Pool #J28722 | | | 3.00 | | | | 7/1/29 | | | | 461 | |
| | 173 | | | Freddie Mac, Pool #C91819 | | | 3.00 | | | | 4/1/35 | | | | 176 | |
| | 90 | | | Freddie Mac, Pool #J29932 | | | 3.00 | | | | 11/1/29 | | | | 93 | |
| | 332 | | | Freddie Mac, Pool #Q08998 | | | 3.50 | | | | 6/1/42 | | | | 342 | |
| | 455 | | | Freddie Mac, Pool #C91456 | | | 3.50 | | | | 6/1/32 | | | | 476 | |
| | 322 | | | Freddie Mac, Pool #C91403 | | | 3.50 | | | | 3/1/32 | | | | 336 | |
| | 521 | | | Freddie Mac, Pool #G08627 | | | 3.50 | | | | 2/1/45 | | | | 537 | |
| | 90 | | | Freddie Mac, Pool #C03920 | | | 3.50 | | | | 5/1/42 | | | | 93 | |
| | 465 | | | Freddie Mac, Pool #Q20860 | | | 3.50 | | | | 8/1/43 | | | | 479 | |
| | 449 | | | Freddie Mac, Pool #J26144 | | | 3.50 | | | | 10/1/23 | | | | 473 | |
| | 409 | | | Freddie Mac, Pool #J15105 | | | 3.50 | | | | 4/1/26 | | | | 431 | |
| | 476 | | | Freddie Mac, Pool #J14232 | | | 3.50 | | | | 1/1/21 | | | | 502 | |
| | 174 | | | Freddie Mac, Pool #G08605 | | | 3.50 | | | | 9/1/44 | | | | 179 | |
| | 2,880 | | | Freddie Mac, Pool #G08495 | | | 3.50 | | | | 6/1/42 | | | | 2,970 | |
| | 801 | | | Freddie Mac, Pool #G08562 | | | 3.50 | | | | 1/1/44 | | | | 825 | |
| | 174 | | | Freddie Mac, Pool #G08599 | | | 3.50 | | | | 8/1/44 | | | | 179 | |
| | 823 | | | Freddie Mac, Pool #G08554 | | | 3.50 | | | | 10/1/43 | | | | 847 | |
| | 898 | | | Freddie Mac, Pool #G08641 | | | 3.50 | | | | 5/1/45 | | | | 925 | |
| | 433 | | | Freddie Mac, Pool #Q09896 | | | 3.50 | | | | 8/1/42 | | | | 447 | |
| | 341 | | | Freddie Mac, Pool #Q08903 | | | 3.50 | | | | 6/1/42 | | | | 352 | |
| | 238 | | | Freddie Mac, Pool #Q06749 | | | 3.50 | | | | 3/1/42 | | | | 246 | |
| | 895 | | | Freddie Mac, Pool #G08636 | | | 3.50 | | | | 4/1/45 | | | | 921 | |
| | 276 | | | Freddie Mac, Pool #C91765 | | | 4.00 | | | | 5/1/34 | | | | 295 | |
| | 467 | | | Freddie Mac, Pool #J11263 | | | 4.00 | | | | 11/1/19 | | | | 489 | |
| | 470 | | | Freddie Mac, Pool #G08618 | | | 4.00 | | | | 12/1/44 | | | | 498 | |
| | 68 | | | Freddie Mac, Pool #J12435 | | | 4.00 | | | | 6/1/25 | | | | 72 | |
| | 164 | | | Freddie Mac, Pool #C91738 | | | 4.00 | | | | 11/1/33 | | | | 175 | |
| | 215 | | | Freddie Mac, Pool #G08601 | | | 4.00 | | | | 8/1/44 | | | | 228 | |
See accompanying notes to portfolio of investments.
205
HC CAPITAL TRUST
The U.S. Mortgage/Asset Backed Fixed Income Securities Portfolio
Portfolio of Investments (continued) — June 30, 2015
| | | | | | | | | | | | | | | | |
Principal
Amount
(000) | | | | | Rate % | | | Maturity
Date | | | Value
(000) | |
| | | | U.S. Government Agency Mortgages (continued) | | | | | | | | | | | | |
| $ | 479 | | | Freddie Mac, Pool #G08595 | | | 4.00 | | | | 7/1/44 | | | $ | 507 | |
| | 471 | | | Freddie Mac, Pool #C09070 | | | 4.00 | | | | 12/1/44 | | | | 499 | |
| | 386 | | | Freddie Mac, Pool #G08567 | | | 4.00 | | | | 1/1/44 | | | | 408 | |
| | 3,804 | | | Freddie Mac, Pool #A96286 | | | 4.00 | | | | 1/1/41 | | | | 4,037 | |
| | 53 | | | Freddie Mac, Pool #G08633 | | | 4.00 | | | | 3/1/45 | | | | 56 | |
| | 2 | | | Freddie Mac, Pool #G14786 | | | 4.00 | | | | 4/1/19 | | | | 3 | |
| | 436 | | | Freddie Mac, Pool #Q24955 | | | 4.00 | | | | 2/1/44 | | | | 463 | |
| | 462 | | | Freddie Mac, Pool #Q27594 | | | 4.00 | | | | 8/1/44 | | | | 489 | |
| | 294 | | | Freddie Mac, Pool #G14453 | | | 4.00 | | | | 6/1/26 | | | | 311 | |
| | 360 | | | Freddie Mac, Pool #G08459 | | | 4.00 | | | | 9/1/41 | | | | 381 | |
| | 488 | | | Freddie Mac, Pool #V81430 | | | 4.00 | | | | 11/1/44 | | | | 516 | |
| | 130 | | | Freddie Mac, Pool #G08483 | | | 4.00 | | | | 3/1/42 | | | | 138 | |
| | 4,270 | | | Freddie Mac, Pool #A97692 | | | 4.50 | | | | 3/1/41 | | | | 4,616 | |
| | 189 | | | Freddie Mac, Pool #J09503 | | | 4.50 | | | | 4/1/24 | | | | 202 | |
| | 198 | | | Freddie Mac, Pool #Q25432 | | | 4.50 | | | | 3/1/44 | | | | 215 | |
| | 442 | | | Freddie Mac, Pool #A97495 | | | 4.50 | | | | 3/1/41 | | | | 478 | |
| | 64 | | | Freddie Mac, Pool #C09059 | | | 4.50 | | | | 3/1/44 | | | | 69 | |
| | 300 | | | Freddie Mac, Pool #A90437 | | | 4.50 | | | | 1/1/40 | | | | 324 | |
| | 96 | | | Freddie Mac, Pool #Q22671 | | | 4.50 | | | | 11/1/43 | | | | 103 | |
| | 117 | | | Freddie Mac, Pool #E02862 | | | 4.50 | | | | 3/1/26 | | | | 126 | |
| | 91 | | | Freddie Mac, Pool #J07849 | | | 4.50 | | | | 5/1/23 | | | | 97 | |
| | 158 | | | Freddie Mac, Pool #J09311 | | | 4.50 | | | | 2/1/24 | | | | 168 | |
| | 46 | | | Freddie Mac, Pool #357316 | | | 4.50 | | | | 12/1/17 | | | | 48 | |
| | 32 | | | Freddie Mac, Pool #1G2883 (a) | | | 4.86 | | | | 6/1/38 | | | | 34 | |
| | 100 | | | Freddie Mac, Pool #G05205 | | | 5.00 | | | | 1/1/39 | | | | 110 | |
| | 171 | | | Freddie Mac, Pool #G07068 | | | 5.00 | | | | 7/1/41 | | | | 188 | |
| | 1,590 | | | Freddie Mac, Pool #G04913 | | | 5.00 | | | | 3/1/38 | | | | 1,751 | |
| | 500 | | | Freddie Mac, Pool #Q00763 | | | 5.00 | | | | 5/1/41 | | | | 551 | |
| | 87 | | | Freddie Mac, Pool #C90845 | | | 5.00 | | | | 8/1/24 | | | | 96 | |
| | 226 | | | Freddie Mac, Pool #G13255 | | | 5.00 | | | | 7/1/23 | | | | 245 | |
| | 1,358 | | | Freddie Mac, Pool #C01598 | | | 5.00 | | | | 8/1/33 | | | | 1,514 | |
| | 8 | | | Freddie Mac, Pool #G06091 | | | 5.50 | | | | 5/1/40 | | | | 9 | |
| | 205 | | | Freddie Mac, Pool #G06031 | | | 5.50 | | | | 3/1/40 | | | | 229 | |
| | 1,540 | | | Freddie Mac, Pool #G01665 | | | 5.50 | | | | 3/1/34 | | | | 1,734 | |
| | 167 | | | Freddie Mac, Pool #G03551 | | | 6.00 | | | | 11/1/37 | | | | 189 | |
| | 822 | | | Freddie Mac, Pool #G02794 | | | 6.00 | | | | 5/1/37 | | | | 934 | |
| | 96 | | | Freddie Mac, Pool #G05709 | | | 6.00 | | | | 6/1/38 | | | | 109 | |
| | 76 | | | Freddie Mac, Pool #A62706 | | | 6.00 | | | | 6/1/37 | | | | 85 | |
| | 725 | | | Freddie Mac, Gold 15 YR TBA | | | 2.50 | | | | 7/15/30 | | | | 733 | |
| | 100 | | | Freddie Mac, Gold 15 YR TBA | | | 2.50 | | | | 8/15/30 | | | | 101 | |
| | 250 | | | Freddie Mac, Gold 15 YR TBA | | | 3.00 | | | | 8/15/30 | | | | 258 | |
| | 350 | | | Freddie Mac, Gold 15 YR TBA | | | 3.00 | | | | 7/15/30 | | | | 362 | |
| | 100 | | | Freddie Mac, Gold 30 YR TBA | | | 2.50 | | | | 7/15/45 | | | | 95 | |
| | 250 | | | Freddie Mac, Gold 30 YR TBA | | | 3.00 | | | | 8/15/45 | | | | 248 | |
| | 1,350 | | | Freddie Mac, Gold 30 YR TBA | | | 3.00 | | | | 7/15/45 | | | | 1,342 | |
| | 100 | | | Freddie Mac, Gold 30 YR TBA | | | 3.50 | | | | 7/15/45 | | | | 105 | |
| | 2,325 | | | Freddie Mac, Gold 30 YR TBA | | | 3.50 | | | | 7/15/45 | | | | 2,392 | |
| | 500 | | | Freddie Mac, Gold 30 YR TBA | | | 3.50 | | | | 8/15/45 | | | | 513 | |
| | 2,125 | | | Freddie Mac, Gold 30 YR TBA | | | 4.00 | | | | 7/15/45 | | | | 2,247 | |
| | 300 | | | Freddie Mac, Gold 30 YR TBA | | | 4.50 | | | | 7/15/45 | | | | 324 | |
| | 171 | | | Government National Mortgage Association, Pool #MA0712 (a) | | | 2.50 | | | | 1/20/43 | | | | 176 | |
| | 397 | | | Government National Mortgage Association, Pool #MA2767 (a) | | | 2.50 | | | | 4/20/45 | | | | 407 | |
| | 180 | | | Government National Mortgage Association, Pool #MA1283 | | | 2.50 | | | | 9/20/43 | | | | 174 | |
| | 83 | | | Government National Mortgage Association, Pool #MA0908 | | | 2.50 | | | | 4/20/28 | | | | 85 | |
See accompanying notes to portfolio of investments.
206
HC CAPITAL TRUST
The U.S. Mortgage/Asset Backed Fixed Income Securities Portfolio
Portfolio of Investments (continued) — June 30, 2015
| | | | | | | | | | | | | | | | |
Principal
Amount
(000) | | | | | Rate % | | | Maturity
Date | | | Value
(000) | |
| | | | U.S. Government Agency Mortgages (continued) | | | | | | | | | | | | |
| $ | 148 | | | Government National Mortgage Association, Pool #MA0601 | | | 2.50 | | | | 12/20/27 | | | $ | 152 | |
| | 81 | | | Government National Mortgage Association, Pool #MA1133 | | | 2.50 | | | | 7/20/28 | | | | 83 | |
| | 94 | | | Government National Mortgage Association, Pool #776954 | | | 2.50 | | | | 11/15/42 | | | | 90 | |
| | 153 | | | Government National Mortgage Association, Pool #AA8341 | | | 2.50 | | | | 2/15/28 | | | | 157 | |
| | 431 | | | Government National Mortgage Association, Pool #AA6149 | | | 3.00 | | | | 3/20/43 | | | | 436 | |
| | 265 | | | Government National Mortgage Association, Pool #AA2654 | | | 3.00 | | | | 6/15/43 | | | | 269 | |
| | 439 | | | Government National Mortgage Association, Pool #MA1374 | | | 3.00 | | | | 10/20/43 | | | | 446 | |
| | 2,669 | | | Government National Mortgage Association, Pool #MA0624 | | | 3.00 | | | | 12/20/42 | | | | 2,712 | |
| | 908 | | | Government National Mortgage Association, Pool #MA2147 | | | 3.00 | | | | 8/20/44 | | | | 923 | |
| | 481 | | | Government National Mortgage Association, Pool #MA2444 | | | 3.00 | | | | 12/20/44 | | | | 487 | |
| | 84 | | | Government National Mortgage Association, Pool #AA2934 | | | 3.00 | | | | 7/15/42 | | | | 85 | |
| | 425 | | | Government National Mortgage Association, Pool #MA0461 | | | 3.00 | | | | 10/20/42 | | | | 431 | |
| | 340 | | | Government National Mortgage Association, Pool #779084 | | | 3.00 | | | | 4/15/42 | | | | 345 | |
| | 374 | | | Government National Mortgage Association, Pool #AD8433 | | | 3.00 | | | | 7/15/43 | | | | 379 | |
| | 449 | | | Government National Mortgage Association, Pool #AG0440 | | | 3.00 | | | | 8/15/43 | | | | 455 | |
| | 265 | | | Government National Mortgage Association, Pool #MA0205 | | | 3.00 | | | | 7/20/27 | | | | 277 | |
| | 399 | | | Government National Mortgage Association, Pool #MA2825 | | | 3.00 | | | | 5/20/45 | | | | 404 | |
| | 158 | | | Government National Mortgage Association, Pool #MA1265 | | | 3.00 | | | | 9/20/28 | | | | 165 | |
| | 556 | | | Government National Mortgage Association, Pool #MA0391 | | | 3.00 | | | | 9/20/42 | | | | 565 | |
| | 481 | | | Government National Mortgage Association, Pool #MA0153 | | | 3.00 | | | | 6/20/42 | | | | 488 | |
| | 162 | | | Government National Mortgage Association, Pool #MA0851 | | | 3.00 | | | | 3/20/43 | | | | 164 | |
| | 502 | | | Government National Mortgage Association, Pool #MA0022 | | | 3.50 | | | | 4/20/42 | | | | 522 | |
| | 91 | | | Government National Mortgage Association, Pool #796271 | | | 3.50 | | | | 7/15/42 | | | | 94 | |
| | 42 | | | Government National Mortgage Association, Pool #MA1266 | | | 3.50 | | | | 9/20/28 | | | | 45 | |
| | 722 | | | Government National Mortgage Association, Pool #MA0852 | | | 3.50 | | | | 3/20/43 | | | | 752 | |
| | 631 | | | Government National Mortgage Association, Pool #MA0088 | | | 3.50 | | | | 5/20/42 | | | | 656 | |
| | 1,999 | | | Government National Mortgage Association, Pool #MA0220 | | | 3.50 | | | | 7/20/42 | | | | 2,081 | |
| | 330 | | | Government National Mortgage Association, Pool #AC3938 | | | 3.50 | | | | 1/15/43 | | | | 344 | |
| | 239 | | | Government National Mortgage Association, Pool #778157 | | | 3.50 | | | | 3/15/42 | | | | 249 | |
| | 785 | | | Government National Mortgage Association, Pool #MA1090 | | | 3.50 | | | | 6/20/43 | | | | 817 | |
| | 745 | | | Government National Mortgage Association, Pool #MA0934 | | | 3.50 | | | | 4/20/43 | | | | 775 | |
| | 242 | | | Government National Mortgage Association, Pool #738602 | | | 3.50 | | | | 8/15/26 | | | | 257 | |
| | 98 | | | Government National Mortgage Association, Pool #740798 | | | 3.50 | | | | 1/15/42 | | | | 102 | |
| | 1,208 | | | Government National Mortgage Association, Pool #MA2073 | | | 3.50 | | | | 7/20/44 | | | | 1,256 | |
| | 387 | | | Government National Mortgage Association, Pool #MA1838 | | | 3.50 | | | | 4/20/44 | | | | 403 | |
| | 369 | | | Government National Mortgage Association, Pool #AD2954 | | | 3.50 | | | | 7/15/44 | | | | 383 | |
| | 241 | | | Government National Mortgage Association, Pool #AD2416 | | | 3.50 | | | | 5/15/43 | | | | 250 | |
| | 315 | | | Government National Mortgage Association, Pool #MA1919 | | | 3.50 | | | | 5/20/44 | | | | 327 | |
| | 70 | | | Government National Mortgage Association, Pool #MA1574 | | | 3.50 | | | | 1/20/29 | | | | 73 | |
| | 1,651 | | | Government National Mortgage Association, Pool #MA2148 | | | 3.50 | | | | 8/20/44 | | | | 1,717 | |
| | 832 | | | Government National Mortgage Association, Pool #MA0462 | | | 3.50 | | | | 10/20/42 | | | | 866 | |
| | 389 | | | Government National Mortgage Association, Pool #MA2371 | | | 3.50 | | | | 11/20/44 | | | | 406 | |
| | 469 | | | Government National Mortgage Association, Pool #MA2445 | | | 3.50 | | | | 12/20/44 | | | | 489 | |
| | 402 | | | Government National Mortgage Association, Pool #MA0699 | | | 3.50 | | | | 1/20/43 | | | | 418 | |
| | 250 | | | Government National Mortgage Association, Pool #MA2372 | | | 4.00 | | | | 11/20/44 | | | | 265 | |
| | 618 | | | Government National Mortgage Association, Pool #MA2304 | | | 4.00 | | | | 10/20/44 | | | | 655 | |
| | 749 | | | Government National Mortgage Association, Pool #MA1996 | | | 4.00 | | | | 6/20/44 | | | | 795 | |
| | 730 | | | Government National Mortgage Association, Pool #MA1839 | | | 4.00 | | | | 4/20/44 | | | | 774 | |
| | 73 | | | Government National Mortgage Association, Pool #779401 | | | 4.00 | | | | 6/15/42 | | | | 78 | |
| | 153 | | | Government National Mortgage Association, Pool #MA0155 | | | 4.00 | | | | 6/20/42 | | | | 163 | |
| | 284 | | | Government National Mortgage Association, Pool #AD5627 | | | 4.00 | | | | 4/15/43 | | | | 303 | |
| | 77 | | | Government National Mortgage Association, Pool #766495 | | | 4.00 | | | | 10/15/41 | | | | 82 | |
| | 333 | | | Government National Mortgage Association, Pool #MA0319 | | | 4.00 | | | | 8/20/42 | | | | 354 | |
| | 480 | | | Government National Mortgage Association, Pool #MA2522 | | | 4.00 | | | | 1/20/45 | | | | 508 | |
See accompanying notes to portfolio of investments.
207
HC CAPITAL TRUST
The U.S. Mortgage/Asset Backed Fixed Income Securities Portfolio
Portfolio of Investments (continued) — June 30, 2015
| | | | | | | | | | | | | | | | |
Principal
Amount
(000) | | | | | Rate % | | | Maturity
Date | | | Value
(000) | |
| | | | U.S. Government Agency Mortgages (continued) | | | | | | | | | | | | |
| $ | 79 | | | Government National Mortgage Association, Pool #004922 | | | 4.00 | | | | 1/20/41 | | | $ | 85 | |
| | 635 | | | Government National Mortgage Association, Pool #MA1761 | | | 4.00 | | | | 3/20/44 | | | | 673 | |
| | 724 | | | Government National Mortgage Association, Pool #MA2074 | | | 4.00 | | | | 7/20/44 | | | | 768 | |
| | 1,586 | | | Government National Mortgage Association, Pool #005139 | | | 4.00 | | | | 8/20/41 | | | | 1,698 | |
| | 339 | | | Government National Mortgage Association, Pool #713876 | | | 4.00 | | | | 8/15/39 | | | | 362 | |
| | 274 | | | Government National Mortgage Association, Pool #753254 | | | 4.00 | | | | 9/15/43 | | | | 292 | |
| | 376 | | | Government National Mortgage Association, Pool #MA1678 | | | 4.00 | | | | 2/20/44 | | | | 399 | |
| | 267 | | | Government National Mortgage Association, Pool #MA1286 | | | 4.00 | | | | 9/20/43 | | | | 283 | |
| | 498 | | | Government National Mortgage Association, Pool #MA1376 | | | 4.00 | | | | 10/20/43 | | | | 528 | |
| | 194 | | | Government National Mortgage Association, Pool #738710 | | | 4.00 | | | | 9/15/41 | | | | 207 | |
| | 505 | | | Government National Mortgage Association, Pool #MA1449 | | | 4.00 | | | | 11/20/43 | | | | 536 | |
| | 177 | | | Government National Mortgage Association, Pool #AB1483 | | | 4.00 | | | | 8/15/42 | | | | 189 | |
| | 200 | | | Government National Mortgage Association, Pool #740068 | | | 4.00 | | | | 9/15/40 | | | | 213 | |
| | 408 | | | Government National Mortgage Association, Pool #MA2224 | | | 4.00 | | | | 9/20/44 | | | | 433 | |
| | 745 | | | Government National Mortgage Association, Pool #MA2149 | | | 4.00 | | | | 8/20/44 | | | | 791 | |
| | 314 | | | Government National Mortgage Association, Pool #MA0701 | | | 4.50 | | | | 1/20/43 | | | | 343 | |
| | 498 | | | Government National Mortgage Association, Pool #MA1762 | | | 4.50 | | | | 3/20/44 | | | | 537 | |
| | 119 | | | Government National Mortgage Association, Pool #MA1092 | | | 4.50 | | | | 6/20/43 | | | | 130 | |
| | 2,859 | | | Government National Mortgage Association, Pool #004801 | | | 4.50 | | | | 9/20/40 | | | | 3,120 | |
| | 383 | | | Government National Mortgage Association, Pool #005260 | | | 4.50 | | | | 12/20/41 | | | | 418 | |
| | 500 | | | Government National Mortgage Association, Pool #MA2756 | | | 4.50 | | | | 4/20/45 | | | | 540 | |
| | 88 | | | Government National Mortgage Association, Pool #738793 | | | 4.50 | | | | 9/15/41 | | | | 96 | |
| | 1,495 | | | Government National Mortgage Association, Pool #721760 | | | 4.50 | | | | 8/15/40 | | | | 1,642 | |
| | 1,013 | | | Government National Mortgage Association, Pool #717148 | | | 4.50 | | | | 5/15/39 | | | | 1,106 | |
| | 76 | | | Government National Mortgage Association, Pool #782468 | | | 5.00 | | | | 11/15/38 | | | | 84 | |
| | 250 | | | Government National Mortgage Association, Pool #604285 | | | 5.00 | | | | 5/15/33 | | | | 278 | |
| | 220 | | | Government National Mortgage Association, Pool #712690 | | | 5.00 | | | | 4/15/39 | | | | 245 | |
| | 450 | | | Government National Mortgage Association, Pool #782523 | | | 5.00 | | | | 11/15/35 | | | | 503 | |
| | 2 | | | Government National Mortgage Association, Pool #673496 | | | 5.00 | | | | 4/15/38 | | | | 3 | |
| | 400 | | | Government National Mortgage Association, Pool #MA2076 | | | 5.00 | | | | 7/20/44 | | | | 436 | |
| | 46 | | | Government National Mortgage Association, Pool #MA0465 | | | 5.00 | | | | 10/20/42 | | | | 51 | |
| | 2,266 | | | Government National Mortgage Association, Pool #004559 | | | 5.00 | | | | 10/20/39 | | | | 2,524 | |
| | 105 | | | Government National Mortgage Association, Pool #675179 | | | 5.00 | | | | 3/15/38 | | | | 116 | |
| | 358 | | | Government National Mortgage Association, Pool #694531 | | | 5.00 | | | | 11/15/38 | | | | 397 | |
| | 340 | | | Government National Mortgage Association, Pool #783284 | | | 5.50 | | | | 6/20/40 | | | | 381 | |
| | 518 | | | Government National Mortgage Association, Pool #510835 | | | 5.50 | | | | 2/15/35 | | | | 592 | |
| | 112 | | | Government National Mortgage Association, Pool #658181 | | | 5.50 | | | | 11/15/36 | | | | 127 | |
| | 56 | | | Government National Mortgage Association, Pool #MA0538 | | | 5.50 | | | | 11/20/42 | | | | 64 | |
| | 88 | | | Government National Mortgage Association, Pool #MA0466 | | | 5.50 | | | | 10/20/42 | | | | 99 | |
| | 223 | | | Government National Mortgage Association, Pool #004245 | | | 6.00 | | | | 9/20/38 | | | | 252 | |
| | 401 | | | Government National Mortgage Association, Pool #781959 | | | 6.00 | | | | 7/15/35 | | | | 469 | |
| | 196 | | | Government National Mortgage Association, Pool #004222 | | | 6.00 | | | | 8/20/38 | | | | 222 | |
| | 49 | | | Government National Mortgage Association, Pool #699237 | | | 6.50 | | | | 9/15/38 | | | | 56 | |
| | 2 | | | Government National Mortgage Association, Pool #690789 | | | 6.50 | | | | 5/15/38 | | | | 2 | |
| | 19 | | | Government National Mortgage Association, Pool #695773 | | | 6.50 | | | | 11/15/38 | | | | 22 | |
| | 25 | | | Government National Mortgage Association, 30 YR TBA | | | 2.50 | | | | 7/15/45 | | | | 24 | |
| | 25 | | | Government National Mortgage Association, 30 YR TBA | | | 2.50 | | | | 7/20/45 | | | | 24 | |
| | 350 | | | Government National Mortgage Association, 30 YR TBA | | | 3.00 | | | | 8/20/45 | | | | 352 | |
| | 2,225 | | | Government National Mortgage Association, 30 YR TBA | | | 3.00 | | | | 7/20/45 | | | | 2,246 | |
| | 150 | | | Government National Mortgage Association, 30 YR TBA | | | 3.00 | | | | 7/15/45 | | | | 151 | |
| | 675 | | | Government National Mortgage Association, 30 YR TBA | | | 3.50 | | | | 8/20/45 | | | | 699 | |
| | 3,900 | | | Government National Mortgage Association, 30 YR TBA | | | 3.50 | | | | 7/20/45 | | | | 4,049 | |
| | 325 | | | Government National Mortgage Association, 30 YR TBA | | | 3.50 | | | | 7/15/45 | | | | 337 | |
| | 450 | | | Government National Mortgage Association, 30 YR TBA | | | 4.00 | | | | 7/15/45 | | | | 479 | |
See accompanying notes to portfolio of investments.
208
HC CAPITAL TRUST
The U.S. Mortgage/Asset Backed Fixed Income Securities Portfolio
Portfolio of Investments (continued) — June 30, 2015
| | | | | | | | | | | | | | | | |
Shares or
Principal
Amount
(000) | | | | | Rate % | | | Maturity
Date | | | Value
(000) | |
| | | | U.S. Government Agency Mortgages (continued) | | | | | | | | | | | | |
| $ | 300 | | | Government National Mortgage Association, 30 YR TBA | | | 4.00 | | | | 7/20/45 | | | $ | 318 | |
| | 400 | | | Government National Mortgage Association, 30 YR TBA | | | 4.50 | | | | 7/15/45 | | | | 434 | |
| | 150 | | | Government National Mortgage Association, 30 YR TBA | | | 4.50 | | | | 7/20/45 | | | | 162 | |
| | 400 | | | Government National Mortgage Association, 30 YR TBA | | | 5.00 | | | | 7/15/45 | | | | 443 | |
| | | | | | | | | | | | | | | | |
| | | | Total U.S. Government Agency Mortgages | | | | | | | | | | | 222,173 | |
| | | | | | | | | | | | | | | | |
| | | | Yankee Dollars — 0.26% | | | | | | | | | | | | |
| | 100 | | | Bank of Nova Scotia (Banks) | | | 1.85 | | | | 4/14/20 | | | | 99 | |
| | 100 | | | Bank of Nova Scotia (Banks) | | | 2.13 | | | | 9/11/19 | | | | 101 | |
| | 200 | | | Royal Bank of Canada (Banks) | | | 1.20 | | | | 9/19/17 | | | | 199 | |
| | 150 | | | Royal Bank of Canada (Banks) | | | 1.88 | | | | 2/5/20 | | | | 149 | |
| | 100 | | | Royal Bank of Canada (Banks) | | | 2.20 | | | | 9/23/19 | | | | 101 | |
| | | | | | | | | | | | | | | | |
| | | | Total Yankee Dollars | | | | | | | | | | | 649 | |
| | | | | | | | | | | | | | | | |
| | | | Mutual Funds — 18.64% | | | | | | | | | | | | |
| | 12,875,444 | | | Federated U.S. Treasury Cash Reserve Fund, Institutional Shares (b) | | | 0.00 | | | | | | | | 12,875 | |
| | 34,097,734 | | | SSgA Treasury Money Market Fund (b) | | | 0.00 | | | | | | | | 34,097 | |
| | | | | | | | | | | | | | | | |
| | | | Total Mutual Funds | | | | | | | | | | | 46,972 | |
| | | | | | | | | | | | | | | | |
| | | | Total Investments Before TBA Sale Commitments
(cost $287,386) — 114.79% | | | | | | | | | | | 289,323 | |
| | | | TBA Sale Commitments (c) — (0.70)% | | | | | | | | | | | | |
| $ | (300 | ) | | Fannie Mae, 15 YR TBA | | | 5.50 | | | | 7/25/30 | | | | (315 | ) |
| | (1,000 | ) | | Fannie Mae, 15 YR TBA | | | 4.00 | | | | 7/25/30 | | | | (1,049 | ) |
| | (200 | ) | | Freddie Mac, Gold 15 YR TBA | | | 4.50 | | | | 7/15/30 | | | | (208 | ) |
| | (100 | ) | | Freddie Mac, Gold 15 YR TBA | | | 4.00 | | | | 7/15/30 | | | | (105 | ) |
| | (100 | ) | | Government National Mortgage Association, 30 YR TBA | | | 5.50 | | | | 7/20/45 | | | | (111 | ) |
| | | | | | | | | | | | | | | | |
| | | | Total TBA Sale Commitments | | | | | | | | | | | (1,788 | ) |
| | | | | | | | | | | | | | | | |
| | | | Liabilities in excess of other assets — (14.09)% | | | | | | | | | | | (35,507 | ) |
| | | | | | | | | | | | | | | | |
| | | | Net Assets — 100.00% | | | | | | | | | | $ | 252,028 | |
| | | | | | | | | | | | | | | | |
| (a) | Variable Rate Security. The rate reflected is the rate in effect on June 30, 2015. |
| (b) | The rate disclosed is the rate in effect on June 30, 2015. |
| (c) | Represents a “to be announced” transaction. The Portfolio has committed to sell securities for which all specific information is not available at this time. (See Note 2 in the Notes to Financial Statements.) |
TBA — To Be Announced purchase or sale commitment. Security is subject to delayed delivery.
See accompanying notes to portfolio of investments.
209
HC CAPITAL TRUST
The U.S. Mortgage/Asset Backed Fixed Income Securities Portfolio
Portfolio of Investments (concluded) — June 30, 2015
The following table reflects the percentage of total net assets of the Portfolio attributable to each Specialist Manager, see Note 3 in the Notes to Financial Statements.
| | | | | | | | | | | | |
The U.S. Mortgage/Asset Backed Fixed Income Securities Portfolio | | Mellon Capital
Management
Corporation | | | HC Capital
Solutions | | | Total | |
Asset Backed Securities | | | 1.72 | % | | | — | | | | 1.72 | % |
Collateralized Mortgage Obligations | | | 6.03 | % | | | — | | | | 6.03 | % |
U.S. Government Agency Mortgages | | | 88.14 | % | | | — | | | | 88.14 | % |
Yankee Dollars | | | 0.26 | % | | | — | | | | 0.26 | % |
Mutual Funds | | | 13.54 | % | | | 5.10 | % | | | 18.64 | % |
TBA Sale Commitments | | | -0.70 | % | | | — | | | | -0.70 | % |
Other Assets (Liabilities) | | | -14.09 | % | | | — | | | | -14.09 | % |
| | | | | | | | | | | | |
Total Net Assets | | | 94.90 | % | | | 5.10 | % | | | 100.00 | % |
| | | | | | | | | | | | |
See accompanying notes to portfolio of investments.
210
HC CAPITAL TRUST
The Short-Term Municipal Bond Portfolio
Portfolio of Investments — June 30, 2015
| | | | | | | | | | | | | | | | |
Principal
Amount
(000) | | | | | Rate % | | | Maturity
Date | | | Value
(000) | |
| | | | Municipal Bonds — 98.74% | | | | | | | | | | | | |
| | | | Alabama — 2.51% | | | | | | | | | | | | |
| $ | 525 | | | Madison County Alabama Board of Education Capital Outlay, Tax Anticipation Warrants Revenue | | | 2.00 | | | | 9/1/15 | | | $ | 526 | |
| | | | | | | | | | | | | | | | |
| | | | Arizona — 5.74% | | | | | | | | | | | | |
| | 650 | | | Arizona State Transportation Board Grant Anticipation Notes Revenue, Series A | | | 5.00 | | | | 7/1/17 | | | | 704 | |
| | 460 | | | Gilbert Arizona Public Facilities Municipal Property Corp. Revenue | | | 5.00 | | | | 7/1/17 | | | | 498 | |
| | | | | | | | | | | | | | | | |
| | | | | | | | | | | | | | | 1,202 | |
| | | | | | | | | | | | | | | | |
| | | | Arkansas — 1.97% | | | | | | | | | | | | |
| | 400 | | | Rogers Arkansas Sales & USE Tax Revenue | | | 3.00 | | | | 11/1/16 | | | | 412 | |
| | | | | | | | | | | | | | | | |
| | | | Colorado — 2.42% | | | | | | | | | | | | |
| | 500 | | | Colorado Springs Colorado Utilities Revenue, Series C-1 | | | 4.00 | | | | 11/15/15 | | | | 507 | |
| | | | | | | | | | | | | | | | |
| | | | Delaware — 2.73% | | | | | | | | | | | | |
| | 570 | | | New Castle County Delaware, GO, Series A | | | 3.00 | | | | 7/15/15 | | | | 571 | |
| | | | | | | | | | | | | | | | |
| | | | Florida — 2.03% | | | | | | | | | | | | |
| | 255 | | | Port St. Lucie Florida Utility Revenue (NATL-RE) | | | 5.00 | | | | 9/1/16 | | | | 268 | |
| | 150 | | | Tallahassee Florida Energy System Revenue | | | 5.00 | | | | 10/1/16 | | | | 158 | |
| | | | | | | | | | | | | | | | |
| | | | | | | | | | | | | | | 426 | |
| | | | | | | | | | | | | | | | |
| | | | Illinois — 9.89% | | | | | | | | | | | | |
| | 500 | | | Kane County Illinois Forest Preserve District, GO | | | 4.00 | | | | 12/15/15 | | | | 508 | |
| | 425 | | | Mchenry County Illinois Conservation District, GO | | | 5.00 | | | | 2/1/20 | | | | 489 | |
| | 475 | | | Northbrook Illinois, GO, Series A | | | 5.00 | | | | 12/1/19 | | | | 548 | |
| | 500 | | | Regional Transportation Authority Revenue (AGM/GO of Authority) | | | 5.75 | | | | 6/1/16 | | | | 523 | |
| | | | | | | | | | | | | | | | |
| | | | | | | | | | | | | | | 2,068 | |
| | | | | | | | | | | | | | | | |
| | | | Iowa — 5.11% | | | | | | | | | | | | |
| | 450 | | | Waukee Iowa Community School District, GO, Series C | | | 5.00 | | | | 6/1/19 | | | | 512 | |
| | 500 | | | West Des Moines Iowa, GO, Series B | | | 5.00 | | | | 6/1/18 | | | | 557 | |
| | | | | | | | | | | | | | | | |
| | | | | | | | | | | | | | | 1,069 | |
| | | | | | | | | | | | | | | | |
| | | | Maryland — 2.50% | | | | | | | | | | | | |
| | 450 | | | Maryland State, GO, Series A | | | 5.00 | | | | 3/1/20 | | | | 524 | |
| | | | | | | | | | | | | | | | |
| | | | Massachusetts — 2.57% | | | | | | | | | | | | |
| | 525 | | | Ashburnham Massachusetts, GO | | | 5.00 | | | | 1/15/16 | | | | 538 | |
| | | | | | | | | | | | | | | | |
| | | | Michigan — 10.18% | | | | | | | | | | | | |
| | 1,000 | | | Michigan State, GO, Series A | | | 4.00 | | | | 11/1/16 | | | | 1,045 | |
| | 500 | | | Michigan State Trunk Line Revenue (NATL-RE/FGIC) | | | 5.25 | | | | 11/1/15 | | | | 508 | |
| | 500 | | | Oakland University Michigan Revenue | | | 5.00 | | | | 3/1/21 | | | | 580 | |
| | | | | | | | | | | | | | | | |
| | | | | | | | | | | | | | | 2,133 | |
| | | | | | | | | | | | | | | | |
| | | | Nevada — 2.64% | | | | | | | | | | | | |
| | 535 | | | Las Vegas Valley Nevada Water District, GO, Series B | | | 4.00 | | | | 6/1/16 | | | | 552 | |
| | | | | | | | | | | | | | | | |
| | | | New Jersey — 0.69% | | | | | | | | | | | | |
| | 130 | | | South Brunswick Township New Jersey, GO | | | 4.00 | | | | 9/1/20 | | | | 144 | |
| | | | | | | | | | | | | | | | |
| | | | New Mexico — 2.62% | | | | | | | | | | | | |
| | 500 | | | New Mexico Finance Authority State Transportation Revenue, Series A-2 | | | 5.00 | | | | 12/15/17 | | | | 549 | |
| | | | | | | | | | | | | | | | |
| | | | New York — 10.45% | | | | | | | | | | | | |
| | 525 | | | Albany NY, GO, Series A | | | 3.00 | | | | 6/1/17 | | | | 547 | |
| | 310 | | | New York City Transitional Finance Authority Future Tax Secured Revenue, Series D, ETM (Pre-Refunded/Escrowed to Maturity) | | | 5.00 | | | | 11/1/17 | | | | 339 | |
| | 1,190 | | | New York City Transitional Finance Authority Future Tax Secured Revenue, Series D | | | 5.00 | | | | 11/1/17 | | | | 1,302 | |
| | | | | | | | | | | | | | | | |
| | | | | | | | | | | | | | | 2,188 | |
| | | | | | | | | | | | | | | | |
See accompanying notes to portfolio of investments.
211
HC CAPITAL TRUST
The Short-Term Municipal Bond Portfolio
Portfolio of Investments (concluded) — June 30, 2015
| | | | | | | | | | | | | | | | |
Shares or
Principal
Amount
(000) | | | | | Rate % | | | Maturity
Date | | | Value
(000) | |
| | | | Municipal Bonds (continued) | | | | | | | | | | | | |
| | | | Ohio — 3.52% | | | | | | | | | | | | |
| $ | 730 | | | Ohio State, GO | | | 3.00 | | | | 11/1/15 | | | $ | 737 | |
| | | | | | | | | | | | | | | | |
| | | | Pennsylvania — 1.83% | | | | | | | | | | | | |
| | 380 | | | South Eastern Pennsylvania School District York County, GO (State Aid Withholding) | | | 2.00 | | | | 2/15/16 | | | | 384 | |
| | | | | | | | | | | | | | | | |
| | | | Tennessee — 2.69% | | | | | | | | | | | | |
| | 525 | | | Tennessee State School Bond Authority Revenue, Series A | | | 4.00 | | | | 11/1/17 | | | | 564 | |
| | | | | | | | | | | | | | | | |
| | | | Texas — 5.74% | | | | | | | | | | | | |
| | 745 | | | College Station Texas, GO | | | 5.00 | | | | 2/15/16 | | | | 767 | |
| | 400 | | | Hurst-Euless-Bedford Texas Independent School District, GO (PSF-GTD) | | | 5.00 | | | | 8/15/17 | | | | 435 | |
| | | | | | | | | | | | | | | | |
| | | | | | | | | | | | | | | 1,202 | |
| | | | | | | | | | | | | | | | |
| | | | Utah — 2.54% | | | | | | | | | | | | |
| | 500 | | | Washington County Utah Water Conservancy District Revenue | | | 5.25 | | | | 10/1/16 | | | | 530 | |
| | | | | | | | | | | | | | | | |
| | | | Virginia — 1.26% | | | | | | | | | | | | |
| | 250 | | | Virginia State CommonwealthTransprtation Board Revenue, Series B | | | 5.00 | | | | 9/15/16 | | | | 264 | |
| | | | | | | | | | | | | | | | |
| | | | Washington — 13.32% | | | | | | | | | | | | |
| | 200 | | | Cascade Water Alliance Washington Water System Revenue (AMBAC) | | | 5.00 | | | | 9/1/15 | | | | 202 | |
| | 475 | | | Clark County Washington Public Utilities District No. 1 System Revenue | | | 5.00 | | | | 1/1/18 | | | | 520 | |
| | 275 | | | King County Washington, GO, Series B | | | 4.00 | | | | 12/1/16 | | | | 289 | |
| | 350 | | | King County Washington Sewer Revenue, Callable 7/1/20 @ 100.00 | | | 5.00 | | | | 1/1/22 | | | | 404 | |
| | 500 | | | Tacoma Washington Electric System Revenue, Series A | | | 4.00 | | | | 1/1/20 | | | | 553 | |
| | 800 | | | Washington State Health Care Facilities Authority, Catholic Health Revenue, Series A | | | 5.00 | | | | 2/1/16 | | | | 820 | |
| | | | | | | | | | | | | | | | |
| | | | | | | | | | | | | | | 2,788 | |
| | | | | | | | | | | | | | | | |
| | | | Wisconsin — 3.79% | | | | | | | | | | | | |
| | 600 | | | Madison Wisconsin Area Technical College, Promissory Notes, GO, Series B | | | 3.00 | | | | 3/1/16 | | | | 610 | |
| | 175 | | | Wisconsin State Clean Water Revenue, Series 3 | | | 5.00 | | | | 6/1/16 | | | | 182 | |
| | | | | | | | | | | | | | | | |
| | | | | | | | | | | | | | | 792 | |
| | | | | | | | | | | | | | | | |
| | | | Total Municipal Bonds | | | | | | | | | | | 20,670 | |
| | | | | | | | | | | | | | | | |
| | | | Mutual Fund — 0.19% | | | | | | | | | | | | |
| | 38,640 | | | SSgA Treasury Money Market Fund (a) | | | 0.00 | | | | | | | | 39 | |
| | | | | | | | | | | | | | | | |
| | | | Total Mutual Fund | | | | | | | | | | | 39 | |
| | | | | | | | | | | | | | | | |
| | | | Total Investments (cost $20,541) — 98.93% | | | | | | | | | | | 20,709 | |
| | | | Other assets in excess of liabilities — 1.07% | | | | | | | | | | | 224 | |
| | | | | | | | | | | | | | | | |
| | | | Net Assets — 100.00% | | | | | | | | | | $ | 20,933 | |
| | | | | | | | | | | | | | | | |
| (a) | The rate disclosed is the rate in effect on June 30, 2015. |
AGM — Assured Guaranty Municipal Corporation
AMBAC — American Municipal Bond Assurance Corporation
ETM — Escrowed to Maturity
FGIC — Financial Guaranty Insurance Company
GO — General Obligation
NATL-RE — Reinsurance provided by National Reinsurance
PSF-GTD — Public School Fund Guaranteed
As of June 30, 2015, 100% of the Portfolio’s net assets were managed by Breckenridge Capital Advisors, Inc.
See accompanying notes to portfolio of investments.
212
HC CAPITAL TRUST
The Intermediate Term Municipal Bond Portfolio
Portfolio of Investments — June 30, 2015
| | | | | | | | | | | | | | | | |
Principal
Amount
(000) | | | | | Rate % | | | Maturity
Date | | | Value
(000) | |
| | | | Municipal Bonds — 93.89% | | | | | | | | | | | | |
| | | | Alabama — 2.51% | | | | | | | | | | | | |
| $ | 1,500 | | | Alabama State Public School & College Authority Revenue, Series A | | | 5.00 | | | | 5/1/18 | | | $ | 1,662 | |
| | 2,500 | | | Alabama State Public School & College Authority Revenue, Series B | | | 5.00 | | | | 1/1/19 | | | | 2,814 | |
| | 2,500 | | | Birmingham Alabama Waterworks Board Water Revenue, Series A, Callable 1/1/19 @ 100.00 (Assured GTY) | | | 5.00 | | | | 1/1/21 | | | | 2,827 | |
| | 2,920 | | | Birmingham Alabama Waterworks Board Water Revenue, Series A, Callable 1/1/19 @ 100.00 (Assured GTY) | | | 5.00 | | | | 1/1/22 | | | | 3,302 | |
| | | | | | | | | | | | | | | | |
| | | | | | | | | | | | | | | 10,605 | |
| | | | | | | | | | | | | | | | |
| | | | Alaska — 0.62% | | | | | | | | | | | | |
| | 2,265 | | | Alaska Industrial Development & Export Authority Revenue, Revolving Fund, Series A,
Callable 4/1/20 @ 100.00 (GO of Authority) | | | 5.25 | | | | 4/1/22 | | | | 2,608 | |
| | | | | | | | | | | | | | | | |
| | | | Arizona — 0.85% | | | | | | | | | | | | |
| | 1,500 | | | Phoenix Arizona Civic Improvement Corp. Wastewater System Revenue, Junior Lien | | | 5.00 | | | | 7/1/21 | | | | 1,772 | |
| | 1,625 | | | Phoenix Arizona Civic Improvement Corp. Transportation Excise Tax Revenue | | | 5.00 | | | | 7/1/18 | | | | 1,813 | |
| | | | | | | | | | | | | | | | |
| | | | | | | | | | | | | | | 3,585 | |
| | | | | | | | | | | | | | | | |
| | | | Arkansas — 0.33% | | | | | | | | | | | | |
| | 1,200 | | | Arkansas State Development Finance Authority Hospital Revenue, Series B | | | 5.00 | | | | 2/1/23 | | | | 1,373 | |
| | | | | | | | | | | | | | | | |
| | | | California — 11.70% | | | | | | | | | | | | |
| | 5,000 | | | California State, GO, Callable 4/1/19 @ 100.00 | | | 5.50 | | | | 4/1/21 | | | | 5,757 | |
| | 5,000 | | | California State, GO, Callable 10/1/19 @ 100.00 | | | 5.25 | | | | 10/1/20 | | | | 5,788 | |
| | 3,705 | | | California State Department of Water Resources Revenue, Central Valley Project | | | 5.25 | | | | 7/1/22 | | | | 3,718 | |
| | 1,000 | | | California State Public Works Board Lease Revenue, Department of Forestry & Fire, Series E | | | 5.00 | | | | 11/1/22 | | | | 1,098 | |
| | 1,000 | | | California State Public Works Board Lease Revenue, Series B | | | 5.00 | | | | 10/1/21 | | | | 1,182 | |
| | 565 | | | California Statewide Communities Development Authority, Multi-Family, Pioneer Park, Series T, AMT (GNMA) | | | 6.10 | | | | 12/20/20 | | | | 566 | |
| | 1,480 | | | Los Angeles California Wastewater System Revenue, Series D | | | 5.00 | | | | 6/1/21 | | | | 1,754 | |
| | 2,500 | | | Los Angeles California Department of Water & Power System Revenue, Series A | | | 5.00 | | | | 7/1/20 | | | | 2,923 | |
| | 1,650 | | | Los Angeles California Department of Water & Power System Revenue, Series A | | | 5.00 | | | | 7/1/21 | | | | 1,956 | |
| | 5,000 | | | Los Angeles California Harbor Department Revenue, Series C, Callable 8/1/19 @ 100.00 | | | 5.25 | | | | 8/1/22 | | | | 5,787 | |
| | 1,250 | | | North Natomas California Community Facilities District Special Tax Revenue, Series E | | | 5.00 | | | | 9/1/18 | | | | 1,370 | |
| | 5,000 | | | Orange County California Sanitation District Wastewater Revenue, Series A | | | 5.00 | | | | 2/1/22 | | | | 5,959 | |
| | 3,500 | | | San Francisco California City & County Airports Commission International Terminal Revenue, AMT | | | 5.25 | | | | 5/1/18 | | | | 3,883 | |
| | 3,925 | | | San Francisco California City & County Airports Commission International Terminal Revenue, Series F, AMT, Callable 5/1/21 @ 100.00 | | | 5.00 | | | | 5/1/22 | | | | 4,474 | |
| | 65 | | | University of California Revenue, Series Q, Callable 5/15/17 @ 101.00 | | | 5.25 | | | | 5/15/23 | | | | 71 | |
| | 1,500 | | | University of California Revenue, Series AO | | | 5.00 | | | | 5/15/20 | | | | 1,756 | |
| | 1,435 | | | University of California Revenue, Series Q | | | 5.25 | | | | 5/15/23 | | | | 1,570 | |
| | | | | | | | | | | | | | | | |
| | | | | | | | | | | | | | | 49,612 | |
| | | | | | | | | | | | | | | | |
| | | | Colorado — 1.24% | | | | | | | | | | | | |
| | 3,495 | | | Colorado State Educational & Cultural Facilities Authority Revenue, Series B | | | 5.00 | | | | 4/1/19 | | | | 3,943 | |
| | 1,150 | | | Denver City & County Colorado Airport Revenue, Series A, AMT, Callable 7/1/16 @ 100.00 | | | 5.00 | | | | 11/15/19 | | | | 1,302 | |
| | | | | | | | | | | | | | | | |
| | | | | | | | | | | | | | | 5,245 | |
| | | | | | | | | | | | | | | | |
| | | | Connecticut — 0.70% | | | | | | | | | | | | |
| | 2,500 | | | Connecticut State Special Tax Obligation Revenue, Transportation Infrastructure, Series A | | | 5.00 | | | | 9/1/21 | | | | 2,940 | |
| | | | | | | | | | | | | | | | |
| | | | Florida — 10.77% | | | | | | | | | | | | |
| | 2,000 | | | Citizens Property Insurance Corp. Florida Revenue, Series A-1 | | | 5.00 | | | | 6/1/19 | | | | 2,249 | |
| | 2,500 | | | Citizens Property Insurance Corp. Florida Revenue, Senior Secured Bonds, Series A-1 | | | 5.00 | | | | 6/1/19 | | | | 2,811 | |
| | 5,000 | | | Citizens Property Insurance Corp. Florida Revenue, Series A-1, Callable 12/1/19 @ 100.00 | | | 5.00 | | | | 6/1/20 | | | | 5,645 | |
| | 2,795 | | | Clearwater Florida Water & Sewer Revenue, Series B | | | 5.00 | | | | 12/1/17 | | | | 3,064 | |
See accompanying notes to portfolio of investments.
213
HC CAPITAL TRUST
The Intermediate Term Municipal Bond Portfolio
Portfolio of Investments (continued) — June 30, 2015
| | | | | | | | | | | | | | | | |
Principal
Amount
(000) | | | | | Rate % | | | Maturity
Date | | | Value
(000) | |
| | | | Municipal Bonds (continued) | | | | | | | | | | | | |
| | | | Florida (continued) | | | | | | | | | | | | |
| $ | 2,000 | | | Florida State Municipal Power Agency Revenue, Series A, Callable 10/1/19 @ 100.00 | | | 5.25 | | | | 10/1/22 | | | $ | 2,311 | |
| | 4,435 | | | Florida State Turnpike Authority Revenue, Department of Transportation, Series C | | | 5.00 | | | | 7/1/20 | | | | 5,157 | |
| | 2,245 | | | Hillsborough County Florida Solid Waste & Resource Recovery Revenue, Series A, AMT, Callable 9/1/16 @ 100.00 (AMBAC) | | | 5.00 | | | | 9/1/18 | | | | 2,352 | |
| | 1,100 | | | JEA Florida Electric System Revenue, Series A | | | 5.00 | | | | 10/1/20 | | | | 1,281 | |
| | 4,700 | | | Lakeland Florida Energy System Revenue, Series B (AGM) | | | 5.00 | | | | 10/1/17 | | | | 5,126 | |
| | 1,600 | | | Lee County Florida Transportation Facilities Revenue (AGM) | | | 5.00 | | | | 10/1/20 | | | | 1,863 | |
| | 4,570 | | | Miami-Dade County Florida Aviation Revenue, Series A | | | 5.00 | | | | 10/1/21 | | | | 5,268 | |
| | 2,000 | | | Orange Country Florida Tourist Development Tax Revenue | | | 5.00 | | | | 10/1/20 | | | | 2,333 | |
| | 2,250 | | | Orlando & Orange County Expressway Authority Revenue, Series B | | | 5.00 | | | | 7/1/17 | | | | 2,430 | |
| | 1,845 | | | Palm Beach County Florida School Board, Series D | | | 5.00 | | | | 8/1/21 | | | | 2,139 | |
| | 1,155 | | | Tampa Bay Florida Water Regional Supply Authority Utility System Revenue | | | 5.00 | | | | 10/1/20 | | | | 1,355 | |
| | | | | | | | | | | | | | | | |
| | | | | | | | | | | | | | | 45,384 | |
| | | | | | | | | | | | | | | | |
| | | | Georgia — 4.10% | | | | | | | | | | | | |
| | 1,000 | | | Atlanta Georgia Development Authority revenue, Series A-1 | | | 5.00 | | | | 7/1/23 | | | | 1,169 | |
| | 3,650 | | | Atlanta Georgia Water & Wastewater Revenue, Series A, Callable 11/1/19 @ 100.00 | | | 6.00 | | | | 11/1/21 | | | | 4,370 | |
| | 1,700 | | | Atlanta Georgia Water & Wastewater Revenue, Series B | | | 5.00 | | | | 11/1/19 | | | | 1,958 | |
| | 3,050 | | | Georgia State Municipal Gas Authority Revenue, Gas Portfolio III Project, Series U | | | 5.00 | | | | 10/1/21 | | | | 3,562 | |
| | 4,500 | | | Metropolitan Atlanta Georgia Rapid Transit Authority Sales Tax Revenue,
Series A (NATL-RE) | | | 5.00 | | | | 7/1/19 | | | | 5,141 | |
| | 1,000 | | | Municipal Electric Authority of Georgia Revenue, Series D, Callable 7/1/18 @ 100.00 | | | 5.75 | | | | 1/1/19 | | | | 1,134 | |
| | | | | | | | | | | | | | | | |
| | | | | | | | | | | | | | | 17,334 | |
| | | | | | | | | | | | | | | | |
| | | | Idaho — 0.08% | | | | | | | | | | | | |
| | 350 | | | Idaho Housing & Finance Association, Single Family Mortgage Revenue, Series B, Class III, AMT | | | 5.40 | | | | 7/1/28 | | | | 356 | |
| | | | | | | | | | | | | | | | |
| | | | Illinois — 2.91% | | | | | | | | | | | | |
| | 2,550 | | | Chicago Illinois Certificates of Participation, Tax Increment Allocation Revenue, Diversey/Narragansett Project, Series NT, Callable 8/13/15 @ 100.00 (a) | | | 7.46 | | | | 2/15/26 | | | | 1,749 | |
| | 1,205 | | | City of Chicago Illinois Water Revenue | | | 4.00 | | | | 11/1/19 | | | | 1,277 | |
| | 2,500 | | | Illinois State Sales Tax Revenue (NATL-RE) | | | 5.75 | | | | 6/15/18 | | | | 2,813 | |
| | 2,490 | | | Railsplitter Tobacco Settlement Authority Illinois Revenue | | | 5.00 | | | | 6/1/17 | | | | 2,651 | |
| | 3,500 | | | Railsplitter Illinois Tobacco Settlement Authority Revenue | | | 5.00 | | | | 6/1/18 | | | | 3,800 | |
| | | | | | | | | | | | | | | | |
| | | | | | | | | | | | | | | 12,290 | |
| | | | | | | | | | | | | | | | |
| | | | Indiana — 0.98% | | | | | | | | | | | | |
| | 1,000 | | | Indiana State Finance Authority Revenue, Stadium Project, Series A | | | 5.00 | | | | 2/1/23 | | | | 1,182 | |
| | 1,655 | | | Indianapolis Indiana Thermal Energy System Revenue (AGM) | | | 5.00 | | | | 10/1/17 | | | | 1,798 | |
| | 1,000 | | | Richmond Indiana Hospital Authority Revenue, Reid Hospital & Health Care, Series A | | | 5.00 | | | | 1/1/21 | | | | 1,147 | |
| | | | | | | | | | | | | | | | |
| | | | | | | | | | | | | | | 4,127 | |
| | | | | | | | | | | | | | | | |
| | | | Kansas — 0.28% | | | | | | | | | | | | |
| | 1,185 | | | Kansas State Department of Transportation Highway Revenue, Series B-5 (b) | | | 0.52 | | | | 9/1/19 | | | | 1,180 | |
| | | | | | | | | | | | | | | | |
| | | | Louisiana — 1.84% | | | | | | | | | | | | |
| | 1,000 | | | Louisiana Stadium & Exposition District, Series A | | | 5.00 | | | | 7/1/18 | | | | 1,111 | |
| | 6,000 | | | Tobacco Settlement Financing Corp. Louisiana Revenue, Series A | | | 5.00 | | | | 5/15/19 | | | | 6,686 | |
| | | | | | | | | | | | | | | | |
| | | | | | | | | | | | | | | 7,797 | |
| | | | | | | | | | | | | | | | |
| | | | Massachusetts — 6.75% | | | | | | | | | | | | |
| | 1,690 | | | Massachusetts State Clean Energy Cooperative Corp. Revenue | | | 4.00 | | | | 7/1/17 | | | | 1,793 | |
| | 4,730 | | | Massachusetts State Educational Financing Authority Revenue, Series K | | | 5.00 | | | | 7/1/19 | | | | 5,242 | |
| | 2,315 | | | Massachusetts State Development Finance Agency Revenue, Bentley University,
Callable 7/1/20 @ 100.00 | | | 5.00 | | | | 7/1/21 | | | | 2,627 | |
See accompanying notes to portfolio of investments.
214
HC CAPITAL TRUST
The Intermediate Term Municipal Bond Portfolio
Portfolio of Investments (continued) — June 30, 2015
| | | | | | | | | | | | | | | | |
Principal
Amount
(000) | | | | | Rate % | | | Maturity
Date | | | Value
(000) | |
| | | | Municipal Bonds (continued) | | | | | | | | | | | | |
| | | | Massachusetts (continued) | | | | | | | | | | | | |
| $ | 2,180 | | | Massachusetts State Development Finance Agency Revenue, Bentley University,
Callable 7/1/20 @ 100.00 | | | 5.00 | | | | 7/1/22 | | | $ | 2,467 | |
| | 2,920 | | | Massachusetts State Development Finance Agency Revenue, Tufts Medical Center, Inc.,
Series I | | | 5.25 | | | | 1/1/21 | | | | 3,369 | |
| | 4,170 | | | Massachusetts State Health & Educational Facilities Authority Revenue, Northeastern University, Series A | | | 5.00 | | | | 10/1/17 | | | | 4,530 | |
| | 1,390 | | | Massachusetts State Health & Educational Facilities Authority Revenue, Massachusetts Eye & Ear Infirmary, Series C | | | 5.00 | | | | 7/1/18 | | | | 1,524 | |
| | 1,250 | | | Massachusetts State Health & Educational Facilities Authority Revenue, Massachusetts Eye & Ear Infirmary, Series C | | | 5.00 | | | | 7/1/19 | | | | 1,397 | |
| | 5,000 | | | Massachusetts State School Building Authority Sales Tax Revenue, Series B | | | 5.00 | | | | 10/15/18 | | | | 5,627 | |
| | | | | | | | | | | | | | | | |
| | | | | | | | | | | | | | | 28,576 | |
| | | | | | | | | | | | | | | | |
| | | | Michigan — 5.71% | | | | | | | | | | | | |
| | 2,300 | | | Michigan State Finance Authority Revenue, Beaumont Health Credit Group | | | 4.00 | | | | 8/1/20 | | | | 2,534 | |
| | 2,000 | | | Michigan State Finance Authority Revenue, Detroit School District, Series A (Q-SBLF) | | | 5.00 | | | | 5/1/21 | | | | 2,289 | |
| | 4,000 | | | Michigan State Finance Authority Revenue, Series D1 (AGM) | | | 5.00 | | | | 7/1/21 | | | | 4,562 | |
| | 6,000 | | | Michigan State Finance Authority Revenue, Series B, Callable 7/1/18 @ 100.00 | | | 5.00 | | | | 7/1/21 | | | | 6,663 | |
| | 2,000 | | | Michigan State, GO, Series A | | | 5.00 | | | | 11/1/19 | | | | 2,303 | |
| | 2,530 | | | Michigan State Trunk Line Revenue | | | 5.00 | | | | 11/15/18 | | | | 2,847 | |
| | 1,665 | | | Wayne County Michigan Airport Authority Revenue, Detroit Metropolitan Airport, Junior Lien, AMT, Callable 12/1/17 @ 100.00 (NATL-RE/FGIC) | | | 5.00 | | | | 12/1/22 | | | | 1,800 | |
| | 1,000 | | | Wayne County Michigan Airport Authority Revenue, Series A, AMT | | | 5.00 | | | | 12/1/19 | | | | 1,120 | |
| | | | | | | | | | | | | | | | |
| | | | | | | | | | | | | | | 24,118 | |
| | | | | | | | | | | | | | | | |
| | | | Minnesota — 0.26% | | | | | | | | | | | | |
| | 1,000 | | | Western Minnesota Municipal Power Agency Revenue, Series A | | | 4.00 | | | | 1/1/19 | | | | 1,094 | |
| | | | | | | | | | | | | | | | |
| | | | Missouri — 2.14% | | | | | | | | | | | | |
| | 2,500 | | | Kansas City Missouri Airport Revenue, Series A, AMT | | | 5.00 | | | | 9/1/20 | | | | 2,846 | |
| | 1,600 | | | Missouri State Joint Municipal Electric Utility Commission Power Project Revenue, Series A | | | 5.00 | | | | 1/1/21 | | | | 1,855 | |
| | 2,410 | | | Missouri State Regional Convention & Sports Complex Authority Revenue, Series A | | | 5.00 | | | | 8/15/17 | | | | 2,613 | |
| | 1,500 | | | Missouri State Development Finance Board Infrastructure Facilities Revenue, Branson Landing Project, Series A | | | 5.00 | | | | 6/1/20 | | | | 1,721 | |
| | | | | | | | | | | | | | | | |
| | | | | | | | | | | | | | | 9,035 | |
| | | | | | | | | | | | | | | | |
| | | | Nevada — 1.35% | | | | | | | | | | | | |
| | 4,865 | | | Las Vegas Valley Nevada Water District, GO, Series A | | | 5.00 | | | | 6/1/21 | | | | 5,713 | |
| | | | | | | | | | | | | | | | |
| | | | New Jersey — 1.53% | | | | | | | | | | | | |
| | 750 | | | New Jersey State Health Care Facilities Financing Authority Revenue, Virtua Health, Inc. | | | 5.00 | | | | 7/1/19 | | | | 848 | |
| | 5,000 | | | New Jersey State Higher Education Assistance Authority Senior Revenue, Series 2015-1A | | | 5.00 | | | | 12/1/20 | | | | 5,615 | |
| | | | | | | | | | | | | | | | |
| | | | | | | | | | | | | | | 6,463 | |
| | | | | | | | | | | | | | | | |
| | | | New Mexico — 0.83% | | | | | | | | | | | | |
| | 1,000 | | | New Mexico State Municipal Energy Acquisition Authority Gas Supply Revenue, Series B
(RBC: ROYAL BANK OF CANADA) (b) | | | 0.77 | | | | 2/1/19 | | | | 1,003 | |
| | 2,500 | | | New Mexico State Municipal Energy Acquisition Authority Gas Supply Revenue,
Callable 2/1/19 @ 100.00 (SPA) (b) | | | 0.87 | | | | 11/1/39 | | | | 2,503 | |
| | | | | | | | | | | | | | | | |
| | | | | | | | | | | | | | | 3,506 | |
| | | | | | | | | | | | | | | | |
| | | | New York — 10.42% | | | | | | | | | | | | |
| | 2,110 | | | Metropolitan Transportation Authority New York Revenue, Series A-1 | | | 5.00 | | | | 11/15/22 | | | | 2,484 | |
| | 1,500 | | | Metropolitan Transportation Authority New York Revenue, Series C | | | 5.00 | | | | 11/15/18 | | | | 1,687 | |
| | 2,000 | | | Metropolitan Transportation Authority New York Revenue, Series B | | | 5.00 | | | | 11/15/22 | | | | 2,355 | |
| | 3,020 | | | New York State, GO, Series E, Callable 8/1/19 @ 100.00 | | | 5.00 | | | | 8/1/21 | | | | 3,429 | |
| | 3,250 | | | New York State, GO, Series G | | | 5.00 | | | | 8/1/19 | | | | 3,707 | |
See accompanying notes to portfolio of investments.
215
HC CAPITAL TRUST
The Intermediate Term Municipal Bond Portfolio
Portfolio of Investments (continued) — June 30, 2015
| | | | | | | | | | | | | | | | |
Principal
Amount
(000) | | | | | Rate % | | | Maturity
Date | | | Value
(000) | |
| | | | Municipal Bonds (continued) | | | | | | | | | | | | |
| | | | New York (continued) | | | | | | | | | | | | |
| $ | 2,500 | | | New York City Health & Hospital Corp. Revenue, Health System, Series A,
Callable 2/15/20 @ 100.00 (GO of Corp.) | | | 5.00 | | | | 2/15/22 | | | $ | 2,846 | |
| | 2,000 | | | New York City Transitional Finance Authority Future Tax Revenue, Series E | | | 5.00 | | | | 11/1/18 | | | | 2,252 | |
| | 1,520 | | | New York City Transitional Finance Authority Building AID Revenue, Series S-2 (STATE AID WITHHOLDING) | | | 5.00 | | | | 7/15/21 | | | | 1,787 | |
| | 325 | | | New York State Housing Finance Agency Revenue, St. Philips Housing, Series A (FNMA) | | | 4.05 | | | | 11/15/16 | | | | 328 | |
| | 2,500 | | | New York State Dormitory Authority State Personal Income Tax Revenue, Series A | | | 5.00 | | | | 2/15/19 | | | | 2,831 | |
| | 1,200 | | | New York State Thruway Authority Revenue, Series J | | | 5.00 | | | | 1/1/20 | | | | 1,380 | |
| | 5,000 | | | New York State Thruway Authority General Revenue, Junior Indebtedness Obligations, Series A | | | 5.00 | | | | 5/1/19 | | | | 5,649 | |
| | 3,000 | | | Port Authority of New York & New Jersey NY Revenue, Consolidated 175th Series | | | 5.00 | | | | 12/1/17 | | | | 3,292 | |
| | 2,000 | | | Port Authority of New York & New Jersey NY Revenue, Consolidated 185th Series, AMT | | | 5.00 | | | | 9/1/22 | | | | 2,316 | |
| | 3,000 | | | Sales Tax Asset Receivable Corp. NY Revenue, Series A | | | 5.00 | | | | 10/15/19 | | | | 3,470 | |
| | 2,500 | | | Triborough New York Bridge & Tunnel Authority Revenue, Series 2003B-2,
Callable 6/3/19 @ 100.00 (b),(c) | | | 0.47 | | | | 1/1/33 | | | | 2,496 | |
| | 1,500 | | | Triborough New York Bridge & Tunnel Authority Revenue, Series A (GO of Authority) | | | 5.00 | | | | 11/15/18 | | | | 1,690 | |
| | | | | | | | | | | | | | | | |
| | | | | | | | | | | | | | | 43,999 | |
| | | | | | | | | | | | | | | | |
| | | | Ohio — 3.22% | | | | | | | | | | | | |
| | 6,535 | | | Kent State University Revenue, Series B, Callable 5/1/19 @ 100.00 (Assured GTY) | | | 5.00 | | | | 5/1/22 | | | | 7,371 | |
| | 990 | | | Mahoning County Ohio Hospital Facilities Revenue, Western Reserve Care System, ETM (MBIA) | | | 5.50 | | | | 10/15/25 | | | | 1,166 | |
| | 2,500 | | | Montgomery County Ohio Revenue, Miami Valley Hospital, Series A,
Callable 11/15/20 @ 100.00 | | | 5.75 | | | | 11/15/22 | | | | 2,959 | |
| | 1,875 | | | Ohio State Capital Facilities Lease Appropriation Revenue, Administrative Building Fund Project, Series A | | | 5.00 | | | | 10/1/18 | | | | 2,099 | |
| | | | | | | | | | | | | | | | |
| | | | | | | | | | | | | | | 13,595 | |
| | | | | | | | | | | | | | | | |
| | | | Pennsylvania — 3.62% | | | | | | | | | | | | |
| | 1,230 | | | Montgomery County Pennsylvania Industrial Development Authority Revenue, Acts Retirement-Life Communities, Inc., Series B, Callable 11/15/16 @ 100.00 | | | 5.00 | | | | 11/15/17 | | | | 1,297 | |
| | 2,960 | | | Pennsylvania State Economic Development Finance Authority, Unemployment Compensation Revenue, Series B, Callable 1/1/18 @ 100.00 | | | 5.00 | | | | 7/1/21 | | | | 3,233 | |
| | 3,500 | | | Pennsylvania State Economic Development Finance Authority, Unemployment Compensation Revenue, Series B, Callable 7/1/17 @ 100.00 | | | 5.00 | | | | 1/1/22 | | | | 3,790 | |
| | 2,500 | | | Pennsylvania Intergovernmental Cooperative Authority, Special Tax Revenue | | | 5.00 | | | | 6/15/18 | | | | 2,785 | |
| | 1,590 | | | Pittsburgh Pennsylvania Water & Sewer Authority Revenue, First Lien, Series A (AGM) | | | 5.00 | | | | 9/1/19 | | | | 1,802 | |
| | 2,000 | | | University of Pittsburgh Revenue, Commonwealth Systems of Higher Education, Series B, Callable 3/15/19 @ 100.00 (GO of University) | | | 5.50 | | | | 9/15/21 | | | | 2,306 | |
| | | | | | | | | | | | | | | | |
| | | | | | | | | | | | | | | 15,213 | |
| | | | | | | | | | | | | | | | |
| | | | South Carolina — 0.93% | | | | | | | | | | | | |
| | 3,500 | | | Piedmont Municipal Power Agency Electric Revenue, Series A-2, Callable 1/1/21 @ 100.00 | | | 5.00 | | | | 1/1/22 | | | | 3,927 | |
| | | | | | | | | | | | | | | | |
| | | | South Dakota — 0.02% | | | | | | | | | | | | |
| | 80 | | | Heartland Consumers Power District South Dakota Electric Revenue, ETM | | | 6.38 | | | | 1/1/16 | | | | 82 | |
| | | | | | | | | | | | | | | | |
| | | | Texas — 14.10% | | | | | | | | | | | | |
| | 1,650 | | | Allen Texas Independent School District, GO (PSF-GTD) | | | 5.00 | | | | 2/15/21 | | | | 1,942 | |
| | 1,000 | | | Austin Texas Community College District, GO | | | 5.00 | | | | 8/1/23 | | | | 1,193 | |
| | 3,500 | | | Dallas-Fort Worth Texas International Airport Revenue, Series E, AMT | | | 5.00 | | | | 11/1/19 | | | | 3,968 | |
| | 20 | | | Dallas Texas, GO, Series A, ETM | | | 5.00 | | | | 2/15/18 | | | | 22 | |
| | 2,090 | | | Dickinson Texas Independent School District, GO (PSF-GTD) | | | 5.00 | | | | 2/15/21 | | | | 2,451 | |
| | 1,000 | | | El Paso Texas Water & Sewer Revenue | | | 5.00 | | | | 3/1/22 | | | | 1,181 | |
| | 5,000 | | | Fort Worth Texas Independent School District, GO, Callable 2/15/18 @ 100.00 (PSF-GTD) | | | 5.00 | | | | 2/15/21 | | | | 5,526 | |
| | 2,800 | | | Fort Worth Texas Water & Sewer Revenue | | | 5.00 | | | | 2/15/19 | | | | 3,171 | |
| | 3,235 | | | Harris County Houston Texas Sports Authority Revenue, Series A | | | 5.00 | | | | 11/15/20 | | | | 3,736 | |
See accompanying notes to portfolio of investments.
216
HC CAPITAL TRUST
The Intermediate Term Municipal Bond Portfolio
Portfolio of Investments (continued) — June 30, 2015
| | | | | | | | | | | | | | | | |
Principal
Amount
(000) | | | | | Rate % | | | Maturity
Date | | | Value
(000) | |
| | | | Municipal Bonds (continued) | | | | | | | | | | | | |
| | | | Texas (continued) | | | | | | | | | | | | |
| $ | 1,450 | | | Houston Texas Community College Revenue | | | 5.00 | | | | 4/15/21 | | | $ | 1,686 | |
| | 2,000 | | | Houston Texas Hotel Occupancy Tax & Special Revenue, Series A | | | 5.00 | | | | 9/1/20 | | | | 2,296 | |
| | 2,500 | | | Houston Texas Utility System Revenue (b) | | | 0.97 | | | | 5/15/34 | | | | 2,502 | |
| | 1,000 | | | Lower Colorado River Texas Authority Transmission Contract Revenue | | | 5.00 | | | | 5/15/21 | | | | 1,165 | |
| | 1,000 | | | Lower Colorado River Texas Authority Transmission Contract Revenue | | | 5.00 | | | | 5/15/22 | | | | 1,170 | |
| | 3,400 | | | North East Texas Independent School District, GO (PSF-GTD) | | | 5.00 | | | | 2/1/20 | | | | 3,922 | |
| | 1,695 | | | North Texas Tollway Authority Revenue, Series A | | | 5.00 | | | | 1/1/22 | | | | 1,970 | |
| | 2,500 | | | North Texas Tollway Authority Revenue, Series A | | | 5.00 | | | | 1/1/22 | | | | 2,880 | |
| | 2,345 | | | Retama Texas Development Corp., Special Facilities Revenue, ETM | | | 8.75 | | | | 12/15/18 | | | | 2,910 | |
| | 2,000 | | | San Antonio Texas, GO | | | 5.00 | | | | 2/1/20 | | | | 2,307 | |
| | 4,150 | | | San Antonio Texas Electricity & Gas Revenue, Junior Lien | | | 5.00 | | | | 2/1/20 | | | | 4,764 | |
| | 2,500 | | | San Antonio Texas Electricity & Gas Revenue, Series D | | | 5.00 | | | | 2/1/18 | | | | 2,756 | |
| | 1,175 | | | San Antonio Texas Water Revenue, Junior Lien, Series A | | | 5.00 | | | | 5/15/22 | | | | 1,390 | |
| | 2,500 | | | Texas State College Student Loan, GO, AMT | | | 5.50 | | | | 8/1/19 | | | | 2,904 | |
| | 1,500 | | | Texas State Transportation Commission Highway Fund Revenue, Series A | | | 5.00 | | | | 4/1/19 | | | | 1,708 | |
| | | | | | | | | | | | | | | | |
| | | | | | | | | | | | | | | 59,520 | |
| | | | | | | | | | | | | | | | |
| | | | Utah — 0.42% | | | | | | | | | | | | |
| | 1,500 | | | Intermountain Power Agency Power Supply Revenue, Series A | | | 5.00 | | | | 7/1/17 | | | | 1,622 | |
| | 160 | | | Utah Housing Corp., Single Family Mortgage, Series D-2, Class III, AMT,
Callable 8/13/15 @ 100.00 | | | 5.00 | | | | 7/1/18 | | | | 160 | |
| | | | | | | | | | | | | | | | |
| | | | | | | | | | | | | | | 1,782 | |
| | | | | | | | | | | | | | | | |
| | | | Washington — 3.40% | | | | | | | | | | | | |
| | 1,155 | | | Energy Northwest Washington Electric Revenue, Columbia Generating Station, Series A | | | 5.00 | | | | 7/1/20 | | | | 1,345 | |
| | 1,070 | | | Grant County Washington Public Utilities District #2 Priest Rapids Hydro Electric Revenue, Series B, AMT | | | 5.00 | | | | 1/1/20 | | | | 1,216 | |
| | 1,650 | | | Grant County Washington Public Utilities District #2 Priest Rapids Hydro Electric Revenue, Series B, AMT | | | 5.00 | | | | 1/1/21 | | | | 1,900 | |
| | 1,420 | | | Grant County Washington Public Utilities District #2 Priest Rapids Hydro Electric Revenue, Series B, AMT | | | 5.00 | | | | 1/1/22 | | | | 1,646 | |
| | 1,000 | | | Port of Seattle Washington, GO, AMT, Callable 6/1/21 @ 100.00 | | | 5.25 | | | | 12/1/21 | | | | 1,165 | |
| | 2,500 | | | Washington State, GO, Series B | | | 5.00 | | | | 7/1/23 | | | | 2,998 | |
| | 2,500 | | | Washington State Motor Vehicle Fuel Tax, GO, Series C | | | 5.00 | | | | 2/1/21 | | | | 2,932 | |
| | 1,000 | | | Washington State Health Care Facilities Authority Revenue, Providence Health & Services, Series B | | | 5.00 | | | | 10/1/19 | | | | 1,146 | |
| | | | | | | | | | | | | | | | |
| | | | | | | | | | | | | | | 14,348 | |
| | | | | | | | | | | | | | | | |
| | | | Wisconsin — 0.28% | | | | | | | | | | | | |
| | 1,000 | | | Wisconsin State Health & Educational Facilities Authority Health Facilities Revenue, UnityPoint Health, Series A | | | 5.00 | | | | 12/1/21 | | | | 1,167 | |
| | | | | | | | | | | | | | | | |
| | | | Total Municipal Bonds | | | | | | | | | | | 396,574 | |
| | | | | | | | | | | | | | | | |
| | | | Corporate Bond — 0.00% | | | | | | | | | | | | |
| | 3,939 | | | ASC Equipment (Trading Companies & Distributors)* (d)(e) | | | 5.13 | | | | 3/1/08 | | | | — | |
| | | | | | | | | | | | | | | | |
| | | | Total Corporate Bond | | | | | | | | | | | — | |
| | | | | | | | | | | | | | | | |
| | | | Time Deposit — 2.31% | | | | | | | | | | | | |
| | 9,775 | | | State Street Liquidity Management Control System Eurodollar Time Deposit | | | 0.01 | | | | 7/1/15 | | | | 9,775 | |
| | | | | | | | | | | | | | | | |
| | | | Total Time Deposit | | | | | | | | | | | 9,775 | |
| | | | | | | | | | | | | | | | |
See accompanying notes to portfolio of investments.
217
HC CAPITAL TRUST
The Intermediate Term Municipal Bond Portfolio
Portfolio of Investments (concluded) — June 30, 2015
| | | | | | | | | | | | | | |
| Shares | | | | | Rate % | | | Maturity
Date | | Value
(000) | |
| | | | Mutual Fund — 4.87% | | | | | | | | | | |
| | 20,563,266 | | | Federated U.S. Treasury Cash Reserve Fund, Institutional Shares (f) | | | 0.00 | | | | | $ | 20,563 | |
| | | | | | | | | | | | | | |
| | | | Total Mutual Fund | | | | | | | | | 20,563 | |
| | | | | | | | | | | | | | |
| | | | Total Investments (cost $419,500) — 101.07% | | | | | | | | | 426,912 | |
| | | | Liabilities in excess of other assets — (1.07)% | | | | | | | | | (4,504 | ) |
| | | | | | | | | | | | | | |
| | | | Net Assets — 100.00% | | | | | | | | $ | 422,408 | |
| | | | | | | | | | | | | | |
| Amounts | designated as “—” are $0 or have been rounded to $0. |
| * | Security was fair valued on June 30, 2015 and represents a Level 2 security. Refer to Note 2 in the Notes to Financial Statements. |
| (a) | Represents a security purchased under Rule 144A or Section 4(2) and is exempt from registration under the Securities Act of 1933, as amended, or is otherwise restricted to resale. This security may be resold in transactions exempt from registration, normally to qualified institutional buyers. This security has been deemed illiquid by the Specialist Manager and represents 0.41% of the Portfolio’s net assets. |
| (b) | Variable Rate Security. The rate reflected is the rate in effect on June 30, 2015. The maturity date represents actual maturity date. |
| (c) | Continuously callable. |
| (d) | Escrow security due to bankruptcy. |
| (e) | Issuer has defaulted on the payment of principal and interest. These securities have been deemed illiquid by the Specialist Manager and represents 0.00% of the Portfolio’s net assets. |
| (f) | The rate disclosed is the rate in effect on June 30, 2015. |
AGM — Assured Guaranty Municipal Corporation
AMBAC — American Municipal Bond Assurance Corporation
AMT — Alternative Minimum Tax
ETM — Escrowed to Maturity
FGIC — Financial Guaranty Insurance Company
FNMA — Federal National Mortgage Association
GNMA — Government National Mortgage Association
GO — General Obligation
GTY — Guaranty
MBIA — Municipal Bond Insurance Association
NATL-RE — Reinsurance provided by National Reinsurance
PSF-GTD — Public School Fund Guaranteed
The following table reflects the percentage of total net assets of the Portfolio attributable to each Specialist Manager, see Note 3 in the Notes to Financial Statements.
| | | | | | | | | | | | |
The Intermediate Term Municipal Bond Portfolio | | Standish Mellon
Asset Management Company | | | HC Capital
Solutions | | | Total | |
Municipal Bonds | | | 93.89 | % | | | — | | | | 93.89 | % |
Corporate Bond | | | 0.00 | % | | | — | | | | 0.00 | % |
Time Deposit | | | 2.31 | % | | | — | | | | 2.31 | % |
Mutual Fund | | | — | | | | 4.87 | % | | | 4.87 | % |
Other Assets (Liabilities) | | | -1.07 | % | | | — | | | | -1.07 | % |
| | | | | | | | | | | | |
Total Net Assets | | | 95.13 | % | | | 4.87 | % | | | 100.00 | % |
| | | | | | | | | | | | |
See accompanying notes to portfolio of investments.
218
HC CAPITAL TRUST
The Intermediate Term Municipal Bond II Portfolio
Portfolio of Investments — June 30, 2015
| | | | | | | | | | | | | | | | |
Principal
Amount
(000) | | | | | Rate % | | | Maturity
Date | | | Value
(000) | |
| | | | Municipal Bonds — 95.67% | | | | | | | | | | | | |
| | | | Alabama — 6.21% | | | | | | | | | | | | |
| $ | 1,500 | | | Alabama State Public School & College Authority Revenue, Series A | | | 5.00 | | | | 5/1/19 | | | $ | 1,706 | |
| | 1,235 | | | Birmingham Alabama, GO, Series A, Callable 6/1/24 @ 100.00 | | | 5.00 | | | | 12/1/26 | | | | 1,433 | |
| | 1,000 | | | Pell City Alabama, GO, Series A, Callable 2/1/25 @ 100.00 | | | 5.00 | | | | 2/1/26 | | | | 1,165 | |
| | 500 | | | Tuscaloosa Alabama, GO, Series C | | | 3.00 | | | | 1/1/18 | | | | 523 | |
| | | | | | | | | | | | | | | | |
| | | | | | | | | | | | | | | 4,827 | |
| | | | | | | | | | | | | | | | |
| | | | Arizona — 0.20% | | | | | | | | | | | | |
| | 140 | | | Yuma County Arizona Jail District Revenue, Pledge Obligation | | | 5.00 | | | | 7/1/20 | | | | 153 | |
| | | | | | | | | | | | | | | | |
| | | | California — 3.44% | | | | | | | | | | | | |
| | 620 | | | California State Department Water Resources Power Supply Revenue, Series L,
Callable 5/1/20 @ 100.00 | | | 5.00 | | | | 5/1/22 | | | | 727 | |
| | 380 | | | California State Department Water Resources Power Supply Revenue, Series L,
Callable 5/1/20 @ 100.00 | | | 5.00 | | | | 5/1/22 | | | | 440 | |
| | 1,500 | | | Los Angeles California Unified School District, GO, Series A-2,
Callable 7/1/15 @ 100.00 (NATL-RE) | | | 5.00 | | | | 7/1/19 | | | | 1,500 | |
| | | | | | | | | | | | | | | | |
| | | | | | | | | | | | | | | 2,667 | |
| | | | | | | | | | | | | | | | |
| | | | Florida — 16.51% | | | | | | | | | | | | |
| | 1,550 | | | Florida Water Pollution Control Financing Corp. Revenue, Series A | | | 5.00 | | | | 7/15/16 | | | | 1,624 | |
| | 400 | | | JEA Florida Electric System Revenue, Series A | | | 5.00 | | | | 10/1/15 | | | | 405 | |
| | 1,400 | | | Lee County Florida School Board Certificates of Participation, Series A,
Callable 8/1/24 @ 100.00 | | | 5.00 | | | | 8/1/27 | | | | 1,596 | |
| | 895 | | | Lee County Florida Water & Sewer Revenue Certification of Participation | | | 4.00 | | | | 10/1/15 | | | | 903 | |
| | 1,000 | | | Miami-Dade County Florida, GO, Series A, Callable 11/1/24 @ 100.00 | | | 5.00 | | | | 11/1/27 | | | | 1,158 | |
| | 1,750 | | | Miami-Dade County Florida School Board, Series A, Callable 11/1/16 @ 100.00
(Insurance/Program – AMBAC) | | | 5.00 | | | | 11/1/31 | | | | 1,850 | |
| | 1,000 | | | Miami-Dade County Florida Water & Sewer Revenue, Series B (AGM) | | | 5.25 | | | | 10/1/20 | | | | 1,172 | |
| | 1,085 | | | Orange County Florida School Board Certificates of Participation, Series A | | | 5.00 | | | | 8/1/23 | | | | 1,289 | |
| | 1,000 | | | Palm Beach County Florida Public Improvement Revenue, Series 2 | | | 5.00 | | | | 11/1/16 | | | | 1,059 | |
| | 1,500 | | | West Palm Beach Florida Utility System Revenue, Series A, Callable 10/1/21 @ 100.00 | | | 5.00 | | | | 10/1/22 | | | | 1,772 | |
| | | | | | | | | | | | | | | | |
| | | | | | | | | | | | | | | 12,828 | |
| | | | | | | | | | | | | | | | |
| | | | Hawaii — 2.25% | | | | | | | | | | | | |
| | 1,500 | | | Honolulu City & County Hawaii, GO, Series B, Callable 12/1/20 @ 100.00 | | | 5.00 | | | | 12/1/23 | | | | 1,750 | |
| | | | | | | | | | | | | | | | |
| | | | Idaho — 1.91% | | | | | | | | | | | | |
| | 1,285 | | | Idaho State Housing & Finance Association, Grant & Revenue Anticipation Federal Highway Trust, Series A | | | 5.00 | | | | 7/15/22 | | | | 1,484 | |
| | | | | | | | | | | | | | | | |
| | | | Illinois — 2.17% | | | | | | | | | | | | |
| | 1,325 | | | DuPage & Cook Counties Illinois Community Unit School District #205, GO (NATL-RE) | | | 5.50 | | | | 1/1/16 | | | | 1,357 | |
| | 320 | | | Northbrook Illinois, GO | | | 3.00 | | | | 12/1/15 | | | | 324 | |
| | | | | | | | | | | | | | | | |
| | | | | | | | | | | | | | | 1,681 | |
| | | | | | | | | | | | | | | | |
| | | | Maryland — 1.96% | | | | | | | | | | | | |
| | 1,330 | | | Maryland State Transportation Authority Revenue, Transportation Facilities Project, Series A | | | 5.00 | | | | 7/1/19 | | | | 1,520 | |
| | | | | | | | | | | | | | | | |
| | | | Massachusetts — 1.55% | | | | | | | | | | | | |
| | 1,000 | | | Massachusetts Bay Transportation Authority Sales Tax Revenue, Series B | | | 5.25 | | | | 7/1/21 | | | | 1,201 | |
| | | | | | | | | | | | | | | | |
| | | | Michigan — 1.42% | | | | | | | | | | | | |
| | 1,000 | | | Grand Rapids Michigan Community College, GO (AGM) | | | 5.00 | | | | 5/1/18 | | | | 1,106 | |
| | | | | | | | | | | | | | | | |
| | | | Minnesota — 0.58% | | | | | | | | | | | | |
| | 400 | | | Crow Wing County Minnesota, GO, Series A | | | 5.00 | | | | 2/1/19 | | | | 448 | |
| | | | | | | | | | | | | | | | |
| | | | Nebraska — 1.37% | | | | | | | | | | | | |
| | 1,000 | | | Lincoln Nebraska Waterworks Revenue | | | 3.00 | | | | 8/15/18 | | | | 1,061 | |
| | | | | | | | | | | | | | | | |
See accompanying notes to portfolio of investments.
219
HC CAPITAL TRUST
The Intermediate Term Municipal Bond II Portfolio
Portfolio of Investments (continued) — June 30, 2015
| | | | | | | | | | | | | | | | |
Principal
Amount
(000) | | | | | Rate % | | | Maturity
Date | | | Value
(000) | |
| | | | Municipal Bonds (continued) | | | | | | | | | | | | |
| | | | Nevada — 4.15% | | | | | | | | | | | | |
| $ | 800 | | | Clark County Nevada Highway Improvement Revenue | | | 5.00 | | | | 7/1/23 | | | $ | 958 | |
| | 1,105 | | | Las Vegas Valley Nevada Water District, GO, Series B | | | 5.00 | | | | 12/1/24 | | | | 1,333 | |
| | 800 | | | Nevada State System of Higher Education Certificates of Participation, Series A,
Callable 7/1/24 @ 100.00 | | | 5.00 | | | | 7/1/26 | | | | 929 | |
| | | | | | | | | | | | | | | | |
| | | | | | | | | | | | | | | 3,220 | |
| | | | | | | | | | | | | | | | |
| | | | New York — 3.21% | | | | | | | | | | | | |
| | 1,495 | | | New York City Transitional Finance Authority Revenue, Series D, Callable 2/1/21 @ 100.00 | | | 5.25 | | | | 2/1/22 | | | | 1,763 | |
| | 625 | | | New York State Dormitory Authority State Personal Income Tax Revenue, Series A,
Callable 2/15/24 @ 100.00 | | | 5.00 | | | | 2/15/26 | | | | 736 | |
| | | | | | | | | | | | | | | | |
| | | | | | | | | | | | | | | 2,499 | |
| | | | | | | | | | | | | | | | |
| | | | North Carolina — 1.32% | | | | | | | | | | | | |
| | 1,000 | | | North Carolina State Grant Anticipation Revenue, Vehicle Garvee | | | 5.00 | | | | 3/1/16 | | | | 1,028 | |
| | | | | | | | | | | | | | | | |
| | | | Ohio — 8.51% | | | | | | | | | | | | |
| | 700 | | | American Municipal Power, Inc. Revenue, Series A, Callable 2/15/24 @ 100.00 | | | 5.00 | | | | 2/15/27 | | | | 803 | |
| | 1,600 | | | Columbus Ohio State, GO, Series 1, Callable 7/1/23 @ 100.00 | | | 5.00 | | | | 7/1/24 | | | | 1,929 | |
| | 1,400 | | | Cuyahoga County Ohio, GO, Series A | | | 5.00 | | | | 12/1/19 | | | | 1,612 | |
| | 1,000 | | | Ohio State, GO, Series B | | | 5.00 | | | | 9/15/17 | | | | 1,091 | |
| | 1,000 | | | Ohio State Building Authority State Facilities Revenue | | | 5.00 | | | | 10/1/21 | | | | 1,176 | |
| | | | | | | | | | | | | | | | |
| | | | | | | | | | | | | | | 6,611 | |
| | | | | | | | | | | | | | | | |
| | | | Oklahoma — 2.20% | | | | | | | | | | | | |
| | 450 | | | Oklahoma State Capital Improvement Authority State Facilities Revenue, Series A | | | 2.00 | | | | 7/1/16 | | | | 457 | |
| | 1,150 | | | Oklahoma State Capital Improvement Authority State Facilities Revenue, Series A | | | 5.00 | | | | 7/1/17 | | | | 1,244 | |
| | | | | | | | | | | | | | | | |
| | | | | | | | | | | | | | | 1,701 | |
| | | | | | | | | | | | | | | | |
| | | | Pennsylvania — 4.85% | | | | | | | | | | | | |
| | 1,010 | | | Lackawanna County Pennsylvania Abington Heights School District, GO (State Aid Withholding) | | | 3.00 | | | | 3/15/16 | | | | 1,028 | |
| | 1,375 | | | Blairsville-Saltsburg School District, GO (BAM State Aid Withholding) | | | 5.00 | | | | 3/15/23 | | | | 1,599 | |
| | 1,000 | | | Pennsylvania State, GO, Series A | | | 5.00 | | | | 5/1/20 | | | | 1,144 | |
| | | | | | | | | | | | | | | | |
| | | | | | | | | | | | | | | 3,771 | |
| | | | | | | | | | | | | | | | |
| | | | South Carolina — 1.60% | | | | | | | | | | | | |
| | 1,100 | | | Richland County School District No. 2, GO, Series A, Callable 2/1/19 @ 100.00 (SCSDE) | | | 5.00 | | | | 2/1/20 | | | | 1,245 | |
| | | | | | | | | | | | | | | | |
| | | | Texas — 12.94% | | | | | | | | | | | | |
| | 1,000 | | | Collin County Texas, GO, Series A | | | 4.00 | | | | 2/15/19 | | | | 1,097 | |
| | 1,250 | | | Dallas Texas Waterworks & Sewer System Revenue, Callable 10/1/21 @ 100.00 | | | 5.00 | | | | 10/1/23 | | | | 1,466 | |
| | 1,500 | | | Harris County Texas Cultural Education Facilities Finance Corp. Revenue, Texas Childrens Hospital, Callable 10/1/25 @ 100.00 | | | 5.00 | | | | 10/1/27 | | | | 1,736 | |
| | 300 | | | La Porte Texas Independent School District, GO | | | 4.00 | | | | 2/15/17 | | | | 316 | |
| | 1,000 | | | San Antonio Texas Electric & Gas Systems Revenue, Series D | | | 5.00 | | | | 2/1/17 | | | | 1,068 | |
| | 1,435 | | | Sugar Land Texas, GO, Callable 2/15/19 @ 100.00 | | | 5.00 | | | | 2/15/21 | | | | 1,620 | |
| | 1,800 | | | Texas State University Systems Financing Revenue | | | 5.00 | | | | 3/15/17 | | | | 1,931 | |
| | 750 | | | Webb County Texas, GO | | | 4.50 | | | | 2/15/19 | | | | 823 | |
| | | | | | | | | | | | | | | | |
| | | | | | | | | | | | | | | 10,057 | |
| | | | | | | | | | | | | | | | |
| | | | Washington — 15.64% | | | | | | | | | | | | |
| | 500 | | | Everett Washington Water & Sewer Revenue | | | 5.00 | | | | 12/1/17 | | | | 546 | |
| | 1,000 | | | King County Washington, GO | | | 5.25 | | | | 1/1/23 | | | | 1,216 | |
| | 1,400 | | | King County Washington Sewer Revenue, Callable 1/1/22 @ 100.00 | | | 5.00 | | | | 1/1/24 | | | | 1,628 | |
| | 750 | | | King County Washington Sewer Revenue | | | 5.00 | | | | 1/1/20 | | | | 865 | |
| | 1,580 | | | Port of Seattle Washington Revenue, Intermediate Lien, Series B | | | 5.00 | | | | 6/1/18 | | | | 1,749 | |
| | 1,150 | | | Skagit County Washington, GO | | | 4.00 | | | | 12/1/17 | | | | 1,233 | |
| | 1,500 | | | Tacoma Washington Water Revenue, Series A, Callable 6/1/20 @ 100.00 | | | 5.00 | | | | 12/1/22 | | | | 1,728 | |
See accompanying notes to portfolio of investments.
220
HC CAPITAL TRUST
The Intermediate Term Municipal Bond II Portfolio
Portfolio of Investments (concluded) — June 30, 2015
| | | | | | | | | | | | | | | | |
Shares or
Principal
Amount
(000) | | | | | Rate % | | | Maturity
Date | | | Value
(000) | |
| | | | Municipal Bonds (continued) | | | | | | | | | | | | |
| | | | Washington (continued) | | | | | | | | | | | | |
| $ | 1,800 | | | Washington State, GO, Series R-2011-A | | | 5.00 | | | | 1/1/18 | | | $ | 1,982 | |
| | 1,100 | | | Washington State Health Care Facilities Authority Revenue, Providence Health & Services,
Series A | | | 5.00 | | | | 10/1/17 | | | | 1,199 | |
| | | | | | | | | | | | | | | | |
| | | | | | | | | | | | | | | 12,146 | |
| | | | | | | | | | | | | | | | |
| | | | Wisconsin — 1.68% | | | | | | | | | | | | |
| | 1,220 | | | Menomonee Falls Wisconsin School District, GO, Callable 4/1/17 @ 100.00 (NATL-RE/FGIC) | | | 4.75 | | | | 4/1/21 | | | | 1,307 | |
| | | | | | | | | | | | | | | | |
| | | | Total Municipal Bonds | | | | | | | | | | | 74,311 | |
| | | | | | | | | | | | | | | | |
| | | | Mutual Funds — 5.05% | | | | | | | | | | | | |
| | 3,793,074 | | | Federated U.S. Treasury Cash Reserve Fund, Institutional Shares (a) | | | 0.00 | | | | | | | | 3,793 | |
| | 133,352 | | | SSgA Treasury Money Market Fund (a) | | | 0.00 | | | | | | | | 133 | |
| | | | | | | | | | | | | | | | |
| | | | Total Mutual Funds | | | | | | | | | | | 3,926 | |
| | | | | | | | | | | | | | | | |
| | | | Total Investments (cost $76,045) — 100.72% | | | | | | | | | | | 78,237 | |
| | | | Liabilities in excess of other assets — (0.72)% | | | | | | | | | | | (560 | ) |
| | | | | | | | | | | | | | | | |
| | | | Net Assets — 100.00% | | | | | | | | | | $ | 77,677 | |
| | | | | | | | | | | | | | | | |
| (a) | The rate disclosed is the rate in effect on June 30, 2015. |
AGM — Assured Guaranty Municipal Corporation
AMBAC — American Municipal Bond Assurance Corporation
FGIC — Financial Guaranty Insurance Company
GO — General Obligation
NATL-RE — Reinsurance provided by National Reinsurance
SCSDE — Insured by South Carolina School Discount Enhancement
The following table reflects the percentage of total net assets of the Portfolio attributable to each Specialist Manager, see Note 3 in the Notes to Financial Statements.
| | | | | | | | | | | | |
The Intermediate Term Municipal Bond II Portfolio | | Breckenridge Capital
Advisors, Inc. | | | HC Capital
Solutions | | | Total | |
Municipal Bonds | | | 95.67 | % | | | — | | | | 95.67 | % |
Mutual Fund | | | 0.18 | % | | | 4.87 | % | | | 5.05 | % |
Other Assets (Liabilities) | | | -0.72 | % | | | — | | | | -0.72 | % |
| | | | | | | | | | | | |
Total Net Assets | | | 95.13 | % | | | 4.87 | % | | | 100.00 | % |
| | | | | | | | | | | | |
See accompanying notes to portfolio of investments.
221
HC CAPITAL TRUST
Statements of Assets and Liabilities
As of June 30, 2015
(Amounts in thousands except per share amounts)
| | | | | | | | | | | | | | | | |
| |
| The Value
Equity
Portfolio |
| |
| The
Institutional
Value Equity
Portfolio |
| |
| The Growth
Equity
Portfolio |
| |
| The
Institutional
Growth Equity
Portfolio |
|
ASSETS: | | | | | | | | | | | | | | | | |
Investments, at cost | | $ | 539,622 | | | $ | 794,354 | | | $ | 599,230 | | | $ | 973,369 | |
Repurchase agreements, at value and cost | | | 2,411 | | | | 3,770 | | | | — | | | | — | |
Unrealized appreciation | | | 77,376 | | | | 107,839 | | | | 219,302 | | | | 268,910 | |
| | | | | | | | | | | | | | | | |
Investments, at value | | | 619,409 | | | | 905,963 | | | | 818,532 | | | | 1,242,279 | |
Cash | | | 17,007 | | | | 20,025 | | | | 63,958 | | | | 72,674 | |
Foreign currency, at value (Cost $0, $0, $0 and $2, respectively) | | | — | | | | — | | | | — | | | | 2 | |
Dividends and interest receivable | | | 1,192 | | | | 1,743 | | | | 717 | | | | 1,080 | |
Margin deposits | | | 1,403 | | | | 1,442 | | | | 4,898 | | | | 6,129 | |
Receivable for portfolio shares issued | | | 174 | | | | 423 | | | | 204 | | | | 309 | |
Receivable from investments sold | | | — | | | | — | | | | 528 | | | | 815 | |
Foreign tax reclaims receivable | | | 6 | | | | 10 | | | | 56 | | | | 3 | |
Prepaid expenses | | | 17 | | | | 16 | | | | 19 | | | | 21 | |
| | | | | | | | | | | | | | | | |
Total assets | | | 639,208 | | | | 929,622 | | | | 888,912 | | | | 1,323,312 | |
| | | | | | | | | | | | | | | | |
LIABILITIES: | | | | | | | | | | | | | | | | |
Unrealized depreciation on futures contracts | | | 405 | | | | 406 | | | | 1,438 | | | | 1,825 | |
Payable for investments purchased | | | 2,925 | | | | 5,527 | | | | 11 | | | | 19 | |
Payable for portfolio shares redeemed | | | 9,362 | | | | 2 | | | | 13,331 | | | | 1,256 | |
Payable for collateral received on loaned securities | | | 3,021 | | | | 6,563 | | | | 121 | | | | 302 | |
Advisory fees payable | | | 220 | | | | 319 | | | | 261 | | | | 406 | |
Management fees payable | | | 27 | | | | 39 | | | | 37 | | | | 56 | |
Administrative services fees payable | | | 4 | | | | 6 | | | | 6 | | | | 7 | |
Trustee fees payable | | | 6 | | | | 9 | | | | 9 | | | | 13 | |
Other accrued expenses | | | 53 | | | | 71 | | | | 71 | | | | 109 | |
| | | | | | | | | | | | | | | | |
Total liabilities | | | 16,023 | | | | 12,942 | | | | 15,285 | | | | 3,993 | |
| | | | | | | | | | | | | | | | |
NET ASSETS | | $ | 623,185 | | | $ | 916,680 | | | $ | 873,627 | | | $ | 1,319,319 | |
| | | | | | | | | | | | | | | | |
NET ASSETS CONSISTS OF: | | | | | | | | | | | | | | | | |
Shares of beneficial interest, at par value | | $ | 34 | | | $ | 68 | | | $ | 39 | | | $ | 77 | |
Additional paid-in capital | | | 536,176 | | | | 729,487 | | | | 528,454 | | | | 868,945 | |
Accumulated net investment income | | | 337 | | | | 616 | | | | 250 | | | | 605 | |
Accumulated net realized gain from investment transactions | | | 9,667 | | | | 79,076 | | | | 127,020 | | | | 182,607 | |
Net unrealized appreciation on investments | | | 76,971 | | | | 107,433 | | | | 217,864 | | | | 267,085 | |
| | | | | | | | | | | | | | | | |
Net Assets | | $ | 623,185 | | | $ | 916,680 | | | $ | 873,627 | | | $ | 1,319,319 | |
| | | | | | | | | | | | | | | | |
NET ASSETS: | | | | | | | | | | | | | | | | |
HC Strategic Shares | | $ | 622,022 | | | $ | 915,067 | | | $ | 872,004 | | | $ | 1,317,132 | |
HC Advisors Shares | | | 1,163 | | | | 1,613 | | | | 1,623 | | | | 2,187 | |
| | | | | | | | | | | | | | | | |
Total | | $ | 623,185 | | | $ | 916,680 | | | $ | 873,627 | | | $ | 1,319,319 | |
| | | | | | | | | | | | | | | | |
SHARES OF BENEFICIAL INTEREST OUTSTANDING | | | | | | | | | | | | | | | | |
(Unlimited number of shares authorized; par value $0.001): | | | | | | | | | | | | | | | | |
HC Strategic Shares | | | 33,700 | | | | 67,810 | | | | 38,975 | | | | 76,827 | |
HC Advisors Shares | | | 63 | | | | 119 | | | | 73 | | | | 128 | |
| | | | | | | | | | | | | | | | |
Total | | | 33,763 | | | | 67,929 | | | | 39,048 | | | | 76,955 | |
| | | | | | | | | | | | | | | | |
Net Asset Value, offering and redemption price per share:(a) | | | | | | | | | | | | | | | | |
HC Strategic Shares | | $ | 18.46 | | | $ | 13.49 | | | $ | 22.37 | | | $ | 17.14 | |
| | | | | | | | | | | | | | | | |
HC Advisors Shares | | $ | 18.46 | | | $ | 13.50 | | | $ | 22.35 | | | $ | 17.15 | |
| | | | | | | | | | | | | | | | |
Amounts designated as “—” are $0 or have been rounded to $0.
| (a) | Per share amounts may not recalculate due to rounding of net assets and/or shares outstanding. |
See accompanying notes to financial statements.
222
HC CAPITAL TRUST
Statements of Assets and Liabilities (continued)
As of June 30, 2015
(Amounts in thousands except per share amounts)
| | | | | | | | | | | | | | | | |
| | | The Small
Capitalization–
Mid Capitalization
Equity Portfolio | | | The
Institutional Small
Capitalization–
Mid Capitalization
Equity Portfolio | | | The
Real Estate
Securities
Portfolio | | | The
Commodity
Returns Strategy
Portfolio(a) | |
ASSETS: | | | | | | | | | | | | | | | | |
Investments, at cost | | $ | 86,133 | | | $ | 147,235 | | | $ | 114,219 | | | $ | 931,430 | |
Repurchase agreements, at value and cost | | | 570 | | | | 3,337 | | | | — | | | | 237,059 | |
Unrealized appreciation (depreciation) | | | 27,112 | | | | 51,294 | | | | 17,137 | | | | (25,649 | ) |
| | | | | | | | | | | | | | | | |
Investments, at value | | | 113,815 | | | | 201,866 | | | | 131,356 | | | | 1,142,840 | |
Cash | | | 3,768 | | | | 4,243 | | | | 1,858 | | | | 45,334 | |
Foreign currency, at value (Cost $0, $0, $0 and $2,113, respectively) | | | — | | | | — | | | | — | | | | 2,105 | |
Segregated cash for collateral | | | — | | | | — | | | | — | | | | 2,958 | |
Swap agreements at value | | | — | | | | — | | | | — | | | | 5,260 | |
Unrealized appreciation on futures contracts | | | 36 | | | | 64 | | | | — | | | | 4 | |
Unrealized appreciation on forward currency contracts | | | — | | | | — | | | | — | | | | 486 | |
Dividends and interest receivable | | | 52 | | | | 100 | | | | 444 | | | | 2,544 | |
Margin deposits | | | 159 | | | | 274 | | | | 289 | | | | 24,337 | |
Receivable for portfolio shares issued | | | — | | | | 7 | | | | 32 | | | | 311 | |
Receivable from investments sold | | | 403 | | | | 740 | | | | — | | | | 3,758 | |
Foreign tax reclaims receivable | | | — | | | | — | | | | 3 | | | | 246 | |
Variation margin receivable on futures contracts | | | — | | | | — | | | | — | | | | 422 | |
Variation margin receivable on interest rate swap agreements | | | — | | | | — | | | | — | | | | 46 | |
Prepaid expenses | | | 12 | | | | 12 | | | | 7 | | | | 32 | |
| | | | | | | | | | | | | | | | |
Total assets | | | 118,245 | | | | 207,306 | | | | 133,989 | | | | 1,230,683 | |
| | | | | | | | | | | | | | | | |
LIABILITIES: | | | | | | | | | | | | | | | | |
Written options, at fair value (premiums received $0, $0, $0 and $463, respectively) | | | — | | | | — | | | | — | | | | 468 | |
Swap agreements, at value | | | — | | | | — | | | | — | | | | 564 | |
Unrealized depreciation on forward currency contracts | | | — | | | | — | | | | — | | | | 716 | |
Unrealized depreciation on futures contracts | | | — | | | | — | | | | 70 | | | | 5,853 | |
Payable for investments purchased | | | 905 | | | | 1,518 | | | | — | | | | 1,419 | |
Payable for portfolio shares redeemed | | | 1,310 | | | | 501 | | | | 936 | | | | 3,584 | |
Payable for collateral received on loaned securities | | | 992 | | | | 4,461 | | | | — | | | | 20,645 | |
Payable to broker for swap collateral | | | — | | | | — | | | | — | | | | 1,081 | |
Variation margin payable on futures contracts | | | — | | | | — | | | | — | | | | 1,009 | |
Variation margin payable on interest rate swap agreements | | | — | | | | — | | | | — | | | | 27 | |
Accrued foreign capital gains tax | | | — | | | | — | | | | — | | | | 29 | |
Advisory fees payable | | | 72 | | | | 107 | | | | 205 | | | | 423 | |
Management fees payable | | | 5 | | | | 8 | | | | 6 | | | | 50 | |
Administrative services fees payable | | | 1 | | | | 1 | | | | 1 | | | | 6 | |
Trustee fees payable | | | 1 | | | | 2 | | | | — | | | | 12 | |
Other accrued expenses | | | 10 | | | | 20 | | | | 13 | | | | 159 | |
| | | | | | | | | | | | | | | | |
Total liabilities | | | 3,296 | | | | 6,618 | | | | 1,231 | | | | 36,045 | |
| | | | | | | | | | | | | | | | |
NET ASSETS | | $ | 114,949 | | | $ | 200,688 | | | $ | 132,758 | | | $ | 1,194,638 | |
| | | | | | | | | | | | | | | | |
NET ASSETS CONSISTS OF: | | | | | | | | | | | | | | | | |
Shares of beneficial interest, at par value | | $ | 5 | | | $ | 12 | | | $ | 41 | | | $ | 136 | |
Additional paid-in capital | | | 105,679 | | | | 144,382 | | | | 101,550 | | | | 1,428,001 | |
Accumulated net investment income/(distributions in excess of net investment income) | | | (83 | ) | | | (157 | ) | | | — | | | | (1,354 | ) |
Accumulated net realized gain/(loss) from investment transactions | | | (17,800 | ) | | | 5,093 | | | | 14,100 | | | | (204,235 | ) |
Net unrealized appreciation/(depreciation) on investments | | | 27,148 | | | | 51,358 | | | | 17,067 | | | | (27,910 | ) |
| | | | | | | | | | | | | | | | |
Net Assets | | $ | 114,949 | | | $ | 200,688 | | | $ | 132,758 | | | $ | 1,194,638 | |
| | | | | | | | | | | | | | | | |
NET ASSETS: | | | | | | | | | | | | | | | | |
HC Strategic Shares | | $ | 114,754 | | | $ | 200,423 | | | $ | 132,758 | | | $ | 1,193,003 | |
HC Advisors Shares | | | 195 | | | | 265 | | | | — | | | | 1,635 | |
| | | | | | | | | | | | | | | | |
Total | | $ | 114,949 | | | $ | 200,688 | | | $ | 132,758 | | | $ | 1,194,638 | |
| | | | | | | | | | | | | | | | |
SHARES OF BENEFICIAL INTEREST OUTSTANDING | | | | | | | | | | | | | | | | |
(Unlimited number of shares authorized; par value $0.001): | | | | | | | | | | | | | | | | |
HC Strategic Shares | | | 5,059 | | | | 12,065 | | | | 41,001 | | | | 135,550 | |
HC Advisors Shares | | | 9 | | | | 16 | | | | — | | | | 186 | |
| | | | | | | | | | | | | | | | |
Total | | | 5,068 | | | | 12,081 | | | | 41,001 | | | | 135,736 | |
| | | | | | | | | | | | | | | | |
Net Asset Value, offering and redemption price per share:(b) | | | | | | | | | | | | | | | | |
HC Strategic Shares | | $ | 22.68 | | | $ | 16.61 | | | $ | 3.24 | | | $ | 8.80 | |
| | | | | | | | | | | | | | | | |
HC Advisors Shares | | $ | 22.66 | | | $ | 16.61 | | | $ | — | | | $ | 8.80 | |
| | | | | | | | | | | | | | | | |
Amounts designated as “—” are $0 or have been rounded to $0.
| (a) | Statement has been consolidated. See Note 2O in Notes to Financial Statements for basis of consolidation. |
| (b) | Per share amounts may not recalculate due to rounding of net assets and/or shares outstanding. |
See accompanying notes to financial statements.
223
HC CAPITAL TRUST
Statements of Assets and Liabilities (continued)
As of June 30, 2015
(Amounts in thousands except per share amounts)
| | | | | | | | | | | | | | | | |
| | | The International
Equity Portfolio | | | The
Institutional
International
Equity Portfolio | | | The
Emerging
Markets
Portfolio | | | The Core
Fixed
Income
Portfolio | |
ASSETS: | | | | | | | | | | | | | | | | |
Investments, at cost | | $ | 1,381,153 | | | $ | 2,671,311 | | | $ | 1,857,908 | | | $ | 105,088 | |
Repurchase agreements, at value and cost | | | 8,884 | | | | 15,040 | | | | 7,723 | | | | — | |
Unrealized appreciation (depreciation) | | | 105,003 | | | | 135,246 | | | | (66,763 | ) | | | (637 | ) |
| | | | | | | | | | | | | | | | |
Investments, at value | | | 1,495,040 | | | | 2,821,597 | | | | 1,798,868 | | | | 104,451 | |
Cash | | | 58,488 | | | | 65,537 | | | | 82,184 | | | | 10 | |
Foreign currency, at value (Cost $4,643, $9,099, $20,823 and $0, respectively) | | | 4,678 | | | | 8,628 | | | | 20,712 | | | | — | |
Unrealized appreciation on futures contracts | | | 50 | | | | 68 | | | | — | | | | — | |
Dividends and interest receivable | | | 5,776 | | | | 10,639 | | | | 12,101 | | | | 574 | |
Margin deposits | | | 2,787 | | | | 2,873 | | | | 5,157 | | | | — | |
Receivable for portfolio shares issued | | | 146 | | | | 573 | | | | 761 | | | | 29 | |
Receivable from investments sold | | | 791 | | | | 3,611 | | | | 2,804 | | | | 1,143 | |
Foreign tax reclaims receivable | | | 2,605 | | | | 4,731 | | | | 43 | | | | — | |
TBA sale commitments receivable | | | — | | | | — | | | | — | | | | 288 | |
Variation margin receivable on futures contracts | | | 10 | | | | 20 | | | | — | | | | — | |
Prepaid expenses | | | 25 | | | | 29 | | | | 22 | | | | 7 | |
| | | | | | | | | | | | | | | | |
Total assets | | | 1,570,396 | | | | 2,918,306 | | | | 1,922,652 | | | | 106,502 | |
| | | | | | | | | | | | | | | | |
LIABILITIES: | | | | | | | | | | | | | | | | |
Unrealized depreciation on futures contracts | | | — | | | | — | | | | 775 | | | | — | |
TBA sale commitments, at fair value | | | — | | | | — | | | | — | | | | 288 | |
Distributions payable | | | — | | | | — | | | | — | | | | 6 | |
Payable for investments purchased | | | 6,450 | | | | 14,056 | | | | 3,973 | | | | 6,407 | |
Payable for portfolio shares redeemed | | | 21,495 | | | | 5 | | | | 6,913 | | | | 21 | |
Payable for collateral received on loaned securities | | | 16,383 | | | | 28,989 | | | | 13,445 | | | | — | |
Accrued foreign capital gains tax | | | 32 | | | | 59 | | | | 233 | | | | — | |
Advisory fees payable | | | 309 | | | | 529 | | | | 537 | | | | 5 | |
Management fees payable | | | 65 | | | | 122 | | | | 78 | | | | 4 | |
Administrative services fees payable | | | 10 | | | | 19 | | | | 13 | | | | 1 | |
Trustee fees payable | | | 14 | | | | 28 | | | | 18 | | | | 1 | |
Other accrued expenses | | | 222 | | | | 406 | | | | 603 | | | | 21 | |
| | | | | | | | | | | | | | | | |
Total liabilities | | | 44,980 | | | | 44,213 | | | | 26,588 | | | | 6,754 | |
| | | | | | | | | | | | | | | | |
NET ASSETS | | $ | 1,525,416 | | | $ | 2,874,093 | | | $ | 1,896,064 | | | $ | 99,748 | |
| | | | | | | | | | | | | | | | |
NET ASSETS CONSISTS OF: | | | | | | | | | | | | | | | | |
Shares of beneficial interest, at par value | | $ | 136 | | | $ | 272 | | | $ | 108 | | | $ | 10 | |
Additional paid-in capital | | | 1,357,982 | | | | 2,653,744 | | | | 1,987,580 | | | | 99,479 | |
Accumulated net investment income/(distributions in excess of net investment income) | | | 532 | | | | (322 | ) | | | 18,500 | | | | 45 | |
Accumulated net realized gain/(loss) from investment transactions | | | 61,968 | | | | 85,734 | | | | (42,133 | ) | | | 851 | |
Net unrealized appreciation/(depreciation) on investments | | | 104,798 | | | | 134,665 | | | | (67,991 | ) | | | (637 | ) |
| | | | | | | | | | | | | | | | |
Net Assets | | $ | 1,525,416 | | | $ | 2,874,093 | | | $ | 1,896,064 | | | $ | 99,748 | |
| | | | | | | | | | | | | | | | |
NET ASSETS: | | | | | | | | | | | | | | | | |
HC Strategic Shares | | $ | 1,522,384 | | | $ | 2,869,985 | | | $ | 1,893,047 | | | $ | 96,952 | |
HC Advisors Shares | | | 3,032 | | | | 4,108 | | | | 3,017 | | | | 2,796 | |
| | | | | | | | | | | | | | | | |
Total | | $ | 1,525,416 | | | $ | 2,874,093 | | | $ | 1,896,064 | | | $ | 99,748 | |
| | | | | | | | | | | | | | | | |
SHARES OF BENEFICIAL INTEREST OUTSTANDING | | | | | | | | | | | | | | | | |
(Unlimited number of shares authorized; par value $0.001): | | | | | | | | | | | | | | | | |
HC Strategic Shares | | | 136,171 | | | | 271,378 | | | | 107,712 | | | | 9,915 | |
HC Advisors Shares | | | 271 | | | | 389 | | | | 172 | | | | 286 | |
| | | | | | | | | | | | | | | | |
Total | | | 136,442 | | | | 271,767 | | | | 107,884 | | | | 10,201 | |
| | | | | | | | | | | | | | | | |
Net Asset Value, offering and redemption price per share:(a) | | | | | | | | | | | | | | | | |
HC Strategic Shares | | $ | 11.18 | | | $ | 10.58 | | | $ | 17.58 | | | $ | 9.78 | |
| | | | | | | | | | | | | | | | |
HC Advisors Shares | | $ | 11.18 | | | $ | 10.57 | | | $ | 17.57 | | | $ | 9.77 | |
| | | | | | | | | | | | | | | | |
Amounts designated as “—” are $0 or have been rounded to $0.
| (a) | Per share amounts may not recalculate due to rounding of net assets and/or shares outstanding. |
See accompanying notes to financial statements.
224
HC CAPITAL TRUST
Statements of Assets and Liabilities (continued)
As of June 30, 2015
(Amounts in thousands except per share amounts)
| | | | | | | | | | | | | | | | |
| | | The Fixed
Income
Opportunity
Portfolio | | | The U.S.
Government
Fixed Income
Securities
Portfolio | | | The
Inflation
Protected
Securities
Portfolio | | | The U.S.
Corporate
Fixed Income
Securities
Portfolio | |
ASSETS: | | | | | | | | | | | | | | | | |
Investments, at cost | | $ | 805,509 | | | $ | 262,501 | | | $ | 507,672 | | | $ | 229,882 | |
Repurchase agreements, at value and cost | | | 11,406 | | | | — | | | | — | | | | — | |
Unrealized appreciation (depreciation) | | | (16,714 | ) | | | 2,284 | | | | 2,360 | | | | (6,694 | ) |
| | | | | | | | | | | | | | | | |
Investments, at value | | | 800,201 | | | | 264,785 | | | | 510,032 | | | | 223,188 | |
Cash | | | 21,739 | | | | — | | | | — | | | | 716 | |
Foreign currency, at value (Cost $132, $0, $0 and $0, respectively) | | | 134 | | | | — | | | | — | | | | — | |
Dividends and interest receivable | | | 10,653 | | | | 1,210 | | | | 1,877 | | | | 2,485 | |
Margin deposits | | | 1,126 | | | | — | | | | — | | | | — | |
Receivable for portfolio shares issued | | | 217 | | | | 505 | | | | 21 | | | | 642 | |
Receivable from investments sold | | | 1,222 | | | | 4,550 | | | | 3,354 | | | | 29 | |
Prepaid expenses | | | 12 | | | | 8 | | | | 27 | | | | 13 | |
| | | | | | | | | | | | | | | | |
Total assets | | | 835,304 | | | | 271,058 | | | | 515,311 | | | | 227,073 | |
| | | | | | | | | | | | | | | | |
LIABILITIES: | | | | | | | | | | | | | | | | |
Unrealized depreciation on forward currency contracts | | | 164 | | | | — | | | | — | | | | — | |
Unrealized depreciation on futures contracts | | | 23 | | | | — | | | | — | | | | — | |
Distributions payable | | | — | | | | 56 | | | | — | | | | 86 | |
Payable for investments purchased | | | 1,217 | | | | 5,261 | | | | 3,358 | | | | 1,353 | |
Payable for portfolio shares redeemed | | | 3,734 | | | | 2,689 | | | | 1,666 | | | | 2,244 | |
Payable for collateral received on loaned securities | | | 18,120 | | | | — | | | | — | | | | — | |
Advisory fees payable | | | 377 | | | | 12 | | | | 16 | | | | 14 | |
Management fees payable | | | 34 | | | | 11 | | | | 21 | | | | 9 | |
Administrative services fees payable | | | 3 | | | | 2 | | | | — | | | | 2 | |
Trustee fees payable | | | 8 | | | | 3 | | | | 1 | | | | 2 | |
Other accrued expenses | | | 64 | | | | 26 | | | | 72 | | | | 34 | |
| | | | | | | | | | | | | | | | |
Total liabilities | | | 23,744 | | | | 8,060 | | | | 5,134 | | | | 3,744 | |
| | | | | | | | | | | | | | | | |
NET ASSETS | | $ | 811,560 | | | $ | 262,998 | | | $ | 510,177 | | | $ | 223,329 | |
| | | | | | | | | | | | | | | | |
NET ASSETS CONSISTS OF: | | | | | | | | | | | | | | | | |
Shares of beneficial interest, at par value | | $ | 115 | | | $ | 26 | | | $ | 51 | | | $ | 23 | |
Additional paid-in capital | | | 822,623 | | | | 259,354 | | | | 509,922 | | | | 224,405 | |
Accumulated net investment income/(distributions in excess of net investment income) | | | 2,991 | | | | 64 | | | | (1,641 | ) | | | 112 | |
Accumulated net realized gain from investment transactions | | | 2,737 | | | | 1,270 | | | | (515 | ) | | | 5,483 | |
Net unrealized appreciation/(depreciation) on investments | | | (16,906 | ) | | | 2,284 | | | | 2,360 | | | | (6,694 | ) |
| | | | | | | | | | | | | | | | |
Net Assets | | $ | 811,560 | | | $ | 262,998 | | | $ | 510,177 | | | $ | 223,329 | |
| | | | | | | | | | | | | | | | |
NET ASSETS: | | | | | | | | | | | | | | | | |
HC Strategic Shares | | $ | 810,466 | | | $ | 262,998 | | | $ | 510,176 | | | $ | 223,329 | |
HC Advisor Shares | | | 1,094 | | | | — | | | | 1 | | | | — | |
| | | | | | | | | | | | | | | | |
Total | | $ | 811,560 | | | $ | 262,998 | | | $ | 510,177 | | | $ | 223,329 | |
| | | | | | | | | | | | | | | | |
SHARES OF BENEFICIAL INTEREST OUTSTANDING | | | | | | | | | | | | | | | | |
(Unlimited number of shares authorized; par value $0.001): | | | | | | | | | | | | | | | | |
HC Strategic Shares | | | 114,402 | | | | 26,253 | | | | 50,918 | | | | 22,600 | |
HC Advisor Shares | | | 154 | | | | — | | | | — | | | | — | |
| | | | | | | | | | | | | | | | |
Total | | | 114,556 | | | | 26,253 | | | | 50,918 | | | | 22,600 | |
| | | | | | | | | | | | | | | | |
Net Asset Value, offering and redemption price per share:(a) | | | | | | | | | | | | | | | | |
HC Strategic Shares | | $ | 7.08 | | | $ | 10.02 | | | $ | 10.02 | | | $ | 9.88 | |
| | | | | | | | | | | | | | | | |
HC Advisor Shares | | $ | 7.08 | | | $ | — | | | $ | 10.01 | | | $ | — | |
| | | | | | | | | | | | | | | | |
Amounts designated as “—” are $0 or have been rounded to $0.
| (a) | Per share amounts may not recalculate due to rounding of net assets and/or shares outstanding. |
See accompanying notes to financial statements.
225
HC CAPITAL TRUST
Statements of Assets and Liabilities (concluded)
As of June 30, 2015
(Amounts in thousands except per share amounts)
| | | | | | | | | | | | | | | | |
| | | The U.S.
Mortgage/Asset
Backed Fixed
Income Securities
Portfolio | | | The Short-Term
Municipal Bond
Portfolio | | | The
Intermediate
Term Municipal
Bond Portfolio | | | The
Intermediate
Term Municipal
Bond II Portfolio | |
ASSETS: | | | | | | | | | | | | | | | | |
Investments, at cost | | $ | 287,386 | | | $ | 20,541 | | | $ | 419,500 | | | $ | 76,045 | |
Unrealized appreciation | | | 1,937 | | | | 168 | | | | 7,412 | | | | 2,192 | |
| | | | | | | | | | | | | | | | |
Investments, at value | | | 289,323 | | | | 20,709 | | | | 426,912 | | | | 78,237 | |
Interest receivable | | | 620 | | | | 226 | | | | 5,091 | | | | 943 | |
Receivable for portfolio shares issued | | | 752 | | | | — | | | | 150 | | | | 50 | |
Receivable from investments sold | | | 8,130 | | | | — | | | | — | | | | — | |
TBA sale commitments receivable | | | 1,788 | | | | — | | | | — | | | | — | |
Prepaid expenses | | | 10 | | | | 5 | | | | 13 | | | | 9 | |
| | | | | | | | | | | | | | | | |
Total assets | | | 300,623 | | | | 20,940 | | | | 432,166 | | | | 79,239 | |
| | | | | | | | | | | | | | | | |
LIABILITIES: | | | | | | | | | | | | | | | | |
TBA sale commitments, at fair value | | | 1,788 | | | | — | | | | — | | | | — | |
Distributions payable | | | 123 | | | | — | | | | 33 | | | | 7 | |
Payable for investments purchased | | | 44,056 | | | | — | | | | 9,210 | | | | 1,483 | |
Payable for portfolio shares redeemed | | | 2,571 | | | | 1 | | | | 286 | | | | 50 | |
Income payable on TBA sale commitments | | | 3 | | | | — | | | | — | | | | — | |
Advisory fees payable | | | 12 | | | | 2 | | | | 164 | | | | 8 | |
Management fees payable | | | 10 | | | | 1 | | | | 17 | | | | 3 | |
Administrative services fees payable | | | 2 | | | | — | | | | 3 | | | | — | |
Trustee fees payable | | | 3 | | | | — | | | | 4 | | | | 1 | |
Other accrued expenses | | | 27 | | | | 3 | | | | 41 | | | | 10 | |
| | | | | | | | | | | | | | | | |
Total liabilities | | | 48,595 | | | | 7 | | | | 9,758 | | | | 1,562 | |
| | | | | | | | | | | | | | | | |
NET ASSETS | | $ | 252,028 | | | $ | 20,933 | | | $ | 422,408 | | | $ | 77,677 | |
| | | | | | | | | | | | | | | | |
NET ASSETS CONSISTS OF: | | | | | | | | | | | | | | | | |
Shares of beneficial interest, at par value | | $ | 25 | | | $ | 2 | | | $ | 42 | | | $ | 8 | |
Additional paid-in capital | | | 255,848 | | | | 20,768 | | | | 422,842 | | | | 75,469 | |
Accumulated net investment income/(distributions in excess of net investment income) | | | 127 | | | | (7 | ) | | | 238 | | | | 5 | |
Accumulated net realized gain/(loss) from investment transactions | | | (5,909 | ) | | | 2 | | | | (8,126 | ) | | | 3 | |
Net unrealized appreciation on investments | | | 1,937 | | | | 168 | | | | 7,412 | | | | 2,192 | |
| | | | | | | | | | | | | | | | |
Net Assets | | $ | 252,028 | | | $ | 20,933 | | | $ | 422,408 | | | $ | 77,677 | |
| | | | | | | | | | | | | | | | |
NET ASSETS: | | | | | | | | | | | | | | | | |
HC Strategic Shares | | $ | 252,028 | | | $ | 20,933 | | | $ | 420,423 | | | $ | 77,102 | |
HC Advisors Shares | | | — | | | | — | | | | 1,985 | | | | 575 | |
| | | | | | | | | | | | | | | | |
Total | | $ | 252,028 | | | $ | 20,933 | | | $ | 422,408 | | | $ | 77,677 | |
| | | | | | | | | | | | | | | | |
SHARES OF BENEFICIAL INTEREST OUTSTANDING | | | | | | | | | | | | | | | | |
(Unlimited number of shares authorized; par value $0.001): | | | | | | | | | | | | | | | | |
HC Strategic Shares | | | 25,696 | | | | 2,107 | | | | 41,776 | | | | 7,477 | |
HC Advisors Shares | | | — | | | | — | | | | 197 | | | | 56 | |
| | | | | | | | | | | | | | | | |
Total | | | 25,696 | | | | 2,107 | | | | 41,973 | | | | 7,533 | |
| | | | | | | | | | | | | | | | |
Net Asset Value, offering and redemption price per share:(a) | | | | | | | | | | | | | | | | |
HC Strategic Shares | | $ | 9.81 | | | $ | 9.94 | | | $ | 10.06 | | | $ | 10.31 | |
| | | | | | | | | | | | | | | | |
HC Advisors Shares | | $ | — | | | $ | — | | | $ | 10.06 | | | $ | 10.31 | |
| | | | | | | | | | | | | | | | |
Amounts designated as “—” are $0 or have been rounded to $0.
| (a) | Per share amounts may not recalculate due to rounding of net assets and/or shares outstanding. |
See accompanying notes to financial statements.
226
HC CAPITAL TRUST
Statements of Operations
For the Year Ended June 30, 2015
(Amounts in thousands)
| | | | | | | | | | | | | | | | |
| | | The Value
Equity
Portfolio | | | The
Institutional
Value Equity
Portfolio | | | The Growth
Equity
Portfolio | | | The
Institutional
Growth Equity
Portfolio | |
INVESTMENT INCOME: | | | | | | | | | | | | | | | | |
Interest | | $ | 13 | | | $ | 1 | | | $ | — | | | $ | 1,552 | |
Dividends (net of foreign withholding tax of $9, $13, $8 and $22, respectively) | | | 14,064 | | | | 22,103 | | | | 10,308 | | | | 15,815 | |
Income from securities lending (net of fees of $42, $67, $6 and $9, respectively) | | | 167 | | | | 268 | | | | 27 | | | | 38 | |
| | | | | | | | | | | | | | | | |
Total Investment Income | | | 14,244 | | | | 22,372 | | | | 10,335 | | | | 17,405 | |
| | | | | | | | | | | | | | | | |
EXPENSES: | | | | | | | | | | | | | | | | |
Advisory fees | | | 1,136 | | | | 1,793 | | | | 1,686 | | | | 2,603 | |
Management fees | | | 320 | | | | 504 | | | | 439 | | | | 717 | |
Administrative services fees | | | 186 | | | | 293 | | | | 255 | | | | 416 | |
Distribution fees – HC Advisors Shares | | | 3 | | | | 4 | | | | 4 | | | | 5 | |
Professional fees | | | 71 | | | | 85 | | | | 85 | | | | 127 | |
Transfer agent fees | | | 5 | | | | 7 | | | | 7 | | | | 11 | |
Compliance service fees | | | 7 | | | | 10 | | | | 10 | | | | 17 | |
Custodian fees | | | 51 | | | | 63 | | | | 64 | | | | 108 | |
Registration and filing fees | | | 19 | | | | 5 | | | | 20 | | | | 10 | |
Trustee fees | | | 24 | | | | 36 | | | | 37 | | | | 60 | |
Other | | | 31 | | | | 46 | | | | 52 | | | | 86 | |
| | | | | | | | | | | | | | | | |
Total expenses before waivers and expenses paid indirectly | | | 1,853 | | | | 2,846 | | | | 2,659 | | | | 4,160 | |
Less: Expenses waived by Specialist Manager | | | — | | | | — | | | | (25 | ) | | | (30 | ) |
Less: Distribution fees waived – HC Advisors Shares | | | (3 | ) | | | (4 | ) | | | (4 | ) | | | (5 | ) |
Expenses paid indirectly | | | (54 | ) | | | (91 | ) | | | (24 | ) | | | (46 | ) |
| | | | | | | | | | | | | | | | |
Net Expenses | | | 1,796 | | | | 2,751 | | | | 2,606 | | | | 4,079 | |
| | | | | | | | | | | | | | | | |
Net Investment Income | | | 12,448 | | | | 19,621 | | | | 7,729 | | | | 13,326 | |
| | | | | | | | | | | | | | | | |
NET REALIZED/UNREALIZED GAIN/(LOSS) ON INVESTMENTS: | | | | | | | | | | | | | | | | |
Net realized gains/(losses) from investment transactions | | | 79,144 | | | | 129,429 | | | | 151,835 | | | | 203,878 | |
Net realized gains/(losses) from futures transactions | | | 88 | | | | 105 | | | | 657 | | | | 12,655 | |
Net realized gains/(losses) from written options transactions | | | — | | | | — | | | | — | | | | (106 | ) |
Net realized gains/(losses) from swap transactions | | | — | | | | — | | | | — | | | | (2,922 | ) |
Net realized gains/(losses) from foreign currency transactions | | | — | | | | — | | | | — | | | | 2,120 | |
| | | | | | | | | | | | | | | | |
Net realized gains/(losses) from investments, futures, written options, swap transactions, and foreign currency transactions | | | 79,232 | | | | 129,534 | | | | 152,492 | | | | 215,625 | |
Change in unrealized appreciation/(depreciation) on investments | | | (58,332 | ) | | | (97,658 | ) | | | (64,493 | ) | | | (71,632 | ) |
Change in unrealized appreciation/(depreciation) on futures | | | (405 | ) | | | (406 | ) | | | (1,438 | ) | | | (3,849 | ) |
Change in unrealized appreciation/(depreciation) on written options | | | — | | | | — | | | | — | | | | (3 | ) |
Change in unrealized appreciation/(depreciation) on swaps | | | — | | | | — | | | | — | | | | (64 | ) |
Change in unrealized appreciation/(depreciation) on foreign currency translations | | | — | | | | — | | | | — | | | | (5 | ) |
| | | | | | | | | | | | | | | | |
Change in unrealized appreciation/(depreciation) on investments, futures, written options, swaps, foreign currency translations | | | (58,737 | ) | | | (98,064 | ) | | | (65,931 | ) | | | (75,553 | ) |
| | | | | | | | | | | | | | | | |
Net realized/unrealized gains/(losses) from investments, futures, written options, swaps, and foreign currency transactions | | | 20,495 | | | | 31,470 | | | | 86,561 | | | | 140,072 | |
| | | | | | | | | | | | | | | | |
Change in net assets resulting from operations | | $ | 32,943 | | | $ | 51,091 | | | $ | 94,290 | | | $ | 153,398 | |
| | | | | | | | | | | | | | | | |
Amounts designated as “—” are $0 or have been rounded to $0.
See accompanying notes to financial statements.
227
HC CAPITAL TRUST
Statements of Operations (continued)
For the Year Ended June 30, 2015
(Amounts in thousands)
| | | | | | | | | | | | | | | | |
| | | The Small
Capitalization–
Mid Capitalization
Equity Portfolio | | | The
Institutional Small
Capitalization–
Mid Capitalization
Equity Portfolio | | | The
Real Estate
Securities
Portfolio | | | The
Commodity
Returns Strategy
Portfolio(a) | |
INVESTMENT INCOME: | | | | | | | | | | | | | | | | |
Interest | | $ | — | | | $ | 1 | | | $ | — | | | $ | 1,995 | |
Dividends (net of foreign withholding tax of $3, $5, $10 and $1,605, respectively) | | | 793 | | | | 1,397 | | | | 3,164 | | | | 20,329 | |
Income from securities lending (net of fees of $16, $41, $0 and $80, respectively) | | | 63 | | | | 167 | | | | — | | | | 326 | |
| | | | | | | | | | | | | | | | |
Total Investment Income | | | 856 | | | | 1,565 | | | | 3,164 | | | | 22,650 | |
| | | | | | | | | | | | | | | | |
EXPENSES: | | | | | | | | | | | | | | | | |
Advisory fees | | | 728 | | | | 1,294 | | | | 1,029 | | | | 5,603 | |
Management fees | | | 56 | | | | 95 | | | | 79 | | | | 559 | |
Administrative services fees | | | 32 | | | | 56 | | | | 47 | | | | 324 | |
Distribution fees – HC Advisors Shares | | | — | | | | 1 | | | | — | | | | 4 | |
Professional fees | | | 24 | | | | 16 | | | | 29 | | | | 166 | |
Transfer agent fees | | | 1 | | | | 1 | | | | 1 | | | | 9 | |
Compliance service fees | | | 1 | | | | 2 | | | | 2 | | | | 16 | |
Custodian fees | | | 26 | | | | 18 | | | | 20 | | | | 201 | |
Registration and filing fees | | | 23 | | | | 23 | | | | 6 | | | | 20 | |
Trustee fees | | | 5 | | | | 7 | | | | 8 | | | | 58 | |
Other | | | 37 | | | | 13 | | | | 23 | | | | 62 | |
| | | | | | | | | | | | | | | | |
Total expenses before waivers and expenses paid indirectly | | | 933 | | | | 1,526 | | | | 1,244 | | | | 7,022 | |
Less: Distribution fees waived – HC Advisors Shares | | | — | | | | (1 | ) | | | — | | | | (4 | ) |
Expenses paid indirectly | | | (8 | ) | | | (10 | ) | | | (2 | ) | | | (9 | ) |
| | | | | | | | | | | | | | | | |
Net Expenses | | | 925 | | | | 1,515 | | | | 1,242 | | | | 7,009 | |
| | | | | | | | | | | | | | | | |
Net Investment Income/(Loss) | | | (69 | ) | | | 50 | | | | 1,922 | | | | 15,641 | |
| | | | | | | | | | | | | | | | |
NET REALIZED/UNREALIZED GAIN/(LOSS) ON INVESTMENTS: | | | | | | | | | | | | | | | | |
Net realized gains/(losses) from investment transactions | | | 10,633 | | | | 11,873 | | | | 18,429 | | | | (43,958 | ) |
Net realized gains/(losses) from futures transactions | | | (29 | ) | | | (74 | ) | | | (210 | ) | | | (46,944 | ) |
Net realized gains/(losses) from written options transactions | | | — | | | | — | | | | — | | | | 287 | |
Net realized gains/(losses) from swap transactions | | | — | | | | — | | | | — | | | | (70,828 | ) |
Net realized gains/(losses) from foreign currency transactions | | | — | | | | — | | | | (2 | ) | | | 5,044 | |
| | | | | | | | | | | | | | | | |
Net realized gains/(losses) from investments, futures, written options, swap transactions, and foreign currency transactions | | | 10,604 | | | | 11,799 | | | | 18,217 | | | | (156,399 | ) |
Change in unrealized appreciation/(depreciation) on investments (Net of deferred foreign tax) | | | (2,996 | ) | | | 1,858 | | | | (6,228 | ) | | | (130,866 | ) |
Change in unrealized appreciation/(depreciation) on futures | | | 36 | | | | 64 | | | | (70 | ) | | | (13,195 | ) |
Change in unrealized appreciation/(depreciation) on written options | | | — | | | | — | | | | — | | | | (38 | ) |
Change in unrealized appreciation/(depreciation) on swaps | | | — | | | | — | | | | — | | | | 4,525 | |
Change in unrealized appreciation/(depreciation) on foreign currency translations | | | — | | | | — | | | | — | | | | (463 | ) |
| | | | | | | | | | | | | | | | |
Change in unrealized appreciation/(depreciation) on investments, futures, written options, swaps, foreign currency translations | | | (2,960 | ) | | | 1,922 | | | | (6,298 | ) | | | (140,037 | ) |
| | | | | | | | | | | | | | | | |
Net realized/unrealized gains/(losses) from investments, futures, written options, swaps, and foreign currency transactions | | | 7,644 | | | | 13,721 | | | | 11,919 | | | | (296,436 | ) |
| | | | | | | | | | | | | | | | |
Change in net assets resulting from operations | | $ | 7,575 | | | $ | 13,771 | | | $ | 13,841 | | | $ | (280,795 | ) |
| | | | | | | | | | | | | | | | |
Amounts designated as “—” are $0 or have been rounded to $0.
| (a) | Statement has been consolidated. See Note 2O in Notes to Financial Statements for basis of consolidation. |
See accompanying notes to financial statements.
228
HC CAPITAL TRUST
Statements of Operations (continued)
For the Year Ended June 30, 2015
(Amounts in thousands)
| | | | | | | | | | | | | | | | |
| | | The International
Equity Portfolio | | | The
Institutional
International
Equity Portfolio | | | The
Emerging
Markets
Portfolio | | | The Core
Fixed
Income
Portfolio | |
INVESTMENT INCOME: | | | | | | | | | | | | | | | | |
Interest | | $ | 1 | | | $ | 2 | | | $ | 2 | | | $ | 2,210 | |
Dividends (net of foreign withholding tax of $6,179, $12,332, $5,805 and $0, respectively) | | | 44,288 | | | | 87,375 | | | | 53,874 | | | | — | |
Income from securities lending (net of fees of $238, $462, $84 and $1, respectively) | | | 947 | | | | 1,852 | | | | 331 | | | | 3 | |
| | | | | | | | | | | | | | | | |
Total Investment Income | | | 45,236 | | | | 89,229 | | | | 54,207 | | | | 2,213 | |
| | | | | | | | | | | | | | | | |
EXPENSES: | | | | | | | | | | | | | | | | |
Advisory fees | | | 3,419 | | | | 6,401 | | | | 6,618 | | | | 92 | |
Management fees | | | 758 | | | | 1,462 | | | | 933 | | | | 51 | |
Administrative services fees | | | 438 | | | | 846 | | | | 541 | | | | 29 | |
Distribution fees – HC Advisors Shares | | | 8 | | | | 10 | | | | 7 | | | | 7 | |
Professional fees | | | 236 | | | | 363 | | | | 247 | | | | 18 | |
Transfer agent fees | | | 13 | | | | 24 | | | | 15 | | | | 1 | |
Compliance service fees | | | 22 | | | | 43 | | | | 29 | | | | 1 | |
Custodian fees | | | 583 | | | | 973 | | | | 2,319 | | | | 23 | |
Registration and filing fees | | | 22 | | | | 14 | | | | 15 | | | | 5 | |
Trustee fees | | | 77 | | | | 153 | | | | 100 | | | | 4 | |
Other | | | 180 | | | | 293 | | | | 176 | | | | 47 | |
| | | | | | | | | | | | | | | | |
Total expenses before waivers and expenses paid indirectly | | | 5,756 | | | | 10,582 | | | | 11,000 | | | | 278 | |
Less: Distribution fees waived – HC Advisors Shares | | | (8 | ) | | | (10 | ) | | | (7 | ) | | | (7 | ) |
Expenses paid indirectly | | | (6 | ) | | | (13 | ) | | | (36 | ) | | | — | |
| | | | | | | | | | | | | | | | |
Net Expenses | | | 5,742 | | | | 10,559 | | | | 10,957 | | | | 271 | |
| | | | | | | | | | | | | | | | |
Net Investment Income | | | 39,494 | | | | 78,670 | | | | 43,250 | | | | 1,942 | |
| | | | | | | | | | | | | | | | |
NET REALIZED/UNREALIZED GAIN/(LOSS) ON INVESTMENTS: | | | | | | | | | | | | | | | | |
Net realized gains/(losses) from investment transactions | | | 99,429 | | | | 142,133 | | | | 12,758 | | | | 1,528 | |
Net realized gains/(losses) from futures transactions | | | (2,549 | ) | | | (3,327 | ) | | | (2,594 | ) | | | — | |
Net realized gains/(losses) from foreign currency transactions | | | (1,499 | ) | | | (2,315 | ) | | | (3,947 | ) | | | — | |
| | | | | | | | | | | | | | | | |
Net realized gains/(losses) from investments, futures, and foreign currency transactions | | | 95,381 | | | | 136,491 | | | | 6,217 | | | | 1,528 | |
Change in unrealized appreciation/(depreciation) on investments (net of deferred foreign tax) | | | (206,353 | ) | | | (344,197 | ) | | | (205,811 | ) | | | (2,243 | ) |
Change in unrealized appreciation/(depreciation) on futures | | | 45 | | | | 61 | | | | (775 | ) | | | — | |
Change in unrealized appreciation/(depreciation) on foreign currency translations | | | (207 | ) | | | (607 | ) | | | (338 | ) | | | — | |
| | | | | | | | | | | | | | | | |
Change in unrealized appreciation/(depreciation) on investments, futures, and foreign currency translations | | | (206,515 | ) | | | (344,743 | ) | | | (206,924 | ) | | | (2,243 | ) |
| | | | | | | | | | | | | | | | |
Net realized/unrealized gains/(losses) from investments, futures, and foreign currency transactions | | | (111,134 | ) | | | (208,252 | ) | | | (200,707 | ) | | | (715 | ) |
| | | | | | | | | | | | | | | | |
Change in net assets resulting from operations | | $ | (71,640 | ) | | $ | (129,582 | ) | | $ | (157,457 | ) | | $ | 1,227 | |
| | | | | | | | | | | | | | | | |
Amounts designated as “—” are $0 or have been rounded to $0.
See accompanying notes to financial statements.
229
HC CAPITAL TRUST
Statements of Operations (continued)
For the Year Ended June 30, 2015
(Amounts in thousands)
| | | | | | | | | | | | | | | | |
| | | The Fixed
Income
Opportunity
Portfolio | | | The U.S.
Government
Fixed Income
Securities
Portfolio | | | The
Inflation
Protected
Securities
Portfolio | | | The U.S.
Corporate
Fixed Income
Securities
Portfolio | |
INVESTMENT INCOME: | | | | | | | | | | | | | | | | |
Interest | | $ | 42,597 | | | $ | 3,580 | | | $ | (359 | ) | | $ | 6,975 | |
Dividends | | | 2,455 | | | | — | | | | — | | | | — | |
Income from securities lending (net of fees of $40, $0, $0 and $5, respectively) | | | 158 | | | | — | | | | — | | | | 19 | |
| | | | | | | | | | | | | | | | |
Total Investment Income | | | 45,210 | | | | 3,580 | | | | (359 | ) | | | 6,994 | |
| | | | | | | | | | | | | | | | |
EXPENSES: | | | | | | | | | | | | | | | | |
Advisory fees | | | 1,648 | | | | 136 | | | | 186 | | | | 388 | |
Management fees | | | 404 | | | | 130 | | | | 259 | | | | 121 | |
Administrative services fees | | | 236 | | | | 76 | | | | 148 | | | | 71 | |
Distribution fees – HC Advisors Shares | | | 3 | | | | — | | | | — | | | | — | |
Professional fees | | | 94 | | | | 21 | | | | 77 | | | | 22 | |
Transfer agent fees | | | 6 | | | | 2 | | | | 4 | | | | 2 | |
Compliance service fees | | | 11 | | | | 2 | | | | 9 | | | | 3 | |
Custodian fees | | | 59 | | | | 17 | | | | 60 | | | | 32 | |
Registration and filing fees | | | 19 | | | | 16 | | | | 125 | | | | 14 | |
Trustee fees | | | 39 | | | | 9 | | | | 32 | | | | 10 | |
Other | | | 93 | | | | 28 | | | | 39 | | | | 22 | |
| | | | | | | | | | | | | | | | |
Total expenses before waivers and expenses paid indirectly | | | 2,612 | | | | 437 | | | | 939 | | | | 685 | |
Less: Distribution fees waived – HC Advisors Shares | | | (3 | ) | | | — | | | | — | | | | — | |
| | | | | | | | | | | | | | | | |
Net Expenses | | | 2,609 | | | | 437 | | | | 939 | | | | 685 | |
| | | | | | | | | | | | | | | | |
Net Investment Income/(Loss) | | | 42,601 | | | | 3,143 | | | | (1,298 | ) | | | 6,309 | |
| | | | | | | | | | | | | | | | |
NET REALIZED/UNREALIZED GAIN/(LOSS) ON INVESTMENTS: | | | | | | | | | | | | | | | | |
Net realized gains/(losses) from investment transactions | | | 4,722 | | | | 2,081 | | | | (420 | ) | | | 7,917 | |
Net realized gains/(losses) from futures transactions | | | 1,017 | | | | — | | | | — | | | | — | |
Net realized gains/(losses) from foreign currency transactions | | | 440 | | | | — | | | | — | | | | — | |
| | | | | | | | | | | | | | | | |
Net realized gains/(losses) from investments, futures, and foreign currency transactions | | | 6,179 | | | | 2,081 | | | | (420 | ) | | | 7,917 | |
Change in unrealized appreciation/(depreciation) on investments | | | (47,427 | ) | | | 324 | | | | (7,328 | ) | | | (13,362 | ) |
Change in unrealized appreciation/(depreciation) on futures | | | (23 | ) | | | — | | | | — | | | | — | |
Change in unrealized appreciation/(depreciation) on foreign currency translations | | | (169 | ) | | | — | | | | — | | | | — | |
| | | | | | | | | | | | | | | | |
Change in unrealized appreciation/(depreciation) on investments, futures, and foreign currency translations | | | (47,619 | ) | | | 324 | | | | (7,328 | ) | | | (13,362 | ) |
| | | | | | | | | | | | | | | | |
Net realized/unrealized gains/(losses) from investments, futures, and foreign currency transactions | | | (41,440 | ) | | | 2,405 | | | | (7,748 | ) | | | (5,445 | ) |
| | | | | | | | | | | | | | | | |
Change in net assets resulting from operations | | $ | 1,161 | | | $ | 5,548 | | | $ | (9,046 | ) | | $ | 864 | |
| | | | | | | | | | | | | | | | |
Amounts designated as “—” are $0 or have been rounded to $0
See accompanying notes to financial statements.
230
HC CAPITAL TRUST
Statements of Operations (concluded)
For the Year Ended June 30, 2015
(Amounts in thousands)
| | | | | | | | | | | | | | | | |
| | | The U.S.
Mortgage/Asset
Backed Fixed
Income Securities
Portfolio | | | The Short-Term
Municipal Bond
Portfolio | | | The
Intermediate
Term Municipal
Bond Portfolio | | | The
Intermediate
Term Municipal
Bond II Portfolio | |
INVESTMENT INCOME: | | | | | | | | | | | | | | | | |
Interest | | $ | 5,395 | | | $ | 318 | | | $ | 9,517 | | | $ | 1,622 | |
| | | | | | | | | | | | | | | | |
Total Investment Income | | | 5,395 | | | | 318 | | | | 9,517 | | | | 1,622 | |
| | | | | | | | | | | | | | | | |
EXPENSES: | | | | | | | | | | | | | | | | |
Advisory fees | | | 137 | | | | 27 | | | | 529 | | | | 85 | |
Management fees | | | 130 | | | | 11 | | | | 210 | | | | 39 | |
Administrative services fees | | | 76 | | | | 6 | | | | 122 | | | | 21 | |
Distribution fees – HC Advisors Shares | | | — | | | | — | | | | 6 | | | | 2 | |
Professional fees | | | 18 | | | | 1 | | | | 36 | | | | 8 | |
Transfer agent fees | | | 2 | | | | — | | | | 3 | | | | 1 | |
Compliance service fees | | | 2 | | | | — | | | | 4 | | | | 1 | |
Custodian fees | | | 15 | | | | 2 | | | | 33 | | | | 7 | |
Registration and filing fees | | | 16 | | | | 14 | | | | 15 | | | | 16 | |
Trustee fees | | | 8 | | | | 1 | | | | 17 | | | | 4 | |
Other | | | 30 | | | | 4 | | | | 36 | | | | 11 | |
| | | | | | | | | | | | | | | | |
Total expenses before waivers and expenses paid indirectly | | | 434 | | | | 66 | | | | 1,011 | | | | 195 | |
Less: Distribution fees waived – HC Advisors Shares | | | — | | | | — | | | | (6 | ) | | | (2 | ) |
| | | | | | | | | | | | | | | | |
Net Expenses | | | 434 | | | | 66 | | | | 1,005 | | | | 193 | |
| | | | | | | | | | | | | | | | |
Net Investment Income | | | 4,961 | | | | 252 | | | | 8,512 | | | | 1,429 | |
| | | | | | | | | | | | | | | | |
NET REALIZED/UNREALIZED GAIN/(LOSS) ON INVESTMENTS: | | | | | | | | | | | | | | | | |
Net realized gains/(losses) from investment transactions | | | 1,318 | | | | 2 | | | | 3,209 | | | | 385 | |
| | | | | | | | | | | | | | | | |
Change in unrealized appreciation/(depreciation) on investments | | | (1,122 | ) | | | (214 | ) | | | (5,140 | ) | | | (774 | ) |
| | | | | | | | | | | | | | | | |
Net realized/unrealized gains/(losses) from investments | | | 196 | | | | (212 | ) | | | (1,931 | ) | | | (389 | ) |
| | | | | | | | | | | | | | | | |
Change in net assets resulting from operations | | $ | 5,157 | | | $ | 40 | | | $ | 6,581 | | | $ | 1,040 | |
| | | | | | | | | | | | | | | | |
Amounts designated as “—” are $0 or have been rounded to $0
See accompanying notes to financial statements.
231
HC CAPITAL TRUST
Statements of Changes in Net Assets
(Amounts in thousands)
| | | | | | | | | | | | | | | | | | | | | | | | |
| | | The Value
Equity Portfolio | | | The Institutional Value
Equity Portfolio | | | The Growth
Equity Portfolio | |
| | | For the
Year Ended
June 30,
2015 | | | For the
Year Ended
June 30,
2014 | | | For the
Year Ended
June 30,
2015 | | | For the
Year Ended
June 30,
2014 | | | For the
Year Ended
June 30,
2015 | | | For the
Year Ended
June 30,
2014 | |
Operations: | | | | | | | | | | | | | | | | | | | | | | | | |
Net investment income | | $ | 12,448 | | | $ | 15,596 | | | $ | 19,621 | | | $ | 23,478 | | | $ | 7,729 | | | $ | 8,703 | |
Net realized gains/(losses) from investments, futures, and foreign currency transactions | | | 79,232 | | | | 100,427 | | | | 129,534 | | | | 135,287 | | | | 152,492 | | | | 73,925 | |
Change in unrealized appreciation/(depreciation) from investments, futures, and foreign currency transactions | | | (58,737 | ) | | | 15,325 | | | | (98,064 | ) | | | 38,645 | | | | (65,931 | ) | | | 76,692 | |
| | | | | | | | | | | | | | | | | | | | | | | | |
Change in net assets resulting from operations | | | 32,943 | | | | 131,348 | | | | 51,091 | | | | 197,410 | | | | 94,290 | | | | 159,320 | |
| | | | | | | | | | | | | | | | | | | | | | | | |
| | | | | | |
Distributions to Shareholders from: | | | | | | | | | | | | | | | | | | | | | | | | |
Net investment income: | | | | | | | | | | | | | | | | | | | | | | | | |
HC Strategic Shares | | | (12,541 | ) | | | (15,732 | ) | | | (19,960 | ) | | | (23,473 | ) | | | (7,774 | ) | | | (8,824 | ) |
HC Advisors Shares | | | (23 | ) | | | (39 | ) | | | (29 | ) | | | (42 | ) | | | (15 | ) | | | (18 | ) |
Net realized gains/(losses) from investments, futures, foreign currency transactions: | | | | | | | | | | | | | | | | | | | | | | | | |
HC Strategic Shares | | | — | | | | — | | | | (120,230 | ) | | | (142,904 | ) | | | (9,890 | ) | | | — | |
HC Advisors Shares | | | — | | | | — | | | | (169 | ) | | | (307 | ) | | | (19 | ) | | | — | |
| | | | | | | | | | | | | | | | | | | | | | | | |
Change in net assets resulting from distributions | | | (12,564 | ) | | | (15,771 | ) | | | (140,388 | ) | | | (166,726 | ) | | | (17,698 | ) | | | (8,842 | ) |
| | | | | | | | | | | | | | | | | | | | | | | | |
| | | | | | |
HC Strategic Shares | | | | | | | | | | | | | | | | | | | | | | | | |
Proceeds from shares issued | | $ | 27,767 | | | $ | 96,390 | | | $ | 72,971 | | | $ | 240,649 | | | $ | 38,244 | | | $ | 160,036 | |
Proceeds from reinvestment of dividends | | | 10,269 | | | | 13,169 | | | | 138,813 | | | | 164,446 | | | | 14,918 | | | | 7,248 | |
Cost of shares redeemed | | | (65,002 | ) | | | (276,146 | ) | | | (244,198 | ) | | | (335,962 | ) | | | (97,423 | ) | | | (213,896 | ) |
| | | | | | | | | | | | | | | | | | | | | | | | |
Change in net assets from HC Strategic Shares of beneficial interest | | | (26,966 | ) | | | (166,587 | ) | | | (32,414 | ) | | | 69,133 | | | | (44,261 | ) | | | (46,612 | ) |
| | | | | | | | | | | | | | | | | | | | | | | | |
| | | | | | |
HC Advisors Shares | | | | | | | | | | | | | | | | | | | | | | | | |
Proceeds from shares issued | | | 20 | | | | 139 | | | | 376 | | | | 311 | | | | — | | | | 136 | |
Cost of shares redeemed | | | (110 | ) | | | (777 | ) | | | (69 | ) | | | (1,008 | ) | | | (207 | ) | | | (289 | ) |
| | | | | | | | | | | | | | | | | | | | | | | | |
Change in net assets from HC Advisors Shares of beneficial interest | | | (90 | ) | | | (638 | ) | | | 307 | | | | (697 | ) | | | (207 | ) | | | (153 | ) |
| | | | | | | | | | | | | | | | | | | | | | | | |
Change in net assets from shares of beneficial interest | | $ | (27,056 | ) | | $ | (167,225 | ) | | $ | (32,107 | ) | | $ | 68,436 | | | $ | (44,468 | ) | | $ | (46,765 | ) |
| | | | | | | | | | | | | | | | | | | | | | | | |
Change in net assets | | | (6,677 | ) | | | (51,648 | ) | | | (121,404 | ) | | | 99,120 | | | | 32,124 | | | | 103,713 | |
| | | | | | |
Net Assets: | | | | | | | | | | | | | | | | | | | | | | | | |
Beginning of period | | | 629,862 | | | | 681,510 | | | | 1,038,084 | | | | 938,964 | | | | 841,503 | | | | 737,790 | |
| | | | | | | | | | | | | | | | | | | | | | | | |
End of period | | $ | 623,185 | | | $ | 629,862 | | | $ | 916,680 | | | $ | 1,038,084 | | | $ | 873,627 | | | $ | 841,503 | |
| | | | | | | | | | | | | | | | | | | | | | | | |
Accumulated net investment income | | $ | 337 | | | $ | 765 | | | $ | 616 | | | $ | 1,312 | | | $ | 250 | | | $ | 335 | |
| | | | | | |
Share Transactions: | | | | | | | | | | | | | | | | | | | | | | | | |
HC Strategic Shares | | | | | | | | | | | | | | | | | | | | | | | | |
Issued | | | 1,516 | | | | 5,816 | | | | 5,124 | | | | 16,618 | | | | 1,783 | | | | 8,247 | |
Reinvested | | | 551 | | | | 792 | | | | 10,313 | | | | 12,076 | | | | 688 | | | | 374 | |
Redeemed | | | (3,519 | ) | | | (16,960 | ) | | | (17,740 | ) | | | (22,760 | ) | | | (4,447 | ) | | | (11,108 | ) |
| | | | | | | | | | | | | | | | | | | | | | | | |
Change in HC Strategic Shares | | | (1,452 | ) | | | (10,352 | ) | | | (2,303 | ) | | | 5,934 | | | | (1,976 | ) | | | (2,487 | ) |
| | | | | | | | | | | | | | | | | | | | | | | | |
| | | | | | |
HC Advisors Shares | | | | | | | | | | | | | | | | | | | | | | | | |
Issued | | | 1 | | | | 9 | | | | 27 | | | | 22 | | | | — | | | | 7 | |
Redeemed | | | (6 | ) | | | (45 | ) | | | (5 | ) | | | (69 | ) | | | (9 | ) | | | (15 | ) |
| | | | | | | | | | | | | | | | | | | | | | | | |
Change in HC Advisors Shares | | | (5 | ) | | | (36 | ) | | | 22 | | | | (47 | ) | | | (9 | ) | | | (8 | ) |
| | | | | | | | | | | | | | | | | | | | | | | | |
Total change in shares | | | (1,457 | ) | | | (10,388 | ) | | | (2,281 | ) | | | 5,887 | | | | (1,985 | ) | | | (2,495 | ) |
| | | | | | | | | | | | | | | | | | | | | | | | |
Amounts designated as “—” are $0 or have been rounded to $0
See accompanying notes to financial statements.
232
HC CAPITAL TRUST
Statements of Changes in Net Assets (continued)
(Amounts in thousands)
| | | | | | | | | | | | | | | | | | | | | | | | |
| | | The Institutional Growth
Equity Portfolio | | | The Small Capitalization–
Mid Capitalization Equity
Portfolio | | | The Institutional
Small Capitalization–
Mid Capitalization
Equity Portfolio | |
| | | For the
Year Ended
June 30,
2015 | | | For the
Year Ended
June 30,
2014 | | | For the
Year Ended
June 30,
2015 | | | For the
Year Ended
June 30,
2014 | | | For the
Year Ended
June 30,
2015 | | | For the
Year Ended
June 30,
2014 | |
Operations: | | | | | | | | | | | | | | | | | | | | | | | | |
Net investment income | | $ | 13,326 | | | $ | 14,857 | | | $ | (69 | ) | | $ | 385 | | | $ | 50 | | | $ | 367 | |
Net realized gains/(losses) from investments, futures, written options, swap transactions, foreign currency transactions | | | 215,625 | | | | 106,235 | | | | 10,604 | | | | 22,534 | | | | 11,799 | | | | 30,944 | |
Change in unrealized appreciation/(depreciation) from investments, futures, written options, swap transactions, foreign currency transactions | | | (75,553 | ) | | | 133,438 | | | | (2,960 | ) | | | 2,920 | | | | 1,922 | | | | 2,645 | |
| | | | | | | | | | | | | | | | | | | | | | | | |
Change in net assets resulting from operations | | | 153,398 | | | | 254,530 | | | | 7,575 | | | | 25,839 | | | | 13,771 | | | | 33,956 | |
| | | | | | | | | | | | | | | | | | | | | | | | |
Distributions to Shareholders from: | | | | | | | | | | | | | | | | | | | | | | | | |
Net investment income: | | | | | | | | | | | | | | | | | | | | | | | | |
HC Strategic Shares | | | (12,694 | ) | | | (15,609 | ) | | | (34 | ) | | | (421 | ) | | | (144 | ) | | | (330 | ) |
HC Advisors Shares | | | (19 | ) | | | (23 | ) | | | — | | | | (1 | ) | | | — | | | | — | |
Net realized gains/(losses) from investments, futures, written options, swap transactions, foreign currency transactions: | | | | | | | | | | | | | | | | | | | | | | | | |
HC Strategic Shares | | | (93,716 | ) | | | (106,330 | ) | | | — | | | | — | | | | (19,022 | ) | | | (27,745 | ) |
HC Advisors Shares | | | (125 | ) | | | (167 | ) | | | — | | | | — | | | | (25 | ) | | | (39 | ) |
| | | | | | | | | | | | | | | | | | | | | | | | |
Change in net assets resulting from distributions | | | (106,554 | ) | | | (122,129 | ) | | | (34 | ) | | | (422 | ) | | | (19,191 | ) | | | (28,114 | ) |
| | | | | | | | | | | | | | | | | | | | | | | | |
HC Strategic Shares | | | | | | | | | | | | | | | | | | | | | | | | |
Proceeds from shares issued | | $ | 73,105 | | | $ | 386,626 | | | $ | 11,619 | | | $ | 22,645 | | | $ | 22,142 | | | $ | 41,223 | |
Proceeds from reinvestment of dividends | | | 105,480 | | | | 120,585 | | | | 28 | | | | 363 | | | | 19,124 | | | | 28,000 | |
Cost of shares redeemed | | | (350,955 | ) | | | (339,573 | ) | | | (18,118 | ) | | | (47,385 | ) | | | (17,890 | ) | | | (69,762 | ) |
| | | | | | | | | | | | | | | | | | | | | | | | |
Change in net assets from HC Strategic Shares of beneficial interest | | | (172,370 | ) | | | 167,638 | | | | (6,471 | ) | | | (24,377 | ) | | | 23,376 | | | | (539 | ) |
| | | | | | | | | | | | | | | | | | | | | | | | |
HC Advisors Shares | | | | | | | | | | | | | | | | | | | | | | | | |
Proceeds from shares issued | | | 359 | | | | 146 | | | | 4 | | | | 17 | | | | 48 | | | | 51 | |
Cost of shares redeemed | | | (170 | ) | | | (245 | ) | | | (30 | ) | | | (43 | ) | | | (15 | ) | | | (60 | ) |
| | | | | | | | | | | | | | | | | | | | | | | | |
Change in net assets from HC Advisors Shares of beneficial interest | | | 189 | | | | (99 | ) | | | (26 | ) | | | (26 | ) | | | 33 | | | | (9 | ) |
| | | | | | | | | | | | | | | | | | | | | | | | |
Change in net assets from shares of beneficial interest | | $ | (172,181 | ) | | $ | 167,539 | | | $ | (6,497 | ) | | $ | (24,403 | ) | | $ | 23,409 | | | $ | (548 | ) |
| | | | | | | | | | | | | | | | | | | | | | | | |
Change in net assets | | | (125,337 | ) | | | 299,940 | | | | 1,044 | | | | 1,014 | | | | 17,989 | | | | 5,294 | |
| | | | | | |
Net Assets: | | | | | | | | | | | | | | | | | | | | | | | | |
Beginning of period | | | 1,444,656 | | | | 1,144,716 | | | | 113,905 | | | | 112,891 | | | | 182,699 | | | | 177,405 | |
| | | | | | | | | | | | | | | | | | | | | | | | |
End of period | | $ | 1,319,319 | | | $ | 1,444,656 | | | $ | 114,949 | | | $ | 113,905 | | | $ | 200,688 | | | $ | 182,699 | |
| | | | | | | | | | | | | | | | | | | | | | | | |
Accumulated net investment income/(distributions in excess of net investment income) | | $ | 605 | | | $ | 157 | | | $ | (83 | ) | | $ | 34 | | | $ | (157 | ) | | $ | (28 | ) |
| | | | | | |
Share Transactions: | | | | | | | | | | | | | | | | | | | | | | | | |
HC Strategic Shares | | | | | | | | | | | | | | | | | | | | | | | | |
Issued | | | 4,295 | | | | 24,108 | | | | 550 | | | | 1,108 | | | | 1,304 | | | | 2,429 | |
Reinvested | | | 6,398 | | | | 7,822 | | | | 1 | | | | 18 | | | | 1,231 | | | | 1,753 | |
Redeemed | | | (20,810 | ) | | | (21,161 | ) | | | (849 | ) | | | (2,352 | ) | | | (1,083 | ) | | | (3,936 | ) |
| | | | | | | | | | | | | | | | | | | | | | | | |
Change in HC Strategic Shares | | | (10,117 | ) | | | 10,769 | | | | (298 | ) | | | (1,226 | ) | | | 1,452 | | | | 246 | |
| | | | | | | | | | | | | | | | | | | | | | | | |
HC Advisors Shares | | | | | | | | | | | | | | | | | | | | | | | | |
Issued | | | 21 | | | | 9 | | | | — | | | | 1 | | | | 3 | | | | 3 | |
Redeemed | | | (10 | ) | | | (15 | ) | | | (1 | ) | | | (2 | ) | | | (1 | ) | | | (3 | ) |
| | | | | | | | | | | | | | | | | | | | | | | | |
Change in HC Advisors Shares | | | 11 | | | | (6 | ) | | | (1 | ) | | | (1 | ) | | | 2 | | | | — | |
| | | | | | | | | | | | | | | | | | | | | | | | |
Total change in shares | | | (10,106 | ) | | | 10,763 | | | | (299 | ) | | | (1,227 | ) | | | 1,454 | | | | 246 | |
| | | | | | | | | | | | | | | | | | | | | | | | |
Amounts designated as “—” are $0 or have been rounded to $0
See accompanying notes to financial statements.
233
HC CAPITAL TRUST
Statements of Changes in Net Assets (continued)
(Amounts in thousands)
| | | | | | | | | | | | | | | | | | | | | | | | |
| | | The Real Estate
Securities Portfolio | | | The Commodity Returns
Strategy Portfolio(b) | | | The International
Equity Portfolio | |
| | | For the
Year Ended
June 30,
2015 | | | For the
Period
September 12,
2013
through
June 30,
2014(a) | | | For the
Year Ended
June 30,
2015 | | | For the
Year Ended
June 30,
2014 | | | For the
Year Ended
June 30,
2015 | | | For the
Year Ended
June 30,
2014 | |
Operations: | | | | | | | | | | | | | | | | | | | | | | | | |
Net investment income | | $ | 1,922 | | | $ | 2,676 | | | $ | 15,641 | | | $ | 9,200 | | | $ | 39,494 | | | $ | 50,196 | |
Net realized gains/(losses) from investments, futures, written options, swap transactions, foreign currency transactions | | | 18,217 | | | | 2,250 | | | | (156,399 | ) | | | 42,982 | | | | 95,381 | | | | 169,384 | |
Change in unrealized appreciation/(depreciation) from investments, futures, written options, swap transactions, foreign currency transactions | | | (6,298 | ) | | | 23,365 | | | | (140,037 | ) | | | 133,259 | | | | (206,515 | ) | | | 101,889 | |
| | | | | | | | | | | | | | | | | | | | | | | | |
Change in net assets resulting from operations | | | 13,841 | | | | 28,291 | | | | (280,795 | ) | | | 185,441 | | | | (71,640 | ) | | | 321,469 | |
| | | | | | | | | | | | | | | | | | | | | | | | |
Distributions to Shareholders from: | | | | | | | | | | | | | | | | | | | | | | | | |
Net investment income: | | | | | | | | | | | | | | | | | | | | | | | | |
HC Strategic Shares | | | (2,342 | ) | | | (1,546 | ) | | | (17,239 | ) | | | (10,032 | ) | | | (43,886 | ) | | | (51,093 | ) |
HC Advisors Shares | | | — | | | | — | | | | (24 | ) | | | (13 | ) | | | (88 | ) | | | (101 | ) |
Net realized gains/(losses) from investments, futures, written options, swap transactions, foreign currency transactions: | | | | | | | | | | | | | | | | | | | | | | | | |
HC Strategic Shares | | | (7,059 | ) | | | (18 | ) | | | (3,435 | ) | | | — | | | | (152,759 | ) | | | (4,102 | ) |
HC Advisors Shares | | | — | | | | — | | | | (5 | ) | | | — | | | | (336 | ) | | | (8 | ) |
| | | | | | | | | | | | | | | | | | | | | | | | |
Change in net assets resulting from distributions | | | (9,401 | ) | | | (1,564 | ) | | | (20,703 | ) | | | (10,045 | ) | | | (197,069 | ) | | | (55,304 | ) |
| | | | | | | | | | | | | | | | | | | | | | | | |
HC Strategic Shares | | | | | | | | | | | | | | | | | | | | | | | | |
Proceeds from shares issued | | $ | 4,961 | | | $ | 177,266 | | | $ | 632,646 | | | $ | 333,653 | | | $ | 264,466 | | | $ | 167,603 | |
Proceeds from reinvestment of dividends | | | 9,270 | | | | 1,291 | | | | 17,809 | | | | 8,308 | | | | 158,574 | | | | 45,940 | |
Cost of shares redeemed | | | (57,496 | ) | | | (33,701 | ) | | | (330,968 | ) | | | (248,890 | ) | | | (246,040 | ) | | | (251,509 | ) |
| | | | | | | | | | | | | | | | | | | | | | | | |
Change in net assets from HC Strategic Shares of beneficial interest | | | (43,265 | ) | | | 144,856 | | | | 319,487 | | | | 93,071 | | | | 177,000 | | | | (37,966 | ) |
| | | | | | | | | | | | | | | | | | | | | | | | |
HC Advisors Shares | | | | | | | | | | | | | | | | | | | | | | | | |
Proceeds from shares issued | | | — | | | | — | | | | 469 | | | | 339 | | | | 615 | | | | 247 | |
Cost of shares redeemed | | | — | | | | — | | | | (34 | ) | | | (93 | ) | | | (179 | ) | | | (377 | ) |
| | | | | | | | | | | | | | | | | | | | | | | | |
Change in net assets from HC Advisors Shares of beneficial interest | | | — | | | | — | | | | 435 | | | | 246 | | | | 436 | | | | (130 | ) |
| | | | | | | | | | | | | | | | | | | | | | | | |
Change in net assets from shares of beneficial interest | | $ | (43,265 | ) | | $ | 144,856 | | | $ | 319,922 | | | $ | 93,317 | | | $ | 177,436 | | | $ | (38,096 | ) |
| | | | | | | | | | | | | | | | | | | | | | | | |
Change in net assets | | | (38,825 | ) | | | 171,583 | | | | 18,424 | | | | 268,713 | | | | (91,273 | ) | | | 228,069 | |
| | | | | | |
Net Assets: | | | | | | | | | | | | | | | | | | | | | | | | |
Beginning of period | | | 171,583 | | | | — | | | | 1,176,214 | | | | 907,501 | | | | 1,616,689 | | | | 1,388,620 | |
| | | | | | | | | | | | | | | | | | | | | | | | |
End of period | | $ | 132,758 | | | $ | 171,583 | | | $ | 1,194,638 | | | $ | 1,176,214 | | | $ | 1,525,416 | | | $ | 1,616,689 | |
| | | | | | | | | | | | | | | | | | | | | | | | |
Accumulated net investment income/(distributions in excess of net investment income) | | $ | — | | | $ | 1,124 | | | $ | (1,354 | ) | | $ | 268 | | | $ | 532 | | | $ | 4,071 | |
| | | | | | |
Share Transactions: | | | | | | | | | | | | | | | | | | | | | | | | |
HC Strategic Shares | | | | | | | | | | | | | | | | | | | | | | | | |
Issued | | | 1,497 | | | | 63,884 | | | | 68,801 | | | | 30,232 | | | | 23,645 | | | | 12,672 | |
Reinvested | | | 2,771 | | | | 467 | | | | 1,948 | | | | 757 | | | | 14,241 | | | | 3,451 | |
Redeemed | | | (16,961 | ) | | | (10,657 | ) | | | (36,159 | ) | | | (22,352 | ) | | | (20,733 | ) | | | (19,178 | ) |
| | | | | | | | | | | | | | | | | | | | | | | | |
Change in HC Strategic Shares | | | (12,693 | ) | | | 53,694 | | | | 34,590 | | | | 8,637 | | | | 17,153 | | | | (3,055 | ) |
| | | | | | | | | | | | | | | | | | | | | | | | |
HC Advisors Shares | | | | | | | | | | | | | | | | | | | | | | | | |
Issued | | | — | | | | — | | | | 50 | | | | 31 | | | | 55 | | | | 20 | |
Redeemed | | | — | | | | — | | | | (3 | ) | | | (9 | ) | | | (15 | ) | | | (29 | ) |
| | | | | | | | | | | | | | | | | | | | | | | | |
Change in HC Advisors Shares | | | — | | | | — | | | | 47 | | | | 22 | | | | 40 | | | | (9 | ) |
| | | | | | | | | | | | | | | | | | | | | | | | |
Total change in shares | | | (12,693 | ) | | | 53,694 | | | | 34,637 | | | | 8,659 | | | | 17,193 | | | | (3,064 | ) |
| | | | | | | | | | | | | | | | | | | | | | | | |
| (a) | For the period September 12, 2013 (recommencement of operations) through June 30, 2014. |
| (b) | Statement has been consolidated. See Note 2O in the Notes to Financial Statements for basis of consolidation. |
Amounts designated as “—” are $0 or have been rounded to $0
See accompanying notes to financial statements.
234
HC CAPITAL TRUST
Statements of Changes in Net Assets (continued)
(Amounts in thousands)
| | | | | | | | | | | | | | | | | | | | | | | | |
| | | The Institutional
International
Equity Portfolio | | | The Emerging
Markets Portfolio | | | The Core Fixed
Income Portfolio | |
| | | For the
Year Ended
June 30,
2015 | | | For the
Year Ended
June 30,
2014 | | | For the
Year Ended
June 30,
2015 | | | For the
Year Ended
June 30,
2014 | | | For the
Year Ended
June 30,
2015 | | | For the
Year Ended
June 30,
2014 | |
Operations: | | | | | | | | | | | | | | | | | | | | | | | | |
Net investment income | | $ | 78,670 | | | $ | 93,123 | | | $ | 43,250 | | | $ | 31,213 | | | $ | 1,942 | | | $ | 2,181 | |
Net realized gains/(losses) from investments, futures, foreign currency transactions | | | 136,491 | | | | 287,397 | | | | 6,217 | | | | 5,309 | | | | 1,528 | | | | 188 | |
Change in unrealized appreciation/(depreciation) from investments, futures, foreign currency transactions | | | (344,743 | ) | | | 207,531 | | | | (206,924 | ) | | | 190,779 | | | | (2,243 | ) | | | 2,262 | |
| | | | | | | | | | | | | | | | | | | | | | | | |
Change in net assets resulting from operations | | | (129,582 | ) | | | 588,051 | | | | (157,457 | ) | | | 227,301 | | | | 1,227 | | | | 4,631 | |
| | | | | | | | | | | | | | | | | | | | | | | | |
Distributions to Shareholders from: | | | | | | | | | | | | | | | | | | | | | | | | |
Net investment income: | | | | | | | | | | | | | | | | | | | | | | | | |
HC Strategic Shares | | | (87,620 | ) | | | (93,524 | ) | | | (41,389 | ) | | | (25,766 | ) | | | (2,162 | ) | | | (2,486 | ) |
HC Advisors Shares | | | (117 | ) | | | (115 | ) | | | (60 | ) | | | (39 | ) | | | (62 | ) | | | (68 | ) |
Net realized gains/(losses) from investments, futures, foreign currency transactions: | | | | | | | | | | | | | | | | | | | | | | | | |
HC Strategic Shares | | | (267,727 | ) | | | (100,495 | ) | | | (28,792 | ) | | | — | | | | (91 | ) | | | (429 | ) |
HC Advisors Shares | | | (343 | ) | | | (137 | ) | | | (44 | ) | | | — | | | | (3 | ) | | | (12 | ) |
| | | | | | | | | | | | | | | | | | | | | | | | |
Change in net assets resulting from distributions | | | (355,807 | ) | | | (194,271 | ) | | | (70,285 | ) | | | (25,805 | ) | | | (2,318 | ) | | | (2,995 | ) |
| | | | | | | | | | | | | | | | | | | | | | | | |
HC Strategic Shares | | | | | | | | | | | | | | | | | | | | | | | | |
Proceeds from shares issued | | $ | 298,647 | | | $ | 444,113 | | | $ | 482,630 | | | $ | 597,280 | | | $ | 8,399 | | | $ | 26,314 | |
Proceeds from reinvestment of dividends | | | 342,849 | | | | 181,429 | | | | 58,999 | | | | 22,829 | | | | 2,249 | | | | 2,910 | |
Cost of shares redeemed | | | (288,563 | ) | | | (448,774 | ) | | | (234,660 | ) | | | (87,035 | ) | | | (12,353 | ) | | | (24,112 | ) |
| | | | | | | | | | | | | | | | | | | | | | | | |
Change in net assets from HC Strategic Shares of beneficial interest | | | 352,933 | | | | 176,768 | | | | 306,969 | | | | 533,074 | | | | (1,705 | ) | | | 5,112 | |
| | | | | | | | | | | | | | | | | | | | | | | | |
HC Advisors Shares | | | | | | | | | | | | | | | | | | | | | | | | |
Proceeds from shares issued | | | 1,282 | | | | 305 | | | | 585 | | | | 1,037 | | | | 284 | | | | 459 | |
Cost of shares redeemed | | | (169 | ) | | | (618 | ) | | | (85 | ) | | | (256 | ) | | | (188 | ) | | | (115 | ) |
| | | | | | | | | | | | | | | | | | | | | | | | |
Change in net assets from HC Advisors Shares of beneficial interest | | | 1,113 | | | | (313 | ) | | | 500 | | | | 781 | | | | 96 | | | | 344 | |
| | | | | | | | | | | | | | | | | | | | | | | | |
HC Fund Shares | | | | | | | | | | | | | | | | | | | | | | | | |
Change in net assets from shares of beneficial interest | | $ | 354,046 | | | $ | 176,455 | | | $ | 307,469 | | | $ | 533,855 | | | $ | (1,609 | ) | | $ | 5,456 | |
| | | | | | | | | | | | | | | | | | | | | | | | |
Change in net assets | | | (131,343 | ) | | | 570,235 | | | | 79,727 | | | | 735,351 | | | | (2,700 | ) | | | 7,092 | |
Net Assets: | | | | | | | | | | | | | | | | | | | | | | | | |
Beginning of period | | | 3,005,436 | | | | 2,435,201 | | | | 1,816,337 | | | | 1,080,986 | | | | 102,448 | | | | 95,356 | |
| | | | | | | | | | | | | | | | | | | | | | | | |
End of period | | $ | 2,874,093 | | | $ | 3,005,436 | | | $ | 1,896,064 | | | $ | 1,816,337 | | | $ | 99,748 | | | $ | 102,448 | |
| | | | | | | | | | | | | | | | | | | | | | | | |
Accumulated net investment income/(distributions in excess of net investment income) | | $ | (322 | ) | | $ | 6,300 | | | $ | 18,500 | | | $ | 18,848 | | | $ | 45 | | | $ | 46 | |
| | | | | | |
Share Transactions: | | | | | | | | | | | | | | | | | | | | | | | | |
HC Strategic Shares | | | | | | | | | | | | | | | | | | | | | | | | |
Issued | | | 26,502 | | | | 36,268 | | | | 26,508 | | | | 32,428 | | | | 846 | | | | 2,690 | |
Reinvested | | | 32,663 | | | | 15,097 | | | | 3,385 | | | | 1,229 | | | | 227 | | | | 299 | |
Redeemed | | | (26,351 | ) | | | (36,469 | ) | | | (12,799 | ) | | | (4,681 | ) | | | (1,243 | ) | | | (2,463 | ) |
| | | | | | | | | | | | | | | | | | | | | | | | |
Change in HC Strategic Shares | | | 32,814 | | | | 14,896 | | | | 17,094 | | | | 28,976 | | | | (170 | ) | | | 526 | |
| | | | | | | | | | | | | | | | | | | | | | | | |
HC Advisors Shares | | | | | | | | | | | | | | | | | | | | | | | | |
Issued | | | 118 | | | | 25 | | | | 33 | | | | 55 | | | | 29 | | | | 47 | |
Redeemed | | | (15 | ) | | | (51 | ) | | | (4 | ) | | | (14 | ) | | | (19 | ) | | | (12 | ) |
| | | | | | | | | | | | | | | | | | | | | | | | |
Change in HC Advisors Shares | | | 103 | | | | (26 | ) | | | 29 | | | | 41 | | | | 10 | | | | 35 | |
| | | | | | | | | | | | | | | | | | | | | | | | |
Total change in shares | | | 32,917 | | | | 14,870 | | | | 17,123 | | | | 29,017 | | | | (160 | ) | | | 561 | |
| | | | | | | | | | | | | | | | | | | | | | | | |
Amounts designated as “—” are $0 or have been rounded to $0
See accompanying notes to financial statements.
235
HC CAPITAL TRUST
Statements of Changes in Net Assets (continued)
(Amounts in thousands)
| | | | | | | | | | | | | | | | | | | | | | | | |
| | | The Fixed Income
Opportunity Portfolio | | | The U.S. Government
Fixed Income Securities
Portfolio | | | The Inflation Protected
Securities Portfolio | |
| | | For the
Year Ended
June 30,
2015 | | | For the
Year Ended
June 30,
2014 | | | For the
Year Ended
June 30,
2015 | | | For the
Year Ended
June 30,
2014 | | | For the
Year Ended
June 30,
2015 | | | For the
period
Apr. 3,
2014(a)
through
Jun. 30,
2014 | |
Operations: | | | | | | | | | | | | | | | | | | | | | | | | |
Net investment income | | $ | 42,601 | | | $ | 49,105 | | | $ | 3,143 | | | $ | 3,176 | | | $ | (1,298 | ) | | $ | 5,407 | |
Net realized gains/(losses) from investments, futures, foreign currency transactions | | | 6,179 | | | | 23,664 | | | | 2,081 | | | | (428 | ) | | | (420 | ) | | | 1,141 | |
Change in unrealized appreciation/(depreciation) from investments, futures, foreign currency transactions | | | (47,619 | ) | | | 23,214 | | | | 324 | | | | 1,789 | | | | (7,328 | ) | | | 9,688 | |
| | | | | | | | | | | | | | | | | | | | | | | | |
Change in net assets resulting from operations | | | 1,161 | | | | 95,983 | | | | 5,548 | | | | 4,537 | | | | (9,046 | ) | | | 16,236 | |
| | | | | | | | | | | | | | | | | | | | | | | | |
Distributions to Shareholders from: | | | | | | | | | | | | | | | | | | | | | | | | |
Net investment income: | | | | | | | | | | | | | | | | | | | | | | | | |
HC Strategic Shares | | | (43,170 | ) | | | (49,510 | ) | | | (3,131 | ) | | | (3,198 | ) | | | (1,507 | ) | | | (5,089 | ) |
HC Advisors Shares | | | (59 | ) | | | (59 | ) | | | — | | | | — | | | | — | | | | — | |
Net realized gains/(losses) from investments, futures, foreign currency transactions: | | | | | | | | | | | | | | | | | | | | | | | | |
HC Strategic Shares | | | (18,509 | ) | | | (15,185 | ) | | | — | | | | (786 | ) | | | (414 | ) | | | — | |
HC Advisors Shares | | | (25 | ) | | | (18 | ) | | | — | | | | — | | | | — | | | | — | |
Tax return of capital: | | | | | | | | | | | | | | | | | | | | | | | | |
HC Strategic Shares | | | — | | | | — | | | | — | | | | — | | | | (868 | ) | | | — | |
HC Advisors Shares | | | — | | | | — | | | | — | | | | — | | | | — | | | | — | |
| | | | | | | | | | | | | | | | | | | | | | | | |
Change in net assets resulting from distributions | | | (61,763 | ) | | | (64,772 | ) | | | (3,131 | ) | | | (3,984 | ) | | | (2,789 | ) | | | (5,089 | ) |
| | | | | | | | | | | | | | | | | | | | | | | | |
HC Strategic Shares | | | | | | | | | | | | | | | | | | | | | | | | |
Proceeds from shares issued | | $ | 102,166 | | | $ | 499,918 | | | $ | 54,854 | | | $ | 66,039 | | | $ | 32,733 | | | $ | 577,167 | |
Proceeds from reinvestment of dividends | | | 57,361 | | | | 61,741 | | | | 2,620 | | | | 3,560 | | | | 2,651 | | | | 4,793 | |
Cost of shares redeemed | | | (92,612 | ) | | | (540,906 | ) | | | (43,807 | ) | | | (88,628 | ) | | | (39,831 | ) | | | (66,648 | ) |
| | | | | | | | | | | | | | | | | | | | | | | | |
Change in net assets from HC Strategic Shares of beneficial interest | | | 66,915 | | | | 20,753 | | | | 13,667 | | | | (19,029 | ) | | | (4,447 | ) | | | 515,312 | |
| | | | | | | | | | | | | | | | | | | | | | | | |
HC Advisors Shares | | | | | | | | | | | | | | | | | | | | | | | | |
Proceeds from shares issued | | | 138 | | | | 153 | | | | — | | | | — | | | | — | | | | — | |
Cost of shares redeemed | | | (11 | ) | | | (51 | ) | | | — | | | | — | | | | — | | | | — | |
| | | | | | | | | | | | | | | | | | | | | | | | |
Change in net assets from HC Advisors Shares of beneficial interest | | | 127 | | | | 102 | | | | — | | | | — | | | | — | | | | — | |
| | | | | | | | | | | | | | | | | | | | | | | | |
Change in net assets from shares of beneficial interest | | $ | 67,042 | | | $ | 20,855 | | | $ | 13,667 | | | $ | (19,029 | ) | | $ | (4,447 | ) | | $ | 515,312 | |
| | | | | | | | | | | | | | | | | | | | | | | | |
Change in net assets | | | 6,440 | | | | 52,066 | | | | 16,084 | | | | (18,476 | ) | | | (16,282 | ) | | | 526,459 | |
Net Assets: | | | | | | | | | | | | | | | | | | | | | | | | |
Beginning of period | | | 805,120 | | | | 753,054 | | | | 246,914 | | | | 265,390 | | | | 526,459 | | | | — | |
| | | | | | | | | | | | | | | | | | | | | | | | |
End of period | | $ | 811,560 | | | $ | 805,120 | | | $ | 262,998 | | | $ | 246,914 | | | $ | 510,177 | | | $ | 526,459 | |
| | | | | | | | | | | | | | | | | | | | | | | | |
Accumulated net investment income/(distributions in excess of net investment income) | | $ | 2,991 | | | $ | 2,472 | | | $ | 64 | | | $ | 52 | | | $ | (1,641 | ) | | $ | 342 | |
Share Transactions: | | | | | | | | | | | | | | | | | | | | | | | | |
HC Strategic Shares | | | | | | | | | | | | | | | | | | | | | | | | |
Issued | | | 14,150 | | | | 65,904 | | | | 5,477 | | | | 6,667 | | | | 3,252 | | | | 57,398 | |
Reinvested | | | 8,023 | | | | 8,242 | | | | 260 | | | | 361 | | | | 260 | | | | 468 | |
Redeemed | | | (12,835 | ) | | | (70,673 | ) | | | (4,317 | ) | | | (8,962 | ) | | | (3,952 | ) | | | (6,508 | ) |
| | | | | | | | | | | | | | | | | | | | | | | | |
Change in HC Strategic Shares | | | 9,338 | | | | 3,473 | | | | 1,420 | | | | (1,934 | ) | | | (440 | ) | | | 51,358 | |
| | | | | | | | | | | | | | | | | | | | | | | | |
HC Advisors Shares | | | | | | | | | | | | | | | | | | | | | | | | |
Issued | | | 19 | | | | 21 | | | | — | | | | — | | | | — | | | | — | |
Redeemed | | | (2 | ) | | | (7 | ) | | | — | | | | — | | | | — | | | | — | |
| | | | | | | | | | | | | | | | | | | | | | | | |
Change in HC Advisors Shares | | | 17 | | | | 14 | | | | — | | | | — | | | | — | | | | — | |
| | | | | | | | | | | | | | | | | | | | | | | | |
Total change in shares | | | 9,355 | | | | 3,487 | | | | 1,420 | | | | (1,934 | ) | | | (440 | ) | | | 51,358 | |
| | | | | | | | | | | | | | | | | | | | | | | | |
Amounts designated as “—” are $0 or have been rounded to $0
| (a) | Commencement of operations. |
See accompanying notes to financial statements.
236
HC CAPITAL TRUST
Statements of Changes in Net Assets (continued)
(Amounts in thousands)
| | | | | | | | | | | | | | | | | | | | | | | | |
| | | The U.S. Corporate Fixed
Income Securities Portfolio | | | The U.S. Mortgage/Asset
Backed Fixed Income
Securities Portfolio | | | The Short-Term Municipal
Bond Portfolio | |
| | | For the
Year Ended
June 30,
2015 | | | For the
Year Ended
June 30,
2014 | | | For the
Year Ended
June 30,
2015 | | | For the
Year Ended
June 30,
2014 | | | For the
Year Ended
June 30,
2015 | | | For the
Year Ended
June 30,
2014 | |
Operations: | | | | | | | | | | | | | | | | | | | | | | | | |
Net investment income | | $ | 6,309 | | | $ | 7,108 | | | $ | 4,961 | | | $ | 5,320 | | | $ | 252 | | | $ | 260 | |
Net realized gains/(losses) from investments | | | 7,917 | | | | 45 | | | | 1,318 | | | | 638 | | | | 2 | | | | 8 | |
Change in unrealized appreciation/(depreciation) from investments | | | (13,362 | ) | | | 9,909 | | | | (1,122 | ) | | | 4,143 | | | | (214 | ) | | | 8 | |
| | | | | | | | | | | | | | | | | | | | | | | | |
Change in net assets resulting from operations | | | 864 | | | | 17,062 | | | | 5,157 | | | | 10,101 | | | | 40 | | | | 276 | |
| | | | | | | | | | | | | | | | | | | | | | | | |
Distributions to Shareholders from: | | | | | | | | | | | | | | | | | | | | | | | | |
Net investment income: | | | | | | | | | | | | | | | | | | | | | | | | |
HC Strategic Shares | | | (6,349 | ) | | | (7,199 | ) | | | (6,634 | ) | | | (7,654 | ) | | | (250 | ) | | | (261 | ) |
Net realized gains/(losses) from investments: | | | | | | | | | | | | | | | | | | | | | | | | |
HC Strategic Shares | | | (2,303 | ) | | | (3,582 | ) | | | — | | | | — | | | | (4 | ) | | | (44 | ) |
| | | | | | | | | | | | | | | | | | | | | | | | |
Change in net assets resulting from distributions | | | (8,652 | ) | | | (10,781 | ) | | | (6,634 | ) | | | (7,654 | ) | | | (254 | ) | | | (305 | ) |
| | | | | | | | | | | | | | | | | | | | | | | | |
HC Strategic Shares | | | | | | | | | | | | | | | | | | | | | | | | |
Proceeds from shares issued | | $ | 37,375 | | | $ | 79,521 | | | $ | 39,644 | | | $ | 51,694 | | | $ | 640 | | | $ | 2,017 | |
Proceeds from reinvestment of dividends | | | 7,765 | | | | 9,991 | | | | 5,402 | | | | 6,485 | | | | 254 | | | | 301 | |
Cost of shares redeemed | | | (71,627 | ) | | | (58,243 | ) | | | (42,173 | ) | | | (63,542 | ) | | | (1,450 | ) | | | (3,194 | ) |
| | | | | | | | | | | | | | | | | | | | | | | | |
Change in net assets from HC Strategic Shares of beneficial interest | | | (26,487 | ) | | | 31,269 | | | | 2,873 | | | | (5,363 | ) | | | (556 | ) | | | (876 | ) |
| | | | | | | | | | | | | | | | | | | | | | | | |
HC Fund Shares | | | | | | | | | | | | | | | | | | | | | | | | |
Change in net assets from shares of beneficial interest | | $ | (26,487 | ) | | $ | 31,269 | | | $ | 2,873 | | | $ | (5,363 | ) | | $ | (556 | ) | | $ | (876 | ) |
| | | | | | | | | | | | | | | | | | | | | | | | |
Change in net assets | | | (34,275 | ) | | | 37,550 | | | | 1,396 | | | | (2,916 | ) | | | (770 | ) | | | (905 | ) |
Net Assets: | | | | | | | | | | | | | | | | | | | | | | | | |
Beginning of period | | | 257,604 | | | | 220,054 | | | | 250,632 | | | | 253,548 | | | | 21,703 | | | | 22,608 | |
| | | | | | | | | | | | | | | | | | | | | | | | |
End of period | | $ | 223,329 | | | $ | 257,604 | | | $ | 252,028 | | | $ | 250,632 | | | $ | 20,933 | | | $ | 21,703 | |
| | | | | | | | | | | | | | | | | | | | | | | | |
Accumulated net investment income/(distributions in excess of net investment income) | | $ | 112 | | | $ | 131 | | | $ | 127 | | | $ | 129 | | | $ | (7 | ) | | $ | (9 | ) |
Share Transactions: | | | | | | | | | | | | | | | | | | | | | | | | |
HC Strategic Shares | | | | | | | | | | | | | | | | | | | | | | | | |
Issued | | | 3,677 | | | | 7,881 | | | | 4,011 | | | | 5,267 | | | | 64 | | | | 201 | |
Reinvested | | | 765 | | | | 1,006 | | | | 547 | | | | 664 | | | | 25 | | | | 30 | |
Redeemed | | | (7,008 | ) | | | (5,791 | ) | | | (4,251 | ) | | | (6,475 | ) | | | (145 | ) | | | (318 | ) |
| | | | | | | | | | | | | | | | | | | | | | | | |
Change in HC Strategic Shares | | | (2,566 | ) | | | 3,096 | | | | 307 | | | | (544 | ) | | | (56 | ) | | | (87 | ) |
| | | | | | | | | | | | | | | | | | | | | | | | |
Total change in shares | | | (2,566 | ) | | | 3,096 | | | | 307 | | | | (544 | ) | | | (56 | ) | | | (87 | ) |
| | | | | | | | | | | | | | | | | | | | | | | | |
Amounts designated as “—” are $0 or have been rounded to $0
See accompanying notes to financial statements.
237
HC CAPITAL TRUST
Statements of Changes in Net Assets (concluded)
(Amounts in thousands)
| | | | | | | | | | | | | | | | |
| | | The Intermediate Term
Municipal Bond Portfolio | | | The Intermediate Term
Municipal Bond II
Portfolio | |
| | | For the
Year Ended
June 30,
2015 | | | For the
Year Ended
June 30,
2014 | | | For the
Year Ended
June 30,
2015 | | | For the
Year Ended
June 30,
2014 | |
Operations: | | | | | | | | | | | | | | | | |
Net investment income | | $ | 8,512 | | | $ | 10,475 | | | $ | 1,429 | | | $ | 1,609 | |
Net realized gains/(losses) from investments | | | 3,209 | | | | 611 | | | | 385 | | | | (57 | ) |
Change in unrealized appreciation/(depreciation) from investments | | | (5,140 | ) | | | 5,645 | | | | (774 | ) | | | 1,224 | |
| | | | | | | | | | | | | | | | |
Change in net assets resulting from operations | | | 6,581 | | | | 16,731 | | | | 1,040 | | | | 2,776 | |
| | | | | | | | | | | | | | | | |
Distributions to Shareholders from: | | | | | | | | | | | | | | | | |
Net investment income: | | | | | | | | | | | | | | | | |
HC Strategic Shares | | | (8,450 | ) | | | (10,544 | ) | | | (1,411 | ) | | | (1,605 | ) |
HC Advisors Shares | | | (45 | ) | | | (55 | ) | | | (12 | ) | | | (12 | ) |
Net realized gains/(losses) from investments: | | | | | | | | | | | | | | | | |
HC Strategic Shares | | | — | | | | — | | | | (319 | ) | | | (225 | ) |
HC Advisors Shares | | | — | | | | — | | | | (3 | ) | | | (1 | ) |
| | | | | | | | | | | | | | | | |
Change in net assets resulting from distributions | | | (8,495 | ) | | | (10,599 | ) | | | (1,745 | ) | | | (1,843 | ) |
| | | | | | | | | | | | | | | | |
HC Strategic Shares | | | | | | | | | | | | | | | | |
Proceeds from shares issued | | $ | 33,215 | | | $ | 83,412 | | | $ | 7,805 | | | $ | 19,161 | |
Proceeds from reinvestment of dividends | | | 8,157 | | | | 10,168 | | | | 1,675 | | | | 1,785 | |
Cost of shares redeemed | | | (42,300 | ) | | | (96,267 | ) | | | (9,380 | ) | | | (17,642 | ) |
| | | | | | | | | | | | | | | | |
Change in net assets from HC Strategic Shares of beneficial interest | | | (928 | ) | | | (2,687 | ) | | | 100 | | | | 3,304 | |
| | | | | | | | | | | | | | | | |
HC Advisors Shares | | | | | | | | | | | | | | | | |
Proceeds from shares issued | | | 52 | | | | 655 | | | | 16 | | | | 263 | |
Proceeds from reinvestment of dividends | | | — | | | | — | | | | — | | | | — | |
Cost of shares redeemed | | | (549 | ) | | | (39 | ) | | | (160 | ) | | | (9 | ) |
| | | | | | | | | | | | | | | | |
Change in net assets from HC Advisors Shares of beneficial interest | | | (497 | ) | | | 616 | | | | (144 | ) | | | 254 | |
| | | | | | | | | | | | | | | | |
Change in net assets from shares of beneficial interest | | $ | (1,425 | ) | | $ | (2,071 | ) | | $ | (44 | ) | | $ | 3,558 | |
| | | | | | | | | | | | | | | | |
Change in net assets | | | (3,339 | ) | | | 4,061 | | | | (749 | ) | | | 4,491 | |
Net Assets: | | | | | | | | | | | | | | | | |
Beginning of period | | | 425,747 | | | | 421,686 | | | | 78,426 | | | | 73,935 | |
| | | | | | | | | | | | | | | | |
End of period | | $ | 422,408 | | | $ | 425,747 | | | $ | 77,677 | | | $ | 78,426 | |
| | | | | | | | | | | | | | | | |
Accumulated net investment income/(distributions in excess of net investment income) | | $ | 238 | | | $ | 172 | | | $ | 5 | | | $ | (1 | ) |
Share Transactions: | | | | | | | | | | | | | | | | |
HC Strategic Shares | | | | | | | | | | | | | | | | |
Issued | | | 3,277 | | | | 8,286 | | | | 750 | | | | 1,850 | |
Reinvested | | | 806 | | | | 1,016 | | | | 161 | | | | 173 | |
Redeemed | | | (4,173 | ) | | | (9,573 | ) | | | (900 | ) | | | (1,701 | ) |
| | | | | | | | | | | | | | | | |
Change in HC Strategic Shares | | | (90 | ) | | | (271 | ) | | | 11 | | | | 322 | |
| | | | | | | | | | | | | | | | |
HC Advisors Shares | | | | | | | | | | | | | | | | |
Issued | | | 5 | | | | 65 | | | | 2 | | | | 26 | |
Redeemed | | | (54 | ) | | | (4 | ) | | | (16 | ) | | | (1 | ) |
| | | | | | | | | | | | | | | | |
Change in HC Advisors Shares | | | (49 | ) | | | 61 | | | | (14 | ) | | | 25 | |
| | | | | | | | | | | | | | | | |
Total change in shares | | | (139 | ) | | | (210 | ) | | | (3 | ) | | | 347 | |
| | | | | | | | | | | | | | | | |
Amounts designated as “—” are $0 or have been rounded to $0
See accompanying notes to financial statements.
238
(This page intentionally left blank.)
HC CAPITAL TRUST
Financial Highlights
Selected data for a share outstanding throughout the periods indicated.
| | | | | | | | | | | | | | | | | | | | | | | | | | | | |
| | | | | | Change in Net Assets Resulting
From Operations: | | | Distributions to Shareholders: | |
| | | Net Asset
Value,
Beginning of
Period | | | Net
Investment
Income/
(Loss) | | | Net Realized/
Unrealized
Gains/
(Losses) from
Investments | | | Total from
Operations | | | Net
Investment
Income | | | Net
Realized
Gains from
Investments | | | Total
Distributions to
Shareholders | |
The Value Equity Portfolio | | | | | | | | | | | | | | | | | | | | | | | | | | | | |
HC Strategic Shares | | | | | | | | | | | | | | | | | | | | | | | | | | | | |
Year Ended June 30, 2015 | | $ | 17.88 | | | $ | 0.36 | | | $ | 0.58 | | | $ | 0.94 | | | $ | (0.36 | ) | | $ | — | | | $ | (0.36 | ) |
Year Ended June 30, 2014 | | | 14.94 | | | | 0.42 | | | | 2.94 | | | | 3.36 | | | | (0.42 | ) | | | — | | | | (0.42 | ) |
Year Ended June 30, 2013 | | | 12.22 | | | | 0.38 | | | | 2.69 | | | | 3.07 | | | | (0.35 | ) | | | — | | | | (0.35 | ) |
Year Ended June 30, 2012 | | | 12.50 | | | | 0.30 | | | | (0.28 | ) | | | 0.02 | | | | (0.30 | ) | | | — | | | | (0.30 | ) |
Year Ended June 30, 2011 | | | 9.98 | | | | 0.22 | | | | 2.52 | | | | 2.74 | | | | (0.22 | ) | | | — | | | | (0.22 | ) |
HC Advisors Shares | | | | | | | | | | | | | | | | | | | | | | | | | | | | |
Year Ended June 30, 2015 | | $ | 17.88 | | | $ | 0.36 | | | $ | 0.58 | | | $ | 0.94 | | | $ | (0.36 | ) | | $ | — | | | $ | (0.36 | ) |
Year Ended June 30, 2014 | | | 14.94 | | | | 0.43 | | | | 2.93 | | | | 3.36 | | | | (0.42 | ) | | | — | | | | (0.42 | ) |
Year Ended June 30, 2013 | | | 12.22 | | | | 0.35 | | | | 2.72 | | | | 3.07 | | | | (0.35 | ) | | | — | | | | (0.35 | ) |
Year Ended June 30, 2012 | | | 12.49 | | | | 0.31 | | | | (0.28 | ) | | | 0.03 | | | | (0.30 | ) | | | — | | | | (0.30 | ) |
Period Ended June 30, 2011(d) | | | 9.93 | | | | 0.21 | | | | 2.57 | | | | 2.78 | | | | (0.22 | ) | | | — | | | | (0.22 | ) |
The Institutional Value Equity Portfolio | | | | | | | | | | | | | | | | | | | | | | | | | | | | |
HC Strategic Shares | | | | | | | | | | | | | | | | | | | | | | | | | | | | |
Year Ended June 30, 2015 | | $ | 14.79 | | | $ | 0.27 | | | $ | 0.44 | | | $ | 0.71 | | | $ | (0.28 | ) | | $ | (1.73 | ) | | $ | (2.01 | ) |
Year Ended June 30, 2014 | | | 14.60 | | | | 0.36 | (e) | | | 2.66 | (e) | | | 3.02 | | | | (0.35 | ) | | | (2.48 | ) | | | (2.83 | ) |
Year Ended June 30, 2013 | | | 12.55 | | | | 0.38 | | | | 2.69 | | | | 3.07 | | | | (0.37 | ) | | | (0.65 | ) | | | (1.02 | ) |
Year Ended June 30, 2012 | | | 12.96 | | | | 0.13 | | | | (0.06 | ) | | | 0.07 | | | | (0.30 | ) | | | (0.18 | ) | | | (0.48 | ) |
Year Ended June 30, 2011 | | | 10.26 | | | | 0.23 | | | | 2.67 | | | | 2.90 | | | | (0.20 | ) | | | — | | | | (0.20 | ) |
HC Advisors Shares | | | | | | | | | | | | | | | | | | | | | | | | | | | | |
Year Ended June 30, 2015 | | $ | 14.79 | | | $ | 0.27 | | | $ | 0.45 | | | $ | 0.72 | | | $ | (0.28 | ) | | $ | (1.73 | ) | | $ | (2.01 | ) |
Year Ended June 30, 2014 | | | 14.60 | | | | 0.36 | (e) | | | 2.66 | (e) | | | 3.02 | | | | (0.35 | ) | | | (2.48 | ) | | | (2.83 | ) |
Year Ended June 30, 2013 | | | 12.55 | | | | 0.37 | | | | 2.70 | | | | 3.07 | | | | (0.37 | ) | | | (0.65 | ) | | | (1.02 | ) |
Year Ended June 30, 2012 | | | 12.97 | | | | 0.14 | | | | (0.08 | ) | | | 0.06 | | | | (0.30 | ) | | | (0.18 | ) | | | (0.48 | ) |
Period Ended June 30, 2011(d) | | | 10.21 | | | | 0.21 | | | | 2.75 | | | | 2.96 | | | | (0.20 | ) | | | — | | | | (0.20 | ) |
The Growth Equity Portfolio | | | | | | | | | | | | | | | | | | | | | | | | | | | | |
HC Strategic Shares | | | | | | | | | | | | | | | | | | | | | | | | | | | | |
Year Ended June 30, 2015 | | $ | 20.51 | | | $ | 0.19 | | | $ | 2.10 | | | $ | 2.29 | | | $ | (0.19 | ) | | $ | (0.24 | ) | | $ | (0.43 | ) |
Year Ended June 30, 2014 | | | 16.95 | | | | 0.21 | | | | 3.56 | | | | 3.77 | | | | (0.21 | ) | | | — | | | | (0.21 | ) |
Year Ended June 30, 2013 | | | 14.88 | | | | 0.24 | | | | 2.07 | | | | 2.31 | | | | (0.24 | ) | | | — | | | | (0.24 | ) |
Year Ended June 30, 2012 | | | 13.87 | | | | 0.15 | | | | 1.01 | | | | 1.16 | | | | (0.15 | ) | | | — | | | | (0.15 | ) |
Year Ended June 30, 2011 | | | 10.39 | | | | 0.10 | | | | 3.48 | | | | 3.58 | | | | (0.10 | ) | | | — | | | | (0.10 | ) |
HC Advisors Shares | | | | | | | | | | | | | | | | | | | | | | | | | | | | |
Year Ended June 30, 2015 | | $ | 20.48 | | | $ | 0.19 | | | $ | 2.11 | | | $ | 2.30 | | | $ | (0.19 | ) | | $ | (0.24 | ) | | $ | (0.43 | ) |
Year Ended June 30, 2014 | | | 16.93 | | | | 0.21 | | | | 3.55 | | | | 3.76 | | | | (0.21 | ) | | | — | | | | (0.21 | ) |
Year Ended June 30, 2013 | | | 14.86 | | | | 0.22 | | | | 2.09 | | | | 2.31 | | | | (0.24 | ) | | | — | | | | (0.24 | ) |
Year Ended June 30, 2012 | | | 13.85 | | | | 0.15 | | | | 1.01 | | | | 1.16 | | | | (0.15 | ) | | | — | | | | (0.15 | ) |
Period Ended June 30, 2011(d) | | | 10.40 | | | | 0.10 | | | | 3.45 | | | | 3.55 | | | | (0.10 | ) | | | — | | | | (0.10 | ) |
The Institutional Growth Equity Portfolio | | | | | | | | | | | | | | | | | | | | | | | | | | | | |
HC Strategic Shares | | | | | | | | | | | | | | | | | | | | | | | | | | | | |
Year Ended June 30, 2015 | | $ | 16.59 | | | $ | 0.16 | | | $ | 1.63 | | | $ | 1.79 | | | $ | (0.15 | ) | | $ | (1.09 | ) | | $ | (1.24 | ) |
Year Ended June 30, 2014 | | | 15.00 | | | | 0.18 | | | | 3.01 | | | | 3.19 | | | | (0.19 | ) | | | (1.41 | ) | | | (1.60 | ) |
Year Ended June 30, 2013 | | | 15.02 | | | | 0.23 | | | | 2.07 | | | | 2.30 | | | | (0.23 | ) | | | (2.09 | ) | | | (2.32 | ) |
Year Ended June 30, 2012 | | | 14.10 | | | | 0.16 | | | | 0.97 | | | | 1.13 | | | | (0.15 | ) | | | (0.06 | ) | | | (0.21 | ) |
Year Ended June 30, 2011 | | | 10.58 | | | | 0.12 | | | | 3.50 | | | | 3.62 | | | | (0.10 | ) | | | — | | | | (0.10 | ) |
HC Advisors Shares | | | | | | | | | | | | | | | | | | | | | | | | | | | | |
Year Ended June 30, 2015 | | $ | 16.59 | | | $ | 0.16 | | | $ | 1.64 | | | $ | 1.80 | | | $ | (0.15 | ) | | $ | (1.09 | ) | | $ | (1.24 | ) |
Year Ended June 30, 2014 | | | 15.00 | | | | 0.19 | | | | 3.00 | | | | 3.19 | | | | (0.19 | ) | | | (1.41 | ) | | | (1.60 | ) |
Year Ended June 30, 2013 | | | 15.01 | | | | 0.23 | | | | 2.08 | | | | 2.31 | | | | (0.23 | ) | | | (2.09 | ) | | | (2.32 | ) |
Year Ended June 30, 2012 | | | 14.10 | | | | 0.16 | | | | 0.96 | | | | 1.12 | | | | (0.15 | ) | | | (0.06 | ) | | | (0.21 | ) |
Period Ended June 30, 2011(d) | | | 10.59 | | | | 0.11 | | | | 3.50 | | | | 3.61 | | | | (0.10 | ) | | | — | | | | (0.10 | ) |
| (a) | Not annualized for periods less than one year. |
| (b) | Annualized for periods less than one year. |
| (c) | Portfolio turnover is calculated on the basis of the Portfolio, as a whole, without distinguishing between the classes of shares issued. |
| (d) | For the period July 6, 2010 (commencement of operations) through June 30, 2011. |
| (e) | Per share amounts are based on average shares outstanding. |
| (f) | Portfolio Turnover does not include TBA security transactions. |
See accompanying notes to financial statements.
240
| | | | | | | | | | | | | | | | | | | | | | | | | | | | | | |
| | | | | | | | | | | | | | | | | | | | | | | |
Net Asset Value,
End of Period | | | Total
Return(a) | | | Net Assets, at
End of Period
(in thousands) | | | Ratio of Expenses to
Average Net Assets,
Prior to Expenses
Paid Indirectly
and Waivers(b) | | | Ratio of Expenses to
Average Net Assets,
Net of Expenses
Paid Indirectly
and Waivers(b) | | | Ratio of Expenses to
Average Net Assets,
Net of Waivers(b) | | | Ratio of Net
Investment
Income/(Loss)
to Average
Net Assets(b) | | | Portfolio
Turnover
Rate(a)(c) | |
| | | | | | | | | | | | | | | | | | | | | | | | | | | | | | |
| | | | | | | | | | | | | | | | | | | | | | | | | | | | | | |
| $ | 18.46 | | | | 5.27% | | | $ | 622,022 | | | | 0.29% | | | | 0.28% | | | | 0.28% | | | | 1.95% | | | | 123.19% | |
| | 17.88 | | | | 22.69% | | | | 628,645 | | | | 0.32% | | | | 0.31% | | | | 0.31% | | | | 2.44% | | | | 53.96% | |
| | 14.94 | | | | 25.46% | | | | 679,946 | | | | 0.29% | | | | 0.27% | | | | 0.27% | | | | 2.73% | | | | 54.28% | |
| | 12.22 | | | | 0.23% | | | | 608,294 | | | | 0.29% | | | | 0.26% | | | | 0.26% | | | | 2.59% | | | | 108.58% | |
| | 12.50 | | | | 27.56% | | | | 534,710 | | | | 0.37% | | | | 0.31% | | | | 0.31% | | | | 1.90% | | | | 72.04% | |
| | | | | | | | | | | | | | | | | | | | | | | | | | | | | | |
| $ | 18.46 | | | | 5.27% | | | $ | 1,163 | | | | 0.54% | | | | 0.28% | | | | 0.28% | | | | 1.94% | | | | 123.19% | |
| | 17.88 | | | | 22.69% | | | | 1,217 | | | | 0.57% | | | | 0.31% | | | | 0.31% | | | | 2.43% | | | | 53.96% | |
| | 14.94 | | | | 25.46% | | | | 1,564 | | | | 0.48% | | | | 0.27% | | | | 0.27% | | | | 2.74% | | | | 54.28% | |
| | 12.22 | | | | 0.32% | | | | 811 | | | | 0.29% | | | | 0.26% | | | | 0.26% | | | | 2.58% | | | | 108.58% | |
| | 12.49 | | | | 28.10% | | | | 763 | | | | 0.62% | | | | 0.31% | | | | 0.31% | | | | 1.98% | | | | 72.04% | |
| | | | | | | | | | | | | | | | | | | | | | | | | | | | | | |
| | | | | | | | | | | | | | | | | | | | | | | | | | | | | | |
| $ | 13.49 | | | | 5.05% | | | $ | 915,067 | | | | 0.28% | | | | 0.27% | | | | 0.27% | | | | 1.95% | | | | 119.98% | |
| | 14.79 | | | | 22.82% | | | | 1,036,650 | | | | 0.32% | | | | 0.31% | | | | 0.31% | | | | 2.45% | | | | 63.68% | |
| | 14.60 | | | | 25.76% | | | | 936,866 | | | | 0.28% | | | | 0.26% | | | | 0.26% | | | | 2.76% | | | | 51.12% | |
| | 12.55 | | | | 0.78% | | | | 958,796 | | | | 0.29% | | | | 0.26% | | | | 0.26% | | | | 2.58% | | | | 128.77% | |
| | 12.96 | | | | 28.41% | | | | 820,117 | | | | 0.40% | | | | 0.35% | | | | 0.35% | | | | 1.79% | | | | 97.05% | (f) |
| | | | | | | | | | | | | | | | | | | | | | | | | | | | | | |
| $ | 13.50 | | | | 5.12% | | | $ | 1,613 | | | | 0.53% | | | | 0.27% | | | | 0.27% | | | | 1.96% | | | | 119.98% | |
| | 14.79 | | | | 22.82% | | | | 1,434 | | | | 0.57% | | | | 0.31% | | | | 0.31% | | | | 2.45% | | | | 63.68% | |
| | 14.60 | | | | 25.76% | | | | 2,098 | | | | 0.46% | | | | 0.26% | | | | 0.26% | | | | 2.76% | | | | 51.12% | |
| | 12.55 | | | | 0.70% | | | | 1,658 | | | | 0.29% | | | | 0.26% | | | | 0.26% | | | | 2.58% | | | | 128.77% | |
| | 12.97 | | | | 29.14% | | | | 1,292 | | | | 0.65% | | | | 0.35% | | | | 0.35% | | | | 1.83% | | | | 97.05% | (f) |
| | | | | | | | | | | | | | | | | | | | | | | | | | | | | | |
| | | | | | | | | | | | | | | | | | | | | | | | | | | | | | |
| $ | 22.37 | | | | 11.27% | | | $ | 872,004 | | | | 0.30% | | | | 0.30% | | | | 0.30% | | | | 0.88% | | | | 57.33% | |
| | 20.51 | | | | 22.33% | | | | 839,813 | | | | 0.28% | | | | 0.28% | | | | 0.28% | | | | 1.09% | | | | 30.28% | |
| | 16.95 | | | | 15.62% | | | | 736,260 | | | | 0.27% | | | | 0.27% | | | | 0.27% | | | | 1.47% | | | | 23.77% | |
| | 14.88 | | | | 8.49% | | | | 731,586 | | | | 0.31% | | | | 0.31% | | | | 0.31% | | | | 1.11% | | | | 64.59% | |
| | 13.87 | | | | 34.56% | | | | 735,267 | | | | 0.37% | | | | 0.36% | | | | 0.37% | | | | 0.82% | | | | 49.14% | |
| | | | | | | | | | | | | | | | | | | | | | | | | | | | | | |
| $ | 22.35 | | | | 11.34% | | | $ | 1,623 | | | | 0.55% | | | | 0.30% | | | | 0.30% | | | | 0.88% | | | | 57.33% | |
| | 20.48 | | | | 22.29% | | | | 1,690 | | | | 0.53% | | | | 0.28% | | | | 0.28% | | | | 1.09% | | | | 30.28% | |
| | 16.93 | | | | 15.64% | | | | 1,530 | | | | 0.46% | | | | 0.27% | | | | 0.27% | | | | 1.49% | | | | 23.77% | |
| | 14.86 | | | | 8.50% | | | | 928 | | | | 0.31% | | | | 0.31% | | | | 0.31% | | | | 1.10% | | | | 64.59% | |
| | 13.85 | | | | 34.24% | | | | 955 | | | | 0.62% | | | | 0.36% | | | | 0.37% | | | | 0.83% | | | | 49.14% | |
| | | | | | | | | | | | | | | | | | | | | | | | | | | | | | |
| | | | | | | | | | | | | | | | | | | | | | | | | | | | | | |
| $ | 17.14 | | | | 11.14% | | | $ | 1,317,132 | | | | 0.29% | | | | 0.28% | | | | 0.28% | | | | 0.93% | | | | 96.81% | |
| | 16.59 | | | | 22.19% | | | | 1,442,721 | | | | 0.26% | | | | 0.26% | | | | 0.26% | | | | 1.15% | | | | 48.43% | |
| | 15.00 | | | | 17.08% | | | | 1,142,874 | | | | 0.26% | | | | 0.26% | | | | 0.26% | | | | 1.53% | | | | 39.54% | |
| | 15.02 | | | | 8.20% | | | | 1,090,547 | | | | 0.32% | | | | 0.32% | | | | 0.32% | | | | 1.18% | | | | 83.80% | |
| | 14.10 | | | | 34.29% | | | | 1,072,089 | | | | 0.39% | | | | 0.38% | | | | 0.37% | | | | 0.92% | | | | 85.12% | (f) |
| | | | | | | | | | | | | | | | | | | | | | | | | | | | | | |
| $ | 17.15 | | | | 11.20% | | | $ | 2,187 | | | | 0.54% | | | | 0.28% | | | | 0.28% | | | | 0.93% | | | | 96.81% | |
| | 16.59 | | | | 22.19% | | | | 1,935 | | | | 0.51% | | | | 0.26% | | | | 0.26% | | | | 1.16% | | | | 48.43% | |
| | 15.00 | | | | 17.15% | | | | 1,842 | | | | 0.44% | | | | 0.26% | | | | 0.26% | | | | 1.54% | | | | 39.54% | |
| | 15.01 | | | | 8.13% | | | | 1,828 | | | | 0.32% | | | | 0.32% | | | | 0.32% | | | | 1.19% | | | | 83.80% | |
| | 14.10 | | | | 34.16% | | | | 1,555 | | | | 0.64% | | | | 0.38% | | | | 0.37% | | | | 0.92% | | | | 85.12% | (f) |
See accompanying notes to financial statements.
241
HC CAPITAL TRUST
Financial Highlights (continued)
Selected data for a share outstanding throughout the periods indicated.
| | | | | | | | | | | | | | | | | | | | | | | | | | | | |
| | | | | | Change in Net Assets Resulting
From Operations: | | | Distributions to Shareholders: | |
| | | Net Asset
Value,
Beginning of
Period | | | Net
Investment
Income/
(Loss) | | | Net Realized/
Unrealized
Gains/
(Losses) from
Investments | | | Total from
Operations | | | Net
Investment
Income | | | Net
Realized
Gains from
Investments | | | Tax
Return of
Capital | |
The Small Capitalization—Mid Capitalization Equity Portfolio | | | | | | | | | | | | | | | | | | | | | | | | | |
HC Strategic Shares | | | | | | | | | | | | | | | | | | | | | | | | | | | | |
Year Ended June 30, 2015 | | $ | 21.22 | | | $ | (0.01 | ) | | $ | 1.48 | | | $ | 1.47 | | | $ | (0.01 | ) | | $ | — | | | $ | — | |
Year Ended June 30, 2014 | | | 17.12 | | | | 0.06 | | | | 4.11 | | | | 4.17 | | | | (0.07 | ) | | | — | | | | — | |
Year Ended June 30, 2013 | | | 13.68 | | | | 0.15 | | | | 3.43 | | | | 3.58 | | | | (0.14 | ) | | | — | | | | — | |
Year Ended June 30, 2012 | | | 14.04 | | | | 0.07 | | | | (0.36 | ) | | | (0.29 | ) | | | (0.07 | ) | | | — | | | | — | |
Year Ended June 30, 2011 | | | 10.41 | | | | 0.05 | | | | 3.64 | | | | 3.69 | | | | (0.06 | ) | | | — | | | | — | |
HC Advisors Shares | | | | | | | | | | | | | | | | | | | | | | | | | | | | |
Year Ended June 30, 2015 | | $ | 21.20 | | | $ | (0.01 | ) | | $ | 1.48 | | | $ | 1.47 | | | $ | (0.01 | ) | | $ | — | | | $ | — | |
Year Ended June 30, 2014 | | | 17.10 | | | | 0.06 | | | | 4.11 | | | | 4.17 | | | | (0.07 | ) | | | — | | | | — | |
Year Ended June 30, 2013 | | | 13.66 | | | | 0.14 | | | | 3.44 | | | | 3.58 | | | | (0.14 | ) | | | — | | | | — | |
Year Ended June 30, 2012 | | | 14.03 | | | | 0.07 | | | | (0.37 | ) | | | (0.30 | ) | | | (0.07 | ) | | | — | | | | — | |
Period Ended June 30, 2011(d) | | | 10.13 | | | | 0.05 | | | | 3.91 | | | | 3.96 | | | | (0.06 | ) | | | — | | | | — | |
The Institutional Small Capitalization—Mid Capitalization Equity Portfolio | | | | | | | | | | | | | | | | | | | | | | | | | | | | |
HC Strategic Shares | | | | | | | | | | | | | | | | | | | | | | | | | | | | |
Year Ended June 30, 2015 | | $ | 17.19 | | | $ | 0.01 | | | $ | 1.14 | | | $ | 1.15 | | | $ | (0.01 | ) | | $ | (1.72 | ) | | $ | — | |
Year Ended June 30, 2014 | | | 17.09 | | | | 0.03 | | | | 3.28 | | | | 3.31 | | | | (0.03 | ) | | | (3.18 | ) | | | — | |
Year Ended June 30, 2013 | | | 13.52 | | | | 0.09 | | | | 3.58 | | | | 3.67 | | | | (0.10 | ) | | | — | | | | — | |
Year Ended June 30, 2012 | | | 13.90 | | | | 0.04 | | | | (0.38 | ) | | | (0.34 | ) | | | (0.04 | ) | | | — | | | | — | |
Year Ended June 30, 2011 | | | 10.32 | | | | 0.05 | | | | 3.59 | | | | 3.64 | | | | (0.06 | ) | | | — | | | | — | |
HC Advisors Shares | | | | | | | | | | | | | | | | | | | | | | | | | | | | |
Year Ended June 30, 2015 | | $ | 17.19 | | | $ | 0.01 | | | $ | 1.14 | | | $ | 1.15 | | | $ | (0.01 | ) | | $ | (1.72 | ) | | $ | — | |
Year Ended June 30, 2014 | | | 17.09 | | | | 0.03 | | | | 3.28 | | | | 3.31 | | | | (0.03 | ) | | | (3.18 | ) | | | — | |
Year Ended June 30, 2013 | | | 13.52 | | | | 0.09 | | | | 3.58 | | | | 3.67 | | | | (0.10 | ) | | | — | | | | — | |
Year Ended June 30, 2012 | | | 13.90 | | | | 0.04 | | | | (0.38 | ) | | | (0.34 | ) | | | (0.04 | ) | | | — | | | | — | |
Period Ended June 30, 2011(d) | | | 10.05 | | | | 0.05 | | | | 3.86 | | | | 3.91 | | | | (0.06 | ) | | | — | | | | — | |
The Real Estate Securities Portfolio | | | | | | | | | | | | | | | | | | | | | | | | | | | | |
HC Strategic Shares | | | | | | | | | | | | | | | | | | | | | | | | | | | | |
Year Ended June 30, 2015 | | $ | 3.20 | | | $ | 0.04 | | | $ | 0.21 | | | $ | 0.25 | | | $ | (0.05 | ) | | $ | (0.16 | ) | | $ | — | |
Period Ended June 30, 2014(e) | | | 2.76 | | | | 0.05 | | | | 0.41 | | | | 0.46 | | | | (0.02 | ) | | | — | (f) | | | — | |
Year Ended June 30, 2013 | | | 11.16 | | | | 0.09 | | | | 0.94 | | | | 1.03 | | | | (0.11 | ) | | | (6.65 | ) | | | — | (f) |
Year Ended June 30, 2012 | | | 17.60 | | | | 0.13 | | | | 0.63 | | | | 0.76 | | | | (0.20 | ) | | | (7.00 | ) | | | — | |
Year Ended June 30, 2011 | | | 13.53 | | | | 0.20 | | | | 4.71 | | | | 4.91 | | | | (0.33 | ) | | | (0.51 | ) | | | — | |
The Commodity Returns Strategy Portfolio(h) | | | | | | | | | | | | | | | | | | | | | | | | | | | | |
HC Strategic Shares | | | | | | | | | | | | | | | | | | | | | | | | | | | | |
Year Ended June 30, 2015 | | $ | 11.64 | | | $ | 0.13 | | | $ | (2.79 | ) | | $ | (2.66 | ) | | $ | (0.14 | ) | | $ | (0.04 | ) | | $ | — | |
Year Ended June 30, 2014 | | | 9.82 | | | | 0.09 | | | | 1.83 | | | | 1.92 | | | | (0.10 | ) | | | — | | | | — | |
Year Ended June 30, 2013 | | | 10.01 | | | | 0.12 | | | | (0.20 | ) | | | (0.08 | ) | | | (0.11 | ) | | | — | | | | — | |
Year Ended June 30, 2012 | | | 12.62 | | | | 0.07 | | | | (2.46 | ) | | | (2.39 | ) | | | (0.06 | ) | | | (0.16 | ) | | | — | |
Year Ended June 30, 2011 | | | 9.57 | | | | 0.04 | | | | 3.19 | | | | 3.23 | | | | (0.04 | ) | | | (0.14 | ) | | | — | |
HC Advisors Shares | | | | | | | | | | | | | | | | | | | | | | | | | | | | |
Year Ended June 30, 2015 | | $ | 11.63 | | | $ | 0.13 | | | $ | (2.78 | ) | | $ | (2.65 | ) | | $ | (0.14 | ) | | $ | (0.04 | ) | | $ | — | |
Year Ended June 30, 2014 | | | 9.81 | | | | 0.08 | | | | 1.84 | | | | 1.92 | | | | (0.10 | ) | | | — | | | | — | |
Year Ended June 30, 2013 | | | 10.01 | | | | 0.12 | | | | (0.21 | ) | | | (0.09 | ) | | | (0.11 | ) | | | — | | | | — | |
Year Ended June 30, 2012 | | | 12.62 | | | | 0.08 | | | | (2.47 | ) | | | (2.39 | ) | | | (0.06 | ) | | | (0.16 | ) | | | — | |
Period Ended June 30, 2011(d) | | | 9.71 | | | | 0.05 | | | | 3.04 | | | | 3.09 | | | | (0.04 | ) | | | (0.14 | ) | | | — | |
The International Equity Portfolio | | | | | | | | | | | | | | | | | | | | | | | | | | | | |
HC Strategic Shares | | | | | | | | | | | | | | | | | | | | | | | | | | | | |
Year Ended June 30, 2015 | | $ | 13.56 | | | $ | 0.30 | | | $ | (0.96 | ) | | $ | (0.66 | ) | | $ | (0.34 | ) | | $ | (1.38 | ) | | $ | — | |
Year Ended June 30, 2014 | | | 11.35 | | | | 0.43 | | | | 2.25 | | | | 2.68 | | | | (0.43 | ) | | | (0.04 | ) | | | — | |
Year Ended June 30, 2013 | | | 9.74 | | | | 0.32 | | | | 1.61 | | | | 1.93 | | | | (0.32 | ) | | | — | | | | — | |
Year Ended June 30, 2012 | | | 10.98 | | | | 0.24 | | | | (1.25 | ) | | | (1.01 | ) | | | (0.23 | ) | | | — | | | | — | |
Year Ended June 30, 2011 | | | 8.51 | | | | 0.25 | | | | 2.49 | | | | 2.74 | | | | (0.27 | ) | | | — | | | | — | |
HC Advisors Shares | | | | | | | | | | | | | | | | | | | | | | | | | | | | |
Year Ended June 30, 2015 | | $ | 13.56 | | | $ | 0.30 | | | $ | (0.96 | ) | | $ | (0.66 | ) | | $ | (0.34 | ) | | $ | (1.38 | ) | | $ | — | |
Year Ended June 30, 2014 | | | 11.36 | | | | 0.43 | | | | 2.24 | | | | 2.67 | | | | (0.43 | ) | | | (0.04 | ) | | | — | |
Year Ended June 30, 2013 | | | 9.75 | | | | 0.31 | | | | 1.62 | | | | 1.93 | | | | (0.32 | ) | | | — | | | | — | |
Year Ended June 30, 2012 | | | 10.99 | | | | 0.24 | | | | (1.25 | ) | | | (1.01 | ) | | | (0.23 | ) | | | — | | | | — | |
Period Ended June 30, 2011(d) | | | 8.74 | | | | 0.23 | | | | 2.29 | | | | 2.52 | | | | (0.27 | ) | | | — | | | | — | |
| (a) | Not annualized for periods less than one year. |
| (b) | Annualized for periods less than one year. |
| (c) | Portfolio turnover is calculated on the basis of the Portfolio, as a whole, without distinguishing between the classes of shares issued. |
| (d) | For the period July 6, 2010 (commencement of operations) through June 30, 2011. |
| (e) | For the period September 12, 2013 (commencement of operations) through June 30, 2014. |
| (f) | Amount rounds to less than $0.005 per share. |
| (g) | Represents the last traded net asset value per share on June 30, 2013. As of the close of business on June 30, 2013, the Real Estate Securities Portfolio had no assets and no shareholders and was close to new investors. |
| (h) | Statement has been consolidated. Please see Note 2O in the Notes to Financial Statements for basis of consolidation. |
See accompanying notes to financial statements.
242
| | | | | | | | | | | | | | | | | | | | | | | | | | | | | | | | | | |
| | | | | | | | | | | | | | | | | | | | | | | | | | |
Total
Distributions to
Shareholders | | | Net Asset Value,
End of Period | | | Total
Return(a) | | | Net Assets, at
End of Period
(in thousands) | | | Ratio of Expenses to
Average Net Assets,
Prior to Expenses
Paid Indirectly
and Waivers(b) | | | Ratio of Expenses to
Average Net Assets,
Net of Expenses
Paid Indirectly
and Waivers(b) | | | Ratio of Expenses to
Average Net Assets,
Net of Waivers(b) | | | Ratio of Net
Investment
Income/(Loss)
to Average
Net Assets(b) | | | Portfolio
Turnover
Rate(a)(c) | |
| | | | | | | | | | | | | | | | | | | | | | | | | | | | | | | | | | |
| | | | | | | | | | | | | | | | | | | | | | | | | | | | | | | | | | |
| $ | (0.01) | | | $ | 22.68 | | | | 6.91% | | | $ | 114,754 | | | | 0.83% | | | | 0.82% | | | | 0.82% | | | | (0.06)% | | | | 67.34% | |
| | (0.07) | | | | 21.22 | | | | 24.38% | | | | 113,698 | | | | 0.61% | | | | 0.60% | | | | 0.60% | | | | 0.32% | | | | 41.18% | |
| | (0.14) | | | | 17.12 | | | | 26.34% | | | | 112,700 | | | | 0.56% | | | | 0.56% | | | | 0.56% | | | | 0.99% | | | | 34.45% | |
| | (0.07) | | | | 13.68 | | | | (2.06)% | | | | 125,014 | | | | 0.63% | | | | 0.63% | | | | 0.63% | | | | 0.52% | | | | 57.28% | |
| | (0.06) | | | | 14.04 | | | | 35.48% | | | | 134,582 | | | | 0.70% | | | | 0.70% | | | | 0.70% | | | | 0.37% | | | | 51.76% | |
| | | | | | | | | | | | | | | | | | | | | | | | | | | | | | | | | | |
| $ | (0.01) | | | $ | 22.66 | | | | 6.92% | | | $ | 195 | | | | 1.08% | | | | 0.82% | | | | 0.82% | | | | (0.06)% | | | | 67.34% | |
| | (0.07) | | | | 21.20 | | | | 24.41% | | | | 207 | | | | 0.86% | | | | 0.60% | | | | 0.60% | | | | 0.32% | | | | 41.18% | |
| | (0.14) | | | | 17.10 | | | | 26.38% | | | | 191 | | | | 0.75% | | | | 0.56% | | | | 0.56% | | | | 1.02% | | | | 34.45% | |
| | (0.07) | | | | 13.66 | | | | (2.13)% | | | | 162 | | | | 0.63% | | | | 0.63% | | | | 0.63% | | | | 0.52% | | | | 57.28% | |
| | (0.06) | | | | 14.03 | | | | 39.12% | | | | 157 | | | | 0.95% | | | | 0.70% | | | | 0.70% | | | | 0.37% | | | | 51.76% | |
| | | | | | | | | | | | | | | | | | | | | | | | | | | | | | | | | | |
| | | | | | | | | | | | | | | | | | | | | | | | | | | | | | | | | | |
| $ | (1.73) | | | $ | 16.61 | | | | 7.43% | | | $ | 200,423 | | | | 0.81% | | | | 0.80% | | | | 0.80% | | | | 0.03% | | | | 83.94% | |
| | (3.21) | | | | 17.19 | | | | 20.85% | | | | 182,460 | | | | 0.70% | | | | 0.70% | | | | 0.70% | | | | 0.21% | | | | 67.75% | |
| | (0.10) | | | | 17.09 | | | | 27.29% | | | | 177,162 | | | | 0.70% | | | | 0.69% | | | | 0.69% | | | | 0.68% | | | | 58.43% | |
| | (0.04) | | | | 13.52 | | | | (2.45)% | | | | 196,911 | | | | 0.78% | | | | 0.76% | | | | 0.76% | | | | 0.29% | | | | 81.04% | |
| | (0.06) | | | | 13.90 | | | | 35.33% | | | | 188,534 | | | | 0.71% | | | | 0.71% | | | | 0.71% | | | | 0.42% | | | | 100.93% | |
| | | | | | | | | | | | | | | | | | | | | | | | | | | | | | | | | | |
| $ | (1.73) | | | $ | 16.61 | | | | 7.43% | | | $ | 265 | | | | 1.06% | | | | 0.80% | | | | 0.80% | | | | 0.03% | | | | 83.94% | |
| | (3.21) | | | | 17.19 | | | | 20.85% | | | | 239 | | | | 0.95% | | | | 0.70% | | | | 0.70% | | | | 0.22% | | | | 67.75% | |
| | (0.10) | | | | 17.09 | | | | 27.29% | | | | 243 | | | | 0.88% | | | | 0.69% | | | | 0.69% | | | | 0.67% | | | | 58.43% | |
| | (0.04) | | | | 13.52 | | | | (2.45)% | | | | 276 | | | | 0.78% | | | | 0.76% | | | | 0.76% | | | | 0.29% | | | | 81.04% | |
| | (0.06) | | | | 13.90 | | | | 38.97% | | | | 228 | | | | 0.96% | | | | 0.71% | | | | 0.71% | | | | 0.44% | | | | 100.93% | |
| | | | | | | | | | | | | | | | | | | | | | | | | | | | | | | | | | |
| | | | | | | | | | | | | | | | | | | | | | | | | | | | | | | | | | |
| $ | (0.21) | | | $ | 3.24 | | | | 7.44% | | | $ | 132,758 | | | | 0.79% | | | | 0.79% | | | | 0.79% | | | | 1.22% | | | | 60.49% | |
| | (0.02) | | | | 3.20 | | | | 17.00% | | | | 171,583 | | | | 0.79% | | | | 0.78% | | | | 0.78% | | | | 1.94% | | | | 52.49% | |
| | (6.76) | | | | 5.43 | (g) | | | 13.28% | | | | — | | | | 0.88% | | | | 0.88% | | | | 0.88% | | | | 0.98% | | | | 53.50% | |
| | (7.20) | | | | 11.16 | | | | 12.29% | | | | 77,739 | | | | 0.82% | | | | 0.82% | | | | 0.82% | | | | 1.00% | | | | 70.31% | |
| | (0.84) | | | | 17.60 | | | | 37.15% | | | | 147,326 | | | | 0.80% | | | | 0.80% | | | | 0.80% | | | | 2.15% | | | | 79.82% | |
| | | | | | | | | | | | | | | | | | | | | | | | | | | | | | | | | | |
| | | | | | | | | | | | | | | | | | | | | | | | | | | | | | | | | | |
| $ | (0.18) | | | $ | 8.80 | | | | (22.91)% | | | $ | 1,193,003 | | | | 0.63% | | | | 0.63% | | | | 0.63% | | | | 1.40% | | | | 63.29% | |
| | (0.10) | | | | 11.64 | | | | 19.64% | | | | 1,174,593 | | | | 0.66% | | | | 0.66% | | | | 0.66% | | | | 0.87% | | | | 61.70% | |
| | (0.11) | | | | 9.82 | | | | (0.85)% | | | | 906,350 | | | | 0.64% | | | | 0.64% | | | | 0.64% | | | | 1.18% | | | | 34.75% | |
| | (0.22) | | | | 10.01 | | | | (18.95)% | | | | 686,912 | | | | 0.73% | | | | 0.73% | | | | 0.73% | | | | 0.83% | | | | 83.66% | |
| | (0.18) | | | | 12.62 | | | | 33.86% | | | | 500,846 | | | | 1.03% | | | | 1.03% | | | | 1.03% | | | | 0.40% | | | | 79.60% | |
| | | | | | | | | | | | | | | | | | | | | | | | | | | | | | | | | | |
| $ | (0.18) | | | $ | 8.80 | | | | (22.84)% | | | $ | 1,635 | | | | 0.88% | | | | 0.63% | | | | 0.63% | | | | 1.37% | | | | 63.29% | |
| | (0.10) | | | | 11.63 | | | | 19.66% | | | | 1,621 | | | | 0.91% | | | | 0.66% | | | | 0.66% | | | | 0.81% | | | | 61.70% | |
| | (0.11) | | | | 9.81 | | | | (0.95)% | | | | 1,151 | | | | 0.82% | | | | 0.64% | | | | 0.64% | | | | 1.20% | | | | 34.75% | |
| | (0.22) | | | | 10.01 | | | | (18.95)% | | | | 902 | | | | 0.73% | | | | 0.73% | | | | 0.73% | | | | 0.84% | | | | 83.66% | |
| | (0.18) | | | | 12.62 | | | | 31.93% | | | | 609 | | | | 1.28% | | | | 1.03% | | | | 1.03% | | | | 0.44% | | | | 79.60% | |
| | | | | | | | | | | | | | | | | | | | | | | | | | | | | | | | | | |
| | | | | | | | | | | | | | | | | | | | | | | | | | | | | | | | | | |
| $ | (1.72) | | | $ | 11.18 | | | | (4.50)% | | | $ | 1,522,384 | | | | 0.38% | | | | 0.38% | | | | 0.38% | | | | 2.61% | | | | 48.85% | |
| | (0.47) | | | | 13.56 | | | | 23.72% | | | | 1,613,553 | | | | 0.42% | | | | 0.42% | | | | 0.42% | | | | 3.26% | | | | 55.23% | |
| | (0.32) | | | | 11.35 | | | | 19.76% | | | | 1,385,888 | | | | 0.41% | | | | 0.41% | | | | 0.41% | | | | 2.91% | | | | 46.29% | |
| | (0.23) | | | | 9.74 | | | | (9.13)% | | | | 1,190,531 | | | | 0.54% | | | | 0.54% | | | | 0.54% | | | | 2.58% | | | | 68.87% | |
| | (0.27) | | | | 10.98 | | | | 32.30% | | | | 1,204,581 | | | | 0.57% | | | | 0.57% | | | | 0.57% | | | | 2.42% | | | | 49.11% | |
| | | | | | | | | | | | | | | | | | | | | | | | | | | | | | | | | | |
| $ | (1.72) | | | $ | 11.18 | | | | (4.50)% | | | $ | 3,032 | | | | 0.63% | | | | 0.38% | | | | 0.38% | | | | 2.59% | | | | 48.85% | |
| | (0.47) | | | | 13.56 | | | | 23.61% | | | | 3,136 | | | | 0.67% | | | | 0.42% | | | | 0.42% | | | | 3.24% | | | | 55.23% | |
| | (0.32) | | | | 11.36 | | | | 19.74% | | | | 2,732 | | | | 0.61% | | | | 0.41% | | | | 0.41% | | | | 3.07% | | | | 46.29% | |
| | (0.23) | | | | 9.75 | | | | (9.12)% | | | | 1,581 | | | | 0.54% | | | | 0.54% | | | | 0.54% | | | | 2.62% | | | | 68.87% | |
| | (0.27) | | | | 10.99 | | | | 28.93% | | | | 1,466 | | | | 0.82% | | | | 0.57% | | | | 0.57% | | | | 3.05% | | | | 49.11% | |
See accompanying notes to financial statements.
243
HC CAPITAL TRUST
Financial Highlights (continued)
Selected data for a share outstanding throughout the periods indicated.
| | | | | | | | | | | | | | | | | | | | | | | | | | | | |
| | | | | | Change in Net Assets Resulting
From Operations: | | | Distributions to Shareholders: | |
| | | Net Asset
Value,
Beginning of
Period | | | Net
Investment
Income/
(Loss) | | | Net Realized/
Unrealized
Gains/
(Losses) from
Investments | | | Total from
Operations | | | Net
Investment
Income | | | Net
Realized
Gains from
Investments | | | Total
Distributions to
Shareholders | |
The Institutional International Equity Portfolio | | | | | | | | | | | | | | | | | | | | | | | | | | | | |
HC Strategic Shares | | | | | | | | | | | | | | | | | | | | | | | | | | | | |
Year Ended June 30, 2015 | | $ | 12.58 | | | $ | 0.29 | | | $ | (0.89 | ) | | $ | (0.60 | ) | | $ | (0.32 | ) | | $ | (1.08 | ) | | $ | (1.40 | ) |
Year Ended June 30, 2014 | | | 10.87 | | | | 0.40 | | | | 2.17 | | | | 2.57 | | | | (0.40 | ) | | | (0.46 | ) | | | (0.86 | ) |
Year Ended June 30, 2013 | | | 9.38 | | | | 0.30 | | | | 1.56 | | | | 1.86 | | | | (0.30 | ) | | | (0.07 | ) | | | (0.37 | ) |
Year Ended June 30, 2012 | | | 10.97 | | | | 0.22 | | | | (1.29 | ) | | | (1.07 | ) | | | (0.21 | ) | | | (0.31 | ) | | | (0.52 | ) |
Year Ended June 30, 2011 | | | 8.51 | | | | 0.25 | | | | 2.49 | | | | 2.74 | | | | (0.28 | ) | | | — | | | | (0.28 | ) |
HC Advisors Shares | | | | | | | | | | | | | | | | | | | | | | | | | | | | |
Year Ended June 30, 2015 | | $ | 12.57 | | | $ | 0.30 | | | $ | (0.90 | ) | | $ | (0.60 | ) | | $ | (0.32 | ) | | $ | (1.08 | ) | | $ | (1.40 | ) |
Year Ended June 30, 2014 | | | 10.87 | | | | 0.41 | | | | 2.15 | | | | 2.56 | | | | (0.40 | ) | | | (0.46 | ) | | | (0.86 | ) |
Year Ended June 30, 2013 | | | 9.37 | | | | 0.31 | | | | 1.56 | | | | 1.87 | | | | (0.30 | ) | | | (0.07 | ) | | | (0.37 | ) |
Year Ended June 30, 2012 | | | 10.96 | | | | 0.23 | | | | (1.30 | ) | | | (1.07 | ) | | | (0.21 | ) | | | (0.31 | ) | | | (0.52 | ) |
Period Ended June 30, 2011(d) | | | 8.73 | | | | 0.24 | | | | 2.27 | | | | 2.51 | | | | (0.28 | ) | | | — | | | | (0.28 | ) |
The Emerging Markets Portfolio | | | | | | | | | | | | | | | | | | | | | | | | | | | | |
HC Strategic Shares | | | | | | | | | | | | | | | | | | | | | | | | | | | | |
Year Ended June 30, 2015 | | $ | 20.01 | | | $ | 0.40 | | | $ | (2.11 | ) | | $ | (1.71 | ) | | $ | (0.41 | ) | | $ | (0.31 | ) | | $ | (0.72 | ) |
Year Ended June 30, 2014 | | | 17.51 | | | | 0.35 | | | | 2.51 | | | | 2.86 | | | | (0.36 | ) | | | — | | | | (0.36 | ) |
Year Ended June 30, 2013 | | | 17.79 | | | | 0.34 | | | | (0.36 | ) | | | (0.02 | ) | | | (0.26 | ) | | | — | | | | (0.26 | ) |
Year Ended June 30, 2012 | | | 22.42 | | | | 0.18 | | | | (4.20 | ) | | | (4.02 | ) | | | (0.17 | ) | | | (0.44 | ) | | | (0.61 | ) |
Year Ended June 30, 2011 | | | 17.81 | | | | 0.25 | | | | 4.72 | | | | 4.97 | | | | (0.15 | ) | | | (0.21 | ) | | | (0.36 | ) |
HC Advisors Shares | | | | | | | | | | | | | | | | | | | | | | | | | | | | |
Year Ended June 30, 2015 | | $ | 20.00 | | | $ | 0.42 | | | $ | (2.13 | ) | | $ | (1.71 | ) | | $ | (0.41 | ) | | $ | (0.31 | ) | | $ | (0.72 | ) |
Year Ended June 30, 2014 | | | 17.51 | | | | 0.35 | | | | 2.50 | | | | 2.85 | | | | (0.36 | ) | | | — | | | | (0.36 | ) |
Year Ended June 30, 2013 | | | 17.79 | | | | 0.36 | | | | (0.38 | ) | | | (0.02 | ) | | | (0.26 | ) | | | — | | | | (0.26 | ) |
Year Ended June 30, 2012 | | | 22.42 | | | | 0.19 | | | | (4.21 | ) | | | (4.02 | ) | | | (0.17 | ) | | | (0.44 | ) | | | (0.61 | ) |
Period Ended June 30, 2011(d) | | | 18.17 | | | | 0.25 | | | | 4.36 | | | | 4.61 | | | | (0.15 | ) | | | (0.21 | ) | | | (0.36 | ) |
The Core Fixed Income Portfolio | | | | | | | | | | | | | | | | | | | | | | | | | | | | |
HC Strategic Shares | | | | | | | | | | | | | | | | | | | | | | | | | | | | |
Year Ended June 30, 2015 | | $ | 9.89 | | | $ | 0.19 | | | $ | (0.07 | ) | | $ | 0.12 | | | $ | (0.22 | ) | | $ | (0.01 | ) | | $ | (0.23 | ) |
Year Ended June 30, 2014 | | | 9.73 | | | | 0.22 | | | | 0.24 | | | | 0.46 | | | | (0.25 | ) | | | (0.05 | ) | | | (0.30 | ) |
Year Ended June 30, 2013 | | | 10.27 | | | | 0.21 | | | | (0.30 | ) | | | (0.09 | ) | | | (0.26 | ) | | | (0.19 | ) | | | (0.45 | ) |
Year Ended June 30, 2012 | | | 10.14 | | | | 0.24 | | | | 0.53 | | | | 0.77 | | | | (0.25 | ) | | | (0.39 | ) | | | (0.64 | ) |
Year Ended June 30, 2011 | | | 10.25 | | | | 0.19 | | | | 0.15 | | | | 0.34 | | | | (0.25 | ) | | | (0.20 | ) | | | (0.45 | ) |
HC Advisors Shares | | | | | | | | | | | | | | | | | | | | | | | | | | | | |
Year Ended June 30, 2015 | | $ | 9.88 | | | $ | 0.19 | | | $ | (0.07 | ) | | $ | 0.12 | | | $ | (0.22 | ) | | $ | (0.01 | ) | | $ | (0.23 | ) |
Year Ended June 30, 2014 | | | 9.73 | | | | 0.21 | | | | 0.24 | | | | 0.45 | | | | (0.25 | ) | | | (0.05 | ) | | | (0.30 | ) |
Year Ended June 30, 2013 | | | 10.26 | | | | 0.21 | | | | (0.29 | ) | | | (0.08 | ) | | | (0.26 | ) | | | (0.19 | ) | | | (0.45 | ) |
Year Ended June 30, 2012 | | | 10.13 | | | | 0.24 | | | | 0.53 | | | | 0.77 | | | | (0.25 | ) | | | (0.39 | ) | | | (0.64 | ) |
Period Ended June 30, 2011(d) | | | 10.27 | | | | 0.24 | | | | 0.07 | | | | 0.31 | | | | (0.25 | ) | | | (0.20 | ) | | | (0.45 | ) |
The Fixed Income Opportunity Portfolio | | | | | | | | | | | | | | | | | | | | | | | | | | | | |
HC Strategic Shares | | | | | | | | | | | | | | | | | | | | | | | | | | | | |
Year Ended June 30, 2015 | | $ | 7.65 | | | $ | 0.38 | | | $ | (0.39 | ) | | $ | (0.01 | ) | | $ | (0.39 | ) | | $ | (0.17 | ) | | $ | (0.56 | ) |
Year Ended June 30, 2014 | | | 7.41 | | | | 0.43 | | | | 0.37 | | | | 0.80 | | | | (0.43 | ) | | | (0.13 | ) | | | (0.56 | ) |
Year Ended June 30, 2013 | | | 7.22 | | | | 0.47 | | | | 0.19 | | | | 0.66 | | | | (0.47 | ) | | | — | | | | (0.47 | ) |
Year Ended June 30, 2012 | | | 7.39 | | | | 0.52 | | | | (0.16 | ) | | | 0.36 | | | | (0.53 | ) | | | — | | | | (0.53 | ) |
Year Ended June 30, 2011 | | | 6.73 | | | | 0.57 | | | | 0.66 | | | | 1.23 | | | | (0.57 | ) | | | — | | | | (0.57 | ) |
HC Advisors Shares | | | | | | | | | | | | | | | | | | | | | | | | | | | | |
Year Ended June 30, 2015 | | $ | 7.65 | | | $ | 0.38 | | | $ | (0.39 | ) | | $ | (0.01 | ) | | $ | (0.39 | ) | | $ | (0.17 | ) | | $ | (0.56 | ) |
Year Ended June 30, 2014 | | | 7.40 | | | | 0.41 | | | | 0.40 | | | | 0.81 | | | | (0.43 | ) | | | (0.13 | ) | | | (0.56 | ) |
Year Ended June 30, 2013 | | | 7.22 | | | | 0.47 | | | | 0.18 | | | | 0.65 | | | | (0.47 | ) | | | — | | | | (0.47 | ) |
Year Ended June 30, 2012 | | | 7.39 | | | | 0.53 | | | | (0.17 | ) | | | 0.36 | | | | (0.53 | ) | | | — | | | | (0.53 | ) |
Period Ended June 30, 2011(d) | | | 6.74 | | | | 0.53 | | | | 0.69 | | | | 1.22 | | | | (0.57 | ) | | | — | | | | (0.57 | ) |
| (a) | Not annualized for periods less than one year. |
| (b) | Annualized for periods less than one year. |
| (c) | Portfolio turnover is calculated on the basis of the Portfolio, as a whole, without distinguishing between the classes of shares issued. |
| (d) | For the period July 6, 2010 (commencement of operations) through June 30, 2011. |
See accompanying notes to financial statements.
244
| | | | | | | | | | | | | | | | | | | | | | | | | | | | | | |
| | | | | | | | |
Net Asset Value,
End of Period | | | Total
Return(a) | | | Net Assets, at
End of Period
(in thousands) | | | Ratio of Expenses to
Average Net Assets,
Prior to Expenses
Paid Indirectly
and Waivers(b) | | | Ratio of Expenses to
Average Net Assets,
Net of Expenses
Paid Indirectly
and Waivers(b) | | | Ratio of Expenses to
Average Net Assets,
Net of Waivers(b) | | | Ratio of Net
Investment
Income/(Loss)
to Average
Net Assets(b) | | | Portfolio
Turnover
Rate(a)(c) | |
| | | | | | | | | | | | | | | | | | | | | | | | | | | | | | |
| | | | | | | | | | | | | | | | | | | | | | | | | | | | | | |
| $ | 10.58 | | | | (4.38)% | | | $ | 2,869,985 | | | | 0.36% | | | | 0.36% | | | | 0.36% | | | | 2.69% | | | | 52.55% | |
| | 12.58 | | | | 24.16% | | | | 3,001,838 | | | | 0.40% | | | | 0.40% | | | | 0.40% | | | | 3.35% | | | | 64.38% | |
| | 10.87 | | | | 19.86% | | | | 2,431,816 | | | | 0.42% | | | | 0.42% | | | | 0.42% | | | | 2.93% | | | | 47.98% | |
| | 9.38 | | | | (9.40)% | | | | 1,990,173 | | | | 0.55% | | | | 0.55% | | | | 0.55% | | | | 2.59% | | | | 68.64% | |
| | 10.97 | | | | 32.24% | | | | 1,753,957 | | | | 0.58% | | | | 0.58% | | | | 0.58% | | | | 2.30% | | | | 54.67% | |
| | | | | | | | | | | | | | | | | | | | | | | | | | | | | | |
| $ | 10.57 | | | | (4.38)% | | | $ | 4,108 | | | | 0.61% | | | | 0.36% | | | | 0.36% | | | | 2.81% | | | | 52.55% | |
| | 12.57 | | | | 24.07% | | | | 3,598 | | | | 0.65% | | | | 0.40% | | | | 0.40% | | | | 3.27% | | | | 64.38% | |
| | 10.87 | | | | 19.99% | | | | 3,385 | | | | 0.63% | | | | 0.42% | | | | 0.42% | | | | 2.89% | | | | 47.98% | |
| | 9.37 | | | | (9.41)% | | | | 3,148 | | | | 0.55% | | | | 0.55% | | | | 0.55% | | | | 2.68% | | | | 68.64% | |
| | 10.96 | | | | 28.79% | | | | 2,399 | | | | 0.83% | | | | 0.58% | | | | 0.58% | | | | 2.53% | | | | 54.67% | |
| | | | | | | | | | | | | | | | | | | | | | | | | | | | | | |
| | | | | | | | | | | | | | | | | | | | | | | | | | | | | | |
| $ | 17.58 | | | | (8.48)% | | | $ | 1,893,047 | | | | 0.59% | | | | 0.59% | | | | 0.59% | | | | 2.32% | | | | 85.72% | |
| | 20.01 | | | | 16.48% | | | | 1,813,476 | | | | 0.73% | | | | 0.73% | | | | 0.73% | | | | 2.26% | | | | 75.84% | |
| | 17.51 | | | | (0.28)% | | | | 1,079,208 | | | | 0.77% | | | | 0.77% | | | | 0.77% | | | | 2.27% | | | | 63.21% | |
| | 17.79 | | | | (17.81)% | | | | 719,013 | | | | 0.98% | | | | 0.98% | | | | 0.98% | | | | 1.68% | | | | 52.27% | |
| | 22.42 | | | | 28.05% | | | | 510,732 | | | | 1.00% | | | | 1.00% | | | | 1.00% | | | | 1.21% | | | | 61.56% | |
| | | | | | | | | | | | | | | | | | | | | | | | | | | | | | |
| $ | 17.57 | | | | (8.49)% | | | $ | 3,017 | | | | 0.84% | | | | 0.59% | | | | 0.59% | | | | 2.34% | | | | 85.72% | |
| | 20.00 | | | | 16.42% | | | | 2,861 | | | | 0.98% | | | | 0.73% | | | | 0.73% | | | | 2.25% | | | | 75.84% | |
| | 17.51 | | | | (0.28)% | | | | 1,778 | | | | 0.95% | | | | 0.77% | | | | 0.77% | | | | 2.24% | | | | 63.21% | |
| | 17.79 | | | | (17.81)% | | | | 1,350 | | | | 0.98% | | | | 0.98% | | | | 0.98% | | | | 1.68% | | | | 52.27% | |
| | 22.42 | | | | 25.44% | | | | 966 | | | | 1.25% | | | | 1.00% | | | | 1.00% | | | | 1.28% | | | | 61.56% | |
| | | | | | | | | | | | | | | | | | | | | | | | | | | | | | |
| | | | | | | | | | | | | | | | | | | | | | | | | | | | | | |
| $ | 9.78 | | | | 1.16% | | | $ | 96,952 | | | | 0.27% | | | | 0.27% | | | | 0.27% | | | | 1.90% | | | | 89.60% | |
| | 9.89 | | | | 4.78% | | | | 99,718 | | | | 0.25% | | | | 0.25% | | | | 0.25% | | | | 2.22% | | | | 75.17% | |
| | 9.73 | | | | (1.02)% | | | | 93,015 | | | | 0.27% | | | | 0.26% | | | | 0.26% | | | | 2.09% | | | | 53.26% | |
| | 10.27 | | | | 7.75% | | | | 94,895 | | | | 0.30% | | | | 0.30% | | | | 0.30% | | | | 2.34% | | | | 64.20% | |
| | 10.14 | | | | 3.36% | | | | 103,528 | | | | 0.33% | | | | 0.33% | | | | 0.33% | | | | 2.30% | | | | 684.04% | |
| | | | | | | | | | | | | | | | | | | | | | | | | | | | | | |
| $ | 9.77 | | | | 1.16% | | | $ | 2,796 | | | | 0.52% | | | | 0.27% | | | | 0.27% | | | | 1.90% | | | | 89.60% | |
| | 9.88 | | | | 4.68% | | | | 2,730 | | | | 0.50% | | | | 0.25% | | | | 0.25% | | | | 2.22% | | | | 75.17% | |
| | 9.73 | | | | (0.92)% | | | | 2,341 | | | | 0.45% | | | | 0.26% | | | | 0.26% | | | | 2.08% | | | | 53.26% | |
| | 10.26 | | | | 7.76% | | | | 2,232 | | | | 0.30% | | | | 0.30% | | | | 0.30% | | | | 2.36% | | | | 64.20% | |
| | 10.13 | | | | 3.05% | | | | 2,659 | | | | 0.58% | | | | 0.33% | | | | 0.33% | | | | 2.26% | | | | 684.04% | |
| | | | | | | | | | | | | | | | | | | | | | | | | | | | | | |
| | | | | | | | | | | | | | | | | | | | | | | | | | | | | | |
| $ | 7.08 | | | | 0.06% | | | $ | 810,466 | | | | 0.32% | | | | 0.32% | | | | 0.32% | | | | 5.27% | | | | 55.80% | |
| | 7.65 | | | | 11.23% | | | | 804,070 | | | | 0.30% | | | | 0.30% | | | | 0.30% | | | | 5.52% | | | | 82.94% | |
| | 7.41 | | | | 9.17% | | | | 752,140 | | | | 0.43% | | | | 0.43% | | | | 0.43% | | | | 6.33% | | | | 74.84% | |
| | 7.22 | | | | 5.27% | | | | 585,953 | | | | 0.53% | | | | 0.53% | | | | 0.53% | | | | 7.30% | | | | 104.25% | |
| | 7.39 | | | | 18.78% | | | | 452,436 | | | | 0.54% | | | | 0.54% | | | | 0.54% | | | | 7.84% | | | | 157.18% | |
| | | | | | | | | | | | | | | | | | | | | | | | | | | | | | |
| $ | 7.08 | | | | 0.07% | | | $ | 1,094 | | | | 0.57% | | | | 0.32% | | | | 0.32% | | | | 5.27% | | | | 55.80% | |
| | 7.65 | | | | 11.39% | | | | 1,050 | | | | 0.55% | | | | 0.30% | | | | 0.30% | | | | 5.52% | | | | 82.94% | |
| | 7.40 | | | | 9.03% | | | | 914 | | | | 0.64% | | | | 0.43% | | | | 0.43% | | | | 6.33% | | | | 74.84% | |
| | 7.22 | | | | 5.27% | | | | 753 | | | | 0.53% | | | | 0.53% | | | | 0.53% | | | | 7.33% | | | | 104.25% | |
| | 7.39 | | | | 18.61% | | | | 824 | | | | 0.79% | | | | 0.54% | | | | 0.54% | | | | 7.80% | | | | 157.18% | |
See accompanying notes to financial statements.
245
HC CAPITAL TRUST
Financial Highlights (continued)
Selected data for a share outstanding throughout the periods indicated.
| | | | | | | | | | | | | | | | | | | | | | | | | | | | |
| | | | | | Change in Net Assets Resulting
From Operations: | | | Distributions to Shareholders: | |
| | | Net Asset
Value,
Beginning of
Period | | | Net
Investment
Income/
(Loss) | | | Net Realized/
Unrealized
Gains/
(Losses) from
Investments | | | Total from
Operations | | | Net
Investment
Income | | | Net
Realized
Gains from
Investments | | | Tax
Return of
Capital | |
The U.S. Government Fixed Income Securities Portfolio | | | | | | | | | | | | | | | | | | | | | | | | | | | | |
HC Strategic Shares | | | | | | | | | | | | | | | | | | | | | | | | | | | | |
Year Ended June 30, 2015 | | $ | 9.94 | | | $ | 0.12 | | | $ | 0.08 | | | $ | 0.20 | | | $ | (0.12 | ) | | $ | — | | | $ | — | |
Year Ended June 30, 2014 | | | 9.91 | | | | 0.12 | | | | 0.07 | | | | 0.19 | | | | (0.13 | ) | | | (0.03 | ) | | | — | |
Year Ended June 30, 2013 | | | 10.48 | | | | 0.12 | | | | (0.30 | ) | | | (0.18 | ) | | | (0.12 | ) | | | (0.27 | ) | | | — | |
Year Ended June 30, 2012 | | | 10.01 | | | | 0.15 | | | | 0.66 | | | | 0.81 | | | | (0.15 | ) | | | (0.19 | ) | | | — | |
Period Ended June 30, 2011(d) | | | 10.00 | | | | 0.07 | | | | 0.01 | | | | 0.08 | | | | (0.07 | ) | | | — | | | | — | |
The Inflation Protected Securities Portfolio | | | | | | | | | | | | | | | | | | | | | | | | | | | | |
HC Strategic Shares | | | | | | | | | | | | | | | | | | | | | | | | | | | | |
Year Ended June 30, 2015 | | $ | 10.25 | | | $ | (0.03 | ) | | $ | (0.14 | ) | | $ | (0.17 | ) | | $ | (0.03 | ) | | $ | (0.01 | ) | | $ | (0.02 | ) |
Period Ended June 30, 2014(e) | | | 10.00 | | | | 0.11 | | | | 0.24 | | | | 0.35 | | | | (0.10 | ) | | | — | | | | — | |
HC Advisors Shares | | | | | | | | | | | | | | | | | | | | | | | | | | | | |
Year Ended June 30, 2015 | | $ | 10.26 | | | $ | (0.04 | ) | | $ | (0.15 | ) | | $ | (0.19 | ) | | $ | (0.05 | ) | | $ | (0.01 | ) | | | — | |
Period Ended June 30, 2014(e) | | | 10.00 | | | | 0.12 | | | | 0.24 | | | | 0.36 | | | | (0.10 | ) | | | — | | | | — | |
The U.S. Corporate Fixed Income Securities Portfolio | | | | | | | | | | | | | | | | | | | | | | | | | | | | |
HC Strategic Shares | | | | | | | | | | | | | | | | | | | | | | | | | | | | |
Year Ended June 30, 2015 | | $ | 10.24 | | | $ | 0.27 | | | $ | (0.27 | ) | | $ | — | | | $ | (0.27 | ) | | $ | (0.09 | ) | | $ | — | |
Year Ended June 30, 2014 | | | 9.97 | | | | 0.31 | | | | 0.44 | | | | 0.75 | | | | (0.32 | ) | | | (0.16 | ) | | | — | |
Year Ended June 30, 2013 | | | 10.59 | | | | 0.35 | | | | (0.35 | ) | | | — | (f) | | | (0.34 | ) | | | (0.28 | ) | | | — | |
Year Ended June 30, 2012 | | | 9.96 | | | | 0.26 | | | | 0.81 | | | | 1.07 | | | | (0.35 | ) | | | (0.09 | ) | | | — | |
Period Ended June 30, 2011(d) | | | 10.00 | | | | 0.18 | | | | (0.04 | ) | | | 0.14 | | | | (0.18 | ) | | | — | | | | — | |
The U.S. Mortgage/Asset Backed Fixed Income Securities Portfolio | | | | | | | | | | | | | | | | | | | | | | | | | | | | |
HC Strategic Shares | | | | | | | | | | | | | | | | | | | | | | | | | | | | |
Year Ended June 30, 2015 | | $ | 9.87 | | | $ | 0.19 | | | $ | — | | | $ | 0.19 | | | $ | (0.25 | ) | | $ | — | | | $ | — | |
Year Ended June 30, 2014 | | | 9.78 | | | | 0.21 | | | | 0.18 | | | | 0.39 | | | | (0.30 | ) | | | — | | | | — | |
Year Ended June 30, 2013 | | | 10.22 | | | | 0.20 | | | | (0.30 | ) | | | (0.10 | ) | | | (0.34 | ) | | | — | | | | — | |
Year Ended June 30, 2012 | | | 10.13 | | | | 0.25 | | | | 0.24 | | | | 0.49 | | | | (0.36 | ) | | | (0.04 | ) | | | — | |
Period Ended June 30, 2011(d) | | | 10.00 | | | | 0.10 | | | | 0.13 | | | | 0.23 | | | | (0.10 | ) | | | — | | | | — | |
The Short-Term Municipal Bond Portfolio | | | | | | | | | | | | | | | | | | | | | | | | | | | | |
HC Strategic Shares | | | | | | | | | | | | | | | | | | | | | | | | | | | | |
Year Ended June 30, 2015 | | $ | 10.04 | | | $ | 0.12 | | | $ | (0.10 | ) | | $ | 0.02 | | | $ | (0.12 | ) | | $ | — | | | $ | — | |
Year Ended June 30, 2014 | | | 10.05 | | | | 0.12 | | | | 0.01 | | | | 0.13 | | | | (0.12 | ) | | | (0.02 | ) | | | — | |
Year Ended June 30, 2013 | | | 10.26 | | | | 0.13 | | | | (0.11 | ) | | | 0.02 | | | | (0.13 | ) | | | (0.10 | ) | | | — | |
Year Ended June 30, 2012 | | | 10.24 | | | | 0.20 | | | | 0.04 | | | | 0.24 | | | | (0.20 | ) | | | (0.02 | ) | | | — | |
Year Ended June 30, 2011 | | | 10.28 | | | | 0.22 | | | | (0.03 | ) | | | 0.19 | | | | (0.22 | ) | | | (0.01 | ) | | | — | |
The Intermediate Term Municipal Bond Portfolio | | | | | | | | | | | | | | | | | | | | | | | | | | | | |
HC Strategic Shares | | | | | | | | | | | | | | | | | | | | | | | | | | | | |
Year Ended June 30, 2015 | | $ | 10.11 | | | $ | 0.21 | | | $ | (0.05 | ) | | $ | 0.16 | | | $ | (0.21 | ) | | $ | — | | | $ | — | |
Year Ended June 30, 2014 | | | 9.96 | | | | 0.25 | | | | 0.15 | | | | 0.40 | | | | (0.25 | ) | | | — | | | | — | |
Year Ended June 30, 2013 | | | 10.10 | | | | 0.28 | | | | (0.14 | ) | | | 0.14 | | | | (0.28 | ) | | | — | | | | — | |
Year Ended June 30, 2012 | | | 9.64 | | | | 0.33 | | | | 0.46 | | | | 0.79 | | | | (0.33 | ) | | | — | | | | — | |
Year Ended June 30, 2011 | | | 9.59 | | | | 0.34 | | | | 0.05 | | | | 0.39 | | | | (0.34 | ) | | | — | | | | — | |
HC Advisors Shares | | | | | | | | | | | | | | | | | | | | | | | | | | | | |
Year Ended June 30, 2015 | | $ | 10.11 | | | $ | 0.21 | | | $ | (0.05 | ) | | $ | 0.16 | | | $ | (0.21 | ) | | $ | — | | | $ | — | |
Year Ended June 30, 2014 | | | 9.96 | | | | 0.25 | | | | 0.15 | | | | 0.40 | | | | (0.25 | ) | | | — | | | | — | |
Year Ended June 30, 2013 | | | 10.10 | | | | 0.26 | | | | (0.12 | ) | | | 0.14 | | | | (0.28 | ) | | | — | | | | — | |
Year Ended June 30, 2012 | | | 9.64 | | | | 0.33 | | | | 0.46 | | | | 0.79 | | | | (0.33 | ) | | | — | | | | — | |
Period Ended June 30, 2011(h) | | | 9.61 | | | | 0.32 | | | | 0.05 | | | | 0.37 | | | | (0.34 | ) | | | — | | | | — | |
The Intermediate Term Municipal Bond II Portfolio | | | | | | | | | | | | | | | | | | | | | | | | | | | | |
HC Strategic Shares | | | | | | | | | | | | | | | | | | | | | | | | | | | | |
Year Ended June 30, 2015 | | $ | 10.41 | | | $ | 0.19 | | | $ | (0.06 | ) | | $ | 0.13 | | | $ | (0.19 | ) | | $ | (0.04 | ) | | $ | — | |
Year Ended June 30, 2014 | | | 10.28 | | | | 0.22 | | | | 0.16 | | | | 0.38 | | | | (0.22 | ) | | | (0.03 | ) | | | — | |
Year Ended June 30, 2013 | | | 10.56 | | | | 0.22 | | | | (0.25 | ) | | | (0.03 | ) | | | (0.22 | ) | | | (0.03 | ) | | | — | |
Year Ended June 30, 2012 | | | 10.10 | | | | 0.23 | | | | 0.47 | | | | 0.70 | | | | (0.23 | ) | | | (0.01 | ) | | | — | |
Period Ended June 30, 2011(i) | | | 10.00 | | | | 0.17 | | | | 0.10 | | | | 0.27 | | | | (0.17 | ) | | | — | | | | — | |
HC Advisors Shares | | | | | | | | | | | | | | | | | | | | | | | | | | | | |
Year Ended June 30, 2015 | | $ | 10.41 | | | $ | 0.19 | | | $ | (0.06 | ) | | $ | 0.13 | | | $ | (0.19 | ) | | $ | (0.04 | ) | | $ | — | |
Year Ended June 30, 2014 | | | 10.29 | | | | 0.22 | | | | 0.15 | | | | 0.37 | | | | (0.22 | ) | | | (0.03 | ) | | | — | |
Year Ended June 30, 2013 | | | 10.56 | | | | 0.22 | | | | (0.24 | ) | | | (0.02 | ) | | | (0.22 | ) | | | (0.03 | ) | | | — | |
Year Ended June 30, 2012 | | | 10.10 | | | | 0.23 | | | | 0.47 | | | | 0.70 | | | | (0.23 | ) | | | (0.01 | ) | | | — | |
Period Ended June 30, 2011(j) | | | 10.11 | | | | 0.14 | | | | (0.01 | ) | | | 0.13 | | | | (0.14 | ) | | | — | | | | — | |
See accompanying notes to financial statements.
246
| | | | | | | | | | | | | | | | | | | | | | | | | | | | | | | | | | |
| | | | | | | | | | | |
Total
Distributions to
Shareholders | | | Net Asset Value,
End of Period | | | Total
Return(a) | | | Net Assets, at
End of Period
(in thousands) | | | Ratio of Expenses to
Average Net Assets,
Prior to Expenses
Paid Indirectly
and Waivers(b) | | | Ratio of Expenses to
Average Net Assets,
Net of Expenses
Paid Indirectly
and Waivers(b) | | | Ratio of Expenses to
Average Net Assets,
Net of Waivers(b) | | | Ratio of Net
Investment
Income/(Loss)
to Average
Net Assets(b) | | | Portfolio
Turnover
Rate(a)(c) | |
| | | | | | | | | | | | | | | | | | | | | | | | | | | | | | | | | | |
| | | | | | | | | | | | | | | | | | | | | | | | | | | | | | | | | | |
| $ | (0.12) | | | $ | 10.02 | | | | 2.03% | | | $ | 262,998 | | | | 0.17% | | | | 0.17% | | | | 0.17% | | | | 1.21% | | | | 99.54% | |
| | (0.16) | | | | 9.94 | | | | 1.91% | | | | 246,914 | | | | 0.18% | | | | 0.18% | | | | 0.18% | | | | 1.29% | | | | 62.52% | |
| | (0.39) | | | | 9.91 | | | | (1.75)% | | | | 265,390 | | | | 0.18% | | | | 0.18% | | | | 0.18% | | | | 1.21% | | | | 41.62% | |
| | (0.34) | | | | 10.48 | | | | 8.10% | | | | 250,150 | | | | 0.25% | | | | 0.25% | | | | 0.25% | | | | 1.40% | | | | 89.01% | |
| | (0.07) | | | | 10.01 | | | | 0.85% | | | | 291,810 | | | | 0.26% | | | | 0.26% | | | | 0.26% | | | | 1.43% | | | | 73.52% | |
| | | | | | | | | | | | | | | | | | | | | | | | | | | | | | | | | | |
| | | | | | | | | | | | | | | | | | | | | | | | | | | | | | | | | | |
| $ | (0.06) | | | $ | 10.02 | | | | (1.72)% | | | $ | 510,176 | | | | 0.18% | | | | 0.18% | | | | 0.18% | | | | (0.25)% | | | | 27.12% | |
| | (0.10) | | | | 10.25 | | | | 3.50% | | | | 526,458 | | | | 0.15% | | | | 0.15% | | | | 0.15% | | | | 4.55% | | | | 18.56% | |
| | | | | | | | | | | | | | | | | | | | | | | | | | | | | | | | | | |
| $ | (0.06) | | | $ | 10.01 | | | | (1.91)% | | | $ | 1 | | | | 0.43% | | | | 0.18% | | | | 0.18% | | | | (0.25)% | | | | 27.12% | |
| | (0.10) | | | | 10.26 | | | | 3.60% | | | | 1 | | | | 0.40% | | | | 0.15% | | | | 0.15% | | | | 4.58% | | | | 18.56% | |
| | | | | | | | | | | | | | | | | | | | | | | | | | | | | | | | | | |
| | | | | | | | | | | | | | | | | | | | | | | | | | | | | | | | | | |
| $ | (0.36) | | | $ | 9.88 | | | | (0.01)% | | | $ | 223,329 | | | | 0.28% | | | | 0.28% | | | | 0.28% | | | | 2.60% | | | | 158.19% | |
| | (0.48) | | | | 10.24 | | | | 7.76% | | | | 257,604 | | | | 0.33% | | | | 0.33% | | | | 0.33% | | | | 3.16% | | | | 130.81% | |
| | (0.62) | | | | 9.97 | | | | (0.24)% | | | | 220,054 | | | | 0.33% | | | | 0.33% | | | | 0.33% | | | | 3.26% | | | | 52.16% | |
| | (0.44) | | | | 10.59 | | | | 10.87% | | | | 207,893 | | | | 0.35% | | | | 0.35% | | | | 0.35% | | | | 3.33% | | | | 56.04% | |
| | (0.18) | | | | 9.96 | | | | 1.44% | | | | 233,801 | | | | 0.36% | | | | 0.36% | | | | 0.36% | | | | 3.48% | | | | 127.65% | |
| | | | | | | | | | | | | | | | | | | | | | | | | | | | | | | | | | |
| | | | | | | | | | | | | | | | | | | | | | | | | | | | | | | | | | |
| $ | (0.25) | | | $ | 9.81 | | | | 1.97% | | | $ | 252,028 | | | | 0.17% | | | | 0.17% | | | | 0.17% | | | | 1.91% | | | | 29.92% | (g) |
| | (0.30) | | | | 9.87 | | | | 4.04% | | | | 250,632 | | | | 0.17% | | | | 0.17% | | | | 0.17% | | | | 2.12% | | | | 26.46% | (g) |
| | (0.34) | | | | 9.78 | | | | (1.05)% | | | | 253,548 | | | | 0.23% | | | | 0.23% | | | | 0.23% | | | | 1.84% | | | | 34.20% | (g) |
| | (0.40) | | | | 10.22 | | | | 4.95% | | | | 237,857 | | | | 0.30% | | | | 0.30% | | | | 0.30% | | | | 2.49% | | | | 28.67% | (g) |
| | (0.10) | | | | 10.13 | | | | 2.33% | | | | 278,160 | | | | 0.31% | | | | 0.31% | | | | 0.31% | | | | 1.60% | | | | 10.64% | (g) |
| | | | | | | | | | | | | | | | | | | | | | | | | | | | | | | | | | |
| | | | | | | | | | | | | | | | | | | | | | | | | | | | | | | | | | |
| $ | (0.12) | | | $ | 9.94 | | | | 0.19% | | | $ | 20,933 | | | | 0.31% | | | | 0.31% | | | | 0.31% | | | | 1.18% | | | | 26.24% | |
| | (0.14) | | | | 10.04 | | | | 1.26% | | | | 21,703 | | | | 0.29% | | | | 0.29% | | | | 0.29% | | | | 1.16% | | | | 25.15% | |
| | (0.23) | | | | 10.05 | | | | 0.21% | | | | 22,608 | | | | 0.27% | | | | 0.27% | | | | 0.27% | | | | 1.27% | | | | 5.92% | |
| | (0.22) | | | | 10.26 | | | | 2.33% | | | | 25,718 | | | | 0.27% | | | | 0.27% | | | | 0.27% | | | | 1.88% | | | | 22.24% | |
| | (0.23) | | | | 10.24 | | | | 1.92% | | | | 32,518 | | | | 0.28% | | | | 0.28% | | | | 0.28% | | | | 2.17% | | | | 19.68% | |
| | | | | | | | | | | | | | | | | | | | | | | | | | | | | | | | | | |
| | | | | | | | | | | | | | | | | | | | | | | | | | | | | | | | | | |
| $ | (0.21) | | | $ | 10.06 | | | | 1.54% | | | $ | 420,423 | | | | 0.24% | | | | 0.24% | | | | 0.24% | | | | 2.03% | | | | 25.67% | |
| | (0.25) | | | | 10.11 | | | | 4.10% | | | | 423,257 | | | | 0.29% | | | | 0.29% | | | | 0.29% | | | | 2.49% | | | | 34.05% | |
| | (0.28) | | | | 9.96 | | | | 1.39% | | | | 419,846 | | | | 0.29% | | | | 0.29% | | | | 0.29% | | | | 2.74% | | | | 59.43% | |
| | (0.33) | | | | 10.10 | | | | 8.29% | | | | 442,365 | | | | 0.31% | | | | 0.31% | | | | 0.31% | | | | 3.24% | | | | 16.99% | |
| | (0.34) | | | | 9.64 | | | | 4.13% | | | | 493,229 | | | | 0.33% | | | | 0.33% | | | | 0.33% | | | | 3.48% | | | | 21.78% | |
| | | | | | | | | | | | | | | | | | | | | | | | | | | | | | | | | | |
| $ | (0.21) | | | $ | 10.06 | | | | 1.54% | | | $ | 1,985 | | | | 0.49% | | | | 0.24% | | | | 0.24% | | | | 2.03% | | | | 25.67% | |
| | (0.25) | | | | 10.11 | | | | 4.10% | | | | 2,490 | | | | 0.54% | | | | 0.29% | | | | 0.29% | | | | 2.48% | | | | 34.05% | |
| | (0.28) | | | | 9.96 | | | | 1.39% | | | | 1,840 | | | | 0.48% | | | | 0.29% | | | | 0.29% | | | | 2.70% | | | | 59.43% | |
| | (0.33) | | | | 10.10 | | | | 8.29% | | | | 1,056 | | | | 0.31% | | | | 0.31% | | | | 0.31% | | | | 3.24% | | | | 16.99% | |
| | (0.34) | | | | 9.64 | | | | 3.92% | | | | 1,211 | | | | 0.58% | | | | 0.33% | | | | 0.33% | | | | 3.50% | | | | 21.78% | |
| | | | | | | | | | | | | | | | | | | | | | | | | | | | | | | | | | |
| | | | | | | | | | | | | | | | | | | | | | | | | | | | | | | | | | |
| $ | (0.23) | | | $ | 10.31 | | | | 1.31% | | | $ | 77,102 | | | | 0.25% | | | | 0.25% | | | | 0.25% | | | | 1.85% | | | | 21.51% | |
| | (0.25) | | | | 10.41 | | | | 3.76% | | | | 77,702 | | | | 0.25% | | | | 0.25% | | | | 0.25% | | | | 2.12% | | | | 17.84% | |
| | (0.25) | | | | 10.28 | | | | (0.37)% | | | | 73,472 | | | | 0.25% | | | | 0.25% | | | | 0.25% | | | | 2.06% | | | | 3.76% | |
| | (0.24) | | | | 10.56 | | | | 6.97% | | | | 72,377 | | | | 0.25% | | | | 0.25% | | | | 0.25% | | | | 2.17% | | | | 12.31% | |
| | (0.17) | | | | 10.10 | | | | 2.72% | | | | 72,294 | | | | 0.32% | | | | 0.32% | | | | 0.32% | | | | 1.86% | | | | 2.81% | |
| | | | | | | | | | | | | | | | | | | | | | | | | | | | | | | | | | |
| $ | (0.23) | | | $ | 10.31 | | | | 1.31% | | | $ | 575 | | | | 0.50% | | | | 0.25% | | | | 0.25% | | | | 1.85% | | | | 21.51% | |
| | (0.25) | | | | 10.41 | | | | 3.66% | | | | 724 | | | | 0.50% | | | | 0.25% | | | | 0.25% | | | | 2.11% | | | | 17.84% | |
| | (0.25) | | | | 10.29 | | | | (0.27)% | | | | 463 | | | | 0.44% | | | | 0.25% | | | | 0.25% | | | | 2.06% | | | | 3.76% | |
| | (0.24) | | | | 10.56 | | | | 6.97% | | | | 277 | | | | 0.25% | | | | 0.25% | | | | 0.25% | | | | 2.24% | | | | 12.31% | |
| | (0.14) | | | | 10.10 | | | | 1.54% | | | | 303 | | | | 0.57% | | | | 0.32% | | | | 0.32% | | | | 1.99% | | | | 2.81% | |
See accompanying notes to financial statements.
247
HC CAPITAL TRUST
Financial Highlights (concluded)
Selected data for a share outstanding throughout the periods indicated.
| (a) | Not annualized for periods less than one year. |
| (b) | Annualized for periods less than one year. |
| (c) | Portfolio turnover is calculated on the basis of the Portfolio, as a whole, without distinguishing between the classes of shares issued. |
| (d) | For the period December 6, 2010 (commencement of operations) through June 30, 2011. |
| (e) | For the period April 3, 2014 (commencement of operations) through June 30, 2014. |
| (f) | Amount rounds to less than $0.005 per share. |
| (g) | Portfolio Turnover does not include TBA security transactions. |
| (h) | For the period July 6, 2010 (commencement of operations) through June 30, 2011. |
| (i) | For the period July 13, 2010 (commencement of operations) through June 30, 2011. |
| (j) | For the period October 6, 2010 (commencement of operations) through June 30, 2011. |
See accompanying notes to financial statements.
248
HC CAPITAL TRUST
Notes to Financial Statements — June 30, 2015
1. DESCRIPTION. HC Capital Trust (the “Trust”) is registered under the Investment Company Act of 1940, as amended (the “1940 Act”), as an open-end management series investment company. The Trust is a Delaware statutory trust which was organized on December 15, 1994. As of June 30, 2015, the Trust offered twenty separate investment portfolios: The Value Equity Portfolio (“Value Portfolio”), The Institutional Value Equity Portfolio (“Institutional Value Portfolio”), The Growth Equity Portfolio (“Growth Portfolio”), The Institutional Growth Equity Portfolio (“Institutional Growth Portfolio”), The Small Capitalization-Mid Capitalization Equity Portfolio (“Small Cap-Mid Cap Portfolio”), The Institutional Small Capitalization-Mid Capitalization Equity Portfolio (“Institutional Small Cap-Mid Cap Portfolio”), The Real Estate Securities Portfolio (“Real Estate Portfolio”), The Commodity Returns Strategy Portfolio (“Commodity Portfolio”), The International Equity Portfolio (“International Portfolio”), The Institutional International Equity Portfolio (“Institutional International Portfolio”), The Emerging Markets Portfolio (“Emerging Markets Portfolio”), The Core Fixed Income Portfolio (“Core Fixed Income Portfolio”), The Fixed Income Opportunity Portfolio (“Fixed Opportunity Portfolio”), The U.S. Government Fixed Income Securities Portfolio (“U.S. Government Fixed Income Portfolio”), The Inflation Protected Securities Portfolio (“Inflation Protected Portfolio”), The U.S. Corporate Fixed Income Securities Portfolio (“U.S. Corporate Fixed Income Portfolio”), The U.S. Mortgage/Asset Backed Fixed Income Securities Portfolio (“U.S. Mortgage/Asset Backed Fixed Income Portfolio”), The Short-Term Municipal Bond Portfolio (“Short-Term Municipal Portfolio”), The Intermediate Term Municipal Bond Portfolio (“Intermediate Municipal Portfolio”) and The Intermediate Term Municipal Bond II Portfolio (“Intermediate Municipal II Portfolio) (each a “Portfolio” and collectively the “Portfolios”).
Each Portfolio is authorized to issue an unlimited number of shares of beneficial interest with a par value of $0.001 each in two classes of shares: HC Advisors Shares and HC Strategic Shares. As of June 30, 2015, the HC Advisors Shares for U.S. Government Fixed Income Portfolio, U.S. Corporate Fixed Income Portfolio, U.S. Mortgage/Asset Backed Fixed Income Portfolio and Short-Term Municipal Portfolio had not yet commenced operations. Each class of shares for each of the Portfolios has identical rights and privileges except with respect to voting rights on matters affecting a single class of shares. The Trust’s investment adviser is HC Capital Solutions (the “Adviser”), an operating division of Hirtle Callaghan & Co., LLC.
All the Portfolios in the Trust, except the Real Estate Portfolio, are diversified portfolios under the 1940 Act. The Real Estate Portfolio is a non-diversified portfolio, which means that it may concentrate its investments in the securities of a limited number of issuers.
As is customary, the Trust’s organizational documents permit the Trust to indemnify its officers and trustees against certain liabilities under certain circumstances. In addition, in the normal course of business, the Trust enters into contracts with its vendors and others that also permit the indemnification of parties to the contract under certain circumstances. The Trust’s maximum exposure under these arrangements is unknown, as this would involve future claims that may be made against the Trust.
2. SIGNIFICANT ACCOUNTING POLICIES. The following is a summary of the significant accounting policies followed by the Portfolios in the preparation of their financial statements. The Portfolios are investment companies and follow accounting and reporting guidance under Financial Accounting Standards Board (“FASB”) Accounting Standards Codification (“ASC”) Topic 946, “Financial Services - Investment Companies”. The policies are in conformity with accounting principles generally accepted in the United States of America (“GAAP”). The presentation of the Portfolios’ financial statements in conformity with GAAP requires management to make estimates and assumptions that affect the reported amounts of assets and liabilities at the date of the financial statements and the reported amounts of income and expenses for the period. Actual results could differ from those estimates.
A. Portfolio Valuation. The net asset value (“NAV”) per share of each Portfolio is determined at the close of regular trading on the New York Stock Exchange (“NYSE”), normally at 4:00 p.m. Eastern time, on days the NYSE is open. Each class’s NAV per share is calculated by adding the market value or fair value, as applicable, of all securities and other assets of the Portfolio, subtracting its liabilities and dividing the result by the number of its outstanding shares.
B. Securities Valuation. Security values are ordinarily obtained through the use of independent pricing services in accordance with procedures adopted by the Trust’s Board of Trustees (the “Board”). Pursuant to such procedures, the Portfolios may use a pricing service, bank, or broker-dealer experienced in such matters to value the Portfolio’s securities. When reliable market quotations are not readily available for any security, the fair value of that security will be determined by a committee established by the Board in accordance with procedures adopted by the Board. The fair valuation process is designed to value the subject security at the price the Portfolio would reasonably expect to receive upon its current sale. Additional consideration is given to securities that have experienced a decrease in the volume or level of activity or to circumstances that indicate that a transaction is not orderly.
249
HC CAPITAL TRUST
Notes to Financial Statements (continued) — June 30, 2015
For disclosure purposes, the Trust has a three-tier fair value hierarchy that is dependent upon the observability of various “inputs” used to determine the value of the Portfolios’ investments. These inputs are summarized in the three broad levels listed below:
| | | | |
| • Level 1 | | — | | quoted prices in active markets for identical assets |
| | |
| • Level 2 | | — | | other significant observable inputs (including quoted prices for similar securities, interest rates, prepayment speeds, credit risk, etc.) |
| | |
| • Level 3 | | — | | significant unobservable inputs (including a Portfolio’s own assumptions in determining the fair value of investments) |
The inputs or methodology used for valuing securities are not necessarily an indication of the risks associated with investing in those securities.
Equity Securities (Common and Preferred Stock and Exchange-Traded Funds): Readily marketable portfolio securities listed on a national securities exchange or on NASDAQ are valued at the closing price on the exchange or at the NASDAQ Official Closing Price. If there have been no sales on such exchange, or on NASDAQ, the securities are valued at the closing bid price. In each of these situations, valuations are typically categorized as Level 1 in the fair value hierarchy. Readily marketable securities traded only in the over-the-counter market and not on NASDAQ are valued at the closing price and are typically categorized as Level 1 in the fair value hierarchy, or, if there have been no sales, are valued at the mean of the last reported bid and asked prices and are typically categorized as Level 2 in the fair value hierarchy.
Securities listed on a foreign exchange are valued at the closing price on that exchange provided that where the prices of such securities are denominated in foreign currencies, such prices are converted into U.S. dollars at the bid price of such currencies against U.S. dollars at the time of the NAV calculation. If there have been no sales on such exchange, the security is valued at the closing bid price. In each of these situations, valuations are typically categorized as Level 1 in the fair value hierarchy. Fair value pricing may be used if events materially affecting the value of foreign securities occur between the time when the exchange on which they are traded closes and the time when the NAV is calculated. Such securities may be valued at fair value in accordance with procedures adopted by the Board. Management identifies possible fluctuations in international securities by monitoring the increase or decrease in the value of a designated benchmark index. In the event of an increase or decrease greater than predetermined levels, a Portfolio may use a systematic valuation model provided by an independent third party to fair value its international securities. Such systematic valuations are typically categorized as Level 2 in the fair value hierarchy.
Mutual Funds: Mutual funds are valued at their respective daily net asset value and are typically categorized as Level 1 in the fair value hierarchy.
Fixed Income Securities (Corporate, Municipal and Foreign Bonds, U.S. Government and Agency Securities and Inflation Indexed Bonds): Fixed income securities are valued using various inputs including benchmark yields, reported trades, broker/dealer quotes, issuer spreads, two-sided markets, benchmark securities, bids, offers, reference data, and industry and market events, and are typically categorized as Level 2 in the fair value hierarchy.
Asset Backed and Mortgage Backed Securities: In addition to the inputs discussed above for fixed income securities, asset backed and mortgage backed securities are valued using new issue data, monthly payment information and collateral performance and are typically categorized as Level 2 in the fair value hierarchy.
Short-Term Obligations: Short-term obligations with maturities of 60 days or less may also be valued at amortized cost, which constitutes fair value as determined by the Board. Such securities are typically categorized as Level 2 in the fair value hierarchy.
Derivative Instruments (Futures, Options, Swaps and Forward Currency Contracts): Swaps are valued using interdealer broker rates, benchmark yields, and swap details and are typically categorized as Level 2 in the fair value hierarchy. Exchange traded futures, swaps and options are valued using quoted prices from the exchange and are typically categorized as Level 1 in the fair value hierarchy. Interest rate swaptions are valued using future interest rate volatility, yield curve, and strike price and are typically categorized as Level 2 in the fair value hierarchy. Forward currency contracts are valued using market quotes posted by major currency dealers and are typically categorized as Level 2 in the fair value hierarchy.
250
HC CAPITAL TRUST
Notes to Financial Statements (continued) — June 30, 2015
The following is a summary of the valuation input used as of June 30, 2015 in valuing the Portfolios’ investments based upon the three levels defined above (amounts in thousands). The breakdown of investment categorization is disclosed in the Schedule of Portfolio Investments for each Portfolio.
| | | | | | | | | | | | | | | | |
Portfolio | | LEVEL 1 –
Quoted Prices | | | LEVEL 2 – Other
Significant
Observable Inputs | | | LEVEL 3 –
Significant
Unobservable Inputs | | | Total | |
Value Portfolio | | | | | | | | | |
Common Stocks | | $ | 516,574 | | | $ | 12 | | | $ | — | | | $ | 516,586 | |
Time Deposit | | | — | | | | 3,610 | | | | — | | | | 3,610 | |
Mutual Funds | | | 96,802 | | | | — | | | | — | | | | 96,802 | |
Repurchase Agreement | | | — | | | | 2,411 | | | | — | | | | 2,411 | |
| | | | | | | | | | | | | | | | |
Total Investments | | $ | 613,376 | | | $ | 6,033 | | | $ | — | | | $ | 619,409 | |
| | | | | | | | | | | | | | | | |
Other Financial Instruments1 | | | | | | | | | | | | | | | | |
Futures | | $ | (405 | ) | | $ | — | | | $ | — | | | $ | (405 | ) |
| | | | |
Institutional Value Portfolio | | | | | | | | | | | | | | | | |
Common Stocks | | $ | 752,829 | | | $ | 20 | | | $ | — | | | $ | 752,849 | |
Time Deposit | | | — | | | | 10,943 | | | | — | | | | 10,943 | |
Mutual Funds | | | 138,401 | | | | — | | | | — | | | | 138,401 | |
Repurchase Agreement | | | — | | | | 3,770 | | | | — | | | | 3,770 | |
| | | | | | | | | | | | | | | | |
Total Investments | | $ | 891,230 | | | $ | 14,733 | | | $ | — | | | $ | 905,963 | |
| | | | | | | | | | | | | | | | |
Other Financial Instruments1 | | | | | | | | | | | | | | | | |
Futures | | $ | (406 | ) | | $ | — | | | $ | — | | | $ | (406 | ) |
| | | | |
Growth Portfolio | | | | | | | | | | | | | | | | |
Common Stocks | | $ | 716,689 | | | $ | — | | | $ | — | | | $ | 716,689 | |
Time Deposit | | | — | | | | 8,379 | | | | — | | | | 8,379 | |
Mutual Funds | | | 93,464 | | | | — | | | | — | | | | 93,464 | |
| | | | | | | | | | | | | | | | |
Total Investments | | $ | 810,153 | | | $ | 8,379 | | | $ | — | | | $ | 818,532 | |
| | | | | | | | | | | | | | | | |
Other Financial Instruments1 | | | | | | | | | | | | | | | | |
Futures | | $ | (1,438 | ) | | $ | — | | | $ | — | | | $ | (1,438 | ) |
| | | | |
Institutional Growth Portfolio | | | | | | | | | | | | | | | | |
Common Stocks | | $ | 1,087,227 | | | $ | — | | | $ | — | | | $ | 1,087,227 | |
Time Deposit | | | — | | | | 11,297 | | | | — | | | | 11,297 | |
Mutual Funds | | | 143,755 | | | | — | | | | — | | | | 143,755 | |
| | | | | | | | | | | | | | | | |
Total Investments | | $ | 1,230,982 | | | $ | 11,297 | | | $ | — | | | $ | 1,242,279 | |
| | | | | | | | | | | | | | | | |
Other Financial Instruments1 | | | | | | | | | | | | | | | | |
Futures | | $ | (1,825 | ) | | $ | — | | | $ | — | | | $ | (1,825 | ) |
| | | | |
Small Capitalization–Mid Capitalization Portfolio | | | | | | | | | | | | | | | | |
Common Stocks | | $ | 97,856 | | | $ | — | | | $ | — | | | $ | 97,856 | |
Time Deposit | | | — | | | | 3,469 | | | | — | | | | 3,469 | |
Mutual Funds | | | 11,920 | | | | — | | | | — | | | | 11,920 | |
Repurchase Agreement | | | — | | | | 570 | | | | — | | | | 570 | |
Contingent Rights | | | — | | | | — | | | | — | | | | — | |
Warrant | | | — | | | | — | | | | — | | | | — | |
| | | | | | | | | | | | | | | | |
Total Investments | | $ | 109,776 | | | $ | 4,039 | | | $ | — | | | $ | 113,815 | |
| | | | | | | | | | | | | | | | |
Other Financial Instruments1 | | | | | | | | | | | | | | | | |
Futures | | $ | 36 | | | $ | — | | | $ | — | | | $ | 36 | |
251
HC CAPITAL TRUST
Notes to Financial Statements (continued) — June 30, 2015
| | | | | | | | | | | | | | | | |
Portfolio | | LEVEL 1 –
Quoted Prices | | | LEVEL 2 – Other
Significant
Observable Inputs | | | LEVEL 3 –
Significant
Unobservable Inputs | | | Total | |
| | | | |
Institutional Small–Mid Capitalization Portfolio | | | | | | | | | | | | | | | | |
Common Stocks | | $ | 172,352 | | | $ | — | | | $ | — | | | $ | 172,352 | |
Contingent Rights | | | — | | | | — | | | | — | | | | — | |
Time Deposit | | | — | | | | 5,644 | | | | — | | | | 5,644 | |
Mutual Funds | | | 20,533 | | | | — | | | | — | | | | 20,533 | |
Repurchase Agreement | | | — | | | | 3,337 | | | | — | | | | 3,337 | |
| | | | | | | | | | | | | | | | |
Total Investments | | $ | 192,885 | | | $ | 8,981 | | | $ | — | | | $ | 201,866 | |
| | | | | | | | | | | | | | | | |
Other Financial Instruments1 | | | | | | | | | | | | | | | | |
Futures | | $ | 64 | | | $ | — | | | $ | — | | | $ | 64 | |
| | | | |
Real Estate Portfolio | | | | | | | | | | | | | | | | |
Common Stocks | | $ | 121,599 | | | $ | — | | | $ | — | | | $ | 121,599 | |
Mutual Funds | | | 9,757 | | | | — | | | | — | | | | 9,757 | |
| | | | | | | | | | | | | | | | |
Total Investments | | $ | 131,356 | | | $ | — | | | $ | — | | | $ | 131,356 | |
| | | | | | | | | | | | | | | | |
Other Financial Instruments1 | | | | | | | | | | | | | | | | |
Futures | | $ | (70 | ) | | $ | — | | | $ | — | | | $ | (70 | ) |
| | | | |
Commodity Portfolio | | | | | | | | | | | | | | | | |
Common Stocks | | $ | 735,390 | | | $ | 2,995 | | | $ | — | | | $ | 738,385 | |
Preferred Stocks | | | 3,884 | | | | — | | | | — | | | | 3,884 | |
Right | | | — | | | | 49 | | | | — | | | | 49 | |
Commercial Paper | | | — | | | | 1,296 | | | | — | | | | 1,296 | |
Corporate Bonds | | | — | | | | 18,252 | | | | — | | | | 18,252 | |
Asset Backed Securities | | | — | | | | 7,754 | | | | — | | | | 7,754 | |
Collateralized Mortgage Obligations | | | — | | | | 8,433 | | | | — | | | | 8,433 | |
Certificate of Deposit | | | — | | | | 1,403 | | | | — | | | | 1,403 | |
Global Bonds | | | — | | | | 21,505 | | | | — | | | | 21,505 | |
U.S. Government Agency Securities | | | — | | | | 11,879 | | | | — | | | | 11,879 | |
U.S. Treasury Obligations | | | — | | | | 50,935 | | | | — | | | | 50,935 | |
Yankee Dollars | | | — | | | | 23,250 | | | | — | | | | 23,250 | |
Time Deposit | | | — | | | | 11,347 | | | | — | | | | 11,347 | |
Mutual Funds | | | 7,140 | | | | — | | | | — | | | | 7,140 | |
Purchased Options | | | 183 | | | | 86 | | | | — | | | | 269 | |
Repurchase Agreements | | | — | | | | 237,059 | | | | — | | | | 237,059 | |
| | | | | | | | | | | | | | | | |
Total Investments | | $ | 746,597 | | | $ | 396,243 | | | $ | — | | | $ | 1,142,840 | |
| | | | | | | | | | | | | | | | |
Other Financial Instruments1 | | | | | | | | | | | | | | | | |
Futures | | $ | (6,274 | ) | | $ | — | | | $ | | | | $ | (6,274 | ) |
Forward Currency Contracts | | | — | | | | (230 | ) | | | — | | | | (230 | ) |
Written Options & Swaptions | | | (342 | ) | | | (126 | ) | | | — | | | | (468 | ) |
Total Return Swap Agreements | | | — | | | | 277 | | | | — | | | | 277 | |
Interest Rate Swap Agreements | | | — | | | | 1,090 | | | | — | | | | 1,090 | |
Commodity Forward Swap Agreements | | | — | | | | (189 | ) | | | — | | | | (189 | ) |
Commodity Swap Agreements | | | — | | | | 4,530 | | | | — | | | | 4,530 | |
Variance Swap Agreements | | | — | | | | 32 | | | | — | | | | 32 | |
| | | | |
International Portfolio | | | | | | | | | | | | | | | | |
Common Stocks | | $ | 1,452,748 | | | $ | 318 | | | $ | — | | | $ | 1,453,066 | |
Preferred Stocks | | | 13,354 | | | | — | | | | — | | | | 13,354 | |
U.S. Treasury Obligations | | | — | | | | 28 | | | | — | | | | 28 | |
Time Deposit | | | — | | | | 7,923 | | | | — | | | | 7,923 | |
Right | | | 40 | | | | — | | | | — | | | | 40 | |
Mutual Funds | | | 11,745 | | | | — | | | | — | | | | 11,745 | |
Repurchase Agreement | | | — | | | | 8,884 | | | | — | | | | 8,884 | |
| | | | | | | | | | | | | | | | |
Total Investments | | $ | 1,477,887 | | | $ | 17,153 | | | $ | — | | | $ | 1,495,040 | |
| | | | | | | | | | | | | | | | |
Other Financial Instruments1 | | | | | | | | | | | | | | | | |
Futures | | $ | 45 | | | $ | — | | | $ | — | | | $ | 45 | |
Forward Currency Contracts | | | — | | | | — | | | | — | | | | — | |
252
HC CAPITAL TRUST
Notes to Financial Statements (continued) — June 30, 2015
| | | | | | | | | | | | | | | | |
Portfolio | | LEVEL 1 –
Quoted Prices | | | LEVEL 2 – Other
Significant
Observable Inputs | | | LEVEL 3 –
Significant
Unobservable Inputs | | | Total | |
Institutional International Portfolio | | | | | | | | | | | | | | | | |
Common Stocks | | $ | 2,750,349 | | | $ | 550 | | | $ | — | | | $ | 2,750,899 | |
Preferred Stocks | | | 22,188 | | | | — | | | | — | | | | 22,188 | |
U.S. Treasury Obligations | | | — | | | | 60 | | | | — | | | | 60 | |
Time Deposit | | | — | | | | 10,551 | | | | — | | | | 10,551 | |
Right | | | 72 | | | | — | | | | — | | | | 72 | |
Mutual Funds | | | 22,787 | | | | — | | | | — | | | | 22,787 | |
Repurchase Agreement | | | — | | | | 15,040 | | | | — | | | | 15,040 | |
| | | | | | | | | | | | | | | | |
Total Investments | | $ | 2,795,396 | | | $ | 26,201 | | | $ | — | | | $ | 2,821,597 | |
| | | | | | | | | | | | | | | | |
Other Financial Instruments1 | | | | | | | | | | | | | | | | |
Futures | | $ | 59 | | | $ | — | | | $ | — | | | $ | 59 | |
Forward Currency Contracts | | | — | | | | — | | | | — | | | | — | |
| | | | |
Emerging Markets Portfolio | | | | | | | | | | | | | | | | |
Common Stocks | | $ | 1,714,041 | | | $ | 3,071 | | | $ | — | | | $ | 1,717,112 | |
Preferred Stocks | | | 42,146 | | | | — | | | | — | | | | 42,146 | |
Time Deposit | | | — | | | | 10,162 | | | | — | | | | 10,162 | |
Mutual Funds | | | 21,719 | | | | — | | | | — | | | | 21,719 | |
Repurchase Agreement | | | — | | | | 7,723 | | | | — | | | | 7,723 | |
Foreign Bond | | | — | | | | 6 | | | | — | | | | 6 | |
| | | | | | | | | | | | | | | | |
Total Investments | | $ | 1,777,906 | | | $ | 20,962 | | | $ | — | | | $ | 1,798,868 | |
| | | | | | | | | | | | | | | | |
Other Financial Instruments1 | | | | | | | | | | | | | | | | |
Futures | | $ | (775 | ) | | $ | — | | | $ | — | | | $ | (775 | ) |
| | | | |
Core Fixed Income Portfolio | | | | | | | | | | | | | | | | |
Corporate Bonds | | $ | — | | | $ | 27,300 | | | $ | — | | | $ | 27,300 | |
Asset Backed Securities | | | — | | | | 539 | | | | — | | | | 539 | |
Collateralized Mortgage Obligations | | | — | | | | 2,459 | | | | — | | | | 2,459 | |
U.S. Government Agency Securities | | | — | | | | 2,004 | | | | — | | | | 2,004 | |
U.S. Government Agency Mortgages | | | — | | | | 34,392 | | | | — | | | | 34,392 | |
U.S. Treasury Obligations | | | — | | | | 22,396 | | | | — | | | | 22,396 | |
Yankee Dollars | | | — | | | | 4,678 | | | | — | | | | 4,678 | |
Time Deposit | | | — | | | | 75 | | | | — | | | | 75 | |
Mutual Funds | | | 10,608 | | | | — | | | | — | | | | 10,608 | |
| | | | | | | | | | | | | | | | |
Total Investments | | $ | 10,608 | | | $ | 93,843 | | | $ | — | | | $ | 104,451 | |
| | | | | | | | | | | | | | | | |
TBA Sale Commitments | | $ | — | | | $ | (288 | ) | | $ | — | | | $ | (288 | ) |
| | | | |
Fixed Opportunity Portfolio | | | | | | | | | | | | | | | | |
Preferred Stock | | $ | 184 | | | $ | — | | | $ | — | | | $ | 184 | |
Corporate Bonds | | | — | | | | 487,967 | | | | — | | | | 487,967 | |
Asset Backed Security | | | — | | | | 5,334 | | | | — | | | | 5,334 | |
Collateralized Mortgage Obligations | | | — | | | | 53,479 | | | | — | | | | 53,479 | |
Yankee Dollars | | | — | | | | 127,148 | | | | — | | | | 127,148 | |
Time Deposit | | | — | | | | 5,430 | | | | — | | | | 5,430 | |
Mutual Funds | | | 109,253 | | | | — | | | | — | | | | 109,253 | |
Repurchase Agreement | | | — | | | | 11,406 | | | | — | | | | 11,406 | |
| | | | | | | | | | | | | | | | |
Total Investments | | $ | 109,437 | | | $ | 690,764 | | | $ | — | | | $ | 800,201 | |
| | | | | | | | | | | | | | | | |
Other Financial Instruments1 | | | | | | | | | | | | | | | | |
Futures | | $ | (23 | ) | | $ | — | | | $ | — | | | $ | (23 | ) |
Forward Currency Contracts | | | — | | | | (164 | ) | | | — | | | | (164 | ) |
| | | | |
U.S. Government Fixed Income Portfolio | | | | | | | | | | | | | | | | |
Corporate Bond | | $ | — | | | $ | 275 | | | $ | — | | | $ | 275 | |
U.S. Government Agency Securities | | | — | | | | 20,071 | | | | — | | | | 20,071 | |
U.S. Treasury Obligations | | | — | | | | 230,453 | | | | — | | | | 230,453 | |
Yankee Dollar | | | — | | | | 139 | | | | — | | | | 139 | |
Time Deposit | | | — | | | | 872 | | | | — | | | | 872 | |
Mutual Fund | | | 12,975 | | | | — | | | | — | | | | 12,975 | |
| | | | | | | | | | | | | | | | |
Total Investments | | $ | 12,975 | | | $ | 251,810 | | | $ | — | | | $ | 264,785 | |
| | | | | | | | | | | | | | | | |
253
HC CAPITAL TRUST
Notes to Financial Statements (continued) — June 30, 2015
| | | | | | | | | | | | | | | | |
Portfolio | | LEVEL 1 –
Quoted Prices | | | LEVEL 2 – Other
Significant
Observable Inputs | | | LEVEL 3 –
Significant
Unobservable Inputs | | | Total | |
| | | | |
Inflation Protected Portfolio | | | | | | | | | | | | | | | | |
U.S. Treasury Obligations | | $ | — | | | $ | 484,035 | | | $ | — | | | $ | 484,035 | |
Mutual Funds | | | 25,997 | | | | — | | | | — | | | | 25,997 | |
| | | | | | | | | | | | | | | | |
Total Investments | | $ | 25,997 | | | $ | 484,035 | | | $ | — | | | $ | 510,032 | |
| | | | | | | | | | | | | | | | |
| | | | |
U.S. Corporate Fixed Income Portfolio | | | | | | | | | | | | | | | | |
Corporate Bonds | | $ | — | | | $ | 178,040 | | | $ | — | | | $ | 178,040 | |
Yankee Dollars | | | — | | | | 29,370 | | | | — | | | | 29,370 | |
Mutual Funds | | | 15,778 | | | | — | | | | — | | | | 15,778 | |
| | | | | | | | | | | | | | | | |
Total Investments | | $ | 15,778 | | | $ | 207,410 | | | $ | — | | | $ | 223,188 | |
| | | | | | | | | | | | | | | | |
| | | | |
U.S. Mortgage/Asset Backed Fixed Income Portfolio | | | | | | | | | | | | | | | | |
Asset Backed Securities | | $ | — | | | $ | 4,336 | | | $ | — | | | $ | 4,336 | |
Collateralized Mortgage Obligations | | | — | | | | 15,193 | | | | — | | | | 15,193 | |
U.S. Government Agency Mortgages | | | — | | | | 222,173 | | | | — | | | | 222,173 | |
Yankee Dollars | | | — | | | | 649 | | | | — | | | | 649 | |
Mutual Funds | | | 46,972 | | | | — | | | | — | | | | 46,972 | |
| | | | | | | | | | | | | | | | |
Total Investments | | $ | 46,972 | | | $ | 242,351 | | | $ | — | | | $ | 289,323 | |
| | | | | | | | | | | | | | | | |
TBA Sale Commitments | | $ | — | | | $ | (1,788 | ) | | $ | — | | | $ | (1,788 | ) |
| | | | |
Short-Term Municipal Portfolio | | | | | | | | | | | | | | | | |
Municipal Bonds | | $ | — | | | $ | 20,670 | | | $ | — | | | $ | 20,670 | |
Mutual Fund | | | 39 | | | | — | | | | — | | | | 39 | |
| | | | | | | | | | | | | | | | |
Total Investments | | $ | 39 | | | $ | 20,670 | | | $ | — | | | $ | 20,709 | |
| | | | | | | | | | | | | | | | |
| | | | |
Intermediate Municipal Portfolio | | | | | | | | | | | | | | | | |
Corporate Bond | | $ | — | | | $ | — | | | $ | — | | | $ | — | |
Municipal Bonds | | | — | | | | 396,574 | | | | — | | | | 396,574 | |
Time Deposit | | | — | | | | 9,775 | | | | — | | | | 9,775 | |
Mutual Fund | | | 20,563 | | | | — | | | | — | | | | 20,563 | |
| | | | | | | | | | | | | | | | |
Total Investments | | $ | 20,563 | | | $ | 406,349 | | | $ | — | | | $ | 426,912 | |
| | | | | | | | | | | | | | | | |
| | | | |
Intermediate Municipal II Portfolio | | | | | | | | | | | | | | | | |
Municipal Bonds | | $ | — | | | $ | 74,311 | | | $ | — | | | $ | 74,311 | |
Mutual Funds | | | 3,926 | | | | — | | | | — | | | | 3,926 | |
| | | | | | | | | | | | | | | | |
Total Investments | | $ | 3,926 | | | $ | 74,311 | | | $ | — | | | $ | 78,237 | |
| | | | | | | | | | | | | | | | |
| 1 | Other Financial Instruments are derivative instruments not reflected in the Portfolio of Investments, such as futures and forward currency contracts, which are valued at the unrealized appreciation/(depreciation) on the instrument and written options and swap agreements, which are valued at fair value. |
The Trust’s policy is to disclose transfers between fair value hierarchy levels based on valuations at the end of the reporting period. There were no transfers from Level 1 to Level 2 and Level 2 to Level 1 during the year ended June 30, 2015.
C. Securities Transactions and Investment Income. For financial reporting purposes, portfolio securities transactions are reported on trade date. However, for daily NAV determination, portfolio securities transactions are reflected no later than in the first calculation on the first business day following trade date. Dividend income is recognized on the ex-dividend date and foreign dividends are recognized as soon as reliable information is available from the Portfolio’s sources. Interest income, including amortization of premium and accretion of discount on investments, is accrued daily, as earned. Realized gains and losses from securities transactions are determined by comparing the identified cost of the security lot sold to the net sales proceeds. Realized gains and losses from principal payment transactions on mortgage backed and asset backed securities are classified as investment income or loss for financial reporting purposes.
For certain securities, including real estate investment trusts, the Portfolio records distributions received in excess of income as a reduction of cost of investments and/or realized gain. Such amounts are based on estimates if actual amounts are not available. Actual amounts of income, realized gain and return of capital may differ from the estimated amounts. The Portfolio records adjustments to the estimated amounts of the components of distributions to investment income, unrealized appreciation/depreciation and realized gain/loss on investments as necessary, once the issuers provide information about the actual composition of the distributions.
254
HC CAPITAL TRUST
Notes to Financial Statements (continued) — June 30, 2015
D. Restricted Securities. A restricted security is a security that cannot be offered for public sale without prior registration under the Securities Act of 1933 (the “1933 Act”) (absent an exemption). Whether a restricted security is illiquid is determined pursuant to guidelines established by the Board of Trustees. Not all restricted securities are considered illiquid. At June 30, 2015, the Commodity Portfolio and Intermediate Municipal Portfolio held illiquid restricted securities representing 0.41% and 0.41% of net assets, respectively. The illiquid restricted securities held as of June 30, 2015 are identified below:
| | | | | | | | | | | | | | | | |
Security | | Acquisition
Date | | | Acquisition
Cost
(000) | | | Principal
Amount
(000) | | | Fair Value
(000) | |
Commodity Portfolio | | | | | | | | | | | | | | | | |
Bonos y Obligaciones del Estado,
5.85%, 1/31/12 | | | 6/5/14 | | | $ | 6,107 | | | $ | 3,500 | | | $ | 4,899 | |
| | | | | | | | | | | | | | | | |
| | | | | | $ | 6,107 | | | | | | | $ | 4,899 | |
| | | | | | | | | | | | | | | | |
| | | | |
Intermediate Municipal Portfolio | | | | | | | | | | | | | | | | |
City of Chicago Certificates of Participation Tax Increment Allocation Revenue Diversey/Narragansett Project, Series NT, Callable 8/13/15@100.00 | | | 8/1/06 | | | $ | 2,722 | | | $ | 2,550 | | | $ | 1,749 | |
| | | | | | | | | | | | | | | | |
| | | | | | $ | 2,722 | | | | | | | $ | 1,749 | |
| | | | | | | | | | | | | | | | |
E. Allocations. Expenses directly attributable to a Portfolio are charged to that Portfolio. Class specific expenses, if any, are borne by that class. Other expenses are allocated proportionately among the Portfolios in relation to the net assets of each Portfolio or by another appropriate method. Income, non-class specific expenses and realized and unrealized gains and losses are allocated to the respective classes based on relative net assets.
F. Dividends and Capital Gain Distributions to Shareholders. The Core Fixed Income Portfolio, U.S. Government Fixed Income Portfolio, Inflation Protected Portfolio, U.S. Corporate Fixed Income Portfolio, U.S. Mortgage/Asset Backed Fixed Income Portfolio, Short-Term Municipal Portfolio, Intermediate Municipal Portfolio and Intermediate Municipal II Portfolio declare and distribute dividends from net investment income, if any, on a monthly basis. The Value Portfolio, Institutional Value Portfolio, Growth Portfolio, Institutional Growth Portfolio, Small Cap-Mid Cap Portfolio, Institutional Small Cap-Mid Cap Portfolio, Real Estate Portfolio, Commodity Portfolio and Fixed Opportunity Portfolio declare and distribute dividends from net investment income, if any, on a quarterly basis. The International Portfolio and the Institutional International Portfolio declare and distribute dividends from net investment income, if any, on a semiannual basis. The Emerging Markets Portfolio declares and distributes dividends from net investment income, if any, on an annual basis. Net realized capital gains, if any, are declared and distributed at least annually by each Portfolio.
G. Repurchase Agreements. Among the instruments that each of the Portfolios may use for temporary investment purposes are repurchase agreements. Under the terms of a typical repurchase agreement, a Portfolio would acquire an underlying debt security for a relatively short period (usually not more than one week), subject to an obligation of the seller to repurchase that security and the obligation of the Portfolio to resell that security at an agreed-upon price and date. Repurchase agreements could involve certain risks in the event of default or insolvency of the counterparty, including possible delays or restrictions upon the Portfolio’s ability to dispose of the underlying securities. The creditworthiness of those banks and non-bank dealers with which the Portfolios may enter into repurchase agreements are monitored in accordance with guidelines adopted by the Board, as is the market value of the securities underlying any repurchase agreement to ensure that the repurchase obligation of the seller is collateralized by an amount at least equal to the repurchase price including accrued interest. All repurchase agreements are fully collateralized by cash and/or government securities (as defined in the 1940 Act). If approved by the Adviser, repurchase agreements may also be fully collateralized by other securities that, at the time the repurchase agreement is entered into, are determined by the Board, or its authorized delegate, to be (i) issued by an issuer that has an exceptionally strong capacity to meet its obligations on the collateral, and (ii) sufficiently liquid that they can be sold by the Trust at approximately their carrying value in the ordinary course of business within seven calendar days. Master Repurchase Agreements (“MRA”) permit the Portfolios, under certain circumstances, including an event of default (such as bankruptcy or insolvency), to offset receivables under the MRA with collateral posted by the counterparty and create one net payment due to or from the Portfolios. However, bankruptcy or insolvency laws of a particular jurisdiction may impose restrictions on or prohibitions against such a right of offset in the event of the MRA counterparty’s bankruptcy or insolvency. Pursuant to the terms of the MRA, the Portfolios receive securities as collateral with a
255
HC CAPITAL TRUST
Notes to Financial Statements (continued) — June 30, 2015
market value in excess of the repurchase price to be received by the Portfolios upon the maturity of the transaction. Upon a bankruptcy or insolvency of the MRA counterparty, the Portfolios would recognize a liability with respect to such excess collateral to reflect the Portfolio’s obligation under bankruptcy law to return the excess to the counterparty.
The following table is a summary of each Portfolio’s open repurchase agreements which are subject to offset under an MRA on a net basis as of June 30, 2015:
| | | | | | | | | | | | |
Portfolio | | Value of Repurchase
Agreements
(000) | | | Value of Collateral
Received
(000) | | | Net Amount
(000) | |
Commodity Portfolio | | $ | 225,200 | | | $ | 225,200 | | | $ | — | |
H. TBA Purchase and Sale Commitments. Certain of the Portfolios may enter into “TBA” (to be announced) commitments to purchase or sell securities for a fixed price at a future date, typically not to exceed 45 days. TBA commitments may be considered securities in themselves, and involve a risk of loss if the value of the security to be purchased or sold declines or increases, respectively, prior to settlement date. Unsettled TBA commitments are valued at the current market value of the underlying securities, according to the procedures described under “Securities Valuation” above.
I. Commission Recapture. Certain of the Portfolios participate in a commission recapture program. These Portfolios will utilize the recaptured commissions to pay for, in whole or in part, certain expenses of the Portfolios, excluding investment advisory and distribution fees. The expenses eligible to be paid will include, but are not limited to, administration fees, audit fees, custodian fees, legal fees and printing expenses, as directed by the Trust. These amounts are disclosed as “Expenses paid indirectly” on the Statements of Operations.
For the year ended June 30, 2015, the following commissions were recaptured (amounts in thousands):
| | | | |
| | | Commissions | |
Portfolio | | Recaptured | |
Value Equity Portfolio | | $ | 54 | |
Institutional Value Equity Portfolio | | | 91 | |
Growth Portfolio | | | 24 | |
Institutional Growth Equity Portfolio | | | 46 | |
Small Capitalization-Mid Capitalization Equity Portfolio | | | 8 | |
Institutional Small Capitalization-Mid Capitalization Equity Portfolio | | | 10 | |
Real Estate Securities Portfolio | | | 2 | |
Commodity Returns Strategy Portfolio | | | 9 | |
International Equity Portfolio | | | 6 | |
Institutional International Equity Portfolio | | | 13 | |
Emerging Markets Portfolio | | | 36 | |
J. Foreign Exchange Transactions. The books and records of the Portfolios are maintained in U.S. dollars. Non-U.S. dollar denominated amounts are translated into U.S. dollars as follows, with the resultant exchange gains and losses recorded in the Statements of Operations:
| | i) | value of investment securities and other assets and liabilities at the exchange rate on the valuation date; and |
| | ii) | purchases and sales of investment securities and income and expenses at the exchange rate prevailing on the respective date of such transactions. |
The Portfolios do not isolate realized and unrealized gains and losses attributable to changes in the exchange rates from gains and losses that arise from changes in the value of investments. Such fluctuations are included with net realized and unrealized gain or loss on investments.
Dividends and interest from non-U.S. sources received by a Portfolio are generally subject to non-U.S. withholding taxes at rates ranging up to 30%. Such withholding taxes may be reduced or eliminated under the terms of applicable U.S. income tax treaties, and each Portfolio intends to, if reasonable, undertake any procedural steps required to claim the benefits of such treaties. If the value of more than 50% of a Portfolio’s total assets at the close of any taxable year consists of stock or securities of non-U.S. corporations, the Portfolio may elect to treat any non-U.S. taxes paid by it as paid by its shareholders.
256
HC CAPITAL TRUST
Notes to Financial Statements (continued) — June 30, 2015
The Portfolios may be subject to foreign taxes on gains in investments or currency repatriation. The Portfolios accrue such taxes, as applicable, based on their current interpretation of tax rules in the foreign markets in which they invest.
K. Derivative Instruments. Certain of the Portfolios may invest in various financial instruments including positions in forward currency contracts, financial futures contracts, options contracts and swap agreements.
The following is a summary of the fair value of derivative instruments held by the Portfolios as of June 30, 2015 (amounts in thousands).
| | | | | | | | | | | | | | | | | | | | |
| | | Assets | |
Portfolio | | Unrealized
appreciation
on futures
contracts* | | | Investments,
at value
for purchased
options | | | Investments,
at value
for written
options | | | Unrealized
appreciation
on forward
currency
contracts | | | Swap
agreements,
at value* | |
Equity Risk Exposure: | | | | | | | | | | | | | | | | | | | | |
Small Cap-Mid Cap Portfolio | | $ | 36 | | | $ | — | | | $ | — | | | $ | — | | | $ | — | |
Institutional Small Cap-Mid Cap Portfolio | | | 64 | | | | — | | | | — | | | | — | | | | — | |
Real Estate Portfolio | | | — | | | | — | | | | — | | | | — | | | | — | |
International Portfolio | | | 78 | | | | — | | | | — | | | | — | | | | — | |
Institutional International Portfolio | | | 81 | | | | — | | | | — | | | | — | | | | — | |
| | | | | |
Foreign Exchange Rate Risk Exposure: | | | | | | | | | | | | | | | | | | | | |
Commodity Portfolio | | | — | | | | 1 | | | | — | | | | 486 | | | | — | |
| | | | | |
Commodity Risk Exposure: | | | | | | | | | | | | | | | | | | | | |
Commodity Portfolio | | | 4,260 | | | | 268 | | | | — | | | | — | | | | 5,163 | |
| | | | | |
Interest Rate Risk Exposure: | | | | | | | | | | | | | | | | | | | | |
Commodity Portfolio | | | 7 | | | | — | | | | — | | | | — | | | | 1,230 | |
Fixed Income Opportunity Portfolio | | | 56 | | | | — | | | | — | | | | — | | | | — | |
| | | Liabilities | |
Portfolio | | Net
unrealized
deprecation
on futures
contracts* | | | Purchased
options, at
fair value | | | Written
options, at
fair value | | | Unrealized
depreciation
on forward
currency
contracts | | | Swap
agreements,
at value* | |
Equity Risk Exposure: | | | | | | | | | | | | | | | | | | | | |
Value Portfolio | | $ | 405 | | | $ | — | | | $ | — | | | $ | — | | | $ | — | |
Institutional Value Portfolio | | | 406 | | | | — | | | | — | | | | — | | | | — | |
Growth Portfolio | | | 1,438 | | | | — | | | | — | | | | — | | | | — | |
Institutional Growth Portfolio | | | 1,825 | | | | — | | | | — | | | | — | | | | — | |
Real Estate Portfolio | | | 70 | | | | — | | | | — | | | | — | | | | — | |
Commodity Portfolio | | | 468 | | | | — | | | | — | | | | — | | | | — | |
International Portfolio | | | 21 | | | | — | | | | — | | | | — | | | | — | |
Institutional International Portfolio | | | 9 | | | | — | | | | — | | | | — | | | | — | |
Emerging Markets Portfolio | | | 775 | | | | — | | | | — | | | | — | | | | — | |
| | | | | |
Foreign Exchange Rate Risk Exposure: | | | | | | | | | | | | | | | | | | | | |
Commodity Portfolio | | | 171 | | | | — | | | | 26 | | | | 716 | | | | | |
International Portfolio | | | 12 | | | | — | | | | — | | | | — | | | | — | |
Institutional International Portfolio | | | 13 | | | | — | | | | — | | | | — | | | | — | |
Fixed Income Opportunity Portfolio | | | 11 | | | | — | | | | — | | | | 164 | | | | — | |
| | | | | |
Commodity Risk Exposure: | | | | | | | | | | | | | | | | | | | | |
Commodity Portfolio | | | 9,895 | | | | — | | | | 227 | | | | — | | | | 513 | |
Interest Rate Risk Exposure: | | | | | | | | | | | | | | | | | | | | |
Commodity Portfolio | | | 7 | | | | — | | | | 215 | | | | — | | | | 140 | |
Fixed Income Opportunity Portfolio | | | 68 | | | | — | | | | — | | | �� | — | | | | — | |
| * | Total fair value is presented by Primary Risk Exposure. For forward currency contracts, such amounts represent the appreciation (for asset derivatives) or depreciation (for liability derivatives). For futures contracts and centrally cleared swaps, the amounts represent their cumulative appreciation/depreciation. |
257
HC CAPITAL TRUST
Notes to Financial Statements (continued) — June 30, 2015
Amounts designated as “—” are $0 or have been rounded to $0.
The following is a summary of the effect of derivative instruments on the Statements of Operations for the year ended June 30, 2015 (amounts in thousands).
| | | | | | | | | | | | | | | | | | | | |
Portfolio | | Net realized
gains/(losses)
from futures
transactions | | | Net realized
gains/(losses)
from written
options
transactions | | | Net realized
gains/(losses)
from purchased
options
transactions | | | Net realized
gains/(losses)
from foreign
currency
transactions | | | Net realized
gains/(losses)
from swap
transactions | |
Equity Risk Exposure: | | | | | | | | | | | | | | | | | | | | |
Value Portfolio | | $ | 88 | | | $ | — | | | $ | — | | | $ | — | | | $ | — | |
Institutional Value Portfolio | | | 105 | | | | — | | | | — | | | | — | | | | — | |
Growth Portfolio | | | 657 | | | | — | | | | — | | | | — | | | | — | |
Institutional Growth Portfolio | | | 12,688 | | | | (34 | ) | | | — | | | | — | | | | — | |
Small Cap-Mid Cap Portfolio | | | (29 | ) | | | — | | | | — | | | | — | | | | — | |
Institutional Small Cap-Mid Cap Portfolio | | | (74 | ) | | | — | | | | — | | | | — | | | | — | |
Real Estate Portfolio | | | (210 | ) | | | — | | | | — | | | | — | | | | — | |
Commodity Portfolio | | | (93 | ) | | | — | | | | — | | | | — | | | | (20 | ) |
International Portfolio | | | (2,549 | ) | | | — | | | | — | | | | — | | | | — | |
Institutional International Portfolio | | | (3,327 | ) | | | — | | | | — | | | | — | | | | — | |
Emerging Markets Portfolio | | | (2,594 | ) | | | — | | | | — | | | | — | | | | — | |
| | | | | |
Foreign Exchange Rate Risk Exposure: | | | | | | | | | | | | | | | | | | | | |
Institutional Growth Portfolio | | | (1 | ) | | | (118 | ) | | | — | | | | 2,394 | | | | — | |
Commodity Portfolio | | | (57 | ) | | | 34 | | | | — | | | | 4,915 | | | | — | |
International Portfolio | | | — | | | | — | | | | — | | | | (89 | ) | | | — | |
Institutional International Portfolio | | | — | | | | — | | | | — | | | | 291 | | | | — | |
Emerging Markets Portfolio | | | — | | | | — | | | | — | | | | (1,298 | ) | | | — | |
Fixed Income Opportunity Portfolio | | | 715 | | | | — | | | | — | | | | 417 | | | | — | |
| | | | | |
Commodity Risk Exposure: | | | | | | | | | | | | | | | | | | | | |
Commodity Portfolio | | | (46,209 | ) | | | 399 | | | | (200 | ) | | | — | | | | (70,037 | ) |
| | | | | |
Interest Rate Risk Exposure: | | | | | | | | | | | | | | | | | | | | |
Institutional Growth Portfolio | | | (32 | ) | | | 46 | | | | — | | | | — | | | | (2,922 | ) |
Commodity Portfolio | | | (585 | ) | | | (146 | ) | | | — | | | | — | | | | (771 | ) |
Fixed Income Opportunity Portfolio | | | 302 | | | | — | | | | — | | | | — | | | | — | |
| | | | | | | | | | | | | | | | | | | | |
| | | Net Change in Unrealized Appreciation (Depreciation)
on Derivatives Recognized as a Result from Operations | |
Portfolio | | Change in
unrealized
appreciation/
(depreciation)
on futures | | | Change in
unrealized
appreciation/
(depreciation)
on written
options | | | Change in
unrealized
appreciation/
(depreciation)
on purchased
options | | | Change in
unrealized
appreciation/
(depreciation)
on foreign
currency
translations | | | Change in
unrealized
appreciation/
(depreciation)
on swaps | |
Equity Risk Exposure: | | | | | | | | | | | | | | | | | | | | |
Value Portfolio | | $ | (405 | ) | | $ | — | | | $ | — | | | $ | — | | | $ | — | |
Institutional Value Portfolio | | | (406 | ) | | | — | | | | — | | | | — | | | | — | |
Growth Portfolio | | | (1,438 | ) | | | — | | | | — | | | | — | | | | — | |
Institutional Growth Portfolio | | | (3,930 | ) | | | — | | | | — | | | | — | | | | — | |
Small Cap-Mid Cap Portfolio | | | 36 | | | | — | | | | — | | | | — | | | | — | |
Institutional Small Cap-Mid Cap Portfolio | | | 64 | | | | — | | | | — | | | | — | | | | — | |
Real Estate Portfolio | | | (70 | ) | | | — | | | | — | | | | — | | | | — | |
Commodity Portfolio | | | (465 | ) | | | — | | | | — | | | | — | | | | — | |
International Portfolio | | | 57 | | | | — | | | | — | | | | — | | | | — | |
Institutional International Portfolio | | | 74 | | | | — | | | | — | | | | — | | | | — | |
Emerging Markets Portfolio | | | (775 | ) | | | — | | | | — | | | | — | | | | — | |
Foreign Exchange Rate Risk Exposure: | | | | | | | | | | | | | | | | | | | | |
Institutional Growth Portfolio | | | — | | | | (3 | ) | | | — | | | | 162 | | | | — | |
Commodity Portfolio | | | (171 | ) | | | — | | | | — | | | | (173 | ) | | | — | |
International Portfolio | | | (12 | ) | | | — | | | | — | | | | 19 | | | | — | |
Institutional International Portfolio | | | (13 | ) | | | — | | | | — | | | | 22 | | | | — | |
Fixed Income Opportunity Portfolio | | | (11 | ) | | | — | | | | — | | | | (164 | ) | | | — | |
| | | | | |
Commodity Risk Exposure: | | | | | | | | | | | | | | | | | | | | |
Commodity Portfolio | | | (12,559 | ) | | | (62 | ) | | | (84 | ) | | | — | | | | 3,723 | |
| | | | | |
Interest Rate Risk Exposure: | | | | | | | | | | | | | | | | | | | | |
Institutional Growth Portfolio | | | 81 | | | | — | | | | — | | | | — | | | | — | |
Commodity Portfolio | | | — | | | | 24 | | | | — | | | | — | | | | 802 | |
Fixed Income Opportunity Portfolio | | | (12 | ) | | | — | | | | — | | | | — | | | | — | |
Amounts designated as “—” are $0 or have been rounded to $0.
258
HC CAPITAL TRUST
Notes to Financial Statements (continued) — June 30, 2015
The Trust is generally subject to master netting agreements (“MNA”) that allow for amounts owed between the Portfolio and the counterparty to be netted. The party that has the larger payable pays the excess of the larger amount over the smaller amount to the counterparty. The MNA do not apply to amounts owed to/from different counterparties. The amounts shown in the Statement of Assets and Liabilities do not take into consideration the effects of legally enforceable MNA. The table below presents the gross and net amounts of these assets and liabilities with any offsets to reflect the Portfolio’s ability to transact net amounts with counterparties at June 30, 2015.
As of June 30, 2015 each Portfolio’s derivative assets and liabilities by type are as follows (amounts in thousands):
| | | | | | | | | | | | | | | | | | | | | | | | | | | | | | | | |
| | | Value
Portfolio | | | Institutional
Value
Portfolio | | | Growth
Portfolio | | | Institutional
Growth
Portfolio | |
| | | Assets | | | Liabilities | | | Assets | | | Liabilities | | | Assets | | | Liabilities | | | Assets | | | Liabilities | |
Derivative Financial Instruments: | | | | | | | | | | | | | | | | | | | | | | | | | | | | | | | | |
Futures contracts | | $ | — | | | $ | 405 | | | $ | — | | | $ | 406 | | | $ | — | | | $ | 1,438 | | | $ | — | | | $ | 1,825 | |
Total derivative assets and liabilities in the Statement of Assets and Liabilities | | | — | | | | 405 | | | | — | | | | 406 | | | | — | | | | 1,438 | | | | — | | | | 1,825 | |
Derivatives not subject to a master netting agreement or similar agreement (“MNA”) | | | — | | | | (405 | ) | | | — | | | | (406 | ) | | | — | | | | (1,438 | ) | | | — | | | | (1,825 | ) |
| | | | | | | | | | | | | | | | | | | | | | | | | | | | | | | | |
Total assets and liabilities subject to a MNA | | $ | — | | | $ | — | | | $ | — | | | $ | — | | | $ | — | | | $ | — | | | $ | — | | | $ | — | |
| | | | | | | | | | | | | | | | | | | | | | | | | | | | | | | | |
| | | Small Cap-Mid
Cap Portfolio | | | Institutional
Small Cap-Mid
Cap Portfolio | | | Real Estate
Portfolio | | | Commodity
Portfolio | |
| | | Assets | | | Liabilities | | | Assets | | | Liabilities | | | Assets | | | Liabilities | | | Assets | | | Liabilities | |
Derivative Financial Instruments: | | | | | | | | | | | | | | | | | | | | | | | | | | | | | | | | |
Futures contracts | | $ | 36 | | | $ | — | | | $ | 64 | | | $ | — | | | $ | — | | | $ | 70 | | | $ | 4,267 | | | $ | 10,541 | |
Forward currency contracts | | | — | | | | — | | | | — | | | | — | | | | — | | | | — | | | | 486 | | | | 716 | |
Option contracts* | | | — | | | | — | | | | — | | | | — | | | | — | | | | — | | | | 270 | | | | 469 | |
Swap agreements | | | — | | | | — | | | | — | | | | — | | | | — | | | | — | | | | 6,393 | | | | 653 | |
| | | | | | | | | | | | | | | | | | | | | | | | | | | | | | | | |
Total derivative assets and liabilities in the Statement of Assets and Liabilities | | | 36 | | | | — | | | | 64 | | | | — | | | | — | | | | 70 | | | | 11,416 | | | | 12,379 | |
Derivatives not subject to a master netting agreement or similar agreement (“MNA”) | | | (36 | ) | | | — | | | | (64 | ) | | | — | | | | — | | | | (70 | ) | | | (5,650 | ) | | | (10,844 | ) |
| | | | | | | | | | | | | | | | | | | | | | | | | | | | | | | | |
Total assets and liabilities subject to a MNA | | $ | — | | | $ | — | | | $ | — | | | $ | — | | | $ | — | | | $ | — | | | $ | 5,766 | | | $ | 1,535 | |
| | | | | | | | | | | | | | | | | | | | | | | | | | | | | | | | |
| | | | |
| | | International
Portfolio | | | Institutional
International
Portfolio | | | Emerging
Markets
Portfolio | | | Fixed
Opportunity
Portfolio | |
| | | Assets | | | Liabilities | | | Assets | | | Liabilities | | | Assets | | | Liabilities | | | Assets | | | Liabilities | |
Derivative Financial Instruments: | | | | | | | | | | | | | | | | | | | | | | | | | | | | | | | | |
Futures contracts | | $ | 78 | | | $ | 33 | | | $ | 81 | | | $ | 22 | | | $ | — | | | $ | 775 | | | $ | 56 | | | $ | 79 | |
Forward currency contracts | | | — | | | | — | | | | — | | | | — | | | | — | | | | — | | | | — | | | | 164 | |
Option contracts* | | | — | | | | — | | | | — | | | | — | | | | — | | | | — | | | | — | | | | — | |
Swap agreements | | | — | | | | — | | | | — | | | | — | | | | — | | | | — | | | | — | | | | — | |
| | | | | | | | | | | | | | | | | | | | | | | | | | | | | | | | |
Total derivative assets and liabilities in the Statement of Assets and Liabilities | | | 78 | | | | 33 | | | | 81 | | | | 22 | | | | — | | | | 775 | | | | 56 | | | | 243 | |
Derivatives not subject to a master netting agreement or similar agreement (“MNA”) | | | (78 | ) | | | (33 | ) | | | (81 | ) | | | (22 | ) | | | — | | | | (775 | ) | | | (56 | ) | | | (79 | ) |
| | | | | | | | | | | | | | | | | | | | | | | | | | | | | | | | |
Total assets and liabilities subject to a MNA | | $ | — | | | $ | — | | | $ | — | | | $ | — | | | $ | — | | | $ | — | | | $ | — | | | $ | 164 | |
| | | | | | | | | | | | | | | | | | | | | | | | | | | | | | | | |
| * | Includes option contracts purchased at value as reported in the Statement of Assets and Liabilities. |
259
HC CAPITAL TRUST
Notes to Financial Statements (continued) — June 30, 2015
The following table represents the Portfolios’ derivative assets by counterparty, net of amounts available for offset under an MNA and net of the related collateral received by each Portfolio as of June 30, 2015 (amounts in thousands).
| | | | | | | | | | | | | | | | | | | | |
Counterparty | | Derivative
Assets
Subject to a MNA
by Counterparty | | | Derivatives
Available for
Offset | | | Non-cash
Collateral
Received
(a) | | | Cash
Collateral
Received
(a) | | | Net Amount of
Derivative
Assets | |
Commodity Portfolio: | | | | | | | | | | | | | | | | | | | | |
Barclays Bank | | $ | 415 | | | $ | (15 | ) | | $ | — | | | $ | — | | | $ | 400 | |
BNP Paribas | | | 916 | | | | (52 | ) | | | — | | | | (270 | ) | | | 594 | |
Canadian Imperial Bank of Commerce | | | 521 | | | | — | | | | — | | | | — | | | | 521 | |
Credit Suisse | | | 1 | | | | — | | | | — | | | | — | | | | 1 | |
Deutsche Bank | | | 103 | | | | (95 | ) | | | — | | | | (8 | ) | | | — | |
Goldman Sachs | | | 1,778 | | | | (775 | ) | | | — | | | | (300 | ) | | | 703 | |
JPMorgan Chase | | | 2,032 | | | | (183 | ) | | | — | | | | (309 | ) | | | 1,540 | |
| | | | | | | | | | | | | | | | | | | | |
Total | | $ | 5,766 | | | $ | (1,120 | ) | | $ | — | | | $ | (887 | ) | | $ | 3,759 | |
| | | | | | | | | | | | | | | | | | | | |
The following table represents the Portfolios’ derivative liabilities by counterparty, net of amounts available for offset under an MNA and net of the related collateral pledged by each Portfolio as of June 30, 2015 (amounts in thousands).
| | | | | | | | | | | | | | | | | | | | |
Counterparty | | Derivative
Liabilities
Subject to a MNA
by Counterparty | | | Derivatives
Available for
Offset | | | Non-cash
Collateral
Pledged
(a) | | | Cash
Collateral
Pledged
(a) | | | Net Amount of
Derivative
Liabilities | |
Commodity Portfolio: | | | | | | | | | | | | | | | | | | | | |
Barclays Bank | | $ | 15 | | | $ | (15 | ) | | $ | — | | | $ | — | | | $ | — | |
BNP Paribas | | | 52 | | | | (52 | ) | | | — | | | | — | | | | — | |
Deutsche Bank | | | 95 | | | | (95 | ) | | | — | | | | — | | | | — | |
Goldman Sachs | | | 1,190 | | | | (814 | ) | | | (143 | ) | | | (265 | ) | | | (32 | ) |
JPMorgan Chase | | | 183 | | | | (183 | ) | | | — | | | | — | | | | — | |
| | | | | | | | | | | | | | | | | | | | |
Total | | $ | 1,535 | | | $ | (1,159 | ) | | $ | (143 | ) | | $ | (265 | ) | | $ | (32 | ) |
| | | | | | | | | | | | | | | | | | | | |
| | | | | |
Fixed Opportunity Portfolio: | | | | | | | | | | | | | | | | | | | | |
Citibank | | $ | 164 | | | $ | — | | | $ | — | | | $ | — | | | $ | 164 | |
| | | | | | | | | | | | | | | | | | | | |
Total | | $ | 164 | | | $ | — | | | $ | — | | | $ | — | | | $ | 164 | |
| | | | | | | | | | | | | | | | | | | | |
| (a) | The actual collateral received or pledged may be in excess of the amounts shown in the table. The table only reflects collateral amounts up to the amount of the financial instruments disclosed on the Statements of Assets and Liabilities. |
Forward Currency Contracts: Certain of the Portfolios may be subject to currency exchange rate risk in the normal course of pursuing their investment objectives. A Portfolio enters into forward currency contracts (“forward contracts”) for the purpose of hedging exposure to changes in foreign currency exchange rates on its holdings. A forward contract is an agreement between two parties to buy and sell a currency at a set price on a future date. The value of the forward contract fluctuates with changes in currency exchange rates. The forward contract is marked-to-market daily and the change in value is recorded by the Portfolio as unrealized appreciation or depreciation. When the forward contract is closed, the Portfolio records a realized gain or loss equal to the fluctuation in value during the period the forward contract was open. The Portfolio could be exposed to credit risk if the counterparty is unable to meet the terms of a forward contract, or market risk if the value of the currency changes unfavorably.
Forward contracts may involve credit or market risk in excess of the amounts reflected on a Portfolio’s Statement of Assets and Liabilities. The gain or loss from the difference between the cost of original contracts and the amount realized upon the closing of such forward contracts is included in net realized gains or losses on foreign currency transactions. Fluctuations in the value of forward contracts held at June 30, 2015 are recorded for financial reporting purposes as net unrealized gains or losses by the Portfolio. In addition, at June 30, 2015, the Portfolios entered into currency contracts to settle trades in foreign currencies. These transactions are included in “Receivable from investments sold” and “Payable for
260
HC CAPITAL TRUST
Notes to Financial Statements (continued) — June 30, 2015
investments purchased” in the Statements of Assets and Liabilities. The settlement value of the forward contracts outstanding at June 30, 2015 and the month-end average contract amount for all forward contracts during the year ended June 30, 2015 are detailed in the table below:
| | | | | | | | |
Portfolio | | Average
Month-End
Contract Amount
(000) | | | Forward
Contracts Amount
Outstanding at
June 30, 2015
(000) | |
Institutional Growth Portfolio | | $ | 37,494 | | | $ | — | |
Real Estate Portfolio | | | 3 | | | | — | |
Commodity Portfolio | | | 101,869 | | | | 89,470 | |
International Portfolio | | | 4,193 | | | | 122 | |
Institutional International Portfolio | | | 7,163 | | | | 62 | |
Emerging Markets Portfolio | | | 1,516 | | | | — | |
Fixed Opportunity Portfolio | | | 1,682 | | | | 3,154 | |
Financial Futures Contracts: Certain of the Portfolios may be subject to equity price risk, interest rate risk, commodity price risk and foreign currency exchange rate risk in the normal course of pursuing their investment objectives. Certain of the Portfolios may invest in financial futures contracts (“futures contracts”) as part of their investment strategies, to gain exposure to or hedge against changes in the value of equities, interest rates or foreign currencies. The Commodity Portfolio may invest in commodity-linked futures contracts to gain exposure to the commodities market. A futures contract represents a commitment for the future purchase or sale of an asset at a specified price on a specified date. Upon entering into a futures contract, a Portfolio is required to pledge to the broker an amount of cash and/or other assets equal to a certain percentage of the contract amount (initial margin deposit). Subsequent payments, known as “variation margin,” are made or received by a Portfolio each day, depending on the daily fluctuations in the value of the underlying financial instrument. A Portfolio recognizes a gain or loss equal to the daily variation margin, which is recorded as a receivable or payable on the Statement of Assets and Liabilities (if applicable). When a futures contract is closed, a realized gain or loss is recorded as “Net realized gains/(losses) from futures transactions” on the Statement of Operations. Should market conditions move unexpectedly, the Portfolio may not achieve the anticipated benefits of the futures contracts and may realize a loss. The use of futures transactions involves the risk of an imperfect correlation in movements in the price of futures contracts, interest rates, and the underlying hedged assets. With futures contracts, there is minimal counterparty credit risk to the Portfolios since futures contracts are exchange traded and the exchange’s clearinghouse, as counterparty to all exchange-traded futures contracts, guarantees the futures contracts against default. Securities designated as collateral for market value on futures contracts are noted in each Portfolio’s Portfolio of Investments (if applicable). Such collateral is held with the Trust’s custodian. The notional value of the futures contracts outstanding at June 30, 2015 and the month-end average notional amount for the year ended June 30, 2015 are detailed in the table below:
| | | | | | | | |
Portfolio | | Average
Month-End
Notional Amount
(000) | | | Notional Amount
of Futures Contracts
Outstanding at
June 30, 2015
(000) | |
Value Portfolio | | $ | 4,614 | | | $ | 18,451 | |
Institutional Value Portfolio | | | 6,640 | | | | 18,349 | |
Growth Portfolio | | | 9,944 | | | | 68,910 | |
Institutional Growth Portfolio | | | 90,576 | | | | 83,950 | |
Small Cap-Mid Cap Portfolio | | | 971 | | | | 4,626 | |
Institutional Small Cap-Mid Cap Portfolio | | | 1,620 | | | | 8,128 | |
Real Estate Portfolio | | | 856 | | | | 2,782 | |
Commodity Portfolio | | | 288,733 | | | | 356,769 | |
International Portfolio | | | 17,704 | | | | 106,185 | |
Institutional International Portfolio | | | 24,933 | | | | 108,146 | |
Emerging Markets Portfolio | | | 10,994 | | | | 76,848 | |
Fixed Opportunity Portfolio | | | 17,357 | | | | 45,930 | |
261
HC CAPITAL TRUST
Notes to Financial Statements (continued) — June 30, 2015
Purchased Options Contracts: Certain of the Portfolios may be subject to equity price risk, commodities price risk and interest rate risk in the normal course of pursuing their investment objectives. In order to reduce such risks and/or in anticipation of future purchases, including to achieve market exposure, pending direct investment in securities, certain of the Portfolios may purchase put or call options. Options contracts provide the purchaser with the right, but not the obligation, to buy or sell (call or put option, respectively) a financial instrument at the exercise price. The Portfolio pays a premium which is included in ‘‘Investments, at value’’ on the Statement of Assets and Liabilities and marked-to-market to reflect the current value of the option. Premiums paid for purchasing options which expire are treated as realized losses. When an option is exercised or closed, premiums paid for purchasing options are offset against proceeds to determine the realized gain or loss on the transaction.
Written Options Contracts: Certain of the Portfolios may be subject to equity price risk and interest rate risk in the normal course of pursuing their investment objectives. In order to reduce such risks and/or in anticipation of future purchases, including to achieve market exposure, pending direct investment in securities, certain of the Portfolios may write put or call options. Premiums received from written options contracts are recorded as liabilities on the Statement of Assets and Liabilities and are marked-to-market to reflect the current value of the options written. Premiums received from writing options which expire are treated as realized gains. Premiums received from writing options, which are either exercised or closed, are offset against the proceeds received or the amount paid on the transaction to determine realized gains or losses. Realized gains and losses are reported as “Net realized gains/(losses) from written options transactions” on the Statement of Operations (if applicable). When writing an option, the Portfolio bears the market risk of unfavorable changes in the price of the underlying instrument.
With exchange-traded options, there is minimal counterparty credit risk to the Portfolios since the exchange’s clearinghouse, as counterparty to all exchange-traded options, guarantees the options against default. With over-the-counter options, the Portfolios bear the risk that counterparties will be unable to perform under the terms of the contracts.
The Institutional Growth Portfolio and Commodity Portfolio had the following transactions in purchased call and put options during the year ended June 30, 2015:
| | | | | | | | |
Institutional Growth Portfolio | | Number of
Contracts | | | Cost
(000) | |
Options outstanding at June 30, 2014 | | | 28 | | | $ | 2 | |
Options purchased | | | 28 | | | | — | |
Options exercised | | | — | | | | — | |
Options expired | | | — | | | | — | |
Options closed | | | (56 | ) | | | (2 | ) |
| | | | | | | | |
Options outstanding at June 30, 2015 | | | — | | | $ | — | |
| | | | | | | | |
| | | | | | | | |
| | |
Commodity Portfolio | | Number of
Contracts | | | Cost
(000) | |
Options outstanding at June 30, 2014 | | | 50 | | | $ | 192 | |
Options purchased | | | 6,527 | | | | 604 | |
Options exercised | | | — | | | | — | |
Options expired | | | (134 | ) | | | (167 | ) |
Options closed | | | (83 | ) | | | (155 | ) |
| | | | | | | | |
Options outstanding at June 30, 2015 | | | 6,360 | | | $ | 474 | |
| | | | | | | | |
262
HC CAPITAL TRUST
Notes to Financial Statements (continued) — June 30, 2015
The Institutional Growth Portfolio and Commodity Portfolio had the following transactions in written call and put options during the year ended June 30, 2015:
| | | | | | | | |
Institutional Growth Portfolio | | Number of
Contracts | | | Premiums
Received
(000) | |
Options outstanding at June 30, 2014 | | | (28 | ) | | $ | (3 | ) |
Options written | | | (7,767,622 | ) | | | (213 | ) |
Options exercised | | | — | | | | — | |
Options expired | | | 3,014,480 | | | | 66 | |
Options closed | | | 4,753,170 | | | | 150 | |
| | | | | | | | |
Options outstanding at June 30, 2015 | | | — | | | $ | — | |
| | | | | | | | |
| | | | | | | | | | | | |
| | | |
Commodity Portfolio | | Number of
Contracts | | | Notional
(000)1 | | | Premiums
Received
(000) | |
Options outstanding at June 30, 2014 | | | (646 | ) | | $ | — | | | $ | (113 | ) |
Options written | | | (10,653,572 | ) | | | (60,252 | ) | | | (1,106 | ) |
Options exercised | | | — | | | | — | | | | — | |
Options expired | | | (9,296,599 | ) | | | 33,552 | | | | 390 | |
Options closed | | | 15,170,627 | | | | — | | | | 366 | |
| | | | | | | | | | | | |
Options outstanding at June 30, 2015 | | | (4,780,190 | ) | | $ | (26,700 | ) | | $ | (463 | ) |
| | | | | | | | | | | | |
Swap Agreements: Certain of the Portfolios may enter into swap agreements (“swap”) for purposes of attempting to gain exposure to the securities making up an index without actually purchasing those instruments, to hedge a position or to gain exposure to a particular instrument or currency. A swap is a two-party contract entered into for periods ranging from one day to more than one year. In a standard swap transaction, two parties agree to exchange the returns (or differentials in rates of return) earned or realized on particular predetermined investments or instruments. The gross returns to be exchanged or “swapped” between the parties are calculated with respect to a “notional amount,” i.e., the return on or increase in value of a particular dollar amount invested in a “basket” of securities representing a particular index.
Interest Rate Swaps: Certain of the Portfolios are subject to interest rate risk exposure in the normal course of pursuing their investment objectives. Because certain Portfolios hold fixed-rate bonds, the value of these bonds may decrease if interest rates rise. In order to reduce such risks, certain Portfolios may enter into interest rate swaps. Interest rate swaps involve the exchange of commitments to pay and receive a fixed or floating rate of interest based on a notional principal amount. The risks of interest rate swaps include changes in market conditions that will affect their value or the cash flows and the possible inability of the counterparty to fulfill its obligations under the agreement. A Portfolio’s maximum risk of loss from counterparty credit risk is the discounted net value of the cash flows to be received from the counterparty over the swap’s remaining life. Net periodic interest payments to be received or paid are accrued daily and are recorded as realized gains or losses on the Statements of Operations.
Total Return Swaps: Certain of the Portfolios are subject to equity price risk in the normal course of pursuing their investment objectives. In order to reduce such risks, certain Portfolios may enter into total return swaps to gain or mitigate exposure to the underlying securities or indices. In “long” total return swaps, the counterparty will generally agree to pay the Portfolio the amount, if any, by which the notional amount of the swaps would have increased in value had it been invested in the particular instruments, plus an amount equal to any dividends or interest that would have been received on those instruments. The Portfolio will agree to pay to the counterparty an amount equal to a fixed or floating rate of interest on the notional amount of the swaps plus the amount, if any, by which the notional amount would have decreased in value had it been invested in such instruments plus, in certain instances, commissions or trading spreads on the notional amount. Total return swaps do not involve the delivery of securities or other underlying instruments. The net amount of the excess, if any, of a Portfolio’s obligations over its entitlements with respect to each swap is accrued on a daily basis and an amount of cash or liquid assets, having an aggregate value at least equal to such accrued excess, is maintained at the broker-dealer or the
263
HC CAPITAL TRUST
Notes to Financial Statements (continued) — June 30, 2015
Portfolio’s custodian. Until a total return swap is settled in cash, the gain or loss on the notional amount plus dividends or interest on the instruments less the interest paid by the Portfolio on the notional amount are recorded as “unrealized appreciation or depreciation on swap agreements” and when cash is exchanged, the gain or loss realized is recorded as “realized gains or losses on swap transactions.” A Portfolio may enter into total return swaps that provide the opposite return of its benchmark index or security (“short” the index or security). Its operations are similar to those swaps disclosed above except that the counterparty pays interest to the Portfolio on the notional amount outstanding and that dividends or interest on the underlying instruments reduce the value of the swaps plus, in certain instances, the Portfolio will agree to pay to the counterparty commissions or trading spreads on the notional amount. These amounts are netted against any unrealized appreciation or depreciation to determine the value of the swaps.
Variance Swaps: Certain of the Portfolios may invest in variance swaps to gain or reduce exposure to the underlying reference securities. Variance swaps involve two parties agreeing to exchange cash flows based on the measured variance (or square of the volatility) of a specified underlying asset. One party agrees to exchange a “fixed rate” or strike price payment for the “floating rate” or realized price variance on the underlying asset with respect to the notional amount. At inception, the strike price is generally chosen such that the fair value of the swaps is zero. At the maturity date, a net cash flow is exchanged, where the payoff amount is equivalent to the difference between the realized price variance of the underlying asset and the strike price multiplied by the notional amount. As a receiver of the realized price variance, a Portfolio would receive the payoff amount when the realized price variance of the underlying asset is greater than the strike price and would owe the payoff amount when the variance is less than the strike price. As a payer of the realized price variance, a Portfolio would owe the payoff amount when the realized price variance of the underlying asset is greater than the strike price and would receive the payoff amount when the variance is less than the strike price. This type of swap is essentially a forward contract on the future realized price variance of the underlying asset.
The primary risks associated with the use of swaps are an imperfect correlation between the price of financial instruments and movements in the prices of the underlying investments and the inability of counterparties to perform under the agreement. The counterparty to any swap agreement will typically be a bank, investment banking firm or broker-dealer. The Portfolio will bear the counterparty risk, i.e., the risk of loss of the net amount, if any, expected to be received under a swap in the event of the default or bankruptcy of the swap counterparty. The unrealized gain or loss at June 30, 2015 is disclosed in the swap tables included in the Portfolios of Investments. The notional value of the swap agreements outstanding at June 30, 2015 and the month-end average notional amount for the year ended June 30, 2015 are detailed in the table below:
| | | | | | | | |
Portfolio | | Average
Month-End
Notional Amount
(000) | | | Notional Amount of
Swap Agreements
Outstanding at
June 30, 2015
(000) | |
Institutional Growth Portfolio | | $ | 61,392 | | | $ | — | |
Commodity Portfolio | | | 310,460 | | | | 341,158 | |
L. Inflation Indexed Bonds. Certain of the Portfolios may invest in inflation-indexed bonds, which are fixed income securities whose principal value is periodically adjusted to the rate of inflation. The interest rate on these bonds is generally fixed at issuance at a rate lower than typical bonds. Over the life of an inflation-indexed bond, however, interest will be paid based on a principal value which is adjusted for inflation. Any increase or decrease in the principal amount of an inflation-indexed bond resulting from inflation or deflation, respectively, as measured by the change in the Consumer Price Index, will be included as interest income or loss on the Statements of Operations, even though investors do not receive their principal until maturity. During the year ended June 30, 2015, the Inflation Protected Portfolio experienced negative income due to the deflation in the Consumer Price Index.
Interest rates on conventional bonds have two primary components: a “real” yield and an increment that reflects investor expectations of future inflation. By contrast, interest rates on inflation-indexed bonds are adjusted for inflation and, therefore, are not affected meaningfully by inflation expectations. This leaves only real rates to influence the price of inflation-indexed bonds. A rise in real rates will cause the price of inflation-indexed bonds to fall, while a decline in real rates will boost the price of inflation-indexed bonds. Inflation-indexed bonds issued by non-U.S. governments would be expected to be indexed to the inflation rates prevailing in those countries.
The primary risk associated with the use of inflation-indexed bonds is that the principal value of an investment is not protected or otherwise guaranteed by virtue of the Fund’s investments in inflation-indexed bonds. Inflation-indexed bonds
264
HC CAPITAL TRUST
Notes to Financial Statements (continued) — June 30, 2015
are fixed-income securities whose principal value is periodically adjusted according to the rate of inflation. If the index measuring inflation falls, the principal value of inflation-indexed bonds will be adjusted downward, and consequently the interest payable on these securities (calculated with respect to a smaller principal amount) will be reduced. Repayment of the original bond principal upon maturity (as adjusted for inflation) is guaranteed in the case of U.S. Treasury inflation-indexed bonds. For bonds that do not provide a similar guarantee, the adjusted principal value of the bond repaid at maturity may be less than the original principal value. Deflation risk is the possibility that prices throughout the economy decline over time and, in which case, the principal and income of an inflation-protected bond will decline and could result in losses.
M. Bank Loans. Certain Portfolios may invest in bank loans, which generally have interest rates which are reset periodically by reference to a base lending rate plus a premium. These base rates are primarily the London-Interbank Offered Rate, and secondarily the prime rate offered by one or more major U. S. banks and the certificate of deposit rate or other base lending rates used by commercial lenders. Bank loans often require prepayments from excess cash flows or allow the borrower to repay at its election. The rate at which the borrower repays cannot be predicted with accuracy. Therefore, the anticipated or actual maturity may be considerably earlier than the stated maturity shown in the Portfolio of Investments.
All or a portion of any bank loans may be unfunded. The Portfolio is obligated to fund any commitments at the borrower’s discretion. Therefore, the Portfolio must have funds sufficient to cover its contractual obligation. These unfunded loan commitments, which are marked-to-market daily, are presented in the Portfolio of Investments. At June 30, 2015, none of the Portfolios invested in bank loans.
N. Securities Lending. Certain of the Portfolios may lend from their total assets in the form of their portfolio securities to broker-dealers under contracts calling for collateral equal to at least the market value of the securities loaned, marked to market on a daily basis. The Portfolios will continue to benefit from interest or dividends on the securities loaned and may also earn a return from the collateral. The Portfolios pay various fees in connection with the investment of the collateral. Any voting rights, or rights to consent, relating to securities loaned, pass to the borrower. Currently cash collateral received by a Portfolio in securities lending transactions may only be invested in repurchase agreements or money market funds investing in U.S. Treasury Obligations. A Portfolio bears the risk of such investments. Securities on loan at June 30, 2015 are presented in the Portfolio of Investments. The Portfolios pay the Securities Lending Agent fees based on the investment income received from securities lending activities as reflected on the Statement of Operations.
Securities lending transactions are entered into by a Portfolio under a Master Securities Lending Agreement (“MSLA”) which permits the Portfolio, under certain circumstances including an event of default (such as bankruptcy or insolvency), to offset amounts payable by the Portfolio to the same counterparty against amounts to be received and create a net payment due to or from the Portfolio.
The following table is a summary of the Portfolios’ securities lending agreements which are subject to offset under an MSLA at June 30, 2015:
| | | | | | | | | | | | |
Portfolio | | Value of Securities
On Loan
(000) | | | Value of Collateral
Received
(000)(a) | | | Net Amount
(000) | |
Value Portfolio | | $ | 2,948 | | | $ | 2,948 | | | $ | — | |
Institutional Value Portfolio | | | 6,379 | | | | 6,379 | | | | — | |
Growth Portfolio | | | 118 | | | | 118 | | | | — | |
Institutional Growth Portfolio | | | 295 | | | | 295 | | | | — | |
Small Cap–Mid Cap Portfolio | | | 924 | | | | 924 | | | | — | |
Institutional Small Cap–Mid Cap Portfolio | | | 4,315 | | | | 4,315 | | | | — | |
Commodity Portfolio | | | 19,745 | | | | 19,745 | | | | — | |
International Portfolio | | | 11,669 | | | | 11,669 | | | | — | |
Institutional International Portfolio | | | 19,393 | | | | 19,393 | | | | — | |
Emerging Markets Portfolio | | | 12,908 | | | | 12,908 | | | | — | |
Fixed Opportunity Portfolio | | | 17,715 | | | | 17,715 | | | | — | |
| (a) | The actual collateral received may be in excess of the amounts shown in the table. The table only reflects collateral amounts up to the amount of the value of securities on loan as disclosed in the Portfolio of Investments. |
265
HC CAPITAL TRUST
Notes to Financial Statements (continued) — June 30, 2015
O. Basis for Consolidation for the Commodity Portfolio. The HC Commodity Related Securities Fund, Ltd. and the HC Commodity Related Securities Fund II, Ltd. (the “Funds”) are incorporated as Cayman Islands exempted companies. The Funds are wholly-owned subsidiaries of the Commodity Portfolio and act as investment vehicles for the Commodity Portfolio for the purpose of effecting certain commodity-linked investments consistent with its investment objectives. The Funds may invest in commodity-linked derivative instruments including options, futures and swaps. The Funds may also invest in debt securities, some of which are intended to serve as margin or collateral for the Funds’ derivative positions.
Under the Articles of Association of each of the Funds, shares issued by the Funds give the Commodity Portfolio, as the sole shareholder, the right to receive notice of, to attend, and to vote at general meetings of the Funds, the right to participate in the profits of the Funds and rights to the assets of the Funds in the event that they are liquidated.
The following table summarizes the structure, incorporation and relationship information of the Funds, and certain financial information of the Funds recognized in the consolidated financial statements referred to above (amounts in thousands).
| | | | | | | | |
| | | HC Commodity
Related Securities
Fund, Ltd. | | | HC Commodity
Related Securities
Fund II, Ltd. | |
Date of Incorporation | | | April 27, 2011 | | | | June 2, 2011 | |
| | |
Fund Net Assets | | | | | | | | |
Commodity Portfolio | | $ | 54,868 | | | $ | 63,355 | |
Subsidiary % of Fund net assets | | | 4.58 | % | | | 5.29 | % |
| | |
Consolidated Financial Statement Information | | | | | | | | |
Total assets | | $ | 61,351 | | | $ | 63,713 | |
Total liabilities | | | 6,483 | | | | 358 | |
Net assets | | | 54,868 | | | | 63,355 | |
Total investment income | | | 36 | | | | 72 | |
Net investment income (loss) | | | 20 | | | | 38 | |
Net realized gains/(losses) from investment transactions | | | (471 | ) | | | 49 | |
Net realized gains/(losses) from futures transactions | | | (48,684 | ) | | | 1,034 | |
Net realized gains/(losses) from written options transactions | | | 35 | | | | 353 | |
Net realized gains/(losses) from swap transactions | | | (1,349 | ) | | | (68,687 | ) |
Net realized gains/(losses) from foreign currency transactions | | | — | | | | (141 | ) |
Change in net unrealized appreciation (depreciation) on investments | | | (20 | ) | | | (75 | ) |
Change in net unrealized appreciation (depreciation) on futures | | | (12,378 | ) | | | (576 | ) |
Change in net unrealized appreciation (depreciation) on written options | | | (19 | ) | | | (43 | ) |
Change in net unrealized appreciation (depreciation) on swaps | | | 28 | | | | 3,695 | |
Change in net unrealized appreciation (depreciation) on foreign currency translations | | | — | | | | 14 | |
Net realized/unrealized gains/(losses) from investments, futures, written options, swap transactions, foreign currency transactions | | | (62,858 | ) | | | (64,377 | ) |
Change in net assets resulting from operations | | | (62,838 | ) | | | (64,339 | ) |
The Commodity Portfolio’s investments in these Funds have been consolidated and include the portfolio holdings of the underlying Funds. The consolidated financial statements include the accounts of the Commodity Portfolio and the Funds. All intercompany transactions and balances have been eliminated.
P. Recent Accounting Pronouncements. In June 2014, the Financial Accounting Standards Board (“FASB”) issued Accounting Standards Update (“ASU”) No. 2014-11 “Transfers and Servicing (Topic 860), Repurchase-to-Maturity Transactions, Repurchase Financing, and Disclosures (“ASU 2014-11”). ASU 2014-11 changes the accounting for repurchase-to-maturity transactions and enhances the required disclosures for repurchase agreements and other similar transactions. ASU 2014-11 is effective for interim and annual reporting periods beginning after December 15, 2014.
In May 2015, the FASB issued ASU No. 2015-07 “Fair Value Measurement (Topic 820), Disclosures for Investments in Certain Entities That Calculate Net Asset Value per Share (or Its Equivalent) (“ASU 2015-07”). ASU 2015-07 removes the requirement to categorize within the fair value hierarchy all investments for which fair value is measured using the net asset
266
HC CAPITAL TRUST
Notes to Financial Statements (continued) — June 30, 2015
value per share practical expedient and amends certain disclosure requirements for such investments. ASU 2015-07 is effective for interim and annual reporting periods beginning after December 15, 2015.
Management is evaluating any impact ASU 2014-11 and ASU 2015-07 may have on the Portfolio’s financial statements.
3. INVESTMENT ADVISORY AND ADMINISTRATIVE CONTRACTS. The Trust has entered into investment advisory contracts (“Portfolio Management Contracts”) on behalf of each of the Portfolios with one or more investment management organizations (each, a “Specialist Manager”). For the Portfolio(s) it serves, each Specialist Manager is responsible for providing a continuous program of investment management for that portion of the Portfolio allocated to it and for placing all orders for the purchase and sale of securities and other instruments for such portion of the Portfolio. Except as noted, each Specialist Manager earns a fee, accrued daily and paid either monthly or quarterly, based on average daily net assets of that portion of the Portfolio managed.
For the year ending June 30, 2015, the Portfolios incurred the following investment advisory fees, before any applicable fee waivers, with respect to the services of the indicated Specialist Manager(s). The following annual fee rates are applied to the portions of the Portfolios that are managed by the Specialist Managers in determining amounts earned, except as footnoted.
Value Portfolio:
| | | | | | | | |
Specialist Manager | | Amount
Earned
(000) | | | Fee | |
Institutional Capital, LLC* | | $ | 175 | | | | 0.35 | % |
AllianceBernstein, L.P. | | | 781 | | | | 0.32 | %(a) |
Cadence Capital Management, LLC | | | 176 | | | | 0.065 | %(b) |
Mellon Capital Management Corporation | | | — | | | | 0.065 | %(c)(d) |
Parametric Portfolio Associates, LLC | | | 4 | | | | 0.08 | %(e) |
Parametric Portfolio Associates, LLC | | | — | | | | 0.35 | %(c)(gg) |
| | | | | | | | |
Total | | $ | 1,136 | | | | 0.19 | % |
| | | | | | | | |
Institutional Value Portfolio:
| | | | | | | | |
Specialist Manager | | Amount
Earned
(000) | | | Fee | |
Institutional Capital, LLC* | | $ | 234 | | | | 0.35 | % |
AllianceBernstein, L.P. | | | 1,275 | | | | 0.32 | %(a) |
Cadence Capital Management, LLC | | | 278 | | | | 0.065 | %(b) |
Pacific Investment Management Company, LLC | | | — | | | | 0.25 | %(c) |
Mellon Capital Management Corporation | | | — | | | | 0.065 | %(c)(d) |
Parametric Portfolio Associates, LLC | | | 6 | | | | 0.07 | %(e) |
Parametric Portfolio Associates, LLC | | | — | | | | 0.35 | %(c)(gg) |
| | | | | | | | |
Total | | $ | 1,793 | | | | 0.19 | % |
| | | | | | | | |
Growth Portfolio:
| | | | | | | | |
Specialist Manager | | Amount
Earned
(000) | | | Fee | |
Jennison Associates LLC | | $ | 766 | | | | 0.24 | %(f) |
Sustainable Growth Advisers, LP | | | 757 | | | | 0.35 | %(g) |
Mellon Capital Management Corporation | | | 158 | | | | 0.065 | %(d) |
Cadence Capital Management, LLC | | | — | | | | 0.065 | %(b)(c) |
Parametric Portfolio Associates, LLC | | | 5 | | | | 0.07 | %(e) |
Parametric Portfolio Associates, LLC | | | — | | | | 0.35 | %(c)(gg) |
| | | | | | | | |
Total | | $ | 1,686 | | | | 0.21 | % |
| | | | | | | | |
267
HC CAPITAL TRUST
Notes to Financial Statements (continued) — June 30, 2015
Institutional Growth Portfolio:
| | | | | | | | |
Specialist Manager | | Amount
Earned
(000) | | | Fee | |
Jennison Associates, LLC | | $ | 1,332 | | | | 0.24 | %(f) |
Sustainable Growth Advisers, LP | | | 785 | | | | 0.34 | %(g) |
Pacific Investment Management Company, LLC* | | | 207 | | | | 0.25 | % |
Mellon Capital Management Corporation | | | 273 | | | | 0.065 | %(d) |
Cadence Capital Management, LLC | | | — | | | | 0.065 | %(b)(c) |
Parametric Portfolio Associates, LLC | | | 6 | | | | 0.07 | %(e) |
Parametric Portfolio Associates, LLC | | | — | | | | 0.35 | %(c)(gg) |
| | | | | | | | |
Total | | $ | 2,603 | | | | 0.20 | % |
| | | | | | | | |
Small Cap–Mid Cap Portfolio:
| | | | | | | | |
Specialist Manager | | Amount
Earned
(000) | | | Fee | |
Frontier Capital Management Company, LLC | | $ | 151 | | | | 0.45 | %(h) |
Mellon Capital Management Corporation | | | 3 | | | | 0.065 | %(d) |
IronBridge Capital Management LP | | | 330 | | | | 0.95 | %(i) |
Pzena Investment Management, LLC | | | 88 | | | | 1.00 | % |
Cupps Capital Management, LLC | | | 100 | | | | 0.85 | % |
Cadence Capital Management, LLC | | | — | | | | 0.065 | %(b)(c) |
Ariel Investments, LLC | | | 54 | | | | 1.00 | %(j) |
Parametric Portfolio Associates, LLC | | | 2 | | | | 0.33 | %(e) |
| | | | | | | | |
Total | | $ | 728 | | | | 0.70 | % |
| | | | | | | | |
Institutional Small Cap–Mid Cap Portfolio:
| | | | | | | | |
Specialist Manager | | Amount
Earned
(000) | | | Fee | |
Frontier Capital Management Company, LLC | | $ | 258 | | | | 0.45 | %(h) |
IronBridge Capital Management LP | | | 658 | | | | 0.95 | %(i) |
Pzena Investment Management, LLC | | | 149 | | | | 1.00 | % |
Cupps Capital Management, LLC | | | 225 | | | | 0.85 | % |
Mellon Capital Management Corporation | | | 2 | | | | 0.065 | %(d) |
Cadence Capital Management, LLC | | | — | | | | 0.065 | %(b)(c) |
Ariel Investments, LLC | | | — | | | | 1.00 | %(c)(j) |
Parametric Portfolio Associates, LLC | | | 2 | | | | 0.24 | %(e) |
| | | | | | | | |
Total | | $ | 1,294 | | | | 0.74 | % |
| | | | | | | | |
Real Estate Portfolio:
| | | | | | | | |
Specialist Manager | | Amount
Earned
(000) | | | Fee | |
Wellington Management Company, LLP | | $ | 1,027 | | | | 0.68 | %(k) |
Mellon Capital Management Corporation | | | — | | | | 0.10 | %(c)(l) |
Cadence Capital Management, LLC | | | — | | | | 0.10 | %(c)(m) |
Parametric Portfolio Associates, LLC | | | 2 | | | | 0.31 | %(e) |
| | | | | | | | |
Total | | $ | 1,029 | | | | 0.66 | % |
| | | | | | | | |
268
HC CAPITAL TRUST
Notes to Financial Statements (continued) — June 30, 2015
Commodity Portfolio:
| | | | | | | | |
Specialist Manager | | Amount
Earned
(000) | | | Fee | |
Wellington Management Company, LLP | | $ | 2,448 | | | | 0.76 | %(n) |
Wellington Management Company, LLP | | | 1,728 | | | | 0.75 | %(o) |
Pacific Investment Management Company, LLC | | | 1,084 | | | | 0.49 | % |
Mellon Capital Management Corporation | | | 338 | | | | 0.10 | %(l) |
Cadence Capital Management, LLC | | | — | | | | 0.10 | %(c)(m) |
Parametric Portfolio Associates, LLC | | | 5 | | | | 0.08 | %(e) |
| | | | | | | | |
Total | | $ | 5,603 | | | | 0.49 | % |
| | | | | | | | |
International Portfolio:
| | | | | | | | |
Specialist Manager | | Amount
Earned
(000) | | | Fee | |
Causeway Capital Management, LLC | | $ | 777 | | | | 0.45 | % |
Artisan Partners Limited Partnership | | | 910 | | | | 0.69 | %(p) |
Capital Guardian Trust Company | | | 685 | | | | 0.39 | %(q) |
Cadence Capital Management, LLC | | | 897 | | | | 0.10 | %(r)(s) |
City of London Investment Management Company Ltd. | | | — | | | | 0.80 | %(c)(cc) |
Mellon Capital Management Corporation | | | 144 | | | | 0.13 | %(t)(u) |
Parametric Portfolio Associates, LLC | | | 6 | | | | 0.07 | %(e) |
| | | | | | | | |
Total | | $ | 3,419 | | | | 0.22 | % |
| | | | | | | | |
Institutional International Equity Portfolio:
| | | | | | | | |
Specialist Manager | | Amount
Earned
(000) | | | Fee | |
Causeway Capital Management, LLC | | $ | 1,097 | | | | 0.45 | % |
Artisan Partners Limited Partnership | | | 1,522 | | | | 0.66 | %(p) |
Capital Guardian Trust Company | | | 692 | | | | 0.39 | %(q) |
Cadence Capital Management, LLC | | | 1,714 | | | | 0.10 | %(r)(s) |
City of London Investment Management Company Ltd. | | | — | | | | 0.80 | %(c)(cc) |
Lazard International Management, LLC | | | 1,109 | | | | 0.36 | %(v) |
Mellon Capital Management Corporation | | | 259 | | | | 0.13 | %(t)(u) |
Parametric Portfolio Associates, LLC | | | 8 | | | | 0.06 | %(e) |
| | | | | | | | |
Total | | $ | 6,401 | | | | 0.22 | % |
| | | | | | | | |
Emerging Markets Portfolio:
| | | | | | | | |
Specialist Manager | | Amount
Earned
(000) | | | Fee | |
Boston Company Asset Management, LLC | | $ | 5,441 | | | | 0.58 | %(w) |
Mellon Capital Management Corporation | | | 1,175 | | | | 0.13 | %(u) |
Cadence Capital Management, LLC | | | — | | | | 0.13 | %(c)(r) |
City of London Investment Management Company Ltd. | | | — | | | | 1.00 | %(c)(ff) |
Parametric Portfolio Associates, LLC | | | 2 | | | | 0.31 | %(e) |
| | | | | | | | |
Total | | $ | 6,618 | | | | 0.35 | % |
| | | | | | | | |
269
HC CAPITAL TRUST
Notes to Financial Statements (continued) — June 30, 2015
Core Fixed Income Portfolio:
| | | | | | | | |
Specialist Manager | | Amount
Earned
(000) | | | Fee | |
Agincourt Capital Management, LLC | | $ | 6 | | | | 0.08 | % |
Seix Investment Advisors LLC* | | | 51 | | | | 0.22 | %(x) |
Mellon Capital Management Corporation | | | 14 | | | | 0.06 | %(y) |
Mellon Capital Management Corporation | | | 21 | | | | 0.15 | %(z) |
| | | | | | | | |
Total | | $ | 92 | | | | 0.10 | % |
| | | | | | | | |
Fixed Income Opportunity Portfolio:
| | | | | | | | |
Specialist Manager | | Amount
Earned
(000) | | | Fee | |
Fort Washington Investment Advisors, Inc. | | $ | 1,185 | | | | 0.20 | %(aa) |
Western Asset Management Company | | | 328 | | | | 0.75 | %(bb) |
City of London Investment Management Company Ltd. | | | 131 | | | | 0.45 | % |
Mellon Capital Management | | | — | | | | 0.25 | %(c) |
Parametric Portfolio Associates, LLC | | | 4 | | | | 0.10 | %(e) |
| | | | | | | | |
Total | | $ | 1,648 | | | | 0.23 | % |
| | | | | | | | |
U.S. Government Fixed Income Securities Portfolio:
| | | | | | | | |
Specialist Manager | | Amount
Earned
(000) | | | Fee | |
Mellon Capital Management Corporation | | $ | 136 | | | | 0.06 | % |
| | | | | | | | |
Inflation Protected Securities Portfolio:
| | | | | | | | |
Specialist Manager | | Amount
Earned
(000) | | | Fee | |
Mellon Capital Management Corporation | | $ | 186 | | | | 0.04 | %(dd) |
| | | | | | | | |
U.S. Corporate Fixed Income Securities Portfolio:
| | | | | | | | |
Specialist Manager | | Amount
Earned
(000) | | | Fee | |
Agincourt Capital Management, LLC | | $ | 35 | | | | 0.08 | % |
Seix Investment Advisors LLC* | | | 353 | | | | 0.22 | %(x) |
Mellon Capital Management Corporation | | | — | | | | 0.15 | %(c) |
| | | | | | | | |
Total | | $ | 388 | | | | 0.19 | % |
| | | | | | | | |
U.S. Mortgage/Asset Backed Fixed Income Securities Portfolio:
| | | | | | | | |
Specialist Manager | | Amount
Earned
(000) | | | Fee | |
Mellon Capital Management Corporation | | $ | 137 | | | | 0.06 | % |
| | | | | | | | |
270
HC CAPITAL TRUST
Notes to Financial Statements (continued) — June 30, 2015
Short-Term Municipal Bond Portfolio:
| | | | | | | | |
Specialist Manager | | Amount
Earned
(000) | | | Fee | |
Breckinridge Capital Advisors, Inc. | | $ | 27 | | | | 0.125 | % |
| | | | | | | | |
Intermediate Municipal Bond Portfolio:
| | | | | | | | |
Specialist Manager | | Amount
Earned
(000) | | | Fee | |
Standish Mellon Asset Management Company, LLC | | $ | 529 | | | | 0.16 | %(ee) |
| | | | | | | | |
Intermediate Municipal Bond II Portfolio:
| | | | | | | | |
Specialist Manager | | Amount
Earned
(000) | | | Fee | |
Breckinridge Capital Advisors, Inc. | | $ | 85 | | | | 0.125 | % |
| | | | | | | | |
| * | The Specialist Manager’s portfolio management agreement with the portfolio was terminated during the year ended June 30, 2015. |
| (a) | AllianceBernstein, L.P. (“AllianceBernstein”) receives a fee, which shall be payable monthly in arrears, of 0.37% of the average daily net assets of the first $150 million of the Combined Assets (as defined below), 0.35% of the next $150 million of Combined Assets and 0.29% of the Combined Assets exceeding $300 million. |
“Combined Assets” shall mean the sum of: the average net assets of the portion of the Value Portfolio managed by AllianceBernstein, the average net assets of the portion of the Institutional Value Portfolio managed by AllianceBernstein, and assets invested in the same investment strategy as the Portfolio that are managed by AllianceBernstein for certain other clients of the Trust’s primary adviser.
| (b) | Cadence Capital Management, LLC (“Cadence”) receives a fee, which shall be calculated daily and payable monthly in arrears. For so long as Combined Assets (as defined below) are greater than $2 billion, the fee shall be at the annual rate of 0.065% of the average daily net assets of the portion of the Portfolio managed by Cadence. If the Combined Assets are reduced to $2 billion or less due to redemptions, the fee shall be calculated at the annual rate of 0.075% beginning in the following calendar year. |
“Combined Assets” shall mean the sum of: the net assets managed by Cadence in the Value Portfolio, Institutional Value Portfolio, Growth Portfolio, Institutional Growth Portfolio, Small Cap–Mid Cap Portfolio, Institutional Small Cap–Mid Cap Portfolio, Real Estate Portfolio, Commodity Portfolio, International Portfolio, Institutional International Portfolio, Emerging Markets Portfolio, and the net assets managed by Cadence in other investment advisory accounts for which HC Capital Solutions or certain of its affiliates serves as investment adviser.
| (c) | Specialist manager approved by the Board but to which no assets were allocated during the year ended June 30, 2015. |
| (d) | Mellon Capital Management Corporation (“Mellon”) receives a fee, which shall be calculated daily and payable monthly in arrears. For so long as Combined Assets (as defined below) are greater than $2 billion, the fee shall be at the annual rate of 0.065% of the average daily net assets of the portion of the Portfolio managed by Mellon. If the Combined Assets are reduced to $2 billion or less due to redemptions, the fee shall be calculated at the annual rate of 0.075% beginning in the following calendar year. |
“Combined Assets” shall mean the sum of: the net assets managed by Mellon in the Value Portfolio, Institutional Value Portfolio, Growth Portfolio, Institutional Growth Portfolio, Small Cap–Mid Cap Portfolio, Institutional Small Cap–Mid Cap Portfolio, Real Estate Portfolio, Commodity Portfolio, International Portfolio, Institutional International Portfolio, Emerging Markets Portfolio, and the net assets managed by Mellon in other investment advisory accounts for which HC Capital Solutions or certain of its affiliates serves as investment adviser.
271
HC CAPITAL TRUST
Notes to Financial Statements (continued) — June 30, 2015
| (e) | With respect to its Liquidity Strategy, Parametric Portfolio Associates, LLC (“Parametric”) receives a fee, which shall be calculated daily and payable monthly in arrears, at an annual rate of 0.15% of the first $50 million of the Combined Assets (as defined below); 0.10% of the next $100 million of Combined Assets; and 0.05% of Combined Assets over $150 million. Parametric is also entitled to receive a flat fee of $10,000 per year for each Portfolio, provided that 1/12 of such fee will be waived with respect to each calendar month during which no Portfolio assets were allocated to a Portfolio. |
“Combined Assets” shall mean the sum of: the net assets managed by Parametric in the Value Portfolio, Institutional Value Portfolio, Growth Portfolio, Institutional Growth Portfolio, Small Cap–Mid Cap Portfolio, Institutional Small Cap–Mid Cap Portfolio, Real Estate Portfolio, Commodity Portfolio, International Portfolio, Institutional International Portfolio, Emerging Markets Portfolio and Fixed Income Opportunity Portfolio.
| (f) | Jennison Associates LLC (“Jennison”) is entitled to receive an annual fee of no more than 0.30% of average daily net assets of that portion of the Growth Portfolio and Institutional Growth Portfolio allocated to Jennison (the “Jennison Accounts”). While the rate at which Jennison’s fee for managing the Portfolios will not exceed 0.30%, the fee may decrease based on the aggregate market value of the Jennison Accounts and certain other assets managed by Jennison (which may pay fees exceeding 0.30%) for the benefit of certain investors who are clients of the Trust’s primary adviser at the following annual rates: |
| | — | 0.75% on the first $10 million; |
| | — | 0.50% on the next $30 million; |
| | — | 0.35% on the next $25 million; |
| | — | 0.25% on the next $335 million; |
| | — | 0.22% on the next $600 million; |
| | — | 0.20% on the next $4 billion; and |
| (g) | Effective June 10, 2015, Sustainable Growth Advisers, LP (“SGA”) receives a fee, which shall be calculated daily and payable quarterly, at an annual rate of 0.35% of the first $200 million of Combined Assets (as defined below); 0.30% of the next $200 million of Combined Assets; 0.25% of the next $200 million of Combined Assets; 0.22% of the next $400 million of Combined Assets; and 0.20% of Combined Assets exceeding $1 billion. Prior to June 10, 2015, SGA received an annual fee of 0.35% of the average daily net assets. |
“Combined Assets” shall mean the sum of: the net assets managed by SGA in the Growth Portfolio, the net assets managed by SGA in the Institutional Growth Portfolio, and the net assets invested in the same strategy as the Portfolio that are managed by SGA for certain other clients of the Trust’s primary adviser.
| (h) | Effective March 11, 2015, Frontier Capital Management Company, LLC (“Frontier”) receives a fee, which shall be calculated daily and payable monthly, at an annual rate of 0.45% of the first $90 million of Combined Assets (as defined below) and 0.75% of Combined Assets exceeding $90 million. Prior to March 11, 2015, Frontier received an annual fee of 0.45% of the average daily net assets. |
“Combined Assets” shall mean the sum of: the net assets managed by Frontier in the Small Cap–Mid Cap Portfolio, the net assets managed by Frontier in the Institutional Small Cap–Mid Cap Portfolio, and the net assets invested in the same strategy as the Portfolio what are managed by Frontier for certain other clients of the Trust’s primary adviser.
| (i) | IronBridge Capital Management LP (“IronBridge”) receives a fee at an annual rate of 0.95% of the average daily net assets that it manages for the Portfolio. Effective July 1, 2015, IronBridge will receive a fee at an annual rate of 0.70% of the average daily net assets that it manages. |
| (j) | For its services to the Small Cap–Mid Cap Portfolio and the Institutional Small Cap–Mid Cap Portfolio, Ariel Investments, LLC (“Ariel”) will be paid an annual fee, calculated daily and payable quarterly, in arrears, based on the Combined Assets (as defined below), in accordance with the following schedule: 1.00% of the first $10 million of the Combined Assets, 0.75% of the next $10 million of Combined Assets and 0.50% of the Combined Assets exceeding $20 million. Ariel did not manage assets for the Institutional Small Cap–Mid Cap Portfolio during the period shown in the table. |
272
HC CAPITAL TRUST
Notes to Financial Statements (continued) — June 30, 2015
“Combined Assets” shall mean the sum of: the net assets managed by Ariel in the Small Cap–Mid Cap Portfolio, the Institutional Small Cap–Mid Cap Portfolio and the net assets invested in the same strategy as the Portfolios that are managed by Ariel for the benefit of certain investors who are clients of certain affiliates of the Trust’s primary adviser.
| (k) | Wellington Management Company, LLP (“Wellington”) receives a fee, which shall be payable monthly in arrears of 0.75% of the average daily net assets of the first $50 million of the Combined Assets (as defined below). On Combined Assets over $50 million, the fee shall be at the annual rate of 0.65% of the Combined Assets. |
“Combined Assets” shall mean the sum of: the net assets of the Real Estate Portfolio and assets invested in the same investment strategy as the Portfolio that are managed by Wellington for certain other clients of the Trust’s primary adviser.
| (l) | Mellon receives a fee, which shall be calculated daily and payable monthly in arrears. For so long as Combined Assets (as defined below) are greater than $2 billion, the fee shall be at the annual rate of 0.10% of the average daily net assets of the portion of the Portfolio managed by Mellon. If the Combined Assets are reduced to $2 billion or less due to redemptions, the fee shall be calculated at the annual rate of 0.11% beginning in the following calendar year. |
“Combined Assets” shall mean the sum of: the net assets managed by Mellon in the Value Portfolio, Institutional Value Portfolio, Growth Portfolio, Institutional Growth Portfolio, Small Cap–Mid Cap Portfolio, Institutional Small Cap–Mid Cap Portfolio, Real Estate Portfolio, Commodity Portfolio, International Portfolio, Institutional International Portfolio, Emerging Markets Portfolio, and the net assets managed by Mellon in other investment advisory accounts for which HC Capital Solutions or certain of its affiliates serves as investment adviser.
| (m) | Cadence receives a fee, which shall be calculated daily and payable monthly in arrears. For so long as Combined Assets (as defined below) are greater than $2 billion, the fee shall be at the annual rate of 0.10% of the average daily net assets of the portion of the Portfolio managed by Cadence. If the Combined Assets are reduced to $2 billion or less due to redemptions, the fee shall be calculated at the annual rate of 0.11% beginning in the following calendar year. |
“Combined Assets” shall mean the sum of: the net assets managed by Cadence in the Value Portfolio, Institutional Value Portfolio, Growth Portfolio, Institutional Growth Portfolio, Small Cap–Mid Cap Portfolio, Institutional Small Cap–Mid Cap Portfolio, Real Estate Portfolio, Commodity Portfolio, International Portfolio, Institutional International Portfolio, Emerging Markets Portfolio, and the net assets managed by Cadence in other investment advisory accounts for which HC Capital Solutions or certain of its affiliates serves as investment adviser.
| (n) | Effective March 11, 2015, with respect to its Global National Resources Strategy (“GNRS”), Wellington is entitled to receive a fee, which shall be payable monthly in arrears at the annual rate of 0.60%, so long as at least $150 million in assets are present in the GNRS and 0.85% if less than $150 million in assets are present in the GNRS. Prior to March 11, 2015, Wellington was entitled to receive a fee, which was payable monthly in arrears at the annual rate of 0.85%, so long as at least $50 million in assets were present in the GNRS and 1.00% if less than $50 million in assets were present in the GNRS. |
| (o) | With respect to its Commodity Futures Strategy account, Wellington is entitled to receive a fee, which shall be payable monthly in arrears at the annual rate of 0.75% of the average daily net assets of the Commodity Futures Strategy account. |
| (p) | Artisan Partners Limited Partnership (“Artisan”) receives a fee, which shall be payable monthly in arrears within 30 days after each month end. For so long as the Combined Assets (as defined below) are greater than $500 million, the fee shall be at the annual rate of 0.47% of the average daily net assets of the Portfolios. If the Combined Assets are reduced to $500 million or less, the fee shall be calculated based on average daily net assets of the Portfolios at the following annual rates: |
| | — | 0.80% on assets up to $50 million; and |
| | — | 0.60% on assets in excess of $50 million |
“Combined Assets” shall mean the sum of: the net assets of the International Portfolio managed by Artisan and the net assets of the Institutional International Portfolio managed by Artisan.
273
HC CAPITAL TRUST
Notes to Financial Statements (continued) — June 30, 2015
| (q) | Capital Guardian Trust Company (“CapGuardian”) receives a fee, which shall be payable quarterly in arrears in accordance with the following annual rates. The minimum annual fee (based on an account size of $50 million) is $312,500. |
| | — | 0.70% on the first $25 million; |
| | — | 0.55% on the next $25 million; |
| | — | 0.425% on the next $200 million; and |
When the total aggregated fees exceed $3 million, before discounts (as set forth below), fee break points are to be eliminated and the Portfolio will pay its fee at an annual rate of 0.375% on all assets in the Portfolio managed by CapGuardian.
The following fee discounts will be applied based upon the total annualized aggregate fees, which include fees from separate accounts, pooled investments vehicles, and funds with internally charged fees managed by The Capital Group Companies, Inc. The resulting discount percentage will be applied to each account’s fees (excluding fees related to investments in funds with internally charged fees):
| | — | 5% discount on fees from $1.25 million to $4 million; |
| | — | 7.5% discount on fees from $4 million to $8 million; |
| | — | 10% discount on fees from $8 million to $12 million; and |
| | — | 12.5% discount on fees over $12 million |
| (r) | With respect to the emerging markets portion of the Portfolio managed by Cadence, Cadence receives a fee, which shall be calculated daily and payable monthly in arrears. For so long as Combined Assets (as defined below) are greater than $2 billion, the fee shall be at the annual rate of 0.13% of the average daily net assets of that portion of the Portfolio. If the Combined Assets are reduced to $2 billion or less due to redemptions, the fee shall be calculated at the annual rate of 0.15% beginning in the following calendar year. |
“Combined Assets” shall mean the sum of: the net assets managed by Cadence in the Value Portfolio, Institutional Value Portfolio, Growth Portfolio, Institutional Growth Portfolio, Small Cap–Mid Cap Portfolio, Institutional Small Cap–Mid Cap Portfolio, Real Estate Portfolio, Commodity Portfolio, International Portfolio, Institutional International Portfolio, Emerging Markets Portfolio, and the net assets managed by Cadence in other investment advisory accounts for which HC Capital Solutions or certain of its affiliates serves as investment adviser.
| (s) | With respect to the developed markets portion of the Portfolio managed by Cadence, Cadence receives a fee, which shall be calculated daily and payable monthly in arrears. For so long as Combined Assets (as defined below) are greater than $2 billion, the fee shall be at the annual rate of 0.10% of the average daily net assets of that portion of the Portfolio. If the Combined Assets are reduced to $2 billion or less due to redemptions, the fee shall be calculated at the annual rate of 0.11% beginning in the following calendar year. |
“Combined Assets” shall mean the sum of: the net assets managed by Cadence in the Value Portfolio, Institutional Value Portfolio, Growth Portfolio, Institutional Growth Portfolio, Small Cap–Mid Cap Portfolio, Institutional Small Cap–Mid Cap Portfolio, Real Estate Portfolio, Commodity Portfolio, International Portfolio, Institutional International Portfolio, Emerging Markets Portfolio, and the net assets managed by Cadence in other investment advisory accounts for which HC Capital Solutions or certain of its affiliates serves as investment adviser.
| (t) | With respect to the developed markets portion of the Portfolio managed by Mellon, Mellon receives a fee, which shall be calculated daily and payable monthly in arrears. For so long as Combined Assets (as defined below) are greater than $2 billion, the fee shall be at the annual rate of 0.10% of the average daily net assets of that portion of the Portfolio. If the Combined Assets are reduced to $2 billion or less due to redemptions, the fee shall be calculated at the annual rate of 0.11% beginning in the following calendar year. |
“Combined Assets” shall mean the sum of: the net assets managed by Mellon in the Value Portfolio, Institutional Value Portfolio, Growth Portfolio, Institutional Growth Portfolio, Small Cap–Mid Cap Portfolio, Institutional Small Cap–Mid Cap Portfolio, Real Estate Portfolio, Commodity Portfolio, International Portfolio, Institutional International Portfolio, Emerging Markets Portfolio, and the net assets managed by Mellon in other investment advisory accounts for which HC Capital Solutions or certain of its affiliates serves as investment adviser.
274
HC CAPITAL TRUST
Notes to Financial Statements (continued) — June 30, 2015
| (u) | With respect to the emerging markets portion of the portfolio managed by Mellon, Mellon receives a fee, which shall be calculated daily and payable monthly in arrears. For so long as Combined Assets (as defined below) are greater than $2 billion, the fee shall be at the annual rate of 0.13% of the average daily net assets of that portion of the Portfolio. If the Combined Assets are reduced to $2 billion or less due to redemptions, the fee shall be calculated at the annual rate of 0.15% beginning in the following calendar year. |
“Combined Assets” shall mean the sum of: the net assets managed by Mellon in the Value Portfolio, Institutional Value Portfolio, Growth Portfolio, Institutional Growth Portfolio, Small Cap–Mid Cap Portfolio, Institutional Small Cap–Mid Cap Portfolio, Real Estate Portfolio, Commodity Portfolio, International Portfolio, Institutional International Portfolio, Emerging Markets Portfolio, and the net assets managed by Mellon in other investment advisory accounts for which HC Capital Solutions or one of its affiliates serves as investment adviser.
| (v) | Lazard Asset Management, LLC (“Lazard”) receives a fee which shall be payable monthly in arrears of 0.40% of the average daily net assets of the first $75 million and 0.35% on the excess over $75 million of that portion of the Portfolio managed by Lazard. |
| (w) | Boston Company Asset Management, LLC (“Boston Company”) receives an annual fee of 0.90% of the average daily net assets of the first $50 million; 0.85% of the average daily net assets on the next $50 million; 0.70% of the average daily net assets on the next $100 million; 0.55% of the average daily net assets on the next $200 million; and 0.50% of the average daily net assets over $400 million of that portion of the Portfolio managed by Boston Company. |
| (x) | Seix Investment Advisors LLC’s (“Seix”) Portfolio Management Agreement was terminated as of March 13, 2015. Prior to March 13, 2015, Seix received a fee, which was calculated daily and payable monthly in arrears at the annual rate of 0.25% of the first $100 million of the Combined Assets (as defined below) and 0.20% of the Combined Assets exceeding $100 million. |
“Combined Assets” meant the sum of: the net assets managed by Seix in the Core Fixed Income Portfolio and the net assets managed by Seix in the U.S. Corporate Fixed Income Portfolio.
| (y) | Mellon receives a fee which shall be calculated daily and payable monthly at the annual rate of 0.06% of the average daily net assets of the U.S. mortgage– and asset–backed and U.S. Government securities portions of the Core Fixed Income Portfolio managed by Mellon. Mellon also receives a fee at the annual rate of 0.06% of the average daily net assets of the U.S. Government Fixed Income Portfolio and the U.S. Mortgage/Asset Backed Fixed Income Portfolio. |
| (z) | Mellon receives a fee which shall be calculated daily and payable monthly at the annual rate of 0.15% of the average daily net assets of the U.S. corporate fixed–income securities portion of the Core Fixed Income Portfolio managed by Mellon. Mellon also receives a fee at the annual rate of 0.15% of the average daily net assets of the portion of the U.S. Corporate Fixed Income Portfolio managed by Mellon. |
| (aa) | Fort Washington Investment Advisors, Inc. (“Fort Washington”) receives a fee, which shall be payable monthly in arrears. For so long as the Combined Assets (as defined below) are greater than $200 million, the fee shall be at the annual rate of 0.20% of the Combined Assets. If the Combined Assets are reduced to $200 million or less due to withdrawals or redemptions, beginning with the first calendar quarter following the date of such withdrawals or redemptions, the fee shall be based on 0.40% of the Combined Assets of the first $25 million, 0.375% of the Combined Assets of the next $25 million, 0.3375% of the Combined Assets of the next $50 million, and 0.25% of the Combined Assets of the next $100 million, and 0.20% of the Combined Assets exceeding $200 million. |
“Combined Assets” shall mean the sum of: the net assets managed by Fort Washington in the Portfolio and the net assets invested in the same strategy as the Portfolio that are managed by Fort Washington for the benefit of certain investors who are clients of the Trust’s primary adviser.
| (bb) | Effective August 29, 2014, Western Asset Management Company (“Western Asset”) receives an annual fee of 0.75% of the average daily net assets of that portion of the Fixed Income Opportunity Portfolio allocated to Western Asset. Prior to August 29, 2014, Western Asset received a fee of 0.40% of the first $25 million of the Combined Assets (as defined below); 0.375% of the next $25 million of the Combined Assets; 0.3375% of the next $50 million of the Combined Assets; 0.25% of the next $100 million of the Combined Assets; and 0.20% of the Combined Assets over $200 million. |
“Combined Assets” meant the sum of: the net assets managed by Western Asset in the Fixed Income Opportunity Portfolio and certain other net assets managed by Western Asset for clients of the Trust’s primary advisor.
275
HC CAPITAL TRUST
Notes to Financial Statements (continued) — June 30, 2015
| (cc) | City of London Investment Management Company Ltd. (“CLIM”) receives a fee, which shall be calculated daily and payable quarterly in arrears at the annual rate of 0.80% of the first $50 million of the Combined Assets (as defined below) and 0.40% of the Combined assets exceeding $50 million. |
“Combined Assets” shall mean the sum of: the net assets managed by CLIM in the Portfolio and the net assets invested in the same strategy as the Portfolio that are managed by CLIM for certain other clients of the Trust’s primary adviser.
| (dd) | Mellon receives a fee, which shall be payable monthly in arrears, at the annual rate of: 0.04% of the average daily net assets invested according to a domestic inflation–protected securities strategy; 0.07% of the average daily net assets invested according to a global inflation–protected securities strategy; and 0.13% of the average daily net assets invested according to an emerging–markets inflation–protected securities strategy. |
| (ee) | Standish Mellon Asset Management Company, LLC (“Standish Mellon”) receives a fee, which shall be calculated daily and payable quarterly, at an annual rate of 0.25% for the first $100 million of the Combined Assets (as defined below) and 0.15% of the Combined Assets exceeding $100 million. Standish Mellon is entitled to receive a fee at an annual rate not to exceed 0.20% of the Combined Assets. |
“Combined Assets” shall mean the sum of: the net assets managed by Standish Mellon in the Portfolio and the net assets invested in the same strategy as the Portfolio that are managed by Standish Mellon for the benefit of certain investors who are clients of the Trust’s primary adviser.
| (ff) | City of London Investment Management Company Ltd. (“CLIM”) receives a fee, which shall be calculated daily and payable quarterly in arrears at the annual rate of 1.00% of the first $100 million of the Combined Assets (as defined below); 0.80% of the next $100 million of the Combined Assets; and 0.50% of the Combined Assets exceeding $200 million. |
“Combined Assets” shall mean the sum of: the net assets managed by CLIM in the Portfolio and the net assets invested in the same strategy as the Portfolio that are managed by CLIM for certain other clients of the Trust’s primary adviser.
| (gg) | With respect to its Defensive Strategy, Parametric Portfolio Associates, LLC (“Parametric”) receives a fee, which shall be calculated daily and payable monthly in arrears, at an annual rate of 0.35% of the first $50 million of the Combined Assets (as defined below) and 0.25% of Combined Assets over $50 million. |
“Combined Assets” shall mean the sum of: the net assets managed by Parametric in the Value Portfolio, Institutional Value Portfolio, Growth Portfolio and Institutional Growth Portfolio.
Pursuant to discretionary investment advisory agreements between the Trust and the Adviser, the Adviser is paid a fee which is accrued daily and paid monthly at an annual rate of 0.05% of average daily net assets per Portfolio. The fees that the Adviser receives are listed as ‘‘Management fees’’ on the Statements of Operations. The Adviser continuously monitors the performance of various investment management organizations, including the Specialist Managers retained by the Trust, and generally oversees the services provided to the Trust by its administrator, custodian and other service providers. The Adviser is also authorized to allocate and reallocate assets among Specialist Managers in multi–manager portfolios of the Trust from time to time without additional authorization of the Trust’s Board. In addition, the Adviser will make its officers available to serve as officers and/or Trustees of the Trust, and maintain office space sufficient for the Trust’s principal office. The Securities and Exchange Commission has issued an order that permits the Trust to enter into portfolio management agreements with Specialist Managers upon the approval of the Board but without submitting such contracts for the approval of the shareholders of the relevant Portfolio under certain circumstances.
Prior to March 31, 2015, Citi Fund Services Ohio, Inc. (“Citi”) was responsible for providing the Portfolios with administrative, fund accounting, dividend and capital gains disbursing agent and transfer agency services. Citi received compensation for providing administration, fund accounting and transfer agency services at an all–inclusive fee based on a percentage of each Portfolio’s average net assets. The fees are disclosed as “Administrative service fees” on the Statements of Operations. The fees were accrued daily and payable on a monthly basis at an annual rate of 0.054% of the Trust’s Portfolios’ average daily net assets up to $6 billion; 0.005% of the Trust’s Portfolios’ average daily net assets between $6 billion and $12 billion; and 0.0295% in excess of $12 billion.
Effective March 31, 2015, Citi provides the Portfolios with administrative and fund accounting services. The fees for these services are disclosed as “Administrative service fees” on the Statements of Operations. The fees are accrued daily and payable on a monthly basis at an annual rate of 0.0506% of the Trust’s Portfolios’ average daily net assets up to $6 billion; 0.0047% of the Trust’s Portfolios’ average daily net assets between $6 billion and $12 billion; and 0.0276% in excess of $12 billion.
276
HC CAPITAL TRUST
Notes to Financial Statements (continued) — June 30, 2015
In addition, effective March 31, 2015, SunGard Investor Services LLC provides dividend and capital gains disbursing agent and transfer agency services. The fees for these services are disclosed as “Transfer agency fees” on the Statements of Operations. The fees are accrued daily and payable on a monthly basis at an annual rate of 0.0034% of the Trust’s Portfolios’ average daily net assets up to $6 billion; 0.0003% of the Trust’s Portfolios’ average daily net assets between $6 billion and $12 billion; and 0.0019% in excess of $12 billion.
The Trust has adopted a Distribution Plan for the HC Advisors Shares under which the Adviser may receive compensation for distribution services. Under the Distribution Plan, which was adopted pursuant to Rule 12b–1 under the 1940 Act, the Adviser is entitled to receive a fee of up to 0.25% annually of the average daily net assets attributable to the HC Advisors Shares. Currently, the Adviser is voluntarily waiving all fees associated with the Distribution Plan, and there is no current intention to collect such a fee.
Unified Financial Securities, Inc. (“Unified”), a wholly–owned subsidiary of Huntington Bancshares, Inc., provides certain distribution services to the Trust. Unified receives an annual fee of $50,000 for performing the services listed under its agreement with the Trust. None of Unified’s duties under its agreement are primarily intended to result in the sale of Trust shares.
Alaric Compliance Services, LLC. (“Alaric”) provides an employee to serve as the Trust’s Chief Compliance Officer. For these services, Alaric was compensated $110,000 per year through December 31, 2014. Effective January 1, 2015, Alaric is compensated $150,000 per year for these services.
4. PURCHASE AND SALE TRANSACTIONS. The aggregate cost of purchases and proceeds from sales of investment securities, other than long–term U.S. Government securities, TBA securities and short–term securities, for the year ended June 30, 2015 were as follows (amounts in thousands):
| | | | | | | | |
Portfolio | | Purchases | | | Sales | |
Value Portfolio | | $ | 684,495 | | | $ | 731,264 | |
Institutional Value Portfolio | | | 1,050,257 | | | | 1,221,590 | |
Growth Portfolio | | | 434,290 | | | | 576,959 | |
Institutional Growth Portfolio | | | 750,113 | | | | 1,000,143 | |
Small Cap–Mid Cap Portfolio | | | 64,692 | | | | 73,805 | |
Institutional Small Cap–Mid Cap Portfolio | | | 138,237 | | | | 140,458 | |
Real Estate Portfolio | | | 90,367 | | | | 150,142 | |
Commodity Portfolio | | | 726,597 | | | | 389,688 | |
International Portfolio | | | 790,731 | | | | 717,919 | |
Institutional International Portfolio | | | 1,667,041 | | | | 1,494,573 | |
Emerging Markets Portfolio | | | 1,785,159 | | | | 1,555,540 | |
Core Fixed Income Portfolio | | | 50,612 | | | | 48,749 | |
Fixed Opportunity Portfolio | | | 408,226 | | | | 401,934 | |
U.S. Government Fixed Income Portfolio | | | 140 | | | | — | |
U.S. Corporate Fixed Income Portfolio | | | 327,981 | | | | 336,140 | |
U.S. Mortgage/Asset Backed Fixed Income Portfolio | | | 8,867 | | | | 8,382 | |
Short–Term Municipal Portfolio | | | 5,431 | | | | 5,839 | |
Intermediate Municipal Portfolio | | | 124,398 | | | | 94,274 | |
Intermediate Municipal II Portfolio | | | 20,490 | | | | 14,397 | |
The aggregate cost of purchases and proceeds from sales of long–term U.S. Government securities for the year ended June 30, 2015 were as follows (amounts in thousands):
| | | | | | | | |
Portfolio | | Purchases | | | Sales | |
Institutional Growth Portfolio | | $ | 347,441 | | | $ | 391,838 | |
Commodity Portfolio | | | 128,888 | | | | 129,218 | |
Core Fixed Income Portfolio | | | 29,127 | | | | 27,930 | |
U.S. Government Fixed Income Portfolio | | | 252,896 | | | | 224,833 | |
Inflation Protected Portfolio | | | 151,377 | | | | 126,283 | |
U.S. Mortgage/Asset Backed Fixed Income Portfolio | | | 63,170 | | | | 52,559 | |
277
HC CAPITAL TRUST
Notes to Financial Statements (continued) — June 30, 2015
5. FEDERAL INCOME TAXES. It is the policy of each Portfolio to continue to qualify as a regulated investment company by complying with the provisions available to certain investment companies, as defined in applicable sections of the Internal Revenue Code (the “Code”), and to make distributions of net investment income and net realized capital gains sufficient to relieve it (but not the shareholders) from all, or substantially all, federal income taxes. The Portfolios may utilize equalization accounting for tax purposes by designating earnings and profits, including net realized gains distributed to shareholders on redemption of shares, as a part of the dividends paid deduction for income tax purposes.
The Trust has evaluated tax positions taken or expected to be taken in the course of preparing each Portfolio’s tax returns to determine whether it is more likely than not (i.e., greater than 50–percent chance) that each tax position will be sustained upon examination by a tax authority based on the technical merits of the position. A tax position that meets the more–likely–than–not recognition threshold is measured to determine the amount of benefit to recognize in the financial statements. Differences between tax positions taken in a tax return and amounts recognized in the financial statements will generally result in an increase in a liability for taxes payable (or a reduction of a tax refund receivable), including the recognition of any related interest and penalties as an operating expense. Tax positions taken in tax years remain subject to examination by tax authorities (generally the last three tax year ends 2012 to 2014, and the interim tax period since then). The determination has been made that there are no uncertain tax positions that would require the Portfolios to record a tax liability and, therefore, there is no impact to the Portfolios’ financial statements. Furthermore, management of the Portfolios is not aware of any tax position for which it is reasonably possible that the total amounts of unrecognized tax benefits will significantly change in the next 12 months.
A. Unrealized Appreciation/Depreciation on securities (amounts in thousands):
| | | | | | | | | | | | | | | | |
Portfolio | | Tax Cost of
Securities | | | Tax
Unrealized
Appreciation | | | Tax
Unrealized
(Depreciation) | | | Net Tax
Unrealized
Appreciation/
(Depreciation) | |
Value Portfolio | | $ | 548,782 | | | $ | 87,522 | | | $ | (16,895 | ) | | $ | 70,627 | |
Institutional Value Portfolio | | | 806,725 | | | | 124,667 | | | | (25,429 | ) | | | 99,238 | |
Growth Portfolio | | | 606,249 | | | | 222,677 | | | | (10,394 | ) | | | 212,283 | |
Institutional Growth Portfolio | | | 981,309 | | | | 274,521 | | | | (13,551 | ) | | | 260,970 | |
Small Cap Mid-Cap Portfolio | | | 87,780 | | | | 30,516 | | | | (4,481 | ) | | | 26,035 | |
Institutional Small Cap-Mid Cap Portfolio | | | 152,409 | | | | 54,699 | | | | (5,242 | ) | | | 49,457 | |
Real Estate Portfolio | | | 114,739 | | | | 18,154 | | | | (1,537 | ) | | | 16,617 | |
International Portfolio | | | 1,410,938 | | | | 183,511 | | | | (99,409 | ) | | | 84,102 | |
Institutional International Portfolio | | | 2,721,495 | | | | 298,813 | | | | (198,711 | ) | | | 100,102 | |
Emerging Markets Portfolio | | | 1,890,721 | | | | 117,214 | | | | (209,067 | ) | | | (91,853 | ) |
Core Fixed Income Portfolio | | | 105,117 | | | | 852 | | | | (1,518 | ) | | | (666 | ) |
Fixed Opportunity Portfolio | | | 817,151 | | | | 10,058 | | | | (27,008 | ) | | | (16,950 | ) |
U.S. Government Fixed Income Portfolio | | | 262,836 | | | | 3,163 | | | | (1,214 | ) | | | 1,949 | |
Inflation Protected Portfolio | | | 508,460 | | | | 3,676 | | | | (2,104 | ) | | | 1,572 | |
U.S. Corporate Fixed Income Portfolio | | | 229,904 | | | | 278 | | | | (6,994 | ) | | | (6,716 | ) |
U.S. Mortgage/Asset Backed Fixed Income Portfolio | | | 287,426 | | | | 3,675 | | | | (1,778 | ) | | | 1,897 | |
Short-Term Municipal Portfolio | | | 20,541 | | | | 187 | | | | (19 | ) | | | 168 | |
Intermediate Municipal Portfolio | | | 419,524 | | | | 12,792 | | | | (5,404 | ) | | | 7,388 | |
Intermediate Municipal II Portfolio | | | 76,045 | | | | 2,372 | | | | (180 | ) | | | 2,192 | |
The differences between book-basis and tax-basis unrealized appreciation/depreciation are attributable primarily to: tax deferral of losses on wash sales, the realization for tax purposes of unrealized gains/losses on investments in passive foreign investment companies and the difference between book and tax accretion methods for market discount.
278
HC CAPITAL TRUST
Notes to Financial Statements (continued) — June 30, 2015
B. Tax Characteristics of Distributions Paid
The tax characteristics of distributions paid during the fiscal years ended June 30, 2015 and June 30, 2014 were as follows (amounts in thousands):
| | | | | | | | | | | | | | | | | | | | | | | | |
Year Ended June 30, 2015 | | Distributions Paid From: | | | | | | | | | | | | | |
| | Ordinary
Income | | | Net Long
Term Gains | | | Total
Taxable
Distributions | | | Tax Return
of Capital | | | Tax-Exempt
Distributions | | | Total
Distributions
Paid* | |
Value Portfolio | | $ | 12,564 | | | $ | — | | | $ | 12,564 | | | $ | — | | | $ | — | | | $ | 12,564 | |
Institutional Value Portfolio | | | 42,720 | | | | 97,668 | | | | 140,388 | | | | — | | | | — | | | | 140,388 | |
Growth Portfolio | | | 7,789 | | | | 9,909 | | | | 17,698 | | | | — | | | | — | | | | 17,698 | |
Institutional Growth Portfolio | | | 23,423 | | | | 83,131 | | | | 106,554 | | | | — | | | | — | | | | 106,554 | |
Small Cap-Mid Cap Portfolio | | | 34 | | | | — | | | | 34 | | | | — | | | | — | | | | 34 | |
Institutional Small Cap-Mid Cap Portfolio | | | 377 | | | | 18,814 | | | | 19,191 | | | | — | | | | — | | | | 19,191 | |
Real Estate Portfolio | | | 6,811 | | | | 2,590 | | | | 9,401 | | | | — | | | | — | | | | 9,401 | |
International Portfolio | | | 44,795 | | | | 152,274 | | | | 197,069 | | | | — | | | | — | | | | 197,069 | |
Institutional International Portfolio | | | 119,433 | | | | 236,374 | | | | 355,807 | | | | — | | | | — | | | | 355,807 | |
Emerging Markets Portfolio | | | 53,137 | | | | 17,148 | | | | 70,285 | | | | — | | | | — | | | | 70,285 | |
Core Fixed Income Portfolio | | | 2,521 | | | | — | | | | 2,521 | | | | — | | | | — | | | | 2,521 | |
Fixed Opportunity Portfolio | | | 51,313 | | | | 10,450 | | | | 61,763 | | | | — | | | | — | | | | 61,763 | |
U.S. Government Fixed Income Portfolio | | | 3,348 | | | | — | | | | 3,348 | | | | — | | | | — | | | | 3,348 | |
Inflation Protected Portfolio | | | 3,769 | | | | — | | | | 3,769 | | | | 868 | | | | — | | | | 4,637 | |
U.S. Corporate Fixed Income Portfolio | | | 8,967 | | | | 140 | | | | 9,107 | | | | — | | | | — | | | | 9,107 | |
U.S. Mortgage/Asset Backed Fixed Income Portfolio | | | 7,141 | | | | — | | | | 7,141 | | | | — | | | | — | | | | 7,141 | |
Short-Term Municipal Portfolio | | | — | | | | 4 | | | | 4 | | | | — | | | | 268 | | | | 272 | |
Intermediate Municipal Portfolio | | | 68 | | | | — | | | | 68 | | | | — | | | | 9,181 | | | | 9,249 | |
Intermediate Municipal II Portfolio | | | — | | | | 322 | | | | 322 | | | | — | | | | 1,543 | | | | 1,865 | |
| | | | | | | | | | | | | | | | | | | | |
Year Ended June 30, 2014 | | Distributions Paid From: | | | | | | | | | | |
| | Ordinary
Income | | | Net Long
Term Gains | | | Total
Taxable
Distributions | | | Tax-Exempt
Distributions | | | Total
Distributions
Paid* | |
Value Portfolio | | $ | 15,771 | | | $ | — | | | $ | 15,771 | | | $ | — | | | $ | 15,771 | |
Institutional Value Portfolio | | | 66,819 | | | | 99,907 | | | | 166,726 | | | | — | | | | 166,726 | |
Growth Portfolio | | | 8,842 | | | | — | | | | 8,842 | | | | — | | | | 8,842 | |
Institutional Growth Portfolio | | | 33,110 | | | | 89,019 | | | | 122,129 | | | | — | | | | 122,129 | |
Small Cap-Mid Cap Portfolio | | | 422 | | | | — | | | | 422 | | | | — | | | | 422 | |
Institutional Small Cap-Mid Cap Portfolio | | | 5,542 | | | | 22,572 | | | | 28,114 | | | | — | | | | 28,114 | |
Real Estate Portfolio | | | 1,564 | | | | — | | | | 1,564 | | | | — | | | | 1,564 | |
International Portfolio | | | 51,194 | | | | 4,110 | | | | 55,304 | | | | — | | | | 55,304 | |
Institutional International Portfolio | | | 120,895 | | | | 73,376 | | | | 194,271 | | | | — | | | | 194,271 | |
Emerging Markets Portfolio | | | 25,805 | | | | — | | | | 25,805 | | | | — | | | | 25,805 | |
Core Fixed Income Portfolio | | | 2,561 | | | | 430 | | | | 2,991 | | | | — | | | | 2,991 | |
Fixed Opportunity Portfolio | | | 49,569 | | | | 15,203 | | | | 64,772 | | | | — | | | | 64,772 | |
U.S. Government Fixed Income Portfolio | | | 3,179 | | | | 786 | | | | 3,965 | | | | — | | | | 3,965 | |
Inflation Protected Portfolio | | | 3,240 | | | | — | | | | 3,240 | | | | — | | | | 3,240 | |
U.S. Corporate Fixed Income Portfolio | | | 7,699 | | | | 3,116 | | | | 10,815 | | | | — | | | | 10,815 | |
U.S. Mortgage/Asset Backed Fixed Income Portfolio | | | 7,656 | | | | — | | | | 7,656 | | | | — | | | | 7,656 | |
Short-Term Municipal Portfolio | | | — | | | | 44 | | | | 44 | | | | 266 | | | | 310 | |
Intermediate Municipal Portfolio | | | 2 | | | | — | | | | 2 | | | | 10,643 | | | | 10,645 | |
Intermediate Municipal II Portfolio | | | — | | | | 226 | | | | 226 | | | | 1,611 | | | | 1,837 | |
| * | Total distributions paid may differ from what appears in the Statements of Changes in Net Assets because dividends for tax purposes are recognized when actually paid. |
Amounts designated as “—” are $0 or have been rounded to $0.
279
HC CAPITAL TRUST
Notes to Financial Statements (continued) — June 30, 2015
C. Components of Accumulated Earnings
As of June 30, 2015, the components of accumulated earnings/(deficit) on a tax basis were as follows (amounts in thousands):
| | | | | | | | | | | | | | | | | | | | | | | | | | | | |
Portfolio | | Undistributed
Ordinary
Income/Tax
Exempt
Income | | | Undistributed
Long Term
Capital Gains | | | Accumulated
Earnings | | | Dividends
Payable | | | Accumulated
Capital and
Other Losses | | | Unrealized
Appreciation/
Depreciation | | | Total
Accumulated
Earnings/
(Deficit) | |
Value Portfolio | | $ | 337 | | | $ | 16,011 | | | $ | 16,348 | | | $ | — | | | $ | — | | | $ | 70,627 | | | $ | 86,975 | |
Institutional Value Portfolio | | | 20,151 | | | | 67,736 | | | | 87,887 | | | | — | | | | — | | | | 99,238 | | | | 187,125 | |
Growth Portfolio | | | 250 | | | | 132,601 | | | | 132,851 | | | | — | | | | — | | | | 212,283 | | | | 345,134 | |
Institutional Growth Portfolio | | | 5,562 | | | | 183,765 | | | | 189,327 | | | | — | | | | — | | | | 260,970 | | | | 450,297 | |
Small Cap-Mid Cap Portfolio | | | — | | | | — | | | | — | | | | — | | | | (16,770 | ) | | | 26,035 | | | | 9,265 | |
Institutional Small Cap-Mid Cap Portfolio | | | 71 | | | | 8,491 | | | | 8,562 | | | | — | | | | (1,719 | ) | | | 49,457 | | | | 56,300 | |
Real Estate Portfolio | | | 2,962 | | | | 11,585 | | | | 14,547 | | | | — | | | | — | | | | 16,618 | | | | 31,165 | |
International Portfolio | | | 9,800 | | | | 73,644 | | | | 83,444 | | | | — | | | | — | | | | 83,851 | | | | 167,295 | |
Institutional International Portfolio | | | 28,392 | | | | 92,233 | | | | 120,625 | | | | — | | | | — | | | | 99,463 | | | | 220,088 | |
Emerging Markets Portfolio | | | 20,947 | | | | — | | | | 20,947 | | | | — | | | | (20,242 | ) | | | (92,306 | ) | | | (91,601 | ) |
Core Fixed Income Portfolio | | | 404 | | | | 524 | | | | 928 | | | | (6 | ) | | | — | | | | (666 | ) | | | 256 | |
Fixed Opportunity Portfolio | | | 2,819 | | | | 3,169 | | | | 5,988 | | | | — | | | | (209 | ) | | | (16,956 | ) | | | (11,177 | ) |
U.S. Government Fixed Income Portfolio | | | 548 | | | | 1,180 | | | | 1,728 | | | | (56 | ) | | | — | | | | 1,949 | | | | 3,621 | |
Inflation Protected Portfolio | | | — | | | | — | | | | — | | | | — | | | | (1,369 | ) | | | 1,572 | | | | 203 | |
U.S. Corporate Fixed Income Portfolio | | | 2,143 | | | | 3,560 | | | | 5,703 | | | | (86 | ) | | | — | | | | (6,716 | ) | | | (1,099 | ) |
U.S. Mortgage/Asset Backed Fixed Income Portfolio | | | 253 | | | | — | | | | 253 | | | | (123 | ) | | | (5,869 | ) | | | 1,897 | | | | (3,842 | ) |
Short-Term Municipal Portfolio | | | 3 | | | | 2 | | | | 5 | | | | — | | | | — | | | | 168 | | | | 173 | |
Intermediate Municipal Portfolio | | | 270 | | | | — | | | | 270 | | | | (33 | ) | | | (8,102 | ) | | | 7,388 | | | | (477 | ) |
Intermediate Municipal II Portfolio | | | 36 | | | | 4 | | | | 40 | | | | (7 | ) | | | — | | | | 2,192 | | | | 2,225 | |
D. Capital Loss Carryforwards
As of their tax year ended June 30, 2015, the following Portfolios had capital loss carryforwards (“CLCFs”) as summarized below (amounts in thousands):
CLCFs subject to expiration:
| | | | | | | | | | | | |
Portfolio | | Expires
2018 | | | Expires
2019 | | | Total | |
Small Cap-Mid Cap Portfolio | | $ | 16,097 | | | $ | — | | | $ | 16,097 | |
Intermediate Municipal Portfolio | | | — | | | | 8,102 | | | | 8,102 | |
CLCFs not subject to expiration:
| | | | | | | | | | | | |
Portfolio | | Short-Term
Amount | | | Long-Term
Amount | | | Total | |
U.S. Mortgage/Asset Backed Fixed Income Portfolio | | $ | 1,302 | | | $ | 4,131 | | | $ | 5,433 | |
CLCFs that are not subject to expiration must be utilized before those that are subject to expiration. During the year ending June 30, 2015, the Portfolios utilized CLCFs as follows (amounts in thousands):
| | | | |
Portfolio | | Total | |
Value Portfolio | | $ | 63,831 | |
Growth Portfolio | | | 5,297 | |
280
HC CAPITAL TRUST
Notes to Financial Statements (continued) — June 30, 2015
| | | | |
Portfolio | | Total | |
Small Cap-Mid Cap Portfolio | | $ | 11,279 | |
Core Fixed Income Portfolio | | | 256 | |
U.S. Government Fixed Income Portfolio | | | 434 | |
U.S. Corporate Fixed Income Portfolio | | | 70 | |
Intermediate Municipal Portfolio | | | 2,839 | |
E. Deferred Losses
Under current tax law, capital losses and specified ordinary losses realized after October 31 and non-specified ordinary losses incurred after December 31 (ordinary losses collectively known as “late year ordinary loss”) may be deferred and treated as occurring on the first business day of the following fiscal year. The following Portfolios had deferred losses, which will be treated as arising on the first day of the fiscal year ending June 30, 2016 (amounts in thousands):
| | | | | | | | |
Portfolio | | Post-October
Capital Losses | | | Late Year
Ordinary Losses | |
Small Cap-Mid Cap Portfolio | | $ | 589 | | | $ | 84 | |
Institutional Small Cap-Mid Cap Portfolio | | | 1,673 | | | | 46 | |
Emerging Markets Portfolio | | | 20,242 | | | | — | |
Fixed Income Opportunity Portfolio | | | 209 | | | | — | |
Inflation Protected Securities Portfolio | | | 99 | | | | 1,270 | |
U.S. Mortgage/Asset Backed Fixed Income Portfolio | | | 436 | | | | — | |
F. Book-To-Tax Differences
Distributions are based on amounts calculated in accordance with applicable federal tax regulations, which may differ from GAAP. To the extent these differences are permanent in nature (e.g., net operating losses, reclassification of bond discount and premium, equalization accounting, treatment of gains (and losses) relating to foreign currency transactions and differing treatment of income relating to swap agreements), such amounts are reclassified within the capital accounts based on their federal tax-basis treatment; temporary differences do not require reclassifications.
On the Statements of Assets and Liabilities, as a result of permanent book-to-tax differences, reclassification adjustments were made as follows (amounts in thousands):
| | | | | | | | | | | | |
Portfolio | | Accumulated Net
Investment
Income/(Distributions
in Excess of Net
Investment Income) | | | Accumulated
Net Realized
Gains/(Losses) | | | Paid-In
Capital | |
Value Portfolio | | $ | (312 | ) | | $ | 136 | | | $ | 176 | |
Institutional Value Portfolio | | | (328 | ) | | | 328 | | | | — | |
Growth Portfolio | | | (25 | ) | | | (3,299 | ) | | | 3,324 | |
Institutional Growth Portfolio | | | (165 | ) | | | 165 | | | | — | |
Small Cap-Mid Cap Portfolio | | | (14 | ) | | | 28 | | | | (14 | ) |
Institutional Small Cap-Mid Cap Portfolio | | | (35 | ) | | | 35 | | | | — | |
Real Estate Portfolio | | | (704 | ) | | | 704 | | | | — | |
International Portfolio | | | 941 | | | | (6,423 | ) | | | 5,482 | |
Institutional International Portfolio | | | 2,445 | | | | (2,445 | ) | | | — | |
Emerging Markets Portfolio | | | (2,149 | ) | | | (15 | ) | | | 2,164 | |
Core Fixed Income Portfolio | | | 281 | | | | (281 | ) | | | — | |
Fixed Opportunity Portfolio | | | 1,147 | | | | (1,147 | ) | | | — | |
Inflation Protected Portfolio | | | 1,690 | | | | (822 | ) | | | (868 | ) |
U.S. Corporate Fixed Income Portfolio | | | 21 | | | | (21 | ) | | | — | |
U.S. Mortgage/Asset Backed Fixed Income Portfolio | | | 1,671 | | | | (1,671 | ) | | | — | |
Intermediate Municipal Portfolio | | | 49 | | | | (49 | ) | | | — | |
281
HC CAPITAL TRUST
Notes to Financial Statements (continued) — June 30, 2015
G. Commodity Portfolio Tax Information
The Commodity Portfolio has a tax year end of December 31.
The Commodity Portfolio’s tax cost of securities as of December 31, 2014 was $916,233, resulting in accumulated net unrealized depreciation of $2,179, consisting of $80,375 in gross unrealized appreciation and $82,554 in gross unrealized depreciation.
The tax characteristics of distributions paid during the tax years ended December 31, 2014 and December 31, 2013 were as follows (amounts in thousands):
| | | | | | | | | | | | | | | | | | | | |
| | | Distributions Paid From: | | | | | | | | | | |
Year Ended December 31, 2014 | | Ordinary
Income | | | Net Long
Term Gains | | | Total
Taxable
Distributions | | | Tax-Exempt
Distributions | | | Total
Distributions
Paid* | |
Commodity Portfolio | | $ | 8,151 | | | $ | 3,440 | | | $ | 11,591 | | | $ | — | | | $ | 11,591 | |
| | | | | | | | | | | | | | | | | | | | |
| | | Distributions Paid From: | | | | | | | | | | |
Year Ended December 31, 2013 | | Ordinary
Income | | | Net Long
Term Gains | | | Total
Taxable
Distributions | | | Tax-Exempt
Distributions | | | Total
Distributions
Paid* | |
Commodity Portfolio | | $ | 8,445 | | | $ | — | | | $ | 8,445 | | | $ | — | | | $ | 8,445 | |
| * | Total distributions paid may differ from what appears in the Statements of Changes in Net Assets because dividends for tax purposes are recognized when actually paid. |
Amounts designated as “—” are $0 or have been rounded to $0.
As of December 31, 2014, the components of accumulated earnings (deficit) on a tax basis were as follows:
| | | | | | | | | | | | | | | | | | | | | | | | | | | | |
Portfolio | | Undistributed
Ordinary
Income/Tax
Exempt
Income | | | Undistributed
Long Term
Capital Gains | | | Accumulated
Earnings | | | Dividends
Payable | | | Accumulated
Capital and
Other Losses | | | Unrealized
Appreciation/
(Depreciation) | | | Total
Accumulated
Earnings/
(Deficit) | |
Commodity Portfolio | | $ | 4,315 | | | $ | — | | | $ | 4,315 | | | $ | (4,062 | ) | | $ | (7,344 | ) | | $ | (101,397 | ) | | $ | (108,488 | ) |
Amounts designated as “—” are $0 or have been rounded to $0.
At December 31, 2014, the Commodity Portfolio did not have any CLCFs available to offset future capital gains.
At December 31, 2014, the Commodity Portfolio had deferred losses, which will be treated as arising on the first day of the tax year ending December 31, 2015.
| | | | |
Portfolio | | Post-October
Capital Losses | |
Commodity Portfolio | | $ | 7,344 | |
6. RISK CONSIDERATIONS.
Market Risk — Each Portfolio bears a basic risk that the value of the securities held by a Portfolio may decline in response to general market and economic conditions, or conditions that affect specific market sectors or individual companies.
Credit Risk — Credit risk is the risk that an issuer (or in the case of certain securities, the guarantor or counterparty) will be unable to make principal and interest payments when due. The creditworthiness of an issuer may be affected by a number of factors, including the financial condition of the issuer (or guarantor) and, in the case of foreign issuers, the financial condition of the region.
Foreign Investment Risk — Investments in securities issued by non-U.S. companies and non-U.S. governments and their agencies may be adversely affected by the lack of timely or reliable financial information, political, social and/or economic developments abroad and foreign regulatory requirements and market practices. Securities denominated in foreign currencies are subject to the risk that the value of the foreign currency will decline in relation to the U.S. dollar. In addition, risks associated with foreign investments may be intensified in the case of investments in emerging-market countries, whose political, legal and economic systems are less developed and less stable than those of more developed nations.
282
HC CAPITAL TRUST
Notes to Financial Statements (concluded) — June 30, 2015
Concentration Risk — Concentration risk is the risk that results from focusing investments in one industry or market sector. The Real Estate Portfolio and Commodity Portfolio concentrate their investments in real estate securities and commodity-related industries, respectively, which may present greater risks of loss than if the Portfolios were more broadly diversified over numerous unrelated industries.
Commodity-Related Derivatives Risk — The Commodity Portfolio, through its investment in its subsidiaries, will hold commodity-related derivatives. Commodity-related derivatives provide exposure, which may include long and/or short exposure, to the investment returns of physical commodities that trade in the commodities markets without investing directly in physical commodities. The value of a commodity-related derivative typically is based on the price movements of a physical commodity (such as heating oil, precious metals, livestock, or agricultural products), a commodity futures contract or commodity index, or some other readily measurable economic variable. The value of commodity-related derivatives may be affected by changes in overall market movements, volatility of the underlying benchmark, changes in interest rates, or factors affecting a particular industry or commodity, such as drought, floods, weather, livestock disease, embargoes, tariffs and international economic, political and regulatory developments. The value of commodity-related derivatives will rise or fall in response to changes in the underlying commodity or related index. Investments in commodity-related derivatives may be subject to greater volatility than non-derivative based investments. A highly liquid secondary market may not exist for certain commodity-related derivatives, and there can be no assurance that one will develop.
7. SUBSEQUENT EVENTS. Management has evaluated subsequent events through the date these financial statements were issued. Based on the evaluation, no additional disclosures or adjustments were required to the financial statements as of June 30, 2015, except as stated below.
The ESG Growth Portfolio commenced operations on July 13, 2015.
283
REPORT OF INDEPENDENT REGISTERED PUBLIC ACCOUNTING FIRM
To the Trustees and Shareholders of
HC Capital Trust:
In our opinion, the accompanying statements of assets and liabilities, including the portfolios of investments, and the related statements of operations and of changes in net assets and the financial highlights present fairly, in all material respects, the financial position of The Value Equity Portfolio, The Institutional Value Equity Portfolio, The Growth Equity Portfolio, The Institutional Growth Equity Portfolio, The Small Capitalization–Mid Capitalization Equity Portfolio, The Institutional Small Capitalization–Mid Capitalization Equity Portfolio, The Real Estate Securities Portfolio, The Commodity Returns Strategy Portfolio, The International Equity Portfolio, The Institutional International Equity Portfolio, The Emerging Markets Portfolio, The Core Fixed Income Portfolio, The Fixed Income Opportunity Portfolio, The U.S. Government Fixed Income Securities Portfolio, The Inflation Protected Securities Portfolio, The U.S. Corporate Fixed Income Securities Portfolio, The U.S. Mortgage/Asset Backed Fixed Income Securities Portfolio, The Short-Term Municipal Bond Portfolio, The Intermediate Term Municipal Bond Portfolio and The Intermediate Term Municipal Bond II Portfolio (twenty portfolios constituting HC Capital Trust, hereafter collectively referred to as the ‘‘Trust’’ and individually a ‘‘Portfolio’’) at June 30, 2015, the results of each of their operations for the year then ended, the changes in each of their net assets and their financial highlights for each of the periods presented, in conformity with accounting principles generally accepted in the United States of America. These financial statements and financial highlights (hereafter referred to as ‘‘financial statements’’) are the responsibility of the Trust’s management. Our responsibility is to express an opinion on these financial statements based on our audits. We conducted our audits of these financial statements in accordance with the standards of the Public Company Accounting Oversight Board (United States). Those standards require that we plan and perform the audit to obtain reasonable assurance about whether the financial statements are free of material misstatement. An audit includes examining, on a test basis, evidence supporting the amounts and disclosures in the financial statements, assessing the accounting principles used and significant estimates made by management, and evaluating the overall financial statement presentation. We believe that our audits, which included confirmation of securities at June 30, 2015 by correspondence with the custodian and brokers, provide a reasonable basis for our opinion.

Columbus, Ohio
August 21, 2015
284
HC CAPITAL TRUST
Additional Information — June 30, 2015 (Unaudited)
1. SECURITY PROXY VOTING. A description of the policies and procedures that the Trust uses to determine how to vote proxies relating to portfolio securities is contained in the Statement of Additional Information. Information regarding how the Portfolios voted proxies relating to portfolio securities during the most recent twelve months ended June 30, is available without charge, upon request, by calling 800-242-9596 and on the Securities and Exchange Commission’s (‘‘SEC’’) website at http://www.sec.gov.
2. SHAREHOLDER VOTES. During the year ended June 30, 2015, the following actions were taken by the shareholders of the Portfolios.
SPECIAL MEETING OF THE SHAREHOLDERS — JANUARY 23, 2015
A special meeting of shareholders of each of The International Equity Portfolio, The Institutional International Equity Portfolio, The Emerging Markets Portfolio, and The Fixed Income Opportunity Portfolio was held on January 23, 2015. At the January 23, 2015 meeting, shareholders of The International Equity Portfolio, The Institutional International Equity Portfolio, The Emerging Markets Portfolio, and The Fixed Income Opportunity Portfolio approved the portfolio management agreements between the Trust and City of London Investment Management Company Limited.
| 1. | Approval of a portfolio management agreement between the Trust, on behalf of The International Equity Portfolio, and City of London Investment Management Company Limited (“CLIM”); |
| | | | | | | | | | | | | | | | | | | | |
Portfolio | | Record Date
Shares | | | Shares Voted | | | % of Total
Shares | | | For Proposal | | | % of Votes
in Favor | |
The International Equity Portfolio | | | 117,229,026.561 | | | | 107,013,149.742 | | | | 91.285 | % | | | 107,013,149.742 | | | | 100 | % |
| 2. | Approval of a portfolio management agreement between the Trust, on behalf of The Institutional International Equity Portfolio, and CLIM; |
| | | | | | | | | | | | | | | | | | | | |
Portfolio | | Record Date
Shares | | | Shares Voted | | | % of Total
Shares | | | For Proposal | | | % of Votes
in Favor | |
The Institutional International Equity Portfolio | | | 273,344,208.803 | | | | 206,161,930.339 | | | | 75.422 | % | | | 155,004,022.099 | | | | 75.186 | % |
| 3. | Approval of a portfolio management agreement between the Trust, on behalf of The Emerging Markets Portfolio, and CLIM; |
| | | | | | | | | | | | | | | | | | | | |
Portfolio | | Record Date
Shares | | | Shares Voted | | | % of Total
Shares | | | For Proposal | | | % of Votes
in Favor | |
The Emerging Markets Portfolio | | | 96,049,757.4 | | | | 82,029,057.196 | | | | 85.402 | % | | | 72,267,763.196 | | | | 88.101 | % |
| 4. | Approval of a portfolio management agreement between the Trust, on behalf of The Fixed Income Opportunity Portfolio, and CLIM; |
| | | | | | | | | | | | | | | | | | | | |
Portfolio | | Record Date
Shares | | | Shares Voted | | | % of Total
Shares | | | For Proposal | | | % of Votes
in Favor | |
The Fixed Income Opportunity Portfolio | | | 110,200,876.185 | | | | 70,412,554.646 | | | | 63.894 | % | | | 69,549,226.806 | | | | 98.774 | % |
3. EXPENSE EXAMPLE. As a shareholder of the Trust, you incur ongoing costs, including management fees and other Portfolio expenses. This example (as set forth in the table below) is intended to help you understand your ongoing costs (in dollars) of investing in the Trust and to compare these costs with the ongoing costs of investing in other mutual funds. The example is based on an investment of $1,000 invested at the beginning of the period and held for the entire period from January 1, 2015 through June 30, 2015.
Actual Expenses: The table below provides information about actual account values and actual expenses. You may use the information below, together with the amount you invested, to estimate the expenses that you paid over the period. Simply divide your account value by $1,000 (for example, an $8,600 account value divided by $1,000 = 8.6), then multiply the result by the number in the table under the heading entitled ‘‘Expenses Paid During Period’’ to estimate the expenses you paid on your account during this period.
Hypothetical Example for Comparison Purposes: The table below provides information about hypothetical account values and hypothetical expenses based on each of the Portfolio’s actual expense ratio and an assumed rate of return of 5% per year before expenses, which is not the Portfolio’s actual return. The hypothetical account values and expenses may
285
HC CAPITAL TRUST
Additional Information (continued) — June 30, 2015 (Unaudited)
not be used to estimate the actual ending account balance or expenses you paid for the period. You may use this information to compare this 5% hypothetical example with the 5% hypothetical examples that appear in the shareholder reports of other funds.
Please note that the expenses shown in the table are meant to highlight your ongoing costs only and do not reflect any transactional costs, such as redemption fees or exchange fees. Therefore, the table is useful in comparing ongoing costs only, and will not help you determine the relative total costs of owning different funds. In addition, if these transactional costs were included, your costs would have been higher.
| | | | | | | | | | | | | | | | | | | | |
| | | | | | | Beginning
Account Value,
January 1, 2015 | | | Ending
Account
Value,
June 30, 2015 | | | Expenses
Paid
During
Period2 | | | Annualized
Expense
Ratio | |
Value Portfolio | | HC Strategic Shares | | Actual | | $ | 1,000 | | | $ | 1,006.00 | | | $ | 1.29 | | | | 0.26 | % |
| | | | Hypothetical1 | | $ | 1,000 | | | $ | 1,023.51 | | | $ | 1.30 | | | | 0.26 | % |
| | HC Advisors Shares | | Actual | | $ | 1,000 | | | $ | 1,006.00 | | | $ | 1.29 | | | | 0.26 | % |
| | | | Hypothetical1 | | $ | 1,000 | | | $ | 1,023.51 | | | $ | 1.30 | | | | 0.26 | % |
| | | | | | |
Institutional Value Portfolio | | HC Strategic Shares | | Actual | | $ | 1,000 | | | $ | 1,005.20 | | | $ | 1.29 | | | | 0.26 | % |
| | | | Hypothetical1 | | $ | 1,000 | | | $ | 1,023.51 | | | $ | 1.30 | | | | 0.26 | % |
| | HC Advisors Shares | | Actual | | $ | 1,000 | | | $ | 1,005.20 | | | $ | 1.29 | | | | 0.26 | % |
| | | | Hypothetical1 | | $ | 1,000 | | | $ | 1,023.51 | | | $ | 1.30 | | | | 0.26 | % |
| | | | | | |
Growth Portfolio | | HC Strategic Shares | | Actual | | $ | 1,000 | | | $ | 1,040.10 | | | $ | 1.52 | | | | 0.30 | % |
| | | | Hypothetical1 | | $ | 1,000 | | | $ | 1,023.31 | | | $ | 1.51 | | | | 0.30 | % |
| | HC Advisors Shares | | Actual | | $ | 1,000 | | | $ | 1,040.60 | | | $ | 1.52 | | | | 0.30 | % |
| | | | Hypothetical1 | | $ | 1,000 | | | $ | 1,023.31 | | | $ | 1.51 | | | | 0.30 | % |
| | | | | | |
Institutional Growth Portfolio | | HC Strategic Shares | | Actual | | $ | 1,000 | | | $ | 1,040.90 | | | $ | 1.47 | | | | 0.29 | % |
| | | | Hypothetical1 | | $ | 1,000 | | | $ | 1,023.36 | | | $ | 1.45 | | | | 0.29 | % |
| | HC Advisors Shares | | Actual | | $ | 1,000 | | | $ | 1,042.20 | | | $ | 1.47 | | | | 0.29 | % |
| | | | Hypothetical1 | | $ | 1,000 | | | $ | 1,023.36 | | | $ | 1.45 | | | | 0.29 | % |
| | | | | | |
Small Cap–Mid Cap Portfolio | | HC Strategic Shares | | Actual | | $ | 1,000 | | | $ | 1,038.50 | | | $ | 4.25 | | | | 0.84 | % |
| | | | Hypothetical1 | | $ | 1,000 | | | $ | 1,020.63 | | | $ | 4.21 | | | | 0.84 | % |
| | HC Advisors Shares | | Actual | | $ | 1,000 | | | $ | 1,038.50 | | | $ | 4.25 | | | | 0.84 | % |
| | | | Hypothetical1 | | $ | 1,000 | | | $ | 1,020.63 | | | $ | 4.21 | | | | 0.84 | % |
| | | | | | |
Institutional Small Cap–Mid Cap Portfolio | | HC Strategic Shares | | Actual | | $ | 1,000 | | | $ | 1,042.90 | | | $ | 4.10 | | | | 0.81 | % |
| | | | Hypothetical1 | | $ | 1,000 | | | $ | 1,020.78 | | | $ | 4.06 | | | | 0.81 | % |
| | HC Advisors Shares | | Actual | | $ | 1,000 | | | $ | 1,042.90 | | | $ | 4.10 | | | | 0.81 | % |
| | | | Hypothetical1 | | $ | 1,000 | | | $ | 1,020.78 | | | $ | 4.06 | | | | 0.81 | % |
| | | | | | |
Real Estate Portfolio | | HC Strategic Shares | | Actual | | $ | 1,000 | | | $ | 965.00 | | | $ | 3.95 | | | | 0.81 | % |
| | | | Hypothetical1 | | $ | 1,000 | | | $ | 1,020.78 | | | $ | 4.06 | | | | 0.81 | % |
| | | | | | |
Commodity Portfolio | | HC Strategic Shares | | Actual | | $ | 1,000 | | | $ | 985.60 | | | $ | 2.86 | | | | 0.58 | % |
| | | | Hypothetical1 | | $ | 1,000 | | | $ | 1,021.92 | | | $ | 2.91 | | | | 0.58 | % |
| | HC Advisors Shares | | Actual | | $ | 1,000 | | | $ | 985.60 | | | $ | 2.86 | | | | 0.58 | % |
| | | | Hypothetical1 | | $ | 1,000 | | | $ | 1,021.92 | | | $ | 2.91 | | | | 0.58 | % |
International Portfolio | | HC Strategic Shares | | Actual | | $ | 1,000 | | | $ | 1,052.80 | | | $ | 1.93 | | | | 0.38 | % |
| | | | Hypothetical1 | | $ | 1,000 | | | $ | 1,022.91 | | | $ | 1.91 | | | | 0.38 | % |
| | HC Advisors Shares | | Actual | | $ | 1,000 | | | $ | 1,052.80 | | | $ | 1.93 | | | | 0.38 | % |
| | | | Hypothetical1 | | $ | 1,000 | | | $ | 1,022.91 | | | $ | 1.91 | | | | 0.38 | % |
| | | | | | |
Institutional International Portfolio | | HC Strategic Shares | | Actual | | $ | 1,000 | | | $ | 1,055.30 | | | $ | 1.83 | | | | 0.36 | % |
| | | | Hypothetical1 | | $ | 1,000 | | | $ | 1,023.01 | | | $ | 1.81 | | | | 0.36 | % |
| | HC Advisors Shares | | Actual | | $ | 1,000 | | | $ | 1,054.30 | | | $ | 1.83 | | | | 0.36 | % |
| | | | Hypothetical1 | | $ | 1,000 | | | $ | 1,023.01 | | | $ | 1.81 | | | | 0.36 | % |
286
HC CAPITAL TRUST
Additional Information (continued) — June 30, 2015 (Unaudited)
| | | | | | | | | | | | | | | | | | | | |
| | | | | | | Beginning
Account Value,
January 1, 2015 | | | Ending
Account
Value,
June 30, 2015 | | | Expenses
Paid
During
Period2 | | | Annualized
Expense
Ratio | |
| | | | | | |
Emerging Markets Portfolio | | HC Strategic Shares | | Actual | | $ | 1,000 | | | $ | 1,019.10 | | | $ | 2.95 | | | | 0.59 | % |
| | | | Hypothetical1 | | $ | 1,000 | | | $ | 1,021.87 | | | $ | 2.96 | | | | 0.59 | % |
| | HC Advisors Shares | | Actual | | $ | 1,000 | | | $ | 1,019.10 | | | $ | 2.95 | | | | 0.59 | % |
| | | | Hypothetical1 | | $ | 1,000 | | | $ | 1,021.87 | | | $ | 2.96 | | | | 0.59 | % |
| | | | | | |
Core Fixed Income Portfolio | | HC Strategic Shares | | Actual | | $ | 1,000 | | | $ | 997.00 | | | $ | 1.39 | | | | 0.28 | % |
| | | | Hypothetical1 | | $ | 1,000 | | | $ | 1,023.41 | | | $ | 1.40 | | | | 0.28 | % |
| | HC Advisors Shares | | Actual | | $ | 1,000 | | | $ | 997.00 | | | $ | 1.39 | | | | 0.28 | % |
| | | | Hypothetical1 | | $ | 1,000 | | | $ | 1,023.41 | | | $ | 1.40 | | | | 0.28 | % |
| | | | | | |
Fixed Opportunity Portfolio | | HC Strategic Shares | | Actual | | $ | 1,000 | | | $ | 1,029.70 | | | $ | 1.56 | | | | 0.31 | % |
| | | | Hypothetical1 | | $ | 1,000 | | | $ | 1,023.26 | | | $ | 1.56 | | | | 0.31 | % |
| | HC Advisors Shares | | Actual | | $ | 1,000 | | | $ | 1,029.70 | | | $ | 1.56 | | | | 0.31 | % |
| | | | Hypothetical1 | | $ | 1,000 | | | $ | 1,023.26 | | | $ | 1.56 | | | | 0.31 | % |
| | | | | | |
U.S. Government Fixed Income Portfolio | | HC Strategic Shares | | Actual | | $ | 1,000 | | | $ | 1,001.00 | | | $ | 0.84 | | | | 0.17 | % |
| | | | Hypothetical1 | | $ | 1,000 | | | $ | 1,023.95 | | | $ | 0.85 | | | | 0.17 | % |
| | | | | | |
Inflation Protected Portfolio | | HC Strategic Shares | | Actual | | $ | 1,000 | | | $ | 1,003.00 | | | $ | 0.89 | | | | 0.18 | % |
| | | | Hypothetical1 | | $ | 1,000 | | | $ | 1,023.90 | | | $ | 0.09 | | | | 0.18 | % |
| | HC Advisors Shares | | Actual | | $ | 1,000 | | | $ | 1,002.00 | | | $ | 0.89 | | | | 0.18 | % |
| | | | Hypothetical1 | | $ | 1,000 | | | $ | 1,023.90 | | | $ | 0.09 | | | | 0.18 | % |
| | | | | | |
U.S. Corporate Fixed Income Portfolio | | HC Strategic Shares | | Actual | | $ | 1,000 | | | $ | 990.30 | | | $ | 1.18 | | | | 0.24 | % |
| | | | Hypothetical1 | | $ | 1,000 | | | $ | 1,023.60 | | | $ | 1.20 | | | | 0.24 | % |
| | | | | | |
U.S. Mortgage/Asset Backed Fixed Income Portfolio | | HC Strategic Shares | | Actual | | $ | 1,000 | | | $ | 1,002.90 | | | $ | 0.79 | | | | 0.16 | % |
| | | | Hypothetical1 | | $ | 1,000 | | | $ | 1,024.00 | | | $ | 0.80 | | | | 0.16 | % |
| | | | | | |
Short-Term Municipal Portfolio | | HC Strategic Shares | | Actual | | $ | 1,000 | | | $ | 1,002.20 | | | $ | 1.59 | | | | 0.32 | % |
| | | | Hypothetical1 | | $ | 1,000 | | | $ | 1,023.21 | | | $ | 1.61 | | | | 0.32 | % |
| | | | | | |
Intermediate Municipal Portfolio | | HC Strategic Shares | | Actual | | $ | 1,000 | | | $ | 1,004.50 | | | $ | 1.09 | | | | 0.22 | % |
| | | | Hypothetical1 | | $ | 1,000 | | | $ | 1,023.70 | | | $ | 1.10 | | | | 0.22 | % |
| | HC Advisors Shares | | Actual | | $ | 1,000 | | | $ | 1,004.50 | | | $ | 1.09 | | | | 0.22 | % |
| | | | Hypothetical1 | | $ | 1,000 | | | $ | 1,023.70 | | | $ | 1.10 | | | | 0.22 | % |
| | | | | | |
Intermediate Muni II | | HC Strategic Shares | | Actual | | $ | 1,000 | | | $ | 1,001.50 | | | $ | 0.89 | | | | 0.19 | % |
| | | | Hypothetical1 | | $ | 1,000 | | | $ | 1,023.85 | | | $ | 0.95 | | | | 0.19 | % |
| | HC Advisors Shares | | Actual | | $ | 1,000 | | | $ | 1,001.50 | | | $ | 1.69 | | | | 0.19 | % |
| | | | Hypothetical1 | | $ | 1,000 | | | $ | 1,023.85 | | | $ | 0.95 | | | | 0.19 | % |
| 1 | Represents the hypothetical 5% annual return before expenses. |
| 2 | Expenses are equal to the Portfolio’s annualized expense ratio multiplied by the average account value over the period multiplied by 181/365 (to reflect the one-half year period). |
287
HC CAPITAL TRUST
Additional Information (continued) — June 30, 2015 (Unaudited)
4. ADDITIONAL FEDERAL INCOME TAX INFORMATION
A. Dividends Received Deduction. For corporate shareholders, the following percentage of the total ordinary income distributions paid during the fiscal year ended June 30, 2015, qualify for the corporate dividend received deduction for the following Portfolio:
| | | | |
Portfolio | | Dividends
Received
Deduction | |
Value Portfolio | | | 85.51% | |
Institutional Value Portfolio | | | 41.62% | |
Growth Portfolio | | | 100.00% | |
Institutional Growth Portfolio | | | 62.62% | |
Small Cap-Mid Cap Portfolio | | | 100.00% | |
Institutional Small Cap-Mid Cap Portfolio | | | 28.43% | |
Real Estate Portfolio | | | 4.29% | |
Institutional International Portfolio | | | 0.81% | |
Emerging Markets Portfolio | | | 2.63% | |
Core Fixed Income Portfolio | | | 0.07% | |
Fixed Income Opportunity Portfolio | | | 0.02% | |
U.S. Corporate Fixed Income Portfolio | | | 6.09% | |
B. Qualified Dividends. For the fiscal year ended June 30, 2015, under current tax law, the following dividends paid may be subject to a maximum tax rate of 15%.
| | | | |
Portfolio | | Dividends
Paid | |
Value Portfolio | | | 100.00% | |
Institutional Value Portfolio | | | 43.13% | |
Growth Portfolio | | | 100.00% | |
Institutional Growth Portfolio | | | 65.41% | |
Small Cap-Mid Cap Portfolio | | | 100.00% | |
Institutional Small Cap-Mid Cap Portfolio | | | 29.69% | |
Real Estate Portfolio | | | 5.10% | |
International Portfolio | | | 8.08% | |
Institutional International Portfolio | | | 16.52% | |
Emerging Markets Portfolio | | | 49.81% | |
Core Fixed Income Portfolio | | | 0.10% | |
Fixed Income Opportunity Portfolio | | | 0.01% | |
U.S. Corporate Fixed Income Portfolio | | | 6.92% | |
C. Foreign Tax Pass through Credit. Certain HC Capital Trust Portfolios intend to elect to pass through to shareholders the income tax credit for taxes paid to foreign countries. The pass through of the credit will only affect those persons who are shareholders of the Portfolio on a dividend record date in calendar year 2015. These shareholders will receive more detailed information along with their 2014 Form 1099-DIV. Foreign source income and foreign tax expense per outstanding share on June 30, 2015, are as follows:
| | | | | | | | |
Portfolio | | Foreign
Source
Income | | | Foreign
Tax
Expense | |
International Portfolio | | $ | 0.30 | | | $ | 0.02 | |
Institutional International Portfolio | | $ | 0.28 | | | $ | 0.02 | |
Emerging Markets Portfolio | | $ | 0.54 | | | $ | 0.07 | |
The Portfolios intend to designate the maximum amount allowable as taxed at a maximum rate of 15%. Complete information will be reported in conjunction with your 2015 Form 1099-DIV.
288
HC CAPITAL TRUST
Additional Information (continued) — June 30, 2015 (Unaudited)
D. Qualified Interest Income. For the fiscal year ending June 30, 2015, the following dividends paid by the Portfolios were designated as Qualified Interest Income that may be exempt from U.S. withholding tax on accounts of foreign investors.
| | | | |
Portfolio | | Qualified
Interest Income | |
Core Fixed Income Portfolio | | | 99.84% | |
Fixed Income Opportunity Portfolio | | | 92.67% | |
U.S. Government Fixed Income Portfolio | | | 100.00% | |
U.S. Corporate Fixed Income Portfolio | | | 99.39% | |
U.S. Mortgage/Asset Backed Fixed Income Portfolio | | | 99.95% | |
E. Long Term Capital Gains. The Portfolios declared long term distributions of realized gains qualifying for a maximum 15% capital gains tax rate for individuals as follows:
| | | | |
Portfolio | | Amount
(in thousands) | |
Value Equity Portfolio | | $ | 177 | |
Institutional Value Portfolio | | | 97,669 | |
Growth Equity Portfolio | | | 13,233 | |
Institutional Growth Portfolio | | | 83,131 | |
Institutional Small Cap-Mid Cap Portfolio | | | 18,814 | |
Real Estate Portfolio | | | 2,590 | |
International Equity Portfolio | | | 157,756 | |
Institutional International Portfolio | | | 236,375 | |
Emerging Markets Portfolio | | | 17,491 | |
Fixed Income Opportunity Portfolio | | | 10,450 | |
U.S. Corporate Fixed Income Portfolio | | | 140 | |
Short-Term Municipal Portfolio | | | 4 | |
Intermediate Municipal II Portfolio | | | 322 | |
F. Short Term Capital Gains. The Portfolios declared short term distributions of realized gains as follows:
| | | | |
Portfolio | | Amount
(in thousands) | |
Institutional Value Portfolio | | $ | 22,730 | |
Institutional Growth Portfolio | | | 10,710 | |
Institutional Small Cap-Mid Cap Portfolio | | | 233 | |
Real Estate Portfolio | | | 4,521 | |
International Equity Portfolio | | | 1,549 | |
Institutional International Portfolio | | | 31,772 | |
Emerging Markets Portfolio | | | 11,226 | |
Core Fixed Income Portfolio | | | 94 | |
Fixed Income Opportunity Portfolio | | | 8,084 | |
Inflation Protected Securities Portfolio | | | 1,236 | |
U.S. Corporate Fixed Income Portfolio | | | 2,163 | |
G. Tax Exempt Distributions. The Portfolios declared and paid tax exempt distributions for the fiscal year ended June 30, 2015, as follows:
| | | | |
Portfolio | | Amount
(in thousands) | |
Short-Term Municipal Portfolio | | $ | 268 | |
Intermediate Municipal Portfolio | | | 9,181 | |
Intermediate Municipal II Portfolio | | | 1,543 | |
289
HC CAPITAL TRUST
Additional Information (continued) — June 30, 2015 (Unaudited)
5. ACCESS TO QUARTERLY HOLDINGS
A complete schedule of each Portfolio’s portfolio holdings for the first and third fiscal quarter of each fiscal year is filed with the SEC on Form N-Q and is available on the SEC’s website at http://www.sec.gov. In addition, the schedules may be reviewed and copied at the SEC’s Public Reference Room in Washington D.C. Information on the operation of the Public Reference Room may be obtained by calling 1-800-SEC-0330.
6. ADDITIONAL PORTFOLIO HOLDINGS INFORMATION
The following tables reflect the percentage of the total investments of each Portfolio attributable to the indicated industry sector, type of security or geographic region, as appropriate for the indicated Portfolio.
Value Portfolio
| | | | |
Security Allocation | | Percentage
of Value | |
Consumer Discretionary | | | 10.5 | % |
Consumer Staples | | | 7.5 | % |
Energy | | | 10.9 | % |
Financials | | | 31.6 | % |
Health Care | | | 7.5 | % |
Industrials | | | 9.3 | % |
Information Technology | | | 11.0 | % |
Materials | | | 4.5 | % |
Telecommunication Services | | | 1.8 | % |
Utilities | | | 4.4 | % |
Other | | | 1.0 | % |
| | | | |
Total | | | 100.0 | % |
| | | | |
Institutional Value Portfolio
| | | | |
Security Allocation | | Percentage
of Value | |
Consumer Discretionary | | | 10.5 | % |
Consumer Staples | | | 7.5 | % |
Energy | | | 11.4 | % |
Financials | | | 30.7 | % |
Health Care | | | 7.4 | % |
Industrials | | | 9.3 | % |
Information Technology | | | 11.2 | % |
Materials | | | 4.2 | % |
Telecommunication Services | | | 1.8 | % |
Utilities | | | 4.4 | % |
Other | | | 1.6 | % |
| | | | |
Total | | | 100.0 | % |
| | | | |
Growth Portfolio
| | | | |
Security Allocation | | Percentage
of Value | |
Consumer Discretionary | | | 15.8 | % |
Consumer Staples | | | 11.7 | % |
Energy | | | 4.1 | % |
Financials | | | 16.7 | % |
Health Care | | | 15.9 | % |
Industrials | | | 4.4 | % |
Information Technology | | | 26.9 | % |
Materials | | | 3.5 | % |
Other | | | 1.0 | % |
| | | | |
Total | | | 100.0 | % |
| | | | |
Institutional Growth Portfolio
| | | | |
Security Allocation | | Percentage
of Value | |
Consumer Discretionary | | | 15.4 | % |
Consumer Staples | | | 11.9 | % |
Energy | | | 4.1 | % |
Financials | | | 16.4 | % |
Health Care | | | 16.2 | % |
Industrials | | | 4.8 | % |
Information Technology | | | 27.1 | % |
Materials | | | 3.2 | % |
Other | | | 0.9 | % |
| | | | |
Total | | | 100.0 | % |
| | | | |
Small Capitalization Portfolio
| | | | |
Security Allocation | | Percentage
of Value | |
Consumer Discretionary | | | 10.9 | % |
Consumer Staples | | | 1.2 | % |
Energy | | | 3.5 | % |
Financials | | | 23.7 | % |
Health Care | | | 13.5 | % |
Industrials | | | 13.6 | % |
Information Technology | | | 22.8 | % |
Materials | | | 5.1 | % |
Telecommunication Services | | | 0.9 | % |
Utilities | | | 1.3 | % |
Other | | | 3.5 | % |
| | | | |
Total | | | 100.0 | % |
| | | | |
290
HC CAPITAL TRUST
Additional Information (continued) — June 30, 2015 (Unaudited)
Institutional Small Capitalization Portfolio
| | | | |
Security Allocation | | Percentage
of Value | |
Consumer Discretionary | | | 10.9 | % |
Consumer Staples | | | 1.2 | % |
Energy | | | 3.2 | % |
Financials | | | 23.3 | % |
Health Care | | | 14.5 | % |
Industrials | | | 12.9 | % |
Information Technology | | | 22.5 | % |
Materials | | | 5.1 | % |
Telecommunication Services | | | 0.6 | % |
Utilities | | | 1.3 | % |
Other | | | 4.5 | % |
| | | | |
Total | | | 100.0 | % |
| | | | |
Real Estate Portfolio
| | | | |
Security Allocation | | Percentage
of Value | |
Consumer Discretionary | | | 5.4 | % |
Consumer Staples | | | 1.6 | % |
Financials | | | 91.9 | % |
Health Care | | | 1.0 | % |
Telecommunication Services | | | 0.1 | % |
Other | | | 0.0 | % |
| | | | |
Total | | | 100.0 | % |
| | | | |
Commodity Portfolio
| | | | |
Security Allocation | | Percentage
of Value | |
Consumer Discretionary | | | 0.0 | % |
Energy | | | 38.6 | % |
Financials | | | 4.4 | % |
Health Care | | | 0.3 | % |
Industrials | | | 1.4 | % |
Information Technology | | | 0.6 | % |
Materials | | | 25.1 | % |
Sovereign Bonds | | | 0.4 | % |
Telecommunication Services | | | 0.3 | % |
Other | | | 28.9 | % |
| | | | |
Total | | | 100.0 | % |
| | | | |
International Portfolio
| | | | |
Security Allocation | | Percentage
of Value | |
Consumer Discretionary | | | 13.8 | % |
Consumer Staples | | | 9.5 | % |
Energy | | | 8.1 | % |
Financials | | | 19.8 | % |
Health Care | | | 10.1 | % |
Industrials | | | 14.6 | % |
Information Technology | | | 5.7 | % |
Materials | | | 7.6 | % |
Telecommunication Services | | | 7.6 | % |
Utilities | | | 2.1 | % |
Other | | | 1.1 | % |
| | | | |
Total | | | 100.0 | % |
| | | | |
Institutional International Portfolio
| | | | |
Security Allocation | | Percentage
of Value | |
Consumer Discretionary | | | 13.4 | % |
Consumer Staples | | | 10.0 | % |
Energy | | | 7.6 | % |
Financials | | | 20.4 | % |
Health Care | | | 10.5 | % |
Industrials | | | 15.0 | % |
Information Technology | | | 5.4 | % |
Materials | | | 7.5 | % |
Telecommunication Services | | | 7.3 | % |
Utilities | | | 2.0 | % |
Other | | | 0.9 | % |
| | | | |
Total | | | 100.0 | % |
| | | | |
Emerging Markets Portfolio
| | | | |
Security Allocation | | Percentage
of Value | |
Consumer Discretionary | | | 9.5 | % |
Consumer Staples | | | 6.1 | % |
Energy | | | 9.8 | % |
Financials | | | 33.9 | % |
Health Care | | | 0.8 | % |
Industrials | | | 7.2 | % |
Information Technology | | | 12.2 | % |
Materials | | | 7.3 | % |
Telecommunication Services | | | 7.4 | % |
Utilities | | | 4.8 | % |
Other | | | 1.0 | % |
| | | | |
Total | | | 100.0 | % |
| | | | |
291
HC CAPITAL TRUST
Additional Information (continued) — June 30, 2015 (Unaudited)
Core Fixed Income Portfolio
| | | | |
Security Allocation | | Percentage
of Value | |
Airport | | | 0.4 | % |
Consumer Discretionary | | | 2.8 | % |
Consumer Staples | | | 2.4 | % |
Energy | | | 4.0 | % |
Financials | | | 18.3 | % |
Health Care | | | 2.0 | % |
Industrials | | | 1.8 | % |
Information Technology | | | 2.2 | % |
Materials | | | 2.7 | % |
Telecommunication Services | | | 2.4 | % |
Utilities | | | 1.9 | % |
Other | | | 59.1 | % |
| | | | |
Total | | | 100.0 | % |
| | | | |
Fixed Opportunity Portfolio
| | | | |
Security Allocation | | Percentage
of Value | |
Consumer Discretionary | | | 13.7 | % |
Consumer Staples | | | 2.7 | % |
Energy | | | 15.4 | % |
Financials | | | 22.7 | % |
Health Care | | | 6.1 | % |
Industrials | | | 7.6 | % |
Information Technology | | | 3.6 | % |
Materials | | | 7.2 | % |
Telecommunication Services | | | 8.6 | % |
Utilities | | | 2.8 | % |
Other | | | 9.6 | % |
| | | | |
Total | | | 100.0 | % |
| | | | |
U.S. Government Fixed Income Portfolio
| | | | |
Security Allocation | | Percentage
of Value | |
Treasury | | | 87.0 | % |
Agency | | | 7.6 | % |
Corporate | | | 0.1 | % |
Yankee Dollar | | | 0.1 | % |
Other | | | 5.2 | % |
| | | | |
Total | | | 100.0 | % |
| | | | |
Inflation Protected Securities Portfolio
| | | | |
Security Allocation | | Percentage
of Value | |
Treasury | | | 94.9 | % |
Other | | | 5.1 | % |
| | | | |
Total | | | 100.0 | % |
| | | | |
U.S. Corporate Fixed Income Portfolio
| | | | |
Security Allocation | | Percentage
of Value | |
Airport | | | 1.3 | % |
Consumer Discretionary | | | 8.2 | % |
Consumer Staples | | | 7.5 | % |
Energy | | | 12.3 | % |
Financials | | | 31.6 | % |
Health Care | | | 6.4 | % |
Industrials | | | 5.3 | % |
Information Technology | | | 6.0 | % |
Materials | | | 8.0 | % |
Telecommunication Services | | | 7.5 | % |
Utilities | | | 5.9 | % |
Other | | | 0.0 | % |
| | | | |
Total | | | 100.0 | % |
| | | | |
U.S. Mortgage/Asset Backed Fixed Income Portfolio
| | | | |
Security Allocation | | Percentage
of Value | |
Agency | | | 76.7 | % |
Mortgage | | | 5.3 | % |
Asset Backed Securities | | | 1.5 | % |
Yankee Dollar | | | 0.2 | % |
Other | | | 16.3 | % |
| | | | |
Total | | | 100.0 | % |
| | | | |
Short-Term Municipal Portfolio
| | | | |
Security Allocation | | Percentage
of Value | |
Financials | | | 0.2 | % |
General | | | 4.9 | % |
General Obligation | | | 35.2 | % |
Higher Education | | | 11.0 | % |
Medical | | | 4.0 | % |
Power | | | 2.7 | % |
School District | | | 4.0 | % |
Transportation | | | 22.2 | % |
Utilities | | | 8.1 | % |
Water | | | 7.7 | % |
Other | | | 0.0 | % |
| | | | |
Total | | | 100.0 | % |
| | | | |
292
HC CAPITAL TRUST
Additional Information (continued) — June 30, 2015 (Unaudited)
Intermediate Municipal Portfolio
| | | | |
Security Allocation | | Percentage
of Value | |
Airport | | | 5.8 | % |
Development | | | 1.2 | % |
Education | | | 4.5 | % |
Facilities | | | 2.2 | % |
Financials | | | 4.8 | % |
General | | | 17.9 | % |
General Obligation | | | 8.3 | % |
Higher Education | | | 4.7 | % |
Industrials | | | — | % |
Medical | | | 5.0 | % |
Multi-Family Housing | | | 0.2 | % |
Nursing Homes | | | 0.3 | % |
Pollution | | | 0.6 | % |
Power | | | 6.4 | % |
School District | | | 3.2 | % |
Single Family Housing | | | 0.1 | % |
Student Loan | | | 1.2 | % |
Tobacco Settlement | | | 3.1 | % |
Transportation | | | 11.6 | % |
Utilities | | | 5.8 | % |
Water | | | 10.8 | % |
Other | | | 2.3 | % |
| | | | |
Total | | | 100.0 | % |
| | | | |
Intermediate Municipal II Portfolio
| | | | |
Security Allocation | | Percentage
of Value | |
Education | | | 6.2 | % |
Facilities | | | 6.2 | % |
Financials | | | 5.0 | % |
General | | | 6.5 | % |
General Obligation | | | 40.0 | % |
Higher Education | | | 3.7 | % |
Pollution | | | 2.1 | % |
Power | | | 5.1 | % |
School District | | | 2.0 | % |
Transportation | | | 7.4 | % |
Utilities | | | 5.7 | % |
Water | | | 10.1 | % |
Other | | | 0.0 | % |
| | | | |
Total | | | 100.0 | % |
| | | | |
7. BOARD APPROVAL OF INVESTMENT ADVISORY CONTRACTS
The Trust’s investment adviser is HC Capital Solutions (the “Adviser”), an operating division of Hirtle Callaghan & Co. LLC, (“Hirtle Callaghan”). The Adviser provides overall investment management services with respect to the Trust and its Portfolios pursuant to the terms of two separate agreements with the Trust (“HC Contracts”). The Adviser is authorized under the HC Contracts to purchase and sell portfolio securities for the Portfolios. Day-to-day portfolio management services are generally provided to the respective Portfolios by one or more investment advisory organizations (each a “Specialist Manager”) pursuant to the terms of separate investment advisory agreements (each, a “Portfolio Management Agreement”). During the fiscal year ended June 30, 2015, the Trust offered twenty Portfolios, fourteen of which were managed by two or more Specialist Managers.1 Subsequently, a twenty-first Portfolio, The ESG Growth Portfolio (“ESG Portfolio”), commenced operations managed by four Specialist Managers. Each Specialist Manager is responsible for providing day-to-day portfolio management services for that portion of a Portfolio’s assets allocated to it by, and under the supervision of, the Adviser.
During the six-month period covered by this report, the Trust’s Board of Trustees (the “Board”):
| | • | | Approved Amended and Restated HC Contracts; |
| | • | | Approved continuation of certain Portfolio Management Agreements, as set forth below; |
| | • | | Approved New Portfolio Management Agreements with Parametric Portfolio Associates, LLC (“Parametric”) relating to twelve existing Portfolios and with Agincourt Capital Management, LLC (“Agincourt”) relating to two existing Portfolios; |
| | • | | Approved New Portfolio Management Agreements with each of Cadence Capital Management, LLC (“Cadence”), Mellon Capital Management Corporation (“Mellon Capital”), Parametric and Agincourt relating to the ESG Portfolio; |
293
HC CAPITAL TRUST
Additional Information (continued) — June 30, 2015 (Unaudited)
| | • | | Approved amendments to the Portfolio Management Agreements between the Trust and Sustainable Growth Advisors, LP (“SGA”) reducing the rate at which advisory fees payable to SGA are computed. |
| | • | | Approved amendments to the Portfolio Management Agreements between the Trust and Frontier Capital Management Company, LLC (“Frontier”) increasing the rate at which advisory fees payable to Frontier are computed. |
Approval of Amended and Restated HC Contracts. During the six-month period covered by this report, the Trust’s Board approved the HC Contracts in an amended and re-stated form. As approved, the HC Contracts reflected certain non-material changes designed to update references to the Adviser and the Trust, certain regulatory provisions and persons designated to receive notifications under the respective contracts, but are otherwise identical to the prior HC Contracts with respect to the respective parties’ rights and obligations, including fees, compliance obligations and standards of care. In approving the HC Contracts, the Board gave substantial weight to the fact that the Trust and the Portfolios are designed primarily to serve as asset allocation vehicles for, and are available exclusively to, clients of Hirtle Callaghan. Other factors considered by the Board in connection with its determination to approve the HC Contracts are summarized below.
With respect to the nature and quality of the Adviser’s services to the Trust, the Board concluded that the overall quality of the services provided by the Adviser merited approval of the HC Contracts. The Board found that the Adviser’s services, including the Adviser’s role in the selection of the Specialist Managers, continuing commitment to strategic planning, manager research and development and implementation of tax efficient strategies where appropriate were consistent with the expectations of the Trust’s shareholders. In reaching this determination, the Board also considered the services of the Trust’s executive officers, each of whom is an employee of Hirtle Callaghan, their oversight of the activities of the Trust’s administrator and other service providers, as well as the oversight of the Specialist Managers provided by the Adviser within the framework of its manager oversight programs. The Board also considered the Adviser’s efforts to control the costs of the Trust, including obtaining advisory fee concessions from various Specialist Managers.
With respect to the performance achieved by the Trust’s Portfolios, the Board viewed the overall performance of the respective Portfolios in the context of their use as vehicles through which the Adviser seeks to access specific asset classes within the framework of Hirtle Callaghan client accounts. In concluding that overall investment results achieved by the Portfolios reflect appropriate manager selection by the Adviser, the Board was informed with respect to publicly available information about the performance of peer funds but based its findings primarily on the specific facts and circumstances of the Trust. The Board concluded that the overall investment results achieved by the Portfolios reflect appropriate manager selection by the Adviser and that continuation of the relationship with the Adviser and approval of the HC Contracts were in the best interests of the Trust’s shareholders and consistent with shareholder expectations.
With respect to the fees paid to the Adviser under the HC Contracts, the Board considered the fact that Hirtle Callaghan’s standard client agreement relating to private clients includes a 0.05% “breakpoint” to the extent that a client’s assets are invested in the Trust. Although informed with respect to the financial position of the Adviser, as well as fees charged by peer funds, the Board did not consider such information as a material factor in its conclusions. Nor did the Board consider specific information with respect to the costs and expenses incurred by the Adviser in providing services to the Trust in light of the unique breakpoint feature embedded in Hirtle Callaghan’s standard client agreements. Given the structure of the Advisor’s fee schedule, the Board also concluded that there was little, if any, opportunity for economies of scale with respect to the level of the Adviser’s fee, which is fixed under the HC Contracts as an annual fee of 0.05% of the assets of the Portfolios to which each agreement relates. Based on the foregoing and other information relating to the structure and level of the Adviser’s fee provided to the Board, the Trustees concluded that the rate at which the Adviser is compensated for its services is reasonable.
Continuation of Certain Portfolio Management Agreements. The Portfolio Management Agreements (collectively, the “Continuing Agreements”) approved for continuance during the period are identified below, together with the Specialist Managers subject to review during the period.
294
HC CAPITAL TRUST
Additional Information (continued) — June 30, 2015 (Unaudited)
| | |
Specialist Manager | | Portfolios |
| Breckinridge Capital Advisors, Inc. | | The Short-Term Municipal Bond Portfolio |
| | The Intermediate Term Municipal Bond II Portfolio |
| |
| Fort Washington Investment Advisors, Inc. | | The Fixed Income Opportunity Portfolio |
| |
| Mellon Capital Management Corp. | | The Value Equity Portfolio The Institutional Value Equity Portfolio The Growth Equity Portfolio The Institutional Growth Equity Portfolio The Small Capitalization-Mid Capitalization Equity Portfolio The Institutional Small Capitalization-Mid Capitalization Equity Portfolio The Commodity Returns Strategy Portfolio The Real Estate Securities Portfolio The International Equity Portfolio The Institutional International Equity Portfolio The Emerging Markets Portfolio The Core Fixed Income Portfolio The Fixed Income Opportunity Portfolio The U.S. Government Fixed Income Securities Portfolio The Inflation Protected Securities Portfolio The U.S. Mortgage/Asset Backed Fixed Income Securities Portfolio The U.S. Corporate Fixed Income Securities Portfolio |
| |
| Standish Mellon Asset Management Company LLC | | The Intermediate Term Municipal Bond Portfolio |
| |
| AllianceBernstein, LP | | The Value Equity Portfolio The Institutional Value Equity Portfolio |
| |
| Jennison Associates LLC | | The Growth Equity Portfolio The Institutional Growth Equity Portfolio |
| |
| Pacific Investment Management Co., LLC | | The Institutional Value Equity Portfolio The Institutional Growth Equity Portfolio The Commodity Returns Strategy Portfolio |
| |
| Sustainable Growth Advisors, LP | | The Growth Equity Portfolio The Institutional Growth Equity Portfolio |
In its deliberations with respect to each of the Continuing Agreements, the Board recognized that, under each such agreement, a Specialist Manager is responsible only for day-to-day investment decisions with respect to that portion of a Portfolio’s assets allocated to it. The Board further recognized that Specialist Managers do not participate in the administration of any of the Portfolios or in the distribution of shares of any Portfolio and thus receive limited, if any, benefit from their association with the Trust other than the fee paid to them by the respective Portfolios for investment management services.
In approving the Continuing Agreements, the Board concluded that continuation of each of the Continuing Agreements was in the best interests of the Trust and consistent with the expectations of shareholders of the respective Portfolios. While the Board did not identify any particular factor as controlling, the Board gave substantial weight to the fact that the Trust is designed primarily to serve as a vehicle through which the Adviser implements asset allocation strategies on behalf of Hirtle Callaghan’s clients; and that shares of the respective Portfolios are generally available only to such clients. The Board also considered representations by the Adviser that the performance achieved by the relevant Specialist Managers was consistent with the Adviser’s expectations in the context of overall objectives, and multi-manager strategy, of each of the respective Portfolios. During the course of its deliberations, the Board was informed with respect to publicly available information assembled by a third-party service provider about the performance of peer funds managed by other investment advisory organizations. The Board did not specifically rely on such information but based its conclusions on the facts and circumstances of the Trust.
295
HC CAPITAL TRUST
Additional Information (continued) — June 30, 2015 (Unaudited)
In concluding that continuation of the Portfolio Management Agreements identified above was appropriate, the Board did not rely upon any single factor but gave considerable weight to the Adviser’s recommendations and its assessment of each Specialist Manager’s overall compliance profile and the success and future ability of each Specialist Manager in capturing the respective Portfolios’ desired asset classes. Based on the foregoing, the Board concluded that the performance of the Specialist Managers was satisfactory and that continuation of such contracts was in the best interest of shareholders of the respective Portfolios.
The Board also determined that the rate at which each of the Specialist Managers is compensated under the Continuing Agreements is reasonable. In reaching this conclusion, the Board had before it information about the impact of break-points, financial information about the Specialist Managers relating to factors such as profitability, comparable fees charged to other institutional clients and/or to peer funds for similar services and costs incurred by the Specialist Managers in providing services to the respective Portfolios. In considering this information, the Board gave substantial weight to information demonstrating that the rate at which these Specialist Managers are compensated was determined as a result of arms-length negotiations conducted by the officers of the Trust and the Adviser, including in several cases, negotiated fee waivers/reductions and scheduled breakpoints designed to recognize economies of scale where appropriate.
Approval of New Portfolio Management Agreements with Parametric. During the period, the Board approved new Portfolio Management Agreements (the “Parametric Agreements) between the Trust and Parametric relating to each of the Portfolios (collectively, the “Affected Portfolios”) listed below:
The Value Equity Portfolio
The Institutional Value Equity Portfolio
The Growth Equity Portfolio
The Institutional Growth Equity Portfolio
The Small Capitalization-Mid Capitalization Equity Portfolio
The Institutional Small Capitalization-Mid Capitalization Equity Portfolio
The Commodity Returns Strategy Portfolio
The Real Estate Securities Portfolio
The International Equity Portfolio
The Institutional International Equity Portfolio
The Emerging Markets Portfolio
The Fixed Income Opportunity Portfolio
The following is a summary of the factors considered by the Board in approving the Parametric Agreements.
In approving the Parametric Agreements, the Board received information from Parametric regarding its “liquidity” strategies (“Parametric Strategies”) and information from the Adviser regarding the Adviser’s belief that the Parametric Strategies would allow Portfolios to maintain a small portion of the assets of each Portfolio in cash in order to be able to meet redemption requests without disrupting the strategies being executed by each of the other Specialist Managers in implementing each Portfolio’s principal investment strategies, but while maintaining exposure to the appropriate asset class through the use of exchange-traded futures. With respect to the nature and quality of the services expected to be provided to the Affected Portfolios, the Board gave considerable weight to the Adviser’s recommendation as well as the Board’s familiarity with Parametric arising from the firm having provided portfolio management services, using a different strategy, to four of the Affected Portfolios since July, 2014. The Board also considered fact that Parametric would not participate in the administration or distribution of shares of the Portfolios and that, other than advisory fees payable under the terms of the Parametric Agreements, it was not expected that Parametric would benefit materially from its association with the Trust. In concluding that approval of the Parametric Agreements was in the best interests of the Affected Portfolios, the Board was informed with respect to publicly available information about the performance of other managers employing similar strategies but did not base its determination on results reported to have achieved by such managers.
With respect to the fee schedules pursuant to which Parametric would be compensated for its services, the Board was informed with respect to, among other relevant factors, comparative fee information, including information regarding both peer group fees and fees charged to the Portfolios by each of the other Specialist Managers then serving them, Parametric’s financial position and projected profitability as well as data regarding advisory fees paid by other funds with similar investment policies. The Board did not specifically rely upon such information, but gave substantial weight to the fact that
296
HC CAPITAL TRUST
Additional Information (continued) — June 30, 2015 (Unaudited)
the rate at which Parametric was to be compensated was determined as a result of arms-length negotiations conducted by the officers of the Trust and the Adviser. The Board determined that the proposed fee schedule was fair and reasonable. In making this determination, the Board recognized that the impact of the fee to be paid to Parametric on overall advisory fees would depend on the allocation of assets within the Affected Portfolios.
Approval of New Portfolio Management Agreements with Agincourt. During the period, the Board approved new Portfolio Management Agreements (the “Agincourt Agreements) between the Trust and Agincourt relating to The Core Fixed Income Portfolio and The U.S. Corporate Fixed Income Securities Portfolio. The following is a summary of the factors considered by the Board in approving the Agincourt Agreements.
In approving the Agincourt Agreements, the Board received information from Agincourt regarding its fixed income strategies (“Agincourt Strategies”) and information from the Adviser regarding the Adviser’s belief that the Agincourt Strategies would be effectively comparable to the strategies employed by the Portfolios’ previous Specialist Manager, but at less than half the cost. With respect to the nature and quality of the services expected to be provided to the Portfolios, the Board gave considerable weight to the Adviser’s recommendation as well as the Adviser’s familiarity with Agincourt arising from the Adviser having maintained a working relationship with Agincourt dating from 2003. The Board also considered fact that Agincourt would not participate in the administration or distribution of shares of the Portfolios and that, other than advisory fees payable under the terms of the Agincourt Agreements, it was not expected that Agincourt would benefit materially from its association with the Trust. In concluding that approval of the Agincourt Agreements was in the best interests of the Portfolios, the Board was informed with respect to publicly available information about the performance of other managers employing similar strategies but did not base its determination on results reported to have achieved by such managers. The Board also considered information provided to it by the Adviser and Agincourt with respect to the nature and quality of the services expected to be provided by Agincourt, its performance record in managing investment accounts similar to the Portfolios, its commitment to maintaining a consistent investment strategy, the size and depth of the organization and other factors.
With respect to the fee schedules pursuant to which Agincourt would be compensated for its services, the Board was informed with respect to, among other relevant factors, comparative fee information, including information regarding both peer group fees and fees charged to the Portfolios by the other Specialist Manager currently serving them and the fees previously charged by the Specialist Manager that Agincourt was replacing. The Board did not specifically rely upon such information, but gave substantial weight to the fact that the rate at which Agincourt was to be compensated was determined as a result of arms-length negotiations conducted by the officers of the Trust and the Adviser. The Board determined that the proposed fee schedule was fair and reasonable. In making this determination, the Board recognized that the impact of the fee to be paid to Agincourt on overall advisory fees would depend on the allocation of assets within the Portfolios.
Approval of New Portfolio Management Agreements Related to the ESG Portfolio. During the period, the Board approved new Portfolio Management Agreements (the “ESG Agreements”) between the Trust and each of Cadence, Mellon Capital, Parametric and Agincourt (the “ESG Managers”) relating to the newly formed ESG Growth Portfolio. The following is a summary of the factors considered by the Board in approving the ESG Agreements.
In approving the ESG Agreements, the Board received information from Cadence and Mellon Capital regarding their passive equity investing strategies, information from Parametric regarding its “liquidity strategies, information from Agincourt regarding its fixed income strategies and information from the Adviser regarding the Adviser’s belief that the ESG Managers’ strategies would provide an appropriate foundation upon which to build the new Portfolio. With respect to the nature and quality of the services expected to be provided to the Portfolios, the Board gave considerable weight to the Adviser’s recommendation as well as the Board’s familiarity with the ESG Managers, each of which served as a Specialist Manager to multiple other Portfolios of the Trust at the time it was approved with respect to the ESG Portfolio. The Board also considered fact that the ESG Managers would not participate in the administration or distribution of shares of the Portfolio and that, other than advisory fees payable under the terms of the ESG Agreements, it was not expected that the ESG Managers would benefit materially from their association with the Trust. In concluding that approval of the ESG Agreements was in the best interests of the Portfolio, the Board was informed with respect to publicly available information about the performance of other managers employing similar strategies but did not base its determination on results reported to have achieved by such managers. The Board also considered information provided to it by the Adviser and the ESG Managers with respect to the nature and quality of the services expected to be provided by the ESG Managers, their performance record in managing investment accounts similar to the Portfolio, their commitment to maintaining a consistent investment strategy, the size and depth of their respective organizations and other factors.
297
HC CAPITAL TRUST
Additional Information (continued) — June 30, 2015 (Unaudited)
With respect to the fee schedules pursuant to which the ESG Managers would be compensated for its services, the Board was informed with respect to, among other relevant factors, comparative fee information, including information regarding both peer group fees, fees charged by the ESG Managers to other Portfolios of the Trust for which they provide advisory services and the rationale supporting the differences in the various fee schedules relating to different asset classes to be included in the Portfolio. The Board did not specifically rely upon such information, but gave substantial weight to the fact that the rates at which the ESG Managers were to be compensated were determined as a result of arms-length negotiations conducted by the officers of the Trust and the Adviser. The Board determined that the proposed fee schedules were fair and reasonable. In making this determination, the Board recognized that the impact of the fee to be paid to each of the ESG Managers on overall advisory fees would depend on the allocation of assets within the Portfolio.
Approval of Amendments to the Portfolio Management Agreements with SGA. During the period, the Board also approved an amendment to each of the Portfolio Management Agreements with SGA, relating to the Growth Equity and Institutional Growth Equity Portfolios (the “Growth Portfolios”). In approving the amendments, which reduced the rate at which fees payable by the Growth Portfolios to SGA are computed, the Board reviewed information with respect to the nature of the services provided by SGA and the role of the organization in the context of the Growth Portfolios, as well the view of the Adviser to the effect that reduction of the advisory fee rate would not change or impair the nature or quality of services provided to the Growth Portfolios. Based on all of the information presented, the Board concluded that implementation of the amendments was in the best interests of shareholders of the Growth Portfolios.
Approval of Amendments to the Portfolio Management Agreements with Frontier. During the period, the Board also approved an amendment to each of the Portfolio Management Agreements with Frontier, relating to the Small Capitalization-Mid Capitalization Equity and Institutional Small Capitalization-Mid Capitalization Equity Portfolios (the “Small Cap Portfolios”). In approving the amendments, which increased the rate at which fees payable by the Portfolios to Frontier are computed at certain asset levels, the Board reviewed information with respect to the nature of the services provided by Frontier and the role of the organization in the context of the Small Cap Portfolios. The Board was also informed that Frontier had indicated to the Adviser that it was unwilling to accept more than $90 million in aggregate assets from the Small Cap Portfolios at its then-current fee level, citing the limited capacity of its small and mid capitalization strategies, and noting that the fee payable by the Small Cap Portfolios was the lowest fee applicable to any of its clients in these strategies. The Board considered the view of the Adviser that the Small Cap Portfolios could benefit from the ability to increase allocations of their respective assets to Frontier in the future, although neither Small Cap Portfolio had a present intention to do so, and the fact that the Small Cap Portfolios had combined assets of just under $90 million and the increased fee would only be applicable to assets in excess of $90 million. Based on all of the information presented, the Board concluded that implementation of the amendments was in the interests of shareholders of the Small Cap Portfolios.
OFFICERS AND AFFILIATED TRUSTEES. The table below sets forth certain information about each of the Trust’s Affiliated Trustees, as well as its executive officers.
| | | | | | | | | | |
NAME, ADDRESS, AND AGE | | POSITION(S) HELD WITH TRUST | | TERM OF OFFICE; TERM SERVED IN OFFICE | | PRINCIPAL OCCUPATION(S) DURING PAST 5 YEARS | | NUMBER OF PORTFOLIOS IN FUND COMPLEX OVERSEEN | | OTHER
DIRECTORSHIPS
HELD BY
TRUSTEE** |
Robert J. Zion* Five Tower Bridge, 300 Barr Harbor Drive, West Conshohocken, PA 19428 Born: 1961 | | Trustee; President | | Indefinite; Trustee since 4/30/07; President since 6/12/12 | | Mr. Zion is currently the Chief Operating Officer, Secretary and a Principal of Hirtle Callaghan & Co. LLC (“Hirtle Callaghan”), a registered investment company of the Adviser. He has been with Hirtle Callaghan for more than the past five years. | | 20 | | None |
| | | | | |
Colette L. Bergman Five Tower Bridge, 300 Barr Harbor Drive, West Conshohocken, PA 19428 Born: 1970 | | Vice President & Treasurer | | Indefinite; Since 6/12/12 | | Ms. Bergman is currently a Vice President of Hirtle Callaghan. She has been with Hirtle Callaghan for more than the past five years. | | 20 | | None |
298
HC CAPITAL TRUST
Additional Information (concluded) — June 30, 2015 (Unaudited)
| | | | | | | | | | |
NAME, ADDRESS, AND AGE | | POSITION(S) HELD WITH TRUST | | TERM OF OFFICE; TERM SERVED IN OFFICE | | PRINCIPAL OCCUPATION(S) DURING PAST 5 YEARS | | NUMBER OF PORTFOLIOS IN FUND COMPLEX OVERSEEN | | OTHER
DIRECTORSHIPS
HELD BY
TRUSTEE** |
| | | | | |
Guy Talarico Alaric Compliance Services, LLC 150 Broadway, Suite 302 New York, NY 10038 Born: 1955 | | Chief Compliance Officer | | Indefinite; Since 4/25/13 | | Mr. Talarico is the founder of Alaric Compliance Services LLC served as its President and Chief Executive Officer for more than the past five years. | | 20 | | NA |
| | | | | |
Curtis Barnes Citi Fund Services 3435 Stelzer Road Columbus, OH 43219 Born: 1953 | | Secretary | | Indefinite; Since 6/05/14 | | Mr. Barnes is a Senior Vice President and has been with Citi Fund Services Ohio, Inc. since June 1995. | | 20 | | N/A |
| * | Mr. Zion may be deemed to be an “interested person” of the Adviser as that term is defined by the 1940 Act, as a result of his past or present positions with the Adviser or its affiliates. |
| ** | The information in this column relates only to directorships in companies required to file certain reports with the SEC under the various federal securities laws. |
INDEPENDENT TRUSTEES. The following table sets forth certain information about the Independent Trustees.
| | | | | | | | | | |
NAME, ADDRESS, AND AGE | | POSITION(S) HELD WITH TRUST | | TERM OF OFFICE; TERM SERVED IN OFFICE | | PRINCIPAL OCCUPATION(S) DURING PAST 5 YEARS | | NUMBER OF PORTFOLIOS IN FUND COMPLEX OVERSEEN | | OTHER
DIRECTORSHIPS
HELD BY
TRUSTEE* |
Jarrett Burt Kling Five Tower Bridge, 300 Barr Harbor Drive, West Conshohocken, PA 19428 Born: 1943 | | Trustee | | Indefinite; Since 7/20/95 | | For more than the past five years Mr. Kling has been a managing director of CBRE Clarion Securities, LLC, a registered investment adviser. | | 20 | | None |
| | | | | |
Harvey G. Magarick Five Tower Bridge, 300 Barr Harbor Drive, West Conshohocken, PA 19428 Born: 1939 | | Trustee | | Indefinite; Since 7/01/04 | | Mr. Magarick is retired. Prior to June 3, 2004, he was a partner in the accounting firm of BDO Seidman, LLP. | | 20 | | Resource
Credit
Opportunity,
Inc. Resource Real
Estate
Innovation
Office REIT,
Inc. |
| | | | | |
R. Richard Williams Five Tower Bridge, 300 Barr Harbor Drive, West Conshohocken, PA 19428 Born: 1945 | | Trustee | | Indefinite; Since 7/15/99 | | Since 2000, Mr. Williams has been the owner of Seaboard Advisers (consulting services). | | 20 | | Franklin Square
Energy and
Power Fund |
| | | | | |
Richard W. Wortham, III Five Tower Bridge, 300 Barr Harbor Drive, West Conshohocken, PA 19428 Born: 1938 | | Trustee | | Indefinite; Since 7/20/95 | | Mr. Wortham is currently the Chairman/CEO of The Wortham Foundation and has been a Trustee for more than the past five years. | | 20 | | Oncor Electric
Delivery
Company LLC |
| * | The information in this column relates only to directorships in companies required to file certain reports with the SEC under the various federal securities laws. |
299
[THIS PAGE INTENTIONALLY LEFT BLANK]
HC CAPITAL TRUST
Trustees
JARRETT B. KLING
HARVEY G. MAGARICK
RICHARD W. WORTHAM III
R. RICHARD WILLIAMS
ROBERT J. ZION*
* “Interested Person” as that term is defined in the Investment Company Act of 1940
Investment Adviser
HC Capital Solutions
Five Tower Bridge
300 Barr Harbor Drive, Suite 500
West Conshohocken, PA 19428
Administrator
Citi Fund Services Ohio, Inc.
3435 Stelzer Road
Columbus, OH 43219
Distributor
Unified Financial Securities, Inc.
2960 North Meridian Street, Suite 300
Indianapolis, IN 46208-4715
Counsel
Stradley Ronon Stevens & Young, LLP
2005 Market Street, Suite 2600
Philadelphia, PA 19103-7018
McCarter & English, LLP
1735 Market Street, Suite 700
Philadelphia, PA 19103
Independent Registered Public Accounting Firm
PricewaterhouseCoopers LLP
41 South High Street, Suite 2500
Columbus, OH 43215
Custodian
State Street Bank and Trust Company
State Street Financial Center
1 Lincoln Street
Boston, MA 02111-2900
This report is for the information of the shareholders of HC Capital Trust. Its use in connection with any offering of the Trust’s shares is authorized only in case of a concurrent or prior delivery of the Trust’s current prospectus. The prospectus contains more complete information, including investment objectives, risks, fees and expenses and should be read carefully before investing or sending any money.
8/15
Item 2. Code of Ethics.
(a) The registrant has adopted a code of ethics that applies to the registrant’s principal executive officer, principal financial officer, principal accounting officer or controller, or persons performing similar functions. This code of ethics is included as an Exhibit.
(b) During the period covered by the report, with respect to the registrant’s code of ethics that applies to its principal executive officer, principal financial officer, principal accounting officer or controller, or persons performing similar functions; there have been no amendments to, nor any waivers granted from, a provision that relates to any element of the code of ethics definition enumerated in paragraph (b) of this Item 2.
Item 3. Audit Committee Financial Expert.
3(a)(1) The registrant’s board of directors has determined that the registrant has at least one audit committee financial expert serving on its audit committee.
3(a)(2) The audit committee financial expert is Harvey Magarick, who is “independent” for purposes of this Item 3 of Form N-CSR. Mr. Magarick was appointed to the board effective July 1, 2004 and was determined to be an audit committee financial expert on August 26, 2004.
Item 4. Principal Accountant Fees and Services.
For the fiscal years ended June 30, 2015 and June 30, 2014 the aggregate fees billed by PricewaterhouseCoopers LLP for professional services rendered for the audits of the financial statements, or services that are normally provided in connection with statutory and regulatory filings or engagements for the fiscal year for the Registrant are shown in the table below.
(a) Audit Fees,
| | | | |
2014 | | $ | 427,346 | |
2015 | | $ | 503,000 | |
Audit fees include amounts related to the audit of the Registrant’s annual financial statements and services normally provided by the accountant in connection with statutory and regulatory filings.
(b) Audit-Related Fees,
(c) Tax Fees,
| | | | |
2014 | | $ | 290,190 | |
2015 | | $ | 336,541 | |
For the fiscal year ended June 30, 2014, the aggregate tax fees billed for professional services rendered by PricewaterhouseCoopers LLP for tax compliance, tax advice, and tax planning were $290,190. Such tax services included the review of income and excise tax returns for the Registrant. For the fiscal year ended June 30, 2015, the aggregate tax fees billed for professional services rendered by PricewaterhouseCoopers LLP for tax compliance, tax advice, and tax planning were $336,541. Such tax services included the review of income and excise tax returns for the Registrant.
(d) All Other Fees,
(e)(1) - Except as permitted by Rule 2-01 (c)(7)(i)(c) of Regulation S-X, the HC Capital Trust Audit Committee must pre-approve all audit and non-audit services provided by the independent accountants relating to the operations or financial reporting of the Funds. Prior to the commencement of any audit or non-audit services to a Fund, the Audit Committee reviews the services to determine whether they are appropriate and permissible under applicable law.
(e)(2) - The following percentages of the services summarized in (b)-(d) above, were approved by the Audit Committee pursuant to Rule 2-01 (c)(i)(c) of Regulation S-X.
(f) Not applicable.
(g) - For the fiscal years ended June 30, 2015 and June 30, 2014 the Aggregate non-audit fees billed by PricewaterhouseCoopers LLP for services rendered to the Registrant and the Advisers and any entity controlling, controlled by, or under common control with the Advisers that provided ongoing services to the Registrant were $0 and $0 respectively.
(h) Not applicable
| Item 5. | Audit Committee of Listed Registrants. |
Not applicable.
| Item 6. | Schedule of Investments. |
(a) Not applicable.
(b) Not applicable.
(b) (1) Not applicable.
(b) (2) Not applicable.
(b) (3) Not applicable.
(b) (4) Not applicable.
(b) (5) Not applicable.
Item 7. Disclosure of Proxy Voting Policies and Procedures for Closed-End Management Investment Companies.
Not applicable.
Item 8. Portfolio Managers of Closed-End Management Investment Companies.
Not applicable.
Item 9. Purchases of Equity Securities by Closed-End Management Investment Company and Affiliated Purchasers.
Not applicable.
Item 10. Submission of Matters to a Vote of Security Holders.
Not applicable.
Item 11. Controls and Procedures.
(a) The registrant’s principal executive officer and principal financial officer have concluded, based on their evaluation of the registrant’s disclosure controls and procedures as conducted within 90 days of the filing date of this report, that these disclosure controls and procedures are adequately designed and are operating effectively to ensure that information required to be disclosed by the registrant on Form N-CSR is recorded, processed, summarized and reported within the time periods specified in the Securities and Exchange Commission’s rules and forms.
(b) There were no changes in the registrant’s internal control over financial reporting (as defined in Rule 30a-3(d) under the Act 17 CFR 270.30a-3(d)) that occurred during the second fiscal quarter of the period covered by this report that have materially affected or are reasonably likely to materially affect, the registrant’s internal control over financial reporting.
Item 12. Exhibits.
(a)(1) The code of ethics that is the subject of the disclosure required by Item 2 is attached hereto.
(a)(2) Certifications pursuant to Rule 30a-2(a) are attached hereto.
(a)(3) Not applicable.
(b) Certifications pursuant to Rule 30a-2(b) are furnished herewith.
SIGNATURES
Pursuant to the requirements of the Securities Exchange Act of 1934 and the Investment Company Act of 1940, the registrant has duly caused this report to be signed on its behalf by the undersigned, thereunto duly authorized.
| | | | |
| (Registrant) | | HC Capital Trust | | |
| | | | |
| | |
| By (Signature and Title)* | | /s/ Robert J. Zion | | |
| | Robert J. Zion, Principal Executive Officer | | |
Date: August 28, 2015
Pursuant to the requirements of the Securities Exchange Act of 1934 and the Investment Company Act of 1940, this report has been signed below by the following persons on behalf of the registrant and in the capacities and on the dates indicated.
| | | | |
| By (Signature and Title)* | | /s/ Colette L. Bergman | | |
| | Colette L. Bergman, Principal Financial Officer | | |
Date: August 28, 2015
| | | | |
| By (Signature and Title)* | | /s/ Robert J. Zion | | |
| | Robert J. Zion, Principal Executive Officer | | |
Date: August 28, 2015