UNITED STATES
SECURITIES AND EXCHANGE COMMISSION
Washington, D.C. 20549
FORM N-CSR
CERTIFIED SHAREHOLDER REPORT OF REGISTERED
MANAGEMENT INVESTMENT COMPANIES
Investment Company Act file number 811-08918
HC Capital Trust
(Exact name of Registrant as specified in charter)
Five Tower Bridge, 300 Barr Harbor Drive, 5th Floor, West Conshohocken, PA 19428
(Address of principal executive offices) (Zip code)
Citi Fund Services Ohio, Inc., 4400 Easton Commons, Suite 200, Columbus, OH 43219
(Name and address of agent for service)
Registrant’s telephone number, including area code: 800-242-9596
Date of fiscal year end: June 30
Date of reporting period: June 30, 2018
Item 1. Reports to Stockholders.

Annual Report
The Value Equity Portfolio
The Institutional Value Equity Portfolio
The Growth Equity Portfolio
The Institutional Growth Equity Portfolio
The Small Capitalization–Mid Capitalization Equity Portfolio
The Institutional Small Capitalization–Mid Capitalization Equity Portfolio
The Real Estate Securities Portfolio
The Commodity Returns Strategy Portfolio
The ESG Growth Portfolio
The Catholic SRI Growth Portfolio
The International Equity Portfolio
The Institutional International Equity Portfolio
The Emerging Markets Portfolio
The Core Fixed Income Portfolio
The Fixed Income Opportunity Portfolio
The U.S. Government Fixed Income Securities Portfolio
The Inflation Protected Securities Portfolio
The U.S. Corporate Fixed Income Securities Portfolio
The U.S. Mortgage/Asset Backed Fixed Income Securities Portfolio
The Short-Term Municipal Bond Portfolio
The Intermediate Term Municipal Bond Portfolio
The Intermediate Term Municipal Bond II Portfolio
June 30, 2018
June 30, 2018
We are pleased to present the June 30, 2018 Annual Report for the HC Capital Trust (the “Trust”).
The Trust is an open-end management investment company. As of June 30, 2018, the Trust consisted of twenty-two separate investment portfolios (the “Portfolios”). Day-to-day portfolio management services are provided to each of the Trust’s Portfolios by one or more independent money management organizations (“Specialist Managers”). Each Specialist Manager is subject to the supervision of HC Capital Solutions, an operating division of Hirtle Callaghan & Co., LLC, which serves as the Trust’s primary investment adviser and to the general oversight of the Trust’s Board of Trustees.
The Value Equity Portfolio, seeks total return by investing in a diversified portfolio of equity securities of large companies with relatively low price-earnings ratios and high dividend yields.
The Institutional Value Equity Portfolio, seeks total return by investing in a diversified portfolio of equity securities of large companies with relatively low price-earnings ratios and high dividend yields.
The Growth Equity Portfolio, seeks capital appreciation by investing in a diversified portfolio of equity securities of large and mid-capitalization companies with superior prospects for earnings growth.
The Institutional Growth Equity Portfolio, seeks capital appreciation by investing in a diversified portfolio of equity securities of large and mid-capitalization companies with superior prospects for earnings growth.
The Small Capitalization–Mid Capitalization Equity Portfolio, seeks long-term capital appreciation by investing in a diversified portfolio of equity securities of small and mid-capitalization companies.
The Institutional Small Capitalization–Mid Capitalization Equity Portfolio, seeks long-term capital appreciation by investing in a diversified portfolio of equity securities of small and mid-capitalization companies.
The Real Estate Securities Portfolio, seeks to provide a total return consisting of both capital appreciation and current income by managing securities issued by real-estate related companies.
The Commodity Returns Strategy Portfolio, presented as Consolidated, seeks capital appreciation by investing in a diversified portfolio of commodity-related instruments.
The ESG Growth Portfolio, seeks to maximize total return subject to emphasizing environmental, social and governance (“ESG”) focused investments.
The Catholic SRI Growth Portfolio, seeks to maximize total return integrating a range of social and moral concerns into its security selection process.
The International Equity Portfolio, seeks total return by investing in a diversified portfolio of equity securities of companies based in countries other than the United States of America.
The Institutional International Equity Portfolio, seeks total return by investing in a diversified portfolio of equity securities of companies based in countries other than the United States of America.
The Emerging Markets Portfolio, seeks total return, primarily through capital appreciation, by investing in a diversified portfolio of securities issued by companies domiciled, or doing a substantial portion of their business, in countries with a developing or emerging economy or securities market.
The Core Fixed Income Portfolio, seeks current income, consistent with the preservation of capital, by investing in a diversified portfolio of debt securities, including U.S. and non-U.S. government securities, corporate debt securities, and asset-backed issues.
The Fixed Income Opportunity Portfolio, seeks to achieve above-average total return by investing in high yield securities (commonly referred to as “junk bonds”).
The U.S. Government Fixed Income Securities Portfolio, seeks to provide a moderate and sustainable level of current income, consistent with the preservation of capital by investing primarily in a diversified portfolio of U.S. Treasury and government related fixed income securities.
The Inflation Protected Securities Portfolio, seeks to provide inflation protection and income consistent with investment in inflation-indexed securities.
The U.S. Corporate Fixed Income Securities Portfolio, seeks to provide a moderate and sustainable level of current income, consistent with the preservation of capital by investing primarily in a diversified portfolio of investment grade fixed income securities issued by U.S. corporations.
The U.S. Mortgage/Asset Backed Fixed Income Securities Portfolio, seeks to provide a moderate and sustainable level of current income, consistent with the preservation of capital by investing primarily in a diversified portfolio of publicly issued mortgage and asset backed securities.
The Short-Term Municipal Bond Portfolio, seeks current income exempt from Federal income tax, consistent with preservation of capital, by investing primarily in securities issued by municipalities and related securities.
The Intermediate Term Municipal Bond Portfolio, seeks current income, consistent with the preservation of capital, exempt from Federal income tax by investing in securities issued by municipalities and related entities.
The Intermediate Term Municipal Bond II Portfolio, seeks current income, consistent with the preservation of capital, exempt from Federal income tax by investing in securities issued by municipalities and related entities.
| | | | |
| HC CAPITAL TRUST | | | | Annual Report |
June 30, 2018
Table of Contents
Fiscal Year 2018 Summary
General Market
(Unaudited — June 30, 2018)
The Portfolios of the HC Capital Trust provide clients with diversified exposure to multiple asset classes (for both taxable and institutional investors). The Portfolios diversify, where appropriate, across multiple managers and strategies. The Portfolios enable the construction of custom asset allocation portfolios that best meet clients’ overall investment policies and objectives. Depending upon the objective, each Portfolio will generally seek to deliver performance that exceeds, or is in-line with, the benchmark for the Portfolio as well as a peer universe of mutual funds with similar investment strategies.
Financial markets experienced a dramatic upswing in the first part of the Fiscal Year as risk assets rose strongly (The MSCI All-Country World Index rose 18.86%). The rally stemmed from a recovery of economic growth prospects across the developed and emerging economies that coincided with improving expectations for corporate profits. The U.S. Economy benefitted from the Administration’s fiscal stimulus enacted in December 2017 as well as a continued measured normalization of policy rates. U.S. unemployment has fallen to 4.0% and inflation expectations accelerated modestly to about 2.00%. Given the achievement of those policy mandates, the U.S. Federal Reserve continued to raise interest rates from emergency levels that have persisted since the Global Financial Crisis in 2008. Despite structural and demographic challenges to growth, Europe and Japan have benefitted from a sustained monetary stimulus and cyclical upturns in manufacturing and trade. Because Non-U.S. Developed Markets have recovered so weakly to date, the cyclical recovery prospects are positive. The slack in the labor market, pent up consumer demand and delayed investment mean that those markets have a substantial gap versus potential as compared to the U.S. China’s policy of reining in non-bank credit tempered growth in China. Although concerns remain about the rapid expansion of credit and mal-investment, Chinese authorities have shown a willingness and ability to rationalize and reform while compensating for misallocation of credit. As world-wide growth improved, energy prices recovered. OPEC’s output restrictions and capital restraint among U.S. on-shore shale producers worked excess inventories downwards. West Texas Intermediate Crude spot price traded from approximately $45/barrel at the beginning of the fiscal year to $70/barrel by year-end. In the second half of the year, financial markets began to discount a moderately faster pace of Fed tightening. In addition, the U.S. Administration’s trade agenda dampened risk sentiment severely.
The improved outlook for economic activity and the Federal Reserve’s normalization of money market rates led to a continuing rise in U.S. short rates. However, market’s inflation expectations at longer horizons remain fixed, leading to a flattening of the U.S. Treasury yield curve. The U.S. 10-year Treasury yield barely rose from 2.30% to 2.86% while the U.S. 1-month maturity Treasury bill sold off from 0.85% to 2.30%. Corporate spreads widened modestly from 110 basis points to 120 basis points for U.S. Investment Grade Credit.
U.S. equities appreciated strongly over the twelve months ended June 30, 2018 (14.37% for the S&P 500). Growth outperformed Value stocks (Russell 1000® Growth Index 22.51% versus Russell 1000® Value Index 6.77%). International developed market equities rose 6.11% in local currency terms (MSCI EAFE) and 6.84% in U.S. Dollar terms. The MSCI Emerging Markets index led the developed markets, rising 8.2% in U.S. Dollar terms. The U.S. 10-year Treasury yield rose from 2.30% to 2.86% over the year. Rising yields led the US Investment Grade Bond market to a slight loss for the year (Bloomberg Barclays U.S. Aggregate Bond Index –0.40%).
1
Each of the Portfolios provided results consistent with their stated objectives over the fiscal year ended June 30, 2018. The performance of each Portfolio is listed in the table below and detailed summaries of the objectives, managers, and results are contained in the subsequent sections.
| | | | |
HC Capital Trust Portfolios | | Fiscal Year
2018 Return | |
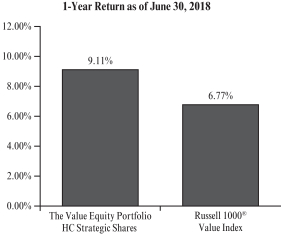
The Value Equity Portfolio | | | 9.11% | (a) |
Russell 1000® Value Index1 | | | 6.77% | |
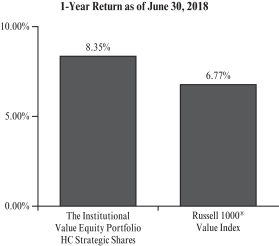
The Institutional Value Equity Portfolio | | | 8.35% | (a) |
Russell 1000® Value Index1 | | | 6.77% | |
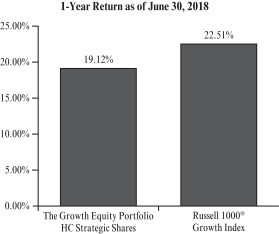
The Growth Equity Portfolio | | | 19.12% | (a) |
Russell 1000® Growth Index1 | | | 22.51% | |
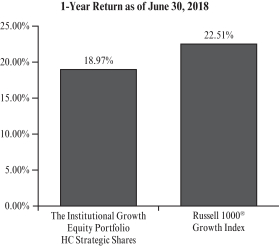
The Institutional Growth Equity Portfolio | | | 18.97% | (a) |
Russell 1000® Growth Index1 | | | 22.51% | |
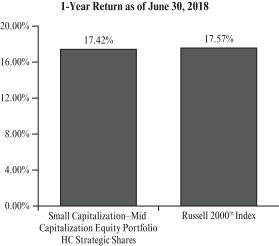
The Small Capitalization–Mid Capitalization Equity Portfolio | | | 17.42% | (a) |
Russell 2000® Index1 | | | 17.57% | |
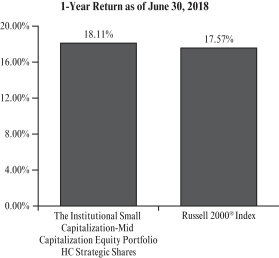
The Institutional Small Capitalization–Mid Capitalization Equity Portfolio | | | 18.11% | (a) |
Russell 2000® Index1 | | | 17.57% | |
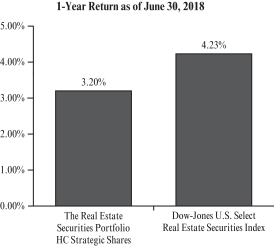
The Real Estate Securities Portfolio | | | 3.20% | |
Dow-Jones U.S. Select Real Estate Securities Index2 | | | 4.23% | |
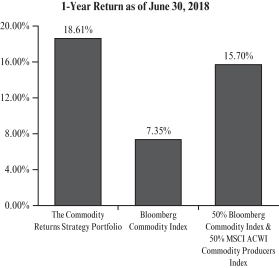
The Commodity Returns Strategy Portfolio | | | 18.61% | (a) |
Bloomberg Commodity Index3 | | | 7.35% | |
HC Commodities Benchmark4 | | | 15.70% | |
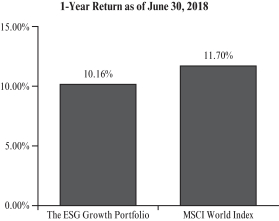
The ESG Growth Portfolio | | | 10.16% | (a) |
MSCI World Index5 | | | 11.70% | |
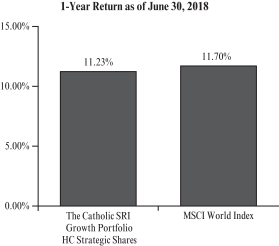
The Catholic SRI Growth Portfolio | | | 11.23% | (a) |
MSCI World Index5 | | | 11.70% | |
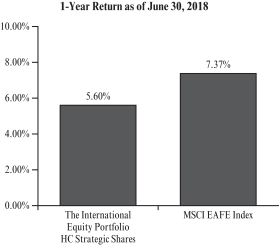
The International Equity Portfolio | | | 5.60% | (a) |
MSCI EAFE Index6 | | | 7.37% | |
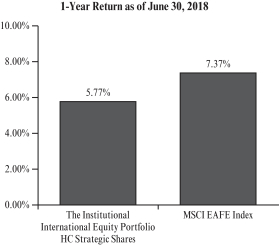
The Institutional International Equity Portfolio | | | 5.77% | (a) |
MSCI EAFE Index6 | | | 7.37% | |
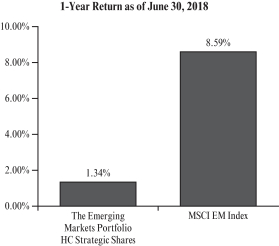
The Emerging Markets Portfolio | | | 1.34% | (a) |
MSCI EM Index7 | | | 8.59% | |
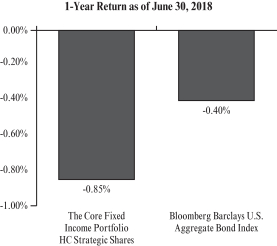
The Core Fixed Income Portfolio | | | -0.85% | (a) |
Bloomberg Barclays U.S. Aggregate Bond Index8 | | | -0.40% | |
The Fixed Income Opportunity Portfolio | | | 4.06% | (a) |
Bloomberg Barclays U.S. High Yield Ba/B 2% Issuer Capped Index9 | | | 1.80% | |
The U.S. Government Fixed Income Securities Portfolio | | | -0.79% | |
Bloomberg Barclays U.S. Government Bond Index10 | | | -0.63% | |
The Inflation Protected Securities Portfolio | | | 1.83% | (a) |
Bloomberg Barclays U.S. Treasury Inflation Protected Securities Index11 | | | 2.11% | |
The U.S. Corporate Fixed Income Securities Portfolio | | | -1.21% | |
Bloomberg Barclays U.S. Corporate Index12 | | | -0.83% | |
The U.S. Mortgage/Asset Backed Fixed Income Securities Portfolio | | | -0.20% | |
Bloomberg Barclays U.S. Securitized Index13 | | | 0.13% | |
The Short-Term Municipal Bond Portfolio | | | 0.34% | |
BofA Merrill Lynch 1-3 Year Municipal Index14 | | | 0.72% | |
The Intermediate Term Municipal Bond Portfolio | | | 0.13% | (a) |
Bloomberg Barclays 3-15 Year Blend Muni Index15 | | | 1.02% | |
The Intermediate Term Municipal Bond II Portfolio | | | 0.07% | (a) |
Bloomberg Barclays 5-Year General Obligation Muni Index16 | | | 0.18% | |
In reviewing the table above and the remainder of this report, note that past performance does not guarantee future results. The remainder of this report contains more specific details about the performance, strategy and managers in each of the portfolios.
| (a) | The return shown is that of HC Strategic Shares and has not been adjusted to reflect HC Advisors Shares expenses, which may be higher. |
2
| 1 | Each of the Russell indices is a market cap-weighted index of common stocks domiciled in the U.S. Unlike the S&P 500 Stock Index however, the basket of securities included in the various Russell indices is reconstituted each year. The Russell 3000® Index is constructed by ranking U.S. common stocks from largest to smallest market capitalization, and including in the index the top 3,000 stocks. The largest 1,000 stocks become the Russell 1000® Index and the next 2,000 stocks are included in the Russell 2000® Index. The Russell 1000® Growth Index is designed to measure the performance of those companies included in the Russell 1000 Index that have relatively higher price-to-book ratios and higher forecasted growth values. The Russell 1000 Value® Index is designed to measure the performance of those companies included in the Russell 1000® Index that have relatively lower price-to-book ratios and lower forecasted growth values. |
| 2 | The Dow-Jones U.S. Select Real Estate Securities Index is a broad measure of the performance of publicly traded global real estate securities, such as Real Estate Investment Trusts (“REITs”) and Real Estate Operating Companies (“REOCs”). The index is capitalization-weighted. The global index is an expansion of the original U.S. index, developed in 1991. |
| 3 | The Bloomberg Commodity Index is a broadly diversified index that allows investors to track commodity futures through a single, simple measure. The index is designed to minimize concentration in one commodity or sector. It currently includes 22 commodity futures in six groups. No one commodity can comprise less than 2% or more than 15% of the index, and no group can represent more than 33% of the index (as of the annual re-weightings of the components). |
| 4 | The HC Commodities Benchmark is comprised 50% of the Bloomberg Commodity Index and 50% of the MSCI ACWI Commodity Producers Index. The MSCI ACWI Commodity Producers Index captures the global opportunity set of commodity produces in the energy, metal and agricultural sectors. Constituents are selected from the equity universe of MSCI ACWI, the parent index, which covers mid and large cap securities across 24 Developed Markets (DM) and 21 Emerging Markets (EM) countries. All index constituents are categorized in one of twelve sub industries according to the Global Industry Classification Standard (GICS), including: integrated oil & gas, oil & gas exploration & production, gold, steel, aluminum, precious metals & minerals, agricultural products, paper products, and forest products. |
| 5 | The MSCI World Index is a broad global equity benchmark that represents lard and mid-cap equity performance across 23 developed markets countries. It covers approximately 85% of the free float-adjusted market capitalization in each country and does not offer exposure to emerging markets. As of June 30, 2018, the MSCI World Index consisted of the following 23 development markets: Australia, Austria, Belgium, Canada, Denmark, Finland, France, Germany, Hong Kong, Ireland, Israel, Italy, Japan, the Netherlands, New Zealand, Norway, Portugal, Singapore, Spain, Sweden, Switzerland, the United Kingdom and the United States. |
| 6 | The Morgan Stanley Capital International Europe, Australasia, and Far East Index (“MSCI EAFE Index”) is an unmanaged, free float-adjusted market capitalization index that is designed to measure the equity market performance of developed markets, excluding Canada and the United States. As of June 2018, the MSCI EAFE Index consisted of the following 21 developed market country indices: Australia, Austria, Belgium, Denmark, Finland, France, Germany, Hong Kong, Ireland, Israel, Italy, Japan, the Netherlands, New Zealand, Norway, Portugal, Singapore, Spain, Sweden, Switzerland and the United Kingdom. |
| 7 | The MSCI Emerging Markets Index (“MSCI EM Index”) is an unmanaged free float-adjusted market capitalization index that is designed to measure equity market performance of emerging markets. As of June 30, 2018, the MSCI EM Index consisted of the following 24 emerging market country indices: Brazil, Chile, China, Colombia, Czech Republic, Egypt, Greece, Hungary, India, Indonesia, Korea, Malaysia, Mexico, Pakistan, Peru, Philippines, Poland, Qatar, Russia, South Africa, Taiwan, Thailand, Turkey and United Arab Emirates. |
| 8 | The Bloomberg Barclays U.S. Aggregate Bond Index is an unmanaged index that includes more than 5,000 taxable government, investment-grade corporate and mortgage backed securities. |
| 9 | The Bloomberg Barclays U.S. High Yield Ba/B 2% Issuer Capped Index is an unmanaged index designed to mirror the investable universe of the U.S. dollar denominated high yield debt market. |
| 10 | The Bloomberg Barclays U.S. Government Index is a broad-based index that represents the general performance of U.S. Treasury and U.S. Government agency and debt securities. |
| 11 | The Bloomberg Barclays U.S. Treasury Inflation Protected Securities Index consists of Inflation-Protection securities issued by the U.S. Treasury. |
| 12 | The Bloomberg Barclays U.S. Corporate Index is an unmanaged index that covers USD-denominated, investment-grade, fixed-rate and taxable securities sold by industrial, utility and financial issuers. It includes publicly issued U.S. corporate and foreign debentures and secured notes that meet specified maturity, liquidity and quality requirements. |
| 13 | The Bloomberg Barclays U.S. Securitized Index is an unmanaged index that tracks the performance of mortgage-backed pass-through securities issued by Ginnie Mae, Fannie Mae and Freddie Mac, investment-grade bonds and asset-backed securities. |
| 14 | The Bank of America (“BofA”) Merrill Lynch 1-3 Year Municipal Index is an equal-weighted index that tracks the total return performance of the domestic U.S. municipal market. The index consists of investment-grade, publicly traded, fixed-rate and coupon bearing municipal securities with a maturity of one to three years. |
| 15 | The Bloomberg Barclays 3-15 Year Blend Muni Index is an index composed of tax-exempt bonds with maturities ranging between 2 and 17 years. |
| 16 | The Bloomberg Barclays 5-Year General Obligations Muni Index is an unmanaged index generally representative of investment grade fixed rate debt obligations issued by state and local government entities, with maturities of no more than six years. |
3
The Value Equity Portfolio
The Institutional Value Equity Portfolio
(Unaudited)
The Value Equity Portfolio, which was managed during the period by AllianceBernstein, L.P. (“AllianceBernstein”), Cadence Capital Management, LLC (“Cadence”), BNY Mellon Asset Management North America Corporation (“BNY Mellon AMNA-Mellon”) (formerly Mellon Capital Management Corporation) and Parametric Portfolio Associates, LLC (“Parametric”) returned 9.11% for the fiscal year compared to 6.77% for the Russell 1000® Value Index1 and 8.33% for the average manager in the Lipper2 universe of Large Cap Value Funds.
The Institutional Value Equity Portfolio, which was managed during the period by AllianceBernstein, Cadence, BNY Mellon AMNA-Mellon and Parametric returned 8.35% for the fiscal year compared to 6.77% for the Russell 1000®1 Value Index and 8.33% for the average manager in the Lipper2 universe of Large Cap Value Funds.3
The Portfolios outperformed both their benchmark and their peer group over the period. The Portfolios benefited from their allocation to traditional value and yield oriented strategies employed by Cadence. The traditional value strategy tends to have higher beta relative to benchmark and tends to select stocks with price/book, price/earnings, and price/cash flow measures at a substantial discount to the overall market. The yield oriented strategy offers some relative balance sheet quality and high dividend yields.
The Portfolios’ cash positions detracted from performance as markets rose through the fiscal year. The Portfolios’ cash positions serve two purposes. First, they are intended to provide protection in the event of a market correction. Second, they allow the Portfolios to take overweight positions in more volatile strategies without increasing the Portfolios’ overall sensitivity to the market, or beta.
The Trust terminated AllianceBernstein during the second half of the fiscal year. The decision to terminate a long-standing relationship with a manager involves numerous qualitative assessments and quantitative analytics. After going through a process that involved multiple viewpoints from the Adviser’s entire investment strategy group over a period of six months and deliberating over the a number of options which involved consideration of several alternative courses and their likely returns, the Adviser concluded that the best course of action was to recommend that the Trust’s Board of Trustees terminate AllianceBernstein.
Both Portfolios are diversified across multiple managers and strategies to ensure proper portfolio diversification, with the goal of providing superior long-term returns in as stable and consistent a manner as possible. As a result, it is expected that some managers and styles will be leading at times, while others are lagging and vice versa. The Portfolios expect to capitalize on this cyclicality of manager styles by reducing exposure to investment managers whose strategy and style realize exceptional excess returns and allocating to good long-term managers whose investment strategy and style have been out of favor in the short-term.
| 1 | The Russell 1000® Value Index measures the performance of those companies included in the Russell 1000® Stock Index with lower price-to-book ratios and lower forecasted growth rates. This index is unmanaged, thus the index results do not reflect the impact of expenses associated with any investment in securities, such as brokerage commission or other transaction costs. Benchmark performance is shown for comparison purposes only, as it is not possible to invest directly in a securities index. |
| 2 | Lipper, Inc. is an independent statistical monitoring organization that compiles performance on mutual funds and further categorizes them by investment objective. |
| 3 | During the fiscal year, Pacific Investment Management Company, LLC was also under contract to manage the Institutional Portfolio but did not have assets allocated to it. |
4
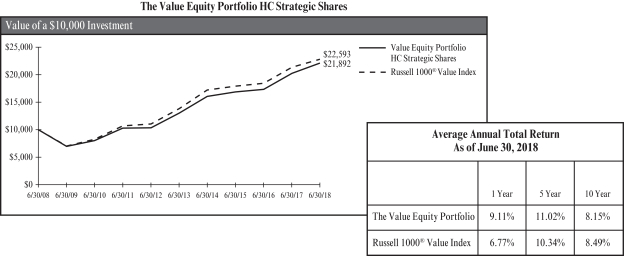
The chart represents historical performance of a hypothetical investment of $10,000 in The Value Equity Portfolio for the 10-year period ended 6/30/18, and represents the reinvestment of dividends and capital gains in the Portfolio.
Past performance does not guarantee future results. The performance data quoted represents past performance and current returns may be lower or higher. The investment return and principal value will fluctuate so that an investor’s shares, when redeemed, may be worth more or less than the original cost. To obtain performance information current to the most recent month end, please call (800) 242-9596.
The Portfolio’s performance above is compared to the Russell 1000® Value Index. The index is unmanaged and does not reflect the deduction of fees associated with a mutual fund, such as investment management and fund accounting fees, or the deduction of taxes. An investor cannot invest directly in an index. The performance of The Value Equity Portfolio reflects the deduction of fees for these value-added services, but does not reflect the deduction of taxes that a shareholder would pay on the Portfolio’s distributions or redemptions of the Portfolio’s shares.
Expense Ratio
HC Strategic Shares 0.23%
HC Advisors Shares 0.48%1
| 1 | HC Advisors Shares include Distribution Plan fees of 0.25% which are voluntarily waived by the Adviser. Such waiver is not reflected in the expense ratio shown. |
This information is included in the most current prospectus available to current and prospective shareholders of the Portfolio. Additional information pertaining to the June 30, 2018, expense ratios can be found in the financial highlights.
5
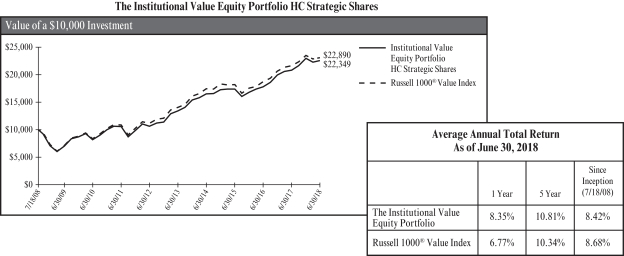
The chart represents historical performance of a hypothetical investment of $10,000 in The Institutional Value Equity Portfolio from 7/18/08 to 6/30/18, and represents the reinvestment of dividends and capital gains in the Portfolio.
Past performance does not guarantee future results. The performance data quoted represents past performance and current returns may be lower or higher. The investment return and principal value will fluctuate so that an investor’s shares, when redeemed, may be worth more or less than the original cost. To obtain performance information current to the most recent month end, please call (800) 242-9596.
The Portfolio’s performance above is compared to the Russell 1000® Value Index. The index is unmanaged and does not reflect the deduction of fees associated with a mutual fund, such as investment management and fund accounting fees, or the deduction of taxes. An investor cannot invest directly in an index. The performance of The Institutional Value Equity Portfolio reflects the deduction of fees for these value-added services, but does not reflect the deduction of taxes that a shareholder would pay on the Portfolio’s distributions or redemptions of the Portfolio’s shares.
Expense Ratio
HC Strategic Shares 0.32%
HC Advisors Shares 0.57%1
| 1 | HC Advisors Shares include Distribution Plan fees of 0.25% which are voluntarily waived by the Adviser. Such waiver is not reflected in the expense ratio shown. |
This information is included in the most current prospectus available to current and prospective shareholders of the Portfolio. Additional information pertaining to the June 30, 2018, expense ratios can be found in the financial highlights.
6
The Growth Equity Portfolio
The Institutional Growth Equity Portfolio
(Unaudited)
The Growth Equity Portfolio, which was managed during the period by Jennison Associates, LLC (“Jennison”), BNY Mellon Asset Management North America Corporation (“BNY Mellon AMNA-Mellon”) (formerly Mellon Capital Management Corporation), Parametric Portfolio Associates, LLC (“Parametric”) and Sustainable Growth Advisers, LP (“SGA”) returned 19.12% for the fiscal year compared to 22.51% for the Russell 1000® Growth Index1 and 22.38% for the average manager in the Lipper2 universe of Large Cap Growth Funds.3
The Institutional Growth Equity Portfolio, which was managed during the period by Jennison, BNY Mellon AMNA-Mellon, Parametric and SGA returned 18.97% for the fiscal year compared to 22.51% for the Russell 1000® Growth Index1 and 22.38% for the average manager in the Lipper2 universe of Large Cap Growth Funds.3
The Portfolios underperformed their benchmark and peer group because of higher allocations to quality growth style strategies. Quality growth managers favor companies with quality balance sheets and high growth potential which are also reasonably priced. The resulting portfolio includes relatively large companies with dominant market positions and, frequently, multinational exposure. Over the period earnings momentum-oriented stocks posted stronger performance as investors rewarded names that delivered above average earnings growth.
The Trust terminated SGA during the second half of the fiscal year. The decision to terminate a long-standing relationship with a manager involves numerous qualitative assessments and quantitative analytics. After going through a process that involved multiple viewpoints from the Adviser’s entire investment strategy group over a period of six months and deliberating over the a number of options which involved consideration of several alternative courses and their likely returns, the Adviser concluded that the best course of action was to recommend that the Trust’s Board of Trustees terminate SGA.
Both Portfolios are diversified across multiple managers and strategies to ensure proper portfolio diversification, with the goal of providing superior long-term returns in as stable and consistent a manner as possible. As a result, it is expected that some managers and styles will be leading at times, while others are lagging and vice versa. The Portfolios expect to capitalize on this cyclicality of manager styles by reducing exposure to investment managers whose strategy and style realize extraordinary excess returns and allocating to good long-term managers whose investment strategy and style have been out of favor in the short-term.
| 1 | The Russell 1000® Growth Index measures the performance of those companies included in the Russell 1000® Index with higher price-to-book ratios and higher forecasted growth rates. This index is unmanaged, thus the index results do not reflect the impact of expenses associated with any investment in securities, such as brokerage commission or other transaction costs. Benchmark performance is shown for comparison purposes only, as it is not possible to invest directly in a securities index. |
| 2 | Lipper, Inc. is an independent statistical monitoring organization that compiles performance on mutual funds and further categorizes them by investment objective. |
| 3 | During the fiscal year, Cadence Capital Management, LLC was also under contract to manage the Portfolios but did not have assets allocated to it. Pacific Investment Management Company, LLC was also under contract to manage the Institutional Value Portfolio but did not have assets allocated to it. |
7
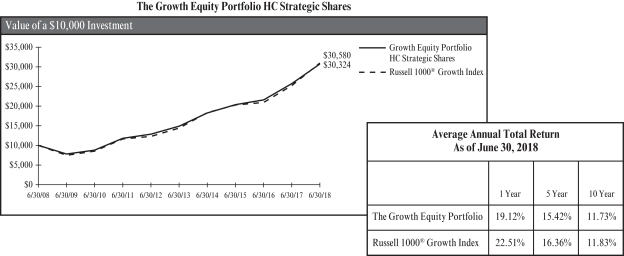
The chart represents historical performance of a hypothetical investment of $10,000 in The Growth Equity Portfolio for the 10-year period ended 6/30/18, and represents the reinvestment of dividends and capital gains in the Portfolio.
Past performance does not guarantee future results. The performance data quoted represents past performance and current returns may be lower or higher. The investment return and principal value will fluctuate so that an investor’s shares, when redeemed, may be worth more or less than the original cost. To obtain performance information current to the most recent month end, please call (800) 242-9596.
The Portfolio’s performance above is compared to the Russell 1000® Growth Index. The index is unmanaged and does not reflect the deduction of fees associated with a mutual fund, such as investment management and fund accounting fees, or the deduction of taxes. An investor cannot invest directly in an index. The performance of The Growth Equity Portfolio reflects the deduction of fees for these value-added services, but does not reflect the deduction of taxes that a shareholder would pay on the Portfolio’s distributions or redemptions of the Portfolio’s shares.
Expense Ratio
HC Strategic Shares 0.28%
HC Advisors Shares 0.53%1
| 1 | HC Advisors Shares include Distribution Plan fees of 0.25% which are voluntarily waived by the Adviser. Such waiver is not reflected in the expense ratio shown. |
This information is included in the most current prospectus available to current and prospective shareholders of the Portfolio. Additional information pertaining to the June 30, 2018, expense ratios can be found in the financial highlights.
8
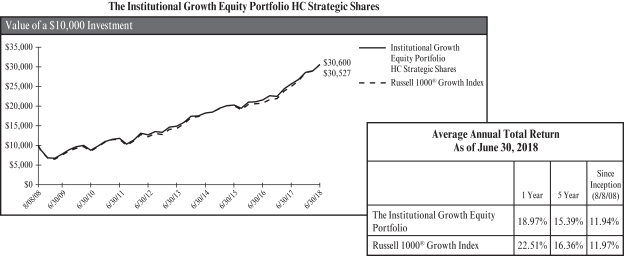
The chart represents historical performance of a hypothetical investment of $10,000 in The Institutional Growth Equity Portfolio from 8/8/08 to 6/30/18, and represents the reinvestment of dividends and capital gains in the Portfolio.
Past performance does not guarantee future results. The performance data quoted represents past performance and current returns may be lower or higher. The investment return and principal value will fluctuate so that an investor’s shares, when redeemed, may be worth more or less than the original cost. To obtain performance information current to the most recent month end, please call (800) 242-9596.
The Portfolio’s performance above is compared to the Russell 1000® Growth Index. The index is unmanaged and does not reflect the deduction of fees associated with a mutual fund, such as investment management and fund accounting fees, or the deduction of taxes. An investor cannot invest directly in an index. The performance of The Institutional Growth Equity Portfolio reflects the deduction of fees for these value-added services, but does not reflect the deduction of taxes that a shareholder would pay on the Portfolio’s distributions or redemptions of the Portfolio’s shares.
Expense Ratio
HC Strategic Shares 0.32%
HC Advisors Shares 0.57%1
| 1 | HC Advisors Shares include Distribution Plan fees of 0.25% which are voluntarily waived by the Adviser. Such waiver is not reflected in the expense ratio shown. |
This information is included in the most current prospectus available to current and prospective shareholders of the Portfolio. Additional information pertaining to the June 30, 2018, expense ratios can be found in the financial highlights.
9
The Small Capitalization–Mid Capitalization Equity Portfolio
The Institutional Small Capitalization–Mid Capitalization Equity Portfolio
(Unaudited)
The Small Capitalization–Mid Capitalization Equity Portfolio (the “Portfolio”), which was managed during the period by Advisory Research, Inc. (“ARI”), Ariel Investments, LLC (“Ariel”), Frontier Capital Management Company, LLC (“Frontier”), BNY Mellon Asset Management North America Corporation (“BNY Mellon AMNA-Mellon”) (formerly Mellon Capital Management Corporation), Parametric Portfolio Associates, LLC (“Parametric”), Pzena Investment Management, LLC (“Pzena”) and RMB Capital Management, LLC (“RMB”), returned 17.42% for the period compared to 17.57% return for the Russell 2000®1 Index and 13.99% for the average manager in the Lipper2 universe of Small Cap Core Funds.3
The Portfolio outperformed its peer group but slightly underperformed the benchmark for the period. The Portfolio was hampered by allocations to (1) a Growth at a Reasonable Price or “GARP” style managed by Frontier, and (2) a deep value micro-cap strategy managed by Ariel. The Portfolio benefited from a high growth, momentum-oriented portfolio managed by ARI.
The Institutional Small Capitalization–Mid Capitalization Equity Portfolio (the “Institutional Portfolio”), which was managed during the period by ARI, Frontier, BNY Mellon AMNA-Mellon, Parametric, Pzena and RMB returned 18.11% for the period compared to a 17.57% return for the Russell 2000®1 Index and 13.99% for the average manager in the Lipper2 universe of Small Cap Core Funds.3
The Institutional Portfolio outperformed both its peer group and the benchmark for the period. The Institutional Portfolio benefited from allocations to a high growth, momentum-oriented portfolio managed by ARI.
The performance difference between the Institutional Portfolio and the Portfolio was primarily driven by the inclusion of Ariels’s deep value style in the Small Capitalization-Mid Capitalization Equity Portfolio. Ariel uses the market’s short-term focus to uncover mispriced companies whose true value will be realized over time. Small capitalization equities outperformed their large capitalization cousins in the U.S.
The Trust terminated RMB during the second half of the fiscal year. The decision to terminate a long-standing relationship with a manager involves numerous qualitative assessments and quantitative analytics. After going through a process that involved multiple viewpoints from the Adviser’s entire investment strategy group over a period of six months and deliberating over the a number of options which involved consideration of several alternative courses and their likely returns, the Adviser concluded that the best course of action was to recommend that the Trust’s Board of Trustees terminate RMB.
Both the Portfolio and Institutional Portfolio (collectively the “Portfolios”) are diversified across multiple managers and strategies to ensure proper portfolio diversification, with the goal of providing superior long-term returns in as stable and consistent a manner as possible. As a result, it is expected that some managers and styles will be leading at times, while others are lagging and vice versa. The Portfolios expect to capitalize on this cyclicality of manager styles by reducing exposure to investment managers whose strategy and style realize extraordinary excess returns and allocating to good long-term managers whose investment strategy and style have been out of favor in the short-term.
| 1 | The Russell 2000® Index measures the performance of smaller capitalization U.S. companies. The largest 1,000 stocks become the Russell 1000® Index and the next 2,000 stocks become the Russell 2000® Index. This index is unmanaged, thus the index results do not reflect the impact of expenses associated with any investment in securities, such as brokerage commission or other transaction costs. Benchmark performance is shown for comparison purposes only, as it is not possible to invest directly in a securities index. |
| 2 | Lipper, Inc. is an independent statistical monitoring organization that compiles performance on mutual funds and further categorizes them by investment objective. |
| 3 | During the fiscal year, Ariel Investments, LLC (Institutional Portfolio only) and Cadence Capital Management, LLC were also under contract to manage the Portfolios but did not have assets allocated to them. |
10
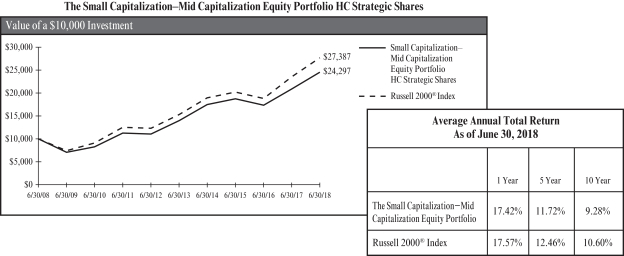
The chart represents historical performance of a hypothetical investment of $10,000 in The Small Capitalization–Mid Capitalization Equity Portfolio for the 10-year period ended 6/30/18, and represents the reinvestment of dividends and capital gains in the Portfolio.
Past performance does not guarantee future results. The performance data quoted represents past performance and current returns may be lower or higher. The investment return and principal value will fluctuate so that an investor’s shares, when redeemed, may be worth more or less than the original cost. To obtain performance information current to the most recent month end, please call (800) 242-9596.
The Portfolio’s performance above is compared to the Russell 2000® Index, which represents the performance of domestically traded common stocks of small to mid-sized companies. The index is unmanaged and does not reflect the deduction of fees associated with a mutual fund, such as investment management and fund accounting fees, or the deduction of taxes. An investor cannot invest directly in an index. The performance of The Small Capitalization–Mid Capitalization Equity Portfolio reflects the deduction of fees for these value-added services, but does not reflect the deduction of taxes that a shareholder would pay on the Portfolio’s distributions or redemptions of the Portfolio’s shares.
Expense Ratio
HC Strategic Shares 0.70%
HC Advisors Shares 0.95%1
| 1 | HC Advisors Shares include Distribution Plan fees of 0.25% which are voluntarily waived by the Adviser. Such waiver is not reflected in the expense ratio shown. |
This information is included in the most current prospectus available to current and prospective shareholders of the Portfolio. Additional information pertaining to the June 30, 2018, expense ratios can be found in the financial highlights.
11
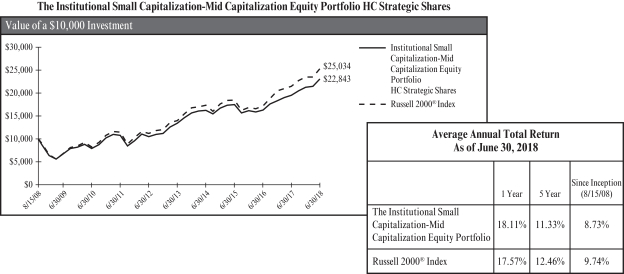
The chart represents historical performance of a hypothetical investment of $10,000 in The Institutional Small Capitalization–Mid Capitalization Equity Portfolio from 8/15/08 to 6/30/18, and represents the reinvestment of dividends and capital gains in the Portfolio.
Past performance does not guarantee future results. The performance data quoted represents past performance and current returns may be lower or higher. The investment return and principal value will fluctuate so that an investor’s shares, when redeemed, may be worth more or less than the original cost. To obtain performance information current to the most recent month end, please call (800) 242-9596.
The Portfolio’s performance above is compared to the Russell 2000® Index, which represents the performance of domestically traded common stocks of small to mid-sized companies. The index is unmanaged and does not reflect the deduction of fees associated with a mutual fund, such as investment management and fund accounting fees, or the deduction of taxes. An investor cannot invest directly in an index. The performance of The Institutional Small Capitalization–Mid Capitalization Equity Portfolio reflects the deduction of fees for these value-added services, but does not reflect the deduction of taxes that a shareholder would pay on the Portfolio’s distributions or redemptions of the Portfolio’s shares.
Expense Ratio
HC Strategic Shares 0.79%
HC Advisors Shares 1.04%1
| 1 | HC Advisors Shares include Distribution Plan fees of 0.25% which are voluntarily waived by the Adviser. Such waiver is not reflected in the expense ratio shown. |
This information is included in the most current prospectus available to current and prospective shareholders of the Portfolio. Additional information pertaining to the June 30, 2018, expense ratios can be found in the financial highlights.
12
The Real Estate Securities Portfolio
(Unaudited)
The Real Estate Securities Portfolio (the “Portfolio”) managed by Parametric Portfolio Associates, LLC and Wellington Management Company, LLP returned 3.20% for the year compared to 4.23% for the Dow-Jones U.S. Select Real Estate Securities Index1 and 3.18% for the average manager in the Lipper2 universe of Real Estate funds.3 The U.S. Real Estate Market underperformed many equity markets over the last twelve months as interest rates rose.
The Portfolio slightly outperformed its peer group and underperformed the benchmark for the period. The Portfolio benefited from an underweight to senior housing while multi-family REITs detracted from the Portfolio’s relative returns.
| 1 | The Dow-Jones U.S. Select Real Estate Securities Index is a broad measure of the performance of publicly traded global real estate securities, such as Real Estate Investment Trust (REITs) and Real Estate Operating Companies (REOCs). The index is capitalization-weighted. The global index is an expansion of the original U.S. index, developed in 1991. This index is unmanaged, thus the index results do not reflect the impact of expenses associated with any investment in securities, such as brokerage commission or other transaction costs. Benchmark performance is shown for comparison purposes only as it is not possible to invest directly in a securities index. |
| 2 | Lipper, Inc. is an independent statistical monitoring organization that compiles performance on mutual funds and further categorizes them by investment objective. |
| 3 | During the fiscal year, Cadence Capital Management, LLC and BNY Mellon Asset Management North America Corporation (formerly Mellon Capital Management Corporation) were also under contract to manage the Portfolio but did not have assets allocated to them. |
13
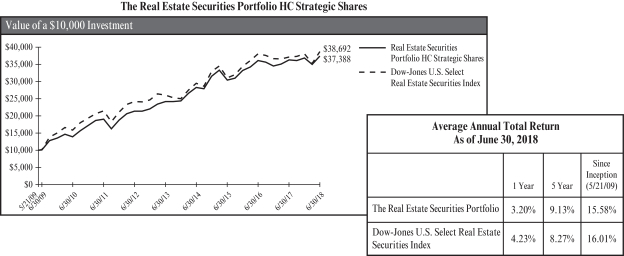
The chart represents historical performance of a hypothetical investment of $10,000 in The Real Estate Securities Portfolio from 5/21/09 to 6/30/18, and represents the reinvestment of dividends and capital gains in the Portfolio. The Real Estate Securities Portfolio was redeemed in full on June 30, 2013 and recommenced operations on September 12, 2013.
Past performance does not guarantee future results. The performance data quoted represents past performance and current returns may be lower or higher. The investment return and principal value will fluctuate so that an investor’s shares, when redeemed, may be worth more or less than the original cost. To obtain performance information current to the most recent month end, please call (800) 242-9596.
The Portfolio’s performance above is compared to the Dow-Jones U.S. Select Real Estate Securities Index. The index is unmanaged and does not reflect the deduction of fees associated with a mutual fund, such as investment management and fund accounting fees, or the deduction of taxes. An investor cannot invest directly in an index. The performance of The Real Estate Securities Portfolio reflects the deduction of fees for these value-added services, but does not reflect the deduction of taxes that a shareholder would pay on the Portfolio’s distributions or redemptions of the Portfolio’s shares.
Expense Ratio
HC Strategic Shares 0.76%
This information is included in the most current prospectus available to current and prospective shareholders of the Portfolio. Additional information pertaining to the June 30, 2018, expense ratios can be found in the financial highlights.
14
The Commodity Returns Strategy Portfolio
(Unaudited)
The Commodity Returns Strategy Portfolio (the “Portfolio”) managed by BNY Mellon Asset Management North America Corporation (formerly Mellon Capital Management Corporation), Pacific Investment Management Company, LLC, Parametric Portfolio Associates, LLC, Vaughan Nelson Investment Management, L.P. and Wellington Management Company, LLP, returned 18.61% for the year compared to 7.35% for the Bloomberg Commodity Index1, 15.70% for the HC Commodities Benchmark2, and 15.95% for the average manager in the Lipper3 universe of Global Natural Resources Funds.4
The Portfolio outperformed the HC Commodities Benchmark, the Bloomberg Commodity Index and the peer group. The outperformance was primarily due to the Portfolio’s overweight in commodity-linked equities, which outperformed lower returns from commodity futures markets. The Portfolio holds more commodity-linked equities than futures to capture better risk/return characteristics for securities with commodity exposure.
| 1 | The Bloomberg Commodity Index is a broadly diversified index that allows investors to track commodity futures through a single, simple measure. The index is designed to minimize concentration in one commodity or sector. It currently includes 22 commodity futures in six groups. No one commodity can comprise less than 2% or more than 15% of the index, and no group can represent more than 33% of the index (as of the annual re-weightings of the components). This index is unmanaged, thus the index results do not reflect the impact of expenses associated with any investment in securities, such as brokerage commission or other transaction costs. Benchmark performance is shown for comparison purposes only, as it is not possible to invest directly in a securities index. |
| 2 | The HC Commodities Benchmark is composed of 50% of the Bloomberg Commodity Index2 and 50% of the MSCI ACWI Commodity Producers Index5. |
| 3 | Lipper, Inc. is an independent statistical monitoring organization that compiles performance on mutual funds and further categorizes them by investment objective. |
| 4 | During the fiscal year, Cadence Capital Management, LLC was also under contract to manage the Portfolio but did not have assets allocated to it. |
15
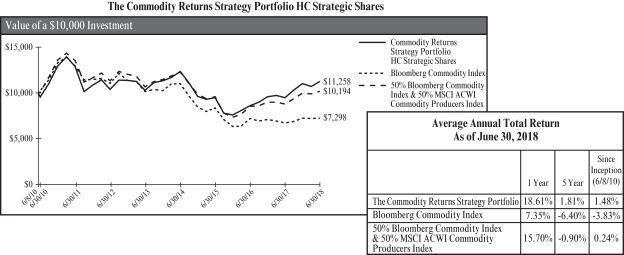
The chart represents historical performance of a hypothetical investment of $10,000 in The Commodity Returns Strategy Portfolio from 6/8/10 to 6/30/18, and represents the reinvestment of dividends and capital gains in the Portfolio.
Past performance does not guarantee future results. The performance data quoted represents past performance and current returns may be lower or higher. The investment return and principal value will fluctuate so that an investor’s shares, when redeemed, may be worth more or less than the original cost. To obtain performance information current to the most recent month end, please call (800) 242-9596.
The Portfolio’s performance above is compared to the Bloomberg Commodity Index and the 50% Bloomberg Commodity Index & 50% MSCI ACWI Commodity Producers Index. The Dow-Jones UBS Commodity Index is unmanaged and does not reflect the deduction of fees associated with a mutual fund, such as investment management and fund accounting fees, or the deduction of taxes. The MSCI ACWI Commodity Producers Index is unmanaged, thus the index results do not reflect the impact of expenses associated with any investment in securities, such as brokerage commission or other transaction costs. An investor cannot invest directly in an index. The performance of The Commodity Returns Strategy Portfolio reflects the deduction of fees for these value-added services, but does not reflect the deduction of taxes that a shareholder would pay on the Portfolio’s distributions or redemptions of the Portfolio’s shares.
Expense Ratio
HC Strategic Shares 0.43%
HC Advisors Shares 0.68%1
| 1 | HC Advisors Shares include Distribution Plan fees of 0.25% which are voluntarily waived by the Adviser. Such waiver is not reflected in the expense ratio shown. |
This information is included in the most current prospectus available to current and prospective shareholders of the Portfolio. Additional information pertaining to the June 30, 2018, expense ratios can be found in the financial highlights.
16
The ESG Growth Portfolio
(Unaudited)
The ESG Growth Portfolio (the “Portfolio”) managed by Cadence Capital Management, LLC (“Cadence”), BNY Mellon Asset Management North America Corporation (“BNY Mellon AMNA-Mellon”) (formerly Mellon Capital Management Corporation) and Parametric Portfolio Associates, LLC returned 10.16% for the year compared to 11.70% for the MSCI World Index.1
The Portfolio allocated to higher quality strategies, in both the U.S. and International Developed markets. The Portfolio had an overweight allocation to International Developed markets, a strategy managed by Cadence that prioritized high dividend paying companies with a below average price to book and quality earnings. This overweight hampered the Portfolio as the strategy underperformed on a relative basis and trailed the EAFE benchmark. The U.S. strategy, which was run by BNY Mellon AMNA-Mellon, favored companies with strong balance sheets, steady earnings growth, and low leverage. Similar to the International Developed allocation, this strategy underperformed its Russell 1000 benchmark as the U.S. market favored more momentum driven stocks. The Portfolio’s underperformance can be attributed to a combination of unfavorable style allocations, Portfolio expenses and foreign tax withholdings that are not incorporated into the benchmark returns.
The Portfolio is diversified across multiple managers and strategies to ensure proper portfolio diversification, with the goal of providing superior long-term returns in as stable and consistent a manner as possible.2 As a result, it is expected that some styles will be leading at times, while others are lagging and vice versa. The Portfolio expects to capitalize on this cyclicality of styles by reducing exposure to strategies and styles that realize extraordinary excess returns and allocating to strategies and styles that have been out of favor in the short-term.
The Portfolio requires that the underlying managers integrate Environmental, Social and Governance (“ESG”) criteria in their investment selection. Both Cadence and BNY Mellon AMNA-Mellon use third party ESG data, to better understand the environmental, social and governance risks and opportunities, when making investment decisions.
| 1 | The MSCI World Index is an unmanaged index that is designed to capture large and mid-cap representation across 23 developed markets countries. The Index covers approximately 85% of the free float-adjusted market capitalization in each of the following countries: Australia, Austria, Belgium, Canada, Denmark, Finland, France, Germany, Hong Kong, Ireland, Israel, Italy, Japan, the Netherlands, New Zealand, Norway, Portugal, Singapore, Spain, Sweden, Switzerland, the United Kingdom and the United States. Benchmark performance is shown for comparison purposes only, as it is not possible to invest directly in a securities index. |
| 2 | During the fiscal year, Agincourt Capital Management, LLC was also under contract to manage the Portfolio but did not have assets allocated to it. |
17
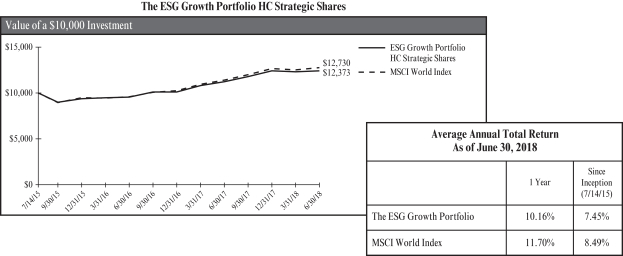
The chart represents historical performance of a hypothetical investment of $10,000 in The ESG Growth Portfolio from 7/14/15 to 6/30/18, and represents the reinvestment of dividends and capital gains in the Portfolio.
Past performance does not guarantee future results. The performance data quoted represents past performance and current returns may be lower or higher. The investment return and principal value will fluctuate so that an investor’s shares, when redeemed, may be worth more or less than the original cost. To obtain performance information current to the most recent month end, please call (800) 242-9596.
The Portfolio’s performance above is compared to the MCSI World Index is unmanaged and does not reflect the deduction of fees associated with a mutual fund, such as investment management and fund accounting fees, or the deduction of taxes. An investor cannot invest directly in an index. The performance of The ESG Growth Portfolio reflects the deduction of fees for these value-added services, but does not reflect the deduction of taxes that a shareholder would pay on the Portfolio’s distributions or redemptions of the Portfolio’s shares.
Expense Ratio
HC Strategic Shares 0.37%
HC Advisors Shares 0.62%1
| 1 | HC Advisors Shares include Distribution Plan fees of 0.25% which are voluntarily waived by the Adviser. Such waiver is not reflected in the expense ratio shown. |
This information is included in the most current prospectus available to current and prospective shareholders of the Portfolio. Additional information pertaining to the June 30, 2018, expense ratios can be found in the financial highlights.
18
The Catholic SRI Growth Portfolio
(Unaudited)
The Catholic SRI Growth Portfolio (the “Portfolio”) managed by Cadence Capital Management, LLC (“Cadence”) and BNY Mellon Asset Management North America Corporation (“BNY Mellon AMNA-Mellon”) (formerly Mellon Capital Management Corporation) returned 11.23% for the year compared to 11.70% for the MSCI World Index.1
The Portfolio allocated to higher quality strategies, in both the U.S. and International Developed markets. The Portfolio had an overweight allocation to International Developed markets, a strategy managed by Cadence that prioritized high dividend paying companies with a below average price to book and quality earnings. This overweight hampered the Portfolio as the strategy underperformed on a relative basis. The U.S. strategy, which was run by BNY Mellon AMNA-Mellon, favored companies with strong balance sheets, steady earnings growth, and low leverage. This strategy outperformed its Russell 1000 benchmark as the U.S. market favored firms with high quality earnings. The U.S. Catholic SRI strategy is constructed in a similar manner as the U.S. ESG strategy but contains additional Catholic SRI constraints which causes firms within specific industries to be screened out. This can result in a slightly different sectoral composition which can lead to return differential between the two strategies overtime. The overall portfolio slightly underperformed the benchmark as the outperformance in the U.S. market was offset by the underperformance in the International Developed markets
The Portfolio is diversified across multiple managers and strategies to ensure proper portfolio diversification, with the goal of providing superior long-term returns in as stable and consistent a manner as possible.2 As a result, it is expected that some styles will be leading at times, while others are lagging and vice versa. The Portfolio expects to capitalize on this cyclicality of styles by reducing exposure to strategies and styles that realize extraordinary excess returns and allocating to strategies and styles that have been out of favor in the short-term.
The Portfolio requires that the underlying managers integrate Catholic values in their investment selections, which include a combination of negative and positive screens. Both Cadence and BNY Mellon AMNA-Mellon use third party data to implement the positive and negative screens in the Portfolio.
| 1 | The MSCI World Index is an unmanaged index that is designed to capture large and mid-cap representation across 23 developed markets countries. The Index covers approximately 85% of the free float-adjusted market capitalization in each of the following countries: Australia, Austria, Belgium, Canada, Denmark, Finland, France, Germany, Hong Kong, Ireland, Israel, Italy, Japan, the Netherlands, New Zealand, Norway, Portugal, Singapore, Spain, Sweden, Switzerland, the United Kingdom and the United States. Benchmark performance is shown for comparison purposes only, as it is not possible to invest directly in a securities index. |
| 2 | During the fiscal year, Agincourt Capital Management, LLC and Parametric Portfolio Associates, LLC were also under contract to manage the Portfolio but did not have assets allocated to them. |
19
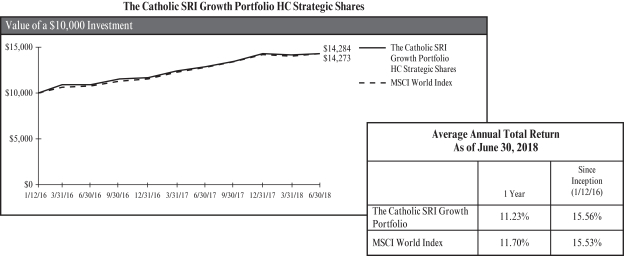
The chart represents historical performance of a hypothetical investment of $10,000 in The Catholic SRI Growth Portfolio from 1/12/16 to 6/30/18, and represents the reinvestment of dividends and capital gains in the Portfolio.
Past performance does not guarantee future results. The performance data quoted represents past performance and current returns may be lower or higher. The investment return and principal value will fluctuate so that an investor’s shares, when redeemed, may be worth more or less than the original cost. To obtain performance information current to the most recent month end, please call (800) 242-9596.
The Portfolio’s performance above is compared to the MCSI World Index is unmanaged and does not reflect the deduction of fees associated with a mutual fund, such as investment management and fund accounting fees, or the deduction of taxes. An investor cannot invest directly in an index. The performance of The Catholic SRI Growth Portfolio reflects the deduction of fees for these value-added services, but does not reflect the deduction of taxes that a shareholder would pay on the Portfolio’s distributions or redemptions of the Portfolio’s shares.
Expense Ratio
HC Strategic Shares 0.60%
HC Advisors Shares 0.85%1
| 1 | HC Advisors Shares include Distribution Plan fees of 0.25% which are voluntarily waived by the Adviser. Such waiver is not reflected in the expense ratio shown. |
This information is included in the most current prospectus available to current and prospective shareholders of the Portfolio. Additional information pertaining to the June 30, 2018, expense ratios can be found in the financial highlights.
20
The International Equity Portfolio
The Institutional International Equity Portfolio
(Unaudited)
The International Equity Portfolio (the “Portfolio”) managed by Artisan Partners Limited Partnership (“Artisan”), Cadence Capital Management, LLC (“Cadence”), Causeway Capital Management, LLC (“Causeway”) and Parametric Portfolio Associates, LLC (“Parametric”) returned 5.60% for the period compared to 7.37% for the MSCI EAFE Index1 and 6.04% for the average manager in the Lipper2 universe of International Large-Cap Core Funds.3
The Portfolio underperformed its benchmark and slightly underperformed its peer group. A strong first half to the fiscal year ended when global equity markets peaked in January. Developed international markets declined in the second half of the fiscal year. Both Cadence and Causeway, which manage value styles, outperformed the MSCI EAFE Value Index, which was up 4.3%, while Artisan, which manages a growth style, underperformed the MSCI EAFE Growth Index, which was up 9.4%. The overall portfolio lagged its benchmark due to its overweight to value style as the market favored firms which had higher earnings growth.
The Institutional International Equity Portfolio (the “Institutional Portfolio”) managed by Artisan, Cadence, Causeway, City of London Investment Management Company, Ltd., Lazard Asset Management, LLC and Parametric returned 5.77% for the fiscal year compared to 7.37% for the MSCI EAFE Index1 and 6.04% for the average manager in the Lipper2 universe of International Large-Cap Core Funds.4
The Institutional Portfolio underperformed its benchmark and slightly underperformed its peer group. A strong first half to the fiscal year ended when global equity markets peaked in January. Developed international markets declined in the second half of the fiscal year. The performance difference between the Institutional Portfolio and the Portfolio was primarily driven by tax management considerations in the Portfolio.
Both the Portfolio and Institutional Portfolio (collectively the “Portfolios”) are diversified across multiple managers and strategies to ensure proper portfolio diversification. Exposures in Germany and the United Kingdom added performance relative to the benchmark index while exposures in Japan, France, and Switzerland detracted from performance relative to the benchmark.
| 1 | The Morgan Stanley Capital International Europe, Australasia, and Far East Index (“MSCI EAFE Index”) is an unmanaged, market value weighted index designed to measure the overall condition of developed overseas equities markets. This index is unmanaged, thus the index results do not reflect the impact of expenses associated with any investment in securities, such as brokerage commission or other transaction costs. Benchmark performance is shown for comparison purposes only, as it is not possible to invest directly in a securities index. |
| 2 | Lipper, Inc. is an independent statistical monitoring organization that compiles performance on mutual funds and further categorizes them by investment objective. |
| 3 | During the fiscal year, City of London Investment Management Company, Ltd. and BNY Mellon Asset Management North America Corporation (“BNY Mellon AMNA-Mellon”) (formerly Mellon Capital Management Corporation) were also under contract to manage the Portfolio but did not have assets allocated to them. |
| 4 | During the fiscal year, BNY Mellon AMNA-Mellon (formerly Mellon Capital Management Corporation) was also under contract to manage the Institutional Portfolio but did not have assets allocated to it. |
21
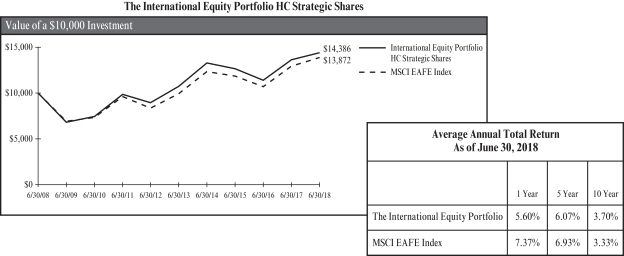
The chart represents historical performance of a hypothetical investment of $10,000 in The International Equity Portfolio for the 10-year period ended 6/30/18, and represents the reinvestment of dividends and capital gains in the Portfolio.
Past performance does not guarantee future results. The performance data quoted represents past performance and current returns may be lower or higher. The investment return and principal value will fluctuate so that an investor’s shares, when redeemed, may be worth more or less than the original cost. To obtain performance information current to the most recent month end, please call (800) 242-9596.
The Portfolio’s performance above is compared to the MSCI EAFE Index, which represents the performance of the major stock markets in those regions. The index is unmanaged and does not reflect the deduction of fees associated with a mutual fund, such as investment management and fund accounting fees, or the deduction of taxes. An investor cannot invest directly in an index. The performance of The International Equity Portfolio reflects the deduction of fees for these value-added services, but does not reflect the deduction of taxes that a shareholder would pay on the Portfolio’s distributions or redemptions of the Portfolio’s shares.
Expense Ratio
HC Strategic Shares 0.46%
HC Advisors Shares 0.71%1
| 1 | HC Advisors Shares include Distribution Plan fees of 0.25% which are voluntarily waived by the Adviser. Such waiver is not reflected in the expense ratio shown. |
This information is included in the most current prospectus available to current and prospective shareholders of the Portfolio. Additional information pertaining to the June 30, 2018, expense ratios can be found in the financial highlights.
22
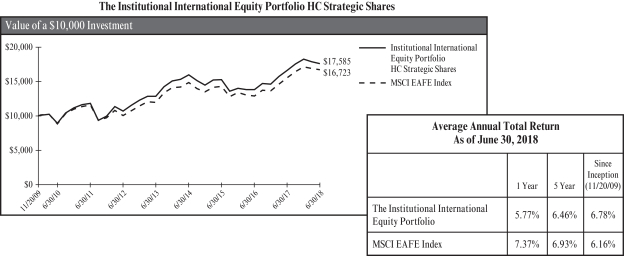
The chart represents historical performance of a hypothetical investment of $10,000 in The Institutional International Equity Portfolio from 11/20/09 to 6/30/18, and represents the reinvestment of dividends and capital gains in the Portfolio.
Past performance does not guarantee future results. The performance data quoted represents past performance and current returns may be lower or higher. The investment return and principal value will fluctuate so that an investor’s shares, when redeemed, may be worth more or less than the original cost. To obtain performance information current to the most recent month end, please call (800) 242-9596.
The Portfolio’s performance above is compared to the MSCI EAFE Index, which represents the performance of the major stock markets in those regions. The index is unmanaged and does not reflect the deduction of fees associated with a mutual fund, such as investment management and fund accounting fees, or the deduction of taxes. An investor cannot invest directly in an index. The performance of The Institutional International Equity Portfolio reflects the deduction of fees for these value-added services, but does not reflect the deduction of taxes that a shareholder would pay on the Portfolio’s distributions or redemptions of the Portfolio’s shares.
Expense Ratio
HC Strategic Shares 0.45%
HC Advisors Shares 0.70%1
| 1 | HC Advisors Shares include Distribution Plan fees of 0.25% which are voluntarily waived by the Adviser. Such waiver is not reflected in the expense ratio shown. |
This information is included in the most current prospectus available to current and prospective shareholders of the Portfolio. Additional information pertaining to the June 30, 2018, expense ratios can be found in the financial highlights.
23
The Emerging Markets Portfolio
(Unaudited)
The Emerging Markets Portfolio (the “Portfolio”) managed by BNY Mellon Asset Management North America Corporation (“BNY Mellon AMNA-Boston”) (formerly The Boston Company Asset Management) and (“BNY Mellon AMNA-Mellon”) (formerly Mellon Capital Management Corporation), which managed both an active strategy and a passive strategy, Parametric Portfolio Associates, LLC (“Parametric”) and RBC Global Asset Management (U.K.) Ltd. (“RBC”) returned 1.34% compared to 8.59% for the MSCI EM Index1 and 6.10% for the average manager in the Lipper2 universe of Emerging Markets Funds.3
For the fiscal year 2018, the Portfolio underperformed both the benchmark, and the average manager in the industry universe. The underperformance was primarily due to the Portfolio’s overall value orientation. The value oriented active strategy managed by BNY Mellon AMNA-Boston was the largest detractor. The portfolio underperformed the index due to negative exposure to high growth and momentum names which had very strong returns. Security selection and sector allocation contributed negatively to performance for the fiscal year. The Portfolio’s passive yield strategy also managed by BNY Mellon AMNA-Boston was diminished by an underweight to technology oriented names. The quality growth-oriented strategy run by RBC also contributed negatively to the overall portfolio performance. The strategy had an underweight to the energy sector which had a strong performance due to the rally in oil prices. Security selection also contributed negatively to overall performance. Changes in the value of local currencies relative to the U.S. Dollar had a negative impact on the performance of the benchmark and the Portfolio. The MSCI EM Index1 returned 8.59% in U.S. Dollar terms and 10.47% in local terms.
The Portfolio provides broad access to international emerging markets equity. The Portfolio is managed with multiple managers to provide diversification of manager style as well as diversification of firm specific risks. BNY Mellon AMNA-Boston employs a quantitatively driven investment process that seeks to identify companies paying high dividends relative to the benchmark while maintaining quality balance sheets. The Portfolio diversifies amongst a large number of names and across geographies and sectors to capture its specified factor. BNY Mellon AMNA-Boston’s active strategy employs a fundamentally driven investment process to identify attractive value companies within the international emerging markets equity universe and then constructs a diversified portfolio of those companies in accordance with industry and individual company allocation guidelines. RBC employs a fundamentally driven investment process to identify attractive quality and growing companies and then constructs a diversified portfolio of those companies in accordance with industry and individual allocation guidelines. Parametric replicates benchmark index (MSCI Emerging Markets Index) using futures. This allows the Portfolio to have cash on hand to meet redemptions and invest opportunistically.
| 1 | The Morgan Stanley Capital International Emerging Markets Index (“MSCI EM Index”) is a free float-adjusted market capitalization index that is designed to measure equity market performance in the global emerging markets. As of June 30, 2018 the MSCI EM Index consisted of the following 24 emerging market country indices: Brazil, Chile, China, Colombia, Czech Republic, Egypt, Greece, Hungary, India, Indonesia, Korea, Malaysia, Mexico, Pakistan, Peru, Philippines, Poland, Qatar, Russia, South Africa, Taiwan, Thailand, Turkey and United Arab Emirates. This index is unmanaged, thus the index results do not reflect the impact of expenses associated with any investment in securities, such as brokerage commission or other transaction costs. Benchmark performance is shown for comparison purposes only as it is not possible to invest directly in a securities index. |
| 2 | Lipper, Inc. is an independent statistical monitoring organization that compiles performance on mutual funds and further categorizes them by investment objective. |
| 3 | During the fiscal year, Cadence Capital Management, LLC and City of London Investment Management Company, Ltd. were also under contract to manage the Portfolio but did not have assets allocated to them. |
24
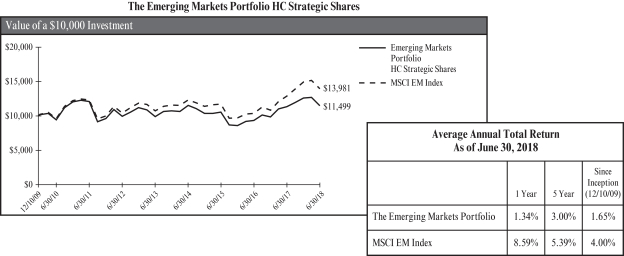
The chart represents historical performance of a hypothetical investment of $10,000 in The Emerging Markets Portfolio from 12/10/09 to 6/30/18, and represents the reinvestment of dividends and capital gains in the Portfolio.
Past performance does not guarantee future results. The performance data quoted represents past performance and current returns may be lower or higher. The investment return and principal value will fluctuate so that an investor’s shares, when redeemed, may be worth more or less than the original cost. To obtain performance information current to the most recent month end, please call (800) 242-9596.
The Portfolio’s performance above is compared to the MSCI EM Index, which represents the performance of the major stock markets in those regions. The index is unmanaged and does not reflect the deduction of fees associated with a mutual fund, such as investment management and fund accounting fees, or the deduction of taxes. An investor cannot invest directly in an index. The performance of The Emerging Markets Portfolio reflects the deduction of fees for these value-added services, but does not reflect the deduction of taxes that a shareholder would pay on the Portfolio’s distributions or redemptions of the Portfolio’s shares.
Expense Ratio
HC Strategic Shares 0.70%
HC Advisors Shares 0.95%1
| 1 | HC Advisors Shares include Distribution Plan fees of 0.25% which are voluntarily waived by the Adviser. Such waiver is not reflected in the expense ratio shown. |
This information is included in the most current prospectus available to current and prospective shareholders of the Portfolio. Additional information pertaining to the June 30, 2018, expense ratios can be found in the financial highlights.
25
The Core Fixed Income Portfolio
(Unaudited)
The Core Fixed Income Portfolio (the “Portfolio”) managed by Agincourt Capital Management, LLC and BNY Mellon Asset Management North America Corporation (formerly Mellon Capital Management Corporation) returned -0.85% for the fiscal year compared to -0.40% for the Bloomberg Barclays U.S. Aggregate Bond Index1 (“BarCap”) and -0.52% for the average fixed income manager in the Lipper2 universe of Core Bond Funds. The Portfolio underperformed due to a strategic overweight to investment grade corporate credit – which underperformed the other sectors of the Index.
The Federal Reserve continued to hike interest rates during the year causing the yield curve to continue to flatten as rates at the short end of the curve rose faster than the long end. This resulted in low returns for fixed income securities across different maturities. Spreads narrowed during the first half of the fiscal year resulting in strong performance from fixed income securities. Inflation fears at the beginning of the year resulted in spreads widening causing fixed income securities to erase all their gains. The Bloomberg Barclays U.S. Corporate Bond Index, a broad measure the U.S. bond market was down -0.40% for the year.
The Portfolio is allocated across the three major sectors of the BarCap Index: governments, credit, and asset backed securities. The government and asset backed sectors are passively managed to provide performance in-line with their respective benchmarks. Actual results may vary marginally from the underlying benchmarks because of cash flows and because for practical purposes, the portfolios hold a representative group of the securities in the benchmarks and do not seek to fully replicate all of the individual holdings. The credit portfolio has a bit more flexibility to vary from the index by avoiding credits that the manager feels have adverse price risk. The allocations across the three sectors will vary over time based upon the relative attractiveness of the sectors. In general, the Portfolio maintains aggregate characteristics – duration, weighted average yield-to-maturity, and average credit quality comparable to the benchmark.
| 1 | The Bloomberg Barclays U.S. Aggregate Bond Index includes more than 8,000 taxable government, investment-grade corporate and mortgage backed securities. This index is unmanaged, thus the index results do not reflect the impact of expenses associated with any investment in securities, such as brokerage commission or other transaction costs. Benchmark performance is shown for comparison purposes only, as it is not possible to invest directly in a securities index. |
| 2 | Lipper, Inc. is an independent statistical monitoring organization that compiles performance on mutual funds and further categorizes them by investment objective. |
26
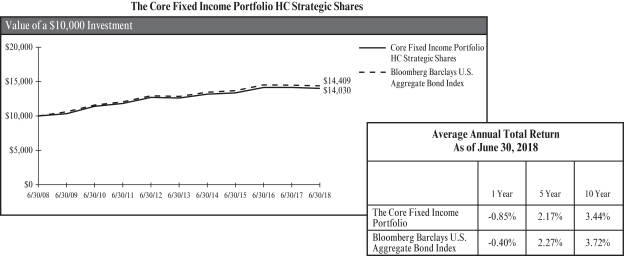
The chart represents historical performance of a hypothetical investment of $10,000 in The Core Fixed Income Portfolio for the 10-year period ended 6/30/18, and represents the reinvestment of dividends and capital gains in the Portfolio.
Past performance does not guarantee future results. The performance data quoted represents past performance and current returns may be lower or higher. The investment return and principal value will fluctuate so that an investor’s shares, when redeemed, may be worth more or less than the original cost. To obtain performance information current to the most recent month end, please call (800) 242-9596.
The Portfolio’s performance above is compared to the Bloomberg Barclays U.S. Aggregate Bond Index. The index is unmanaged and does not reflect the deduction of fees associated with a mutual fund, such as investment management and fund accounting fees, or the deduction of taxes. An investor cannot invest directly in an index. The performance of The Core Fixed Income Portfolio reflects the deduction of fees for these value-added services, but does not reflect the deduction of taxes that a shareholder would pay on the Portfolio’s distributions or redemptions of the Portfolio’s shares.
Expense Ratio
HC Strategic Shares 0.38%
HC Advisors Shares 0.63%1
| 1 | Advisors Shares include Distribution Plan fees of 0.25% which are voluntarily waived by the Adviser. Such waiver is not reflected in the expense ratio shown. |
This information is included in the most current prospectus available to current and prospective shareholders of the Portfolio. Additional information pertaining to the June 30, 2018, expense ratios can be found in the financial highlights.
27
The Fixed Income Opportunity Portfolio
(Unaudited)
For the fiscal year, the Fixed Income Opportunity Portfolio (the “Portfolio”), managed by City of London Investment Management Company, Ltd.1, Fort Washington Investment Advisors, Inc. (“Fort Washington”), Parametric Portfolio Associates, LLC and Western Asset Management Company, Ltd. (“WAMCO”) had a return of 4.06% compared to 1.80% for the Bloomberg Barclays U.S. High Yield Ba/B 2% Issuer Capped Index2 and 2.01% for the average manager in the Lipper3 High Yield Funds universe.4
The Portfolio is designed to provide investors with higher returns over time than traditional fixed income investments primarily through investment in a diversified portfolio of high yield bonds. The Portfolio may also opportunistically invest in international bonds, convertible bonds, preferred stocks, treasury inflation bonds, loan participations and fixed and floating rate loans.
Within the U.S. Fixed Income markets, the Federal Reserve continued to hike interest rates during the year causing the yield curve to continue to flatten as rates at the short end of the curve rose faster than the long end. Spreads on higher quality (investment grade) issues widened by approximately 15 basis points whereas spreads on lower quality issues (high yield) were virtually flat. This resulted in lower quality issues outperforming higher quality issues. Both Fort Washington and WAMCO outperformed their benchmarks primarily through security selection and sector allocation.
The Portfolio has flexibility to vary from the index by avoiding credits that the managers feel have adverse price risk.
| 1 | As of July 5, 2018, City of London Investment Management Company, Ltd. did not have assets allocated to it. |
| 2 | The Bloomberg Barclays U.S. High Yield Ba/B 2% Issuer Capped Index is a market capitalization-weighted index that measures fixed rate non-investment grade debt securities of U.S. and non-U.S. corporations. No single issuer accounts for more than 2% of market cap. The index is calculated on a total return basis. This index is unmanaged, thus the index results do not reflect the impact of expenses associated with any investment in securities, such as brokerage commission or other transaction costs. Benchmark performance is shown for comparison purposes only, as it is not possible to invest directly in a securities index. |
| 3 | Lipper, Inc. is an independent statistical monitoring organization that compiles performance on mutual funds and further categorizes them by investment objective. |
| 4 | During the fiscal year, BNY Mellon Asset Management North America Corporation (formerly Mellon Capital Management Corporation) was also under contract to manage the Portfolio but did not have assets allocated to it. |
28
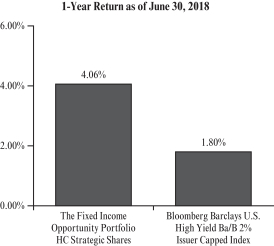
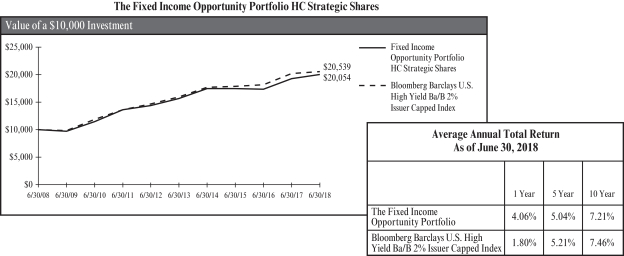
The chart represents historical performance of a hypothetical investment of $10,000 in The Fixed Income Opportunity Portfolio for the 10-year period ended 6/30/18, and represents the reinvestment of dividends and capital gains in the Portfolio.
Past performance does not guarantee future results. The performance data quoted represents past performance and current returns may be lower or higher. The investment return and principal value will fluctuate so that an investor’s shares, when redeemed, may be worth more or less than the original cost. To obtain performance information current to the most recent month end, please call (800) 242-9596.
The Portfolio’s performance above is compared to the Bloomberg Barclays U.S. High Yield Ba/B 2% Issuer Capped Index. The index is unmanaged and does not reflect the deduction of fees associated with a mutual fund, such as investment management and fund accounting fees, or the deduction of taxes. An investor cannot invest directly in an index. The performance of The Fixed Income Opportunity Portfolio reflects the deduction of fees for these value-added services, but does not reflect the deduction of taxes that a shareholder would pay on the Portfolio’s distributions or redemptions of the Portfolio’s shares.
Expense Ratio
HC Strategic Shares 0.48%
HC Advisors Shares 0.73%1
| 1 | HC Advisors Shares include Distribution Plan fees of 0.25% which are voluntarily waived by the Adviser. Such waiver is not reflected in the expense ratio shown. |
This information is included in the most current prospectus available to current and prospective shareholders of the Portfolio. Additional information pertaining to the June 30, 2018, expense ratios can be found in the financial highlights.
29
The U.S. Government Fixed Income Securities Portfolio
(Unaudited)
The U.S. Government Fixed Income Securities Portfolio (the “Portfolio”) managed by BNY Mellon Asset Management North America Corporation (formerly Mellon Capital Management Corporation) returned -0.79% compared to -0.63% for the Bloomberg Barclays U.S. Government Bond Index1 and –1.08% for the average fixed income manager in the Lipper2 universe of General U.S. Government Funds.
The Federal Reserve continued to hike interest rates during the year causing the yield curve to continue to flatten as rates at the short end of the curve rose faster than the long end. The U.S. 10-year bond yields rose from 2.31% in June 2017 to 2.86% at the end of the fiscal year. Most of the move higher came in the second half of the fiscal year as higher wages amid continued strength in the U.S. labor market raised inflation expectations.
The Portfolio is structured to perform similarly to the benchmark. As such it uses a sampling methodology to select a subset of the index universe that maintains aggregate characteristics – duration, weighted average yield-to-maturity, and average credit quality in line with the benchmark. Since the Portfolio owns a subset of securities of the Index, there will necessarily be some tracking error.
| 1 | The Bloomberg Barclays U.S. Government Bond Index is a broad-based unmanaged index that represents the general performance of U.S. Treasury and U.S. Government Agency debt securities. |
| 2 | Lipper, Inc. is an independent statistical monitoring organization that compiles performance on mutual funds and further categorizes them by investment objective. |
30
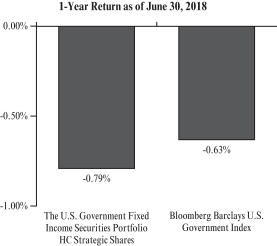
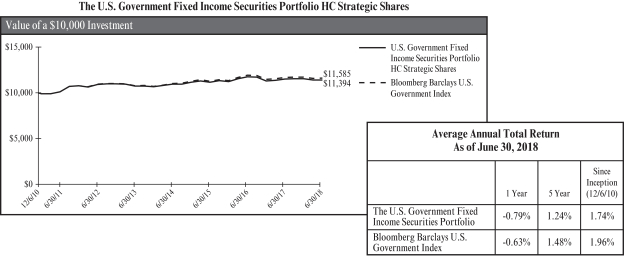
The chart represents historical performance of a hypothetical investment of $10,000 in The U.S. Government Fixed Income Securities Portfolio from 12/6/10 to 6/30/18, and represents the reinvestment of dividends and capital gains in the Portfolio.
Past performance does not guarantee future results. The performance data quoted represents past performance and current returns may be lower or higher. The investment return and principal value will fluctuate so that an investor’s shares, when redeemed, may be worth more or less than the original cost. To obtain performance information current to the most recent month end, please call (800) 242-9596.
The Portfolio’s performance above is compared to the Bloomberg Barclays U.S. Government Index. The index is unmanaged and does not reflect the deduction of fees associated with a mutual fund, such as investment management and fund accounting fees, or the deduction of taxes. An investor cannot invest directly in an index. The performance of The U.S. Government Fixed Income Securities Portfolio reflects the deduction of fees for these value-added services, but does not reflect the deduction of taxes that a shareholder would pay on the Portfolio’s distributions or redemptions of the Portfolio’s shares.
Expense Ratio
HC Strategic Shares 0.21%
This information is included in the most current prospectus available to current and prospective shareholders of the Portfolio. Additional information pertaining to the June 30, 2018, expense ratios can be found in the financial highlights.
31
The Inflation Protected Securities Portfolio
(Unaudited)
The Inflation Protected Securities Portfolio (the “Portfolio”) managed by BNY Mellon Asset Management North America Corporation (formerly Mellon Capital Management Corporation) returned 1.83% compared to 2.11% for the Bloomberg Barclays U.S. Treasury Inflation Protected Securities Index1 and 1.89% for the average fixed income manager in the Lipper2 universe of Inflation Protected Bond Funds.
Broad U.S. Fixed Income markets declined during the fiscal year as the Federal Reserve raised short-term interest rates. At the same time, inflation protected securities outperformed comparable treasury securities as the treasury bonds repriced for higher expected inflation.
The Portfolio is currently structured to perform similarly to the benchmark. As such, it utilizes a full replication approach to duplicate the fundamental characteristics and performance of the Bloomberg Barclays U.S. Treasury Inflation Protected Securities Index. The portfolio may slightly outperform or underperform the benchmark from time to time due to several factors such as; fund inflows/outflows, cash held for tactical purposes, different rebalancing frequency and fees.
| 1 | The Bloomberg Barclays U.S. Treasury Inflation Protected Securities Index is an unmanaged index generally consisting of all inflation-protection securities issued by the U.S. Treasury. |
| 2 | Lipper, Inc. is an independent statistical monitoring organization that compiles performance on mutual funds and further categorizes them by investment objective. |
32
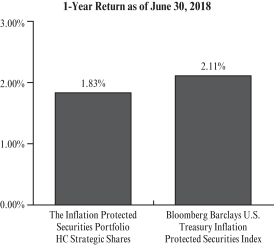
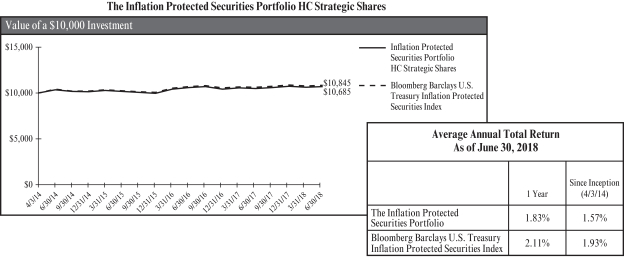
The chart represents historical performance of a hypothetical investment of $10,000 in The U.S. Inflation Protected Securities Portfolio from 4/3/14 to 6/30/18, and represents the reinvestment of dividends and capital gains in the Portfolio.
Past performance does not guarantee future results. The performance data quoted represents past performance and current returns may be lower or higher. The investment return and principal value will fluctuate so that an investor’s shares, when redeemed, may be worth more or less than the original cost. To obtain performance information current to the most recent month end, please call (800) 242-9596.
The Portfolio’s performance above is compared to the Bloomberg Barclays U.S. Treasury Inflation Protected Securities Index. The index is unmanaged and does not reflect the deduction of fees associated with a mutual fund, such as investment management and fund accounting fees, or the deduction of taxes. An investor cannot invest directly in an index. The performance of The Inflation Protected Securities Portfolio reflects the deduction of fees for these value-added services, but does not reflect the deduction of taxes that a shareholder would pay on the Portfolio’s distributions or redemptions of the Portfolio’s shares.
Expense Ratio
HC Strategic Shares 0.16%
HC Advisors Shares 0.41%1
| 1 | HC Advisors Shares include Distribution Plan fees of 0.25% which are voluntarily waived by the Adviser. Such waiver is not reflected in the expense ratio shown. |
This information is included in the most current prospectus available to current and prospective shareholders of the Portfolio. Additional information pertaining to the June 30, 2018, expense ratios can be found in the financial highlights.
33
The U.S. Corporate Fixed Income Securities Portfolio
(Unaudited)
The U.S. Corporate Fixed Income Securities Portfolio (the “Portfolio”) managed by Agincourt Capital Management, LLC (“Agincourt”) returned -1.21% compared to -0.83% for the Bloomberg Barclays U.S. Corporate Index1 and –0.80% for the average fixed income manager in the Lipper2 universe of Corporate Debt Funds BBB-Rated Funds.3
The Federal Reserve continued to hike interest rates during the year causing the yield curve to continue to flatten as rates at the short end of the curve rose faster than the long end. The U.S. 10-year bond yields rose from 2.31% in June 2017 to 2.86% at the end of the fiscal year.
Agincourt performed in line with the benchmark however the overall Portfolio underperformed due to the cash allocation in the Portfolio.
| 1 | The Bloomberg Barclays U.S. Corporate Index covers USD denominated, investment-grade, fixed-rate, taxable securities sold by industrial, utility and financial issuers. It includes publicly issued U.S. corporate and foreign debentures and secured notes that meet specified maturity, liquidity and quality requirements. Securities in the index roll up to the U.S. Credit and U.S. Aggregate indices. |
| 2 | Lipper, Inc. is an independent statistical monitoring organization that compiles performance on mutual funds and further categorizes them by investment objective. |
| 3 | During the fiscal year, BNY Mellon Asset Management North America Corporation (formerly Mellon Capital Management Corporation) was also under contract to manage the Portfolio but did not have assets allocated to it. |
34
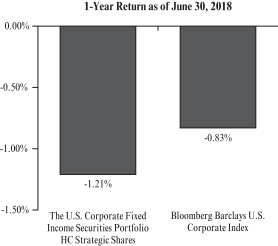
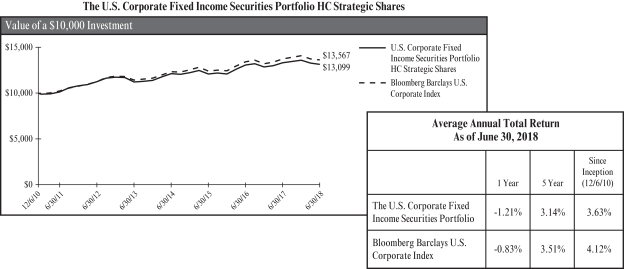
The chart represents historical performance of a hypothetical investment of $10,000 in The U.S. Corporate Fixed Income Securities Portfolio from 12/6/10 to 6/30/18, and represents the reinvestment of dividends and capital gains in the Portfolio.
Past performance does not guarantee future results. The performance data quoted represents past performance and current returns may be lower or higher. The investment return and principal value will fluctuate so that an investor’s shares, when redeemed, may be worth more or less than the original cost. To obtain performance information current to the most recent month end, please call (800) 242-9596.
The Portfolio’s performance above is compared to the Bloomberg Barclays U.S. Corporate Index. The index is unmanaged and does not reflect the deduction of fees associated with a mutual fund, such as investment management and fund accounting fees, or the deduction of taxes. An investor cannot invest directly in an index. The performance of The U.S. Corporate Fixed Income Securities Portfolio reflects the deduction of fees for these value-added services, but does not reflect the deduction of taxes that a shareholder would pay on the Portfolio’s distributions or redemptions of the Portfolio’s shares.
Expense Ratio
HC Strategic Shares 0.22%
This information is included in the most current prospectus available to current and prospective shareholders of the Portfolio. Additional information pertaining to the June 30, 2018, expense ratios can be found in the financial highlights.
35
The U.S. Mortgage/Asset Backed Fixed Income Securities Portfolio
(Unaudited)
The U.S. Mortgage/Asset Backed Fixed Income Securities Portfolio (the “Portfolio”) managed by BNY Mellon Asset Management North America Corporation (formerly Mellon Capital Management Corporation) returned -0.20% compared to 0.13% for the Bloomberg Barclays U.S. Securitized Index1 and 0.28% for the average fixed income manager in the Lipper2 universe of U.S. Mortgage Funds.
The Federal Reserve continued to hike interest rates during the year causing the yield curve to continue to flatten as rates at the short end of the curve rose faster than the long end. The U.S. 10-year bond yields rose from 2.31% in June 2017 to 2.86% at the end of the fiscal year.
The Portfolio is structured to simulate the performance of the benchmark. As such the Portfolio maintains aggregate characteristics – duration, weighted average yield-to-maturity, and average credit quality in line with the benchmark. Since the Portfolio holds a subset of the securities represented in the benchmark, it is expected to generate a small amount of tracking error.
| 1 | The Bloomberg Barclays U.S. Securitized Index is an unmanaged index that tracks the performance of mortgage-backed pass through securities issued by Ginnie Mae, Fannie Mae and Freddie Mac, investment-grade bonds and asset-backed securities. |
| 2 | Lipper, Inc. is an independent statistical monitoring organization that compiles performance on mutual funds and further categorizes them by investment objective. |
36
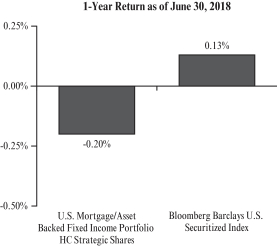
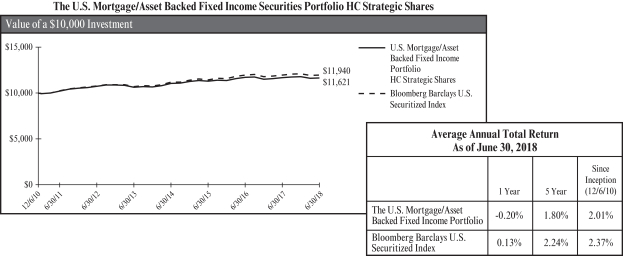
The chart represents historical performance of a hypothetical investment of $10,000 in The U.S. Mortgage/Asset Backed Fixed Income Portfolio from 12/6/10 to 6/30/18, and represents the reinvestment of dividends and capital gains in the Portfolio.
Past performance does not guarantee future results. The performance data quoted represents past performance and current returns may be lower or higher. The investment return and principal value will fluctuate so that an investor’s shares, when redeemed, may be worth more or less than the original cost. To obtain performance information current to the most recent month end, please call (800) 242-9596.
The Portfolio’s performance above is compared to the Bloomberg Barclays U.S. Securitized Index. The index is unmanaged and does not reflect the deduction of fees associated with a mutual fund, such as investment management and fund accounting fees, or the deduction of taxes. An investor cannot invest directly in an index. The performance of The U.S. Mortgage/Asset Backed Fixed Income Portfolio reflects the deduction of fees for these value-added services, but does not reflect the deduction of taxes that a shareholder would pay on the Portfolio’s distributions or redemptions of the Portfolio’s shares.
Expense Ratio
HC Strategic Shares 0.26%
This information is included in the most current prospectus available to current and prospective shareholders of the Portfolio. Additional information pertaining to the June 30, 2018, expense ratios can be found in the financial highlights.
37
The Short-Term Municipal Bond Portfolio
(Unaudited)
The Short-Term Municipal Bond Portfolio managed by Breckinridge Capital Advisors, Inc. (“Breckinridge”) returned 0.34% for the fiscal year compared to 0.72% for the ICE BofA Merrill Lynch 1-3 Year Municipal Index1 and 0.69% for the average manager in the Lipper2 universe of Short Municipal Debt Funds.
During the fiscal year, municipal bonds generated modestly positive results. Breckinridge has a modest overweight to longer duration bonds and a higher quality bias. Both factors (longer duration and higher quality bias) were detractors and resulted in the strategy underperforming the benchmark and the peer universe for the fiscal year 2018.
| 1 | The ICE BofA Merrill Lynch 1-3 Year Municipal Index is an unmanaged, equal-weighted index that tracks the total return performance of the domestic U.S. municipal market. The index consists of investment grade, publicly traded, fixed-rate and coupon bearing municipal securities with a maturity of one to three years. This index is unmanaged, thus the index results do not reflect the impact of expenses associated with any investment in securities, such as brokerage commission or other transaction costs. Benchmark performance is shown for comparison purposes only, as it is not possible to invest directly in a securities index. |
| 2 | Lipper, Inc. is an independent statistical monitoring organization that organization compiles performance on mutual funds and further categorizes them by investment objective. |
38
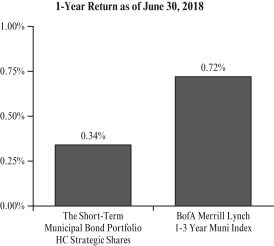
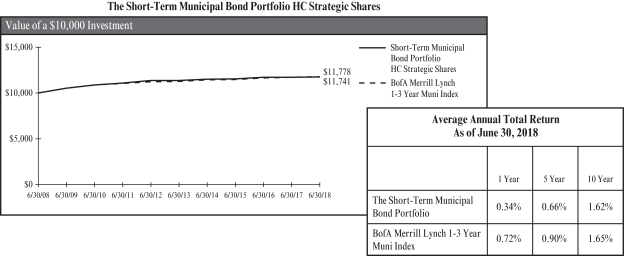
The chart represents historical performance of a hypothetical investment of $10,000 in The Short-Term Municipal Bond Portfolio for the 10-year period ended 6/30/18, and represents the reinvestment of dividends and capital gains in the Portfolio.
Past performance does not guarantee future results. The performance data quoted represents past performance and current returns may be lower or higher. The investment return and principal value will fluctuate so that an investor’s shares, when redeemed, may be worth more or less than the original cost. To obtain performance information current to the most recent month end, please call (800) 242-9596.
The Portfolio’s performance above is compared to the BofA Merrill Lynch 1-3 Year Muni Index. The index is unmanaged and does not reflect the deduction of fees associated with a mutual fund, such as investment management and fund accounting fees, or the deduction of taxes. An investor cannot invest directly in an index. The performance of The Short-Term Municipal Bond Portfolio reflects the deduction of fees for these value-added services, but does not reflect the deduction of taxes that a shareholder would pay on the Portfolio’s distributions or redemptions of the Portfolio’s shares.
Expense Ratio
HC Strategic Shares 0.36%
This information is included in the most current prospectus available to current and prospective shareholders of the Portfolio. Additional information pertaining to the June 30, 2018, expense ratios can be found in the financial highlights.
39
The Intermediate Term Municipal Bond Portfolio
(Unaudited)
The Intermediate Term Municipal Bond Portfolio managed by BNY Mellon Asset Management North America Corporation (“BNY Mellon AMNA-Standish”) (formerly Standish Mellon Asset Management Company LLC) returned 0.13% for the fiscal year compared to 1.02% for the Bloomberg Barclays 3-15 Year Blend Municipal Index1 and 1.07% for average manager in the Lipper2 Intermediate Municipal Debt Funds universe.
The BNY Mellon AMNA-Standish strategy underperformed the benchmark during the twelve-month reporting period. An overweight to revenue bonds compared to general obligation bonds, a slight overweight to higher rated issues and yield curve positioning towards the shorter end of the curve were detractors contributing to the underperformance during the fiscal year.
| 1 | The Bloomberg Barclays 3-15 Year Blend Municipal Index is an index of government bonds. This index is unmanaged, thus the index results do not reflect the impact of expenses associated with any investment in securities, such as brokerage commission or other transaction costs. Benchmark performance is shown for comparison purposes only, as it is not possible to invest directly in a securities index. |
| 2 | Lipper, Inc. is an independent statistical monitoring organization that compiles performance on mutual funds and further categorizes them by investment objective. |
40
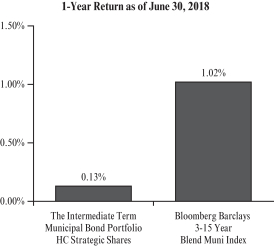
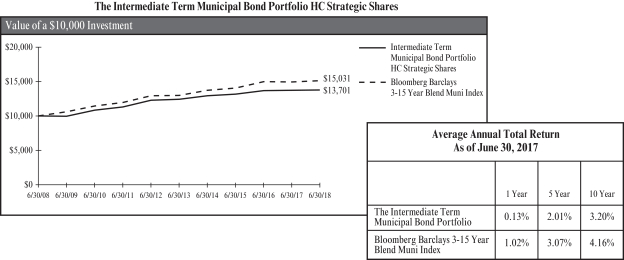
The chart represents historical performance of a hypothetical investment of $10,000 in The Intermediate Term Municipal Bond Portfolio for the 10-year period ended 6/30/18, and represents the reinvestment of dividends and capital gains in the Portfolio.
Past performance does not guarantee future results. The performance data quoted represents past performance and current returns may be lower or higher. The investment return and principal value will fluctuate so that an investor’s shares, when redeemed, may be worth more or less than the original cost. To obtain performance information current to the most recent month end, please call (800) 242-9596.
The Portfolio’s performance above is compared to the Bloomberg Barclays 3-15 Year Blend Muni Index. The index is unmanaged and does not reflect the deduction of fees associated with a mutual fund, such as investment management and fund accounting fees, or the deduction of taxes. An investor cannot invest directly in an index. The performance of The Intermediate Term Municipal Bond Portfolio reflects the deduction of fees for these value-added services, but does not reflect the deduction of taxes that a shareholder would pay on the Portfolio’s distributions or redemptions of the Portfolio’s shares.
Expense Ratio
HC Strategic Shares 0.34%
HC Advisors Shares 0.59%1
| 1 | HC Advisors Shares include Distribution Plan fees of 0.25% which are voluntarily waived by the Adviser. Such waiver is not reflected in the expense ratio shown. |
This information is included in the most current prospectus available to current and prospective shareholders of the Portfolio. Additional information pertaining to the June 30, 2018, expense ratios can be found in the financial highlights.
41
The Intermediate Term Municipal Bond II Portfolio
(Unaudited)
The Intermediate Term Municipal Bond II Portfolio managed by Breckinridge Capital Advisors, Inc. (“Breckinridge”) returned 0.07% compared to 0.18% for the Bloomberg Barclays 5-Year General Obligation Municipal Index1 and 1.07% for average manager in the Lipper2 Intermediate Municipal Debt Funds universe.
The Breckinridge strategy underperformed the benchmark and the peer universe due to higher duration and a higher quality bias than the benchmark for the fiscal year end. Breckinridge maintains a diversified portfolio structure invested only in high-grade, intermediate-term municipal bonds.
| 1 | The Bloomberg Barclays 5-Year General Obligation Municipal Index is an unmanaged index generally representative of investment grade fixed rate debt obligations issued by state and local government entities, with maturities of no more than six years. |
| 2 | Lipper, Inc. is an independent statistical monitoring organization that compiles performance on mutual funds and further categorizes them by investment objective. |
42
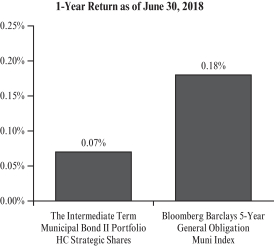
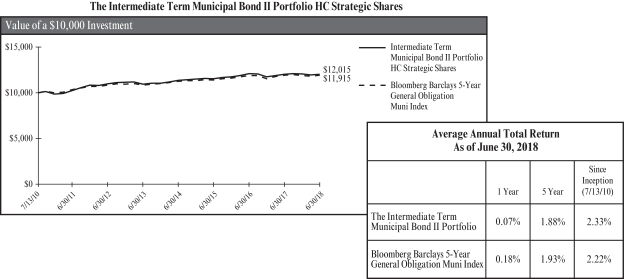
The chart represents historical performance of a hypothetical investment of $10,000 in The Intermediate Term Municipal Bond II Portfolio from 7/13/10 to 6/30/18, and represents the reinvestment of dividends and capital gains in the Portfolio.
Past performance does not guarantee future results. The performance data quoted represents past performance and current returns may be lower or higher. The investment return and principal value will fluctuate so that an investor’s shares, when redeemed, may be worth more or less than the original cost. To obtain performance information current to the most recent month end, please call (800) 242-9596.
The Portfolio’s performance above is compared to the Bloomberg Barclays 5-Year General Obligation Muni Index. The index is unmanaged and does not reflect the deduction of fees associated with a mutual fund, such as investment management and fund accounting fees, or the deduction of taxes. An investor cannot invest directly in an index. The performance of The Intermediate Term Municipal Bond II Portfolio reflects the deduction of fees for these value-added services, but does not reflect the deduction of taxes that a shareholder would pay on the Portfolio’s distributions or redemptions of the Portfolio’s shares.
Expense Ratio
HC Strategic Shares 0.35%
HC Advisors Shares 0.60%1
| 1 | HC Advisors Shares include Distribution Plan fees of 0.25% which are voluntarily waived by the Adviser. Such waiver is not reflected in the expense ratio shown. |
This information is included in the most current prospectus available to current and prospective shareholders of the Portfolio. Additional information pertaining to the June 30, 2018, expense ratios can be found in the financial highlights.
43
Conclusion
The performance of the Portfolios for the fiscal year was consistent with our expectations. For the U.S. equity market, our current judgment is that the risk/reward relationship is roughly balanced compared to history. Our decision to overweight companies with higher quality and/or dividend yield characteristics reflects this relatively conservative posture.
We continue to seek to add new portfolios as appropriate to broaden the opportunity set of investment portfolios available to our clients for fulfilling their asset allocation and investment policy objectives. We also continue to maintain a comprehensive dual-track, investment management and compliance review and due diligence processes to identify, select, implement, monitor and manage the investment managers and investment strategies we employ within each Portfolio.
Finally, we are constantly seeking ways to improve our management of each Portfolio. To that end, over the period we continued to adjust our custom defined investment style portfolio strategies to express the most attractive return opportunities. We continue to explore new strategies that exploit more differentiated opportunities among factor-based investment styles.
As ever, we appreciate your continued trust and confidence.
HC Capital Solutions
44
HC CAPITAL TRUST
The Value Equity Portfolio
Portfolio of Investments — June 30, 2018
| | | | | | | | |
| Shares | | | Security Description | | Value
(000) | |
| | | | Common Stocks — 92.59% | |
| | | | Aerospace & Defense — 2.47% | |
| | 4,050 | | | General Dynamics Corp. | | $ | 755 | |
| | 1,299 | | | Hexcel Corp. | | | 86 | |
| | 565 | | | Huntington Ingalls Industries, Inc. | | | 122 | |
| | 438 | | | L3 Technologies, Inc. | | | 84 | |
| | 5,553 | | | Lockheed Martin Corp. | | | 1,641 | |
| | 32,806 | | | Raytheon Co. | | | 6,338 | |
| | 679 | | | Spirit Aerosystems Holdings, Inc., Class – A | | | 58 | |
| | 200 | | | Teledyne Technologies, Inc. (a) | | | 40 | |
| | 4,843 | | | Textron, Inc. | | | 319 | |
| | 8,265 | | | The Boeing Co. | | | 2,773 | |
| | 20,736 | | | United Technologies Corp. | | | 2,593 | |
| | | | | | | | |
| | | | | | | 14,809 | |
| | | | | | | | |
| | | | Air Freight & Logistics — 0.43% | |
| | 305 | | | Expeditors International of Washington, Inc. | | | 22 | |
| | 23,747 | | | United Parcel Service, Inc., Class – B | | | 2,523 | |
| | 200 | | | XPO Logistics, Inc. (a) | | | 20 | |
| | | | | | | | |
| | | | | | | 2,565 | |
| | | | | | | | |
| | | | Airlines — 0.38% | |
| | 4,639 | | | Alaska Air Group, Inc. | | | 280 | |
| | 1,426 | | | American Airlines Group, Inc. | | | 54 | |
| | 863 | | | Copa Holdings SA, Class – A | | | 82 | |
| | 27,057 | | | Delta Air Lines, Inc. | | | 1,341 | |
| | 7,575 | | | JetBlue Airways Corp. (a) | | | 144 | |
| | 996 | | | Spirit Airlines, Inc. (a) | | | 36 | |
| | 5,485 | | | United Continental Holdings, Inc. (a) | | | 382 | |
| | | | | | | | |
| | | | | | | 2,319 | |
| | | | | | | | |
| | | | Auto Components — 1.15% | |
| | 1,070 | | | BorgWarner, Inc. | | | 46 | |
| | 672 | | | Delphi Technologies PLC | | | 31 | |
| | 585 | | | Gentex Corp. | | | 13 | |
| | 1,903 | | | Goodyear Tire & Rubber Co. | | | 44 | |
| | 12,869 | | | Lear Corp. | | | 2,392 | |
| | 75,082 | | | Magna International, Inc., ADR | | | 4,364 | |
| | | | | | | | |
| | | | | | | 6,890 | |
| | | | | | | | |
| | | | Automobiles — 0.66% | |
| | 149,185 | | | Ford Motor Co. | | | 1,651 | |
| | 41,348 | | | General Motors Co. | | | 1,629 | |
| | 16,774 | | | Harley-Davidson, Inc. | | | 706 | |
| | | | | | | | |
| | | | | | | 3,986 | |
| | | | | | | | |
| | | | Banks — 9.26% | |
| | 7,391 | | | Associated Banc-Corp. | | | 202 | |
| | 412,261 | | | Bank of America Corp. | | | 11,623 | |
| | 1,701 | | | Bank of Hawaii Corp. | | | 142 | |
| | 2,113 | | | Bank of the Ozarks, Inc. | | | 95 | |
| | 4,331 | | | BankUnited, Inc. | | | 177 | |
| | 34,809 | | | BB&T Corp. | | | 1,756 | |
| | 345 | | | BOK Financial Corp. | | | 32 | |
| | 2,618 | | | CIT Group, Inc. | | | 132 | |
| | 41,328 | | | Citigroup, Inc. | | | 2,766 | |
| | 9,728 | | | Citizens Financial Group, Inc. | | | 378 | |
| | 49,550 | | | Comerica, Inc. | | | 4,505 | |
| | 1,856 | | | Commerce Bancshares, Inc. | | | 120 | |
| | 2,281 | | | Cullen/Frost Bankers, Inc. | | | 247 | |
| | | | | | | | |
| Shares | | | Security Description | | Value
(000) | |
| | | | Banks (continued) | |
| | 2,791 | | | East West Bancorp, Inc. | | $ | 182 | |
| | 13,936 | | | Fifth Third Bancorp | | | 400 | |
| | 2,152 | | | First Hawaiian, Inc. | | | 62 | |
| | 12,236 | | | First Horizon National Corp. | | | 218 | |
| | 2,455 | | | First Republic Bank | | | 238 | |
| | 11,279 | | | FNB Corp. | | | 151 | |
| | 58,498 | | | Huntington Bancshares, Inc. | | | 863 | |
| | 95,855 | | | JPMorgan Chase & Co. | | | 9,989 | |
| | 60,656 | | | KeyCorp | | | 1,185 | |
| | 2,821 | | | M&T Bank Corp. | | | 480 | |
| | 5,542 | | | PacWest Bancorp | | | 274 | |
| | 14,461 | | | People’s United Financial, Inc. | | | 262 | |
| | 268 | | | Pinnacle Financial Partners, Inc. | | | 16 | |
| | 8,772 | | | PNC Financial Services Group, Inc. | | | 1,185 | |
| | 9,580 | | | Popular, Inc. | | | 433 | |
| | 1,353 | | | Prosperity Bancshares, Inc. | | | 92 | |
| | 22,879 | | | Regions Financial Corp. | | | 407 | |
| | 769 | | | Signature Bank (a) | | | 98 | |
| | 21,859 | | | SunTrust Banks, Inc. | | | 1,443 | |
| | 822 | | | SVB Financial Group (a) | | | 237 | |
| | 660 | | | Synovus Financial Corp. | | | 35 | |
| | 6,844 | | | TCF Financial Corp. | | | 168 | |
| | 73,369 | | | U.S. Bancorp | | | 3,670 | |
| | 545 | | | Webster Financial Corp. | | | 35 | |
| | 197,452 | | | Wells Fargo & Co. | | | 10,948 | |
| | 1,588 | | | Western Alliance Bancorp (a) | | | 90 | |
| | 3,966 | | | Zions Bancorp | | | 209 | |
| | | | | | | | |
| | | | | | | 55,545 | |
| | | | | | | | |
| | | | Beverages — 1.38% | |
| | 22 | | | Brown-Forman Corp., Class – A | | | 1 | |
| | 80 | | | Brown-Forman Corp., Class – B | | | 4 | |
| | 4,414 | | | Monster Beverage Corp. (a) | | | 253 | |
| | 34,404 | | | PepsiCo, Inc. | | | 3,746 | |
| | 97,231 | | | The Coca-Cola Co. | | | 4,264 | |
| | | | | | | | |
| | | | | | | 8,268 | |
| | | | | | | | |
| | | | Biotechnology — 2.57% | |
| | 30,010 | | | AbbVie, Inc. | | | 2,780 | |
| | 52 | | | Agios Pharmaceuticals, Inc. (a) | | | 4 | |
| | 8,485 | | | Alexion Pharmaceuticals, Inc. (a) | | | 1,053 | |
| | 20,149 | | | Amgen, Inc. | | | 3,719 | |
| | 2,178 | | | Biogen Idec, Inc. (a) | | | 632 | |
| | 101,371 | | | Gilead Sciences, Inc. | | | 7,182 | |
| | 447 | | | United Therapeutics Corp. (a) | | | 51 | |
| | | | | | | | |
| | | | | | | 15,421 | |
| | | | | | | | |
| | | | Building Products — 0.35% | |
| | 1,226 | | | Allegion PLC | | | 95 | |
| | 11,691 | | | Fortune Brands Home & Security, Inc. | | | 628 | |
| | 33,732 | | | Johnson Controls International PLC | | | 1,128 | |
| | 16 | | | Lennox International, Inc. | | | 3 | |
| | 613 | | | Masco Corp. | | | 23 | |
| | 2,048 | | | Owens Corning, Inc. | | | 130 | |
| | 1,649 | | | USG Corp. (a) | | | 71 | |
| | | | | | | | |
| | | | | | | 2,078 | |
| | | | | | | | |
See accompanying notes to financial statements.
45
HC CAPITAL TRUST
The Value Equity Portfolio
Portfolio of Investments (continued) — June 30, 2018
| | | | | | | | |
| Shares | | | Security Description | | Value
(000) | |
| | | | Common Stocks (continued) | |
| | | | Capital Markets — 2.28% | |
| | 720 | | | Affiliated Managers Group, Inc. | | $ | 107 | |
| | 4,162 | | | Ameriprise Financial, Inc. | | | 582 | |
| | 12,942 | | | Bank of New York Mellon Corp. | | | 698 | |
| | 5,527 | | | BGC Partners, Inc., Class – A | | | 63 | |
| | 3,698 | | | BlackRock, Inc., Class – A | | | 1,846 | |
| | 1,669 | | | CME Group, Inc. | | | 274 | |
| | 1,544 | | | E*Trade Financial Corp. (a) | | | 94 | |
| | 3,934 | | | Eaton Vance Corp. | | | 205 | |
| | 3,145 | | | Federated Investors, Inc., Class – B | | | 73 | |
| | 27,031 | | | Franklin Resources, Inc. | | | 866 | |
| | 19,142 | | | Goldman Sachs Group, Inc. | | | 4,223 | |
| | 427 | | | Interactive Brokers Group, Inc., Class – A | | | 28 | |
| | 1,491 | | | IntercontinentalExchange Group, Inc. | | | 110 | |
| | 18,503 | | | Invesco Ltd. | | | 492 | |
| | 5,615 | | | Jefferies Financial Group, Inc. | | | 128 | |
| | 4,364 | | | Lazard Ltd., Class – A | | | 213 | |
| | 4,844 | | | Legg Mason, Inc. | | | 168 | |
| | 22,245 | | | Morgan Stanley | | | 1,054 | |
| | 3,733 | | | Northern Trust Corp. | | | 384 | |
| | 2,211 | | | Raymond James Financial, Inc. | | | 198 | |
| | 6,923 | | | State Street Corp. | | | 644 | |
| | 9,375 | | | T. Rowe Price Group, Inc. | | | 1,088 | |
| | 162 | | | TD Ameritrade Holding Corp. | | | 9 | |
| | 1,370 | | | The Charles Schwab Corp. | | | 70 | |
| | 629 | | | The NASDAQ OMX Group, Inc. | | | 57 | |
| | | | | | | | |
| | | | | | | 13,674 | |
| | | | | | | | |
| | | | Chemicals — 2.36% | |
| | 9,498 | | | Air Products & Chemicals, Inc. | | | 1,479 | |
| | 505 | | | Albemarle Corp. | | | 48 | |
| | 349 | | | Ashland Global Holdings, Inc. | | | 27 | |
| | 1,643 | | | Cabot Corp. | | | 101 | |
| | 1,734 | | | Celanese Corp., Series A | | | 193 | |
| | 53,440 | | | CF Industries Holdings, Inc. | | | 2,373 | |
| | 79,533 | | | DowDuPont, Inc. | | | 5,242 | |
| | 5,815 | | | Eastman Chemical Co. | | | 581 | |
| | 6,961 | | | Huntsman Corp. | | | 203 | |
| | 11,571 | | | LyondellBasell Industries N.V., Class – A | | | 1,271 | |
| | 3,433 | | | Olin Corp. | | | 99 | |
| | 13,146 | | | Praxair, Inc. | | | 2,079 | |
| | 4,149 | | | RPM International, Inc. | | | 242 | |
| | 5,874 | | | The Mosaic Co. | | | 165 | |
| | 983 | | | The Scotts Miracle-Gro Co. | | | 82 | |
| | 111 | | | Westlake Chemical Corp. | | | 12 | |
| | | | | | | | |
| | | | | | | 14,197 | |
| | | | | | | | |
| | | | Commercial Services & Supplies — 0.44% | |
| | 11,948 | | | Clean Harbors, Inc. (a) | | | 664 | |
| | 1,532 | | | Copart, Inc. (a) | | | 87 | |
| | 3,003 | | | KAR Auction Services, Inc. | | | 165 | |
| | 7,118 | | | Pitney Bowes, Inc. | | | 61 | |
| | 1,304 | | | Republic Services, Inc., Class – A | | | 89 | |
| | 12,081 | | | Stericycle, Inc. (a) | | | 788 | |
| | 9,591 | | | Waste Management, Inc. | | | 780 | |
| | | | | | | | |
| | | | | | | 2,634 | |
| | | | | | | | |
| | | | | | | | |
| Shares | | | Security Description | | Value
(000) | |
| | | | Communications Equipment — 1.38% | |
| | 2,305 | | | Arris International PLC (a) | | $ | 56 | |
| | 152,568 | | | Cisco Systems, Inc. | | | 6,566 | |
| | 259 | | | EchoStar Corp., Class – A (a) | | | 11 | |
| | 836 | | | F5 Networks, Inc. (a) | | | 144 | |
| | 515 | | | Harris Corp. | | | 74 | |
| | 22,253 | | | Juniper Networks, Inc. | | | 611 | |
| | 826 | | | Motorola Solutions, Inc. | | | 96 | |
| | 123,443 | | | Nokia Corp., ADR | | | 710 | |
| | | | | | | | |
| | | | | | | 8,268 | |
| | | | | | | | |
| | | | Construction & Engineering — 0.07% | |
| | 1,986 | | | AECOM Technology Corp. (a) | | | 66 | |
| | 1,788 | | | Fluor Corp. | | | 87 | |
| | 2,235 | | | Jacobs Engineering Group, Inc. | | | 142 | |
| | 2,491 | | | Quanta Services, Inc. (a) | | | 83 | |
| | 280 | | | Valmont Industries, Inc. | | | 42 | |
| | | | | | | | |
| | | | | | | 420 | |
| | | | | | | | |
| | | | Construction Materials — 0.01% | |
| | 486 | | | Eagle Materials, Inc., Class – A | | | 51 | |
| | | | | | | | |
| | | | Consumer Finance — 2.15% | |
| | 8,251 | | | Ally Financial, Inc. | | | 217 | |
| | 31,564 | | | American Express Co. | | | 3,093 | |
| | 47,949 | | | Capital One Financial Corp. | | | 4,407 | |
| | 155 | | | Credit Acceptance Corp. (a) | | | 55 | |
| | 6,592 | | | Discover Financial Services | | | 464 | |
| | 11,988 | | | Navient Corp. | | | 156 | |
| | 40,816 | | | OneMain Holdings, Inc. (a) | | | 1,359 | |
| | 2,682 | | | Santander Consumer USA Holdings, Inc. | | | 51 | |
| | 7,983 | | | SLM Corp. (a) | | | 91 | |
| | 90,332 | | | Synchrony Financial | | | 3,015 | |
| | | | | | | | |
| | | | | | | 12,908 | |
| | | | | | | | |
| | | | Containers & Packaging — 0.34% | |
| | 262 | | | AptarGroup, Inc. | | | 24 | |
| | 27 | | | Avery Dennison Corp. | | | 3 | |
| | 3,079 | | | Bemis Company, Inc. | | | 130 | |
| | 1,314 | | | Berry Plastics Group, Inc. (a) | | | 60 | |
| | 1,315 | | | Crown Holdings, Inc. (a) | | | 59 | |
| | 553 | | | Graphic Packaging Holding Co. | | | 8 | |
| | 13,466 | | | International Paper Co. | | | 702 | |
| | 2,050 | | | Packaging Corporation of America | | | 229 | |
| | 747 | | | Silgan Holdings | | | 20 | |
| | 2,452 | | | Sonoco Products Co. | | | 129 | |
| | 12,063 | | | WestRock Co. | | | 688 | |
| | | | | | | | |
| | | | | | | 2,052 | |
| | | | | | | | |
| | | | Distributors — 0.09% | |
| | 5,994 | | | Genuine Parts Co. | | | 550 | |
| | | | | | | | |
| | | | Diversified Consumer Services — 0.03% | |
| | 33 | | | Graham Holdings Co. | | | 19 | |
| | 6,788 | | | H&R Block, Inc. | | | 155 | |
| | | | | | | | |
| | | | | | | 174 | |
| | | | | | | | |
| | | | Diversified Financial Services — 1.22% | |
| | 38,849 | | | Berkshire Hathaway, Inc., Class – B (a) | | | 7,251 | |
| | 973 | | | Voya Financial, Inc. | | | 46 | |
| | | | | | | | |
| | | | | | | 7,297 | |
| | | | | | | | |
See accompanying notes to financial statements.
46
HC CAPITAL TRUST
The Value Equity Portfolio
Portfolio of Investments (continued) — June 30, 2018
| | | | | | | | |
| Shares | | | Security Description | | Value
(000) | |
| | | | Common Stocks (continued) | |
| | | | Diversified Telecommunication Services — 1.23% | |
| | 87,680 | | | AT&T, Inc. | | $ | 2,815 | |
| | 8,938 | | | CenturyLink, Inc. | | | 167 | |
| | 85,260 | | | Verizon Communications, Inc. | | | 4,290 | |
| | 2,498 | | | Zayo Group Holdings, Inc. (a) | | | 91 | |
| | | | | | | | |
| | | | | | | 7,363 | |
| | | | | | | | |
| | | | Electric Utilities — 2.72% | |
| | 2,144 | | | Alliant Energy Corp. | | | 91 | |
| | 50,227 | | | American Electric Power, Inc. | | | 3,479 | |
| | 822 | | | Avangrid, Inc. | | | 44 | |
| | 31,577 | | | Duke Energy Corp. | | | 2,497 | |
| | 37,577 | | | Edison International | | | 2,377 | |
| | 1,595 | | | Entergy Corp. | | | 129 | |
| | 3,710 | | | Evergy, Inc. | | | 208 | |
| | 14,064 | | | Eversource Energy | | | 824 | |
| | 18,505 | | | Exelon Corp. | | | 788 | |
| | 5,434 | | | FirstEnergy Corp. | | | 195 | |
| | 2,048 | | | Hawaiian Electric Industries, Inc. | | | 70 | |
| | 9,020 | | | NextEra Energy, Inc. | | | 1,507 | |
| | 3,260 | | | OGE Energy Corp. | | | 115 | |
| | 1,593 | | | Pinnacle West Capital Corp. | | | 128 | |
| | 43,385 | | | PPL Corp. | | | 1,239 | |
| | 48,022 | | | The Southern Co. | | | 2,224 | |
| | 8,718 | | | Xcel Energy, Inc. | | | 398 | |
| | | | | | | | |
| | | | | | | 16,313 | |
| | | | | | | | |
| | | | Electrical Equipment — 0.99% | |
| | 537 | | | Acuity Brands, Inc. | | | 62 | |
| | 14,763 | | | AMETEK, Inc. | | | 1,065 | |
| | 18,868 | | | Eaton Corp. PLC | | | 1,410 | |
| | 35,946 | | | Emerson Electric Co. | | | 2,486 | |
| | 1,753 | | | Hubbell, Inc. | | | 185 | |
| | 15,953 | | | nVent Electric PLC (a) | | | 400 | |
| | 4,146 | | | Regal-Beloit Corp. | | | 339 | |
| | 481 | | | Sensata Technologies Holding PLC (a) | | | 23 | |
| | | | | | | | |
| | | | | | | 5,970 | |
| | | | | | | | |
| | | | Electronic Equipment, Instruments &
Components — 0.18% | |
| | 1,164 | | | Arrow Electronics, Inc. (a) | | | 88 | |
| | 1,600 | | | Avnet, Inc. | | | 69 | |
| | 26,211 | | | Corning, Inc. | | | 720 | |
| | 1,055 | | | Dolby Laboratories, Inc., Class – A | | | 65 | |
| | 1,811 | | | FLIR Systems, Inc. | | | 94 | |
| | 1,050 | | | Keysight Technologies, Inc. (a) | | | 62 | |
| | | | | | | | |
| | | | | | | 1,098 | |
| | | | | | | | |
| | | | Energy Equipment & Services — 0.92% | |
| | 371 | | | Apergy Corp. (a) | | | 15 | |
| | 5,359 | | | Baker Hughes, Inc. | | | 177 | |
| | 1,586 | | | Halliburton Co. | | | 71 | |
| | 4,327 | | | Helmerich & Payne, Inc. | | | 276 | |
| | 13,484 | | | Nabors Industries Ltd. | | | 86 | |
| | 8,585 | | | National Oilwell Varco, Inc. | | | 373 | |
| | 3,780 | | | Oceaneering International, Inc. | | | 96 | |
| | 1,235 | | | RPC, Inc.^ | | | 18 | |
| | | | | | | | |
| Shares | | | Security Description | | Value
(000) | |
| | | | Energy Equipment & Services (continued) | |
| | 64,853 | | | Schlumberger Ltd. | | $ | 4,348 | |
| | 2,301 | | | Transocean Ltd. (a) | | | 31 | |
| | | | | | | | |
| | | | | | | 5,491 | |
| | | | | | | | |
| | | | Equity Real Estate Investment Trusts — 5.16% | |
| | 2,286 | | | Alexandria Real Estate Equities, Inc. | | | 288 | |
| | 20,695 | | | American Campus Communities, Inc. | | | 887 | |
| | 1,289 | | | American Homes 4 Rent, Class – A | | | 29 | |
| | 4,005 | | | Apartment Investment & Management Co.,
Class – A | | | 169 | |
| | 42,096 | | | Apple Hospitality REIT, Inc. | | | 753 | |
| | 9,514 | | | AvalonBay Communities, Inc. | | | 1,636 | |
| | 3,481 | | | Boston Properties, Inc. | | | 437 | |
| | 4,364 | | | Brandywine Realty Trust | | | 74 | |
| | 7,200 | | | Brixmor Property Group, Inc. | | | 125 | |
| | 8,924 | | | Camden Property Trust | | | 813 | |
| | 2,862 | | | Colony Capital, Inc. | | | 18 | |
| | 2,528 | | | Columbia Property Trust, Inc. | | | 57 | |
| | 2,519 | | | CoreCivic, Inc. | | | 60 | |
| | 630 | | | Coresite Realty Corp. | | | 70 | |
| | 2,267 | | | Corporate Office Properties Trust | | | 66 | |
| | 7,791 | | | Crown Castle International Corp. | | | 840 | |
| | 3,669 | | | CubeSmart | | | 118 | |
| | 2,018 | | | CyrusOne, Inc. | | | 118 | |
| | 2,344 | | | DCT Industrial Trust, Inc. | | | 156 | |
| | 3,979 | | | DDR Corp. | | | 71 | |
| | 3,941 | | | Digital Realty Trust, Inc. | | | 440 | |
| | 3,087 | | | Douglas Emmett, Inc. | | | 124 | |
| | 8,053 | | | Duke Realty Corp. | | | 234 | |
| | 2,797 | | | Empire State Realty Trust, Inc., Class – A | | | 48 | |
| | 11,119 | | | EPR Properties | | | 720 | |
| | 1,337 | | | Equinix, Inc. | | | 575 | |
| | 606 | | | Equity Commonwealth (a) | | | 19 | |
| | 1,648 | | | Equity Lifestyle Properties, Inc. | | | 151 | |
| | 8,248 | | | Equity Residential | | | 525 | |
| | 5,323 | | | Essex Property Trust, Inc. | | | 1,274 | |
| | 2,281 | | | Extra Space Storage, Inc. | | | 228 | |
| | 7,953 | | | Federal Realty Investment Trust | | | 1,006 | |
| | 5,595 | | | Forest City Realty Trust, Inc., Class – A | | | 128 | |
| | 4,638 | | | Gaming & Leisure Properties, Inc. | | | 166 | |
| | 14,460 | | | GGP, Inc. | | | 295 | |
| | 11,429 | | | HCP, Inc. | | | 295 | |
| | 31,243 | | | Healthcare Trust of America, Inc., Class – A | | | 842 | |
| | 17,756 | | | Highwoods Properties, Inc. | | | 901 | |
| | 4,247 | | | Hospitality Properties Trust | | | 122 | |
| | 20,370 | | | Host Hotels & Resorts, Inc. | | | 429 | |
| | 3,567 | | | Hudson Pacific Property, Inc. | | | 126 | |
| | 1,566 | | | Invitation Homes, Inc. | | | 36 | |
| | 5,681 | | | Iron Mountain, Inc. | | | 199 | |
| | 1,456 | | | JBG Smith Properties | | | 53 | |
| | 2,236 | | | Kilroy Realty Corp. | | | 169 | |
| | 4,197 | | | Kimco Realty Corp. | | | 71 | |
| | 1,416 | | | Lamar Advertising Co., Class – A | | | 97 | |
| | 3,193 | | | Liberty Property Trust | | | 142 | |
| | 1,366 | | | Life Storage, Inc. | | | 133 | |
| | 7,938 | | | Medical Properties Trust, Inc. | | | 111 | |
See accompanying notes to financial statements.
47
HC CAPITAL TRUST
The Value Equity Portfolio
Portfolio of Investments (continued) — June 30, 2018
| | | | | | | | |
| Shares | | | Security Description | | Value
(000) | |
| | | | Common Stocks (continued) | |
| | | | Equity Real Estate Investment Trusts (continued) | |
| | 2,758 | | | Mid-America Apartment Communities, Inc. | | $ | 278 | |
| | 3,912 | | | National Retail Properties, Inc. | | | 172 | |
| | 5,399 | | | OMEGA Healthcare Investors, Inc. | | | 167 | |
| | 3,536 | | | Outfront Media, Inc. | | | 69 | |
| | 48,503 | | | Paramount Group, Inc. | | | 747 | |
| | 4,182 | | | Parks Hotels & Resorts, Inc. | | | 128 | |
| | 3,571 | | | Piedmont Office Realty Trust, Inc., Class – A | | | 71 | |
| | 15,474 | | | Prologis, Inc. | | | 1,016 | |
| | 3,022 | | | Public Storage | | | 686 | |
| | 3,267 | | | Rayonier, Inc. | | | 126 | |
| | 23,745 | | | Realty Income Corp. | | | 1,278 | |
| | 16,316 | | | Regency Centers Corp. | | | 1,013 | |
| | 6,027 | | | Retail Properties of America, Inc., Class – A | | | 77 | |
| | 5,930 | | | Senior Housing Properties Trust | | | 107 | |
| | 6,759 | | | Simon Property Group, Inc. | | | 1,150 | |
| | 2,344 | | | SL Green Realty Corp. | | | 236 | |
| | 1,241 | | | Spirit MTA REIT (a) | | | 13 | |
| | 12,424 | | | Spirit Realty Capital, Inc. | | | 100 | |
| | 4,135 | | | Store Capital Corp. | | | 113 | |
| | 2,079 | | | Sun Communities, Inc. | | | 203 | |
| | 32,107 | | | Tanger Factory Outlet Centers, Inc. | | | 754 | |
| | 1,044 | | | Taubman Centers, Inc. | | | 61 | |
| | 3,559 | | | The Macerich Co. | | | 202 | |
| | 26,165 | | | UDR, Inc. | | | 982 | |
| | 9,303 | | | Ventas, Inc. | | | 530 | |
| | 21,723 | | | VEREIT, Inc. | | | 162 | |
| | 15,941 | | | Vornado Realty Trust | | | 1,179 | |
| | 3,248 | | | Weingarten Realty Investors | | | 100 | |
| | 27,609 | | | Welltower, Inc. | | | 1,732 | |
| | 24,140 | | | Weyerhaeuser Co. | | | 880 | |
| | 2,734 | | | WP Carey, Inc. | | | 181 | |
| | | | | | | | |
| | | | | | | 30,957 | |
| | | | | | | | |
| | | | Food & Staples Retailing — 1.54% | |
| | 2,997 | | | Casey’s General Stores, Inc. | | | 315 | |
| | 31,693 | | | CVS Caremark Corp. | | | 2,039 | |
| | 10,797 | | | Sysco Corp. | | | 737 | |
| | 13,834 | | | The Kroger Co. | | | 394 | |
| | 1,201 | | | US Foods Holding Corp. (a) | | | 45 | |
| | 6,908 | | | Walgreens Boots Alliance, Inc. | | | 415 | |
| | 61,852 | | | Wal-Mart Stores, Inc. | | | 5,298 | |
| | | | | | | | |
| | | | | | | 9,243 | |
| | | | | | | | |
| | | | Food Products — 3.15% | |
| | 70,128 | | | Archer-Daniels-Midland Co. | | | 3,214 | |
| | 17,171 | | | Bunge Ltd. | | | 1,197 | |
| | 14,623 | | | ConAgra Foods, Inc. | | | 522 | |
| | 6,795 | | | Flowers Foods, Inc. | | | 142 | |
| | 42,421 | | | General Mills, Inc. | | | 1,878 | |
| | 10,211 | | | Hershey Co. | | | 950 | |
| | 13,912 | | | Hormel Foods Corp. | | | 518 | |
| | 774 | �� | | Ingredion, Inc. | | | 86 | |
| | 19,372 | | | Kellogg Co. | | | 1,354 | |
| | 2,174 | | | Lamb Weston Holding, Inc. | | | 149 | |
| | | | | | | | |
| Shares | | | Security Description | | Value
(000) | |
| | | | Food Products (continued) | |
| | 59,031 | | | Mondelez International, Inc., Class – A | | $ | 2,420 | |
| | 589 | | | Pilgrim’s Pride Corp. (a) | | | 12 | |
| | 4,211 | | | Pinnacle Foods, Inc. | | | 274 | |
| | 2 | | | Seaboard Corp. | | | 8 | |
| | 1,065 | | | The Hain Celestial Group, Inc. (a) | | | 32 | |
| | 4,894 | | | The J.M. Smucker Co. | | | 526 | |
| | 15,720 | | | The Kraft Heinz Co. | | | 988 | |
| | 13,757 | | | TreeHouse Foods, Inc. (a) | | | 722 | |
| | 56,607 | | | Tyson Foods, Inc., Class – A | | | 3,896 | |
| | | | | | | | |
| | | | | | | 18,888 | |
| | | | | | | | |
| | | | Gas Utilities — 0.05% | |
| | 1,082 | | | Atmos Energy Corp. | | | 98 | |
| | 1,211 | | | National Fuel Gas Co. | | | 64 | |
| | 2,533 | | | UGI Corp. | | | 132 | |
| | | | | | | | |
| | | | | | | 294 | |
| | | | | | | | |
| | | | Health Care Equipment & Supplies — 1.76% | |
| | 48,674 | | | Abbott Laboratories | | | 2,968 | |
| | 2,545 | | | Baxter International, Inc. | | | 188 | |
| | 3,475 | | | Danaher Corp. | | | 343 | |
| | 13,402 | | | Dentsply Sirona, Inc. | | | 587 | |
| | 25 | | | Hill-Rom Holdings, Inc. | | | 2 | |
| | 70,816 | | | Medtronic PLC | | | 6,062 | |
| | 597 | | | Steris PLC | | | 63 | |
| | 212 | | | Teleflex, Inc. | | | 57 | |
| | 59 | | | The Cooper Companies, Inc. | | | 14 | |
| | 2,580 | | | Zimmer Holdings, Inc. | | | 288 | |
| | | | | | | | |
| | | | | | | 10,572 | |
| | | | | | | | |
| | | | Health Care Providers & Services — 1.94% | |
| | 20,579 | | | Aetna, Inc. | | | 3,777 | |
| | 1,431 | | | Anthem, Inc. | | | 341 | |
| | 3,042 | | | Centene Corp. (a) | | | 375 | |
| | 9,390 | | | CIGNA Corp. | | | 1,597 | |
| | 2,853 | | | DaVita Healthcare Partners, Inc. (a) | | | 198 | |
| | 10,108 | | | Express Scripts Holding Co. (a) | | | 780 | |
| | 1,525 | | | HCA Holdings, Inc. | | | 156 | |
| | 2,038 | | | Henry Schein, Inc. (a) | | | 148 | |
| | 1,906 | | | Humana, Inc. | | | 567 | |
| | 2,236 | | | Laboratory Corporation of America Holdings (a) | | | 401 | |
| | 467 | | | LifePoint Hospitals, Inc., Class – A (a) | | | 23 | |
| | 2,820 | | | McKesson Corp. | | | 376 | |
| | 1,188 | | | MEDNAX, Inc. (a) | | | 51 | |
| | 28,071 | | | Patterson Companies, Inc. | | | 636 | |
| | 8,793 | | | Quest Diagnostics, Inc. | | | 967 | |
| | 3,706 | | | UnitedHealth Group, Inc. | | | 909 | |
| | 1,592 | | | Universal Health Services, Inc., Class – B | | | 177 | |
| | 591 | | | WellCare Health Plans, Inc. (a) | | | 146 | |
| | | | | | | | |
| | | | | | | 11,625 | |
| | | | | | | | |
| | | | Health Care Technology — 0.04% | |
| | 3,740 | | | Cerner Corp. (a) | | | 224 | |
| | | | | | | | |
| | | | Hotels, Restaurants & Leisure — 1.40% | |
| | 17,128 | | | Carnival Corp., Class – A | | | 981 | |
| | 2,712 | | | Darden Restaurants, Inc. | | | 290 | |
| | 2,069 | | | Dunkin’ Brands Group, Inc. | | | 143 | |
| | 6,020 | | | Extended Stay America, Inc. | | | 130 | |
See accompanying notes to financial statements.
48
HC CAPITAL TRUST
The Value Equity Portfolio
Portfolio of Investments (continued) — June 30, 2018
| | | | | | | | |
| Shares | | | Security Description | | Value
(000) | |
| | | | Common Stocks (continued) | |
| | | | Hotels, Restaurants & Leisure (continued) | |
| | 523 | | | Hilton Grand Vacations (a) | | $ | 18 | |
| | 148 | | | Hilton Worldwide Holdings, Inc. | | | 12 | |
| | 288 | | | Hyatt Hotels Corp., Class – A | | | 22 | |
| | 2,921 | | | International Game Technology PLC | | | 68 | |
| | 8,417 | | | Las Vegas Sands Corp. | | | 643 | |
| | 16,910 | | | McDonald’s Corp. | | | 2,651 | |
| | 2,617 | | | MGM Resorts International | | | 76 | |
| | 2,240 | | | Royal Caribbean Cruises Ltd. | | | 232 | |
| | 2,345 | | | Six Flags Entertainment Corp. | | | 164 | |
| | 46,908 | | | Starbucks Corp. | | | 2,291 | |
| | 927 | | | Vail Resorts, Inc. | | | 254 | |
| | 3,777 | | | Wyndham Hotels & Resorts, Inc. | | | 222 | |
| | 3,777 | | | Wyndham Worldwide Corp. | | | 167 | |
| | 269 | | | Yum China Holdings, Inc. | | | 10 | |
| | | | | | | | |
| | | | | | | 8,374 | |
| | | | | | | | |
| | | | Household Durables — 0.41% | |
| | 4,348 | | | D.R. Horton, Inc. | | | 178 | |
| | 4,468 | | | Garmin Ltd. | | | 272 | |
| | 3,252 | | | Leggett & Platt, Inc. | | | 145 | |
| | 3,711 | | | Lennar Corp., Class – A | | | 195 | |
| | 235 | | | Lennar Corp., Class – B | | | 10 | |
| | 33,359 | | | Newell Rubbermaid, Inc. | | | 860 | |
| | 3,874 | | | PulteGroup, Inc. | | | 111 | |
| | 1,886 | | | Toll Brothers, Inc. | | | 70 | |
| | 1,274 | | | Tupperware Brands Corp. | | | 53 | |
| | 4,142 | | | Whirlpool Corp. | | | 606 | |
| | | | | | | | |
| | | | | | | 2,500 | |
| | | | | | | | |
| | | | Household Products — 2.14% | |
| | 1,944 | | | Church & Dwight Co., Inc. | | | 103 | |
| | 33,968 | | | Colgate-Palmolive Co. | | | 2,201 | |
| | 461 | | | Energizer Holdings, Inc. | | | 29 | |
| | 20,551 | | | Kimberly-Clark Corp. | | | 2,165 | |
| | 189 | | | Spectrum Brands Holdings, Inc. | | | 15 | |
| | 4,169 | | | The Clorox Co. | | | 564 | |
| | 99,796 | | | The Procter & Gamble Co. | | | 7,791 | |
| | | | | | | | |
| | | | | | | 12,868 | |
| | | | | | | | |
| | | | Independent Power & Renewable Electricity Producers — 0.04% | |
| | 1,358 | | | NRG Energy, Inc., Class – C | | | 42 | |
| | 10,409 | | | The AES Corp. | | | 139 | |
| | 1,390 | | | Vistra Energy Corp. (a) | | | 33 | |
| | | | | | | | |
| | | | | | | 214 | |
| | | | | | | | |
| | | | Industrial Conglomerates — 1.21% | |
| | 12,652 | | | 3M Co. | | | 2,489 | |
| | 1,103 | | | Carlisle Companies, Inc. | | | 119 | |
| | 323,170 | | | General Electric Co. | | | 4,399 | |
| | 1,794 | | | Honeywell International, Inc. | | | 258 | |
| | 41 | | | Roper Industries, Inc. | | | 11 | |
| | | | | | | | |
| | | | | | | 7,276 | |
| | | | | | | | |
| | | | Insurance — 4.54% | |
| | 37,080 | | | Aflac, Inc. | | | 1,595 | |
| | 57,662 | | | Allstate Corp. | | | 5,264 | |
| | 385 | | | American Financial Group, Inc. | | | 41 | |
| | | | | | | | |
| Shares | | | Security Description | | Value
(000) | |
| | | | Insurance (continued) | |
| | 34,050 | | | American International Group, Inc. | | $ | 1,805 | |
| | 3,381 | | | Arthur J. Gallagher & Co. | | | 221 | |
| | 2,239 | | | Aspen Insurance Holdings Ltd. | | | 91 | |
| | 2,258 | | | Assurant, Inc. | | | 234 | |
| | 1,576 | | | Athene Holding, Ltd. (a) | | | 69 | |
| | 3,387 | | | AXIS Capital Holdings Ltd. | | | 188 | |
| | 1,344 | | | Brown & Brown, Inc. | | | 37 | |
| | 53 | | | Chubb Ltd. | | | 7 | |
| | 3,479 | | | Cincinnati Financial Corp. | | | 233 | |
| | 1,116 | | | CNA Financial Corp. | | | 51 | |
| | 15,688 | | | Everest Re Group Ltd. | | | 3,617 | |
| | 35,509 | | | First American Financial Corp. | | | 1,837 | |
| | 114,032 | | | FNF Group | | | 4,290 | |
| | 1,885 | | | Hartford Financial Services Group, Inc. | | | 96 | |
| | 4,055 | | | Lincoln National Corp. | | | 252 | |
| | 5,733 | | | Loews Corp. | | | 277 | |
| | 48 | | | Markel Corp. (a) | | | 52 | |
| | 1,369 | | | Mercury General Corp. | | | 62 | |
| | 49,160 | | | MetLife, Inc. | | | 2,143 | |
| | 8,720 | | | Old Republic International Corp. | | | 174 | |
| | 15,770 | | | Principal Financial Group, Inc. | | | 835 | |
| | 1,156 | | | ProAssurance Corp. | | | 41 | |
| | 21,821 | | | Prudential Financial, Inc. | | | 2,040 | |
| | 1,321 | | | Reinsurance Group of America | | | 176 | |
| | 7,273 | | | The Travelers Companies, Inc. | | | 890 | |
| | 643 | | | Torchmark Corp. | | | 52 | |
| | 3,476 | | | Unum Group | | | 129 | |
| | 1,384 | | | Validus Holdings Ltd. | | | 94 | |
| | 1,964 | | | W.R. Berkley Corp. | | | 142 | |
| | 53 | | | White Mountains Insurance Group Ltd. | | | 48 | |
| | 707 | | | Willis Towers Watson PLC | | | 107 | |
| | | | | | | | |
| | | | | | | 27,190 | |
| | | | | | | | |
| | | | Internet & Direct Marketing Retail — 0.00% | |
| | 312 | | | TripAdvisor, Inc. (a) | | | 17 | |
| | | | | | | | |
| | | | Internet Software & Services — 0.12% | |
| | 2,108 | | | Akamai Technologies, Inc. (a) | | | 154 | |
| | 12,093 | | | eBay, Inc. (a) | | | 438 | |
| | 104 | | | LogMeln, Inc. | | | 11 | |
| | 3,080 | | | Twitter, Inc. (a) | | | 135 | |
| | | | | | | | |
| | | | | | | 738 | |
| | | | | | | | |
| | | | IT Services — 1.32% | |
| | 3,234 | | | Accenture PLC, Class – A | | | 529 | |
| | 10,263 | | | Automatic Data Processing, Inc. | | | 1,377 | |
| | 4,570 | | | Cognizant Technology Solutions Corp. | | | 361 | |
| | 642 | | | Fidelity National Information Services, Inc. | | | 68 | |
| | 1,167 | | | Global Payments, Inc. | | | 130 | |
| | 18,407 | | | International Business Machines Corp. | | | 2,571 | |
| | 804 | | | Leidos Holdings, Inc. | | | 47 | |
| | 7,633 | | | Paychex, Inc. | | | 522 | |
| | 30,823 | | | Sabre Corp. | | | 759 | |
| | 45,568 | | | Switch, Inc., Class – A | | | 555 | |
| | 692 | | | Teradata Corp. (a) | | | 28 | |
See accompanying notes to financial statements.
49
HC CAPITAL TRUST
The Value Equity Portfolio
Portfolio of Investments (continued) — June 30, 2018
| | | | | | | | |
| Shares | | | Security Description | | Value
(000) | |
| | | | Common Stocks (continued) | |
| | | | IT Services (continued) | |
| | 47,936 | | | Western Union Co. | | $ | 975 | |
| | 43 | | | WEX, Inc. (a) | | | 8 | |
| | | | | | | | |
| | | | | | | 7,930 | |
| | | | | | | | |
| | | | Leisure Products — 0.05% | |
| | 1,001 | | | Brunswick Corp. | | | 65 | |
| | 2,745 | | | Hasbro, Inc. | | | 253 | |
| | | | | | | | |
| | | | | | | 318 | |
| | | | | | | | |
| | | | Life Sciences Tools & Services — 0.24% | |
| | 5,005 | | | Agilent Technologies, Inc. | | | 309 | |
| | 114 | | | Bio-Rad Laboratories, Inc., Class – A (a) | | | 33 | |
| | 408 | | | Bio-Techne Corp. | | | 60 | |
| | 1,466 | | | Bruker Biosciences Corp. | | | 43 | |
| | 1,641 | | | Illumina, Inc. (a) | | | 457 | |
| | 337 | | | IQVIA Holdings, Inc. (a) | | | 34 | |
| | 485 | | | PerkinElmer, Inc. | | | 36 | |
| | 881 | | | Qiagen N.V. (a) | | | 32 | |
| | 1,216 | | | Thermo Electron Corp. | | | 252 | |
| | 835 | | | Waters Corp. (a) | | | 162 | |
| | | | | | | | |
| | | | | | | 1,418 | |
| | | | | | | | |
| | | | Machinery — 1.31% | |
| | 1,209 | | | AGCO Corp. | | | 73 | |
| | 12,196 | | | Caterpillar, Inc. | | | 1,655 | |
| | 1,610 | | | Colfax Corp. (a) | | | 49 | |
| | 275 | | | Crane Co. | | | 22 | |
| | 6,462 | | | Cummins, Inc. | | | 859 | |
| | 53 | | | Donaldson Company, Inc. | | | 2 | |
| | 743 | | | Dover Corp. | | | 54 | |
| | 5,669 | | | Flowserve Corp. | | | 229 | |
| | 4,181 | | | Fortive Corp. | | | 322 | |
| | 28 | | | IDEX Corp. | | | 4 | |
| | 3,851 | | | Ingersoll-Rand PLC | | | 346 | |
| | 1,620 | | | ITT, Inc. | | | 85 | |
| | 743 | | | Lincoln Electric Holdings, Inc. | | | 65 | |
| | 31,572 | | | Oshkosh Corp. | | | 2,221 | |
| | 6,195 | | | PACCAR, Inc. | | | 384 | |
| | 114 | | | Parker Hannifin Corp. | | | 18 | |
| | 15,953 | | | Pentair PLC | | | 671 | |
| | 2,102 | | | Snap-on, Inc. | | | 338 | |
| | 785 | | | Stanley Black & Decker, Inc. | | | 104 | |
| | 1,488 | | | Terex Corp. | | | 63 | |
| | 2,724 | | | The Timken Co. | | | 119 | |
| | 2,755 | | | Trinity Industries, Inc. | | | 94 | |
| | 640 | | | WABCO Holdings, Inc. (a) | | | 75 | |
| | 485 | | | Xylem, Inc. | | | 33 | |
| | | | | | | | |
| | | | | | | 7,885 | |
| | | | | | | | |
| | | | Marine — 0.01% | |
| | 1,058 | | | Kirby Corp. (a) | | | 88 | |
| | | | | | | | |
| | | | Media — 2.46% | |
| | 453 | | | AMC Networks, Inc. (a) | | | 28 | |
| | 5,861 | | | Cinemark Holdings, Inc. | | | 206 | |
| | 108,211 | | | Comcast Corp., Class – A | | | 3,550 | |
| | 1,406 | | | Discovery Communications, Inc., Class – A (a) | | | 39 | |
| | | | | | | | |
| Shares | | | Security Description | | Value
(000) | |
| | | | Media (continued) | |
| | 2,742 | | | Discovery Communications, Inc., Class – C (a) | | $ | 70 | |
| | 939 | | | GCI Liberty, Inc., Class – A (a) | | | 42 | |
| | 663 | | | John Wiley & Sons, Inc., Class – A | | | 41 | |
| | 236 | | | Liberty Broadband, Class – A (a) | | | 18 | |
| | 964 | | | Liberty Broadband, Class – C (a) | | | 73 | |
| | 229 | | | Liberty Media Group, Class – A (a) | | | 8 | |
| | 1,715 | | | Liberty Media Group, Class – C (a) | | | 64 | |
| | 827 | | | Liberty SiriusXM Group, Class – A (a) | | | 37 | |
| | 483 | | | Lions Gate Entertainment Corp., Class – A | | | 12 | |
| | 807 | | | Lions Gate Entertainment Corp., Class – B | | | 19 | |
| | 703 | | | News Corp., Inc. | | | 11 | |
| | 5,717 | | | News Corp., Inc., Class – A | | | 89 | |
| | 14,580 | | | Omnicom Group, Inc. | | | 1,112 | |
| | 14,076 | | | Sirius XM Holdings, Inc. | | | 95 | |
| | 4,763 | | | TEGNA, Inc. | | | 52 | |
| | 46,501 | | | The Interpublic Group of Companies, Inc. | | | 1,090 | |
| | 92 | | | The Madison Square Garden Co., Class – A (a) | | | 29 | |
| | 563 | | | The Walt Disney Co. | | | 59 | |
| | 1,674 | | | Tribune Media Co., Class – A | | | 64 | |
| | 151,242 | | | Twenty-First Century Fox, Inc. | | | 7,515 | |
| | 1,706 | | | Twenty-First Century Fox, Inc., Class – B | | | 84 | |
| | 11,481 | | | Viacom, Inc., Class – B | | | 346 | |
| | | | | | | | |
| | | | | | | 14,753 | |
| | | | | | | | |
| | | | Metals & Mining — 0.76% | |
| | 63,804 | | | Alcoa Corp. (a) | | | 2,991 | |
| | 17,263 | | | Freeport-McMoRan Copper & Gold, Inc. | | | 298 | |
| | 6,905 | | | Newmont Mining Corp. | | | 260 | |
| | 11,064 | | | Nucor Corp. | | | 692 | |
| | 2,260 | | | Reliance Steel & Aluminum Co. | | | 198 | |
| | 100 | | | Southern Copper Corp. | | | 5 | |
| | 2,312 | | | Steel Dynamics, Inc. | | | 106 | |
| | 1,041 | | | United States Steel Corp. | | | 36 | |
| | | | | | | | |
| | | | | | | 4,586 | |
| | | | | | | | |
| | | | Mortgage Real Estate Investment Trusts — 0.18% | |
| | 13,310 | | | AGNC Investment Corp. | | | 248 | |
| | 24,412 | | | Annaly Capital Management, Inc. | | | 252 | |
| | 6,438 | | | Chimera Investment Corp. | | | 118 | |
| | 13,651 | | | MFA Financial, Inc. | | | 103 | |
| | 6,075 | | | New Residential Investment Corp. | | | 106 | |
| | 9,039 | | | Starwood Property Trust, Inc. | | | 196 | |
| | 2,246 | | | Two Harbors Investment Corp. | | | 35 | |
| | | | | | | | |
| | | | | | | 1,058 | |
| | | | | | | | |
| | | | Multiline Retail — 0.57% | |
| | 952 | | | Dollar General Corp. | | | 94 | |
| | 65 | | | Dollar Tree, Inc. (a) | | | 6 | |
| | 7,092 | | | Kohl’s Corp. | | | 517 | |
| | 10,274 | | | Macy’s, Inc. | | | 385 | |
| | 3,254 | | | Nordstrom, Inc. | | | 168 | |
| | 29,610 | | | Target Corp. | | | 2,253 | |
| | | | | | | | |
| | | | | | | 3,423 | |
| | | | | | | | |
| | | | Multi-Utilities — 1.42% | |
| | 3,262 | | | Ameren Corp. | | | 198 | |
| | 6,826 | | | CenterPoint Energy, Inc. | | | 189 | |
See accompanying notes to financial statements.
50
HC CAPITAL TRUST
The Value Equity Portfolio
Portfolio of Investments (continued) — June 30, 2018
| | | | | | | | |
| Shares | | | Security Description | | Value
(000) | |
| | | | Common Stocks (continued) | |
| | | | Multi-Utilities (continued) | |
| | 2,657 | | | CMS Energy Corp. | | $ | 126 | |
| | 5,470 | | | Consolidated Edison, Inc. | | | 427 | |
| | 34,708 | | | Dominion Resources, Inc. | | | 2,366 | |
| | 2,674 | | | DTE Energy Co. | | | 277 | |
| | 2,729 | | | MDU Resources Group, Inc. | | | 78 | |
| | 96,320 | | | NiSource, Inc. | | | 2,532 | |
| | 7,219 | | | Public Service Enterprise Group, Inc. | | | 391 | |
| | 2,167 | | | SCANA Corp. | | | 83 | |
| | 3,128 | | | Sempra Energy | | | 363 | |
| | 1,214 | | | Vectren Corp. | | | 87 | |
| | 21,428 | | | WEC Energy Group, Inc. | | | 1,385 | |
| | | | | | | | |
| | | | | | | 8,502 | |
| | | | | | | | |
| | | | Oil, Gas & Consumable Fuels — 9.44% | |
| | 806 | | | Anadarko Petroleum Corp. | | | 59 | |
| | 6,667 | | | Andeavor | | | 875 | |
| | 2,962 | | | Antero Resources Corp. (a) | | | 63 | |
| | 21,605 | | | Apache Corp. | | | 1,010 | |
| | 5,941 | | | Cabot Oil & Gas Corp. | | | 141 | |
| | 97,330 | | | Canadian Natural Resources Ltd. | | | 3,511 | |
| | 875 | | | Centennial Resource Development, Inc. (a) | | | 16 | |
| | 59,620 | | | Chevron Corp. | | | 7,539 | |
| | 2,935 | | | CNX Resources Corp. (a) | | | 52 | |
| | 2,258 | | | Concho Resources, Inc. (a) | | | 312 | |
| | 15,356 | | | ConocoPhillips | | | 1,069 | |
| | 391 | | | CONSOL Energy, Inc. (a) | | | 15 | |
| | 1,102 | | | Continental Resources, Inc. (a) | | | 71 | |
| | 1,720 | | | Devon Energy Corp. | | | 76 | |
| | 1,666 | | | Diamondback Energy, Inc. | | | 219 | |
| | 1,194 | | | Energen Corp. (a) | | | 87 | |
| | 32,480 | | | EOG Resources, Inc. | | | 4,041 | |
| | 3,079 | | | EQT Corp. | | | 170 | |
| | 1,497 | | | Extraction Oil & Gas, Inc. (a) | | | 22 | |
| | 152,514 | | | Exxon Mobil Corp. | | | 12,618 | |
| | 66,065 | | | Hess Corp. | | | 4,419 | |
| | 7,010 | | | HollyFrontier Corp. | | | 480 | |
| | 126,111 | | | Kinder Morgan, Inc. | | | 2,228 | |
| | 2,935 | | | Kosmos Energy Ltd. (a) | | | 24 | |
| | 13,434 | | | Marathon Oil Corp. | | | 280 | |
| | 95,602 | | | Marathon Petroleum Corp. | | | 6,707 | |
| | 6,375 | | | Murphy Oil Corp. | | | 215 | |
| | 7,642 | | | Noble Energy, Inc. | | | 270 | |
| | 27,015 | | | Occidental Petroleum Corp. | | | 2,261 | |
| | 13,974 | | | ONEOK, Inc. | | | 976 | |
| | 2,914 | | | Parsley Energy, Inc., Class – A (a) | | | 88 | |
| | 4,112 | | | PBF Energy, Inc., Class – A | | | 172 | |
| | 19,342 | | | Phillips 66 | | | 2,172 | |
| | 2,428 | | | Pioneer Natural Resources Co. | | | 459 | |
| | 2,033 | | | RSP Permian, Inc. (a) | | | 89 | |
| | 2,084 | | | SM Energy Co. | | | 54 | |
| | 9,770 | | | Southwestern Energy Co. (a) | | | 52 | |
| | 7,146 | | | Targa Resources Corp. | | | 354 | |
| | 36,562 | | | The Williams Companies, Inc. | | | 991 | |
| | 19,759 | | | Valero Energy Corp. | | | 2,190 | |
| | | | | | | | |
| Shares | | | Security Description | | Value
(000) | |
| | | | Oil, Gas & Consumable Fuels (continued) | |
| | 484 | | | Whiting Petroleum Corp. (a) | | $ | 26 | |
| | 7,852 | | | World Fuel Services Corp. | | | 160 | |
| | | | | | | | |
| | | | | | | 56,633 | |
| | | | | | | | |
| | | | Paper & Forest Products — 0.02% | |
| | 2,326 | | | Domtar Corp. | | | 111 | |
| | | | | | | | |
| | | | Personal Products — 0.21% | |
| | 13,021 | | | Coty, Inc., Class – A | | | 184 | |
| | 14,635 | | | Edgewell Personal Care Co. (a) | | | 738 | |
| | 972 | | | Herbalife Ltd. (a) | | | 52 | |
| | 600 | | | Nu Skin Enterprises, Inc., Class – A | | | 47 | |
| | 1,698 | | | The Estee Lauder Companies, Inc., Class – A | | | 242 | |
| | | | | | | | |
| | | | | | | 1,263 | |
| | | | | | | | |
| | | | Pharmaceuticals — 5.59% | |
| | 983 | | | Akorn, Inc. (a) | | | 16 | |
| | 52,943 | | | Bristol-Myers Squibb Co. | | | 2,930 | |
| | 24,187 | | | Eli Lilly & Co. | | | 2,064 | |
| | 70,216 | | | Johnson & Johnson | | | 8,520 | |
| | 119,918 | | | Merck & Co., Inc. | | | 7,279 | |
| | 7,259 | | | Mylan N.V. (a) | | | 262 | |
| | 9,443 | | | Perrigo Co. PLC | | | 688 | |
| | 249,365 | | | Pfizer, Inc. | | | 9,048 | |
| | 113,000 | | | Teva Pharmaceutical Industries Ltd., ADR | | | 2,748 | |
| | | | | | | | |
| | | | | | | 33,555 | |
| | | | | | | | |
| | | | Professional Services — 0.17% | |
| | 950 | | | IHS Markit Ltd. (a) | | | 49 | |
| | 881 | | | ManpowerGroup, Inc. | | | 76 | |
| | 27,475 | | | Nielsen Holdings PLC | | | 850 | |
| | 936 | | | Robert Half International, Inc. | | | 61 | |
| | | | | | | | |
| | | | | | | 1,036 | |
| | | | | | | | |
| | | | Real Estate Management & Development — 0.05% | |
| | 2,497 | | | CBRE Group, Inc., Class – A (a) | | | 120 | |
| | 402 | | | Howard Hughes Corp. (a) | | | 53 | |
| | 508 | | | Jones Lang LaSalle, Inc. | | | 84 | |
| | 714 | | | Realogy Holdings Corp. | | | 16 | |
| | | | | | | | |
| | | | | | | 273 | |
| | | | | | | | |
| | | | Road & Rail — 1.07% | |
| | 539 | | | CSX Corp. | | | 34 | |
| | 9,399 | | | Genesee & Wyoming, Inc., Class – A (a) | | | 764 | |
| | 6,860 | | | Kansas City Southern | | | 727 | |
| | 12,209 | | | Norfolk Southern Corp. | | | 1,842 | |
| | 128 | | | Old Dominion Freight Line, Inc. | | | 19 | |
| | 1,974 | | | Ryder System, Inc. | | | 142 | |
| | 20,604 | | | Union Pacific Corp. | | | 2,920 | |
| | | | | | | | |
| | | | | | | 6,448 | |
| | | | | | | | |
| | | | Semiconductors & Semiconductor Equipment — 3.42% | |
| | 7,694 | | | Analog Devices, Inc. | | | 738 | |
| | 888 | | | Broadcom, Inc. | | | 215 | |
| | 8,610 | | | Cypress Semiconductor Corp. | | | 134 | |
| | 1,189 | | | First Solar, Inc. (a) | | | 63 | |
| | 224,815 | | | Intel Corp. | | | 11,175 | |
| | 3,622 | | | KLA-Tencor Corp. | | | 371 | |
| | 1,456 | | | Lam Research Corp. | | | 252 | |
| | 2,191 | | | Marvell Technology Group Ltd. | | | 47 | |
See accompanying notes to financial statements.
51
HC CAPITAL TRUST
The Value Equity Portfolio
Portfolio of Investments (continued) — June 30, 2018
| | | | | | | | |
| Shares | | | Security Description | | Value
(000) | |
| | | | Common Stocks (continued) | |
| | | | Semiconductors & Semiconductor Equipment (continued) | |
| | 5,918 | | | Maxim Integrated Products, Inc. | | $ | 347 | |
| | 11,661 | | | Micron Technology, Inc. (a) | | | 612 | |
| | 3,862 | | | NXP Semiconductors N.V. (a) | | | 422 | |
| | 321 | | | ON Semiconductor Corp. (a) | | | 7 | |
| | 57,741 | | | Qualcomm, Inc. | | | 3,240 | |
| | 1,542 | | | Skyworks Solutions, Inc. | | | 149 | |
| | 1,892 | | | Teradyne, Inc. | | | 72 | |
| | 23,905 | | | Texas Instruments, Inc. | | | 2,636 | |
| | 531 | | | Versum Materials, Inc. | | | 20 | |
| | 115 | | | Xilinx, Inc. | | | 8 | |
| | | | | | | | |
| | | | | | | 20,508 | |
| | | | | | | | |
| | | | Software — 1.22% | |
| | 207 | | | Autodesk, Inc. (a) | | | 27 | |
| | 8,566 | | | CA, Inc. | | | 305 | |
| | 1,622 | | | Dell Technologies, Inc., Class – V (a) | | | 137 | |
| | 1,058 | | | FireEye, Inc. (a) | | | 16 | |
| | 284 | | | Guidewire Software, Inc. (a) | | | 25 | |
| | 151,626 | | | Oracle Corp. | | | 6,682 | |
| | 668 | | | Synopsys, Inc. (a) | | | 57 | |
| | 533 | | | VMware, Inc., Class – A (a) | | | 78 | |
| | | | | | | | |
| | | | | | | 7,327 | |
| | | | | | | | |
| | | | Specialty Retail — 1.24% | |
| | 297 | | | Advance Auto Parts, Inc. | | | 40 | |
| | 346 | | | AutoNation, Inc. (a) | | | 17 | |
| | 22 | | | AutoZone, Inc. (a) | | | 15 | |
| | 41,527 | | | Bed Bath & Beyond, Inc. | | | 827 | |
| | 10,735 | | | Best Buy Co., Inc. | | | 801 | |
| | 172 | | | Burlington Stores, Inc. (a) | | | 26 | |
| | 5,282 | | | Dick’s Sporting Goods, Inc. | | | 186 | |
| | 10,645 | | | Foot Locker, Inc. | | | 560 | |
| | 1,205 | | | GameStop Corp., Class – A | | | 18 | |
| | 9,406 | | | Gap, Inc. | | | 305 | |
| | 1,404 | | | Penske Automotive Group, Inc. | | | 66 | |
| | 18,896 | | | Signet Jewelers Ltd. | | | 1,053 | |
| | 15,649 | | | The Home Depot, Inc. | | | 3,053 | |
| | 620 | | | Tiffany & Co. | | | 82 | |
| | 1,402 | | | Urban Outfitters, Inc. (a) | | | 62 | |
| | 5,753 | | | Williams-Sonoma, Inc. | | | 353 | |
| | | | | | | | |
| | | | | | | 7,464 | |
| | | | | | | | |
| | | | Technology Hardware, Storage & Peripherals — 1.29% | |
| | 5,355 | | | Apple, Inc. | | | 992 | |
| | 250,925 | | | HP, Inc. | | | 5,694 | |
| | 3,862 | | | NetApp, Inc. | | | 303 | |
| | 7,226 | | | Western Digital Corp. | | | 559 | |
| | 7,936 | | | Xerox Corp. | | | 190 | |
| | | | | | | | |
| | | | | | | 7,738 | |
| | | | | | | | |
| | | | Textiles, Apparel & Luxury Goods — 0.61% | |
| | 22,929 | | | Hanesbrands, Inc. | | | 505 | |
| | 942 | | | Lululemon Athletica, Inc. (a) | | | 118 | |
| | 2,170 | | | Michael Kors Holdings Ltd. (a) | | | 145 | |
| | 433 | | | PVH Corp. | | | 65 | |
| | 4,349 | | | Ralph Lauren Corp. | | | 547 | |
| | 399 | | | Skechers USA, Inc., Class – A (a) | | | 12 | |
| | | | | | | | |
| Shares | | | Security Description | | Value
(000) | |
| | | | Textiles, Apparel & Luxury Goods (continued) | |
| | 7,332 | | | Tapestry, Inc. | | $ | 342 | |
| | 266 | | | Under Armour, Inc., Class – A (a) | | | 6 | |
| | 38,555 | | | Under Armour, Inc., Class – C (a) | | | 813 | |
| | 13,622 | | | V.F. Corp. | | | 1,110 | |
| | | | | | | | |
| | | | | | | 3,663 | |
| | | | | | | | |
| | | | Thrifts & Mortgage Finance — 0.03% | |
| | 17,223 | | | New York Community Bancorp, Inc. | | | 190 | |
| | | | | | | | |
| | | | Tobacco — 0.66% | |
| | 43,309 | | | Altria Group, Inc. | | | 2,460 | |
| | 18,828 | | | Philip Morris International, Inc. | | | 1,520 | |
| | | | | | | | |
| | | | | | | 3,980 | |
| | | | | | | | |
| | | | Trading Companies & Distributors — 0.17% | |
| | 1,710 | | | Air Lease Corp. | | | 72 | |
| | 6,388 | | | Fastenal Co. | | | 308 | |
| | 2,413 | | | HD Supply Holdings, Inc. (a) | | | 103 | |
| | 1,918 | | | MSC Industrial Direct Co., Inc., Class – A | | | 163 | |
| | 687 | | | W.W. Grainger, Inc. | | | 212 | |
| | 763 | | | Watsco, Inc. | | | 136 | |
| | 884 | | | WESCO International, Inc. (a) | | | 50 | |
| | | | | | | | |
| | | | | | | 1,044 | |
| | | | | | | | |
| | | | Transportation Infrastructure — 0.04% | |
| | 5,788 | | | Macquarie Infrastructure Corp. | | | 244 | |
| | | | | | | | |
| | | | Water Utilities — 0.01% | |
| | 1,776 | | | Aqua America, Inc. | | | 62 | |
| | | | | | | | |
| | | | Wireless Telecommunication Services — 0.47% | |
| | 5,576 | | | Telephone & Data Systems, Inc. | | | 153 | |
| | 44,793 | | | T-Mobile USA, Inc. (a) | | | 2,677 | |
| | 200 | | | U.S. Cellular Corp. (a) | | | 7 | |
| | | | | | | | |
| | | | | | | 2,837 | |
| | | | | | | | |
| | | | Total Common Stocks | | | 555,658 | |
| | | | | | | | |
| | |
Principal
Amount
(000) | | | | | | |
| | | | Time Deposit — 0.00% | |
| $ | 9 | | | State Street Liquidity Management Control System Eurodollar Time Deposit,
0.53%, 7/2/18 | | | 9 | |
| | | | | | | | |
| | | | Total Time Deposit | | | 9 | |
| | | | | | | | |
| | |
| Shares | | | | | | |
| | | | Mutual Funds — 7.07% | |
| | 2,085,124 | | | Dreyfus Treasury Prime Cash Management Fund, Institutional Shares, 1.68% (b) | | | 2,085 | |
| | 6,840 | | | Federated Treasury Obligations Fund, Institutional Shares, 1.75%^^ (b) | | | 7 | |
| | 40,346,546 | | | State Street Institutional Treasury Plus Money Market Fund, Trust Class, 1.72% (b) | | | 40,347 | |
| | | | | | | | |
| | | | Total Mutual Funds | | | 42,439 | |
| | | | | | | | |
See accompanying notes to financial statements.
52
HC CAPITAL TRUST
The Value Equity Portfolio
Portfolio of Investments (concluded) — June 30, 2018
| | | | | | | | |
| | |
Principal
Amount
(000) | | | Security Description | | Value
(000) | |
| | | | Repurchase Agreement — 0.00% | |
| $ | 11 | | | Jefferies LLC, 2.00%, 7/2/18
(Purchased on 6/29/18, proceeds at maturity $11,488 collateralized by U.S. Treasury Obligations, 2.50% – 2.92%, 2/15/20 – 2/15/44 fair value $11,716)^^ | | $ | 11 | |
| | | | | | | | |
| | | | Total Repurchase Agreement | | | 11 | |
| | | | | | | | |
| | | | Total Investments
(cost $480,056) — 99.66% | | | 598,117 | |
| | | | Other assets in excess of
liabilities — 0.34% | | | 2,015 | |
| | | | | | | | |
| | | | Net Assets — 100.00% | | $ | 600,132 | |
| | | | | | | | |
| ^ | All or part of this security was on loan as of June 30, 2018. The total value of securities on loan as of June 30, 2018, was $18 (amount in thousands). |
| ^^ | Purchased with cash collateral held from securities lending. The value of the collateral could include collateral held for securities that were sold on or before June 30, 2018. |
| (a) | Represents non-income producing security. |
| (b) | The rate disclosed is the rate in effect on June 30, 2018. |
ADR — American Depositary Receipt
REIT — Real Estate Investment Trust
The following table reflects the percentage of total net assets of the Portfolio attributable to each Specialist Manager as of June 30, 2018.
| | | | | | | | | | | | | | | | |
The Value Equity Portfolio | | Cadence Capital
Management, LLC | | | Parametric Portfolio
Associates, LLC | | | HC Capital Solutions | | | Total | |
Common Stocks | | | 46.30 | % | | | 46.29 | % | | | — | | | | 92.59 | % |
Time Deposit | | | — | | | | 0.00 | % | | | — | | | | 0.00 | % |
Mutual Funds | | | 0.45 | % | | | 5.91 | % | | | 0.71 | % | | | 7.07 | % |
Repurchase Agreement | | | 0.00 | % | | | — | | | | — | | | | 0.00 | % |
Other Assets (Liabilities) | | | 0.05 | % | | | 0.29 | % | | | 0.00 | % | | | 0.34 | % |
| | | | | | | | | | | | | | | | |
Total Net Assets | | | 46.80 | % | | | 52.49 | % | | | 0.71 | % | | | 100.00 | % |
| | | | | | | | | | | | | | | | |
Amounts designated as “—” indicate the Specialist Manager did not manage any holdings in that category.
The following table reflects the open derivative positions held by the Portfolio as of June 30, 2018.
Futures Contracts Purchased^
| | | | | | | | | | | | | | |
Description | | Number of
Contracts | | Expiration
Date | | | Notional
Amount
(000) | | | Value and
Unrealized
Appreciation/
(Depreciation)
(000) | |
E-Mini S&P 500 Future | | 163 | | | 9/21/18 | | | $ | 22,181 | | | $ | (437 | ) |
E-Mini S&P Midcap 400 Future | | 56 | | | 9/21/18 | | | | 10,954 | | | | (277 | ) |
| | | | | | | | | | | | | | |
| | | | | $ | 33,135 | | | $ | (714 | ) |
| | | | | | | | | | | | | | |
| | |
| | Total Unrealized Appreciation | | | $ | — | |
| | Total Unrealized Depreciation | | | | (714 | ) |
| | | | | | | | | | | | | | |
| | Total Net Unrealized Appreciation/(Depreciation) | | | $ | (714 | ) |
| | | | | | | | | | | | | | |
| ^ | Cash has been pledged as collateral for futures contracts held by the Portfolio. |
Amounts designated as “—” are $0 or have been rounded to $0.
See accompanying notes to financial statements.
53
HC CAPITAL TRUST
The Institutional Value Equity Portfolio
Portfolio of Investments — June 30, 2018
| | | | | | | | |
| Shares | | | Security Description | | Value
(000) | |
| | | | Common Stocks — 86.11% | |
| | | | Aerospace & Defense — 1.73% | |
| | 14,293 | | | Arconic, Inc. | | $ | 243 | |
| | 1,249 | | | Curtiss-Wright Corp. | | | 149 | |
| | 10,258 | | | General Dynamics Corp. | | | 1,912 | |
| | 4,088 | | | Hexcel Corp. | | | 271 | |
| | 1,119 | | | Huntington Ingalls Industries, Inc. | | | 243 | |
| | 2,599 | | | L3 Technologies, Inc. | | | 500 | |
| | 7,955 | | | Lockheed Martin Corp. | | | 2,350 | |
| | 4,632 | | | Rockwell Collins, Inc. | | | 624 | |
| | 1,175 | | | Teledyne Technologies, Inc. (a) | | | 234 | |
| | 12,769 | | | Textron, Inc. | | | 842 | |
| | 9,356 | | | The Boeing Co. | | | 3,139 | |
| | 44,428 | | | United Technologies Corp. | | | 5,554 | |
| | | | | | | | |
| | | | | | | 16,061 | |
| | | | | | | | |
| | | | Air Freight & Logistics — 0.32% | |
| | 28,213 | | | United Parcel Service, Inc., Class – B | | | 2,997 | |
| | | | | | | | |
| | | | Airlines — 0.64% | |
| | 11,450 | | | Alaska Air Group, Inc. | | | 691 | |
| | 13,753 | | | American Airlines Group, Inc. | | | 522 | |
| | 1,938 | | | Copa Holdings SA, Class – A | | | 183 | |
| | 57,722 | | | Delta Air Lines, Inc. | | | 2,861 | |
| | 18,040 | | | JetBlue Airways Corp. (a) | | | 342 | |
| | 5,020 | | | Southwest Airlines Co. | | | 255 | |
| | 1,621 | | | Spirit Airlines, Inc. (a) | | | 59 | |
| | 14,730 | | | United Continental Holdings, Inc. (a) | | | 1,027 | |
| | | | | | | | |
| | | | | | | 5,940 | |
| | | | | | | | |
| | | | Auto Components — 0.18% | |
| | 5,485 | | | Adient PLC | | | 270 | |
| | 1,077 | | | Aptiv PLC | | | 98 | |
| | 6,681 | | | BorgWarner, Inc. | | | 288 | |
| | 1,094 | | | Delphi Technologies PLC | | | 50 | |
| | 2,959 | | | Gentex Corp. | | | 68 | |
| | 18,442 | | | Goodyear Tire & Rubber Co. | | | 430 | |
| | 1,936 | | | Lear Corp. | | | 360 | |
| | 335 | | | Visteon Corp. (a) | | | 43 | |
| | | | | | | | |
| | | | | | | 1,607 | |
| | | | | | | | |
| | | | Automobiles — 0.88% | |
| | 279,031 | | | Ford Motor Co. | | | 3,089 | |
| | 96,668 | | | General Motors Co. | | | 3,809 | |
| | 30,541 | | | Harley-Davidson, Inc. | | | 1,285 | |
| | 269 | | | Thor Industries, Inc. | | | 26 | |
| | | | | | | | |
| | | | | | | 8,209 | |
| | | | | | | | |
| | | | Banks — 9.01% | |
| | 13,739 | | | Associated Banc-Corp. | | | 375 | |
| | 359,201 | | | Bank of America Corp. | | | 10,126 | |
| | 3,306 | | | Bank of Hawaii Corp. | | | 276 | |
| | 6,666 | | | Bank of the Ozarks, Inc. | | | 300 | |
| | 5,819 | | | BankUnited, Inc. | | | 238 | |
| | 75,503 | | | BB&T Corp. | | | 3,808 | |
| | 1,436 | | | BOK Financial Corp. | | | 135 | |
| | 7,208 | | | CIT Group, Inc. | | | 363 | |
| | 103,785 | | | Citigroup, Inc. | | | 6,945 | |
| | 42,590 | | | Citizens Financial Group, Inc. | | | 1,657 | |
| | 9,410 | | | Comerica, Inc. | | | 856 | |
| | | | | | | | |
| Shares | | | Security Description | | Value
(000) | |
| | | | Banks (continued) | |
| | 5,312 | | | Commerce Bancshares, Inc. | | $ | 344 | |
| | 4,624 | | | Cullen/Frost Bankers, Inc. | | | 501 | |
| | 7,764 | | | East West Bancorp, Inc. | | | 506 | |
| | 59,477 | | | Fifth Third Bancorp | | | 1,707 | |
| | 243 | | | First Citizens BancShares, Inc., Class – A | | | 98 | |
| | 5,121 | | | First Hawaiian, Inc. | | | 149 | |
| | 25,370 | | | First Horizon National Corp. | | | 453 | |
| | 8,966 | | | First Republic Bank | | | 868 | |
| | 26,261 | | | FNB Corp. | | | 352 | |
| | 115,444 | | | Huntington Bancshares, Inc. | | | 1,704 | |
| | 157,537 | | | JPMorgan Chase & Co. | | | 16,416 | |
| | 93,835 | | | KeyCorp | | | 1,834 | |
| | 8,064 | | | M&T Bank Corp. | | | 1,372 | |
| | 10,405 | | | PacWest Bancorp | | | 514 | |
| | 28,501 | | | People’s United Financial, Inc. | | | 516 | |
| | 1,434 | | | Pinnacle Financial Partners, Inc. | | | 88 | |
| | 39,320 | | | PNC Financial Services Group, Inc. | | | 5,312 | |
| | 8,354 | | | Popular, Inc. | | | 378 | |
| | 3,742 | | | Prosperity Bancshares, Inc. | | | 256 | |
| | 64,405 | | | Regions Financial Corp. | | | 1,145 | |
| | 1,927 | | | Signature Bank (a) | | | 246 | |
| | 6,871 | | | Sterling Bancorp/DE | | | 161 | |
| | 40,939 | | | SunTrust Banks, Inc. | | | 2,703 | |
| | 1,621 | | | SVB Financial Group (a) | | | 468 | |
| | 3,615 | | | Synovus Financial Corp. | | | 191 | |
| | 14,328 | | | TCF Financial Corp. | | | 353 | |
| | 558 | | | Texas Capital Bancshares, Inc. (a) | | | 51 | |
| | 121,401 | | | U.S. Bancorp | | | 6,072 | |
| | 6,758 | | | Umpqua Holdings Corp. | | | 153 | |
| | 3,022 | | | Webster Financial Corp. | | | 193 | |
| | 226,451 | | | Wells Fargo & Co. | | | 12,554 | |
| | 3,506 | | | Western Alliance Bancorp (a) | | | 198 | |
| | 1,720 | | | Wintrust Financial Corp. | | | 150 | |
| | 11,016 | | | Zions Bancorp | | | 580 | |
| | | | | | | | |
| | | | | | | 83,665 | |
| | | | | | | | |
| | | | Beverages — 1.01% | |
| | 12,924 | | | Molson Coors Brewing Co., Class – B | | | 879 | |
| | 7,185 | | | Monster Beverage Corp.(a) | | | 412 | |
| | 33,960 | | | PepsiCo, Inc. | | | 3,697 | |
| | 99,729 | | | The Coca-Cola Co. | | | 4,374 | |
| | | | | | | | |
| | | | | | | 9,362 | |
| | | | | | | | |
| | | | Biotechnology — 1.75% | |
| | 33,214 | | | AbbVie, Inc. | | | 3,077 | |
| | 134 | | | Agios Pharmaceuticals, Inc. (a) | | | 11 | |
| | 5,298 | | | Alexion Pharmaceuticals, Inc. (a) | | | 658 | |
| | 347 | | | Alnylam Pharmaceuticals, Inc. (a) | | | 34 | |
| | 24,716 | | | Amgen, Inc. | | | 4,562 | |
| | 3,916 | | | Biogen Idec, Inc. (a) | | | 1,137 | |
| | 482 | | | Bluebird Bio, Inc. (a) | | | 76 | |
| | 12,325 | | | Celgene Corp. (a) | | | 979 | |
| | 69,912 | | | Gilead Sciences, Inc. | | | 4,952 | |
| | 1,554 | | | Regeneron Pharmaceuticals, Inc. (a) | | | 536 | |
| | 2,146 | | | United Therapeutics Corp. (a) | | | 243 | |
| | | | | | | | |
| | | | | | | 16,265 | |
| | | | | | | | |
See accompanying notes to financial statements.
54
HC CAPITAL TRUST
The Institutional Value Equity Portfolio
Portfolio of Investments (continued) — June 30, 2018
| | | | | | | | |
| Shares | | | Security Description | | Value
(000) | |
| | | | Common Stocks (continued) | |
| | | | Building Products — 0.39% | |
| | 2,499 | | | Allegion PLC | | $ | 193 | |
| | 5,813 | | | Fortune Brands Home & Security, Inc. | | | 312 | |
| | 72,183 | | | Johnson Controls International PLC | | | 2,414 | |
| | 100 | | | Lennox International, Inc. | | | 20 | |
| | 3,303 | | | Masco Corp. | | | 124 | |
| | 5,959 | | | Owens Corning, Inc. | | | 378 | |
| | 4,590 | | | USG Corp. | | | 198 | |
| | | | | | | | |
| | | | | | | 3,639 | |
| | | | | | | | |
| | | | Capital Markets — 2.54% | |
| | 2,968 | | | Affiliated Managers Group, Inc. | | | 441 | |
| | 8,845 | | | Ameriprise Financial, Inc. | | | 1,237 | |
| | 21,069 | | | Bank of New York Mellon Corp. | | | 1,136 | |
| | 14,604 | | | BGC Partners, Inc., Class – A | | | 165 | |
| | 7,396 | | | BlackRock, Inc., Class – A | | | 3,692 | |
| | 252 | | | CBOE Holdings, Inc. | | | 26 | |
| | 10,181 | | | CME Group, Inc. | | | 1,669 | |
| | 7,033 | | | E*Trade Financial Corp. (a) | | | 430 | |
| | 5,400 | | | Eaton Vance Corp. | | | 282 | |
| | 4,859 | | | Federated Investors, Inc., Class – B | | | 113 | |
| | 29,969 | | | Franklin Resources, Inc. | | | 961 | |
| | 11,730 | | | Goldman Sachs Group, Inc. | | | 2,587 | |
| | 473 | | | Interactive Brokers Group, Inc., Class – A | | | 30 | |
| | 9,257 | | | IntercontinentalExchange Group, Inc. | | | 681 | |
| | 36,855 | | | Invesco Ltd. | | | 979 | |
| | 16,954 | | | Jefferies Financial Group, Inc. | | | 386 | |
| | 6,006 | | | Lazard Ltd., Class – A | | | 294 | |
| | 9,853 | | | Legg Mason, Inc. | | | 342 | |
| | 66,108 | | | Morgan Stanley | | | 3,134 | |
| | 9,332 | | | Northern Trust Corp. | | | 960 | |
| | 5,802 | | | Raymond James Financial, Inc. | | | 518 | |
| | 19,380 | | | State Street Corp. | | | 1,804 | |
| | 11,992 | | | T. Rowe Price Group, Inc. | | | 1,392 | |
| | 3,867 | | | The NASDAQ OMX Group, Inc. | | | 353 | |
| | | | | | | | |
| | | | | | | 23,612 | |
| | | | | | | | |
| | | | Chemicals — 2.35% | |
| | 18,947 | | | Air Products & Chemicals, Inc. | | | 2,951 | |
| | 3,588 | | | Albemarle Corp. | | | 338 | |
| | 2,059 | | | Ashland Global Holdings, Inc. | | | 161 | |
| | 3,993 | | | Axalta Coating Systems Ltd. (a) | | | 121 | |
| | 3,627 | | | Cabot Corp. | | | 224 | |
| | 3,993 | | | Celanese Corp., Series A | | | 443 | |
| | 13,735 | | | CF Industries Holdings, Inc. | | | 610 | |
| | 123,359 | | | DowDuPont, Inc. | | | 8,131 | |
| | 11,439 | | | Eastman Chemical Co. | | | 1,143 | |
| | 4,559 | | | Ecolab, Inc. | | | 640 | |
| | 2,593 | | | FMC Corp. | | | 231 | |
| | 15,474 | | | Huntsman Corp. | | | 452 | |
| | 3,692 | | | International Flavors & Fragrances, Inc. | | | 458 | |
| | 19,576 | | | LyondellBasell Industries N.V., Class – A | | | 2,150 | |
| | 19 | | | NewMarket Corp. | | | 8 | |
| | 9,705 | | | Olin Corp. | | | 279 | |
| | 3,710 | | | Platform Specialty Products Corp. (a) | | | 43 | |
| | 7,613 | | | PPG Industries, Inc. | | | 790 | |
| | 8,933 | | | Praxair, Inc. | | | 1,413 | |
| | | | | | | | |
| Shares | | | Security Description | | Value
(000) | |
| | | | Chemicals (continued) | |
| | 6,883 | | | RPM International, Inc. | | $ | 401 | |
| | 17,564 | | | The Mosaic Co. | | | 493 | |
| | 1,860 | | | The Scotts Miracle-Gro Co. | | | 155 | |
| | 6,489 | | | Valvoline, Inc. | | | 140 | |
| | 524 | | | W.R. Grace & Co. | | | 38 | |
| | 158 | | | Westlake Chemical Corp. | | | 17 | |
| | | | | | | | |
| | | | | | | 21,830 | |
| | | | | | | | |
| | | | Commercial Services & Supplies — 0.26% | |
| | 3,333 | | | ADT, Inc. | | | 29 | |
| | 1,620 | | | Clean Harbors, Inc. (a) | | | 90 | |
| | 2,493 | | | Copart, Inc. (a) | | | 141 | |
| | 3,861 | | | KAR Auction Services, Inc. | | | 212 | |
| | 10,555 | | | Pitney Bowes, Inc. | | | 90 | |
| | 6,916 | | | Republic Services, Inc., Class – A | | | 473 | |
| | 3,814 | | | Stericycle, Inc. (a) | | | 249 | |
| | 13,703 | | | Waste Management, Inc. | | | 1,114 | |
| | | | | | | | |
| | | | | | | 2,398 | |
| | | | | | | | |
| | | | Communications Equipment — 1.47% | |
| | 9,534 | | | Arris International PLC (a) | | | 233 | |
| | 267,204 | | | Cisco Systems, Inc. | | | 11,498 | |
| | 6,049 | | | Commscope Holding, Inc. (a) | | | 177 | |
| | 1,655 | | | EchoStar Corp., Class – A (a) | | | 73 | |
| | 1,393 | | | F5 Networks, Inc. (a) | | | 240 | |
| | 32,570 | | | Juniper Networks, Inc. | | | 893 | |
| | 4,776 | | | Motorola Solutions, Inc. | | | 556 | |
| | | | | | | | |
| | | | | | | 13,670 | |
| | | | | | | | |
| | | | Construction & Engineering — 0.16% | |
| | 8,561 | | | AECOM Technology Corp. (a) | | | 283 | |
| | 7,588 | | | Fluor Corp. | | | 370 | |
| | 6,710 | | | Jacobs Engineering Group, Inc. | | | 426 | |
| | 6,619 | | | Quanta Services, Inc. (a) | | | 221 | |
| | 1,187 | | | Valmont Industries, Inc. | | | 179 | |
| | | | | | | | |
| | | | | | | 1,479 | |
| | | | | | | | |
| | | | Construction Materials — 0.02% | |
| | 966 | | | Eagle Materials, Inc., Class – A | | | 101 | |
| | 177 | | | Martin Marietta Materials, Inc. | | | 40 | |
| | 269 | | | Vulcan Materials Co. | | | 35 | |
| | | | | | | | |
| | | | | | | 176 | |
| | | | | | | | |
| | | | Consumer Finance — 0.87% | |
| | 23,693 | | | Ally Financial, Inc. | | | 622 | |
| | 21,818 | | | American Express Co. | | | 2,138 | |
| | 25,220 | | | Capital One Financial Corp. | | | 2,319 | |
| | 279 | | | Credit Acceptance Corp. (a) | | | 99 | |
| | 14,010 | | | Discover Financial Services | | | 986 | |
| | 21,660 | | | Navient Corp. | | | 282 | |
| | 3,725 | | | OneMain Holdings, Inc. (a) | | | 124 | |
| | 6,595 | | | Santander Consumer USA Holdings, Inc. | | | 126 | |
| | 23,443 | | | SLM Corp. (a) | | | 268 | |
| | 33,172 | | | Synchrony Financial | | | 1,107 | |
| | | | | | | | |
| | | | | | | 8,071 | |
| | | | | | | | |
| | | | Containers & Packaging — 0.57% | |
| | 2,015 | | | AptarGroup, Inc. | | | 188 | |
| | 755 | | | Ardagh Group SA | | | 13 | |
| | 11,252 | | | Ball Corp. | | | 400 | |
See accompanying notes to financial statements.
55
HC CAPITAL TRUST
The Institutional Value Equity Portfolio
Portfolio of Investments (continued) — June 30, 2018
| | | | | | | | |
| Shares | | | Security Description | �� | Value
(000) | |
| | | | Common Stocks (continued) | |
| | | | Containers & Packaging (continued) | |
| | 7,219 | | | Bemis Company, Inc. | | $ | 305 | |
| | 4,164 | | | Berry Plastics Group, Inc. (a) | | | 191 | |
| | 2,139 | | | Crown Holdings, Inc. (a) | | | 96 | |
| | 16,014 | | | Graphic Packaging Holding Co. | | | 232 | |
| | 31,390 | | | International Paper Co. | | | 1,635 | |
| | 5,060 | | | Owens-Illinois, Inc. (a) | | | 85 | |
| | 2,466 | | | Packaging Corporation of America | | | 276 | |
| | 2,455 | | | Sealed Air Corp. | | | 104 | |
| | 2,798 | | | Silgan Holdings | | | 75 | |
| | 5,980 | | | Sonoco Products Co. | | | 314 | |
| | 23,729 | | | WestRock Co. | | | 1,353 | |
| | | | | | | | |
| | | | | | | 5,267 | |
| | | | | | | | |
| | | | Distributors — 0.16% | |
| | 13,193 | | | Genuine Parts Co. | | | 1,211 | |
| | 8,534 | | | LKQ Corp. (a) | | | 272 | |
| | | | | | | | |
| | | | | | | 1,483 | |
| | | | | | | | |
| | | | Diversified Consumer Services — 0.06% | |
| | 274 | | | Bright Horizons Family Solutions, Inc. (a) | | | 28 | |
| | 193 | | | Graham Holdings Co. | | | 113 | |
| | 14,764 | | | H&R Block, Inc. | | | 337 | |
| | 2,889 | | | Service Corporation International | | | 103 | |
| | | | | | | | |
| | | | | | | 581 | |
| | | | | | | | |
| | | | Diversified Financial Services — 1.32% | |
| | 4,244 | | | AXA Equitable Holdings, Inc. (a) | | | 87 | |
| | 64,034 | | | Berkshire Hathaway, Inc., Class – B (a) | | | 11,953 | |
| | 5,240 | | | Voya Financial, Inc. | | | 246 | |
| | | | | | | | |
| | | | | | | 12,286 | |
| | | | | | | | |
| | | | Diversified Telecommunication Services — 2.64% | |
| | 374,476 | | | AT&T, Inc. | | | 12,024 | |
| | 53,159 | | | CenturyLink, Inc. | | | 991 | |
| | 225,989 | | | Verizon Communications, Inc. | | | 11,370 | |
| | 4,066 | | | Zayo Group Holdings, Inc. (a) | | | 148 | |
| | | | | | | | |
| | | | | | | 24,533 | |
| | | | | | | | |
| | | | Electric Utilities — 2.32% | |
| | 10,050 | | | Alliant Energy Corp. | | | 425 | |
| | 21,212 | | | American Electric Power, Inc. | | | 1,469 | |
| | 2,985 | | | Avangrid, Inc. | | | 158 | |
| | 36,916 | | | Duke Energy Corp. | | | 2,919 | |
| | 17,079 | | | Edison International | | | 1,081 | |
| | 7,669 | | | Entergy Corp. | | | 620 | |
| | 10,068 | | | Evergy, Inc. | | | 565 | |
| | 16,925 | | | Eversource Energy | | | 992 | |
| | 47,879 | | | Exelon Corp. | | | 2,040 | |
| | 19,424 | | | FirstEnergy Corp. | | | 698 | |
| | 5,642 | | | Hawaiian Electric Industries, Inc. | | | 194 | |
| | 23,732 | | | NextEra Energy, Inc. | | | 3,964 | |
| | 10,380 | | | OGE Energy Corp. | | | 365 | |
| | 21,181 | | | PG&E Corp. | | | 901 | |
| | 5,749 | | | Pinnacle West Capital Corp. | | | 463 | |
| | 35,980 | | | PPL Corp. | | | 1,027 | |
| | 53,037 | | | The Southern Co. | | | 2,456 | |
| | 26,429 | | | Xcel Energy, Inc. | | | 1,207 | |
| | | | | | | | |
| | | | | | | 21,544 | |
| | | | | | | | |
| | | | | | | | |
| Shares | | | Security Description | | Value
(000) | |
| | | | Electrical Equipment — 0.72% | |
| | 2,157 | | | Acuity Brands, Inc. | | $ | 250 | |
| | 10,788 | | | AMETEK, Inc. | | | 778 | |
| | 36,390 | | | Eaton Corp. PLC | | | 2,719 | |
| | 23,265 | | | Emerson Electric Co. | | | 1,609 | |
| | 1,178 | | | GrafTech International Ltd. | | | 21 | |
| | 2,867 | | | Hubbell, Inc. | | | 303 | |
| | 5,343 | | | nVent Electric PLC (a) | | | 134 | |
| | 2,366 | | | Regal-Beloit Corp. | | | 194 | |
| | 3,418 | | | Rockwell Automation, Inc. | | | 568 | |
| | 2,578 | | | Sensata Technologies Holding PLC (a) | | | 123 | |
| | | | | | | | |
| | | | | | | 6,699 | |
| | | | | | | | |
| | | | Electronic Equipment, Instruments & Components — 0.39% | |
| | 4,772 | | | Arrow Electronics, Inc. (a) | | | 359 | |
| | 6,493 | | | Avnet, Inc. | | | 278 | |
| | 216 | | | Coherent, Inc. (a) | | | 34 | |
| | 52,490 | | | Corning, Inc. | | | 1,445 | |
| | 3,196 | | | Dolby Laboratories, Inc., Class – A | | | 197 | |
| | 6,857 | | | FLIR Systems, Inc. | | | 356 | |
| | 5,617 | | | Jabil Circuit, Inc. | | | 155 | |
| | 6,195 | | | Keysight Technologies, Inc. (a) | | | 366 | |
| | 126 | | | Littelfuse, Inc. | | | 29 | |
| | 3,648 | | | National Instruments Corp. | | | 153 | |
| | 8,145 | | | Trimble Navigation Ltd. (a) | | | 267 | |
| | | | | | | | |
| | | | | | | 3,639 | |
| | | | | | | | |
| | | | Energy Equipment & Services — 1.17% | |
| | 2,426 | | | Apergy Corp. (a) | | | 101 | |
| | 33,532 | | | Baker Hughes, Inc. | | | 1,108 | |
| | 8,619 | | | Helmerich & Payne, Inc. | | | 550 | |
| | 30,215 | | | Nabors Industries Ltd. | | | 194 | |
| | 20,488 | | | National Oilwell Varco, Inc. | | | 889 | |
| | 2,219 | | | Oceaneering International, Inc. | | | 56 | |
| | 7,294 | | | Patterson-UTI Energy, Inc. | | | 131 | |
| | 2,410 | | | RPC, Inc. | | | 35 | |
| | 112,043 | | | Schlumberger Ltd. | | | 7,511 | |
| | 14,181 | | | Transocean Ltd. (a) | | | 191 | |
| | 30,983 | | | Weatherford International PLC (a) | | | 102 | |
| | | | | | | | |
| | | | | | | 10,868 | |
| | | | | | | | |
| | | | Equity Real Estate Investment Trusts — 3.76% | |
| | 4,260 | | | Alexandria Real Estate Equities, Inc. | | | 537 | |
| | 7,348 | | | American Campus Communities, Inc. | | | 315 | |
| | 10,499 | | | American Homes 4 Rent, Class – A | | | 233 | |
| | 5,254 | | | American Tower Corp. | | | 757 | |
| | 8,504 | | | Apartment Investment & Management Co., Class – A | | | 360 | |
| | 11,748 | | | Apple Hospitality REIT, Inc. | | | 210 | |
| | 7,524 | | | AvalonBay Communities, Inc. | | | 1,294 | |
| | 8,147 | | | Boston Properties, Inc. | | | 1,022 | |
| | 9,530 | | | Brandywine Realty Trust | | | 161 | |
| | 16,275 | | | Brixmor Property Group, Inc. | | | 284 | |
| | 4,764 | | | Camden Property Trust | | | 434 | |
| | 20,224 | | | Colony Capital, Inc. | | | 126 | |
| | 6,085 | | | Columbia Property Trust, Inc. | | | 138 | |
| | 2,245 | | | CoreCivic, Inc. | | | 54 | |
| | 423 | | | Coresite Realty Corp. | | | 47 | |
See accompanying notes to financial statements.
56
HC CAPITAL TRUST
The Institutional Value Equity Portfolio
Portfolio of Investments (continued) — June 30, 2018
| | | | | | | | |
| Shares | | | Security Description | | Value
(000) | |
| | | | Common Stocks (continued) | |
| | | | Equity Real Estate Investment Trusts (continued) | |
| | 5,306 | | | Corporate Office Properties Trust | | $ | 154 | |
| | 8,329 | | | Crown Castle International Corp. | | | 898 | |
| | 7,953 | | | CubeSmart | | | 256 | |
| | 4,193 | | | CyrusOne, Inc. | | | 245 | |
| | 4,096 | | | DCT Industrial Trust, Inc. | | | 273 | |
| | 8,314 | | | DDR Corp. | | | 149 | |
| | 9,136 | | | Digital Realty Trust, Inc. | | | 1,019 | |
| | 6,704 | | | Douglas Emmett, Inc. | | | 269 | |
| | 18,468 | | | Duke Realty Corp. | | | 536 | |
| | 6,969 | | | Empire State Realty Trust, Inc., Class – A | | | 119 | |
| | 3,735 | | | EPR Properties | | | 242 | |
| | 877 | | | Equinix, Inc. | | | 377 | |
| | 4,880 | | | Equity Commonwealth (a) | | | 154 | |
| | 1,072 | | | Equity Lifestyle Properties, Inc. | | | 99 | |
| | 19,222 | | | Equity Residential | | | 1,225 | |
| | 3,638 | | | Essex Property Trust, Inc. | | | 870 | |
| | 1,906 | | | Extra Space Storage, Inc. | | | 190 | |
| | 3,935 | | | Federal Realty Investment Trust | | | 498 | |
| | 12,292 | | | Forest City Realty Trust, Inc., Class – A | | | 280 | |
| | 8,388 | | | Gaming & Leisure Properties, Inc. | | | 300 | |
| | 33,252 | | | GGP, Inc. | | | 679 | |
| | 25,066 | | | HCP, Inc. | | | 647 | |
| | 10,794 | | | Healthcare Trust of America, Inc., Class – A | | | 291 | |
| | 5,498 | | | Highwoods Properties, Inc. | | | 279 | |
| | 8,731 | | | Hospitality Properties Trust | | | 250 | |
| | 38,901 | | | Host Hotels & Resorts, Inc. | | | 820 | |
| | 7,633 | | | Hudson Pacific Property, Inc. | | | 270 | |
| | 12,416 | | | Invitation Homes, Inc. | | | 286 | |
| | 12,736 | | | Iron Mountain, Inc. | | | 446 | |
| | 4,318 | | | JBG Smith Properties | | | 157 | |
| | 5,226 | | | Kilroy Realty Corp. | | | 395 | |
| | 22,254 | | | Kimco Realty Corp. | | | 378 | |
| | 1,257 | | | Lamar Advertising Co., Class – A | | | 86 | |
| | 7,500 | | | Liberty Property Trust | | | 332 | |
| | 2,304 | | | Life Storage, Inc. | | | 224 | |
| | 19,090 | | | Medical Properties Trust, Inc. | | | 268 | |
| | 6,041 | | | Mid-America Apartment Communities, Inc. | | | 608 | |
| | 8,158 | | | National Retail Properties, Inc. | | | 359 | |
| | 10,366 | | | OMEGA Healthcare Investors, Inc. | | | 321 | |
| | 7,201 | | | Outfront Media, Inc. | | | 140 | |
| | 10,985 | | | Paramount Group, Inc. | | | 169 | |
| | 8,596 | | | Parks Hotels & Resorts, Inc. | | | 263 | |
| | 2,923 | | | Piedmont Office Realty Trust, Inc., Class – A | | | 58 | |
| | 28,535 | | | Prologis, Inc. | | | 1,875 | |
| | 1,732 | | | Public Storage | | | 393 | |
| | 6,674 | | | Rayonier, Inc. | | | 258 | |
| | 15,479 | | | Realty Income Corp. | | | 833 | |
| | 8,050 | | | Regency Centers Corp. | | | 500 | |
| | 11,967 | | | Retail Properties of America, Inc., Class – A | | | 153 | |
| | 12,443 | | | Senior Housing Properties Trust | | | 225 | |
| | 4,706 | | | Simon Property Group, Inc. | | | 801 | |
| | 4,904 | | | SL Green Realty Corp. | | | 493 | |
| | 384 | | | Spirit MTA REIT (a) | | | 4 | |
| | | | | | | | |
| Shares | | | Security Description | | Value
(000) | |
| | | | Equity Real Estate Investment Trusts (continued) | |
| | 24,589 | | | Spirit Realty Capital, Inc. | | $ | 197 | |
| | 9,390 | | | Store Capital Corp. | | | 257 | |
| | 4,003 | | | Sun Communities, Inc. | | | 392 | |
| | 1,845 | | | Tanger Factory Outlet Centers, Inc. | | | 43 | |
| | 713 | | | Taubman Centers, Inc. | | | 42 | |
| | 7,470 | | | The Macerich Co. | | | 425 | |
| | 14,109 | | | UDR, Inc. | | | 530 | |
| | 7,400 | | | Uniti Group, Inc. | | | 148 | |
| | 19,591 | | | Ventas, Inc. | | | 1,116 | |
| | 51,643 | | | VEREIT, Inc. | | | 384 | |
| | 11,975 | | | VICI Properties, Inc. | | | 247 | |
| | 9,241 | | | Vornado Realty Trust | | | 683 | |
| | 6,507 | | | Weingarten Realty Investors | | | 200 | |
| | 20,494 | | | Welltower, Inc. | | | 1,286 | |
| | 33,579 | | | Weyerhaeuser Co. | | | 1,225 | |
| | 5,754 | | | WP Carey, Inc. | | | 382 | |
| | | | | | | | |
| | | | | | | 34,943 | |
| | | | | | | | |
| | | | Food & Staples Retailing — 2.06% | |
| | 1,232 | | | Casey’s General Stores, Inc. | | | 129 | |
| | 81,423 | | | CVS Caremark Corp. | | | 5,240 | |
| | 11,105 | | | Sysco Corp. | | | 758 | |
| | 46,894 | | | The Kroger Co. | | | 1,334 | |
| | 6,771 | | | US Foods Holding Corp. (a) | | | 256 | |
| | 71,993 | | | Walgreens Boots Alliance, Inc. | | | 4,321 | |
| | 82,977 | | | Wal-Mart Stores, Inc. | | | 7,107 | |
| | | | | | | | |
| | | | | | | 19,145 | |
| | | | | | | | |
| | | | Food Products — 2.20% | |
| | 43,291 | | | Archer-Daniels-Midland Co. | | | 1,984 | |
| | 27,413 | | | Bunge Ltd. | | | 1,910 | |
| | 9,988 | | | Campbell Soup Co. | | | 405 | |
| | 29,707 | | | ConAgra Foods, Inc. | | | 1,061 | |
| | 14,356 | | | Flowers Foods, Inc. | | | 299 | |
| | 57,160 | | | General Mills, Inc. | | | 2,530 | |
| | 5,583 | | | Hershey Co. | | | 520 | |
| | 21,854 | | | Hormel Foods Corp. | | | 813 | |
| | 5,521 | | | Ingredion, Inc. | | | 611 | |
| | 10,834 | | | Kellogg Co. | | | 757 | |
| | 7,267 | | | Lamb Weston Holding, Inc. | | | 498 | |
| | 3,735 | | | McCormick & Company, Inc. | | | 434 | |
| | 86,038 | | | Mondelez International, Inc., Class – A | | | 3,527 | |
| | 2,623 | | | Pilgrim’s Pride Corp. (a) | | | 53 | |
| | 3,954 | | | Pinnacle Foods, Inc. | | | 257 | |
| | 1,067 | | | Post Holdings, Inc. (a) | | | 92 | |
| | 9 | | | Seaboard Corp. | | | 36 | |
| | 4,914 | | | The Hain Celestial Group, Inc. (a) | | | 146 | |
| | 10,337 | | | The J.M. Smucker Co. | | | 1,111 | |
| | 35,098 | | | The Kraft Heinz Co. | | | 2,205 | |
| | 2,692 | | | TreeHouse Foods, Inc. (a) | | | 141 | |
| | 14,351 | | | Tyson Foods, Inc., Class – A | | | 988 | |
| | | | | | | | |
| | | | | | | 20,378 | |
| | | | | | | | |
| | | | Gas Utilities — 0.12% | |
| | 4,706 | | | Atmos Energy Corp. | | | 424 | |
| | 4,240 | | | National Fuel Gas Co. | | | 225 | |
| | 8,594 | | | UGI Corp. | | | 447 | |
| | | | | | | | |
| | | | | | | 1,096 | |
| | | | | | | | |
See accompanying notes to financial statements.
57
HC CAPITAL TRUST
The Institutional Value Equity Portfolio
Portfolio of Investments (continued) — June 30, 2018
| | | | | | | | |
| Shares | | | Security Description | | Value
(000) | |
| | | | Common Stocks (continued) | |
| | | | Health Care Equipment & Supplies — 2.02% | |
| | 56,292 | | | Abbott Laboratories | | $ | 3,432 | |
| | 14,762 | | | Baxter International, Inc. | | | 1,090 | |
| | 7,893 | | | Becton, Dickinson & Co. | | | 1,891 | |
| | 10,393 | | | Boston Scientific Corp. (a) | | | 340 | |
| | 20,490 | | | Danaher Corp. | | | 2,022 | |
| | 7,409 | | | Dentsply Sirona, Inc. | | | 324 | |
| | 724 | | | Hill-Rom Holdings, Inc. | | | 63 | |
| | 8,622 | | | Hologic, Inc. (a) | | | 343 | |
| | 505 | | | Integra LifeSciences Holdings Corp. (a) | | | 33 | |
| | 80,485 | | | Medtronic PLC | | | 6,891 | |
| | 2,792 | | | Steris PLC | | | 293 | |
| | 1,223 | | | Teleflex, Inc. | | | 328 | |
| | 1,329 | | | The Cooper Companies, Inc. | | | 313 | |
| | 1,733 | | | West Pharmaceutical Services, Inc. | | | 172 | |
| | 11,026 | | | Zimmer Holdings, Inc. | | | 1,229 | |
| | | | | | | | |
| | | | | | | 18,764 | |
| | | | | | | | |
| | | | Health Care Providers & Services — 1.93% | |
| | 2,752 | | | Acadia Healthcare Company, Inc. (a) | | | 113 | |
| | 6,819 | | | Aetna, Inc. | | | 1,251 | |
| | 8,484 | | | Anthem, Inc. | | | 2,019 | |
| | 44,794 | | | Cardinal Health, Inc. | | | 2,187 | |
| | 4,408 | | | Centene Corp. (a) | | | 543 | |
| | 9,802 | | | CIGNA Corp. | | | 1,666 | |
| | 5,715 | | | DaVita Healthcare Partners, Inc. (a) | | | 397 | |
| | 3,325 | | | Envision Healthcare Corp. (a) | | | 146 | |
| | 29,477 | | | Express Scripts Holding Co. (a) | | | 2,277 | |
| | 2,653 | | | HCA Holdings, Inc. | | | 272 | |
| | 7,650 | | | Henry Schein, Inc. (a) | | | 556 | |
| | 3,326 | | | Humana, Inc. | | | 990 | |
| | 3,209 | | | Laboratory Corporation of America Holdings (a) | | | 576 | |
| | 760 | | | LifePoint Hospitals, Inc., Class – A (a) | | | 37 | |
| | 10,597 | | | McKesson Corp. | | | 1,414 | |
| | 4,984 | | | MEDNAX, Inc. (a) | | | 216 | |
| | 293 | | | Molina Heathcare, Inc. (a) | | | 29 | |
| | 8,614 | | | Patterson Companies, Inc. | | | 195 | |
| | 1,176 | | | Premier, Inc., Class – A (a) | | | 43 | |
| | 4,495 | | | Quest Diagnostics, Inc. | | | 494 | |
| | 13,777 | | | Qurate Retail, Inc. (a) | | | 292 | |
| | 6,033 | | | UnitedHealth Group, Inc. | | | 1,480 | |
| | 4,604 | | | Universal Health Services, Inc., Class – B | | | 513 | |
| | 1,033 | | | WellCare Health Plans, Inc. (a) | | | 254 | |
| | | | | | | | |
| | | | | | | 17,960 | |
| | | | | | | | |
| | | | Health Care Technology — 0.08% | |
| | 11,922 | | | Cerner Corp. (a) | | | 713 | |
| | | | | | | | |
| | | | Hotels, Restaurants & Leisure — 1.91% | |
| | 7,831 | | | Aramark | | | 291 | |
| | 19,370 | | | Caesars Entertainment Corp. (a) | | | 207 | |
| | 35,425 | | | Carnival Corp., Class – A | | | 2,031 | |
| | 4,510 | | | Darden Restaurants, Inc. | | | 483 | |
| | 9,502 | | | Extended Stay America, Inc. | | | 205 | |
| | 851 | | | Hilton Grand Vacations (a) | | | 30 | |
| | 1,504 | | | Hyatt Hotels Corp., Class – A | | | 116 | |
| | 5,664 | | | International Game Technology PLC | | | 132 | |
| | | | | | | | |
| Shares | | | Security Description | | Value
(000) | |
| | | | Hotels, Restaurants & Leisure (continued) | |
| | 14,955 | | | Las Vegas Sands Corp. | | $ | 1,142 | |
| | 40,218 | | | McDonald’s Corp. | | | 6,301 | |
| | 15,614 | | | MGM Resorts International | | | 453 | |
| | 6,768 | | | Norwegian Cruise Line Holdings Ltd. (a) | | | 320 | |
| | 12,796 | | | Royal Caribbean Cruises Ltd. | | | 1,326 | |
| | 1,740 | | | Six Flags Entertainment Corp. | | | 122 | |
| | 61,356 | | | Starbucks Corp. | | | 2,996 | |
| | 1,060 | | | Vail Resorts, Inc. | | | 291 | |
| | 6,008 | | | Wyndham Worldwide Corp. | | | 266 | |
| | 11,074 | | | Yum China Holdings, Inc. | | | 426 | |
| | 7,477 | | | YUM! Brands, Inc. | | | 585 | |
| | | | | | | | |
| | | | | | | 17,723 | |
| | | | | | | | |
| | | | Household Durables — 0.53% | |
| | 10,440 | | | D.R. Horton, Inc. | | | 428 | |
| | 8,614 | | | Garmin Ltd. | | | 525 | |
| | 7,715 | | | Leggett & Platt, Inc. | | | 344 | |
| | 8,792 | | | Lennar Corp., Class – A | | | 462 | |
| | 519 | | | Lennar Corp., Class – B | | | 22 | |
| | 2,037 | | | Mohawk Industries, Inc. (a) | | | 436 | |
| | 34,961 | | | Newell Rubbermaid, Inc. | | | 902 | |
| | 10,320 | | | PulteGroup, Inc. | | | 297 | |
| | 4,676 | | | Toll Brothers, Inc. | | | 173 | |
| | 1,604 | | | Tupperware Brands Corp. | | | 66 | |
| | 8,447 | | | Whirlpool Corp. | | | 1,235 | |
| | | | | | | | |
| | | | | | | 4,890 | |
| | | | | | | | |
| | | | Household Products — 2.07% | |
| | 4,310 | | | Church & Dwight Co., Inc. | | | 229 | |
| | 71,411 | | | Colgate-Palmolive Co. | | | 4,628 | |
| | 1,524 | | | Energizer Holdings, Inc. | | | 96 | |
| | 28,949 | | | Kimberly-Clark Corp. | | | 3,049 | |
| | 985 | | | Spectrum Brands Holdings, Inc. | | | 80 | |
| | 5,668 | | | The Clorox Co. | | | 767 | |
| | 133,143 | | | The Procter & Gamble Co. | | | 10,394 | |
| | | | | | | | |
| | | | | | | 19,243 | |
| | | | | | | | |
| | | | Independent Power & Renewable Electricity
Producers — 0.11% | |
| | 10,210 | | | NRG Energy, Inc., Class – C | | | 313 | |
| | 29,449 | | | The AES Corp. | | | 396 | |
| | 13,373 | | | Vistra Energy Corp. (a) | | | 316 | |
| | | | | | | | |
| | | | | | | 1,025 | |
| | | | | | | | |
| | | | Industrial Conglomerates — 1.43% | |
| | 19,024 | | | 3M Co. | | | 3,742 | |
| | 3,212 | | | Carlisle Companies, Inc. | | | 348 | |
| | 524,107 | | | General Electric Co. | | | 7,134 | |
| | 9,312 | | | Honeywell International, Inc. | | | 1,341 | |
| | 2,692 | | | Roper Industries, Inc. | | | 743 | |
| | | | | | | | |
| | | | | | | 13,308 | |
| | | | | | | | |
| | | | Insurance — 4.07% | |
| | 67,738 | | | Aflac, Inc. | | | 2,914 | |
| | 439 | | | Alleghany Corp. | | | 252 | |
| | 11,515 | | | Allstate Corp. | | | 1,051 | |
| | 2,370 | | | American Financial Group, Inc. | | | 254 | |
See accompanying notes to financial statements.
58
HC CAPITAL TRUST
The Institutional Value Equity Portfolio
Portfolio of Investments (continued) — June 30, 2018
| | | | | | | | |
| Shares | | | Security Description | | Value
(000) | |
| | | | Common Stocks (continued) | |
| | | | Insurance (continued) | |
| | 70,621 | | | American International Group, Inc. | | $ | 3,744 | |
| | 262 | | | American National Insurance Co. | | | 31 | |
| | 10,749 | | | Arch Capital Group Ltd. (a) | | | 284 | |
| | 10,143 | | | Arthur J. Gallagher & Co. | | | 662 | |
| | 4,853 | | | Aspen Insurance Holdings Ltd. | | | 198 | |
| | 3,398 | | | Assurant, Inc. | | | 352 | |
| | 3,674 | | | Assured Guaranty Ltd. | | | 131 | |
| | 7,712 | | | Athene Holding Ltd. (a) | | | 338 | |
| | 7,425 | | | AXIS Capital Holdings Ltd. | | | 413 | |
| | 3,879 | | | Brighthouse Financial, Inc. (a) | | | 155 | |
| | 7,220 | | | Brown & Brown, Inc. | | | 200 | |
| | 38,867 | | | Chubb Ltd. | | | 4,937 | |
| | 9,460 | | | Cincinnati Financial Corp. | | | 632 | |
| | 2,443 | | | CNA Financial Corp. | | | 112 | |
| | 233 | | | Erie Indemnity Co., Class – A | | | 27 | |
| | 2,981 | | | Everest Re Group Ltd. | | | 686 | |
| | 6,814 | | | First American Financial Corp. | | | 352 | |
| | 21,742 | | | FNF Group | | | 818 | |
| | 1,416 | | | Hanover Insurance Group, Inc. | | | 169 | |
| | 11,843 | | | Hartford Financial Services Group, Inc. | | | 606 | |
| | 12,388 | | | Lincoln National Corp. | | | 771 | |
| | 16,049 | | | Loews Corp. | | | 775 | |
| | 417 | | | Markel Corp. (a) | | | 452 | |
| | 8,828 | | | Marsh & McLennan Companies, Inc. | | | 724 | |
| | 2,425 | | | Mercury General Corp. | | | 110 | |
| | 91,207 | | | MetLife, Inc. | | | 3,978 | |
| | 21,891 | | | Old Republic International Corp. | | | 436 | |
| | 34,348 | | | Principal Financial Group, Inc. | | | 1,819 | |
| | 1,543 | | | ProAssurance Corp. | | | 55 | |
| | 42,903 | | | Prudential Financial, Inc. | | | 4,013 | |
| | 3,685 | | | Reinsurance Group of America | | | 492 | |
| | 1,202 | | | RenaissanceRe Holdings Ltd. | | | 145 | |
| | 17,541 | | | The Travelers Companies, Inc. | | | 2,146 | |
| | 3,524 | | | Torchmark Corp. | | | 287 | |
| | 19,366 | | | Unum Group | | | 716 | |
| | 3,963 | | | Validus Holdings Ltd. | | | 268 | |
| | 5,455 | | | W.R. Berkley Corp. | | | 395 | |
| | 190 | | | White Mountains Insurance Group Ltd. | | | 172 | |
| | 4,330 | | | Willis Towers Watson PLC | | | 656 | |
| | 5,415 | | | XL Group Ltd. | | | 303 | |
| | | | | | | | |
| | | | | | | 38,031 | |
| | | | | | | | |
| | | | Internet Software & Services — 0.17% | |
| | 2,459 | | | Akamai Technologies, Inc. (a) | | | 180 | |
| | 35,019 | | | eBay, Inc. (a) | | | 1,270 | |
| | 584 | | | LogMeln, Inc. | | | 60 | |
| | 513 | | | Zillow Group, Inc., Class – A (a) | | | 31 | |
| | 1,049 | | | Zillow Group, Inc., Class – C (a) | | | 62 | |
| | | | | | | | |
| | | | | | | 1,603 | |
| | | | | | | | |
| | | | IT Services — 1.19% | |
| | 5,366 | | | Accenture PLC, Class – A | | | 878 | |
| | 4,724 | | | Amdocs Ltd. | | | 313 | |
| | 296 | | | Booz Allen Hamilton Holding Corp. | | | 13 | |
| | 9,344 | | | Cognizant Technology Solutions Corp. | | | 738 | |
| | 6,295 | | | Conduent, Inc. (a) | | | 114 | |
| | | | | | | | |
| Shares | | | Security Description | | Value
(000) | |
| | | | IT Services (continued) | |
| | 1,021 | | | CoreLogic, Inc. (a) | | $ | 53 | |
| | 9,319 | | | DXC Technology Co. | | | 751 | |
| | 754 | | | Euronet Worldwide, Inc. (a) | | | 63 | |
| | 9,877 | | | Fidelity National Information Services, Inc. | | | 1,047 | |
| | 2,929 | | | Genpact Ltd. | | | 85 | |
| | 1,940 | | | Global Payments, Inc. | | | 216 | |
| | 30,879 | | | International Business Machines Corp. | | | 4,315 | |
| | 8,486 | | | Leidos Holdings, Inc. | | | 501 | |
| | 7,862 | | | Paychex, Inc. | | | 537 | |
| | 7,915 | | | Sabre Corp. | | | 195 | |
| | 447 | | | Switch, Inc., Class – A | | | 5 | |
| | 1,564 | | | Teradata Corp. (a) | | | 63 | |
| | 22,576 | | | Western Union Co. | | | 459 | |
| | 8,722 | | | Worldpay, Inc., Class – A (a) | | | 713 | |
| | | | | | | | |
| | | | | | | 11,059 | |
| | | | | | | | |
| | | | Leisure Products — 0.08% | |
| | 3,924 | | | Brunswick Corp. | | | 253 | |
| | 3,661 | | | Hasbro, Inc. | | | 338 | |
| | 8,908 | | | Mattel, Inc. | | | 146 | |
| | | | | | | | |
| | | | | | | 737 | |
| | | | | | | | |
| | | | Life Sciences Tools & Services — 0.66% | |
| | 16,384 | | | Agilent Technologies, Inc. | | | 1,013 | |
| | 699 | | | Bio-Rad Laboratories, Inc., Class – A (a) | | | 202 | |
| | 663 | | | Bio-Techne Corp. | | | 98 | |
| | 3,808 | | | Bruker Biosciences Corp. | | | 111 | |
| | 413 | | | Charles River Laboratories International, Inc. (a) | | | 46 | |
| | 2,727 | | | Illumina, Inc. (a) | | | 762 | |
| | 5,341 | | | IQVIA Holdings, Inc. (a) | | | 533 | |
| | 3,578 | | | PerkinElmer, Inc. | | | 262 | |
| | 7,150 | | | Qiagen N.V. (a) | | | 259 | |
| | 12,377 | | | Thermo Electron Corp. | | | 2,563 | |
| | 1,564 | | | Waters Corp. (a) | | | 303 | |
| | | | | | | | |
| | | | | | | 6,152 | |
| | | | | | | | |
| | | | Machinery — 1.49% | |
| | 3,577 | | | AGCO Corp. | | | 217 | |
| | 16,164 | | | Caterpillar, Inc. | | | 2,193 | |
| | 4,928 | | | Colfax Corp. (a) | | | 151 | |
| | 1,652 | | | Crane Co. | | | 132 | |
| | 12,131 | | | Cummins, Inc. | | | 1,613 | |
| | 360 | | | Donaldson Company, Inc. | | | 16 | |
| | 9,319 | | | Dover Corp. | | | 682 | |
| | 4,367 | | | Flowserve Corp. | | | 176 | |
| | 7,455 | | | Fortive Corp. | | | 575 | |
| | 2,199 | | | Gardner Denver Holdings, Inc. (a) | | | 65 | |
| | 1,418 | | | Gates Industrial Corp. PLC (a) | | | 23 | |
| | 157 | | | IDEX Corp. | | | 21 | |
| | 8,840 | | | Illinois Tool Works, Inc. | | | 1,225 | |
| | 16,904 | | | Ingersoll-Rand PLC | | | 1,517 | |
| | 4,739 | | | ITT, Inc. | | | 248 | |
| | 1,208 | | | Lincoln Electric Holdings, Inc. | | | 106 | |
| | 117 | | | Nordson, Inc. | | | 15 | |
| | 3,992 | | | Oshkosh Corp. | | | 281 | |
| | 18,683 | | | PACCAR, Inc. | | | 1,158 | |
| | 3,552 | | | Parker Hannifin Corp. | | | 554 | |
See accompanying notes to financial statements.
59
HC CAPITAL TRUST
The Institutional Value Equity Portfolio
Portfolio of Investments (continued) — June 30, 2018
| | | | | | | | |
| Shares | | | Security Description | | Value
(000) | |
| | | | Common Stocks (continued) | |
| | | | Machinery (continued) | |
| | 5,344 | | | Pentair PLC | | $ | 225 | |
| | 4,836 | | | Snap-on, Inc. | | | 777 | |
| | 5,060 | | | Stanley Black & Decker, Inc. | | | 672 | |
| | 3,895 | | | Terex Corp. | | | 164 | |
| | 697 | | | The Middleby Corp. (a) | | | 73 | |
| | 5,343 | | | The Timken Co. | | | 233 | |
| | 8,043 | | | Trinity Industries, Inc. | | | 276 | |
| | 1,044 | | | WABCO Holdings, Inc. (a) | | | 122 | |
| | 1,832 | | | Wabtec Corp. | | | 181 | |
| | 2,646 | | | Xylem, Inc. | | | 178 | |
| | | | | | | | |
| | | | | | | 13,869 | |
| | | | | | | | |
| | | | Marine — 0.03% | |
| | 3,103 | | | Kirby Corp. (a) | | | 259 | |
| | | | | | | | |
| | | | Media — 2.34% | |
| | 737 | | | AMC Networks, Inc. (a) | | | 46 | |
| | 1,766 | | | Charter Communications, Inc., Class – A (a) | | | 518 | |
| | 12,244 | | | Cinemark Holdings, Inc. | | | 430 | |
| | 268,648 | | | Comcast Corp., Class – A | | | 8,813 | |
| | 7,368 | | | Discovery Communications, Inc., Class – A (a) | | | 203 | |
| | 15,624 | | | Discovery Communications, Inc., Class – C (a) | | | 398 | |
| | 10,284 | | | Dish Network Corp. (a) | | | 346 | |
| | 4,805 | | | GCI Liberty, Inc., Class – A (a) | | | 217 | |
| | 2,133 | | | John Wiley & Sons, Inc., Class – A | | | 133 | |
| | 1,280 | | | Liberty Broadband, Class – A (a) | | | 97 | |
| | 5,011 | | | Liberty Broadband, Class – C (a) | | | 379 | |
| | 1,251 | | | Liberty Media Group, Class – A (a) | | | 44 | |
| | 9,331 | | | Liberty Media Group, Class – C (a) | | | 346 | |
| | 4,153 | | | Liberty SiriusXM Group, Class – A (a) | | | 187 | |
| | 5,667 | | | Liberty SiriusXM Group, Class – C (a) | | | 257 | |
| | 2,232 | | | Lions Gate Entertainment Corp., Class – A | | | 55 | |
| | 4,136 | | | Lions Gate Entertainment Corp., Class – B | | | 97 | |
| | 4,264 | | | News Corp., Inc. | | | 68 | |
| | 18,458 | | | News Corp., Inc., Class – A | | | 286 | |
| | 11,748 | | | Omnicom Group, Inc. | | | 896 | |
| | 22,250 | | | Sirius XM Holdings, Inc. | | | 151 | |
| | 5,303 | | | TEGNA, Inc. | | | 58 | |
| | 75,629 | | | The Interpublic Group of Companies, Inc. | | | 1,773 | |
| | 550 | | | The Madison Square Garden Co., Class – A (a) | | | 171 | |
| | 13,955 | | | The Walt Disney Co. | | | 1,463 | |
| | 4,652 | | | Tribune Media Co., Class – A | | | 178 | |
| | 50,621 | | | Twenty-First Century Fox, Inc. | | | 2,514 | |
| | 15,988 | | | Twenty-First Century Fox, Inc., Class – B | | | 788 | |
| | 361 | | | Viacom, Inc., Class – A | | | 13 | |
| | 26,177 | | | Viacom, Inc., Class – B | | | 789 | |
| | | | | | | | |
| | | | | | | 21,714 | |
| | | | | | | | |
| | | | Metals & Mining — 0.57% | |
| | 6,214 | | | Alcoa Corp. (a) | | | 291 | |
| | 70,003 | | | Freeport-McMoRan Copper & Gold, Inc. | | | 1,208 | |
| | 26,646 | | | Newmont Mining Corp. | | | 1,005 | |
| | 23,371 | | | Nucor Corp. | | | 1,460 | |
| | 5,413 | | | Reliance Steel & Aluminum Co. | | | 474 | |
| | 1,278 | | | Royal Gold, Inc. | | | 119 | |
| | 2,086 | | | Southern Copper Corp. | | | 98 | |
| | | | | | | | |
| Shares | | | Security Description | | Value
(000) | |
| | | | Metals & Mining (continued) | | | | |
| | 10,135 | | | Steel Dynamics, Inc. | | $ | 466 | |
| | 5,821 | | | United States Steel Corp. | | | 202 | |
| | | | | | | | |
| | | | | | | 5,323 | |
| | | | | | | | |
| | | | Mortgage Real Estate Investment Trusts — 0.24% | |
| | 22,047 | | | AGNC Investment Corp. | | | 410 | |
| | 38,317 | | | Annaly Capital Management, Inc. | | | 394 | |
| | 14,564 | | | Chimera Investment Corp. | | | 266 | |
| | 30,904 | | | MFA Financial, Inc. | | | 234 | |
| | 17,969 | | | New Residential Investment Corp. | | | 314 | |
| | 20,338 | | | Starwood Property Trust, Inc. | | | 443 | |
| | 9,382 | | | Two Harbors Investment Corp. | | | 148 | |
| | | | | | | | |
| | | | | | | 2,209 | |
| | | | | | | | |
| | | | Multiline Retail — 0.64% | |
| | 6,359 | | | Dollar Tree, Inc. (a) | | | 541 | |
| | 13,151 | | | Kohl’s Corp. | | | 959 | |
| | 24,050 | | | Macy’s, Inc. | | | 900 | |
| | 2,922 | | | Nordstrom, Inc. | | | 151 | |
| | 44,701 | | | Target Corp. | | | 3,402 | |
| | | | | | | | |
| | | | | | | 5,953 | |
| | | | | | | | |
| | | | Multi-Utilities — 1.16% | |
| | 10,056 | | | Ameren Corp. | | | 612 | |
| | 18,810 | | | CenterPoint Energy, Inc. | | | 521 | |
| | 12,088 | | | CMS Energy Corp. | | | 572 | |
| | 16,092 | | | Consolidated Edison, Inc. | | | 1,255 | |
| | 34,225 | | | Dominion Resources, Inc. | | | 2,333 | |
| | 7,892 | | | DTE Energy Co. | | | 818 | |
| | 10,003 | | | MDU Resources Group, Inc. | | | 287 | |
| | 15,122 | | | NiSource, Inc. | | | 397 | |
| | 20,995 | | | Public Service Enterprise Group, Inc. | | | 1,137 | |
| | 7,116 | | | SCANA Corp. | | | 274 | |
| | 11,214 | | | Sempra Energy | | | 1,302 | |
| | 3,469 | | | Vectren Corp. | | | 248 | |
| | 16,542 | | | WEC Energy Group, Inc. | | | 1,069 | |
| | | | | | | | |
| | | | | | | 10,825 | |
| | | | | | | | |
| | | | Oil, Gas & Consumable Fuels — 7.78% | |
| | 11,288 | | | Anadarko Petroleum Corp. | | | 827 | |
| | 8,052 | | | Andeavor | | | 1,056 | |
| | 8,571 | | | Antero Resources Corp. (a) | | | 183 | |
| | 29,720 | | | Apache Corp. | | | 1,389 | |
| | 13,653 | | | Cabot Oil & Gas Corp. | | | 325 | |
| | 5,513 | | | Centennial Resource Development, Inc. (a) | | | 100 | |
| | 2,137 | | | Cheniere Energy, Inc. (a) | | | 139 | |
| | 29,580 | | | Chesapeake Energy Corp. (a) | | | 155 | |
| | 99,163 | | | Chevron Corp. | | | 12,537 | |
| | 2,685 | | | Cimarex Energy Co. | | | 273 | |
| | 11,908 | | | CNX Resources Corp. (a) | | | 212 | |
| | 7,943 | | | Concho Resources, Inc. (a) | | | 1,099 | |
| | 62,634 | | | ConocoPhillips | | | 4,361 | |
| | 635 | | | CONSOL Energy, Inc. (a) | | | 24 | |
| | 3,311 | | | Continental Resources, Inc. (a) | | | 214 | |
| | 17,207 | | | Devon Energy Corp. | | | 756 | |
| | 4,473 | | | Diamondback Energy, Inc. | | | 589 | |
| | 4,873 | | | Energen Corp. (a) | | | 355 | |
| | 16,882 | | | EOG Resources, Inc. | | | 2,101 | |
See accompanying notes to financial statements.
60
HC CAPITAL TRUST
The Institutional Value Equity Portfolio
Portfolio of Investments (continued) — June 30, 2018
| | | | | | | | |
| Shares | | | Security Description | | Value
(000) | |
| | | | Common Stocks (continued) | |
| | | | Oil, Gas & Consumable Fuels (continued) | |
| | 13,628 | | | EQT Corp. | | $ | 752 | |
| | 6,142 | | | Extraction Oil & Gas, Inc. (a) | | | 90 | |
| | 196,359 | | | Exxon Mobil Corp. | | | 16,246 | |
| | 8,886 | | | Hess Corp. | | | 594 | |
| | 9,208 | | | HollyFrontier Corp. | | | 630 | |
| | 150,961 | | | Kinder Morgan, Inc. | | | 2,667 | |
| | 11,287 | | | Kosmos Energy Ltd. (a) | | | 93 | |
| | 45,710 | | | Marathon Oil Corp. | | | 954 | |
| | 41,244 | | | Marathon Petroleum Corp. | | | 2,894 | |
| | 13,176 | | | Murphy Oil Corp. | | | 445 | |
| | 3,906 | | | Newfield Exploration Co. (a) | | | 118 | |
| | 25,963 | | | Noble Energy, Inc. | | | 916 | |
| | 46,028 | | | Occidental Petroleum Corp. | | | 3,852 | |
| | 25,304 | | | ONEOK, Inc. | | | 1,767 | |
| | 7,375 | | | Parsley Energy, Inc., Class – A (a) | | | 223 | |
| | 8,298 | | | PBF Energy, Inc., Class – A | | | 348 | |
| | 36,775 | | | Phillips 66 | | | 4,130 | |
| | 6,009 | | | Pioneer Natural Resources Co. | | | 1,137 | |
| | 7,827 | | | QEP Resources, Inc. (a) | | | 96 | |
| | 7,047 | | | Range Resources Corp. | | | 118 | |
| | 5,032 | | | RSP Permian, Inc. (a) | | | 222 | |
| | 5,946 | | | SM Energy Co. | | | 153 | |
| | 10,637 | | | Southwestern Energy Co. (a) | | | 56 | |
| | 12,552 | | | Targa Resources Corp. | | | 621 | |
| | 65,595 | | | The Williams Companies, Inc. | | | 1,778 | |
| | 37,733 | | | Valero Energy Corp. | | | 4,182 | |
| | 2,967 | | | Whiting Petroleum Corp. (a) | | | 156 | |
| | 1,376 | | | World Fuel Services Corp. | | | 28 | |
| | 13,120 | | | WPX Energy, Inc. (a) | | | 237 | |
| | | | | | | | |
| | | | | | | 72,198 | |
| | | | | | | | |
| | | | Paper & Forest Products — 0.02% | |
| | 4,597 | | | Domtar Corp. | | | 219 | |
| | | | | | | | |
| | | | Personal Products — 0.14% | |
| | 32,706 | | | Coty, Inc., Class – A | | | 461 | |
| | 704 | | | Edgewell Personal Care Co. (a) | | | 36 | |
| | 4,485 | | | Herbalife Ltd. (a) | | | 241 | |
| | 1,899 | | | Nu Skin Enterprises, Inc., Class – A | | | 148 | |
| | 2,765 | | | The Estee Lauder Companies, Inc., Class – A | | | 395 | |
| | | | | | | | |
| | | | | | | 1,281 | |
| | | | | | | | |
| | | | Pharmaceuticals — 4.68% | |
| | 1,600 | | | Akorn, Inc. (a) | | | 27 | |
| | 11,220 | | | Allergan PLC | | | 1,871 | |
| | 88,707 | | | Bristol-Myers Squibb Co. | | | 4,909 | |
| | 3,142 | | | Catalent, Inc. (a) | | | 132 | |
| | 34,770 | | | Eli Lilly & Co. | | | 2,967 | |
| | 147 | | | Jazz Pharmaceuticals PLC (a) | | | 25 | |
| | 106,495 | | | Johnson & Johnson | | | 12,922 | |
| | 133,373 | | | Merck & Co., Inc. | | | 8,096 | |
| | 26,876 | | | Mylan N.V. (a) | | | 971 | |
| | 4,287 | | | Perrigo Co. PLC | | | 313 | |
| | 309,604 | | | Pfizer, Inc. | | | 11,232 | |
| | | | | | | | |
| | | | | | | 43,465 | |
| | | | | | | | |
| | | | | | | | |
| Shares | | | Security Description | | Value
(000) | |
| | | | Professional Services — 0.29% | |
| | 2,843 | | | Equifax, Inc. | | $ | 356 | |
| | 12,738 | | | IHS Markit Ltd. (a) | | | 657 | |
| | 4,881 | | | ManpowerGroup, Inc. | | | 420 | |
| | 35,059 | | | Nielsen Holdings PLC | | | 1,084 | |
| | 1,524 | | | Robert Half International, Inc. | | | 99 | |
| | 699 | | | The Dun & Bradstreet Corp. | | | 86 | |
| | | | | | | | |
| | | | | | | 2,702 | |
| | | | | | | | |
| | | | Real Estate Management & Development — 0.10% | |
| | 7,998 | | | CBRE Group, Inc., Class – A (a) | | | 382 | |
| | 1,109 | | | Howard Hughes Corp. (a) | | | 147 | |
| | 1,894 | | | Jones Lang LaSalle, Inc. | | | 314 | |
| | 5,382 | | | Realogy Holdings Corp. | | �� | 123 | |
| | | | | | | | |
| | | | | | | 966 | |
| | | | | | | | |
| | | | Road & Rail — 0.84% | |
| | 226 | | | AMERCO, Inc. | | | 80 | |
| | 14,461 | | | CSX Corp. | | | 922 | |
| | 1,611 | | | Genesee & Wyoming, Inc., Class – A (a) | | | 131 | |
| | 3,390 | | | Kansas City Southern | | | 359 | |
| | 3,973 | | | Knight-Swift Transportation Holdings, Inc. | | | 152 | |
| | 16,369 | | | Norfolk Southern Corp. | | | 2,470 | |
| | 4,150 | | | Ryder System, Inc. | | | 298 | |
| | 1,223 | | | Schneider National, Inc. | | | 34 | |
| | 23,770 | | | Union Pacific Corp. | | | 3,368 | |
| | | | | | | | |
| | | | | | | 7,814 | |
| | | | | | | | |
| | | | Semiconductors & Semiconductor Equipment — 3.65% | |
| | 10,167 | | | Analog Devices, Inc. | | | 975 | |
| | 17,893 | | | Broadcom, Inc. | | | 4,342 | |
| | 13,161 | | | Cypress Semiconductor Corp. | | | 205 | |
| | 3,870 | | | First Solar, Inc. (a) | | | 204 | |
| | 235,005 | | | Intel Corp. | | | 11,682 | |
| | 4,461 | | | KLA-Tencor Corp. | | | 457 | |
| | 6,986 | | | Lam Research Corp. | | | 1,208 | |
| | 13,184 | | | Marvell Technology Group Ltd. | | | 283 | |
| | 6,821 | | | Maxim Integrated Products, Inc. | | | 400 | |
| | 24,900 | | | Micron Technology, Inc. (a) | | | 1,306 | |
| | 15,684 | | | NXP Semiconductors N.V. (a) | | | 1,714 | |
| | 4,024 | | | Qorvo, Inc. (a) | | | 323 | |
| | 118,448 | | | Qualcomm, Inc. | | | 6,647 | |
| | 4,148 | | | Skyworks Solutions, Inc. | | | 401 | |
| | 7,806 | | | Teradyne, Inc. | | | 297 | |
| | 28,127 | | | Texas Instruments, Inc. | | | 3,101 | |
| | 7,173 | | | Xilinx, Inc. | | | 468 | |
| | | | | | | | |
| | | | | | | 34,013 | |
| | | | | | | | |
| | | | Software — 0.94% | |
| | 119 | | | Aspen Technology, Inc. (a) | | | 11 | |
| | 1,175 | | | Autodesk, Inc. (a) | | | 154 | |
| | 17,443 | | | CA, Inc. | | | 622 | |
| | 8,688 | | | Dell Technologies, Inc., Class – V (a) | | | 735 | |
| | 2,589 | | | FireEye, Inc. (a) | | | 40 | |
| | 13,158 | | | Microsoft Corp. | | | 1,298 | |
| | 9,717 | | | Nuance Communications, Inc. (a) | | | 135 | |
| | 102,019 | | | Oracle Corp. | | | 4,494 | |
| | 529 | | | SS&C Technologies Holdings, Inc. | | | 27 | |
| | 20,199 | | | Symantec Corp. | | | 417 | |
See accompanying notes to financial statements.
61
HC CAPITAL TRUST
The Institutional Value Equity Portfolio
Portfolio of Investments (continued) — June 30, 2018
| | | | | | | | |
| Shares | | | Security Description | | Value
(000) | |
| | | | Common Stocks (continued) | |
| | | | Software (continued) | |
| | 4,447 | | | Synopsys, Inc. (a) | | $ | 381 | |
| | 1,418 | | | Take-Two Interactive Software, Inc. (a) | | | 168 | |
| | 867 | | | VMware, Inc., Class – A (a) | | | 127 | |
| | 25,315 | | | Zynga, Inc. (a) | | | 103 | |
| | | | | | | | |
| | | | | | | 8,712 | |
| | | | | | | | |
| | | | Specialty Retail — 0.89% | |
| | 1,645 | | | Advance Auto Parts, Inc. | | | 223 | |
| | 1,844 | | | AutoNation, Inc. (a) | | | 90 | |
| | 115 | | | AutoZone, Inc. (a) | | | 77 | |
| | 12,699 | | | Bed Bath & Beyond, Inc. | | | 253 | |
| | 18,107 | | | Best Buy Co., Inc. | | | 1,350 | |
| | 2,164 | | | CarMax, Inc. (a) | | | 158 | |
| | 6,303 | | | Dick’s Sporting Goods, Inc. | | | 222 | |
| | 9,759 | | | Foot Locker, Inc. | | | 514 | |
| | 4,477 | | | GameStop Corp., Class – A | | | 65 | |
| | 17,313 | | | Gap, Inc. | | | 561 | |
| | 12,923 | | | L Brands, Inc. | | | 477 | |
| | 2,933 | | | Michaels Companies, Inc. The (a) | | | 56 | |
| | 2,318 | | | Penske Automotive Group, Inc. | | | 109 | |
| | 2,882 | | | Signet Jewelers Ltd. | | | 161 | |
| | 15,793 | | | The Home Depot, Inc. | | | 3,081 | |
| | 3,403 | | | Tiffany & Co. | | | 448 | |
| | 1,530 | | | Urban Outfitters, Inc. (a) | | | 68 | |
| | 6,195 | | | Williams-Sonoma, Inc. | | | 380 | |
| | | | | | | | |
| | | | | | | 8,293 | |
| | | | | | | | |
| | | | Technology Hardware, Storage & Peripherals — 0.82% | |
| | 8,718 | | | Apple, Inc. | | | 1,614 | |
| | 95,201 | | | Hewlett Packard Enterprise Co. | | | 1,391 | |
| | 103,030 | | | HP, Inc. | | | 2,338 | |
| | 648 | | | NCR Corp. (a) | | | 19 | |
| | 5,936 | | | NetApp, Inc. | | | 466 | |
| | 17,802 | | | Western Digital Corp. | | | 1,378 | |
| | 17,575 | | | Xerox Corp. | | | 422 | |
| | | | | | | | |
| | | | | | | 7,628 | |
| | | | | | | | |
| | | | Textiles, Apparel & Luxury Goods — 0.37% | |
| | 826 | | | Columbia Sportswear Co. | | | 76 | |
| | 15,414 | | | Hanesbrands, Inc. | | | 339 | |
| | 1,534 | | | Lululemon Athletica, Inc. (a) | | | 192 | |
| | 4,790 | | | Michael Kors Holdings Ltd. (a) | | | 319 | |
| | 2,534 | | | PVH Corp. | | | 379 | |
| | 2,754 | | | Ralph Lauren Corp. | | | 346 | |
| | 2,338 | | | Skechers USA, Inc., Class – A (a) | | | 70 | |
| | 14,876 | | | Tapestry, Inc. | | | 695 | |
| | 1,504 | | | Under Armour, Inc., Class – A (a) | | | 34 | |
| | 1,536 | | | Under Armour, Inc., Class – C (a) | | | 32 | |
| | 12,766 | | | V.F. Corp. | | | 1,041 | |
| | | | | | | | |
| | | | | | | 3,523 | |
| | | | | | | | |
| | | | Thrifts & Mortgage Finance — 0.05% | |
| | 39,972 | | | New York Community Bancorp, Inc. | | | 442 | |
| | 1,862 | | | TFS Financial Corp. | | | 29 | |
| | | | | | | | |
| | | | | | | 471 | |
| | | | | | | | |
| | | | | | | | |
| Shares | | | Security Description | | Value
(000) | |
| | | | Tobacco — 1.31% | |
| | 70,998 | | | Altria Group, Inc. | | $ | 4,032 | |
| | 100,900 | | | Philip Morris International, Inc. | | | 8,147 | |
| | | | | | | | |
| | | �� | | | | 12,179 | |
| | | | | | | | |
| | | | Trading Companies & Distributors — 0.22% | |
| | 4,961 | | | Air Lease Corp. | | | 208 | |
| | 8,433 | | | Fastenal Co. | | | 407 | |
| | 7,937 | | | HD Supply Holdings, Inc. (a) | | | 340 | |
| | 3,357 | | | MSC Industrial Direct Co., Inc., Class – A | | | 285 | |
| | 3,020 | | | Univar, Inc. (a) | | | 79 | |
| | 1,090 | | | W.W. Grainger, Inc. | | | 336 | |
| | 1,385 | | | Watsco, Inc. | | | 247 | |
| | 2,546 | | | WESCO International, Inc. (a) | | | 145 | |
| | | | | | | | |
| | | | | | | 2,047 | |
| | | | | | | | |
| | | | Transportation Infrastructure — 0.02% | |
| | 5,023 | | | Macquarie Infrastructure Corp. | | | 212 | |
| | | | | | | | |
| | | | Water Utilities — 0.10% | |
| | 7,651 | | | American Water Works Co., Inc. | | | 653 | |
| | 7,862 | | | Aqua America, Inc. | | | 277 | |
| | | | | | | | |
| | | | | | | 930 | |
| | | | | | | | |
| | | | Wireless Telecommunication Services — 0.10% | |
| | 21,293 | | | Sprint Nextel Corp. (a) | | | 116 | |
| | 5,556 | | | Telephone & Data Systems, Inc. | | | 152 | |
| | 10,211 | | | T-Mobile USA, Inc. (a) | | | 611 | |
| | 822 | | | U.S. Cellular Corp. (a) | | | 30 | |
| | | | | | | | |
| | | | | | | 909 | |
| | | | | | | | |
| | | | Total Common Stocks | | | 800,365 | |
| | | | | | | | |
Principal
Amount
(000) | | | | | | |
| | | | U.S. Treasury Obligation — 0.02% | |
| $ | 145 | | | U.S. Treasury Bill, 1.83%, 9/6/18 (b)(c) | | | 145 | |
| | | | | | | | |
| | | | Total U.S. Treasury Obligation | | | 145 | |
| | | | | | | | |
| | | | Time Deposit — 0.00% | |
| | 38 | | | State Street Liquidity Management Control System Eurodollar Time Deposit,
0.53%, 7/2/18 | | | 38 | |
| | | | | | | | |
| | | | Total Time Deposit | | | 38 | |
| | | | | | | | |
| Shares | | | | | | |
| | | | Mutual Funds — 13.11% | |
| | 937,033 | | | Dreyfus Treasury Prime Cash Management Fund, Institutional Shares, 1.68% (d) | | | 937 | |
| | 120,877,655 | | | State Street Institutional Treasury Plus Money Market Fund, Trust Class, 1.72% (d) | | | 120,878 | |
| | | | | | | | |
| | | | Total Mutual Funds | | | 121,815 | |
| | | | | | | | |
| | | | Total Investments
(cost $830,008) — 99.24% | | | 922,363 | |
| | | | Other assets in excess of
liabilities — 0.76% | | | 7,058 | |
| | | | | | | | |
| | | | Net Assets — 100.00% | | $ | 929,421 | |
| | | | | | | | |
See accompanying notes to financial statements.
62
HC CAPITAL TRUST
The Institutional Value Equity Portfolio
Portfolio of Investments (concluded) — June 30, 2018
| (a) | Represents non-income producing security. |
| (b) | Rate disclosed represents effective yield at purchase. |
| (c) | All or part of this security has been pledged as collateral for derivative instruments held by the Portfolio. |
| (d) | The rate disclosed is the rate in effect on June 30, 2018. |
REIT — Real Estate Investment Trust
The following table reflects the percentage of total net assets of the Portfolio attributable to each Specialist Manager as of June 30, 2018.
| | | | | | | | | | | | | | | | | | | | |
The Institutional Value Equity Portfolio | | Cadence Capital
Management,
LLC | | | BNY Mellon Asset
Management North
America Corporation* | | | Parametric
Portfolio
Associates, LLC | | | HC Capital
Solutions | | | Total | |
Common Stocks | | | 40.06 | % | | | 46.05 | % | | | — | | | | — | | | | 86.11 | % |
U.S. Treasury Obligation | | | — | | | | 0.02 | % | | | — | | | | — | | | | 0.02 | % |
Time Deposit | | | — | | | | — | | | | 0.00 | % | | | — | | | | 0.00 | % |
Mutual Funds | | | 0.13 | % | | | 0.29 | % | | | 10.84 | % | | | 1.85 | % | | | 13.11 | % |
Other Assets (Liabilities) | | | 0.05 | % | | | 0.05 | % | | | 0.66 | % | | | 0.00 | % | | | 0.76 | % |
| | | | | | | | | | | | | | | | | | | | |
Total Net Assets | | | 40.24 | % | | | 46.41 | % | | | 11.50 | % | | | 1.85 | % | | | 100.00 | % |
| | | | | | | | | | | | | | | | | | | | |
| * | Formerly Mellon Capital Management Corporation. |
Amounts designated as “—” indicate the Specialist Manager did not manage any holdings in that category.
The following table reflects the open derivative positions held by the Portfolio as of June 30, 2018.
Futures Contracts Purchased^
| | | | | | | | | | | | | | |
Description | | Number of
Contracts | | Expiration
Date | | | Notional
Amount
(000) | | | Value and
Unrealized
Appreciation/
(Depreciation)
(000) | |
E-Mini S&P 500 Future | | 761 | | | 9/21/18 | | | $ | 103,557 | | | $ | (1,879 | ) |
E-Mini S&P Midcap 400 Future | | 70 | | | 9/21/18 | | | | 13,693 | | | | (340 | ) |
| | | | | | | | | | | | | | |
| | | | | $ | 117,250 | | | $ | (2,219 | ) |
| | | | | | | | | | | | | | |
| | |
| | Total Unrealized Appreciation | | | $ | — | |
| | Total Unrealized Depreciation | | | | (2,219 | ) |
| | | | | | | | | | | | | | |
| | Total Net Unrealized Appreciation/(Depreciation) | | | $ | (2,219 | ) |
| | | | | | | | | | | | | | |
| ^ | Cash and treasuries have been pledged as collateral for futures contracts held by the Portfolio. |
Amounts designated as “—” are $0 or have been rounded to $0.
See accompanying notes to financial statements.
63
HC CAPITAL TRUST
The Growth Equity Portfolio
Portfolio of Investments — June 30, 2018
| | | | | | | | |
| Shares | | | Security Description | | Value
(000) | |
| | | | Common Stocks — 96.86% | |
| | | | Aerospace & Defense — 2.66% | |
| | 890 | | | BWX Technologies, Inc. | | $ | 55 | |
| | 7,473 | | | General Dynamics Corp. | | | 1,393 | |
| | 391 | | | HEICO Corp. | | | 29 | |
| | 729 | | | HEICO Corp., Class – A | | | 44 | |
| | 605 | | | Hexcel Corp. | | | 40 | |
| | 360 | | | Huntington Ingalls Industries, Inc. | | | 78 | |
| | 1,905 | | | L3 Technologies, Inc. | | | 366 | |
| | 8,440 | | | Lockheed Martin Corp. | | | 2,493 | |
| | 1,571 | | | Northrop Grumman Corp. | | | 483 | |
| | 8,110 | | | Raytheon Co. | | | 1,567 | |
| | 4,653 | | | Rockwell Collins, Inc. | | | 627 | |
| | 35,220 | | | The Boeing Co. | | | 11,818 | |
| | 475 | | | TransDigm Group, Inc. | | | 164 | |
| | 19,353 | | | United Technologies Corp. | | | 2,420 | |
| | | | | | | | |
| | | | | | | 21,577 | |
| | | | | | | | |
| | | | Air Freight & Logistics — 0.25% | |
| | 4,751 | | | C.H. Robinson Worldwide, Inc. | | | 397 | |
| | 5,627 | | | Expeditors International of Washington, Inc. | | | 411 | |
| | 2,409 | | | FedEx Corp. | | | 547 | |
| | 5,612 | | | United Parcel Service, Inc., Class – B | | | 597 | |
| | 833 | | | XPO Logistics, Inc. (a) | | | 83 | |
| | | | | | | | |
| | | | | | | 2,035 | |
| | | | | | | | |
| | | | Airlines — 0.16% | |
| | 27,192 | | | American Airlines Group, Inc. | | | 1,032 | |
| | 5,393 | | | Southwest Airlines Co. | | | 274 | |
| | 23 | | | Spirit Airlines, Inc. (a) | | | 1 | |
| | | | | | | | |
| | | | | | | 1,307 | |
| | | | | | | | |
| | | | Auto Components — 0.05% | |
| | 2,588 | | | Aptiv PLC | | | 237 | |
| | 262 | | | BorgWarner, Inc. | | | 11 | |
| | 862 | | | Delphi Technologies PLC | | | 39 | |
| | 1,730 | | | Gentex Corp. | | | 40 | |
| | 555 | | | Lear Corp. | | | 103 | |
| | 333 | | | Visteon Corp. (a) | | | 43 | |
| | | | | | | | |
| | | | | | | 473 | |
| | | | | | | | |
| | | | Automobiles — 0.34% | |
| | 7,982 | | | Tesla Motors, Inc.^ (a) | | | 2,737 | |
| | 469 | | | Thor Industries, Inc. | | | 46 | |
| | | | | | | | |
| | | | | | | 2,783 | |
| | | | | | | | |
| | | | Banks — 0.75% | |
| | 549 | | | Bank of the Ozarks, Inc. | | | 25 | |
| | 7,305 | | | Citizens Financial Group, Inc. | | | 284 | |
| | 1,356 | | | Cullen/Frost Bankers, Inc. | | | 147 | |
| | 80 | | | East West Bancorp, Inc. | | | 5 | |
| | 4,426 | | | First Republic Bank | | | 428 | |
| | 34,054 | | | JPMorgan Chase & Co. | | | 3,548 | |
| | 207 | | | Pinnacle Financial Partners, Inc. | | | 13 | |
| | 10,863 | | | PNC Financial Services Group, Inc. | | | 1,468 | |
| | 368 | | | SVB Financial Group (a) | | | 106 | |
| | 522 | | | Western Alliance Bancorp (a) | | | 30 | |
| | | | | | | | |
| | | | | | | 6,054 | |
| | | | | | | | |
| | | | | | | | |
| Shares | | | Security Description | | Value
(000) | |
| | | | Beverages — 1.41% | |
| | 510 | | | Brown-Forman Corp., Class – A | | $ | 25 | |
| | 10,645 | | | Brown-Forman Corp., Class – B | | | 522 | |
| | 8,447 | | | Constellation Brands, Inc., Class – A | | | 1,849 | |
| | 6,183 | | | Dr. Pepper Snapple Group, Inc. | | | 754 | |
| | 10,539 | | | Monster Beverage Corp. (a) | | | 604 | |
| | 34,298 | | | PepsiCo, Inc. | | | 3,734 | |
| | 90,117 | | | The Coca-Cola Co. | | | 3,952 | |
| | | | | | | | |
| | | | | | | 11,440 | |
| | | | | | | | |
| | | | Biotechnology — 2.52% | |
| | 57,865 | | | AbbVie, Inc. | | | 5,360 | |
| | 435 | | | Agios Pharmaceuticals, Inc. (a) | | | 37 | |
| | 4,339 | | | Alexion Pharmaceuticals, Inc. (a) | | | 539 | |
| | 29,160 | | | Amgen, Inc. | | | 5,382 | |
| | 274 | | | Biogen Idec, Inc. (a) | | | 80 | |
| | 19,843 | | | BioMarin Pharmaceutical, Inc. (a) | | | 1,869 | |
| | 4,412 | | | Celgene Corp. (a) | | | 350 | |
| | 17,966 | | | Gilead Sciences, Inc. | | | 1,273 | |
| | 7,181 | | | Intercept Pharmaceuticals, Inc. (a) | | | 603 | |
| | 1,172 | | | Ionis Pharmaceuticals, Inc. (a) | | | 49 | |
| | 14,521 | | | Neurocrine Biosciences, Inc. (a) | | | 1,427 | |
| | 2,019 | | | Regeneron Pharmaceuticals, Inc. (a) | | | 697 | |
| | 1,014 | | | Seattle Genetics, Inc. (a) | | | 67 | |
| | 15,761 | | | Vertex Pharmaceuticals, Inc. (a) | | | 2,679 | |
| | | | | | | | |
| | | | | | | 20,412 | |
| | | | | | | | |
| | | | Building Products — 0.04% | |
| | 1,367 | | | A.O. Smith Corp. | | | 81 | |
| | 906 | | | Allegion PLC | | | 70 | |
| | 404 | | | Armstrong World Industries, Inc. (a) | | | 26 | |
| | 347 | | | Lennox International, Inc. | | | 69 | |
| | 2,011 | | | Masco Corp. | | | 75 | |
| | | | | | | | |
| | | | | | | 321 | |
| | | | | | | | |
| | | | Capital Markets — 2.27% | |
| | 10,500 | | | Ameriprise Financial, Inc. | | | 1,469 | |
| | 79,314 | | | BGC Partners, Inc., Class – A | | | 898 | |
| | 2,929 | | | CBOE Holdings, Inc. | | | 305 | |
| | 7,376 | | | CME Group, Inc. | | | 1,209 | |
| | 1,417 | | | FactSet Research Systems, Inc. | | | 281 | |
| | 2,291 | | | Federated Investors, Inc., Class – B | | | 53 | |
| | 9,102 | | | Franklin Resources, Inc. | | | 292 | |
| | 12,219 | | | Goldman Sachs Group, Inc. | | | 2,695 | |
| | 2,695 | | | IntercontinentalExchange Group, Inc. | | | 198 | |
| | 34,854 | | | Invesco Ltd. | | | 925 | |
| | 4,519 | | | Jefferies Financial Group, Inc. | | | 103 | |
| | 24,888 | | | Legg Mason, Inc. | | | 864 | |
| | 5,422 | | | LPL Financial Holdings, Inc. | | | 355 | |
| | 349 | | | MarketAxess Holdings, Inc. | | | 69 | |
| | 1,603 | | | Moody’s Corp. | | | 273 | |
| | 36,187 | | | Morgan Stanley | | | 1,715 | |
| | 457 | | | Morningstar, Inc. | | | 59 | |
| | 838 | | | MSCI, Inc. Common | | | 139 | |
| | 3,606 | | | Raymond James Financial, Inc. | | | 322 | |
| | 20,796 | | | S&P Global, Inc. | | | 4,240 | |
| | 4,491 | | | SEI Investments Co. | | | 281 | |
| | 176 | | | State Street Corp. | | | 16 | |
See accompanying notes to financial statements.
64
HC CAPITAL TRUST
The Growth Equity Portfolio
Portfolio of Investments (continued) — June 30, 2018
| | | | | | | | |
| Shares | | | Security Description | | Value
(000) | |
| | | | Common Stocks (continued) | |
| | | | Capital Markets (continued) | |
| | 6,386 | | | T. Rowe Price Group, Inc. | | $ | 741 | |
| | 8,465 | | | TD Ameritrade Holding Corp. | | | 464 | |
| | 9,130 | | | The Charles Schwab Corp. | | | 467 | |
| | 206 | | | Waddell & Reed Financial, Inc., Class – A | | | 4 | |
| | | | | | | | |
| | | | | | | 18,437 | |
| | | | | | | | |
| | | | Chemicals — 2.23% | |
| | 4,941 | | | Air Products & Chemicals, Inc. | | | 769 | |
| | 19,830 | | | Albemarle Corp. | | | 1,871 | |
| | 807 | | | Celanese Corp., Series A | | | 90 | |
| | 45,585 | | | DowDuPont, Inc. | | | 3,005 | |
| | 60,082 | | | Ecolab, Inc. | | | 8,431 | |
| | 1,293 | | | FMC Corp. | | | 115 | |
| | 893 | | | Huntsman Corp. | | | 26 | |
| | 1,894 | | | International Flavors & Fragrances, Inc. | | | 235 | |
| | 1,388 | | | LyondellBasell Industries N.V., Class – A | | | 152 | |
| | 9,075 | | | Praxair, Inc. | | | 1,435 | |
| | 23,432 | | | The Chemours Co. | | | 1,039 | |
| | 2,060 | | | The Sherwin-Williams Co. | | | 840 | |
| | 163 | | | Westlake Chemical Corp. | | | 18 | |
| | | | | | | | |
| | | | | | | 18,026 | |
| | | | | | | | |
| | | | Commercial Services & Supplies — 0.23% | |
| | 3,016 | | | Cintas Corp. | | | 558 | |
| | 7,509 | | | Copart, Inc. (a) | | | 425 | |
| | 1,301 | | | KAR Auction Services, Inc. | | | 71 | |
| | 3,252 | | | Rollins, Inc. | | | 171 | |
| | 26 | | | Stericycle, Inc. (a) | | | 2 | |
| | 4,338 | | | Waste Connections, Inc. | | | 327 | |
| | 3,522 | | | Waste Management, Inc. | | | 286 | |
| | | | | | | | |
| | | | | | | 1,840 | |
| | | | | | | | |
| | | | Communications Equipment — 0.79% | |
| | 1,342 | | | Arista Networks, Inc. (a) | | | 346 | |
| | 120,151 | | | Cisco Systems, Inc. | | | 5,170 | |
| | 2,130 | | | F5 Networks, Inc. (a) | | | 367 | |
| | 3,170 | | | Harris Corp. | | | 458 | |
| | 153 | | | Motorola Solutions, Inc. | | | 18 | |
| | 377 | | | Palo Alto Networks, Inc. (a) | | | 77 | |
| | | | | | | | |
| | | | | | | 6,436 | |
| | | | | | | | |
| | | | Construction & Engineering — 0.05% | |
| | 3,444 | | | Fluor Corp. | | | 168 | |
| | 3,130 | | | Jacobs Engineering Group, Inc. | | | 199 | |
| | 374 | | | Quanta Services, Inc. (a) | | | 12 | |
| | | | | | | | |
| | | | | | | 379 | |
| | | | | | | | |
| | | | Construction Materials — 0.01% | |
| | 445 | | | Eagle Materials, Inc., Class – A | | | 47 | |
| | | | | | | | |
| | | | Consumer Finance — 0.21% | |
| | 10,711 | | | Capital One Financial Corp. | | | 984 | |
| | 95 | | | Credit Acceptance Corp. (a) | | | 34 | |
| | 19,438 | | | Synchrony Financial | | | 649 | |
| | | | | | | | |
| | | | | | | 1,667 | |
| | | | | | | | |
| | | | Containers & Packaging — 0.25% | |
| | 1,512 | | | AptarGroup, Inc. | | | 141 | |
| | 792 | | | Avery Dennison Corp. | | | 81 | |
| | 1,231 | | | Berry Plastics Group, Inc. (a) | | | 57 | |
| | | | | | | | |
| Shares | | | Security Description | | Value
(000) | |
| | | | Containers & Packaging (continued) | | | | |
| | 2,165 | | | Graphic Packaging Holding Co. | | $ | 31 | |
| | 27,876 | | | International Paper Co. | | | 1,452 | |
| | 1,251 | | | Owens-Illinois, Inc. (a) | | | 21 | |
| | 907 | | | Packaging Corporation of America | | | 101 | |
| | 2,460 | | | Sonoco Products Co. | | | 129 | |
| | | | | | | | |
| | | | | | | 2,013 | |
| | | | | | | | |
| | | | Distributors — 0.08% | |
| | 3,498 | | | Genuine Parts Co. | | | 320 | |
| | 7,196 | | | LKQ Corp. (a) | | | 230 | |
| | 381 | | | Pool Corp. | | | 58 | |
| | | | | | | | |
| | | | | | | 608 | |
| | | | | | | | |
| | | | Diversified Consumer Services — 0.02% | |
| | 516 | | | Bright Horizons Family Solutions, Inc. (a) | | | 53 | |
| | 1,727 | | | Service Corporation International | | | 62 | |
| | 1,276 | | | ServiceMaster Global Holdings, Inc. (a) | | | 76 | |
| | | | | | | | |
| | | | | | | 191 | |
| | | | | | | | |
| | | | Diversified Financial Services — 0.00% | |
| | 99 | | | Voya Financial, Inc. | | | 5 | |
| | | | | | | | |
| | | | Diversified Telecommunication Services — 0.50% | |
| | 78,730 | | | Verizon Communications, Inc. | | | 3,961 | |
| | 1,761 | | | Zayo Group Holdings, Inc. (a) | | | 64 | |
| | | | | | | | |
| | | | | | | 4,025 | |
| | | | | | | | |
| | | | Electrical Equipment — 0.24% | |
| | 6,021 | | | AMETEK, Inc. | | | 434 | |
| | 16,573 | | | Emerson Electric Co. | | | 1,147 | |
| | 1,431 | | | Hubbell, Inc. | | | 151 | |
| | 1,239 | | | Rockwell Automation, Inc. | | | 206 | |
| | 788 | | | Sensata Technologies Holding PLC (a) | | | 37 | |
| | | | | | | | |
| | | | | | | 1,975 | |
| | | | | | | | |
| | | | Electronic Equipment, Instruments & Components — 0.21% | |
| | 10,102 | | | Amphenol Corp., Class – A | | | 881 | |
| | 1,465 | | | CDW Corporation of Delaware | | | 118 | |
| | 1,578 | | | Cognex Corp. | | | 70 | |
| | 1,205 | | | Dolby Laboratories, Inc., Class – A | | | 74 | |
| | 4,157 | | | FLIR Systems, Inc. | | | 216 | |
| | 340 | | | IPG Photonics Corp. (a) | | | 75 | |
| | 3,573 | | | National Instruments Corp. | | | 150 | |
| | 1,884 | | | Trimble Navigation Ltd. (a) | | | 62 | |
| | 493 | | | Zebra Technologies Corp., Class – A (a) | | | 71 | |
| | | | | | | | |
| | | | | | | 1,717 | |
| | | | | | | | |
| | | | Energy Equipment & Services — 1.03% | |
| | 1,976 | | | Apergy Corp. (a) | | | 82 | |
| | 13 | | | Dril-Quip, Inc. (a) | | | 1 | |
| | 867 | | | Franks International N.V. | | | 7 | |
| | 5,681 | | | Halliburton Co. | | | 256 | |
| | 2,412 | | | Helmerich & Payne, Inc. | | | 154 | |
| | 9,199 | | | National Oilwell Varco, Inc. | | | 399 | |
| | 31 | | | Oceaneering International, Inc. | | | 1 | |
| | 108,684 | | | Schlumberger Ltd. | | | 7,285 | |
| | 5,721 | | | TechnipFMC PLC | | | 182 | |
| | | | | | | | |
| | | | | | | 8,367 | |
| | | | | | | | |
See accompanying notes to financial statements.
65
HC CAPITAL TRUST
The Growth Equity Portfolio
Portfolio of Investments (continued) — June 30, 2018
| | | | | | | | |
| Shares | | | Security Description | | Value
(000) | |
| | | | Common Stocks (continued) | |
| | | | Equity Real Estate Investment Trusts — 1.18% | |
| | 529 | | | American Tower Corp. | | $ | 76 | |
| | 260 | | | CoreCivic, Inc. | | | 6 | |
| | 968 | | | Crown Castle International Corp. | | | 104 | |
| | 16,745 | | | Equinix, Inc. | | | 7,199 | |
| | 804 | | | Equity Lifestyle Properties, Inc. | | | 74 | |
| | 15,987 | | | Lamar Advertising Co., Class – A | | | 1,092 | |
| | 48,584 | | | Outfront Media, Inc. | | | 945 | |
| | 482 | | | SBA Communications Corp. (a) | | | 80 | |
| | | | | | | | |
| | | | | | | 9,576 | |
| | | | | | | | |
| | | | Food & Staples Retailing — 1.77% | |
| | 32,795 | | | Costco Wholesale Corp. | | | 6,853 | |
| | 26,443 | | | CVS Caremark Corp. | | | 1,702 | |
| | 69 | | | Sprouts Farmers Market, Inc. (a) | | | 2 | |
| | 18,514 | | | Sysco Corp. | | | 1,264 | |
| | 4,764 | | | The Kroger Co. | | | 136 | |
| | 20,035 | | | Walgreens Boots Alliance, Inc. | | | 1,202 | |
| | 36,940 | | | Wal-Mart Stores, Inc. | | | 3,164 | |
| | | | | | | | |
| | | | | | | 14,323 | |
| | | | | | | | |
| | | | Food Products — 0.89% | |
| | 4,253 | | | Flowers Foods, Inc. | | | 89 | |
| | 3,345 | | | Hershey Co. | | | 311 | |
| | 6,169 | | | Hormel Foods Corp. | | | 230 | |
| | 413 | | | Lamb Weston Holding, Inc. | | | 28 | |
| | 3,592 | | | McCormick & Company, Inc. | | | 417 | |
| | 142,800 | | | Mondelez International, Inc., Class – A | | | 5,855 | |
| | 2,756 | | | The J.M. Smucker Co. | | | 296 | |
| | | | | | | | |
| | | | | | | 7,226 | |
| | | | | | | | |
| | | | Health Care Equipment & Supplies — 3.18% | |
| | 40,365 | | | Abbott Laboratories | | | 2,461 | |
| | 398 | | | Abiomed, Inc. (a) | | | 163 | |
| | 771 | | | Align Technology, Inc. (a) | | | 264 | |
| | 13,039 | | | Baxter International, Inc. | | | 963 | |
| | 41,829 | | | Becton, Dickinson & Co. | | | 10,020 | |
| | 13,310 | | | Boston Scientific Corp. (a) | | | 435 | |
| | 13,838 | | | Danaher Corp. | | | 1,366 | |
| | 3,653 | | | Dentsply Sirona, Inc. | | | 160 | |
| | 813 | | | Dexcom, Inc. (a) | | | 77 | |
| | 5,921 | | | Edwards Lifesciences Corp. (a) | | | 862 | |
| | 584 | | | Hill-Rom Holdings, Inc. | | | 51 | |
| | 4,656 | | | IDEXX Laboratories, Inc. (a) | | | 1,015 | |
| | 3,678 | | | Intuitive Surgical, Inc. (a) | | | 1,760 | |
| | 33,206 | | | Medtronic PLC | | | 2,843 | |
| | 4,618 | | | ResMed, Inc. | | | 478 | |
| | 11,056 | | | Stryker Corp. | | | 1,867 | |
| | 85 | | | Teleflex, Inc. | | | 23 | |
| | 332 | | | The Cooper Companies, Inc. | | | 78 | |
| | 978 | | | Varex Imaging Corp. (a) | | | 36 | |
| | 3,200 | | | Varian Medical Systems, Inc. (a) | | | 364 | |
| | 3,954 | | | Zimmer Holdings, Inc. | | | 441 | |
| | | | | | | | |
| | | | | | | 25,727 | |
| | | | | | | | |
| | | | Health Care Providers & Services — 3.64% | |
| | 9,141 | | | Aetna, Inc. | | | 1,676 | |
| | 6,159 | | | Anthem, Inc. | | | 1,466 | |
| | | | | | | | |
| Shares | | | Security Description | | Value
(000) | |
| | | | Health Care Providers & Services (continued) | | | | |
| | 209 | | | Centene Corp. (a) | | $ | 26 | |
| | 782 | | | CIGNA Corp. | | | 133 | |
| | 16,068 | | | Express Scripts Holding Co. (a) | | | 1,241 | |
| | 10,019 | | | HCA Holdings, Inc. | | | 1,028 | |
| | 3,876 | | | Henry Schein, Inc. (a) | | | 282 | |
| | 1,265 | | | Humana, Inc. | | | 377 | |
| | 2,309 | | | Laboratory Corporation of America Holdings (a) | | | 415 | |
| | 5,422 | | | McKesson Corp. | | | 723 | |
| | 2,241 | | | MEDNAX, Inc. (a) | | | 97 | |
| | 2,072 | | | Patterson Companies, Inc. | | | 47 | |
| | 3,312 | | | Quest Diagnostics, Inc. | | | 364 | |
| | 86,756 | | | UnitedHealth Group, Inc. | | | 21,284 | |
| | 2,121 | | | Universal Health Services, Inc., Class – B | | | 236 | |
| | 389 | | | WellCare Health Plans, Inc. (a) | | | 96 | |
| | | | | | | | |
| | | | | | | 29,491 | |
| | | | | | | | |
| | | | Health Care Technology — 0.42% | |
| | 374 | | | athenahealth, Inc. (a) | | | 60 | |
| | 52,483 | | | Cerner Corp. (a) | | | 3,137 | |
| | 2,869 | | | Veeva Systems, Inc. (a) | | | 221 | |
| | | | | | | | |
| | | | | | | 3,418 | |
| | | | | | | | |
| | | | Hotels, Restaurants & Leisure — 3.21% | |
| | 2,116 | | | Chipotle Mexican Grill, Inc. (a) | | | 913 | |
| | 1,177 | | | Choice Hotels International, Inc. | | | 89 | |
| | 1,050 | | | Darden Restaurants, Inc. | | | 112 | |
| | 419 | | | Domino’s Pizza, Inc. | | | 118 | |
| | 874 | | | Dunkin’ Brands Group, Inc. | | | 60 | |
| | 1,069 | | | Extended Stay America, Inc. | | | 23 | |
| | 678 | | | Hilton Grand Vacations (a) | | | 24 | |
| | 1,871 | | | Hilton Worldwide Holdings, Inc. | | | 148 | |
| | 3,492 | | | Las Vegas Sands Corp. | | | 267 | |
| | 36,572 | | | Marriott International, Inc., Class – A | | | 4,630 | |
| | 52,805 | | | McDonald’s Corp. | | | 8,274 | |
| | 387 | | | MGM Resorts International | | | 11 | |
| | 15,757 | | | Six Flags Entertainment Corp. | | | 1,104 | |
| | 117,066 | | | Starbucks Corp. | | | 5,719 | |
| | 1,730 | | | The Wendy’s Co. | | | 30 | |
| | 391 | | | Vail Resorts, Inc. | | | 107 | |
| | 992 | | | Wyndham Hotels & Resorts, Inc. | | | 58 | |
| | 992 | | | Wyndham Worldwide Corp. | | | 44 | |
| | 775 | | | Wynn Resorts Ltd. | | | 130 | |
| | 12,340 | | | Yum China Holdings, Inc. | | | 475 | |
| | 46,410 | | | YUM! Brands, Inc. | | | 3,630 | |
| | | | | | | | |
| | | | | | | 25,966 | |
| | | | | | | | |
| | | | Household Durables — 0.03% | |
| | 1,654 | | | D.R. Horton, Inc. | | | 68 | |
| | 2,920 | | | Garmin Ltd. | | | 178 | |
| | 810 | | | PulteGroup, Inc. | | | 23 | |
| | 711 | | | Toll Brothers, Inc. | | | 26 | |
| | | | | | | | |
| | | | | | | 295 | |
| | | | | | | | |
| | | | Household Products — 0.92% | |
| | 6,066 | | | Church & Dwight Co., Inc. | | | 322 | |
| | 20,880 | | | Colgate-Palmolive Co. | | | 1,353 | |
| | 11,107 | | | Energizer Holdings, Inc. | | | 699 | |
| | 8,412 | | | Kimberly-Clark Corp. | | | 886 | |
See accompanying notes to financial statements.
66
HC CAPITAL TRUST
The Growth Equity Portfolio
Portfolio of Investments (continued) — June 30, 2018
| | | | | | | | |
| Shares | | | Security Description | | Value
(000) | |
| | | | Common Stocks (continued) | |
| | | | Household Products (continued) | |
| | 3,016 | | | The Clorox Co. | | $ | 408 | |
| | 48,550 | | | The Procter & Gamble Co. | | | 3,791 | |
| | | | | | | | |
| | | | | | | 7,459 | |
| | | | | | | | |
| | | | Independent Power & Renewable Electricity Producers — 0.00% | |
| | 541 | | | NRG Energy, Inc., Class – C | | | 17 | |
| | | | | | | | |
| | | | Industrial Conglomerates — 0.95% | |
| | 30,666 | | | 3M Co. | | | 6,032 | |
| | 1,588 | | | Carlisle Companies, Inc. | | | 172 | |
| | 4,278 | | | Honeywell International, Inc. | | | 616 | |
| | 3,282 | | | Roper Industries, Inc. | | | 906 | |
| | | | | | | | |
| | | | | | | 7,726 | |
| | | | | | | | |
| | | | Insurance — 0.58% | |
| | 978 | | | Allstate Corp. | | | 89 | |
| | 9,001 | | | Aon PLC | | | 1,235 | |
| | 1,196 | | | Arthur J. Gallagher & Co. | | | 78 | |
| | 10,254 | | | Assurant, Inc. | | | 1,061 | |
| | 5,697 | | | Brown & Brown, Inc. | | | 158 | |
| | 171 | | | Erie Indemnity Co., Class – A | | | 20 | |
| | 17,417 | | | Marsh & McLennan Companies, Inc. | | | 1,429 | |
| | 5,631 | | | The Progressive Corp. | | | 333 | |
| | 2,952 | | | Torchmark Corp. | | | 240 | |
| | 781 | | | XL Group Ltd. | | | 44 | |
| | | | | | | | |
| | | | | | | 4,687 | |
| | | | | | | | |
| | | | Internet & Direct Marketing Retail — 6.34% | |
| | 17,449 | | | Amazon.com, Inc. (a) | | | 29,659 | |
| | 5,153 | | | Booking Holdings, Inc. (a) | | | 10,446 | |
| | 28,181 | | | Netflix, Inc. (a) | | | 11,031 | |
| | 2,830 | | | TripAdvisor, Inc. (a) | | | 158 | |
| | | | | | | | |
| | | | | | | 51,294 | |
| | | | | | | | |
| | | | Internet Software & Services — 8.44% | |
| | 43,136 | | | Alibaba Group Holding Ltd., ADR (a) | | | 8,003 | |
| | 12,761 | | | Alphabet, Inc., Class – A (a) | | | 14,410 | |
| | 15,877 | | | Alphabet, Inc., Class – C (a) | | | 17,713 | |
| | 105,757 | | | Facebook, Inc., Class – A (a) | | | 20,550 | |
| | 1,209 | | | GoDaddy, Inc., Class – A (a) | | | 85 | |
| | 646 | | | Interactive Corp. (a) | | | 99 | |
| | 974 | | | LogMeln, Inc. | | | 101 | |
| | 344 | | | Match Group, Inc. (a) | | | 13 | |
| | 142,231 | | | Tencent Holdings Ltd., ADR | | | 7,147 | |
| | 854 | | | VeriSign, Inc. (a) | | | 117 | |
| | | | | | | | |
| | | | | | | 68,238 | |
| | | | | | | | |
| | | | IT Services — 10.21% | |
| | 15,070 | | | Accenture PLC, Class – A | | | 2,465 | |
| | 8,492 | | | Alliance Data Systems Corp. | | | 1,980 | |
| | 3,609 | | | Amdocs Ltd. | | | 239 | |
| | 79,133 | | | Automatic Data Processing, Inc. | | | 10,615 | |
| | 1,138 | | | Black Knight, Inc. (a) | | | 61 | |
| | 1,297 | | | Booz Allen Hamilton Holding Corp. | | | 57 | |
| | 3,948 | | | Broadridge Financial Solutions, Inc. | | | 454 | |
| | 15,099 | | | Cognizant Technology Solutions Corp. | | | 1,193 | |
| | 11,026 | | | DXC Technology Co. | | | 889 | |
| | 1,807 | | | Fidelity National Information Services, Inc. | | | 192 | |
| | | | | | | | |
| Shares | | | Security Description | | Value
(000) | |
| | | | IT Services (continued) | | | | |
| | 4,581 | | | First Data Corp. (a) | | $ | 96 | |
| | 4,092 | | | Fiserv, Inc. (a) | | | 303 | |
| | 51,307 | | | FleetCor Technologies, Inc. (a) | | | 10,808 | |
| | 1,448 | | | Genpact Ltd. | | | 42 | |
| | 4,550 | | | Global Payments, Inc. | | | 507 | |
| | 24,739 | | | International Business Machines Corp. | | | 3,456 | |
| | 2,500 | | | Jack Henry & Associates, Inc. | | | 326 | |
| | 70,512 | | | MasterCard, Inc., Class – A | | | 13,856 | |
| | 8,720 | | | Paychex, Inc. | | | 596 | |
| | 80,412 | | | PayPal Holdings, Inc. (a) | | | 6,696 | |
| | 5,513 | | | Perspecta, Inc. | | | 113 | |
| | 10,609 | | | Square, Inc., Class – A (a) | | | 654 | |
| | 3,326 | | | Teradata Corp. (a) | | | 134 | |
| | 5,556 | | | Total System Services, Inc. | | | 470 | |
| | 194,731 | | | Visa, Inc., Class – A | | | 25,791 | |
| | 12,029 | | | Western Union Co. | | | 245 | |
| | 304 | | | WEX, Inc. (a) | | | 58 | |
| | 2,790 | | | Worldpay, Inc., Class – A (a) | | | 228 | |
| | | | | | | | |
| | | | | | | 82,524 | |
| | | | | | | | |
| | | | Leisure Products — 0.03% | |
| | 2,240 | | | Polaris Industries, Inc. | | | 274 | |
| | | | | | | | |
| | | | Life Sciences Tools & Services — 0.84% | |
| | 754 | | | Agilent Technologies, Inc. | | | 47 | |
| | 1,282 | | | Bio-Techne Corp. | | | 190 | |
| | 440 | | | Bruker Biosciences Corp. | | | 13 | |
| | 447 | | | Charles River Laboratories International, Inc. (a) | | | 50 | |
| | 11,214 | | | Illumina, Inc. (a) | | | 3,131 | |
| | 817 | | | IQVIA Holdings, Inc. (a) | | | 82 | |
| | 881 | | | Mettler-Toledo International, Inc. (a) | | | 510 | |
| | 239 | | | PerkinElmer, Inc. | | | 18 | |
| | 10,979 | | | Thermo Electron Corp. | | | 2,273 | |
| | 2,617 | | | Waters Corp. (a) | | | 507 | |
| | | | | | | | |
| | | | | | | 6,821 | |
| | | | | | | | |
| | | | Machinery — 1.81% | |
| | 1,300 | | | Allison Transmission Holdings, Inc. | | | 53 | |
| | 34,770 | | | Caterpillar, Inc. | | | 4,718 | |
| | 1,202 | | | Crane Co. | | | 96 | |
| | 15,268 | | | Deere & Co. | | | 2,134 | |
| | 3,374 | | | Donaldson Company, Inc. | | | 152 | |
| | 3,952 | | | Dover Corp. | | | 289 | |
| | 9,591 | | | Fortive Corp. | | | 740 | |
| | 711 | | | Gardner Denver Holdings, Inc. (a) | | | 21 | |
| | 1,569 | | | Graco, Inc. | | | 71 | |
| | 2,502 | | | IDEX Corp. | | | 341 | |
| | 9,875 | | | Illinois Tool Works, Inc. | | | 1,368 | |
| | 1,218 | | | Ingersoll-Rand PLC | | | 109 | |
| | 551 | | | Lincoln Electric Holdings, Inc. | | | 48 | |
| | 546 | | | Nordson, Inc. | | | 70 | |
| | 21,983 | | | Parker Hannifin Corp. | | | 3,427 | |
| | 1,357 | | | Snap-on, Inc. | | | 218 | |
| | 153 | | | Stanley Black & Decker, Inc. | | | 20 | |
| | 1,424 | | | The Middleby Corp. (a) | | | 149 | |
| | 1,001 | | | The Toro Co. | | | 60 | |
| | 491 | | | WABCO Holdings, Inc. (a) | | | 57 | |
See accompanying notes to financial statements.
67
HC CAPITAL TRUST
The Growth Equity Portfolio
Portfolio of Investments (continued) — June 30, 2018
| | | | | | | | |
| Shares | | | Security Description | | Value
(000) | |
| | | | Common Stocks (continued) | |
| | | | Machinery (continued) | |
| | 2,395 | | | Wabtec Corp. | | $ | 236 | |
| | 5,084 | | | Xylem, Inc. | | | 343 | |
| | | | | | | | |
| | | | | | | 14,720 | |
| | | | | | | | |
| | | | Marine — 0.01% | |
| | 1,366 | | | Kirby Corp. (a) | | | 114 | |
| | | | | | | | |
| | | | Media — 0.16% | |
| | 46 | | | Cable One, Inc. | | | 34 | |
| | 1,164 | | | Charter Communications, Inc., Class – A (a) | | | 341 | |
| | 2,366 | | | Discovery Communications, Inc., Class – C (a) | | | 60 | |
| | 1,129 | | | John Wiley & Sons, Inc., Class – A | | | 70 | |
| | 1,253 | | | Live Nation Entertainment, Inc. (a) | | | 61 | |
| | 6,695 | | | Omnicom Group, Inc. | | | 512 | |
| | 13,640 | | | Sirius XM Holdings, Inc. | | | 92 | |
| | 729 | | | The Walt Disney Co. | | | 76 | |
| | 546 | | | Twenty-First Century Fox, Inc. | | | 27 | |
| | 199 | | | Twenty-First Century Fox, Inc., Class – B | | | 10 | |
| | | | | | | | |
| | | | | | | 1,283 | |
| | | | | | | | |
| | | | Metals & Mining — 0.01% | |
| | 2,599 | | | Freeport-McMoRan Copper & Gold, Inc. | | | 44 | |
| | 223 | | | Royal Gold, Inc. | | | 21 | |
| | 716 | | | Southern Copper Corp. | | | 34 | |
| | 369 | | | Steel Dynamics, Inc. | | | 17 | |
| | | | | | | | |
| | | | | | | 116 | |
| | | | | | | | |
| | | | Multiline Retail — 0.35% | |
| | 7,761 | | | Dollar General Corp. | | | 765 | |
| | 7,440 | | | Dollar Tree, Inc. (a) | | | 632 | |
| | 4,434 | | | Kohl’s Corp. | | | 323 | |
| | 14,881 | | | Target Corp. | | | 1,134 | |
| | | | | | | | |
| | | | | | | 2,854 | |
| | | | | | | | |
| | | | Oil, Gas & Consumable Fuels — 1.76% | |
| | 1,313 | | | Cheniere Energy, Inc. (a) | | | 86 | |
| | 77,041 | | | Chesapeake Energy Corp. (a) | | | 404 | |
| | 42,811 | | | Chevron Corp. | | | 5,412 | |
| | 782 | | | Cimarex Energy Co. | | | 80 | |
| | 7,232 | | | Concho Resources, Inc. (a) | | | 1,001 | |
| | 342 | | | Continental Resources, Inc. (a) | | | 22 | |
| | 8,580 | | | EOG Resources, Inc. | | | 1,068 | |
| | 48,018 | | | Exxon Mobil Corp. | | | 3,972 | |
| | 15,021 | | | ONEOK, Inc. | | | 1,049 | |
| | 1,534 | | | Parsley Energy, Inc., Class – A (a) | | | 46 | |
| | 607 | | | RSP Permian, Inc. (a) | | | 27 | |
| | 39,644 | | | The Williams Companies, Inc. | | | 1,074 | |
| | | | | | | | |
| | | | | | | 14,241 | |
| | | | | | | | |
| | | | Personal Products — 0.55% | |
| | 1,318 | | | Herbalife Ltd. (a) | | | 71 | |
| | 1,567 | | | Nu Skin Enterprises, Inc., Class – A | | | 123 | |
| | 29,603 | | | The Estee Lauder Companies, Inc., Class – A | | | 4,224 | |
| | | | | | | | |
| | | | | | | 4,418 | |
| | | | | | | | |
| | | | Pharmaceuticals — 2.60% | |
| | 51,322 | | | AstraZeneca PLC, ADR | | | 1,802 | |
| | 43,877 | | | Bristol-Myers Squibb Co. | | | 2,428 | |
| | 22,900 | | | Eli Lilly & Co. | | | 1,954 | |
| | | | | | | | |
| Shares | | | Security Description | | Value
(000) | |
| | | | Pharmaceuticals (continued) | | | | |
| | 36,941 | | | Johnson & Johnson | | $ | 4,483 | |
| | 65,621 | | | Merck & Co., Inc. | | | 3,983 | |
| | 128,085 | | | Novo Nordisk A/S, Class – B, ADR | | | 5,907 | |
| | 4,788 | | | Zoetis, Inc. | | | 408 | |
| | | | | | | | |
| | | | | | | 20,965 | |
| | | | | | | | |
| | | | Professional Services — 0.23% | |
| | 331 | | | CoStar Group, Inc. (a) | | | 137 | |
| | 2,779 | | | Equifax, Inc. | | | 348 | |
| | 8,040 | | | IHS Markit Ltd. (a) | | | 415 | |
| | 4,514 | | | Robert Half International, Inc. | | | 294 | |
| | 1,724 | | | Transunion Holding Company, Inc. | | | 124 | |
| | 5,415 | | | Versik Analytics, Inc., Class – A (a) | | | 582 | |
| | | | | | | | |
| | | | | | | 1,900 | |
| | | | | | | | |
| | | | Real Estate Management & Development — 0.01% | |
| | 1,272 | | | CBRE Group, Inc., Class – A (a) | | | 61 | |
| | | | | | | | |
| | | | Road & Rail — 1.96% | |
| | 61,098 | | | CSX Corp. | | | 3,897 | |
| | 65,079 | | | Hunt (JB) Transportation Services, Inc. | | | 7,911 | |
| | 1,468 | | | Landstar System, Inc. | | | 160 | |
| | 375 | | | Old Dominion Freight Line, Inc. | | | 56 | |
| | 27,359 | | | Union Pacific Corp. | | | 3,876 | |
| | | | | | | | |
| | | | | | | 15,900 | |
| | | | | | | | |
| | | | Semiconductors & Semiconductor Equipment — 4.14% | |
| | 96,872 | | | Advanced Micro Devices, Inc. (a) | | | 1,452 | |
| | 12,105 | | | Analog Devices, Inc. | | | 1,161 | |
| | 10,280 | | | Applied Materials, Inc. | | | 475 | |
| | 30,143 | | | Broadcom, Inc. | | | 7,313 | |
| | 642 | | | Cavium, Inc. (a) | | | 56 | |
| | 4,763 | | | Cypress Semiconductor Corp. | | | 74 | |
| | 111,393 | | | Intel Corp. | | | 5,537 | |
| | 13,120 | | | KLA-Tencor Corp. | | | 1,345 | |
| | 1,574 | | | Lam Research Corp. | | | 272 | |
| | 2,737 | | | Maxim Integrated Products, Inc. | | | 161 | |
| | 2,084 | | | Microchip Technology, Inc. | | | 190 | |
| | 40,518 | | | Micron Technology, Inc. (a) | | | 2,125 | |
| | 40,122 | | | NVIDIA Corp. | | | 9,504 | |
| | 1,813 | | | NXP Semiconductors N.V. (a) | | | 198 | |
| | 3,857 | | | ON Semiconductor Corp. (a) | | | 86 | |
| | 635 | | | Qorvo, Inc. (a) | | | 51 | |
| | 35,525 | | | Qualcomm, Inc. | | | 1,994 | |
| | 1,575 | | | Skyworks Solutions, Inc. | | | 152 | |
| | 1,814 | | | Teradyne, Inc. | | | 69 | |
| | 9,632 | | | Texas Instruments, Inc. | | | 1,062 | |
| | 2,769 | | | Versum Materials, Inc. | | | 103 | |
| | 2,267 | | | Xilinx, Inc. | | | 148 | |
| | | | | | | | |
| | | | | | | 33,528 | |
| | | | | | | | |
| | | | Software — 11.87% | |
| | 44,989 | | | Activision Blizzard, Inc. | | | 3,434 | |
| | 29,480 | | | Adobe Systems, Inc. (a) | | | 7,188 | |
| | 2,920 | | | ANSYS, Inc. (a) | | | 509 | |
| | 908 | | | Atlassian Corp. PLC, Class – A (a) | | | 57 | |
| | 73,136 | | | Autodesk, Inc. (a) | | | 9,587 | |
| | 4,548 | | | Citrix Systems, Inc. (a) | | | 477 | |
See accompanying notes to financial statements.
68
HC CAPITAL TRUST
The Growth Equity Portfolio
Portfolio of Investments (continued) — June 30, 2018
| | | | | | | | |
| Shares | | | Security Description | | Value
(000) | |
| | | | Common Stocks (continued) | |
| | | | Software (continued) | |
| | 1,982 | | | Dell Technologies, Inc., Class – V (a) | | $ | 168 | |
| | 2,875 | | | Electronic Arts, Inc. (a) | | | 405 | |
| | 1,303 | | | Fortinet, Inc. (a) | | | 81 | |
| | 6,824 | | | Intuit, Inc. | | | 1,394 | |
| | 296,349 | | | Microsoft Corp. | | | 29,222 | |
| | 74,793 | | | Oracle Corp. | | | 3,295 | |
| | 1,114 | | | PTC, Inc. (a) | | | 105 | |
| | 78,437 | | | Red Hat, Inc. (a) | | | 10,540 | |
| | 116,687 | | | Salesforce.com, Inc. (a) | | | 15,915 | |
| | 66,571 | | | SAP AG, ADR | | | 7,700 | |
| | 1,619 | | | ServiceNow, Inc. (a) | | | 279 | |
| | 22,109 | | | Splunk, Inc. (a) | | | 2,191 | |
| | 1,505 | | | SS&C Technologies Holdings, Inc. | | | 78 | |
| | 151 | | | Synopsys, Inc. (a) | | | 13 | |
| | 615 | | | Tableau Software, Inc., Class – A (a) | | | 60 | |
| | 963 | | | Take-Two Interactive Software, Inc. (a) | | | 114 | |
| | 271 | | | The Ultimate Software Group, Inc. (a) | | | 70 | |
| | 327 | | | Tyler Technologies, Inc. (a) | | | 73 | |
| | 2,621 | | | VMware, Inc., Class – A (a) | | | 385 | |
| | 22,414 | | | Workday, Inc., Class – A (a) | | | 2,715 | |
| | | | | | | | |
| | | | | | | 96,055 | |
| | | | | | | | |
| | | | Specialty Retail — 4.30% | |
| | 1,595 | | | Aaron’s, Inc. | | | 69 | |
| | 1,738 | | | Advance Auto Parts, Inc. | | | 236 | |
| | 702 | | | AutoZone, Inc. (a) | | | 471 | |
| | 54 | | | Bed Bath & Beyond, Inc. | | | 1 | |
| | 7,090 | | | Best Buy Co., Inc. | | | 529 | |
| | 376 | | | Burlington Stores, Inc. (a) | | | 57 | |
| | 2,250 | | | Dick’s Sporting Goods, Inc. | | | 79 | |
| | 234 | | | Floor & Decor Holdings, Inc., Class – A (a) | | | 12 | |
| | 5,871 | | | Gap, Inc. | | | 190 | |
| | 77,845 | | | Lowe’s Companies, Inc. | | | 7,440 | |
| | 842 | | | Michaels Companies, Inc. The (a) | | | 16 | |
| | 2,298 | | | O’Reilly Automotive, Inc. (a) | | | 629 | |
| | 10,510 | | | Ross Stores, Inc. | | | 891 | |
| | 29,785 | | | The Home Depot, Inc. | | | 5,811 | |
| | 103,367 | | | The TJX Cos., Inc. | | | 9,838 | |
| | 2,635 | | | Tiffany & Co. | | | 347 | |
| | 1,256 | | | Tractor Supply Co. | | | 96 | |
| | 34,479 | | | Ulta Salon, Cosmetics & Fragrance, Inc. (a) | | | 8,049 | |
| | 2,164 | | | Urban Outfitters, Inc. (a) | | | 96 | |
| | | | | | | | |
| | | | | | | 34,857 | |
| | | | | | | | |
| | | | Technology Hardware, Storage & Peripherals — 4.55% | |
| | 189,234 | | | Apple, Inc. | | | 35,029 | |
| | 23,154 | | | NCR Corp. (a) | | | 694 | |
| | 2,245 | | | NetApp, Inc. | | | 176 | |
| | 12,409 | | | Western Digital Corp. | | | 961 | |
| | | | | | | | |
| | | | | | | 36,860 | |
| | | | | | | | |
| | | | Textiles, Apparel & Luxury Goods — 2.81% | |
| | 1,286 | | | Carter’s, Inc. | | | 139 | |
| | 65,870 | | | Kering, ADR | | | 3,695 | |
| | 3,341 | | | Lululemon Athletica, Inc. (a) | | | 417 | |
| | 4,270 | | | Michael Kors Holdings Ltd. (a) | | | 284 | |
| | 211,110 | | | NIKE, Inc., Class – B | | | 16,822 | |
| | | | | | | | |
| Shares | | | Security Description | | Value
(000) | |
| | | | Textiles, Apparel & Luxury Goods (continued) | |
| | 1,481 | | | Ralph Lauren Corp. | | $ | 186 | |
| | 6,411 | | | Tapestry, Inc. | | | 299 | |
| | 4,425 | | | Under Armour, Inc., Class – A (a) | | | 99 | |
| | 4,454 | | | Under Armour, Inc., Class – C (a) | | | 94 | |
| | 7,936 | | | V.F. Corp. | | | 648 | |
| | | | | | | | |
| | | | | | | 22,683 | |
| | | | | | | | |
| | | | Tobacco — 0.51% | |
| | 51,612 | | | Philip Morris International, Inc. | | | 4,167 | |
| | | | | | | | |
| | | | Trading Companies & Distributors — 0.29% | |
| | 21,657 | | | Air Lease Corp. | | | 910 | |
| | 8,270 | | | Fastenal Co. | | | 398 | |
| | 1,918 | | | HD Supply Holdings, Inc. (a) | | | 82 | |
| | 1,313 | | | MSC Industrial Direct Co., Inc., Class – A | | | 111 | |
| | 34 | | | NOW, Inc. (a) | | | — | |
| | 2,401 | | | United Rentals, Inc. (a) | | | 354 | |
| | 1,443 | | | W.W. Grainger, Inc. | | | 446 | |
| | 286 | | | Watsco, Inc. | | | 51 | |
| | | | | | | | |
| | | | | | | 2,352 | |
| | | | | | | | |
| | | | Wireless Telecommunication Services — 0.01% | |
| | 1,571 | | | T-Mobile USA, Inc. (a) | | | 94 | |
| | | | | | | | |
| | | | Total Common Stocks | | | 784,365 | |
| | | | | | | | |
| | |
Principal
Amount
(000) | | | | | | |
| | | | Time Deposit — 0.64% | |
| $ | 5,212 | | | State Street Liquidity Management Control System Eurodollar Time Deposit,
0.53%, 7/2/18 | | | 5,212 | |
| | | | | | | | |
| | | | Total Time Deposit | | | 5,212 | |
| | | | | | | | |
| | |
| Shares | | | | | | |
| | | | Exchange-Traded Fund — 0.65% | |
| | 36,639 | | | iShares Russell 1000 Growth Fund ETF | | | 5,269 | |
| | | | | | | | |
| | | | Total Exchange-Traded Fund | | | 5,269 | |
| | | | | | | | |
| | | | Mutual Fund — 1.71% | |
| | 13,817,587 | | | State Street Institutional Treasury Plus Money Market Fund, Trust Class, 1.72% (b) | | | 13,818 | |
| | | | | | | | |
| | | | Total Mutual Fund | | | 13,818 | |
| | | | | | | | |
| | | | Total Investments
(cost $449,121) — 99.86% | | | 808,664 | |
| | | | Other assets in excess of liabilities — 0.14% | | | 1,126 | |
| | | | | | | | |
| | | | Net Assets — 100.00% | | $ | 809,790 | |
| | | | | | | | |
Amounts designated as “—” are $0 or have been rounded to $0.
| ^ | All or part of this security was on loan as of June 30, 2018. The total value of securities on loan as of June 30, 2018, was $2,332 (amount in thousands). |
| (a) | Represents non-income producing security. |
| (b) | The rate disclosed is the rate in effect on June 30, 2018. |
ADR — American Depositary Receipt
ETF — Exchange-Traded Fund
See accompanying notes to financial statements.
69
HC CAPITAL TRUST
The Growth Equity Portfolio
Portfolio of Investments (concluded) — June 30, 2018
The following table reflects the percentage of total net assets of the Portfolio attributable to each Specialist Manager as of June 30, 2018.
| | | | | | | | | | | | | | | | | | | | |
The Growth Equity Portfolio | | Jennison
Associates, LLC | | | BNY Mellon Asset
Management North
America Corporation* | | | Parametric
Portfolio
Associates, LLC | | | HC Capital
Solutions | | | Total | |
Common Stocks | | | 24.42 | % | | | 25.59 | % | | | 46.85 | % | | | — | | | | 96.86 | % |
Time Deposit | | | 0.64 | % | | | — | | | | — | | | | — | | | | 0.64 | % |
Exchange Traded Fund | | | 0.65 | % | | | — | | | | — | | | | — | | | | 0.65 | % |
Mutual Funds | | | — | | | | 0.29 | % | | | 1.08 | % | | | 0.34 | % | | | 1.71 | % |
Other Assets (Liabilities) | | | 0.15 | % | | | 0.01 | % | | | -0.02 | % | | | — | | | | 0.14 | % |
| | | | | | | | | | | | | | | | | | | | |
Total Net Assets | | | 25.86 | % | | | 25.89 | % | | | 47.91 | % | | | 0.34 | % | | | 100.00 | % |
| | | | | | | | | | | | | | | | | | | | |
| * | Formerly Mellon Capital Management Corporation. |
Amounts designated as “—” indicate the Specialist Manager did not manage any holdings in that category.
The following table reflects the open derivative positions held by the Portfolio as of June 30, 2018.
Futures Contracts Purchased^
| | | | | | | | | | | | | | |
Description | | Number of Contracts | | Expiration
Date | | | Notional
Amount
(000) | | | Value and
Unrealized
Appreciation/
(Depreciation)
(000) | |
E-Mini NASDAQ 100 Future | | 6 | | | 9/21/18 | | | $ | 848 | | | $ | (14 | ) |
E-Mini S&P 500 Future | | 6 | | | 9/21/18 | | | | 816 | | | | (16 | ) |
E-Mini S&P Midcap 400 Future | | 1 | | | 9/21/18 | | | | 196 | | | | (5 | ) |
| | | | | | | | | | | | | | |
| | | | | $ | 1,860 | | | $ | (35 | ) |
| | | | | | | | | | | | | | |
| | |
| | Total Unrealized Appreciation | | | $ | — | |
| | Total Unrealized Depreciation | | | | (35 | ) |
| | | | | | | | | | | | | | |
| | Total Net Unrealized Appreciation/(Depreciation) | | | $ | (35 | ) |
| | | | | | | | | | | | | | |
| ^ | Cash has been pledged as collateral for futures contracts held by the Portfolio. |
Amounts designated as “—” are $0 or have been rounded to $0.
See accompanying notes to financial statements.
70
HC CAPITAL TRUST
The Institutional Growth Equity Portfolio
Portfolio of Investments — June 30, 2018
| | | | | | | | |
| Shares | | | Security Description | | Value
(000) | |
| | | | Common Stocks — 93.66% | |
| | | | Aerospace & Defense — 3.13% | |
| | 3,696 | | | BWX Technologies, Inc. | | $ | 230 | |
| | 122 | | | Curtiss-Wright Corp. | | | 15 | |
| | 15,208 | | | General Dynamics Corp. | | | 2,835 | |
| | 1,439 | | | HEICO Corp. | | | 105 | |
| | 2,818 | | | HEICO Corp., Class – A | | | 172 | |
| | 853 | | | Hexcel Corp. | | | 57 | |
| | 1,391 | | | Huntington Ingalls Industries, Inc. | | | 302 | |
| | 3,200 | | | L3 Technologies, Inc. | | | 615 | |
| | 19,057 | | | Lockheed Martin Corp. | | | 5,629 | |
| | 6,079 | | | Northrop Grumman Corp. | | | 1,871 | |
| | 22,671 | | | Raytheon Co. | | | 4,380 | |
| | 6,154 | | | Rockwell Collins, Inc. | | | 829 | |
| | 4,238 | | | Spirit Aerosystems Holdings, Inc., Class – A | | | 364 | |
| | 1,518 | | | Textron, Inc. | | | 100 | |
| | 44,814 | | | The Boeing Co. | | | 15,035 | |
| | 1,805 | | | TransDigm Group, Inc. | | | 623 | |
| | 32,443 | | | United Technologies Corp. | | | 4,056 | |
| | | | | | | | |
| | | | | | | 37,218 | |
| | | | | | | | |
| | | | Air Freight & Logistics — 0.61% | |
| | 10,828 | | | C.H. Robinson Worldwide, Inc. | | | 906 | |
| | 13,965 | | | Expeditors International of Washington, Inc. | | | 1,021 | |
| | 9,301 | | | FedEx Corp. | | | 2,112 | |
| | 25,961 | | | United Parcel Service, Inc., Class – B | | | 2,758 | |
| | 4,465 | | | XPO Logistics, Inc. (a) | | | 447 | |
| | | | | | | | |
| | | | | | | 7,244 | |
| | | | | | | | |
| | | | Airlines — 0.10% | |
| | 6,072 | | | Delta Air Lines, Inc. | | | 301 | |
| | 14,343 | | | Southwest Airlines Co. | | | 730 | |
| | 3,029 | | | Spirit Airlines, Inc. (a) | | | 110 | |
| | | | | | | | |
| | | | | | | 1,141 | |
| | | | | | | | |
| | | | Auto Components — 0.10% | |
| | 8,671 | | | Aptiv PLC | | | 795 | |
| | 6,919 | | | Gentex Corp. | | | 159 | |
| | 307 | | | Lear Corp. | | | 57 | |
| | 739 | | | Visteon Corp. (a) | | | 96 | |
| | | | | | | | |
| | | | | | | 1,107 | |
| | | | | | | | |
| | | | Automobiles — 0.63% | |
| | 21,335 | | | Tesla Motors, Inc.^ (a) | | | 7,316 | |
| | 1,566 | | | Thor Industries, Inc. | | | 153 | |
| | | | | | | | |
| | | | | | | 7,469 | |
| | | | | | | | |
| | | | Banks — 0.77% | |
| | 12,298 | | | Citizens Financial Group, Inc. | | | 478 | |
| | 352 | | | Comerica, Inc. | | | 32 | |
| | 2,293 | | | Cullen/Frost Bankers, Inc. | | | 248 | |
| | 300 | | | East West Bancorp, Inc. | | | 20 | |
| | 5,582 | | | First Republic Bank | | | 540 | |
| | 47,367 | | | JPMorgan Chase & Co. | | | 4,937 | |
| | 1,186 | | | Pinnacle Financial Partners, Inc. | | | 73 | |
| | 15,080 | | | PNC Financial Services Group, Inc. | | | 2,037 | |
| | 1,258 | | | Signature Bank (a) | | | 161 | |
| | 1,511 | | | SVB Financial Group (a) | | | 436 | |
| | | | | | | | |
| Shares | | | Security Description | | Value
(000) | |
| | | | Banks (continued) | | | | |
| | 324 | | | Synovus Financial Corp. | | $ | 17 | |
| | 1,117 | | | Texas Capital Bancshares, Inc. (a) | | | 102 | |
| | 2,196 | | | Western Alliance Bancorp (a) | | | 124 | |
| | | | | | | | |
| | | | | | | 9,205 | |
| | | | | | | | |
| | | | Beverages — 2.76% | |
| | 1,781 | | | Brown-Forman Corp., Class – A | | | 87 | |
| | 24,970 | | | Brown-Forman Corp., Class – B | | | 1,224 | |
| | 11,837 | | | Constellation Brands, Inc., Class – A | | | 2,591 | |
| | 14,095 | | | Dr. Pepper Snapple Group, Inc. | | | 1,720 | |
| | 75,838 | | | Monster Beverage Corp. (a) | | | 4,346 | |
| | 104,735 | | | PepsiCo, Inc. | | | 11,401 | |
| | 259,872 | | | The Coca-Cola Co. | | | 11,398 | |
| | | | | | | | |
| | | | | | | 32,767 | |
| | | | | | | | |
| | | | Biotechnology — 3.45% | |
| | 64,173 | | | AbbVie, Inc. | | | 5,946 | |
| | 1,756 | | | Agios Pharmaceuticals, Inc. (a) | | | 148 | |
| | 32,806 | | | Alexion Pharmaceuticals, Inc. (a) | | | 4,073 | |
| | 5,723 | | | Alkermes PLC (a) | | | 236 | |
| | 2,936 | | | Alnylam Pharmaceuticals, Inc. (a) | | | 289 | |
| | 53,388 | | | Amgen, Inc. | | | 9,856 | |
| | 7,511 | | | Biogen Idec, Inc. (a) | | | 2,180 | |
| | 39,387 | | | BioMarin Pharmaceutical, Inc. (a) | | | 3,710 | |
| | 1,290 | | | Bluebird Bio, Inc. (a) | | | 202 | |
| | 45,819 | | | Celgene Corp. (a) | | | 3,639 | |
| | 4,481 | | | Exact Sciences Corp. (a) | | | 268 | |
| | 10,910 | | | Exelixis, Inc. (a) | | | 235 | |
| | 36,247 | | | Gilead Sciences, Inc. | | | 2,568 | |
| | 6,530 | | | Incyte Corp. (a) | | | 438 | |
| | 4,642 | | | Ionis Pharmaceuticals, Inc. (a) | | | 193 | |
| | 3,319 | | | Neurocrine Biosciences, Inc. (a) | | | 326 | |
| | 2,994 | | | Regeneron Pharmaceuticals, Inc. (a) | | | 1,033 | |
| | 1,700 | | | Sage Therapeutics, Inc. (a) | | | 266 | |
| | 2,317 | | | Sarepta Therapeutics, Inc. (a) | | | 306 | |
| | 3,982 | | | Seattle Genetics, Inc. (a) | | | 264 | |
| | 1,292 | | | Tesaro, Inc. (a) | | | 57 | |
| | 28,162 | | | Vertex Pharmaceuticals, Inc. (a) | | | 4,786 | |
| | | | | | | | |
| | | | | | | 41,019 | |
| | | | | | | | |
| | | | Building Products — 0.11% | |
| | 5,295 | | | A.O. Smith Corp. | | | 313 | |
| | 2,987 | | | Allegion PLC | | | 231 | |
| | 1,674 | | | Armstrong World Industries, Inc. (a) | | | 106 | |
| | 2,552 | | | Fortune Brands Home & Security, Inc. | | | 137 | |
| | 1,289 | | | Lennox International, Inc. | | | 258 | |
| | 7,855 | | | Masco Corp. | | | 294 | |
| | | | | | | | |
| | | | | | | 1,339 | |
| | | | | | | | |
| | | | Capital Markets — 2.42% | |
| | 982 | | | Ameriprise Financial, Inc. | | | 137 | |
| | 7,161 | | | CBOE Holdings, Inc. | | | 745 | |
| | 13,536 | | | CME Group, Inc. | | | 2,219 | |
| | 2,238 | | | E*Trade Financial Corp. (a) | | | 137 | |
| | 4,300 | | | Eaton Vance Corp. | | | 224 | |
| | 1,504 | | | Evercore Partners, Inc., Class – A | | | 159 | |
| | 3,169 | | | FactSet Research Systems, Inc. | | | 628 | |
See accompanying notes to financial statements.
71
HC CAPITAL TRUST
The Institutional Growth Equity Portfolio
Portfolio of Investments (continued) — June 30, 2018
| | | | | | | | |
| Shares | | | Security Description | | Value
(000) | |
| | | | Common Stocks (continued) | |
| | | | Capital Markets (continued) | |
| | 3,878 | | | Federated Investors, Inc., Class – B | | $ | 90 | |
| | 15,313 | | | Franklin Resources, Inc. | | | 491 | |
| | 16,999 | | | Goldman Sachs Group, Inc. | | | 3,749 | |
| | 2,394 | | | Interactive Brokers Group, Inc., Class – A | | | 154 | |
| | 11,094 | | | IntercontinentalExchange Group, Inc. | | | 816 | |
| | 3,947 | | | Lazard Ltd., Class – A | | | 193 | |
| | 3,291 | | | LPL Financial Holdings, Inc. | | | 216 | |
| | 1,366 | | | MarketAxess Holdings, Inc. | | | 270 | |
| | 6,260 | | | Moody’s Corp. | | | 1,068 | |
| | 50,412 | | | Morgan Stanley | | | 2,390 | |
| | 1,464 | | | Morningstar, Inc. | | | 188 | |
| | 3,280 | | | MSCI, Inc. Common | | | 543 | |
| | 2,184 | | | Northern Trust Corp. | | | 225 | |
| | 1,432 | | | Raymond James Financial, Inc. | | | 128 | |
| | 36,708 | | | S&P Global, Inc. | | | 7,484 | |
| | 10,410 | | | SEI Investments Co. | | | 651 | |
| | 843 | | | State Street Corp. | | | 78 | |
| | 18,392 | | | T. Rowe Price Group, Inc. | | | 2,135 | |
| | 20,981 | | | TD Ameritrade Holding Corp. | | | 1,149 | |
| | 45,128 | | | The Charles Schwab Corp. | | | 2,306 | |
| | 1,385 | | | Virtu Financial, Inc., Class – A | | | 37 | |
| | 3,455 | | | Waddell & Reed Financial, Inc., Class – A | | | 62 | |
| | | | | | | | |
| | | | | | | 28,672 | |
| | | | | | | | |
| | | | Chemicals — 1.23% | |
| | 8,317 | | | Air Products & Chemicals, Inc. | | | 1,295 | |
| | 27,530 | | | Albemarle Corp. | | | 2,597 | |
| | 3,681 | | | Axalta Coating Systems Ltd. (a) | | | 112 | |
| | 3,196 | | | Celanese Corp., Series A | | | 355 | |
| | 14,796 | | | Ecolab, Inc. | | | 2,076 | |
| | 2,119 | | | FMC Corp. | | | 189 | |
| | 4,598 | | | International Flavors & Fragrances, Inc. | | | 570 | |
| | 5,765 | | | LyondellBasell Industries N.V., Class – A | | | 634 | |
| | 277 | | | NewMarket Corp. | | | 112 | |
| | 4,134 | | | Platform Specialty Products Corp. (a) | | | 48 | |
| | 819 | | | PPG Industries, Inc. | | | 85 | |
| | 20,866 | | | Praxair, Inc. | | | 3,300 | |
| | 1,341 | | | RPM International, Inc. | | | 78 | |
| | 6,558 | | | The Chemours Co. | | | 291 | |
| | 804 | | | The Scotts Miracle-Gro Co. | | | 67 | |
| | 6,271 | | | The Sherwin-Williams Co. | | | 2,556 | |
| | 1,902 | | | W.R. Grace & Co. | | | 139 | |
| | 1,222 | | | Westlake Chemical Corp. | | | 132 | |
| | | | | | | | |
| | | | | | | 14,636 | |
| | | | | | | | |
| | | | Commercial Services & Supplies — 0.41% | |
| | 6,933 | | | Cintas Corp. | | | 1,282 | |
| | 17,000 | | | Copart, Inc. (a) | | | 962 | |
| | 4,885 | | | KAR Auction Services, Inc. | | | 268 | |
| | 506 | | | Republic Services, Inc., Class – A | | | 35 | |
| | 7,541 | | | Rollins, Inc. | | | 397 | |
| | 3,480 | | | Stericycle, Inc. (a) | | | 227 | |
| | 7,297 | | | Waste Connections, Inc. | | | 550 | |
| | 13,738 | | | Waste Management, Inc. | | | 1,117 | |
| | | | | | | | |
| | | | | | | 4,838 | |
| | | | | | | | |
| | | | | | | | |
| Shares | | | Security Description | | Value
(000) | |
| | | | Communications Equipment — 1.06% | |
| | 3,508 | | | Arista Networks, Inc. (a) | | $ | 903 | |
| | 201,413 | | | Cisco Systems, Inc. | | | 8,667 | |
| | 5,125 | | | F5 Networks, Inc. (a) | | | 884 | |
| | 9,294 | | | Harris Corp. | | | 1,343 | |
| | 676 | | | Motorola Solutions, Inc. | | | 79 | |
| | 3,301 | | | Palo Alto Networks, Inc. (a) | | | 678 | |
| | 682 | | | Ubiquiti Networks, Inc. (a) | | | 58 | |
| | | | | | | | |
| | | | | | | 12,612 | |
| | | | | | | | |
| | | | Construction & Engineering — 0.06% | |
| | 5,809 | | | Fluor Corp. | | | 283 | |
| | 5,274 | | | Jacobs Engineering Group, Inc. | | | 335 | |
| | 1,602 | | | Quanta Services, Inc. (a) | | | 54 | |
| | | | | | | | |
| | | | | | | 672 | |
| | | | | | | | |
| | | | Construction Materials — 0.10% | |
| | 1,638 | | | Eagle Materials, Inc., Class – A | | | 172 | |
| | 2,144 | | | Martin Marietta Materials, Inc. | | | 479 | |
| | 4,599 | | | Vulcan Materials Co. | | | 593 | |
| | | | | | | | |
| | | | | | | 1,244 | |
| | | | | | | | |
| | | | Consumer Finance — 0.33% | |
| | 18,128 | | | American Express Co. | | | 1,776 | |
| | 1,377 | | | Capital One Financial Corp. | | | 127 | |
| | 384 | | | Credit Acceptance Corp. (a) | | | 136 | |
| | 5,978 | | | Discover Financial Services | | | 421 | |
| | 528 | | | Santander Consumer USA Holdings, Inc. | | | 10 | |
| | 42,568 | | | Synchrony Financial | | | 1,421 | |
| | | | | | | | |
| | | | | | | 3,891 | |
| | | | | | | | |
| | | | Containers & Packaging — 0.15% | |
| | 2,575 | | | AptarGroup, Inc. | | | 240 | |
| | 3,258 | | | Avery Dennison Corp. | | | 333 | |
| | 2,708 | | | Berry Plastics Group, Inc. (a) | | | 124 | |
| | 4,741 | | | Crown Holdings, Inc. (a) | | | 212 | |
| | 2,570 | | | Graphic Packaging Holding Co. | | | 37 | |
| | 2,065 | | | International Paper Co. | | | 108 | |
| | 3,480 | | | Packaging Corporation of America | | | 389 | |
| | 3,198 | | | Sealed Air Corp. | | | 136 | |
| | 1,147 | | | Silgan Holdings | | | 31 | |
| | 4,150 | | | Sonoco Products Co. | | | 218 | |
| | | | | | | | |
| | | | | | | 1,828 | |
| | | | | | | | |
| | | | Distributors — 0.10% | |
| | 5,891 | | | Genuine Parts Co. | | | 540 | |
| | 14,005 | | | LKQ Corp. (a) | | | 447 | |
| | 1,463 | | | Pool Corp. | | | 222 | |
| | | | | | | | |
| | | | | | | 1,209 | |
| | | | | | | | |
| | | | Diversified Consumer Services — 0.07% | |
| | 1,835 | | | Bright Horizons Family Solutions, Inc. (a) | | | 188 | |
| | 1,767 | | | Grand Canyon Education, Inc. (a) | | | 197 | |
| | 1,100 | | | H&R Block, Inc. | | | 25 | |
| | 3,461 | | | Service Corporation International | | | 124 | |
| | 5,052 | | | ServiceMaster Global Holdings, Inc. (a) | | | 301 | |
| | | | | | | | |
| | | | | | | 835 | |
| | | | | | | | |
| | | | Diversified Financial Services — 0.15% | |
| | 9,155 | | | Berkshire Hathaway, Inc., Class – B (a) | | | 1,709 | |
| | 357 | | | Voya Financial, Inc. | | | 17 | |
| | | | | | | | |
| | | | | | | 1,726 | |
| | | | | | | | |
See accompanying notes to financial statements.
72
HC CAPITAL TRUST
The Institutional Growth Equity Portfolio
Portfolio of Investments (continued) — June 30, 2018
| | | | | | | | |
| Shares | | | Security Description | | Value
(000) | |
| | | | Common Stocks (continued) | |
| | | | Diversified Telecommunication Services — 0.02% | |
| | 7,375 | | | Zayo Group Holdings, Inc. (a) | | $ | 269 | |
| | | | | | | | |
| | | | Electrical Equipment — 0.43% | |
| | 11,111 | | | AMETEK, Inc. | | | 802 | |
| | 43,093 | | | Emerson Electric Co. | | | 2,979 | |
| | 3,780 | | | Hubbell, Inc. | | | 400 | |
| | 4,667 | | | Rockwell Automation, Inc. | | | 776 | |
| | 3,421 | | | Sensata Technologies Holding PLC (a) | | | 163 | |
| | | | | | | | |
| | | | | | | 5,120 | |
| | | | | | | | |
| | | | Electronic Equipment, Instruments & Components — 0.38% | |
| | 23,207 | | | Amphenol Corp., Class – A | | | 2,023 | |
| | 5,518 | | | CDW Corporation of Delaware | | | 446 | |
| | 6,159 | | | Cognex Corp. | | | 275 | |
| | 683 | | | Coherent, Inc. (a) | | | 107 | |
| | 2,020 | | | Dolby Laboratories, Inc., Class – A | | | 125 | |
| | 6,492 | | | FLIR Systems, Inc. | | | 337 | |
| | 1,342 | | | IPG Photonics Corp. (a) | | | 296 | |
| | 750 | | | Littelfuse, Inc. | | | 171 | |
| | 8,009 | | | National Instruments Corp. | | | 336 | |
| | 1,580 | | | Universal Display Corp. | | | 136 | |
| | 1,965 | | | Zebra Technologies Corp., Class – A (a) | | | 281 | |
| | | | | | | | |
| | | | | | | 4,533 | |
| | | | | | | | |
| | | | Energy Equipment & Services — 0.47% | |
| | 3,204 | | | Apergy Corp. (a) | | | 134 | |
| | 1,630 | | | Dril-Quip, Inc. (a) | | | 84 | |
| | 1,455 | | | Franks International N.V. | | | 11 | |
| | 32,780 | | | Halliburton Co. | | | 1,477 | |
| | 4,085 | | | Helmerich & Payne, Inc. | | | 260 | |
| | 15,420 | | | National Oilwell Varco, Inc. | | | 669 | |
| | 4,107 | | | Oceaneering International, Inc. | | | 105 | |
| | 1,847 | | | RPC, Inc. | | | 27 | |
| | 36,562 | | | Schlumberger Ltd. | | | 2,451 | |
| | 9,671 | | | TechnipFMC PLC | | | 307 | |
| | | | | | | | |
| | | | | | | 5,525 | |
| | | | | | | | |
| | | | Equity Real Estate Investment Trusts — 0.85% | |
| | 285 | | | Alexandria Real Estate Equities, Inc. | | | 36 | |
| | 16,482 | | | American Tower Corp. | | | 2,376 | |
| | 4,855 | | | CoreCivic, Inc. | | | 116 | |
| | 1,269 | | | Coresite Realty Corp. | | | 141 | |
| | 11,939 | | | Crown Castle International Corp. | | | 1,287 | |
| | 2,977 | | | Equinix, Inc. | | | 1,280 | |
| | 3,151 | | | Equity Lifestyle Properties, Inc. | | | 290 | |
| | 3,935 | | | Extra Space Storage, Inc. | | | 393 | |
| | 2,686 | | | Gaming & Leisure Properties, Inc. | | | 96 | |
| | 550 | | | Hudson Pacific Property, Inc. | | | 19 | |
| | 2,808 | | | Lamar Advertising Co., Class – A | | | 192 | |
| | 91 | | | Life Storage, Inc. | | | 9 | |
| | 577 | | | OMEGA Healthcare Investors, Inc. | | | 18 | |
| | 5,575 | | | Public Storage | | | 1,265 | |
| | 4,247 | | | SBA Communications Corp. (a) | | | 701 | |
| | 10,629 | | | Simon Property Group, Inc. | | | 1,809 | |
| | 2,151 | | | Taubman Centers, Inc. | | | 126 | |
| | | | | | | | |
| | | | | | | 10,154 | |
| | | | | | | | |
| | | | | | | | |
| Shares | | | Security Description | | Value
(000) | |
| | | | Food & Staples Retailing — 2.15% | |
| | 59,069 | | | Costco Wholesale Corp. | | $ | 12,344 | |
| | 44,501 | | | CVS Caremark Corp. | | | 2,864 | |
| | 11,320 | | | Sprouts Farmers Market, Inc. (a) | | | 250 | |
| | 41,031 | | | Sysco Corp. | | | 2,802 | |
| | 450 | | | US Foods Holding Corp. (a) | | | 17 | |
| | 33,695 | | | Walgreens Boots Alliance, Inc. | | | 2,022 | |
| | 61,925 | | | Wal-Mart Stores, Inc. | | | 5,304 | |
| | | | | | | | |
| | | | | | | 25,603 | |
| | | | | | | | |
| | | | Food Products — 0.30% | |
| | 11,661 | | | Campbell Soup Co. | | | 473 | |
| | 7,147 | | | Flowers Foods, Inc. | | | 149 | |
| | 1,490 | | | General Mills, Inc. | | | 66 | |
| | 10,381 | | | Hershey Co. | | | 965 | |
| | 10,397 | | | Hormel Foods Corp. | | | 387 | |
| | 4,748 | | | Kellogg Co. | | | 332 | |
| | 5,253 | | | McCormick & Company, Inc. | | | 610 | |
| | 1,341 | | | Post Holdings, Inc. (a) | | | 115 | |
| | 4,620 | | | The J.M. Smucker Co. | | | 497 | |
| | | | | | | | |
| | | | | | | 3,594 | |
| | | | | | | | |
| | | | Health Care Equipment & Supplies — 3.03% | |
| | 67,967 | | | Abbott Laboratories | | | 4,145 | |
| | 1,570 | | | Abiomed, Inc. (a) | | | 642 | |
| | 2,977 | | | Align Technology, Inc. (a) | | | 1,019 | |
| | 23,231 | | | Baxter International, Inc. | | | 1,715 | |
| | 10,657 | | | Becton, Dickinson & Co. | | | 2,553 | |
| | 40,014 | | | Boston Scientific Corp. (a) | | | 1,308 | |
| | 1,305 | | | Cantel Medical Corp. | | | 128 | |
| | 23,268 | | | Danaher Corp. | | | 2,296 | |
| | 9,431 | | | Dentsply Sirona, Inc. | | | 413 | |
| | 3,249 | | | Dexcom, Inc. (a) | | | 309 | |
| | 16,311 | | | Edwards Lifesciences Corp. (a) | | | 2,374 | |
| | 1,661 | | | Hill-Rom Holdings, Inc. | | | 145 | |
| | 583 | | | ICU Medical, Inc. (a) | | | 171 | |
| | 9,053 | | | IDEXX Laboratories, Inc. (a) | | | 1,973 | |
| | 2,187 | | | Insulet Corp. (a) | | | 187 | |
| | 2,099 | | | Integra LifeSciences Holdings Corp. (a) | | | 135 | |
| | 8,562 | | | Intuitive Surgical, Inc. (a) | | | 4,097 | |
| | 1,688 | | | Masimo Corp. (a) | | | 165 | |
| | 55,859 | | | Medtronic PLC | | | 4,782 | |
| | 1,147 | | | Penumbra, Inc. (a) | | | 158 | |
| | 10,714 | | | ResMed, Inc. | | | 1,110 | |
| | 25,914 | | | Stryker Corp. | | | 4,377 | |
| | 321 | | | Teleflex, Inc. | | | 86 | |
| | 317 | | | The Cooper Companies, Inc. | | | 75 | |
| | 1,648 | | | Varex Imaging Corp. (a) | | | 61 | |
| | 7,321 | | | Varian Medical Systems, Inc. (a) | | | 833 | |
| | 844 | | | West Pharmaceutical Services, Inc. | | | 84 | |
| | 6,643 | | | Zimmer Holdings, Inc. | | | 740 | |
| | | | | | | | |
| | | | | | | 36,081 | |
| | | | | | | | |
| | | | Health Care Providers & Services — 3.30% | |
| | 18,046 | | | Aetna, Inc. | | | 3,311 | |
| | 5,959 | | | AmerisourceBergen Corp. | | | 508 | |
| | 10,366 | | | Anthem, Inc. | | | 2,467 | |
| | 6,723 | | | Centene Corp. (a) | | | 828 | |
See accompanying notes to financial statements.
73
HC CAPITAL TRUST
The Institutional Growth Equity Portfolio
Portfolio of Investments (continued) — June 30, 2018
| | | | | | | | |
| Shares | | | Security Description | | Value
(000) | |
| | | | Common Stocks (continued) | |
| | | | Health Care Providers & Services (continued) | |
| | 580 | | | Chemed Corp. | | $ | 187 | |
| | 3,629 | | | CIGNA Corp. | | | 617 | |
| | 2,640 | | | DaVita Healthcare Partners, Inc. (a) | | | 183 | |
| | 3,666 | | | Encompass Health Corp. | | | 248 | |
| | 833 | | | Envision Healthcare Corp. (a) | | | 37 | |
| | 28,116 | | | Express Scripts Holding Co. (a) | | | 2,171 | |
| | 7,406 | | | HCA Holdings, Inc. | | | 760 | |
| | 7,524 | | | Henry Schein, Inc. (a) | | | 547 | |
| | 4,907 | | | Humana, Inc. | | | 1,460 | |
| | 4,123 | | | Laboratory Corporation of America
Holdings (a) | | | 740 | |
| | 10,060 | | | McKesson Corp. | | | 1,342 | |
| | 3,805 | | | MEDNAX, Inc. (a) | | | 165 | |
| | 1,945 | | | Molina Heathcare, Inc. (a) | | | 190 | |
| | 3,510 | | | Patterson Companies, Inc. | | | 80 | |
| | 532 | | | Premier, Inc., Class – A (a) | | | 19 | |
| | 5,578 | | | Quest Diagnostics, Inc. | | | 613 | |
| | 89,484 | | | UnitedHealth Group, Inc. | | | 21,955 | |
| | 3,586 | | | Universal Health Services, Inc., Class – B | | | 400 | |
| | 1,548 | | | WellCare Health Plans, Inc. (a) | | | 381 | |
| | | | | | | | |
| | | | | | | 39,209 | |
| | | | | | | | |
| | | | Health Care Technology — 0.16% | |
| | 1,489 | | | athenahealth, Inc. (a) | | | 237 | |
| | 17,544 | | | Cerner Corp. (a) | | | 1,049 | |
| | 7,497 | | | Veeva Systems, Inc. (a) | | | 576 | |
| | | | | | | | |
| | | | | | | 1,862 | |
| | | | | | | | |
| | | | Hotels, Restaurants & Leisure — 2.79% | |
| | 4,055 | | | Chipotle Mexican Grill, Inc. (a) | | | 1,749 | |
| | 2,756 | | | Choice Hotels International, Inc. | | | 208 | |
| | 2,555 | | | Darden Restaurants, Inc. | | | 274 | |
| | 1,571 | | | Domino’s Pizza, Inc. | | | 443 | |
| | 3,270 | | | Dunkin’ Brands Group, Inc. | | | 226 | |
| | 4,212 | | | Extended Stay America, Inc. | | | 91 | |
| | 3,589 | | | Hilton Grand Vacations (a) | | | 125 | |
| | 10,481 | | | Hilton Worldwide Holdings, Inc. | | | 830 | |
| | 8,315 | | | Las Vegas Sands Corp. | | | 635 | |
| | 57,670 | | | Marriott International, Inc., Class – A | | | 7,301 | |
| | 76,061 | | | McDonald’s Corp. | | | 11,919 | |
| | 1,703 | | | MGM Resorts International | | | 49 | |
| | 2,647 | | | Six Flags Entertainment Corp. | | | 185 | |
| | 109,518 | | | Starbucks Corp. | | | 5,350 | |
| | 6,985 | | | The Wendy’s Co. | | | 120 | |
| | 1,493 | | | Vail Resorts, Inc. | | | 409 | |
| | 3,646 | | | Wyndham Hotels & Resorts, Inc. | | | 214 | |
| | 3,667 | | | Wyndham Worldwide Corp. | | | 162 | |
| | 3,859 | | | Wynn Resorts Ltd. | | | 646 | |
| | 17,058 | | | Yum China Holdings, Inc. | | | 656 | |
| | 19,391 | | | YUM! Brands, Inc. | | | 1,517 | |
| | | | | | | | |
| | | | | | | 33,109 | |
| | | | | | | | |
| | | | Household Durables — 0.13% | |
| | 7,505 | | | D.R. Horton, Inc. | | | 308 | |
| | 4,941 | | | Garmin Ltd. | | | 301 | |
| | 5,685 | | | Lennar Corp., Class – A | | | 298 | |
| | 296 | | | Lennar Corp., Class – B | | | 13 | |
| | | | | | | | |
| Shares | | | Security Description | | Value
(000) | |
| | | | Household Durables (continued) | | | | |
| | 117 | | | NVR, Inc. (a) | | $ | 348 | |
| | 3,054 | | | PulteGroup, Inc. | | | 88 | |
| | 1,673 | | | Tempur Sealy International, Inc. (a) | | | 80 | |
| | 2,654 | | | Toll Brothers, Inc. | | | 98 | |
| | | | | | | | |
| | | | | | | 1,534 | |
| | | | | | | | |
| | | | Household Products — 1.18% | |
| | 18,048 | | | Church & Dwight Co., Inc. | | | 959 | |
| | 41,003 | | | Colgate-Palmolive Co. | | | 2,657 | |
| | 1,352 | | | Energizer Holdings, Inc. | | | 85 | |
| | 25,544 | | | Kimberly-Clark Corp. | | | 2,691 | |
| | 9,268 | | | The Clorox Co. | | | 1,253 | |
| | 81,386 | | | The Procter & Gamble Co. | | | 6,354 | |
| | | | | | | | |
| | | | | | | 13,999 | |
| | | | | | | | |
| | | | Industrial Conglomerates — 1.06% | |
| | 42,976 | | | 3M Co. | | | 8,455 | |
| | 2,682 | | | Carlisle Companies, Inc. | | | 290 | |
| | 17,397 | | | Honeywell International, Inc. | | | 2,506 | |
| | 4,742 | | | Roper Industries, Inc. | | | 1,308 | |
| | | | | | | | |
| | | | | | | 12,559 | |
| | | | | | | | |
| | | | Insurance — 0.70% | |
| | 60 | | | Alleghany Corp. | | | 34 | |
| | 4,786 | | | American International Group, Inc. | | | 254 | |
| | 20,243 | | | Aon PLC | | | 2,776 | |
| | 2,268 | | | Arch Capital Group Ltd. (a) | | | 60 | |
| | 314 | | | AXIS Capital Holdings Ltd. | | | 17 | |
| | 10,077 | | | Brown & Brown, Inc. | | | 279 | |
| | 702 | | | Erie Indemnity Co., Class – A | | | 82 | |
| | 567 | | | Everest Re Group Ltd. | | | 131 | |
| | 43 | | | Markel Corp. (a) | | | 47 | |
| | 30,129 | | | Marsh & McLennan Companies, Inc. | | | 2,471 | |
| | 110 | | | RenaissanceRe Holdings Ltd. | | | 13 | |
| | 21,783 | | | The Progressive Corp. | | | 1,289 | |
| | 1,973 | | | The Travelers Companies, Inc. | | | 241 | |
| | 4,943 | | | Torchmark Corp. | | | 402 | |
| | 383 | | | Validus Holdings Ltd. | | | 26 | |
| | 3,338 | | | XL Group Ltd. | | | 187 | |
| | | | | | | | |
| | | | | | | 8,309 | |
| | | | | | | | |
| | | | Internet & Direct Marketing Retail — 6.00% | |
| | 25,305 | | | Amazon.com, Inc. (a) | | | 43,013 | |
| | 3,812 | | | Booking Holdings, Inc. (a) | | | 7,727 | |
| | 4,492 | | | Expedia, Inc. | | | 540 | |
| | 49,315 | | | Netflix, Inc. (a) | | | 19,303 | |
| | 8,558 | | | TripAdvisor, Inc. (a) | | | 477 | |
| | 2,054 | | | Wayfair, Inc., Class – A (a) | | | 244 | |
| | | | | | | | |
| | | | | | | 71,304 | |
| | | | | | | | |
| | | | Internet Software & Services — 8.74% | |
| | 2,020 | | | 2U, Inc. (a) | | | 169 | |
| | 5,822 | | | Akamai Technologies, Inc. (a) | | | 426 | |
| | 59,882 | | | Alibaba Group Holding Ltd., ADR (a) | | | 11,110 | |
| | 26,305 | | | Alphabet, Inc., Class – A (a) | | | 29,702 | |
| | 17,952 | | | Alphabet, Inc., Class – C (a) | | | 20,028 | |
| | 887 | | | Docusign, Inc. (a) | | | 47 | |
| | 7,608 | | | eBay, Inc. (a) | | | 276 | |
| | 145,186 | | | Facebook, Inc., Class – A (a) | | | 28,212 | |
See accompanying notes to financial statements.
74
HC CAPITAL TRUST
The Institutional Growth Equity Portfolio
Portfolio of Investments (continued) — June 30, 2018
| | | | | | | | |
| Shares | | | Security Description | | Value
(000) | |
| | | | Common Stocks (continued) | |
| | | | Internet Software & Services (continued) | |
| | 5,555 | | | GoDaddy, Inc., Class – A (a) | | $ | 392 | |
| | 3,380 | | | GrubHub, Inc. (a) | | | 355 | |
| | 2,765 | | | Interactive Corp. (a) | | | 422 | |
| | 2,410 | | | LogMeln, Inc. | | | 249 | |
| | 1,895 | | | Match Group, Inc. (a) | | | 73 | |
| | 3,985 | | | Nutanix, Inc., Class – A (a) | | | 206 | |
| | 3,209 | | | Okta, Inc. (a) | | | 162 | |
| | 198,125 | | | Tencent Holdings Ltd., ADR | | | 9,956 | |
| | 2,680 | | | Twilio, Inc., Class – A (a) | | | 150 | |
| | 26,520 | | | Twitter, Inc. (a) | | | 1,158 | |
| | 3,951 | | | VeriSign, Inc. (a) | | | 543 | |
| | 1,493 | | | Zillow Group, Inc., Class – A (a) | | | 89 | |
| | 3,060 | | | Zillow Group, Inc., Class – C (a) | | | 181 | |
| | | | | | | | |
| | | | | | | 103,906 | |
| | | | | | | | |
| | | | IT Services — 8.74% | |
| | 48,699 | | | Accenture PLC, Class – A | | | 7,967 | |
| | 1,797 | | | Alliance Data Systems Corp. | | | 419 | |
| | 6,080 | | | Amdocs Ltd. | | | 402 | |
| | 34,876 | | | Automatic Data Processing, Inc. | | | 4,678 | |
| | 5,282 | | | Black Knight, Inc. (a) | | | 283 | |
| | 5,040 | | | Booz Allen Hamilton Holding Corp. | | | 220 | |
| | 9,071 | | | Broadridge Financial Solutions, Inc. | | | 1,044 | |
| | 43,494 | | | Cognizant Technology Solutions Corp. | | | 3,436 | |
| | 1,891 | | | CoreLogic, Inc. (a) | | | 98 | |
| | 1,900 | | | EPAM Systems, Inc. (a) | | | 236 | |
| | 1,013 | | | Euronet Worldwide, Inc. (a) | | | 85 | |
| | 1,201 | | | Fidelity National Information Services, Inc. | | | 127 | |
| | 17,869 | | | First Data Corp. (a) | | | 374 | |
| | 15,384 | | | Fiserv, Inc. (a) | | | 1,140 | |
| | 6,901 | | | FleetCor Technologies, Inc. (a) | | | 1,454 | |
| | 3,295 | | | Gartner Group, Inc. (a) | | | 438 | |
| | 2,307 | | | Genpact Ltd. | | | 67 | |
| | 11,071 | | | Global Payments, Inc. | | | 1,234 | |
| | 60,865 | | | International Business Machines Corp. | | | 8,503 | |
| | 6,047 | | | Jack Henry & Associates, Inc. | | | 788 | |
| | 126,531 | | | MasterCard, Inc., Class – A | | | 24,865 | |
| | 24,621 | | | Paychex, Inc. | | | 1,683 | |
| | 149,522 | | | PayPal Holdings, Inc. (a) | | | 12,450 | |
| | 7,174 | | | Sabre Corp. | | | 177 | |
| | 21,580 | | | Square, Inc., Class – A (a) | | | 1,330 | |
| | 895 | | | Switch, Inc., Class – A | | | 11 | |
| | 8,656 | | | Teradata Corp. (a) | | | 348 | |
| | 13,116 | | | Total System Services, Inc. | | | 1,109 | |
| | 211,473 | | | Visa, Inc., Class – A | | | 28,009 | |
| | 25,320 | | | Western Union Co. | | | 515 | |
| | 1,519 | | | WEX, Inc. (a) | | | 289 | |
| | 1,223 | | | Worldpay, Inc., Class – A (a) | | | 100 | |
| | | | | | | | |
| | | | | | | 103,879 | |
| | | | | | | | |
| | | | Leisure Products — 0.08% | |
| | 548 | | | Brunswick Corp. | | | 35 | |
| | 3,328 | | | Hasbro, Inc. | | | 307 | |
| | 2,810 | | | Mattel, Inc. (a) | | | 46 | |
| | 5,048 | | | Polaris Industries, Inc. | | | 617 | |
| | | | | | | | |
| | | | | | | 1,005 | |
| | | | | | | | |
| | | | | | | | |
| Shares | | | Security Description | | Value
(000) | |
| | | | Life Sciences Tools & Services — 1.00% | |
| | 2,963 | | | Bio-Techne Corp. | | $ | 438 | |
| | 1,277 | | | Bruker Biosciences Corp. | | | 37 | |
| | 1,306 | | | Charles River Laboratories International, Inc. (a) | | | 147 | |
| | 19,127 | | | Illumina, Inc. (a) | | | 5,342 | |
| | 2,014 | | | Mettler-Toledo International, Inc. (a) | | | 1,165 | |
| | 1,891 | | | PRA Health Sciences, Inc. (a) | | | 177 | |
| | 16,524 | | | Thermo Electron Corp. | | | 3,423 | |
| | 5,899 | | | Waters Corp. (a) | | | 1,142 | |
| | | | | | | | |
| | | | | | | 11,871 | |
| | | | | | | | |
| | | | Machinery — 1.79% | |
| | 4,348 | | | Allison Transmission Holdings, Inc. | | | 176 | |
| | 39,624 | | | Caterpillar, Inc. | | | 5,377 | |
| | 2,025 | | | Crane Co. | | | 162 | |
| | 2,044 | | | Cummins, Inc. | | | 272 | |
| | 12,163 | | | Deere & Co. | | | 1,700 | |
| | 10,234 | | | Donaldson Company, Inc. | | | 462 | |
| | 6,409 | | | Dover Corp. | | | 469 | |
| | 22,234 | | | Fortive Corp. | | | 1,714 | |
| | 1,554 | | | Gardner Denver Holdings, Inc. (a) | | | 46 | |
| | 6,202 | | | Graco, Inc. | | | 280 | |
| | 5,752 | | | IDEX Corp. | | | 785 | |
| | 24,366 | | | Illinois Tool Works, Inc. | | | 3,377 | |
| | 4,974 | | | Ingersoll-Rand PLC | | | 446 | |
| | 2,334 | | | Lincoln Electric Holdings, Inc. | | | 205 | |
| | 2,075 | | | Nordson, Inc. | | | 266 | |
| | 19,682 | | | Parker Hannifin Corp. | | | 3,068 | |
| | 2,278 | | | Snap-on, Inc. | | | 366 | |
| | 3,681 | | | The Middleby Corp. (a) | | | 384 | |
| | 3,938 | | | The Toro Co. | | | 237 | |
| | 1,987 | | | WABCO Holdings, Inc. (a) | | | 233 | |
| | 5,175 | | | Wabtec Corp. | | | 510 | |
| | 4,863 | | | Welbilt, Inc. (a) | | | 108 | |
| | 10,781 | | | Xylem, Inc. | | | 726 | |
| | | | | | | | |
| | | | | | | 21,369 | |
| | | | | | | | |
| | | | Marine — 0.02% | |
| | 2,315 | | | Kirby Corp. (a) | | | 194 | |
| | | | | | | | |
| | | | Media — 0.72% | |
| | 1,708 | | | AMC Networks, Inc. (a) | | | 106 | |
| | 163 | | | Cable One, Inc. | | | 120 | |
| | 12,280 | | | CBS Corp., Class – B | | | 690 | |
| | 4,741 | | | Charter Communications, Inc., Class – A (a) | | | 1,390 | |
| | 4,003 | | | Discovery Communications, Inc., Class – C (a) | | | 102 | |
| | 1,915 | | | John Wiley & Sons, Inc., Class – A | | | 119 | |
| | 246 | | | Lions Gate Entertainment Corp., Class – A | | | 6 | |
| | 483 | | | Lions Gate Entertainment Corp., Class – B | | | 11 | |
| | 5,125 | | | Live Nation Entertainment, Inc. (a) | | | 249 | |
| | 15,371 | | | Omnicom Group, Inc. | | | 1,172 | |
| | 47,807 | | | Sirius XM Holdings, Inc. | | | 324 | |
| | 1,739 | | | The Interpublic Group of Companies, Inc. | | | 41 | |
| | 60 | | | The Madison Square Garden Co., Class – A (a) | | | 19 | |
| | 40,128 | | | The Walt Disney Co. | | | 4,206 | |
| | | | | | | | |
| | | | | | | 8,555 | |
| | | | | | | | |
See accompanying notes to financial statements.
75
HC CAPITAL TRUST
The Institutional Growth Equity Portfolio
Portfolio of Investments (continued) — June 30, 2018
| | | | | | | | |
| Shares | | | Security Description | | Value
(000) | |
| | | | Common Stocks (continued) | |
| | | | Metals & Mining — 0.02% | |
| | 994 | | | Royal Gold, Inc. | | $ | 92 | |
| | 3,052 | | | Southern Copper Corp. | | | 143 | |
| | 1,278 | | | Steel Dynamics, Inc. | | | 59 | |
| | | | | | | | |
| | | | | | | 294 | |
| | | | | | | | |
| | | | Multiline Retail — 0.48% | |
| | 21,830 | | | Dollar General Corp. | | | 2,152 | |
| | 10,645 | | | Dollar Tree, Inc. (a) | | | 905 | |
| | 7,449 | | | Kohl’s Corp. | | | 543 | |
| | 4,377 | | | Nordstrom, Inc. | | | 227 | |
| | 24,945 | | | Target Corp. | | | 1,899 | |
| | | | | | | | |
| | | | | | | 5,726 | |
| | | | | | | | |
| | | | Oil, Gas & Consumable Fuels — 1.85% | |
| | 6,486 | | | Anadarko Petroleum Corp. | | | 475 | |
| | 4,759 | | | Antero Resources Corp. (a) | | | 102 | |
| | 888 | | | Apache Corp. | | | 42 | |
| | 12,204 | | | Cabot Oil & Gas Corp. | | | 290 | |
| | 5,394 | | | Cheniere Energy, Inc. (a) | | | 352 | |
| | 69,961 | | | Chevron Corp. | | | 8,844 | |
| | 514 | | | Cimarex Energy Co. | | | 52 | |
| | 10,038 | | | Concho Resources, Inc. (a) | | | 1,389 | |
| | 1,560 | | | Continental Resources, Inc. (a) | | | 101 | |
| | 949 | | | Diamondback Energy, Inc. | | | 125 | |
| | 15,515 | | | EOG Resources, Inc. | | | 1,931 | |
| | 80,494 | | | Exxon Mobil Corp. | | | 6,659 | |
| | 1,624 | | | Kosmos Energy Ltd. (a) | | | 13 | |
| | 3,164 | | | Newfield Exploration Co. (a) | | | 96 | |
| | 6,563 | | | ONEOK, Inc. | | | 458 | |
| | 6,633 | | | Parsley Energy, Inc., Class – A (a) | | | 201 | |
| | 3,497 | | | Pioneer Natural Resources Co. | | | 662 | |
| | 2,929 | | | RSP Permian, Inc. (a) | | | 129 | |
| | 3,042 | | | World Fuel Services Corp. | | | 62 | |
| | | | | | | | |
| | | | | | | 21,983 | |
| | | | | | | | |
| | | | Personal Products — 0.60% | |
| | 1,172 | | | Herbalife Ltd. (a) | | | 63 | |
| | 3,043 | | | Nu Skin Enterprises, Inc., Class – A | | | 238 | |
| | 47,825 | | | The Estee Lauder Companies, Inc., Class – A | | | 6,824 | |
| | | | | | | | |
| | | | | | | 7,125 | |
| | | | | | | | |
| | | | Pharmaceuticals — 2.67% | |
| | 71,248 | | | AstraZeneca PLC, ADR | | | 2,501 | |
| | 93,989 | | | Bristol-Myers Squibb Co. | | | 5,201 | |
| | 1,097 | | | Catalent, Inc. (a) | | | 46 | |
| | 61,108 | | | Eli Lilly & Co. | | | 5,214 | |
| | 2,022 | | | Jazz Pharmaceuticals PLC (a) | | | 348 | |
| | 78,509 | | | Johnson & Johnson | | | 9,527 | |
| | 116,677 | | | Merck & Co., Inc. | | | 7,082 | |
| | 5,849 | | | Nektar Therapeutics (a) | | | 286 | |
| | 18,204 | | | Zoetis, Inc. | | | 1,551 | |
| | | | | | | | |
| | | | | | | 31,756 | |
| | | | | | | | |
| | | | Professional Services — 0.37% | |
| | 1,331 | | | CoStar Group, Inc. (a) | | | 549 | |
| | 5,982 | | | Equifax, Inc. | | | 748 | |
| | 9,861 | | | IHS Markit Ltd. (a) | | | 509 | |
| | 10,087 | | | Robert Half International, Inc. | | | 657 | |
| | | | | | | | |
| Shares | | | Security Description | | Value
(000) | |
| | | | Professional Services (continued) | | | | |
| | 599 | | | The Dun & Bradstreet Corp. | | $ | 73 | |
| | 6,842 | | | Transunion Holding Company, Inc. | | | 490 | |
| | 12,578 | | | Versik Analytics, Inc., Class – A (a) | | | 1,355 | |
| | | | | | | | |
| | | | | | | 4,381 | |
| | | | | | | | |
| | | | Real Estate Management & Development — 0.03% | |
| | 5,647 | | | CBRE Group, Inc., Class – A (a) | | | 270 | |
| | 558 | | | Howard Hughes Corp. (a) | | | 74 | |
| | | | | | | | |
| | | | | | | 344 | |
| | | | | | | | |
| | | | Road & Rail — 1.15% | |
| | 54,243 | | | CSX Corp. | | | 3,460 | |
| | 446 | | | Genesee & Wyoming, Inc., Class – A (a) | | | 36 | |
| | 6,815 | | | Hunt (JB) Transportation Services, Inc. | | | 828 | |
| | 3,374 | | | Landstar System, Inc. | | | 368 | |
| | 2,470 | | | Old Dominion Freight Line, Inc. | | | 368 | |
| | 277 | | | Schneider National, Inc. | | | 8 | |
| | 60,965 | | | Union Pacific Corp. | | | 8,638 | |
| | | | | | | | |
| | | | | | | 13,706 | |
| | | | | | | | |
| | | | Semiconductors & Semiconductor Equipment — 4.01% | |
| | 33,715 | | | Advanced Micro Devices, Inc. (a) | | | 505 | |
| | 16,865 | | | Analog Devices, Inc. | | | 1,618 | |
| | 39,465 | | | Applied Materials, Inc. | | | 1,823 | |
| | 30,669 | | | Broadcom, Inc. | | | 7,442 | |
| | 2,527 | | | Cavium, Inc. (a) | | | 219 | |
| | 8,813 | | | Cypress Semiconductor Corp. | | | 137 | |
| | 186,733 | | | Intel Corp. | | | 9,282 | |
| | 5,811 | | | KLA-Tencor Corp. | | | 596 | |
| | 6,159 | | | Lam Research Corp. | | | 1,065 | |
| | 10,369 | | | Maxim Integrated Products, Inc. | | | 608 | |
| | 8,563 | | | Microchip Technology, Inc. | | | 779 | |
| | 34,053 | | | Micron Technology, Inc. (a) | | | 1,786 | |
| | 2,025 | | | MKS Instruments, Inc. | | | 194 | |
| | 1,523 | | | Monolithic Power Systems, Inc. | | | 204 | |
| | 50,826 | | | NVIDIA Corp. | | | 12,040 | |
| | 846 | | | NXP Semiconductors N.V. (a) | | | 92 | |
| | 15,714 | | | ON Semiconductor Corp. (a) | | | 349 | |
| | 59,764 | | | Qualcomm, Inc. | | | 3,354 | |
| | 4,981 | | | Skyworks Solutions, Inc. | | | 481 | |
| | 1,723 | | | Teradyne, Inc. | | | 66 | |
| | 36,827 | | | Texas Instruments, Inc. | | | 4,060 | |
| | 8,453 | | | Versum Materials, Inc. | | | 314 | |
| | 9,462 | | | Xilinx, Inc. | | | 617 | |
| | | | | | | | |
| | | | | | | 47,631 | |
| | | | | | | | |
| | | | Software — 9.89% | |
| | 80,780 | | | Activision Blizzard, Inc. | | | 6,165 | |
| | 52,786 | | | Adobe Systems, Inc. (a) | | | 12,870 | |
| | 6,620 | | | ANSYS, Inc. (a) | | | 1,153 | |
| | 2,531 | | | Aspen Technology, Inc. (a) | | | 235 | |
| | 3,421 | | | Atlassian Corp. PLC, Class – A (a) | | | 214 | |
| | 6,919 | | | Autodesk, Inc. (a) | | | 907 | |
| | 10,394 | | | Cadence Design Systems, Inc. (a) | | | 450 | |
| | 4,888 | | | CDK Global, Inc. | | | 318 | |
| | 837 | | | Ceridian HCM Holding, Inc. (a) | | | 28 | |
| | 11,437 | | | Citrix Systems, Inc. (a) | | | 1,199 | |
| | 715 | | | Dell Technologies, Inc., Class – V (a) | | | 60 | |
See accompanying notes to financial statements.
76
HC CAPITAL TRUST
The Institutional Growth Equity Portfolio
Portfolio of Investments (continued) — June 30, 2018
| | | | | | | | |
| Shares | | | Security Description | | Value
(000) | |
| | | | Common Stocks (continued) | |
| | | | Software (continued) | |
| | 11,313 | | | Electronic Arts, Inc. (a) | | $ | 1,595 | |
| | 1,100 | | | Fair Isaac Corp. (a) | | | 213 | |
| | 4,435 | | | FireEye, Inc. (a) | | | 68 | |
| | 5,173 | | | Fortinet, Inc. (a) | | | 323 | |
| | 2,997 | | | Guidewire Software, Inc. (a) | | | 266 | |
| | 19,948 | | | Intuit, Inc. | | | 4,075 | |
| | 2,355 | | | Manhattan Associates, Inc. (a) | | | 111 | |
| | 511,005 | | | Microsoft Corp. | | | 50,390 | |
| | 135,696 | | | Oracle Corp. | | | 5,979 | |
| | 1,858 | | | Paycom Software, Inc. (a) | | | 184 | |
| | 1,334 | | | Pegasystems, Inc. | | | 73 | |
| | 1,883 | | | Proofpoint, Inc. (a) | | | 217 | |
| | 4,258 | | | PTC, Inc. (a) | | | 399 | |
| | 2,629 | | | RealPage, Inc. (a) | | | 145 | |
| | 46,112 | | | Red Hat, Inc. (a) | | | 6,196 | |
| | 2,489 | | | RingCentral, Inc., Class – A (a) | | | 175 | |
| | 89,196 | | | Salesforce.com, Inc. (a) | | | 12,166 | |
| | 6,578 | | | ServiceNow, Inc. (a) | | | 1,135 | |
| | 35,183 | | | Splunk, Inc. (a) | | | 3,487 | |
| | 7,128 | | | SS&C Technologies Holdings, Inc. | | | 370 | |
| | 513 | | | Synopsys, Inc. (a) | | | 44 | |
| | 2,516 | | | Tableau Software, Inc., Class – A (a) | | | 246 | |
| | 2,656 | | | Take-Two Interactive Software, Inc. (a) | | | 314 | |
| | 1,109 | | | The Ultimate Software Group, Inc. (a) | | | 285 | |
| | 1,397 | | | Tyler Technologies, Inc. (a) | | | 310 | |
| | 5,817 | | | VMware, Inc., Class – A (a) | | | 855 | |
| | 34,891 | | | Workday, Inc., Class – A (a) | | | 4,226 | |
| | 3,846 | | | Zendesk, Inc. (a) | | | 210 | |
| | | | | | | | |
| | | | | | | 117,656 | |
| | | | | | | | |
| | | | Specialty Retail — 2.76% | |
| | 2,702 | | | Aaron’s, Inc. | | | 117 | |
| | 3,752 | | | Advance Auto Parts, Inc. | | | 509 | |
| | 2,055 | | | AutoZone, Inc. (a) | | | 1,379 | |
| | 7,113 | | | Bed Bath & Beyond, Inc. | | | 142 | |
| | 14,263 | | | Best Buy Co., Inc. | | | 1,064 | |
| | 2,500 | | | Burlington Stores, Inc. (a) | | | 376 | |
| | 4,267 | | | CarMax, Inc. (a) | | | 311 | |
| | 3,817 | | | Dick’s Sporting Goods, Inc. | | | 135 | |
| | 1,492 | | | Floor & Decor Holdings, Inc., Class – A (a) | | | 74 | |
| | 4,371 | | | GameStop Corp., Class – A | | | 64 | |
| | 10,330 | | | Gap, Inc. | | | 335 | |
| | 1,614 | | | L Brands, Inc. | | | 60 | |
| | 31,053 | | | Lowe’s Companies, Inc. | | | 2,968 | |
| | 888 | | | Michaels Companies, Inc. The (a) | | | 17 | |
| | 6,876 | | | O’Reilly Automotive, Inc. (a) | | | 1,881 | |
| | 30,027 | | | Ross Stores, Inc. | | | 2,545 | |
| | 70,118 | | | The Home Depot, Inc. | | | 13,678 | |
| | 50,120 | | | The TJX Cos., Inc. | | | 4,769 | |
| | 5,208 | | | Tiffany & Co. | | | 685 | |
| | 4,538 | | | Tractor Supply Co. | | | 347 | |
| | 4,633 | | | Ulta Salon, Cosmetics & Fragrance, Inc. (a) | | | 1,082 | |
| | 6,274 | | | Urban Outfitters, Inc. (a) | | | 280 | |
| | 701 | | | Williams-Sonoma, Inc. | | | 43 | |
| | | | | | | | |
| | | | | | | 32,861 | |
| | | | | | | | |
| | | | | | | | |
| Shares | | | Security Description | | Value
(000) | |
| | | | Technology Hardware, Storage & Peripherals — 4.98% | |
| | 313,886 | | | Apple, Inc. | | $ | 58,103 | |
| | 3,683 | | | NCR Corp. (a) | | | 110 | |
| | 10,077 | | | NetApp, Inc. | | | 791 | |
| | 6,157 | | | Pure Storage, Inc., Class – A (a) | | | 147 | |
| | | | | | | | |
| | | | | | | 59,151 | |
| | | | | | | | |
| | | | Textiles, Apparel & Luxury Goods — 1.92% | |
| | 3,890 | | | Carter’s, Inc. | | | 422 | |
| | 135 | | | Columbia Sportswear Co. | | | 12 | |
| | 1,794 | | | Fossil Group, Inc. (a) | | | 48 | |
| | 13,362 | | | Hanesbrands, Inc. | | | 294 | |
| | 91,433 | | | Kering, ADR^ | | | 5,129 | |
| | 8,024 | | | Lululemon Athletica, Inc. (a) | | | 1,002 | |
| | 10,072 | | | Michael Kors Holdings Ltd. (a) | | | 671 | |
| | 148,976 | | | NIKE, Inc., Class – B | | | 11,871 | |
| | 2,511 | | | Ralph Lauren Corp. | | | 316 | |
| | 2,320 | | | Skechers USA, Inc., Class – A (a) | | | 70 | |
| | 12,895 | | | Tapestry, Inc. | | | 602 | |
| | 12,692 | | | Under Armour, Inc., Class – A (a) | | | 285 | |
| | 12,872 | | | Under Armour, Inc., Class – C (a) | | | 271 | |
| | 22,710 | | | V.F. Corp. | | | 1,851 | |
| | | | | | | | |
| | | | | | | 22,844 | |
| | | | | | | | |
| | | | Tobacco — 0.82% | |
| | 71,181 | | | Altria Group, Inc. | | | 4,042 | |
| | 16,884 | | | British American Tobacco PLC, ADR | | | 852 | |
| | 60,164 | | | Philip Morris International, Inc. | | | 4,858 | |
| | | | | | | | |
| | | | | | | 9,752 | |
| | | | | | | | |
| | | | Trading Companies & Distributors — 0.29% | |
| | 239 | | | Air Lease Corp. | | | 10 | |
| | 22,186 | | | Fastenal Co. | | | 1,069 | |
| | 2,576 | | | HD Supply Holdings, Inc. (a) | | | 110 | |
| | 2,683 | | | MSC Industrial Direct Co., Inc., Class – A | | | 228 | |
| | 4,525 | | | NOW, Inc. (a) | | | 60 | |
| | 3,110 | | | United Rentals, Inc. (a) | | | 459 | |
| | 1,003 | | | Univar, Inc. (a) | | | 26 | |
| | 4,126 | | | W.W. Grainger, Inc. | | | 1,273 | |
| | 967 | | | Watsco, Inc. | | | 172 | |
| | | | | | | | |
| | | | | | | 3,407 | |
| | | | | | | | |
| | | | Wireless Telecommunication Services — 0.04% | |
| | 7,448 | | | T-Mobile USA, Inc. (a) | | | 445 | |
| | | | | | | | |
| | | | Total Common Stocks | | | 1,113,277 | |
| | | | | | | | |
Principal
Amount
(000) | | | | | | |
| | | | | | | | |
| | | | U.S. Treasury Obligation — 0.01% | |
| $ | 175 | | | U.S. Treasury Bill, 1.83%, 9/6/18 (b)(c) | | | 174 | |
| | | | | | | | |
| | | | Total U.S. Treasury Obligation | | | 174 | |
| | | | | | | | |
| | | | Time Deposit — 0.51% | |
| | 6,045 | | | State Street Liquidity Management Control System Eurodollar Time Deposit,
0.53%, 7/2/18 | | | 6,045 | |
| | | | | | | | |
| | | | Total Time Deposit | | | 6,045 | |
| | | | | | | | |
See accompanying notes to financial statements.
77
HC CAPITAL TRUST
The Institutional Growth Equity Portfolio
Portfolio of Investments (continued) — June 30, 2018
| | | | | | | | |
| Shares | | | Security Description | | Value
(000) | |
| | | | Mutual Funds — 5.60% | |
| | 591,145 | | | Federated Treasury Obligations Fund, Institutional Shares, 1.75%^^ (d) | | $ | 591 | |
| | 65,983,344 | | | State Street Institutional Treasury Plus Money Market Fund, Trust Class,
1.72% (d) | | | 65,983 | |
| | | | | | | | |
| | | | Total Mutual Funds | | | 66,574 | |
| | | | | | | | |
Principal
Amount
(000) | | | | | | |
| | | | Repurchase Agreement — 0.08% | |
| $ | 993 | | | Jefferies LLC, 2.00%, 7/2/18
(Purchased on 6/29/18, proceeds at maturity $992,845 collateralized by U.S. Treasury Obligations, 2.50% – 2.92%, 2/15/20 – 2/15/44 fair value $1,012,534)^^ | | | 993 | |
| | | | | | | | |
| | | | Total Repurchase Agreement | | | 993 | |
| | | | | | | | |
| | | | Total Investments
(cost $753,187) — 99.86% | | | 1,187,063 | |
| | | | Other assets in excess of
liabilities — 0.14% | | | 1,678 | |
| | | | | | | | |
| | | | Net Assets — 100.00% | | $ | 1,188,741 | |
| | | | | | | | |
| ^ | All or part of this security was on loan as of June 30, 2018. The total value of securities on loan as of June 30, 2018, was $6,042 (amount in thousands). |
| ^^ | Purchased with cash collateral held from securities lending. The value of the collateral could include collateral held for securities that were sold on or before June 30, 2018. |
| (a) | Represents non-income producing security. |
| (b) | Rate disclosed represents effective yield at purchase. |
| (c) | All or part of this security has been pledged as collateral for derivative instruments held by the Portfolio. |
| (d) | The rate disclosed is the rate in effect on June 30, 2018. |
ADR — American Depositary Receipt
The following table reflects the percentage of total net assets of the Portfolio attributable to each Specialist Manager as of June 30, 2018.
| | | | | | | | | | | | | | | | | | | | |
The Institutional Growth Equity Portfolio | | Jennison
Associates, LLC | | | BNY Mellon Asset
Management North
America Corporation* | | | Parametric
Portfolio
Associates, LLC | | | HC Capital
Solutions | | | Total | |
Common Stocks | | | 23.81 | % | | | 69.85 | % | | | — | | | | — | | | | 93.66 | % |
U.S. Treasury Obligation | | | 0.00 | % | | | 0.01 | % | | | — | | | | — | | | | 0.01 | % |
Time Deposit | | | 0.51 | % | | | — | | | | 0.00 | % | | | — | | | | 0.51 | % |
Mutual Funds | | | 0.05 | % | | | 0.55 | % | | | 2.56 | % | | | 2.44 | % | | | 5.60 | % |
Repurchase Agreement | | | 0.08 | % | | | — | | | | — | | | | — | | | | 0.08 | % |
Other Assets (Liabilities) | | | 0.06 | % | | | -0.20 | % | | | 0.28 | % | | | — | | | | 0.14 | % |
| | | | | | | | | | | | | | | | | | | | |
Total Net Assets | | | 24.51 | % | | | 70.21 | % | | | 2.84 | % | | | 2.44 | % | | | 100.00 | % |
| | | | | | | | | | | | | | | | | | | | |
| * | Formerly Mellon Capital Management Corporation. |
Amounts designated as “—” indicate the Specialist Manager did not manage any holdings in that category.
See accompanying notes to financial statements.
78
HC CAPITAL TRUST
The Institutional Growth Equity Portfolio
Portfolio of Investments (concluded) — June 30, 2018
The following table reflects the open derivative positions held by the Portfolio as of June 30, 2018.
Futures Contracts Purchased^
| | | | | | | | | | | | | | |
Description | | Number of
Contracts | | Expiration
Date | | | Notional
Amount
(000) | | | Value and
Unrealized
Appreciation/
(Depreciation)
(000) | |
E-Mini NASDAQ 100 Future | | 21 | | | 9/21/18 | | | $ | 2,968 | | | $ | (50 | ) |
E-Mini S&P 500 Future | | 348 | | | 9/21/18 | | | | 47,356 | | | | (842 | ) |
E-Mini S&P Midcap 400 Future | | 3 | | | 9/21/18 | | | | 587 | | | | (15 | ) |
| | | | | | | | | | | | | | |
| | | | | $ | 50,911 | | | $ | (907 | ) |
| | | | | | | | | | | | | | |
| | |
| | Total Unrealized Appreciation | | | $ | — | |
| | Total Unrealized Depreciation | | | | (907 | ) |
| | | | | | | | | | | | | | |
| | Total Net Unrealized Appreciation/(Depreciation) | | | $ | (907 | ) |
| | | | | | | | | | | | | | |
| ^ | Cash and treasuries have been pledged as collateral for futures contracts held by the Portfolio. |
Amounts designated as “—” are $0 or have been rounded to $0.
See accompanying notes to financial statements.
79
HC CAPITAL TRUST
The Small Capitalization-Mid Capitalization Equity Portfolio
Portfolio of Investments — June 30, 2018
| | | | | | | | |
| Shares | | | Security Description | | Value
(000) | |
| | | | Common Stocks — 88.38% | |
| | | | Aerospace & Defense — 0.78% | |
| | 1,494 | | | Astronics Corp. (a) | | $ | 54 | |
| | 11,400 | | | CPI Aerostructures, Inc. (a) | | | 120 | |
| | 1,811 | | | Cubic Corp. | | | 116 | |
| | 1,610 | | | Curtiss-Wright Corp. | | | 191 | |
| | 118 | | | Ducommun, Inc. (a) | | | 4 | |
| | 6,266 | | | Kratos Defense & Security Solutions, Inc. (a) | | | 72 | |
| | 26 | | | National Presto Industries, Inc. | | | 3 | |
| | 850 | | | Teledyne Technologies, Inc. (a) | | | 169 | |
| | 1,584 | | | Vectrus, Inc. (a) | | | 49 | |
| | 7,353 | | | Wesco Aircraft Holdings, Inc. (a) | | | 83 | |
| | | | | | | | |
| | | | | | | 861 | |
| | | | | | | | |
| | | | Air Freight & Logistics — 0.01% | |
| | 3,812 | | | Radiant Logistics, Inc. (a) | | | 15 | |
| | | | | | | | |
| | | | Airlines — 1.77% | |
| | 4,655 | | | American Airlines Group, Inc. | | | 177 | |
| | 37 | | | Copa Holdings SA, Class – A | | | 3 | |
| | 2,144 | | | Hawaiian Holdings, Inc. | | | 77 | |
| | 13,447 | | | JetBlue Airways Corp. (a) | | | 255 | |
| | 20,840 | | | United Continental Holdings, Inc. (a) | | | 1,453 | |
| | | | | | | | |
| | | | | | | 1,965 | |
| | | | | | | | |
| | | | Auto Components — 0.65% | |
| | 4,621 | | | American Axle & Manufacturing
Holdings, Inc. (a) | | | 72 | |
| | 903 | | | Cooper-Standard Holding, Inc. (a) | | | 118 | |
| | 5,318 | | | Dana Holding Corp. | | | 107 | |
| | 7,282 | | | Horizon Global Corp. (a) | | | 43 | |
| | 7,335 | | | Modine Manufacturing Co. (a) | | | 134 | |
| | 2,951 | | | Shiloh Industries, Inc. (a) | | | 26 | |
| | 7,000 | | | Strattec Security Corp. | | | 214 | |
| | 90 | | | Tower International, Inc. | | | 3 | |
| | | | | | | | |
| | | | | | | 717 | |
| | | | | | | | |
| | | | Automobiles — 0.03% | |
| | 933 | | | Winnebago Industries, Inc. | | | 38 | |
| | | | | | | | |
| | | | Banks — 5.51% | |
| | 52 | | | 1st Source, Inc. | | | 3 | |
| | 66 | | | American National Bankshares, Inc. | | | 3 | |
| | 11,900 | | | Associated Banc-Corp. | | | 325 | |
| | 62 | | | Banco Latinoamericano de Comercio Exterior SA, Class – E | | | 2 | |
| | 4,690 | | | Banner Corp. | | | 282 | |
| | 38 | | | C&F Financial Corp. | | | 2 | |
| | 9,057 | | | Centerstate Bank Corp. | | | 270 | |
| | 2,524 | | | Chemical Financial Corp. | | | 141 | |
| | 56 | | | Chemung Financial Corp. | | | 3 | |
| | 92 | | | CNB Financial Corp. | | | 3 | |
| | 11,887 | | | Columbia Banking System, Inc. | | | 486 | |
| | 48 | | | Community Trust Bancorp, Inc. | | | 2 | |
| | 3,445 | | | Cullen/Frost Bankers, Inc. | | | 373 | |
| | 5,382 | | | CVB Financial Corp. | | | 121 | |
| | 104 | | | Fidelity Southern Corp. | | | 3 | |
| | 65 | | | Financial Institutions, Inc. | | | 2 | |
| | 27,295 | | | First BanCorp (a) | | | 209 | |
| | 95 | | | First Bancorp | | | 4 | |
| | | | | | | | |
| Shares | | | Security Description | | Value
(000) | |
| | | | Banks (continued) | |
| | 73 | | | First Business Financial Services, Inc. | | $ | 2 | |
| | 7 | | | First Citizens BancShares, Inc., Class – A | | | 3 | |
| | 77 | | | First Community Bancshares, Inc. | | | 2 | |
| | 106 | | | First Financial BanCorp | | | 3 | |
| | 46 | | | First Financial Corp. | | | 2 | |
| | 9,144 | | | First Horizon National Corp. | | | 163 | |
| | 61 | | | First Interstate BancSystem, Inc., Class – A | | | 3 | |
| | 5,875 | | | First Midwest Bancorp, Inc. | | | 150 | |
| | 46 | | | Great Southern Bancorp, Inc. | | | 3 | |
| | 63 | | | Hancock Holding Co. | | | 3 | |
| | 48 | | | Heartland Financial USA, Inc. | | | 3 | |
| | 15,411 | | | Hope Bancorp, Inc. | | | 275 | |
| | 148 | | | Horizon Bancorp, Inc. | | | 3 | |
| | 144 | | | Huntington Bancshares, Inc. | | | 2 | |
| | 1,190 | | | Iberiabank Corp. | | | 90 | |
| | 116 | | | Independent Bank Corp. | | | 3 | |
| | 63 | | | International Bancshares Corp. | | | 3 | |
| | 6,730 | | | Investors Bancorp, Inc. | | | 86 | |
| | 114 | | | KeyCorp | | | 2 | |
| | 148 | | | Lakeland Bancorp, Inc. | | | 3 | |
| | 2,800 | | | MB Financial, Inc. | | | 131 | |
| | 50 | | | National Bankshares, Inc. | | | 2 | |
| | 61 | | | Northrim BanCorp, Inc. | | | 2 | |
| | 133 | | | Old National Bancorp | | | 2 | |
| | 7,195 | | | PacWest Bancorp | | | 356 | |
| | 79 | | | Peoples Bancorp, Inc. | | | 3 | |
| | 7,366 | | | Popular, Inc. | | | 333 | |
| | 141 | | | Premier Financial Bancorp, Inc. | | | 3 | |
| | 14,170 | | | Seacoast Banking Corporation of Florida (a) | | | 447 | |
| | 102 | | | Sierra Bancorp | | | 3 | |
| | 2,599 | | | Signature Bank (a) | | | 332 | |
| | 3,340 | | | Synovus Financial Corp. | | | 176 | |
| | 6,923 | | | TCF Financial Corp. | | | 170 | |
| | 8,889 | | | TriCo Bancshares | | | 333 | |
| | 101 | | | Triumph Bancorp, Inc. (a) | | | 4 | |
| | 67 | | | Trustmark Corp. | | | 2 | |
| | 109 | | | Umpqua Holdings Corp. | | | 2 | |
| | 11,670 | | | Webster Financial Corp. | | | 743 | |
| | | | | | | | |
| | | | | | | 6,082 | |
| | | | | | | | |
| | | | Biotechnology — 3.27% | |
| | 3,334 | | | Abeona Therapeutics, Inc. (a) | | | 53 | |
| | 2,297 | | | Acceleron Pharma, Inc. (a) | | | 111 | |
| | 9,390 | | | Achaogen, Inc. (a) | | | 81 | |
| | 24,419 | | | Advaxis, Inc. | | | 35 | |
| | 264 | | | Alkermes PLC (a) | | | 10 | |
| | 41 | | | Aptevo Therapeutics, Inc. (a) | | | — | |
| | 1,298 | | | Bluebird Bio, Inc. (a) | | | 204 | |
| | 9,769 | | | Conatus Pharmaceuticals, Inc. | | | 42 | |
| | 116 | | | Emergent BioSolutions, Inc. (a) | | | 6 | |
| | 1,550 | | | Enanta Pharmaceuticals, Inc. (a) | | | 180 | |
| | 5,630 | | | Exact Sciences Corp. (a) | | | 337 | |
| | 5,978 | | | ImmunoGen, Inc. (a) | | | 58 | |
| | 580 | | | Ionis Pharmaceuticals, Inc. (a) | | | 24 | |
| | 36,800 | | | Kindred Biosciences, Inc. (a) | | | 391 | |
| | 916 | | | Ligand Pharmaceuticals, Inc., Class – B (a) | | | 190 | |
See accompanying notes to financial statements.
80
HC CAPITAL TRUST
The Small Capitalization-Mid Capitalization Equity Portfolio
Portfolio of Investments (continued) — June 30, 2018
| | | | | | | | |
| Shares | | | Security Description | | Value
(000) | |
| | | | Common Stocks (continued) | |
| | | | Biotechnology (continued) | |
| | 754 | | | Loxo Oncology, Inc. (a) | | $ | 131 | |
| | 519 | | | Madrigal Pharmaceuticals, Inc. (a) | | | 145 | |
| | 4,860 | | | Merrimack Pharmaceuticals, Inc. | | | 24 | |
| | 4,247 | | | Miragen Therapeutics, Inc. (a) | | | 27 | |
| | 9,279 | | | Myriad Genetics, Inc. (a) | | | 347 | |
| | 7,494 | | | Natera, Inc. (a) | | | 141 | |
| | 1,780 | | | Neurocrine Biosciences, Inc. (a) | | | 175 | |
| | 3,169 | | | Protagonist Therapeutics, Inc. | | | 21 | |
| | 5,180 | | | Repligen Corp. (a) | | | 244 | |
| | 560 | | | Sage Therapeutics, Inc. (a) | | | 88 | |
| | 9,974 | | | Sangamo BioSciences, Inc. (a) | | | 142 | |
| | 1,685 | | | Seattle Genetics, Inc. (a) | | | 112 | |
| | 890 | | | Spark Therapeutics, Inc. (a) | | | 74 | |
| | 3,920 | | | Tesaro, Inc. (a) | | | 174 | |
| | 23,278 | | | Trevena, Inc. (a) | | | 34 | |
| | | | | | | | |
| | | | | | | 3,601 | |
| | | | | | | | |
| | | | Building Products — 1.41% | |
| | 704 | | | American Woodmark Corp. (a) | | | 64 | |
| | 8,060 | | | Gibraltar Industries, Inc. (a) | | | 302 | |
| | 10,485 | | | Jeld-Wen Holding, Inc. (a) | | | 300 | |
| | 4,476 | | | Masonite International Corp. (a) | | | 322 | |
| | 6,668 | | | Trex Company, Inc. (a) | | | 418 | |
| | 4,158 | | | Universal Forest Products, Inc. | | | 152 | |
| | | | | | | | |
| | | | | | | 1,558 | |
| | | | | | | | |
| | | | Capital Markets — 2.63% | |
| | 4,895 | | | Arlington Asset Investment Corp. | | | 50 | |
| | 5,530 | | | Artisan Partners Asset Management, Inc.,
Class – A | | | 167 | |
| | 17,500 | | | Capital Southwest Corp. | | | 317 | |
| | 29,775 | | | Cowen Group, Inc., Class – A (a) | | | 411 | |
| | 2,250 | | | E*Trade Financial Corp. (a) | | | 138 | |
| | 2,141 | | | Evercore Partners, Inc., Class – A | | | 226 | |
| | 246 | | | Gain Capital Holdings, Inc. | | | 2 | |
| | 7,796 | | | Greenhill & Co., Inc. | | | 221 | |
| | 75 | | | Houlihan Lokey, Inc. | | | 4 | |
| | 10,185 | | | Jefferies Financial Group, Inc. | | | 232 | |
| | 4,715 | | | LPL Financial Holdings, Inc. | | | 309 | |
| | 3,327 | | | Pzena Investment Management, Inc. | | | 31 | |
| | 2,744 | | | Raymond James Financial, Inc. | | | 245 | |
| | 25,500 | | | Safeguard Scientifics, Inc. (a) | | �� | 326 | |
| | 4,394 | | | Stifel Financial Corp. | | | 230 | |
| | | | | | | | |
| | | | | | | 2,909 | |
| | | | | | | | |
| | | | Chemicals — 2.11% | |
| | 97 | | | A. Schulman, Inc. | | | 4 | |
| | 2,573 | | | Albemarle Corp. | | | 243 | |
| | 48 | | | Cabot Corp. | | | 3 | |
| | 5,744 | | | FMC Corp. | | | 513 | |
| | 158 | | | Huntsman Corp. | | | 5 | |
| | 1,859 | | | Innophos Holdings, Inc. | | | 88 | |
| | 12,409 | | | Kraton Performance Polymers, Inc. (a) | | | 574 | |
| | 4,552 | | | LSB Industries, Inc. (a) | | | 24 | |
| | 669 | | | NewMarket Corp. | | | 271 | |
| | 19,412 | | | Platform Specialty Products Corp. (a) | | | 225 | |
| | 57 | | | Stepan Co. | | | 4 | |
| | | | | | | | |
| Shares | | | Security Description | | Value
(000) | |
| | | | Chemicals (continued) | | | | |
| | 47 | | | Trinseo SA | | $ | 3 | |
| | 17,503 | | | Tronox Ltd., Class – A | | | 344 | |
| | 6,588 | | | Valhi, Inc. | | | 31 | |
| | 59 | | | Westlake Chemical Corp. | | | 6 | |
| | | | | | | | |
| | | | | | | 2,338 | |
| | | | | | | | |
| | | | Commercial Services & Supplies — 2.05% | |
| | 5,628 | | | ACCO Brands Corp. | | | 78 | |
| | 16,923 | | | Aqua Metals, Inc. (a) | | | 49 | |
| | 16,053 | | | ARC Document Solutions, Inc. (a) | | | 28 | |
| | 7,424 | | | CECO Environmental Corp. | | | 46 | |
| | 14,773 | | | Covanta Holding Corp. | | | 244 | |
| | 93 | | | Ennis, Inc. | | | 2 | |
| | 22,252 | | | Essendant, Inc. | | | 294 | |
| | 12,353 | | | Hudson Technologies, Inc. Com (a) | | | 25 | |
| | 7,288 | | | Interface, Inc. | | | 167 | |
| | 3,406 | | | LSC Communications, Inc. | | | 53 | |
| | 4,970 | | | McGrath RentCorp | | | 314 | |
| | 6,434 | | | Mobile Mini, Inc. | | | 302 | |
| | 2,173 | | | Multi-Color Corp. | | | 140 | |
| | 2,818 | | | NL Industries, Inc. (a) | | | 25 | |
| | 2,497 | | | Quad Graphics, Inc. | | | 52 | |
| | 17,847 | | | Steelcase, Inc., Class – A | | | 241 | |
| | 9,018 | | | Team, Inc. (a) | | | 208 | |
| | 15 | | | UniFirst Corp. | | | 3 | |
| | 48 | | | VSE Corp. | | | 2 | |
| | | | | | | | |
| | | | | | | 2,273 | |
| | | | | | | | |
| | | | Communications Equipment — 1.23% | |
| | 7,822 | | | Acacia Communications, Inc. (a) | | | 271 | |
| | 13,195 | | | Aerohive Networks, Inc. (a) | | | 52 | |
| | 361 | | | Applied Optoelectronics, Inc. (a) | | | 16 | |
| | 5,470 | | | Ciena Corp. (a) | | | 145 | |
| | 129 | | | Comtech Telecommunications Corp. | | | 4 | |
| | 48,614 | | | EMCORE Corp. (a) | | | 246 | |
| | 2,864 | | | Extreme Networks, Inc. (a) | | | 23 | |
| | 16,266 | | | Infinera Corp. (a) | | | 162 | |
| | 2,397 | | | Lumentum Holdings, Inc. (a) | | | 139 | |
| | 8,657 | | | Oclaro, Inc. (a) | | | 77 | |
| | 35,500 | | | PC-Telephone, Inc. | | | 222 | |
| | | | | | | | |
| | | | | | | 1,357 | |
| | | | | | | | |
| | | | Construction & Engineering — 1.51% | |
| | 1,546 | | | Ameresco, Inc., Class – A (a) | | | 19 | |
| | 3,756 | | | Granite Construction, Inc. | | | 209 | |
| | 21,062 | | | KBR, Inc. | | | 377 | |
| | 15,518 | | | MasTec, Inc. (a) | | | 787 | |
| | 107 | | | MYR Group, Inc. (a) | | | 4 | |
| | 3,741 | | | Orion Group Holdings, Inc. (a) | | | 31 | |
| | 9,171 | | | Tutor Perini Corp. (a) | | | 169 | |
| | 5,047 | | | Willscot Corp. (a) | | | 75 | |
| | | | | | | | |
| | | | | | | 1,671 | |
| | | | | | | | |
| | | | Construction Materials — 0.76% | |
| | 3,291 | | | Eagle Materials, Inc., Class – A | | | 346 | |
| | 26,412 | | | Forterra, Inc. (a) | | | 257 | |
| | 1,089 | | | Martin Marietta Materials, Inc. | | | 243 | |
| | | | | | | | |
| | | | | | | 846 | |
| | | | | | | | |
See accompanying notes to financial statements.
81
HC CAPITAL TRUST
The Small Capitalization-Mid Capitalization Equity Portfolio
Portfolio of Investments (continued) — June 30, 2018
| | | | | | | | |
| Shares | | | Security Description | | Value
(000) | |
| | | | Common Stocks (continued) | |
| | | | Consumer Finance — 0.48% | |
| | 68 | | | Encore Capital Group, Inc. (a) | | $ | 2 | |
| | 2,188 | | | Enova International, Inc. (a) | | | 80 | |
| | 1,630 | | | EZCORP, Inc., Class – A (a) | | | 20 | |
| | 2,227 | | | Green Dot Corp., Class – A (a) | | | 163 | |
| | 23,416 | | | LendingClub Corp. (a) | | | 89 | |
| | 43 | | | Nelnet, Inc., Class – A | | | 3 | |
| | 4,470 | | | PRA Group, Inc. (a) | | | 172 | |
| | 147 | | | Santander Consumer USA Holdings, Inc. | | | 3 | |
| | | | | | | | |
| | | | | | | 532 | |
| | | | | | | | |
| | | | Containers & Packaging — 0.89% | |
| | 3,071 | | | AptarGroup, Inc. | | | 287 | |
| | 10,625 | | | Berry Plastics Group, Inc. (a) | | | 488 | |
| | 14,703 | | | Graphic Packaging Holding Co. | | | 213 | |
| | | | | | | | |
| | | | | | | 988 | |
| | | | | | | | |
| | | | Distributors — 0.11% | |
| | 830 | | | Pool Corp. | | | 126 | |
| | | | | | | | |
| | | | Diversified Consumer Services — 1.85% | |
| | 99 | | | Adtalem Global Education, Inc. (a) | | | 5 | |
| | 67 | | | American Public Education, Inc. (a) | | | 3 | |
| | 1,850 | | | Bright Horizons Family Solutions, Inc. (a) | | | 190 | |
| | 39 | | | Capella Education Co. | | | 4 | |
| | 24,072 | | | Career Education Corp. (a) | | | 388 | |
| | 20,388 | | | Chegg, Inc. (a) | | | 566 | |
| | 2,890 | | | Grand Canyon Education, Inc. (a) | | | 323 | |
| | 3,032 | | | Strayer Education, Inc. | | | 343 | |
| | 2,172 | | | Weight Watchers International, Inc. (a) | | | 220 | |
| | | | | | | | |
| | | | | | | 2,042 | |
| | | | | | | | |
| | | | Diversified Financial Services — 0.00% | |
| | 99 | | | Marlin Business Services Corp. | | | 3 | |
| | | | | | | | |
| | | | Diversified Telecommunication Services — 1.06% | |
| | 11,932 | | | Cogent Communications Group, Inc. | | | 637 | |
| | 6,195 | | | IDT Corp. | | | 35 | |
| | 5,781 | | | Intelsat SA (a) | | | 97 | |
| | 136 | | | Iridium Communications, Inc. (a) | | | 2 | |
| | 39,800 | | | ORBCOMM, Inc. (a) | | | 402 | |
| | | | | | | | |
| | | | | | | 1,173 | |
| | | | | | | | |
| | | | Electric Utilities — 0.14% | |
| | 1,522 | | | El Paso Electric Co. | | | 91 | |
| | 3,048 | | | Genie Energy, Ltd. | | | 15 | |
| | 98 | | | Hawaiian Electric Industries, Inc. | | | 3 | |
| | 158 | | | PNM Resources, Inc. | | | 6 | |
| | 73 | | | Portland General Electric Co. | | | 3 | |
| | 4,328 | | | Spark Energy, Inc., Class – A | | | 42 | |
| | | | | | | | |
| | | | | | | 160 | |
| | | | | | | | |
| | | | Electrical Equipment — 0.52% | |
| | 24,925 | | | Babcock & Wilcox Enterprises, Inc. (a) | | | 59 | |
| | 3,066 | | | Encore Wire Corp. | | | 145 | |
| | 2,774 | | | EnerSys | | | 208 | |
| | 42,800 | | | Orion Energy Systems, Inc. | | | 47 | |
| | 7,843 | | | Revolution Lighting Technologies, Inc. | | | 32 | |
| | 6,717 | | | Sunrun, Inc. (a) | | | 88 | |
| | | | | | | | |
| | | | | | | 579 | |
| | | | | | | | |
| | | | | | | | |
| Shares | | | Security Description | | Value
(000) | |
| | | | Electronic Equipment, Instruments &
Components — 4.83% | |
| | 4,861 | | | Anixter International, Inc. (a) | | $ | 308 | |
| | 6,176 | | | Belden, Inc. | | | 377 | |
| | 75 | | | Benchmark Electronics, Inc. | | | 2 | |
| | 14,618 | | | Celestica, Inc. (a) | | | 174 | |
| | 1,242 | | | Control4 Corp. (a) | | | 30 | |
| | 34 | | | Dolby Laboratories, Inc., Class – A | | | 2 | |
| | 47 | | | ePlus, Inc. (a) | | | 4 | |
| | 3,155 | | | Fabrinet (a) | | | 117 | |
| | 22,022 | | | Flextronics International Ltd. (a) | | | 311 | |
| | 4,315 | | | II-VI, Inc. (a) | | | 187 | |
| | 4,568 | | | Insight Enterprises, Inc. (a) | | | 224 | |
| | 565 | | | IPG Photonics Corp. (a) | | | 125 | |
| | 5,724 | | | Itron, Inc. (a) | | | 344 | |
| | 12,813 | | | Jabil Circuit, Inc. | | | 354 | |
| | 3,712 | | | KEMET Corp. (a) | | | 90 | |
| | 131 | | | Kimball Electronics, Inc. (a) | | | 2 | |
| | 3,074 | | | Littelfuse, Inc. | | | 702 | |
| | 5,248 | | | Methode Electronics, Inc. | | | 211 | |
| | 4,881 | | | nLight, Inc. (a) | | | 161 | |
| | 3,012 | | | Novanta, Inc. (a) | | | 188 | |
| | 64 | | | PC Connection, Inc. | | | 2 | |
| | 3,113 | | | PCM, Inc. (a) | | | 47 | |
| | 9,200 | | | Perceptron, Inc. (a) | | | 97 | |
| | 37 | | | Plexus Corp. (a) | | | 2 | |
| | 4,105 | | | Rogers Corp. (a) | | | 458 | |
| | 59 | | | Sanmina Corp. (a) | | | 2 | |
| | 6,659 | | | ScanSource, Inc. (a) | | | 268 | |
| | 25 | | | SYNNEX Corp. | | | 2 | |
| | 22 | | | Tech Data Corp. (a) | | | 2 | |
| | 327 | | | TTM Technologies, Inc. (a) | | | 6 | |
| | 3,236 | | | Universal Display Corp.^ | | | 278 | |
| | 11,298 | | | VeriFone Systems, Inc. (a) | | | 258 | |
| | 135 | | | Vishay Intertechnology, Inc. | | | 3 | |
| | | | | | | | |
| | | | | | | 5,338 | |
| | | | | | | | |
| | | | Energy Equipment & Services — 1.23% | |
| | 22,800 | | | Aspen Aerogels, Inc. (a) | | | 112 | |
| | 20,179 | | | Bristow Group, Inc. (a) | | | 285 | |
| | 6,177 | | | CARBO Ceramics, Inc. (a) | | | 57 | |
| | 2,279 | | | Covia Holdings Corp. (a) | | | 42 | |
| | 1,912 | | | Dril-Quip, Inc. (a) | | | 98 | |
| | 4,143 | | | Ensco PLC, Class – A, ADR | | | 30 | |
| | 97 | | | Exterran Corp. (a) | | | 2 | |
| | 13,586 | | | Gulf Island Fabrication, Inc. | | | 122 | |
| | 15,100 | | | Mitcham Industries, Inc. (a) | | | 61 | |
| | 6,691 | | | Noble Corp. PLC (a) | | | 42 | |
| | 355 | | | Smart Sand, Inc. (a) | | | 2 | |
| | 4,777 | | | Superior Energy Services, Inc. (a) | | | 47 | |
| | 3,092 | | | TechnipFMC PLC | | | 99 | |
| | 3,011 | | | Transocean Ltd. (a) | | | 40 | |
| | 12,500 | | | US Silica Holdings, Inc. | | | 321 | |
| | | | | | | | |
| | | | | | | 1,360 | |
| | | | | | | | |
| | | | Equity Real Estate Investment Trusts — 1.64% | |
| | 718 | | | Ashford Hospitality Trust | | | 6 | |
| | 6,079 | | | Bluerock Residential Growth REIT, Inc. | | | 54 | |
See accompanying notes to financial statements.
82
HC CAPITAL TRUST
The Small Capitalization-Mid Capitalization Equity Portfolio
Portfolio of Investments (continued) — June 30, 2018
| | | | | | | | |
| Shares | | | Security Description | | Value
(000) | |
| | | | Common Stocks (continued) | |
| | | | Equity Real Estate Investment Trusts (continued) | |
| | 16,280 | | | Catchmark Timber Trust, Inc. | | $ | 207 | |
| | 14,484 | | | Cedar Realty Trust, Inc. | | | 68 | |
| | 1,747 | | | Clipper Realty, Inc. | | | 15 | |
| | 5,174 | | | Corporate Office Properties Trust | | | 150 | |
| | 3,859 | | | DiamondRock Hospitality Co. | | | 47 | |
| | 3,301 | | | EastGroup Properties, Inc. | | | 316 | |
| | 6,984 | | | Equity Commonwealth (a) | | | 221 | |
| | 7,230 | | | Farmland Partners, Inc. | | | 64 | |
| | 6,912 | | | Global Medical REIT, Inc. | | | 61 | |
| | 3,640 | | | Global Net Lease, Inc. | | | 74 | |
| | 2,387 | | | Independence Realty Trust, Inc. | | | 25 | |
| | 5,724 | | | LaSalle Hotel Properties | | | 196 | |
| | 252 | | | Lexington Realty Trust | | | 2 | |
| | 6,230 | | | Pennsylvania Real Estate Investment Trust | | | 68 | |
| | 24 | | | PS Business Parks, Inc. | | | 3 | |
| | 3,543 | | | Quality Care Properties (a) | | | 76 | |
| | 128 | | | RLJ Lodging Trust | | | 3 | |
| | 3,532 | | | Select Income REIT | | | 79 | |
| | 10,364 | | | Washington Prime Group, Inc. | | | 84 | |
| | | | | | | | |
| | | | | | | 1,819 | |
| | | | | | | | |
| | | | Food & Staples Retailing — 0.50% | |
| | 2,817 | | | Casey’s General Stores, Inc. | | | 297 | |
| | 9,033 | | | Chefs’ Warehouse Holdings LLC (a) | | | 257 | |
| | 37 | | | Ingles Markets, Inc., Class – A | | | 1 | |
| | | | | | | | |
| | | | | | | 555 | |
| | | | | | | | |
| | | | Food Products — 0.51% | |
| | 41 | | | Cal-Maine Foods, Inc. (a) | | | 2 | |
| | 4,706 | | | Darling Ingredients, Inc. (a) | | | 94 | |
| | 33 | | | Fresh Del Monte Produce, Inc. | | | 1 | |
| | 2,504 | | | J&J Snack Foods Corp. | | | 381 | |
| | 39 | | | John B. Sanfilippo & Son, Inc. | | | 3 | |
| | 5,200 | | | Landec Corp. (a) | | | 77 | |
| | 25 | | | Sanderson Farms, Inc. | | | 3 | |
| | | | | | | | |
| | | | | | | 561 | |
| | | | | | | | |
| | | | Gas Utilities — 0.41% | |
| | 38 | | | Southwest Gas Corp. | | | 3 | |
| | 8,617 | | | UGI Corp. | | | 449 | |
| | | | | | | | |
| | | | | | | 452 | |
| | | | | | | | |
| | | | Health Care Equipment & Supplies — 6.29% | |
| | 1,040 | | | Abiomed, Inc. (a) | | | 425 | |
| | 2,630 | | | AxoGen, Inc. (a) | | | 132 | |
| | 3,210 | | | Cantel Medical Corp. | | | 316 | |
| | 9,373 | | | Cardiovascular Systems, Inc. (a) | | | 303 | |
| | 4,641 | | | Dexcom, Inc. (a) | | | 441 | |
| | 3,022 | | | Edwards Lifesciences Corp. (a) | | | 440 | |
| | 13,799 | | | Insulet Corp. (a) | | | 1,182 | |
| | 5,085 | | | iRhythm Technologies, Inc. (a) | | | 413 | |
| | 3,198 | | | Neogen Corp. (a) | | | 256 | |
| | 831 | | | Neuronetics, Inc. (a) | | | 22 | |
| | 1,870 | | | Nevro Corp. (a) | | | 149 | |
| | 12,287 | | | Novocure Ltd. (a) | | | 385 | |
| | 893 | | | Penumbra, Inc. (a) | | | 123 | |
| | 11,984 | | | STAAR Surgical Co. (a) | | | 372 | |
| | | | | | | | |
| Shares | | | Security Description | | Value
(000) | |
| | | | Health Care Equipment & Supplies (continued) | | | | |
| | 1,886 | | | Steris PLC | | $ | 198 | |
| | 29,328 | | | Tandem Diabetes Care, Inc. (a) | | | 646 | |
| | 2,751 | | | The Cooper Companies, Inc. | | | 648 | |
| | 4,945 | | | West Pharmaceutical Services, Inc. | | | 491 | |
| | | | | | | | |
| | | | | | | 6,942 | |
| | | | | | | | |
| | | | Health Care Providers & Services — 2.22% | |
| | 4,740 | | | AAC Holdings, Inc. (a) | | | 44 | |
| | 11,394 | | | Acadia Healthcare Company, Inc. (a) | | | 467 | |
| | 10,517 | | | Aceto Corp. | | | 35 | |
| | 13 | | | Chemed Corp. | | | 4 | |
| | 16,020 | | | Diplomat Pharmacy, Inc. (a) | | | 409 | |
| | 2,827 | | | Encompass Health Corp. | | | 191 | |
| | 15,760 | | | Genesis Healthcare, Inc. (a) | | | 36 | |
| | 5,202 | | | HealthEquity, Inc. (a) | | | 391 | |
| | 81 | | | LHC Group, Inc. (a) | | | 7 | |
| | 29 | | | LifePoint Hospitals, Inc., Class – A (a) | | | 1 | |
| | 27 | | | Magellan Health Services, Inc. (a) | | | 3 | |
| | 36 | | | Molina Heathcare, Inc. (a) | | | 4 | |
| | 29 | | | National Healthcare Corp. | | | 2 | |
| | 39 | | | Providence Service Corp. (a) | | | 3 | |
| | 164 | | | Select Medical Holdings Corp. (a) | | | 3 | |
| | 3,489 | | | Surgery Partners, Inc. (a) | | | 52 | |
| | 9,086 | | | Teladoc, Inc. (a) | | | 528 | |
| | 86 | | | The Ensign Group, Inc. | | | 3 | |
| | 7,002 | | | Triple-S Management Corp., Class – A (a) | | | 273 | |
| | | | | | | | |
| | | | | | | 2,456 | |
| | | | | | | | |
| | | | Health Care Technology — 0.27% | |
| | 1,190 | | | Medidata Solutions, Inc. (a) | | | 96 | |
| | 3,964 | | | Omnicell, Inc. (a) | | | 208 | |
| | | | | | | | |
| | | | | | | 304 | |
| | | | | | | | |
| | | | Hotels, Restaurants & Leisure — 1.84% | |
| | 105 | | | Bloomin’ Brands, Inc. | | | 2 | |
| | 1,279 | | | Brinker International, Inc. | | | 61 | |
| | 51,100 | | | Century Casinos, Inc. (a) | | | 447 | |
| | 871 | | | DineEquity, Inc. | | | 65 | |
| | 54 | | | International Speedway Corp., Class – A | | | 2 | |
| | 88 | | | Marcus Corp. | | | 3 | |
| | 240 | | | Pinnacle Entertainment, Inc. (a) | | | 8 | |
| | 5,909 | | | Planet Fitness, Inc., Class – A (a) | | | 260 | |
| | 995 | | | Red Robin Gourmet Burgers, Inc. (a) | | | 46 | |
| | 5,408 | | | The Habit Restaurants, Inc. (a) | | | 54 | |
| | 3,690 | | | Vail Resorts, Inc. | | | 1,013 | |
| | 1,426 | | | Wingstop, Inc. | | | 74 | |
| | | | | | | | |
| | | | | | | 2,035 | |
| | | | | | | | |
| | | | Household Durables — 0.97% | |
| | 220 | | | Beazer Homes USA, Inc. (a) | | | 3 | |
| | 932 | | | Cavco Industries, Inc. (a) | | | 194 | |
| | 661 | | | Century Communities, Inc. (a) | | | 21 | |
| | 48 | | | Flexsteel Industries, Inc. | | | 2 | |
| | 30,500 | | | Green Brick Partners, Inc. (a) | | | 299 | |
| | 4,646 | | | iRobot Corp.^ (a) | | | 351 | |
| | 968 | | | LGI Homes, Inc. (a) | | | 56 | |
| | 7,087 | | | Libbey, Inc. | | | 58 | |
| | 1,463 | | | NACCO Industries, Inc., Class – A | | | 49 | |
See accompanying notes to financial statements.
83
HC CAPITAL TRUST
The Small Capitalization-Mid Capitalization Equity Portfolio
Portfolio of Investments (continued) — June 30, 2018
| | | | | | | | |
| Shares | | | Security Description | | Value
(000) | |
| | | | Common Stocks (continued) | |
| | | | Household Durables (continued) | |
| | 128 | | | Taylor Morrison Home Corp., Class – A (a) | | $ | 3 | |
| | 3,897 | | | The New Home Co., Inc. (a) | | | 39 | |
| | 128 | | | William Lyon Homes, Class – A (a) | | | 3 | |
| | | | | | | | |
| | | | | | | 1,078 | |
| | | | | | | | |
| | | | Household Products — 0.01% | |
| | 33 | | | Central Garden & Pet Co. (a) | | | 1 | |
| | 35 | | | Central Garden & Pet Co., Class – A (a) | | | 1 | |
| | 2,781 | | | Orchids Paper Products Co. (a) | | | 12 | |
| | | | | | | | |
| | | | | | | 14 | |
| | | | | | | | |
| | | | Independent Power & Renewable Electricity Producers — 0.12% | |
| | 3,390 | | | NRG Yield, Inc. | | | 58 | |
| | 220 | | | NRG Yield, Inc., Class – C | | | 4 | |
| | 3,840 | | | Pattern Energy Group, Inc. | | | 72 | |
| | | | | | | | |
| | | | | | | 134 | |
| | | | | | | | |
| | | | Insurance — 2.96% | |
| | 7,412 | | | American Equity Investment Life Holding Co. | | | 267 | |
| | 7,821 | | | American Financial Group, Inc. | | | 838 | |
| | 6,075 | | | Argo Group International Holdings Ltd. | | | 354 | |
| | 11,409 | | | Aspen Insurance Holdings Ltd. | | | 465 | |
| | 10,500 | | | Atlas Financial Holdings, Inc. (a) | | | 92 | |
| | 4,244 | | | AXIS Capital Holdings Ltd. | | | 236 | |
| | 1,385 | | | Everest Re Group Ltd. | | | 319 | |
| | 5,700 | | | First American Financial Corp. | | | 295 | |
| | 1,554 | | | Hanover Insurance Group, Inc. | | | 186 | |
| | 79 | | | Universal Insurance Holdings, Inc. | | | 3 | |
| | 3,087 | | | W.R. Berkley Corp. | | | 224 | |
| | | | | | | | |
| | | | | | | 3,279 | |
| | | | | | | | |
| | | | Internet & Direct Marketing Retail — 1.14% | |
| | 185 | | | 1-800-FLOWERS.COM, Inc., Class – A (a) | | | 2 | |
| | 11,575 | | | Etsy, Inc. (a) | | | 488 | |
| | 2,369 | | | NutriSystem, Inc. | | | 91 | |
| | 24,848 | | | Stitch Fix, Inc., Class – A (a) | | | 683 | |
| | | | | | | | |
| | | | | | | 1,264 | |
| | | | | | | | |
| | | | Internet Software & Services — 4.16% | |
| | 4,367 | | | 2U, Inc. (a) | | | 365 | |
| | 3,346 | | | Akamai Technologies, Inc. (a) | | | 245 | |
| | 1,959 | | | Alteryx, Inc. (a) | | | 75 | |
| | 4,872 | | | Amber Road, Inc. (a) | | | 46 | |
| | 13,700 | | | AutoWeb, Inc. (a) | | | 62 | |
| | 9,668 | | | Benefitfocus, Inc. (a) | | | 325 | |
| | 211 | | | Blucora, Inc. (a) | | | 8 | |
| | 36,957 | | | Brightcove, Inc. (a) | | | 357 | |
| | 1,987 | | | Carbonite, Inc. (a) | | | 69 | |
| | 2,744 | | | Cardlytics, Inc. (a) | | | 60 | |
| | 4,897 | | | Care.com, Inc. (a) | | | 102 | |
| | 4,882 | | | Cloudera, Inc. (a) | | | 67 | |
| | 9,683 | | | Coupa Software, Inc. (a) | | | 602 | |
| | 4,522 | | | GrubHub, Inc. (a) | | | 474 | |
| | 3,718 | | | Hortonworks, Inc. (a) | | | 68 | |
| | 4,662 | | | Internap Corp. (a) | | | 49 | |
| | 29 | | | J2 Global, Inc. | | | 3 | |
| | 11,232 | | | Limelight Networks, Inc. (a) | | | 50 | |
| | | | | | | | |
| Shares | | | Security Description | | Value
(000) | |
| | | | Internet Software & Services (continued) | | | | |
| | 126 | | | Match Group, Inc. (a) | | $ | 5 | |
| | 5,455 | | | New Relic, Inc. (a) | | | 548 | |
| | 9,431 | | | Nutanix, Inc., Class – A (a) | | | 485 | |
| | 5,095 | | | QuinStreet, Inc. (a) | | | 65 | |
| | 61,412 | | �� | RealNetworks, Inc. (a) | | | 227 | |
| | 22,715 | | | The Meet Group, Inc. (a) | | | 102 | |
| | 2,550 | | | Veritone, Inc. (a) | | | 43 | |
| | 3,276 | | | Web.com Group, Inc. (a) | | | 85 | |
| | | | | | | | |
| | | | | | | 4,587 | |
| | | | | | | | |
| | | | IT Services — 1.70% | |
| | 1,343 | | | Alliance Data Systems Corp. | | | 314 | |
| | 62 | | | Booz Allen Hamilton Holding Corp. | | | 3 | |
| | 20 | | | CACI International, Inc., Class – A (a) | | | 3 | |
| | 39 | | | Cass Information Systems, Inc. | | | 3 | |
| | 72 | | | Convergys Corp. | | | 2 | |
| | 47 | | | CoreLogic, Inc. (a) | | | 2 | |
| | 46 | | | CSG Systems International, Inc. | | | 2 | |
| | 44,800 | | | Edgewater Technology, Inc. (a) | | | 243 | |
| | 2,405 | | | Euronet Worldwide, Inc. (a) | | | 201 | |
| | 5,985 | | | EVERTEC, Inc. | | | 131 | |
| | 95 | | | Evo Payments, Inc., Class – A (a) | | | 2 | |
| | 2,398 | | | Global Payments, Inc. | | | 267 | |
| | 1,574 | | | Information Services Group, Inc. (a) | | | 6 | |
| | 5,174 | | | Jack Henry & Associates, Inc. | | | 675 | |
| | 38 | | | Leidos Holdings, Inc. | | | 2 | |
| | 49 | | | ManTech International Corp., Class – A | | | 3 | |
| | 88 | | | Perficient, Inc. (a) | | | 2 | |
| | 32 | | | Science Applications International Corp. | | | 3 | |
| | 1,795 | | | Startek, Inc. (a) | | | 11 | |
| | 61 | | | Sykes Enterprises, Inc. (a) | | | 2 | |
| | 135 | | | The Hackett Group, Inc. | | | 2 | |
| | 143 | | | Travelport Worldwide Ltd. | | | 3 | |
| | 69 | | | TTEC Holdings, Inc. | | | 2 | |
| | | | | | | | |
| | | | | | | 1,884 | |
| | | | | | | | |
| | | | Leisure Products — 0.40% | |
| | 21,624 | | | Callaway Golf Co. | | | 410 | |
| | 111 | | | Johnson Outdoors, Inc., Class – A | | | 9 | |
| | 1,784 | | | Vista Outdoor, Inc. (a) | | | 28 | |
| | | | | | | | |
| | | | | | | 447 | |
| | | | | | | | |
| | | | Life Sciences Tools & Services — 0.70% | |
| | 26 | | | Bio-Rad Laboratories, Inc., Class – A (a) | | | 8 | |
| | 102 | | | Bruker Biosciences Corp. | | | 3 | |
| | 2,503 | | | Cambrex Corp. (a) | | | 131 | |
| | 4,775 | | | Fluidigm Corp. (a) | | | 28 | |
| | 113 | | | Luminex Corp. | | | 3 | |
| | 21,104 | | | NeoGenomics, Inc. (a) | | | 278 | |
| | 17,306 | | | Pacific Biosciences of California, Inc. (a) | | | 61 | |
| | 58 | | | PRA Health Sciences, Inc. (a) | | | 5 | |
| | 7,145 | | | Qiagen N.V. (a) | | | 258 | |
| | | | | | | | |
| | | | | | | 775 | |
| | | | | | | | |
| | | | Machinery — 3.33% | |
| | 11,908 | | | Actuant Corp., Class – A | | | 349 | |
| | 48 | | | AGCO Corp. | | | 3 | |
| | 8,551 | | | Chart Industries, Inc. (a) | | | 527 | |
See accompanying notes to financial statements.
84
HC CAPITAL TRUST
The Small Capitalization-Mid Capitalization Equity Portfolio
Portfolio of Investments (continued) — June 30, 2018
| | | | | | | | |
| Shares | | | Security Description | | Value
(000) | |
| | | | Common Stocks (continued) | |
| | | | Machinery (continued) | |
| | 168 | | | Columbus McKinnon Corp. | | $ | 7 | |
| | 5,372 | | | Commercial Vehicle Group, Inc. (a) | | | 39 | |
| | 83 | | | Global Brass & Copper Holdings, Inc. | | | 3 | |
| | 4,350 | | | IDEX Corp. | | | 594 | |
| | 1,220 | | | ITT, Inc. | | | 64 | |
| | 2,630 | | | Kadant, Inc. | | | 253 | |
| | 5,889 | | | Kornit Digital Ltd. (a) | | | 105 | |
| | 3,904 | | | Lincoln Electric Holdings, Inc. | | | 343 | |
| | 15,156 | | | Meritor, Inc. (a) | | | 312 | |
| | 151 | | | Miller Industries, Inc. | | | 4 | |
| | 47 | | | Oshkosh Corp. | | | 3 | |
| | 3,551 | | | Proto Labs, Inc. (a) | | | 422 | |
| | 4,026 | | | Terex Corp. | | | 170 | |
| | 74 | | | The Greenbrier Companies, Inc. | | | 4 | |
| | 11,824 | | | TriMas Corp. (a) | | | 348 | |
| | 116 | | | Trinity Industries, Inc. | | | 4 | |
| | 150 | | | Wabash National Corp. | | | 3 | |
| | 974 | | | WABCO Holdings, Inc. (a) | | | 114 | |
| | | | | | | | |
| | | | | | | 3,671 | |
| | | | | | | | |
| | | | Marine — 0.34% | |
| | 3,351 | | | Genco Shipping & Trading Ltd. (a) | | | 52 | |
| | 2,745 | | | Kirby Corp. (a) | | | 229 | |
| | 1,552 | | | Matson, Inc. | | | 60 | |
| | 11,317 | | | Safe Bulkers, Inc. (a) | | | 38 | |
| | | | | | | | |
| | | | | | | 379 | |
| | | | | | | | |
| | | | Media — 0.57% | |
| | 50,600 | | | Ballantyne Strong, Inc. (a) | | | 245 | |
| | 2,330 | | | Eros International PLC (a) | | | 30 | |
| | 5,607 | | | Gray Television, Inc. (a) | | | 89 | |
| | 4,583 | | | Lions Gate Entertainment Corp., Class – B | | | 108 | |
| | 2,305 | | | Townsquare Media, Inc., Class – A | | | 15 | |
| | 3,085 | | | tronc, Inc. (a) | | | 53 | |
| | 8,565 | | | Wideopenwest, Inc. (a) | | | 83 | |
| | | | | | | | |
| | | | | | | 623 | |
| | | | | | | | |
| | | | Metals & Mining — 2.20% | |
| | 5,644 | | | Agnico-Eagle Mines Ltd. | | | 259 | |
| | 32,753 | | | Allegheny Technologies, Inc. (a) | | | 823 | |
| | 8,913 | | | Carpenter Technology Corp. | | | 469 | |
| | 27,148 | | | Coeur d’Alene Mines Corp. (a) | | | 206 | |
| | 151 | | | Commercial Metals Co. | | | 3 | |
| | 38,146 | | | Ferroglobe PLC | | | 327 | |
| | 45,455 | | | Ferroglobe R&W Insurance Trust Co.* | | | — | |
| | 72,651 | | | Tahoe Resources, Inc. | | | 356 | |
| | | | | | | | |
| | | | | | | 2,443 | |
| | | | | | | | |
| | | | Mortgage Real Estate Investment Trusts — 0.14% | |
| | 81 | | | Apollo Commercial Real Estate Finance, Inc. | | | 1 | |
| | 253 | | | MTGE Investment Corp. | | | 5 | |
| | 307 | | | New Residential Investment Corp. | | | 5 | |
| | 8,825 | | | Redwood Trust, Inc. | | | 146 | |
| | | | | | | | |
| | | | | | | 157 | |
| | | | | | | | |
| | | | Multiline Retail — 0.05% | |
| | 36 | | | Big Lots, Inc. | | | 2 | |
| | 29 | | | Dillard’s, Inc., Class – A | | | 3 | |
| | | | | | | | |
| Shares | | | Security Description | | Value
(000) | |
| | | | Multiline Retail (continued) | | | | |
| | 22,194 | | | Fred’s, Inc., Class – A | | $ | 50 | |
| | | | | | | | |
| | | | | | | 55 | |
| | | | | | | | |
| | | | Multi-Utilities — 0.01% | |
| | 124 | | | Avista Corp. | | | 7 | |
| | 121 | | | Unitil Corp. | | | 6 | |
| | | | | | | | |
| | | | | | | 13 | |
| | | | | | | | |
| | | | Oil, Gas & Consumable Fuels — 2.75% | |
| | 29 | | | Andeavor | | | 4 | |
| | 16,025 | | | Approach Resources, Inc. (a) | | | 39 | |
| | 187 | | | Ardmore Shipping Corp. (a) | | | 2 | |
| | 2,576 | | | California Resources Corp. (a) | | | 117 | |
| | 17,912 | | | Carrizo Oil & Gas, Inc. (a) | | | 500 | |
| | 18,185 | | | Centennial Resource Development, Inc. (a) | | | 329 | |
| | 17,245 | | | Cloud Peak Energy, Inc. (a) | | | 60 | |
| | 14,257 | | | Contango Oil & Gas Co. (a) | | | 81 | |
| | 267 | | | Delek US Holdings, Inc. | | | 13 | |
| | 20,764 | | | Denbury Resources, Inc. (a) | | | 100 | |
| | 136,440 | | | Enbridge Energy Management LLC* (a)(b) | | | — | |
| | 2,340 | | | Energen Corp. (a) | | | 170 | |
| | 8,745 | | | Euronav N.V. | | | 80 | |
| | 15,839 | | | GasLog Ltd. | | | 302 | |
| | 3,799 | | | Golar LNG Ltd. | | | 112 | |
| | 1,258 | | | Halcon Resources Corp. (a) | | | 6 | |
| | 8,771 | | | Highpoint Resources Corp. (a) | | | 53 | |
| | 6,920 | | | Matador Resources Co. (a) | | | 208 | |
| | 9,677 | | | Murphy Oil Corp. | | | 327 | |
| | 16,291 | | | Navigator Holdings Ltd. (a) | | | 206 | |
| | 14,525 | | | Overseas Shipholding Group, Inc. (a) | | | 56 | |
| | 7,984 | | | SM Energy Co. | | | 205 | |
| | 3,628 | | | Ultra Petroleum Corp. (a) | | | 8 | |
| | 9,701 | | | W&T Offshore, Inc. (a) | | | 69 | |
| | | | | | | | |
| | | | | | | 3,047 | |
| | | | | | | | |
| | | | Paper & Forest Products — 0.03% | |
| | 67 | | | Domtar Corp. | | | 3 | |
| | 112 | | | P.H. Glatfelter Co. | | | 2 | |
| | 1,490 | | | Verso Corp. (a) | | | 33 | |
| | | | | | | | |
| | | | | | | 38 | |
| | | | | | | | |
| | | | Personal Products — 0.00% | |
| | 16 | | | Nu Skin Enterprises, Inc., Class – A | | | 1 | |
| | | | | | | | |
| | | | Pharmaceuticals — 1.25% | |
| | 12,530 | | | Amneal Pharmaceuticals, Inc. (a) | | | 207 | |
| | 122 | | | Catalent, Inc. (a) | | | 5 | |
| | 7,139 | | | Collegium Pharmaceutical, Inc. (a) | | | 170 | |
| | 17,100 | | | Cumberland Pharmaceuticals, Inc. (a) | | | 105 | |
| | 19,529 | | | Durect Corp. (a) | | | 30 | |
| | 12,535 | | | Intersect ENT, Inc. (a) | | | 470 | |
| | 3,234 | | | Lannett Co., Inc. (a) | | | 44 | |
| | 2,385 | | | Nektar Therapeutics (a) | | | 116 | |
| | 6,582 | | | Neos Therapeutics, Inc. (a) | | | 41 | |
| | 200 | | | Omthera Pharmaceuticals, Inc.* (a) | | | — | |
| | 182 | | | Phibro Animal Health Corp., Class – A | | | 8 | |
| | 14,794 | | | Teligent, Inc. (a) | | | 51 | |
| | 70 | | | The Medicines Co. (a) | | | 3 | |
See accompanying notes to financial statements.
85
HC CAPITAL TRUST
The Small Capitalization-Mid Capitalization Equity Portfolio
Portfolio of Investments (continued) — June 30, 2018
| | | | | | | | |
| Shares | | | Security Description | | Value
(000) | |
| | | | Common Stocks (continued) | |
| | | | Pharmaceuticals (continued) | |
| | 1,749 | | | Zogenix, Inc. (a) | | $ | 77 | |
| | 5,216 | | | Zynerba Pharmaceuticals, Inc. | | | 51 | |
| | | | | | | | |
| | | | | | | 1,378 | |
| | | | | | | | |
| | | | Professional Services — 0.75% | |
| | 160 | | | CBIZ, Inc. (a) | | | 4 | |
| | 2,159 | | | Kelly Services, Inc., Class – A | | | 48 | |
| | 982 | | | Kforce, Inc. | | | 34 | |
| | 6,805 | | | Korn Ferry International | | | 422 | |
| | 8,823 | | | Navigant Consulting, Inc. (a) | | | 195 | |
| | 2,460 | | | TrueBlue, Inc. (a) | | | 66 | |
| | 1,821 | | | Willdan Group, Inc. (a) | | | 56 | |
| | | | | | | | |
| | | | | | | 825 | |
| | | | | | | | |
| | | | Real Estate Investment Trusts — 0.03% | |
| | 3,214 | | | Ellington Residential Mortgage REIT | | | 35 | |
| | | | | | | | |
| | | | Real Estate Management & Development — 0.45% | |
| | 611 | | | Alexander & Baldwin, Inc. | | | 14 | |
| | 2,037 | | | Altisource Portfolio Solutions SA (a) | | | 59 | |
| | 610 | | | Consolidated-Tomoka Land Co. | | | 38 | |
| | 40 | | | Rafael Holdings, Inc., Class – B (a) | | | — | |
| | 7,170 | | | Realogy Holdings Corp. | | | 163 | |
| | 9,225 | | | Tejon Ranch Co. (a) | | | 225 | |
| | | | | | | | |
| | | | | | | 499 | |
| | | | | | | | |
| | | | Road & Rail — 0.52% | |
| | 93 | | | ArcBest Corp. | | | 4 | |
| | 5,416 | | | Avis Budget Group, Inc. (a) | | | 177 | |
| | 84 | | | Covenant Transportation Group, Inc.,
Class – A (a) | | | 3 | |
| | 3,058 | | | Hertz Global Holdings, Inc. (a) | | | 47 | |
| | 2,941 | | | Knight-Swift Transportation Holdings, Inc. | | | 112 | |
| | 103 | | | P.A.M. Transportation Services, Inc. (a) | | | 5 | |
| | 4,518 | | | Roadrunner Transportation Systems, Inc. (a) | | | 9 | |
| | 2,120 | | | Ryder System, Inc. | | | 152 | |
| | 6,670 | | | YRC Worldwide, Inc. (a) | | | 67 | |
| | | | | | | | |
| | | | | | | 576 | |
| | | | | | | | |
| | | | Semiconductors & Semiconductor Equipment — 5.28% | |
| | 1,488 | | | Cavium, Inc. (a) | | | 129 | |
| | 58 | | | Cirrus Logic, Inc. (a) | | | 2 | |
| | 140 | | | Cohu, Inc. | | | 3 | |
| | 7,198 | | | Cree, Inc. (a) | | | 299 | |
| | 1,243 | | | Cyberoptics Corp. (a) | | | 22 | |
| | 30,184 | | | Cypress Semiconductor Corp. | | | 470 | |
| | 109 | | | Diodes, Inc. (a) | | | 4 | |
| | 186 | | | Entegris, Inc. | | | 6 | |
| | 43 | | | First Solar, Inc. (a) | | | 2 | |
| | 5,618 | | | FormFactor, Inc. (a) | | | 75 | |
| | 29,100 | | | GSI Technology, Inc. (a) | | | 219 | |
| | 5,591 | | | Inphi Corp. (a) | | | 182 | |
| | 9,650 | | | Integrated Device Technology, Inc. (a) | | | 308 | |
| | 5,866 | | | MA-COM Technology Solutions
Holdings, Inc. (a) | | | 135 | |
| | 5,616 | | | Maxim Integrated Products, Inc. | | | 329 | |
| | 1,930 | | | MKS Instruments, Inc. | | | 185 | |
| | 7,357 | | | Monolithic Power Systems, Inc. | | | 984 | |
| | | | | | | | |
| Shares | | | Security Description | | Value
(000) | |
| | | | Semiconductors & Semiconductor Equipment (continued) | |
| | 9,554 | | | ON Semiconductor Corp. (a) | | $ | 212 | |
| | 8,941 | | | Qorvo, Inc. (a) | | | 717 | |
| | 33,030 | | | QuickLogic Corp. (a) | | | 38 | |
| | 18,007 | | | Semtech Corp. (a) | | | 847 | |
| | 1,629 | | | Silicon Laboratories, Inc. (a) | | | 162 | |
| | 3,931 | | | Skyworks Solutions, Inc. | | | 380 | |
| | 1,448 | | | SMART Global Holdings, Inc. (a) | | | 46 | |
| | 988 | | | SolarEdge Technologies, Inc. (a) | | | 47 | |
| | 367 | | | Ultra Clean Holdings, Inc. (a) | | | 6 | |
| | 1,530 | | | Veeco Instruments, Inc. (a) | | | 22 | |
| | | | | | | | |
| | | | | | | 5,831 | |
| | | | | | | | |
| | | | Software — 4.63% | |
| | 10,121 | | | Blackline, Inc. (a) | | | 440 | |
| | 1,140 | | | CommVault Systems, Inc. (a) | | | 75 | |
| | 1,462 | | | Digimarc Corp. (a) | | | 39 | |
| | 35 | | | Ebix, Inc. | | | 3 | |
| | 2,647 | | | Ellie Mae, Inc. (a) | | | 275 | |
| | 830 | | | Fair Isaac Corp. (a) | | | 160 | |
| | 16,700 | | | Glu Mobile, Inc. (a) | | | 107 | |
| | 3,279 | | | Guidewire Software, Inc. (a) | | | 291 | |
| | 3,896 | | | HubSpot, Inc. (a) | | | 489 | |
| | 21,218 | | | Nuance Communications, Inc. (a) | | | 295 | |
| | 2,770 | | | Proofpoint, Inc. (a) | | | 319 | |
| | 5,451 | | | PTC, Inc. (a) | | | 510 | |
| | 6,057 | | | RingCentral, Inc., Class – A (a) | | | 426 | |
| | 11,200 | | | Rosetta Stone, Inc. (a) | | | 180 | |
| | 54,000 | | | SeaChange International, Inc. (a) | | | 185 | |
| | 64,200 | | | Telenav, Inc. (a) | | | 360 | |
| | 16,408 | | | TiVo Corp. | | | 221 | |
| | 1,013 | | | Tyler Technologies, Inc. (a) | | | 225 | |
| | 14,385 | | | Zscaler, Inc.^ (a) | | | 513 | |
| | | | | | | | |
| | | | | | | 5,113 | |
| | | | | | | | |
| | | | Specialty Retail — 1.72% | |
| | 2,206 | | | Abercrombie & Fitch Co., Class – A | | | 54 | |
| | 10,892 | | | Boot Barn Holdings, Inc. (a) | | | 226 | |
| | 553 | | | Build-A-Bear Workshop, Inc. (a) | | | 4 | |
| | 19,403 | | | Carvana Co.^ (a) | | | 808 | |
| | 2,276 | | | Conn’s, Inc. (a) | | | 75 | |
| | 33 | | | Group 1 Automotive, Inc. | | | 2 | |
| | 10,371 | | | J. Jill, Inc. (a) | | | 97 | |
| | 3,993 | | | Lumber Liquidators Holdings, Inc. (a) | | | 97 | |
| | 610 | | | Monro Muffler Brake, Inc. | | | 35 | |
| | 53 | | | Penske Automotive Group, Inc. | | | 2 | |
| | 24,349 | | | Pier 1 Imports, Inc. | | | 58 | |
| | 98 | | | Sonic Automotive, Inc., Class – A | | | 2 | |
| | 10,886 | | | Sportsman’s Warehouse Holdings, Inc. (a) | | | 56 | |
| | 13,455 | | | Tailored Brands, Inc. | | | 344 | |
| | 4,960 | | | The Container Store Group, Inc. (a) | | | 42 | |
| | 293 | | | Tilly’s, Inc., Class – A | | | 4 | |
| | | | | | | | |
| | | | | | | 1,906 | |
| | | | | | | | |
| | | | Technology Hardware, Storage & Peripherals — 0.57% | |
| | 7,400 | | | Astronova, Inc. | | | 139 | |
| | 17,850 | | | Diebold, Inc. | | | 213 | |
| | 11,832 | | | Pure Storage, Inc., Class – A (a) | | | 283 | |
| | | | | | | | |
| | | | | | | 635 | |
| | | | | | | | |
See accompanying notes to financial statements.
86
HC CAPITAL TRUST
The Small Capitalization-Mid Capitalization Equity Portfolio
Portfolio of Investments (continued) — June 30, 2018
| | | | | | | | |
| Shares | | | Security Description | | Value
(000) | |
| | | | Common Stocks (continued) | |
| | | | Textiles, Apparel & Luxury Goods — 0.96% | |
| | 3,290 | | | Columbia Sportswear Co. | | $ | 301 | |
| | 8,900 | | | Lakeland Industries, Inc. (a) | | | 126 | |
| | 1,791 | | | Movado Group, Inc. | | | 87 | |
| | 2,301 | | | Oxford Industries, Inc. | | | 191 | |
| | 10,394 | | | Wolverine World Wide, Inc. | | | 361 | |
| | | | | | | | |
| | | | | | | 1,066 | |
| | | | | | | | |
| | | | Thrifts & Mortgage Finance — 0.17% | |
| | 379 | | | Federal Agricultural Mortgage Corp., Class – C | | | 34 | |
| | 44 | | | First Defiance Financial Corp. | | | 3 | |
| | 79 | | | HomeStreet, Inc. (a) | | | 2 | |
| | 1,616 | | | Impac Mortgage Holdings, Inc. (a) | | | 15 | |
| | 382 | | | MGIC Investment Corp. (a) | | | 4 | |
| | 4,468 | | | NMI Holdings, Inc. (a) | | | 73 | |
| | 132 | | | PennyMac Financial Services, Inc. (a) | | | 3 | |
| | 263 | | | TrustCo Bank Corp. NY | | | 2 | |
| | 85 | | | Walker & Dunlop, Inc. | | | 5 | |
| | 808 | | | WSFS Financial Corp. | | | 43 | |
| | | | | | | | |
| | | | | | | 184 | |
| | | | | | | | |
| | | | Tobacco — 0.23% | |
| | 3,797 | | | Universal Corp. | | | 251 | |
| | | | | | | | |
| | | | Trading Companies & Distributors — 1.53% | |
| | 83 | | | Air Lease Corp. | | | 3 | |
| | 111 | | | Aircastle Ltd. | | | 2 | |
| | 5,768 | | | Beacon Roofing Supply, Inc. (a) | | | 246 | |
| | 13,284 | | | BMC Stock Holdings, Inc. (a) | | | 277 | |
| | 2,521 | | | CAI International, Inc. (a) | | | 59 | |
| | 6,872 | | | DXP Enterprises, Inc. (a) | | | 263 | |
| | 83 | | | GATX Corp. | | | 6 | |
| | 8,408 | | | MRC Global, Inc. (a) | | | 182 | |
| | 2,603 | | | SiteOne Landscape Supply, Inc. (a) | | | 219 | |
| | 3,364 | | | Textainer Group Holdings Ltd. (a) | | | 53 | |
| | 2,263 | | | Triton International Ltd. | | | 70 | |
| | 1,724 | | | Watsco, Inc. | | | 307 | |
| | 51 | | | WESCO International, Inc. (a) | | | 3 | |
| | | | | | | | |
| | | | | | | 1,690 | |
| | | | | | | | |
| | | | Transportation Infrastructure — 0.05% | |
| | 1,426 | | | Macquarie Infrastructure Corp. | | | 60 | |
| | | | | | | | |
| | | | Water Utilities — 0.15% | |
| | 3,004 | | | Cadiz, Inc. (a) | | | 39 | |
| | 430 | | | Connecticut Water Service, Inc. | | | 28 | |
| | 1,573 | | | Consolidated Water Co. Ltd. | | | 20 | |
| | 602 | | | Global Water Resources, Inc. | | | 6 | |
| | 1,064 | | | SJW Corp. | | | 71 | |
| | | | | | | | |
| | | | | | | 164 | |
| | | | | | | | |
| | | | Wireless Telecommunication Services — 0.00% | |
| | 64 | | | Spok Holdings, Inc. | | | 1 | |
| | | | | | | | |
| | | | Total Common Stocks | | | 97,759 | |
| | | | | | | | |
| | | | Contingent Rights — 0.00% | |
| | | | Biotechnology — 0.00% | |
| | 500 | | | Clinical Data, Inc.*(a)(c) | | | — | |
| | 24 | | | Dyax Corp. CVR*(a) | | | — | |
| | 1 | | | Tobira Therapeutics, Inc. CVR*(a) | | | — | |
| | | | | | | | |
| | | | Total Contingent Rights | | | — | |
| | | | | | | | |
| | | | | | | | |
Principal
Amount
(000) | | | Security Description | | Value
(000) | |
| | | | Time Deposit — 2.56% | |
| $ | 2,829 | | | State Street Liquidity Management Control System Eurodollar Time Deposit,
0.53%, 7/2/18 | | $ | 2,829 | |
| | | | | | | | |
| | | | Total Time Deposit | | | 2,829 | |
| | | | | | | | |
| | |
| Shares | | | | | | |
| | | | Mutual Funds — 9.86% | |
| | 73,600 | | | 180 Degree Capital Corp. | | | 170 | |
| | 768,449 | | | Federated Treasury Obligations Fund, Institutional Shares, 1.75%^^ (d) | | | 768 | |
| | 320,627 | | | State Street Institutional Liquid Reserves Fund, Trust Class, 1.04% (d) | | | 321 | |
| | 9,648,495 | | | State Street Institutional Treasury Plus Money Market Fund, Trust Class, 1.72% (d) | | | 9,649 | |
| | | | | | | | |
| | | | Total Mutual Funds | | | 10,908 | |
| | | | | | | | |
| | |
Principal
Amount
(000) | | | | | | |
| | | | Repurchase Agreement — 1.17% | |
| $ | 1,290 | | | Jefferies LLC, 2.00%, 7/2/18
(Purchased on 6/29/18, proceeds at maturity $1,290,632 collateralized by U.S. Treasury Obligations, 2.50% – 2.92%, 2/15/20 – 2/15/44 fair value $1,316,226)^^ | | | 1,290 | |
| | | | | | | | |
| | | | Total Repurchase Agreement | | | 1,290 | |
| | | | | | | | |
| | | | Total Investments
(cost $78,396) — 101.97% | | | 112,786 | |
| | | | Liabilities in excess of
other assets — (1.97)% | | | (2,176 | ) |
| | | | | | | | |
| | | | Net Assets — 100.00% | | $ | 110,610 | |
| | | | | | | | |
| Amounts | designated as “—” are $0 or have been rounded to $0. |
| * | Security was fair valued on June 30, 2018 and represents a Level 2 security. Refer to Note 2 in the Notes to Financial Statements. |
| ^ | All or part of this security was on loan as of June 30, 2018. The total value of securities on loan as of June 30, 2018, was $2,009 (amount in thousands). |
| ^^ | Purchased with cash collateral held from securities lending. The value of the collateral could include collateral held for securities that were sold on or before June 30, 2018. |
| (a) | Represents non-income producing security. |
| (b) | This security has been deemed illiquid by the Specialist Manager and represents 0.00% of the Portfolio’s net assets. |
| (c) | Rights entitle the Portfolio to cash based on the company’s achievement of milestones in connection with a pharmaceutical drug that was brought to market. |
| (d) | The rate disclosed is the rate in effect on June 30, 2018. |
ADR — American Depositary Receipt
REIT — Real Estate Investment Trust
See accompanying notes to financial statements.
87
HC CAPITAL TRUST
The Small Capitalization-Mid Capitalization Equity Portfolio
Portfolio of Investments (concluded) — June 30, 2018
The following table reflects the percentage of total net assets of the Portfolio attributable to each Specialist Manager as of June 30, 2018.
| | | | | | | | | | | | | | | | | | | | | | | | | | | | |
The Small Capitalization-Mid
Capitalization Equity Portfolio | | Advisory
Research, Inc. | | | Ariel
Investments,
LLC | | | Frontier
Capital
Management
Company,
LLC | | | Parametric
Portfolio
Associates,
LLC | | | Pzena
Investment
Management,
LLC | | | HC Capital
Solutions | | | Total | |
Common Stocks | | | 16.70 | % | | | 7.08 | % | | | 31.94 | % | | | 25.07 | % | | | 7.59 | % | | | — | | | | 88.38 | % |
Contingent Rights | | | — | | | | — | | | | — | | | | 0.00 | % | | | — | | | | — | | | | 0.00 | % |
Time Deposit | | | — | | | | 0.31 | % | | | 0.93 | % | | | 1.21 | % | | | 0.11 | % | | | — | | | | 2.56 | % |
Mutual Funds | | | 0.85 | % | | | 0.20 | % | | | 0.09 | % | | | 8.31 | % | | | — | | | | 0.41 | % | | | 9.86 | % |
Repurchase Agreement | | | 0.93 | % | | | 0.08 | % | | | 0.16 | % | | | — | | | | — | | | | — | | | | 1.17 | % |
Other Assets (Liabilities) | | | -1.69 | % | | | -0.20 | % | | | -0.28 | % | | | 0.19 | % | | | 0.01 | % | | | 0.00 | % | | | -1.97 | % |
| | | | | | | | | | | | | | | | | | | | | | | | | | | | |
Total Net Assets | | | 16.79 | % | | | 7.47 | % | | | 32.84 | % | | | 34.78 | % | | | 7.71 | % | | | 0.41 | % | | | 100.00 | % |
| | | | | | | | | | | | | | | | | | | | | | | | | | | | |
Amounts designated as “—” indicate the Specialist Manager did not manage any holdings in that category.
The following table reflects the open derivative positions held by the Portfolio as of June 30, 2018.
Futures Contracts Purchased^
| | | | | | | | | | | | | | |
Description | | Number of
Contracts | | Expiration
Date | | | Notional
Amount
(000) | | | Value and
Unrealized
Appreciation/
(Depreciation)
(000) | |
Russell 2000 Mini Index Future | | 77 | | | 9/21/18 | | | $ | 6,343 | | | $ | (114 | ) |
| | | | | | | | | | | | | | |
| | | | | $ | 6,343 | | | $ | (114 | ) |
| | | | | | | | | | | | | | |
| | |
| | Total Unrealized Appreciation | | | $ | — | |
| | Total Unrealized Depreciation | | | | (114 | ) |
| | | | | | | | | | | | | | |
| | Total Net Unrealized Appreciation/(Depreciation) | | | $ | (114 | ) |
| | | | | | | | | | | | | | |
| ^ | Cash has been pledged as collateral for futures contracts held by the Portfolio. |
Amounts designated as “—” are $0 or have been rounded to $0.
See accompanying notes to financial statements.
88
HC CAPITAL TRUST
The Institutional Small Capitalization-Mid Capitalization Equity Portfolio
Portfolio of Investments — June 30, 2018
| | | | | | | | |
| Shares | | | Security Description | | Value
(000) | |
| | | | Common Stocks — 94.81% | |
| | | | Aerospace & Defense — 0.67% | |
| | 862 | | | AAR Corp. | | $ | 40 | |
| | 1,889 | | | Aerojet Rocketdyne Holdings, Inc. (a) | | | 56 | |
| | 573 | | | Aerovironment, Inc. (a) | | | 41 | |
| | 2,661 | | | Astronics Corp. (a) | | | 96 | |
| | 1,422 | | | Axon Enterprise, Inc.â (a) | | | 90 | |
| | 2,692 | | | Cubic Corp. | | | 174 | |
| | 285 | | | Ducommun, Inc. (a) | | | 9 | |
| | 499 | | | Engility Holdings, Inc. (a) | | | 15 | |
| | 694 | | | Esterline Technologies Corp. (a) | | | 51 | |
| | 1,360 | | | KLX, Inc. (a) | | | 98 | |
| | 2,368 | | | Kratos Defense & Security Solutions, Inc. (a) | | | 27 | |
| | 1,531 | | | Maxar Technologies Ltd. | | | 77 | |
| | 1,271 | | | Mercury Systems, Inc. (a) | | | 48 | |
| | 868 | | | Moog, Inc., Class – A | | | 68 | |
| | 138 | | | National Presto Industries, Inc. | | | 17 | |
| | 288 | | | Sparton Corp. (a) | | | 5 | |
| | 1,384 | | | The KEYW Holding Corp. (a) | | | 12 | |
| | 1,271 | | | Triumph Group, Inc. | | | 25 | |
| | 318 | | | Vectrus, Inc. (a) | | | 10 | |
| | 9,714 | | | Wesco Aircraft Holdings, Inc. (a) | | | 109 | |
| | | | | | | | |
| | | | | | | 1,068 | |
| | | | | | | | |
| | | | Air Freight & Logistics — 0.13% | |
| | 1,555 | | | Air Transport Services Group, Inc. (a) | | | 35 | |
| | 640 | | | Atlas Air Worldwide Holdings, Inc. (a) | | | 47 | |
| | 731 | | | Echo Global Logistics, Inc. (a) | | | 21 | |
| | 784 | | | Forward Air Corp. | | | 47 | |
| | 884 | | | Hub Group, Inc., Class – A (a) | | | 44 | |
| | 251 | | | Park-Ohio Holdings Corp. | | | 9 | |
| | 1,142 | | | Radiant Logistics, Inc. (a) | | | 4 | |
| | | | | | | | |
| | | | | | | 207 | |
| | | | | | | | |
| | | | Airlines — 2.04% | |
| | 349 | | | Allegiant Travel Co. | | | 48 | |
| | 6,488 | | | American Airlines Group, Inc. | | | 246 | |
| | 4,072 | | | Hawaiian Holdings, Inc. | | | 146 | |
| | 18,678 | | | JetBlue Airways Corp. (a) | | | 355 | |
| | 1,378 | | | SkyWest, Inc. | | | 72 | |
| | 1,855 | | | Spirit Airlines, Inc. (a) | | | 67 | |
| | 28,974 | | | United Continental Holdings, Inc. (a) | | | 2,021 | |
| | 60,535 | | | Volaris Aviation Holding Co., ADR (a) | | | 308 | |
| | | | | | | | |
| | | | | | | 3,263 | |
| | | | | | | | |
| | | | Auto Components — 0.70% | |
| | 3,004 | | | American Axle & Manufacturing
Holdings, Inc. (a) | | | 47 | |
| | 1,361 | | | Cooper Tire & Rubber Co. | | | 36 | |
| | 1,875 | | | Cooper-Standard Holding, Inc. (a) | | | 246 | |
| | 11,125 | | | Dana Holding Corp. | | | 225 | |
| | 714 | | | Dorman Products, Inc. (a) | | | 49 | |
| | 975 | | | Fox Factory Holding Corp. (a) | | | 45 | |
| | 969 | | | Gentherm, Inc. (a) | | | 38 | |
| | 660 | | | LCI Industries | | | 59 | |
| | 11,334 | | | Modine Manufacturing Co. (a) | | | 207 | |
| | 545 | | | Motorcar Parts of America, Inc. (a) | | | 10 | |
| | 446 | | | Shiloh Industries, Inc. (a) | | | 4 | |
| | | | | | | | |
| Shares | | | Security Description | | Value
(000) | |
| | | | Auto Components (continued) | | | | |
| | 962 | | | Spartan Motors, Inc. | | $ | 15 | |
| | 562 | | | Standard Motor Products, Inc. | | | 27 | |
| | 744 | | | Stoneridge, Inc. (a) | | | 26 | |
| | 625 | | | Superior Industries, Inc. | | | 11 | |
| | 1,376 | | | Tenneco, Inc. | | | 60 | |
| | 509 | | | Tower International, Inc. | | | 16 | |
| | | | | | | | |
| | | | | | | 1,121 | |
| | | | | | | | |
| | | | Automobiles — 0.02% | |
| | 832 | | | Winnebago Industries, Inc. | | | 34 | |
| | | | | | | | |
| | | | Banks — 6.17% | |
| | 177 | | | 1st Constitution BanCorp | | | 4 | |
| | 446 | | | 1st Source, Inc. | | | 24 | |
| | 421 | | | Access National Corp. | | | 12 | |
| | 205 | | | ACNB Corp. | | | 7 | |
| | 324 | | | Allegiance Bancshares, Inc. (a) | | | 14 | |
| | 238 | | | American National Bankshares, Inc. | | | 10 | |
| | 1,077 | | | Ameris BanCorp | | | 57 | |
| | 251 | | | Ames National Corp. | | | 8 | |
| | 337 | | | Arrow Financial Corp. | | | 12 | |
| | 13,224 | | | Associated Banc-Corp. | | | 361 | |
| | 688 | | | Atlantic Capital Bancshares, Inc. (a) | | | 14 | |
| | 55 | | | Auburn National BanCorp. | | | 3 | |
| | 1,203 | | | Banc of California, Inc. | | | 24 | |
| | 487 | | | BancFirst Corp. | | | 29 | |
| | 839 | | | Banco Latinoamericano de Comercio Exterior SA, Class – E | | | 21 | |
| | 1,388 | | | BanCorp, Inc. (a) | | | 15 | |
| | 2,580 | | | BancorpSouth Bank | | | 85 | |
| | 465 | | | Bank of Commerce Holdings | | | 6 | |
| | 190 | | | Bank of Marin BanCorp | | | 15 | |
| | 1,476 | | | Bank of N.T. Butterfield & Son Ltd. (The) | | | 67 | |
| | 141 | | | Bank of Princeton (The) (a) | | | 5 | |
| | 179 | | | Bankwell Financial Group, Inc. | | | 6 | |
| | 861 | | | Banner Corp. | | | 52 | |
| | 426 | | | Bar Harbor Bankshares, Inc. | | | 13 | |
| | 253 | | | Baycom Corp. (a) | | | 6 | |
| | 375 | | | BCB BanCorp, Inc. | | | 6 | |
| | 1,101 | | | Berkshire Hills BanCorp, Inc. | | | 45 | |
| | 673 | | | Blue Hills BanCorp, Inc. | | | 15 | |
| | 2,205 | | | Boston Private Financial Holdings, Inc. | | | 35 | |
| | 486 | | | Bridge BanCorp, Inc. | | | 17 | |
| | 2,134 | | | Brookline BanCorp, Inc. | | | 40 | |
| | 539 | | | Bryn Mawr Bank Corp. | | | 25 | |
| | 236 | | | Business First Bancshares, Inc. | | | 6 | |
| | 464 | | | Byline BanCorp, Inc. (a) | | | 10 | |
| | 83 | | | C&F Financial Corp. | | | 5 | |
| | 1,273 | | | Cadence Bancorporation | | | 37 | |
| | 93 | | | Cambridge BanCorp | | | 8 | |
| | 424 | | | Camden National Corp. | | | 19 | |
| | 323 | | | Capital City Bank Group, Inc. | | | 8 | |
| | 269 | | | Capstar Financial Holdings, Inc. (a) | | | 5 | |
| | 524 | | | Carolina Financial Corp. | | | 22 | |
| | 2,092 | | | Cathay BanCorp, Inc. | | | 85 | |
| | 113 | | | CB Financial Services, Inc. | | | 4 | |
See accompanying notes to portfolio of investments
89
HC CAPITAL TRUST
The Institutional Small Capitalization-Mid Capitalization Equity Portfolio
Portfolio of Investments (continued) — June 30, 2018
| | | | | | | | |
| Shares | | | Security Description | | Value
(000) | |
| | | | Common Stocks (continued) | |
| | | | Banks (continued) | |
| | 489 | | | CBTX, Inc. | | $ | 16 | |
| | 16,209 | | | Centerstate Bank Corp. | | | 483 | |
| | 808 | | | Central Pacific Financial Corp. | | | 23 | |
| | 295 | | | Central Valley Comm BanCorp | | | 6 | |
| | 86 | | | Century Bancorp, Inc., Class – A | | | 7 | |
| | 5,822 | | | Chemical Financial Corp. | | | 324 | |
| | 86 | | | Chemung Financial Corp. | | | 4 | |
| | 342 | | | Citizens & Northern Corp. | | | 9 | |
| | 420 | | | City Holding Co. | | | 32 | |
| | 292 | | | Civista Bancshares, Inc. | | | 7 | |
| | 420 | | | CNB Financial Corp. | | | 13 | |
| | 1,065 | | | CoBiz Financial, Inc. | | | 23 | |
| | 250 | | | Codorus Valley BanCorp, Inc. | | | 8 | |
| | 1,977 | | | Columbia Banking System, Inc. | | | 81 | |
| | 1,357 | | | Community Bank System, Inc. | | | 80 | |
| | 641 | | | Community Bankers Trust Corp. (a) | | | 6 | |
| | 121 | | | Community Financial Corp.(The) | | | 4 | |
| | 426 | | | Community Trust Bancorp, Inc. | | | 21 | |
| | 836 | | | ConnectOne Bancorp, Inc. | | | 21 | |
| | 144 | | | County Bancorp, Inc. | | | 4 | |
| | 799 | | | Customers BanCorp, Inc. (a) | | | 23 | |
| | 2,803 | | | CVB Financial Corp. | | | 63 | |
| | 862 | | | Eagle BanCorp, Inc. (a) | | | 53 | |
| | 273 | | | Enterprise BanCorp, Inc. | | | 11 | |
| | 612 | | | Enterprise Financial Services Corp. | | | 33 | |
| | 360 | | | Equity Bancshares, Inc. (a) | | | 15 | |
| | 144 | | | Esquire Financial Holdings, Inc. (a) | | | 4 | |
| | 137 | | | Evans BanCorp, Inc. | | | 6 | |
| | 255 | | | Farmers & Merchants Banco | | | 10 | |
| | 185 | | | Farmers Capital Bank Corp. | | | 10 | |
| | 738 | | | Farmers National Banc Corp. | | | 12 | |
| | 360 | | | FB Financial Corp. | | | 15 | |
| | 1,143 | | | FCB Financial Holdings (a) | | | 67 | |
| | 68 | | | Fidelity D&D BanCorp, Inc. | | | 4 | |
| | 566 | | | Fidelity Southern Corp. | | | 14 | |
| | 424 | | | Financial Institutions, Inc. | | | 14 | |
| | 791 | | | First Bancorp | | | 32 | |
| | 43,720 | | | First BanCorp (a) | | | 334 | |
| | 297 | | | First Bancorp, Inc. | | | 8 | |
| | 334 | | | First Bancshares, Inc. | | | 12 | |
| | 402 | | | First Bank/Hamilton | | | 6 | |
| | 1,180 | | | First Busey Corp. | | | 37 | |
| | 245 | | | First Business Financial Services, Inc. | | | 6 | |
| | 142 | | | First Choice BanCorp | | | 4 | |
| | 2,698 | | | First Commonwealth Financial Corp. | | | 42 | |
| | 425 | | | First Community Bancshares, Inc. | | | 14 | |
| | 174 | | | First Community Corp. | | | 4 | |
| | 406 | | | First Connecticut BanCorp, Inc. | | | 12 | |
| | 2,584 | | | First Financial BanCorp | | | 79 | |
| | 1,757 | | | First Financial Bankshares, Inc. | | | 89 | |
| | 300 | | | First Financial Corp. | | | 14 | |
| | 248 | | | First Financial Northwest, Inc. | | | 5 | |
| | 905 | | | First Foundation, Inc. (a) | | | 17 | |
| | 141 | | | First Guaranty Bancshares, Inc. | | | 4 | |
| | | | | | | | |
| Shares | | | Security Description | | Value
(000) | |
| | | | Banks (continued) | |
| | 12,702 | | | First Horizon National Corp. | | $ | 227 | |
| | 232 | | | First Internet BanCorp | | | 8 | |
| | 885 | | | First Interstate BancSystem, Inc., Class – A | | | 37 | |
| | 1,329 | | | First Merchants Corp. | | | 62 | |
| | 321 | | | First Mid-Illinois Bancshares, Inc. | | | 13 | |
| | 9,300 | | | First Midwest Bancorp, Inc. | | | 237 | |
| | 298 | | | First Northwest BanCorp (a) | | | 5 | |
| | 661 | | | First of Long Island Corp. (The) | | | 16 | |
| | 43 | | | First Savings Financial GRP | | | 3 | |
| | 164 | | | First United Corp. | | | 3 | |
| | 768 | | | Flushing Financial Corp. | | | 20 | |
| | 160 | | | FNB BanCorp | | | 6 | |
| | 339 | | | Franklin Financial Network, Inc. (a) | | | 13 | |
| | 4,662 | | | Fulton Financial Corp. | | | 77 | |
| | 586 | | | German American BanCorp, Inc. | | | 21 | |
| | 2,292 | | | Glacier BanCorp, Inc. | | | 89 | |
| | 301 | | | Great Southern Bancorp, Inc. | | | 17 | |
| | 1,602 | | | Great Western Bancorp, Inc. | | | 67 | |
| | 673 | | | Green BanCorp, Inc. | | | 15 | |
| | 680 | | | Guaranty BanCorp | | | 20 | |
| | 231 | | | Guaranty Bancshares, Inc. | | | 8 | |
| | 2,302 | | | Hancock Holding Co. | | | 107 | |
| | 863 | | | Hanmi Financial Corp. | | | 24 | |
| | 382 | | | Harborone BanCorp, Inc. (a) | | | 7 | |
| | 791 | | | Heartland Financial USA, Inc. | | | 43 | |
| | 1,079 | | | Heritage Commerce Corp. | | | 18 | |
| | 909 | | | Heritage Financial Corp. | | | 32 | |
| | 1,942 | | | Hilltop Holdings, Inc. | | | 43 | |
| | 4,309 | | | Home Bancshares, Inc. | | | 97 | |
| | 472 | | | Hometrust Bancshares, Inc. (a) | | | 13 | |
| | 20,617 | | | Hope Bancorp, Inc. | | | 368 | |
| | 955 | | | Horizon Bancorp, Inc. | | | 20 | |
| | 333 | | | Howard BanCorp, Inc. (a) | | | 6 | |
| | 3,169 | | | Iberiabank Corp. | | | 240 | |
| | 576 | | | Independent Bank Corp. | | | 15 | |
| | 736 | | | Independent Bank Corp. | | | 58 | |
| | 571 | | | Independent Bank Group, Inc. | | | 38 | |
| | 1,496 | | | International Bancshares Corp. | | | 64 | |
| | 242 | | | Investar Holding Corp. | | | 7 | |
| | 6,798 | | | Investors Bancorp, Inc. | | | 87 | |
| | 1,215 | | | Lakeland Bancorp, Inc. | | | 24 | |
| | 668 | | | Lakeland Financial Corp. | | | 32 | |
| | 267 | | | LCNB Corp. | | | 5 | |
| | 1,287 | | | LegacyTexas Financial Group, Inc. | | | 50 | |
| | 688 | | | Live Oak Bancshares, Inc. | | | 21 | |
| | 758 | | | Macatawa Bank Corp. | | | 9 | |
| | 2,245 | | | MB Financial, Inc. | | | 105 | |
| | 532 | | | MBT Financial Corp. | | | 6 | |
| | 454 | | | Mercantile Bank Corp. | | | 17 | |
| | 174 | | | Metropolitan Bank Holding Corp. (a) | | | 9 | |
| | 113 | | | Mid Penn BanCorp, Inc. | | | 4 | |
| | 80 | | | Middlefield Banc Corp. | | | 4 | |
| | 567 | | | Midland States BanCorp, Inc. | | | 19 | |
| | 435 | | | MidSouth Bancorp, Inc. | | | 6 | |
| | 323 | | | MidWestOne Financial Group, Inc. | | | 11 | |
See accompanying notes to financial statements.
90
HC CAPITAL TRUST
The Institutional Small Capitalization-Mid Capitalization Equity Portfolio
Portfolio of Investments (continued) — June 30, 2018
| | | | | | | | |
| Shares | | | Security Description | | Value
(000) | |
| | | | Common Stocks (continued) | |
| | | | Banks (continued) | |
| | 180 | | | Mutualfirst Financial, Inc. | | $ | 7 | |
| | 202 | | | MVB Financial Corp. | | | 4 | |
| | 775 | | | National Bank Holdings Corp., Class – A | | | 30 | |
| | 197 | | | National Bankshares, Inc. | | | 9 | |
| | 401 | | | National Commerce Corp. (a) | | | 19 | |
| | 1,130 | | | NBT Bancorp, Inc. | | | 43 | |
| | 249 | | | Nicolet Bankshares, Inc. (a) | | | 14 | |
| | 225 | | | Northeast BanCorp | | | 5 | |
| | 200 | | | Northrim BanCorp, Inc. | | | 8 | |
| | 172 | | | Norwood Financial Corp. | | | 6 | |
| | 166 | | | Oak Valley BanCorp | | | 4 | |
| | 1,111 | | | OFG Bancorp | | | 16 | |
| | 123 | | | Ohio Valley Banc Corp. | | | 6 | |
| | 419 | | | Old Line Bancshares, Inc. | | | 15 | |
| | 4,075 | | | Old National Bancorp | | | 76 | |
| | 830 | | | Old Second BanCorp, Inc. | | | 12 | |
| | 553 | | | Opus Bank | | | 16 | |
| | 429 | | | Origin BanCorp, Inc. | | | 18 | |
| | 222 | | | Orrstown Financial Services, Inc. | | | 6 | |
| | 470 | | | Pacific Mercantile BanCorp (a) | | | 5 | |
| | 1,228 | | | Pacific Premier Bancorp, Inc. (a) | | | 47 | |
| | 363 | | | Park National Corp. | | | 40 | |
| | 198 | | | Parke BanCorp, Inc. | | | 5 | |
| | 495 | | | Peapack-Gladstone Financial Corp. | | | 17 | |
| | 138 | | | Penns Woods BanCorp, Inc. | | | 6 | |
| | 143 | | | Peoples BanCorp | | | 5 | |
| | 456 | | | Peoples Bancorp, Inc. | | | 17 | |
| | 198 | | | Peoples Financial Services Corp. | | | 9 | |
| | 395 | | | People’s Utah BanCorp | | | 14 | |
| | 10,162 | | | Popular, Inc. | | | 460 | |
| | 372 | | | Preferred Bank | | | 23 | |
| | 299 | | | Premier Financial Bancorp, Inc. | | | 6 | |
| | 353 | | | QCR Holdings, Inc. | | | 17 | |
| | 366 | | | RBB BanCorp | | | 12 | |
| | 258 | | | Reliant BanCorp, Inc. | | | 7 | |
| | 1,302 | | | Renasant Co. | | | 59 | |
| | 266 | | | Republic Bancorp, Inc., Class – A | | | 12 | |
| | 1,383 | | | Republic First Bancorp, Inc. (a) | | | 11 | |
| | 910 | | | S & T BanCorp, Inc. | | | 39 | |
| | 935 | | | Sandy Spring BanCorp, Inc. | | | 38 | |
| | 176 | | | SB One BanCorp | | | 5 | |
| | 1,241 | | | Seacoast Banking Corporation of Florida (a) | | | 39 | |
| | 267 | | | Select BanCorp, Inc. (a) | | | 4 | |
| | 1,258 | | | ServisFirst Bancshares, Inc. | | | 52 | |
| | 367 | | | Shore Bancshares, Inc. | | | 7 | |
| | 389 | | | Sierra Bancorp | | | 11 | |
| | 3,614 | | | Signature Bank (a) | | | 462 | |
| | 2,442 | | | Simmons First National Corp. | | | 73 | |
| | 292 | | | Smartfinancial, Inc. (a) | | | 8 | |
| | 988 | | | South State Corp. | | | 85 | |
| | 191 | | | Southern First Bancshares (a) | | | 8 | |
| | 619 | | | Southern National BanCorp | | | 11 | |
| | 895 | | | Southside Bancshares, Inc. | | | 30 | |
| | 991 | | | State Bank Financial Corp. | | | 33 | |
| | | | | | | | |
| Shares | | | Security Description | | Value
(000) | |
| | | | Banks (continued) | |
| | 604 | | | Stock Yards BanCorp, Inc. | | $ | 23 | |
| | 317 | | | Summit Financial Group, Inc. | | | 9 | |
| | 3,526 | | | Synovus Financial Corp. | | | 186 | |
| | 7,532 | | | TCF Financial Corp. | | | 185 | |
| | 399 | | | Tompkins TrustCo, Inc. | | | 34 | |
| | 1,781 | | | TowneBank | | | 57 | |
| | 529 | | | TriCo Bancshares | | | 20 | |
| | 618 | | | Tristate Capital Holdings, Inc. (a) | | | 16 | |
| | 644 | | | Triumph Bancorp, Inc. (a) | | | 26 | |
| | 1,824 | | | Trustmark Corp. | | | 60 | |
| | 1,226 | | | UMB Financial Corp. | | | 93 | |
| | 1,764 | | | Union Bankshares Corp. | | | 69 | |
| | 116 | | | Union Bankshares, Inc. | | | 6 | |
| | 2,738 | | | United Bankshares, Inc. | | | 100 | |
| | 2,118 | | | United Community Banks, Inc. | | | 65 | |
| | 397 | | | United Security Bancshare/CA | | | 4 | |
| | 231 | | | Unity BanCorp, Inc. | | | 5 | |
| | 790 | | | Univest Corp. | | | 22 | |
| | 8,681 | | | Valley National Bancorp | | | 106 | |
| | 624 | | | Veritex Holdings, Inc. (a) | | | 19 | |
| | 407 | | | Washington Trust BanCorp, Inc. | | | 24 | |
| | 8,955 | | | Webster Financial Corp. | | | 569 | |
| | 1,202 | | | WesBanco, Inc. | | | 54 | |
| | 455 | | | West Bancorporation, Inc. | | | 11 | |
| | 696 | | | Westamerica Bancorp | | | 39 | |
| | | | | | | | |
| | | | | | | 9,873 | |
| | | | | | | | |
| | | | Beverages — 0.11% | |
| | 2,808 | | | Castle Brands, Inc. (a) | | | 3 | |
| | 524 | | | Celsius Holdings, Inc. (a) | | | 2 | |
| | 130 | | | Coca-Cola Bottling Co. Consolidated | | | 18 | |
| | 371 | | | Craft Brew Alliance, Inc. (a) | | | 8 | |
| | 357 | | | MGP Ingredients, Inc. | | | 32 | |
| | 310 | | | National Beverage Corp. (a) | | | 33 | |
| | 732 | | | Primo Water Corp. (a) | | | 13 | |
| | 227 | | | The Boston Beer Co., Inc., Class – A (a) | | | 68 | |
| | | | | | | | |
| | | | | | | 177 | |
| | | | | | | | |
| | | | Biotechnology — 4.14% | |
| | 778 | | | Abeona Therapeutics, Inc. (a) | | | 12 | |
| | 2,659 | | | Acadia Pharmaceuticals, Inc. (a) | | | 41 | |
| | 4,589 | | | Acceleron Pharma, Inc. (a) | | | 223 | |
| | 859 | | | Achaogen, Inc.^ (a) | | | 7 | |
| | 3,829 | | | Achillion Pharmaceuticals, Inc. (a) | | | 11 | |
| | 1,145 | | | Acorda Therapeutics, Inc. (a) | | | 33 | |
| | 590 | | | Adamas Pharmaceuticals, Inc. (a) | | | 15 | |
| | 425 | | | ADMA Biologics, Inc. (a) | | | 2 | |
| | 1,722 | | | Aduro Biotech, Inc. (a) | | | 12 | |
| | 1,369 | | | Adverum Biotechnologies, Inc. (a) | | | 7 | |
| | 395 | | | Aeglea BioTherapeutics, Inc. (a) | | | 4 | |
| | 2,168 | | | Agenus, Inc. (a) | | | 5 | |
| | 1,166 | | | Aimmune Therapeutics, Inc. (a) | | | 31 | |
| | 1,361 | | | Akebia Therapeutics, Inc. (a) | | | 14 | |
| | 228 | | | Albireo Pharma, Inc. (a) | | | 8 | |
| | 1,753 | | | Alder Biopharmaceuticals, Inc. (a) | | | 28 | |
| | 375 | | | Aldeyra Therapeutics, Inc. (a) | | | 3 | |
See accompanying notes to financial statements.
91
HC CAPITAL TRUST
The Institutional Small Capitalization-Mid Capitalization Equity Portfolio
Portfolio of Investments (continued) — June 30, 2018
| | | | | | | | |
| Shares | | | Security Description | | Value
(000) | |
| | | | Common Stocks (continued) | |
| | | | Biotechnology (continued) | |
| | 369 | | | Alkermes PLC (a) | | $ | 15 | |
| | 277 | | | Allena Pharmaceuticals, Inc. (a) | | | 4 | |
| | 970 | | | AMAG Pharmaceuticals, Inc. (a) | | | 19 | |
| | 5,118 | | | Amicus Therapeutics, Inc. (a) | | | 80 | |
| | 501 | | | Anaptysbio, Inc. (a) | | | 36 | |
| | 957 | | | Apellis Pharmaceuticals, Inc. (a) | | | 21 | |
| | 875 | | | Arbutus BioPharma Corp. (a) | | | 6 | |
| | 136 | | | Arcus Biosciences, Inc. (a) | | | 2 | |
| | 1,002 | | | Ardelyx, Inc. (a) | | | 4 | |
| | 1,341 | | | Arena Pharmaceuticals, Inc. (a) | | | 58 | |
| | 2,279 | | | ArQule, Inc. (a) | | | 13 | |
| | 5,511 | | | Array BioPharma, Inc. (a) | | | 92 | |
| | 2,285 | | | Arrowhead Pharmaceuticals, Inc. (a) | | | 31 | |
| | 101 | | | Arsanis, Inc. (a) | | | — | |
| | 1,093 | | | Atara Biotherapeutics, Inc. (a) | | | 40 | |
| | 1,111 | | | Athenex, Inc. (a) | | | 21 | |
| | 3,034 | | | Athersys, Inc. (a) | | | 6 | |
| | 857 | | | Audentes Therapeutics, Inc. (a) | | | 33 | |
| | 2,517 | | | Aveo Phamaceuticals, Inc. (a) | | | 6 | |
| | 1,222 | | | Avid Bioservices, Inc. (a) | | | 5 | |
| | 1,026 | | | Bellicum Pharmaceuticals, Inc. (a) | | | 8 | |
| | 2,767 | | | BioCryst Pharmaceuticals, Inc. (a) | | | 16 | |
| | 840 | | | Biohaven Pharmaceutical Holding Co. Ltd. (a) | | | 34 | |
| | 165 | | | BioSpecifics Technologies Corp. (a) | | | 7 | |
| | 2,560 | | | BioTime, Inc. (a) | | | 5 | |
| | 877 | | | Bluebird Bio, Inc. (a) | | | 138 | |
| | 1,129 | | | Blueprint Medicines Corp. (a) | | | 72 | |
| | 916 | | | Calithera Biosciences, Inc. (a) | | | 5 | |
| | 135 | | | Calyxt, Inc. (a) | | | 3 | |
| | 731 | | | Cara Therapeutics, Inc. (a) | | | 14 | |
| | 849 | | | CareDx, Inc. (a) | | | 10 | |
| | 1,309 | | | CASI Pharmaceuticals, Inc.^ (a) | | | 11 | |
| | 279 | | | Catalyst Biosciences, Inc. (a) | | | 3 | |
| | 2,577 | | | Catalyst Pharmaceuticals, Inc. (a) | | | 8 | |
| | 136 | | | Celcuity, Inc. (a) | | | 3 | |
| | 284 | | | Cellular Biomedicine Group, Inc.^ (a) | | | 6 | |
| | 708 | | | ChemoCentryx, Inc. (a) | | | 9 | |
| | 1,383 | | | Chimerix, Inc. (a) | | | 7 | |
| | 1,284 | | | Clovis Oncology, Inc. (a) | | | 58 | |
| | 550 | | | Cohbar, Inc. (a) | | | 4 | |
| | 1,262 | | | Coherus Biosciences, Inc. (a) | | | 18 | |
| | 574 | | | Concert Pharmaceuticals, Inc. (a) | | | 10 | |
| | 1,424 | | | Corbus Pharmaceuticals Holdings, Inc. (a) | | | 7 | |
| | 336 | | | Corvus Pharmaceuticals, Inc. (a) | | | 4 | |
| | 1,269 | | | CTI BioPharma Corp. (a) | | | 6 | |
| | 443 | | | Cue BioPharma, Inc. (a) | | | 5 | |
| | 1,203 | | | Cytokinetics, Inc. (a) | | | 10 | |
| | 1,037 | | | CytomX Therapeutics, Inc. (a) | | | 24 | |
| | 228 | | | Deciphera Pharmaceuticals, Inc. (a) | | | 9 | |
| | 446 | | | Denali Therapeutics, Inc. (a) | | | 7 | |
| | 1,166 | | | Dicerna Pharmaceuticals, Inc. (a) | | | 14 | |
| | 1,684 | | | Dynavax Technologies Corp. (a) | | | 26 | |
| | 280 | | | Eagle Pharmaceuticals, Inc. (a) | | | 21 | |
| | 1,227 | | | Editas Medicine, Inc. (a) | | | 44 | |
| | | | | | | | |
| Shares | | | Security Description | | Value
(000) | |
| | | | Biotechnology (continued) | |
| | 1,194 | | | Emergent BioSolutions, Inc. (a) | | $ | 60 | |
| | 2,843 | | | Enanta Pharmaceuticals, Inc. (a) | | | 329 | |
| | 1,354 | | | Epizyme, Inc. (a) | | | 18 | |
| | 615 | | | Esperion Therapeutics, Inc. (a) | | | 24 | |
| | 114 | | | Evelo Biosciences, Inc. (a) | | | 1 | |
| | 8,682 | | | Exact Sciences Corp. (a) | | | 518 | |
| | 1,361 | | | Fate Therapeutics, Inc. (a) | | | 15 | |
| | 265 | | | Fennec Pharmaceuticals, Inc. (a) | | | 3 | |
| | 2,018 | | | Fibrogen, Inc. (a) | | | 126 | |
| | 928 | | | Five Prime Therapeutics, Inc. (a) | | | 15 | |
| | 906 | | | Flexion Therapeutics, Inc.^ (a) | | | 23 | |
| | 997 | | | Fortress Biotech, Inc. (a) | | | 3 | |
| | 412 | | | Foundation Medicine, Inc. (a) | | | 56 | |
| | 547 | | | G1 Therapeutics, Inc. (a) | | | 24 | |
| | 553 | | | Genomic Health, Inc. (a) | | | 28 | |
| | 4,185 | | | Geron Corp.^ (a) | | | 14 | |
| | 1,342 | | | Global Blood Therapeutics, Inc. (a) | | | 61 | |
| | 883 | | | GlycoMimetics Industries, Inc. (a) | | | 14 | |
| | 102 | | | GTx, Inc. (a) | | | 2 | |
| | 3,371 | | | Halozyme Therapeutics, Inc. (a) | | | 57 | |
| | 1,718 | | | Heron Therapeutics, Inc. (a) | | | 67 | |
| | 275 | | | Homology Medicines, Inc. (a) | | | 6 | |
| | 4,131 | | | Idera Pharmaceuticals, Inc. (a) | | | 5 | |
| | 1,001 | | | Immune Design Corp. (a) | | | 5 | |
| | 3,447 | | | ImmunoGen, Inc. (a) | | | 34 | |
| | 3,541 | | | Immunomedics, Inc. (a) | | | 84 | |
| | 2,310 | | | Inovio Pharmaceuticals, Inc. (a) | | | 9 | |
| | 2,071 | | | Insmed, Inc. (a) | | | 49 | |
| | 705 | | | Insys Therapeutics, Inc. (a) | | | 5 | |
| | 886 | | | Intellia Therapeutics, Inc. (a) | | | 24 | |
| | 592 | | | Intercept Pharmaceuticals, Inc. (a) | | | 50 | |
| | 1,825 | | | Intrexon Corp. (a) | | | 25 | |
| | 1,708 | | | Invitae Corp. (a) | | | 13 | |
| | 2,218 | | | Iovance Biotherapeutics, Inc. (a) | | | 28 | |
| | 3,744 | | | Ironwood Pharmaceuticals, Inc. (a) | | | 72 | |
| | 400 | | | Jounce Therapeutics, Inc. (a) | | | 3 | |
| | 1,729 | | | Kadmon Holdings, Inc. (a) | | | 7 | |
| | 1,302 | | | Karyopharm Therapeutics, Inc. (a) | | | 22 | |
| | 2,538 | | | Keryx Biopharmaceuticals, Inc. (a) | | | 10 | |
| | 749 | | | Kindred Biosciences, Inc. (a) | | | 8 | |
| | 671 | | | Kura Oncology, Inc. (a) | | | 12 | |
| | 577 | | | La Jolla Pharmaceutical Co. (a) | | | 17 | |
| | 1,192 | | | Lexicon Pharmaceuticals, Inc. (a) | | | 14 | |
| | 1,983 | | | Ligand Pharmaceuticals, Inc., Class – B (a) | | | 410 | |
| | 1,876 | | | Loxo Oncology, Inc. (a) | | | 324 | |
| | 1,057 | | | MacroGenics, Inc. (a) | | | 22 | |
| | 156 | | | Madrigal Pharmaceuticals, Inc. (a) | | | 44 | |
| | 3,489 | | | MannKind Corp. (a) | | | 7 | |
| | 1,094 | | | MediciNova, Inc. (a) | | | 9 | |
| | 334 | | | Mersana Therapeutics, Inc. (a) | | | 6 | |
| | 2,867 | | | MiMedx Group, Inc.^ (a) | | | 18 | |
| | 791 | | | Minerva Neurosciences, Inc. (a) | | | 7 | |
| | 530 | | | Miragen Therapeutics, Inc. (a) | | | 3 | |
| | 475 | | | Mirati Therapeutics, Inc. (a) | | | 23 | |
| | 2,075 | | | Momenta Pharmaceuticals, Inc. (a) | | | 42 | |
See accompanying notes to financial statements.
92
HC CAPITAL TRUST
The Institutional Small Capitalization-Mid Capitalization Equity Portfolio
Portfolio of Investments (continued) — June 30, 2018
| | | | | | | | |
| Shares | | | Security Description | | Value
(000) | |
| | | | Common Stocks (continued) | |
| | | | Biotechnology (continued) | |
| | 385 | | | Mustang Bio, Inc. (a) | | $ | 3 | |
| | 14,709 | | | Myriad Genetics, Inc. (a) | | | 549 | |
| | 924 | | | Nantkwest, Inc. (a) | | | 3 | |
| | 12,467 | | | Natera, Inc. (a) | | | 235 | |
| | 894 | | | NewLink Genetics Corp. (a) | | | 4 | |
| | 10,266 | | | Novavax, Inc. (a) | | | 14 | |
| | 973 | | | Nymox Pharmaceutical Corp.^ (a) | | | 3 | |
| | 8,691 | | | OPKO Health, Inc.^ (a) | | | 41 | |
| | 3,286 | | | Organovo Holdings, Inc.^ (a) | | | 5 | |
| | 385 | | | Ovid Therapeutics, Inc. (a) | | | 3 | |
| | 4,759 | | | Palatin Technologies, Inc. (a) | | | 5 | |
| | 4,324 | | | PDL BioPharma, Inc. (a) | | | 10 | |
| | 493 | | | Pfenex, Inc. (a) | | | 3 | |
| | 1,168 | | | Pieris Pharmaceuticals, Inc. (a) | | | 6 | |
| | 228 | | | PolarityTE, Inc. (a) | | | 5 | |
| | 1,754 | | | Portola Pharmaceuticals, Inc. (a) | | | 66 | |
| | 2,001 | | | Progenics Pharmaceuticals, Inc. (a) | | | 16 | |
| | 543 | | | Proteostasis Therapeutics, Inc. (a) | | | 2 | |
| | 1,074 | | | Prothena Corp. PLC (a) | | | 16 | |
| | 1,220 | | | PTC Therapeutics, Inc. (a) | | | 41 | |
| | 771 | | | Puma Biotechnology, Inc. (a) | | | 46 | |
| | 344 | | | Ra Pharmaceuticals, Inc. (a) | | | 3 | |
| | 1,094 | | | Radius Health, Inc. (a) | | | 32 | |
| | 414 | | | Recro Pharma, Inc. (a) | | | 2 | |
| | 773 | | | Regenxbio, Inc. (a) | | | 55 | |
| | 1,056 | | | Repligen Corp. (a) | | | 50 | |
| | 1,080 | | | Retrophin, Inc. (a) | | | 29 | |
| | 322 | | | Rhythm Pharmaceuticals, Inc. (a) | | | 10 | |
| | 4,166 | | | Rigel Pharmaceuticals, Inc. (a) | | | 12 | |
| | 548 | | | Rocket Pharmaceuticals, Inc. (a) | | | 11 | |
| | 10,799 | | | Sangamo BioSciences, Inc. (a) | | | 153 | |
| | 630 | | | Savara, Inc. (a) | | | 7 | |
| | 424 | | | Selecta Biosciences, Inc. (a) | | | 6 | |
| | 618 | | | Seres Therapeutics, Inc. (a) | | | 5 | |
| | 239 | | | Solid Biosciences, Inc. (a) | | | 9 | |
| | 2,282 | | | Sorrento Therapeutics, Inc.^ (a) | | | 16 | |
| | 847 | | | Spark Therapeutics, Inc. (a) | | | 70 | |
| | 2,669 | | | Spectrum Pharmaceuticals, Inc. (a) | | | 56 | |
| | 190 | | | Spero Therapeutics, Inc. (a) | | | 3 | |
| | 265 | | | Spring Bank Pharmaceuticals, Inc. (a) | | | 3 | |
| | 751 | | | Stemline Therapeutics, Inc. (a) | | | 12 | |
| | 191 | | | Surface Oncology, Inc. (a) | | | 3 | |
| | 362 | | | Syndax Pharmaceuticals, Inc. (a) | | | 3 | |
| | 7,037 | | | Synergy Pharmaceuticals, Inc.^ (a) | | | 12 | |
| | 369 | | | Synlogic, Inc. (a) | | | 4 | |
| | 629 | | | Syros Pharmaceuticals, Inc. (a) | | | 6 | |
| | 628 | | | T2 Biosystems, Inc. (a) | | | 5 | |
| | 6,024 | | | Tesaro, Inc. (a) | | | 267 | |
| | 1,596 | | | TG Therapeutics, Inc. (a) | | | 21 | |
| | 530 | | | Tocagen, Inc. (a) | | | 5 | |
| | 1,002 | | | Tyme Technologies, Inc. (a) | | | 3 | |
| | 1,269 | | | Ultragenyx Pharmaceutical, Inc. (a) | | | 98 | |
| | 133 | | | UNITY Biotechnology, Inc. (a) | | | 2 | |
| | 93 | | | Unum Therapeutics, Inc. (a) | | | 1 | |
| | | | | | | | |
| Shares | | | Security Description | | Value
(000) | |
| | | | Biotechnology (continued) | |
| | 1,385 | | | Vanda Pharmaceuticals, Inc. (a) | | $ | 26 | |
| | 729 | | | Veracyte, Inc. (a) | | | 7 | |
| | 1,387 | | | Verastem, Inc. (a) | | | 10 | |
| | 968 | | | Vericel Corp. (a) | | | 9 | |
| | 1,143 | | | Viking Therapeutics, Inc. (a) | | | 11 | |
| | 737 | | | Vital Therapies, Inc. (a) | | | 5 | |
| | 578 | | | Voyager Therapeutics, Inc. (a) | | | 11 | |
| | 1,244 | | | Xencor, Inc. (a) | | | 46 | |
| | 132 | | | Xoma Corp. (a) | | | 3 | |
| | 551 | | | Zafgen, Inc. (a) | | | 6 | |
| | 3,633 | | | ZIOPHARM Oncology, Inc. (a) | | | 11 | |
| | | | | | | | |
| | | | | | | 6,644 | |
| | | | | | | | |
| | | | Building Products — 1.59% | |
| | 1,096 | | | AAON, Inc. | | | 36 | |
| | 1,196 | | | Advanced Drainage Systems, Inc. | | | 34 | |
| | 382 | | | American Woodmark Corp. (a) | | | 35 | |
| | 738 | | | Apogee Enterprises, Inc. | | | 36 | |
| | 631 | | | Armstrong Flooring, Inc. (a) | | | 9 | |
| | 3,055 | | | Builders FirstSource, Inc. (a) | | | 56 | |
| | 9,846 | | | Caesarstone, Ltd. | | | 149 | |
| | 1,004 | | | Continental Building Products, Inc. (a) | | | 32 | |
| | 426 | | | CSW Industrials, Inc. (a) | | | 23 | |
| | 9,779 | | | Gibraltar Industries, Inc. (a) | | | 367 | |
| | 811 | | | Griffon Corp. | | | 14 | |
| | 467 | | | Insteel Industries, Inc. | | | 16 | |
| | 14,111 | | | Jeld-Wen Holding, Inc. (a) | | | 403 | |
| | 5,721 | | | Masonite International Corp. (a) | | | 412 | |
| | 1,183 | | | NCI Building Systems, Inc. (a) | | | 25 | |
| | 642 | | | Patrick Industries, Inc. (a) | | | 36 | |
| | 1,320 | | | PGT, Inc. (a) | | | 28 | |
| | 900 | | | Quanex Building Products Corp. | | | 16 | |
| | 1,121 | | | Simpson Manufacturing Co., Inc. | | | 70 | |
| | 10,892 | | | Trex Company, Inc. (a) | | | 681 | |
| | 1,622 | | | Universal Forest Products, Inc. | | | 59 | |
| | | | | | | | |
| | | | | | | 2,537 | |
| | | | | | | | |
| | | | Capital Markets — 1.94% | |
| | 798 | | | Arlington Asset Investment Corp. | | | 8 | |
| | 11,677 | | | Artisan Partners Asset Management, Inc., Class – A | | | 351 | |
| | 16 | | | Ashford, Inc. | | | 1 | |
| | 119 | | | Associated Capital Group, Inc., Class – A | | | 5 | |
| | 589 | | | B. Riley Financial, Inc. | | | 13 | |
| | 2,206 | | | Brightsphere Investment Group | | | 31 | |
| | 590 | | | Cohen & Steers, Inc. | | | 25 | |
| | 737 | | | Cowen Group, Inc., Class – A (a) | | | 10 | |
| | 88 | | | Diamond Hill Investment Group | | | 17 | |
| | 944 | | | Donnelley Financial Solutions, Inc. (a) | | | 16 | |
| | 3,128 | | | E*Trade Financial Corp. (a) | | | 191 | |
| | 3,310 | | | Evercore Partners, Inc., Class – A | | | 348 | |
| | 2,617 | | | Federated Investors, Inc., Class – B | | | 61 | |
| | 1,717 | | | Financial Engines, Inc. | | | 77 | |
| | 1,004 | | | Gain Capital Holdings, Inc. | | | 8 | |
| | 159 | | | GAMCO Investors, Inc., Class – A | | | 4 | |
| | 11,469 | | | Greenhill & Co., Inc. | | | 326 | |
See accompanying notes to financial statements.
93
HC CAPITAL TRUST
The Institutional Small Capitalization-Mid Capitalization Equity Portfolio
Portfolio of Investments (continued) — June 30, 2018
| | | | | | | | |
| Shares | | | Security Description | | Value
(000) | |
| | | | Common Stocks (continued) | |
| | | | Capital Markets (continued) | |
| | 390 | | | Hamilton Lane, Inc. | | $ | 19 | |
| | 804 | | | Houlihan Lokey, Inc. | | | 41 | |
| | 419 | | | International Fcstone, Inc. (a) | | | 22 | |
| | 909 | | | Investment Technology Group, Inc. | | | 19 | |
| | 14,191 | | | Jefferies Financial Group, Inc. | | | 323 | |
| | 2,937 | | | Ladenburg Thalmann Financial Services, Inc. | | | 10 | |
| | 6,556 | | | LPL Financial Holdings, Inc. | | | 429 | |
| | 1,051 | | | Moelis & Co., Class – A | | | 62 | |
| | 283 | | | Oppenheimer Holdings, Inc., Class – A | | | 8 | |
| | 398 | | | Piper Jaffray Cos., Inc. | | | 31 | |
| | 539 | | | PJT Partners, Inc. | | | 29 | |
| | 5,638 | | | Pzena Investment Management, Inc. | | | 52 | |
| | 3,815 | | | Raymond James Financial, Inc. | | | 341 | |
| | 594 | | | Safeguard Scientifics, Inc. (a) | | | 8 | |
| | 154 | | | Siebert Financial Corp.(a) | | | 2 | |
| | 224 | | | Silvercrest Asset Management Group, Inc. | | | 4 | |
| | 1,876 | | | Stifel Financial Corp. | | | 98 | |
| | 190 | | | Virtus Investment Partners, Inc. | | | 24 | |
| | 2,127 | | | Waddell & Reed Financial, Inc., Class – A | | | 38 | |
| | 230 | | | Westwood Holdings Group, Inc. | | | 14 | |
| | 3,161 | | | WisdomTree Investments, Inc. | | | 29 | |
| | | | | | | | |
| | | | | | | 3,095 | |
| | | | | | | | |
| | | | Chemicals — 2.52% | |
| | 755 | | | A. Schulman, Inc. | | | 34 | |
| | 585 | | | Advanced Emissions Solutions, Inc. | | | 7 | |
| | 830 | | | Advansix, Inc. (a) | | | 30 | |
| | 802 | | | Agrofresh Solutions, Inc. (a) | | | 6 | |
| | 3,543 | | | Albemarle Corp. | | | 334 | |
| | 794 | | | American Vanguard Corp. | | | 18 | |
| | 867 | | | Balchem Corp. | | | 85 | |
| | 198 | | | Chase Corp. | | | 23 | |
| | 1,368 | | | Codexis, Inc. (a) | | | 20 | |
| | 2,280 | | | Ferro Corp. (a) | | | 48 | |
| | 1,595 | | | Flotek Industries, Inc. (a) | | | 5 | |
| | 7,986 | | | FMC Corp. | | | 711 | |
| | 721 | | | FutureFuel Corp. | | | 10 | |
| | 1,945 | | | GCP Applied Technologies (a) | | | 56 | |
| | 1,370 | | | H.B. Fuller Co. | | | 74 | |
| | 278 | | | Hawkins, Inc. | | | 10 | |
| | 1,147 | | | Ingevity Corp. (a) | | | 93 | |
| | 3,027 | | | Innophos Holdings, Inc. | | | 144 | |
| | 655 | | | Innospec, Inc. | | | 50 | |
| | 2,727 | | | Intrepid Potash, Inc. (a) | | | 11 | |
| | 397 | | | KMG Chemicals, Inc. | | | 29 | |
| | 570 | | | Koppers Holdings, Inc. (a) | | | 22 | |
| | 18,113 | | | Kraton Performance Polymers, Inc. (a) | | | 835 | |
| | 628 | | | Kronos Worldwide, Inc. | | | 14 | |
| | 668 | | | LSB Industries, Inc. (a) | | | 4 | |
| | 1,223 | | | Marrone Bio Innovations, Inc. (a) | | | 2 | |
| | 957 | | | Minerals Technologies, Inc. | | | 72 | |
| | 1,222 | | | Omnova Solutions, Inc. (a) | | | 13 | |
| | 26,991 | | | Platform Specialty Products Corp. (a) | | | 313 | |
| | 2,161 | | | PolyOne Corp. | | | 93 | |
| | 985 | | | PQ Group Holdings, Inc. (a) | | | 18 | |
| | | | | | | | |
| Shares | | | Security Description | | Value
(000) | |
| | | | Chemicals (continued) | | | | |
| | 354 | | | Quaker Chemical Corp. | | $ | 55 | |
| | 1,372 | | | Rayonier Advanced Materials, Inc. | | | 23 | |
| | 1,156 | | | Sensient Technologies Corp. | | | 83 | |
| | 548 | | | Stepan Co. | | | 43 | |
| | 573 | | | Trecora Resources (a) | | | 9 | |
| | 663 | | | Tredegar Industries, Inc. | | | 16 | |
| | 1,180 | | | Trinseo SA | | | 84 | |
| | 26,869 | | | Tronox Ltd., Class – A | | | 529 | |
| | 699 | | | Valhi, Inc. | | | 3 | |
| | | | | | | | |
| | | | | | | 4,029 | |
| | | | | | | | |
| | | | Commercial Services & Supplies — 2.14% | |
| | 1,782 | | | ABM Industries, Inc. | | | 52 | |
| | 2,871 | | | ACCO Brands Corp. | | | 40 | |
| | 1,952 | | | Advanced Disposal Services, Inc. (a) | | | 48 | |
| | 17,401 | | | Aqua Metals, Inc.^ (a) | | | 50 | |
| | 10,561 | | | ARC Document Solutions, Inc.(a) | | | 19 | |
| | 1,270 | | | Brady Corp., Class – A | | | 49 | |
| | 1,077 | | | Casella Waste Systems, Inc. (a) | | | 28 | |
| | 915 | | | CECO Environmental Corp. | | | 6 | |
| | 23,721 | | | Covanta Holding Corp. | | | 391 | |
| | 1,292 | | | Deluxe Corp. | | | 86 | |
| | 708 | | | Ennis, Inc. | | | 14 | |
| | 27,707 | | | Essendant, Inc. | | | 366 | |
| | 2,002 | | | Healthcare Services Group, Inc. | | | 86 | |
| | 411 | | | Heritage-Crystal Clean, Inc. (a) | | | 8 | |
| | 1,583 | | | Herman Miller, Inc. | | | 54 | |
| | 1,174 | | | HNI Corp. | | | 44 | |
| | 1,305 | | | InnerWorkings, Inc. (a) | | | 11 | |
| | 11,736 | | | Interface, Inc. | | | 269 | |
| | 1,027 | | | Kimball International, Inc., Class – B | | | 17 | |
| | 1,308 | | | Knoll, Inc. | | | 27 | |
| | 967 | | | LSC Communications, Inc. | | | 15 | |
| | 829 | | | Matthews International Corp., Class – A | | | 49 | |
| | 6,690 | | | McGrath RentCorp | | | 424 | |
| | 8,391 | | | Mobile Mini, Inc. | | | 394 | |
| | 922 | | | MSA Safety, Inc. | | | 89 | |
| | 375 | | | Multi-Color Corp. | | | 24 | |
| | 219 | | | NL Industries, Inc.(a) | | | 2 | |
| | 5,085 | | | Pitney Bowes, Inc. | | | 44 | |
| | 869 | | | Quad Graphics, Inc. | | | 18 | |
| | 1,974 | | | RR Donnelley & Sons Co. | | | 11 | |
| | 609 | | | SP Plus Corp.(a) | | | 23 | |
| | 22,017 | | | Steelcase, Inc., Class – A | | | 297 | |
| | 798 | | | Team, Inc.(a) | | | 18 | |
| | 1,486 | | | Tetra Tech, Inc. | | | 87 | |
| | 1,357 | | | The Brink’s Co. | | | 108 | |
| | 413 | | | UniFirst Corp. | | | 73 | |
| | 578 | | | US Ecology, Inc. | | | 37 | |
| | 559 | | | Viad Corp. | | | 30 | |
| | 218 | | | VSE Corp. | | | 10 | |
| | | | | | | | |
| | | | | | | 3,418 | |
| | | | | | | | |
| | | | Communications Equipment — 1.20% | |
| | 8,711 | | | Acacia Communications, Inc.(a) | | | 303 | |
| | 1,343 | | | ADTRAN, Inc. | | | 20 | |
| | 990 | | | Aerohive Networks, Inc.(a) | | | 4 | |
See accompanying notes to financial statements.
94
HC CAPITAL TRUST
The Institutional Small Capitalization-Mid Capitalization Equity Portfolio
Portfolio of Investments (continued) — June 30, 2018
| | | | | | | | |
| Shares | | | Security Description | | Value
(000) | |
| | | | Common Stocks (continued) | |
| | | | Communications Equipment (continued) | |
| | 485 | | | Applied Optoelectronics, Inc.^ (a) | | $ | 22 | |
| | 241 | | | BEL Fuse, Inc., Class – B | | | 5 | |
| | 956 | | | CalAmp Corp. (a) | | | 22 | |
| | 1,259 | | | Calix, Inc. (a) | | | 10 | |
| | 386 | | | Casa Systems, Inc. (a) | | | 6 | |
| | 12,313 | | | Ciena Corp. (a) | | | 326 | |
| | 348 | | | Clearfield, Inc. (a) | | | 4 | |
| | 637 | | | Comtech Telecommunications Corp. | | | 20 | |
| | 117 | | | DASAN Zhone Solutions, Inc. (a) | | | 1 | |
| | 784 | | | Digi International, Inc. (a) | | | 10 | |
| | 3,102 | | | Extreme Networks, Inc. (a) | | | 25 | |
| | 3,107 | | | Finisar Corp. (a) | | | 56 | |
| | 2,334 | | | Harmonic, Inc. (a) | | | 10 | |
| | 26,648 | | | Infinera Corp. (a) | | | 265 | |
| | 936 | | | InterDigital, Inc. | | | 76 | |
| | 469 | | | KVH Industries, Inc. (a) | | | 6 | |
| | 5,400 | | | Lumentum Holdings, Inc. (a) | | | 313 | |
| | 845 | | | NETGEAR, Inc. (a) | | | 53 | |
| | 2,279 | | | NetScout Systems, Inc. (a) | | | 68 | |
| | 4,550 | | | Oclaro, Inc. (a) | | | 41 | |
| | 897 | | | Plantronics, Inc. | | | 68 | |
| | 891 | | | Quantenna Communications, Inc. (a) | | | 14 | |
| | 1,368 | | | Ribbon Communications, Inc. (a) | | | 10 | |
| | 1,481 | | | ViaSat, Inc. (a) | | | 97 | |
| | 6,073 | | | Viavi Solutions, Inc. (a) | | | 62 | |
| | | | | | | | |
| | | | | | | 1,917 | |
| | | | | | | | |
| | | | Construction & Engineering — 2.24% | |
| | 893 | | | Aegion Corp. (a) | | | 23 | |
| | 550 | | | Ameresco, Inc., Class – A (a) | | | 7 | |
| | 410 | | | Argan, Inc. | | | 17 | |
| | 976 | | | Comfort Systems USA, Inc. | | | 45 | |
| | 817 | | | Dycom Industries, Inc. (a) | | | 77 | |
| | 1,568 | | | EMCOR Group, Inc. | | | 119 | |
| | 6,406 | | | Granite Construction, Inc. | | | 357 | |
| | 1,659 | | | Great Lakes Dredge & Dock Co. (a) | | | 9 | |
| | 1,228 | | | HC2 Holdings, Inc. (a) | | | 7 | |
| | 264 | | | IES Holdings, Inc. (a) | | | 4 | |
| | 411 | | | Infrastructure And Energy Alternatives, Inc. (a) | | | 4 | |
| | 30,041 | | | KBR, Inc. | | | 538 | |
| | 23,886 | | | MasTec, Inc. (a) | | | 1,211 | |
| | 409 | | | MYR Group, Inc. (a) | | | 15 | |
| | 285 | | | Northwest Pipe Co. (a) | | | 6 | |
| | 223 | | | NV5 Holdings, Inc. (a) | | | 15 | |
| | 822 | | | Orion Group Holdings, Inc. (a) | | | 7 | |
| | 1,131 | | | Primoris Services Corp. | | | 31 | |
| | 751 | | | Sterling Construction Co., Inc. (a) | | | 10 | |
| | 51,948 | | | Tutor Perini Corp. (a) | | | 958 | |
| | 8,640 | | | Willscot Corp. (a) | | | 128 | |
| | | | | | | | |
| | | | | | | 3,588 | |
| | | | | | | | |
| | | | Construction Materials — 0.81% | |
| | 4,575 | | | Eagle Materials, Inc., Class – A | | | 479 | |
| | 37,268 | | | Forterra, Inc.^ (a) | | | 363 | |
| | 1,513 | | | Martin Marietta Materials, Inc. | | | 338 | |
| | 3,032 | | | Summit Materials, Inc., Class – A (a) | | | 80 | |
| | | | | | | | |
| Shares | | | Security Description | | Value
(000) | |
| | | | Construction Materials (continued) | | | | |
| | 434 | | | U.S. Concrete, Inc. (a) | | $ | 23 | |
| | 60 | | | United States Lime & Minerals, Inc. | | | 5 | |
| | | | | | | | |
| | | | | | | 1,288 | |
| | | | | | | | |
| | | | Consumer Finance — 0.56% | |
| | 214 | | | Curo Group Holdings Corp. (a) | | | 5 | |
| | 535 | | | Elevate Credit, Inc. (a) | | | 5 | |
| | 702 | | | Encore Capital Group, Inc. (a) | | | 26 | |
| | 873 | | | Enova International, Inc. (a) | | | 32 | |
| | 1,381 | | | EZCORP, Inc., Class – A (a) | | | 17 | |
| | 1,233 | | | Firstcash, Inc. | | | 111 | |
| | 4,385 | | | Green Dot Corp., Class – A (a) | | | 321 | |
| | 8,634 | | | LendingClub Corp. (a) | | | 33 | |
| | 528 | | | Nelnet, Inc., Class – A | | | 31 | |
| | 7,399 | | | PRA Group, Inc. (a) | | | 284 | |
| | 295 | | | Regional Management Corp. (a) | | | 10 | |
| | 168 | | | World Acceptance Corp. (a) | | | 19 | |
| | | | | | | | |
| | | | | | | 894 | |
| | | | | | | | |
| | | | Containers & Packaging — 0.65% | |
| | 14,771 | | | Berry Plastics Group, Inc. (a) | | | 679 | |
| | 20,488 | | | Graphic Packaging Holding Co. | | | 297 | |
| | 145 | | | Greif, Inc. | | | 8 | |
| | 675 | | | Greif, Inc., Class – A | | | 36 | |
| | 823 | | | Myers Industries, Inc. | | | 16 | |
| | 191 | | | UFP Technologies, Inc. (a) | | | 6 | |
| | | | | | | | |
| | | | | | | 1,042 | |
| | | | | | | | |
| | | | Distributors — 0.02% | |
| | 1,235 | | | Core-Mark Holding Co., Inc. | | | 28 | |
| | 244 | | | Funko, Inc. (a) | | | 3 | |
| | 183 | | | Weyco Group, Inc. | | | 7 | |
| | | | | | | | |
| | | | | | | 38 | |
| | | | | | | | |
| | | | Diversified Consumer Services — 1.75% | |
| | 1,601 | | | Adtalem Global Education, Inc. (a) | | | 77 | |
| | 439 | | | American Public Education, Inc. (a) | | | 18 | |
| | 407 | | | Cambium Learning Group, Inc. (a) | | | 5 | |
| | 313 | | | Capella Education Co. | | | 31 | |
| | 35,309 | | | Career Education Corp. (a) | | | 571 | |
| | 421 | | | Carriage Services, Inc. | | | 10 | |
| | 34,386 | | | Chegg, Inc. (a) | | | 956 | |
| | 2,861 | | | Houghton Mifflin Harcourt Co. (a) | | | 22 | |
| | 990 | | | K12, Inc. (a) | | | 16 | |
| | 1,530 | | | Laureate Education, Inc., Class – A (a) | | | 22 | |
| | 983 | | | Regis Corp. (a) | | | 16 | |
| | 1,011 | | | Sotheby’s (a) | | | 55 | |
| | 4,876 | | | Strayer Education, Inc. | | | 551 | |
| | 4,390 | | | Weight Watchers International, Inc. (a) | | | 444 | |
| | | | | | | | |
| | | | | | | 2,794 | |
| | | | | | | | |
| | | | Diversified Financial Services — 0.06% | |
| | 1,834 | | | Cannae Holdings, Inc. (a) | | | 34 | |
| | 3,723 | | | FGL Holdings (a) | | | 31 | |
| | 213 | | | Marlin Business Services Corp. | | | 6 | |
| | 1,254 | | | On Deck Capital, Inc. (a) | | | 9 | |
| | 650 | | | PICO Holdings, Inc. | | | 8 | |
| | 774 | | | Tiptree, Inc., Class B | | | 5 | |
| | | | | | | | |
| | | | | | | 93 | |
| | | | | | | | |
See accompanying notes to financial statements.
95
HC CAPITAL TRUST
The Institutional Small Capitalization-Mid Capitalization Equity Portfolio
Portfolio of Investments (continued) — June 30, 2018
| | | | | | | | |
| Shares | | | Security Description | | Value
(000) | |
| | | | Common Stocks (continued) | |
| | | | Diversified Telecommunication Services — 0.75% | |
| | 290 | | | ATN International, Inc. | | $ | 15 | |
| | 1,182 | | | Cincinnati Bell, Inc. (a) | | | 19 | |
| | 17,724 | | | Cogent Communications Group, Inc. | | | 946 | |
| | 1,896 | | | Consolidated Communications Holdings, Inc. | | | 23 | |
| | 2,213 | | | Frontier Communications Corp.^ | | | 12 | |
| | 88 | | | Hawaiian Telcom Holdco, Inc. (a) | | | 3 | |
| | 1,078 | | | Intelsat SA (a) | | | 18 | |
| | 2,587 | | | Iridium Communications, Inc. (a) | | | 42 | |
| | 524 | | | Ooma, Inc. (a) | | | 7 | |
| | 1,878 | | | ORBCOMM, Inc. (a) | | | 19 | |
| | 271 | | | pdvWireless, Inc. (a) | | | 7 | |
| | 5,969 | | | Vonage Holdings Corp. (a) | | | 77 | |
| | 1,064 | | | Windstream Holdings, Inc. (a) | | | 6 | |
| | | | | | | | |
| | | | | | | 1,194 | |
| | | | | | | | |
| | | | Electric Utilities — 0.37% | |
| | 1,394 | | | ALLETE, Inc. | | | 108 | |
| | 1,095 | | | El Paso Electric Co. | | | 65 | |
| | 1,366 | | | IDACORP, Inc. | | | 125 | |
| | 944 | | | MGE Energy, Inc. | | | 60 | |
| | 1,065 | | | Otter Tail Corp. | | | 51 | |
| | 2,154 | | | PNM Resources, Inc. | | | 84 | |
| | 2,421 | | | Portland General Electric Co. | | | 104 | |
| | 250 | | | Spark Energy, Inc., Class – A | | | 2 | |
| | | | | | | | |
| | | | | | | 599 | |
| | | | | | | | |
| | | | Electrical Equipment — 0.38% | |
| | 193 | | | Allied Motion Technologies, Inc. | | | 9 | |
| | 1,064 | | | Atkore International Group, Inc. (a) | | | 22 | |
| | 718 | | | AZZ, Inc. | | | 31 | |
| | 1,002 | | | Babcock & Wilcox Enterprises, Inc. (a) | | | 2 | |
| | 4,823 | | | Encore Wire Corp. | | | 230 | |
| | 606 | | | Energous Corp. (a) | | | 9 | |
| | 1,139 | | | EnerSys | | | 85 | |
| | 2,271 | | | Enphase Energy, Inc. (a) | | | 15 | |
| | 1,924 | | | FuelCell Energy, Inc. (a) | | | 3 | |
| | 1,641 | | | Generac Holdings, Inc. (a) | | | 85 | |
| | 1,677 | | | LSI Industries, Inc. | | | 9 | |
| | 6,477 | | | Plug Power, Inc.^ (a) | | | 13 | |
| | 257 | | | Powell Industries, Inc. | | | 9 | |
| | 90 | | | Preformed Line Products Co. | | | 8 | |
| | 2,565 | | | Sunrun, Inc. (a) | | | 34 | |
| | 891 | | | Thermon Group Holdings, Inc. (a) | | | 20 | |
| | 391 | | | TPI Composites, Inc. (a) | | | 11 | |
| | 463 | | | Vicor Corp. (a) | | | 20 | |
| | | | | | | | |
| | | | | | | 615 | |
| | | | | | | | |
| | | | Electronic Equipment, Instruments & Components — 4.53% | |
| | 458 | | | Agilysys, Inc. (a) | | | 7 | |
| | 6,186 | | | Anixter International, Inc. (a) | | | 392 | |
| | 1,277 | | | AVX Corp. | | | 20 | |
| | 772 | | | Badger Meter, Inc. | | | 35 | |
| | 9,703 | | | Belden, Inc. | | | 592 | |
| | 1,323 | | | Benchmark Electronics, Inc. | | | 39 | |
| | 16,198 | | | Celestica, Inc. (a) | | | 192 | |
| | 2,547 | | | Control4 Corp. (a) | | | 62 | |
| | | | | | | | |
| Shares | | | Security Description | | Value
(000) | |
| | | | Electronic Equipment, Instruments & Components (continued) | | | | |
| | 883 | | | CTS Corp. | | $ | 32 | |
| | 1,028 | | | Daktronics, Inc. | | | 9 | |
| | 896 | | | Electro Scientific Industries, Inc. (a) | | | 14 | |
| | 367 | | | ePlus, Inc. (a) | | | 35 | |
| | 5,346 | | | Fabrinet (a) | | | 198 | |
| | 458 | | | FARO Technologies, Inc. (a) | | | 25 | |
| | 5,583 | | | Fitbit, Inc., Class – A (a) | | | 36 | |
| | 30,286 | | | Flextronics International Ltd. (a) | | | 427 | |
| | 8,325 | | | II-VI, Inc. (a) | | | 362 | |
| | 5,935 | | | Insight Enterprises, Inc. (a) | | | 290 | |
| | 151 | | | Intricon Corp. (a) | | | 6 | |
| | 790 | | | Iteris, Inc. (a) | | | 4 | |
| | 8,940 | | | Itron, Inc. (a) | | | 537 | |
| | 17,733 | | | Jabil Circuit, Inc. | | | 490 | |
| | 1,465 | | | KEMET Corp. (a) | | | 35 | |
| | 743 | | | Kimball Electronics, Inc. (a) | | | 14 | |
| | 2,331 | | | Knowles Corp. (a) | | | 36 | |
| | 1,643 | | | Littelfuse, Inc. | | | 375 | |
| | 1,080 | | | Maxwell Technologies, Inc. (a) | | | 6 | |
| | 89 | | | Mesa Laboratories, Inc. | | | 19 | |
| | 974 | | | Methode Electronics, Inc. | | | 39 | |
| | 466 | | | MTS Systems Corp. | | | 25 | |
| | 368 | | | Napco Security Technologies (a) | | | 5 | |
| | 7,727 | | | nLight, Inc. (a) | | | 255 | |
| | 5,538 | | | Novanta, Inc. (a) | | | 345 | |
| | 467 | | | OSI Systems, Inc. (a) | | | 36 | |
| | 277 | | | Par Technology Corp. (a) | | | 5 | |
| | 555 | | | Park Electrochemical Corp. | | | 13 | |
| | 321 | | | PC Connection, Inc. | | | 11 | |
| | 890 | | | Plexus Corp. (a) | | | 53 | |
| | 6,214 | | | Rogers Corp. (a) | | | 692 | |
| | 1,878 | | | Sanmina Corp. (a) | | | 55 | |
| | 8,070 | | | ScanSource, Inc. (a) | | | 325 | |
| | 820 | | | SYNNEX Corp. | | | 79 | |
| | 318 | | | Systemax, Inc. | | | 11 | |
| | 1,032 | | | Tech Data Corp. (a) | | | 85 | |
| | 2,536 | | | TTM Technologies, Inc. (a) | | | 45 | |
| | 4,773 | | | Universal Display Corp.^ | | | 410 | |
| | 15,488 | | | VeriFone Systems, Inc. (a) | | | 353 | |
| | 3,585 | | | Vishay Intertechnology, Inc. | | | 83 | |
| | 255 | | | Vishay Precision Group, Inc. (a) | | | 10 | |
| | | | | | | | |
| | | | | | | 7,224 | |
| | | | | | | | |
| | | | Energy Equipment & Services — 1.01% | |
| | 3,449 | | | Archrock, Inc. Com | | | 41 | |
| | 509 | | | Basic Energy Services, Inc. (a) | | | 6 | |
| | 915 | | | Bristow Group, Inc. (a) | | | 13 | |
| | 1,733 | | | C&J Energy Services, Inc. (a) | | | 41 | |
| | 720 | | | Cactus, Inc., Class – A (a) | | | 24 | |
| | 685 | | | CARBO Ceramics, Inc.^ (a) | | | 6 | |
| | 858 | | | Covia Holdings Corp. (a) | | | 16 | |
| | 508 | | | Dawson Geophysical Co. (a) | | | 4 | |
| | 1,790 | | | Diamond Offshore Drilling, Inc.^ (a) | | | 37 | |
| | 3,689 | | | Dril-Quip, Inc. (a) | | | 189 | |
| | 6,271 | | | Ensco PLC, Class – A, ADR | | | 46 | |
See accompanying notes to financial statements.
96
HC CAPITAL TRUST
The Institutional Small Capitalization-Mid Capitalization Equity Portfolio
Portfolio of Investments (continued) — June 30, 2018
| | | | | | | | |
| Shares | | | Security Description | | Value
(000) | |
| | | | Common Stocks (continued) | |
| | | | Energy Equipment & Services (continued) | |
| | 587 | | | Era Group, Inc. (a) | | $ | 8 | |
| | 890 | | | Exterran Corp. (a) | | | 22 | |
| | 2,229 | | | Forum Energy Technologies, Inc. (a) | | | 28 | |
| | 1,963 | | | Franks International N.V. (a) | | | 15 | |
| | 627 | | | FTS International, Inc. (a) | | | 9 | |
| | 86 | | | Gulfmark Offshore, Inc. (a) | | | 3 | |
| | 3,801 | | | Helix Energy Solutions Group, Inc. (a) | | | 32 | |
| | 1,045 | | | Independence Contract Drilling, Inc. (a) | | | 4 | |
| | 263 | | | Ion Geophysical (a) | | | 6 | |
| | 1,475 | | | Keane Group, Inc. (a) | | | 20 | |
| | 315 | | | Key Energy Services, Inc. (a) | | | 5 | |
| | 409 | | | Liberty Oilfield Services, Inc. (a) | | | 8 | |
| | 223 | | | Mammoth Energy Services, Inc. (a) | | | 8 | |
| | 668 | | | Matrix Service Co. (a) | | | 12 | |
| | 4,852 | | | McDermott International, Inc. (a) | | | 95 | |
| | 358 | | | Natural Gas Services Group, Inc. (a) | | | 8 | |
| | 293 | | | NCS Multistage Holdings, Inc. (a) | | | 4 | |
| | 2,328 | | | Newpark Resources, Inc. (a) | | | 25 | |
| | 225 | | | Nine Energy Service, Inc. (a) | | | 7 | |
| | 16,797 | | | Noble Corp. PLC (a) | | | 106 | |
| | 1,475 | | | Ocean RIG Udw, Inc. (a) | | | 43 | |
| | 2,672 | | | Oceaneering International, Inc. | | | 68 | |
| | 1,606 | | | Oil States International, Inc. (a) | | | 52 | |
| | 279 | | | PHI, Inc. (a) | | | 3 | |
| | 1,899 | | | Pioneer Energy Services Corp. (a) | | | 11 | |
| | 543 | | | Profire Energy, Inc. (a) | | | 2 | |
| | 1,909 | | | ProPetro Holding Corp. (a) | | | 30 | |
| | 123 | | | Quintana Energy Services, Inc. (a) | | | 1 | |
| | 397 | | | RigNet, Inc. (a) | | | 4 | |
| | 3,439 | | | Rowan Cos. PLC, Class – A (a) | | | 56 | |
| | 454 | | | SEACOR Holdings, Inc. | | | 26 | |
| | 467 | | | SEACOR Marine Holdings, Inc. (a) | | | 11 | |
| | 1,208 | | | Select Energy Services, Inc. (a) | | | 18 | |
| | 666 | | | Smart Sand, Inc.^ (a) | | | 4 | |
| | 675 | | | Solaris Oilfield Infrastructure, Inc. (a) | | | 10 | |
| | 9,452 | | | Superior Energy Services, Inc. (a) | | | 92 | |
| | 4,299 | | | TechnipFMC PLC | | | 136 | |
| | 3,249 | | | TETRA Technologies, Inc. (a) | | | 14 | |
| | 629 | | | Tidewater, Inc. (a) | | | 18 | |
| | 4,557 | | | Transocean Ltd. (a) | | | 61 | |
| | 1,433 | | | Unit Corp. (a) | | | 37 | |
| | 2,167 | | | US Silica Holdings, Inc. | | | 56 | |
| | | | | | | | |
| | | | | | | 1,601 | |
| | | | | | | | |
| | | | Equity Real Estate Investment Trusts — 2.65% | |
| | 2,201 | | | Acadia Realty Trust | | | 60 | |
| | 814 | | | Agree Realty Corp. | | | 43 | |
| | 59 | | | Alexander’s, Inc. | | | 23 | |
| | 1,069 | | | American Assets Trust, Inc. | | | 41 | |
| | 1,455 | | | Americold Realty Trust | | | 32 | |
| | 1,151 | | | Armada Hoffler Properties, Inc. | | | 17 | |
| | 2,290 | | | Ashford Hospitality Trust | | | 19 | |
| | 683 | | | Bluerock Residential Growth REIT, Inc. | | | 6 | |
| | 189 | | | BRT Apartments Corp. | | | 2 | |
| | 1,993 | | | CareTrust REIT, Inc. | | | 33 | |
| | | | | | | | |
| Shares | | | Security Description | | Value
(000) | |
| | | | Equity Real Estate Investment Trusts (continued) | | | | |
| | 1,322 | | | Catchmark Timber Trust, Inc. | | $ | 17 | |
| | 4,578 | | | CBL & Associates Properties, Inc. | | | 25 | |
| | 2,552 | | | Cedar Realty Trust, Inc. | | | 12 | |
| | 1,223 | | | Chatham Lodging Trust | | | 26 | |
| | 1,605 | | | Chesapeake Lodging Trust | | | 51 | |
| | 1,010 | | | City Office REIT, Inc. | | | 13 | |
| | 485 | | | Clipper Realty, Inc. | | | 4 | |
| | 488 | | | Community Healthcare Trust, Inc. | | | 15 | |
| | 3,210 | | | CoreCivic, Inc. | | | 77 | |
| | 337 | | | Corenergy Infrastructure Trust, Inc. | | | 13 | |
| | 1,128 | | | CorePoint Lodging, Inc. (a) | | | 29 | |
| | 7,192 | | | Corporate Office Properties Trust | | | 207 | |
| | 11,376 | | | Cousins Properties, Inc. | | | 110 | |
| | 9,724 | | | DiamondRock Hospitality Co. | | | 119 | |
| | 1,238 | | | Easterly Government Properties, Inc. | | | 24 | |
| | 930 | | | EastGroup Properties, Inc. | | | 89 | |
| | 2,057 | | | Education Realty Trust, Inc. (a) | | | 85 | |
| | 931 | | | Farmland Partners, Inc. | | | 8 | |
| | 3,366 | | | First Industrial Realty Trust, Inc. | | | 112 | |
| | 1,632 | | | Four Corners Property Trust, Inc. | | | 40 | |
| | 2,892 | | | Franklin Street Properties Corp. | | | 25 | |
| | 1,402 | | | Front Yard Residential Corp. | | | 15 | |
| | 856 | | | Getty Realty Corp. | | | 24 | |
| | 793 | | | Gladstone Commercial Corp. | | | 15 | |
| | 315 | | | Gladstone Land Corp. | | | 4 | |
| | 559 | | | Global Medical REIT, Inc. | | | 5 | |
| | 1,791 | | | Global Net Lease, Inc. | | | 37 | |
| | 2,669 | | | Government Properties Income Trust | | | 42 | |
| | 4,338 | | | Gramercy Property Trust | | | 119 | |
| | 3,354 | | | Healthcare Realty Trust, Inc. | | | 98 | |
| | 1,073 | | | Hersha Hospitality Trust | | | 23 | |
| | 2,321 | | | Independence Realty Trust, Inc. | | | 24 | |
| | 559 | | | Industrial Logistics Property Trust | | | 12 | |
| | 1,174 | | | InfraREIT, Inc. | | | 26 | |
| | 158 | | | Innovative Industrial Properties, Inc. | | | 6 | |
| | 3,109 | | | Investors Real Estate Trust | | | 17 | |
| | 1,822 | | | iStar, Inc. (a) | | | 20 | |
| | 387 | | | Jernigan Capital, Inc. | | | 7 | |
| | 2,190 | | | Kite Realty Group Trust | | | 37 | |
| | 3,026 | | | LaSalle Hotel Properties | | | 104 | |
| | 5,742 | | | Lexington Realty Trust | | | 50 | |
| | 1,042 | | | LTC Properties, Inc. | | | 45 | |
| | 2,447 | | | Mack-Cali Realty Corp. | | | 50 | |
| | 835 | | | Medequities Realty Trust, Inc. | | | 9 | |
| | 2,055 | | | Monmouth Real Estate Investment Corp., Class – A | | | 34 | |
| | 1,089 | | | National Health Investors, Inc. | | | 80 | |
| | 1,369 | | | National Storage Affiliates | | | 42 | |
| | 2,271 | | | New Senior Investment Group, Inc. | | | 17 | |
| | 487 | | | Nexpoint Residential Trust, Inc. | | | 14 | |
| | 1,506 | | | NorthStar Realty Europe Corp. | | | 22 | |
| | 418 | | | One Liberty Properties, Inc. | | | 11 | |
| | 1,828 | | | Pebblebrook Hotel Trust | | | 71 | |
| | 1,896 | | | Pennsylvania Real Estate Investment Trust | | | 21 | |
| | 4,940 | | | Physicians Realty Trust | | | 79 | |
See accompanying notes to financial statements.
97
HC CAPITAL TRUST
The Institutional Small Capitalization-Mid Capitalization Equity Portfolio
Portfolio of Investments (continued) — June 30, 2018
| | | | | | | | |
| Shares | | | Security Description | | Value
(000) | |
| | | | Common Stocks (continued) | |
| | | | Equity Real Estate Investment Trusts (continued) | | | | |
| | 3,464 | | | Piedmont Office Realty Trust, Inc., Class – A | | $ | 69 | |
| | 1,665 | | | Potlatch Corp. | | | 85 | |
| | 1,081 | | | Preferred Apartment Communities, Inc., Class – A | | | 18 | |
| | 539 | | | PS Business Parks, Inc. | | | 69 | |
| | 1,377 | | | QTS Realty Trust, Inc., Class – L | | | 54 | |
| | 2,566 | | | Quality Care Properties (a) | | | 55 | |
| | 2,144 | | | Ramco-Gershenson Properties Trust | | | 28 | |
| | 3,003 | | | Retail Opportunity Investments Corp. | | | 58 | |
| | 2,179 | | | Rexford Industrial Realty, Inc. | | | 68 | |
| | 4,701 | | | RLJ Lodging Trust | | | 104 | |
| | 1,210 | | | Ryman Hospitality Properties, Inc. | | | 101 | |
| | 4,813 | | | Sabra Healthcare REIT, Inc. | | | 105 | |
| | 314 | | | Saul Centers, Inc. | | | 17 | |
| | 1,675 | | | Select Income REIT | | | 38 | |
| | 869 | | | Seritage Growth Properties^ | | | 37 | |
| | 1,130 | | | Spirit MTA REIT (a) | | | 12 | |
| | 2,645 | | | STAG Industrial, Inc. | | | 72 | |
| | 2,742 | | | Summit Hotel Properties, Inc. | | | 39 | |
| | 6,104 | | | Sunstone Hotel Investors, Inc. | | | 101 | |
| | 2,483 | | | Tanger Factory Outlet Centers, Inc. | | | 58 | |
| | 1,488 | | | Terreno Realty Corp. | | | 56 | |
| | 3,252 | | | The Geo Group, Inc. | | | 90 | |
| | 1,289 | | | Tier REIT, Inc. | | | 31 | |
| | 883 | | | UMH Properties, Inc. | | | 14 | |
| | 350 | | | Universal Health Realty Income Trust | | | 22 | |
| | 2,955 | | | Urban Edge Properties | | | 68 | |
| | 760 | | | Urstadt Biddle Properties, Inc., Class – A | | | 17 | |
| | 5,053 | | | Washington Prime Group, Inc. | | | 41 | |
| | 2,132 | | | Washington Real Estate Investment Trust | | | 65 | |
| | 1,030 | | | Whitestone REIT | | | 13 | |
| | 2,910 | | | Xenia Hotels & Resorts, Inc. | | | 71 | |
| | | | | | | | |
| | | | | | | 4,233 | |
| | | | | | | | |
| | | | Food & Staples Retailing — 0.49% | |
| | 14,516 | | | Chefs’ Warehouse Holdings LLC (a) | | | 415 | |
| | 400 | | | Ingles Markets, Inc., Class – A | | | 13 | |
| | 208 | | | Natural Grocers by Vitamin Cottage, Inc. (a) | | | 3 | |
| | 2,755 | | | Performance Food Group Co. (a) | | | 101 | |
| | 599 | | | PriceSmart, Inc. | | | 54 | |
| | 28,443 | | | Rite Aid Corp. (a) | | | 49 | |
| | 704 | | | Smart & Final Stores, Inc. (a) | | | 4 | |
| | 953 | | | SpartanNash Co. | | | 24 | |
| | 993 | | | SuperValu, Inc. (a) | | | 20 | |
| | 735 | | | The Andersons, Inc. | | | 25 | |
| | 1,344 | | | United Natural Foods, Inc. (a) | | | 57 | |
| | 237 | | | Village Super Market, Inc., Class – A | | | 7 | |
| | 264 | | | Weis Markets, Inc. | | | 14 | |
| | | | | | | | |
| | | | | | | 786 | |
| | | | | | | | |
| | | | Food Products — 0.47% | |
| | 63 | | | Alico, Inc. | | | 2 | |
| | 1,778 | | | B&G Foods, Inc., Class – A^ | | | 53 | |
| | 424 | | | Calavo Growers, Inc. | | | 41 | |
| | 841 | | | Cal-Maine Foods, Inc. (a) | | | 39 | |
| | | | | | | | |
| Shares | | | Security Description | | Value
(000) | |
| | | | Food Products (continued) | | | | |
| | 10,996 | | | Darling Ingredients, Inc. (a) | | $ | 218 | |
| | 2,466 | | | Dean Foods Co. | | | 26 | |
| | 250 | | | Farmer Brothers Co. (a) | | | 8 | |
| | 857 | | | Fresh Del Monte Produce, Inc. | | | 38 | |
| | 708 | | | Freshpet, Inc. (a) | | | 19 | |
| | 2,658 | | | Hostess Brands, Inc. (a) | | | 36 | |
| | 407 | | | J&J Snack Foods Corp. | | | 62 | |
| | 221 | | | John B. Sanfilippo & Son, Inc. | | | 16 | |
| | 511 | | | Lancaster Colony Corp. | | | 70 | |
| | 773 | | | Landec Corp. (a) | | | 12 | |
| | 352 | | | Limoneira Co. | | | 9 | |
| | 552 | | | Sanderson Farms, Inc. | | | 58 | |
| | 207 | | | Seneca Foods Corp., Class – A (a) | | | 6 | |
| | 1,583 | | | Simply Good Foods Co. (The) (a) | | | 23 | |
| | 475 | | | Tootsie Roll Industries, Inc. | | | 15 | |
| | | | | | | | |
| | | | | | | 751 | |
| | | | | | | | |
| | | | Gas Utilities — 0.43% | |
| | 418 | | | Chesapeake Utilities Corp. | | | 33 | |
| | 2,360 | | | New Jersey Resources Corp. | | | 106 | |
| | 774 | | | Northwest Natural Gas Co. | | | 49 | |
| | 1,410 | | | One Gas, Inc. | | | 105 | |
| | 202 | | | RGC Resources, Inc. | | | 6 | |
| | 2,317 | | | South Jersey Industries, Inc. | | | 78 | |
| | 1,306 | | | Southwest Gas Corp. | | | 100 | |
| | 1,332 | | | Spire, Inc. | | | 94 | |
| | 1,387 | | | WGL Holdings, Inc. | | | 123 | |
| | | | | | | | |
| | | | | | | 694 | |
| | | | | | | | |
| | | | Health Care Equipment & Supplies — 6.20% | |
| | 593 | | | Abaxis, Inc. | | | 49 | |
| | 2,397 | | | Accuray, Inc. (a) | | | 10 | |
| | 1,010 | | | AngioDynamics, Inc. (a) | | | 22 | |
| | 398 | | | Anika Therapeutics, Inc. (a) | | | 13 | |
| | 4,148 | | | Antares Pharma, Inc. (a) | | | 11 | |
| | 905 | | | AtriCure, Inc. (a) | | | 24 | |
| | 39 | | | Atrion Corp. | | | 23 | |
| | 5,052 | | | AxoGen, Inc. (a) | | | 254 | |
| | 13,940 | | | Cardiovascular Systems, Inc. (a) | | | 451 | |
| | 3,516 | | | Cerus Corp. (a) | | | 23 | |
| | 728 | | | CONMED Corp. | | | 53 | |
| | 959 | | | CryoLife, Inc. (a) | | | 27 | |
| | 632 | | | Cryoport, Inc. (a) | | | 10 | |
| | 365 | | | Cutera, Inc. (a) | | | 15 | |
| | 712 | | | CytoSorbents Corp. (a) | | | 8 | |
| | 7,026 | | | Dexcom, Inc. (a) | | | 667 | |
| | 4,176 | | | Edwards Lifesciences Corp. (a) | | | 608 | |
| | 2,095 | | | Endologix, Inc. (a) | | | 12 | |
| | 186 | | | Fonar Corp. (a) | | | 5 | |
| | 1,275 | | | GenMark Diagnostics, Inc. (a) | | | 8 | |
| | 889 | | | Glaukos Corp. (a) | | | 36 | |
| | 1,937 | | | Globus Medical, Inc., Class – A (a) | | | 98 | |
| | 1,453 | | | Haemonetics Corp. (a) | | | 130 | |
| | 1,268 | | | Halyard Health, Inc. (a) | | | 73 | |
| | 398 | | | Helius Medical Technologies, Inc. (a) | | | 4 | |
| | 476 | | | Inogen, Inc. (a) | | | 89 | |
| | 20,989 | | | Insulet Corp. (a) | | | 1,799 | |
See accompanying notes to financial statements.
98
HC CAPITAL TRUST
The Institutional Small Capitalization-Mid Capitalization Equity Portfolio
Portfolio of Investments (continued) — June 30, 2018
| | | | | | | | |
| Shares | | | Security Description | | Value
(000) | |
| | | | Common Stocks (continued) | |
| | | | Health Care Equipment & Supplies (continued) | |
| | 831 | | | Integer Holdings Corp. (a) | | $ | 54 | |
| | 889 | | | Invacare Corp. | | | 17 | |
| | 73 | | | Iradimed Corp. (a) | | | 2 | |
| | 8,491 | | | iRhythm Technologies, Inc. (a) | | | 689 | |
| | 1,139 | | | K2M Group Holdings, Inc. (a) | | | 26 | |
| | 1,001 | | | Lantheus Holdings, Inc. (a) | | | 15 | |
| | 421 | | | LeMaitre Vascular, Inc. | | | 14 | |
| | 1,317 | | | LivaNova PLC (a) | | | 132 | |
| | 1,073 | | | Meridian Bioscience, Inc. | | | 17 | |
| | 1,328 | | | Merit Medical Systems, Inc. (a) | | | 68 | |
| | 871 | | | Natus Medical, Inc. (a) | | | 30 | |
| | 1,360 | | | Neogen Corp. (a) | | | 109 | |
| | 1,257 | | | Neuronetics, Inc. (a) | | | 33 | |
| | 787 | | | Nevro Corp. (a) | | | 63 | |
| | 20,917 | | | Novocure Ltd. (a) | | | 655 | |
| | 1,391 | | | NuVasive, Inc. (a) | | | 72 | |
| | 349 | | | Nuvectra Corp. (a) | | | 7 | |
| | 1,778 | | | NxStage Medical, Inc. (a) | | | 50 | |
| | 1,624 | | | OraSure Technologies, Inc. (a) | | | 27 | |
| | 472 | | | Orthofix International NV (a) | | | 27 | |
| | 168 | | | Orthopediatrics Corp. (a) | | | 4 | |
| | 731 | | | Oxford Immunotec Global PLC (a) | | | 9 | |
| | 1,382 | | | Penumbra, Inc. (a) | | | 191 | |
| | 275 | | | Pulse Biosciences, Inc. (a) | | | 4 | |
| | 883 | | | Quidel Corp. (a) | | | 59 | |
| | 1,392 | | | Rockwell Medical Technologies, Inc.^ (a) | | | 7 | |
| | 1,607 | | | RTI Surgical, Inc. (a) | | | 7 | |
| | 277 | | | Seaspine Holdings Corp. (a) | | | 3 | |
| | 1,746 | | | Senseonics Holdings, Inc. (a) | | | 7 | |
| | 620 | | | Sientra, Inc. (a) | | | 12 | |
| | 19,608 | | | STAAR Surgical Co. (a) | | | 608 | |
| | 2,622 | | | Steris PLC | | | 276 | |
| | 333 | | | SurModics, Inc. (a) | | | 18 | |
| | 465 | | | Tactile Systems Technology, Inc. (a) | | | 24 | |
| | 45,575 | | | Tandem Diabetes Care, Inc. (a) | | | 1,004 | |
| | 3,824 | | | The Cooper Companies, Inc. | | | 900 | |
| | 4,094 | | | Transenterix, Inc. (a) | | | 18 | |
| | 98 | | | Utah Medical Products, Inc. | | | 11 | |
| | 1,032 | | | Varex Imaging Corp. (a) | | | 38 | |
| | 1,326 | | | Viewray, Inc.^ (a) | | | 9 | |
| | 2,869 | | | Wright Medical Group NV (a) | | | 74 | |
| | | | | | | | |
| | | | | | | 9,912 | |
| | | | | | | | |
| | | | Health Care Providers & Services — 2.56% | |
| | 353 | | | AAC Holdings, Inc. (a) | | | 3 | |
| | 15,840 | | | Acadia Healthcare Company, Inc. (a) | | | 648 | |
| | 213 | | | Addus HomeCare Corp. (a) | | | 12 | |
| | 773 | | | Amedisys, Inc. (a) | | | 66 | |
| | 352 | | | American Renal Associates Holdings, Inc. (a) | | | 6 | |
| | 1,277 | | | AMN Healthcare Services, Inc. (a) | | | 75 | |
| | 650 | | | Apollo Medical Holdings, Inc. (a) | | | 17 | |
| | 3,375 | | | BioScrip, Inc. (a) | | | 10 | |
| | 877 | | | Biotelemetry, Inc. (a) | | | 39 | |
| | 5,053 | | | Brookdale Senior Living, Inc. (a) | | | 46 | |
| | 718 | | | Capital Senior Living Corp. (a) | | | 8 | |
| | | | | | | | |
| Shares | | | Security Description | | Value
(000) | |
| | | | Health Care Providers & Services (continued) | | | | |
| | 464 | | | Civitas Solutions, Inc. (a) | | $ | 8 | |
| | 2,704 | | | Community Health Systems, Inc. (a) | | | 9 | |
| | 256 | | | CorVel Corp. (a) | | | 14 | |
| | 1,016 | | | Cross Country Healthcare, Inc. (a) | | | 11 | |
| | 23,803 | | | Diplomat Pharmacy, Inc. (a) | | | 608 | |
| | 4,295 | | | Encompass Health Corp. | | | 291 | |
| | 1,336 | | | Genesis Healthcare, Inc. (a) | | | 3 | |
| | 4,463 | | | HealthEquity, Inc. (a) | | | 335 | |
| | 2,359 | | | Kindred Healthcare, Inc. (a) | | | 21 | |
| | 833 | | | LHC Group, Inc. (a) | | | 71 | |
| | 960 | | | LifePoint Hospitals, Inc., Class – A (a) | | | 47 | |
| | 665 | | | Magellan Health Services, Inc. (a) | | | 64 | |
| | 327 | | | National Healthcare Corp. | | | 23 | |
| | 298 | | | National Research Corp., Class – A | | | 11 | |
| | 1,651 | | | Owens & Minor, Inc. | | | 28 | |
| | 2,216 | | | Patterson Companies, Inc. | | | 50 | |
| | 274 | | | Petiq, Inc. (a) | | | 7 | |
| | 313 | | | Providence Service Corp. (a) | | | 25 | |
| | 678 | | | Quorum Health Corp. (a) | | | 3 | |
| | 2,774 | | | R1 RCM, Inc. (a) | | | 24 | |
| | 1,024 | | | RadNet, Inc. (a) | | | 15 | |
| | 2,932 | | | Select Medical Holdings Corp. (a) | | | 53 | |
| | 522 | | | Surgery Partners, Inc. (a) | | | 8 | |
| | 15,722 | | | Teladoc, Inc. (a) | | | 914 | |
| | 2,262 | | | Tenet Healthcare Corp. (a) | | | 76 | |
| | 1,333 | | | The Ensign Group, Inc. | | | 48 | |
| | 1,079 | | | Tivity Health, Inc. (a) | | | 38 | |
| | 8,278 | | | Triple-S Management Corp., Class – A (a) | | | 323 | |
| | 336 | | | U.S. Physical Therapy, Inc. | | | 32 | |
| | | | | | | | |
| | | | | | | 4,090 | |
| | | | | | | | |
| | | | Health Care Technology — 0.33% | |
| | 4,819 | | | Allscripts Healthcare Solutions, Inc. (a) | | | 58 | |
| | 1,894 | | | Castlight Health, Inc., Class – B (a) | | | 8 | |
| | 329 | | | Computer Programs & Systems, Inc. | | | 11 | |
| | 1,066 | | | Cotiviti Holdings, Inc. (a) | | | 47 | |
| | 1,818 | | | Evolent Health, Inc. (a) | | | 38 | |
| | 713 | | | HealthStream, Inc. | | | 19 | |
| | 2,223 | | | HMS Holdings Corp. (a) | | | 48 | |
| | 1,775 | | | Inovalon Holdings, Inc., Class – A (a) | | | 18 | |
| | 206 | | | Inspire Medical System, Inc. (a) | | | 7 | |
| | 1,561 | | | Medidata Solutions, Inc. (a) | | | 126 | |
| | 421 | | | Nanthealth, Inc. (a) | | | 1 | |
| | 1,037 | | | Omnicell, Inc. (a) | | | 54 | |
| | 1,467 | | | Quality Systems, Inc. (a) | | | 29 | |
| | 326 | | | Simulations Plus, Inc. | | | 7 | |
| | 464 | | | Tabula Rasa Healthcare, Inc. (a) | | | 30 | |
| | 800 | | | Vocera Communications, Inc. (a) | | | 24 | |
| | | | | | | | |
| | | | | | | 525 | |
| | | | | | | | |
| | | | Hotels, Restaurants & Leisure — 1.41% | |
| | 1,723 | | | BBX Capital Corp. | | | 16 | |
| | 2,475 | | | Belmond Ltd. (a) | | | 28 | |
| | 2 | | | Biglari Holdings, Inc., Class – A (a) | | | 2 | |
| | 29 | | | Biglari Holdings, Inc., Class – B (a) | | | 5 | |
| | 557 | | | BJ’s Restaurant, Inc. | | | 33 | |
| | 2,402 | | | Bloomin’ Brands, Inc. | | | 48 | |
See accompanying notes to financial statements.
99
HC CAPITAL TRUST
The Institutional Small Capitalization-Mid Capitalization Equity Portfolio
Portfolio of Investments (continued) — June 30, 2018
| | | | | | | | |
| Shares | | | Security Description | | Value
(000) | |
| | | | Common Stocks (continued) | |
| | | | Hotels, Restaurants & Leisure (continued) | |
| | 209 | | | Bluegreen Vacations Corp. | | $ | 5 | |
| | 506 | | | Bojangles’, Inc. (a) | | | 7 | |
| | 2,208 | | | Boyd Gaming Corp. | | | 77 | |
| | 1,235 | | | Brinker International, Inc. | | | 59 | |
| | 873 | | | Carrols Restaurant Group, Inc. (a) | | | 13 | |
| | 682 | | | Century Casinos, Inc. (a) | | | 6 | |
| | 321 | | | Churchill Downs, Inc. | | | 95 | |
| | 469 | | | Chuy’s Holdings, Inc. (a) | | | 14 | |
| | 521 | | | Cracker Barrel Old Country Store, Inc.^ | | | 81 | |
| | 1,080 | | | Dave & Buster’s Entertainment, Inc. (a) | | | 51 | |
| | 612 | | | Del Frisco’s Restaurant Group, Inc. (a) | | | 8 | |
| | 832 | | | Del Taco Restaurants, Inc. (a) | | | 12 | |
| | 1,668 | | | Denny’s Corp. (a) | | | 27 | |
| | 455 | | | DineEquity, Inc. | | | 34 | |
| | 1,571 | | | Drive Shack, Inc. (a) | | | 12 | |
| | 606 | | | El Pollo Loco Holdings, Inc. (a) | | | 7 | |
| | 1,766 | | | Eldorado Resorts, Inc. (a) | | | 69 | |
| | 92 | | | Empire Resorts, Inc. (a) | | | 2 | |
| | 665 | | | Fiesta Restaurant Group, Inc. (a) | | | 19 | |
| | 491 | | | Golden Entertainment, Inc. (a) | | | 13 | |
| | 2,860 | | | ILG, Inc. | | | 94 | |
| | 655 | | | International Speedway Corp., Class – A | | | 29 | |
| | 391 | | | J Alexander’s Holdings, Inc. (a) | | | 4 | |
| | 797 | | | Jack in the Box, Inc. | | | 68 | |
| | 581 | | | Lindblad Expeditions Holdings, Inc. (a) | | | 8 | |
| | 515 | | | Marcus Corp. | | | 17 | |
| | 581 | | | Marriott Vacations Worldwide Corp. | | | 66 | |
| | 303 | | | Monarch Casino & Resort, Inc. (a) | | | 13 | |
| | 85 | | | Nathan’s Famous, Inc. | | | 8 | |
| | 333 | | | Noodles & Co. (a) | | | 4 | |
| | 687 | | | Papa John’s International, Inc. | | | 35 | |
| | 2,314 | | | Penn National Gaming, Inc. (a) | | | 78 | |
| | 1,402 | | | Pinnacle Entertainment, Inc. (a) | | | 47 | |
| | 10,625 | | | Planet Fitness, Inc., Class – A (a) | | | 467 | |
| | 430 | | | Playags, Inc. (a) | | | 12 | |
| | 666 | | | Potbelly Corp. (a) | | | 9 | |
| | 266 | | | RCI Hospitality Holdings, Inc. | | | 8 | |
| | 499 | | | Red Lion Hotels Corp. (a) | | | 6 | |
| | 357 | | | Red Robin Gourmet Burgers, Inc. (a) | | | 17 | |
| | 1,880 | | | Red Rock Resorts, Inc., Class – A | | | 63 | |
| | 809 | | | Ruth’s Hospitality Group, Inc. | | | 23 | |
| | 1,486 | | | Scientific Games Corp., Class – A (a) | | | 73 | |
| | 1,515 | | | SeaWorld Entertainment, Inc. (a) | | | 33 | |
| | 665 | | | Shake Shack, Inc., Class – A (a) | | | 44 | |
| | 984 | | | Sonic Corp. | | | 34 | |
| | 275 | | | Speedway Motorsports, Inc. | | | 5 | |
| | 1,834 | | | Texas Roadhouse, Inc., Class – A | | | 120 | |
| | 1,156 | | | The Cheesecake Factory, Inc. | | | 64 | |
| | 605 | | | The Habit Restaurants, Inc. (a) | | | 6 | |
| | 349 | | | Town Sports International Holdings, Inc. (a) | | | 5 | |
| | 769 | | | Wingstop, Inc. | | | 40 | |
| | 557 | | | Zoe’s Kitchen, Inc. (a) | | | 5 | |
| | | | | | | | |
| | | | | | | 2,248 | |
| | | | | | | | |
| | | | | | | | |
| Shares | | | Security Description | | Value
(000) | |
| | | | Household Durables — 1.35% | |
| | 351 | | | AV Homes, Inc. (a) | | $ | 8 | |
| | 295 | | | Bassett Furniture Industries, Inc. | | | 8 | |
| | 842 | | | Beazer Homes USA, Inc. (a) | | | 12 | |
| | 1,665 | | | Cavco Industries, Inc. (a) | | | 345 | |
| | 1,612 | | | Century Communities, Inc. (a) | | | 51 | |
| | 638 | | | Ethan Allen Interiors, Inc. | | | 16 | |
| | 223 | | | Flexsteel Industries, Inc. | | | 9 | |
| | 3,050 | | | Gopro, Inc., Class – A (a) | | | 20 | |
| | 686 | | | Green Brick Partners, Inc. (a) | | | 7 | |
| | 156 | | | Hamilton Beach Brands Holding Co. | | | 5 | |
| | 724 | | | Helen of Troy Ltd. (a) | | | 71 | |
| | 295 | | | Hooker Furniture Corp. | | | 14 | |
| | 3,635 | | | Hovnanian Enterprises, Inc., Class – A (a) | | | 6 | |
| | 594 | | | Installed Building Products, Inc. (a) | | | 34 | |
| | 7,913 | | | iRobot Corp.^ (a) | | | 599 | |
| | 2,324 | | | KB Home | | | 63 | |
| | 1,239 | | | La-Z-Boy, Inc. | | | 38 | |
| | 500 | | | LGI Homes, Inc. (a) | | | 29 | |
| | 290 | | | Lifetime Brands, Inc. | | | 4 | |
| | 733 | | | M/I Homes, Inc. (a) | | | 19 | |
| | 1,226 | | | MDC Holdings, Inc. | | | 38 | |
| | 1,048 | | | Meritage Homes Corp. (a) | | | 46 | |
| | 124 | | | NACCO Industries, Inc., Class – A | | | 4 | |
| | 1,171 | | | Roku, Inc. (a) | | | 50 | |
| | 180 | | | Skyline Champion Corp. | | | 6 | |
| | 3,033 | | | Taylor Morrison Home Corp., Class – A (a) | | | 63 | |
| | 381 | | | The New Home Co., Inc. (a) | | | 4 | |
| | 959 | | | TopBuild Corp. (a) | | | 75 | |
| | 4,095 | | | TRI Pointe Homes, Inc. (a) | | | 67 | |
| | 1,386 | | | Tupperware Brands Corp. | | | 57 | |
| | 190 | | | Turtle Beach Corp. (a) | | | 4 | |
| | 10,612 | | | Universal Electronics, Inc. (a) | | | 350 | |
| | 568 | | | Vuzix Corp. (a) | | | 4 | |
| | 887 | | | William Lyon Homes, Class – A (a) | | | 21 | |
| | 691 | | | Zagg, Inc. (a) | | | 12 | |
| | | | | | | | |
| | | | | | | 2,159 | |
| | | | | | | | |
| | | | Household Products — 0.10% | |
| | 299 | | | Central Garden & Pet Co. (a) | | | 13 | |
| | 965 | | | Central Garden & Pet Co., Class – A (a) | | | 39 | |
| | 3,360 | | | HRG Group, Inc. (a) | | | 44 | |
| | 149 | | | Oil-Dri Corporation of America | | | 6 | |
| | 366 | | | WD-40 Co. | | | 54 | |
| | | | | | | | |
| | | | | | | 156 | |
| | | | | | | | |
| | | | Independent Power & Renewable Electricity Producers — 0.11% | |
| | 3,356 | | | Atlantic Power Corp. (a) | | | 7 | |
| | 911 | | | NRG Yield, Inc. | | | 16 | |
| | 1,778 | | | NRG Yield, Inc., Class – C | | | 31 | |
| | 1,070 | | | Ormat Technologies, Inc. | | | 56 | |
| | 2,186 | | | Pattern Energy Group, Inc. | | | 41 | |
| | 1,958 | | | Terraform Power, Inc., Class – A | | | 23 | |
| | 804 | | | Vivint Solar, Inc. (a) | | | 4 | |
| | | | | | | | |
| | | | | | | 178 | |
| | | | | | | | |
| | | | Industrial Conglomerates — 0.02% | |
| | 956 | | | Raven Industries, Inc. | | | 37 | |
| | | | | | | | |
See accompanying notes to financial statements.
100
HC CAPITAL TRUST
The Institutional Small Capitalization-Mid Capitalization Equity Portfolio
Portfolio of Investments (continued) — June 30, 2018
| | | | | | | | |
| Shares | | | Security Description | | Value
(000) | |
| | | | Common Stocks (continued) | |
| | | | Insurance — 2.45% | |
| | 1,181 | | | Ambac Financial Group, Inc. (a) | | $ | 23 | |
| | 10,528 | | | American Equity Investment Life Holding Co. | | | 380 | |
| | 529 | | | AMERISAFE, Inc. | | | 31 | |
| | 2,974 | | | AmTrust Financial Services, Inc. | | | 43 | |
| | 4,227 | | | Argo Group International Holdings Ltd. | | | 246 | |
| | 1,372 | | | ASGN, Inc. (a) | | | 107 | |
| | 14,395 | | | Aspen Insurance Holdings Ltd. | | | 587 | |
| | 4,701 | | | AXIS Capital Holdings Ltd. | | | 261 | |
| | 276 | | | Baldwin & Lyons, Inc. | | | 7 | |
| | 773 | | | Braemar Hotels & Resorts, Inc. | | | 9 | |
| | 1,344 | | | Citizens, Inc.^ (a) | | | 10 | |
| | 4,521 | | | CNO Fincancial Group, Inc. | | | 86 | |
| | 378 | | | Crawford & Co. | | | 3 | |
| | 270 | | | Donegal Group, Inc. | | | 4 | |
| | 505 | | | eHealth, Inc. (a) | | | 11 | |
| | 253 | | | EMC Insurance Group, Inc. | | | 7 | |
| | 871 | | | Employers Holdings, Inc. | | | 35 | |
| | 325 | | | Enstar Group Ltd. (a) | | | 67 | |
| | 1,925 | | | Everest Re Group Ltd. | | | 444 | |
| | 274 | | | FBL Financial Group, Inc., Class – A | | | 22 | |
| | 352 | | | FedNat Holding Co. | | | 8 | |
| | 13,638 | | | Genworth Financial, Inc., Class – A (a) | | | 61 | |
| | 240 | | | Global Indemnity Ltd. | | | 9 | |
| | 242 | | | Goosehead Insurance, Inc. (a) | | | 6 | |
| | 852 | | | Greenlight Capital Re Ltd. (a) | | | 12 | |
| | 317 | | | Hallmark Financial Services, Inc. (a) | | | 3 | |
| | 1,688 | | | Hanover Insurance Group, Inc. | | | 202 | |
| | 230 | | | HCI Group, Inc. | | | 10 | |
| | 297 | | | Health Insurance Innovations, Inc., Class – A (a) | | | 10 | |
| | 626 | | | Heritage Insurance Holdings, Inc. | | | 10 | |
| | 1,113 | | | Horace Mann Educators Corp. | | | 50 | |
| | 142 | | | Independence Holding Co. | | | 5 | |
| | 295 | | | Infinity Property & Casualty Corp. | | | 42 | |
| | 43 | | | Investors Title Co. | | | 8 | |
| | 706 | | | James River Group Holdings | | | 28 | |
| | 1,078 | | | Kemper Corp. | | | 82 | |
| | 274 | | | Kingstone Cos., Inc. | | | 5 | |
| | 524 | | | Kinsale Capital Group, Inc. | | | 29 | |
| | 1,799 | | | Maiden Holdings Ltd. | | | 14 | |
| | 2,459 | | | MBIA, Inc. (a) | | | 22 | |
| | 1,657 | | | National General Holdings Corp. | | | 44 | |
| | 62 | | | National Western Life Group, Inc., Class – A | | | 19 | |
| | 305 | | | NI Holdings, Inc. (a) | | | 5 | |
| | 1,179 | | | Primerica, Inc. | | | 117 | |
| | 1,434 | | | ProAssurance Corp. | | | 51 | |
| | 1,061 | | | RLI Corp. | | | 70 | |
| | 387 | | | Safety Insurance Group, Inc. | | | 33 | |
| | 1,570 | | | Selective Insurance Group, Inc. | | | 86 | |
| | 440 | | | State Auto Financial Corp. | | | 13 | |
| | 630 | | | Stewart Information Services Corp. | | | 27 | |
| | 569 | | | The Navigators Group, Inc. | | | 32 | |
| | 2,429 | | | Third Point Reinsurance Ltd. (a) | | | 30 | |
| | 629 | | | Trupanion, Inc.^ (a) | | | 24 | |
| | | | | | | | |
| Shares | | | Security Description | | Value
(000) | |
| | | | Insurance (continued) | | | | |
| | 586 | | | United Fire Group, Inc. | | $ | 32 | |
| | 569 | | | United Insurance Holdings Corp. | | | 11 | |
| | 863 | | | Universal Insurance Holdings, Inc. | | | 30 | |
| | 4,300 | | | W.R. Berkley Corp. | | | 311 | |
| | 5,637 | | | WMIH Corp. (a) | | | 8 | |
| | | | | | | | |
| | | | | | | 3,942 | |
| | | | | | | | |
| | | | Internet & Direct Marketing Retail — 1.44% | |
| | 713 | | | 1-800-FLOWERS.COM, Inc., Class – A (a) | | | 9 | |
| | 216 | | | Duluth Holdings, Inc., Class – B (a) | | | 5 | |
| | 18,985 | | | Etsy, Inc. (a) | | | 801 | |
| | 269 | | | Gaia, Inc. (a) | | | 5 | |
| | 11,849 | | | Groupon, Inc. (a) | | | 51 | |
| | 367 | | | Lands’ End, Inc. (a) | | | 10 | |
| | 1,472 | | | Liberty Expedia Holdings, Class – A (a) | | | 65 | |
| | 1,919 | | | Liberty TripAdvisor Holdings, Inc., Class – A (a) | | | 31 | |
| | 4,069 | | | NutriSystem, Inc. | | | 157 | |
| | 558 | | | Overstock.com, Inc. (a) | | | 19 | |
| | 546 | | | PetMed Express, Inc. | | | 24 | |
| | 893 | | | Shutterfly, Inc. (a) | | | 80 | |
| | 38,317 | | | Stitch Fix, Inc., Class – A (a) | | | 1,052 | |
| | | | | | | | |
| | | | | | | 2,309 | |
| | | | | | | | |
| | | | Internet Software & Services — 4.73% | |
| | 6,409 | | | 2U, Inc. (a) | | | 536 | |
| | 4,654 | | | Akamai Technologies, Inc. (a) | | | 341 | |
| | 826 | | | Alarm.com Holding, Inc. (a) | | | 33 | |
| | 754 | | | Alteryx, Inc. (a) | | | 29 | |
| | 603 | | | Amber Road, Inc. (a) | | | 6 | |
| | 395 | | | AppFolio, Inc., Class – A (a) | | | 24 | |
| | 905 | | | Apptio, Inc. (a) | | | 33 | |
| | 13,977 | | | Benefitfocus, Inc. (a) | | | 470 | |
| | 1,267 | | | Blucora, Inc. (a) | | | 47 | |
| | 3,405 | | | Box, Inc., Class – A (a) | | | 85 | |
| | 52,245 | | | Brightcove, Inc. (a) | | | 504 | |
| | 695 | | | Carbonite, Inc. (a) | | | 24 | |
| | 3,963 | | | Cardlytics, Inc. (a) | | | 86 | |
| | 8,079 | | | Care.com, Inc. (a) | | | 169 | |
| | 1,329 | | | Cargurus, Inc. (a) | | | 46 | |
| | 1,961 | | | Cars.com, Inc. (a) | | | 56 | |
| | 643 | | | ChannelAdvisor Corp. (a) | | | 9 | |
| | 600 | | | Cimpress NV (a) | | | 87 | |
| | 1,028 | | | Cision Ltd. (a) | | | 15 | |
| | 2,793 | | | Cloudera, Inc. (a) | | | 38 | |
| | 1,444 | | | Cornerstone OnDemand, Inc. (a) | | | 68 | |
| | 16,372 | | | Coupa Software, Inc. (a) | | | 1,018 | |
| | 436 | | | eGain Corp. (a) | | | 7 | |
| | 1,890 | | | Endurance International Group Holdings, Inc. (a) | | | 19 | |
| | 1,195 | | | Envestnet, Inc. (a) | | | 66 | |
| | 1,532 | | | Five9, Inc. (a) | | | 53 | |
| | 452 | | | Fusion Connect, Inc. (a) | | | 2 | |
| | 45,670 | | | Gogo, Inc.^ (a) | | | 222 | |
| | 6,974 | | | GrubHub, Inc. (a) | | | 732 | |
| | 941 | | | GTT Communications, Inc. (a) | | | 42 | |
| | 1,844 | | | Hortonworks, Inc. (a) | | | 34 | |
| | 841 | | | Instructure, Inc. (a) | | | 36 | |
See accompanying notes to financial statements.
101
HC CAPITAL TRUST
The Institutional Small Capitalization-Mid Capitalization Equity Portfolio
Portfolio of Investments (continued) — June 30, 2018
| | | | | | | | |
| Shares | | | Security Description | | Value
(000) | |
| | | | Common Stocks (continued) | |
| | | | Internet Software & Services (continued) | |
| | 597 | | | Internap Corp. (a) | | $ | 6 | |
| | 1,267 | | | J2 Global, Inc. | | | 110 | |
| | 449 | | | Leaf Group, Ltd. (a) | | | 5 | |
| | 2,896 | | | Limelight Networks, Inc. (a) | | | 13 | |
| | 785 | | | Liquidity Services, Inc. (a) | | | 5 | |
| | 1,525 | | | LivePerson, Inc. (a) | | | 32 | |
| | 1,162 | | | MINDBODY, Inc., Class – A (a) | | | 45 | |
| | 9,612 | | | New Relic, Inc. (a) | | | 966 | |
| | 1,740 | | | NIC, Inc. | | | 27 | |
| | 14,544 | | | Nutanix, Inc., Class – A (a) | | | 750 | |
| | 6,922 | | | Pandora Media, Inc. (a) | | | 55 | |
| | 987 | | | Q2 Holdings, Inc. (a) | | | 56 | |
| | 1,054 | | | QuinStreet, Inc. (a) | | | 13 | |
| | 2,092 | | | Quotient Technology, Inc. (a) | | | 27 | |
| | 269 | | | Reis, Inc. | | | 6 | |
| | 643 | | | Remark Holdings, Inc. (a) | | | 3 | |
| | 236 | | | Sendgrid, Inc. (a) | | | 6 | |
| | 190 | | | ShotSpotter, Inc. (a) | | | 7 | |
| | 513 | | | Shutterstock, Inc. (a) | | | 24 | |
| | 446 | | | SPS Commerce, Inc. (a) | | | 33 | |
| | 469 | | | Stamps.com, Inc. (a) | | | 119 | |
| | 549 | | | TechTarget (a) | | | 16 | |
| | 1,068 | | | Telaria, Inc. (a) | | | 4 | |
| | 1,647 | | | The Meet Group, Inc. (a) | | | 7 | |
| | 847 | | | The Trade Desk, Inc. (a) | | | 79 | |
| | 104 | | | Travelzoo, Inc. (a) | | | 2 | |
| | 2,459 | | | TrueCar, Inc. (a) | | | 25 | |
| | 256 | | | Tucows, Inc. (a) | | | 16 | |
| | 171 | | | Veritone, Inc. (a) | | | 3 | |
| | 1,063 | | | Web.com Group, Inc. (a) | | | 27 | |
| | 638 | | | XO Group, Inc. (a) | | | 20 | |
| | 2,194 | | | Yelp, Inc. (a) | | | 86 | |
| | 2,151 | | | Yext, Inc. (a) | | | 42 | |
| | | | | | | | |
| | | | | | | 7,572 | |
| | | | | | | | |
| | | | IT Services — 1.41% | |
| | 2,103 | | | Acxiom Corp. (a) | | | 63 | |
| | 1,866 | | | Alliance Data Systems Corp. | | | 434 | |
| | 665 | | | CACI International, Inc., Class – A (a) | | | 112 | |
| | 1,190 | | | Cardtronics PLC (a) | | | 29 | |
| | 332 | | | Cass Information Systems, Inc. | | | 23 | |
| | 649 | | | ConvergeOne Holdings, Inc. | | | 6 | |
| | 2,448 | | | Convergys Corp. | | | 60 | |
| | 882 | | | CSG Systems International, Inc. | | | 36 | |
| | 3,344 | | | Euronet Worldwide, Inc. (a) | | | 280 | |
| | 1,841 | | | Everi Holdings, Inc. (a) | | | 13 | |
| | 8,278 | | | EVERTEC, Inc. | | | 181 | |
| | 131 | | | Evo Payments, Inc., Class – A (a) | | | 3 | |
| | 1,245 | | | Exela Technologies, Inc. (a) | | | 6 | |
| | 902 | | | Exlservice Holdings, Inc. (a) | | | 51 | |
| | 282 | | | Forrester Research, Inc. | | | 12 | |
| | 3,310 | | | Global Payments, Inc. | | | 369 | |
| | 994 | | | Information Services Group, Inc. (a) | | | 4 | |
| | 715 | | | ManTech International Corp., Class – A | | | 38 | |
| | 1,755 | | | MAXIMUS, Inc. | | | 109 | |
| | | | | | | | |
| Shares | | | Security Description | | Value
(000) | |
| | | | IT Services (continued) | | | | |
| | 841 | | | MoneyGram International, Inc. (a) | | $ | 6 | |
| | 893 | | | Perficient, Inc. (a) | | | 24 | |
| | 3,883 | | | Perspecta, Inc. | | | 80 | |
| | 365 | | | PFSweb, Inc. (a) | | | 4 | |
| | 872 | | | Presidio, Inc. (a) | | | 11 | |
| | 501 | | | PRGX Global, Inc. (a) | | | 5 | |
| | 1,139 | | | Science Applications International Corp. | | | 92 | |
| | 2,241 | | | ServiceSource International, Inc. (a) | | | 9 | |
| | 1,086 | | | Sykes Enterprises, Inc. (a) | | | 31 | |
| | 961 | | | Syntel, Inc. (a) | | | 31 | |
| | 668 | | | The Hackett Group, Inc. | | | 11 | |
| | 3,394 | | | Travelport Worldwide Ltd. | | | 63 | |
| | 385 | | | TTEC Holdings, Inc. | | | 13 | |
| | 1,297 | | | Unisys Corp. (a) | | | 17 | |
| | 760 | | | Virtusa Corp. (a) | | | 37 | |
| | | | | | | | |
| | | | | | | 2,263 | |
| | | | | | | | |
| | | | Leisure Products – 0.78% | |
| | 935 | | | Acushnet Holdings Corp. | | | 23 | |
| | 1,386 | | | American Outdoor Brands Corp. (a) | | | 17 | |
| | 35,944 | | | Callaway Golf Co. | | | 681 | |
| | 630 | | | Clarus Corp. (a) | | | 5 | |
| | 324 | | | Escalade, Inc. | | | 5 | |
| | 121 | | | Johnson Outdoors, Inc., Class – A | | | 10 | |
| | 569 | | | Malibu Boats, Inc., Class – A (a) | | | 24 | |
| | 197 | | | Marine Products Corp. | | | 4 | |
| | 470 | | | MCBC Holdings, Inc. (a) | | | 14 | |
| | 768 | | | Nautilus, Inc. (a) | | | 12 | |
| | 441 | | | Sturm, Ruger & Co., Inc. | | | 25 | |
| | 28,138 | | | Vista Outdoor, Inc. (a) | | | 435 | |
| | | | | | | | |
| | | | | | | 1,255 | |
| | | | | | | | |
| | | | Life Sciences Tools & Services – 0.42% | |
| | 729 | | | Accelerate Diagnostics, Inc. (a) | | | 16 | |
| | 890 | | | Cambrex Corp. (a) | | | 47 | |
| | 906 | | | Chromadex Corp.^ (a) | | | 3 | |
| | 1,286 | | | ENZO Biochem, Inc. (a) | | | 7 | |
| | 1,140 | | | Fluidigm Corp. (a) | | | 7 | |
| | 853 | | | Harvard Bioscience, Inc. (a) | | | 5 | |
| | 1,121 | | | Luminex Corp. | | | 33 | |
| | 321 | | | Medpace Holdings, Inc. (a) | | | 14 | |
| | 613 | | | NanoString Technologies, Inc. (a) | | | 8 | |
| | 1,462 | | | NeoGenomics, Inc. (a) | | | 19 | |
| | 27,347 | | | Pacific Biosciences of California, Inc. (a) | | | 96 | |
| | 9,381 | | | Qiagen N.V. (a) | | | 340 | |
| | 109 | | | Quanterix Corp. (a) | | | 2 | |
| | 1,513 | | | Syneos Health, Inc. (a) | | | 71 | |
| | | | | | | | |
| | | | | | | 668 | |
| | | | | | | | |
| | | | Machinery — 3.29% | |
| | 14,852 | | | Actuant Corp., Class – A | | | 437 | |
| | 262 | | | Alamo Group, Inc. | | | 24 | |
| | 776 | | | Albany International Corp., Class – A | | | 47 | |
| | 782 | | | Altra Holdings, Inc. | | | 34 | |
| | 202 | | | American Railcar Industries | | | 8 | |
| | 618 | | | Astec Industries, Inc. | | | 37 | |
| | 1,335 | | | Barnes Group, Inc. | | | 79 | |
See accompanying notes to financial statements.
102
HC CAPITAL TRUST
The Institutional Small Capitalization-Mid Capitalization Equity Portfolio
Portfolio of Investments (continued) — June 30, 2018
| | | | | | | | |
| Shares | | | Security Description | | Value
(000) | |
| | | | Common Stocks (continued) | |
| | | | Machinery (continued) | |
| | 393 | | | Blue Bird Corp. (a) | | $ | 9 | |
| | 1,156 | | | Briggs & Stratton Corp. | | | 20 | |
| | 13,253 | | | Chart Industries, Inc. (a) | | | 818 | |
| | 457 | | | CIRCOR International, Inc. | | | 17 | |
| | 596 | | | Columbus McKinnon Corp. | | | 26 | |
| | 750 | | | Commercial Vehicle Group, Inc. (a) | | | 6 | |
| | 385 | | | DMC Global, Inc. | | | 17 | |
| | 600 | | | Douglas Dynamics, Inc. | | | 29 | |
| | 169 | | | Eastern Co. (The) | | | 5 | |
| | 1,039 | | | Energy Recovery, Inc. (a) | | | 8 | |
| | 560 | | | ENPRO Industries, Inc. | | | 39 | |
| | 674 | | | ESCO Technologies, Inc. | | | 39 | |
| | 1,607 | | | Federal Signal Corp. | | | 37 | |
| | 1,254 | | | Franklin Electric Co., Inc. | | | 57 | |
| | 257 | | | Freightcar America, Inc. | | | 4 | |
| | 268 | | | Gencor Industries, Inc. (a) | | | 4 | |
| | 601 | | | Global Brass & Copper Holdings, Inc. | | | 19 | |
| | 283 | | | Graham Corp. | | | 7 | |
| | 2,177 | | | Harsco Corp. (a) | | | 48 | |
| | 1,682 | | | Hillenbrand, Inc. | | | 79 | |
| | 180 | | | Hurco Companies, Inc. | | | 8 | |
| | 286 | | | Hyster-Yale Materials Handling, Inc., Class – A | | | 18 | |
| | 847 | | | John Bean Technologies Corp. | | | 75 | |
| | 296 | | | Kadant, Inc. | | | 28 | |
| | 2,204 | | | Kennametal, Inc. | | | 79 | |
| | 9,077 | | | Kornit Digital Ltd.^ (a) | | | 161 | |
| | 248 | | | L.B. Foster Co., Class – A (a) | | | 6 | |
| | 289 | | | Lindsay Corp. | | | 28 | |
| | 462 | | | Lydall, Inc. (a) | | | 20 | |
| | 350 | | | Manitex International, Inc. (a) | | | 4 | |
| | 954 | | | Manitowoc Co., Inc. (a) | | | 25 | |
| | 23,347 | | | Meritor, Inc. (a) | | | 481 | |
| | 1,874 | | | Milacron Holdings Corp. (a) | | | 35 | |
| | 283 | | | Miller Industries, Inc. | | | 7 | |
| | 1,509 | | | Mueller Industries, Inc. | | | 45 | |
| | 4,184 | | | Mueller Water Products, Inc., Class – A | | | 49 | |
| | 1,319 | | | Navistar International Corp. (a) | | | 54 | |
| | 763 | | | NN, Inc. | | | 14 | |
| | 80 | | | Omega Flex, Inc. | | | 6 | |
| | 6,215 | | | Proto Labs, Inc. (a) | | | 740 | |
| | 638 | | | RBC Bearings, Inc. (a) | | | 82 | |
| | 843 | | | REV Group, Inc. | | | 14 | |
| | 2,828 | | | Rexnord Corp. (a) | | | 82 | |
| | 1,164 | | | SPX Corp. (a) | | | 41 | |
| | 1,140 | | | SPX FLOW, Inc. (a) | | | 50 | |
| | 344 | | | Standex International Corp. | | | 35 | |
| | 773 | | | Sun Hydraulics Corp. | | | 37 | |
| | 482 | | | Tennant Co. | | | 38 | |
| | 4,460 | | | Terex Corp. | | | 188 | |
| | 488 | | | The Gorman-Rupp Co. | | | 17 | |
| | 853 | | | The Greenbrier Companies, Inc. | | | 45 | |
| | 1,378 | | | Titan International, Inc. | | | 15 | |
| | 14,329 | | | TriMas Corp. (a) | | | 421 | |
| | | | | | | | |
| Shares | | | Security Description | | Value
(000) | |
| | | | Machinery (continued) | |
| | 254 | | | Twin Disc, Inc. (a) | | $ | 6 | |
| | 1,542 | | | Wabash National Corp. | | | 29 | |
| | 1,358 | | | WABCO Holdings, Inc. (a) | | | 159 | |
| | 752 | | | Watts Water Technologies, Inc., Class – A | | | 59 | |
| | 1,450 | | | Woodward, Inc. | | | 111 | |
| | | | | | | | |
| | | | | | | 5,266 | |
| | | | | | | | |
| | | | Marine — 0.25% | |
| | 1,408 | | | Costamare, Inc. | | | 11 | |
| | 1,146 | | | Eagle Bulk Shipping, Inc. (a) | | | 6 | |
| | 232 | | | Genco Shipping & Trading Ltd. (a) | | | 4 | |
| | 3,816 | | | Kirby Corp. (a) | | | 319 | |
| | 1,146 | | | Matson, Inc. | | | 44 | |
| | 1,494 | | | Safe Bulkers, Inc. (a) | | | 5 | |
| | 1,706 | | | Scorpio Bulkers, Inc. | | | 12 | |
| | | | | | | | |
| | | | | | | 401 | |
| | | | | | | | |
| | | | Media — 0.95% | |
| | 1,475 | | | AMC Entertainment Holdings, Inc., Class – A | | | 23 | |
| | 96 | | | Beasley Broadcast Group, Inc. | | | 1 | |
| | 133 | | | Boston Omaha Corp. (a) | | | 3 | |
| | 2,351 | | | Central Eurpoean Media Enterprises Ltd. (a) | | | 10 | |
| | 1,102 | | | Clear Channel Outdoor Holdings, Inc. | | | 5 | |
| | 33 | | | Daily Journal Corp. (a) | | | 8 | |
| | 666 | | | Emerald Expositions Events, Inc. | | | 14 | |
| | 3,460 | | | Entercom Communications Corp. | | | 26 | |
| | 1,917 | | | Entravision Communications Corp., Class – A | | | 10 | |
| | 876 | | | Eros International PLC (a) | | | 11 | |
| | 733 | | | Fluent, Inc. (a) | | | 2 | |
| | 3,112 | | | Gannett Company, Inc. | | | 33 | |
| | 91,162 | | | Global Eagle Entertainment, Inc.^ (a) | | | 229 | |
| | 2,159 | | | Gray Television, Inc. (a) | | | 34 | |
| | 439 | | | Hemisphere Media Group, Inc. (a) | | | 6 | |
| | 1,481 | | | IMAX Corp. (a) | | | 33 | |
| | 293 | | | Liberty Braves Group (a) | | | 8 | |
| | 949 | | | Liberty Braves Group (a) | | | 25 | |
| | 1,141 | | | Liberty Lilac Group, Class – A (a) | | | 22 | |
| | 3,072 | | | Liberty Lilac Group, Class – C (a) | | | 59 | |
| | 13,391 | | | Lions Gate Entertainment Corp., Class – B | | | 314 | |
| | 355 | | | Loral Space & Communications, Inc. (a) | | | 13 | |
| | 1,615 | | | MDC Partners, Inc., Class – A (a) | | | 7 | |
| | 1,049 | | | Meredith Corp. | | | 53 | |
| | 1,583 | | | MSG Networks, Inc., Class – A (a) | | | 38 | |
| | 2,078 | | | National CineMedia, Inc. | | | 17 | |
| | 1,606 | | | New Media Investment Group, Inc. | | | 30 | |
| | 1,211 | | | Nexstar Broadcasting Group, Inc., Class – A | | | 89 | |
| | 484 | | | Reading International, Inc. (a) | | | 8 | |
| | 115 | | | Saga Communications, Inc. | | | 4 | |
| | 748 | | | Scholastic Corp. | | | 33 | |
| | 1,949 | | | Sinclair Broadcast Group, Inc., Class – A | | | 63 | |
| | 5,860 | | | TEGNA, Inc. | | | 64 | |
| | 1,278 | | | The E.W. Scripps Co., Class – A | | | 17 | |
| | 3,549 | | | The New York Times Co., Class – A | | | 91 | |
| | 572 | | | tronc, Inc. (a) | | | 10 | |
| | 796 | | | Wideopenwest, Inc. (a) | | | 8 | |
See accompanying notes to financial statements.
103
HC CAPITAL TRUST
The Institutional Small Capitalization-Mid Capitalization Equity Portfolio
Portfolio of Investments (continued) — June 30, 2018
| | | | | | | | |
| Shares | | | Security Description | | Value
(000) | |
| | | | Common Stocks (continued) | |
| | | | Media (continued) | |
| | 1,142 | | | World Wrestling Entertainment, Inc., Class – A | | $ | 83 | |
| | | | | | | | |
| | | | | | | 1,504 | |
| | | | | | | | |
| | | | Metals & Mining — 2.39% | |
| | 7,864 | | | Agnico-Eagle Mines Ltd. | | | 360 | |
| | 8,346 | | | AK Steel Holding Corp. (a) | | | 36 | |
| | 49,040 | | | Allegheny Technologies, Inc. (a) | | | 1,232 | |
| | 3,767 | | | Carpenter Technology Corp. | | | 198 | |
| | 1,379 | | | Century Aluminum Co. (a) | | | 22 | |
| | 8,056 | | | Cleveland- Cliffs, Inc. (a) | | | 68 | |
| | 40,547 | | | Coeur d’Alene Mines Corp. (a) | | | 308 | |
| | 3,150 | | | Commercial Metals Co. | | | 66 | |
| | 922 | | | Compass Minerals International, Inc. | | | 61 | |
| | 68,542 | | | Ferroglobe PLC | | | 588 | |
| | 61,874 | | | Ferroglobe R&W Insurance Trust Co.* | | | – | |
| | 1,540 | | | Gold Resource Corp. | | | 10 | |
| | 350 | | | Haynes International, Inc. | | | 13 | |
| | 10,750 | | | Hecla Mining Co. | | | 37 | |
| | 439 | | | Kaiser Aluminum Corp. | | | 46 | |
| | 5,050 | | | Klondex Mines Ltd. (a) | | | 12 | |
| | 544 | | | Materion Corp. | | | 29 | |
| | 273 | | | Olympic Steel, Inc. | | | 6 | |
| | 486 | | | Ryerson Holding Corp. (a) | | | 5 | |
| | 688 | | | Schnitzer Steel Industries, Inc., Class – A | | | 23 | |
| | 1,756 | | | SunCoke Energy, Inc. (a) | | | 24 | |
| | 200 | | | Synalloy Corp. | | | 4 | |
| | 117,328 | | | Tahoe Resources, Inc. | | | 578 | |
| | 1,096 | | | Timkensteel Corp. (a) | | | 18 | |
| | 170 | | | Universal Stainless & Alloy Products, Inc. (a) | | | 4 | |
| | 970 | | | Warrior Met Coal, Inc. | | | 27 | |
| | 1,155 | | | Worthington Industries, Inc. | | | 48 | |
| | | | | | | | |
| | | | | | | 3,823 | |
| | | | | | | | |
| | | | Mortgage Real Estate Investment Trusts — 0.41% | |
| | 715 | | | AG Mortgage Investment Trust, Inc. | | | 13 | |
| | 2,765 | | | Anworth Mortgage Asset Corp. | | | 14 | |
| | 3,323 | | | Apollo Commercial Real Estate Finance, Inc. | | | 61 | |
| | 1,428 | | | Arbor Realty Trust, Inc. | | | 15 | |
| | 777 | | | Ares Commercial Real Estate Corp. | | | 11 | |
| | 1,083 | | | ARMOUR Residential REIT, Inc. | | | 25 | |
| | 2,763 | | | Blackstone Mortgage Trust, Inc. | | | 87 | |
| | 2,477 | | | Capstead Mortgage Corp. | | | 22 | |
| | 348 | | | Cherry Hill Mortgage Investment Corp. | | | 6 | |
| | 2,270 | | | Colony Credit Real Estate, Inc.^ | | | 47 | |
| | 4,286 | | | CYS Investments, Inc. | | | 32 | |
| | 1,516 | | | Dynex Capital, Inc. | | | 10 | |
| | 877 | | | Exantas Capital Corp. | | | 9 | |
| | 1,193 | | | Granite Point Mortgage Trust, Inc. | | | 22 | |
| | 464 | | | Great Ajax Corp. | | | 6 | |
| | 1,374 | | | Hannon Armstrong Sustainable Infrastructure Capital, Inc. | | | 27 | |
| | 2,979 | | | Invesco Mortgage Capital, Inc. | | | 47 | |
| | 428 | | | KKR Real Estate Finance Trust, Inc. | | | 8 | |
| | 2,346 | | | Ladder Capital Corp. | | | 37 | |
| | 1,189 | | | MTGE Investment Corp. | | | 23 | |
| | | | | | | | |
| Shares | | | Security Description | | Value
(000) | |
| | | | Mortgage Real Estate Investment Trusts (continued) | |
| | 3,083 | | | New York Mortgage Trust, Inc. | | $ | 19 | |
| | 1,458 | | | Orchid Island Capital, Inc. | | | 11 | |
| | 1,678 | | | Pennymac Mortgage Investment Trust | | | 32 | |
| | 2,025 | | | Redwood Trust, Inc. | | | 33 | |
| | 506 | | | Sutherland Asset Management Corp. | | | 8 | |
| | 842 | | | TPG RE Finance Trust, Inc. | | | 17 | |
| | 1,032 | | | Western Asset Mortgage Capital Corp. | | | 11 | |
| | | | | | | | |
| | | | | | | 653 | |
| | | | | | | | |
| | | | Multiline Retail — 0.13% | |
| | 1,129 | | | Big Lots, Inc. | | | 47 | |
| | 360 | | | Dillard’s, Inc., Class – A^ | | | 34 | |
| | 8,582 | | | J.C. Penney Co., Inc.^ (a) | | | 20 | |
| | 1,344 | | | Ollie’s Bargain Outlet Holdings, Inc. (a) | | | 98 | |
| | 921 | | | Sears Holdings Corp.^ (a) | | | 2 | |
| | | | | | | | |
| | | | | | | 201 | |
| | | | | | | | |
| | | | Multi-Utilities — 0.18% | |
| | 1,772 | | | Avista Corp. | | | 93 | |
| | 1,449 | | | Black Hills Corp. | | | 89 | |
| | 1,344 | | | NorthWestern Corp. | | | 77 | |
| | 406 | | | Unitil Corp. | | | 21 | |
| | | | | | | | |
| | | | | | | 280 | |
| | | | | | | | |
| | | | Oil, Gas & Consumable Fuels — 3.16% | |
| | 4,355 | | | Abraxas Petroleum Corp. (a) | | | 13 | |
| | 43 | | | Adams Resources & Energy, Inc. | | | 2 | |
| | 2,518 | | | Alta Mesa Resources, Inc. (a) | | | 17 | |
| | 572 | | | Amyris, Inc. (a) | | | 4 | |
| | 1,344 | | | Approach Resources, Inc.^ (a) | | | 3 | |
| | 508 | | | Arch Coal, Inc. | | | 40 | |
| | 946 | | | Ardmore Shipping Corp. (a) | | | 8 | |
| | 523 | | | Bonanza Creek Energy, Inc. (a) | | | 20 | |
| | 1,220 | | | California Resources Corp. (a) | | | 55 | |
| | 6,077 | | | Callon Petroleum Co. (a) | | | 65 | |
| | 27,625 | | | Carrizo Oil & Gas, Inc. (a) | | | 769 | |
| | 28,049 | | | Centennial Resource Development, Inc. (a) | | | 507 | |
| | 3,437 | | | Clean Energy Fuels Corp. (a) | | | 13 | |
| | 2,180 | | | Cloud Peak Energy, Inc. (a) | | | 8 | |
| | 737 | | | CONSOL Energy, Inc. (a) | | | 28 | |
| | 437 | | | CVR Energy, Inc.^ | | | 16 | |
| | 2,258 | | | Delek US Holdings, Inc. | | | 113 | |
| | 11,861 | | | Denbury Resources, Inc. (a) | | | 57 | |
| | 2,448 | | | DHT Holdings, Inc. | | | 11 | |
| | 736 | | | Dorian LPG Ltd. (a) | | | 6 | |
| | 551 | | | Earthstone Energy, Inc. (a) | | | 5 | |
| | 2,722 | | | Eclipse Resources Corp. (a) | | | 4 | |
| | 1,754 | | | Energy Fuels, Inc. (a) | | | 4 | |
| | 858 | | | Energy XXI Gulf Coast, Inc. (a) | | | 8 | |
| | 1,061 | | | EP Energy Corp. (a) | | | 3 | |
| | 12,158 | | | Euronav N.V. | | | 112 | |
| | 750 | | | Evolution Petroleum Corp. | | | 7 | |
| | 2,129 | | | Frontline Ltd./Bermuda (a) | | | 12 | |
| | 23,672 | | | GasLog Ltd. | | | 452 | |
| | 7,834 | | | Golar LNG Ltd. | | | 231 | |
| | 199 | | | Goodrich Petroleum Corp. (a) | | | 2 | |
| | 1,077 | | | Green Plains, Inc. | | | 20 | |
See accompanying notes to financial statements.
104
HC CAPITAL TRUST
The Institutional Small Capitalization-Mid Capitalization Equity Portfolio
Portfolio of Investments (continued) — June 30, 2018
| | | | | | | | |
| Shares | | | Security Description | | Value
(000) | |
| | | | Common Stocks (continued) | |
| | | | Oil, Gas & Consumable Fuels (continued) | |
| | 4,721 | | | Gulfport Energy Corp. (a) | | $ | 59 | |
| | 3,805 | | | Halcon Resources Corp. (a) | | | 17 | |
| | 509 | | | Hallador Energy Co. | | | 4 | |
| | 2,937 | | | Highpoint Resources Corp. (a) | | | 18 | |
| | 754 | | | International Seaways, Inc. (a) | | | 17 | |
| | 16 | | | Isramco, Inc. (a) | | | 2 | |
| | 1,733 | | | Jagged Peak Energy, Inc. (a) | | | 23 | |
| | 4,203 | | | Laredo Petroleum, Inc. (a) | | | 40 | |
| | 1,284 | | | Lilis Energy, Inc.^ (a) | | | 7 | |
| | 13,347 | | | Matador Resources Co. (a) | | | 401 | |
| | 339 | | | Midstates Petroleum Co., Inc. (a) | | | 5 | |
| | 10,490 | | | Murphy Oil Corp. | | | 354 | |
| | 22,646 | | | Navigator Holdings Ltd. (a) | | | 286 | |
| | 201 | | | Nextdecade Corp. (a) | | | 1 | |
| | 4,047 | | | Nordic American Tankers Limited | | | 11 | |
| | 2,835 | | | Northern Oil & Gas, Inc. (a) | | | 9 | |
| | 7,288 | | | Oasis Petroleum, Inc. (a) | | | 95 | |
| | 1,378 | | | Overseas Shipholding Group, Inc. (a) | | | 5 | |
| | 455 | | | Panhandle Oil & Gas, Inc., Class – A | | | 9 | |
| | 879 | | | Par Petroleum Corp. (a) | | | 15 | |
| | 1,793 | | | PDC Energy, Inc. (a) | | | 108 | |
| | 2,175 | | | Peabody Energy Corp. | | | 99 | |
| | 376 | | | Penn Virginia Corp. (a) | | | 32 | |
| | 981 | | | Renewable Energy Group, Inc. (a) | | | 18 | |
| | 600 | | | Resolute Energy Corp.^ (a) | | | 19 | |
| | 166 | | | REX American Resources Corp. (a) | | | 13 | |
| | 1,544 | | | Ring Energy, Inc. (a) | | | 19 | |
| | 2,117 | | | Sanchez Energy Corp.^ (a) | | | 10 | |
| | 987 | | | SandRidge Energy, Inc. (a) | | | 18 | |
| | 7,932 | | | Scorpio Tankers, Inc. | | | 23 | |
| | 2,131 | | | Semgroup Corp., Class – A | | | 54 | |
| | 2,238 | | | Ship Finance International Ltd. | | | 33 | |
| | 206 | | | Silverbow Resources, Inc. (a) | | | 6 | |
| | 11,100 | | | SM Energy Co. | | | 285 | |
| | 15,936 | | | Southwestern Energy Co. (a) | | | 84 | |
| | 6,544 | | | SRC Energy, Inc. (a) | | | 72 | |
| | 540 | | | Talos Energy, Inc. (a) | | | 17 | |
| | 1,738 | | | Teekay Shipping Corp. | | | 13 | |
| | 5,985 | | | Teekay Tankers Ltd. | | | 7 | |
| | 2,173 | | | Tellurian, Inc. (a) | | | 18 | |
| | 5,488 | | | Ultra Petroleum Corp. (a) | | | 13 | |
| | 4,044 | | | Uranium Energy Corp. (a) | | | 7 | |
| | 2,594 | | | W&T Offshore, Inc. (a) | | | 19 | |
| | 763 | | | Wildhorse Resource Development Corp. (a) | | | 19 | |
| | 1,811 | | | World Fuel Services Corp. | | | 37 | |
| | 1,289 | | | Zion Oil & Gas, Inc.^ (a) | | | 5 | |
| | | | | | | | |
| | | | | | | 5,041 | |
| | | | | | | | |
| | | | Paper & Forest Products — 0.23% | |
| | 1,051 | | | Boise Cascade Co. | | | 47 | |
| | 455 | | | Clearwater Paper Corp. (a) | | | 11 | |
| | 2,376 | | | KapStone Paper & Packaging Corp. | | | 82 | |
| | 3,950 | | | Louisiana-Pacific Corp. | | | 107 | |
| | 440 | | | Neenah Paper, Inc. | | | 37 | |
| | 1,204 | | | P.H. Glatfelter Co. | | | 24 | |
| | | | | | | | |
| Shares | | | Security Description | | Value
(000) | |
| | | | Paper & Forest Products (continued) | | | | |
| | 831 | | | Schweitzer-Mauduit International, Inc. | | $ | 36 | |
| | 930 | | | Verso Corp. (a) | | | 20 | |
| | | | | | | | |
| | | | | | | 364 | |
| | | | | | | | |
| | | | Personal Products — 0.13% | |
| | 580 | | | e.l.f Beauty, Inc. (a) | | | 9 | |
| | 1,458 | | | Edgewell Personal Care Co. (a) | | | 73 | |
| | 478 | | | Inter Parfums, Inc. | | | 26 | |
| | 315 | | | Medifast, Inc. | | | 50 | |
| | 224 | | | Natural Health Trends Corp.^ | | | 6 | |
| | 338 | | | Nature’s Sunshine Products, Inc. (a) | | | 3 | |
| | 327 | | | Revlon, Inc., Class – A^ (a) | | | 6 | |
| | 342 | | | USANA Health Sciences, Inc. (a) | | | 39 | |
| | | | | | | | |
| | | | | | | 212 | |
| | | | | | | | |
| | | | Pharmaceuticals — 1.54% | |
| | 721 | | | Aclaris Therapeutics, Inc. (a) | | | 14 | |
| | 961 | | | Aerie Pharmaceuticals, Inc. (a) | | | 65 | |
| | 415 | | | Akcea Therapeutics, Inc. (a) | | | 10 | |
| | 2,523 | | | Akorn, Inc. (a) | | | 42 | |
| | 12,575 | | | Amneal Pharmaceuticals, Inc. (a) | | | 205 | |
| | 1,004 | | | Amphastar Pharmaceuticals, Inc. (a) | | | 15 | |
| | 1,875 | | | Ampio Pharmaceuticals, Inc. (a) | | | 4 | |
| | 222 | | | ANI Pharmaceuticals, Inc. (a) | | | 15 | |
| | 1,225 | | | Aratana Therapeutics, Inc. (a) | | | 5 | |
| | 450 | | | Assembly Biosciences, Inc. (a) | | | 18 | |
| | 720 | | | Clearside Biomedical, Inc. (a) | | | 8 | |
| | 7,937 | | | Collegium Pharmaceutical, Inc. (a) | | | 189 | |
| | 2,636 | | | Corcept Therapeutics, Inc. (a) | | | 41 | |
| | 601 | | | Corium International, Inc. (a) | | | 5 | |
| | 1,547 | | | Cymabay Therapeutics, Inc. (a) | | | 21 | |
| | 1,637 | | | DepoMed, Inc. (a) | | | 11 | |
| | 956 | | | Dermira, Inc. (a) | | | 9 | |
| | 315 | | | Dova Pharmaceuticals, Inc. (a) | | | 9 | |
| | 4,132 | | | Durect Corp. (a) | | | 6 | |
| | 565 | | | Eloxx Pharmaceuticals, Inc. (a) | | | 10 | |
| | 6,055 | | | ENDO International PLC (a) | | | 57 | |
| | 1,706 | | | Endocyte, Inc. (a) | | | 24 | |
| | 133 | | | Evolus, Inc. (a) | | | 4 | |
| | 180 | | | Heska Corp. (a) | | | 19 | |
| | 4,471 | | | Horizon Pharma PLC (a) | | | 74 | |
| | 498 | | | Innovate Biopharmaceuticals, Inc. (a) | | | 12 | |
| | 2,074 | | | Innoviva, Inc. (a) | | | 29 | |
| | 20,138 | | | Intersect ENT, Inc. (a) | | | 753 | |
| | 1,174 | | | Intra-Cellular Therapies, Inc. (a) | | | 21 | |
| | 419 | | | Kala Pharmaceuticals, Inc. (a) | | | 6 | |
| | 806 | | | Lannett Co., Inc. (a) | | | 11 | |
| | 2,224 | | | Mallinckrodt PLC (a) | | | 41 | |
| | 903 | | | Marinus Pharmaceuticals, Inc. (a) | | | 6 | |
| | 477 | | | Melinta Therapeutics, Inc. (a) | | | 3 | |
| | 127 | | | Menlo Therapeutics, Inc. (a) | | | 1 | |
| | 817 | | | Myokardia, Inc. (a) | | | 41 | |
| | 3,142 | | | Nektar Therapeutics (a) | | | 153 | |
| | 733 | | | Neos Therapeutics, Inc. (a) | | | 5 | |
| | 861 | | | Ocular Therapeutix, Inc. (a) | | | 6 | |
| | 178 | | | Odonate Therapeutics, Inc. (a) | | | 4 | |
| | 1,258 | | | Omeros Corp. (a) | | | 23 | |
See accompanying notes to financial statements.
105
HC CAPITAL TRUST
The Institutional Small Capitalization-Mid Capitalization Equity Portfolio
Portfolio of Investments (continued) — June 30, 2018
| | | | | | | | |
| Shares | | | Security Description | | Value
(000) | |
| | | | Common Stocks (continued) | |
| | | | Pharmaceuticals (continued) | |
| | 426 | | | Optinose, Inc. (a) | | $ | 12 | |
| | 1,079 | | | Pacira Pharmaceuticals, Inc. (a) | | | 35 | |
| | 759 | | | Paratek Pharmaceuticals, Inc. (a) | | | 8 | |
| | 539 | | | Phibro Animal Health Corp., Class – A | | | 25 | |
| | 1,444 | | | Prestige Brands Holdings, Inc. (a) | | | 55 | |
| | 426 | | | Reata Pharmaceuticals, Inc., Class – A (a) | | | 15 | |
| | 140 | | | resTORbio, Inc. (a) | | | 1 | |
| | 884 | | | Revance Therapeutics, Inc. (a) | | | 24 | |
| | 439 | | | Sienna Biopharmaceuticals, Inc. (a) | | | 7 | |
| | 1,363 | | | SIGA Technologies, Inc.^ (a) | | | 8 | |
| | 1,324 | | | Supernus Pharmaceuticals, Inc. (a) | | | 79 | |
| | 1,283 | | | Teligent, Inc.^ (a) | | | 4 | |
| | 1,552 | | | Tetraphase Pharmaceuticals, Inc. (a) | | | 6 | |
| | 1,850 | | | The Medicines Co. (a) | | | 68 | |
| | 4,582 | | | TherapeuticsMD, Inc.^ (a) | | | 29 | |
| | 1,171 | | | Theravance Biopharma, Inc. (a) | | | 27 | |
| | 473 | | | WaVe Life Sciences Ltd. (a) | | | 18 | |
| | 954 | | | Zogenix, Inc. (a) | | | 42 | |
| | 846 | | | Zomedica Pharmaceuticals Corp.^ (a) | | | 2 | |
| | | | | | | | |
| | | | | | | 2,460 | |
| | | | | | | | |
| | | | Professional Services — 1.00% | |
| | 1,484 | | | Acacia Research Corp. (a) | | | 6 | |
| | 199 | | | Barrett Business Services, Inc. | | | 19 | |
| | 212 | | | BG Staffing, Inc. | | | 5 | |
| | 1,417 | | | CBIZ, Inc. (a) | | | 33 | |
| | 224 | | | CRA International, Inc. | | | 11 | |
| | 1,396 | | | Exponent, Inc. | | | 67 | |
| | 284 | | | Franklin Covey Co. (a) | | | 7 | |
| | 1,004 | | | FTI Consulting, Inc. (a) | | | 61 | |
| | 366 | | | GP Strategies Corp. (a) | | | 6 | |
| | 504 | | | Heidrick & Struggles International, Inc. | | | 18 | |
| | 1,256 | | | Hill International, Inc. (a) | | | 7 | |
| | 606 | | | Huron Consulting Group, Inc. (a) | | | 25 | |
| | 489 | | | ICF International, Inc. | | | 35 | |
| | 1,035 | | | Insperity, Inc. | | | 99 | |
| | 846 | | | Kelly Services, Inc., Class – A | | | 19 | |
| | 601 | | | Kforce, Inc. | | | 21 | |
| | 12,040 | | | Korn Ferry International | | | 746 | |
| | 493 | | | Mistras Group, Inc. (a) | | | 9 | |
| | 10,979 | | | Navigant Consulting, Inc. (a) | | | 243 | |
| | 857 | | | Resources Connections, Inc. | | | 14 | |
| | 1,179 | | | TriNet Group, Inc. (a) | | | 66 | |
| | 1,131 | | | TrueBlue, Inc. (a) | | | 30 | |
| | 1,055 | | | WageWorks, Inc. (a) | | | 53 | |
| | 227 | | | Willdan Group, Inc. (a) | | | 7 | |
| | | | | | | | |
| | | | | | | 1,607 | |
| | | | | | | | |
| | | | Real Estate Management & Development — 0.34% | |
| | 1,846 | | | Alexander & Baldwin, Inc. | | | 43 | |
| | 313 | | | Altisource Portfolio Solutions SA (a) | | | 9 | |
| | 115 | | | Consolidated-Tomoka Land Co. | | | 7 | |
| | 291 | | | Forestar Group, Inc. (a) | | | 6 | |
| | 186 | | | FRP Holdings, Inc. (a) | | | 12 | |
| | 1,015 | | | HFF, Inc., Class – A | | | 35 | |
| | | | | | | | |
| Shares | | | Security Description | | Value
(000) | |
| | | | Real Estate Management & Development (continued) | |
| | 3,387 | | | Kennedy-Wilson Holdings, Inc. | | $ | 72 | |
| | 524 | | | Marcus & Millichap, Inc. (a) | | | 20 | |
| | 148 | | | Maui Land & Pineapple Co., Inc. (a) | | | 2 | |
| | 643 | | | Newmark Group, Inc., Class – A | | | 9 | |
| | 464 | | | RE/MAX Holdings, Inc., Class – A | | | 24 | |
| | 7,950 | | | Realogy Holdings Corp. | | | 182 | |
| | 1,990 | | | Redfin Corp.^ (a) | | | 46 | |
| | 310 | | | Safety Income and Growth, Inc. | | | 6 | |
| | 1,228 | | | St. Joe Corp. (a) | | | 22 | |
| | 177 | | | Stratus Properties, Inc. (a) | | | 5 | |
| | 568 | | | Tejon Ranch Co. (a) | | | 14 | |
| | 194 | | | The RMR Group, Inc., Class – A | | | 15 | |
| | 34 | | | Transcontinental Realty Investors, Inc. (a) | | | 1 | |
| | 565 | | | Trinity Place Holdings, Inc. (a) | | | 4 | |
| | | | | | | | |
| | | | | | | 534 | |
| | | | | | | | |
| | | | Road & Rail — 0.52% | |
| | 685 | | | ArcBest Corp. | | | 31 | |
| | 7,928 | | | Avis Budget Group, Inc. (a) | | | 259 | |
| | 328 | | | Covenant Transportation Group, Inc., Class – A (a) | | | 10 | |
| | 1,105 | | | Daseke, Inc. (a) | | | 11 | |
| | 1,308 | | | Heartland Express, Inc. | | | 24 | |
| | 1,514 | | | Hertz Global Holdings, Inc. (a) | | | 23 | |
| | 3,987 | | | Knight-Swift Transportation Holdings, Inc. | | | 153 | |
| | 1,078 | | | Marten Transport Ltd. | | | 25 | |
| | 49 | | | P.A.M. Transportation Services, Inc. (a) | | | 2 | |
| | 2,284 | | | Ryder System, Inc. | | | 165 | |
| | 693 | | | Saia, Inc. (a) | | | 56 | |
| | 245 | | | Universal Truckload Services, Inc. | | | 6 | |
| | 191 | | | USA Truck, Inc. (a) | | | 4 | |
| | 1,293 | | | Werner Enterprises, Inc. | | | 49 | |
| | 826 | | | YRC Worldwide, Inc. (a) | | | 8 | |
| | | | | | | | |
| | | | | | | 826 | |
| | | | | | | | |
| | | | Semiconductors & Semiconductor Equipment — 5.75% | |
| | 184 | | | ACM Research, Inc., Class – A (a) | | | 2 | |
| | 436 | | | Adesto Technologies Corp. (a) | | | 4 | |
| | 1,054 | | | Advanced Energy Industries, Inc. (a) | | | 61 | |
| | 580 | | | Alpha & Omega Semiconductor Ltd. (a) | | | 8 | |
| | 858 | | | Ambarella, Inc. (a) | | | 33 | |
| | 2,826 | | | Amkor Technology, Inc. (a) | | | 24 | |
| | 556 | | | Aquantia Corp. (a) | | | 6 | |
| | 847 | | | Axcelis Technologies, Inc. (a) | | | 17 | |
| | 1,088 | | | AXT, Inc. (a) | | | 8 | |
| | 1,880 | | | Brooks Automation, Inc. | | | 61 | |
| | 688 | | | Cabot Microelectronics Corp. | | | 74 | |
| | 2,069 | | | Cavium, Inc. (a) | | | 179 | |
| | 605 | | | CEVA, Inc. (a) | | | 18 | |
| | 1,722 | | | Cirrus Logic, Inc. (a) | | | 66 | |
| | 773 | | | Cohu, Inc. | | | 19 | |
| | 12,730 | | | Cree, Inc. (a) | | | 529 | |
| | 23,134 | | | Cypress Semiconductor Corp. | | | 360 | |
| | 1,076 | | | Diodes, Inc. (a) | | | 37 | |
| | 3,841 | | | Entegris, Inc. | | | 130 | |
| | 10,926 | | | FormFactor, Inc. (a) | | | 145 | |
| | 680 | | | Ichor Holdings Ltd. (a) | | | 14 | |
See accompanying notes to financial statements.
106
HC CAPITAL TRUST
The Institutional Small Capitalization-Mid Capitalization Equity Portfolio
Portfolio of Investments (continued) — June 30, 2018
| | | | | | | | |
| Shares | | | Security Description | | Value
(000) | |
| | | | Common Stocks (continued) | |
| | | | Semiconductors & Semiconductor Equipment (continued) | |
| | 505 | | | Impinj, Inc. (a) | | $ | 11 | |
| | 8,946 | | | Inphi Corp. (a) | | | 292 | |
| | 17,012 | | | Integrated Device Technology, Inc. (a) | | | 542 | |
| | 1,829 | | | Kopin Corp. (a) | | | 5 | |
| | 3,396 | | | Lattice Semiconductor Corp. (a) | | | 22 | |
| | 27,664 | | | MA-COM Technology Solutions Holdings, Inc.^ (a) | | | 637 | |
| | 7,721 | | | Maxim Integrated Products, Inc. | | | 453 | |
| | 1,703 | | | MaxLinear, Inc., Class – A (a) | | | 27 | |
| | 7,477 | | | Monolithic Power Systems, Inc. | | | 1,000 | |
| | 635 | | | Nanometrics, Inc. (a) | | | 22 | |
| | 972 | | | Neophotonics Corp. (a) | | | 6 | |
| | 122 | | | NVE Corp. | | | 15 | |
| | 12,875 | | | ON Semiconductor Corp. (a) | | | 286 | |
| | 807 | | | PDF Solutions, Inc. (a) | | | 10 | |
| | 1,887 | | | Photronics, Inc. (a) | | | 15 | |
| | 775 | | | Power Integrations, Inc. | | | 57 | |
| | 12,459 | | | Qorvo, Inc. (a) | | | 1,000 | |
| | 101,497 | | | QuickLogic Corp. (a) | | | 117 | |
| | 2,869 | | | Rambus, Inc. (a) | | | 36 | |
| | 852 | | | Rudolph Technologies, Inc. (a) | | | 25 | |
| | 28,284 | | | Semtech Corp. (a) | | | 1,332 | |
| | 1,122 | | | Sigma Designs, Inc. (a) | | | 7 | |
| | 3,393 | | | Silicon Laboratories, Inc. (a) | | | 338 | |
| | 5,851 | | | Skyworks Solutions, Inc. | | | 565 | |
| | 263 | | | SMART Global Holdings, Inc. (a) | | | 8 | |
| | 1,524 | | | SolarEdge Technologies, Inc. (a) | | | 73 | |
| | 1,653 | | | SunPower Corp.^ (a) | | | 13 | |
| | 937 | | | Synaptics, Inc. (a) | | | 47 | |
| | 1,054 | | | Ultra Clean Holdings, Inc. (a) | | | 17 | |
| | 26,356 | | | Veeco Instruments, Inc. (a) | | | 376 | |
| | 1,498 | | | Xcerra Corp. (a) | | | 21 | |
| | 1,354 | | | Xperi Corp. | | | 22 | |
| | | | | | | | |
| | | | | | | 9,192 | |
| | | | | | | | |
| | | | Software — 3.76% | |
| | 2,456 | | | 8x8, Inc. (a) | | | 49 | |
| | 1,243 | | | A10 Networks, Inc. (a) | | | 8 | |
| | 3,096 | | | ACI Worldwide, Inc. (a) | | | 76 | |
| | 655 | | | Altair Engineering, Inc., Class – A (a) | | | 22 | |
| | 789 | | | American Software, Inc., Class – A | | | 11 | |
| | 239 | | | Asure Software, Inc. (a) | | | 4 | |
| | 2,830 | | | Avaya Holdings Corp. (a) | | | 57 | |
| | 1,305 | | | Blackbaud, Inc. | | | 134 | |
| | 16,515 | | | Blackline, Inc. (a) | | | 718 | |
| | 1,088 | | | Bottomline Technologies, Inc. (a) | | | 54 | |
| | 211 | | | Carbon Black, Inc. (a) | | | 5 | |
| | 1,063 | | | CommVault Systems, Inc. (a) | | | 70 | |
| | 290 | | | Digimarc Corp. (a) | | | 8 | |
| | 651 | | | Ebix, Inc. | | | 50 | |
| | 4,558 | | | Ellie Mae, Inc. (a) | | | 473 | |
| | 704 | | | Everbridge, Inc. (a) | | | 33 | |
| | 762 | | | Forescout Technologies, Inc. (a) | | | 26 | |
| | 2,966 | | | Glu Mobile, Inc. (a) | | | 19 | |
| | 6,987 | | | HubSpot, Inc. (a) | | | 877 | |
| | | | | | | | |
| Shares | | | Security Description | | Value
(000) | |
| | | | Software (continued) | | | | |
| | 942 | | | Imperva, Inc. (a) | | $ | 45 | |
| | 262 | | | MicroStrategy, Inc., Class – A (a) | | | 33 | |
| | 946 | | | Mitek Systems, Inc. (a) | | | 8 | |
| | 1,912 | | | MobileIron, Inc. (a) | | | 9 | |
| | 673 | | | Model N, Inc. (a) | | | 13 | |
| | 1,150 | | | Monotype Imaging Holdings, Inc. | | | 23 | |
| | 29,497 | | | Nuance Communications, Inc. (a) | | | 410 | |
| | 851 | | | Onespan, Inc. (a) | | | 17 | |
| | 411 | | | Park City Group, Inc. (a) | | | 3 | |
| | 782 | | | Paylocity Holding Corp. (a) | | | 46 | |
| | 1,217 | | | Progress Software Corp. | | | 47 | |
| | 738 | | | PROS Holdings, Inc. (a) | | | 27 | |
| | 276 | | | QAD, Inc., Class – A | | | 14 | |
| | 911 | | | Qualys, Inc. (a) | | | 77 | |
| | 969 | | | Rapid7, Inc. (a) | | | 27 | |
| | 198 | | | Rimini Street, Inc. (a) | | | 1 | |
| | 9,345 | | | RingCentral, Inc., Class – A (a) | | | 657 | |
| | 501 | | | Rosetta Stone, Inc. (a) | | | 8 | |
| | 1,040 | | | Sailpoint Technologies Holding, Inc. (a) | | | 26 | |
| | 197 | | | Secureworks Corp. (a) | | | 2 | |
| | 874 | | | Telenav, Inc. (a) | | | 5 | |
| | 62,112 | | | TiVo Corp. | | | 836 | |
| | 420 | | | Upland Software, Inc. (a) | | | 14 | |
| | 745 | | | Varonis Systems, Inc. (a) | | | 56 | |
| | 1,722 | | | Verint Systems, Inc. (a) | | | 76 | |
| | 1,521 | | | VirnetX Holding Corp.^ (a) | | | 5 | |
| | 747 | | | Workiva, Inc. (a) | | | 18 | |
| | 1,594 | | | Zix Corp. (a) | | | 9 | |
| | 22,550 | | | Zscaler, Inc.^ (a) | | | 807 | |
| | | | | | | | |
| | | | | | | 6,013 | |
| | | | | | | | |
| | | | Specialty Retail — 2.47% | |
| | 1,899 | | | Aaron’s, Inc. | | | 83 | |
| | 1,810 | | | Abercrombie & Fitch Co., Class – A | | | 44 | |
| | 4,364 | | | American Eagle Outfitters, Inc. | | | 101 | |
| | 175 | | | America’s Car-Mart, Inc. (a) | | | 11 | |
| | 551 | | | Asbury Automotive Group, Inc. (a) | | | 38 | |
| | 4,730 | | | Ascena Retail Group, Inc. (a) | | | 19 | |
| | 706 | | | AT Home Group, Inc. (a) | | | 28 | |
| | 1,127 | | | Barnes & Noble Education, Inc. (a) | | | 6 | |
| | 1,724 | | | Barnes & Noble, Inc. | | | 11 | |
| | 3,635 | | | Bed Bath & Beyond, Inc. | | | 72 | |
| | 493 | | | Big 5 Sporting Goods Corp. | | | 4 | |
| | 17,395 | | | Boot Barn Holdings, Inc. (a) | | | 361 | |
| | 1,113 | | | Caleres, Inc. | | | 38 | |
| | 878 | | | Camping World Holdings, Inc., Class- A | | | 22 | |
| | 30,687 | | | Carvana Co.^ (a) | | | 1,278 | |
| | 3,456 | | | Chico’s FAS, Inc. | | | 28 | |
| | 377 | | | Citi Trends, Inc. | | | 10 | |
| | 521 | | | Conn’s, Inc. (a) | | | 17 | |
| | 1,855 | | | DSW, Inc., Class – A | | | 48 | |
| | 1,994 | | | Express, Inc. (a) | | | 18 | |
| | 1,478 | | | Five Below, Inc. (a) | | | 144 | |
| | 1,090 | | | Francesca’s Holdings Corp. (a) | | | 8 | |
| | 2,710 | | | GameStop Corp., Class – A | | | 39 | |
| | 539 | | | Genesco, Inc. (a) | | | 21 | |
See accompanying notes to financial statements.
107
HC CAPITAL TRUST
The Institutional Small Capitalization-Mid Capitalization Equity Portfolio
Portfolio of Investments (continued) — June 30, 2018
| | | | | | | | |
| Shares | | | Security Description | | Value
(000) | |
| | | | Common Stocks (continued) | |
| | | | Specialty Retail (continued) | | | | |
| | 1,984 | | | GNC Holdings, Inc., Class – A (a) | | $ | 7 | |
| | 544 | | | Group 1 Automotive, Inc. | | | 34 | |
| | 1,584 | | | Guess?, Inc. | | | 34 | |
| | 473 | | | Haverty Furniture Cos., Inc. | | | 10 | |
| | 541 | | | Hibbett Sports, Inc. (a) | | | 12 | |
| | 1,029 | | | Hudson Ltd., Class A (a) | | | 18 | |
| | 392 | | | J. Jill, Inc. (a) | | | 4 | |
| | 464 | | | Kirkland’s, Inc. (a) | | | 5 | |
| | 641 | | | Lithia Motors, Inc. | | | 61 | |
| | 6,329 | | | Lumber Liquidators Holdings, Inc. (a) | | | 154 | |
| | 602 | | | MarineMax, Inc. (a) | | | 11 | |
| | 861 | | | Monro Muffler Brake, Inc. | | | 50 | |
| | 839 | | | Murphy USA, Inc. (a) | | | 62 | |
| | 919 | | | National Vision Holdings, Inc. (a) | | | 34 | |
| | 675 | | | New York & Co., Inc. (a) | | | 3 | |
| | 14,990 | | | Office Depot, Inc. | | | 38 | |
| | 968 | | | Party City Holdco, Inc. (a) | | | 15 | |
| | 2,334 | | | Pier 1 Imports, Inc. | | | 6 | |
| | 1,198 | | | Rent-A-Center, Inc. (a) | | | 18 | |
| | 534 | | | Restoration Hardware Co. (a) | | | 75 | |
| | 3,311 | | | Sally Beauty Holdings, Inc. (a) | | | 53 | |
| | 288 | | | Shoe Carnival, Inc. | | | 9 | |
| | 1,595 | | | Signet Jewelers Ltd. | | | 89 | |
| | 1,026 | | | Sleep Number Corp. (a) | | | 30 | |
| | 645 | | | Sonic Automotive, Inc., Class – A | | | 13 | |
| | 1,082 | | | Sportsman’s Warehouse Holdings, Inc. (a) | | | 6 | |
| | 20,048 | | | Tailored Brands, Inc. | | | 513 | |
| | 796 | | | The Buckle, Inc.^ | | | 21 | |
| | 583 | | | The Cato Corp. | | | 14 | |
| | 458 | | | The Children’s Place Retail Stores, Inc. | | | 55 | |
| | 372 | | | The Container Store Group, Inc. (a) | | | 3 | |
| | 996 | | | Tile Shop Holdings, Inc. | | | 8 | |
| | 310 | | | Tilly’s, Inc., Class – A | | | 5 | |
| | 61 | | | Winmark Corp. | | | 9 | |
| | 522 | | | Zumiez, Inc. (a) | | | 13 | |
| | | | | | | | |
| | | | | | | 3,941 | |
| | | | | | | | |
| | | | Technology Hardware, Storage & Peripherals — 0.56% | |
| | 2,893 | | | 3D Systems Corp.^ (a) | | | 40 | |
| | 1,011 | | | Avid Technology, Inc. (a) | | | 5 | |
| | 1,093 | | | Cray, Inc. (a) | | | 27 | |
| | 22,123 | | | Diebold, Inc. | | | 264 | |
| | 374 | | | Eastman Kodak Co. (a) | | | 1 | |
| | 1,205 | | | Electronics for Imaging, Inc. (a) | | | 39 | |
| | 818 | | | Immersion Corp. (a) | | | 13 | |
| | 18,281 | | | Pure Storage, Inc., Class – A (a) | | | 437 | |
| | 1,369 | | | Stratasys Ltd. (a) | | | 26 | |
| | 1,078 | | | Super Micro Computer, Inc. (a) | | | 25 | |
| | 1,395 | | | USA Technologies, Inc. (a) | | | 20 | |
| | | | | | | | |
| | | | | | | 897 | |
| | | | | | | | |
| | | | Textiles, Apparel & Luxury Goods — 0.49% | |
| | 1,839 | | | Crocs, Inc. (a) | | | 32 | |
| | 316 | | | Culp, Inc. | | | 8 | |
| | 862 | | | Deckers Outdoor Corp. (a) | | | 97 | |
| | 1,233 | | | Fossil Group, Inc. (a) | | | 33 | |
| | | | | | | | |
| Shares | | | Security Description | | Value
(000) | |
| | | | Textiles, Apparel & Luxury Goods (continued) | | | | |
| | 1,176 | | | G-III Apparel Group Ltd. (a) | | $ | 52 | |
| | 425 | | | Movado Group, Inc. | | | 21 | |
| | 4,007 | | | Oxford Industries, Inc. | | | 333 | |
| | 369 | | | Perry Ellis International, Inc. (a) | | | 10 | |
| | 167 | | | Rocky Brands, Inc. | | | 5 | |
| | 1,570 | | | Steven Madden Ltd. | | | 83 | |
| | 250 | | | Superior Uniform Group, Inc. | | | 5 | |
| | 426 | | | Unifi, Inc. (a) | | | 14 | |
| | 581 | | | Vera Bradley, Inc. (a) | | | 8 | |
| | 2,476 | | | Wolverine World Wide, Inc. | | | 86 | |
| | | | | | | | |
| | | | | | | 787 | |
| | | | | | | | |
| | | | Thrifts & Mortgage Finance — 0.86% | |
| | 414 | | | Bankfinancial Corp. | | | 7 | |
| | 1,880 | | | Beneficial BanCorp, Inc. | | | 30 | |
| | 1,601 | | | BOFI Holding, Inc. (a) | | | 65 | |
| | 102 | | | Bridgewater Bancshares, Inc. (a) | | | 1 | |
| | 244 | | | BSB BanCorp, Inc. (a) | | | 8 | |
| | 3,485 | | | Capitol Federal Financial, Inc. | | | 46 | |
| | 359 | | | Charter Financial Corp. | | | 9 | |
| | 1,304 | | | Columbia Financial, Inc. (a) | | | 22 | |
| | 876 | | | Dime Community Bancshares | | | 17 | |
| | 200 | | | Entegra Financial Corp. (a) | | | 6 | |
| | 274 | | | Essa BanCorp, Inc. | | | 4 | |
| | 2,587 | | | Essent Group Ltd. (a) | | | 93 | |
| �� | 243 | | | Federal Agricultural Mortgage Corp., Class – C | | | 22 | |
| | 255 | | | First Defiance Financial Corp. | | | 17 | |
| | 799 | | | Flagstar Bancorp, Inc. (a) | | | 27 | |
| | 78 | | | FS BanCorp, Inc. | | | 5 | |
| | 95 | | | Greene County BanCorp, Inc. | | | 3 | |
| | 37 | | | Hingham Institution For SVGS | | | 8 | |
| | 211 | | | Home BanCorp, Inc. | | | 10 | |
| | 748 | | | HomeStreet, Inc. (a) | | | 20 | |
| | 221 | | | Impac Mortgage Holdings, Inc. (a) | | | 2 | |
| | 2,668 | | | Kearny Financial Corp. of Maryland | | | 36 | |
| | 209 | | | LendingTree, Inc. (a) | | | 45 | |
| | 389 | | | Luther Burbank Corp. | | | 4 | |
| | 195 | | | Malvern BanCorp, Inc. (a) | | | 5 | |
| | 423 | | | Merchants BanCorp/IN | | | 12 | |
| | 1,299 | | | Meridian Bancorp, Inc. | | | 25 | |
| | 252 | | | Meta Financial Group, Inc. | | | 25 | |
| | 10,035 | | | MGIC Investment Corp. (a) | | | 109 | |
| | 809 | | | Nationstar Mortgage Holdings, Inc. (a) | | | 14 | |
| | 1,678 | | | NMI Holdings, Inc. (a) | | | 27 | |
| | 1,191 | | | Northfield BanCorp, Inc. | | | 20 | |
| | 2,588 | | | Northwest Bancshares, Inc. | | | 45 | |
| | 1,279 | | | OceanFirst Financial Corp. | | | 38 | |
| | 3,053 | | | Ocwen Financial Corp. (a) | | | 12 | |
| | 298 | | | OP BanCorp (a) | | | 4 | |
| | 1,094 | | | Oritani Financial Corp. | | | 18 | |
| | 521 | | | PCSB Financial Corp. | | | 10 | |
| | 209 | | | PDL Community BanCorp (a) | | | 3 | |
| | 535 | | | PennyMac Financial Services, Inc. (a) | | | 11 | |
| | 925 | | | PHH Corp. (a) | | | 10 | |
| | 139 | | | Provident BanCorp, Inc. (a) | | | 4 | |
See accompanying notes to financial statements.
108
HC CAPITAL TRUST
The Institutional Small Capitalization-Mid Capitalization Equity Portfolio
Portfolio of Investments (continued) — June 30, 2018
| | | | | | | | |
| Shares | | | Security Description | | Value
(000) | |
| | | | Common Stocks (continued) | |
| | | | Thrifts & Mortgage Finance (continued) | |
| | 1,678 | | | Provident Financial Services, Inc. | | $ | 46 | |
| | 248 | | | Prudential BanCorp, Inc. | | | 5 | |
| | 5,846 | | | Radian Group, Inc. | | | 95 | |
| | 635 | | | Riverview BanCorp, Inc. | | | 5 | |
| | 340 | | | SI Financial Group, Inc. | | | 5 | |
| | 199 | | | Southern Missouri BanCorp, Inc. | | | 8 | |
| | 482 | | | Sterling Bancorp, Inc./MI | | | 6 | |
| | 227 | | | Territorial BanCorp, Inc. | | | 7 | |
| | 186 | | | Timberland BanCorp, Inc./Wa | | | 7 | |
| | 2,560 | | | TrustCo Bank Corp. NY | | | 23 | |
| | 1,385 | | | United Community Financial Corp. | | | 15 | |
| | 1,400 | | | United Financial Bancorp, Inc. | | | 25 | |
| | 735 | | | Walker & Dunlop, Inc. | | | 41 | |
| | 2,284 | | | Washington Federal, Inc. | | | 75 | |
| | 724 | | | Waterstone Financial, Inc. | | | 12 | |
| | 804 | | | Western New England BanCorp, Inc. | | | 9 | |
| | 1,697 | | | WSFS Financial Corp. | | | 90 | |
| | | | | | | | |
| | | | | | | 1,373 | |
| | | | | | | | |
| | | | Tobacco — 0.25% | |
| | 2,882 | | | 22nd Century Group, Inc.^ (a) | | | 7 | |
| | 198 | | | Alliance One International, Inc. (a) | | | 3 | |
| | 212 | | | Turning Point Brands, Inc. | | | 7 | |
| | 5,047 | | | Universal Corp. | | | 333 | |
| | 2,601 | | | Vector Group Ltd. | | | 50 | |
| | | | | | | | |
| | | | | | | 400 | |
| | | | | | | | |
| | | | Trading Companies & Distributors — 1.77% | |
| | 1,317 | | | Aircastle Ltd. | | | 27 | |
| | 1,033 | | | Applied Industrial Technologies, Inc. | | | 72 | |
| | 10,413 | | | Beacon Roofing Supply, Inc. (a) | | | 445 | |
| | 225 | | | Bluelinx Holdings, Inc. (a) | | | 8 | |
| | 20,289 | | | BMC Stock Holdings, Inc. (a) | | | 423 | |
| | 466 | | | CAI International, Inc. (a) | | | 11 | |
| | 7,692 | | | DXP Enterprises, Inc. (a) | | | 294 | |
| | 113 | | | Envirostar, Inc. | | | 5 | |
| | 387 | | | Foundation Building Materials, Inc. (a) | | | 6 | |
| | 1,016 | | | GATX Corp. | | | 75 | |
| | 226 | | | General Finance Corp. (a) | | | 3 | |
| | 900 | | | GMS, Inc. (a) | | | 24 | |
| | 871 | | | H&E Equipment Services, Inc. | | | 33 | |
| | 641 | | | Herc Holdings, Inc. (a) | | | 36 | |
| | 747 | | | Kaman Corp. | | | 52 | |
| | 195 | | | Lawson Products, Inc. (a) | | | 5 | |
| | 13,936 | | | MRC Global, Inc. (a) | | | 302 | |
| | 882 | | | Nexeo Solutions, Inc. (a) | | | 8 | |
| | 2,917 | | | NOW, Inc. (a) | | | 39 | |
| | 152 | | | Rush Enterprises, Inc. (a) | | | 7 | |
| | 805 | | | Rush Enterprises, Inc., Class – A (a) | | | 35 | |
| | 5,097 | | | SiteOne Landscape Supply, Inc. (a) | | | 428 | |
| | 750 | | | Textainer Group Holdings Ltd. (a) | | | 12 | |
| | 534 | | | Titan Machinery, Inc. (a) | | | 8 | |
| | 1,410 | | | Triton International Ltd. | | | 43 | |
| | 327 | | | Veritiv Corp. (a) | | | 13 | |
| | 2,397 | | | Watsco, Inc. | | | 427 | |
| | | | | | | | |
| Shares | | | Security Description | | Value
(000) | |
| | | | Trading Companies & Distributors (continued) | |
| | 107 | | | Willis Lease Finance Corp. (a) | | $ | 3 | |
| | | | | | | | |
| | | | | | | 2,844 | |
| | | | | | | | |
| | | | Transportation Infrastructure — 0.32% | |
| | 12,036 | | | Macquarie Infrastructure Corp. | | | 508 | |
| | | | | | | | |
| | | | Water Utilities — 0.16% | |
| | 990 | | | American States Water Co. | | | 57 | |
| | 350 | | | Aquaventure Holdings Ltd. (a) | | | 5 | |
| | 228 | | | Artesian Resources Corp. | | | 9 | |
| | 622 | | | Cadiz, Inc.^ (a) | | | 8 | |
| | 1,298 | | | California Water Service Group | | | 51 | |
| | 329 | | | Connecticut Water Service, Inc. | | | 21 | |
| | 434 | | | Consolidated Water Co. Ltd. | | | 6 | |
| | 2,029 | | | Evoqua Water Technologies Co. (a) | | | 42 | |
| | 222 | | | Global Water Resources, Inc. | | | 2 | |
| | 410 | | | Middlesex Water Co. | | | 17 | |
| | 518 | | | Pure Cycle Corp. (a) | | | 5 | |
| | 452 | | | SJW Corp. | | | 30 | |
| | 368 | | | The York Water Co. | | | 12 | |
| | | | | | | | |
| | | | | | | 265 | |
| | | | | | | | |
| | | | Wireless Telecommunication Services — 0.05% | |
| | 1,095 | | | Boingo Wireless, Inc. (a) | | | 25 | |
| | 2,233 | | | NII Holdings, Inc. (a) | | | 9 | |
| | 1,263 | | | Shenandoah Telecommunications Co. | | | 40 | |
| | 577 | | | Spok Holdings, Inc. | | | 9 | |
| | | | | | | | |
| | | | | | | 83 | |
| | | | | | | | |
| | | | Total Common Stocks | | | 151,606 | |
| | | | | | | | |
| | | | Contingent Right — 0.00% | |
| | | | Biotechnology — 0.00% | |
| | 700 | | | Clinical Data, Inc.*(a)(b) | | | — | |
| | | | | | | | |
| | | | Total Contingent Right | | | — | |
| | | | | | | | |
| | |
Principal
Amount
(000) | | | | | | |
| | | | U.S. Treasury Obligation — 0.01% | |
| $ | 20 | | | U.S. Treasury Bill, 1.83%, 9/6/18(c)(d) | | | 20 | |
| | | | | | | | |
| | | | Total U.S. Treasury Obligation | | | 20 | |
| | | | | | | | |
| | | | Time Deposit — 0.59% | |
| | 936 | | | State Street Liquidity Management Control System Eurodollar Time Deposit, 0.53%, 7/2/18 | | | 936 | |
| | | | | | | | |
| | | | Total Time Deposit | | | 936 | |
| | | | | | | | |
| | |
| Shares | | | | | | |
| | | | Mutual Funds — 6.04% | |
| | 1,983,170 | | | Federated Treasury Obligations Fund, Institutional Shares, 1.75%^^(e) | | | 1,983 | |
| | 459,973 | | | State Street Institutional Liquid Reserves Fund, Trust Class, 1.04%(e) | | | 460 | |
| | 7,220,203 | | | State Street Institutional Treasury Plus Money Market Fund, Trust Class, 1.72%(e) | | | 7,220 | |
| | | | | | | | |
| | | | Total Mutual Funds | | | 9,663 | |
| | | | | | | | |
See accompanying notes to financial statements.
109
HC CAPITAL TRUST
The Institutional Small Capitalization-Mid Capitalization Equity Portfolio
Portfolio of Investments (concluded) — June 30, 2018
| | | | | | | | |
Principal
Amount
(000) | | | Security Description | | Value
(000) | |
| | | | Repurchase Agreement — 2.08% | |
| $ | 3,330 | | | Jefferies LLC, 2.00%, 7/2/18 (Purchased on 6/29/18, proceeds at maturity $3,330,790 collateralized by U.S. Treasury Obligations, 2.50% – 2.92%, 2/15/20 – 2/15/44 fair value $3,396,843)^^ | | $ | 3,330 | |
| | | | | | | | |
| | | | Total Repurchase Agreement | | | 3,330 | |
| | | | | | | | |
| | | | Total Investments
(cost $130,502) — 103.53% | | | 165,555 | |
| | | | Liabilities in excess of
other assets — (3.53)% | | | (5,649 | ) |
| | | | | | | | |
| | | | Net Assets — 100.00% | | $ | 159,906 | |
| | | | | | | | |
Amounts designated as “—” are $0 or have been rounded to $0.
| * | Security was fair valued on June 30, 2018 and represents a Level 2 security. Refer to Note 2 in the Notes to Financial Statements. |
| ^ | All or part of this security was on loan as of June 30, 2018. The total value of securities on loan as of June 30, 2018, was $5,161 (amount in thousands). |
| ^^ | Purchased with cash collateral held from securities lending. The value of the collateral could include collateral held for securities that were sold on or before June 30, 2018. |
| (a) | Represents non-income producing security. |
| (b) | Rights entitle the Portfolio to cash based on the company’s achievement of milestones in connection with a pharmaceutical drug that was brought to market. |
| (c) | Rate disclosed represents effective yield at purchase. |
| (d) | All or part of this security has been pledged as collateral for derivative instruments held by the Portfolio. |
| (e) | The rate disclosed is the rate in effect on June 30, 2018. |
ADR — American Depositary Receipt
REIT — Real Estate Investment Trust
The following table reflects the percentage of total net assets of the Portfolio attributable to each Specialist Manager as of June 30, 2018.
| | | | | | | | | | | | | | | | | | | | | | | | | | | | |
The Institutional Small
Capitalization-Mid Capitalization
Equity Portfolio | | Advisory
Research,
Inc. | | | Frontier
Capital
Management
Company,
LLC | | | BNY Mellon Asset
Management North
America Corporation* | | | Parametric
Portfolio
Associates,
LLC | | | Pzena
Investment
Management,
LLC | | | HC
Capital
Solutions | | | Total | |
Common Stocks | | | 17.85 | % | | | 33.90 | % | | | 37.23 | % | | | — | | | | 5.83 | % | | | — | | | | 94.81 | % |
Contingent Right | | | 0.00 | % | | | — | | |
| —
|
| | | — | | | | — | | | | — | | | | 0.00 | % |
U.S. Treasury Obligations | | | — | | | | — | | | | 0.01 | % | | | — | | | | — | | | | — | | | | 0.01 | % |
Time Deposit | | | — | | | | 0.51 | % | |
| —
|
| | | — | | | | 0.08 | % | | | — | | | | 0.59 | % |
Mutual Funds | | | 0.92 | % | | | 0.42 | % | | | 0.37 | % | | | 1.86 | % | | | — | | | | 2.47 | % | | | 6.04 | % |
Repurchase Agreement | | | 1.06 | % | | | 0.71 | % | | | 0.31 | % | | | — | | | | — | | | | — | | | | 2.08 | % |
Other Assets (Liabilities) | | | -1.91 | % | | | -1.20 | % | | | -0.50 | % | | | 0.07 | % | | | 0.00 | % | | | 0.01 | % | | | -3.53 | % |
| | | | | | | | | | | | | | | | | | | | | | | | | | | | |
Total Net Assets | | | 17.92 | % | | | 34.34 | % | | | 37.42 | % | | | 1.93 | % | | | 5.91 | % | | | 2.48 | % | | | 100.00 | % |
| | | | | | | | | | | | | | | | | | | | | | | | | | | | |
| * | Formerly Mellon Capital Management Corporation. |
Amounts designated as “—” indicate the Specialist Manager did not manage any holdings in that category.
The following table reflects the open derivative positions held by the Portfolio as of June 30, 2018.
Futures Contracts Purchased^
| | | | | | | | | | | | | | |
Description | | Number of
Contracts | | Expiration
Date | | | Notional
Amount
(000) | | | Value and
Unrealized
Appreciation/
(Depreciation)
(000) | |
Russell 2000 Mini Index Future | | 31 | | | 9/21/18 | | | $ | 2,554 | | | $ | (95 | ) |
| | | | | | | | | | | | | | |
| | | | | $ | 2,554 | | | $ | (95 | ) |
| | | | | | | | | | | | | | |
| | |
| | Total Unrealized Appreciation | | | $ | — | |
| | Total Unrealized Depreciation | | | | (95 | ) |
| | | | | | | | | | | | | | |
| | Total Net Unrealized Appreciation/(Depreciation) | | | $ | (95 | ) |
| | | | | | | | | | | | | | |
| ^ | Cash has been pledged as collateral for futures contracts held by the Portfolio. |
Amounts designated as “—” are $0 or have been rounded to $0.
See accompanying notes to financial statements.
110
HC CAPITAL TRUST
The Real Estate Securities Portfolio
Portfolio of Investments — June 30, 2018
| | | | | | | | |
| Shares | | | Security Description | | Value
(000) | |
| | | | Common Stocks — 84.03% | |
| | | | Equity Real Estate Investment Trusts — 77.46% | |
| | 48,551 | | | Acadia Realty Trust | | $ | 1,329 | |
| | 30,660 | | | Agree Realty Corp. | | | 1,618 | |
| | 44,323 | | | Alexandria Real Estate Equities, Inc. | | | 5,592 | |
| | 31,613 | | | American Tower Corp. | | | 4,558 | |
| | 57,496 | | | Apartment Investment & Management Co., Class – A | | | 2,432 | |
| | 11,286 | | | AvalonBay Communities, Inc. | | | 1,940 | |
| | 36,988 | | | Boston Properties, Inc. | | | 4,639 | |
| | 43,145 | | | Camden Property Trust | | | 3,932 | |
| | 65,900 | | | Community Healthcare Trust, Inc. | | | 1,968 | |
| | 20,481 | | | Coresite Realty Corp. | | | 2,270 | |
| | 80,319 | | | Corporate Office Properties Trust | | | 2,328 | |
| | 56,260 | | | DDR Corp. | | | 1,007 | |
| | 82,849 | | | Douglas Emmett, Inc. | | | 3,329 | |
| | 4,676 | | | Equinix, Inc. | | | 2,010 | |
| | 30,844 | | | Equity Lifestyle Properties, Inc. | | | 2,835 | |
| | 16,453 | | | Essex Property Trust, Inc. | | | 3,933 | |
| | 40,497 | | | Extra Space Storage, Inc. | | | 4,042 | |
| | 180,579 | | | HCP, Inc. | | | 4,663 | |
| | 98,585 | | | Host Hotels & Resorts, Inc. | | | 2,077 | |
| | 97,617 | | | Invitation Homes, Inc. | | | 2,251 | |
| | 49,725 | | | JBG Smith Properties | | | 1,813 | |
| | 20,771 | | | Potlatch Corp. | | | 1,056 | |
| | 97,561 | | | Prologis, Inc. | | | 6,409 | |
| | 13,868 | | | PS Business Parks, Inc. | | | 1,782 | |
| | 34,330 | | | Public Storage | | | 7,789 | |
| | 53,954 | | | Regency Centers Corp. | | | 3,349 | |
| | 101,742 | | | Rexford Industrial Realty, Inc. | | | 3,194 | |
| | 58,724 | | | Simon Property Group, Inc. | | | 9,995 | |
| | 70,180 | | | Store Capital Corp. | | | 1,923 | |
| | 28,263 | | | Sun Communities, Inc. | | | 2,766 | |
| | 14,972 | | | Taubman Centers, Inc. | | | 880 | |
| | 1,026 | | | The Macerich Co. | | | 58 | |
| | 88,572 | | | Xenia Hotels & Resorts, Inc. | | | 2,158 | |
| | | | | | | | |
| | | | | | | 101,925 | |
| | | | | | | | |
| | | | | | | | |
| Shares | | | Security Description | | Value
(000) | |
| | | | Health Care Providers & Services — 0.13% | |
| | 74,846 | | | Genesis Healthcare, Inc. (a) | | $ | 171 | |
| | | | | | | | |
| | | | Hotels, Restaurants & Leisure — 5.42% | |
| | 32,959 | | | Hilton Worldwide Holdings, Inc. | | | 2,608 | |
| | 29,354 | | | Hyatt Hotels Corp., Class – A | | | 2,265 | |
| | 8,252 | | | Vail Resorts, Inc. | | | 2,263 | |
| | | | | | | | |
| | | | | | | 7,136 | |
| | | | | | | | |
| | | | Multiline Retail — 0.37% | |
| | 13,123 | | | Macy’s, Inc. | | | 491 | |
| | | | | | | | |
| | | | Real Estate Management & Development — 0.65% | |
| | 40,272 | | | Kennedy-Wilson Holdings, Inc. | | | 852 | |
| | | | | | | | |
| | | | Total Common Stocks | | | 110,575 | |
| | | | | | | | |
| | | | Mutual Funds — 15.45% | |
| | 1,117,564 | | | DWS Government Cash Money Market Fund, Institutional Shares, 1.80% (b) | | | 1,118 | |
| | 19,219,869 | | | State Street Institutional Treasury Plus Money Market Fund, Trust Class, 1.72% (b) | | | 19,219 | |
| | | | | | | | |
| | | | Total Mutual Funds | | | 20,337 | |
| | | | | | | | |
| | | | Total Investments
(cost $110,830) — 99.48% | | | 130,912 | |
| | | | Other assets in excess of
liabilities — 0.52% | | | 689 | |
| | | | | | | | |
| | | | Net Assets — 100.00% | | $ | 131,601 | |
| | | | | | | | |
| (a) | Represents non-income producing security. |
| (b) | The rate disclosed is the rate in effect on June 30, 2018. |
See accompanying notes to financial statements.
111
HC CAPITAL TRUST
The Real Estate Securities Portfolio
Portfolio of Investments (concluded) — June 30, 2018
The following table reflects the percentage of total net assets of the Portfolio attributable to each Specialist Manager as of June 30, 2018.
| | | | | | | | | | | | | | | | |
The Real Estate Securities Portfolio | | Parametric
Portfolio
Associates,
LLC | | | Wellington
Management
Company,
LLP | | | HC Capital
Solutions | | | Total | |
Common Stocks | | | — | | | | 84.03 | % | | | — | | | | 84.03 | % |
Mutual Funds | | | 9.28 | % | | | 0.85 | % | | | 5.32 | % | | | 15.45 | % |
Other Assets (Liabilities) | | | 0.41 | % | | | 0.10 | % | | | 0.01 | % | | | 0.52 | % |
| | | | | | | | | | | | | | | | |
Total Net Assets | | | 9.69 | % | | | 84.98 | % | | | 5.33 | % | | | 100.00 | % |
| | | | | | | | | | | | | | | | |
Amounts designated as “—” indicate the Specialist Manager did not manage any holdings in that category.
The following table reflects the open derivative positions held by the Portfolio as of June 30, 2018.
Futures Contracts Purchased^
| | | | | | | | | | | | | | |
Description | | Number of
Contracts | | Expiration
Date | | | Notional
Amount
(000) | | | Value and
Unrealized
Appreciation/
(Depreciation)
(000) | |
Dow Jones U.S. Real Estate Index Future | | 367 | | | 9/21/18 | | | $ | 11,737 | | | $ | 273 | |
| | | | | | | | | | | | | | |
| | | | | $ | 11,737 | | | $ | 273 | |
| | | | | | | | | | | | | | |
| | |
| | Total Unrealized Appreciation | | | $ | 273 | |
| | Total Unrealized Depreciation | | | | — | |
| | | | | | | | | | | | | | |
| | Total Net Unrealized Appreciation/(Depreciation) | | | $ | 273 | |
| | | | | | | | | | | | | | |
| ^ | Cash has been pledged as collateral for futures contracts held by the Portfolio. |
Amounts designated as “—” are $0 or have been rounded to $0.
See accompanying notes to portfolio of investments.
112
HC CAPITAL TRUST
The Commodity Returns Strategy Portfolio
Consolidated Portfolio of Investments — June 30, 2018
| | | | | | | | |
| Shares | | | Security Description | | Value
(000) | |
| | | | Common Stocks — 83.60% | | | | |
| | | | Australia — 3.21% | |
| | 274,615 | | | Alumina Ltd. (Metals & Mining) | | $ | 569 | |
| | 121,932 | | | Amcor Ltd. (Containers & Packaging) | | | 1,300 | |
| | 364,061 | | | BHP Billiton Ltd. (Metals & Mining) | | | 9,135 | |
| | 141,644 | | | BlueScope Steel Ltd. (Metals & Mining) | | | 1,809 | |
| | 120,998 | | | Boral Ltd. (Construction Materials) | | | 585 | |
| | 29,130 | | | Caltex Australia Ltd. (Oil, Gas & Consumable Fuels) | | | 701 | |
| | 174,661 | | | Fortescue Metals Group Ltd. (Metals & Mining) | | | 567 | |
| | 189,276 | | | Incitec Pivot Ltd. (Chemicals) | | | 508 | |
| | 191,018 | | | Newcrest Mining Ltd. (Metals & Mining) | | | 3,081 | |
| | 42,062 | | | Orica Ltd. (Chemicals) | | | 553 | |
| | 202,696 | | | Origin Energy Ltd. (Oil, Gas & Consumable Fuels) (a) | | | 1,504 | |
| | 44,660 | | | Rio Tinto Ltd. (Metals & Mining) | | | 2,757 | |
| | 178,448 | | | Santos Ltd. (Oil, Gas & Consumable
Fuels) (a) | | | 828 | |
| | 583,052 | | | South32 Ltd. (Metals & Mining) | | | 1,557 | |
| | 84,259 | | | Woodside Petroleum Ltd. (Oil, Gas & Consumable Fuels) | | | 2,211 | |
| | | | | | | | |
| | | | | | | 27,665 | |
| | | | | | | | |
| | | | Austria — 0.18% | |
| | 17,440 | | | OMV AG (Oil, Gas & Consumable Fuels) | | | 989 | |
| | 12,757 | | | Voestalpine AG (Metals & Mining) | | | 588 | |
| | | | | | | | |
| | | | | | | 1,577 | |
| | | | | | | | |
| | | | Belgium — 0.26% | |
| | 8,116 | | | Solvay SA (Chemicals) | | | 1,025 | |
| | 21,360 | | | Umicore SA (Chemicals) | | | 1,226 | |
| | | | | | | | |
| | | | | | | 2,251 | |
| | | | | | | | |
| | | | Bermuda — 0.06% | |
| | 360,000 | | | Kunlun Energy Co. Ltd. (Oil, Gas & Consumable Fuels) | | | 315 | |
| | 183,000 | | | Nine Dragons Paper Holdings Ltd. (Paper & Forest Products) | | | 233 | |
| | | | | | | | |
| | | | | | | 548 | |
| | | | | | | | |
| | | | Brazil — 1.42% | |
| | 70,000 | | | Companhia Siderurgica Nacional SA (CSN) (Metals & Mining) (a) | | | 142 | |
| | 13,613 | | | Cosan SA Industria e Comercio (Oil, Gas & Consumable Fuels) | | | 125 | |
| | 20,577 | | | Duratex SA (Paper & Forest Products) | | | 46 | |
| | 28,000 | | | Fibria Celulose SA (Paper & Forest Products) | | | 522 | |
| | 89,329 | | | Petroleo Brasileiro SA, ADR (Oil, Gas & Consumable Fuels) | | | 896 | |
| | 330,812 | | | Petroleo Brasileiro SA (Oil, Gas & Consumable Fuels) | | | 1,656 | |
| | 45,300 | | | Suzano Papel e Celulose SA (Paper & Forest Products) | | | 523 | |
| | 42,803 | | | Ultrapar Participacoes SA (Oil, Gas & Consumable Fuels) | | | 507 | |
| | 286,044 | | | Vale SA, ADR (Metals & Mining) | | | 3,667 | |
| | 324,876 | | | Vale SA (Metals & Mining) | | | 4,140 | |
| | | | | | | | |
| | | | | | | 12,224 | |
| | | | | | | | |
| | | | | | | | |
| Shares | | | Security Description | | Value
(000) | |
| | | | Canada — 8.43% | |
| | 62,576 | | | Agnico-Eagle Mines Ltd. (Metals & Mining) | | $ | 2,869 | |
| | 18,300 | | | AltaGas Ltd. (Oil, Gas & Consumable Fuels)^ | | | 378 | |
| | 39,300 | | | ARC Resources Ltd. (Oil, Gas & Consumable Fuels) | | | 406 | |
| | 146,330 | | | Barrick Gold Corp., ADR (Metals & Mining) | | | 1,921 | |
| | 172,333 | | | Barrick Gold Corp. (Metals & Mining) | | | 2,264 | |
| | 44,200 | | | Cameco Corp. (Oil, Gas & Consumable Fuels) | | | 497 | |
| | 231,312 | | | Canadian Natural Resources Ltd. (Oil, Gas & Consumable Fuels) | | | 8,350 | |
| | 15,500 | | | CCL Industries, Inc., Class B (Containers & Packaging) | | | 760 | |
| | 96,414 | | | Cenovus Energy, Inc. (Oil, Gas & Consumable Fuels) | | | 1,001 | |
| | 60,400 | | | Crescent Point Energy Corp. (Oil, Gas & Consumable Fuels) | | | 444 | |
| | 80,404 | | | Eldorado Gold Corp. (Metals & Mining) (a) | | | 81 | |
| | 103,311 | | | Enbridge, Inc. (Oil, Gas & Consumable Fuels) | | | 3,694 | |
| | 72,203 | | | Enbridge, Inc. (Oil, Gas & Consumable Fuels) | | | 2,577 | |
| | 298,203 | | | Encana Corp. (Oil, Gas & Consumable Fuels) | | | 3,895 | |
| | 218,070 | | | First Quantum Minerals Ltd. (Metals & Mining) | | | 3,212 | |
| | 18,640 | | | Franco-Nevada Corp. (Metals & Mining) | | | 1,361 | |
| | 89,800 | | | Goldcorp, Inc. (Metals & Mining) | | | 1,233 | |
| | 39,275 | | | Husky Energy, Inc. (Oil, Gas & Consumable Fuels) | | | 612 | |
| | 34,260 | | | Imperial Oil Ltd. (Oil, Gas & Consumable Fuels) | | | 1,139 | |
| | 40,100 | | | Inter Pipeline Ltd. (Oil, Gas & Consumable Fuels) | | | 752 | |
| | 6,970 | | | International Petroleum Corp. (Oil, Gas & Consumable Fuels) (a) | | | 47 | |
| | 20,500 | | | Keyera Corp. (Oil, Gas & Consumable Fuels) | | | 570 | |
| | 139,600 | | | Kinross Gold Corp. (Metals & Mining) (a) | | | 526 | |
| | 309,999 | | | Lucara Diamond Corp. (Metals & Mining) | | | 498 | |
| | 10,100 | | | Methanex Corp. (Chemicals) | | | 714 | |
| | 66,083 | | | Nutrien Ltd. (Chemicals) | | | 3,596 | |
| | 53,971 | | | Pembina Pipelines Corp. (Oil, Gas & Consumable Fuels) | | | 1,869 | |
| | 18,400 | | | Peyto Exploration & Development Corp. (Oil, Gas & Consumable Fuels)^ | | | 142 | |
| | 23,000 | | | PrairieSky Royalty Ltd. (Oil, Gas & Consumable Fuels)^ | | | 454 | |
| | 26,900 | | | Seven Generations Energy (Oil, Gas & Consumable Fuels) (a) | | | 297 | |
| | 336,019 | | | Suncor Energy, Inc. (Oil, Gas & Consumable Fuels) | | | 13,676 | |
| | 59,697 | | | Teck Cominco Ltd., Class B (Metals & Mining) | | | 1,521 | |
| | 23,600 | | | Tourmaline Oil Corp. (Oil, Gas & Consumable Fuels) | | | 422 | |
See accompanying notes to financial statements.
113
HC CAPITAL TRUST
The Commodity Returns Strategy Portfolio
Consolidated Portfolio of Investments (continued) — June 30, 2018
| | | | | | | | |
| Shares | | | Security Description | | Value
(000) | |
| | | | Common Stocks (continued) | | | | |
| | | | Canada (continued) | |
| | 172,550 | | | TransCanada Corp. (Oil, Gas & Consumable Fuels)^ | | $ | 7,466 | |
| | 161,990 | | | Trican Well Service, Inc. (Energy Equipment & Services) (a) | | | 368 | |
| | 112,906 | | | Turquoise Hill Resources Ltd. (Metals & Mining) (a) | | | 320 | |
| | 137,748 | | | Uranium Participation Corp. (Capital Markets) (a)(b) | | | 427 | |
| | 13,000 | | | Vermilion Energy, Inc. (Oil, Gas & Consumable Fuels)^ | | | 469 | |
| | 7,400 | | | West Fraser Timber Co. Ltd. (Paper & Forest Products) | | | 509 | |
| | 48,151 | | | Wheaton Precious Metals Corp. (Metals & Mining) | | | 1,063 | |
| | 106,300 | | | Yamana Gold, Inc. (Metals & Mining) | | | 310 | |
| | | | | | | | |
| | | | | | | 72,710 | |
| | | | | | | | |
| | | | Chile — 0.32% | |
| | 114,018 | | | Antofagasta PLC (Metals & Mining) | | | 1,490 | |
| | 140,232 | | | Empresas CMPC SA (Paper & Forest Products) | | | 511 | |
| | 50,814 | | | Empresas Copec SA (Oil, Gas & Consumable Fuels) | | | 778 | |
| | | | | | | | |
| | | | | | | 2,779 | |
| | | | | | | | |
| | | | China — 1.64% | |
| | 442,000 | | | Aluminum Corporation of China Ltd., H Shares (Metals & Mining) (a) | | | 195 | |
| | 138,700 | | | Anhui Conch Cement Co. Ltd., H Shares (Construction Materials) | | | 795 | |
| | 229,000 | | | China Coal Energy Co. Ltd., H Shares (Oil, Gas & Consumable Fuels) | | | 95 | |
| | 324,000 | | | China National Building Material Co. Ltd., H Shares (Construction Materials) | | | 321 | |
| | 203,000 | | | China Oilfield Services Ltd., H Shares (Energy Equipment & Services) | | | 192 | |
| | 2,835,869 | | | China Petroleum & Chemical Corp., H Shares (Oil, Gas & Consumable Fuels) | | | 2,534 | |
| | 402,800 | | | China Shenhua Energy Co. Ltd., H Shares (Oil, Gas & Consumable Fuels) | | | 956 | |
| | 3,662,340 | | | CNOOC Ltd. (Oil, Gas & Consumable Fuels) | | | 6,320 | |
| | 140,000 | | | Jiangxi Copper Co. Ltd., H Shares (Metals & Mining) | | | 178 | |
| | 2,346,729 | | | PetroChina, H Shares (Oil, Gas & Consumable Fuels) | | | 1,786 | |
| | 392,000 | | | Sinopec Shanghai Petrochemical Co. Ltd., H Shares (Chemicals) | | | 239 | |
| | 208,000 | | | Yanzhou Coal Mining Co., H Shares (Oil, Gas & Consumable Fuels) | | | 272 | |
| | 643,000 | | | Zijin Mining Group Co. Ltd., H Shares (Metals & Mining) | | | 246 | |
| | | | | | | | |
| | | | | | | 14,129 | |
| | | | | | | | |
| | | | Colombia — 0.11% | |
| | 51,680 | | | Cementos Argos SA (Construction Materials) | | | 173 | |
| | 551,082 | | | Ecopetrol SA (Oil, Gas & Consumable Fuels) | | | 569 | |
| | 32,582 | | | Grupo Argos SA (Construction Materials) | | | 221 | |
| | | | | | | | |
| | | | | | | 963 | |
| | | | | | | | |
| | | | | | | | |
| Shares | | | Security Description | | Value
(000) | |
| | | | Denmark — 0.27% | |
| | 11,094 | | | Christian Hansen Holding A/S (Chemicals) | | $ | 1,025 | |
| | 25,258 | | | Novozymes A/S, B Shares (Chemicals) | | | 1,282 | |
| | | | | | | | |
| | | | | | | 2,307 | |
| | | | | | | | |
| | | | Finland — 0.51% | |
| | 15,181 | | | Neste Oil Oyj (Oil, Gas & Consumable Fuels) | | | 1,191 | |
| | 61,803 | | | Stora Enso Oyj, R Shares (Paper & Forest Products) | | | 1,210 | |
| | 56,193 | | | UPM-Kymmene Oyj (Paper & Forest Products) | | | 2,009 | |
| | | | | | | | |
| | | | | | | 4,410 | |
| | | | | | | | |
| | | | France — 3.59% | |
| | 43,809 | | | Air Liquide SA (Chemicals) | | | 5,510 | |
| | 7,620 | | | Arkema SA (Chemicals) | | | 902 | |
| | 4,017 | | | Imerys SA (Construction Materials) | | | 325 | |
| | 397,251 | | | Total SA (Oil, Gas & Consumable Fuels)^ | | | 24,218 | |
| | | | | | | | |
| | | | | | | 30,955 | |
| | | | | | | | |
| | | | Germany — 2.22% | |
| | 94,086 | | | BASF SE (Chemicals) | | | 8,999 | |
| | 7,951 | | | Covestro AG (Chemicals) | | | 710 | |
| | 18,297 | | | Evonik Industries AG (Chemicals) | | | 627 | |
| | 15,668 | | | HeidelbergCement AG (Construction Materials) | | | 1,319 | |
| | 21,472 | | | K+S AG – Registered (Chemicals) | | | 530 | |
| | 10,268 | | | Lanxess AG (Chemicals) | | | 801 | |
| | 19,026 | | | Linde AG (Chemicals) | | | 3,973 | |
| | 13,835 | | | Symrise AG (Chemicals) | | | 1,213 | |
| | 40,287 | | | ThyssenKrupp AG (Metals & Mining) | | | 979 | |
| | | | | | | | |
| | | | | | | 19,151 | |
| | | | | | | | |
| | | | Greece — 0.01% | |
| | 3,504 | | | Titan Cement Co. SA (Construction Materials) | | | 89 | |
| | | | | | | | |
| | | | Hungary — 0.04% | |
| | 32,032 | | | MOL Hungarian Oil & Gas PLC (Oil, Gas & Consumable Fuels) | | | 310 | |
| | | | | | | | |
| | | | India — 0.55% | |
| | 143,775 | | | Reliance Industries Ltd., GDR (Oil, Gas & Consumable Fuels) (c) | | | 4,040 | |
| | 34,160 | | | Tata Steel Ltd., Registered Shares, GDR (Metals & Mining) | | | 282 | |
| | 28,883 | | | Vedanta Ltd., ADR (Metals & Mining) | | | 393 | |
| | | | | | | | |
| | | | | | | 4,715 | |
| | | | | | | | |
| | | | Indonesia — 0.11% | |
| | 1,607,600 | | | PT Adaro Energy Tbk (Oil, Gas & Consumable Fuels) | | | 201 | |
| | 165,200 | | | PT Indocement Tunggal Prakarsa Tbk (Construction Materials) | | | 157 | |
| | 332,700 | | | PT Semen Gresik (Persero) Tbk (Construction Materials) | | | 166 | |
| | 187,500 | | | PT United Tractors Tbk (Oil, Gas & Consumable Fuels) | | | 413 | |
| | | | | | | | |
| | | | | | | 937 | |
| | | | | | | | |
| | | | Ireland (Republic of) — 0.36% | |
| | 87,357 | | | CRH PLC (Construction Materials) | | | 3,096 | |
| | | | | | | | |
See accompanying notes to financial statements.
114
HC CAPITAL TRUST
The Commodity Returns Strategy Portfolio
Consolidated Portfolio of Investments (continued) — June 30, 2018
| | | | | | | | |
| Shares | | | Security Description | | Value
(000) | |
| | | | Common Stocks (continued) | | | | |
| | | | Israel — 0.08% | |
| | 4,298 | | | Frutarom Industries Ltd. (Chemicals) | | $ | 421 | |
| | 57,266 | | | Israel Chemicals Ltd. (Chemicals) | | | 262 | |
| | | | | | | | |
| | | | | | | 683 | |
| | | | | | | | |
| | | | Italy — 0.77% | |
| | 275,067 | | | Eni SpA (Oil, Gas & Consumable Fuels) | | | 5,109 | |
| | 67,749 | | | Saipem SpA (Energy Equipment & Services) (a) | | | 312 | |
| | 283,278 | | | Snam Rete Gas SpA (Oil, Gas & Consumable Fuels) | | | 1,183 | |
| | | | | | | | |
| | | | | | | 6,604 | |
| | | | | | | | |
| | | | Japan — 3.23% | |
| | 16,700 | | | Air Water, Inc. (Chemicals) | | | 307 | |
| | 134,000 | | | Asahi Kasei Corp. (Chemicals) | | | 1,704 | |
| | 31,400 | | | Daicel Corp. (Chemicals) | | | 348 | |
| | 11,700 | | | Hitachi Chemical Co. Ltd. (Chemicals) | | | 236 | |
| | 24,100 | | | Hitachi Metals Ltd. (Metals & Mining) | | | 250 | |
| | 9,800 | | | Idemitsu Kosan Co. Ltd. (Oil, Gas & Consumable Fuels) | | | 350 | |
| | 109,900 | | | INPEX Corp. (Oil, Gas & Consumable Fuels) | | | 1,141 | |
| | 57,200 | | | JFE Holdings, Inc. (Metals & Mining) | | | 1,083 | |
| | 21,600 | | | JSR Corp. (Chemicals) | | | 368 | |
| | 334,494 | | | JX Holdings, Inc. (Oil, Gas & Consumable Fuels) | | | 2,327 | |
| | 31,000 | | | Kaneka Corp. (Chemicals) | | | 278 | |
| | 24,500 | | | Kansai Paint Co. Ltd. (Chemicals) | | | 509 | |
| | 34,700 | | | Kobe Steel Ltd. (Metals & Mining) | | | 318 | |
| | 39,800 | | | Kuraray Co. Ltd. (Chemicals) | | | 549 | |
| | 6,300 | | | Maruichi Steel Tube Ltd. (Metals & Mining) | | | 214 | |
| | 148,500 | | | Mitsubishi Chemical Holdings Corp. (Chemicals) | | | 1,244 | |
| | 20,300 | | | Mitsubishi Gas Chemical Co., Inc. (Chemicals) | | | 460 | |
| | 12,500 | | | Mitsubishi Materials Corp. (Metals & Mining) | | | 344 | |
| | 20,600 | | | Mitsui Chemicals, Inc. (Chemicals) | | | 549 | |
| | 18,300 | | | Nippon Paint Holdings Co. Ltd. (Chemicals) | | | 789 | |
| | 178,400 | | | Nippon Steel & Sumitomo Metal Corp. (Metals & Mining) | | | 3,505 | |
| | 13,800 | | | Nissan Chemical Industries Ltd. (Chemicals) | | | 644 | |
| | 17,400 | | | Nitto Denko Corp. (Chemicals) | | | 1,318 | |
| | 91,000 | | | Oji Paper Co. Ltd. (Paper & Forest Products) | | | 565 | |
| | 39,915 | | | Shin-Etsu Chemical Co. Ltd. (Chemicals) | | | 3,560 | |
| | 21,000 | | | Showa Shell Sekiyu KK (Oil, Gas & Consumable Fuels) | | | 314 | |
| | 176,000 | | | Sumitomo Chemical Co. Ltd. (Chemicals) | | | 998 | |
| | 27,500 | | | Sumitomo Metal Mining Co. Ltd. (Metals & Mining) | | | 1,053 | |
| | 13,600 | | | Taiheiyo Cement Corp. (Construction Materials) | | | 448 | |
| | 11,500 | | | Taiyo Nippon Sanso Corp. (Chemicals) | | | 165 | |
| | 21,000 | | | Teijin Ltd. (Chemicals) | | | 385 | |
| | | | | | | | |
| Shares | | | Security Description | | Value
(000) | |
| | | | Japan (continued) | |
| | 155,000 | | | Toray Industries, Inc. (Chemicals) | | $ | 1,224 | |
| | 18,300 | | | Toyo Seikan Kaisha Ltd. (Containers & Packaging) | | | 322 | |
| | | | | | | | |
| | | | | | | 27,869 | |
| | | | | | | | |
| | | | Jersey — 1.50% | |
| | 2,490,938 | | | Glencore International PLC (Metals & Mining) | | | 11,899 | |
| | 28,976 | | | Petrofac Ltd. (Energy Equipment & Services) | | | 223 | |
| | 10,511 | | | Randgold Resources Ltd. (Metals & Mining) | | | 807 | |
| | | | | | | | |
| | | | | | | 12,929 | |
| | | | | | | | |
| | | | Luxembourg — 0.85% | |
| | 20,237 | | | ArcelorMittal, NYS (Metals & Mining) | | | 582 | |
| | 157,293 | | | ArcelorMittal (Metals & Mining) | | | 4,613 | |
| | 114,190 | | | Tenaris SA (Energy Equipment & Services) | | | 2,095 | |
| | | | | | | | |
| | | | | | | 7,290 | |
| | | | | | | | |
| | | | Malaysia — 0.09% | |
| | 31,600 | | | Lafarge Malayan Cement Berhad (Construction Materials) (a) | | | 24 | |
| | 269,200 | | | Petronas Chemicals Group Berhad (Chemicals) | | | 562 | |
| | 22,200 | | | Petronas Dagangan Berhad (Oil, Gas & Consumable Fuels) | | | 136 | |
| | 544,300 | | | SapuraKencana Petroleum Berhad (Energy Equipment & Services) (a) | | | 86 | |
| | | | | | | | |
| | | | | | | 808 | |
| | | | | | | | |
| | | | Mexico — 0.32% | |
| | 1,535,741 | | | CEMEX SAB de CV (Construction Materials) (a) | | | 1,011 | |
| | 401,534 | | | Grupo Mexico SAB de CV, Series B (Metals & Mining) | | | 1,139 | |
| | 15,609 | | | Industrias Penoles SAB de CV (Metals & Mining) | | | 280 | |
| | 119,820 | | | Mexichem SAB de CV (Chemicals) | | | 346 | |
| | | | | | | | |
| | | | | | | 2,776 | |
| | | | | | | | |
| | | | Netherlands — 1.07% | |
| | 26,070 | | | Akzo Nobel N.V. (Chemicals) | | | 2,232 | |
| | 4,889 | | | Core Laboratories N.V. (Energy Equipment & Services) | | | 617 | |
| | 19,869 | | | Koninklijke DSM N.V. (Chemicals) | | | 1,998 | |
| | 7,853 | | | Koninklijke Vopak N.V. (Oil, Gas & Consumable Fuels) | | | 363 | |
| | 36,228 | | | LyondellBasell Industries N.V., Class – A (Chemicals) | | | 3,980 | |
| | | | | | | | |
| | | | | | | 9,190 | |
| | | | | | | | |
| | | | New Zealand — 0.04% | |
| | 77,688 | | | Fletcher Building Ltd. (Construction Materials) | | | 366 | |
| | | | | | | | |
| | | | Norway — 1.15% | |
| | 265,653 | | | Equinor ASA (Oil, Gas & Consumable Fuels) | | | 7,061 | |
| | 333,160 | | | Norsk Hydro ASA (Metals & Mining) | | | 1,997 | |
| | 19,923 | | | Yara International ASA (Chemicals) | | | 827 | |
| | | | | | | | |
| | | | | | | 9,885 | |
| | | | | | | | |
See accompanying notes to financial statements.
115
HC CAPITAL TRUST
The Commodity Returns Strategy Portfolio
Consolidated Portfolio of Investments (continued) — June 30, 2018
| | | | | | | | |
| Shares | | | Security Description | | Value
(000) | |
| | | | Common Stocks (continued) | | | | |
| | | | Papua New Guinea — 0.12% | |
| | 162,281 | | | Oil Search Ltd. (Oil, Gas & Consumable Fuels) | | $ | 1,069 | |
| | | | | | | | |
| | | | Peru — 0.03% | |
| | 21,300 | | | Compania de Minas Buenaventura SA, ADR (Metals & Mining) | | | 290 | |
| | | | | | | | |
| | | | Poland — 0.22% | |
| | 3,383 | | | Grupa Azoty SA (Chemicals) | | | 39 | |
| | 15,267 | | | Grupa Lotos SA (Oil, Gas & Consumable Fuels) | | | 232 | |
| | 5,927 | | | Jastrzebska Spolka Weglowa SA (Metals & Mining) (a) | | | 121 | |
| | 15,706 | | | KGHM Polska Miedz SA (Metals & Mining) | | | 370 | |
| | 37,986 | | | Polski Koncern Naftowy Orlen SA (Oil, Gas & Consumable Fuels) | | | 852 | |
| | 197,692 | | | Polskie Gornictwo Naftowe i Gazownictwo SA (Oil, Gas & Consumable Fuels) | | | 302 | |
| | | | | | | | |
| | | | | | | 1,916 | |
| | | | | | | | |
| | | | Portugal — 0.45% | |
| | 203,905 | | | Galp Energia SGPS SA, B Shares (Oil, Gas & Consumable Fuels) | | | 3,889 | |
| | | | | | | | |
| | | | Qatar — 0.02% | |
| | 30,321 | | | Qatar Gas Transport Co. Ltd. (Oil, Gas & Consumable Fuels) | | | 132 | |
| | | | | | | | |
| | | | Russia — 1.73% | |
| | 289,200 | | | ALROSA AO (Metals & Mining) | | | 461 | |
| | 30,500 | | | Gazprom Neft-Sponsored ADR (Oil, Gas & Consumable Fuels) | | | 791 | |
| | 654,251 | | | Gazprom OAO — Sponsored ADR (Oil, Gas & Consumable Fuels) | | | 2,879 | |
| | 47,296 | | | LUKOIL PJSC, ADR (Oil, Gas & Consumable Fuels) | | | 3,234 | |
| | 130,218 | | | MMC Norilsk Nickel PJSC, ADR (Metals & Mining) | | | 2,347 | |
| | 10,530 | | | Novatek OAO, Registered Shares, GDR (Oil, Gas & Consumable Fuels) | | | 1,562 | |
| | 10,897 | | | Phosagro OAO, GDR (Chemicals) | | | 140 | |
| | 132,013 | | | Rosneft Oil Co. OJSC, Registered Shares, GDR (Oil, Gas & Consumable Fuels) | | | 821 | |
| | 23,380 | | | Severstal, Registered Shares, GDR (Metals & Mining) | | | 342 | |
| | 161,639 | | | Surgutneftegas, ADR (Oil, Gas & Consumable Fuels) | | | 721 | |
| | 25,684 | | | Tatneft PJSC, ADR (Oil, Gas & Consumable Fuels) | | | 1,625 | |
| | | | | | | | |
| | | | | | | 14,923 | |
| | | | | | | | |
| | | | South Africa — 0.48% | |
| | 6,051 | | | Anglo Platinum Ltd. (Metals & Mining) | | | 158 | |
| | 45,789 | | | AngloGold Ashanti Ltd. (Metals & Mining) | | | 375 | |
| | 23,659 | | | Exxaro Resources Ltd. (Oil, Gas & Consumable Fuels) | | | 217 | |
| | 92,164 | | | Gold Fields Ltd. (Metals & Mining) | | | 331 | |
| | 70,067 | | | Impala Platinum Holdings Ltd. (Metals & Mining) (a) | | | 103 | |
| | 13,273 | | | Mondi Ltd. (Paper & Forest Products) | | | 360 | |
| | | | | | | | |
| Shares | | | Security Description | | Value
(000) | |
| | | | South Africa (continued) | |
| | 60,742 | | | Sappi Ltd. (Paper & Forest Products) | | $ | 405 | |
| | 58,293 | | | Sasol Ltd. (Chemicals) | | | 2,138 | |
| | 82,919 | | | Sibanye Gold Ltd. (Metals & Mining)^ | | | 50 | |
| | | | | | | | |
| | | | | | | 4,137 | |
| | | | | | | | |
| | | | South Korea — 1.02% | |
| | 5,708 | | | GS Holdings Corp. (Oil, Gas & Consumable Fuels) | | | 279 | |
| | 12,018 | | | Hanwha Chemical Corp. (Chemicals) | | | 236 | |
| | 1,730 | | | Honam Petrochemical Corp. (Chemicals) | | | 540 | |
| | 2,364 | | | Hyosung Corp. (Chemicals) (d) | | | 284 | |
| | 8,982 | | | Hyundai Steel Co. (Metals & Mining) | | | 424 | |
| | 3,365 | | | Korea Zinc Co. (Metals & Mining) | | | 1,166 | |
| | 2,051 | | | Kumho Petro Chemical Co. Ltd. (Chemicals) | | | 214 | |
| | 5,080 | | | LG Chem Ltd. (Chemicals) | | | 1,521 | |
| | 1,265 | | | OCI Co. Ltd. (Chemicals) | | | 117 | |
| | 7,344 | | | POSCO (Metals & Mining) | | | 2,167 | |
| | 7,482 | | | SK Innovation Co. Ltd. (Oil, Gas & Consumable Fuels) | | | 1,356 | |
| | 5,030 | | | S-Oil Corp. (Oil, Gas & Consumable Fuels) | | | 494 | |
| | | | | | | | |
| | | | | | | 8,798 | |
| | | | | | | | |
| | | | Spain — 0.28% | |
| | 122,159 | | | Repsol YPF SA (Oil, Gas & Consumable Fuels) | | | 2,391 | |
| | | | | | | | |
| | | | Sweden — 0.61% | |
| | 30,684 | | | Boliden AB (Metals & Mining) | | | 996 | |
| | 134,843 | | | Lundin Petroleum AB (Oil, Gas & Consumable Fuels) | | | 4,302 | |
| | | | | | | | |
| | | | | | | 5,298 | |
| | | | | | | | |
| | | | Switzerland — 0.86% | |
| | 918 | | | EMS-Chemie Holding AG, Registered Shares (Chemicals) | | | 590 | |
| | 972 | | | Givaudan SA (Chemicals) | | | 2,212 | |
| | 47,923 | | | LafargeHolcim Ltd., Registered Shares (Construction Materials) | | | 2,342 | |
| | 14,100 | | | Sika AG, Registered Shares (Chemicals) | | | 1,957 | |
| | 104,200 | | | Weatherford International PLC (Energy Equipment & Services) (a) | | | 343 | |
| | | | | | | | |
| | | | | | | 7,444 | |
| | | | | | | | |
| | | | Taiwan — 0.80% | |
| | 264,082 | | | Asia Cement Corp. (Construction Materials) | | | 290 | |
| | 1,293,376 | | | China Steel Corp. (Metals & Mining) | | | 1,006 | |
| | 353,000 | | | Formosa Chemicals & Fibre Corp. (Chemicals) | | | 1,407 | |
| | 128,000 | | | Formosa Petrochemical Corp. (Oil, Gas & Consumable Fuels) | | | 514 | |
| | 435,160 | | | Formosa Plastics Corp. (Chemicals) | | | 1,607 | |
| | 501,010 | | | Nan Ya Plastics Corp. (Chemicals) | | | 1,433 | |
| | 373,000 | | | Taiwan Cement Corp. (Construction Materials) | | | 518 | |
| | 67,000 | | | Taiwan Fertilizer Co. Ltd. (Chemicals) | | | 92 | |
| | | | | | | | |
| | | | | | | 6,867 | |
| | | | | | | | |
See accompanying notes to financial statements.
116
HC CAPITAL TRUST
The Commodity Returns Strategy Portfolio
Consolidated Portfolio of Investments (continued) — June 30, 2018
| | | | | | | | |
| Shares | | | Security Description | | Value
(000) | |
| | | | Common Stocks (continued) | | | | |
| | | | Thailand — 0.52% | |
| | 139,000 | | | Banpu Public Co. Ltd., Registered Shares (Oil, Gas & Consumable Fuels) | | $ | 82 | |
| | 125,000 | | | Energy Absolute Public Co. Ltd. (Oil, Gas & Consumable Fuels) | | | 124 | |
| | 94,900 | | | Indorama Ventures PCL (Chemicals) | | | 157 | |
| | 1,622,100 | | | IRPC PCL — Foreign (Oil, Gas & Consumable Fuels) | | | 284 | |
| | 251,055 | | | PTT Chemical Public Co. Ltd. (Chemicals) | | | 553 | |
| | 178,504 | | | PTT Exploration & Production Public Co. Ltd. (Oil, Gas & Consumable Fuels) | | | 757 | |
| | 1,225,000 | | | PTT PCL (Oil, Gas & Consumable Fuels) | | | 1,775 | |
| | 45,800 | | | Siam Cement PCL (Construction Materials) | | | 570 | |
| | 91,500 | | | Thai Oil Public Co. Ltd. (Oil, Gas & Consumable Fuels) | | | 215 | |
| | | | | | | | |
| | | | | | | 4,517 | |
| | | | | | | | |
| | | | Turkey — 0.08% | |
| | 157,059 | | | Eregli Demir ve Celik Fabrikalari TAS (Metals & Mining) | | | 349 | |
| | 49,620 | | | Petkim Petrokimya Holding A/S (Chemicals) | | | 52 | |
| | 13,985 | | | Tupras-Turkiye Petrol Rafinerileri A/S (Oil, Gas & Consumable Fuels) | | | 329 | |
| | | | | | | | |
| | | | | | | 730 | |
| | | | | | | | |
| | | | United Kingdom — 12.50% | |
| | 333,803 | | | Anglo American PLC (Metals & Mining) | | | 7,465 | |
| | 726,594 | | | BHP Billiton PLC (Metals & Mining) | | | 16,356 | |
| | 2,035,374 | | | BP PLC (Oil, Gas & Consumable Fuels) | | | 15,531 | |
| | 14,724 | | | Croda International PLC (Chemicals) | | | 933 | |
| | 24,801 | | | Fresnillo PLC (Metals & Mining) | | | 374 | |
| | 21,712 | | | Johnson Matthey PLC (Chemicals) | | | 1,037 | |
| | 104,893 | | | Kazakhmys PLC (Metals & Mining) (a) | | | 1,167 | |
| | 41,199 | | | Mondi PLC (Paper & Forest Products) | | | 1,115 | |
| | 290,432 | | | Rio Tinto PLC (Metals & Mining) | | | 16,099 | |
| | 913,108 | | | Royal Dutch Shell PLC, A Shares (Oil, Gas & Consumable Fuels) | | | 31,675 | |
| | 404,988 | | | Royal Dutch Shell PLC, B Shares (Oil, Gas & Consumable Fuels) | | | 14,501 | |
| | 24,010 | | | TechnipFMC PLC (Energy Equipment & Services) | | | 767 | |
| | 24,600 | | | TechnipFMC PLC (Energy Equipment & Services) | | | 781 | |
| | | | | | | | |
| | | | | | | 107,801 | |
| | | | | | | | |
| | | | United States — 31.49% | |
| | 21,660 | | | Air Products & Chemicals, Inc. (Chemicals) | | | 3,373 | |
| | 12,278 | | | Albemarle Corp. (Chemicals) | | | 1,158 | |
| | 27,095 | | | Alcoa Corp. (Metals & Mining) (a) | | | 1,270 | |
| | 59,800 | | | Anadarko Petroleum Corp. (Oil, Gas & Consumable Fuels) | | | 4,380 | |
| | 32,813 | | | Andeavor (Oil, Gas & Consumable Fuels) | | | 4,304 | |
| | 17,200 | | | Antero Resources Corp. (Oil, Gas & Consumable Fuels (a) | | | 367 | |
| | 42,200 | | | Apache Corp. (Oil, Gas & Consumable Fuels) | | | 1,973 | |
| | 7,000 | | | Ashland Global Holdings, Inc. (Chemicals) | | | 547 | |
| | 10,000 | | | Avery Dennison Corp. (Containers & Packaging) | | | 1,021 | |
| | | | | | | | |
| Shares | | | Security Description | | Value
(000) | |
| | | | United States (continued) | | | | |
| | 24,100 | | | Axalta Coating Systems Ltd. (Chemicals) (a) | | $ | 730 | |
| | 45,225 | | | Baker Hughes, Inc. (Energy Equipment & Services) | | | 1,494 | |
| | 34,962 | | | Ball Corp. (Containers & Packaging) | | | 1,243 | |
| | 121,960 | | | Cabot Oil & Gas Corp. (Oil, Gas & Consumable Fuels) | | | 2,903 | |
| | 15,200 | | | Celanese Corp., Series A (Chemicals) | | | 1,688 | |
| | 25,525 | | | CF Industries Holdings, Inc. (Chemicals) | | | 1,133 | |
| | 21,560 | | | Cheniere Energy, Inc. (Oil, Gas & Consumable Fuels) (a) | | | 1,405 | |
| | 186,366 | | | Chevron Corp. (Oil, Gas & Consumable Fuels) | | | 23,562 | |
| | 10,500 | | | Cimarex Energy Co. (Oil, Gas & Consumable Fuels) | | | 1,068 | |
| | 42,598 | | | Concho Resources, Inc. (Oil, Gas & Consumable Fuels) (a) | | | 5,893 | |
| | 133,971 | | | ConocoPhillips (Oil, Gas & Consumable Fuels) | | | 9,327 | |
| | 10,438 | | | Continental Resources, Inc. (Oil, Gas & Consumable Fuels) (a) | | | 676 | |
| | 15,700 | | | Crown Holdings, Inc. (Containers & Packaging) (a) | | | 703 | |
| | 92,933 | | | Devon Energy Corp. (Oil, Gas & Consumable Fuels) | | | 4,085 | |
| | 25,971 | | | Diamondback Energy, Inc. (Oil, Gas & Consumable Fuels) | | | 3,417 | |
| | 230,309 | | | DowDuPont, Inc. (Chemicals) | | | 15,183 | |
| | 15,556 | | | Eastman Chemical Co. (Chemicals) | | | 1,555 | |
| | 26,936 | | | Ecolab, Inc. (Chemicals) | | | 3,780 | |
| | 108,554 | | | EOG Resources, Inc. (Oil, Gas & Consumable Fuels) | | | 13,507 | |
| | 19,938 | | | EQT Corp. (Oil, Gas & Consumable Fuels) | | | 1,100 | |
| | 361,866 | | | Exxon Mobil Corp. (Oil, Gas & Consumable Fuels) | | | 29,937 | |
| | 14,962 | | | FMC Corp. (Chemicals) | | | 1,335 | |
| | 132,817 | | | Freeport-McMoRan Copper & Gold, Inc. (Metals & Mining) | | | 2,292 | |
| | 174,170 | | | Halliburton Co. (Energy Equipment & Services) | | | 7,848 | |
| | 11,800 | | | Helmerich & Payne, Inc. (Energy Equipment & Services) | | | 752 | |
| | 31,648 | | | Hess Corp. (Oil, Gas & Consumable Fuels) | | | 2,117 | |
| | 19,872 | | | HollyFrontier Corp. (Oil, Gas & Consumable Fuels) | | | 1,360 | |
| | 8,700 | | | International Flavors & Fragrances, Inc. (Chemicals) | | | 1,078 | |
| | 41,100 | | | International Paper Co. (Containers & Packaging) | | | 2,141 | |
| | 205,200 | | | Kinder Morgan, Inc. (Oil, Gas & Consumable Fuels) | | | 3,626 | |
| | 94,234 | | | Marathon Oil Corp. (Oil, Gas & Consumable Fuels) | | | 1,966 | |
| | 92,163 | | | Marathon Petroleum Corp. (Oil, Gas & Consumable Fuels) | | | 6,466 | |
| | 6,228 | | | Martin Marietta Materials, Inc. (Construction Materials) | | | 1,391 | |
| | 18,300 | | | Murphy Oil Corp. (Oil, Gas & Consumable Fuels) | | | 618 | |
See accompanying notes to financial statements.
117
HC CAPITAL TRUST
The Commodity Returns Strategy Portfolio
Consolidated Portfolio of Investments (continued) — June 30, 2018
| | | | | | | | |
| Shares | | | Security Description | | Value
(000) | |
| | | | Common Stocks (continued) | | | | |
| | | | United States (continued) | |
| | 41,958 | | | National Oilwell Varco, Inc. (Energy Equipment & Services) | | $ | 1,821 | |
| | 106,140 | | | Newfield Exploration Co. (Oil, Gas & Consumable Fuels) (a) | | | 3,211 | |
| | 55,875 | | | Newmont Mining Corp. (Metals & Mining) | | | 2,107 | |
| | 135,807 | | | Noble Energy, Inc. (Oil, Gas & Consumable Fuels) | | | 4,791 | |
| | 33,500 | | | Nucor Corp. (Metals & Mining) | | | 2,094 | |
| | 155,756 | | | Occidental Petroleum Corp. (Oil, Gas & Consumable Fuels) | | | 13,034 | |
| | 24,300 | | | ONEOK, Inc. (Oil, Gas & Consumable Fuels) | | | 1,697 | |
| | 10,300 | | | Packaging Corporation of America (Containers & Packaging) | | | 1,151 | |
| | 17,100 | | | Parsley Energy, Inc., Class – A (Oil, Gas & Consumable Fuels) (a) | | | 518 | |
| | 83,081 | | | Phillips 66 (Oil, Gas & Consumable Fuels) | | | 9,331 | |
| | 34,249 | | | Pioneer Natural Resources Co. (Oil, Gas & Consumable Fuels) | | | 6,481 | |
| | 66,067 | | | Plains GP Holdings LP, Class A (Oil, Gas & Consumable Fuels) | | | 1,580 | |
| | 28,122 | | | PPG Industries, Inc. (Chemicals) | | | 2,917 | |
| | 29,150 | | | Praxair, Inc. (Chemicals) | | | 4,610 | |
| | 85,436 | | | ProPetro Holding Corp. (Energy Equipment & Services) (a) | | | 1,340 | |
| | 20,729 | | | Range Resources Corp. (Oil, Gas & Consumable Fuels) | | | 347 | |
| | 15,474 | | | Reliance Steel & Aluminum Co. (Metals & Mining) | | | 1,355 | |
| | 150,308 | | | Schlumberger Ltd. (Energy Equipment & Services) | | | 10,075 | |
| | 21,600 | | | Sealed Air Corp. (Containers & Packaging) | | | 917 | |
| | 30,279 | | | Southern Copper Corp. (Metals & Mining) | | | 1,419 | |
| | 52,631 | | | Steel Dynamics, Inc. (Metals & Mining) | | | 2,419 | |
| | 46,670 | | | Targa Resources Corp. (Oil, Gas & Consumable Fuels) | | | 2,310 | |
| | 36,418 | | | The Mosaic Co. (Chemicals) | | | 1,022 | |
| | 8,251 | | | The Sherwin-Williams Co. (Chemicals) | | | 3,363 | |
| | 79,200 | | | The Williams Companies, Inc. (Oil, Gas & Consumable Fuels) | | | 2,147 | |
| | 83,409 | | | Valero Energy Corp. (Oil, Gas & Consumable Fuels) | | | 9,244 | |
| | 19,217 | | | Valvoline, Inc. (Chemicals) | | | 415 | |
| | 13,900 | | | Vulcan Materials Co. (Construction Materials) | | | 1,794 | |
| | 7,900 | | | W.R. Grace & Co. (Chemicals) | | | 579 | |
| | 26,400 | | | WestRock Co. (Containers & Packaging) | | | 1,505 | |
| | | | | | | | |
| | | | | | | 271,366 | |
| | | | | | | | |
| | | | Total Common Stocks | | | 720,784 | |
| | | | | | | | |
| | | | Preferred Stocks — 0.56% | | | | |
| | | | Brazil — 0.40% | |
| | 17,400 | | | Braskem SA — Preferred, Class A (Chemicals) | | | 226 | |
| | 255,700 | | | Gerdau SA — Preferred (Metals & Mining) | | | 914 | |
| | 377,400 | | | Klabin SA — Preferred (Containers & Packaging) | | | 305 | |
| | | | | | | | |
| Shares | | | Security Description | | Value
(000) | |
| | | | Brazil (continued) | |
| | 435,875 | | | Petroleo Brasileiro SA — Preferred (Oil, Gas & Consumable Fuels) (a) | | $ | 1,930 | |
| | | | | | | | |
| | | | | | | 3,375 | |
| | | | | | | | |
| | | | Chile — 0.06% | |
| | 10,804 | | | Sociedad Quimica y Minera de Chile SA — Preferred, B Shares (Chemicals) | | | 519 | |
| | | | | | | | |
| | | | Germany — 0.04% | |
| | 7,797 | | | Fuchs Petrolub AG — Preferred (Chemicals) | | | 385 | |
| | | | | | | | |
| | | | Russia — 0.05% | |
| | 174 | | | AK Transneft OAO — Preferred (Oil, Gas & Consumable Fuels) | | | 461 | |
| | | | | | | | |
| | | | South Korea — 0.01% | |
| | 578 | | | LG Chem Ltd. – Preferred (Chemicals) | | | 105 | |
| | | | | | | | |
| | | | Total Preferred Stocks | | | 4,845 | |
| | | | | | | | |
| | | | Right — 0.01% | | | | |
| | | | Spain — 0.01% | |
| | 122,159 | | | Repsol SA (Oil, Gas & Consumable Fuels) (a) | | | 69 | |
| | | | | | | | |
| | | | Total Right | | | 69 | |
| | | | | | | | |
| | |
Principal
Amount
(000) | | | | | | |
| | | | Corporate Bonds — 2.95% | | | | |
| $ | 1,000 | | | Albemarle Corp., 5.45%, 12/1/44, Callable 6/1/44 @ 100(Chemicals) | | | 1,064 | |
| | 2,000 | | | Anadarko Petroleum Corp., 5.55%, 3/15/26, Callable 12/15/25 @ 100(Oil, Gas & Consumable Fuels) | | | 2,142 | |
| | 2,000 | | | Antero Resources Corp., 5.63%, 6/1/23, Callable 8/9/18 @ 104.22(Oil, Gas & Consumable Fuels) | | | 2,025 | |
| | 1,050 | | | Boardwalk Pipelines LP, 4.95%, 12/15/24, Callable 9/15/24 @ 100(Oil, Gas & Consumable Fuels) | | | 1,069 | |
| | 2,000 | | | Buckeye Partners LP, 3.95%, 12/1/26, Callable 9/1/26 @ 100(Oil, Gas & Consumable Fuels) | | | 1,814 | |
| | 1,800 | | | Carrizo Oil & Gas, Inc., 6.25%, 4/15/23, Callable 8/9/18 @ 104.69(Oil, Gas & Consumable Fuels) | | | 1,823 | |
| | 2,000 | | | Continental Resources, Inc., 5.00%, 9/15/22, Callable 8/9/18 @ 101.67(Oil, Gas & Consumable Fuels) | | | 2,030 | |
| | 2,020 | | | Hess Corp., 4.30%, 4/1/27, Callable 1/1/27 @ 100(Oil, Gas & Consumable Fuels) | | | 1,953 | |
| | 660 | | | Murphy Oil Corp., 4.00%, 6/1/22, Callable 3/1/22 @ 100(Oil, Gas & Consumable Fuels) | | | 644 | |
| | 1,000 | | | Murphy Oil Corp., 5.75%, 8/15/25, Callable 8/15/20 @ 104.31(Oil, Gas & Consumable Fuels) | | | 997 | |
| | 1,263 | | | Nabors Industries, Inc., 4.63%, 9/15/21(Energy Equipment & Services) | | | 1,235 | |
| | 2,000 | | | Newfield Exploration Co., 5.75%, 1/30/22(Oil, Gas & Consumable Fuels) | | | 2,082 | |
| | 1,350 | | | Plains All American Pipeline, LP, 3.60%, 11/1/24, Callable 8/1/24 @ 100(Oil, Gas & Consumable Fuels) | | | 1,278 | |
See accompanying notes to financial statements.
118
HC CAPITAL TRUST
The Commodity Returns Strategy Portfolio
Consolidated Portfolio of Investments (continued) — June 30, 2018
| | | | | | | | |
Principal
Amount
(000) | | | Security Description | | Value
(000) | |
| | | | Corporate Bonds (continued) | | | | |
| $ | 1,250 | | | QEP Resources, Inc., 5.25%, 5/1/23, Callable 2/1/23 @ 100(Oil, Gas & Consumable Fuels) | | $ | 1,222 | |
| | 2,000 | | | Range Resources Corp., 5.75%, 6/1/21, Callable 3/1/21 @ 100(Oil, Gas & Consumable Fuels) | | | 2,049 | |
| | 2,000 | | | Whiting Petroleum Corp., 5.75%, 3/15/21, Callable 12/15/20 @ 100(Oil, Gas & Consumable Fuels) | | | 2,044 | |
| | | | | | | | |
| | | | Total Corporate Bonds | | | 25,471 | |
| | | | | | | | |
| | | | Yankee Dollar — 0.23% | | | | |
| | | | Canada — 0.23% | |
| | 2,000 | | | Cenovus Energy, Inc., 3.80%, 9/15/23, Callable 6/15/23 @ 100(Oil, Gas & Consumable Fuels) | | | 1,949 | |
| | | | | | | | |
| | | | Total Yankee Dollar | | | 1,949 | |
| | | | | | | | |
| | | | Time Deposit — 0.51% | | | | |
| | 4,399 | | | State Street Liquidity Management Control System Eurodollar Time Deposit, 0.53%, 7/2/18 (b) | | | 4,399 | |
| | | | | | | | |
| | | | Total Time Deposit | | | 4,399 | |
| | | | | | | | |
| Shares | | | | | | |
| | | | Mutual Funds — 8.12% | | | | |
| | 3,366,095 | | | Federated Treasury Obligations Fund, Institutional Shares, 1.75%^^ (e) | | | 3,366 | |
| | 66,640,620 | | | State Street Institutional Treasury Plus Money Market Fund, Trust Class, 1.72% (e) | | | 66,641 | |
| | | | | | | | |
| | | | Total Mutual Funds | | | 70,007 | |
| | | | | | | | |
| | | | Purchased Options — 0.01% | |
| | | | Total Purchased Options | | | 96 | |
| | | | | | | | |
Principal
Amount
(000) | | | | | | |
| | | | Repurchase Agreements — 3.71% | | | | |
| $ | 6,600 | | | Bank of America Corp., 2.08%, 7/2/18 (Purchased on 6/29/18, proceeds at maturity $6,601,144 collateralized by U.S. Treasury Note, 4.00%, 8/15/18, fair value $6,732,041)(b) | | | 6,600 | |
| | 6,500 | | | BNP Paribas, 2.10%, 7/2/18 (Purchased on 6/29/18, proceeds at maturity $6,501,138 collateralized by U.S. Treasury Obligations, 1.38% — 7.50%, 2/29/20 — 11/15/44, fair value $6,630,145) (b) | | | 6,500 | |
| | 6,500 | | | Deutsche Bank Securities, Inc., 2.10%, 7/2/18 (Purchased on 6/29/18, proceeds at maturity $6,501,138 collateralized by U.S. Treasury Obligations, 0.00% — 0.13%, 9/13/18 — 4/15/19, fair value $6,630,110) (b) | | | 6,500 | |
| | | | | | | | |
Principal
Amount
(000) | | | Security Description | | Value
(000) | |
| | | | Repurchase Agreements (continued) | | | | |
| $ | 5,653 | | | Jefferies LLC, 2.00%, 7/2/18 (Purchased on 6/29/18, proceeds at maturity $5,653,451 collateralized by U.S. Treasury Obligations, 2.50% — 2.92%, 2/15/20 — 2/15/44 fair value $5,765,565)^^ | | $ | 5,653 | |
| | 6,700 | | | RBS Securities, Inc., 2.10%, 7/2/18 (Purchased on 6/29/18, proceeds at maturity $6,701,173 collateralized by U.S. Treasury Note, 1.75%, 10/31/20, fair value $6,840,907) (b) | | | 6,700 | |
| | | | | | | | |
| | | | Total Repurchase Agreements | | | 31,953 | |
| | | | | | | | |
| | | | Total Investments
(cost $704,725) — 99.70% | | | 859,573 | |
| | | | Other assets in excess of liabilities — 0.30% | | | 2,556 | |
| | | | | | | | |
| | | | Net Assets — 100.00% | | $ | 862,129 | |
| | | | | | | | |
| Amounts designated as “—” are $0 or have been rounded to $0. | |
Portfolio of Investments is presented on a consolidated basis. See Note 2.O. in the Notes to Financial Statements.
| ^ | All or part of this security was on loan as of June 30, 2018. The total value of securities on loan as of June 30, 2018, was $9,001 (amount in thousands). |
| ^^ | Purchased with cash collateral held from securities lending. The value of the collateral could include collateral held for securities that were sold on or before June 30, 2018. |
| (a) | Represents non-income producing security. |
| (b) | All or a portion of these investments are held by the wholly-owned subsidiaries of the Portfolio. See Note 2.O. in the Notes to Financial Statements. |
| (c) | Represents a security purchased under Rule 144A or Section 4(2) and is exempt from registration under the Securities Act of 1933, as amended, or is otherwise restricted to resale. Certain of these securities may be resold in transactions exempt from registration, normally to qualified institutional buyers. These securities have been deemed liquid by the Specialist Manager. |
| (d) | This security has been deemed illiquid by the Specialist Manager and represents 0.03% of the Portfolio’s net assets. |
| (e) | The rate disclosed is the rate in effect on June 30, 2018. |
ADR — American Depositary Receipt
GDR — Global Depositary Receipt
See accompanying notes to financial statements.
119
HC CAPITAL TRUST
The Commodity Returns Strategy Portfolio
Consolidated Portfolio of Investments — June 30, 2018
The following table reflects the percentage of total net assets of the Portfolio attributable to each Specialist Manager as of June 30, 2018.
| | | | | | | | | | | | | | | | | | | | | | | | |
The Commodity Returns
Strategy Portfolio | | BNY Mellon Asset
Management North
America Corporation* | | | Parametric
Portfolio
Associates, LLC | | | Vaughan Nelson
Investment
Management L.P. | | | Wellington
Management
Company, LLP | | | HC Capital
Solutions | | | Total | |
Common Stocks | | | 61.63 | % | | | — | | | | — | | | | 21.97 | % | | | — | | | | 83.60 | % |
Preferred Stocks | | | 0.50 | % | | | — | | | | — | | | | 0.06 | % | | | — | | | | 0.56 | % |
Right | | | 0.01 | % | | | — | | | | — | | | | — | | | | — | | | | 0.01 | % |
Corporate Bonds | | | — | | | | — | | | | 2.95 | % | | | — | | | | — | | | | 2.95 | % |
Yankee Dollars | | | — | | | | — | | | | 0.23 | % | | | — | | | | — | | | | 0.23 | % |
Time Deposit | | | — | | | | 0.06 | % | | | — | | | | 0.45 | % | | | — | | | | 0.51 | % |
Mutual Funds | | | 1.29 | % | | | 6.43 | % | | | 0.01 | % | | | 0.15 | % | | | 0.24 | % | | | 8.12 | % |
Purchased Options | | | — | | | | — | | | | — | | | | 0.01 | % | | | — | | | | 0.01 | % |
Repurchase Agreements | | | 0.39 | % | | | — | | | | — | | | | 3.32 | % | | | — | | | | 3.71 | % |
Other Assets | | | 0.48 | % | | | 0.01 | % | | | 0.03 | % | | | -0.22 | % | | | 0.00 | % | | | 0.30 | % |
| | | | | | | | | | | | | | | | | | | | | | | | |
Total Net Assets | | | 64.30 | % | | | 6.50 | % | | | 3.22 | % | | | 25.74 | % | | | 0.24 | % | | | 100.00 | % |
| | | | | | | | | | | | | | | | | | | | | | | | |
| * | Formerly Mellon Capital Management Corporation. |
Amounts designated as “—” indicate the Specialist Manager did not manage any holdings in that category.
The following tables reflect the open derivative positions held by the Portfolio as of June 30, 2018.
Futures Contracts Purchased^
| | | | | | | | | | | | | | | | |
Description | | Number of
Contracts | | | Expiration
Date | | | Notional
Amount
(000) | | | Value and
Unrealized
Appreciation/
(Depreciation)
(000) | |
Brent Crude Future (a) | | | 23 | | | | 7/31/18 | | | $ | 1,822 | | | $ | 68 | |
Brent Crude Future (a) | | | 13 | | | | 8/31/18 | | | | 1,026 | | | | 52 | |
Brent Crude Future (a) | | | 5 | | | | 10/29/21 | | | | 326 | | | | 39 | |
Canadian Dollar Future | | | 89 | | | | 9/18/18 | | | | 6,778 | | | | (56 | ) |
Cocoa Future (a) | | | 4 | | | | 9/13/18 | | | | 100 | | | | 7 | |
Coffee ‘C’ Future (a) | | | 9 | | | | 9/18/18 | | | | 388 | | | | (29 | ) |
Corn Future (a) | | | 105 | | | | 9/14/18 | | | | 1,887 | | | | (101 | ) |
Corn Future (a) | | | 7 | | | | 12/13/19 | | | | 138 | | | | (6 | ) |
Cotton No.2 Future (a) | | | 2 | | | | 12/6/18 | | | | 84 | | | | (7 | ) |
Electrolytic Copper Future (a) | | | 20 | | | | 9/17/18 | | | | 3,314 | | | | (104 | ) |
E-Mini S&P 500 Future | | | 21 | | | | 9/21/18 | | | | 2,858 | | | | (71 | ) |
Gas Oil Future (a) | | | 16 | | | | 7/12/18 | | | | 1,081 | | | | 61 | |
Gasoline RBOB Future (a) | | | 3 | | | | 7/31/18 | | | | 271 | | | | 9 | |
Gold 100 Oz Future (a) | | | 32 | | | | 8/29/18 | | | | 4,014 | | | | (190 | ) |
Hard Red Winter Wheat Future (a) | | | 14 | | | | 9/14/18 | | | | 342 | | | | (51 | ) |
Lean Hogs Future (a) | | | 2 | | | | 8/14/18 | | | | 61 | | | | 2 | |
Live Cattle Future (a) | | | 14 | | | | 8/31/18 | | | | 598 | | | | 11 | |
MSCI EAFE Index Future | | | 23 | | | | 9/21/18 | | | | 2,249 | | | | (75 | ) |
MSCI Emerging Markets Index Future | | | 16 | | | | 9/21/18 | | | | 851 | | | | (47 | ) |
Natural Gas Future (a) | | | 52 | | | | 3/27/19 | | | | 1,390 | | | | 19 | |
NY Harbor ULSD Future (a) | | | 7 | | | | 7/31/18 | | | | 650 | | | | 7 | |
NYMEX WTI Crude Future (a) | | | 19 | | | | 9/20/18 | | | | 1,347 | | | | 48 | |
NYMEX WTI Crude Future (a) | | | 18 | | | | 11/19/18 | | | | 1,251 | | | | 82 | |
Primary Aluminum Future (a) | | | 47 | | | | 9/17/18 | | | | 2,505 | | | | (171 | ) |
Primary Nickel Future (a) | | | 7 | | | | 9/17/18 | | | | 626 | | | | 34 | |
S&P/Toronto Stock Exchange 60 Index Future | | | 45 | | | | 9/20/18 | | | | 6,595 | | | | 22 | |
Silver Future (a) | | | 12 | | | | 9/26/18 | | | | 972 | | | | (27 | ) |
Soybean Future (a) | | | 22 | | | | 9/14/18 | | | | 956 | | | | (80 | ) |
Soybean Future (a) | | | 11 | | | | 11/14/18 | | | | 484 | | | | (47 | ) |
Soybean Meal Future (a) | | | 4 | | | | 9/14/18 | | | | 132 | | | | (12 | ) |
Soybean Meal Future (a) | | | 3 | | | | 12/14/18 | | | | 99 | | | | (5 | ) |
See accompanying notes to financial statements.
120
HC CAPITAL TRUST
The Commodity Returns Strategy Portfolio
Consolidated Portfolio of Investments (continued) — June 30, 2018
| | | | | | | | | | | | | | | | |
Description | | Number of
Contracts | | | Expiration
Date | | | Notional
Amount
(000) | | | Value and
Unrealized
Appreciation/
(Depreciation)
(000) | |
Sugar #11 (World) Future (a) | | | 74 | | | | 9/28/18 | | | $ | 1,015 | | | $ | (8 | ) |
Wheat (CBT) Future (a) | | | 40 | | | | 9/14/18 | | | | 1,003 | | | | (66 | ) |
Zinc Future (a) | | | 13 | | | | 9/17/18 | | | | 929 | | | | (101 | ) |
| | | | | | | | | | | | | | | | |
| | | | | | | | | | $ | 48,142 | | | $ | (793 | ) |
| | | | | | | | | | | | | | | | |
Futures Contracts Sold^
| | | | | | | | | | | | | | |
Description | | Number of
Contracts | | Expiration
Date | | | Notional
Amount
(000) | | | Value and
Unrealized
Appreciation/
(Depreciation)
(000) | |
Brent Crude Future (a) | | 2 | | | 10/31/18 | | | $ | 156 | | | $ | (33 | ) |
Brent Crude Future (a) | | 5 | | | 10/30/20 | | | | 341 | | | $ | (69 | ) |
Coffee Robusta 10TN Future (a) | | 21 | | | 9/24/18 | | | | 355 | | | | 3 | |
Corn Future (a) | | 14 | | | 12/14/18 | | | | 259 | | | | 8 | |
Natural Gas Future (a) | | 8 | | | 7/27/18 | | | | 234 | | | | (2 | ) |
Natural Gas Future (a) | | 38 | | | 9/26/18 | | | | 1,106 | | | | (57 | ) |
NYMEX WTI Crude Future (a) | | 5 | | | 11/20/19 | | | | 318 | | | | (53 | ) |
Sugar #11 (World) Future (a) | | 27 | | | 2/28/19 | | | | 392 | | | | 35 | |
Wheat (CBT) Future (a) | | 33 | | | 12/14/18 | | | | 853 | | | | (28 | ) |
Wheat (CBT) Future (a) | | 5 | | | 7/12/19 | | | | 137 | | | | 12 | |
| | | | | | | | | | | | | | |
| | | | | $ | 4,151 | | | $ | (184 | ) |
| | | | | | | | | | | | | | |
| | |
| | Total Unrealized Appreciation | | | $ | 519 | |
| | Total Unrealized Depreciation | | | | (1,496 | ) |
| | | | | | | | | | | | | | |
| | Total Net Unrealized Appreciation/(Depreciation) | | | $ | (977 | ) |
| | | | | | | | | | | | | | |
| ^ | Cash has been pledged as collateral for futures contracts held by the Portfolio. |
Options Contracts
Exchange-traded options purchased as of June 30, 2018 were as follows:
| | | | | | | | | | | | | | | | | | | | |
Description | | Number of
Contracts | | | Notional
Amount
(000) | | | Exercise
Price | | | Expiration
Date | | | Value
(000) | |
Crude Oil Call Option (a) | | | 33 | | | $ | 33 | | | $ | 80.00 | | | | 11/14/18 | | | $ | 33 | |
Crude Oil Call Option (a) | | | 29 | | | | 24 | | | | 85.00 | | | | 2/14/19 | | | | 24 | |
Crude Oil Call Option (a) | | | 35 | | | | 36 | | | | 85.00 | | | | 5/16/19 | | | | 36 | |
Silver Call Option (a) | | | 2 | | | | 3 | | | | 17.50 | | | | 11/27/18 | | | | 3 | |
| | | | | | | | | | | | | | | | | | | | |
Total | | | | | | | | | | | | | | | | | | $ | 96 | |
| | | | | | | | | | | | | | | | | | | | |
Exchange-traded options written as of June 30, 2018 were as follows:
| | | | | | | | | | | | | | | | | | | | |
Description | | Number of
Contracts | | | Notional
Amount
(000) | | | Exercise
Price | | | Expiration
Date | | | Value
(000) | |
Silver Call Option (a) | | | 2 | | | $ | — | | | $ | 21.00 | | | | 11/27/18 | | | $ | — | |
| | | | | | | | | | | | | | | | | | | | |
Total | | | | | | | | | | | | | | | | | | $ | — | |
| | | | | | | | | | | | | | | | | | | | |
See accompanying notes to financial statements.
121
HC CAPITAL TRUST
The Commodity Returns Strategy Portfolio
Consolidated Portfolio of Investments (concluded) — June 30, 2018
Total Return Swap Agreements
| | | | | | | | | | | | | | | | | | | | | | | | | | | | | | | | |
Pay/ Receive (b) | | Financing
Rate | | | Description | | Counterparty | | Expiration
Date | | | Payment
Frequency | | | Notional
Amount
(000) | | | Value
(000) | | | Upfront
Premiuims
Paid/(Received)
(000) | | | Unrealized
Appreciation/
(Depreciation)
(000) | |
Receive | | | 0.12 | % | | Bloomberg Silver Subindex (a) | | Goldman Sachs International | | | 10/31/18 | | | | Monthly | | | $ | 537 | | | $ | (11 | ) | | $ | — | | | $ | (11 | ) |
Receive | | | 0.35 | % | | Bloomberg Soybean Meal Index (a) | | Barclays Bank PLC | | | 8/31/18 | | | | Monthly | | | | 277 | | | | (36 | ) | | | — | | | | (36 | ) |
Receive | | | 0.15 | % | | S&P GSCI Grains Index (a) | | Barclays Bank PLC | | | 8/31/18 | | | | Monthly | | | | 25 | | | | (3 | ) | | | — | | | | (3 | ) |
Receive | | | 0.10 | % | | S&P GSCI Grains Index (a) | | Goldman Sachs International | | | 11/30/18 | | | | Monthly | | | | 477 | | | | (23 | ) | | | — | | | | (23 | ) |
| | | | | | | | | | | | | | | | | | | | | | | | | | | | | | | | |
| | | | | | | | | | | | | | | | | | | | | | $ | (73 | ) | | $ | — | | | $ | (73 | ) |
| | | | | | | | | | | | | | | | | | | | | | | | | | | | | | | | |
Commodity Forward Swap Agreements
| | | | | | | | | | | | | | | | | | | | | | | | | | | | | | |
Pay/ Receive (b) | | Underlying
Instruments | | Counterparty | | | Expiration
Date | | | Exercise
Price | | | Notional
Amount
(000) | | | Value
(000) | | | Upfront
Premiums
Paid/(Received)
(000) | | | Unrealized
Appreciation/
(Depreciation)
(000) | |
Receive | | Gold (a) | |
| Goldman Sachs
International |
| | | 7/31/18 | | | $ | 1,349.67 | | | $ | 346 | | | $ | (24 | ) | | $ | — | | | $ | (24 | ) |
Receive | | Silver (a) | |
| Goldman Sachs
International |
| | | 11/30/18 | | | | 16.78 | | | | 232 | | | | (7 | ) | | $ | — | | | | (7 | ) |
| | | | | | | | | | | | | | | | | | | | | | | | | | | | | | |
| | | | | | | | | | | | | | | | | | | | $ | (31 | ) | | | — | | | $ | (31 | ) |
| | | | | | | | | | | | | | | | | | | | | | | | | | | | | | |
Total swap agreements at value (assets) | | | $ | — | |
Total swap agreements at value (liabilities) | | | | (104 | ) |
| | | | | | | | | | | | | | | | | | | | | | | | | | |
Net swap agreements at value | | | $ | (104 | ) |
| | | | | | | | | | | | | | | | | | | | | | | | | | |
Amounts designated as “—” are $0 or have been rounded to $0.
| (a) | All or a portion of these investments are held by the wholly-owned subsidiaries of the Portfolio. See Note 2.O. in the Notes to Financial Statements. |
| (b) | Receive represents that the Portfolio receives payments for any positive return on the underlying reference. The Portfolio makes payments for any negative return on such underlying reference. Pay represents that the Portfolio receives payments for any negative return on the underlying reference. The Portfolio makes payments for any positive return on such underlying reference. |
See accompanying notes to financial statements.
122
HC CAPITAL TRUST
The ESG Growth Portfolio
Portfolio of Investments — June 30, 2018
| | | | | | | | |
| Shares | | | Security Description | | Value
(000) | |
| | | | Common Stocks — 97.65% | | | | |
| | | | Australia — 3.87% | |
| | 20,238 | | | AMP Ltd. (Diversified Financial Services) | | $ | 53 | |
| | 15,645 | | | APA Group (Gas Utilities) | | | 114 | |
| | 51,156 | | | Aurizon Holdings Ltd. (Road & Rail) | | | 164 | |
| | 24,407 | | | AusNet Services (Electric Utilities) | | | 29 | |
| | 30,073 | | | Australia & New Zealand Banking Group Ltd. (Banks) | | | 628 | |
| | 4,897 | | | Bendigo & Adelaide Bank Ltd. (Banks) | | | 39 | |
| | 15,669 | | | Coca-Cola Amatil Ltd. (Beverages) | | | 107 | |
| | 17,871 | | | Commonwealth Bank of Australia (Banks) | | | 964 | |
| | 10,686 | | | Crown Resorts Ltd. (Hotels, Restaurants & Leisure) | | | 107 | |
| | 13,735 | | | Dexus Property Group (Equity Real Estate Investment Trusts) | | | 99 | |
| | 24,582 | | | GPT Group (Equity Real Estate Investment Trusts) | | | 92 | |
| | 16,767 | | | Harvey Norman Holdings Ltd. (Multiline Retail) | | | 41 | |
| | 23,828 | | | Insurance Australia Group Ltd. (Insurance) | | | 151 | |
| | 2,169 | | | Macquarie Group Ltd. (Capital Markets) | | | 198 | |
| | 51,459 | | | Mirvac Group (Equity Real Estate Investment Trusts) | | | 83 | |
| | 27,101 | | | National Australia Bank Ltd. (Banks) | | | 550 | |
| | 15,008 | | | QBE Insurance Group Ltd. (Insurance) | | | 108 | |
| | 72,235 | | | Scentre Group (Equity Real Estate Investment Trusts) | | | 234 | |
| | 32,558 | | | Stockland Trust Group (Equity Real Estate Investment Trusts) | | | 96 | |
| | 13,063 | | | Suncorp Group Ltd. (Insurance) | | | 141 | |
| | 29,332 | | | Sydney Airport (Transportation Infrastructure) | | | 155 | |
| | 53,023 | | | Tabcorp Holdings Ltd. (Hotels, Restaurants & Leisure) | | | 175 | |
| | 65,482 | | | Telstra Corp. Ltd. (Diversified Telecommunication Services) | | | 127 | |
| | 49,515 | | | Transurban Group (Transportation Infrastructure) | | | 439 | |
| | 46,996 | | | Vicinity Centres (Equity Real Estate Investment Trusts) | | | 90 | |
| | 19,584 | | | Wesfarmers Ltd. (Food & Staples Retailing) | | | 715 | |
| | 34,199 | | | Westpac Banking Corp. (Banks) | | | 741 | |
| | | | | | | | |
| | | | | | | 6,440 | |
| | | | | | | | |
| | | | Austria — 0.08% | |
| | 424 | | | ANDRITZ AG (Machinery) | | | 23 | |
| | 590 | | | Erste Group Bank AG (Banks) | | | 25 | |
| | 882 | | | OMV AG (Oil, Gas & Consumable Fuels) | | | 50 | |
| | 662 | | | Voestalpine AG (Metals & Mining) | | | 30 | |
| | | | | | | | |
| | | | | | | 128 | |
| | | | | | | | |
| | | | Belgium — 0.59% | |
| | 8,599 | | | Anheuser-Busch InBev N.V. (Beverages) | | | 869 | |
| | 1,067 | | | Belgacom SA (Diversified Telecommunication Services) | | | 24 | |
| | 1,258 | | | KBC Groep N.V. (Banks) | | | 97 | |
| | | | | | | | |
| | | | | | | 990 | |
| | | | | | | | |
| | | | Bermuda — 0.08% | |
| | 2,439 | | | IHS Markit Ltd. (Professional Services) (a) | | | 126 | |
| | | | | | | | |
| | | | | | | | |
| Shares | | | Security Description | | Value
(000) | |
| | | | Denmark — 1.03% | |
| | 1,719 | | | Christian Hansen Holding A/S (Chemicals) | | $ | 159 | |
| | 3,087 | | | ISS A/S (Commercial Services & Supplies) | | | 106 | |
| | 25,811 | | | Novo Nordisk A/S, Class – B (Pharmaceuticals) | | | 1,197 | |
| | 795 | | | Tryg A/S (Insurance) | | | 19 | |
| | 3,774 | | | Vestas Wind Systems A/S (Electrical Equipment) | | | 234 | |
| | | | | | | | |
| | | | | | | 1,715 | |
| | | | | | | | |
| | | | Finland — 0.59% | |
| | 3,489 | | | Elisa Oyj (Diversified Telecommunication Services) | | | 162 | |
| | 14,272 | | | Fortum Oyj (Electric Utilities) | | | 340 | |
| | 4,701 | | | Metso Oyj (Machinery) | | | 158 | |
| | 5,146 | | | Nokian Renkaat Oyj (Auto Components) | | | 203 | |
| | 4,487 | | | Orion Oyj, Class – B (Pharmaceuticals) | | | 121 | |
| | | | | | | | |
| | | | | | | 984 | |
| | | | | | | | |
| | | | France — 4.87% | |
| | 322 | | | Amundi SA (Capital Markets) | | | 22 | |
| | 1,919 | | | Atos SE (IT Services) | | | 262 | |
| | 15,651 | | | AXA SA (Insurance) | | | 384 | |
| | 8,981 | | | BNP Paribas (Banks) | | | 557 | |
| | 4,647 | | | Bouygues SA (Construction & Engineering) | | | 200 | |
| | 11,946 | | | Carrefour SA (Food & Staples Retailing) | | | 194 | |
| | 1,267 | | | Casino Guichard-Perrachon SA (Food & Staples Retailing) | | | 49 | |
| | 1,443 | | | CNP Assurances (Insurance) | | | 33 | |
| | 9,287 | | | Credit Agricole SA (Banks) | | | 124 | |
| | 19,008 | | | ENGIE (Multi-Utilities) | | | 292 | |
| | 3,676 | | | Eutelsat Communications (Media) | | | 76 | |
| | 349 | | | Fonciere des Regions (Equity Real Estate Investment Trusts) | | | 36 | |
| | 549 | | | Gecina SA (Equity Real Estate Investment Trusts) | | | 92 | |
| | 453 | | | Icade (Equity Real Estate Investment Trusts) | | | 42 | |
| | 1,232 | | | Ingenico Group SA (Electronic Equipment, Instruments & Components) | | | 111 | |
| | 2,496 | | | Klepierre (Equity Real Estate Investment Trusts) | | | 94 | |
| | 2,576 | | | Lagardere SCA (Media) | | | 68 | |
| | 7,691 | | | Natixism SA (Banks) | | | 55 | |
| | 21,336 | | | Orange SA (Diversified Telecommunication Services) | | | 357 | |
| | 4,114 | | | Publicis Groupe (Media) | | | 283 | |
| | 16,997 | | | Sanofi-Aventis (Pharmaceuticals) | | | 1,363 | |
| | 11,346 | | | Schneider Electric SA (Electrical Equipment) | | | 946 | |
| | 593 | | | Societe BIC SA (Commercial Services & Supplies) | | | 55 | |
| | 6,421 | | | Societe Generale (Banks) | | | 271 | |
| | 4,001 | | | Suez Environnement Co. (Multi-Utilities) | | | 52 | |
| | 28,480 | | | Total SA (Oil, Gas & Consumable Fuels) | | | 1,736 | |
| | 1,085 | | | Unibail-Rodamco-Westfield (Equity Real Estate Investment Trusts) | | | 240 | |
| | 5,107 | | | Veolia Environnement (Multi-Utilities) | | | 109 | |
| | | | | | | | |
| | | | | | | 8,103 | |
| | | | | | | | |
See accompanying notes to portfolio of investments.
123
HC CAPITAL TRUST
The ESG Growth Portfolio
Portfolio of Investments (continued) — June 30, 2018
| | | | | | | | |
| Shares | | | Security Description | | Value
(000) | |
| | | | Common Stocks (continued) | | | | |
| | | | Germany — 4.04% | |
| | 2,188 | | | Allianz SE (Insurance) | | $ | 453 | |
| | 595 | | | Axel Springer AG (Media) | | | 43 | |
| | 9,145 | | | BASF SE (Chemicals) | | | 875 | |
| | 6,718 | | | Bayer AG (Pharmaceuticals) | | | 740 | |
| | 4,499 | | | Bayerische Motoren Werke Aktiengesellschaft (Automobiles) | | | 408 | |
| | 11,727 | | | Daimler AG, Registered Shares (Automobiles) | | | 756 | |
| | 12,382 | | | Deutsche Post AG (Air Freight & Logistics) | | | 404 | |
| | 21,305 | | | Deutsche Telekom AG (Diversified Telecommunication Services) | | | 330 | |
| | 2,194 | | | Evonik Industries AG (Chemicals) | | | 75 | |
| | 831 | | | Hugo Boss AG (Textiles, Apparel & Luxury Goods) | | | 75 | |
| | 828 | | | Innogy SE (Multi-Utilities) | | | 35 | |
| | 488 | | | MAN SE (Machinery) | | | 55 | |
| | 2,230 | | | Metro AG (Food & Staples Retailing) | | | 28 | |
| | 758 | | | Muenchener Rueckversicherungs-Gesellschaft AG (Insurance) | | | 160 | |
| | 3,289 | | | ProSiebenSat.1 Media AG (Media) | | | 83 | |
| | 8,181 | | | SAP SE (Software) | | | 945 | |
| | 6,664 | | | Siemens AG (Industrial Conglomerates) | | | 881 | |
| | 5,214 | | | Telefonica Deutschland Holding AG (Diversified Telecommunication Services) | | | 21 | |
| | 9,761 | | | TUI AG (Hotels, Restaurants & Leisure) | | | 214 | |
| | 3,135 | | | Vonovia SE (Real Estate Management & Development) | | | 149 | |
| | | | | | | | |
| | | | | | | 6,730 | |
| | | | | | | | |
| | | | Hong Kong — 1.60% | |
| | 53,500 | | | BOC Hong Kong (Holdings) Ltd. (Banks) | | | 252 | |
| | 25,500 | | | CLP Holdings Ltd. (Electric Utilities) | | | 274 | |
| | 50,000 | | | Hang Lung Properties Ltd. (Real Estate Management & Development) | | | 103 | |
| | 9,900 | | | Hang Seng Bank Ltd. (Banks) | | | 248 | |
| | 27,236 | | | Henderson Land Development Co. Ltd. (Real Estate Management & Development) | | | 144 | |
| | 46,767 | | | HK Electric Investments Ltd. (Electric Utilities) | | | 45 | |
| | 69,000 | | | HKT Trust & HKT Ltd. (Diversified Telecommunication Services) | | | 88 | |
| | 13,000 | | | Hysan Development Co. (Real Estate Management & Development) | | | 73 | |
| | 262,000 | | | Li & Fung Ltd. (Textiles, Apparel & Luxury Goods) | | | 96 | |
| | 1,695 | | | Michael Kors Holdings Ltd. (Textiles, Apparel & Luxury Goods) (a) | | | 113 | |
| | 99,000 | | | PCCW Ltd. (Diversified Telecommunication Services) | | | 56 | |
| | 25,000 | | | Power Assets Holdings Ltd. (Electric Utilities) | | | 175 | |
| | 25,000 | | | Sun Hung Kai Properties Ltd. (Real Estate Management & Development) | | | 377 | |
| | 17,000 | | | Swire Pacific Ltd., Class – A (Real Estate Management & Development) | | | 180 | |
| | 18,600 | | | Swire Properties Ltd. (Real Estate Management & Development) | | | 69 | |
| | 34,500 | | | The Link Real Estate Investment Trust (Equity Real Estate Investment Trusts) | | | 315 | |
| | | | | | | | |
| Shares | | | Security Description | | Value
(000) | |
| | | | Hong Kong (continued) | |
| | 19,000 | | | The Wharf (Holdings) Ltd. (Real Estate Management & Development) | | $ | 61 | |
| | | | | | | | |
| | | | | | | 2,669 | |
| | | | | | | | |
| | | | Ireland (Republic of) — 0.20% | |
| | 7,490 | | | CRH PLC (Construction Materials) | | | 265 | |
| | 567 | | | Paddy Power PLC (Hotels, Restaurants & Leisure) | | | 63 | |
| | | | | | | | |
| | | | | | | 328 | |
| | | | | | | | |
| | | | Israel — 0.36% | |
| | 392 | | | Azrieli Group (Real Estate Management & Development) | | | 19 | |
| | 16,026 | | | Bank Hapoalim Ltd. (Banks) | | | 109 | |
| | 100,968 | | | Israel Chemicals Ltd. (Chemicals) | | | 461 | |
| | 934 | | | Mizrahi Tefahot Bank Ltd. (Banks) | | | 17 | |
| | | | | | | | |
| | | | | | | 606 | |
| | | | | | | | |
| | | | Italy — 0.86% | |
| | 5,321 | | | Assicurazioni Generali SpA (Insurance) | | | 90 | |
| | 4,926 | | | Atlantia SpA (Transportation Infrastructure) | | | 146 | |
| | 40,628 | | | Enel SpA (Electric Utilities) | | | 226 | |
| | 30,968 | | | Eni SpA (Oil, Gas & Consumable Fuels) | | | 575 | |
| | 56,662 | | | Intesa Sanpaolo SpA (Banks) | | | 165 | |
| | 4,939 | | | Intesa Sanpaolo SpA (Banks) | | | 15 | |
| | 29,014 | | | Snam Rete Gas SpA (Oil, Gas & Consumable Fuels) | | | 121 | |
| | 37,353 | | | Telecom Italia SpA (Diversified Telecommunication Services) | | | 24 | |
| | 8,946 | | | Terna – Rete Elettrica Nazionale SpA (Electric Utilities) | | | 48 | |
| | 6,937 | | | UnipolSai SpA (Insurance) | | | 15 | |
| | | | | | | | |
| | | | | | | 1,425 | |
| | | | | | | | |
| | | | Japan — 12.88% | |
| | 400 | | | AEON Credit Service Co. Ltd. (Consumer Finance) | | | 9 | |
| | 3,200 | | | Aisin Seiki Co. Ltd. (Auto Components) | | | 146 | |
| | 6,500 | | | Amada Holdings Co. Ltd. (Machinery) | | | 63 | |
| | 4,000 | | | Asahi Glass Co. Ltd. (Building Products) | | | 156 | |
| | 23,100 | | | Asahi Kasei Corp. (Chemicals) | | | 293 | |
| | 39,800 | | | Astellas Pharma, Inc. (Pharmaceuticals) | | | 608 | |
| | 1,400 | | | Benesse Holdings, Inc. (Diversified Consumer Services) | | | 50 | |
| | 12,500 | | | Bridgestone Corp. (Auto Components) | | | 489 | |
| | 19,000 | | | Canon, Inc. (Technology Hardware, Storage & Peripherals) | | | 623 | |
| | 4,100 | | | Casio Computer Co. Ltd. (Household Durables) | | | 67 | |
| | 4,900 | | | Dai Nippon Printing Co. Ltd. (Commercial Services & Supplies) | | | 111 | |
| | 5,100 | | | Daicel Corp. (Chemicals) | | | 56 | |
| | 10,600 | | | Daiichi Sankyo Co. Ltd. (Pharmaceuticals) | | | 406 | |
| | 5,300 | | | Daiwa House Industry Co. Ltd. (Real Estate Management & Development) | | | 180 | |
| | 9,000 | | | Daiwa Securities Group, Inc. (Capital Markets) | | | 52 | |
| | 9,200 | | | Denso Corp. (Auto Components) | | | 450 | |
| | 4,800 | | | Eisai Co. Ltd. (Pharmaceuticals) | | | 338 | |
See accompanying notes to financial statements.
124
HC CAPITAL TRUST
The ESG Growth Portfolio
Portfolio of Investments (continued) — June 30, 2018
| | | | | | | | |
| Shares | | | Security Description | | Value
(000) | |
| | | | Common Stocks (continued) | | | | |
| | | | Japan (continued) | |
| | 1,400 | | | Electric Power Development Co. Ltd. (Independent Power & Renewable Electricity Producers) | | $ | 36 | |
| | 11,900 | | | Fuji Heavy Industries Ltd. (Automobiles) | | | 347 | |
| | 7,300 | | | FUJIFILM Holdings Corp. (Technology Hardware, Storage & Peripherals) | | | 285 | |
| | 36,000 | | | Fujitsu Ltd. (IT Services) | | | 218 | |
| | 4,800 | | | Hino Motors Ltd. (Machinery) | | | 51 | |
| | 1,900 | | | Hitachi Chemical Co. Ltd. (Chemicals) | | | 38 | |
| | 90,000 | | | Hitachi Ltd. (Electronic Equipment, Instruments & Components) | | | 635 | |
| | 31,300 | | | Honda Motor Co. Ltd. (Automobiles) | | | 920 | |
| | 28,500 | | | ITOCHU Corp. (Trading Companies & Distributors) | | | 517 | |
| | 2,400 | | | Japan Exchange Group, Inc. (Capital Markets) | | | 45 | |
| | 25 | | | Japan Retail Fund Investment Corp. (Equity Real Estate Investment Trusts) | | | 46 | |
| | 20,500 | | | Japan Tobacco, Inc. (Tobacco) | | | 573 | |
| | 4,900 | | | JS Group Corp. (Building Products) | | | 98 | |
| | 3,500 | | | JSR Corp. (Chemicals) | | | 60 | |
| | 63,050 | | | JX Holdings, Inc. (Oil, Gas & Consumable Fuels) | | | 439 | |
| | 17,000 | | | Kajima Corp. (Construction & Engineering) | | | 132 | |
| | 17,400 | | | KDDI Corp. (Wireless Telecommunication Services) | | | 476 | |
| | 18,100 | | | Komatsu Ltd. (Machinery) | | | 517 | |
| | 8,900 | | | Konica Minolta, Inc. (Technology Hardware, Storage & Peripherals) | | | 83 | |
| | 6,900 | | | Kuraray Co. Ltd. (Chemicals) | | | 95 | |
| | 6,000 | | | Kyocera Corp. (Electronic Equipment, Instruments & Components) | | | 339 | |
| | 1,200 | | | Lawson, Inc. (Food & Staples Retailing) | | | 75 | |
| | 4,100 | | | Marui Group Co. Ltd. (Multiline Retail) | | | 86 | |
| | 6,800 | | | Mebuki Financial Group, Inc. (Banks) | | | 23 | |
| | 26,600 | | | Mitsubishi Chemical Holdings Corp. (Chemicals) | | | 223 | |
| | 28,100 | | | Mitsubishi Corp. (Trading Companies & Distributors) | | | 782 | |
| | 6,100 | | | Mitsubishi Heavy Industries Ltd. (Machinery) | | | 222 | |
| | 2,100 | | | Mitsubishi Materials Corp. (Metals & Mining) | | | 58 | |
| | 4,200 | | | Mitsubishi Tanabe Pharma Corp. (Pharmaceuticals) | | | 73 | |
| | 1,700 | | | Mitsubishi UFJ Lease & Finance Co. Ltd. (Diversified Financial Services) | | | 10 | |
| | 31,700 | | | Mitsui & Co. Ltd. (Trading Companies & Distributors) | | | 529 | |
| | 3,400 | | | Mitsui Chemicals, Inc. (Chemicals) | | | 91 | |
| | 175,200 | | | Mizuho Financial Group, Inc. (Banks) | | | 295 | |
| | 3,500 | | | MS&AD Insurance Group Holdings, Inc. (Insurance) | | | 109 | |
| | 4,700 | | | NEC Corp. (Technology Hardware, Storage & Peripherals) | | | 129 | |
| | 4,800 | | | NGK Insulators Ltd. (Machinery) | | | 86 | |
| | 1,700 | | | Nippon Electric Glass Co. Ltd. (Electronic Equipment, Instruments & Components) | | | 47 | |
| | | | | | | | |
| Shares | | | Security Description | | Value
(000) | |
| | | | Japan (continued) | |
| | 19 | | | Nippon Prologis REIT, Inc. (Equity Real Estate Investment Trusts) | | $ | 39 | |
| | 14,200 | | | Nippon Steel & Sumitomo Metal Corp. (Metals & Mining) | | | 279 | |
| | 6,300 | | | Nippon Telegraph & Telephone Corp. (Diversified Telecommunication Services) | | | 287 | |
| | 1,200 | | | Nomura Real Estate Holdings, Inc. (Real Estate Management & Development) | | | 27 | |
| | 2,300 | | | Nomura Research Institute Ltd. (IT Services) | | | 112 | |
| | 11,600 | | | NTT Data Corp. (IT Services) | | | 134 | |
| | 13,100 | | | NTT DoCoMo, Inc. (Wireless Telecommunication Services) | | | 334 | |
| | 12,100 | | | Obayashi Corp. (Construction & Engineering) | | | 126 | |
| | 3,700 | | | OMRON Corp. (Electronic Equipment, Instruments & Components) | | | 173 | |
| | 6,300 | | | ORIX Corp. (Diversified Financial Services) | | | 100 | |
| | 3,600 | | | Osaka Gas Co. Ltd. (Gas Utilities) | | | 75 | |
| | 7,500 | | | Otsuka Holdings Co. Ltd. (Pharmaceuticals) | | | 363 | |
| | 2,000 | | | Park24 Co. Ltd. (Commercial Services & Supplies) | | | 54 | |
| | 15,800 | | | Resona Holdings, Inc. (Banks) | | | 85 | |
| | 900 | | | Sankyo Co. Ltd. (Leisure Products) | | | 35 | |
| | 3,500 | | | Sega Sammy Holdings, Inc. (Leisure Products) | | | 60 | |
| | 5,265 | | | Seiko Epson Corp. (Technology Hardware, Storage & Peripherals) | | | 92 | |
| | 11,400 | | | Sekisui House Ltd. (Household Durables) | | | 202 | |
| | 13,700 | | | Seven & I Holdings Co. Ltd. (Food & Staples Retailing) | | | 598 | |
| | 3,700 | | | Showa Shell Sekiyu KK (Oil, Gas & Consumable Fuels) | | | 55 | |
| | 2,400 | | | Sompo Japan Nipponkoa Holdings, Inc. (Insurance) | | | 97 | |
| | 32,000 | | | Sumitomo Chemical Co. Ltd. (Chemicals) | | | 182 | |
| | 21,800 | | | Sumitomo Corp. (Trading Companies & Distributors) | | | 358 | |
| | 9,600 | | | Sumitomo Mitsui Financial Group, Inc. (Banks) | | | 373 | |
| | 2,400 | | | Sumitomo Mitsui Trust Holdings, Inc. (Banks) | | | 95 | |
| | 3,400 | | | Sumitomo Rubber Industries Ltd. (Auto Components) | | | 54 | |
| | 4,100 | | | T&D Holdings, Inc. (Insurance) | | | 62 | |
| | 13,800 | | | Takeda Pharmaceutical Co. Ltd. (Pharmaceuticals) | | | 583 | |
| | 3,900 | | | Teijin Ltd. (Chemicals) | | | 72 | |
| | 2,500 | | | The Chugoku Electric Power Company, Inc. (Electric Utilities) | | | 32 | |
| | 7,600 | | | The Dai-ichi Life Insurance Co. Ltd. (Insurance) | | | 136 | |
| | 5,000 | | | The Shizuoka Bank Ltd. (Banks) | | | 45 | |
| | 4,900 | | | Tokio Marine Holdings, Inc. (Insurance) | | | 229 | |
| | 3,200 | | | Tokyo Electron Ltd. (Semiconductors & Semiconductor Equipment) | | | 550 | |
| | 3,600 | | | Tokyo Gas Co. Ltd. (Gas Utilities) | | | 95 | |
| | 10,000 | | | Toppan Printing Co. Ltd. (Commercial Services & Supplies) | | | 78 | |
| | 1,400 | | | Toyoda Gosei Co. Ltd. (Auto Components) | | | 36 | |
See accompanying notes to financial statements.
125
HC CAPITAL TRUST
The ESG Growth Portfolio
Portfolio of Investments (continued) — June 30, 2018
| | | | | | | | |
| Shares | | | Security Description | | Value
(000) | |
| | | | Common Stocks (continued) | | | | |
| | | | Japan (continued) | |
| | 23,900 | | | Toyota Motor Corp. (Automobiles) | | $ | 1,547 | |
| | 4,100 | | | Toyota Tsusho Corp. (Trading Companies & Distributors) | | | 137 | |
| | 4,100 | | | USS Co. Ltd. (Specialty Retail) | | | 78 | |
| | 3,000 | | | West Japan Railway Co. (Road & Rail) | | | 221 | |
| | 11,500 | | | Yamada Denki Co. Ltd. (Specialty Retail) | | | 57 | |
| | 5,800 | | | Yamaha Motor Co. Ltd. (Automobiles) | | | 146 | |
| | 4,200 | | | Yokogawa Electric Corp. (Electronic Equipment, Instruments & Components) | | | 75 | |
| | | | | | | | |
| | | | | | | 21,453 | |
| | | | | | | | |
| | | | Jersey — 0.30% | |
| | 31,642 | | | WPP PLC (Media) | | | 498 | |
| | | | | | | | |
| | | | Luxembourg — 0.11% | |
| | 1,074 | | | Millicom International Cellular SA (Wireless Telecommunication Services) | | | 63 | |
| | 6,376 | | | SES – FDR, Class – A (Media) | | | 117 | |
| | | | | | | | |
| | | | | | | 180 | |
| | | | | | | | |
| | | | Netherlands — 1.42% | |
| | 1,984 | | | ABN AMRO Group N.V. (Banks) | | | 51 | |
| | 7,735 | | | AEGON N.V. (Insurance) | | | 46 | |
| | 334 | | | Franks International N.V. (Energy Equipment & Services) | | | 3 | |
| | 18,108 | | | ING Groep N.V. (Banks) | | | 261 | |
| | 21,948 | | | Koninklijke (Royal) KPN N.V. (Diversified Telecommunication Services) | | | 60 | |
| | 14,900 | | | Koninklijke Ahold Delhaize N.V. (Food & Staples Retailing) | | | 357 | |
| | 1,079 | | | Koninklijke Boskalis Westminster N.V. (Construction & Engineering) | | | 31 | |
| | 11,478 | | | Koninklijke Philips Electronics N.V. (Industrial Conglomerates) | | | 488 | |
| | 874 | | | Koninklijke Vopak N.V. (Oil, Gas & Consumable Fuels) | | | 40 | |
| | 1,413 | | | NN Group N.V. (Insurance) | | | 58 | |
| | 1,481 | | | Randstad Holding N.V. (Professional Services) | | | 87 | |
| | 15,812 | | | Unilever N.V. (Personal Products) | | | 883 | |
| | | | | | | | |
| | | | | | | 2,365 | |
| | | | | | | | |
| | | | New Zealand — 0.09% | |
| | 14,176 | | | Fletcher Building Ltd. (Construction Materials) | | | 67 | |
| | 10,116 | | | Meridian Energy Ltd. (Independent Power & Renewable Electricity Producers) | | | 21 | |
| | 25,717 | | | Telecom Corporation of New Zealand Ltd. (Diversified Telecommunication Services) | | | 65 | |
| | | | | | | | |
| | | | | | | 153 | |
| | | | | | | | |
| | | | Norway — 0.48% | |
| | 19,078 | | | Equinor ASA (Oil, Gas & Consumable Fuels) | | | 506 | |
| | 1,312 | | | Gjensidige Forsikring ASA (Insurance) | | | 22 | |
| | 6,954 | | | Marine Harvest ASA (Food Products) | | | 139 | |
| | 6,162 | | | Telenor ASA (Diversified Telecommunication Services) | | | 127 | |
| | | | | | | | |
| | | | | | | 794 | |
| | | | | | | | |
| | | | | | | | |
| Shares | | | Security Description | | Value
(000) | |
| | | | Portugal — 0.15% | |
| | 64,275 | | | EDP – Energias de Portugal SA (Electric Utilities) | | $ | 255 | |
| | | | | | | | |
| | | | Singapore — 0.83% | |
| | 76,300 | | | Ascendas Real Estate Investment Trust (Equity Real Estate Investment Trusts) | | | 148 | |
| | 79,200 | | | CapitaCommercial Trust (Equity Real Estate Investment Trusts) | | | 97 | |
| | 75,900 | | | CapitaMall Trust (Equity Real Estate Investment Trusts) | | | 115 | |
| | 30,300 | | | SATS Ltd. (Transportation Infrastructure) | | | 111 | |
| | 12,800 | | | Singapore Exchange Ltd. (Capital Markets) | | | 67 | |
| | 64,600 | | | Singapore Press Holdings Ltd. (Media) | | | 123 | |
| | 59,400 | | | Singapore Tech Engineering (Aerospace & Defense) | | | 143 | |
| | 256,100 | | | Singapore Telecommunications Ltd. (Diversified Telecommunication Services) | | | 580 | |
| | | | | | | | |
| | | | | | | 1,384 | |
| | | | | | | | |
| | | | Spain — 1.43% | |
| | 14,155 | | | Abertis Infraestructuras SA (Transportation Infrastructure) | | | 304 | |
| | 49,959 | | | Banco Bilbao Vizcaya Argentaria SA (Banks) | | | 354 | |
| | 7,770 | | | Corporacion Mapfre (Insurance) | | | 23 | |
| | 4,533 | | | Enagas (Oil, Gas & Consumable Fuels) | | | 133 | |
| | 3,305 | | | Endesa (Electric Utilities) | | | 73 | |
| | 3,620 | | | Gas Natural SDG SA (Gas Utilities) | | | 96 | |
| | 58,133 | | | Iberdrola SA (Electric Utilities) | | | 450 | |
| | 4,524 | | | Red Electrica Corp. (Electric Utilities) | | | 92 | |
| | 24,033 | | | Repsol YPF SA (Oil, Gas & Consumable Fuels) | | | 470 | |
| | 45,321 | | | Telefonica SA (Diversified Telecommunication Services) | | | 385 | |
| | | | | | | | |
| | | | | | | 2,380 | |
| | | | | | | | |
| | | | Sweden — 1.60% | |
| | 29,769 | | | Hennes & Mauritz AB, B Shares (Specialty Retail) | | | 444 | |
| | 2,591 | | | ICA Gruppen AB (Food & Staples Retailing) | | | 79 | |
| | 35,264 | | | Nordea Bank AB (Banks) | | | 341 | |
| | 17,638 | | | Skandinaviska Enskilda Banken AB, Class – A (Banks) | | | 168 | |
| | 10,658 | | | Skanska AB, B Shares (Construction & Engineering) | | | 194 | |
| | 18,019 | | | Svenska Handelsbanken AB, A Shares (Banks) | | | 200 | |
| | 10,509 | | | Swedbank AB, A Shares (Banks) | | | 225 | |
| | 5,817 | | | Tele2 AB, B Shares (Wireless Telecommunication Services) | | | 68 | |
| | 95,891 | | | Telefonaktiebolaget LM Ericsson, B Shares (Communications Equipment) | | | 742 | |
| | 43,124 | | | TeliaSonera AB (Diversified Telecommunication Services) | | | 197 | |
| | | | | | | | |
| | | | | | | 2,658 | |
| | | | | | | | |
| | | | Switzerland — 4.72% | |
| | 53,355 | | | ABB Ltd., Registered Shares (Electrical Equipment) | | | 1,169 | |
| | 4,606 | | | Adecco SA, Registered Shares (Professional Services) | | | 273 | |
See accompanying notes to financial statements.
126
HC CAPITAL TRUST
The ESG Growth Portfolio
Portfolio of Investments (continued) — June 30, 2018
| | | | | | | | |
| Shares | | | Security Description | | Value
(000) | |
| | | | Common Stocks (continued) | | | | |
| | | | Switzerland (continued) | |
| | 1,108 | | | Garmin Ltd. (Household Durables) | | $ | 68 | |
| | 1,623 | | | Kuehne & Nagel International Ltd. (Marine) | | | 245 | |
| | 13,231 | | | LafargeHolcim Ltd., Registered Shares (Construction Materials) | | | 647 | |
| | 23,049 | | | Novartis AG, Registered Shares (Pharmaceuticals) | | | 1,753 | |
| | 8,320 | | | Roche Holding AG (Pharmaceuticals) | | | 1,853 | |
| | 154 | | | SGS SA, Registered Shares (Professional Services) | | | 411 | |
| | 1,052 | | | Swiss Prime Site AG (Real Estate Management & Development) | | | 97 | |
| | 3,407 | | �� | Swiss Re AG (Insurance) | | | 295 | |
| | 370 | | | Swisscom AG (Diversified Telecommunication Services) | | | 166 | |
| | 26,071 | | | UBS Group AG (Capital Markets) | | | 404 | |
| | 1,621 | | | Zurich Financial Services AG (Insurance) | | | 482 | |
| | | | | | | | |
| | | | | | | 7,863 | |
| | | | | | | | |
| | | | United Kingdom — 10.35% | |
| | 2,718 | | | Aon PLC (Insurance) | | | 373 | |
| | 25,411 | | | AstraZeneca PLC (Pharmaceuticals) | | | 1,761 | |
| | 39,421 | | | Aviva PLC (Insurance) | | | 262 | |
| | 6,702 | | | Babcock International Group PLC (Commercial Services & Supplies) | | | 72 | |
| | 77,748 | | | BAE Systems PLC (Aerospace & Defense) | | | 664 | |
| | 26,942 | | | Barratt Developments PLC (Household Durables) | | | 183 | |
| | 59,861 | | | BHP Billiton PLC (Metals & Mining) | | | 1,348 | |
| | 4,228 | | | British American Tobacco PLC, ADR (Tobacco) | | | 213 | |
| | 13,388 | | | British Land Co. PLC (Equity Real Estate Investment Trusts) | | | 119 | |
| | 110,144 | | | BT Group PLC (Diversified Telecommunication Services) | | | 317 | |
| | 17,774 | | | Capita PLC (Professional Services) | | | 37 | |
| | 71,571 | | | Centrica PLC (Multi-Utilities) | | | 149 | |
| | 13,972 | | | Direct Line Insurance Group PLC (Insurance) | | | 63 | |
| | 101,773 | | | GlaxoSmithKline PLC (Pharmaceuticals) | | | 2,055 | |
| | 11,489 | | | Hammerson PLC (Equity Real Estate Investment Trusts) | | | 79 | |
| | 23,757 | | | Imperial Tobacco Group PLC (Tobacco) | | | 885 | |
| | 4,345 | | | Investec PLC (Capital Markets) | | | 31 | |
| | 108,409 | | | ITV PLC (Media) | | | 248 | |
| | 41,452 | | | J Sainsbury PLC (Food & Staples Retailing) | | | 176 | |
| | 9,925 | | | Land Securities Group PLC (Equity Real Estate Investment Trusts) | | | 125 | |
| | 58,083 | | | Legal & General Group PLC (Insurance) | | | 204 | |
| | 41,745 | | | Marks & Spencer Group PLC (Multiline Retail) | | | 163 | |
| | 46,106 | | | National Grid PLC (Multi-Utilities) | | | 510 | |
| | 3,804 | | | Next PLC (Multiline Retail) | | | 303 | |
| | 20,939 | | | Pearson PLC (Media) | | | 245 | |
| | 7,688 | | | Persimmon PLC (Household Durables) | | | 257 | |
| | 38,398 | | | Rio Tinto PLC (Metals & Mining) | | | 2,128 | |
| | 35,445 | | | Royal Dutch Shell PLC, A Shares (Oil, Gas & Consumable Fuels) | | | 1,230 | |
| | | | | | | | |
| Shares | | | Security Description | | Value
(000) | |
| | | | United Kingdom (continued) | |
| | 32,768 | | | Royal Dutch Shell PLC, B Shares (Oil, Gas & Consumable Fuels) | | $ | 1,173 | |
| | 23,058 | | | Royal Mail PLC (Air Freight & Logistics) | | | 154 | |
| | 3,289 | | | Severn Trent PLC (Water Utilities) | | | 86 | |
| | 13,502 | | | SSE PLC (Electric Utilities) | | | 241 | |
| | 21,938 | | | Standard Life PLC (Insurance) | | | 94 | |
| | 87,201 | | | Taylor Wimpey PLC (Household Durables) | | | 206 | |
| | 2,166 | | | TechnipFMC PLC (Energy Equipment & Services) | | | 69 | |
| | 9,339 | | | United Utilities Group PLC (Water Utilities) | | | 94 | |
| | 376,592 | | | Vodafone Group PLC (Wireless Telecommunication Services) | | | 913 | |
| | | | | | | | |
| | | | | | | 17,230 | |
| | | | | | | | |
| | | | United States — 45.12% | |
| | 6,345 | | | 3M Co. (Industrial Conglomerates) | | | 1,248 | |
| | 1,104 | | | Aaron’s, Inc. (Specialty Retail) | | | 48 | |
| | 6,285 | | | Accenture PLC, Class – A (IT Services) | | | 1,028 | |
| | 710 | | | Advance Auto Parts, Inc. (Specialty Retail) | | | 96 | |
| | 2,074 | | | Air Products & Chemicals, Inc. (Chemicals) | | | 323 | |
| | 1,736 | | | Akamai Technologies, Inc. (Internet Software & Services) (a) | | | 127 | |
| | 800 | | | Align Technology, Inc. (Health Care Equipment & Supplies) (a) | | | 274 | |
| | 1,921 | | | Alphabet, Inc., Class – A (Internet Software & Services) (a) | | | 2,170 | |
| | 4,786 | | | American Electric Power, Inc. (Electric Utilities) | | | 331 | |
| | 7,609 | | | Amgen, Inc. (Biotechnology) | | | 1,405 | |
| | 2,989 | | | Amphenol Corp., Class – A (Electronic Equipment, Instruments & Components) | | | 261 | |
| | 3,588 | | | Analog Devices, Inc. (Semiconductors & Semiconductor Equipment) | | | 344 | |
| | 882 | | | ANSYS, Inc. (Software) (a) | | | 154 | |
| | 2,608 | | | Anthem, Inc. (Health Care Providers & Services) | | | 621 | |
| | 736 | | | Apergy Corp. (Energy Equipment & Services) (a) | | | 31 | |
| | 12,216 | | | Apple, Inc. (Technology Hardware, Storage & Peripherals) | | | 2,261 | |
| | 1,664 | | | Aqua America, Inc. (Water Utilities) | | | 59 | |
| | 314 | | | Arista Networks, Inc. (Communications Equipment) (a) | | | 81 | |
| | 2,269 | | | Autodesk, Inc. (Software) (a) | | | 297 | |
| | 4,735 | | | Automatic Data Processing, Inc. (IT Services) | | | 635 | |
| | 292 | | | AutoZone, Inc. (Specialty Retail) (a) | | | 196 | |
| | 2,088 | | | Becton, Dickinson & Co. (Health Care Equipment & Supplies) | | | 500 | |
| | 1,595 | | | Bed Bath & Beyond, Inc. (Specialty Retail) | | | 32 | |
| | 912 | | | Bemis Company, Inc. (Containers & Packaging) | | | 38 | |
| | 2,959 | | | Best Buy Co., Inc. (Specialty Retail) | | | 221 | |
| | 454 | | | Bio-Techne Corp. (Life Sciences Tools & Services) | | | 67 | |
| | 1,192 | | | Broadridge Financial Solutions, Inc. (IT Services) | | | 137 | |
| | 2,179 | | | Brown & Brown, Inc. (Insurance) | | | 60 | |
See accompanying notes to financial statements.
127
HC CAPITAL TRUST
The ESG Growth Portfolio
Portfolio of Investments (continued) — June 30, 2018
| | | | | | | | |
| Shares | | | Security Description | | Value
(000) | |
| | | | Common Stocks (continued) | | | | |
| | | | United States (continued) | |
| | 1,428 | | | C.H. Robinson Worldwide, Inc. (Air Freight & Logistics) | | $ | 119 | |
| | 1,701 | | | Campbell Soup Co. (Food Products) | | | 69 | |
| | 3,118 | | | Cardinal Health, Inc. (Health Care Providers & Services) | | | 152 | |
| | 609 | | | Carlisle Companies, Inc. (Industrial Conglomerates) | | | 66 | |
| | 489 | | | Carter’s, Inc. (Textiles, Apparel & Luxury Goods) | | | 53 | |
| | 1,566 | | | CDK Global, Inc. (Software) | | | 102 | |
| | 2,928 | | | Cerner Corp. (Health Care Technology) (a) | | | 175 | |
| | 302 | | | Chipotle Mexican Grill, Inc. (Hotels, Restaurants & Leisure) (a) | | | 130 | |
| | 354 | | | Choice Hotels International, Inc. (Hotels, Restaurants & Leisure) | | | 27 | |
| | 894 | | | Cintas Corp. (Commercial Services & Supplies) | | | 165 | |
| | 48,482 | | | Cisco Systems, Inc. (Communications Equipment) | | | 2,086 | |
| | 3,090 | | | Citizens Financial Group, Inc. (Banks) | | | 120 | |
| | 1,565 | | | Citrix Systems, Inc. (Software) (a) | | | 164 | |
| | 3,189 | | | CME Group, Inc. (Capital Markets) | | | 523 | |
| | 6,111 | | | Cognizant Technology Solutions Corp. (IT Services) | | | 483 | |
| | 9,072 | | | Colgate-Palmolive Co. (Household Products) | | | 588 | |
| | 890 | | | Commerce Bancshares, Inc. (Banks) | | | 58 | |
| | 2,260 | | | Copart, Inc. (Commercial Services & Supplies) (a) | | | 128 | |
| | 727 | | | Crane Co. (Machinery) | | | 58 | |
| | 9,832 | | | CSX Corp. (Road & Rail) | | | 627 | |
| | 885 | | | Cullen/Frost Bankers, Inc. (Banks) | | | 96 | |
| | 1,717 | | | Cummins, Inc. (Machinery) | | | 229 | |
| | 5,969 | | | Danaher Corp. (Health Care Equipment & Supplies) | | | 588 | |
| | 1,721 | | | DaVita Healthcare Partners, Inc. (Health Care Providers & Services) (a) | | | 120 | |
| | 2,342 | | | Dentsply Sirona, Inc. (Health Care Equipment & Supplies) | | | 103 | |
| | 864 | | | Dick’s Sporting Goods, Inc. (Specialty Retail) | | | 30 | |
| | 903 | | | Discovery Communications, Inc., Class – C (Media) (a) | | | 23 | |
| | 751 | | | Dolby Laboratories, Inc., Class – A (Electronic Equipment, Instruments & Components) | | | 46 | |
| | 2,175 | | | Dollar Tree, Inc. (Multiline Retail) (a) | | | 185 | |
| | 1,276 | | | Donaldson Company, Inc. (Machinery) | | | 58 | |
| | 1,561 | | | Dover Corp. (Machinery) | | | 114 | |
| | 1,808 | | | Dr. Pepper Snapple Group, Inc. (Beverages) | | | 221 | |
| | 359 | | | Dril-Quip, Inc. (Energy Equipment & Services) (a) | | | 18 | |
| | 1,106 | | | Eaton Vance Corp. (Capital Markets) | | | 58 | |
| | 12,056 | | | eBay, Inc. (Internet Software & Services) (a) | | | 437 | |
| | 2,541 | | | Ecolab, Inc. (Chemicals) | | | 357 | |
| | 2,077 | | | Edwards Lifesciences Corp. (Health Care Equipment & Supplies) (a) | | | 302 | |
| | 9,821 | | | Eli Lilly & Co. (Pharmaceuticals) | | | 838 | |
| | | | | | | | |
| Shares | | | Security Description | | Value
(000) | |
| | | | United States (continued) | |
| | 1,865 | | | Expeditors International of Washington, Inc. (Air Freight & Logistics) | | $ | 137 | |
| | 6,747 | | | Express Scripts Holding Co. (Health Care Providers & Services) (a) | | | 521 | |
| | 17,348 | | | Exxon Mobil Corp. (Oil, Gas & Consumable Fuels) | | | 1,435 | |
| | 714 | | | F5 Networks, Inc. (Communications Equipment) (a) | | | 123 | |
| | 393 | | | FactSet Research Systems, Inc. (Capital Markets) | | | 78 | |
| | 2,863 | | | Fastenal Co. (Trading Companies & Distributors) | | | 138 | |
| | 1,385 | | | First Republic Bank (Banks) | | | 134 | |
| | 4,527 | | | Fiserv, Inc. (IT Services) (a) | | | 335 | |
| | 900 | | | FleetCor Technologies, Inc. (IT Services) (a) | | | 190 | |
| | 1,317 | | | FLIR Systems, Inc. (Electronic Equipment, Instruments & Components) | | | 68 | |
| | 1,301 | | | Fluor Corp. (Construction & Engineering) | | | 63 | |
| | 2,816 | | | Fortive Corp. (Machinery) | | | 217 | |
| | 735 | | | Fossil Group, Inc. (Textiles, Apparel & Luxury Goods) (a) | | | 20 | |
| | 3,787 | | | Franklin Resources, Inc. (Capital Markets) | | | 121 | |
| | 1,317 | | | GameStop Corp., Class – A (Specialty Retail) | | | 19 | |
| | 2,230 | | | Gap, Inc. (Specialty Retail) | | | 72 | |
| | 2,737 | | | General Dynamics Corp. (Aerospace & Defense) | | | 510 | |
| | 5,880 | | | General Mills, Inc. (Food Products) | | | 260 | |
| | 1,487 | | | Genuine Parts Co. (Distributors) | | | 136 | |
| | 1,207 | | | Harris Corp. (Communications Equipment) | | | 174 | |
| | 1,644 | | | Henry Schein, Inc. (Health Care Providers & Services) (a) | | | 119 | |
| | 1,427 | | | Hershey Co. (Food Products) | | | 133 | |
| | 2,615 | | | Hormel Foods Corp. (Food Products) | | | 97 | |
| | 546 | | | Hubbell, Inc. (Electrical Equipment) | | | 58 | |
| | 732 | | | IDEX Corp. (Machinery) | | | 100 | |
| | 930 | | | IDEXX Laboratories, Inc. (Health Care Equipment & Supplies) (a) | | | 203 | |
| | 42,624 | | | Intel Corp. (Semiconductors & Semiconductor Equipment) | | | 2,118 | |
| | 9,078 | | | International Business Machines Corp. (IT Services) | | | 1,268 | |
| | 787 | | | International Flavors & Fragrances, Inc. (Chemicals) | | | 98 | |
| | 2,659 | | | Intuit, Inc. (Software) | | | 543 | |
| | 810 | | | Jack Henry & Associates, Inc. (IT Services) | | | 106 | |
| | 1,167 | | | Jacobs Engineering Group, Inc. (Construction & Engineering) | | | 75 | |
| | 693 | | | John Wiley & Sons, Inc., Class – A (Media) | | | 43 | |
| | 13,333 | | | Johnson & Johnson (Pharmaceuticals) | | | 1,618 | |
| | 3,622 | | | Kimberly-Clark Corp. (Household Products) | | | 382 | |
| | 1,874 | | | Kohl’s Corp. (Multiline Retail) | | | 137 | |
| | 802 | | | L3 Technologies, Inc. (Aerospace & Defense) | | | 154 | |
| | 983 | | | Laboratory Corporation of America Holdings (Health Care Providers & Services) (a) | | | 176 | |
| | 416 | | | Landstar System, Inc. (Road & Rail) | | | 45 | |
| | 705 | | | Lincoln Electric Holdings, Inc. (Machinery) | | | 62 | |
See accompanying notes to financial statements.
128
HC CAPITAL TRUST
The ESG Growth Portfolio
Portfolio of Investments (continued) — June 30, 2018
| | | | | | | | |
| Shares | | | Security Description | | Value
(000) | |
| | | | Common Stocks (continued) | | | | |
| | | | United States (continued) | |
| | 2,963 | | | LKQ Corp. (Distributors) (a) | | $ | 95 | |
| | 2,710 | | | Lockheed Martin Corp. (Aerospace & Defense) | | | 801 | |
| | 253 | | | LogMeln, Inc. (Internet Software & Services) | | | 26 | |
| | 1,042 | | | Lululemon Athletica, Inc. (Textiles, Apparel & Luxury Goods) (a) | | | 130 | |
| | 441 | | | Lumentum Holdings, Inc. (Communications Equipment) (a) | | | 26 | |
| | 5,398 | | | Marsh & McLennan Companies, Inc. (Insurance) | | | 443 | |
| | 9,994 | | | MasterCard, Inc., Class – A (IT Services) | | | 1,963 | |
| | 1,252 | | | McCormick & Company, Inc. (Food Products) | | | 145 | |
| | 9,574 | | | McDonald’s Corp. (Hotels, Restaurants & Leisure) | | | 1,500 | |
| | 2,231 | | | McKesson Corp. (Health Care Providers & Services) | | | 298 | |
| | 870 | | | MEDNAX, Inc. (Health Care Providers & Services) (a) | | | 38 | |
| | 25,598 | | | Merck & Co., Inc. (Pharmaceuticals) | | | 1,554 | |
| | 268 | | | Mettler-Toledo International, Inc. (Life Sciences Tools & Services) (a) | | | 155 | |
| | 25,021 | | | Microsoft Corp. (Software) | | | 2,467 | |
| | 190 | | | Morningstar, Inc. (Capital Markets) | | | 24 | |
| | 444 | | | MSC Industrial Direct Co., Inc., Class – A (Trading Companies & Distributors) | | | 38 | |
| | 789 | | | National Fuel Gas Co. (Gas Utilities) | | | 42 | |
| | 1,049 | | | National Instruments Corp. (Electronic Equipment, Instruments & Components) | | | 44 | |
| | 3,786 | | | National Oilwell Varco, Inc. (Energy Equipment & Services) | | | 164 | |
| | 13,556 | | | NIKE, Inc., Class – B (Textiles, Apparel & Luxury Goods) | | | 1,079 | |
| | 1,199 | | | Nordstrom, Inc. (Multiline Retail) | | | 62 | |
| | 3,108 | | | Norfolk Southern Corp. (Road & Rail) | | | 469 | |
| | 7,662 | | | Occidental Petroleum Corp. (Oil, Gas & Consumable Fuels) | | | 641 | |
| | 1,416 | | | Oceaneering International, Inc. (Energy Equipment & Services) | | | 36 | |
| | 653 | | | Old Dominion Freight Line, Inc. (Road & Rail) | | | 97 | |
| | 31,750 | | | Oracle Corp. (Software) | | | 1,399 | |
| | 812 | | | Patterson Companies, Inc. (Health Care Providers & Services) | | | 18 | |
| | 3,070 | | | Paychex, Inc. (IT Services) | | | 210 | |
| | 12,031 | | | PayPal Holdings, Inc. (IT Services) (a) | | | 1,002 | |
| | 14,754 | | | PepsiCo, Inc. (Beverages) | | | 1,606 | |
| | 5,441 | | | Phillips 66 (Oil, Gas & Consumable Fuels) | | | 611 | |
| | 617 | | | Polaris Industries, Inc. (Leisure Products) | | | 75 | |
| | 2,816 | | | Praxair, Inc. (Chemicals) | | | 444 | |
| | 1,400 | | | Quest Diagnostics, Inc. (Health Care Providers & Services) | | | 154 | |
| | 3,027 | | | Raytheon Co. (Aerospace & Defense) | | | 585 | |
| | 1,830 | | | Red Hat, Inc. (Software) (a) | | | 246 | |
| | 1,371 | | | ResMed, Inc. (Health Care Equipment & Supplies) | | | 142 | |
| | | | | | | | |
| Shares | | | Security Description | | Value
(000) | |
| | | | United States (continued) | |
| | 1,262 | | | Robert Half International, Inc. (Professional Services) | | $ | 82 | |
| | 1,291 | | | Rockwell Collins, Inc. (Aerospace & Defense) | | | 174 | |
| | 879 | | | Rollins, Inc. (Commercial Services & Supplies) | | | 46 | |
| | 1,011 | | | Roper Industries, Inc. (Industrial Conglomerates) | | | 279 | |
| | 3,949 | | | Ross Stores, Inc. (Specialty Retail) | | | 335 | |
| | 2,634 | | | S&P Global, Inc. (Capital Markets) | | | 537 | |
| | 1,395 | | | SCANA Corp. (Multi-Utilities) | | | 54 | |
| | 12,700 | | | Schlumberger Ltd. (Energy Equipment & Services) | | | 852 | |
| | 560 | | | Snap-on, Inc. (Machinery) | | | 90 | |
| | 943 | | | Sonoco Products Co. (Containers & Packaging) | | | 50 | |
| | 684 | | | Spirit Airlines, Inc. (Airlines) (a) | | | 25 | |
| | 1,432 | | | Sprouts Farmers Market, Inc. (Food & Staples Retailing) (a) | | | 32 | |
| | 1,456 | | | Stanley Black & Decker, Inc. (Machinery) | | | 193 | |
| | 14,986 | | | Starbucks Corp. (Hotels, Restaurants & Leisure) | | | 732 | |
| | 5,782 | | | Sysco Corp. (Food & Staples Retailing) | | | 395 | |
| | 2,513 | | | T. Rowe Price Group, Inc. (Capital Markets) | | | 292 | |
| | 2,698 | | | Tapestry, Inc. (Textiles, Apparel & Luxury Goods) | | | 126 | |
| | 2,636 | | | TD Ameritrade Holding Corp. (Capital Markets) | | | 144 | |
| | 1,733 | | | Teradata Corp. (IT Services) (a) | | | 70 | |
| | 10,429 | | | Texas Instruments, Inc. (Semiconductors & Semiconductor Equipment) | | | 1,150 | |
| | 1,244 | | | The Clorox Co. (Household Products) | | | 168 | |
| | 33,364 | | | The Coca-Cola Co. (Beverages) | | | 1,463 | |
| | 337 | | | The Dun & Bradstreet Corp. (Professional Services) | | | 41 | |
| | 2,033 | | | The Estee Lauder Companies, Inc., Class – A (Personal Products) | | | 290 | |
| | 1,168 | | | The J.M. Smucker Co. (Food Products) | | | 126 | |
| | 5,993 | | | The Kraft Heinz Co. (Food Products) | | | 377 | |
| | 9,606 | | | The Kroger Co. (Food & Staples Retailing) | | | 273 | |
| | 569 | | | The Middleby Corp. (Machinery) (a) | | | 59 | |
| | 18,106 | | | The Procter & Gamble Co. (Household Products) | | | 1,413 | |
| | 785 | | | The Sherwin-Williams Co. (Chemicals) | | | 320 | |
| | 9,041 | | | The Southern Co. (Electric Utilities) | | | 419 | |
| | 14,826 | | | The Walt Disney Co. (Media) | | | 1,554 | |
| | 3,978 | | | Thermo Electron Corp. (Life Sciences Tools & Services) | | | 824 | |
| | 1,123 | | | Tiffany & Co. (Specialty Retail) | | | 148 | |
| | 1,336 | | | Tractor Supply Co. (Specialty Retail) | | | 102 | |
| | 2,567 | | | Trimble Navigation Ltd. (Electronic Equipment, Instruments & Components) (a) | | | 85 | |
| | 624 | | | Ulta Salon, Cosmetics & Fragrance, Inc. (Specialty Retail) (a) | | | 146 | |
| | 1,678 | | | Under Armour, Inc., Class – A (Textiles, Apparel & Luxury Goods) (a) | | | 38 | |
| | 1,687 | | | Under Armour, Inc., Class – C (Textiles, Apparel & Luxury Goods) (a) | | | 36 | |
See accompanying notes to financial statements.
129
HC CAPITAL TRUST
The ESG Growth Portfolio
Portfolio of Investments (continued) — June 30, 2018
| | | | | | | | |
| Shares | | | Security Description | | Value
(000) | |
| | | | Common Stocks (continued) | | | | |
| | | | United States (continued) | |
| | 8,799 | | | Union Pacific Corp. (Road & Rail) | | $ | 1,247 | |
| | 8,358 | | | United Technologies Corp. (Aerospace & Defense) | | | 1,045 | |
| | 3,196 | | | V.F. Corp. (Textiles, Apparel & Luxury Goods) | | | 261 | |
| | 370 | | | Varex Imaging Corp. (Health Care Equipment & Supplies) (a) | | | 14 | |
| | 984 | | | Varian Medical Systems, Inc. (Health Care Equipment & Supplies) (a) | | | 112 | |
| | 958 | | | Versum Materials, Inc. (Semiconductors & Semiconductor Equipment) | | | 36 | |
| | 18,401 | | | Visa, Inc., Class – A (IT Services) | | | 2,436 | |
| | 767 | | | VMware, Inc., Class – A (Software) (a) | | | 113 | |
| | 608 | | | W.W. Grainger, Inc. (Trading Companies & Distributors) | | | 187 | |
| | 902 | | | Wabtec Corp. (Machinery) | | | 89 | |
| | 15,884 | | | Wal-Mart Stores, Inc. (Food & Staples Retailing) | | | 1,360 | |
| | 810 | | | Waters Corp. (Life Sciences Tools & Services) (a) | | | 157 | |
| | 5,050 | | | Western Union Co. (IT Services) | | | 103 | |
| | 863 | | | Williams-Sonoma, Inc. (Specialty Retail) | | | 53 | |
| | 1,019 | | | World Fuel Services Corp. (Oil, Gas & Consumable Fuels) | | | 21 | |
| | 4,789 | | | Xcel Energy, Inc. (Electric Utilities) | | | 219 | |
| | 2,526 | | | Xilinx, Inc. (Semiconductors & Semiconductor Equipment) | | | 165 | |
| | 1,787 | | | Xylem, Inc. (Machinery) | | | 120 | |
| | | | | | | | |
| | | | | | | 75,154 | |
| | | | | | | | |
| | | | Total Common Stocks | | | 162,611 | |
| | | | | | | | |
| | | | | | | | |
| Shares | | | Security Description | | Value
(000) | |
| | | | Preferred Stock — 0.03% | | | | |
| | | | Germany — 0.03% | |
| | 612 | | | Bayerische Motoren Werke Aktiengesellschaft – Preferred (Automobiles) | | $ | 49 | |
| | | | | | | | |
| | | | Total Preferred Stock | | | 49 | |
| | | | | | | | |
| | | | Right — 0.00% | | | | |
| | | | Italy — 0.00% | |
| | 61,601 | | | Intesa Sanpaolo SpA (Banks) (a) | | | — | |
| | | | | | | | |
| | | | Total Right | | | — | |
| | | | | | | | |
| | | | Mutual Funds — 1.42% | | | | |
| | 9,342 | | | Altaba, Inc. | | | 683 | |
| | 4,526 | | | Dreyfus Treasury Prime Cash Management Fund, Institutional Shares, 1.68% (b) | | | 5 | |
| | 1,674,676 | | | State Street Institutional Treasury Plus Money Market Fund, Trust Class, 1.72% (b) | | | 1,675 | |
| | | | | | | | |
| | | | Total Mutual Funds | | | 2,363 | |
| | | | | | | | |
| | | | Total Investments
(cost $143,648) — 99.10% | | | 165,023 | |
| | | | Other assets in excess of
liabilities — 0.90% | | | 1,501 | |
| | | | | | | | |
| | | | Net Assets — 100.00% | | $ | 166,524 | |
| | | | | | | | |
Amounts designated as “—” are $0 or have been rounded to $0.
| (a) | Represents non-income producing security. |
| (b) | The rate disclosed is the rate in effect on June 30, 2018. |
ADR — American Depositary Receipt
FDR — Fiduciary Depositary Receipt
REIT — Real Estate Investment Trust
See accompanying notes to financial statements.
130
HC CAPITAL TRUST
The ESG Growth Portfolio
Portfolio of Investments (concluded) — June 30, 2018
The following table reflects the percentage of total net assets of the Portfolio attributable to each Specialist Manager as of June 30, 2018.
| | | | | | | | | | | | | | | | |
The ESG Growth Portfolio | | Cadence Capital
Management, LLC | | | BNY Mellon Asset
Management North
America Corporation* | | | Parametric
Portfolio
Associates, LLC | | | Total | |
Common Stocks | | | 51.94 | % | | | 45.71 | % | | | — | | | | 97.65 | % |
Preferred Stock | | | 0.03 | % | | | — | | | | — | | | | 0.03 | % |
Right | | | 0.00 | % | | | — | | | | — | | | | 0.00 | % |
Mutual Funds | | | 0.00 | % | | | 0.76 | % | | | 0.66 | % | | | 1.42 | % |
Other Assets (Liabilities) | | | 0.82 | % | | | 0.01 | % | | | 0.07 | % | | | 0.90 | % |
| | | | | | | | | | | | | | | | |
Total Net Assets | | | 52.79 | % | | | 46.48 | % | | | 0.73 | % | | | 100.00 | % |
| | | | | | | | | | | | | | | | |
| * | Formerly Mellon Capital Management Corporation. |
Amounts designated as “—” indicate the Specialist Manager did not manage any holdings in that category.
The following table reflects the open derivative positions held by the Portfolio as of June 30, 2018.
Futures Contracts Purchased^
| | | | | | | | | | | | | | |
Description | | Number of
Contracts | | Expiration
Date | | | Notional
Amount
(000) | | | Value and
Unrealized
Appreciation/
(Depreciation)
(000) | |
E-Mini S&P 500 Future | | 4 | | | 9/21/18 | | | $ | 544 | | | $ | (11 | ) |
MSCI EAFE Index Future | | 6 | | | 9/21/18 | | | | 587 | | | | (18 | ) |
| | | | | | | | | | | | | | |
| | | | | $ | 1,131 | | | $ | (29 | ) |
| | | | | | | | | | | | | | |
| | |
| | Total Unrealized Appreciation | | | $ | — | |
| | Total Unrealized Depreciation | | | | (29 | ) |
| | | | | | | | | | | | | | |
| | Total Net Unrealized Appreciation/(Depreciation) | | | $ | (29 | ) |
| | | | | | | | | | | | | | |
| ^ | Cash has been pledged as collateral for futures contracts held by the Portfolio. |
Amounts designated as “—” are $0 or have been rounded to $0.
See accompanying notes to portfolio of investments.
131
HC CAPITAL TRUST
The Catholic SRI Growth Portfolio
Portfolio of Investments — June 30, 2018
| | | | | | | | |
| Shares | | | Security Description | | Value
(000) | |
| | | | Common Stocks — 98.37% | | | | |
| | | | Australia — 3.82% | | | | |
| | 3,402 | | | AMP Ltd. (Diversified Financial Services) | | $ | 9 | |
| | 2,759 | | | APA Group (Gas Utilities) | | | 20 | |
| | 8,878 | | | Aurizon Holdings Ltd. (Road & Rail) | | | 28 | |
| | 4,218 | | | AusNet Services (Electric Utilities) | | | 5 | |
| | 5,272 | | | Australia & New Zealand Banking Group Ltd. (Banks) | | | 110 | |
| | 840 | | | Bendigo & Adelaide Bank Ltd. (Banks) | | | 7 | |
| | 2,676 | | | Coca-Cola Amatil Ltd. (Beverages) | | | 18 | |
| | 3,151 | | | Commonwealth Bank of Australia (Banks) | | | 170 | |
| | 1,847 | | | Crown Resorts Ltd. (Hotels, Restaurants & Leisure) | | | 18 | |
| | 2,302 | | | Dexus Property Group (Equity Real Estate Investment Trusts) | | | 17 | |
| | 4,143 | | | GPT Group (Equity Real Estate Investment Trusts) | | | 16 | |
| | 2,577 | | | Harvey Norman Holdings Ltd. (Multiline Retail) | | | 6 | |
| | 4,212 | | | Insurance Australia Group Ltd. (Insurance) | | | 26 | |
| | 379 | | | Macquarie Group Ltd. (Capital Markets) | | | 35 | |
| | 8,640 | | | Mirvac Group (Equity Real Estate Investment Trusts) | | | 14 | |
| | 4,782 | | | National Australia Bank Ltd. (Banks) | | | 97 | |
| | 2,588 | | | QBE Insurance Group Ltd. (Insurance) | | | 19 | |
| | 12,499 | | | Scentre Group (Equity Real Estate Investment Trusts) | | | 40 | |
| | 5,609 | | | Stockland Trust Group (Equity Real Estate Investment Trusts) | | | 16 | |
| | 2,287 | | | Suncorp Group Ltd. (Insurance) | | | 25 | |
| | 5,138 | | | Sydney Airport (Transportation Infrastructure) | | | 27 | |
| | 8,820 | | | Tabcorp Holdings Ltd. (Hotels, Restaurants & Leisure) | | | 30 | |
| | 10,255 | | | Telstra Corp. Ltd. (Diversified Telecommunication Services) | | | 20 | |
| | 8,804 | | | Transurban Group (Transportation Infrastructure) | | | 78 | |
| | 7,944 | | | Vicinity Centres (Equity Real Estate Investment Trusts) | | | 15 | |
| | 3,466 | | | Wesfarmers Ltd. (Food & Staples Retailing) | | | 127 | |
| | 6,036 | | | Westpac Banking Corp. (Banks) | | | 131 | |
| | | | | | | | |
| | | | | | | 1,124 | |
| | | | | | | | |
| | | | Austria — 0.08% | | | | |
| | 78 | | | ANDRITZ AG (Machinery) | | | 4 | |
| | 109 | | | Erste Group Bank AG (Banks) | | | 5 | |
| | 148 | | | OMV AG (Oil, Gas & Consumable Fuels) | | | 8 | |
| | 120 | | | Voestalpine AG (Metals & Mining) | | | 6 | |
| | | | | | | | |
| | | | | | | 23 | |
| | | | | | | | |
| | | | Belgium — 0.58% | | | | |
| | 1,470 | | | Anheuser-Busch InBev N.V. (Beverages) | | | 148 | |
| | 222 | | | Belgacom SA (Diversified Telecommunication Services) | | | 5 | |
| | 246 | | | KBC Groep N.V. (Banks) | | | 19 | |
| | | | | | | | |
| | | | | | | 172 | |
| | | | | | | | |
| | | | Bermuda — 0.09% | | | | |
| | 526 | | | IHS Markit Ltd. (Professional Services) (a) | | | 27 | |
| | | | | | | | |
| | | | Cayman Islands — 0.05% | | | | |
| | 272 | | | Herbalife Ltd. (Personal Products) (a) | | | 15 | |
| | | | | | | | |
| | | | | | | | |
| Shares | | | Security Description | | Value
(000) | |
| | | | Denmark — 0.83% | | | | |
| | 385 | | | Christian Hansen Holding A/S (Chemicals) | | $ | 36 | |
| | 1,788 | | | ISS A/S (Commercial Services & Supplies) | | | 61 | |
| | 1,397 | | | Tryg A/S (Insurance) | | | 33 | |
| | 1,838 | | | Vestas Wind Systems A/S (Electrical Equipment) | | | 114 | |
| | | | | | | | |
| | | | | | | 244 | |
| | | | | | | | |
| | | | Finland — 0.60% | | | | |
| | 751 | | | Elisa Oyj (Diversified Telecommunication Services) | | | 35 | |
| | 2,898 | | | Fortum Oyj (Electric Utilities) | | | 68 | |
| | 948 | | | Metso Oyj (Machinery) | | | 32 | |
| | 1,026 | | | Nokian Renkaat Oyj (Auto Components) | | | 41 | |
| | | | | | | | |
| | | | | | | 176 | |
| | | | | | | | |
| | | | France — 4.71% | | | | |
| | 58 | | | Amundi SA (Capital Markets) | | | 4 | |
| | 404 | | | Atos SE (IT Services) | | | 55 | |
| | 3,297 | | | AXA SA (Insurance) | | | 81 | |
| | 1,901 | | | BNP Paribas (Banks) | | | 118 | |
| | 1,010 | | | Bouygues SA (Construction & Engineering) | | | 44 | |
| | 2,528 | | | Carrefour SA (Food & Staples Retailing) | | | 41 | |
| | 263 | | | Casino Guichard-Perrachon SA (Food & Staples Retailing) | | | 10 | |
| | 307 | | | CNP Assurances (Insurance) | | | 7 | |
| | 2,034 | | | Credit Agricole SA (Banks) | | | 27 | |
| | 3,972 | | | ENGIE (Multi-Utilities) | | | 60 | |
| | 790 | | | Eutelsat Communications (Media) | | | 16 | |
| | 82 | | | Fonciere des Regions (Equity Real Estate Investment Trusts) | | | 9 | |
| | 113 | | | Gecina SA (Equity Real Estate Investment Trusts) | | | 19 | |
| | 86 | | | Icade (Equity Real Estate Investment Trusts) | | | 8 | |
| | 256 | | | Ingenico Group SA (Electronic Equipment, Instruments & Components) | | | 23 | |
| | 520 | | | Klepierre (Equity Real Estate Investment Trusts) | | | 20 | |
| | 500 | | | Lagardere SCA (Media) | | | 13 | |
| | 1,646 | | | Natixism SA (Banks) | | | 12 | |
| | 4,657 | | | Orange SA (Diversified Telecommunication Services) | | | 78 | |
| | 862 | | | Publicis Groupe (Media) | | | 60 | |
| | 2,398 | | | Schneider Electric SA (Electrical Equipment) | | | 200 | |
| | 119 | | | Societe BIC SA (Commercial Services & Supplies) | | | 11 | |
| | 1,372 | | | Societe Generale (Banks) | | | 58 | |
| | 824 | | | Suez Environnement Co. (Multi-Utilities) | | | 11 | |
| | 5,262 | | | Total SA (Oil, Gas & Consumable Fuels) | | | 321 | |
| | 251 | | | Unibail-Rodamco-Westfield (Equity Real Estate Investment Trusts) | | | 54 | |
| | 1,099 | | | Veolia Environnement (Multi-Utilities) | | | 24 | |
| | | | | | | | |
| | | | | | | 1,384 | |
| | | | | | | | |
| | | | Germany — 3.98% | | | | |
| | 471 | | | Allianz SE (Insurance) | | | 98 | |
| | 131 | | | Axel Springer AG (Media) | | | 9 | |
| | 1,610 | | | BASF SE (Chemicals) | | | 154 | |
| | 940 | | | Bayerische Motoren Werke Aktiengesellschaft (Automobiles) | | | 85 | |
| | 2,047 | | | Daimler AG, Registered Shares (Automobiles) | | | 132 | |
See accompanying notes to portfolio of investments.
132
HC CAPITAL TRUST
The Catholic SRI Growth Portfolio
Portfolio of Investments (continued) — June 30, 2018
| | | | | | | | |
| Shares | | | Security Description | | Value
(000) | |
| | | | Common Stocks (continued) | | | | |
| | | | Germany (continued) | |
| | 2,738 | | | Deutsche Post AG (Air Freight & Logistics) | | $ | 89 | |
| | 4,727 | | | Deutsche Telekom AG (Diversified Telecommunication Services) | | | 74 | |
| | 456 | | | Evonik Industries AG (Chemicals) | | | 16 | |
| | 179 | | | Hugo Boss AG (Textiles, Apparel & Luxury Goods) | | | 16 | |
| | 188 | | | Innogy SE (Multi-Utilities) | | | 8 | |
| | 99 | | | MAN SE (Machinery) | | | 11 | |
| | 496 | | | Metro AG (Food & Staples Retailing) | | | 6 | |
| | 163 | | | Muenchener Rueckversicherungs-Gesellschaft AG (Insurance) | | | 34 | |
| | 663 | | | ProSiebenSat.1 Media AG (Media) | | | 17 | |
| | 1,565 | | | SAP SE (Software) | | | 181 | |
| | 1,240 | | | Siemens AG (Industrial Conglomerates) | | | 164 | |
| | 1,100 | | | Telefonica Deutschland Holding AG (Diversified Telecommunication Services) | | | 4 | |
| | 1,878 | | | TUI AG (Hotels, Restaurants & Leisure) | | | 41 | |
| | 686 | | | Vonovia SE (Real Estate Management & Development) | | | 33 | |
| | | | | | | | |
| | | | | | | 1,172 | |
| | | | | | | | |
| | | | Hong Kong — 1.64% | |
| | 11,024 | | | BOC Hong Kong (Holdings) Ltd. (Banks) | | | 52 | |
| | 4,540 | | | CLP Holdings Ltd. (Electric Utilities) | | | 50 | |
| | 7,043 | | | Hang Lung Properties Ltd. (Real Estate Management & Development) | | | 15 | |
| | 1,613 | | | Hang Seng Bank Ltd. (Banks) | | | 40 | |
| | 5,203 | | | Henderson Land Development Co. Ltd. (Real Estate Management & Development) | | | 28 | |
| | 9,615 | | | HK Electric Investments Ltd. (Electric Utilities) | | | 9 | |
| | 12,000 | | | HKT Trust & HKT Ltd. (Diversified Telecommunication Services) | | | 15 | |
| | 2,000 | | | Hysan Development Co. (Real Estate Management & Development) | | | 11 | |
| | 34,836 | | | Li & Fung Ltd. (Textiles, Apparel & Luxury Goods) | | | 13 | |
| | 406 | | | Michael Kors Holdings Ltd. (Textiles, Apparel & Luxury Goods) (a) | | | 27 | |
| | 12,000 | | | PCCW Ltd. (Diversified Telecommunication Services) | | | 7 | |
| | 4,500 | | | Power Assets Holdings Ltd. (Electric Utilities) | | | 31 | |
| | 5,000 | | | Sun Hung Kai Properties Ltd. (Real Estate Management & Development) | | | 74 | |
| | 2,738 | | | Swire Pacific Ltd., Class – A (Real Estate Management & Development) | | | 29 | |
| | 3,200 | | | Swire Properties Ltd. (Real Estate Management & Development) | | | 12 | |
| | 6,500 | | | The Link Real Estate Investment Trust (Equity Real Estate Investment Trusts) | | | 59 | |
| | 3,000 | | | The Wharf (Holdings) Ltd. (Real Estate Management & Development) | | | 10 | |
| | | | | | | | |
| | | | | | | 482 | |
| | | | | | | | |
| | | | Ireland (Republic of) — 0.19% | |
| | 1,261 | | | CRH PLC (Construction Materials) | | | 44 | |
| | 106 | | | Paddy Power PLC (Hotels, Restaurants & Leisure) | | | 12 | |
| | | | | | | | |
| | | | | | | 56 | |
| | | | | | | | |
| | | | | | | | |
| Shares | | | Security Description | | Value
(000) | |
| | | | Israel — 0.36% | |
| | 112 | | | Azrieli Group (Real Estate Management & Development) | | $ | 6 | |
| | 2,648 | | | Bank Hapoalim Ltd. (Banks) | | | 18 | |
| | 17,453 | | | Israel Chemicals Ltd. (Chemicals) | | | 79 | |
| | 171 | | | Mizrahi Tefahot Bank Ltd. (Banks) | | | 3 | |
| | | | | | | | |
| | | | | | | 106 | |
| | | | | | | | |
| | | | Italy — 0.84% | |
| | 942 | | | Assicurazioni Generali SpA (Insurance) | | | 16 | |
| | 866 | | | Atlantia SpA (Transportation Infrastructure) | | | 26 | |
| | 7,058 | | | Enel SpA (Electric Utilities) | | | 40 | |
| | 5,399 | | | Eni SpA (Oil, Gas & Consumable Fuels) | | | 100 | |
| | 9,871 | | | Intesa Sanpaolo SpA (Banks) | | | 28 | |
| | 831 | | | Intesa Sanpaolo SpA (Banks) | | | 3 | |
| | 5,022 | | | Snam Rete Gas SpA (Oil, Gas & Consumable Fuels) | | | 21 | |
| | 6,842 | | | Telecom Italia SpA (Diversified Telecommunication Services) | | | 4 | |
| | 1,542 | | | Terna — Rete Elettrica Nazionale SpA (Electric Utilities) | | | 8 | |
| | 992 | | | UnipolSai SpA (Insurance) | | | 2 | |
| | | | | | | | |
| | | | | | | 248 | |
| | | | | | | | |
| | | | Japan — 12.80% | |
| | 110 | | | AEON Credit Service Co. Ltd. (Consumer Finance) | | | 2 | |
| | 700 | | | Aisin Seiki Co. Ltd. (Auto Components) | | | 32 | |
| | 1,413 | | | Amada Holdings Co. Ltd. (Machinery) | | | 14 | |
| | 807 | | | Asahi Glass Co. Ltd. (Building Products) | | | 31 | |
| | 4,700 | | | Asahi Kasei Corp. (Chemicals) | | | 60 | |
| | 310 | | | Benesse Holdings, Inc. (Diversified Consumer Services) | | | 11 | |
| | 2,570 | | | Bridgestone Corp. (Auto Components) | | | 100 | |
| | 3,900 | | | Canon, Inc. (Technology Hardware, Storage & Peripherals) | | | 127 | |
| | 900 | | | Casio Computer Co. Ltd. (Household Durables) | | | 15 | |
| | 1,151 | | | Dai Nippon Printing Co. Ltd. (Commercial Services & Supplies) | | | 25 | |
| | 1,000 | | | Daicel Corp. (Chemicals) | | | 11 | |
| | 1,110 | | | Daiwa House Industry Co. Ltd. (Real Estate Management & Development) | | | 38 | |
| | 2,000 | | | Daiwa Securities Group, Inc. (Capital Markets) | | | 12 | |
| | 1,936 | | | Denso Corp. (Auto Components) | | | 94 | |
| | 300 | | | Electric Power Development Co. Ltd. (Independent Power & Renewable Electricity Producers) | | | 8 | |
| | 2,358 | | | Fuji Heavy Industries Ltd. (Automobiles) | | | 69 | |
| | 1,500 | | | FUJIFILM Holdings Corp. (Technology Hardware, Storage & Peripherals) | | | 59 | |
| | 7,211 | | | Fujitsu Ltd. (IT Services) | | | 44 | |
| | 1,000 | | | Hino Motors Ltd. (Machinery) | | | 11 | |
| | 400 | | | Hitachi Chemical Co. Ltd. (Chemicals) | | | 8 | |
| | 18,788 | | | Hitachi Ltd. (Electronic Equipment, Instruments & Components) | | | 133 | |
| | 6,217 | | | Honda Motor Co. Ltd. (Automobiles) | | | 183 | |
| | 5,768 | | | ITOCHU Corp. (Trading Companies & Distributors) | | | 105 | |
| | 500 | | | Japan Exchange Group, Inc. (Capital Markets) | | | 9 | |
| | 5 | | | Japan Retail Fund Investment Corp. (Equity Real Estate Investment Trusts) | | | 9 | |
See accompanying notes to financial statements.
133
HC CAPITAL TRUST
The Catholic SRI Growth Portfolio
Portfolio of Investments (continued) — June 30, 2018
| | | | | | | | |
| Shares | | | Security Description | | Value
(000) | |
| | | | Common Stocks (continued) | | | | |
| | | | Japan (continued) | |
| | 4,200 | | | Japan Tobacco, Inc. (Tobacco) | | $ | 117 | |
| | 1,000 | | | JS Group Corp. (Building Products) | | | 20 | |
| | 714 | | | JSR Corp. (Chemicals) | | | 12 | |
| | 13,149 | | | JX Holdings, Inc. (Oil, Gas & Consumable Fuels) | | | 92 | |
| | 4,000 | | | Kajima Corp. (Construction & Engineering) | | | 31 | |
| | 3,496 | | | KDDI Corp. (Wireless Telecommunication Services) | | | 96 | |
| | 3,635 | | | Komatsu Ltd. (Machinery) | | | 103 | |
| | 1,781 | | | Konica Minolta, Inc. (Technology Hardware, Storage & Peripherals) | | | 17 | |
| | 1,328 | | | Kuraray Co. Ltd. (Chemicals) | | | 18 | |
| | 1,241 | | | Kyocera Corp. (Electronic Equipment, Instruments & Components) | | | 70 | |
| | 300 | | | Lawson, Inc. (Food & Staples Retailing) | | | 19 | |
| | 810 | | | Marui Group Co. Ltd. (Multiline Retail) | | | 17 | |
| | 1,400 | | | Mebuki Financial Group, Inc. (Banks) | | | 5 | |
| | 5,717 | | | Mitsubishi Corp. (Trading Companies & Distributors) | | | 158 | |
| | 400 | | | Mitsubishi Materials Corp. (Metals & Mining) | | | 11 | |
| | 456 | | | Mitsubishi UFJ Lease & Finance Co. Ltd. (Diversified Financial Services) | | | 3 | |
| | 6,525 | | | Mitsui & Co. Ltd. (Trading Companies & Distributors) | | | 109 | |
| | 700 | | | Mitsui Chemicals, Inc. (Chemicals) | | | 19 | |
| | 35,731 | | | Mizuho Financial Group, Inc. (Banks) | | | 60 | |
| | 630 | | | MS&AD Insurance Group Holdings, Inc. (Insurance) | | | 20 | |
| | 930 | | | NEC Corp. (Technology Hardware, Storage & Peripherals) | | | 26 | |
| | 1,000 | | | NGK Insulators Ltd. (Machinery) | | | 18 | |
| | 402 | | | Nippon Electric Glass Co. Ltd. (Electronic Equipment, Instruments & Components) | | | 11 | |
| | 4 | | | Nippon Prologis REIT, Inc. (Equity Real Estate Investment Trusts) | | | 8 | |
| | 2,900 | | | Nippon Steel & Sumitomo Metal Corp. (Metals & Mining) | | | 57 | |
| | 1,231 | | | Nippon Telegraph & Telephone Corp. (Diversified Telecommunication Services) | | | 56 | |
| | 210 | | | Nomura Real Estate Holdings, Inc. (Real Estate Management & Development) | | | 5 | |
| | 500 | | | Nomura Research Institute Ltd. (IT Services) | | | 24 | |
| | 2,300 | | | NTT Data Corp. (IT Services) | | | 27 | |
| | 2,666 | | | NTT DoCoMo, Inc. (Wireless Telecommunication Services) | | | 68 | |
| | 2,500 | | | Obayashi Corp. (Construction & Engineering) | | | 26 | |
| | 800 | | | OMRON Corp. (Electronic Equipment, Instruments & Components) | | | 37 | |
| | 1,261 | | | ORIX Corp. (Diversified Financial Services) | | | 20 | |
| | 702 | | | Osaka Gas Co. Ltd. (Gas Utilities) | | | 15 | |
| | 1,540 | | | Otsuka Holdings Co. Ltd. (Pharmaceuticals) | | | 75 | |
| | 400 | | | Park24 Co. Ltd. (Commercial Services & Supplies) | | | 11 | |
| | 3,130 | | | Resona Holdings, Inc. (Banks) | | | 17 | |
| | 200 | | | Sankyo Co. Ltd. (Leisure Products) | | | 8 | |
| | 700 | | | Sega Sammy Holdings, Inc. (Leisure Products) | | | 12 | |
| | | | | | | | |
| Shares | | | Security Description | | Value
(000) | |
| | | | Japan (continued) | |
| | 1,045 | | | Seiko Epson Corp. (Technology Hardware, Storage & Peripherals) | | $ | 18 | |
| | 2,310 | | | Sekisui House Ltd. (Household Durables) | | | 41 | |
| | 2,800 | | | Seven & I Holdings Co. Ltd. (Food & Staples Retailing) | | | 122 | |
| | 816 | | | Showa Shell Sekiyu KK (Oil, Gas & Consumable Fuels) | | | 12 | |
| | 500 | | | Sompo Japan Nipponkoa Holdings, Inc. (Insurance) | | | 20 | |
| | 4,477 | | | Sumitomo Corp. (Trading Companies & Distributors) | | | 74 | |
| | 1,900 | | | Sumitomo Mitsui Financial Group, Inc. (Banks) | | | 74 | |
| | 523 | | | Sumitomo Mitsui Trust Holdings, Inc. (Banks) | | | 21 | |
| | 600 | | | Sumitomo Rubber Industries Ltd. (Auto Components) | | | 10 | |
| | 862 | | | T&D Holdings, Inc. (Insurance) | | | 13 | |
| | 700 | | | Teijin Ltd. (Chemicals) | | | 13 | |
| | 500 | | | The Chugoku Electric Power Company, Inc. (Electric Utilities) | | | 6 | |
| | 1,486 | | | The Dai-ichi Life Insurance Co. Ltd. (Insurance) | | | 27 | |
| | 1,020 | | | The Shizuoka Bank Ltd. (Banks) | | | 9 | |
| | 1,043 | | | Tokio Marine Holdings, Inc. (Insurance) | | | 48 | |
| | 600 | | | Tokyo Electron Ltd. (Semiconductors & Semiconductor Equipment) | | | 103 | |
| | 800 | | | Tokyo Gas Co. Ltd. (Gas Utilities) | | | 21 | |
| | 2,000 | | | Toppan Printing Co. Ltd. (Commercial Services & Supplies) | | | 16 | |
| | 300 | | | Toyoda Gosei Co. Ltd. (Auto Components) | | | 8 | |
| | 4,280 | | | Toyota Motor Corp. (Automobiles) | | | 277 | |
| | 812 | | | Toyota Tsusho Corp. (Trading Companies & Distributors) | | | 27 | |
| | 825 | | | USS Co. Ltd. (Specialty Retail) | | | 16 | |
| | 2,300 | | | Yamada Denki Co. Ltd. (Specialty Retail) | | | 11 | |
| | 1,229 | | | Yamaha Motor Co. Ltd. (Automobiles) | | | 31 | |
| | 900 | | | Yokogawa Electric Corp. (Electronic Equipment, Instruments & Components) | | | 16 | |
| | | | | | | | |
| | | | | | | 3,762 | |
| | | | | | | | |
| | | | Jersey — 0.42% | |
| | 7,837 | | | WPP PLC (Media) | | | 123 | |
| | | | | | | | |
| | | | Luxembourg — 0.12% | |
| | 179 | | | Millicom International Cellular SA (Wireless Telecommunication Services) | | | 11 | |
| | 1,386 | | | SES – FDR, Class – A (Media) | | | 25 | |
| | | | | | | | |
| | | | | | | 36 | |
| | | | | | | | |
| | | | Netherlands — 1.40% | |
| | 364 | | | ABN AMRO Group N.V. (Banks) | | | 9 | |
| | 1,467 | | | AEGON N.V. (Insurance) | | | 9 | |
| | 56 | | | Franks International N.V. (Energy Equipment & Services) | | | — | |
| | 3,284 | | | ING Groep N.V. (Banks) | | | 48 | |
| | 3,826 | | | Koninklijke (Royal) KPN N.V. (Diversified Telecommunication Services) | | | 10 | |
| | 2,824 | | | Koninklijke Ahold Delhaize N.V. (Food & Staples Retailing) | | | 68 | |
| | 207 | | | Koninklijke Boskalis Westminster N.V. (Construction & Engineering) | | | 6 | |
See accompanying notes to financial statements.
134
HC CAPITAL TRUST
The Catholic SRI Growth Portfolio
Portfolio of Investments (continued) — June 30, 2018
| | | | | | | | |
| Shares | | | Security Description | | Value
(000) | |
| | | | Common Stocks (continued) | | | | |
| | | | Netherlands (continued) | |
| | 2,098 | | | Koninklijke Philips Electronics N.V. (Industrial Conglomerates) | | $ | 89 | |
| | 157 | | | Koninklijke Vopak N.V. (Oil, Gas & Consumable Fuels) | | | 7 | |
| | 264 | | | NN Group N.V. (Insurance) | | | 11 | |
| | 265 | | | Randstad Holding N.V. (Professional Services) | | | 16 | |
| | 2,499 | | | Unilever N.V. (Personal Products) | | | 139 | |
| | | | | | | | |
| | | | | | | 412 | |
| | | | | | | | |
| | | | New Zealand — 0.09% | |
| | 2,361 | | | Fletcher Building Ltd. (Construction Materials) | | | 11 | |
| | 1,818 | | | Meridian Energy Ltd. (Independent Power & Renewable Electricity Producers) | | | 4 | |
| | 4,312 | | | Telecom Corporation of New Zealand Ltd. (Diversified Telecommunication Services) | | | 11 | |
| | | | | | | | |
| | | | | | | 26 | |
| | | | | | | | |
| | | | Norway — 0.47% | |
| | 3,332 | | | Equinor ASA (Oil, Gas & Consumable Fuels) | | | 88 | |
| | 245 | | | Gjensidige Forsikring ASA (Insurance) | | | 4 | |
| | 1,239 | | | Marine Harvest ASA (Food Products) | | | 25 | |
| | 1,073 | | | Telenor ASA (Diversified Telecommunication Services) | | | 22 | |
| | | | | | | | |
| | | | | | | 139 | |
| | | | | | | | |
| | | | Portugal — 0.15% | |
| | 11,158 | | | EDP – Energias de Portugal SA (Electric Utilities) | | | 44 | |
| | | | | | | | |
| | | | Singapore — 0.82% | |
| | 15,182 | | | Ascendas Real Estate Investment Trust (Equity Real Estate Investment Trusts) | | | 29 | |
| | 15,327 | | | CapitaCommercial Trust (Equity Real Estate Investment Trusts) | | | 19 | |
| | 15,175 | | | CapitaMall Trust (Equity Real Estate Investment Trusts) | | | 23 | |
| | 5,200 | | | SATS Ltd. (Transportation Infrastructure) | | | 19 | |
| | 2,500 | | | Singapore Exchange Ltd. (Capital Markets) | | | 13 | |
| | 11,643 | | | Singapore Press Holdings Ltd. (Media) | | | 22 | |
| | 51,209 | | | Singapore Telecommunications Ltd. (Diversified Telecommunication Services) | | | 116 | |
| | | | | | | | |
| | | | | | | 241 | |
| | | | | | | | |
| | | | Spain — 1.41% | |
| | 2,402 | | | Abertis Infraestructuras SA (Transportation Infrastructure) | | | 52 | |
| | 8,644 | | | Banco Bilbao Vizcaya Argentaria SA (Banks) | | | 61 | |
| | 1,350 | | | Corporacion Mapfre (Insurance) | | | 4 | |
| | 801 | | | Enagas (Oil, Gas & Consumable Fuels) | | | 23 | |
| | 567 | | | Endesa (Electric Utilities) | | | 13 | |
| | 614 | | | Gas Natural SDG SA (Gas Utilities) | | | 16 | |
| | 10,213 | | | Iberdrola SA (Electric Utilities) | | | 78 | |
| | 768 | | | Red Electrica Corp. (Electric Utilities) | | | 16 | |
| | 4,341 | | | Repsol YPF SA (Oil, Gas & Consumable Fuels) | | | 86 | |
| | 7,884 | | | Telefonica SA (Diversified Telecommunication Services) | | | 67 | |
| | | | | | | | |
| | | | | | | 416 | |
| | | | | | | | |
| | | | | | | | |
| Shares | | | Security Description | | Value
(000) | |
| | | | Sweden — 1.57% | |
| | 5,230 | | | Hennes & Mauritz AB, B Shares (Specialty Retail) | | $ | 78 | |
| | 441 | | | ICA Gruppen AB (Food & Staples Retailing) | | | 14 | |
| | 6,076 | | | Nordea Bank AB (Banks) | | | 58 | |
| | 3,040 | | | Skandinaviska Enskilda Banken AB, Class – A (Banks) | | | 29 | |
| | 1,854 | | | Skanska AB, B Shares (Construction & Engineering) | | | 34 | |
| | 3,140 | | | Svenska Handelsbanken AB, A Shares (Banks) | | | 35 | |
| | 1,825 | | | Swedbank AB, A Shares (Banks) | | | 39 | |
| | 978 | | | Tele2 AB, B Shares (Wireless Telecommunication Services) | | | 12 | |
| | 16,846 | | | Telefonaktiebolaget LM Ericsson, B Shares (Communications Equipment) | | | 130 | |
| | 7,522 | | | TeliaSonera AB (Diversified Telecommunication Services) | | | 34 | |
| | | | | | | | |
| | | | | | | 463 | |
| | | | | | | | |
| | | | Switzerland — 4.52% | |
| | 14,199 | | | ABB Ltd., Registered Shares (Electrical Equipment) | | | 311 | |
| | 2,064 | | | Adecco SA, Registered Shares (Professional Services) | | | 122 | |
| | 264 | | | Garmin Ltd. (Household Durables) | | | 16 | |
| | 382 | | | Kuehne & Nagel International Ltd. (Marine) | | | 58 | |
| | 4,037 | | | LafargeHolcim Ltd., Registered Shares (Construction Materials) | | | 197 | |
| | 40 | | | SGS SA, Registered Shares (Professional Services) | | | 107 | |
| | 304 | | | Swiss Prime Site AG (Real Estate Management & Development) | | | 28 | |
| | 1,269 | | | Swiss Re AG (Insurance) | | | 110 | |
| | 132 | | | Swisscom AG (Diversified Telecommunication Services) | | | 59 | |
| | 9,406 | | | UBS Group AG (Capital Markets) | | | 146 | |
| | 589 | | | Zurich Financial Services AG (Insurance) | | | 175 | |
| | | | | | | | |
| | | | | | | 1,329 | |
| | | | | | | | |
| | | | United Kingdom — 10.01% | |
| | 726 | | | Aon PLC (Insurance) | | | 99 | |
| | 9,570 | | | Aviva PLC (Insurance) | | | 64 | |
| | 6,625 | | | Barratt Developments PLC (Household Durables) | | | 45 | |
| | 14,591 | | | BHP Billiton PLC (Metals & Mining) | | | 328 | |
| | 969 | | | British American Tobacco PLC, ADR (Tobacco) | | | 49 | |
| | 3,182 | | | British Land Co. PLC (Equity Real Estate Investment Trusts) | | | 28 | |
| | 27,588 | | | BT Group PLC (Diversified Telecommunication Services) | | | 79 | |
| | 4,086 | | | Capita PLC (Professional Services) | | | 9 | |
| | 18,698 | | | Centrica PLC (Multi-Utilities) | | | 39 | |
| | 3,685 | | | Direct Line Insurance Group PLC (Insurance) | | | 17 | |
| | 2,658 | | | Hammerson PLC (Equity Real Estate Investment Trusts) | | | 18 | |
| | 4,264 | | | Imperial Tobacco Group PLC (Tobacco) | | | 159 | |
| | 1,071 | | | Investec PLC (Capital Markets) | | | 8 | |
| | 34,435 | | | ITV PLC (Media) | | | 79 | |
| | 13,130 | | | J Sainsbury PLC (Food & Staples Retailing) | | | 56 | |
See accompanying notes to financial statements.
135
HC CAPITAL TRUST
The Catholic SRI Growth Portfolio
Portfolio of Investments (continued) — June 30, 2018
| | | | | | | | |
| Shares | | | Security Description | | Value
(000) | |
| | | | Common Stocks (continued) | | | | |
| | | | United Kingdom (continued) | |
| | 2,405 | | | Land Securities Group PLC (Equity Real Estate Investment Trusts) | | $ | 31 | |
| | 15,930 | | | Legal & General Group PLC (Insurance) | | | 56 | |
| | 10,108 | | | Marks & Spencer Group PLC (Multiline Retail) | | | 39 | |
| | 11,596 | | | National Grid PLC (Multi-Utilities) | | | 128 | |
| | 945 | | | Next PLC (Multiline Retail) | | | 76 | |
| | 9,269 | | | Pearson PLC (Media) | | | 108 | |
| | 2,471 | | | Persimmon PLC (Household Durables) | | | 83 | |
| | 7,379 | | | Rio Tinto PLC (Metals & Mining) | | | 408 | |
| | 6,095 | | | Royal Dutch Shell PLC, A Shares (Oil, Gas & Consumable Fuels) | | | 211 | |
| | 5,863 | | | Royal Dutch Shell PLC, B Shares (Oil, Gas & Consumable Fuels) | | | 210 | |
| | 7,967 | | | Royal Mail PLC (Air Freight & Logistics) | | | 53 | |
| | 759 | | | Severn Trent PLC (Water Utilities) | | | 20 | |
| | 3,328 | | | SSE PLC (Electric Utilities) | | | 60 | |
| | 8,605 | | | Standard Life PLC (Insurance) | | | 37 | |
| | 21,474 | | | Taylor Wimpey PLC (Household Durables) | | | 51 | |
| | 509 | | | TechnipFMC PLC (Energy Equipment & Services) | | | 16 | |
| | 906 | | | The Berkeley Group Holdings PLC (Household Durables) | | | 45 | |
| | 2,161 | | | United Utilities Group PLC (Water Utilities) | | | 22 | |
| | 87,629 | | | Vodafone Group PLC (Wireless Telecommunication Services) | | | 213 | |
| | | | | | | | |
| | | | | | | 2,944 | |
| | | | | | | | |
| | | | United States — 46.82% | |
| | 1,445 | | | 3M Co. (Industrial Conglomerates) | | | 284 | |
| | 133 | | | Aaron’s, Inc. (Specialty Retail) | | | 6 | |
| | 1,465 | | | Accenture PLC, Class – A (IT Services) | | | 240 | |
| | 151 | | | Advance Auto Parts, Inc. (Specialty Retail) | | | 20 | |
| | 551 | | | Air Products & Chemicals, Inc. (Chemicals) | | | 86 | |
| | 395 | | | Akamai Technologies, Inc. (Internet Software & Services) (a) | | | 29 | |
| | 196 | | | Align Technology, Inc. (Health Care Equipment & Supplies) (a) | | | 67 | |
| | 311 | | | Alphabet, Inc., Class – A (Internet Software & Services) (a) | | | 351 | |
| | 1,231 | | | American Electric Power, Inc. (Electric Utilities) | | | 85 | |
| | 1,659 | | | Amgen, Inc. (Biotechnology) | | | 306 | |
| | 732 | | | Amphenol Corp., Class – A (Electronic Equipment, Instruments & Components) | | | 63 | |
| | 903 | | | Analog Devices, Inc. (Semiconductors & Semiconductor Equipment) | | | 87 | |
| | 194 | | | ANSYS, Inc. (Software) (a) | | | 34 | |
| | 643 | | | Anthem, Inc. (Health Care Providers & Services) | | | 152 | |
| | 177 | | | Apergy Corp. (Energy Equipment &
Services) (a) | | | 7 | |
| | 1,978 | | | Apple, Inc. (Technology Hardware, Storage & Peripherals) | | | 366 | |
| | 342 | | | Aqua America, Inc. (Water Utilities) | | | 12 | |
| | 68 | | | Arista Networks, Inc. (Communications Equipment) (a) | | | 18 | |
| | 374 | | | Arthur J. Gallagher & Co. (Insurance) | | | 24 | |
| | 1,129 | | | Automatic Data Processing, Inc. (IT Services) | | | 151 | |
| | | | | | | | |
| Shares | | | Security Description | | Value
(000) | |
| | | | United States (continued) | |
| | 82 | | | AutoZone, Inc. (Specialty Retail) (a) | | $ | 56 | |
| | 305 | | | Avnet, Inc. (Electronic Equipment, Instruments & Components) | | | 13 | |
| | 85 | | | Bank of Hawaii Corp. (Banks) | | | 7 | |
| | 537 | | | Becton, Dickinson & Co. (Health Care Equipment & Supplies) | | | 129 | |
| | 388 | | | Bed Bath & Beyond, Inc. (Specialty Retail) | | | 8 | |
| | 181 | | | Bemis Company, Inc. (Containers & Packaging) | | | 8 | |
| | 729 | | | Best Buy Co., Inc. (Specialty Retail) | | | 54 | |
| | 79 | | | Bio-Techne Corp. (Life Sciences Tools & Services) | | | 12 | |
| | 274 | | | Broadridge Financial Solutions, Inc. (IT Services) | | | 32 | |
| | 446 | | | Brown & Brown, Inc. (Insurance) | | | 12 | |
| | 310 | | | C.H. Robinson Worldwide, Inc. (Air Freight & Logistics) | | | 26 | |
| | 360 | | | Campbell Soup Co. (Food Products) | | | 15 | |
| | 791 | | | Cardinal Health, Inc. (Health Care Providers & Services) | | | 39 | |
| | 144 | | | Carlisle Companies, Inc. (Industrial Conglomerates) | | | 16 | |
| | 101 | | | Carter’s, Inc. (Textiles, Apparel & Luxury Goods) | | | 11 | |
| | 353 | | | CDK Global, Inc. (Software) | | | 23 | |
| | 696 | | | Cerner Corp. (Health Care Technology) (a) | | | 42 | |
| | 65 | | | Chipotle Mexican Grill, Inc. (Hotels, Restaurants & Leisure) (a) | | | 28 | |
| | 68 | | | Choice Hotels International, Inc. (Hotels, Restaurants & Leisure) | | | 5 | |
| | 221 | | | Cintas Corp. (Commercial Services & Supplies) | | | 41 | |
| | 7,845 | | | Cisco Systems, Inc. (Communications Equipment) | | | 337 | |
| | 697 | | | Citizens Financial Group, Inc. (Banks) | | | 27 | |
| | 341 | | | Citrix Systems, Inc. (Software) (a) | | | 36 | |
| | 762 | | | CME Group, Inc. (Capital Markets) | | | 125 | |
| | 1,496 | | | Cognizant Technology Solutions Corp. (IT Services) | | | 118 | |
| | 2,136 | | | Colgate-Palmolive Co. (Household Products) | | | 138 | |
| | 182 | | | Commerce Bancshares, Inc. (Banks) | | | 12 | |
| | 554 | | | Copart, Inc. (Commercial Services &
Supplies) (a) | | | 31 | |
| | 143 | | | Crane Co. (Machinery) | | | 11 | |
| | 2,348 | | | CSX Corp. (Road & Rail) | | | 150 | |
| | 177 | | | Cullen/Frost Bankers, Inc. (Banks) | | | 19 | |
| | 463 | | | Cummins, Inc. (Machinery) | | | 62 | |
| | 375 | | | DaVita Healthcare Partners, Inc. (Health Care Providers & Services) (a) | | | 26 | |
| | 534 | | | Dentsply Sirona, Inc. (Health Care Equipment & Supplies) | | | 23 | |
| | 172 | | | Dick’s Sporting Goods, Inc. (Specialty Retail) | | | 6 | |
| | 216 | | | Discovery Communications, Inc., Class – C (Media) (a) | | | 6 | |
| | 143 | | | Dolby Laboratories, Inc., Class – A (Electronic Equipment, Instruments & Components) | | | 9 | |
| | 557 | | | Dollar Tree, Inc. (Multiline Retail) (a) | | | 47 | |
| | 260 | | | Donaldson Company, Inc. (Machinery) | | | 12 | |
| | 355 | | | Dover Corp. (Machinery) | | | 26 | |
See accompanying notes to financial statements.
136
HC CAPITAL TRUST
The Catholic SRI Growth Portfolio
Portfolio of Investments (continued) — June 30, 2018
| | | | | | | | |
| Shares | | | Security Description | | Value
(000) | |
| | | | Common Stocks (continued) | | | | |
| | | | United States (continued) | |
| | 451 | | | Dr. Pepper Snapple Group, Inc. (Beverages) | | $ | 55 | |
| | 72 | | | Dril-Quip, Inc. (Energy Equipment &
Services) (a) | | | 4 | |
| | 219 | | | Eaton Vance Corp. (Capital Markets) | | | 11 | |
| | 680 | | | Ecolab, Inc. (Chemicals) | | | 95 | |
| | 524 | | | Edwards Lifesciences Corp. (Health Care Equipment & Supplies) (a) | | | 76 | |
| | 423 | | | Expeditors International of Washington, Inc. (Air Freight & Logistics) | | | 31 | |
| | 1,604 | | | Express Scripts Holding Co. (Health Care Providers & Services) (a) | | | 124 | |
| | 3,218 | | | Exxon Mobil Corp. (Oil, Gas & Consumable Fuels) | | | 266 | |
| | 167 | | | F5 Networks, Inc. (Communications
Equipment) (a) | | | 28 | |
| | 90 | | | FactSet Research Systems, Inc. (Capital Markets) | | | 18 | |
| | 610 | | | Fastenal Co. (Trading Companies & Distributors) | | | 29 | |
| | 345 | | | First Republic Bank (Banks) | | | 34 | |
| | 1,231 | | | Fiserv, Inc. (IT Services) (a) | | | 91 | |
| | 218 | | | FleetCor Technologies, Inc. (IT Services) (a) | | | 46 | |
| | 306 | | | Fluor Corp. (Construction & Engineering) | | | 15 | |
| | 139 | | | Fossil Group, Inc. (Textiles, Apparel & Luxury Goods) (a) | | | 4 | |
| | 876 | | | Franklin Resources, Inc. (Capital Markets) | | | 28 | |
| | 210 | | | GameStop Corp., Class – A (Specialty Retail) | | | 3 | |
| | 452 | | | Gap, Inc. (Specialty Retail) | | | 15 | |
| | 1,494 | | | General Mills, Inc. (Food Products) | | | 66 | |
| | 104 | | | Genesee & Wyoming, Inc., Class – A (Road & Rail) (a) | | | 8 | |
| | 349 | | | Genuine Parts Co. (Distributors) | | | 32 | |
| | 2,142 | | | Halliburton Co. (Energy Equipment & Services) | | | 97 | |
| | 373 | | | Henry Schein, Inc. (Health Care Providers & Services) (a) | | | 27 | |
| | 336 | | | Hershey Co. (Food Products) | | | 31 | |
| | 181 | | | Hexcel Corp. (Aerospace & Defense) | | | 12 | |
| | 599 | | | Hormel Foods Corp. (Food Products) | | | 22 | |
| | 134 | | | Hubbell, Inc. (Electrical Equipment) | | | 14 | |
| | 172 | | | IDEX Corp. (Machinery) | | | 23 | |
| | 220 | | | IDEXX Laboratories, Inc. (Health Care Equipment & Supplies) (a) | | | 48 | |
| | 720 | | | Illinois Tool Works, Inc. (Machinery) | | | 99 | |
| | 7,245 | | | Intel Corp. (Semiconductors & Semiconductor Equipment) | | | 361 | |
| | 1,709 | | | International Business Machines Corp. (IT Services) | | | 239 | |
| | 173 | | | International Flavors & Fragrances, Inc. (Chemicals) | | | 21 | |
| | 657 | | | Intuit, Inc. (Software) | | | 134 | |
| | 68 | | | IPG Photonics Corp. (Electronic Equipment, Instruments & Components) (a) | | | 15 | |
| | 185 | | | Jack Henry & Associates, Inc. (IT Services) | | | 24 | |
| | 283 | | | Jacobs Engineering Group, Inc. (Construction & Engineering) | | | 18 | |
| | 92 | | | John Wiley & Sons, Inc., Class – A (Media) | | | 6 | |
| | 946 | | | Kimberly-Clark Corp. (Household Products) | | | 100 | |
| | | | | | | | |
| Shares | | | Security Description | | Value
(000) | |
| | | | United States (continued) | |
| | 426 | | | Kohl’s Corp. (Multiline Retail) | | $ | 31 | |
| | 229 | | | Laboratory Corporation of America Holdings (Health Care Providers & Services) (a) | | | 41 | |
| | 87 | | | Landstar System, Inc. (Road & Rail) | | | 10 | |
| | 172 | | | Lincoln Electric Holdings, Inc. (Machinery) | | | 15 | |
| | 646 | | | LKQ Corp. (Distributors) (a) | | | 21 | |
| | 49 | | | LogMeln, Inc. (Internet Software & Services) | | | 5 | |
| | 245 | | | Lululemon Athletica, Inc. (Textiles, Apparel & Luxury Goods) (a) | | | 31 | |
| | 97 | | | Lumentum Holdings, Inc. (Communications Equipment) (a) | | | 6 | |
| | 1,361 | | | Marsh & McLennan Companies, Inc. (Insurance) | | | 112 | |
| | 2,000 | | | MasterCard, Inc., Class – A (IT Services) | | | 394 | |
| | 265 | | | McCormick & Company, Inc. (Food Products) | | | 31 | |
| | 2,018 | | | McDonald’s Corp. (Hotels, Restaurants & Leisure) | | | 317 | |
| | 596 | | | McKesson Corp. (Health Care Providers & Services) | | | 80 | |
| | 205 | | | MEDNAX, Inc. (Health Care Providers & Services) (a) | | | 9 | |
| | 63 | | | Mettler-Toledo International, Inc. (Life Sciences Tools & Services) (a) | | | 36 | |
| | 3,729 | | | Microsoft Corp. (Software) | | | 368 | |
| | 365 | | | Molson Coors Brewing Co., Class – B (Beverages) | | | 25 | |
| | 37 | | | Morningstar, Inc. (Capital Markets) | | | 5 | |
| | 90 | | | MSC Industrial Direct Co., Inc., Class – A (Trading Companies & Distributors) | | | 8 | |
| | 158 | | | National Fuel Gas Co. (Gas Utilities) | | | 8 | |
| | 209 | | | National Instruments Corp. (Electronic Equipment, Instruments & Components) | | | 9 | |
| | 871 | | | National Oilwell Varco, Inc. (Energy Equipment & Services) | | | 38 | |
| | 3,146 | | | NIKE, Inc., Class – B (Textiles, Apparel & Luxury Goods) | | | 250 | |
| | 291 | | | Nordstrom, Inc. (Multiline Retail) | | | 15 | |
| | 782 | | | Norfolk Southern Corp. (Road & Rail) | | | 118 | |
| | 1,849 | | | Occidental Petroleum Corp. (Oil, Gas & Consumable Fuels) | | | 155 | |
| | 264 | | | Oceaneering International, Inc. (Energy Equipment & Services) | | | 7 | |
| | 150 | | | Old Dominion Freight Line, Inc. (Road & Rail) | | | 22 | |
| | 6,398 | | | Oracle Corp. (Software) | | | 282 | |
| | 159 | | | Patterson Companies, Inc. (Health Care Providers & Services) | | | 4 | |
| | 758 | | | Paychex, Inc. (IT Services) | | | 52 | |
| | 2,871 | | | PayPal Holdings, Inc. (IT Services) (a) | | | 239 | |
| | 2,659 | | | PepsiCo, Inc. (Beverages) | | | 290 | |
| | 1,320 | | | Phillips 66 (Oil, Gas & Consumable Fuels) | | | 148 | |
| | 127 | | | Polaris Industries, Inc. (Leisure Products) | | | 16 | |
| | 729 | | | Praxair, Inc. (Chemicals) | | | 116 | |
| | 320 | | | Quest Diagnostics, Inc. (Health Care Providers & Services) | | | 35 | |
| | 424 | | | Red Hat, Inc. (Software) (a) | | | 57 | |
| | 311 | | | ResMed, Inc. (Health Care Equipment & Supplies) | | | 32 | |
| | 310 | | | Robert Half International, Inc. (Professional Services) | | | 20 | |
See accompanying notes to financial statements.
137
HC CAPITAL TRUST
The Catholic SRI Growth Portfolio
Portfolio of Investments (continued) — June 30, 2018
| | | | | | | | |
| Shares | | | Security Description | | Value
(000) | |
| | | | Common Stocks (continued) | | | | |
| | | | United States (continued) | |
| | 194 | | | Rollins, Inc. (Commercial Services & Supplies) | | $ | 10 | |
| | 248 | | | Roper Industries, Inc. (Industrial Conglomerates) | | | 68 | |
| | 1,006 | | | Ross Stores, Inc. (Specialty Retail) | | | 86 | |
| | 652 | | | S&P Global, Inc. (Capital Markets) | | | 132 | |
| | 312 | | | SCANA Corp. (Multi-Utilities) | | | 12 | |
| | 2,942 | | | Schlumberger Ltd. (Energy Equipment & Services) | | | 196 | |
| | 135 | | | Snap-on, Inc. (Machinery) | | | 22 | |
| | 199 | | | Sonoco Products Co. (Containers & Packaging) | | | 10 | |
| | 142 | | | Spirit Airlines, Inc. (Airlines) (a) | | | 5 | |
| | 286 | | | Sprouts Farmers Market, Inc. (Food & Staples Retailing) (a) | | | 6 | |
| | 355 | | | Stanley Black & Decker, Inc. (Machinery) | | | 47 | |
| | 3,486 | | | Starbucks Corp. (Hotels, Restaurants & Leisure) | | | 170 | |
| | 1,510 | | | Sysco Corp. (Food & Staples Retailing) | | | 103 | |
| | 644 | | | T. Rowe Price Group, Inc. (Capital Markets) | | | 75 | |
| | 576 | | | Tapestry, Inc. (Textiles, Apparel & Luxury Goods) | | | 27 | |
| | 596 | | | TD Ameritrade Holding Corp. (Capital Markets) | | | 33 | |
| | 352 | | | Teradata Corp. (IT Services) (a) | | | 14 | |
| | 2,405 | | | Texas Instruments, Inc. (Semiconductors & Semiconductor Equipment) | | | 265 | |
| | 311 | | | The Clorox Co. (Household Products) | | | 42 | |
| | 6,212 | | | The Coca-Cola Co. (Beverages) | | | 272 | |
| | 67 | | | The Dun & Bradstreet Corp. (Professional Services) | | | 8 | |
| | 280 | | | The J.M. Smucker Co. (Food Products) | | | 30 | |
| | 1,522 | | | The Kraft Heinz Co. (Food Products) | | | 96 | |
| | 2,452 | | | The Kroger Co. (Food & Staples Retailing) | | | 70 | |
| | 34 | | | The Madison Square Garden Co., Class – A (Media) (a) | | | 11 | |
| | 132 | | | The Middleby Corp. (Machinery) (a) | | | 14 | |
| | 203 | | | The Sherwin-Williams Co. (Chemicals) | | | 83 | |
| | 2,358 | | | The Southern Co. (Electric Utilities) | | | 110 | |
| | 260 | | | The Toro Co. (Machinery) | | | 16 | |
| | 2,701 | | | The Walt Disney Co. (Media) | | | 282 | |
| | 254 | | | Tiffany & Co. (Specialty Retail) | | | 33 | |
| | 290 | | | Tractor Supply Co. (Specialty Retail) | | | 22 | |
| | 164 | | | Ulta Salon, Cosmetics & Fragrance, Inc. (Specialty Retail) (a) | | | 38 | |
| | 339 | | | Under Armour, Inc., Class – A (Textiles, Apparel & Luxury Goods) (a) | | | 8 | |
| | 341 | | | Under Armour, Inc., Class – C (Textiles, Apparel & Luxury Goods) (a) | | | 7 | |
| | 2,023 | | | Union Pacific Corp. (Road & Rail) | | | 287 | |
| | 791 | | | V.F. Corp. (Textiles, Apparel & Luxury Goods) | | | 64 | |
| | 76 | | | Varex Imaging Corp. (Health Care Equipment & Supplies) (a) | | | 3 | |
| | | | | | | | |
| Shares | | | Security Description | | Value
(000) | |
| | | | United States (continued) | |
| | 225 | | | Varian Medical Systems, Inc. (Health Care Equipment & Supplies) (a) | | $ | 26 | |
| | 196 | | | Versum Materials, Inc. (Semiconductors & Semiconductor Equipment) | | | 7 | |
| | 2,856 | | | Visa, Inc., Class – A (IT Services) | | | 379 | |
| | 188 | | | VMware, Inc., Class – A (Software) (a) | | | 28 | |
| | 134 | | | W.W. Grainger, Inc. (Trading Companies & Distributors) | | | 41 | |
| | 213 | | | Wabtec Corp. (Machinery) | | | 21 | |
| | 3,654 | | | Wal-Mart Stores, Inc. (Food & Staples Retailing) | | | 313 | |
| | 181 | | | Waters Corp. (Life Sciences Tools &
Services) (a) | | | 35 | |
| | 1,155 | | | Western Union Co. (IT Services) | | | 23 | |
| | 169 | | | Williams-Sonoma, Inc. (Specialty Retail) | | | 10 | |
| | 157 | | | World Fuel Services Corp. (Oil, Gas & Consumable Fuels) | | | 3 | |
| | 1,206 | | | Xcel Energy, Inc. (Electric Utilities) | | | 55 | |
| | 574 | | | Xilinx, Inc. (Semiconductors & Semiconductor Equipment) | | | 37 | |
| | | | | | | | |
| | | | | | | 13,769 | |
| | | | | | | | |
| | | | Total Common Stocks | | | 28,933 | |
| | | | | | | | |
| | | | Preferred Stock — 0.03% | | | | |
| | | | Germany — 0.03% | |
| | 115 | | | Bayerische Motoren Werke
Aktiengesellschaft – Preferred (Automobiles) | | | 9 | |
| | | | | | | | |
| | | | Total Preferred Stock | | | 9 | |
| | | | | | | | |
| | | | Right — 0.00% | | | | |
| | | | Italy — 0.00% | |
| | 10,702 | | | Intesa Sanpaolo SpA (Banks) (a) | | | — | |
| | | | | | | | |
| | | | Total Right | | | — | |
| | | | | | | | |
| | | | Mutual Fund — 0.44% | | | | |
| | 129,845 | | | State Street Institutional Treasury Plus Money Market Fund, Trust Class, 1.72% (b) | | | 130 | |
| | | | | | | | |
| | | | Total Mutual Fund | | | 130 | |
| | | | | | | | |
| | | | Total Investments
(cost $23,982) — 98.84% | | | 29,072 | |
| | | | Other assets in excess of liabilities — 1.16% | | | 342 | |
| | | | | | | | |
| | | | Net Assets — 100.00% | | $ | 29,414 | |
| | | | | | | | |
| Amounts designated as “—” are $0 or have been rounded to $0. | |
| (a) | Represents non-income producing security. |
| (b) | The rate disclosed is the rate in effect on June 30, 2018. |
ADR — American Depositary Receipt
FDR — Fiduciary Depositary Receipt
REIT — Real Estate Investment Trust
See accompanying notes to financial statements.
138
HC CAPITAL TRUST
The Catholic SRI Growth Portfolio
Portfolio of Investments (concluded) — June 30, 2018
The following table reflects the percentage of total net assets of the Portfolio attributable to each Specialist Manager as of June 30, 2018.
| | | | | | | | | | | | |
The Catholic SRI Growth Portfolio | | Cadence Capital
Management, LLC | | | BNY Mellon Asset
Management North
America Corporation* | | | Total | |
Common Stocks | | | 50.71 | % | | | 47.66 | % | | | 98.37 | % |
Preferred Stock | | | 0.03 | % | | | — | | | | 0.03 | % |
Right | | | 0.00 | % | | | — | | | | 0.00 | % |
Mutual Fund | | | 0.01 | % | | | 0.43 | % | | | 0.44 | % |
Other Assets (Liabilities) | | | 1.22 | % | | | -0.06 | % | | | 1.16 | % |
| | | | | | | | | | | | |
Total Net Assets | | | 51.97 | % | | | 48.03 | % | | | 100.00 | % |
| | | | | | | | | | | | |
| * | Formerly Mellon Capital Management Corporation. |
Amounts designated as “—” indicate the Specialist Manager did not manage any holdings in that category.
See accompanying notes to portfolio of investments.
139
HC CAPITAL TRUST
The International Equity Portfolio
Portfolio of Investments — June 30, 2018
| | | | | | | | |
| Shares | | | Security Description | | Value
(000) | |
| | | | Common Stocks — 86.92% | | | | |
| | | | Australia — 2.62% | |
| | 106,043 | | | APA Group (Gas Utilities) | | $ | 773 | |
| | 351,197 | | | Aurizon Holdings Ltd. (Road & Rail) | | | 1,125 | |
| | 173,190 | | | AusNet Services (Electric Utilities) | | | 206 | |
| | 207,407 | | | Australia & New Zealand Banking Group Ltd. (Banks) | | | 4,333 | |
| | 27,850 | | | Bank of Queensland Ltd. (Banks) | | | 210 | |
| | 34,426 | | | Bendigo & Adelaide Bank Ltd. (Banks) | | | 276 | |
| | 107,550 | | | Coca-Cola Amatil Ltd. (Beverages) | | | 732 | |
| | 71,102 | | | Commonwealth Bank of Australia (Banks) | | | 3,834 | |
| | 72,664 | | | Crown Resorts Ltd. (Hotels, Restaurants & Leisure) | | | 726 | |
| | 90,491 | | | Dexus Property Group (Equity Real Estate Investment Trusts) | | | 650 | |
| | 162,885 | | | GPT Group (Equity Real Estate Investment Trusts) | | | 610 | |
| | 115,826 | | | Harvey Norman Holdings Ltd. (Multiline Retail)^ | | | 285 | |
| | 165,562 | | | Insurance Australia Group Ltd. (Insurance) | | | 1,045 | |
| | 14,987 | | | Macquarie Group Ltd. (Capital Markets) | | | 1,371 | |
| | 339,573 | | | Mirvac Group (Equity Real Estate Investment Trusts) | | | 545 | |
| | 33,917 | | | National Australia Bank Ltd. (Banks) | | | 688 | |
| | 103,826 | | | QBE Insurance Group Ltd. (Insurance) | | | 748 | |
| | 491,167 | | | Scentre Group (Equity Real Estate Investment Trusts) | | | 1,595 | |
| | 220,469 | | | Stockland Trust Group (Equity Real Estate Investment Trusts) | | | 648 | |
| | 89,944 | | | Suncorp Group Ltd. (Insurance) | | | 971 | |
| | 201,950 | | | Sydney Airport (Transportation Infrastructure) | | | 1,070 | |
| | 127,260 | | | Tabcorp Holdings Ltd. (Hotels, Restaurants & Leisure) | | | 420 | |
| | 349,521 | | | Transurban Group (Transportation Infrastructure) | | | 3,095 | |
| | 312,200 | | | Vicinity Centres (Equity Real Estate Investment Trusts) | | | 598 | |
| | 140,345 | | | Wesfarmers Ltd. (Food & Staples Retailing) | | | 5,126 | |
| | 5,967 | | | Westpac Banking Corp. (Banks) | | | 129 | |
| | | | | | | | |
| | | | | | | 31,809 | |
| | | | | | | | |
| | | | Austria — 0.07% | |
| | 3,019 | | | ANDRITZ AG (Machinery) | | | 160 | |
| | 4,220 | | | Erste Group Bank AG (Banks) | | | 176 | |
| | 5,808 | | | OMV AG (Oil, Gas & Consumable Fuels) | | | 330 | |
| | 4,326 | | | Voestalpine AG (Metals & Mining) | | | 199 | |
| | | | | | | | |
| | | | | | | 865 | |
| | | | | | | | |
| | | | Belgium — 0.08% | |
| | 5,940 | | | Ageas (Insurance)^ | | | 300 | |
| | 7,334 | | | Belgacom SA (Diversified Telecommunication Services) | | | 165 | |
| | 7,254 | | | KBC Groep N.V. (Banks) | | | 560 | |
| | | | | | | | |
| | | | | | | 1,025 | |
| | | | | | | | |
| | | | | | | | |
| Shares | | | Security Description | | Value
(000) | |
| | | | Bermuda — 0.02% | |
| | 99,167 | | | Yue Yuen Industrial Holdings Ltd. (Textiles, Apparel & Luxury Goods) | | $ | 280 | |
| | | | | | | | |
| | | | Brazil — 0.24% | |
| | 71,595 | | | B3 SA (Capital Markets) | | | 379 | |
| | 253,760 | | | Petroleo Brasileiro SA, ADR (Oil, Gas & Consumable Fuels) | | | 2,546 | |
| | | | | | | | |
| | | | | | | 2,925 | |
| | | | | | | | |
| | | | Canada — 3.26% | |
| | 17,000 | | | Canadian Imperial Bank of Commerce (Banks) | | | 1,479 | |
| | 49,140 | | | Canadian Pacific Railway Ltd. (Road & Rail) | | | 9,007 | |
| | 22,825 | | | Canadian Pacific Railway Ltd. (Road & Rail) | | | 4,177 | |
| | 703,134 | | | Encana Corp. (Oil, Gas & Consumable Fuels) | | | 9,184 | |
| | 196,909 | | | Gildan Activewear, Inc. (Textiles, Apparel & Luxury Goods) | | | 5,547 | |
| | 565,739 | | | Manulife Financial Corp. (Insurance) | | | 10,166 | |
| | | | | | | | |
| | | | | | | 39,560 | |
| | | | | | | | |
| | | | China — 1.75% | |
| | 10,502 | | | Alibaba Group Holding Ltd., ADR (Internet Software & Services) (a) | | | 1,948 | |
| | 43,900 | | | Baidu, Inc., ADR (Internet Software & Services) (a) | | | 10,669 | |
| | 325,650 | | | China Mobile Ltd. (Wireless Telecommunication Services) | | | 2,893 | |
| | 3,600 | | | Kweichow Moutai Co. Ltd. (Beverages) | | | 397 | |
| | 285,500 | | | Ping An Insurance (Group) Company of China Ltd. (Insurance) | | | 2,627 | |
| | 40,800 | | | Tencent Holdings Ltd. (Internet Software & Services) | | | 2,048 | |
| | 7,598 | | | Weibo Corp., ADR (Internet Software & Services) (a) | | | 674 | |
| | | | | | | | |
| | | | | | | 21,256 | |
| | | | | | | | |
| | | | Denmark — 1.08% | |
| | 9,831 | | | Christian Hansen Holding A/S (Chemicals) | | | 908 | |
| | 29,000 | | | Danske Bank A/S (Banks) | | | 908 | |
| | 8,303 | | | Genmab A/S (Biotechnology) (a) | | | 1,282 | |
| | 17,123 | | | ISS A/S (Commercial Services & Supplies) | | | 589 | |
| | 171,580 | | | Novo Nordisk A/S, Class – B (Pharmaceuticals) | | | 7,961 | |
| | 4,678 | | | Tryg A/S (Insurance) | | | 110 | |
| | 21,495 | | | Vestas Wind Systems A/S (Electrical Equipment) | | | 1,331 | |
| | | | | | | | |
| | | | | | | 13,089 | |
| | | | | | | | |
| | | | Finland — 0.53% | |
| | 16,687 | | | Elisa Oyj (Diversified Telecommunication Services) | | | 773 | |
| | 51,461 | | | Fortum Oyj (Electric Utilities) | | | 1,228 | |
| | 25,154 | | | Metso Oyj (Machinery) | | | 843 | |
| | 27,142 | | | Nokian Renkaat Oyj (Auto Components) | | | 1,073 | |
| | 23,346 | | | Orion Oyj, Class – B (Pharmaceuticals) | | | 629 | |
| | 39,024 | | | Sampo Oyj, Class – A (Insurance) | | | 1,905 | |
| | | | | | | | |
| | | | | | | 6,451 | |
| | | | | | | | |
See accompanying notes to financial statements.
140
HC CAPITAL TRUST
The International Equity Portfolio
Portfolio of Investments (continued) — June 30, 2018
| | | | | | | | |
| Shares | | | Security Description | | Value
(000) | |
| | | | Common Stocks (continued) | | | | |
| | | | France — 6.18% | |
| | 21,684 | | | Air Liquide SA (Chemicals) | | $ | 2,727 | |
| | 2,312 | | | Amundi SA (Capital Markets) | | | 160 | |
| | 12,394 | | | Atos SE (IT Services) | | | 1,693 | |
| | 100,873 | | | AXA SA (Insurance) | | | 2,476 | |
| | 205,797 | | | BNP Paribas (Banks) | | | 12,782 | |
| | 30,709 | | | Bouygues SA (Construction & Engineering) | | | 1,324 | |
| | 9,181 | | | CNP Assurances (Insurance) | | | 209 | |
| | 60,377 | | | Credit Agricole SA (Banks) | | | 806 | |
| | 22,313 | | | Eiffage SA (Construction & Engineering) (b) | | | 2,427 | |
| | 329,444 | | | ENGIE (Multi-Utilities) | | | 5,051 | |
| | 24,786 | | | Eutelsat Communications (Media) | | | 514 | |
| | 2,328 | | | Fonciere des Regions (Equity Real Estate Investment Trusts) | | | 242 | |
| | 3,487 | | | Gecina SA (Equity Real Estate Investment Trusts) | | | 583 | |
| | 2,624 | | | Icade (Equity Real Estate Investment Trusts) | | | 246 | |
| | 8,099 | | | Ingenico Group SA (Electronic Equipment, Instruments & Components) | | | 728 | |
| | 15,617 | | | Klepierre (Equity Real
Estate Investment Trusts) | | | 588 | |
| | 16,446 | | | Lagardere SCA (Media) | | | 434 | |
| | 51,100 | | | Natixism SA (Banks) | | | 363 | |
| | 137,940 | | | Orange SA (Diversified Telecommunication Services) | | | 2,311 | |
| | 27,268 | | | Publicis Groupe (Media) | | | 1,877 | |
| | 12,427 | | | Safran SA (Aerospace & Defense) | | | 1,510 | |
| | 20,357 | | | Sanofi-Aventis (Pharmaceuticals) | | | 1,632 | |
| | 178,224 | | | Schneider Electric SA (Electrical Equipment) | | | 14,863 | |
| | 9,400 | | | SCOR SE (Insurance) | | | 349 | |
| | 3,817 | | | Societe BIC SA (Commercial Services & Supplies) | | | 354 | |
| | 41,846 | | | Societe Generale (Banks) | | | 1,765 | |
| | 26,231 | | | Suez Environnement Co. (Multi-Utilities) | | | 340 | |
| | 210,945 | | | Total SA (Oil, Gas & Consumable Fuels) | | | 12,860 | |
| | 7,068 | | | Unibail-Rodamco-Westfield (Equity Real Estate Investment Trusts) | | | 1,557 | |
| | 33,108 | | | Veolia Environnement (Multi-Utilities) | | | 709 | |
| | 16,500 | | | Vinci SA (Construction & Engineering) | | | 1,587 | |
| | | | | | | | |
| | | | | | | 75,067 | |
| | | | | | | | |
| | | | Germany — 10.52% | |
| | 34,329 | | | Allianz SE (Insurance) | | | 7,096 | |
| | 3,884 | | | Axel Springer AG (Media) | | | 281 | |
| | 194,386 | | | BASF SE (Chemicals) | | | 18,592 | |
| | 48,018 | | | Bayer AG (Pharmaceuticals) | | | 5,290 | |
| | 27,615 | | | Bayerische Motoren Werke Aktiengesellschaft (Automobiles) | | | 2,503 | |
| | 29,630 | | | Beiersdorf AG (Personal Products) | | | 3,364 | |
| | 77,911 | | | Daimler AG, Registered Shares (Automobiles) | | | 5,016 | |
| | 81,055 | | | Deutsche Boerse AG (Capital Markets) | | | 10,804 | |
| | | | | | | | |
| Shares | | | Security Description | | Value
(000) | |
| | | | Germany (continued) | |
| | 189,487 | | | Deutsche Post AG (Air Freight & Logistics) | | $ | 6,189 | |
| | 134,740 | | | Deutsche Telekom AG (Diversified Telecommunication Services) | | | 2,088 | |
| | 2,159 | | | Drillisch AG (Wireless Telecommunication Services) | | | 123 | |
| | 13,879 | | | Evonik Industries AG (Chemicals) | | | 475 | |
| | 1,799 | | | Hannover Rueckversicherung AG (Insurance) | | | 224 | |
| | 5,128 | | | Hugo Boss AG (Textiles, Apparel & Luxury Goods) | | | 466 | |
| | 5,597 | | | Innogy SE (Multi-Utilities) | | | 240 | |
| | 114,795 | | | Linde AG (Chemicals) | | | 27,388 | |
| | 2,938 | | | MAN SE (Machinery) | | | 333 | |
| | 14,697 | | | Metro AG (Food & Staples Retailing) | | | 182 | |
| | 4,818 | | | Muenchener Rueckversicherungs-Gesellschaft AG (Insurance) | | | 1,019 | |
| | 20,838 | | | ProSiebenSat.1 Media AG (Media) | | | 529 | |
| | 139,067 | | | SAP SE (Software) | | | 16,068 | |
| | 13,221 | | | Schaeffler AG (Auto Components) | | | 172 | |
| | 48,751 | | | Siemens AG (Industrial Conglomerates) | | | 6,445 | |
| | 6,007 | | | Symrise AG (Chemicals) | | | 527 | |
| | 31,054 | | | Telefonica Deutschland Holding AG (Diversified Telecommunication Services) | | | 122 | |
| | 58,724 | | | TUI AG (Hotels, Restaurants & Leisure) | | | 1,288 | |
| | 19,716 | | | Vonovia SE (Real Estate Management & Development) | | | 938 | |
| | 61,972 | | | Wirecard AG (IT Services) | | | 9,983 | |
| | | | | | | | |
| | | | | | | 127,745 | |
| | | | | | | | |
| | | | Hong Kong — 1.77% | |
| | 615,280 | | | AIA Group Ltd. (Insurance) (b) | | | 5,380 | |
| | 198,055 | | | BOC Hong Kong (Holdings) Ltd. (Banks) | | | 933 | |
| | 290,000 | | | CK Hutchison Holdings Ltd. (Industrial Conglomerates) | | | 3,075 | |
| | 49,500 | | | CK Infrastructure Holdings Ltd. (Electric Utilities) | | | 367 | |
| | 101,593 | | | CLP Holdings Ltd. (Electric Utilities) | | | 1,094 | |
| | 334,000 | | | Hanergy Thin Film Power Group Ltd. (Semiconductors & Semiconductor Equipment)* (a) | | | — | |
| | 160,675 | | | Hang Lung Properties Ltd. (Real Estate Management & Development) | | | 331 | |
| | 39,806 | | | Hang Seng Bank Ltd. (Banks) | | | 995 | |
| | 98,472 | | | Henderson Land Development Co. Ltd. (Real Estate Management & Development) | | | 521 | |
| | 213,073 | | | HK Electric Investments Ltd. (Electric Utilities) | | | 203 | |
| | 284,000 | | | HKT Trust & HKT Ltd. (Diversified Telecommunication Services) | | | 363 | |
| | 69,400 | | | Hongkong Land Holdings Ltd. (Real Estate Management & Development) | | | 496 | |
| | 47,000 | | | Hysan Development Co. (Real Estate Management & Development) | | | 262 | |
| | 51,500 | | | Kerry Properties Ltd. (Real Estate Management & Development) | | | 246 | |
See accompanying notes to financial statements.
141
HC CAPITAL TRUST
The International Equity Portfolio
Portfolio of Investments (continued) — June 30, 2018
| | | | | | | | |
| Shares | | | Security Description | | Value
(000) | |
| | | | Common Stocks (continued) | | | | |
| | | | Hong Kong (continued) | |
| | 160,000 | | | Li & Fung Ltd. (Textiles, Apparel & Luxury Goods) | | $ | 59 | |
| | 423,483 | | | New World Development Co. Ltd. (Real Estate Management & Development) | | | 596 | |
| | 115,000 | | | NWS Holdings Ltd. (Industrial Conglomerates) | | | 199 | |
| | 323,000 | | | PCCW Ltd. (Diversified Telecommunication Services) | | | 182 | |
| | 102,224 | | | Power Assets Holdings Ltd. (Electric Utilities) | | | 715 | |
| | 205,205 | | | Sino Land Co. Ltd. (Real Estate Management & Development) | | | 334 | |
| | 290,000 | | | SJM Holdings Ltd. (Hotels, Restaurants & Leisure) | | | 361 | |
| | 108,256 | | | Sun Hung Kai Properties Ltd. (Real Estate Management & Development) | | | 1,635 | |
| | 41,208 | | | Swire Pacific Ltd., Class—A (Real Estate Management & Development) | | | 436 | |
| | 83,200 | | | Swire Properties Ltd. (Real Estate Management & Development) | | | 308 | |
| | 51,600 | | | The Bank of East Asia Ltd. (Banks) | | | 206 | |
| | 154,917 | | | The Link Real Estate Investment Trust (Equity Real Estate Investment Trusts) | | | 1,415 | |
| | 982,500 | | | WH Group Ltd. (Food Products) | | | 800 | |
| | | | | | | | |
| | | | | | | 21,512 | |
| | | | | | | | |
| | | | Indonesia — 0.08% | |
| | 5,157,500 | | | PT Bank Rakyat Indonesia Persero Tbk (Banks) | | | 1,022 | |
| | | | | | | | |
| | | | Ireland (Republic of) — 0.81% | |
| | 50,685 | | | CRH PLC (Construction Materials) | | | 1,796 | |
| | 79,836 | | | Experian PLC (Professional Services) | | | 1,975 | |
| | 65,699 | | | Medtronic PLC (Health Care Equipment & Supplies) | | | 5,625 | |
| | 4,257 | | | Paddy Power PLC (Hotels, Restaurants & Leisure) | | | 472 | |
| | | | | | | | |
| | | | | | | 9,868 | |
| | | | | | | | |
| | | | Israel — 0.20% | |
| | 1,865 | | | Azrieli Group (Real Estate Management & Development) | | | 93 | |
| | 137,361 | | | Bank Hapoalim Ltd. (Banks) | | | 930 | |
| | 212,172 | | | Israel Chemicals Ltd. (Chemicals) | | | 969 | |
| | 3,643 | | | Mizrahi Tefahot Bank Ltd. (Banks) | | | 67 | |
| | 14,018 | | | Teva Pharmaceutical Industries Ltd., ADR (Pharmaceuticals) | | | 341 | |
| | | | | | | | |
| | | | | | | 2,400 | |
| | | | | | | | |
| | | | Italy — 2.53% | |
| | 245,161 | | | Assicurazioni Generali SpA (Insurance) | | | 4,114 | |
| | 34,489 | | | Atlantia SpA (Transportation Infrastructure) | | | 1,020 | |
| | 270,052 | | | Enel SpA (Electric Utilities) | | | 1,500 | |
| | 216,469 | | | Eni SpA (Oil, Gas & Consumable Fuels) | | | 4,021 | |
| | 1,476,908 | | | Intesa Sanpaolo SpA (Banks) | | | 4,288 | |
| | 36,549 | | | Intesa Sanpaolo SpA (Banks) | | | 111 | |
| | 15,371 | | | Mediobanca SpA (Banks) | | | 143 | |
| | 18,408 | | | Poste Italiane SpA (Insurance) | | | 154 | |
| | | | | | | | |
| Shares | | | Security Description | | Value
(000) | |
| | | | Italy (continued) | |
| | 204,505 | | | Snam Rete Gas SpA (Oil, Gas & Consumable Fuels) | | $ | 854 | |
| | 297,031 | | | Telecom Italia SpA (Diversified Telecommunication Services) | | | 194 | |
| | 61,694 | | | Terna – Rete Elettrica Nazionale SpA (Electric Utilities) | | | 334 | |
| | 835,969 | | | Unicredit SpA (Banks) | | | 13,954 | |
| | 42,893 | | | UnipolSai SpA (Insurance)^ | | | 95 | |
| | | | | | | | |
| | | | | | | 30,782 | |
| | | | | | | | |
| | | | Japan — 16.27% | |
| | 3,600 | | | ABC-Mart, Inc. (Specialty Retail) | | | 197 | |
| | 4,361 | | | AEON Credit Service Co. Ltd. (Consumer Finance) | | | 93 | |
| | 19,300 | | | Aisin Seiki Co. Ltd. (Auto Components) | | | 880 | |
| | 37,900 | | | Amada Holdings Co. Ltd. (Machinery) | | | 365 | |
| | 4,916 | | | Aozora Bank Ltd. (Banks) | | | 187 | |
| | 22,345 | | | Asahi Glass Co. Ltd. (Building Products) | | | 871 | |
| | 140,600 | | | Asahi Kasei Corp. (Chemicals) | | | 1,788 | |
| | 227,100 | | | Astellas Pharma, Inc. (Pharmaceuticals) | | | 3,465 | |
| | 8,180 | | | Benesse Holdings, Inc. (Diversified Consumer Services) | | | 290 | |
| | 72,311 | | | Bridgestone Corp. (Auto Components) | | | 2,831 | |
| | 25,600 | | | Brother Industries Ltd. (Technology Hardware, Storage & Peripherals) | | | 506 | |
| | 23,800 | | | CALBEE, Inc. (Food Products) | | | 896 | |
| | 115,010 | | | Canon, Inc. (Technology Hardware, Storage & Peripherals) | | | 3,772 | |
| | 26,400 | | | Casio Computer Co. Ltd. (Household Durables) | | | 430 | |
| | 36,500 | | | Chubu Electric Power Company, Inc. (Electric Utilities) | | | 548 | |
| | 28,688 | | | Dai Nippon Printing Co. Ltd. (Commercial Services & Supplies) | | | 642 | |
| | 31,300 | | | Daicel Corp. (Chemicals) | | | 347 | |
| | 66,778 | | | Daiichi Sankyo Co. Ltd. (Pharmaceuticals) | | | 2,556 | |
| | 3,979 | | | Daito Trust Construction Co. Ltd. (Real Estate Management & Development) | | | 647 | |
| | 31,050 | | | Daiwa House Industry Co. Ltd. (Real Estate Management & Development) | | | 1,060 | |
| | 91 | | | Daiwa House REIT Investment Corp. (Equity Real Estate Investment Trusts) | | | 216 | |
| | 47,000 | | | Daiwa Securities Group, Inc. (Capital Markets) | | | 273 | |
| | 53,500 | | | Denso Corp. (Auto Components) | | | 2,616 | |
| | 119,200 | | | East Japan Railway Co. (Road & Rail) | | | 11,430 | |
| | 29,157 | | | Eisai Co. Ltd. (Pharmaceuticals) | | | 2,055 | |
| | 8,100 | | | Electric Power Development Co. Ltd. (Independent Power & Renewable Electricity Producers) | | | 209 | |
| | 68,498 | | | Fuji Heavy Industries Ltd. (Automobiles) | | | 1,996 | |
| | 44,300 | | | FUJIFILM Holdings Corp. (Technology Hardware, Storage & Peripherals) | | | 1,731 | |
| | 216,000 | | | Fujitsu Ltd. (IT Services) | | | 1,311 | |
| | 33,886 | | | Fukuoka Financial Group, Inc. (Banks) | | | 171 | |
See accompanying notes to financial statements.
142
HC CAPITAL TRUST
The International Equity Portfolio
Portfolio of Investments (continued) — June 30, 2018
| | | | | | | | |
| Shares | | | Security Description | | Value
(000) | |
| | | | Common Stocks (continued) | | | | |
| | | | Japan (continued) | |
| | 28,600 | | | Hino Motors Ltd. (Machinery) | | $ | 306 | |
| | 12,000 | | | Hitachi Chemical Co. Ltd. (Chemicals) | | | 242 | |
| | 546,000 | | | Hitachi Ltd. (Electronic Equipment, Instruments & Components) | | | 3,855 | |
| | 189,136 | | | Honda Motor Co. Ltd. (Automobiles) | | | 5,557 | |
| | 17,000 | | | Iida Group Holdings Co. Ltd. (Household Durables) | | | 328 | |
| | 66,900 | | | Isuzu Motors Ltd. (Automobiles) | | | 889 | |
| | 163,817 | | | ITOCHU Corp. (Trading Companies & Distributors) | | | 2,971 | |
| | 309,400 | | | Japan Airlines Co. Ltd. (Airlines) | | | 10,979 | |
| | 63,400 | | | Japan Exchange Group, Inc. (Capital Markets) | | | 1,179 | |
| | 17,500 | | | Japan Post Bank Co. Ltd. (Banks) | | | 204 | |
| | 66,600 | | | Japan Post Holdings Co. Ltd. (Insurance) | | | 730 | |
| | 51 | | | Japan Prime Realty Investment Corp. (Equity Real Estate Investment Trusts) | | | 185 | |
| | 70 | | | Japan Real Estate Investment Corp. (Equity Real Estate Investment Trusts) | | | 371 | |
| | 159 | | | Japan Retail Fund Investment Corp. (Equity Real Estate Investment Trusts) | | | 287 | |
| | 15,400 | | | Japan Tobacco, Inc. (Tobacco) | | | 431 | |
| | 30,079 | | | JS Group Corp. (Building Products) | | | 602 | |
| | 20,954 | | | JSR Corp. (Chemicals) | | | 357 | |
| | 27,400 | | | JTEKT Corp. (Machinery) | | | 373 | |
| | 364,857 | | | JX Holdings, Inc. (Oil, Gas & Consumable Fuels) | | | 2,539 | |
| | 100,000 | | | Kajima Corp. (Construction & Engineering) | | | 775 | |
| | 551,800 | | | KDDI Corp. (Wireless Telecommunication Services) | | | 15,107 | |
| | 105,245 | | | Komatsu Ltd. (Machinery) | | | 3,011 | |
| | 53,900 | | | Konica Minolta, Inc. (Technology Hardware, Storage & Peripherals) | | | 501 | |
| | 39,584 | | | Kuraray Co. Ltd. (Chemicals) | | | 546 | |
| | 35,300 | | | Kyocera Corp. (Electronic Equipment, Instruments & Components) | | | 1,992 | |
| | 14,300 | | | Kyushu Financial Holdings, Inc. (Banks) | | | 69 | |
| | 6,494 | | | Lawson, Inc. (Food & Staples Retailing) | | | 406 | |
| | 180,916 | | | Marubeni Corp. (Trading Companies & Distributors) | | | 1,381 | |
| | 23,800 | | | Marui Group Co. Ltd. (Multiline Retail) | | | 502 | |
| | 6,387 | | | Maruichi Steel Tube Ltd. (Metals & Mining) | | | 217 | |
| | 41,900 | | | Mebuki Financial Group, Inc. (Banks) | | | 141 | |
| | 160,100 | | | Mitsubishi Chemical Holdings Corp. (Chemicals) | | | 1,341 | |
| | 164,645 | | | Mitsubishi Corp. (Trading Companies & Distributors) | | | 4,578 | |
| | 36,000 | | | Mitsubishi Heavy Industries Ltd. (Machinery) | | | 1,311 | |
| | 12,300 | | | Mitsubishi Materials Corp. (Metals & Mining) | | | 338 | |
| | | | | | | | |
| Shares | | | Security Description | | Value
(000) | |
| | | | Japan (continued) | |
| | 24,926 | | | Mitsubishi Tanabe Pharma Corp. (Pharmaceuticals) | | $ | 431 | |
| | 517,505 | | | Mitsubishi UFJ Financial Group, Inc. (Banks) | | | 2,950 | |
| | 12,000 | | | Mitsubishi UFJ Lease & Finance Co. Ltd. (Diversified Financial Services) | | | 74 | |
| | 188,488 | | | Mitsui & Co. Ltd. (Trading Companies & Distributors) | | | 3,146 | |
| | 20,700 | | | Mitsui Chemicals, Inc. (Chemicals) | | | 552 | |
| | 5,200 | | | Mixi, Inc. (Internet Software & Services) | | | 132 | |
| | 1,001,677 | | | Mizuho Financial Group, Inc. (Banks) | | | 1,688 | |
| | 19,700 | | | MS&AD Insurance Group Holdings, Inc. (Insurance) | | | 613 | |
| | 28,900 | | | NEC Corp. (Technology Hardware, Storage & Peripherals) | | | 794 | |
| | 28,900 | | | NGK Insulators Ltd. (Machinery) | | | 515 | |
| | 10,000 | | | NH Foods Ltd. (Food Products) | | | 404 | |
| | 80 | | | Nippon Building Fund, Inc. (Equity Real Estate Investment Trusts) | | | 462 | |
| | 10,084 | | | Nippon Electric Glass Co. Ltd. (Electronic Equipment, Instruments & Components) | | | 281 | |
| | 104 | | | Nippon Prologis REIT, Inc. (Equity Real Estate Investment Trusts) | | | 216 | |
| | 85,700 | | | Nippon Steel & Sumitomo Metal Corp. (Metals & Mining) | | | 1,684 | |
| | 37,800 | | | Nippon Telegraph & Telephone Corp. (Diversified Telecommunication Services) | | | 1,720 | |
| | 258,454 | | | Nissan Motor Co. Ltd. (Automobiles) | | | 2,517 | |
| | 11,800 | | | NOK Corp. (Auto Components) | | | 229 | |
| | 6,811 | | | Nomura Real Estate Holdings, Inc. (Real Estate Management & Development) | | | 151 | |
| | 241 | | | Nomura Real Estate Master Fund, Inc. (Equity Real Estate Investment Trusts) | | | 340 | |
| | 14,300 | | | Nomura Research Institute Ltd. (IT Services) | | | 694 | |
| | 68,400 | | | NTT Data Corp. (IT Services) | | | 788 | |
| | 75,725 | | | NTT DoCoMo, Inc. (Wireless Telecommunication Services) | | | 1,931 | |
| | 70,800 | | | Obayashi Corp. (Construction & Engineering) | | | 737 | |
| | 21,500 | | | OMRON Corp. (Electronic Equipment, Instruments & Components) | | | 1,004 | |
| | 36,700 | | | ORIX Corp. (Diversified Financial Services) | | | 581 | |
| | 21,342 | | | Osaka Gas Co. Ltd. (Gas Utilities) | | | 442 | |
| | 42,715 | | | Otsuka Holdings Co. Ltd. (Pharmaceuticals) | | | 2,070 | |
| | 12,100 | | | Park24 Co. Ltd. (Commercial Services & Supplies) | | | 330 | |
| | 92,138 | | | Resona Holdings, Inc. (Banks) | | | 493 | |
| | 77,283 | | | Ricoh Co. Ltd. (Technology Hardware, Storage & Peripherals) | | | 709 | |
| | 13,800 | | | Rohm Co. Ltd. (Semiconductors & Semiconductor Equipment) | | | 1,159 | |
| | 5,515 | | | Sankyo Co. Ltd. (Leisure Products) | | | 216 | |
| | 5,000 | | | SBI Holdings, Inc. (Capital Markets) | | | 129 | |
See accompanying notes to financial statements.
143
HC CAPITAL TRUST
The International Equity Portfolio
Portfolio of Investments (continued) — June 30, 2018
| | | | | | | | |
| Shares | | | Security Description | | Value
(000) | |
| | | | Common Stocks (continued) | | | | |
| | | | Japan (continued) | |
| | 21,700 | | | Sega Sammy Holdings, Inc. (Leisure Products) | | $ | 372 | |
| | 30,496 | | | Seiko Epson Corp. (Technology Hardware, Storage & Peripherals) | | | 531 | |
| | 64,352 | | | Sekisui House Ltd. (Household Durables) | | | 1,139 | |
| | 84,500 | | | Seven & I Holdings Co. Ltd. (Food & Staples Retailing) | | | 3,688 | |
| | 25,200 | | | Seven Bank Ltd. (Banks) | | | 77 | |
| | 23,594 | | | Showa Shell Sekiyu KK (Oil, Gas & Consumable Fuels) | | | 352 | |
| | 176,300 | | | Sompo Japan Nipponkoa Holdings, Inc. (Insurance) | | | 7,135 | |
| | 7,608 | | | Sony Financial Holdings, Inc. (Insurance) | | | 145 | |
| | 179,000 | | | Sumitomo Chemical Co. Ltd. (Chemicals) | | | 1,015 | |
| | 130,186 | | | Sumitomo Corp. (Trading Companies & Distributors) | | | 2,140 | |
| | 83,100 | | | Sumitomo Electric Industries Ltd. (Auto Components) | | | 1,239 | |
| | 47,824 | | | Sumitomo Metal Mining Co. Ltd. (Metals & Mining) | | | 1,831 | |
| | 192,248 | | | Sumitomo Mitsui Financial Group, Inc. (Banks) | | | 7,478 | |
| | 14,083 | | | Sumitomo Mitsui Trust Holdings, Inc. (Banks) | | | 559 | |
| | 20,591 | | | Sumitomo Rubber Industries Ltd. (Auto Components) | | | 327 | |
| | 24,000 | | | T&D Holdings, Inc. (Insurance) | | | 361 | |
| | 108,511 | | | Takeda Pharmaceutical Co. Ltd. (Pharmaceuticals) | | | 4,586 | |
| | 21,500 | | | Teijin Ltd. (Chemicals) | | | 395 | |
| | 15,442 | | | The Chugoku Electric Power Company, Inc. (Electric Utilities) | | | 200 | |
| | 44,700 | | | The Dai-ichi Life Insurance Co. Ltd. (Insurance) | | | 798 | |
| | 39,200 | | | The Kansai Electric Power Co., Inc. (Electric Utilities) | | | 572 | |
| | 21,000 | | | The Shizuoka Bank Ltd. (Banks) | | | 190 | |
| | 13,600 | | | The Yokohama Rubber Co. Ltd. (Auto Components)^ | | | 283 | |
| | 25,200 | | | Tohoku Electric Power Co., Inc. (Electric Utilities) | | | 308 | |
| | 27,700 | | | Tokio Marine Holdings, Inc. (Insurance) | | | 1,299 | |
| | 18,800 | | | Tokyo Electron Ltd. (Semiconductors & Semiconductor Equipment) | | | 3,230 | |
| | 21,400 | | | Tokyo Gas Co. Ltd. (Gas Utilities) | | | 568 | |
| | 58,000 | | | Toppan Printing Co. Ltd. (Commercial Services & Supplies) | | | 455 | |
| | 7,500 | | | Toyoda Gosei Co. Ltd. (Auto Components) | | | 190 | |
| | 18,100 | | | Toyota Industries Corp. (Auto Components) | | | 1,015 | |
| | 157,600 | | | Toyota Motor Corp. (Automobiles) | | | 10,207 | |
| | 23,270 | | | Toyota Tsusho Corp. (Trading Companies & Distributors) | | | 780 | |
| | 13,227 | | | Trend Micro, Inc. (Software) | | | 755 | |
| | | | | | | | |
| Shares | | | Security Description | | Value
(000) | |
| | | | Japan (continued) | |
| | 168 | | | United Urban Investment Corp. (Equity Real Estate Investment Trusts) | | $ | 261 | |
| | 24,700 | | | USS Co. Ltd. (Specialty Retail) | | | 470 | |
| | 18,300 | | | West Japan Railway Co. (Road & Rail) | | | 1,350 | |
| | 167,100 | | | Yahoo Japan Corp. (Internet Software & Services)^ | | | 555 | |
| | 70,100 | | | Yamada Denki Co. Ltd. (Specialty Retail)^ | | | 349 | |
| | 32,500 | | | Yamaha Motor Co. Ltd. (Automobiles) | | | 818 | |
| | 25,200 | | | Yokogawa Electric Corp. (Electronic Equipment, Instruments & Components) | | | 449 | |
| | | | | | | | |
| | | | | | | 197,634 | |
| | | | | | | | |
| | | | Jersey — 0.32% | |
| | 712,341 | | | Glencore International PLC (Metals & Mining) | | | 3,402 | |
| | 30,347 | | | WPP PLC (Media) | | | 478 | |
| | | | | | | | |
| | | | | | | 3,880 | |
| | | | | | | | |
| | | | Luxembourg — 0.06% | |
| | 7,110 | | | Millicom International Cellular SA (Wireless Telecommunication Services) | | | 420 | |
| | 3,163 | | | RTL Group (Media) | | | 215 | |
| | 5,409 | | | SES – FDR, Class – A (Media) | | | 99 | |
| | | | | | | | |
| | | | | | | 734 | |
| | | | | | | | |
| | | | Netherlands — 3.90% | |
| | 12,755 | | | ABN AMRO Group N.V. (Banks) | | | 331 | |
| | 52,600 | | | AEGON N.V. (Insurance) | | | 315 | |
| | 57,236 | | | Airbus Group N.V. (Aerospace & Defense) | | | 6,701 | |
| | 142,364 | | | Akzo Nobel N.V. (Chemicals) | | | 12,189 | |
| | 15,859 | | | ASML Holding N.V. (Semiconductors & Semiconductor Equipment) | | | 3,143 | |
| | 679,752 | | | ING Groep N.V. (Banks) | | | 9,785 | |
| | 139,537 | | | Koninklijke (Royal) KPN N.V. (Diversified Telecommunication Services) | | | 380 | |
| | 101,101 | | | Koninklijke Ahold Delhaize N.V. (Food & Staples Retailing) | | | 2,421 | |
| | 7,355 | | | Koninklijke Boskalis Westminster N.V. (Construction & Engineering)^ | | | 214 | |
| | 7,484 | | | Koninklijke DSM N.V. (Chemicals) | | | 753 | |
| | 75,164 | | | Koninklijke Philips Electronics N.V. (Industrial Conglomerates) | | | 3,197 | |
| | 5,542 | | | Koninklijke Vopak N.V. (Oil, Gas & Consumable Fuels) | | | 256 | |
| | 9,118 | | | NN Group N.V. (Insurance) | | | 371 | |
| | 9,537 | | | Randstad Holding N.V. (Professional Services) | | | 561 | |
| | 120,269 | | | Unilever N.V. (Personal Products) | | | 6,711 | |
| | | | | | | | |
| | | | | | | 47,328 | |
| | | | | | | | |
| | | | New Zealand — 0.08% | |
| | 94,050 | | | Fletcher Building Ltd. (Construction Materials) | | | 442 | |
| | 72,471 | | | Meridian Energy Ltd. (Independent Power & Renewable Electricity Producers) | | | 153 | |
| | 171,722 | | | Telecom Corporation of New Zealand Ltd. (Diversified Telecommunication Services) | | | 434 | |
| | | | | | | | |
| | | | | | | 1,029 | |
| | | | | | | | |
See accompanying notes to financial statements.
144
HC CAPITAL TRUST
The International Equity Portfolio
Portfolio of Investments (continued) — June 30, 2018
| | | | | | | | |
| Shares | | | Security Description | | Value
(000) | |
| | | | Common Stocks (continued) | | | | |
| | | | Norway — 0.45% | |
| | 132,650 | | | Equinor ASA (Oil, Gas & Consumable Fuels) | | $ | 3,525 | |
| | 9,727 | | | Gjensidige Forsikring ASA (Insurance) | | | 160 | |
| | 47,866 | | | Marine Harvest ASA (Food Products) | | | 954 | |
| | 43,086 | | | Telenor ASA (Diversified Telecommunication Services) | | | 885 | |
| | | | | | | | |
| | | | | | | 5,524 | |
| | | | | | | | |
| | | | Portugal — 0.14% | |
| | 441,979 | | | EDP – Energias de Portugal SA (Electric Utilities) | | | 1,755 | |
| | | | | | | | |
| | | | Russia — 0.18% | |
| | 120,994 | | | MMC Norilsk Nickel PJSC, ADR (Metals & Mining) | | | 2,172 | |
| | | | | | | | |
| | | | Singapore — 0.75% | |
| | 397,672 | | | Ascendas Real Estate Investment Trust (Equity Real Estate Investment Trusts) | | | 770 | |
| | 400,444 | | | CapitaCommercial Trust (Equity Real Estate Investment Trusts) | | | 488 | |
| | 395,915 | | | CapitaMall Trust (Equity Real Estate Investment Trusts) | | | 602 | |
| | 707,700 | | | ComfortDelGro Corp. Ltd. (Road & Rail) | | | 1,221 | |
| | 1,710,900 | | | Hutchison Port Holdings Trust (Transportation Infrastructure) | | | 479 | |
| | 172,500 | | | SATS Ltd. (Transportation Infrastructure) | | | 633 | |
| | 64,600 | | | Singapore Exchange Ltd. (Capital Markets) | | | 340 | |
| | 69,600 | | | Singapore Press Holdings Ltd. (Media) | | | 133 | |
| | 383,427 | | | Singapore Tech Engineering (Aerospace & Defense) | | | 926 | |
| | 1,339,679 | | | Singapore Telecommunications Ltd. (Diversified Telecommunication Services) | | | 3,029 | |
| | 405,380 | | | Suntec REIT (Equity Real Estate Investment Trusts) | | | 515 | |
| | | | | | | | |
| | | | | | | 9,136 | |
| | | | | | | | |
| | | | South Korea — 1.45% | |
| | 175,400 | | | Samsung Electronics Co. Ltd. (Technology Hardware, Storage & Peripherals) | | | 7,342 | |
| | 49,084 | | | SK Telecom Co. Ltd. (Wireless Telecommunication Services) | | | 10,263 | |
| | | | | | | | |
| | | | | | | 17,605 | |
| | | | | | | | |
| | | | Spain — 1.52% | |
| | 95,647 | | | Abertis Infraestructuras SA (Transportation Infrastructure) | | | 2,051 | |
| | 157,036 | | | Banco Bilbao Vizcaya Argentaria SA (Banks) | | | 1,114 | |
| | 1,020,302 | | | CaixaBank SA (Banks) | | | 4,415 | |
| | 52,344 | | | Corporacion Mapfre (Insurance) | | | 158 | |
| | 30,944 | | | Enagas (Oil, Gas & Consumable Fuels) | | | 905 | |
| | 21,929 | | | Endesa (Electric Utilities)^ | | | 484 | |
| | 23,373 | | | Gas Natural SDG SA (Gas Utilities)^ | | | 619 | |
| | 404,552 | | | Iberdrola SA (Electric Utilities) | | | 3,130 | |
| | 103,356 | | | Red Electrica Corp. (Electric Utilities) | | | 2,105 | |
| | | | | | | | |
| Shares | | | Security Description | | Value
(000) | |
| | | | Spain (continued) | |
| | 171,907 | | | Repsol YPF SA (Oil, Gas & Consumable Fuels) | | $ | 3,365 | |
| | 10,640 | | | Telefonica SA (Diversified Telecommunication Services) | | | 90 | |
| | | | | | | | |
| | | | | | | 18,436 | |
| | | | | | | | |
| | | | Sweden — 1.22% | |
| | 40,821 | | | Alfa Laval AB (Machinery) | | | 969 | |
| | 59,586 | | | Hennes & Mauritz AB, B Shares (Specialty Retail)^ | | | 888 | |
| | 17,354 | | | ICA Gruppen AB (Food & Staples Retailing)^ | | | 532 | |
| | 245,398 | | | Nordea Bank AB (Banks) | | | 2,366 | |
| | 121,035 | | | Skandinaviska Enskilda Banken AB, Class – A (Banks) | | | 1,151 | |
| | 73,187 | | | Skanska AB, B Shares (Construction & Engineering) | | | 1,331 | |
| | 124,286 | | | Svenska Handelsbanken AB, A Shares (Banks) | | | 1,382 | |
| | 72,578 | | | Swedbank AB, A Shares (Banks) | | | 1,555 | |
| | 38,949 | | | Tele2 AB, B Shares (Wireless Telecommunication Services) | | | 458 | |
| | 411,766 | | | Telefonaktiebolaget LM Ericsson, B Shares (Communications Equipment) | | | 3,185 | |
| | 211,473 | | | TeliaSonera AB (Diversified Telecommunication Services) | | | 967 | |
| | | | | | | | |
| | | | | | | 14,784 | |
| | | | | | | | |
| | | | Switzerland — 8.39% | |
| | 892,636 | | | ABB Ltd., Registered Shares (Electrical Equipment) | | | 19,577 | |
| | 28,003 | | | Adecco SA, Registered Shares (Professional Services) | | | 1,662 | |
| | 3,187 | | | Baloise Holding AG, Registered Shares (Insurance) | | | 465 | |
| | 52,201 | | | Compagnie Financiere Richemont SA, Registered Shares (Textiles, Apparel & Luxury Goods) | | | 4,436 | |
| | 170,000 | | | Credit Suisse Group AG (Capital Markets) | | | 2,567 | |
| | 49,483 | | | Ferguson PLC (Trading Companies & Distributors) | | | 4,016 | |
| | 2,019 | | | Givaudan SA (Chemicals) | | | 4,593 | |
| | 9,480 | | | Idorsia Ltd. (Biotechnology) (a) | | | 252 | |
| | 9,851 | | | Kuehne & Nagel International Ltd. (Marine) | | | 1,485 | |
| | 80,316 | | | LafargeHolcim Ltd., Registered Shares (Construction Materials) | | | 3,925 | |
| | 6,353 | | | Lonza Group AG (Life Sciences Tools & Services) | | | 1,691 | |
| | 70,850 | | | Nestle SA (Food Products) | | | 5,504 | |
| | 316,591 | | | Novartis AG, Registered Shares (Pharmaceuticals) | | | 24,077 | |
| | 1,689 | | | Pargesa Holding SA (Diversified Financial Services) | | | 143 | |
| | 50,072 | | | Roche Holding AG (Pharmaceuticals) | | | 11,156 | |
| | 942 | | | SGS SA, Registered Shares (Professional Services) | | | 2,514 | |
| | 4,452 | | | Sonova Holding AG, Registered Shares (Health Care Equipment & Supplies) | | | 800 | |
| | 19,246 | | | STMicroelectronics N.V. (Semiconductors & Semiconductor Equipment) | | | 430 | |
See accompanying notes to financial statements.
145
HC CAPITAL TRUST
The International Equity Portfolio
Portfolio of Investments (continued) — June 30, 2018
| | | | | | | | |
| Shares | | | Security Description | | Value
(000) | |
| | | | Common Stocks (continued) | | | | |
| | | | Switzerland (continued) | |
| | 2,089 | | | Swiss Life Holding AG (Insurance) | | $ | 728 | |
| | 6,385 | | | Swiss Prime Site AG (Real Estate Management & Development) | | | 588 | |
| | 20,561 | | | Swiss Re AG (Insurance) | | | 1,780 | |
| | 2,253 | | | Swisscom AG (Diversified Telecommunication Services) | | | 1,009 | |
| | 1,990 | | | The Swatch Group AG, B Shares (Textiles, Apparel & Luxury Goods) | | | 947 | |
| | 157,843 | | | UBS Group AG (Capital Markets) | | | 2,444 | |
| | 17,269 | | | Zurich Financial Services AG (Insurance) | | | 5,130 | |
| | | | | | | | |
| | | | | | | 101,919 | |
| | | | | | | | |
| | | | United Kingdom — 20.02% | |
| | 9,366 | | | Admiral Group PLC (Insurance) | | | 236 | |
| | 25,558 | | | Aon PLC (Insurance) | | | 3,506 | |
| | 277,313 | | | AstraZeneca PLC (Pharmaceuticals) | | | 19,222 | |
| | 1,481,769 | | | Aviva PLC (Insurance) | | | 9,854 | |
| | 31,399 | | | Babcock International Group PLC (Commercial Services & Supplies) | | | 339 | |
| | 412,658 | | | BAE Systems PLC (Aerospace & Defense) | | | 3,522 | |
| | 1,252,516 | | | Balfour Beatty PLC (Construction & Engineering) | | | 4,689 | |
| | 4,658,241 | | | Barclays PLC (Banks) | | | 11,617 | |
| | 134,440 | | | Barratt Developments PLC (Household Durables) | | | 914 | |
| | 494,784 | | | BHP Billiton PLC (Metals & Mining) | | | 11,138 | |
| | 3,539,000 | | | BP PLC (Oil, Gas & Consumable Fuels) | | | 27,004 | |
| | 51,346 | | | British American Tobacco PLC (Tobacco) | | | 2,595 | |
| | 65,074 | | | British Land Co. PLC (Equity Real Estate Investment Trusts) | | | 577 | |
| | 86,883 | | | Capita PLC (Professional Services) | | | 183 | |
| | 116,707 | | | Carnival PLC (Hotels, Restaurants & Leisure) | | | 6,694 | |
| | 76,494 | | | Centrica PLC (Multi-Utilities) | | | 159 | |
| | 1,151,217 | | | Cobham PLC (Aerospace & Defense) (a) | | | 1,954 | |
| | 7,125 | | | Coca-Cola European Partners PLC (Beverages) | | | 290 | |
| | 772,115 | | | ConvaTec Group PLC (Health Care Equipment & Supplies) (b) | | | 2,164 | |
| | 146,372 | | | Diageo PLC (Beverages) | | | 5,257 | |
| | 65,386 | | | Direct Line Insurance Group PLC (Insurance) | | | 296 | |
| | 202,304 | | | G4S PLC (Commercial Services & Supplies) | | | 715 | |
| | 895,501 | | | GlaxoSmithKline PLC (Pharmaceuticals) | | | 18,076 | |
| | 54,523 | | | Hammerson PLC (Equity Real Estate Investment Trusts) | | | 376 | |
| | 1,200,709 | | | HSBC Holdings PLC (Banks) | | | 11,260 | |
| | 3,079 | | | Imperial Tobacco Group PLC (Tobacco) | | | 115 | |
| | 20,674 | | | Investec PLC (Capital Markets) | | | 147 | |
| | 61,386 | | | ITV PLC (Media) | | | 141 | |
| | | | | | | | |
| Shares | | | Security Description | | Value
(000) | |
| | | | United Kingdom (continued) | |
| | 208,954 | | | J Sainsbury PLC (Food & Staples Retailing) | | $ | 886 | |
| | 16,245 | | | Johnson Matthey PLC (Chemicals) | | | 776 | |
| | 49,074 | | | Land Securities Group PLC (Equity Real Estate Investment Trusts) | | | 620 | |
| | 288,974 | | | Legal & General Group PLC (Insurance) | | | 1,014 | |
| | 10,210,398 | | | Lloyds Banking Group PLC (Banks) | | | 8,495 | |
| | 31,011 | | | London Stock Exchange Group (Capital Markets) | | | 1,829 | |
| | 8,321 | | | Marks & Spencer Group PLC (Multiline Retail) | | | 32 | |
| | 117,355 | | | Micro Focus International PLC (Software) | | | 2,049 | |
| | 230,324 | | | National Grid PLC (Multi-Utilities) | | | 2,548 | |
| | 19,012 | | | Next PLC (Multiline Retail) | | | 1,518 | |
| | 53,990 | | | Pearson PLC (Media) | | | 630 | |
| | 38,398 | | | Persimmon PLC (Household Durables) | | | 1,284 | |
| | 562,207 | | | Prudential PLC (Insurance) | | | 12,867 | |
| | 329,487 | | | Rentokil Initial PLC (Commercial Services & Supplies) | | | 1,525 | |
| | 178,273 | | | Rio Tinto PLC (Metals & Mining) | | | 9,882 | |
| | 541,383 | | | Rolls-Roycec Holdings PLC (Aerospace & Defense) | | | 7,059 | |
| | 30,289,168 | | | Rolls-Royce Holdings PLC, Class C Redemption Shares (Aerospace & Defense) | | | 40 | |
| | 240,853 | | | Royal Dutch Shell PLC, A Shares (Oil, Gas & Consumable Fuels) | | | 8,355 | |
| | 602,799 | | | Royal Dutch Shell PLC, B Shares (Oil, Gas & Consumable Fuels) | | | 21,583 | |
| | 114,985 | | | Royal Mail PLC (Air Freight & Logistics) | | | 767 | |
| | 15,391 | | | Severn Trent PLC (Water Utilities) | | | 402 | |
| | 587,370 | | | SSE PLC (Electric Utilities) | | | 10,502 | |
| | 182,239 | | | Standard Chartered PLC (Banks) | | | 1,665 | |
| | 101,479 | | | Standard Life PLC (Insurance) | | | 436 | |
| | 436,774 | | | Taylor Wimpey PLC (Household Durables) | | | 1,031 | |
| | 16,377 | | | The Berkeley Group Holdings PLC (Household Durables) | | | 818 | |
| | 42,640 | | | United Utilities Group PLC (Water Utilities) | | | 429 | |
| | 464,172 | | | Vodafone Group PLC (Wireless Telecommunication Services) | | | 1,126 | |
| | | | | | | | |
| | | | | | | 243,208 | |
| | | | | | | | |
| | | | United States — 0.43% | |
| | 2,055 | | | Amazon.com, Inc. (Internet & Direct Marketing Retail) (a) | | | 3,494 | |
| | 677 | | | MercadoLibre, Inc. (Internet Software & Services) | | | 202 | |
| | 12,914 | | | WABCO Holdings, Inc. (Machinery) (a) | | | 1,511 | |
| | | | | | | | |
| | | | | | | 5,207 | |
| | | | | | | | |
| | | | Total Common Stocks | | | 1,056,007 | |
| | | | | | | | |
| | | | Preferred Stocks — 1.79% | | | | |
| | | | Brazil — 0.17% | |
| | 468,795 | | | Petroleo Brasileiro SA — Preferred (Oil, Gas & Consumable Fuels) (a) | | | 2,077 | |
| | | | | | | | |
See accompanying notes to financial statements.
146
HC CAPITAL TRUST
The International Equity Portfolio
Portfolio of Investments (continued) — June 30, 2018
| | | | | | | | |
| Shares | | | Security Description | | Value
(000) | |
| | | | Preferred Stocks (continued) | | | | |
| | | | Germany — 1.62% | |
| | 3,980 | | | Bayerische Motoren Werke Aktiengesellschaft – Preferred (Automobiles) | | $ | 317 | |
| | 27,999 | | | Henkel AG & Co. KGaA – Preferred (Household Products) | | | 3,580 | |
| | 94,635 | | | Volkswagen AG – Preferred (Automobiles) | | | 15,717 | |
| | | | | | | | |
| | | | | | | 19,614 | |
| | | | | | | | |
| | | | Total Preferred Stocks | | | 21,691 | |
| | | | | | | | |
| | | | Right — 0.00% | | | | |
| | | | Italy — 0.00% | |
| | 1,513,457 | | | Intesa Sanpaolo SpA (Banks) (a)(c) | | | — | |
| | | | | | | | |
| | | | Total Right | | | — | |
| | | | | | | | |
Principal
Amount
(000) | | | | | | |
| | | | Time Deposit — 2.14% | | | | |
| $ | 25,972 | | | State Street Liquidity Management Control System Eurodollar Time Deposit, 0.53%, 7/2/18 | | | 25,972 | |
| | | | | | | | |
| | | | Total Time Deposit | | | 25,972 | |
| | | | | | | | |
| Shares | | | | | | |
| | | | Mutual Funds — 1.91% | | | | |
| | 1,369,120 | | | Dreyfus Treasury Prime Cash Management Fund, Institutional Shares, 1.68% (d) | | | 1,369 | |
| | 1,387,283 | | | Federated Treasury Obligations Fund, Institutional Shares, 1.75%^^ (d) | | | 1,387 | |
| | 20,390,734 | | | State Street Institutional Treasury Plus Money Market Fund, Trust Class, 1.72% (d) | | | 20,391 | |
| | | | | | | | |
| | | | Total Mutual Funds | | | 23,147 | |
| | | | | | | | |
| | | | | | | | |
Principal
Amount
(000) | | | Security Description | | Value
(000) | |
| | | | Repurchase Agreement – 0.19% | | | | |
| $ | 2,330 | | | Jefferies LLC, 2.00%, 7/2/18 (Purchased on 6/29/18, proceeds at maturity $2,329,981 collateralized by U.S. Treasury Obligations, 2.50% – 2.92%, 2/15/20 – 2/15/44 fair value $2,376,187)^^ | | $ | 2,330 | |
| | | | | | | | |
| | | | Total Repurchase Agreement | | | 2,330 | |
| | | | | | | | |
| | | | Total Investments (cost $963,374) — 92.95% | | | 1,129,147 | |
| | | | Other assets in excess of liabilities — 7.05% | | | 85,705 | |
| | | | | | | | |
| | | | Net Assets – 100.00% | | $ | 1,214,852 | |
| | | | | | | | |
Amounts designated as “—” are $0 or have been rounded to $0.
| * | Security was fair valued on June 30, 2018 and represents a Level 2 security. Refer to Note 2 in the Notes to Financial Statements. |
| ^ | All or part of this security was on loan as of June 30, 2018. The total value of securities on loan as of June 30, 2018, was $4,489 (amount in thousands). |
| ^^ | Purchased with cash collateral held from securities lending. The value of the collateral could include collateral held for securities that were sold on or before June 30, 2018. |
| (a) | Represents non-income producing security. |
| (b) | Represents a security purchased under Rule 144A or Section 4(2) and is exempt from registration under the Securities Act of 1933, as amended, or is otherwise restricted to resale. Certain of these securities may be resold in transactions exempt from registration, normally to qualified institutional buyers. These securities have been deemed liquid by the Specialist Manager. |
| (c) | This security has been deemed illiquid by the Specialist Manager and represents 0.00% of the Portfolio’s net assets. |
| (d) | The rate disclosed is the rate in effect on June 30, 2018. |
ADR — American Depositary Receipt
FDR—Fiduciary Depositary Receipt
REIT—Real Estate Investment Trust
See accompanying notes to financial statements.
147
HC CAPITAL TRUST
The International Equity Portfolio
Portfolio of Investments (concluded) — June 30, 2018
The following table reflects the percentage of total net assets of the Portfolio attributable to each Specialist Manager as of June 30, 2018.
| | | | | | | | | | | | | | | | | | | | | | | | |
The International Equity Portfolio | | Artisan
Partners LP | | | Cadence Capital
Management, LLC | | | Causeway Capital
Management
LLC | | | Parametric Portfolio
Associates, LLC | | | HC Capital
Solutions | | | Total | |
Common Stocks | | | 13.00 | % | | | 43.40 | % | | | 30.52 | % | | | — | | | | — | | | | 86.92 | % |
Preferred Stocks | | | 0.47 | % | | | 0.03 | % | | | 1.29 | % | | | — | | | | — | | | | 1.79 | % |
Right | | | 0.00 | % | | | — | | | | — | | | | — | | | | — | | | | 0.00 | % |
Time Deposit | | | 0.59 | % | | | — | | | | 1.55 | % | | | — | | | | — | | | | 2.14 | % |
Mutual Funds | | | — | | | | 0.23 | % | | | — | | | | 1.68 | % | | | 0.00 | % | | | 1.91 | % |
Repurchase Agreement | | | — | | | | 0.19 | % | | | — | | | | — | | | | — | | | | 0.19 | % |
Other Assets (Liabilities) | | | 0.03 | % | | | 6.48 | % | | | 0.17 | % | | | 0.37 | % | | | 0.00 | % | | | 7.05 | % |
| | | | | | | | | | | | | | | | | | | | | | | | |
Total Net Assets | | | 14.09 | % | | | 50.33 | % | | | 33.53 | % | | | 2.05 | % | | | 0.00 | % | | | 100.00 | % |
| | | | | | | | | | | | | | | | | | | | | | | | |
Amounts designated as “—” indicate the Specialist Manager did not manage any holdings in that category.
The following table reflects the open derivative positions held by the Portfolio as of June 30, 2018.
Futures Contracts Purchased^
| | | | | | | | | | | | | | | | |
Description | | Number of
Contracts | | | Expiration
Date | | | Notional
Amount
(000) | | | Value and
Unrealized
Appreciation/
(Depreciation)
(000) | |
MSCI EAFE Index Future | | | 1,046 | | | | 9/21/18 | | | $ | 102,268 | | | $ | (2,747 | ) |
| | | | | | | | | | | | | | | | |
| | | | | | | | | | $ | 102,268 | | | $ | (2,747 | ) |
| | | | | | | | | | | | |
Futures Contracts Sold^
| | | | | | | | | | | | | | |
Description | | Number of
Contracts | | Expiration
Date | | | Notional
Amount
(000) | | | Value and
Unrealized
Appreciation/
(Depreciation)
(000) | |
Japanese Yen Future | | 107 | | | 9/17/18 | | | $ | 12,128 | | | $ | 63 | |
| | | | | | | | | | | | | | |
| | | | | $ | 12,128 | | | $ | 63 | |
| | | | | | | | | | | | | | |
| | |
| | Total Unrealized Appreciation | | | $ | 63 | |
| | Total Unrealized Depreciation | | | | (2,747 | ) |
| | | | | | | | | | | | | | |
| | Total Net Unrealized Appreciation/(Depreciation) | | | $ | (2,684 | ) |
| | | | | | | | | | | | | | |
| ^ | Cash has been pledged as collateral for futures contracts held by the Portfolio. |
See accompanying notes to financial statements.
148
HC CAPITAL TRUST
The Institutional International Equity Portfolio
Portfolio of Investments — June 30, 2018
| | | | | | | | |
| Shares | | | Security Description | | Value
(000) | |
| | | | Common Stocks — 90.76% | | | | |
| | | | Australia — 4.50% | |
| | 107,802 | | | AGL Energy Ltd. (Multi-Utilities) | | $ | 1,793 | |
| | 794,934 | | | Alumina Ltd. (Metals & Mining) | | | 1,647 | |
| | 270,053 | | | AMP Ltd. (Diversified Financial Services) | | | 711 | |
| | 195,648 | | | APA Group (Gas Utilities) | | | 1,426 | |
| | 64,582 | | | APN Outdoor Group Ltd. (Media) | | | 300 | |
| | 124,357 | | | Aristocrat Leisure Ltd. (Hotels, Restaurants & Leisure) | | | 2,842 | |
| | 667,314 | | | Aurizon Holdings Ltd. (Road & Rail) | | | 2,138 | |
| | 355,318 | | | AusNet Services (Electric Utilities) | | | 422 | |
| | 400,553 | | | Australia & New Zealand Banking Group Ltd. (Banks) | | | 8,369 | |
| | 56,813 | | | Bank of Queensland Ltd. (Banks) | | | 428 | |
| | 67,062 | | | Bendigo & Adelaide Bank Ltd. (Banks) | | | 538 | |
| | 90,041 | | | BlueScope Steel Ltd. (Metals & Mining) | | | 1,150 | |
| | 16,524 | | | CIMIC Group Ltd. (Construction & Engineering) | | | 517 | |
| | 246,458 | | | Coca-Cola Amatil Ltd. (Beverages) | | | 1,678 | |
| | 8,701 | | | Cochlear Ltd. (Health Care Equipment & Supplies) | | | 1,289 | |
| | 237,910 | | | Commonwealth Bank of Australia (Banks) | | | 12,828 | |
| | 136,812 | | | Crown Resorts Ltd. (Hotels, Restaurants & Leisure) | | | 1,367 | |
| | 54,319 | | | CSL Ltd. (Biotechnology) | | | 7,742 | |
| | 171,020 | | | Dexus Property Group (Equity Real Estate Investment Trusts) | | | 1,229 | |
| | 310,631 | | | GPT Group (Equity Real Estate Investment Trusts) | | | 1,163 | |
| | 224,005 | | | Harvey Norman Holdings Ltd. (Multiline Retail)^ | | | 550 | |
| | 312,698 | | | Insurance Australia Group Ltd. (Insurance) | | | 1,973 | |
| | 200,802 | | | Link Administration Holdings Ltd. (IT Services) | | | 1,089 | |
| | 28,844 | | | Macquarie Group Ltd. (Capital Markets) | | | 2,639 | |
| | 649,333 | | | Mirvac Group (Equity Real Estate Investment Trusts) | | | 1,043 | |
| | 358,425 | | | National Australia Bank Ltd. (Banks) | | | 7,269 | |
| | 283,569 | | | Qantas Airways Ltd. (Airlines) | | | 1,292 | |
| | 2,311 | | | Rio Tinto Ltd. (Metals & Mining) | | | 143 | |
| | 203,651 | | | Saracen Mineral Holdings Ltd. (Metals & Mining) (a) | | | 330 | |
| | 933,347 | | | Scentre Group (Equity Real Estate Investment Trusts) | | | 3,031 | |
| | 33,638 | | | Smartgroup Corp. Ltd. (Commercial Services & Supplies) | | | 290 | |
| | 98,915 | | | South32 Ltd. (Metals & Mining) | | | 264 | |
| | 425,998 | | | Stockland Trust Group (Equity Real Estate Investment Trusts) | | | 1,251 | |
| | 170,883 | | | Suncorp Group Ltd. (Insurance) | | | 1,845 | |
| | 383,362 | | | Sydney Airport (Transportation Infrastructure) | | | 2,031 | |
| | 678,057 | | | Tabcorp Holdings Ltd. (Hotels, Restaurants & Leisure) | | | 2,238 | |
| | 824,154 | | | Telstra Corp. Ltd. (Diversified Telecommunication Services) | | | 1,598 | |
| | 661,474 | | | Transurban Group (Transportation Infrastructure) | | | 5,858 | |
| | | | | | | | |
| Shares | | | Security Description | | Value
(000) | |
| | | | Australia (continued) | | | | |
| | 596,278 | | | Vicinity Centres (Equity Real Estate Investment Trusts) | | $ | 1,143 | |
| | 265,236 | | | Wesfarmers Ltd. (Food & Staples Retailing) | | | 9,687 | |
| | 457,481 | | | Westpac Banking Corp. (Banks) | | | 9,918 | |
| | | | | | | | |
| | | | | | | 105,059 | |
| | | | | | | | |
| | | | Austria — 0.11% | |
| | 6,457 | | | ANDRITZ AG (Machinery) | | | 343 | |
| | 19,751 | | | Erste Group Bank AG (Banks) | | | 824 | |
| | 10,944 | | | OMV AG (Oil, Gas & Consumable Fuels) | | | 621 | |
| | 17,276 | | | Voestalpine AG (Metals & Mining) | | | 796 | |
| | | | | | | | |
| | | | | | | 2,584 | |
| | | | | | | | |
| | | | Belgium — 0.60% | |
| | 11,909 | | | Ageas (Insurance)^ | | | 601 | |
| | 117,158 | | | Anheuser-Busch InBev N.V. (Beverages) | | | 11,834 | |
| | 15,442 | | | Belgacom SA (Diversified Telecommunication Services) | | | 348 | |
| | 14,378 | | | KBC Groep N.V. (Banks) | | | 1,110 | |
| | | | | | | | |
| | | | | | | 13,893 | |
| | | | | | | | |
| | | | Bermuda — 0.03% | |
| | 224,000 | | | Yue Yuen Industrial Holdings Ltd. (Textiles, Apparel & Luxury Goods) | | | 632 | |
| | | | | | | | |
| | | | Brazil — 0.15% | |
| | 89,982 | | | B3 SA (Capital Markets) | | | 477 | |
| | 305,448 | | | Petroleo Brasileiro SA, ADR (Oil, Gas & Consumable Fuels) | | | 3,064 | |
| | | | | | | | |
| | | | | | | 3,541 | |
| | | | | | | | |
| | | | Canada — 1.89% | |
| | 13,798 | | | Canadian Imperial Bank of Commerce (Banks) | | | 1,200 | |
| | 55,818 | | | Canadian Pacific Railway Ltd. (Road & Rail) | | | 10,231 | |
| | 28,406 | | | Canadian Pacific Railway Ltd. (Road & Rail) | | | 5,199 | |
| | 773,725 | | | Encana Corp. (Oil, Gas & Consumable Fuels) | | | 10,106 | |
| | 221,049 | | | Gildan Activewear, Inc. (Textiles, Apparel & Luxury Goods) | | | 6,227 | |
| | 622,631 | | | Manulife Financial Corp. (Insurance) | | | 11,188 | |
| | | | | | | | |
| | | | | | | 44,151 | |
| | | | | | | | |
| | | | China — 1.80% | |
| | 13,761 | | | Alibaba Group Holding Ltd., ADR (Internet Software & Services) (a) | | | 2,553 | |
| | 48,400 | | | Baidu, Inc., ADR (Internet Software & Services) (a) | | | 11,760 | |
| | 1,004,827 | | | China Merchants Holdings (International) Co. Ltd. (Transportation Infrastructure) | | | 2,042 | |
| | 1,576,482 | | | China Mobile Ltd. (Wireless Telecommunication Services) | | | 14,006 | |
| | 33,900 | | | Jardine Matheson Holdings Ltd. (Industrial Conglomerates) | | | 2,139 | |
| | 4,440 | | | Kweichow Moutai Co. Ltd. (Beverages) | | | 490 | |
| | 9,601 | | | NetEase, Inc., ADR (Internet Software & Services) | | | 2,426 | |
| | 340,500 | | | Ping An Insurance (Group) Company of China Ltd. (Insurance) | | | 3,134 | |
See accompanying notes to financial statements.
149
HC CAPITAL TRUST
The Institutional International Equity Portfolio
Portfolio of Investments (continued) — June 30, 2018
| | | | | | | | |
| Shares | | | Security Description | | Value
(000) | |
| | | | Common Stocks (continued) | | | | |
| | | | China (continued) | |
| | 51,300 | | | Tencent Holdings Ltd. (Internet Software & Services) | | $ | 2,575 | |
| | 9,583 | | | Weibo Corp., ADR (Internet Software & Services) (a) | | | 851 | |
| | | | | | | | |
| | | | | | | 41,976 | |
| | | | | | | | |
| | | | Denmark — 1.22% | |
| | 16,741 | | | Carlsberg A/S, Class – B (Beverages) | | | 1,972 | |
| | 16,642 | | | Christian Hansen Holding A/S (Chemicals) | | | 1,538 | |
| | 71,540 | | | Danske Bank A/S (Banks) | | | 2,240 | |
| | 14,735 | | | Dong Energy A/S (Electric Utilities) | | | 892 | |
| | 10,426 | | | Genmab A/S (Biotechnology) (a) | | | 1,610 | |
| | 6,364 | | | H. Lundbeck A/S (Pharmaceuticals) | | | 447 | |
| | 29,142 | | | ISS A/S (Commercial Services & Supplies) | | | 1,002 | |
| | 350,242 | | | Novo Nordisk A/S, Class – B (Pharmaceuticals) | | | 16,251 | |
| | 10,029 | | | Tryg A/S (Insurance) | | | 236 | |
| | 36,381 | | | Vestas Wind Systems A/S (Electrical Equipment) | | | 2,253 | |
| | | | | | | | |
| | | | | | | 28,441 | |
| | | | | | | | |
| | | | Finland — 0.61% | |
| | 32,420 | | | DNA OYJ (Diversified Telecommunication Services) | | | 776 | |
| | 37,718 | | | Elisa Oyj (Diversified Telecommunication Services) | | | 1,747 | |
| | 141,836 | | | Fortum Oyj (Electric Utilities) | | | 3,385 | |
| | 61,393 | | | Nokian Renkaat Oyj (Auto Components) | | | 2,426 | |
| | 57,049 | | | Orion Oyj, Class – B (Pharmaceuticals) | | | 1,538 | |
| | 90,588 | | | Sampo Oyj, Class – A (Insurance) | | | 4,422 | |
| | | | | | | | |
| | | | | | | 14,294 | |
| | | | | | | | |
| | | | France — 7.34% | |
| | 65,540 | | | Air France-KLM (Airlines) (a) | | | 534 | |
| | 27,334 | | | Air Liquide SA (Chemicals) | | | 3,438 | |
| | 4,612 | | | Amundi SA (Capital Markets) | | | 320 | |
| | 21,926 | | | Atos SE (IT Services) | | | 2,994 | |
| | 410,685 | | | AXA SA (Insurance) | | | 10,078 | |
| | 301,524 | | | BNP Paribas (Banks) | | | 18,727 | |
| | 55,291 | | | Bouygues SA (Construction & Engineering) | | | 2,383 | |
| | 140,313 | | | Carrefour SA (Food & Staples Retailing)^ | | | 2,272 | |
| | 14,059 | | | Casino Guichard-Perrachon SA (Food & Staples Retailing) | | | 546 | |
| | 16,691 | | | CNP Assurances (Insurance) | | | 380 | |
| | 145,653 | | | Credit Agricole SA (Banks) | | | 1,945 | |
| | 28,020 | | | Eiffage SA (Construction & Engineering) (b) | | | 3,049 | |
| | 492,390 | | | ENGIE (Multi-Utilities) | | | 7,549 | |
| | 44,887 | | | Eutelsat Communications (Media) | | | 931 | |
| | 14,049 | | | Faurecia (Auto Components) | | | 1,003 | |
| | 4,280 | | | Fonciere des Regions (Equity Real Estate Investment Trusts) | | | 445 | |
| | 5,962 | | | Gecina SA (Equity Real Estate Investment Trusts) | | | 998 | |
| | 4,961 | | | Icade (Equity Real Estate Investment Trusts) | | | 465 | |
| | | | | | | | |
| Shares | | | Security Description | | Value
(000) | |
| | | | France (continued) | |
| | 14,278 | | | Ingenico Group SA (Electronic Equipment, Instruments & Components) | | $ | 1,284 | |
| | 14,441 | | | Ipsen SA (Pharmaceuticals) | | | 2,266 | |
| | 28,299 | | | Klepierre (Equity Real Estate Investment Trusts) | | | 1,066 | |
| | 7,981 | | | L’Oreal SA (Personal Products) | | | 1,971 | |
| | 96,913 | | | Natixism SA (Banks) | | | 688 | |
| | 6,506 | | | Nexity (Real Estate Management & Development) | | | 411 | |
| | 246,078 | | | Orange (Diversified Telecommunication Services) | | | 4,122 | |
| | 111,246 | | | Peugeot SA (Automobiles) | | | 2,541 | |
| | 48,621 | | | Publicis Groupe (Media) | | | 3,346 | |
| | 45,960 | | | Renault SA (Automobiles)^ | | | 3,909 | |
| | 72,309 | | | Rexel SA (Trading Companies & Distributors) | | | 1,040 | |
| | 24,720 | | | Safran SA (Aerospace & Defense) | | | 3,003 | |
| | 240,026 | | | Sanofi-Aventis (Pharmaceuticals) | | | 19,241 | |
| | 261,607 | | | Schneider Electric SA (Electrical Equipment) | | | 21,817 | |
| | 17,335 | | | SCOR SE (Insurance) | | | 644 | |
| | 6,995 | | | Societe BIC SA (Commercial Services & Supplies) | | | 649 | |
| | 118,754 | | | Societe Generale (Banks) | | | 5,008 | |
| | 21,320 | | | Sodexo (Hotels, Restaurants & Leisure)^ | | | 2,132 | |
| | 48,807 | | | Suez Environnement Co. (Multi-Utilities) | | | 633 | |
| | 2,715 | | | Thales SA (Aerospace & Defense) | | | 350 | |
| | 504,160 | | | Total SA (Oil, Gas & Consumable Fuels) | | | 30,736 | |
| | 13,873 | | | Unibail-Rodamco-Westfield (Equity Real Estate Investment Trusts) | | | 3,054 | |
| | 60,922 | | | Veolia Environnement (Multi-Utilities) | | | 1,304 | |
| | 20,565 | | | Vinci SA (Construction & Engineering) | | | 1,978 | |
| | | | | | | | |
| | | | | | | 171,250 | |
| | | | | | | | |
| | | | Germany — 9.31% | |
| | 76,517 | | | Allianz SE (Insurance) | | | 15,816 | |
| | 8,164 | | | Axel Springer AG (Media) | | | 591 | |
| | 293,226 | | | BASF SE (Chemicals) | | | 28,046 | |
| | 108,557 | | | Bayer AG (Pharmaceuticals) | | | 11,960 | |
| | 55,415 | | | Bayerische Motoren Werke Aktiengesellschaft (Automobiles) | | | 5,023 | |
| | 36,697 | | | Beiersdorf AG (Personal Products) | | | 4,167 | |
| | 17,497 | | | Continental AG (Auto Components) | | | 3,995 | |
| | 82,308 | | | Covestro AG (Chemicals) | | | 7,345 | |
| | 163,753 | | | Daimler AG, Registered Shares (Automobiles) | | | 10,542 | |
| | 100,991 | | | Deutsche Boerse AG (Capital Markets) | | | 13,461 | |
| | 134,378 | | | Deutsche Lufthansa AG, Registered Shares (Airlines) | | | 3,232 | |
| | 353,777 | | | Deutsche Post AG (Air Freight & Logistics) | | | 11,555 | |
| | 330,883 | | | Deutsche Telekom AG (Diversified Telecommunication Services) | | | 5,127 | |
| | 4,866 | | | Drillisch AG (Wireless Telecommunication Services) | | | 277 | |
| | 27,173 | | | Evonik Industries AG (Chemicals) | | | 931 | |
| | 4,054 | | | Hannover Rueckversicherung AG (Insurance) | | | 506 | |
See accompanying notes to financial statements.
150
HC CAPITAL TRUST
The Institutional International Equity Portfolio
Portfolio of Investments (continued) — June 30, 2018
| | | | | | | | |
| Shares | | | Security Description | | Value
(000) | |
| | | | Common Stocks (continued) | | | | |
| | | | Germany (continued) | |
| | 21,699 | | | Hugo Boss AG (Textiles, Apparel & Luxury Goods) | | $ | 1,970 | |
| | 22,990 | | | Infineon Technologies AG (Semiconductors & Semiconductor Equipment) | | | 586 | |
| | 132,817 | | | Linde AG (Chemicals) | | | 31,686 | |
| | 6,107 | | | MAN SE (Machinery) | | | 691 | |
| | 29,982 | | | Metro AG (Food & Staples Retailing) | | | 371 | |
| | 9,909 | | | Muenchener Rueckversicherungs-Gesellschaft AG (Insurance) | | | 2,095 | |
| | 40,726 | | | ProSiebenSat.1 Media AG (Media) | | | 1,033 | |
| | 8,027 | | | Rheinmetall AG (Industrial Conglomerates) | | | 886 | |
| | 218,142 | | | SAP SE (Software) | | | 25,205 | |
| | 72,401 | | | Schaeffler AG (Auto Components) | | | 943 | |
| | 99,177 | | | Siemens AG (Industrial Conglomerates) | | | 13,112 | |
| | 7,108 | | | Siltronic AG (Semiconductors & Semiconductor Equipment) | | | 1,017 | |
| | 7,487 | | | Symrise AG (Chemicals) | | | 657 | |
| | 66,176 | | | Telefonica Deutschland Holding AG (Diversified Telecommunication Services) | | | 261 | |
| | 39,635 | | | Vonovia SE (Real Estate Management & Development) | | | 1,886 | |
| | 77,124 | | | Wirecard AG (IT Services) | | | 12,424 | |
| | | | | | | | |
| | | | | | | 217,397 | |
| | | | | | | | |
| | | | Hong Kong — 2.18% | |
| | 765,718 | | | AIA Group Ltd. (Insurance) (b) | | | 6,695 | |
| | 431,005 | | | BOC Hong Kong (Holdings) Ltd. (Banks) | | | 2,030 | |
| | 216,000 | | | CK Asset Holdings Ltd. (Real Estate Management & Development) | | | 1,715 | |
| | 679,000 | | | CK Hutchison Holdings Ltd. (Industrial Conglomerates) | | | 7,201 | |
| | 103,000 | | | CK Infrastructure Holdings Ltd. (Electric Utilities) | | | 763 | |
| | 251,419 | | | CLP Holdings Ltd. (Electric Utilities) | | | 2,708 | |
| | 21,983 | | | Global Cord Blood Corp. (Health Care Providers & Services) (a) | | | 209 | |
| | 588,000 | | | Hanergy Thin Film Power Group Ltd. (Semiconductors & Semiconductor Equipment) (a) | | | — | |
| | 326,000 | | | Hang Lung Properties Ltd. (Real Estate Management & Development) | | | 672 | |
| | 87,709 | | | Hang Seng Bank Ltd. (Banks) | | | 2,194 | |
| | 204,414 | | | Henderson Land Development Co. Ltd. (Real Estate Management & Development) | | | 1,081 | |
| | 423,377 | | | HK Electric Investments Ltd. (Electric Utilities) | | | 404 | |
| | 581,000 | | | HKT Trust & HKT Ltd. (Diversified Telecommunication Services) | | | 742 | |
| | 44,300 | | | Hong Kong Exchanges & Clearing Ltd. (Capital Markets) | | | 1,333 | |
| | 180,400 | | | Hongkong Land Holdings Ltd. (Real Estate Management & Development) | | | 1,290 | |
| | 98,000 | | | Hysan Development Co. (Real Estate Management & Development) | | | 547 | |
| | 100,000 | | | Kerry Properties Ltd. (Real Estate Management & Development) | | | 479 | |
| | | | | | | | |
| Shares | | | Security Description | | Value
(000) | |
| | | | Hong Kong (continued) | |
| | 1,806,000 | | | Li & Fung Ltd. (Textiles, Apparel & Luxury Goods) | | $ | 663 | |
| | 903,000 | | | New World Development Co. Ltd. (Real Estate Management & Development) | | | 1,271 | |
| | 229,000 | | | NWS Holdings Ltd. (Industrial Conglomerates) | | | 396 | |
| | 639,000 | | | PCCW Ltd. (Diversified Telecommunication Services) | | | 360 | |
| | 214,538 | | | Power Assets Holdings Ltd. (Electric Utilities) | | | 1,500 | |
| | 479,839 | | | Sino Land Co. Ltd. (Real Estate Management & Development) | | | 780 | |
| | 222,040 | | | Sun Hung Kai Properties Ltd. (Real Estate Management & Development) | | | 3,350 | |
| | 82,326 | | | Swire Pacific Ltd., Class – A (Real Estate Management & Development) | | | 872 | |
| | 180,200 | | | Swire Properties Ltd. (Real Estate Management & Development) | | | 666 | |
| | 52,500 | | | Techtronic Industries Co. (Household Durables) | | | 293 | |
| | 142,000 | | | The Bank of East Asia Ltd. (Banks) | | | 567 | |
| | 339,826 | | | The Link Real Estate Investment Trust (Equity Real Estate Investment Trusts) | | | 3,104 | |
| | 786,000 | | | The Wharf (Holdings) Ltd. (Real Estate Management & Development) | | | 2,525 | |
| | 3,276,500 | | | WH Group Ltd. (Food Products) | | | 2,669 | |
| | 90,000 | | | Wharf Real Estate Investment Co. Ltd. (Real Estate Management & Development) | | | 641 | |
| | 129,000 | | | Wheelock & Co. Ltd. (Real Estate Management & Development) | | | 899 | |
| | 112,000 | | | Wynn Macau Ltd. (Hotels, Restaurants & Leisure) | | | 360 | |
| | | | | | | | |
| | | | | | | 50,979 | |
| | | | | | | | |
| | | | Indonesia — 0.05% | |
| | 6,127,100 | | | PT Bank Rakyat Indonesia Persero Tbk (Banks) | | | 1,215 | |
| | | | | | | | |
| | | | Ireland (Republic of) — 0.65% | |
| | 87,728 | | | CRH PLC (Construction Materials) | | | 3,109 | |
| | 100,203 | | | Experian PLC (Professional Services) | | | 2,478 | |
| | 5,177 | | | ICON PLC (Life Sciences Tools & Services) (a) | | | 686 | |
| | 81,800 | | | Medtronic PLC (Health Care Equipment & Supplies) | | | 7,003 | |
| | 8,371 | | | Paddy Power PLC (Hotels, Restaurants & Leisure) | | | 929 | |
| | 23,918 | | | Smurfit Kappa Group PLC (Containers & Packaging) | | | 969 | |
| | | | | | | | |
| | | | | | | 15,174 | |
| | | | | | | | |
| | | | Israel — 0.25% | |
| | 3,282 | | | Azrieli Group (Real Estate Management & Development) | | | 163 | |
| | 212,021 | | | Bank Hapoalim Ltd. (Banks) | | | 1,436 | |
| | 42,520 | | | Bank Leumi Le (Banks) | | | 251 | |
| | 643,873 | | | Bezeq The Israeli Telecommunication Corp. Ltd. (Diversified Telecommunication Services) | | | 725 | |
| | 320,942 | | | Israel Chemicals Ltd. (Chemicals) | | | 1,466 | |
| | 6,030 | | | Mizrahi Tefahot Bank Ltd. (Banks) | | | 111 | |
| | 73,522 | | | Teva Pharmaceutical Industries Ltd., ADR (Pharmaceuticals) | | | 1,788 | |
| | | | | | | | |
| | | | | | | 5,940 | |
| | | | | | | | |
See accompanying notes to financial statements.
151
HC CAPITAL TRUST
The Institutional International Equity Portfolio
Portfolio of Investments (continued) — June 30, 2018
| | | | | | | | |
| Shares | | | Security Description | | Value
(000) | |
| | | | Common Stocks (continued) | | | | |
| | | | Italy — 2.32% | |
| | 327,723 | | | Assicurazioni Generali SpA (Insurance) | | $ | 5,499 | |
| | 69,263 | | | Atlantia SpA (Transportation Infrastructure) | | | 2,048 | |
| | 1,455,070 | | | Enel SpA (Electric Utilities) | | | 8,082 | |
| | 391,146 | | | Eni SpA (Oil, Gas & Consumable Fuels) | | | 7,265 | |
| | 51,403 | | | Fiat DaimlerChrysler Automobiles NV (Automobiles) | | | 980 | |
| | 3,248,873 | | | Intesa Sanpaolo SpA (Banks) | | | 9,433 | |
| | 64,520 | | | Intesa Sanpaolo SpA (Banks) | | | 196 | |
| | 35,545 | | | Mediobanca SpA (Banks) | | | 330 | |
| | 35,296 | | | Poste Italiane SpA (Insurance) | | | 296 | |
| | 374,083 | | | Snam Rete Gas SpA (Oil, Gas & Consumable Fuels) | | | 1,562 | |
| | 602,917 | | | Telecom Italia SpA (Diversified Telecommunication Services) | | | 394 | |
| | 115,703 | | | Terna – Rete Elettrica Nazionale SpA (Electric Utilities) | | | 626 | |
| | 1,047,476 | | | Unicredit SpA (Banks) | | | 17,487 | |
| | | | | | | | |
| | | | | | | 54,198 | |
| | | | | | | | |
| | | | Japan — 18.68% | |
| | 7,600 | | | ABC-Mart, Inc. (Specialty Retail) | | | 416 | |
| | 25,600 | | | Adastria Co. Ltd. (Specialty Retail)^ | | | 325 | |
| | 8,800 | | | AEON Credit Service Co. Ltd. (Consumer Finance) | | | 188 | |
| | 35,400 | | | Aisin Seiki Co. Ltd. (Auto Components) | | | 1,615 | |
| | 73,600 | | | Amada Holdings Co. Ltd. (Machinery) | | | 708 | |
| | 10,500 | | | Aozora Bank Ltd. (Banks) | | | 400 | |
| | 91,515 | | | Asahi Glass Co. Ltd. (Building Products) | | | 3,567 | |
| | 252,700 | | | Asahi Kasei Corp. (Chemicals) | | | 3,214 | |
| | 418,400 | | | Astellas Pharma, Inc. (Pharmaceuticals) | | | 6,384 | |
| | 16,749 | | | Benesse Holdings, Inc. (Diversified Consumer Services) | | | 595 | |
| | 134,500 | | | Bridgestone Corp. (Auto Components) | | | 5,264 | |
| | 48,500 | | | Brother Industries Ltd. (Technology Hardware, Storage & Peripherals) | | | 959 | |
| | 82,500 | | | CALBEE, Inc. (Food Products) | | | 3,104 | |
| | 296,267 | | | Canon, Inc. (Technology Hardware, Storage & Peripherals)^ | | | 9,718 | |
| | 48,000 | | | Casio Computer Co. Ltd. (Household Durables) | | | 781 | |
| | 65,100 | | | Chubu Electric Power Company, Inc. (Electric Utilities) | | | 977 | |
| | 91,500 | | | Concordia Financial Group Ltd. (Banks) | | | 466 | |
| | 54,439 | | | Dai Nippon Printing Co. Ltd. (Commercial Services & Supplies) | | | 1,219 | |
| | 207,900 | | | Daicel Corp. (Chemicals) | | | 2,302 | |
| | 125,491 | | | Daiichi Sankyo Co. Ltd. (Pharmaceuticals) | | | 4,803 | |
| | 16,667 | | | Daito Trust Construction Co. Ltd. (Real Estate Management & Development) | | | 2,712 | |
| | 150,600 | | | Daiwa House Industry Co. Ltd. (Real Estate Management & Development) | | | 5,136 | |
| | 181 | | | Daiwa House REIT Investment Corp. (Equity Real Estate Investment Trusts) | | | 430 | |
| | 94,300 | | | Daiwa Securities Group, Inc. (Capital Markets) | | | 548 | |
| | 21,700 | | | DeNA Co. Ltd. (Internet Software & Services) | | | 407 | |
| | | | | | | | |
| Shares | | | Security Description | | Value
(000) | |
| | | | Japan (continued) | |
| | 113,700 | | | Denso Corp. (Auto Components) | | $ | 5,558 | |
| | 144,200 | | | East Japan Railway Co. (Road & Rail) | | | 13,827 | |
| | 52,671 | | | Eisai Co. Ltd. (Pharmaceuticals) | | | 3,713 | |
| | 17,600 | | | Electric Power Development Co. Ltd. (Independent Power & Renewable Electricity Producers) | | | 455 | |
| | 39,500 | | | Fanuc Ltd. (Machinery) | | | 7,852 | |
| | 129,794 | | | Fuji Heavy Industries Ltd. (Automobiles) | | | 3,781 | |
| | 119,000 | | | FUJIFILM Holdings Corp. (Technology Hardware, Storage & Peripherals) | | | 4,650 | |
| | 401,000 | | | Fujitsu Ltd. (IT Services) | | | 2,434 | |
| | 66,000 | | | Fukuoka Financial Group, Inc. (Banks) | | | 332 | |
| | 124,500 | | | HASEKO Corp. (Household Durables) | | | 1,722 | |
| | 55,300 | | | Hino Motors Ltd. (Machinery) | | | 591 | |
| | 22,400 | | | Hitachi Chemical Co. Ltd. (Chemicals) | | | 452 | |
| | 22,400 | | | Hitachi Construction Machinery Co. Ltd. (Machinery) | | | 728 | |
| | 1,203,000 | | | Hitachi Ltd. (Electronic Equipment, Instruments & Components) | | | 8,493 | |
| | 45,600 | | | Hitachi Metals Ltd. (Metals & Mining) | | | 474 | |
| | 355,024 | | | Honda Motor Co. Ltd. (Automobiles) | | | 10,432 | |
| | 31,500 | | | Hulic Co. Ltd. (Real Estate Management & Development) | | | 337 | |
| | 34,300 | | | Iida Group Holdings Co. Ltd. (Household Durables) | | | 662 | |
| | 126,200 | | | Isuzu Motors Ltd. (Automobiles) | | | 1,678 | |
| | 301,668 | | | ITOCHU Corp. (Trading Companies & Distributors) | | | 5,471 | |
| | 39,500 | | | ITOCHU Techno-Solutions Corp. (IT Services) | | | 683 | |
| | 350,700 | | | Japan Airlines Co. Ltd. (Airlines) | | | 12,444 | |
| | 89,000 | | | Japan Exchange Group, Inc. (Capital Markets) | | | 1,656 | |
| | 38,300 | | | Japan Post Bank Co. Ltd. (Banks) | | | 446 | |
| | 283,800 | | | Japan Post Holdings Co. Ltd. (Insurance) | | | 3,110 | |
| | 94 | | | Japan Prime Realty Investment Corp. (Equity Real Estate Investment Trusts) | | | 342 | |
| | 142 | | | Japan Real Estate Investment Corp. (Equity Real Estate Investment Trusts) | | | 752 | |
| | 281 | | | Japan Retail Fund Investment Corp. (Equity Real Estate Investment Trusts) | | | 507 | |
| | 225,897 | | | Japan Tobacco, Inc. (Tobacco) | | | 6,316 | |
| | 43,200 | | | JFE Holdings, Inc. (Metals & Mining) | | | 818 | |
| | 55,745 | | | JS Group Corp. (Building Products) | | | 1,116 | |
| | 38,083 | | | JSR Corp. (Chemicals) | | | 649 | |
| | 50,200 | | | JTEKT Corp. (Machinery) | | | 684 | |
| | 650,818 | | | JX Holdings, Inc. (Oil, Gas & Consumable Fuels) | | | 4,528 | |
| | 190,000 | | | Kajima Corp. (Construction & Engineering) | | | 1,473 | |
| | 28,600 | | | Kakaku.com, Inc. (Internet Software & Services) | | | 646 | |
| | 9,000 | | | Kao Corp. (Personal Products) | | | 687 | |
| | 722,000 | | | KDDI Corp. (Wireless Telecommunication Services) | | | 19,768 | |
| | 194,700 | | | Komatsu Ltd. (Machinery) | | | 5,572 | |
| | 102,000 | | | Konica Minolta, Inc. (Technology Hardware, Storage & Peripherals) | | | 948 | |
| | 73,629 | | | Kuraray Co. Ltd. (Chemicals) | | | 1,015 | |
See accompanying notes to financial statements.
152
HC CAPITAL TRUST
The Institutional International Equity Portfolio
Portfolio of Investments (continued) — June 30, 2018
| | | | | | | | |
| Shares | | | Security Description | | Value
(000) | |
| | | | Common Stocks (continued) | | | | |
| | | | Japan (continued) | |
| | 66,700 | | | Kyocera Corp. (Electronic Equipment, Instruments & Components) | | $ | 3,764 | |
| | 32,200 | | | Kyushu Railway Co. (Road & Rail) | | | 986 | |
| | 12,426 | | | Lawson, Inc. (Food & Staples Retailing) | | | 777 | |
| | 23,500 | | | Maeda Corp. (Construction & Engineering) | | | 270 | |
| | 330,931 | | | Marubeni Corp. (Trading Companies & Distributors) | | | 2,526 | |
| | 12,577 | | | Maruichi Steel Tube Ltd. (Metals & Mining) | | | 427 | |
| | 83,200 | | | Mebuki Financial Group, Inc. (Banks) | | | 280 | |
| | 7,400 | | | Miraca Holdings, Inc. (Health Care Providers & Services) | | | 221 | |
| | 288,400 | | | Mitsubishi Chemical Holdings Corp. (Chemicals) | | | 2,416 | |
| | 301,040 | | | Mitsubishi Corp. (Trading Companies & Distributors) | | | 8,371 | |
| | 474,300 | | | Mitsubishi Electric Corp. (Electrical Equipment) | | | 6,318 | |
| | 66,400 | | | Mitsubishi Heavy Industries Ltd. (Machinery) | | | 2,418 | |
| | 24,000 | | | Mitsubishi Materials Corp. (Metals & Mining) | | | 660 | |
| | 45,143 | | | Mitsubishi Tanabe Pharma Corp. (Pharmaceuticals) | | | 781 | |
| | 2,043,482 | | | Mitsubishi UFJ Financial Group, Inc. (Banks) | | | 11,649 | |
| | 25,700 | | | Mitsubishi UFJ Lease & Finance Co. Ltd. (Diversified Financial Services) | | | 158 | |
| | 341,626 | | | Mitsui & Co. Ltd. (Trading Companies & Distributors) | | | 5,701 | |
| | 38,800 | | | Mitsui Chemicals, Inc. (Chemicals) | | | 1,034 | |
| | 1,867,092 | | | Mizuho Financial Group, Inc. (Banks) | | | 3,146 | |
| | 129,000 | | | MS&AD Insurance Group Holdings, Inc. (Insurance) | | | 4,013 | |
| | 38,200 | | | Namco Bandai Holdings, Inc. (Leisure Products) | | | 1,577 | |
| | 51,800 | | | NEC Corp. (Technology Hardware, Storage & Peripherals) | | | 1,423 | |
| | 53,800 | | | NGK Insulators Ltd. (Machinery) | | | 959 | |
| | 39,700 | | | NH Foods Ltd. (Food Products) | | | 1,605 | |
| | 155 | | | Nippon Building Fund, Inc. (Equity Real Estate Investment Trusts) | | | 894 | |
| | 19,400 | | | Nippon Electric Glass Co. Ltd. (Electronic Equipment, Instruments & Components) | | | 540 | |
| | 91,800 | | | Nippon Light Metal Holdings Co. (Metals & Mining) | | | 206 | |
| | 198 | | | Nippon Prologis REIT, Inc. (Equity Real Estate Investment Trusts) | | | 411 | |
| | 175,300 | | | Nippon Steel & Sumitomo Metal Corp. (Metals & Mining) | | | 3,445 | |
| | 69,300 | | | Nippon Telegraph & Telephone Corp. (Diversified Telecommunication Services) | | | 3,153 | |
| | 42,500 | | | Nishimatsu Construction Co. Ltd. (Construction & Engineering) | | | 1,221 | |
| | 895,279 | | | Nissan Motor Co. Ltd. (Automobiles) | | | 8,718 | |
| | 19,500 | | | Nitto Denko Corp. (Chemicals) | | | 1,477 | |
| | 24,400 | | | NOK Corp. (Auto Components) | | | 473 | |
| | | | | | | | |
| Shares | | | Security Description | | Value
(000) | |
| | | | Japan (continued) | |
| | 189,300 | | | Nomura Holdings, Inc. (Capital Markets) | | $ | 920 | |
| | 14,900 | | | Nomura Real Estate Holdings, Inc. (Real Estate Management & Development) | | | 331 | |
| | 432 | | | Nomura Real Estate Master Fund, Inc. (Equity Real Estate Investment Trusts) | | | 610 | |
| | 26,700 | | | Nomura Research Institute Ltd. (IT Services) | | | 1,295 | |
| | 381,400 | | | NTT DoCoMo, Inc. (Wireless Telecommunication Services) | | | 9,724 | |
| | 133,200 | | | Obayashi Corp. (Construction & Engineering) | | | 1,387 | |
| | 16,700 | | | Okumura Corp. (Construction & Engineering) | | | 545 | |
| | 40,300 | | | OMRON Corp. (Electronic Equipment, Instruments & Components) | | | 1,882 | |
| | 7,700 | | | Oracle Corp. Japan (Software) | | | 629 | |
| | 280,500 | | | ORIX Corp. (Diversified Financial Services) | | | 4,439 | |
| | 39,195 | | | Osaka Gas Co. Ltd. (Gas Utilities) | | | 812 | |
| | 78,681 | | | Otsuka Holdings Co. Ltd. (Pharmaceuticals) | | | 3,813 | |
| | 25,100 | | | Park24 Co. Ltd. (Commercial Services & Supplies) | | | 684 | |
| | 71,000 | | | Prima Meat Packers Ltd. (Food Products) | | | 411 | |
| | 170,385 | | | Resona Holdings, Inc. (Banks) | | | 912 | |
| | 138,200 | | | Ricoh Co. Ltd. (Technology Hardware, Storage & Peripherals) | | | 1,268 | |
| | 17,400 | | | Rohm Co. Ltd. (Semiconductors & Semiconductor Equipment) | | | 1,462 | |
| | 11,204 | | | Sankyo Co. Ltd. (Leisure Products) | | | 439 | |
| | 11,600 | | | SBI Holdings, Inc. (Capital Markets) | | | 299 | |
| | 40,300 | | | Sega Sammy Holdings, Inc. (Leisure Products) | | | 691 | |
| | 58,769 | | | Seiko Epson Corp. (Technology Hardware, Storage & Peripherals) | | | 1,022 | |
| | 81,100 | | | Sekisui Chemical Co. Ltd. (Household Durables) | | | 1,383 | |
| | 119,965 | | | Sekisui House Ltd. (Household Durables) | | | 2,125 | |
| | 183,500 | | | Seven & I Holdings Co. Ltd. (Food & Staples Retailing) | | | 8,008 | |
| | 54,100 | | | Seven Bank Ltd. (Banks) | | | 166 | |
| | 4,700 | | | Shimamura Co. Ltd. (Specialty Retail) | | | 414 | |
| | 2,800 | | | Shin-Etsu Chemical Co. Ltd. (Chemicals) | | | 250 | |
| | 19,300 | | | Shionogi & Co. Ltd. (Pharmaceuticals) | | | 992 | |
| | 43,400 | | | Showa Shell Sekiyu KK (Oil, Gas & Consumable Fuels) | | | 648 | |
| | 266,500 | | | Sompo Japan Nipponkoa Holdings, Inc. (Insurance) | | | 10,785 | |
| | 16,700 | | | Sony Financial Holdings, Inc. (Insurance) | | | 319 | |
| | 36,300 | | | Start Today Co. Ltd. (Internet & Direct Marketing Retail) | | | 1,317 | |
| | 330,000 | | | Sumitomo Chemical Co. Ltd. (Chemicals) | | | 1,872 | |
| | 241,500 | | | Sumitomo Corp. (Trading Companies & Distributors) | | | 3,970 | |
| | 157,600 | | | Sumitomo Electric Industries Ltd. (Auto Components) | | | 2,349 | |
| | 60,089 | | | Sumitomo Metal Mining Co. Ltd. (Metals & Mining) | | | 2,300 | |
| | 253,623 | | | Sumitomo Mitsui Financial Group, Inc. (Banks) | | | 9,864 | |
See accompanying notes to financial statements.
153
HC CAPITAL TRUST
The Institutional International Equity Portfolio
Portfolio of Investments (continued) — June 30, 2018
| | | | | | | | |
| Shares | | | Security Description | | Value
(000) | |
| | | | Common Stocks (continued) | | | | |
| | | | Japan (continued) | |
| | 26,300 | | | Sumitomo Mitsui Trust Holdings, Inc. (Banks) | | $ | 1,044 | |
| | 39,031 | | | Sumitomo Rubber Industries Ltd. (Auto Components) | | | 621 | |
| | 47,800 | | | T&D Holdings, Inc. (Insurance) | | | 719 | |
| | 37,100 | | | Taisei Corp. (Construction & Engineering) | | | 2,048 | |
| | 481,285 | | | Takeda Pharmaceutical Co. Ltd. (Pharmaceuticals) | | | 20,337 | |
| | 74,100 | | | Teijin Ltd. (Chemicals) | | | 1,360 | |
| | 39,100 | | | The Chiba Bank Ltd. (Banks) | | | 277 | |
| | 31,700 | | | The Chugoku Electric Power Company, Inc. (Electric Utilities) | | | 410 | |
| | 132,600 | | | The Dai-ichi Life Insurance Co. Ltd. (Insurance) | | | 2,367 | |
| | 71,700 | | | The Kansai Electric Power Co., Inc. (Electric Utilities) | | | 1,047 | |
| | 43,000 | | | The Shizuoka Bank Ltd. (Banks) | | | 389 | |
| | 27,300 | | | The Yokohama Rubber Co. Ltd. (Auto Components)^ | | | 568 | |
| | 48,300 | | | Tohoku Electric Power Co., Inc. (Electric Utilities) | | | 590 | |
| | 50,900 | | | Tokio Marine Holdings, Inc. (Insurance) | | | 2,388 | |
| | 52,200 | | | Tokyo Electron Ltd. (Semiconductors & Semiconductor Equipment) | | | 8,969 | |
| | 85,800 | | | Tokyo Gas Co. Ltd. (Gas Utilities) | | | 2,279 | |
| | 21,200 | | | Tokyo Tatemono Co. Ltd. (Real Estate Management & Development) | | | 291 | |
| | 107,000 | | | Toppan Printing Co. Ltd. (Commercial Services & Supplies) | | | 839 | |
| | 51,700 | | | Toyo Construction Co. Ltd. (Construction & Engineering) | | | 230 | |
| | 32,500 | | | Toyo Seikan Kaisha Ltd. (Containers & Packaging) | | | 571 | |
| | 13,800 | | | Toyoda Gosei Co. Ltd. (Auto Components) | | | 350 | |
| | 34,200 | | | Toyota Industries Corp. (Auto Components) | | | 1,919 | |
| | 290,700 | | | Toyota Motor Corp. (Automobiles) | | | 18,828 | |
| | 42,800 | | | Toyota Tsusho Corp. (Trading Companies & Distributors) | | | 1,434 | |
| | 23,900 | | | Trend Micro, Inc. (Software) | | | 1,365 | |
| | 333 | | | United Urban Investment Corp. (Equity Real Estate Investment Trusts) | | | 517 | |
| | 46,700 | | | USS Co. Ltd. (Specialty Retail) | | | 889 | |
| | 1,500 | | | V Technology Co. Ltd. (Electronic Equipment, Instruments & Components) | | | 278 | |
| | 33,500 | | | West Japan Railway Co. (Road & Rail) | | | 2,471 | |
| | 303,100 | | | Yahoo Japan Corp. (Internet Software & Services)^ | | | 1,008 | |
| | 136,400 | | | Yamada Denki Co. Ltd. (Specialty Retail)^ | | | 679 | |
| | 60,600 | | | Yamaha Motor Co. Ltd. (Automobiles) | | | 1,525 | |
| | 47,100 | | | Yokogawa Electric Corp. (Electronic Equipment, Instruments & Components) | | | 839 | |
| | | | | | | | |
| | | | | | | 435,841 | |
| | | | | | | | |
| | | | | | | | |
| Shares | | | Security Description | | Value
(000) | |
| | | | Jersey — 0.38% | |
| | 880,406 | | | Glencore International PLC (Metals & Mining) | | $ | 4,205 | |
| | 296,830 | | | WPP PLC (Media) | | | 4,673 | |
| | | | | | | | |
| | | | | | | 8,878 | |
| | | | | | | | |
| | | | Luxembourg — 0.12% | |
| | 12,434 | | | Millicom International Cellular SA (Wireless Telecommunication Services) | | | 735 | |
| | 6,595 | | | RTL Group (Media) | | | 447 | |
| | 83,087 | | | SES – FDR, Class – A (Media) | | | 1,522 | |
| | | | | | | | |
| | | | | | | 2,704 | |
| | | | | | | | |
| | | | Netherlands — 3.41% | |
| | 26,691 | | | ABN AMRO Group N.V. (Banks) | | | 693 | |
| | 318,680 | | | AEGON N.V. (Insurance) | | | 1,911 | |
| | 71,271 | | | Airbus Group N.V. (Aerospace & Defense) | | | 8,344 | |
| | 196,236 | | | Akzo Nobel N.V. (Chemicals) | | | 16,801 | |
| | 19,619 | | | ASML Holding N.V. (Semiconductors & Semiconductor Equipment) | | | 3,888 | |
| | 933,270 | | | ING Groep N.V. (Banks) | | | 13,434 | |
| | 285,273 | | | Koninklijke (Royal) KPN N.V. (Diversified Telecommunication Services) | | | 776 | |
| | 283,811 | | | Koninklijke Ahold Delhaize N.V. (Food & Staples Retailing) | | | 6,796 | |
| | 9,443 | | | Koninklijke DSM N.V. (Chemicals) | | | 950 | |
| | 11,653 | | | Koninklijke Vopak N.V. (Oil, Gas & Consumable Fuels) | | | 538 | |
| | 18,683 | | | NN Group N.V. (Insurance) | | | 760 | |
| | 19,710 | | | Randstad Holding N.V. (Professional Services) | | | 1,160 | |
| | 373,734 | | | Unilever N.V. (Personal Products) | | | 20,854 | |
| | 49,674 | | | Wolters Kluwer N.V. (Professional Services) | | | 2,800 | |
| | | | | | | | |
| | | | | | | 79,705 | |
| | | | | | | | |
| | | | New Zealand — 0.10% | |
| | 45,027 | | | A2 Milk Co. Ltd. (Food Products) (a) | | | 349 | |
| | 64,697 | | | Auckland International Airport Ltd. (Transportation Infrastructure) | | | 297 | |
| | 155,016 | | | Fletcher Building Ltd. (Construction Materials) | | | 730 | |
| | 119,869 | | | Meridian Energy Ltd. (Independent Power & Renewable Electricity Producers) | | | 253 | |
| | 276,463 | | | Telecom Corporation of New Zealand Ltd. (Diversified Telecommunication Services) | | | 698 | |
| | | | | | | | |
| | | | | | | 2,327 | |
| | | | | | | | |
| | | | Norway — 0.83% | |
| | 156,921 | | | DNB ASA (Banks) | | | 3,071 | |
| | 169,954 | | | DNO International ASA (Oil, Gas & Consumable Fuels) (a) | | | 315 | |
| | 273,410 | | | Equinor ASA (Oil, Gas & Consumable Fuels) | | | 7,267 | |
| | 32,794 | | | Gjensidige Forsikring ASA (Insurance) | | | 538 | |
| | 175,893 | | | Marine Harvest ASA (Food Products) | | | 3,504 | |
| | 16,472 | | | Salmar ASA (Food Products) | | | 692 | |
| | 192,422 | | | Telenor ASA (Diversified Telecommunication Services) | | | 3,951 | |
| | | | | | | | |
| | | | | | | 19,338 | |
| | | | | | | | |
See accompanying notes to financial statements.
154
HC CAPITAL TRUST
The Institutional International Equity Portfolio
Portfolio of Investments (continued) — June 30, 2018
| | | | | | | | |
| Shares | | | Security Description | | Value
(000) | |
| | | | Common Stocks (continued) | | | | |
| | | | Portugal — 0.16% | |
| | 741,149 | | | EDP – Energias de Portugal SA (Electric Utilities) | | $ | 2,942 | |
| | 51,908 | | | Jeronimo Martins, SGPS, SA (Food & Staples Retailing) | | | 750 | |
| | | | | | | | |
| | | | | | | 3,692 | |
| | | | | | | | |
| | | | Russia — 0.11% | |
| | 144,139 | | | MMC Norilsk Nickel PJSC, ADR (Metals & Mining) | | | 2,587 | |
| | | | | | | | |
| | | | Singapore — 1.03% | |
| | 959,100 | | | Ascendas Real Estate Investment Trust (Equity Real Estate Investment Trusts) | | | 1,859 | |
| | 964,209 | | | CapitaCommercial Trust (Equity Real Estate Investment Trusts) | | | 1,175 | |
| | 967,100 | | | CapitaMall Trust (Equity Real Estate Investment Trusts) | | | 1,470 | |
| | 1,528,800 | | | ComfortDelGro Corp. Ltd. (Road & Rail) | | | 2,637 | |
| | 42,600 | | | DBS Group Holdings Ltd. (Banks) | | | 832 | |
| | 192,700 | | | Oversea-Chinese Banking Corp. Ltd. (Banks) | | | 1,647 | |
| | 156,700 | | | Singapore Exchange Ltd. (Capital Markets) | | | 825 | |
| | 842,347 | | | Singapore Press Holdings Ltd. (Media)^ | | | 1,608 | |
| | 833,900 | | | Singapore Tech Engineering (Aerospace & Defense) | | | 2,014 | |
| | 2,950,410 | | | Singapore Telecommunications Ltd. (Diversified Telecommunication Services) | | | 6,671 | |
| | 864,680 | | | Suntec REIT (Equity Real Estate Investment Trusts) | | | 1,098 | |
| | 65,200 | | | United Overseas Bank Ltd. (Banks) | | | 1,281 | |
| | 100,500 | | | United Overseas Land Ltd. (Real Estate Management & Development) | | | 562 | |
| | 34,700 | | | Venture Corp. Ltd. (Electronic Equipment, Instruments & Components) | | | 454 | |
| | | | | | | | |
| | | | | | | 24,133 | |
| | | | | | | | |
| | | | South Korea — 0.83% | |
| | 192,950 | | | Samsung Electronics Co. Ltd. (Technology Hardware, Storage & Peripherals) | | | 8,077 | |
| | 54,012 | | | SK Telecom Co. Ltd. (Wireless Telecommunication Services) | | | 11,293 | |
| | | | | | | | |
| | | | | | | 19,370 | |
| | | | | | | | |
| | | | Spain — 1.80% | |
| | 27,739 | | | Amadeus IT Holding SA, A Shares (IT Services) | | | 2,190 | |
| | 1,061,630 | | | Banco Bilbao Vizcaya Argentaria SA (Banks) | | | 7,529 | |
| | 107,203 | | | Banco de Sabadell SA (Banks) | | | 180 | |
| | 280,570 | | | Banco Santander SA (Banks) | | | 1,504 | |
| | 1,127,552 | | | CaixaBank SA (Banks) | | | 4,880 | |
| | 125,484 | | | Corporacion Mapfre (Insurance) | | | 379 | |
| | 65,280 | | | Enagas (Oil, Gas & Consumable Fuels) | | | 1,909 | |
| | 44,710 | | | Endesa (Electric Utilities) | | | 986 | |
| | 49,636 | | | Gas Natural SDG SA (Gas Utilities)^ | | | 1,315 | |
| | 848,250 | | | Iberdrola SA (Electric Utilities) | | | 6,562 | |
| | 121,254 | | | Red Electrica Corp. (Electric Utilities) | | | 2,469 | |
| | 340,778 | | | Repsol YPF SA (Oil, Gas & Consumable Fuels) | | | 6,671 | |
| | | | | | | | |
| Shares | | | Security Description | | Value
(000) | |
| | | | Spain (continued) | |
| | 652,054 | | | Telefonica SA (Diversified Telecommunication Services) | | $ | 5,542 | |
| | | | | | | | |
| | | | | | | 42,116 | |
| | | | | | | | |
| | | | Sweden — 1.97% | |
| | 44,940 | | | Alfa Laval AB (Machinery) | | | 1,067 | |
| | 30,819 | | | Atlas Copco AB, A Shares (Machinery) | | | 898 | |
| | 136,569 | | | Electrolux AB, B Shares (Household Durables) | | | 3,112 | |
| | 30,819 | | | Epiroc AB, Class – A (Machinery) (a) | | | 324 | |
| | 33,043 | | | Granges AB (Metals & Mining) | | | 433 | |
| | 371,816 | | | Hennes & Mauritz AB, B Shares (Specialty Retail)^ | | | 5,544 | |
| | 30,316 | | | ICA Gruppen AB (Food & Staples Retailing)^ | | | 930 | |
| | 27,128 | | | Micronic Mydata AB (Electronic Equipment, Instruments & Components)^ | | | 304 | |
| | 436,691 | | | Nordea Bank AB (Banks) | | | 4,207 | |
| | 55,417 | | | Sandvik AB (Machinery) | | | 984 | |
| | 217,849 | | | Skandinaviska Enskilda Banken AB, Class – A (Banks) | | | 2,072 | |
| | 132,578 | | | Skanska AB, B Shares (Construction & Engineering) | | | 2,411 | |
| | 219,976 | | | Svenska Handelsbanken AB, A Shares (Banks) | | | 2,446 | |
| | 128,309 | | | Swedbank AB, A Shares (Banks) | | | 2,749 | |
| | 66,331 | | | Swedish Match AB (Tobacco) | | | 3,287 | |
| | 69,216 | | | Tele2 AB, B Shares (Wireless Telecommunication Services) | | | 814 | |
| | 1,196,519 | | | Telefonaktiebolaget LM Ericsson, B Shares (Communications Equipment) | | | 9,255 | |
| | 528,767 | | | TeliaSonera AB (Diversified Telecommunication Services) | | | 2,419 | |
| | 163,446 | | | Volvo AB, B Shares (Machinery) | | | 2,613 | |
| | | | | | | | |
| | | | | | | 45,869 | |
| | | | | | | | |
| | | | Switzerland — 8.68% | |
| | 1,281,381 | | | ABB Ltd., Registered Shares (Electrical Equipment) | | | 28,103 | |
| | 81,953 | | | Adecco SA, Registered Shares (Professional Services) | | | 4,865 | |
| | 168,837 | | | Aryzta AG (Food Products)^ (a) | | | 2,540 | |
| | 6,494 | | | Baloise Holding AG, Registered Shares (Insurance) | | | 947 | |
| | 150 | | | Barry Callebaut AG (Food Products) | | | 270 | |
| | 57,454 | | | Compagnie Financiere Richemont SA, Registered Shares (Textiles, Apparel & Luxury Goods) | | | 4,883 | |
| | 82,479 | | | Credit Suisse Group AG (Capital Markets) | | | 1,246 | |
| | 61,158 | | | Ferguson PLC (Trading Companies & Distributors) | | | 4,963 | |
| | 2,221 | | | Givaudan SA (Chemicals) | | | 5,053 | |
| | 11,893 | | | Idorsia Ltd. (Biotechnology) (a) | | | 316 | |
| | 19,104 | | | Kuehne & Nagel International Ltd. (Marine) | | | 2,879 | |
| | 161,785 | | | LafargeHolcim Ltd., Registered Shares (Construction Materials) | | | 7,907 | |
| | 7,898 | | | Lonza Group AG (Life Sciences Tools & Services) | | | 2,102 | |
| | 131,895 | | | Nestle SA (Food Products) | | | 10,246 | |
See accompanying notes to financial statements.
155
HC CAPITAL TRUST
The Institutional International Equity Portfolio
Portfolio of Investments (continued) — June 30, 2018
| | | | | | | | |
| Shares | | | Security Description | | Value
(000) | |
| | | | Common Stocks (continued) | | | | |
| | | | Switzerland (continued) | |
| | 624,698 | | | Novartis AG, Registered Shares (Pharmaceuticals) | | $ | 47,507 | |
| | 2,489 | | | Partners Group Holding AG (Capital Markets) | | | 1,829 | |
| | 209,807 | | | Roche Holding AG (Pharmaceuticals) | | | 46,745 | |
| | 2,267 | | | Roche Holding AG (Pharmaceuticals) | | | 513 | |
| | 1,881 | | | SGS SA, Registered Shares (Professional Services) | | | 5,020 | |
| | 5,610 | | | Sonova Holding AG, Registered Shares (Health Care Equipment & Supplies) | | | 1,008 | |
| | 23,960 | | | STMicroelectronics N.V. (Semiconductors & Semiconductor Equipment) | | | 535 | |
| | 4,352 | | | Swiss Life Holding AG (Insurance) | | | 1,517 | |
| | 12,484 | | | Swiss Prime Site AG (Real Estate Management & Development) | | | 1,150 | |
| | 42,582 | | | Swiss Re AG (Insurance) | | | 3,687 | |
| | 4,550 | | | Swisscom AG (Diversified Telecommunication Services) | | | 2,037 | |
| | 2,499 | | | The Swatch Group AG, B Shares (Textiles, Apparel & Luxury Goods) | | | 1,189 | |
| | 328,674 | | | UBS Group AG (Capital Markets) | | | 5,088 | |
| | 28,320 | | | Zurich Financial Services AG (Insurance) | | | 8,413 | |
| | | | | | | | |
| | | | | | | 202,558 | |
| | | | | | | | |
| | | | United Kingdom — 19.38% | |
| | 18,252 | | | Admiral Group PLC (Insurance) | | | 459 | |
| | 26,521 | | | Anglo American PLC (Metals & Mining) | | | 593 | |
| | 31,588 | | | Aon PLC (Insurance) | | | 4,333 | |
| | 54,726 | | | Ashtead Group PLC (Trading Companies & Distributors) | | | 1,641 | |
| | 78,790 | | | Associated British Foods PLC (Food Products) | | | 2,846 | |
| | 421,901 | | | AstraZeneca PLC (Pharmaceuticals) | | | 29,244 | |
| | 1,776,451 | | | Aviva PLC (Insurance) | | | 11,814 | |
| | 1,378,420 | | | Balfour Beatty PLC (Construction & Engineering) | | | 5,160 | |
| | 5,333,036 | | | Barclays PLC (Banks) | | | 13,300 | |
| | 250,669 | | | Barratt Developments PLC (Household Durables) | | | 1,705 | |
| | 763,511 | | | BHP Billiton PLC (Metals & Mining) | | | 17,187 | |
| | 4,970,583 | | | BP PLC (Oil, Gas & Consumable Fuels) | | | 37,928 | |
| | 679,863 | | | British American Tobacco PLC (Tobacco) | | | 34,359 | |
| | 123,186 | | | British Land Co. PLC (Equity Real Estate Investment Trusts) | | | 1,093 | |
| | 1,027,847 | | | BT Group PLC (Diversified Telecommunication Services) | | | 2,954 | |
| | 164,690 | | | Carnival PLC (Hotels, Restaurants & Leisure) | | | 9,447 | |
| | 642,587 | | | Centrica PLC (Multi-Utilities) | | | 1,337 | |
| | 336,171 | | | Cineworld Group PLC (Media) | | | 1,178 | |
| | 4,072,602 | | | Cobham PLC (Aerospace & Defense) (a) | | | 6,913 | |
| | 41,289 | | | Coca-Cola European Partners PLC (Beverages) | | | 1,678 | |
| | 958,441 | | | ConvaTec Group PLC (Health Care Equipment & Supplies) (b) | | | 2,686 | |
| | 155,531 | | | Diageo PLC (Beverages) | | | 5,586 | |
| | 126,370 | | | Direct Line Insurance Group PLC (Insurance) | | | 572 | |
| | 271,790 | | | Evraz PLC (Metals & Mining) | | | 1,823 | |
| | | | | | | | |
| Shares | | | Security Description | | Value
(000) | |
| | | | United Kingdom (continued) | |
| | 1,422,597 | | | GlaxoSmithKline PLC (Pharmaceuticals) | | $ | 28,716 | |
| | 101,729 | | | Hammerson PLC (Equity Real Estate Investment Trusts) | | | 701 | |
| | 127,312 | | | Hargreaves Lansdown PLC (Capital Markets) | | | 3,312 | |
| | 599,159 | | | Howden Joinery Group PLC (Trading Companies & Distributors) | | | 4,240 | |
| | 2,116,259 | | | HSBC Holdings PLC (Banks) | | | 19,845 | |
| | 318,596 | | | Imperial Tobacco Group PLC (Tobacco) | | | 11,863 | |
| | 369,037 | | | International Consolidated Airlines Group SA (Airlines)^ | | | 3,241 | |
| | 41,474 | | | Investec PLC (Capital Markets) | | | 294 | |
| | 911,132 | | | ITV PLC (Media) | | | 2,092 | |
| | 17,878 | | | Johnson Matthey PLC (Chemicals) | | | 854 | |
| | 45,126 | | | Kazakhmys PLC (Metals & Mining) (a) | | | 502 | |
| | 91,429 | | | Land Securities Group PLC (Equity Real Estate Investment Trusts) | | | 1,155 | |
| | 533,693 | | | Legal & General Group PLC (Insurance) | | | 1,873 | |
| | 15,421,220 | | | Lloyds Banking Group PLC (Banks) | | | 12,830 | |
| | 38,323 | | | London Stock Exchange Group (Capital Markets) | | | 2,261 | |
| | 397,522 | | | Marks & Spencer Group PLC (Multiline Retail) | | | 1,548 | |
| | 306,151 | | | Micro Focus International PLC (Software) | | | 5,347 | |
| | 11,192 | | | Mondi PLC (Paper & Forest Products) | | | 303 | |
| | 450,661 | | | National Grid PLC (Multi-Utilities) | | | 4,985 | |
| | 145,282 | | | Persimmon PLC (Household Durables) | | | 4,856 | |
| | 694,489 | | | Prudential PLC (Insurance) | | | 15,895 | |
| | 78,091 | | | Redrow PLC (Household Durables) | | | 549 | |
| | 412,947 | | | Rentokil Initial PLC (Commercial Services & Supplies) | | | 1,911 | |
| | 328,501 | | | Rio Tinto PLC (Metals & Mining) | | | 18,210 | |
| | 604,063 | | | Rolls-Royce Holdings PLC (Aerospace & Defense) | | | 7,877 | |
| | 33,335,352 | | | Rolls-Royce Holdings PLC, Class C Redemption Shares (Aerospace & Defense) | | | 44 | |
| | 1,516,204 | | | Royal Bank of Scotland Group PLC (Banks) (a) | | | 5,124 | |
| | 613,396 | | | Royal Dutch Shell PLC, A Shares (Oil, Gas & Consumable Fuels) | | | 21,279 | |
| | 817,290 | | | Royal Dutch Shell PLC, B Shares (Oil, Gas & Consumable Fuels) | | | 29,262 | |
| | 216,254 | | | Royal Mail PLC (Air Freight & Logistics) | | | 1,442 | |
| | 28,323 | | | Severn Trent PLC (Water Utilities) | | | 740 | |
| | 80,810 | | | Sophos Group PLC (Software) | | | 681 | |
| | 825,152 | | | SSE PLC (Electric Utilities) | | | 14,753 | |
| | 27,019 | | | SSP Group PLC (Hotels, Restaurants & Leisure) | | | 226 | |
| | 224,835 | | | Standard Chartered PLC (Banks) | | | 2,055 | |
| | 183,913 | | | Standard Life PLC (Insurance) | | | 790 | |
| | 185,568 | | | Tate & Lyle PLC (Food Products) | | | 1,584 | |
| | 1,296,273 | | | Taylor Wimpey PLC (Household Durables) | | | 3,060 | |
| | 84,722 | | | United Utilities Group PLC (Water Utilities) | | | 853 | |
| | 7,317,646 | | | Vodafone Group PLC (Wireless Telecommunication Services) | | | 17,749 | |
| | 54,891 | | | WH Smith PLC (Specialty Retail) | | | 1,448 | |
| | | | | | | | |
| | | | | | | 452,186 | |
| | | | | | | | |
See accompanying notes to financial statements.
156
HC CAPITAL TRUST
The Institutional International Equity Portfolio
Portfolio of Investments (continued) — June 30, 2018
| | | | | | | | |
| Shares | | | Security Description | | Value
(000) | |
| | | | Common Stocks (continued) | | | | |
| | | | United States — 0.27% | |
| | 2,557 | | | Amazon.com, Inc. (Internet & Direct Marketing Retail) (a) | | $ | 4,346 | |
| | 440 | | | MercadoLibre, Inc. (Internet Software & Services) | | | 132 | |
| | 15,944 | | | WABCO Holdings, Inc. (Machinery) (a) | | | 1,866 | |
| | | | | | | | |
| | | | | | | 6,344 | |
| | | | | | | | |
| | | | Total Common Stocks | | | 2,118,372 | |
| | | | | | | | |
| | | | Preferred Stocks — 1.09% | | | | |
| | | | Brazil — 0.11% | |
| | 591,480 | | | Petroleo Brasileiro SA – Preferred (Oil, Gas & Consumable Fuels) (a) | | | 2,621 | |
| | | | | | | | |
| | | | Germany — 0.98% | |
| | 8,623 | | | Bayerische Motoren Werke Aktiengesellschaft – Preferred (Automobiles) | | | 688 | |
| | 34,827 | | | Henkel AG & Co. KGaA – Preferred (Household Products) | | | 4,453 | |
| | 107,062 | | | Volkswagen AG – Preferred (Automobiles) | | | 17,780 | |
| | | | | | | | |
| | | | | | | 22,921 | |
| | | | | | | | |
| | | | Total Preferred Stocks | | | 25,542 | |
| | | | | | | | |
| | | | Rights — 0.00% | | | | |
| | | | Italy — 0.00% | |
| | 3,313,393 | | | Intesa Sanpaolo SpA (Banks) (a)(c) | | | — | |
| | | | | | | | |
| | | | United States — 0.00% | |
| | 24,985 | | | Royce Value Trust, Inc. (Capital Markets) (a) | | | 1 | |
| | | | | | | | |
| | | | Total Rights | | | 1 | |
| | | | | | | | |
Principal
Amount
(000) | | | | | | |
| | | | Time Deposit — 0.99% | | | | |
| $ | 23,062 | | | State Street Liquidity Management Control System Eurodollar Time Deposit,
0.53%, 7/2/18 | | | 23,062 | |
| | | | | | | | |
| | | | Total Time Deposit | | | 23,062 | |
| | | | | | | | |
| Shares | | | | | | |
| | | | Mutual Funds — 6.80% | | | | |
| | 150,415 | | | Aberdeen Japan Investment Trust PLC | | | 1,201 | |
| | 94,000 | | | Alliance Trust PLC | | | 928 | |
| | 284,906 | | | Biotech Growth Trust PLC (The) | | | 2,910 | |
| | 480,360 | | | BlackRock Greater Europe Investment Trust PLC | | | 2,206 | |
| | 312,198 | | | British Empire Trust PLC | | | 3,102 | |
| | 1,383,166 | | | Dreyfus Treasury Prime Cash Management Fund, Institutional Shares, 1.68% (d) | | | 1,383 | |
| | 753,255 | | | Dunedin Income Growth Investment Trust PLC | | | 2,544 | |
| | 523,600 | | | Edinburgh Dragon Trust PLC | | | 2,515 | |
| | 444,214 | | | Edinburgh Investment Trust PLC | | | 3,997 | |
| | 264,149 | | | European Investment Trust PLC | | | 3,130 | |
| | 9,784,646 | | | Federated Treasury Obligations Fund, Institutional Shares, 1.75%^^ (d) | | | 9,785 | |
| | 1,871,855 | | | Fidelity European Values PLC | | | 5,519 | |
| | 193,000 | | | Henderson European Focus Trust PLC | | | 3,018 | |
| | 89,245 | | | Henderson EuroTrust PLC | | | 1,289 | |
| | 414,178 | | | Japan Smaller Capitalization Fund, Inc. | | | 4,824 | |
| | | | | | | | |
| Shares | | | Security Description | | Value
(000) | |
| | | | Mutual Funds (continued) | | | | |
| | 237,585 | | | JPMorgan European Investment Trust PLC – Growth | | $ | 925 | |
| | 743,689 | | | JPMorgan European Smaller Companies Trust PLC | | | 3,994 | |
| | 837,001 | | | JPMorgan Japan Smaller Companies Investment Trust, Ordinary Shares | | | 4,715 | |
| | 757,201 | | | JPMorgan Japanese Investment Trust PLC | | | 4,676 | |
| | 670,000 | | | Lazard World Trust Fund | | | 3,351 | |
| | 390,497 | | | Martin Currie Asia Unconstrained Trust PLC | | | 2,010 | |
| | 9,001 | | | Morgan Stanley China Fund, Inc. | | | 208 | |
| | 482,993 | | | Neuberger Berman MLP Income Fund, Inc. | | | 4,236 | |
| | 100,908 | | | New Germany Fund, Inc. (The) | | | 1,841 | |
| | 892,182 | | | Oakley Capital Investments Ltd. | | | 2,172 | |
| | 825,000 | | | Perpetual Income & Growth Investment Trust | | | 3,903 | |
| | 175,573 | | | Pershing Square Holdings Fund Ltd. | | | 2,553 | |
| | 1,922,330 | | | Polar Capital Global Financials Trust PLC | | | 3,386 | |
| | 740,000 | | | River & Mercantile UK Micro Cap Investment Co. Ltd. | | | 1,938 | |
| | 115,132 | | | Riverstone Energy Ltd. | | | 1,938 | |
| | 636,429 | | | Schroder Japan Growth Fund PLC | | | 1,764 | |
| | 1,100,700 | | | Schroder UK Growth Fund PLC | | | 2,818 | |
| | 5,448,915 | | | SSgA U.S. Government Money Market Fund, Administrative
Class, 1.55% (d) | | | 5,449 | |
| | 49,472,659 | | | State Street Institutional Treasury Plus Money Market Fund, Trust
Class, 1.72% (d) | | | 49,472 | |
| | 147,756 | | | Swiss Helvetia Fund, Inc. | | | 1,825 | |
| | 105,216 | | | Tekla Healthcare Investors Fund | | | 2,262 | |
| | 216,113 | | | Templeton Emerging Markets Investment Trust PLC | | | 1,999 | |
| | 139,500 | | | TR European Growth Trust PLC | | | 1,878 | |
| | 1,019,603 | | | Woodford Patient Capital Trust PLC | | | 1,117 | |
| | | | | | | | |
| | | | Total Mutual Funds | | | 158,781 | |
| | | | | | | | |
| | |
Principal
Amount
(000) | | | | | | |
| | | | Repurchase Agreement — 0.70% | | | | |
| $ | 16,431 | | | Jefferies LLC,
2.00%, 7/2/18 (Purchased on 6/29/18, proceeds at maturity $16,433,585 collateralized by U.S. Treasury Obligations,
2.50% - 2.92%, 2/15/20 - 2/15/44
fair value $16,759,482)^^ | | | 16,431 | |
| | | | | | | | |
| | | | Total Repurchase Agreement | | | 16,431 | |
| | | | | | | | |
| | | | Total Investments
(cost $2,132,919) — 100.34% | | | 2,342,189 | |
| | | | Liabilities in excess of other
assets — (0.34%) | | | (7,968 | ) |
| | | | | | | | |
| | | | Net Assets — 100.00% | | $ | 2,334,221 | |
| | | | | | | | |
See accompanying notes to financial statements.
157
HC CAPITAL TRUST
The Institutional International Equity Portfolio
Portfolio of Investments (concluded) — June 30, 2018
| Amounts | designated as “—” are $0 or have been rounded to $0. |
| ^ | All or part of this security was on loan as of June 30, 2018. The total value of securities on loan as of June 30, 2018, was $30,534 (amount in thousands). |
| ^^ | Purchased with cash collateral held from securities lending. The value of the collateral could include collateral held for securities that were sold on or before June 30, 2018. |
| (a) | Represents non-income producing security. |
| (b) | Represents a security purchased under Rule 144A or Section 4(2) and is exempt from registration under the Securities Act of 1933, as amended, or is otherwise restricted to resale. Certain of these |
| | securities may be resold in transactions exempt from registration, normally to qualified institutional buyers. These securities have been deemed liquid by the Specialist Manager. |
| (c) | This security has been deemed illiquid by the Specialist Manager and represents 0.00% of the Portfolio’s net assets. |
| (d) | The rate disclosed is the rate in effect on June 30, 2018. |
ADR — American Depositary Receipt
FDR — Fiduciary Depositary Receipt
REIT — Real Estate Investment Trust
The following table reflects the percentage of total net assets of the Portfolio attributable to each Specialist Manager as of June 30, 2018.
| | | | | | | | | | | | | | | | | | | | | | | | | | | | | | | | |
The Institutional
International Equity
Portfolio | | Artisan
Partners LP | | | Cadence Capital
Management,
LLC | | | Causeway
Capital
Management
LLC | | | City of
London
Investment
Management
Company,
Ltd. | | | Lazard Asset
Management
LLC | | | Parametric
Portfolio
Associates, LLC | | | HC Capital
Solutions | | | Total | |
Common Stocks | | | 8.67 | % | | | 50.20 | % | | | 20.13 | % | | | — | | | | 11.76 | % | | | — | | | | — | | | | 90.76 | % |
Preferred Stocks | | | 0.30 | % | | | 0.03 | % | | | 0.76 | % | | | — | | | | — | | | | — | | | | — | | | | 1.09 | % |
Rights | | | 0.00 | % | | | 0.00 | % | | | — | | | | 0.00 | % | | | 0.00 | % | | | — | | | | — | | | | 0.00 | % |
Time Deposit | | | 0.49 | % | | | — | | | | 0.50 | % | | | — | | | | — | | | | — | | | | — | | | | 0.99 | % |
Mutual Funds | | | — | | | | 0.41 | % | | | 0.00 | % | | | 4.04 | % | | | 0.30 | % | | | 2.05 | % | | | 0.00 | % | | | 6.80 | % |
Repurchase Agreement | | | — | | | | 0.60 | % | | | 0.00 | % | | | — | | | | 0.10 | % | | | — | | | | — | | | | 0.70 | % |
Other Assets (Liabilities) | | | 0.02 | % | | | -0.41 | % | | | 0.09 | % | | | 0.02 | % | | | -0.21 | % | | | 0.15 | % | | | 0.00 | % | | | -0.34 | % |
| | | | | | | | | | | | | | | | | | | | | | | | | | | | | | | | |
Total Net Assets | | | 9.48 | % | | | 50.83 | % | | | 21.48 | % | | | 4.06 | % | | | 11.95 | % | | | 2.20 | % | | | 0.00 | % | | | 100.00 | % |
| | | | | | | | | | | | | | | | | | | | | | | | | | | | | | | | |
Amounts designated as “—” indicate the Specialist Manager did not manage any holdings in that category.
The following table reflects the open derivative positions held by the Portfolio as of June 30, 2018.
| | | | | | | | | | | | | | |
Futures Contracts Purchased^ | | | | | | | | | |
Description | | Number of
Contracts | | Expiration
Date | | | Notional
Amount
(000) | | | Value and
Unrealized
Appreciation/
(Depreciation)
(000) | |
| MSCI EAFE Index Future | | 526 | | | 9/21/18 | | | $ | 51,427 | | | $ | (1,654 | ) |
| | | | | | | | | | | |
| | | | | $ | 51,427 | | | $ | (1,654 | ) |
| | | | | | | | | | | |
| | | |
Futures Contracts Sold^ | | | | | | | | | |
Description | | Number of
Contracts | | Expiration
Date | | | Notional
Amount
(000) | | | Value and
Unrealized
Appreciation/
(Depreciation)
(000) | |
Japanese Yen Future | | 223 | | | 9/17/18 | | | $
| 25,276
|
| | $ | 132 | |
| | | | | | | | | | | | | | |
| | | | | $ | 25,276 | | | $ | 132 | |
| | | | | | | | | | | | | | |
| | |
| | Total Unrealized Appreciation | | | $ | 132 | |
| | Total Unrealized Depreciation | | | | (1,654 | ) |
| | | | | | | | | | | | | | |
| | Total Net Unrealized Appreciation/(Depreciation) | | | $ | (1,522 | ) |
| | | | | | | | | | | | | | |
| ^ | Cash has been pledged as collateral for futures contracts held by the Portfolio. |
See accompanying notes to financial statements.
158
HC CAPITAL TRUST
The Emerging Markets Portfolio
Portfolio of Investments — June 30, 2018
| | | | | | | | |
| Shares | | | Security Description | | Value
(000) | |
| | | | Common Stocks — 94.24% | | | | |
| | | | Argentina — 0.16% | |
| | 77,600 | | | Grupo Financiero Galicia SA, ADR (Banks) | | $ | 2,559 | |
| | | | | | | | |
| | | | Bermuda — 0.57% | |
| | 17,123,733 | | | Beijing Enterprises Water Group Ltd. (Water Utilities) | | | 9,342 | |
| | | | | | | | |
| | | | Brazil — 3.94% | |
| | 1,571,900 | | | Ambev SA (Beverages) | | | 7,294 | |
| | 2,228,000 | | | Banco do Brasil SA (Banks) | | | 16,357 | |
| | 646,900 | | | BB Seguridade Participacoes SA (Insurance) | | | 4,107 | |
| | 793,748 | | | BRF – Brazil Foods SA, ADR (Food Products)^(a) | | | 3,715 | |
| | 154,500 | | | BRF SA (Food Products) (a) | | | 717 | |
| | 140,400 | | | Companhia Brasileira de Destribuicao Grupo PAO de, Series c (Food & Staples Retailing) | | | 2,806 | |
| | 2,741,216 | | | Companhia Energetica de Minas Gerais SA – Sponsored ADR (Electric Utilities) | | | 5,043 | |
| | 781,398 | | | Companhia Paranaense de Energia-Copel, ADR (Electric Utilities) | | | 4,360 | |
| | 233,381 | | | CPFL Energia SA (Electric Utilities) | | | 1,309 | |
| | 460,500 | | | Cyrela Brazil Realty SA Empreendimentos (Household Durables) | | | 1,305 | |
| | 2,138,488 | | | Duratex SA (Paper & Forest Products) | | | 4,796 | |
| | 533,250 | | | MRV Engenharia E Participacoes SA (Household Durables) | | | 1,647 | |
| | 780,400 | | | Natura Cosmeticos SA (Personal Products) | | | 6,104 | |
| | 240,200 | | | Raia Drogasil SA (Food & Staples Retailing) | | | 4,061 | |
| | 36,200 | | | Totvs SA (Software) | | | 251 | |
| | 74,400 | | | Transmissora Alianca de Energia Eletrica SA (Electric Utilities) | | | 361 | |
| | | | | | | | |
| | | | | | | 64,233 | |
| | | | | | | | |
| | | | Cayman Islands — 0.80% | |
| | 1,615,000 | | | Geely Automobile Holdings Ltd. (Automobiles) | | | 4,189 | |
| | 88,538 | | | YY, Inc., ADR (Internet Software & Services)(a) | | | 8,896 | |
| | | | | | | | |
| | | | | | | 13,085 | |
| | | | | | | | |
| | | | Chile — 1.99% | |
| | 858,648 | | | Antofagasta PLC (Metals & Mining) | | | 11,216 | |
| | 16,281 | | | Banco de Credito e Inversiones SA (Banks) | | | 1,084 | |
| | 282,912 | | | Compania Cervecerias Unidas SA (Beverages) | | | 3,545 | |
| | 1,604,500 | | | Empresa Nacional de Electricidad SA (Independent Power & Renewable Electricity Producers) | | | 1,078 | |
| | 542,819 | | | Empresa Nacional de Telecomunicaciones SA (Wireless Telecommunication Services) | | | 4,989 | |
| | 9,436,244 | | | Enersis Chile SA (Electric Utilities) | | | 932 | |
| | 13,750,484 | | | Enersis SA (Electric Utilities) | | | 2,432 | |
| | 651,613,306 | | | Itau CorpBanca (Banks) | | | 6,369 | |
| | 433,100 | | | Vina Concha y Toro SA (Beverages) | | | 892 | |
| | | | | | | | |
| | | | | | | 32,537 | |
| | | | | | | | |
| | | | | | | | |
| Shares | | | Security Description | | Value
(000) | |
| | | | China — 26.63% | |
| | 12,829,000 | | | Agricultural Bank of China Ltd., H Shares (Banks) | | $ | 6,001 | |
| | 310,936 | | | Alibaba Group Holding Ltd., ADR (Internet Software & Services)(a) | | | 57,688 | |
| | 107,750 | | | Baidu, Inc., ADR (Internet Software & Services) (a) | | | 26,183 | |
| | 18,657,100 | | | Bank of China Ltd., H Shares (Banks) | | | 9,251 | |
| | 5,579,000 | | | Bank of Communications Co. Ltd., H Shares (Banks) | | | 4,274 | |
| | 3,738,000 | | | Brilliance China Automotive Holdings Ltd. (Automobiles) | | | 6,747 | |
| | 15,234,000 | | | China Communications Services Corp. Ltd., H Shares (Diversified Telecommunication Services) | | | 9,651 | |
| | 1,511,000 | | | China Conch Venture Holdings Ltd. (Machinery) | | | 5,528 | |
| | 32,065,350 | | | China Construction Bank Corp., H Shares (Banks) | | | 29,631 | |
| | 1,641,000 | | | China Everbright Bank Co. Ltd., H Shares (Banks) | | | 705 | |
| | 1,142,337 | | | China Evergrande Group (Real Estate Management & Development) (a) | | | 2,912 | |
| | 4,209,000 | | | China Life Insurance Co. Ltd., H Shares (Insurance) | | | 10,864 | |
| | 10,058,000 | | | China Machinery Engineering Corp., H Shares (Construction & Engineering) (b) | | | 4,820 | |
| | 1,427,000 | | | China Merchants Bank Co. Ltd., H Shares (Banks) (a) | | | 5,266 | |
| | 1,434,000 | | | China Merchants Holdings (International) Co. Ltd. (Transportation Infrastructure) | | | 2,913 | |
| | 1,852,000 | | | China Mobile Ltd. (Wireless Telecommunication Services) | | | 16,454 | |
| | 5,561,400 | | | China Petroleum & Chemical Corp., H Shares (Oil, Gas & Consumable Fuels) | | | 4,969 | |
| | 1,254,000 | | | China Resources Cement Holdings Ltd. (Construction Materials) | | | 1,271 | |
| | 998,000 | | | China Resources Land Ltd. (Real Estate Management & Development) | | | 3,365 | |
| | 5,370,143 | | | China Resources Power Holdings Co. Ltd. (Independent Power & Renewable Electricity Producers) | | | 9,460 | |
| | 2,040,000 | | | China Shenhua Energy Co. Ltd., H Shares (Oil, Gas & Consumable Fuels) | | | 4,842 | |
| | 823,000 | | | China Vanke Co. Ltd., H Shares (Real Estate Management & Development) | | | 2,880 | |
| | 10,279,500 | | | China Zhentong Auto Services Holdings Ltd. (Specialty Retail) | | | 6,853 | |
| | 1,444,000 | | | Chongqing Rural Commercial Bank Co. Ltd., H Shares (Banks) | | | 860 | |
| | 73,810 | | | CNOOC Ltd., ADR (Oil, Gas & Consumable Fuels) | | | 12,639 | |
| | 3,170,000 | | | CNOOC Ltd. (Oil, Gas & Consumable Fuels) | | | 5,471 | |
| | 3,599,000 | | | Country Garden Holdings Co. (Real Estate Management & Development) | | | 6,330 | |
| | 413,678 | | | Country Garden Services Holdings Co. Ltd., Series S (Commercial Services & Supplies) (a) | | | 530 | |
| | 438,000 | | | ENN Energy Holdings Ltd. (Gas Utilities) | | | 4,307 | |
| | 2,006,000 | | | Fuyao Glass Industry Group Co. Ltd. (Auto Components) | | | 6,776 | |
See accompanying notes to financial statements.
159
HC CAPITAL TRUST
The Emerging Markets Portfolio
Portfolio of Investments (continued) — June 30, 2018
| | | | | | | | |
| Shares | | | Security Description | | Value
(000) | |
| | | | Common Stocks (continued) | | | | |
| | | | China (continued) | | | | |
| | 31,157,440 | | | Industrial & Commercial Bank of China Ltd., H Shares (Banks) | | $ | 23,311 | |
| | 1,516,000 | | | Jiangsu Expressway Co. Ltd., H Shares (Transportation Infrastructure) | | | 1,807 | |
| | 8,818,000 | | | Lianhua Supermarket Holdings Ltd., H Shares (Food & Staples Retailing) (a) (b) | | | 2,574 | |
| | 616,091 | | | Midea Group Co. Ltd., Class – A (Household Durables) | | | 4,856 | |
| | 38,554,237 | | | Parkson Retail Group Ltd. (Multiline Retail)^ (a) (b) | | | 4,718 | |
| | 20,498,000 | | | PetroChina, H Shares (Oil, Gas & Consumable Fuels) | | | 15,597 | |
| | 6,105,000 | | | PICC Property & Casualty Co. Ltd., H Shares (Insurance) | | | 6,591 | |
| | 1,487,000 | | | Ping An Insurance (Group) Company of China Ltd. (Insurance) | | | 13,685 | |
| | 2,608,000 | | | Shanghai Industrial Holdings Ltd. (Industrial Conglomerates) | | | 6,077 | |
| | 2,592,000 | | | Shanghai Pharmaceuticals Holding Co. Ltd., H Shares (Health Care Providers & Services) | | | 7,153 | |
| | 873,000 | | | Shimao Property Holdings Ltd. (Real Estate Management & Development) | | | 2,292 | |
| | 1,147,500 | | | SOHO China Ltd. (Real Estate Management & Development) | | | 546 | |
| | 1,456,600 | | | Tencent Holdings Ltd. (Internet Software & Services) | | | 73,114 | |
| | 748,400 | | | Weifu High Technology Group Co. Ltd. (Auto Components) | | | 1,629 | |
| | 1,818,000 | | | Zhejiang Expressway Co. Ltd., H Shares (Transportation Infrastructure) | | | 1,622 | |
| | | | | | | | |
| | | | | | | 435,013 | |
| | | | | | | | |
| | | | Colombia — 0.53% | |
| | 75,613 | | | Bancolombia SA, ADR (Banks) | | | 3,613 | |
| | 4,891,836 | | | Ecopetrol SA (Oil, Gas & Consumable Fuels) | | | 5,052 | |
| | | | | | | | |
| | | | | | | 8,665 | |
| | | | | | | | |
| | | | Egypt — 0.15% | |
| | 526,825 | | | Commercial International Bank Egypt SAE (Banks) | | | 2,518 | |
| | | | | | | | |
| | | | Greece — 0.33% | |
| | 439,818 | | | Hellenic Telecommunication Organization SA (Diversified Telecommunication Services) | | | 5,444 | |
| | | | | | | | |
| | | | Hong Kong — 3.17% | |
| | 1,797,800 | | | AIA Group Ltd. (Insurance) | | | 15,721 | |
| | 5,311,000 | | | China Everbright International Ltd. (Commercial Services & Supplies) | | | 6,864 | |
| | 1,850,000 | | | China Overseas Land & Investment Ltd. (Real Estate Management & Development) | | | 6,096 | |
| | 4,347,500 | | | Dali Foods Group Co. Ltd. (Food Products) | | | 3,353 | |
| | 1,172,000 | | | Far East Horizon Ltd. (Diversified Financial Services) | | | 1,137 | |
| | 2,368,000 | | | Franshion Properties China Ltd. (Real Estate Management & Development) | | | 1,189 | |
| | 624,800 | | | Guangzhou R&F Properties Co. Ltd., H Shares (Real Estate Management & Development) | | | 1,261 | |
| | | | | | | | |
| Shares | | | Security Description | | Value
(000) | |
| | | | Hong Kong (continued) | | | | |
| | 626,500 | | | Hengan International Group Co. Ltd. (Personal Products) | | $ | 6,029 | |
| | 3,400,000 | | | Nagacorp Ltd. (Hotels, Restaurants & Leisure) | | | 3,094 | |
| | 1,362,900 | | | Samsonite International SA (Textiles, Apparel & Luxury Goods) | | | 4,821 | |
| | 2,184,500 | | | Sino-Ocean Land Holdings Ltd. (Real Estate Management & Development) | | | 1,270 | |
| | 4,500,000 | | | Yuexiu Property Co. Ltd. (Real Estate Management & Development) | | | 860 | |
| | | | | | | | |
| | | | | | | 51,695 | |
| | | | | | | | |
| | | | Hungary — 0.75% | |
| | 326,720 | | | MOL Hungarian Oil & Gas PLC (Oil, Gas & Consumable Fuels) | | | 3,160 | |
| | 107,086 | | | OTP Bank Nyrt PLC (Banks) | | | 3,885 | |
| | 288,599 | | | Richter Gedeon Nyrt (Pharmaceuticals) | | | 5,283 | |
| | | | | | | | |
| | | | | | | 12,328 | |
| | | | | | | | |
| | | | India — 8.06% | |
| | 20,590 | | | ACC Ltd. (Construction Materials) | | | 403 | |
| | 319,100 | | | Ambuja Cements Ltd. (Construction Materials) | | | 966 | |
| | 869,711 | | | Apollo Tyres Ltd. (Auto Components) | | | 3,224 | |
| | 476,080 | | | Aurobindo Pharma Ltd. (Pharmaceuticals) | | | 4,219 | |
| | 74,400 | | | Bajaj Auto Ltd. (Automobiles) | | | 3,052 | |
| | 474,300 | | | Bharat Pertoleum Corp. Ltd. (Oil, Gas & Consumable Fuels) | | | 2,584 | |
| | 8,842,285 | | | Chennai Super Kings Cricket Ltd. (Media)* (a) | | | — | |
| | 1,906,224 | | | Coal India Ltd. (Oil, Gas & Consumable Fuels) | | | 7,355 | |
| | 224,302 | | | Dr. Reddy’s Laboratories Ltd., ADR (Pharmaceuticals) | | | 7,222 | |
| | 239,866 | | | GAIL India Ltd. (Gas Utilities) | | | 1,191 | |
| | 70,522 | | | Hero MotoCorp Ltd. (Automobiles) | | | 3,575 | |
| | 612,753 | | | Housing Development Finance Corp. Ltd. (Thrifts & Mortgage Finance) | | | 17,066 | |
| | 122,923 | | | ICICI Bank Ltd., ADR (Banks) | | | 987 | |
| | 2,481,496 | | | ICICI Bank Ltd. (Banks) | | | 9,975 | |
| | 2,739,948 | | | India Cements Ltd. (Construction Materials) | | | 4,227 | |
| | 606,615 | | | Infosys Ltd. (IT Services) | | | 11,575 | |
| | 1,317,147 | | | ITC Ltd. (Tobacco) | | | 5,118 | |
| | 245,668 | | | Mahindra & Mahindra Ltd. (Automobiles) | | | 3,219 | |
| | 2,145,929 | | | NTPC Ltd. (Independent Power & Renewable Electricity Producers) | | | 5,001 | |
| | 980,385 | | | Oil & Natural Gas Corp. Ltd. (Oil, Gas & Consumable Fuels) | | | 2,267 | |
| | 203,299 | | | Oil India Ltd. (Oil, Gas & Consumable Fuels) | | | 623 | |
| | 261,508 | | | Rural Electrification Corp. Ltd. (Diversified Financial Services) | | | 399 | |
| | 612,770 | | | Sesa Sterlite Ltd. (Metals & Mining) | | | 2,113 | |
| | 2,062,226 | | | State Bank of India (Banks) (a) | | | 7,807 | |
| | 843,412 | | | Tata Consultancy Services Ltd. (IT Services) | | | 22,748 | |
| | 493,600 | | | Tata Power Co. Ltd. (Electric Utilities) | | | 528 | |
| | 1,085,500 | | | Wipro Ltd. (IT Services) | | | 4,143 | |
| | | | | | | | |
| | | | | | | 131,587 | |
| | | | | | | | |
See accompanying notes to financial statements.
160
HC CAPITAL TRUST
The Emerging Markets Portfolio
Portfolio of Investments (continued) — June 30, 2018
| | | | | | | | |
| Shares | | | Security Description | | Value
(000) | |
| | | | Common Stocks (continued) | | | | |
| | | | Indonesia — 2.71% | |
| | 4,626,177 | | | PT Astra Agro Lestari Tbk (Food Products) | | $ | 3,617 | |
| | 13,844,000 | | | PT Astra International Tbk (Automobiles) | | | 6,378 | |
| | 4,097,400 | | | PT Bank Central Asia Tbk (Banks) | | | 6,142 | |
| | 16,210,000 | | | PT Bank Rakyat Indonesia Persero Tbk (Banks) | | | 3,214 | |
| | 436,600 | | | PT Indocement Tunggal Prakarsa Tbk (Construction Materials) (b) | | | 416 | |
| | 2,506,800 | | | PT Indofood Sukses Makmur Tbk (Food Products) | | | 1,164 | |
| | 59,043,000 | | | PT Kalbe Farma Tbk (Pharmaceuticals) | | | 5,028 | |
| | 3,254,500 | | | PT Perusahaan Gas Negara Tbk (Gas Utilities) | | | 453 | |
| | 7,331,800 | | | PT Semen Gresik (Persero) Tbk (Construction Materials) | | | 3,647 | |
| | 46,271,950 | | | PT Telekomunikasi Indonesia Persero Tbk (Diversified Telecommunication Services) | | | 12,114 | |
| | 967,300 | | | PT United Tractors Tbk (Oil, Gas & Consumable Fuels) | | | 2,134 | |
| | | | | | | | |
| | | | | | | 44,307 | |
| | | | | | | | |
| | | | Japan — 0.23% | |
| | 52,100 | | | SoftBank Group Corp. (Wireless Telecommunication Services) | | | 3,752 | |
| | | | | | | | |
| | | | Luxembourg — 0.22% | |
| | 105,486 | | | Ternium SA, ADR (Metals & Mining) | | | 3,673 | |
| | | | | | | | |
| | | | Malaysia — 1.06% | |
| | 741,500 | | | AMMB Holdings Berhad (Banks) | | | 689 | |
| | 550,387 | | | Berjaya Sports Toto Berhard (Hotels, Restaurants & Leisure) | | | 334 | |
| | 994,100 | | | Felda Global Ventures Holdings Berhad (Food Products) | | | 372 | |
| | 2,304,300 | | | IOI Corp. Berhad (Food Products) | | | 2,590 | |
| | 174,300 | | | Lafarge Malayan Cement Berhad (Construction Materials) (a) | | | 134 | |
| | 1,648,214 | | | Malayan Banking Berhad (Banks) | | | 3,673 | |
| | 741,400 | | | Maxis Berhad (Wireless Telecommunication Services) | | | 1,002 | |
| | 609,000 | | | Public Bank Berhad (Banks) | | | 3,523 | |
| | 1,695,900 | | | Sime Darby Berhad (Industrial Conglomerates) | | | 1,029 | |
| | 1,695,900 | | | Sime Darby Plantation Berhad (Food Products) | | | 2,239 | |
| | 1,695,900 | | | Sime Darby Property Berhad (Real Estate Management & Development) | | | 504 | |
| | 454,700 | | | UMW Holdings Berhad (Automobiles) | | | 672 | |
| | 448,872 | | | UMW Oil & Gas Corp. Berhad (Energy Equipment & Services) (a) | | | 31 | |
| | 1,566,312 | | | YTL Corp. Berhad (Multi-Utilities) | | | 439 | |
| | 490,926 | | | YTL Power International Berhad (Multi-Utilities) | | | 125 | |
| | | | | | | | |
| | | | | | | 17,356 | |
| | | | | | | | |
| | | | Mexico — 4.10% | |
| | 3,412,400 | | | Alfa SAB de CV, Class – A (Industrial Conglomerates) | | | 3,963 | |
| | 4,025,162 | | | Alpek SAB de CV (Chemicals) | | | 5,958 | |
| | 5,161,500 | | | America Movil SAB de CV (Wireless Telecommunication Services) | | | 4,310 | |
| | 1,209,144 | | | Cemex SAB de CV, ADR (Construction Materials) (a) | | | 7,932 | |
| | | | | | | | |
| Shares | | | Security Description | | Value
(000) | |
| | | | Mexico (continued) | | | | |
| | 2,392,600 | | | CEMEX SAB de CV (Construction Materials) (a) | | $ | 1,575 | |
| | 415,300 | | | Coca-Cola FEMSA SAB de CV, Series L (Beverages) | | | 2,343 | |
| | 8,273,966 | | | Compartamos SAB de CV (Consumer Finance)^ | | | 7,292 | |
| | 1,141,900 | | | Fibra Uno Amdinistracion SA (Equity Real Estate Investment Trusts) | | | 1,665 | |
| | 39,701 | | | Fomento Economico Mexicano SAB de CV, ADR (Beverages) | | | 3,486 | |
| | 204,305 | | | Grupo Aeroportuario del Sureste SAB de CV, Class – B (Transportation Infrastructure) | | | 3,246 | |
| | 1,864,100 | | | Grupo Financiero Banorte SAB de CV (Banks) | | | 10,964 | |
| | 1,725,445 | | | Grupo Mexico SAB de CV, Series B (Metals & Mining) | | | 4,892 | |
| | 2,716,800 | | | Kimberly-Clark de Mexico SAB de CV, A Shares (Household Products) | | | 4,593 | |
| | 1,601,524 | | | Mexichem SAB de CV (Chemicals) | | | 4,628 | |
| | 240,905 | | | Telesites SAB de CV (Diversified Telecommunication Services) (a) | | | 176 | |
| | | | | | | | |
| | | | | | | 67,023 | |
| | | | | | | | |
| | | | Nigeria — 0.17% | |
| | 24,137,479 | | | Guaranty Trust Bank PLC (Banks) | | | 2,708 | |
| | | | | | | | |
| | | | Peru — 0.78% | |
| | 227,067 | | | Compania de Minas Buenaventura SA, ADR (Metals & Mining) | | | 3,095 | |
| | 700 | | | Credicorp Ltd. (Banks) | | | 158 | |
| | 42,500 | | | Credicorp Ltd. (Banks) | | | 9,567 | |
| | | | | | | | |
| | | | | | | 12,820 | |
| | | | | | | | |
| | | | Philippines — 1.09% | |
| | 1,181,140 | | | Aboitiz Equity Ventures, Inc. (Industrial Conglomerates) | | | 1,207 | |
| | 719,500 | | | Aboitiz Power Corp. (Independent Power & Renewable Electricity Producers) | | | 469 | |
| | 2,027,900 | | | Alliance Global Group, Inc. (Industrial Conglomerates) (a) | | | 442 | |
| | 4,014,700 | | | DMCI Holdings, Inc. (Industrial Conglomerates) | | | 790 | |
| | 3,265,782 | | | Metropolitan Bank & Trust Co. (Banks) | | | 4,493 | |
| | 48,400 | | | PLDT, Inc. (Wireless Telecommunication Services) | | | 1,170 | |
| | 562,255 | | | SM Investments Corp. (Industrial Conglomerates) | | | 9,221 | |
| | | | | | | | |
| | | | | | | 17,792 | |
| | | | | | | | |
| | | | Poland — 1.10% | |
| | 15,630 | | | Bank Handlowy w Warszawie SA (Banks) | | | 296 | |
| | 378,033 | | | Bank Pekao SA (Banks)^ | | | 11,410 | |
| | 104,800 | | | Energa SA (Electric Utilities) | | | 250 | |
| | 541,543 | | | Powszechny Zaklad Ubezpieczen SA (Insurance) | | | 5,639 | |
| | 269,900 | | | Telekomunikacja Polska SA (Diversified Telecommunication Services) (a) | | | 335 | |
| | | | | | | | |
| | | | | | | 17,930 | |
| | | | | | | | |
| | | | Qatar — 0.29% | |
| | 38,940 | | | Doha Bank QSC (Banks) | | | 286 | |
| | 136,155 | | | Industries Qatar QSC (Industrial Conglomerates) | | | 4,002 | |
See accompanying notes to financial statements.
161
HC CAPITAL TRUST
The Emerging Markets Portfolio
Portfolio of Investments (continued) — June 30, 2018
| | | | | | | | |
| Shares | | | Security Description | | Value
(000) | |
| | | | Common Stocks (continued) | | | | |
| | | | Qatar (continued) | | | | |
| | 42,755 | | | The Commercial Bank of Qatar QSC (Banks) | | $ | 448 | |
| | | | | | | | |
| | | | | | | 4,736 | |
| | | | | | | | |
| | | | Russia — 1.57% | |
| | 181,219 | | | LUKOIL PJSC, ADR (Oil, Gas & Consumable Fuels) | | | 12,491 | |
| | 2,605,589 | | | Sberbank (Banks) | | | 9,047 | |
| | 166,779 | | | Sberbank of Russia, ADR (Banks) | | | 2,407 | |
| | 113,164 | | | Severstal, Registered Shares, GDR (Metals & Mining) | | | 1,656 | |
| | | | | | | | |
| | | | | | | 25,601 | |
| | | | | | | | |
| | | | South Africa — 6.46% | |
| | 50,100 | | | African Rainbow Minerals Ltd. (Metals & Mining) | | | 399 | |
| | 245,959 | | | Aspen Pharmacare Holdings Ltd. (Pharmaceuticals) | | | 4,632 | |
| | 396,256 | | | Clicks Group Ltd. (Food & Staples Retailing) | | | 5,680 | |
| | 110,600 | | | Coronation Fund Managers Ltd. (Capital Markets) | | | 470 | |
| | 137,800 | | | Exxaro Resources Ltd. (Oil, Gas & Consumable Fuels) | | | 1,263 | |
| | 3,064,244 | | | FirstRand Ltd. (Diversified Financial Services) | | | 14,280 | |
| | 1,116,666 | | | Growthpoint Properties Ltd. (Equity Real Estate Investment Trusts) | | | 2,174 | |
| | 238,500 | | | Hyprop Investments Ltd. (Equity Real Estate Investment Trusts) | | | 1,780 | |
| | 181,795 | | | Imperial Holdings Ltd. (Distributors) | | | 2,598 | |
| | 51,643 | | | Liberty Holdings Ltd. (Insurance) | | | 438 | |
| | 902,400 | | | Life Healthcare Group Holdings Ltd. (Health Care Providers & Services)^ | | | 1,638 | |
| | 542,500 | | | MMI Holdings Ltd. (Insurance) | | | 699 | |
| | 277,661 | | | Mondi Ltd. (Paper & Forest Products) | | | 7,526 | |
| | 286,830 | | | MTN Group Ltd. (Wireless Telecommunication Services) | | | 2,257 | |
| | 307,400 | | | Nampak Ltd. (Containers & Packaging) (a) | | | 352 | |
| | 89,044 | | | Naspers Ltd. (Media) | | | 22,634 | |
| | 3,370,906 | | | Redefine Properties Ltd. (Equity Real Estate Investment Trusts) | | | 2,579 | |
| | 255,600 | | | Resilient REIT Ltd. (Equity Real Estate Investment Trusts) | | | 1,049 | |
| | 327,981 | | | Sasol Ltd. (Chemicals) | | | 12,030 | |
| | 109,573 | | | Sasol Ltd. – Sponsored ADR (Chemicals) | | | 4,004 | |
| | 233,169 | | | Shoprite Holdings Ltd. (Food & Staples Retailing) | | | 3,752 | |
| | 388,358 | | | Standard Bank Group Ltd. (Banks) | | | 5,435 | |
| | 448,820 | | | The Foschini Group Ltd. (Specialty Retail) | | | 5,697 | |
| | 374,200 | | | Truworths International Ltd. (Specialty Retail) | | | 2,108 | |
| | | | | | | | |
| | | | | | | 105,474 | |
| | | | | | | | |
| | | | South Korea — 13.50% | |
| | 16,120 | | | Amorepacific Corp. (Personal Products) | | | 4,665 | |
| | 26,424 | | | CJ Cheiljedang Corp. (Food Products) | | | 8,358 | |
| | 51,400 | | | Coway Co. Ltd. (Household Durables) | | | 3,994 | |
| | 44,500 | | | Daewoo International Corp. (Trading Companies & Distributors) | | | 855 | |
| | | | | | | | |
| Shares | | | Security Description | | Value
(000) | |
| | | | South Korea (continued) | | | | |
| | 87,500 | | | Daewoo Securities Co. Ltd. (Capital Markets) | | $ | 669 | |
| | 64,293 | | | DGB Financial Group, Inc. (Banks) | | | 591 | |
| | 20,870 | | | Dongbu Insurance Co. Ltd. (Insurance) | | | 1,105 | |
| | 135,410 | | | Doosan Bobcat, Inc. (Machinery) | | | 3,888 | |
| | 6,000 | | | Doosan Corp. (Industrial Conglomerates) | | | 560 | |
| | 49,700 | | | GS Holdings Corp. (Oil, Gas & Consumable Fuels) | | | 2,426 | |
| | 135,689 | | | Hana Financial Group, Inc. (Banks) | | | 5,217 | |
| | 168,273 | | | Hankook Tire Co. Ltd. (Auto Components) | | | 6,358 | |
| | 551,972 | | | Hanon Systems (Auto Components) | | | 5,250 | |
| | 10,600 | | | Hyosung Corp. (Chemicals) (b) | | | 1,275 | |
| | 56,392 | | | Hyundai Engineering & Construction Co. Ltd. (Construction & Engineering) | | | 2,910 | |
| | 29,641 | | | Hyundai Marine & Fire Insurance Co. Ltd. (Insurance) | | | 896 | |
| | 31,620 | | | Hyundai Mobis Co. Ltd. (Auto Components) | | | 6,015 | |
| | 30,947 | | | Hyundai Motor Co. Ltd. (Automobiles) | | | 3,485 | |
| | 95,163 | | | Hyundai Steel Co. (Metals & Mining) | | | 4,492 | |
| | 123,200 | | | Industrial Bank of Korea (Banks) | | | 1,703 | |
| | 109,700 | | | Kangwon Land, Inc. (Hotels, Restaurants & Leisure) | | | 2,574 | |
| | 92,583 | | | KB Financial Group, Inc., ADR (Banks) | | | 4,303 | |
| | 161,388 | | | KB Financial Group, Inc. (Banks) | | | 7,647 | |
| | 19,030 | | | KEPCO Plant Service & Engineering Co. Ltd. (Commercial Services & Supplies) | | | 609 | |
| | 115,781 | | | Kia Motors Corp. (Automobiles) | | | 3,205 | |
| | 94,555 | | | Korea Electric Power Corp., ADR (Electric Utilities) | | | 1,356 | |
| | 197,066 | | | Korea Electric Power Corp. (Electric Utilities) | | | 5,659 | |
| | 106,000 | | | Korea Life Insurance Co. Ltd. (Insurance) | | | 504 | |
| | 54,564 | | | KT&G Corp. (Tobacco) | | | 5,239 | |
| | 6,700 | | | Kumho Petro Chemical Co. Ltd. (Chemicals) | | | 700 | |
| | 19,577 | | | LG Chem Ltd. (Chemicals) | | | 5,859 | |
| | 194,900 | | | LG Display Co. Ltd. (Electronic Equipment, Instruments & Components) | | | 3,201 | |
| | 14,361 | | | LS Corp. (Electrical Equipment) | | | 966 | |
| | 14,000 | | | LS Industrial Systems Co. Ltd. (Electrical Equipment) | | | 886 | |
| | 13,384 | | | NCsoft Corp. (Software) | | | 4,456 | |
| | 103,820 | | | POSCO, ADR (Metals & Mining) | | | 7,695 | |
| | 22,383 | | | POSCO (Metals & Mining) | | | 6,608 | |
| | 16,220 | | | Samsung Card Co. Ltd. (Consumer Finance) | | | 557 | |
| | 1,251,011 | | | Samsung Electronics Co. Ltd. (Technology Hardware, Storage & Peripherals) | | | 52,368 | |
| | 42,745 | | | Samsung Fire & Marine Insurance Co. Ltd. (Insurance) | | | 10,127 | |
| | 513,618 | | | Shinhan Financial Group Co. Ltd. (Banks) | | | 19,956 | |
| | 9,219 | | | SK Telecom Co. Ltd. (Wireless Telecommunication Services) | | | 1,928 | |
| | 221,295 | | | SK Telecom Co. Ltd., ADR (Wireless Telecommunication Services) | | | 5,160 | |
| | 284,654 | | | Woori Bank (Banks) | | | 4,164 | |
| | | | | | | | |
| | | | | | | 220,439 | |
| | | | | | | | |
See accompanying notes to financial statements.
162
HC CAPITAL TRUST
The Emerging Markets Portfolio
Portfolio of Investments (continued) — June 30, 2018
| | | | | | | | |
| Shares | | | Security Description | | Value
(000) | |
| | | | Common Stocks (continued) | | | | |
| | | | Taiwan — 9.62% | |
| | 3,028,672 | | | ASE Technology Holding Co. Ltd., Class – H (Semiconductors & Semiconductor Equipment) (a) | | $ | 7,114 | |
| | 787,971 | | | Asia Cement Corp. (Construction Materials) | | | 866 | |
| | 338,000 | | | Asustek Computer, Inc. (Technology Hardware, Storage & Peripherals) | | | 3,089 | |
| | 1,187,000 | | | Cheng Shin Rubber Industry Co. Ltd. (Auto Components) | | | 1,785 | |
| | 381,144 | | | Chicony Electronics Co. Ltd. (Technology Hardware, Storage & Peripherals) | | | 859 | |
| | 5,034,000 | | | China Development Financial Holding Corp. (Banks) | | | 1,841 | |
| | 391,000 | | | China Motor Corp. (Automobiles) | | | 364 | |
| | 1,219,000 | | | Chunghwa Telecom Co. Ltd. (Diversified Telecommunication Services) | | | 4,399 | |
| | 2,939,000 | | | Compal Electronics, Inc. (Technology Hardware, Storage & Peripherals) | | | 1,851 | |
| | 438,000 | | | CTCI Corp. (Construction & Engineering) | | | 701 | |
| | 5,710,000 | | | E.Sun Financial Holding Co. Ltd. (Banks) | | | 3,981 | |
| | 589,000 | | | Far EasTone Telecommunications Co. Ltd. (Wireless Telecommunication Services) | | | 1,523 | |
| | 539,000 | | | Formosa Taffeta Co. Ltd. (Textiles, Apparel & Luxury Goods) | | | 590 | |
| | 5,707,996 | | | Fubon Financial Holding Co. Ltd. (Diversified Financial Services) | | | 9,569 | |
| | 651,000 | | | Giant Manufacturing Co. Ltd. (Leisure Products) | | | 2,755 | |
| | 1,000 | | | Grand Pacific Petrochemical Corp. (Chemicals) | | | 1 | |
| | 279,700 | | | Highwealth Construction Corp. (Real Estate Management & Development) | | | 415 | |
| | 2,751,839 | | | Hon Hai Precision Industry Co. Ltd. (Electronic Equipment, Instruments & Components) | | | 7,511 | |
| | 499,000 | | | HTC Corp. (Technology Hardware, Storage & Peripherals) (a) | | | 931 | |
| | 1,717,000 | | | Inventec Corp. (Technology Hardware, Storage & Peripherals) | | | 1,349 | |
| | 214,000 | | | Kinsus Interconnect Technology Corp. (Semiconductors & Semiconductor Equipment) | | | 367 | |
| | 1,488,554 | | | Lite-On Technology Corp. (Technology Hardware, Storage & Peripherals) | | | 1,802 | |
| | 1,133,962 | | | MediaTek, Inc. (Semiconductors & Semiconductor Equipment) | | | 11,160 | |
| | 3,561,477 | | | Mega Financial Holding Co. Ltd. (Banks) | | | 3,143 | |
| | 423,000 | | | Novatek Microelectronics Corp. (Semiconductors & Semiconductor Equipment) | | | 1,908 | |
| | 1,157,000 | | | Pegatron Corp. (Technology Hardware, Storage & Peripherals) | | | 2,380 | |
| | 1,620 | | | Pou Chen Corp. (Textiles, Apparel & Luxury Goods) | | | 2 | |
| | 490,000 | | | Powertech Technology, Inc. (Semiconductors & Semiconductor Equipment) | | | 1,423 | |
| | 3,221,000 | | | President Enterprises Corp. (Food Products) | | | 8,178 | |
| | 1,364,000 | | | Quanta Computer, Inc. (Technology Hardware, Storage & Peripherals) | | | 2,394 | |
| | 296,000 | | | Radiant Opto-Electronics Corp. (Semiconductors & Semiconductor Equipment) | | | 592 | |
| | | | | | | | |
| Shares | | | Security Description | | Value
(000) | |
| | | | Taiwan (continued) | | | | |
| | 309,000 | | | Realtek Semiconductor Corp. (Semiconductors & Semiconductor Equipment) | | $ | 1,125 | |
| | 298,800 | | | Ruentex Development Co. Ltd. (Real Estate Management & Development) | | | 345 | |
| | 375,000 | | | Ruentex Industries Ltd. (Textiles, Apparel & Luxury Goods) | | | 765 | |
| | 120,000 | | | Simplo Technology Co. Ltd. (Electronic Equipment, Instruments & Components) | | | 705 | |
| | 2,533,200 | | | Standard Foods Corp. (Food Products) | | | 5,128 | |
| | 940,900 | | | Synnex Technology International Corp. (Electronic Equipment, Instruments & Components) | | | 1,420 | |
| | 1,198,000 | | | Taiwan Cement Corp. (Construction Materials) | | | 1,664 | |
| | 286,000 | | | Taiwan Fertilizer Co. Ltd. (Chemicals) | | | 393 | |
| | 615,000 | | | Taiwan Mobile Co. Ltd. (Wireless Telecommunication Services) | | | 2,229 | |
| | 6,672,000 | | | Taiwan Semiconductor Manufacturing Co. Ltd. (Semiconductors & Semiconductor Equipment) | | | 47,389 | |
| | 138,000 | | | Transcend Information, Inc. (Technology Hardware, Storage & Peripherals) | | | 383 | |
| | 314,000 | | | U-Ming Marine Transport Corp. (Marine) | | | 345 | |
| | 569,000 | | | Vanguard International Semiconductor Corp. (Semiconductors & Semiconductor Equipment) | | | 1,303 | |
| | 377,000 | | | Wan Hai Lines Ltd. (Marine) | | | 209 | |
| | 1,823,595 | | | Wistron Corp. (Technology Hardware, Storage & Peripherals) | | | 1,355 | |
| | 995,000 | | | WPG Holdings Ltd. (Electronic Equipment, Instruments & Components) | | | 1,410 | |
| | 13,431,000 | | | Yuanta Financial Holding Co. Ltd. (Capital Markets) | | | 6,125 | |
| | | | | | | | |
| | | | | | | 157,136 | |
| | | | | | | | |
| | | | Thailand — 1.58% | |
| | 275,000 | | | Advanced Info Service Public Co. Ltd. (Wireless Telecommunication Services) | | | 1,536 | |
| | 12,200 | | | Bangkok Bank Public Co. Ltd. – Foreign Registered Shares (Banks) | | | 73 | |
| | 216,400 | | | Bangkok Bank Public Co. Ltd. – NVDR (Banks) | | | 1,277 | |
| | 946,200 | | | Banpu Public Co. Ltd., Registered Shares (Oil, Gas & Consumable Fuels) | | | 557 | |
| | 538,900 | | | BEC World Public Co. Ltd. (Media) | | | 128 | |
| | 3,111,600 | | | BTS Group Holdings PCL (Road & Rail) | | | 827 | |
| | 2,982,700 | | | Delta Electronics (Thailand) Public Co. Ltd. (Electronic Equipment, Instruments & Components) | | | 5,268 | |
| | 136,600 | | | Glow Energy Public Co. Ltd. (Independent Power & Renewable Electricity Producers) | | | 391 | |
| | 476,500 | | | Kasikornbank Public Co. Ltd. (Banks) | | | 2,791 | |
| | 14,734,400 | | | Krung Thai Bank Public Co. Ltd., Registered Shares (Banks) | | | 7,429 | |
| | 888,000 | | | Krung Thai Bank Public Co. Ltd. – NVDR (Banks) | | | 448 | |
| | 429,142 | | | PTT Chemical Public Co. Ltd. (Chemicals) | | | 946 | |
| | 634,175 | | | PTT Exploration & Production Public Co. Ltd. (Oil, Gas & Consumable Fuels) | | | 2,690 | |
See accompanying notes to financial statements.
163
HC CAPITAL TRUST
The Emerging Markets Portfolio
Portfolio of Investments (continued) — June 30, 2018
| | | | | | | | |
| Shares | | | Security Description | | Value
(000) | |
| | | | Common Stocks (continued) | | | | |
| | | | Thailand (continued) | | | | |
| | 411,000 | | | Siam Commercial Bank Public Co. Ltd.– NVDR (Banks) | | $ | 1,471 | |
| | | | | | | | |
| | | | | | | 25,832 | |
| | | | | | | | |
| | | | Turkey — 1.69% | |
| | 331,331 | | | Coca-Cola Icecek A/S (Beverages) | | | 2,448 | |
| | 5,157,176 | | | Enka Insaat ve Sanayi A/S (Industrial Conglomerates) | | | 5,246 | |
| | 693,800 | | | Eregli Demir ve Celik Fabrikalari TAS (Metals & Mining) | | | 1,542 | |
| | 1 | | | Kardemir Karabuk Demir Celik Sanayi ve Ticaret A/S, Class – D (Metals & Mining) (a) | | | — | |
| | 162,200 | | | TAV Havalimanlari Holding A/S (Transportation Infrastructure) | | | 793 | |
| | 120,400 | | | Tofas Turk Otomobil Fabrikasi A/S (Automobiles) | | | 631 | |
| | 290,564 | | | Tupras-Turkiye Petrol Rafinerileri A/S (Oil, Gas & Consumable Fuels) | | | 6,835 | |
| | 257,700 | | | Turk Telekomunikasyon A/S (Diversified Telecommunication Services) (a) | | | 280 | |
| | 1,287,500 | | | Turkcell Iletisim Hizmetleri A/S (Wireless Telecommunication Services) | | | 3,413 | |
| | 3,473,047 | | | Turkiye Garanti Bankasi A/S (Banks) | | | 6,340 | |
| | | | | | | | |
| | | | | | | 27,528 | |
| | | | | | | | |
| | | | United Arab Emirates — 0.21% | |
| | 528,300 | | | Abu Dhabi Commercial Bank PJSC (Banks) | | | 1,016 | |
| | 488,800 | | | Dubai Islamic Bank PJSC (Banks) | | | 648 | |
| | 542,072 | | | National Bank of Abu Dhabi (Banks) | | | 1,793 | |
| | | | | | | | |
| | | | | | | 3,457 | |
| | | | | | | | |
| | | | United Kingdom — 0.78% | |
| | 229,849 | | | Unilever PLC (Personal Products) | | | 12,714 | |
| | | | | | | | |
| | | | Total Common Stocks | | | 1,539,284 | |
| | | | | | | | |
| | | | Preferred Stocks — 1.94% | | | | |
| | | | Brazil — 1.12% | |
| | 1,441,800 | | | Banco do Estado do Rio Grande do Sul SA – Preferred, Series B, B Shares (Banks) | | | 5,478 | |
| | 1,721,170 | | | Companhia Energetica de Minas Gerais SA – Preferred, ADR (Electric Utilities) | | | 3,207 | |
| | 161,900 | | | Companhia Paranaense de Energia-COPEL – Preferred, B Shares (Electric Utilities) | | | 908 | |
| | 1,472,641 | | | Gerdau SA – Preferred, ADR (Metals & Mining) | | | 5,213 | |
| | 2,094,222 | | | Randon Participacoes SA – Preferred (Machinery) | | | 3,372 | |
| | | | | | | | |
| | | | | | | 18,178 | |
| | | | | | | | |
| | | | Colombia — 0.04% | |
| | 1,637,100 | | | Grupo Aval Acciones y Valores SA – Preferred (Banks) | | | 687 | |
| | | | | | | | |
| | | | India — 0.02% | |
| | 2,625,080 | | | Vedanta Ltd. – Preferred (Metals & Mining)* | | | 389 | |
| | | | | | | | |
| | | | South Korea — 0.76% | |
| | 35,800 | | | Hyundai Motor Co. Ltd. – Preferred (Automobiles) | | | 2,917 | |
| | 22,900 | | | Hyundai Motor Co. Ltd. – Preferred (Automobiles) | | | 1,691 | |
| | | | | | | | |
| Shares | | | Security Description | | Value
(000) | |
| | | | South Korea (continued) | |
| | 230,850 | | | Samsung Electronics Co. Ltd. – Preferred (Technology Hardware, Storage & Peripherals) | | $ | 7,799 | |
| | | | | | | | |
| | | | | | | 12,407 | |
| | | | | | | | |
| | | | Total Preferred Stocks | | | 31,661 | |
| | | | | | | | |
Principal
Amount
(000) | | | | | | |
| | | | Time Deposit — 0.51% | | | | |
| $ | 8,347 | | | State Street Liquidity Management Control System Eurodollar Time Deposit, 0.53%, 7/2/18 | | | 8,347 | |
| | | | | | | | |
| | | | Total Time Deposit | | | 8,347 | |
| | | | | | | | |
| Shares | | | | | | |
| | | | Exchange-Traded Fund — 0.28% | | | | |
| | 105,590 | | | iShares MSCI Emerging Markets Index Fund ETF | | | 4,575 | |
| | | | | | | | |
| | | | Total Exchange-Traded Fund | | | 4,575 | |
| | | | | | | | |
| | | | Mutual Funds — 1.80% | | | | |
| | 6,051,580 | | | Federated Treasury Obligations Fund, Institutional Shares, 1.75%^^ (c) | | | 6,052 | |
| | 23,268,850 | | | State Street Institutional Treasury Plus Money Market Fund, Trust Class, 1.72% (c) | | | 23,268 | |
| | | | | | | | |
| | | | Total Mutual Funds | | | 29,320 | |
| | | | | | | | |
Principal
Amount
(000) | | | | | | |
| | | | Repurchase Agreement — 0.62% | | | | |
| $ | 10,162 | | | Jefferies LLC, 2.00%, 7/2/18 (Purchased on 6/29/18, proceeds at maturity $10,163,796 collateralized by U.S. Treasury Obligations, 2.50% – 2.92%, 2/15/20 – 2/15/44 fair value $10,365,356)^^ | | | 10,162 | |
| | | | | | | | |
| | | | Total Repurchase Agreement | | | 10,162 | |
| | | | | | | | |
| | | | Total Investments (cost $1,578,286) — 99.39% | | | 1,623,349 | |
| | | | Other assets in excess of liabilities — 0.61% | | | 9,965 | |
| | | | | | | | |
| | | | Net Assets—100.00% | | | $1,633,314 | |
| | | | | | | | |
| | Amounts designated as “—” are $0 or have been rounded to $0. | |
| * | Security was fair valued on June 30, 2018 and represents a Level 2 security. Refer to Note 2 in the Notes to Financial Statements. |
| ^ | All or part of this security was on loan as of June 30, 2018. The total value of securities on loan as of June 30, 2018, was $16,135 (amount in thousands). |
| ^^ | Purchased with cash collateral held from securities lending. The value of the collateral could include collateral held for securities that were sold on or before June 30, 2018. |
| (a) | Represents non-income producing security. |
| (b) | These securities have been deemed illiquid by the Specialist Manager and represents 0.85% of the Portfolio’s net assets. |
| (c) | The rate disclosed is the rate in effect on June 30, 2018. |
See accompanying notes to financial statements.
164
HC CAPITAL TRUST
The Emerging Markets Portfolio
Portfolio of Investments (concluded) — June 30, 2018
ADR — American Depositary Receipt
ETF — Exchange-Traded Fund
GDR — Global Depositary Receipt
NVDR — Non-Voting Depository Receipt
REIT — Real Estate Investment Trust
The following table reflects the percentage of total net assets of the Portfolio attributable to each Specialist Manager as of June 30, 2018.
| | | | | | | | | | | | | | | | | | | | | | | | |
The Emerging Markets Portfolio | | BNY Mellon Asset
Management North
America Corporation^ | | | BNY Mellon Asset
Management North
America Corporation* | | | Parametric
Portfolio
Associates,
LLC | | | RBC Global
Asset
Management
(UK) Limited | | | HC
Capital
Solutions | | | Total | |
| Common Stocks | | | 38.32% | | | | 35.03% | | | | — | | | | 20.90 | % | | | — | | | | 94.24% | |
| Preferred Stocks | | | 1.01% | | | | 0.93% | | | | — | | | | — | | | | — | | | | 1.94% | |
| Time Deposit | | | 0.51% | | | | — | | | | — | | | | — | | | | — | | | | 0.51% | |
| Exchange-Traded Fund | | | 0.22% | | | | 0.06% | | | | — | | | | — | | | | — | | | | 0.28% | |
| Mutual Funds | | | 0.29% | | | | 0.32% | | | | 0.66% | | | | 0.53% | | | | 0.00% | | | | 1.80% | |
| Repurchase Agreement | | | 0.48% | | | | 0.14% | | | | — | | | | — | | | | — | | | | 0.62% | |
| Other Assets (Liabilities) | | | -0.01% | | | | 0.48% | | | | 0.12% | | | | 0.01% | | | | 0.00% | | | | 0.61% | |
| | | | | | | | | | | | | | | | | | | | | | | | |
Total Net Assets | | | 40.82% | | | | 36.96% | | | | 0.78% | | | | 21.44% | | | | 0.00% | | | | 100.00% | |
| | | | | | | | | | | | | | | | | | | | | | | | |
| ^ | Formerly The Boston Company Asset Management LLC. |
| * | Formerly Mellon Capital Management Corporation. |
Amounts designated as “—” indicate the Specialist Manager did not manage any holdings in that category.
The following table reflects the open derivative positions held by the Portfolio as of June 30, 2018.
| | | | | | | | | | | | | | |
Futures Contracts Purchased^ | | | | | | | | | |
Description | | Number of
Contracts | | Expiration
Date | | | Notional
Amount
(000) | | | Value and
Unrealized
Appreciation/
(Depreciation)
(000) | |
MSCI Emerging Markets Index Future | | 203 | | | 9/21/18 | | | $ | 10,793 | | | $ | (123 | ) |
| | | | | | | | | | | | | | |
| | | | | $ | 10,793 | | | $ | (123 | ) |
| | | | | | | | | | | | | | |
| | |
| | Total Unrealized Appreciation | | | $ | — | |
| | Total Unrealized Depreciation | | | | (123 | ) |
| | | | | | | | | | | | | | |
| | Total Net Unrealized Appreciation/(Depreciation) | | | $ | (123 | ) |
| | | | | | | | | | | | | | |
| ^ | Cash has been pledged as collateral for futures contracts held by the Portfolio. |
Amounts designated as “—” are $0 or have been rounded to $0.
165
HC CAPITAL TRUST
The Core Fixed Income Portfolio
Portfolio of Investments — June 30, 2018
| | | | | | | | | | | | | | | | |
Principal
Amount
(000) | | | Security Description | | Rate % | | | Maturity
Date | | | Value
(000) | |
| | | | Asset Backed Securities — 0.50% | | | | | | | | | | | | |
| $ | 25 | | | BMW Vehicle Owner Trust, Series 2016-A, Class A4, Callable 3/25/20 @ 100.00 | | | 1.37 | | | | 12/27/22 | | | $ | 24 | |
| | 50 | | | Capital One Multi-Asset Execution Trust, Series 2017-A4, Class A4 | | | 1.99 | | | | 7/17/23 | | | | 49 | |
| | 25 | | | Capital One Multi-Asset Execution Trust, Series 2017-A1, Class A1 | | | 2.00 | | | | 1/17/23 | | | | 25 | |
| | 25 | | | CarMax Auto Owner Trust, Series 2017-2, Class A4, Callable 3/15/21 @ 100.00 | | | 2.25 | | | | 9/15/22 | | | | 24 | |
| | 100 | | | Citibank Credit Card Issuance Trust, Series 2014-A5, Class A5 | | | 2.68 | | | | 6/7/23 | | | | 99 | |
| | 45 | | | Honda Auto Receivables Owner Trust, Series 2018-1, Class A3, Callable 6/15/21 @ 100.00 | | | 2.64 | | | | 2/15/22 | | | | 45 | |
| | 25 | | | Toyota Auto Receivables Owner Trust, Series 2017-A, Class A4, Callable 11/15/20 @ 100.00 | | | 2.10 | | | | 9/15/22 | | | | 25 | |
| | 25 | | | Toyota Auto Receivables Owner Trust, Series 2018-A, Class A4, Callable 10/15/21 @ 100.00 | | | 2.52 | | | | 5/15/23 | | | | 25 | |
| | 18 | | | World Financial Network Credit Card Master Trust, Series 2016-A, Class A | | | 2.03 | | | | 4/15/25 | | | | 17 | |
| | | | | | | | | | | | | | | | |
| | | | Total Asset Backed Securities | | | | | | | | | | | 333 | |
| | | | | | | | | | | | | | | | |
| | | | Collateralized Mortgage Obligations — 1.57% | | | | | | | | | | | | |
| | 40 | | | Bank, Series 2017-BNK8, Class A3 | | | 3.23 | | | | 11/15/50 | | | | 38 | |
| | 25 | | | Bank, Series 2017-BNK9, Class ASB | | | 3.47 | | | | 11/15/54 | | | | 25 | |
| | 25 | | | Citigroup Commercial Mortgage Trust, Series 2015-GC27, Class A4 | | | 2.88 | | | | 2/10/48 | | | | 24 | |
| | 20 | | | Citigroup Commercial Mortgage Trust, Series 2015-GC27, Class A5 | | | 3.14 | | | | 2/10/48 | | | | 19 | |
| | 25 | | | Citigroup Commercial Mortgage Trust, Series 2016-GC37, Class A4 | | | 3.31 | | | | 4/10/49 | | | | 24 | |
| | 25 | | | Citigroup Commercial Mortgage Trust, Series 2014-GC23, Class A4 | | | 3.62 | | | | 7/10/47 | | | | 25 | |
| | 25 | | | Commercial Mortgage Trust, Series 2015-LC19, Class A4 | | | 3.18 | | | | 2/10/48 | | | | 24 | |
| | 20 | | | Commercial Mortgage Trust, Series 2015-DC1, Class A5 | | | 3.35 | | | | 2/10/48 | | | | 20 | |
| | 25 | | | Commercial Mortgage Trust, Series 2013-CR8, Class A5 | | | 3.61 (a) | | | | 6/10/46 | | | | 25 | |
| | 25 | | | Commercial Mortgage Trust, Series 2014-UBS3, Class A4 | | | 3.82 | | | | 6/10/47 | | | | 25 | |
| | 25 | | | Commercial Mortgage Trust, Series 2013-CR11, Class B | | | 5.33 (a) | | | | 8/10/50 | | | | 26 | |
| | 25 | | | Fannie Mae, Series 2016-M1, Class A2 | | | 2.94 (a) | | | | 1/25/26 | | | | 24 | |
| | 38 | | | Fannie Mae-ACES, Series 2017-M7, Class A2 | | | 2.96 | | | | 2/25/27 | | | | 37 | |
| | 25 | | | Fannie Mae-ACES, Series 2018-M1, Class A2 | | | 3.09 (a) | | | | 12/25/27 | | | | 24 | |
| | 30 | | | Fannie Mae-ACES, Series 2014-M9, Class A2 | | | 3.10 (a) | | | | 7/25/24 | | | | 30 | |
| | 25 | | | Fannie Mae-ACES, Series 2017-M12, Class A2 | | | 3.18 (a) | | | | 6/25/27 | | | | 24 | |
| | 19 | | | Freddie Mac, Series K726, Class A1 | | | 2.60 | | | | 8/25/23 | | | | 19 | |
| | 25 | | | Freddie Mac Multifamily Structured Pass-Through Certificates, Series K023, Class A2 | | | 2.31 | | | | 8/25/22 | | | | 24 | |
| | 25 | | | Freddie Mac Multifamily Structured Pass-Through Certificates, Series K017, Class A2 | | | 2.87 | | | | 12/25/21 | | | | 25 | |
| | 12 | | | Freddie Mac Multifamily Structured Pass-Through Certificates, Series K032, Class A1 | | | 3.02 | | | | 2/25/23 | | | | 12 | |
| | 30 | | | Freddie Mac Multifamily Structured Pass-Through Certificates, Series K033, Class A2 | | | 3.06 (a) | | | | 7/25/23 | | | | 30 | |
| | 50 | | | Freddie Mac Multifamily Structured Pass-Through Certificates, Series K043, Class A2 | | | 3.06 | | | | 12/25/24 | | | | 50 | |
| | 19 | | | Freddie Mac Multifamily Structured Pass-Through Certificates, Series K716, Class A2 | | | 3.13 | | | | 6/25/21 | | | | 19 | |
| | 25 | | | Freddie Mac Multifamily Structured Pass-Through Certificates, Series K052, Class A2 | | | 3.15 | | | | 11/25/25 | | | | 25 | |
| | 35 | | | Freddie Mac Multifamily Structured Pass-Through Certificates, Series K032, Class A2 | | | 3.31 (a) | | | | 5/25/23 | | | | 35 | |
| | 20 | | | Freddie Mac Multifamily Structured Pass-Through Certificates, Series K006, Class A2 | | | 4.25 | | | | 1/25/20 | | | | 20 | |
| | 20 | | | GS Mortgage Securities Trust, Series 2015-GC32, Class A2 | | | 3.06 | | | | 7/10/48 | | | | 20 | |
| | 25 | | | GS Mortgage Securities Trust, Series 2017-GS5, Class A2 | | | 3.22 | | | | 3/10/50 | | | | 25 | |
| | 25 | | | GS Mortgage Securities Trust, Series 2013-GC14, Class A5 | | | 4.24 | | | | 8/10/46 | | | | 26 | |
| | 25 | | | JPMBB Commercial Mortgage Securities Trust, Series 2014-C24, Class A5 | | | 3.64 | | | | 11/15/47 | | | | 25 | |
| | 25 | | | JPMBB Commercial Mortgage Securities Trust, Series 2014-C22, Class A4,
Callable 7/15/24 @ 100.00 | | | 3.80 | | | | 9/15/47 | | | | 25 | |
| | 50 | | | JPMDB Commercial Mortgage Securities Trust, Series 2016-C4, Class A3 | | | 3.14 | | | | 12/15/49 | | | | 49 | |
| | 24 | | | JPMorgan Chase Commercial Mortgage Securities Corp., Series 2012-C8, Class A3 | | | 2.83 | | | | 10/15/45 | | | | 23 | |
| | 25 | | | Morgan Stanley BAML Trust, Series 2015-C21, Class ASB | | | 3.15 | | | | 3/15/48 | | | | 25 | |
| | 25 | | | Morgan Stanley BAML Trust, Series 2013-C9, Class AS | | | 3.46 | | | | 5/15/46 | | | | 25 | |
| | 25 | | | Morgan Stanley BAML Trust, Series 2014-C19, Class A4 | | | 3.53 | | | | 12/15/47 | | | | 25 | |
| | 25 | | | Morgan Stanley BAML Trust, Series 2017-C33, Class A5 | | | 3.60 | | | | 5/15/50 | | | | 25 | |
| | 25 | | | SG Commercial Mortgage Securities Trust, Series 2016-C5, Class A4 | | | 3.06 | | | | 10/10/48 | | | | 24 | |
| | 50 | | | Wells Fargo Commercial Mortgage Trust, Series 2016-C36, Class ASB | | | 2.93 | | | | 11/15/59 | | | | 50 | |
| | 9 | | | WF-RBS Commercial Mortgage Trust, Series 2012-C7, Class A1 | | | 2.30 | | | | 6/15/45 | | | | 9 | |
| | | | | | | | | | | | | | | | |
| | | | Total Collateralized Mortgage Obligations | | | | | | | | | | | 1,049 | |
| | | | | | | | | | | | | | | | |
See accompanying notes to financial statements.
166
HC CAPITAL TRUST
The Core Fixed Income Portfolio
Portfolio of Investments (continued) — June 30, 2018
| | | | | | | | | | | | | | | | |
Principal
Amount
(000) | | | Security Description | | Rate % | | | Maturity
Date | | | Value
(000) | |
| | | | U.S. Government Agency Mortgages — 22.64% | | | | | | | | | | | | |
| $ | 54 | | | Fannie Mae, Pool #AS2673 | | | 2.00 | | | | 5/1/29 | | | $ | 52 | |
| | 24 | | | Fannie Mae, Pool #MA3246 | | | 2.50 | | | | 1/1/33 | | | | 23 | |
| | 22 | | | Fannie Mae, Pool #MA2789 | | | 2.50 | | | | 10/1/36 | | | | 21 | |
| | 76 | | | Fannie Mae, Pool #AP4742 | | | 2.50 | | | | 8/1/27 | | | | 74 | |
| | 76 | | | Fannie Mae, Pool #MA1277 | | | 2.50 | | | | 12/1/27 | | | | 75 | |
| | 24 | | | Fannie Mae, Pool #BH5772 | | | 2.50 | | | | 11/1/32 | | | | 24 | |
| | 23 | | | Fannie Mae, Pool #MA3154 | | | 2.50 | | | | 10/1/32 | | | | 22 | |
| | 34 | | | Fannie Mae, Pool #AB7391 | | | 2.50 | | | | 12/1/42 | | | | 32 | |
| | 24 | | | Fannie Mae, Pool #AS4946 | | | 2.50 | | | | 5/1/30 | | | | 23 | |
| | 49 | | | Fannie Mae, Pool #AU6677 | | | 2.50 | | | | 9/1/28 | | | | 48 | |
| | 43 | | | Fannie Mae, Pool #BC9041 | | | 2.50 | | | | 11/1/31 | | | | 42 | |
| | 50 | | | Fannie Mae, Pool #AU1660 | | | 2.50 | | | | 7/1/28 | | | | 49 | |
| | 26 | | | Fannie Mae, Series 2015-M1, Class A2 | | | 2.53 | | | | 9/25/24 | | | | 25 | |
| | 18 | | | Fannie Mae, Pool #MA2523 | | | 3.00 | | | | 2/1/36 | | | | 18 | |
| | 22 | | | Fannie Mae, Pool #MA2897 | | | 3.00 | | | | 2/1/37 | | | | 22 | |
| | 45 | | | Fannie Mae, Pool #BC9003 | | | 3.00 | | | | 11/1/46 | | | | 44 | |
| | 134 | | | Fannie Mae, Pool #AQ7920 | | | 3.00 | | | | 12/1/42 | | | | 130 | |
| | 54 | | | Fannie Mae, Pool #AY2961 | | | 3.00 | | | | 5/1/45 | | | | 52 | |
| | 67 | | | Fannie Mae, Pool #AS0302 | | | 3.00 | | | | 8/1/43 | | | | 65 | |
| | 23 | | | Fannie Mae, Pool #MA2863 | | | 3.00 | | | | 1/1/47 | | | | 22 | |
| | 43 | | | Fannie Mae, Pool #BC9681 | | | 3.00 | | | | 6/1/46 | | | | 42 | |
| | 46 | | | Fannie Mae, Pool #BD2446 | | | 3.00 | | | | 1/1/47 | | | | 45 | |
| | 46 | | | Fannie Mae, Pool #BD5797 | | | 3.00 | | | | 9/1/46 | | | | 44 | |
| | 23 | | | Fannie Mae, Pool #AS8739 | | | 3.00 | | | | 2/1/37 | | | | 22 | |
| | 46 | | | Fannie Mae, Pool #AL9865 | | | 3.00 | | | | 2/1/47 | | | | 45 | |
| | 23 | | | Fannie Mae, Pool #BD5545 | | | 3.00 | | | | 10/1/46 | | | | 22 | |
| | 13 | | | Fannie Mae, Pool #AO7628 | | | 3.00 | | | | 6/1/27 | | | | 13 | |
| | 98 | | | Fannie Mae, Pool #AO0752 | | | 3.00 | | | | 4/1/42 | | | | 96 | |
| | 23 | | | Fannie Mae, Pool #MA3127 | | | 3.00 | | | | 9/1/37 | | | | 23 | |
| | 25 | | | Fannie Mae, Pool #AL9996 | | | 3.00 | | | | 4/1/32 | | | | 25 | |
| | 70 | | | Fannie Mae, Pool #AK0006 | | | 3.00 | | | | 1/1/27 | | | | 70 | |
| | 17 | | | Fannie Mae, Pool #MA2416 | | | 3.00 | | | | 10/1/35 | | | | 17 | |
| | 43 | | | Fannie Mae, Pool #AS7908 | | | 3.00 | | | | 9/1/46 | | | | 42 | |
| | 76 | | | Fannie Mae, Pool #MA1307 | | | 3.00 | | | | 1/1/33 | | | | 76 | |
| | 24 | | | Fannie Mae, Pool #MA3339 | | | 3.00 | | | | 4/1/33 | | | | 24 | |
| | 60 | | | Fannie Mae, Pool #MA2246 | | | 3.00 | | | | 4/1/30 | | | | 60 | |
| | 44 | | | Fannie Mae, Pool #AS8276 | | | 3.00 | | | | 11/1/46 | | | | 43 | |
| | 50 | | | Fannie Mae, Pool #AS5977 | | | 3.00 | | | | 10/1/30 | | | | 50 | |
| | 18 | | | Fannie Mae, Pool #890566 | | | 3.00 | | | | 12/1/43 | | | | 18 | |
| | 92 | | | Fannie Mae, Pool #AS8483 | | | 3.00 | | | | 12/1/46 | | | | 89 | |
| | 62 | | | Fannie Mae, Pool #AT2127 | | | 3.00 | | | | 4/1/43 | | | | 61 | |
| | 24 | | | Fannie Mae, Pool #MA3237 | | | 3.00 | | | | 1/1/48 | | | | 24 | |
| | 62 | | | Fannie Mae, Pool #AT0682 | | | 3.00 | | | | 4/1/43 | | | | 61 | |
| | 30 | | | Fannie Mae, Pool #AU3353 | | | 3.00 | | | | 8/1/43 | | | | 30 | |
| | 84 | | | Fannie Mae, Pool #AB7099 | | | 3.00 | | | | 11/1/42 | | | | 82 | |
| | 61 | | | Fannie Mae, Pool #AB8897 | | | 3.00 | | | | 4/1/43 | | | | 60 | |
| | 44 | | | Fannie Mae, Pool #AB2047 | | | 3.00 | | | | 1/1/26 | | | | 44 | |
| | 38 | | | Fannie Mae, Pool #AU8932 | | | 3.00 | | | | 11/1/28 | | | | 38 | |
| | 48 | | | Fannie Mae, Pool #MA3082 | | | 3.00 | | | | 7/1/47 | | | | 47 | |
| | 45 | | | Fannie Mae, Pool #BC4764 | | | 3.00 | | | | 10/1/46 | | | | 44 | |
| | 27 | | | Fannie Mae, Pool #AZ2936 | | | 3.00 | | | | 9/1/45 | | | | 26 | |
| | 23 | | | Fannie Mae, Pool #MA3059 | | | 3.50 | | | | 7/1/37 | | | | 23 | |
| | 39 | | | Fannie Mae, Pool #MA2706 | | | 3.50 | | | | 8/1/46 | | | | 39 | |
| | 18 | | | Fannie Mae, Pool #MA2522 | | | 3.50 | | | | 2/1/46 | | | | 18 | |
See accompanying notes to financial statements.
167
HC CAPITAL TRUST
The Core Fixed Income Portfolio
Portfolio of Investments (continued) — June 30, 2018
| | | | | | | | | | | | | | | | |
Principal
Amount
(000) | | | Security Description | | Rate % | | | Maturity
Date | | | Value
(000) | |
| | | | U.S. Government Agency Mortgages (continued) | | | | | | | | | | | | |
| $ | 48 | | | Fannie Mae, Pool #MA3182 | | | 3.50 | | | | 11/1/47 | | | $ | 48 | |
| | 30 | | | Fannie Mae, Pool #AL1717 | | | 3.50 | | | | 5/1/27 | | | | 30 | |
| | 19 | | | Fannie Mae, Pool #MA2389 | | | 3.50 | | | | 9/1/35 | | | | 19 | |
| | 49 | | | Fannie Mae, Pool #MA1059 | | | 3.50 | | | | 5/1/32 | | | | 50 | |
| | 28 | | | Fannie Mae, Pool #AJ4867 | | | 3.50 | | | | 1/1/42 | | | | 28 | |
| | 17 | | | Fannie Mae, Pool #AJ1886 | | | 3.50 | | | | 3/1/42 | | | | 17 | |
| | 26 | | | Fannie Mae, Pool #MA3148 | | | 3.50 | | | | 10/1/47 | | | | 26 | |
| | 45 | | | Fannie Mae, Pool #MA3026 | | | 3.50 | | | | 6/1/47 | | | | 45 | |
| | 25 | | | Fannie Mae, Pool #MA3305 | | | 3.50 | | | | 3/1/48 | | | | 25 | |
| | 43 | | | Fannie Mae, Pool #MA1980 | | | 3.50 | | | | 8/1/44 | | | | 43 | |
| | 58 | | | Fannie Mae, Pool #MA2125 | | | 3.50 | | | | 12/1/44 | | | | 58 | |
| | 39 | | | Fannie Mae, Pool #BC2926 | | | 3.50 | | | | 3/1/46 | | | | 39 | |
| | 100 | | | Fannie Mae, Pool #AB6017 | | | 3.50 | | | | 8/1/42 | | | | 100 | |
| | 44 | | | Fannie Mae, Pool #AB2052 | | | 3.50 | | | | 1/1/26 | | | | 45 | |
| | 31 | | | Fannie Mae, Pool #AY3377 | | | 3.50 | | | | 4/1/45 | | | | 31 | |
| | 91 | | | Fannie Mae, Pool #AQ0546 | | | 3.50 | | | | 11/1/42 | | | | 91 | |
| | 40 | | | Fannie Mae, Pool #AX9530 | | | 3.50 | | | | 2/1/45 | | | | 40 | |
| | 33 | | | Fannie Mae, Pool #BC1158 | | | 3.50 | | | | 2/1/46 | | | | 33 | |
| | 36 | | | Fannie Mae, Pool #AZ0862 | | | 3.50 | | | | 7/1/45 | | | | 35 | |
| | 19 | | | Fannie Mae, Pool #AS6394 | | | 3.50 | | | | 12/1/45 | | | | 19 | |
| | 37 | | | Fannie Mae, Pool #AS6102 | | | 3.50 | | | | 11/1/45 | | | | 37 | |
| | 26 | | | Fannie Mae, Pool #AT2673 | | | 3.50 | | | | 4/1/43 | | | | 26 | |
| | 15 | | | Fannie Mae, Pool #AS5596 | | | 3.50 | | | | 8/1/45 | | | | 15 | |
| | 23 | | | Fannie Mae, Pool #BM1568 | | | 3.50 | | | | 7/1/47 | | | | 23 | |
| | 42 | | | Fannie Mae, Pool #AS7491 | | | 3.50 | | | | 7/1/46 | | | | 42 | |
| | 39 | | | Fannie Mae, Pool #AS7388 | | | 3.50 | | | | 6/1/46 | | | | 39 | |
| | 64 | | | Fannie Mae, Pool #AS3133 | | | 3.50 | | | | 8/1/44 | | | | 64 | |
| | 33 | | | Fannie Mae, Pool #BE1435 | | | 3.50 | | | | 12/1/46 | | | | 33 | |
| | 23 | | | Fannie Mae, Pool #BC0443 | | | 3.50 | | | | 12/1/45 | | | | 23 | |
| | 22 | | | Fannie Mae, Pool #BD5046 | | | 3.50 | | | | 2/1/47 | | | | 22 | |
| | 60 | | | Fannie Mae, Pool #AS4771 | | | 3.50 | | | | 4/1/45 | | | | 59 | |
| | 48 | | | Fannie Mae, Pool #AS4772 | | | 3.50 | | | | 4/1/45 | | | | 48 | |
| | 40 | | | Fannie Mae, Pool #BA3123 | | | 3.50 | | | | 2/1/46 | | | | 40 | |
| | 201 | | | Fannie Mae, Pool #AO2548 | | | 3.50 | | | | 4/1/42 | | | | 200 | |
| | 17 | | | Fannie Mae, Pool #BA1893 | | | 3.50 | | | | 8/1/45 | | | | 17 | |
| | 24 | | | Fannie Mae, Pool #AS0024 | | | 3.50 | | | | 7/1/43 | | | | 24 | |
| | 16 | | | Fannie Mae, Pool #AS4236 | | | 3.50 | | | | 1/1/45 | | | | 15 | |
| | 19 | | | Fannie Mae, Pool #BC1074 | | | 3.50 | | | | 12/1/45 | | | | 19 | |
| | 11 | | | Fannie Mae, Pool #AZ1210 | | | 4.00 | | | | 5/1/45 | | | | 11 | |
| | 23 | | | Fannie Mae, Pool #CA0183 | | | 4.00 | | | | 8/1/47 | | | | 23 | |
| | 23 | | | Fannie Mae, Pool #BH2623 | | | 4.00 | | | | 8/1/47 | | | | 24 | |
| | 44 | | | Fannie Mae, Pool #BM2002 | | | 4.00 | | | | 10/1/47 | | | | 45 | |
| | 24 | | | Fannie Mae, Pool #MA3183 | | | 4.00 | | | | 11/1/47 | | | | 24 | |
| | 26 | | | Fannie Mae, Pool #BD7165 | | | 4.00 | | | | 4/1/47 | | | | 27 | |
| | 46 | | | Fannie Mae, Pool #MA3121 | | | 4.00 | | | | 9/1/47 | | | | 47 | |
| | 22 | | | Fannie Mae, Pool #BE8373 | | | 4.00 | | | | 2/1/47 | | | | 23 | |
| | 23 | | | Fannie Mae, Pool #AH5859 | | | 4.00 | | | | 2/1/41 | | | | 24 | |
| | 13 | | | Fannie Mae, Pool #AY9901 | | | 4.00 | | | | 7/1/45 | | | | 13 | |
| | 49 | | | Fannie Mae, Pool #AS3468 | | | 4.00 | | | | 10/1/44 | | | | 50 | |
| | 40 | | | Fannie Mae, Pool #AS6213 | | | 4.00 | | | | 11/1/45 | | | | 41 | |
| | 121 | | | Fannie Mae, Pool #190405 | | | 4.00 | | | | 10/1/40 | | | | 125 | |
| | 43 | | | Fannie Mae, Pool #AH6242 | | | 4.00 | | | | 4/1/26 | | | | 44 | |
| | 43 | | | Fannie Mae, Pool #AS3293 | | | 4.00 | | | | 9/1/44 | | | | 44 | |
| | 39 | | | Fannie Mae, Pool #AX0841 | | | 4.00 | | | | 9/1/44 | | | | 40 | |
See accompanying notes to financial statements.
168
HC CAPITAL TRUST
The Core Fixed Income Portfolio
Portfolio of Investments (continued) — June 30, 2018
| | | | | | | | | | | | | | | | |
Principal
Amount
(000) | | | Security Description | | Rate % | | | Maturity
Date | | | Value
(000) | |
| | | | U.S. Government Agency Mortgages (continued) | | | | | | | | | | | | |
| $ | 13 | | | Fannie Mae, Pool #AV0606 | | | 4.00 | | | | 11/1/43 | | | $ | 14 | |
| | 26 | | | Fannie Mae, Pool #AU8849 | | | 4.00 | | | | 11/1/43 | | | | 27 | |
| | 23 | | | Fannie Mae, Pool #AS3975 | | | 4.00 | | | | 12/1/44 | | | | 24 | |
| | 51 | | | Fannie Mae, Pool #AS3467 | | | 4.00 | | | | 10/1/44 | | | | 53 | |
| | 49 | | | Fannie Mae, Pool #AO2959 | | | 4.00 | | | | 5/1/42 | | | | 50 | |
| | 47 | | | Fannie Mae, Pool #MA2995 | | | 4.00 | | | | 5/1/47 | | | | 48 | |
| | 46 | | | Fannie Mae, Pool #AC7328 | | | 4.00 | | | | 12/1/39 | | | | 47 | |
| | 29 | | | Fannie Mae, Pool #MA0534 | | | 4.00 | | | | 10/1/30 | | | | 30 | |
| | 24 | | | Fannie Mae, Pool #MA3216 | | | 4.00 | | | | 12/1/37 | | | | 24 | |
| | 31 | | | Fannie Mae, Pool #AS3452 | | | 4.00 | | | | 9/1/44 | | | | 31 | |
| | 46 | | | Fannie Mae, Pool #AS9831 | | | 4.00 | | | | 6/1/47 | | | | 47 | |
| | 21 | | | Fannie Mae, Pool #AS8532 | | | 4.00 | | | | 12/1/46 | | | | 22 | |
| | 19 | | | Fannie Mae, Pool #MA2415 | | | 4.00 | | | | 10/1/45 | | | | 19 | |
| | 22 | | | Fannie Mae, Pool #AS7600 | | | 4.00 | | | | 7/1/46 | | | | 22 | |
| | 44 | | | Fannie Mae, Pool #AS9314 | | | 4.00 | | | | 3/1/47 | | | | 45 | |
| | 18 | | | Fannie Mae, Pool #AZ7362 | | | 4.00 | | | | 11/1/45 | | | | 18 | |
| | 68 | | | Fannie Mae, Pool #AJ5303 | | | 4.00 | | | | 11/1/41 | | | | 70 | |
| | 28 | | | Fannie Mae, Pool #AA9781 | | | 4.50 | | | | 7/1/24 | | | | 29 | |
| | 11 | | | Fannie Mae, Pool #930998 | | | 4.50 | | | | 4/1/29 | | | | 12 | |
| | 1 | | | Fannie Mae, Pool #AB0339 | | | 4.50 | | | | 1/1/20 | | | | 1 | |
| | 2 | | | Fannie Mae, Pool #745278 | | | 4.50 | | | | 6/1/19 | | | | 2 | |
| | 20 | | | Fannie Mae, Pool #BH3310 | | | 4.50 | | | | 5/1/47 | | | | 21 | |
| | 8 | | | Fannie Mae, Pool #829106 | | | 4.50 | | | | 10/1/20 | | | | 8 | |
| | 20 | | | Fannie Mae, Pool #AS2751 | | | 4.50 | | | | 6/1/44 | | | | 21 | |
| | 21 | | | Fannie Mae, Pool #AL6567 | | | 4.50 | | | | 10/1/44 | | | | 21 | |
| | 64 | | | Fannie Mae, Pool #AL1107 | | | 4.50 | | | | 11/1/41 | | | | 67 | |
| | 18 | | | Fannie Mae, Pool #BE6489 | | | 4.50 | | | | 1/1/47 | | | | 18 | |
| | 58 | | | Fannie Mae, Pool #AE0954 | | | 4.50 | | | | 2/1/41 | | | | 61 | |
| | 3 | | | Fannie Mae, Pool #735646 | | | 4.50 | | | | 7/1/20 | | | | 3 | |
| | 78 | | | Fannie Mae, Pool #AE0217 | | | 4.50 | | | | 8/1/40 | | | | 82 | |
| | 15 | | | Fannie Mae, Pool #AU9017 | | | 4.50 | | | | 9/1/43 | | | | 15 | |
| | 19 | | | Fannie Mae, Pool #AH7521 | | | 4.50 | | | | 3/1/41 | | | | 20 | |
| | 12 | | | Fannie Mae, Pool #725027 | | | 5.00 | | | | 11/1/33 | | | | 13 | |
| | 28 | | | Fannie Mae, Pool #725238 | | | 5.00 | | | | 3/1/34 | | | | 30 | |
| | 60 | | | Fannie Mae, Pool #889117 | | | 5.00 | | | | 10/1/35 | | | | 64 | |
| | 9 | | | Fannie Mae, Pool #890603 | | | 5.00 | | | | 8/1/41 | | | | 10 | |
| | 11 | | | Fannie Mae, Pool #890221 | | | 5.50 | | | | 12/1/33 | | | | 12 | |
| | 25 | | | Fannie Mae, Pool #254800 | | | 5.50 | | | | 7/1/23 | | | | 27 | |
| | 65 | | | Fannie Mae, Pool #725228 | | | 6.00 | | | | 3/1/34 | | | | 72 | |
| | 25 | | | Fannie Mae, Pool #959451 | | | 6.00 | | | | 12/1/37 | | | | 28 | |
| | 35 | | | Fannie Mae, Pool #AE0442 | | | 6.50 | | | | 1/1/39 | | | | 39 | |
| | 25 | | | Fannie Mae, 15 YR TBA | | | 3.00 | | | | 8/25/33 | | | | 25 | |
| | 25 | | | Fannie Mae, 15 YR TBA | | | 3.00 | | | | 7/25/33 | | | | 25 | |
| | 50 | | | Fannie Mae, 15 YR TBA | | | 3.50 | | | | 7/25/33 | | | | 51 | |
| | 25 | | | Fannie Mae, 30 YR TBA | | | 3.00 | | | | 7/25/48 | | | | 24 | |
| | 300 | | | Fannie Mae, 30 YR TBA | | | 3.50 | | | | 7/25/48 | | | | 297 | |
| | 25 | | | Fannie Mae, 30 YR TBA | | | 3.50 | | | | 8/25/48 | | | | 25 | |
| | 125 | | | Fannie Mae, 30 YR TBA | | | 4.00 | | | | 7/25/48 | | | | 127 | |
| | 25 | | | Fannie Mae, 30 YR TBA | | | 4.00 | | | | 8/25/48 | | | | 25 | |
| | 100 | | | Fannie Mae, 30 YR TBA | | | 4.50 | | | | 7/25/47 | | | | 104 | |
| | 31 | | | Freddie Mac, Pool #J25686 | | | 2.00 | | | | 9/1/28 | | | | 29 | |
| | 25 | | | Freddie Mac, Pool #J36237 | | | 2.50 | | | | 2/1/32 | | | | 24 | |
| | 50 | | | Freddie Mac, Pool #G18470 | | | 2.50 | | | | 6/1/28 | | | | 49 | |
| | 24 | | | Freddie Mac, Pool #G18680 | | | 2.50 | | | | 3/1/33 | | | | 24 | |
See accompanying notes to financial statements.
169
HC CAPITAL TRUST
The Core Fixed Income Portfolio
Portfolio of Investments (continued) — June 30, 2018
| | | | | | | | | | | | | | | | |
Principal
Amount
(000) | | | Security Description | | Rate % | | | Maturity
Date | | | Value
(000) | |
| | | | U.S. Government Agency Mortgages (continued) | | | | | | | | | | | | |
| $ | 22 | | | Freddie Mac, Pool #G18635 | | | 2.50 | | | | 3/1/32 | | | $ | 21 | |
| | 42 | | | Freddie Mac, Pool #J35896 | | | 2.50 | | | | 12/1/31 | | | | 41 | |
| | 90 | | | Freddie Mac, Pool #G18459 | | | 2.50 | | | | 3/1/28 | | | | 88 | |
| | 19 | | | Freddie Mac, Pool #G07445 | | | 2.50 | | | | 7/1/43 | | | | 17 | |
| | 50 | | | Freddie Mac, Pool #G18485 | | | 2.50 | | | | 10/1/28 | | | | 49 | |
| | 32 | | | Freddie Mac, Pool #J25193 | | | 3.00 | | | | 8/1/23 | | | | 32 | |
| | 15 | | | Freddie Mac, Pool #C91809 | | | 3.00 | | | | 2/1/35 | | | | 15 | |
| | 23 | | | Freddie Mac, Pool #Q46441 | | | 3.00 | | | | 2/1/47 | | | | 22 | |
| | 35 | | | Freddie Mac, Pool #G15145 | | | 3.00 | | | | 7/1/29 | | | | 35 | |
| | 69 | | | Freddie Mac, Pool #G08524 | | | 3.00 | | | | 3/1/43 | | | | 68 | |
| | 30 | | | Freddie Mac, Pool #J31327 | | | 3.00 | | | | 4/1/30 | | | | 30 | |
| | 128 | | | Freddie Mac, Pool #G08537 | | | 3.00 | | | | 7/1/43 | | | | 125 | |
| | 47 | | | Freddie Mac, Pool #G60989 | | | 3.00 | | | | 12/1/46 | | | | 46 | |
| | 40 | | | Freddie Mac, Pool #C91709 | | | 3.00 | | | | 6/1/33 | | | | 40 | |
| | 12 | | | Freddie Mac, Pool #G18518 | | | 3.00 | | | | 7/1/29 | | | | 12 | |
| | 23 | | | Freddie Mac, Pool #J15438 | | | 3.00 | | | | 5/1/21 | | | | 22 | |
| | 100 | | | Freddie Mac, Pool #C09035 | | | 3.00 | | | | 4/1/43 | | | | 98 | |
| | 23 | | | Freddie Mac, Pool #C91927 | | | 3.00 | | | | 5/1/37 | | | | 22 | |
| | 46 | | | Freddie Mac, Pool #G08750 | | | 3.00 | | | | 3/1/47 | | | | 45 | |
| | 23 | | | Freddie Mac, Pool #Q44452 | | | 3.00 | | | | 11/1/46 | | | | 22 | |
| | 32 | | | Freddie Mac, Pool #Q20138 | | | 3.00 | | | | 7/1/43 | | | | 31 | |
| | 19 | | | Freddie Mac, Pool #G18601 | | | 3.00 | | | | 5/1/31 | | | | 19 | |
| | 47 | | | Freddie Mac, Pool #G18663 | | | 3.00 | | | | 10/1/32 | | | | 47 | |
| | 92 | | | Freddie Mac, Pool #G08741 | | | 3.00 | | | | 1/1/47 | | | | 89 | |
| | 70 | | | Freddie Mac, Pool #G08631 | | | 3.00 | | | | 3/1/45 | | | | 68 | |
| | 22 | | | Freddie Mac, Pool #G08732 | | | 3.00 | | | | 11/1/46 | | | | 22 | |
| | 72 | | | Freddie Mac, Pool #G08635 | | | 3.00 | | | | 4/1/45 | | | | 70 | |
| | 45 | | | Freddie Mac, Pool #G08737 | | | 3.00 | | | | 12/1/46 | | | | 43 | |
| | 38 | | | Freddie Mac, Pool #G08680 | | | 3.00 | | | | 12/1/45 | | | | 37 | |
| | 26 | | | Freddie Mac, Pool #K90311 | | | 3.00 | | | | 4/1/33 | | | | 26 | |
| | 48 | | | Freddie Mac, Pool #G08701 | | | 3.00 | | | | 4/1/46 | | | | 47 | |
| | 44 | | | Freddie Mac, Pool #Q18101 | | | 3.50 | | | | 5/1/43 | | | | 44 | |
| | 19 | | | Freddie Mac, Pool #Q40395 | | | 3.50 | | | | 5/1/46 | | | | 19 | |
| | 19 | | | Freddie Mac, Pool #G08623 | | | 3.50 | | | | 1/1/45 | | | | 19 | |
| | 45 | | | Freddie Mac, Pool #G08761 | | | 3.50 | | | | 5/1/47 | | | | 44 | |
| | 47 | | | Freddie Mac, Pool #G61148 | | | 3.50 | | | | 9/1/47 | | | | 47 | |
| | 37 | | | Freddie Mac, Pool #Q43933 | | | 3.50 | | | | 10/1/46 | | | | 36 | |
| | 39 | | | Freddie Mac, Pool #G08698 | | | 3.50 | | | | 3/1/46 | | | | 39 | |
| | 24 | | | Freddie Mac, Pool #Q52319 | | | 3.50 | | | | 11/1/47 | | | | 24 | |
| | 20 | | | Freddie Mac, Pool #Q20614 | | | 3.50 | | | | 8/1/43 | | | | 20 | |
| | 18 | | | Freddie Mac, Pool #J13919 | | | 3.50 | | | | 12/1/20 | | | | 18 | |
| | 55 | | | Freddie Mac, Pool #C03759 | | | 3.50 | | | | 2/1/42 | | | | 55 | |
| | 21 | | | Freddie Mac, Pool #J14069 | | | 3.50 | | | | 1/1/26 | | | | 21 | |
| | 24 | | | Freddie Mac, Pool #G08620 | | | 3.50 | | | | 12/1/44 | | | | 24 | |
| | 43 | | | Freddie Mac, Pool #C91456 | | | 3.50 | | | | 6/1/32 | | | | 44 | |
| | 17 | | | Freddie Mac, Pool #G08627 | | | 3.50 | | | | 2/1/45 | | | | 17 | |
| | 36 | | | Freddie Mac, Pool #G08693 | | | 3.50 | | | | 3/1/46 | | | | 36 | |
| | 38 | | | Freddie Mac, Pool #G08687 | | | 3.50 | | | | 1/1/46 | | | | 38 | |
| | 76 | | | Freddie Mac, Pool #G08636 | | | 3.50 | | | | 4/1/45 | | | | 76 | |
| | 64 | | | Freddie Mac, Pool #G08667 | | | 3.50 | | | | 9/1/45 | | | | 64 | |
| | 23 | | | Freddie Mac, Pool #G08757 | | | 3.50 | | | | 4/1/47 | | | | 22 | |
| | 39 | | | Freddie Mac, Pool #G08784 | | | 3.50 | | | | 10/1/47 | | | | 39 | |
| | 108 | | | Freddie Mac, Pool #G08495 | | | 3.50 | | | | 6/1/42 | | | | 109 | |
| | 61 | | | Freddie Mac, Pool #G08554 | | | 3.50 | | | | 10/1/43 | | | | 61 | |
See accompanying notes to financial statements.
170
HC CAPITAL TRUST
The Core Fixed Income Portfolio
Portfolio of Investments (continued) — June 30, 2018
| | | | | | | | | | | | | | | | |
Principal
Amount
(000) | | | Security Description | | Rate % | | | Maturity
Date | | | Value
(000) | |
| | | | U.S. Government Agency Mortgages (continued) | | | | | | | | | | | | |
| $ | 51 | | | Freddie Mac, Pool #Q09896 | | | 3.50 | | | | 8/1/42 | | | $ | 52 | |
| | 16 | | | Freddie Mac, Pool #J30284 | | | 3.50 | | | | 11/1/29 | | | | 16 | |
| | 69 | | | Freddie Mac, Pool #G08681 | | | 3.50 | | | | 12/1/45 | | | | 69 | |
| | 20 | | | Freddie Mac, Pool #G08702 | | | 3.50 | | | | 4/1/46 | | | | 20 | |
| | 66 | | | Freddie Mac, Pool #G08637 | | | 4.00 | | | | 4/1/45 | | | | 68 | |
| | 77 | | | Freddie Mac, Pool #G08601 | | | 4.00 | | | | 8/1/44 | | | | 78 | |
| | 28 | | | Freddie Mac, Pool #G08563 | | | 4.00 | | | | 1/1/44 | | | | 28 | |
| | 39 | | | Freddie Mac, Pool #G08669 | | | 4.00 | | | | 9/1/45 | | | | 40 | |
| | 46 | | | Freddie Mac, Pool #G08775 | | | 4.00 | | | | 8/1/47 | | | | 47 | |
| | 2 | | | Freddie Mac, Pool #J06163 | | | 4.00 | | | | 1/1/20 | | | | 2 | |
| | 47 | | | Freddie Mac, Pool #G06506 | | | 4.00 | | | | 12/1/40 | | | | 49 | |
| | 9 | | | Freddie Mac, Pool #G11690 | | | 4.00 | | | | 2/1/20 | | | | 9 | |
| | 47 | | | Freddie Mac, Pool #G08606 | | | 4.00 | | | | 9/1/44 | | | | 49 | |
| | 19 | | | Freddie Mac, Pool #C91395 | | | 4.00 | | | | 9/1/31 | | | | 19 | |
| | 38 | | | Freddie Mac, Pool #A96286 | | | 4.00 | | | | 1/1/41 | | | | 39 | |
| | 52 | | | Freddie Mac, Pool #Q24955 | | | 4.00 | | | | 2/1/44 | | | | 54 | |
| | 39 | | | Freddie Mac, Pool #G08567 | | | 4.00 | | | | 1/1/44 | | | | 40 | |
| | 46 | | | Freddie Mac, Pool #V83344 | | | 4.00 | | | | 8/1/47 | | | | 47 | |
| | 41 | | | Freddie Mac, Pool #G08752 | | | 4.00 | | | | 3/1/47 | | | | 42 | |
| | 16 | | | Freddie Mac, Pool #C09059 | | | 4.50 | | | | 3/1/44 | | | | 17 | |
| | 62 | | | Freddie Mac, Pool #A97692 | | | 4.50 | | | | 3/1/41 | | | | 65 | |
| | 24 | | | Freddie Mac, Pool #Q52321 | | | 4.50 | | | | 11/1/47 | | | | 26 | |
| | 9 | | | Freddie Mac, Pool #C90686 | | | 4.50 | | | | 6/1/23 | | | | 9 | |
| | 21 | | | Freddie Mac, Pool #A97186 | | | 4.50 | | | | 3/1/41 | | | | 22 | |
| | 41 | | | Freddie Mac, Pool #G01890 | | | 4.50 | | | | 10/1/35 | | | | 43 | |
| | 27 | | | Freddie Mac, Pool #Q04294 | | | 4.50 | | | | 11/1/41 | | | | 28 | |
| | 21 | | | Freddie Mac, Pool #G08781 | | | 4.50 | | | | 9/1/47 | | | | 22 | |
| | 25 | | | Freddie Mac, Pool #G04817 | | | 5.00 | | | | 9/1/38 | | | | 27 | |
| | 28 | | | Freddie Mac, Pool #G05904 | | | 5.00 | | | | 9/1/39 | | | | 30 | |
| | 20 | | | Freddie Mac, Pool #G04913 | | | 5.00 | | | | 3/1/38 | | | | 21 | |
| | 26 | | | Freddie Mac, Pool #G01962 | | | 5.00 | | | | 12/1/35 | | | | 28 | |
| | 126 | | | Freddie Mac, Pool #G01665 | | | 5.50 | | | | 3/1/34 | | | | 135 | |
| | 26 | | | Freddie Mac, Pool #G02794 | | | 6.00 | | | | 5/1/37 | | | | 28 | |
| | 13 | | | Freddie Mac, Pool #G03616 | | | 6.00 | | | | 12/1/37 | | | | 14 | |
| | 5 | | | Freddie Mac, Pool #C90989 | | | 6.00 | | | | 9/1/26 | | | | 5 | |
| | 50 | | | Freddie Mac, Gold 15 YR TBA | | | 3.00 | | | | 7/15/33 | | | | 50 | |
| | 50 | | | Freddie Mac, Gold 30 YR TBA | | | 3.00 | | | | 7/15/48 | | | | 48 | |
| | 225 | | | Freddie Mac, Gold 30 YR TBA | | | 3.50 | | | | 7/15/47 | | | | 225 | |
| | 125 | | | Freddie Mac, Gold 30 YR TBA | | | 4.00 | | | | 7/15/48 | | | | 127 | |
| | 25 | | | Freddie Mac, Gold 30 YR TBA | | | 4.00 | | | | 8/15/48 | | | | 25 | |
| | 25 | | | Freddie Mac, Gold 30 YR TBA | | | 4.50 | | | | 7/15/48 | | | | 26 | |
| | 25 | | | Freddie Mac, Gold 30 YR TBA | | | 4.50 | | | | 8/15/48 | | | | 26 | |
| | 10 | | | Government National Mortgage Association, Pool #AA8341 | | | 2.50 | | | | 2/15/28 | | | | 10 | |
| | 15 | | | Government National Mortgage Association, Pool #G25339 | | | 2.50 | | | | 3/20/27 | | | | 15 | |
| | 22 | | | Government National Mortgage Association, Pool #MA4194 | | | 2.50 | | | | 1/20/47 | | | | 21 | |
| | 12 | | | Government National Mortgage Association, Pool #MA1155 | | | 2.50 | | | | 7/20/43 | | | | 11 | |
| | 22 | | | Government National Mortgage Association, Pool #MA4355 | | | 2.50 | | | | 4/20/32 | | | | 21 | |
| | 20 | | | Government National Mortgage Association, Pool #MA3735 | | | 3.00 | | | | 6/20/46 | | | | 19 | |
| | 40 | | | Government National Mortgage Association, Pool #MA3802 | | | 3.00 | | | | 7/20/46 | | | | 40 | |
| | 47 | | | Government National Mortgage Association, Pool #MA2520 | | | 3.00 | | | | 1/20/45 | | | | 46 | |
| | 23 | | | Government National Mortgage Association, Pool #MA2444 | | | 3.00 | | | | 12/20/44 | | | | 23 | |
| | 38 | | | Government National Mortgage Association, Pool #MA3662 | | | 3.00 | | | | 5/20/46 | | | | 38 | |
| | 48 | | | Government National Mortgage Association, Pool #MA0851 | | | 3.00 | | | | 3/20/43 | | | | 47 | |
| | 31 | | | Government National Mortgage Association, Pool #MA0205 | | | 3.00 | | | | 7/20/27 | | | | 31 | |
See accompanying notes to financial statements.
171
HC CAPITAL TRUST
The Core Fixed Income Portfolio
Portfolio of Investments (continued) — June 30, 2018
| | | | | | | | | | | | | | | | |
Principal
Amount
(000) | | | Security Description | | Rate % | | | Maturity
Date | | | Value
(000) | |
| | | | U.S. Government Agency Mortgages (continued) | | | | | | | | | | | | |
| $ | 50 | | | Government National Mortgage Association, Pool #MA0461 | | | 3.00 | | | | 10/20/42 | | | $ | 49 | |
| | 56 | | | Government National Mortgage Association, Pool #AA6149 | | | 3.00 | | | | 3/20/43 | | | | 55 | |
| | 48 | | | Government National Mortgage Association, Pool #MA1011 | | | 3.00 | | | | 5/20/43 | | | | 47 | |
| | 74 | | | Government National Mortgage Association, Pool #MA4899 | | | 3.00 | | | | 12/20/47 | | | | 72 | |
| | 24 | | | Government National Mortgage Association, Pool #AA5897 | | | 3.00 | | | | 12/15/42 | | | | 24 | |
| | 48 | | | Government National Mortgage Association, Pool #MA4777 | | | 3.00 | | | | 10/20/47 | | | | 47 | |
| | 36 | | | Government National Mortgage Association, Pool #AA2654 | | | 3.00 | | | | 6/15/43 | | | | 35 | |
| | 42 | | | Government National Mortgage Association, Pool #MA3936 | | | 3.00 | | | | 9/20/46 | | | | 41 | |
| | 18 | | | Government National Mortgage Association, Pool #MA3596 | | | 3.00 | | | | 4/20/46 | | | | 18 | |
| | 43 | | | Government National Mortgage Association, Pool #MA4320 | | | 3.00 | | | | 3/20/47 | | | | 43 | |
| | 28 | | | Government National Mortgage Association, Pool #MA1374 | | | 3.00 | | | | 10/20/43 | | | | 27 | |
| | 22 | | | Government National Mortgage Association, Pool #MA4261 | | | 3.00 | | | | 2/20/47 | | | | 22 | |
| | 56 | | | Government National Mortgage Association, Pool #MA1447 | | | 3.00 | | | | 11/20/43 | | | | 55 | |
| | 34 | | | Government National Mortgage Association, Pool #MA2960 | | | 3.00 | | | | 7/20/45 | | | | 33 | |
| | 34 | | | Government National Mortgage Association, Pool #MA3309 | | | 3.00 | | | | 12/20/45 | | | | 34 | |
| | 53 | | | Government National Mortgage Association, Pool #MA2147 | | | 3.00 | | | | 8/20/44 | | | | 52 | |
| | 32 | | | Government National Mortgage Association, Pool #MA2223 | | | 3.50 | | | | 9/20/44 | | | | 32 | |
| | 22 | | | Government National Mortgage Association, Pool #MA1012 | | | 3.50 | | | | 5/20/43 | | | | 23 | |
| | 20 | | | Government National Mortgage Association, Pool #AC3938 | | | 3.50 | | | | 1/15/43 | | | | 20 | |
| | 76 | | | Government National Mortgage Association, Pool #MA0462 | | | 3.50 | | | | 10/20/42 | | | | 77 | |
| | 24 | | | Government National Mortgage Association, Pool #MA4719 | | | 3.50 | | | | 9/20/47 | | | | 24 | |
| | 47 | | | Government National Mortgage Association, Pool #MA4652 | | | 3.50 | | | | 8/20/47 | | | | 47 | |
| | 24 | | | Government National Mortgage Association, Pool #MA4837 | | | 3.50 | | | | 11/20/47 | | | | 24 | |
| | 42 | | | Government National Mortgage Association, Pool #MA0318 | | | 3.50 | | | | 8/20/42 | | | | 42 | |
| | 24 | | | Government National Mortgage Association, Pool #MA4778 | | | 3.50 | | | | 10/20/47 | | | | 24 | |
| | 44 | | | Government National Mortgage Association, Pool #MA0699 | | | 3.50 | | | | 1/20/43 | | | | 44 | |
| | 34 | | | Government National Mortgage Association, Pool #MA3597 | | | 3.50 | | | | 4/20/46 | | | | 34 | |
| | 139 | | | Government National Mortgage Association, Pool #MA0220 | | | 3.50 | | | | 7/20/42 | | | | 140 | |
| | 28 | | | Government National Mortgage Association, Pool #MA2961 | | | 3.50 | | | | 7/20/45 | | | | 28 | |
| | 34 | | | Government National Mortgage Association, Pool #MA2371 | | | 3.50 | | | | 11/20/44 | | | | 35 | |
| | 26 | | | Government National Mortgage Association, Pool #MA2826 | | | 3.50 | | | | 5/20/45 | | | | 27 | |
| | 41 | | | Government National Mortgage Association, Pool #MA0154 | | | 3.50 | | | | 6/20/42 | | | | 41 | |
| | 53 | | | Government National Mortgage Association, Pool #MA1157 | | | 3.50 | | | | 7/20/43 | | | | 54 | |
| | 39 | | | Government National Mortgage Association, Pool #MA0934 | | | 3.50 | | | | 4/20/43 | | | | 39 | |
| | 17 | | | Government National Mortgage Association, Pool #MA1574 | | | 3.50 | | | | 1/20/29 | | | | 17 | |
| | 10 | | | Government National Mortgage Association, Pool #MA1600 | | | 3.50 | | | | 1/20/44 | | | | 10 | |
| | 15 | | | Government National Mortgage Association, Pool #AB9211 | | | 3.50 | | | | 11/15/42 | | | | 15 | |
| | 39 | | | Government National Mortgage Association, Pool #MA3937 | | | 3.50 | | | | 9/20/46 | | | | 39 | |
| | 41 | | | Government National Mortgage Association, Pool #MA4127 | | | 3.50 | | | | 12/20/46 | | | | 41 | |
| | 31 | | | Government National Mortgage Association, Pool #MA3310 | | | 3.50 | | | | 12/20/45 | | | | 31 | |
| | 42 | | | Government National Mortgage Association, Pool #MA4262 | | | 3.50 | | | | 2/20/47 | | | | 42 | |
| | 18 | | | Government National Mortgage Association, Pool #MA3663 | | | 3.50 | | | | 5/20/46 | | | | 18 | |
| | 39 | | | Government National Mortgage Association, Pool #MA4004 | | | 3.50 | | | | 10/20/46 | | | | 40 | |
| | 33 | | | Government National Mortgage Association, Pool #MA3105 | | | 3.50 | | | | 9/20/45 | | | | 33 | |
| | 44 | | | Government National Mortgage Association, Pool #MA4382 | | | 3.50 | | | | 4/20/47 | | | | 44 | |
| | 47 | | | Government National Mortgage Association, Pool #MA3173 | | | 3.50 | | | | 10/20/45 | | | | 47 | |
| | 21 | | | Government National Mortgage Association, Pool #AM4971 | | | 3.50 | | | | 4/20/45 | | | | 21 | |
| | 22 | | | Government National Mortgage Association, Pool #AJ0411 | | | 3.50 | | | | 9/15/44 | | | | 22 | |
| | 32 | | | Government National Mortgage Association, Pool #MA3376 | | | 3.50 | | | | 1/20/46 | | | | 32 | |
| | 38 | | | Government National Mortgage Association, Pool #MA3803 | | | 3.50 | | | | 7/20/46 | | | | 38 | |
| | 45 | | | Government National Mortgage Association, Pool #MA4510 | | | 3.50 | | | | 6/20/47 | | | | 46 | |
| | 40 | | | Government National Mortgage Association, Pool #MA4586 | | | 3.50 | | | | 7/20/47 | | | | 40 | |
| | 37 | | | Government National Mortgage Association, Pool #MA3736 | | | 3.50 | | | | 6/20/46 | | | | 37 | |
| | 17 | | | Government National Mortgage Association, Pool #MA3454 | | | 3.50 | | | | 2/20/46 | | | | 17 | |
See accompanying notes to financial statements.
172
HC CAPITAL TRUST
The Core Fixed Income Portfolio
Portfolio of Investments (continued) — June 30, 2018
| | | | | | | | | | | | | | | | |
Principal
Amount
(000) | | | Security Description | | Rate % | | | Maturity
Date | | | Value
(000) | |
| | | | U.S. Government Agency Mortgages (continued) | | | | | | | | | | | | |
| $ | 43 | | | Government National Mortgage Association, Pool #MA4321 | | | 3.50 | | | | 3/20/47 | | | $ | 43 | |
| | 38 | | | Government National Mortgage Association, Pool #MA3874 | | | 3.50 | | | | 8/20/46 | | | | 39 | |
| | 21 | | | Government National Mortgage Association, Pool #MA2372 | | | 4.00 | | | | 11/20/44 | | | | 22 | |
| | 13 | | | Government National Mortgage Association, Pool #MA3245 | | | 4.00 | | | | 11/20/45 | | | | 14 | |
| | 18 | | | Government National Mortgage Association, Pool #MA4263 | | | 4.00 | | | | 2/20/47 | | | | 19 | |
| | 21 | | | Government National Mortgage Association, Pool #MA3522 | | | 4.00 | | | | 3/20/46 | | | | 21 | |
| | 24 | | | Government National Mortgage Association, Pool #MA2224 | | | 4.00 | | | | 9/20/44 | | | | 25 | |
| | 45 | | | Government National Mortgage Association, Pool #MA3737 | | | 4.00 | | | | 6/20/46 | | | | 46 | |
| | 28 | | | Government National Mortgage Association, Pool #MA1286 | | | 4.00 | | | | 9/20/43 | | | | 29 | |
| | 24 | | | Government National Mortgage Association, Pool #MA2304 | | | 4.00 | | | | 10/20/44 | | | | 24 | |
| | 14 | | | Government National Mortgage Association, Pool #MA3377 | | | 4.00 | | | | 1/20/46 | | | | 14 | |
| | 32 | | | Government National Mortgage Association, Pool #MA2149 | | | 4.00 | | | | 8/20/44 | | | | 33 | |
| | 23 | | | Government National Mortgage Association, Pool #MA1996 | | | 4.00 | | | | 6/20/44 | | | | 24 | |
| | 12 | | | Government National Mortgage Association, Pool #MA0023 | | | 4.00 | | | | 4/20/42 | | | | 13 | |
| | 41 | | | Government National Mortgage Association, Pool #MA4511 | | | 4.00 | | | | 6/20/47 | | | | 42 | |
| | 19 | | | Government National Mortgage Association, Pool #770602 | | | 4.00 | | | | 9/15/41 | | | | 19 | |
| | 23 | | | Government National Mortgage Association, Pool #MA1761 | | | 4.00 | | | | 3/20/44 | | | | 24 | |
| | 76 | | | Government National Mortgage Association, Pool #MA1091 | | | 4.00 | | | | 6/20/43 | | | | 78 | |
| | 26 | | | Government National Mortgage Association, Pool #738710 | | | 4.00 | | | | 9/15/41 | | | | 27 | |
| | 43 | | | Government National Mortgage Association, Pool #MA4587 | | | 4.00 | | | | 7/20/47 | | | | 44 | |
| | 20 | | | Government National Mortgage Association, Pool #MA4452 | | | 4.00 | | | | 5/20/47 | | | | 21 | |
| | 19 | | | Government National Mortgage Association, Pool #MA4322 | | | 4.00 | | | | 3/20/47 | | | | 20 | |
| | 40 | | | Government National Mortgage Association, Pool #MA4383 | | | 4.00 | | | | 4/20/47 | | | | 41 | |
| | 22 | | | Government National Mortgage Association, Pool #MA4653 | | | 4.00 | | | | 8/20/47 | | | | 23 | |
| | 23 | | | Government National Mortgage Association, Pool #738906 | | | 4.50 | | | | 10/15/41 | | | | 24 | |
| | 104 | | | Government National Mortgage Association, Pool #4801 | | | 4.50 | | | | 9/20/40 | | | | 109 | |
| | 20 | | | Government National Mortgage Association, Pool #MA4721 | | | 4.50 | | | | 9/20/47 | | | | 21 | |
| | 48 | | | Government National Mortgage Association, Pool #721760 | | | 4.50 | | | | 8/15/40 | | | | 51 | |
| | 18 | | | Government National Mortgage Association, Pool #MA2373 | | | 4.50 | | | | 11/20/44 | | | | 19 | |
| | 24 | | | Government National Mortgage Association, Pool #MA2756 | | | 4.50 | | | | 4/20/45 | | | | 25 | |
| | 10 | | | Government National Mortgage Association, Pool #MA1762 | | | 4.50 | | | | 3/20/44 | | | | 10 | |
| | 22 | | | Government National Mortgage Association, Pool #697974 | | | 5.00 | | | | 6/15/40 | | | | 23 | |
| | 72 | | | Government National Mortgage Association, Pool #4559 | | | 5.00 | | | | 10/20/39 | | | | 77 | |
| | 34 | | | Government National Mortgage Association, Pool #697946 | | | 5.00 | | | | 3/15/39 | | | | 36 | |
| | 21 | | | Government National Mortgage Association, Pool #MA0466 | | | 5.50 | | | | 10/20/42 | | | | 23 | |
| | 20 | | | Government National Mortgage Association, Pool #510835 | | | 5.50 | | | | 2/15/35 | | | | 22 | |
| | 22 | | | Government National Mortgage Association, Pool #4222 | | | 6.00 | | | | 8/20/38 | | | | 24 | |
| | 3 | | | Government National Mortgage Association, Pool #582199 | | | 6.50 | | | | 1/15/32 | | | | 3 | |
| | 275 | | | Government National Mortgage Association, 30 YR TBA | | | 3.00 | | | | 7/20/48 | | | | 270 | |
| | 300 | | | Government National Mortgage Association, 30 YR TBA | | | 3.50 | | | | 7/20/48 | | | | 302 | |
| | 25 | | | Government National Mortgage Association, 30 YR TBA | | | 3.50 | | | | 8/20/48 | | | | 25 | |
| | 25 | | | Government National Mortgage Association, 30 YR TBA | | | 4.00 | | | | 7/15/48 | | | | 26 | |
| | 150 | | | Government National Mortgage Association, 30 YR TBA | | | 4.00 | | | | 7/20/48 | | | | 154 | |
| | 50 | | | Government National Mortgage Association, 30 YR TBA | | | 4.00 | | | | 8/20/48 | | | | 51 | |
| | 25 | | | Government National Mortgage Association, 30 YR TBA | | | 4.50 | | | | 7/20/48 | | | | 26 | |
| | 50 | | | Government National Mortgage Association, 30 YR TBA | | | 4.50 | | | | 8/20/48 | | | | 52 | |
| | | | | | | | | | | | | | | | |
| | | | Total U.S. Government Agency Mortgages | | | | | | | | | | | 15,114 | |
| | | | | | | | | | | | | | | | |
| | | | U.S. Government Agency Securities — 1.37% | | | | | | | | | | | | |
| | 25 | | | Fannie Mae | | | 1.00 | | | | 8/28/19 | | | | 25 | |
| | 65 | | | Fannie Mae | | | 1.25 | | | | 5/6/21 | | | | 63 | |
| | 60 | | | Fannie Mae | | | 1.50 | | | | 6/22/20 | | | | 59 | |
| | 50 | | | Fannie Mae, Callable 7/27/18 @ 100.00 | | | 1.70 | | | | 1/27/20 | | | | 49 | |
| | 30 | | | Fannie Mae | | | 2.13 | | | | 4/24/26 | | | | 28 | |
| | 25 | | | Fannie Mae | | | 2.54 | (b) (c) | | | 10/9/19 | | | | 24 | |
See accompanying notes to financial statements.
173
HC CAPITAL TRUST
The Core Fixed Income Portfolio
Portfolio of Investments (continued) — June 30, 2018
| | | | | | | | | | | | | | | | |
Principal
Amount
(000) | | | Security Description | | Rate % | | | Maturity
Date | | | Value
(000) | |
| | | | U.S. Government Agency Securities (continued) | | | | | | | | | | | | |
| $ | 10 | | | Fannie Mae | | | 5.63 | | | | 7/15/37 | | | $ | 13 | |
| | 50 | | | Fannie Mae | | | 6.25 | | | | 5/15/29 | | | | 64 | |
| | 20 | | | Fannie Mae | | | 6.63 | | | | 11/15/30 | | | | 27 | |
| | 25 | | | Federal Home Loan Bank | | | 1.13 | | | | 7/14/21 | | | | 24 | |
| | 25 | | | Federal Home Loan Bank | | | 1.38 | | | | 9/28/20 | | | | 24 | |
| | 60 | | | Federal Home Loan Bank | | | 1.38 | | | | 11/15/19 | | | | 60 | |
| | 25 | | | Federal Home Loan Bank | | | 1.88 | | | | 11/29/21 | | | | 24 | |
| | 25 | | | Federal Home Loan Bank | | | 2.13 | | | | 3/10/23 | | | | 24 | |
| | 20 | | | Federal Home Loan Bank | | | 4.13 | | | | 3/13/20 | | | | 21 | |
| | 15 | | | Federal Home Loan Bank | | | 5.63 | | | | 6/11/21 | | | | 16 | |
| | 80 | | | Freddie Mac | | | 1.25 | | | | 10/2/19 | | | | 79 | |
| | 25 | | | Freddie Mac | | | 1.38 | | | | 5/1/20 | | | | 24 | |
| | 20 | | | Freddie Mac | | | 1.40 | | | | 8/22/19 | | | | 20 | |
| | 25 | | | Freddie Mac | | | 1.50 | | | | 1/17/20 | | | | 25 | |
| | 50 | | | Freddie Mac | | | 1.88 | | | | 11/17/20 | | | | 49 | |
| | 40 | | | Freddie Mac | | | 2.38 | | | | 1/13/22 | | | | 39 | |
| | 15 | | | Freddie Mac | | | 6.25 | | | | 7/15/32 | | | | 20 | |
| | 10 | | | Freddie Mac | | | 6.75 | | | | 3/15/31 | | | | 14 | |
| | 25 | | | Freddie Mac | | | 6.75 | | | | 9/15/29 | | | | 33 | |
| | 5 | | | Tennessee Valley Authority | | | 3.50 | | | | 12/15/42 | | | | 5 | |
| | 30 | | | Tennessee Valley Authority | | | 5.88 | | | | 4/1/36 | | | | 39 | |
| | 20 | | | Tennessee Valley Authority, Series E | | | 6.75 | | | | 11/1/25 | | | | 25 | |
| | | | | | | | | | | | | | | | |
| | | | Total U.S. Government Agency Securities | | | | | | | | | | | 917 | |
| | | | | | | | | | | | | | | | |
| | | | Corporate Bonds — 33.24% | | | | | | | | | | | | |
| | 300 | | | Abbott Laboratories (Health Care Equipment & Supplies), Callable 8/30/26 @ 100.00 | | | 3.75 | | | | 11/30/26 | | | | 295 | |
| | 120 | | | AbbVie, Inc. (Biotechnology) | | | 4.40 | | | | 11/6/42 | | | | 114 | |
| | 175 | | | AbbVie, Inc. (Biotechnology), Callable 11/14/34 @ 100.00 | | | 4.50 | | | | 5/14/35 | | | | 171 | |
| | 25 | | | Alabama Power Co. (Electric Utilities), Callable 2/15/44 @ 100.00 | | | 4.15 | | | | 8/15/44 | | | | 25 | |
| | 310 | | | American Express Co. (Consumer Finance), Callable 7/1/22 @ 100.00 | | | 2.50 | | | | 8/1/22 | | | | 297 | |
| | 395 | | | Ameriprise Financial, Inc. (Capital Markets) | | | 3.70 | | | | 10/15/24 | | | | 395 | |
| | 150 | | | Amgen, Inc. (Biotechnology), Callable 4/11/22 @ 100.00 | | | 2.65 | | | | 5/11/22 | | | | 145 | |
| | 230 | | | Amgen, Inc. (Biotechnology), Callable 2/1/25 @ 100.00 | | | 3.13 | | | | 5/1/25 | | | | 221 | |
| | 100 | | | Amgen, Inc. (Biotechnology), Callable 8/15/21 @ 100.00 | | | 3.88 | | | | 11/15/21 | | | | 101 | |
| | 20 | | | Analog Devices, Inc. (Semiconductors & Semiconductor Equipment), Callable 9/5/26 @ 100.00 | | | 3.50 | | | | 12/5/26 | | | | 19 | |
| | 350 | | | Analog Devices, Inc. (Semiconductors & Semiconductor Equipment), Callable 9/15/25 @ 100.00 | | | 3.90 | | | | 12/15/25 | | | | 347 | |
| | 625 | | | Anheuser-Busch InBev Finance, Inc. (Beverages), Callable 11/1/25 @ 100.00 | | | 3.65 | | | | 2/1/26 | | | | 612 | |
| | 65 | | | Anheuser-Busch InBev Finance, Inc. (Beverages), Callable 8/1/45 @ 100.00 | | | 4.90 | | | | 2/1/46 | | | | 67 | |
| | 25 | | | Anheuser-Busch InBev N.V. (Beverages), Callable 8/1/35 @ 100.00 | | | 4.70 | | | | 2/1/36 | | | | 25 | |
| | 240 | | | Anthem, Inc. (Health Care Providers & Services) | | | 3.13 | | | | 5/15/22 | | | | 237 | |
| | 50 | | | Anthem, Inc. (Health Care Providers & Services), Callable 9/1/27 @ 100.00 | | | 3.65 | | | | 12/1/27 | | | | 47 | |
| | 145 | | | Anthem, Inc. (Health Care Providers & Services), Callable 5/15/21 @ 100.00 | | | 3.70 | | | | 8/15/21 | | | | 147 | |
| | 20 | | | Anthem, Inc. (Health Care Providers & Services) | | | 4.63 | | | | 5/15/42 | | | | 19 | |
| | 90 | | | Archer-Daniels-Midland Co. (Food Products) | | | 4.02 | | | | 4/16/43 | | | | 88 | |
| | 90 | | | AT&T, Inc. (Diversified Telecommunication Services) | | | 3.80 | | | | 3/15/22 | | | | 90 | |
| | 295 | | | AT&T, Inc. (Diversified Telecommunication Services), Callable 1/1/24 @ 100.00 | | | 4.45 | | | | 4/1/24 | | | | 298 | |
| | 205 | | | AT&T, Inc. (Diversified Telecommunication Services) | | | 5.35 | | | | 9/1/40 | | | | 200 | |
| | 90 | | | AT&T, Inc. (Diversified Telecommunication Services) | | | 5.55 | | | | 8/15/41 | | | | 90 | |
| | 40 | | | Atmos Energy Corp. (Gas Utilities), Callable 4/15/44 @ 100.00 | | | 4.13 | | | | 10/15/44 | | | | 40 | |
| | 865 | | | Bank of America Corp., MTN (Banks) | | | 3.88 | | | | 8/1/25 | | | | 861 | |
| | 110 | | | Bank One Corp. (Banks) | | | 8.00 | | | | 4/29/27 | | | | 137 | |
| | 20 | | | Berkshire Hathaway, Inc. (Diversified Financial Services), Callable 8/1/44 @ 100.00 | | | 4.50 | | | | 2/1/45 | | | | 20 | |
| | 50 | | | Bunge Limited Finance Corp. (Food Products), Callable 8/25/22 @ 100.00 | | | 3.00 | | | | 9/25/22 | | | | 48 | |
| | 155 | | | Bunge Limited Finance Corp. (Food Products), Callable 5/15/26 @ 100.00 | | | 3.25 | | | | 8/15/26 | | | | 141 | |
| | 100 | | | Bunge Limited Finance Corp. (Food Products) | | | 8.50 | | | | 6/15/19 | | | | 105 | |
See accompanying notes to financial statements.
174
HC CAPITAL TRUST
The Core Fixed Income Portfolio
Portfolio of Investments (continued) — June 30, 2018
| | | | | | | | | | | | | | | | |
Principal
Amount
(000) | | | Security Description | | Rate % | | | Maturity
Date | | | Value
(000) | |
| | | | Corporate Bonds (continued) | | | | | | | | | | | | |
| $ | 130 | | | Capital One Financial Corp. (Consumer Finance), Callable 3/30/21 @ 100.00 | | | 3.45 | | | | 4/30/21 | | | $ | 130 | |
| | 470 | | | Capital One Financial Corp. (Consumer Finance) | | | 3.50 | | | | 6/15/23 | | | | 459 | |
| | 120 | | | Capital One Financial Corp. (Consumer Finance) | | | 4.75 | | | | 7/15/21 | | | | 124 | |
| | 80 | | | Cisco Systems, Inc. (Communications Equipment) | | | 5.50 | | | | 1/15/40 | | | | 95 | |
| | 280 | | | Citigroup, Inc. (Banks), Callable 11/8/21 @ 100.00 | | | 2.90 | | | | 12/8/21 | | | | 274 | |
| | 390 | | | Citigroup, Inc. (Banks) | | | 3.40 | | | | 5/1/26 | | | | 370 | |
| | 210 | | | Citigroup, Inc. (Banks) | | | 4.50 | | | | 1/14/22 | | | | 216 | |
| | 10 | | | Comcast Corp. (Media), Callable 9/1/37 @ 100.00 | | | 3.90 | | | | 3/1/38 | | | | 9 | |
| | 245 | | | Comcast Corp. (Media) | | | 4.75 | | | | 3/1/44 | | | | 241 | |
| | 160 | | | ConocoPhillips (Oil, Gas & Consumable Fuels) | | | 6.50 | | | | 2/1/39 | | | | 204 | |
| | 20 | | | Consolidated Edison Company of New York, Inc., Series 2008-B (Multi-Utilities) | | | 6.75 | | | | 4/1/38 | | | | 26 | |
| | 180 | | | Constellation Brands, Inc. (Beverages) | | | 4.75 | | | | 11/15/24 | | | | 187 | |
| | 70 | | | Constellation Brands, Inc. (Beverages) | | | 4.75 | | | | 12/1/25 | | | | 72 | |
| | 190 | | | CSX Corp. (Road & Rail) | | | 6.22 | | | | 4/30/40 | | | | 229 | |
| | 145 | | | CVS Health Corp. (Food & Staples Retailing), Callable 9/1/22 @ 100.00 | | | 2.75 | | | | 12/1/22 | | | | 139 | |
| | 535 | | | CVS Health Corp. (Food & Staples Retailing), Callable 12/25/27 @ 100.00 | | | 4.30 | | | | 3/25/28 | | | | 528 | |
| | 45 | | | Devon Energy Corp. (Oil, Gas & Consumable Fuels), Callable 2/15/22 @ 100.00 | | | 3.25 | | | | 5/15/22 | | | | 44 | |
| | 150 | | | Devon Energy Corp. (Oil, Gas & Consumable Fuels), Callable 4/15/21 @ 100.00 | | | 4.00 | | | | 7/15/21 | | | | 152 | |
| | 188 | | | Devon Energy Corp. (Oil, Gas & Consumable Fuels), Callable 1/15/41 @ 100.00 | | | 5.60 | | | | 7/15/41 | | | | 203 | |
| | 35 | | | Devon Energy Corp. (Oil, Gas & Consumable Fuels), Callable 9/15/25 @ 100.00 | | | 5.85 | | | | 12/15/25 | | | | 39 | |
| | 190 | | | Digital Realty Trust LP (Equity Real Estate Investment Trusts), Callable 1/1/23 @ 100.00 | | | 2.75 | | | | 2/1/23 | | | | 181 | |
| | 225 | | | Dominion Gas Holdings LLC (Multi-Utilities), Callable 9/15/24 @ 100.00 | | | 3.60 | | | | 12/15/24 | | | | 224 | |
| | 350 | | | Dominion Resources, Inc. (Multi-Utilities) | | | 5.20 | | | | 8/15/19 | | | | 358 | |
| | 20 | | | Dow Chemical Co. (The) (Chemicals), Callable 4/1/34 @ 100.00 | | | 4.25 | | | | 10/1/34 | | | | 19 | |
| | 15 | | | Dow Chemical Co. (The) (Chemicals), Callable 5/15/41 @ 100.00 | | | 5.25 | | | | 11/15/41 | | | | 16 | |
| | 35 | | | Duke Energy Carolinas LLC (Electric Utilities), Callable 6/15/41 @ 100.00 | | | 4.25 | | | | 12/15/41 | | | | 36 | |
| | 65 | | | Duke Energy Corp. (Electric Utilities), Callable 6/1/26 @ 100.00 | | | 2.65 | | | | 9/1/26 | | | | 59 | |
| | 100 | | | Duke Energy Corp. (Electric Utilities), Callable 1/15/24 @ 100.00 | | | 3.75 | | | | 4/15/24 | | | | 100 | |
| | 55 | | | Duke Energy Progress LLC (Electric Utilities), Callable 2/15/45 @ 100.00 | | | 4.20 | | | | 8/15/45 | | | | 55 | |
| | 40 | | | Energy Transfer Partners LP (Oil, Gas & Consumable Fuels), Callable 3/15/28 @ 100.00 | | | 4.95 | | | | 6/15/28 | | | | 40 | |
| | 85 | | | Enterprise Products Operating LLC (Oil, Gas & Consumable Fuels), Callable 11/15/24 @ 100.00 | | | 3.75 | | | | 2/15/25 | | | | 84 | |
| | 284 | | | Enterprise Products Operating LLC (Oil, Gas & Consumable Fuels), Callable 9/15/43 @ 100.00 | | | 4.85 | | | | 3/15/44 | | | | 284 | |
| | 100 | | | FedEx Corp. (Air Freight & Logistics) | | | 4.90 | | | | 1/15/34 | | | | 105 | |
| | 55 | | | Fiserv, Inc. (IT Services), Callable 7/1/22 @ 100.00 | | | 3.50 | | | | 10/1/22 | | | | 54 | |
| | 190 | | | Fiserv, Inc. (IT Services), Callable 3/1/25 @ 100.00 | | | 3.85 | | | | 6/1/25 | | | | 189 | |
| | 91 | | | Gilead Sciences, Inc. (Biotechnology), Callable 8/1/44 @ 100.00 | | | 4.50 | | | | 2/1/45 | | | | 91 | |
| | 50 | | | GlaxoSmithKline PLC (Pharmaceuticals) | | | 6.38 | | | | 5/15/38 | | | | 64 | |
| | 335 | | | Goldman Sachs Group, Inc. (Capital Markets), Callable 10/23/24 @ 100.00 | | | 3.50 | | | | 1/23/25 | | | | 323 | |
| | 255 | | | Goldman Sachs Group, Inc. (Capital Markets) | | | 5.25 | | | | 7/27/21 | | | | 268 | |
| | 90 | | | International Paper Co. (Containers & Packaging), Callable 5/15/41 @ 100.00 | | | 6.00 | | | | 11/15/41 | | | | 99 | |
| | 45 | | | Interpublic Group of Companies, Inc. (Media) | | | 4.00 | | | | 3/15/22 | | | | 45 | |
| | 250 | | | Interpublic Group of Companies, Inc. (Media) | | | 4.20 | | | | 4/15/24 | | | | 252 | |
| | 550 | | | JPMorgan Chase & Co. (Banks), Callable 10/23/24 @ 100.00 | | | 3.13 | | | | 1/23/25 | | | | 526 | |
| | 50 | | | JPMorgan Chase & Co. (Banks) | | | 3.63 | | | | 5/13/24 | | | | 50 | |
| | 15 | | | JPMorgan Chase & Co. (Banks) | | | 4.35 | | | | 8/15/21 | | | | 15 | |
| | 150 | | | JPMorgan Chase & Co. (Banks) | | | 4.50 | | | | 1/24/22 | | | | 155 | |
| | 60 | | | Lincoln National Corp. (Insurance) | | | 4.85 | | | | 6/24/21 | | | | 62 | |
| | 75 | | | Lincoln National Corp. (Insurance) | | | 7.00 | | | | 6/15/40 | | | | 94 | |
| | 135 | | | Lockheed Martin Corp. (Aerospace & Defense), Callable 11/15/35 @ 100.00 | | | 4.50 | | | | 5/15/36 | | | | 140 | |
| | 85 | | | LYB International Finance BV (Chemicals), Callable 9/15/43 @ 100.00 | | | 4.88 | | | | 3/15/44 | | | | 85 | |
| | 45 | | | Martin Marietta Materials, Inc. (Construction Materials), Callable 3/1/27 @ 100.00 | | | 3.45 | | | | 6/1/27 | | | | 42 | |
| | 135 | | | Martin Marietta Materials, Inc. (Construction Materials), Callable 4/2/24 @ 100.00 | | | 4.25 | | | | 7/2/24 | | | | 136 | |
| | 25 | | | Medtronic, Inc. (Health Care Equipment & Supplies), Callable 9/15/43 @ 100.00 | | | 4.63 | | | | 3/15/44 | | | | 26 | |
| | 35 | | | Medtronic, Inc. (Health Care Equipment & Supplies) | | | 4.63 | | | | 3/15/45 | | | | 37 | |
See accompanying notes to financial statements.
175
HC CAPITAL TRUST
The Core Fixed Income Portfolio
Portfolio of Investments (continued) — June 30, 2018
| | | | | | | | | | | | | | | | |
Principal
Amount
(000) | | | Security Description | | Rate % | | | Maturity
Date | | | Value
(000) | |
| | | | Corporate Bonds (continued) | | | | | | | | | | | | |
| $ | 40 | | | MetLife, Inc. (Insurance) | | | 3.00 | | | | 3/1/25 | | | $ | 38 | |
| | 105 | | | MetLife, Inc. (Insurance) | | | 6.50 | | | | 12/15/32 | | | | 129 | |
| | 385 | | | Microsoft Corp. (Software), Callable 8/6/56 @ 100.00 | | | 4.50 | | | | 2/6/57 | | | | 417 | |
| | 270 | | | MidAmerican Energy Holdings Co. (Electric Utilities) | | | 6.13 | | | | 4/1/36 | | | | 332 | |
| | 265 | | | Morgan Stanley (Capital Markets) | | | 2.63 | | | | 11/17/21 | | | | 257 | |
| | 70 | | | Morgan Stanley (Capital Markets) | | | 3.13 | | | | 1/23/23 | | | | 68 | |
| | 465 | | | National Rural Utilities Cooperative Finance Corp. (Diversified Financial Services), Callable 12/7/23 @ 100.00 | | | 2.95 | | | | 2/7/24 | | | | 449 | |
| | 290 | | | Nucor Corp. (Metals & Mining), Callable 6/15/22 @ 100.00 | | | 4.13 | | | | 9/15/22 | | | | 298 | |
| | 100 | | | Nucor Corp. (Metals & Mining), Callable 2/1/43 @ 100.00 | | | 5.20 | | | | 8/1/43 | | | | 110 | |
| | 160 | | | NVIDIA Corp. (Semiconductors & Semiconductor Equipment), Callable 6/16/26 @ 100.00 | | | 3.20 | | | | 9/16/26 | | | | 154 | |
| | 25 | | | Oracle Corp. (Software), Callable 11/15/44 @ 100.00 | | | 4.13 | | | | 5/15/45 | | | | 24 | |
| | 225 | | | Oracle Corp. (Software) | | | 5.38 | | | | 7/15/40 | | | | 254 | |
| | 95 | | | Philip Morris International, Inc. (Tobacco) | | | 4.50 | | | | 3/20/42 | | | | 93 | |
| | 250 | | | PNC Bank NA (Banks), Callable 10/6/20 @ 100.00 | | | 2.45 | | | | 11/5/20 | | | | 246 | |
| | 70 | | | PNC Financial Services Group, Inc. (Banks) | | | 2.85 | (d) | | | 11/9/22 | | | | 68 | |
| | 65 | | | Procter & Gamble Co. (The) (Household Products) | | | 9.36 | | | | 1/1/21 | | | | 70 | |
| | 150 | | | Progress Energy, Inc. (Electric Utilities) | | | 6.00 | | | | 12/1/39 | | | | 180 | |
| | 45 | | | Prudential Financial, Inc., MTN (Insurance), Callable 12/27/27 @ 100.00 | | | 3.88 | | | | 3/27/28 | | | | 44 | |
| | 15 | | | Prudential Financial, Inc. (Insurance) | | | 6.63 | | | | 6/21/40 | | | | 19 | |
| | 30 | | | Public Service Electric & Gas Co. (Multi-Utilities), Callable 3/1/42 @ 100.00 | | | 3.65 | | | | 9/1/42 | | | | 29 | |
| | 120 | | | RELX Capital, Inc. (Professional Services), Callable 7/15/22 @ 100.00 | | | 3.13 | | | | 10/15/22 | | | | 118 | |
| | 75 | | | RELX Capital, Inc. (Professional Services), Callable 2/16/23 @ 100.00 | | | 3.50 | | | | 3/16/23 | | | | 74 | |
| | 105 | | | Rockwell Collins, Inc. (Aerospace & Defense), Callable 12/15/26 @ 100.00 | | | 3.50 | | | | 3/15/27 | | | | 100 | |
| | 35 | | | Roper Industries, Inc. (Industrial Conglomerates), Callable 8/15/22 @ 100.00 | | | 3.13 | | | | 11/15/22 | | | | 34 | |
| | 190 | | | Roper Technologies, Inc. (Industrial Conglomerates), Callable 9/15/25 @ 100.00 | | | 3.85 | | | | 12/15/25 | | | | 187 | |
| | 25 | | | Ryder System, Inc., MTN (Road & Rail), Callable 8/1/21 @ 100.00 | | | 2.25 | | | | 9/1/21 | | | | 24 | |
| | 115 | | | Ryder System, Inc. (Road & Rail), Callable 2/1/22 @ 100.00 | | | 2.80 | | | | 3/1/22 | | | | 112 | |
| | 50 | | | Ryder System, Inc. (Road & Rail), Callable 10/15/21 @ 100.00 | | | 3.45 | | | | 11/15/21 | | | | 50 | |
| | 40 | | | Southern Co. Gas Capital Corp. (Electric Utilities), Callable 8/1/23 @ 100.00 | | | 2.45 | | | | 10/1/23 | | | | 38 | |
| | 60 | | | Southwest Airlines Co. (Airlines), Callable 8/15/26 @ 100.00 | | | 3.00 | | | | 11/15/26 | | | | 56 | |
| | 187 | | | Southwest Airlines Co., Series 2017-1 (Airlines) | | | 6.15 | | | | 2/1/24 | | | | 198 | |
| | 255 | | | Sunoco Logistics Partners LP (Oil, Gas & Consumable Fuels), Callable 10/15/22 @ 100.00 | | | 3.45 | | | | 1/15/23 | | | | 247 | |
| | 135 | | | Sunoco Logistics Partners LP (Oil, Gas & Consumable Fuels), Callable 7/15/42 @ 100.00 | | | 4.95 | | | | 1/15/43 | | | | 117 | |
| | 260 | | | SunTrust Banks, Inc. (Banks), Callable 2/3/21 @ 100.00 | | | 2.90 | | | | 3/3/21 | | | | 257 | |
| | 215 | | | The Sherwin-Williams Co. (Chemicals), Callable 4/1/24 @ 100.00 | | | 3.13 | | | | 6/1/24 | | | | 205 | |
| | 170 | | | The Travelers Companies, Inc. (Insurance) | | | 6.25 | | | | 6/15/37 | | | | 210 | |
| | 175 | | | Thermo Fisher Scientific, Inc. (Life Sciences Tools & Services), Callable 2/15/23 @ 100.00 | | | 3.00 | | | | 4/15/23 | | | | 170 | |
| | 140 | | | Thermo Fisher Scientific, Inc. (Life Sciences Tools & Services), Callable 11/1/23 @ 100.00 | | | 4.15 | | | | 2/1/24 | | | | 142 | |
| | 115 | | | Twenty-First Century Fox, Inc. (Media), Callable 3/15/44 @ 100.00 | | | 4.75 | | | | 9/15/44 | | | | 116 | |
| | 170 | | | Twenty-First Century Fox, Inc. (Media) | | | 6.20 | | | | 12/15/34 | | | | 201 | |
| | 100 | | | United Parcel Service, Inc. (Air Freight & Logistics) | | | 6.20 | | | | 1/15/38 | | | | 126 | |
| | 50 | | | United Technologies Corp. (Aerospace & Defense) | | | 4.50 | | | | 6/1/42 | | | | 49 | |
| | 100 | | | UnitedHealth Group, Inc. (Health Care Providers & Services) | | | 6.88 | | | | 2/15/38 | | | | 132 | |
| | 110 | | | Valero Energy Corp. (Oil, Gas & Consumable Fuels) | | | 6.63 | | | | 6/15/37 | | | | 131 | |
| | 40 | | | Ventas Realty LP (Equity Real Estate Investment Trusts), Callable 5/15/22 @ 100.00 | | | 3.25 | | | | 8/15/22 | | | | 39 | |
| | 175 | | | Ventas Realty LP (Equity Real Estate Investment Trusts), Callable 11/1/24 @ 100.00 | | | 3.50 | | | | 2/1/25 | | | | 168 | |
| | 170 | | | Verizon Communications, Inc. (Diversified Telecommunication Services) | | | 5.01 | | | | 8/21/54 | | | | 160 | |
| | 540 | | | Verizon Communications, Inc. (Diversified Telecommunication Services) | | | 5.15 | | | | 9/15/23 | | | | 574 | |
| | 80 | | | Virginia Electric & Power Co. (Electric Utilities), Callable 2/15/43 @ 100.00 | | | 4.65 | | | | 8/15/43 | | | | 83 | |
| | 25 | | | Wal-Mart Stores, Inc. (Food & Staples Retailing) | | | 5.63 | | | | 4/1/40 | | | | 30 | |
| | 90 | | | Wells Fargo & Co., MTN (Banks) | | | 2.63 | | | | 7/22/22 | | | | 87 | |
| | 430 | | | Wells Fargo & Co. (Banks) | | | 3.00 | | | | 2/19/25 | | | | 405 | |
| | 150 | | | Wells Fargo & Co. (Banks) | | | 3.30 | | | | 9/9/24 | | | | 145 | |
See accompanying notes to financial statements.
176
HC CAPITAL TRUST
The Core Fixed Income Portfolio
Portfolio of Investments (continued) — June 30, 2018
| | | | | | | | | | | | | | | | |
Principal
Amount
(000) | | | Security Description | | Rate % | | | Maturity
Date | | | Value
(000) | |
| | | | Corporate Bonds (continued) | | | | | | | | | | | | |
| $ | 190 | | | Wells Fargo & Co., MTN (Banks) | | | 4.60 | | | | 4/1/21 | | | $ | 196 | |
| | 250 | | | WestRock Co. (Containers & Packaging) | | | 4.90 | | | | 3/1/22 | | | | 260 | |
| | 55 | | | Westvaco Corp. (Containers & Packaging) | | | 8.20 | | | | 1/15/30 | | | | 73 | |
| | 100 | | | XTO Energy, Inc. (Oil, Gas & Consumable Fuels) | | | 6.75 | | | | 8/1/37 | | | | 132 | |
| | | | | | | | | | | | | | | | |
| | | | Total Corporate Bonds | | | | | | | | | | | 22,182 | |
| | | | | | | | | | | | | | | | |
| | | | U.S. Treasury Obligations — 33.71% | | | | | | | | | | | | |
| | 112 | | | U.S. Treasury Bond | | | 2.25 | | | | 8/15/46 | | | | 96 | |
| | 135 | | | U.S. Treasury Bond | | | 2.50 | | | | 5/15/46 | | | | 123 | |
| | 160 | | | U.S. Treasury Bond | | | 2.50 | | | | 2/15/46 | | | | 145 | |
| | 45 | | | U.S. Treasury Bond | | | 2.50 | | | | 2/15/45 | | | | 41 | |
| | 63 | | | U.S. Treasury Bond | | | 2.75 | | | | 8/15/42 | | | | 61 | |
| | 185 | | | U.S. Treasury Bond | | | 2.75 | | | | 8/15/47 | | | | 176 | |
| | 74 | | | U.S. Treasury Bond | | | 2.75 | | | | 11/15/42 | | | | 71 | |
| | 105 | | | U.S. Treasury Bond | | | 2.75 | | | | 11/15/47 | | | | 100 | |
| | 140 | | | U.S. Treasury Bond | | | 2.88 | | | | 5/15/43 | | | | 137 | |
| | 115 | | | U.S. Treasury Bond | | | 2.88 | | | | 11/15/46 | | | | 112 | |
| | 120 | | | U.S. Treasury Bond | | | 2.88 | | | | 8/15/45 | | | | 117 | |
| | 120 | | | U.S. Treasury Bond | | | 3.00 | | | | 11/15/44 | | | | 120 | |
| | 160 | | | U.S. Treasury Bond | | | 3.00 | | | | 2/15/47 | | | | 160 | |
| | 50 | | | U.S. Treasury Bond | | | 3.00 | | | | 2/15/48 | | | | 50 | |
| | 100 | | | U.S. Treasury Bond | | | 3.00 | | | | 5/15/47 | | | | 100 | |
| | 175 | | | U.S. Treasury Bond | | | 3.00 | | | | 11/15/45 | | | | 175 | |
| | 44 | | | U.S. Treasury Bond | | | 3.00 | | | | 5/15/42 | | | | 44 | |
| | 160 | | | U.S. Treasury Bond | | | 3.00 | | | | 5/15/45 | | | | 160 | |
| | 67 | | | U.S. Treasury Bond | | | 3.13 | | | | 2/15/42 | | | | 69 | |
| | 130 | | | U.S. Treasury Bond | | | 3.13 | | | | 8/15/44 | | | | 133 | |
| | 75 | | | U.S. Treasury Bond | | | 3.13 | | | | 11/15/41 | | | | 77 | |
| | 45 | | | U.S. Treasury Bond | | | 3.13 | | | | 5/15/48 | | | | 46 | |
| | 90 | | | U.S. Treasury Bond | | | 3.13 | | | | 2/15/43 | | | | 92 | |
| | 115 | | | U.S. Treasury Bond | | | 3.38 | | | | 5/15/44 | | | | 123 | |
| | 135 | | | U.S. Treasury Bond | | | 3.63 | | | | 2/15/44 | | | | 150 | |
| | 75 | | | U.S. Treasury Bond | | | 3.63 | | | | 8/15/43 | | | | 83 | |
| | 53 | | | U.S. Treasury Bond | | | 3.75 | | | | 8/15/41 | | | | 60 | |
| | 120 | | | U.S. Treasury Bond | | | 3.75 | | | | 11/15/43 | | | | 136 | |
| | 55 | | | U.S. Treasury Bond | | | 3.88 | | | | 8/15/40 | | | | 63 | |
| | 40 | | | U.S. Treasury Bond | | | 4.25 | | | | 11/15/40 | | | | 48 | |
| | 85 | | | U.S. Treasury Bond | | | 4.38 | | | | 11/15/39 | | | | 104 | |
| | 60 | | | U.S. Treasury Bond | | | 4.38 | | | | 5/15/40 | | | | 74 | |
| | 45 | | | U.S. Treasury Bond | | | 4.38 | | | | 2/15/38 | | | | 55 | |
| | 35 | | | U.S. Treasury Bond | | | 4.38 | | | | 5/15/41 | | | | 43 | |
| | 10 | | | U.S. Treasury Bond | | | 4.50 | | | | 2/15/36 | | | | 12 | |
| | 25 | | | U.S. Treasury Bond | | | 4.50 | | | | 8/15/39 | | | | 31 | |
| | 70 | | | U.S. Treasury Bond | | | 4.63 | | | | 2/15/40 | | | | 89 | |
| | 70 | | | U.S. Treasury Bond | | | 4.75 | | | | 2/15/41 | | | | 91 | |
| | 40 | | | U.S. Treasury Bond | | | 5.00 | | | | 5/15/37 | | | | 52 | |
| | 30 | | | U.S. Treasury Bond | | | 5.25 | | | | 11/15/28 | | | | 36 | |
| | 10 | | | U.S. Treasury Bond | | | 5.25 | | | | 2/15/29 | | | | 12 | |
| | 55 | | | U.S. Treasury Bond | | | 5.38 | | | | 2/15/31 | | | | 69 | |
| | 25 | | | U.S. Treasury Bond | | | 6.00 | | | | 2/15/26 | | | | 30 | |
| | 35 | | | U.S. Treasury Bond | | | 6.13 | | | | 11/15/27 | | | | 44 | |
| | 25 | | | U.S. Treasury Bond | | | 6.13 | | | | 8/15/29 | | | | 33 | |
| | 35 | | | U.S. Treasury Bond | | | 6.25 | | | | 5/15/30 | | | | 47 | |
| | 50 | | | U.S. Treasury Bond | | | 6.38 | | | | 8/15/27 | | | | 64 | |
| | 15 | | | U.S. Treasury Bond | | | 6.50 | | | | 11/15/26 | | | | 19 | |
See accompanying notes to financial statements.
177
HC CAPITAL TRUST
The Core Fixed Income Portfolio
Portfolio of Investments (continued) — June 30, 2018
| | | | | | | | | | | | | | | | |
Principal
Amount
(000) | | | Security Description | | Rate % | | | Maturity
Date | | | Value
(000) | |
| | | | U.S. Treasury Obligations (continued) | | | | | | | | | | | | |
| $ | 17 | | | U.S. Treasury Bond | | | 7.50 | | | | 11/15/24 | | | $ | 22 | |
| | 15 | | | U.S. Treasury Bond | | | 7.63 | | | | 2/15/25 | | | | 19 | |
| | 40 | | | U.S. Treasury Bond | | | 8.00 | | | | 11/15/21 | | | | 47 | |
| | 65 | | | U.S. Treasury Note | | | 0.75 | | | | 7/15/19 | | | | 64 | |
| | 95 | | | U.S. Treasury Note | | | 0.75 | | | | 8/15/19 | | | | 93 | |
| | 45 | | | U.S. Treasury Note | | | 0.88 | | | | 9/15/19 | | | | 44 | |
| | 45 | | | U.S. Treasury Note | | | 0.88 | | | | 7/31/19 | | | | 44 | |
| | 100 | | | U.S. Treasury Note | | | 1.00 | | | | 11/30/19 | | | | 98 | |
| | 70 | | | U.S. Treasury Note | | | 1.00 | | | | 10/15/19 | | | | 69 | |
| | 95 | | | U.S. Treasury Note | | | 1.00 | | | | 9/30/19 | | | | 93 | |
| | 70 | | | U.S. Treasury Note | | | 1.00 | | | | 11/15/19 | | | | 69 | |
| | 67 | | | U.S. Treasury Note | | | 1.00 | | | | 8/31/19 | | | | 66 | |
| | 70 | | | U.S. Treasury Note | | | 1.13 | | | | 3/31/20 | | | | 68 | |
| | 65 | | | U.S. Treasury Note | | | 1.13 | | | | 12/31/19 | | | | 64 | |
| | 100 | | | U.S. Treasury Note | | | 1.13 | | | | 6/30/21 | | | | 96 | |
| | 80 | | | U.S. Treasury Note | | | 1.13 | | | | 9/30/21 | | | | 76 | |
| | 100 | | | U.S. Treasury Note | | | 1.13 | | | | 8/31/21 | | | | 95 | |
| | 150 | | | U.S. Treasury Note | | | 1.13 | | | | 7/31/21 | | | | 143 | |
| | 120 | | | U.S. Treasury Note | | | 1.13 | | | | 2/28/21 | | | | 115 | |
| | 65 | | | U.S. Treasury Note | | | 1.13 | | | | 4/30/20 | | | | 63 | |
| | 105 | | | U.S. Treasury Note | | | 1.25 | | | | 8/31/19 | | | | 104 | |
| | 50 | | | U.S. Treasury Note | | | 1.25 | | | | 10/31/19 | | | | 49 | |
| | 20 | | | U.S. Treasury Note | | | 1.25 | | | | 7/31/23 | | | | 19 | |
| | 100 | | | U.S. Treasury Note | | | 1.25 | | | | 3/31/21 | | | | 96 | |
| | 105 | | | U.S. Treasury Note | | | 1.25 | | | | 1/31/20 | | | | 103 | |
| | 140 | | | U.S. Treasury Note | | | 1.25 | | | | 10/31/21 | | | | 134 | |
| | 55 | | | U.S. Treasury Note | | | 1.25 | | | | 2/29/20 | | | | 54 | |
| | 50 | | | U.S. Treasury Note | | | 1.38 | | | | 8/31/20 | | | | 49 | |
| | 50 | | | U.S. Treasury Note | | | 1.38 | | | | 2/15/20 | | | | 49 | |
| | 105 | | | U.S. Treasury Note | | | 1.38 | | | | 1/31/21 | | | | 102 | |
| | 65 | | | U.S. Treasury Note | | | 1.38 | | | | 9/30/23 | | | | 61 | |
| | 100 | | | U.S. Treasury Note | | | 1.38 | | | | 5/31/21 | | | | 97 | |
| | 75 | | | U.S. Treasury Note | | | 1.38 | | | | 1/15/20 | | | | 74 | |
| | 5 | | | U.S. Treasury Note | | | 1.38 | | | | 8/31/23 | | | | 5 | |
| | 50 | | | U.S. Treasury Note | | | 1.38 | | | | 5/31/20 | | | | 49 | |
| | 70 | | | U.S. Treasury Note | | | 1.38 | | | | 1/31/20 | | | | 69 | |
| | 75 | | | U.S. Treasury Note | | | 1.38 | | | | 12/15/19 | | | | 74 | |
| | 105 | | | U.S. Treasury Note | | | 1.38 | | | | 9/30/19 | | | | 104 | |
| | 115 | | | U.S. Treasury Note | | | 1.38 | | | | 3/31/20 | | | | 113 | |
| | 100 | | | U.S. Treasury Note | | | 1.38 | | | | 4/30/21 | | | | 97 | |
| | 110 | | | U.S. Treasury Note | | | 1.38 | | | | 4/30/20 | | | | 108 | |
| | 120 | | | U.S. Treasury Note | | | 1.38 | | | | 2/29/20 | | | | 118 | |
| | 105 | | | U.S. Treasury Note | | | 1.38 | | | | 7/31/19 | | | | 104 | |
| | 100 | | | U.S. Treasury Note | | | 1.50 | | | | 4/15/20 | | | | 98 | |
| | 100 | | | U.S. Treasury Note | | | 1.50 | | | | 5/15/20 | | | | 98 | |
| | 50 | | | U.S. Treasury Note | | | 1.50 | | | | 8/15/20 | | | | 49 | |
| | 105 | | | U.S. Treasury Note | | | 1.50 | | | | 5/31/20 | | | | 103 | |
| | 100 | | | U.S. Treasury Note | | | 1.50 | | | | 7/15/20 | | | | 98 | |
| | 80 | | | U.S. Treasury Note | | | 1.50 | | | | 1/31/22 | | | | 77 | |
| | 105 | | | U.S. Treasury Note | | | 1.50 | | | | 11/30/19 | | | | 104 | |
| | 195 | | | U.S. Treasury Note | | | 1.50 | | | | 10/31/19 | | | | 193 | |
| | 110 | | | U.S. Treasury Note | | | 1.50 | | | | 6/15/20 | | | | 108 | |
| | 155 | | | U.S. Treasury Note | | | 1.50 | | | | 2/28/23 | | | | 147 | |
| | 185 | | | U.S. Treasury Note | | | 1.50 | | | | 8/15/26 | | | | 167 | |
See accompanying notes to financial statements.
178
HC CAPITAL TRUST
The Core Fixed Income Portfolio
Portfolio of Investments (continued) — June 30, 2018
| | | | | | | | | | | | | | | | |
Principal
Amount
(000) | | | Security Description | | Rate % | | | Maturity
Date | | | Value
(000) | |
| | | | U.S. Treasury Obligations (continued) | | | | | | | | | | | | |
| $ | 135 | | | U.S. Treasury Note | | | 1.63 | | | | 8/31/22 | | | $ | 129 | |
| | 125 | | | U.S. Treasury Note | | | 1.63 | | | | 8/31/19 | | | | 124 | |
| | 100 | | | U.S. Treasury Note | | | 1.63 | | | | 6/30/20 | | | | 98 | |
| | 110 | | | U.S. Treasury Note | | | 1.63 | | | | 7/31/20 | | | | 108 | |
| | 35 | | | U.S. Treasury Note | | | 1.63 | | | | 10/15/20 | | | | 34 | |
| | 100 | | | U.S. Treasury Note | | | 1.63 | | | | 3/15/20 | | | | 99 | |
| | 110 | | | U.S. Treasury Note | | | 1.63 | | | | 12/31/19 | | | | 109 | |
| | 100 | | | U.S. Treasury Note | | | 1.63 | | | | 10/31/23 | | | | 94 | |
| | 255 | | | U.S. Treasury Note | | | 1.63 | | | | 2/15/26 | | | | 235 | |
| | 65 | | | U.S. Treasury Note | | | 1.63 | | | | 8/15/22 | | | | 62 | |
| | 50 | | | U.S. Treasury Note | | | 1.63 | | | | 7/31/19 | | | | 50 | |
| | 102 | | | U.S. Treasury Note | | | 1.63 | | | | 11/15/22 | | | | 97 | |
| | 80 | | | U.S. Treasury Note | | | 1.63 | | | | 5/31/23 | | | | 76 | |
| | 185 | | | U.S. Treasury Note | | | 1.63 | | | | 5/15/26 | | | | 169 | |
| | 95 | | | U.S. Treasury Note | | | 1.75 | | | | 10/31/20 | | | | 93 | |
| | 105 | | | U.S. Treasury Note | | | 1.75 | | | | 12/31/20 | | | | 103 | |
| | 164 | | | U.S. Treasury Note | | | 1.75 | | | | 5/15/23 | | | | 157 | |
| | 105 | | | U.S. Treasury Note | | | 1.75 | | | | 11/30/19 | | | | 104 | |
| | 85 | | | U.S. Treasury Note | | | 1.75 | | | | 2/28/22 | | | | 82 | |
| | 100 | | | U.S. Treasury Note | | | 1.75 | | | | 11/15/20 | | | | 98 | |
| | 90 | | | U.S. Treasury Note | | | 1.75 | | | | 5/15/22 | | | | 87 | |
| | 80 | | | U.S. Treasury Note | | | 1.75 | | | | 1/31/23 | | | | 77 | |
| | 130 | | | U.S. Treasury Note | | | 1.75 | | | | 11/30/21 | | | | 126 | |
| | 85 | | | U.S. Treasury Note | | | 1.75 | | | | 3/31/22 | | | | 82 | |
| | 110 | | | U.S. Treasury Note | | | 1.75 | | | | 9/30/22 | | | | 106 | |
| | 115 | | | U.S. Treasury Note | | | 1.75 | | | | 4/30/22 | | | | 111 | |
| | 140 | | | U.S. Treasury Note | | | 1.75 | | | | 5/31/22 | | | | 135 | |
| | 105 | | | U.S. Treasury Note | | | 1.75 | | | | 9/30/19 | | | | 104 | |
| | 140 | | | U.S. Treasury Note | | | 1.75 | | | | 6/30/22 | | | | 135 | |
| | 105 | | | U.S. Treasury Note | | | 1.88 | | | | 1/31/22 | | | | 102 | |
| | 90 | | | U.S. Treasury Note | | | 1.88 | | | | 9/30/22 | | | | 87 | |
| | 85 | | | U.S. Treasury Note | | | 1.88 | | | | 5/31/22 | | | | 82 | |
| | 100 | | | U.S. Treasury Note | | | 1.88 | | | | 8/31/24 | | | | 95 | |
| | 75 | | | U.S. Treasury Note | | | 1.88 | | | | 12/31/19 | | | | 74 | |
| | 65 | | | U.S. Treasury Note | | | 1.88 | | | | 7/31/22 | | | | 63 | |
| | 125 | | | U.S. Treasury Note | | | 1.88 | | | | 4/30/22 | | | | 121 | |
| | 70 | | | U.S. Treasury Note | | | 1.88 | | | | 12/15/20 | | | | 69 | |
| | 145 | | | U.S. Treasury Note | | | 1.88 | | | | 2/28/22 | | | | 141 | |
| | 105 | | | U.S. Treasury Note | | | 1.88 | | | | 6/30/20 | | | | 104 | |
| | 125 | | | U.S. Treasury Note | | | 1.88 | | | | 10/31/22 | | | | 121 | |
| | 110 | | | U.S. Treasury Note | | | 1.88 | | | | 11/30/21 | | | | 107 | |
| | 100 | | | U.S. Treasury Note | | | 1.88 | | | | 3/31/22 | | | | 97 | |
| | 85 | | | U.S. Treasury Note | | | 1.88 | | | | 8/31/22 | | | | 82 | |
| | 185 | | | U.S. Treasury Note | | | 2.00 | | | | 11/15/26 | | | | 173 | |
| | 100 | | | U.S. Treasury Note | | | 2.00 | | | | 2/15/22 | | | | 98 | |
| | 80 | | | U.S. Treasury Note | | | 2.00 | | | | 8/31/21 | | | | 78 | |
| | 195 | | | U.S. Treasury Note | | | 2.00 | | | | 8/15/25 | | | | 185 | |
| | 200 | | | U.S. Treasury Note | | | 2.00 | | | | 11/30/22 | | | | 194 | |
| | 145 | | | U.S. Treasury Note | | | 2.00 | | | | 11/15/21 | | | | 142 | |
| | 195 | | | U.S. Treasury Note | | | 2.00 | | | | 2/15/25 | | | | 185 | |
| | 70 | | | U.S. Treasury Note | | | 2.00 | | | | 10/31/21 | | | | 69 | |
| | 110 | | | U.S. Treasury Note | | | 2.00 | | | | 12/31/21 | | | | 108 | |
| | 60 | | | U.S. Treasury Note | | | 2.00 | | | | 11/30/20 | | | | 59 | |
| | 170 | | | U.S. Treasury Note | | | 2.00 | | | | 2/15/23 | | | | 165 | |
See accompanying notes to financial statements.
179
HC CAPITAL TRUST
The Core Fixed Income Portfolio
Portfolio of Investments (continued) — June 30, 2018
| | | | | | | | | | | | | | | | |
Principal
Amount
(000) | | | Security Description | | Rate % | | | Maturity
Date | | | Value
(000) | |
| | | | U.S. Treasury Obligations (continued) | | | | | | | | | | | | |
| $ | 100 | | | U.S. Treasury Note | | | 2.00 | | | | 10/31/22 | | | $ | 97 | |
| | 100 | | | U.S. Treasury Note | | | 2.00 | | | | 2/28/21 | | | | 98 | |
| | 100 | | | U.S. Treasury Note | | | 2.00 | | | | 5/31/21 | | | | 98 | |
| | 10 | | | U.S. Treasury Note | | | 2.00 | | | | 1/15/21 | | | | 10 | |
| | 135 | | | U.S. Treasury Note | | | 2.00 | | | | 5/31/24 | | | | 129 | |
| | 95 | | | U.S. Treasury Note | | | 2.00 | | | | 7/31/22 | | | | 92 | |
| | 65 | | | U.S. Treasury Note | | | 2.00 | | | | 9/30/20 | | | | 64 | |
| | 80 | | | U.S. Treasury Note | | | 2.00 | | | | 1/31/20 | | | | 79 | |
| | 90 | | | U.S. Treasury Note | | | 2.00 | | | | 6/30/24 | | | | 86 | |
| | 70 | | | U.S. Treasury Note | | | 2.00 | | | | 4/30/24 | | | | 67 | |
| | 50 | | | U.S. Treasury Note | | | 2.00 | | | | 7/31/20 | | | | 49 | |
| | 90 | | | U.S. Treasury Note | | | 2.13 | | | | 11/30/23 | | | | 87 | |
| | 115 | | | U.S. Treasury Note | | | 2.13 | | | | 11/30/24 | | | | 110 | |
| | 115 | | | U.S. Treasury Note | | | 2.13 | | | | 2/29/24 | | | | 111 | |
| | 70 | | | U.S. Treasury Note | | | 2.13 | | | | 6/30/21 | | | | 69 | |
| | 85 | | | U.S. Treasury Note | | | 2.13 | | | | 3/31/24 | | | | 82 | |
| | 115 | | | U.S. Treasury Note | | | 2.13 | | | | 9/30/24 | | | | 111 | |
| | 210 | | | U.S. Treasury Note | | | 2.13 | | | | 12/31/22 | | | | 206 | |
| | 90 | | | U.S. Treasury Note | | | 2.13 | | | | 6/30/22 | | | | 88 | |
| | 80 | | | U.S. Treasury Note | | | 2.13 | | | | 8/31/20 | | | | 79 | |
| | 115 | | | U.S. Treasury Note | | | 2.13 | | | | 7/31/24 | | | | 111 | |
| | 65 | | | U.S. Treasury Note | | | 2.13 | | | | 9/30/21 | | | | 64 | |
| | 120 | | | U.S. Treasury Note | | | 2.13 | | | | 8/15/21 | | | | 118 | |
| | 195 | | | U.S. Treasury Note | | | 2.13 | | | | 5/15/25 | | | | 187 | |
| | 135 | | | U.S. Treasury Note | | | 2.13 | | | | 1/31/21 | | | | 133 | |
| | 105 | | | U.S. Treasury Note | | | 2.13 | | | | 12/31/21 | | | | 103 | |
| | 195 | | | U.S. Treasury Note | | | 2.25 | | | | 11/15/25 | | | | 188 | |
| | 90 | | | U.S. Treasury Note | | | 2.25 | | | | 1/31/24 | | | | 88 | |
| | 80 | | | U.S. Treasury Note | | | 2.25 | | | | 3/31/21 | | | | 79 | |
| | 80 | | | U.S. Treasury Note | | | 2.25 | | | | 4/30/21 | | | | 79 | |
| | 80 | | | U.S. Treasury Note | | | 2.25 | | | | 12/31/23 | | | | 78 | |
| | 225 | | | U.S. Treasury Note | | | 2.25 | | | | 2/15/27 | | | | 216 | |
| | 140 | | | U.S. Treasury Note | | | 2.25 | | | | 7/31/21 | | | | 138 | |
| | 185 | | | U.S. Treasury Note | | | 2.25 | | | | 8/15/27 | | | | 176 | |
| | 85 | | | U.S. Treasury Note | | | 2.25 | | | | 2/15/21 | | | | 84 | |
| | 80 | | | U.S. Treasury Note | | | 2.25 | | | | 12/31/24 | | | | 77 | |
| | 175 | | | U.S. Treasury Note | | | 2.25 | | | | 11/15/27 | | | | 166 | |
| | 90 | | | U.S. Treasury Note | | | 2.25 | | | | 2/29/20 | | | | 90 | |
| | 115 | | | U.S. Treasury Note | | | 2.25 | | | | 10/31/24 | | | | 111 | |
| | 10 | | | U.S. Treasury Note | | | 2.25 | | | | 3/31/20 | | | | 10 | |
| | 215 | | | U.S. Treasury Note | | | 2.25 | | | | 11/15/24 | | | | 209 | |
| | 90 | | | U.S. Treasury Note | | | 2.38 | | | | 4/15/21 | | | | 89 | |
| | 10 | | | U.S. Treasury Note | | | 2.38 | | | | 3/15/21 | | | | 10 | |
| | 175 | | | U.S. Treasury Note | | | 2.38 | | | | 5/15/27 | | | | 168 | |
| | 125 | | | U.S. Treasury Note | | | 2.38 | | | | 12/31/20 | | | | 124 | |
| | 110 | | | U.S. Treasury Note | | | 2.38 | | | | 1/31/23 | | | | 108 | |
| | 95 | | | U.S. Treasury Note | | | 2.38 | | | | 4/30/20 | | | | 95 | |
| | 240 | | | U.S. Treasury Note | | | 2.38 | | | | 8/15/24 | | | | 235 | |
| | 127 | | | U.S. Treasury Note | | | 2.50 | | | | 8/15/23 | | | | 125 | |
| | 100 | | | U.S. Treasury Note | | | 2.50 | | | | 5/31/20 | | | | 100 | |
| | 100 | | | U.S. Treasury Note | | | 2.50 | | | | 6/30/20 | | | | 100 | |
| | 205 | | | U.S. Treasury Note | | | 2.50 | | | | 5/15/24 | | | | 203 | |
| | 50 | | | U.S. Treasury Note | | | 2.50 | | | | 3/31/23 | | | | 49 | |
| | 90 | | | U.S. Treasury Note | | | 2.50 | | | | 1/31/25 | | | | 88 | |
See accompanying notes to financial statements.
180
HC CAPITAL TRUST
The Core Fixed Income Portfolio
Portfolio of Investments (continued) — June 30, 2018
| | | | | | | | | | | | | | | | |
Principal
Amount
(000) | | | Security Description | | Rate % | | | Maturity
Date | | | Value
(000) | |
| | | | U.S. Treasury Obligations (continued) | | | | | | | | | | | | |
| $ | 95 | | | U.S. Treasury Note | | | 2.63 | | | | 6/15/21 | | | $ | 95 | |
| | 200 | | | U.S. Treasury Note | | | 2.63 | | | | 11/15/20 | | | | 201 | |
| | 95 | | | U.S. Treasury Note | | | 2.63 | | | | 5/15/21 | | | | 95 | |
| | 160 | | | U.S. Treasury Note | | | 2.63 | | | | 8/15/20 | | | | 160 | |
| | 100 | | | U.S. Treasury Note | | | 2.63 | | | | 3/31/25 | | | | 99 | |
| | 110 | | | U.S. Treasury Note | | | 2.63 | | | | 2/28/23 | | | | 110 | |
| | 105 | | | U.S. Treasury Note | | | 2.63 | | | | 6/30/23 | | | | 104 | |
| | 45 | | | U.S. Treasury Note | | | 2.75 | | | | 4/30/23 | | | | 45 | |
| | 90 | | | U.S. Treasury Note | | | 2.75 | | | | 2/28/25 | | | | 90 | |
| | 90 | | | U.S. Treasury Note | | | 2.75 | | | | 6/30/25 | | | | 90 | |
| | 170 | | | U.S. Treasury Note | | | 2.75 | | | | 11/15/23 | | | | 170 | |
| | 100 | | | U.S. Treasury Note | | | 2.75 | | | | 2/15/24 | | | | 100 | |
| | 95 | | | U.S. Treasury Note | | | 2.75 | | | | 5/31/23 | | | | 95 | |
| | 30 | | | U.S. Treasury Note | | | 2.75 | | | | 2/15/28 | | | | 30 | |
| | 90 | | | U.S. Treasury Note | | | 2.88 | | | | 4/30/25 | | | | 90 | |
| | 125 | | | U.S. Treasury Note | | | 2.88 | | | | 5/15/28 | | | | 125 | |
| | 90 | | | U.S. Treasury Note | | | 2.88 | | | | 5/31/25 | | | | 90 | |
| | 50 | | | U.S. Treasury Note | | | 3.13 | | | | 5/15/21 | | | | 51 | |
| | 75 | | | U.S. Treasury Note | | | 3.38 | | | | 11/15/19 | | | | 76 | |
| | 100 | | | U.S. Treasury Note | | | 3.50 | | | | 5/15/20 | | | | 102 | |
| | 100 | | | U.S. Treasury Note | | | 3.63 | | | | 2/15/21 | | | | 103 | |
| | 80 | | | U.S. Treasury Note | | | 3.63 | | | | 8/15/19 | | | | 81 | |
| | 100 | | | U.S. Treasury Note | | | 3.63 | | | | 2/15/20 | | | | 102 | |
| | | | | | | | | | | | | | | | |
| | | | Total U.S. Treasury Obligations | | | | | | | | | | | 22,495 | |
| | | | | | | | | | | | | | | | |
| | | | Yankee Dollars — 6.03% | | | | | | | | | | | | |
| | 100 | | | America Movil SAB de CV (Wireless Telecommunication Services) | | | 5.00 | | | | 3/30/20 | | | | 103 | |
| | 85 | | | America Movil SAB de CV (Wireless Telecommunication Services) | | | 6.13 | | | | 11/15/37 | | | | 98 | |
| | 100 | | | Aptiv PLC (Auto Components), Callable 10/15/25 @ 100.00 | | | 4.25 | | | | 1/15/26 | | | | 100 | |
| | 25 | | | Bank of Nova Scotia (Banks) | | | 1.85 | | | | 4/14/20 | | | | 25 | |
| | 200 | | | Barclays PLC (Banks), Callable 1/10/22 @ 100.00 | | | 3.68 | | | | 1/10/23 | | | | 195 | |
| | 45 | | | BHP Billiton Ltd. (Metals & Mining) | | | 5.00 | | | | 9/30/43 | | | | 50 | |
| | 255 | | | BP Capital Markets PLC (Oil, Gas & Consumable Fuels) | | | 3.54 | | | | 11/4/24 | | | | 253 | |
| | 129 | | | British Telecommunications PLC (Diversified Telecommunication Services) | | | 9.63 | | | | 12/15/30 | | | | 184 | |
| | 205 | | | Canadian Natural Resources Ltd. (Oil, Gas & Consumable Fuels), Callable 12/15/22 @ 100.00 | | | 2.95 | | | | 1/15/23 | | | | 197 | |
| | 90 | | | Canadian Natural Resources Ltd. (Oil, Gas & Consumable Fuels), Callable 8/15/21 @ 100.00 | | | 3.45 | | | | 11/15/21 | | | | 90 | |
| | 50 | | | Canadian Natural Resources Ltd. (Oil, Gas & Consumable Fuels), Callable 3/1/27 @ 100.00 | | | 3.85 | | | | 6/1/27 | | | | 49 | |
| | 270 | | | Canadian Pacific Railway Co. (Road & Rail), Callable 12/15/22 @ 100.00 | | | 4.45 | | | | 3/15/23 | | | | 281 | |
| | 90 | | | Deutsche Telekom International Finance BV (Diversified Financial Services) | | | 8.75 | (d) | | | 6/15/30 | | | | 119 | |
| | 90 | | | HSBC Holdings PLC (Banks) | | | 4.00 | | | | 3/30/22 | | | | 91 | |
| | 120 | | | HSBC Holdings PLC (Banks) | | | 6.80 | | | | 6/1/38 | | | | 145 | |
| | 140 | | | Iberdrola International BV (Electric Utilities) | | | 5.81 | | | | 3/15/25 | | | | 153 | |
| | 145 | | | Iberdrola International BV (Electric Utilities) | | | 6.75 | | | | 7/15/36 | | | | 186 | |
| | 50 | | | LyondellBasell Industries N.V. (Chemicals) | | | 4.00 | | | | 7/15/23 | | | | 50 | |
| | 35 | | | LyondellBasell Industries N.V. (Chemicals), Callable 8/26/54 @ 100.00 | | | 4.63 | | | | 2/26/55 | | | | 32 | |
| | 110 | | | Orange SA (Diversified Telecommunication Services) | | | 9.00 | | | | 3/1/31 | | | | 151 | |
| | 25 | | | Royal Bank of Canada (Banks) | | | 2.20 | | | | 9/23/19 | | | | 24 | |
| | 75 | | | Shell International Finance BV (Oil, Gas & Consumable Fuels) | | | 4.13 | | | | 5/11/35 | | | | 76 | |
| | 185 | | | Shell International Finance BV (Oil, Gas & Consumable Fuels) | | | 6.38 | | | | 12/15/38 | | | | 240 | |
| | 100 | | | Statoil ASA (Oil, Gas & Consumable Fuels) | | | 5.10 | | | | 8/17/40 | | | | 111 | |
| | 180 | | | Statoil ASA (Oil, Gas & Consumable Fuels) | | | 7.75 | | | | 6/15/23 | | | | 214 | |
| | 10 | | | Telefonica Emisiones SAU (Diversified Telecommunication Services) | | | 5.13 | | | | 4/27/20 | | | | 10 | |
| | 35 | | | Telefonica Emisiones SAU (Diversified Telecommunication Services) | | | 5.46 | | | | 2/16/21 | | | | 37 | |
| | 90 | | | Telefonica Emisiones SAU (Diversified Telecommunication Services) | | | 7.05 | | | | 6/20/36 | | | | 108 | |
| | 105 | | | TransCanada PipeLines Ltd. (Oil, Gas & Consumable Fuels) | | | 2.50 | | | | 8/1/22 | | | | 101 | |
See accompanying notes to financial statements.
181
HC CAPITAL TRUST
The Core Fixed Income Portfolio
Portfolio of Investments (continued) — June 30, 2018
| | | | | | | | | | | | | | | | |
Principal
Amount
(000) | | | Security Description | | Rate % | | | Maturity
Date | | | Value
(000) | |
| | | | Yankee Dollars (continued) | | | | | | | | | | | | |
| $ | 240 | | | TransCanada PipeLines Ltd. (Oil, Gas & Consumable Fuels), Callable 2/15/28 @ 100.00 | | | 4.25 | | | | 5/15/28 | | | $ | 240 | |
| | 140 | | | TransCanada PipeLines Ltd. (Oil, Gas & Consumable Fuels) | | | 6.10 | | | | 6/1/40 | | | | 159 | |
| | 20 | | | TransCanada PipeLines Ltd. (Oil, Gas & Consumable Fuels) | | | 6.20 | | | | 10/15/37 | | | | 23 | |
| | 35 | | | Vodafone Group PLC (Wireless Telecommunication Services) | | | 5.00 | | | | 5/30/38 | | | | 35 | |
| | 90 | | | Vodafone Group PLC (Wireless Telecommunication Services) | | | 6.15 | | | | 2/27/37 | | | | 98 | |
| | | | | | | | | | | | | | | | |
| | | | Total Yankee Dollars | | | | | | | | | | | 4,028 | |
| | | | | | | | | | | | | | | | |
| | | | Time Deposit — 0.04% | | | | | | | | | | | | |
| | 29 | | | State Street Liquidity Management Control System Eurodollar Time Deposit | | | 0.53 | | | | 7/2/18 | | | | 29 | |
| | | | | | | | | | | | | | | | |
| | | | Total Time Deposit | | | | | | | | | | | 29 | |
| | | | | | | | | | | | | | | | |
| Shares | | | | | | | | | | | | |
| | | | Mutual Funds — 3.51% | | | | | | | | | | | | |
| | 36,904 | | | SSgA U.S. Government Money Market Fund, Premier Class | | | 1.73 | (e) | | | | | | | 37 | |
| | 2,306,027 | | | State Street Institutional Treasury Plus Money Market Fund, Trust Class | | | 1.72 | (e) | | | | | | | 2,306 | |
| | | | | | | | | | | | | | | | |
| | | | Total Mutual Funds | | | | | | | | | | | 2,343 | |
| | | | | | | | | | | | | | | | |
| | | | Total Investments Before TBA Sale Commitments (cost $69,938) — 102.61% | | | | | | | | | | | 68,490 | |
Principal
Amount
(000) | | | | | | | | | | | | |
| | | | TBA Sale Commitments (f) — (0.22)% | | | | | | | | | | | | |
| $ | (40 | ) | | Fannie Mae, 15 YR TBA | | | 4.50 | | | | 7/25/33 | | | | (40 | ) |
| | (100 | ) | | Freddie Mac, Gold 30 YR TBA | | | 5.50 | | | | 7/15/48 | | | | (107 | ) |
| | | | | | | | | | | | | | | | |
| | | | Total TBA Sale Commitments | | | | | | | | | | | (147 | ) |
| | | | | | | | | | | | | | | | |
| | | | Liabilities in excess of other assets — (2.39)% | | | | | | | | | | | (1,594 | ) |
| | | | | | | | | | | | | | | | |
| | | | Net Assets — 100.00% | | | | | | | | | | $ | 66,749 | |
| | | | | | | | | | | | | | | | |
| (a) | The rate for certain asset-backed and mortgage-backed securities may vary based on factors relating to the pool of assets underlying the security. The rate disclosed is the rate in effect on June 30, 2018. |
| (b) | Zero Coupon Security. Effective rate shown is as of June 30, 2018. |
| (c) | Rate disclosed represents effective yield at purchase. |
| (d) | Step Bond: Coupon rate is set for an initial period and then increased to a higher coupon rate at a specified date. The rate shown is the rate in effect at June 30, 2018. |
| (e) | The rate disclosed is the rate in effect on June 30, 2018. |
| (f) | Represents a “to be announced” transaction. The Portfolio has committed to sell securities for which all specific information is not available at this time. (See Note 2 in the Notes to Financial Statements.) |
MTN — Medium Term Note
TBA — To Be Announced purchase or sale commitment. Security is subject to delayed delivery
See accompanying notes to financial statements.
182
HC CAPITAL TRUST
The Core Fixed Income Portfolio
Portfolio of Investments (concluded) — June 30, 2018
The following table reflects the percentage of total net assets of the Portfolio attributable to each Specialist Manager as of June 30, 2018.
| | | | | | | | | | | | | | | | |
The Core Fixed Income Portfolio | | Agincourt Capital
Management,
LLC | | | BNY Mellon Asset
Management North
America Corporation* | | | HC Capital
Solutions | | | Total | |
Asset Backed Securities | | | — | | | | 0.50% | | | | — | | | | 0.50% | |
Collateralized Mortgage Obligations | | | — | | | | 1.57% | | | | — | | | | 1.57% | |
U.S. Government Agency Mortgages | | | — | | | | 22.64% | | | | — | | | | 22.64% | |
U.S. Government Agency Securities | | | — | | | | 1.37% | | | | — | | | | 1.37% | |
Corporate Bonds | | | 33.24% | | | | — | | | | — | | | | 33.24% | |
U.S. Treasury Obligations | | | — | | | | 33.71% | | | | — | | | | 33.71% | |
Yankee Dollars | | | 5.96% | | | | 0.07% | | | | — | | | | 6.03% | |
Time Deposit | | | — | | | | 0.04% | | | | — | | | | 0.04% | |
Mutual Funds | | | 0.05% | | | | 2.99% | | | | 0.47% | | | | 3.51% | |
TBA Sale Commitments | | | — | | | | -0.22% | | | | — | | | | -0.22% | |
Other Assets (Liabilities) | | | 0.39% | | | | -2.65% | | | | -0.13% | | | | -2.39% | |
| | | | | | | | | | | | | | | | |
Total Net Assets | | | 39.64% | | | | 60.02% | | | | 0.34% | | | | 100.00% | |
| | | | | | | | | | | | | | | | |
| * | Formerly Mellon Capital Management Corporation. |
Amounts designated as “—” indicate the Specialist Manager did not manage any holdings in that category.
See accompanying notes to financial statements.
183
HC CAPITAL TRUST
The Fixed Income Opportunity Portfolio
Portfolio of Investments — June 30, 2018
| | | | | | | | | | | | | | | | |
Principal
Amount
(000) | | | Security Description | | Rate % | | | Maturity
Date | | | Value
(000) | |
| | | | Collateralized Mortgage Obligations — 19.62% | | | | | | | | | | | | |
| $ | 2,070 | | | BAMLL Commercial Mortgage Securities Trust,
Series 2014-FL1, Class E (a) | |
| 5.53 (LIBOR01M +
550.00 bps)(b) |
| | | 12/15/31 | | | $ | 1,996 | |
| | 5,687 | | | Bank of America Merrill Lynch Large, Series 2016-GG10, Class AJA (a) | | | 5.98(c) | | | | 8/10/45 | | | | 4,248 | |
| | 3,000 | | | BX Trust, Series 2017-IMC, Class G (a) | |
| 7.57 (LIBOR01M +
550.00 bps)(b) |
| | | 10/15/32 | | | | 3,011 | |
| | 4,000 | | | Citigroup Commercial Mortgage Trust, Series 2015-GC27, Class E (a) | | | 3.00 | | | | 2/10/48 | | | | 2,677 | |
| | 1,500 | | | Citigroup Commercial Mortgage Trust, Series 2014-GC23, Class E (a) | | | 3.21(c) | | | | 7/10/47 | | | | 1,017 | |
| | 1,300 | | | Citigroup Commercial Mortgage Trust, Series 2015-GC29, Class F (a) | | | 4.28(c) | | | | 4/10/48 | | | | 790 | |
| | 2,700 | | | Citigroup Commercial Mortgage Trust, Series 2015-GC29, Class E (a) | | | 4.28(c) | | | | 4/10/48 | | | | 1,831 | |
| | 6,000 | | | Commercial Mortgage Trust, Series 2014-CR21, Class F (a) | | | 3.00 | | | | 12/10/47 | | | | 3,888 | |
| | 2,700 | | | Commercial Mortgage Trust, Series 2015-LC21, Class E (a) | | | 3.25 | | | | 7/10/48 | | | | 1,816 | |
| | 3,409 | | | Commercial Mortgage Trust, Series 2015-CR24, Class E (a) | | | 3.28(c) | | | | 8/10/48 | | | | 2,099 | |
| | 1,100 | | | Commercial Mortgage Trust, Series 2014-LC17, Class D (a) | | | 3.69 | | | | 10/10/47 | | | | 868 | |
| | 2,900 | | | Commercial Mortgage Trust, Series 2013-CR7, Class G (a) | | | 4.43(c) | | | | 3/10/46 | | | | 1,043 | |
| | 1,800 | | | Commercial Mortgage Trust, Series 2015-CR25, Class F (a) | | | 4.70(c) | | | | 8/10/48 | | | | 888 | |
| | 4,000 | | | Commercial Mortgage Trust, Series 2015-CR25, Class E (a) | | | 4.70(c) | | | | 8/10/48 | | | | 2,683 | |
| | 420 | | | Commercial Mortgage Trust, Series 2013-CR12, Class E (a) | | | 5.25(c) | | | | 10/10/46 | | | | 325 | |
| | 1,409 | | | Connecticut Avenue Securities, Series 2016-C03, Class 1B,
Callable 4/25/26 @ 100.00 (a) | |
| 13.84 (US0001M +
1175.00 bps)(b) |
| | | 10/25/28 | | | | 2,012 | |
| | 6,332 | | | Connecticut Avenue Securities, Series 2016-C02, Class 1B,
Callable 3/25/26 @ 100.00 (a) | |
| 14.34 (US0001M +
1225.00 bps)(b) |
| | | 9/25/28 | | | | 9,402 | |
| | 1,712 | | | Credit Suisse Mortgage Trust, Series 2017-RPL1, Class B2,
Callable 9/25/48 @ 100.00 (a) | | | 3.10(c) | | | | 7/25/57 | | | | 914 | |
| | 1,492 | | | Credit Suisse Mortgage Trust, Series 2017-RPL1, Class B1,
Callable 9/25/48 @ 100.00 (a) | | | 3.10(c) | | | | 7/25/57 | | | | 1,081 | |
| | 1,659 | | | Credit Suisse Mortgage Trust, Series 2017-RPL1, Class B4,
Callable 9/25/48 @ 100.00 (a) | | | 3.10(c) | | | | 7/25/57 | | | | 281 | |
| | 1,455 | | | Credit Suisse Mortgage Trust, Series 2017-RPL1, Class B3,
Callable 9/25/48 @ 100.00 (a) | | | 3.10(c) | | | | 7/25/57 | | | | 619 | |
| | 1,627 | | | Credit Suisse Mortgage Trust, Series 2007-C5, Class AM | | | 5.87 | | | | 9/15/40 | | | | 1,577 | |
| | 3,944 | | | Credit Suisse Mortgage Trust, Series 2015-LHMZ, Class MZ (a) | | | 8.92(c) | | | | 7/6/20 | | | | 3,958 | |
| | 1,500 | | | Credit Suisse Mortgage Trust, Series 2017-CHOP, Class H (a) | |
| 9.69 (LIBOR01M +
762.00 bps)(b) |
| | | 7/15/32 | | | | 1,494 | |
| | 2,500 | | | CSAIL Commercial Mortgage Trust, Series 2016-C7, Class D (a) | | | 4.54(c) | | | | 11/15/49 | | | | 2,057 | |
| | 2,100 | | | DBUBS Mortgage Trust, Series 2011-LC3A, Class G (a) | | | 3.75 | | | | 8/10/44 | | | | 1,216 | |
| | 4,779 | | | FRESB Mortgage Trust, Series 2018-SB48, Class B, Callable 1/1/28 @ 100.00 (a) | |
| 3.68 (LIBOR06M +
367.72 bps)(b) |
| | | 2/25/38 | | | | 3,476 | |
| | 2,260 | | | GE Commercial Mortgage Corp. Trust, Series 2007-C1, Class AJ | | | 5.68(c) | | | | 12/10/49 | | | | 721 | |
| | 600 | | | Goldman Sachs Mortgage Securities Trust, Series 2013-GC14, Class F (a) | | | 4.92(c) | | | | 8/10/46 | | | | 466 | |
| | 4,850 | | | GS Mortgage Securities Corp. II, Series 2018-SRP5, Class D (a) | |
| 7.98 (LIBOR01M +
600.00 bps)(b) |
| | | 9/15/31 | | | | 4,850 | |
| | 700 | | | JPMBB Commercial Mortgage Securities Trust, Series 2014-C23, Class E,
Callable 10/15/24 @ 100.00 (a) | | | 3.36(c) | | | | 9/15/47 | | | | 466 | |
| | 4,300 | | | JPMBB Commercial Mortgage Securities Trust, Series 2015-C31, Class E (a) | | | 4.77(c) | | | | 8/15/48 | | | | 2,927 | |
| | 6,070 | | | JPMorgan Chase Commercial Mortgage Securities Corp., Series 2007-LDPX, Class AJ, Callable 2/11/22 @ 100.00 | | | 5.50(c) | | | | 1/15/49 | | | | 987 | |
| | 2,724 | | | JPMorgan Chase Commercial Mortgage Securities Corp.,
Series 2007-CB19, Class AJ | | | 6.01(c) | | | | 2/12/49 | | | | 2,021 | |
| | 853 | | | Lone Star Portfolio Trust, Series 2015-LSP, Class E (a) | |
| 7.67 (US0001M
+ 560.00 bps)(b) |
| | | 9/15/28 | | | | 859 | |
| | 4,010 | | | Lone Star Portfolio Trust, Series 2015-LSP, Class F (a) | |
| 8.97 (LIBOR01M +
690.00 bps)(b) |
| | | 9/15/28 | | | | 4,039 | |
| | 1,110 | | | Morgan Stanley BAML Trust, Series 2015-C21, Class E (a) | | | 3.01 | | | | 3/15/48 | | | | 720 | |
| | 1,800 | | | Morgan Stanley BAML Trust, Series 2015-C25, Class F,
Callable 9/11/25 @ 100.00 (a) | |
| 4.68 (US0003M +
125.00 bps)(b) |
| | | 10/15/48 | | | | 1,034 | |
| | 2,250 | | | Morgan Stanley BAML Trust, Series 2015-C25, Class E,
Callable 9/11/25 @ 100.00 (a) | |
| 4.68 (US0003M +
112.00 bps)(b) |
| | | 10/15/48 | | | | 1,718 | |
See accompanying notes to financial statements.
184
HC CAPITAL TRUST
The Fixed Income Opportunity Portfolio
Portfolio of Investments (continued) — June 30, 2018
| | | | | | | | | | | | | | | | |
Principal
Amount
(000) | | | Security Description | | Rate % | | | Maturity
Date | | | Value
(000) | |
| | | | Collateralized Mortgage Obligations (continued) | | | | | | | | | | | | |
| $ | 1,183 | | | Motel 6 Trust, Series 2017-MTL6, Class F (a) | |
| 6.32 (LIBOR01M
+ 425.00 bps)(b) |
| | | 8/15/34 | | | $ | 1,190 | |
| | 2,517 | | | Multifamily Trust, Series 2016-1, Class B (a) | |
| 9.27 (US0003M +
113.00 bps)(b) |
| | | 4/25/46 | | | | 2,630 | |
| | 151,245 | | | Seasoned Credit Risk Transfer, Series 2016-1, Class XSIO,
Callable 6/25/43 @ 100.00 (a) | | | 0.07(c) | | | | 9/25/55 | | | | 557 | |
| | 19,302 | | | Seasoned Credit Risk Transfer, Series 2016-1, Class BIO,
Callable 6/25/43 @ 100.00 (a) | | | 1.02(c) | | | | 9/25/55 | | | | 2,094 | |
| | 8,175 | | | Seasoned Credit Risk Transfer, Series 2016-1, Class B,
Callable 6/25/43 @ 100.00 (a) | | | 6.43 | | | | 9/25/55 | | | | 751 | |
| | 14,967 | | | Structured Agency Credit Risk Debt Notes, Series 2015-DNA3, Class B,
Callable 10/25/25 @ 100.00 | |
| 11.44 (US0001M +
935.00 bps)(b) |
| | | 4/25/28 | | | | 19,537 | |
| | 4,494 | | | Structured Agency Credit Risk Debt Notes, Series 2016-DNA1, Class B,
Callable 1/25/26 @ 100.00 | |
| 12.09 (US0001M +
1000.00 bps)(b) |
| | | 7/25/28 | | | | 5,933 | |
| | 2,785 | | | Tharaldson Hotel Portfolio Trust, Series 2018-THL, Class G (a) | |
| 8.40 (US0001M +
635.00 bps)(b) |
| | | 11/11/34 | | | | 2,779 | |
| | 1,857 | | | Tharaldson Hotel Portfolio Trust, Series 2018-THL, Class H (a) | |
| 11.85 (US0001M +
980.00 bps)(b) |
| | | 11/11/34 | | | | 1,853 | |
| | 4,726 | | | UBS-Barclays Commercial Mortgage Trust, Series 2012-C2, Class G (a) | | | 5.00(c) | | | | 5/10/63 | | | | 3,358 | |
| | 8,192 | | | UBS-Barclays Commercial Mortgage Trust, Series 2012-C2, Class H (a) | | | 5.00(c) | | | | 5/10/63 | | | | 4,265 | |
| | 3,000 | | | Wachovia Bank Commercial Mortgage Trust, Series 2007-C33, Class AJ | | | 6.21(c) | | | | 2/15/51 | | | | 2,985 | |
| | 4,800 | | | Wells Fargo Commercial Mortgage Trust, Series 2015-C28, Class E (a) | | | 3.00 | | | | 5/15/48 | | | | 3,010 | |
| | 510 | | | Wells Fargo Commercial Mortgage Trust, Series 2013-LC12, Class E (a) | | | 3.50 | | | | 7/15/46 | | | | 342 | |
| | 4,000 | | | Wells Fargo Commercial Mortgage Trust, Series 2015-C31, Class E,
Callable 11/11/25 @ 100.00 (a) | | | 4.76(c) | | | | 11/15/48 | | | | 2,807 | |
| | | | | | | | | | | | | | | | |
| | | | Total Collateralized Mortgage Obligations | | | | | | | | | | | 132,166 | |
| | | | | | | | | | | | | | | | |
| | | | U.S. Government Agency Mortgages — 3.30% | | | | | | | | | | | | |
| | 1,140 | | | Fannie Mae, Series 2017-C05, Class 1B1, Callable 7/25/27 @ 100.00 (a) | |
| 5.69 (US0001M +
360.00 bps)(b) |
| | | 1/25/30 | | | | 1,169 | |
| | 5,550 | | | Fannie Mae, Series 2017-C07, Class 1B1, Callable 11/25/27 @ 100.00 (a) | |
| 6.09 (US0001M +
400.00 bps)(b) |
| | | 5/25/30 | | | | 5,766 | |
| | 530 | | | Fannie Mae, Series 2017-C03, Class 1B1, Callable 4/25/27 @ 100.00 (a) | |
| 6.94 (US0001M +
485.00 bps)(b) |
| | | 10/25/29 | | | | 594 | |
| | 1,500 | | | Fannie Mae, Series 2016-C06, Class 1B, Callable 10/25/26 @ 100.00 (a) | |
| 11.34 (US0001M +
925.00 bps)(b) |
| | | 4/25/29 | | | | 1,876 | |
| | 3,499 | | | Fannie Mae, Series 2016-C04, Class 1B, Callable 7/25/26 @ 100.00 (a) | |
| 12.34 (US0001M +
1025.00 bps)(b) |
| | | 1/25/29 | | | | 4,637 | |
| | 340 | | | Fannie Mae, Series 2016-C01, Class 1B, Callable 2/25/26 @ 100.00 (a) | |
| 13.84 (US0001M +
1175.00 bps)(b) |
| | | 8/25/28 | | | | 489 | |
| | 5,970 | | | Freddie Mac, Series 2017-2, Class B, Callable 2/25/48 @ 100.00 (a) | | | 0.00(c) | | | | 8/25/56 | | | | 602 | |
| | 263,323 | | | Freddie Mac, Series 2017-2, Class XSIO, Callable 2/25/48 @ 100.00 (a) | | | 0.07(c) | | | | 8/25/56 | | | | 998 | |
| | 8,974 | | | Freddie Mac, Series 2017-2, Class BIO, Callable 2/25/48 @ 100.00 (a) | | | 1.15(c) | | | | 8/25/56 | | | | 1,015 | |
| | 530 | | | Freddie Mac, Series 2017-DNA1, Class B2, Callable 1/25/27 @ 100.00 | |
| 12.09 (US0001M +
1000.00 bps)(b) |
| | | 7/25/29 | | | | 537 | |
| | 1,090 | | | Freddie Mac Structured Agency Credit Risk Debt Notes, Series 2017-DNA2, Class B1, Callable 4/25/27 @ 100.00 | |
| 7.24 (US0001M +
515.00 bps)(b) |
| | | 10/25/29 | | | | 1,246 | |
| | 3,068 | | | Freddie Mac Structured Agency Credit Risk Debt Notes, Series 2017-DNA2, Class B2, Callable 4/25/27 @ 100.00 | |
| 13.34 (US0001M +
1125.00 bps)(b) |
| | | 10/25/29 | | | | 3,277 | |
| | | | | | | | | | | | | | | | |
| | | | Total U.S. Government Agency Mortgages | | | | | | | | | | | 22,206 | |
| | | | | | | | | | | | | | | | |
| | | | Corporate Bonds — 53.39% | | | | | | | | | | | | |
| | 1,175 | | | Acadia Healthcare Co., Inc. (Health Care Providers & Services),
Callable 8/3/18 @ 102.56 | | | 5.13 | | | | 7/1/22 | | | | 1,172 | |
| | 946 | | | Acadia Healthcare Co., Inc. (Health Care Providers & Services),
Callable 3/1/19 @ 104.88 | | | 6.50 | | | | 3/1/24 | | | | 970 | |
| | 709 | | | ACCO Brands Corp. (Commercial Services & Supplies),
Callable 12/15/19 @ 103.94 | | | 5.25 | | | | 12/15/24 | | | | 707 | |
See accompanying notes to financial statements.
185
HC CAPITAL TRUST
The Fixed Income Opportunity Portfolio
Portfolio of Investments (continued) — June 30, 2018
| | | | | | | | | | | | | | | | |
Principal
Amount
(000) | | | Security Description | | Rate % | | | Maturity
Date | | | Value
(000) | |
| | | | Corporate Bonds (continued) | | | | | | | | | | | | |
| $ | 1,765 | | | AES Corp. (Independent Power & Renewable Electricity Producers),
Callable 8/3/18 @ 102.44 | | | 4.88 | | | | 5/15/23 | | | $ | 1,761 | |
| | 2,335 | | | Albertsons Companies LLC (Food & Staples Retailing),
Callable 9/15/19 @ 104.31 | | | 5.75 | | | | 3/15/25 | | | | 2,066 | |
| | 282 | | | Alcoa, Inc. (Aerospace & Defense) | | | 5.87 | | | | 2/23/22 | | | | 294 | |
| | 111 | | | Ally Financial, Inc. (Consumer Finance), Callable 10/20/25 @ 100.00 | | | 5.75 | | | | 11/20/25 | | | | 113 | |
| | 2,029 | | | Ally Financial, Inc. (Consumer Finance) | | | 8.00 | | | | 11/1/31 | | | | 2,405 | |
| | 968 | | | Altice US Finance I Corp. (Media), Callable 7/16/18 @ 104.03 (a) | | | 5.38 | | | | 7/15/23 | | | | 963 | |
| | 1,141 | | | Altice US Finance I Corp. (Media), Callable 5/15/21 @ 102.75 (a) | | | 5.50 | | | | 5/15/26 | | | | 1,101 | |
| | 868 | | | AMC Entertainment Holdings, Inc. (Media), Callable 11/15/21 @ 102.94 | | | 5.88 | | | | 11/15/26 | | | | 835 | |
| | 509 | | | AMC Networks, Inc. (Media), Callable 8/1/21 @ 102.38 | | | 4.75 | | | | 8/1/25 | | | | 489 | |
| | 785 | | | AMC Networks, Inc. (Media), Callable 4/1/20 @ 102.50 | | | 5.00 | | | | 4/1/24 | | | | 773 | |
| | 629 | | | American Airlines Pass-Through Trust, Series 2013-2, Class B (Airlines) | | | 5.60 | | | | 1/15/22 | | | | 642 | |
| | 613 | | | American Airlines Pass-Through Trust, Class B (Airlines) | | | 5.63 | | | | 7/15/22 | | | | 624 | |
| | 2,022 | | | American Builders & Contractors Supply Co., Inc. (Trading Companies & Distributors), Callable 5/15/21 @ 102.94 (a) | | | 5.88 | | | | 5/15/26 | | | | 1,989 | |
| | 685 | | | American Woodmark Corp. (Building Products), Callable 3/15/21 @ 102.44 | | | 4.88 | | | | 3/15/26 | | | | 649 | |
| | 285 | | | Amsted Industries, Inc. (Machinery), Callable 9/15/19 @ 102.69 | | | 5.38 | | | | 9/15/24 | | | | 283 | |
| | 727 | | | Anixter International, Inc. (Electronic Equipment, Instruments & Components) | | | 5.13 | | | | 10/1/21 | | | | 740 | |
| | 547 | | | Aramark Services, Inc. (Hotels, Restaurants & Leisure), Callable 2/1/23 @ 102.50 | | | 5.00 | | | | 2/1/28 | | | | 522 | |
| | 442 | | | Ashtead Capital, Inc. (Trading Companies & Distributors),
Callable 8/15/20 @ 103.09 (a) | | | 4.13 | | | | 8/15/25 | | | | 412 | |
| | 1,099 | | | Avis Budget Car Rental LLC (Road & Rail), Callable 8/3/18 @ 102.56 ^ | | | 5.13 | | | | 6/1/22 | | | | 1,077 | |
| | 1,156 | | | Avis Budget Car Rental LLC (Road & Rail), Callable 8/3/18 @ 102.75 ^ | | | 5.50 | | | | 4/1/23 | | | | 1,128 | |
| | 2,251 | | | Avon Products, Inc. (Personal Products) | | | 6.60 | | | | 3/15/20 | | | | 2,217 | |
| | 2,369 | | | B&G Foods, Inc. (Food Products), Callable 4/1/20 @ 103.94 ^ | | | 5.25 | | | | 4/1/25 | | | | 2,233 | |
| | 733 | | | Ball Corp. (Containers & Packaging), Callable 12/15/25 @ 100.00 | | | 4.88 | | | | 3/15/26 | | | | 730 | |
| | 1,951 | | | Bank of America Corp. (Banks), Callable 3/17/25 @ 100.00, Perpetual Bond (d) | |
| 6.10 (US0003M +
389.80 bps)(b) |
| | | 12/29/49 | | | | 2,028 | |
| | 1,449 | | | BBA US Holdings, Inc. (Aerospace & Defense), Callable 5/1/21 @ 102.69 (a) | | | 5.38 | | | | 5/1/26 | | | | 1,454 | |
| | 1,177 | | | Beacon Escrow Corp. (Trading Companies & Distributors),
Callable 11/1/20 @ 102.44 (a) | | | 4.88 | | | | 11/1/25 | | | | 1,089 | |
| | 1,682 | | | Belo Corp. (Media) | | | 7.25 | | | | 9/15/27 | | | | 1,732 | |
| | 578 | | | Block Communications, Inc. (Media), Callable 2/15/20 @ 103.44 (a) | | | 6.88 | | | | 2/15/25 | | | | 577 | |
| | 646 | | | Blue Cube Spinco, Inc. (Chemicals), Callable 10/15/20 @ 102.44 | | | 9.75 | | | | 10/15/23 | | | | 730 | |
| | 2,115 | | | Blue Racer Mid LLC/Blue Racer Mid Finance (Oil, Gas & Consumable Fuels), Callable 8/3/18 @ 104.59 (a) | | | 6.13 | | | | 11/15/22 | | | | 2,136 | |
| | 2,639 | | | Blue Racer Midstream LLC/Blue Racer Finance Corp. (Oil, Gas & Consumable Fuels), Callable 7/15/21 @ 104.97 (a) | | | 6.63 | | | | 7/15/26 | | | | 2,612 | |
| | 1,333 | | | Booz Allen Hamilton, Inc. (IT Services), Callable 5/1/20 @ 102.56 (a) | | | 5.13 | | | | 5/1/25 | | | | 1,303 | |
| | 1,126 | | | Brinker International, Inc. (Hotels, Restaurants & Leisure) | | | 3.88 | | | | 5/15/23 | | | | 1,061 | |
| | 1,110 | | | Brinker International, Inc. (Hotels, Restaurants & Leisure),
Callable 7/1/24 @ 100.00 (a) | | | 5.00 | | | | 10/1/24 | | | | 1,071 | |
| | 861 | | | Building Materials Corp. of America (Building Products),
Callable 11/15/19 @ 102.69 (a) | | | 5.38 | | | | 11/15/24 | | | | 850 | |
| | 1,268 | | | Building Materials Corp. of America (Building Products),
Callable 10/15/20 @ 103.00 (a) | | | 6.00 | | | | 10/15/25 | | | | 1,271 | |
| | 856 | | | BWX Technologies, Inc. (Aerospace & Defense), Callable 7/15/21 @ 102.69 (a) | | | 5.38 | | | | 7/15/26 | | | | 867 | |
| | 565 | | | Cable One, Inc. (Media), Callable 8/3/18 @ 102.88 (a) | | | 5.75 | | | | 6/15/22 | | | | 576 | |
| | 2,346 | | | Cablevision Systems Corp. (Media) | | | 5.88 | | | | 9/15/22 | | | | 2,329 | |
| | 1,875 | | | Cardtronics, Inc. (IT Services), Callable 8/3/18 @ 102.56 | | | 5.13 | | | | 8/1/22 | | | | 1,791 | |
| | 572 | | | Cardtronics, Inc. (IT Services), Callable 5/1/20 @ 104.13 (a) | | | 5.50 | | | | 5/1/25 | | | | 518 | |
| | 3,161 | | | Care Capital Properties WI (Equity Real Estate Investment Trusts),
Callable 5/15/26 @ 100.00 | | | 5.13 | | | | 8/15/26 | | | | 3,020 | |
| | 1,837 | | | Carriage Services, Inc. (Diversified Consumer Services),
Callable 6/1/21 @ 104.97 (a) | | | 6.63 | | | | 6/1/26 | | | | 1,862 | |
See accompanying notes to financial statements.
186
HC CAPITAL TRUST
The Fixed Income Opportunity Portfolio
Portfolio of Investments (continued) — June 30, 2018
| | | | | | | | | | | | | | | | |
Principal
Amount
(000) | | | Security Description | | Rate % | | | Maturity
Date | | | Value
(000) | |
| | | | Corporate Bonds (continued) | | | | | | | | | | | | |
| $ | 1,334 | | | Carrizo Oil & Gas, Inc. (Oil, Gas & Consumable Fuels),
Callable 8/9/18 @ 104.69 ^ | | | 6.25 | | | | 4/15/23 | | | $ | 1,351 | |
| | 2,281 | | | CCO Holdings LLC/Capital Corp. (Media), Callable 5/1/22 @ 102.56 (a) | | | 5.13 | | | | 5/1/27 | | | | 2,130 | |
| | 859 | | | CCO Holdings LLC/CCO Holdings Capital Corp. (Media),
Callable 8/3/18 @ 102.56 | | | 5.13 | | | | 2/15/23 | | | | 850 | |
| | 970 | | | CCO Holdings LLC/CCO Holdings Capital Corp. (Media),
Callable 8/3/18 @ 103.84 (a) | | | 5.13 | | | | 5/1/23 | | | | 958 | |
| | 1,010 | | | CCO Holdings LLC/CCO Holdings Capital Corp. (Media),
Callable 2/15/21 @ 102.88 | | | 5.75 | | | | 2/15/26 | | | | 992 | |
| | 777 | | | CCO Holdings LLC/CCO Holdings Capital Corp. (Media),
Callable 8/3/18 @ 102.88 | | | 5.75 | | | | 1/15/24 | | | | 779 | |
| | 298 | | | CCO Holdings LLC/CCO Holdings Capital Corp. (Media),
Callable 4/1/19 @ 104.41 | | | 5.88 | | | | 4/1/24 | | | | 299 | |
| | 1,238 | | | CDK Global, Inc. (Software), Callable 6/1/22 @ 102.44 | | | 4.88 | | | | 6/1/27 | | | | 1,187 | |
| | 582 | | | CDW LLC/CDW Finance (Electronic Equipment, Instruments & Components), Callable 8/3/18 @ 103.75 | | | 5.00 | | | | 9/1/23 | | | | 583 | |
| | 1,605 | | | CDW LLC/CDW Finance (Electronic Equipment, Instruments & Components), Callable 6/1/24 @ 100.00 | | | 5.50 | | | | 12/1/24 | | | | 1,636 | |
| | 1,858 | | | Centene Corp. (Health Care Providers & Services), Callable 1/15/20 @ 103.56 | | | 4.75 | | | | 1/15/25 | | | | 1,849 | |
| | 506 | | | Centene Escrow I Corp. (Health Care Providers & Services),
Callable 6/1/21 @ 104.03 (a) | | | 5.38 | | | | 6/1/26 | | | | 513 | |
| | 1,064 | | | Central Garden & Pet Co. (Household Products), Callable 1/1/23 @ 102.56 | | | 5.13 | | | | 2/1/28 | | | | 984 | |
| | 1,282 | | | Century Communities, Inc. (Household Durables), Callable 7/15/20 @ 104.41 | | | 5.88 | | | | 7/15/25 | | | | 1,211 | |
| | 1,119 | | | CenturyLink, Inc. (Diversified Telecommunication Services),
Callable 1/1/25 @ 100.00^ | | | 5.63 | | | | 4/1/25 | | | | 1,057 | |
| | 3,919 | | | CenturyLink, Inc., Series T (Diversified Telecommunication Services) | | | 5.80 | | | | 3/15/22 | | | | 3,880 | |
| | 189 | | | CenturyLink, Inc. (Diversified Telecommunication Services) | | | 6.45 | | | | 6/15/21 | | | | 194 | |
| | 1,079 | | | CenturyLink, Inc., Series G (Diversified Telecommunication Services) | | | 6.88 | | | | 1/15/28 | | | | 993 | |
| | 2,299 | | | Cheniere Corp. Christi HD (Oil, Gas & Consumable Fuels),
Callable 10/2/24 @ 100.00 | | | 5.88 | | | | 3/31/25 | | | | 2,391 | |
| | 300 | | | Cheniere Corp. Christi HD (Oil, Gas & Consumable Fuels),
Callable 1/1/24 @ 100.00 | | | 7.00 | | | | 6/30/24 | | | | 327 | |
| | 2,466 | | | CHS/Community Health Systems, Inc. (Health Care Providers & Services),
Callable 3/31/20 @ 103.13 | | | 6.25 | | | | 3/31/23 | | | | 2,256 | |
| | 734 | | | CIT Group, Inc. (Banks) | | | 6.13 | | | | 3/9/28 | | | | 754 | |
| | 1,096 | | | Commercial Metals Co. (Metals & Mining), Callable 2/15/23 @ 100.00 | | | 4.88 | | | | 5/15/23 | | | | 1,072 | |
| | 2,170 | | | Commercial Metals Co. (Consumer Finance), Callable 4/15/21 @ 102.88 (a) | | | 5.75 | | | | 4/15/26 | | | | 2,095 | |
| | 1,268 | | | Commscope Tech LLC (Communications Equipment),
Callable 3/15/22 @ 102.50 | | | 5.00 | | | | 3/15/27 | | | | 1,194 | |
| | 350 | | | CommScope, Inc. (Communications Equipment), Callable 6/15/19 @ 102.75 (a) | | | 5.50 | | | | 6/15/24 | | | | 352 | |
| | 1,564 | | | CoreCivic, Inc. (Equity Real Estate Investment Trusts),
Callable 7/15/27 @ 100.00 | | | 4.75 | | | | 10/15/27 | | | | 1,419 | |
| | 261 | | | Corrections Corp. of America (Equity Real Estate Investment Trusts),
Callable 2/1/23 @ 100.00 | | | 4.63 | | | | 5/1/23 | | | | 253 | |
| | 659 | | | Corrections Corp. of America (Equity Real Estate Investment Trusts),
Callable 7/15/22 @ 100.00 | | | 5.00 | | | | 10/15/22 | | | | 659 | |
| | 45 | | | Credit Acceptance Corp. (Consumer Finance), Callable 8/3/18 @ 101.53 | | | 6.13 | | | | 2/15/21 | | | | 45 | |
| | 1,705 | | | Credit Acceptance Corp. (Consumer Finance), Callable 8/3/18 @ 105.53 | | | 7.38 | | | | 3/15/23 | | | | 1,760 | |
| | 1,398 | | | Crown Americas LLC/Crown Americas Capital Corp. VI (Containers & Packaging), Callable 2/1/21 @ 103.56 (a) | | | 4.75 | | | | 2/1/26 | | | | 1,328 | |
| | 6,979 | | | CSC Holdings LLC (Media) | | | 5.25 | | | | 6/1/24 | | | | 6,596 | |
| | 854 | | | Cumberland Farms, Inc. (Food & Staples Retailing), Callable 5/1/20 @ 105.06 (a) | | | 6.75 | | | | 5/1/25 | | | | 865 | |
| | 1,603 | | | CVR Partners/CVR Nitrogen (Chemicals), Callable 6/15/19 @ 104.63 (a) | | | 9.25 | | | | 6/15/23 | | | | 1,651 | |
| | 1,499 | | | CyrusOne LP/CyrusOne Finance Corp. (Equity Real Estate Investment Trusts), Callable 3/15/20 @ 102.50 | | | 5.00 | | | | 3/15/24 | | | | 1,499 | |
| | 477 | | | CyrusOne LP/CyrusOne Finance Corp. (Equity Real Estate Investment Trusts), Callable 3/15/22 @ 102.69 | | | 5.38 | | | | 3/15/27 | | | | 473 | |
See accompanying notes to financial statements.
187
HC CAPITAL TRUST
The Fixed Income Opportunity Portfolio
Portfolio of Investments (continued) — June 30, 2018
| | | | | | | | | | | | | | | | |
Principal
Amount
(000) | | | Security Description | | Rate % | | | Maturity
Date | | | Value
(000) | |
| | | | Corporate Bonds (continued) | | | | | | | | | | | | |
| $ | 1,338 | | | Delek Logistics Partners LP/Delek Logistics Finance Corp. (Oil, Gas & Consumable Fuels), Callable 5/15/20 @ 105.06 | | | 6.75 | | | | 5/15/25 | | | $ | 1,338 | |
| | 309 | | | Diamond 1 Finance/Diamond 2 (Technology Hardware, Storage & Peripherals), Callable 7/19/18 @ 102.94 (a) | | | 5.88 | | | | 6/15/21 | | | | 313 | |
| | 2,465 | | | Diamond 1 Finance/Diamond 2 (Technology Hardware, Storage & Peripherals), Callable 6/15/19 @ 105.34 (a) | | | 7.13 | | | | 6/15/24 | | | | 2,612 | |
| | 1,912 | | | Diebold Nixdorf, Inc. (Technology Hardware, Storage & Peripherals),
Callable 4/15/19 @ 106.38 | | | 8.50 | | | | 4/15/24 | | | | 1,831 | |
| | 3,348 | | | DISH DBS Corp. (Media) | | | 5.88 | | | | 7/15/22 | | | | 3,148 | |
| | 2,671 | | | DISH DBS Corp. (Media) | | | 6.75 | | | | 6/1/21 | | | | 2,675 | |
| | 887 | | | Downstream Development Authority of the Quapaw Tribe of Oklahoma (Hotels, Restaurants & Leisure), Callable 2/15/20 @ 105.25 (a) | | | 10.50 | | | | 2/15/23 | | | | 905 | |
| | 699 | | | Dynegy, Inc. (Independent Power & Renewable Electricity Producers),
Callable 8/3/18 @ 102.94 | | | 5.88 | | | | 6/1/23 | | | | 719 | |
| | 1,419 | | | EMC Corp. (Technology Hardware, Storage & Peripherals),
Callable 3/1/23 @ 100.00 | | | 3.38 | | | | 6/1/23 | | | | 1,327 | |
| | 1,384 | | | Endeavor Energy Resources LP/EER Finance, Inc. (Oil, Gas & Consumable Fuels), Callable 1/30/23 @ 102.88 (a) | | | 5.75 | | | | 1/30/28 | | | | 1,349 | |
| | 242 | | | Energizer Gamma Acquisition, Inc. (Household Products),
Callable 7/15/21 @ 103.19 (a) | | | 6.38 | | | | 7/15/26 | | | | 246 | |
| | 371 | | | Energizer Holdings, Inc. (Household Products), Callable 6/15/20 @ 102.75 (a) | | | 5.50 | | | | 6/15/25 | | | | 365 | |
| | 1,721 | | | Energy Transfer Equity (Oil, Gas & Consumable Fuels),
Callable 3/1/27 @ 100.00 | | | 5.50 | | | | 6/1/27 | | | | 1,721 | |
| | 355 | | | Envision Healthcare Corp. (Health Care Providers & Services),
Callable 7/16/18 @ 102.56 (a) | | | 5.13 | | | | 7/1/22 | | | | 358 | |
| | 1,101 | | | Envision Healthcare Corp. (Health Care Providers & Services),
Callable 8/3/18 @ 102.81 | | | 5.63 | | | | 7/15/22 | | | | 1,120 | |
| | 601 | | | Equinix, Inc. (Equity Real Estate Investment Trusts), Callable 5/15/22 @ 102.69 | | | 5.38 | | | | 5/15/27 | | | | 599 | |
| | 2,564 | | | ESH Hospitality, Inc. (Hotels, Restaurants & Leisure),
Callable 5/1/20 @ 102.63 (a) | | | 5.25 | | | | 5/1/25 | | | | 2,474 | |
| | 362 | | | Exterran Energy Solutions LP/EES Finance Corp. (Energy Equipment & Services), Callable 5/1/20 @ 106.09 | | | 8.13 | | | | 5/1/25 | | | | 382 | |
| | 2,123 | | | Extraction Oil & Gas, Inc. (Oil, Gas & Consumable Fuels),
Callable 2/1/21 @ 104.22 | | | 5.63 | | | | 2/1/26 | | | | 2,033 | |
| | 395 | | | Extraction Oil & Gas, Inc. (Oil, Gas & Consumable Fuels),
Callable 5/15/20 @ 103.69 (a) | | | 7.38 | | | | 5/15/24 | | | | 414 | |
| | 2,342 | | | First Data Corp. (IT Services), Callable 1/15/19 @ 102.50 (a) | | | 5.00 | | | | 1/15/24 | | | | 2,324 | |
| | 1,101 | | | First Data Corp. (IT Services), Callable 8/15/18 @ 102.69 (a) | | | 5.38 | | | | 8/15/23 | | | | 1,111 | |
| | 592 | | | First Data Corp. (IT Services), Callable 12/1/18 @ 103.50 | | | 7.00 | | | | 12/1/23 | | | | 617 | |
| | 1,675 | | | First Quality Finance Co., Inc. (Personal Products), Callable 7/1/20 @ 103.75 (a) | | | 5.00 | | | | 7/1/25 | | | | 1,533 | |
| | 3,176 | | | Freeport-McMoRan, Inc. (Metals & Mining), Callable 12/1/21 @ 100.00 | | | 3.55 | | | | 3/1/22 | | | | 3,018 | |
| | 696 | | | Frontier Communications Corp. (Diversified Telecommunication Services) | | | 7.13 | | | | 1/15/23 | | | | 513 | |
| | 1,696 | | | Frontier Communications Corp. (Diversified Telecommunication Services) ^ | | | 8.50 | | | | 4/15/20 | | | | 1,733 | |
| | 1,383 | | | Frontier Communications Corp. (Diversified Telecommunication Services),
Callable 4/1/21 @ 106.38 (a) | | | 8.50 | | | | 4/1/26 | | | | 1,335 | |
| | 1,065 | | | Frontier Communications Corp. (Diversified Telecommunication Services),
Callable 6/15/22 @ 100.00 | | | 10.50 | | | | 9/15/22 | | | | 966 | |
| | 163 | | | GCI, Inc. (Diversified Telecommunication Services), Callable 8/3/18 @ 101.13 | | | 6.75 | | | | 6/1/21 | | | | 165 | |
| | 371 | | | Genesis Energy LP (Oil, Gas & Consumable Fuels), Callable 8/3/18 @ 104.50 | | | 6.00 | | | | 5/15/23 | | | | 364 | |
| | 1,472 | | | Genesis Energy LP (Oil, Gas & Consumable Fuels), Callable 8/3/18 @ 103.38 | | | 6.75 | | | | 8/1/22 | | | | 1,487 | |
| | 1,399 | | | Genesis Energy LP/Genesis Energy Finance Corp. (Oil, Gas & Consumable Fuels), Callable 2/15/21 @ 104.69 | | | 6.25 | | | | 5/15/26 | | | | 1,319 | |
| | 2,351 | | | GenOn Energy, Inc. (Independent Power & Renewable Electricity Producers), Callable 8/3/18 @ 101.65 ^(e)(f) | | | 9.88 | | | | 10/15/20 | | | | 2,139 | |
| | 575 | | | GLP Capital LP (Equity Real Estate Investment Trusts) | | | 5.25 | | | | 6/1/25 | | | | 575 | |
| | 610 | | | GLP Capital LP (Equity Real Estate Investment Trusts),
Callable 8/1/23 @ 100.00 | | | 5.38 | | | | 11/1/23 | | | | 623 | |
| | 2,480 | | | GLP Capital LP (Equity Real Estate Investment Trusts) | | | 5.38 | | | | 4/15/26 | | | | 2,456 | |
See accompanying notes to financial statements.
188
HC CAPITAL TRUST
The Fixed Income Opportunity Portfolio
Portfolio of Investments (continued) — June 30, 2018
| | | | | | | | | | | | | | | | |
Principal
Amount
(000) | | | Security Description | | Rate % | | | Maturity
Date | | | Value
(000) | |
| | | | Corporate Bonds (continued) | | | | | | | | | | | | |
| $ | 1,007 | | | GLP Capital LP (Equity Real Estate Investment Trusts) | | | 5.75 | | | | 6/1/28 | | | $ | 1,015 | |
| | 1,102 | | | GMAC, Inc. (Consumer Finance) | | | 8.00 | | | | 11/1/31 | | | | 1,311 | |
| | 679 | | | Goldman Sachs Group, Inc., Series P (Capital Markets),
Callable 11/10/22 @ 100.00, Perpetual Bond(d) | |
| 5.00 (US0003M
+ 287.40 bps)(b) |
| | | 12/31/49 | | | | 637 | |
| | 1,116 | | | Graham Holdings Co. (Diversified Consumer Services),
Callable 6/1/21 @ 104.31 (a) | | | 5.75 | | | | 6/1/26 | | | | 1,127 | |
| | 1,093 | | | Gray Television, Inc. (Media), Callable 10/15/19 @ 103.84 (a) | | | 5.13 | | | | 10/15/24 | | | | 1,044 | |
| | 3,253 | | | Gulfport Energy Corp. (Oil, Gas & Consumable Fuels),
Callable 5/15/20 @ 104.78 | | | 6.38 | | | | 5/15/25 | | | | 3,163 | |
| | 936 | | | H&E Equipment Services, Inc. (Trading Companies & Distributors),
Callable 9/1/20 @ 104.22 | | | 5.63 | | | | 9/1/25 | | | | 920 | |
| | 1,304 | | | Hanesbrands, Inc. (Textiles, Apparel & Luxury Goods),
Callable 2/15/24 @ 100.00 (a) | | | 4.63 | | | | 5/15/24 | | | | 1,271 | |
| | 77 | | | Harland Clarke Holdings Corp. (Commercial Services & Supplies),
Callable 2/15/19 @ 104.19 (a) | | | 8.38 | | | | 8/15/22 | | | | 75 | |
| | 4,659 | | | HCA Holdings, Inc. (Health Care Providers & Services),
Callable 8/15/25 @ 100.00 | | | 5.88 | | | | 2/15/26 | | | | 4,699 | |
| | 1,768 | | | HCA, Inc. (Health Care Providers & Services) | | | 5.38 | | | | 2/1/25 | | | | 1,741 | |
| | 601 | | | HCA, Inc. (Health Care Providers & Services) | | | 5.88 | | | | 5/1/23 | | | | 624 | |
| | 2,113 | | | HealthSouth Corp. (Health Care Providers & Services), Callable 8/3/18 @ 102.88 | | | 5.75 | | | | 11/1/24 | | | | 2,114 | |
| | 1,097 | | | Hertz Corp. (Road & Rail), Callable 8/3/18 @ 101.47 | | | 5.88 | | | | 10/15/20 | | | | 1,072 | |
| | 1,016 | | | Hertz Corp. (The) (Road & Rail), Callable 6/1/19 @ 103.81 | | | 7.63 | | | | 6/1/22 | | | | 975 | |
| | 849 | | | Hilcorp Energy Corp. (Oil, Gas & Consumable Fuels),
Callable 4/1/20 @ 102.88 (a) | | | 5.75 | | | | 10/1/25 | | | | 847 | |
| | 1,448 | | | Hilton Domestic Operating Co., Inc. (Hotels, Restaurants & Leisure),
Callable 5/1/21 @ 102.56 (a) | | | 5.13 | | | | 5/1/26 | | | | 1,423 | |
| | 2,179 | | | Ingles Markets, Inc. (Food & Staples Retailing), Callable 8/3/18 @ 102.88 | | | 5.75 | | | | 6/15/23 | | | | 2,146 | |
| | 402 | | | J2 Cloud Services LLC/J2 Global Co-Obligor, Inc. (Internet Software & Services), Callable 7/15/20 @ 104.50 (a) | | | 6.00 | | | | 7/15/25 | | | | 407 | |
| | 739 | | | Jagged Peak Energy LLC (Oil, Gas & Consumable Fuels),
Callable 5/1/21 @ 102.94 (a) | | | 5.88 | | | | 5/1/26 | | | | 724 | |
| | 1,400 | | | JB Poindexter & Co., Inc. (Machinery), Callable 4/15/21 @ 105.34 (a) | | | 7.13 | | | | 4/15/26 | | | | 1,434 | |
| | 693 | | | JBS USA LLC/JBS USA Finance, Inc. (Food Products),
Callable 7/15/19 @ 102.94 (a) | | | 5.88 | | | | 7/15/24 | | | | 662 | |
| | 1,024 | | | JBS USA LLC/JBS USA Finance, Inc. (Food Products),
Callable 8/3/18 @ 101.21 (a) | | | 7.25 | | | | 6/1/21 | | | | 1,034 | |
| | 393 | | | JBS USA LLC/JBS USA Finance, Inc. (Food Products),
Callable 8/3/18 @ 101.21 (a) | | | 7.25 | | | | 6/1/21 | | | | 397 | |
| | 244 | | | JC Penney Corp., Inc. (Multiline Retail) ^ | | | 8.13 | | | | 10/1/19 | | | | 252 | |
| | 1,855 | | | JPMorgan Chase & Co. (Banks), Callable 5/1/20 @ 100.00, Perpetual Bond (d) | |
| 5.30 (US0003M
+ 380.00 bps)(b) |
| | | 12/31/49 | | | | 1,889 | |
| | 211 | | | Kaiser Aluminum Corp. (Metals & Mining), Callable 5/15/19 @ 104.41 | | | 5.88 | | | | 5/15/24 | | | | 215 | |
| | 1,266 | | | KFC HLD/Pizza Hut/Taco (Hotels, Restaurants & Leisure),
Callable 6/1/19 @ 103.75 (a) | | | 5.00 | | | | 6/1/24 | | | | 1,250 | |
| | 872 | | | Lennar Corp. (Household Durables), Callable 10/15/21 @ 100.00 | | | 4.13 | | | | 1/15/22 | | | | 863 | |
| | 948 | | | Lennar Corp. (Household Durables), Callable 5/29/27 @ 100.00 | | | 4.75 | | | | 11/29/27 | | | | 886 | |
| | 1,047 | | | Lennar Corp. (Household Durables), Callable 2/28/25 @ 100.00 | | | 4.75 | | | | 5/30/25 | | | | 1,013 | |
| | 400 | | | Lennar Corp. (Household Durables), Callable 9/15/23 @ 100.00 | | | 4.88 | | | | 12/15/23 | | | | 399 | |
| | 1,223 | | | Lennar Corp. (Household Durables) | | | 5.38 | | | | 10/1/22 | | | | 1,248 | |
| | 190 | | | Lennar Corp. (Household Durables), Callable 5/15/24 @ 100.00 | | | 5.88 | | | | 11/15/24 | | | | 196 | |
| | 873 | | | Level 3 Financing, Inc. (Diversified Telecommunication Services),
Callable 8/3/18 @ 102.81 | | | 5.63 | | | | 2/1/23 | | | | 873 | |
| | 597 | | | Live Nation Entertainment, Inc. (Media), Callable 11/1/19 @ 103.66 (a) | | | 4.88 | | | | 11/1/24 | | | | 578 | |
| | 445 | | | Live Nation Entertainment, Inc. (Media), Callable 3/15/21 @ 104.22 (a) | | | 5.63 | | | | 3/15/26 | | | | 442 | |
| | 2,650 | | | Lockheed Martin Corp. (Aerospace & Defense) (a) | |
| 9.26 (LIBOR01M
+ 721.75 bps)(b) |
| | | 9/15/20 | | | | 2,687 | |
| | 1,500 | | | Louisiana-Pacific Corp. (Paper & Forest Products), Callable 9/15/19 @ 103.66 | | | 4.88 | | | | 9/15/24 | | | | 1,474 | |
See accompanying notes to financial statements.
189
HC CAPITAL TRUST
The Fixed Income Opportunity Portfolio
Portfolio of Investments (continued) — June 30, 2018
| | | | | | | | | | | | | | | | |
Principal
Amount
(000) | | | Security Description | | Rate % | | | Maturity
Date | | | Value
(000) | |
| | | | Corporate Bonds (continued) | | | | | | | | | | | | |
| $ | 1,652 | | | LSC Communications, Inc. (Commercial Services & Supplies),
Callable 10/15/19 @ 106.56 (a) | | | 8.75 | | | | 10/15/23 | | | $ | 1,619 | |
| | 399 | | | M/I Homes, Inc. (Household Durables), Callable 8/1/20 @ 104.22 | | | 5.63 | | | | 8/1/25 | | | | 373 | |
| | 1,006 | | | M/I Homes, Inc. (Household Durables), Callable 7/19/18 @ 103.38 | | | 6.75 | | | | 1/15/21 | | | | 1,037 | |
| | 394 | | | Match Group, Inc. (Internet Software & Services),
Callable 12/15/22 @ 102.50 (a) | | | 5.00 | | | | 12/15/27 | | | | 366 | |
| | 2,224 | | | Mattel, Inc. (Leisure Products), Callable 12/31/20 @ 105.06 (a) | | | 6.75 | | | | 12/31/25 | | | | 2,166 | |
| | 1,154 | | | Meredith Corp. (Media), Callable 2/1/21 @ 103.44 (a) | | | 6.88 | | | | 2/1/26 | | | | 1,138 | |
| | 1,080 | | | Meritage Homes Corp. (Household Durables) | | | 7.15 | | | | 4/15/20 | | | | 1,139 | |
| | 1,933 | | | MetLife, Inc., Series C (Insurance), Callable 6/15/20 @ 100.00,
Perpetual Bond (d) | |
| 5.25 (US0003M +
357.50 bps)(b) |
| | | 12/31/49 | | | | 1,966 | |
| | 1,483 | | | MGIC Investment Corp. (Thrifts & Mortgage Finance) | | | 5.75 | | | | 8/15/23 | | | | 1,513 | |
| | 707 | | | MGM Growth/MGM Finance (Hotels, Restaurants & Leisure),
Callable 2/1/24 @ 100.00 | | | 5.63 | | | | 5/1/24 | | | | 716 | |
| | 2,900 | | | MGM Resorts International (Hotels, Restaurants & Leisure) | | | 6.00 | | | | 3/15/23 | | | | 2,988 | |
| | 1,850 | | | Multi-Color Corp. (Commercial Services & Supplies),
Callable 11/1/20 @ 102.44 (a) | | | 4.88 | | | | 11/1/25 | | | | 1,723 | |
| | 1,425 | | | Multi-Color Corp. (Commercial Services & Supplies),
Callable 8/3/18 @ 104.59 (a) | | | 6.13 | | | | 12/1/22 | | | | 1,457 | |
| | 2,249 | | | Murphy Oil USA, Inc. (Specialty Retail), Callable 5/1/22 @ 102.81 | | | 5.63 | | | | 5/1/27 | | | | 2,198 | |
| | 548 | | | Navient Corp. (Consumer Finance) | | | 6.50 | | | | 6/15/22 | | | | 561 | |
| | 1,927 | | | Navient Corp., MTN (Consumer Finance) | | | 7.25 | | | | 1/25/22 | | | | 2,016 | |
| | 1,069 | | | Navient Corp. (Consumer Finance) | | | 7.25 | | | | 9/25/23 | | | | 1,120 | |
| | 578 | | | NCR Corp. (Technology Hardware, Storage & Peripherals),
Callable 8/3/18 @ 101.16 | | | 4.63 | | | | 2/15/21 | | | | 574 | |
| | 1,279 | | | NCR Corp. (Technology Hardware, Storage & Peripherals),
Callable 8/3/18 @ 102.94 | | | 5.88 | | | | 12/15/21 | | | | 1,298 | |
| | 1,377 | | | Netflix, Inc. (Internet & Direct Marketing Retail) (a) | | | 4.88 | | | | 4/15/28 | | | | 1,312 | |
| | 497 | | | Netflix, Inc. (Internet & Direct Marketing Retail) | | | 5.88 | | | | 2/15/25 | | | | 510 | |
| | 949 | | | New Amethyst Corp. (Health Care Providers & Services),
Callable 12/1/19 @ 104.69 (a) | | | 6.25 | | | | 12/1/24 | | | | 1,011 | |
| | 1,631 | | | New Enterprise Stone & Lime Co., Inc. (Construction Materials),
Callable 3/15/21 @ 103.13 (a) | | | 6.25 | | | | 3/15/26 | | | | 1,647 | |
| | 966 | | | New Home Co., Inc. (The) (Household Durables), Callable 10/1/19 @ 103.63 | | | 7.25 | | | | 4/1/22 | | | | 994 | |
| | 237 | | | Nexstar Escrow Corp. (Media), Callable 8/1/19 @ 104.22 (a) | | | 5.63 | | | | 8/1/24 | | | | 228 | |
| | 1,110 | | | NGL Energy Partners LP/NGL Energy Finance Corp. (Oil, Gas & Consumable Fuels), Callable 3/1/20 @ 104.59 | | | 6.13 | | | | 3/1/25 | | | | 1,049 | |
| | 1,392 | | | NGL Energy Partners LP/NGL Energy Finance Corp. (Oil, Gas & Consumable Fuels), Callable 8/3/18 @ 103.44 | | | 6.88 | | | | 10/15/21 | | | | 1,409 | |
| | 660 | | | NGL Energy Partners LP/NGL Energy Finance Corp. (Oil, Gas & Consumable Fuels), Callable 11/1/19 @ 103.75 | | | 7.50 | | | | 11/1/23 | | | | 667 | |
| | 1,509 | | | NGPL PipeCo LLC (Oil, Gas & Consumable Fuels) (a) | | | 7.77 | | | | 12/15/37 | | | | 1,773 | |
| | 1,755 | | | Novelis Corp. (Metals & Mining), Callable 9/30/21 @ 102.94 (a) | | | 5.88 | | | | 9/30/26 | | | | 1,680 | |
| | 431 | | | Novelis Corp. (Metals & Mining), Callable 8/15/19 @ 104.69 (a) | | | 6.25 | | | | 8/15/24 | | | | 431 | |
| | 436 | | | NRG Energy, Inc. (Independent Power & Renewable Electricity Producers), Callable 1/15/23 @ 102.88 (a) | | | 5.75 | | | | 1/15/28 | | | | 428 | |
| | 1,122 | | | NRG Energy, Inc. (Independent Power & Renewable Electricity Producers), Callable 8/3/18 @ 103.13 | | | 6.25 | | | | 7/15/22 | | | | 1,155 | |
| | 1,032 | | | NRG Energy, Inc. (Independent Power & Renewable Electricity Producers), Callable 5/15/21 @ 103.63 | | | 7.25 | | | | 5/15/26 | | | | 1,099 | |
| | 1,457 | | | Oasis Petroleum, Inc. (Oil, Gas & Consumable Fuels),
Callable 5/1/21 @ 103.13 (a) | | | 6.25 | | | | 5/1/26 | | | | 1,472 | |
| | 803 | | | Olin Corp. (Chemicals), Callable 2/1/24 @ 102.50 | | | 5.00 | | | | 2/1/30 | | | | 761 | |
| | 453 | | | Owens-Brockway Glass Container, Inc. (Containers & Packaging) | | | 5.88 | | | | 8/15/23 | | | | 458 | |
| | 968 | | | PDC Energy, Inc. (Oil, Gas & Consumable Fuels), Callable 5/15/21 @ 104.31 (a) | | | 5.75 | | | | 5/15/26 | | | | 968 | |
| | 2,362 | | | PDC Energy, Inc. (Oil, Gas & Consumable Fuels), Callable 9/15/19 @ 104.59 | | | 6.13 | | | | 9/15/24 | | | | 2,409 | |
| | 1,205 | | | Peabody Finance Corp. (Oil, Gas & Consumable Fuels),
Callable 3/31/19 @ 103.00 (a) | | | 6.00 | | | | 3/31/22 | | | | 1,220 | |
See accompanying notes to financial statements.
190
HC CAPITAL TRUST
The Fixed Income Opportunity Portfolio
Portfolio of Investments (continued) — June 30, 2018
| | | | | | | | | | | | | | | | |
Principal
Amount
(000) | | | Security Description | | Rate % | | | Maturity
Date | | | Value
(000) | |
| | | | Corporate Bonds (continued) | | | | | | | | | | | | |
| $ | 1,991 | | | Peabody Finance Corp. (Oil, Gas & Consumable Fuels),
Callable 3/31/20 @ 104.78 (a) | | | 6.38 | | | | 3/31/25 | | | $ | 2,046 | |
| | 1,463 | | | Penske Automotive Group (Specialty Retail), Callable 12/1/19 @ 102.69 | | | 5.38 | | | | 12/1/24 | | | | 1,437 | |
| | 1,705 | | | Performance Food Group, Inc. (Food & Staples Retailing),
Callable 6/1/19 @ 102.75 (a) | | | 5.50 | | | | 6/1/24 | | | | 1,684 | |
| | 1,397 | | | Pilgrim’s Pride Corp. (Food Products), Callable 3/15/20 @ 102.88 (a) | | | 5.75 | | | | 3/15/25 | | | | 1,341 | |
| | 138 | | | Pilgrim’s Pride Corp. (Food Products), Callable 9/30/22 @ 102.94 (a) | | | 5.88 | | | | 9/30/27 | | | | 128 | |
| | 2,027 | | | Plastipak Holdings, Inc. (Containers & Packaging),
Callable 10/15/20 @ 103.13 (a) | | | 6.25 | | | | 10/15/25 | | | | 1,865 | |
| | 1,905 | | | Post Holdings, Inc. (Food Products), Callable 8/15/21 @ 102.50 (a) | | | 5.00 | | | | 8/15/26 | | | | 1,776 | |
| | 1,101 | | | Post Holdings, Inc. (Food Products), Callable 12/1/22 @ 102.81 (a) | | | 5.63 | | | | 1/15/28 | | | | 1,032 | |
| | 698 | | | PulteGroup, Inc. (Household Durables), Callable 12/1/25 @ 100.00 | | | 5.50 | | | | 3/1/26 | | | | 691 | |
| | 1,076 | | | QEP Resources, Inc. (Oil, Gas & Consumable Fuels), Callable 7/1/22 @ 100.00 | | | 5.38 | | | | 10/1/22 | | | | 1,095 | |
| | 413 | | | QEP Resources, Inc. (Oil, Gas & Consumable Fuels), Callable 12/1/25 @ 100.00 | | | 5.63 | | | | 3/1/26 | | | | 394 | |
| | 1,570 | | | QEP Resources, Inc. (Oil, Gas & Consumable Fuels) | | | 6.80 | | | | 3/1/20 | | | | 1,641 | |
| | 1,877 | | | Quad Graphics, Inc. (Commercial Services & Supplies) | | | 7.00 | | | | 5/1/22 | | | | 1,915 | |
| | 1,377 | | | QualityTech, LP/QTS Finance Corp. (Internet Software & Services),
Callable 11/15/20 @ 103.56 (a) | | | 4.75 | | | | 11/15/25 | | | | 1,289 | |
| | 2,056 | | | Quicken Loans, Inc. (Thrifts & Mortgage Finance),
Callable 1/15/23 @ 102.63 (a) | | | 5.25 | | | | 1/15/28 | | | | 1,895 | |
| | 907 | | | Quicken Loans, Inc. (Thrifts & Mortgage Finance), Callable 5/1/20 @ 102.88 (a) | | | 5.75 | | | | 5/1/25 | | | | 888 | |
| | 684 | | | Quintiles IMS, Inc. (Health Care Technology), Callable 10/15/21 @ 102.50 (a) | | | 5.00 | | | | 10/15/26 | | | | 666 | |
| | 143 | | | Quintiles Transnational (Life Sciences Tools & Services),
Callable 8/3/18 @ 103.66 (a) | | | 4.88 | | | | 5/15/23 | | | | 144 | |
| | 1,128 | | | Radian Group, Inc. (Thrifts & Mortgage Finance), Callable 7/1/24 @ 100.00 | | | 4.50 | | | | 10/1/24 | | | | 1,089 | |
| | 1,018 | | | Range Resources Corp. (Oil, Gas & Consumable Fuels),
Callable 2/15/25 @ 100.00 ^ | | | 4.88 | | | | 5/15/25 | | | | 954 | |
| | 386 | | | Range Resources Corp. (Oil, Gas & Consumable Fuels),
Callable 12/15/22 @ 100.00 | | | 5.00 | | | | 3/15/23 | | | | 375 | |
| | 1,345 | | | Range Resources Corp. (Oil, Gas & Consumable Fuels),
Callable 5/15/22 @ 100.00 | | | 5.00 | | | | 8/15/22 | | | | 1,332 | |
| | 2 | | | Range Resources Corp. (Oil, Gas & Consumable Fuels),
Callable 3/1/21 @ 100.00 | | | 5.75 | | | | 6/1/21 | | | | 2 | |
| | 953 | | | Realogy Group LLC/Realogy Co-Issuer Corp. (Real Estate Management & Development), Callable 3/1/23 @ 100.00 (a) | | | 4.88 | | | | 6/1/23 | | | | 896 | |
| | 4,831 | | | Rite Aid Corp. (Food & Staples Retailing), Callable 8/3/18 @ 104.59 (a) | | | 6.13 | | | | 4/1/23 | | | | 4,899 | |
| | 1,748 | | | Rose Rock Midstream LP (Oil, Gas & Consumable Fuels),
Callable 5/15/19 @ 102.81 | | | 5.63 | | | | 11/15/23 | | | | 1,647 | |
| | 614 | | | Sabre Holdings Corp. (IT Services), Callable 11/15/18 @ 103.94 (a) | | | 5.25 | | | | 11/15/23 | | | | 618 | |
| | 1,146 | | | Sabre Holdings Corp. (IT Services), Callable 8/3/18 @ 104.03 (a) | | | 5.38 | | | | 4/15/23 | | | | 1,157 | |
| | 814 | | | Scotts Miracle-GRO Co. (Chemicals), Callable 12/15/21 @ 102.63 | | | 5.25 | | | | 12/15/26 | | | | 779 | |
| | 2,065 | | | Select Medical Corp. (Health Care Providers & Services),
Callable 8/3/18 @ 101.59 | | | 6.38 | | | | 6/1/21 | | | | 2,093 | |
| | 1,023 | | | Service Corp. International (Diversified Consumer Services),
Callable 5/15/19 @ 102.69 | | | 5.38 | | | | 5/15/24 | | | | 1,046 | |
| | 2,024 | | | Service Master Co. LLC (Diversified Consumer Services),
Callable 11/15/19 @ 103.84 (a) | | | 5.13 | | | | 11/15/24 | | | | 1,964 | |
| | 819 | | | Sirius XM Radio, Inc. (Media), Callable 4/15/20 @ 102.69 | | | 5.38 | | | | 4/15/25 | | | | 808 | |
| | 592 | | | Sirius XM Radio, Inc. (Media), Callable 7/15/21 @ 102.69 | | | 5.38 | | | | 7/15/26 | | | | 570 | |
| | 460 | | | Sonic Automotive, Inc. (Specialty Retail), Callable 8/3/18 @ 102.50 | | | 5.00 | | | | 5/15/23 | | | | 439 | |
| | 1,109 | | | Sonic Automotive, Inc. (Specialty Retail), Callable 3/15/22 @ 103.06 | | | 6.13 | | | | 3/15/27 | | | | 1,048 | |
| | 2,929 | | | Southwestern Energy Co. (Oil, Gas & Consumable Fuels),
Callable 10/23/24 @ 100.00 ^ | | | 6.70 | | | | 1/23/25 | | | | 2,867 | |
| | 1,866 | | | Southwestern Energy Co. (Oil, Gas & Consumable Fuels),
Callable 4/1/21 @ 105.63 | | | 7.50 | | | | 4/1/26 | | | | 1,931 | |
| | 198 | | | Spectrum Brands, Inc. (Household Products), Callable 12/15/19 @ 103.06 | | | 6.13 | | | | 12/15/24 | | | | 200 | |
| | 1,413 | | | Springleaf Finance Corp. (Consumer Finance) | | | 5.63 | | | | 3/15/23 | | | | 1,406 | |
See accompanying notes to financial statements.
191
HC CAPITAL TRUST
The Fixed Income Opportunity Portfolio
Portfolio of Investments (continued) — June 30, 2018
| | | | | | | | | | | | | | | | |
Principal
Amount
(000) | | | Security Description | | Rate % | | | Maturity
Date | | | Value
(000) | |
| | | | Corporate Bonds (continued) | | | | | | | | | | | | |
| $ | 891 | | | Springleaf Finance Corp. (Consumer Finance) | | | 6.88 | | | | 3/15/25 | | | $ | 884 | |
| | 764 | | | Springleaf Finance Corp. (Consumer Finance) | | | 7.13 | | | | 3/15/26 | | | | 760 | |
| | 1,953 | | | Sprint Capital Corp. (Wireless Telecommunication Services) | | | 6.88 | | | | 11/15/28 | | | | 1,875 | |
| | 4,062 | | | Sprint Corp. (Wireless Telecommunication Services) | | | 7.13 | | | | 6/15/24 | | | | 4,101 | |
| | 678 | | | Sprint Corp. (Wireless Telecommunication Services), Callable 11/1/25 @ 100.00 | | | 7.63 | | | | 3/1/26 | | | | 691 | |
| | 487 | | | Sprint Corp. (Wireless Telecommunication Services),
Callable 11/15/24 @ 100.00 | | | 7.63 | | | | 2/15/25 | | | | 499 | |
| | 595 | | | Sprint Nextel Corp. (Wireless Telecommunication Services) | | | 11.50 | | | | 11/15/21 | | | | 702 | |
| | 3,299 | | | Staples, Inc. (Specialty Retail), Callable 9/15/20 @ 104.25 (a) | | | 8.50 | | | | 9/15/25 | | | | 3,077 | |
| | 885 | | | Steel Dynamics, Inc. (Metals & Mining), Callable 9/15/20 @ 102.06 | | | 4.13 | | | | 9/15/25 | | | | 848 | |
| | 430 | | | Steel Dynamics, Inc. (Metals & Mining), Callable 12/15/21 @ 102.50 | | | 5.00 | | | | 12/15/26 | | | | 430 | |
| | 356 | | | Steel Dynamics, Inc. (Metals & Mining), Callable 8/3/18 @ 102.63 | | | 5.25 | | | | 4/15/23 | | | | 359 | |
| | 354 | | | Sunoco LP/Sunoco Finance Corp. (Oil, Gas & Consumable Fuels),
Callable 1/15/20 @ 102.44 (a) | | | 4.88 | | | | 1/15/23 | | | | 340 | |
| | 552 | | | Sunoco LP/Sunoco Finance Corp. (Oil, Gas & Consumable Fuels),
Callable 2/15/21 @ 102.75 (a) | | | 5.50 | | | | 2/15/26 | | | | 523 | |
| | 578 | | | Symantec Corp. (Software), Callable 4/15/20 @ 102.50 (a) | | | 5.00 | | | | 4/15/25 | | | | 560 | |
| | 2,518 | | | Tallgrass Energy Partners (Oil, Gas & Consumable Fuels),
Callable 9/15/19 @ 104.13 | | | 5.50 | | | | 9/15/24 | | | | 2,568 | |
| | 722 | | | Tallgrass Energy Partners LP/Tallgrass Energy Finance Corp. (Oil, Gas & Consumable Fuels), Callable 1/15/23 @ 102.75 (a) | | | 5.50 | | | | 1/15/28 | | | | 713 | |
| | 548 | | | Teleflex, Inc. (Health Care Equipment & Supplies), Callable 11/15/22 @ 102.31 | | | 4.63 | | | | 11/15/27 | | | | 518 | |
| | 261 | | | Teleflex, Inc. (Health Care Equipment & Supplies), Callable 6/1/21 @ 102.44 | | | 4.88 | | | | 6/1/26 | | | | 256 | |
| | 406 | | | Tempur Sealy International, Inc. (Household Durables), Callable 10/15/18 @ 104.22 | | | 5.63 | | | | 10/15/23 | | | | 407 | |
| | 2,415 | | | Tenet Healthcare Corp. (Health Care Providers & Services) | | | 4.50 | | | | 4/1/21 | | | | 2,391 | |
| | 206 | | | Tenet Healthcare Corp. (Health Care Providers & Services) | | | 4.75 | | | | 6/1/20 | | | | 207 | |
| | 3,007 | | | Tenet Healthcare Corp. (Health Care Providers & Services) | | | 6.00 | | | | 10/1/20 | | | | 3,090 | |
| | 584 | | | Tenet Healthcare Corp. (Health Care Providers & Services),
Callable 1/1/19 @ 103.75 (a) | | | 7.50 | | | | 1/1/22 | | | | 607 | |
| | 870 | | | Tenneco, Inc. (Auto Components), Callable 7/15/21 @ 102.50 | | | 5.00 | | | | 7/15/26 | | | | 777 | |
| | 685 | | | TerraForm Power Operating LLC (Independent Power & Renewable Electricity Producers), Callable 10/31/22 @ 100.00 (a) | | | 4.25 | | | | 1/31/23 | | | | 661 | |
| | 685 | | | TerraForm Power Operating LLC (Independent Power & Renewable Electricity Producers), Callable 7/31/27 @ 100.00 (a) | | | 5.00 | | | | 1/31/28 | | | | 649 | |
| | 1,348 | | | THC Escrow Corp. III (Health Care Providers & Services), Callable 5/1/20 @ 102.56 (a) | | | 5.13 | | | | 5/1/25 | | | | 1,281 | |
| | 44 | | | The AES Corp. (Independent Power & Renewable Electricity Producers),
Callable 4/15/20 @ 102.75 | | | 5.50 | | | | 4/15/25 | | | | 44 | |
| | 1,177 | | | The EW Scripps Co. (Media), Callable 5/15/20 @ 103.84 (a) | | | 5.13 | | | | 5/15/25 | | | | 1,103 | |
| | 1,409 | | | T-Mobile USA, Inc. (Wireless Telecommunication Services),
Callable 4/15/19 @ 104.50 | | | 6.00 | | | | 4/15/24 | | | | 1,458 | |
| | 1,481 | | | T-Mobile USA, Inc. (Wireless Telecommunication Services),
Callable 1/15/21 @ 103.25 | | | 6.50 | | | | 1/15/26 | | | | 1,525 | |
| | 464 | | | T-Mobile USA, Inc. (Wireless Telecommunication Services),
Callable 1/15/19 @ 103.25 | | | 6.50 | | | | 1/15/24 | | | | 483 | |
| | 773 | | | Toll Brothers Finance Corp. (Household Durables), Callable 1/15/23 @ 100.00 | | | 4.38 | | | | 4/15/23 | | | | 758 | |
| | 836 | | | Toll Brothers Finance Corp. (Household Durables), Callable 11/15/21 @ 100.00 | | | 5.88 | | | | 2/15/22 | | | | 867 | |
| | 811 | | | TransDigm, Inc. (Aerospace & Defense), Callable 8/3/18 @ 101.38 | | | 5.50 | | | | 10/15/20 | | | | 811 | |
| | 561 | | | Triumph Group, Inc. (Aerospace & Defense), Callable 8/3/18 @ 101.22 | | | 4.88 | | | | 4/1/21 | | | | 540 | |
| | 1,182 | | | Triumph Group, Inc. (Aerospace & Defense), Callable 8/3/18 @ 102.63 | | | 5.25 | | | | 6/1/22 | | | | 1,138 | |
| | 1,005 | | | Triumph Group, Inc. (Aerospace & Defense), Callable 8/15/20 @ 105.81 | | | 7.75 | | | | 8/15/25 | | | | 995 | |
| | 2,084 | | | Tronox, Inc. (Chemicals), Callable 4/15/21 @ 103.25 (a) | | | 6.50 | | | | 4/15/26 | | | | 2,071 | |
| | 636 | | | Ultra Resources, Inc. (Oil, Gas & Consumable Fuels),
Callable 4/15/19 @ 103.44 ^(a) | | | 6.88 | | | | 4/15/22 | | | | 482 | |
| | 1,104 | | | Ultra Resources, Inc. (Oil, Gas & Consumable Fuels),
Callable 4/15/20 @ 105.34 ^(a) | | | 7.13 | | | | 4/15/25 | | | | 776 | |
See accompanying notes to financial statements.
192
HC CAPITAL TRUST
The Fixed Income Opportunity Portfolio
Portfolio of Investments (continued) — June 30, 2018
| | | | | | | | | | | | | | | | |
Principal
Amount
(000) | | | Security Description | | Rate % | | | Maturity
Date | | | Value
(000) | |
| | | | Corporate Bonds (continued) | | | | | | | | | | | | |
| $ | 3,384 | | | Unit Corp. (Energy Equipment & Services), Callable 8/3/18 @ 101.10 | | | 6.63 | | | | 5/15/21 | | | $ | 3,375 | |
| | 541 | | | United Airlines Pass Through Trust, Class B (Airlines) | | | 4.63 | | | | 3/3/24 | | | | 542 | |
| | 709 | | | United Rentals North America, Inc. (Trading Companies & Distributors),
Callable 10/15/20 @ 102.31 | | | 4.63 | | | | 10/15/25 | | | | 675 | |
| | 588 | | | United Rentals North America, Inc. (Trading Companies & Distributors),
Callable 9/15/21 @ 102.94 | | | 5.88 | | | | 9/15/26 | | | | 592 | |
| | 2,210 | | | Universal Hospital Services, Inc. (Media), Callable 8/3/18 @ 101.91 | | | 7.63 | | | | 8/15/20 | | �� | | 2,204 | |
| | 671 | | | Univision Communications, Inc. (Media), Callable 2/15/20 @ 102.56 (a) | | | 5.13 | | | | 2/15/25 | | | | 620 | |
| | 522 | | | Univision Communications, Inc. (Media), Callable 8/3/18 @ 102.56 | | | 5.13 | | | | 5/15/23 | | | | 501 | |
| | 1,497 | | | URS Corp. (Construction & Engineering), Callable 1/1/22 @ 100.00 | | | 5.00 | | | | 4/1/22 | | | | 1,519 | |
| | 220 | | | Valeant Pharmaceuticals International, Inc. (Pharmaceuticals) | | | 6.75 | | | | 8/15/21 | | | | 222 | |
| | 282 | | | VeriSign, Inc. (Internet Software & Services), Callable 7/15/22 @ 102.38 | | | 4.75 | | | | 7/15/27 | | | | 269 | |
| | 1,315 | | | ViaSat, Inc. (Communications Equipment), Callable 9/15/20 @ 102.81 (a) | | | 5.63 | | | | 9/15/25 | | | | 1,235 | |
| | 1,437 | | | Vistra Energy Corp. (Independent Power & Renewable Electricity Producers), Callable 7/30/20 @ 104.06 (a) | | | 8.13 | | | | 1/30/26 | | | | 1,561 | |
| | 1,361 | | | Wabash National Corp. (Machinery), Callable 10/1/20 @ 102.75 (a) | | | 5.50 | | | | 10/1/25 | | | | 1,307 | |
| | 1,372 | | | Western Digital Corp. (Technology Hardware, Storage & Peripherals),
Callable 11/15/25 @ 100.00 | | | 4.75 | | | | 2/15/26 | | | | 1,334 | |
| | 840 | | | William Lyon Homes, Inc. (Household Durables), Callable 1/31/20 @ 102.94 | | | 5.88 | | | | 1/31/25 | | | | 795 | |
| | 903 | | | Williams Companies, Inc. (Oil, Gas & Consumable Fuels),
Callable 10/15/22 @ 100.00 | | | 3.70 | | | | 1/15/23 | | | | 874 | |
| | 465 | | | Williams Companies, Inc. (The), Series A (Oil, Gas & Consumable Fuels) | | | 7.50 | | | | 1/15/31 | | | | 553 | |
| | 1,450 | | | Wyndham Hotels & Resorts, Inc. (Hotels, Restaurants & Leisure),
Callable 4/15/21 @ 102.69 (a) | | | 5.38 | | | | 4/15/26 | | | | 1,439 | |
| | 1,089 | | | Zayo Group LLC/Zayo Capital, Inc. (Diversified Telecommunication Services), Callable 1/15/22 @ 102.88 (a) | | | 5.75 | | | | 1/15/27 | | | | 1,070 | |
| | | | | | | | | | | | | | | | |
| | | | Total Corporate Bonds | | | | | | | | | | | 359,749 | |
| | | | | | | | | | | | | | | | |
| | | | Yankee Dollars — 12.40% | | | | | | | | | | | | |
| | 1,100 | | | 1011778 BC ULC/New Red Finance, Inc. (Hotels, Restaurants & Leisure),
Callable 5/15/20 @ 102.13 | | | 4.25 | | | | 5/15/24 | | | | 1,045 | |
| | 1,518 | | | 1011778 BC ULC/New Red Finance, Inc. (Hotels, Restaurants & Leisure),
Callable 10/15/20 @ 102.50 (a) | | | 5.00 | | | | 10/15/25 | | | | 1,436 | |
| | 1,168 | | | Adient Global Holdings Ltd. (Auto Components), Callable 8/15/21 @ 102.44 (a) | | | 4.88 | | | | 8/15/26 | | | | 1,051 | |
| | 156 | | | Aircastle Ltd. (Trading Companies & Distributors) | | | 5.00 | | | | 4/1/23 | | | | 157 | |
| | 2,424 | | | Aircastle Ltd. (Trading Companies & Distributors) | | | 5.50 | | | | 2/15/22 | | | | 2,487 | |
| | 389 | | | Alcoa Nederland Holding (Metals & Mining), Callable 5/15/23 @ 103.06 (a) | | | 6.13 | | | | 5/15/28 | | | | 391 | |
| | 2,001 | | | Alcoa Nederland Holding (Metals & Mining), Callable 9/30/21 @ 103.50 (a) | | | 7.00 | | | | 9/30/26 | | | | 2,121 | |
| | 3,845 | | | Altice Financing S.A. (Media), Callable 8/3/18 @ 104.97 (a) | | | 6.63 | | | | 2/15/23 | | | | 3,789 | |
| | 730 | | | Altice Financing S.A. (Media), Callable 5/15/21 @ 103.75 (a) | | | 7.50 | | | | 5/15/26 | | | | 706 | |
| | 1,058 | | | Ardagh Packaging Finance/Holdings USA (Containers & Packaging),
Callable 2/15/20 @ 104.50 (a) | | | 6.00 | | | | 2/15/25 | | | | 1,030 | |
| | 1,961 | | | Bombardier, Inc. (Aerospace & Defense), Callable 8/3/18 @ 103.00 (a) | | | 6.00 | | | | 10/15/22 | | | | 1,953 | |
| | 649 | | | Bombardier, Inc. (Aerospace & Defense), Callable 3/15/20 @ 103.75 (a) | | | 7.50 | | | | 3/15/25 | | | | 676 | |
| | 216 | | | Brookfield Residential Properties, Inc. (Household Durables),
Callable 8/3/18 @ 101.63 (a) | | | 6.50 | | | | 12/15/20 | | | | 219 | |
| | 277 | | | Cascades, Inc. (Containers & Packaging), Callable 8/3/18 @ 102.75 | | | 5.50 | | | | 7/15/22 | | | | 275 | |
| | 709 | | | Cascades, Inc. (Containers & Packaging), Callable 8/3/18 @ 104.31 (a) | | | 5.75 | | | | 7/15/23 | | | | 698 | |
| | 3,007 | | | Cimpress NV (Commercial Services & Supplies), Callable 6/15/21 @ 105.25 (a) | | | 7.00 | | | | 6/15/26 | | | | 3,071 | |
| | 1,380 | | | Cooke Omega Investments, Inc./Alpha Vessel Co. Holdings, Inc. (Diversified Financial Services), Callable 6/15/20 @ 104.25 (a) | | | 8.50 | | | | 12/15/22 | | | | 1,394 | |
| | 2,109 | | | Cott Holdings, Inc. (Beverages), Callable 4/1/20 @ 104.13 (a) | | | 5.50 | | | | 4/1/25 | | | | 2,051 | |
| | 1,014 | | | Dana Financing Luxembourg Sarl (Auto Components),
Callable 4/15/20 @ 104.31 | | | 5.75 | | | | 4/15/25 | | | | 999 | |
| | 994 | | | Delphi Jersey Holdings PLC (Auto Components) (a) | | | 5.00 | | | | 10/1/25 | | | | 948 | |
| | 1,846 | | | Ensco PLC (Energy Equipment & Services) | | | 7.75 | | | | 2/1/26 | | | | 1,744 | |
| | 1,572 | | | Hudby Minerals, Inc. (Metals & Mining), Callable 1/15/20 @ 105.72 (a) | | | 7.63 | | | | 1/15/25 | | | | 1,646 | |
See accompanying notes to financial statements.
193
HC CAPITAL TRUST
The Fixed Income Opportunity Portfolio
Portfolio of Investments (continued) — June 30, 2018
| | | | | | | | | | | | | | | | |
Principal
Amount
(000) | | | Security Description | | Rate % | | | Maturity
Date | | | Value
(000) | |
| | | | Yankee Dollars (continued) | | | | | | | | | | | | |
| $ | 685 | | | IHS Markit Ltd. (Professional Services), Callable 12/1/25 @ 100.00 (a) | | | 4.00 | | | | 3/1/26 | | | $ | 653 | |
| | 293 | | | Intelsat Jackson Holdings SA (Diversified Telecommunication Services),
Callable 8/3/18 @ 102.75 | | | 5.50 | | | | 8/1/23 | | | | 263 | |
| | 60 | | | Intelsat Jackson Holdings SA (Diversified Telecommunication Services),
Callable 8/3/18 @ 101.25 | | | 7.50 | | | | 4/1/21 | | | | 60 | |
| | 2,365 | | | International Game Technology (Hotels, Restaurants & Leisure),
Callable 8/15/21 @ 100.00 (a) | | | 6.25 | | | | 2/15/22 | | | | 2,424 | |
| | 639 | | | James Hardie International Finance DAC (Construction Materials),
Callable 1/15/21 @ 102.38 (a) | | | 4.75 | | | | 1/15/25 | | | | 623 | |
| | 1,088 | | | JBS USA Lux S.A. /JBS USA Finance, Inc. (Food Products),
Callable 2/15/23 @ 103.38 | | | 6.75 | | | | 2/15/28 | | | | 1,028 | |
| | 2,087 | | | Kinross Gold Corp. (Metals & Mining), Callable 4/15/27 @ 100.00 (a) | | | 4.50 | | | | 7/15/27 | | | | 1,914 | |
| | 699 | | | Lundin Mining Corp. (Metals & Mining), Callable 11/1/18 @ 103.94 | | | 7.88 | | | | 11/1/22 | | | | 732 | |
| | 1,174 | | | Mallinckrodt International Finance (Pharmaceuticals) ^ | | | 4.75 | | | | 4/15/23 | | | | 983 | |
| | 921 | | | Mallinckrodt International Finance (Pharmaceuticals),
Callable 8/3/18 @ 101.22 ^(a) | | | 4.88 | | | | 4/15/20 | | | | 905 | |
| | 2,200 | | | MDC Partners, Inc. (Media), Callable 5/1/19 @ 104.88 (a) | | | 6.50 | | | | 5/1/24 | | | | 1,909 | |
| | 1,397 | | | MEG Energy Corp. (Oil, Gas & Consumable Fuels),
Callable 8/3/18 @ 102.13 (a) | | | 6.38 | | | | 1/30/23 | | | | 1,304 | |
| | 689 | | | Nokia OYJ (Communications Equipment) | | | 3.38 | | | | 6/12/22 | | | | 667 | |
| | 689 | | | Nokia OYJ (Communications Equipment) | | | 4.38 | | | | 6/12/27 | | | | 648 | |
| | 1,623 | | | Nova Chemicals Corp. (Chemicals), Callable 3/3/24 @ 100.00 (a) | | | 4.88 | | | | 6/1/24 | | | | 1,542 | |
| | 921 | | | Nova Chemicals Corp. (Chemicals), Callable 8/3/18 @ 102.63 (a) | | | 5.25 | | | | 8/1/23 | | | | 919 | |
| | 1,994 | | | Nufarm Australia Ltd./Nufarm Americas, Inc. (Chemicals),
Callable 4/30/21 @ 102.88 (a) | | | 5.75 | | | | 4/30/26 | | | | 1,934 | |
| | 1,536 | | | Numericable – SFR SAS (Diversified Telecommunication Services),
Callable 5/15/19 @ 103.13 (a) | | | 6.25 | | | | 5/15/24 | | | | 1,492 | |
| | 1,043 | | | Numericable – SFR SAS (Diversified Telecommunication Services),
Callable 5/1/21 @ 103.69 (a) | | | 7.38 | | | | 5/1/26 | | | | 1,020 | |
| | 748 | | | NXP BV/NXP Funding LLC (Semiconductors & Semiconductor Equipment) (a) | | | 4.13 | | | | 6/1/21 | | | | 746 | |
| | 1,795 | | | Open Text Corp. (Software), Callable 6/1/21 @ 102.94 (a) | | | 5.88 | | | | 6/1/26 | | | | 1,831 | |
| | 2,779 | | | Parkland Fuel Corp. (Oil, Gas & Consumable Fuels),
Callable 4/1/21 @ 104.50 (a) | | | 6.00 | | | | 4/1/26 | | | | 2,738 | |
| | 691 | | | Precision Drilling Corp. (Energy Equipment & Services),
Callable 11/15/20 @ 105.34 (a) | | | 7.13 | | | | 1/15/26 | | | | 710 | |
| | 1,096 | | | Precision Drilling Corp. (Energy Equipment & Services),
Callable 12/15/19 @ 103.88 | | | 7.75 | | | | 12/15/23 | | | | 1,153 | |
| | 1,907 | | | Quebecor Media, Inc. (Media) | | | 5.75 | | | | 1/15/23 | | | | 1,945 | |
| | 905 | | | Rockpoint Gas Storage Canada Ltd. (Oil, Gas & Consumable Fuels),
Callable 3/31/20 @ 107.00 (a) | | | 7.00 | | | | 3/31/23 | | | | 905 | |
| | 2,743 | | | Royal Bank of Scotland Group PLC (Banks) | | | 6.13 | | | | 12/15/22 | | | | 2,886 | |
| | 1,182 | | | Sensata Technologies BV (Electrical Equipment) (a) | | | 5.00 | | | | 10/1/25 | | | | 1,191 | |
| | 1,503 | | | SFR Group SA (Diversified Telecommunication Services),
Callable 8/3/18 @ 103.00 (a) | | | 6.00 | | | | 5/15/22 | | | | 1,512 | |
| | 3,232 | | | Shelf Drilling Holdings Ltd. (Energy Equipment & Services),
Callable 2/15/21 @ 106.19 (a) | | | 8.25 | | | | 2/15/25 | | | | 3,256 | |
| | 1,219 | | | Teck Resources Ltd. (Metals & Mining), Callable 1/15/41 @ 100.00 | | | 6.25 | | | | 7/15/41 | | | | 1,213 | |
| | 773 | | | Teekay Corp. (Oil, Gas & Consumable Fuels) ^ | | | 8.50 | | | | 1/15/20 | | | | 796 | |
| | 806 | | | Telecom Italia Capital SA (Diversified Telecommunication Services) | | | 6.00 | | | | 9/30/34 | | | | 768 | |
| | 1,995 | | | Telecom Italia Capital SA (Diversified Telecommunication Services) | | | 6.38 | | | | 11/15/33 | | | | 1,965 | |
| | 2,255 | | | Teva Pharmaceutical Finance Netherlands III BV (Pharmaceuticals),
Callable 12/1/27 @ 100.00 ^ | | | 6.75 | | | | 3/1/28 | | | | 2,298 | |
| | 234 | | | Transocean Guardian, Ltd. (Energy Equipment & Services),
Callable 7/15/21 @ 102.94 (a) | | | 5.88 | | | | 1/15/24 | | | | 233 | |
| | 1,771 | | | Transocean Phoenix 2 Ltd. (Energy Equipment & Services),
Callable 10/15/20 @ 103.88 (a) | | | 7.75 | | | | 10/15/24 | | | | 1,897 | |
| | 1,273 | | | Tullow Oil PLC (Oil, Gas & Consumable Fuels), Callable 3/1/21 @ 103.50 (a) | | | 7.00 | | | | 3/1/25 | | | | 1,205 | |
See accompanying notes to financial statements.
194
HC CAPITAL TRUST
The Fixed Income Opportunity Portfolio
Portfolio of Investments (continued) — June 30, 2018
| | | | | | | | | | | | | | | | |
Principal
Amount
(000) | | | Security Description | | Rate % | | | Maturity
Date | | | Value
(000) | |
| | | | Yankee Dollars (continued) | | | | | | | | | | | | |
| $ | 874 | | | UPCB Finance IV Ltd. (Diversified Telecommunication Services),
Callable 1/15/20 @ 102.69 (a) | | | 5.38 | | | | 1/15/25 | | | $ | 830 | |
| | 516 | | | Videotron Ltd (Media) | | | 5.00 | | | | 7/15/22 | | | | 523 | |
| | 1,542 | | | VPII Escrow Corp. (Pharmaceuticals), Callable 8/3/18 @ 101.88 (a) | | | 7.50 | | | | 7/15/21 | | | | 1,566 | |
| | 481 | | | VRX Escrow Corp. (Pharmaceuticals), Callable 4/15/20 @ 103.06 (a) | | | 6.13 | | | | 4/15/25 | | | | 443 | |
| | | | | | | | | | | | | | | | |
| | | | Total Yankee Dollars | | | | | | | | | | | 83,517 | |
| | | | | | | | | | | | | | | | |
| | | | Time Deposit — 0.36% | | | | | | | | | | | | |
| | 2,407 | | | State Street Liquidity Management Control System Eurodollar Time Deposit | | | 0.53 | | | �� | 7/2/18 | | | | 2,407 | |
| | | | | | | | | | | | | | | | |
| | | | Total Time Deposit | | | | | | | | | | | 2,407 | |
| | | | | | | | | | | | | | | | |
Shares | | | | | | | | | | | | |
| | | | Exchange-Traded Fund — 5.27% | | | | | | | | | | | | |
| | 416,956 | | | iShares Iboxx $ High Yield Corporate Bond Fund^ | | | | | | | | | | | 35,475 | |
| | | | | | | | | | | | | | | | |
| | | | Total Exchange-Traded Fund | | | | | | | | | | | 35,475 | |
| | | | | | | | | | | | | | | | |
| | | | Mutual Funds — 7.65% | | | | | | | | | | | | |
| | 20,723,641 | | | Federated Treasury Obligations Fund, Institutional Shares^^ | | | 1.75 (g) | | | | | | | | 20,724 | |
| | 407,317 | | | State Street Institutional Treasury Plus Money Market Fund, Trust Class | | | 1.72 (g) | | | | | | | | 407 | |
| | 30,424,539 | | | State Street Institutional Treasury Plus Money Market Fund, Trust Class | | | 1.72 (g) | | | | | | | | 30,424 | |
| | | | | | | | | | | | | | | | |
| | | | Total Mutual Funds | | | | | | | | | | | 51,555 | |
| | | | | | | | | | | | | | | | |
Principal
Amount (000) | | | | | | | | | | | | |
| | | | Repurchase Agreement — 5.17% | | | | | | | | | | | | |
| $ | 34,800 | | | Jefferies LLC (Purchased on 6/29/18, proceeds at maturity $34,805,932 collateralized by U.S. Treasury Obligations, 2.50% – 2.92%, 2/15/20 – 2/15/44 fair value $35,496,175)^^ | | | 2.00 | | | | 7/2/18 | | | | 34,800 | |
| | | | | | | | | | | | | | | | |
| | | | Total Repurchase Agreement | | | | | | | | | | | 34,800 | |
| | | | | | | | | | | | | | | | |
| | | | Total Investments (cost $717,034) — 107.16% | | | | | | | | | | | 721,875 | |
| | | | Liabilities in excess of other assets — (7.16)% | | | | | | | | | | | (48,242 | ) |
| | | | | | | | | | | | | | | | |
| | | | Net Assets — 100.00% | | | | | | | | | | $ | 673,633 | |
| | | | | | | | | | | | | | | | |
| ^ | All or part of this security was on loan as of June 30, 2018. The total value of securities on loan as of June 30, 2018, was $52,725 (amount in thousands). |
| ^^ | Purchased with cash collateral held from securities lending. The value of the collateral could include collateral held for securities that were sold on or before June 30, 2018. |
| (a) | Represents a security purchased under Rule 144A or Section 4(2) and is exempt from registration under the Securities Act of 1933, as amended, or is otherwise restricted to resale. Certain of these securities may be resold in transactions exempt from registration, normally to qualified institutional buyers. These securities have been deemed liquid by the Specialist Manager. |
| (b) | Variable Rate Security. The rate disclosed is the rate in effect on June 30, 2018. |
| (c) | The rate for certain asset-backed and mortgage-backed securities may vary based on factors relating to the pool of assets underlying the security. The rate disclosed is the rate in effect at June 30, 2018. |
| (d) | A perpetual bond is one with no maturity date that pays a fixed interest rate until the bond insurance is terminated. |
| (e) | Escrow security due to bankruptcy. |
| (f) | Issuer has defaulted on the payment of interest. These securities have been deemed illiquid by the Specialist Manager and represents 0.32% of the Portfolio’s net assets. |
| (g) | The rate disclosed is the rate in effect on June 30, 2018. |
See accompanying notes to financial statements.
195
HC CAPITAL TRUST
The Fixed Income Opportunity Portfolio
Portfolio of Investments (continued) — June 30, 2018
bps — Basis Points
LIBOR01M —1 Month US Dollar LIBOR
LIBOR06 — 6 Month US Dollar LIBOR
MTN — Medium Term Note
ULC — Unlimited Liability Co.
US0001M — 1 Month US Dollar LIBOR
US0003M — 3 Month US Dollar LIBOR
The following table reflects the percentage of total net assets of the Portfolio attributable to each Specialist Manager as of June 30, 2018.
| | | | | | | | | | | | | | | | | | | | |
The Fixed Income Opportunity Portfolio | | Fort Washington
Investment
Advisors, Inc. | | | Parametric Portfolio
Associates, LLC | | | Western Asset
Management
Company | | | HC Capital
Solutions | | | Total | |
Collateralized Mortgage Obligations | | | — | | | | — | | | | 19.62 | % | | | — | | | | 19.62 | % |
U.S. Government Agency Mortgages | | | — | | | | — | | | | 3.30 | % | | | — | | | | 3.30 | % |
Corporate Bonds | | | 53.00 | % | | | — | | | | 0.39 | % | | | — | | | | 53.39 | % |
Yankee Dollars | | | 12.40 | % | | | — | | | | — | | | | — | | | | 12.40 | % |
Time Deposit | | | 0.36 | % | | | — | | | | — | | | | — | | | | 0.36 | % |
Exchange-Traded Fund | | | — | | | | 5.27 | % | | | — | | | | — | | | | 5.27 | % |
Mutual Funds | | | 1.11 | % | | | 5.69 | % | | | 0.85 | % | | | 0.00 | % | | | 7.65 | % |
Repurchase Agreement | | | 1.83 | % | | | 3.34 | % | | | — | | | | — | | | | 5.17 | % |
Other Assets (Liabilities) | | | -2.01 | % | | | -5.27 | % | | | 0.12 | % | | | 0.00 | % | | | -7.16 | % |
| | | | | | | | | | | | | | | | | | | | |
Total Net Assets | | | 66.69 | % | | | 9.03 | % | | | 24.28 | % | | | 0.00 | % | | | 100.00 | % |
| | | | | | | | | | | | | | | | | | | | |
Amounts designated as “—” indicate the Specialist Manager did not manage any holdings in that category.
The following tables reflect the open derivative positions held by the Portfolio as of June 30, 2018.
Futures Contracts Purchased^
| | | | | | | | | | | | | | |
Description | | Number of
Contracts | | Expiration
Date | | | Notional
Amount
(000) | | | Value and
Unrealized
Appreciation/
(Depreciation)
(000) | |
5-Year US Treasury Note Future | | 210 | | | 9/28/18 | | | $ | 23,859 | | | $ | 93 | |
Ultra Long Term US Treasury Bond Future | | 5 | | | 9/19/18 | | | | 798 | | | | 26 | |
| | | | | | | | | | | | | | |
| | | | | $ | 24,657 | | | $ | 119 | |
| | | | | | | | | | | |
Futures Contracts Sold^
| | | | | | | | | | | | | | |
Description | | Number of
Contracts | | Expiration
Date | | | Notional
Amount
(000) | | | Value and
Unrealized
Appreciation/
(Depreciation)
(000) | |
10-Year US Treasury Note Future | | 178 | | | 9/19/18 | | | $ | 21,393 | | | $ | (17 | ) |
10-Year US Treasury Note Future | | 114 | | | 9/19/18 | | | | 14,619 | | | | (252 | ) |
30-Year US Treasury Bond Future | | 20 | | | 9/19/18 | | | | 2,900 | | | | (27 | ) |
5-Year US Treasury Note Future | | 98 | | | 9/28/18 | | | | 11,135 | | | | (77 | ) |
| | | | | | | | | | | | | | |
| | | | | $ | 50,047 | | | $ | (373 | ) |
| | | | | | | | | | | | | | |
| | |
| | Total Unrealized Appreciation | | | $ | 119 | |
| | Total Unrealized Depreciation | | | | (373 | ) |
| | | | | | | |
| | Total Net Unrealized Appreciation/
(Depreciation) | | | $ | (254 | ) |
| | | | | | | | | | | | | | |
| ^ | Cash has been pledged as collateral for futures contracts held by the Portfolio. |
See accompanying notes to financial statements.
196
HC CAPITAL TRUST
The Fixed Income Opportunity Portfolio
Portfolio of Investments (concluded) — June 30, 2018
Over-the-Counter Credit Default Swap Agreements — Buy Protection (a)
Open over-the-counter credit default swap agreements as of June 30, 2018 were as follows:
| | | | | | | | | | | | | | | | | | | | | | | | | | | | | | | | | | |
Underlying Instrument | | Pay Fixed
Rate | | | Payment
Frequency | | | Implied
Credit
Spread at
June 30,
2018 (b) | | | Counterparty | | Expiration
Date | | | Notional
Amount
(000) (c) | | | Value
(000) | | | Upfront
Premiums
Paid/
(Received)
(000) | | | Unrealized
Appreciation/
(Depreciation)
(000) | |
CMEX Index | | | 0.50 | % | | | Monthly | | | | 0.32 | % | | Morgan Stanley | | | 5/11/63 | | | $ | 24,636 | | | $ | (162 | ) | | $ | (128 | ) | | $ | (34 | ) |
CMEX Index | | | 0.50 | % | | | Monthly | | | | 0.32 | % | | Morgan Stanley | | | 5/11/63 | | | | 14,782 | | | | (97 | ) | | | (77 | ) | | | (20 | ) |
| | | | | | | | | | | | | | | | | | | | | | | | | | | | | | | | | | |
| | | | | | | | | | | | | | | | | | | | | | | | $ | (259 | ) | | $ | (205 | ) | | $ | (54 | ) |
| | | | | | | | | | | | | | | | | | | | | | | | | | | | | | | | | | |
| | | | | |
| | | | | | | | | | | | | | Total swap agreements at value (assets) | | | $ | — | |
| | | | | | | | | | | | | | Total swap agreements at value (liabilities) | | | | (259 | ) |
| | | | | | | | | | | | | | | | | | | | | | | | | | | | | | | | | | |
| | | | | | | | | | | | | | Net swap agreements at value | | | $ | (259 | ) |
| | | | | | | | | | | | | | | | | | | | | | | |
Amounts designated as “—” are $0 or have been rounded to $0.
| (a) | When a credit event occurs as defined under the terms of the swap agreement, the Portfolio as a seller of credit protection will either (i) pay to the buyer of protection an amount equal to the par value of the defaulted reference entity and take delivery of the reference entity or (ii) pay a net amount equal to the par value of the defaulted reference entity less its recovery value. Alternatively, the Portfolio as a buyer of credit protection will either (i) receive from the seller of protection an amount equal to the par value of the defaulted reference entity and deliver the reference entity to the seller or (ii) receive a net amount of equal to the par value of the defaulted reference entity less its recovery value. |
| (b) | Implied credit spread, represented in absolute terms, utilized in determining the market value of the credit default swap agreements as of period end will serve as an indicator of the current status of the payment/performance risk and represent the likelihood or risk of default for the credit derivative. The implied credit spread of a referenced entity reflects the cost of buying/selling protection and may include upfront or daily payments required to be made to enter into the agreement. Generally, wider credit spreads represent a perceived deterioration of the referenced entity’s credit soundness and a greater likelihood or risk of default or other credit event occurring as defined under the terms of the swap agreement. |
| (c) | The notional amount represents the maximum potential amount the Portfolio could be required to make as a seller of credit protection if a credit event occurs, as defined under the terms of the swap agreement. |
See accompanying notes to financial statements.
197
HC CAPITAL TRUST
The U.S. Government Fixed Income Securities Portfolio
Portfolio of Investments — June 30, 2018
| | | | | | | | | | | | | | | | |
Principal
Amount
(000) | | | Security Description | | Rate % | | | Maturity
Date | | | Value
(000) | |
| | | | U.S. Government Agency Securities — 3.98% | | | | | | | | | | | | |
| $ | 250 | | | Fannie Mae | | | 0.88 | | | | 8/2/19 | | | $ | 246 | |
| | 300 | | | Fannie Mae | | | 1.13 | | | | 7/26/19 | | | | 296 | |
| | 350 | | | Fannie Mae | | | 1.38 | | | | 10/7/21 | | | | 336 | |
| | 360 | | | Fannie Mae | | | 1.50 | | | | 6/22/20 | | | | 353 | |
| | 200 | | | Fannie Mae | | | 1.75 | | | | 11/26/19 | | | | 198 | |
| | 350 | | | Fannie Mae | | | 1.88 | | | | 9/24/26 | | | | 320 | |
| | 400 | | | Fannie Mae | | | 2.00 | | | | 10/5/22 | | | | 387 | |
| | 630 | | | Fannie Mae | | | 2.54 | (a)(b) | | | 10/9/19 | | | | 609 | |
| | 250 | | | Fannie Mae | | | 2.63 | | | | 9/6/24 | | | | 246 | |
| | 95 | | | Fannie Mae | | | 6.25 | | | | 5/15/29 | | | | 122 | |
| | 160 | | | Fannie Mae | | | 6.63 | | | | 11/15/30 | | | | 215 | |
| | 180 | | | Fannie Mae | | | 7.25 | | | | 5/15/30 | | | | 251 | |
| | 50 | | | Federal Farm Credit Bank, Callable 7/11/18 @ 100.00 | | | 1.58 | | | | 2/17/21 | | | | 48 | |
| | 250 | | | Federal Home Loan Bank | | | 0.88 | | | | 8/5/19 | | | | 246 | |
| | 500 | | | Federal Home Loan Bank | | | 1.13 | | | | 7/14/21 | | | | 478 | |
| | 500 | | | Federal Home Loan Bank | | | 1.38 | | | | 9/28/20 | | | | 486 | |
| | 200 | | | Federal Home Loan Bank | | | 1.38 | | | | 11/15/19 | | | | 197 | |
| | 50 | | | Federal Home Loan Bank | | | 2.13 | | | | 3/10/23 | | | | 49 | |
| | 75 | | | Federal Home Loan Bank, Callable 1/29/20 @ 100.00 | | | 2.25 | | | | 1/29/21 | | | | 74 | |
| | 100 | | | Federal Home Loan Bank, Callable 9/29/18 @ 100.00 | | | 2.51 | | | | 12/29/22 | | | | 98 | |
| | 500 | | | Federal Home Loan Bank | | | 2.63 | | | | 5/28/20 | | | | 500 | |
| | 150 | | | Federal Home Loan Bank | | | 2.88 | | | | 9/13/24 | | | | 150 | |
| | 160 | | | Federal Home Loan Bank | | | 2.88 | | | | 9/11/20 | | | | 161 | |
| | 180 | | | Federal Home Loan Bank | | | 5.25 | | | | 12/11/20 | | | | 191 | |
| | 65 | | | Federal Home Loan Bank | | | 5.50 | | | | 7/15/36 | | | | 85 | |
| | 550 | | | Freddie Mac | | | 1.25 | | | | 10/2/19 | | | | 542 | |
| | 200 | | | Freddie Mac | | | 1.25 | | | | 8/1/19 | | | | 197 | |
| | 200 | | | Freddie Mac | | | 1.38 | | | | 5/1/20 | | | | 196 | |
| | 250 | | | Freddie Mac | | | 1.40 | | | | 8/22/19 | | | | 247 | |
| | 500 | | | Freddie Mac | | | 1.88 | | | | 11/17/20 | | | | 491 | |
| | 350 | | | Freddie Mac | | | 2.38 | | | | 1/13/22 | | | | 345 | |
| | 150 | | | Freddie Mac | | | 6.25 | | | | 7/15/32 | | | | 201 | |
| | 80 | | | Freddie Mac | | | 6.75 | | | | 3/15/31 | | | | 109 | |
| | 110 | | | Tennessee Valley Authority | | | 4.70 | | | | 7/15/33 | | | | 127 | |
| | 85 | | | Tennessee Valley Authority | | | 5.25 | | | | 9/15/39 | | | | 107 | |
| | 100 | | | Tennessee Valley Authority | | | 5.88 | | | | 4/1/36 | | | | 131 | |
| | 190 | | | Tennessee Valley Authority | | | 6.15 | | | | 1/15/38 | | | | 263 | |
| | | | | | | | | | | | | | | | |
| | | | Total U.S. Government Agency Securities | | | | | | | | | | | 9,298 | |
| | | | | | | | | | | | | | | | |
| | | | U.S. Treasury Obligations — 95.17% | | | | | | | | | | | | |
| | 1,460 | | | U.S. Treasury Bond | | | 2.25 | | | | 8/15/46 | | | | 1,256 | |
| | 1,015 | | | U.S. Treasury Bond | | | 2.50 | | | | 2/15/45 | | | | 924 | |
| | 1,135 | | | U.S. Treasury Bond | | | 2.50 | | | | 2/15/46 | | | | 1,031 | |
| | 1,550 | | | U.S. Treasury Bond | | | 2.50 | | | | 5/15/46 | | | | 1,407 | |
| | 1,110 | | | U.S. Treasury Bond | | | 2.75 | | | | 8/15/47 | | | | 1,058 | |
| | 671 | | | U.S. Treasury Bond | | | 2.75 | | | | 11/15/42 | | | | 644 | |
| | 1,720 | | | U.S. Treasury Bond | | | 2.75 | | | | 11/15/47 | | | | 1,639 | |
| | 837 | | | U.S. Treasury Bond | | | 2.75 | | | | 8/15/42 | | | | 804 | |
| | 955 | | | U.S. Treasury Bond | | | 2.88 | | | | 11/15/46 | | | | 934 | |
| | 980 | | | U.S. Treasury Bond | | | 2.88 | | | | 8/15/45 | | | | 959 | |
| | 1,116 | | | U.S. Treasury Bond | | | 2.88 | | | | 5/15/43 | | | | 1,095 | |
| | 1,005 | | | U.S. Treasury Bond | | | 3.00 | | | | 2/15/47 | | | | 1,008 | |
| | 1,015 | | | U.S. Treasury Bond | | | 3.00 | | | | 11/15/44 | | | | 1,018 | |
| | 1,260 | | | U.S. Treasury Bond | | | 3.00 | | | | 5/15/45 | | | | 1,264 | |
| | 1,245 | | | U.S. Treasury Bond | | | 3.00 | | | | 2/15/48 | | | | 1,248 | |
See accompanying notes to financial statements.
198
HC CAPITAL TRUST
The U.S. Government Fixed Income Securities Portfolio
Portfolio of Investments (continued) — June 30, 2018
| | | | | | | | | | | | | | | | |
Principal
Amount
(000) | | | Security Description | | Rate % | | | Maturity
Date | | | Value
(000) | |
| | | | U.S. Treasury Obligations (continued) | | | | | | | | | | | | |
| $ | 925 | | | U.S. Treasury Bond | | | 3.00 | | | | 5/15/47 | | | $ | 927 | |
| | 1,220 | | | U.S. Treasury Bond | | | 3.00 | | | | 11/15/45 | | | | 1,223 | |
| | 389 | | | U.S. Treasury Bond | | | 3.00 | | | | 5/15/42 | | | | 391 | |
| | 1,010 | | | U.S. Treasury Bond | | | 3.13 | | | | 8/15/44 | | | | 1,035 | |
| | 647 | | | U.S. Treasury Bond | | | 3.13 | | | | 2/15/43 | | | | 663 | |
| | 416 | | | U.S. Treasury Bond | | | 3.13 | | | | 11/15/41 | | | | 427 | |
| | 425 | | | U.S. Treasury Bond | | | 3.13 | | | | 2/15/42 | | | | 436 | |
| | 1,225 | | | U.S. Treasury Bond | | | 3.13 | | | | 5/15/48 | | | | 1,258 | |
| | 1,130 | | | U.S. Treasury Bond | | | 3.38 | | | | 5/15/44 | | | | 1,209 | |
| | 805 | | | U.S. Treasury Bond | | | 3.50 | | | | 2/15/39 | | | | 876 | |
| | 900 | | | U.S. Treasury Bond | | | 3.63 | | | | 8/15/43 | | | | 1,002 | |
| | 1,280 | | | U.S. Treasury Bond | | | 3.63 | | | | 2/15/44 | | | | 1,426 | |
| | 230 | | | U.S. Treasury Bond | | | 3.75 | | | | 8/15/41 | | | | 260 | |
| | 1,345 | | | U.S. Treasury Bond | | | 3.75 | | | | 11/15/43 | | | | 1,527 | |
| | 185 | | | U.S. Treasury Bond | | | 3.88 | | | | 8/15/40 | | | | 213 | |
| | 540 | | | U.S. Treasury Bond | | | 4.25 | | | | 11/15/40 | | | | 654 | |
| | 400 | | | U.S. Treasury Bond | | | 4.25 | | | | 5/15/39 | | | | 482 | |
| | 363 | | | U.S. Treasury Bond | | | 4.38 | | | | 5/15/40 | | | | 446 | |
| | 300 | | | U.S. Treasury Bond | | | 4.38 | | | | 11/15/39 | | | | 368 | |
| | 546 | | | U.S. Treasury Bond | | | 4.38 | | | | 5/15/41 | | | | 674 | |
| | 280 | | | U.S. Treasury Bond | | | 4.38 | | | | 2/15/38 | | | | 341 | |
| | 515 | | | U.S. Treasury Bond | | | 4.50 | | | | 5/15/38 | | | | 638 | |
| | 400 | | | U.S. Treasury Bond | | | 4.50 | | | | 8/15/39 | | | | 498 | |
| | 325 | | | U.S. Treasury Bond | | | 4.50 | | | | 2/15/36 | | | | 397 | |
| | 673 | | | U.S. Treasury Bond | | | 4.63 | | | | 2/15/40 | | | | 853 | |
| | 70 | | | U.S. Treasury Bond | | | 4.75 | | | | 2/15/37 | | | | 89 | |
| | 825 | | | U.S. Treasury Bond | | | 4.75 | | | | 2/15/41 | | | | 1,068 | |
| | 235 | | | U.S. Treasury Bond | | | 5.00 | | | | 5/15/37 | | | | 307 | |
| | 230 | | | U.S. Treasury Bond | | | 5.25 | | | | 2/15/29 | | | | 280 | |
| | 282 | | | U.S. Treasury Bond | | | 5.25 | | | | 11/15/28 | | | | 342 | |
| | 299 | | | U.S. Treasury Bond | | | 5.38 | | | | 2/15/31 | | | | 378 | |
| | 85 | | | U.S. Treasury Bond | | | 6.00 | | | | 2/15/26 | | | | 103 | |
| | 235 | | | U.S. Treasury Bond | | | 6.13 | | | | 11/15/27 | | | | 298 | |
| | 150 | | | U.S. Treasury Bond | | | 6.13 | | | | 8/15/29 | | | | 196 | |
| | 122 | | | U.S. Treasury Bond | | | 6.25 | | | | 8/15/23 | | | | 142 | |
| | 320 | | | U.S. Treasury Bond | | | 6.25 | | | | 5/15/30 | | | | 428 | |
| | 100 | | | U.S. Treasury Bond | | | 6.38 | | | | 8/15/27 | | | | 128 | |
| | 218 | | | U.S. Treasury Bond | | | 6.50 | | | | 11/15/26 | | | | 278 | |
| | 200 | | | U.S. Treasury Bond | | | 6.75 | | | | 8/15/26 | | | | 257 | |
| | 100 | | | U.S. Treasury Bond | | | 7.25 | | | | 8/15/22 | | | | 118 | |
| | 295 | | | U.S. Treasury Bond | | | 7.63 | | | | 2/15/25 | | | | 381 | |
| | 7 | | | U.S. Treasury Bond | | | 7.88 | | | | 2/15/21 | | | | 8 | |
| | 400 | | | U.S. Treasury Bond | | | 8.00 | | | | 11/15/21 | | | | 468 | |
| | 110 | | | U.S. Treasury Bond | | | 8.13 | | | | 8/15/21 | | | | 128 | |
| | 350 | | | U.S. Treasury Bond | | | 8.13 | | | | 8/15/19 | | | | 372 | |
| | 835 | | | U.S. Treasury Note | | | 0.75 | | | | 8/15/19 | | | | 820 | |
| | 650 | | | U.S. Treasury Note | | | 0.75 | | | | 7/15/19 | | | | 639 | |
| | 380 | | | U.S. Treasury Note | | | 0.88 | | | | 7/31/19 | | | | 374 | |
| | 1,040 | | | U.S. Treasury Note | | | 0.88 | | | | 9/15/19 | | | | 1,021 | |
| | 1,120 | | | U.S. Treasury Note | | | 1.00 | | | | 11/15/19 | | | | 1,098 | |
| | 1,245 | | | U.S. Treasury Note | | | 1.00 | | | | 10/15/19 | | | | 1,222 | |
| | 425 | | | U.S. Treasury Note | | | 1.00 | | | | 11/30/19 | | | | 416 | |
| | 600 | | | U.S. Treasury Note | | | 1.00 | | | | 8/31/19 | | | | 590 | |
| | 416 | | | U.S. Treasury Note | | | 1.00 | | | | 9/30/19 | | | | 409 | |
See accompanying notes to financial statements.
199
HC CAPITAL TRUST
The U.S. Government Fixed Income Securities Portfolio
Portfolio of Investments (continued) — June 30, 2018
| | | | | | | | | | | | | | | | |
Principal
Amount
(000) | | | Security Description | | Rate % | | | Maturity
Date | | | Value
(000) | |
| | | | U.S. Treasury Obligations (continued) | | | | | | | | | | | | |
| $ | 840 | | | U.S. Treasury Note | | | 1.13 | | | | 7/31/21 | | | $ | 803 | |
| | 750 | | | U.S. Treasury Note | | | 1.13 | | | | 6/30/21 | | | | 718 | |
| | 910 | | | U.S. Treasury Note | | | 1.13 | | | | 2/28/21 | | | | 875 | |
| | 1,005 | | | U.S. Treasury Note | | | 1.13 | | | | 8/31/21 | | | | 959 | |
| | 1,100 | | | U.S. Treasury Note | | | 1.13 | | | | 9/30/21 | | | | 1,048 | |
| | 1,075 | | | U.S. Treasury Note | | | 1.13 | | | | 4/30/20 | | | | 1,048 | |
| | 520 | | | U.S. Treasury Note | | | 1.13 | | | | 3/31/20 | | | | 508 | |
| | 575 | | | U.S. Treasury Note | | | 1.13 | | | | 12/31/19 | | | | 564 | |
| | 915 | | | U.S. Treasury Note | | | 1.25 | | | | 3/31/21 | | | | 882 | |
| | 1,074 | | | U.S. Treasury Note | | | 1.25 | | | | 1/31/20 | | | | 1,053 | |
| | 1,200 | | | U.S. Treasury Note | | | 1.25 | | | | 7/31/23 | | | | 1,115 | |
| | 850 | | | U.S. Treasury Note | | | 1.25 | | | | 10/31/21 | | | | 812 | |
| | 475 | | | U.S. Treasury Note | | | 1.25 | | | | 10/31/19 | | | | 468 | |
| | 500 | | | U.S. Treasury Note | | | 1.25 | | | | 2/29/20 | | | | 490 | |
| | 710 | | | U.S. Treasury Note | | | 1.25 | | | | 8/31/19 | | | | 700 | |
| | 610 | | | U.S. Treasury Note | | | 1.38 | | | | 5/31/20 | | | | 597 | |
| | 1,050 | | | U.S. Treasury Note | | | 1.38 | | | | 1/15/20 | | | | 1,032 | |
| | 1,425 | | | U.S. Treasury Note | | | 1.38 | | | | 6/30/23 | | | | 1,334 | |
| | 1,430 | | | U.S. Treasury Note | | | 1.38 | | | | 8/31/23 | | | | 1,335 | |
| | 1,140 | | | U.S. Treasury Note | | | 1.38 | | | | 5/31/21 | | | | 1,100 | |
| | 695 | | | U.S. Treasury Note | | | 1.38 | | | | 9/30/19 | | | | 686 | |
| | 650 | | | U.S. Treasury Note | | | 1.38 | | | | 2/15/20 | | | | 638 | |
| | 710 | | | U.S. Treasury Note | | | 1.38 | | | | 7/31/19 | | | | 702 | |
| | 890 | | | U.S. Treasury Note | | | 1.38 | | | | 9/15/20 | | | | 867 | |
| | 965 | | | U.S. Treasury Note | | | 1.38 | | | | 1/31/21 | | | | 936 | |
| | 750 | | | U.S. Treasury Note | | | 1.38 | | | | 12/15/19 | | | | 738 | |
| | 900 | | | U.S. Treasury Note | | | 1.38 | | | | 2/29/20 | | | | 883 | |
| | 500 | | | U.S. Treasury Note | | | 1.38 | | | | 1/31/20 | | | | 491 | |
| | 1,178 | | | U.S. Treasury Note | | | 1.38 | | | | 9/30/20 | | | | 1,147 | |
| | 1,430 | | | U.S. Treasury Note | | | 1.38 | | | | 9/30/23 | | | | 1,334 | |
| | 1,120 | | | U.S. Treasury Note | | | 1.38 | | | | 8/31/20 | | | | 1,092 | |
| | 1,310 | | | U.S. Treasury Note | | | 1.38 | | | | 4/30/21 | | | | 1,266 | |
| | 965 | | | U.S. Treasury Note | | | 1.38 | | | | 4/30/20 | | | | 945 | |
| | 1,625 | | | U.S. Treasury Note | | | 1.38 | | | | 10/31/20 | | | | 1,581 | |
| | 900 | | | U.S. Treasury Note | | | 1.38 | | | | 3/31/20 | | | | 882 | |
| | 615 | | | U.S. Treasury Note | | | 1.50 | | | | 7/15/20 | | | | 602 | |
| | 605 | | | U.S. Treasury Note | | | 1.50 | | | | 6/15/20 | | | | 593 | |
| | 1,245 | | | U.S. Treasury Note | | | 1.50 | | | | 5/31/20 | | | | 1,221 | |
| | 1,450 | | | U.S. Treasury Note | | | 1.50 | | | | 10/31/19 | | | | 1,432 | |
| | 1,000 | | | U.S. Treasury Note | | | 1.50 | | | | 11/30/19 | | | | 986 | |
| | 655 | | | U.S. Treasury Note | | | 1.50 | | | | 4/15/20 | | | | 643 | |
| | 680 | | | U.S. Treasury Note | | | 1.50 | | | | 8/15/20 | | | | 665 | |
| | 1,350 | | | U.S. Treasury Note | | | 1.50 | | | | 2/28/23 | | | | 1,278 | |
| | 1,100 | | | U.S. Treasury Note | | | 1.50 | | | | 1/31/22 | | | | 1,056 | |
| | 1,115 | | | U.S. Treasury Note | | | 1.50 | | | | 3/31/23 | | | | 1,054 | |
| | 905 | | | U.S. Treasury Note | | | 1.50 | | | | 5/15/20 | | | | 888 | |
| | 1,800 | | | U.S. Treasury Note | | | 1.50 | | | | 8/15/26 | | | | 1,625 | |
| | 900 | | | U.S. Treasury Note | | | 1.63 | | | | 6/30/20 | | | | 884 | |
| | 770 | | | U.S. Treasury Note | | | 1.63 | | | | 7/31/20 | | | | 756 | |
| | 760 | | | U.S. Treasury Note | | | 1.63 | | | | 8/31/19 | | | | 753 | |
| | 780 | | | U.S. Treasury Note | | | 1.63 | | | | 11/30/20 | | | | 762 | |
| | 1,000 | | | U.S. Treasury Note | | | 1.63 | | | | 10/15/20 | | | | 979 | |
| | 1,200 | | | U.S. Treasury Note | | | 1.63 | | | | 8/31/22 | | | | 1,149 | |
| | 650 | | | U.S. Treasury Note | | | 1.63 | | | | 3/15/20 | | | | 640 | |
See accompanying notes to financial statements.
200
HC CAPITAL TRUST
The U.S. Government Fixed Income Securities Portfolio
Portfolio of Investments (continued) — June 30, 2018
| | | | | | | | | | | | | | | | |
Principal
Amount
(000) | | | Security Description | | Rate % | | | Maturity
Date | | | Value
(000) | |
| | | | U.S. Treasury Obligations (continued) | | | | | | | | | | | | |
| $ | 370 | | | U.S. Treasury Note | | | 1.63 | | | | 8/15/22 | | | $ | 354 | |
| | 1,000 | | | U.S. Treasury Note | | | 1.63 | | | | 12/31/19 | | | | 988 | |
| | 1,580 | | | U.S. Treasury Note | | | 1.63 | | | | 5/15/26 | | | | 1,445 | |
| | 810 | | | U.S. Treasury Note | | | 1.63 | | | | 4/30/23 | | | | 769 | |
| | 2,080 | | | U.S. Treasury Note | | | 1.63 | | | | 2/15/26 | | | | 1,908 | |
| | 877 | | | U.S. Treasury Note | | | 1.63 | | | | 11/15/22 | | | | 838 | |
| | 500 | | | U.S. Treasury Note | | | 1.63 | | | | 7/31/19 | | | | 496 | |
| | 1,250 | | | U.S. Treasury Note | | | 1.63 | | | | 5/31/23 | | | | 1,186 | |
| | 975 | | | U.S. Treasury Note | | | 1.63 | | | | 10/31/23 | | | | 920 | |
| | 1,280 | | | U.S. Treasury Note | | | 1.75 | | | | 11/15/20 | | | | 1,256 | |
| | 915 | | | U.S. Treasury Note | | | 1.75 | | | | 11/30/21 | | | | 888 | |
| | 1,315 | | | U.S. Treasury Note | | | 1.75 | | | | 10/31/20 | | | | 1,290 | |
| | 695 | | | U.S. Treasury Note | | | 1.75 | | | | 11/30/19 | | | | 688 | |
| | 710 | | | U.S. Treasury Note | | | 1.75 | | | | 9/30/22 | | | | 683 | |
| | 1,045 | | | U.S. Treasury Note | | | 1.75 | | | | 2/28/22 | | | | 1,011 | |
| | 700 | | | U.S. Treasury Note | | | 1.75 | | | | 1/31/23 | | | | 671 | |
| | 1,000 | | | U.S. Treasury Note | | | 1.75 | | | | 12/31/20 | | | | 980 | |
| | 820 | | | U.S. Treasury Note | | | 1.75 | | | | 3/31/22 | | | | 793 | |
| | 910 | | | U.S. Treasury Note | | | 1.75 | | | | 4/30/22 | | | | 879 | |
| | 1,603 | | | U.S. Treasury Note | | | 1.75 | | | | 5/15/23 | | | | 1,531 | |
| | 450 | | | U.S. Treasury Note | | | 1.75 | | | | 5/15/22 | | | | 434 | |
| | 850 | | | U.S. Treasury Note | | | 1.75 | | | | 6/30/22 | | | | 819 | |
| | 780 | | | U.S. Treasury Note | | | 1.75 | | | | 9/30/19 | | | | 773 | |
| | 1,395 | | | U.S. Treasury Note | | | 1.75 | | | | 5/31/22 | | | | 1,346 | |
| | 925 | | | U.S. Treasury Note | | | 1.88 | | | | 2/28/22 | | | | 899 | |
| | 1,000 | | | U.S. Treasury Note | | | 1.88 | | | | 4/30/22 | | | | 970 | |
| | 875 | | | U.S. Treasury Note | | | 1.88 | | | | 8/31/22 | | | | 846 | |
| | 1,280 | | | U.S. Treasury Note | | | 1.88 | | | | 12/15/20 | | | | 1,258 | |
| | 685 | | | U.S. Treasury Note | | | 1.88 | | | | 12/31/19 | | | | 679 | |
| | 420 | | | U.S. Treasury Note | | | 1.88 | | | | 6/30/20 | | | | 415 | |
| | 625 | | | U.S. Treasury Note | | | 1.88 | | | | 11/30/21 | | | | 609 | |
| | 1,000 | | | U.S. Treasury Note | | | 1.88 | | | | 1/31/22 | | | | 973 | |
| | 850 | | | U.S. Treasury Note | | | 1.88 | | | | 3/31/22 | | | | 825 | |
| | 665 | | | U.S. Treasury Note | | | 1.88 | | | | 5/31/22 | | | | 645 | |
| | 930 | | | U.S. Treasury Note | | | 1.88 | | | | 7/31/22 | | | | 900 | |
| | 850 | | | U.S. Treasury Note | | | 1.88 | | | | 10/31/22 | | | | 821 | |
| | 910 | | | U.S. Treasury Note | | | 1.88 | | | | 9/30/22 | | | | 880 | |
| | 765 | | | U.S. Treasury Note | | | 1.88 | | | | 8/31/24 | | | | 725 | |
| | 760 | | | U.S. Treasury Note | | | 2.00 | | | | 4/30/24 | | | | 728 | |
| | 745 | | | U.S. Treasury Note | | | 2.00 | | | | 5/31/24 | | | | 713 | |
| | 1,110 | | | U.S. Treasury Note | | | 2.00 | | | | 11/15/21 | | | | 1,087 | |
| | 1,680 | | | U.S. Treasury Note | | | 2.00 | | | | 8/15/25 | | | | 1,591 | |
| | 900 | | | U.S. Treasury Note | | | 2.00 | | | | 10/31/22 | | | | 874 | |
| | 2,025 | | | U.S. Treasury Note | | | 2.00 | | | | 2/15/25 | | | | 1,925 | |
| | 938 | | | U.S. Treasury Note | | | 2.00 | | | | 2/15/22 | | | | 916 | |
| | 700 | | | U.S. Treasury Note | | | 2.00 | | | | 2/28/21 | | | | 689 | |
| | 1,000 | | | U.S. Treasury Note | | | 2.00 | | | | 10/31/21 | | | | 979 | |
| | 1,538 | | | U.S. Treasury Note | | | 2.00 | | | | 2/15/23 | | | | 1,490 | |
| | 840 | | | U.S. Treasury Note | | | 2.00 | | | | 7/31/22 | | | | 817 | |
| | 900 | | | U.S. Treasury Note | | | 2.00 | | | | 8/31/21 | | | | 882 | |
| | 700 | | | U.S. Treasury Note | | | 2.00 | | | | 5/31/21 | | | | 688 | |
| | 940 | | | U.S. Treasury Note | | | 2.00 | | | | 6/30/24 | | | | 899 | |
| | 660 | | | U.S. Treasury Note | | | 2.00 | | | | 7/31/20 | | | | 653 | |
| | 1,050 | | | U.S. Treasury Note | | | 2.00 | | | | 11/30/20 | | | | 1,036 | |
See accompanying notes to financial statements.
201
HC CAPITAL TRUST
The U.S. Government Fixed Income Securities Portfolio
Portfolio of Investments (continued) — June 30, 2018
| | | | | | | | | | | | | | | | |
Principal
Amount
(000) | | | Security Description | | Rate % | | | Maturity
Date | | | Value
(000) | |
| | | | U.S. Treasury Obligations (continued) | | | | | | | | | | | | |
| $ | 725 | | | U.S. Treasury Note | | | 2.00 | | | | 1/31/20 | | | $ | 720 | |
| | 1,350 | | | U.S. Treasury Note | | | 2.00 | | | | 11/30/22 | | | | 1,310 | |
| | 670 | | | U.S. Treasury Note | | | 2.00 | | | | 1/15/21 | | | | 660 | |
| | 1,000 | | | U.S. Treasury Note | | | 2.00 | | | | 12/31/21 | | | | 978 | |
| | 800 | | | U.S. Treasury Note | | | 2.00 | | | | 9/30/20 | | | | 790 | |
| | 2,140 | | | U.S. Treasury Note | | | 2.00 | | | | 11/15/26 | | | | 2,005 | |
| | 750 | | | U.S. Treasury Note | | | 2.13 | | | | 11/30/23 | | | | 726 | |
| | 1,315 | | | U.S. Treasury Note | | | 2.13 | | | | 9/30/24 | | | | 1,264 | |
| | 750 | | | U.S. Treasury Note | | | 2.13 | | | | 1/31/21 | | | | 741 | |
| | 1,680 | | | U.S. Treasury Note | | | 2.13 | | | | 12/31/22 | | | | 1,637 | |
| | 800 | | | U.S. Treasury Note | | | 2.13 | | | | 12/31/21 | | | | 785 | |
| | 760 | | | U.S. Treasury Note | | | 2.13 | | | | 2/29/24 | | | | 734 | |
| | 600 | | | U.S. Treasury Note | | | 2.13 | | | | 8/31/20 | | | | 595 | |
| | 945 | | | U.S. Treasury Note | | | 2.13 | | | | 6/30/22 | | | | 924 | |
| | 1,000 | | | U.S. Treasury Note | | | 2.13 | | | | 6/30/21 | | | | 985 | |
| | 875 | | | U.S. Treasury Note | | | 2.13 | | | | 3/31/24 | | | | 844 | |
| | 745 | | | U.S. Treasury Note | | | 2.13 | | | | 11/30/24 | | | | 715 | |
| | 1,660 | | | U.S. Treasury Note | | | 2.13 | | | | 5/15/25 | | | | 1,588 | |
| | 785 | | | U.S. Treasury Note | | | 2.13 | | | | 9/30/21 | | | | 772 | |
| | 1,115 | | | U.S. Treasury Note | | | 2.13 | | | | 7/31/24 | | | | 1,073 | |
| | 1,095 | | | U.S. Treasury Note | | | 2.13 | | | | 8/15/21 | | | | 1,078 | |
| | 790 | | | U.S. Treasury Note | | | 2.25 | | | | 2/29/20 | | | | 787 | |
| | 700 | | | U.S. Treasury Note | | | 2.25 | | | | 4/30/21 | | | | 693 | |
| | 1,955 | | | U.S. Treasury Note | | | 2.25 | | | | 11/15/24 | | | | 1,891 | |
| | 880 | | | U.S. Treasury Note | | | 2.25 | | | | 12/31/24 | | | | 851 | |
| | 735 | | | U.S. Treasury Note | | | 2.25 | | | | 2/15/21 | | | | 728 | |
| | 785 | | | U.S. Treasury Note | | | 2.25 | | | | 7/31/21 | | | | 776 | |
| | 1,900 | | | U.S. Treasury Note | | | 2.25 | | | | 8/15/27 | | | | 1,808 | |
| | 1,875 | | | U.S. Treasury Note | | | 2.25 | | | | 11/15/25 | | | | 1,803 | |
| | 1,000 | | | U.S. Treasury Note | | | 2.25 | | | | 3/31/21 | | | | 990 | |
| | 1,845 | | | U.S. Treasury Note | | | 2.25 | | | | 11/15/27 | | | | 1,753 | |
| | 950 | | | U.S. Treasury Note | | | 2.25 | | | | 12/31/23 | | | | 925 | |
| | 1,700 | | | U.S. Treasury Note | | | 2.25 | | | | 2/15/27 | | | | 1,622 | |
| | 1,315 | | | U.S. Treasury Note | | | 2.25 | | | | 10/31/24 | | | | 1,273 | |
| | 845 | | | U.S. Treasury Note | | | 2.25 | | | | 3/31/20 | | | | 841 | |
| | 500 | | | U.S. Treasury Note | | | 2.38 | | | | 1/31/23 | | | | 492 | |
| | 790 | | | U.S. Treasury Note | | | 2.38 | | | | 3/15/21 | | | | 785 | |
| | 700 | | | U.S. Treasury Note | | | 2.38 | | | | 12/31/20 | | | | 696 | |
| | 350 | | | U.S. Treasury Note | | | 2.38 | | | | 4/15/21 | | | | 348 | |
| | 1,560 | | | U.S. Treasury Note | | | 2.38 | | | | 5/15/27 | | | | 1,502 | |
| | 1,675 | | | U.S. Treasury Note | | | 2.38 | | | | 8/15/24 | | | | 1,635 | |
| | 900 | | | U.S. Treasury Note | | | 2.38 | | | | 4/30/20 | | | | 898 | |
| | 2,105 | | | U.S. Treasury Note | | | 2.50 | | | | 5/15/24 | | | | 2,073 | |
| | 1,370 | | | U.S. Treasury Note | | | 2.50 | | | | 8/15/23 | | | | 1,354 | |
| | 940 | | | U.S. Treasury Note | | | 2.50 | | | | 5/31/20 | | | | 940 | |
| | 995 | | | U.S. Treasury Note | | | 2.50 | | | | 6/30/20 | | | | 994 | |
| | 700 | | | U.S. Treasury Note | | | 2.50 | | | | 1/31/25 | | | | 687 | |
| | 990 | | | U.S. Treasury Note | | | 2.50 | | | | 3/31/23 | | | | 980 | |
| | 885 | | | U.S. Treasury Note | | | 2.63 | | | | 5/15/21 | | | | 885 | |
| | 500 | | | U.S. Treasury Note | | | 2.63 | | | | 6/30/23 | | | | 497 | |
| | 1,353 | | | U.S. Treasury Note | | | 2.63 | | | | 11/15/20 | | | | 1,354 | |
| | 985 | | | U.S. Treasury Note | | | 2.63 | | | | 2/28/23 | | | | 981 | |
| | 1,377 | | | U.S. Treasury Note | | | 2.63 | | | | 8/15/20 | | | | 1,379 | |
| | 750 | | | U.S. Treasury Note | | | 2.63 | | | | 3/31/25 | | | | 741 | |
See accompanying notes to financial statements.
202
HC CAPITAL TRUST
The U.S. Government Fixed Income Securities Portfolio
Portfolio of Investments (concluded) — June 30, 2018
| | | | | | | | | | | | | | | | |
Principal
Amount
(000) | | | Security Description | | Rate % | | | Maturity
Date | | | Value
(000) | |
| | | | U.S. Treasury Obligations (continued) | | | | | | | | | | | | |
| $ | 935 | | | U.S. Treasury Note | | | 2.63 | | | | 6/15/21 | | | $ | 935 | |
| | 875 | | | U.S. Treasury Note | | | 2.75 | | | | 6/30/25 | | | | 871 | |
| | 800 | | | U.S. Treasury Note | | | 2.75 | | | | 5/31/23 | | | | 801 | |
| | 1,317 | | | U.S. Treasury Note | | | 2.75 | | | | 11/15/23 | | | | 1,316 | |
| | 2,120 | | | U.S. Treasury Note | | | 2.75 | | | | 2/15/28 | | | | 2,102 | |
| | 980 | | | U.S. Treasury Note | | | 2.75 | | | | 4/30/23 | | | | 981 | |
| | 1,415 | | | U.S. Treasury Note | | | 2.75 | | | | 2/15/24 | | | | 1,413 | |
| | 820 | | | U.S. Treasury Note | | | 2.75 | | | | 2/28/25 | | | | 817 | |
| | 815 | | | U.S. Treasury Note | | | 2.88 | | | | 4/30/25 | | | | 818 | |
| | 855 | | | U.S. Treasury Note | | | 2.88 | | | | 5/31/25 | | | | 858 | |
| | 1,370 | | | U.S. Treasury Note | | | 2.88 | | | | 5/15/28 | | | | 1,372 | |
| | 700 | | | U.S. Treasury Note | | | 3.13 | | | | 5/15/21 | | | | 710 | |
| | 1,082 | | | U.S. Treasury Note | | | 3.38 | | | | 11/15/19 | | | | 1,095 | |
| | 825 | | | U.S. Treasury Note | | | 3.50 | | | | 5/15/20 | | | | 840 | |
| | 1,260 | | | U.S. Treasury Note | | | 3.63 | | | | 2/15/20 | | | | 1,282 | |
| | 1,152 | | | U.S. Treasury Note | | | 3.63 | | | | 2/15/21 | | | | 1,181 | |
| | 800 | | | U.S. Treasury Note | | | 3.63 | | | | 8/15/19 | | | | 811 | |
| | 150 | | | U.S. Treasury Note | | | 5.50 | | | | 8/15/28 | | | | 185 | |
| | | | | | | | | | | | | | | | |
| | | | Total U.S. Treasury Obligations | | | | | | | | | | | 222,098 | |
| | | | | | | | | | | | | | | | |
| | | | Yankee Dollar — 0.06% | | | | | | | | | | | | |
| | 115 | | | AID-Israel (Sovereign Bond) | | | 5.50 | | | | 9/18/23 | | | | 129 | |
| | | | | | | | | | | | | | | | |
| | | | Total Yankee Dollar | | | | | | | | | | | 129 | |
| | | | | | | | | | | | | | | | |
| | | | Time Deposit — 0.38% | | | | | | | | | | | | |
| | 885 | | | State Street Liquidity Management Control System Eurodollar Time Deposit | | | 0.53 | | | | 7/2/18 | | | | 885 | |
| | | | | | | | | | | | | | | | |
| | | | Total Time Deposit | | | | | | | | | | | 885 | |
| | | | | | | | | | | | | | | | |
| | | | |
| Shares | | | | | | | | | | | | |
| | | | Mutual Fund — 0.23% | | | | | | | | | | | | |
| | 541,547 | | | State Street Institutional Treasury Plus Money Market Fund, Trust Class | | | 1.72 | (c) | | | | | | | 542 | |
| | | | | | | | | | | | | | | | |
| | | | Total Mutual Fund | | | | | | | | | | | 542 | |
| | | | | | | | | | | | | | | | |
| | | | Total Investments (cost $236,505) — 99.82% | | | | | | | | | | | 232,952 | |
| | | | Other assets in excess of liabilities — 0.18% | | | | | | | | | | | 425 | |
| | | | | | | | | | | | | | | | |
| | | | Net Assets — 100.00% | | | | | | | | | | $ | 233,377 | |
| | | | | | | | | | | | | | | | |
| (a) | Zero Coupon Security. Effective rate shown is as of June 30, 2018. |
| (b) | Rate disclosed represents effective yield at purchase. |
| (c) | The rate disclosed is the rate in effect on June 30, 2018. |
The following table reflects the percentage of total net assets of the Portfolio attributable to each Specialist Manager as of June 30, 2018.
| | | | | | | | | | | | |
The U.S. Government Fixed Income Securities Portfolio | | BNY Mellon Asset
Management North
America Corporation* | | | HC Capital
Solutions | | | Total | |
U.S. Government Agency Securities | | | 3.98 | % | | | — | | | | 3.98 | % |
U.S. Treasury Obligations | | | 95.17 | % | | | — | | | | 95.17 | % |
Yankee Dollar | | | 0.06 | % | | | — | | | | 0.06 | % |
Time Deposit | | | 0.38 | % | | | — | | | | 0.38 | % |
Mutual Fund | | | — | | | | 0.23 | % | | | 0.23 | % |
Other Assets (Liabilities) | | | 0.18 | % | | | 0.00 | % | | | 0.18 | % |
| | | | | | | | | | | | |
Total Net Assets | | | 99.77 | % | | | 0.23 | % | | | 100.00 | % |
| | | | | | | | | | | | |
| * | Formerly Mellon Capital Management Corporation. |
Amounts designated as “—” indicate the Specialist Manager did not manage any holdings in that category.
See accompanying notes to financial statements.
203
HC CAPITAL TRUST
The Inflation Protected Securities Portfolio
Portfolio of Investments — June 30, 2018
| | | | | | | | | | | | | | | | |
Principal
Amount
(000) | | | Security Description | | Rate % | | | Maturity
Date | | | Value
(000) | |
| | | | U.S. Treasury Obligations — 94.81% | | | | | | | | | | | | |
| $ | 4,844 | | | U.S. Treasury Inflation Index Bond | | | 0.63 | | | | 2/15/43 | | | $ | 4,582 | |
| | 6,549 | | | U.S. Treasury Inflation Index Bond | | | 0.75 | | | | 2/15/42 | | | | 6,391 | |
| | 8,144 | | | U.S. Treasury Inflation Index Bond | | | 0.75 | | | | 2/15/45 | | | | 7,897 | |
| | 5,868 | | | U.S. Treasury Inflation Index Bond | | | 0.88 | | | | 2/15/47 | | | | 5,867 | |
| | 5,985 | | | U.S. Treasury Inflation Index Bond | | | 1.00 | | | | 2/15/46 | | | | 6,162 | |
| | 4,060 | | | U.S. Treasury Inflation Index Bond | | | 1.00 | | | | 2/15/48 | | | | 4,195 | |
| | 7,307 | | | U.S. Treasury Inflation Index Bond | | | 1.38 | | | | 2/15/44 | | | | 8,153 | |
| | 5,562 | | | U.S. Treasury Inflation Index Bond | | | 1.75 | | | | 1/15/28 | | | | 6,077 | |
| | 6,906 | | | U.S. Treasury Inflation Index Bond | | | 2.00 | | | | 1/15/26 | | | | 7,566 | |
| | 2,931 | | | U.S. Treasury Inflation Index Bond | | | 2.13 | | | | 2/15/40 | | | | 3,683 | |
| | 3,728 | | | U.S. Treasury Inflation Index Bond | | | 2.13 | | | | 2/15/41 | | | | 4,719 | |
| | 5,555 | | | U.S. Treasury Inflation Index Bond | | | 2.38 | | | | 1/15/27 | | | | 6,318 | |
| | 9,475 | | | U.S. Treasury Inflation Index Bond | | | 2.38 | | | | 1/15/25 | | | | 10,506 | |
| | 5,368 | | | U.S. Treasury Inflation Index Bond | | | 2.50 | | | | 1/15/29 | | | | 6,306 | |
| | 2,163 | | | U.S. Treasury Inflation Index Bond | | | 3.38 | | | | 4/15/32 | | | | 2,887 | |
| | 4,681 | | | U.S. Treasury Inflation Index Bond | | | 3.63 | | | | 4/15/28 | | | | 5,941 | |
| | 5,692 | | | U.S. Treasury Inflation Index Bond | | | 3.88 | | | | 4/15/29 | | | | 7,503 | |
| | 14,806 | | | U.S. Treasury Inflation Index Note | | | 0.13 | | | | 1/15/23 | | | | 14,474 | |
| | 17,803 | | | U.S. Treasury Inflation Index Note | | | 0.13 | | | | 4/15/20 | | | | 17,613 | |
| | 14,398 | | | U.S. Treasury Inflation Index Note | | | 0.13 | | | | 7/15/24 | | | | 13,996 | |
| | 15,082 | | | U.S. Treasury Inflation Index Note | | | 0.13 | | | | 4/15/22 | | | | 14,773 | |
| | 14,736 | | | U.S. Treasury Inflation Index Note | | | 0.13 | | | | 7/15/22 | | | | 14,492 | |
| | 14,286 | | | U.S. Treasury Inflation Index Note | | | 0.13 | | | | 1/15/22 | | | | 14,043 | |
| | 15,480 | | | U.S. Treasury Inflation Index Note | | | 0.13 | | | | 4/15/21 | | | | 15,239 | |
| | 12,176 | | | U.S. Treasury Inflation Index Note | | | 0.13 | | | | 7/15/26 | | | | 11,664 | |
| | 14,433 | | | U.S. Treasury Inflation Index Note | | | 0.25 | | | | 1/15/25 | | | | 14,038 | |
| | 11,939 | | | U.S. Treasury Inflation Index Note | | | 0.38 | | | | 7/15/27 | | | | 11,614 | |
| | 14,687 | | | U.S. Treasury Inflation Index Note | | | 0.38 | | | | 7/15/23 | | | | 14,553 | |
| | 14,417 | | | U.S. Treasury Inflation Index Note | | | 0.38 | | | | 7/15/25 | | | | 14,161 | |
| | 12,081 | | | U.S. Treasury Inflation Index Note | | | 0.38 | | | | 1/15/27 | | | | 11,736 | |
| | 11,840 | | | U.S. Treasury Inflation Index Note | | | 0.50 | | | | 1/15/28 | | | | 11,582 | |
| | 12,981 | | | U.S. Treasury Inflation Index Note | | | 0.63 | | | | 1/15/26 | | | | 12,909 | |
| | 12,945 | | | U.S. Treasury Inflation Index Note | | | 0.63 | | | | 7/15/21 | | | | 12,994 | |
| | 14,644 | | | U.S. Treasury Inflation Index Note | | | 0.63 | | | | 1/15/24 | | | | 14,625 | |
| | 5,372 | | | U.S. Treasury Inflation Index Note | | | 0.63 | | | | 4/15/23 | | | | 5,363 | |
| | 12,195 | | | U.S. Treasury Inflation Index Note | | | 1.13 | | | | 1/15/21 | | | | 12,354 | |
| | 10,660 | | | U.S. Treasury Inflation Index Note | | | 1.25 | | | | 7/15/20 | | | | 10,833 | |
| | 6,919 | | | U.S. Treasury Inflation Index Note | | | 1.38 | | | | 1/15/20 | | | | 6,997 | |
| | 5,711 | | | U.S. Treasury Inflation Index Note | | | 1.88 | | | | 7/15/19 | | | | 5,804 | |
| | | | | | | | | | | | | | | | |
| | | | Total U.S. Treasury Obligations | | | | | | | | | | | 380,610 | |
| | | | | | | | | | | | | | | | |
Shares | | | | | | | | | | | | |
| | | | Mutual Fund — 5.00% | | | | | | | | | | | | |
| | 20,090,617 | | | State Street Institutional Treasury Plus Money Market Fund, Trust Class | | | 1.72 | (a) | | | | | | | 20,091 | |
| | | | | | | | | | | | | | | | |
| | | | Total Mutual Fund | | | | | | | | | | | 20,091 | |
| | | | | | | | | | | | | | | | |
| | | | Total Investments (cost $400,830) — 99.81% | | | | | | | | | | | 400,701 | |
| | | | Other assets in excess of liabilities — 0.19% | | | | | | | | | | | 756 | |
| | | | | | | | | | | | | | | | |
| | | | Net Assets — 100.00% | | | | | | | | | | $ | 401,457 | |
| | | | | | | | | | | | | | | | |
| (a) | The rate disclosed is the rate in effect on June 30, 2018. |
See accompanying notes to financial statements.
204
HC CAPITAL TRUST
The Inflation Protected Securities Portfolio
Portfolio of Investments (concluded) — June 30, 2018
The following table reflects the percentage of total net assets of the Portfolio attributable to each Specialist Manager as of June 30, 2018.
| | | | | | | | | | | | |
The Inflation Protected Securities Portfolio | | BNY Mellon Asset
Management North
America Corporation* | | | HC Capital
Solutions | | | Total | |
U.S. Treasury Obligations | | | 94.81 | % | | | — | | | | 94.81 | % |
Mutual Fund | | | 0.00 | % | | | 5.00 | % | | | 5.00 | % |
Other Assets (Liabilities) | | | 0.76 | % | | | -0.57 | % | | | 0.19 | % |
| | | | | | | | | | | | |
Total Net Assets | | | 95.57 | % | | | 4.43 | % | | | 100.00 | % |
| | | | | | | | | | | | |
| * | Formerly Mellon Capital Management Corporation. |
| Amounts | designated as “—” indicate the Specialist Manager did not manage any holdings in that category. |
See accompanying notes to financial statements.
205
HC CAPITAL TRUST
The U.S. Corporate Fixed Income Securities Portfolio
Portfolio of Investments — June 30, 2018
| | | | | | | | | | | | | | | | |
Principal
Amount
(000) | | | Security Description | | Rate % | | | Maturity
Date | | | Value
(000) | |
| | | | Corporate Bonds — 77.88% | | | | | | | | | | | | |
| $ | 3,015 | | | Abbott Laboratories (Health Care Equipment & Supplies), Callable 8/30/26 @ 100.00 | | | 3.75 | | | | 11/30/26 | | | $ | 2,963 | |
| | 989 | | | AbbVie, Inc. (Biotechnology) | | | 4.40 | | | | 11/6/42 | | | | 939 | |
| | 2,075 | | | AbbVie, Inc. (Biotechnology), Callable 11/14/34 @ 100.00 | | | 4.50 | | | | 5/14/35 | | | | 2,033 | |
| | 530 | | | Alabama Power Co., Series B (Electric Utilities), Callable 6/1/47 @ 100.00 | | | 3.70 | | | | 12/1/47 | | | | 491 | |
| | 155 | | | Alabama Power Co. (Electric Utilities), Callable 2/15/44 @ 100.00 | | | 4.15 | | | | 8/15/44 | | | | 153 | |
| | 3,375 | | | American Express Co. (Consumer Finance), Callable 7/1/22 @ 100.00 | | | 2.50 | | | | 8/1/22 | | | | 3,236 | |
| | 3,990 | | | Ameriprise Financial, Inc. (Capital Markets) | | | 3.70 | | | | 10/15/24 | | | | 3,980 | |
| | 1,515 | | | Amgen, Inc. (Biotechnology), Callable 4/11/22 @ 100.00 | | | 2.65 | | | | 5/11/22 | | | | 1,467 | |
| | 2,235 | | | Amgen, Inc. (Biotechnology), Callable 2/1/25 @ 100.00 | | | 3.13 | | | | 5/1/25 | | | | 2,137 | |
| | 1,320 | | | Amgen, Inc. (Biotechnology), Callable 8/15/21 @ 100.00 | | | 3.88 | | | | 11/15/21 | | | | 1,339 | |
| | 1,408 | | | Analog Devices, Inc. (Semiconductors & Semiconductor Equipment), Callable 9/5/26 @ 100.00 | | | 3.50 | | | | 12/5/26 | | | | 1,342 | |
| | 2,330 | | | Analog Devices, Inc. (Semiconductors & Semiconductor Equipment),
Callable 9/15/25 @ 100.00 | | | 3.90 | | | | 12/15/25 | | | | 2,308 | |
| | 6,158 | | | Anheuser-Busch InBev Finance, Inc. (Beverages), Callable 11/1/25 @ 100.00 | | | 3.65 | | | | 2/1/26 | | | | 6,031 | |
| | 1,910 | | | Anheuser-Busch InBev Finance, Inc. (Beverages), Callable 8/1/45 @ 100.00 | | | 4.90 | | | | 2/1/46 | | | | 1,964 | |
| | 266 | | | Anheuser-Busch InBev N.V. (Beverages), Callable 8/1/35 @ 100.00 | | | 4.70 | | | | 2/1/36 | | | | 269 | |
| | 1,730 | | | Anthem, Inc. (Health Care Providers & Services) | | | 3.13 | | | | 5/15/22 | | | | 1,703 | |
| | 1,095 | | | Anthem, Inc. (Health Care Providers & Services), Callable 9/1/27 @ 100.00 | | | 3.65 | | | | 12/1/27 | | | | 1,037 | |
| | 1,035 | | | Anthem, Inc. (Health Care Providers & Services), Callable 5/15/21 @ 100.00 | | | 3.70 | | | | 8/15/21 | | | | 1,044 | |
| | 115 | | | Anthem, Inc. (Health Care Providers & Services) | | | 4.63 | | | | 5/15/42 | | | | 111 | |
| | 750 | | | Archer-Daniels-Midland Co. (Food Products) | | | 4.02 | | | | 4/16/43 | | | | 731 | |
| | 1,065 | | | AT&T, Inc. (Diversified Telecommunication Services) | | | 3.80 | | | | 3/15/22 | | | | 1,067 | |
| | 4,610 | | | AT&T, Inc. (Diversified Telecommunication Services), Callable 1/1/24 @ 100.00 | | | 4.45 | | | | 4/1/24 | | | | 4,652 | |
| | 1,730 | | | AT&T, Inc. (Diversified Telecommunication Services) | | | 5.35 | | | | 9/1/40 | | | | 1,687 | |
| | 585 | | | AT&T, Inc. (Diversified Telecommunication Services) | | | 5.55 | | | | 8/15/41 | | | | 582 | |
| | 265 | | | Atmos Energy Corp. (Gas Utilities), Callable 4/15/44 @ 100.00 | | | 4.13 | | | | 10/15/44 | | | | 267 | |
| | 9,553 | | | Bank of America Corp., MTN (Banks) | | | 3.88 | | | | 8/1/25 | | | | 9,502 | |
| | 1,033 | | | Bank One Corp. (Banks) | | | 8.00 | | | | 4/29/27 | | | | 1,289 | |
| | 1,820 | | | Berkshire Hathaway, Inc. (Diversified Financial Services), Callable 8/1/44 @ 100.00 | | | 4.50 | | | | 2/1/45 | | | | 1,861 | |
| | 300 | | | Bunge Limited Finance Corp. (Food Products), Callable 8/25/22 @ 100.00 | | | 3.00 | | | | 9/25/22 | | | | 289 | |
| | 1,510 | | | Bunge Limited Finance Corp. (Food Products), Callable 5/15/26 @ 100.00 | | | 3.25 | | | | 8/15/26 | | | | 1,378 | |
| | 935 | | | Bunge Limited Finance Corp. (Food Products) | | | 8.50 | | | | 6/15/19 | | | | 982 | |
| | 1,335 | | | Capital One Financial Corp. (Consumer Finance), Callable 3/30/21 @ 100.00 | | | 3.45 | | | | 4/30/21 | | | | 1,332 | |
| | 4,800 | | | Capital One Financial Corp. (Consumer Finance) | | | 3.50 | | | | 6/15/23 | | | | 4,687 | |
| | 1,708 | | | Capital One Financial Corp. (Consumer Finance) | | | 4.75 | | | | 7/15/21 | | | | 1,765 | |
| | 700 | | | Cisco Systems, Inc. (Communications Equipment) | | | 5.50 | | | | 1/15/40 | | | | 832 | |
| | 6,335 | | | Citigroup, Inc. (Banks), Callable 11/8/21 @ 100.00 | | | 2.90 | | | | 12/8/21 | | | | 6,205 | |
| | 3,460 | | | Citigroup, Inc. (Banks) | | | 3.40 | | | | 5/1/26 | | | | 3,283 | |
| | 695 | | | Citigroup, Inc. (Banks) | | | 4.50 | | | | 1/14/22 | | | | 714 | |
| | 500 | | | Comcast Corp. (Media), Callable 9/1/37 @ 100.00 | | | 3.90 | | | | 3/1/38 | | | | 455 | |
| | 50 | | | Comcast Corp. (Media) | | | 4.65 | | | | 7/15/42 | | | | 49 | |
| | 2,185 | | | Comcast Corp. (Media) | | | 4.75 | | | | 3/1/44 | | | | 2,149 | |
| | 2,220 | | | ConocoPhillips (Oil, Gas & Consumable Fuels) | | | 6.50 | | | | 2/1/39 | | | | 2,834 | |
| | 175 | | | Consolidated Edison Company of New York, Inc., Series 2008-B (Multi-Utilities) | | | 6.75 | | | | 4/1/38 | | | | 231 | |
| | 1,650 | | | Constellation Brands, Inc. (Beverages) | | | 4.75 | | | | 11/15/24 | | | | 1,712 | |
| | 765 | | | Constellation Brands, Inc. (Beverages) | | | 4.75 | | | | 12/1/25 | | | | 792 | |
| | 1,770 | | | CSX Corp. (Road & Rail) | | | 6.22 | | | | 4/30/40 | | | | 2,133 | |
| | 1,454 | | | CVS Health Corp. (Food & Staples Retailing), Callable 9/1/22 @ 100.00 | | | 2.75 | | | | 12/1/22 | | | | 1,393 | |
| | 795 | | | CVS Health Corp. (Food & Staples Retailing), Callable 2/9/23 @ 100.00 | | | 3.70 | | | | 3/9/23 | | | | 787 | |
| | 5,410 | | | CVS Health Corp. (Food & Staples Retailing), Callable 12/25/27 @ 100.00 | | | 4.30 | | | | 3/25/28 | | | | 5,334 | |
| | 980 | | | Devon Energy Corp. (Oil, Gas & Consumable Fuels), Callable 2/15/22 @ 100.00 | | | 3.25 | | | | 5/15/22 | | | | 963 | |
| | 925 | | | Devon Energy Corp. (Oil, Gas & Consumable Fuels), Callable 4/15/21 @ 100.00 | | | 4.00 | | | | 7/15/21 | | | | 937 | |
| | 1,765 | | | Devon Energy Corp. (Oil, Gas & Consumable Fuels), Callable 1/15/41 @ 100.00 | | | 5.60 | | | | 7/15/41 | | | | 1,903 | |
| | 315 | | | Devon Energy Corp. (Oil, Gas & Consumable Fuels), Callable 9/15/25 @ 100.00 | | | 5.85 | | | | 12/15/25 | | | | 347 | |
See accompanying notes to financial statements.
206
HC CAPITAL TRUST
The U.S. Corporate Fixed Income Securities Portfolio
Portfolio of Investments (continued) — June 30, 2018
| | | | | | | | | | | | | | | | |
Principal
Amount
(000) | | | Security Description | | Rate % | | | Maturity
Date | | | Value
(000) | |
| | | | Corporate Bonds (continued) | | | | | | | | | | | | |
| $ | 1,825 | | | Digital Realty Trust LP (Equity Real Estate Investment Trusts), Callable 1/1/23 @ 100.00 | | | 2.75 | | | | 2/1/23 | | | $ | 1,737 | |
| | 1,830 | | | Dominion Gas Holdings LLC (Multi-Utilities), Callable 9/15/24 @ 100.00 | | | 3.60 | | | | 12/15/24 | | | | 1,821 | |
| | 2,000 | | | Dominion Resources, Inc. (Multi-Utilities) | | | 5.20 | | | | 8/15/19 | | | | 2,045 | |
| | 800 | | | Dow Chemical Co. (The) (Chemicals), Callable 7/1/24 @ 100.00 | | | 3.50 | | | | 10/1/24 | | | | 779 | |
| | 120 | | | Dow Chemical Co. (The) (Chemicals), Callable 4/1/34 @ 100.00 | | | 4.25 | | | | 10/1/34 | | | | 115 | |
| | 263 | | | Dow Chemical Co. (The) (Chemicals), Callable 5/15/41 @ 100.00 | | | 5.25 | | | | 11/15/41 | | | | 276 | |
| | 200 | | | Duke Energy Carolinas LLC (Electric Utilities), Callable 6/15/41 @ 100.00 | | | 4.25 | | | | 12/15/41 | | | | 204 | |
| | 635 | | | Duke Energy Corp. (Electric Utilities), Callable 6/1/26 @ 100.00 | | | 2.65 | | | | 9/1/26 | | | | 572 | |
| | 965 | | | Duke Energy Corp. (Electric Utilities), Callable 1/15/24 @ 100.00 | | | 3.75 | | | | 4/15/24 | | | | 961 | |
| | 660 | | | Duke Energy Progress LLC (Electric Utilities), Callable 2/15/45 @ 100.00 | | | 4.20 | | | | 8/15/45 | | | | 661 | |
| | 510 | | | Energy Transfer Partners LP (Oil, Gas & Consumable Fuels), Callable 3/15/28 @ 100.00 | | | 4.95 | | | | 6/15/28 | | | | 508 | |
| | 1,000 | | | Enterprise Products Operating LLC (Oil, Gas & Consumable Fuels),
Callable 11/15/24 @ 100.00 | | | 3.75 | | | | 2/15/25 | | | | 990 | |
| | 2,782 | | | Enterprise Products Operating LLC (Oil, Gas & Consumable Fuels),
Callable 9/15/43 @ 100.00 | | | 4.85 | | | | 3/15/44 | | | | 2,767 | |
| | 995 | | | FedEx Corp. (Air Freight & Logistics) | | | 4.90 | | | | 1/15/34 | | | | 1,047 | |
| | 2,330 | | | Fiserv, Inc. (IT Services), Callable 5/1/20 @ 100.00 | | | 2.70 | | | | 6/1/20 | | | | 2,308 | |
| | 770 | | | Fiserv, Inc. (IT Services), Callable 7/1/22 @ 100.00 | | | 3.50 | | | | 10/1/22 | | | | 758 | |
| | 1,195 | | | Fiserv, Inc. (IT Services), Callable 3/1/25 @ 100.00 | | | 3.85 | | | | 6/1/25 | | | | 1,190 | |
| | 1,175 | | | Gilead Sciences, Inc. (Biotechnology), Callable 8/1/44 @ 100.00 | | | 4.50 | | | | 2/1/45 | | | | 1,174 | |
| | 393 | | | GlaxoSmithKline PLC (Pharmaceuticals) | | | 6.38 | | | | 5/15/38 | | | | 504 | |
| | 3,555 | | | Goldman Sachs Group, Inc. (Capital Markets), Callable 10/23/24 @ 100.00 | | | 3.50 | | | | 1/23/25 | | | | 3,432 | |
| | 2,420 | | | Goldman Sachs Group, Inc. (Capital Markets) | | | 5.25 | | | | 7/27/21 | | | | 2,543 | |
| | 755 | | | International Paper Co. (Containers & Packaging), Callable 5/15/41 @ 100.00 | | | 6.00 | | | | 11/15/41 | | | | 833 | |
| | 480 | | | Interpublic Group of Companies, Inc. (Media) | | | 4.00 | | | | 3/15/22 | | | | 484 | |
| | 2,130 | | | Interpublic Group of Companies, Inc. (Media) | | | 4.20 | | | | 4/15/24 | | | | 2,142 | |
| | 2,870 | | | JPMorgan Chase & Co. (Banks), Callable 10/23/24 @ 100.00 | | | 3.13 | | | | 1/23/25 | | | | 2,744 | |
| | 1,736 | | | JPMorgan Chase & Co. (Banks) | | | 3.63 | | | | 5/13/24 | | | | 1,724 | |
| | 2,045 | | | JPMorgan Chase & Co. (Banks) | | | 4.35 | | | | 8/15/21 | | | | 2,103 | |
| | 1,500 | | | JPMorgan Chase & Co. (Banks) | | | 4.50 | | | | 1/24/22 | | | | 1,551 | |
| | 85 | | | Lincoln National Corp. (Insurance) | | | 4.85 | | | | 6/24/21 | | | | 88 | |
| | 665 | | | Lincoln National Corp. (Insurance) | | | 7.00 | | | | 6/15/40 | | | | 835 | |
| | 1,080 | | | Lockheed Martin Corp. (Aerospace & Defense), Callable 11/15/35 @ 100.00 | | | 4.50 | | | | 5/15/36 | | | | 1,120 | |
| | 295 | | | LYB International Finance BV (Chemicals), Callable 9/15/43 @ 100.00 | | | 4.88 | | | | 3/15/44 | | | | 294 | |
| | 455 | | | Martin Marietta Materials, Inc. (Construction Materials), Callable 3/1/27 @ 100.00 | | | 3.45 | | | | 6/1/27 | | | | 423 | |
| | 1,380 | | | Martin Marietta Materials, Inc. (Construction Materials), Callable 4/2/24 @ 100.00 | | | 4.25 | | | | 7/2/24 | | | | 1,392 | |
| | 295 | | | Medtronic, Inc. (Health Care Equipment & Supplies), Callable 9/15/43 @ 100.00 | | | 4.63 | | | | 3/15/44 | | | | 310 | |
| | 585 | | | Medtronic, Inc. (Health Care Equipment & Supplies) | | | 4.63 | | | | 3/15/45 | | | | 620 | |
| | 670 | | | MetLife, Inc. (Insurance) | | | 3.00 | | | | 3/1/25 | | | | 636 | |
| | 769 | | | MetLife, Inc. (Insurance) | | | 6.50 | | | | 12/15/32 | | | | 946 | |
| | 3,475 | | | Microsoft Corp. (Software), Callable 8/6/56 @ 100.00 | | | 4.50 | | | | 2/6/57 | | | | 3,769 | |
| | 2,679 | | | MidAmerican Energy Holdings Co. (Electric Utilities) | | | 6.13 | | | | 4/1/36 | | | | 3,299 | |
| | 2,695 | | | Morgan Stanley (Capital Markets) | | | 2.63 | | | | 11/17/21 | | | | 2,616 | |
| | 685 | | | Morgan Stanley (Capital Markets) | | | 3.13 | | | | 1/23/23 | | | | 668 | |
| | 3,635 | | | National Rural Utilities Cooperative Finance Corp. (Diversified Financial Services),
Callable 12/7/23 @ 100.00 | | | 2.95 | | | | 2/7/24 | | | | 3,509 | |
| | 2,625 | | | Nucor Corp. (Metals & Mining), Callable 6/15/22 @ 100.00 | | | 4.13 | | | | 9/15/22 | | | | 2,695 | |
| | 760 | | | Nucor Corp. (Metals & Mining), Callable 2/1/43 @ 100.00 | | | 5.20 | | | | 8/1/43 | | | | 839 | |
| | 1,610 | | | NVIDIA Corp. (Semiconductors & Semiconductor Equipment), Callable 6/16/26 @ 100.00 | | | 3.20 | | | | 9/16/26 | | | | 1,551 | |
| | 380 | | | Oracle Corp. (Software), Callable 11/15/44 @ 100.00 | | | 4.13 | | | | 5/15/45 | | | | 366 | |
| | 2,375 | | | Oracle Corp. (Software) | | | 5.38 | | | | 7/15/40 | | | | 2,677 | |
| | 800 | | | Philip Morris International, Inc. (Tobacco) | | | 4.50 | | | | 3/20/42 | | | | 784 | |
| | 1,750 | | | PNC Bank NA (Banks), Callable 10/6/20 @ 100.00 | | | 2.45 | | | | 11/5/20 | | | | 1,720 | |
| | 1,000 | | | PNC Bank NA (Banks), Callable 5/2/25 @ 100.00 | | | 3.25 | | | | 6/1/25 | | | | 972 | |
| | 1,025 | | | PNC Financial Services Group, Inc. (Banks) | | | 2.85 | (a) | | | 11/9/22 | | | | 997 | |
See accompanying notes to financial statements.
207
HC CAPITAL TRUST
The U.S. Corporate Fixed Income Securities Portfolio
Portfolio of Investments (continued) — June 30, 2018
| | | | | | | | | | | | | | | | |
Principal
Amount
(000) | | | Security Description | | Rate % | | | Maturity
Date | | | Value
(000) | |
| | | | Corporate Bonds (continued) | | | | | | | | | | | | |
| $ | 327 | | | Procter & Gamble Co. (The) (Household Products) | | | 9.36 | | | | 1/1/21 | | | $ | 351 | |
| | 1,227 | | | Progress Energy, Inc. (Electric Utilities) | | | 6.00 | | | | 12/1/39 | | | | 1,480 | |
| | 440 | | | Prudential Financial, Inc., MTN (Insurance), Callable 12/27/27 @ 100.00 | | | 3.88 | | | | 3/27/28 | | | | 435 | |
| | 152 | | | Prudential Financial, Inc. (Insurance) | | | 6.63 | | | | 6/21/40 | | | | 190 | |
| | 265 | | | Public Service Electric & Gas Co. (Multi-Utilities), Callable 3/1/42 @ 100.00 | | | 3.65 | | | | 9/1/42 | | | | 254 | |
| | 1,185 | | | RELX Capital, Inc. (Professional Services), Callable 7/15/22 @ 100.00 | | | 3.13 | | | | 10/15/22 | | | | 1,162 | |
| | 730 | | | RELX Capital, Inc. (Professional Services), Callable 2/16/23 @ 100.00 | | | 3.50 | | | | 3/16/23 | | | | 722 | |
| | 1,014 | | | Rockwell Collins, Inc. (Aerospace & Defense), Callable 12/15/26 @ 100.00 | | | 3.50 | | | | 3/15/27 | | | | 966 | |
| | 215 | | | Roper Industries, Inc. (Industrial Conglomerates), Callable 8/15/22 @ 100.00 | | | 3.13 | | | | 11/15/22 | | | | 210 | |
| | 1,950 | | | Roper Technologies, Inc. (Industrial Conglomerates), Callable 9/15/25 @ 100.00 | | | 3.85 | | | | 12/15/25 | | | | 1,917 | |
| | 85 | | | Ryder System, Inc., MTN (Road & Rail), Callable 8/1/21 @ 100.00 | | | 2.25 | | | | 9/1/21 | | | | 82 | |
| | 1,050 | | | Ryder System, Inc. (Road & Rail), Callable 2/1/22 @ 100.00 | | | 2.80 | | | | 3/1/22 | | | | 1,023 | |
| | 735 | | | Ryder System, Inc. (Road & Rail), Callable 10/15/21 @ 100.00 | | | 3.45 | | | | 11/15/21 | | | | 734 | |
| | 375 | | | Sherwin-Williams Co. (The) (Chemicals), Callable 5/1/25 @ 100.00 | | | 3.45 | | | | 8/1/25 | | | | 361 | |
| | 385 | | | Southern Co. Gas Capital Corp. (Electric Utilities), Callable 8/1/23 @ 100.00 | | | 2.45 | | | | 10/1/23 | | | | 362 | |
| | 695 | | | Southwest Airlines Co. (Airlines), Callable 8/15/26 @ 100.00 | | | 3.00 | | | | 11/15/26 | | | | 644 | |
| | 1,177 | | | Southwest Airlines Co., Series 2017-1 (Airlines) | | | 6.15 | | | | 2/1/24 | | | | 1,248 | |
| | 2,530 | | | Sunoco Logistics Partners LP (Oil, Gas & Consumable Fuels), Callable 10/15/22 @ 100.00 | | | 3.45 | | | | 1/15/23 | | | | 2,455 | |
| | 1,225 | | | Sunoco Logistics Partners LP (Oil, Gas & Consumable Fuels), Callable 7/15/42 @ 100.00 | | | 4.95 | | | | 1/15/43 | | | | 1,064 | |
| | 1,950 | | | SunTrust Banks, Inc. (Banks), Callable 2/3/21 @ 100.00 | | | 2.90 | | | | 3/3/21 | | | | 1,926 | |
| | 815 | | | The Home Depot, Inc. (Specialty Retail) | | | 5.88 | | | | 12/16/36 | | | | 989 | |
| | 2,220 | | | The Sherwin-Williams Co. (Chemicals), Callable 4/1/24 @ 100.00 | | | 3.13 | | | | 6/1/24 | | | | 2,119 | |
| | 1,671 | | | The Travelers Companies, Inc. (Insurance) | | | 6.25 | | | | 6/15/37 | | | | 2,060 | |
| | 1,000 | | | Thermo Fisher Scientific, Inc. (Life Sciences Tools & Services), Callable 2/15/23 @ 100.00 | | | 3.00 | | | | 4/15/23 | | | | 972 | |
| | 1,535 | | | Thermo Fisher Scientific, Inc. (Life Sciences Tools & Services), Callable 11/1/23 @ 100.00 | | | 4.15 | | | | 2/1/24 | | | | 1,557 | |
| | 840 | | | Twenty-First Century Fox, Inc. (Media), Callable 3/15/44 @ 100.00 | | | 4.75 | | | | 9/15/44 | | | | 849 | |
| | 1,848 | | | Twenty-First Century Fox, Inc. (Media) | | | 6.20 | | | | 12/15/34 | | | | 2,181 | |
| | 890 | | | United Parcel Service, Inc. (Air Freight & Logistics) | | | 6.20 | | | | 1/15/38 | | | | 1,115 | |
| | 674 | | | United Technologies Corp. (Aerospace & Defense) | | | 4.50 | | | | 6/1/42 | | | | 666 | |
| | 598 | | | UnitedHealth Group, Inc. (Health Care Providers & Services) | | | 6.88 | | | | 2/15/38 | | | | 791 | |
| | 865 | | | Valero Energy Corp. (Oil, Gas & Consumable Fuels) | | | 6.63 | | | | 6/15/37 | | | | 1,034 | |
| | 270 | | | Ventas Realty LP (Equity Real Estate Investment Trusts), Callable 5/15/22 @ 100.00 | | | 3.25 | | | | 8/15/22 | | | | 265 | |
| | 1,245 | | | Ventas Realty LP (Equity Real Estate Investment Trusts), Callable 11/1/24 @ 100.00 | | | 3.50 | | | | 2/1/25 | | | | 1,192 | |
| | 1,622 | | | Verizon Communications, Inc. (Diversified Telecommunication Services) | | | 5.01 | | | | 8/21/54 | | | | 1,523 | |
| | 5,335 | | | Verizon Communications, Inc. (Diversified Telecommunication Services) | | | 5.15 | | | | 9/15/23 | | | | 5,685 | |
| | 820 | | | Virginia Electric & Power Co. (Electric Utilities), Callable 2/15/43 @ 100.00 | | | 4.65 | | | | 8/15/43 | | | | 855 | |
| | 260 | | | Wal-Mart Stores, Inc. (Food & Staples Retailing) | | | 5.63 | | | | 4/1/40 | | | | 314 | |
| | 890 | | | Wells Fargo & Co., MTN (Banks) | | | 2.63 | | | | 7/22/22 | | | | 857 | |
| | 3,995 | | | Wells Fargo & Co. (Banks) | | | 3.00 | | | | 2/19/25 | | | | 3,767 | |
| | 1,848 | | | Wells Fargo & Co. (Banks) | | | 3.30 | | | | 9/9/24 | | | | 1,785 | |
| | 1,525 | | | Wells Fargo & Co., MTN (Banks) | | | 4.60 | | | | 4/1/21 | | | | 1,574 | |
| | 1,375 | | | WestRock Co. (Containers & Packaging) | | | 4.90 | | | | 3/1/22 | | | | 1,432 | |
| | 340 | | | Westvaco Corp. (Containers & Packaging) | | | 8.20 | | | | 1/15/30 | | | | 449 | |
| | 832 | | | XTO Energy, Inc. (Oil, Gas & Consumable Fuels) | | | 6.75 | | | | 8/1/37 | | | | 1,097 | |
| | | | | | | | | | | | | | | | |
| | | | Total Corporate Bonds | | | | | | | | | | | 223,484 | |
| | | | | | | | | | | | | | | | |
| | | | Yankee Dollars — 14.64% | | | | | | | | | | | | |
| | 600 | | | America Movil SAB de CV (Wireless Telecommunication Services) | | | 5.00 | | | | 3/30/20 | | | | 617 | |
| | 800 | | | America Movil SAB de CV (Wireless Telecommunication Services) | | | 6.13 | | | | 11/15/37 | | | | 922 | |
| | 1,007 | | | Aptiv PLC (Auto Components), Callable 10/15/25 @ 100.00 | | | 4.25 | | | | 1/15/26 | | | | 1,003 | |
| | 1,800 | | | Barclays PLC (Banks), Callable 1/10/22 @ 100.00 | | | 3.68 | | | | 1/10/23 | | | | 1,751 | |
| | 430 | | | BHP Billiton Ltd. (Metals & Mining) | | | 5.00 | | | | 9/30/43 | | | | 482 | |
| | 2,094 | | | BP Capital Markets PLC (Oil, Gas & Consumable Fuels) | | | 3.54 | | | | 11/4/24 | | | | 2,077 | |
| | 1,246 | | | British Telecommunications PLC (Diversified Telecommunication Services) | | | 9.63 | | | | 12/15/30 | | | | 1,780 | |
| | 1,305 | | | Canadian Natural Resources Ltd. (Oil, Gas & Consumable Fuels), Callable 12/15/22 @ 100.00 | | | 2.95 | | | | 1/15/23 | | | | 1,259 | |
See accompanying notes to financial statements.
208
HC CAPITAL TRUST
The U.S. Corporate Fixed Income Securities Portfolio
Portfolio of Investments (concluded) — June 30, 2018
| | | | | | | | | | | | | | | | |
Principal
Amount
(000) | | | Security Description | | Rate % | | | Maturity
Date | | | Value
(000) | |
| | | | Yankee Dollars (continued) | | | | | | | | | | | | |
| $ | 520 | | | Canadian Natural Resources Ltd. (Oil, Gas & Consumable Fuels),
Callable 8/15/21 @ 100.00 | | | 3.45 | | | | 11/15/21 | | | $ | 519 | |
| | 850 | | | Canadian Natural Resources Ltd. (Oil, Gas & Consumable Fuels),
Callable 3/1/27 @ 100.00 | | | 3.85 | | | | 6/1/27 | | | | 829 | |
| | 350 | | | Canadian Pacific Railway Co. (Road & Rail), Callable 11/1/24 @ 100.00 | | | 2.90 | | | | 2/1/25 | | | | 333 | |
| | 2,390 | | | Canadian Pacific Railway Co. (Road & Rail), Callable 12/15/22 @ 100.00 | | | 4.45 | | | | 3/15/23 | | | | 2,483 | |
| | 1,106 | | | Deutsche Telekom International Finance BV (Diversified Financial Services) | | | 8.75 | (a) | | | 6/15/30 | | | | 1,465 | |
| | 200 | | | GlaxoSmithKline Capital, Inc. (Pharmaceuticals) | | | 2.80 | | | | 3/18/23 | | | | 195 | |
| | 1,285 | | | HSBC Holdings PLC (Banks) | | | 4.00 | | | | 3/30/22 | | | | 1,303 | |
| | 500 | | | HSBC Holdings PLC (Banks) | | | 4.88 | | | | 1/14/22 | | | | 521 | |
| | 2,325 | | | HSBC Holdings PLC (Banks) | | | 5.10 | | | | 4/5/21 | | | | 2,431 | |
| | 500 | | | HSBC Holdings PLC (Banks) | | | 6.80 | | | | 6/1/38 | | | | 601 | |
| | 1,430 | | | Iberdrola International BV (Electric Utilities) | | | 5.81 | | | | 3/15/25 | | | | 1,567 | |
| | 1,445 | | | Iberdrola International BV (Electric Utilities) | | | 6.75 | | | | 7/15/36 | | | | 1,841 | |
| | 405 | | | LyondellBasell Industries N.V. (Chemicals) | | | 4.00 | | | | 7/15/23 | | | | 406 | |
| | 321 | | | LyondellBasell Industries N.V. (Chemicals), Callable 8/26/54 @ 100.00 | | | 4.63 | | | | 2/26/55 | | | | 296 | |
| | 1,600 | | | LyondellBasell Industries N.V. (Chemicals), Callable 1/15/24 @ 100.00 | | | 5.75 | | | | 4/15/24 | | | | 1,734 | |
| | 1,043 | | | Orange SA (Diversified Telecommunication Services) | | | 9.00 | | | | 3/1/31 | | | | 1,431 | |
| | 790 | | | Shell International Finance BV (Oil, Gas & Consumable Fuels) | | | 4.13 | | | | 5/11/35 | | | | 801 | |
| | 1,925 | | | Shell International Finance BV (Oil, Gas & Consumable Fuels) | | | 6.38 | | | | 12/15/38 | | | | 2,495 | |
| | 995 | | | Statoil ASA (Oil, Gas & Consumable Fuels) | | | 5.10 | | | | 8/17/40 | | | | 1,107 | |
| | 1,221 | | | Statoil ASA (Oil, Gas & Consumable Fuels) | | | 7.75 | | | | 6/15/23 | | | | 1,452 | |
| | 393 | | | Telefonica Emisiones SAU (Diversified Telecommunication Services) | | | 5.13 | | | | 4/27/20 | | | | 405 | |
| | 540 | | | Telefonica Emisiones SAU (Diversified Telecommunication Services) | | | 5.46 | | | | 2/16/21 | | | | 565 | |
| | 745 | | | Telefonica Emisiones SAU (Diversified Telecommunication Services) | | | 7.05 | | | | 6/20/36 | | | | 896 | |
| | 1,090 | | | TransCanada PipeLines Ltd. (Oil, Gas & Consumable Fuels) | | | 2.50 | | | | 8/1/22 | | | | 1,047 | |
| | 2,335 | | | TransCanada PipeLines Ltd. (Oil, Gas & Consumable Fuels), Callable 2/15/28 @ 100.00 | | | 4.25 | | | | 5/15/28 | | | | 2,341 | |
| | 1,040 | | | TransCanada PipeLines Ltd. (Oil, Gas & Consumable Fuels) | | | 6.10 | | | | 6/1/40 | | | | 1,178 | |
| | 451 | | | TransCanada PipeLines Ltd. (Oil, Gas & Consumable Fuels) | | | 6.20 | | | | 10/15/37 | | | | 515 | |
| | 340 | | | Vodafone Group PLC (Wireless Telecommunication Services) | | | 5.00 | | | | 5/30/38 | | | | 336 | |
| | 946 | | | Vodafone Group PLC (Wireless Telecommunication Services) | | | 6.15 | | | | 2/27/37 | | | | 1,039 | |
| | | | | | | | | | | | | | | | |
| | | | Total Yankee Dollars | | | | | | | | | | | 42,023 | |
| | | | | | | | | | | | | | | | |
Shares | | | | | | | | | | | | |
| | | | Mutual Funds — 6.51% | | | | | | | | | | | | |
| | 306,361 | | | SSgA U.S. Government Money Market Fund, Premier Class | | | 1.73 | (b) | | | | | | | 306 | |
| | 18,362,582 | | | State Street Institutional Treasury Plus Money Market Fund, Trust Class | | | 1.72 | (b) | | | | | | | 18,363 | |
| | | | | | | | | | | | | | | | |
| | | | Total Mutual Funds | | | | | | | | | | | 18,669 | |
| | | | | | | | | | | | | | | | |
| | | | Total Investments (cost $292,094) — 99.03% | | | | | | | | | | | 284,176 | |
| | | | Other assets in excess of liabilities — 0.97% | | | | | | | | | | | 2,780 | |
| | | | | | | | | | | | | | | | |
| | | | Net Assets — 100.00% | | | | | | | | | | $ | 286,956 | |
| | | | | | | | | | | | | | | | |
| (a) | Step Bond: Coupon rate is set for an initial period and then increased to a higher coupon rate at a specified date. The rate shown is the rate in effect at June 30, 2018. |
| (b) | The rate disclosed is the rate in effect on June 30, 2018. |
MTN—Medium Term Note
The following table reflects the percentage of total net assets of the Portfolio attributable to each Specialist Manager as of June 30, 2018.
| | | | | | | | | | | | |
The U.S. Corporate Fixed Income Securities Portfolio | | Agincourt Capital
Management, LLC | | | HC Capital
Solutions | | | Total | |
Corporate Bonds | | | 77.88 | % | | | — | | | | 77.88 | % |
Yankee Dollars | | | 14.64 | % | | | — | | | | 14.64 | % |
Mutual Funds | | | 0.11 | % | | | 6.40 | % | | | 6.51 | % |
Other Assets (Liabilities) | | | 1.23 | % | | | -0.26 | % | | | 0.97 | % |
| | | | | | | | | | | | |
Total Net Assets | | | 93.86 | % | | | 6.14 | % | | | 100.00 | % |
| | | | | | | | | | | | |
| Amounts | designated as “—” indicate the Specialist Manager did not manage any holdings in that category. |
See accompanying notes to financial statements.
209
HC CAPITAL TRUST
The U.S. Mortgage/Asset Backed Fixed Income Securities Portfolio
Portfolio of Investments — June 30, 2018
| | | | | | | | | | | | | | | | |
Principal
Amount
(000) | | | Security Description | | Rate % | | | Maturity
Date | | | Value
(000) | |
| | | | Asset Backed Securities — 1.82% | | | | | | | | | | | | |
| $ | 200 | | | American Express Credit Account Master Trust, Series 2017-1, Class A | | | 1.93 | | | | 9/15/22 | | | $ | 197 | |
| | 270 | | | BMW Vehicle Lease Trust, Series 2017-1, Class A4, Callable 10/20/19 @ 100.00 | | | 2.18 | | | | 6/22/20 | | | | 268 | |
| | 200 | | | BMW Vehicle Owner Trust, Series 2016-A, Class A4, Callable 3/25/20 @ 100.00 | | | 1.37 | | | | 12/27/22 | | | | 196 | |
| | 200 | | | BMW Vehicle Owner Trust, Series 2018-A, Class A4, Callable 9/25/21 @ 100.00 | | | 2.51 | | | | 6/25/24 | | | | 197 | |
| | 165 | | | Capital One Multi-Asset Execution Trust, Series 2016-A3, Class A3 | | | 1.34 | | | | 4/15/22 | | | | 163 | |
| | 150 | | | Capital One Multi-Asset Execution Trust, Series 2017-A4, Class A4 | | | 1.99 | | | | 7/17/23 | | | | 147 | |
| | 125 | | | Capital One Multi-Asset Execution Trust, Series 2017-A1, Class A1 | | | 2.00 | | | | 1/17/23 | | | | 123 | |
| | 200 | | | Capital One Multi-Asset Execution Trust, Series 2017-A3, Class A3 | | | 2.43 | | | | 1/15/25 | | | | 196 | |
| | 100 | | | CarMax Auto Owner Trust, Series 2017-2, Class A4, Callable 3/15/21 @ 100.00 | | | 2.25 | | | | 9/15/22 | | | | 98 | |
| | 300 | | | Chase Issuance Trust (CHAIT), Series 2016-A2, Class A | | | 1.37 | | | | 6/15/21 | | | | 295 | |
| | 270 | | | Chase Issuance Trust (CHAIT), Series 2015-A4, Class A | | | 1.84 | | | | 4/15/22 | | | | 265 | |
| | 100 | | | Citibank Credit Card Issuance Trust, Series 2014-A1, Class A1 | | | 2.88 | | | | 1/23/23 | | | | 100 | |
| | 200 | | | Discover Card Execution Note Trust, Series 2014-A4, Class A4 | | | 2.12 | | | | 12/15/21 | | | | 199 | |
| | 100 | | | Discover Card Execution Note Trust, Series 2017-A2, Class A2 | | | 2.39 | | | | 7/15/24 | | | | 98 | |
| | 156 | | | GM Financial Consumer Automobile Receivables Trust, Series 2018-1, Class A4,
Callable 10/16/21 @ 100.00 | | | 2.46 | | | | 7/17/23 | | | | 153 | |
| | 100 | | | Synchrony Credit Card Master Note Trust, Series 2016-1, Class A | | | 2.04 | | | | 3/15/22 | | | | 100 | |
| | 200 | | | Synchrony Credit Card Master Note Trust, Series 2018-1, Class A | | | 2.97 | | | | 3/15/24 | | | | 200 | |
| | 300 | | | Toyota Auto Receivables Owner Trust, Series 2017-A, Class A3,
Callable 11/15/20 @ 100.00 | | | 1.73 | | | | 2/16/21 | | | | 296 | |
| | 200 | | | Toyota Auto Receivables Owner Trust, Series 2018-A, Class A4,
Callable 10/15/21 @ 100.00 | | | 2.52 | | | | 5/15/23 | | | | 197 | |
| | 250 | | | World Omni Auto Receivables, Series 2017-A, Class A3, Callable 11/15/20 @ 100.00 | | | 1.93 | | | | 9/15/22 | | | | 247 | |
| | | | | | | | | | | | | | | | |
| | | | Total Asset Backed Securities | | | | | | | | | | | 3,735 | |
| | | | | | | | | | | | | | | | |
| | | | Collateralized Mortgage Obligations — 5.70% | | | | | | | | | | | | |
| | 250 | | | Bank, Series 2017-BNK9, Class ASB | | | 3.47 | | | | 11/15/54 | | | | 248 | |
| | 200 | | | Bank of America Commercial Mortgage Trust, Series 2017-BNK3, Class A2 | | | 3.12 | | | | 2/15/50 | | | | 199 | |
| | 100 | | | Bank of America Commercial Mortgage Trust, Series 2017-BNK3, Class ASB | | | 3.37 | | | | 2/15/50 | | | | 99 | |
| | 228 | | | Citigroup Commercial Mortgage Trust, Series 2015-GC27, Class A4 | | | 2.88 | | | | 2/10/48 | | | | 219 | |
| | 183 | | | Citigroup Commercial Mortgage Trust, Series 2015-GC27, Class A5 | | | 3.14 | | | | 2/10/48 | | | | 178 | |
| | 100 | | | Citigroup Commercial Mortgage Trust, Series 2016-GC37, Class A4 | | | 3.31 | | | | 4/10/49 | | | | 98 | |
| | 100 | | | Citigroup Commercial Mortgage Trust, Series 2016-GC36, Class A5 | | | 3.62 | | | | 2/10/49 | | | | 100 | |
| | 228 | | | Citigroup Commercial Mortgage Trust, Series 2014-GC23, Class A4 | | | 3.62 | | | | 7/10/47 | | | | 230 | |
| | 183 | | | Commercial Mortgage Trust, Series 2015-LC19, Class A4 | | | 3.18 | | | | 2/10/48 | | | | 178 | |
| | 80 | | | Commercial Mortgage Trust, Series 2015-DC1, Class A5 | | | 3.35 | | | | 2/10/48 | | | | 79 | |
| | 256 | | | Commercial Mortgage Trust, Series 2013-CR8, Class A5 | | | 3.61 | (a) | | | 6/10/46 | | | | 259 | |
| | 100 | | | Commercial Mortgage Trust, Series 2014-UBS4, Class AM | | | 3.97 | | | | 8/10/47 | | | | 100 | |
| | 100 | | | Commercial Mortgage Trust, Series 2013-CR11, Class B | | | 5.33 | (a) | | | 8/10/50 | | | | 104 | |
| | 200 | | | CSAIL Commercial Mortgage Trust, Series 2016-C7, Class ASB | | | 3.31 | | | | 11/15/49 | | | | 198 | |
| | 139 | | | Fannie Mae-ACES, Series 2016-M6, Class A1 | | | 2.14 | | | | 5/25/26 | | | | 134 | |
| | 27 | | | Fannie Mae-ACES, Series 2013-M14, Class APT | | | 2.52 | (a) | | | 4/25/23 | | | | 26 | |
| | 53 | | | Fannie Mae-ACES, Series 2017-M8, Class A1 | | | 2.65 | | | | 5/25/27 | | | | 52 | |
| | 283 | | | Fannie Mae-ACES, Series 2015-M3, Class A2 | | | 2.72 | | | | 10/25/24 | | | | 275 | |
| | 274 | | | Fannie Mae-ACES, Series 2012-M1, Class A2 | | | 2.73 | | | | 10/25/21 | | | | 271 | |
| | 200 | | | Fannie Mae-ACES, Series 2017-M7, Class A2 | | | 2.96 | | | | 2/25/27 | | | | 193 | |
| | 62 | | | Fannie Mae-ACES, Series 2012-M4, Class 1A2 | | | 2.98 | | | | 4/25/22 | | | | 62 | |
| | 250 | | | Fannie Mae-ACES, Series 2017-M11, Class A2 | | | 2.98 | | | | 8/25/29 | | | | 236 | |
| | 228 | | | Fannie Mae-ACES, Series 2014-M9, Class A2 | | | 3.10 | (a) | | | 7/25/24 | | | | 227 | |
| | 200 | | | Fannie Mae-ACES, Series 2017 M15, Class ATS2 | | | 3.14 | (a) | | | 11/25/27 | | | | 195 | |
| | 300 | | | Fannie Mae-ACES, Series 2017-M12, Class A2 | | | 3.18 | (a) | | | 6/25/27 | | | | 292 | |
| | 46 | | | Freddie Mac Multifamily Structured Pass-Through Certificates, Series K023, Class A2 | | | 2.31 | | | | 8/25/22 | | | | 44 | |
| | 96 | | | Freddie Mac Multifamily Structured Pass-Through Certificates, Series K058, Class A1 | | | 2.34 | | | | 7/25/26 | | | | 92 | |
| $ | 183 | | | Freddie Mac Multifamily Structured Pass-Through Certificates, Series K027, Class A2 | | | 2.64 | | | | 1/25/23 | | | | 180 | |
| | 350 | | | Freddie Mac Multifamily Structured Pass-Through Certificates, Series K055, Class A2 | | | 2.67 | | | | 3/25/26 | | | | 336 | |
See accompanying notes to financial statements.
210
HC CAPITAL TRUST
The U.S. Mortgage/Asset Backed Fixed Income Securities Portfolio
Portfolio of Investments (continued) — June 30, 2018
| | | | | | | | | | | | | | | | |
Principal
Amount
(000) | | | Security Description | | Rate % | | | Maturity
Date | | | Value
(000) | |
| | | | Collateralized Mortgage Obligations (continued) | | | | | | | | | | | | |
| $ | 119 | | | Freddie Mac Multifamily Structured Pass-Through Certificates, Series K017, Class A2 | | | 2.87 | | | | 12/25/21 | | | $ | 119 | |
| | 66 | | | Freddie Mac Multifamily Structured Pass-Through Certificates, Series K032, Class A1 | | | 3.02 | | | | 2/25/23 | | | | 66 | |
| | 183 | | | Freddie Mac Multifamily Structured Pass-Through Certificates, Series K033, Class A2 | | | 3.06 | (a) | | | 7/25/23 | | | | 182 | |
| | 365 | | | Freddie Mac Multifamily Structured Pass-Through Certificates, Series K043, Class A2 | | | 3.06 | | | | 12/25/24 | | | | 363 | |
| | 274 | | | Freddie Mac Multifamily Structured Pass-Through Certificates, Series K716, Class A2 | | | 3.13 | | | | 6/25/21 | | | | 275 | |
| | 183 | | | Freddie Mac Multifamily Structured Pass-Through Certificates, Series K032, Class A2 | | | 3.31 | (a) | | | 5/25/23 | | | | 184 | |
| | 183 | | | Freddie Mac Multifamily Structured Pass-Through Certificates, Series K029, Class A2 | | | 3.32 | | | | 2/25/23 | | | | 184 | |
| | 100 | | | Freddie Mac Multifamily Structured Pass-Through Certificates, Series K047, Class A2, Callable 5/11/25 @ 100.00 | | | 3.33 | | | | 5/25/25 | | | | 101 | |
| | 112 | | | Freddie Mac Multifamily Structured Pass-Through Certificates, Series K014, Class A2 | | | 3.87 | | | | 4/25/21 | | | | 114 | |
| | 205 | | | Freddie Mac Multifamily Structured Pass-Through Certificates, Series K012, Class A2 | | | 4.18 | | | | 12/25/20 | | | | 211 | |
| | 183 | | | Freddie Mac Multifamily Structured Pass-Through Certificates, Series K006, Class A2 | | | 4.25 | | | | 1/25/20 | | | | 185 | |
| | 110 | | | Freddie Mac Multifamily Structured Pass-Through Certificates, Series K010, Class A2 | | | 4.33 | | | | 10/25/20 | | | | 113 | |
| | 230 | | | GS Mortgage Securities Trust, Series 2016-GS2, Class A3 | | | 2.79 | | | | 5/10/49 | | | | 217 | |
| | 100 | | | GS Mortgage Securities Trust, Series 2017-GS5, Class A2 | | | 3.22 | | | | 3/10/50 | | | | 99 | |
| | 250 | | | GS Mortgage Securities Trust, Series 2017-GS5, Class A4 | | | 3.67 | | | | 3/10/50 | | | | 249 | |
| | 23 | | | GS Mortgage Securities Trust, Series 2014-GC20, Class A3 | | | 3.68 | | | | 4/10/47 | | | | 23 | |
| | 274 | | | GS Mortgage Securities Trust, Series 2013-GC14, Class A5 | | | 4.24 | | | | 8/10/46 | | | | 284 | |
| | 137 | | | JPMBB Commercial Mortgage Securities Trust, Series 2014-C24, Class A5 | | | 3.64 | | | | 11/15/47 | | | | 138 | |
| | 183 | | | JPMBB Commercial Mortgage Securities Trust, Series 2014-C22, Class A4,
Callable 7/15/24 @ 100.00 | | | 3.80 | | | | 9/15/47 | | | | 185 | |
| | 183 | | | JPMBB Commercial Mortgage Securities Trust, Series 2013-C15, Class A5 | | | 4.13 | | | | 11/15/45 | | | | 189 | |
| | 218 | | | JPMorgan Chase Commercial Mortgage Securities Corp., Series 2012-C8, Class A3 | | | 2.83 | | | | 10/15/45 | | | | 214 | |
| | 155 | | | Morgan Stanley BAML Trust, Series 2015-C20, Class A2 | | | 2.79 | | | | 2/15/48 | | | | 155 | |
| | 100 | | | Morgan Stanley BAML Trust, Series 2015-C21, Class ASB | | | 3.15 | | | | 3/15/48 | | | | 99 | |
| | 183 | | | Morgan Stanley BAML Trust, Series 2015-C20, Class A4 | | | 3.25 | | | | 2/15/48 | | | | 179 | |
| | 200 | | | Morgan Stanley BAML Trust, Series 2014-C19, Class A4 | | | 3.53 | | | | 12/15/47 | | | | 199 | |
| | 200 | | | Morgan Stanley BAML Trust, Series 2017-C33, Class A5 | | | 3.60 | | | | 5/15/50 | | | | 197 | |
| | 100 | | | Morgan Stanley BAML Trust, Series 2014-C17, Class A5, Callable 7/11/24 @ 100.00 | | | 3.74 | | | | 8/15/47 | | | | 101 | |
| | 100 | | | Morgan Stanley BAML Trust, Series 2014-C15, Class A4 | | | 4.05 | | | | 4/15/47 | | | | 102 | |
| | 200 | | | Morgan Stanley Capital I Trust, Series 2017-H1, Class A4 | | | 3.26 | | | | 6/15/50 | | | | 193 | |
| | 183 | | | Morgan Stanley Capital I Trust, Series 2016-UBS9, Class A4 | | | 3.59 | | | | 3/15/49 | | | | 181 | |
| | 100 | | | SG Commercial Mortgage Securities Trust, Series 2016-C5, Class A4 | | | 3.06 | | | | 10/10/48 | | | | 95 | |
| | 170 | | | UBS Commercial Mortgage Trust, Series 2012-C1, Class AAB | | | 3.00 | | | | 5/10/45 | | | | 169 | |
| | 141 | | | UBS-Barclays Commercial Mortgage Trust, Series 2012-C2, Class A4 | | | 3.53 | | | | 5/10/63 | | | | 142 | |
| | 500 | | | Wells Fargo Commercial Mortgage Trust, Series 2016-C34, Class A4 | | | 3.10 | | | | 6/15/49 | | | | 481 | |
| | 183 | | | Wells Fargo Commercial Mortgage Trust, Series 2015-C30, Class A4 | | | 3.66 | | | | 9/15/58 | | | | 183 | |
| | 124 | | | Wells Fargo Commercial Mortgage Trust, Series 2015-P2, Class A4 | | | 3.81 | | | | 12/15/48 | | | | 125 | |
| | 169 | | | Wells Fargo Commercial Mortgage Trust, Series 2014-LC16, Class A5 | | | 3.82 | | | | 8/15/50 | | | | 172 | |
| | 142 | | | Wells Fargo Commercial Mortgage Trust, Series 2015-C26, Class C | | | 4.07 | | | | 2/15/48 | | | | 136 | |
| | 183 | | | WF-RBS Commercial Mortgage Trust, Series 2013-C14, Class ASB | | | 2.98 | | | | 6/15/46 | | | | 182 | |
| | | | | | | | | | | | | | | | |
| | | | Total Collateralized Mortgage Obligations | | | | | | | | | | | 11,690 | |
| | | | | | | | | | | | | | | | |
| | | | U.S. Government Agency Mortgages — 86.49% | | | | | | | | | | | | |
| | 53 | | | Fannie Mae, Pool #AY4232 | | | 2.00 | | | | 5/1/30 | | | | 50 | |
| | 268 | | | Fannie Mae, Pool #AS1058 | | | 2.00 | | | | 11/1/28 | | | | 257 | |
| | 93 | | | Fannie Mae, Pool #BJ4362 | | | 2.00 | | | | 11/1/32 | | | | 88 | |
| | 23 | | | Fannie Mae, Pool #CA0052 | | | 2.00 | | | | 7/1/32 | | | | 22 | |
| | 111 | | | Fannie Mae, Pool #MA2906 | | | 2.00 | | | | 2/1/32 | | | | 105 | |
| | 57 | | | Fannie Mae, Pool #AS0001 | | | 2.00 | | | | 7/1/28 | | | | 55 | |
| | 170 | | | Fannie Mae, Pool #AU5334 | | | 2.50 | | | | 11/1/28 | | | | 166 | |
| | 124 | | | Fannie Mae, Pool #AU6387 | | | 2.50 | | | | 11/1/28 | | | | 121 | |
| | 423 | | | Fannie Mae, Pool #MA1210 | | | 2.50 | | | | 10/1/27 | | | | 414 | |
| | 193 | | | Fannie Mae, Pool #BC9041 | | | 2.50 | | | | 11/1/31 | | | | 187 | |
| | 22 | | | Fannie Mae, Pool #AS8172 | | | 2.50 | | | | 10/1/36 | | | | 21 | |
See accompanying notes to financial statements.
211
HC CAPITAL TRUST
The U.S. Mortgage/Asset Backed Fixed Income Securities Portfolio
Portfolio of Investments (continued) — June 30, 2018
| | | | | | | | | | | | | | | | |
Principal
Amount
(000) | | | Security Description | | Rate % | | | Maturity
Date | | | Value
(000) | |
| | | | U.S. Government Agency Mortgages (continued) | | | | | | | | | | | | |
| $ | 346 | | | Fannie Mae, Pool #AP4742 | | | 2.50 | | | | 8/1/27 | | | $ | 339 | |
| | 186 | | | Fannie Mae, Pool #AB7391 | | | 2.50 | | | | 12/1/42 | | | | 175 | |
| | 23 | | | Fannie Mae, Pool #MA2854 | | | 2.50 | | | | 12/1/46 | | | | 22 | |
| | 182 | | | Fannie Mae, Pool #BE3032 | | | 2.50 | | | | 1/1/32 | | | | 177 | |
| | 125 | | | Fannie Mae, Pool# MA3217 | | | 2.50 | | | | 12/1/32 | | | | 122 | |
| | 228 | | | Fannie Mae, Pool #AS4946 | | | 2.50 | | | | 5/1/30 | | | | 223 | |
| | 128 | | | Fannie Mae, Pool #AS8246 | | | 2.50 | | | | 11/1/31 | | | | 125 | |
| | 384 | | | Fannie Mae, Pool #MA1277 | | | 2.50 | | | | 12/1/27 | | | | 376 | |
| | 53 | | | Fannie Mae, Pool #MA1270 | | | 2.50 | | | | 11/1/32 | | | | 52 | |
| | 366 | | | Fannie Mae, Pool #MA3154 | | | 2.50 | �� | | | 10/1/32 | | | | 356 | |
| | 26 | | | Fannie Mae, Pool #MA1511 | | | 2.50 | | | | 7/1/33 | | | | 25 | |
| | 233 | | | Fannie Mae, Pool #AU2619 | | | 2.50 | | | | 8/1/28 | | | | 228 | |
| | 319 | | | Fannie Mae, Pool #BJ3742 | | | 2.50 | | | | 12/1/32 | | | | 310 | |
| | 97 | | | Fannie Mae, Pool #MA3282 | | | 2.50 | | | | 2/1/33 | | | | 94 | |
| | 22 | | | Fannie Mae, Pool #MA2789 | | | 2.50 | | | | 10/1/36 | | | | 21 | |
| | 337 | | | Fannie Mae, Pool #AO3019 | | | 2.50 | | | | 5/1/27 | | | | 330 | |
| | 45 | | | Fannie Mae, Pool #AS8437 | | | 2.50 | | | | 12/1/36 | | | | 43 | |
| | 80 | | | Fannie Mae, Pool #AS4660 | | | 2.50 | | | | 3/1/30 | | | | 78 | |
| | 98 | | | Fannie Mae, Pool #AZ6458 | | | 2.50 | | | | 7/1/30 | | | | 96 | |
| | 650 | | | Fannie Mae, Pool #MA3246 | | | 2.50 | | | | 1/1/33 | | | | 632 | |
| | 99 | | | Fannie Mae, Pool #BJ3944 | | | 2.50 | | | | 1/1/33 | | | | 96 | |
| | 76 | | | Fannie Mae, Pool #AT2717 | | | 2.50 | | | | 5/1/43 | | | | 71 | |
| | 42 | | | Fannie Mae, Pool #AS0513 | | | 2.50 | | | | 8/1/43 | | | | 39 | |
| | 48 | | | Fannie Mae, Pool #MA2888 | | | 2.50 | | | | 1/1/47 | | | | 45 | |
| | 63 | | | Fannie Mae, Pool #MA2868 | | | 2.50 | | | | 1/1/32 | | | | 62 | |
| | 313 | | | Fannie Mae, Pool #AS4333 | | | 3.00 | | | | 1/1/45 | | | | 305 | |
| | 68 | | | Fannie Mae, Pool #AS4334 | | | 3.00 | | | | 1/1/45 | | | | 66 | |
| | 275 | | | Fannie Mae, Pool #MA2246 | | | 3.00 | | | | 4/1/30 | | | | 274 | |
| | 45 | | | Fannie Mae, Pool #MA2897 | | | 3.00 | | | | 2/1/37 | | | | 44 | |
| | 72 | | | Fannie Mae, Pool #MA2579 | | | 3.00 | | | | 4/1/36 | | | | 71 | |
| | 288 | | | Fannie Mae, Pool #AS4884 | | | 3.00 | | | | 5/1/45 | | | | 280 | |
| | 46 | | | Fannie Mae, Pool #AS8056 | | | 3.00 | | | | 10/1/46 | | | | 45 | |
| | 97 | | | Fannie Mae, Pool #MA3247 | | | 3.00 | | | | 1/1/33 | | | | 97 | |
| | 199 | | | Fannie Mae, Pool #AS1527 | | | 3.00 | | | | 1/1/29 | | | | 199 | |
| | 284 | | | Fannie Mae, Pool #AS0196 | | | 3.00 | | | | 8/1/28 | | | | 283 | |
| | 122 | | | Fannie Mae, Pool #MA3339 | | | 3.00 | | | | 4/1/33 | | | | 121 | |
| | 91 | | | Fannie Mae, Pool #AS3117 | | | 3.00 | | | | 8/1/29 | | | | 91 | |
| | 93 | | | Fannie Mae, Pool #MA3237 | | | 3.00 | | | | 1/1/48 | | | | 90 | |
| | 267 | | | Fannie Mae, Pool #AS7238 | | | 3.00 | | | | 5/1/46 | | | | 259 | |
| | 72 | | | Fannie Mae, Pool #MA3185 | | | 3.00 | | | | 11/1/37 | | | | 71 | |
| | 125 | | | Fannie Mae, Pool# MA3331 | | | 3.00 | | | | 4/1/48 | | | | 121 | |
| | 47 | | | Fannie Mae, Pool #MA3218 | | | 3.00 | | | | 12/1/32 | | | | 47 | |
| | 956 | | | Fannie Mae, Pool #AQ7920 | | | 3.00 | | | | 12/1/42 | | | | 934 | |
| | 44 | | | Fannie Mae, Pool #AR7426 | | | 3.00 | | | | 7/1/43 | | | | 43 | |
| | 148 | | | Fannie Mae, Pool #AQ3223 | | | 3.00 | | | | 11/1/27 | | | | 148 | |
| | 550 | | | Fannie Mae, Pool #AP2465 | | | 3.00 | | | | 8/1/42 | | | | 538 | |
| | 1,225 | | | Fannie Mae, Pool #AP6375 | | | 3.00 | | | | 9/1/42 | | | | 1,198 | |
| | 657 | | | Fannie Mae, Pool #AP6493 | | | 3.00 | | | | 9/1/42 | | | | 643 | |
| | 356 | | | Fannie Mae, Pool #MA2806 | | | 3.00 | | | | 11/1/46 | | | | 345 | |
| | 275 | | | Fannie Mae, Pool #MA2895 | | | 3.00 | | | | 2/1/47 | | | | 266 | |
| | 34 | | | Fannie Mae, Pool #MA2287 | | | 3.00 | | | | 6/1/35 | | | | 34 | |
| | 253 | | | Fannie Mae, Pool #MA2737 | | | 3.00 | | | | 9/1/46 | | | | 245 | |
| | 125 | | | Fannie Mae, Pool #MA2523 | | | 3.00 | | | | 2/1/36 | | | | 124 | |
| | 123 | | | Fannie Mae, Pool #MA2230 | | | 3.00 | | | | 4/1/35 | | | | 122 | |
See accompanying notes to financial statements.
212
HC CAPITAL TRUST
The U.S. Mortgage/Asset Backed Fixed Income Securities Portfolio
Portfolio of Investments (continued) — June 30, 2018
| | | | | | | | | | | | | | | | |
Principal
Amount
(000) | | | Security Description | | Rate % | | | Maturity
Date | | | Value
(000) | |
| | | | U.S. Government Agency Mortgages (continued) | | | | | | | | | | | | |
| $ | 719 | | | Fannie Mae, Pool #AO0752 | | | 3.00 | | | | 4/1/42 | | | $ | 703 | |
| | 273 | | | Fannie Mae, Pool #MA2863 | | | 3.00 | | | | 1/1/47 | | | | 265 | |
| | 129 | | | Fannie Mae, Pool #MA2425 | | | 3.00 | | | | 10/1/30 | | | | 129 | |
| | 122 | | | Fannie Mae, Pool #MA2773 | | | 3.00 | | | | 10/1/36 | | | | 120 | |
| | 367 | | | Fannie Mae, Pool #AL9865 | | | 3.00 | | | | 2/1/47 | | | | 356 | |
| | 97 | | | Fannie Mae, Pool #AL9996 | | | 3.00 | | | | 4/1/32 | | | | 97 | |
| | 23 | | | Fannie Mae, Pool #AL9848 | | | 3.00 | | | | 3/1/47 | | | | 23 | |
| | 144 | | | Fannie Mae, Pool #MA1527 | | | 3.00 | | | | 8/1/33 | | | | 143 | |
| | 109 | | | Fannie Mae, Pool #MA2149 | | | 3.00 | | | | 1/1/30 | | | | 109 | |
| | 49 | | | Fannie Mae, Pool #MA2087 | | | 3.00 | | | | 11/1/34 | | | | 49 | |
| | 34 | | | Fannie Mae, Pool #MA2065 | | | 3.00 | | | | 10/1/34 | | | | 34 | |
| | 39 | | | Fannie Mae, Pool #MA1058 | | | 3.00 | | | | 5/1/32 | | | | 39 | |
| | 269 | | | Fannie Mae, Pool #MA2833 | | | 3.00 | | | | 12/1/46 | | | | 261 | |
| | 316 | | | Fannie Mae, Pool #AK3302 | | | 3.00 | | | | 3/1/27 | | | | 316 | |
| | 339 | | | Fannie Mae, Pool #AK0006 | | | 3.00 | | | | 1/1/27 | | | | 339 | |
| | 65 | | | Fannie Mae, Pool #MA2832 | | | 3.00 | | | | 12/1/36 | | | | 65 | |
| | 146 | | | Fannie Mae, Pool #MA1401 | | | 3.00 | | | | 4/1/33 | | | | 145 | |
| | 74 | | | Fannie Mae, Pool #MA1338 | | | 3.00 | | | | 2/1/33 | | | | 73 | |
| | 349 | | | Fannie Mae, Pool #MA1307 | | | 3.00 | | | | 1/1/33 | | | | 347 | |
| | 117 | | | Fannie Mae, Pool #AS2312 | | | 3.00 | | | | 5/1/29 | | | | 117 | |
| | 90 | | | Fannie Mae, Pool #BE4400 | | | 3.00 | | | | 1/1/47 | | | | 87 | |
| | 93 | | | Fannie Mae, Pool #BE3861 | | | 3.00 | | | | 1/1/47 | | | | 90 | |
| | 49 | | | Fannie Mae, Pool #BE9547 | | | 3.00 | | | | 4/1/47 | | | | 47 | |
| | 316 | | | Fannie Mae, Pool #BC9003 | | | 3.00 | | | | 11/1/46 | | | | 307 | |
| | 88 | | | Fannie Mae, Pool #AS8424 | | | 3.00 | | | | 12/1/36 | | | | 86 | |
| | 201 | | | Fannie Mae, Pool #AY4200 | | | 3.00 | | | | 5/1/45 | | | | 195 | |
| | 306 | | | Fannie Mae, Pool #AT7620 | | | 3.00 | | | | 6/1/43 | | | | 299 | |
| | 138 | | | Fannie Mae, Pool #AZ0538 | | | 3.00 | | | | 9/1/30 | | | | 138 | |
| | 234 | | | Fannie Mae, Pool #AU3735 | | | 3.00 | | | | 8/1/43 | | | | 229 | |
| | 52 | | | Fannie Mae, Pool #AZ4358 | | | 3.00 | | | | 7/1/30 | | | | 52 | |
| | 280 | | | Fannie Mae, Pool #BD4225 | | | 3.00 | | | | 11/1/46 | | | | 271 | |
| | 57 | | | Fannie Mae, Pool #AT1575 | | | 3.00 | | | | 5/1/43 | | | | 55 | |
| | 319 | | | Fannie Mae, Pool #AT2014 | | | 3.00 | | | | 4/1/43 | | | | 311 | |
| | 296 | | | Fannie Mae, Pool #AY4829 | | | 3.00 | | | | 5/1/45 | | | | 288 | |
| | 53 | | | Fannie Mae, Pool #BA4786 | | | 3.00 | | | | 2/1/31 | | | | 53 | |
| | 237 | | | Fannie Mae, Pool #AB4483 | | | 3.00 | | | | 2/1/27 | | | | 237 | |
| | 173 | | | Fannie Mae, Pool #AS7908 | | | 3.00 | | | | 9/1/46 | | | | 168 | |
| | 98 | | | Fannie Mae, Pool #BJ2996 | | | 3.00 | | | | 1/1/33 | | | | 98 | |
| | 403 | | | Fannie Mae, Pool #AS8414 | | | 3.00 | | | | 11/1/46 | | | | 391 | |
| | 311 | | | Fannie Mae, Pool #AS8276 | | | 3.00 | | | | 11/1/46 | | | | 302 | |
| | 315 | | | Fannie Mae, Pool #BC4764 | | | 3.00 | | | | 10/1/46 | | | | 305 | |
| | 84 | | | Fannie Mae, Pool #BC4276 | | | 3.00 | | | | 4/1/46 | | | | 81 | |
| | 67 | | | Fannie Mae, Pool #BM1370 | | | 3.00 | | | | 4/1/37 | | | | 66 | |
| | 15 | | | Fannie Mae, Pool #BA0826 | | | 3.00 | | | | 10/1/30 | | | | 15 | |
| | 975 | | | Fannie Mae, Pool #AB7099 | | | 3.00 | | | | 11/1/42 | | | | 953 | |
| | 341 | | | Fannie Mae, Pool #AB8897 | | | 3.00 | | | | 4/1/43 | | | | 333 | |
| | 108 | | | Fannie Mae, Pool #J24886 | | | 3.00 | | | | 7/1/23 | | | | 109 | |
| | 23 | | | Fannie Mae, Pool #MA3100 | | | 3.00 | | | | 8/1/37 | | | | 23 | |
| | 385 | | | Fannie Mae, Pool #MA3082 | | | 3.00 | | | | 7/1/47 | | | | 374 | |
| | 46 | | | Fannie Mae, Pool #MA3078 | | | 3.00 | | | | 7/1/37 | | | | 45 | |
| | 30 | | | Fannie Mae, Pool #AX8309 | | | 3.00 | | | | 11/1/29 | | | | 30 | |
| | 255 | | | Fannie Mae, Pool #AS8784 | | | 3.00 | | | | 2/1/47 | | | | 247 | |
| | 88 | | | Fannie Mae, Pool #AS8438 | | | 3.00 | | | | 12/1/36 | | | | 87 | |
| | 218 | | | Fannie Mae, Pool #MA3179 | | | 3.00 | | | | 11/1/47 | | | | 211 | |
See accompanying notes to financial statements.
213
HC CAPITAL TRUST
The U.S. Mortgage/Asset Backed Fixed Income Securities Portfolio
Portfolio of Investments (continued) — June 30, 2018
| | | | | | | | | | | | | | | | |
Principal
Amount
(000) | | | Security Description | | Rate % | | | Maturity
Date | | | Value
(000) | |
| | | | U.S. Government Agency Mortgages (continued) | | | | | | | | | | | | |
| $ | 406 | | | Fannie Mae, Pool #MA3106 | | | 3.00 | | | | 8/1/47 | | | $ | 394 | |
| | 370 | | | Fannie Mae, Pool #MA2956 | | | 3.00 | | | | 4/1/47 | | | | 358 | |
| | 45 | | | Fannie Mae, Pool #MA2961 | | | 3.00 | | | | 4/1/37 | | | | 44 | |
| | 74 | | | Fannie Mae, Pool #BK1015 | | | 3.00 | | | | 2/1/33 | | | | 73 | |
| | 347 | | | Fannie Mae, Pool #AT0682 | | | 3.00 | | | | 4/1/43 | | | | 339 | |
| | 47 | | | Fannie Mae, Pool #MA3127 | | | 3.00 | | | | 9/1/37 | | | | 46 | |
| | 412 | | | Fannie Mae, Pool #BD2446 | | | 3.00 | | | | 1/1/47 | | | | 400 | |
| | 195 | | | Fannie Mae, Pool #AS8521 | | | 3.00 | | | | 12/1/46 | | | | 189 | |
| | 173 | | | Fannie Mae, Pool #AW7383 | | | 3.00 | | | | 8/1/29 | | | | 173 | |
| | 181 | | | Fannie Mae, Pool #BE1901 | | | 3.00 | | | | 12/1/46 | | | | 175 | |
| | 84 | | | Fannie Mae, Pool #AW8295 | | | 3.00 | | | | 8/1/29 | | | | 84 | |
| | 208 | | | Fannie Mae, Pool #BD5545 | | | 3.00 | | | | 10/1/46 | | | | 202 | |
| | 93 | | | Fannie Mae, Pool #AS8483 | | | 3.00 | | | | 12/1/46 | | | | 90 | |
| | 345 | | | Fannie Mae, Pool #BD5787 | | | 3.00 | | | | 9/1/46 | | | | 335 | |
| | 101 | | | Fannie Mae, Pool #AU7890 | | | 3.00 | | | | 9/1/28 | | | | 101 | |
| | 388 | | | Fannie Mae, Pool #CA0487 | | | 3.50 | | | | 10/1/47 | | | | 387 | |
| | 1,093 | | | Fannie Mae, Pool #AB6017 | | | 3.50 | | | | 8/1/42 | | | | 1,096 | |
| | 362 | | | Fannie Mae, Pool #BM1568 | | | 3.50 | | | | 7/1/47 | | | | 364 | |
| | 22 | | | Fannie Mae, Pool #MA2909 | | | 3.50 | | | | 2/1/37 | | | | 22 | |
| | 26 | | | Fannie Mae, Pool #MA1021 | | | 3.50 | | | | 3/1/27 | | | | 26 | |
| | 108 | | | Fannie Mae, Pool #MA2923 | | | 3.50 | | | | 3/1/37 | | | | 109 | |
| | 151 | | | Fannie Mae, Pool #BM2001 | | | 3.50 | | | | 12/1/46 | | | | 151 | |
| | 41 | | | Fannie Mae, Pool #BM1231 | | | 3.50 | | | | 11/1/31 | | | | 42 | |
| | 93 | | | Fannie Mae, Pool #MA2389 | | | 3.50 | | | | 9/1/35 | | | | 94 | |
| | 309 | | | Fannie Mae, Pool #MA2292 | | | 3.50 | | | | 6/1/45 | | | | 308 | |
| | 116 | | | Fannie Mae, Pool #BC0163 | | | 3.50 | | | | 1/1/46 | | | | 115 | |
| | 48 | | | Fannie Mae, Pool #MA3243 | | | 3.50 | | | | 1/1/38 | | | | 49 | |
| | 391 | | | Fannie Mae, Pool #BD2436 | | | 3.50 | | | | 1/1/47 | | | | 390 | |
| | 388 | | | Fannie Mae, Pool #MA3182 | | | 3.50 | | | | 11/1/47 | | | | 386 | |
| | 332 | | | Fannie Mae, Pool #BD5046 | | | 3.50 | | | | 2/1/47 | | | | 331 | |
| | 234 | | | Fannie Mae, Pool #MA1980 | | | 3.50 | | | | 8/1/44 | | | | 234 | |
| | 389 | | | Fannie Mae, Pool #MA3238 | | | 3.50 | | | | 1/1/48 | | | | 387 | |
| | 394 | | | Fannie Mae, Pool #MA3305 | | | 3.50 | | | | 3/1/48 | | | | 393 | |
| | 22 | | | Fannie Mae, Pool #MA2996 | | | 3.50 | | | | 5/1/37 | | | | 22 | |
| | 363 | | | Fannie Mae, Pool #MA3026 | | | 3.50 | | | | 6/1/47 | | | | 363 | |
| | 120 | | | Fannie Mae, Pool #AE5487 | | | 3.50 | | | | 10/1/25 | | | | 122 | |
| | 45 | | | Fannie Mae, Pool #MA3059 | | | 3.50 | | | | 7/1/37 | | | | 46 | |
| | 47 | | | Fannie Mae, Pool #MA3152 | | | 3.50 | | | | 10/1/37 | | | | 47 | |
| | 226 | | | Fannie Mae, Pool #MA1982 | | | 3.50 | | | | 8/1/34 | | | | 229 | |
| | 198 | | | Fannie Mae, Pool #MA1059 | | | 3.50 | | | | 5/1/32 | | | | 201 | |
| | 160 | | | Fannie Mae, Pool #BC3126 | | | 3.50 | | | | 1/1/46 | | | | 159 | |
| | 102 | | | Fannie Mae, Pool #BA1893 | | | 3.50 | | | | 8/1/45 | | | | 102 | |
| | 377 | | | Fannie Mae, Pool #BC1158 | | | 3.50 | | | | 2/1/46 | | | | 376 | |
| | 32 | | | Fannie Mae, Pool #BA5031 | | | 3.50 | | | | 1/1/46 | | | | 32 | |
| | 83 | | | Fannie Mae, Pool #BC7633 | | | 3.50 | | | | 6/1/46 | | | | 82 | |
| | 391 | | | Fannie Mae, Pool #BH9215 | | | 3.50 | | | | 1/1/48 | | | | 390 | |
| | 265 | | | Fannie Mae, Pool #MA2125 | | | 3.50 | | | | 12/1/44 | | | | 265 | |
| | 39 | | | Fannie Mae, Pool #MA2692 | | | 3.50 | | | | 7/1/36 | | | | 39 | |
| | 255 | | | Fannie Mae, Pool #MA1107 | | | 3.50 | | | | 7/1/32 | | | | 258 | |
| | 225 | | | Fannie Mae, Pool #AZ9576 | | | 3.50 | | | | 12/1/45 | | | | 225 | |
| | 147 | | | Fannie Mae, Pool #BE5258 | | | 3.50 | | | | 1/1/47 | | | | 146 | |
| | 225 | | | Fannie Mae, Pool #AS6649 | | | 3.50 | | | | 2/1/46 | | | | 225 | |
| | 176 | | | Fannie Mae, Pool #AS5696 | | | 3.50 | | | | 8/1/45 | | | | 176 | |
| | 232 | | | Fannie Mae, Pool #AS5068 | | | 3.50 | | | | 6/1/45 | | | | 232 | |
See accompanying notes to financial statements.
214
HC CAPITAL TRUST
The U.S. Mortgage/Asset Backed Fixed Income Securities Portfolio
Portfolio of Investments (continued) — June 30, 2018
| | | | | | | | | | | | | | | | |
Principal
Amount
(000) | | | Security Description | | Rate % | | | Maturity
Date | | | Value
(000) | |
| | | | U.S. Government Agency Mortgages (continued) | | | | | | | | | | | | |
| $ | 109 | | | Fannie Mae, Pool #AS5892 | | | 3.50 | | | | 10/1/45 | | | $ | 109 | |
| | 203 | | | Fannie Mae, Pool #AS0024 | | | 3.50 | | | | 7/1/43 | | | | 204 | |
| | 230 | | | Fannie Mae, Pool #AY5303 | | | 3.50 | | | | 3/1/45 | | | | 230 | |
| | 245 | | | Fannie Mae, Pool #AY4300 | | | 3.50 | | | | 1/1/45 | | | | 244 | |
| | 268 | | | Fannie Mae, Pool #AS4773 | | | 3.50 | | | | 4/1/45 | | | | 267 | |
| | 137 | | | Fannie Mae, Pool #AS4772 | | | 3.50 | | | | 4/1/45 | | | | 137 | |
| | 272 | | | Fannie Mae, Pool #AS4771 | | | 3.50 | | | | 4/1/45 | | | | 272 | |
| | 145 | | | Fannie Mae, Pool #AS5319 | | | 3.50 | | | | 7/1/45 | | | | 145 | |
| | 106 | | | Fannie Mae, Pool #AX7655 | | | 3.50 | | | | 1/1/45 | | | | 106 | |
| | 311 | | | Fannie Mae, Pool #AS7388 | | | 3.50 | | | | 6/1/46 | | | | 311 | |
| | 375 | | | Fannie Mae, Pool #AS7491 | | | 3.50 | | | | 7/1/46 | | | | 374 | |
| | 183 | | | Fannie Mae, Pool #AY3802 | | | 3.50 | | | | 2/1/45 | | | | 182 | |
| | 129 | | | Fannie Mae, Pool #AX5201 | | | 3.50 | | | | 10/1/29 | | | | 131 | |
| | 160 | | | Fannie Mae, Pool #AZ2614 | | | 3.50 | | | | 8/1/45 | | | | 160 | |
| | 213 | | | Fannie Mae, Pool #AX2486 | | | 3.50 | | | | 10/1/44 | | | | 213 | |
| | 21 | | | Fannie Mae, Pool #AX0159 | | | 3.50 | | | | 9/1/29 | | | | 21 | |
| | 245 | | | Fannie Mae, Pool #AX9530 | | | 3.50 | | | | 2/1/45 | | | | 245 | |
| | 285 | | | Fannie Mae, Pool #AY1306 | | | 3.50 | | | | 3/1/45 | | | | 285 | |
| | 41 | | | Fannie Mae, Pool #AV6407 | | | 3.50 | | | | 2/1/29 | | | | 42 | |
| | 108 | | | Fannie Mae, Pool #AZ6383 | | | 3.50 | | | | 9/1/45 | | | | 108 | |
| | 177 | | | Fannie Mae, Pool #AY3913 | | | 3.50 | | | | 2/1/45 | | | | 176 | |
| | 292 | | | Fannie Mae, Pool #AS3133 | | | 3.50 | | | | 8/1/44 | | | | 292 | |
| | 34 | | | Fannie Mae, Pool #AS2081 | | | 3.50 | | | | 4/1/29 | | | | 35 | |
| | 143 | | | Fannie Mae, Pool #AJ4093 | | | 3.50 | | | | 10/1/26 | | | | 145 | |
| | 87 | | | Fannie Mae, Pool #AY8856 | | | 3.50 | | | | 9/1/45 | | | | 88 | |
| | 317 | | | Fannie Mae, Pool #AZ0862 | | | 3.50 | | | | 7/1/45 | | | | 316 | |
| | 163 | | | Fannie Mae, Pool #AU3742 | | | 3.50 | | | | 8/1/43 | | | | 163 | |
| | 21 | | | Fannie Mae, Pool #AJ6181 | | | 3.50 | | | | 12/1/26 | | | | 22 | |
| | 21 | | | Fannie Mae, Pool #AL8776 | | | 3.50 | | | | 7/1/46 | | | | 21 | |
| | 258 | | | Fannie Mae, Pool #AJ8476 | | | 3.50 | | | | 12/1/41 | | | | 259 | |
| | 1,006 | | | Fannie Mae, Pool #AO8137 | | | 3.50 | | | | 8/1/42 | | | | 1,008 | |
| | 136 | | | Fannie Mae, Pool #AO9140 | | | 3.50 | | | | 7/1/42 | | | | 136 | |
| | 55 | | | Fannie Mae, Pool #AK0706 | | | 3.50 | | | | 2/1/27 | | | | 56 | |
| | 55 | | | Fannie Mae, Pool #AP9390 | | | 3.50 | | | | 10/1/42 | | | | 55 | |
| | 340 | | | Fannie Mae, Pool #AU1635 | | | 3.50 | | | | 7/1/43 | | | | 340 | |
| | 1,189 | | | Fannie Mae, Pool #AK7497 | | | 3.50 | | | | 4/1/42 | | | | 1,193 | |
| | 1,149 | | | Fannie Mae, Pool #AO2548 | | | 3.50 | | | | 4/1/42 | | | | 1,153 | |
| | 456 | | | Fannie Mae, Pool #AQ0546 | | | 3.50 | | | | 11/1/42 | | | | 457 | |
| | 250 | | | Fannie Mae, Pool #AS7239 | | | 3.50 | | | | 5/1/46 | | | | 249 | |
| | 133 | | | Fannie Mae, Pool #AO4647 | | | 3.50 | | | | 6/1/42 | | | | 134 | |
| | 401 | | | Fannie Mae, Pool #AL1717 | | | 3.50 | | | | 5/1/27 | | | | 407 | |
| | 74 | | | Fannie Mae, Pool #310139 | | | 3.50 | | | | 11/1/25 | | | | 75 | |
| | 53 | | | Fannie Mae, Pool #MA2495 | | | 3.50 | | | | 1/1/46 | | | | 53 | |
| | 211 | | | Fannie Mae, Pool #AO4385 | | | 3.50 | | | | 6/1/42 | | | | 212 | |
| | 410 | | | Fannie Mae, Pool #AO3760 | | | 3.50 | | | | 5/1/42 | | | | 411 | |
| | 74 | | | Fannie Mae, Pool #BH2623 | | | 4.00 | | | | 8/1/47 | | | | 76 | |
| | 74 | | | Fannie Mae, Pool# BJ0639 | | | 4.00 | | | | 3/1/48 | | | | 76 | |
| | 378 | | | Fannie Mae, Pool #AS9831 | | | 4.00 | | | | 6/1/47 | | | | 386 | |
| | 366 | | | Fannie Mae, Pool #CA0183 | | | 4.00 | | | | 8/1/47 | | | | 373 | |
| | 279 | | | Fannie Mae, Pool #AS9486 | | | 4.00 | | | | 4/1/47 | | | | 285 | |
| | 177 | | | Fannie Mae, Pool #AW5063 | | | 4.00 | | | | 7/1/44 | | | | 180 | |
| | 53 | | | Fannie Mae, Pool #AW5109 | | | 4.00 | | | | 8/1/44 | | | | 54 | |
| | 385 | | | Fannie Mae, Pool #BD7081 | | | 4.00 | | | | 3/1/47 | | | | 393 | |
| | 380 | | | Fannie Mae, Pool #BE8050 | | | 4.00 | | | | 4/1/47 | | | | 387 | |
See accompanying notes to financial statements.
215
HC CAPITAL TRUST
The U.S. Mortgage/Asset Backed Fixed Income Securities Portfolio
Portfolio of Investments (continued) — June 30, 2018
| | | | | | | | | | | | | | | | |
Principal
Amount
(000) | | | Security Description | | Rate % | | | Maturity
Date | | | Value
(000) | |
| | | | U.S. Government Agency Mortgages (continued) | | | | | | | | | | | | |
| $ | 205 | | | Fannie Mae, Pool #AY1595 | | | 4.00 | | | | 1/1/45 | | | $ | 209 | |
| | 253 | | | Fannie Mae, Pool #AS8532 | | | 4.00 | | | | 12/1/46 | | | | 259 | |
| | 44 | | | Fannie Mae, Pool #AY2291 | | | 4.00 | | | | 3/1/45 | | | | 45 | |
| | 41 | | | Fannie Mae, Pool #AH3394 | | | 4.00 | | | | 1/1/41 | | | | 42 | |
| | 291 | | | Fannie Mae, Pool #BA6910 | | | 4.00 | | | | 2/1/46 | | | | 297 | |
| | 339 | | | Fannie Mae, Pool #AH5859 | | | 4.00 | | | | 2/1/41 | | | | 348 | |
| | 354 | | | Fannie Mae, Pool #BM2002 | | | 4.00 | | | | 10/1/47 | | | | 362 | |
| | 268 | | | Fannie Mae, Pool #AH6242 | | | 4.00 | | | | 4/1/26 | | | | 276 | |
| | 71 | | | Fannie Mae, Pool #MA0493 | | | 4.00 | | | | 8/1/30 | | | | 73 | |
| | 39 | | | Fannie Mae, Pool #MA0695 | | | 4.00 | | | | 4/1/31 | | | | 40 | |
| | 215 | | | Fannie Mae, Pool #MA0641 | | | 4.00 | | | | 2/1/31 | | | | 221 | |
| | 71 | | | Fannie Mae, Pool #G08694 | | | 4.00 | | | | 2/1/46 | | | | 73 | |
| | 126 | | | Fannie Mae, Pool #AC7328 | | | 4.00 | | | | 12/1/39 | | | | 129 | |
| | 56 | | | Fannie Mae, Pool #AT3872 | | | 4.00 | | | | 6/1/43 | | | | 57 | |
| | 86 | | | Fannie Mae, Pool #BA0847 | | | 4.00 | | | | 3/1/46 | | | | 88 | |
| | 222 | | | Fannie Mae, Pool #AZ7362 | | | 4.00 | | | | 11/1/45 | | | | 226 | |
| | 292 | | | Fannie Mae, Pool #AU3753 | | | 4.00 | | | | 8/1/43 | | | | 299 | |
| | 15 | | | Fannie Mae, Pool #AZ8874 | | | 4.00 | | | | 9/1/45 | | | | 16 | |
| | 107 | | | Fannie Mae, Pool #AY8981 | | | 4.00 | | | | 8/1/45 | | | | 109 | |
| | 97 | | | Fannie Mae, Pool #BC5559 | | | 4.00 | | | | 3/1/46 | | | | 99 | |
| | 1,136 | | | Fannie Mae, Pool #190405 | | | 4.00 | | | | 10/1/40 | | | | 1,167 | |
| | 153 | | | Fannie Mae, Pool #AS7600 | | | 4.00 | | | | 7/1/46 | | | | 156 | |
| | 167 | | | Fannie Mae, Pool #AZ8067 | | | 4.00 | | | | 9/1/45 | | | | 170 | |
| | 171 | | | Fannie Mae, Pool #AS7601 | | | 4.00 | | | | 7/1/46 | | | | 174 | |
| | 165 | | | Fannie Mae, Pool #AV2340 | | | 4.00 | | | | 12/1/43 | | | | 169 | |
| | 142 | | | Fannie Mae, Pool #AS3468 | | | 4.00 | | | | 10/1/44 | | | | 145 | |
| | 154 | | | Fannie Mae, Pool #AS3903 | | | 4.00 | | | | 11/1/44 | | | | 157 | |
| | 190 | | | Fannie Mae, Pool #AY1377 | | | 4.00 | | | | 4/1/45 | | | | 195 | |
| | 214 | | | Fannie Mae, Pool #AS3293 | | | 4.00 | | | | 9/1/44 | | | | 219 | |
| | 206 | | | Fannie Mae, Pool #AS3216 | | | 4.00 | | | | 9/1/44 | | | | 211 | |
| | 441 | | | Fannie Mae, Pool #AJ7857 | | | 4.00 | | | | 12/1/41 | | | | 453 | |
| | 153 | | | Fannie Mae, Pool #AL7347 | | | 4.00 | | | | 9/1/45 | | | | 156 | |
| | 44 | | | Fannie Mae, Pool #AS3448 | | | 4.00 | | | | 9/1/44 | | | | 45 | |
| | 18 | | | Fannie Mae, Pool #MA2655 | | | 4.00 | | | | 6/1/36 | | | | 19 | |
| | 220 | | | Fannie Mae, Pool #AS3467 | | | 4.00 | | | | 10/1/44 | | | | 224 | |
| | 377 | | | Fannie Mae, Pool #MA3183 | | | 4.00 | | | | 11/1/47 | | | | 385 | |
| | 91 | | | Fannie Mae, Pool #AL4778 | | | 4.00 | | | | 10/1/32 | | | | 93 | |
| | 479 | | | Fannie Mae, Pool #AS0531 | | | 4.00 | | | | 9/1/43 | | | | 492 | |
| | 34 | | | Fannie Mae, Pool #AS7028 | | | 4.00 | | | | 4/1/46 | | | | 35 | |
| | 49 | | | Fannie Mae, Pool #MA3216 | | | 4.00 | | | | 12/1/37 | | | | 50 | |
| | 464 | | | Fannie Mae, Pool #MA2995 | | | 4.00 | | | | 5/1/47 | | | | 473 | |
| | 17 | | | Fannie Mae, Pool #MA2536 | | | 4.00 | | | | 2/1/36 | | | | 17 | |
| | 323 | | | Fannie Mae, Pool #MA3121 | | | 4.00 | | | | 9/1/47 | | | | 330 | |
| | 22 | | | Fannie Mae, Pool #MA3037 | | | 4.00 | | | | 6/1/37 | | | | 23 | |
| | 181 | | | Fannie Mae, Pool #AS2498 | | | 4.00 | | | | 5/1/44 | | | | 185 | |
| | 48 | | | Fannie Mae, Pool #MA2455 | | | 4.00 | | | | 11/1/35 | | | | 50 | |
| | 99 | | | Fannie Mae, Pool #AY0025 | | | 4.00 | | | | 2/1/45 | | | | 101 | |
| | 25 | | | Fannie Mae, Pool #AW9041 | | | 4.00 | | | | 8/1/44 | | | | 26 | |
| | 198 | | | Fannie Mae, Pool #AX0841 | | | 4.00 | | | | 9/1/44 | | | | 202 | |
| | 222 | | | Fannie Mae, Pool #AO2959 | | | 4.00 | | | | 5/1/42 | | | | 228 | |
| | 32 | | | Fannie Mae, Pool #AS2117 | | | 4.00 | | | | 4/1/44 | | | | 33 | |
| | 250 | | | Fannie Mae, Pool #AL8387 | | | 4.00 | | | | 3/1/46 | | | | 255 | |
| | 560 | | | Fannie Mae, Pool #AJ5303 | | | 4.00 | | | | 11/1/41 | | | | 575 | |
| | 371 | | | Fannie Mae, Pool #MA3027 | | | 4.00 | | | | 6/1/47 | | | | 378 | |
See accompanying notes to financial statements.
216
HC CAPITAL TRUST
The U.S. Mortgage/Asset Backed Fixed Income Securities Portfolio
Portfolio of Investments (continued) — June 30, 2018
| | | | | | | | | | | | | | | | |
Principal
Amount
(000) | | | Security Description | | Rate % | | | Maturity
Date | | | Value
(000) | |
| | | | U.S. Government Agency Mortgages (continued) | | | | | | | | | | | | |
| $ | 611 | | | Fannie Mae, Pool #AJ7689 | | | 4.00 | | | | 12/1/41 | | | $ | 628 | |
| | 31 | | | Fannie Mae, Pool #AA0860 | | | 4.50 | | | | 1/1/39 | | | | 32 | |
| | 125 | | | Fannie Mae, Pool #MA0481 | | | 4.50 | | | | 8/1/30 | | | | 131 | |
| | 205 | | | Fannie Mae, Pool #AB3192 | | | 4.50 | | | | 6/1/41 | | | | 216 | |
| | 53 | | | Fannie Mae, Pool #AA9781 | | | 4.50 | | | | 7/1/24 | | | | 54 | |
| | 36 | | | Fannie Mae, Pool #982892 | | | 4.50 | | | | 5/1/23 | | | | 36 | |
| | 539 | | | Fannie Mae, Pool #AL1107 | | | 4.50 | | | | 11/1/41 | | | | 566 | |
| | 43 | | | Fannie Mae, Pool #AL8816 | | | 4.50 | | | | 9/1/45 | | | | 45 | |
| | 81 | | | Fannie Mae, Pool #BM1285 | | | 4.50 | | | | 5/1/47 | | | | 84 | |
| | 168 | | | Fannie Mae, Pool #AL4450 | | | 4.50 | | | | 12/1/43 | | | | 176 | |
| | 572 | | | Fannie Mae, Pool #AH7521 | | | 4.50 | | | | 3/1/41 | | | | 602 | |
| | 87 | | | Fannie Mae, Pool #AL5082 | | | 4.50 | | | | 3/1/44 | | | | 91 | |
| | 494 | | | Fannie Mae, Pool #AH9055 | | | 4.50 | | | | 4/1/41 | | | | 520 | |
| | 210 | | | Fannie Mae, Pool #AI4815 | | | 4.50 | | | | 6/1/41 | | | | 221 | |
| | 213 | | | Fannie Mae, Pool #AD8529 | | | 4.50 | | | | 8/1/40 | | | | 224 | |
| | 104 | | | Fannie Mae, Pool #AS2276 | | | 4.50 | | | | 4/1/44 | | | | 109 | |
| | 16 | | | Fannie Mae, Pool #AW7048 | | | 4.50 | | | | 6/1/44 | | | | 16 | |
| | 45 | | | Fannie Mae, Pool #AU5302 | | | 4.50 | | | | 10/1/43 | | | | 48 | |
| | 223 | | | Fannie Mae, Pool #AE0217 | | | 4.50 | | | | 8/1/40 | | | | 235 | |
| | 169 | | | Fannie Mae, Pool #BE5992 | | | 4.50 | | | | 2/1/47 | | | | 176 | |
| | 193 | | | Fannie Mae, Pool #BE6489 | | | 4.50 | | | | 1/1/47 | | | | 202 | |
| | 90 | | | Fannie Mae, Pool #AS1638 | | | 4.50 | | | | 2/1/44 | | | | 94 | |
| | 54 | | | Fannie Mae, Pool #AS0861 | | | 4.50 | | | | 10/1/43 | | | | 56 | |
| | 99 | | | Fannie Mae, Pool #AB1389 | | | 4.50 | | | | 8/1/40 | | | | 104 | |
| | 43 | | | Fannie Mae, Pool #AS8576 | | | 4.50 | | | | 12/1/46 | | | | 45 | |
| | 39 | | | Fannie Mae, Pool #AB1470 | | | 4.50 | | | | 9/1/40 | | | | 41 | |
| | 40 | | | Fannie Mae, Pool #AH6790 | | | 4.50 | | | | 3/1/41 | | | | 42 | |
| | 183 | | | Fannie Mae, Pool #AS8157 | | | 4.50 | | | | 10/1/46 | | | | 191 | |
| | 270 | | | Fannie Mae, Pool #MA3184 | | | 4.50 | | | | 11/1/47 | | | | 282 | |
| | 174 | | | Fannie Mae, Pool #AH5988 | | | 5.00 | | | | 3/1/41 | | | | 186 | |
| | 42 | | | Fannie Mae, Pool #890621 | | | 5.00 | | | | 5/1/42 | | | | 45 | |
| | 3 | | | Fannie Mae, Pool #725504 | | | 5.00 | | | | 1/1/19 | | | | 3 | |
| | 38 | | | Fannie Mae, Pool #890603 | | | 5.00 | | | | 8/1/41 | | | | 40 | |
| | 71 | | | Fannie Mae, Pool# BM3781 | | | 5.00 | | | | 11/1/30 | | | | 76 | |
| | 805 | | | Fannie Mae, Pool #889117 | | | 5.00 | | | | 10/1/35 | | | | 863 | |
| | 44 | | | Fannie Mae, Pool #725238 | | | 5.00 | | | | 3/1/34 | | | | 47 | |
| | 1 | | | Fannie Mae, Pool #868986 | | | 5.00 | | | | 5/1/21 | | | | 1 | |
| | 20 | | | Fannie Mae, Pool #796663 | | | 5.00 | | | | 9/1/19 | | | | 21 | |
| | 86 | | | Fannie Mae, Pool #AS0837 | | | 5.00 | | | | 10/1/43 | | | | 92 | |
| | 89 | | | Fannie Mae, Pool #AS0575 | | | 5.00 | | | | 9/1/43 | | | | 95 | |
| | 95 | | | Fannie Mae, Pool #836750 | | | 5.00 | | | | 10/1/35 | | | | 101 | |
| | 84 | | | Fannie Mae, Pool #AL5788 | | | 5.00 | | | | 5/1/42 | | | | 90 | |
| | 5 | | | Fannie Mae, Pool #AL0725 | | | 5.50 | | | | 6/1/24 | | | | 5 | |
| | 5 | | | Fannie Mae, Pool #A69671 | | | 5.50 | | | | 12/1/37 | | | | 5 | |
| | 20 | | | Fannie Mae, Pool #929451 | | | 5.50 | | | | 5/1/38 | | | | 22 | |
| | 39 | | | Fannie Mae, Pool #976945 | | | 5.50 | | | | 2/1/23 | | | | 40 | |
| | 1,253 | | | Fannie Mae, Pool #890221 | | | 5.50 | | | | 12/1/33 | | | | 1,362 | |
| | 19 | | | Fannie Mae, Pool #909662 | | | 5.50 | | | | 2/1/22 | | | | 20 | |
| | 1 | | | Fannie Mae, Pool #A79636 | | | 5.50 | | | | 7/1/38 | | | | 1 | |
| | 747 | | | Fannie Mae, Pool #725228 | | | 6.00 | | | | 3/1/34 | | | | 824 | |
| | 177 | | | Fannie Mae, Pool #889984 | | | 6.50 | | | | 10/1/38 | | | | 196 | |
| | 875 | | | Fannie Mae, 15 YR TBA | | | 3.00 | | | | 7/25/33 | | | | 870 | |
| | 375 | | | Fannie Mae, 15 YR TBA | | | 3.50 | | | | 7/25/33 | | | | 379 | |
| | 3,475 | | | Fannie Mae, 30 YR TBA | | | 3.50 | | | | 7/25/48 | | | | 3,458 | |
See accompanying notes to financial statements.
217
HC CAPITAL TRUST
The U.S. Mortgage/Asset Backed Fixed Income Securities Portfolio
Portfolio of Investments (continued) — June 30, 2018
| | | | | | | | | | | | | | | | |
Principal
Amount
(000) | | | Security Description | | Rate % | | | Maturity
Date | | | Value
(000) | |
| | | | U.S. Government Agency Mortgages (continued) | | | | | | | | | | | | |
| $ | 500 | | | Fannie Mae, 30 YR TBA | | | 4.00 | | | | 8/25/48 | | | $ | 509 | |
| | 1,625 | | | Fannie Mae, 30 YR TBA | | | 4.00 | | | | 7/25/48 | | | | 1,657 | |
| | 675 | | | Fannie Mae, 30 YR TBA | | | 4.50 | | | | 7/25/47 | | | | 703 | |
| | 250 | | | Fannie Mae, 30 YR TBA | | | 4.50 | | | | 8/25/48 | | | | 260 | |
| | 150 | | | Fannie Mae, 30 YR TBA | | | 5.00 | | | | 8/25/48 | | | | 159 | |
| | 138 | | | Freddie Mac, Pool #J25777 | | | 2.00 | | | | 9/1/28 | | | | 133 | |
| | 53 | | | Freddie Mac, Pool #J25759 | | | 2.00 | | | | 8/1/28 | | | | 51 | |
| | 98 | | | Freddie Mac, Pool #G18634 | | | 2.00 | | | | 3/1/32 | | | | 93 | |
| | 65 | | | Freddie Mac, Pool #G18547 | | | 2.00 | | | | 3/1/30 | | | | 62 | |
| | 48 | | | Freddie Mac, Pool #Q42878 | | | 2.50 | | | | 9/1/46 | | | | 44 | |
| | 174 | | | Freddie Mac, Pool #G18635 | | | 2.50 | | | | 3/1/32 | | | | 170 | |
| | 169 | | | Freddie Mac, Pool #J35896 | | | 2.50 | | | | 12/1/31 | | | | 165 | |
| | 81 | | | Freddie Mac, Pool #J25585 | | | 2.50 | | | | 9/1/28 | | | | 79 | |
| | 346 | | | Freddie Mac, Pool #G18680 | | | 2.50 | | | | 3/1/33 | | | | 337 | |
| | 264 | | | Freddie Mac, Pool #J26408 | | | 2.50 | | | | 11/1/28 | | | | 258 | |
| | 202 | | | Freddie Mac, Pool #J23440 | | | 2.50 | | | | 4/1/28 | | | | 198 | |
| | 35 | | | Freddie Mac, Pool #G18472 | | | 2.50 | | | | 7/1/28 | | | | 34 | |
| | 100 | | | Freddie Mac, Pool #G18485 | | | 2.50 | | | | 10/1/28 | | | | 98 | |
| | 232 | | | Freddie Mac, Pool #G18568 | | | 2.50 | | | | 9/1/30 | | | | 226 | |
| | 193 | | | Freddie Mac, Pool #G18533 | | | 2.50 | | | | 12/1/29 | | | | 188 | |
| | 25 | | | Freddie Mac, Pool #G08638 | | | 2.50 | | | | 4/1/45 | | | | 23 | |
| | 44 | | | Freddie Mac, Pool #C91904 | | | 2.50 | | | | 11/1/36 | | | | 42 | |
| | 227 | | | Freddie Mac, Pool #G18470 | | | 2.50 | | | | 6/1/28 | | | | 222 | |
| | 205 | | | Freddie Mac, Pool #G18459 | | | 2.50 | | | | 3/1/28 | | | | 200 | |
| | 17 | | | Freddie Mac, Pool #J30875 | | | 2.50 | | | | 3/1/30 | | | | 16 | |
| | 200 | | | Freddie Mac, Pool# J37902 | | | 2.50 | | | | 11/1/32 | | | | 194 | |
| | 122 | | | Freddie Mac, Pool #J35643 | | | 2.50 | | | | 11/1/31 | | | | 119 | |
| | 128 | | | Freddie Mac, Pool #J36516 | | | 2.50 | | | | 3/1/32 | | | | 124 | |
| | 76 | | | Freddie Mac, Pool #C09026 | | | 2.50 | | | | 2/1/43 | | | | 71 | |
| | 23 | | | Freddie Mac, Pool #G08755 | | | 2.50 | | | | 2/1/47 | | | | 21 | |
| | 218 | | | Freddie Mac, Pool #J18954 | | | 2.50 | | | | 4/1/27 | | | | 213 | |
| | 340 | | | Freddie Mac, Pool #J38477 | | | 2.50 | | | | 2/1/33 | | | | 331 | |
| | 324 | | | Freddie Mac, Pool #Q16222 | | | 3.00 | | | | 3/1/43 | | | | 316 | |
| | 347 | | | Freddie Mac, Pool #G08635 | | | 3.00 | | | | 4/1/45 | | | | 337 | |
| | 230 | | | Freddie Mac, Pool #Q41795 | | | 3.00 | | | | 7/1/46 | | | | 223 | |
| | 22 | | | Freddie Mac, Pool #G30999 | | | 3.00 | | | | 2/1/37 | | | | 22 | |
| | 554 | | | Freddie Mac, Pool #Q21065 | | | 3.00 | | | | 8/1/43 | | | | 540 | |
| | 20 | | | Freddie Mac, Pool #Q39527 | | | 3.00 | | | | 3/1/46 | | | | 19 | |
| | 54 | | | Freddie Mac, Pool #Q18599 | | | 3.00 | | | | 6/1/43 | | | | 52 | |
| | 23 | | | Freddie Mac, Pool #C91939 | | | 3.00 | | | | 6/1/37 | | | | 22 | |
| | 44 | | | Freddie Mac, Pool #C91905 | | | 3.00 | | | | 11/1/36 | | | | 43 | |
| | 226 | | | Freddie Mac, Pool #C91581 | | | 3.00 | | | | 11/1/32 | | | | 225 | |
| | 49 | | | Freddie Mac, Pool #C91969 | | | 3.00 | | | | 1/1/38 | | | | 48 | |
| | 24 | | | Freddie Mac, Pool #C91949 | | | 3.00 | | | | 9/1/37 | | | | 23 | |
| | 46 | | | Freddie Mac, Pool #C91943 | | | 3.00 | | | | 7/1/37 | | | | 45 | |
| | 86 | | | Freddie Mac, Pool #C91798 | | | 3.00 | | | | 12/1/34 | | | | 85 | |
| | 34 | | | Freddie Mac, Pool #C91826 | | | 3.00 | | | | 5/1/35 | | | | 33 | |
| | 506 | | | Freddie Mac, Pool #G08534 | | | 3.00 | | | | 6/1/43 | | | | 494 | |
| | 200 | | | Freddie Mac, Pool #Q46441 | | | 3.00 | | | | 2/1/47 | | | | 193 | |
| | 51 | | | Freddie Mac, Pool #J29932 | | | 3.00 | | | | 11/1/29 | | | | 51 | |
| | 279 | | | Freddie Mac, Pool #G08525 | | | 3.00 | | | | 5/1/43 | | | | 272 | |
| | 14 | | | Freddie Mac, Pool #Q13086 | | | 3.00 | | | | 11/1/42 | | | | 14 | |
| | 178 | | | Freddie Mac, Pool #Q20067 | | | 3.00 | | | | 7/1/43 | | | | 174 | |
| | 53 | | | Freddie Mac, Pool #J33135 | | | 3.00 | | | | 11/1/30 | | | | 53 | |
See accompanying notes to financial statements.
218
HC CAPITAL TRUST
The U.S. Mortgage/Asset Backed Fixed Income Securities Portfolio
Portfolio of Investments (continued) — June 30, 2018
| | | | | | | | | | | | | | | | |
Principal
Amount
(000) | | | Security Description | | Rate % | | | Maturity
Date | | | Value
(000) | |
| | | | U.S. Government Agency Mortgages (continued) | | | | | | | | | | | | |
| $ | 434 | | | Freddie Mac, Pool #Q45735 | | | 3.00 | | | | 1/1/47 | | | $ | 421 | |
| | 276 | | | Freddie Mac, Pool #Q44452 | | | 3.00 | | | | 11/1/46 | | | | 268 | |
| | 50 | | | Freddie Mac, Pool# J38807 | | | 3.00 | | | | 4/1/33 | | | | 49 | |
| | 147 | | | Freddie Mac, Pool #G08640 | | | 3.00 | | | | 5/1/45 | | | | 143 | |
| | 315 | | | Freddie Mac, Pool #G60187 | | | 3.00 | | | | 8/1/45 | | | | 306 | |
| | 63 | | | Freddie Mac, Pool #Q19754 | | | 3.00 | | | | 7/1/43 | | | | 62 | |
| | 386 | | | Freddie Mac, Pool #Q45094 | | | 3.00 | | | | 12/1/46 | | | | 374 | |
| | 62 | | | Freddie Mac, Pool #G30945 | | | 3.00 | | | | 9/1/36 | | | | 62 | |
| | 353 | | | Freddie Mac, Pool #G60989 | | | 3.00 | | | | 12/1/46 | | | | 343 | |
| | 19 | | | Freddie Mac, Pool #Q18882 | | | 3.00 | | | | 5/1/43 | | | | 18 | |
| | 225 | | | Freddie Mac, Pool# G08825 | | | 3.00 | | | | 6/1/48 | | | | 218 | |
| | 467 | | | Freddie Mac, Pool #G08701 | | | 3.00 | | | | 4/1/46 | | | | 453 | |
| | 238 | | | Freddie Mac, Pool #G18673 | | | 3.00 | | | | 1/1/33 | | | | 236 | |
| | 134 | | | Freddie Mac, Pool #G08680 | | | 3.00 | | | | 12/1/45 | | | | 130 | |
| | 17 | | | Freddie Mac, Pool #J17111 | | | 3.00 | | | | 10/1/26 | | | | 17 | |
| | 120 | | | Freddie Mac, Pool #G08648 | | | 3.00 | | | | 6/1/45 | | | | 116 | |
| | 64 | | | Freddie Mac, Pool #G18575 | | | 3.00 | | | | 11/1/30 | | | | 63 | |
| | 117 | | | Freddie Mac, Pool #C91707 | | | 3.00 | | | | 6/1/33 | | | | 117 | |
| | 169 | | | Freddie Mac, Pool #G18569 | | | 3.00 | | | | 9/1/30 | | | | 168 | |
| | 148 | | | Freddie Mac, Pool# G18677 | | | 3.00 | | | | 2/1/33 | | | | 147 | |
| | 97 | | | Freddie Mac, Pool #G18582 | | | 3.00 | | | | 1/1/31 | | | | 96 | |
| | 160 | | | Freddie Mac, Pool #C91724 | | | 3.00 | | | | 9/1/33 | | | | 159 | |
| | 178 | | | Freddie Mac, Pool #G08732 | | | 3.00 | | | | 11/1/46 | | | | 172 | |
| | 286 | | | Freddie Mac, Pool #C04619 | | | 3.00 | | | | 3/1/43 | | | | 279 | |
| | 193 | | | Freddie Mac, Pool #C04422 | | | 3.00 | | | | 12/1/42 | | | | 189 | |
| | 259 | | | Freddie Mac, Pool #C04446 | | | 3.00 | | | | 1/1/43 | | | | 252 | |
| | 268 | | | Freddie Mac, Pool #G08737 | | | 3.00 | | | | 12/1/46 | | | | 260 | |
| | 501 | | | Freddie Mac, Pool #G08741 | | | 3.00 | | | | 1/1/47 | | | | 485 | |
| | 380 | | | Freddie Mac, Pool #G08653 | | | 3.00 | | | | 7/1/45 | | | | 369 | |
| | 358 | | | Freddie Mac, Pool #J17774 | | | 3.00 | | | | 1/1/27 | | | | 358 | |
| | 34 | | | Freddie Mac, Pool #J14241 | | | 3.00 | | | | 1/1/26 | | | | 34 | |
| | 93 | | | Freddie Mac, Pool #G08747 | | | 3.00 | | | | 2/1/47 | | | | 90 | |
| | 184 | | | Freddie Mac, Pool #G08750 | | | 3.00 | | | | 3/1/47 | | | | 178 | |
| | 181 | | | Freddie Mac, Pool #G18531 | | | 3.00 | | | | 11/1/29 | | | | 181 | |
| | 211 | | | Freddie Mac, Pool #G18518 | | | 3.00 | | | | 7/1/29 | | | | 210 | |
| | 260 | | | Freddie Mac, Pool #G18514 | | | 3.00 | | | | 6/1/29 | | | | 259 | |
| | 241 | | | Freddie Mac, Pool #G15217 | | | 3.00 | | | | 11/1/29 | | | | 240 | |
| | 213 | | | Freddie Mac, Pool #G15145 | | | 3.00 | | | | 7/1/29 | | | | 213 | |
| | 68 | | | Freddie Mac, Pool #C91927 | | | 3.00 | | | | 5/1/37 | | | | 67 | |
| | 110 | | | Freddie Mac, Pool #C91819 | | | 3.00 | | | | 4/1/35 | | | | 109 | |
| | 66 | | | Freddie Mac, Pool #G08540 | | | 3.00 | | | | 8/1/43 | | | | 64 | |
| | 1,125 | | | Freddie Mac, Pool #G08537 | | | 3.00 | | | | 7/1/43 | | | | 1,098 | |
| | 45 | | | Freddie Mac, Pool #C91924 | | | 3.00 | | | | 4/1/37 | | | | 44 | |
| | 15 | | | Freddie Mac, Pool #C91809 | | | 3.00 | | | | 2/1/35 | | | | 15 | |
| | 51 | | | Freddie Mac, Pool #G18534 | | | 3.00 | | | | 12/1/29 | | | | 51 | |
| | 184 | | | Freddie Mac, Pool #C91456 | | | 3.50 | | | | 6/1/32 | | | | 187 | |
| | 34 | | | Freddie Mac, Pool #J14232 | | | 3.50 | | | | 1/1/21 | | | | 34 | |
| | 68 | | | Freddie Mac, Pool #C03920 | | | 3.50 | | | | 5/1/42 | | | | 68 | |
| | 169 | | | Freddie Mac, Pool #C91403 | | | 3.50 | | | | 3/1/32 | | | | 171 | |
| | 233 | | | Freddie Mac, Pool #J15105 | | | 3.50 | | | | 4/1/26 | | | | 236 | |
| | 45 | | | Freddie Mac, Pool #C91940 | | | 3.50 | | | | 6/1/37 | | | | 45 | |
| | 17 | | | Freddie Mac, Pool #C91760 | | | 3.50 | | | | 5/1/34 | | | | 17 | |
| | 70 | | | Freddie Mac, Pool #C91950 | | | 3.50 | | | | 9/1/37 | | | | 70 | |
| | 379 | | | Freddie Mac, Pool #G61148 | | | 3.50 | | | | 9/1/47 | | | | 377 | |
See accompanying notes to financial statements.
219
HC CAPITAL TRUST
The U.S. Mortgage/Asset Backed Fixed Income Securities Portfolio
Portfolio of Investments (continued) — June 30, 2018
| | | | | | | | | | | | | | | | |
Principal
Amount
(000) | | | Security Description | | Rate % | | | Maturity
Date | | | Value
(000) | |
| | | | U.S. Government Agency Mortgages (continued) | | | | | | | | | | | | |
| $ | 163 | | | Freddie Mac, Pool #Q37449 | | | 3.50 | | | | 11/1/45 | | | $ | 162 | |
| | 112 | | | Freddie Mac, Pool #J26144 | | | 3.50 | | | | 10/1/23 | | | | 113 | |
| | 108 | | | Freddie Mac, Pool #J13582 | | | 3.50 | | | | 11/1/25 | | | | 109 | |
| | 387 | | | Freddie Mac, Pool #Q52319 | | | 3.50 | | | | 11/1/47 | | | | 385 | |
| | 241 | | | Freddie Mac, Pool #Q51461 | | | 3.50 | | | | 10/1/47 | | | | 240 | |
| | 68 | | | Freddie Mac, Pool #Q31134 | | | 3.50 | | | | 2/1/45 | | | | 68 | |
| | 17 | | | Freddie Mac, Pool #E02735 | | | 3.50 | | | | 10/1/25 | | | | 17 | |
| | 140 | | | Freddie Mac, Pool #Q06749 | | | 3.50 | | | | 3/1/42 | | | | 140 | |
| | 130 | | | Freddie Mac, Pool #Q04087 | | | 3.50 | | | | 10/1/41 | | | | 130 | |
| | 403 | | | Freddie Mac, Pool #Q49490 | | | 3.50 | | | | 7/1/47 | | | | 401 | |
| | 129 | | | Freddie Mac, Pool #Q36040 | | | 3.50 | | | | 9/1/45 | | | | 129 | |
| | 68 | | | Freddie Mac, Pool #J27494 | | | 3.50 | | | | 2/1/29 | | | | 69 | |
| | 58 | | | Freddie Mac, Pool #G14216 | | | 3.50 | | | | 7/1/21 | | | | 59 | |
| | 162 | | | Freddie Mac, Pool #G08706 | | | 3.50 | | | | 5/1/46 | | | | 162 | |
| | 361 | | | Freddie Mac, Pool #G08757 | | | 3.50 | | | | 4/1/47 | | | | 359 | |
| | 953 | | | Freddie Mac, Pool #G08495 | | | 3.50 | | | | 6/1/42 | | | | 956 | |
| | 499 | | | Freddie Mac, Pool #G08636 | | | 3.50 | | | | 4/1/45 | | | | 499 | |
| | 483 | | | Freddie Mac, Pool #G08623 | | | 3.50 | | | | 1/1/45 | | | | 483 | |
| | 437 | | | Freddie Mac, Pool #G08627 | | | 3.50 | | | | 2/1/45 | | | | 436 | |
| | 293 | | | Freddie Mac, Pool #G08667 | | | 3.50 | | | | 9/1/45 | | | | 293 | |
| | 37 | | | Freddie Mac, Pool #G08620 | | | 3.50 | | | | 12/1/44 | | | | 37 | |
| | 47 | | | Freddie Mac, Pool #C91742 | | | 3.50 | | | | 1/1/34 | | | | 48 | |
| | 366 | | | Freddie Mac, Pool #G08693 | | | 3.50 | | | | 3/1/46 | | | | 366 | |
| | 350 | | | Freddie Mac, Pool #G08681 | | | 3.50 | | | | 12/1/45 | | | | 349 | |
| | 342 | | | Freddie Mac, Pool #G08761 | | | 3.50 | | | | 5/1/47 | | | | 340 | |
| | 170 | | | Freddie Mac, Pool #G08687 | | | 3.50 | | | | 1/1/46 | | | | 170 | |
| | 414 | | | Freddie Mac, Pool #G08650 | | | 3.50 | | | | 6/1/45 | | | | 413 | |
| | 140 | | | Freddie Mac, Pool #G08702 | | | 3.50 | | | | 4/1/46 | | | | 140 | |
| | 153 | | | Freddie Mac, Pool #G08698 | | | 3.50 | | | | 3/1/46 | | | | 152 | |
| | 294 | | | Freddie Mac, Pool #G08654 | | | 3.50 | | | | 7/1/45 | | | | 294 | |
| | 318 | | | Freddie Mac, Pool #G08641 | | | 3.50 | | | | 5/1/45 | | | | 318 | |
| | 201 | | | Freddie Mac, Pool #Q08903 | | | 3.50 | | | | 6/1/42 | | | | 202 | |
| | 69 | | | Freddie Mac, Pool #G30776 | | | 3.50 | | | | 7/1/35 | | | | 70 | |
| | 239 | | | Freddie Mac, Pool #Q09896 | | | 3.50 | | | | 8/1/42 | | | | 239 | |
| | 297 | | | Freddie Mac, Pool #G08632 | | | 3.50 | | | | 3/1/45 | | | | 296 | |
| | 98 | | | Freddie Mac, Pool #G08605 | | | 3.50 | | | | 9/1/44 | | | | 98 | |
| | 444 | | | Freddie Mac, Pool #G08554 | | | 3.50 | | | | 10/1/43 | | | | 446 | |
| | 182 | | | Freddie Mac, Pool #Q08998 | | | 3.50 | | | | 6/1/42 | | | | 183 | |
| | 403 | | | Freddie Mac, Pool #G08562 | | | 3.50 | | | | 1/1/44 | | | | 404 | |
| | 280 | | | Freddie Mac, Pool #Q20860 | | | 3.50 | | | | 8/1/43 | | | | 281 | |
| | 124 | | | Freddie Mac, Pool #Q12052 | | | 3.50 | | | | 10/1/42 | | | | 124 | |
| | 100 | | | Freddie Mac, Pool #G08599 | | | 3.50 | | | | 8/1/44 | | | | 100 | |
| | 62 | | | Freddie Mac, Pool #G08672 | | | 4.00 | | | | 10/1/45 | | | | 64 | |
| | 47 | | | Freddie Mac, Pool# J12238 | | | 4.00 | | | | 5/1/20 | | | | 48 | |
| | 91 | | | Freddie Mac, Pool #C91738 | | | 4.00 | | | | 11/1/33 | | | | 94 | |
| | 25 | | | Freddie Mac, Pool #J12435 | | | 4.00 | | | | 6/1/25 | | | | 26 | |
| | 359 | | | Freddie Mac, Pool #G08660 | | | 4.00 | | | | 8/1/45 | | | | 367 | |
| | 226 | | | Freddie Mac, Pool #G08588 | | | 4.00 | | | | 5/1/44 | | | | 231 | |
| | 365 | | | Freddie Mac, Pool #G08775 | | | 4.00 | | | | 8/1/47 | | | | 372 | |
| | 288 | | | Freddie Mac, Pool #G08785 | | | 4.00 | | | | 10/1/47 | | | | 294 | |
| | 21 | | | Freddie Mac, Pool #C91923 | | | 4.00 | | | | 3/1/37 | | | | 21 | |
| | 74 | | | Freddie Mac, Pool# Z50032 | | | 4.00 | | | | 4/1/19 | | | | 76 | |
| | 175 | | | Freddie Mac, Pool #C09070 | | | 4.00 | | | | 12/1/44 | | | | 179 | |
| | 84 | | | Freddie Mac, Pool #C91765 | | | 4.00 | | | | 6/1/34 | | | | 87 | |
See accompanying notes to financial statements.
220
HC CAPITAL TRUST
The U.S. Mortgage/Asset Backed Fixed Income Securities Portfolio
Portfolio of Investments (continued) — June 30, 2018
| | | | | | | | | | | | | | | | |
Principal
Amount
(000) | | | Security Description | | Rate % | | | Maturity
Date | | | Value
(000) | |
| | | | U.S. Government Agency Mortgages (continued) | | | | | | | | | | | | |
| $ | 951 | | | Freddie Mac, Pool #A96286 | | | 4.00 | | | | 1/1/41 | | | $ | 977 | |
| | 73 | | | Freddie Mac, Pool #G08483 | | | 4.00 | | | | 3/1/42 | | | | 75 | |
| | 106 | | | Freddie Mac, Pool #G14453 | | | 4.00 | | | | 6/1/26 | | | | 109 | |
| | 168 | | | Freddie Mac, Pool #G08459 | | | 4.00 | | | | 9/1/41 | | | | 173 | |
| | 34 | | | Freddie Mac, Pool #J11263 | | | 4.00 | | | | 11/1/19 | | | | 35 | |
| | 368 | | | Freddie Mac, Pool #V83344 | | | 4.00 | | | | 8/1/47 | | | | 376 | |
| | 104 | | | Freddie Mac, Pool #G08601 | | | 4.00 | | | | 8/1/44 | | | | 107 | |
| | 139 | | | Freddie Mac, Pool #G08637 | | | 4.00 | | | | 4/1/45 | | | | 142 | |
| | 163 | | | Freddie Mac, Pool #Q27594 | | | 4.00 | | | | 8/1/44 | | | | 167 | |
| | 12 | | | Freddie Mac, Pool #Q27456 | | | 4.00 | | | | 7/1/44 | | | | 13 | |
| | 176 | | | Freddie Mac, Pool #G08567 | | | 4.00 | | | | 1/1/44 | | | | 180 | |
| | 26 | | | Freddie Mac, Pool #G08633 | | | 4.00 | | | | 3/1/45 | | | | 27 | |
| | 239 | | | Freddie Mac, Pool #Q24955 | | | 4.00 | | | | 2/1/44 | | | | 246 | |
| | 305 | | | Freddie Mac, Pool #G08669 | | | 4.00 | | | | 9/1/45 | | | | 312 | |
| | 270 | | | Freddie Mac, Pool #G06506 | | | 4.00 | | | | 12/1/40 | | | | 278 | |
| | 451 | | | Freddie Mac, Pool #G08752 | | | 4.00 | | | | 3/1/47 | | | | 461 | |
| | 215 | | | Freddie Mac, Pool #G08595 | | | 4.00 | | | | 7/1/44 | | | | 220 | |
| | 15 | | | Freddie Mac, Pool #G08642 | | | 4.00 | | | | 5/1/45 | | | | 16 | |
| | 99 | | | Freddie Mac, Pool #Q34081 | | | 4.00 | | | | 6/1/45 | | | | 101 | |
| | 224 | | | Freddie Mac, Pool #G08616 | | | 4.00 | | | | 11/1/44 | | | | 229 | |
| | 203 | | | Freddie Mac, Pool #G08618 | | | 4.00 | | | | 12/1/44 | | | | 207 | |
| | 26 | | | Freddie Mac, Pool #C09059 | | | 4.50 | | | | 3/1/44 | | | | 27 | |
| | 63 | | | Freddie Mac, Pool #E02862 | | | 4.50 | | | | 3/1/26 | | | | 65 | |
| | 41 | | | Freddie Mac, Pool #A90437 | | | 4.50 | | | | 1/1/40 | | | | 43 | |
| | 134 | | | Freddie Mac, Pool #G08754 | | | 4.50 | | | | 3/1/47 | | | | 139 | |
| | 1,715 | | | Freddie Mac, Pool #A97692 | | | 4.50 | | | | 3/1/41 | | | | 1,804 | |
| | 29 | | | Freddie Mac, Pool #J07849 | | | 4.50 | | | | 5/1/23 | | | | 30 | |
| | 34 | | | Freddie Mac, Pool #J09311 | | | 4.50 | | | | 2/1/24 | | | | 35 | |
| | 55 | | | Freddie Mac, Pool #J09503 | | | 4.50 | | | | 4/1/24 | | | | 57 | |
| | 47 | | | Freddie Mac, Pool #Q22671 | | | 4.50 | | | | 11/1/43 | | | | 49 | |
| | 28 | | | Freddie Mac, Pool #Q25432 | | | 4.50 | | | | 3/1/44 | | | | 30 | |
| | 54 | | | Freddie Mac, Pool #G08596 | | | 4.50 | | | | 7/1/44 | | | | 56 | |
| | 60 | | | Freddie Mac, Pool #G60512 | | | 4.50 | | | | 12/1/45 | | | | 63 | |
| | 64 | | | Freddie Mac, Pool #G08781 | | | 4.50 | | | | 9/1/47 | | | | 67 | |
| | 172 | | | Freddie Mac, Pool #A97495 | | | 4.50 | | | | 3/1/41 | | | | 181 | |
| | 246 | | | Freddie Mac, Pool #G08759 | | | 4.50 | | | | 4/1/47 | | | | 256 | |
| | 34 | | | Freddie Mac, Pool# Q49599 | | | 4.50 | | | | 7/1/47 | | | | 35 | |
| | 18 | | | Freddie Mac, Pool #G07068 | | | 5.00 | | | | 7/1/41 | | | | 19 | |
| | 604 | | | Freddie Mac, Pool #C01598 | | | 5.00 | | | | 8/1/33 | | | | 642 | |
| | 49 | | | Freddie Mac, Pool #G13255 | | | 5.00 | | | | 7/1/23 | | | | 51 | |
| | 268 | | | Freddie Mac, Pool #G04913 | | | 5.00 | | | | 3/1/38 | | | | 286 | |
| | 40 | | | Freddie Mac, Pool #G05205 | | | 5.00 | | | | 1/1/39 | | | | 43 | |
| | 245 | | | Freddie Mac, Pool #Q00763 | | | 5.00 | | | | 5/1/41 | | | | 260 | |
| | 4 | | | Freddie Mac, Pool #G06091 | | | 5.50 | | | | 5/1/40 | | | | 4 | |
| | 83 | | | Freddie Mac, Pool #G06031 | | | 5.50 | | | | 3/1/40 | | | | 89 | |
| | 677 | | | Freddie Mac, Pool #G01665 | | | 5.50 | | | | 3/1/34 | | | | 734 | |
| | 64 | | | Freddie Mac, Pool #G03551 | | | 6.00 | | | | 11/1/37 | | | | 71 | |
| | 18 | | | Freddie Mac, Pool #A62706 | | | 6.00 | | | | 6/1/37 | | | | 20 | |
| | 318 | | | Freddie Mac, Pool #G02794 | | | 6.00 | | | | 5/1/37 | | | | 350 | |
| | 38 | | | Freddie Mac, Pool #G05709 | | | 6.00 | | | | 6/1/38 | | | | 42 | |
| | 275 | | | Freddie Mac, Gold 15 YR TBA | | | 2.50 | | | | 7/15/33 | | | | 267 | |
| | 350 | | | Freddie Mac, Gold 15 YR TBA | | | 3.00 | | | | 7/15/33 | | | | 347 | |
| | 150 | | | Freddie Mac, Gold 15 YR TBA | | | 3.50 | | | | 8/15/33 | | | | 151 | |
| | 50 | | | Freddie Mac, Gold 15 YR TBA | | | 4.00 | | | | 7/15/33 | | | | 51 | |
See accompanying notes to financial statements.
221
HC CAPITAL TRUST
The U.S. Mortgage/Asset Backed Fixed Income Securities Portfolio
Portfolio of Investments (continued) — June 30, 2018
| | | | | | | | | | | | | | | | |
Principal
Amount
(000) | | | Security Description | | Rate % | | | Maturity
Date | | | Value
(000) | |
| | | | U.S. Government Agency Mortgages (continued) | | | | | | | | | | | | |
| $ | 1,450 | | | Freddie Mac, Gold 30 YR TBA | | | 3.00 | | | | 7/15/48 | | | $ | 1,403 | |
| | 3,900 | | | Freddie Mac, Gold 30 YR TBA | | | 3.50 | | | | 7/15/47 | | | | 3,877 | |
| | 50 | | | Freddie Mac, Gold 30 YR TBA | | | 3.50 | | | | 8/15/48 | | | | 50 | |
| | 50 | | | Freddie Mac, Gold 30 YR TBA | | | 3.50 | | | | 7/15/33 | | | | 51 | |
| | 250 | | | Freddie Mac, Gold 30 YR TBA | | | 4.00 | | | | 8/15/48 | | | | 254 | |
| | 2,600 | | | Freddie Mac, Gold 30 YR TBA | | | 4.00 | | | | 7/15/48 | | | | 2,648 | |
| | 225 | | | Freddie Mac, Gold 30 YR TBA | | | 4.50 | | | | 7/15/48 | | | | 234 | |
| | 300 | | | Freddie Mac, Gold 30 YR TBA | | | 4.50 | | | | 8/15/48 | | | | 312 | |
| | 81 | | | Government National Mortgage Association, Pool #MA0601 | | | 2.50 | | | | 12/20/27 | | | | 79 | |
| | 45 | | | Government National Mortgage Association, Pool #MA1133 | | | 2.50 | | | | 7/20/28 | | | | 44 | |
| | 19 | | | Government National Mortgage Association, Pool #MA2890 | | | 2.50 | | | | 6/20/45 | | | | 18 | |
| | 46 | | | Government National Mortgage Association, Pool #MA0908 | | | 2.50 | | | | 4/20/28 | | | | 45 | |
| | 18 | | | Government National Mortgage Association, Pool #711729 | | | 2.50 | | | | 3/15/43 | | | | 17 | |
| | 49 | | | Government National Mortgage Association, Pool #MA4717 | | | 2.50 | | | | 9/20/47 | | | | 47 | |
| | 86 | | | Government National Mortgage Association, Pool #MA1283 | | | 2.50 | | | | 9/20/43 | | | | 83 | |
| | 45 | | | Government National Mortgage Association, Pool #MA4194 | | | 2.50 | | | | 1/20/47 | | | | 42 | |
| | 44 | | | Government National Mortgage Association, Pool #MA4424 | | | 2.50 | | | | 5/20/32 | | | | 43 | |
| | 29 | | | Government National Mortgage Association, Pool #776954 | | | 2.50 | | | | 11/15/42 | | | | 28 | |
| | 68 | | | Government National Mortgage Association, Pool #MA4067 | | | 2.50 | | | | 11/20/46 | | | | 65 | |
| | 82 | | | Government National Mortgage Association, Pool #AA8341 | | | 2.50 | | | | 2/15/28 | | | | 80 | |
| | 22 | | | Government National Mortgage Association, Pool #MA4355 | | | 2.50 | | | | 4/20/32 | | | | 21 | |
| | 179 | | | Government National Mortgage Association, Pool #MA4125 | | | 2.50 | | | | 12/20/46 | | | | 170 | |
| | 60 | | | Government National Mortgage Association, Pool #AG0440 | | | 3.00 | | | | 8/15/43 | | | | 59 | |
| | 22 | | | Government National Mortgage Association, Pool #AL5058 | | | 3.00 | | | | 3/15/45 | | | | 21 | |
| | 249 | | | Government National Mortgage Association, Pool #MA0153 | | | 3.00 | | | | 6/20/42 | | | | 246 | |
| | 339 | | | Government National Mortgage Association, Pool #MA2147 | | | 3.00 | | | | 8/20/44 | | | | 335 | |
| | 96 | | | Government National Mortgage Association, Pool #MA0851 | | | 3.00 | | | | 3/20/43 | | | | 95 | |
| | 281 | | | Government National Mortgage Association, Pool #MA3033 | | | 3.00 | | | | 8/20/45 | | | | 277 | |
| | 293 | | | Government National Mortgage Association, Pool #MA0391 | | | 3.00 | | | | 9/20/42 | | | | 290 | |
| | 358 | | | Government National Mortgage Association, Pool #MA3936 | | | 3.00 | | | | 9/20/46 | | | | 352 | |
| | 248 | | | Government National Mortgage Association, Pool #MA3873 | | | 3.00 | | | | 8/20/46 | | | | 243 | |
| | 242 | | | Government National Mortgage Association, Pool #MA3802 | | | 3.00 | | | | 7/20/46 | | | | 238 | |
| | 48 | | | Government National Mortgage Association, Pool #AK7285 | | | 3.00 | | | | 3/15/45 | | | | 47 | |
| | 180 | | | Government National Mortgage Association, Pool #MA2753 | | | 3.00 | | | | 4/20/45 | | | | 178 | |
| | 99 | | | Government National Mortgage Association, Pool #MA4836 | | | 3.00 | | | | 11/20/47 | | | | 96 | |
| | 48 | | | Government National Mortgage Association, Pool #MA2797 | | | 3.00 | | | | 5/20/30 | | | | 48 | |
| | 759 | | | Government National Mortgage Association, Pool #MA4899 | | | 3.00 | | | | 12/20/47 | | | | 742 | |
| | 280 | | | Government National Mortgage Association, Pool #AD8433 | | | 3.00 | | | | 7/15/43 | | | | 276 | |
| | 399 | | | Government National Mortgage Association, Pool# MA5076 | | | 3.00 | | | | 3/20/48 | | | | 390 | |
| | 150 | | | Government National Mortgage Association, Pool #MA5018 | | | 3.00 | | | | 2/20/48 | | | | 146 | |
| | 225 | | | Government National Mortgage Association, Pool #MA2825 | | | 3.00 | | | | 5/20/45 | | | | 221 | |
| | 220 | | | Government National Mortgage Association, Pool #MA3104 | | | 3.00 | | | | 9/20/45 | | | | 217 | |
| | 198 | | | Government National Mortgage Association, Pool #MA3172 | | | 3.00 | | | | 10/20/45 | | | | 195 | |
| | 214 | | | Government National Mortgage Association, Pool #MA2960 | | | 3.00 | | | | 7/20/45 | | | | 211 | |
| | 19 | | | Government National Mortgage Association, Pool #5276 | | | 3.00 | | | | 1/20/27 | | | | 19 | |
| | 251 | | | Government National Mortgage Association, Pool #MA3309 | | | 3.00 | | | | 12/20/45 | | | | 247 | |
| | 24 | | | Government National Mortgage Association, Pool #MA4935 | | | 3.00 | | | | 1/20/33 | | | | 24 | |
| | 35 | | | Government National Mortgage Association, Pool #AN5756 | | | 3.00 | | | | 7/15/45 | | | | 34 | |
| | 253 | | | Government National Mortgage Association, Pool #MA4509 | | | 3.00 | | | | 6/20/47 | | | | 247 | |
| | 237 | | | Government National Mortgage Association, Pool #MA2444 | | | 3.00 | | | | 12/20/44 | | | | 234 | |
| | 141 | | | Government National Mortgage Association, Pool #AA2654 | | | 3.00 | | | | 6/15/43 | | | | 139 | |
| | 370 | | | Government National Mortgage Association, Pool #MA2520 | | | 3.00 | | | | 1/20/45 | | | | 364 | |
| | 304 | | | Government National Mortgage Association, Pool #MA3662 | | | 3.00 | | | | 5/20/46 | | | | 298 | |
| | 262 | | | Government National Mortgage Association, Pool #MA4126 | | | 3.00 | | | | 12/20/46 | | | | 256 | |
See accompanying notes to financial statements.
222
HC CAPITAL TRUST
The U.S. Mortgage/Asset Backed Fixed Income Securities Portfolio
Portfolio of Investments (continued) — June 30, 2018
| | | | | | | | | | | | | | | | |
Principal
Amount
(000) | | | Security Description | | Rate % | | | Maturity
Date | | | Value
(000) | |
| | | | U.S. Government Agency Mortgages (continued) | | | | | | | | | | | | |
| $ | 29 | | | Government National Mortgage Association, Pool #AA2934 | | | 3.00 | | | | 7/15/42 | | | $ | 29 | |
| | 386 | | | Government National Mortgage Association, Pool #MA4777 | | | 3.00 | | | | 10/20/47 | | | | 378 | |
| | 255 | | | Government National Mortgage Association, Pool #AA6149 | | | 3.00 | | | | 3/20/43 | | | | 250 | |
| | 82 | | | Government National Mortgage Association, Pool #MA1265 | | | 3.00 | | | | 9/20/28 | | | | 83 | |
| | 264 | | | Government National Mortgage Association, Pool #MA4195 | | | 3.00 | | | | 1/20/47 | | | | 259 | |
| | 89 | | | Government National Mortgage Association, Pool #MA4559 | | | 3.00 | | | | 7/20/32 | | | | 89 | |
| | 96 | | | Government National Mortgage Association, Pool #MA0205 | | | 3.00 | | | | 7/20/27 | | | | 96 | |
| | 86 | | | Government National Mortgage Association, Pool #MA2600 | | | 3.00 | | | | 2/20/45 | | | | 85 | |
| | 264 | | | Government National Mortgage Association, Pool #MA4381 | | | 3.00 | | | | 4/20/47 | | | | 259 | |
| | 227 | | | Government National Mortgage Association, Pool #MA0461 | | | 3.00 | | | | 10/20/42 | | | | 224 | |
| | 292 | | | Government National Mortgage Association, Pool #MA3596 | | | 3.00 | | | | 4/20/46 | | | | 287 | |
| | 29 | | | Government National Mortgage Association, Pool #MA1890 | | | 3.00 | | | | 5/20/29 | | | | 29 | |
| | 99 | | | Government National Mortgage Association, Pool# MA3520 | | | 3.00 | | | | 3/20/46 | | | | 97 | |
| | 1,417 | | | Government National Mortgage Association, Pool #MA0624 | | | 3.00 | | | | 12/20/42 | | | | 1,399 | |
| | 354 | | | Government National Mortgage Association, Pool #MA4450 | | | 3.00 | | | | 5/20/47 | | | | 347 | |
| | 260 | | | Government National Mortgage Association, Pool #MA4320 | | | 3.00 | | | | 3/20/47 | | | | 255 | |
| | 134 | | | Government National Mortgage Association, Pool #779084 | | | 3.00 | | | | 4/15/42 | | | | 131 | |
| | 236 | | | Government National Mortgage Association, Pool #MA3735 | | | 3.00 | | | | 6/20/46 | | | | 232 | |
| | 251 | | | Government National Mortgage Association, Pool #MA1374 | | | 3.00 | | | | 10/20/43 | | �� | | 248 | |
| | 138 | | | Government National Mortgage Association, Pool #778157 | | | 3.50 | | | | 3/15/42 | | | | 139 | |
| | 200 | | | Government National Mortgage Association, Pool# MA4962 | | | 3.50 | | | | 1/20/48 | | | | 201 | |
| | 389 | | | Government National Mortgage Association, Pool #MA4837 | | | 3.50 | | | | 11/20/47 | | | | 391 | |
| | 235 | | | Government National Mortgage Association, Pool #MA0022 | | | 3.50 | | | | 4/20/42 | | | | 238 | |
| | 164 | | | Government National Mortgage Association, Pool #AC3938 | | | 3.50 | | | | 1/15/43 | | | | 165 | |
| | 391 | | | Government National Mortgage Association, Pool #MA4900 | | | 3.50 | | | | 12/20/47 | | | | 393 | |
| | 22 | | | Government National Mortgage Association, Pool #AL8566 | | | 3.50 | | | | 3/15/45 | | | | 22 | |
| | 335 | | | Government National Mortgage Association, Pool #AM4971 | | | 3.50 | | | | 4/20/45 | | | | 337 | |
| | 33 | | | Government National Mortgage Association, Pool #MA1574 | | | 3.50 | | | | 1/20/29 | | | | 34 | |
| | 389 | | | Government National Mortgage Association, Pool #MA1090 | | | 3.50 | | | | 6/20/43 | | | | 393 | |
| | 346 | | | Government National Mortgage Association, Pool #MA0852 | | | 3.50 | | | | 3/20/43 | | | | 350 | |
| | 353 | | | Government National Mortgage Association, Pool #MA0934 | | | 3.50 | | | | 4/20/43 | | | | 357 | |
| | 414 | | | Government National Mortgage Association, Pool #MA0462 | | | 3.50 | | | | 10/20/42 | | | | 419 | |
| | 341 | | | Government National Mortgage Association, Pool #MA2892 | | | 3.50 | | | | 6/20/45 | | | | 343 | |
| | 20 | | | Government National Mortgage Association, Pool #MA1266 | | | 3.50 | | | | 9/20/28 | | | | 21 | |
| | 417 | | | Government National Mortgage Association, Pool #MA3034 | | | 3.50 | | | | 8/20/45 | | | | 420 | |
| | 403 | | | Government National Mortgage Association, Pool #MA1157 | | | 3.50 | | | | 7/20/43 | | | | 407 | |
| | 296 | | | Government National Mortgage Association, Pool #MA0088 | | | 3.50 | | | | 5/20/42 | | | | 300 | |
| | 759 | | | Government National Mortgage Association, Pool #MA0220 | | | 3.50 | | | | 7/20/42 | | | | 768 | |
| | 203 | | | Government National Mortgage Association, Pool #MA0699 | | | 3.50 | | | | 1/20/43 | | | | 205 | |
| | 82 | | | Government National Mortgage Association, Pool #AD2954 | | | 3.50 | | | | 7/15/44 | | | | 82 | |
| | 284 | | | Government National Mortgage Association, Pool #MA3663 | | | 3.50 | | | | 5/20/46 | | | | 285 | |
| | 414 | | | Government National Mortgage Association, Pool #MA4382 | | | 3.50 | | | | 4/20/47 | | | | 416 | |
| | 259 | | | Government National Mortgage Association, Pool #MA3736 | | | 3.50 | | | | 6/20/46 | | | | 260 | |
| | 279 | | | Government National Mortgage Association, Pool #MA4586 | | | 3.50 | | | | 7/20/47 | | | | 280 | |
| | 177 | | | Government National Mortgage Association, Pool #MA4451 | | | 3.50 | | | | 5/20/47 | | | | 178 | |
| | 144 | | | Government National Mortgage Association, Pool #MA1919 | | | 3.50 | | | | 5/20/44 | | | | 145 | |
| | 301 | | | Government National Mortgage Association, Pool #MA3803 | | | 3.50 | | | | 7/20/46 | | | | 302 | |
| | 269 | | | Government National Mortgage Association, Pool #MA3874 | | | 3.50 | | | | 8/20/46 | | | | 270 | |
| | 321 | | | Government National Mortgage Association, Pool #MA4069 | | | 3.50 | | | | 11/20/46 | | | | 322 | |
| | 354 | | | Government National Mortgage Association, Pool #MA4004 | | | 3.50 | | | | 10/20/46 | | | | 356 | |
| | 311 | | | Government National Mortgage Association, Pool #MA3937 | | | 3.50 | | | | 9/20/46 | | | | 312 | |
| | 341 | | | Government National Mortgage Association, Pool #MA3597 | | | 3.50 | | | | 4/20/46 | | | | 343 | |
| | 392 | | | Government National Mortgage Association, Pool #MA4127 | | | 3.50 | | | | 12/20/46 | | | | 393 | |
| | 337 | | | Government National Mortgage Association, Pool #MA4262 | | | 3.50 | | | | 2/20/47 | | | | 339 | |
See accompanying notes to financial statements.
223
HC CAPITAL TRUST
The U.S. Mortgage/Asset Backed Fixed Income Securities Portfolio
Portfolio of Investments (continued) — June 30, 2018
| | | | | | | | | | | | | | | | |
Principal
Amount
(000) | | | Security Description | | Rate % | | | Maturity
Date | | | Value
(000) | |
| | | | U.S. Government Agency Mortgages (continued) | | | | | | | | | | | | |
| $ | 272 | | | Government National Mortgage Association, Pool #MA4510 | | | 3.50 | | | | 6/20/47 | | | $ | 274 | |
| | 167 | | | Government National Mortgage Association, Pool #MA2371 | | | 3.50 | | | | 11/20/44 | | | | 168 | |
| | 384 | | | Government National Mortgage Association, Pool #MA4321 | | | 3.50 | | | | 3/20/47 | | | | 386 | |
| | 196 | | | Government National Mortgage Association, Pool #MA2445 | | | 3.50 | | | | 12/20/44 | | | | 197 | |
| | 377 | | | Government National Mortgage Association, Pool #MA4652 | | | 3.50 | | | | 8/20/47 | | | | 379 | |
| | 169 | | | Government National Mortgage Association, Pool #MA3521 | | | 3.50 | | | | 3/20/46 | | | | 170 | |
| | 274 | | | Government National Mortgage Association, Pool #MA4778 | | | 3.50 | | | | 10/20/47 | | | | 275 | |
| | 286 | | | Government National Mortgage Association, Pool #MA4719 | | | 3.50 | | | | 9/20/47 | | | | 288 | |
| | 334 | | | Government National Mortgage Association, Pool #MA2303 | | | 3.50 | | | | 10/20/44 | | | | 336 | |
| | 318 | | | Government National Mortgage Association, Pool #MA2678 | | | 3.50 | | | | 3/20/45 | | | | 320 | |
| | 244 | | | Government National Mortgage Association, Pool #MA3244 | | | 3.50 | | | | 11/20/45 | | | | 246 | |
| | 248 | | | Government National Mortgage Association, Pool #MA3310 | | | 3.50 | | | | 12/20/45 | | | | 249 | |
| | 549 | | | Government National Mortgage Association, Pool #MA2073 | | | 3.50 | | | | 7/20/44 | | | | 554 | |
| | 486 | | | Government National Mortgage Association, Pool #MA3173 | | | 3.50 | | | | 10/20/45 | | | | 489 | |
| | 189 | | | Government National Mortgage Association, Pool #MA3454 | | | 3.50 | | | | 2/20/46 | | | | 190 | |
| | 41 | | | Government National Mortgage Association, Pool #796271 | | | 3.50 | | | | 7/15/42 | | | | 41 | |
| | 334 | | | Government National Mortgage Association, Pool #MA3376 | | | 3.50 | | | | 1/20/46 | | | | 336 | |
| | 223 | | | Government National Mortgage Association, Pool #MA2754 | | | 3.50 | | | | 4/20/45 | | | | 225 | |
| | 171 | | | Government National Mortgage Association, Pool #MA1838 | | | 3.50 | | | | 4/20/44 | | | | 173 | |
| | 760 | | | Government National Mortgage Association, Pool #MA2148 | | | 3.50 | | | | 8/20/44 | | | | 766 | |
| | 251 | | | Government National Mortgage Association, Pool #MA2961 | | | 3.50 | | | | 7/20/45 | | | | 252 | |
| | 66 | | | Government National Mortgage Association, Pool #AD2416 | | | 3.50 | | | | 5/15/43 | | | | 67 | |
| | 91 | | | Government National Mortgage Association, Pool #738602 | | | 3.50 | | | | 8/15/26 | | | | 93 | |
| | 83 | | | Government National Mortgage Association, Pool #740798 | | | 3.50 | | | | 1/15/42 | | | | 83 | |
| | 96 | | | Government National Mortgage Association, Pool #MA4322 | | | 4.00 | | | | 3/20/47 | | | | 98 | |
| | 196 | | | Government National Mortgage Association, Pool #MA3377 | | | 4.00 | | | | 1/20/46 | | | | 203 | |
| | 149 | | | Government National Mortgage Association, Pool #MA0319 | | | 4.00 | | | | 8/20/42 | | | | 154 | |
| | 218 | | | Government National Mortgage Association, Pool #MA3598 | | | 4.00 | | | | 4/20/46 | | | | 225 | |
| | 243 | | | Government National Mortgage Association, Pool #MA2224 | | | 4.00 | | | | 9/20/44 | | | | 251 | |
| | 105 | | | Government National Mortgage Association, Pool #MA3245 | | | 4.00 | | | | 11/20/45 | | | | 108 | |
| | 169 | | | Government National Mortgage Association, Pool #MA2522 | | | 4.00 | | | | 1/20/45 | | | | 174 | |
| | 95 | | | Government National Mortgage Association, Pool #MA2149 | | | 4.00 | | | | 8/20/44 | | | | 98 | |
| | 294 | | | Government National Mortgage Association, Pool #MA1839 | | | 4.00 | | | | 4/20/44 | | | | 303 | |
| | 108 | | | Government National Mortgage Association, Pool #MA1996 | | | 4.00 | | | | 6/20/44 | | | | 112 | |
| | 67 | | | Government National Mortgage Association, Pool #MA0155 | | | 4.00 | | | | 6/20/42 | | | | 70 | |
| | 64 | | | Government National Mortgage Association, Pool #MA3106 | | | 4.00 | | | | 9/20/45 | | | | 66 | |
| | 212 | | | Government National Mortgage Association, Pool #MA2304 | | | 4.00 | | | | 10/20/44 | | | | 219 | |
| | 38 | | | Government National Mortgage Association, Pool #MA3174 | | | 4.00 | | | | 10/20/45 | | | | 39 | |
| | 287 | | | Government National Mortgage Association, Pool #MA2074 | | | 4.00 | | | | 7/20/44 | | | | 297 | |
| | 112 | | | Government National Mortgage Association, Pool #MA2602 | | | 4.00 | | | | 2/20/45 | | | | 115 | |
| | 39 | | | Government National Mortgage Association, Pool #779401 | | | 4.00 | | | | 6/15/42 | | | | 40 | |
| | 54 | | | Government National Mortgage Association, Pool #740068 | | | 4.00 | | | | 9/15/40 | | | | 56 | |
| | 551 | | | Government National Mortgage Association, Pool #5139 | | | 4.00 | | | | 8/20/41 | | | | 569 | |
| | 128 | | | Government National Mortgage Association, Pool #MA3737 | | | 4.00 | | | | 6/20/46 | | | | 132 | |
| | 72 | | | Government National Mortgage Association, Pool #738710 | | | 4.00 | | | | 9/15/41 | | | | 74 | |
| | 75 | | | Government National Mortgage Association, Pool #753254 | | | 4.00 | | | | 9/15/43 | | | | 77 | |
| | 93 | | | Government National Mortgage Association, Pool #AD5627 | | | 4.00 | | | | 4/15/43 | | | | 96 | |
| | 39 | | | Government National Mortgage Association, Pool #4922 | | | 4.00 | | | | 1/20/41 | | | | 41 | |
| | 173 | | | Government National Mortgage Association, Pool #713876 | | | 4.00 | | | | 8/15/39 | | | | 178 | |
| | 325 | | | Government National Mortgage Association, Pool #MA4511 | | | 4.00 | | | | 6/20/47 | | | | 333 | |
| | 354 | | | Government National Mortgage Association, Pool #MA4653 | | | 4.00 | | | | 8/20/47 | | | | 363 | |
| | 211 | | | Government National Mortgage Association, Pool #MA4263 | | | 4.00 | | | | 2/20/47 | | | | 216 | |
| | 228 | | | Government National Mortgage Association, Pool #MA4197 | | | 4.00 | | | | 1/20/47 | | | | 234 | |
| | 71 | | | Government National Mortgage Association, Pool #MA3455 | | | 4.00 | | | | 2/20/46 | | | | 73 | |
See accompanying notes to financial statements.
224
HC CAPITAL TRUST
The U.S. Mortgage/Asset Backed Fixed Income Securities Portfolio
Portfolio of Investments (continued) — June 30, 2018
| | | | | | | | | | | | | | | | |
Principal
Amount
(000) | | | Security Description | | Rate % | | | Maturity
Date | | | Value
(000) | |
| | | | U.S. Government Agency Mortgages (continued) | | | | | | | | | | | | |
| $ | 316 | | | Government National Mortgage Association, Pool #MA4383 | | | 4.00 | | | | 4/20/47 | | | $ | 324 | |
| | 308 | | | Government National Mortgage Association, Pool #MA4587 | | | 4.00 | | | | 7/20/47 | | | | 317 | |
| | 522 | | | Government National Mortgage Association, Pool #MA4452 | | | 4.00 | | | | 5/20/47 | | | | 536 | |
| | 50 | | | Government National Mortgage Association, Pool #AV6086 | | | 4.00 | | | | 7/15/47 | | | | 51 | |
| | 249 | | | Government National Mortgage Association, Pool #MA1761 | | | 4.00 | | | | 3/20/44 | | | | 257 | |
| | 150 | | | Government National Mortgage Association, Pool #MA1678 | | | 4.00 | | | | 2/20/44 | | | | 155 | |
| | 121 | | | Government National Mortgage Association, Pool #AM8203 | | | 4.00 | | | | 5/15/45 | | | | 124 | |
| | 44 | | | Government National Mortgage Association, Pool #766495 | | | 4.00 | | | | 10/15/41 | | | | 45 | |
| | 198 | | | Government National Mortgage Association, Pool #MA1449 | | | 4.00 | | | | 11/20/43 | | | | 205 | |
| | 86 | | | Government National Mortgage Association, Pool #AB1483 | | | 4.00 | | | | 8/15/42 | | | | 88 | |
| | 197 | | | Government National Mortgage Association, Pool #MA1376 | | | 4.00 | | | | 10/20/43 | | | | 204 | |
| | 103 | | | Government National Mortgage Association, Pool #MA1286 | | | 4.00 | | | | 9/20/43 | | | | 107 | |
| | 15 | | | Government National Mortgage Association, Pool #AJ2722 | | | 4.00 | | | | 8/15/44 | | | | 15 | |
| | 765 | | | Government National Mortgage Association, Pool #4801 | | | 4.50 | | | | 9/20/40 | | | | 804 | |
| | 130 | | | Government National Mortgage Association, Pool #MA0701 | | | 4.50 | | | | 1/20/43 | | | | 136 | |
| | 544 | | | Government National Mortgage Association, Pool #721760 | | | 4.50 | | | | 8/15/40 | | | | 576 | |
| | 258 | | | Government National Mortgage Association, Pool #717148 | | | 4.50 | | | | 5/15/39 | | | | 272 | |
| | 251 | | | Government National Mortgage Association, Pool #MA4384 | | | 4.50 | | | | 4/20/47 | | | | 262 | |
| | 78 | | | Government National Mortgage Association, Pool #MA3805 | | | 4.50 | | | | 7/20/46 | | | | 82 | |
| | 46 | | | Government National Mortgage Association, Pool #738793 | | | 4.50 | | | | 9/15/41 | | | | 48 | |
| | 196 | | | Government National Mortgage Association, Pool #MA1762 | | | 4.50 | | | | 3/20/44 | | | | 207 | |
| | 42 | | | Government National Mortgage Association, Pool #729511 | | | 4.50 | | | | 4/15/40 | | | | 44 | |
| | 85 | | | Government National Mortgage Association, Pool #MA4721 | | | 4.50 | | | | 9/20/47 | | | | 89 | |
| | 108 | | | Government National Mortgage Association, Pool #MA4780 | | | 4.50 | | | | 10/20/47 | | | | 113 | |
| | 193 | | | Government National Mortgage Association, Pool #MA2756 | | | 4.50 | | | | 4/20/45 | | | | 203 | |
| | 36 | | | Government National Mortgage Association, Pool #MA4129 | | | 4.50 | | | | 12/20/46 | | | | 38 | |
| | 185 | | | Government National Mortgage Association, Pool #MA4512 | | | 4.50 | | | | 6/20/47 | | | | 193 | |
| | 177 | | | Government National Mortgage Association, Pool #5260 | | | 4.50 | | | | 12/20/41 | | | | 186 | |
| | 26 | | | Government National Mortgage Association, Pool #BC0597 | | | 4.50 | | | | 8/15/47 | | | | 27 | |
| | 60 | | | Government National Mortgage Association, Pool #MA1092 | | | 4.50 | | | | 6/20/43 | | | | 63 | |
| | 21 | | | Government National Mortgage Association, Pool #MA0465 | | | 5.00 | | | | 10/20/42 | | | | 23 | |
| | 543 | | | Government National Mortgage Association, Pool #4559 | | | 5.00 | | | | 10/20/39 | | | | 583 | |
| | 93 | | | Government National Mortgage Association, Pool #MA4007 | | | 5.00 | | | | 10/20/46 | | | | 99 | |
| | 110 | | | Government National Mortgage Association, Pool #694531 | | | 5.00 | | | | 11/15/38 | | | | 117 | |
| | 113 | | | Government National Mortgage Association, Pool #MA2076 | | | 5.00 | | | | 7/20/44 | | | | 120 | |
| | 79 | | | Government National Mortgage Association, Pool #712690 | | | 5.00 | | | | 4/15/39 | | | | 84 | |
| | 30 | | | Government National Mortgage Association, Pool #782468 | | | 5.00 | | | | 11/15/38 | | | | 32 | |
| | 35 | | | Government National Mortgage Association, Pool #675179 | | | 5.00 | | | | 3/15/38 | | | | 38 | |
| | 115 | | | Government National Mortgage Association, Pool #604285 | | | 5.00 | | | | 5/15/33 | | | | 123 | |
| | 221 | | | Government National Mortgage Association, Pool #782523 | | | 5.00 | | | | 11/15/35 | | | | 235 | |
| | 112 | | | Government National Mortgage Association, Pool #510835 | | | 5.50 | | | | 2/15/35 | | | | 122 | |
| | 20 | | | Government National Mortgage Association, Pool #MA0466 | | | 5.50 | | | | 10/20/42 | | | | 22 | |
| | 44 | | | Government National Mortgage Association, Pool #658181 | | | 5.50 | | | | 11/15/36 | | | | 48 | |
| | 170 | | | Government National Mortgage Association, Pool #783284 | | | 5.50 | | | | 6/20/40 | | | | 183 | |
| | 69 | | | Government National Mortgage Association, Pool #781959 | | | 6.00 | | | | 7/15/35 | | | | 76 | |
| | 89 | | | Government National Mortgage Association, Pool #4245 | | | 6.00 | | | | 9/20/38 | | | | 98 | |
| | 79 | | | Government National Mortgage Association, Pool #4222 | | | 6.00 | | | | 8/20/38 | | | | 87 | |
| | 2 | | | Government National Mortgage Association, Pool #690789 | | | 6.50 | | | | 5/15/38 | | | | 2 | |
| | 33 | | | Government National Mortgage Association, Pool #699237 | | | 6.50 | | | | 9/15/38 | | | | 36 | |
| | 2,450 | | | Government National Mortgage Association, 30 YR TBA | | | 3.00 | | | | 7/20/48 | | | | 2,395 | |
| | 125 | | | Government National Mortgage Association, 30 YR TBA | | | 3.50 | | | | 7/15/48 | | | | 125 | |
| | 75 | | | Government National Mortgage Association, 30 YR TBA | | | 3.50 | | | | 8/20/48 | | | | 75 | |
| | 4,075 | | | Government National Mortgage Association, 30 YR TBA | | | 3.50 | | | | 7/20/48 | | | | 4,088 | |
| | 2,050 | | | Government National Mortgage Association, 30 YR TBA | | | 4.00 | | | | 7/20/48 | | | | 2,101 | |
See accompanying notes to financial statements.
225
HC CAPITAL TRUST
The U.S. Mortgage/Asset Backed Fixed Income Securities Portfolio
Portfolio of Investments (concluded) — June 30, 2018
| | | | | | | | | | | | | | | | |
Principal
Amount
(000) | | | Security Description | | Rate % | | | Maturity
Date | | | Value
(000) | |
| | | | U.S. Government Agency Mortgages (continued) | | | | | | | | | | | | |
| $ | 400 | | | Government National Mortgage Association, 30 YR TBA | | | 4.00 | | | | 8/20/48 | | | $ | 409 | |
| | 50 | | | Government National Mortgage Association, 30 YR TBA | | | 4.50 | | | | 7/15/48 | | | | 52 | |
| | 225 | | | Government National Mortgage Association, 30 YR TBA | | | 4.50 | | | | 7/20/48 | | | | 234 | |
| | 400 | | | Government National Mortgage Association, 30 YR TBA | | | 4.50 | | | | 8/20/48 | | | | 415 | |
| | | | | | | | | | | | | | | | |
| | | | Total U.S. Government Agency Mortgages | | | | | | | | | | | 177,433 | |
| | | | | | | | | | | | | | | | |
| | | | Yankee Dollars — 0.20% | | | | | | | | | | | | |
| | 91 | | | Bank of Nova Scotia (Banks) | | | 1.85 | | | | 4/14/20 | | | | 89 | |
| | 91 | | | Bank of Nova Scotia (Banks) | | | 2.13 | | | | 9/11/19 | | | | 90 | |
| | 137 | | | Royal Bank of Canada (Banks) | | | 1.88 | | | | 2/5/20 | | | | 136 | |
| | 91 | | | Royal Bank of Canada (Banks) | | | 2.20 | | | | 9/23/19 | | | | 90 | |
| | | | | | | | | | | | | | | | |
| | | | Total Yankee Dollars | | | | | | | | | | | 405 | |
| | | | | | | | | | | | | | | | |
| | | | |
| Shares | | | | | | | | | | | | |
| | | | Mutual Fund — 19.07% | | | | | | | | | | | | |
| | 39,123,842 | | | State Street Institutional Treasury Plus Money Market Fund, Trust Class | | | 1.72 | (b) | | | | | | | 39,124 | |
| | | | | | | | | | | | | | | | |
| | | | Total Mutual Fund | | | | | | | | | | | 39,124 | |
| | | | | | | | | | | | | | | | |
| | | | Total Investments Before TBA Sale Commitments (cost $236,204) — 113.28% | | | | | | | | | | | 232,387 | |
Principal
Amount
(000) | | | | | | | | | | | | |
| | | | TBA Sale Commitments (c) — (0.22)% | | | | | | | | | | | | |
| $ | (100 | ) | | Fannie Mae, 30 YR TBA | | | 5.50 | | | | 7/25/48 | | | | (107 | ) |
| | (50 | ) | | Fannie Mae, 30 YR TBA | | | 3.00 | | | | 8/25/48 | | | | (49 | ) |
| | (175 | ) | | Freddie Mac, Gold 15 YR TBA | | | 4.50 | | | | 7/15/33 | | | | (176 | ) |
| | (125 | ) | | Freddie Mac, Gold 30 YR TBA | | | 5.00 | | | | 7/15/48 | | | | (132 | ) |
| | | | | | | | | | | | | | | | |
| | | | Total TBA Sale Commitments | | | | | | | | | | | (464 | ) |
| | | | | | | | | | | | | | | | |
| | | | Liabilities in excess of other assets — (13.06)% | | | | | | | | | | | (26,785 | ) |
| | | | | | | | | | | | | | | | |
| | | | Net Assets — 100.00% | | | | | | | | | | $ | 205,138 | |
| | | | | | | | | | | | | | | | |
| (a) | The rate for certain asset-backed and mortgage-backed securities may vary based on factors relating to the pool of assets underlying the security. The rate disclosed is the rate in effect on June 30, 2018. |
| (b) | The rate disclosed is the rate in effect on June 30, 2018. |
| (c) | Represents a “to be announced” transaction. The Portfolio has committed to sell securities for which all specific information is not available at this time. (See Note 2 in the Notes to Financial Statements.) |
TBA — To Be Announced purchase or sale commitment. Security is subject to delayed delivery
The following table reflects the percentage of total net assets of the Portfolio attributable to each Specialist Manager as of June 30, 2018.
| | | | | | | | | | | | |
The U.S. Mortgage/Asset Backed Fixed Income Securities Portfolio | | BNY Mellon Asset
Management North
America Corporation* | | | HC Capital
Solutions | | | Total | |
Asset Backed Securities | | | 1.82 | % | | | — | | | | 1.82 | % |
Collateralized Mortgage Obligations | | | 5.70 | % | | | — | | | | 5.70 | % |
U.S. Government Agency Mortgages | | | 86.49 | % | | | — | | | | 86.49 | % |
Yankee Dollars | | | 0.20 | % | | | — | | | | 0.20 | % |
Mutual Fund | | | 13.20 | % | | | 5.87 | % | | | 19.07 | % |
TBA Sale Commitments | | | -0.22 | % | | | — | | | | -0.22 | % |
Other Assets (Liabilities) | | | -12.84 | % | | | -0.22 | % | | | -13.06 | % |
| | | | | | | | | | | | |
Total Net Assets | | | 94.35 | % | | | 5.65 | % | | | 100.00 | % |
| | | | | | | | | | | | |
| * | Formerly Mellon Capital Management Corporation. |
Amounts designated as “—” indicate the Specialist Manager did not manage any holdings in that category.
See accompanying notes to financial statements.
226
HC CAPITAL TRUST
The Short-Term Municipal Bond Portfolio
Portfolio of Investments — June 30, 2018
| | | | | | | | | | | | | | | | |
Principal
Amount
(000) | | | Security Description | | Rate % | | | Maturity
Date | | | Value
(000) | |
| | | | Municipal Bonds — 98.74% | | | | | | | | | | | | |
| | | | Alabama — 1.57% | | | | | | | | | | | | |
| $ | 445 | | | Alabama Public School & College Authority Revenue, Series C | | | 5.00 | | | | 9/1/19 | | | $ | 463 | |
| | 710 | | | University of Alabama Revenue, Series A, Callable 7/1/22 @ 100.00 | | | 5.00 | | | | 7/1/23 | | | | 791 | |
| | | | | | | | | | | | | | | | |
| | | | | | | | | | | | | | | 1,254 | |
| | | | | | | | | | | | | | | | |
| | | | Alaska — 1.91% | | | | | | | | | | | | |
| | 1,385 | | | Municipality of Anchorage Alaska, GO, Series B | | | 5.00 | | | | 9/1/21 | | | | 1,517 | |
| | | | | | | | | | | | | | | | |
| | | | Arizona — 2.02% | | | | | | | | | | | | |
| | 420 | | | Arizona School Facilities Board Revenue (Pre-Refunded/Escrowed to Maturity) | | | 5.38 | | | | 9/1/21 | | | | 423 | |
| | 275 | | | Arizona State Water Infrastructure Finance Authority Water Quality Revenue, Series A (Pre-Refunded/Escrowed to Maturity) | | | 5.00 | | | | 10/1/23 | | | | 277 | |
| | 805 | | | County of Pima Arizona Sewer System Revenue | | | 5.00 | | | | 7/1/23 | | | | 915 | |
| | | | | | | | | | | | | | | | |
| | | | | | | | | | | | | | | 1,615 | |
| | | | | | | | | | | | | | | | |
| | | | Florida — 11.84% | | | | | | | | | | | | |
| | 1,245 | | | School District of Broward County Florida Revenue, Series A | | | 5.00 | | | | 7/1/20 | | | | 1,323 | |
| | 1,400 | | | State of Florida Lottery Revenue, Series A | | | 5.00 | | | | 7/1/20 | | | | 1,491 | |
| | 1,110 | | | State of Florida, GO, Series D | | | 5.00 | | | | 6/1/20 | | | | 1,179 | |
| | 400 | | | Florida State Department of Environmental Protection Preservation Revenue, Series A | | | 5.00 | | | | 7/1/20 | | | | 425 | |
| | 950 | | | State of Florida Department of Education Revenue, Series A | | | 5.00 | | | | 7/1/22 | | | | 1,058 | |
| | 425 | | | JEA Florida Electric System Revenue, Series D | | | 5.00 | | | | 10/1/22 | | | | 476 | |
| | 800 | | | JEA Florida Water & Sewer System Revenue, Series A | | | 5.00 | | | | 10/1/20 | | | | 858 | |
| | 1,000 | | | County of Miami-Dade Florida, GO | | | 5.00 | | | | 7/1/21 | | | | 1,089 | |
| | 1,060 | | | County of Miami-Dade Florida Transit System Revenue | | | 5.00 | | | | 7/1/19 | | | | 1,096 | |
| | 420 | | | South Broward Florida Hospital District Revenue | | | 5.00 | | | | 5/1/19 | | | | 431 | |
| | | | | | | | | | | | | | | | |
| | | | | | | | | | | | | | | 9,426 | |
| | | | | | | | | | | | | | | | |
| | | | Georgia — 2.74% | | | | | | | | | | | | |
| | 2,000 | | | Bulloch County Board of Education, GO (State Aid Withholding) | | | 5.00 | | | | 5/1/21 | | | | 2,174 | |
| | | | | | | | | | | | | | | | |
| | | | Hawaii — 0.58% | | | | | | | | | | | | |
| | 425 | | | State of Hawaii, GO, Series EO | | | 5.00 | | | | 8/1/21 | | | | 465 | |
| | | | | | | | | | | | | | | | |
| | | | Illinois — 2.31% | | | | | | | | | | | | |
| | 885 | | | Illinois State Finance Authority Revenue, Series B (Pre-Refunded/Escrowed to Maturity) (NATL-RE) | | | 5.75 | | | | 11/1/28 | | | | 897 | |
| | 425 | | | McHenry County Illinois Conservation District, GO | | | 5.00 | | | | 2/1/20 | | | | 446 | |
| | 475 | | | Northbrook Illinois, GO, Series A | | | 5.00 | | | | 12/1/19 | | | | 497 | |
| | | | | | | | | | | | | | | | |
| | | | | | | | | | | | | | | 1,840 | |
| | | | | | | | | | | | | | | | |
| | | | Indiana — 2.32% | | | | | | | | | | | | |
| | 1,400 | | | Indiana State Finance Authority Revenue, Callable 11/1/18 @ 100.00 | | | 5.38 | | | | 11/1/32 | | | | 1,418 | |
| | 420 | | | Rush County Elementary School Building Corporation Revenue, Series A (Pre-Refunded/Escrowed to Maturity) (State Aid Withholding) | | | 5.00 | | | | 7/15/19 | | | | 428 | |
| | | | | | | | | | | | | | | | |
| | | | | | | | | | | | | | | 1,846 | |
| | | | | | | | | | | | | | | | |
| | | | Iowa — 4.22% | | | | | | | | | | | | |
| | 1,155 | | | City of Ankeny, GO, Series A | | | 5.00 | | | | 6/1/21 | | | | 1,259 | |
| | 1,440 | | | Ankeny Community School District, GO | | | 5.00 | | | | 6/1/23 | | | | 1,633 | |
| | 450 | | | Waukee Community School District, GO, Series C | | | 5.00 | | | | 6/1/19 | | | | 464 | |
| | | | | | | | | | | | | | | | |
| | | | | | | | | | | | | | | 3,356 | |
| | | | | | | | | | | | | | | | |
| | | | Kentucky — 0.98% | | | | | | | | | | | | |
| | 685 | | | University of Kentucky, GO, Series A, Callable 4/1/24 @ 100.00 (State Intercept) | | | 5.00 | | | | 4/1/25 | | | | 784 | |
| | | | | | | | | | | | | | | | |
| | | | Maryland — 1.99% | | | | | | | | | | | | |
| | 450 | | | Maryland State, GO, Series A | | | 5.00 | | | | 3/1/20 | | | | 475 | |
| | 1,000 | | | University System of Maryland, GO, Series A | | | 5.00 | | | | 4/1/22 | | | | 1,110 | |
| | | | | | | | | | | | | | | | |
| | | | | | | | | | | | | | | 1,585 | |
| | | | | | | | | | | | | | | | |
See accompanying notes to financial statements.
227
HC CAPITAL TRUST
The Short-Term Municipal Bond Portfolio
Portfolio of Investments (continued) — June 30, 2018
| | | | | | | | | | | | | | | | |
Principal
Amount
(000) | | | Security Description | | Rate % | | | Maturity
Date | | | Value
(000) | |
| | | | Municipal Bonds (continued) | | | | | | | | | | | | |
| | | | Massachusetts — 1.69% | | | | | | | | | | | | |
| $ | 1,300 | | | Commonwealth of Massachusetts Federal Highway Grant Anticipation Note Revenue,
Series A | | | 5.00 | | | | 6/15/19 | | | $ | 1,342 | |
| | | | | | | | | | | | | | | | |
| | | | Michigan — 2.55% | | | | | | | | | | | | |
| | 400 | | | Michigan State Finance Authority Revenue | | | 5.00 | | | | 12/1/18 | | | | 406 | |
| | 1,040 | | | State of Michigan Trunk Line Revenue | | | 5.00 | | | | 11/15/19 | | | | 1,088 | |
| | 500 | | | Oakland University Michigan Revenue | | | 5.00 | | | | 3/1/21 | | | | 537 | |
| | | | | | | | | | | | | | | | |
| | | | | | | | | | | | | | | 2,031 | |
| | | | | | | | | | | | | | | | |
| | | | Minnesota — 2.17% | | | | | | | | | | | | |
| | 1,165 | | | Minneapolis Special School District No.1, GO, Series B (SD CRED PROG) | | | 4.00 | | | | 2/1/19 | | | | 1,182 | |
| | 525 | | | Minnesota Higher Education Facilities Authority Revenue
(Pre-Refunded/Escrowed to Maturity) | | | 5.00 | | | | 10/1/21 | | | | 546 | |
| | | | | | | | | | | | | | | | |
| | | | | | | | | | | | | | | 1,728 | |
| | | | | | | | | | | | | | | | |
| | | | Missouri — 1.48% | | | | | | | | | | | | |
| | 1,125 | | | University of Missouri Revenue, Series A | | | 5.00 | | | | 11/1/19 | | | | 1,177 | |
| | | | | | | | | | | | | | | | |
| | | | Nebraska — 1.48% | | | | | | | | | | | | |
| | 1,140 | | | Nebraska State Public Power District Revenue, Series A | | | 4.00 | | | | 1/1/20 | | | | 1,178 | |
| | | | | | | | | | | | | | | | |
| | | | Nevada — 2.74% | | | | | | | | | | | | |
| | 1,765 | | | County of Clark Department of Aviation Revenue, Series A | | | 5.00 | | | | 7/1/21 | | | | 1,920 | |
| | 250 | | | Clark County, Nevada Highway Revenue | | | 5.00 | | | | 7/1/20 | | | | 266 | |
| | | | | | | | | | | | | | | | |
| | | | | | | | | | | | | | | 2,186 | |
| | | | | | | | | | | | | | | | |
| | | | New Jersey — 3.16% | | | | | | | | | | | | |
| | 375 | | | Middlesex County Improvement Authority Revenue (CNTY-GTD) | | | 3.00 | | | | 9/1/20 | | | | 385 | |
| | 130 | | | South Brunswick Township New Jersey, GO | | | 4.00 | | | | 9/1/20 | | | | 136 | |
| | 1,945 | | | County of Union New Jersey, GO, Series A&B | | | 3.00 | | | | 3/1/20 | | | | 1,987 | |
| | | | | | | | | | | | | | | | |
| | | | | | | | | | | | | | | 2,508 | |
| | | | | | | | | | | | | | | | |
| | | | New Mexico — 1.46% | | | | | | | | | | | | |
| | 375 | | | New Mexico State Finance Authority Revenue, Series B | | | 5.00 | | | | 6/15/19 | | | | 387 | |
| | 750 | | | State of New Mexico Severance Tax Permanent Fund Revenue, Series A | | | 5.00 | | | | 7/1/19 | | | | 775 | |
| | | | | | | | | | | | | | | | |
| | | | | | | | | | | | | | | 1,162 | |
| | | | | | | | | | | | | | | | |
| | | | New York — 3.20% | | | | | | | | | | | | |
| | 400 | | | New York City, GO, Series B (AMBAC) | | | 5.00 | | | | 8/15/18 | | | | 402 | |
| | 385 | | | New York City Transitional Finance Authority Future Tax Secured Revenue | | | 5.00 | | | | 11/1/21 | | | | 424 | |
| | 900 | | | New York City Transitional Finance Authority Future Tax Secured Revenue, Series C1 | | | 5.00 | | | | 5/1/21 | | | | 979 | |
| | 250 | | | New York City Municipal Water Finance Authority Water & Sewer System Revenue,
Callable 12/15/21 @ 100.00 | | | 5.00 | | | | 6/15/23 | | | | 276 | |
| | 405 | | | New York State Dormitory Authority Revenue, Series A | | | 5.00 | | | | 2/15/24 | | | | 466 | |
| | | | | | | | | | | | | | | | |
| | | | | | | | | | | | | | | 2,547 | |
| | | | | | | | | | | | | | | | |
| | | | North Carolina — 2.51% | | | | | | | | | | | | |
| | 375 | | | State of North Carolina Revenue | | | 5.00 | | | | 3/1/23 | | | | 423 | |
| | 1,470 | | | North Carolina State University at Raleigh Revenue | | | 5.00 | | | | 10/1/20 | | | | 1,576 | |
| | | | | | | | | | | | | | | | |
| | | | | | | | | | | | | | | 1,999 | |
| | | | | | | | | | | | | | | | |
| | | | Ohio — 1.37% | | | | | | | | | | | | |
| | 1,020 | | | Allen County Ohio Hospital (Pre-Refunded/Escrowed to Maturity) | | | 5.25 | | | | 9/1/27 | | | | 1,094 | |
| | | | | | | | | | | | | | | | |
| | | | Oklahoma — 1.53% | | | | | | | | | | | | |
| | 1,145 | | | Grand River Dam Authority, Revenue, Series A | | | 5.00 | | | | 6/1/20 | | | | 1,215 | |
| | | | | | | | | | | | | | | | |
| | | | Oregon — 0.81% | | | | | | | | | | | | |
| | 590 | | | Multnomah County School District No 1 Portland, GO, Series B (SCH BD GTY) | | | 5.00 | | | | 6/15/21 | | | | 643 | |
| | | | | | | | | | | | | | | | |
See accompanying notes to financial statements.
228
HC CAPITAL TRUST
The Short-Term Municipal Bond Portfolio
Portfolio of Investments (continued) — June 30, 2018
| | | | | | | | | | | | | | | | |
Principal
Amount
(000) | | | Security Description | | Rate % | | | Maturity
Date | | | Value
(000) | |
| | | | Municipal Bonds (continued) | | | | | | | | | | | | |
| | | | Pennsylvania — 4.12% | | | | | | | | | | | | |
| $ | 1,945 | | | Commonwealth of Pennsylvania, GO, Series 2 (Pre-Refunded/Escrowed to Maturity) | | | 5.00 | | | | 4/15/23 | | | $ | 1,998 | |
| | 525 | | | Philadelphia Pennsylvania Authority For Industrial Development Temple University Revenue, Series 2016 | | | 5.00 | | | | 4/1/21 | | | | 567 | |
| | 690 | | | Souderton Area School District, GO (Pre-Refunded/Escrowed to Maturity)
(State Aid Withholding) | | | 4.75 | | | | 11/1/20 | | | | 708 | |
| | | | | | | | | | | | | | | | |
| | | | | | | | | | | | | | | 3,273 | |
| | | | | | | | | | | | | | | | |
| | | | South Dakota — 0.53% | | | | | | | | | | | | |
| | 395 | | | City of Sioux Falls South Dakota Sales Tax Revenue, Series A | | | 5.00 | | | | 11/15/20 | | | | 425 | |
| | | | | | | | | | | | | | | | |
| | | | Tennessee — 0.47% | | | | | | | | | | | | |
| | 350 | | | City of Clarksville Tennessee Water Sewer & Gas Revenue | | | 5.00 | | | | 2/1/21 | | | | 378 | |
| | | | | | | | | | | | | | | | |
| | | | Texas — 17.83% | | | | | | | | | | | | |
| | 1,255 | | | City of Arlington Texas, GO, Series A | | | 5.00 | | | | 8/15/22 | | | | 1,404 | |
| | 1,635 | | | City of Arlington Texas Water & Wastewater System Revenue, Series A | | | 5.00 | | | | 6/1/19 | | | | 1,686 | |
| | 240 | | | Austin Texas Contractual Obligation, GO | | | 5.00 | | | | 5/1/19 | | | | 247 | |
| | 1,015 | | | Conroe Independent School District, GO (PSF-GTD) | | | 5.00 | | | | 2/15/25 | | | | 1,178 | |
| | 685 | | | Cypress-Fairbanks Independent School District, GO, Series C (PSF-GTD) | | | 5.00 | | | | 2/15/22 | | | | 757 | |
| | 660 | | | Dallas Area Rapid Transit Revenue, Series A | | | 5.00 | | | | 12/1/24 | | | | 765 | |
| | 300 | | | City of Frisco, Texas Refunding and Improvement, GO | | | 5.00 | | | | 2/15/19 | | | | 306 | |
| | 450 | | | Goose Creek Texas Consolidated Independent School District, GO,
Callable 2/15/21 @ 100.00 (PSF-GTD) | | | 5.00 | | | | 2/15/22 | | | | 486 | |
| | 430 | | | Harris County Toll Road Authority Revenue, Series B | | | 5.00 | | | | 8/15/22 | | | | 480 | |
| | 440 | | | Hidalgo County Texas, GO | | | 4.00 | | | | 8/15/18 | | | | 441 | |
| | 690 | | | Katy Independent School District, GO, Series B (PSF-GTD) | | | 5.00 | | | | 2/15/22 | | | | 763 | |
| | 250 | | | New Braunfels Texas, GO | | | 5.00 | | | | 2/1/19 | | | | 255 | |
| | 1,150 | | | North Texas Tollway Authority Revenue, Series A | | | 5.00 | | | | 1/1/19 | | | | 1,170 | |
| | 1,875 | | | North Texas Municipal Water District Water System Revenue | | | 5.25 | | | | 9/1/19 | | | | 1,953 | |
| | 405 | | | Nueces County Texas, GO | | | 5.00 | | | | 2/15/19 | | | | 414 | |
| | 210 | | | Rockwall Texas, GO | | | 4.00 | | | | 8/1/18 | | | | 210 | |
| | 950 | | | State of Texas, GO, Series C | | | 1.78 | | | | 10/1/20 | | | | 932 | |
| | 705 | | | County of Travis Texas, GO | | | 5.00 | | | | 3/1/21 | | | | 762 | |
| | | | | | | | | | | | | | | | |
| | | | | | | | | | | | | | | 14,209 | |
| | | | | | | | | | | | | | | | |
| | | | Virginia — 1.76% | | | | | | | | | | | | |
| | 360 | | | Virginia Commonwealth Transportation Board Revenue, Series A | | | 5.00 | | | | 3/15/20 | | | | 380 | |
| | 1,020 | | | Virginia Housing Development Authority Revenue, Series A, Callable 9/1/19 @ 100.00 | | | 2.05 | | | | 3/1/22 | | | | 1,017 | |
| | | | | | | | | | | | | | | | |
| | | | | | | | | | | | | | | 1,397 | |
| | | | | | | | | | | | | | | | |
| | | | Washington — 10.37% | | | | | | | | | | | | |
| | 1,050 | | | Public Utility District No. 1 of Benton County Revenue | | | 5.00 | | | | 11/1/19 | | | | 1,097 | |
| | 420 | | | Grant County Washington Public Utility District Revenue, Series I | | | 5.00 | | | | 1/1/19 | | | | 427 | |
| | 1,085 | | | King County Washington School District No. 405, GO, Series B (SCH BD GTY) | | | 5.00 | | | | 12/1/24 | | | | 1,261 | |
| | 215 | | | King County Washington Sewer Revenue (Pre-Refunded/Escrowed to Maturity) | | | 5.00 | | | | 1/1/22 | | | | 229 | |
| | 135 | | | King County Washington Sewer Revenue, Callable 7/1/20 @ 100.00 | | | 5.00 | | | | 1/1/22 | | | | 143 | |
| | 1,735 | | | City of Seattle Washington Municipal Light & Power Revenue, Series A | | | 5.00 | | | | 1/1/24 | | | | 1,992 | |
| | 500 | | | Tacoma Washington Electric System Revenue, Series A | | | 4.00 | | | | 1/1/20 | | | | 517 | |
| | 820 | | | State of Washington Revenue, Series F | | | 5.00 | | | | 9/1/22 | | | | 914 | |
| | 365 | | | State of Washington Revenue, Series A | | | 5.00 | | | | 7/1/20 | | | | 388 | |
| | 470 | | | Washington State, GO, Series A (Pre-Refunded/Escrowed to Maturity) | | | 5.00 | | | | 7/1/30 | | | | 470 | |
| | 420 | | | Washington State, GO, Series C (Pre-Refunded/Escrowed to Maturity) | | | 5.00 | | | | 2/1/33 | | | | 429 | |
| | 365 | | | Washington State, GO, Series A | | | 5.00 | | | | 8/1/19 | | | | 378 | |
| | | | | | | | | | | | | | | | |
| | | | | | | | | | | | | | | 8,245 | |
| | | | | | | | | | | | | | | | |
See accompanying notes to financial statements.
229
HC CAPITAL TRUST
The Short-Term Municipal Bond Portfolio
Portfolio of Investments (concluded) — June 30, 2018
| | | | | | | | | | | | | | | | |
Principal
Amount
(000) | | | Security Description | | Rate % | | | Maturity
Date | | | Value
(000) | |
| | | | Municipal Bonds (continued) | | | | | | | | | | | | |
| | | | Wisconsin — 5.03% | | | | | | | | | | | | |
| $ | 1,125 | | | City of Janesville Wisconsin, GO | | | 3.00 | | | | 2/1/20 | | | $ | 1,147 | |
| | 380 | | | City of Milwaukee Wisconsin, GO, Series N4&B5 | | | 5.00 | | | | 4/1/23 | | | | 430 | |
| | 200 | | | Milwaukee Wisconsin Area Technical College District, GO, Series C | | | 3.00 | | | | 6/1/19 | | | | 203 | |
| | 525 | | | Wisconsin Energy Power Supply Revenue, Series A | | | 5.00 | | | | 7/1/22 | | | | 585 | |
| | 880 | | | State of Wisconsin Clean Water Fund Leveraged Loan Portfolio Revenue, Series 1 | | | 4.00 | | | | 6/1/21 | | | | 934 | |
| | 665 | | | Wisconsin Health & Educational Facilities Authority Revenue | | | 5.00 | | | | 11/15/20 | | | | 714 | |
| | | | | | | | | | | | | | | | |
| | | | | | | | | | | | | | | 4,013 | |
| | | | | | | | | | | | | | | | |
| | | | Total Municipal Bonds | | | | | | | | | | | 78,612 | |
| | | | | | | | | | | | | | | | |
| | | | |
| Shares | | | | | | | | | | | | |
| | | | Mutual Fund — 2.11% | | | | | | | | | | | | |
| | 1,675,624 | | | State Street Institutional Treasury Plus Money Market Fund, Trust Class | | | 1.72 | (a) | | | | | | | 1,676 | |
| | | | | | | | | | | | | | | | |
| | | | Total Mutual Fund | | | | | | | | | | | 1,676 | |
| | | | | | | | | | | | | | | | |
| | | | Total Investments (cost $80,305) — 100.85% | | | | | | | | | | | 80,288 | |
| | | | Other assets in excess of liabilities — (0.85%) | | | | | | | | | | | (676 | ) |
| | | | | | | | | | | | | | | | |
| | | | Net Assets — 100.00% | | | | | | | | | | $ | 79,612 | |
| | | | | | | | | | | | | | | | |
| (a) | The rate disclosed is the rate in effect on June 30, 2018. |
AMBAC — American Municipal Bond Assurance Corporation
CNTY-GTD — County Guarantee
GO — General Obligation
NATL-RE — Reinsurance provided by National Reinsurance
PSF-GTD — Public School Fund Guaranteed
SCH BD GTY — School Board Guaranty
SD CRED PROG — School District Credit Program
As of June 30, 2018, 100% of the Portfolio’s net assets were managed by Breckinridge Capital Advisors, Inc.
See accompanying notes to financial statements.
230
HC CAPITAL TRUST
The Intermediate Term Municipal Bond Portfolio
Portfolio of Investments — June 30, 2018
| | | | | | | | | | | | | | | | |
Principal
Amount
(000) | | | Security Description | | Rate % | | | Maturity
Date | | | Value
(000) | |
| | | | Municipal Bonds — 99.18% | | | | | | | | | | | | |
| | | | Alabama — 0.70% | | | | | | | | | | | | |
| $ | 1,400 | | | Birmingham Alabama Water Works Board Water Revenue, Series B | | | 5.00 | | | | 1/1/24 | | | $ | 1,590 | |
| | 1,000 | | | Jefferson County Alabama Revenue | | | 5.00 | | | | 9/15/22 | | | | 1,111 | |
| | | | | | | | | | | | | | | | |
| | | | | | | | | | | | | | | 2,701 | |
| | | | | | | | | | | | | | | | |
| | | | Alaska — 0.62% | | | | | | | | | | | | |
| | 2,265 | | | Alaska Industrial Development & Export Authority Revenue, Revolving Fund, Series A, Callable 4/1/20 @ 100.00 (GO of Authority) | | | 5.25 | | | | 4/1/22 | | | | 2,395 | |
| | | | | | | | | | | | | | | | |
| | | | Arizona — 2.52% | | | | | | | | | | | | |
| | 1,000 | | | Maricopa County High School District No. 210-Phoenix, GO | | | 5.00 | | | | 7/1/25 | | | | 1,170 | |
| | 1,500 | | | Phoenix Arizona Civic Improvement Corp. Wastewater System Revenue, Junior Lien | | | 5.00 | | | | 7/1/21 | | | | 1,636 | |
| | 1,000 | | | Salt Verde Arizona Financial Corp. Senior Gas Revenue (Citigroup, Inc.) | | | 5.25 | | | | 12/1/24 | | | | 1,144 | |
| | 5,250 | | | Tucson Arizona Water System Revenue, Series A | | | 5.00 | | | | 7/1/21 | | | | 5,726 | |
| | | | | | | | | | | | | | | | |
| | | | | | | | | | | | | | | 9,676 | |
| | | | | | | | | | | | | | | | |
| | | | Arkansas — 0.35% | | | | | | | | | | | | |
| | 1,200 | | | Arkansas State Development Finance Authority Hospital Revenue, Series B | | | 5.00 | | | | 2/1/23 | | | | 1,330 | |
| | | | | | | | | | | | | | | | |
| | | | California — 6.44% | | | | | | | | | | | | |
| | 1,500 | | | California State, GO | | | 5.00 | | | | 8/1/24 | | | | 1,752 | |
| | 5,000 | | | California State, GO | | | 5.00 | | | | 11/1/23 | | | | 5,771 | |
| | 2,510 | | | California State Department of Water Resources Revenue, Central Valley Project, Continuously Callable @ 100.00 | | | 5.25 | | | | 7/1/22 | | | | 2,517 | |
| | 4,155 | | | California State Public Works Board Lease Revenue, Series D | | | 5.00 | | | | 4/1/24 | | | | 4,816 | |
| | 1,500 | | | Golden State Tobacco Securitization Corp. California Tobacco Settlement Revenue, Series A-1 | | | 5.00 | | | | 6/1/21 | | | | 1,622 | |
| | 2,460 | | | Golden State Tobacco Securitization Corp. California Tobacco Settlement Revenue, Series A-1 | | | 5.00 | | | | 6/1/26 | | | | 2,842 | |
| | 1,000 | | | Los Angeles California Department of Airports Revenue | | | 5.00 | | | | 5/15/23 | | | | 1,131 | |
| | 3,925 | | | San Francisco California City & County Airports Commission International Terminal Revenue, Series F, Callable 5/1/21 @ 100.00 (AMT) | | | 5.00 | | | | 5/1/22 | | | | 4,252 | |
| | 65 | | | University of California Revenue, Series Q, Continuously Callable @ 100.00 | | | 5.25 | | | | 5/15/23 | | | | 65 | |
| | | | | | | | | | | | | | | | |
| | | | | | | | | | | | | | | 24,768 | |
| | | | | | | | | | | | | | | | |
| | | | Colorado — 4.64% | | | | | | | | | | | | |
| | 5,000 | | | Colorado State Health Facilities Authority Revenue, Catholic Health Initiatives, Series D-3 | | | 5.00 | (a) | | | 10/1/38 | | | | 5,409 | |
| | 3,720 | | | City of Colorado Springs Colorado Utilities System Revenue, Series A-3 | | | 5.00 | | | | 11/15/22 | | | | 4,182 | |
| | 1,225 | | | Colorado State Board of Governors University Enterprise System Revenue, Series E-2 | | | 5.00 | | | | 3/1/25 | | | | 1,423 | |
| | 2,970 | | | Denver City & County School District No. 1, GO, Series A (State Aid Withholding) | | | 5.50 | | | | 12/1/25 | | | | 3,605 | |
| | 1,150 | | | Denver City & County Colorado Airport Revenue, Series A (AMT) | | | 5.00 | | | | 11/15/19 | | | | 1,197 | |
| | 1,750 | | | Denver City & County Colorado Airport Revenue, Series A | | | 5.00 | | | | 11/15/23 | | | | 2,002 | |
| | | | | | | | | | | | | | | | |
| | | | | | | | | | | | | | | 17,818 | |
| | | | | | | | | | | | | | | | |
| | | | Connecticut — 2.00% | | | | | | | | | | | | |
| | 3,000 | | | State of Connecticut, GO, Series A, Callable 10/15/23 @ 100.00 | | | 5.00 | | | | 10/15/25 | | | | 3,306 | |
| | 2,500 | | | Connecticut State Special Tax Obligation Revenue, Transportation Infrastructure, Series A | | | 5.00 | | | | 9/1/21 | | | | 2,699 | |
| | 1,570 | | | Connecticut State Special Tax Obligation Revenue, Transportation Infrastructure, Series B | | | 5.00 | | | | 8/1/20 | | | | 1,662 | |
| | | | | | | | | | | | | | | | |
| | | | | | | | | | | | | | | 7,667 | |
| | | | | | | | | | | | | | | | |
| | | | District of Columbia — 0.80% | | | | | | | | | | | | |
| | 1,500 | | | District of Columbia University Revenue | | | 5.00 | | | | 4/1/25 | | | | 1,733 | |
| | 1,200 | | | Metropolitan Washington Airports Authority Revenue, Series A (AMT) | | | 5.00 | | | | 10/1/22 | | | | 1,337 | |
| | | | | | | | | | | | | | | | |
| | | | | | | | | | | | | | | 3,070 | |
| | | | | | | | | | | | | | | | |
See accompanying notes to financial statements.
231
HC CAPITAL TRUST
The Intermediate Term Municipal Bond Portfolio
Portfolio of Investments (continued) — June 30, 2018
| | | | | | | | | | | | | | | | |
Principal
Amount
(000) | | | Security Description | | Rate % | | | Maturity
Date | | | Value
(000) | |
| | | | Municipal Bonds (continued) | | | | | | | | | | | | |
| | | | Florida — 6.80% | | | | | | | | | | | | |
| $ | 5,000 | | | Citizens Property Insurance Corp. Florida Revenue, Series A-1, Callable 12/1/19 @ 100.00 | | | 5.00 | | | | 6/1/20 | | | $ | 5,222 | |
| | 1,285 | | | Greater Orlando Florida Aviation Authority Airport Facilities Revenue, Series A | | | 5.00 | | | | 10/1/21 | | | | 1,400 | |
| | 1,615 | | | Lee County Florida Solid Waste System Revenue | | | 5.00 | | | | 10/1/22 | | | | 1,758 | |
| | 1,500 | | | Lee County Florida Solid Waste System Revenue (AMT) | | | 5.00 | | | | 10/1/25 | | | | 1,671 | |
| | 1,600 | | | Lee County Florida Transportation Facilities Revenue (AGM) | | | 5.00 | | | | 10/1/20 | | | | 1,710 | |
| | 4,570 | | | Miami-Dade County Florida Aviation Revenue, Series A | | | 5.00 | | | | 10/1/21 | | | | 4,979 | |
| | 3,250 | | | Orange County Florida Tourist Development Tax Revenue, Series B | | | 5.00 | | | | 10/1/25 | | | | 3,795 | |
| | 1,500 | | | Palm Beach County Florida Health Facilities Authority Revenue | | | 5.00 | | | | 11/15/21 | | | | 1,640 | |
| | 1,845 | | | Palm Beach County Florida School Board, Series D | | | 5.00 | | | | 8/1/21 | | | | 2,011 | |
| | 1,750 | | | South Florida Water Management District Corps, Certificate of Participation | | | 5.00 | | | | 10/1/21 | | | | 1,914 | |
| | | | | | | | | | | | | | | | |
| | | | | | | | | | | | | | | 26,100 | |
| | | | | | | | | | | | | | | | |
| | | | Georgia — 2.98% | | | | | | | | | | | | |
| | 1,000 | | | Atlanta Georgia Development Authority Revenue, Series A-1 | | | 5.00 | | | | 7/1/23 | | | | 1,133 | |
| | 1,250 | | | Fulton County Georgia Development Authority Revenue, Series A | | | 5.00 | | | | 7/1/23 | | | | 1,411 | |
| | 1,600 | | | Fulton County Georgia Development Authority Revenue, Series A | | | 5.00 | | | | 7/1/24 | | | | 1,828 | |
| | 3,050 | | | Georgia State Municipal Gas Authority Revenue, Gas Portfolio III Project, Series U | | | 5.00 | | | | 10/1/21 | | | | 3,313 | |
| | 1,000 | | | Main Street Natural Gas, Inc. Revenue, Series B, Callable 6/1/23 @ 100.00 | |
| 2.09
(US0001M
+ 75.00 bps)(b |
) | | | 4/1/48 | | | | 996 | |
| | 1,000 | | | Main Street Natural Gas, Inc. Georgia Gas Revenue, Series A (JP Morgan Chase & Co.) | | | 5.00 | | | | 3/15/19 | | | | 1,023 | |
| | 1,620 | | | Municipal Electric Authority of Georgia Revenue, Series A | | | 5.00 | | | | 1/1/21 | | | | 1,732 | |
| | | | | | | | | | | | | | | | |
| | | | | | | | | | | | | | | 11,436 | |
| | | | | | | | | | | | | | | | |
| | | | Illinois — 2.57% | | | | | | | | | | | | |
| | 94 | | | Chicago Illinois Certificates of Participation, Tax Increment Allocation Revenue, Diversey / Narragansett Project, Series NT, Continuously Callable @ 100.00 (c) | | | 7.46 | | | | 2/15/26 | | | | 69 | |
| | 1,000 | | | City of Chicago Illinois Waterworks Revenue | | | 5.00 | | | | 11/1/24 | | | | 1,122 | |
| | 1,000 | | | City of Chicago Illinois Waterworks Revenue, Callable 11/1/22 @ 100.00 | | | 5.00 | | | | 11/1/24 | | | | 1,092 | |
| | 1,240 | | | Illinois State Finance Authority Revenue, Series B | | | 5.00 | | | | 5/1/22 | | | | 1,373 | |
| | 1,500 | | | Illinois State Finance Authority Revenue, University of Chicago, Series A | | | 5.00 | | | | 10/1/20 | | | | 1,604 | |
| | 750 | | | Northern Illinois Municipal Power Agency Project Revenue, Series A | | | 5.00 | | | | 12/1/22 | | | | 832 | |
| | 2,000 | | | Railsplitter Tobacco Settlement Authority Revenue | | | 5.00 | | | | 6/1/22 | | | | 2,197 | |
| | 1,450 | | | University of Illinois Revenue, Series C, Callable 10/1/21 @ 100.00 | | | 5.00 | | | | 4/1/25 | | | | 1,561 | |
| | | | | | | | | | | | | | | | |
| | | | | | | | | | | | | | | 9,850 | |
| | | | | | | | | | | | | | | | |
| | | | Indiana — 2.59% | | | | | | | | | | | | |
| | 1,150 | | | Indiana Finance Authority Revenue, Series A | | | 5.00 | | | | 11/1/23 | | | | 1,310 | |
| | 1,000 | | | Indiana Finance Authority Revenue, Series A | | | 5.00 | | | | 11/1/24 | | | | 1,155 | |
| | 1,000 | | | Indiana State Finance Authority Revenue, Stadium Project, Series A | | | 5.00 | | | | 2/1/23 | | | | 1,122 | |
| | 2,500 | | | Indianapolis Local Public Improvement Bond Bank Airport Authority Revenue,
Series A-1 (AMT) | | | 5.00 | | | | 1/1/21 | | | | 2,685 | |
| | 1,000 | | | Richmond Indiana Hospital Authority Revenue, Reid Hospital & Health Care, Series A | | | 5.00 | | | | 1/1/21 | | | | 1,063 | |
| | 2,250 | | | Whiting Indiana Environmental Facilities Revenue | | | 5.00 | (d) | | | 11/1/47 | | | | 2,600 | |
| | | | | | | | | | | | | | | | |
| | | | | | | | | | | | | | | 9,935 | |
| | | | | | | | | | | | | | | | |
| | | | Kentucky — 1.16% | | | | | | | | | | | | |
| | 3,160 | | | Kentucky Public Energy Authority Revenue, Series A | | | 4.00 | | | | 4/1/23 | | | | 3,375 | |
| | 1,000 | | | Kentucky Public Energy Authority Revenue, Series A, Callable 1/2/24 @ 100.40 | | | 4.00 | | | | 4/1/24 | | | | 1,073 | |
| | | | | | | | | | | | | | | | |
| | | | | | | | | | | | | | | 4,448 | |
| | | | | | | | | | | | | | | | |
| | | | Louisiana — 1.62% | | | | | | | | | | | | |
| | 2,850 | | | Louisiana State Citizens Property Insurance Corp. Revenue (AGM) | | | 5.00 | | | | 6/1/22 | | | | 3,160 | |
| | 3,000 | | | Tobacco Settlement Financing Corp. Louisiana Revenue, Series A | | | 5.00 | | | | 5/15/19 | | | | 3,078 | |
| | | | | | | | | | | | | | | | |
| | | | | | | | | | | | | | | 6,238 | |
| | | | | | | | | | | | | | | | |
See accompanying notes to financial statements.
232
HC CAPITAL TRUST
The Intermediate Term Municipal Bond Portfolio
Portfolio of Investments (continued) — June 30, 2018
| | | | | | | | | | | | | | | | |
Principal
Amount
(000) | | | Security Description | | Rate % | | | Maturity
Date | | | Value
(000) | |
| | | | Municipal Bonds (continued) | | | | | | | | | | | | |
| | | | Maryland — 2.40% | | | | | | | | | | | | |
| $ | 1,000 | | | Maryland State Health & Higher Educational Facilities Authority Revenue, Series B | | | 5.00 | | | | 7/1/22 | | | $ | 1,116 | |
| | 1,000 | | | Maryland State Economic Development Corp. Private Activity Revenue, Series A,
Callable 11/30/21 @ 100.00 (AMT) | | | 5.00 | | | | 3/31/24 | | | | 1,079 | |
| | 4,040 | | | Maryland State Stadium Authority Revenue | | | 5.00 | | | | 5/1/24 | | | | 4,620 | |
| | 2,110 | | | Montgomery County Maryland, GO, Series A | | | 5.00 | | | | 12/1/23 | | | | 2,423 | |
| | | | | | | | | | | | | | | | |
| | | | | | | | | | | | | | | 9,238 | |
| | | | | | | | | | | | | | | | |
| | | | Massachusetts — 3.08% | | | | | | | | | | | | |
| | 4,730 | | | Massachusetts State Educational Financing Authority Revenue, Series K | | | 5.00 | | | | 7/1/19 | | | | 4,872 | |
| | 1,000 | | | Massachusetts State Educational Financing Authority Revenue (AMT) | | | 5.00 | | | | 1/1/25 | | | | 1,129 | |
| | 1,615 | | | Massachusetts State Educational Financing Authority Revenue, Series A (AMT) | | | 5.00 | | | | 7/1/23 | | | | 1,801 | |
| | 835 | | | Massachusetts Development Finance Agency Revenue, Callable 7/1/20 @ 100.00 | | | 5.00 | | | | 7/1/21 | | | | 885 | |
| | 1,750 | | | Massachusetts Development Finance Agency Revenue
(Pre-Refunded/Escrowed to Maturity) | | | 5.25 | | | | 1/1/21 | | | | 1,891 | |
| | 1,170 | | | Massachusetts Development Finance Agency Revenue | | | 5.25 | | | | 1/1/21 | | | | 1,255 | |
| | | | | | | | | | | | | | | | |
| | | | | | | | | | | | | | | 11,833 | |
| | | | | | | | | | | | | | | | |
| | | | Michigan — 2.77% | | | | | | | | | | | | |
| | 1,810 | | | Great Lakes Michigan Water Authority Sewage Disposal System Revenue, Series B | | | 5.00 | | | | 7/1/24 | | | | 2,055 | |
| | 2,000 | | | Michigan State Finance Authority Revenue, Detroit School District, Series A (Q-SBLF) | | | 5.00 | | | | 5/1/21 | | | | 2,157 | |
| | 4,000 | | | Michigan State Finance Authority Revenue, Series D-1 (AGM) | | | 5.00 | | | | 7/1/21 | | | | 4,328 | |
| | 1,000 | | | Michigan State Finance Authority Revenue, Series D-1 | | | 5.00 | | | | 7/1/21 | | | | 1,082 | |
| | 1,000 | | | Wayne County Michigan Airport Authority Revenue, Series A (AMT) | | | 5.00 | | | | 12/1/19 | | | | 1,044 | |
| | | | | | | | | | | | | | | | |
| | | | | | | | | | | | | | | 10,666 | |
| | | | | | | | | | | | | | | | |
| | | | Minnesota — 0.34% | | | | | | | | | | | | |
| | 1,200 | | | Minneapolis-Saint Paul Minnesota Metropolitan Airports Commission Revenue, Series B | | | 5.00 | | | | 1/1/22 | | | | 1,323 | |
| | | | | | | | | | | | | | | | |
| | | | Missouri — 1.85% | | | | | | | | | | | | |
| | 2,500 | | | Kansas City Missouri Airport Revenue, Series A (AMT) | | | 5.00 | | | | 9/1/20 | | | | 2,665 | |
| | 1,600 | | | Missouri State Joint Municipal Electric Utility Commission Power Project Revenue, Series A | | | 5.00 | | | | 1/1/21 | | | | 1,719 | |
| | 1,500 | | | Missouri State Development Finance Board Infrastructure Facilities Revenue, Branson Landing Project, Series A | | | 5.00 | | | | 6/1/20 | | | | 1,588 | |
| | 1,000 | | | Missouri State Health & Educational Facilities Authority Revenue | | | 5.00 | | | | 11/15/23 | | | | 1,139 | |
| | | | | | | | | | | | | | | | |
| | | | | | | | | | | | | | | 7,111 | |
| | | | | | | | | | | | | | | | |
| | | | Nevada — 1.32% | | | | | | | | | | | | |
| | 3,470 | | | Clark County Nevada School District, GO, Series A | | | 5.00 | | | | 6/15/23 | | | | 3,906 | |
| | 1,000 | | | Clark County Nevada School District, GO, Series A | | | 5.00 | | | | 6/15/26 | | | | 1,157 | |
| | | | | | | | | | | | | | | | |
| | | | | | | | | | | | | | | 5,063 | |
| | | | | | | | | | | | | | | | |
| | | | New Jersey — 3.91% | | | | | | | | | | | | |
| | 3,750 | | | New Jersey State Economic Development Authority Revenue, School Facilities Construction, Series NN | | | 5.00 | | | | 3/1/21 | | | | 3,970 | |
| | 5,000 | | | New Jersey State Higher Education Assistance Authority Senior Revenue, Series 2015-1A | | | 5.00 | | | | 12/1/20 | | | | 5,329 | |
| | 2,000 | | | New Jersey State Higher Education Student Assistance Authority Revenue, Series B (AMT) | | | 5.00 | | | | 12/1/22 | | | | 2,200 | |
| | 3,500 | | | Tobacco Settlement Financing Corp. New Jersey Revenue, Series B | | | 3.20 | | | | 6/1/27 | | | | 3,535 | |
| | | | | | | | | | | | | | | | |
| | | | | | | | | | | | | | | 15,034 | |
| | | | | | | | | | | | | | | | |
| | | | New York — 9.05% | | | | | | | | | | | | |
| | 2,000 | | | Long Island New York Power Authority Electricity System Revenue, Series C,
Callable 8/6/18 @ 100.00 | |
| 2.27
(US0001M
+ 88.00 bps)(b) |
| | | 5/1/33 | | | | 2,001 | |
| | 2,110 | | | Metropolitan Transportation Authority New York Revenue, Series A-1 | | | 5.00 | | | | 11/15/22 | | | | 2,363 | |
| | 2,000 | | | Metropolitan Transportation Authority New York Revenue, Series B | | | 5.00 | | | | 11/15/22 | | | | 2,240 | |
See accompanying notes to financial statements.
233
HC CAPITAL TRUST
The Intermediate Term Municipal Bond Portfolio
Portfolio of Investments (continued) — June 30, 2018
| | | | | | | | | | | | | | | | |
Principal
Amount
(000) | | | Security Description | | Rate % | | | Maturity
Date | | | Value
(000) | |
| | | | Municipal Bonds (continued) | | | | | | | | | | | | |
| | | | New York (continued) | | | | | | | | | | | | |
| $ | 1,000 | | | Metropolitan Transportation Authority New York Revenue, Series F | | | 5.00 | | | | 11/15/20 | | | $ | 1,076 | |
| | 1,000 | | | New York State, GO, Series E, Callable 8/1/19 @ 100.00 | | | 5.00 | | | | 8/1/21 | | | | 1,037 | |
| | 2,500 | | | New York State, GO, Series C | | | 5.00 | | | | 8/1/23 | | | | 2,847 | |
| | 3,000 | | | New York City Housing Development Corp. Revenue, Series B-2, Callable 7/1/23 @ 100.00 | | | 5.00 | | | | 7/1/26 | | | | 3,343 | |
| | 2,500 | | | New York City Health & Hospital Corp. Revenue, Health System, Series A,
Callable 2/15/20 @ 100.00 (GO of Corp.) | | | 5.00 | | | | 2/15/22 | | | | 2,630 | |
| | 1,000 | | | New York City Transitional Finance Authority Future Tax Secured Revenue, Series B-1,
Callable 8/1/24 @ 100.00 | | | 5.00 | | | | 8/1/29 | | | | 1,145 | |
| | 700 | | | New York City Water & Sewer System Revenue, Series BB, Callable 7/5/18 @ 100.00
(State Street Bank & Trust Co.) | | | 1.55 | (d) | | | 6/15/49 | | | | 700 | |
| | 1,165 | | | New York State Dormitory Authority Revenues Non State Supported Debt, Icahn School of Medicine at Mount Sinai, Series A | | | 5.00 | | | | 7/1/21 | | | | 1,265 | |
| | 3,000 | | | New York State Dormitory Authority State Personal Income Tax Revenue, Series D | | | 5.00 | | | | 2/15/23 | | | | 3,391 | |
| | 3,255 | | | New York State Transportation Development Corp. Special Facilities Revenue,
Terminal One Group Associates | | | 5.00 | | | | 1/1/21 | | | | 3,465 | |
| | 2,000 | | | Port Authority of New York & New Jersey New York Revenue, Consolidated 185th (AMT) | | | 5.00 | | | | 9/1/22 | | | | 2,219 | |
| | 4,500 | | | Port Authority of New York & New Jersey New York Revenue, Consolidated 185th (AMT) | | | 5.00 | | | | 9/1/23 | | | | 5,067 | |
| | | | | | | | | | | | | | | | |
| | | | | | | | | | | | | | | 34,789 | |
| | | | | | | | | | | | | | | | |
| | | | North Carolina — 3.05% | | | | | | | | | | | | |
| | 1,000 | | | City of Charlotte NC Airport Revenue, Series C | | | 4.00 | | | | 7/1/23 | | | | 1,087 | |
| | 1,000 | | | City of Charlotte NC Airport Revenue, Series C | | | 5.00 | | | | 7/1/24 | | | | 1,155 | |
| | 2,275 | | | County of Mecklenburg North Carolina, GO, Series A | | | 5.00 | | | | 4/1/23 | | | | 2,586 | |
| | 1,000 | | | North Carolina State Turnpike Authority Revenue (AGC) | | | 5.00 | | | | 1/1/24 | | | | 1,128 | |
| | 5,000 | | | County of Wake North Carolina, GO | | | 5.00 | | | | 9/1/24 | | | | 5,821 | |
| | | | | | | | | | | | | | | | |
| | | | | | | | | | | | | | | 11,777 | |
| | | | | | | | | | | | | | | | |
| | | | Ohio — 1.90% | | | | | | | | | | | | |
| | 1,500 | | | American Municipal Power, Inc. Revenue, Series A, Callable 2/15/24 @ 100.00 | | | 5.00 | | | | 2/15/27 | | | | 1,682 | |
| | 1,750 | | | Ohio American Municipal Power, Inc. Revenue, Series A | | | 5.00 | | | | 2/15/24 | | | | 1,991 | |
| | 835 | | | Mahoning County Ohio Hospital Facilities Revenue, Western Reserve Care System, Continuously Callable @ 100.00 (MBIA) | | | 5.50 | | | | 10/15/25 | | | | 933 | |
| | 2,500 | | | Montgomery County Ohio Revenue, Miami Valley Hospital, Series A,
Callable 11/15/20 @ 100.00 | | | 5.75 | | | | 11/15/22 | | | | 2,714 | |
| | | | | | | | | | | | | | | | |
| | | | | | | | | | | | | | | 7,320 | |
| | | | | | | | | | | | | | | | |
| | | | Oklahoma — 0.37% | | | | | | | | | | | | |
| | 1,275 | | | Grand River Oklahoma Dam Authority Revenue, Series A | | | 5.00 | | | | 6/1/22 | | | | 1,419 | |
| | | | | | | | | | | | | | | | |
| | | | Pennsylvania — 4.19% | | | | | | | | | | | | |
| | 1,250 | | | Commonwealth Financing Authority Revenue, Tobacco Master Settlement | | | 5.00 | | | | 6/1/23 | | | | 1,390 | |
| | 4,000 | | | Delaware Valley Regional Finance Authority Revenue, Series B,
Callable 9/1/21 @ 100.00 (CNTY-GTD) | |
| 1.93
(MUNIPSA
+ 42.00
bps)(b) |
| | | 9/1/48 | | | | 4,000 | |
| | 2,500 | | | Pennsylvania State Turnpike Commission Revenue | | | 5.00 | | | | 6/1/24 | | | | 2,836 | |
| | 3,000 | | | Philadelphia Pennsylvania Gas Works Revenue | | | 5.00 | | | | 8/1/21 | | | | 3,250 | |
| | 2,500 | | | Philadelphia Pennsylvania School District, GO, Series C, Callable 9/1/20 @ 100.00
(State Aid Withholding) | | | 5.00 | | | | 9/1/21 | | | | 2,640 | |
| | 1,700 | | | Southeastern Pennsylvania Transportation Authority Revenue | | | 5.00 | | | | 3/1/23 | | | | 1,911 | |
| | | | | | | | | | | | | | | | |
| | | | | | | | | | | | | | | 16,027 | |
| | | | | | | | | | | | | | | | |
| | | | Rhode Island — 0.87% | | | | | | | | | | | | |
| | 2,000 | | | Rhode Island Health & Educational Building Corp. Revenue | | | 5.00 | | | | 5/15/23 | | | | 2,221 | |
| | 1,000 | | | Rhode Island State Student Loan Authority Student Loan Revenue, Series A (AMT) | | | 5.00 | | | | 12/1/22 | | | | 1,095 | |
| | | | | | | | | | | | | | | | |
| | | | | | | | | | | | | | | 3,316 | |
| | | | | | | | | | | | | | | | |
See accompanying notes to financial statements.
234
HC CAPITAL TRUST
The Intermediate Term Municipal Bond Portfolio
Portfolio of Investments (continued) — June 30, 2018
| | | | | | | | | | | | | | | | |
Principal
Amount
(000) | | | Security Description | | Rate % | | | Maturity
Date | | | Value
(000) | |
| | | | Municipal Bonds (continued) | | | | | | | | | | | | |
| | | | South Carolina — 2.11% | | | | | | | | | | | | |
| $ | 3,680 | | | County of Charleston South Carolina, GO, Series A (State Aid Withholding) | | | 5.00 | | | | 11/1/26 | | | $ | 4,401 | |
| | 3,500 | | | Piedmont Municipal Power Agency Electric Revenue, Series A-2, Callable 1/1/21 @ 100.00 | | | 5.00 | | | | 1/1/22 | | | | 3,730 | |
| | | | | | | | | | | | | | | | |
| | | | | | | | | | | | | | | 8,131 | |
| | | | | | | | | | | | | | | | |
| | | | Tennessee — 0.92% | | | | | | | | | | | | |
| | 2,000 | | | Tennessee State Energy Acquisition Corp. Gas Revenue, Series A
(Goldman Sachs Group, Inc.) | | | 5.25 | | | | 9/1/21 | | | | 2,179 | |
| | 1,250 | | | Tennessee State Energy Acquisition Corp. Gas Revenue, Series E, Callable 2/1/23 @ 100.43 | | | 4.00 | (d) | | | 5/1/48 | | | | 1,331 | |
| | | | | | | | | | | | | | | | |
| | | | | | | | | | | | | | | 3,510 | |
| | | | | | | | | | | | | | | | |
| | | | Texas — 18.98% | | | | | | | | | | | | |
| | 2,000 | | | Aldine Texas Independent School District, GO (PSF-GTD) | | | 5.00 | | | | 2/15/25 | | | | 2,318 | |
| | 1,650 | | | Allen Texas Independent School District, GO (PSF-GTD) | | | 5.00 | | | | 2/15/21 | | | | 1,781 | |
| | 1,000 | | | Austin Texas Community College District, GO | | | 5.00 | | | | 8/1/23 | | | | 1,137 | |
| | 1,180 | | | Clifton Higher Education Finance Corp. Revenue (PSF-GTD) | | | 5.00 | | | | 8/15/24 | | | | 1,351 | |
| | 2,200 | | | Clifton Higher Education Finance Corp. Revenue (PSF-GTD) | | | 5.00 | | | | 8/15/25 | | | | 2,546 | |
| | 3,500 | | | Dallas-Fort Worth Texas International Airport Revenue, Series E | | | 5.00 | | | | 11/1/22 | | | | 3,882 | |
| | 1,000 | | | City of Dallas TX, GO, Series A, Callable 2/15/23 @ 100.00 | | | 5.00 | | | | 2/15/26 | | | | 1,111 | |
| | 2,450 | | | City of Dallas TX, GO, Callable 2/15/25 @ 100.00 | | | 5.00 | | | | 2/15/27 | | | | 2,789 | |
| | 2,500 | | | Dallas Independent School District, GO, Series A, Callable 2/15/25 @ 100.00 (PSF-GTD) | | | 5.00 | | | | 2/15/27 | | | | 2,874 | |
| | 1,100 | | | Denton Texas Utility System Revenue | | | 5.00 | | | | 12/1/22 | | | | 1,230 | |
| | 2,090 | | | Dickinson Texas Independent School District, GO (PSF-GTD) | | | 5.00 | | | | 2/15/21 | | | | 2,256 | |
| | 1,000 | | | El Paso Texas Water & Sewer Revenue | | | 5.00 | | | | 3/1/22 | | | | 1,107 | |
| | 3,500 | | | Grand Parkway Transportation Corp. Revenue | | | 5.00 | | | | 2/1/23 | | | | 3,887 | |
| | 3,235 | | | Harris County Houston Texas Sports Authority Revenue, Series A | | | 5.00 | | | | 11/15/20 | | | | 3,454 | |
| | 2,095 | | | Harris County Texas Cultural Education Facilities Finance Corp. Medicine Facilities Revenue, Baylor College of Medicine | | | 5.00 | | | | 11/15/23 | | | | 2,372 | |
| | 1,650 | | | Harris County Cultural Education Facilities Finance Corp. Revenue | | | 5.00 | | | | 11/15/25 | | | | 1,922 | |
| | 1,650 | | | Harris County Toll Road Authority Revenue, Series A | | | 5.00 | | | | 8/15/23 | | | | 1,877 | |
| | 1,450 | | | Houston Texas Community College Revenue | | | 5.00 | | | | 4/15/21 | | | | 1,569 | |
| | 2,000 | | | Houston Texas Hotel Occupancy Tax & Special Revenue, Series A | | | 5.00 | | | | 9/1/20 | | | | 2,127 | |
| | 2,500 | | | Houston Texas Utility System Revenue, Callable 11/1/19 @ 100.00 | |
| 2.41
(MUNIPSA
+
90.00
bps)(b) |
| | | 5/15/34 | | | | 2,517 | |
| | 1,000 | | | Love Field Texas Airport Modernization Corp. General Airport Revenue (AMT) | | | 5.00 | | | | 11/1/22 | | | | 1,110 | |
| | 1,220 | | | Love Field Texas Airport Modernization Corp. General Airport Revenue,
Callable 11/1/22 @ 100.00 | | | 5.00 | | | | 11/1/28 | | | | 1,318 | |
| | 1,000 | | | Lower Colorado River Texas Authority Transmission Contract Revenue | | | 5.00 | | | | 5/15/21 | | | | 1,086 | |
| | 1,000 | | | Lower Colorado River Texas Authority Transmission Contract Revenue | | | 5.00 | | | | 5/15/22 | | | | 1,110 | |
| | 1,075 | | | Lower Colorado River Texas Authority Transmission Contract Revenue | | | 5.00 | | | | 5/15/23 | | | | 1,215 | |
| | 1,695 | | | North Texas Tollway Authority Revenue, Series A | | | 5.00 | | | | 1/1/22 | | | | 1,863 | |
| | 2,500 | | | North Texas Tollway Authority Revenue, Series A | | | 5.00 | | | | 1/1/22 | | | | 2,743 | |
| | 1,000 | | | North Texas Tollway Authority Revenue, Series B, Callable 1/1/23 @ 100.00 | | | 5.00 | | | | 1/1/26 | | | | 1,110 | |
| | 1,000 | | | Northside Texas Independent School District, GO (PSF-GTD) | | | 5.00 | | | | 6/15/24 | | | | 1,155 | |
| | 1,070 | | | Sam Rayburn Texas Municipal Power Agency Revenue | | | 5.00 | | | | 10/1/20 | | | | 1,135 | |
| | 1,175 | | | San Antonio Texas Water Revenue, Junior Lien, Series A | | | 5.00 | | | | 5/15/22 | | | | 1,306 | |
| | 1,505 | | | Texas A&M University Revenue, Series E | | | 5.00 | | | | 5/15/23 | | | | 1,708 | |
| | 4,365 | | | Texas State College Student Loan, GO | | | 5.00 | | | | 8/1/22 | | | | 4,852 | |
| | 2,230 | | | University of Houston Revenue, Series C, Callable 2/15/26 @ 100.00 | | | 5.00 | | | | 2/15/28 | | | | 2,588 | |
| | 3,000 | | | University of Texas Revenue, Series E | | | 5.00 | | | | 8/15/23 | | | | 3,423 | |
| | 1,000 | | | West Travis County Public Utility Agency Revenue (BAM) | | | 5.00 | | | | 8/15/26 | | | | 1,168 | |
| | | | | | | | | | | | | | | | |
| | | | | | | | | | | | | | | 72,997 | |
| | | | | | | | | | | | | | | | |
See accompanying notes to financial statements.
235
HC CAPITAL TRUST
The Intermediate Term Municipal Bond Portfolio
Portfolio of Investments (continued) — June 30, 2018
| | | | | | | | | | | | | | | | |
Principal
Amount
(000) | | | Security Description | | Rate % | | | Maturity
Date | | | Value
(000) | |
| | | | Municipal Bonds (continued) | | | | | | | | | | | | |
| | | | Utah — 0.33% | | | | | | | | | | | | |
| $ | 1,090 | | | Utah Transit Authority Revenue | | | 5.00 | | | | 12/15/26 | | | $ | 1,281 | |
| | | | | | | | | | | | | | | | |
| | | | Virginia — 1.90% | | | | | | | | | | | | |
| | 1,000 | | | Fairfax County Virginia Industrial Development Authority Revenue, Series A | | | 5.00 | | | | 5/15/22 | | | | 1,113 | |
| | 1,000 | | | Fairfax County Virginia Industrial Development Authority Revenue, Series A | | | 5.00 | | | | 5/15/23 | | | | 1,134 | |
| | 1,000 | | | Fairfax County Virginia Industrial Development Authority Revenue, Series A | | | 5.00 | | | | 5/15/24 | | | | 1,152 | |
| | 2,000 | | | Virginia Commonwealth Transportation Board Revenue, Series A | | | 5.00 | | | | 5/15/23 | | | | 2,270 | |
| | 1,400 | | | Virginia Commonwealth Transportation Board Revenue, Series A | | | 5.00 | | | | 5/15/24 | | | | 1,615 | |
| | | | | | | | | | | | | | | | |
| | | | | | | | | | | | | | | 7,284 | |
| | | | | | | | | | | | | | | | |
| | | | Washington — 2.84% | | | | | | | | | | | | |
| | 1,070 | | | Grant County Washington Public Utilities District #2 Priest Rapids Hydro Electric Revenue, Series B (AMT) | | | 5.00 | | | | 1/1/20 | | | | 1,120 | |
| | 1,650 | | | Grant County Washington Public Utilities District #2 Priest Rapids Hydro Electric Revenue, Series B (AMT) | | | 5.00 | | | | 1/1/21 | | | | 1,767 | |
| | 1,420 | | | Grant County Washington Public Utilities District #2 Priest Rapids Hydro Electric Revenue, Series B (AMT) | | | 5.00 | | | | 1/1/22 | | | $ | 1,552 | |
| | 1,000 | | | Port of Seattle Washington, GO, Callable 6/1/21 @ 100.00 (AMT) | | | 5.25 | | | | 12/1/21 | | | | 1,090 | |
| | 1,000 | | | Port of Seattle Washington Revenue, Series C (AMT) | | | 5.00 | | | | 4/1/22 | | | | 1,099 | |
| | 2,500 | | | Washington State, GO, Series B | | | 5.00 | | | | 7/1/23 | | | | 2,846 | |
| | 1,250 | | | Washington Health Care Facilities Authority Revenue | | | 5.00 | | | | 10/1/25 | | | | 1,450 | |
| | | | | | | | | | | | | | | | |
| | | | | | | | | | | | | | | 10,924 | |
| | | | | | | | | | | | | | | | |
| | | | Wisconsin — 1.21% | | | | | | | | | | | | |
| | 1,000 | | | Public Finance Authority Wisconsin Lease Development Revenue | | | 5.00 | | | | 3/1/22 | | | | 1,099 | |
| | 1,000 | | | Public Finance Authority Wisconsin Lease Development Revenue | | | 5.00 | | | | 3/1/23 | | | | 1,121 | |
| | 1,000 | | | Wisconsin State Health & Educational Facilities Authority Health Facilities Revenue,
Unity Point Health, Series A | | | 5.00 | | | | 12/1/21 | | | | 1,097 | |
| | 1,155 | | | Wisconsin State Health & Educational Facilities Authority Revenue, Series A | | | 5.00 | | | | 11/15/22 | | | | 1,294 | |
| | | | | | | | | | | | | | | | |
| | | | | | | | | | | | | | | 4,611 | |
| | | | | | | | | | | | | | | | |
| | | | Total Municipal Bonds | | | | | | | | | | | 381,086 | |
| | | | | | | | | | | | | | | | |
| | | | Corporate Bond — 0.00% | | | | | | | | | | | | |
| | 3,939 | | | ASC Equipment (Trading Companies & Distributors) (e) | | | 5.13 | (f) | | | 3/1/08 | | | | – | |
| | | | | | | | | | | | | | | | |
| | | | Total Corporate Bond | | | | | | | | | | | – | |
| | | | | | | | | | | | | | | | |
| | | | Time Deposit — 0.00% | | | | | | | | | | | | |
| | 4 | | | State Street Liquidity Management Control System Eurodollar Time Deposit | | | 0.53 | | | | 7/2/18 | | | | 4 | |
| | | | | | | | | | | | | | | | |
| | | | Total Time Deposit | | | | | | | | | | | 4 | |
| | | | | | | | | | | | | | | | |
| Shares | | | | | | | | | | | | |
| | | | Mutual Fund — 0.92% | | | | | | | | | | | | |
| | 3,517,451 | | | State Street Institutional Treasury Plus Money Market Fund, Trust Class | | | 1.72 | (f) | | | | | | | 3,517 | |
| | | | | | | | | | | | | | | | |
| | | | Total Mutual Fund | | | | | | | | | | | 3,517 | |
| | | | | | | | | | | | | | | | |
| | | | Total Investments (cost $390,434) — 100.10% | | | | | | | | | | | 384,607 | |
| | | | Liabilities in excess of other assets — (0.10)% | | | | | | | | | | | (399 | ) |
| | | | | | | | | | | | | | | | |
| | | | Net Assets — 100.00% | | | | | | | | | | $ | 384,208 | |
| | | | | | | | | | | | | | | | |
Amounts designated as “—” are $0 or have been rounded to $0.
See accompanying notes to financial statements.
236
HC CAPITAL TRUST
The Intermediate Term Municipal Bond Portfolio
Portfolio of Investments (concluded) — June 30, 2018
| (a) | The rate for certain asset-backed and mortgage-backed securities may vary based on factors relating to the pool of assets underlying the security. The rate disclosed is the rate in effect on June 30, 2018. |
| (b) | Variable Rate Security. The rate disclosed is the rate in effect on June 30, 2018. |
| (c) | This security has been deemed illiquid by the Specialist Manager and represents 0.02% of the Portfolio’s net assets. |
| (d) | Interest rate is determined by the Remarketing Agent. The rate presented is the rate in effect at June 30, 2018. |
| (f) | The rate disclosed is the rate in effect on June 30, 2018. |
AGC — Assured Guaranty Corp.
AGM — Assured Guaranty Municipal Corporation
AMT — Alternative Minimum Tax
BAM — Build America Mutual
bps — Basis Points
CNTY-GTD — County Guarantee
GO — General Obligation
MBIA — Municipal Bond Insurance Association
MUNIPSA — SIFMA Municipal Swap Index Yield
PSF-GTD — Public School Fund Guaranteed
Q-SBLF — Qualified School Bond Loan Fund
US0001M — 1 Month US Dollar LIBOR
The following table reflects the percentage of total net assets of the Portfolio attributable to each Specialist Manager as of June 30, 2018.
| | | | | | | | | | | | |
The Intermediate Term Municipal Bond Portfolio | | BNY Mellon Asset
Management North
America Corporation* | | | HC Capital
Solutions | | | Total | |
Municipal Bonds | | | 99.18 | % | | | — | | | | 99.18 | % |
Corporate Bond | | | 0.00 | % | | | — | | | | 0.00 | % |
Time Deposit | | | 0.00 | % | | | — | | | | 0.00 | % |
Mutual Fund | | | — | | | | 0.92 | % | | | 0.92 | % |
Other Assets (Liabilities) | | | 0.07 | % | | | -0.17 | % | | | -0.10 | % |
| | | | | | | | | | | | |
Total Net Assets | | | 99.25 | % | | | 0.75 | % | | | 100.00 | % |
| | | | | | | | | | | | |
| * | Formerly Standish Mellon Asset Management Company, LLC. |
Amounts designated as “—” indicate the Specialist Manager did not manage any holdings in that category.
See accompanying notes to financial statements.
237
HC CAPITAL TRUST
The Intermediate Term Municipal Bond II Portfolio
Portfolio of Investments — June 30, 2018
| | | | | | | | | | | | | | | | |
Principal
Amount
(000) | | | Security Description | | Rate % | | | Maturity
Date | | | Value
(000) | |
| | | | Municipal Bonds — 98.40% | | | | | | | | | | | | |
| | | | Alabama — 5.52% | | | | | | | | | | | | |
| $ | 1,500 | | | Alabama State Public School & College Authority Revenue, Series A | | | 5.00 | | | | 5/1/19 | | | $ | 1,543 | |
| | 1,415 | | | Birmingham Alabama Special Care Facilities Financing Authority Health Care Facility,
Callable 6/1/25 @ 100.00 | | | 5.00 | | | | 6/1/29 | | | | 1,593 | |
| | 1,000 | | | Pell City Alabama, GO, Series A, Callable 2/1/25 @ 100.00 | | | 5.00 | | | | 2/1/26 | | | | 1,149 | |
| | | | | | | | | | | | | | | | |
| | | | | | | | | | | | | | | 4,285 | |
| | | | | | | | | | | | | | | | |
| | | | Arizona — 0.82% | | | | | | | | | | | | |
| | 450 | | | Maricopa County Arizona Unified School District No. 48, GO | | | 5.00 | | | | 7/1/21 | | | | 491 | |
| | 140 | | | Yuma County Arizona Jail District Revenue, Pledge Obligation | | | 5.00 | | | | 7/1/20 | | | | 149 | |
| | | | | | | | | | | | | | | | |
| | | | | | | | | | | | | | | 640 | |
| | | | | | | | | | | | | | | | |
| | | | California — 1.37% | | | | | | | | | | | | |
| | 620 | | | California State Department Water Resources Power Supply Revenue, Series L (Pre-Refunded/Escrowed to Maturity) | | | 5.00 | | | | 5/1/22 | | | | 659 | |
| | 380 | | | California State Department Water Resources Power Supply Revenue, Series L,
Callable 5/1/20 @ 100.00 | | | 5.00 | | | | 5/1/22 | | | | 403 | |
| | | | | | | | | | | | | | | | |
| | | | | | | | | | | | | | | 1,062 | |
| | | | | | | | | | | | | | | | |
| | | | Florida — 12.84% | | | | | | | | | | | | |
| | 1,250 | | | Florida State Board of Education Lottery Revenue, Series A | | | 5.00 | | | | 7/1/26 | | | | 1,472 | |
| | 800 | | | State of Florida, GO, Series A | | | 5.00 | | | | 6/1/23 | | | | 911 | |
| | 1,525 | | | Florida Department of Environmental Protection Revenue, Series A | | | 5.00 | | | | 7/1/24 | | | | 1,760 | |
| | 1,400 | | | Lee County Florida School Board Certificates of Participation, Series A,
Callable 8/1/24 @ 100.00 | | | 5.00 | | | | 8/1/27 | | | | 1,597 | |
| | 750 | | | Miami-Dade County Florida, GO, Series A, Callable 11/1/24 @ 100.00 | | | 5.00 | | | | 11/1/27 | | | | 867 | |
| | 1,000 | | | Miami-Dade County Florida Water & Sewer Revenue, Series B (AGM) | | | 5.25 | | | | 10/1/20 | | | | 1,076 | |
| | 585 | | | Orange County Florida School Board Certificates of Participation, Series A | | | 5.00 | | | | 8/1/23 | | | | 664 | |
| | 1,500 | | | West Palm Beach Florida Utility System Revenue, Series A, Callable 10/1/21 @ 100.00 | | | 5.00 | | | | 10/1/22 | | | | 1,644 | |
| | | | | | | | | | | | | | | | |
| | | | | | | | | | | | | | | 9,991 | |
| | | | | | | | | | | | | | | | |
| | | | Hawaii — 2.07% | | | | | | | | | | | | |
| | 1,500 | | | Honolulu City & County Hawaii, GO, Series B, Callable 12/1/20 @ 100.00 | | | 5.00 | | | | 12/1/23 | | | | 1,611 | |
| | | | | | | | | | | | | | | | |
| | | | Idaho — 1.83% | | | | | | | | | | | | |
| | 1,285 | | | Idaho State Housing & Finance Association, Grant & Revenue Anticipation Federal Highway Trust, Series A | | | 5.00 | | | | 7/15/22 | | | | 1,425 | |
| | | | | | | | | | | | | | | | |
| | | | Iowa — 2.11% | | | | | | | | | | | | |
| | 1,410 | | | City of Bettendorf Iowa, GO, Series D | | | 5.00 | | | | 6/1/25 | | | | 1,643 | |
| | | | | | | | | | | | | | | | |
| | | | Kansas — 1.25% | | | | | | | | | | | | |
| | 850 | | | City of Olathe Kansas, GO, Series 230 | | | 5.00 | | | | 10/1/23 | | | | 970 | |
| | | | | | | | | | | | | | | | |
| | | | Maryland — 1.77% | | | | | | | | | | | | |
| | 1,330 | | | Maryland State Transportation Authority Revenue, Transportation Facilities Project, Series A | | | 5.00 | | | | 7/1/19 | | | | 1,375 | |
| | | | | | | | | | | | | | | | |
| | | | Massachusetts — 3.05% | | | | | | | | | | | | |
| | 1,000 | | | Massachusetts State Bay Transportation Authority Sales Tax Revenue | | | 4.00 | | | | 12/1/21 | | | | 1,069 | |
| | 600 | | | Massachusetts State, GO, Series A | | | 5.00 | | | | 3/1/23 | | | | 678 | |
| | 600 | | | Massachusetts State Water Resources Authority Revenue, Series A
(Pre-Refunded/Escrowed to Maturity) | | | 5.00 | | | | 8/1/39 | | | | 622 | |
| | | | | | | | | | | | | | | | |
| | | | | | | | | | | | | | | 2,369 | |
| | | | | | | | | | | | | | | | |
| | | | Minnesota — 0.52% | | | | | | | | | | | | |
| | 400 | | | Crow Wing County Minnesota, GO, Series A | | | 5.00 | | | | 2/1/19 | | | | 408 | |
| | | | | | | | | | | | | | | | |
| | | | Nebraska — 0.64% | | | | | | | | | | | | |
| | 500 | | | Lincoln Nebraska Waterworks Revenue | | | 3.00 | | | | 8/15/18 | | | | 501 | |
| | | | | | | | | | | | | | | | |
| | | | Nevada — 3.99% | | | | | | | | | | | | |
| | 800 | | | Clark County Nevada Highway Improvement Revenue | | | 5.00 | | | | 7/1/23 | | | | 907 | |
| | 1,105 | | | Las Vegas Valley Nevada Water District, GO, Series B | | | 5.00 | | | | 12/1/24 | | | | 1,283 | |
See accompanying notes to financial statements.
238
HC CAPITAL TRUST
The Intermediate Term Municipal Bond II Portfolio
Portfolio of Investments (continued) — June 30, 2018
| | | | | | | | | | | | | | | | |
Principal
Amount
(000) | | | Security Description | | Rate % | | | Maturity
Date | | | Value
(000) | |
| | | | Municipal Bonds (continued) | | | | | | | | | | | | |
| | | | Nevada (continued) | | | | | | | | | | | | |
| $ | 800 | | | Nevada State System of Higher Education Certificates of Participation Revenue, Series A,
Callable 7/1/24 @ 100.00 | | | 5.00 | | | | 7/1/26 | | | $ | 909 | |
| | | | | | | | | | | | | | | | |
| | | | | | | | | | | | | | | 3,099 | |
| | | | | | | | | | | | | | | | |
| | | | New Mexico — 1.58% | | | | | | | | | | | | |
| | 1,025 | | | Albuquerque Municipal School District No.12, GO, Callable 8/1/28 @ 100.00
(State Aid Withholding) | | | 5.00 | | | | 8/1/29 | | | | 1,230 | |
| | | | | | | | | | | | | | | | |
| | | | New York — 3.01% | | | | | | | | | | | | |
| | 1,495 | | | New York City Transitional Finance Authority Revenue, Series D,
Callable 2/1/21 @ 100.00 | | | 5.25 | | | | 2/1/22 | | | | 1,622 | |
| | 625 | | | New York State Dormitory Authority State Personal Income Tax Revenue, Series A,
Callable 2/15/24 @ 100.00 | | | 5.00 | | | | 2/15/26 | | | | 713 | |
| | | | | | | | | | | | | | | | |
| | | | | | | | | | | | | | | 2,335 | |
| | | | | | | | | | | | | | | | |
| | | | North Carolina — 4.76% | | | | | | | | | | | | |
| | 1,525 | | | North Carolina State Capital Facilities Finance Agency Educational Revenue
(Pre-Refunded/Escrowed to Maturity) | | | 5.00 | | | | 1/1/38 | | | | 1,552 | |
| | 1,500 | | | North Carolina State Revenue, Series B | | | 5.00 | | | | 5/1/27 | | | | 1,797 | |
| | 300 | | | University of North Carolina at Greensboro Revenue | | | 5.00 | | | | 4/1/25 | | | | 349 | |
| | | | | | | | | | | | | | | | |
| | | | | | | | | | | | | | | 3,698 | |
| | | | | | | | | | | | | | | | |
| | | | Ohio — 9.48% | | | | | | | | | | | | |
| | 700 | | | American Municipal Power, Inc. Revenue, Series A, Callable 2/15/24 @ 100.00 | | | 5.00 | | | | 2/15/27 | | | | 785 | |
| | 1,000 | | | Butler County Ohio Hospital Facilities Revenue, Series X | | | 5.00 | | | | 5/15/29 | | | | 1,196 | |
| | 1,600 | | | Columbus Ohio State, GO, Series 1 (Pre-Refunded/Escrowed to Maturity) | | | 5.00 | | | | 7/1/24 | | | | 1,824 | |
| | 1,400 | | | Cuyahoga County Ohio, GO, Series A | | | 5.00 | | | | 12/1/19 | | | | 1,467 | |
| | 1,000 | | | Ohio State Hospital Facility Revenue, Callable 1/1/28 @ 100.00 | | | 5.00 | | | | 1/1/30 | | | | 1,187 | |
| | 800 | | | Ohio State University Revenue | | | 5.00 | | | | 12/1/22 | | | | 900 | |
| | | | | | | | | | | | | | | | |
| | | | | | | | | | | | | | | 7,359 | |
| | | | | | | | | | | | | | | | |
| | | | Pennsylvania — 3.33% | | | | | | | | | | | | |
| | 1,375 | | | Blairsville-Saltsburg School District, GO (BAM State Aid Withholding) | | | 5.00 | | | | 3/15/23 | | | | 1,532 | |
| | 1,000 | | | Pennsylvania State, GO, Series A | | | 5.00 | | | | 5/1/20 | | | | 1,055 | |
| | | | | | | | | | | | | | | | |
| | | | | | | | | | | | | | | 2,587 | |
| | | | | | | | | | | | | | | | |
| | | | South Dakota — 2.51% | | | | | | | | | | | | |
| | 1,675 | | | South Dakota Board of Regents Revenue, Callable 10/1/27 @ 100.00 | | | 5.00 | | | | 4/1/29 | | | | 1,952 | |
| | | | | | | | | | | | | | | | |
| | | | Texas — 19.51% | | | | | | | | | | | | |
| | 1,325 | | | Dallas Texas Area Rapid Transit Sales Tax Revenue (Insurance/Program BHAC-CR) (Pre-Refunded/Escrowed to Maturity) | | | 5.25 | | | | 12/1/48 | | | | 1,346 | |
| | 710 | | | Dallas Texas Waterworks & Sewer System Revenue (Pre-Refunded/Escrowed to Maturity) | | | 5.00 | | | | 10/1/23 | | | | 778 | |
| | 540 | | | Dallas Texas Waterworks & Sewer System Revenue, Callable 10/1/21 @ 100.00 | | | 5.00 | | | | 10/1/23 | | | | 591 | |
| | 875 | | | City of Denton Texas, GO | | | 5.00 | | | | 2/15/21 | | | | 943 | |
| | 1,545 | | | Harris County Texas Revenue, Series A, Callable 8/15/26 @ 100.00 | | | 5.00 | | | | 8/15/30 | | | | 1,790 | |
| | 1,500 | | | Harris County Texas Cultural Education Facilities Finance Corp. Revenue, Texas Children’s Hospital, Callable 10/1/25 @ 100.00 | | | 5.00 | | | | 10/1/27 | | | | 1,730 | |
| | 1,460 | | | Humble Independent School District, GO, Series C | | | 5.00 | | | | 2/15/24 | | | | 1,671 | |
| | 1,715 | | | North East Independent School District Texas, GO, Series B (PSF-GTD) | | | 5.00 | | | | 2/1/24 | | | | 1,965 | |
| | 300 | | | City of Pearland Texas, GO, Callable 3/1/27 @ 100.00 | | | 5.00 | | | | 3/1/29 | | | | 351 | |
| | 500 | | | Sugar Land Texas (Pre-Refunded/Escrowed to Maturity) | | | 5.00 | | | | 2/15/21 | | | | 511 | |
| | 935 | | | Sugar Land Texas, Callable 2/15/19 @ 100.00 | | | 5.00 | | | | 2/15/21 | | | | 955 | |
| | 1,500 | | | Texas State Water Development Board Revenue, Series A, Callable 10/15/25 @ 100.00 | | | 5.00 | | | | 4/15/26 | | | | 1,761 | |
| | 515 | | | Webb County Texas, GO | | | 4.50 | | | | 2/15/19 | | | | 524 | |
| | 235 | | | Webb County Texas, GO | | | 4.50 | | | | 2/15/19 | | | | 239 | |
| | | | | | | | | | | | | | | | |
| | | | | | | | | | | | | | | 15,155 | |
| | | | | | | | | | | | | | | | |
See accompanying notes to financial statements.
239
HC CAPITAL TRUST
The Intermediate Term Municipal Bond II Portfolio
Portfolio of Investments (concluded) — June 30, 2018
| | | | | | | | | | | | | | | | |
Principal
Amount
(000) | | | Security Description | | Rate % | | | Maturity
Date | | | Value
(000) | |
| | | | Municipal Bonds (continued) | | | | | | | | | | | | |
| | | | Washington — 16.44% | | | | | | | | | | | | |
| $ | 1,415 | | | Energy Northwest Revenue, Series A | | | 5.00 | | | | 7/1/19 | | | $ | 1,464 | |
| | 1,000 | | | King County Washington, GO | | | 5.25 | | | | 1/1/23 | | | | 1,139 | |
| | 1,050 | | | King County School District No. 405 Bellevue, GO,
Callable 12/1/27 @ 100.00 (SCH BD GTY) | | | 5.00 | | | | 12/1/29 | | | | 1,249 | |
| | 1,250 | | | King County School District No. 410 Snoqualmie Valley, GO,
Callable 6/1/27 @ 100.00 (SCH BD GTY) | | | 5.00 | | | | 12/1/27 | | | | 1,486 | |
| | 1,400 | | | King County Washington Sewer Revenue, Callable 1/1/22 @ 100.00 | | | 5.00 | | | | 1/1/24 | | | | 1,540 | |
| | 750 | | | King County Washington Sewer Revenue | | | 5.00 | | | | 1/1/20 | | | | 787 | |
| | 1,540 | | | City of Spokane Washington Water & Wastewater System Revenue | | | 5.00 | | | | 12/1/19 | | | | 1,613 | |
| | 1,500 | | | Tacoma Washington Water Revenue, Series A, Callable 6/1/20 @ 100.00 | | | 5.00 | | | | 12/1/22 | | | | 1,588 | |
| | 1,750 | | | State of Washington, GO, Series A | | | 5.00 | | | | 8/1/21 | | | | 1,914 | |
| | | | | | | | | | | | | | | | |
| | | | | | | | | | | | | | | 12,780 | |
| | | | | | | | | | | | | | | | |
| | | | Total Municipal Bonds | | | | | | | | | | | 76,475 | |
| | | | | | | | | | | | | | | | |
| Shares | | | | | | | | | | | | |
| | | | Mutual Fund — 0.86% | | | | | | | | | | | | |
| | 667,078 | | | State Street Institutional Treasury Plus Money Market Fund, Trust Class | | | 1.72 | (a) | | | | | | | 667 | |
| | | | | | | | | | | | | | | | |
| | | | Total Mutual Fund | | | | | | | | | | | 667 | |
| | | | | | | | | | | | | | | | |
| | | | Total Investments (cost $76,628) — 99.26% | | | | | | | | | | | 77,142 | |
| | | | Other assets in excess of liabilities — 0.74% | | | | | | | | | | | 573 | |
| | | | | | | | | | | | | | | | |
| | | | Net Assets — 100.00% | | | | | | | | | | $ | 77,715 | |
| | | | | | | | | | | | | | | | |
| (a) | The rate disclosed is the rate in effect on June 30, 2018. |
AGM—Assured Guaranty Municipal Corporation
BHAC-CR—Brooklyn Housing Assistance Center
BAM—Build America Mutual
GO—General Obligation
PSF-GTD—Public School Fund Guaranteed
SCH BD GTY—School Board Guaranty
The following table reflects the percentage of total net assets of the Portfolio attributable to each Specialist Manager as of June 30, 2018.
| | | | | | | | | | | | |
The Intermediate Term Municipal Bond II Portfolio | | Breckinridge
Capital Advisors,
Inc. | | | HC Capital
Solutions | | | Total | |
Municipal Bonds | | | 98.40 | % | | | — | | | | 98.40 | % |
Mutual Fund | | | 0.46 | % | | | 0.40 | % | | | 0.86 | % |
Other Assets (Liabilities) | | | 0.92 | % | | | -0.18 | % | | | 0.74 | % |
| | | | | | | | | | | | |
Total Net Assets | | | 99.78 | % | | | 0.22 | % | | | 100.00 | % |
| | | | | | | | | | | | |
Amounts designated as “—” indicate the Specialist Manager did not manage any holdings in that category.
See accompanying notes to financial statements.
240
HC CAPITAL TRUST
Statements of Assets and Liabilities
As of June 30, 2018
(Amounts in thousands except per share amounts)
| | | | | | | | | | | | | | | | |
| | | The Value
Equity
Portfolio | | | The Institutional
Value Equity
Portfolio | | | The Growth
Equity
Portfolio | | | The Institutional
Growth Equity
Portfolio | |
ASSETS: | | | | | | | | | | | | | | | | |
Investments in securities, at value | | $ | 598,106 | | | $ | 922,363 | | | $ | 808,664 | | | $ | 1,186,070 | |
Repurchase agreements, at value and cost | | | 11 | | | | — | | | | — | | | | 993 | |
Cash | | | 165 | | | | 615 | | | | 13 | | | | 300 | |
Foreign currency, at value (Cost $40, $48, $0 and $0, respectively) | | | 40 | | | | 48 | | | | — | | | | — | |
Receivable for portfolio shares issued | | | — | | | | 743 | | | | — | | | | 1,099 | |
Receivable from investments sold | | | — | | | | 1,470 | | | | 1,088 | | | | 3,933 | |
Variation margin receivable on futures contracts | | | 28 | | | | 92 | | | | 1 | | | | 40 | |
Cash held as collateral at broker for futures contracts | | | 1,500 | | | | 5,200 | | | | 100 | | | | 2,300 | |
Dividends and interest receivable | | | 773 | | | | 1,234 | | | | 655 | | | | 933 | |
Foreign tax reclaims receivable | | | — | | | | — | | | | 56 | | | | 60 | |
Prepaid expenses | | | 11 | | | | 11 | | | | 12 | | | | 12 | |
| | | | | | | | | | | | | | | | |
Total assets | | | 600,634 | | | | 931,776 | | | | 810,589 | | | | 1,195,740 | |
| | | | | | | | | | | | | | | | |
LIABILITIES: | | | | | | | | | | | | | | | | |
Payable for investments purchased | | | — | | | | 1,570 | | | | — | | | | 4,466 | |
Payable for portfolio shares redeemed | | | 327 | | | | 571 | | | | 454 | | | | 482 | |
Payable for collateral received on loaned securities | | | 18 | | | | — | | | | — | | | | 1,584 | |
Advisory fees payable | | | 35 | | | | 45 | | | | 189 | | | | 257 | |
Management fees payable | | | 25 | | | | 37 | | | | 35 | | | | 53 | |
Administrative services fees payable | | | 14 | | | | 21 | | | | 19 | | | | 27 | |
Trustee fees payable | | | 2 | | | | 3 | | | | 3 | | | | 4 | |
Professional fees payable | | | 26 | | | | 39 | | | | 36 | | | | 51 | |
Custodian fees payable | | | 14 | | | | 19 | | | | 18 | | | | 25 | |
Other accrued expenses | | | 41 | | | | 50 | | | | 45 | | | | 50 | |
| | | | | | | | | | | | | | | | |
Total liabilities | | | 502 | | | | 2,355 | | | | 799 | | | | 6,999 | |
| | | | | | | | | | | | | | | | |
NET ASSETS | | $ | 600,132 | | | $ | 929,421 | | | $ | 809,790 | | | $ | 1,188,741 | |
| | | | | | | | | | | | | | | | |
NET ASSETS CONSISTS OF: | | | | | | | | | | | | | | | | |
Shares of beneficial interest, at par value | | $ | 30 | | | $ | 72 | | | $ | 34 | | | $ | 65 | |
Additional paid-in capital | | | 468,314 | | | | 793,236 | | | | 420,820 | | | | 688,769 | |
Accumulated net investment income | | | 54 | | | | 251 | | | | 168 | | | | 185 | |
Accumulated net realized gain from investment transactions | | | 14,387 | | | | 45,726 | | | | 29,260 | | | | 66,753 | |
Net unrealized appreciation on investments | | | 117,347 | | | | 90,136 | | | | 359,508 | | | | 432,969 | |
| | | | | | | | | | | | | | | | |
Net Assets | | $ | 600,132 | | | $ | 929,421 | | | $ | 809,790 | | | $ | 1,188,741 | |
| | | | | | | | | | | | | | | | |
NET ASSETS: | | | | | | | | | | | | | | | | |
HC Strategic Shares | | $ | 599,457 | | | $ | 928,683 | | | $ | 808,868 | | | $ | 1,187,715 | |
HC Advisors Shares | | | 675 | | | | 738 | | | | 922 | | | | 1,026 | |
| | | | | | | | | | | | | | | | |
Total | | $ | 600,132 | | | $ | 929,421 | | | $ | 809,790 | | | $ | 1,188,741 | |
| | | | | | | | | | | | | | | | |
SHARES OF BENEFICIAL INTEREST OUTSTANDING | | | | | | | | | | | | | | | | |
(Unlimited number of shares authorized; par value $0.001): | | | | | | | | | | | | | | | | |
HC Strategic Shares | | | 30,049 | | | | 71,692 | | | | 34,360 | | | | 65,092 | |
HC Advisors Shares | | | 34 | | | | 57 | | | | 39 | | | | 56 | |
| | | | | | | | | | | | | | | | |
Total | | | 30,083 | | | | 71,749 | | | | 34,399 | | | | 65,148 | |
| | | | | | | | | | | | | | | | |
Net Asset Value, offering and redemption price per share:(a) | | | | | | | | | | | | | | | | |
HC Strategic Shares | | $ | 19.95 | | | $ | 12.95 | | | $ | 23.54 | | | $ | 18.25 | |
| | | | | | | | | | | | | | | | |
HC Advisors Shares | | $ | 19.95 | | | $ | 12.96 | | | $ | 23.50 | | | $ | 18.25 | |
| | | | | | | | | | | | | | | | |
| | | | | | | | | | | | | | | | |
Investment in securities, at cost | | $ | 480,045 | | | $ | 830,008 | | | $ | 449,121 | | | $ | 752,194 | |
Amounts designated as “—” are $0 or have been rounded to $0.
| (a) | Per share amounts may not recalculate due to rounding of net assets and/or shares outstanding. |
See accompanying notes to financial statements.
241
HC CAPITAL TRUST
Statements of Assets and Liabilities (continued)
As of June 30, 2018
(Amounts in thousands except per share amounts)
| | | | | | | | | | | | | | | | |
| | | The Small
Capitalization–
Mid Capitalization
Equity Portfolio | | | The Institutional
Small Capitalization–
Mid Capitalization
Equity Portfolio | | | The Real Estate
Securities
Portfolio | | | The Commodity
Returns Strategy
Portfolio(a) | |
ASSETS: | | | | | | | | | | | | | | | | |
Investments in securities, at value | | $ | 111,496 | | | $ | 162,225 | | | $ | 130,912 | | | $ | 827,620 | |
Repurchase agreements, at value and cost | | | 1,290 | | | | 3,330 | | | | — | | | | 31,953 | |
Cash | | | 24 | | | | 30 | | | | 106 | | | | 32 | |
Foreign currency, at value (Cost $0, $0, $1 and
$8,605, respectively) | | | — | | | | — | | | | 1 | | | | 8,541 | |
Receivable for portfolio shares issued | | | 13 | | | | 55 | | | | 1 | | | | 51 | |
Receivable from investments sold | | | 113 | | | | 230 | | | | 110 | | | | — | |
Variation margin receivable on futures contracts | | | — | | | | — | | | | 29 | | | | 308 | |
Cash held as collateral at custodian for OTC swap agreements | | | — | | | | — | | | | — | | | | 60 | |
Cash held as collateral at broker for futures and options contracts | | | 300 | | | | 100 | | | | 450 | | | | 2,099 | |
Dividends and interest receivable | | | 92 | | | | 127 | | | | 467 | | | | 1,525 | |
Foreign tax reclaims receivable | | | — | | | | — | | | | — | | | | 330 | |
Prepaid expenses | | | 9 | | | | 9 | | | | 11 | | | | 18 | |
| | | | | | | | | | | | | | | | |
Total assets | | | 113,337 | | | | 166,106 | | | | 132,087 | | | | 872,537 | |
| | | | | | | | | | | | | | | | |
LIABILITIES: | | | | | | | | | | | | | | | | |
Swap agreements, at value | | | — | | | | — | | | | — | | | | 104 | |
Payable for investments purchased | | | 427 | | | | 721 | | | | 212 | | | | — | |
Payable for portfolio shares redeemed | | | 141 | | | | 76 | | | | 61 | | | | 853 | |
Payable for collateral received on loaned securities | | | 2,059 | | | | 5,313 | | | | — | | | | 9,019 | |
Variation margin payable on futures contracts | | | 12 | | | | 5 | | | | — | | | | — | |
Advisory fees payable | | | 57 | | | | 53 | | | | 187 | | | | 136 | |
Management fees payable | | | 4 | | | | 7 | | | | 5 | | | | 36 | |
Administrative services fees payable | | | 3 | | | | 4 | | | | 3 | | | | 20 | |
Trustee fees payable | | | — | | | | 1 | | | | — | | | | 3 | |
Professional fees payable | | | 4 | | | | 7 | | | | 6 | | | | 94 | |
Custodian fees payable | | | 5 | | | | 7 | | | | 4 | | | | 61 | |
Other accrued expenses | | | 15 | | | | 6 | | | | 8 | | | | 82 | |
| | | | | | | | | | | | | | | | |
Total liabilities | | | 2,727 | | | | 6,200 | | | | 486 | | | | 10,408 | |
| | | | | | | | | | | | | | | | |
NET ASSETS | | $ | 110,610 | | | $ | 159,906 | | | $ | 131,601 | | | $ | 862,129 | |
| | | | | | | | | | | | | | | | |
NET ASSETS CONSISTS OF: | | | | | | | | | | | | | | | | |
Shares of beneficial interest, at par value | | $ | 4 | | | $ | 9 | | | $ | 44 | | | $ | 88 | |
Additional paid-in capital | | | 73,241 | | | | 100,024 | | | | 110,174 | | | | 857,212 | |
Accumulated net investment income/(distributions in excess of net investment income) | | | 9 | | | | 22 | | | | 564 | | | | (1,021 | ) |
Accumulated net realized gain/(loss) from investment transactions | | | 3,080 | | | | 24,893 | | | | 464 | | | | (147,262 | ) |
Net unrealized appreciation on investments | | | 34,276 | | | | 34,958 | | | | 20,355 | | | | 153,112 | |
| | | | | | | | | | | | | | | | |
Net Assets | | $ | 110,610 | | | $ | 159,906 | | | $ | 131,601 | | | $ | 862,129 | |
| | | | | | | | | | | | | | | | |
NET ASSETS: | | | | | | | | | | | | | | | | |
HC Strategic Shares | | $ | 110,489 | | | $ | 159,774 | | | $ | 131,601 | | | $ | 861,431 | |
HC Advisors Shares | | | 121 | | | | 132 | | | | — | | | | 698 | |
| | | | | | | | | | | | | | | | |
Total | | $ | 110,610 | | | $ | 159,906 | | | $ | 131,601 | | | $ | 862,129 | |
| | | | | | | | | | | | | | | | |
SHARES OF BENEFICIAL INTEREST OUTSTANDING | | | | | | | | | | | | | | | | |
(Unlimited number of shares authorized; par value $0.001): | | | | | | | | | | | | | | | | |
HC Strategic Shares | | | 3,743 | | | | 8,689 | | | | 44,007 | | | | 88,255 | |
HC Advisors Shares | | | 4 | | | | 7 | | | | — | | | | 72 | |
| | | | | | | | | | | | | | | | |
Total | | | 3,747 | | | | 8,696 | | | | 44,007 | | | | 88,327 | |
| | | | | | | | | | | | | | | | |
Net Asset Value, offering and redemption price per share:(b) | | | | | | | | | | | | | | | | |
HC Strategic Shares | | $ | 29.52 | | | $ | 18.39 | | | $ | 2.99 | | | $ | 9.76 | |
| | | | | | | | | | | | | | | | |
HC Advisors Shares | | $ | 29.49 | | | $ | 18.39 | | | $ | — | | | $ | 9.76 | |
| | | | | | | | | | | | | | | | |
| | | | | | | | | | | | | | | | |
Investment in securities, at cost | | $ | 77,106 | | | $ | 127,172 | | | $ | 110,830 | | | $ | 672,772 | |
Amounts designated as “—” are $0 or have been rounded to $0.
| (a) | Statement has been consolidated. See Note 2.O. in the Notes to Financial Statements for basis of consolidation. |
| (b) | Per share amounts may not recalculate due to rounding of net assets and/or shares outstanding. |
See accompanying notes to financial statements.
242
HC CAPITAL TRUST
Statements of Assets and Liabilities (continued)
As of June 30, 2018
(Amounts in thousands except per share amounts)
| | | | | | | | | | | | | | | | |
| | | The ESG
Growth
Portfolio | | | The Catholic
SRI Growth
Portfolio | | | The
International
Equity
Portfolio | | | The
Institutional
International
Equity
Portfolio | |
ASSETS: | | | | | | | | | | | | | | | | |
Investments in securities, at value | | $ | 165,023 | | | $ | 29,072 | | | $ | 1,126,817 | | | $ | 2,325,758 | |
Repurchase agreements, at value and cost | | | — | | | | — | | | | 2,330 | | | | 16,431 | |
Cash | | | 5 | | | | — | | | | 408 | | | | 354 | |
Foreign currency, at value (Cost $826, $264, $80,332 and $4,763, respectively) | | | 822 | | | | 260 | | | | 79,627 | | | | 4,755 | |
Receivable for portfolio shares issued | | | — | | | | — | | | | 122 | | | | 1,076 | |
Receivable from investments sold | | | — | | | | — | | | | 1,028 | | | | 7,950 | |
Cash held as collateral at broker for futures contracts | | | 100 | | | | — | | | | 5,450 | | | | 3,200 | |
Variation margin receivable on futures contracts | | | 4 | | | | — | | | | 671 | | | | 381 | |
Dividends and interest receivable | | | 393 | | | | 75 | | | | 3,577 | | | | 9,356 | |
Foreign tax reclaims receivable | | | 223 | | | | 32 | | | | 2,835 | | | | 5,534 | |
Prepaid expenses | | | 13 | | | | 1 | | | | 15 | | | | 19 | |
| | | | | | | | | | | | | | | | |
Total assets | | | 166,583 | | | | 29,440 | | | | 1,222,880 | | | | 2,374,814 | |
| | | | | | | | | | | | | | | | |
LIABILITIES: | | | | | | | | | | | | | | | | |
Payable for investments purchased | | | — | | | | — | | | | 1,357 | | | | 11,643 | |
Payable for portfolio shares redeemed | | | — | | | | — | | | | 2,266 | | | | 1,564 | |
Payable for collateral received on loaned securities | | | — | | | | — | | | | 3,717 | | | | 26,215 | |
Advisory fees payable | | | 12 | | | | 6 | | | | 306 | | | | 552 | |
Management fees payable | | | 7 | | | | 1 | | | | 54 | | | | 103 | |
Administrative services fees payable | | | 4 | | | | 1 | | | | 29 | | | | 57 | |
Trustee fees payable | | | 1 | | | | — | | | | 5 | | | | 10 | |
Fund accounting fees payable | | | 3 | | | | 3 | | | | 4 | | | | 5 | |
Professional fees payable | | | 15 | | | | 10 | | | | 64 | | | | 120 | |
Custodian fees payable | | | 9 | | | | 5 | | | | 86 | | | | 160 | |
Other accrued expenses | | | 8 | | | | — | | | | 140 | | | | 164 | |
| | | | | | | | | | | | | | | | |
Total liabilities | | | 59 | | | | 26 | | | | 8,028 | | | | 40,593 | |
| | | | | | | | | | | | | | | | |
NET ASSETS | | $ | 166,524 | | | $ | 29,414 | | | $ | 1,214,852 | | | $ | 2,334,221 | |
| | | | | | | | | | | | | | | | |
NET ASSETS CONSISTS OF: | | | | | | | | | | | | | | | | |
Shares of beneficial interest, at par value | | $ | 15 | | | $ | 2 | | | $ | 113 | | | $ | 221 | |
Additional paid-in capital | | | 145,912 | | | | 23,481 | | | | 1,093,074 | | | | 2,078,355 | |
Accumulated net investment income/(distributions in excess of net investment income) | | | 32 | | | | — | | | | 674 | | | | 2,410 | |
Accumulated net realized gain/(loss) from investment transactions | | | (774 | ) | | | 846 | | | | (41,245 | ) | | | 45,935 | |
Net unrealized appreciation on investments | | | 21,339 | | | | 5,085 | | | | 162,236 | | | | 207,300 | |
| | | | | | | | | | | | | | | | |
Net Assets | | $ | 166,524 | | | $ | 29,414 | | | $ | 1,214,852 | | | $ | 2,334,221 | |
| | | | | | | | | | | | | | | | |
NET ASSETS: | | | | | | | | | | | | | | | | |
HC Strategic Shares | | $ | 166,523 | | | $ | 29,413 | | | $ | 1,213,191 | | | $ | 2,332,353 | |
HC Advisors Shares | | | 1 | | | | 1 | | | | 1,661 | | | | 1,868 | |
| | | | | | | | | | | | | | | | |
Total | | $ | 166,524 | | | $ | 29,414 | | | $ | 1,214,852 | | | $ | 2,334,221 | |
| | | | | | | | | | | | | | | | |
SHARES OF BENEFICIAL INTEREST OUTSTANDING | | | | | | | | | | | | | | | | |
(Unlimited number of shares authorized; par value $0.001): | | | | | | | | | | | | | | | | |
HC Strategic Shares | | | 14,585 | | | | 2,314 | | | | 112,985 | | | | 220,730 | |
HC Advisors Shares | | | — | | | | — | | | | 155 | | | | 177 | |
| | | | | | | | | | | | | | | | |
Total | | | 14,585 | | | | 2,314 | | | | 113,140 | | | | 220,907 | |
| | | | | | | | | | | | | | | | |
Net Asset Value, offering and redemption price per share:(a) | | | | | | | | | | | | | | | | |
HC Strategic Shares | | $ | 11.42 | | | $ | 12.71 | | | $ | 10.74 | | | $ | 10.57 | |
| | | | | | | | | | | | | | | | |
HC Advisors Shares | | $ | 11.41 | | | $ | 12.72 | | | $ | 10.75 | | | $ | 10.56 | |
| | | | | | | | | | | | | | | | |
| | | | | | | | | | | | | | | | |
Investment in securities, at cost | | $ | 143,648 | | | $ | 23,982 | | | $ | 961,044 | | | $ | 2,116,488 | |
Amounts designated as “—” are $0 or have been rounded to $0.
| (a) | Per share amounts may not recalculate due to rounding of net assets and/or shares outstanding. |
See accompanying notes to financial statements.
243
HC CAPITAL TRUST
Statements of Assets and Liabilities (continued)
As of June 30, 2018
(Amounts in thousands except per share amounts)
| | | | | | | | | | | | | | | | |
| | | The Emerging
Markets
Portfolio | | | The Core
Fixed
Income
Portfolio | | | The Fixed
Income
Opportunity
Portfolio | | | The U.S.
Government
Fixed Income
Securities
Portfolio | |
ASSETS: | | | | | | | | | | | | | | | | |
Investments in securities, at value | | $ | 1,613,187 | | | $ | 68,490 | | | $ | 687,075 | | | $ | 232,952 | |
Repurchase agreements, at value and cost | | | 10,162 | | | | — | | | | 34,800 | | | | — | |
Cash | | | 80 | | | | — | | | | 43 | | | | — | |
Foreign currency, at value (Cost $15,851, $0, $0 and $0, respectively) | | | 15,591 | | | | — | | | | — | | | | — | |
Receivable for portfolio shares issued | | | 2,505 | | | | 4 | | | | 141 | | | | 405 | |
Receivable from investments sold | | | 15,315 | | | | 716 | | | | 244 | | | | 4,454 | |
Cash held as collateral at broker for futures contracts | | | 600 | | | | — | | | | 376 | | | | — | |
Cash held as collateral at custodian for OTC swap agreements | | | — | | | | — | | | | 270 | | | | — | |
Variation margin receivable on futures contracts | | | 188 | | | | — | | | | 43 | | | | — | |
Dividends and interest receivable | | | 7,829 | | | | 478 | | | | 7,530 | | | | 1,360 | |
Foreign tax reclaims receivable | | | 5 | | | | — | | | | — | | | | — | |
TBA sale commitments receivable | | | — | | | | 148 | | | | — | | | | — | |
Prepaid expenses | | | 16 | | | | 6 | | | | 10 | | | | 6 | |
| | | | | | | | | | | | | | | | |
Total assets | | | 1,665,478 | | | | 69,842 | | | | 730,532 | | | | 239,177 | |
| | | | | | | | | | | | | | | | |
LIABILITIES: | | | | | | | | | | | | | | | | |
Swap agreements, at value | | | — | | | | — | | | | 259 | | | | — | |
Distributions payable | | | — | | | | 4 | | | | — | | | | 66 | |
Payable for investments purchased | | | 10,478 | | | | 2,837 | | | | 474 | | | | 5,307 | |
Payable for portfolio shares redeemed | | | 1,405 | | | | 73 | | | | 170 | | | | 375 | |
Payable for collateral received on loaned securities | | | 16,214 | | | | — | | | | 55,524 | | | | — | |
Variation margin payable on futures contracts | | | — | | | | — | | | | 4 | | | | — | |
Accrued foreign capital gains tax | | | 2,261 | | | | — | | | | — | | | | — | |
TBA sale commitments, at fair value | | | — | | | | 147 | | | | — | | | | — | |
Advisory fees payable | | | 1,016 | | | | 4 | | | | 333 | | | | 11 | |
Management fees payable | | | 70 | | | | 3 | | | | 28 | | | | 9 | |
Administrative services fees payable | | | 39 | | | | 2 | | | | 15 | | | | 5 | |
Trustee fees payable | | | 7 | | | | — | | | | 3 | | | | 1 | |
Professional fees payable | | | 101 | | | | 3 | | | | 30 | | | | 10 | |
Custodian fees payable | | | 498 | | | | 4 | | | | 23 | | | | 5 | |
Other accrued expenses | | | 75 | | | | 16 | | | | 36 | | | | 11 | |
| | | | | | | | | | | | | | | | |
Total liabilities | | | 32,164 | | | | 3,093 | | | | 56,899 | | | | 5,800 | |
| | | | | | | | | | | | | | | | |
NET ASSETS | | $ | 1,633,314 | | | $ | 66,749 | | | $ | 673,633 | | | $ | 233,377 | |
| | | | | | | | | | | | | | | | |
NET ASSETS CONSISTS OF: | | | | | | | | | | | | | | | | |
Shares of beneficial interest, at par value | | $ | 92 | | | $ | 7 | | | $ | 98 | | | $ | 24 | |
Additional paid-in capital | | | 1,665,229 | | | | 68,531 | | | | 717,109 | | | | 237,944 | |
Accumulated net investment income/(distributions in excess of net investment income) | | | (3,810 | ) | | | 66 | | | | 1,858 | | | | 99 | |
Accumulated net realized loss from investment transactions | | | (70,574 | ) | | | (407 | ) | | | (49,965 | ) | | | (1,137 | ) |
Net unrealized appreciation/(depreciation) on investments | | | 42,377 | | | | (1,448 | ) | | | 4,533 | | | | (3,553 | ) |
| | | | | | | | | | | | | | | | |
Net Assets | | $ | 1,633,314 | | | $ | 66,749 | | | $ | 673,633 | | | $ | 233,377 | |
| | | | | | | | | | | | | | | | |
NET ASSETS: | | | | | | | | | | | | | | | | |
HC Strategic Shares | | $ | 1,631,863 | | | $ | 65,387 | | | $ | 673,271 | | | $ | 233,377 | |
HC Advisors Shares | | | 1,451 | | | | 1,362 | | | | 362 | | | | — | |
| | | | | | | | | | | | | | | | |
Total | | $ | 1,633,314 | | | $ | 66,749 | | | $ | 673,633 | | | $ | 233,377 | |
| | | | | | | | | | | | | | | | |
SHARES OF BENEFICIAL INTEREST OUTSTANDING | | | | | | | | | | | | | | | | |
(Unlimited number of shares authorized; par value $0.001): | | | | | | | | | | | | | | | | |
HC Strategic Shares | | | 91,777 | | | | 6,887 | | | | 98,322 | | | | 24,336 | |
HC Advisors Shares | | | 82 | | | | 143 | | | | 53 | | | | — | |
| | | | | | | | | | | | | | | | |
Total | | | 91,859 | | | | 7,030 | | | | 98,375 | | | | 24,336 | |
| | | | | | | | | | | | | | | | |
Net Asset Value, offering and redemption price per share:(a) | | | | | | | | | | | | | | | | |
HC Strategic Shares | | $ | 17.78 | | | $ | 9.49 | | | $ | 6.85 | | | $ | 9.59 | |
| | | | | | | | | | | | | | | | |
HC Advisors Shares | | $ | 17.78 | | | $ | 9.49 | | | $ | 6.85 | | | $ | — | |
| | | | | | | | | | | | | | | | |
| | | | | | | | | | | | | | | | |
Investment in securities, at cost | | $ | 1,568,124 | | | $ | 69,938 | | | $ | 682,234 | | | $ | 236,505 | |
Amounts designated as “—” are $0 or have been rounded to $0.
| (a) | Per share amounts may not recalculate due to rounding of net assets and/or shares outstanding. |
See accompanying notes to financial statements.
244
HC CAPITAL TRUST
Statements of Assets and Liabilities (continued)
As of June 30, 2018
(Amounts in thousands except per share amounts)
| | | | | | | | | | | | | | | | |
| | | The
Inflation
Protected
Securities
Portfolio | | | The U.S.
Corporate
Fixed
Income
Securities
Portfolio | | | The U.S.
Mortgage/Asset
Backed Fixed
Income
Securities
Portfolio | | | The Short-
Term
Municipal
Bond
Portfolio | |
ASSETS: | | | | | | | | | | | | | | | | |
Investments in securities, at value | | $ | 400,701 | | | $ | 284,176 | | | $ | 232,387 | | | $ | 80,288 | |
Receivable for portfolio shares issued | | | 112 | | | | 80 | | | | 119 | | | | 245 | |
Receivable from investments sold | | | 1,786 | | | | 2,694 | | | | 48 | | | | — | |
Dividends and interest receivable | | | 1,186 | | | | 2,933 | | | | 525 | | | | 838 | |
TBA sale commitments receivable | | | — | | | | — | | | | 464 | | | | — | |
Prepaid expenses | | | 12 | | | | 5 | | | | 5 | | | | 4 | |
| | | | | | | | | | | | | | | | |
Total assets | | | 403,797 | | | | 289,888 | | | | 233,548 | | | | 81,375 | |
| | | | | | | | | | | | | | | | |
LIABILITIES: | | | | | | | | | | | | | | | | |
Distributions payable | | | 431 | | | | 134 | | | | 85 | | | | 2 | |
Payable for investments purchased | | | 1,751 | | | | 2,307 | | | | 27,464 | | | | 1,147 | |
Payable for portfolio shares redeemed | | | 79 | | | | 423 | | | | 344 | | | | 593 | |
TBA sale commitments, at fair value | | | — | | | | — | | | | 464 | | | | — | |
Income payable on TBA sale commitments | | | — | | | | — | | | | 1 | | | | — | |
Advisory fees payable | | | 12 | | | | 18 | | | | 9 | | | | 8 | |
Management fees payable | | | 16 | | | | 11 | | | | 8 | | | | 3 | |
Administrative services fees payable | | | 9 | | | | 6 | | | | 5 | | | | 2 | |
Trustee fees payable | | | 1 | | | | 1 | | | | 1 | | | | — | |
Professional fees payable | | | 17 | | | | 12 | | | | 8 | | | | 3 | |
Custodian fees payable | | | 8 | | | | 6 | | | | 6 | | | | 1 | |
Other accrued expenses | | | 16 | | | | 14 | | | | 15 | | | | 4 | |
| | | | | | | | | | | | | | | | |
Total liabilities | | | 2,340 | | | | 2,932 | | | | 28,410 | | | | 1,763 | |
| | | | | | | | | | | | | | | | |
NET ASSETS | | $ | 401,457 | | | $ | 286,956 | | | $ | 205,138 | | | $ | 79,612 | |
| | | | | | | | | | | | | | | | |
NET ASSETS CONSISTS OF: | | | | | | | | | | | | | | | | |
Shares of beneficial interest, at par value | | $ | 40 | | | $ | 30 | | | $ | 22 | | | $ | 8 | |
Additional paid-in capital | | | 400,357 | | | | 295,135 | | | | 218,587 | | | | 79,611 | |
Accumulated net investment income/(distributions in excess of net investment income) | | | 2,752 | | | | 223 | | | | 128 | | | | 15 | |
Accumulated net realized loss from investment transactions | | | (1,563 | ) | | | (514 | ) | | | (9,782 | ) | | | (5 | ) |
Net unrealized depreciation on investments | | | (129 | ) | | | (7,918 | ) | | | (3,817 | ) | | | (17 | ) |
| | | | | | | | | | | | | | | | |
Net Assets | | $ | 401,457 | | | $ | 286,956 | | | $ | 205,138 | | | $ | 79,612 | |
| | | | | | | | | | | | | | | | |
NET ASSETS: | | | | | | | | | | | | | | | | |
HC Strategic Shares | | $ | 401,456 | | | $ | 286,956 | | | $ | 205,138 | | | $ | 79,612 | |
HC Advisors Shares | | | 1 | | | | — | | | | — | | | | — | |
| | | | | | | | | | | | | | | | |
Total | | $ | 401,457 | | | $ | 286,956 | | | $ | 205,138 | | | $ | 79,612 | |
| | | | | | | | | | | | | | | | |
SHARES OF BENEFICIAL INTEREST OUTSTANDING | | | | | | | | | | | | | | | | |
(Unlimited number of shares authorized; par value $0.001): | | | | | | | | | | | | | | | | |
HC Strategic Shares | | | 40,204 | | | | 29,907 | | | | 22,018 | | | | 8,124 | |
HC Advisors Shares | | | — | | | | — | | | | — | | | | — | |
| | | | | | | | | | | | | | | | |
Total | | | 40,204 | | | | 29,907 | | | | 22,018 | | | | 8,124 | |
| | | | | | | | | | | | | | | | |
Net Asset Value, offering and redemption price per share:(a) | | | | | | | | | | | | | | | | |
HC Strategic Shares | | $ | 9.98 | | | $ | 9.59 | | | $ | 9.32 | | | $ | 9.80 | |
| | | | | | | | | | | | | | | | |
HC Advisors Shares | | $ | 9.98 | | | $ | — | | | $ | — | | | $ | — | |
| | | | | | | | | | | | | | | | |
Investment in securities, at cost | | $ | 400,830 | | | $ | 292,094 | | | $ | 236,204 | | | $ | 80,305 | |
Amounts designated as “—” are $0 or have been rounded to $0.
| (a) | Per share amounts may not recalculate due to rounding of net assets and/or shares outstanding. |
See accompanying notes to financial statements.
245
HC CAPITAL TRUST
Statements of Assets and Liabilities (concluded)
As of June 30, 2018
(Amounts in thousands except per share amounts)
| | | | | | | | |
| | | The Intermediate
Term Municipal
Bond Portfolio | | | The Intermediate
Term Municipal
Bond II Portfolio | |
ASSETS: | | | | | | | | |
Investments in securities, at value | | $ | 384,607 | | | $ | 77,142 | |
Receivable for portfolio shares issued | | | 50 | | | | 10 | |
Dividends and interest receivable | | | 4,626 | | | | 1,039 | |
Prepaid expenses | | | 10 | | | | 8 | |
| | | | | | | | |
Total assets | | | 389,293 | | | | 78,199 | |
| | | | | | | | |
LIABILITIES: | | | | | | | | |
Distributions payable | | | 40 | | | | 10 | |
Payable for investments purchased | | | 3,019 | | | | — | |
Payable for portfolio shares redeemed | | | 1,795 | | | | 456 | |
Advisory fees payable | | | 155 | | | | 8 | |
Management fees payable | | | 16 | | | | 3 | |
Administrative services fees payable | | | 9 | | | | 2 | |
Trustee fees payable | | | 2 | | | | — | |
Professional fees payable | | | 20 | | | | 2 | |
Custodian fees payable | | | 9 | | | | 1 | |
Other accrued expenses | | | 20 | | | | 2 | |
| | | | | | | | |
Total liabilities | | | 5,085 | | | | 484 | |
| | | | | | | | |
NET ASSETS | | $ | 384,208 | | | $ | 77,715 | |
| | | | | | | | |
NET ASSETS CONSISTS OF: | | | | | | | | |
Shares of beneficial interest, at par value | | $ | 39 | | | $ | 8 | |
Additional paid-in capital | | | 390,919 | | | | 77,111 | |
Accumulated net investment income | | | 174 | | | | 17 | |
Accumulated net realized gain/(loss) from investment transactions | | | (1,097 | ) | | | 65 | |
Net unrealized appreciation/(depreciation) on investments | | | (5,827 | ) | | | 514 | |
| | | | | | | | |
Net Assets | | $ | 384,208 | | | $ | 77,715 | |
| | | | | | | | |
NET ASSETS: | | | | | | | | |
HC Strategic Shares | | $ | 383,200 | | | $ | 77,455 | |
HC Advisors Shares | | | 1,008 | | | | 260 | |
| | | | | | | | |
Total | | $ | 384,208 | | | $ | 77,715 | |
| | | | | | | | |
SHARES OF BENEFICIAL INTEREST OUTSTANDING | | | | | | | | |
(Unlimited number of shares authorized; par value $0.001): | | | | | | | | |
HC Strategic Shares | | | 38,706 | | | | 7,678 | |
HC Advisors Shares | | | 102 | | | | 26 | |
| | | | | | | | |
Total | | | 38,808 | | | | 7,704 | |
| | | | | | | | |
Net Asset Value, offering and redemption price per share:(a) | | | | | | | | |
HC Strategic Shares | | $ | 9.90 | | | $ | 10.09 | |
| | | | | | | | |
HC Advisors Shares | | $ | 9.90 | | | $ | 10.09 | |
| | | | | | | | |
Investment in securities, at cost | | $ | 390,434 | | | $ | 76,628 | |
Amounts designated as “—” are $0 or have been rounded to $0.
| (a) | Per share amounts may not recalculate due to rounding of net assets and/or shares outstanding. |
See accompanying notes to financial statements.
246
HC CAPITAL TRUST
Statements of Operations
For the Year Ended June 30, 2018
(Amounts in thousands)
| | | | | | | | | | | | | | | | |
| | | The Value
Equity
Portfolio | | | The
Institutional
Value Equity
Portfolio | | | The Growth
Equity
Portfolio | | | The
Institutional
Growth Equity
Portfolio | |
INVESTMENT INCOME: | | | | | | | | | | | | | | | | |
Interest | | $ | 30 | | | $ | 40 | | | $ | 81 | | | $ | 71 | |
Dividends (net of foreign withholding tax of $0, $0, $0 and $0, respectively) | | | 14,545 | | | | 19,717 | | | | 10,046 | | | | 14,684 | |
Income from securities lending (net of fees of $18, $22, $11 and $16, respectively) | | | 73 | | | | 88 | | | | 45 | | | | 61 | |
| | | | | | | | | | | | | | | | |
Total Investment Income | | | 14,648 | | | | 19,845 | | | | 10,172 | | | | 14,816 | |
| | | | | | | | | | | | | | | | |
EXPENSES: | | | | | | | | | | | | | | | | |
Advisory fees | | | 881 | | | | 1,176 | | | | 1,440 | | | | 1,782 | |
Management fees | | | 310 | | | | 432 | | | | 407 | | | | 567 | |
Administrative services fees | | | 179 | | | | 246 | | | | 227 | | | | 313 | |
Distribution fees – HC Advisors Shares | | | 2 | | | | 3 | | | | 3 | | | | 4 | |
Professional fees | | | 84 | | | | 105 | | | | 100 | | | | 140 | |
Transfer agent fees | | | 15 | | | | 21 | | | | 20 | | | | 28 | |
Compliance service fees | | | 10 | | | | 14 | | | | 13 | | | | 18 | |
Custodian fees | | | 53 | | | | 70 | | | | 68 | | | | 92 | |
Registration and filing fees | | | 17 | | | | 15 | | | | 17 | | | | 17 | |
Trustee fees | | | 34 | | | | 47 | | | | 45 | | | | 63 | |
Other | | | 68 | | | | 88 | | | | 84 | | | | 100 | |
| | | | | | | | | | | | | | | | |
Total expenses before waivers and expenses paid indirectly | | | 1,653 | | | | 2,217 | | | | 2,424 | | | | 3,124 | |
Less: Distribution fees waived – HC Advisors Shares | | | (2 | ) | | | (3 | ) | | | (3 | ) | | | (4 | ) |
Expenses paid indirectly | | | (24 | ) | | | (28 | ) | | | (23 | ) | | | (12 | ) |
| | | | | | | | | | | | | | | | |
Net Expenses | | | 1,627 | | | | 2,186 | | | | 2,398 | | | | 3,108 | |
| | | | | | | | | | | | | | | | |
Net Investment Income | | | 13,021 | | | | 17,659 | | | | 7,774 | | | | 11,708 | |
| | | | | | | | | | | | | | | | |
NET REALIZED/UNREALIZED GAIN/(LOSS) ON INVESTMENTS: | | | | | | | | | | | | | | | | |
Net realized gains/(losses) from investment transactions and foreign currency translations | | | 34,937 | | | | 59,650 | | | | 50,346 | | | | 88,794 | |
Net realized gains/(losses) from futures transactions | | | 2,885 | | | | 8,188 | | | | 2,790 | | | | 4,726 | |
| | | | | | | | | | | | | | | | |
Net realized gains/(losses) from investments and futures transactions, and foreign currency translations | | | 37,822 | | | | 67,838 | | | | 53,136 | | | | 93,520 | |
Change in unrealized appreciation/(depreciation) on investments and foreign currency translations | | | 5,144 | | | | (16,834 | ) | | | 81,009 | | | | 87,507 | |
Change in unrealized appreciation/(depreciation) on futures | | | (517 | ) | | | (2,054 | ) | | | 381 | | | | (698 | ) |
| | | | | | | | | | | | | | | | |
Change in unrealized appreciation/(depreciation) on investments, futures, and foreign currency translations | | | 4,627 | | | | (18,888 | ) | | | 81,390 | | | | 86,809 | |
| | | | | | | | | | | | | | | | |
Net realized/unrealized gains/(losses) from investments, futures, and foreign currency translations | | | 42,449 | | | | 48,950 | | | | 134,526 | | | | 180,329 | |
| | | | | | | | | | | | | | | | |
Change in net assets resulting from operations | | $ | 55,470 | | | $ | 66,609 | | | $ | 142,300 | | | $ | 192,037 | |
| | | | | | | | | | | | | | | | |
See accompanying notes to financial statements.
247
HC CAPITAL TRUST
Statements of Operations (continued)
For the Year Ended June 30, 2018
(Amounts in thousands)
| | | | | | | | | | | | | | | | |
| | | The Small
Capitalization–Mid
Capitalization
Equity Portfolio | | | The Institutional
Small
Capitalization–Mid
Capitalization
Equity Portfolio | | | The Real Estate
Securities Portfolio | | | The Commodity
Returns Strategy
Portfolio (a) | |
INVESTMENT INCOME: | | | | | | | | | | | | | | | | |
Interest | | $ | 20 | | | $ | 24 | | | $ | 4 | | | $ | 2,018 | |
Dividends (net of foreign withholding tax of $2, $3, $0 and $1,822, respectively) | | | 1,160 | | | | 1,760 | | | | 3,086 | | | | 21,772 | |
Income from securities lending (net of fees of $12, $24, $0 and $39, respectively) | | | 50 | | | | 96 | | | | — | | | | 156 | |
| | | | | | | | | | | | | | | | |
Total Investment Income | | | 1,230 | | | | 1,880 | | | | 3,090 | | | | 23,946 | |
| | | | | | | | | | | | | | | | |
EXPENSES: | | | | | | | | | | | | | | | | |
Advisory fees | | | 656 | | | | 883 | | | | 750 | | | | 2,067 | |
Management fees | | | 55 | | | | 79 | | | | 62 | | | | 427 | |
Administrative services fees | | | 36 | | | | 53 | | | | 34 | | | | 298 | |
Distribution fees – HC Advisors Shares | | | — | | | | 1 | | | | — | | | | 3 | |
Professional fees | | | 17 | | | | 21 | | | | 15 | | | | 160 | |
Transfer agent fees | | | 3 | | | | 4 | | | | 3 | | | | 21 | |
Compliance service fees | | | 2 | | | | 3 | | | | 2 | | | | 13 | |
Custodian fees | | | 21 | | | | 28 | | | | 14 | | | | 217 | |
Registration and filing fees | | | 16 | | | | 15 | | | | 16 | | | | — | |
Trustee fees | | | 7 | | | | 9 | | | | 7 | | | | 45 | |
Other | | | 23 | | | | 14 | | | | 12 | | | | 150 | |
| | | | | | | | | | | | | | | | |
Total expenses before waivers and expenses paid indirectly | | | 836 | | | | 1,110 | | | | 915 | | | | 3,401 | |
Less: Expenses waived by Specialist Manager | | | — | | | | — | | | | — | | | | (432 | ) |
Distribution fees waived – HC Advisors Shares | | | — | | | | (1 | ) | | | — | | | | (3 | ) |
Expenses paid indirectly | | | (11 | ) | | | (3 | ) | | | — | | | | — | |
| | | | | | | | | | | | | | | | |
Net Expenses | | | 825 | | | | 1,106 | | | | 915 | | | | 2,966 | |
| | | | | | | | | | | | | | | | |
Net Investment Income | | | 405 | | | | 774 | | | | 2,175 | | | | 20,980 | |
| | | | | | | | | | | | | | | | |
NET REALIZED/UNREALIZED GAIN/(LOSS) ON INVESTMENTS: | | | | | | | | | | | | | | | | |
Net realized gains/(losses) from investment transactions and foreign currency translations | | | 9,220 | | | | 29,521 | | | | 1,261 | | | | 10,353 | |
Net realized gains/(losses) from futures transactions | | | 626 | | | | 1,015 | | | | 450 | | | | 7,276 | |
Net realized gains/(losses) from options and swaptions transactions | | | — | | | | — | | | | — | | | | (61 | ) |
Net realized gains/(losses) from swap transactions | | | — | | | | — | | | | — | | | | 2,655 | |
Net realized gains/(losses) from forward currency contracts transactions | | | — | | | | — | | | | — | | | | 174 | |
| | | | | | | | | | | | | | | | |
Net realized gains/(losses) from investments, futures, options and swaptions, swaps, and forward currency contracts transactions, and foreign currency translations | | | 9,846 | | | | 30,536 | | | | 1,711 | | | | 20,397 | |
Change in unrealized appreciation/(depreciation) on investments and foreign currency translations | | | 7,370 | | | | (4,482 | ) | | | 355 | | | | 102,405 | |
Change in unrealized appreciation/(depreciation) on futures | | | (94 | ) | | | (74 | ) | | | 291 | | | | (1,287 | ) |
Change in unrealized appreciation/(depreciation) on options and swaptions | | | — | | | | — | | | | — | | | | 7 | |
Change in unrealized appreciation/(depreciation) on swaps | | | — | | | | — | | | | — | | | | (453 | ) |
Change in unrealized appreciation/(depreciation) on forward currency contracts | | | — | | | | — | | | | — | | | | (6 | ) |
| | | | | | | | | | | | | | | | |
Change in unrealized appreciation/(depreciation) on investments, futures, options and swaptions, swaps, and foreign currency translations | | | 7,276 | | | | (4,556 | ) | | | 646 | | | | 100,666 | |
| | | | | | | | | | | | | | | | |
Net realized/unrealized gains/(losses) from investments, futures options and swaptions, swaps, forward currency contracts, and foreign currency translations | | | 17,122 | | | | 25,980 | | | | 2,357 | | | | 121,063 | |
| | | | | | | | | | | | | | | | |
Change in net assets resulting from operations | | $ | 17,527 | | | $ | 26,754 | | | $ | 4,532 | | | $ | 142,043 | |
| | | | | | | | | | | | | | | | |
Amounts designated as “—” are $0 or have been rounded to $0.
| (a) | Statement has been consolidated. See Note 2.O. in the Notes to Financial Statements for basis of consolidation. |
See accompanying notes to financial statements.
248
HC CAPITAL TRUST
Statements of Operations (continued)
For the Year Ended June 30, 2018
(Amounts in thousands)
| | | | | | | | | | | | | | | | |
| | | The ESG
Growth
Portfolio | | | The Catholic
SRI Growth
Portfolio | | | The International
Equity
Portfolio | | | The Institutional
International
Equity Portfolio | |
INVESTMENT INCOME: | | | | | | | | | | | | | | | | |
Interest | | $ | 1 | | | $ | — | | | $ | 129 | | | $ | 181 | |
Dividends (net of foreign withholding tax of $400, $77, $4,496 and $9,267, respectively) | | | 4,777 | | | | 883 | | | | 42,807 | | | | 90,605 | |
Income from securities lending (net of fees of $0, $0, $92 and $210, respectively) | | | — | | | | — | | | | 371 | | | | 838 | |
| | | | | | | | | | | | | | | | |
Total Investment Income | | | 4,778 | | | | 883 | | | | 43,307 | | | | 91,624 | |
| | | | | | | | | | | | | | | | |
EXPENSES: | | | | | | | | | | | | | | | | |
Advisory fees | | | 195 | | | | 35 | | | | 3,865 | | | | 6,788 | |
Management fees | | | 80 | | | | 15 | | | | 653 | | | | 1,305 | |
Administrative services fees | | | 69 | | | | 30 | | | | 393 | | | | 764 | |
Distribution fees – HC Advisors Shares | | | — | | | | — | | | | 5 | | | | 9 | |
Professional fees | | | 23 | | | | 9 | | | | 163 | | | | 330 | |
Transfer agent fees | | | 3 | | | | 1 | | | | 31 | | | | 65 | |
Compliance service fees | | | 2 | | | | — | | | | 20 | | | | 42 | |
Custodian fees | | | 29 | | | | 11 | | | | 307 | | | | 598 | |
Registration and filing fees | | | 22 | | | | — | | | | 16 | | | | 13 | |
Trustee fees | | | 8 | | | | 1 | | | | 70 | | | | 145 | |
Other | | | 29 | | | | 10 | | | | 233 | | | | 327 | |
| | | | | | | | | | | | | | | | |
Total expenses before waivers and expenses paid indirectly | | | 460 | | | | 112 | | | | 5,756 | | | | 10,386 | |
Less: Distribution fees waived – HC Advisors Shares | | | — | | | | — | | | | (5 | ) | | | (9 | ) |
Expenses paid indirectly | | | — | | | | — | | | | (8 | ) | | | (11 | ) |
Expenses waived and/or reimbursed by Advisor | | | — | | | | (19 | ) | | | — | | | | — | |
| | | | | | | | | | | | | | | | |
Net Expenses | | | 460 | | | | 93 | | | | 5,743 | | | | 10,366 | |
| | | | | | | | | | | | | | | | |
Net Investment Income | | | 4,318 | | | | 790 | | | | 37,564 | | | | 81,258 | |
| | | | | | | | | | | | | | | | |
NET REALIZED/UNREALIZED GAIN/(LOSS) ON INVESTMENTS: | | | | | | | | | | | | | | | | |
Net realized gains/(losses) from investment transactions and foreign currency translations | | | 1,704 | | | | 848 | | | | 8,068 | | | | 103,359 | |
Net realized gains/(losses) from futures transactions | | | 152 | | | | — | | | | 2,281 | | | | 5,900 | |
Net realized gains/(losses) from forward currency contracts transactions | | | — | | | | — | | | | (25 | ) | | | 293 | |
| | | | | | | | | | | | | | | | |
Net realized gains/(losses) from investments, futures, and forward currency contracts transactions, and foreign currency translations | | | 1,856 | | | | 848 | | | | 10,324 | | | | 109,552 | |
Change in unrealized appreciation/(depreciation) on investments and foreign currency translations | | | 8,889 | | | | 1,505 | | | | 25,358 | | | | (43,015 | ) |
Change in unrealized appreciation/(depreciation) on futures | | | (29 | ) | | | — | | | | (3,095 | ) | | | (2,381 | ) |
Change in unrealized appreciation/(depreciation) on forward currency contracts | | | — | | | | — | | | | 3 | | | | 20 | |
| | | | | | | | | | | | | | | | |
Change in unrealized appreciation/(depreciation) on investments, futures, forward currency contracts, and foreign currency translations | | | 8,860 | | | | 1,505 | | | | 22,266 | | | | (45,376 | ) |
| | | | | | | | | | | | | | | | |
Net realized/unrealized gains/(losses) from investments, futures, forward currency contracts, and foreign currency translations | | | 10,716 | | | | 2,353 | | | | 32,590 | | | | 64,176 | |
| | | | | | | | | | | | | | | | |
Change in net assets resulting from operations | | $ | 15,034 | | | $ | 3,143 | | | $ | 70,154 | | | $ | 145,434 | |
| | | | | | | | | | | | | | | | |
Amounts designated as “—” are $0 or have been rounded to $0.
See accompanying notes to financial statements.
249
HC CAPITAL TRUST
Statements of Operations (continued)
For the Year Ended June 30, 2018
(Amounts in thousands)
| | | | | | | | | | | | | | | | |
| | | The Emerging
Markets
Portfolio | | | The Core
Fixed Income
Portfolio | | | The Fixed
Income
Opportunity
Portfolio | | | The U.S.
Government Fixed
Income Securities
Portfolio | |
INVESTMENT INCOME: | | | | | | | | | | | | | | | | |
Interest | | $ | 99 | | | $ | 2,009 | | | $ | 37,432 | | | $ | 4,334 | |
Dividends (net of foreign withholding tax of $6,038, $0, $0 and $0, respectively) | | | 49,371 | | | | 60 | | | | 2,400 | | | | 39 | |
Income from securities lending (net of fees of $73, $0, $128 and $0, respectively) | | | 294 | | | | — | | | | 509 | | | | — | |
| | | | | | | | | | | | | | | | |
Total Investment Income | | | 49,764 | | | | 2,069 | | | | 40,341 | | | | 4,373 | |
| | | | | | | | | | | | | | | | |
EXPENSES: | | | | | | | | | | | | | | | | |
Advisory fees | | | 8,057 | | | | 52 | | | | 2,146 | | | | 128 | |
Management fees | | | 902 | | | | 40 | | | | 342 | | | | 109 | |
Administrative services fees | | | 528 | | | | 113 | | | | 233 | | | | 90 | |
Distribution fees – HC Advisors Shares | | | 6 | | | | 6 | | | | 2 | | | | — | |
Professional fees | | | 277 | | | | 10 | | | | 82 | | | | 27 | |
Transfer agent fees | | | 48 | | | | 2 | | | | 17 | | | | 5 | |
Compliance service fees | | | 31 | | | | 1 | | | | 11 | | | | 4 | |
Custodian fees | | | 1,910 | | | | 17 | | | | 86 | | | | 18 | |
Registration and filing fees | | | 14 | | | | 10 | | | | 11 | | | | 11 | |
Trustee fees | | | 107 | | | | 5 | | | | 38 | | | | 12 | |
Other | | | 180 | | | | 12 | | | | 60 | | | | 18 | |
| | | | | | | | | | | | | | | | |
Total expenses before waivers and expenses paid indirectly | | | 12,060 | | | | 268 | | | | 3,028 | | | | 422 | |
Less: Distribution fees waived – HC Advisors Shares | | | (6 | ) | | | (6 | ) | | | (2 | ) | | | — | |
Expenses paid indirectly | | | (9 | ) | | | — | | | | — | | | | — | |
| | | | | | | | | | | | | | | | |
Net Expenses | | | 12,045 | | | | 262 | | | | 3,026 | | | | 422 | |
| | | | | | | | | | | | | | | | |
Net Investment Income | | | 37,719 | | | | 1,807 | | | | 37,315 | | | | 3,951 | |
| | | | | | | | | | | | | | | | |
NET REALIZED/UNREALIZED GAIN/(LOSS) ON INVESTMENTS: | | | | | | | | | | | | | | | | |
Net realized gains/(losses) from investment transactions and foreign currency translations | | | 68,323 | | | | (14 | ) | | | 7,238 | | | | (604 | ) |
Net realized gains/(losses) from futures transactions | | | 4,866 | | | | — | | | | 241 | | | | — | |
Net realized gains/(losses) from options and swaptions transactions | | | — | | | | — | | | | (357 | ) | | | — | |
Net realized gains/(losses) from swap transactions | | | — | | | | — | | | | (118 | ) | | | — | |
Net realized gains/(losses) from forward currency contracts transactions | | | 131 | | | | — | | | | — | | | | — | |
| | | | | | | | | | | | | | | | |
Net realized gains/(losses) from investments, futures, options and swaptions, swaps, and forward currency contracts transactions, and foreign currency translations | | | 73,320 | | | | (14 | ) | | | 7,004 | | | | (604 | ) |
Change in unrealized appreciation/(depreciation) on investments and foreign currency translations (net of deferred foreign tax) | | | (77,077 | ) | | | (2,115 | ) | | | (17,000 | ) | | | (5,057 | ) |
Change in unrealized appreciation/(depreciation) on futures | | | 95 | | | | — | | | | (268 | ) | | | — | |
Change in unrealized appreciation/(depreciation) on swaps | | | — | | | | — | | | | (3 | ) | | | — | |
Change in unrealized appreciation/(depreciation) on forward currency contracts | | | — | | | | — | | | | — | | | | — | |
| | | | | | | | | | | | | | | | |
Change in unrealized appreciation/(depreciation) on investments, futures, swaps, forward currency contracts, and foreign currency translations | | | (76,982 | ) | | | (2,115 | ) | | | (17,271 | ) | | | (5,057 | ) |
| | | | | | | | | | | | | | | | |
Net realized/unrealized gains/(losses) from investments, futures, options and swaptions, swaps, forward currency contracts, and foreign currency translations | | | (3,662 | ) | | | (2,129 | ) | | | (10,267 | ) | | | (5,661 | ) |
| | | | | | | | | | | | | | | | |
Change in net assets resulting from operations | | $ | 34,057 | | | $ | (322 | ) | | $ | 27,048 | | | $ | (1,710 | ) |
| | | | | | | | | | | | | | | | |
Amounts designated as “—” are $0 or have been rounded to $0.
See accompanying notes to financial statements.
250
HC CAPITAL TRUST
Statements of Operations (continued)
For the Year Ended June 30, 2018
(Amounts in thousands)
| | | | | | | | | | | | | | | | |
| | | The Inflation
Protected
Securities Portfolio | | | The U.S.
Corporate Fixed
Income Securities
Portfolio | | | The U.S.
Mortgage/Asset
Backed Fixed
Income Securities
Portfolio | | | The Short-Term
Municipal Bond
Portfolio | |
INVESTMENT INCOME: | | | | | | | | | | | | | | | | |
Interest | | $ | 10,508 | | | $ | 8,301 | | | $ | 4,357 | | | $ | 420 | |
Dividends | | | 117 | | | | 266 | | | | 368 | | | | 45 | |
| | | | | | | | | | | | | | | | |
Total Investment Income | | | 10,625 | | | | 8,567 | | | | 4,725 | | | | 465 | |
| | | | | | | | | | | | | | | | |
EXPENSES: | | | | | | | | | | | | | | | | |
Advisory fees | | | 146 | | | | 194 | | | | 110 | | | | 37 | |
Management fees | | | 189 | | | | 134 | | | | 96 | | | | 15 | |
Administrative services fees | | | 107 | | | | 92 | | | | 141 | | | | 20 | |
Distribution fees – HC Advisors Shares | | | — | | | | — | | | | — | | | | — | |
Professional fees | | | 46 | | | | 33 | | | | 24 | | | | 6 | |
Transfer agent fees | | | 9 | | | | 7 | | | | 5 | | | | 1 | |
Compliance service fees | | | 6 | | | | 4 | | | | 3 | | | | — | |
Custodian fees | | | 31 | | | | 23 | | | | 24 | | | | 3 | |
Registration and filing fees | | | 19 | | | | 11 | | | | 11 | | | | 11 | |
Trustee fees | | | 21 | | | | 15 | | | | 11 | | | | 1 | |
Other | | | 30 | | | | 23 | | | | 17 | | | | 4 | |
| | | | | | | | | | | | | | | | |
Total expenses before waivers | | | 604 | | | | 536 | | | | 442 | | | | 98 | |
Less: Distribution fees waived – HC Advisors Shares | | | — | | | | — | | | | — | | | | — | |
| | | | | | | | | | | | | | | | |
Net Expenses | | | 604 | | | | 536 | | | | 442 | | | | 98 | |
| | | | | | | | | | | | | | | | |
Net Investment Income | | | 10,021 | | | | 8,031 | | | | 4,283 | | | | 367 | |
| | | | | | | | | | | | | | | | |
NET REALIZED/UNREALIZED GAIN/(LOSS) ON INVESTMENTS: | | | | | | | | | | | | | | | | |
Net realized gains/(losses) from investment transactions | | | (534 | ) | | | 336 | | | | (686 | ) | | | (2 | ) |
| | | | | | | | | | | | | | | | |
Change in unrealized appreciation/(depreciation) on investments | | | (2,329 | ) | | | (11,731 | ) | | | (4,024 | ) | | | (66 | ) |
| | | | | | | | | | | | | | | | |
Net realized/unrealized gains/(losses) from investments | | | (2,863 | ) | | | (11,395 | ) | | | (4,710 | ) | | | (68 | ) |
| | | | | | | | | | | | | | | | |
Change in net assets resulting from operations | | $ | 7,158 | | | $ | (3,364 | ) | | $ | (427 | ) | | $ | 299 | |
| | | | | | | | | | | | | | | | |
Amounts designated as “—” are $0 or have been rounded to $0.
See accompanying notes to financial statements.
251
HC CAPITAL TRUST
Statements of Operations (concluded)
For the Year Ended June 30, 2018
(Amounts in thousands)
| | | | | | | | |
| | | The Intermediate
Term Municipal
Bond Portfolio | | | The Intermediate
Term Municipal
Bond II Portfolio | |
INVESTMENT INCOME: | | | | | | | | |
Interest | | $ | 8,645 | | | $ | 1,829 | |
Dividends | | | 121 | | | | 41 | |
| | | | | | | | |
Total Investment Income | | | 8,766 | | | | 1,870 | |
| | | | | | | | |
EXPENSES: | | | | | | | | |
Advisory fees | | | 627 | | | | 94 | |
Management fees | | | 197 | | | | 39 | |
Administrative services fees | | | 137 | | | | 32 | |
Distribution fees – HC Advisors Shares | | | 3 | | | | 1 | |
Professional fees | | | 54 | | | | 14 | |
Transfer agent fees | | | 10 | | | | 2 | |
Compliance service fees | | | 6 | | | | 1 | |
Custodian fees | | | 30 | | | | 8 | |
Registration and filing fees | | | 12 | | | | 12 | |
Trustee fees | | | 22 | | | | 4 | |
Other | | | 32 | | | | 7 | |
| | | | | | | | |
Total expenses before waivers | | | 1,130 | | | | 214 | |
Less: Distribution fees waived – HC Advisors Shares | | | (3 | ) | | | (1 | ) |
| | | | | | | | |
Net Expenses | | | 1,127 | | | | 213 | |
| | | | | | | | |
Net Investment Income | | | 7,639 | | | | 1,657 | |
| | | | | | | | |
NET REALIZED/UNREALIZED GAIN/(LOSS) ON INVESTMENTS: | | | | | | | | |
Net realized gains/(losses) from investment transactions | | | 1,004 | | | | 66 | |
| | | | | | | | |
Change in unrealized appreciation/(depreciation) on investments | | | (8,265 | ) | | | (1,674 | ) |
| | | | | | | | |
Net realized/unrealized gains/(losses) from investments | | | (7,261 | ) | | | (1,608 | ) |
| | | | | | | | |
Change in net assets resulting from operations | | $ | 378 | | | $ | 49 | |
| | | | | | | | |
See accompanying notes to financial statements.
252
HC CAPITAL TRUST
Statements of Changes in Net Assets
(Amounts in thousands)
| | | | | | | | | | | | | | | | | | | | | | | | |
| | | The Value
Equity Portfolio | | | The Institutional
Value Equity Portfolio | | | The Growth
Equity Portfolio | |
| | | For the
Year Ended
June 30,
2018 | | | For the
Year Ended
June 30,
2017 | | | For the
Year Ended
June 30,
2018 | | | For the
Year Ended
June 30,
2017 | | | For the
Year Ended
June 30,
2018 | | | For the
Year Ended
June 30,
2017 | |
Operations: | | | | | | | | | | | | | | | | | | | | | | | | |
Net investment income | | $ | 13,021 | | | $ | 13,490 | | | $ | 17,659 | | | $ | 15,723 | | | $ | 7,774 | | | $ | 7,552 | |
Net realized gains/(losses) from investments, futures | | | 37,822 | | | | 31,334 | | | | 67,838 | | | | 81,872 | | | | 53,136 | | | | 40,790 | |
Change in unrealized appreciation/(depreciation) from investments, futures | | | 4,627 | | | | 50,048 | | | | (18,888 | ) | | | 21,447 | | | | 81,390 | | | | 88,001 | |
| | | | | | | | | | | | | | | | | | | | | | | | |
Change in net assets resulting from operations | | | 55,470 | | | | 94,872 | | | | 66,609 | | | | 119,042 | | | | 142,300 | | | | 136,343 | |
| | | | | | | | | | | | | | | | | | | | | | | | |
Distributions to Shareholders from: | | | | | | | | | | | | | | | | | | | | | | | | |
Net investment income: | | | | | | | | | | | | | | | | | | | | | | | | |
HC Strategic Shares | | | (13,471 | ) | | | (13,041 | ) | | | (17,837 | ) | | | (15,089 | ) | | | (7,693 | ) | | | (7,522 | ) |
HC Advisors Shares | | | (18 | ) | | | (18 | ) | | | (25 | ) | | | (30 | ) | | | (10 | ) | | | (11 | ) |
Net realized gains/(losses) from investments, futures: | | | | | | | | | | | | | | | | | | | | | | | | |
HC Strategic Shares | | | (28,142 | ) | | | (22,077 | ) | | | (54,372 | ) | | | (38,357 | ) | | | (38,337 | ) | | | (44,277 | ) |
HC Advisors Shares | | | (40 | ) | | | (30 | ) | | | (102 | ) | | | (83 | ) | | | (54 | ) | | | (63 | ) |
| | | | | | | | | | | | | | | | | | | | | | | | |
Change in net assets resulting from distributions | | | (41,671 | ) | | | (35,166 | ) | | | (72,336 | ) | | | (53,559 | ) | | | (46,094 | ) | | | (51,873 | ) |
| | | | | | | | | | | | | | | | | | | | | | | | |
HC Strategic Shares | | | | | | | | | | | | | | | | | | | | | | | | |
Proceeds from shares issued | | $ | 14,232 | | | $ | 15,134 | | | $ | 174,514 | | | $ | 124,538 | | | $ | 11,927 | | | $ | 19,925 | |
Proceeds from reinvestment of dividends | | | 36,777 | | | | 30,156 | | | | 71,888 | | | | 53,180 | | | | 40,172 | | | | 44,844 | |
Cost of shares redeemed | | | (77,844 | ) | | | (75,487 | ) | | | (109,132 | ) | | | (153,268 | ) | | | (125,879 | ) | | | (126,326 | ) |
Cost of shares redeemed in redemption in-kind | | | — | | | | — | | | | — | | | | (204,698 | ) | | | — | | | | — | |
| | | | | | | | | | | | | | | | | | | | | | | | |
Change in net assets from HC Strategic Shares of beneficial interest | | | (26,835 | ) | | | (30,197 | ) | | | 137,270 | | | | (180,248 | ) | | | (73,780 | ) | | | (61,557 | ) |
| | | | | | | | | | | | | | | | | | | | | | | | |
HC Advisors Shares | | | | | | | | | | | | | | | | | | | | | | | | |
Proceeds from shares issued | | | 33 | | | | 70 | | | | 127 | | | | 91 | | | | 6 | | | | 70 | |
Cost of shares redeemed | | | (218 | ) | | | (90 | ) | | | (889 | ) | | | (150 | ) | | | (323 | ) | | | (157 | ) |
| | | | | | | | | | | | | | | | | | | | | | | | |
Change in net assets from HC Advisors Shares of beneficial interest | | | (185 | ) | | | (20 | ) | | | (762 | ) | | | (59 | ) | | | (317 | ) | | | (87 | ) |
| | | | | | | | | | | | | | | | | | | | | | | | |
Change in net assets from shares of beneficial interest | | $ | (27,020 | ) | | $ | (30,217 | ) | | $ | 136,508 | | | $ | (180,307 | ) | | $ | (74,097 | ) | | $ | (61,644 | ) |
| | | | | | | | | | | | | | | | | | | | | | | | |
Change in net assets | | | (13,221 | ) | | | 29,489 | | | | 130,781 | | | | (114,824 | ) | | | 22,109 | | | | 22,826 | |
Net Assets: | | | | | | | | | | | | | | | | | | | | | | | | |
Beginning of period | | | 613,353 | | | | 583,864 | | | | 798,640 | | | | 913,464 | | | | 787,681 | | | | 764,855 | |
| | | | | | | | | | | | | | | | | | | | | | | | |
End of period | | $ | 600,132 | | | $ | 613,353 | | | $ | 929,421 | | | $ | 798,640 | | | $ | 809,790 | | | $ | 787,681 | |
| | | | | | | | | | | | | | | | | | | | | | | | |
Accumulated net investment income | | $ | 54 | | | $ | 499 | | | $ | 251 | | | $ | 525 | | | $ | 168 | | | $ | 100 | |
Share Transactions: | | | | | | | | | | | | | | | | | | | | | | | | |
HC Strategic Shares | | | | | | | | | | | | | | | | | | | | | | | | |
Issued | | | 700 | | | | 790 | | | | 13,104 | | | | 9,831 | | | | 522 | | | | 1,035 | |
Reinvested | | | 1,807 | | | | 1,573 | | | | 5,414 | | | | 4,161 | | | | 1,799 | | | | 2,386 | |
Redeemed | | | (3,827 | ) | | | (3,943 | ) | | | (8,182 | ) | | | (12,145 | ) | | | (5,599 | ) | | | (6,442 | ) |
Redeemed in redemption in-kind | | | — | | | | — | | | | — | | | | (16,548 | ) | | | — | | | | — | |
| | | | | | | | | | | | | | | | | | | | | | | | |
Change in HC Strategic Shares | | | (1,320 | ) | | | (1,580 | ) | | | 10,336 | | | | (14,701 | ) | | | (3,278 | ) | | | (3,021 | ) |
| | | | | | | | | | | | | | | | | | | | | | | | |
HC Advisors Shares | | | | | | | | | | | | | | | | | | | | | | | | |
Issued | | | 1 | | | | 4 | | | | 9 | | | | 7 | | | | — | | | | 4 | |
Redeemed | | | (11 | ) | | | (5 | ) | | | (67 | ) | | | (12 | ) | | | (15 | ) | | | (8 | ) |
| | | | | | | | | | | | | | | | | | | | | | | | |
Change in HC Advisors Shares | | | (10 | ) | | | (1 | ) | | | (58 | ) | | | (5 | ) | | | (15 | ) | | | (4 | ) |
| | | | | | | | | | | | | | | | | | | | | | | | |
Total change in shares | | | (1,330 | ) | | | (1,581 | ) | | | 10,278 | | | | (14,706 | ) | | | (3,293 | ) | | | (3,025 | ) |
| | | | | | | | | | | | | | | | | | | | | | | | |
Amounts designated as “—” are $0 or have been rounded to $0.
See accompanying notes to financial statements.
253
HC CAPITAL TRUST
Statements of Changes in Net Assets (continued)
(Amounts in thousands)
| | | | | | | | | | | | | | | | | | | | | | | | |
| | | The Institutional Growth
Equity Portfolio | | | The Small Capitalization-Mid
Capitalization Equity Portfolio | | | The Institutional Small
Capitalization-Mid
Capitalization Equity Portfolio | |
| | | For the Year
Ended
June 30, 2018 | | | For the Year
Ended
June 30, 2017 | | | For the Year
Ended
June 30, 2018 | | | For the Year
Ended
June 30, 2017 | | | For the Year
Ended
June 30, 2018 | | | For the Year
Ended
June 30, 2017 | |
Operations: | | | | | | | | | | | | | | | | | | | | | | | | |
Net investment income | | $ | 11,708 | | | $ | 10,543 | | | $ | 405 | | | $ | 94 | | | $ | 774 | | | $ | 194 | |
Net realized gains/(losses) from investments, futures | | | 93,520 | | | | 74,059 | | | | 9,846 | | | | 10,069 | | | | 30,536 | | | | 22,734 | |
Change in unrealized appreciation/(depreciation) from investments, futures | | | 86,809 | | | | 100,065 | | | | 7,276 | | | | 9,023 | | | | (4,556 | ) | | | 3,722 | |
| | | | | | | | | | | | | | | | | | | | | | | | |
Change in net assets resulting from operations | | | 192,037 | | | | 184,667 | | | | 17,527 | | | | 19,186 | | | | 26,754 | | | | 26,650 | |
| | | | | | | | | | | | | | | | | | | | | | | | |
Distributions to Shareholders from: | | | | | | | | | | | | | | | | | | | | | | | | |
Net investment income: | | | | | | | | | | | | | | | | | | | | | | | | |
HC Strategic Shares | | | (11,617 | ) | | | (10,527 | ) | | | (391 | ) | | | (136 | ) | | | (745 | ) | | | (223 | ) |
HC Advisors Shares | | | (16 | ) | | | (21 | ) | | | (1 | ) | | | — | | | | (1 | ) | | | — | |
Net realized gains/(losses) from investments, futures: | | | | | | | | | | | | | | | | | | | | | | | | |
HC Strategic Shares | | | (42,580 | ) | | | (69,792 | ) | | | — | | | | — | | | | (13,508 | ) | | | (2,340 | ) |
HC Advisors Shares | | | (82 | ) | | | (151 | ) | | | — | | | | — | | | | (22 | ) | | | (4 | ) |
| | | | | | | | | | | | | | | | | | | | | | | | |
Change in net assets resulting from distributions | | | (54,295 | ) | | | (80,491 | ) | | | (392 | ) | | | (136 | ) | | | (14,276 | ) | | | (2,567 | ) |
| | | | | | | | | | | | | | | | | | | | | | | | |
HC Strategic Shares | | | | | | | | | | | | | | | | | | | | | | | | |
Proceeds from shares issued | | $ | 151,336 | | | $ | 102,997 | | | $ | 3,677 | | | $ | 3,472 | | | $ | 18,867 | | | $ | 19,283 | |
Proceeds from reinvestment of dividends | | | 53,469 | | | | 78,013 | | | | 323 | | | | 112 | | | | 14,112 | | | | 2,521 | |
Cost of shares redeemed | | | (188,900 | ) | | | (242,143 | ) | | | (18,022 | ) | | | (13,539 | ) | | | (29,666 | ) | | | (35,767 | ) |
Cost of shares redeemed in redemption in-kind | | | — | | | | (291,050 | ) | | | — | | | | — | | | | — | | | | (58,339 | ) |
| | | | | | | | | | | | | | | | | | | | | | | | |
Change in net assets from HC Strategic Shares of beneficial interest | | | 15,905 | | | | (352,183 | ) | | | (14,022 | ) | | | (9,955 | ) | | | 3,313 | | | | (72,302 | ) |
| | | | | | | | | | | | | | | | | | | | | | | | |
HC Advisors Shares | | | | | | | | | | | | | | | | | | | | | | | | |
Proceeds from shares issued | | | 11 | | | | 110 | | | | — | | | | 7 | | | | 26 | | | | 11 | |
Cost of shares redeemed | | | (1,219 | ) | | | (205 | ) | | | (39 | ) | | | (22 | ) | | | (154 | ) | | | (37 | ) |
| | | | | | | | | | | | | | | | | | | | | | | | |
Change in net assets from HC Advisors Shares of beneficial interest | | | (1,208 | ) | | | (95 | ) | | | (39 | ) | | | (15 | ) | | | (128 | ) | | | (26 | ) |
| | | | | | | | | | | | | | | | | | | | | | | | |
Change in net assets from shares of beneficial interest | | $ | 14,697 | | | $ | (352,278 | ) | | $ | (14,061 | ) | | $ | (9,970 | ) | | $ | 3,185 | | | $ | (72,328 | ) |
| | | | | | | | | | | | | | | | | | | | | | | | |
Change in net assets | | | 152,439 | | | | (248,102 | ) | | | 3,074 | | | | 9,080 | | | | 15,663 | | | | (48,245 | ) |
Net Assets: | | | | | | | | | | | | | | | | | | | | | | | | |
Beginning of period | | | 1,036,302 | | | | 1,284,404 | | | | 107,536 | | | | 98,456 | | | | 144,243 | | | | 192,488 | |
| | | | | | | | | | | | | | | | | | | | | | | | |
End of period | | $ | 1,188,741 | | | $ | 1,036,302 | | | $ | 110,610 | | | $ | 107,536 | | | $ | 159,906 | | | $ | 144,243 | |
| | | | | | | | | | | | | | | | | | | | | | | | |
Accumulated net investment income/(distributions in excess of net investment income) | | $ | 185 | | | $ | 112 | | | $ | 9 | | | $ | — | | | $ | 22 | | | $ | (6 | ) |
Share Transactions: | | | | | | | | | | | | | | | | | | | | | | | | |
HC Strategic Shares | | | | | | | | | | | | | | | | | | | | | | | | |
Issued | | | 8,511 | | | | 6,738 | | | | 134 | | | | 143 | | | | 1,066 | | | | 1,189 | |
Reinvested | | | 3,080 | | | | 5,372 | | | | 12 | | | | 5 | | | | 828 | | | | 154 | |
Redeemed | | | (10,746 | ) | | | (15,660 | ) | | | (659 | ) | | | (564 | ) | | | (1,638 | ) | | | (2,271 | ) |
Redeemed in redemption in-kind | | | — | | | | (18,863 | ) | | | — | | | | — | | | | — | | | | (3,831 | ) |
| | | | | | | | | | | | | | | | | | | | | | | | |
Change in HC Strategic Shares | | | 845 | | | | (22,413 | ) | | | (513 | ) | | | (416 | ) | | | 256 | | | | (4,759 | ) |
| | | | | | | | | | | | | | | | | | | | | | | | |
HC Advisors Shares | | | | | | | | | | | | | | | | | | | | | | | | |
Issued | | | 1 | | | | 8 | | | | — | | | | — | | | | 1 | | | | 1 | |
Redeemed | | | (70 | ) | | | (13 | ) | | | (1 | ) | | | (1 | ) | | | (9 | ) | | | (2 | ) |
| | | | | | | | | | | | | | | | | | | | | | | | |
Change in HC Advisors Shares | | | (69 | ) | | | (5 | ) | | | (1 | ) | | | (1 | ) | | | (8 | ) | | | (1 | ) |
| | | | | | | | | | | | | | | | | | | | | | | | |
Total change in shares | | | 776 | | | | (22,418 | ) | | | (514 | ) | | | (417 | ) | | | 248 | | | | (4,760 | ) |
| | | | | | | | | | | | | | | | | | | | | | | | |
Amounts designated as “—” are $0 or have been rounded to $0.
See accompanying notes to financial statements.
254
HC CAPITAL TRUST
Statements of Changes in Net Assets (continued)
(Amounts in thousands)
| | | | | | | | | | | | | | | | | | | | | | | | |
| | | The Real Estate
Securities Portfolio | | | The Commodity Returns
Strategy Portfolio (a) | | | The ESG
Growth Portfolio | |
| | | For the Year
Ended
June 30, 2018 | | | For the Year
Ended
June 30, 2017 | | | For the Year
Ended
June 30, 2018 | | | For the Year
Ended
June 30, 2017 | | | For the Year
Ended
June 30, 2018 | | | For the Year
Ended
June 30, 2017 | |
Operations: | | | | | | | | | | | | | | | | | | | | | | | | |
Net investment income | | $ | 2,175 | | | $ | 1,402 | | | $ | 20,980 | | | $ | 17,155 | | | $ | 4,318 | | | $ | 3,609 | |
Net realized gains/(losses) from investments, futures, written options, swap transactions, and foreign currency transactions | | | 1,711 | | | | 12,554 | | | | 20,397 | | | | 47,964 | | | | 1,856 | | | | 39 | |
Change in unrealized appreciation/(depreciation) from investments, futures, written options, swap transactions, and foreign currency transactions | | | 646 | | | | (13,259 | ) | | | 100,666 | | | | 28,689 | | | | 8,860 | | | | 17,486 | |
| | | | | | | | | | | | | | | | | | | | | | | | |
Change in net assets resulting from operations | | | 4,532 | | | | 697 | | | | 142,043 | | | | 93,808 | | | | 15,034 | | | | 21,134 | |
| | | | | | | | | | | | | | | | | | | | | | | | |
Distributions to Shareholders from: | | | | | | | | | | | | | | | | | | | | | | | | |
Net investment income: | | | | | | | | | | | | | | | | | | | | | | | | |
HC Strategic Shares | | | (1,919 | ) | | | (1,360 | ) | | | (25,672 | ) | | | (15,525 | ) | | | (4,367 | ) | | | (3,827 | ) |
HC Advisors Shares | | | — | | | | — | | | | (31 | ) | | | (25 | ) | | | — | | | | — | |
Net realized gains/(losses) from investments, futures, written options, swap transactions, and foreign currency transactions: | | | | | | | | | | | | | | | | | | | | | | | | |
HC Strategic Shares | | | (3,669 | ) | | | (10,727 | ) | | | — | | | | — | | | | — | | | | — | |
| | | | | | | | | | | | | | | | | | | | | | | | |
Change in net assets resulting from distributions | | | (5,588 | ) | | | (12,087 | ) | | | (25,703 | ) | | | (15,550 | ) | | | (4,367 | ) | | | (3,827 | ) |
| | | | | | | | | | | | | | | | | | | | | | | | |
HC Strategic Shares | | | | | | | | | | | | | | | | | | | | | | | | |
Proceeds from shares issued | | $ | 16,037 | | | $ | 32,836 | | | $ | 59,959 | | | $ | 54,265 | | | $ | 9,739 | | | $ | 11,630 | |
Proceeds from reinvestment of dividends | | | 5,446 | | | | 11,943 | | | | 21,931 | | | | 13,209 | | | | 1,277 | | | | 995 | |
Cost of shares redeemed | | | (12,620 | ) | | | (35,530 | ) | | | (101,457 | ) | | | (491,877 | ) | | | (3,803 | ) | | | (2,614 | ) |
Cost of shares redeemed in redemption in-kind | | | — | | | | (25,577 | ) | | | — | | | | — | | | | — | | | | — | |
| | | | | | | | | | | | | | | | | | | | | | | | |
Change in net assets from HC Strategic Shares of beneficial interest | | | 8,863 | | | | (16,328 | ) | | | (19,567 | ) | | | (424,403 | ) | | | 7,213 | | | | 10,011 | |
| | | | | | | | | | | | | | | | | | | | | | | | |
HC Advisors Shares | | | | | | | | | | | | | | | | | | | | | | | | |
Proceeds from shares issued | | | — | | | | — | | | | 83 | | | | 11 | | | | — | | | | — | |
Cost of shares redeemed | | | — | | | | — | | | | (613 | ) | | | (402 | ) | | | — | | | | — | |
| | | | | | | | | | | | | | | | | | | | | | | | |
Change in net assets from HC Advisors Shares of beneficial interest | | | — | | | | — | | | | (530 | ) | | | (391 | ) | | | — | | | | — | |
| | | | | | | | | | | | | | | | | | | | | | | | |
Change in net assets from shares of beneficial interest | | $ | 8,863 | | | $ | (16,328 | ) | | $ | (20,097 | ) | | $ | (424,794 | ) | | $ | 7,213 | | | $ | 10,011 | |
| | | | | | | | | | | | | | | | | | | | | | | | |
Change in net assets | | | 7,807 | | | | (27,718 | ) | | | 96,243 | | | | (346,536 | ) | | | 17,880 | | | | 27,318 | |
Net Assets: | | | | | | | | | | | | | | | | | | | | | | | | |
Beginning of period | | | 123,794 | | | | 151,512 | | | | 765,886 | | | | 1,112,422 | | | | 148,644 | | | | 121,326 | |
| | | | | | | | | | | | | | | | | | | | | | | | |
End of period | | $ | 131,601 | | | $ | 123,794 | | | $ | 862,129 | | | $ | 765,886 | | | $ | 166,524 | | | $ | 148,644 | |
| | | | | | | | | | | | | | | | | | | | | | | | |
Accumulated net investment income/(distributions in excess of net investment income) | | $ | 564 | | | $ | 284 | | | $ | (1,021 | ) | | $ | (462 | ) | | $ | 32 | | | $ | 21 | |
Share Transactions: | | | | | | | | | | | | | | | | | | | | | | | | |
HC Strategic Shares | | | | | | | | | | | | | | | | | | | | | | | | |
Issued | | | 5,549 | | | | 10,670 | | | | 6,283 | | | | 6,369 | | | | 837 | | | | 1,134 | |
Reinvested | | | 1,840 | | | | 4,162 | | | | 2,322 | | | | 1,566 | | | | 112 | | | | 96 | |
Redeemed | | | (4,276 | ) | | | (11,235 | ) | | | (10,504 | ) | | | (59,033 | ) | | | (328 | ) | | | (260 | ) |
Redeemed in redemption in-kind | | | — | | | | (7,435 | ) | | | — | | | | — | | | | — | | | | — | |
| | | | | | | | | | | | | | | | | | | | | | | | |
Change in HC Strategic Shares | | | 3,113 | | | | (3,838 | ) | | | (1,899 | ) | | | (51,098 | ) | | | 621 | | | | 970 | |
| | | | | | | | | | | | | | | | | | | | | | | | |
HC Advisors Shares | | | | | | | | | | | | | | | | | | | | | | | | |
Issued | | | — | | | | — | | | | 10 | | | | 1 | | | | — | | | | — | |
Redeemed | | | — | | | | — | | | | (64 | ) | | | (47 | ) | | | — | | | | — | |
| | | | | | | | | | | | | | | | | | | | | | | | |
Change in HC Advisors Shares | | | — | | | | — | | | | (54 | ) | | | (46 | ) | | | — | | | | — | |
| | | | | | | | | | | | | | | | | | | | | | | | |
Total change in shares | | | 3,113 | | | | (3,838 | ) | | | (1,953 | ) | | | (51,144 | ) | | | 621 | | | | 970 | |
| | | | | | | | | | | | | | | | | | | | | | | | |
Amounts designated as “—” are $0 or have been rounded to $0.
| (a) | Statement has been consolidated. Please see Note 2.O. in the Notes to Financial Statements for basis of consolidation. |
See accompanying notes to financial statements.
255
HC CAPITAL TRUST
Statements of Changes in Net Assets (continued)
(Amounts in thousands)
| | | | | | | | | | | | | | | | | | | | | | | | |
| | | The Catholic SRI
Growth Portfolio | | | The International
Equity Portfolio | | | The Institutional International
Equity Portfolio | |
| | | For the Year
Ended
June 30, 2018 | | | For the Year
Ended
June 30, 2017 | | | For the Year
Ended
June 30, 2018 | | | For the Year
Ended
June 30, 2017 | | | For the Year
Ended
June 30, 2018 | | | For the Year
Ended
June 30, 2017 | |
Operations: | | | | | | | | | | | | | | | | | | | | | | | | |
Net investment income | | $ | 790 | | | $ | 674 | | | $ | 37,564 | | | $ | 33,130 | | | $ | 81,258 | | | $ | 64,841 | |
Net realized gains/(losses) from investments, futures, and foreign currency transactions | | | 848 | | | | 701 | | | | 10,324 | | | | 22,097 | | | | 109,552 | | | | (7,740 | ) |
Change in unrealized appreciation/(depreciation) from investments, futures, and foreign currency transactions | | | 1,505 | | | | 2,509 | | | | 22,266 | | | | 158,821 | | | | (45,376 | ) | | | 381,285 | |
| | | | | | | | | | | | | | | | | | | | | | | | |
Change in net assets resulting from operations | | | 3,143 | | | | 3,884 | | | | 70,154 | | | | 214,048 | | | | 145,434 | | | | 438,386 | |
| | | | | | | | | | | | | | | | | | | | | | | | |
Distributions to Shareholders from: | | | | | | | | | | | | | | | | | | | | | | | | |
Net investment income: | | | | | | | | | | | | | | | | | | | | | | | | |
HC Strategic Shares | | | (805 | ) | | | (735 | ) | | | (37,147 | ) | | | (34,041 | ) | | | (92,471 | ) | | | (67,741 | ) |
HC Advisors Shares | | | — | | | | — | | | | (52 | ) | | | (63 | ) | | | (118 | ) | | | (112 | ) |
Net realized gains/(losses) from investments, futures, and foreign currency transactions: | | | | | | | | | | | | | | | | | | | | | | | | |
HC Strategic Shares | | | (719 | ) | | | (536 | ) | | | — | | | | — | | | | (3,589 | ) | | | — | |
HC Advisors Shares | | | — | | | | — | | | | — | | | | — | | | | (6 | ) | | | — | |
| | | | | | | | | | | | | | | | | | | | | | | | |
Change in net assets resulting from distributions | | | (1,524 | ) | | | (1,271 | ) | | | (37,199 | ) | | | (34,104 | ) | | | (96,184 | ) | | | (67,853 | ) |
| | | | | | | | | | | | | | | | | | | | | | | | |
HC Strategic Shares | | | | | | | | | | | | | | | | | | | | | | | | |
Proceeds from shares issued | | $ | 122 | | | $ | 4,766 | | | $ | 74,982 | | | $ | 169,035 | | | $ | 217,409 | | | $ | 247,963 | |
Proceeds from reinvestment of dividends | | | 1,524 | | | | 1,271 | | | | 26,226 | | | | 30,331 | | | | 80,159 | | | | 56,336 | |
Cost of shares redeemed | | | (1,844 | ) | | | (982 | ) | | | (155,020 | ) | | | (309,892 | ) | | | (466,891 | ) | | | (248,501 | ) |
Cost of shares redeemed in redemption
in-kind | | | — | | | | — | | | | — | | | | — | | | | — | | | | (559,861 | ) |
| | | | | | | | | | | | | | | | | | | | | | | | |
Change in net assets from HC Strategic Shares of beneficial interest | | | (198 | ) | | | 5,055 | | | | (53,812 | ) | | | (110,526 | ) | | | (169,323 | ) | | | (504,063 | ) |
| | | | | | | | | | | | | | | | | | | | | | | | |
HC Advisors Shares | | | | | | | | | | | | | | | | | | | | | | | | |
Proceeds from shares issued | | | — | | | | — | | | | 1 | | | | 77 | | | | 100 | | | | 233 | |
Cost of shares redeemed | | | — | | | | — | | | | (648 | ) | | | (166 | ) | | | (2,393 | ) | | | (412 | ) |
| | | | | | | | | | | | | | | | | | | | | | | | |
Change in net assets from HC Advisors Shares of beneficial interest | | | — | | | | — | | | | (647 | ) | | | (89 | ) | | | (2,293 | ) | | | (179 | ) |
| | | | | | | | | | | | | | | | | | | | | | | | |
Change in net assets from shares of beneficial interest | | $ | (198 | ) | | $ | 5,055 | | | $ | (54,459 | ) | | $ | (110,615 | ) | | $ | (171,616 | ) | | $ | (504,242 | ) |
| | | | | | | | | | | | | | | | | | | | | | | | |
Change in net assets | | | 1,421 | | | | 7,668 | | | | (21,504 | ) | | | 69,329 | | | | (122,366 | ) | | | (133,709 | ) |
Net Assets: | | | | | | | | | | | | | | | | | | | | | | | | |
Beginning of period | | | 27,993 | | | | 20,325 | | | | 1,236,356 | | | | 1,167,027 | | | | 2,456,587 | | | | 2,590,296 | |
| | | | | | | | | | | | | | | | | | | | | | | | |
End of period | | $ | 29,414 | | | $ | 27,993 | | | $ | 1,214,852 | | | $ | 1,236,356 | | | $ | 2,334,221 | | | $ | 2,456,587 | |
| | | | | | | | | | | | | | | | | | | | | | | | |
Accumulated net investment income/(distributions in excess of net investment income) | | $ | — | | | $ | (2 | ) | | $ | 674 | | | $ | (152 | ) | | $ | 2,410 | | | $ | 3,537 | |
Share Transactions: | | | | | | | | | | | | | | | | | | | | | | | | |
HC Strategic Shares | | | | | | | | | | | | | | | | | | | | | | | | |
Issued | | | 10 | | | | 410 | | | | 6,628 | | | | 18,007 | | | | 19,692 | | | | 25,832 | |
Reinvested | | | 119 | | | | 111 | | | | 2,429 | | | | 2,916 | | | | 7,360 | | | | 5,527 | |
Redeemed | | | (143 | ) | | | (83 | ) | | | (13,814 | ) | | | (32,676 | ) | | | (42,632 | ) | | | (25,848 | ) |
Redeemed in redemption in-kind | | | — | | | | — | | | | — | | | | — | | | | — | | | | (60,921 | ) |
| | | | | | | | | | | | | | | | | | | | | | | | |
Change in HC Strategic Shares | | | (14 | ) | | | 438 | | | | (4,757 | ) | | | (11,753 | ) | | | (15,580 | ) | | | (55,410 | ) |
| | | | | | | | | | | | | | | | | | | | | | | | |
HC Advisors Shares | | | | | | | | | | | | | | | | | | | | | | | | |
Issued | | | — | | | | — | | | | — | | | | 8 | | | | 9 | | | | 25 | |
Redeemed | | | — | | | | — | | | | (57 | ) | | | (17 | ) | | | (216 | ) | | | (42 | ) |
| | | | | | | | | | | | | | | | | | | | | | | | |
Change in HC Advisors Shares | | | — | | | | — | | | | (57 | ) | | | (9 | ) | | | (207 | ) | | | (17 | ) |
| | | | | | | | | | | | | | | | | | | | | | | | |
Total change in shares | | | (14 | ) | | | 438 | | | | (4,814 | ) | | | (11,762 | ) | | | (15,787 | ) | | | (55,427 | ) |
| | | | | | | | | | | | | | | | | | | | | | | | |
Amounts designated as “—” are $0 or have been rounded to $0.
See accompanying notes to financial statements.
256
HC CAPITAL TRUST
Statements of Changes in Net Assets (continued)
(Amounts in thousands)
| | | | | | | | | | | | | | | | | | | | | | | | |
| | | The Emerging
Markets Portfolio | | | The Core Fixed
Income Portfolio | | | The Fixed Income
Opportunity Portfolio | |
| | | For the
Year Ended
June 30,
2018 | | | For the
Year Ended
June 30,
2017 | | | For the
Year Ended
June 30,
2018 | | | For the
Year Ended
June 30,
2017 | | | For the
Year Ended
June 30,
2018 | | | For the
Year Ended
June 30,
2017 | |
Operations: | | | | | | | | | | | | | | | | | | | | | | | | |
Net investment income | | $ | 37,719 | | | $ | 34,948 | | | $ | 1,807 | | | $ | 1,747 | | | $ | 37,315 | | | $ | 36,557 | |
Net realized gains/(losses) from investments, futures, written options, swap transactions, and foreign currency transactions | | | 73,320 | | | | (13,102 | ) | | | (14 | ) | | | (18 | ) | | | 7,004 | | | | 4,774 | |
Change in unrealized appreciation/(depreciation) from investments, futures, swap transactions, and foreign currency transactions | | | (76,982 | ) | | | 326,926 | | | | (2,115 | ) | | | (1,718 | ) | | | (17,271 | ) | | | 30,043 | |
| | | | | | | | | | | | | | | | | | | | | | | | |
Change in net assets resulting from operations | | | 34,057 | | | | 348,772 | | | | (322 | ) | | | 11 | | | | 27,048 | | | | 71,374 | |
| | | | | | | | | | | | | | | | | | | | | | | | |
Distributions to Shareholders from: | | | | | | | | | | | | | | | | | | | | | | | | |
Net investment income: | | | | | | | | | | | | | | | | | | | | | | | | |
HC Strategic Shares | | | (37,919 | ) | | | (41,803 | ) | | | (1,807 | ) | | | (1,883 | ) | | | (36,991 | ) | | | (36,065 | ) |
HC Advisors Shares | | | (59 | ) | | | (61 | ) | | | (59 | ) | | | (58 | ) | | | (36 | ) | | | (54 | ) |
| | | | | | | | | | | | | | | | | | | | | | | | |
Change in net assets resulting from distributions | | | (37,978 | ) | | | (41,864 | ) | | | (1,866 | ) | | | (1,941 | ) | | | (37,027 | ) | | | (36,119 | ) |
| | | | | | | | | | | | | | | | | | | | | | | | |
HC Strategic Shares | | | | | | | | | | | | | | | | | | | | | | | | |
Proceeds from shares issued | | $ | 152,878 | | | $ | 125,040 | | | $ | 11,829 | | | $ | 12,461 | | | $ | 69,888 | | | $ | 54,946 | |
Proceeds from reinvestment of dividends | | | 32,032 | | | | 31,831 | | | | 1,802 | | | | 1,878 | | | | 32,361 | | | | 31,388 | |
Cost of shares redeemed | | | (324,405 | ) | | | (521,553 | ) | | | (31,780 | ) | | | (13,578 | ) | | | (92,686 | ) | | | (109,003 | ) |
Cost of shares redeemed in redemption in-kind | | | — | | | | — | | | | — | | | | — | | | | — | | | | (123,294 | ) |
| | | | | | | | | | | | | | | | | | | | | | | | |
Change in net assets from HC Strategic Shares of beneficial interest | | | (139,495 | ) | | | (364,682 | ) | | | (18,149 | ) | | | 761 | | | | 9,563 | | | | (145,963 | ) |
| | | | | | | | | | | | | | | | | | | | | | | | |
HC Advisors Shares | | | | | | | | | | | | | | | | | | | | | | | | |
Proceeds from shares issued | | | 43 | | | | 126 | | | | 320 | | | | 565 | | | | 74 | | | | 21 | |
Cost of shares redeemed | | | (1,325 | ) | | | (260 | ) | | | (1,829 | ) | | | (193 | ) | | | (495 | ) | | | (290 | ) |
| | | | | | | | | | | | | | | | | | | | | | | | |
Change in net assets from HC Advisors Shares of beneficial interest | | | (1,282 | ) | | | (134 | ) | | | (1,509 | ) | | | 372 | | | | (421 | ) | | | (269 | ) |
| | | | | | | | | | | | | | | | | | | | | | | | |
Change in net assets from shares of beneficial interest | | $ | (140,777 | ) | | $ | (364,816 | ) | | $ | (19,658 | ) | | $ | 1,133 | | | $ | 9,142 | | | $ | (146,232 | ) |
| | | | | | | | | | | | | | | | | | | | | | | | |
Change in net assets | | | (144,698 | ) | | | (57,908 | ) | | | (21,846 | ) | | | (797 | ) | | | (837 | ) | | | (110,977 | ) |
Net Assets: | | | | | | | | | | | | | | | | | | | | | | | | |
Beginning of period | | | 1,778,012 | | | | 1,835,920 | | | | 88,595 | | | | 89,392 | | | | 674,470 | | | | 785,447 | |
| | | | | | | | | | | | | | | | | | | | | | | | |
End of period | | $ | 1,633,314 | | | $ | 1,778,012 | | | $ | 66,749 | | | $ | 88,595 | | | $ | 673,633 | | | $ | 674,470 | |
| | | | | | | | | | | | | | | | | | | | | | | | |
Accumulated net investment income/(distributions in excess of net investment income) | | $ | (3,810 | ) | | $ | (2,563 | ) | | $ | 66 | | | $ | 26 | | | $ | 1,858 | | | $ | 1,567 | |
Share Transactions: | | | | | | | | | | | | | | | | | | | | | | | | |
HC Strategic Shares | | | | | | | | | | | | | | | | | | | | | | | | |
Issued | | | 7,956 | | | | 7,507 | | | | 1,218 | | | | 1,273 | | | | 9,968 | | | | 7,981 | |
Reinvested | | | 1,658 | | | | 2,075 | | | | 186 | | | | 191 | | | | 4,672 | | | | 4,611 | |
Redeemed | | | (16,917 | ) | | | (31,504 | ) | | | (3,261 | ) | | | (1,387 | ) | | | (13,264 | ) | | | (15,959 | ) |
Redeemed in redemption in-kind | | | — | | | | — | | | | — | | | | — | | | | — | | | | (18,105 | ) |
| | | | | | | | | | | | | | | | | | | | | | | | |
Change in HC Strategic Shares | | | (7,303 | ) | | | (21,922 | ) | | | (1,857 | ) | | | 77 | | | | 1,376 | | | | (21,472 | ) |
| | | | | | | | | | | | | | | | | | | | | | | | |
HC Advisors Shares | | | | | | | | | | | | | | | | | | | | | | | | |
Issued | | | 3 | | | | 8 | | | | 32 | | | | 58 | | | | 10 | | | | 3 | |
Redeemed | | | (68 | ) | | | (16 | ) | | | (190 | ) | | | (19 | ) | | | (71 | ) | | | (42 | ) |
| | | | | | | | | | | | | | | | | | | | | | | | |
Change in HC Advisors Shares | | | (65 | ) | | | (8 | ) | | | (158 | ) | | | 39 | | | | (61 | ) | | | (39 | ) |
| | | | | | | | | | | | | | | | | | | | | | | | |
Total change in shares | | | (7,368 | ) | | | (21,930 | ) | | | (2,015 | ) | | | 116 | | | | 1,315 | | | | (21,511 | ) |
| | | | | | | | | | | | | | | | | | | | | | | | |
Amounts designated as “—” are $0 or have been rounded to $0.
See accompanying notes to financial statements.
257
HC CAPITAL TRUST
Statements of Changes in Net Assets (continued)
(Amounts in thousands)
| | | | | | | | | | | | | | | | | | | | | | | | |
| | | The U.S. Government Fixed
Income Securities Portfolio | | | The Inflation Protected
Securities Portfolio | | | The U.S. Corporate Fixed
Income Securities Portfolio | |
| | | For the Year
Ended
June 30, 2018 | | | For the Year
Ended
June 30, 2017 | | | For the Year
Ended
June 30, 2018 | | | For the Year
Ended
June 30, 2017 | | | For the Year
Ended
June 30, 2018 | | | For the Year
Ended
June 30, 2017 | |
Operations: | | | | | | | | | | | | | | | | | | | | | | | | |
Net investment income | | $ | 3,951 | | | $ | 3,142 | | | $ | 10,021 | | | $ | 8,318 | | | $ | 8,031 | | | $ | 6,602 | |
Net realized gains/(losses) from investments | | | (604 | ) | | | 821 | | | | (534 | ) | | | 3,832 | | | | 336 | | | | 1,333 | |
Change in unrealized appreciation/(depreciation) from investments | | | (5,057 | ) | | | (7,898 | ) | | | (2,329 | ) | | | (14,671 | ) | | | (11,731 | ) | | | (3,463 | ) |
| | | | | | | | | | | | | | | | | | | | | | | | |
Change in net assets resulting from operations | | | (1,710 | ) | | | (3,935 | ) | | | 7,158 | | | | (2,521 | ) | | | (3,364 | ) | | | 4,472 | |
| | | | | | | | | | | | | | | | | | | | | | | | |
Distributions to Shareholders from: | | | | | | | | | | | | | | | | | | | | | | | | |
Net investment income: | | | | | | | | | | | | | | | | | | | | | | | | |
HC Strategic Shares | | | (3,895 | ) | | | (3,151 | ) | | | (8,925 | ) | | | (9,596 | ) | | | (7,952 | ) | | | (6,639 | ) |
HC Advisors Shares | | | — | | | | — | | | | — | | | | — | | | | — | | | | — | |
Net realized gains/(losses) from investments: | | | | | | | | | | | | | | | | | | | | | | | | |
HC Strategic Shares | | | — | | | | (2,142 | ) | | | — | | | | — | | | | (857 | ) | | | (675 | ) |
HC Advisors Shares | | | — | | | | — | | | | — | | | | — | | | | — | | | | — | |
| | | | | | | | | | | | | | | | | | | | | | | | |
Change in net assets resulting from distributions | | | (3,895 | ) | | | (5,293 | ) | | | (8,925 | ) | | | (9,596 | ) | | | (8,809 | ) | | | (7,314 | ) |
| | | | | | | | | | | | | | | | | | | | | | | | |
HC Strategic Shares | | | | | | | | | | | | | | | | | | | | | | | | |
Proceeds from shares issued | | $ | 42,103 | | | $ | 31,031 | | | $ | 63,067 | | | $ | 53,079 | | | $ | 56,118 | | | $ | 24,763 | |
Proceeds from reinvestment of dividends | | | 3,129 | | | | 4,634 | | | | 7,611 | | | | 8,536 | | | | 7,308 | | | | 5,980 | |
Cost of shares redeemed | | | (21,845 | ) | | | (52,637 | ) | | | (29,451 | ) | | | (31,326 | ) | | | (19,205 | ) | | | (62,324 | ) |
Cost of shares redeemed in redemption in-kind | | | — | | | | — | | | | — | | | | (149,328 | ) | | | — | | | | — | |
| | | | | | | | | | | | | | | | | | | | | | | | |
Change in net assets from HC Strategic Shares of beneficial interest | | | 23,387 | | | | (16,972 | ) | | | 41,227 | | | | (119,039 | ) | | | 44,221 | | | | (31,581 | ) |
| | | | | | | | | | | | | | | | | | | | | | | | |
HC Advisors Shares | | | | | | | | | | | | | | | | | | | | | | | | |
Proceeds from shares issued | | | — | | | | — | | | | — | | | | — | | | | — | | | | — | |
Cost of shares redeemed | | | — | | | | — | | | | — | | | | — | | | | — | | | | — | |
| | | | | | | | | | | | | | | | | | | | | | | | |
Change in net assets from HC Advisors Shares of beneficial interest | | | — | | | | — | | | | — | | | | — | | | | — | | | | — | |
| | | | | | | | | | | | | | | | | | | | | | | | |
Change in net assets from shares of beneficial interest | | | 23,387 | | | | (16,972 | ) | | | 41,227 | | | | (119,039 | ) | | | 44,221 | | | | (31,581 | ) |
| | | | | | | | | | | | | | | | | | | | | | | | |
Change in net assets | | | 17,782 | | | | (26,200 | ) | | | 39,460 | | | | (131,156 | ) | | | 32,048 | | | | (34,423 | ) |
Net Assets: | | | | | | | | | | | | | | | | | | | | | | | | |
Beginning of period | | | 215,595 | | | | 241,795 | | | | 361,997 | | | | 493,153 | | | | 254,908 | | | | 289,331 | |
| | | | | | | | | | | | | | | | | | | | | | | | |
End of period | | $ | 233,377 | | | $ | 215,595 | | | $ | 401,457 | | | $ | 361,997 | | | $ | 286,956 | | | $ | 254,908 | |
| | | | | | | | | | | | | | | | | | | | | | | | |
Accumulated net investment income | | $ | 99 | | | $ | 43 | | | $ | 2,752 | | | $ | 1,656 | | | $ | 223 | | | $ | 116 | |
Share Transactions: | | | | | | | | | | | | | | | | | | | | | | | | |
HC Strategic Shares | | | | | | | | | | | | | | | | | | | | | | | | |
Issued | | | 4,358 | | | | 3,136 | | | | 6,280 | | | | 5,229 | | | | 5,682 | | | | 2,485 | |
Reinvested | | | 322 | | | | 471 | | | | 757 | | | | 841 | | | | 738 | | | | 599 | |
Redeemed | | | (2,243 | ) | | | (5,194 | ) | | | (2,920 | ) | | | (3,040 | ) | | | (1,936 | ) | | | (6,148 | ) |
Redeemed in redemption in-kind | | | — | | | | — | | | | — | | | | (14,345 | ) | | | — | | | | — | |
| | | | | | | | | | | | | | | | | | | | | | | | |
Change in HC Strategic Shares | | | 2,437 | | | | (1,587 | ) | | | 4,117 | | | | (11,315 | ) | | | 4,484 | | | | (3,064 | ) |
| | | | | | | | | | | | | | | | | | | | | | | | |
HC Advisors Shares | | | | | | | | | | | | | | | | | | | | | | | | |
Issued | | | — | | | | — | | | | — | | | | — | | | | — | | | | — | |
Redeemed | | | — | | | | — | | | | — | | | | — | | | | — | | | | — | |
| | | | | | | | | | | | | | | | | | | | | | | | |
Change in HC Advisors Shares | | | — | | | | — | | | | — | | | | — | | | | — | | | | — | |
| | | | | | | | | | | | | | | | | | | | | | | | |
Total change in shares | | | 2,437 | | | | (1,587 | ) | | | 4,117 | | | | (11,315 | ) | | | 4,484 | | | | (3,064 | ) |
| | | | | | | | | | | | | | | | | | | | | | | | |
Amounts designated as “—” are $0 or have been rounded to $0.
See accompanying notes to financial statements.
258
HC CAPITAL TRUST
Statements of Changes in Net Assets (continued)
(Amounts in thousands)
| | | | | | | | | | | | | | | | | | | | | | | | |
| | | The U.S. Mortgage/Asset
Backed Fixed Income
Securities Portfolio | | | The Short-Term
Municipal Bond Portfolio | | | The Intermediate Term
Municipal Bond Portfolio | |
| | | For the Year
Ended
June 30, 2018 | | | For the Year
Ended
June 30, 2017 | | | For the Year
Ended
June 30, 2018 | | | For the Year
Ended
June 30, 2017 | | | For the Year
Ended
June 30, 2018 | | | For the Year
Ended
June 30, 2017 | |
Operations: | | | | | | | | | | | | | | | | | | | | | | | | |
Net investment income | | $ | 4,283 | | | $ | 3,431 | | | $ | 367 | | | $ | 190 | | | $ | 7,639 | | | $ | 7,587 | |
Net realized gains/(losses) from investments | | | (686 | ) | | | 433 | | | | (2 | ) | | | (1 | ) | | | 1,004 | | | | 2,048 | |
Change in unrealized appreciation/(depreciation) from investments | | | (4,024 | ) | | | (4,556 | ) | | | (66 | ) | | | (173 | ) | | | (8,265 | ) | | | (8,782 | ) |
| | | | | | | | | | | | | | | | | | | | | | | | |
Change in net assets resulting from operations | | | (427 | ) | | | (692 | ) | | | 299 | | | | 16 | | | | 378 | | | | 853 | |
| | | | | | | | | | | | | | | | | | | | | | | | |
Distributions to Shareholders from: | | | | | | | | | | | | | | | | | | | | | | | | |
Net investment income: | | | | | | | | | | | | | | | | | | | | | | | | |
HC Strategic Shares | | | (5,116 | ) | | | (4,771 | ) | | | (347 | ) | | | (186 | ) | | | (7,581 | ) | | | (7,564 | ) |
HC Advisors Shares | | | — | | | | — | | | | — | | | | — | | | | (26 | ) | | | (28 | ) |
| | | | | | | | | | | | | | | | | | | | | | | | |
Change in net assets resulting from distributions | | | (5,116 | ) | | | (4,771 | ) | | | (347 | ) | | | (186 | ) | | | (7,607 | ) | | | (7,592 | ) |
| | | | | | | | | | | | | | | | | | | | | | | | |
HC Strategic Shares | | | | | | | | | | | | | | | | | | | | | | | | |
Proceeds from shares issued | | $ | 37,726 | | | $ | 20,065 | | | $ | 67,127 | | | $ | 211 | | | $ | 42,500 | | | $ | 22,340 | |
Proceeds from reinvestment of dividends | | | 4,123 | | | | 3,790 | | | | 340 | | | | 186 | | | | 7,137 | | | | 7,067 | |
Cost of shares redeemed | | | (15,002 | ) | | | (30,213 | ) | | | (5,595 | ) | | | (1,104 | ) | | | (44,369 | ) | | | (43,861 | ) |
Cost of shares redeemed in redemption in-kind | | | — | | | | (13,314 | ) | | | — | | | | — | | | | — | | | | — | |
| | | | | | | | | | | | | | | | | | | | | | | | |
Change in net assets from HC Strategic Shares of beneficial interest | | | 26,847 | | | | (19,672 | ) | | | 61,872 | | | | (707 | ) | | | 5,268 | | | | (14,454 | ) |
| | | | | | | | | | | | | | | | | | | | | | | | |
HC Advisors Shares | | | | | | | | | | | | | | | | | | | | | | | | |
Proceeds from shares issued | | | — | | | | — | | | | — | | | | — | | | | 129 | | | | 123 | |
Cost of shares redeemed | | | — | | | | — | | | | — | | | | — | | | | (530 | ) | | | (62 | ) |
| | | | | | | | | | | | | | | | | | | | | | | | |
Change in net assets from HC Advisors Shares of beneficial interest | | | — | | | | — | | | | — | | | | — | | | | (401 | ) | | | 61 | |
| | | | | | | | | | | | | | | | | | | | | | | | |
Change in net assets from shares of beneficial interest | | $ | 26,847 | | | $ | (19,672 | ) | | $ | 61,872 | | | $ | (707 | ) | | $ | 4,867 | | | $ | (14,393 | ) |
| | | | | | | | | | | | | | | | | | | | | | | | |
Change in net assets | | | 21,304 | | | | (25,135 | ) | | | 61,824 | | | | (877 | ) | | | (2,362 | ) | | | (21,132 | ) |
Net Assets: | | | | | | | | | | | | | | | | | | | | | | | | |
Beginning of period | | | 183,834 | | | | 208,969 | | | | 17,788 | | | | 18,665 | | | | 386,570 | | | | 407,702 | |
| | | | | | | | | | | | | | | | | | | | | | | | |
End of period | | $ | 205,138 | | | $ | 183,834 | | | $ | 79,612 | | | $ | 17,788 | | | $ | 384,208 | | | $ | 386,570 | |
| | | | | | | | | | | | | | | | | | | | | | | | |
Accumulated net investment income/(distributions in excess of net investment income) | | $ | 128 | | | $ | 65 | | | $ | 15 | | | $ | (5 | ) | | $ | 174 | | | $ | 142 | |
Share Transactions: | | | | | | | | | | | | | | | | | | | | | | | | |
HC Strategic Shares | | | | | | | | | | | | | | | | | | | | | | | | |
Issued | | | 3,997 | | | | 2,078 | | | | 6,858 | | | | 21 | | | | 4,253 | | | | 2,220 | |
Reinvested | | | 436 | | | | 391 | | | | 35 | | | | 19 | | | | 715 | | | | 702 | |
Redeemed | | | (1,587 | ) | | | (3,093 | ) | | | (572 | ) | | | (111 | ) | | | (4,468 | ) | | | (4,361 | ) |
Redeemed in redemption in-kind | | | — | | | | (1,346 | ) | | | — | | | | — | | | | — | | | | — | |
| | | | | | | | | | | | | | | | | | | | | | | | |
Change in HC Strategic Shares | | | 2,846 | | | | (1,970 | ) | | | 6,321 | | | | (71 | ) | | | 500 | | | | (1,439 | ) |
| | | | | | | | | | | | | | | | | | | | | | | | |
HC Advisors Shares | | | | | | | | | | | | | | | | | | | | | | | | |
Issued | | | — | | | | — | | | | — | | | | — | | | | 13 | | | | 13 | |
Redeemed | | | — | | | | — | | | | — | | | | — | | | | (54 | ) | | | (6 | ) |
| | | | | | | | | | | | | | | | | | | | | | | | |
Change in HC Advisors Shares | | | — | | | | — | | | | — | | | | — | | | | (41 | ) | | | 7 | |
| | | | | | | | | | | | | | | | | | | | | | | | |
Total change in shares | | | 2,846 | | | | (1,970 | ) | | | 6,321 | | | | (71 | ) | | | 459 | | | | (1,432 | ) |
| | | | | | | | | | | | | | | | | | | | | | | | |
Amounts designated as “—” are $0 or have been rounded to $0.
See accompanying notes to financial statements.
259
HC CAPITAL TRUST
Statements of Changes in Net Assets (concluded)
(Amounts in thousands)
| | | | | | | | |
| | | The Intermediate Term
Municipal Bond II Portfolio | |
| | | For the Year
Ended
June 30, 2018 | | | For the Year
Ended
June 30, 2017 | |
Operations: | | | | | | | | |
Net investment income | | $ | 1,657 | | | $ | 1,562 | |
Net realized gains/(losses) from investments | | | 66 | | | | 4 | |
Change in unrealized appreciation/(depreciation) from investments | | | (1,674 | ) | | | (1,926 | ) |
| | | | | | | | |
Change in net assets resulting from operations | | | 49 | | | | (360 | ) |
| | | | | | | | |
Distributions to Shareholders from: | | | | | | | | |
Net investment income: | | | | | | | | |
HC Strategic Shares | | | (1,642 | ) | | | (1,550 | ) |
HC Advisors Shares | | | (8 | ) | | | (9 | ) |
Net realized gains/(losses) from investments: | | | | | | | | |
HC Strategic Shares | | | (3 | ) | | | (97 | ) |
HC Advisors Shares | | | — | | | | (1 | ) |
| | | | | | | | |
Change in net assets resulting from distributions | | | (1,653 | ) | | | (1,657 | ) |
| | | | | | | | |
HC Strategic Shares | | | | | | | | |
Proceeds from shares issued | | $ | 10,763 | | | $ | 7,701 | |
Proceeds from reinvestment of dividends | | | 1,533 | | | | 1,532 | |
Cost of shares redeemed | | | (7,407 | ) | | | (8,212 | ) |
| | | | | | | | |
Change in net assets from HC Strategic Shares of beneficial interest | | | 4,889 | | | | 1,021 | |
| | | | | | | | |
HC Advisors Shares | | | | | | | | |
Proceeds from shares issued | | | 33 | | | | 38 | |
Cost of shares redeemed | | | (138 | ) | | | (62 | ) |
| | | | | | | | |
Change in net assets from HC Advisors Shares of beneficial interest | | | (105 | ) | | | (24 | ) |
| | | | | | | | |
Change in net assets from shares of beneficial interest | | $ | 4,784 | | | $ | 997 | |
| | | | | | | | |
Change in net assets | | | 3,180 | | | | (1,020 | ) |
Net Assets: | | | | | | | | |
Beginning of period | | | 74,535 | | | | 75,555 | |
| | | | | | | | |
End of period | | $ | 77,715 | | | $ | 74,535 | |
| | | | | | | | |
Accumulated net investment income | | $ | 17 | | | $ | 10 | |
Share Transactions: | | | | | | | | |
HC Strategic Shares | | | | | | | | |
Issued | | | 1,053 | | | | 748 | |
Reinvested | | | 151 | | | | 148 | |
Redeemed | | | (729 | ) | | | (794 | ) |
| | | | | | | | |
Change in HC Strategic Shares | | | 475 | | | | 102 | |
| | | | | | | | |
HC Advisors Shares | | | | | | | | |
Issued | | | 3 | | | | 3 | |
Redeemed | | | (13 | ) | | | (6 | ) |
| | | | | | | | |
Change in HC Advisors Shares | | | (10 | ) | | | (3 | ) |
| | | | | | | | |
Total change in shares | | | 465 | | | | 99 | |
| | | | | | | | |
Amounts designated as “—” are $0 or have been rounded to $0.
See accompanying notes to financial statements.
260
(This page intentionally left blank.)
HC CAPITAL TRUST
Financial Highlights
Selected data for a share outstanding throughout the periods indicated.
| | | | | | | | | | | | | | | | | | | | | | | | | | | | |
| | | | | | Change in Net Assets Resulting
From Operations: | | | Distributions to Shareholders: | |
| | | Net Asset
Value,
Beginning
of Period | | | Net
Investment
Income/
(Loss) | | | Net Realized/
Unrealized
Gains/
(Losses) on
Investments | | | Total from
Operations | | | Net
Investment
Income | | | Net
Realized
Gains from
Investments | | | Total
Distributions to
Shareholders | |
The Value Equity Portfolio | | | | | | | | | | | | | | | | | | | | | | | | | | | | |
HC Strategic Shares | | | | | | | | | | | | | | | | | | | | | | | | | | | | |
Year Ended June 30, 2018 | | $ | 19.53 | | | $ | 0.42 | | | | $1.36 | | | $ | 1.78 | | | $ | (0.44 | ) | | $ | (0.92 | ) | | $ | (1.36 | ) |
Year Ended June 30, 2017 | | | 17.70 | | | | 0.42 | | | | 2.51 | | | | 2.93 | | | | (0.41 | ) | | | (0.69 | ) | | | (1.10 | ) |
Year Ended June 30, 2016 | | | 18.46 | | | | 0.41 | | | | (0.02 | ) | | | 0.39 | | | | (0.41 | ) | | | (0.74 | ) | | | (1.15 | ) |
Year Ended June 30, 2015 | | | 17.88 | | | | 0.36 | | | | 0.58 | | | | 0.94 | | | | (0.36 | ) | | | — | | | | (0.36 | ) |
Year Ended June 30, 2014 | | | 14.94 | | | | 0.42 | | | | 2.94 | | | | 3.36 | | | | (0.42 | ) | | | — | | | | (0.42 | ) |
HC Advisors Shares | | | | | | | | | | | | | | | | | | | | | | | | | | | | |
Year Ended June 30, 2018 | | $ | 19.52 | | | $ | 0.43 | | | | $1.36 | | | $ | 1.79 | | | $ | (0.44 | ) | | $ | (0.92 | ) | | $ | (1.36 | ) |
Year Ended June 30, 2017 | | | 17.69 | | | | 0.42 | | | | 2.51 | | | | 2.93 | | | | (0.41 | ) | | | (0.69 | ) | | | (1.10 | ) |
Year Ended June 30, 2016 | | | 18.46 | | | | 0.44 | | | | (0.06 | ) | | | 0.38 | | | | (0.41 | ) | | | (0.74 | ) | | | (1.15 | ) |
Year Ended June 30, 2015 | | | 17.88 | | | | 0.36 | | | | 0.58 | | | | 0.94 | | | | (0.36 | ) | | | — | | | | (0.36 | ) |
Year Ended June 30, 2014 | | | 14.94 | | | | 0.43 | | | | 2.93 | | | | 3.36 | | | | (0.42 | ) | | | — | | | | (0.42 | ) |
The Institutional Value Equity Portfolio | | | | | | | | | | | | | | | | | | | | | | | | | | | | |
HC Strategic Shares | | | | | | | | | | | | | | | | | | | | | | | | | | | | |
Year Ended June 30, 2018 | | $ | 12.99 | | | $ | 0.26 | | | | $0.83 | | | $ | 1.09 | | | $ | (0.27 | ) | | $ | (0.86 | ) | | $ | (1.13 | ) |
Year Ended June 30, 2017 | | | 11.99 | | | | 0.27 | | | | 1.69 | | | | 1.96 | | | | (0.26 | ) | | | (0.70 | ) | | | (0.96 | ) |
Year Ended June 30, 2016 | | | 13.49 | | | | 0.27 | | | | (0.05 | ) | | | 0.22 | | | | (0.27 | ) | | | (1.45 | ) | | | (1.72 | ) |
Year Ended June 30, 2015 | | | 14.79 | | | | 0.27 | | | | 0.44 | | | | 0.71 | | | | (0.28 | ) | | | (1.73 | ) | | | (2.01 | ) |
Year Ended June 30, 2014 | | | 14.60 | | | | 0.36 | (b) | | | 2.66 | (b) | | | 3.02 | | | | (0.35 | ) | | | (2.48 | ) | | | (2.83 | ) |
HC Advisors Shares | | | | | | | | | | | | | | | | | | | | | | | | | | | | |
Year Ended June 30, 2018 | | $ | 13.00 | | | $ | 0.30 | | | | $0.79 | | | $ | 1.09 | | | $ | (0.27 | ) | | $ | (0.86 | ) | | $ | (1.13 | ) |
Year Ended June 30, 2017 | | | 12.00 | | | | 0.27 | | | | 1.69 | | | | 1.96 | | | | (0.26 | ) | | | (0.70 | ) | | | (0.96 | ) |
Year Ended June 30, 2016 | | | 13.50 | | | | 0.28 | | | | (0.06 | ) | | | 0.22 | | | | (0.27 | ) | | | (1.45 | ) | | | (1.72 | ) |
Year Ended June 30, 2015 | | | 14.79 | | | | 0.27 | | | | 0.45 | | | | 0.72 | | | | (0.28 | ) | | | (1.73 | ) | | | (2.01 | ) |
Year Ended June 30, 2014 | | | 14.60 | | | | 0.36 | (b) | | | 2.66 | (b) | | | 3.02 | | | | (0.35 | ) | | | (2.48 | ) | | | (2.83 | ) |
The Growth Equity Portfolio | | | | | | | | | | | | | | | | | | | | | | | | | | | | |
HC Strategic Shares | | | | | | | | | | | | | | | | | | | | | | | | | | | | |
Year Ended June 30, 2018 | | $ | 20.90 | | | $ | 0.22 | | | | $3.70 | | | $ | 3.92 | | | $ | (0.22 | ) | | $ | (1.06 | ) | | $ | (1.28 | ) |
Year Ended June 30, 2017 | | | 18.78 | | | | 0.19 | | | | 3.27 | | | | 3.46 | | | | (0.19 | ) | | | (1.15 | ) | | | (1.34 | ) |
Year Ended June 30, 2016 | | | 22.37 | | | | 0.20 | | | | 1.03 | | | | 1.23 | | | | (0.20 | ) | | | (4.62 | ) | | | (4.82 | ) |
Year Ended June 30, 2015 | | | 20.51 | | | | 0.19 | | | | 2.10 | | | | 2.29 | | | | (0.19 | ) | | | (0.24 | ) | | | (0.43 | ) |
Year Ended June 30, 2014 | | | 16.95 | | | | 0.21 | | | | 3.56 | | | | 3.77 | | | | (0.21 | ) | | | — | | | | (0.21 | ) |
HC Advisors Shares | | | | | | | | | | | | | | | | | | | | | | | | | | | | |
Year Ended June 30, 2018 | | $ | 20.86 | | | $ | 0.22 | | | | $3.70 | | | $ | 3.92 | | | $ | (0.22 | ) | | $ | (1.06 | ) | | $ | (1.28 | ) |
Year Ended June 30, 2017 | | | 18.76 | | | | 0.19 | | | | 3.25 | | | | 3.44 | | | | (0.19 | ) | | | (1.15 | ) | | | (1.34 | ) |
Year Ended June 30, 2016 | | | 22.35 | | | | 0.22 | | | | 1.01 | | | | 1.23 | | | | (0.20 | ) | | | (4.62 | ) | | | (4.82 | ) |
Year Ended June 30, 2015 | | | 20.48 | | | | 0.19 | | | | 2.11 | | | | 2.30 | | | | (0.19 | ) | | | (0.24 | ) | | | (0.43 | ) |
Year Ended June 30, 2014 | | | 16.93 | | | | 0.21 | | | | 3.55 | | | | 3.76 | | | | (0.21 | ) | | | — | | | | (0.21 | ) |
The Institutional Growth Equity Portfolio | | | | | | | | | | | | | | | | | | | | | | | | | | | | |
HC Strategic Shares | | | | | | | | | | | | | | | | | | | | | | | | | | | | |
Year Ended June 30, 2018 | | $ | 16.10 | | | $ | 0.18 | | | | $2.82 | | | $ | 3.00 | | | $ | (0.18 | ) | | $ | (0.67 | ) | | $ | (0.85 | ) |
Year Ended June 30, 2017 | | | 14.80 | | | | 0.17 | | | | 2.48 | | | | 2.65 | | | | (0.17 | ) | | | (1.18 | ) | | | (1.35 | ) |
Year Ended June 30, 2016 | | | 17.14 | | | | 0.16 | | | | 0.85 | | | | 1.01 | | | | (0.16 | ) | | | (3.19 | ) | | | (3.35 | ) |
Year Ended June 30, 2015 | | | 16.59 | | | | 0.16 | | | | 1.63 | | | | 1.79 | | | | (0.15 | ) | | | (1.09 | ) | | | (1.24 | ) |
Year Ended June 30, 2014 | | | 15.00 | | | | 0.18 | | | | 3.01 | | | | 3.19 | | | | (0.19 | ) | | | (1.41 | ) | | | (1.60 | ) |
HC Advisors Shares | | | | | | | | | | | | | | | | | | | | | | | | | | | | |
Year Ended June 30, 2018 | | $ | 16.10 | | | $ | 0.20 | | | | $2.80 | | | $ | 3.00 | | | $ | (0.18 | ) | | $ | (0.67 | ) | | $ | (0.85 | ) |
Year Ended June 30, 2017 | | | 14.80 | | | | 0.17 | | | | 2.48 | | | | 2.65 | | | | (0.17 | ) | | | (1.18 | ) | | | (1.35 | ) |
Year Ended June 30, 2016 | | | 17.15 | | | | 0.17 | | | | 0.83 | | | | 1.00 | | | | (0.16 | ) | | | (3.19 | ) | | | (3.35 | ) |
Year Ended June 30, 2015 | | | 16.59 | | | | 0.16 | | | | 1.64 | | | | 1.80 | | | | (0.15 | ) | | | (1.09 | ) | | | (1.24 | ) |
Year Ended June 30, 2014 | | | 15.00 | | | | 0.19 | | | | 3.00 | | | | 3.19 | | | | (0.19 | ) | | | (1.41 | ) | | | (1.60 | ) |
| (a) | Portfolio turnover is calculated on the basis of the Portfolio, as a whole, without distinguishing between the classes of shares issued. |
| (b) | Per share amounts are based on average shares outstanding. |
See accompanying notes to financial statements.
262
| | | | | | | | | | | | | | | | | | | | | | | | | | |
| | | | | | | | | | Ratios/Supplementary Data: | |
Net Asset Value,
End of Period | | | Total
Return | | | Net Assets at
End of Period
(in thousands) | | | Ratio of Expenses to
Average Net Assets,
Prior to Expenses
Paid Indirectly
and Waivers | | | Ratio of Expenses to
Average Net Assets,
Net of Expenses
Paid Indirectly
and Waivers | | | Ratio of Net
Investment
Income (Loss)
to Average
Net Assets | | | Portfolio
Turnover
Rate(a) | |
| | | | | | | | | | | | | | | | | | | | | | | | | | |
| | | | | | | | | | | | | | | | | | | | | | | | | | |
| | $19.95 | | | | 9.11% | | | | $599,457 | | | | 0.27% | | | | 0.26% | | | | 2.10% | | | | 58.60% | |
| | 19.53 | | | | 16.78% | | | | 612,508 | | | | 0.29% | | | | 0.28% | | | | 2.22% | | | | 61.30% | |
| | 17.70 | | | | 2.49% | | | | 583,078 | | | | 0.27% | | | | 0.26% | | | | 2.35% | | | | 66.86% | |
| | 18.46 | | | | 5.27% | | | | 622,022 | | | | 0.29% | | | | 0.28% | | | | 1.95% | | | | 123.19% | |
| | 17.88 | | | | 22.69% | | | | 628,645 | | | | 0.32% | | | | 0.31% | | | | 2.44% | | | | 53.96% | |
| | | | | | | | | | | | | | | | | | | | | | | | | | |
| | $19.95 | | | | 9.17% | | | | $675 | | | | 0.52% | | | | 0.26% | | | | 2.08% | | | | 58.60% | |
| | 19.52 | | | | 16.79% | | | | 845 | | | | 0.54% | | | | 0.28% | | | | 2.22% | | | | 61.30% | |
| | 17.69 | | | | 2.43% | | | | 786 | | | | 0.52% | | | | 0.26% | | | | 2.38% | | | | 66.86% | |
| | 18.46 | | | | 5.27% | | | | 1,163 | | | | 0.54% | | | | 0.28% | | | | 1.94% | | | | 123.19% | |
| | 17.88 | | | | 22.69% | | | | 1,217 | | | | 0.57% | | | | 0.31% | | | | 2.43% | | | | 53.96% | |
| | | | | | | | | | | | | | | | | | | | | | | | | | |
| | | | | | | | | | | | | | | | | | | | | | | | | | |
| | $12.95 | | | | 8.35% | | | | $928,683 | | | | 0.26% | | | | 0.25% | | | | 2.04% | | | | 68.39% | |
| | 12.99 | | | | 16.66% | | | | 797,147 | | | | 0.29% | | | | 0.28% | | | | 2.08% | | | | 55.25% | |
| | 11.99 | | | | 2.44% | | | | 912,029 | | | | 0.26% | | | | 0.25% | | | | 2.24% | | | | 67.08% | |
| | 13.49 | | | | 5.05% | | | | 915,067 | | | | 0.28% | | | | 0.27% | | | | 1.95% | | | | 119.98% | |
| | 14.79 | | | | 22.82% | | | | 1,036,650 | | | | 0.32% | | | | 0.31% | | | | 2.45% | | | | 63.68% | |
| | | | | | | | | | | | | | | | | | | | | | | | | | |
| | $12.96 | | | | 8.34% | | | | $738 | | | | 0.51% | | | | 0.25% | | | | 1.99% | | | | 68.39% | |
| | 13.00 | | | | 16.65% | | | | 1,493 | | | | 0.54% | | | | 0.28% | | | | 2.13% | | | | 55.25% | |
| | 12.00 | | | | 2.44% | | | | 1,435 | | | | 0.51% | | | | 0.25% | | | | 2.25% | | | | 67.08% | |
| | 13.50 | | | | 5.12% | | | | 1,613 | | | | 0.53% | | | | 0.27% | | | | 1.96% | | | | 119.98% | |
| | 14.79 | | | | 22.82% | | | | 1,434 | | | | 0.57% | | | | 0.31% | | | | 2.45% | | | | 63.68% | |
| | | | | | | | | | | | | | | | | | | | | | | | | | |
| | | | | | | | | | | | | | | | | | | | | | | | | | |
| | $23.54 | | | | 19.12% | | | | $808,868 | | | | 0.30% | | | | 0.29% | | | | 0.96% | | | | 39.77% | |
| | 20.90 | | | | 19.31% | | | | 786,563 | | | | 0.31% | | | | 0.31% | | | | 0.98% | | | | 38.28% | |
| | 18.78 | | | | 5.88% | | | | 763,770 | | | | 0.29% | | | | 0.29% | | | | 0.99% | | | | 38.90% | |
| | 22.37 | | | | 11.27% | | | | 872,004 | | | | 0.30% | | | | 0.30% | | | | 0.88% | | | | 57.33% | |
| | 20.51 | | | | 22.33% | | | | 839,813 | | | | 0.28% | | | | 0.28% | | | | 1.09% | | | | 30.28% | |
| | | | | | | | | | | | | | | | | | | | | | | | | | |
| | $23.50 | | | | 19.16% | | | | $922 | | | | 0.55% | | | | 0.29% | | | | 0.94% | | | | 39.77% | |
| | 20.86 | | | | 19.23% | | | | 1,118 | | | | 0.56% | | | | 0.31% | | | | 0.98% | | | | 38.28% | |
| | 18.76 | | | | 5.89% | | | | 1,085 | | | | 0.54% | | | | 0.29% | | | | 1.00% | | | | 38.90% | |
| | 22.35 | | | | 11.34% | | | | 1,623 | | | | 0.55% | | | | 0.30% | | | | 0.88% | | | | 57.33% | |
| | 20.48 | | | | 22.29% | | | | 1,690 | | | | 0.53% | | | | 0.28% | | | | 1.09% | | | | 30.28% | |
| | | | | | | | | | | | | | | | | | | | | | | | | | |
| | | | | | | | | | | | | | | | | | | | | | | | | | |
| | $18.25 | | | | 18.97% | | | | $1,187,715 | | | | 0.28% | | | | 0.28% | | | | 1.04% | | | | 43.36% | |
| | 16.10 | | | | 19.03% | | | | 1,034,294 | | | | 0.29% | | | | 0.29% | | | | 1.06% | | | | 21.93% | |
| | 14.80 | | | | 6.36% | | | | 1,282,473 | | | | 0.27% | | | | 0.27% | | | | 1.05% | | | | 37.43% | |
| | 17.14 | | | | 11.14% | | | | 1,317,132 | | | | 0.29% | | | | 0.28% | | | | 0.93% | | | | 96.81% | |
| | 16.59 | | | | 22.19% | | | | 1,442,721 | | | | 0.26% | | | | 0.26% | | | | 1.15% | | | | 48.43% | |
| | | | | | | | | | | | | | | | | | | | | | | | | | |
| | $18.25 | | | | 18.97% | | | | $1,026 | | | | 0.53% | | | | 0.28% | | | | 1.00% | | | | 43.36% | |
| | 16.10 | | | | 19.03% | | | | 2,008 | | | | 0.54% | | | | 0.29% | | | | 1.08% | | | | 21.93% | |
| | 14.80 | | | | 6.30% | | | | 1,931 | | | | 0.52% | | | | 0.27% | | | | 1.05% | | | | 37.43% | |
| | 17.15 | | | | 11.20% | | | | 2,187 | | | | 0.54% | | | | 0.28% | | | | 0.93% | | | | 96.81% | |
| | 16.59 | | | | 22.19% | | | | 1,935 | | | | 0.51% | | | | 0.26% | | | | 1.16% | | | | 48.43% | |
See accompanying notes to financial statements.
263
HC CAPITAL TRUST
Financial Highlights (continued)
Selected data for a share outstanding throughout the periods indicated.
| | | | | | | | | | | | | | | | | | | | | | | | | | | | |
| | | | | | Change in Net Assets Resulting
From Operations: | | | Distributions to Shareholders: | |
| | | Net Asset
Value,
Beginning of
Period | | | Net
Investment
Income/
(Loss) | | | Net Realized/
Unrealized
Gains/
(Losses) on
Investments | | | Total from
Operations | | | Net
Investment
Income | | | Net
Realized
Gains from
Investments | | | Tax
Return of
Capital | |
The Small Capitalization-Mid Capitalization
Equity Portfolio | |
HC Strategic Shares | | | | | | | | | | | | | | | | | | | | | | | | | | | | |
Year Ended June 30, 2018 | | $ | 25.23 | | | | $0.10 | | | | $4.29 | | | | $4.39 | | | $ | (0.10 | ) | | $ | — | | | $ | — | |
Year Ended June 30, 2017 | | | 21.04 | | | | 0.02 | | | | 4.20 | | | | 4.22 | | | | (0.03 | ) | | | — | | | | — | |
Year Ended June 30, 2016 | | | 22.68 | | | | 0.02 | | | | (1.65 | ) | | | (1.63 | ) | | | (0.01 | ) | | | — | | | | — | (d) |
Year Ended June 30, 2015 | | | 21.22 | | | | (0.01 | ) | | | 1.48 | | | | 1.47 | | | | (0.01 | ) | | | — | | | | — | |
Year Ended June 30, 2014 | | | 17.12 | | | | 0.06 | | | | 4.11 | | | | 4.17 | | | | (0.07 | ) | | | — | | | | — | |
HC Advisors Shares | |
Year Ended June 30, 2018 | | $ | 25.21 | | | | $0.10 | | | | $4.28 | | | | $4.38 | | | $ | (0.10 | ) | | $ | — | | | $ | — | |
Year Ended June 30, 2017 | | | 21.02 | | | | 0.02 | | | | 4.20 | | | | 4.22 | | | | (0.03 | ) | | | — | | | | — | |
Year Ended June 30, 2016 | | | 22.66 | | | | 0.01 | | | | (1.64 | ) | | | (1.63 | ) | | | (0.01 | ) | | | — | | | | — | (d) |
Year Ended June 30, 2015 | | | 21.20 | | | | (0.01 | ) | | | 1.48 | | | | 1.47 | | | | (0.01 | ) | | | — | | | | — | |
Year Ended June 30, 2014 | | | 17.10 | | | | 0.06 | | | | 4.11 | | | | 4.17 | | | | (0.07 | ) | | | — | | | | — | |
The Institutional Small Capitalization-Mid
Capitalization Equity Portfolio | |
HC Strategic Shares | | | | | | | | | | | | | | | | | | | | | | | | | | | | |
Year Ended June��30, 2018 | | $ | 17.08 | | | | $0.08 | | | | $2.88 | | | | $2.96 | | | $ | (0.08 | ) | | $ | (1.57 | ) | | $ | — | |
Year Ended June 30, 2017 | | | 14.57 | | | | 0.02 | | | | 2.81 | | | | 2.83 | | | | (0.03 | ) | | | (0.29 | ) | | | — | |
Year Ended June 30, 2016 | | | 16.61 | | | | 0.03 | | | | (1.15 | ) | | | (1.12 | ) | | | — | (d) | | | (0.90 | ) | | | (0.02 | ) |
Year Ended June 30, 2015 | | | 17.19 | | | | 0.01 | | | | 1.14 | | | | 1.15 | | | | (0.01 | ) | | | (1.72 | ) | | | — | |
Year Ended June 30, 2014 | | | 17.09 | | | | 0.03 | | | | 3.28 | | | | 3.31 | | | | (0.03 | ) | | | (3.18 | ) | | | — | |
HC Advisors Shares | |
Year Ended June 30, 2018 | | $ | 17.07 | | | | $0.10 | | | | $2.87 | | | | $2.97 | | | $ | (0.08 | ) | | $ | (1.57 | ) | | $ | — | |
Year Ended June 30, 2017 | | | 14.57 | | | | 0.03 | | | | 2.79 | | | | 2.82 | | | | (0.03 | ) | | | (0.29 | ) | | | — | |
Year Ended June 30, 2016 | | | 16.61 | | | | 0.03 | | | | (1.15 | ) | | | (1.12 | ) | | | — | (d) | | | (0.90 | ) | | | (0.02 | ) |
Year Ended June 30, 2015 | | | 17.19 | | | | 0.01 | | | | 1.14 | | | | 1.15 | | | | (0.01 | ) | | | (1.72 | ) | | | — | |
Year Ended June 30, 2014 | | | 17.09 | | | | 0.03 | | | | 3.28 | | | | 3.31 | | | | (0.03 | ) | | | (3.18 | ) | | | — | |
The Real Estate Securities Portfolio | |
HC Strategic Shares | | | | | | | | | | | | | | | | | | | | | | | | | | | | |
Year Ended June 30, 2018 | | $ | 3.03 | | | | $0.05 | | | | $0.05 | | | | $0.10 | | | $ | (0.05 | ) | | $ | (0.09 | ) | | $ | — | |
Year Ended June 30, 2017 | | | 3.39 | | | | 0.04 | | | | (0.05 | ) | | | (0.01 | ) | | | (0.04 | ) | | | (0.31 | ) | | | — | |
Year Ended June 30, 2016 | | | 3.24 | | | | 0.05 | | | | 0.52 | | | | 0.57 | | | | (0.04 | ) | | | (0.38 | ) | | | — | |
Year Ended June 30, 2015 | | | 3.20 | | | | 0.04 | | | | 0.21 | | | | 0.25 | | | | (0.05 | ) | | | (0.16 | ) | | | — | |
Year Ended June 30, 2014(e) | | | 2.76 | | | | 0.05 | | | | 0.41 | | | | 0.46 | | | | (0.02 | ) | | | — | (d) | | | — | |
| (a) | Not annualized for periods less than one year. |
| (b) | Annualized for periods less than one year. |
| (c) | Portfolio turnover is calculated on the basis of the Portfolio, as a whole, without distinguishing between the classes of shares issued. |
| (d) | Amount rounds to less than $0.005 per share. |
| (e) | For the period September 12, 2013 (commencement of operations) through June 30, 2014. |
See accompanying notes to financial statements.
264
| | | | | | | | | | | | | | | | | | | | | | | | | | | | | | |
Distributions to
Shareholders: | | | | | | | | | | | | Ratios/Supplementary Data: | |
Total
Distributions to
Shareholders | | | Net Asset Value,
End of Period | | | Total
Return(a) | | | Net Assets at
End of Period
(in thousands) | | | Ratio of Expenses to
Average Net Assets,
Prior to Expenses
Paid Indirectly
and Waivers(b) | | | Ratio of Expenses to
Average Net Assets,
Net of Expenses
Paid Indirectly
and Waivers(b) | | | Ratio of Net
Investment
Income (Loss)
to Average
Net Assets(b) | | | Portfolio
Turnover
Rate(a)(c) | |
| | | | | | | | | | | | | | | | | | | | | | | | | | | | | | |
| | | | | | | | | | | | | | | | | | | | | | | | | | | | | | |
| $ | (0.10) | | | $ | 29.52 | | | | 17.42 | % | | $ | 110,489 | | | | 0.77% | | | | 0.76% | | | | 0.37 | % | | | 61.65% | |
| | (0.03) | | | | 25.23 | | | | 20.07 | % | | | 107,395 | | | | 0.83% | | | | 0.82% | | | | 0.09 | % | | | 48.52% | |
| | (0.01) | | | | 21.04 | | | | (7.17 | )% | | | 98,325 | | | | 0.79% | | | | 0.76% | | | | 0.09 | % | | | 48.89% | |
| | (0.01) | | | | 22.68 | | | | 6.91 | % | | | 114,754 | | | | 0.83% | | | | 0.82% | | | | (0.06 | )% | | | 67.34% | |
| | (0.07) | | | | 21.22 | | | | 24.38 | % | | | 113,698 | | | | 0.61% | | | | 0.60% | | | | 0.32 | % | | | 41.18% | |
| | | | | | | | | | | | | | | | | | | | | | | | | | | | | | |
| $ | (0.10) | | | $ | 29.49 | | | | 17.40 | % | | $ | 121 | | | | 1.02% | | | | 0.76% | | | | 0.36 | % | | | 61.65% | |
| | (0.03) | | | | 25.21 | | | | 20.09 | % | | | 141 | | | | 1.08% | | | | 0.82% | | | | 0.09 | % | | | 48.52% | |
| | (0.01) | | | | 21.02 | | | | (7.18 | )% | | | 131 | | | | 1.04% | | | | 0.76% | | | | 0.08 | % | | | 48.89% | |
| | (0.01) | | | | 22.66 | | | | 6.92 | % | | | 195 | | | | 1.08% | | | | 0.82% | | | | (0.06 | )% | | | 67.34% | |
| | (0.07) | | | | 21.20 | | | | 24.41 | % | | | 207 | | | | 0.86% | | | | 0.60% | | | | 0.32 | % | | | 41.18% | |
| | | | | | | | | | | | | | | | | | | | | | | | | | | | | | |
| | | | | | | | | | | | | | | | | | | | | | | | | | | | | | |
| $ | (1.65) | | | $ | 18.39 | | | | 18.11 | % | | $ | 159,774 | | | | 0.70% | | | | 0.70% | | | | 0.49 | % | | | 95.15% | |
| | (0.32) | | | | 17.08 | | | | 19.50 | % | | | 143,995 | | | | 0.75% | | | | 0.75% | | | | 0.14 | % | | | 47.63% | |
| | (0.92) | | | | 14.57 | | | | (6.69 | )% | | | 192,253 | | | | 0.72% | | | | 0.69% | | | | 0.17 | % | | | 52.38% | |
| | (1.73) | | | | 16.61 | | | | 7.43 | % | | | 200,423 | | | | 0.81% | | | | 0.80% | | | | 0.03 | % | | | 83.94% | |
| | (3.21) | | | | 17.19 | | | | 20.85 | % | | | 182,460 | | | | 0.70% | | | | 0.70% | | | | 0.21 | % | | | 67.75% | |
| | | | | | | | | | | | | | | | | | | | | | | | | | | | | | |
| $ | (1.65) | | | $ | 18.39 | | | | 18.18 | % | | $ | 132 | | | | 0.95% | | | | 0.70% | | | | 0.50 | % | | | 95.15% | |
| | (0.32) | | | | 17.07 | | | | 19.43 | % | | | 248 | | | | 1.00% | | | | 0.75% | | | | 0.16 | % | | | 47.63% | |
| | (0.92) | | | | 14.57 | | | | (6.69 | )% | | | 235 | | | | 0.97% | | | | 0.69% | | | | 0.16 | % | | | 52.38% | |
| | (1.73) | | | | 16.61 | | | | 7.43 | % | | | 265 | | | | 1.06% | | | | 0.80% | | | | 0.03 | % | | | 83.94% | |
| | (3.21) | | | | 17.19 | | | | 20.85 | % | | | 239 | | | | 0.95% | | | | 0.70% | | | | 0.22 | % | | | 67.75% | |
| | | | | | | | | | | | | | | | | | | | | | | | | | | | | | |
| | | | | | | | | | | | | | | | | | | | | | | | | | | | | | |
| $ | (0.14) | | | $ | 2.99 | | | | 3.20 | % | | $ | 131,601 | | | | 0.74% | | | | 0.74% | | | | 1.76 | % | | | 49.59% | |
| | (0.35) | | | | 3.03 | | | | 0.44 | % | | | 123,794 | | | | 0.77% | | | | 0.77% | | | | 1.19 | % | | | 58.32% | |
| | (0.42) | | | | 3.39 | | | | 18.81 | % | | | 151,512 | | | | 0.77% | | | | 0.77% | | | | 1.44 | % | | | 51.03% | |
| | (0.21) | | | | 3.24 | | | | 7.44 | % | | | 132,758 | | | | 0.79% | | | | 0.79% | | | | 1.22 | % | | | 60.49% | |
| | (0.02) | | | | 3.20 | | | | 17.00 | % | | | 171,583 | | | | 0.79% | | | | 0.78% | | | | 1.94 | % | | | 52.49% | |
See accompanying notes to financial statements.
265
HC CAPITAL TRUST
Financial Highlights (continued)
Selected data for a share outstanding throughout the periods indicated.
| | | | | | | | | | | | | | | | | | | | | | | | | | | | |
| | | | | | Change in Net Assets Resulting
From Operations: | | | Distributions to Shareholders: | |
| | | Net Asset
Value,
Beginning of
Period | | | Net
Investment
Income/
(Loss) | | | Net Realized/
Unrealized
Gains/
(Losses) on
Investments | | | Total from
Operations | | | Net
Investment
Income | | | Net
Realized
Gains from
Investments | | | Total
Distributions to
Shareholders | |
The Commodity Returns Strategy Portfolio(d) | | | | | | | | | | | | | | | | | | | | | | | | | | | | |
HC Strategic Shares | | | | | | | | | | | | | | | | | | | | | | | | | | | | |
Year Ended June 30, 2018 | | $ | 8.48 | | | $ | 0.23 | | | $ | 1.34 | | | $ | 1.57 | | | $ | (0.29 | ) | | $ | — | | | $ | (0.29 | ) |
Year Ended June 30, 2017 | | | 7.87 | | | | 0.18 | | | | 0.60 | | | | 0.78 | | | | (0.17 | ) | | | — | | | | (0.17 | ) |
Year Ended June 30, 2016 | | | 8.80 | | | | 0.14 | | | | (0.94 | ) | | | (0.80 | ) | | | (0.13 | ) | | | — | | | | (0.13 | ) |
Year Ended June 30, 2015 | | | 11.64 | | | | 0.13 | | | | (2.79 | ) | | | (2.66 | ) | | | (0.14 | ) | | | (0.04 | ) | | | (0.18 | ) |
Year Ended June 30, 2014 | | | 9.82 | | | | 0.09 | | | | 1.83 | | | | 1.92 | | | | (0.10 | ) | | | — | | | | (0.10 | ) |
HC Advisors Shares | | | | | | | | | | | | | | | | | | | | | | | | | | | | |
Year Ended June 30, 2018 | | $ | 8.48 | | | $ | 0.20 | | | $ | 1.37 | | | $ | 1.57 | | | $ | (0.29 | ) | | $ | — | | | $ | (0.29 | ) |
Year Ended June 30, 2017 | | | 7.86 | | | | 0.17 | | | | 0.62 | | | | 0.79 | | | | (0.17 | ) | | | — | | | | (0.17 | ) |
Year Ended June 30, 2016 | | | 8.80 | | | | 0.14 | | | | (0.95 | ) | | | (0.81 | ) | | | (0.13 | ) | | | — | | | | (0.13 | ) |
Year Ended June 30, 2015 | | | 11.63 | | | | 0.13 | | | | (2.78 | ) | | | (2.65 | ) | | | (0.14 | ) | | | (0.04 | ) | | | (0.18 | ) |
Year Ended June 30, 2014 | | | 9.81 | | | | 0.08 | | | | 1.84 | | | | 1.92 | | | | (0.10 | ) | | | — | | | | (0.10 | ) |
The ESG Growth Portfolio | | | | | | | | | | | | | | | | | | | | | | | | | | | | |
HC Strategic Shares | | | | | | | | | | | | | | | | | | | | | | | | | | | | |
Year Ended June 30, 2018 | | $ | 10.65 | | | $ | 0.30 | | | $ | 0.78 | | | $ | 1.08 | | | $ | (0.31 | ) | | $ | — | | | $ | (0.31 | ) |
Year Ended June 30, 2017 | | | 9.34 | | | | 0.27 | | | | 1.32 | | | | 1.59 | | | | (0.28 | ) | | | — | | | | (0.28 | ) |
Period Ended June 30, 2016(e) | | | 10.00 | | | | 0.24 | | | | (0.65 | ) | | | (0.41 | ) | | | (0.23 | ) | | | (0.02 | ) | | | (0.25 | ) |
HC Advisors Shares | | | | | | | | | | | | | | | | | | | | | | | | | | | | |
Year Ended June 30, 2018 | | $ | 10.64 | | | $ | 0.30 | | | $ | 0.78 | | | $ | 1.08 | | | $ | (0.31 | ) | | $ | — | | | $ | (0.31 | ) |
Year Ended June 30, 2017 | | | 9.34 | | | | 0.27 | | | | 1.31 | | | | 1.58 | | | | (0.28 | ) | | | — | | | | (0.28 | ) |
Period Ended June 30, 2016(e) | | | 10.00 | | | | 0.24 | | | | (0.65 | ) | | | (0.41 | ) | | | (0.23 | ) | | | (0.02 | ) | | | (0.25 | ) |
The Catholic SRI Growth Portfolio | | | | | | | | | | | | | | | | | | | | | | | | | | | | |
HC Strategic Shares | | | | | | | | | | | | | | | | | | | | | | | | | | | | |
Year Ended June 30, 2018 | | $ | 12.02 | | | $ | 0.34 | | | $ | 1.00 | | | $ | 1.34 | | | $ | (0.34 | ) | | $ | (0.31 | ) | | $ | (0.65 | ) |
Year Ended June 30, 2017 | | | 10.75 | | | | 0.31 | | | | 1.58 | | | | 1.89 | | | | (0.35 | ) | | | (0.27 | ) | | | (0.62 | ) |
Period Ended June 30, 2016(f) | | | 10.00 | | | | 0.19 | | | | 0.74 | | | | 0.93 | | | | (0.18 | ) | | | — | | | | (0.18 | ) |
HC Advisors Shares | | | | | | | | | | | | | | | | | | | | | | | | | | | | |
Year Ended June 30, 2018 | | $ | 12.03 | | | $ | 0.35 | | | $ | 0.99 | | | $ | 1.34 | | | $ | (0.34 | ) | | $ | (0.31 | ) | | $ | (0.65 | ) |
Year Ended June 30, 2017 | | | 10.76 | | | | 0.32 | | | | 1.57 | | | | 1.89 | | | | (0.35 | ) | | | (0.27 | ) | | | (0.62 | ) |
Period Ended June 30, 2016(f) | | | 10.00 | | | | 0.19 | | | | 0.75 | | | | 0.94 | | | | (0.18 | ) | | | — | | | | (0.18 | ) |
The International Equity Portfolio | | | | | | | | | | | | | | | | | | | | | | | | | | | | |
HC Strategic Shares | | | | | | | | | | | | | | | | | | | | | | | | | | | | |
Year Ended June 30, 2018 | | $ | 10.48 | | | $ | 0.33 | | | $ | 0.26 | | | $ | 0.59 | | | $ | (0.33 | ) | | $ | — | | | $ | (0.33 | ) |
Year Ended June 30, 2017 | | | 9.00 | | | | 0.29 | | | | 1.49 | | | | 1.78 | | | | (0.30 | ) | | | — | | | | (0.30 | ) |
Year Ended June 30, 2016 | | | 11.18 | | | | 0.28 | | | | (1.40 | ) | | | (1.12 | ) | | | (0.27 | ) | | | (0.79 | ) | | | (1.06 | ) |
Year Ended June 30, 2015 | | | 13.56 | | | | 0.30 | | | | (0.96 | ) | | | (0.66 | ) | | | (0.34 | ) | | | (1.38 | ) | | | (1.72 | ) |
Year Ended June 30, 2014 | | | 11.35 | | | | 0.43 | | | | 2.25 | | | | 2.68 | | | | (0.43 | ) | | | (0.04 | ) | | | (0.47 | ) |
HC Advisors Shares | | | | | | | | | | | | | | | | | | | | | | | | | | | | |
Year Ended June 30, 2018 | | $ | 10.49 | | | $ | 0.38 | | | $ | 0.21 | | | $ | 0.59 | | | $ | (0.33 | ) | | $ | — | | | $ | (0.33 | ) |
Year Ended June 30, 2017 | | | 9.00 | | | | 0.28 | | | | 1.51 | | | | 1.79 | | | | (0.30 | ) | | | — | | | | (0.30 | ) |
Year Ended June 30, 2016 | | | 11.18 | | | | 0.28 | | | | (1.40 | ) | | | (1.12 | ) | | | (0.27 | ) | | | (0.79 | ) | | | (1.06 | ) |
Year Ended June 30, 2015 | | | 13.56 | | | | 0.30 | | | | (0.96 | ) | | | (0.66 | ) | | | (0.34 | ) | | | (1.38 | ) | | | (1.72 | ) |
Year Ended June 30, 2014 | | | 11.36 | | | | 0.43 | | | | 2.24 | | | | 2.67 | | | | (0.43 | ) | | | (0.04 | ) | | | (0.47 | ) |
| (a) | Not annualized for periods less than one year. |
| (b) | Annualized for periods less than one year. |
| (c) | Portfolio turnover is calculated on the basis of the Portfolio, as a whole, without distinguishing between the classes of shares issued. |
| (d) | Statement has been consolidated. See Note 2.O. in the Notes to Financial Statements for basis of consolidation. |
| (e) | For the period July 14, 2015 (commencement of operations) through June 30, 2016. |
| (f) | For the period January 12, 2016 (commencement of operations) through June 30, 2016. |
See accompanying notes to financial statements.
266
| | | | | | | | | | | | | | | | | | | | | | | | | | |
| | | | | | | | | | Ratios/Supplementary Data: | |
Net Asset Value,
End of Period | | | Total
Return(a) | | | Net Assets at
End of Period
(in thousands) | | | Ratio of Expenses to
Average Net Assets,
Prior to Expenses
Paid Indirectly
and Waivers(b) | | | Ratio of Expenses to
Average Net Assets,
Net of Expenses
Paid Indirectly
and Waivers(b) | | | Ratio of Net
Investment
Income (Loss)
to Average
Net Assets(b) | | | Portfolio
Turnover
Rate(a)(c) | |
| | | | | | | | | | | | | | | | | | | | | | | | | | |
| | | | | | | | | | | | | | | | | | | | | | | | | | |
| $ | 9.76 | | | | 18.61 | % | | $ | 861,431 | | | | 0.40% | | | | 0.35% | | | | 2.46% | | | | 28.82% | |
| | 8.48 | | | | 9.87 | % | | | 764,818 | | | | 0.42% | | | | 0.42% | | | | 1.99% | | | | 56.34% | |
| | 7.87 | | | | (9.01 | )% | | | 1,111,071 | | | | 0.44% | | | | 0.44% | | | | 1.89% | | | | 130.01% | |
| | 8.80 | | | | (22.91 | )% | | | 1,193,003 | | | | 0.63% | | | | 0.63% | | | | 1.40% | | | | 63.29% | |
| | 11.64 | | | | 19.64 | % | | | 1,174,593 | | | | 0.66% | | | | 0.66% | | | | 0.87% | | | | 61.70% | |
| | | | | | | | | | | | | | | | | | | | | | | | | | |
| $ | 9.76 | | | | 18.61 | % | | $ | 698 | | | | 0.65% | | | | 0.35% | | | | 2.38% | | | | 28.82% | |
| | 8.48 | | | | 10.01 | % | | | 1,068 | | | | 0.67% | | | | 0.42% | | | | 1.99% | | | | 56.34% | |
| | 7.86 | | | | (9.12 | )% | | | 1,351 | | | | 0.69% | | | | 0.44% | | | | 1.86% | | | | 130.01% | |
| | 8.80 | | | | (22.84 | )% | | | 1,635 | | | | 0.88% | | | | 0.63% | | | | 1.37% | | | | 63.29% | |
| | 11.63 | | | | 19.66 | % | | | 1,621 | | | | 0.91% | | | | 0.66% | | | | 0.81% | | | | 61.70% | |
| | | | | | | | | | | | | | | | | | | | | | | | | | |
| | | | | | | | | | | | | | | | | | | | | | | | | | |
| $ | 11.42 | | | | 10.16 | % | | $ | 166,523 | | | | 0.29% | | | | 0.29% | | | | 2.69% | | | | 15.54% | |
| | 10.65 | | | | 17.19 | % | | | 148,643 | | | | 0.35% | | | | 0.34% | | | | 2.70% | | | | 25.45% | |
| | 9.34 | | | | (4.16 | )% | | | 121,325 | | | | 0.42% | | | | 0.42% | | | | 2.76% | | | | 35.90% | |
| | | | | | | | | | | | | | | | | | | | | | | | | | |
| $ | 11.41 | | | | 10.17 | % | | $ | 1 | | | | 0.54% | | | | 0.29% | | | | 2.67% | | | | 15.54% | |
| | 10.64 | | | | 17.08 | % | | | 1 | | | | 0.60% | | | | 0.34% | | | | 2.67% | | | | 25.45% | |
| | 9.34 | | | | (4.16 | )% | | | 1 | | | | 0.67% | | | | 0.42% | | | | 2.76% | | | | 35.90% | |
| | | | | | | | | | | | | | | | | | | | | | | | | | |
| | | | | | | | | | | | | | | | | | | | | | | | | | |
| $ | 12.71 | | | | 11.23 | % | | $ | 29,413 | | | | 0.37% | | | | 0.31% | | | | 2.65% | | | | 17.01% | |
| | 12.02 | | | | 18.02 | % | | | 27,992 | | | | 0.57% | | | | 0.31% | | | | 2.85% | | | | 27.41% | |
| | 10.75 | | | | 8.81 | % | | | 20,324 | | | | 0.84% | | | | 0.31% | | | | 3.88% | | | | 25.63% | |
| | | | | | | | | | | | | | | | | | | | | | | | | | |
| $ | 12.72 | | | | 11.22 | % | | $ | 1 | | | | 0.62% | | | | 0.31% | | | | 2.72% | | | | 17.01% | |
| | 12.03 | | | | 18.00 | % | | | 1 | | | | 0.82% | | | | 0.31% | | | | 2.77% | | | | 27.41% | |
| | 10.76 | | | | 8.91 | % | | | 1 | | | | 1.09% | | | | 0.31% | | | | 3.88% | | | | 25.63% | |
| | | | | | | | | | | | | | | | | | | | | | | | | | |
| | | | | | | | | | | | | | | | | | | | | | | | | | |
| $ | 10.74 | | | | 5.60 | % | | $ | 1,213,191 | | | | 0.44% | | | | 0.44% | | | | 2.88% | | | | 29.94% | |
| | 10.48 | | | | 19.75 | % | | | 1,234,134 | | | | 0.43% | | | | 0.42% | | | | 2.74% | | | | 52.75% | |
| | 9.00 | | | | (10.15 | )% | | | 1,165,041 | | | | 0.38% | | | | 0.37% | | | | 2.75% | | | | 42.41% | |
| | 11.18 | | | | (4.50 | )% | | | 1,522,384 | | | | 0.38% | | | | 0.38% | | | | 2.61% | | | | 48.85% | |
| | 13.56 | | | | 23.72 | % | | | 1,613,553 | | | | 0.42% | | | | 0.42% | | | | 3.26% | | | | 55.23% | |
| | | | | | | | | | | | | | | | | | | | | | | | | | |
| $ | 10.75 | | | | 5.60 | % | | $ | 1,661 | | | | 0.69% | | | | 0.44% | | | | 2.77% | | | | 29.94% | |
| | 10.49 | | | | 19.87 | % | | | 2,222 | | | | 0.68% | | | | 0.42% | | | | 2.79% | | | | 52.75% | |
| | 9.00 | | | | (10.16 | )% | | | 1,986 | | | | 0.63% | | | | 0.37% | | | | 2.64% | | | | 42.41% | |
| | 11.18 | | | | (4.50 | )% | | | 3,032 | | | | 0.63% | | | | 0.38% | | | | 2.59% | | | | 48.85% | |
| | 13.56 | | | | 23.61 | % | | | 3,136 | | | | 0.67% | | | | 0.42% | | | | 3.24% | | | | 55.23% | |
See accompanying notes to financial statements.
267
HC CAPITAL TRUST
Financial Highlights
Selected data for a share outstanding throughout the periods indicated.
| | | | | | | | | | | | | | | | | | | | | | | | | | | | |
| | | | | | Change in Net Assets Resulting
From Operations: | | | Distributions to Shareholders: | |
| | | Net Asset
Value,
Beginning of
Period | | | Net
Investment
Income/
(Loss) | | | Net Realized/
Unrealized
Gains/
(Losses) on
Investments | | | Total from
Operations | | | Net
Investment
Income | | | Net
Realized
Gains from
Investments | | | Total
Distributions to
Shareholders | |
The Institutional International Equity Portfolio | | | | | |
HC Strategic Shares | | | | | | | | | | | | | | | | | | | | | | | | | | | | |
Year Ended June 30, 2018 | | $ | 10.38 | | | $ | 0.35 | | | $ | 0.26 | | | $ | 0.61 | | | $ | (0.40 | ) | | $ | (0.02 | ) | | $ | (0.42 | ) |
Year Ended June 30, 2017 | | | 8.87 | | | | 0.28 | | | | 1.52 | | | | 1.80 | | | | (0.29 | ) | | | — | | | | (0.29 | ) |
Year Ended June 30, 2016 | | | 10.58 | | | | 0.28 | | | | (1.28 | ) | | | (1.00 | ) | | | (0.27 | ) | | | (0.44 | ) | | | (0.71 | ) |
Year Ended June 30, 2015 | | | 12.58 | | | | 0.29 | | | | (0.89 | ) | | | (0.60 | ) | | | (0.32 | ) | | | (1.08 | ) | | | (1.40 | ) |
Year Ended June 30, 2014 | | | 10.87 | | | | 0.40 | | | | 2.17 | | | | 2.57 | | | | (0.40 | ) | | | (0.46 | ) | | | (0.86 | ) |
HC Advisors Shares | | | | | |
Year Ended June 30, 2018 | | $ | 10.37 | | | $ | 0.30 | | | $ | 0.31 | | | $ | 0.61 | | | $ | (0.40 | ) | | $ | (0.02 | ) | | $ | (0.42 | ) |
Year Ended June 30, 2017 | | | 8.86 | | | | 0.28 | | | | 1.52 | | | | 1.80 | | | | (0.29 | ) | | | — | | | | (0.29 | ) |
Year Ended June 30, 2016 | | | 10.57 | | | | 0.28 | | | | (1.28 | ) | | | (1.00 | ) | | | (0.27 | ) | | | (0.44 | ) | | | (0.71 | ) |
Year Ended June 30, 2015 | | | 12.57 | | | | 0.30 | | | | (0.90 | ) | | | (0.60 | ) | | | (0.32 | ) | | | (1.08 | ) | | | (1.40 | ) |
Year Ended June 30, 2014 | | | 10.87 | | | | 0.41 | | | | 2.15 | | | | 2.56 | | | | (0.40 | ) | | | (0.46 | ) | | | (0.86 | ) |
The Emerging Markets Portfolio | | | | | |
HC Strategic Shares | | | | | | | | | | | | | | | | | | | | | | | | | | | | |
Year Ended June 30, 2018 | | $ | 17.92 | | | $ | 0.40 | (c) | | $ | (0.13 | ) | | $ | 0.27 | | | $ | (0.41 | ) | | $ | — | | | $ | (0.41 | ) |
Year Ended June 30, 2017 | | | 15.15 | | | | 0.35 | | | | 2.84 | | | | 3.19 | | | | (0.42 | ) | | | — | | | | (0.42 | ) |
Year Ended June 30, 2016 | | | 17.58 | | | | 0.37 | | | | (2.44 | ) | | | (2.07 | ) | | | (0.36 | ) | | | — | | | | (0.36 | ) |
Year Ended June 30, 2015 | | | 20.01 | | | | 0.40 | | | | (2.11 | ) | | | (1.71 | ) | | | (0.41 | ) | | | (0.31 | ) | | | (0.72 | ) |
Year Ended June 30, 2014 | | | 17.51 | | | | 0.35 | | | | 2.51 | | | | 2.86 | | | | (0.36 | ) | | | — | | | | (0.36 | ) |
HC Advisors Shares | | | | | |
Year Ended June 30, 2018 | | $ | 17.92 | | | $ | 0.38 | (c) | | $ | (0.11 | ) | | $ | 0.27 | | | $ | (0.41 | ) | | $ | — | | | $ | (0.41 | ) |
Year Ended June 30, 2017 | | | 15.15 | | | | 0.35 | | | | 2.84 | | | | 3.19 | | | | (0.42 | ) | | | — | | | | (0.42 | ) |
Year Ended June 30, 2016 | | | 17.57 | | | | 0.39 | | | | (2.45 | ) | | | (2.06 | ) | | | (0.36 | ) | | | — | | | | (0.36 | ) |
Year Ended June 30, 2015 | | | 20.00 | | | | 0.42 | | | | (2.13 | ) | | | (1.71 | ) | | | (0.41 | ) | | | (0.31 | ) | | | (0.72 | ) |
Year Ended June 30, 2014 | | | 17.51 | | | | 0.35 | | | | 2.50 | | | | 2.85 | | | | (0.36 | ) | | | — | | | | (0.36 | ) |
The Core Fixed Income Portfolio | | | | | |
HC Strategic Shares | | | | | | | | | | | | | | | | | | | | | | | | | | | | |
Year Ended June 30, 2018 | | $ | 9.80 | | | $ | 0.22 | | | $ | (0.30 | ) | | $ | (0.08 | ) | | $ | (0.23 | ) | | $ | — | | | $ | (0.23 | ) |
Year Ended June 30, 2017 | | | 10.01 | | | | 0.19 | | | | (0.18 | ) | | | 0.01 | | | | (0.22 | ) | | | — | | | | (0.22 | ) |
Year Ended June 30, 2016 | | | 9.78 | | | | 0.21 | | | | 0.35 | | | | 0.56 | | | | (0.24 | ) | | | (0.09 | ) | | | (0.33 | ) |
Year Ended June 30, 2015 | | | 9.89 | | | | 0.19 | | | | (0.07 | ) | | | 0.12 | | | | (0.22 | ) | | | (0.01 | ) | | | (0.23 | ) |
Year Ended June 30, 2014 | | | 9.73 | | | | 0.22 | | | | 0.24 | | | | 0.46 | | | | (0.25 | ) | | | (0.05 | ) | | | (0.30 | ) |
HC Advisors Shares | | | | | |
Year Ended June 30, 2018 | | $ | 9.79 | | | $ | 0.23 | | | $ | (0.30 | ) | | $ | (0.07 | ) | | $ | (0.23 | ) | | $ | — | | | $ | (0.23 | ) |
Year Ended June 30, 2017 | | | 10.01 | | | | 0.20 | | | | (0.20 | ) | | | — | | | | (0.22 | ) | | | — | | | | (0.22 | ) |
Year Ended June 30, 2016 | | | 9.77 | | | | 0.21 | | | | 0.36 | | | | 0.57 | | | | (0.24 | ) | | | (0.09 | ) | | | (0.33 | ) |
Year Ended June 30, 2015 | | | 9.88 | | | | 0.19 | | | | (0.07 | ) | | | 0.12 | | | | (0.22 | ) | | | (0.01 | ) | | | (0.23 | ) |
Year Ended June 30, 2014 | | | 9.73 | | | | 0.21 | | | | 0.24 | | | | 0.45 | | | | (0.25 | ) | | | (0.05 | ) | | | (0.30 | ) |
The Fixed Income Opportunity Portfolio | | | | | |
HC Strategic Shares | | | | | | | | | | | | | | | | | | | | | | | | | | | | |
Year Ended June 30, 2018 | | $ | 6.95 | | | $ | 0.38 | | | $ | (0.10 | ) | | $ | 0.28 | | | $ | (0.38 | ) | | $ | — | | | $ | (0.38 | ) |
Year Ended June 30, 2017 | | | 6.62 | | | | 0.39 | | | | 0.33 | | | | 0.72 | | | | (0.39 | ) | | | — | | | | (0.39 | ) |
Year Ended June 30, 2016 | | | 7.08 | | | | 0.37 | | | | (0.43 | ) | | | (0.06 | ) | | | (0.38 | ) | | | (0.02 | ) | | | (0.40 | ) |
Year Ended June 30, 2015 | | | 7.65 | | | | 0.38 | | | | (0.39 | ) | | | (0.01 | ) | | | (0.39 | ) | | | (0.17 | ) | | | (0.56 | ) |
Year Ended June 30, 2014 | | | 7.41 | | | | 0.43 | | | | 0.37 | | | | 0.80 | | | | (0.43 | ) | | | (0.13 | ) | | | (0.56 | ) |
HC Advisors Shares | | | | | |
Year Ended June 30, 2018 | | $ | 6.95 | | | $ | 0.42 | | | $ | (0.14 | ) | | $ | 0.28 | | | $ | (0.38 | ) | | $ | — | | | $ | (0.38 | ) |
Year Ended June 30, 2017 | | | 6.62 | | | | 0.38 | | | | 0.34 | | | | 0.72 | | | | (0.39 | ) | | | — | | | | (0.39 | ) |
Year Ended June 30, 2016 | | | 7.08 | | | | 0.38 | | | | (0.44 | ) | | | (0.06 | ) | | | (0.38 | ) | | | (0.02 | ) | | | (0.40 | ) |
Year Ended June 30, 2015 | | | 7.65 | | | | 0.38 | | | | (0.39 | ) | | | (0.01 | ) | | | (0.39 | ) | | | (0.17 | ) | | | (0.56 | ) |
Year Ended June 30, 2014 | | | 7.40 | | | | 0.41 | | | | 0.40 | | | | 0.81 | | | | (0.43 | ) | | | (0.13 | ) | | | (0.56 | ) |
| (a) | Portfolio turnover is calculated on the basis of the Portfolio, as a whole, without distinguishing between the classes of shares issued. |
| (b) | Portfolio turnover does not include TBA security transactions. |
| (c) | Calculated based on average shares outstanding. |
See accompanying notes to financial statements.
268
| | | | | | | | | | | | | | | | | | | | | | | | | | |
| | | | | | | | | | Ratios/Supplementary Data: | |
Net Asset Value,
End of Period | | | Total
Return | | | Net Assets at
End of Period
(in thousands) | | | Ratio of Expenses to
Average Net Assets,
Prior to Expenses
Paid Indirectly
and Waivers | | | Ratio of Expenses to
Average Net Assets,
Net of Expenses
Paid Indirectly
and Waivers | | | Ratio of Net
Investment
Income (Loss)
to Average
Net Assets | | | Portfolio
Turnover
Rate(a) | |
| | | | | | | | | | | | | | | | | | | | | | | | | | |
| | | | | | | | | | | | | | | | | | | | | | | | | | |
| $ | 10.57 | | | | 5.77% | | | $ | 2,332,353 | | | | 0.40% | | | | 0.40% | | | | 3.11% | | | | 40.38% | |
| | 10.38 | | | | 20.38% | | | | 2,452,608 | | | | 0.40% | | | | 0.40% | | | | 2.83% | | | | 52.79% | |
| | 8.87 | | | | (9.54)% | | | | 2,586,742 | | | | 0.36% | | | | 0.36% | | | | 3.00% | | | | 43.96% | |
| | 10.58 | | | | (4.38)% | | | | 2,869,985 | | | | 0.36% | | | | 0.36% | | | | 2.69% | | | | 52.55% | |
| | 12.58 | | | | 24.16% | | | | 3,001,838 | | | | 0.40% | | | | 0.40% | | | | 3.35% | | | | 64.38% | |
| | | | | | | | | | | | | | | | | | | | | | | | | | |
| $ | 10.56 | | | | 5.78% | | | $ | 1,868 | | | | 0.65% | | | | 0.40% | | | | 2.78% | | | | 40.38% | |
| | 10.37 | | | | 20.40% | | | | 3,979 | | | | 0.65% | | | | 0.40% | | | | 2.84% | | | | 52.79% | |
| | 8.86 | | | | (9.56)% | | | | 3,554 | | | | 0.61% | | | | 0.36% | | | | 2.98% | | | | 43.96% | |
| | 10.57 | | | | (4.38)% | | | | 4,108 | | | | 0.61% | | | | 0.36% | | | | 2.81% | | | | 52.55% | |
| | 12.57 | | | | 24.07% | | | | 3,598 | | | | 0.65% | | | | 0.40% | | | | 3.27% | | | | 64.38% | |
| | | | | | | | | | | | | | | | | | | | | | | | | | |
| | | | | | | | | | | | | | | | | | | | | | | | | | |
| $ | 17.78 | | | | 1.34% | | | $ | 1,631,863 | | | | 0.67% | | | | 0.67% | | | | 2.09% | | | | 54.90% | |
| | 17.92 | | | | 21.51% | | | | 1,775,379 | | | | 0.59% | | | | 0.59% | | | | 2.04% | | | | 60.79% | |
| | 15.15 | | | | (11.66)% | | | | 1,833,571 | | | | 0.57% | | | | 0.57% | | | | 2.82% | | | | 40.02% | |
| | 17.58 | | | | (8.48)% | | | | 1,893,047 | | | | 0.59% | | | | 0.59% | | | | 2.32% | | | | 85.72% | |
| | 20.01 | | | | 16.48% | | | | 1,813,476 | | | | 0.73% | | | | 0.73% | | | | 2.26% | | | | 75.84% | |
| | | | | | | | | | | | | | | | | | | | | | | | | | |
| $ | 17.78 | | | | 1.34% | | | $ | 1,451 | | | | 0.92% | | | | 0.67% | | | | 1.97% | | | | 54.90% | |
| | 17.92 | | | | 21.51% | | | | 2,633 | | | | 0.84% | | | | 0.59% | | | | 2.04% | | | | 60.79% | |
| | 15.15 | | | | (11.61)% | | | | 2,349 | | | | 0.82% | | | | 0.57% | | | | 2.69% | | | | 40.02% | |
| | 17.57 | | | | (8.49)% | | | | 3,017 | | | | 0.84% | | | | 0.59% | | | | 2.34% | | | | 85.72% | |
| | 20.00 | | | | 16.42% | | | | 2,861 | | | | 0.98% | | | | 0.73% | | | | 2.25% | | | | 75.84% | |
| | | | | | | | | | | | | | | | | | | | | | | | | | |
| | | | | | | | | | | | | | | | | | | | | | | | | | |
| $ | 9.49 | | | | (0.85)% | | | $ | 65,387 | | | | 0.33% | | | | 0.33% | | | | 2.26% | | | | 43.79% | (b) |
| | 9.80 | | | | 0.07% | | | | 85,653 | | | | 0.33% | | | | 0.33% | | | | 1.97% | | | | 45.74% | (b) |
| | 10.01 | | | | 5.87% | | | | 86,767 | | | | 0.27% | | | | 0.27% | | | | 2.11% | | | | 58.47% | (b) |
| | 9.78 | | | | 1.16% | | | | 96,952 | | | | 0.27% | | | | 0.27% | | | | 1.90% | | | | 89.60% | (b) |
| | 9.89 | | | | 4.78% | | | | 99,718 | | | | 0.25% | | | | 0.25% | | | | 2.22% | | | | 75.17% | (b) |
| | | | | | | | | | | | | | | | | | | | | | | | | | |
| $ | 9.49 | | | | (0.75)% | | | $ | 1,362 | | | | 0.58% | | | | 0.33% | | | | 2.25% | | | | 43.79% | (b) |
| | 9.79 | | | | (0.03)% | | | | 2,942 | | | | 0.58% | | | | 0.33% | | | | 1.97% | | | | 45.74% | (b) |
| | 10.01 | | | | 5.98% | | | | 2,625 | | | | 0.52% | | | | 0.27% | | | | 2.11% | | | | 58.47% | (b) |
| | 9.77 | | | | 1.16% | | | | 2,796 | | | | 0.52% | | | | 0.27% | | | | 1.90% | | | | 89.60% | (b) |
| | 9.88 | | | | 4.68% | | | | 2,730 | | | | 0.50% | | | | 0.25% | | | | 2.22% | | | | 75.17% | (b) |
| | | | | | | | | | | | | | | | | | | | | | | | | | |
| | | | | | | | | | | | | | | | | | | | | | | | | | |
| $ | 6.85 | | | | 4.06% | | | $ | 673,271 | | | | 0.44% | | | | 0.44% | | | | 5.46% | | | | 37.57% | |
| | 6.95 | | | | 11.07% | | | | 673,681 | | | | 0.43% | | | | 0.43% | | | | 5.53% | | | | 41.48% | |
| | 6.62 | | | | (0.61)% | | | | 784,435 | | | | 0.39% | | | | 0.39% | | | | 5.57% | | | | 66.76% | (b) |
| | 7.08 | | | | 0.06% | | | | 810,466 | | | | 0.32% | | | | 0.32% | | | | 5.27% | | | | 55.80% | |
| | 7.65 | | | | 11.23% | | | | 804,070 | | | | 0.30% | | | | 0.30% | | | | 5.52% | | | | 82.94% | |
| | | | | | | | | | | | | | | | | | | | | | | | | | |
| $ | 6.85 | | | | 4.06% | | | $ | 362 | | | | 0.69% | | | | 0.44% | | | | 5.43% | | | | 37.57% | |
| | 6.95 | | | | 11.08% | | | | 789 | | | | 0.68% | | | | 0.43% | | | | 5.54% | | | | 41.48% | |
| | 6.62 | | | | (0.60)% | | | | 1,012 | | | | 0.64% | | | | 0.39% | | | | 5.58% | | | | 66.76% | (b) |
| | 7.08 | | | | 0.07% | | | | 1,094 | | | | 0.57% | | | | 0.32% | | | | 5.27% | | | | 55.80% | |
| | 7.65 | | | | 11.39% | | | | 1,050 | | | | 0.55% | | | | 0.30% | | | | 5.52% | | | | 82.94% | |
See accompanying notes to financial statements.
269
HC CAPITAL TRUST
Financial Highlights (continued)
Selected data for a share outstanding throughout the periods indicated.
| | | | | | | | | | | | | | | | | | | | | | | | | | | | |
| | | | | | Change in Net Assets Resulting
From Operations: | | | Distributions to Shareholders: | |
| | | Net Asset
Value,
Beginning
of Period | | | Net
Investment
Income/
(Loss) | | | Net Realized/
Unrealized
Gains/
(Losses) on
Investments | | | Total from
Operations | | | Net
Investment
Income | | | Net
Realized
Gains from
Investments | | | Tax Return
of Capital | |
The U.S. Government Fixed Income Securities Portfolio | | | | | | | | | | | | | | | | | | | | | | | | | | | | |
HC Strategic Shares | | | | | | | | | | | | | | | | | | | | | | | | | | | | |
Year Ended June 30, 2018 | | $ | 9.84 | | | $ | 0.17 | | | $ | (0.25 | ) | | $ | (0.08 | ) | | $ | (0.17 | ) | | $ | — | | | $ | — | |
Year Ended June 30, 2017 | | | 10.30 | | | | 0.15 | | | | (0.36 | ) | | | (0.21 | ) | | | (0.15 | ) | | | (0.10 | ) | | | — | |
Year Ended June 30, 2016 | | | 10.02 | | | | 0.14 | | | | 0.38 | | | | 0.52 | | | | (0.14 | ) | | | (0.10 | ) | | | — | |
Year Ended June 30, 2015 | | | 9.94 | | | | 0.12 | | | | 0.08 | | | | 0.20 | | | | (0.12 | ) | | | — | | | | — | |
Year Ended June 30, 2014 | | | 9.91 | | | | 0.12 | | | | 0.07 | | | | 0.19 | | | | (0.13 | ) | | | (0.03 | ) | | | — | |
The Inflation Protected Securities Portfolio | | | | | | | | | | | | | | | | | | | | | | | | | | | | |
HC Strategic Shares | | | | | | | | | | | | | | | | | | | | | | | | | | | | |
Year Ended June 30, 2018 | | $ | 10.03 | | | $ | 0.26 | | | $ | (0.08 | ) | | $ | 0.18 | | | $ | (0.23 | ) | | $ | — | | | $ | — | |
Year Ended June 30, 2017 | | | 10.40 | | | | 0.27 | | | | (0.35 | ) | | | (0.08 | ) | | | (0.29 | ) | | | — | | | | — | |
Year Ended June 30, 2016 | | | 10.02 | | | | 0.11 | | | | 0.29 | | | | 0.40 | | | | (0.02 | ) | | | — | | | | — | |
Year Ended June 30, 2015 | | | 10.25 | | | | (0.03 | ) | | | (0.14 | ) | | | (0.17 | ) | | | (0.03 | ) | | | (0.01 | ) | | | (0.02 | ) |
Period Ended June 30, 2014(d) | | | 10.00 | | | | 0.11 | | | | 0.24 | | | | 0.35 | | | | (0.10 | ) | | | — | | | | — | |
HC Advisors Shares | | | | | | | | | | | | | | | | | | | | | | | | | | | | |
Year Ended June 30, 2018 | | $ | 10.02 | | | $ | 0.27 | | | $ | (0.08 | ) | | $ | 0.19 | | | $ | (0.23 | ) | | $ | — | | | $ | — | |
Year Ended June 30, 2017 | | | 10.39 | | | | 0.23 | | | | (0.31 | ) | | | (0.08 | ) | | | (0.29 | ) | | | — | | | | — | |
Year Ended June 30, 2016 | | | 10.01 | | | | 0.11 | | | | 0.29 | | | | 0.40 | | | | (0.02 | ) | | | — | | | | — | |
Year Ended June 30, 2015 | | | 10.26 | | | | (0.04 | ) | | | (0.15 | ) | | | (0.19 | ) | | | (0.05 | ) | | | (0.01 | ) | | | — | |
Period Ended June 30, 2014(d) | | | 10.00 | | | | 0.12 | | | | 0.24 | | | | 0.36 | | | | (0.10 | ) | | | — | | | | — | |
The U.S. Corporate Fixed Income Securities Portfolio | | | | | | | | | | | | | | | | | | | | | | | | | | | | |
HC Strategic Shares | | | | | | | | | | | | | | | | | | | | | | | | | | | | |
Year Ended June 30, 2018 | | $ | 10.03 | | | $ | 0.29 | | | $ | (0.41 | ) | | $ | (0.12 | ) | | $ | (0.29 | ) | | $ | (0.03 | ) | | $ | — | |
Year Ended June 30, 2017 | | | 10.16 | | | | 0.26 | | | | (0.10 | ) | | | 0.16 | | | | (0.26 | ) | | | (0.03 | ) | | | — | |
Year Ended June 30, 2016 | | | 9.88 | | | | 0.27 | | | | 0.48 | | | | 0.75 | | | | (0.27 | ) | | | (0.20 | ) | | | — | |
Year Ended June 30, 2015 | | | 10.24 | | | | 0.27 | | | | (0.27 | ) | | | — | | | | (0.27 | ) | | | (0.09 | ) | | | — | |
Year Ended June 30, 2014 | | | 9.97 | | | | 0.31 | | | | 0.44 | | | | 0.75 | | | | (0.32 | ) | | | (0.16 | ) | | | — | |
The U.S. Mortgage/Asset Backed Fixed Income Securities Portfolio | | | | | | | | | | | | | | | | | | | | | | | | | | | | |
HC Strategic Shares | | | | | | | | | | | | | | | | | | | | | | | | | | | | |
Year Ended June 30, 2018 | | $ | 9.59 | | | $ | 0.21 | | | $ | (0.23 | ) | | $ | (0.02 | ) | | $ | (0.25 | ) | | $ | — | | | $ | — | |
Year Ended June 30, 2017 | | | 9.88 | | | | 0.18 | | | | (0.22 | ) | | | (0.04 | ) | | | (0.25 | ) | | | — | | | | — | |
Year Ended June 30, 2016 | | | 9.81 | | | | 0.21 | | | | 0.14 | | | | 0.35 | | | | (0.28 | ) | | | — | | | | — | |
Year Ended June 30, 2015 | | | 9.87 | | | | 0.19 | | | | — | | | | 0.19 | | | | (0.25 | ) | | | — | | | | — | |
Year Ended June 30, 2014 | | | 9.78 | | | | 0.21 | | | | 0.18 | | | | 0.39 | | | | (0.30 | ) | | | — | | | | — | |
| (a) | Not annualized for periods less than one year. |
| (b) | Annualized for periods less than one year. |
| (c) | Portfolio turnover is calculated on the basis of the Portfolio, as a whole, without distinguishing between the classes of shares issued. |
| (d) | For the period April 3, 2014 (commencement of operations) through June 30, 2014. |
| (e) | Portfolio turnover does not include TBA security transactions. |
See accompanying notes to financial statements.
270
| | | | | | | | | | | | | | | | | | | | | | | | | | | | | | |
Distributions to
Shareholders: | | | | | | | | | | | | Ratios/Supplementary Data: | |
Total
Distributions to Shareholders | | | Net Asset Value,
End of Period | | | Total
Return(a) | | | Net Assets at
End of Period
(in thousands) | | | Ratio of Expenses to
Average Net Assets,
Prior to Expenses
Paid Indirectly
and Waivers(b) | | | Ratio of Expenses to
Average Net Assets,
Net of Expenses
Paid Indirectly
and Waivers(b) | | | Ratio of Net
Investment
Income (Loss)
to Average
Net Assets(b) | | | Portfolio
Turnover
Rate(a)(c) | |
| | | | | | | | | | | | | | | | | | | | | | | | | | | | | | |
| | | | | | | | | | | | | | | | | | | | | | | | | | | | | | |
| $ | (0.17) | | | $ | 9.59 | | | | (0.79)% | | | $ | 233,377 | | | | 0.19% | | | | 0.19% | | | | 1.81% | | | | 32.58% | |
| | (0.25) | | | | 9.84 | | | | (2.03)% | | | | 215,595 | | | | 0.19% | | | | 0.19% | | | | 1.47% | | | | 46.76% | |
| | (0.24) | | | | 10.30 | | | | 5.26% | | | | 241,795 | | | | 0.17% | | | | 0.17% | | | | 1.38% | | | | 50.10% | |
| | (0.12) | | | | 10.02 | | | | 2.03% | | | | 262,998 | | | | 0.17% | | | | 0.17% | | | | 1.21% | | | | 99.54% | |
| | (0.16) | | | | 9.94 | | | | 1.91% | | | | 246,914 | | | | 0.18% | | | | 0.18% | | | | 1.29% | | | | 62.52% | |
| | | | | | | | | | | | | | | | | | | | | | | | | | | | | | |
| | | | | | | | | | | | | | | | | | | | | | | | | | | | | | |
| $ | (0.23) | | | $ | 9.98 | | | | 1.83% | | | $ | 401,456 | | | | 0.16% | | | | 0.16% | | | | 2.66% | | | | 20.77% | |
| | (0.29) | | | | 10.03 | | | | (0.81)% | | | | 361,996 | | | | 0.15% | | | | 0.15% | | | | 2.31% | | | | 21.69% | |
| | (0.02) | | | | 10.40 | | | | 3.99% | | | | 493,152 | | | | 0.15% | | | | 0.15% | | | | 1.11% | | | | 20.88% | |
| | (0.06) | | | | 10.02 | | | | (1.72)% | | | | 510,176 | | | | 0.18% | | | | 0.18% | | | | (0.25)% | | | | 27.12% | |
| | (0.10) | | | | 10.25 | | | | 3.50% | | | | 526,458 | | | | 0.15% | | | | 0.15% | | | | 4.55% | | | | 18.56% | |
| | | | | | | | | | | | | | | | | | | | | | | | | | | | | | |
| $ | (0.23) | | | $ | 9.98 | | | | 1.93% | | | $ | 1 | | | | 0.41% | | | | 0.16% | | | | 2.70% | | | | 20.77% | |
| | (0.29) | | | | 10.02 | | | | (0.81)% | | | | 1 | | | | 0.40% | | | | 0.15% | | | | 2.28% | | | | 21.69% | |
| | (0.02) | | | | 10.39 | | | | 4.00% | | | | 1 | | | | 0.40% | | | | 0.15% | | | | 1.09% | | | | 20.88% | |
| | (0.06) | | | | 10.01 | | | | (1.91)% | | | | 1 | | | | 0.43% | | | | 0.18% | | | | (0.25)% | | | | 27.12% | |
| | (0.10) | | | | 10.26 | | | | 3.60% | | | | 1 | | | | 0.40% | | | | 0.15% | | | | 4.58% | | | | 18.56% | |
| | | | | | | | | | | | | | | | | | | | | | | | | | | | | | |
| | | | | | | | | | | | | | | | | | | | | | | | | | | | | | |
| $ | (0.32) | | | $ | 9.59 | | | | (1.21)% | | | $ | 286,956 | | | | 0.20% | | | | 0.20% | | | | 3.00% | | | | 44.69% | |
| | (0.29) | | | | 10.03 | | | | 1.62% | | | | 254,908 | | | | 0.19% | | | | 0.19% | | | | 2.59% | | | | 40.47% | |
| | (0.47) | | | | 10.16 | | | | 7.92% | | | | 289,331 | | | | 0.19% | | | | 0.19% | | | | 2.84% | | | | 64.20% | |
| | (0.36) | | | | 9.88 | | | | (0.01)% | | | | 223,329 | | | | 0.28% | | | | 0.28% | | | | 2.60% | | | | 158.19% | |
| | (0.48) | | | | 10.24 | | | | 7.76% | | | | 257,604 | | | | 0.33% | | | | 0.33% | | | | 3.16% | | | | 130.81% | |
| | | | | | | | | | | | | | | | | | | | | | | | | | | | | | |
| | | | | | | | | | | | | | | | | | | | | | | | | | | | | | |
| $ | (0.25) | | | $ | 9.32 | | | | (0.20)% | | | $ | 205,138 | | | | 0.23% | | | | 0.23% | | | | 2.24% | | | | 17.13% | (e) |
| | (0.25) | | | | 9.59 | | | | (0.38)% | | | | 183,834 | | | | 0.22% | | | | 0.22% | | | | 1.86% | | | | 17.58% | (e) |
| | (0.28) | | | | 9.88 | | | | 3.67% | | | | 208,969 | | | | 0.19% | | | | 0.19% | | | | 2.12% | | | | 15.24% | (e) |
| | (0.25) | | | | 9.81 | | | | 1.97% | | | | 252,028 | | | | 0.17% | | | | 0.17% | | | | 1.91% | | | | 29.92% | (e) |
| | (0.30) | | | | 9.87 | | | | 4.04% | | | | 250,632 | | | | 0.17% | | | | 0.17% | | | | 2.12% | | | | 26.46% | (e) |
See accompanying notes to financial statements.
271
HC CAPITAL TRUST
Financial Highlights (concluded)
Selected data for a share outstanding throughout the periods indicated.
| | | | | | | | | | | | | | | | | | | | | | | | | | | | |
| | | | | | Change in Net Assets Resulting
From Operations: | | | Distributions to Shareholders: | |
| | | Net Asset
Value,
Beginning
of Period | | | Net
Investment
Income/
(Loss) | | | Net Realized/
Unrealized
Gains/
(Losses) on
Investments | | | Total from
Operations | | | Net
Investment
Income | | | Net Realized
Gains from
Investments | | | Total
Distributions to
Shareholders | |
The Short-Term Municipal Bond Portfolio | | | | | | | | | | | | | | | | | | | | | | | | | | | | |
HC Strategic Shares | | | | | | | | | | | | | | | | | | | | | | | | | | | | |
Year Ended June 30, 2018 | | $ | 9.87 | | | $ | 0.11 | | | $ | (0.08 | ) | | $ | 0.03 | | | $ | (0.10 | ) | | $ | — | | | $ | (0.10 | ) |
Year Ended June 30, 2017 | | | 9.96 | | | | 0.10 | | | | (0.09 | ) | | | 0.01 | | | | (0.10 | ) | | | — | | | | (0.10 | ) |
Year Ended June 30, 2016 | | | 9.94 | | | | 0.12 | | | | 0.02 | | | | 0.14 | | | | (0.12 | ) | | | — | (b) | | | (0.12 | ) |
Year Ended June 30, 2015 | | | 10.04 | | | | 0.12 | | | | (0.10 | ) | | | 0.02 | | | | (0.12 | ) | | | — | | | | (0.12 | ) |
Year Ended June 30, 2014 | | | 10.05 | | | | 0.12 | | | | 0.01 | | | | 0.13 | | | | (0.12 | ) | | | (0.02 | ) | | | (0.14 | ) |
The Intermediate Term Municipal Bond Portfolio | | | | | | | | | | | | | | | | | | | | | | | | | | | | |
HC Strategic Shares | | | | | | | | | | | | | | | | | | | | | | | | | | | | |
Year Ended June 30, 2018 | | $ | 10.08 | | | $ | 0.19 | | | $ | (0.18 | ) | | $ | 0.01 | | | $ | (0.19 | ) | | $ | — | | | $ | (0.19 | ) |
Year Ended June 30, 2017 | | | 10.25 | | | | 0.20 | | | | (0.17 | ) | | | 0.03 | | | | (0.20 | ) | | | — | | | | (0.20 | ) |
Year Ended June 30, 2016 | | | 10.06 | | | | 0.21 | | | | 0.19 | | | | 0.40 | | | | (0.21 | ) | | | — | | | | (0.21 | ) |
Year Ended June 30, 2015 | | | 10.11 | | | | 0.21 | | | | (0.05 | ) | | | 0.16 | | | | (0.21 | ) | | | — | | | | (0.21 | ) |
Year Ended June 30, 2014 | | | 9.96 | | | | 0.25 | | | | 0.15 | | | | 0.40 | | | | (0.25 | ) | | | — | | | | (0.25 | ) |
HC Advisors Shares | | | | | | | | | | | | | | | | | | | | | | | | | | | | |
Year Ended June 30, 2018 | | $ | 10.08 | | | $ | 0.20 | | | $ | (0.19 | ) | | $ | 0.01 | | | $ | (0.19 | ) | | $ | — | | | $ | (0.19 | ) |
Year Ended June 30, 2017 | | | 10.25 | | | | 0.20 | | | | (0.17 | ) | | | 0.03 | | | | (0.20 | ) | | | — | | | | (0.20 | ) |
Year Ended June 30, 2016 | | | 10.06 | | | | 0.21 | | | | 0.19 | | | | 0.40 | | | | (0.21 | ) | | | — | | | | (0.21 | ) |
Year Ended June 30, 2015 | | | 10.11 | | | | 0.21 | | | | (0.05 | ) | | | 0.16 | | | | (0.21 | ) | | | — | | | | (0.21 | ) |
Year Ended June 30, 2014 | | | 9.96 | | | | 0.25 | | | | 0.15 | | | | 0.40 | | | | (0.25 | ) | | | — | | | | (0.25 | ) |
The Intermediate Term Municipal Bond II Portfolio | | | | | | | | | | | | | | | | | | | | | | | | | | | | |
HC Strategic Shares | | | | | | | | | | | | | | | | | | | | | | | | | | | | |
Year Ended June 30, 2018 | | $ | 10.30 | | | $ | 0.22 | | | $ | (0.21 | ) | | $ | 0.01 | | | $ | (0.22 | ) | | $ | — | (b) | | $ | (0.22 | ) |
Year Ended June 30, 2017 | | | 10.58 | | | | 0.22 | | | | (0.27 | ) | | | (0.05 | ) | | | (0.22 | ) | | | (0.01 | ) | | | (0.23 | ) |
Year Ended June 30, 2016 | | | 10.31 | | | | 0.21 | | | | 0.27 | | | | 0.48 | | | | (0.21 | ) | | | — | (b) | | | (0.21 | ) |
Year Ended June 30, 2015 | | | 10.41 | | | | 0.19 | | | | (0.06 | ) | | | 0.13 | | | | (0.19 | ) | | | (0.04 | ) | | | (0.23 | ) |
Year Ended June 30, 2014 | | | 10.28 | | | | 0.22 | | | | 0.16 | | | | 0.38 | | | | (0.22 | ) | | | (0.03 | ) | | | (0.25 | ) |
HC Advisors Shares | | | | | | | | | | | | | | | | | | | | | | | | | | | | |
Year Ended June 30, 2018 | | $ | 10.30 | | | $ | 0.22 | | | $ | (0.21 | ) | | $ | 0.01 | | | $ | (0.22 | ) | | $ | — | (b) | | $ | (0.22 | ) |
Year Ended June 30, 2017 | | | 10.59 | | | | 0.22 | | | | (0.28 | ) | | | (0.06 | ) | | | (0.22 | ) | | | (0.01 | ) | | | (0.23 | ) |
Year Ended June 30, 2016 | | | 10.31 | | | | 0.21 | | | | 0.28 | | | | 0.49 | | | | (0.21 | ) | | | — | (b) | | | (0.21 | ) |
Year Ended June 30, 2015 | | | 10.41 | | | | 0.19 | | | | (0.06 | ) | | | 0.13 | | | | (0.19 | ) | | | (0.04 | ) | | | (0.23 | ) |
Year Ended June 30, 2014 | | | 10.29 | | | | 0.22 | | | | 0.15 | | | | 0.37 | | | | (0.22 | ) | | | (0.03 | ) | | | (0.25 | ) |
| (a) | Portfolio turnover is calculated on the basis of the Portfolio, as a whole, without distinguishing between the classes of shares issued. |
| (b) | Amount rounds to less than $0.005 per share. |
See accompanying notes to financial statements.
272
| | | | | | | | | | | | | | | | | | | | | | | | | | |
| | | | | | | | | | Ratios/Supplementary Data: | |
Net Asset Value, End of Period | | | Total
Return | | | Net Assets at
End of Period
(in thousands) | | | Ratio of Expenses to
Average Net Assets,
Prior to Expenses
Paid Indirectly
and Waivers | | | Ratio of Expenses to
Average Net Assets,
Net of Expenses
Paid Indirectly
and Waivers | | | Ratio of Net
Investment
Income (Loss)
to Average
Net Assets | | | Portfolio
Turnover
Rate(a) | |
| | | | | | | | | | | | | | | | | | | | | | | | | | |
| | | | | | | | | | | | | | | | | | | | | | | | | | |
| $ | 9.80 | | | | 0.34 | % | | $ | 79,612 | | | | 0.33% | | | | 0.33% | | | | 1.23% | | | | 18.84% | |
| | 9.87 | | | | 0.12 | % | | | 17,788 | | | | 0.35% | | | | 0.35% | | | | 1.05% | | | | 25.02% | |
| | 9.96 | | | | 1.37 | % | | | 18,665 | | | | 0.31% | | | | 0.31% | | | | 1.13% | | | | 38.47% | |
| | 9.94 | | | | 0.19 | % | | | 20,933 | | | | 0.31% | | | | 0.31% | | | | 1.18% | | | | 26.24% | |
| | 10.04 | | | | 1.26 | % | | | 21,703 | | | | 0.29% | | | | 0.29% | | | | 1.16% | | | | 25.15% | |
| | | | | | | | | | | | | | | | | | | | | | | | | | |
| | | | | | | | | | | | | | | | | | | | | | | | | | |
| | | | | | | | | | | | | | | | | | | | | | | | | | |
| $ | 9.90 | | | | 0.13 | % | | $ | 383,200 | | | | 0.29% | | | | 0.29% | | | | 1.94% | | | | 26.27% | |
| | 10.08 | | | | 0.28 | % | | | 385,133 | | | | 0.28% | | | | 0.28% | | | | 1.94% | | | | 19.75% | |
| | 10.25 | | | | 4.05 | % | | | 406,302 | | | | 0.26% | | | | 0.26% | | | | 2.08% | | | | 30.35% | |
| | 10.06 | | | | 1.54 | % | | | 420,423 | | | | 0.24% | | | | 0.24% | | | | 2.03% | | | | 25.67% | |
| | 10.11 | | | | 4.10 | % | | | 423,257 | | | | 0.29% | | | | 0.29% | | | | 2.49% | | | | 34.05% | |
| | | | | | | | | | | | | | | | | | | | | | | | | | |
| $ | 9.90 | | | | 0.14 | % | | $ | 1,008 | | | | 0.54% | | | | 0.29% | | | | 1.94% | | | | 26.27% | |
| | 10.08 | | | | 0.28 | % | | | 1,437 | | | | 0.53% | | | | 0.28% | | | | 1.94% | | | | 19.75% | |
| | 10.25 | | | | 4.05 | % | | | 1,400 | | | | 0.51% | | | | 0.26% | | | | 2.08% | | | | 30.35% | |
| | 10.06 | | | | 1.54 | % | | | 1,985 | | | | 0.49% | | | | 0.24% | | | | 2.03% | | | | 25.67% | |
| | 10.11 | | | | 4.10 | % | | | 2,490 | | | | 0.54% | | | | 0.29% | | | | 2.48% | | | | 34.05% | |
| | | | | | | | | | | | | | | | | | | | | | | | | | |
| | | | | | | | | | | | | | | | | | | | | | | | | | |
| | | | | | | | | | | | | | | | | | | | | | | | | | |
| $ | 10.09 | | | | 0.07 | % | | $ | 77,455 | | | | 0.27% | | | | 0.27% | | | | 2.14% | | | | 21.56% | |
| | 10.30 | | | | (0.41 | )% | | | 74,163 | | | | 0.27% | | | | 0.27% | | | | 2.13% | | | | 15.48% | |
| | 10.58 | | | | 4.77 | % | | | 75,147 | | | | 0.25% | | | | 0.25% | | | | 2.03% | | | | 11.22% | |
| | 10.31 | | | | 1.31 | % | | | 77,102 | | | | 0.25% | | | | 0.25% | | | | 1.85% | | | | 21.51% | |
| | 10.41 | | | | 3.76 | % | | | 77,702 | | | | 0.25% | | | | 0.25% | | | | 2.12% | | | | 17.84% | |
| | | | | | | | | | | | | | | | | | | | | | | | | | |
| $ | 10.09 | | | | 0.07 | % | | $ | 260 | | | | 0.52% | | | | 0.27% | | | | 2.13% | | | | 21.56% | |
| | 10.30 | | | | (0.50 | )% | | | 372 | | | | 0.52% | | | | 0.27% | | | | 2.13% | | | | 15.48% | |
| | 10.59 | | | | 4.87 | % | | | 408 | | | | 0.50% | | | | 0.25% | | | | 2.02% | | | | 11.22% | |
| | 10.31 | | | | 1.31 | % | | | 575 | | | | 0.50% | | | | 0.25% | | | | 1.85% | | | | 21.51% | |
| | 10.41 | | | | 3.66 | % | | | 724 | | | | 0.50% | | | | 0.25% | | | | 2.11% | | | | 17.84% | |
See accompanying notes to financial statements.
273
HC CAPITAL TRUST
Notes to Financial Statements — June 30, 2018
1. DESCRIPTION. HC Capital Trust (the “Trust”) is registered under the Investment Company Act of 1940, as amended (the “1940 Act”), as an open-end management series investment company. The Trust is a Delaware statutory trust which was organized on December 15, 1994. As of June 30, 2018, the Trust offered twenty-two separate investment portfolios: The Value Equity Portfolio (“Value Portfolio”), The Institutional Value Equity Portfolio (“Institutional Value Portfolio”), The Growth Equity Portfolio (“Growth Portfolio”), The Institutional Growth Equity Portfolio (“Institutional Growth Portfolio”), The Small Capitalization-Mid Capitalization Equity Portfolio (“Small Cap-Mid Cap Portfolio”), The Institutional Small Capitalization-Mid Capitalization Equity Portfolio (“Institutional Small Cap-Mid Cap Portfolio”), The Real Estate Securities Portfolio (“Real Estate Portfolio”), The Commodity Returns Strategy Portfolio (“Commodity Portfolio”), The ESG Growth Portfolio (“ESG Growth Portfolio”), The Catholic SRI Growth Portfolio (“Catholic SRI Growth Portfolio”), The International Equity Portfolio (“International Portfolio”), The Institutional International Equity Portfolio (“Institutional International Portfolio”), The Emerging Markets Portfolio (“Emerging Markets Portfolio”), The Core Fixed Income Portfolio (“Core Fixed Income Portfolio”), The Fixed Income Opportunity Portfolio (“Fixed Opportunity Portfolio”), The U.S. Government Fixed Income Securities Portfolio (“U.S. Government Fixed Income Portfolio”), The Inflation Protected Securities Portfolio (“Inflation Protected Portfolio”), The U.S. Corporate Fixed Income Securities Portfolio (“U.S. Corporate Fixed Income Portfolio”), The U.S. Mortgage/Asset Backed Fixed Income Securities Portfolio (“U.S. Mortgage/Asset Backed Fixed Income Portfolio”), The Short-Term Municipal Bond Portfolio (“Short-Term Municipal Portfolio”), The Intermediate Term Municipal Bond Portfolio (“Intermediate Municipal Portfolio”), and The Intermediate Term Municipal Bond II Portfolio (“Intermediate Municipal II Portfolio) (each a “Portfolio” and collectively the “Portfolios”).
Each Portfolio is authorized to issue an unlimited number of shares of beneficial interest with a par value of $0.001 each in two classes of shares: HC Advisors Shares and HC Strategic Shares. As of June 30, 2018, the HC Advisors Shares for U.S. Government Fixed Income Portfolio, U.S. Corporate Fixed Income Portfolio, U.S. Mortgage/Asset Backed Fixed Income Portfolio, and Short-Term Municipal Portfolio had not yet commenced operations and the HC Advisors Shares were not currently active for the Real Estate Portfolio. Each class of shares for each of the Portfolios has identical rights and privileges except with respect to voting rights on matters affecting a single class of shares. The Trust’s investment adviser is HC Capital Solutions (the “Adviser”), an operating division of Hirtle Callaghan & Co., LLC.
During the fiscal year ended June 30, 2018, all the Portfolios in the Trust, except the Real Estate Portfolio, the ESG Growth Portfolio, and the Catholic SRI Growth Portfolio were diversified Portfolios under the 1940 Act. The Real Estate Portfolio, the ESG Growth Portfolio, and the Catholic SRI Growth Portfolio were classified as non-diversified Portfolios, which means that they may concentrate their investments in the securities of a limited number of issuers. The ESG Growth Portfolio and the Catholic SRI Growth Portfolio, however, operated with diversified investment portfolios.
As is customary, the Trust’s organizational documents permit the Trust to indemnify its officers and trustees against certain liabilities under certain circumstances. In addition, in the normal course of business, the Trust enters into contracts with its vendors and others that also permit the indemnification of parties to the contract under certain circumstances. The Trust’s maximum exposure under these arrangements is unknown, as this would involve future claims that may be made against the Trust.
2. SIGNIFICANT ACCOUNTING POLICIES. The following is a summary of the significant accounting policies followed by the Portfolios in the preparation of their financial statements. The Portfolios are investment companies and follow accounting and reporting guidance under Financial Accounting Standards Board (“FASB”) Accounting Standards Codification (“ASC”) Topic 946, “Financial Services — Investment Companies.” The policies are in conformity with accounting principles generally accepted in the United States of America (“GAAP”). The presentation of the Portfolios’ financial statements in conformity with GAAP requires management to make estimates and assumptions that affect the reported amounts of assets and liabilities at the date of the financial statements and the reported amounts of income and expenses for the period. Actual results could differ from those estimates.
A. Portfolio Valuation. The net asset value (“NAV”) per share of each Portfolio is determined at the close of regular trading on the New York Stock Exchange (“NYSE”), normally at 4:00 p.m. Eastern time, on days the NYSE is open. Each class’s NAV per share is calculated by adding the market value or fair value, as applicable, of all securities and other assets of the Portfolio, subtracting its liabilities and dividing the result by the number of its outstanding shares.
B. Securities Valuation. Security values are ordinarily obtained through the use of independent pricing services in accordance with procedures adopted by the Trust’s Board of Trustees (the “Board”). Pursuant to such procedures, the
274
HC CAPITAL TRUST
Notes to Financial Statements (continued) — June 30, 2018
Portfolios may use a pricing service, bank, or broker-dealer experienced in such matters to value the Portfolio’s securities. When reliable market quotations are not readily available for any security, the fair value of that security will be determined by a committee established by the Board in accordance with procedures adopted by the Board. The fair valuation process is designed to value the subject security at the price the Portfolio would reasonably expect to receive upon its current sale. Additional consideration is given to securities that have experienced a decrease in the volume or level of activity or to circumstances that indicate that a transaction is not orderly.
For disclosure purposes, the Trust has a three-tier fair value hierarchy that is dependent upon the observability of various “inputs” used to determine the value of the Portfolios’ investments. These inputs are summarized in the three broad levels listed below:
| | • | | Level 1 — quoted prices in active markets for identical assets |
| | • | | Level 2 — other significant observable inputs (including quoted prices for similar securities, interest rates, prepayment speeds, credit risk, etc.) |
| | • | | Level 3 — significant unobservable inputs (including a Portfolio’s own assumptions in determining the fair value of investments) |
The inputs or methodology used for valuing securities are not necessarily an indication of the risks associated with investing in those securities.
Equity Securities (Common and Preferred Stock and Exchange-Traded Funds): Readily marketable portfolio securities listed on a securities exchange, including NASDAQ, are valued at the closing price on the exchange or at the NASDAQ Official Closing Price. If there have been no sales on such exchange, the securities are valued at the closing bid price. In each of these situations, valuations are typically categorized as Level 1 in the fair value hierarchy. Readily marketable securities traded only in the over-the-counter market are valued at the closing price and are typically categorized as Level 1 in the fair value hierarchy, or, if there have been no sales, are valued at the mean of the last reported bid and asked prices and are typically categorized as Level 2 in the fair value hierarchy.
Securities listed on a foreign exchange are valued at the closing price on that exchange provided that where the prices of such securities are denominated in foreign currencies, such prices are converted into U.S. dollars at the bid price of such currencies against U.S. dollars at the time of the NAV calculation. If there have been no sales on such exchange, the security is valued at the closing bid price. In each of these situations, valuations are typically categorized as Level 1 in the fair value hierarchy. Fair value pricing may be used if events materially affecting the value of foreign securities occur between the time when the exchange on which they are traded closes and the time when the NAV is calculated. Such securities may be valued at fair value in accordance with procedures adopted by the Board. Management identifies possible fluctuations in international securities by monitoring the increase or decrease in the value of a designated benchmark index. In the event of an increase or decrease greater than predetermined levels, a Portfolio may use a systematic valuation model provided by an independent third party to fair value its international securities. Such systematic valuations are typically categorized as Level 2 in the fair value hierarchy.
Mutual Funds: Mutual funds are valued at their respective daily net asset value and are typically categorized as Level 1 in the fair value hierarchy.
Fixed Income Securities (Corporate, Municipal and Foreign Bonds, U.S. Government and Agency Securities and Inflation Indexed Bonds): Fixed income securities are valued using various inputs including benchmark yields, reported trades, broker/dealer quotes, issuer spreads, two-sided markets, benchmark securities, bids, offers, reference data, and industry and market events, and are typically categorized as Level 2 in the fair value hierarchy.
Asset-Backed and Mortgage-Backed Securities: In addition to the inputs discussed above for fixed-income securities, asset-backed and mortgage-backed securities are valued using new issue data, monthly payment information and collateral performance, and are typically categorized as Level 2 in the fair value hierarchy.
Short-Term Obligations: Short-term obligations with maturities of 60 days or less may also be valued at amortized cost, which constitutes fair value as determined by the Board. Such securities are typically categorized as Level 2 in the fair value hierarchy.
275
HC CAPITAL TRUST
Notes to Financial Statements (continued) — June 30, 2018
Derivative Instruments (Futures, Options, Swaps and Forward Currency Contracts): Swaps are valued using interdealer broker rates, benchmark yields, and swap details and are typically categorized as Level 2 in the fair value hierarchy. Exchange traded futures, swaps and options are valued using quoted prices from the exchange and are typically categorized as Level 1 in the fair value hierarchy. Forward currency contracts are valued using market quotes posted by major currency dealers and are typically categorized as Level 2 in the fair value hierarchy.
The following is a summary of the inputs used to value the following Portfolios’ securities as of June 30, 2018 (amounts in thousands). The breakdown of investment categorization is disclosed in the Schedule of Portfolio Investments for each Portfolio.
| | | | | | | | | | | | | | | | |
Portfolio | | LEVEL 1 –
Quoted Prices | | | LEVEL 2 – Other
Significant
Observable Inputs | | | LEVEL 3 –
Significant
Unobservable Inputs | | | Total | |
Value Portfolio | | | | | | | | | | | | | | | | |
Common Stocks | | $ | 555,658 | | | $ | — | | | $ | — | | | $ | 555,658 | |
Time Deposit | | | — | | | | 9 | | | | — | | | | 9 | |
Mutual Funds | | | 42,439 | | | | — | | | | — | | | | 42,439 | |
Repurchase Agreement | | | — | | | | 11 | | | | — | | | | 11 | |
| | | | | | | | | | | | | | | | |
Total Investment Securities | | $ | 598,097 | | | $ | 20 | | | $ | — | | | $ | 598,117 | |
| | | | | | | | | | | | | | | | |
Other Financial Instruments1 | | | | | | | | | | | | | | | | |
Futures | | $ | (714 | ) | | $ | — | | | $ | — | | | $ | (714 | ) |
| | | | | | | | | | | | | | | | |
Total Investments | | $ | 597,383 | | | $ | 20 | | | $ | — | | | $ | 597,403 | |
| | | | | | | | | | | | | | | | |
| | | | |
Institutional Value Portfolio | | | | | | | | | | | | | | | | |
Common Stocks | | $ | 800,365 | | | $ | — | | | $ | — | | | $ | 800,365 | |
U.S. Treasury Obligations | | | — | | | | 145 | | | | — | | | | 145 | |
Time Deposit | | | — | | | | 38 | | | | — | | | | 38 | |
Mutual Funds | | | 121,815 | | | | — | | | | — | | | | 121,815 | |
| | | | | | | | | | | | | | | | |
Total Investment Securities | | $ | 922,180 | | | $ | 183 | | | $ | — | | | $ | 922,363 | |
| | | | | | | | | | | | | | | | |
Other Financial Instruments1 | | | | | | | | | | | | | | | | |
Futures | | $ | (2,219 | ) | | $ | — | | | $ | — | | | $ | (2,219 | ) |
| | | | | | | | | | | | | | | | |
Total Investments | | $ | 919,961 | | | $ | 183 | | | $ | — | | | $ | 920,144 | |
| | | | | | | | | | | | | | | | |
| | | | |
Growth Portfolio | | | | | | | | | | | | | | | | |
Common Stocks | | $ | 784,365 | | | $ | — | | | $ | — | | | $ | 784,365 | |
Time Deposit | | | — | | | | 5,212 | | | | — | | | | 5,212 | |
Exchange-Traded Fund | | | 5,269 | | | | — | | | | — | | | | 5,269 | |
Mutual Fund | | | 13,818 | | | | — | | | | — | | | | 13,818 | |
| | | | | | | | | | | | | | | | |
Total Investment Securities | | $ | 803,452 | | | $ | 5,212 | | | $ | — | | | $ | 808,664 | |
| | | | | | | | | | | | | | | | |
Other Financial Instruments1 | | | | | | | | | | | | | | | | |
Futures | | $ | (35 | ) | | $ | — | | | $ | — | | | $ | (35 | ) |
| | | | | | | | | | | | | | | | |
Total Investments | | $ | 803,417 | | | $ | 5,212 | | | $ | — | | | $ | 808,629 | |
| | | | | | | | | | | | | | | | |
| | | | |
Institutional Growth Portfolio | | | | | | | | | | | | | | | | |
Common Stocks | | $ | 1,113,277 | | | $ | — | | | $ | — | | | $ | 1,113,277 | |
U.S. Treasury Obligations | | | — | | | | 174 | | | | — | | | | 174 | |
Time Deposit | | | — | | | | 6,045 | | | | — | | | | 6,045 | |
Mutual Funds | | | 66,574 | | | | — | | | | — | | | | 66,574 | |
Repurchase Agreement | | | — | | | | 993 | | | | — | | | | 993 | |
| | | | | | | | | | | | | | | | |
Total Investment Securities | | $ | 1,179,851 | | | $ | 7,212 | | | $ | — | | | $ | 1,187,063 | |
| | | | | | | | | | | | | | | | |
276
HC CAPITAL TRUST
Notes to Financial Statements (continued) — June 30, 2018
| | | | | | | | | | | | | | | | |
Portfolio | | LEVEL 1 –
Quoted Prices | | | LEVEL 2 – Other
Significant
Observable Inputs | | | LEVEL 3 –
Significant
Unobservable Inputs | | | Total | |
| | | | |
Institutional Growth Portfolio (continued) | | | | | | | | | | | | | | | | |
Other Financial Instruments1 | | | | | | | | | | | | | | | | |
Futures | | $ | (907 | ) | | $ | — | | | $ | — | | | $ | (907 | ) |
| | | | | | | | | | | | | | | | |
Total Investments | | $ | 1,178,944 | | | $ | 7,212 | | | $ | — | | | $ | 1,186,156 | |
| | | | | | | | | | | | | | | | |
| | | | |
Small Cap–Mid Cap Portfolio | | | | | | | | | | | | | | | | |
Common Stocks | | $ | 97,759 | | | $ | — | * | | $ | — | | | $ | 97,759 | |
Contingent Rights | | | — | | | | — | | | | — | | | | — | |
Time Deposit | | | — | | | | 2,829 | | | | — | | | | 2,829 | |
Mutual Funds | | | 10,908 | | | | — | | | | — | | | | 10,908 | |
Repurchase Agreement | | | — | | | | 1,290 | | | | — | | | | 1,290 | |
| | | | | | | | | | | | | | | | |
Total Investment Securities | | $ | 108,667 | | | $ | 4,119 | | | $ | — | | | $ | 112,786 | |
| | | | | | | | | | | | | | | | |
Other Financial Instruments1 | | | | | | | | | | | | | | | | |
Futures | | $ | (114 | ) | | $ | — | | | $ | — | | | $ | (114 | ) |
| | | | | | | | | | | | | | | | |
Total Investments | | $ | 108,553 | | | $ | 4,119 | | | $ | — | | | $ | 112,672 | |
| | | | | | | | | | | | | | | | |
| | | | |
Institutional Small Cap–Mid Cap Portfolio | | | | | | | | | | | | | | | | |
Common Stocks | | $ | 151,606 | | | $ | — | | | $ | — | | | $ | 151,606 | |
Contingent Right | | | — | | | | — | | | | — | | | | — | |
U.S. Treasury Obligations | | | — | | | | 20 | | | | — | | | | 20 | |
Time Deposit | | | — | | | | 936 | | | | — | | | | 936 | |
Mutual Funds | | | 9,663 | | | | — | | | | — | | | | 9,663 | |
Repurchase Agreement | | | — | | | | 3,330 | | | | — | | | | 3,330 | |
| | | | | | | | | | | | | | | | |
Total Investment Securities | | $ | 161,269 | | | $ | 4,286 | | | $ | — | | | $ | 165,555 | |
| | | | | | | | | | | | | | | | |
Other Financial Instruments1 | | | | | | | | | | | | | | | | |
Futures | | $ | (95 | ) | | $ | — | | | $ | — | | | $ | (95 | ) |
| | | | | | | | | | | | | | | | |
Total Investments | | $ | 161,174 | | | $ | 4,286 | | | $ | — | | | $ | 165,460 | |
| | | | | | | | | | | | | | | | |
| | | | |
Real Estate Portfolio | | | | | | | | | | | | | | | | |
Common Stocks | | $ | 110,575 | | | $ | — | | | $ | — | | | $ | 110,575 | |
Mutual Funds | | | 20,337 | | | | — | | | | — | | | | 20,337 | |
| | | | | | | | | | | | | | | | |
Total Investment Securities | | $ | 130,912 | | | $ | — | | | $ | — | | | $ | 130,912 | |
| | | | | | | | | | | | | | | | |
Other Financial Instruments1 | | | | | | | | | | | | | | | | |
Futures | | $ | 273 | | | $ | — | | | $ | — | | | $ | 273 | |
| | | | | | | | | | | | | | | | |
Total Investments | | $ | 131,185 | | | $ | — | | | $ | — | | | $ | 131,185 | |
| | | | | | | | | | | | | | | | |
| | | | |
Commodity Portfolio | | | | | | | | | | | | | | | | |
Common Stocks | | $ | 720,500 | | | $ | 284 | | | $ | — | | | $ | 720,784 | |
Preferred Stocks | | | 4,845 | | | | — | | | | — | | | | 4,845 | |
Right | | | — | | | | 69 | | | | — | | | | 69 | |
Corporate Bonds | | | — | | | | 25,471 | | | | — | | | | 25,471 | |
Yankee Dollar | | | — | | | | 1,949 | | | | — | | | | 1,949 | |
Time Deposit | | | — | | | | 4,399 | | | | — | | | | 4,399 | |
Mutual Funds | | | 70,007 | | | | — | | | | — | | | | 70,007 | |
Purchased Options | | | 96 | | | | — | | | | — | | | | 96 | |
Repurchase Agreements | | | — | | | | 31,953 | | | | — | | | | 31,953 | |
| | | | | | | | | | | | | | | | |
Total Investment Securities | | $ | 795,448 | | | $ | 64,125 | | | $ | — | | | $ | 859,573 | |
| | | | | | | | | | | | | | | | |
277
HC CAPITAL TRUST
Notes to Financial Statements (continued) — June 30, 2018
| | | | | | | | | | | | | | | | |
Portfolio | | LEVEL 1 –
Quoted Prices | | | LEVEL 2 – Other
Significant
Observable Inputs | | | LEVEL 3 –
Significant
Unobservable Inputs | | | Total | |
| | | | |
Commodity Portfolio (continued) | | | | | | | | | | | | | | | | |
Other Financial Instruments1 | | | | | | | | | | | | | | | | |
Futures | | $ | (977 | ) | | $ | — | | | $ | — | | | $ | (977 | ) |
Written Option | | | — | | | | — | | | | — | | | | — | |
Total Return Swap Agreements | | | — | | | | (73 | ) | | | — | | | | (73 | ) |
Commodity Forward Swap Agreements | | | — | | | | (31 | ) | | | — | | | | (31 | ) |
| | | | | | | | | | | | | | | | |
Total Investments | | $ | 794,471 | | | $ | 64,021 | | | $ | — | | | $ | 858,492 | |
| | | | | | | | | | | | | | | | |
| | | | |
ESG Growth Portfolio | | | | | | | | | | | | | | | | |
Common Stocks | | $ | 162,611 | | | $ | — | | | $ | — | | | $ | 162,611 | |
Preferred Stock | | | 49 | | | | — | | | | — | | | | 49 | |
Right | | | — | | | | — | | | | — | | | | — | |
Mutual Funds | | | 2,363 | | | | — | | | | — | | | | 2,363 | |
| | | | | | | | | | | | | | | | |
Total Investment Securities | | $ | 165,023 | | | $ | — | | | $ | — | | | $ | 165,023 | |
| | | | | | | | | | | | | | | | |
Other Financial Instruments1 | | | | | | | | | | | | | | | | |
Futures | | $ | (29 | ) | | $ | — | | | $ | — | | | $ | (29 | ) |
| | | | | | | | | | | | | | | | |
Total Investments | | $ | 164,994 | | | $ | — | | | $ | — | | | $ | 164,994 | |
| | | | | | | | | | | | | | | | |
| | | | |
Catholic SRI Growth Portfolio | | | | | | | | | | | | | | | | |
Common Stocks | | $ | 28,933 | | | $ | — | | | $ | — | | | $ | 28,933 | |
Preferred Stock | | | 9 | | | | — | | | | — | | | | 9 | |
Right | | | — | | | | — | | | | — | | | | — | |
Mutual Fund | | | 130 | | | | — | | | | — | | | | 130 | |
| | | | | | | | | | | | | | | | |
Total Investment Securities | | $ | 29,072 | | | $ | — | | | $ | — | | | $ | 29,072 | |
| | | | | | | | | | | | | | | | |
| | | | |
International Portfolio | | | | | | | | | | | | | | | | |
Common Stocks | | $ | 1,055,967 | | | $ | 40 | | | $ | — | | | $ | 1,056,007 | |
Preferred Stocks | | | 21,691 | | | | — | | | | — | | | | 21,691 | |
Right | | | — | | | | — | | | | — | | | | — | |
Time Deposit | | | — | | | | 25,972 | | | | — | | | | 25,972 | |
Mutual Funds | | | 23,147 | | | | — | | | | — | | | | 23,147 | |
Repurchase Agreement | | | — | | | | 2,330 | | | | — | | | | 2,330 | |
| | | | | | | | | | | | | | | | |
Total Investment Securities | | $ | 1,100,805 | | | $ | 28,342 | | | $ | — | | | $ | 1,129,147 | |
| | | | | | | | | | | | | | | | |
Other Financial Instruments1 | | | | | | | | | | | | | | | | |
Futures | | $ | (2,684 | ) | | $ | — | | | $ | — | | | $ | (2,684 | ) |
| | | | | | | | | | | | | | | | |
Total Investments | | $ | 1,098,121 | | | $ | 28,342 | | | $ | — | | | $ | 1,126,463 | |
| | | | | | | | | | | | | | | | |
| | | | |
Institutional International Portfolio | | | | | | | | | | | | | | | | |
Common Stocks | | $ | 2,118,328 | | | $ | 44 | | | $ | — | | | $ | 2,118,372 | |
Preferred Stocks | | | 25,542 | | | | — | | | | — | | | | 25,542 | |
Rights | | | — | | | | 1 | | | | — | | | | 1 | |
Time Deposit | | | — | | | | 23,062 | | | | — | | | | 23,062 | |
Mutual Funds | | | 158,781 | | | | — | | | | — | | | | 158,781 | |
Repurchase Agreement | | | — | | | | 16,431 | | | | — | | | | 16,431 | |
| | | | | | | | | | | | | | | | |
Total Investment Securities | | $ | 2,302,651 | | | $ | 39,538 | | | $ | — | | | $ | 2,342,189 | |
| | | | | | | | | | | | | | | | |
Other Financial Instruments1 | | | | | | | | | | | | | | | | |
Futures | | $ | (1,522 | ) | | $ | — | | | $ | — | | | $ | (1,522 | ) |
| | | | | | | | | | | | | | | | |
Total Investments | | $ | 2,301,129 | | | $ | 39,538 | | | $ | — | | | $ | 2,340,667 | |
| | | | | | | | | | | | | | | | |
278
HC CAPITAL TRUST
Notes to Financial Statements (continued) — June 30, 2018
| | | | | | | | | | | | | | | | |
Portfolio | | LEVEL 1 –
Quoted Prices | | | LEVEL 2 – Other
Significant
Observable Inputs | | | LEVEL 3 –
Significant
Unobservable Inputs | | | Total | |
| | | | |
Emerging Markets Portfolio | | | | | | | | | | | | | | | | |
Common Stocks | | $ | 1,521,086 | | | $ | 18,198 | | | $ | — | | | $ | 1,539,284 | |
Preferred Stocks | | | 31,661 | | | | — | | | | — | | | | 31,661 | |
Time Deposit | | | — | | | | 8,347 | | | | — | | | | 8,347 | |
Exchange-Traded Fund | | | 4,575 | | | | — | | | | — | | | | 4,575 | |
Mutual Funds | | | 29,320 | | | | — | | | | — | | | | 29,320 | |
Repurchase Agreement | | | — | | | | 10,162 | | | | — | | | | 10,162 | |
| | | | | | | | | | | | | | | | |
Total Investment Securities | | $ | 1,586,642 | | | $ | 36,707 | | | $ | — | | | $ | 1,623,349 | |
| | | | | | | | | | | | | | | | |
Other Financial Instruments1 | | | | | | | | | | | | | | | | |
Futures | | $ | (123 | ) | | $ | — | | | $ | — | | | $ | (123 | ) |
| | | | | | | | | | | | | | | | |
Total Investments | | $ | 1,586,519 | | | $ | 36,707 | | | $ | — | | | $ | 1,623,226 | |
| | | | | | | | | | | | | | | | |
| | | | |
Core Fixed Income Portfolio | | | | | | | | | | | | | | | | |
Asset Backed Securities | | $ | — | | | $ | 333 | | | $ | — | | | $ | 333 | |
Collateralized Mortgage Obligations | | | — | | | | 1,049 | | | | — | | | | 1,049 | |
U.S. Government Agency Mortgages | | | — | | | | 15,114 | | | | — | | | | 15,114 | |
U.S. Government Agency Securities | | | — | | | | 917 | | | | — | | | | 917 | |
Corporate Bonds | | | — | | | | 22,182 | | | | — | | | | 22,182 | |
U.S. Treasury Obligations | | | — | | | | 22,495 | | | | — | | | | 22,495 | |
Yankee Dollars | | | — | | | | 4,028 | | | | — | | | | 4,028 | |
Time Deposit | | | — | | | | 29 | | | | — | | | | 29 | |
Mutual Funds | | | 2,343 | | | | — | | | | — | | | | 2,343 | |
| | | | | | | | | | | | | | | | |
Total Investment Securities | | $ | 2,343 | | | $ | 66,147 | | | $ | — | | | $ | 68,490 | |
| | | | | | | | | | | | | | | | |
Other Financial Instruments2 | | | | | | | | | | | | | | | | |
TBA Sale Commitments | | $ | — | | | $ | (147 | ) | | $ | — | | | $ | (147 | ) |
| | | | | | | | | | | | | | | | |
Total Investments | | $ | 2,343 | | | $ | 66,000 | | | $ | — | | | $ | 68,343 | |
| | | | | | | | | | | | | | | | |
| | | | |
Fixed Opportunity Portfolio | | | | | | | | | | | | | | | | |
Collateralized Mortgage Obligations | | $ | — | | | $ | 132,166 | | | $ | — | | | $ | 132,166 | |
U.S. Government Agency Mortgages | | | — | | | | 22,206 | | | | — | | | | 22,206 | |
Corporate Bonds | | | — | | | | 359,749 | | | | — | | | | 359,749 | |
Yankee Dollars | | | — | | | | 83,517 | | | | — | | | | 83,517 | |
Time Deposit | | | — | | | | 2,407 | | | | — | | | | 2,407 | |
Exchange-Traded Fund | | | 35,475 | | | | — | | | | — | | | | 35,475 | |
Mutual Funds | | | 51,555 | | | | — | | | | — | | | | 51,555 | |
Repurchase Agreement | | | — | | | | 34,800 | | | | — | | | | 34,800 | |
| | | | | | | | | | | | | | | | |
Total Investment Securities | | $ | 87,030 | | | $ | 634,845 | | | $ | — | | | $ | 721,875 | |
| | | | | | | | | | | | | | | | |
Other Financial Instruments1 | | | | | | | | | | | | | | | | |
Futures | | $ | (254 | ) | | $ | — | | | $ | — | | | $ | (254 | ) |
Credit Default Swap Agreements | | | — | | | | (259 | ) | | | — | | | | (259 | ) |
| | | | | | | | | | | | | | | | |
Total Investments | | $ | 86,776 | | | $ | 634,586 | | | $ | — | | | $ | 721,362 | |
| | | | | | | | | | | | | | | | |
| | | | |
U.S. Government Fixed Income Portfolio | | | | | | | | | | | | | | | | |
U.S. Government Agency Securities | | $ | — | | | $ | 9,298 | | | $ | — | | | $ | 9,298 | |
U.S. Treasury Obligations | | | — | | | | 222,098 | | | | — | | | | 222,098 | |
Yankee Dollar | | | — | | | | 129 | | | | — | | | | 129 | |
Time Deposit | | | — | | | | 885 | | | | — | | | | 885 | |
Mutual Fund | | | 542 | | | | — | | | | — | | | | 542 | |
| | | | | | | | | | | | | | | | |
Total Investment Securities | | $ | 542 | | | $ | 232,410 | | | $ | — | | | $ | 232,952 | |
| | | | | | | | | | | | | | | | |
279
HC CAPITAL TRUST
Notes to Financial Statements (continued) — June 30, 2018
| | | | | | | | | | | | | | | | |
Portfolio | | LEVEL 1 –
Quoted Prices | | | LEVEL 2 – Other
Significant
Observable Inputs | | | LEVEL 3 –
Significant
Unobservable Inputs | | | Total | |
| | | | |
Inflation Protected Portfolio | | | | | | | | | | | | | | | | |
U.S. Treasury Obligations | | $ | — | | | $ | 380,610 | | | $ | — | | | $ | 380,610 | |
Mutual Fund | | | 20,091 | | | | — | | | | — | | | | 20,091 | |
| | | | | | | | | | | | | | | | |
Total Investment Securities | | $ | 20,091 | | | $ | 380,610 | | | $ | — | | | $ | 400,701 | |
| | | | | | | | | | | | | | | | |
| | | | |
U.S. Corporate Fixed Income Portfolio | | | | | | | | | | | | | | | | |
Corporate Bonds | | $ | — | | | $ | 223,484 | | | $ | — | | | $ | 223,484 | |
Yankee Dollars | | | — | | | | 42,023 | | | | — | | | | 42,023 | |
Mutual Funds | | | 18,669 | | | | — | | | | — | | | | 18,669 | |
| | | | | | | | | | | | | | | | |
Total Investment Securities | | $ | 18,669 | | | $ | 265,507 | | | $ | — | | | $ | 284,176 | |
| | | | | | | | | | | | | | | | |
| | | | |
U.S. Mortgage/Asset Backed Fixed Income Portfolio | | | | | | | | | | | | | | | | |
Asset Backed Securities | | $ | — | | | $ | 3,735 | | | $ | — | | | $ | 3,735 | |
Collateralized Mortgage Obligations | | | — | | | | 11,690 | | | | — | | | | 11,690 | |
U.S. Government Agency Mortgages | | | — | | | | 177,433 | | | | — | | | | 177,433 | |
Yankee Dollars | | | — | | | | 405 | | | | — | | | | 405 | |
Mutual Fund | | | 39,124 | | | | — | | | | — | | | | 39,124 | |
| | | | | | | | | | | | | | | | |
Total Investment Securities | | $ | 39,124 | | | $ | 193,263 | | | $ | — | | | $ | 232,387 | |
| | | | | | | | | | | | | | | | |
Other Financial Instruments2 | | | | | | | | | | | | | | | | |
TBA Sale Commitments | | | — | | | | (464 | ) | | | — | | | | (464 | ) |
| | | | | | | | | | | | | | | | |
Total Investments | | $ | 39,124 | | | $ | 192,799 | | | $ | — | | | $ | 231,923 | |
| | | | | | | | | | | | | | | | |
| | | | |
Short-Term Municipal Portfolio | | | | | | | | | | | | | | | | |
Municipal Bonds | | $ | — | | | $ | 78,612 | | | $ | — | | | $ | 78,612 | |
Mutual Fund | | | 1,676 | | | | — | | | | — | | | | 1,676 | |
| | | | | | | | | | | | | | | | |
Total Investment Securities | | $ | 1,676 | | | $ | 78,612 | | | $ | — | | | $ | 80,288 | |
| | | | | | | | | | | | | | | | |
| | | | |
Intermediate Municipal Portfolio | | | | | | | | | | | | | | | | |
Municipal Bonds | | $ | — | | | $ | 381,086 | | | $ | — | | | $ | 381,086 | |
Corporate Bond | | | — | | | | — | | | | — | | | | — | |
Time Deposit | | | — | | | | 4 | | | | — | | | | 4 | |
Mutual Fund | | | 3,517 | | | | — | | | | — | | | | 3,517 | |
| | | | | | | | | | | | | | | | |
Total Investment Securities | | $ | 3,517 | | | $ | 381,090 | | | $ | — | | | $ | 384,607 | |
| | | | | | | | | | | | | | | | |
| | | | |
Intermediate Municipal II Portfolio | | | | | | | | | | | | | | | | |
Municipal Bonds | | $ | — | | | $ | 76,475 | | | $ | — | | | $ | 76,475 | |
Mutual Fund | | | 667 | | | | — | | | | — | | | | 667 | |
| | | | | | | | | | | | | | | | |
Total Investment Securities | | $ | 667 | | | $ | 76,475 | | | $ | — | | | $ | 77,142 | |
| | | | | | | | | | | | | | | | |
Amounts designated as “—” are $0 or have been rounded to $0.
| * | Represents a security that was fair valued as of June 30, 2018 at $0. |
| 1 | Other Financial Instruments are derivative instruments not reflected in the total investments, such as futures and currency contracts, which are valued at the unrealized appreciation/(depreciation) on the instrument and written options and swap agreements, which are valued at fair value. |
| 2 | Represents a “to be announced” transaction. The Portfolio has committed to sell securities for which all specific information is not available at the time. |
The Trust’s policy is to disclose transfers between fair value hierarchy levels based on valuations at the end of the reporting period. There were no transfers between levels during the year ended June 30, 2018.
C. Securities Transactions and Investment Income. For financial reporting purposes, portfolio securities transactions are reported on trade date. However, for daily NAV determination, portfolio securities transactions are reflected no later than
280
HC CAPITAL TRUST
Notes to Financial Statements (continued) — June 30, 2018
in the first calculation on the first business day following trade date. Dividend income is recognized on the ex-dividend date and foreign dividends are recognized as soon as reliable information is available from the Portfolio’s sources. Interest income, including amortization of premium and accretion of discount on investments, is accrued daily. Realized gains and losses from securities transactions are determined by comparing the identified cost of the security lot sold to the net sales proceeds. Realized gains and losses from principal payment transactions on mortgage-backed and asset-backed securities are classified as investment income or loss for financial reporting purposes.
For certain securities, including real estate investment trusts, the Portfolio records distributions received in excess of income as a reduction of the cost of investments and/or realized gain. Such amounts are based on estimates if actual amounts are not available. Actual amounts of income, realized gain and return of capital may differ from the estimated amounts. The Portfolio records adjustments to the estimated amounts of the components of distributions to investment income, unrealized appreciation/depreciation and realized gain/loss on investments as necessary, once the issuers provide information about the actual composition of the distributions.
D. Restricted Securities. A restricted security is a security that cannot be offered for public sale without prior registration under the Securities Act of 1933 (the “1933 Act”) (absent an exemption). Whether a restricted security is illiquid is determined pursuant to guidelines established by the Board. Not all restricted securities are considered illiquid. At June 30, 2018, all restricted securities were deemed liquid.
E. Allocations. Expenses directly attributable to a Portfolio are charged to that Portfolio. Class-specific expenses, if any, are borne by that class. Other expenses are allocated proportionately among the Portfolios in relation to the net assets of each Portfolio or by another appropriate method. Income, non-class-specific expenses and realized and unrealized gains and losses are allocated to the respective classes based on relative net assets.
F. Dividends and Capital Gain Distributions to Shareholders. The Core Fixed Income Portfolio, U.S. Government Fixed Income Portfolio, Inflation Protected Portfolio, U.S. Corporate Fixed Income Portfolio, U.S. Mortgage/Asset Backed Fixed Income Portfolio, Short-Term Municipal Portfolio, Intermediate Municipal Portfolio, and Intermediate Municipal II Portfolio declare and distribute dividends from net investment income, if any, on a monthly basis. The Value Portfolio, Institutional Value Portfolio, Growth Portfolio, Institutional Growth Portfolio, Small Cap-Mid Cap Portfolio, Institutional Small Cap-Mid Cap Portfolio, Real Estate Portfolio, Commodity Portfolio, ESG Growth Portfolio, Catholic SRI Growth Portfolio and Fixed Opportunity Portfolio declare and distribute dividends from net investment income, if any, on a quarterly basis. The International Portfolio and Institutional International Portfolio declare and distribute dividends from net investment income, if any, on a semiannual basis. The Emerging Markets Portfolio declares and distributes dividends from net investment income, if any, on an annual basis. Net realized capital gains, if any, are declared and distributed at least annually by each Portfolio.
G. Repurchase Agreements. Among the instruments that each of the Portfolios may use for temporary investment purposes are repurchase agreements. Under the terms of a typical repurchase agreement, a Portfolio would acquire an underlying debt security for a relatively short period (usually not more than one week), subject to an obligation of the seller to repurchase that security from the Portfolio at an agreed-upon price and date. Repurchase agreements may involve certain risks in the event of default or insolvency of the counterparty, including possible delays or restrictions upon the Portfolio’s ability to dispose of the underlying securities. The creditworthiness of those banks and non-bank dealers with which the Portfolios may enter into repurchase agreements are monitored in accordance with guidelines adopted by the Board, as is the market value of the securities underlying any repurchase agreement to ensure that the seller’s obligation to repurchase is collateralized by an amount at least equal to the repurchase price including accrued interest. All repurchase agreements are fully collateralized by cash and/or government securities (as defined in the 1940 Act). If approved by the Adviser, repurchase agreements may also be fully collateralized by other securities that, at the time the repurchase agreement is entered into, are determined by the Board, or its authorized delegate, to be (i) issued by an issuer that has an exceptionally strong capacity to meet its obligations on the collateral, and (ii) sufficiently liquid that they can be sold by the Portfolio at approximately their carrying value in the ordinary course of business within seven calendar days. Master Repurchase Agreements (“MRA”) permit the Portfolios, under certain circumstances, including an event of default (such as bankruptcy or insolvency), to offset receivables under the MRA with collateral posted by the counterparty and create one net payment due to or from the Portfolios. However, bankruptcy or insolvency laws of a particular jurisdiction may impose restrictions on or prohibitions against such a right of offset in the event of the counterparty’s bankruptcy or insolvency. Pursuant to the terms of the MRA, the Portfolios receive securities as collateral with a market value in excess of the repurchase price to be received by the
281
HC CAPITAL TRUST
Notes to Financial Statements (continued) — June 30, 2018
Portfolios upon the maturity of the transaction. Upon a bankruptcy or insolvency of the counterparty, the Portfolios would recognize a liability with respect to such excess collateral to reflect the Portfolio’s obligation under bankruptcy law to return the excess to the counterparty.
The following table is a summary of each Portfolio’s open repurchase agreements that are subject to offset under an MRA on a net basis as of June 30, 2018 (amounts in thousands):
| | | | | | | | | | | | |
Portfolio | | Value of Repurchase
Agreements | | | Value of Collateral
Received | | | Net
Amount | |
Commodity Portfolio | | $ | 26,300 | | | $ | 26,300 | | | $ | — | |
H. TBA Purchase and Sale Commitments. Certain of the Portfolios may enter into “TBA” (to be announced) commitments to purchase or sell securities for a fixed price at a future date, typically not to exceed 45 days. TBA commitments may be considered securities in themselves, and involve a risk of loss if the value of the security to be purchased or sold declines or increases, respectively, prior to settlement date. Unsettled TBA commitments are valued at the current market value of the underlying securities, according to the procedures described under “Securities Valuation” above.
I. Commission Recapture. Certain of the Portfolios participate in a commission recapture program. These Portfolios will utilize the recaptured commissions to pay for, in whole or in part, certain expenses of the Portfolios, excluding investment advisory and distribution fees. The expenses eligible to be paid will include, but are not limited to, administrative service fees, audit fees, custodian fees, legal fees and printing expenses, as directed by the Trust. These amounts are disclosed as “Expenses paid indirectly” on the Statements of Operations.
For the year ended June 30, 2018, the following commissions were recaptured:
| | | | |
Portfolio | | Commissions
Recaptured
(000) | |
Value Portfolio | | $ | 24 | |
Institutional Value Portfolio | | | 28 | |
Growth Portfolio | | | 23 | |
Institutional Growth Portfolio | | | 12 | |
Small Cap–Mid Cap Portfolio | | | 11 | |
Institutional Small Cap–Mid Cap Portfolio | | | 3 | |
International Portfolio | | | 8 | |
Institutional International Portfolio | | | 11 | |
Emerging Markets Portfolio | | | 9 | |
J. Foreign Exchange Transactions. The books and records of the Portfolios are maintained in U.S. dollars. Non-U.S. dollar denominated amounts are translated into U.S. dollars as follows, with the resultant exchange gains and losses recorded in the Statements of Operations:
| | i) | value of investment securities and other assets and liabilities at the exchange rate on the valuation date; and |
| | ii) | purchases and sales of investment securities and income and expenses at the exchange rate prevailing on the respective date of such transactions. |
The Portfolios do not isolate realized and unrealized gains and losses attributable to changes in the exchange rates from gains and losses that arise from changes in the value of investments. Such fluctuations are included with net realized and unrealized gain or loss on investments.
Dividends and interest from non-U.S. sources received by a Portfolio are generally subject to non-U.S. withholding taxes at rates ranging up to 30%. Such withholding taxes may be reduced or eliminated under the terms of applicable U.S. income tax treaties, and each Portfolio intends to, if reasonable, undertake any procedural steps required to claim the benefits of such treaties. If the value of more than 50% of a Portfolio’s total assets at the close of any taxable year consists of stock or securities of non-U.S. corporations, the Portfolio may elect to treat any non-U.S. taxes paid by it as paid by its shareholders.
The Portfolios may be subject to foreign taxes on gains in investments or currency repatriation. The Portfolios accrue such taxes, as applicable, based on their current interpretation of tax rules in the foreign markets in which they invest.
282
HC CAPITAL TRUST
Notes to Financial Statements (continued) — June 30, 2018
K. Derivative Instruments. Certain of the Portfolios may invest in various financial instruments including positions in forward currency contracts, financial futures contracts, options contracts and swap agreements.
The following is a summary of the fair value of derivative instruments held by the Portfolios as of June 30, 2018 (amounts in thousands).
| | | | | | | | | | | | | | | | | | | | |
| | | Assets | |
Portfolio | | Unrealized
appreciation
on futures
contracts* | | | Investments,
at value
for purchased
options | | | Investments,
at value for
written
options | | | Unrealized
appreciation
on forward
currency
contracts* | | | Swap
agreements,
at value* | |
Equity Risk Exposure: | | | | | | | | | | | | | | | | | | | | |
Real Estate Portfolio | | $ | 273 | | | $ | — | | | $ | — | | | $ | — | | | $ | — | |
Commodity Portfolio | | | 22 | | | | — | | | | — | | | | — | | | | — | |
| | | | | |
Foreign Exchange Rate Risk Exposure: | | | | | | | | | | | | | | | | | | | | |
International Portfolio | | | 63 | | | | — | | | | — | | | | — | | | | — | |
Institutional International Portfolio | | | 132 | | | | — | | | | — | | | | — | | | | — | |
| | | | | |
Commodity Risk Exposure: | | | | | | | | | | | | | | | | | | | | |
Commodity Portfolio | | | 497 | | | | 96 | | | | — | | | | — | | | | — | |
| | | | | |
Interest Rate Risk Exposure: | | | | | | | | | | | | | | | | | | | | |
Fixed Opportunity Portfolio | | | 119 | | | | — | | | | — | | | | — | | | | — | |
| | | | | | | | | | | | | | | | | | | | |
| | | Liabilities | |
Portfolio | | Net
unrealized
depreciation
on futures
contracts* | | | Purchased
options,
at fair value | | | Written
options,
at fair value | | | Unrealized
depreciation
on forward
currency
contracts* | | | Swap
agreements,
at value* | |
Equity Risk Exposure: | | | | | | | | | | | | | | | | | | | | |
Value Portfolio | | $ | 714 | | | $ | — | | | $ | — | | | $ | — | | | $ | — | |
Institutional Value Portfolio | | | 2,219 | | | | — | | | | — | | | | — | | | | — | |
Growth Portfolio | | | 35 | | | | — | | | | — | | | | — | | | | — | |
Institutional Growth Portfolio | | | 907 | | | | — | | | | — | | | | — | | | | — | |
Small Cap–Mid Cap Portfolio | | | 114 | | | | — | | | | — | | | | — | | | | — | |
Institutional Small Cap–Mid Cap Portfolio | | | 95 | | | | — | | | | — | | | | — | | | | — | |
Commodity Portfolio | | | 193 | | | | — | | | | — | | | | — | | | | — | |
ESG Growth Portfolio | | | 29 | | | | — | | | | — | | | | — | | | | — | |
International Portfolio | | | 2,747 | | | | — | | | | — | | | | — | | | | — | |
Institutional International Portfolio | | | 1,654 | | | | — | | | | — | | | | — | | | | — | |
Emerging Markets Portfolio | | | 123 | | | | — | | | | — | | | | — | | | | — | |
| | | | | |
Foreign Exchange Rate Risk Exposure: | | | | | | | | | | | | | | | | | | | | |
Commodity Portfolio | | | 56 | | | | — | | | | — | | | | — | | | | — | |
| | | | | |
Commodity Risk Exposure: | | | | | | | | | | | | | | | | | | | | |
Commodity Portfolio | | | 1,247 | | | | — | | | | — | | | | — | | | | 104 | |
| | | | | |
Interest Rate Risk Exposure: | | | | | | | | | | | | | | | | | | | | |
Fixed Opportunity Portfolio | | | 373 | | | | — | | | | — | | | | — | | | | — | |
| | | | | |
Credit Risk Exposure: | | | | | | | | | | | | | | | | | | | | |
Fixed Opportunity Portfolio | | | — | | | | — | | | | — | | | | — | | | | 259 | |
| * | Total fair value is presented by Primary Risk Exposure. For forward currency contracts, such amounts represent appreciation (for asset derivatives) or depreciation (for liability derivatives). For futures contracts and centrally cleared swaps, the amounts represent their cumulative appreciation/depreciation, which includes movements of variation margin. |
Amounts designated as “—” are $0 or have been rounded to $0.
283
HC CAPITAL TRUST
Notes to Financial Statements (continued) — June 30, 2018
The following is a summary of the effect of derivative instruments on the Statements of Operations for the year ended June 30, 2018 (amounts in thousands):
| | | | | | | | | | | | | | | | | | | | |
Portfolio | | Net realized
gains/(losses)
from futures
transactions | | | Net realized
gains/(losses)
from written
options
transactions | | | Net realized
gains/(losses)
from purchased
options
transactions | | | Net realized
gains/(losses)
from forward
currency
contracts | | | Net realized
gains/(losses)
from swap
transactions | |
Equity Risk Exposure: | | | | | | | | | | | | | | | | | | | | |
Value Portfolio | | $ | 2,885 | | | $ | — | | | $ | — | | | $ | — | | | $ | — | |
Institutional Value Portfolio | | | 8,188 | | | | — | | | | — | | | | — | | | | — | |
Growth Portfolio | | | 2,790 | | | | — | | | | — | | | | — | | | | — | |
Institutional Growth Portfolio | | | 4,726 | | | | — | | | | — | | | | — | | | | — | |
Small Cap–Mid Cap Portfolio | | | 626 | | | | — | | | | — | | | | — | | | | — | |
Institutional Small Cap–Mid Cap Portfolio | | | 1,015 | | | | — | | | | — | | | | — | | | | — | |
Real Estate Portfolio | | | 450 | | | | — | | | | — | | | | — | | | | — | |
Commodity Portfolio | | | 2,512 | | | | — | | | | — | | | | — | | | | — | |
ESG Growth Portfolio | | | 152 | | | | — | | | | — | | | | — | | | | — | |
International Portfolio | | | 1,884 | | | | — | | | | — | | | | — | | | | — | |
Institutional International Portfolio | | | 5,900 | | | | — | | | | — | | | | — | | | | — | |
Emerging Markets Portfolio | | | 4,866 | | | | — | | | | — | | | | — | | | | — | |
| | | | | |
Foreign Exchange Rate Risk Exposure: | | | | | | | | | | | | | | | | | | | | |
Commodity Portfolio | | | 495 | | | | — | | | | — | | | | 174 | | | | — | |
International Portfolio | | | 397 | | | | — | | | | — | | | | (25 | ) | | | — | |
Institutional International Portfolio | | | — | | | | — | | | | — | | | | 293 | | | | — | |
Emerging Markets Portfolio | | | — | | | | — | | | | — | | | | 131 | | | | — | |
| | | | | |
Commodity Risk Exposure: | | | | | | | | | | | | | | | | | | | | |
Commodity Portfolio | | | 4,326 | | | | 15 | | | | (62 | ) | | | — | | | | 2,584 | |
| | | | | |
Interest Rate Risk Exposure: | | | | | | | | | | | | | | | | | | | | |
Commodity Portfolio | | | (57 | ) | | | — | | | | (14 | ) | | | — | | | | 71 | |
Fixed Opportunity Portfolio | | | 241 | | | | (357 | ) | | | — | | | | — | | | | — | |
| | | | | |
Credit Risk Exposure: | | | | | | | | | | | | | | | | | | | | |
Fixed Opportunity Portfolio | | | — | | | | — | | | | — | | | | — | | | | (118 | ) |
| |
| | | Net Change in Unrealized Appreciation (Depreciation)
on Derivatives Recognized as a Result from Operations | |
Portfolio | | Change in
unrealized
appreciation/
(depreciation)
on futures | | | Change in
unrealized
appreciation/
(depreciation)
on written
options | | | Change in
unrealized
appreciation/
(depreciation)
on purchased
options | | | Change in
unrealized
appreciation/
(depreciation)
on forward
currency
contracts | | | Change in
unrealized
appreciation/
(depreciation)
on swaps | |
Equity Risk Exposure: | | | | | | | | | | | | | | | | | | | | |
Value Portfolio | | $ | (517 | ) | | $ | — | | | $ | — | | | $ | — | | | $ | — | |
Institutional Value Portfolio | | | (2,054 | ) | | | — | | | | — | | | | — | | | | — | |
Growth Portfolio | | | 381 | | | | — | | | | — | | | | — | | | | — | |
Institutional Growth Portfolio | | | (698 | ) | | | — | | | | — | | | | — | | | | — | |
Small Cap–Mid Cap Portfolio | | | (94 | ) | | | — | | | | — | | | | — | | | | — | |
Institutional Small Cap–Mid Cap Portfolio | | | (74 | ) | | | — | | | | — | | | | — | | | | — | |
Real Estate Portfolio | | | 291 | | | | — | | | | — | | | | — | | | | — | |
Commodity Portfolio | | | (170 | ) | | | — | | | | — | | | | — | | | | — | |
ESG Growth Portfolio | | | (29 | ) | | | — | | | | — | | | | — | | | | — | |
International Portfolio | | | (3,095 | ) | | | — | | | | — | | | | — | | | | — | |
Institutional International Portfolio | | | (2,381 | ) | | | — | | | | — | | | | — | | | | — | |
Emerging Markets Portfolio | | | 95 | | | | — | | | | — | | | | — | | | | — | |
284
HC CAPITAL TRUST
Notes to Financial Statements (continued) — June 30, 2018
| | | | | | | | | | | | | | | | | | | | |
| |
| | | Net Change in Unrealized Appreciation (Depreciation)
on Derivatives Recognized as a Result from Operations | |
Portfolio | | Change in
unrealized
appreciation/
(depreciation)
on futures | | | Change in
unrealized
appreciation/
(depreciation)
on written
options | | | Change in
unrealized
appreciation/
(depreciation)
on purchased
options | | | Change in
unrealized
appreciation/
(depreciation)
on forward
currency
contracts | | | Change in
unrealized
appreciation/
(depreciation)
on swaps | |
| | | | | |
Foreign Exchange Rate Risk Exposure: | | | | | | | | | | | | | | | | | | | | |
Commodity Portfolio | | $ | (56 | ) | | $ | — | | | $ | — | | | $ | (6 | ) | | $ | — | |
International Portfolio | | | — | | | | — | | | | — | | | | 3 | | | | — | |
Institutional International Portfolio | | | — | | | | — | | | | — | | | | 20 | | | | — | |
| | | | | |
Commodity Risk Exposure: | | | | | | | | | | | | | | | | | | | | |
Commodity Portfolio | | | (1,061 | ) | | | — | | | | 7 | | | | — | | | | (550 | ) |
| | | | | |
Interest Rate Risk Exposure: | | | | | | | | | | | | | | | | | | | | |
Commodity Portfolio | | | — | | | | — | | | | — | | | | — | | | | 97 | |
Fixed Opportunity Portfolio | | | (268 | ) | | | — | | | | — | | | | — | | | | — | |
| | | | | |
Credit Risk Exposure: | | | | | | | | | | | | | | | | | | | | |
Fixed Opportunity Portfolio | | | — | | | | — | | | | — | | | | — | | | | (3 | ) |
Amounts designated as “—” are $0 or have been rounded to $0.
The Trust is generally subject to master netting agreements (“MNA”) that allow for amounts owed between a Portfolio and the counterparty to be netted. The party that has the larger payable pays the excess of the larger amount over the smaller amount to the counterparty. The MNA do not apply to amounts owed to/from different counterparties. The amounts shown in the Statement of Assets and Liabilities do not take into consideration the effects of legally enforceable MNA. The table below presents the gross and net amounts of these assets and liabilities with any offsets to reflect the Portfolio’s ability to transact net amounts with counterparties at June 30, 2018.
As of June 30, 2018, each Portfolio’s derivative assets and liabilities by type are as follows (amounts in thousands):
| | | | | | | | | | | | | | | | | | | | | | | | | | | | | | | | |
| | | Value Portfolio | | | Institutional
Value Portfolio | | | Growth Portfolio | | | Institutional
Growth Portfolio | |
| | | Assets | | | Liabilities | | | Assets | | | Liabilities | | | Assets | | | Liabilities | | | Assets | | | Liabilities | |
Derivative Financial Instruments: | | | | | | | | | | | | | | | | | | | | | | | | | | | | | | | | |
Futures contracts | | $ | — | | | $ | 714 | | | $ | — | | | $ | 2,170 | | | $ | — | | | $ | 35 | | | $ | — | | | $ | 928 | |
| | | | | | | | | | | | | | | | | | | | | | | | | | | | | | | | |
Total derivative assets and liabilities in the Statements of Assets and Liabilities | | | — | | | | 714 | | | | — | | | | 2,170 | | | | — | | | | 35 | | | | — | | | | 928 | |
Derivatives not subject to a MNA or similar agreement | | | — | | | | (714 | ) | | | — | | | | (2,170 | ) | | | — | | | | (35 | ) | | | — | | | | (928 | ) |
| | | | | | | | | | | | | | | | | | | | | | | | | | | | | | | | |
Total assets and liabilities subject to a MNA | | $ | — | | | $ | — | | | $ | — | | | $ | — | | | $ | — | | | $ | — | | | $ | — | | | $ | — | |
| | | | | | | | | | | | | | | | | | | | | | | | | | | | | | | | |
285
HC CAPITAL TRUST
Notes to Financial Statements (continued) — June 30, 2018
| | | | | | | | | | | | | | | | | | | | | | | | | | | | | | | | |
| | | | |
| | | Small Cap–Mid
Cap Portfolio | | | Institutional Small
Cap–Mid Cap Portfolio | | | Real Estate Portfolio | | | Commodity Portfolio | |
| | | Assets | | | Liabilities | | | Assets | | | Liabilities | | | Assets | | | Liabilities | | | Assets | | | Liabilities | |
Derivative Financial Instruments: | | | | | | | | | | | | | | | | | | | | | | | | | | | | | | | | |
Futures contracts | | $ | — | | | $ | 114 | | | $ | — | | | $ | 88 | | | $ | 273 | | | $ | — | | | $ | 519 | | | $ | 1,496 | |
Option contracts* | | | — | | | | — | | | | — | | | | — | | | | — | | | | — | | | | 96 | | | | — | |
Swap agreements | | | — | | | | — | | | | — | | | | — | | | | — | | | | — | | | | — | | | | 104 | |
| | | | | | | | | | | | | | | | | | | | | | | | | | | | | | | | |
Total derivative assets and liabilities in the Statements of Assets and Liabilities | | | — | | | | 114 | | | | — | | | | 88 | | | | 273 | | | | — | | | | 615 | | | | 1,600 | |
Derivatives not subject to a MNA or similar agreement | | | — | | | | (114 | ) | | | — | | | | (88 | ) | | | (273 | ) | | | — | | | | (615 | ) | | | (1,496 | ) |
| | | | | | | | | | | | | | | | | | | | | | | | | | | | | | | | |
Total assets and liabilities subject to a MNA | | $ | — | | | $ | — | | | $ | — | | | $ | — | | | $ | — | | | $ | — | | | $ | — | | | $ | 104 | |
| | | | | | | | | | | | | | | | | | | | | | | | | | | | | | | | |
| | | | |
| | | ESG Growth Portfolio | | | International Portfolio | | | Institutional
International Portfolio | | | Emerging
Markets Portfolio | |
| | | Assets | | | Liabilities | | | Assets | | | Liabilities | | | Assets | | | Liabilities | | | Assets | | | Liabilities | |
Derivative Financial Instruments: | | | | | | | | | | | | | | | | | | | | | | | | | | | | | | | | |
Futures contracts | | $ | — | | | $ | 29 | | | $ | 63 | | | $ | 2,747 | | | $ | 132 | | | $ | 1,654 | | | $ | — | | | $ | 123 | |
| | | | | | | | | | | | | | | | | | | | | | | | | | | | | | | | |
Total derivative assets and liabilities in the Statements of Assets and Liabilities | | | — | | | | 29 | | | | 63 | | | | 2,747 | | | | 132 | | | | 1,654 | | | | — | | | | 123 | |
Derivatives not subject to a MNA or similar agreement | | | — | | | | (29 | ) | | | (63 | ) | | | (2,747 | ) | | | (132 | ) | | | (1,654 | ) | | | — | | | | (123 | ) |
| | | | | | | | | | | | | | | | | | | | | | | | | | | | | | | | |
Total assets and liabilities subject to a MNA | | $ | — | | | $ | — | | | $ | — | | | $ | — | | | $ | — | | | $ | — | | | $ | — | | | $ | — | |
| | | | | | | | | | | | | | | | | | | | | | | | | | | | | | | | |
| | | | | | | |
| | | Fixed Opportunity
Portfolio | | | | | | | | | | | | | | | | | | | |
| | | Assets | | | Liabilities | | | | | | | | | | | | | | | | | | | |
Derivative Financial Instruments: | | | | | | | | | | | | | | | | | | | | | | | | | | | | | | | | |
Futures contracts | | $ | 119 | | | $ | 373 | | | | | | | | | | | | | | | | | | | | | | | | | |
Swap agreements | | | — | | | | 259 | | | | | | | | | | | | | | | | | | | | | | | | | |
| | | | | | | | | | | | | | | | | | | | | | | | | | | | | | | | |
Total derivative assets and liabilities in the Statements of Assets and Liabilities | | | 119 | | | | 632 | | | | | | | | | | | | | | | | | | | | | | | | | |
Derivatives not subject to a MNA or similar agreement | | | (119 | ) | | | (373 | ) | | | | | | | | | | | | | | | | | | | | | | | | |
| | | | | | | | | | | | | | | | | | | | | | | | | | | | | | | | |
Total assets and liabilities subject to a MNA | | $ | — | | | $ | 259 | | | | | | | | | | | | | | | | | | | | | | | | | |
| | | | | | | | | | | | | | | | | | | | | | | | | | | | | | | | |
| * | Includes options contracts purchased at value as reported in the Statements of Assets and Liabilities. |
286
HC CAPITAL TRUST
Notes to Financial Statements (continued) — June 30, 2018
The following table represents the Commodity Portfolio’s and the Fixed Opportunity Portfolio’s derivative liabilities by counterparty, net of amounts available for offset under an MNA and net of the related collateral pledged by the Portfolios as of June 30, 2018 (amounts in thousands).
| | | | | | | | | | | | | | | | | | | | |
Counterparty | | Derivative
Liabilities
Subject to a
MNA by
Counterparty | | | Derivatives
Available
for Offset | | | Non-cash
Collateral
Pledged (a) | | | Cash
Collateral
Pledged (a) | | | Net Amount
of Derivative
Liabilities | |
Commodity Portfolio | | | | | | | | | | | | | | | | | | | | |
Barclays Bank PLC | | $ | 39 | | | $ | — | | | $ | — | | | $ | — | | | $ | 39 | |
Goldman Sachs International | | | 65 | | | | — | | | | — | | | | (60 | ) | | | 5 | |
| | | | | | | | | | | | | | | | | | | | |
Total | | $ | 104 | | | $ | — | | | $ | — | | | $ | (60 | ) | | $ | 44 | |
| | | | | | | | | | | | | | | | | | | | |
| | | | | |
Fixed Opportunity Portfolio: | | | | | | | | | | | | | | | | | | | | |
Morgan Stanley | | $ | 259 | | | $ | — | | | $ | — | | | $ | (259 | ) | | $ | — | |
| | | | | | | | | | | | | | | | | | | | |
Total | | $ | 259 | | | $ | — | | | $ | — | | | $ | (259 | ) | | $ | — | |
| | | | | | | | | | | | | | | | | | | | |
| (a) | The actual collateral received or pledged may be in excess of the amounts shown in the tables. The tables only reflect collateral amounts up to the amount of the financial instruments disclosed on the Statements of Assets and Liabilities. |
Amounts designated as “—” are $0 or have been rounded to $0.
Forward Currency Contracts: Certain of the Portfolios may be subject to currency exchange rate risk in the normal course of pursuing their investment objectives. A Portfolio enters into forward currency contracts (“forward contracts”) for the purpose of hedging exposure to changes in foreign currency exchange rates on its holdings. A forward contract is an agreement between two parties to buy and sell a currency at a set price on a future date. The value of the forward contract fluctuates with changes in currency exchange rates. The forward contract is marked-to-market daily and the change in value is recorded by the Portfolio as unrealized appreciation or depreciation. When the forward contract is closed, the Portfolio records a realized gain or loss equal to the fluctuation in value during the period the forward contract was open. The Portfolio is subject to credit risk, which is the risk that the counterparty is unable to meet the terms of a forward contract, and market risk, which is the risk that the value of the currency changes unfavorably.
Forward contracts may involve credit or market risk in excess of the amounts reflected on a Portfolio’s Statement of Assets and Liabilities. The gain or loss from the difference between the cost of original contracts and the amount realized upon the closing of such forward contracts is included in net realized gains or losses on foreign currency transactions. Fluctuations in the value of forward contracts held at June 30, 2018 are recorded for financial reporting purposes as net unrealized gains or losses. In addition, at June 30, 2018, the Portfolios entered into currency contracts to settle trades in foreign currencies. These transactions are included in “Receivable from investments sold” and “Payable for investments purchased” on the Statements of Assets and Liabilities. There were no open forward currency contracts as of June 30, 2018. The month-end average contract amount for all forward contracts, during the year ended June 30, 2018 are detailed in the table below:
| | | | | | | | | | | | | | | | |
| | | Outstanding
Notional Amount
(000) | | | Monthly Average
Notional Amount
(000) | |
Forward Foreign Currency Exchange Contracts: | | Long | | | Short | | | Long | | | Short | |
Commodity Portfolio | | $ | — | | | $ | — | | | $ | 484 | | | $ | 1,643 | |
International Portfolio | | | — | | | | — | | | | 64 | | | | 585 | |
Institutional International Portfolio | | | — | | | | — | | | | 85 | | | | 94 | |
Emerging Markets Portfolio | | | — | | | | — | | | | 4 | | | | 4 | |
Financial Futures Contracts: Certain of the Portfolios may be subject to equity price risk, interest rate risk, commodity price risk and foreign currency exchange rate risk in the normal course of pursuing their investment objectives. Certain of the Portfolios may invest in financial futures contracts (“futures contracts”) as part of their investment strategies, to gain exposure to or hedge against changes in the value of equities, interest rates or foreign currencies. The Commodity Portfolio may invest in commodity-linked futures contracts to gain exposure to the commodities market. A futures contract represents a commitment for the future purchase or sale of an asset at a specified price on a specified date. Upon entering into a futures contract, a Portfolio is
287
HC CAPITAL TRUST
Notes to Financial Statements (continued) — June 30, 2018
required to pledge to the broker an amount of cash and/or other assets equal to a certain percentage of the contract amount (initial margin deposit). Subsequent payments, known as “variation margin,” may be made or received by a Portfolio each day, depending on the daily fluctuations in the value of the underlying financial instrument. A Portfolio recognizes a gain or loss equal to the daily variation margin, which is recorded as a receivable or payable on the Statement of Assets and Liabilities (if applicable). When a futures contract is closed, a realized gain or loss is recorded as “Net realized gains/(losses) from futures transactions” on the Statement of Operations. Should market conditions move unexpectedly, the Portfolio may not achieve the anticipated benefits of the futures contracts and may realize a loss. The use of futures transactions involves the risk of an imperfect correlation in movements in the price of futures contracts, interest rates, and the underlying hedged assets. With futures contracts, there is minimal counterparty credit risk to the Portfolios since futures contracts are exchange traded and the exchange’s clearinghouse, as counterparty to all exchange-traded futures contracts, guarantees the futures contracts against default. Securities designated as collateral for market value on futures contracts are noted in each Portfolio’s Portfolio of Investments (if applicable). Such collateral is held with the broker. The notional value of the futures contracts outstanding at June 30, 2018 and the month-end average notional amount for the year ended June 30, 2018 are detailed in the table below:
| | | | | | | | | | | | | | | | |
| | | Outstanding
Notional Amount
(000) | | | Monthly Average
Notional Amount
(000) | |
Futures Contracts: | | Long | | | Short | | | Long | | | Short | |
Value Portfolio | | $ | 33,135 | | | $ | — | | | $ | 17,494 | | | $ | — | |
Institutional Value Portfolio | | | 117,250 | | | | — | | | | 60,108 | | | | — | |
Growth Portfolio | | | 1,860 | | | | — | | | | 12,422 | | | | — | |
Institutional Growth Portfolio | | | 50,911 | | | | — | | | | 29,363 | | | | — | |
Small Cap–Mid Cap Portfolio | | | 6,343 | | | | — | | | | 4,742 | | | | — | |
Institutional Small Cap–Mid Cap Portfolio | | | 2,554 | | | | — | | | | 5,754 | | | | — | |
Real Estate Portfolio | | | 11,737 | | | | — | | | | 11,514 | | | | — | |
Commodity Portfolio | | | 48,142 | | | | 4,151 | | | | 68,776 | | | | 5,044 | |
ESG Growth Portfolio | | | 1,131 | | | | — | | | | 905 | | | | — | |
International Portfolio | | | 102,268 | | | | 12,128 | | | | 40,199 | | | | 12,172 | |
Institutional International Portfolio | | | 51,427 | | | | 25,276 | | | | 94,668 | | | | 25,368 | |
Emerging Markets Portfolio | | | 10,793 | | | | — | | | | 39,268 | | | | — | |
Fixed Opportunity Portfolio | | | 24,657 | | | | 50,047 | | | | 31,419 | | | | 32,632 | |
Purchased Options Contracts: Certain of the Portfolios may be subject to equity price risk, commodities price risk and interest rate risk in the normal course of pursuing their investment objectives. In order to reduce such risks and/or in anticipation of future purchases, including to achieve market exposure pending direct investment in securities, certain of the Portfolios may purchase put or call options. Options contracts provide the purchaser with the right, but not the obligation, to buy or sell (call or put option, respectively) a financial instrument at the exercise price. The Portfolio pays a premium which is included in “Investments, at value” on the Statement of Assets and Liabilities and marked-to-market to reflect the current value of the option. Premiums paid for purchasing options which expire are treated as realized losses. When an option is exercised or closed, premiums paid for purchasing options are offset against proceeds to determine the realized gain or loss on the transaction.
Written Options Contracts: Certain of the Portfolios may be subject to equity price risk, commodities price risk and interest rate risk in the normal course of pursuing their investment objectives. In order to reduce such risks and/or in anticipation of future purchases, including to achieve market exposure pending direct investment in securities, certain of the Portfolios may write put or call options. Premiums received from written options contracts are recorded as liabilities on the Statement of Assets and Liabilities and are marked-to-market to reflect the current value of the options written. Premiums received from writing options which expire are treated as realized gains. Premiums received from writing options, which are either exercised or closed, are offset against the proceeds received or the amount paid on the transaction to determine realized gains or losses. Realized gains and losses are reported as “Net realized gains/(losses) from written options transactions” on the Statement of Operations (if applicable). When writing an option, the Portfolio bears the market risk of unfavorable changes in the price of the underlying instrument.
With exchange-traded options, there is minimal counterparty credit risk to the Portfolios since the exchange’s clearinghouse, as counterparty to all exchange-traded options, guarantees the options against default. With over-the-counter options, the Portfolios bear the risk that counterparties will be unable to perform under the terms of the contracts.
288
HC CAPITAL TRUST
Notes to Financial Statements (continued) — June 30, 2018
The notional value of purchased and written options outstanding at June 30, 2018 and the month-end average notional amount for the year ended June 30, 2018 are detailed in the table below:
| | | | | | | | |
Option Contracts: | | Outstanding
Notional Amount
(000) | | | Monthly Average
Notional Amount
(000) | |
Commodity Portfolio | | $ | 96 | | | $ | 103 | |
Fixed Opportunity Portfolio | | | — | | | | 632 | |
Swap Agreements: Certain of the Portfolios may enter into swap agreements (“swaps”) for purposes of attempting to gain exposure to the securities making up an index without actually purchasing those instruments, to hedge a position or to gain exposure to a particular instrument or currency. A swap is a two-party contract entered into for periods ranging from one day to more than one year. In a standard swap transaction, two parties agree to exchange the returns (or differentials in rates of return) earned or realized on particular predetermined investments or instruments. The gross returns to be exchanged or “swapped” between the parties are calculated with respect to a “notional amount,” i.e., the return on or increase in value of a particular dollar amount invested in a “basket” of securities representing a particular index. Swap agreements are privately negotiated in the over-the-counter (“OTC”) market and may be entered into as a bilateral contract (“OTC swaps”) or cleared through a third party, known as a clearing organization (“centrally cleared swap”). Swaps are marked to market daily based upon valuations as determined from the underlying contract or in accordance with the requirements of the clearing organization. Changes in market value, if any, are reflected as a component of net change in unrealized appreciation or depreciation on swap agreements on the Statement of Operations. Daily changes in valuation of centrally cleared swaps, if any, are recorded as variation margin on swap agreements on the Statement of Assets and Liabilities.
Interest Rate Swaps: Certain of the Portfolios are subject to interest rate risk exposure in the normal course of pursuing their investment objectives. Because certain Portfolios hold fixed-rate bonds, the value of these bonds may decrease if interest rates rise. In order to reduce such risks, certain Portfolios may enter into interest rate swaps. Interest rate swaps involve the exchange of commitments to pay and receive a fixed or floating rate of interest based on a notional principal amount. The risks of interest rate swaps include changes in market conditions that will affect their value or the cash flows and the possible inability of the counterparty to fulfill its obligations under the agreement. A Portfolio’s maximum risk of loss from counterparty credit risk is the discounted net value of the cash flows to be received from the counterparty over the swap’s remaining life. Net periodic interest payments to be received or paid are accrued daily and are recorded as realized gains or losses on the Statement of Operations.
Total Return Swaps: Certain of the Portfolios may enter into total return swaps to gain or mitigate exposure to the underlying securities or indices. In “long” total return swaps, the counterparty will generally agree to pay the Portfolio the amount, if any, by which the notional amount of the swaps would have increased in value had it been invested in the particular instruments, plus an amount equal to any dividends or interest that would have been received on those instruments. The Portfolio will agree to pay to the counterparty an amount equal to a fixed or floating rate of interest on the notional amount of the swaps plus the amount, if any, by which the notional amount would have decreased in value had it been invested in such instruments plus, in certain instances, commissions or trading spreads on the notional amount. Total return swaps do not involve the delivery of securities or other underlying instruments. The net amount of the excess, if any, of a Portfolio’s obligations over its entitlements with respect to each swap is accrued on a daily basis and an amount of cash or liquid assets, having an aggregate value at least equal to such accrued excess, is maintained at the broker-dealer or the Portfolio’s custodian. Until a total return swap is settled in cash, the gain or loss on the notional amount plus dividends or interest on the instruments less the interest paid by the Portfolio on the notional amount is recorded as “unrealized appreciation or depreciation on swap agreements” and, when cash is exchanged, the gain or loss realized is recorded as “realized gains or losses on swap transactions.” A Portfolio may enter into total return swaps that provide the opposite return of its benchmark index or security (“short” the index or security). Its operations are similar to those swaps disclosed above except that the counterparty pays interest to the Portfolio on the notional amount outstanding and that dividends or interest on the underlying instruments reduce the value of the swaps plus, in certain instances, the Portfolio will agree to pay to the counterparty commissions or trading spreads on the notional amount. These amounts are netted against any unrealized appreciation or depreciation to determine the value of the swaps.
Credit Default Swaps: Certain of the Portfolios may invest in credit default swaps for hedging purposes or for market exposure. Credit default swaps involve one party making a stream of payments (referred to as the buyer of protection) to
289
HC CAPITAL TRUST
Notes to Financial Statements (continued) — June 30, 2018
another party (the seller of protection) in exchange for the right to receive a specified return in the event of a default or other credit event for the referenced entity, obligation or index and are subject to credit risk exposure. The maximum potential amount of future payments that a Portfolio as a seller of protection could be required to make under a credit default swap agreement would be an amount equal to the notional amount of the agreement. Notional amounts of each individual credit default swap agreement outstanding for which a Portfolio is the seller of protection are disclosed in the Portfolio of Investments. These potential amounts would be partially offset by any recovery values of the respective referenced obligations, upfront payments received upon entering into the agreement, or net amounts received from the settlement of buy protection credit default swap agreements entered into by a Portfolio for the same referenced entity or entities.
Variance Swaps: Certain of the Portfolios may invest in variance swaps to gain or reduce exposure to the underlying reference securities. Variance swaps involve the agreement of two parties to exchange cash flows based on the measured variance (or square of the volatility) of a specified underlying asset. One party agrees to exchange a “fixed rate” or strike price payment for the “floating rate” or realized price variance on the underlying asset with respect to the notional amount. At inception, the strike price is generally chosen such that the fair value of the swaps is zero. At the maturity date, a net cash flow is exchanged, where the payoff amount is equivalent to the difference between the realized price variance of the underlying asset and the strike price multiplied by the notional amount. As a receiver of the realized price variance, a Portfolio would receive the payoff amount when the realized price variance of the underlying asset is greater than the strike price and would owe the payoff amount when the variance is less than the strike price. As a payer of the realized price variance, a Portfolio would owe the payoff amount when the realized price variance of the underlying asset is greater than the strike price and would receive the payoff amount when the variance is less than the strike price. This type of swap is essentially a forward contract on the future realized price variance of the underlying asset.
The primary risks associated with the use of swaps are an imperfect correlation between the prices of financial instruments and movements in the prices of the underlying investments and the inability of counterparties to perform under the agreement. The counterparty to any swap agreement will typically be a bank, investment banking firm or broker-dealer. The Portfolio will bear the counterparty risk, i.e., the risk of loss of the net amount, if any, expected to be received under a swap in the event of the default or bankruptcy of the swap counterparty. The counterparty risk for centrally cleared swap agreements is generally lower than for OTC swap agreements because generally a clearing organization becomes substituted for each counterparty to a centrally cleared swap agreement and, in effect, guarantees the parties’ performance under the contract as each party to a trade looks only to a clearing house for performance of financial obligations. However, there can be no assurance that the clearing house, or its members will satisfy obligations to the Portfolio. The unrealized gain or loss at June 30, 2018 is disclosed in the swap tables included in the Portfolios of Investments. The notional value of the swap agreements outstanding at June 30, 2018 and the month-end average notional amount for the year ended June 30, 2018 are detailed in the tables below (amounts in thousands):
| | | | | | | | |
| | | Outstanding
Notional Amount | | | Monthly Average
Notional Amount | |
Interest Rate Swap Agreements: | | | | | | | | |
Commodity Portfolio | | $ | — | | | $ | 5,625 | |
| | |
Variance Swap Agreements: | | | | | | | | |
Commodity Portfolio | | | — | | | | 628 | |
| | |
Total Return Swap Agreements: | | | | | | | | |
Commodity Portfolio | | | 1,316 | | | | 1,362 | |
| | |
Commodity Swap Agreements: | | | | | | | | |
Commodity Portfolio | | | — | | | | 21,583 | |
| | |
Commodity Forward Swap Agreements: | | | | | | | | |
Commodity Portfolio | | | 578 | | | | 611 | |
| | | | | | | | | | | | | | | | |
| | | Outstanding
Notional Amount | | | Monthly Average
Notional Amount | |
| | | Buy Protection | | | Sell Protection | | | Buy Protection | | | Sell Protection | |
Credit Default Swap Agreements: | | | | | | | | | | | | | | | | |
Fixed Opportunity Portfolio | | $ | — | | | $ | 39,418 | | | $ | — | | | $ | 26,322 | |
290
HC CAPITAL TRUST
Notes to Financial Statements (continued) — June 30, 2018
L. Inflation Indexed Bonds. Certain of the Portfolios may invest in inflation-indexed bonds, which are fixed-income securities whose principal value is periodically adjusted based on the rate of inflation. The interest rate on these bonds is generally fixed at issuance at a rate lower than typical bonds. Over the life of an inflation-indexed bond, however, interest will be paid based on a principal value which is adjusted for inflation. Any increase or decrease in the principal amount of an inflation-indexed bond resulting from inflation or deflation, respectively, as measured by the change in the Consumer Price Index, will be included as interest income or loss on the Statements of Operations, even though investors do not receive their principal until maturity. During the year ended June 30, 2018, the Inflation Protected Portfolio recognized income due to the increase in the Consumer Price Index.
Interest rates on conventional bonds have two primary components: a “real” yield and an increment that reflects investor expectations of future inflation. By contrast, interest payments on inflation-indexed bonds are adjusted for inflation and, therefore, are not affected meaningfully by inflation expectations. This leaves only changes in real rates to influence the price of inflation-indexed bonds. A rise in real rates will cause the price of inflation-indexed bonds to fall, while a decline in real rates will boost the price of inflation-indexed bonds. Inflation-indexed bonds issued by non-U.S. governments are generally indexed to the inflation rates prevailing in those countries.
The primary risk associated with the use of inflation-indexed bonds is that the principal value of an investment is not protected or otherwise guaranteed by virtue of the Portfolio’s investments in inflation-indexed bonds. If the index measuring inflation falls, the principal value of inflation-indexed bonds will be adjusted downward and, consequently, the interest payable on these securities (calculated with respect to a smaller principal amount) will be reduced. Repayment of the original bond principal upon maturity (as adjusted for inflation) is guaranteed in the case of U.S. treasury inflation-indexed bonds. For bonds that do not provide a similar guarantee, the adjusted principal value of the bond repaid at maturity may be less than the original principal value. Deflation risk is the possibility that prices throughout the economy decline over time, in which case, the principal and income of an inflation-protected bond will decline and may result in losses.
M. Bank Loans. Certain Portfolios may invest in bank loans, which generally have interest rates which are reset periodically by reference to a base lending rate plus a premium. These base rates are primarily the London-Interbank Offered Rate and, secondarily, the prime rate offered by one or more major U.S. banks and the certificate of deposit rate or other base lending rates used by commercial lenders. Bank loans often require prepayments from excess cash flows or allow the borrower to repay at its election. The rate at which the borrower repays cannot be predicted with accuracy. Therefore, the anticipated or actual maturity may be considerably earlier than the stated maturity shown in the Portfolio of Investments. The Portfolios did not hold any bank loans as of June 30, 2018.
All or a portion of any bank loans may be unfunded. A Portfolio is obligated to fund any commitments at the borrower’s discretion. Therefore, the Portfolio must have funds sufficient to cover its contractual obligation. These unfunded loan commitments, which are marked-to-market daily, are presented in the Portfolio of Investments.
N. Securities Lending. Certain of the Portfolios may lend their portfolio securities to broker-dealers pursuant to a Master Securities Lending Agreement (“MSLA”) that requires the borrower to post collateral equal to at least the market value of the securities loaned, which is marked-to-market on a daily basis. Any collateral shortfalls associated with increases in the valuation of the securities loaned are adjusted the next business day. The Portfolios will continue to benefit from interest or dividends on the securities loaned and may also earn a return from the collateral. The Portfolios pay various fees in connection with the investment of the collateral. Any voting rights, or rights to consent, relating to securities loaned, pass to the borrower. Currently cash collateral received by a Portfolio in securities lending transactions may only be invested in repurchase agreements or money market funds that invest in U.S. treasury obligations. A Portfolio bears the risk of such investments. Securities on loan at June 30, 2018 are presented in the Portfolios of Investments. The Portfolios pay the Securities Lending Agent fees based on the investment income received from securities lending activities as reflected on the Statements of Operations.
Cash collateral received from the borrower is recorded in the Statements of Assets and Liabilities as “Payable for collateral received on loaned securities.” Investments acquired with such cash collateral are reported in a manner consistent with other portfolio investments held by the Portfolios as an investment, at value on the Statements of Assets and Liabilities. The Portfolios may receive non-cash collateral in the form of securities such as U.S. treasuries, which the Portfolios may not sell or re-pledge and accordingly are not reflected in the Statements of Assets and Liabilities.
291
HC CAPITAL TRUST
Notes to Financial Statements (continued) — June 30, 2018
Securities lending transactions are entered into by a Portfolio under a MSLA which permits the Portfolio, under certain circumstances, including an event of default (such as bankruptcy or insolvency), to offset amounts payable by the Portfolio to the same counterparty against amounts to be received and create a net payment due to or from the Portfolio.
The following table is a summary of the Portfolios’ securities lending transactions accounted for as secured borrowings, which are subject to offset under an MSLA, at June 30, 2018 (amounts in thousands):
| | | | | | | | | | | | |
Portfolio | | Value of
Securities on
Loan | | | Value of
Collateral
Received* | | | Net
Amount | |
Value Portfolio | | $ | 18 | | | $ | 18 | | | $ | — | |
Growth Portfolio | | | 2,332 | | | | 2,332 | | | | — | |
Institutional Growth Portfolio | | | 6,042 | | | | 6,042 | | | | — | |
Small Cap–Mid Cap Portfolio | | | 2,009 | | | | 2,009 | | | | — | |
Institutional Small Cap–Mid Cap Portfolio | | | 5,161 | | | | 5,161 | | | | — | |
Commodity Portfolio | | | 9,001 | | | | 9,001 | | | | — | |
International Portfolio | | | 4,489 | | | | 4,489 | | | | — | |
Institutional International Portfolio | | | 30,534 | | | | 30,534 | | | | — | |
Emerging Markets Portfolio | | | 16,135 | | | | 16,135 | | | | — | |
Fixed Opportunity Portfolio | | | 52,725 | | | | 52,725 | | | | — | |
| * | The actual collateral received may be in excess of the amounts shown in the table. The table only reflects collateral amounts up to the amount of the value of securities on loan as disclosed in the Portfolios of Investments. Any collateral shortfalls associated with increases in the valuation of the securities loaned are adjusted the next business day. |
Securities lending transactions as of June 30, 2018 (amounts in thousands):
| | | | | | | | | | | | | | | | | | | | | | | | | | | | | | | | | | | | |
| | | Security Type | | | Remaining Contractual
Maturity of the
Agreements | | | | | | | | | | |
Portfolio | | Common
Stock | | | Corporate
Bonds | | | Yankee
Dollars | | | Exchange-
Traded
Fund | | | Overnight
and
Continuous | | | Up to 30
days | | | Total Value
of Securities
on Loan | | | Value of
Collateral
Received* | | | Net Amount
Due to/(from)
Counterparty | |
Value Portfolio | �� | $ | 18 | | | $ | — | | | $ | — | | | $ | — | | | $ | 18 | | | $ | — | | | $ | 18 | | | $ | 18 | | | $ | — | |
Growth Portfolio | | | 2,332 | | | | — | | | | — | | | | — | | | | 2,332 | | | | — | | | | 2,332 | | | | 2,427 | | | | 95 | |
Institutional Growth Portfolio | | | 6,042 | | | | — | | | | — | | | | — | | | | 6,042 | | | | — | | | | 6,042 | | | | 6,260 | | | | 218 | |
Small Cap–Mid Cap Portfolio | | | 2,009 | | | | — | | | | — | | | | — | | | | 2,009 | | | | — | | | | 2,009 | | | | 2,059 | | | | 50 | |
Institutional Small Cap–Mid Cap Portfolio | | | 5,161 | | | | — | | | | — | | | | — | | | | 5,161 | | | | — | | | | 5,161 | | | | 5,313 | | | | 152 | |
Commodity Portfolio | | | 9,001 | | | | — | | | | — | | | | — | | | | 151 | | | | 8,850 | | | | 9,001 | | | | 9,167 | | | | 166 | |
International Portfolio | | | 4,489 | | | | — | | | | — | | | | — | | | | 3,403 | | | | 1,086 | | | | 4,489 | | | | 4,744 | | | | 255 | |
Institutional International Portfolio | | | 30,534 | | | | — | | | | — | | | | — | | | | 26,047 | | | | 4,487 | | | | 30,534 | | | | 36,242 | | | | 5,708 | |
Emerging Markets Portfolio | | | 16,135 | | | | — | | | | — | | | | — | | | | 3,245 | | | | 12,890 | | | | 16,135 | | | | 16,789 | | | | 654 | |
Fixed Opportunity Portfolio | | | — | | | | 13,310 | | | | 4,296 | | | | 35,119 | | | | 52,725 | | | | — | | | | 52,725 | | | | 55,524 | | | | 2,799 | |
| * | Includes cash collateral and non-cash collateral. |
O. Basis for Consolidation for the Commodity Portfolio. The HC Commodity Related Securities Fund, Ltd. and the HC Commodity Related Securities Fund II, Ltd. (the “Funds”) are incorporated as Cayman Islands exempted companies. The Funds are wholly-owned subsidiaries of the Commodity Portfolio and act as investment vehicles for the Commodity Portfolio for the purpose of effecting certain commodity-linked investments consistent with its investment objectives. The Funds may invest in commodity-linked derivative instruments including options, futures and swaps. The Funds may also invest in debt securities, some of which are intended to serve as margin or collateral for the Funds’ derivative positions.
Under the Articles of Association of each of the Funds, shares issued by the Funds give the Commodity Portfolio, as the sole shareholder, the right to receive notice of, to attend, and to vote at general meetings of the Funds, the right to participate in the profits of the Funds and rights to the assets of the Funds in the event that they are liquidated.
292
HC CAPITAL TRUST
Notes to Financial Statements (continued) — June 30, 2018
The following table summarizes the structure, incorporation and relationship information of the Funds, and certain financial information of the Funds recognized in the consolidated financial statements referred to above (amounts in thousands).
| | | | | | | | |
| | | HC Commodity
Related Securities
Fund, Ltd. | | | HC Commodity
Related Securities
Fund II, Ltd. | |
Date of Incorporation | | | April 27, 2011 | | | | June 2, 2011 | |
| | |
Fund Net Assets | | | | | | | | |
Commodity Portfolio | | | 8,509 | | | | 55 | |
Subsidiary percentage of Fund net assets | | | 0.99 | % | | | 0.01 | % |
| | |
Consolidated Financial Statement Information | | | | | | | | |
Total assets | | | 8,529 | | | | 85 | |
Total liabilities | | | 20 | | | | 30 | |
Net assets | | | 8,509 | | | | 55 | |
Total investment income | | | 102 | | | | 111 | |
Net investment income | | | 73 | | | | 61 | |
Net realized gains/(losses) from investment transactions and foreign currency translations | | | 1 | | | | 49 | |
Net realized gains/(losses) from futures transactions | | | 4,335 | | | | (26 | ) |
Net realized gains/(losses) from options and swaptions transactions | | | (47 | ) | | | — | |
Net realized gains/(losses) from swap transactions | | | 74 | | | | 2,510 | |
Net realized gains/(losses) from forward currency contracts | | | — | | | | 33 | |
Change in net unrealized appreciation/(depreciation) on investments and foreign currency translations | | | 60 | | | | 2 | |
Change in net unrealized appreciation/(depreciation) on futures | | | (1,095 | ) | | | (14 | ) |
Change in net unrealized appreciation/(depreciation) on options and swaptions | | | 8 | | | | (1 | ) |
Change in net unrealized appreciation/(depreciation) on swaps | | | (98 | ) | | | (451 | ) |
Change in net unrealized appreciation/(depreciation) on forward currency contracts | | | — | | | | (23 | ) |
Net realized/unrealized gains/(losses) from investments, futures, options, | | | | | | | | |
swaps and foreign currency transactions | | | 3,239 | | | | 2,078 | |
Change in net assets resulting from operations | | | 3,312 | | | | 2,139 | |
The Commodity Portfolio’s investments in these Funds have been consolidated and include the portfolio holdings of the underlying Funds. The consolidated financial statements include the accounts of the Commodity Portfolio and the Funds. All intercompany transactions and balances have been eliminated.
P. Recent Accounting Pronouncements. In March 2017, FASB issued Accounting Standards Update No. 2017-08 “Premium Amortization on Purchased Callable Debt Securities” (“ASU 2017-08”), which shortens the premium amortization period for purchased non-contingently callable debt securities. ASU 2017-08 specifies that the premium amortization period ends at the earliest call date, for purchased non-contingently callable debt securities. ASU 2017-08 is effective for fiscal years, and interim periods within those fiscal years, beginning after December 15, 2018. Management is currently evaluating the implications of ASU 2017-08 and its impact on the financial statements and related disclosures has not yet been determined.
3. INVESTMENT ADVISORY AND ADMINISTRATIVE CONTRACTS. The Trust has entered into investment advisory contracts (“Portfolio Management Contracts”) on behalf of each of the Portfolios with one or more investment management organizations (each, a “Specialist Manager”). For the Portfolio(s) it serves, each Specialist Manager is responsible for providing a continuous program of investment management for that portion of the Portfolio allocated to it and for placing all orders for the purchase and sale of securities and other instruments for such portion of the Portfolio. Except as noted, each Specialist Manager earns a fee, accrued daily and paid either monthly or quarterly, based on average daily net assets of that portion of the Portfolio managed.
293
HC CAPITAL TRUST
Notes to Financial Statements (continued) — June 30, 2018
For the year ended June 30, 2018, the Portfolios incurred the following investment advisory fees, before any applicable fee waivers, with respect to the services of the indicated Specialist Manager(s). The following annual fee rates are applied to the portions of the Portfolios that are managed by the Specialist Managers in determining amounts earned, except as footnoted.
Value Portfolio:
| | | | | | | | |
Specialist Manager | | Amount
Earned
(000) | | | Fee | |
AllianceBernstein, L.P. | | $ | 567 | | | | 0.35 | %(a) |
Cadence Capital Management, LLC | | | 196 | | | | 0.065 | %(b) |
BNY Mellon Asset Management North America Corporation (formerly Mellon Capital Management Corporation) | | | 34 | | | | 0.065 | %(c) |
Parametric Portfolio Associates, LLC | | | 25 | | | | 0.12 | %(d) |
Parametric Portfolio Associates, LLC | | | — | | | | 0.35 | %(e)(f) |
Parametric Portfolio Associates, LLC | | | 2 | | | | — | %(e)(g) |
Parametric Portfolio Associates, LLC | | | 57 | | | | 0.09 | %(h) |
| | | | | | | | |
Total | | $ | 881 | | | | 0.14 | % |
| | | | | | | | |
Institutional Value Portfolio:
| | | | | | | | |
Specialist Manager | | Amount
Earned
(000) | | | Fee | |
AllianceBernstein, L.P. | | $ | 763 | | | | 0.35 | %(a) |
Cadence Capital Management, LLC | | | 237 | | | | 0.065 | %(b) |
BNY Mellon Asset Management North America Corporation (formerly Mellon Capital Management Corporation) | | | 123 | | | | 0.065 | %(c) |
Pacific Investment Management Company, LLC | | | — | | | | 0.25 | %(e) |
Parametric Portfolio Associates, LLC | | | 51 | | | | 0.09 | %(d) |
Parametric Portfolio Associates, LLC | | | — | | | | 0.35 | %(e)(f) |
Parametric Portfolio Associates, LLC | | | 2 | | | | — | %(e)(g) |
| | | | | | | | |
Total | | $ | 1,176 | | | | 0.14 | % |
| | | | | | | | |
Growth Portfolio:
| | | | | | | | |
Specialist Manager | | Amount
Earned
(000) | | | Fee | |
Cadence Capital Management, LLC | | $ | — | | | | 0.065 | %(b)(e) |
Jennison Associates, LLC | | | 538 | | | | 0.28 | %(i) |
BNY Mellon Asset Management North America Corporation (formerly Mellon Capital Management Corporation) | | | 194 | | | | 0.065 | %(c) |
Sustainable Growth Advisers, LP | | | 604 | | | | 0.35 | %(j) |
Parametric Portfolio Associates, LLC | | | 27 | | | | 0.11 | %(d) |
Parametric Portfolio Associates, LLC | | | — | | | | 0.35 | %(e)(f) |
Parametric Portfolio Associates, LLC | | | — | | | | 0.05 | %(e)(g) |
Parametric Portfolio Associates, LLC | | | 77 | | | | 0.09 | %(h) |
| | | | | | | | |
Total | | $ | 1,440 | | | | 0.18 | % |
| | | | | | | | |
294
HC CAPITAL TRUST
Notes to Financial Statements (continued) — June 30, 2018
Institutional Growth Portfolio:
| | | | | | | | |
Specialist Manager | | Amount
Earned
(000) | | | Fee | |
Cadence Capital Management, LLC | | $ | — | | | | 0.065 | %(b)(e) |
Jennison Associates, LLC | | | 750 | | | | 0.28 | %(i) |
BNY Mellon Asset Management North America Corporation (formerly Mellon Capital Management Corporation) | | | 383 | | | | 0.065 | %(c) |
Pacific Investment Management Company, LLC | | | — | | | | 0.25 | %(e) |
Sustainable Growth Advisers, LP | | | 623 | | | | 0.35 | %(j) |
Parametric Portfolio Associates, LLC | | | 26 | | | | 0.08 | %(d) |
Parametric Portfolio Associates, LLC | | | — | | | | 0.35 | %(e)(f) |
Parametric Portfolio Associates, LLC | | | — | | | | 0.05 | %(e)(g) |
| | | | | | | | |
Total | | $ | 1,782 | | | | 0.16 | % |
| | | | | | | | |
Small Cap-Mid Cap Portfolio:
| | | | | | | | |
Specialist Manager | | Amount
Earned
(000) | | | Fee | |
Advisory Research, Inc. | | $ | 139 | | | | 0.85 | % |
Ariel Investments, LLC | | | 69 | | | | 0.88 | %(k) |
Cadence Capital Management, LLC | | | — | | | | 0.065 | %(b)(e) |
Frontier Capital Management Company, LLC | | | 173 | | | | 0.45 | %(l) |
BNY Mellon Asset Management North America Corporation (formerly Mellon Capital Management Corporation) | | | — | | | | 0.065 | %(c)(e) |
Pzena Investment Management, LLC | | | 78 | | | | 1.00 | % |
RMB Capital Management, LLC | | | 177 | | | | 0.70 | %(m) |
Parametric Portfolio Associates, LLC | | | 15 | | | | 0.22 | %(d) |
Parametric Portfolio Associates, LLC | | | — | | | | 0.05 | %(e)(g) |
Parametric Portfolio Associates, LLC | | | 5 | | | | 0.09 | %(h) |
| | | | | | | | |
Total | | $ | 656 | | | | 0.60 | % |
| | | | | | | | |
Institutional Small Cap-Mid Cap Portfolio:
| | | | | | | | |
Specialist Manager | | Amount
Earned
(000) | | | Fee | |
Advisory Research, Inc. | | $ | 204 | | | | 0.85 | % |
Ariel Investments, LLC | | | — | | | | 1.00 | %(e)(k) |
Cadence Capital Management, LLC | | | — | | | | 0.065 | %(b)(e) |
Frontier Capital Management Company, LLC | | | 250 | | | | 0.45 | %(l) |
BNY Mellon Asset Management North America Corporation (formerly Mellon Capital Management Corporation) | | | 9 | | | | 0.065 | %(c) |
Pzena Investment Management, LLC | | | 86 | | | | 1.00 | % |
RMB Capital Management, LLC | | | 318 | | | | 0.70 | %(m) |
Parametric Portfolio Associates, LLC | | | 16 | | | | 0.22 | %(d) |
Parametric Portfolio Associates, LLC | | | — | | | | 0.05 | %(e)(g) |
| | | | | | | | |
Total | | $ | 883 | | | | 0.56 | % |
| | | | | | | | |
295
HC CAPITAL TRUST
Notes to Financial Statements (continued) — June 30, 2018
Real Estate Portfolio:
| | | | | | | | |
Specialist Manager | | Amount
Earned
(000) | | | Fee | |
Cadence Capital Management, LLC | | $ | — | | | | 0.10 | %(e)(n) |
BNY Mellon Asset Management North America Corporation (formerly Mellon Capital Management Corporation) | | | — | | | | 0.10 | %(e)(o) |
Wellington Management Company, LLP | | | 731 | | | | 0.70 | %(p) |
Parametric Portfolio Associates, LLC | | | 19 | | | | 0.15 | %(d) |
Parametric Portfolio Associates, LLC | | | — | | | | 0.05 | %(e)(g) |
| | | | | | | | |
Total | | $ | 750 | | | | 0.61 | % |
| | | | | | | | |
Commodity Portfolio:
| | | | | | | | |
Specialist Manager | | Amount
Earned
(000) | | | Fee | |
Cadence Capital Management, LLC | | $ | — | | | | 0.10 | %(e)(n) |
BNY Mellon Asset Management North America Corporation (formerly Mellon Capital Management Corporation) | | | 526 | | | | 0.10 | %(o) |
Pacific Investment Management Company, LLC | | | 106 | | | | 0.49 | %(e) |
Vaughan Nelson Investment Management, L.P. | | | 94 | | | | 0.34 | %(q) |
Wellington Management Company, LLP | | | 1,069 | | | | 0.60 | %(r) |
Wellington Management Company, LLP | | | 206 | | | | 0.75 | %(s) |
Parametric Portfolio Associates, LLC | | | 66 | | | | 0.09 | %(d) |
Parametric Portfolio Associates, LLC | | | — | | | | 0.05 | %(e)(g) |
Parametric Portfolio Associates, LLC | | | — | | | | 0.09 | %(e)(h) |
| | | | | | | | |
Total | | $ | 2,067 | | | | 0.24 | % |
| | | | | | | | |
ESG Growth Portfolio:
| | | | | | | | |
Specialist Manager | | Amount
Earned
(000) | | | Fee | |
Agincourt Capital Management, LLC | | $ | — | | | | 0.12 | %(e) |
Cadence Capital Management, LLC | | | 123 | | | | 0.14 | %(t) |
BNY Mellon Asset Management North America Corporation (formerly Mellon Capital Management Corporation) | | | 63 | | | | 0.09 | %(u) |
BNY Mellon Asset Management North America Corporation (formerly Mellon Capital Management Corporation) | | | 2 | | | | 0.16 | %(u) |
Parametric Portfolio Associates, LLC | | | 7 | | | | 0.15 | %(d) |
Parametric Portfolio Associates, LLC | | | — | | | | 0.05 | %(e)(g) |
| | | | | | | | |
Total | | $ | 195 | | | | 0.12 | % |
| | | | | | | | |
296
HC CAPITAL TRUST
Notes to Financial Statements (continued) — June 30, 2018
Catholic SRI Growth Portfolio
| | | | | | | | |
Specialist Manager | | Amount
Earned
(000) | | | Fee | |
Agincourt Capital Management, LLC | | $ | — | | | | 0.12 | %(e) |
Cadence Capital Management, LLC | | | 23 | | | | 0.14 | %(t) |
BNY Mellon Asset Management North America Corporation (formerly Mellon Capital Management Corporation) | | | 12 | | | | 0.09 | %(u) |
BNY Mellon Asset Management North America Corporation (formerly Mellon Capital Management Corporation) | | | — | | | | 0.16 | %(u) |
Parametric Portfolio Associates, LLC | | | — | | | | 0.15 | %(d)(e) |
Parametric Portfolio Associates, LLC | | | — | | | | 0.05 | %(e)(g) |
| | | | | | | | |
Total | | $ | 35 | | | | 0.12 | % |
| | | | | | | | |
International Portfolio:
| | | | | | | | |
Specialist Manager | | Amount
Earned
(000) | | | Fee | |
Artisan Partners Limited Partnership | | $ | 1,110 | | | | 0.63 | %(v) |
Cadence Capital Management, LLC | | | — | | | | 0.13 | %(e)(w) |
Cadence Capital Management, LLC | | | 637 | | | | 0.10 | %(x) |
Causeway Capital Management, LLC | | | 2,082 | | | | 0.45 | % |
City of London Investment Management Company, Ltd. | | | — | | | | 0.74 | %(e)(y) |
BNY Mellon Asset Management North America Corporation (formerly Mellon Capital Management Corporation) | | | — | | | | 0.10 | %(e)(z) |
BNY Mellon Asset Management North America Corporation (formerly Mellon Capital Management Corporation) | | | — | | | | 0.13 | %(e)(aa) |
Parametric Portfolio Associates, LLC | | | 30 | | | | 0.11 | %(d) |
Parametric Portfolio Associates, LLC | | | 6 | | | | 0.52 | %(g) |
Parametric Portfolio Associates, LLC | | | — | | | | 0.09 | %(e)(h) |
| | | | | | | | |
Total | | $ | 3,865 | | | | 0.30 | % |
| | | | | | | | |
Institutional International Portfolio:
| | | | | | | | |
Specialist Manager | | Amount
Earned
(000) | | | Fee | |
Artisan Partners Limited Partnership | | $ | 1,397 | | | | 0.63 | %(v) |
Cadence Capital Management, LLC | | | — | | | | 0.13 | %(e)(w) |
Cadence Capital Management, LLC | | | 1,390 | | | | 0.10 | %(x) |
Causeway Capital Management, LLC | | | 2,304 | | | | 0.45 | % |
City of London Investment Management Company, Ltd. | | | 574 | | | | 0.61 | %(y) |
Lazard Asset Management LLC | | | 1,032 | | | | 0.36 | %(bb) |
BNY Mellon Asset Management North America Corporation (formerly Mellon Capital Management Corporation) | | | — | | | | 0.10 | %(e)(z) |
BNY Mellon Asset Management North America Corporation (formerly Mellon Capital Management Corporation) | | | — | | | | 0.13 | %(e)(aa) |
Parametric Portfolio Associates, LLC | | | 81 | | | | 0.08 | %(d) |
Parametric Portfolio Associates, LLC | | | 10 | | | | 0.12 | %(g) |
| | | | | | | | |
Total | | $ | 6,788 | | | | 0.26 | % |
| | | | | | | | |
297
HC CAPITAL TRUST
Notes to Financial Statements (continued) — June 30, 2018
Emerging Markets Portfolio:
| | | | | | | | |
Specialist Manager | | Amount
Earned
(000) | | | Fee | |
BNY Mellon Asset Management North America Corporation (formerly The Boston Company Asset Management, LLC) | | $ | 4,805 | | | | 0.58 | %(cc) |
Cadence Capital Management, LLC | | | — | | | | 0.13 | %(e)(y) |
City of London Investment Management Company, Ltd. | | | — | | | | 1.00 | %(e)(dd) |
BNY Mellon Asset Management North America Corporation (formerly Mellon Capital Management Corporation) | | | 727 | | | | 0.13 | %(ee) |
RBC Global Asset Management (UK) Limited | | | 2,477 | | | | 0.68 | %(ff) |
Parametric Portfolio Associates, LLC | | | 48 | | | | 0.09 | %(d) |
Parametric Portfolio Associates, LLC | | | — | | | | 0.05 | %(e)(g) |
Parametric Portfolio Associates, LLC | | | — | | | | 0.09 | %(e)(h) |
| | | | | | | | |
Total | | $ | 8,057 | | | | 0.45 | % |
| | | | | | | | |
Core Fixed Income Portfolio:
| | | | | | | | |
Specialist Manager | | Amount
Earned
(000) | | | Fee | |
Agincourt Capital Management, LLC | | $ | 25 | | | | 0.08 | % |
BNY Mellon Asset Management North America Corporation (formerly Mellon Capital Management Corporation) | | | 17 | | | | 0.06 | %(gg) |
BNY Mellon Asset Management North America Corporation (formerly Mellon Capital Management Corporation) | | | 10 | | | | 0.15 | %(hh) |
| | | | | | | | |
Total | | $ | 52 | | | | 0.07 | % |
| | | | | | | | |
Fixed Opportunity Portfolio:
| | | | | | | | |
Specialist Manager | | Amount
Earned
(000) | | | Fee | |
Fort Washington Investment Advisors, Inc. | | $ | 901 | | | | 0.20 | %(ii) |
Western Asset Management Company, Ltd. | | | 1,189 | | | | 0.75 | % |
Parametric Portfolio Associates, LLC | | | 29 | | | | 0.09 | %(d) |
Parametric Portfolio Associates, LLC | | | 27 | | | | 0.08 | %(g) |
| | | | | | | | |
Total | | $ | 2,146 | | | | 0.31 | % |
| | | | | | | | |
U.S. Government Fixed Income Portfolio:
| | | | | | | | |
Specialist Manager | | Amount
Earned
(000) | | | Fee | |
BNY Mellon Asset Management North America Corporation (formerly Mellon Capital Management Corporation) | | $ | 128 | | | | 0.06 | %(gg) |
| | | | | | | | |
298
HC CAPITAL TRUST
Notes to Financial Statements (continued) — June 30, 2018
Inflation Protected Portfolio:
| | | | | | | | |
Specialist Manager | | Amount
Earned
(000) | | | Fee | |
BNY Mellon Asset Management North America Corporation (formerly Mellon Capital Management Corporation) | | $ | 146 | | | | 0.04 | %(jj) |
| | | | | | | | |
U.S. Corporate Fixed Income Portfolio:
| | | | | | | | |
Specialist Manager | | Amount
Earned
(000) | | | Fee | |
Agincourt Capital Management, LLC | | $ | 194 | | | | 0.08 | % |
BNY Mellon Asset Management North America Corporation (formerly Mellon Capital Management Corporation) | | | — | | | | 0.15 | %(e)(hh) |
| | | | | | | | |
Total | | $ | 194 | | | | 0.08 | % |
| | | | | | | | |
U.S. Mortgage/Asset Backed Fixed Income Portfolio:
| | | | | | | | |
Specialist Manager | | Amount
Earned
(000) | | | Fee | |
BNY Mellon Asset Management North America Corporation (formerly Mellon Capital Management Corporation) | | $ | 110 | | | | 0.06 | %(gg) |
| | | | | | | | |
Short-Term Municipal Portfolio:
| | | | | | | | |
Specialist Manager | | Amount
Earned
(000) | | | Fee | |
Breckinridge Capital Advisors, Inc. | | $ | 37 | | | | 0.125 | % |
| | | | | | | | |
Intermediate Municipal Portfolio:
| | | | | | | | |
Specialist Manager | | Amount
Earned
(000) | | | Fee | |
BNY Mellon Asset Management North America Corporation (formerly Standish Mellon Asset Management Company LLC) | | $ | 627 | | | | 0.16 | %(kk) |
City of London Investment Management Company, Ltd. | | | — | | | | 0.16 | %(e)(ll) |
| | | | | | | | |
Total | | $ | 627 | | | | 0.16 | % |
| | | | | | | | |
Intermediate Municipal II Portfolio:
| | | | | | | | |
Specialist Manager | | Amount
Earned
(000) | | | Fee | |
Breckinridge Capital Advisors, Inc. | | $ | 94 | | | | 0.125 | % |
City of London Investment Management Company, Ltd. | | | — | | | | 0.125 | %(e) |
| | | | | | | | |
Total | | $ | 94 | | | | 0.125 | % |
| | | | | | | | |
299
HC CAPITAL TRUST
Notes to Financial Statements (continued) — June 30, 2018
| (a) | AllianceBernstein L.P. (“AllianceBernstein”) received a fee, which was payable monthly in arrears, of 0.37% of the average daily net assets of the first $150 million of the Combined Assets (as defined below), 0.35% of the next $150 million of Combined Assets, and 0.29% of the Combined Assets exceeding $300 million. |
“Combined Assets” shall mean the sum of: the net assets of the portion of the Value Portfolio and the Institutional Value Portfolio managed by AllianceBernstein, and assets invested in the same investment strategy as the Portfolio that were managed by AllianceBernstein for certain other clients of the Trust’s primary adviser.
AllianceBernstein’s Portfolio Management Agreement was terminated effective May 15, 2018.
| (b) | Cadence Capital Management, LLC (“Cadence”) receives a fee, which shall be calculated daily and payable monthly in arrears. For so long as Combined Assets (as defined below) are greater than $2 billion, the fee shall be at the annual rate of 0.065% of the average daily net assets of the portion of the Portfolio managed by Cadence. If the Combined Assets are reduced to $2 billion or less due to redemptions, the fee shall be calculated at the annual rate of 0.075% beginning in the following calendar year. |
“Combined Assets” shall mean the sum of: the net assets managed by Cadence in the Value Portfolio, Institutional Value Portfolio, Growth Portfolio, Institutional Growth Portfolio, Small Cap-Mid Cap Portfolio, Institutional Small Cap-Mid Cap Portfolio, Real Estate Portfolio, Commodity Portfolio, International Portfolio, Institutional International Portfolio, Emerging Markets Portfolio, and the net assets managed by Cadence using these strategies in other investment advisory accounts for which HC Capital Solutions or certain of its affiliates serves as investment adviser.
| (c) | BNY Mellon Asset Management North America Corporation (formerly Mellon Capital Management Corporation, The Boston Company Asset Management, LLC and Standish Mellon Asset Management Company, LLC) (“BNY Mellon AMNA-Mellon”), (“BNY Mellon AMNA-Boston”) and (“BNY Mellon AMNA-Standish”), respectively, receives a fee, which shall be calculated daily and payable monthly in arrears. For so long as Combined Assets (as defined below) are greater than $2 billion, the fee shall be at the annual rate of 0.065% of the average daily net assets of the portion of the Portfolio managed by Mellon. If the Combined Assets are reduced to $2 billion or less due to redemptions, the fee shall be calculated at the annual rate of 0.075% beginning in the following calendar year. |
“Combined Assets” shall mean the sum of: the net assets managed by BNY Mellon AMNA-Mellon in the Value Portfolio, Institutional Value Portfolio, Growth Portfolio, Institutional Growth Portfolio, Small Cap-Mid Cap Portfolio, Institutional Small Cap-Mid Cap Portfolio, Real Estate Portfolio, Commodity Portfolio, International Portfolio, Institutional International Portfolio, Emerging Markets Portfolio, and the net assets managed by BNY Mellon AMNA-Mellon using these strategies in other investment advisory accounts for which HC Capital Solutions serves as investment adviser.
| (d) | With respect to its Liquidity Strategy, Parametric Portfolio Associates, LLC (“Parametric”) receives a fee, which shall be calculated daily and payable monthly in arrears, at an annual rate of 0.15% of the first $50 million of the Combined Liquidity Assets (as defined below); 0.10% of the next $100 million of Combined Liquidity Assets; and 0.05% of Combined Liquidity Assets over $150 million. Parametric is also entitled to receive a flat fee of $10,000 per year for each Portfolio. 1/12 of such fee will be waived with respect to each calendar month during which no Portfolio assets were allocated to that Portfolio. |
“Combined Liquidity Assets” shall mean the sum of: the net assets of that portion of each Portfolio managed by Parametric for investment in its Liquidity Strategy.
| (e) | Specialist Manager approved by the Board but a strategy to which no assets were allocated during the year ended June 30, 2018. |
| (f) | With respect to its Defensive Strategy, Parametric receives a fee, which shall be calculated daily and payable monthly in arrears, at an annual rate of 0.35% of the first $50 million of the Combined Defensive Assets (as defined below) and 0.25% of Combined Defensive Assets over $50 million. |
“Combined Defensive Assets” shall mean the sum of: the net assets of that portion of the Value Portfolio, Institutional Value Portfolio, Growth Portfolio, and Institutional Growth Portfolio managed by Parametric for investment in its Defensive Strategy.
| (g) | With respect to its Targeted Strategy, Parametric receives a fee, which shall be calculated daily and payable in arrears at the rate of 0.05%. Parametric is also entitled to receive a flat fee of $5,000 per year for each Portfolio, provided that such fee will be waived with respect to each calendar year during which no Portfolio assets were allocated to that Portfolio. |
| (h) | With respect to its Tax-Managed Custom Strategy, Parametric receives a fee, which shall be calculated daily and payable in arrears at the annual rate of 0.10% of the first $250 million of the Combined Tax-Managed Custom Strategy Assets; 0.09% of the next $250 million of the Combined Tax-Managed Custom Strategy Assets; 0.08% of the next $500 million of the Combined Tax-Managed Custom Strategy Assets; and 0.07% of the Combined Tax-Managed Custom Strategy Assets over $1 billion. |
“Combined Tax-Managed Custom Strategy Assets” shall man the sum of: the net assets of the portion of each of the other Portfolio of the Trust allocated to Parametric from time to time for investment in their Tax-Management Custom Core Strategy.
If, at the close of business on September 30, 2019, the Combined Tax-Managed Custom Strategy Assets are less than $500 million, the fee for the first $250 million shall be permanently increased to 0.13% of the first $250 million of the Combined Tax-Managed Custom Strategy Assets; 0.09% of the next $250 million of the Combined Tax-Managed Custom Strategy Assets; 0.08% of the next $500 million of the Combined Tax-Managed Custom Strategy Assets; and 0.07% of the Combined Tax-Managed Custom Strategy Assets over $1 billion.
| (i) | Jennison Associates LLC (“Jennison”) is entitled to receive an annual fee of no more than 0.30% of average daily net assets of that portion of the Growth Portfolio and Institutional Growth Portfolio allocated to Jennison (the “Jennison Accounts”). While the rate at which Jennison’s fee for |
300
HC CAPITAL TRUST
Notes to Financial Statements (continued) — June 30, 2018
| | managing the Portfolios will not exceed 0.30%, the fee may decrease based on the aggregate market value of the Jennison Accounts and certain other assets managed by Jennison (which may pay fees exceeding 0.30%) for the benefit of certain investors who are clients of the Trust’s primary adviser at the following annual rates: |
— 0.75% on the first $10 million;
— 0.50% on the next $30 million;
— 0.35% on the next $25 million;
— 0.25% on the next $335 million;
— 0.22% on the next $600 million;
— 0.20% on the next $4 billion; and
— 0.25% on the balance
| (j) | Sustainable Growth Advisers, LP (“SGA”) received a fee, which was calculated daily and payable monthly, at an annual rate of 0.35% of the first $200 million of Combined Assets (as defined below); 0.30% of the next $200 million of Combined Assets; 0.25% of the next $200 million of Combined Assets; 0.22% of the next $400 million of Combined Assets; and 0.20% of Combined Assets exceeding $1 billion. |
“Combined Assets” shall mean the sum of: the net assets managed by SGA in the Growth Portfolio, the net assets managed by SGA in the Institutional Growth Portfolio, and the net assets invested in the same strategy as the Portfolios that were managed by SGA for certain other clients of the Trust’s primary adviser.
SGA’s Portfolio Management Agreement was terminated effective May 15, 2018.
| (k) | For its services to the Small Cap-Mid Cap Portfolio and the Institutional Small Cap-Mid Cap Portfolio, Ariel Investments, LLC (“Ariel”) receives an annual fee, calculated daily and payable quarterly, in arrears, based on the Combined Assets (as defined below), in accordance with the following schedule: 1.00% of the first $10 million of the Combined Assets, 0.75% of the next $10 million of Combined Assets, and 0.50% of the Combined Assets exceeding $20 million. |
“Combined Assets” shall mean the sum of: the net assets managed by Ariel in the Small Cap-Mid Cap Portfolio, the Institutional Small Cap-Mid Cap Portfolio and the net assets invested in the same strategy as the Portfolios that are managed by Ariel for certain other clients of the Trust’s primary adviser or certain of its affiliates.
| (l) | Frontier Capital Management Company, LLC (“Frontier”) receives a fee, which shall be calculated daily and payable monthly, at an annual rate of 0.45% of the first $90 million of Combined Assets (as defined below) and 0.75% of Combined Assets exceeding $90 million. |
“Combined Assets” shall mean the sum of: the net assets managed by Frontier in the Small Cap-Mid Cap Portfolio, the net assets managed by Frontier in the Institutional Small Cap-Mid Cap Portfolio, and the net assets invested in the same strategy as the Portfolios that are managed by Frontier for certain other clients of the Trust’s primary adviser.
| (m) | RMB Capital Management, LLC’s Portfolio Management Agreement was terminated effective May 15, 2018. |
| (n) | Cadence receives a fee, which shall be calculated daily and payable monthly in arrears. For so long as combined Assets (as defined below) are greater than $2 billion, the fee shall be at the annual rate of 0.10% of the average daily net assets of the portion of the Portfolio managed by Cadence. If the Combined Assets are reduced to $2 billion or less due to redemptions, the fee shall be calculated at the annual rate of 0.11% beginning in the following calendar year. |
“Combined Assets” shall mean the sum of: the net assets managed by Cadence in the Value Portfolio, Institutional Value Portfolio, Growth Portfolio, Institutional Growth Portfolio, Small Cap-Mid Cap Portfolio, Institutional Small Cap-Mid Cap Portfolio, Real Estate Portfolio, Commodity Portfolio, International Portfolio, Institutional International Portfolio, Emerging Markets Portfolio, and the net assets managed by Cadence in other investment advisory accounts for which HC Capital Solutions or certain of its affiliates serves as investment adviser.
| (o) | BNY Mellon AMNA-Mellon receives a fee, which shall be calculated daily and payable monthly in arrears. For so long as Combined Assets (as defined below) are greater than $2 billion, the fee shall be at the annual rate of 0.10% of the average daily net assets of the portion of the Portfolio managed by BNY Mellon AMNA- Mellon. If the Combined Assets are reduced to $2 billion or less due to redemptions, the fee shall be calculated at the annual rate of 0.11% beginning in the following calendar year. |
“Combined Assets” shall mean the sum of: the net assets managed by BNY Mellon AMNA-Mellon in the Value Portfolio, Institutional Value Portfolio, Growth Portfolio, Institutional Growth Portfolio, Small Cap-Mid Cap Portfolio, Institutional Small Cap-Mid Cap Portfolio, Real Estate Portfolio, Commodity Portfolio, International Portfolio, Institutional International Portfolio, Emerging Markets Portfolio, and the net assets managed by Mellon in other investment advisory accounts for which HC Capital Solutions or certain of its affiliates serves as investment adviser.
| (p) | Wellington Management Company, LLP (“Wellington”) receives a fee, which shall be payable monthly in arrears of 0.75% of the average daily net assets of the first $50 million of the Combined Assets (as defined below). On Combined Assets over $50 million, the fee shall be at the annual rate of 0.65% of the Combined Assets. |
“Combined Assets” shall mean the sum of: the net assets of the Real Estate Portfolio and assets invested in the same investment strategy as the Portfolio that are managed by Wellington for certain other clients of the Trust’s primary adviser.
| (q) | Vaughan Nelson Investment Management L.P. (“Vaughan Nelson”) receives a fee, which is calculated daily and payable quarterly, at the annual rate of 0.35% of the first $25 million of Combined Assets (as defined below), 0.25% of the next $75 million of Combined Assets, and 0.20% of the Combined Assets exceeding $100 million. |
301
HC CAPITAL TRUST
Notes to Financial Statements (continued) — June 30, 2018
“Combined Assets” shall mean the sum of: the net assets of the Commodity Portfolio and the net assets managed by Vaughan Nelson in other investment advisory accounts for which HC Capital Solutions serves as investment adviser.
| (r) | With respect to its Global National Resources Strategy (“GNRS”), Wellington is entitled to receive a fee, which shall be payable monthly in arrears at the annual rate of 0.60% of the average daily net assets of the GNRS account, so long as at least $150 million in assets are present in the GNRS and 0.85% if less than $150 million in assets are present in the GNRS. Effective November 1, 2017 through June 30, 2018, Wellington has temporarily and voluntarily waived fees in excess of 0.25% of the average daily net assets in the Portfolio. |
| (s) | With respect to its Commodity Futures Strategy account, Wellington is entitled to receive a fee, which shall be payable monthly in arrears at the annual rate of 0.75% of the average daily net assets of the Commodity Futures Strategy account. |
| (t) | For its services to the Portfolio, Cadence received a fee calculated based on the average daily net assets of that portion of the assets of the Portfolio managed by it based on the asset class in which assets of the account are invested, as set forth below. In each case, the annual rate set forth was applied to the average daily net assets of that portion of the assets allocated to the designated asset class (“Designated Assets”). |
Domestic Large Cap Equity Securities at the rate of 0.09% of the net asset value of Designated Assets; Domestic Small and Mid Cap Equity Securities at the rate of 0.12% of the net asset value of Designated Assets; Developed Markets International Equity Securities at the rate of 0.14% of the net asset value of Designated Assets; and Emerging Markets International Equity Securities at the rate of 0.18% of the net asset value of Designated Assets.
Cadence’s Portfolio Management Agreements with the Portfolios were terminated on July 6, 2018.
| (u) | Effective June 23, 2018, BNY Mellon AMNA-Mellon was entitled to receive a fee, which is payable in arrears within 30 days after each month end at the annual rate of 0.16% of the average daily net assets of the Account. |
For the period prior to June 23, 2018, with respect to the Domestic Large Cap Equity Securities portion of the Portfolio managed by BNY Mellon AMNA-Mellon, BNY Mellon AMNA-Mellon received a fee, which was calculated daily and payable monthly in arrears at the rate of 0.09% of the net assets value of Designated Assets.
For the period prior to June 23, 2018 with respect to the Developed Markets International Equity Securities portion of the Portfolio managed by BNY Mellon AMNA-Mellon, BNY Mellon AMNA-Mellon received a fee, which was calculated daily and payable monthly in arrears at the rate of 0.14% of the net asset value of Designated Assets.
For the period prior to June 23, 2018, with respect to the Domestic Small and Mid Cap Equity Securities portion of the Portfolio managed by BNY Mellon AMNA-Mellon, BNY Mellon AMNA-Mellon received a fee, which was calculated daily and payable monthly in arrears at the rate of 0.12% of such net assets.
For the period prior to June 23, 2018, with respect to the Emerging Markets International Equity Securities portion of the Portfolio managed by BNY Mellon AMNA-Mellon, BNY Mellon AMNA-Mellon received a fee, which was calculated daily and payable monthly in arrears at the rate of 0.18% of such net assets.
| (v) | Artisan Partners Limited Partnership (“Artisan”) receives a fee, which shall be payable monthly in arrears. For so long as the Combined Assets (as defined below) are greater than $500 million, the fee shall be at the annual rate of 0.47% of the average daily net assets of the Portfolios. If the Combined Assets are reduced to $500 million or less, the fee shall be calculated based on average daily net assets of the Portfolios at the following annual rates: |
— 0.80% on assets up to $50 million; and
— 0.60% on assets in excess of $50 million
“Combined Assets” shall mean the sum of: the net assets of the International Portfolio managed by Artisan and the net assets of the Institutional International Portfolio managed by Artisan.
| (w) | With respect to the emerging markets portion of the Portfolio managed by Cadence, Cadence receives a fee, which shall be calculated daily and payable monthly in arrears. For so long as Combined Assets (as defined below) are greater than $2 billion, the fee shall be at the annual rate of 0.13% of the average daily net assets of that portion of the Portfolio. If the Combined Assets are reduced to $2 billion or less due to redemptions, the fee shall be calculated at the annual rate of 0.15% beginning in the following calendar year. |
“Combined Assets” shall mean the sum of: the net assets managed by Cadence in the Value Portfolio, Institutional Value Portfolio, Growth Portfolio, Institutional Growth Portfolio, Small Cap-Mid Cap Portfolio, Institutional Small Cap-Mid Cap Portfolio, Real Estate Portfolio, Commodity Portfolio, International Portfolio, Institutional International Portfolio, Emerging Markets Portfolio, and the net assets managed by Cadence in other investment advisory accounts for which HC Capital Solutions or certain of its affiliates serves as investment adviser.
| (x) | With respect to the developed markets portion of the Portfolio managed by Cadence, Cadence receives a fee, which shall be calculated daily and payable monthly in arrears. For so long as Combined Assets (as defined below) are greater than $2 billion, the fee shall be at the annual rate of 0.10% of the average daily net assets of that portion of the Portfolio. If the Combined Assets are reduced to $2 billion or less due to redemptions, the fee shall be calculated at the annual rate of 0.11% beginning in the following calendar year. |
“Combined Assets” shall mean the sum of: the net assets managed by Cadence in the Value Portfolio, Institutional Value Portfolio, Growth Portfolio, Institutional Growth Portfolio, Small Cap-Mid Cap Portfolio, Institutional Small Cap-Mid Cap Portfolio, Real Estate Portfolio, Commodity Portfolio, International Portfolio, Institutional International Portfolio, Emerging Markets Portfolio, and the net assets managed by Cadence in other investment advisory accounts for which HC Capital Solutions or certain of its affiliates serves as investment adviser.
| (y) | City of London Investment Management Company, Ltd. (“CLIM”) receives a fee, which shall be calculated daily and payable monthly in arrears at the annual rate of 0.80% of the first $50 million of the Combined Assets (as defined below) and 0.40% of the Combined assets exceeding $50 million. |
302
HC CAPITAL TRUST
Notes to Financial Statements (continued) — June 30, 2018
“Combined Assets” shall mean the sum of: the net assets managed by CLIM in the Portfolio and the net assets invested in the same strategy as the Portfolio that are managed by CLIM for certain other clients of the Trust’s primary adviser.
| (z) | With respect to the developed markets portion of the Portfolio managed by BNY Mellon AMNA-Mellon, BNY Mellon AMNA-Mellon receives a fee, which shall be calculated daily and payable monthly in arrears. For so long as Combined Assets (as defined below) are greater than $2 billion, the fee shall be at the annual rate of 0.10% of the average daily net assets of that portion of the Portfolio. If the Combined Assets are reduced to $2 billion or less due to redemptions, the fee shall be calculated at the annual rate of 0.11% beginning in the following calendar year. |
“Combined Assets” shall mean the sum of: the net assets managed by BNY Mellon AMNA-Mellon in the Value Portfolio, Institutional Value Portfolio, Growth Portfolio, Institutional Growth Portfolio, Small Cap-Mid Cap Portfolio, Institutional Small Cap-Mid Cap Portfolio, Real Estate Portfolio, Commodity Portfolio, International Portfolio, Institutional International Portfolio, Emerging Markets Portfolio, and the net assets managed by BNY Mellon AMNA-Mellon in other investment advisory accounts for which HC Capital Solutions or certain of its affiliates serves as investment adviser.
| (aa) | With respect to the emerging markets portion of the Portfolio managed by BNY Mellon AMNA-Mellon, BNY Mellon AMNA-Mellon receives a fee, which shall be calculated daily and payable monthly in arrears. For so long as Combined Assets (as defined below) are greater than $2 billion, the fee shall be at the annual rate of 0.13% of the average daily net assets of that portion of the Portfolio. If the Combined Assets are reduced to $2 billion or less due to redemptions, the fee shall be calculated at the annual rate of 0.15% beginning in the following calendar year. |
“Combined Assets” shall mean the sum of: the net assets managed by BNY Mellon AMNA-Mellon in the Value Portfolio, Institutional Value Portfolio, Growth Portfolio, Institutional Growth Portfolio, Small Cap-Mid Cap Portfolio, Institutional Small Cap-Mid Cap Portfolio, Real Estate Portfolio, Commodity Portfolio, International Portfolio, Institutional International Portfolio, Emerging Markets Portfolio, and the net assets managed by BNY Mellon AMNA-Mellon in other investment advisory accounts for which HC Capital Solutions or one of its affiliates serves as investment adviser.
| (bb) | Lazard Asset Management, LLC (“Lazard”) receives a fee which shall be payable monthly in arrears at the annual rate of 0.40% of the average daily net assets of the first $75 million and 0.35% on the excess over $75 million of that portion of the Portfolio managed by Lazard. |
| (cc) | BNY Mellon AMNA-Boston (receives an annual fee of 0.90% of the average daily net assets of the first $50 million; 0.85% of the average daily net assets on the next $50 million; 0.70% of the average daily net assets on the next $100 million; 0.55% of the average daily net assets on the next $200 million; and 0.50% of the average daily net assets over $400 million of that portion of the Portfolio managed by BNY Mellon AMNA-Boston. |
| (dd) | CLIM receives a fee, which shall be calculated daily and payable quarterly in arrears at the annual rate of 1.00% of the first $100 million of the Combined Assets (as defined below); 0.80% of the next $100 million of the Combined Assets; and 0.50% of the Combined Assets exceeding $200 million. |
“Combined Assets” shall mean the sum of: the net assets managed by CLIM in the Portfolio and the net assets invested in the same strategy as the Portfolio that are managed by CLIM for certain other clients of the Trust’s primary adviser.
| (ee) | With respect to the emerging markets portion of the Portfolio managed by BNY Mellon AMNA-Mellon, BNY Mellon AMNA-Mellon receives a fee, which shall be calculated daily and payable monthly in arrears. For so long as Combined Assets (as defined below) are greater than $2 billion, the fee shall be at the annual rate of 0.13% of the average daily net assets of that portion of the Portfolio. If the Combined Assets are reduced to $2 billion or less due to redemptions, the fee shall be calculated at the annual rate of 0.15% beginning in the following calendar year. |
“Combined Assets” shall mean the sum of: the net assets managed by BNY Mellon AMNA-Mellon in the Value Portfolio, Institutional Value Portfolio, Growth Portfolio, Institutional Growth Portfolio, Small Cap-Mid Cap Portfolio, Institutional Small Cap-Mid Cap Portfolio, Real Estate Portfolio, Commodity Portfolio, International Portfolio, Institutional International Portfolio, Emerging Markets Portfolio, and the net assets managed by BNY Mellon AMNA in other investment advisory accounts for which HC Capital Solutions or one of its affiliates serves as investment adviser.
| (ff) | RBC Global Asset Management (U.K.) Limited receives a fee which shall be payable quarterly in arrears at the annual rate of 0.80% of the first $100 million of Combined Assets; 0.65% of the next $150 million of Combined Assets; and 0.60% of Combined Assets in excess of $250 million. |
“Combined Assets” shall mean the sum of (i) the net assets of the Account; and (ii) the net assets of each other investment advisory account for which Hirtle Callaghan & Co serves as investment adviser and for which Portfolio Manager provides portfolio management services (“Other Hirtle Accounts”) using the same strategies as employed for the Account.
| (gg) | BNY Mellon AMNA-Mellon receives a fee which shall be calculated daily and payable monthly at the annual rate of 0.06% of the average daily net assets of the U.S. mortgage- and asset-backed and U.S. Government securities portions of the Core Fixed Income Portfolio managed by BNY Mellon AMNA-Mellon. BNY Mellon AMNA-Mellon also receives a fee at the annual rate of 0.06% of the average daily net assets of the U.S. Government Fixed Income Portfolio and the U.S. Mortgage/Asset Backed Fixed Income Portfolio. |
| (hh) | BNY Mellon AMNA-Mellon receives a fee which shall be calculated daily and payable monthly at the annual rate of 0.15% of the average daily net assets of the corporate securities portions of the Core Fixed Income Portfolio and U.S. Corporate Fixed Income Portfolio managed by BNY Mellon AMNA-Mellon. |
| (ii) | Fort Washington Investment Advisors, Inc. (“Fort Washington”) receives a fee, which shall be payable quarterly in arrears. For so long as the Combined Assets (as defined below) are greater than $200 million, the fee shall be at the annual rate of 0.20% of the Combined Assets. If the Combined Assets are reduced to $200 million or less due to withdrawals or redemptions, beginning with the first calendar quarter following the date of such withdrawals or redemptions, the fee shall be based on 0.40% of the Combined Assets of the first $25 million, 0.375% of the Combined Assets of the next $25 million, 0.3375% of the Combined Assets of the next $50 million, 0.25% of the Combined Assets of the next $100 million, and 0.20% of the Combined Assets exceeding $200 million. |
303
HC CAPITAL TRUST
Notes to Financial Statements (continued) — June 30, 2018
“Combined Assets” shall mean the sum of: the net assets managed by Fort Washington in the Portfolio and the net assets invested in the same strategy as the Portfolio that are managed by Fort Washington for the benefit of certain investors who are clients of the Trust’s primary adviser.
| (jj) | BNY Mellon AMNA-Mellon receives a fee, which shall be payable monthly in arrears, at the annual rate of: 0.04% of the average daily net assets invested according to a domestic inflation-protected securities strategy; 0.07% of the average daily net assets invested according to a global inflation-protected securities strategy; and 0.13% of the average daily net assets invested according to an emerging-markets inflation-protected securities strategy. |
| (kk) | BNY Mellon AMNA-Standish receives a fee, which shall be calculated daily and payable quarterly, at an annual rate of 0.25% for the first $100 million of the Combined Assets (as defined below) and 0.15% of the Combined Assets exceeding $100 million. BNY Mellon AMNA-Standish is entitled to receive a fee at an annual rate not to exceed 0.20% of the Combined Assets. |
“Combined Assets” shall mean the sum of: the net assets managed by BNY Mellon AMNA-Standish in the Portfolio and the net assets invested in the same strategy as the Portfolio that are managed by BNY Mellon AMNA-Standish for the benefit of certain investors who are clients of the Trust’s primary adviser.
| (ll) | CLIM is entitled to receive a fee, based on the average net assets of that portion of each Affected Portfolio’s assets allocated to CLIM by the Adviser, at the following rates; 0.25% of the first $100 million of the Combined Assets; 0.15% of the Combined Assets exceeding $100 million. |
Combined Assets shall mean the sum of all assets managed in this strategy for clients of the Adviser and certain of its affiliates. Maximum fee is 0.20% regardless of asset levels.
Pursuant to discretionary investment advisory agreements between the Trust and the Adviser, the Adviser is paid a fee which is accrued daily and paid monthly at an annual rate of 0.05% of average daily net assets per Portfolio. The fees that the Adviser receives are listed as “Management fees” on the Statements of Operations. The Adviser continuously monitors the performance of various investment management organizations, including the Specialist Managers retained by the Trust, and generally oversees the services provided to the Trust by its administrator, custodian and other service providers. The Adviser is also authorized to allocate and reallocate assets among Specialist Managers in multi-manager portfolios of the Trust from time to time without additional authorization of the Board. In addition, the Adviser makes its officers available to serve as officers and/or Trustees of the Trust, and maintains office space sufficient for the Trust’s principal office. The Securities and Exchange Commission has issued an order that permits the Trust to enter into portfolio management agreements with Specialist Managers upon the approval of the Board but without submitting such contracts for the approval of the shareholders of the relevant Portfolio under certain circumstances.
Citi Fund Services Ohio, Inc. (“Citi”) provides the Portfolios with administrative and fund accounting services. The fees for these services are disclosed as “Administrative service fees” on the Statements of Operations. The fees are accrued daily and payable on a monthly basis at an annual rate of 0.0506% of the Trust’s Portfolios’ average daily net assets up to $6 billion; 0.0047% of the Trust’s Portfolios’ average daily net assets between $6 billion and $12 billion; and 0.0276% of average daily net assets in excess of $12 billion. Citi receives additional fees paid by the Trust for compliance services, regulatory reporting services and reimbursement of certain expenses.
FIS Investor Services LLC, a wholly-owned subsidiary of Fidelity National Information Services, provides dividend and capital gains disbursing agent and transfer agency services. The fees for these services are disclosed as “Transfer agency fees” on the Statements of Operations. The fees are accrued daily and payable on a monthly basis at an annual rate of 0.0034% of the Trust’s Portfolios’ average daily net assets up to $6 billion; 0.0003% of the Trust’s Portfolios’ average daily net assets between $6 billion and $12 billion; and 0.0019% of average daily net assets in excess of $12 billion.
The Trust has adopted a Distribution Plan for the HC Advisors Shares under which the Adviser may receive compensation for distribution services. Under the Distribution Plan, which was adopted pursuant to Rule 12b-1 under the 1940 Act, the Adviser is entitled to receive a fee of up to 0.25% annually of the average daily net assets attributable to the HC Advisors Shares. Currently, the Adviser is voluntarily waiving all fees associated with the Distribution Plan, and there is no current intention to collect such a fee.
Unified Financial Securities, LLC (“Unified”), a wholly-owned subsidiary of Ultimus Fund Solutions LLC, provides certain distribution services to the Trust. Unified receives an annual fee of $50,000 for performing the services listed under its agreement with the Trust. None of Unified’s duties under its agreement are primarily intended to result in the sale of Trust shares.
Alaric Compliance Services, LLC (“Alaric”) provides an employee to serve as the Trust’s Chief Compliance Officer. For these services, Alaric is compensated $155,000 for the year ended June 30, 2018.
304
HC CAPITAL TRUST
Notes to Financial Statements (continued) — June 30, 2018
The Portfolios may use related party broker-dealers. For the year ended June 30, 2018, the following Portfolio incurred brokerage commissions with broker-dealers affiliated with the Specialist Managers as follows:
| | | | |
Portfolio | | Commissions
Amount
(000) | |
Emerging Markets Portfolio | | $ | 22 | |
4. PURCHASE AND SALE TRANSACTIONS. The aggregate cost of purchases and proceeds from sales of investment securities, other than long-term U.S. government securities, TBA securities and short-term securities, for the year ended June 30, 2018 were as follows (amounts in thousands):
| | | | | | | | |
Portfolio | | Purchases | | | Sales | |
Value Portfolio | | $ | 341,540 | | | $ | 371,371 | |
Institutional Value Portfolio | | | 570,578 | | | | 533,244 | |
Growth Portfolio | | | 303,493 | | | | 350,588 | |
Institutional Growth Portfolio | | | 455,435 | | | | 486,883 | |
Small Cap–Mid Cap Portfolio | | | 60,520 | | | | 76,455 | |
Institutional Small Cap–Mid Cap Portfolio | | | 135,943 | | | | 140,806 | |
Real Estate Portfolio | | | 58,956 | | | | 51,627 | |
Commodity Portfolio | | | 204,159 | | | | 198,495 | |
ESG Growth Portfolio | | | 30,756 | | | | 24,351 | |
Catholic SRI Growth Portfolio | | | 5,011 | | | | 6,043 | |
International Portfolio | | | 369,074 | | | | 506,186 | |
Institutional International Portfolio | | | 961,685 | | | | 1,083,391 | |
Emerging Markets Portfolio | | | 939,425 | | | | 1,015,934 | |
Core Fixed Income Portfolio | | | 17,083 | | | | 22,834 | |
Fixed Opportunity Portfolio | | | 261,457 | | | | 233,659 | |
U.S. Government Fixed Income Portfolio | | | — | | | | 255 | |
U.S. Corporate Fixed Income Portfolio | | | 175,692 | | | | 106,260 | |
U.S. Mortgage/Asset Backed Fixed Income Portfolio | | | 3,668 | | | | 2,078 | |
Short-Term Municipal Portfolio | | | 61,895 | | | | 5,407 | |
Intermediate Municipal Portfolio | | | 135,493 | | | | 98,965 | |
Intermediate Municipal II Portfolio | | | 26,011 | | | | 15,888 | |
The aggregate cost of purchases and proceeds from sales of long-term U.S. government securities for the year ended June 30, 2018 were as follows (amounts in thousands):
| | | | | | | | |
Portfolio | | Purchases | | | Sales | |
Commodity Portfolio | | $ | 6,776 | | | $ | 9,204 | |
Core Fixed Income Portfolio | | | 14,764 | | | | 23,243 | |
Fixed Opportunity Portfolio | | | 10,820 | | | | — | |
U.S. Government Fixed Income Portfolio | | | 99,737 | | | | 69,145 | |
Inflation Protected Portfolio | | | 107,851 | | | | 75,836 | |
U.S. Mortgage/Asset Backed Fixed Income Portfolio | | | 45,938 | | | | 25,230 | |
5. FEDERAL INCOME TAXES. It is the policy of each Portfolio to continue to qualify as a regulated investment company by complying with the provisions available to certain investment companies, as defined in applicable sections of the Internal Revenue Code (the “Code”), and to make distributions of net investment income and net realized capital gains sufficient to relieve it (but not the shareholders) from all, or substantially all, federal income taxes. The Portfolios may, under certain circumstances, utilize equalization accounting for tax purposes by designating earnings and profits, including net realized gains distributed to shareholders on redemption of shares, as a part of the dividends paid deduction for income tax purposes.
The Trust has evaluated tax positions taken or expected to be taken in the course of preparing each Portfolio’s tax returns to determine whether it is more likely than not (i.e., greater than 50-percent chance) that each tax position will be
305
HC CAPITAL TRUST
Notes to Financial Statements (continued) — June 30, 2018
sustained upon examination by a tax authority based on the technical merits of the position. A tax position that meets the more-likely-than-not recognition threshold is measured to determine the amount of benefit to recognize in the financial statements. Differences between tax positions taken in a tax return and amounts recognized in the financial statements will generally result in an increase in a liability for taxes payable (or a reduction of a tax refund receivable), including the recognition of any related interest and penalties as an operating expense. Tax positions taken in tax years remain subject to examination by tax authorities (generally the last three tax year ends 2015 to 2017, and the interim tax period since then). The determination has been made that there are no uncertain tax positions that would require the Portfolios to record a tax liability and, therefore, there is no impact to the Portfolios’ financial statements. Furthermore, management of the Portfolios is not aware of any tax position for which it is reasonably possible that the total amounts of unrecognized tax benefits will significantly change in the next 12 months.
A. Unrealized Appreciation/Depreciation on investments (amounts in thousands):
| | | | | | | | | | | | | | | | |
Portfolio | | Tax Cost of
Investments | | | Tax
Unrealized
Appreciation | | | Tax
Unrealized
(Depreciation) | | | Net Tax
Unrealized
Appreciation/
(Depreciation) | |
Value Portfolio | | $ | 486,588 | | | $ | 123,186 | | | $ | (11,657 | ) | | $ | 111,529 | |
Institutional Value Portfolio | | | 837,920 | | | | 112,760 | | | | (28,317 | ) | | | 84,443 | |
Growth Portfolio | | | 453,277 | | | | 362,212 | | | | (6,825 | ) | | | 355,387 | |
Institutional Growth Portfolio | | | 756,689 | | | | 440,645 | | | | (10,271 | ) | | | 430,374 | |
Small Cap Mid–Cap Portfolio | | | 79,863 | | | | 35,925 | | | | (3,002 | ) | | | 32,923 | |
Institutional Small Cap–Mid Cap Portfolio | | | 132,030 | | | | 40,128 | | | | (6,603 | ) | | | 33,525 | |
Real Estate Portfolio | | | 111,074 | | | | 21,148 | | | | (1,310 | ) | | | 19,838 | |
ESG Growth Portfolio | | | 145,005 | | | | 28,206 | | | | (8,188 | ) | | | 20,018 | |
Catholic SRI Growth Portfolio | | | 23,849 | | | | 6,201 | | | | (978 | ) | | | 5,223 | |
International Portfolio | | | 980,340 | | | | 183,290 | | | | (34,483 | ) | | | 148,807 | |
Institutional International Portfolio | | | 2,171,935 | | | | 302,549 | | | | (132,295 | ) | | | 170,254 | |
Emerging Markets Portfolio | | | 1,593,502 | | | | 180,522 | | | | (150,675 | ) | | | 29,847 | |
Core Fixed Income Portfolio | | | 69,858 | | | | 251 | | | | (1,766 | ) | | | (1,515 | ) |
Fixed Opportunity Portfolio | | | 716,828 | | | | 22,892 | | | | (18,051 | ) | | | 4,841 | |
U.S. Government Fixed Income Portfolio | | | 237,175 | | | | 1,088 | | | | (5,311 | ) | | | (4,223 | ) |
Inflation Protected Portfolio | | | 401,612 | | | | 3,197 | | | | (4,108 | ) | | | (911 | ) |
U.S. Corporate Fixed Income Portfolio | | | 292,115 | | | | 494 | | | | (8,433 | ) | | | (7,939 | ) |
U.S. Mortgage/Asset Backed Fixed Income Portfolio | | | 235,740 | | | | 561 | | | | (4,378 | ) | | | (3,817 | ) |
Short-Term Municipal Portfolio | | | 80,305 | | | | 83 | | | | (100 | ) | | | (17 | ) |
Intermediate Municipal Portfolio | | | 390,434 | | | | 2,222 | | | | (8,049 | ) | | | (5,827 | ) |
Intermediate Municipal II Portfolio | | | 76,628 | | | | 1,038 | | | | (524 | ) | | | 514 | |
The tax cost of investments includes the cost of securities, proceeds received from TBA sales commitments and any upfront premiums paid or received on derivatives, as applicable. The tax unrealized appreciation/depreciation includes securities, TBA sales commitments and derivatives that are not considered realized for tax purposes, as applicable.
The differences between book-basis and tax-basis unrealized appreciation/depreciation are attributable primarily to: tax deferral of losses on wash sales, the realization for tax purposes of unrealized gains/losses on investments in passive foreign investment companies, the difference between book and tax accretion methods for market discount, derivatives, and an in-kind purchase by an investor that, for tax purposes, created a controlling interest in a Portfolio.
306
HC CAPITAL TRUST
Notes to Financial Statements (continued) — June 30, 2018
B. Tax Characteristics of Distributions Paid
The tax characteristics of distributions paid during the fiscal years ended June 30, 2018 and June 30, 2017 were as follows (amounts in thousands):
| | | | | | | | | | | | | | | | | | | | | | | | | | | | |
| | | Distributions Paid From: | | | | | | | | | | | | | | | | |
Year Ended June 30, 2018 | | Ordinary
Income | | | Net Long
Term Gains | | | Total
Taxable
Distributions | | | In Excess
of Net
Investment
Income | | | Total
Taxable
Distributions | | | Tax-Exempt
Distributions | | | Total
Distributions
Paid* | |
Value Portfolio | | $ | 19,780 | | | $ | 21,891 | | | $ | 41,671 | | | $ | — | | | $ | 41,671 | | | $ | — | | | $ | 41,671 | |
Institutional Value Portfolio | | | 41,677 | | | | 30,659 | | | | 72,336 | | | | — | | | | 72,336 | | | | — | | | | 72,336 | |
Growth Portfolio | | | 10,120 | | | | 35,974 | | | | 46,094 | | | | — | | | | 46,094 | | | | — | | | | 46,094 | |
Institutional Growth Portfolio | | | 21,304 | | | | 32,991 | | | | 54,295 | | | | — | | | | 54,295 | | | | — | | | | 54,295 | |
Small Cap–Mid Cap Portfolio | | | 392 | | | | — | | | | 392 | | | | — | | | | 392 | | | | — | | | | 392 | |
Institutional Small Cap–Mid Cap Portfolio | | | 1,697 | | | | 12,579 | | | | 14,276 | | | | — | | | | 14,276 | | | | — | | | | 14,276 | |
Real Estate Portfolio | | | 1,879 | | | | 3,709 | | | | 5,588 | | | | — | | | | 5,588 | | | | — | | | | 5,588 | |
ESG Growth Portfolio | | | 4,367 | | | | — | | | | 4,367 | | | | — | | | | 4,367 | | | | — | | | | 4,367 | |
Catholic SRI Growth Portfolio | | | 1,216 | | | | 308 | | | | 1,524 | | | | — | | | | 1,524 | | | | — | | | | 1,524 | |
International Portfolio | | | 37,199 | | | | — | | | | 37,199 | | | | — | | | | 37,199 | | | | — | | | | 37,199 | |
Institutional International Portfolio | | | 96,184 | | | | — | | | | 96,184 | | | | — | | | | 96,184 | | | | — | | | | 96,184 | |
Emerging Markets Portfolio | | | 37,447 | | | | — | | | | 37,447 | | | | 531 | | | | 37,978 | | | | — | | | | 37,978 | |
Core Fixed Income Portfolio | | | 1,868 | | | | — | | | | 1,868 | | | | — | | | | 1,868 | | | | — | | | | 1,868 | |
Fixed Opportunity Portfolio | | | 37,027 | | | | — | | | | 37,027 | | | | — | | | | 37,027 | | | | — | | | | 37,027 | |
U.S. Government Fixed Income Portfolio | | | 3,889 | | | | — | | | | 3,889 | | | | — | | | | 3,889 | | | | — | | | | 3,889 | |
Inflation Protected Portfolio | | | 8,494 | | | | — | | | | 8,494 | | | | — | | | | 8,494 | | | | — | | | | 8,494 | |
U.S. Corporate Fixed Income Portfolio | | | 8,055 | | | | 735 | | | | 8,790 | | | | — | | | | 8,790 | | | | — | | | | 8,790 | |
U.S. Mortgage/Asset Backed Fixed Income Portfolio | | | 5,111 | | | | — | | | | 5,111 | | | | — | | | | 5,111 | | | | — | | | | 5,111 | |
Short-Term Municipal Portfolio | | | 42 | | | | — | | | | 42 | | | | — | | | | 42 | | | | 303 | | | | 345 | |
Intermediate Municipal Portfolio | | | 130 | | | | — | | | | 130 | | | | — | | | | 130 | | | | 7,477 | | | | 7,607 | |
Intermediate Municipal II Portfolio | | | 38 | | | | 3 | | | | 41 | | | | — | | | | 41 | | | | 1,612 | | | | 1,653 | |
| | | | | | | | | | | | | | | | | | | | | | | | | | | | |
| | | Distributions Paid From: | | | | | | | | | | | | | | | | |
Year Ended June 30, 2017 | | Ordinary
Income | | | Net Long
Term Gains | | | Total
Taxable
Distributions | | | In Excess
of Net
Investment
Income | | | Total
Taxable
Distributions | | | Tax-Exempt
Distributions | | | Total
Distributions
Paid* | |
Value Portfolio | | $ | 17,474 | | | $ | 17,692 | | | $ | 35,166 | | | $ | — | | �� | $ | 35,166 | | | $ | — | | | $ | 35,166 | |
Institutional Value Portfolio | | | 24,153 | | | | 29,406 | | | | 53,559 | | | | — | | | | 53,559 | | | | — | | | | 53,559 | |
Growth Portfolio | | | 10,748 | | | | 41,125 | | | | 51,873 | | | | — | | | | 51,873 | | | | — | | | | 51,873 | |
Institutional Growth Portfolio | | | 19,107 | | | | 61,384 | | | | 80,491 | | | | — | | | | 80,491 | | | | — | | | | 80,491 | |
Small Cap–Mid Cap Portfolio | | | 89 | | | | — | | | | 89 | | | | 47 | | | | 136 | | | | — | | | | 136 | |
Institutional Small Cap–Mid Cap Portfolio | | | 188 | | | | 2,379 | | | | 2,567 | | | | — | | | | 2,567 | | | | — | | | | 2,567 | |
Real Estate Portfolio | | | 2,191 | | | | 9,896 | | | | 12,087 | | | | — | | | | 12,087 | | | | — | | | | 12,087 | |
ESG Growth Portfolio | | | 3,827 | | | | — | | | | 3,827 | | | | — | | | | 3,827 | | | | — | | | | 3,827 | |
Catholic SRI Growth Portfolio | | | 1,271 | | | | — | | | | 1,271 | | | | — | | | | 1,271 | | | | — | | | | 1,271 | |
International Portfolio | | | 34,104 | | | | — | | | | 34,104 | | | | — | | | | 34,104 | | | | — | | | | 34,104 | |
Institutional International Portfolio | | | 67,853 | | | | — | | | | 67,853 | | | | — | | | | 67,853 | | | | — | | | | 67,853 | |
307
HC CAPITAL TRUST
Notes to Financial Statements (continued) — June 30, 2018
| | | | | | | | | | | | | | | | | | | | | | | | | | | | |
| | | Distributions Paid From: | | | | | | | | | | | | | | | | |
Year Ended June 30, 2017 | | Ordinary
Income | | | Net Long
Term Gains | | | Total
Taxable
Distributions | | | In Excess
of Net
Investment
Income | | | Total
Taxable
Distributions | | | Tax-Exempt
Distributions | | | Total
Distributions
Paid* | |
Emerging Markets Portfolio | | $ | 39,612 | | | $ | — | | | $ | 39,612 | | | $ | 2,252 | | | $ | 41,864 | | | $ | — | | | $ | 41,864 | |
Core Fixed Income Portfolio | | | 1,941 | | | | — | | | | 1,941 | | | | — | | | | 1,941 | | | | — | | | | 1,941 | |
Fixed Opportunity Portfolio | | | 36,119 | | | | — | | | | 36,119 | | | | — | | | | 36,119 | | | | — | | | | 36,119 | |
U.S. Government Fixed Income Portfolio | | | 3,597 | | | | 1,686 | | | | 5,283 | | | | — | | | | 5,283 | | | | — | | | | 5,283 | |
Inflation Protected Portfolio | | | 9,596 | | | | — | | | | 9,596 | | | | — | | | | 9,596 | | | | — | | | | 9,596 | |
U.S. Corporate Fixed Income Portfolio | | | 6,632 | | | | 675 | | | | 7,307 | | | | — | | | | 7,307 | | | | — | | | | 7,307 | |
U.S. Mortgage/Asset Backed Fixed Income Portfolio | | | 4,778 | | | | — | | | | 4,778 | | | | — | | | | 4,778 | | | | — | | | | 4,778 | |
Short-Term Municipal Portfolio | | | 1 | | | | — | | | | 1 | | | | — | | | | 1 | | | | 185 | | | | 186 | |
Intermediate Municipal Portfolio | | | 67 | | | | — | | | | 67 | | | | — | | | | 67 | | | | 7,528 | | | | 7,595 | |
Intermediate Municipal II Portfolio | | | 16 | | | | 98 | | | | 114 | | | | — | | | | 114 | | | | 1,543 | | | | 1,657 | |
| * | Total distributions paid may differ from what appears in the Statements of Changes in Net Assets because dividends for tax purposes are recognized when actually paid. |
Amounts designated as “—” are $0 or have been rounded to $0.
C. Components of Accumulated Earnings
As of June 30, 2018, the components of accumulated earnings/(deficit) on a tax basis were as follows (amounts in thousands):
| | | | | | | | | | | | | | | | | | | | | | | | | | | | |
Portfolio | | Undistributed
Ordinary
Income/Tax
Exempt
Income | | | Undistributed
Long Term
Capital Gains | | | Accumulated
Earnings | | | Dividends
Payable | | | Accumulated
Capital and
Other Losses | | | Unrealized
Appreciation/
(Depreciation) | | | Total
Accumulated
Earnings/
(Deficit) | |
Value Portfolio | | $ | 55 | | | $ | 20,720 | | | $ | 20,775 | | | $ | — | | | $ | (516 | ) | | $ | 111,529 | | | $ | 131,788 | |
Institutional Value Portfolio | | | 7,668 | | | | 44,002 | | | | 51,670 | | | | — | | | | — | | | | 84,443 | | | | 136,113 | |
Growth Portfolio | | | 168 | | | | 33,381 | | | | 33,549 | | | | — | | | | — | | | | 355,387 | | | | 388,936 | |
Institutional Growth Portfolio | | | 3,200 | | | | 66,333 | | | | 69,533 | | | | — | | | | — | | | | 430,374 | | | | 499,907 | |
Small Cap–Mid Cap Portfolio | | | 10 | | | | 4,435 | | | | 4,445 | | | | — | | | | — | | | | 32,923 | | | | 37,368 | |
Institutional Small Cap–Mid Cap Portfolio | | | 4,422 | | | | 22,037 | | | | 26,459 | | | | — | | | | — | | | | 33,525 | | | | 59,984 | |
Real Estate Portfolio | | | 564 | | | | 981 | | | | 1,545 | | | | — | | | | — | | | | 19,838 | | | | 21,383 | |
ESG Growth Portfolio | | | 344 | | | | 241 | | | | 585 | | | | — | | | | — | | | | 20,011 | | | | 20,596 | |
Catholic SRI Growth Portfolio | | | 198 | | | | 515 | | | | 713 | | | | — | | | | — | | | | 5,218 | | | | 5,931 | |
International Portfolio | | | 3,071 | | | | — | | | | 3,071 | | | | — | | | | (29,362 | ) | | | 147,954 | | | | 121,663 | |
Institutional International Portfolio | | | 30,164 | | | | 55,682 | | | | 85,846 | | | | — | | | | — | | | | 169,806 | | | | 255,652 | |
Emerging Markets Portfolio | | | — | | | | — | | | | — | | | | — | | | | (59,344 | ) | | | 27,354 | | | | (31,990 | ) |
Core Fixed Income Portfolio | | | 68 | | | | — | | | | 68 | | | | (4 | ) | | | (340 | ) | | | (1,517 | ) | | | (1,793 | ) |
Fixed Opportunity Portfolio | | | 1,805 | | | | — | | | | 1,805 | | | | — | | | | (50,220 | ) | | | 4,841 | | | | (43,574 | ) |
U.S. Government Fixed Income Portfolio | | | 167 | | | | — | | | | 167 | | | | (66 | ) | | | (467 | ) | | | (4,223 | ) | | | (4,589 | ) |
Inflation Protected Portfolio | | | 3,183 | | | | — | | | | 3,183 | | | | (431 | ) | | | (781 | ) | | | (911 | ) | | | 1,060 | |
U.S. Corporate Fixed Income Portfolio | | | 357 | | | | — | | | | 357 | | | | (134 | ) | | | (493 | ) | | | (7,939 | ) | | | (8,209 | ) |
308
HC CAPITAL TRUST
Notes to Financial Statements (continued) — June 30, 2018
| | | | | | | | | | | | | | | | | | | | | | | | | | | | |
Portfolio | | Undistributed
Ordinary
Income/Tax
Exempt
Income | | | Undistributed
Long Term
Capital Gains | | | Accumulated
Earnings | | | Dividends
Payable | | | Accumulated
Capital and
Other Losses | | | Unrealized
Appreciation/
(Depreciation) | | | Total
Accumulated
Earnings/
(Deficit) | |
U.S. Mortgage/Asset Backed Fixed Income Portfolio | | $ | 214 | | | $ | — | | | $ | 214 | | | $ | (85 | ) | | $ | (9,781 | ) | | $ | (3,818 | ) | | $ | (13,470 | ) |
Short-Term Municipal Portfolio | | | 22 | | | | — | | | | 22 | | | | (2 | ) | | | (4 | ) | | | (17 | ) | | | (1 | ) |
Intermediate Municipal Portfolio | | | 215 | | | | — | | | | 215 | | | | (40 | ) | | | (1,100 | ) | | | (5,827 | ) | | | (6,752 | ) |
Intermediate Municipal II Portfolio | | | 46 | | | | 63 | | | | 109 | | | | (10 | ) | | | — | | | | 514 | | | | 613 | |
D. Capital Loss Carryforwards
As of their tax year ended June 30, 2018, the following Portfolios had capital loss carryforwards (“CLCFs”) as summarized below (amounts in thousands):
CLCFs subject to expiration:
| | | | | | | | |
Portfolio | | Expires
2019 | | | Total | |
Intermediate Municipal Portfolio | | $ | 1,099 | | | $ | 1,099 | |
CLCFs not subject to expiration:
| | | | | | | | | | | | |
Portfolio | | Short-Term
Amount | | | Long-Term
Amount | | | Total | |
International Portfolio | | $ | 18,057 | | | $ | 11,305 | | | $ | 29,362 | |
Emerging Markets Portfolio | | | — | | | | 55,986 | | | | 55,986 | |
Core Fixed Income Portfolio | | | 260 | | | | 80 | | | | 340 | |
Fixed Opportunity Portfolio | | | 2,419 | | | | 47,801 | | | | 50,220 | |
U.S. Government Fixed Income Portfolio | | | 223 | | | | 244 | | | | 467 | |
Inflation Protected Portfolio | | | 637 | | | | 144 | | | | 781 | |
U.S. Mortgage/Asset Backed Fixed Income Portfolio | | | 2,651 | | | | 7,130 | | | | 9,781 | |
Short-Term Municipal Portfolio | | | 2 | | | | 2 | | | | 4 | |
CLCFs that are not subject to expiration must be utilized before those that are subject to expiration. During the year ended June 30, 2018, the Portfolios utilized CLCFs as follows:
| | | | |
Portfolio | | Total | |
Small Cap-Mid Cap Portfolio | | $ | 5,648 | |
ESG Growth Portfolio | | | 1,734 | |
Institutional International Portfolio | | | 23,216 | |
Emerging Markets Portfolio | | | 71,338 | |
Intermediate Municipal Portfolio | | | 880 | |
E. Deferred Losses
Under current tax law, capital losses and specified ordinary losses realized after October 31 or non-specified ordinary losses realized after December 31 (ordinary losses collectively known as “late year ordinary loss”) may be deferred and treated as occurring on the first business day of the following fiscal year. The following Portfolios had deferred losses, which will be treated as arising on the first day of the fiscal year ended June 30, 2019 (amounts in thousands):
| | | | | | | | |
Portfolio | | Post-October
Capital Losses | | | Late Year
Ordinary Losses | |
Value Portfolio | | $ | 516 | | | $ | — | |
Emerging Markets Portfolio | | | 3,358 | | | | — | |
U.S. Corporate Fixed Income Portfolio | | | 493 | | | | — | |
309
HC CAPITAL TRUST
Notes to Financial Statements (continued) — June 30, 2018
F. Book-To-Tax Differences
Distributions are based on amounts calculated in accordance with applicable federal tax regulations, which may differ from GAAP. To the extent these differences are permanent in nature (e.g., net operating losses, reclassification of bond discount and premium, equalization accounting, treatment of gains and losses relating to foreign currency transactions, distribution re-characterization, in-kind redemptions and differing treatment of income relating to swap agreements), such amounts are reclassified within the capital accounts based on their federal tax-basis treatment; temporary differences do not require reclassifications.
On the Statements of Assets and Liabilities, as a result of permanent book-to-tax differences, reclassification adjustments were made as follows (amounts in thousands):
| | | | | | | | | | | | |
Portfolio | | Accumulated Net
Investment
Income/(Distributions
in Excess of Net
Investment Income) | | | Accumulated
Net Realized
Gains/(Losses) | | | Paid-In
Capital | |
Value Portfolio | | $ | 23 | | | $ | (1,610 | ) | | $ | 1,587 | |
Institutional Value Portfolio | | | (71 | ) | | | 71 | | | | — | |
Growth Portfolio | | | (3 | ) | | | (2,879 | ) | | | 2,882 | |
Institutional Growth Portfolio | | | (2 | ) | | | 2 | | | | — | |
Small Cap–Mid Cap Portfolio | | | (4 | ) | | | 6 | | | | (2 | ) |
Real Estate Portfolio | | | 24 | | | | (24 | ) | | | — | |
ESG Growth Portfolio | | | 60 | | | | (60 | ) | | | — | |
Catholic SRI Growth Portfolio | | | 17 | | | | (17 | ) | | | — | |
International Portfolio | | | 461 | | | | (461 | ) | | | — | |
Institutional International Portfolio | | | 10,204 | | | | (9,553 | ) | | | (651 | ) |
Emerging Markets Portfolio | | | (988 | ) | | | 1,519 | | | | (531 | ) |
Core Fixed Income Portfolio | | | 99 | | | | (99 | ) | | | — | |
Fixed Opportunity Portfolio | | | 3 | | | | (3 | ) | | | — | |
U.S. Corporate Fixed Income Portfolio | | | 28 | | | | (28 | ) | | | — | |
U.S. Mortgage/Asset Backed Fixed Income Portfolio | | | 896 | | | | (1,250 | ) | | | 354 | |
G. Commodity Portfolio Tax Information
The Commodity Portfolio has a tax year end of December 31.
The Commodity Portfolio’s tax cost of investments as of December 31, 2017 was $750,341, resulting in accumulated net unrealized appreciation of $137,982, consisting of $163,306 in gross unrealized appreciation and $25,324 in gross unrealized depreciation (amounts in thousands). The tax cost of investments includes the cost of securities and any upfront premiums paid or received on derivatives. The tax unrealized appreciation/depreciation includes securities and derivatives that are not considered realized for tax purposes.
The tax characteristics of distributions paid during the tax years ended December 31, 2017 and December 31, 2016 were as follows (amounts in thousands):
| | | | | | | | | | | | | | | | | | | | | | | | |
| | | Distributions Paid From: | | | | | | | | | | | | | |
Year Ended December 31, 2017 | | Ordinary
Income | | | Net Long
Term Gains | | | Total
Taxable
Distributions | | | Tax Return
of Capital | | | Tax-Exempt
Distributions | | | Total
Distributions
Paid* | |
Commodity Portfolio | | $ | 21,235 | | | $ | — | | | $ | 21,235 | | | $ | 171 | | | $ | — | | | $ | 21,406 | |
| | | | | | |
Year Ended December 31, 2016 | | | | | | | | | | | | | | | | | | |
Commodity Portfolio | | $ | 18,034 | | | $ | — | | | $ | 18,034 | | | $ | — | | | $ | — | | | $ | 18,034 | |
| * | Total distributions paid may differ from the Statements of Changes in Net Assets because dividends for tax purposes are recognized when actually paid. |
Amounts designated as “—” are $0 or have been rounded to $0.
310
HC CAPITAL TRUST
Notes to Financial Statements (continued) — June 30, 2018
As of December 31, 2017, the components of accumulated earnings (deficit) on a tax basis were as follows (amounts in thousands):
| | | | | | | | | | | | | | | | | | | | | | | | | | | | |
Portfolio | | Undistributed
Ordinary
Income/Tax
Exempt
Income | | | Undistributed
Long Term
Capital Gains | | | Accumulated
Earnings | | | Dividends
Payable | | | Accumulated
Capital and
Other Losses | | | Unrealized
Appreciation/
(Depreciation) | | | Total
Accumulated
Earnings/
(Deficit) | |
Commodity Portfolio | | $ | — | | | $ | — | | | $ | — | | | $ | — | | | $ | (66,950 | ) | | $ | 252,138 | | | $ | 185,188 | |
Amounts designated as “—” are $0 or have been rounded to $0.
During the tax year ended December 31, 2017, the Commodity Portfolio utilized $19,618 in CLCFs (amounts in thousands).
At December 31, 2017, the Commodity Portfolio had the following CLCFs not subject to expiration (amounts in thousands):
| | | | | | | | | | | | |
Portfolio | | Short-Term
Amount | | | Long-Term
Amount | | | Total | |
Commodity Portfolio | | $ | — | | | $ | 66,950 | | | $ | 66,950 | |
At December 31, 2017, the Commodity Portfolio had no deferred losses.
On the Statements of Assets and Liabilities, as a result of permanent book-to-tax differences, reclassification adjustments were made as follows (amounts in thousands):
| | | | | | | | | | | | |
Portfolio | | Accumulated Net
Investment
Income/(Distributions
in Excess of Net
Investment Income) | | | Accumulated
Net Realized
Gains/(Losses) | | | Paid-In
Capital | |
Commodity Portfolio | | $ | 4,164 | | | $ | 1,938 | | | $ | (6,102 | ) |
6. RISK CONSIDERATIONS.
Market Risk — Each Portfolio bears a basic risk that the value of the securities held by a Portfolio may decline in response to general market and economic conditions, or conditions that affect specific market sectors or individual companies.
Credit Risk — Credit risk is the risk that an issuer (or in the case of certain securities, the guarantor or counterparty) will be unable to make principal and interest payments when due. The creditworthiness of an issuer may be affected by a number of factors, including the financial condition of the issuer (or guarantor) and, in the case of foreign issuers, the financial condition of the region.
Foreign Investment Risk — Investments in securities issued by non-U.S. companies and non-U.S. governments and their agencies may be adversely affected by the lack of timely or reliable financial information, political, social and/or economic developments abroad and foreign regulatory requirements and market practices. Securities denominated in foreign currencies are subject to the risk that the value of the foreign currency will decline in relation to the U.S. dollar. In addition, risks associated with foreign investments may be intensified in the case of investments in emerging-market countries, whose political, legal and economic systems are less developed and less stable than those of more developed nations.
Concentration Risk — Concentration risk is the risk that results from focusing investments in one industry or market sector. The Real Estate Portfolio and Commodity Portfolio concentrate their investments in real estate securities and commodity-related industries, respectively, which may present greater risks of loss than if the Portfolios were more broadly diversified over numerous unrelated industries.
Commodity-Related Derivatives Risk — The Commodity Portfolio, through its investment in its subsidiaries, will hold commodity-related derivatives. Commodity-related derivatives provide exposure, which may include long and/or short exposure, to the investment returns of physical commodities that trade in the commodities markets without investing directly in such physical commodities. The value of a commodity-related derivative typically is based on the price movements of a
311
HC CAPITAL TRUST
Notes to Financial Statements (continued) — June 30, 2018
physical commodity (such as heating oil, precious metals, livestock, or agricultural products), a commodity futures contract or commodity index, or some other readily measurable economic variable. The value of commodity-related derivatives may be affected by changes in overall market movements, volatility of the underlying benchmark, changes in interest rates, or factors affecting a particular industry or commodity, such as drought, floods, weather, livestock disease, embargoes, tariffs and international economic, political and regulatory developments. The value of commodity-related derivatives will rise or fall in response to changes in the underlying commodity or related index. Investments in commodity-related derivatives may be subject to greater volatility than non-derivative based investments. A highly liquid secondary market may not exist for certain commodity-related derivatives, and there can be no assurance that one will develop.
7. SIGNIFICANT SHAREHOLDERS.
Shareholders, including other funds, individuals, accounts, as well as the Portfolio’s investment manager(s) and/or investment personnel, may from time to time own (beneficially or of record) a significant percentage of the Portfolio’s Shares and can be considered to “control” the Portfolio when that ownership exceeds 25% of the Portfolio’s assets (which may differ from control as determined in accordance with accounting principles generally accepted in the United States of America).
The following list includes the Portfolios which had individual shareholder accounts with ownership of voting securities greater than 10% of the total outstanding voting securities but less than 25% and/or accounts with ownership of voting securities greater than 25% of the total outstanding voting securities.
| | | | | | | | |
Portfolio | | Number of shareholders with
ownership of voting securities of
the Portfolio greater than 10%
and less than 25% of the total
Portfolio’s outstanding voting
securities | | | Number of shareholders with
ownership of voting securities
of the Portfolio greater than
25% of the total Portfolio’s
outstanding voting securities | |
Small Cap-Mid Cap Portfolio | | | 1 | | | | — | |
Institutional Small Cap–Mid Cap Portfolio | | | 1 | | | | — | |
Real Estate Portfolio | | | 1 | | | | — | |
Commodity Portfolio | | | 1 | | | | — | |
ESG Growth Portfolio | | | 1 | | | | 1 | |
Catholic SRI Growth Portfolio | | | 2 | | | | 1 | |
Short-Term Municipal Portfolio | | | 1 | | | | — | |
8. SUBSEQUENT EVENTS.
Management has evaluated subsequent events through the date these financial statements were issued.
Effective July 16, 2018, the ESG Growth Portfolio is re-classified as a “diversified” investment company and will continue to operate as a diversified investment company as it has done since its inception on July 14, 2015.
On July 27, 2018, amendments to CLIM’s Portfolio Management Agreements with the Intermediate Municipal Portfolio and the Intermediate Municipal II Portfolio were approved by the shareholders of each these respective Portfolios. These amendments provide for an increase in the Specialist Manager fee payable to CLIM to an annual rate of 0.45% of the average daily net assets of each of these respective Portfolios allocated to CLIM.
Based on the evaluation, no additional disclosures or adjustments were required to the financial statements as of June 30, 2018.
312
REPORT OF INDEPENDENT REGISTERED PUBLIC ACCOUNTING FIRM
To the Board of Trustees of HC Capital Trust and Shareholders of
| | |
| The Value Equity Portfolio | | The Institutional International Equity Portfolio |
| The Institutional Value Equity Portfolio | | The Emerging Markets Portfolio |
| The Growth Equity Portfolio | | The Core Fixed Income Portfolio |
| The Institutional Growth Equity Portfolio | | The Fixed Income Opportunity Portfolio |
The Small Capitalization–Mid Capitalization Equity
Portfolio | | The U.S. Government Fixed Income Securities Portfolio |
| The Institutional Small Capitalization–Mid Capitalization Equity Portfolio | | The Inflation Protected Securities Portfolio |
| The Real Estate Securities Portfolio | | The U.S. Corporate Fixed Income Securities Portfolio |
| The Commodity Returns Strategy Portfolio | | The U.S. Mortgage/Asset Backed Fixed Income Securities Portfolio |
| The ESG Growth Portfolio | | The Short-Term Municipal Bond Portfolio |
| The Catholic SRI Growth Portfolio | | The Intermediate Term Municipal Bond Portfolio |
| The International Equity Portfolio | | The Intermediate Term Municipal Bond II Portfolio |
Opinions on the Financial Statements
We have audited the accompanying statements of assets and liabilities, including the portfolios of investments, of The Value Equity Portfolio, The Institutional Value Equity Portfolio, The Growth Equity Portfolio, The Institutional Growth Equity Portfolio, The Small Capitalization-Mid Capitalization Equity Portfolio, The Institutional Small Capitalization-Mid Capitalization Equity Portfolio, The Real Estate Securities Portfolio, The Commodity Returns Strategy Portfolio, The ESG Growth Portfolio, The Catholic SRI Growth Portfolio, The International Equity Portfolio, The Institutional International Equity Portfolio, The Emerging Markets Portfolio, The Core Fixed Income Portfolio, The Fixed Income Opportunity Portfolio, The U.S. Government Fixed Income Securities Portfolio, The Inflation Protected Securities Portfolio, The U.S. Corporate Fixed Income Securities Portfolio, The U.S. Mortgage/Asset Backed Fixed Income Securities Portfolio, The Short-Term Municipal Bond Portfolio, The Intermediate Term Municipal Bond Portfolio, and The Intermediate Term Municipal Bond II Portfolio (twenty two of the funds constituting HC Capital Trust; hereafter collectively referred to as the “Funds”) as of June 30, 2018, the related statements of operations for the year ended June 30, 2018, the statements of changes in net assets for each of the two years in the period ended June 30, 2018, including the related notes, and the financial highlights for each of the periods indicated therein (collectively referred to as the “financial statements”). In our opinion, the financial statements present fairly, in all material respects, the financial position of each of the Funds as of June 30, 2018, the results of each of their operations for the year then ended, the changes in each of their net assets for each of the two years in the period ended June 30, 2018, and each of the financial highlights for each of the periods indicated therein in conformity with accounting principles generally accepted in the United States of America.
Basis for Opinions
These financial statements are the responsibility of the Funds’ management. Our responsibility is to express an opinion on the Funds’ financial statements based on our audits. We are a public accounting firm registered with the Public Company Accounting Oversight Board (United States) (“PCAOB”) and are required to be independent with respect to the Funds in accordance with the U.S. federal securities laws and the applicable rules and regulations of the Securities and Exchange Commission and the PCAOB.
We conducted our audits of these financial statements in accordance with the standards of the PCAOB. Those standards require that we plan and perform the audit to obtain reasonable assurance about whether the financial statements are free of material misstatement, whether due to error or fraud.
313
Our audits included performing procedures to assess the risks of material misstatement of the financial statements, whether due to error or fraud, and performing procedures that respond to those risks. Such procedures included examining, on a test basis, evidence regarding the amounts and disclosures in the financial statements. Our audits also included evaluating the accounting principles used and significant estimates made by management, as well as evaluating the overall presentation of the financial statements. Our procedures included confirmation of securities owned as of June 30, 2018 by correspondence with the custodian and brokers; when replies were not received from brokers, we performed other auditing procedures. We believe that our audits provide a reasonable basis for our opinion.

Columbus, Ohio
August 24, 2018
We have served as the auditor of one or more investment companies in HC Capital Trust since 1995.
314
HC CAPITAL TRUST
Additional Information – June 30, 2018 (Unaudited)
1. SECURITY PROXY VOTING. A description of the policies and procedures that the Trust uses to determine how to vote proxies relating to portfolio securities is contained in the Statement of Additional Information. Information regarding how the Portfolios voted proxies relating to portfolio securities during the most recent twelve months ended June 30, is available without charge, upon request, by calling 800-242-9596 and on the Securities and Exchange Commission’s (“SEC”) website at http://www.sec.gov.
2. SHAREHOLDER VOTES. During the period ended June 30, 2018, no actions were taken by the shareholders of the Portfolios.
3. EXPENSE EXAMPLE. As a shareholder of the Trust, you incur ongoing costs, including management fees and other Portfolio expenses. This example (as set forth in the table below) is intended to help you understand your ongoing costs (in dollars) of investing in the Trust and to compare these costs with the ongoing costs of investing in other mutual funds. The example is based on an investment of $1,000 invested at the beginning of the period and held for the entire period from January 1, 2018 through June 30, 2018.
Actual Expenses: The table below provides information about actual account values and actual expenses. You may use the information below, together with the amount you invested, to estimate the expenses that you paid over the period. Simply divide your account value by $1,000 (for example, an $8,600 account value divided by $1,000 = 8.6), then multiply the result by the number in the table under the heading entitled “Expenses Paid During Period” to estimate the expenses you paid on your account during this period.
Hypothetical Example for Comparison Purposes: The table below provides information about hypothetical account values and hypothetical expenses based on each of the Portfolio’s actual expense ratio and an assumed rate of return of 5% per year before expenses, which is not the Portfolio’s actual return. The hypothetical account values and expenses may not be used to estimate the actual ending account balance or expenses you paid for the period. You may use this information to compare this 5% hypothetical example with the 5% hypothetical examples that appear in the shareholder reports of other funds.
Please note that the expenses shown in the table are meant to highlight your ongoing costs only and do not reflect any transactional costs, such as redemption fees or exchange fees. Therefore, the table is useful in comparing ongoing costs only, and will not help you determine the relative total costs of owning different funds. In addition, if these transactional costs were included, your costs would have been higher.
| | | | | | | | | | | | | | | | | | | | |
| | | | | | | Beginning
Account
Value
January 1, 2018 | | | Ending
Account
Value
June 30, 2018 | | | Expenses
Paid
During
Period1 | | | Annualized
Expense
Ratio | |
Value Portfolio | | HC Strategic Shares | | Actual | | $ | 1,000.00 | | | $ | 986.00 | | | $ | 1.18 | | | | 0.24 | % |
| | | | Hypothetical2 | | $ | 1,000.00 | | | $ | 1,023.60 | | | $ | 1.20 | | | | 0.24 | % |
| | HC Advisors Shares | | Actual | | $ | 1,000.00 | | | $ | 986.50 | | | $ | 1.18 | | | | 0.24 | % |
| | | | Hypothetical2 | | $ | 1,000.00 | | | $ | 1,023.60 | | | $ | 1.20 | | | | 0.24 | % |
| | | | | | |
Institutional Value Portfolio | | HC Strategic Shares | | Actual | | $ | 1,000.00 | | | $ | 982.50 | | | $ | 1.13 | | | | 0.23 | % |
| | | | Hypothetical2 | | $ | 1,000.00 | | | $ | 1,023.65 | | | $ | 1.15 | | | | 0.23 | % |
| | HC Advisors Shares | | Actual | | $ | 1,000.00 | | | $ | 983.30 | | | $ | 1.18 | | | | 0.24 | % |
| | | | Hypothetical2 | | $ | 1,000.00 | | | $ | 1,023.60 | | | $ | 1.20 | | | | 0.24 | % |
| | | | | | |
Growth Portfolio | | HC Strategic Shares | | Actual | | $ | 1,000.00 | | | $ | 1,070.10 | | | $ | 1.44 | | | | 0.28 | % |
| | | | Hypothetical2 | | $ | 1,000.00 | | | $ | 1,023.41 | | | $ | 1.40 | | | | 0.28 | % |
| | HC Advisors Shares | | Actual | | $ | 1,000.00 | | | $ | 1,070.20 | | | $ | 1.44 | | | | 0.28 | % |
| | | | Hypothetical2 | | $ | 1,000.00 | | | $ | 1,023.41 | | | $ | 1.40 | | | | 0.28 | % |
| | | | | | |
Institutional Growth Portfolio | | HC Strategic Shares | | Actual | | $ | 1,000.00 | | | $ | 1,068.60 | | | $ | 1.33 | | | | 0.26 | % |
| | | | Hypothetical2 | | $ | 1,000.00 | | | $ | 1,023.51 | | | $ | 1.30 | | | | 0.26 | % |
| | HC Advisors Shares | | Actual | | $ | 1,000.00 | | | $ | 1,067.90 | | | $ | 1.38 | | | | 0.27 | % |
| | | | Hypothetical2 | | $ | 1,000.00 | | | $ | 1,023.46 | | | $ | 1.35 | | | | 0.27 | % |
| | | | | | |
Small Cap-Mid Cap Portfolio | | HC Strategic Shares | | Actual | | $ | 1,000.00 | | | $ | 1,084.10 | | | $ | 3.67 | | | | 0.71 | % |
| | | | Hypothetical2 | | $ | 1,000.00 | | | $ | 1,021.27 | | | $ | 3.56 | | | | 0.71 | % |
| | HC Advisors Shares | | Actual | | $ | 1,000.00 | | | $ | 1,084.20 | | | $ | 3.72 | | | | 0.72 | % |
| | | | Hypothetical2 | | $ | 1,000.00 | | | $ | 1,021.22 | | | $ | 3.61 | | | | 0.72 | % |
315
HC CAPITAL TRUST
Additional Information (continued) — June 30, 2018 (Unaudited)
| | | | | | | | | | | | | | | | | | | | |
| | | | | | | Beginning
Account
Value
January 1, 2018 | | | Ending
Account
Value
June 30, 2018 | | | Expenses
Paid
During
Period1 | | | Annualized
Expense
Ratio | |
| | | | | | |
Institutional Small Cap-Mid Cap Portfolio | | HC Strategic Shares | | Actual | | $ | 1,000.00 | | | $ | 1,085.90 | | | $ | 3.36 | | | | 0.65 | % |
| | | | Hypothetical2 | | $ | 1,000.00 | | | $ | 1,021.57 | | | $ | 3.26 | | | | 0.65 | % |
| | HC Advisors Shares | | Actual | | $ | 1,000.00 | | | $ | 1,085.90 | | | $ | 3.47 | | | | 0.67 | % |
| | | | Hypothetical2 | | $ | 1,000.00 | | | $ | 1,021.47 | | | $ | 3.36 | | | | 0.67 | % |
| | | | | | |
Real Estate Portfolio | | HC Strategic Shares | | Actual | | $ | 1,000.00 | | | $ | 1,016.50 | | | $ | 3.70 | | | | 0.74 | % |
| | | | Hypothetical2 | | $ | 1,000.00 | | | $ | 1,021.12 | | | $ | 3.71 | | | | 0.74 | % |
| | | | | | |
Commodity Portfolio | | HC Strategic Shares | | Actual | | $ | 1,000.00 | | | $ | 1,023.60 | | | $ | 1.61 | | | | 0.32 | % |
| | | | Hypothetical2 | | $ | 1,000.00 | | | $ | 1,023.21 | | | $ | 1.61 | | | | 0.32 | % |
| | HC Advisors Shares | | Actual | | $ | 1,000.00 | | | $ | 1,023.60 | | | $ | 1.56 | | | | 0.31 | % |
| | | | Hypothetical2 | | $ | 1,000.00 | | | $ | 1,023.26 | | | $ | 1.56 | | | | 0.31 | % |
| | | | | | |
ESG Growth Portfolio | | HC Strategic Shares | | Actual | | $ | 1,000.00 | | | $ | 999.10 | | | $ | 1.39 | | | | 0.28 | % |
| | | | Hypothetical2 | | $ | 1,000.00 | | | $ | 1,023.41 | | | $ | 1.40 | | | | 0.28 | % |
| | HC Advisors Shares | | Actual | | $ | 1,000.00 | | | $ | 998.80 | | | $ | 1.39 | | | | 0.28 | % |
| | | | Hypothetical2 | | $ | 1,000.00 | | | $ | 1,023.41 | | | $ | 1.40 | | | | 0.28 | % |
| | | | | | |
Catholic SRI Growth Portfolio | | HC Strategic Shares | | Actual | | $ | 1,000.00 | | | $ | 998.80 | | | $ | 1.54 | | | | 0.31 | % |
| | | | Hypothetical2 | | $ | 1,000.00 | | | $ | 1,023.26 | | | $ | 1.56 | | | | 0.31 | % |
| | HC Advisors Shares | | Actual | | $ | 1,000.00 | | | $ | 998.80 | | | $ | 1.54 | | | | 0.31 | % |
| | | | Hypothetical2 | | $ | 1,000.00 | | | $ | 1,023.26 | | | $ | 1.56 | | | | 0.31 | % |
| | | | | | |
International Portfolio | | HC Strategic Shares | | Actual | | $ | 1,000.00 | | | $ | 957.70 | | | $ | 2.14 | | | | 0.44 | % |
| | | | Hypothetical2 | | $ | 1,000.00 | | | $ | 1,022.61 | | | $ | 2.21 | | | | 0.44 | % |
| | HC Advisors Shares | | Actual | | $ | 1,000.00 | | | $ | 958.50 | | | $ | 2.14 | | | | 0.44 | % |
| | | | Hypothetical2 | | $ | 1,000.00 | | | $ | 1,022.61 | | | $ | 2.21 | | | | 0.44 | % |
| | | | | | |
Institutional International Portfolio | | HC Strategic Shares | | Actual | | $ | 1,000.00 | | | $ | 964.00 | | | $ | 1.95 | | | | 0.40 | % |
| | | | Hypothetical2 | | $ | 1,000.00 | | | $ | 1,022.81 | | | $ | 2.01 | | | | 0.40 | % |
| | HC Advisors Shares | | Actual | | $ | 1,000.00 | | | $ | 964.00 | | | $ | 1.95 | | | | 0.40 | % |
| | | | Hypothetical2 | | $ | 1,000.00 | | | $ | 1,022.81 | | | $ | 2.01 | | | | 0.40 | % |
| | | | | | |
Emerging Markets Portfolio | | HC Strategic Shares | | Actual | | $ | 1,000.00 | | | $ | 909.90 | | | $ | 3.17 | | | | 0.67 | % |
| | | | Hypothetical2 | | $ | 1,000.00 | | | $ | 1,021.47 | | | $ | 3.36 | | | | 0.67 | % |
| | HC Advisors Shares | | Actual | | $ | 1,000.00 | | | $ | 909.90 | | | $ | 3.17 | | | | 0.67 | % |
| | | | Hypothetical2 | | $ | 1,000.00 | | | $ | 1,021.47 | | | $ | 3.36 | | | | 0.67 | % |
| | | | | | |
Core Fixed Income Portfolio | | HC Strategic Shares | | Actual | | $ | 1,000.00 | | | $ | 979.50 | | | $ | 1.72 | | | | 0.35 | % |
| | | | Hypothetical2 | | $ | 1,000.00 | | | $ | 1,023.06 | | | $ | 1.76 | | | | 0.35 | % |
| | HC Advisors Shares | | Actual | | $ | 1,000.00 | | | $ | 979.50 | | | $ | 1.62 | | | | 0.33 | % |
| | | | Hypothetical2 | | $ | 1,000.00 | | | $ | 1,023.16 | | | $ | 1.66 | | | | 0.33 | % |
| | | | | | |
Fixed Opportunity Portfolio | | HC Strategic Shares | | Actual | | $ | 1,000.00 | | | $ | 1,007.70 | | | $ | 2.24 | | | | 0.45 | % |
| | | | Hypothetical2 | | $ | 1,000.00 | | | $ | 1,022.56 | | | $ | 2.26 | | | | 0.45 | % |
| | HC Advisors Shares | | Actual | | $ | 1,000.00 | | | $ | 1,007.70 | | | $ | 2.24 | | | | 0.45 | % |
| | | | Hypothetical2 | | $ | 1,000.00 | | | $ | 1,022.56 | | | $ | 2.26 | | | | 0.45 | % |
| | | | | | |
U.S. Government Fixed Income Portfolio | | HC Strategic Shares | | Actual | | $ | 1,000.00 | | | $ | 988.50 | | | $ | 0.99 | | | | 0.20 | % |
| | | | Hypothetical2 | | $ | 1,000.00 | | | $ | 1,023.80 | | | $ | 1.00 | | | | 0.20 | % |
| | | | | | |
Inflation Protected Portfolio | | HC Strategic Shares | | Actual | | $ | 1,000.00 | | | $ | 997.40 | | | $ | 0.79 | | | | 0.16 | % |
| | | | Hypothetical2 | | $ | 1,000.00 | | | $ | 1,024.00 | | | $ | 0.80 | | | | 0.16 | % |
| | HC Advisors Shares | | Actual | | $ | 1,000.00 | | | $ | 997.40 | | | $ | 0.79 | | | | 0.16 | % |
| | | | Hypothetical2 | | $ | 1,000.00 | | | $ | 1,024.00 | | | $ | 0.80 | | | | 0.16 | % |
316
HC CAPITAL TRUST
Additional Information (continued) — June 30, 2018 (Unaudited)
| | | | | | | | | | | | | | | | | | | | |
| | | | | | | Beginning
Account
Value
January 1, 2018 | | | Ending
Account
Value
June 30, 2018 | | | Expenses
Paid
During
Period1 | | | Annualized
Expense
Ratio | |
| | | | | | |
U.S. Corporate Fixed Income Portfolio | | HC Strategic Shares | | Actual | | $ | 1,000.00 | | | $ | 966.00 | | | $ | 1.02 | | | | 0.21 | % |
| | | | Hypothetical2 | | $ | 1,000.00 | | | $ | 1,023.75 | | | $ | 1.05 | | | | 0.21 | % |
| | | | | | |
U.S. Mortgage/Asset Backed Fixed Income Portfolio | | HC Strategic Shares | | Actual | | $ | 1,000.00 | | | $ | 988.80 | | | $ | 1.18 | | | | 0.24 | % |
| | | | Hypothetical2 | | $ | 1,000.00 | | | $ | 1,023.60 | | | $ | 1.20 | | | | 0.24 | % |
| | | | | | |
Short-Term Municipal Portfolio | | HC Strategic Shares | | Actual | | $ | 1,000.00 | | | $ | 1,005.70 | | | $ | 1.59 | | | | 0.32 | % |
| | | | Hypothetical2 | | $ | 1,000.00 | | | $ | 1,023.71 | | | $ | 1.61 | | | | 0.32 | % |
| | | | | | |
Intermediate Municipal Portfolio | | HC Strategic Shares | | Actual | | $ | 1,000.00 | | | $ | 1,001.20 | | | $ | 1.44 | | | | 0.29 | % |
| | | | Hypothetical2 | | $ | 1,000.00 | | | $ | 1,023.36 | | | $ | 1.45 | | | | 0.29 | % |
| | HC Advisors Shares | | Actual | | $ | 1,000.00 | | | $ | 1,001.20 | | | $ | 1.44 | | | | 0.29 | % |
| | | | Hypothetical2 | | $ | 1,000.00 | | | $ | 1,023.36 | | | $ | 1.45 | | | | 0.29 | % |
| | | | | | |
Intermediate Municipal II Portfolio | | HC Strategic Shares | | Actual | | $ | 1,000.00 | | | $ | 997.60 | | | $ | 1.34 | | | | 0.27 | % |
| | | | Hypothetical2 | | $ | 1,000.00 | | | $ | 1,023.46 | | | $ | 1.35 | | | | 0.27 | % |
| | HC Advisors Shares | | Actual | | $ | 1,000.00 | | | $ | 997.60 | | | $ | 1.34 | | | | 0.27 | % |
| | | | Hypothetical2 | | $ | 1,000.00 | | | $ | 1,023.46 | | | $ | 1.35 | | | | 0.27 | % |
| 1 | Expenses are equal to the average account value over the period, multiplied by the Portfolio’s annualized expense ratio, multiplied by 181/365 (to reflect the one half year period). |
| 2 | Represents the hypothetical 5% annual return before expenses. |
4. ADDITIONAL FEDERAL INCOME TAX INFORMATION
A. Dividends Received Deduction. For corporate shareholders, the following percentage of the total ordinary income distributions paid during the fiscal year ended June 30, 2018, qualify for the corporate dividend received deduction for the following Portfolio:
| | | | |
Portfolio | | Dividends
Received
Deduction | |
Value Portfolio | | | 77.65% | |
Institutional Value Portfolio | | | 43.29% | |
Growth Portfolio | | | 89.81% | |
Institutional Growth Portfolio | | | 59.96% | |
Small Cap–Mid Cap Portfolio | | | 100.00% | |
Institutional Small Cap–Mid Cap Portfolio | | | 22.38% | |
Real Estate Portfolio | | | 7.10% | |
ESG Growth Portfolio | | | 26.88% | |
Catholic SRI Growth Portfolio | | | 21.03% | |
For corporate shareholders, the following percentage of the total ordinary income distributions paid during the tax year ended December 31, 2017, qualify for the corporate dividend received deduction for the following Portfolio:
| | | | |
Portfolio | | Dividends
Received
Deduction | |
Commodity Portfolio | | | 28.49% | |
B. Qualified Dividends. For the fiscal year ended June 30, 2018, under current tax law, the following dividends paid may be subject to a maximum tax rate of 15%.
317
HC CAPITAL TRUST
Additional Information (continued) — June 30, 2018 (Unaudited)
| | | | |
Portfolio | | Dividends
Paid | |
Value Portfolio | | | 83.76% | |
Institutional Value Portfolio | | | 44.49% | |
Growth Portfolio | | | 91.11% | |
Institutional Growth Portfolio | | | 66.46% | |
Small Cap–Mid Cap Portfolio | | | 100.00% | |
Institutional Small Cap–Mid Cap Portfolio | | | 24.51% | |
Real Estate Portfolio | | | 7.09% | |
ESG Growth Portfolio | | | 94.40% | |
Catholic SRI Growth Portfolio | | | 73.49% | |
International Portfolio | | | 79.58% | |
Institutional International Portfolio | | | 65.95% | |
Emerging Markets Portfolio | | | 61.73% | |
For the tax year ended December 31, 2017, under current tax law, the following dividends paid may be subject to a maximum tax rate of 15%.
| | | | |
Portfolio | | Dividends
Paid | |
Commodity Portfolio | | | 79.21% | |
C. Foreign Tax Pass through Credit. Certain HC Capital Trust Portfolios intend to elect to pass through to shareholders the income tax credit for taxes paid to foreign countries. The pass through of the credit will only affect those persons who are shareholders of the Portfolio on a dividend record date in calendar year 2018. These shareholders will receive more detailed information along with their 2018 Form 1099-DIV. Foreign source income and foreign tax expense per outstanding share on June 30, 2018, are as follows:
| | | | | | | | |
Portfolio | | Foreign
Source
Income | | | Foreign
Tax
Expense | |
ESG Growth Portfolio | | $ | 0.26 | | | $ | 0.03 | |
International Portfolio | | $ | 0.32 | | | $ | 0.03 | |
Institutional International Portfolio | | $ | 0.34 | | | $ | 0.03 | |
Emerging Markets Portfolio | | $ | 0.56 | | | $ | 0.07 | |
The Portfolios intend to designate the maximum amount allowable as taxed at a maximum rate of 15%. Complete information will be reported in conjunction with your 2018 Form 1099-DIV.
D. Qualified Interest Income. For the fiscal year ended June 30, 2018, the following dividends paid by the Portfolios were designated as Qualified Interest Income that may be exempt from U.S. withholding tax on accounts of foreign investors.
| | | | |
Portfolio | | Qualified
Interest Income | |
Core Fixed Income Portfolio | | | 100.00 | % |
Fixed Opportunity Portfolio | | | 100.00 | % |
U.S. Government Fixed Income Portfolio | | | 100.00 | % |
U.S. Corporate Fixed Income Portfolio | | | 100.00 | % |
U.S. Mortgage/Asset Backed Fixed Income Portfolio | | | 100.00 | % |
E. Long Term Capital Gains. The Portfolios declared long term distributions of realized gains qualifying for a maximum 15% capital gains tax rate for individuals as follows:
| | | | |
Portfolio | | Amount
(000) | |
Value Portfolio | | $ | 23,478 | |
Institutional Value Portfolio | | | 30,659 | |
Growth Portfolio | | | 38,856 | |
Institutional Growth Portfolio | | | 32,991 | |
Institutional Small Cap–Mid Cap Portfolio | | | 12,579 | |
Real Estate Portfolio | | | 3,708 | |
Catholic SRI Growth Portfolio | | | 308 | |
U.S. Corporate Fixed Income Portfolio | | | 734 | |
Intermediate Municipal II Portfolio | | | 3 | |
318
HC CAPITAL TRUST
Additional Information (continued) — June 30, 2018 (Unaudited)
F. Short Term Capital Gains. The Portfolios declared short term distributions of realized gains as follows:
| | | | |
Portfolio | | Amount
(000) | |
Value Portfolio | | $ | 6,368 | |
Institutional Value Portfolio | | | 23,815 | |
Growth Portfolio | | | 2,417 | |
Institutional Growth Portfolio | | | 9,670 | |
Institutional Small Cap–Mid Cap Portfolio | | | 952 | |
Real Estate Portfolio | | | 11 | |
Catholic SRI Growth Portfolio | | | 411 | |
Institutional International Portfolio | | | 3,595 | |
U.S. Corporate Fixed Income Portfolio | | | 122 | |
G. Tax Exempt Distributions. The Portfolios declared and paid tax exempt distributions for the fiscal year ended June 30, 2018, as follows:
| | | | |
Portfolio | | Amount
(000) | |
Short-Term Municipal Portfolio | | $ | 303 | |
Intermediate Municipal Portfolio | | | 7,477 | |
Intermediate Municipal II Portfolio | | | 1,611 | |
5. ACCESS TO QUARTERLY HOLDINGS
A complete schedule of each Portfolio’s portfolio holdings for the first and third fiscal quarter of each fiscal year is filed with the SEC on Form N-Q and is available on the SEC’s website at http://www.sec.gov. In addition, the schedules may be reviewed and copied at the SEC’s Public Reference Room in Washington D.C. Information on the operation of the Public Reference Room may be obtained by calling 1-800-SEC-0330.
6. ADDITIONAL PORTFOLIO HOLDINGS INFORMATION
The following tables reflect the percentage of the total investments of each Portfolio attributable to the indicated industry sector, type of security or geographic region, as appropriate for the indicated Portfolio.
Value Portfolio
| | | | |
Security Allocation | | Percentage
of Value | |
Consumer Discretionary | | | 8.9 | % |
Consumer Staples | | | 9.2 | % |
Energy | | | 10.4 | % |
Financials | | | 26.8 | % |
Health Care | | | 12.1 | % |
Industrials | | | 9.1 | % |
Information Technology | | | 9.0 | % |
Materials | | | 3.5 | % |
Real Estate | | | 5.2 | % |
Telecommunication Services | | | 1.7 | % |
Utilities | | | 4.1 | % |
Other | | | 0.0 | % |
| | | | |
Total | | | 100.0 | % |
| | | | |
Institutional Value Portfolio
| | | | |
Security Allocation | | Percentage
of Value | |
Consumer Discretionary | | | 8.0 | % |
Consumer Staples | | | 8.9 | % |
Energy | | | 9.0 | % |
Financials | | | 31.6 | % |
Health Care | | | 11.3 | % |
Industrials | | | 8.5 | % |
Information Technology | | | 8.7 | % |
Materials | | | 3.5 | % |
Real Estate | | | 3.9 | % |
Telecommunication Services | | | 2.8 | % |
Utilities | | | 3.8 | % |
Other | | | 0.0 | % |
| | | | |
Total | | | 100.0 | % |
| | | | |
319
HC CAPITAL TRUST
Additional Information (continued) — June 30, 2018 (Unaudited)
Growth Portfolio
| | | | |
Security Allocation | | Percentage
of Value | |
Consumer Discretionary | | | 17.7 | % |
Consumer Staples | | | 6.0 | % |
Energy | | | 2.8 | % |
Financials | | | 5.5 | % |
Health Care | | | 13.0 | % |
Industrials | | | 9.0 | % |
Information Technology | | | 40.6 | % |
Materials | | | 2.4 | % |
Real Estate | | | 1.2 | % |
Telecommunication Services | | | 0.5 | % |
Utilities | | | 0.0 | % |
Other | | | 1.3 | % |
| | | | |
Total | | | 100.0 | % |
| | | | |
Institutional Growth Portfolio
| | | | |
Security Allocation | | Percentage
of Value | |
Consumer Discretionary | | | 15.8 | % |
Consumer Staples | | | 7.9 | % |
Energy | | | 2.3 | % |
Financials | | | 9.8 | % |
Health Care | | | 13.6 | % |
Industrials | | | 9.7 | % |
Information Technology | | | 37.8 | % |
Materials | | | 1.6 | % |
Real Estate | | | 0.9 | % |
Telecommunication Services | | | 0.0 | % |
Other | | | 0.6 | % |
| | | | |
Total | | | 100.0 | % |
| | | | |
Small Cap–Mid Cap Portfolio
| | | | |
Security Allocation | | Percentage
of Value | |
Consumer Discretionary | | | 9.9 | % |
Consumer Staples | | | 1.2 | % |
Energy | | | 4.0 | % |
Financials | | | 21.5 | % |
Health Care | | | 13.7 | % |
Industrials | | | 14.3 | % |
Information Technology | | | 22.2 | % |
Materials | | | 5.8 | % |
Real Estate | | | 2.1 | % |
Telecommunication Services | | | 1.0 | % |
Utilities | | | 0.7 | % |
Other | | | 3.6 | % |
| | | | |
Total | | | 100.0 | % |
| | | | |
Institutional Small Cap–Mid Cap Portfolio
| | | | |
Security Allocation | | Percentage
of Value | |
Consumer Discretionary | | | 11.1 | % |
Consumer Staples | | | 1.4 | % |
Energy | | | 4.0 | % |
Financials | | | 17.9 | % |
Health Care | | | 14.7 | % |
Industrials | | | 15.8 | % |
Information Technology | | | 21.2 | % |
Materials | | | 6.4 | % |
Real Estate | | | 2.8 | % |
Telecommunication Services | | | 0.8 | % |
Utilities | | | 1.3 | % |
Other | | | 2.6 | % |
| | | | |
Total | | | 100.0 | % |
| | | | |
Real Estate Portfolio
| | | | |
Security Allocation | | Percentage
of Value | |
Consumer Discretionary | | | 5.9 | % |
Financials | | | 15.5 | % |
Health Care | | | 0.1 | % |
Real Estate | | | 78.5 | % |
Other | | | 0.0 | % |
| | | | |
Total | | | 100.0 | % |
| | | | |
Commodity Portfolio
| | | | |
Security Allocation | | Percentage
of Value | |
Energy | | | 52.6 | % |
Financials | | | 8.1 | % |
Materials | | | 35.1 | % |
Other | | | 4.2 | % |
| | | | |
Total | | | 100.0 | % |
| | | | |
320
HC CAPITAL TRUST
Additional Information (continued) — June 30, 2018 (Unaudited)
ESG Growth Portfolio
| | | | |
Security Allocation | | Percentage
of Value | |
Consumer Discretionary | | | 11.1 | % |
Consumer Staples | | | 9.0 | % |
Energy | | | 6.3 | % |
Financials | | | 10.8 | % |
Health Care | | | 14.8 | % |
Industrials | | | 13.7 | % |
Information Technology | | | 20.2 | % |
Materials | | | 5.8 | % |
Real Estate | | | 2.3 | % |
Telecommunication Services | | | 3.0 | % |
Utilities | | | 3.0 | % |
Other | | | 0.0 | % |
| | | | |
Total | | | 100.0 | % |
| | | | |
Catholic SRI Growth Portfolio
| | | | |
Security Allocation | | Percentage
of Value | |
Consumer Discretionary | | | 13.7 | % |
Consumer Staples | | | 9.8 | % |
Energy | | | 7.4 | % |
Financials | | | 11.9 | % |
Health Care | | | 5.0 | % |
Industrials | | | 14.4 | % |
Information Technology | | | 20.9 | % |
Materials | | | 6.8 | % |
Real Estate | | | 2.6 | % |
Telecommunication Services | | | 3.7 | % |
Utilities | | | 3.8 | % |
Other | | | 0.0 | % |
| | | | |
Total | | | 100.0 | % |
| | | | |
International Portfolio
| | | | |
Security Allocation | | Percentage
of Value | |
Consumer Discretionary | | | 8.6 | % |
Consumer Staples | | | 4.0 | % |
Energy | | | 8.9 | % |
Financials | | | 22.3 | % |
Health Care | | | 10.2 | % |
Industrials | | | 15.9 | % |
Information Technology | | | 7.7 | % |
Materials | | | 10.3 | % |
Real Estate | | | 2.2 | % |
Telecommunication Services | | | 4.2 | % |
Utilities | | | 3.2 | % |
Other | | | 2.5 | % |
| | | | |
Total | | | 100.0 | % |
| | | | |
Institutional International Portfolio
| | | | |
Security Allocation | | Percentage
of Value | |
Consumer Discretionary | | | 8.9 | % |
Consumer Staples | | | 7.3 | % |
Energy | | | 7.1 | % |
Financials | | | 24.9 | % |
Health Care | | | 11.6 | % |
Industrials | | | 13.3 | % |
Information Technology | | | 6.6 | % |
Materials | | | 7.9 | % |
Real Estate | | | 2.6 | % |
Telecommunication Services | | | 4.9 | % |
Utilities | | | 3.2 | % |
Other | | | 1.7 | % |
| | | | |
Total | | | 100.0 | % |
| | | | |
Emerging Markets Portfolio
| | | | |
Security Allocation | | Percentage
of Value | |
Consumer Discretionary | | | 8.7 | % |
Consumer Staples | | | 7.7 | % |
Energy | | | 5.8 | % |
Financials | | | 27.8 | % |
Health Care | | | 2.2 | % |
Industrials | | | 4.5 | % |
Information Technology | | | 23.3 | % |
Materials | | | 7.7 | % |
Real Estate | | | 2.4 | % |
Telecommunication Services | | | 4.9 | % |
Utilities | | | 3.6 | % |
Other | | | 1.4 | % |
| | | | |
Total | | | 100.0 | % |
| | | | |
Core Fixed Income Portfolio
| | | | |
Security Allocation | | Percentage
of Value | |
Treasury | | | 33.0 | % |
Corporate | | | 32.5 | % |
Agency | | | 23.2 | % |
Yankee Dollar | | | 5.9 | % |
Mutual Fund | | | 3.4 | % |
Mortgage | | | 1.5 | % |
Asset Backed Securities | | | 0.5 | % |
Other | | | 0.0 | % |
| | | | |
Total | | | 100.0 | % |
| | | | |
321
HC CAPITAL TRUST
Additional Information (continued) — June 30, 2018 (Unaudited)
Fixed Opportunity Portfolio
| | | | |
Security Allocation | | Percentage
of Value | |
Corporate | | | 49.9 | % |
Mortgage | | | 18.3 | % |
Yankee Dollar | | | 11.6 | % |
Mutual Fund | | | 7.1 | % |
Exchange-Traded Fund | | | 4.9 | % |
Repurchase Agreement | | | 4.8 | % |
U.S. Government Agency Mortgages | | | 3.1 | % |
Other | | | 0.3 | % |
| | | | |
Total | | | 100.0 | % |
| | | | |
U.S. Government Fixed Income Portfolio
| | | | |
Security Allocation | | Percentage
of Value | |
Treasury | | | 95.3 | % |
Agency | | | 4.0 | % |
Mutual Fund | | | 0.2 | % |
Yankee Dollar | | | 0.1 | % |
Other | | | 0.4 | % |
| | | | |
Total | | | 100.0 | % |
| | | | |
Inflation Protected Portfolio
| | | | |
Security Allocation | | Percentage
of Value | |
Treasury | | | 95.0 | % |
Mutual Fund | | | 5.0 | % |
| | | | |
Total | | | 100.0 | % |
| | | | |
U.S. Corporate Fixed Income Portfolio
| | | | |
Security Allocation | | Percentage
of Value | |
Consumer Discretionary | | | 3.6 | % |
Consumer Staples | | | 8.2 | % |
Energy | | | 11.4 | % |
Financials | | | 36.7 | % |
Health Care | | | 7.4 | % |
Industrials | | | 6.3 | % |
Information Technology | | | 6.0 | % |
Materials | | | 5.3 | % |
Real Estate | | | 1.1 | % |
Telecommunication Services | | | 8.1 | % |
Utilities | | | 5.9 | % |
Other | | | 0.0 | % |
| | | | |
Total | | | 100.0 | % |
| | | | |
U.S. Mortgage/Asset Backed Fixed Income Portfolio
| | | | |
Security Allocation | | Percentage
of Value | |
Agency | | | 76.3 | % |
Mutual Fund | | | 16.9 | % |
Mortgage | | | 5.0 | % |
Asset Backed Securities | | | 1.6 | % |
Yankee Dollar | | | 0.2 | % |
| | | | |
Total | | | 100.0 | % |
| | | | |
Short-Term Municipal Portfolio
| | | | |
Security Allocation | | Percentage
of Value | |
General Obligation | | | 44.1 | % |
Health Care | | | 0.5 | % |
Higher Education | | | 1.3 | % |
Medical | | | 0.5 | % |
Power | | | 1.3 | % |
Revenue Bonds | | | 50.5 | % |
School District | | | 0.6 | % |
Water | | | 1.2 | % |
Other | | | 0.0 | % |
| | | | |
Total | | | 100.0 | % |
| | | | |
Intermediate Municipal Portfolio
| | | | |
Security Allocation | | Percentage
of Value | |
Airport | | | 6.4 | % |
Bond Bank | | | 0.7 | % |
Education | | | 4.3 | % |
Facilities | | | 5.2 | % |
Financials | | | 0.9 | % |
General | | | 14.0 | % |
General Obligation | | | 13.7 | % |
Higher Education | | | 2.5 | % |
Industrials | | | 0.0 | % |
Medical | | | 6.1 | % |
Nursing Homes | | | 0.4 | % |
Power | | | 3.9 | % |
Revenue Bonds | | | 14.8 | % |
School District | | | 3.3 | % |
Student Loan | | | 2.4 | % |
Tobacco Settlement | | | 2.9 | % |
Transportation | | | 8.4 | % |
Utilities | | | 3.1 | % |
Water | | | 7.0 | % |
Other | | | 0.0 | % |
| | | | |
Total | | | 100.0 | % |
| | | | |
322
HC CAPITAL TRUST
Additional Information (continued) — June 30, 2018 (Unaudited)
Intermediate Municipal II Portfolio
| | | | |
Security Allocation | | Percentage
of Value | |
Education | | | 2.9 | % |
Facilities | | | 0.2 | % |
Financials | | | 0.9 | % |
General | | | 6.1 | % |
General Obligation | | | 35.7 | % |
Higher Education | | | 3.2 | % |
Medical | | | 3.6 | % |
Power | | | 7.1 | % |
Revenue Bonds | | | 14.0 | % |
School District | | | 3.7 | % |
Transportation | | | 5.4 | % |
Utilities | | | 3.1 | % |
Water | | | 14.1 | % |
Other | | | 0.0 | % |
| | | | |
Total | | | 100.0 | % |
| | | | |
7. BOARD APPROVAL OF INVESTMENT ADVISORY CONTRACTS
The Trust’s investment adviser is HC Capital Solutions (the “Adviser”), an operating division of Hirtle Callaghan & Co. LLC (“Hirtle Callaghan”). The Adviser provides overall investment management services with respect to HC Capital Trust (the “Trust”) and each separate series of the Trust (each a “Portfolio”) pursuant to the terms of two separate agreements with the Trust (the “HC Contracts”). The Adviser is authorized under the HC Contracts to purchase and sell portfolio securities for the Portfolios. Day-to-day portfolio management services are generally provided to the respective Portfolios by one or more independent investment advisory organizations (each a “Specialist Manager”) pursuant to the terms of separate investment advisory agreements (each a “Portfolio Management Agreement”). During the fiscal year ended June 30, 2018, the Trust offered twenty-two Portfolios, eighteen of which were managed by two or more Specialist Managers.1 Each Specialist Manager is responsible for providing day-to-day portfolio management services for that portion of a Portfolio’s assets allocated to it by, and under the supervision of, the Adviser.
During the six-month period covered by this report, the Trust’s Board of Trustees (the “Board”):
| | • | | Approved the continuation of the HC Contracts; |
| | • | | Approved the continuation of certain Portfolio Management Agreements, as set forth below; |
| | • | | Approved New Portfolio Management Agreements with Parametric Portfolio Associates (“Parametric”) relating to six Portfolios; |
| | • | | Approved New Portfolio Management Agreements with City of London Investment Management Company (“CLIM”) relating to two Portfolios; |
| | • | | Approved Amendments to Portfolio Management Agreements with BNY Mellon Asset Management North America Corporation (“BNY AMNA”) relating to two Portfolios; and |
| | • | | Approved Amendments to Portfolio Management Agreements with CLIM relating to two Portfolios. |
In considering the information and materials described herein, the Trust’s Independent Trustees were represented by, and met separately with, their independent legal counsel and were provided with a written description of their statutory responsibilities and the legal standards that are applicable to approvals of advisory agreements. In view of the broad scope and variety of factors and information, the Board did not always find it practicable to, and did not in all cases, assign relative weights to the specific factors considered in reaching its conclusions to approve the HC Contracts and the various Portfolio Management Agreements. Rather, the conclusions were made on the basis of each Trustee’s business judgment after consideration of all of the factors taken in their entirety.
323
HC CAPITAL TRUST
Additional Information (continued) — June 30, 2018 (Unaudited)
Approval of the HC Contracts. During the six-month period covered by this report, the Trust’s Board approved the continuation of both of the HC Contracts. In approving the HC Contracts, the Board gave substantial weight to the fact that the Trust and the Portfolios are designed to serve as asset allocation vehicles for, and are available exclusively to, clients of Hirtle Callaghan. Other factors considered by the Board in connection with its determination to approve the HC Contracts are summarized below.
With respect to the nature, extent and quality of the services provided by the Adviser to the Trust, the Board concluded that it was satisfied with the services. The Board determined that the Adviser’s services, including its role in the selection and oversight of the Specialist Managers, the allocation of assets among the Specialist Managers in multi-manager Portfolios, the process for identifying instances where there may be a need to replace a Specialist Manager and the process with regard to the efficient and economical implementation of such changes were consistent with the expectations of the Trust’s shareholders. In reaching this determination, the Board considered the services of the Trust’s executive officers, each of whom is an employee of Hirtle Callaghan, their oversight of the activities of the Trust’s administrator and other service providers, and the oversight of the Specialist Managers provided by the Adviser. The Board also considered the Adviser’s efforts to control the costs of the Trust, including obtaining advisory fee concessions from various Specialist Managers.
With respect to the performance achieved by the Trust’s Portfolios, the Board viewed the overall performance of the respective Portfolios in the context of their use as vehicles through which the Adviser seeks to access specific asset classes on behalf of Hirtle Callaghan clients. The Board was informed with respect to publicly available information about the performance of peer funds but based its conclusions primarily on the specific facts and circumstances of the Trust. The Board concluded that the performance results achieved by each Portfolio reflect appropriate manager selection by the Adviser and that the continuation of the relationship with the Adviser and approval of the HC Contracts were in the best interests of the Trust’s shareholders and consistent with shareholder expectations.
With respect to the fees paid to the Adviser under the HC Contracts, the Board considered the fact that Hirtle Callaghan’s standard client agreement provides for a fee reduction to the extent that a client’s assets are invested in a Portfolio that is equal to the 0.05% fee payable to the Adviser by each Portfolio under the HC Contract, effectively reducing the Adviser’s income from the Trust to 0.00%. Although informed with respect to advisory fees charged by peer funds, the Board did not consider such information to be a material factor in reaching its conclusion regarding the reasonableness of the fees paid to the Adviser by the Portfolios under the HC Contracts although the Board did consider comparisons of overall expenses to those of peer funds. In light of the unique fee reduction feature embedded in Hirtle Callaghan’s standard client agreements, the Board did not consider the financial position of the Adviser or specific information with respect to the costs and expenses incurred by the Adviser in providing services to the Trust other than to confirm the Adviser’s continued financial viability. Given the structure of the Advisor’s fee schedule, the Board determined that there was little, if any, opportunity for a Portfolio to achieve economies of scale with respect to the level of the Adviser’s fee. Based on the foregoing and other information relating to the structure and level of the Adviser’s fee provided to the Board, the Board concluded that the rate at which the Adviser is paid by the Trust for the services it provides to each Portfolio is reasonable.
Continuation of Certain Portfolio Management Agreements. The Portfolio Management Agreements approved for continuance during the period (collectively, the “Continuing Agreements”) are identified below, together with the Specialist Managers subject to review during the period.
| | |
Specialist Manager | | Portfolios |
| Agincourt Capital Management, LLC | | The Catholic SRI Growth Portfolio The Core Fixed Income Portfolio The ESG Growth Portfolio The U.S. Corporate Fixed Income Securities Portfolio |
324
HC CAPITAL TRUST
Additional Information (continued) — June 30, 2018 (Unaudited)
| | |
Specialist Manager | | Portfolios |
| |
| BNY Mellon Asset Management North America Corp. | | The Value Equity Portfolio The Institutional Value Equity Portfolio The Growth Equity Portfolio The Institutional Growth Equity Portfolio The Small Capitalization-Mid Capitalization Equity Portfolio The Institutional Small Capitalization-Mid Capitalization Equity Portfolio The Commodity Returns Strategy Portfolio The ESG Growth Portfolio The Catholic SRI Growth Portfolio The Real Estate Securities Portfolio The International Equity Portfolio The Institutional International Equity Portfolio The Emerging Markets Portfolio (two agreements related to two different strategies) The Core Fixed Income Portfolio The Fixed Income Opportunity Portfolio The U.S. Government Fixed Income Securities Portfolio The Inflation Protected Securities Portfolio The U.S. Mortgage/Asset Backed Fixed Income Securities Portfolio The U.S. Corporate Fixed Income Securities Portfolio The Intermediate Term Municipal Bond Portfolio |
| |
| Breckinridge Capital Advisors, Inc. | | The Short-Term Municipal Bond Portfolio The Intermediate Term Municipal Bond Portfolio II |
| |
| City of London Investment Management Company, Limited | | The International Equity Portfolio The Institutional International Equity Portfolio The Emerging Markets Portfolio The Fixed Income Opportunity Portfolio |
| |
| Fort Washington Investment Advisors, Inc. | | The Fixed Income Opportunity Portfolio |
| |
| Western Asset Management Company, Ltd. | | The Fixed Income Opportunity Portfolio |
| |
| Jennison Associates LLC | | The Growth Equity Portfolio The Institutional Growth Equity Portfolio |
| |
| Pacific Investment Management Co., LLC | | The Institutional Value Equity Portfolio The Institutional Growth Equity Portfolio The Commodity Returns Strategy Portfolio |
325
HC CAPITAL TRUST
Additional Information (continued) — June 30, 2018 (Unaudited)
| | |
Specialist Manager | | Portfolios |
| |
| Parametric Portfolio Associates, LLC | | The Value Equity Portfolio (three agreements related to three different strategies) The Institutional Value Equity Portfolio (three agreements related to three different strategies) The Growth Equity Portfolio (three agreements related to three different strategies) The Institutional Growth Equity Portfolio (three agreements related to three different strategies) The Small Capitalization-Mid Capitalization Equity Portfolio (two agreements related to two different strategies) The Institutional Small Capitalization-Mid Capitalization Equity Portfolio (two agreements related to two different strategies) The Commodity Returns Strategy Portfolio (two agreements related to two different strategies) The ESG Growth Portfolio (two agreements related to two different strategies) The Catholic SRI Growth Portfolio (two agreements related to two different strategies) The Real Estate Securities Portfolio (two agreements related to two different strategies) The International Equity Portfolio (two agreements related to two different strategies) The Institutional International Equity Portfolio (two agreements related to two different strategies) The Emerging Markets Portfolio (two agreements related to two different strategies) The Fixed Income Opportunity Portfolio (two agreements related to two different strategies) |
| |
| Vaughan Nelson Investment Management, L.P. | | The Commodity Returns Strategy Portfolio |
In its deliberations with respect to each of the Continuing Agreements, the Board recognized that, under each such agreement, the named Specialist Manager is responsible for day-to-day investment decisions only with respect to its allocated portion of the respective Portfolio’s assets. The Board further recognized that the Specialist Managers do not participate in the administration of any of the Portfolios or in the distribution of shares of any of the Portfolios and thus receive limited, if any, benefit from their association with the Trust other than the fee paid to them by the respective Portfolios for investment management services.
In approving the Continuing Agreements, the Board concluded that continuation of each of the Continuing Agreements was in the best interests of each respective Portfolio and consistent with the expectations of shareholders of the Portfolios. While the Board did not identify any particular factor as controlling, the Board gave substantial weight to the fact that the Trust is designed primarily to serve as a vehicle through which the Adviser implements asset allocation strategies on behalf of Hirtle Callaghan’s clients; and that shares of the respective Portfolios are generally available only to such clients. With respect to the nature, extent and quality of the services provided by each of the Specialist Managers, the Board was informed with respect to the specific investment process employed by each of the Specialist Managers in managing the assets of the respective Portfolios allocated to them and the qualifications of each Specialist Manager’s investment management personnel. The Board was also informed with respect to each Specialist Manager’s infrastructure and whether it appears to adequately support the strategies being implemented for the various Portfolios. The Board concluded that the nature, extent and quality of the portfolio management services provided by each of the Specialist Managers were satisfactory in light of the specific strategies employed on behalf of the respective Portfolios and, thus, supported a decision to approve the continuation of each of the Continuing Agreements.
326
HC CAPITAL TRUST
Additional Information (continued) — June 30, 2018 (Unaudited)
The Board also considered representations made by the Adviser that the performance achieved by the relevant Specialist Managers was consistent with the Adviser’s expectations in the context of the overall objectives, and multi-manager strategy, of each of the respective Portfolios. During the course of its deliberations, the Board was informed with respect to publicly available information assembled by a third-party service provider about the performance of peer funds managed by other investment advisory organizations. The Board did not specifically rely on such information but based its conclusions on the facts and circumstances related to each Portfolio.
In concluding that continuation of the Continuing Agreements was appropriate, the Board did not rely upon any single factor but gave considerable weight to the Adviser’s recommendations and its assessment of each Specialist Manager’s overall compliance profile and the success and future ability of each Specialist Manager in capturing the respective Portfolios’ desired asset classes. Based on the foregoing, the Board concluded that the performance of the Specialist Managers was satisfactory and that continuation of such contracts was in the best interest of shareholders of the respective Portfolios.
The Board also concluded that the rate at which each of the Specialist Managers is compensated under the Continuing Agreements is reasonable. In reaching this conclusion, the Board had before it information about the impact of break-points, financial information about the Specialist Managers relating to factors such as profitability, comparable fees charged to other institutional clients and/or to peer funds for similar services and costs incurred by the Specialist Managers in providing services to the respective Portfolios. In considering this information, the Board gave substantial weight to information demonstrating that the rate at which these Specialist Managers are compensated was determined as a result of arms-length negotiations conducted by the officers of the Trust and the Adviser, including in several cases, negotiated fee waivers/reductions and scheduled breakpoints designed to recognize economies of scale where appropriate.
Approval of New Portfolio Management Agreements with Parametric. During the period, the Board approved new Portfolio Management Agreements (the “Parametric Agreements”) between the Trust and Parametric relating to each of the Value Equity, Growth Equity; Small Capitalization – Mid Capitalization Equity; International Equity; Emerging Markets and Commodity Returns Strategy Portfolios (collectively, the “Affected Portfolios”).
In approving the Parametric Agreements, the Board was informed that Parametric had more than twenty-five years of experience managing tax overlay strategies that defer realization of capital gains and harvest losses while maintaining market exposure. The Adviser recommended to the Board that each of the Affected Portfolios would benefit from access to this “tax-managed custom core” strategy in order to minimize the tax impact of their capital gains on shareholders.
With respect to the nature, extent and quality of the services expected to be provided to the Affected Portfolios, the Board gave considerable weight to the Adviser’s recommendation as well as the Board’s familiarity with the services provided by Parametric, which had managed several different strategies for multiple Trust Portfolios for several years. The Board also considered the fact that Parametric would not participate in the administration or distribution of shares of the Affected Portfolios and that, other than advisory fees payable under the terms of the Parametric Agreements, it was not expected that Parametric would benefit materially from its association with the Trust. The Board further considered the qualifications of the investment management personnel included on the Parametric team. The Board concluded that it was satisfied with the nature, extent and quality of the services expected to be provided by Parametric in light of the strategy it was being engaged to employ under the Parametric Agreements and that access to such services was likely to benefit the Affected Portfolios.
In concluding that approval of the Parametric Agreements was in the best interests of shareholders of the Affected Portfolios, the Board considered information with respect to the past performance of Parametric’s similar strategies as well as the past performance achieved by Parametric for various Trust Portfolios using different strategies, but the Board did not base its determination on such past results.
With respect to the fee schedules pursuant to which Parametric would be compensated for its services, the Board was informed with respect to, among other relevant factors, comparative fee information, including information regarding both peer group fees and fees charged to the Affected Portfolios by each of the other Specialist Managers then serving them, Parametric’s financial position and projected profitability as well as data regarding advisory fees paid by other funds with similar investment policies. The Board did not specifically rely upon such information, but gave substantial weight to the facts that: the rate at which Parametric was to be compensated was lower than the fee paid to some of the other Specialist Managers serving each of the Affected Portfolios, but might be higher than others depending on how the assets of each
327
HC CAPITAL TRUST
Additional Information (continued) — June 30, 2018 (Unaudited)
Affected Portfolio were to be allocated among the respective Specialist Managers; the rate was determined as a result of arms-length negotiations conducted by the officers of the Trust and the Adviser; and the Adviser believed the agreed upon rate to be reasonable. The Board concluded that the proposed rate was reasonable. In reaching its conclusion, the Board recognized that the impact of the rate to be paid to Parametric on overall advisory fees would depend on the allocation of assets within the Affected Portfolios.
Approval of New Portfolio Management Agreements with CLIM. During the period, the Board approved new Portfolio Management Agreements (the “CLIM Agreements”) between the Trust and CLIM relating to each of the Intermediate Term Municipal Bond and Intermediate Term Municipal Bond II Portfolios (collectively, the “Affected Portfolios”). In approving the CLIM Agreements, the Board was informed with respect to the Adviser’s belief that implementation of the CLIM’s closed-end fund investment strategies in the Affected Portfolios could allow the Affected Portfolios to benefit from the then-existing volatility in the discounts at which municipal bond closed-end funds may trade. Accordingly, the Adviser recommended to the Board that each of the Affected Portfolios would benefit from immediate access to CLIM’s strategies.
With respect to the nature, extent and quality of the services expected to be provided to the Affected Portfolios, the Board gave considerable weight to the Adviser’s recommendation as well as the Board’s familiarity with the services provided by CLIM, which had managed similar closed-end fund strategies for multiple Trust Portfolios for several years. The Board also considered the fact that CLIM would not participate in the administration or distribution of shares of the Affected Portfolios and that, other than advisory fees payable under the terms of the CLIM Agreements, it was not expected that CLIM would benefit materially from its association with the Trust. The Board further considered the qualifications of the investment management personnel included on the CLIM team. The Board concluded that it was satisfied with the nature, extent and quality of the services expected to be provided by CLIM in light of the strategy it was being engaged to employ under the CLIM Agreements and that access to such services was likely to benefit the Affected Portfolios.
In concluding that approval of the CLIM Agreements was in the best interests of shareholders of the Affected Portfolios, the Board considered information with respect to the past performance of CLIM’s similar strategies as well as the past performance achieved by CLIM for other Trust Portfolios using similar strategies, but the Board did not base its determination on such past results.
With respect to the fee schedules pursuant to which Parametric would be compensated for its services, the Board was informed with respect to, among other relevant factors, comparative fee information, including information regarding both peer group fees and fees charged to the Affected Portfolios by each of the other Specialist Managers then serving them, CLIM’s financial position and projected profitability, data regarding advisory fees paid by other funds with similar investment policies as well as the fact that CLIM had agreed to accept an initial fee that was substantially lower than its standard fee for the strategy in order to be able to begin managing assets of the Affected Portfolios immediately, under the Trust’s “manager of managers” exemptive order2 while the Trust sought shareholder approval for CLIM’s higher standard fee (see discussion of amendments to the CLIM Agreements, below). The Board did not specifically rely upon such information, but gave substantial weight to the facts that: the fee rate was determined as a result of arms-length negotiations conducted by the officers of the Trust and the Adviser; and the Adviser believed the agreed upon rate to be reasonable. The Board concluded that the proposed rate was reasonable. In reaching its conclusion, the Board recognized that the impact of the rate to be paid to CLIM on overall advisory fees would depend on the allocation of assets within the Affected Portfolios.
Approval of Amendments to Portfolio Management Agreements with BNY AMNA. During the period, the Board also approved amendments (the “BNY AMNA Amendments”) to the Portfolio Management Agreements (the “BNY AMNA Agreements”) with BNY AMNA related to each of the ESG Growth and Catholic SRI Growth Portfolios. The Board was informed with respect to the fact that under the BNY AMNA Agreements, as previously amended, BNY AMNA had been contracted to manage assets in four different specific asset classes and that the BNY AMNA Agreements set forth four different, asset class specific, fee rates at which BNY AMNA was to be compensated, with each of those rates set to increase unless a specified amount of assets was allocated to BNY AMNA to manage in each respective asset class.
At its meeting in June, 2018, the Board approved amendments to each of the BNY AMNA Agreements that set forth one flat fee rate to be applied to all assets managed by BNY AMNA for each of the ESG Growth and Catholic SRI Growth
328
HC CAPITAL TRUST
Additional Information (continued) — June 30, 2018 (Unaudited)
Portfolios, regardless of asset class. This single fee rate was lower than the highest of the previous multiple fee rates, but higher than the lowest of such rates.
In approving the BNY AMNA Amendments, the Board reviewed information with respect to the nature, extent and quality of the services provided by BNY AMNA and the role of the organization in the context of the Portfolios, as well as BNY AMNA’s representations and the view of the Adviser to the effect that rationalization of the advisory fee rate would not change or impair the nature, extent or quality of services provided to the Portfolios. Based on all of the information presented, the Board concluded that implementation of the BNY AMNA Amendments was in the interests of shareholders of the Portfolios.
Approval of Amendments to Portfolio Management Agreements with CLIM. During the period, the Board also approved amendments (the “CLIM Amendments”) to the Portfolio Management Agreements (the “CLIM Agreements”) with CLIM related to each of Intermediate Term Municipal Bond and Intermediate Term Municipal Bond II Portfolios (the “Affected Portfolios”) discussed above. The Board was informed with respect to the fact that under the CLIM Agreements, CLIM had agreed to manage assets in each of the Affected Portfolios for an initial period of time at a fee rate substantially lower than its standard fee for the services being provided in order to be able to begin managing assets for each of the Affected Portfolios immediately under the Trust’s “manager of managers” exemptive order3 and with the understanding that the Trust would seek shareholder approval of the higher standard fee as soon as reasonably practicable.
At its meeting in June, 2018, the Board approved the CLIM Amendments, which provide for CLIM’s standard fee rate for its strategy and authorized a special meeting of the shareholders of each of the Affected Portfolios to seek shareholder approval of the CLIM Amendments.
In approving the CLIM Amendments, the Board reviewed information with respect to the anticipated nature, extent and quality of the services provided by CLIM and the projected role of the organization in the context of the Affected Portfolios, as well as CLIM’s representations and the view of the Adviser to the effect that CLIM would not be able to continue to provide its services to the Affected Portfolios at the initial fee rate. Based on all of the information presented, the Board concluded that implementation of the CLIM Amendments was in the interests of shareholders of the Portfolios.
OFFICERS. The table below sets forth certain information about each of the Trust’s executive officers.
| | | | | | | | | | |
NAME, ADDRESS, AND AGE | | POSITION(S) HELD WITH TRUST | | TERM OF OFFICE; TERM SERVED IN OFFICE | | PRINCIPAL OCCUPATION(S) DURING PAST 5 YEARS | | NUMBER OF
PORTFOLIOS
IN FUND
COMPLEX
OVERSEEN | | |
Jonathan J. Hirtle Five Tower Bridge, 300 Barr Harbor Drive, West Conshohocken, PA 19428 Born: 1952 | | President | | Indefinite; President since 2/01/17 | | Mr. Hirtle is currently the Executive Chairman of the Adviser. He has been with the Adviser for more than the past five years. | | 22 | | |
| | | | | |
Colette Bergman Five Tower Bridge, 300 Barr Harbor Drive, West Conshohocken, PA 19428 Born: 1970 | | Vice President & Treasurer | | Indefinite; Since 6/12/12 | | Ms. Bergman is currently a Vice President of the Adviser. She has been with the Adviser for more than 5 years. | | 22 | | |
Guy Talarico Alaric Compliance Services, LLC 150 Broadway, Suite 302 New York, NY 10038 Born: 1955 | | Chief Compliance Officer | | Indefinite; Since 4/25/13 | | Mr. Talarico is President and CEO of Alaric Compliance Services, LLC and has been since the company’s inception in 2004. | | 22 | | |
| | | | | |
Curtis Barnes Citi Fund Services 4400 Easton Commons, Suite 200 Columbus, OH 43219 Born: 1953 | | Secretary | | Indefinite; Since 6/05/14 | | Mr. Barnes is a Senior Vice President and has been with Citi Fund Services Ohio, Inc. since June 1995. | | 22 | | |
329
HC CAPITAL TRUST
Additional Information (concluded) — June 30, 2018 (Unaudited)
INDEPENDENT TRUSTEES. The table below sets forth certain information about each of the Trust’s Independent Trustees.
| | | | | | | | | | |
NAME, ADDRESS, AND AGE | | POSITION(S) HELD WITH TRUST | | TERM OF OFFICE; TERM SERVED IN OFFICE | | PRINCIPAL OCCUPATION(S) DURING PAST 5 YEARS | | NUMBER OF
PORTFOLIOS
IN FUND
COMPLEX
OVERSEEN | | OTHER
DIRECTORSHIPS
HELD BY
TRUSTEE* |
Jarrett Burt Kling Five Tower Bridge, 300 Barr Harbor Drive, West Conshohocken, PA 19428 Born: 1943 | | Trustee | | Indefinite; Since 7/20/95 | | For more than the past five years Mr. Kling has been a managing director of CBRE Clarion Securities, LLC, a registered investment adviser. | | 22 | | None |
| | | | | |
Harvey G. Magarick Five Tower Bridge, 300 Barr Harbor Drive, West Conshohocken, PA 19428 Born: 1939 | | Trustee | | Indefinite; Since 7/01/04 | | Mr. Magarick is retired. Prior to June 3, 2004, he was a partner in the accounting firm of BDO Seidman, LLP. | | 22 | | Resource
Apartment
REIT III, Inc. |
| | | | | |
R. Richard Williams Five Tower Bridge, 300 Barr Harbor Drive, West Conshohocken, PA 19428 Born: 1945 | | Trustee and Chairman | | Indefinite; Trustee since 7/15/99; Chairman since 3/21/17 | | Since 2000, Mr. Williams has been the owner of Seaboard Advisers (consulting services). | | 22 | | Franklin
Square Energy
and Power
Fund |
| | | | | |
Richard W. Wortham, III Five Tower Bridge, 300 Barr Harbor Drive, West Conshohocken, PA 19428 Born: 1938 | | Trustee | | Indefinite; Since 7/20/95 | | Mr. Wortham is currently the Chairman and Chief Executive Officer of The Wortham Foundation and has been a Trustee for more than the past five years. | | 22 | | Oncor Electric
Delivery
Company
LLC |
INTERESTED TRUSTEE. The following table sets forth certain information about each of the Trust’s Interested Trustee.
| | | | | | | | | | |
NAME, ADDRESS, AND AGE | | POSITION(S)
HELD WITH
TRUST | | TERM OF OFFICE; TERM SERVED IN OFFICE | | PRINCIPAL OCCUPATION(S) DURING PAST 5 YEARS | | NUMBER OF
PORTFOLIOS
IN FUND
COMPLEX
OVERSEEN | | OTHER
DIRECTORSHIPS
HELD BY
TRUSTEE* |
Laura Anne Corsell** Five Tower Bridge, 300 Barr Harbor Drive, West Conshohocken, PA 19428 Born: 1948 | | None | | Indefinite; Since 3/17/17 | | Ms. Corsell is retired. During the past five years she was a Partner at each of McCarter & English, LLP (law firm) (2013-2016) and Montgomery, McCracken, Walker & Rhoads, LLP (law firm) (2007-2014). | | 22 | | None |
| * | The information in this column relates only to directorships in companies required to file certain reports with the SEC under the various federal securities laws. |
| ** | Ms. Corsell is considered to be “interested” due to her historical relationship with the Adviser, including, prior to retiring, serving as counsel to the Trust and the Adviser. |
330
HC CAPITAL TRUST
Trustees
LAURA ANNE CORSELL
JARRETT B. KLING
HARVEY G. MAGARICK
R. RICHARD WILLIAMS
RICHARD W. WORTHAM III
Investment Adviser
HC Capital Solutions
Five Tower Bridge
300 Barr Harbor Drive, 5th Floor
West Conshohocken, PA 19428
Administrator
Citi Fund Services Ohio, Inc.
4400 Easton Commons, Suite 200
Columbus, OH 43219
Distributor
Unified Financial Securities, LLC
A subsidiary of Ultimus Fund Solutions, LLC
9465 Counselors Row, Suite 200
Indianapolis, IN 46240
Counsel
Stradley Ronon Stevens & Young, LLP
2005 Market Street, Suite 2600
Philadelphia, PA 19103-7018
Independent Registered Public Accounting Firm
PricewaterhouseCoopers LLP
41 South High Street, Suite 2500
Columbus, OH 43215
Custodian
State Street Bank and Trust Company
State Street Financial Center
1 Lincoln Street
Boston, MA 02111-2900
This report is for the information of the shareholders of HC Capital Trust. Its use in connection with any offering of the Trust’s shares is authorized only in case of a concurrent or prior delivery of the Trust’s current prospectus. The prospectus contains more complete information, including investment objectives, risks, fees and expenses and should be read carefully before investing or sending any money.
8/18
Item 2. Code of Ethics.
(a) The Registrant has adopted a code of ethics that applies to the Registrant’s principal executive officer, principal financial officer, principal accounting officer or controller, or persons performing similar functions, regardless of whether these individuals are employed by the Registrant or a third party (the “Code of Ethics”). The Code of Ethics is included as an Exhibit. During the period covered by the report, with respect to the Registrant’s Code of Ethics, there have been no amendments to, nor any waivers granted from, a provision that relates to any element of the code of ethics definition enumerated in paragraph (b) of this Item 2 of Form N-CSR.
Item 3. Audit Committee Financial Expert.
3(a)(1) The Registrant’s Board of Trustees has determined that the Registrant has at least one audit committee financial expert serving on its audit committee.
3(a)(2) The audit committee financial expert is Harvey Magarick, who is “independent” for purposes of this Item 3 of Form N-CSR. Mr. Magarick was appointed to the Board of Trustees effective July 1, 2004 and was determined to be an audit committee financial expert on August 26, 2004.
Item 4. Principal Accountant Fees and Services.
(a) Audit Fees
2017 $607,336
2018 $631,517
For the fiscal years ended June 30, 2017 and June 30, 2018, the aggregate fees billed by PricewaterhouseCoopers LLP for professional services rendered for the audits of the financial statements or services that are normally provided in connection with statutory and regulatory filings or engagements for the fiscal year for the Registrant are shown in the table above.
Audit-related fees include the aggregate fees billed in each of the last two fiscal years for assurance and related services provides by PricewaterhouseCoopers LLP reasonably related to the performance of the audit of the Registrant’s financial statements and not reported under Audit fees under Item 4(a).
(b) Audit-Related Fees
2017 $0
2018 $0
(c) Tax Fees
2017 $150,875
2018 $155,430
Tax fees include amounts related to tax compliance, tax advice, and tax planning. Such tax services included the review of income and excise tax returns for the Registrant as shown in the table above for the fiscal years ended June 30, 2017 and June 30, 2018.
(d) All Other Fees
2017 $135,000
2018 $160,000
Other fees include amounts related to international tax services for the Registrant as shown in the table above for the fiscal years ended June 30, 2017 and June 30, 2018.
(e)(1)—Except as permitted by Rule 2-01 (c)(7)(i)(c) of Regulation S-X, the HC Capital Trust Audit Committee must pre-approve all audit and non-audit services provided by the independent accountants relating to the operations or financial reporting of the Portfolios. Prior to the commencement of any audit or non-audit services to a Fund, the Audit Committee reviews the services to determine whether they are appropriate and permissible under applicable law.
(e)(2)—The following percentages of the services summarized in (b)-(d) above were approved by the Audit Committee pursuant to Rule 2-01 (c)(i)(c) of Regulation S-X.
2017 47%
2018 51%
(f)—Not applicable.
(g)—For the fiscal years ended June 30, 2017 and June 30, 2018, the aggregate non-audit fees billed by PricewaterhouseCoopers LLP for services rendered to the Registrant and to the Registrant’s investment advisers (the “Advisers”) and any entity controlling, controlled by, or under common control with the Advisers that provided ongoing services to the Registrant were $0 and $0, respectively.
(h)—PricewaterhouseCoopers LLP has informed the Registrant that it has identified an issue related to its independence under Rule 2-01(c)(1)(ii)(A) of Regulation S-X (referred to as the “Loan Rule”). The Loan Rule prohibits accounting firms, such as PricewaterhouseCoopers LLP, from being considered independent if they have certain financial relationships with their audit clients or certain affiliates of those clients. The Registrant is required under various securities laws to have its financial statements audited by an independent accounting firm. PricewaterhouseCoopers LLP has informed the Registrant that PricewaterhouseCoopers LLP has relationships with lenders who hold or own more than ten percent of the shares of certain Portfolios of the Registrant. These relationships call into question PricewaterhouseCoopers LLP’s independence under the Loan Rule with respect to those Portfolios, as well as all other funds in the complex. The Securities and Exchange Commission has granted no-action relief to another fund complex in circumstances that appear to be substantially similar to the Registrant’s (see Fidelity Management & Research Company et al., No-Action Letter (June 20, 2016)). In addition, PricewaterhouseCoopers LLP has advised the Registrant’s Audit Committee that PricewaterhouseCoopers LLP believes that under the facts and circumstances surrounding PricewaterhouseCoopers LLP’s lending relationships, its ability to exercise objective and impartial judgment in connection with its audit engagement with the Registrant has not been impaired and that a reasonable investor with knowledge of all relevant facts and circumstances would reach the same conclusion. If in the future, however, the independence of PricewaterhouseCoopers LLP is called into question under the Loan Rule
by circumstances that are not addressed in the Securities and Exchange Commission’s no-action letter, the Registrant will need to take other action in order for the Registrant’s filings with the Securities and Exchange Commission containing financial statements to be deemed compliant with applicable securities laws. Finally, the Securities and Exchange Commission has indicated that its no-action relief will expire 18 months from its issuance, after which PricewaterhouseCoopers LLP and the Registrant will no longer be able rely on the letter unless its term is extended or made permanent by the Securities and Exchange Commission Staff.
Item 5. Audit Committee of Listed Registrants.
Not applicable.
Item 6. Schedule of Investments.
(a) Not applicable.
(b) Not applicable.
Item 7. Disclosure of Proxy Voting Policies and Procedures for Closed-End Management Investment Companies.
Not applicable.
Item 8. Portfolio Managers of Closed-End Management Investment Companies.
Not applicable.
Item 9. Purchases of Equity Securities by Closed-End Management Investment Company and Affiliated Purchasers.
Not applicable.
Item 10. Submission of Matters to a Vote of Security Holders.
Not applicable.
Item 11. Controls and Procedures.
(a) The Registrant’s principal executive officer and principal financial officer have concluded, based on their evaluation of the Registrant’s disclosure controls and procedures as conducted within 90 days of the filing date of this report, that these disclosure controls and procedures are adequately designed and are operating effectively to ensure that information required to be disclosed by the Registrant on Form N-CSR is recorded, processed, summarized and reported within the time periods specified in the Securities and Exchange Commission’s rules and forms.
(b) There were no changes in the Registrant’s internal control over financial reporting (as defined in Rule 30a-3(d) under the Investment Company Act of 1940 (“the Act”) (17 CFR 270.30a-3(d)) that occurred during the second fiscal quarter of the period covered by this report that have materially affected or are reasonably likely to materially affect, the Registrant’s internal control over financial reporting.
Item 12. Disclosures of Securities Lending Activities for Closed-End Management Investment Companies.
Not applicable.
Item 13. Exhibits.
(a)(1) The Code of Ethics that is the subject of the disclosure required by Item 2 is attached hereto.
(a)(2) Certifications pursuant to Rule 30a-2(a) under the Act are attached hereto.
(a)(3) Not applicable.
(b) Certifications pursuant to Rule 30a-2(b) under the Act are attached hereto.
SIGNATURES
Pursuant to the requirements of the Securities Exchange Act of 1934 and the Investment Company Act of 1940, the Registrant has duly caused this report to be signed on its behalf by the undersigned, thereunto duly authorized.
| | | | |
| (Registrant) | | HC Capital Trust | | |
| | | | |
| | |
By (Signature and Title) | | /s/ Jonathan J. Hirtle | | |
| | |
| | Jonathan J. Hirtle, Principal Executive Officer | | |
Date: August 31, 2018
Pursuant to the requirements of the Securities Exchange Act of 1934 and the Investment Company Act of 1940, this report has been signed below by the following persons on behalf of the Registrant and in the capacities and on the dates indicated.
| | | | |
| | |
By (Signature and Title) | | /s/ Colette L. Bergman | | |
| | Colette L. Bergman, Principal Financial Officer | | |
Date: August 31, 2018
| | | | |
| | |
By (Signature and Title) | | /s/ Jonathan J. Hirtle | | |
| | Jonathan J. Hirtle, Principal Executive Officer | | |
Date: August 31, 2018