-
UNITED STATES
SECURITIES AND EXCHANGE COMMISSION
Washington, D.C. 20549
FORM N-CSR
CERTIFIED SHAREHOLDER REPORT OF REGISTERED
MANAGEMENT INVESTMENT COMPANIES
| Investment Company Act file number | 811-08918 | |
HC Capital Trust
(Exact name of Registrant as specified in charter)
Five Tower Bridge, 300 Barr Harbor Drive, 5th Floor, West Conshohocken, PA 19428
(Address of principal executive offices) (Zip code)
Citi Fund Services Ohio, Inc., 4400 Easton Commons, Suite 200, Columbus, OH 43219
(Name and address of agent for service)
| Registrant's telephone number, including area code: | 800-242-9596 | |
| Date of fiscal year end: | June 30 | |
| Date of reporting period: | June 30, 2022 | |
Item 1. Reports to Stockholders.

Annual Report
The Value Equity Portfolio
The Growth Equity Portfolio
The Institutional U.S. Equity Portfolio
The Small Capitalization-Mid Capitalization Equity Portfolio
The ESG Growth Portfolio
The Catholic SRI Growth Portfolio
The International Equity Portfolio
The Institutional International Equity Portfolio
The Emerging Markets Portfolio
The Core Fixed Income Portfolio
The Corporate Opportunities Portfolio
The U.S. Government Fixed Income Securities Portfolio
The U.S. Corporate Fixed Income Securities Portfolio
The U.S. Mortgage/Asset Backed Fixed Income Securities Portfolio
The Short-Term Municipal Bond Portfolio
The Intermediate Term Municipal Bond Portfolio
The Intermediate Term Municipal Bond II Portfolio
June 30, 2022
HC CAPITAL TRUST | | Annual Report |
June 30, 2022
Table of Contents
| | |
Management Discussion of Portfolio Performance | 1 |
Shareholder Letter | 37 |
Portfolios of Investments | 38 |
Statements of Assets and Liabilities | 275 |
Statements of Operations | 280 |
Statements of Changes in Net Assets | 285 |
Financial Highlights | 291 |
Notes to Financial Statements | 298 |
Report of Independent Registered Public Accounting Firm | 331 |
Additional Information | 333 |
Trustees and Officers | 348 |
Fiscal Year 2022 Summary
General Market
(Unaudited — June 30, 2022)
The Portfolios of the HC Capital Trust provide clients with diversified exposure to multiple asset classes (for both taxable and institutional investors). The Portfolios diversify, where appropriate, across multiple independent investment advisory organizations (“Specialist Managers”) and strategies. The Portfolios enable the construction of custom asset allocation portfolios that best meet clients’ overall investment policies and objectives. Depending upon the objective, each Portfolio will generally seek to deliver performance that exceeds, or is in-line with, the benchmark for the Portfolio as well as a peer universe of mutual funds with similar investment strategies.
Financial markets experienced a great deal of volatility over the course of the Fiscal Year with the MSCI World Index down 13.75%. During 2021, the markets rose steadily on the heels of the economy’s reopening and worldwide fiscal and monetary stimulus. However, this policy-induced euphoria was brought to a halt in the winter of 2022 with Russia’s invasion of the Ukraine. As leading suppliers of oil and wheat to the global economy, the Russia-Ukraine war caused energy and commodity prices to skyrocket, exacerbating already elevated inflation and supply chain constraints. The Consumer Price Index increased by 9.1% year-over-year in June 2022 – the largest 12-month increase in over four decades. The Fed and other Central Banks rapidly increased interest rates to quell inflation expectations, increasing the prospects for a global recession. In June, the Fed increased the Fed Funds Target range to 1.50% - 1.75% and is now projecting a year-end Fed Funds rate of 3.40%.
There were few places to hide, geographically or by asset class. The S&P 500 declined over the twelve months ended June 30, 2022 by 10.62%. Value outperformed Growth stocks as inflation hit record levels. Rising oil and gas prices and higher U.S. Treasury yields caused energy and financial stocks to significantly outperform the rest of the market. The Russell 1000® Value Index declined by 6.82% compared to the Russell 1000® Growth Index which fell 18.77% during the Fiscal Year. The MSCI EAFE Index and the MSCI Emerging Markets Index declined by 17.33% and 25.00% in U.S. Dollar terms, respectively, for the Fiscal Year. The fixed income markets were similarly impacted, as the Fed’s tightening triggered a major adjustment in yields. The U.S. 10-year Treasury yield rose from 1.47% to 3.01% over the year. The Bloomberg U.S. Aggregate Bond Index declined by 10.29% during the year.
1
Each of the Portfolios provided results consistent with their stated objectives over the fiscal year ended June 30, 2022. The performance of each Portfolio is listed in the table below and detailed summaries of the objectives, managers, and results are contained in the subsequent sections.
HC Capital Trust Portfolios | | Fiscal Year
2022 Return | |
The Value Equity Portfolio | | | -13.10 | % |
Russell 1000® Value Index1 | | | -6.82 | % |
The Growth Equity Portfolio . | | | -16.30 | % |
Russell 1000® Growth Index1 | | | -18.77 | % |
The Institutional U.S. Equity Portfolio | | | -15.30 | % |
MSCI USA Index2 | | | -12.80 | % |
The Small Capitalization-Mid Capitalization Equity Portfolio | | | -22.74 | % |
Russell 2000® Index1 | | | -25.20 | % |
The ESG Growth Portfolio | | | -14.80 | % |
MSCI World Index3 | | | -13.94 | % |
The Catholic SRI Growth Portfolio | | | -16.17 | % |
MSCI World Index3 | | | -13.94 | % |
The International Equity Portfolio | | | -15.85 | % |
MSCI EAFE Index4 | | | -17.33 | % |
The Institutional International Equity Portfolio | | | -18.16 | % |
MSCI EAFE Index4 | | | -17.33 | % |
The Emerging Markets Portfolio | | | -23.87 | % |
MSCI EM Index5 | | | -25.00 | % |
The Core Fixed Income Portfolio | | | -11.58 | % |
Bloomberg U.S. Aggregate Bond Index6 | | | -10.29 | % |
The Corporate Opportunities Portfolio | | | -8.03 | % |
Bloomberg U.S. High Yield Ba/B 2% Issuer Capped Index7 | | | -12.44 | % |
The U.S. Government Fixed Income Securities Portfolio | | | -9.40 | % |
Bloomberg U.S. Government Bond Index8 | | | -8.82 | % |
The U.S. Corporate Fixed Income Securities Portfolio | | | -12.12 | % |
Bloomberg U.S. Corporate Bond Index9 | | | -14.19 | % |
The U.S. Mortgage/Asset Backed Fixed Income Securities Portfolio | | | -8.51 | % |
Bloomberg U.S. Securitized Index10 | | | -8.97 | % |
The Short-Term Municipal Bond Portfolio | | | -3.27 | % |
ICE BofA Merrill Lynch 1-3 Year Municipal Index11 | | | -2.15 | % |
The Intermediate Term Municipal Bond Portfolio | | | -5.98 | % |
Bloomberg 3-10 Year Blend (2-12) Total Return Index Unhedged12 | | | -5.95 | % |
The Intermediate Term Municipal Bond II Portfolio | | | -9.35 | % |
Bloomberg 5-Year General Obligation Municipal Index13 | | | -5.03 | % |
Bloomberg Managed Money Short/Intermediate Index14 | | | -6.14 | % |
In reviewing the table above and the remainder of this report, note that past performance does not guarantee future results. The remainder of this report contains more specific details about the performance, strategy and managers in each of the Portfolios.
2
1 | Each of the Russell indices is a market cap-weighted index of common stocks domiciled in the U.S. Unlike the S&P 500 Stock Index however, the basket of securities included in the various Russell indices is reconstituted each year. The Russell 3000® Index is constructed by ranking U.S. common stocks from largest to smallest market capitalization, and including in the index the top 3,000 stocks. The largest 1,000 stocks become the Russell 1000® Index and the next 2,000 stocks are included in the Russell 2000® Index. The Russell 1000® Growth Index is designed to measure the performance of those companies included in the Russell 1000® Index that have relatively higher price-to-book ratios and higher forecasted growth values. The Russell 1000 Value® Index is designed to measure the performance of those companies included in the Russell 1000® Index that have relatively lower price-to- book ratios and lower forecasted growth values. |
2 | The MSCI USA Index is designed to measure the performance of the large and mid-cap segments of the U.S. market. With 627 constituents, the index covers approximately 85% of the free float-adjusted market capitalization in the U.S. |
3 | The MSCI World Index is a broad global equity benchmark that represents large and mid-cap equity performance across 23 developed markets countries. The index covers approximately 85% of the free float-adjusted market capitalization in each country and does not offer exposure to emerging markets. As of June 30, 2022, the MSCI World Index consisted of the following 23 development markets: Australia, Austria, Belgium, Canada, Denmark, Finland, France, Germany, Hong Kong, Ireland, Israel, Italy, Japan, Netherlands, New Zealand, Norway, Portugal, Singapore, Spain, Sweden, Switzerland, the United Kingdom and the United States. |
4 | The Morgan Stanley Capital International Europe, Australasia, and Far East Index (“MSCI EAFE Index”) is an unmanaged, free float-adjusted market capitalization index that is designed to measure the equity market performance of developed markets, excluding Canada and the United States. As of June 30, 2022, the MSCI EAFE Index consisted of the following 21 developed market country indices: Australia, Austria, Belgium, Denmark, Finland, France, Germany, Hong Kong, Ireland, Israel, Italy, Japan, Netherlands, New Zealand, Norway, Portugal, Singapore, Spain, Sweden, Switzerland and the United Kingdom. |
5 | The MSCI Emerging Markets Index (“MSCI EM Index”) is an unmanaged free float-adjusted market capitalization index that is designed to measure equity market performance of emerging markets. As of June 30, 2022, the MSCI EM Index consisted of the following 24 emerging market country indices: Brazil, Chile, China, Colombia, Czech Republic, Egypt, Greece, Hungary, India, Indonesia, Kuwait, Malaysia, Mexico, Peru, Philippines, Poland, Qatar, Saudi Arabia, South Africa, South Korea, Taiwan, Thailand, Turkey and United Arab Emirates. |
6 | The Bloomberg U.S. Aggregate Bond Index covers the USD-denominated, investment-grade, fixed-rate, taxable bond market of SEC-registered securities. |
7 | The Bloomberg U.S. High Yield Ba/B 2% Issuer Capped Index is designed to mirror the investable universe of the U.S. dollar denominated high yield debt market. |
8 | The Bloomberg U.S. Government Bond Index is a broad-based index that represents the general performance of U.S. Treasury and U.S. Government agency debt securities. The index includes U.S. dollar-denominated, fixed-rate, nominal U.S. Treasuries, and U.S. agency debentures. |
9 | The Bloomberg U.S. Corporate Bond Index measures the investment grade, fixed-rate, taxable corporate bond market. It includes USD- denominated securities publicly issued by U.S. and non-U.S. industrial, utility, and financial issuers. |
10 | The Bloomberg U.S. Securitized Index tracks the performance of mortgage-backed pass-through securities issued by Ginnie Mae, Fannie Mae and Freddie Mac, investment-grade bonds and asset-backed securities. |
11 | The ICE Bank of America (“BofA”) Merrill Lynch 1-3 Year Municipal Index is an equal-weighted index that tracks the total return performance of the domestic U.S. municipal market. The index consists of investment-grade, publicly traded, fixed-rate and coupon bearing municipal securities with a maturity of one to three years. |
12 | The Bloomberg 3-10 Year Blend (2-12) Total Return Index Unhedged is an index composed of bonds with maturities ranging between 2 and 12 years. |
13 | The Bloomberg 5-Year General Obligations Municipal Index is an unmanaged index generally representative of investment grade fixed-rate debt obligations issued by state and local government entities, with maturities of no more than six years. |
14 | The Bloomberg Managed Money Short/Intermediate Index is a rules-based and market-value weighted index that measures the performance of the publicly traded municipal bonds that cover the USD-denominated short/intermediate term tax-exempt bond market, including state and local general obligation bonds, revenue bonds, insured bonds, and pre-refunded bonds. |
3
The Value Equity Portfolio
(Unaudited)
The Value Equity Portfolio (the “Portfolio”) managed by Parametric Portfolio Associates, LLC (“Parametric”) returned -13.10% for the fiscal year compared to -6.82% for the Russell 1000® Value Index1 and -6.00% for the average manager in the Lipper2 universe of Large Cap Value Funds.3
The Portfolio underperformed its benchmark over the period. The tax-managed strategy run by Parametric focuses on minimizing taxable gains subject to a tracking error constraint. The tracking error generated by tax minimization created modest before-tax underperformance during the period.
The Portfolio is able to diversify across multiple managers and strategies to ensure proper portfolio diversification, with the goal of providing superior long-term returns in as stable and consistent an after-tax manner as possible. As a result, it is expected that some managers and styles will be leading at times, while others are lagging and vice versa. The Portfolio expects to attribute some of its performance to this cyclicality of styles.
1 | The Russell 1000® Value Index measures the performance of those companies included in the Russell 1000® Index with lower price-to-book ratios and lower forecasted growth rates. This index is unmanaged, thus the index results do not reflect the impact of expenses associated with any investment in securities, such as brokerage commission or other transaction costs. Benchmark performance is shown for comparison purposes only, as it is not possible to invest directly in a securities index. |
2 | Lipper, Inc. is an independent statistical monitoring organization that compiles performance on mutual funds and further categorizes them by investment objective. |
3 | During the fiscal year, Echo Street Capital Management LLC, Frontier Capital Management Company, LLC and Mellon Investments Corporation were also under contract to manage the Portfolio but did not have assets allocated to them. |
4

The chart represents historical performance of a hypothetical investment of $10,000 in The Value Equity Portfolio for the 10- year period ended 6/30/22, and represents the reinvestment of dividends and capital gains in the Portfolio.
Past performance does not guarantee future results. The performance data quoted represents past performance and current returns may be lower or higher. The investment return and principal value will fluctuate so that an investor’s shares, when redeemed, may be worth more or less than the original cost. To obtain performance information current to the most recent month end, please call (800) 242-9596.
The Portfolio’s performance above is compared to the Russell 1000® Value Index. The index is unmanaged and does not reflect the deduction of fees associated with a mutual fund, such as investment management and fund accounting fees, or the deduction of taxes. An investor cannot invest directly in an index. The performance of The Value Equity Portfolio reflects the deduction of fees for these value-added services, but does not reflect the deduction of taxes that a shareholder would pay on the Portfolio’s distributions or redemptions of the Portfolio’s shares.
Expense Ratio
HC Strategic Shares 0.22%
HC Advisors Shares 0.47%1
1 | HC Advisors Shares include Distribution Plan fees of 0.25% which are voluntarily waived by the Adviser. Such waiver is not reflected in the expense ratio shown. |
This information is included in the most current prospectus available to current and prospective shareholders of the Portfolio. Additional information pertaining to the June 30, 2022, expense ratios can be found in the financial highlights.
5
The Growth Equity Portfolio
(Unaudited)
The Growth Equity Portfolio (the “Portfolio”) managed by Jennison Associates, LLC (“Jennison”) and Parametric Portfolio Associates, LLC (“Parametric”) returned -16.30% for the fiscal year compared to -18.77% for the Russell 1000® Growth Index1 and -24.50% for the average manager in the Lipper2 universe of Large Cap Growth Funds.3
The Portfolio outperformed its benchmark over the period. The tax-managed strategy run by Parametric focuses on minimizing taxable gains subject to a tracking error constraint. The tracking error generated by tax minimization created before-tax outperformance during the period. Jennison underperformed the benchmark while Parametric outperformed the benchmark. Jennison’s underperformance was driven by manager security selection
The Portfolio is diversified across multiple managers and strategies to ensure proper portfolio diversification, with the goal of providing superior long-term returns in as stable and consistent a manner as possible. As a result, it is expected that some managers and styles will be leading at times, while others are lagging and vice versa. The Portfolio expects to attribute some of its performance to this cyclicality of styles.
1 | The Russell 1000® Growth Index measures the performance of those companies included in the Russell 1000® Index with higher price-to-book ratios and higher forecasted growth rates. This index is unmanaged, thus the index results do not reflect the impact of expenses associated with any investment in securities, such as brokerage commission or other transaction costs. Benchmark performance is shown for comparison purposes only, as it is not possible to invest directly in a securities index. |
2 | Lipper, Inc. is an independent statistical monitoring organization that compiles performance on mutual funds and further categorizes them by investment objective. |
3 | During the fiscal year, Echo Street Capital Management LLC and Mellon Investments Corporation were also under contract to manage the Portfolio but did not have assets allocated to them. |
6

The chart represents historical performance of a hypothetical investment of $10,000 in The Growth Equity Portfolio for the 10-year period ended 6/30/22, and represents the reinvestment of dividends and capital gains in the Portfolio.
Past performance does not guarantee future results. The performance data quoted represents past performance and current returns may be lower or higher. The investment return and principal value will fluctuate so that an investor’s shares, when redeemed, may be worth more or less than the original cost. To obtain performance information current to the most recent month end, please call (800) 242-9596.
The Portfolio’s performance above is compared to the Russell 1000® Growth Index. The index is unmanaged and does not reflect the deduction of fees associated with a mutual fund, such as investment management and fund accounting fees, or the deduction of taxes. An investor cannot invest directly in an index. The performance of The Growth Equity Portfolio reflects the deduction of fees for these value-added services, but does not reflect the deduction of taxes that a shareholder would pay on the Portfolio’s distributions or redemptions of the Portfolio’s shares.
Expense Ratio
HC Strategic Shares 0.27%
HC Advisors Shares 0.52%1
1 | HC Advisors Shares include Distribution Plan fees of 0.25% which are voluntarily waived by the Adviser. Such waiver is not reflected in the expense ratio shown. |
This information is included in the most current prospectus available to current and prospective shareholders of the Portfolio. Additional information pertaining to the June 30, 2022, expense ratios can be found in the financial highlights.
7
The Institutional U.S. Equity Portfolio
(Unaudited)
The Institutional U.S. Equity Portfolio (the “Portfolio”) managed by Echo Street Capital Management LLC (“Echo Street”), Jennison Associates, LLC (“Jennison”), Mellon Investments Corporation (“Mellon”), Parametric Portfolio Associates, LLC and Wellington Management Company, LLP (“Wellington”) returned -15.30% for the fiscal year compared to -12.80% for the MSCI USA Index1 and -13.94% for the average manager in the Lipper2 universe of Multi-Cap Core Funds.3
The Portfolio modestly underperformed the benchmark primarily due to the performance of Echo Street and Jennison. Echo Street and Jennison’s growth bias resulted in relative underperformance as growth stocks lagged the broad market. Mellon performed in-line with the benchmark and Wellington outperformed the benchmark. Wellington’s outperformance was driven primarily by sector allocation.
The Portfolio is diversified across multiple managers and strategies to ensure proper portfolio diversification, with the goal of providing superior long-term returns in as stable and consistent a manner as possible. As a result, it is expected that some managers and styles will be leading at times, while others are lagging and vice versa. The Portfolio expects to attribute some of its performance to this cyclicality of styles.
1 | The MSCI USA Index is designed to measure the performance of the large and mid cap segments of the U.S. market. With 627 constituents, the index covers approximately 85% of the free float-adjusted market capitalization in the U.S. This index is unmanaged, thus the index results do not reflect the impact of expenses associated with any investment in securities, such as brokerage commission or other transaction costs. Benchmark performance is shown for comparison purposes only, as it is not possible to invest directly in a securities index. |
2 | Lipper, Inc. is an independent statistical monitoring organization that compiles performance on mutual funds and further categorizes them by investment objective. |
3 | During the fiscal year, Frontier Capital Management Company, LLC and Pacific Investment Management Company, LLC were also under contract to manage the Portfolio but did not have assets allocated to them. |
8

The chart represents historical performance of a hypothetical investment of $10,000 in The Institutional U.S. Equity Portfolio for the 10-year period ended 6/30/22, and represents the reinvestment of dividends and capital gains in the Portfolio.
Past performance does not guarantee future results. The performance data quoted represents past performance and current returns may be lower or higher. The investment return and principal value will fluctuate so that an investor’s shares, when redeemed, may be worth more or less than the original cost. To obtain performance information current to the most recent month end, please call (800) 242-9596.
The Portfolio’s performance above is compared to the MSCI USA Index. The index is unmanaged and does not reflect the deduction of fees associated with a mutual fund, such as investment management and fund accounting fees, or the deduction of taxes. An investor cannot invest directly in an index. The performance of The Institutional U.S. Equity Portfolio reflects the deduction of fees for these value-added services, but does not reflect the deduction of taxes that a shareholder would pay on the Portfolio’s distributions or redemptions of the Portfolio’s shares.
Expense Ratio
HC Strategic Shares 0.29%
HC Advisors Shares 0.54%1
1 | HC Advisors Shares include Distribution Plan fees of 0.25% which are voluntarily waived by the Adviser. Such waiver is not reflected in the expense ratio shown. |
This information is included in the most current prospectus available to current and prospective shareholders of the Portfolio. Additional information pertaining to the June 30, 2022, expense ratios can be found in the financial highlights.
9
The Small Capitalization-Mid Capitalization Equity Portfolio
(Unaudited)
The Small Capitalization-Mid Capitalization Equity Portfolio (the “Portfolio”) managed by Frontier Capital Management Company, LLC (“Frontier”) and Parametric Portfolio Associates, LLC (“Parametric”) returned -22.74% for the fiscal year compared to -25.20% for the Russell 2000® Index1 and -15.77% for the average manager in the Lipper2 universe of Small Cap Core Funds.3
The Portfolio outperformed its benchmark over the period. The tax-managed strategy run by Parametric focuses on minimizing taxable gains subject to a tracking error constraint. The tracking error generated by tax minimization contributed to before-tax outperformance during the period. Frontier outperformed the benchmark as well as a result of manager security selection. During the period, all securities in the Frontier portfolio were liquidated for tax loss harvesting purposes and the contract was terminated.
The Portfolio is diversified across multiple managers and strategies to ensure proper portfolio diversification, with the goal of providing superior long-term returns in as stable and consistent a manner as possible. As a result, it is expected that some managers and styles will be leading at times, while others are lagging and vice versa. The Portfolio expects to attribute some of its performance to this cyclicality of styles.
1 | The Russell 2000® Index measures the performance of smaller capitalization U.S. companies. The largest 1,000 stocks become the Russell 1000® Index and the next 2,000 stocks become the Russell 2000® Index. This index is unmanaged, thus the index results do not reflect the impact of expenses associated with any investment in securities, such as brokerage commission or other transaction costs. Benchmark performance is shown for comparison purposes only, as it is not possible to invest directly in a securities index. |
2 | Lipper, Inc. is an independent statistical monitoring organization that compiles performance on mutual funds and further categorizes them by investment objective. |
3 | During the fiscal year, Mellon Investments Corporation was also under contract to manage the Portfolio but did not have assets allocated to it. |
10
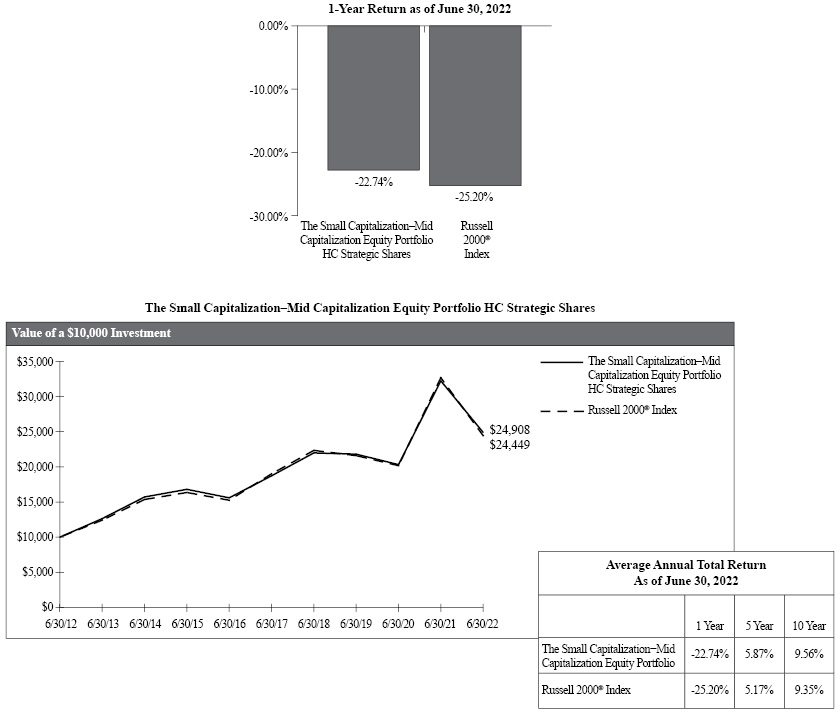
The chart represents historical performance of a hypothetical investment of $10,000 in The Small Capitalization–Mid Capitalization Equity Portfolio for the 10-year period ended 6/30/22, and represents the reinvestment of dividends and capital gains in the Portfolio.
Past performance does not guarantee future results. The performance data quoted represents past performance and current returns may be lower or higher. The investment return and principal value will fluctuate so that an investor’s shares, when redeemed, may be worth more or less than the original cost. To obtain performance information current to the most recent month end, please call (800) 242-9596.
The Portfolio’s performance above is compared to the Russell 2000® Index, which represents the performance of domestically traded common stocks of small to mid-sized companies. The index is unmanaged and does not reflect the deduction of fees associated with a mutual fund, such as investment management and fund accounting fees, or the deduction of taxes. An investor cannot invest directly in an index. The performance of The Small Capitalization-Mid Capitalization Equity Portfolio reflects the deduction of fees for these value-added services, but does not reflect the deduction of taxes that a shareholder would pay on the Portfolio’s distributions or redemptions of the Portfolio’s shares.
Expense Ratio
HC Strategic Shares 0.50%
HC Advisors Shares 0.75%1
1 | HC Advisors Shares include Distribution Plan fees of 0.25% which are voluntarily waived by the Adviser. Such waiver is not reflected in the expense ratio shown. |
This information is included in the most current prospectus available to current and prospective shareholders of the Portfolio. Additional information pertaining to the June 30, 2022, expense ratios can be found in the financial highlights.
11
The ESG Growth Portfolio
(Unaudited)
The ESG Growth Portfolio (the “Portfolio”) managed by Mellon Investments Corporation (“Mellon”), Parametric Portfolio Associates, LLC and RBC Global Asset Management (U.K.) Limited (“RBC GAM”) returned -14.80% for the fiscal year compared to -13.94% for the MSCI World Index.1, 2
The Portfolio’s underperformance can be attributed to the RBC GAM strategy. Its strategy expressed a growth bias that contributed to its underperformance over the period, as growth positions generally underperformed the market as a whole. RBC GAM considers each potential investment on the strengths of its business model, opportunity to take market share, end market growth, and management & ESG practices. The Global screening strategy, which was run by Mellon, modestly outperformed.
The Portfolio is diversified across multiple managers and strategies to ensure proper portfolio diversification, with the goal of providing superior long-term returns in as stable and consistent a manner as possible. As a result, it is expected that some styles will be leading at times, while others are lagging and vice versa. The Portfolio expects to attribute some of its performance to this cyclicality of styles.
The Portfolio requires that the underlying managers integrate ESG criteria in their investment selection. Mellon uses third party ESG data to better understand the environmental, social and governance risks and opportunities when making investment decisions.
1 | The MSCI World Index is an unmanaged index that is designed to capture large and mid-cap representation across 23 developed markets countries. The Index covers approximately 85% of the free float-adjusted market capitalization in each of the following countries: Australia, Austria, Belgium, Canada, Denmark, Finland, France, Germany, Hong Kong, Ireland, Israel, Italy, Japan, Netherlands, New Zealand, Norway, Portugal, Singapore, Spain, Sweden, Switzerland, the United Kingdom and the United States. This index is unmanaged, thus the index results do not reflect the impact of expenses associated with any investment in securities, such as brokerage commission or other transaction costs. Benchmark performance is shown for comparison purposes only, as it is not possible to invest directly in a securities index. |
2 | During the fiscal year, Agincourt Capital Management, LLC was also under contract to manage the Portfolio but did not have assets allocated to it. |
12
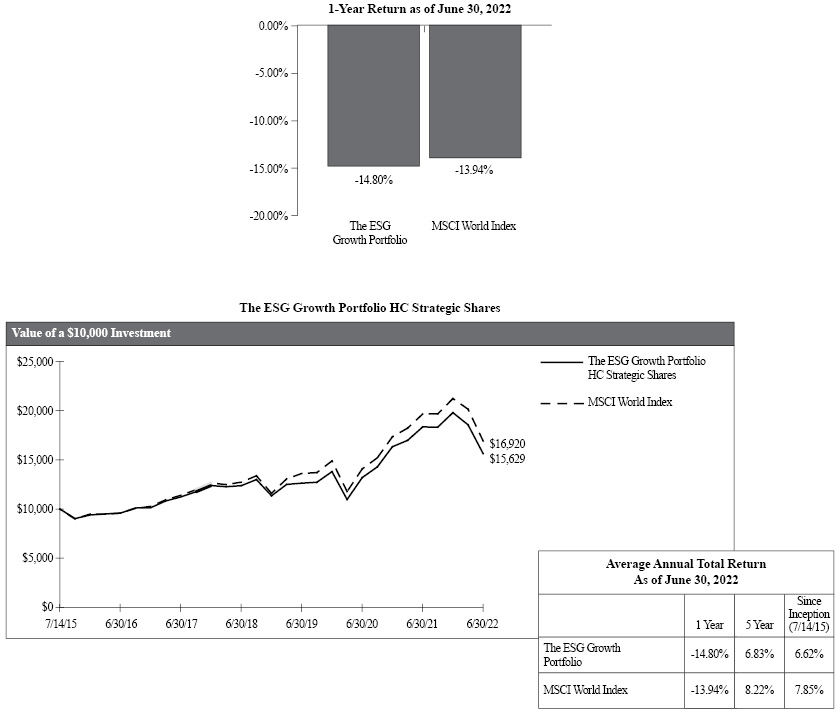
The chart represents historical performance of a hypothetical investment of $10,000 in The ESG Growth Portfolio from 7/14/15 to 6/30/22 and represents the reinvestment of dividends and capital gains in the Portfolio.
Past performance does not guarantee future results. The performance data quoted represents past performance and current returns may be lower or higher. The investment return and principal value will fluctuate so that an investor’s shares, when redeemed, may be worth more or less than the original cost. To obtain performance information current to the most recent month end, please call (800) 242-9596.
The Portfolio’s performance above is compared to the MCSI World Index is unmanaged and does not reflect the deduction of fees associated with a mutual fund, such as investment management and fund accounting fees, or the deduction of taxes. An investor cannot invest directly in an index. The performance of The ESG Growth Portfolio reflects the deduction of fees for these value-added services, but does not reflect the deduction of taxes that a shareholder would pay on the Portfolio’s distributions or redemptions of the Portfolio’s shares.
Expense Ratio
HC Strategic Shares 0.36%
HC Advisors Shares 0.61%1
1 | HC Advisors Shares include Distribution Plan fees of 0.25% which are voluntarily waived by the Adviser. Such waiver is not reflected in the expense ratio shown. |
This information is included in the most current prospectus available to current and prospective shareholders of the Portfolio. Additional information pertaining to the June 30, 2022, expense ratios can be found in the financial highlights.
13
The Catholic SRI Growth Portfolio
(Unaudited)
The Catholic SRI Growth Portfolio (the “Portfolio”) managed by Mellon Investments Corporation (“Mellon”) returned -16.17% for the fiscal year compared to -13.94% for the MSCI World Index.1, 2
The Portfolio’s underperformance can be attributed primarily to the screening that is required to adhere to Catholic values, which is managed by Mellon.
The Portfolio is diversified across securities to ensure proper portfolio diversification, with the goal of providing competitive long-term returns in as consistent a manner as possible. As a result, it is expected that some styles will be leading at times, while others are lagging and vice versa. The Portfolio expects to participate in this cyclicality of styles by maintaining market exposure comparable to MSCI World Index.
The Portfolio requires that the underlying managers integrate Catholic values in their investment selections, which includes negative screens. Mellon uses third party data to implement the negative screens in the Portfolio.
1 | The MSCI World Index is an unmanaged index that is designed to capture large and mid-cap representation across 23 developed markets countries. The Index covers approximately 85% of the free float-adjusted market capitalization in each of the following countries: Australia, Austria, Belgium, Canada, Denmark, Finland, France, Germany, Hong Kong, Ireland, Israel, Italy, Japan, Netherlands, New Zealand, Norway, Portugal, Singapore, Spain, Sweden, Switzerland, the United Kingdom and the United States. This index is unmanaged, thus the index results do not reflect the impact of expenses associated with any investment in securities, such as brokerage commission or other transaction costs. Benchmark performance is shown for comparison purposes only, as it is not possible to invest directly in a securities index. |
2 | During the fiscal year, Agincourt Capital Management, LLC and Parametric Portfolio Associates, LLC were also under contract to manage the Portfolio but did not have assets allocated to them. |
14

The chart represents historical performance of a hypothetical investment of $10,000 in The Catholic SRI Growth Portfolio from 1/12/16 to 6/30/22, and represents the reinvestment of dividends and capital gains in the Portfolio.
Past performance does not guarantee future results. The performance data quoted represents past performance and current returns may be lower or higher. The investment return and principal value will fluctuate so that an investor’s shares, when redeemed, may be worth more or less than the original cost. To obtain performance information current to the most recent month end, please call (800) 242-9596.
The Portfolio’s performance above is compared to the MCSI World Index is unmanaged and does not reflect the deduction of fees associated with a mutual fund, such as investment management and fund accounting fees, or the deduction of taxes. An investor cannot invest directly in an index. The performance of The Catholic SRI Growth Portfolio reflects the deduction of fees for these value-added services, but does not reflect the deduction of taxes that a shareholder would pay on the Portfolio’s distributions or redemptions of the Portfolio’s shares.
Expense Ratio
HC Strategic Shares 0.38%
HC Advisors Shares 0.63%1
1 | HC Advisors Shares include Distribution Plan fees of 0.25% which are voluntarily waived by the Adviser. Such waiver is not reflected in the expense ratio shown. |
This information is included in the most current prospectus available to current and prospective shareholders of the Portfolio. Additional information pertaining to the June 30, 2022, expense ratios can be found in the financial highlights.
15
The International Equity Portfolio
The Institutional International Equity Portfolio
(Unaudited)
The International Equity Portfolio (the “Portfolio”) managed by Parametric Portfolio Associates, LLC (“Parametric”) returned -15.85% for the fiscal year compared to -17.33% for the MSCI EAFE Index1 and -17.45% for the average manager in the Lipper2 universe of International Large-Cap Core Funds.3
The Portfolio outperformed the benchmark and the peer group. The tax-managed strategy run by Parametric focuses on minimizing taxable gains subject to a tracking error constraint. The tracking error generated by tax minimization contributed to before-tax outperformance during the period.
The Institutional International Equity Portfolio (the “Institutional Portfolio”) managed by City of London Investment Management Company, Limited (“City of London”), Mellon Investments Corporation (“Mellon”) and Parametric returned -18.16% for the fiscal year compared to -17.33% for the MSCI EAFE Index1 and -17.45% for the average manager in the Lipper2 universe of International Large-Cap Core Funds.3
The Institutional Portfolio underperformed its benchmark and its peer group. The majority of the assets are managed by Mellon and Parametric with a mandate to provide passive exposure to the benchmark index (MSCI EAFE Index). Parametric replicates the benchmark index using futures. This allows the Portfolio to have cash on hand to meet redemptions and invest opportunistically. City of London underperformed due to an unfavorable environment for its closed-end fund strategy that seeks portfolio appreciation derived from a top-down macro process, bottom-up stock picking, and a narrowing of the closed-end fund discount to net asset value.
1 | The Morgan Stanley Capital International Europe, Australasia, and Far East Index (“MSCI EAFE Index”) is a market value weighted index designed to measure the overall condition of developed overseas equities markets. This index is unmanaged, thus the index results do not reflect the impact of expenses associated with any investment in securities, such as brokerage commission or other transaction costs. Benchmark performance is shown for comparison purposes only, as it is not possible to invest directly in a securities index. |
2 | Lipper, Inc. is an independent statistical monitoring organization that compiles performance on mutual funds and further categorizes them by investment objective. |
3 | During the fiscal year, WCM Investment Management LLC was also under contract to manage the Portfolios but did not have assets allocated to it. City of London Investment Management Company, Limited and Mellon Investments Corporation were also under contract to manage the Portfolio but did not have assets allocated to them. Pacific Investment Management Company, LLC was also under contract to manage the Institutional Portfolio but did not have assets allocated to it. |
16

The chart represents historical performance of a hypothetical investment of $10,000 in The International Equity Portfolio for the 10-year period ended 6/30/22, and represents the reinvestment of dividends and capital gains in the Portfolio.
Past performance does not guarantee future results. The performance data quoted represents past performance and current returns may be lower or higher. The investment return and principal value will fluctuate so that an investor’s shares, when redeemed, may be worth more or less than the original cost. To obtain performance information current to the most recent month end, please call (800) 242-9596.
The Portfolio’s performance above is compared to the MSCI EAFE Index, which represents the performance of the major stock markets in those regions. The index is unmanaged and does not reflect the deduction of fees associated with a mutual fund, such as investment management and fund accounting fees, or the deduction of taxes. An investor cannot invest directly in an index. The performance of The International Equity Portfolio reflects the deduction of fees for these value-added services, but does not reflect the deduction of taxes that a shareholder would pay on the Portfolio’s distributions or redemptions of the Portfolio’s shares.
Expense Ratio
HC Strategic Shares 0.25%
HC Advisors Shares 0.50%1
1 | HC Advisors Shares include Distribution Plan fees of 0.25% which are voluntarily waived by the Adviser. Such waiver is not reflected in the expense ratio shown. |
This information is included in the most current prospectus available to current and prospective shareholders of the Portfolio. Additional information pertaining to the June 30, 2022, expense ratios can be found in the financial highlights.
17

The chart represents historical performance of a hypothetical investment of $10,000 in The Institutional International Equity Portfolio for the 10-year period ended 6/30/22, and represents the reinvestment of dividends and capital gains in the Portfolio.
Past performance does not guarantee future results. The performance data quoted represents past performance and current returns may be lower or higher. The investment return and principal value will fluctuate so that an investor’s shares, when redeemed, may be worth more or less than the original cost. To obtain performance information current to the most recent month end, please call (800) 242-9596.
The Portfolio’s performance above is compared to the MSCI EAFE Index, which represents the performance of the major stock markets in those regions. The index is unmanaged and does not reflect the deduction of fees associated with a mutual fund, such as investment management and fund accounting fees, or the deduction of taxes. An investor cannot invest directly in an index. The performance of The Institutional International Equity Portfolio reflects the deduction of fees for these value-added services, but does not reflect the deduction of taxes that a shareholder would pay on the Portfolio’s distributions or redemptions of the Portfolio’s shares.
Expense Ratio
HC Strategic Shares 0.40%
HC Advisors Shares 0.65%1
1 | HC Advisors Shares include Distribution Plan fees of 0.25% which are voluntarily waived by the Adviser. Such waiver is not reflected in the expense ratio shown. |
This information is included in the most current prospectus available to current and prospective shareholders of the Portfolio. Additional information pertaining to the June 30, 2022, expense ratios can be found in the financial highlights.
18
The Emerging Markets Portfolio
(Unaudited)
The Emerging Markets Portfolio (the “Portfolio”) managed by Mellon Investments Corporation (“Mellon”), Parametric Portfolio Associates, LLC (“Parametric”), RBC Global Asset Management (U.K.) Limited (“RBC GAM”) and XY Investments (HK) Limited (“XY Investments”) returned -23.87% for the fiscal year compared to -25.00% for the MSCI EM Index1 and -28.32% for the average manager in the Lipper2 universe of Emerging Markets Funds.3
For the fiscal year 2022, the Portfolio outperformed both the benchmark and the average manager in the industry universe. The outperformance was primarily due to the quantitative strategy run by XY Investments utilizing equity-based total return swaps. During the fiscal year, XY Investment’s style benchmark (MSCI China A Onshore Net Return Index USD) returned -14.00% compared to -25.00% for the MSCI EM Index.
RBC GAM was terminated during the reporting period. Following an extensive review by the investment strategy group, the decision to terminate the manager was made due to lower conviction in the manager’s strategy to add value over the emerging markets equity opportunity set.
The Portfolio provides broad access to international emerging markets equity. The Portfolio is managed with multiple managers to provide diversification of manager style as well as diversification of firm specific risks. Mellon’s strategy provides passive exposure to the MSCI EM Index. The Portfolio diversifies amongst a large number of names and across geographies and sectors. Parametric replicates benchmark index (MSCI Emerging Markets Index) using futures. This allows the Portfolio to have cash on hand to meet redemptions and invest opportunistically.
1 | The Morgan Stanley Capital International Emerging Markets Index (“MSCI EM Index”) is a free float-adjusted market capitalization index that is designed to measure equity market performance in the global emerging markets. As of June 30, 2022, the MSCI EM Index consisted of the following 24 emerging market country indices: Brazil, Chile, China, Colombia, Czech Republic, Egypt, Greece, Hungary, India, Indonesia, Kuwait, Malaysia, Mexico, Peru, Philippines, Poland, Qatar, Saudi Arabia, South Africa, South Korea, Taiwan, Thailand, Turkey and United Arab Emirates. This index is unmanaged, thus the index results do not reflect the impact of expenses associated with any investment in securities, such as brokerage commission or other transaction costs. Benchmark performance is shown for comparison purposes only as it is not possible to invest directly in a securities index. |
2 | Lipper, Inc. is an independent statistical monitoring organization that compiles performance on mutual funds and further categorizes them by investment objective. |
3 | During the fiscal year, City of London Investment Management Company, Limited was also under contract to manage the Portfolio but did not have assets allocated to it. |
19

The chart represents historical performance of a hypothetical investment of $10,000 in The Emerging Markets Portfolio for the 10-year period ended 6/30/22, and represents the reinvestment of dividends and capital gains in the Portfolio.
Past performance does not guarantee future results. The performance data quoted represents past performance and current returns may be lower or higher. The investment return and principal value will fluctuate so that an investor’s shares, when redeemed, may be worth more or less than the original cost. To obtain performance information current to the most recent month end, please call (800) 242-9596.
The Portfolio’s performance above is compared to the MSCI EM Index, which represents the performance of the major stock markets in those regions. The index is unmanaged and does not reflect the deduction of fees associated with a mutual fund, such as investment management and fund accounting fees, or the deduction of taxes. An investor cannot invest directly in an index. The performance of The Emerging Markets Portfolio reflects the deduction of fees for these value-added services, but does not reflect the deduction of taxes that a shareholder would pay on the Portfolio’s distributions or redemptions of the Portfolio’s shares.
Expense Ratio
HC Strategic Shares 0.52%
HC Advisors Shares 0.77%1
1 | HC Advisors Shares include Distribution Plan fees of 0.25% which are voluntarily waived by the Adviser. Such waiver is not reflected in the expense ratio shown. |
This information is included in the most current prospectus available to current and prospective shareholders of the Portfolio. Additional information pertaining to the June 30, 2022, expense ratios can be found in the financial highlights.
20
The Core Fixed Income Portfolio
(Unaudited)
The Core Fixed Income Portfolio (the “Portfolio”) managed by Agincourt Capital Management, LLC (“Agincourt”) and Mellon Investments Corporation returned -11.58% for the fiscal year compared to -10.29% for the Bloomberg U.S. Aggregate Bond Index1 (“BarCap”) and -11.09% for the average fixed income manager in the Lipper2 universe of Core Bond Funds.3
The Portfolio underperformed due to an overweight allocation to Agincourt’s Corporate Credit strategy which suffered from rising credit spreads as well as rising rates. The U.S. bond market declined over the prior year as intermediate government rates rose from 0.89% to 3.04% (U.S. Government 5-year Note).
The Portfolio is allocated across the three major sectors of the BarCap Index: governments, credit, and asset-backed securities. The government and asset backed sectors are passively managed to provide performance in-line with their respective benchmarks. Actual results for the government and asset-backed portfolios may vary marginally from the underlying benchmarks because of cash flows and because for practical purposes, the portfolios hold a representative group of the securities in the benchmarks and do not seek to fully replicate all of the individual holdings. The credit portfolio has a bit more flexibility to vary from the index by avoiding credits that the manager feels have adverse price risk. The allocations across the three sectors will vary over time based upon the relative attractiveness of the sectors. In general, the Portfolio maintains aggregate characteristics – duration, weighted average yield-to-maturity, and average credit quality comparable to the benchmark.
1 | The Bloomberg U.S. Aggregate Bond Index includes more than 8,000 taxable government, investment-grade corporate and mortgage backed securities. This index is unmanaged, thus the index results do not reflect the impact of expenses associated with any investment in securities, such as brokerage commission or other transaction costs. Benchmark performance is shown for comparison purposes only, as it is not possible to invest directly in a securities index. |
2 | Lipper, Inc. is an independent statistical monitoring organization that compiles performance on mutual funds and further categorizes them by investment objective. |
3 | During the fiscal year, Pacific Investment Management Company, LLC and Parametric Portfolio Associates, LLC were also under contract to manage the Portfolio but did not have assets allocated to them. |
21

The chart represents historical performance of a hypothetical investment of $10,000 in The Core Fixed Income Portfolio for the 10-year period ended 6/30/22, and represents the reinvestment of dividends and capital gains in the Portfolio.
Past performance does not guarantee future results. The performance data quoted represents past performance and current returns may be lower or higher. The investment return and principal value will fluctuate so that an investor’s shares, when redeemed, may be worth more or less than the original cost. To obtain performance information current to the most recent month end, please call (800) 242-9596.
The Portfolio’s performance above is compared to the Bloomberg U.S. Aggregate Bond Index. The index is unmanaged and does not reflect the deduction of fees associated with a mutual fund, such as investment management and fund accounting fees, or the deduction of taxes. An investor cannot invest directly in an index. The performance of The Core Fixed Income Portfolio reflects the deduction of fees for these value-added services, but does not reflect the deduction of taxes that a shareholder would pay on the Portfolio’s distributions or redemptions of the Portfolio’s shares.
Expense Ratio
HC Strategic Shares 0.34%
HC Advisors Shares 0.59%1
1 | HC Advisors Shares include Distribution Plan fees of 0.25% which are voluntarily waived by the Adviser. Such waiver is not reflected in the expense ratio shown. |
This information is included in the most current prospectus available to current and prospective shareholders of the Portfolio. Additional information pertaining to the June 30, 2022, expense ratios can be found in the financial highlights.
22
The Corporate Opportunities Portfolio
(Unaudited)
The Corporate Opportunities Portfolio (the “Portfolio”) managed by Parametric Portfolio Associates, LLC (“Parametric”) returned -8.03% for the fiscal year compared to -12.44% for the Bloomberg U.S. High Yield Ba/B 2% Issuer Capped Index1 and -12.19% for the average manager in the Lipper2 universe of High Yield Funds.3
The Portfolio outperformed the benchmark and its peer group due to the Parametric futures strategy which seeks to replicate the risk profile of the benchmark. Parametric manages a portfolio of futures contracts that reflects the underlying risks of the asset class. In the fiscal year, high yield bonds dramatically underperformed the instruments chosen to replicate the risk exposure of the benchmark. The Adviser also directed the investment of a portion of the Portfolio’s assets in a private loan participation that contributed positively due to a higher yield than the benchmark.
The Portfolio is designed to provide investors with higher returns over time than traditional fixed income investments primarily through investment in a diversified portfolio of high yield bonds. The Portfolio may also opportunistically invest in international bonds, convertible bonds, preferred stocks, treasury inflation bonds, loan participations and fixed and floating rate loans.
The Portfolio has flexibility to vary from the index by avoiding credits that the managers feel have adverse price risk.
1 | The Bloomberg U.S. High Yield Ba/B 2% Issuer Capped Index is a market capitalization-weighted index that measures fixed rate non- investment grade debt securities of U.S. and non-U.S. corporations. No single issuer accounts for more than 2% of market cap. The index is calculated on a total return basis. This index is unmanaged, thus the index results do not reflect the impact of expenses associated with any investment in securities, such as brokerage commission or other transaction costs. Benchmark performance is shown for comparison purposes only, as it is not possible to invest directly in a securities index. |
2 | Lipper, Inc. is an independent statistical monitoring organization that compiles performance on mutual funds and further categorizes them by investment objective. |
3 | During the fiscal year, City of London Investment Management Company, Limited, Fort Washington Investment Advisors, Inc., Mellon Investments Corporation, Pacific Investment Management Company, LLC and Western Asset Management Company, Ltd. were also under contract to manage the Portfolio but did not have assets allocated to them. |
23

The chart represents historical performance of a hypothetical investment of $10,000 in The Corporate Opportunities Portfolio for the 10-year period ended 6/30/22, and represents the reinvestment of dividends and capital gains in the Portfolio.
Past performance does not guarantee future results. The performance data quoted represents past performance and current returns may be lower or higher. The investment return and principal value will fluctuate so that an investor’s shares, when redeemed, may be worth more or less than the original cost. To obtain performance information current to the most recent month end, please call (800) 242-9596.
The Portfolio’s performance above is compared to the Bloomberg U.S. High Yield Ba/B 2% Issuer Capped Index. The index is unmanaged and does not reflect the deduction of fees associated with a mutual fund, such as investment management and fund accounting fees, or the deduction of taxes. An investor cannot invest directly in an index. The performance of The Corporate Opportunities Portfolio reflects the deduction of fees for these value-added services, but does not reflect the deduction of taxes that a shareholder would pay on the Portfolio’s distributions or redemptions of the Portfolio’s shares.
Expense Ratio
HC Strategic Shares 0.32%
HC Advisors Shares 0.57%1
1 | HC Advisors Shares include Distribution Plan fees of 0.25% which are voluntarily waived by the Adviser. Such waiver is not reflected in the expense ratio shown. |
This information is included in the most current prospectus available to current and prospective shareholders of the Portfolio. Additional information pertaining to the June 30, 2022, expense ratios can be found in the financial highlights.
24
The U.S. Government Fixed Income Securities Portfolio
(Unaudited)
The U.S. Government Fixed Income Securities Portfolio (the “Portfolio”) managed by Mellon Investments Corporation and Parametric Portfolio Associates, LLC returned -9.40% for the fiscal year compared to -8.82% for the Bloomberg U.S. Government Bond Index1 and -9.02% for the average fixed income manager in the Lipper2 universe of General U.S. Government Funds.
The Portfolio slightly underperformed the benchmark due to a slightly longer duration positioning relative to the Benchmark. As yields moved up, longer duration securities underperformed those with less duration. The Portfolio is structured to perform similarly to the benchmark. As such it uses a sampling methodology to select a subset of the index universe that maintains aggregate characteristics – duration, weighted average yield-to-maturity, and average credit quality in-line with the benchmark. Since the Portfolio owns a subset of securities of the Index, there will necessarily be some tracking error.
The U.S. Government bond market posted weak performance for the fiscal year as the rates normalized from the extreme lows of the COVID crisis, pushing up long rates and concurrently pushing down prices (which move inversely to rates). The rise in global bond yields over the past year is consistent with stronger than expected inflation data and stronger growth.
1 | The Bloomberg U.S. Government Bond Index is a broad-based index that represents the general performance of U.S. Treasury and U.S. Government Agency debt securities. This index is unmanaged, thus the index results do not reflect the impact of expenses associated with any investment in securities, such as brokerage commission or other transaction costs. Benchmark performance is shown for comparison purposes only, as it is not possible to invest directly in a securities index. |
2 | Lipper, Inc. is an independent statistical monitoring organization that compiles performance on mutual funds and further categorizes them by investment objective. |
25

The chart represents historical performance of a hypothetical investment of $10,000 in The U.S. Government Fixed Income Securities Portfolio for the 10-year period ended 6/30/22, and represents the reinvestment of dividends and capital gains in the Portfolio.
Past performance does not guarantee future results. The performance data quoted represents past performance and current returns may be lower or higher. The investment return and principal value will fluctuate so that an investor’s shares, when redeemed, may be worth more or less than the original cost. To obtain performance information current to the most recent month end, please call (800) 242-9596.
The Portfolio’s performance above is compared to the Bloomberg U.S. Government Bond Index. The index is unmanaged and does not reflect the deduction of fees associated with a mutual fund, such as investment management and fund accounting fees, or the deduction of taxes. An investor cannot invest directly in an index. The performance of The U.S. Government Fixed Income Securities Portfolio reflects the deduction of fees for these value-added services, but does not reflect the deduction of taxes that a shareholder would pay on the Portfolio’s distributions or redemptions of the Portfolio’s shares.
Expense Ratio
HC Strategic Shares 0.20%
This information is included in the most current prospectus available to current and prospective shareholders of the Portfolio. Additional information pertaining to the June 30, 2022, expense ratios can be found in the financial highlights.
26
The U.S. Corporate Fixed Income Securities Portfolio
(Unaudited)
The U.S. Corporate Fixed Income Securities Portfolio (the “Portfolio”) managed by Agincourt Capital Management, LLC (“Agincourt”) returned -12.12% for the fiscal year compared to -14.19% for the Bloomberg U.S. Corporate Bond Index1 and -13.79% for the average fixed income manager in the Lipper2 universe of Corporate Debt Funds BBB-Rated Funds.3 Agincourt modestly underperformed the benchmark by 17 basis points while maintaining duration, weighted average yield-to-maturity, and average credit quality in line with the benchmark. The Adviser also directed the investment of a portion of the Portfolio’s assets in private loan participation vehicles that contributed positively to performance.
1 | The Bloomberg U.S. Corporate Bond Index covers USD denominated, investment-grade, fixed-rate, taxable securities sold by industrial, utility and financial issuers. It includes publicly issued U.S. corporate and foreign debentures and secured notes that meet specified maturity, liquidity and quality requirements. Securities in the index roll up to the U.S. Credit and U.S. Aggregate indices. This index is unmanaged, thus the index results do not reflect the impact of expenses associated with any investment in securities, such as brokerage commission or other transaction costs. Benchmark performance is shown for comparison purposes only, as it is not possible to invest directly in a securities index. |
2 | Lipper, Inc. is an independent statistical monitoring organization that compiles performance on mutual funds and further categorizes them by investment objective. |
3 | During the fiscal year, Mellon Investments Corporation, Pacific Investment Management Company, LLC and Parametric Portfolio Associates, LLC were also under contract to manage the Portfolio but did not have assets allocated to them. |
27

The chart represents historical performance of a hypothetical investment of $10,000 in The U.S. Corporate Fixed Income Securities Portfolio for the 10-year period ended 6/30/22, and represents the reinvestment of dividends and capital gains in the Portfolio.
Past performance does not guarantee future results. The performance data quoted represents past performance and current returns may be lower or higher. The investment return and principal value will fluctuate so that an investor’s shares, when redeemed, may be worth more or less than the original cost. To obtain performance information current to the most recent month end, please call (800) 242-9596.
The Portfolio’s performance above is compared to the Bloomberg U.S. Corporate Bond Index. The index is unmanaged and does not reflect the deduction of fees associated with a mutual fund, such as investment management and fund accounting fees, or the deduction of taxes. An investor cannot invest directly in an index. The performance of The U.S. Corporate Fixed Income Securities Portfolio reflects the deduction of fees for these value-added services, but does not reflect the deduction of taxes that a shareholder would pay on the Portfolio’s distributions or redemptions of the Portfolio’s shares.
Expense Ratio
HC Strategic Shares 0.22%
This information is included in the most current prospectus available to current and prospective shareholders of the Portfolio. Additional information pertaining to the June 30, 2022, expense ratios can be found in the financial highlights.
28
The U.S. Mortgage/Asset Backed Fixed Income Securities Portfolio
(Unaudited)
The U.S. Mortgage/Asset Backed Fixed Income Securities Portfolio (the “Portfolio”) managed by Mellon Investments Corporation returned -8.51% for the fiscal year compared to -8.97% for the Bloomberg U.S. Securitized Index1 and -8.31% for the average fixed income manager in the Lipper2 universe of U.S. Mortgage Funds.3
The bond market posted negative performance for the fiscal year as rates rose from extremely low levels during the fiscal year. The rise in global bond yields over the past year is consistent with stronger inflation trends and stronger growth.
The Portfolio is structured to simulate the performance of the benchmark. As such the Portfolio maintains aggregate characteristics – duration, weighted average yield-to-maturity, and average credit quality in line with the benchmark. The Portfolio holds a subset of the securities represented in the benchmark and as a result the underperformance after fees and expenses is attributable to the tracking error of not holding every security in the index.
1 | The Bloomberg U.S. Securitized Index is an index that tracks the performance of mortgage-backed pass through securities issued by Ginnie Mae, Fannie Mae and Freddie Mac, investment-grade bonds and asset-backed securities. This index is unmanaged, thus the index results do not reflect the impact of expenses associated with any investment in securities, such as brokerage commission or other transaction costs. Benchmark performance is shown for comparison purposes only, as it is not possible to invest directly in a securities index. |
2 | Lipper, Inc. is an independent statistical monitoring organization that compiles performance on mutual funds and further categorizes them by investment objective. |
3 | During the fiscal year, Pacific Investment Management Company, LLC and Parametric Portfolio Associates, LLC were also under contract to manage the Portfolio but did not have assets allocated to them. |
29

��
The chart represents historical performance of a hypothetical investment of $10,000 in The U.S. Mortgage/Asset Backed Fixed Income Securities Portfolio for the 10-year period ended 6/30/22, and represents the reinvestment of dividends and capital gains in the Portfolio.
Past performance does not guarantee future results. The performance data quoted represents past performance and current returns may be lower or higher. The investment return and principal value will fluctuate so that an investor’s shares, when redeemed, may be worth more or less than the original cost. To obtain performance information current to the most recent month end, please call (800) 242-9596.
The Portfolio’s performance above is compared to the Bloomberg U.S. Securitized Index. The index is unmanaged and does not reflect the deduction of fees associated with a mutual fund, such as investment management and fund accounting fees, or the deduction of taxes. An investor cannot invest directly in an index. The performance of The U.S. Mortgage/Asset Backed Fixed Income Securities Portfolio reflects the deduction of fees for these value-added services, but does not reflect the deduction of taxes that a shareholder would pay on the Portfolio’s distributions or redemptions of the Portfolio’s shares.
Expense Ratio
HC Strategic Shares 0.26%
This information is included in the most current prospectus available to current and prospective shareholders of the Portfolio. Additional information pertaining to the June 30, 2022, expense ratios can be found in the financial highlights.
30
The Short-Term Municipal Bond Portfolio
(Unaudited)
The Short-Term Municipal Bond Portfolio (the “Portfolio”) managed by Breckinridge Capital Advisors, Inc. returned -3.27% for the fiscal year compared to -2.15% for the ICE BofA Merrill Lynch 1-3 Year Municipal Index1 and -2.64% for the average manager in the Lipper2 universe of Short Municipal Debt Funds.
The Portfolio underperformed its benchmark and its peer group due to an intentional overweight to longer duration bonds than the benchmark.
1 | The ICE BofA Merrill Lynch 1-3 Year Municipal Index is an equal-weighted index that tracks the total return performance of the domestic U.S. municipal market. The index consists of investment grade, publicly traded, fixed-rate and coupon bearing municipal securities with a maturity of one to three years. This index is unmanaged, thus the index results do not reflect the impact of expenses associated with any investment in securities, such as brokerage commission or other transaction costs. Benchmark performance is shown for comparison purposes only, as it is not possible to invest directly in a securities index. |
2 | Lipper, Inc. is an independent statistical monitoring organization that organization compiles performance on mutual funds and further categorizes them by investment objective. |
31
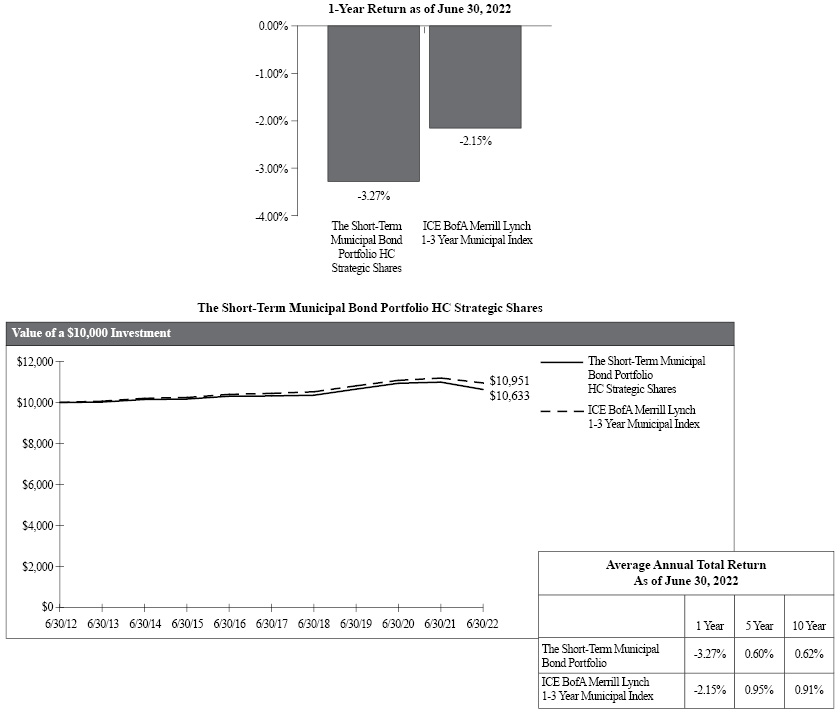
The chart represents historical performance of a hypothetical investment of $10,000 in The Short-Term Municipal Bond Portfolio for the 10-year period ended 6/30/22, and represents the reinvestment of dividends and capital gains in the Portfolio.
Past performance does not guarantee future results. The performance data quoted represents past performance and current returns may be lower or higher. The investment return and principal value will fluctuate so that an investor’s shares, when redeemed, may be worth more or less than the original cost. To obtain performance information current to the most recent month end, please call (800) 242-9596.
The Portfolio’s performance above is compared to the ICE BofA Merrill Lynch 1-3 Year Municipal Index. The index is unmanaged and does not reflect the deduction of fees associated with a mutual fund, such as investment management and fund accounting fees, or the deduction of taxes. An investor cannot invest directly in an index. The performance of The Short-Term Municipal Bond Portfolio reflects the deduction of fees for these value-added services, but does not reflect the deduction of taxes that a shareholder would pay on the Portfolio’s distributions or redemptions of the Portfolio’s shares.
Expense Ratio
HC Strategic Shares 0.28%
This information is included in the most current prospectus available to current and prospective shareholders of the Portfolio. Additional information pertaining to the June 30, 2022, expense ratios can be found in the financial highlights.
32
The Intermediate Term Municipal Bond Portfolio
(Unaudited)
The Intermediate Term Municipal Bond Portfolio managed by Insight North America LLC (“Insight”) returned -5.98% for the fiscal year compared to -5.95% for the Bloomberg 3-10 Year Blend (2-12) Total Return Index Unhedged1 and -7.71% for the average manager in the Lipper2 universe of Intermediate Municipal Debt Funds.3
The Insight strategy performed similarly to the benchmark during the twelve-month reporting period. An overweight to revenue bonds compared to general obligation bonds, and an underweight to higher rated issues were detractors contributing to the underperformance during the fiscal year.
1 | The Bloomberg 3-10 Year Blend (2-12) Total Return Index is an index composed of bonds with maturities ranging between 2 and 12 years. This index is unmanaged, thus the index results do not reflect the impact of expenses associated with any investment in securities, such as brokerage commission or other transaction costs. Benchmark performance is shown for comparison purposes only, as it is not possible to invest directly in a securities index. |
2 | Lipper, Inc. is an independent statistical monitoring organization that compiles performance on mutual funds and further categorizes them by investment objective. |
3 | During the fiscal year, Breckinridge Capital Advisors, Inc., City of London Investment Management Company, Limited and Parametric Portfolio Associates, LLC were also under contract to manage the Portfolio but did not have assets allocated to them. |
33
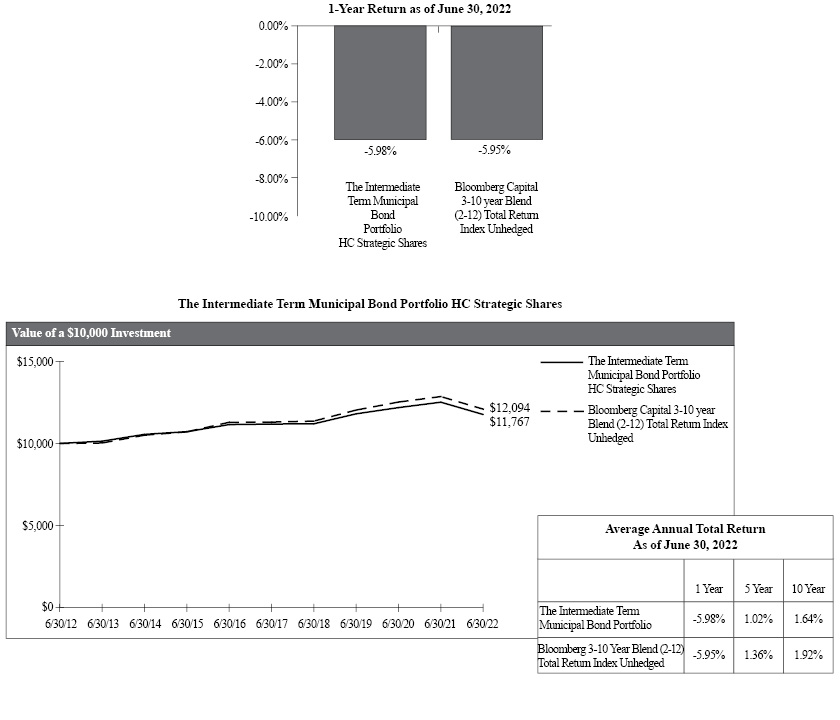
The chart represents historical performance of a hypothetical investment of $10,000 in The Intermediate Term Municipal Bond Portfolio for the 10-year period ended 6/30/22, and represents the reinvestment of dividends and capital gains in the Portfolio.
Past performance does not guarantee future results. The performance data quoted represents past performance and current returns may be lower or higher. The investment return and principal value will fluctuate so that an investor’s shares, when redeemed, may be worth more or less than the original cost. To obtain performance information current to the most recent month end, please call (800) 242-9596.
The Portfolio’s performance above is compared to the Bloomberg 3-10 Year Blend (2-12) Total Return Index Unhedged. The index is unmanaged and does not reflect the deduction of fees associated with a mutual fund, such as investment management and fund accounting fees, or the deduction of taxes. An investor cannot invest directly in an index. The performance of The Intermediate Term Municipal Bond Portfolio reflects the deduction of fees for these value-added services, but does not reflect the deduction of taxes that a shareholder would pay on the Portfolio’s distributions or redemptions of the Portfolio’s shares.
Expense Ratio
HC Strategic Shares 0.29%
HC Advisors Shares 0.54%1
1 | HC Advisors Shares include Distribution Plan fees of 0.25% which are voluntarily waived by the Adviser. Such waiver is not reflected in the expense ratio shown. |
This information is included in the most current prospectus available to current and prospective shareholders of the Portfolio. Additional information pertaining to the June 30, 2022, expense ratios can be found in the financial highlights.
34
The Intermediate Term Municipal Bond II Portfolio
(Unaudited)
The Intermediate Term Municipal Bond II Portfolio (the “Portfolio”) managed by Breckinridge Capital Advisors, Inc. (“Breckinridge”) and City of London Investment Management Company, Limited (“City of London”) returned -9.35% for the fiscal year compared to -5.03% for the Bloomberg 5-Year General Obligation Municipal Index1, -6.14% for the Bloomberg Managed Money Short/Intermediate Index2 and -7.71% for the average manager in the Lipper3 universe of Intermediate Municipal Debt Funds.4
The principal performance detractor was the allocation to City of London’s strategy. City of London manages a portfolio of closed-end funds which each hold underlying portfolios of municipal bonds. The strategy has under-performed dramatically from widening discounts to net asset value and declining net asset values due to levered exposure to duration in the underling funds held in the strategy.
The Breckinridge strategy underperformed the benchmark and outperformed the peer universe. The Portfolio’s higher quality bias modestly detracted from performance, which was offset by a modest contribution from security selection. Breckinridge maintains a diversified portfolio structure invested only in high-grade, intermediate-term municipal bonds.
1 | The Bloomberg 5-Year General Obligation Municipal Index is an index generally representative of investment grade fixed rate debt obligations issued by state and local government entities, with maturities of no more than six years. This index is unmanaged, thus the index results do not reflect the impact of expenses associated with any investment in securities, such as brokerage commission or other transaction costs. Benchmark performance is shown for comparison purposes only, as it is not possible to invest directly in a securities index. |
2 | The Bloomberg Managed Money Short/Intermediate Index is a rules-based and market-value weighted index that measures the performance of the publicly traded municipal bonds that cover the USD-denominated short/intermediate term tax-exempt bond market, including state and local general obligation bonds, revenue bonds, insured bonds, and pre-refunded bonds. This index is unmanaged, thus the index results do not reflect the impact of expenses associated with any investment in securities, such as brokerage commission or other transaction costs. Benchmark performance is shown for comparison purposes only, as it is not possible to invest directly in a securities index. |
3 | Lipper, Inc. is an independent statistical monitoring organization that compiles performance on mutual funds and further categorizes them by investment objective. |
4 | During the fiscal year, Parametric Portfolio Associates, LLC was also under contract to manage the Portfolio but did not have assets allocated to it. |
35

The chart represents historical performance of a hypothetical investment of $10,000 in The Intermediate Term Municipal Bond II Portfolio for the 10-year period ended 6/30/22, and represents the reinvestment of dividends and capital gains in the Portfolio.
Past performance does not guarantee future results. The performance data quoted represents past performance and current returns may be lower or higher. The investment return and principal value will fluctuate so that an investor’s shares, when redeemed, may be worth more or less than the original cost. To obtain performance information current to the most recent month end, please call (800) 242-9596.
The Portfolio’s performance above is compared to the Bloomberg 5-Year General Obligation Municipal Index and the Bloomberg Managed Money Short/Intermediate Index. The indices are unmanaged and do not reflect the deduction of fees associated with a mutual fund, such as investment management and fund accounting fees, or the deduction of taxes. An investor cannot invest directly in an index. The performance of The Intermediate Term Municipal Bond II Portfolio reflects the deduction of fees for these value-added services, but does not reflect the deduction of taxes that a shareholder would pay on the Portfolio’s distributions or redemptions of the Portfolio’s shares.
Expense Ratio
HC Strategic Shares 0.59%
HC Advisors Shares 0.84%1
1 | HC Advisors Shares include Distribution Plan fees of 0.25% which are voluntarily waived by the Adviser. Such waiver is not reflected in the expense ratio shown. |
This information is included in the most current prospectus available to current and prospective shareholders of the Portfolio. Additional information pertaining to the June 30, 2022, expense ratios can be found in the financial highlights.
36
Conclusion
The performance of the Portfolios for the fiscal year was consistent with our expectations. We are maintaining a neutral weight to global equities. While corporate earnings were incredibly strong during the fiscal year, companies face multiple headwinds in the year ahead. Wages and input costs are increasing, interest rates are rising and surveys point to a slowdown in business activities. As the economy slows, earnings expectations are likely to be revised downwards, which could weigh on investor sentiment. However, equity valuations remain attractive as the equity risk premium for U.S., International Developed and Emerging Markets is above its long-term average.
We continue to seek to broaden the opportunity set of investment portfolios available to our clients for fulfilling their asset allocation and investment policy objectives. We also continue to maintain a comprehensive dual-track, investment management and compliance review and due diligence processes to identify, select, implement, monitor and manage the investment managers and investment strategies we employ within each Portfolio.
Finally, we are constantly seeking ways to improve our management of each Portfolio. We continue to explore new strategies that exploit more differentiated opportunities among factor-based investment styles.
As ever, we appreciate your continued trust and confidence.
HC Capital Solutions
37
HC CAPITAL TRUST
The Value Equity Portfolio
Portfolio of Investments — June 30, 2022
| | Shares | | Security Description | | Value
(000) | |
| | | | | Common Stocks — 98.99% |
| | | | | Aerospace & Defense — 1.43% |
| | | 3,065 | | HEICO Corp. | | $ | 402 | |
| | | 1,057 | | L3Harris Technologies, Inc. | | | 255 | |
| | | 5,411 | | Lockheed Martin Corp. | | | 2,327 | |
| | | 747 | | Northrop Grumman Corp. | | | 357 | |
| | | 18,437 | | Raytheon Technologies Corp. | | | 1,772 | |
| | | 6,782 | | Spirit Aerosystems Holdings, Inc., Class - A | | | 199 | |
| | | 4,758 | | The Boeing Co.(a) | | | 651 | |
| | | 4,420 | | TransDigm Group, Inc.(a) | | | 2,372 | |
| | | | | | | | 8,335 | |
| | | | | Air Freight & Logistics — 0.75% |
| | | 305 | | Expeditors International of Washington, Inc. | | | 30 | |
| | | 4,786 | | FedEx Corp. | | | 1,085 | |
| | | 1,886 | | GXO Logistics, Inc.(a) | | | 82 | |
| | | 16,845 | | United Parcel Service, Inc., Class - B | | | 3,074 | |
| | | 1,886 | | XPO Logistics, Inc.(a) | | | 91 | |
| | | | | | | | 4,362 | |
| | | | | Airlines — 0.16% |
| | | 11,583 | | Alaska Air Group, Inc.(a) | | | 464 | |
| | | 28,157 | | American Airlines Group, Inc.(a) | | | 357 | |
| | | 2,097 | | Copa Holdings SA, Class - A(a) | | | 133 | |
| | | | | | | | 954 | |
| | | | | Auto Components — 0.34% |
| | | 585 | | Gentex Corp. | | | 16 | |
| | | 12,500 | | Lear Corp. | | | 1,574 | |
| | | 37,827 | | The Goodyear Tire & Rubber Co.(a) | | | 405 | |
| | | | | | | | 1,995 | |
| | | | | Automobiles — 1.65% |
| | | 7,064 | | General Motors Co.(a) | | | 224 | |
| | | 16,041 | | Lucid Group, Inc.^(a) | | | 275 | |
| | | 9,877 | | Rivian Automotive, Inc., Class - A(a) | | | 254 | |
| | | 13,242 | | Tesla, Inc.(a) | | | 8,918 | |
| | | | | | | | 9,671 | |
| | | | | Banks — 4.08% |
| | | 225,733 | | Bank of America Corp. | | | 7,028 | |
| | | 16,687 | | Bank OZK | | | 626 | |
| | | 16,009 | | Citigroup, Inc. | | | 736 | |
| | | 1,826 | | Citizens Financial Group, Inc. | | | 65 | |
| | | 15,989 | | Comerica, Inc. | | | 1,173 | |
| | | 625 | | Commerce Bancshares, Inc. | | | 41 | |
| | | 1,552 | | Cullen/Frost Bankers, Inc. | | | 181 | |
| | | 3,013 | | East West Bancorp, Inc. | | | 195 | |
| | | 13,076 | | Fifth Third Bancorp | | | 439 | |
| | | 6,815 | | First Hawaiian, Inc. | | | 155 | |
| | | 1,892 | | First Republic Bank | | | 273 | |
| | | 41,225 | | Huntington Bancshares, Inc. | | | 496 | |
| | | 52,407 | | JPMorgan Chase & Co. | | | 5,903 | |
| | | 17,314 | | KeyCorp | | | 298 | |
| | Shares | | Security Description | | Value
(000) | |
| | | | | Banks (continued) |
| | | 3,497 | | M&T Bank Corp. | | $ | 557 | |
| | | 8,270 | | PNC Financial Services Group, Inc. | | | 1,305 | |
| | | 710 | | SVB Financial Group(a) | | | 280 | |
| | | 42,174 | | Synovus Financial Corp. | | | 1,520 | |
| | | 32,258 | | Truist Financial Corp. | | | 1,530 | |
| | | 9,426 | | Umpqua Holdings Corp. | | | 158 | |
| | | 10,083 | | Wells Fargo & Co. | | | 395 | |
| | | 9,321 | | Zions Bancorp NA | | | 474 | |
| | | | | | | | 23,828 | |
| | | | | Beverages — 2.03% |
| | | 4,600 | | Brown-Forman Corp., Class - B | | | 323 | |
| | | 2,846 | | Constellation Brands, Inc., Class - A | | | 663 | |
| | | 6,891 | | Keurig Dr Pepper, Inc. | | | 244 | |
| | | 4,530 | | Monster Beverage Corp.(a) | | | 420 | |
| | | 28,839 | | PepsiCo, Inc. | | | 4,806 | |
| | | 85,987 | | The Coca-Cola Co. | | | 5,410 | |
| | | | | | | | 11,866 | |
| | | | | Biotechnology — 2.76% |
| | | 34,760 | | AbbVie, Inc. | | | 5,323 | |
| | | 2,223 | | Alnylam Pharmaceuticals, Inc.(a) | | | 324 | |
| | | 14,171 | | Amgen, Inc. | | | 3,448 | |
| | | 3,274 | | Moderna, Inc.(a) | | | 468 | |
| | | 8,247 | | Seagen, Inc.(a) | | | 1,459 | |
| | | 17,938 | | United Therapeutics Corp.(a) | | | 4,227 | |
| | | 3,143 | | Vertex Pharmaceuticals, Inc.(a) | | | 886 | |
| | | | | | | | 16,135 | |
| | | | | Building Products — 0.56% |
| | | 10,045 | | A.O. Smith Corp. | | | 549 | |
| | | 21,311 | | Carrier Global Corp. | | | 760 | |
| | | 13,273 | | Johnson Controls International PLC | | | 636 | |
| | | 6,549 | | Masco Corp. | | | 331 | |
| | | 7,831 | | Trane Technologies PLC | | | 1,017 | |
| | | | | | | | 3,293 | |
| | | | | Capital Markets — 2.43% |
| | | 4,496 | | Affiliated Managers Group, Inc. | | | 524 | |
| | | 2,506 | | Ameriprise Financial, Inc. | | | 596 | |
| | | 2,656 | | Ares Management Corp., Class - A | | | 151 | |
| | | 4,582 | | BlackRock, Inc., Class - A | | | 2,791 | |
| | | 1,669 | | CME Group, Inc. | | | 342 | |
| | | 4,721 | | Evercore, Inc. | | | 442 | |
| | | 16,955 | | Franklin Resources, Inc. | | | 395 | |
| | | 2,293 | | Interactive Brokers Group, Inc., Class - A | | | 126 | |
| | | 3,061 | | Intercontinental Exchange, Inc. | | | 288 | |
| | | 9,972 | | Invesco Ltd. | | | 161 | |
| | | 9,493 | | KKR & Co., Inc. | | | 439 | |
| | | 20,369 | | Morgan Stanley | | | 1,549 | |
| | | 686 | | Morningstar, Inc. | | | 166 | |
| | | 629 | | Nasdaq, Inc. | | | 96 | |
See accompanying notes to financial statements.
38
HC CAPITAL TRUST
The Value Equity Portfolio
Portfolio of Investments (continued) — June 30, 2022
| | Shares | | Security Description | | Value
(000) | |
| | | | | Common Stocks (continued) |
| | | | | Capital Markets (continued) |
| | | 3,423 | | Northern Trust Corp. | | $ | 330 | |
| | | 269 | | S&P Global, Inc. | | | 91 | |
| | | 7,695 | | State Street Corp. | | | 474 | |
| | | 7,780 | | T. Rowe Price Group, Inc. | | | 884 | |
| | | 25,629 | | The Charles Schwab Corp. | | | 1,619 | |
| | | 7,506 | | The Goldman Sachs Group, Inc. | | | 2,229 | |
| | | 6,297 | | Tradeweb Markets, Inc., Class - A | | | 430 | |
| | | 4,599 | | Virtu Financial, Inc., Class - A | | | 108 | |
| | | | | | | | 14,231 | |
| | | | | Chemicals — 1.65% |
| | | 7,464 | | Air Products & Chemicals, Inc. | | | 1,795 | |
| | | 1,327 | | Albemarle Corp. | | | 277 | |
| | | 4,923 | | Axalta Coating Systems Ltd.(a) | | | 109 | |
| | | 1,640 | | Celanese Corp., Series A | | | 193 | |
| | | 30,439 | | CF Industries Holdings, Inc. | | | 2,610 | |
| | | 9,311 | | Corteva, Inc. | | | 504 | |
| | | 9,217 | | Dow, Inc. | | | 476 | |
| | | 13,149 | | DuPont de Nemours, Inc. | | | 731 | |
| | | 2,542 | | International Flavors & Fragrances, Inc. | | | 303 | |
| | | 7,173 | | LyondellBasell Industries N.V., Class - A | | | 627 | |
| | | 24,876 | | Olin Corp. | | | 1,151 | |
| | | 6,716 | | PPG Industries, Inc. | | | 768 | |
| | | 1,538 | | The Scotts Miracle-Gro Co. | | | 121 | |
| | | | | | | | 9,665 | |
| | | | | Commercial Services & Supplies — 1.01% |
| | | 11,948 | | Clean Harbors, Inc.(a) | | | 1,047 | |
| | | 27,349 | | Copart, Inc.(a) | | | 2,973 | |
| | | 3,003 | | IAA, Inc.(a) | | | 98 | |
| | | 1,270 | | Republic Services, Inc. | | | 166 | |
| | | 2,747 | | Stericycle, Inc.(a) | | | 120 | |
| | | 9,682 | | Waste Management, Inc. | | | 1,481 | |
| | | | | | | | 5,885 | |
| | | | | Communications Equipment — 0.72% |
| | | 90,637 | | Cisco Systems, Inc. | | | 3,865 | |
| | | 31,124 | | Commscope Holding, Inc.(a) | | | 190 | |
| | | 774 | | Motorola Solutions, Inc. | | | 162 | |
| | | | | | | | 4,217 | |
| | | | | Construction & Engineering — 0.10% |
| | | 3,578 | | AECOM | | | 233 | |
| | | 841 | | Arcosa, Inc. | | | 39 | |
| | | 2,295 | | Quanta Services, Inc. | | | 288 | |
| | | | | | | | 560 | |
| | | | | Construction Materials — 0.13% |
| | | 1,351 | | Martin Marietta Materials, Inc. | | | 405 | |
| | | 2,578 | | Vulcan Materials Co. | | | 366 | |
| | | | | | | | 771 | |
| | Shares | | Security Description | | Value
(000) | |
| | | | | Consumer Finance — 1.09% |
| | | 20,855 | | American Express Co. | | $ | 2,891 | |
| | | 20,025 | | Capital One Financial Corp. | | | 2,086 | |
| | | 6,409 | | Discover Financial Services | | | 606 | |
| | | 14,450 | | OneMain Holdings, Inc. | | | 540 | |
| | | 50,199 | | SoFi Technologies, Inc.(a) | | | 265 | |
| | | | | | | | 6,388 | |
| | | | | Containers & Packaging — 0.44% |
| | | 262 | | AptarGroup, Inc. | | | 27 | |
| | | 27 | | Avery Dennison Corp. | | | 4 | |
| | | 22,939 | | Ball Corp. | | | 1,577 | |
| | | 10,608 | | International Paper Co. | | | 444 | |
| | | 2,050 | | Packaging Corporation of America | | | 282 | |
| | | 2,320 | | Silgan Holdings, Inc. | | | 96 | |
| | | 2,452 | | Sonoco Products Co. | | | 140 | |
| | | | | | | | 2,570 | |
| | | | | Distributors — 0.09% |
| | | 3,827 | | Genuine Parts Co. | | | 509 | |
| | | | | Diversified Consumer Services — 0.19% |
| | | 33,749 | | Chegg, Inc.(a) | | | 634 | |
| | | 7,498 | | H&R Block, Inc. | | | 265 | |
| | | 3,097 | | Service Corp. International | | | 214 | |
| | | | | | | | 1,113 | |
| | | | | Diversified Financial Services — 1.19% |
| | | 7,259 | | Apollo Global Management, Inc. | | | 352 | |
| | | 21,024 | | Berkshire Hathaway, Inc., Class - B(a) | | | 5,740 | |
| | | 14,613 | | Equitable Holdings, Inc. | | | 381 | |
| | | 17,093 | | Jefferies Financial Group, Inc. | | | 472 | |
| | | | | | | | 6,945 | |
| | | | | Diversified Telecommunication Services — 0.59% |
| | | 27,151 | | AT&T, Inc. | | | 569 | |
| | | 35,894 | | Lumen Technologies, Inc. | | | 392 | |
| | | 48,924 | | Verizon Communications, Inc. | | | 2,483 | |
| | | | | | | | 3,444 | |
| | | | | Electric Utilities — 1.85% |
| | | 1,604 | | Alliant Energy Corp. | | | 94 | |
| | | 30,034 | | American Electric Power Company, Inc. | | | 2,882 | |
| | | 3,035 | | Constellation Energy Corp. | | | 174 | |
| | | 7,685 | | Duke Energy Corp. | | | 824 | |
| | | 1,914 | | Edison International | | | 121 | |
| | | 9,746 | | Eversource Energy | | | 823 | |
| | | 9,106 | | Exelon Corp. | | | 413 | |
| | | 3,311 | | Hawaiian Electric Industries, Inc. | | | 135 | |
| | | 35,480 | | NextEra Energy, Inc. | | | 2,748 | |
| | | 32,159 | | The Southern Co. | | | 2,293 | |
| | | 4,017 | | Xcel Energy, Inc. | | | 284 | |
| | | | | | | | 10,791 | |
See accompanying notes to financial statements.
39
HC CAPITAL TRUST
The Value Equity Portfolio
Portfolio of Investments (continued) — June 30, 2022
| | Shares | | Security Description | | Value
(000) | |
| | | | | Common Stocks (continued) |
| | | | | Electrical Equipment — 0.63% |
| | | 3,350 | | AMETEK, Inc. | | $ | 368 | |
| | | 12,355 | | Eaton Corp. PLC | | | 1,557 | |
| | | 16,658 | | Emerson Electric Co. | | | 1,325 | |
| | | 3,984 | | Regal Rexnord Corp. | | | 452 | |
| | | | | | | | 3,702 | |
| | | | | Electronic Equipment, Instruments & Components — 0.03% |
| | | 512 | | Dolby Laboratories, Inc., Class - A | | | 37 | |
| | | 1,050 | | Keysight Technologies, Inc.(a) | | | 144 | |
| | | | | | | | 181 | |
| | | | | Energy Equipment & Services — 0.86% |
| | | 26,930 | | Halliburton Co. | | | 845 | |
| | | 6,095 | | Helmerich & Payne, Inc. | | | 262 | |
| | | 153,313 | | Patterson-UTI Energy, Inc. | | | 2,416 | |
| | | 42,009 | | Schlumberger N.V. | | | 1,502 | |
| | | | | | | | 5,025 | |
| | | | | Entertainment — 0.75% |
| | | 2,063 | | Activision Blizzard, Inc. | | | 161 | |
| | | 2,970 | | Liberty Media Corp. - Liberty Formula One, Class - C(a) | | | 189 | |
| | | 4,444 | | Netflix, Inc.(a) | | | 777 | |
| | | 2,832 | | Spotify Technology SA(a) | | | 266 | |
| | | 28,322 | | The Walt Disney Co.(a) | | | 2,673 | |
| | | 22,012 | | Warner Bros. Discovery, Inc.(a) | | | 295 | |
| | | | | | | | 4,361 | |
| | | | | Equity Real Estate Investment Trusts — 3.09% |
| | | 4,517 | | Alexandria Real Estate Equities, Inc. | | | 655 | |
| | | 3,172 | | American Campus Communities, Inc. | | | 204 | |
| | | 24,071 | | American Homes 4 Rent, Class - A | | | 853 | |
| | | 5,297 | | American Tower Corp. | | | 1,355 | |
| | | 13,797 | | Americold Realty Trust, Inc. | | | 414 | |
| | | 566 | | Apartment Income REIT Corp. | | | 24 | |
| | | 2,773 | | Boston Properties, Inc. | | | 247 | |
| | | 27,975 | | Brixmor Property Group, Inc. | | | 565 | |
| | | 7,024 | | Camden Property Trust | | | 945 | |
| | | 7,417 | | Crown Castle International Corp. | | | 1,249 | |
| | | 5,913 | | CubeSmart | | | 253 | |
| | | 3,960 | | Digital Realty Trust, Inc. | | | 514 | |
| | | 21,951 | | Duke Realty Corp. | | | 1,206 | |
| | | 449 | | Equinix, Inc. | | | 295 | |
| | | 2,122 | | Equity Lifestyle Properties, Inc. | | | 150 | |
| | | 507 | | Essex Property Trust, Inc. | | | 133 | |
| | | 2,294 | | Extra Space Storage, Inc. | | | 390 | |
| | | 1,385 | | Federal Realty Investment Trust | | | 133 | |
| | | 26,253 | | Healthcare Trust of America, Inc., Class - A | | | 733 | |
| | | 2,505 | | Healthpeak Properties, Inc. | | | 65 | |
| | | 17,384 | | Invitation Homes, Inc. | | | 619 | |
| | | 5,259 | | Iron Mountain, Inc. | | | 256 | |
| | Shares | | Security Description | | Value
(000) | |
| | | | | Equity Real Estate Investment Trusts (continued) |
| | | 846 | | Lamar Advertising Co., Class - A | | $ | 74 | |
| | | 3,183 | | Life Storage, Inc. | | | 355 | |
| | | 6,040 | | Medical Properties Trust, Inc. | | | 92 | |
| | | 2,029 | | Mid-America Apartment Communities, Inc. | | | 354 | |
| | | 10,542 | | Prologis, Inc. | | | 1,240 | |
| | | 2,688 | | Public Storage | | | 840 | |
| | | 19,572 | | Realty Income Corp. | | | 1,336 | |
| | | 8,746 | | Rexford Industrial Realty, Inc. | | | 504 | |
| | | 3,747 | | Sun Communities, Inc. | | | 597 | |
| | | 35,601 | | The Macerich Co. | | | 310 | |
| | | 4,609 | | UDR, Inc. | | | 212 | |
| | | 8,362 | | VICI Properties, Inc. | | | 249 | |
| | | 6,417 | | Welltower, Inc. | | | 528 | |
| | | 1,573 | | WP Carey, Inc. | | | 130 | |
| | | | | | | | 18,079 | |
| | | | | Food & Staples Retailing — 1.20% |
| | | 3,254 | | Casey’s General Stores, Inc. | | | 602 | |
| | | 1,943 | | Costco Wholesale Corp. | | | 931 | |
| | | 9,412 | | Sysco Corp. | | | 797 | |
| | | 9,040 | | The Kroger Co. | | | 428 | |
| | | 34,781 | | Walmart, Inc. | | | 4,229 | |
| | | | | | | | 6,987 | |
| | | | | Food Products — 1.07% |
| | | 13,782 | | Archer-Daniels-Midland Co. | | | 1,069 | |
| | | 3,437 | | Campbell Soup Co. | | | 165 | |
| | | 16,807 | | Conagra Brands, Inc. | | | 575 | |
| | | 5,689 | | Flowers Foods, Inc. | | | 150 | |
| | | 12,760 | | General Mills, Inc. | | | 963 | |
| | | 2,450 | | Hormel Foods Corp. | | | 116 | |
| | | 10,284 | | Kellogg Co. | | | 734 | |
| | | 9,502 | | Mondelez International, Inc., Class - A | | | 590 | |
| | | 1,277 | | Post Holdings, Inc.(a) | | | 105 | |
| | | 12,213 | | The Hain Celestial Group, Inc.(a) | | | 290 | |
| | | 1,964 | | The Hershey Co. | | | 423 | |
| | | 13,887 | | The Kraft Heinz Co. | | | 530 | |
| | | 6,256 | | Tyson Foods, Inc., Class - A | | | 538 | |
| | | | | | | | 6,248 | |
| | | | | Gas Utilities — 0.02% |
| | | 808 | | Atmos Energy Corp. | | | 91 | |
| | | | | Health Care Equipment & Supplies — 2.42% |
| | | 48,674 | | Abbott Laboratories | | | 5,288 | |
| | | 1,636 | | Align Technology, Inc.(a) | | | 387 | |
| | | 2,461 | | Baxter International, Inc. | | | 158 | |
| | | 4,797 | | Becton Dickinson & Co. | | | 1,183 | |
| | | 3,501 | | Danaher Corp. | | | 888 | |
| | | 5,354 | | Dexcom, Inc.(a) | | | 399 | |
| | | 2,250 | | Edwards Lifesciences Corp.(a) | | | 214 | |
| | | 1,648 | | Enovis Corp.(a) | | | 91 | |
See accompanying notes to financial statements.
40
HC CAPITAL TRUST
The Value Equity Portfolio
Portfolio of Investments (continued) — June 30, 2022
| | Shares | | Security Description | | Value
(000) | |
| | | | | Common Stocks (continued) |
| | | | | Health Care Equipment & Supplies (continued) |
| | | 1,800 | | ICU Medical, Inc.(a) | | $ | 296 | |
| | | 1,653 | | IDEXX Laboratories, Inc.(a) | | | 580 | |
| | | 2,647 | | Intuitive Surgical, Inc.(a) | | | 531 | |
| | | 37,560 | | Medtronic PLC | | | 3,371 | |
| | | 1,498 | | STERIS PLC | | | 309 | |
| | | 5,001 | | Tandem Diabetes Care, Inc.(a) | | | 296 | |
| | | 212 | | Teleflex, Inc. | | | 52 | |
| | | 352 | | The Cooper Companies, Inc. | | | 110 | |
| | | | | | | | 14,153 | |
| | | | | Health Care Providers & Services — 3.27% |
| | | 3,127 | | AmerisourceBergen Corp. | | | 442 | |
| | | 24,101 | | Centene Corp.(a) | | | 2,039 | |
| | | 11,241 | | Cigna Corp. | | | 2,963 | |
| | | 14,322 | | CVS Health Corp. | | | 1,327 | |
| | | 4,252 | | Elevance Health, Inc. | | | 2,053 | |
| | | 4,756 | | HCA Healthcare, Inc. | | | 799 | |
| | | 2,789 | | Humana, Inc. | | | 1,305 | |
| | | 2,131 | | Laboratory Corporation of America Holdings | | | 499 | |
| | | 4,072 | | McKesson Corp. | | | 1,328 | |
| | | 992 | | Molina Heathcare, Inc.(a) | | | 277 | |
| | | 2,928 | | Quest Diagnostics, Inc. | | | 389 | |
| | | 11,048 | | UnitedHealth Group, Inc. | | | 5,676 | |
| | | | | | | | 19,097 | |
| | | | | Health Care Technology — 0.46% |
| | | 9,979 | | Teladoc Health, Inc.(a) | | | 331 | |
| | | 11,861 | | Veeva Systems, Inc., Class - A(a) | | | 2,349 | |
| | | | | | | | 2,680 | |
| | | | | Hotels, Restaurants & Leisure — 1.81% |
| | | 3,359 | | Airbnb, Inc., Class - A(a) | | | 299 | |
| | | 7,828 | | Caesars Entertainment, Inc.(a) | | | 300 | |
| | | 41,046 | | Carnival Corp.(a) | | | 355 | |
| | | 2,249 | | Darden Restaurants, Inc. | | | 254 | |
| | | 23,594 | | DraftKings, Inc.(a) | | | 275 | |
| | | 148 | | Hilton Worldwide Holdings, Inc. | | | 16 | |
| | | 3,826 | | Hyatt Hotels Corp., Class - A(a) | | | 283 | |
| | | 1,434 | | Marriott International, Inc., Class - A | | | 195 | |
| | | 20,166 | | McDonald’s Corp. | | | 4,979 | |
| | | 51,410 | | Norwegian Cruise Line Holdings Ltd.(a) | | | 572 | |
| | | 16,947 | | Royal Caribbean Cruises Ltd.(a) | | | 592 | |
| | | 30,827 | | Starbucks Corp. | | | 2,355 | |
| | | 546 | | Vail Resorts, Inc. | | | 119 | |
| | | | | | | | 10,594 | |
| | | | | Household Durables — 0.36% |
| | | 3,443 | | D.R. Horton, Inc. | | | 228 | |
| | | 3,121 | | Garmin Ltd. | | | 307 | |
| | | 3,252 | | Leggett & Platt, Inc. | | | 112 | |
| | | 6,964 | | Lennar Corp., Class - A | | | 491 | |
| | Shares | | Security Description | | Value
(000) | |
| | | | | Household Durables (continued) |
| | | 83 | | Lennar Corp., Class - B | | $ | 5 | |
| | | 4,132 | | PulteGroup, Inc. | | | 164 | |
| | | 17,676 | | Toll Brothers, Inc. | | | 788 | |
| | | | | | | | 2,095 | |
| | | | | Household Products — 1.76% |
| | | 2,171 | | Church & Dwight Co., Inc. | | | 201 | |
| | | 16,240 | | Kimberly-Clark Corp. | | | 2,195 | |
| | | 428 | | Spectrum Brands Holdings, Inc. | | | 35 | |
| | | 1,218 | | The Clorox Co. | | | 172 | |
| | | 53,465 | | The Procter & Gamble Co. | | | 7,688 | |
| | | | | | | | 10,291 | |
| | | | | Independent Power and Renewable Electricity Producers — 0.10% |
| | | 26,502 | | Vistra Corp. | | | 606 | |
| | | | | Industrial Conglomerates — 0.57% |
| | | 7,946 | | General Electric Co. | | | 506 | |
| | | 16,050 | | Honeywell International, Inc. | | | 2,790 | |
| | | 41 | | Roper Technologies, Inc. | | | 16 | |
| | | | | | | | 3,312 | |
| | | | | Insurance — 2.04% |
| | | 23,465 | | Aflac, Inc. | | | 1,298 | |
| | | 560 | | Aon PLC, Class - A | | | 151 | |
| | | 3,483 | | Arthur J. Gallagher & Co. | | | 568 | |
| | | 1,195 | | Assurant, Inc. | | | 207 | |
| | | 1,709 | | Brown & Brown, Inc. | | | 100 | |
| | | 3,252 | | Cincinnati Financial Corp. | | | 387 | |
| | | 52,976 | | Fidelity National Financial, Inc. | | | 1,958 | |
| | | 9,177 | | Lincoln National Corp. | | | 429 | |
| | | 2,577 | | Marsh & McLennan Companies, Inc. | | | 400 | |
| | | 2,536 | | Mercury General Corp. | | | 112 | |
| | | 26,353 | | MetLife, Inc. | | | 1,655 | |
| | | 7,077 | | Old Republic International Corp. | | | 158 | |
| | | 6,114 | | Prudential Financial, Inc. | | | 585 | |
| | | 26,534 | | The Allstate Corp. | | | 3,363 | |
| | | 2,945 | | The Progressive Corp. | | | 342 | |
| | | 3,246 | | W.R. Berkley Corp. | | | 222 | |
| | | | | | | | 11,935 | |
| | | | | Interactive Media & Services — 5.46% |
| | | 6,267 | | Alphabet, Inc., Class - A(a) | | | 13,657 | |
| | | 4,583 | | Alphabet, Inc., Class - C(a) | | | 10,025 | |
| | | 49,461 | | Meta Platforms, Inc., Class - A(a) | | | 7,976 | |
| | | 7,379 | | Twitter, Inc.(a) | | | 276 | |
| | | | | | | | 31,934 | |
| | | | | Internet & Direct Marketing Retail — 2.92% |
| | | 154,380 | | Amazon.com, Inc.(a) | | | 16,396 | |
| | | 15,760 | | eBay, Inc. | | | 657 | |
| | | | | | | | 17,053 | |
See accompanying notes to financial statements.
41
HC CAPITAL TRUST
The Value Equity Portfolio
Portfolio of Investments (continued) — June 30, 2022
| | Shares | | Security Description | | Value
(000) | |
| | | | | Common Stocks (continued) |
| | | | | IT Services — 3.64% |
| | | 2,831 | | Accenture PLC, Class - A | | $ | 786 | |
| | | 3,168 | | Akamai Technologies, Inc.(a) | | | 289 | |
| | | 10,724 | | Block, Inc.(a) | | | 659 | |
| | | 1,853 | | Cognizant Technology Solutions Corp. | | | 125 | |
| | | 8,471 | | EPAM Systems, Inc.(a) | | | 2,497 | |
| | | 5,082 | | Fidelity National Information Services, Inc. | | | 466 | |
| | | 3,316 | | Fiserv, Inc.(a) | | | 295 | |
| | | 13,957 | | GoDaddy, Inc., Class - A(a) | | | 971 | |
| | | 4,187 | | International Business Machines Corp. | | | 591 | |
| | | 18,311 | | MasterCard, Inc., Class - A | | | 5,776 | |
| | | 14,603 | | Okta, Inc.(a) | | | 1,320 | |
| | | 6,910 | | Paychex, Inc. | | | 787 | |
| | | 4,262 | | Snowflake, Inc., Class - A(a) | | | 593 | |
| | | 10,501 | | The Western Union Co. | | | 173 | |
| | | 7,862 | | Twilio, Inc., Class - A(a) | | | 659 | |
| | | 4,247 | | VeriSign, Inc.(a) | | | 711 | |
| | | 23,246 | | Visa, Inc., Class - A | | | 4,577 | |
| | | 43 | | WEX, Inc.(a) | | | 7 | |
| | | | | | | | 21,282 | |
| | | | | Leisure Products — 0.15% |
| | | 1,780 | | Brunswick Corp. | | | 116 | |
| | | 2,849 | | Hasbro, Inc. | | | 233 | |
| | | 10,271 | | Mattel, Inc.(a) | | | 229 | |
| | | 3,276 | | Polaris, Inc. | | | 326 | |
| | | | | | | | 904 | |
| | | | | Life Sciences Tools & Services — 1.12% |
| | | 4,371 | | Agilent Technologies, Inc. | | | 519 | |
| | | 398 | | Bio-Rad Laboratories, Inc., Class - A(a) | | | 197 | |
| | | 1,294 | | Bruker Corp. | | | 81 | |
| | | 438 | | Charles River Laboratories International, Inc.(a) | | | 94 | |
| | | 710 | | IQVIA Holdings, Inc.(a) | | | 154 | |
| | | 2,796 | | Mettler-Toledo International, Inc.(a) | | | 3,212 | |
| | | 485 | | PerkinElmer, Inc. | | | 69 | |
| | | 2,339 | | QIAGEN N.V.(a) | | | 110 | |
| | | 3,456 | | Thermo Fisher Scientific, Inc. | | | 1,878 | |
| | | 720 | | Waters Corp.(a) | | | 238 | |
| | | | | | | | 6,552 | |
| | | | | Machinery — 1.42% |
| | | 11,054 | | AGCO Corp. | | | 1,091 | |
| | | 12,196 | | Caterpillar, Inc. | | | 2,179 | |
| | | 5,428 | | Cummins, Inc. | | | 1,050 | |
| | | 53 | | Donaldson Companies, Inc. | | | 3 | |
| | | 4,752 | | Dover Corp. | | | 577 | |
| | | 1,648 | | Esab Corp. | | | 72 | |
| | | 28 | | IDEX Corp. | | | 5 | |
| | | 6,910 | | Ingersoll Rand, Inc. | | | 291 | |
| | | 1,442 | | ITT, Inc. | | | 97 | |
| | Shares | | Security Description | | Value
(000) | |
| | | | | Machinery (continued) |
| | | 1,244 | | Nordson Corp. | | $ | 252 | |
| | | 17,062 | | Oshkosh Corp. | | | 1,401 | |
| | | 7,507 | | Otis Worldwide Corp. | | | 531 | |
| | | 1,693 | | Parker Hannifin Corp. | | | 417 | |
| | | 2,490 | | The Timken Co. | | | 132 | |
| | | 1,711 | | Westinghouse Air Brake Technologies Corp. | | | 140 | |
| | | 485 | | Xylem, Inc. | | | 38 | |
| | | | | | | | 8,276 | |
| | | | | Media — 1.13% |
| | | 297 | | Cable One, Inc. | | | 383 | |
| | | 1,042 | | Charter Communications, Inc., Class - A(a) | | | 488 | |
| | | 108,767 | | Comcast Corp., Class - A | | | 4,269 | |
| | | 4,889 | | Fox Corp., Class - A | | | 157 | |
| | | 2,709 | | Liberty Broadband Corp., Class - C(a) | | | 313 | |
| | | 3,789 | | Omnicom Group, Inc. | | | 241 | |
| | | 15,400 | | Paramount Global, Class - B | | | 380 | |
| | | 14,641 | | The Interpublic Group of Companies, Inc. | | | 403 | |
| | | | | | | | 6,634 | |
| | | | | Metals & Mining — 0.36% |
| | | 18,550 | | Newmont Corp. | | | 1,107 | |
| | | 8,225 | | Nucor Corp. | | | 859 | |
| | | 1,912 | | Steel Dynamics, Inc. | | | 126 | |
| | | | | | | | 2,092 | |
| | | | | Mortgage Real Estate Investment Trusts — 0.02% |
| | | 15,165 | | New Residential Investment Corp. | | | 141 | |
| | | | | Multiline Retail — 0.63% |
| | | 952 | | Dollar General Corp. | | | 234 | |
| | | 4,169 | | Dollar Tree, Inc.(a) | | | 650 | |
| | | 5,126 | | Ollie’s Bargain Outlet Holdings, Inc.(a) | | | 301 | |
| | | 17,745 | | Target Corp. | | | 2,506 | |
| | | | | | | | 3,691 | |
| | | | | Multi-Utilities — 1.21% |
| | | 2,674 | | Ameren Corp. | | | 242 | |
| | | 1,937 | | CMS Energy Corp. | | | 131 | |
| | | 1,642 | | Consolidated Edison, Inc. | | | 156 | |
| | | 24,990 | | Dominion Energy, Inc. | | | 1,994 | |
| | | 1,043 | | DTE Energy Co. | | | 132 | |
| | | 72,854 | | NiSource, Inc. | | | 2,149 | |
| | | 5,865 | | Public Service Enterprise Group, Inc. | | | 371 | |
| | | 951 | | Sempra Energy | | | 143 | |
| | | 17,371 | | WEC Energy Group, Inc. | | | 1,748 | |
| | | | | | | | 7,066 | |
| | | | | Oil, Gas & Consumable Fuels — 3.61% |
| | | 19,551 | | Antero Midstream Corp. | | | 177 | |
| | | 7,263 | | Cheniere Energy, Inc. | | | 966 | |
| | | 19,851 | | Chevron Corp. | | | 2,874 | |
| | | 5,077 | | ConocoPhillips | | | 456 | |
See accompanying notes to financial statements.
42
HC CAPITAL TRUST
The Value Equity Portfolio
Portfolio of Investments (continued) — June 30, 2022
| | Shares | | Security Description | | Value
(000) | |
| | | | | Common Stocks (continued) |
| | | | | Oil, Gas & Consumable Fuels (continued) |
| | | 45,056 | | Continental Resources, Inc. | | $ | 2,944 | |
| | | 63,641 | | Coterra Energy, Inc. | | | 1,641 | |
| | | 30,851 | | Devon Energy Corp. | | | 1,700 | |
| | | 521 | | DT Midstream, Inc. | | | 26 | |
| | | 3,995 | | EOG Resources, Inc. | | | 441 | |
| | | 7,396 | | EQT Corp. | | | 254 | |
| | | 35,550 | | Exxon Mobil Corp. | | | 3,046 | |
| | | 16,993 | | Hess Corp. | | | 1,800 | |
| | | 11,538 | | Marathon Petroleum Corp. | | | 949 | |
| | | 26,124 | | Occidental Petroleum Corp. | | | 1,538 | |
| | | 6,401 | | ONEOK, Inc. | | | 355 | |
| | | 6,951 | | Targa Resources Corp. | | | 415 | |
| | | 41,203 | | The Williams Companies, Inc. | | | 1,286 | |
| | | 2,242 | | Valero Energy Corp. | | | 238 | |
| | | | | | | | 21,106 | |
| | | | | Paper & Forest Products — 0.01% |
| | | 964 | | Sylvamo Corp. | | | 32 | |
| | | | | Personal Products — 0.07% |
| | | 1,700 | | The Estee Lauder Companies, Inc. | | | 433 | |
| | | | | Pharmaceuticals — 4.74% |
| | | 30,890 | | Bristol-Myers Squibb Co. | | | 2,379 | |
| | | 1,441 | | Catalent, Inc.(a) | | | 155 | |
| | | 19,272 | | Eli Lilly & Co. | | | 6,248 | |
| | | 1,000 | | Jazz Pharmaceuticals PLC(a) | | | 156 | |
| | | 44,819 | | Johnson & Johnson | | | 7,955 | |
| | | 58,424 | | Merck & Co., Inc. | | | 5,327 | |
| | | 6,434 | | Organon & Co. | | | 217 | |
| | | 99,288 | | Pfizer, Inc. | | | 5,206 | |
| | | 8,047 | | Viatris, Inc. | | | 84 | |
| | | | | | | | 27,727 | |
| | | | | Professional Services — 0.69% |
| | | 26,820 | | CoStar Group, Inc.(a) | | | 1,620 | |
| | | 1,081 | | Equifax, Inc. | | | 198 | |
| | | 717 | | Jacobs Engineering Group, Inc. | | | 91 | |
| | | 1,829 | | Leidos Holdings, Inc. | | | 184 | |
| | | 825 | | Robert Half International, Inc. | | | 62 | |
| | | 10,910 | | Verisk Analytics, Inc., Class - A | | | 1,888 | |
| | | | | | | | 4,043 | |
| | | | | Real Estate Management & Development — 0.07% |
| | | 1,691 | | CBRE Group, Inc., Class - A(a) | | | 124 | |
| | | 4,563 | | Howard Hughes Corp.(a) | | | 311 | |
| | | | | | | | 435 | |
| | | | | Road & Rail — 1.15% |
| | | 327 | | AMERCO | | | 156 | |
| | | 4,011 | | CSX Corp. | | | 117 | |
| | | 2,655 | | Knight-Swift Transportation Holdings, Inc. | | | 123 | |
| | | 5,345 | | Norfolk Southern Corp. | | | 1,215 | |
| | Shares | | Security Description | | Value
(000) | |
| | | | | Road & Rail (continued) |
| | | 1,462 | | Old Dominion Freight Line, Inc. | | $ | 375 | |
| | | 7,527 | | Ryder System, Inc. | | | 535 | |
| | | 13,196 | | Uber Technologies, Inc.(a) | | | 270 | |
| | | 18,473 | | Union Pacific Corp. | | | 3,939 | |
| | | | | | | | 6,730 | |
| | | | | Semiconductors & Semiconductor Equipment — 4.30% |
| | | 5,394 | | Advanced Micro Devices, Inc.(a) | | | 412 | |
| | | 3,728 | | Analog Devices, Inc. | | | 545 | |
| | | 21,151 | | Applied Materials, Inc. | | | 1,924 | |
| | | 2,567 | | Broadcom, Inc. | | | 1,247 | |
| | | 7,850 | | Enphase Energy, Inc.(a) | | | 1,533 | |
| | | 113,563 | | Intel Corp. | | | 4,248 | |
| | | 3,302 | | KLA Corp. | | | 1,054 | |
| | | 1,129 | | Lam Research Corp. | | | 481 | |
| | | 6,026 | | Marvell Technology, Inc. | | | 262 | |
| | | 2,758 | | Micron Technology, Inc. | | | 152 | |
| | | 50,260 | | NVIDIA Corp. | | | 7,620 | |
| | | 7,270 | | QUALCOMM, Inc. | | | 929 | |
| | | 3,842 | | Skyworks Solutions, Inc. | | | 356 | |
| | | 23,905 | | Texas Instruments, Inc. | | | 3,673 | |
| | | 6,964 | | Universal Display Corp. | | | 704 | |
| | | | | | | | 25,140 | |
| | | | | Software — 9.76% |
| | | 12,361 | | Adobe, Inc.(a) | | | 4,525 | |
| | | 10,190 | | Autodesk, Inc.(a) | | | 1,752 | |
| | | 27,227 | | Manhattan Associates, Inc.(a) | | | 3,120 | |
| | | 139,124 | | Microsoft Corp. | | | 35,732 | |
| | | 56,988 | | Oracle Corp. | | | 3,982 | |
| | | 8,321 | | PAYCOM Software, Inc.(a) | | | 2,331 | |
| | | 8,575 | | Salesforce, Inc.(a) | | | 1,415 | |
| | | 8,243 | | ServiceNow, Inc.(a) | | | 3,920 | |
| | | 668 | | Synopsys, Inc.(a) | | | 203 | |
| | | | | | | | 56,980 | |
| | | | | Specialty Retail — 2.15% |
| | | 1,187 | | Advance Auto Parts, Inc. | | | 205 | |
| | | 2,829 | | AutoNation, Inc.(a) | | | 316 | |
| | | 22 | | AutoZone, Inc.(a) | | | 47 | |
| | | 6,524 | | Bath & Body Works, Inc. | | | 176 | |
| | | 7,757 | | Best Buy Co., Inc. | | | 506 | |
| | | 631 | | Burlington Stores, Inc.(a) | | | 86 | |
| | | 4,224 | | CarMax, Inc.(a) | | | 382 | |
| | | 4,609 | | Dick’s Sporting Goods, Inc. | | | 347 | |
| | | 923 | | Five Below, Inc.(a) | | | 105 | |
| | | 36,426 | | Floor & Decor Holdings, Inc., Class - A(a) | | | 2,293 | |
| | | 3,541 | | Lowe’s Companies, Inc. | | | 619 | |
| | | 7,287 | | Penske Automotive Group, Inc. | | | 763 | |
| | | 17,296 | | The Home Depot, Inc. | | | 4,743 | |
| | | 21,249 | | The TJX Companies, Inc. | | | 1,187 | |
See accompanying notes to financial statements.
43
HC CAPITAL TRUST
The Value Equity Portfolio
Portfolio of Investments (concluded) — June 30, 2022
| | Shares | | Security Description | | Value
(000) | |
| | | | | Common Stocks (continued) |
| | | | | Specialty Retail (continued) |
| | | 2,059 | | Tractor Supply Co. | | $ | 399 | |
| | | 2,174 | | Victoria’s Secret & Co.(a) | | | 61 | |
| | | 3,016 | | Williams-Sonoma, Inc. | | | 335 | |
| | | | | | | | 12,570 | |
| | | | | Technology Hardware, Storage & Peripherals — 7.12% |
| | | 283,165 | | Apple, Inc. | | | 38,715 | |
| | | 83,952 | | HP, Inc. | | | 2,752 | |
| | | 2,448 | | NetApp, Inc. | | | 160 | |
| | | | | | | | 41,627 | |
| | | | | Textiles, Apparel & Luxury Goods — 0.33% |
| | | 6,619 | | Capri Holdings Ltd.(a) | | | 271 | |
| | | 30,504 | | Hanesbrands, Inc. | | | 314 | |
| | | 9,230 | | NIKE, Inc., Class - B | | | 944 | |
| | | 1,533 | | Ralph Lauren Corp. | | | 137 | |
| | | 7,801 | | Tapestry, Inc. | | | 238 | |
| | | | | | | | 1,904 | |
| | | | | Tobacco — 0.37% |
| | | 36,600 | | Altria Group, Inc. | | | 1,528 | |
| | | 6,325 | | Philip Morris International, Inc. | | | 625 | |
| | | | | | | | 2,153 | |
| | | | | Trading Companies & Distributors — 0.31% |
| | | 13,428 | | Fastenal Co. | | | 670 | |
| | | 1,130 | | Watsco, Inc. | | | 270 | |
| | | 8,335 | | WESCO International, Inc.(a) | | | 893 | |
| | | | | | | | 1,833 | |
| | Shares | | Security Description | | Value
(000) | |
| | | | | Water Utilities — 0.03% |
| | | 1,178 | | American Water Works Co., Inc. | | $ | 175 | |
| | | | | Wireless Telecommunication Services — 0.54% |
| | | 23,667 | | T-Mobile US, Inc.(a) | | | 3,184 | |
| | | | | Total Common Stocks | | | 578,662 | |
| | | | | Investment Companies — 0.96% |
| | | 284,400 | | Federated Hermes Treasury Obligations Fund, Institutional Shares, 1.37%^^(b) | | | 284 | |
| | | 5,334,964 | | State Street Institutional Treasury Plus Money Market Fund, Trust Class, 1.40%(b) | | | 5,335 | |
| | | | | Total Investment Companies | | | 5,619 | |
| | | | | Total Investments (cost $302,813) — 99.95% | | | 584,281 | |
| | | | | Other assets in excess of liabilities — 0.05% | | | 284 | |
| | | | | Net Assets — 100.00% | | $ | 584,565 | |
^ | All or part of this security was on loan as of June 30, 2022. |
^^ | Purchased with cash collateral held from securities lending. The value of the collateral could include collateral held for securities that were sold on or before June 30, 2022. |
(a) | Represents non-income producing security. |
(b) | Annualized 7-day yield as of period-end. |
| As of June 30, 2022, 100% of the Portfolio’s net assets were managed by Parametric Portfolio Associates, LLC. |
| REIT—Real Estate Investment Trust |
The following table reflects the open derivative positions held by the Portfolio as of June 30, 2022.
Futures Contracts Purchased*
Description | | Number of
Contracts | | | Expiration
Date | | | Notional
Amount
(000) | | | Value and
Unrealized
Appreciation/
(Depreciation)
(000) | |
E-Mini S&P 500 Future | | | 19 | | | | 9/16/22 | | | $ | 3,600 | | | $ | 47 | |
E-Mini S&P Midcap 400 Future | | | 5 | | | | 9/16/22 | | | | 1,134 | | | | (19 | ) |
| | | | | | | | | | | $ | 4,734 | | | $ | 28 | |
| | Total Unrealized Appreciation | | $ | 47 | |
| | Total Unrealized Depreciation | | | (19 | ) |
| | Total Net Unrealized Appreciation/(Depreciation) | | $ | 28 | |
* | Cash has been pledged as collateral for futures contracts held by the Portfolio. |
See accompanying notes to financial statements.
44
HC CAPITAL TRUST
The Growth Equity Portfolio
Portfolio of Investments — June 30, 2022
| | Shares | | Security Description | | Value
(000) | |
| | | | | Common Stocks — 97.38% |
| | | | | Aerospace & Defense — 1.01% |
| | | 5,461 | | General Dynamics Corp. | | $ | 1,208 | |
| | | 391 | | HEICO Corp. | | | 51 | |
| | | 728 | | HEICO Corp., Class - A | | | 77 | |
| | | 4,930 | | L3Harris Technologies, Inc. | | | 1,192 | |
| | | 2,363 | | Northrop Grumman Corp. | | | 1,131 | |
| | | 33,522 | | Raytheon Technologies Corp. | | | 3,221 | |
| | | 475 | | TransDigm Group, Inc.(a) | | | 255 | |
| | | | | | | | 7,135 | |
| | | | | Air Freight & Logistics — 0.11% |
| | | 4,946 | | Expeditors International of Washington, Inc. | | | 482 | |
| | | 7,548 | | GXO Logistics, Inc.(a) | | | 327 | |
| | | | | | | | 809 | |
| | | | | Airlines — 0.13% |
| | | 10,129 | | Alaska Air Group, Inc.(a) | | | 406 | |
| | | 18,665 | | Delta Air Lines, Inc.(a) | | | 540 | |
| | | | | | | | 946 | |
| | | | | Automobiles — 2.91% |
| | | 71,725 | | Ford Motor Co. | | | 798 | |
| | | 55,394 | | Rivian Automotive, Inc., Class - A(a) | | | 1,426 | |
| | | 27,198 | | Tesla, Inc.(a) | | | 18,316 | |
| | | | | | | | 20,540 | |
| | | | | Banks — 2.72% |
| | | 3,139 | | Bank of America Corp. | | | 98 | |
| | | 13,206 | | Bank OZK | | | 496 | |
| | | 53,577 | | Citigroup, Inc. | | | 2,464 | |
| | | 13,240 | | Citizens Financial Group, Inc. | | | 473 | |
| | | 40,559 | | Comerica, Inc. | | | 2,975 | |
| | | 1,150 | | Cullen/Frost Bankers, Inc. | | | 134 | |
| | | 29,928 | | East West Bancorp, Inc. | | | 1,939 | |
| | | 86,090 | | First Horizon Corp. | | | 1,882 | |
| | | 3,853 | | First Republic Bank | | | 556 | |
| | | 36,888 | | Huntington Bancshares, Inc. | | | 444 | |
| | | 23,176 | | JPMorgan Chase & Co. | | | 2,609 | |
| | | 74,674 | | KeyCorp | | | 1,287 | |
| | | 106,556 | | Regions Financial Corp. | | | 1,998 | |
| | | 209 | | SVB Financial Group(a) | | | 83 | |
| | | 34,522 | | Zions Bancorp NA | | | 1,757 | |
| | | | | | | | 19,195 | |
| | | | | Beverages — 1.54% |
| | | 7,236 | | Brown-Forman Corp., Class - B | | | 508 | |
| | | 8,931 | | Monster Beverage Corp.(a) | | | 828 | |
| | | 29,046 | | PepsiCo, Inc. | | | 4,840 | |
| | | 74,917 | | The Coca-Cola Co. | | | 4,713 | |
| | | | | | | | 10,889 | |
| | Shares | | Security Description | | Value
(000) | |
| | | | | Biotechnology — 1.79% |
| | | 4,254 | | AbbVie, Inc. | | $ | 652 | |
| | | 9,107 | | Alnylam Pharmaceuticals, Inc.(a) | | | 1,328 | |
| | | 15,193 | | Amgen, Inc. | | | 3,697 | |
| | | 14,489 | | Mirati Therapeutics, Inc.(a) | | | 973 | |
| | | 19,253 | | Moderna, Inc.(a) | | | 2,751 | |
| | | 14,430 | | Natera, Inc.(a) | | | 511 | |
| | | 800 | | Neurocrine Biosciences, Inc.(a) | | | 78 | |
| | | 12,521 | | Novavax, Inc.(a) | | | 644 | |
| | | 2,019 | | Regeneron Pharmaceuticals, Inc.(a) | | | 1,193 | |
| | | 1,014 | | Seagen, Inc.(a) | | | 179 | |
| | | 2,251 | | Vertex Pharmaceuticals, Inc.(a) | | | 634 | |
| | | | | | | | 12,640 | |
| | | | | Building Products — 0.25% |
| | | 404 | | Armstrong World Industries, Inc. | | | 30 | |
| | | 17,452 | | Carrier Global Corp. | | | 622 | |
| | | 50,415 | | Resideo Technologies, Inc.(a) | | | 980 | |
| | | 1,218 | | Trane Technologies PLC | | | 158 | |
| | | | | | | | 1,790 | |
| | | | | Capital Markets — 2.34% |
| | | 2,335 | | CBOE Global Markets, Inc. | | | 264 | |
| | | 6,242 | | CME Group, Inc. | | | 1,278 | |
| | | 1,203 | | FactSet Research Systems, Inc. | | | 463 | |
| | | 2,582 | | Intercontinental Exchange, Inc. | | | 243 | |
| | | 143,372 | | Invesco Ltd. | | | 2,313 | |
| | | 18,395 | | Janus Henderson Group PLC | | | 432 | |
| | | 713 | | LPL Financial Holdings, Inc. | | | 132 | |
| | | 349 | | MarketAxess Holdings, Inc. | | | 89 | |
| | | 1,577 | | Moody’s Corp. | | | 429 | |
| | | 31,488 | | Morgan Stanley | | | 2,395 | |
| | | 390 | | Morningstar, Inc. | | | 94 | |
| | | 838 | | MSCI, Inc. | | | 345 | |
| | | 36,398 | | Robinhood Markets, Inc., Class - A(a) | | | 299 | |
| | | 11,523 | | S&P Global, Inc. | | | 3,885 | |
| | | 2,032 | | T. Rowe Price Group, Inc. | | | 231 | |
| | | 16,324 | | The Charles Schwab Corp. | | | 1,031 | |
| | | 8,823 | | The Goldman Sachs Group, Inc. | | | 2,620 | |
| | | | | | | | 16,543 | |
| | | | | Chemicals — 1.61% |
| | | 3,430 | | Air Products & Chemicals, Inc. | | | 825 | |
| | | 18,396 | | CF Industries Holdings, Inc. | | | 1,577 | |
| | | 30,407 | | Ecolab, Inc. | | | 4,675 | |
| | | 999 | | FMC Corp. | | | 107 | |
| | | 28,629 | | LyondellBasell Industries N.V., Class - A | | | 2,504 | |
| | | 19,809 | | The Chemours Co. | | | 634 | |
| | | 4,752 | | The Sherwin-Williams Co. | | | 1,064 | |
| | | | | | | | 11,386 | |
| | | | | Commercial Services & Supplies — 0.25% |
| | | 1,845 | | Cintas Corp. | | | 689 | |
See accompanying notes to financial statements.
45
HC CAPITAL TRUST
The Growth Equity Portfolio
Portfolio of Investments (continued) — June 30, 2022
| | Shares | | Security Description | | Value
(000) | |
| | | | | Common Stocks (continued) |
| | | | | Commercial Services & Supplies (continued) |
| | | 6,652 | | Copart, Inc.(a) | | $ | 723 | |
| | | 2,752 | | Waste Connections, Inc. | | | 341 | |
| | | | | | | | 1,753 | |
| | | | | Communications Equipment — 0.70% |
| | | 4,776 | | Arista Networks, Inc.(a) | | | 448 | |
| | | 101,754 | | Cisco Systems, Inc. | | | 4,339 | |
| | | 825 | | F5, Inc.(a) | | | 126 | |
| | | 153 | | Motorola Solutions, Inc. | | | 32 | |
| | | | | | | | 4,945 | |
| | | | | Construction & Engineering — 0.01% |
| | | 374 | | Quanta Services, Inc. | | | 47 | |
| | | | | Consumer Finance — 0.38% |
| | | 95 | | Credit Acceptance Corp.(a) | | | 45 | |
| | | 141,214 | | SLM Corp. | | | 2,251 | |
| | | 11,412 | | Upstart Holdings, Inc.^(a) | | | 361 | |
| | | | | | | | 2,657 | |
| | | | | Containers & Packaging — 0.18% |
| | | 23,054 | | Amcor PLC | | | 287 | |
| | | 1,280 | | AptarGroup, Inc. | | | 132 | |
| | | 747 | | Avery Dennison Corp. | | | 121 | |
| | | 841 | | Packaging Corporation of America | | | 116 | |
| | | 14,972 | | Silgan Holdings, Inc. | | | 618 | |
| | | | | | | | 1,274 | |
| | | | | Distributors — 0.07% |
| | | 2,966 | | Genuine Parts Co. | | | 394 | |
| | | 381 | | Pool Corp. | | | 134 | |
| | | | | | | | 528 | |
| | | | | Diversified Consumer Services — 0.14% |
| | | 3,660 | | Grand Canyon Education, Inc.(a) | | | 345 | |
| | | 8,138 | | H&R Block, Inc. | | | 287 | |
| | | 4,568 | | Service Corp. International | | | 316 | |
| | | 1,276 | | Terminix Global Holdings, Inc.(a) | | | 52 | |
| | | | | | | | 1,000 | |
| | | | | Diversified Financial Services — 1.08% |
| | | 17,401 | | Berkshire Hathaway, Inc., Class - B(a) | | | 4,750 | |
| | | 34,972 | | Equitable Holdings, Inc. | | | 912 | |
| | | 32,550 | | Voya Financial, Inc. | | | 1,938 | |
| | | | | | | | 7,600 | |
| | | | | Diversified Telecommunication Services — 0.70% |
| | | 190,186 | | AT&T, Inc. | | | 3,986 | |
| | | 19,371 | | Verizon Communications, Inc. | | | 983 | |
| | | | | | | | 4,969 | |
| | | | | Electric Utilities — 1.11% |
| | | 15,796 | | Edison International | | | 999 | |
| | | 12,342 | | Entergy Corp. | | | 1,390 | |
| | | 60,365 | | FirstEnergy Corp. | | | 2,317 | |
| | Shares | | Security Description | | Value
(000) | |
| | | | | Electric Utilities (continued) |
| | | 23,487 | | Hawaiian Electric Industries, Inc. | | $ | 961 | |
| | | 4,256 | | NextEra Energy, Inc. | | | 330 | |
| | | 36,550 | | NRG Energy, Inc. | | | 1,395 | |
| | | 12,422 | | OGE Energy Corp. | | | 479 | |
| | | | | | | | 7,871 | |
| | | | | Electrical Equipment — 0.29% |
| | | 5,157 | | AMETEK, Inc. | | | 567 | |
| | | 13,294 | | Emerson Electric Co. | | | 1,057 | |
| | | 1,210 | | Hubbell, Inc. | | | 216 | |
| | | 931 | | Rockwell Automation, Inc. | | | 186 | |
| | | | | | | | 2,026 | |
| | | | | Electronic Equipment, Instruments & Components — 0.13% |
| | | 12,210 | | Amphenol Corp., Class - A | | | 785 | |
| | | 2,343 | | Vontier Corp. | | | 54 | |
| | | 376 | | Zebra Technologies Corp.(a) | | | 111 | |
| | | | | | | | 950 | |
| | | | | Energy Equipment & Services — 0.16% |
| | | 32,149 | | Schlumberger N.V. | | | 1,150 | |
| | | | | Entertainment — 0.62% |
| | | 24,348 | | Live Nation Entertainment, Inc.(a) | | | 2,011 | |
| | | 13,500 | | Netflix, Inc.(a) | | | 2,361 | |
| | | 248 | | The Walt Disney Co.(a) | | | 23 | |
| | | | | | | | 4,395 | |
| | | | | Equity Real Estate Investment Trusts — 2.74% |
| | | 7,525 | | American Tower Corp. | | | 1,923 | |
| | | 16,012 | | Equinix, Inc. | | | 10,521 | |
| | | 1,608 | | Equity Lifestyle Properties, Inc. | | | 113 | |
| | | 37,873 | | Healthpeak Properties, Inc. | | | 981 | |
| | | 12,459 | | Kilroy Realty Corp. | | | 652 | |
| | | 41,185 | | Omega Healthcare Investors, Inc. | | | 1,161 | |
| | | 3,998 | | Public Storage | | | 1,250 | |
| | | 52,271 | | SITE Centers Corp. | | | 704 | |
| | | 40,605 | | Ventas, Inc. | | | 2,089 | |
| | | | | | | | 19,394 | |
| | | | | Food & Staples Retailing — 1.82% |
| | | 18,462 | | Costco Wholesale Corp. | | | 8,848 | |
| | | 8,706 | | Sysco Corp. | | | 737 | |
| | | 1,413 | | Walgreens Boots Alliance, Inc. | | | 54 | |
| | | 26,416 | | Walmart, Inc. | | | 3,212 | |
| | | | | | | | 12,851 | |
| | | | | Food Products — 1.01% |
| | | 70,463 | | Conagra Brands, Inc. | | | 2,412 | |
| | | 5,224 | | Hormel Foods Corp. | | | 247 | |
| | | 413 | | Lamb Weston Holdings, Inc. | | | 30 | |
| | | 5,092 | | McCormick & Company, Inc. | | | 424 | |
| | | 56,218 | | Mondelez International, Inc., Class - A | | | 3,490 | |
| | | 1,045 | | The Hershey Co. | | | 225 | |
See accompanying notes to financial statements.
46
HC CAPITAL TRUST
The Growth Equity Portfolio
Portfolio of Investments (continued) — June 30, 2022
| | Shares | | Security Description | | Value
(000) | |
| | | | | Common Stocks (continued) |
| | | | | Food Products (continued) |
| | | 2,332 | | The J.M. Smucker Co. | | $ | 299 | |
| | | | | | | | 7,127 | |
| | | | | Gas Utilities — 0.56% |
| | | 34,942 | | National Fuel Gas Co. | | | 2,308 | |
| | | 42,971 | | UGI Corp. | | | 1,659 | |
| | | | | | | | 3,967 | |
| | | | | Health Care Equipment & Supplies — 3.35% |
| | | 51,368 | | Abbott Laboratories | | | 5,580 | |
| | | 11,112 | | Baxter International, Inc. | | | 714 | |
| | | 6,721 | | Becton Dickinson & Co. | | | 1,657 | |
| | | 10,892 | | Boston Scientific Corp.(a) | | | 406 | |
| | | 22,316 | | Danaher Corp. | | | 5,658 | |
| | | 15,756 | | Dexcom, Inc.(a) | | | 1,174 | |
| | | 15,477 | | Edwards Lifesciences Corp.(a) | | | 1,472 | |
| | | 1,344 | | Embecta Corp.(a) | | | 34 | |
| | | 2,690 | | IDEXX Laboratories, Inc.(a) | | | 943 | |
| | | 14,634 | | Intuitive Surgical, Inc.(a) | | | 2,937 | |
| | | 4,072 | | ResMed, Inc. | | | 854 | |
| | | 9,642 | | Stryker Corp. | | | 1,918 | |
| | | 3,346 | | Zimmer Biomet Holdings, Inc. | | | 352 | |
| | | | | | | | 23,699 | |
| | | | | Health Care Providers & Services — 3.32% |
| | | 22,388 | | Acadia Healthcare Co., Inc.(a) | | | 1,514 | |
| | | 1,650 | | Centene Corp.(a) | | | 140 | |
| | | 22,394 | | CVS Health Corp. | | | 2,075 | |
| | | 13,068 | | DaVita, Inc.(a) | | | 1,045 | |
| | | 5,215 | | Elevance Health, Inc. | | | 2,517 | |
| | | 3,283 | | Henry Schein, Inc.(a) | | | 252 | |
| | | 1,952 | | Laboratory Corporation of America Holdings | | | 457 | |
| | | 4,595 | | McKesson Corp. | | | 1,499 | |
| | | 2,799 | | Quest Diagnostics, Inc. | | | 372 | |
| | | 26,444 | | UnitedHealth Group, Inc. | | | 13,582 | |
| | | | | | | | 23,453 | |
| | | | | Health Care Technology — 0.30% |
| | | 48,062 | | Teladoc Health, Inc.(a) | | | 1,596 | |
| | | 2,596 | | Veeva Systems, Inc., Class - A(a) | | | 514 | |
| | | | | | | | 2,110 | |
| | | | | Hotels, Restaurants & Leisure — 2.15% |
| | | 21,152 | | Airbnb, Inc., Class - A(a) | | | 1,884 | |
| | | 1,179 | | Booking Holdings, Inc.(a) | | | 2,062 | |
| | | 1,800 | | Chipotle Mexican Grill, Inc.(a) | | | 2,353 | |
| | | 1,046 | | Choice Hotels International, Inc. | | | 117 | |
| | | 9,159 | | Marriott International, Inc., Class - A | | | 1,246 | |
| | | 98,020 | | Starbucks Corp. | | | 7,487 | |
| | | 310 | | Vail Resorts, Inc. | | | 68 | |
| | | | | | | | 15,217 | |
| | Shares | | Security Description | | Value
(000) | |
| | | | | Household Durables — 0.03% |
| | | 2,470 | | Garmin Ltd. | | $ | 243 | |
| | | | | Household Products — 1.20% |
| | | 5,143 | | Church & Dwight Co., Inc. | | | 477 | |
| | | 9,514 | | Colgate-Palmolive Co. | | | 762 | |
| | | 7,129 | | Kimberly-Clark Corp. | | | 963 | |
| | | 2,554 | | The Clorox Co. | | | 360 | |
| | | 41,123 | | The Procter & Gamble Co. | | | 5,914 | |
| | | | | | | | 8,476 | |
| | | | | Independent Power and Renewable Electricity Producers — 0.17% |
| | | 51,268 | | Vistra Corp. | | | 1,171 | |
| | | | | Industrial Conglomerates — 0.58% |
| | | 12,543 | | 3M Co. | | | 1,622 | |
| | | 11,662 | | General Electric Co. | | | 743 | |
| | | 4,278 | | Honeywell International, Inc. | | | 744 | |
| | | 2,488 | | Roper Technologies, Inc. | | | 982 | |
| | | | | | | | 4,091 | |
| | | | | Insurance — 2.20% |
| | | 9,715 | | Aflac, Inc. | | | 538 | |
| | | 7,992 | | Aon PLC, Class - A | | | 2,155 | |
| | | 1,155 | | Arthur J. Gallagher & Co. | | | 188 | |
| | | 16,505 | | Axis Capital Holdings Ltd. | | | 942 | |
| | | 11,297 | | Chubb Ltd. | | | 2,222 | |
| | | 171 | | Erie Indemnity Co., Class - A | | | 33 | |
| | | 9,236 | | Fidelity National Financial, Inc. | | | 341 | |
| | | 43,476 | | Lincoln National Corp. | | | 2,033 | |
| | | 11,845 | | Marsh & McLennan Companies, Inc. | | | 1,839 | |
| | | 22,534 | | Principal Financial Group, Inc. | | | 1,505 | |
| | | 4,893 | | Prudential Financial, Inc. | | | 468 | |
| | | 7,591 | | Reinsurance Group of America | | | 890 | |
| | | 5,565 | | The Progressive Corp. | | | 647 | |
| | | 6,974 | | The Travelers Companies, Inc. | | | 1,180 | |
| | | 15,794 | | Unum Group | | | 537 | |
| | | | | | | | 15,518 | |
| | | | | Interactive Media & Services — 5.31% |
| | | 6,174 | | Alphabet, Inc., Class - A(a) | | | 13,455 | |
| | | 8,293 | | Alphabet, Inc., Class - C(a) | | | 18,142 | |
| | | 646 | | IAC/InterActiveCorp.(a) | | | 49 | |
| | | 6,699 | | Match Group, Inc.(a) | | | 466 | |
| | | 33,693 | | Meta Platforms, Inc., Class - A(a) | | | 5,433 | |
| | | 1,048 | | Vimeo, Inc.(a) | | | 6 | |
| | | | | | | | 37,551 | |
| | | | | Internet & Direct Marketing Retail — 4.10% |
| | | 255,200 | | Amazon.com, Inc.(a) | | | 27,105 | |
| | | 2,900 | | MercadoLibre, Inc.(a) | | | 1,847 | |
| | | | | | | | 28,952 | |
| | | | | IT Services — 6.98% |
| | | 12,354 | | Accenture PLC, Class - A | | | 3,430 | |
See accompanying notes to financial statements.
47
HC CAPITAL TRUST
The Growth Equity Portfolio
Portfolio of Investments (continued) — June 30, 2022
| | Shares | | Security Description | | Value
(000) | |
| | | | | Common Stocks (continued) |
| | | | | IT Services (continued) |
| | | 144,784 | | Adyen N.V., ADR(a) | | $ | 2,115 | |
| | | 57,727 | | Automatic Data Processing, Inc. | | | 12,125 | |
| | | 2,371 | | Broadridge Financial Solutions, Inc. | | | 338 | |
| | | 2,241 | | Cognizant Technology Solutions Corp. | | | 151 | |
| | | 756 | | Fiserv, Inc.(a) | | | 67 | |
| | | 1,270 | | FleetCor Technologies, Inc.(a) | | | 267 | |
| | | 7,975 | | Global Payments, Inc. | | | 882 | |
| | | 1,598 | | Jack Henry & Associates, Inc. | | | 288 | |
| | | 13,591 | | MasterCard, Inc., Class - A | | | 4,288 | |
| | | 18,740 | | Okta, Inc.(a) | | | 1,694 | |
| | | 35,193 | | PayPal Holdings, Inc.(a) | | | 2,458 | |
| | | 19,050 | | Shopify, Inc., Class - A(a) | | | 595 | |
| | | 104,737 | | Visa, Inc., Class - A | | | 20,623 | |
| | | | | | | | 49,321 | |
| | | | | Leisure Products — 0.02% |
| | | 1,422 | | Polaris, Inc. | | | 141 | |
| | | | | Life Sciences Tools & Services — 1.07% |
| | | 1,141 | | Bio-Techne Corp. | | | 396 | |
| | | 440 | | Bruker Corp. | | | 28 | |
| | | 1,386 | | Illumina, Inc.(a) | | | 256 | |
| | | 758 | | Mettler-Toledo International, Inc.(a) | | | 871 | |
| | | 239 | | PerkinElmer, Inc. | | | 34 | |
| | | 9,568 | | Thermo Fisher Scientific, Inc. | | | 5,197 | |
| | | 2,297 | | Waters Corp.(a) | | | 760 | |
| | | | | | | | 7,542 | |
| | | | | Machinery — 1.46% |
| | | 9,555 | | Caterpillar, Inc. | | | 1,708 | |
| | | 4,840 | | Deere & Co. | | | 1,449 | |
| | | 3,369 | | Dover Corp. | | | 409 | |
| | | 5,857 | | Fortive Corp. | | | 319 | |
| | | 34,446 | | Gates Industrial Corp. PLC(a) | | | 372 | |
| | | 1,569 | | Graco, Inc. | | | 93 | |
| | | 2,179 | | IDEX Corp. | | | 396 | |
| | | 8,257 | | Illinois Tool Works, Inc. | | | 1,505 | |
| | | 6,973 | | Ingersoll Rand, Inc. | | | 293 | |
| | | 506 | | Nordson Corp. | | | 102 | |
| | | 8,726 | | Otis Worldwide Corp. | | | 617 | |
| | | 11,372 | | The Middleby Corp.(a) | | | 1,426 | |
| | | 927 | | The Toro Co. | | | 70 | |
| | | 14,765 | | Westinghouse Air Brake Technologies Corp. | | | 1,212 | |
| | | 4,438 | | Xylem, Inc. | | | 347 | |
| | | | | | | | 10,318 | |
| | | | | Media — 0.61% |
| | | 82,346 | | Altice USA, Inc., Class - A(a) | | | 762 | |
| | | 7,142 | | Comcast Corp., Class - A | | | 280 | |
| | | 4,935 | | Omnicom Group, Inc. | | | 314 | |
| | | 74,543 | | Paramount Global, Class - B | | | 1,839 | |
| | Shares | | Security Description | | Value
(000) | |
| | | | | Media (continued) |
| | | 30,009 | | Sinclair Broadcast Group, Inc., Class - A | | $ | 612 | |
| | | 17,241 | | The Interpublic Group of Companies, Inc. | | | 475 | |
| | | | | | | | 4,282 | |
| | | | | Metals & Mining — 0.45% |
| | | 33,504 | | Newmont Corp. | | | 1,999 | |
| | | 11,294 | | Royal Gold, Inc. | | | 1,206 | |
| | | | | | | | 3,205 | |
| | | | | Mortgage Real Estate Investment Trusts — 0.30% |
| | | 183,185 | | New Residential Investment Corp. | | | 1,707 | |
| | | 20,515 | | Starwood Property Trust, Inc. | | | 429 | |
| | | | | | | | 2,136 | |
| | | | | Multiline Retail — 0.28% |
| | | 939 | | Dollar General Corp. | | | 230 | |
| | | 4,517 | | Dollar Tree, Inc.(a) | | | 704 | |
| | | 7,596 | | Target Corp. | | | 1,073 | |
| | | | | | | | 2,007 | |
| | | | | Multi-Utilities — 0.64% |
| | | 84,210 | | CenterPoint Energy, Inc. | | | 2,491 | |
| | | 15,797 | | DTE Energy Co. | | | 2,002 | |
| | | | | | | | 4,493 | |
| | | | | Oil, Gas & Consumable Fuels — 2.93% |
| | | 64,022 | | Antero Midstream Corp. | | | 579 | |
| | | 2,070 | | Cheniere Energy, Inc. | | | 275 | |
| | | 24,368 | | ConocoPhillips | | | 2,188 | |
| | | 79,339 | | Devon Energy Corp. | | | 4,373 | |
| | | 7,898 | | DT Midstream, Inc. | | | 387 | |
| | | 21,212 | | EQT Corp. | | | 730 | |
| | | 10,924 | | Exxon Mobil Corp. | | | 936 | |
| | | 8,012 | | HF Sinclair Corp. | | | 362 | |
| | | 114,575 | | Marathon Oil Corp. | | | 2,576 | |
| | | 13,944 | | ONEOK, Inc. | | | 774 | |
| | | 4,640 | | Pioneer Natural Resources Co. | | | 1,035 | |
| | | 95,111 | | Range Resources Corp.(a) | | | 2,354 | |
| | | 28,597 | | Targa Resources Corp. | | | 1,706 | |
| | | 77,642 | | The Williams Companies, Inc. | | | 2,423 | |
| | | | | | | | 20,698 | |
| | | | | Personal Products — 0.65% |
| | | 17,953 | | The Estee Lauder Companies, Inc. | | | 4,572 | |
| | | | | Pharmaceuticals — 4.12% |
| | | 32,406 | | Eli Lilly & Co. | | | 10,508 | |
| | | 31,287 | | Johnson & Johnson | | | 5,554 | |
| | | 55,581 | | Merck & Co., Inc. | | | 5,067 | |
| | | 59,714 | | Novo Nordisk A/S, ADR | | | 6,653 | |
| | | 5,558 | | Organon & Co. | | | 188 | |
| | | 5,712 | | Pfizer, Inc. | | | 299 | |
| | | 4,788 | | Zoetis, Inc. | | | 823 | |
| | | | | | | | 29,092 | |
See accompanying notes to financial statements.
48
HC CAPITAL TRUST
The Growth Equity Portfolio
Portfolio of Investments (continued) — June 30, 2022
| | Shares | | Security Description | | Value
(000) | |
| | | | | Common Stocks (continued) |
| | | | | Professional Services — 0.16% |
| | | 3,010 | | CoStar Group, Inc.(a) | | $ | 182 | |
| | | 2,353 | | Equifax, Inc. | | | 430 | |
| | | 2,931 | | Verisk Analytics, Inc., Class - A | | | 507 | |
| | | | | | | | 1,119 | |
| | | | | Real Estate Management & Development — 0.01% |
| | | 1,272 | | CBRE Group, Inc., Class - A(a) | | | 94 | |
| | | | | Road & Rail — 1.35% |
| | | 916 | | AMERCO | | | 438 | |
| | | 124,263 | | CSX Corp. | | | 3,611 | |
| | | 1,274 | | Landstar System, Inc. | | | 185 | |
| | | 562 | | Old Dominion Freight Line, Inc. | | | 144 | |
| | | 24,231 | | Union Pacific Corp. | | | 5,168 | |
| | | | | | | | 9,546 | |
| | | | | Semiconductors & Semiconductor Equipment — 3.99% |
| | | 71,539 | | Advanced Micro Devices, Inc.(a) | | | 5,471 | |
| | | 8,866 | | Analog Devices, Inc. | | | 1,295 | |
| | | 6,209 | | Applied Materials, Inc. | | | 565 | |
| | | 7,015 | | Broadcom, Inc. | | | 3,408 | |
| | | 4,234 | | First Solar, Inc.(a) | | | 288 | |
| | | 73,074 | | Intel Corp. | | | 2,734 | |
| | | 1,378 | | KLA Corp. | | | 440 | |
| | | 1,153 | | Lam Research Corp. | | | 491 | |
| | | 28,189 | | Marvell Technology, Inc. | | | 1,227 | |
| | | 3,708 | | Microchip Technology, Inc. | | | 215 | |
| | | 7,602 | | Micron Technology, Inc. | | | 420 | |
| | | 50,325 | | NVIDIA Corp. | | | 7,629 | |
| | | 3,257 | | ON Semiconductor Corp.(a) | | | 164 | |
| | | 30,091 | | QUALCOMM, Inc. | | | 3,844 | |
| | | | | | | | 28,191 | |
| | | | | Software — 11.11% |
| | | 12,173 | | Adobe, Inc.(a) | | | 4,456 | |
| | | 1,974 | | ANSYS, Inc.(a) | | | 472 | |
| | | 11,429 | | Atlassian Corp. PLC, Class - A(a) | | | 2,142 | |
| | | 15,696 | | Crowdstrike Holdings, Inc., Class - A(a) | | | 2,646 | |
| | | 6,515 | | Fortinet, Inc.(a) | | | 369 | |
| | | 5,422 | | Intuit, Inc. | | | 2,090 | |
| | | 183,203 | | Microsoft Corp. | | | 47,052 | |
| | | 63,347 | | Oracle Corp. | | | 4,426 | |
| | | 377 | | Palo Alto Networks, Inc.(a) | | | 186 | |
| | | 80,693 | | Salesforce, Inc.(a) | | | 13,317 | |
| | | 1,391 | | SS&C Technologies Holdings, Inc. | | | 81 | |
| | | 151 | | Synopsys, Inc.(a) | | | 46 | |
| | | 25,729 | | The Trade Desk, Inc., Class - A(a) | | | 1,078 | |
| | | 1,628 | | VMware, Inc., Class - A | | | 186 | |
| | | 566 | | Workday, Inc., Class - A(a) | | | 79 | |
| | | | | | | | 78,626 | |
| | Shares | | Security Description | | Value
(000) | |
| | | | | Specialty Retail — 2.83% |
| | | 854 | | Advance Auto Parts, Inc. | | $ | 148 | |
| | | 597 | | AutoZone, Inc.(a) | | | 1,283 | |
| | | 5,882 | | Best Buy Co., Inc. | | | 383 | |
| | | 376 | | Burlington Stores, Inc.(a) | | | 51 | |
| | | 41,191 | | Lowe’s Companies, Inc. | | | 7,196 | |
| | | 3,411 | | O’Reilly Automotive, Inc.(a) | | | 2,155 | |
| | | 9,045 | | Ross Stores, Inc. | | | 635 | |
| | | 11,575 | | The Home Depot, Inc. | | | 3,174 | |
| | | 75,659 | | The TJX Companies, Inc. | | | 4,226 | |
| | | 1,256 | | Tractor Supply Co. | | | 243 | |
| | | 1,253 | | Ulta Beauty, Inc.(a) | | | 483 | |
| | | | | | | | 19,977 | |
| | | | | Technology Hardware, Storage & Peripherals — 7.13% |
| | | 368,386 | | Apple, Inc. | | | 50,367 | |
| | | | | Textiles, Apparel & Luxury Goods — 1.69% |
| | | 960 | | Kontoor Brands, Inc. | | | 32 | |
| | | 9,221 | | Lululemon Athletica, Inc.(a) | | | 2,514 | |
| | | 29,287 | | LVMH Moet Hennessy Louis Vuitton SE, ADR | | | 3,579 | |
| | | 54,266 | | NIKE, Inc., Class - B | | | 5,546 | |
| | | 6,722 | | V.F. Corp. | | | 297 | |
| | | | | | | | 11,968 | |
| | | | | Tobacco — 0.24% |
| | | 17,508 | | Philip Morris International, Inc. | | | 1,729 | |
| | | | | Trading Companies & Distributors — 0.29% |
| | | 23,095 | | Air Lease Corp. | | | 772 | |
| | | 14,448 | | Fastenal Co. | | | 721 | |
| | | 1,221 | | W.W. Grainger, Inc. | | | 555 | |
| | | | | | | | 2,048 | |
| | | | | Total Common Stocks | | | 688,330 | |
| | | | | Investment Companies — 1.88% |
| | | 368,480 | | Federated Hermes Treasury Obligations Fund, Institutional Shares, 1.37%^^(b) | | | 368 | |
| | | 12,940,650 | | State Street Institutional Treasury Plus Money Market Fund, Trust Class, 1.40%(b) | | | 12,941 | |
| | | | | Total Investment Companies | | | 13,309 | |
| | | | | Total Investments (cost $261,255) — 99.26% | | | 701,639 | |
| | | | | Other assets in excess of liabilities — 0.74% | | | 5,237 | |
| | | | | Net Assets — 100.00% | | $ | 706,876 | |
^ | All or part of this security was on loan as of June 30, 2022. |
^^ | Purchased with cash collateral held from securities lending. The value of the collateral could include collateral held for securities that were sold on or before June 30, 2022. |
(a) | Represents non-income producing security. |
(b) | Annualized 7-day yield as of period-end. |
| ADR—American Depositary Receipt |
See accompanying notes to financial statements.
49
HC CAPITAL TRUST
The Growth Equity Portfolio
Portfolio of Investments (concluded) — June 30, 2022
The following table reflects the percentage of total net assets of the Portfolio attributable to each Specialist Manager as of June 30, 2022.
| The Growth Equity Portfolio | | Jennison
Associates,
LLC | | | Parametric
Portfolio
Associates,
LLC | | | Total | |
| Common Stocks | | | 18.99 | % | | | 78.39 | % | | | 97.38 | % |
| Investment Companies | | | — | | | | 1.88 | % | | | 1.88 | % |
| Other Assets (Liabilities) | | | 0.62 | % | | | 0.12 | % | | | 0.74 | % |
| Total Net Assets | | | 19.61 | % | | | 80.39 | % | | | 100.00 | % |
Amounts designated as “—” indicate the Specialist Manager did not manage any holdings in that category.
The following table reflects the open derivative positions held by the Portfolio as of June 30, 2022.
Futures Contracts Purchased*
Description | | Number of
Contracts | | | Expiration
Date | | | Notional
Amount
(000) | | | Value and
Unrealized
Appreciation/
(Depreciation)
(000) | |
E-Mini S&P 500 Future | | | 7 | | | | 9/16/22 | | | $ | 1,326 | | | $ | 9 | |
E-Mini S&P Midcap 400 Future | | | 1 | | | | 9/16/22 | | | | 227 | | | | (4 | ) |
NASDAQ 100 E Mini Future | | | 49 | | | | 9/16/22 | | | | 11,299 | | | | 35 | |
| | | | | | | | | | | $ | 12,852 | | | $ | 40 | |
| | Total Unrealized Appreciation | | $ | 44 | |
| | Total Unrealized Depreciation | | | (4 | ) |
| | Total Net Unrealized Appreciation/(Depreciation) | | $ | 40 | |
* | Cash has been pledged as collateral for futures contracts held by the Portfolio. |
See accompanying notes to financial statements.
50
HC CAPITAL TRUST
The Institutional U.S. Equity Portfolio
Portfolio of Investments — June 30, 2022
| | Shares | | Security Description | | Value
(000) | |
| | | | | Common Stocks — 73.90% |
| | | | | Aerospace & Defense — 1.14% |
| | | 9,541 | | General Dynamics Corp. | | $ | 2,111 | |
| | | 1,244 | | HEICO Corp. | | | 163 | |
| | | 2,091 | | HEICO Corp., Class - A | | | 220 | |
| | | 91,231 | | Howmet Aerospace, Inc. | | | 2,869 | |
| | | 4,879 | | Huntington Ingalls Industries, Inc. | | | 1,062 | |
| | | 8,905 | | L3Harris Technologies, Inc. | | | 2,153 | |
| | | 9,078 | | Lockheed Martin Corp. | | | 3,903 | |
| | | 6,414 | | Northrop Grumman Corp. | | | 3,070 | |
| | | 42,680 | | Raytheon Technologies Corp. | | | 4,103 | |
| | | 6,205 | | Textron, Inc. | | | 379 | |
| | | 15,852 | | The Boeing Co.(a) | | | 2,167 | |
| | | 6,645 | | TransDigm Group, Inc.(a) | | | 3,566 | |
| | | | | | | | 25,766 | |
| | | | | Air Freight & Logistics — 0.50% |
| | | 13,336 | | C.H. Robinson Worldwide, Inc. | | | 1,352 | |
| | | 11,747 | | Expeditors International of Washington, Inc. | | | 1,145 | |
| | | 7,189 | | FedEx Corp. | | | 1,630 | |
| | | 24,680 | | United Parcel Service, Inc., Class - B | | | 4,505 | |
| | | 53,303 | | XPO Logistics, Inc.(a) | | | 2,567 | |
| | | | | | | | 11,199 | |
| | | | | Airlines — 0.01% |
| | | 4,579 | | Delta Air Lines, Inc.(a) | | | 133 | |
| | | 4,234 | | Southwest Airlines Co.(a) | | | 153 | |
| | | | | | | | 286 | |
| | | | | Auto Components — 0.05% |
| | | 7,743 | | Aptiv PLC(a) | | | 690 | |
| | | 6,867 | | BorgWarner, Inc. | | | 229 | |
| | | 1,710 | | Lear Corp. | | | 215 | |
| | | | | | | | 1,134 | |
| | | | | Automobiles — 1.16% |
| | | 112,681 | | Ford Motor Co. | | | 1,254 | |
| | | 39,508 | | General Motors Co.(a) | | | 1,255 | |
| | | 11,539 | | Lucid Group, Inc.^(a) | | | 198 | |
| | | 5,930 | | Rivian Automotive, Inc., Class - A(a) | | | 153 | |
| | | 34,522 | | Tesla, Inc.(a) | | | 23,247 | |
| | | | | | | | 26,107 | |
| | | | | Banks — 1.51% |
| | | 208,284 | | Bank of America Corp. | | | 6,484 | |
| | | 56,813 | | Citigroup, Inc. | | | 2,613 | |
| | | 14,060 | | Citizens Financial Group, Inc. | | | 502 | |
| | | 20,232 | | Fifth Third Bancorp | | | 680 | |
| | | 335 | | First Citizens BancShares, Inc., Class - A | | | 219 | |
| | | 5,057 | | First Republic Bank | | | 729 | |
| | | 41,258 | | Huntington Bancshares, Inc. | | | 496 | |
| | | 84,668 | | JPMorgan Chase & Co. | | | 9,534 | |
| | | 26,630 | | KeyCorp | | | 459 | |
| | | 5,132 | | M&T Bank Corp. | | | 818 | |
| | Shares | | Security Description | | Value
(000) | |
| | | | | Banks (continued) |
| | | 11,965 | | PNC Financial Services Group, Inc. | | $ | 1,888 | |
| | | 26,845 | | Regions Financial Corp. | | | 503 | |
| | | 1,799 | | Signature Bank | | | 322 | |
| | | 1,673 | | SVB Financial Group(a) | | | 661 | |
| | | 37,999 | | Truist Financial Corp. | | | 1,802 | |
| | | 40,316 | | U.S. Bancorp | | | 1,855 | |
| | | 5,186 | | Webster Financial Corp. | | | 219 | |
| | | 109,082 | | Wells Fargo & Co. | | | 4,273 | |
| | | | | | | | 34,057 | |
| | | | | Beverages — 1.14% |
| | | 20,176 | | Brown-Forman Corp., Class - B | | | 1,416 | |
| | | 7,146 | | Constellation Brands, Inc., Class - A | | | 1,666 | |
| | | 51,015 | | Keurig Dr Pepper, Inc. | | | 1,806 | |
| | | 19,953 | | Molson Coors Beverage Co., Class - B | | | 1,088 | |
| | | 43,517 | | Monster Beverage Corp.(a) | | | 4,034 | |
| | | 44,095 | | PepsiCo, Inc. | | | 7,348 | |
| | | 131,684 | | The Coca-Cola Co. | | | 8,283 | |
| | | | | | | | 25,641 | |
| | | | | Biotechnology — 1.60% |
| | | 56,762 | | AbbVie, Inc. | | | 8,695 | |
| | | 10,099 | | Alnylam Pharmaceuticals, Inc.(a) | | | 1,473 | |
| | | 19,713 | | Amgen, Inc. | | | 4,796 | |
| | | 7,629 | | Biogen, Inc.(a) | | | 1,556 | |
| | | 10,513 | | BioMarin Pharmaceutical, Inc.(a) | | | 871 | |
| | | 4,903 | | Exact Sciences Corp.(a) | | | 193 | |
| | | 53,269 | | Gilead Sciences, Inc. | | | 3,292 | |
| | | 17,982 | | Incyte Corp.(a) | | | 1,366 | |
| | | 17,641 | | Moderna, Inc.(a) | | | 2,520 | |
| | | 12,245 | | Neurocrine Biosciences, Inc.(a) | | | 1,194 | |
| | | 8,627 | | Novavax, Inc.(a) | | | 444 | |
| | | 4,593 | | Regeneron Pharmaceuticals, Inc.(a) | | | 2,715 | |
| | | 9,008 | | Seagen, Inc.(a) | | | 1,593 | |
| | | 11,737 | | Vertex Pharmaceuticals, Inc.(a) | | | 3,307 | |
| | | 88,065 | | Vitrolife AB | | | 2,026 | |
| | | | | | | | 36,041 | |
| | | | | Building Products — 0.31% |
| | | 16,499 | | A.O. Smith Corp. | | | 903 | |
| | | 3,393 | | Allegion PLC | | | 333 | |
| | | 43,125 | | Carrier Global Corp. | | | 1,537 | |
| | | 3,801 | | Fortune Brands Home & Security, Inc. | | | 228 | |
| | | 25,907 | | Johnson Controls International PLC | | | 1,239 | |
| | | 4,440 | | Lennox International, Inc. | | | 917 | |
| | | 11,215 | | Masco Corp. | | | 568 | |
| | | 2,831 | | Owens Corning | | | 210 | |
| | | 8,579 | | Trane Technologies PLC | | | 1,114 | |
| | | | | | | | 7,049 | |
| | | | | Capital Markets — 2.62% |
| | | 3,174 | | Ameriprise Financial, Inc. | | | 754 | |
See accompanying notes to financial statements.
51
HC CAPITAL TRUST
The Institutional U.S. Equity Portfolio
Portfolio of Investments (continued) — June 30, 2022
| | Shares | | Security Description | | Value
(000) | |
| | | | | Common Stocks (continued) |
| | | | | Capital Markets (continued) |
| | | 4,388 | | BlackRock, Inc., Class - A | | $ | 2,672 | |
| | | 20,032 | | Blackstone, Inc., Class - A | | | 1,828 | |
| | | 10,941 | | CBOE Global Markets, Inc. | | | 1,239 | |
| | | 25,446 | | CME Group, Inc. | | | 5,210 | |
| | | 3,437 | | Coinbase Global, Inc., Class - A^(a) | | | 162 | |
| | | 9,924 | | FactSet Research Systems, Inc. | | | 3,816 | |
| | | 8,637 | | Franklin Resources, Inc. | | | 201 | |
| | | 57,588 | | Intercontinental Exchange, Inc. | | | 5,415 | |
| | | 9,906 | | Invesco Ltd. | | | 160 | |
| | | 23,635 | | KKR & Co., Inc. | | | 1,094 | |
| | | 2,295 | | LPL Financial Holdings, Inc. | | | 423 | |
| | | 3,685 | | MarketAxess Holdings, Inc. | | | 944 | |
| | | 16,156 | | Moody’s Corp. | | | 4,394 | |
| | | 38,203 | | Morgan Stanley | | | 2,906 | |
| | | 1,185 | | Morningstar, Inc. | | | 287 | |
| | | 5,310 | | MSCI, Inc. | | | 2,188 | |
| | | 4,447 | | Nasdaq, Inc. | | | 679 | |
| | | 5,645 | | Northern Trust Corp. | | | 545 | |
| | | 5,637 | | Raymond James Financial, Inc. | | | 504 | |
| | | 32,425 | | S&P Global, Inc. | | | 10,928 | |
| | | 3,419 | | SEI Investments Co. | | | 185 | |
| | | 10,466 | | State Street Corp. | | | 645 | |
| | | 6,552 | | T. Rowe Price Group, Inc. | | | 744 | |
| | | 21,870 | | The Bank of New York Mellon Corp. | | | 912 | |
| | | 5,679 | | The Carlyle Group, Inc. | | | 180 | |
| | | 88,336 | | The Charles Schwab Corp. | | | 5,581 | |
| | | 11,205 | | The Goldman Sachs Group, Inc. | | | 3,328 | |
| | | 15,431 | | Tradeweb Markets, Inc., Class - A | | | 1,053 | |
| | | | | | | | 58,977 | |
| | | | | Chemicals — 1.16% |
| | | 7,130 | | Air Products & Chemicals, Inc. | | | 1,715 | |
| | | 3,348 | | Albemarle Corp. | | | 700 | |
| | | 3,093 | | Celanese Corp., Series A | | | 364 | |
| | | 5,932 | | CF Industries Holdings, Inc. | | | 509 | |
| | | 70,014 | | Corteva, Inc. | | | 3,791 | |
| | | 21,049 | | Dow, Inc. | | | 1,086 | |
| | | 14,675 | | DuPont de Nemours, Inc. | | | 816 | |
| | | 3,702 | | Eastman Chemical Co. | | | 332 | |
| | | 7,369 | | Ecolab, Inc. | | | 1,133 | |
| | | 3,601 | | FMC Corp. | | | 385 | |
| | | 10,857 | | International Flavors & Fragrances, Inc. | | | 1,294 | |
| | | 27,455 | | Linde PLC | | | 7,893 | |
| | | 414 | | Linde PLC | | | 119 | |
| | | 7,508 | | LyondellBasell Industries N.V., Class - A | | | 657 | |
| | | 8,982 | | PPG Industries, Inc. | | | 1,027 | |
| | | 6,407 | | RPM International, Inc. | | | 504 | |
| | | 10,595 | | The Mosaic Co. | | | 500 | |
| | | 14,054 | | The Sherwin-Williams Co. | | | 3,147 | |
| | Shares | | Security Description | | Value
(000) | |
| | | | | Chemicals (continued) |
| | | 1,104 | | Westlake Corp. | | $ | 108 | |
| | | | | | | | 26,080 | |
| | | | | Commercial Services & Supplies — 0.63% |
| | | 2,673 | | Cintas Corp. | | | 998 | |
| | | 25,747 | | Copart, Inc.(a) | | | 2,798 | |
| | | 12,048 | | Republic Services, Inc. | | | 1,577 | |
| | | 29,973 | | Rollins, Inc. | | | 1,046 | |
| | | 40,137 | | Waste Connections, Inc. | | | 4,976 | |
| | | 17,585 | | Waste Management, Inc. | | | 2,690 | |
| | | | | | | | 14,085 | |
| | | | | Communications Equipment — 0.38% |
| | | 7,052 | | Arista Networks, Inc.(a) | | | 661 | |
| | | 122,420 | | Cisco Systems, Inc. | | | 5,221 | |
| | | 4,543 | | F5, Inc.(a) | | | 695 | |
| | | 29,743 | | Juniper Networks, Inc. | | | 847 | |
| | | 5,730 | | Motorola Solutions, Inc. | | | 1,201 | |
| | | | | | | | 8,625 | |
| | | | | Construction & Engineering — 0.14% |
| | | 4,111 | | Quanta Services, Inc. | | | 515 | |
| | | 78,813 | | WillScot Mobile Mini Holdings Corp.(a) | | | 2,555 | |
| | | | | | | | 3,070 | |
| | | | | Construction Materials — 0.06% |
| | | 1,786 | | Martin Marietta Materials, Inc. | | | 534 | |
| | | 5,843 | | Vulcan Materials Co. | | | 831 | |
| | | | | | | | 1,365 | |
| | | | | Consumer Finance — 0.24% |
| | | 9,550 | | Ally Financial, Inc. | | | 320 | |
| | | 18,468 | | American Express Co. | | | 2,559 | |
| | | 11,840 | | Capital One Financial Corp. | | | 1,234 | |
| | | 8,149 | | Discover Financial Services | | | 771 | |
| | | 14,941 | | Synchrony Financial | | | 413 | |
| | | 1,945 | | Upstart Holdings, Inc.^(a) | | | 62 | |
| | | | | | | | 5,359 | |
| | | | | Containers & Packaging — 0.46% |
| | | 43,274 | | Amcor PLC | | | 538 | |
| | | 19,996 | | Amcor PLC | | | 249 | |
| | | 2,938 | | Avery Dennison Corp. | | | 475 | |
| | | 54,741 | | Ball Corp. | | | 3,764 | |
| | | 30,242 | | Crown Holdings, Inc. | | | 2,788 | |
| | | 10,213 | | International Paper Co. | | | 427 | |
| | | 7,050 | | Packaging Corporation of America | | | 969 | |
| | | 13,547 | | Sealed Air Corp. | | | 782 | |
| | | 7,426 | | WestRock Co. | | | 296 | |
| | | | | | | | 10,288 | |
| | | | | Distributors — 0.24% |
| | | 4,170 | | Genuine Parts Co. | | | 555 | |
| | | 7,754 | | LKQ Corp. | | | 381 | |
See accompanying notes to financial statements.
52
HC CAPITAL TRUST
The Institutional U.S. Equity Portfolio
Portfolio of Investments (continued) — June 30, 2022
| | Shares | | Security Description | | Value
(000) | |
| | | | | Common Stocks (continued) |
| | | | | Distributors (continued) |
| | | 12,801 | | Pool Corp. | | $ | 4,495 | |
| | | | | | | | 5,431 | |
| | | | | Diversified Financial Services — 0.62% |
| | | 63,202 | | Apollo Global Management, Inc. | | | 3,064 | |
| | | 39,033 | | Berkshire Hathaway, Inc., Class - B(a) | | | 10,657 | |
| | | 11,230 | | Equitable Holdings, Inc. | | | 293 | |
| | | | | | | | 14,014 | |
| | | | | Diversified Telecommunication Services — 0.62% |
| | | 249,364 | | AT&T, Inc. | | | 5,227 | |
| | | 34,803 | | Liberty Global PLC, Class - C(a) | | | 769 | |
| | | 64,682 | | Lumen Technologies, Inc. | | | 705 | |
| | | 142,471 | | Verizon Communications, Inc. | | | 7,231 | |
| | | | | | | | 13,932 | |
| | | | | Electric Utilities — 1.34% |
| | | 23,612 | | Alliant Energy Corp. | | | 1,384 | |
| | | 24,775 | | American Electric Power Company, Inc. | | | 2,376 | |
| | | 9,294 | | Constellation Energy Corp. | | | 532 | |
| | | 30,103 | | Duke Energy Corp. | | | 3,228 | |
| | | 20,879 | | Edison International | | | 1,320 | |
| | | 10,717 | | Entergy Corp. | | | 1,207 | |
| | | 14,908 | | Evergy, Inc. | | | 973 | |
| | | 19,738 | | Eversource Energy | | | 1,668 | |
| | | 31,108 | | Exelon Corp. | | | 1,410 | |
| | | 30,045 | | FirstEnergy Corp. | | | 1,154 | |
| | | 65,437 | | NextEra Energy, Inc. | | | 5,069 | |
| | | 11,938 | | NRG Energy, Inc. | | | 455 | |
| | | 42,615 | | PG&E Corp.(a) | | | 425 | |
| | | 39,729 | | PPL Corp. | | | 1,078 | |
| | | 40,136 | | The Southern Co. | | | 2,862 | |
| | | 70,970 | | Xcel Energy, Inc. | | | 5,022 | |
| | | | | | | | 30,163 | |
| | | | | Electrical Equipment — 0.22% |
| | | 6,617 | | AMETEK, Inc. | | | 727 | |
| | | 11,409 | | Eaton Corp. PLC | | | 1,437 | |
| | | 16,992 | | Emerson Electric Co. | | | 1,352 | |
| | | 1,807 | | Generac Holdings, Inc.(a) | | | 381 | |
| | | 14,740 | | Plug Power, Inc.(a) | | | 244 | |
| | | 3,322 | | Rockwell Automation, Inc. | | | 662 | |
| | | 4,532 | | Sensata Technologies Holding PLC | | | 187 | |
| | | | | | | | 4,990 | |
| | | | | Electronic Equipment, Instruments & Components — 0.27% |
| | | 17,122 | | Amphenol Corp., Class - A | | | 1,101 | |
| | | 1,932 | | Arrow Electronics, Inc.(a) | | | 217 | |
| | | 3,859 | | CDW Corp. | | | 608 | |
| | | 5,039 | | Cognex Corp. | | | 214 | |
| | | 22,910 | | Corning, Inc. | | | 722 | |
| | | 5,195 | | Keysight Technologies, Inc.(a) | | | 716 | |
| | Shares | | Security Description | | Value
(000) | |
| | | | | Electronic Equipment, Instruments & Components (continued) |
| | | 9,306 | | TE Connectivity Ltd. | | $ | 1,053 | |
| | | 1,361 | | Teledyne Technologies, Inc.(a) | | | 511 | |
| | | 7,175 | | Trimble, Inc.(a) | | | 418 | |
| | | 1,523 | | Zebra Technologies Corp.(a) | | | 448 | |
| | | | | | | | 6,008 | |
| | | | | Energy Equipment & Services — 0.16% |
| | | 27,263 | | Baker Hughes, Inc. | | | 787 | |
| | | 25,741 | | Halliburton Co. | | | 807 | |
| | | 56,844 | | Schlumberger N.V. | | | 2,033 | |
| | | | | | | | 3,627 | |
| | | | | Entertainment — 0.84% |
| | | 22,306 | | Activision Blizzard, Inc. | | | 1,737 | |
| | | 14,688 | | AMC Entertainment Holdings, Inc.^(a) | | | 199 | |
| | | 15,924 | | Electronic Arts, Inc. | | | 1,937 | |
| | | 5,515 | | Liberty Media Corp. - Liberty Formula One, Class - C(a) | | | 350 | |
| | | 4,847 | | Live Nation Entertainment, Inc.(a) | | | 400 | |
| | | 34,376 | | Netflix, Inc.(a) | | | 6,012 | |
| | | 17,805 | | ROBLOX Corp., Class - A(a) | | | 585 | |
| | | 3,437 | | Roku, Inc.(a) | | | 282 | |
| | | 3,212 | | Spotify Technology SA(a) | | | 301 | |
| | | 11,832 | | Take-Two Interactive Software, Inc.(a) | | | 1,449 | |
| | | 52,047 | | The Walt Disney Co.(a) | | | 4,914 | |
| | | 63,826 | | Warner Bros. Discovery, Inc.(a) | | | 857 | |
| | | | | | | | 19,023 | |
| | | | | Equity Real Estate Investment Trusts — 5.33% |
| | | 18,582 | | Agree Realty Corp. | | | 1,340 | |
| | | 6,415 | | Alexandria Real Estate Equities, Inc. | | | 931 | |
| | | 9,640 | | American Campus Communities, Inc. | | | 621 | |
| | | 132,519 | | American Homes 4 Rent, Class - A | | | 4,696 | |
| | | 32,103 | | American Tower Corp. | | | 8,205 | |
| | | 33,771 | | AvalonBay Communities, Inc. | | | 6,560 | |
| | | 27,575 | | Boston Properties, Inc. | | | 2,454 | |
| | | 82,996 | | Brixmor Property Group, Inc. | | | 1,677 | |
| | | 20,366 | | Camden Property Trust | | | 2,739 | |
| | | 30,018 | | Corporate Office Properties Trust | | | 786 | |
| | | 28,410 | | Crown Castle International Corp. | | | 4,784 | |
| | | 37,856 | | CubeSmart | | | 1,617 | |
| | | 26,421 | | Digital Realty Trust, Inc. | | | 3,430 | |
| | | 37,471 | | Douglas Emmett, Inc. | | | 839 | |
| | | 13,632 | | Duke Realty Corp. | | | 750 | |
| | | 6,537 | | Equinix, Inc. | | | 4,294 | |
| | | 10,635 | | Equity Lifestyle Properties, Inc. | | | 749 | |
| | | 34,633 | | Equity Residential | | | 2,501 | |
| | | 2,731 | | Essex Property Trust, Inc. | | | 714 | |
| | | 9,130 | | Extra Space Storage, Inc. | | | 1,554 | |
| | | 14,903 | | First Industrial Realty Trust, Inc. | | | 708 | |
See accompanying notes to financial statements.
53
HC CAPITAL TRUST
The Institutional U.S. Equity Portfolio
Portfolio of Investments (continued) — June 30, 2022
| | Shares | | Security Description | | Value
(000) | |
| | | | | Common Stocks (continued) |
| | | | | Equity Real Estate Investment Trusts (continued) |
| | | 15,426 | | Healthpeak Properties, Inc. | | $ | 400 | |
| | | 82,870 | | Host Hotels & Resorts, Inc. | | | 1,299 | |
| | | 63,127 | | Independence Realty Trust, Inc. | | | 1,309 | |
| | | 110,424 | | Invitation Homes, Inc. | | | 3,929 | |
| | | 18,811 | | Iron Mountain, Inc. | | | 916 | |
| | | 115,707 | | Kimco Realty Corp. | | | 2,288 | |
| | | 19,053 | | Life Storage, Inc. | | | 2,127 | |
| | | 32,780 | | LTC Properties, Inc. | | | 1,258 | |
| | | 17,050 | | Medical Properties Trust, Inc. | | | 260 | |
| | | 5,648 | | Mid-America Apartment Communities, Inc. | | | 987 | |
| | | 5,642 | | National Health Investors, Inc. | | | 342 | |
| | | 50,337 | | Phillips Edison & Co., Inc. | | | 1,682 | |
| | | 77,388 | | Prologis, Inc. | | | 9,103 | |
| | | 18,408 | | Public Storage | | | 5,755 | |
| | | 16,924 | | Realty Income Corp. | | | 1,155 | |
| | | 4,360 | | Regency Centers Corp. | | | 259 | |
| | | 41,118 | | Rexford Industrial Realty, Inc. | | | 2,368 | |
| | | 12,068 | | Ryman Hospitality Properties, Inc.(a) | | | 918 | |
| | | 9,522 | | SBA Communications Corp. | | | 3,048 | |
| | | 21,019 | | Simon Property Group, Inc. | | | 1,995 | |
| | | 51,331 | | Sun Communities, Inc. | | | 8,180 | |
| | | 23,406 | | Tanger Factory Outlet Centers, Inc. | | | 333 | |
| | | 61,000 | | UDR, Inc. | | | 2,808 | |
| | | 48,242 | | Ventas, Inc. | | | 2,482 | |
| | | 24,995 | | Veris Residential, Inc.(a) | | | 331 | |
| | | 110,330 | | VICI Properties, Inc. | | | 3,287 | |
| | | 4,661 | | Vornado Realty Trust | | | 133 | |
| | | 63,521 | | Welltower, Inc. | | | 5,231 | |
| | | 21,458 | | Weyerhaeuser Co. | | | 711 | |
| | | 37,809 | | WP Carey, Inc. | | | 3,133 | |
| | | | | | | | 119,976 | |
| | | | | Food & Staples Retailing — 0.90% |
| | | 19,288 | | Costco Wholesale Corp. | | | 9,244 | |
| | | 14,515 | | Sysco Corp. | | | 1,230 | |
| | | 42,339 | | The Kroger Co. | | | 2,004 | |
| | | 38,076 | | Walgreens Boots Alliance, Inc. | | | 1,443 | |
| | | 52,000 | | Walmart, Inc. | | | 6,322 | |
| | | | | | | | 20,243 | |
| | | | | Food Products — 1.12% |
| | | 22,245 | | Archer-Daniels-Midland Co. | | | 1,726 | |
| | | 8,253 | | Bunge Ltd. | | | 749 | |
| | | 28,701 | | Campbell Soup Co. | | | 1,379 | |
| | | 45,268 | | Conagra Brands, Inc. | | | 1,550 | |
| | | 32,576 | | General Mills, Inc. | | | 2,458 | |
| | | 29,804 | | Hormel Foods Corp. | | | 1,411 | |
| | | 22,672 | | Kellogg Co. | | | 1,617 | |
| | | 43,999 | | Lamb Weston Holdings, Inc. | | | 3,145 | |
| | Shares | | Security Description | | Value
(000) | |
| | | | | Food Products (continued) |
| | | 17,278 | | McCormick & Company, Inc. | | $ | 1,439 | |
| | | 52,682 | | Mondelez International, Inc., Class - A | | | 3,271 | |
| | | 8,576 | | The Hershey Co. | | | 1,845 | |
| | | 11,018 | | The J.M. Smucker Co. | | | 1,410 | |
| | | 40,202 | | The Kraft Heinz Co. | | | 1,533 | |
| | | 18,910 | | Tyson Foods, Inc., Class - A | | | 1,627 | |
| | | | | | | | 25,160 | |
| | | | | Gas Utilities — 0.08% |
| | | 12,353 | | Atmos Energy Corp. | | | 1,385 | |
| | | 12,220 | | UGI Corp. | | | 472 | |
| | | | | | | | 1,857 | |
| | | | | Health Care Equipment & Supplies — 2.57% |
| | | 64,742 | | Abbott Laboratories | | | 7,035 | |
| | | 3,334 | | Abiomed, Inc.(a) | | | 825 | |
| | | 13,136 | | Align Technology, Inc.(a) | | | 3,108 | |
| | | 27,339 | | Baxter International, Inc. | | | 1,756 | |
| | | 12,387 | | Becton Dickinson & Co. | | | 3,054 | |
| | | 44,150 | | Boston Scientific Corp.(a) | | | 1,645 | |
| | | 39,663 | | Danaher Corp. | | | 10,056 | |
| | | 20,943 | | DENTSPLY SIRONA, Inc. | | | 749 | |
| | | 19,766 | | Dexcom, Inc.(a) | | | 1,473 | |
| | | 18,993 | | Edwards Lifesciences Corp.(a) | | | 1,806 | |
| | | 13,925 | | Hologic, Inc.(a) | | | 965 | |
| | | 8,733 | | IDEXX Laboratories, Inc.(a) | | | 3,063 | |
| | | 20,926 | | Insulet Corp.(a) | | | 4,561 | |
| | | 13,343 | | Intuitive Surgical, Inc.(a) | | | 2,678 | |
| | | 7,171 | | Masimo Corp.(a) | | | 937 | |
| | | 42,526 | | Medtronic PLC | | | 3,817 | |
| | | 2,660 | | Novocure Ltd.(a) | | | 185 | |
| | | 5,133 | | ResMed, Inc. | | | 1,076 | |
| | | 16,395 | | STERIS PLC | | | 3,380 | |
| | | 9,714 | | Stryker Corp. | | | 1,932 | |
| | | 2,328 | | Teleflex, Inc. | | | 572 | |
| | | 2,682 | | The Cooper Companies, Inc. | | | 839 | |
| | | 4,567 | | West Pharmaceutical Services, Inc. | | | 1,381 | |
| | | 8,739 | | Zimmer Biomet Holdings, Inc. | | | 918 | |
| | | | | | | | 57,811 | |
| | | | | Health Care Providers & Services — 1.87% |
| | | 8,961 | | AmerisourceBergen Corp. | | | 1,268 | |
| | | 17,912 | | Cardinal Health, Inc. | | | 936 | |
| | | 18,589 | | Centene Corp.(a) | | | 1,573 | |
| | | 9,179 | | Cigna Corp. | | | 2,419 | |
| | | 46,017 | | CVS Health Corp. | | | 4,265 | |
| | | 9,630 | | DaVita, Inc.(a) | | | 770 | |
| | | 6,901 | | Elevance Health, Inc. | | | 3,330 | |
| | | 6,950 | | HCA Healthcare, Inc. | | | 1,168 | |
| | | 11,964 | | Henry Schein, Inc.(a) | | | 918 | |
| | | 4,187 | | Humana, Inc. | | | 1,959 | |
See accompanying notes to financial statements.
54
HC CAPITAL TRUST
The Institutional U.S. Equity Portfolio
Portfolio of Investments (continued) — June 30, 2022
| | Shares | | Security Description | | Value
(000) | |
| | | | | Common Stocks (continued) |
| | | | | Health Care Providers & Services (continued) |
| | | 3,289 | | Laboratory Corporation of America Holdings | | $ | 771 | |
| | | 5,882 | | McKesson Corp. | | | 1,918 | |
| | | 2,452 | | Molina Heathcare, Inc.(a) | | | 686 | |
| | | 10,363 | | Quest Diagnostics, Inc. | | | 1,378 | |
| | | 36,150 | | UnitedHealth Group, Inc. | | | 18,568 | |
| | | 1,945 | | Universal Health Services, Inc., Class - B | | | 196 | |
| | | | | | | | 42,123 | |
| | | | | Health Care Technology — 0.40% |
| | | 88,684 | | Definitive Healthcare Corp.(a) | | | 2,034 | |
| | | 47,663 | | Doximity, Inc., Class - A(a) | | | 1,660 | |
| | | 32,964 | | Teladoc Health, Inc.(a) | | | 1,094 | |
| | | 21,181 | | Veeva Systems, Inc., Class - A(a) | | | 4,195 | |
| | | | | | | | 8,983 | |
| | | | | Hotels, Restaurants & Leisure — 1.48% |
| | | 20,372 | | Airbnb, Inc., Class - A(a) | | | 1,815 | |
| | | 89,009 | | Aramark | | | 2,726 | |
| | | 2,492 | | Booking Holdings, Inc.(a) | | | 4,358 | |
| | | 6,086 | | Caesars Entertainment, Inc.(a) | | | 233 | |
| | | 23,698 | | Carnival Corp.(a) | | | 205 | |
| | | 1,885 | | Chipotle Mexican Grill, Inc.(a) | | | 2,464 | |
| | | 17,032 | | Choice Hotels International, Inc. | | | 1,901 | |
| | | 3,647 | | Darden Restaurants, Inc. | | | 413 | |
| | | 4,300 | | Domino’s Pizza, Inc. | | | 1,676 | |
| | | 27,393 | | Expedia Group, Inc.(a) | | | 2,597 | |
| | | 9,141 | | Hilton Worldwide Holdings, Inc. | | | 1,019 | |
| | | 9,841 | | Las Vegas Sands Corp.(a) | | | 331 | |
| | | 11,558 | | Marriott International, Inc., Class - A | | | 1,572 | |
| | | 23,796 | | McDonald’s Corp. | | | 5,875 | |
| | | 10,103 | | MGM Resorts International | | | 292 | |
| | | 98,966 | | Playa Hotels & Resorts N.V.(a) | | | 680 | |
| | | 6,561 | | Royal Caribbean Cruises Ltd.(a) | | | 229 | |
| | | 32,906 | | Starbucks Corp. | | | 2,514 | |
| | | 2,963 | | Vail Resorts, Inc. | | | 646 | |
| | | 3,194 | | Wynn Resorts Ltd.(a) | | | 182 | |
| | | 13,796 | | YUM! Brands, Inc. | | | 1,566 | |
| | | | | | | | 33,294 | |
| | | | | Household Durables — 0.33% |
| | | 72,351 | | D.R. Horton, Inc. | | | 4,788 | |
| | | 7,631 | | Garmin Ltd. | | | 750 | |
| | | 7,480 | | Lennar Corp., Class - A | | | 528 | |
| | | 1,491 | | Mohawk Industries, Inc.(a) | | | 185 | |
| | | 11,593 | | Newell Brands, Inc. | | | 221 | |
| | | 92 | | NVR, Inc.(a) | | | 368 | |
| | | 7,119 | | PulteGroup, Inc. | | | 282 | |
| | | 1,677 | | Whirlpool Corp. | | | 260 | |
| | | | | | | | 7,382 | |
| | Shares | | Security Description | | Value
(000) | |
| | | | | Household Products — 1.01% |
| | | 55,947 | | Church & Dwight Co., Inc. | | $ | 5,184 | |
| | | 36,083 | | Colgate-Palmolive Co. | | | 2,892 | |
| | | 17,583 | | Kimberly-Clark Corp. | | | 2,377 | |
| | | 10,848 | | The Clorox Co. | | | 1,529 | |
| | | 75,360 | | The Procter & Gamble Co. | | | 10,835 | |
| | | | | | | | 22,817 | |
| | | | | Independent Power and Renewable Electricity Producers — 0.05% |
| | | 19,072 | | The AES Corp. | | | 401 | |
| | | 29,462 | | Vistra Corp. | | | 673 | |
| | | | | | | | 1,074 | |
| | | | | Industrial Conglomerates — 0.53% |
| | | 21,452 | | 3M Co. | | | 2,776 | |
| | | 31,417 | | General Electric Co. | | | 2,000 | |
| | | 19,624 | | Honeywell International, Inc. | | | 3,411 | |
| | | 9,503 | | Roper Technologies, Inc. | | | 3,751 | |
| | | | | | | | 11,938 | |
| | | | | Insurance — 1.59% |
| | | 17,674 | | Aflac, Inc. | | | 978 | |
| | | 386 | | Alleghany Corp.(a) | | | 322 | |
| | | 2,063 | | American Financial Group, Inc. | | | 286 | |
| | | 23,302 | | American International Group, Inc. | | | 1,191 | |
| | | 8,562 | | Aon PLC, Class - A | | | 2,309 | |
| | | 10,830 | | Arch Capital Group Ltd.(a) | | | 493 | |
| | | 24,237 | | Arthur J. Gallagher & Co. | | | 3,953 | |
| | | 3,245 | | Assurant, Inc. | | | 560 | |
| | | 12,034 | | Brown & Brown, Inc. | | | 702 | |
| | | 13,351 | | Chubb Ltd. | | | 2,624 | |
| | | 4,366 | | Cincinnati Financial Corp. | | | 519 | |
| | | 6,168 | | Erie Indemnity Co., Class - A | | | 1,185 | |
| | | 1,838 | | Everest Re Group Ltd. | | | 515 | |
| | | 11,296 | | Fidelity National Financial, Inc. | | | 418 | |
| | | 2,663 | | Globe Life, Inc. | | | 260 | |
| | | 4,722 | | Lincoln National Corp. | | | 221 | |
| | | 5,998 | | Loews Corp. | | | 355 | |
| | | 2,036 | | Markel Corp.(a) | | | 2,633 | |
| | | 35,343 | | Marsh & McLennan Companies, Inc. | | | 5,488 | |
| | | 20,065 | | MetLife, Inc. | | | 1,260 | |
| | | 7,491 | | Principal Financial Group, Inc. | | | 500 | |
| | | 10,764 | | Prudential Financial, Inc. | | | 1,030 | |
| | | 11,474 | | The Allstate Corp. | | | 1,454 | |
| | | 9,486 | | The Hartford Financial Services Group, Inc. | | | 621 | |
| | | 24,996 | | The Progressive Corp. | | | 2,906 | |
| | | 8,495 | | The Travelers Companies, Inc. | | | 1,437 | |
| | | 6,099 | | W.R. Berkley Corp. | | | 416 | |
| | | 5,821 | | Willis Towers Watson PLC | | | 1,149 | |
| | | | | | | | 35,785 | |
See accompanying notes to financial statements.
55
HC CAPITAL TRUST
The Institutional U.S. Equity Portfolio
Portfolio of Investments (continued) — June 30, 2022
| | Shares | | Security Description | | Value
(000) | |
| | | | | Common Stocks (continued) |
| | | | | Interactive Media & Services — 3.26% |
| | | 12,771 | | Alphabet, Inc., Class - A(a) | | $ | 27,831 | |
| | | 9,275 | | Alphabet, Inc., Class - C(a) | | | 20,289 | |
| | | 402,360 | | Auto Trader Group PLC | | | 2,718 | |
| | | 52,255 | | IAC/InterActiveCorp.(a) | | | 3,970 | |
| | | 8,173 | | Match Group, Inc.(a) | | | 570 | |
| | | 85,009 | | Meta Platforms, Inc., Class - A(a) | | | 13,707 | |
| | | 16,406 | | Pinterest, Inc., Class - A(a) | | | 298 | |
| | | 48,047 | | Scout24 AG | | | 2,466 | |
| | | 31,217 | | Snap, Inc., Class - A(a) | | | 410 | |
| | | 22,838 | | Twitter, Inc.(a) | | | 854 | |
| | | 7,532 | | ZoomInfo Technologies, Inc.(a) | | | 250 | |
| | | | | | | | 73,363 | |
| | | | | Internet & Direct Marketing Retail — 1.93% |
| | | 30,826 | | Alibaba Group Holding Ltd., ADR(a) | | | 3,504 | |
| | | 332,963 | | Amazon.com, Inc.(a) | | | 35,364 | |
| | | 17,135 | | Chewy, Inc., Class - A(a) | | | 595 | |
| | | 5,455 | | DoorDash, Inc., Class - A(a) | | | 350 | |
| | | 34,705 | | eBay, Inc. | | | 1,446 | |
| | | 3,609 | | Etsy, Inc.(a) | | | 264 | |
| | | 2,779 | | MercadoLibre, Inc.(a) | | | 1,770 | |
| | | 2,103 | | Wayfair, Inc., Class - A(a) | | | 92 | |
| | | | | | | | 43,385 | |
| | | | | IT Services — 4.06% |
| | | 18,143 | | Accenture PLC, Class - A | | | 5,037 | |
| | | 73,861 | | Adyen N.V., ADR(a) | | | 1,079 | |
| | | 880 | | Adyen N.V.(a) | | | 1,280 | |
| | | 5,479 | | Affirm Holdings, Inc.(a) | | | 99 | |
| | | 14,649 | | Akamai Technologies, Inc.(a) | | | 1,338 | |
| | | 12,014 | | Automatic Data Processing, Inc. | | | 2,523 | |
| | | 93,312 | | Bigcommerce Holdings, Inc.(a) | | | 1,512 | |
| | | 16,987 | | Black Knight, Inc.(a) | | | 1,111 | |
| | | 67,231 | | Block, Inc.(a) | | | 4,132 | |
| | | 7,897 | | Broadridge Financial Solutions, Inc. | | | 1,126 | |
| | | 14,988 | | Cognizant Technology Solutions Corp. | | | 1,012 | |
| | | 1,621 | | EPAM Systems, Inc.(a) | | | 478 | |
| | | 42,032 | | Fidelity National Information Services, Inc. | | | 3,853 | |
| | | 46,752 | | Fiserv, Inc.(a) | | | 4,159 | |
| | | 2,204 | | FleetCor Technologies, Inc.(a) | | | 463 | |
| | | 2,356 | | Gartner, Inc.(a) | | | 570 | |
| | | 38,948 | | Global Payments, Inc. | | | 4,309 | |
| | | 43,590 | | GoDaddy, Inc., Class - A(a) | | | 3,032 | |
| | | 29,471 | | International Business Machines Corp. | | | 4,161 | |
| | | 6,957 | | Jack Henry & Associates, Inc. | | | 1,252 | |
| | | 165,260 | | Marqeta, Inc., Class - A(a) | | | 1,340 | |
| | | 49,942 | | MasterCard, Inc., Class - A | | | 15,756 | |
| | | 1,914 | | MongoDB, Inc.(a) | | | 497 | |
| | | 4,247 | | Okta, Inc.(a) | | | 384 | |
| | Shares | | Security Description | | Value
(000) | |
| | | | | IT Services (continued) |
| | | 9,320 | | Paychex, Inc. | | $ | 1,061 | |
| | | 31,657 | | PayPal Holdings, Inc.(a) | | | 2,211 | |
| | | 85,560 | | Shopify, Inc., Class - A(a) | | | 2,673 | |
| | | 10,375 | | Snowflake, Inc., Class - A(a) | | | 1,442 | |
| | | 52,274 | | The Western Union Co. | | | 861 | |
| | | 4,947 | | Twilio, Inc., Class - A(a) | | | 415 | |
| | | 25,173 | | VeriSign, Inc.(a) | | | 4,213 | |
| | | 91,577 | | Visa, Inc., Class - A | | | 18,030 | |
| | | | | | | | 91,409 | |
| | | | | Leisure Products — 0.04% |
| | | 3,730 | | Hasbro, Inc. | | | 305 | |
| | | 68,378 | | Peloton Interactive, Inc., Class - A(a) | | | 628 | |
| | | | | | | | 933 | |
| | | | | Life Sciences Tools & Services — 2.25% |
| | | 54,384 | | Agilent Technologies, Inc. | | | 6,459 | |
| | | 17,554 | | Avantor, Inc.(a) | | | 546 | |
| | | 1,923 | | Bio-Rad Laboratories, Inc., Class - A(a) | | | 952 | |
| | | 2,453 | | Bio-Techne Corp. | | | 850 | |
| | | 1,443 | | Charles River Laboratories International, Inc.(a) | | | 309 | |
| | | 64,288 | | Eurofins Scientific SE | | | 5,057 | |
| | | 4,497 | | Illumina, Inc.(a) | | | 829 | |
| | | 19,299 | | IQVIA Holdings, Inc.(a) | | | 4,188 | |
| | | 14,663 | | Medpace Holdings, Inc.(a) | | | 2,195 | |
| | | 4,178 | | Mettler-Toledo International, Inc.(a) | | | 4,799 | |
| | | 24,930 | | PerkinElmer, Inc. | | | 3,546 | |
| | | 14,951 | | Repligen Corp.(a) | | | 2,428 | |
| | | 11,125 | | Sartorius Stedim Biotech | | | 3,489 | |
| | | 25,811 | | Thermo Fisher Scientific, Inc. | | | 14,022 | |
| | | 3,054 | | Waters Corp.(a) | | | 1,011 | |
| | | | | | | | 50,680 | |
| | | | | Machinery — 0.91% |
| | | 17,146 | | Caterpillar, Inc. | | | 3,066 | |
| | | 6,090 | | Cummins, Inc. | | | 1,178 | |
| | | 8,336 | | Deere & Co. | | | 2,496 | |
| | | 4,121 | | Dover Corp. | | | 500 | |
| | | 9,733 | | Fortive Corp. | | | 529 | |
| | | 22,336 | | IDEX Corp. | | | 4,058 | |
| | | 10,029 | | Illinois Tool Works, Inc. | | | 1,828 | |
| | | 11,600 | | Ingersoll Rand, Inc. | | | 488 | |
| | | 1,492 | | Nordson Corp. | | | 302 | |
| | | 24,945 | | Otis Worldwide Corp. | | | 1,763 | |
| | | 16,941 | | PACCAR, Inc. | | | 1,395 | |
| | | 3,736 | | Parker Hannifin Corp. | | | 919 | |
| | | 4,748 | | Pentair PLC | | | 217 | |
| | | 2,210 | | Snap-on, Inc. | | | 435 | |
| | | 4,663 | | Stanley Black & Decker, Inc. | | | 489 | |
| | | 5,028 | | Westinghouse Air Brake Technologies Corp. | | | 413 | |
See accompanying notes to financial statements.
56
HC CAPITAL TRUST
The Institutional U.S. Equity Portfolio
Portfolio of Investments (continued) — June 30, 2022
| | Shares | | Security Description | | Value
(000) | |
| | | | | Common Stocks (continued) |
| | | | | Machinery (continued) |
| | | 5,156 | | Xylem, Inc. | | $ | 403 | |
| | | | | | | | 20,479 | |
| | | | | Media — 0.79% |
| | | 423 | | Cable One, Inc. | | | 545 | |
| | | 5,315 | | Charter Communications, Inc., Class - A(a) | | | 2,490 | |
| | | 141,581 | | Comcast Corp., Class - A | | | 5,556 | |
| | | 7,016 | | Dish Network Corp.(a) | | | 126 | |
| | | 26,750 | | Fox Corp., Class - A | | | 860 | |
| | | 20,445 | | Fox Corp., Class - B | | | 607 | |
| | | 5,713 | | Liberty Broadband Corp., Class - A(a) | | | 649 | |
| | | 33,644 | | Liberty Broadband Corp., Class - C(a) | | | 3,891 | |
| | | 29,452 | | Liberty Global PLC, Class - A(a) | | | 620 | |
| | | 2,116 | | Liberty Media Corp. - Liberty SiriusXM, Class - A(a) | | | 76 | |
| | | 4,816 | | Liberty Media Corp. - Liberty SiriusXM, Class - C(a) | | | 174 | |
| | | 11,156 | | News Corp., Class - A | | | 174 | |
| | | 10,848 | | Omnicom Group, Inc. | | | 690 | |
| | | 17,275 | | Paramount Global, Class - B | | | 426 | |
| | | 95,390 | | Sirius XM Holdings, Inc.^ | | | 585 | |
| | | 11,263 | | The Interpublic Group of Companies, Inc. | | | 310 | |
| | | | | | | | 17,779 | |
| | | | | Metals & Mining — 0.23% |
| | | 5,269 | | Alcoa Corp. | | | 240 | |
| | | 15,002 | | Cleveland-Cliffs, Inc.(a) | | | 231 | |
| | | 41,559 | | Freeport-McMoRan, Inc. | | | 1,216 | |
| | | 40,159 | | Newmont Corp. | | | 2,397 | |
| | | 7,694 | | Nucor Corp. | | | 803 | |
| | | 5,464 | | Steel Dynamics, Inc. | | | 361 | |
| | | | | | | | 5,248 | |
| | | | | Mortgage Real Estate Investment Trusts — 0.06% |
| | | 66,233 | | AGNC Investment Corp. | | | 733 | |
| | | 93,564 | | Annaly Capital Management, Inc. | | | 553 | |
| | | | | | | | 1,286 | |
| | | | | Multiline Retail — 0.34% |
| | | 11,339 | | Dollar General Corp. | | | 2,783 | |
| | | 11,714 | | Dollar Tree, Inc.(a) | | | 1,826 | |
| | | 21,792 | | Target Corp. | | | 3,077 | |
| | | | | | | | 7,686 | |
| | | | | Multi-Utilities — 0.99% |
| | | 16,583 | | Ameren Corp. | | | 1,498 | |
| | | 18,046 | | CenterPoint Energy, Inc. | | | 534 | |
| | | 71,161 | | CMS Energy Corp. | | | 4,803 | |
| | | 21,400 | | Consolidated Edison, Inc. | | | 2,035 | |
| | | 33,670 | | Dominion Energy, Inc. | | | 2,688 | |
| | | 9,212 | | DTE Energy Co. | | | 1,168 | |
| | | 34,766 | | NiSource, Inc. | | | 1,025 | |
| | Shares | | Security Description | | Value
(000) | |
| | | | | Multi-Utilities (continued) |
| | | 27,096 | | Public Service Enterprise Group, Inc. | | $ | 1,714 | |
| | | 12,264 | | Sempra Energy | | | 1,843 | |
| | | 50,081 | | WEC Energy Group, Inc. | | | 5,041 | |
| | | | | | | | 22,349 | |
| | | | | Oil, Gas & Consumable Fuels — 1.91% |
| | | 9,923 | | APA Corp. | | | 346 | |
| | | 32,279 | | Cheniere Energy, Inc. | | | 4,295 | |
| | | 55,689 | | Chevron Corp. | | | 8,063 | |
| | | 37,403 | | ConocoPhillips | | | 3,359 | |
| | | 53,433 | | Coterra Energy, Inc. | | | 1,378 | |
| | | 18,039 | | Devon Energy Corp. | | | 994 | |
| | | 4,824 | | Diamondback Energy, Inc. | | | 584 | |
| | | 16,711 | | EOG Resources, Inc. | | | 1,846 | |
| | | 9,692 | | EQT Corp. | | | 333 | |
| | | 123,535 | | Exxon Mobil Corp. | | | 10,580 | |
| | | 7,976 | | Hess Corp. | | | 845 | |
| | | 64,812 | | Kinder Morgan, Inc. | | | 1,086 | |
| | | 20,524 | | Marathon Oil Corp. | | | 461 | |
| | | 16,164 | | Marathon Petroleum Corp. | | | 1,329 | |
| | | 26,723 | | Occidental Petroleum Corp. | | | 1,573 | |
| | | 12,755 | | ONEOK, Inc. | | | 708 | |
| | | 13,731 | | Phillips 66 | | | 1,126 | |
| | | 6,596 | | Pioneer Natural Resources Co. | | | 1,471 | |
| | | 6,233 | | Targa Resources Corp. | | | 372 | |
| | | 34,774 | | The Williams Companies, Inc. | | | 1,085 | |
| | | 11,701 | | Valero Energy Corp. | | | 1,244 | |
| | | | | | | | 43,078 | |
| | | | | Personal Products — 0.28% |
| | | 4,621 | | L’Oreal SA | | | 1,594 | |
| | | 18,913 | | The Estee Lauder Companies, Inc. | | | 4,817 | |
| | | | | | | | 6,411 | |
| | | | | Pharmaceuticals — 2.52% |
| | | 76,093 | | Bristol-Myers Squibb Co. | | | 5,860 | |
| | | 4,875 | | Catalent, Inc.(a) | | | 523 | |
| | | 17,383 | | Elanco Animal Health, Inc.(a) | | | 341 | |
| | | 33,003 | | Eli Lilly & Co. | | | 10,700 | |
| | | 11,416 | | Horizon Therapeutics PLC(a) | | | 910 | |
| | | 5,907 | | Jazz Pharmaceuticals PLC(a) | | | 921 | |
| | | 81,100 | | Johnson & Johnson | | | 14,397 | |
| | | 83,414 | | Merck & Co., Inc. | | | 7,605 | |
| | | 7,189 | | Novo Nordisk A/S, ADR | | | 801 | |
| | | 181,852 | | Pfizer, Inc. | | | 9,535 | |
| | | 33,990 | | Royalty Pharma PLC, Class - A | | | 1,429 | |
| | | 96,716 | | Viatris, Inc. | | | 1,013 | |
| | | 15,618 | | Zoetis, Inc. | | | 2,684 | |
| | | | | | | | 56,719 | |
| | | | | Professional Services — 0.59% |
| | | 15,421 | | Booz Allen Hamilton Holding Corp. | | | 1,393 | |
See accompanying notes to financial statements.
57
HC CAPITAL TRUST
The Institutional U.S. Equity Portfolio
Portfolio of Investments (continued) — June 30, 2022
| | Shares | | Security Description | | Value
(000) | |
| | | | | Common Stocks (continued) |
| | | | | Professional Services (continued) |
| | | 28,509 | | Clarivate PLC(a) | | $ | 396 | |
| | | 74,888 | | CoStar Group, Inc.(a) | | | 4,524 | |
| | | 5,106 | | Equifax, Inc. | | | 933 | |
| | | 5,712 | | Jacobs Engineering Group, Inc. | | | 726 | |
| | | 9,133 | | Leidos Holdings, Inc. | | | 920 | |
| | | 5,018 | | Robert Half International, Inc. | | | 376 | |
| | | 5,481 | | TransUnion | | | 438 | |
| | | 20,319 | | Verisk Analytics, Inc., Class - A | | | 3,517 | |
| | | | | | | | 13,223 | |
| | | | | Real Estate Management & Development — 0.23% |
| | | 16,438 | | CBRE Group, Inc., Class - A(a) | | | 1,210 | |
| | | 4,663 | | Colliers International Group, Inc. | | | 512 | |
| | | 107,375 | | Tricon Residential, Inc. | | | 1,088 | |
| | | 72,130 | | Zillow Group, Inc., Class - C(a) | | | 2,290 | |
| | | | | | | | 5,100 | |
| | | | | Road & Rail — 1.18% |
| | | 1,224 | | AMERCO | | | 585 | |
| | | 38,761 | | Canadian Pacific Railway Ltd. | | | 2,708 | |
| | | 126,970 | | CSX Corp. | | | 3,690 | |
| | | 5,278 | | JB Hunt Transport Services, Inc. | | | 831 | |
| | | 20,750 | | Knight-Swift Transportation Holdings, Inc. | | | 960 | |
| | | 8,816 | | Lyft, Inc., Class - A(a) | | | 117 | |
| | | 6,855 | | Norfolk Southern Corp. | | | 1,558 | |
| | | 12,202 | | Old Dominion Freight Line, Inc. | | | 3,127 | |
| | | 209,675 | | Uber Technologies, Inc.(a) | | | 4,290 | |
| | | 40,799 | | Union Pacific Corp. | | | 8,702 | |
| | | | | | | | 26,568 | |
| | | | | Semiconductors & Semiconductor Equipment — 2.53% |
| | | 46,751 | | Advanced Micro Devices, Inc.(a) | | | 3,575 | |
| | | 14,967 | | Analog Devices, Inc. | | | 2,187 | |
| | | 25,268 | | Applied Materials, Inc. | | | 2,299 | |
| | | 13,549 | | Broadcom, Inc. | | | 6,583 | |
| | | 3,832 | | Enphase Energy, Inc.(a) | | | 748 | |
| | | 3,867 | | Entegris, Inc. | | | 356 | |
| | | 116,438 | | Intel Corp. | | | 4,356 | |
| | | 4,310 | | KLA Corp. | | | 1,375 | |
| | | 3,990 | | Lam Research Corp. | | | 1,700 | |
| | | 24,153 | | Marvell Technology, Inc. | | | 1,051 | |
| | | 15,911 | | Microchip Technology, Inc. | | | 924 | |
| | | 32,443 | | Micron Technology, Inc. | | | 1,793 | |
| | | 1,269 | | Monolithic Power Systems, Inc. | | | 487 | |
| | | 103,535 | | NVIDIA Corp. | | | 15,696 | |
| | | 7,507 | | NXP Semiconductors N.V. | | | 1,111 | |
| | | 12,455 | | ON Semiconductor Corp.(a) | | | 627 | |
| | | 3,073 | | Qorvo, Inc.(a) | | | 290 | |
| | | 32,228 | | QUALCOMM, Inc. | | | 4,117 | |
| | | 4,709 | | Skyworks Solutions, Inc. | | | 436 | |
| | Shares | | Security Description | | Value
(000) | |
| | | | | Semiconductors & Semiconductor Equipment (continued) |
| | | 1,600 | | SolarEdge Technologies, Inc.(a) | | $ | 438 | |
| | | 29,764 | | Taiwan Semiconductor Manufacturing Co. Ltd., ADR | | | 2,433 | |
| | | 4,604 | | Teradyne, Inc. | | | 412 | |
| | | 26,404 | | Texas Instruments, Inc. | | | 4,057 | |
| | | | | | | | 57,051 | |
| | | | | Software — 9.08% |
| | | 25,734 | | Adobe, Inc.(a) | | | 9,420 | |
| | | 15,958 | | ANSYS, Inc.(a) | | | 3,818 | |
| | | 23,643 | | Appfolio, Inc., Class - A(a) | | | 2,143 | |
| | | 3,422 | | AppLovin Corp., Class A(a) | | | 118 | |
| | | 5,373 | | Atlassian Corp. PLC, Class - A(a) | | | 1,007 | |
| | | 6,274 | | Autodesk, Inc.(a) | | | 1,079 | |
| | | 57,027 | | Avalara, Inc.(a) | | | 4,026 | |
| | | 28,653 | | Bentley Systems, Inc., Class - B | | | 954 | |
| | | 2,673 | | Bill.com Holdings, Inc.(a) | | | 294 | |
| | | 24,785 | | Blackline, Inc.(a) | | | 1,651 | |
| | | 21,952 | | Cadence Design Systems, Inc.(a) | | | 3,294 | |
| | | 41,465 | | Ceridian HCM Holding, Inc.(a) | | | 1,952 | |
| | | 14,254 | | Citrix Systems, Inc. | | | 1,385 | |
| | | 7,161 | | Cloudflare, Inc., Class - A(a) | | | 313 | |
| | | 44,254 | | Coupa Software, Inc.(a) | | | 2,527 | |
| | | 13,755 | | Crowdstrike Holdings, Inc., Class - A(a) | | | 2,318 | |
| | | 55,839 | | Dassault Systemes SE | | | 2,055 | |
| | | 6,436 | | Datadog, Inc., Class - A(a) | | | 613 | |
| | | 5,685 | | DocuSign, Inc.(a) | | | 326 | |
| | | 25,619 | | Dropbox, Inc., Class - A(a) | | | 537 | |
| | | 161,021 | | Duck Creek Technologies, Inc.(a) | | | 2,391 | |
| | | 5,762 | | Dynatrace, Inc.(a) | | | 227 | |
| | | 47,968 | | Elastic N.V.(a) | | | 3,246 | |
| | | 32,162 | | Envestnet, Inc.(a) | | | 1,697 | |
| | | 753 | | Fair Isaac Corp.(a) | | | 302 | |
| | | 29,854 | | Five9, Inc.(a) | | | 2,721 | |
| | | 19,565 | | Fortinet, Inc.(a) | | | 1,107 | |
| | | 6,562 | | Guidewire Software, Inc.(a) | | | 466 | |
| | | 2,140 | | HubSpot, Inc.(a) | | | 643 | |
| | | 18,884 | | Intuit, Inc. | | | 7,278 | |
| | | 25,301 | | Kinaxis, Inc.(a) | | | 2,732 | |
| | | 284,657 | | Microsoft Corp. | | | 72,015 | |
| | | 124,633 | | Money Forward, Inc. | | | 3,105 | |
| | | 62,591 | | New Relic, Inc.(a) | | | 3,133 | |
| | | 59,948 | | Nortonlifelock, Inc. | | | 1,316 | |
| | | 90,546 | | Oracle Corp. | | | 6,326 | |
| | | 47,014 | | Palantir Technologies, Inc., Class - A(a) | | | 426 | |
| | | 9,060 | | Palo Alto Networks, Inc.(a) | | | 4,475 | |
| | | 11,118 | | PAYCOM Software, Inc.(a) | | | 3,115 | |
| | | 10,749 | | Paylocity Holding Corp.(a) | | | 1,875 | |
| | | 59,128 | | Procore Technologies, Inc.(a) | | | 2,684 | |
| | | 3,180 | | PTC, Inc.(a) | | | 338 | |
See accompanying notes to financial statements.
58
HC CAPITAL TRUST
The Institutional U.S. Equity Portfolio
Portfolio of Investments (continued) — June 30, 2022
| | Shares | | Security Description | | Value
(000) | |
| | | | | Common Stocks (continued) |
| | | | | Software (continued) |
| | | 2,713 | | RingCentral, Inc., Class - A(a) | | $ | 142 | |
| | | 58,376 | | Salesforce, Inc.(a) | | | 9,634 | |
| | | 12,252 | | ServiceNow, Inc.(a) | | | 5,826 | |
| | | 75,786 | | Smartsheet, Inc., Class - A(a) | | | 2,382 | |
| | | 4,554 | | Splunk, Inc.(a) | | | 403 | |
| | | 52,548 | | SS&C Technologies Holdings, Inc. | | | 3,051 | |
| | | 4,383 | | Synopsys, Inc.(a) | | | 1,331 | |
| | | 47,685 | | The Descartes Systems Group, Inc.(a) | | | 2,964 | |
| | | 434,995 | | The Sage Group PLC | | | 3,361 | |
| | | 25,718 | | The Trade Desk, Inc., Class - A(a) | | | 1,077 | |
| | | 13,642 | | Tyler Technologies, Inc.(a) | | | 4,536 | |
| | | 5,495 | | Unity Software, Inc.(a) | | | 202 | |
| | | 9,207 | | VMware, Inc., Class - A | | | 1,050 | |
| | | 21,920 | | Workday, Inc., Class - A(a) | | | 3,060 | |
| | | 25,756 | | Xero Ltd.(a) | | | 1,368 | |
| | | 3,433 | | Zendesk, Inc.(a) | | | 254 | |
| | | 18,612 | | Zoom Video Communications, Inc., Class - A(a) | | | 2,010 | |
| | | 3,946 | | Zscaler, Inc.(a) | | | 590 | |
| | | | | | | | 204,689 | |
| | | | | Specialty Retail — 1.25% |
| | | 3,365 | | Advance Auto Parts, Inc. | | | 582 | |
| | | 888 | | AutoZone, Inc.(a) | | | 1,908 | |
| | | 67,660 | | Bath & Body Works, Inc. | | | 1,821 | |
| | | 6,203 | | Best Buy Co., Inc. | | | 404 | |
| | | 1,910 | | Burlington Stores, Inc.(a) | | | 260 | |
| | | 4,664 | | CarMax, Inc.(a) | | | 422 | |
| | | 2,746 | | Carvana Co.(a) | | | 62 | |
| | | 9,171 | | Lithia Motors, Inc., Class - A | | | 2,520 | |
| | | 19,163 | | Lowe’s Companies, Inc. | | | 3,347 | |
| | | 3,506 | | O’Reilly Automotive, Inc.(a) | | | 2,215 | |
| | | 10,061 | | Ross Stores, Inc. | | | 707 | |
| | | 33,376 | | The Home Depot, Inc. | | | 9,155 | |
| | | 50,469 | | The TJX Companies, Inc. | | | 2,819 | |
| | | 7,303 | | Tractor Supply Co. | | | 1,416 | |
| | | 1,553 | | Ulta Beauty, Inc.(a) | | | 599 | |
| | | | | | | | 28,237 | |
| | | | | Technology Hardware, Storage & Peripherals — 3.50% |
| | | 526,713 | | Apple, Inc. | | | 73,108 | |
| | | 8,286 | | DELL Technologies, Inc., Class - C | | | 383 | |
| | | 37,365 | | Hewlett Packard Enterprise Co. | | | 495 | |
| | | 30,122 | | HP, Inc. | | | 987 | |
| | | 79,901 | | NCR Corp.(a) | | | 2,486 | |
| | | 6,388 | | NetApp, Inc. | | | 417 | |
| | | 7,506 | | Seagate Technology Holdings PLC | | | 536 | |
| | | 8,973 | | Western Digital Corp.(a) | | | 402 | |
| | | | | | | | 78,814 | |
| | Shares | | Security Description | | Value
(000) | |
| | | | | Textiles, Apparel & Luxury Goods — 0.39% |
| | | 6,829 | | Lululemon Athletica, Inc.(a) | | $ | 1,861 | |
| | | 14,950 | | LVMH Moet Hennessy Louis Vuitton SE, ADR | | | 1,827 | |
| | | 45,989 | | NIKE, Inc., Class - B | | | 4,701 | |
| | | 9,551 | | V.F. Corp. | | | 422 | |
| | | | | | | | 8,811 | |
| | | | | Tobacco — 0.36% |
| | | 70,598 | | Altria Group, Inc. | | | 2,949 | |
| | | 52,024 | | Philip Morris International, Inc. | | | 5,137 | |
| | | | | | | | 8,086 | |
| | | | | Trading Companies & Distributors — 0.17% |
| | | 50,433 | | Fastenal Co. | | | 2,518 | |
| | | 2,072 | | United Rentals, Inc.(a) | | | 503 | |
| | | 1,808 | | W.W. Grainger, Inc. | | | 822 | |
| | | | | | | | 3,843 | |
| | | | | Water Utilities — 0.10% |
| | | 10,875 | | American Water Works Co., Inc. | | | 1,617 | |
| | | 15,997 | | Essential Utilities, Inc. | | | 734 | |
| | | | | | | | 2,351 | |
| | | | | Wireless Telecommunication Services — 0.27% |
| | | 44,447 | | T-Mobile US, Inc.(a) | | | 5,980 | |
| | | | | Total Common Stocks | | | 1,664,318 | |
| | | | | Contingent Right — 0.00% |
| | | | | Biotechnology — 0.00% |
| | | 14 | | Oncternal Therapeutics, Inc. CVR, 12/31/49(b) | | | — | |
| | | | | Total Contingent Right | | | — | |
| | | | | Exchange-Traded Funds — 4.91% |
| | | 1,538,340 | | Invesco S&P 500 Low Volatility ETF | | | 95,377 | |
| | | 33,317 | | SPDR S&P 500 ETF Trust | | | 12,569 | |
| | | 7,517 | | Vanguard S&P 500 ETF | | | 2,607 | |
| | | | | Total Exchange-Traded Funds | | | 110,553 | |
| | | | | Investment Companies — 19.48% |
| | | 1,231,509 | | Federated Hermes Treasury Obligations Fund, Institutional Shares, 1.37%^^(c) | | | 1,232 | |
| | | 437,511,845 | | State Street Institutional Treasury Plus Money Market Fund, Trust Class, 1.40%(c) | | | 437,512 | |
| | | | | Total Investment Companies | | | 438,744 | |
| | | | | Total Investments (cost $1,736,862) — 98.29% | | | 2,213,615 | |
| | | | | Other assets in excess of liabilities — 1.71% | | | 38,625 | |
| | | | | Net Assets — 100.00% | | $ | 2,252,240 | |
Amounts designated as “—” are $0 or have been rounded to $0.
^ | All or part of this security was on loan as of June 30, 2022. |
^^ | Purchased with cash collateral held from securities lending. The value of the collateral could include collateral held for securities that were sold on or before June 30, 2022. |
See accompanying notes to financial statements.
59
HC CAPITAL TRUST
The Institutional U.S. Equity Portfolio
Portfolio of Investments (concluded) — June 30, 2022
(a) | Represents non-income producing security. |
(b) | Security was valued using significant unobservable inputs as of June 30, 2022. |
(c) | Annualized 7-day yield as of period-end. |
| ADR—American Depositary Receipt |
The following table reflects the percentage of total net assets of the Portfolio attributable to each Specialist Manager as of June 30, 2022.
| The Institutional U.S. Equity Portfolio | | Echo Street
Capital
Management
LLC | | | Jennison
Associates,
LLC | | | Mellon
Investments
Corporation | | | Parametric
Portfolio
Associates,
LLC | | | Wellington
Management
Company,
LLP | | | HC
Capital
Solutions | | | Total | |
| Common Stocks | | | 11.64 | % | | | 3.17 | % | | | 56.09 | % | | | — | | | | 3.00 | % | | | — | | | | 73.90 | % |
| Contingent Right | | | — | | | | — | | | | 0.00 | % | | | — | | | | — | | | | — | | | | 0.00 | % |
| Exchange-Traded Funds | | | 0.56 | % | | | — | | | | 0.12 | % | | | 4.23 | % | | | — | | | | — | | | | 4.91 | % |
| Investment Companies | | | — | | | | — | | | | 0.07 | % | | | 19.38 | % | | | 0.03 | % | | | 0.00 | % | | | 19.48 | % |
| Other Assets (Liabilities) | | | 0.05 | % | | | 0.11 | % | | | 0.40 | % | | | 1.12 | % | | | 0.01 | % | | | 0.02 | % | | | 1.71 | % |
| Total Net Assets | | | 12.25 | % | | | 3.28 | % | | | 56.68 | % | | | 24.73 | % | | | 3.04 | % | | | 0.02 | % | | | 100.00 | % |
Amounts designated as “—” indicate the Specialist Manager did not manage any holdings in that category.
Amounts designated as 0.00% round to less than 0.005%.
The following table reflects the open derivative positions held by the Portfolio as of June 30, 2022.
Futures Contracts Purchased*
Description | | Number of
Contracts | | | Expiration
Date | | | Notional
Amount
(000) | | | Value and
Unrealized
Appreciation/
(Depreciation)
(000) | |
E-Mini S&P 500 Future | | | 2,575 | | | | 9/16/22 | | | $ | 487,899 | | | $ | 4,415 | |
Russell 2000 Mini Index Future | | | 216 | | | | 9/16/22 | | | | 18,446 | | | | (987 | ) |
| | | | | | | | | | | $ | 506,345 | | | $ | 3,428 | |
| | Total Unrealized Appreciation | | $ | 4,415 | |
| | Total Unrealized Depreciation | | | (987 | ) |
| | Total Net Unrealized Appreciation/(Depreciation) | | $ | 3,428 | |
* | Cash has been pledged as collateral for futures contracts held by the Portfolio. |
See accompanying notes to financial statements.
60
HC CAPITAL TRUST
The Small Capitalization-Mid Capitalization Equity Portfolio
Portfolio of Investments — June 30, 2022
| | Shares | | Security Description | | Value
(000) | |
| | | | | Common Stocks — 93.49% |
| | | | | Aerospace & Defense — 0.48% |
| | | 89 | | Aerojet Rocketdyne Holdings, Inc.(a) | | $ | 4 | |
| | | 176 | | AeroVironment, Inc.(a) | | | 14 | |
| | | 700 | | Curtiss-Wright Corp. | | | 92 | |
| | | 9,716 | | Kratos Defense & Security Solutions, Inc.(a) | | | 136 | |
| | | 581 | | Maxar Technologies, Inc. | | | 15 | |
| | | 64 | | Moog, Inc., Class - A | | | 5 | |
| | | 4,770 | | Triumph Group, Inc.(a) | | | 63 | |
| | | | | | | | 329 | |
| | | | | Air Freight & Logistics — 0.21% |
| | | 1,731 | | Atlas Air Worldwide Holdings, Inc.(a) | | | 106 | |
| | | 586 | | Hub Group, Inc., Class - A(a) | | | 42 | |
| | | | | | | | 148 | |
| | | | | Airlines — 0.53% |
| | | 20 | | Alaska Air Group, Inc.(a) | | | 1 | |
| | | 30,681 | | Controladora Vuela Cia de Aviacion SAB de CV, ADR(a) | | | 316 | |
| | | 1,060 | | Hawaiian Holdings, Inc.(a) | | | 15 | |
| | | 1,487 | | Spirit Airlines, Inc.(a) | | | 35 | |
| | | | | | | | 367 | |
| | | | | Auto Components — 1.72% |
| | | 1,571 | | Adient PLC(a) | | | 47 | |
| | | 2,008 | | American Axle & Manufacturing Holdings, Inc.(a) | | | 15 | |
| | | 3,395 | | BorgWarner, Inc. | | | 113 | |
| | | 26,419 | | Dana, Inc. | | | 372 | |
| | | 554 | | Dorman Products, Inc.(a) | | | 61 | |
| | | 56 | | Gentherm, Inc.(a) | | | 3 | |
| | | 32 | | LCI Industries | | | 4 | |
| | | 10,286 | | Modine Manufacturing Co.(a) | | | 108 | |
| | | 91 | | Patrick Industries, Inc. | | | 5 | |
| | | 3,182 | | Standard Motor Products, Inc. | | | 143 | |
| | | 9,781 | | Stoneridge, Inc.(a) | | | 168 | |
| | | 2,188 | | Tenneco, Inc., Class - A(a) | | | 38 | |
| | | 2,005 | | The Goodyear Tire & Rubber Co.(a) | | | 21 | |
| | | 872 | | Visteon Corp.(a) | | | 90 | |
| | | 72 | | XPEL, Inc.(a) | | | 3 | |
| | | | | | | | 1,191 | |
| | | | | Automobiles — 0.04% |
| | | 895 | | Arcimoto, Inc.^(a) | | | 3 | |
| | | 522 | | Winnebago Industries, Inc. | | | 25 | |
| | | | | | | | 28 | |
| | | | | Banks — 8.30% |
| | | 92 | | 1st Source, Inc. | | | 4 | |
| | | 1,715 | | Ameris Bancorp | | | 69 | |
| | | 813 | | Banc of California, Inc. | | | 14 | |
| | | 1,048 | | BancFirst Corp. | | | 100 | |
| | | 6,654 | | BankUnited, Inc. | | | 237 | |
| | Shares | | Security Description | | Value
(000) | |
| | | | | Banks (continued) |
| | | 1,471 | | Bankwell Financial Group, Inc. | | $ | 46 | |
| | | 2,204 | | BCB Bancorp, Inc. | | | 38 | |
| | | 4,171 | | Berkshire Hills Bancorp, Inc. | | | 103 | |
| | | 418 | | Byline Bancorp, Inc. | | | 10 | |
| | | 5,139 | | Cadence Bank | | | 121 | |
| | | 2,951 | | Cathay General Bancorp. | | | 116 | |
| | | 1,054 | | Central Valley Community Bancorp | | | 15 | |
| | | 229 | | Civista Bancshares, Inc. | | | 5 | |
| | | 3,735 | | Columbia Banking System, Inc. | | | 107 | |
| | | 2,630 | | ConnectOne Bancorp, Inc. | | | 64 | |
| | | 777 | | Cullen/Frost Bankers, Inc. | | | 90 | |
| | | 581 | | Eagle Bancorp, Inc. | | | 28 | |
| | | 688 | | Enterprise Financial Services Corp. | | | 29 | |
| | | 1,703 | | FB Financial Corp. | | | 67 | |
| | | 952 | | First Bancorp | | | 33 | |
| | | 29,399 | | First Bancorp | | | 381 | |
| | | 2,341 | | First Bank | | | 33 | |
| | | 7,136 | | First Busey Corp. | | | 163 | |
| | | 124 | | First Citizens BancShares, Inc., Class - A | | | 81 | |
| | | 3,478 | | First Financial Bancorp | | | 67 | |
| | | 5,034 | | First Horizon Corp. | | | 110 | |
| | | 2,416 | | First Merchants Corp. | | | 86 | |
| | | 6,458 | | Fulton Financial Corp. | | | 93 | |
| | | 70 | | German American Bancorp, Inc. | | | 2 | |
| | | 144 | | Glacier Bancorp, Inc. | | | 7 | |
| | | 3,205 | | Hancock Whitney Corp. | | | 142 | |
| | | 868 | | Hilltop Holdings, Inc. | | | 23 | |
| | | 1,293 | | Hope Bancorp, Inc. | | | 18 | |
| | | 2,366 | | Horizon Bancorp, Inc. | | | 41 | |
| | | 941 | | Independent Bank Corp. | | | 75 | |
| | | 1,662 | | Independent Bank Group, Inc. | | | 113 | |
| | | 129 | | International Bancshares Corp. | | | 5 | |
| | | 1,596 | | Lakeland Bancorp, Inc. | | | 23 | |
| | | 441 | | Lakeland Financial Corp. | | | 29 | |
| | | 2,021 | | Live Oak Bancshares, Inc. | | | 68 | |
| | | 1,295 | | Midland States Bancorp, Inc. | | | 31 | |
| | | 1,880 | | MidWestOne Financial Group, Inc. | | | 56 | |
| | | 1,622 | | Northrim Bancorp, Inc. | | | 65 | |
| | | 2,194 | | Old Second Bancorp, Inc. | | | 29 | |
| | | 1,149 | | Orrstown Financial Services, Inc. | | | 28 | |
| | | 1,042 | | Pacific Premier Bancorp, Inc. | | | 30 | |
| | | 5,624 | | Peoples Bancorp, Inc. | | | 150 | |
| | | 3,233 | | Pinnacle Financial Partners, Inc. | | | 234 | |
| | | 4,394 | | Popular, Inc. | | | 339 | |
| | | 1,394 | | Republic Bancorp, Inc., Class - A | | | 67 | |
| | | 7,725 | | Republic First Bancorp, Inc.(a) | | | 29 | |
| | | 734 | | ServisFirst Bancshares, Inc. | | | 58 | |
| | | 4,386 | | Southside Bancshares, Inc. | | | 164 | |
| | | 113 | | SouthState Corp. | | | 9 | |
See accompanying notes to financial statements.
61
HC CAPITAL TRUST
The Small Capitalization-Mid Capitalization Equity Portfolio
Portfolio of Investments (continued) — June 30, 2022
| | Shares | | Security Description | | Value
(000) | |
| | | | | Common Stocks (continued) |
| | | | | Banks (continued) |
| | | 1,311 | | Stock Yards Bancorp, Inc. | | $ | 78 | |
| | | 510 | | Texas Capital Bancshares, Inc.(a) | | | 27 | |
| | | 21,920 | | The Bancorp, Inc.(a) | | | 429 | |
| | | 5,652 | | The Bank of N.T. Butterfield & Son Ltd. | | | 176 | |
| | | 3,235 | | Towne Bank | | | 88 | |
| | | 126 | | Triumph Bancorp, Inc.(a) | | | 8 | |
| | | 2,275 | | United Bankshares, Inc. | | | 80 | |
| | | 3,391 | | United Community Banks, Inc. | | | 102 | |
| | | 2,879 | | Veritex Holdings, Inc. | | | 84 | |
| | | 3,173 | | Washington Trust Bancorp, Inc. | | | 153 | |
| | | 2,812 | | WesBanco, Inc. | | | 89 | |
| | | 3,643 | | Wintrust Financial Corp. | | | 293 | |
| | | | | | | | 5,752 | |
| | | | | Beverages — 0.12% |
| | | 816 | | Celsius Holdings, Inc.(a) | | | 54 | |
| | | 37 | | MGP Ingredients, Inc. | | | 4 | |
| | | 543 | | The Duckhorn Portfolio, Inc.(a) | | | 11 | |
| | | 341 | | The Vita Coco Co., Inc.(a) | | | 3 | |
| | | 3,519 | | Zevia PBC, Class - A(a) | | | 10 | |
| | | | | | | | 82 | |
| | | | | Biotechnology — 6.06% |
| | | 353 | | 2seventy bio, Inc.(a) | | | 5 | |
| | | 15,327 | | 4D Molecular Therapeutics, Inc.(a) | | | 107 | |
| | | 3,641 | | Acumen Pharmaceuticals, Inc.(a) | | | 17 | |
| | | 1,338 | | Adagio Therapeutics, Inc.(a) | | | 4 | |
| | | 3,315 | | Agenus, Inc.(a) | | | 6 | |
| | | 868 | | Altimmune, Inc.(a) | | | 10 | |
| | | 564 | | AnaptysBio, Inc.(a) | | | 11 | |
| | | 1,323 | | Anavex Life Sciences Corp.(a) | | | 13 | |
| | | 3,852 | | Annexon, Inc.(a) | | | 15 | |
| | | 468 | | Apellis Pharmaceuticals, Inc.(a) | | | 21 | |
| | | 1,659 | | Arbutus BioPharma Corp.(a) | | | 4 | |
| | | 734 | | Arcus Biosciences, Inc.(a) | | | 19 | |
| | | 1,554 | | Arrowhead Pharmaceuticals, Inc.(a) | | | 55 | |
| | | 1,323 | | Atea Pharmaceuticals, Inc.(a) | | | 9 | |
| | | 2,816 | | Atreca, Inc., Class - A(a) | | | 5 | |
| | | 914 | | Avid Bioservices, Inc.(a) | | | 14 | |
| | | 2,733 | | Beyondspring, Inc.(a) | | | 4 | |
| | | 11,191 | | BioAtla, Inc.(a) | | | 32 | |
| | | 2,995 | | BioCryst Pharmaceuticals, Inc.(a) | | | 32 | |
| | | 842 | | Biohaven Pharmaceutical Holding Co. Ltd.(a) | | | 123 | |
| | | 1,694 | | BioMarin Pharmaceutical, Inc.(a) | | | 141 | |
| | | 2,914 | | Bioxcel Therapeutics, Inc.(a) | | | 38 | |
| | | 18,086 | | Bridgebio Pharma, Inc.(a) | | | 165 | |
| | | 585 | | C4 Therapeutics, Inc.(a) | | | 4 | |
| | | 672 | | Cara Therapeutics, Inc.(a) | | | 6 | |
| | | 323 | | Castle Biosciences, Inc.(a) | | | 7 | |
| | Shares | | Security Description | | Value
(000) | |
| | | | | Biotechnology (continued) |
| | | 166 | | Cerevel Therapeutics Holdings, Inc.(a) | | $ | 4 | |
| | | 817 | | ChemoCentryx, Inc.(a) | | | 20 | |
| | | 66,858 | | Chimerix, Inc.(a) | | | 139 | |
| | | 611 | | Chinook Therapeutics, Inc.(a) | | | 11 | |
| | | 16,043 | | Cogent Biosciences, Inc.(a) | | | 146 | |
| | | 697 | | Crinetics Pharmaceuticals, Inc.(a) | | | 13 | |
| | | 467 | | Cytokinetics, Inc.(a) | | | 18 | |
| | | 1,419 | | Dynavax Technologies Corp.(a) | | | 18 | |
| | | 37,045 | | Enochian Biosciences, Inc.(a) | | | 71 | |
| | | 1,435 | | Esperion Therapeutics, Inc.(a) | | | 9 | |
| | | 1,338 | | Fate Therapeutics, Inc.(a) | | | 33 | |
| | | 5,466 | | Forma Therapeutics Holdings, Inc.(a) | | | 38 | |
| | | 760 | | G1 Therapeutics, Inc.(a) | | | 4 | |
| | | 1,612 | | Gritstone bio, Inc.(a) | | | 4 | |
| | | 4,978 | | Halozyme Therapeutics, Inc.(a) | | | 220 | |
| | | 1,898 | | Humanigen, Inc.(a) | | | 3 | |
| | | 489 | | Icosavax, Inc.(a) | | | 3 | |
| | | 496 | | Ideaya Biosciences, Inc.(a) | | | 7 | |
| | | 2,658 | | Immuneering Corp., Class - A(a) | | | 14 | |
| | | 652 | | Immunic, Inc.(a) | | | 2 | |
| | | 21,053 | | ImmunityBio, Inc.(a) | | | 78 | |
| | | 3,251 | | ImmunoGen, Inc.(a) | | | 15 | |
| | | 1,913 | | Incyte Corp.(a) | | | 146 | |
| | | 920 | | Insmed, Inc.(a) | | | 18 | |
| | | 1,055 | | Intellia Therapeutics, Inc.(a) | | | 55 | |
| | | 185 | | Iovance Biotherapeutics, Inc.(a) | | | 2 | |
| | | 7,006 | | Ironwood Pharmaceuticals, Inc.(a) | | | 81 | |
| | | 16,848 | | Jounce Therapeutics, Inc.(a) | | | 51 | |
| | | 5,243 | | KalVista Pharmaceuticals, Inc.(a) | | | 52 | |
| | | 38 | | Karuna Therapeutics, Inc.(a) | | | 5 | |
| | | 975 | | Kezar Life Sciences, Inc.(a) | | | 8 | |
| | | 442 | | Kiniksa Pharmaceuticals Ltd., Class - A(a) | | | 4 | |
| | | 388 | | Krystal Biotech, Inc.(a) | | | 25 | |
| | | 1,009 | | Kura Oncology, Inc.(a) | | | 18 | |
| | | 7,491 | | Kymera Therapeutics, Inc.(a) | | | 148 | |
| | | 12,224 | | Lexicon Pharmaceuticals, Inc.(a) | | | 23 | |
| | | 25,020 | | Lyell Immunopharma, Inc.(a) | | | 164 | |
| | | 45,403 | | MacroGenics, Inc.(a) | | | 134 | |
| | | 179 | | Madrigal Pharmaceuticals, Inc.(a) | | | 13 | |
| | | 3,734 | | MannKind Corp.(a) | | | 14 | |
| | | 1,311 | | Myriad Genetics, Inc.(a) | | | 24 | |
| | | 432 | | Natera, Inc.(a) | | | 15 | |
| | | 566 | | Nkarta, Inc.(a) | | | 7 | |
| | | 651 | | Novavax, Inc.(a) | | | 33 | |
| | | 6,995 | | Olema Pharmaceuticals, Inc.(a) | | | 28 | |
| | | 9,226 | | OPKO Health, Inc.(a) | | | 23 | |
| | | 7,585 | | Pardes Biosciences, Inc.(a) | | | 23 | |
| | | 2,087 | | PDL BioPharma, Inc.(a) | | | 5 | |
| | | 56,100 | | Praxis Precision Medicines, Inc.(a) | | | 137 | |
See accompanying notes to financial statements.
62
HC CAPITAL TRUST
The Small Capitalization-Mid Capitalization Equity Portfolio
Portfolio of Investments (continued) — June 30, 2022
| | Shares | | Security Description | | Value
(000) | |
| | | | | Common Stocks (continued) |
| | | | | Biotechnology (continued) |
| | | 10,928 | | Precision Biosciences, Inc.(a) | | $ | 17 | |
| | | 997 | | Protagonist Therapeutics, Inc.(a) | | | 8 | |
| | | 700 | | Prothena Corp. PLC(a) | | | 19 | |
| | | 142 | | PTC Therapeutics, Inc.(a) | | | 6 | |
| | | 322 | | RAPT Therapeutics, Inc.(a) | | | 6 | |
| | | 20,115 | | Recursion Pharmaceuticals, Inc., Class - A(a) | | | 165 | |
| | | 16,609 | | Sana Biotechnology, Inc.(a) | | | 107 | |
| | | 3,638 | | Shattuck Labs, Inc.(a) | | | 15 | |
| | | 7,589 | | Silverback Therapeutics, Inc.(a) | | | 32 | |
| | | 3,339 | | Societal CDMO, Inc(a) | | | 3 | |
| | | 1,087 | | SQZ Biotechnologies Co.(a) | | | 3 | |
| | | 26,396 | | Sutro Biopharma, Inc.(a) | | | 138 | |
| | | 2,137 | | Syndax Pharmaceuticals, Inc.(a) | | | 41 | |
| | | 4,673 | | Travere Therapeutics, Inc.(a) | | | 113 | |
| | | 1,713 | | Turning Point Therapeutics, Inc.(a) | | | 129 | |
| | | 1,299 | | Ultragenyx Pharmaceutical, Inc.(a) | | | 77 | |
| | | 789 | | United Therapeutics Corp.(a) | | | 187 | |
| | | 802 | | Vericel Corp.(a) | | | 20 | |
| | | 551 | | Verve Therapeutics, Inc.(a) | | | 8 | |
| | | 16,422 | | Viking Therapeutics, Inc.(a) | | | 47 | |
| | | 1,674 | | Viracta Therapeutics, Inc.(a) | | | 6 | |
| | | 854 | | Xencor, Inc.(a) | | | 23 | |
| | | 1,004 | | Xoma Corp.(a) | | | 22 | |
| | | 551 | | Zentalis Pharmaceuticals, Inc.(a) | | | 15 | |
| | | | | | | | 4,200 | |
| | | | | Building Products — 2.04% |
| | | 1,948 | | Apogee Enterprises, Inc. | | | 76 | |
| | | 13,025 | | Builders FirstSource, Inc.(a) | | | 700 | |
| | | 5,042 | | Caesarstone Ltd. | | | 46 | |
| | | 354 | | CSW Industrials, Inc. | | | 36 | |
| | | 815 | | Gibraltar Industries, Inc.(a) | | | 32 | |
| | | 1,230 | | Griffon Corp. | | | 34 | |
| | | 443 | | Insteel Industries, Inc. | | | 15 | |
| | | 887 | | Masonite International Corp.(a) | | | 68 | |
| | | 3,555 | | Trex Co., Inc.(a) | | | 194 | |
| | | 2,155 | | UFP Industries, Inc. | | | 147 | |
| | | 2,342 | | Zurn Water Solutions Corp. | | | 64 | |
| | | | | | | | 1,412 | |
| | | | | Capital Markets — 2.91% |
| | | 1,343 | | Ares Management Corp., Class - A | | | 76 | |
| | | 4,822 | | Arlington Asset Investment Corp., Class - A(a) | | | 16 | |
| | | 1,338 | | Artisan Partners Asset Management, Inc., Class - A | | | 48 | |
| | | 493 | | B. Riley Financial, Inc. | | | 21 | |
| | | 12,428 | | Bakkt Holdings, Inc.(a) | | | 26 | |
| | | 13,347 | | BGC Partners, Inc., Class - A | | | 45 | |
| | | 1,179 | | Brightsphere Investment Group, Inc. | | | 21 | |
| | Shares | | Security Description | | Value
(000) | |
| | | | | Capital Markets (continued) |
| | | 979 | | Cohen & Steers, Inc. | | $ | 62 | |
| | | 677 | | Cowen, Inc., Class - A | | | 16 | |
| | | 1,749 | | Evercore, Inc. | | | 164 | |
| | | 3,056 | | Federated Hermes, Inc., Class - B | | | 97 | |
| | | 1,301 | | Focus Financial Partners, Inc., Class - A(a) | | | 44 | |
| | | 62 | | GlassBridge Enterprises, Inc.(a) | | | 1 | |
| | | 184 | | Hamilton Lane, Inc. | | | 12 | |
| | | 75 | | Houlihan Lokey, Inc. | | | 6 | |
| | | 3,694 | | LPL Financial Holdings, Inc. | | | 682 | |
| | | 128 | | Moelis & Co., Class - A | | | 5 | |
| | | 3,315 | | Raymond James Financial, Inc. | | | 296 | |
| | | 1,512 | | Stifel Financial Corp. | | | 85 | |
| | | 5,156 | | The Carlyle Group, Inc. | | | 163 | |
| | | 2,045 | | Victory Capital Holdings, Inc., Class - A | | | 49 | |
| | | 157 | | Virtus Investment Partners, Inc. | | | 27 | |
| | | 9,720 | | WisdomTree Investments, Inc. | | | 49 | |
| | | | | | | | 2,011 | |
| | | | | Chemicals — 2.52% |
| | | 8,475 | | Advanced Emissions Solutions, Inc.(a) | | | 40 | |
| | | 2,308 | | Albemarle Corp. | | | 481 | |
| | | 828 | | Avient Corp. | | | 33 | |
| | | 695 | | Balchem Corp. | | | 90 | |
| | | 48 | | Cabot Corp. | | | 3 | |
| | | 3,202 | | FMC Corp. | | | 343 | |
| | | 158 | | Huntsman Corp. | | | 4 | |
| | | 1,018 | | Innospec, Inc. | | | 98 | |
| | | 36,795 | | Kronos Bio, Inc.(a) | | | 134 | |
| | | 1,908 | | Kronos Worldwide, Inc. | | | 35 | |
| | | 9,191 | | Livent Corp.(a) | | | 209 | |
| | | 617 | | Minerals Technologies, Inc. | | | 38 | |
| | | 129 | | NewMarket Corp. | | | 39 | |
| | | 1,544 | | Orion Engineered Carbons SA | | | 24 | |
| | | 866 | | PureCycle Technologies, Inc.(a) | | | 6 | |
| | | 898 | | Sensient Technologies Corp. | | | 72 | |
| | | 85 | | Stepan Co. | | | 9 | |
| | | 1,217 | | Trinseo PLC | | | 47 | |
| | | 2,194 | | Tronox Holdings PLC, Class - A | | | 37 | |
| | | | | | | | 1,742 | |
| | | | | Commercial Services & Supplies — 0.59% |
| | | 1,375 | | ABM Industries, Inc. | | | 60 | |
| | | 1,728 | | ACCO Brands Corp. | | | 11 | |
| | | 79 | | Brady Corp., Class - A | | | 4 | |
| | | 1,307 | | Casella Waste Systems, Inc.(a) | | | 95 | |
| | | 656 | | HNI Corp. | | | 23 | |
| | | 6,800 | | Interface, Inc. | | | 85 | |
| | | 749 | | McGrath RentCorp | | | 57 | |
| | | 1,301 | | MillerKnoll, Inc. | | | 34 | |
| | | 33 | | MSA Safety, Inc. | | | 4 | |
See accompanying notes to financial statements.
63
HC CAPITAL TRUST
The Small Capitalization-Mid Capitalization Equity Portfolio
Portfolio of Investments (continued) — June 30, 2022
| | Shares | | Security Description | | Value
(000) | |
| | | | | Common Stocks (continued) |
| | | | | Commercial Services & Supplies (continued) |
| | | 1,559 | | Quad/Graphics, Inc.(a) | | $ | 4 | |
| | | 142 | | SP Plus Corp.(a) | | | 4 | |
| | | 111 | | Tetra Tech, Inc. | | | 15 | |
| | | 39 | | UniFirst Corp. | | | 7 | |
| | | 48 | | VSE Corp. | | | 2 | |
| | | | | | | | 405 | |
| | | | | Communications Equipment — 0.35% |
| | | 1,460 | | ADTRAN, Inc. | | | 26 | |
| | | 835 | | Calix, Inc.(a) | | | 29 | |
| | | 963 | | Casa Systems, Inc.(a) | | | 4 | |
| | | 673 | | Clearfield, Inc.(a) | | | 42 | |
| | | 2,372 | | Infinera Corp.(a) | | | 13 | |
| | | 724 | | InterDigital, Inc. | | | 43 | |
| | | 1,545 | | KVH Industries, Inc.(a) | | | 13 | |
| | | 475 | | Lumentum Holdings, Inc.(a) | | | 38 | |
| | | 103 | | NetScout Systems, Inc.(a) | | | 3 | |
| | | 6,830 | | Ribbon Communications, Inc.(a) | | | 21 | |
| | | 564 | | Viavi Solutions, Inc.(a) | | | 7 | |
| | | | | | | | 239 | |
| | | | | Construction & Engineering — 2.52% |
| | | 5,028 | | AECOM | | | 329 | |
| | | 1,546 | | Ameresco, Inc., Class - A(a) | | | 70 | |
| | | 1,585 | | Dycom Industries, Inc.(a) | | | 147 | |
| | | 1,160 | | EMCOR Group, Inc. | | | 119 | |
| | | 2,153 | | Fluor Corp.(a) | | | 52 | |
| | | 5,866 | | Granite Construction, Inc. | | | 171 | |
| | | 4,033 | | MasTec, Inc.(a) | | | 289 | |
| | | 117 | | MYR Group, Inc.(a) | | | 10 | |
| | | 2,758 | | Primoris Services Corp. | | | 60 | |
| | | 3,082 | | Quanta Services, Inc. | | | 387 | |
| | | 1,696 | | Tutor Perini Corp.(a) | | | 15 | |
| | | 2,938 | | WillScot Mobile Mini Holdings Corp.(a) | | | 95 | |
| | | | | | | | 1,744 | |
| | | | | Construction Materials — 0.49% |
| | | 2,193 | | Eagle Materials, Inc. | | | 241 | |
| | | 4,300 | | Summit Materials, Inc., Class - A(a) | | | 100 | |
| | | | | | | | 341 | |
| | | | | Consumer Finance — 0.23% |
| | | 2,560 | | Green Dot Corp., Class - A(a) | | | 64 | |
| | | 3,434 | | LendingClub Corp.(a) | | | 40 | |
| | | 875 | | Navient Corp. | | | 12 | |
| | | 351 | | Nelnet, Inc., Class - A | | | 30 | |
| | | 131 | | World Acceptance Corp.(a) | | | 15 | |
| | | | | | | | 161 | |
| | | | | Containers & Packaging — 0.37% |
| | | 693 | | AptarGroup, Inc. | | | 72 | |
| | | 5,432 | | Graphic Packaging Holding Co. | | | 111 | |
| | Shares | | Security Description | | Value
(000) | |
| | | | | Containers & Packaging (continued) |
| | | 3,245 | | Myers Industries, Inc. | | $ | 74 | |
| | | | | | | | 257 | |
| | | | | Diversified Consumer Services — 0.66% |
| | | 3,247 | | Adtalem Global Education, Inc.(a) | | | 117 | |
| | | 2,186 | | Chegg, Inc.(a) | | | 41 | |
| | | 1,491 | | Franchise Group, Inc. | | | 52 | |
| | | 17,248 | | Perdoceo Education Corp.(a) | | | 203 | |
| | | 647 | | PowerSchool Holdings, Inc.(a) | | | 8 | |
| | | 374 | | Strategic Education, Inc. | | | 26 | |
| | | 95 | | Stride, Inc.(a) | | | 4 | |
| | | 782 | | Universal Technical Institute, Inc.(a) | | | 6 | |
| | | | | | | | 457 | |
| | | | | Diversified Financial Services — 0.06% |
| | | 2,195 | | Cannae Holdings, Inc.(a) | | | 42 | |
| | | | | Diversified Telecommunication Services — 0.73% |
| | | 2,365 | | Anterix, Inc.(a) | | | 97 | |
| | | 1,103 | | Consolidated Communications Holdings, Inc.(a) | | | 8 | |
| | | 3,094 | | IDT Corp.(a) | | | 78 | |
| | | 221 | | Iridium Communications, Inc.(a) | | | 8 | |
| | | 20,415 | | Radius Global Infrastructure, Inc., Class - A(a) | | | 311 | |
| | | | | | | | 502 | |
| | | | | Electric Utilities — 0.32% |
| | | 1,876 | | ALLETE, Inc. | | | 110 | |
| | | 3,048 | | Genie Energy Ltd. | | | 28 | |
| | | 175 | | MGE Energy, Inc. | | | 14 | |
| | | 528 | | Otter Tail Corp. | | | 35 | |
| | | 185 | | PNM Resources, Inc. | | | 9 | |
| | | 509 | | Portland General Electric Co. | | | 25 | |
| | | | | | | | 221 | |
| | | | | Electrical Equipment — 0.84% |
| | | 8,245 | | Array Technologies, Inc.(a) | | | 91 | |
| | | 326 | | Beam Global(a) | | | 5 | |
| | | 1,099 | | Bloom Energy Corp., Class - A(a) | | | 18 | |
| | | 2,360 | | EnerSys | | | 140 | |
| | | 1,208 | | FTC Solar, Inc.(a) | | | 4 | |
| | | 5,592 | | FuelCell Energy, Inc.(a) | | | 21 | |
| | | 1,604 | | Plug Power, Inc.(a) | | | 27 | |
| | | 522 | | Regal Rexnord Corp. | | | 59 | |
| | | 6,744 | | Shoals Technologies Group, Inc., Class - A(a) | | | 111 | |
| | | 1,724 | | Stem, Inc.(a) | | | 12 | |
| | | 3,233 | | Sunrun, Inc.(a) | | | 76 | |
| | | 340 | | TPI Composites, Inc.(a) | | | 4 | |
| | | 294 | | Vicor Corp.(a) | | | 16 | |
| | | | | | | | 584 | |
| | | | | Electronic Equipment, Instruments & Components — 2.15% |
| | | 517 | | Airgain, Inc.(a) | | | 4 | |
| | | 1,155 | | Arlo Technologies, Inc.(a) | | | 7 | |
See accompanying notes to financial statements.
64
HC CAPITAL TRUST
The Small Capitalization-Mid Capitalization Equity Portfolio
Portfolio of Investments (continued) — June 30, 2022
| | Shares | | Security Description | | Value
(000) | |
| | | | | Common Stocks (continued) |
| | | | | Electronic Equipment, Instruments & Components (continued) |
| | | 521 | | Badger Meter, Inc. | | $ | 42 | |
| | | 544 | | Belden, Inc. | | | 29 | |
| | | 34 | | Dolby Laboratories, Inc., Class - A | | | 2 | |
| | | 92 | | ePlus, Inc.(a) | | | 5 | |
| | | 2,761 | | Fabrinet(a) | | | 225 | |
| | | 18,320 | | Flex Ltd.(a) | | | 266 | |
| | | 1,590 | | II-VI, Inc.(a) | | | 81 | |
| | | 1,005 | | Insight Enterprises, Inc.(a) | | | 87 | |
| | | 548 | | IPG Photonics Corp.(a) | | | 52 | |
| | | 5,296 | | Iteris, Inc.(a) | | | 15 | |
| | | 7,371 | | Jabil, Inc. | | | 378 | |
| | | 414 | | Kimball Electronics, Inc.(a) | | | 8 | |
| | | 2,844 | | Knowles Corp.(a) | | | 49 | |
| | | 368 | | Littelfuse, Inc. | | | 93 | |
| | | 1,326 | | Methode Electronics, Inc. | | | 49 | |
| | | 2,486 | | MicroVision, Inc.^(a) | | | 10 | |
| | | 111 | | Novanta, Inc.(a) | | | 13 | |
| | | 382 | | Par Technology Corp.(a) | | | 14 | |
| | | 110 | | PC Connection, Inc. | | | 5 | |
| | | 51 | | Plexus Corp.(a) | | | 4 | |
| | | 120 | | Rogers Corp.(a) | | | 31 | |
| | | 86 | | Sanmina Corp.(a) | | | 4 | |
| | | 34 | | TD SYNNEX Corp. | | | 3 | |
| | | 801 | | TTM Technologies, Inc.(a) | | | 10 | |
| | | 290 | | Vishay Intertechnology, Inc. | | | 5 | |
| | | | | | | | 1,491 | |
| | | | | Energy Equipment & Services — 0.97% |
| | | 1,012 | | Archrock, Inc. | | | 8 | |
| | | 460 | | Cactus, Inc., Class - A | | | 19 | |
| | | 4,798 | | Championx Corp. | | | 95 | |
| | | 12,375 | | Expro Group Holdings NV(a) | | | 143 | |
| | | 655 | | Helmerich & Payne, Inc. | | | 28 | |
| | | 4,448 | | Liberty Oilfield Services, Inc., Class - A(a) | | | 57 | |
| | | 39 | | Nabors Industries Ltd.(a) | | | 5 | |
| | | 2,855 | | Nextier Oilfield Solutions, Inc.(a) | | | 27 | |
| | | 1,775 | | Oceaneering International, Inc.(a) | | | 19 | |
| | | 9,817 | | Patterson-UTI Energy, Inc. | | | 155 | |
| | | 2,735 | | Solaris Oilfield Infrastructure, Inc., Class - A | | | 30 | |
| | | 4,093 | | Tidewater, Inc.(a) | | | 86 | |
| | | | | | | | 672 | |
| | | | | Entertainment — 0.38% |
| | | 682 | | Cinemark Holdings, Inc.(a) | | | 10 | |
| | | 6,620 | | CuriosityStream, Inc.(a) | | | 11 | |
| | | 230 | | IMAX Corp.(a) | | | 4 | |
| | | 1,640 | | Liberty Media Corp. - Liberty Braves, Class - A(a) | | | 41 | |
| | Shares | | Security Description | | Value
(000) | |
| | | | | Entertainment (continued) |
| | | 2,497 | | Liberty Media Corp. - Liberty Braves, Class - C(a) | | $ | 60 | |
| | | 18,030 | | Redbox Entertainment, Inc.(a) | | | 134 | |
| | | | | | | | 260 | |
| | | | | Equity Real Estate Investment Trusts — 6.47% |
| | | 2,803 | | Agree Realty Corp. | | | 202 | |
| | | 9,306 | | Alexander & Baldwin, Inc. | | | 167 | |
| | | 516 | | Alpine Income Property Trust, Inc. | | | 9 | |
| | | 674 | | Ashford Hospitality Trust, Inc.(a) | | | 4 | |
| | | 2,381 | | Broadstone Net Lease, Inc. | | | 49 | |
| | | 2,068 | | Centerspace | | | 169 | |
| | | 4,816 | | Chatham Lodging Trust(a) | | | 50 | |
| | | 8,931 | | Clipper Realty, Inc. | | | 69 | |
| | | 4,343 | | Community Healthcare Trust, Inc. | | | 157 | |
| | | 1,360 | | CoreCivic, Inc.(a) | | | 15 | |
| | | 9,566 | | Corporate Office Properties Trust | | | 252 | |
| | | 9,262 | | DiamondRock Hospitality Co.(a) | | | 76 | |
| | | 11,256 | | DigitalBridge Group, Inc.(a) | | | 55 | |
| | | 9,462 | | Easterly Government Properties, Inc. | | | 180 | |
| | | 1,133 | | EastGroup Properties, Inc. | | | 175 | |
| | | 264 | | Essential Properties Realty Trust, Inc. | | | 6 | |
| | | 681 | | Farmland Partners, Inc. | | | 9 | |
| | | 2,615 | | Four Corners Property Trust, Inc. | | | 70 | |
| | | 6,119 | | Getty Realty Corp. | | | 162 | |
| | | 2,520 | | Gladstone Commercial Corp. | | | 47 | |
| | | 6,912 | | Global Medical REIT, Inc. | | | 78 | |
| | | 12,130 | | Global Net Lease, Inc. | | | 172 | |
| | | 964 | | Healthcare Realty Trust, Inc. | | | 26 | |
| | | 6,232 | | Hersha Hospitality Trust(a) | | | 61 | |
| | | 2,757 | | Independence Realty Trust, Inc. | | | 57 | |
| | | 711 | | Innovative Industrial Properties, Inc. | | | 78 | |
| | | 566 | | iStar, Inc. | | | 8 | |
| | | 3,897 | | Kite Realty Group Trust | | | 67 | |
| | | 713 | | LTC Properties, Inc. | | | 27 | |
| | | 1,990 | | LXP Industrial Trust | | | 21 | |
| | | 763 | | National Health Investors, Inc. | | | 46 | |
| | | 1,574 | | National Storage Affiliates | | | 79 | |
| | | 8,190 | | NETSTREIT Corp. | | | 155 | |
| | | 7,865 | | Office Properties Income Trust | | | 157 | |
| | | 12,717 | | Orion Office REIT, Inc. | | | 139 | |
| | | 290 | | Pebblebrook Hotel Trust | | | 5 | |
| | | 234 | | Phillips Edison & Co., Inc. | | | 8 | |
| | | 1,185 | | PotlatchDeltic Corp. | | | 52 | |
| | | 34 | | PS Business Parks, Inc. | | | 6 | |
| | | 788 | | Retail Opportunity Investments Corp. | | | 12 | |
| | | 6,433 | | RLJ Lodging Trust | | | 71 | |
| | | 1,766 | | Ryman Hospitality Properties, Inc.(a) | | | 134 | |
| | | 6,550 | | Sabra Health Care REIT, Inc. | | | 92 | |
| | | 2,602 | | Saul Centers, Inc. | | | 123 | |
See accompanying notes to financial statements.
65
HC CAPITAL TRUST
The Small Capitalization-Mid Capitalization Equity Portfolio
Portfolio of Investments (continued) — June 30, 2022
| | Shares | | Security Description | | Value
(000) | |
| | | | | Common Stocks (continued) |
| | | | | Equity Real Estate Investment Trusts (continued) |
| | | 10,954 | | SITE Centers Corp. | | $ | 148 | |
| | | 3,436 | | STAG Industrial, Inc. | | | 106 | |
| | | 7,641 | | Summit Hotel Properties, Inc.(a) | | | 56 | |
| | | 960 | | Tanger Factory Outlet Centers, Inc. | | | 14 | |
| | | 1,472 | | The GEO Group, Inc.(a) | | | 10 | |
| | | 7,560 | | The Macerich Co. | | | 66 | |
| | | 18,290 | | The Necessity Retail REIT, Inc. | | | 133 | |
| | | 1,806 | | Uniti Group, Inc. | | | 17 | |
| | | 2,876 | | Universal Health Realty Income Trust | | | 153 | |
| | | 3,762 | | Urban Edge Properties | | | 57 | |
| | | 1,486 | | Ventas, Inc. | | | 76 | |
| | | 3,365 | | Veris Residential, Inc.(a) | | | 45 | |
| | | 676 | | Xenia Hotels & Resorts, Inc.(a) | | | 10 | |
| | | | | | | | 4,488 | |
| | | | | Food & Staples Retailing — 0.81% |
| | | 2,670 | | BJ’s Wholesale Club Holdings, Inc., Class - C(a) | | | 167 | |
| | | 205 | | Casey’s General Stores, Inc. | | | 38 | |
| | | 230 | | Ingles Markets, Inc., Class - A | | | 20 | |
| | | 1,659 | | MedAvail Holdings, Inc.(a) | | | 3 | |
| | | 828 | | Performance Food Group Co.(a) | | | 38 | |
| | | 202 | | PriceSmart, Inc. | | | 14 | |
| | | 1,071 | | SpartanNash Co. | | | 32 | |
| | | 1,208 | | The Andersons, Inc. | | | 40 | |
| | | 3,462 | | United Natural Foods, Inc.(a) | | | 136 | |
| | | 834 | | Village Super Market, Inc., Class - A | | | 19 | |
| | | 714 | | Weis Markets, Inc. | | | 53 | |
| | | | | | | | 560 | |
| | | | | Food Products — 1.51% |
| | | 1,351 | | AppHarvest, Inc.^(a) | | | 5 | |
| | | 7,217 | | B&G Foods, Inc.^ | | | 171 | |
| | | 1,312 | | Calavo Growers, Inc., Class - I | | | 55 | |
| | | 1,587 | | Darling Ingredients, Inc.(a) | | | 95 | |
| | | 5,555 | | Fresh Del Monte Produce, Inc. | | | 163 | |
| | | 409 | | Freshpet, Inc.(a) | | | 21 | |
| | | 682 | | J&J Snack Foods Corp. | | | 95 | |
| | | 2,078 | | John B. Sanfilippo & Son, Inc. | | | 151 | |
| | | 1,757 | | Landec Corp.(a) | | | 18 | |
| | | 321 | | Limoneira Co. | | | 5 | |
| | | 9,470 | | Mission Produce, Inc.(a) | | | 135 | |
| | | 18 | | Sanderson Farms, Inc. | | | 4 | |
| | | 1,116 | | The Simply Good Foods Co.(a) | | | 42 | |
| | | 1,534 | | Tootsie Roll Industries, Inc. | | | 54 | |
| | | 786 | | TreeHouse Foods, Inc.(a) | | | 33 | |
| | | | | | | | 1,047 | |
| | | | | Gas Utilities — 0.93% |
| | | 1,534 | | Chesapeake Utilities Corp. | | | 199 | |
| | | 812 | | New Jersey Resources Corp. | | | 36 | |
| | Shares | | Security Description | | Value
(000) | |
| | | | | Gas Utilities (continued) |
| | | 3,443 | | Northwest Natural Holding Co. | | $ | 183 | |
| | | 1,558 | | South Jersey Industries, Inc. | | | 53 | |
| | | 1,235 | | Spire, Inc. | | | 92 | |
| | | 2,134 | | UGI Corp. | | | 82 | |
| | | | | | | | 645 | |
| | | | | Health Care Equipment & Supplies — 3.88% |
| | | 287 | | Abiomed, Inc.(a) | | | 71 | |
| | | 568 | | AngioDynamics, Inc.(a) | | | 11 | |
| | | 2,962 | | Apyx Medical Corp.(a) | | | 17 | |
| | | 575 | | Artivion, Inc.(a) | | | 11 | |
| | | 155 | | AtriCure, Inc.(a) | | | 6 | |
| | | 728 | | Avanos Medical, Inc.(a) | | | 20 | |
| | | 694 | | Axonics, Inc.(a) | | | 39 | |
| | | 325 | | BioLife Solutions, Inc.(a) | | | 4 | |
| | | 2,544 | | Cerus Corp.(a) | | | 13 | |
| | | 42 | | CONMED Corp. | | | 4 | |
| | | 799 | | CVRx, Inc.(a) | | | 5 | |
| | | 2,010 | | Eargo, Inc.(a) | | | 2 | |
| | | 698 | | Glaukos Corp.(a) | | | 32 | |
| | | 140 | | Globus Medical, Inc.(a) | | | 8 | |
| | | 434 | | Haemonetics Corp.(a) | | | 28 | |
| | | 2,795 | | Hologic, Inc.(a) | | | 195 | |
| | | 2,199 | | Insulet Corp.(a) | | | 480 | |
| | | 479 | | Integer Holdings Corp.(a) | | | 34 | |
| | | 933 | | iRhythm Technologies, Inc.(a) | | | 101 | |
| | | 546 | | Lantheus Holdings, Inc.(a) | | | 36 | |
| | | 211 | | LeMaitre Vascular, Inc. | | | 10 | |
| | | 158 | | LENSAR, Inc.(a) | | | 1 | |
| | | 526 | | LivaNova PLC(a) | | | 33 | |
| | | 194 | | Meridian Bioscience, Inc.(a) | | | 6 | |
| | | 4,151 | | Merit Medical Systems, Inc.(a) | | | 226 | |
| | | 106 | | Natus Medical, Inc.(a) | | | 3 | |
| | | 4,046 | | Neogen Corp.(a) | | | 97 | |
| | | 718 | | Nevro Corp.(a) | | | 31 | |
| | | 489 | | NuVasive, Inc.(a) | | | 24 | |
| | | 49,211 | | OraSure Technologies, Inc.(a) | | | 133 | |
| | | 209 | | OrthoPediatrics Corp.(a) | | | 9 | |
| | | 29,848 | | Owlet, Inc.(a) | | | 51 | |
| | | 267 | | Paragon 28, Inc.^(a) | | | 4 | |
| | | 271 | | QuidelOrtho Corp.(a) | | | 26 | |
| | | 6,621 | | SeaSpine Holdings Corp.(a) | | | 37 | |
| | | 138 | | Shockwave Medical, Inc.(a) | | | 26 | |
| | | 492 | | SI-BONE, Inc.(a) | | | 6 | |
| | | 464 | | Sight Sciences, Inc., Class - I(a) | | | 4 | |
| | | 1,272 | | STAAR Surgical Co.(a) | | | 90 | |
| | | 18,085 | | Tactile Systems Technology, Inc.(a) | | | 132 | |
| | | 2,286 | | Tandem Diabetes Care, Inc.(a) | | | 135 | |
| | | 1,363 | | The Cooper Companies, Inc. | | | 428 | |
| | | 391 | | TransMedics Group, Inc.(a) | | | 12 | |
See accompanying notes to financial statements.
66
HC CAPITAL TRUST
The Small Capitalization-Mid Capitalization Equity Portfolio
Portfolio of Investments (continued) — June 30, 2022
| | Shares | | Security Description | | Value
(000) | |
| | | | | Common Stocks (continued) |
| | | | | Health Care Equipment & Supplies (continued) |
| | | 8,408 | | Vapotherm, Inc.(a) | | $ | 21 | |
| | | 1,150 | | Varex Imaging Corp.(a) | | | 25 | |
| | | | | | | | 2,687 | |
| | | | | Health Care Providers & Services — 2.11% |
| | | 3,094 | | Acadia Healthcare Co., Inc.(a) | | | 209 | |
| | | 103 | | Addus HomeCare Corp.(a) | | | 9 | |
| | | 1,217 | | Alignment Healthcare, Inc.(a) | | | 14 | |
| | | 590 | | AMN Healthcare Services, Inc.(a) | | | 65 | |
| | | 1,325 | | Aveanna Healthcare Holdings, Inc.(a) | | | 3 | |
| | | 7,905 | | Cano Health, Inc.(a) | | | 35 | |
| | | 13 | | Chemed Corp. | | | 6 | |
| | | 1,165 | | Community Health Systems, Inc.(a) | | | 4 | |
| | | 153 | | CorVel Corp.(a) | | | 23 | |
| | | 1,566 | | Covetrus, Inc.(a) | | | 32 | |
| | | 47 | | Encompass Health Corp. | | | 3 | |
| | | 776 | | LHC Group, Inc.(a) | | | 121 | |
| | | 277 | | Modivcare, Inc.(a) | | | 23 | |
| | | 816 | | Molina Heathcare, Inc.(a) | | | 227 | |
| | | 2,256 | | National Healthcare Corp. | | | 158 | |
| | | 2,404 | | Option Care Health, Inc.(a) | | | 67 | |
| | | 1,478 | | Owens & Minor, Inc. | | | 46 | |
| | | 3,683 | | Patterson Companies, Inc. | | | 112 | |
| | | 446 | | Pediatrix Medical Group, Inc.(a) | | | 9 | |
| | | 1,149 | | R1 RCM, Inc.(a) | | | 24 | |
| | | 2,950 | | RadNet, Inc.(a) | | | 51 | |
| | | 1,380 | | Select Medical Holdings Corp. | | | 33 | |
| | | 3,910 | | Sharps Compliance Corp.(a) | | | 11 | |
| | | 435 | | Surgery Partners, Inc.(a) | | | 13 | |
| | | 2,414 | | Tenet Healthcare Corp.(a) | | | 127 | |
| | | 222 | | The Ensign Group, Inc. | | | 16 | |
| | | 193 | | US Physical Therapy, Inc. | | | 21 | |
| | | | | | | | 1,462 | |
| | | | | Health Care Technology — 0.62% |
| | | 358 | | Allscripts Healthcare Solutions, Inc.(a) | | | 5 | |
| | | 745 | | Convey Health Solutions Holdings, Inc.(a) | | | 8 | |
| | | 1,328 | | Evolent Health, Inc., Class - A(a) | | | 41 | |
| | | 4,446 | | iCAD, Inc.(a) | | | 18 | |
| | | 883 | | Inspire Medical System, Inc.(a) | | | 161 | |
| | | 2,060 | | NextGen Healthcare, Inc.(a) | | | 36 | |
| | | 1,347 | | Omnicell, Inc.(a) | | | 153 | |
| | | 155 | | OptimizeRx Corp.(a) | | | 4 | |
| | | | | | | | 426 | |
| | | | | Hotels, Restaurants & Leisure — 2.02% |
| | | 162 | | BJ’s Restaurants, Inc.(a) | | | 4 | |
| | | 805 | | Bloomin’ Brands, Inc. | | | 13 | |
| | | 5,300 | | Boyd Gaming Corp. | | | 265 | |
| | | 4,346 | | Caesars Entertainment, Inc.(a) | | | 166 | |
| | Shares | | Security Description | | Value
(000) | |
| | | | | Hotels, Restaurants & Leisure (continued) |
| | | 398 | | Chuy’s Holdings, Inc.(a) | | $ | 8 | |
| | | 1,221 | | Dave & Buster’s Entertainment, Inc.(a) | | | 40 | |
| | | 1,018 | | Dine Brands Global, Inc. | | | 66 | |
| | | 7,017 | | Fiesta Restaurant Group, Inc.(a) | | | 50 | |
| | | 2,169 | | First Watch Restaurant Group, Inc.(a) | | | 31 | |
| | | 428 | | Golden Entertainment, Inc.(a) | | | 17 | |
| | | 1,218 | | Hilton Grand Vacations, Inc.(a) | | | 44 | |
| | | 181 | | Jack in the Box, Inc. | | | 10 | |
| | | 5,491 | | Lindblad Expeditions Holdings, Inc.(a) | | | 44 | |
| | | 731 | | Papa John’s International, Inc. | | | 61 | |
| | | 3,679 | | Planet Fitness, Inc., Class - A(a) | | | 250 | |
| | | 3,075 | | PlayAGS, Inc.(a) | | | 16 | |
| | | 3,161 | | Red Rock Resorts, Inc., Class - A | | | 105 | |
| | | 999 | | Scientific Games Corp., Class - A(a) | | | 47 | |
| | | 581 | | Texas Roadhouse, Inc. | | | 43 | |
| | | 145 | | Vail Resorts, Inc. | | | 32 | |
| | | 1,153 | | Wingstop, Inc. | | | 86 | |
| | | | | | | | 1,398 | |
| | | | | Household Durables — 0.93% |
| | | 57,930 | | Aterian, Inc.(a) | | | 124 | |
| | | 972 | | Gopro, Inc., Class - A(a) | | | 5 | |
| | | 4,688 | | Green Brick Partners, Inc.(a) | | | 92 | |
| | | 891 | | Hamilton Beach Brands Holding Co., Class - A | | | 11 | |
| | | 370 | | Installed Building Products, Inc. | | | 31 | |
| | | 748 | | LGI Homes, Inc.(a) | | | 65 | |
| | | 485 | | M/I Homes, Inc.(a) | | | 19 | |
| | | 1,850 | | MDC Holdings, Inc. | | | 60 | |
| | | 1,111 | | Meritage Homes Corp.(a) | | | 81 | |
| | | 147 | | Skyline Champion Corp.(a) | | | 7 | |
| | | 584 | | The Lovesac Co.(a) | | | 16 | |
| | | 428 | | TopBuild Corp.(a) | | | 72 | |
| | | 6,945 | | Tupperware Brands Corp.(a) | | | 44 | |
| | | 554 | | VOXX International Corp.(a) | | | 5 | |
| | | 887 | | Vuzix Corp.^(a) | | | 6 | |
| | | 497 | | Weber, Inc., Class - A | | | 4 | |
| | | | | | | | 642 | |
| | | | | Household Products — 0.12% |
| | | 240 | | Central Garden & Pet Co.(a) | | | 10 | |
| | | 990 | | Central Garden & Pet Co., Class - A(a) | | | 40 | |
| | | 1,019 | | Oil-Dri Corp. | | | 31 | |
| | | | | | | | 81 | |
| | | | | Independent Power and Renewable Electricity Producers — 0.52% |
| | | 20,906 | | Altus Power, Inc.(a) | | | 131 | |
| | | 1,499 | | Clearway Energy, Inc., Class - C | | | 52 | |
| | | 10,502 | | Montauk Renewables, Inc.(a) | | | 106 | |
| | | 373 | | Ormat Technologies, Inc. | | | 29 | |
See accompanying notes to financial statements.
67
HC CAPITAL TRUST
The Small Capitalization-Mid Capitalization Equity Portfolio
Portfolio of Investments (continued) — June 30, 2022
| | Shares | | Security Description | | Value
(000) | |
| | | | | Common Stocks (continued) |
| | | | | Independent Power and Renewable Electricity Producers (continued) |
| | | 2,146 | | Sunnova Energy International, Inc.(a) | | $ | 40 | |
| | | | | | | | 358 | |
| | | | | Insurance — 2.35% |
| | | 689 | | Ambac Financial Group, Inc.(a) | | | 8 | |
| | | 2,133 | | American Equity Investment Life Holding Co. | | | 78 | |
| | | 1,616 | | Argo Group International Holdings Ltd. | | | 60 | |
| | | 192 | | BRP Group, Inc., Class - A(a) | | | 5 | |
| | | 3,379 | | CNO Financial Group, Inc. | | | 61 | |
| | | 302 | | Donegal Group, Inc., Class - A | | | 5 | |
| | | 371 | | eHealth, Inc.(a) | | | 3 | |
| | | 875 | | Everest Re Group Ltd. | | | 245 | |
| | | 1,150 | | Goosehead Insurance, Inc. | | | 53 | |
| | | 86 | | HCI Group, Inc. | | | 6 | |
| | | 92 | | Horace Mann Educators Corp. | | | 4 | |
| | | 287 | | James River Group Holdings Ltd. | | | 7 | |
| | | 655 | | Kinsale Capital Group, Inc. | | | 150 | |
| | | 280 | | MBIA, Inc.(a) | | | 3 | |
| | | 146 | | Palomar Holdings, Inc.(a) | | | 9 | |
| | | 2,483 | | ProAssurance Corp. | | | 59 | |
| | | 66 | | RLI Corp. | | | 8 | |
| | | 1,404 | | Selective Insurance Group, Inc. | | | 122 | |
| | | 974 | | Trean Insurance Group, Inc.(a) | | | 6 | |
| | | 3,225 | | Trupanion, Inc.(a) | | | 194 | |
| | | 409 | | Universal Insurance Holdings, Inc. | | | 5 | |
| | | 7,873 | | W.R. Berkley Corp. | | | 538 | |
| | | | | | | | 1,629 | |
| | | | | Interactive Media & Services — 0.07% |
| | | 8,509 | | DHI Group, Inc.(a) | | | 42 | |
| | | 139 | | Yelp, Inc.(a) | | | 4 | |
| | | 53 | | Ziff Davis, Inc.(a) | | | 4 | |
| | | | | | | | 50 | |
| | | | | Internet & Direct Marketing Retail — 0.29% |
| | | 64,170 | | Boxed, Inc.(a) | | | 119 | |
| | | 1,172 | | Chewy, Inc., Class - A(a) | | | 41 | |
| | | 331 | | Etsy, Inc.(a) | | | 24 | |
| | | 607 | | Lands’ End, Inc.(a) | | | 6 | |
| | | 373 | | Xometry, Inc., Class A(a) | | | 13 | |
| | | | | | | | 203 | |
| | | | | IT Services — 2.08% |
| | | 882 | | Cantaloupe, Inc.(a) | | | 5 | |
| | | 34 | | Concentrix Corp. | | | 5 | |
| | | 35,121 | | Conduent, Inc.(a) | | | 152 | |
| | | 1,652 | | CSG Systems International, Inc. | | | 99 | |
| | | 111 | | DigitalOcean Holdings, Inc.(a) | | | 5 | |
| | | 2,141 | | EVERTEC, Inc. | | | 79 | |
| | | 717 | | Evo Payments, Inc., Class - A(a) | | | 17 | |
| | Shares | | Security Description | | Value
(000) | |
| | | | | IT Services (continued) |
| | | 514 | | Exlservice Holdings, Inc.(a) | | $ | 76 | |
| | | 3,629 | | Genpact Ltd. | | | 154 | |
| | | 688 | | Grid Dynamics Holdings, Inc.(a) | | | 12 | |
| | | 328 | | I3 Verticals, Inc., Class - A(a) | | | 8 | |
| | | 254 | | Jack Henry & Associates, Inc. | | | 46 | |
| | | 979 | | MAXIMUS, Inc. | | | 61 | |
| | | 1,838 | | MoneyGram International, Inc.(a) | | | 18 | |
| | | 263 | | MongoDB, Inc.(a) | | | 68 | |
| | | 601 | | Okta, Inc.(a) | | | 54 | |
| | | 10,990 | | Paymentus Holdings, Inc., Class - A(a) | | | 147 | |
| | | 2,840 | | Payoneer Global, Inc.(a) | | | 11 | |
| | | 88 | | Perficient, Inc.(a) | | | 8 | |
| | | 496 | | Remitly Global, Inc.(a) | | | 4 | |
| | | 12,526 | | Repay Holdings Corp.(a) | | | 160 | |
| | | 1,367 | | StarTek, Inc.(a) | | | 4 | |
| | | 135 | | The Hackett Group, Inc. | | | 3 | |
| | | 81 | | TTEC Holdings, Inc. | | | 5 | |
| | | 13,073 | | Unisys Corp.(a) | | | 157 | |
| | | 2,286 | | Verra Mobility Corp.(a) | | | 36 | |
| | | 317 | | WEX, Inc.(a) | | | 49 | |
| | | | | | | | 1,443 | |
| | | | | Leisure Products — 0.81% |
| | | 324 | | American Outdoor Brands, Inc.(a) | | | 3 | |
| | | 925 | | Callaway Golf Co.(a) | | | 19 | |
| | | 77 | | Johnson Outdoors, Inc., Class - A | | | 5 | |
| | | 356 | | Mastercraft Boat Holdings, Inc.(a) | | | 7 | |
| | | 19,915 | | Mattel, Inc.(a) | | | 446 | |
| | | 1,378 | | Nautilus, Inc.(a) | | | 2 | |
| | | 1,298 | | Smith & Wesson Brands, Inc. | | | 17 | |
| | | 1,461 | | Yeti Holdings, Inc.(a) | | | 63 | |
| | | | | | | | 562 | |
| | | | | Life Sciences Tools & Services — 0.60% |
| | | 979 | | Absci Corp.(a) | | | 3 | |
| | | 908 | | Berkeley Lights, Inc.(a) | | | 5 | |
| | | 102 | | Bruker Corp. | | | 6 | |
| | | 991 | | Codex DNA, Inc.(a) | | | 2 | |
| | | 1,476 | | Cytek Biosciences, Inc.(a) | | | 16 | |
| | | 1,767 | | Harvard Bioscience, Inc.(a) | | | 6 | |
| | | 599 | | Medpace Holdings, Inc.(a) | | | 90 | |
| | | 10,719 | | NeoGenomics, Inc.(a) | | | 87 | |
| | | 493 | | Repligen Corp.(a) | | | 80 | |
| | | 45,122 | | Science 37 Holdings, Inc.(a) | | | 90 | |
| | | 7,468 | | Singular Genomics Systems, Inc.(a) | | | 29 | |
| | | | | | | | 414 | |
| | | | | Machinery — 1.95% |
| | | 68 | | Albany International Corp. | | | 5 | |
| | | 1,637 | | Astec Industries, Inc. | | | 67 | |
| | | 1,248 | | Chart Industries, Inc.(a) | | | 208 | |
See accompanying notes to financial statements.
68
HC CAPITAL TRUST
The Small Capitalization-Mid Capitalization Equity Portfolio
Portfolio of Investments (continued) — June 30, 2022
| | Shares | | Security Description | | Value
(000) | |
| | | | | Common Stocks (continued) |
| | | | | Machinery (continued) |
| | | 855 | | CIRCOR International, Inc.(a) | | $ | 14 | |
| | | 168 | | Columbus McKinnon Corp. | | | 5 | |
| | | 3,382 | | Evoqua Water Technologies Co.(a) | | | 110 | |
| | | 1,773 | | Federal Signal Corp. | | | 63 | |
| | | 141 | | Franklin Electric Co., Inc. | | | 10 | |
| | | 434 | | Helios Technologies, Inc. | | | 29 | |
| | | 1,773 | | Hyliion Holdings Corp.(a) | | | 6 | |
| | | 1,220 | | Hyster-Yale Materials Handling, Inc. | | | 39 | |
| | | 332 | | IDEX Corp. | | | 60 | |
| | | 1,076 | | ITT, Inc. | | | 72 | |
| | | 819 | | John Bean Technologies Corp. | | | 90 | |
| | | 217 | | Kadant, Inc. | | | 40 | |
| | | 198 | | Kennametal, Inc. | | | 5 | |
| | | 939 | | Kornit Digital Ltd.(a) | | | 30 | |
| | | 771 | | Lincoln Electric Holdings, Inc. | | | 95 | |
| | | 118 | | Mueller Industries, Inc. | | | 6 | |
| | | 47 | | Oshkosh Corp. | | | 4 | |
| | | 420 | | Proto Labs, Inc.(a) | | | 20 | |
| | | 21 | | RBC Bearings, Inc.(a) | | | 4 | |
| | | 1,356 | | SPX Corp.(a) | | | 72 | |
| | | 2,067 | | Terex Corp. | | | 57 | |
| | | 3,411 | | The Gorman-Rupp Co. | | | 97 | |
| | | 2,085 | | The Greenbrier Companies, Inc. | | | 75 | |
| | | 2,838 | | Welbilt, Inc.(a) | | | 68 | |
| | | | | | | | 1,351 | |
| | | | | Marine — 0.42% |
| | | 3,393 | | Kirby Corp.(a) | | | 206 | |
| | | 1,166 | | Matson, Inc. | | | 85 | |
| | | | | | | | 291 | |
| | | | | Media — 0.95% |
| | | 13,170 | | AdTheorent Holding Co., Inc.(a) | | | 41 | |
| | | 21,777 | | Advantage Solutions, Inc.(a) | | | 83 | |
| | | 2,263 | | AMC Networks, Inc., Class - A(a) | | | 66 | |
| | | 2,111 | | Cardlytics, Inc.(a) | | | 47 | |
| | | 6,437 | | comScore, Inc.(a) | | | 13 | |
| | | 1,110 | | Emerald Holding, Inc.(a) | | | 5 | |
| | | 2,513 | | Entravision Communications Corp., Class - A | | | 11 | |
| | | 5,444 | | Gray Television, Inc. | | | 92 | |
| | | 4,195 | | Hemisphere Media Group, Inc.(a) | | | 32 | |
| | | 28,935 | | Innovid Corp.(a) | | | 48 | |
| | | 31,882 | | Loyalty Ventures, Inc.(a) | | | 113 | |
| | | 3,824 | | Magnite, Inc.(a) | | | 34 | |
| | | 535 | | Scholastic Corp. | | | 19 | |
| | | 188 | | Sinclair Broadcast Group, Inc., Class - A | | | 4 | |
| | | 55 | | TechTarget, Inc.(a) | | | 4 | |
| | | 2,249 | | TEGNA, Inc. | | | 47 | |
| | | | | | | | 659 | |
| | Shares | | Security Description | | Value
(000) | |
| | | | | Metals & Mining — 1.67% |
| | | 1,382 | | Alcoa Corp. | | $ | 63 | |
| | | 22,749 | | Allegheny Technologies, Inc.(a) | | | 516 | |
| | | 1,962 | | Carpenter Technology Corp. | | | 55 | |
| | | 3,871 | | Coeur Mining, Inc.(a) | | | 12 | |
| | | 759 | | Haynes International, Inc. | | | 25 | |
| | | 9,750 | | Hecla Mining Co. | | | 38 | |
| | | 191 | | Materion Corp. | | | 14 | |
| | | 8,475 | | Pan American Silver Corp. | | | 167 | |
| | | 2,916 | | Ryerson Holding Corp. | | | 62 | |
| | | 5,772 | | Timkensteel Corp.(a) | | | 108 | |
| | | 365 | | United States Steel Corp. | | | 7 | |
| | | 137 | | Warrior Met Coal, Inc. | | | 4 | |
| | | 1,868 | | Worthington Industries, Inc. | | | 82 | |
| | | | | | | | 1,153 | |
| | | | | Mortgage Real Estate Investment Trusts — 0.56% |
| | | 3,370 | | AG Mortgage Investment Trust, Inc. | | | 23 | |
| | | 7,810 | | BrightSpire Capital, Inc. | | | 59 | |
| | | 9,231 | | Dynex Capital, Inc. | | | 147 | |
| | | 975 | | Franklin BSP Realty Trust, Inc. | | | 13 | |
| | | 1,873 | | Hannon Armstrong Sustainable Infrastructure Capital, Inc. | | | 71 | |
| | | 1,597 | | MFA Financial, Inc. | | | 17 | |
| | | 13,958 | | Orchid Island Capital, Inc.^ | | | 40 | |
| | | 2,348 | | Redwood Trust, Inc. | | | 18 | |
| | | | | | | | 388 | |
| | | | | Multiline Retail — 0.23% |
| | | 8,527 | | Macy’s, Inc. | | | 156 | |
| | | | | Multi-Utilities — 0.46% |
| | | 726 | | Black Hills Corp. | | | 53 | |
| | | 820 | | NorthWestern Corp. | | | 48 | |
| | | 2,722 | | Unitil Corp. | | | 160 | |
| | | 7,727 | | Via Renewables, Inc. | | | 59 | |
| | | | | | | | 320 | |
| | | | | Oil, Gas & Consumable Fuels — 3.90% |
| | | 3,497 | | Antero Resources Corp.(a) | | | 107 | |
| | | 1,094 | | Arch Resources, Inc. | | | 157 | |
| | | 9,716 | | Berry Corp. | | | 74 | |
| | | 2,500 | | Centennial Resource Development, Inc., Class - A(a) | | | 15 | |
| | | 757 | | Chesapeake Energy Corp. | | | 61 | |
| | | 2,408 | | Clean Energy Fuels Corp.(a) | | | 11 | |
| | | 8,222 | | CNX Resources Corp.(a) | | | 135 | |
| | | 9,016 | | Comstock Resources, Inc.(a) | | | 109 | |
| | | 2,431 | | CONSOL Energy, Inc.(a) | | | 120 | |
| | | 3,905 | | Delek US Holdings, Inc.(a) | | | 101 | |
| | | 7,630 | | Devon Energy Corp. | | | 421 | |
| | | 1,588 | | Earthstone Energy, Inc., Class - A(a) | | | 22 | |
| | | 2,568 | | Evolution Petroleum Corp. | | | 14 | |
See accompanying notes to financial statements.
69
HC CAPITAL TRUST
The Small Capitalization-Mid Capitalization Equity Portfolio
Portfolio of Investments (continued) — June 30, 2022
| | Shares | | Security Description | | Value
(000) | |
| | | | | Common Stocks (continued) |
| | | | | Oil, Gas & Consumable Fuels (continued) |
| | | 2,312 | | Golar LNG Ltd.(a) | | $ | 53 | |
| | | 4,130 | | Kinetik Holdings, Inc. | | | 141 | |
| | | 20,751 | | Kosmos Energy Ltd.(a) | | | 128 | |
| | | 416 | | Matador Resources Co. | | | 19 | |
| | | 150 | | Murphy Oil Corp. | | | 5 | |
| | | 21,248 | | Navigator Holdings Ltd.(a) | | | 241 | |
| | | 2,578 | | Nordic American Tankers Ltd.^ | | | 5 | |
| | | 3,747 | | Ovintiv, Inc. | | | 166 | |
| | | 327 | | PDC Energy, Inc. | | | 20 | |
| | | 1,094 | | Peabody Energy Corp.(a) | | | 23 | |
| | | 2,186 | | Range Resources Corp.(a) | | | 54 | |
| | | 2,901 | | Ranger Oil Corp.(a) | | | 95 | |
| | | 52 | | REX American Resources Corp.(a) | | | 4 | |
| | | 588 | | Scorpio Tankers, Inc. | | | 20 | |
| | | 15,562 | | SFL Corp. Ltd. | | | 148 | |
| | | 549 | | Sitio Royalties Corp. | | | 13 | |
| | | 419 | | SM Energy Co. | | | 14 | |
| | | 30,524 | | Southwestern Energy Co.(a) | | | 191 | |
| | | 403 | | Talos Energy, Inc.(a) | | | 6 | |
| | | 3,667 | | Tellurian, Inc.(a) | | | 11 | |
| | | | | | | | 2,704 | |
| | | | | Personal Products — 0.44% |
| | | 494 | | e.l.f. Beauty, Inc.(a) | | | 15 | |
| | | 853 | | Inter Parfums, Inc. | | | 62 | |
| | | 235 | | Medifast, Inc. | | | 42 | |
| | | 3,174 | | Nature’s Sunshine Products, Inc.(a) | | | 34 | |
| | | 3,017 | | Revlon, Inc., Class - A^(a) | | | 16 | |
| | | 1,318 | | The Beauty Health Co.(a) | | | 17 | |
| | | 1,555 | | USANA Health Sciences, Inc.(a) | | | 113 | |
| | | 418 | | Veru, Inc.^(a) | | | 5 | |
| | | | | | | | 304 | |
| | | | | Pharmaceuticals — 2.16% |
| | | 337 | | Aclaris Therapeutics, Inc.(a) | | | 5 | |
| | | 6,939 | | Adicet Bio, Inc.(a) | | | 101 | |
| | | 2,129 | | Amneal Pharmaceuticals, Inc.(a) | | | 7 | |
| | | 5,164 | | Amphastar Pharmaceuticals, Inc.(a) | | | 179 | |
| | | 1,153 | | Amryt Pharma PLC, ADR(a) | | | 8 | |
| | | 7,009 | | Amylyx Pharmaceuticals, Inc.(a) | | | 134 | |
| | | 166 | | ANI Pharmaceuticals, Inc.(a) | | | 5 | |
| | | 713 | | Arvinas, Inc.(a) | | | 30 | |
| | | 12,181 | | Athira Pharma, Inc.(a) | | | 37 | |
| | | 579 | | Cassava Science, Inc.^(a) | | | 16 | |
| | | 81 | | Catalent, Inc.(a) | | | 9 | |
| | | 376 | | Corcept Therapeutics, Inc.(a) | | | 9 | |
| | | 586 | | Edgewise Therapeutics, Inc.(a) | | | 5 | |
| | | 19,751 | | Fulcrum Therapeutics, Inc.(a) | | | 97 | |
| | | 2,328 | | Harmony Biosciences Holdings, Inc.(a) | | | 114 | |
| | Shares | | Security Description | | Value
(000) | |
| | | | | Pharmaceuticals (continued) |
| | | 1,228 | | Harrow Health, Inc.(a) | | $ | 9 | |
| | | 653 | | Horizon Therapeutics PLC(a) | | | 52 | |
| | | 1,079 | | Innoviva, Inc.(a) | | | 16 | |
| | | 711 | | Intra-Cellular Therapies, Inc.(a) | | | 41 | |
| | | 850 | | KemPharm, Inc.^(a) | | | 4 | |
| | | 477 | | NGM Biopharmaceuticals, Inc.(a) | | | 6 | |
| | | 1,160 | | Ocular Therapeutix, Inc.(a) | | | 5 | |
| | | 1,308 | | Omeros Corp.(a) | | | 4 | |
| | | 878 | | Oramed Pharmaceuticals, Inc.^(a) | | | 4 | |
| | | 5,685 | | Pacira BioSciences, Inc.(a) | | | 330 | |
| | | 15,971 | | Paratek Pharmaceuticals, Inc.(a) | | | 31 | |
| | | 678 | | Phathom Pharmaceuticals, Inc.(a) | | | 6 | |
| | | 1,203 | | Phibro Animal Health Corp., Class - A | | | 23 | |
| | | 3,964 | | Pliant Therapeutics, Inc.(a) | | | 32 | |
| | | 1,583 | | Prestige Consumer Healthcare, Inc.(a) | | | 93 | |
| | | 920 | | Provention Bio, Inc.(a) | | | 4 | |
| | | 3,235 | | Satsuma Pharmaceuticals, Inc.(a) | | | 13 | |
| | | 2,190 | | Supernus Pharmaceuticals, Inc.(a) | | | 63 | |
| | | 224 | | Vaxcyte, Inc.(a) | | | 5 | |
| | | | | | | | 1,497 | |
| | | | | Professional Services — 2.12% |
| | | 917 | | ASGN, Inc.(a) | | | 83 | |
| | | 62 | | Booz Allen Hamilton Holding Corp. | | | 6 | |
| | | 20 | | CACI International, Inc., Class - A(a) | | | 6 | |
| | | 1,815 | | CBIZ, Inc.(a) | | | 73 | |
| | | 217 | | Huron Consulting Group, Inc.(a) | | | 14 | |
| | | 173 | | ICF International, Inc. | | | 16 | |
| | | 35 | | Insperity, Inc. | | | 3 | |
| | | 15,350 | | KBR, Inc. | | | 742 | |
| | | 594 | | Kelly Services, Inc., Class - A | | | 12 | |
| | | 982 | | Kforce, Inc. | | | 60 | |
| | | 1,998 | | Korn Ferry | | | 116 | |
| | | 103 | | ManTech International Corp., Class - A | | | 10 | |
| | | 9,154 | | Mistras Group, Inc.(a) | | | 54 | |
| | | 1,018 | | Science Applications International Corp. | | | 95 | |
| | | 7,048 | | Upwork, Inc.(a) | | | 146 | |
| | | 1,031 | | Willdan Group, Inc.(a) | | | 28 | |
| | | | | | | | 1,464 | |
| | | | | Real Estate Management & Development — 0.29% |
| | | 1,451 | | BBX Capital, Inc.(a) | | | 10 | |
| | | 1,232 | | eXp World Holdings, Inc. | | | 15 | |
| | | 299 | | Forestar Group, Inc.(a) | | | 4 | |
| | | 821 | | Marcus & Millichap, Inc. | | | 30 | |
| | | 3,583 | | Newmark Group, Inc., Class - A | | | 35 | |
| | | 279 | | RE/MAX Holdings, Inc. | | | 7 | |
| | | 3,465 | | The RMR Group, Inc., Class - A | | | 98 | |
| | | | | | | | 199 | |
See accompanying notes to financial statements.
70
HC CAPITAL TRUST
The Small Capitalization-Mid Capitalization Equity Portfolio
Portfolio of Investments (continued) — June 30, 2022
| | Shares | | Security Description | | Value
(000) | |
| | | | | Common Stocks (continued) |
| | | | | Road & Rail — 0.69% |
| | | 119 | | Avis Budget Group, Inc.(a) | | $ | 18 | |
| | | 6,392 | | Knight-Swift Transportation Holdings, Inc. | | | 296 | |
| | | 412 | | P.A.M. Transportation Services, Inc.(a) | | | 11 | |
| | | 752 | | Saia, Inc.(a) | | | 141 | |
| | | 3,453 | | Yellow Corp.(a) | | | 10 | |
| | | | | | | | 476 | |
| | | | | Semiconductors & Semiconductor Equipment — 4.78% |
| | | 809 | | Advanced Energy Industries, Inc. | | | 59 | |
| | | 485 | | Alpha & Omega Semiconductor Ltd.(a) | | | 16 | |
| | | 658 | | Ambarella, Inc.(a) | | | 43 | |
| | | 3,622 | | Amkor Technology, Inc. | | | 61 | |
| | | 3,010 | | AXT, Inc.(a) | | | 18 | |
| | | 75 | | Azenta, Inc. | | | 5 | |
| | | 353 | | CEVA, Inc.(a) | | | 12 | |
| | | 55 | | Cirrus Logic, Inc.(a) | | | 4 | |
| | | 140 | | CMC Materials, Inc. | | | 24 | |
| | | 169 | | Diodes, Inc.(a) | | | 11 | |
| | | 613 | | Enphase Energy, Inc.(a) | | | 120 | |
| | | 126 | | Entegris, Inc. | | | 12 | |
| | | 3,557 | | FormFactor, Inc.(a) | | | 138 | |
| | | 188 | | Impinj, Inc.(a) | | | 11 | |
| | | 3,757 | | Lattice Semiconductor Corp.(a) | | | 182 | |
| | | 12,580 | | MACOM Technology Solutions Holdings, Inc.(a) | | | 581 | |
| | | 3,366 | | MaxLinear, Inc., Class - A(a) | | | 114 | |
| | | 624 | | MKS Instruments, Inc. | | | 64 | |
| | | 506 | | Monolithic Power Systems, Inc. | | | 194 | |
| | | 2,203 | | Power Integrations, Inc. | | | 165 | |
| | | 2,745 | | Qorvo, Inc.(a) | | | 259 | |
| | | 5,703 | | Semtech Corp.(a) | | | 314 | |
| | | 1,346 | | Silicon Laboratories, Inc.(a) | | | 189 | |
| | | 604 | | SiTime Corp.(a) | | | 98 | |
| | | 683 | | SkyWater Technology, Inc.(a) | | | 4 | |
| | | 648 | | SMART Global Holdings, Inc.(a) | | | 11 | |
| | | 799 | | Synaptics, Inc.(a) | | | 94 | |
| | | 212 | | Ultra Clean Holdings, Inc.(a) | | | 6 | |
| | | 1,179 | | Universal Display Corp. | | | 119 | |
| | | 661 | | Veeco Instruments, Inc.(a) | | | 13 | |
| | | 5,774 | | Wolfspeed, Inc.(a) | | | 367 | |
| | | | | | | | 3,308 | |
| | | | | Software — 4.51% |
| | | 909 | | A10 Networks, Inc. | | | 13 | |
| | | 880 | | Alarm.com Holding, Inc.(a) | | | 54 | |
| | | 1,591 | | Alkami Technology, Inc.(a) | | | 22 | |
| | | 829 | | Altair Engineering, Inc., Class - A(a) | | | 44 | |
| | | 343 | | Alteryx, Inc., Class - A(a) | | | 17 | |
| | | 289 | | Appfolio, Inc., Class - A(a) | | | 26 | |
| | | 351 | | Appian Corp.(a) | | | 17 | |
| | Shares | | Security Description | | Value
(000) | |
| | | | | Software (continued) |
| | | 3,150 | | Asure Software, Inc.(a) | | $ | 18 | |
| | | 49 | | Avalara, Inc.(a) | | | 3 | |
| | | 57,397 | | Avaya Holdings Corp.(a) | | | 129 | |
| | | 23,967 | | AvidXchange Holdings, Inc.(a) | | | 147 | |
| | | 53,388 | | Benson Hill, Inc.(a) | | | 146 | |
| | | 1,284 | | Blackbaud, Inc.(a) | | | 75 | |
| | | 101 | | Blackline, Inc.(a) | | | 7 | |
| | | 1,162 | | Box, Inc., Class - A(a) | | | 29 | |
| | | 32,378 | | Cleanspark, Inc.(a) | | | 127 | |
| | | 979 | | Cognyte Software, Ltd.(a) | | | 4 | |
| | | 674 | | CommVault Systems, Inc.(a) | | | 42 | |
| | | 77 | | Consensus Cloud Solutions, Inc.(a) | | | 3 | |
| | | 1,426 | | CoreCard Corp.(a) | | | 35 | |
| | | 356 | | Couchbase, Inc.(a) | | | 6 | |
| | | 313 | | Digimarc Corp.(a) | | | 4 | |
| | | 740 | | Digital Turbine, Inc.(a) | | | 13 | |
| | | 500 | | Domo, Inc., Class - B(a) | | | 14 | |
| | | 3,008 | | E2open Parent Holdings, Inc.(a) | | | 23 | |
| | | 1,935 | | Ebix, Inc. | | | 33 | |
| | | 581 | | eGain Corp.(a) | | | 6 | |
| | | 2,856 | | Enfusion, Inc., Class - A(a) | | | 29 | |
| | | 83 | | Fair Isaac Corp.(a) | | | 33 | |
| | | 631 | | Five9, Inc.(a) | | | 58 | |
| | | 18,406 | | Greenidge Generation Holdings, Inc.(a) | | | 47 | |
| | | 846 | | Guidewire Software, Inc.(a) | | | 60 | |
| | | 186 | | HubSpot, Inc.(a) | | | 56 | |
| | | 22,456 | | IronNet, Inc.(a) | | | 50 | |
| | | 16,977 | | Kaleyra, Inc.(a) | | | 35 | |
| | | 6,215 | | Model N, Inc.(a) | | | 158 | |
| | | 16,199 | | N-able, Inc.(a) | | | 146 | |
| | | 67,471 | | NextNav, Inc.(a) | | | 153 | |
| | | 192 | | Ping Identity Holding Corp.(a) | | | 3 | |
| | | 717 | | Progress Software Corp. | | | 32 | |
| | | 604 | | PROS Holdings, Inc.(a) | | | 16 | |
| | | 868 | | PTC, Inc.(a) | | | 92 | |
| | | 4,601 | | Qualtrics International, Inc., Class - A(a) | | | 58 | |
| | | 680 | | Qualys, Inc.(a) | | | 86 | |
| | | 1,182 | | Rapid7, Inc.(a) | | | 79 | |
| | | 1,020 | | Sailpoint Technologies Holdings, Inc.(a) | | | 64 | |
| | | 670 | | Sapiens International Corp. N.V. | | | 16 | |
| | | 831 | | SPS Commerce, Inc.(a) | | | 94 | |
| | | 2,158 | | SS&C Technologies Holdings, Inc. | | | 125 | |
| | | 1,659 | | Stronghold Digital Mining, Inc., Class - A(a) | | | 3 | |
| | | 829 | | Tenable Holdings, Inc.(a) | | | 38 | |
| | | 26,633 | | UserTesting, Inc.(a) | | | 134 | |
| | | 606 | | Varonis Systems, Inc.(a) | | | 18 | |
| | | 979 | | Verint Systems, Inc.(a) | | | 41 | |
| | | 15,346 | | Veritone, Inc.(a) | | | 100 | |
| | | 5,863 | | Viant Technology, Inc., Class - A(a) | | | 30 | |
See accompanying notes to financial statements.
71
HC CAPITAL TRUST
The Small Capitalization-Mid Capitalization Equity Portfolio
Portfolio of Investments (continued) — June 30, 2022
| | Shares | | Security Description | | Value
(000) | |
| | | | | Common Stocks (continued) |
| | | | | Software (continued) |
| | | 340 | | Vonage Holdings Corp.(a) | | $ | 6 | |
| | | 18,867 | | Weave Communications, Inc.(a) | | | 57 | |
| | | 2,085 | | Workiva, Inc.(a) | | | 138 | |
| | | 72 | | Zscaler, Inc.(a) | | | 11 | |
| | | | | | | | 3,123 | |
| | | | | Specialty Retail — 1.84% |
| | | 713 | | Advance Auto Parts, Inc. | | | 124 | |
| | | 1,447 | | American Eagle Outfitters, Inc. | | | 16 | |
| | | 1,764 | | Arko Corp. | | | 14 | |
| | | 520 | | Asbury Automotive Group, Inc.(a) | | | 88 | |
| | | 1,430 | | Barnes & Noble Education, Inc.(a) | | | 4 | |
| | | 7,181 | | Camping World Holdings, Inc., Class - A^ | | | 156 | |
| | | 64,449 | | Express, Inc.(a) | | | 127 | |
| | | 1,956 | | Floor & Decor Holdings, Inc., Class - A(a) | | | 123 | |
| | | 1,806 | | Genesco, Inc.(a) | | | 90 | |
| | | 72 | | Group 1 Automotive, Inc. | | | 12 | |
| | | 1,362 | | Guess?, Inc. | | | 23 | |
| | | 334 | | Lithia Motors, Inc., Class - A | | | 92 | |
| | | 289 | | Monro, Inc. | | | 12 | |
| | | 324 | | Murphy USA, Inc. | | | 75 | |
| | | 149 | | National Vision Holdings, Inc.(a) | | | 4 | |
| | | 53 | | Penske Automotive Group, Inc. | | | 6 | |
| | | 231 | | Restoration Hardware Co.(a) | | | 49 | |
| | | 2,077 | | Sally Beauty Holdings, Inc.(a) | | | 25 | |
| | | 708 | | Shoe Carnival, Inc. | | | 15 | |
| | | 158 | | Signet Jewelers Ltd. | | | 8 | |
| | | 7,426 | | Sportsman’s Warehouse Holdings, Inc.(a) | | | 71 | |
| | | 468 | | The Aaron’s Co., Inc. | | | 7 | |
| | | 297 | | The Buckle, Inc. | | | 8 | |
| | | 3,215 | | The Cato Corp., Class - A | | | 37 | |
| | | 1,585 | | The ODP Corp.(a) | | | 48 | |
| | | 10,683 | | Tile Shop Holdings, Inc. | | | 33 | |
| | | 560 | | Tilly’s, Inc., Class - A | | | 4 | |
| | | | | | | | 1,271 | |
| | | | | Technology Hardware, Storage & Peripherals — 0.09% |
| | | 6,396 | | Integral Ad Science Holding Corp.(a) | | | 64 | |
| | | | | Textiles, Apparel & Luxury Goods — 0.43% |
| | | 47 | | Columbia Sportswear Co. | | | 3 | |
| | | 1,065 | | Crocs, Inc.(a) | | | 52 | |
| | | 3,666 | | Fossil Group, Inc.(a) | | | 19 | |
| | | 792 | | G-III Apparel Group Ltd.(a) | | | 16 | |
| | | 2,897 | | Kontoor Brands, Inc. | | | 97 | |
| | | 412 | | Steven Madden Ltd. | | | 13 | |
| | | 4,730 | | Wolverine World Wide, Inc. | | | 95 | |
| | | | | | | | 295 | |
| | | | | Thrifts & Mortgage Finance — 1.63% |
| | | 1,712 | | Axos Financial, Inc.(a) | | | 61 | |
| | Shares | | Security Description | | Value
(000) | |
| | | | | Thrifts & Mortgage Finance (continued) |
| | | 17,894 | | Capitol Federal Financial, Inc. | | $ | 164 | |
| | | 3,488 | | Columbia Financial, Inc.(a) | | | 76 | |
| | | 47 | | Federal Agricultural Mortgage Corp., Class - C | | | 5 | |
| | | 17,081 | | Finance of America Cos., Inc., Class - A(a) | | | 27 | |
| | | 667 | | Flagstar Bancorp, Inc. | | | 24 | |
| | | 79 | | HomeStreet, Inc. | | | 3 | |
| | | 155 | | Meta Financial Group, Inc. | | | 6 | |
| | | 228 | | MGIC Investment Corp. | | | 3 | |
| | | 1,030 | | Mr Cooper Group, Inc.(a) | | | 38 | |
| | | 13,708 | | Northwest Bancshares, Inc. | | | 175 | |
| | | 8,522 | | OceanFirst Financial Corp. | | | 163 | |
| | | 871 | | PennyMac Financial Services, Inc. | | | 38 | |
| | | 6,085 | | Premier Financial Corp. | | | 154 | |
| | | 3,124 | | Provident Financial Services, Inc. | | | 70 | |
| | | 3,405 | | Sterling Bancorp, Inc.(a) | | | 19 | |
| | | 928 | | Walker & Dunlop, Inc. | | | 89 | |
| | | 623 | | Western New England Bancorp, Inc. | | | 5 | |
| | | 247 | | WSFS Financial Corp. | | | 10 | |
| | | | | | | | 1,130 | |
| | | | | Tobacco — 0.31% |
| | | 220 | | Turning Point Brands, Inc. | | | 6 | |
| | | 2,846 | | Universal Corp. | | | 172 | |
| | | 3,202 | | Vector Group Ltd. | | | 34 | |
| | | | | | | | 212 | |
| | | | | Trading Companies & Distributors — 1.51% |
| | | 63 | | Applied Industrial Technologies, Inc. | | | 6 | |
| | | 5,077 | | Beacon Roofing Supply, Inc.(a) | | | 261 | |
| | | 563 | | Boise Cascade Co. | | | 33 | |
| | | 200 | | DXP Enterprises, Inc.(a) | | | 6 | |
| | | 192 | | GMS, Inc.(a) | | | 9 | |
| | | 1,021 | | Herc Holdings, Inc. | | | 92 | |
| | | 38,523 | | MRC Global, Inc.(a) | | | 384 | |
| | | 1,578 | | Rush Enterprises, Inc., Class - A | | | 76 | |
| | | 548 | | SiteOne Landscape Supply, Inc.(a) | | | 65 | |
| | | 3,496 | | Textainer Group Holdings Ltd. | | | 96 | |
| | | 166 | | WESCO International, Inc.(a) | | | 18 | |
| | | | | | | | 1,046 | |
| | | | | Water Utilities — 0.82% |
| | | 161 | | American States Water Co. | | | 13 | |
| | | 1,709 | | Cadiz, Inc.(a) | | | 4 | |
| | | 1,134 | | California Water Service Group | | | 63 | |
| | | 602 | | Global Water Resources, Inc. | | | 8 | |
| | | 2,024 | | Middlesex Water Co. | | | 177 | |
| | | 4,311 | | Pure Cycle Corp.(a) | | | 45 | |
| | | 2,918 | | SJW Group | | | 183 | |
| | | 1,877 | | The York Water Co. | | | 76 | |
| | | | | | | | 569 | |
See accompanying notes to financial statements.
72
HC CAPITAL TRUST
The Small Capitalization-Mid Capitalization Equity Portfolio
Portfolio of Investments (concluded) — June 30, 2022
| | Shares | | Security Description | | Value
(000) | |
| | | | | Common Stocks (continued) |
| | | | | Wireless Telecommunication Services — 0.02% |
| | | 331 | | Gogo, Inc.(a) | | $ | 5 | |
| | | 231 | | United States Cellular Corp.(a) | | | 7 | |
| | | | | | | | 12 | |
| | | | | Total Common Stocks | | | 64,725 | |
| | | | | Contingent Rights — 0.11% |
| | | | | Biotechnology — 0.00% |
| | | 1 | | Tobira Therapeutics, Inc. CVR, 12/31/18(a)(b) | | | — | |
| | | | | Health Care — 0.00% |
| | | 1,646 | | Progenics Pharma CVR, 12/31/22(a)(b) | | | — | |
| | | | | Metals & Mining — 0.11% |
| | | 108,208 | | Pan American Silver Corp. CVR, 02/22/29(a) | | | 77 | |
| | | | | Pharmaceuticals — 0.00% |
| | | 759 | | Aratana Therapeutics, Inc. CVR, (a)(b) | | | — | |
| | | 5,589 | | Xeris BioPharma Hold CVR, 10/06/49(a) | | | 1 | |
| | | | | | | | 1 | |
| | | | | Total Contingent Rights | | | 78 | |
| | Shares | | Security Description | | Value
(000) | |
| | | | | Investment Companies — 6.29% |
| | | 180,285 | | Federated Hermes Treasury Obligations Fund, Institutional Shares, 1.37%^^(c) | | $ | 180 | |
| | | 4,172,933 | | State Street Institutional Treasury Plus Money Market Fund, Trust Class, 1.40%(c) | | | 4,173 | |
| | | | | Total Investment Companies | | | 4,353 | |
| | | | | Total Investments (cost $44,036) — 99.89% | | | 69,156 | |
| | | | | Other assets in excess of liabilities — 0.11% | | | 79 | |
| | | | | Net Assets — 100.00% | | $ | 69,235 | |
Amounts designated as “—” are $0 or have been rounded to $0.
^ | All or part of this security was on loan as of June 30, 2022. |
^^ | Purchased with cash collateral held from securities lending. The value of the collateral could include collateral held for securities that were sold on or before June 30, 2022. |
(a) | Represents non-income producing security. |
(b) | Security was valued using significant unobservable inputs as of June 30, 2022. |
(c) | Annualized 7-day yield as of period-end. |
| As of June 30, 2022, 100% of the Portfolio’s net assets were managed by Parametric Portfolio Associates, LLC. |
| ADR—American Depositary Receipt |
| REIT—Real Estate Investment Trust |
The following table reflects the open derivative positions held by the Portfolio as of June 30, 2022.
Futures Contracts Purchased*
Description | | Number of
Contracts | | | Expiration
Date | | | Notional
Amount
(000) | | | Value and
Unrealized
Appreciation/
(Depreciation)
(000) | |
Russell 2000 Mini Index Future | | | 40 | | | | 9/16/22 | | | $ | 3,416 | | | $ | (186 | ) |
| | | | | | | | | | | $ | 3,416 | | | $ | (186 | ) |
| | Total Unrealized Appreciation | | $ | — | |
| | Total Unrealized Depreciation | | | (186 | ) |
| | Total Net Unrealized Appreciation/(Depreciation) | | $ | (186 | ) |
* | Cash has been pledged as collateral for futures contracts held by the Portfolio. |
Amounts designated as “—” are $0 or have been rounded to $0.
See accompanying notes to financial statements.
73
HC CAPITAL TRUST
The ESG Growth Portfolio
Portfolio of Investments — June 30, 2022
| | Shares | | Security Description | | Value
(000) | |
| | | | | Common Stocks — 98.97% |
| | | | | Australia — 1.79% |
| | | 693 | | Ampol Ltd. (Oil, Gas & Consumable Fuels) | | $ | 16 | |
| | | 2,941 | | APA Group (Gas Utilities) | | | 23 | |
| | | 1,433 | | Aristocrat Leisure Ltd. (Hotels, Restaurants & Leisure) | | | 34 | |
| | | 485 | | ASX Ltd. (Capital Markets) | | | 27 | |
| | | 4,501 | | Aurizon Holdings Ltd. (Road & Rail) | | | 12 | |
| | | 6,890 | | Australia & New Zealand Banking Group Ltd. (Banks) | | | 105 | |
| | | 12,319 | | BHP Group Ltd. (Metals & Mining) | | | 352 | |
| | | 1,230 | | BlueScope Steel Ltd. (Metals & Mining) | | | 13 | |
| | | 3,525 | | Brambles Ltd. (Commercial Services & Supplies) | | | 26 | |
| | | 165 | | Cochlear Ltd. (Health Care Equipment & Supplies) | | | 23 | |
| | | 3,429 | | Coles Group Ltd. (Food & Staples Retailing) | | | 42 | |
| | | 4,123 | | Commonwealth Bank of Australia (Banks) | | | 257 | |
| | | 1,360 | | Computershare Ltd. (IT Services) | | | 23 | |
| | | 1,155 | | CSL Ltd. (Biotechnology) | | | 214 | |
| | | 2,615 | | Dexus (Equity Real Estate Investment Trusts) | | | 16 | |
| | | 148 | | Domino’s Pizza Enterprises Ltd. (Hotels, Restaurants & Leisure) | | | 7 | |
| | | 3,057 | | Endeavour Group Ltd. (Food & Staples Retailing) | | | 16 | |
| | | 4,387 | | Evolution Mining Ltd. (Metals & Mining) | | | 7 | |
| | | 4,206 | | Fortescue Metals Group Ltd. (Metals & Mining) | | | 51 | |
| | | 4,174 | | Goodman Group (Equity Real Estate Investment Trusts) | | | 51 | |
| | | 478 | | IDP Education Ltd. (Diversified Consumer Services) | | | 8 | |
| | | 5,779 | | Insurance Australia Group Ltd. (Insurance) | | | 17 | |
| | | 1,593 | | LendLease Group (Real Estate Management & Development)(a) | | | 10 | |
| | | 863 | | Macquarie Group Ltd. (Capital Markets) | | | 98 | |
| | | 7,667 | | Medibank Private Ltd. (Insurance) | | | 17 | |
| | | 419 | | Mineral Resources Ltd. (Metals & Mining) | | | 14 | |
| | | 9,646 | | Mirvac Group (Equity Real Estate Investment Trusts) | | | 13 | |
| | | 8,028 | | National Australia Bank Ltd. (Banks) | | | 152 | |
| | | 2,021 | | Newcrest Mining Ltd. (Metals & Mining) | | | 29 | |
| | | 2,645 | | Northern Star Resources Ltd. (Metals & Mining) | | | 12 | |
| | | 927 | | Orica Ltd. (Chemicals) | | | 10 | |
| | | 4,121 | | Origin Energy Ltd. (Electric Utilities) | | | 16 | |
| | | 2,446 | | Qantas Airways Ltd. (Airlines)(b) | | | 8 | |
| | | 3,741 | | QBE Insurance Group Ltd. (Insurance) | | | 31 | |
| | | 427 | | Ramsay Health Care Ltd. (Health Care Providers & Services) | | | 22 | |
| | | 112 | | REA Group Ltd. (Interactive Media & Services) | | | 9 | |
| | | 687 | | Reece Ltd. (Trading Companies & Distributors) | | | 7 | |
| | Shares | | Security Description | | Value
(000) | |
| | | | | Australia (continued) |
| | | 914 | | Rio Tinto Ltd. (Metals & Mining) | | $ | 65 | |
| | | 7,479 | | Santos Ltd. (Oil, Gas & Consumable Fuels)(a) | | | 38 | |
| | | 12,339 | | Scentre Group (Equity Real Estate Investment Trusts) | | | 22 | |
| | | 923 | | SEEK Ltd. (Interactive Media & Services) | | | 13 | |
| | | 1,187 | | Sonic Healthcare Ltd. (Health Care Providers & Services) | | | 27 | |
| | | 11,701 | | South32 Ltd. (Metals & Mining) | | | 32 | |
| | | 5,512 | | Stockland (Equity Real Estate Investment Trusts) | | | 14 | |
| | | 3,312 | | Suncorp Group Ltd. (Insurance) | | | 25 | |
| | | 10,531 | | Telstra Corp. Ltd. (Diversified Telecommunication Services) | | | 28 | |
| | | 3,178 | | The GPT Group (Equity Real Estate Investment Trusts) | | | 9 | |
| | | 5,667 | | The Lottery Corp. Ltd. (Hotels, Restaurants & Leisure)(b) | | | 18 | |
| | | 6,949 | | Transurban Group (Transportation Infrastructure) | | | 69 | |
| | | 2,004 | | Treasury Wine Estates Ltd. (Beverages) | | | 16 | |
| | | 8,881 | | Vicinity Centres (Equity Real Estate Investment Trusts)(a) | | | 11 | |
| | | 528 | | Washington H Soul Pattinson & Co. Ltd. (Oil, Gas & Consumable Fuels) | | | 9 | |
| | | 2,750 | | Wesfarmers Ltd. (Multiline Retail) | | | 80 | |
| | | 8,782 | | Westpac Banking Corp. (Banks) | | | 118 | |
| | | 358 | | WiseTech Global Ltd. (Software) | | | 9 | |
| | | 928 | | Woodside Energy Group Ltd. (Oil, Gas & Consumable Fuels) | | | 20 | |
| | | 3,686 | | Woodside Energy Group Ltd. (Oil, Gas & Consumable Fuels) | | | 81 | |
| | | 3,057 | | Woolworths Group Ltd. (Food & Staples Retailing) | | | 75 | |
| | | | | | | | 2,567 | |
| | | | | Austria — 0.04% |
| | | 836 | | Erste Group Bank AG (Banks)(a) | | | 22 | |
| | | 383 | | OMV AG (Oil, Gas & Consumable Fuels) | | | 18 | |
| | | 147 | | Verbund AG (Electric Utilities) | | | 14 | |
| | | 246 | | Voestalpine AG (Metals & Mining) | | | 5 | |
| | | | | | | | 59 | |
| | | | | Belgium — 0.94% |
| | | 444 | | Ageas SA (Insurance) | | | 20 | |
| | | 21,961 | | Anheuser-Busch InBev N.V. (Beverages) | | | 1,183 | |
| | | 58 | | D’ieteren Group (Distributors) | | | 8 | |
| | | 67 | | Elia Group SA (Electric Utilities)(a) | | | 9 | |
| | | 217 | | Groupe Bruxelles Lambert SA (Diversified Financial Services) | | | 18 | |
| | | 634 | | KBC Group N.V. (Banks) | | | 36 | |
| | | 370 | | Proximus SADP (Diversified Telecommunication Services) | | | 5 | |
| | | 31 | | Sofina SA (Diversified Financial Services) | | | 6 | |
See accompanying notes to financial statements.
74
HC CAPITAL TRUST
The ESG Growth Portfolio
Portfolio of Investments (continued) — June 30, 2022
| | Shares | | Security Description | | Value
(000) | |
| | | | | Common Stocks (continued) |
| | | | | Belgium (continued) |
| | | 183 | | Solvay SA, Class - A (Chemicals) | | $ | 15 | |
| | | 321 | | UCB SA (Pharmaceuticals) | | | 27 | |
| | | 491 | | Umicore SA (Chemicals)(a) | | | 17 | |
| | | 360 | | Warehouses De Pauw CVA (Equity Real Estate Investment Trusts)(a) | | | 11 | |
| | | | | | | | 1,355 | |
| | | | | Bermuda — 0.08% |
| | | 887 | | Arch Capital Group Ltd. (Insurance)(b) | | | 41 | |
| | | 325 | | Bunge Ltd. (Food Products) | | | 29 | |
| | | 98 | | Everest Re Group Ltd. (Insurance) | | | 27 | |
| | | 902 | | Invesco Ltd. (Capital Markets) | | | 15 | |
| | | | | | | | 112 | |
| | | | | Canada — 3.29% |
| | | 1,099 | | Agnico Eagle Mines Ltd. (Metals & Mining) | | | 50 | |
| | | 400 | | Air Canada (Airlines)(a)(b) | | | 5 | |
| | | 2,006 | | Algonquin Power & Utilities Corp. (Multi-Utilities) | | | 27 | |
| | | 2,000 | | Alimentation Couche-Tard, Inc. (Food & Staples Retailing) | | | 78 | |
| | | 800 | | AltaGas Ltd. (Gas Utilities) | | | 17 | |
| | | 1,804 | | ARC Resources Ltd. (Oil, Gas & Consumable Fuels) | | | 23 | |
| | | 1,555 | | Bank of Montreal (Banks) | | | 150 | |
| | | 4,364 | | Barrick Gold Corp. (Metals & Mining) | | | 77 | |
| | | 200 | | BCE, Inc. (Diversified Telecommunication Services) | | | 10 | |
| | | 1,495 | | Blackberry Ltd. (Software)(b) | | | 8 | |
| | | 3,443 | | Brookfield Asset Management, Inc. (Capital Markets) | | | 153 | |
| | | 92 | | BRP, Inc. (Leisure Products) | | | 6 | |
| | | 800 | | CAE, Inc. (Aerospace & Defense)(b) | | | 20 | |
| | | 996 | | Cameco Corp. (Oil, Gas & Consumable Fuels) | | | 21 | |
| | | 200 | | Canadian Apartment Properties REIT (Equity Real Estate Investment Trusts)(a) | | | 7 | |
| | | 2,200 | | Canadian Imperial Bank of Commerce (Banks) | | | 107 | |
| | | 1,410 | | Canadian National Railway Co. (Road & Rail) | | | 159 | |
| | | 2,900 | | Canadian Natural Resources Ltd. (Oil, Gas & Consumable Fuels) | | | 156 | |
| | | 2,256 | | Canadian Pacific Railway Ltd. (Road & Rail) | | | 158 | |
| | | 143 | | Canadian Tire Corp. Ltd., Class - A (Multiline Retail) | | | 18 | |
| | | 300 | | Canadian Utilities Ltd., Class - A (Multi-Utilities) | | | 9 | |
| | | 3,493 | | Cenovus Energy, Inc. (Oil, Gas & Consumable Fuels) | | | 66 | |
| | | 500 | | CGI, Inc. (IT Services)(b) | | | 40 | |
| | | 49 | | Constellation Software, Inc. (Software) | | | 73 | |
| | | 700 | | Dollarama, Inc. (Multiline Retail) | | | 40 | |
| | Shares | | Security Description | | Value
(000) | |
| | | | | Canada (continued) |
| | | 600 | | Emera, Inc. (Electric Utilities) | | $ | 28 | |
| | | 400 | | Empire Co. Ltd. (Food & Staples Retailing) | | | 12 | |
| | | 4,900 | | Enbridge, Inc. (Oil, Gas & Consumable Fuels) | | | 207 | |
| | | 19,849 | | First Quantum Minerals Ltd. (Metals & Mining) | | | 375 | |
| | | 100 | | FirstService Corp. (Real Estate Management & Development) | | | 12 | |
| | | 1,100 | | Fortis, Inc. (Electric Utilities) | | | 52 | |
| | | 500 | | Franco-Nevada Corp. (Metals & Mining) | | | 66 | |
| | | 200 | | George Weston Ltd. (Food & Staples Retailing) | | | 23 | |
| | | 500 | | Gildan Activewear, Inc. (Textiles, Apparel & Luxury Goods) | | | 14 | |
| | | 600 | | Great-West Lifeco, Inc. (Insurance) | | | 15 | |
| | | 800 | | Hydro One Ltd. (Electric Utilities)(a) | | | 22 | |
| | | 300 | | iA Financial Corp., Inc. (Insurance) | | | 15 | |
| | | 200 | | IGM Financial, Inc. (Capital Markets) | | | 5 | |
| | | 132 | | Imperial Oil Ltd. (Oil, Gas & Consumable Fuels) | | | 6 | |
| | | 419 | | Intact Financial Corp. (Insurance) | | | 59 | |
| | | 1,227 | | Ivanhoe Mines Ltd. (Metals & Mining)(b) | | | 7 | |
| | | 600 | | Keyera Corp. (Oil, Gas & Consumable Fuels)(a) | | | 14 | |
| | | 3,200 | | Kinross Gold Corp. (Metals & Mining) | | | 11 | |
| | | 300 | | Lightspeed Commerce, Inc. (Software)(b) | | | 7 | |
| | | 400 | | Loblaw Companies Ltd. (Food & Staples Retailing) | | | 36 | |
| | | 301 | | Lululemon Athletica, Inc. (Textiles, Apparel & Luxury Goods)(b) | | | 82 | |
| | | 1,400 | | Lundin Mining Corp. (Metals & Mining)(a) | | | 9 | |
| | | 700 | | Magna International, Inc. (Auto Components) | | | 38 | |
| | | 4,700 | | Manulife Financial Corp. (Insurance) | | | 82 | |
| | | 600 | | Metro, Inc. (Food & Staples Retailing) | | | 32 | |
| | | 800 | | National Bank of Canada (Banks) | | | 53 | |
| | | 500 | | Northland Power, Inc. (Independent Power and Renewable Electricity Producers) | | | 15 | |
| | | 1,400 | | Nutrien Ltd. (Chemicals) | | | 112 | |
| | | 150 | | Nuvei Corp. (IT Services)(b) | | | 5 | |
| | | 200 | | Onex Corp. (Diversified Financial Services) | | | 10 | |
| | | 700 | | Open Text Corp. (Software)(a) | | | 26 | |
| | | 500 | | Pan American Silver Corp. (Metals & Mining) | | | 10 | |
| | | 400 | | Parkland Corp. (Oil, Gas & Consumable Fuels)(a) | | | 11 | |
| | | 1,400 | | Pembina Pipelines Corp. (Oil, Gas & Consumable Fuels) | | | 49 | |
| | | 1,350 | | Power Corp. of Canada (Insurance) | | | 35 | |
| | | 500 | | Quebecor, Inc., Class - B (Media) | | | 11 | |
| | | 700 | | Restaurant Brands International, Inc. (Hotels, Restaurants & Leisure) | | | 35 | |
| | | 300 | | RioCan Real Estate Investment Trust (Equity Real Estate Investment Trusts)(a) | | | 5 | |
| | | 300 | | Ritchie Bros. Auctioneers, Inc. (Commercial Services & Supplies) | | | 20 | |
See accompanying notes to financial statements.
75
HC CAPITAL TRUST
The ESG Growth Portfolio
Portfolio of Investments (continued) — June 30, 2022
| | Shares | | Security Description | | Value
(000) | |
| | | | | Common Stocks (continued) |
| | | | | Canada (continued) |
| | | 900 | | Rogers Communications, Inc., Class - B (Wireless Telecommunication Services) | | $ | 43 | |
| | | 3,361 | | Royal Bank of Canada (Banks) | | | 325 | |
| | | 691 | | Saputo, Inc. (Food Products)(a) | | | 15 | |
| | | 1,200 | | Shaw Communications, Inc., Class - B (Media) | | | 35 | |
| | | 2,750 | | Shopify, Inc. (IT Services)(b) | | | 86 | |
| | | 1,400 | | Sun Life Financial, Inc. (Insurance) | | | 64 | |
| | | 3,502 | | Suncor Energy, Inc. (Oil, Gas & Consumable Fuels) | | | 123 | |
| | | 2,300 | | TC Energy Corp. (Oil, Gas & Consumable Fuels) | | | 119 | |
| | | 1,100 | | Teck Resources Ltd., Class - B (Metals & Mining) | | | 34 | |
| | | 1,000 | | TELUS Corp. (Diversified Telecommunication Services) | | | 22 | |
| | | 213 | | TFI International, Inc. (Road & Rail) | | | 17 | |
| | | 2,968 | | The Bank of Nova Scotia (Banks) | | | 176 | |
| | | 4,436 | | The Toronto-Dominion Bank (Banks) | | | 291 | |
| | | 400 | | Thomson Reuters Corp. (Professional Services) | | | 42 | |
| | | 100 | | TMX Group Ltd. (Capital Markets) | | | 10 | |
| | | 200 | | Toromont Industries Ltd. (Trading Companies & Distributors) | | | 16 | |
| | | 737 | | Tourmaline Oil Corp. (Oil, Gas & Consumable Fuels) | | | 38 | |
| | | 620 | | Waste Connections, Inc. (Commercial Services & Supplies) | | | 77 | |
| | | 230 | | West Fraser Timber Co. Ltd. (Paper & Forest Products) | | | 18 | |
| | | 1,100 | | Wheaton Precious Metals Corp. (Metals & Mining) | | | 40 | |
| | | 300 | | WSP Global, Inc. (Construction & Engineering)(a) | | | 34 | |
| | | | | | | | 4,729 | |
| | | | | China — 0.01% |
| | | 3,000 | | SITC International Holdings Co. Ltd. (Marine) | | | 8 | |
| | | | | Denmark — 0.83% |
| | | 8 | | A.P. Moller - Maersk A/S, Class - A (Marine) | | | 18 | |
| | | 14 | | A.P. Moller - Maersk A/S, Class - B (Marine) | | | 33 | |
| | | 251 | | Carlsberg A/S, Class - B (Beverages) | | | 32 | |
| | | 263 | | Christian Hansen Holding A/S (Chemicals)(a) | | | 19 | |
| | | 302 | | Coloplast A/S, Class - B (Health Care Equipment & Supplies) | | | 34 | |
| | | 1,609 | | Danske Bank A/S (Banks) | | | 23 | |
| | | 292 | | Demant A/S (Health Care Equipment & Supplies)(b) | | | 11 | |
| | | 500 | | DSV A/S (Road & Rail) | | | 70 | |
| | | 165 | | Genmab A/S (Biotechnology)(a)(b) | | | 53 | |
| | | 278 | | GN Store Nord A/S (Health Care Equipment & Supplies) | | | 10 | |
| | Shares | | Security Description | | Value
(000) | |
| | | | | Denmark (continued) |
| | | 4,099 | | Novo Nordisk A/S, Class - B (Pharmaceuticals) | | $ | 455 | |
| | | 501 | | Novozymes A/S, B Shares (Chemicals) | | | 30 | |
| | | 3,049 | | Orsted A/S (Electric Utilities)(a) | | | 319 | |
| | | 245 | | Pandora A/S (Textiles, Apparel & Luxury Goods) | | | 15 | |
| | | 18 | | ROCKWOOL A/S, Class - B (Building Products) | | | 4 | |
| | | 810 | | Tryg A/S (Insurance)(a) | | | 18 | |
| | | 2,458 | | Vestas Wind Systems A/S (Electrical Equipment) | | | 52 | |
| | | | | | | | 1,196 | |
| | | | | Finland — 0.61% |
| | | 360 | | Elisa Oyj (Diversified Telecommunication Services) | | | 20 | |
| | | 1,122 | | Fortum Oyj (Electric Utilities) | | | 17 | |
| | | 684 | | Kesko Oyj, Class - B (Food & Staples Retailing) | | | 16 | |
| | | 864 | | Kone Oyj, Class - B (Machinery) | | | 41 | |
| | | 11,696 | | Neste Oyj (Oil, Gas & Consumable Fuels) | | | 518 | |
| | | 13,185 | | Nokia Oyj (Communications Equipment) | | | 61 | |
| | | 7,916 | | Nordea Bank Abp (Banks) | | | 70 | |
| | | 243 | | Orion Oyj, Class - B (Pharmaceuticals) | | | 11 | |
| | | 1,192 | | Sampo Oyj, Class - A (Insurance) | | | 52 | |
| | | 1,360 | | Stora Enso Oyj, Registered Shares (Paper & Forest Products) | | | 21 | |
| | | 1,356 | | UPM-Kymmene Oyj (Paper & Forest Products) | | | 41 | |
| | | 1,231 | | Wartsila Oyj Abp (Machinery) | | | 10 | |
| | | | | | | | 878 | |
| | | | | France — 2.40% |
| | | 434 | | Accor SA (Hotels, Restaurants & Leisure)(a)(b) | | | 12 | |
| | | 91 | | Aeroports de Paris (Transportation Infrastructure)(b) | | | 12 | |
| | | 1,269 | | Air Liquide SA (Chemicals) | | | 170 | |
| | | 817 | | Alstom SA (Machinery) | | | 18 | |
| | | 152 | | Amundi SA (Capital Markets) | | | 8 | |
| | | 151 | | Arkema SA (Chemicals) | | | 13 | |
| | | 4,688 | | AXA SA (Insurance) | | | 106 | |
| | | 104 | | BioMerieux (Health Care Equipment & Supplies) | | | 10 | |
| | | 2,734 | | BNP Paribas SA (Banks) | | | 130 | |
| | | 566 | | Bouygues SA (Construction & Engineering) | | | 17 | |
| | | 727 | | Bureau Veritas SA (Professional Services)(a) | | | 19 | |
| | | 403 | | Capgemini SE (IT Services) | | | 69 | |
| | | 1,562 | | Carrefour SA (Food & Staples Retailing)(a) | | | 28 | |
| | | 1,612 | | Cie Generale des Etablissements Michelin SCA (Auto Components) | | | 44 | |
| | | 1,237 | | Compagnie de Saint-Gobain (Building Products) | | | 53 | |
| | | 115 | | Covivio (Equity Real Estate Investment Trusts) | | | 6 | |
| | | 2,961 | | Credit Agricole SA (Banks) | | | 27 | |
| | | 1,592 | | Danone SA (Food Products) | | | 89 | |
| | | 1,670 | | Dassault Systemes SE (Software) | | | 61 | |
| | | 640 | | Edenred (IT Services) | | | 30 | |
See accompanying notes to financial statements.
76
HC CAPITAL TRUST
The ESG Growth Portfolio
Portfolio of Investments (continued) — June 30, 2022
| | Shares | | Security Description | | Value
(000) | |
| | | | | Common Stocks (continued) |
| | | | | France (continued) |
| | | 195 | | Eiffage SA (Construction & Engineering)(a) | | $ | 18 | |
| | | 1,408 | | Electricite de France SA (Electric Utilities) | | | 12 | |
| | | 4,644 | | Engie SA (Multi-Utilities) | | | 53 | |
| | | 706 | | EssilorLuxottica SA (Textiles, Apparel & Luxury Goods) | | | 106 | |
| | | 78 | | Eurazeo SE (Diversified Financial Services) | | | 5 | |
| | | 116 | | Gecina SA (Equity Real Estate Investment Trusts)(a) | | | 11 | |
| | | 1,089 | | Getlink SE (Transportation Infrastructure) | | | 19 | |
| | | 77 | | Hermes International (Textiles, Apparel & Luxury Goods) | | | 86 | |
| | | 89 | | Ipsen SA (Pharmaceuticals) | | | 8 | |
| | | 184 | | Kering SA (Textiles, Apparel & Luxury Goods) | | | 94 | |
| | | 568 | | Klepierre SA (Equity Real Estate Investment Trusts) | | | 11 | |
| | | 256 | | LA Francaise des Jeux SAEM (Hotels, Restaurants & Leisure) | | | 9 | |
| | | 606 | | Legrand SA (Electrical Equipment) | | | 45 | |
| | | 583 | | L’Oreal SA (Personal Products) | | | 201 | |
| | | 668 | | LVMH Moet Hennessy Louis Vuitton SE (Textiles, Apparel & Luxury Goods) | | | 407 | |
| | | 4,724 | | Orange SA (Diversified Telecommunication Services)(a) | | | 56 | |
| | | 508 | | Pernod Ricard SA (Beverages) | | | 93 | |
| | | 528 | | Publicis Groupe SA (Media) | | | 26 | |
| | | 49 | | Remy Cointreau SA (Beverages) | | | 9 | |
| | | 440 | | Renault SA (Automobiles)(b) | | | 11 | |
| | | 854 | | Safran SA (Aerospace & Defense) | | | 84 | |
| | | 2,789 | | Sanofi (Pharmaceuticals) | | | 282 | |
| | | 70 | | Sartorius Stedim Biotech (Life Sciences Tools & Services) | | | 22 | |
| | | 1,313 | | Schneider Electric SE (Electrical Equipment)(a) | | | 155 | |
| | | 55 | | SEB SA (Household Durables) | | | 5 | |
| | | 2,059 | | Societe Generale SA (Banks) | | | 45 | |
| | | 224 | | Sodexo SA (Hotels, Restaurants & Leisure) | | | 16 | |
| | | 149 | | Teleperformance (Professional Services) | | | 46 | |
| | | 270 | | Thales SA (Aerospace & Defense) | | | 33 | |
| | | 6,009 | | TotalEnergies SE (Oil, Gas & Consumable Fuels) | | | 317 | |
| | | 225 | | UbiSoft Entertainment SA (Entertainment)(b) | | | 10 | |
| | | 305 | | Unibail-Rodamco-Westfield (Equity Real Estate Investment Trusts)(b) | | | 16 | |
| | | 595 | | Valeo (Auto Components) | | | 11 | |
| | | 1,599 | | Veolia Environnement SA (Multi-Utilities)(b) | | | 39 | |
| | | 1,264 | | Vinci SA (Construction & Engineering) | | | 113 | |
| | | 1,744 | | Vivendi SE (Entertainment) | | | 18 | |
| | | 71 | | Wendel SE (Diversified Financial Services) | | | 6 | |
| | | 558 | | Worldline SA (IT Services)(b) | | | 21 | |
| | | | | | | | 3,441 | |
| | Shares | | Security Description | | Value
(000) | |
| | | | | Germany — 2.04% |
| | | 410 | | adidas AG (Textiles, Apparel & Luxury Goods) | | $ | 72 | |
| | | 980 | | Allianz SE (Insurance) | | | 187 | |
| | | 2,278 | | Aroundtown SA (Real Estate Management & Development)(a) | | | 7 | |
| | | 2,237 | | BASF SE (Chemicals) | | | 97 | |
| | | 2,390 | | Bayer AG, Registered Shares (Pharmaceuticals) | | | 142 | |
| | | 809 | | Bayerische Motoren Werke AG (Automobiles) | | | 62 | |
| | | 177 | | Bechtle AG (IT Services) | | | 7 | |
| | | 255 | | Beiersdorf AG (Personal Products) | | | 26 | |
| | | 400 | | Brenntag AG (Trading Companies & Distributors) | | | 26 | |
| | | 99 | | Carl Zeiss Meditec AG (Health Care Equipment & Supplies) | | | 12 | |
| | | 2,817 | | Commerzbank AG (Banks)(b) | | | 20 | |
| | | 279 | | Continental AG (Auto Components) | | | 19 | |
| | | 494 | | Covestro AG (Chemicals) | | | 17 | |
| | | 1,041 | | Daimler Truck Holding AG (Machinery)(b) | | | 27 | |
| | | 405 | | Delivery Hero SE (Internet & Direct Marketing Retail)(b) | | | 15 | |
| | | 4,983 | | Deutsche Bank AG, Registered Shares (Capital Markets) | | | 43 | |
| | | 464 | | Deutsche Boerse AG (Capital Markets) | | | 78 | |
| | | 1,458 | | Deutsche Lufthansa AG, Registered Shares (Airlines)(b) | | | 9 | |
| | | 16,240 | | Deutsche Post AG, Registered Shares (Air Freight & Logistics) | | | 609 | |
| | | 7,840 | | Deutsche Telekom AG (Diversified Telecommunication Services)(a) | | | 156 | |
| | | 5,467 | | E.ON SE (Multi-Utilities) | | | 46 | |
| | | 515 | | Evonik Industries AG (Chemicals) | | | 11 | |
| | | 500 | | Fresenius Medical Care AG & Co. KGaA (Health Care Providers & Services) | | | 25 | |
| | | 1,062 | | Fresenius SE & Co. KGaA (Health Care Providers & Services) | | | 32 | |
| | | 419 | | GEA Group AG (Machinery) | | | 14 | |
| | | 153 | | Hannover Rueck SE (Insurance) | | | 22 | |
| | | 370 | | HeidelbergCement AG (Construction Materials) | | | 18 | |
| | | 423 | | HelloFresh SE (Food & Staples Retailing)(b) | | | 14 | |
| | | 263 | | Henkel AG & Co. KGaA (Household Products) | | | 16 | |
| | | 3,171 | | Infineon Technologies AG (Semiconductors & Semiconductor Equipment)(a) | | | 77 | |
| | | 195 | | KION Group AG (Machinery)(a) | | | 8 | |
| | | 186 | | Knorr-Bremse AG (Machinery) | | | 11 | |
| | | 193 | | LEG Immobilien AG (Real Estate Management & Development) | | | 16 | |
| | | 1,903 | | Mercedes-Benz Group AG (Automobiles)(a) | | | 110 | |
| | | 314 | | Merck KGaA (Pharmaceuticals) | | | 53 | |
| | | 130 | | MTU Aero Engines AG (Aerospace & Defense) | | | 24 | |
See accompanying notes to financial statements.
77
HC CAPITAL TRUST
The ESG Growth Portfolio
Portfolio of Investments (continued) — June 30, 2022
| | Shares | | Security Description | | Value
(000) | |
| | | | | Common Stocks (continued) |
| | | | | Germany (continued) |
| | | 339 | | Muenchener Rueckversicherungs-Gesellschaft AG, Registered Shares (Insurance) | | $ | 80 | |
| | | 126 | | Nemetschek SE (Software) | | | 8 | |
| | | 239 | | Puma SE (Textiles, Apparel & Luxury Goods)(a) | | | 16 | |
| | | 11 | | Rational AG (Machinery) | | | 6 | |
| | | 105 | | Rheinmetall AG (Industrial Conglomerates) | | | 24 | |
| | | 1,593 | | RWE AG (Multi-Utilities) | | | 59 | |
| | | 2,550 | | SAP SE (Software) | | | 233 | |
| | | 221 | | Scout24 AG (Interactive Media & Services) | | | 11 | |
| | | 1,868 | | Siemens AG, Registered Shares (Industrial Conglomerates) | | | 190 | |
| | | 975 | | Siemens Energy AG (Electrical Equipment) | | | 14 | |
| | | 674 | | Siemens Healthineers AG (Health Care Equipment & Supplies) | | | 34 | |
| | | 326 | | Symrise AG (Chemicals)(a) | | | 35 | |
| | | 3,222 | | Telefonica Deutschland Holding AG (Diversified Telecommunication Services) | | | 9 | |
| | | 228 | | Uniper SE (Independent Power and Renewable Electricity Producers) | | | 3 | |
| | | 258 | | United Internet AG (Diversified Telecommunication Services)(a) | | | 7 | |
| | | 1,772 | | Vonovia SE (Real Estate Management & Development) | | | 55 | |
| | | 543 | | Zalando SE (Internet & Direct Marketing Retail)(b) | | | 14 | |
| | | | | | | | 2,926 | |
| | | | | Hong Kong — 1.30% |
| | | 107,347 | | AIA Group Ltd. (Insurance) | | | 1,165 | |
| | | 9,500 | | BOC Hong Kong Holdings Ltd. (Banks) | | | 38 | |
| | | 4,200 | | Budweiser Brewing Co. APAC Ltd. (Beverages) | | | 13 | |
| | | 4,800 | | Chow Tai Fook Jewellery Group Ltd. (Specialty Retail) | | | 9 | |
| | | 5,000 | | CK Asset Holdings Ltd. (Real Estate Management & Development) | | | 35 | |
| | | 1,500 | | CK Infrastructure Holdings Ltd. (Electric Utilities) | | | 9 | |
| | | 4,000 | | CLP Holdings Ltd. (Electric Utilities) | | | 33 | |
| | | 4,200 | | ESR Cayman Ltd. (Real Estate Management & Development)(b) | | | 11 | |
| | | 5,000 | | Galaxy Entertainment Group Ltd. (Hotels, Restaurants & Leisure) | | | 30 | |
| | | 5,000 | | Hang Lung Properties Ltd. (Real Estate Management & Development) | | | 9 | |
| | | 2,000 | | Hang Seng Bank Ltd. (Banks) | | | 35 | |
| | | 4,000 | | Henderson Land Development Co. Ltd. (Real Estate Management & Development) | | | 15 | |
| | Shares | | Security Description | | Value
(000) | |
| | | | | Hong Kong (continued) |
| | | 6,500 | | HK Electric Investments & HK Electric Investments Ltd. (Electric Utilities) | | $ | 6 | |
| | | 10,000 | | HKT Trust & HKT Ltd. (Diversified Telecommunication Services)(a) | | | 13 | |
| | | 28,665 | | Hong Kong & China Gas Co. Ltd. (Gas Utilities) | | | 31 | |
| | | 2,949 | | Hong Kong Exchanges & Clearing Ltd. (Capital Markets) | | | 145 | |
| | | 2,400 | | Hongkong Land Holdings Ltd. (Real Estate Management & Development) | | | 12 | |
| | | 4,000 | | MTR Corp. Ltd. (Road & Rail) | | | 21 | |
| | | 4,000 | | New World Development Co. Ltd. (Real Estate Management & Development) | | | 14 | |
| | | 3,500 | | Power Assets Holdings Ltd. (Electric Utilities) | | | 22 | |
| | | 6,000 | | Sands China Ltd. (Hotels, Restaurants & Leisure)(b) | | | 14 | |
| | | 8,000 | | Sino Land Co. Ltd. (Real Estate Management & Development) | | | 12 | |
| | | 4,000 | | Sun Hung Kai Properties Ltd. (Real Estate Management & Development) | | | 47 | |
| | | 1,000 | | Swire Pacific Ltd., Class - A (Real Estate Management & Development) | | | 6 | |
| | | 3,000 | | Swire Properties Ltd. (Real Estate Management & Development) | | | 7 | |
| | | 3,500 | | Techtronic Industries Co. Ltd. (Machinery) | | | 37 | |
| | | 5,023 | | The Link Real Estate Investment Trust (Equity Real Estate Investment Trusts) | | | 41 | |
| | | 18,450 | | WH Group Ltd. (Food Products) | | | 14 | |
| | | 4,000 | | Wharf Real Estate Investment Co. Ltd. (Real Estate Management & Development) | | | 19 | |
| | | 4,000 | | Xinyi Glass Holdings Ltd. (Building Products) | | | 10 | |
| | | | | | | | 1,873 | |
| | | | | Ireland (Republic of) — 0.94% |
| | | 322 | | AerCap Holdings N.V. (Trading Companies & Distributors)(b) | | | 13 | |
| | | 234 | | Allegion PLC (Building Products) | | | 23 | |
| | | 1,896 | | CRH PLC (Construction Materials)(a) | | | 66 | |
| | | 235 | | DCC PLC (Industrial Conglomerates)(a) | | | 15 | |
| | | 971 | | Eaton Corp. PLC (Electrical Equipment) | | | 122 | |
| | | 2,241 | | Experian PLC (Professional Services) | | | 66 | |
| | | 417 | | Flutter Entertainment PLC (Hotels, Restaurants & Leisure)(b) | | | 42 | |
| | | 540 | | Horizon Therapeutics PLC (Pharmaceuticals)(b) | | | 43 | |
| | | 1,037 | | James Hardie Industries PLC (Construction Materials) | | | 23 | |
| | | 5,235 | | Kerry Group PLC, Class - A (Food Products)(a) | | | 501 | |
| | | 384 | | Kingspan Group PLC (Building Products) | | | 23 | |
| | | 3,258 | | Medtronic PLC (Health Care Equipment & Supplies) | | | 292 | |
| | | 406 | | Pentair PLC (Machinery) | | | 19 | |
See accompanying notes to financial statements.
78
HC CAPITAL TRUST
The ESG Growth Portfolio
Portfolio of Investments (continued) — June 30, 2022
| | Shares | | Security Description | | Value
(000) | |
| | | | | Common Stocks (continued) |
| | | | | Ireland (Republic of) (continued) |
| | | 480 | | Seagate Technology Holdings PLC (Technology Hardware, Storage & Peripherals) | | $ | 34 | |
| | | 540 | | Smurfit Kappa Group PLC (Containers & Packaging)(a) | | | 18 | |
| | | 243 | | STERIS PLC (Health Care Equipment & Supplies) | | | 50 | |
| | | | | | | | 1,350 | |
| | | | | Isle of Man — 0.01% |
| | | 1,361 | | Entain PLC (Hotels, Restaurants & Leisure)(b) | | | 21 | |
| | | | | Israel — 0.18% |
| | | 101 | | Azrieli Group Ltd. (Real Estate Management & Development) | | | 7 | |
| | | 3,082 | | Bank Hapoalim BM (Banks) | | | 26 | |
| | | 3,663 | | Bank Leumi Le (Banks) | | | 33 | |
| | | 265 | | Check Point Software Technologies Ltd. (Software)(b) | | | 32 | |
| | | 88 | | CyberArk Software Ltd. (Software)(b) | | | 11 | |
| | | 54 | | Elbit Systems Ltd. (Aerospace & Defense) | | | 12 | |
| | | 1,724 | | ICL Group Ltd. (Chemicals) | | | 16 | |
| | | 1 | | Isacard Ltd. (Consumer Finance) | | | — | |
| | | 3,213 | | Israel Discount Bank Ltd., Class - A (Banks) | | | 17 | |
| | | 119 | | Kornit Digital Ltd. (Machinery)(b) | | | 4 | |
| | | 304 | | Mizrahi Tefahot Bank Ltd. (Banks) | | | 10 | |
| | | 155 | | Nice Ltd. (Software)(b) | | | 30 | |
| | | 125 | | SolarEdge Technologies, Inc. (Semiconductors & Semiconductor Equipment)(b) | | | 34 | |
| | | 268 | | Tower Semiconductor Ltd. (Semiconductors & Semiconductor Equipment)(b) | | | 12 | |
| | | 136 | | Wix.com Ltd. (IT Services)(b) | | | 9 | |
| | | | | | | | 253 | |
| | | | | Italy — 0.45% |
| | | 266 | | Amplifon SpA (Health Care Providers & Services) | | | 8 | |
| | | 2,629 | | Assicurazioni Generali SpA (Insurance) | | | 42 | |
| | | 1,251 | | Atlantia SpA (Transportation Infrastructure) | | | 29 | |
| | | 1,427 | | Davide Campari-Milano N.V., Class - M (Beverages) | | | 15 | |
| | | 54 | | DiaSorin SpA (Health Care Equipment & Supplies) | | | 7 | |
| | | 19,818 | | Enel SpA (Electric Utilities)(a) | | | 108 | |
| | | 6,167 | | Eni SpA (Oil, Gas & Consumable Fuels) | | | 73 | |
| | | 320 | | Ferrari N.V. (Automobiles) | | | 59 | |
| | | 1,425 | | FinecoBank Banca Fineco SpA (Banks) | | | 17 | |
| | | 1,050 | | Infrastrutture Wireless Italiane SpA (Diversified Telecommunication Services)(a) | | | 11 | |
| | Shares | | Security Description | | Value
(000) | |
| | | | | Italy (continued) |
| | | 39,570 | | Intesa Sanpaolo SpA (Banks)(a) | | $ | 74 | |
| | | 1,412 | | Mediobanca Banca di Credito Finanziario SpA (Banks) | | | 12 | |
| | | 450 | | Moncler SpA (Textiles, Apparel & Luxury Goods) | | | 19 | |
| | | 1,124 | | Nexi SpA (IT Services)(b) | | | 9 | |
| | | 1,363 | | Poste Italiane SpA (Insurance) | | | 13 | |
| | | 676 | | Prusmian SpA (Electrical Equipment) | | | 19 | |
| | | 257 | | Recordati SpA (Pharmaceuticals) | | | 11 | |
| | | 6,246 | | Snam SpA (Gas Utilities) | | | 33 | |
| | | 25,056 | | Telecom Italia SpA (Diversified Telecommunication Services)(b) | | | 7 | |
| | | 4,316 | | Terna - Rete Elettrica Nazionale SpA (Electric Utilities) | | | 34 | |
| | | 5,375 | | Unicredit SpA (Banks) | | | 51 | |
| | | | | | | | 651 | |
| | | | | Japan — 5.41% |
| | | 500 | | Advantest Corp. (Semiconductors & Semiconductor Equipment)(a) | | | 27 | |
| | | 1,600 | | Aeon Co. Ltd. (Food & Staples Retailing) | | | 28 | |
| | | 500 | | AGC, Inc. (Building Products) | | | 18 | |
| | | 1,100 | | Ajinomoto Co., Inc. (Food Products) | | | 27 | |
| | | 300 | | ANA Holdings, Inc. (Airlines)(a)(b) | | | 6 | |
| | | 1,100 | | Asahi Group Holdings Ltd. (Beverages)(a) | | | 36 | |
| | | 500 | | Asahi Intecc Co. Ltd. (Health Care Equipment & Supplies) | | | 8 | |
| | | 3,200 | | Asahi Kasei Corp. (Chemicals) | | | 24 | |
| | | 4,500 | | Astellas Pharma, Inc. (Pharmaceuticals) | | | 70 | |
| | | 300 | | Azbil Corp. (Electronic Equipment, Instruments & Components) | | | 8 | |
| | | 1,300 | | Bridgestone Corp. (Auto Components) | | | 47 | |
| | | 500 | | Brother Industries Ltd. (Technology Hardware, Storage & Peripherals) | | | 9 | |
| | | 2,400 | | Canon, Inc. (Technology Hardware, Storage & Peripherals) | | | 55 | |
| | | 400 | | Capcom Co. Ltd. (Entertainment) | | | 10 | |
| | | 300 | | Central Japan Railway Co. (Road & Rail) | | | 35 | |
| | | 1,600 | | Chubu Electric Power Co., Inc. (Electric Utilities) | | | 16 | |
| | | 1,600 | | Chugai Pharmaceutical Co. Ltd. (Pharmaceuticals) | | | 41 | |
| | | 2,800 | | Concordia Financial Group Ltd. (Banks) | | | 10 | |
| | | 1,100 | | CyberAgent, Inc. (Media) | | | 11 | |
| | | 600 | | Dai Nippon Printing Co. Ltd. (Commercial Services & Supplies) | | | 13 | |
| | | 200 | | Daifuku Co. Ltd. (Machinery) | | | 11 | |
| | | 2,500 | | Dai-ichi Life Holdings, Inc. (Insurance) | | | 46 | |
| | | 4,200 | | Daiichi Sankyo Co. Ltd. (Pharmaceuticals) | | | 106 | |
| | | 600 | | Daikin Industries Ltd. (Building Products) | | | 96 | |
See accompanying notes to financial statements.
79
HC CAPITAL TRUST
The ESG Growth Portfolio
Portfolio of Investments (continued) — June 30, 2022
| | Shares | | Security Description | | Value
(000) | |
| | | | | Common Stocks (continued) |
| | | | | Japan (continued) |
| | | 200 | | Daito Trust Construction Co. Ltd. (Real Estate Management & Development) | | $ | 17 | |
| | | 1,300 | | Daiwa House Industry Co. Ltd. (Real Estate Management & Development) | | | 30 | |
| | | 5 | | Daiwa House REIT Investment Corp. (Equity Real Estate Investment Trusts)(a) | | | 11 | |
| | | 3,800 | | Daiwa Securities Group, Inc. (Capital Markets) | | | 17 | |
| | | 1,100 | | Denso Corp. (Auto Components) | | | 58 | |
| | | 500 | | Dentsu Group, Inc. (Media) | | | 15 | |
| | | 100 | | Disco Corp. (Semiconductors & Semiconductor Equipment) | | | 24 | |
| | | 700 | | East Japan Railway Co. (Road & Rail) | | | 36 | |
| | | 600 | | Eisai Co. Ltd. (Pharmaceuticals) | | | 25 | |
| | | 7,800 | | ENEOS Holdings, Inc. (Oil, Gas & Consumable Fuels) | | | 30 | |
| | | 500 | | FANUC Corp. (Machinery) | | | 78 | |
| | | 200 | | Fast Retailing Co. Ltd. (Specialty Retail) | | | 105 | |
| | | 300 | | Fuji Electric Co. Ltd. (Electrical Equipment) | | | 12 | |
| | | 900 | | FUJIFILM Holdings Corp. (Technology Hardware, Storage & Peripherals) | | | 48 | |
| | | 500 | | Fujitsu Ltd. (IT Services)(a) | | | 63 | |
| | | 100 | | GMO Payment Gateway, Inc. (IT Services) | | | 7 | |
| | | 600 | | Hakuhodo DY Holdings, Inc. (Media) | | | 6 | |
| | | 600 | | Hankyu Hanshin Holdings, Inc. (Road & Rail) | | | 16 | |
| | | 100 | | Hirose Electric Co. Ltd. (Electronic Equipment, Instruments & Components) | | | 13 | |
| | | 300 | | Hitachi Construction Machinery Co. Ltd. (Machinery) | | | 7 | |
| | | 2,400 | | Hitachi Ltd. (Industrial Conglomerates) | | | 114 | |
| | | 500 | | Hitachi Metals Ltd. (Metals & Mining)(b) | | | 8 | |
| | | 4,000 | | Honda Motor Co. Ltd. (Automobiles) | | | 97 | |
| | | 200 | | Hoshizaki Corp. (Machinery) | | | 6 | |
| | | 900 | | HOYA Corp. (Health Care Equipment & Supplies) | | | 77 | |
| | | 800 | | Hulic Co. Ltd. (Real Estate Management & Development)(a) | | | 6 | |
| | | 300 | �� | Ibiden Co. Ltd. (Electronic Equipment, Instruments & Components) | | | 8 | |
| | | 500 | | Idemitsu Kosan Co. Ltd. (Oil, Gas & Consumable Fuels)(a) | | | 12 | |
| | | 2,500 | | Inpex Corp. (Oil, Gas & Consumable Fuels) | | | 27 | |
| | | 1,500 | | Isuzu Motors Ltd. (Automobiles) | | | 17 | |
| | | 100 | | ITO EN Ltd. (Beverages) | | | 4 | |
| | | 2,900 | | ITOCHU Corp. (Trading Companies & Distributors) | | | 78 | |
| | | 200 | | Itochu Techno-Solutions Corp. (IT Services) | | | 5 | |
| | | 1,300 | | Japan Exchange Group, Inc. (Capital Markets) | | | 19 | |
| | | 6,100 | | Japan Post Holdings Co. Ltd. (Insurance)(a) | | | 44 | |
| | Shares | | Security Description | | Value
(000) | |
| | | | | Japan (continued) |
| | | 500 | | Japan Post Insurance Co. Ltd. (Insurance)(a) | | $ | 8 | |
| | | 3 | | Japan Real Estate Investment Corp. (Equity Real Estate Investment Trusts) | | | 14 | |
| | | 18 | | Japan Retail Fund Investment Corp. (Equity Real Estate Investment Trusts) | | | 14 | |
| | | 1,400 | | JFE Holdings, Inc. (Metals & Mining) | | | 15 | |
| | | 500 | | JSR Corp. (Chemicals) | | | 13 | |
| | | 1,100 | | Kajima Corp. (Construction & Engineering) | | | 13 | |
| | | 300 | | Kakaku.com, Inc. (Interactive Media & Services) | | | 5 | |
| | | 1,100 | | Kao Corp. (Personal Products) | | | 44 | |
| | | 3,900 | | KDDI Corp. (Wireless Telecommunication Services) | | | 123 | |
| | | 300 | | Keio Corp. (Road & Rail) | | | 11 | |
| | | 300 | | Keisei Electric Railway Co. Ltd. (Road & Rail) | | | 8 | |
| | | 500 | | Keyence Corp. (Electronic Equipment, Instruments & Components) | | | 171 | |
| | | 400 | | Kikkoman Corp. (Food Products) | | | 21 | |
| | | 400 | | Kintetsu Group Holdings Co. Ltd. (Road & Rail) | | | 12 | |
| | | 2,100 | | Kirin Holdings Co. Ltd. (Beverages) | | | 33 | |
| | | 100 | | Kobayashi Pharmaceutical Co. Ltd. (Personal Products) | | | 6 | |
| | | 300 | | Kobe Bussan Co. Ltd. (Food & Staples Retailing) | | | 7 | |
| | | 2,100 | | Komatsu Ltd. (Machinery) | | | 47 | |
| | | 200 | | Konami Holdings Corp. (Entertainment) | | | 11 | |
| | | 100 | | Kose Corp. (Personal Products) | | | 9 | |
| | | 2,600 | | Kubota Corp. (Machinery) | | | 39 | |
| | | 200 | | Kurita Water Industries Ltd. (Machinery) | | | 7 | |
| | | 800 | | Kyocera Corp. (Electronic Equipment, Instruments & Components) | | | 43 | |
| | | 700 | | Kyowa Kirin Co. Ltd. (Pharmaceuticals) | | | 16 | |
| | | 700 | | Lixil Corp. (Building Products) | | | 13 | |
| | | 1,100 | | M3, Inc. (Health Care Technology) | | | 32 | |
| | | 500 | | Makita Corp. (Machinery) | | | 12 | |
| | | 3,900 | | Marubeni Corp. (Trading Companies & Distributors) | | | 35 | |
| | | 1,500 | | Mazda Motor Corp. (Automobiles) | | | 12 | |
| | | 200 | | McDonald’s Holdings Co. Ltd. (Hotels, Restaurants & Leisure) | | | 7 | |
| | | 300 | | MEIJI Holdings Co. Ltd. (Food Products) | | | 15 | |
| | | 900 | | MINEBEA MITSUMI, Inc. (Machinery) | | | 15 | |
| | | 8,649 | | MISUMI Group, Inc. (Machinery) | | | 183 | |
| | | 3,200 | | Mitsubishi Chemical Holdings Corp. (Chemicals) | | | 17 | |
| | | 3,000 | | Mitsubishi Corp. (Trading Companies & Distributors) | | | 89 | |
| | | 4,400 | | Mitsubishi Electric Corp. (Electrical Equipment) | | | 47 | |
| | | 3,000 | | Mitsubishi Estate Co. Ltd. (Real Estate Management & Development) | | | 44 | |
See accompanying notes to financial statements.
80
HC CAPITAL TRUST
The ESG Growth Portfolio
Portfolio of Investments (continued) — June 30, 2022
| | Shares | | Security Description | | Value
(000) | |
| | | | | Common Stocks (continued) |
| | | | | Japan (continued) |
| | | 800 | | Mitsubishi Heavy Industries Ltd. (Machinery) | | $ | 28 | |
| | | 29,700 | | Mitsubishi UFJ Financial Group, Inc. (Banks) | | | 160 | |
| | | 3,200 | | Mitsui & Co. Ltd. (Trading Companies & Distributors) | | | 71 | |
| | | 400 | | Mitsui Chemicals, Inc. (Chemicals) | | | 9 | |
| | | 2,300 | | Mitsui Fudosan Co. Ltd. (Real Estate Management & Development) | | | 49 | |
| | | 900 | | Mitsui O.S.K. Lines Ltd. (Marine) | | | 21 | |
| | | 5,840 | | Mizuho Financial Group, Inc. (Banks) | | | 66 | |
| | | 600 | | MonotaRO Co. Ltd. (Trading Companies & Distributors) | | | 9 | |
| | | 1,100 | | MS&AD Insurance Group Holdings, Inc. (Insurance) | | | 34 | |
| | | 1,400 | | Murata Manufacturing Co. Ltd. (Electronic Equipment, Instruments & Components) | | | 76 | |
| | | 600 | | NEC Corp. (Technology Hardware, Storage & Peripherals) | | | 23 | |
| | | 1,100 | | Nexon Co. Ltd. (Entertainment) | | | 23 | |
| | | 600 | | NGK Insulators Ltd. (Machinery) | | | 8 | |
| | | 8,150 | | Nidec Corp. (Electrical Equipment) | | | 502 | |
| | | 800 | | Nihon M&A Center Holdings, Inc. (Professional Services) | | | 9 | |
| | | 300 | | Nintendo Co. Ltd. (Entertainment) | | | 130 | |
| | | 4 | | Nippon Building Fund, Inc. (Equity Real Estate Investment Trusts) | | | 20 | |
| | | 200 | | NIPPON EXPRESS HOLDINGS, INC. (Road & Rail) | | | 11 | |
| | | 2,100 | | Nippon Paint Holdings Co. Ltd. (Chemicals)(a) | | | 16 | |
| | | 5 | | Nippon Prologis REIT, Inc. (Equity Real Estate Investment Trusts)(a) | | | 12 | |
| | | 100 | | Nippon Shinyaku Co. Ltd. (Pharmaceuticals) | | | 6 | |
| | | 2,000 | | Nippon Steel Corp. (Metals & Mining)(a) | | | 28 | |
| | | 2,700 | | Nippon Telegraph & Telephone Corp. (Diversified Telecommunication Services) | | | 78 | |
| | | 400 | | Nippon Yusen KK (Marine) | | | 27 | |
| | | 300 | | Nissan Chemical Corp. (Chemicals) | | | 14 | |
| | | 500 | | Nisshin Seifun Group, Inc. (Food Products) | | | 6 | |
| | | 200 | | Nissin Foods Holdings Co. Ltd. (Food Products)(a) | | | 14 | |
| | | 200 | | Nitori Holdings Co. Ltd. (Specialty Retail) | | | 19 | |
| | | 300 | | Nitto Denko Corp. (Chemicals) | | | 19 | |
| | | 7,500 | | Nomura Holdings, Inc. (Capital Markets) | | | 27 | |
| | | 400 | | Nomura Real Estate Holdings, Inc. (Real Estate Management & Development) | | | 10 | |
| | | 11 | | Nomura Real Estate Master Fund, Inc. (Equity Real Estate Investment Trusts) | | | 14 | |
| | | 800 | | Nomura Research Institute Ltd. (IT Services) | | | 21 | |
| | Shares | | Security Description | | Value
(000) | |
| | | | | Japan (continued) |
| | | 1,600 | | NTT Data Corp. (IT Services) | | $ | 22 | |
| | | 1,500 | | Obayashi Corp. (Construction & Engineering) | | | 11 | |
| | | 200 | | Obic Co. Ltd. (IT Services) | | | 28 | |
| | | 700 | | Odakyu Electric Railway Co. Ltd. (Road & Rail) | | | 9 | |
| | | 2,400 | | Oji Paper Co. Ltd. (Paper & Forest Products) | | | 10 | |
| | | 3,000 | | Olympus Corp. (Health Care Equipment & Supplies) | | | 60 | |
| | | 500 | | OMRON Corp. (Electronic Equipment, Instruments & Components) | | | 25 | |
| | | 900 | | Ono Pharmaceutical Co. Ltd. (Pharmaceuticals) | | | 23 | |
| | | 200 | | Open House Group Co. Ltd. (Household Durables)(a) | | | 8 | |
| | | 100 | | Oracle Corp. (Software) | | | 6 | |
| | | 500 | | Oriental Land Co. Ltd. (Hotels, Restaurants & Leisure) | | | 70 | |
| | | 2,700 | | ORIX Corp. (Diversified Financial Services) | | | 45 | |
| | | 1,000 | | Osaka Gas Co. Ltd. (Gas Utilities) | | | 19 | |
| | | 300 | | OTSUKA Corp. (IT Services) | | | 9 | |
| | | 1,000 | | Otsuka Holdings Co. Ltd. (Pharmaceuticals) | | | 36 | |
| | | 1,100 | | Pan Pacific International Holdings Corp. (Multiline Retail) | | | 18 | |
| | | 5,600 | | Panasonic Holdings Corp. (Household Durables) | | | 45 | |
| | | 500 | | Persol Holdings Co. Ltd. (Professional Services)(a) | | | 9 | |
| | | 2,200 | | Rakuten Group, Inc. (Internet & Direct Marketing Retail) | | | 10 | |
| | | 3,300 | | Recruit Holdings Co. Ltd. (Professional Services) | | | 97 | |
| | | 2,700 | | Renesas Electronics Corp. (Semiconductors & Semiconductor Equipment)(a)(b) | | | 25 | |
| | | 5,200 | | Resona Holdings, Inc. (Banks) | | | 19 | |
| | | 1,600 | | Ricoh Co. Ltd. (Technology Hardware, Storage & Peripherals) | | | 13 | |
| | | 200 | | Rohm Co. Ltd. (Semiconductors & Semiconductor Equipment) | | | 14 | |
| | | 600 | | SBI Holdings, Inc. (Capital Markets) | | | 12 | |
| | | 300 | | SCSK Corp. (IT Services) | | | 5 | |
| | | 500 | | Secom Co. Ltd. (Commercial Services & Supplies) | | | 31 | |
| | | 600 | | Seiko Epson Corp. (Technology Hardware, Storage & Peripherals) | | | 8 | |
| | | 1,000 | | Sekisui Chemical Co. Ltd. (Household Durables) | | | 14 | |
| | | 1,600 | | Sekisui House Ltd. (Household Durables) | | | 28 | |
| | | 1,800 | | Seven & i Holdings Co. Ltd. (Food & Staples Retailing) | | | 70 | |
| | | 800 | | SG Holdings Co. Ltd. (Air Freight & Logistics) | | | 13 | |
| | | 500 | | Sharp Corp. (Household Durables)(a) | | | 4 | |
See accompanying notes to financial statements.
81
HC CAPITAL TRUST
The ESG Growth Portfolio
Portfolio of Investments (continued) — June 30, 2022
| | Shares | | Security Description | | Value
(000) | |
| | | | | Common Stocks (continued) |
| | | | | Japan (continued) |
| | | 500 | | Shimadzu Corp. (Electronic Equipment, Instruments & Components) | | $ | 16 | |
| | | 200 | | Shimano, Inc. (Leisure Products) | | | 34 | |
| | | 1,400 | | Shimizu Corp. (Construction & Engineering) | | | 8 | |
| | | 900 | | Shin-Etsu Chemical Co. Ltd. (Chemicals) | | | 102 | |
| | | 600 | | Shionogi & Co. Ltd. (Pharmaceuticals) | | | 30 | |
| | | 1,000 | | Shiseido Co. Ltd. (Personal Products) | | | 40 | |
| | | 100 | | SMC Corp. (Machinery) | | | 45 | |
| | | 6,900 | | Softbank Corp. (Wireless Telecommunication Services) | | | 77 | |
| | | 2,900 | | SoftBank Group Corp. (Wireless Telecommunication Services) | | | 112 | |
| | | 800 | | Sompo Holdings, Inc. (Insurance) | | | 35 | |
| | | 3,100 | | Sony Corp. (Household Durables) | | | 254 | |
| | | 200 | | Square Enix Holdings Co. Ltd. (Entertainment) | | | 9 | |
| | | 800 | | SUMCO Corp. (Semiconductors & Semiconductor Equipment)(a) | | | 10 | |
| | | 3,600 | | Sumitomo Chemical Co. Ltd. (Chemicals) | | | 14 | |
| | | 2,700 | | Sumitomo Corp. (Trading Companies & Distributors) | | | 37 | |
| | | 1,900 | | Sumitomo Electric Industries Ltd. (Auto Components) | | | 21 | |
| | | 600 | | Sumitomo Metal Mining Co. Ltd. (Metals & Mining) | | | 19 | |
| | | 3,200 | | Sumitomo Mitsui Financial Group, Inc. (Banks) | | | 95 | |
| | | 800 | | Sumitomo Mitsui Trust Holdings, Inc. (Banks) | | | 25 | |
| | | 700 | | Sumitomo Realty & Development Co. Ltd. (Real Estate Management & Development) | | | 18 | |
| | | 300 | | Suntory Beverage & Food Ltd. (Beverages) | | | 11 | |
| | | 400 | | Sysmex Corp. (Health Care Equipment & Supplies) | | | 24 | |
| | | 1,300 | | T&D Holdings, Inc. (Insurance) | | | 16 | |
| | | 500 | | Taisei Corp. (Construction & Engineering) | | | 16 | |
| | | 3,800 | | Takeda Pharmaceutical Co. Ltd. (Pharmaceuticals) | | | 107 | |
| | | 900 | | TDK Corp. (Electronic Equipment, Instruments & Components) | | | 28 | |
| | | 1,600 | | Terumo Corp. (Health Care Equipment & Supplies) | | | 48 | |
| | | 1,200 | | The Chiba Bank Ltd. (Banks) | | | 7 | |
| | | 1,800 | | The Kansai Electric Power Co., Inc. (Electric Utilities) | | | 18 | |
| | | 1,000 | | The Shizuoka Bank Ltd. (Banks) | | | 6 | |
| | | 500 | | TIS, Inc. (IT Services) | | | 13 | |
| | | 500 | | Tobu Railway Co. Ltd. (Road & Rail) | | | 11 | |
| | | 300 | | Toho Co. Ltd. (Entertainment) | | | 11 | |
| | | 1,500 | | Tokio Marine Holdings, Inc. (Insurance) | | | 87 | |
| | Shares | | Security Description | | Value
(000) | |
| | | | | Japan (continued) |
| | | 400 | | Tokyo Electron Ltd. (Semiconductors & Semiconductor Equipment) | | $ | 131 | |
| | | 1,000 | | Tokyo Gas Co. Ltd. (Gas Utilities) | | | 21 | |
| | | 1,300 | | Tokyu Corp. (Road & Rail) | | | 15 | |
| | | 600 | | TOPPAN, Inc. (Commercial Services & Supplies) | | | 10 | |
| | | 3,400 | | Toray Industries, Inc. (Chemicals) | | | 19 | |
| | | 1,000 | | Toshiba Corp. (Industrial Conglomerates) | | | 41 | |
| | | 600 | | Tosoh Corp. (Chemicals) | | | 7 | |
| | | 300 | | TOTO Ltd. (Building Products) | | | 10 | |
| | | 300 | | Toyota Industries Corp. (Auto Components) | | | 19 | |
| | | 25,600 | | Toyota Motor Corp. (Automobiles) | | | 396 | |
| | | 500 | | Toyota Tsusho Corp. (Trading Companies & Distributors) | | | 16 | |
| | | 300 | | Trend Micro, Inc. (Software) | | | 15 | |
| | | 1,000 | | Unicharm Corp. (Household Products) | | | 33 | |
| | | 500 | | USS Co. Ltd. (Specialty Retail) | | | 9 | |
| | | 200 | | Welcia Holdings Co. Ltd. (Food & Staples Retailing) | | | 4 | |
| | | 500 | | West Japan Railway Co. (Road & Rail)(a) | | | 18 | |
| | | 300 | | Yakult Honsha Co. Ltd. (Food Products) | | | 17 | |
| | | 300 | | Yamaha Corp. (Leisure Products) | | | 12 | |
| | | 800 | | Yamaha Motor Co. Ltd. (Automobiles) | | | 15 | |
| | | 800 | | Yamato Holdings Co. Ltd. (Air Freight & Logistics) | | | 13 | |
| | | 600 | | Yaskawa Electric Corp. (Machinery) | | | 19 | |
| | | 600 | | Yokogawa Electric Corp. (Electronic Equipment, Instruments & Components) | | | 10 | |
| | | 6,700 | | Z Holdings Corp. (Interactive Media & Services) | | | 20 | |
| | | 300 | | ZOZO, Inc. (Internet & Direct Marketing Retail)(a) | | | 5 | |
| | | | | | | | 7,764 | |
| | | | | Jersey — 0.12% |
| | | 24,155 | | Glencore PLC (Metals & Mining)(a) | | | 131 | |
| | | 204 | | Novocure Ltd. (Health Care Equipment & Supplies)(b) | | | 14 | |
| | | 2,653 | | WPP PLC (Media) | | | 27 | |
| | | | | | | | 172 | |
| | | | | Liberia — 0.01% |
| | | 579 | | Royal Caribbean Cruises Ltd. (Hotels, Restaurants & Leisure)(b) | | | 20 | |
| | | | | Luxembourg — 0.05% |
| | | 1,541 | | ArcelorMittal SA (Metals & Mining) | | | 34 | |
| | | 330 | | Eurofins Scientific SE (Life Sciences Tools & Services) | | | 26 | |
| | | 1,138 | | Tenaris SA (Energy Equipment & Services) | | | 15 | |
| | | | | | | | 75 | |
See accompanying notes to financial statements.
82
HC CAPITAL TRUST
The ESG Growth Portfolio
Portfolio of Investments (continued) — June 30, 2022
| | Shares | | Security Description | | Value
(000) | |
| | | | | Common Stocks (continued) |
| | | | | Netherlands — 1.42% |
| | | 1,034 | | ABN AMRO Bank N.V. (Banks) | | $ | 12 | |
| | | 223 | | Adyen N.V. (IT Services)(a)(b) | | | 325 | |
| | | 4,449 | | AEGON N.V. (Insurance) | | | 19 | |
| | | 1,431 | | Airbus SE (Aerospace & Defense) | | | 139 | |
| | | 461 | | Akzo Nobel N.V. (Chemicals) | | | 30 | |
| | | 108 | | Argenx SE (Biotechnology)(b) | | | 40 | |
| | | 110 | | ASM International N.V. (Semiconductors & Semiconductor Equipment) | | | 28 | |
| | | 977 | | ASML Holding N.V. (Semiconductors & Semiconductor Equipment)(a) | | | 468 | |
| | | 2,515 | | CNH Industrial N.V. (Machinery) | | | 29 | |
| | | 214 | | Euronext N.V. (Capital Markets) | | | 17 | |
| | | 274 | | EXOR N.V. (Diversified Financial Services) | | | 17 | |
| | | 129 | | Heineken Holding N.V. (Beverages) | | | 9 | |
| | | 659 | | Heineken N.V. (Beverages) | | | 60 | |
| | | 131 | | IMCD NV (Trading Companies & Distributors)(a) | | | 18 | |
| | | 9,432 | | ING Groep N.V. (Banks) | | | 93 | |
| | | 175 | | JDE Peet’s N.V. (Food Products) | | | 5 | |
| | | 431 | | Just Eat Takeaway.com N.V. (Internet & Direct Marketing Retail)(b) | | | 7 | |
| | | 2,558 | | Koninklijke Ahold Delhaize N.V. (Food & Staples Retailing) | | | 67 | |
| | | 426 | | Koninklijke DSM N.V. (Chemicals) | | | 61 | |
| | | 6,568 | | Koninklijke KPN N.V. (Diversified Telecommunication Services) | | | 23 | |
| | | 2,335 | | Koninklijke Philips N.V. (Health Care Equipment & Supplies) | | | 50 | |
| | | 680 | | LyondellBasell Industries N.V., Class - A (Chemicals) | | | 59 | |
| | | 680 | | NN Group N.V. (Insurance) | | | 31 | |
| | | 619 | | NXP Semiconductors N.V. (Semiconductors & Semiconductor Equipment) | | | 92 | |
| | | 248 | | OCI N.V. (Chemicals)(a) | | | 8 | |
| | | 2,082 | | Prosus N.V. (Internet & Direct Marketing Retail)(a) | | | 136 | |
| | | 568 | | QIAGEN N.V. (Life Sciences Tools & Services)(b) | | | 27 | |
| | | 276 | | Randstad N.V. (Professional Services) | | | 13 | |
| | | 1,666 | | STMicroelectronics N.V. (Semiconductors & Semiconductor Equipment) | | | 52 | |
| | | 1,744 | | Universal Music Group N.V. (Entertainment) | | | 35 | |
| | | 654 | | Wolters Kluwer N.V. (Professional Services) | | | 63 | |
| | | | | | | | 2,033 | |
| | Shares | | Security Description | | Value
(000) | |
| | | | | New Zealand — 0.05% |
| | | 2,680 | | Auckland International Airport Ltd. (Transportation Infrastructure)(b) | | $ | 12 | |
| | | 1,455 | | Fisher & Paykel Healthcare Corp. Ltd. (Health Care Equipment & Supplies) | | | 19 | |
| | | 1,764 | | Mercury NZ Ltd. (Electric Utilities) | | | 6 | |
| | | 2,860 | | Meridian Energy Ltd. (Independent Power and Renewable Electricity Producers) | | | 8 | |
| | | 5,100 | | Spark New Zealand Ltd. (Diversified Telecommunication Services) | | | 15 | |
| | | 332 | | Xero Ltd. (Software)(b) | | | 18 | |
| | | | | | | | 78 | |
| | | | | Norway — 0.94% |
| | | 571 | | Adevinta ASA (Interactive Media & Services)(b) | | | 4 | |
| | | 763 | | Aker BP ASA (Oil, Gas & Consumable Fuels) | | | 27 | |
| | | 2,403 | | DNB Bank ASA (Banks) | | | 43 | |
| | | 33,166 | | Equinor ASA (Oil, Gas & Consumable Fuels) | | | 1,154 | |
| | | 485 | | Gjensidige Forsikring ASA (Insurance) | | | 10 | |
| | | 217 | | Kongsberg Gruppen ASA (Aerospace & Defense) | | | 8 | |
| | | 1,094 | | Mowi ASA (Food Products)(a) | | | 25 | |
| | | 2,954 | | Norsk Hydro ASA (Metals & Mining) | | | 17 | |
| | | 1,866 | | Orkla ASA (Food Products) | | | 15 | |
| | | 134 | | Salmar ASA (Food Products) | | | 9 | |
| | | 1,828 | | Telenor ASA (Diversified Telecommunication Services) | | | 24 | |
| | | 438 | | Yara International ASA (Chemicals) | | | 18 | |
| | | | | | | | 1,354 | |
| | | | | Portugal — 0.04% |
| | | 6,487 | | EDP - Energias de Portugal SA (Electric Utilities) | | | 30 | |
| | | 1,241 | | Galp Energia SGPS SA, B Shares (Oil, Gas & Consumable Fuels)(a) | | | 15 | |
| | | 752 | | Jeronimo Martins SGPS, SA (Food & Staples Retailing)(a) | | | 16 | |
| | | | | | | | 61 | |
| | | | | Singapore — 0.29% |
| | | 8,441 | | Ascendas Real Estate Investment Trust (Equity Real Estate Investment Trusts) | | | 17 | |
| | | 12,356 | | CapitaLand Integrated Commercial Trust (Equity Real Estate Investment Trusts) | | | 19 | |
| | | 6,700 | | Capitaland Investment, Ltd. (Real Estate Management & Development) | | | 18 | |
| | | 1,000 | | City Developments Ltd. (Real Estate Management & Development) | | | 6 | |
| | | 4,361 | | DBS Group Holdings Ltd. (Banks) | | | 94 | |
| | | 15,700 | | Genting Singapore Ltd. (Hotels, Restaurants & Leisure) | | | 8 | |
| | | 1,880 | | Grab Holdings Ltd. (Road & Rail)(b) | | | 5 | |
See accompanying notes to financial statements.
83
HC CAPITAL TRUST
The ESG Growth Portfolio
Portfolio of Investments (continued) — June 30, 2022
| | Shares | | Security Description | | Value
(000) | |
| | | | | Common Stocks (continued) |
| | | | | Singapore (continued) |
| | | 4,100 | | Keppel Corp. Ltd. (Industrial Conglomerates) | | $ | 19 | |
| | | 5,600 | | Mapletree Commercial Trust (Equity Real Estate Investment Trusts) | | | 7 | |
| | | 6,014 | | Mapletree Logistics Trust (Equity Real Estate Investment Trusts) | | | 7 | |
| | | 8,090 | | Oversea-Chinese Banking Corp. Ltd. (Banks) | | | 66 | |
| | | 2,700 | | Singapore Airlines Ltd. (Airlines)(b) | | | 10 | |
| | | 2,000 | | Singapore Exchange Ltd. (Capital Markets) | | | 14 | |
| | | 2,100 | | Singapore Technologies Engineering Ltd. (Aerospace & Defense) | | | 6 | |
| | | 20,700 | | Singapore Telecommunications Ltd. (Diversified Telecommunication Services) | | | 38 | |
| | | 3,100 | | United Overseas Bank Ltd. (Banks) | | | 59 | |
| | | 1,000 | | United Overseas Land Group Ltd. (Real Estate Management & Development) | | | 5 | |
| | | 700 | | Venture Corp. Ltd. (Electronic Equipment, Instruments & Components) | | | 8 | |
| | | 5,000 | | Wilmar International Ltd. (Food Products) | | | 15 | |
| | | | | | | | 421 | |
| | | | | Spain — 0.59% |
| | | 48 | | Acciona SA (Electric Utilities) | | | 9 | |
| | | 329 | | ACS Actividades de Construccion y Servicios SA (Construction & Engineering) | | | 8 | |
| | | 171 | | Aena SME SA (Transportation Infrastructure)(b) | | | 22 | |
| | | 1,097 | | Amadeus IT Group SA (IT Services)(b) | | | 61 | |
| | | 16,116 | | Banco Bilbao Vizcaya Argentaria SA (Banks) | | | 73 | |
| | | 42,146 | | Banco Santander SA (Banks)(a) | | | 119 | |
| | | 11,788 | | CaixaBank SA (Banks) | | | 41 | |
| | | 1,212 | | Cellnex Telecom SA (Diversified Telecommunication Services) | | | 47 | |
| | | 703 | | EDP Renovaveis SA (Independent Power and Renewable Electricity Producers) | | | 17 | |
| | | 585 | | Enagas SA (Gas Utilities)(a) | | | 13 | |
| | | 802 | | Endesa SA (Electric Utilities) | | | 15 | |
| | | 1,187 | | Ferrovial SA (Construction & Engineering) | | | 30 | |
| | | 756 | | Grifols SA (Biotechnology)(b) | | | 14 | |
| | | 14,070 | | Iberdrola SA (Electric Utilities) | | | 145 | |
| | | 2,635 | | Industria de Diseno Textil SA (Specialty Retail) | | | 60 | |
| | | 491 | | Naturgy Energy Group SA (Gas Utilities) | | | 14 | |
| | | 1,081 | | Red Electrica Corp. SA (Electric Utilities) | | | 20 | |
| | | 3,642 | | Repsol SA (Oil, Gas & Consumable Fuels) | | | 54 | |
| | | 597 | | Siemens Gamesa Renewable Energy SA, Registered Shares (Electrical Equipment)(b) | | | 11 | |
| | | 13,517 | | Telefonica SA (Diversified Telecommunication Services) | | | 69 | |
| | | | | | | | 842 | |
| | | | | Sweden — 0.70% |
| | | 779 | | Alfa Laval AB (Machinery) | | | 19 | |
| | Shares | | Security Description | | Value
(000) | |
| | | | | Sweden (continued) |
| | | 2,440 | | Assa Abloy AB, B Shares (Building Products) | | $ | 52 | |
| | | 6,496 | | Atlas Copco AB, Class - A (Machinery)(b) | | | 62 | |
| | | 3,956 | | Atlas Copco AB, Class - B (Machinery)(b) | | | 33 | |
| | | 666 | | Boliden AB (Metals & Mining) | | | 21 | |
| | | 623 | | Electrolux AB, Class - B (Household Durables) | | | 8 | |
| | | 1,497 | | Embracer Group AB (Entertainment)(b) | | | 11 | |
| | | 1,637 | | Epiroc AB, Class - A (Machinery) | | | 25 | |
| | | 1,066 | | Epiroc AB, Class - B (Machinery) | | | 14 | |
| | | 721 | | Equities AB (Capital Markets) | | | 15 | |
| | | 1,541 | | Essity AB, Class - B (Household Products) | | | 40 | |
| | | 446 | | Evolution AB (Hotels, Restaurants & Leisure) | | | 41 | |
| | | 1,608 | | Fastighets AB Balder, B Shares (Real Estate Management & Development)(b) | | | 8 | |
| | | 571 | | Getinge AB, B Shares (Health Care Equipment & Supplies) | | | 13 | |
| | | 1,788 | | H & M Hennes & Mauritz AB, B Shares (Specialty Retail) | | | 21 | |
| | | 4,977 | | Hexagon AB, Class - B (Electronic Equipment, Instruments & Components) | | | 52 | |
| | | 172 | | Holmen AB, B Shares (Paper & Forest Products) | | | 7 | |
| | | 854 | | Husqvarna AB, B Shares (Machinery) | | | 6 | |
| | | 282 | | Industrivarden AB, A Shares (Diversified Financial Services)(a) | | | 6 | |
| | | 451 | | Industrivarden AB, Class - C (Diversified Financial Services) | | | 10 | |
| | | 508 | | Indutrade AB (Trading Companies & Distributors) | | | 9 | |
| | | 321 | | Investment AB Latour, Class - B (Industrial Conglomerates) | | | 6 | |
| | | 978 | | Investor AB, Class - A (Diversified Financial Services) | | | 18 | |
| | | 4,536 | | Investor AB, Class - B (Diversified Financial Services) | | | 76 | |
| | | 569 | | Kinnevik AB, Class - B (Diversified Financial Services)(b) | | | 9 | |
| | | 169 | | L E Lundbergforetagen AB, Class - B (Diversified Financial Services) | | | 7 | |
| | | 580 | | Lifco AB, Class - B (Industrial Conglomerates) | | | 9 | |
| | | 4,054 | | Nibe Industrier AB, Class - B (Building Products) | | | 30 | |
| | | 352 | | Sagax AB, Class - B (Real Estate Management & Development) | | | 6 | |
| | | 2,611 | | Sandvik AB (Machinery) | | | 42 | |
| | | 856 | | Securitas AB, Class - B (Commercial Services & Supplies) | | | 7 | |
| | | 1,234 | | Sinch AB (Software)(b) | | | 4 | |
| | | 4,127 | | Skandinaviska Enskilda Banken AB, Class - A (Banks) | | | 41 | |
See accompanying notes to financial statements.
84
HC CAPITAL TRUST
The ESG Growth Portfolio
Portfolio of Investments (continued) — June 30, 2022
| | Shares | | Security Description | | Value
(000) | |
| | | | | Common Stocks (continued) |
| | | | | Sweden (continued) |
| | | 933 | | Skanska AB, B Shares (Construction & Engineering) | | $ | 14 | |
| | | 888 | | SKF AB, B Shares (Machinery) | | | 13 | |
| | | 1,426 | | Svenska Cellulosa AB SCA, Class - B (Paper & Forest Products) | | | 21 | |
| | | 3,569 | | Svenska Handelsbanken AB, A Shares (Banks) | | | 31 | |
| | | 2,295 | | Swedbank AB, A Shares (Banks) | | | 29 | |
| | | 1,442 | | Tele2 AB, B Shares (Wireless Telecommunication Services) | | | 16 | |
| | | 7,063 | | Telefonaktiebolaget LM Ericsson, Class - B (Communications Equipment) | | | 54 | |
| | | 6,801 | | Telia Co. AB (Diversified Telecommunication Services)(a) | | | 26 | |
| | | 3,442 | | Volvo AB, B Shares (Machinery) | | | 54 | |
| | | 648 | | Volvo AB, Class - A (Machinery) | | | 10 | |
| | | 1,383 | | Volvo Car AB, Class - B (Automobiles)(b) | | | 9 | |
| | | | | | | | 1,005 | |
| | | | | Switzerland — 3.66% |
| | | 3,880 | | ABB Ltd., Registered Shares (Electrical Equipment) | | | 103 | |
| | | 371 | | Adecco Group AG (Professional Services)(a) | | | 13 | |
| | | 1,226 | | Alcon, Inc. (Health Care Equipment & Supplies) | | | 86 | |
| | | 75 | | Bachem Holding AG, Registered Shares (Life Sciences Tools & Services) | | | 5 | |
| | | 117 | | Baloise Holding AG, Registered Shares (Insurance) | | | 19 | |
| | | 8 | | Barry Callebaut AG, Registered Shares (Food Products)(a) | | | 18 | |
| | | 4 | | Chocoladefabriken Lindt & Spruengli AG (Food Products) | | | 41 | |
| | | 1,052 | | Chubb Ltd. (Insurance) | | | 207 | |
| | | 1,267 | | cie Financiere Richemont SA, Registered Shares (Textiles, Apparel & Luxury Goods) | | | 135 | |
| | | 541 | | Clariant AG, Registered Shares (Chemicals)(b) | | | 10 | |
| | | 520 | | Coca-Cola HBC AG (Beverages) | | | 12 | |
| | | 6,878 | | Credit Suisse Group AG, Registered Shares (Capital Markets) | | | 39 | |
| | | 14 | | EMS-Chemie Holding AG (Chemicals) | | | 10 | |
| | | 361 | | Garmin Ltd. (Household Durables) | | | 35 | |
| | | 90 | | Geberit AG, Registered Shares (Building Products) | | | 43 | |
| | | 22 | | Givaudan SA, Registered Shares (Chemicals) | | | 77 | |
| | | 1,325 | | Holcim Ltd., Registered Shares (Construction Materials)(a) | | | 57 | |
| | | 559 | | Julius Baer Group Ltd. (Capital Markets) | | | 26 | |
| | | 137 | | Kuehne & Nagel International AG, Registered Shares (Marine) | | | 32 | |
| | Shares | | Security Description | | Value
(000) | |
| | | | | Switzerland (continued) |
| | | 392 | | Logitech International SA, Registered Shares (Technology Hardware, Storage & Peripherals) | | $ | 20 | |
| | | 181 | | Lonza Group AG, Registered Shares (Life Sciences Tools & Services)(a) | | | 97 | |
| | | 6,858 | | Nestle SA, Registered Shares (Food Products) | | | 801 | |
| | | 5,341 | | Novartis AG, Registered Shares (Pharmaceuticals) | | | 452 | |
| | | 53 | | Partners Group Holding AG (Capital Markets) | | | 48 | |
| | | 6,024 | | Roche Holding AG (Pharmaceuticals) | | | 2,011 | |
| | | 75 | | Roche Holding AG (Pharmaceuticals) | | | 29 | |
| | | 102 | | Schindler Holding AG (Machinery) | | | 19 | |
| | | 50 | | Schindler Holding AG, Registered Shares (Machinery) | | | 9 | |
| | | 15 | | SGS SA, Registered Shares (Professional Services)(a) | | | 34 | |
| | | 345 | | Sika AG, Registered Shares (Chemicals)(a) | | | 80 | |
| | | 139 | | Sonova Holding AG, Registered Shares (Health Care Equipment & Supplies)(a) | | | 44 | |
| | | 260 | | Straumann Holding AG, Registered Shares (Health Care Equipment & Supplies) | | | 31 | |
| | | 77 | | Swiss Life Holding AG (Insurance) | | | 38 | |
| | | 190 | | Swiss Prime Site AG, Registered Shares (Real Estate Management & Development) | | | 17 | |
| | | 749 | | Swiss Re AG (Insurance) | | | 58 | |
| | | 66 | | Swisscom AG, Registered Shares (Diversified Telecommunication Services) | | | 36 | |
| | | 800 | | TE Connectivity Ltd. (Electronic Equipment, Instruments & Components) | | | 91 | |
| | | 164 | | Temenos AG, Registered Shares (Software) | | | 14 | |
| | | 108 | | The Swatch Group AG (Textiles, Apparel & Luxury Goods) | | | 5 | |
| | | 67 | | The Swatch Group AG, B Shares (Textiles, Apparel & Luxury Goods) | | | 16 | |
| | | 8,627 | | UBS Group AG (Capital Markets) | | | 139 | |
| | | 65 | | VAT Group AG (Machinery) | | | 15 | |
| | | 113 | | Vifor Pharma AG (Pharmaceuticals) | | | 20 | |
| | | 366 | | Zurich Financial Services AG (Insurance) | | | 159 | |
| | | | | | | | 5,251 | |
| | | | | Taiwan — 0.53% |
| | | 9,334 | | Taiwan Semiconductor Manufacturing Co. Ltd., ADR (Semiconductors & Semiconductor Equipment) | | | 763 | |
| | | | | United Arab Emirates — 0.00% |
| | | 339 | | NMC Health PLC (Health Care Providers & Services)(b)(c) | | | — | |
| | | | | United Kingdom — 4.93% |
| | | 2,438 | | 3i Group PLC (Capital Markets) | | | 33 | |
| | | 5,849 | | abrdn PLC (Diversified Financial Services) | | | 11 | |
See accompanying notes to financial statements.
85
HC CAPITAL TRUST
The ESG Growth Portfolio
Portfolio of Investments (continued) — June 30, 2022
| | Shares | | Security Description | | Value
(000) | |
| | | | | Common Stocks (continued) |
| | | | | United Kingdom (continued) |
| | | 496 | | Admiral Group PLC (Insurance)(a) | | $ | 14 | |
| | | 3,739 | | Amcor PLC (Containers & Packaging) | | | 46 | |
| | | 3,061 | | Anglo American PLC (Metals & Mining) | | | 109 | |
| | | 961 | | Antofagasta PLC (Metals & Mining) | | | 14 | |
| | | 517 | | Aon PLC, Class - A (Insurance) | | | 139 | |
| | | 651 | | Aptiv PLC (Auto Components)(b) | | | 58 | |
| | | 1,093 | | Ashtead Group PLC (Trading Companies & Distributors) | | | 46 | |
| | | 902 | | Associated British Foods PLC (Food Products) | | | 17 | |
| | | 3,767 | | AstraZeneca PLC (Pharmaceuticals)(a) | | | 495 | |
| | | 2,623 | | Auto Trader Group PLC (Interactive Media & Services)(a) | | | 18 | |
| | | 258 | | Aveva Group PLC (Software) | | | 7 | |
| | | 6,745 | | Aviva PLC (Insurance) | | | 33 | |
| | | 7,610 | | BAE Systems PLC (Aerospace & Defense) | | | 77 | |
| | | 40,207 | | Barclays PLC (Banks)(a) | | | 75 | |
| | | 2,421 | | Barratt Developments PLC (Household Durables)(a) | | | 13 | |
| | | 314 | | Berkeley Group Holdings PLC (Household Durables)(b) | | | 14 | |
| | | 46,981 | | BP PLC (Oil, Gas & Consumable Fuels) | | | 222 | |
| | | 2,489 | | British Land Co. PLC (Equity Real Estate Investment Trusts) | | | 14 | |
| | | 16,279 | | BT Group PLC (Diversified Telecommunication Services) | | | 37 | |
| | | 886 | | Bunzl PLC (Trading Companies & Distributors) | | | 29 | |
| | | 1,017 | | Burberry Group PLC (Textiles, Apparel & Luxury Goods)(a) | | | 20 | |
| | | 861 | | Clarivate PLC (Professional Services)(b) | | | 12 | |
| | | 530 | | Coca-Cola Europacific Partners PLC (Beverages) | | | 27 | |
| | | 4,480 | | Compass Group PLC (Hotels, Restaurants & Leisure) | | | 92 | |
| | | 4,236 | | Croda International PLC (Chemicals)(a) | | | 333 | |
| | | 5,525 | | Diageo PLC (Beverages) | | | 237 | |
| | | 550 | | Ferguson PLC (Trading Companies & Distributors) | | | 62 | |
| | | 12,229 | | GlaxoSmithKline PLC (Pharmaceuticals) | | | 263 | |
| | | 950 | | Halma PLC (Electronic Equipment, Instruments & Components) | | | 23 | |
| | | 823 | | Hargreaves Lansdown PLC (Capital Markets) | | | 8 | |
| | | 496 | | Hikma Pharmaceuticals PLC (Pharmaceuticals)(a) | | | 10 | |
| | | 48,816 | | HSBC Holdings PLC (Banks) | | | 318 | |
| | | 3,731 | | Informa PLC (Media)(b) | | | 24 | |
| | | 8,828 | | Intercontinental Hotels Group PLC (Hotels, Restaurants & Leisure) | | | 468 | |
| | | 405 | | Intertek Group PLC (Professional Services) | | | 21 | |
| | | 4,095 | | J Sainsbury PLC (Food & Staples Retailing) | | | 10 | |
| | Shares | | Security Description | | Value
(000) | |
| | | | | United Kingdom (continued) |
| | | 6,250 | | JD Sports Fashion PLC (Specialty Retail)(b) | | $ | 9 | |
| | | 474 | | Johnson Matthey PLC (Chemicals) | | | 11 | |
| | | 5,168 | | Kingfisher PLC (Specialty Retail) | | | 15 | |
| | | 1,659 | | Land Securities Group PLC (Equity Real Estate Investment Trusts) | | | 13 | |
| | | 194,459 | | Legal & General Group PLC (Insurance) | | | 567 | |
| | | 439 | | Liberty Global PLC, Class - A (Media)(b) | | | 9 | |
| | | 718 | | Liberty Global PLC, Class - C (Diversified Telecommunication Services)(b) | | | 16 | |
| | | 1,235 | | Linde PLC (Chemicals) | | | 355 | |
| | | 174,705 | | Lloyds Banking Group PLC (Banks) | | | 90 | |
| | | 793 | | London Stock Exchange Group PLC (Capital Markets)(a) | | | 74 | |
| | | 6,041 | | M&G PLC (Diversified Financial Services) | | | 14 | |
| | | 10,478 | | Melrose Industries PLC (Industrial Conglomerates) | | | 19 | |
| | | 1,214 | | Mondi PLC (Paper & Forest Products) | | | 21 | |
| | | 8,973 | | National Grid PLC (Multi-Utilities) | | | 115 | |
| | | 14,125 | | Natwest Group PLC (Banks)(a) | | | 38 | |
| | | 350 | | Next PLC (Multiline Retail) | | | 25 | |
| | | 1,147 | | Ocado Group PLC (Food & Staples Retailing)(a)(b) | | | 11 | |
| | | 1,722 | | Pearson PLC (Media) | | | 16 | |
| | | 795 | | Persimmon PLC (Household Durables) | | | 18 | |
| | | 1,175 | | Phoenix Group Holdings PLC (Insurance) | | | 8 | |
| | | 6,528 | | Prudential PLC (Insurance) | | | 81 | |
| | | 1,729 | | RecKitt Benckiser Group PLC (Household Products) | | | 130 | |
| | | 4,686 | | RELX PLC (Professional Services) | | | 127 | |
| | | 4,625 | | Rentokil Initial PLC (Commercial Services & Supplies) | | | 27 | |
| | | 2,735 | | Rio Tinto PLC (Metals & Mining) | | | 164 | |
| | | 20,995 | | Rolls-Royce Holdings PLC (Aerospace & Defense)(b) | | | 21 | |
| | | 325 | | Schroders PLC (Capital Markets) | | | 11 | |
| | | 3,088 | | Segro PLC (Equity Real Estate Investment Trusts) | | | 37 | |
| | | 377 | | Sensata Technologies Holding PLC (Electrical Equipment) | | | 16 | |
| | | 626 | | Severn Trent PLC (Water Utilities)(a) | | | 21 | |
| | | 18,353 | | Shell PLC (Oil, Gas & Consumable Fuels) | | | 477 | |
| | | 2,223 | | Smith & Nephew PLC (Health Care Equipment & Supplies) | | | 31 | |
| | | 939 | | Smiths Group PLC (Industrial Conglomerates) | | | 16 | |
| | | 184 | | Spirax-Sarco Engineering PLC (Machinery) | | | 22 | |
| | | 2,541 | | SSE PLC (Electric Utilities) | | | 50 | |
| | | 21,298 | | St. James Place PLC (Capital Markets) | | | 286 | |
| | | 6,902 | | Standard Chartered PLC (Banks) | | | 52 | |
| | | 4,956 | | Stellantis N.V. (Automobiles) | | | 61 | |
See accompanying notes to financial statements.
86
HC CAPITAL TRUST
The ESG Growth Portfolio
Portfolio of Investments (continued) — June 30, 2022
| | Shares | | Security Description | | Value
(000) | |
| | | | | Common Stocks (continued) |
| | | | | United Kingdom (continued) |
| | | 7,703 | | Taylor Wimpey PLC (Household Durables)(a) | | $ | 11 | |
| | | 18,103 | | Tesco PLC (Food & Staples Retailing) | | | 56 | |
| | | 2,722 | | The Sage Group PLC (Software) | | | 21 | |
| | | 6,205 | | Unilever PLC (Personal Products) | | | 281 | |
| | | 1,702 | | United Utilities Group PLC (Water Utilities) | | | 21 | |
| | | 66,705 | | Vodafone Group PLC (Wireless Telecommunication Services) | | | 103 | |
| | | 468 | | Whitbread PLC (Hotels, Restaurants & Leisure) | | | 14 | |
| | | 275 | | Willis Towers Watson PLC (Insurance) | | | 54 | |
| | | | | | | | 7,084 | |
| | | | | United States — 65.32% |
| | | 1,377 | | 3M Co. (Industrial Conglomerates) | | | 178 | |
| | | 352 | | A.O. Smith Corp. (Building Products) | | | 19 | |
| | | 4,288 | | Abbott Laboratories (Health Care Equipment & Supplies) | | | 466 | |
| | | 4,329 | | AbbVie, Inc. (Biotechnology) | | | 663 | |
| | | 110 | | Abiomed, Inc. (Health Care Equipment & Supplies)(b) | | | 27 | |
| | | 1,528 | | Accenture PLC, Class - A (IT Services) | | | 424 | |
| | | 1,897 | | Activision Blizzard, Inc. (Entertainment) | | | 148 | |
| | | 1,161 | | Adobe, Inc. (Software)(b) | | | 425 | |
| | | 160 | | Advance Auto Parts, Inc. (Specialty Retail) | | | 28 | |
| | | 4,029 | | Advanced Micro Devices, Inc. (Semiconductors & Semiconductor Equipment)(b) | | | 308 | |
| | | 1,458 | | Aflac, Inc. (Insurance) | | | 81 | |
| | | 747 | | Agilent Technologies, Inc. (Life Sciences Tools & Services) | | | 89 | |
| | | 547 | | Air Products & Chemicals, Inc. (Chemicals) | | | 132 | |
| | | 412 | | Akamai Technologies, Inc. (IT Services)(b) | | | 38 | |
| | | 281 | | Albemarle Corp. (Chemicals) | | | 59 | |
| | | 433 | | Alcoa Corp. (Metals & Mining) | | | 20 | |
| | | 357 | | Alexandria Real Estate Equities, Inc. (Equity Real Estate Investment Trusts) | | | 52 | |
| | | 181 | | Align Technology, Inc. (Health Care Equipment & Supplies)(b) | | | 43 | |
| | | 34 | | Alleghany Corp. (Insurance)(b) | | | 28 | |
| | | 624 | | Alliant Energy Corp. (Electric Utilities) | | | 37 | |
| | | 918 | | Ally Financial, Inc. (Consumer Finance) | | | 31 | |
| | | 293 | | Alnylam Pharmaceuticals, Inc. (Biotechnology)(b) | | | 43 | |
| | | 1,473 | | Alphabet, Inc., Class - A (Interactive Media & Services)(b) | | | 3,208 | |
| | | 688 | | Alphabet, Inc., Class - C (Interactive Media & Services)(b) | | | 1,504 | |
| | | 32,060 | | Amazon.com, Inc. (Internet & Direct Marketing Retail)(b) | | | 3,404 | |
| | Shares | | Security Description | | Value
(000) | |
| | | | | United States (continued) |
| | | 1,223 | | AMC Entertainment Holdings, Inc. (Entertainment)(b) | | $ | 17 | |
| | | 22 | | AMERCO (Road & Rail) | | | 11 | |
| | | 628 | | Ameren Corp. (Multi-Utilities) | | | 57 | |
| | | 1,229 | | American Electric Power Company, Inc. (Electric Utilities) | | | 118 | |
| | | 1,597 | | American Express Co. (Consumer Finance) | | | 221 | |
| | | 651 | | American Homes 4 Rent, Class - A (Equity Real Estate Investment Trusts) | | | 23 | |
| | | 2,083 | | American International Group, Inc. (Insurance) | | | 107 | |
| | | 1,114 | | American Tower Corp. (Equity Real Estate Investment Trusts) | | | 285 | |
| | | 441 | | American Water Works Co., Inc. (Water Utilities) | | | 66 | |
| | | 286 | | Ameriprise Financial, Inc. (Capital Markets) | | | 68 | |
| | | 394 | | AmerisourceBergen Corp. (Health Care Providers & Services) | | | 56 | |
| | | 2,759 | | Amgen, Inc. (Biotechnology) | | | 672 | |
| | | 1,444 | | Amphenol Corp., Class - A (Electronic Equipment, Instruments & Components) | | | 93 | |
| | | 1,296 | | Analog Devices, Inc. (Semiconductors & Semiconductor Equipment) | | | 189 | |
| | | 3,608 | | Annaly Capital Management, Inc. (Mortgage Real Estate Investment Trusts) | | | 21 | |
| | | 215 | | ANSYS, Inc. (Software)(b) | | | 51 | |
| | | 827 | | APA Corp. (Oil, Gas & Consumable Fuels) | | | 29 | |
| | | 39,724 | | Apple, Inc. (Technology Hardware, Storage & Peripherals) | | | 5,430 | |
| | | 2,178 | | Applied Materials, Inc. (Semiconductors & Semiconductor Equipment) | | | 198 | |
| | | 597 | | Aramark (Hotels, Restaurants & Leisure) | | | 18 | |
| | | 1,364 | | Archer-Daniels-Midland Co. (Food Products) | | | 106 | |
| | | 580 | | Arista Networks, Inc. (Communications Equipment)(b) | | | 54 | |
| | | 181 | | Arrow Electronics, Inc. (Electronic Equipment, Instruments & Components)(b) | | | 20 | |
| | | 527 | | Arthur J. Gallagher & Co. (Insurance) | | | 86 | |
| | | 147 | | Assurant, Inc. (Insurance) | | | 25 | |
| | | 17,298 | | AT&T, Inc. (Diversified Telecommunication Services) | | | 363 | |
| | | 304 | | Atmos Energy Corp. (Gas Utilities) | | | 34 | |
| | | 533 | | Autodesk, Inc. (Software)(b) | | | 92 | |
| | | 1,047 | | Automatic Data Processing, Inc. (IT Services) | | | 220 | |
| | | 473 | | AutoZone, Inc. (Specialty Retail)(b) | | | 1,016 | |
| | | 210 | | Avalara, Inc. (Software)(b) | | | 15 | |
| | | 346 | | AvalonBay Communities, Inc. (Equity Real Estate Investment Trusts) | | | 67 | |
| | | 1,324 | | Avantor, Inc. (Life Sciences Tools & Services)(b) | | | 41 | |
| | | 211 | | Avery Dennison Corp. (Containers & Packaging) | | | 34 | |
See accompanying notes to financial statements.
87
HC CAPITAL TRUST
The ESG Growth Portfolio
Portfolio of Investments (continued) — June 30, 2022
| | Shares | | Security Description | | Value
(000) | |
| | | | | Common Stocks (continued) |
| | | | | United States (continued) |
| | | 2,288 | | Baker Hughes, Inc. (Energy Equipment & Services) | | $ | 66 | |
| | | 826 | | Ball Corp. (Containers & Packaging) | | | 57 | |
| | | 17,525 | | Bank of America Corp. (Banks) | | | 546 | |
| | | 646 | | Bath & Body Works, Inc. (Specialty Retail) | | | 17 | |
| | | 700 | | Bausch Health Companies, Inc. (Pharmaceuticals)(b) | | | 6 | |
| | | 1,224 | | Baxter International, Inc. (Health Care Equipment & Supplies) | | | 79 | |
| | | 691 | | Becton Dickinson & Co. (Health Care Equipment & Supplies) | | | 170 | |
| | | 420 | | Bentley Systems, Inc., Class - B (Software) | | | 14 | |
| | | 3,136 | | Berkshire Hathaway, Inc., Class - B (Diversified Financial Services)(b) | | | 856 | |
| | | 559 | | Best Buy Co., Inc. (Specialty Retail) | | | 36 | |
| | | 188 | | Bill.com Holdings, Inc. (Software)(b) | | | 21 | |
| | | 366 | | Biogen, Inc. (Biotechnology)(b) | | | 75 | |
| | | 458 | | BioMarin Pharmaceutical, Inc. (Biotechnology)(b) | | | 38 | |
| | | 47 | | Bio-Rad Laboratories, Inc., Class - A (Life Sciences Tools & Services)(b) | | | 23 | |
| | | 87 | | Bio-Techne Corp. (Life Sciences Tools & Services) | | | 30 | |
| | | 378 | | Black Knight, Inc. (IT Services)(b) | | | 25 | |
| | | 368 | | BlackRock, Inc., Class - A (Capital Markets) | | | 224 | |
| | | 7,614 | | Blackstone, Inc., Class - A (Capital Markets) | | | 694 | |
| | | 1,270 | | Block, Inc. (IT Services)(b) | | | 78 | |
| | | 101 | | Booking Holdings, Inc. (Hotels, Restaurants & Leisure)(b) | | | 177 | |
| | | 354 | | Booz Allen Hamilton Holding Corp. (Professional Services) | | | 32 | |
| | | 595 | | BorgWarner, Inc. (Auto Components) | | | 20 | |
| | | 362 | | Boston Properties, Inc. (Equity Real Estate Investment Trusts) | | | 32 | |
| | | 3,476 | | Boston Scientific Corp. (Health Care Equipment & Supplies)(b) | | | 130 | |
| | | 5,279 | | Bristol-Myers Squibb Co. (Pharmaceuticals) | | | 406 | |
| | | 988 | | Broadcom, Inc. (Semiconductors & Semiconductor Equipment) | | | 480 | |
| | | 292 | | Broadridge Financial Solutions, Inc. (IT Services) | | | 42 | |
| | | 300 | | Brookfield Renewable Corp., Class - A (Independent Power and Renewable Electricity Producers)(a) | | | 11 | |
| | | 611 | | Brown & Brown, Inc. (Insurance) | | | 36 | |
| | | 787 | | Brown-Forman Corp., Class - B (Beverages) | | | 55 | |
| | | 169 | | Burlington Stores, Inc. (Specialty Retail)(b) | | | 23 | |
| | Shares | | Security Description | | Value
(000) | |
| | | | | United States (continued) |
| | | 341 | | C.H. Robinson Worldwide, Inc. (Air Freight & Logistics) | | $ | 35 | |
| | | 12 | | Cable One, Inc. (Media) | | | 15 | |
| | | 674 | | Cadence Design Systems, Inc. (Software)(b) | | | 101 | |
| | | 509 | | Caesars Entertainment, Inc. (Hotels, Restaurants & Leisure)(b) | | | 19 | |
| | | 252 | | Camden Property Trust (Equity Real Estate Investment Trusts) | | | 34 | |
| | | 423 | | Campbell Soup Co. (Food Products) | | | 20 | |
| | | 1,022 | | Capital One Financial Corp. (Consumer Finance) | | | 106 | |
| | | 746 | | Cardinal Health, Inc. (Health Care Providers & Services) | | | 39 | |
| | | 415 | | CarMax, Inc. (Specialty Retail)(b) | | | 38 | |
| | | 1,986 | | Carrier Global Corp. (Building Products) | | | 71 | |
| | | 431 | | Catalent, Inc. (Pharmaceuticals)(b) | | | 46 | |
| | | 1,293 | | Caterpillar, Inc. (Machinery) | | | 231 | |
| | | 283 | | CBOE Global Markets, Inc. (Capital Markets) | | | 32 | |
| | | 811 | | CBRE Group, Inc., Class - A (Real Estate Management & Development)(b) | | | 60 | |
| | | 338 | | CDW Corp. (Electronic Equipment, Instruments & Components) | | | 53 | |
| | | 280 | | Celanese Corp., Series A (Chemicals) | | | 33 | |
| | | 1,423 | | Centene Corp. (Health Care Providers & Services)(b) | | | 120 | |
| | | 1,460 | | CenterPoint Energy, Inc. (Multi-Utilities) | | | 43 | |
| | | 325 | | Ceridian HCM Holding, Inc. (Software)(b) | | | 15 | |
| | | 523 | | CF Industries Holdings, Inc. (Chemicals) | | | 45 | |
| | | 122 | | Charles River Laboratories International, Inc. (Life Sciences Tools & Services)(b) | | | 26 | |
| | | 578 | | Cheniere Energy, Inc. (Oil, Gas & Consumable Fuels) | | | 77 | |
| | | 4,718 | | Chevron Corp. (Oil, Gas & Consumable Fuels) | | | 683 | |
| | | 67 | | Chipotle Mexican Grill, Inc. (Hotels, Restaurants & Leisure)(b) | | | 88 | |
| | | 557 | | Church & Dwight Co., Inc. (Household Products) | | | 52 | |
| | | 804 | | Cigna Corp. (Health Care Providers & Services) | | | 212 | |
| | | 361 | | Cincinnati Financial Corp. (Insurance) | | | 43 | |
| | | 224 | | Cintas Corp. (Commercial Services & Supplies) | | | 84 | |
| | | 10,064 | | Cisco Systems, Inc. (Communications Equipment) | | | 429 | |
| | | 4,856 | | Citigroup, Inc. (Banks) | | | 223 | |
| | | 1,159 | | Citizens Financial Group, Inc. (Banks) | | | 41 | |
| | | 300 | | Citrix Systems, Inc. (Software) | | | 29 | |
| | | 1,262 | | Cleveland-Cliffs, Inc. (Metals & Mining)(b) | | | 19 | |
| | | 643 | | Cloudflare, Inc., Class - A (Software)(b) | | | 28 | |
| | | 873 | | CME Group, Inc. (Capital Markets) | | | 179 | |
| | | 724 | | CMS Energy Corp. (Multi-Utilities) | | | 49 | |
See accompanying notes to financial statements.
88
HC CAPITAL TRUST
The ESG Growth Portfolio
Portfolio of Investments (continued) — June 30, 2022
| | Shares | | Security Description | | Value
(000) | |
| | | | | Common Stocks (continued) |
| | | | | United States (continued) |
| | | 430 | | Cognex Corp. (Electronic Equipment, Instruments & Components) | | $ | 18 | |
| | | 1,313 | | Cognizant Technology Solutions Corp. (IT Services) | | | 89 | |
| | | 302 | | Coinbase Global, Inc., Class - A (Capital Markets)(b) | | | 14 | |
| | | 1,956 | | Colgate-Palmolive Co. (Household Products) | | | 157 | |
| | | 11,031 | | Comcast Corp., Class - A (Media) | | | 433 | |
| | | 1,241 | | Conagra Brands, Inc. (Food Products) | | | 42 | |
| | | 3,148 | | ConocoPhillips (Oil, Gas & Consumable Fuels) | | | 283 | |
| | | 876 | | Consolidated Edison, Inc. (Multi-Utilities) | | | 83 | |
| | | 407 | | Constellation Brands, Inc., Class - A (Beverages) | | | 95 | |
| | | 776 | | Constellation Energy Corp. (Electric Utilities) | | | 44 | |
| | | 534 | | Copart, Inc. (Commercial Services & Supplies)(b) | | | 58 | |
| | | 1,975 | | Corning, Inc. (Electronic Equipment, Instruments & Components) | | | 62 | |
| | | 1,807 | | Corteva, Inc. (Chemicals) | | | 98 | |
| | | 1,081 | | Costco Wholesale Corp. (Food & Staples Retailing) | | | 518 | |
| | | 2,053 | | Coterra Energy, Inc. (Oil, Gas & Consumable Fuels) | | | 53 | |
| | | 178 | | Coupa Software, Inc. (Software)(b) | | | 10 | |
| | | 477 | | Crowdstrike Holdings, Inc., Class - A (Software)(b) | | | 80 | |
| | | 1,067 | | Crown Castle International Corp. (Equity Real Estate Investment Trusts) | | | 180 | |
| | | 342 | | Crown Holdings, Inc. (Containers & Packaging) | | | 32 | |
| | | 31,291 | | CSX Corp. (Road & Rail) | | | 909 | |
| | | 356 | | Cummins, Inc. (Machinery) | | | 69 | |
| | | 3,116 | | CVS Health Corp. (Health Care Providers & Services) | | | 289 | |
| | | 832 | | D.R. Horton, Inc. (Household Durables) | | | 55 | |
| | | 4,972 | | Danaher Corp. (Health Care Equipment & Supplies) | | | 1,260 | |
| | | 338 | | Darden Restaurants, Inc. (Hotels, Restaurants & Leisure) | | | 38 | |
| | | 546 | | Datadog, Inc., Class - A (Software)(b) | | | 52 | |
| | | 185 | | DaVita, Inc. (Health Care Providers & Services)(b) | | | 15 | |
| | | 708 | | Deere & Co. (Machinery) | | | 212 | |
| | | 702 | | DELL Technologies, Inc., Class - C (Technology Hardware, Storage & Peripherals) | | | 32 | |
| | | 418 | | Delta Air Lines, Inc. (Airlines)(b) | | | 12 | |
| | | 561 | | DENTSPLY SIRONA, Inc. (Health Care Equipment & Supplies) | | | 20 | |
| | Shares | | Security Description | | Value
(000) | |
| | | | | United States (continued) |
| | | 1,569 | | Devon Energy Corp. (Oil, Gas & Consumable Fuels) | | $ | 86 | |
| | | 944 | | Dexcom, Inc. (Health Care Equipment & Supplies)(b) | | | 70 | |
| | | 412 | | Diamondback Energy, Inc. (Oil, Gas & Consumable Fuels) | | | 50 | |
| | | 695 | | Digital Realty Trust, Inc. (Equity Real Estate Investment Trusts) | | | 90 | |
| | | 738 | | Discover Financial Services (Consumer Finance) | | | 70 | |
| | | 466 | | DocuSign, Inc. (Software)(b) | | | 27 | |
| | | 576 | | Dollar General Corp. (Multiline Retail) | | | 141 | |
| | | 565 | | Dollar Tree, Inc. (Multiline Retail)(b) | | | 88 | |
| | | 1,969 | | Dominion Energy, Inc. (Multi-Utilities) | | | 157 | |
| | | 99 | | Domino’s Pizza, Inc. (Hotels, Restaurants & Leisure) | | | 39 | |
| | | 504 | | DoorDash, Inc., Class - A (Internet & Direct Marketing Retail)(b) | | | 32 | |
| | | 350 | | Dover Corp. (Machinery) | | | 42 | |
| | | 1,796 | | Dow, Inc. (Chemicals) | | | 93 | |
| | | 766 | | Dropbox, Inc., Class - A (Software)(b) | | | 16 | |
| | | 490 | | DTE Energy Co. (Multi-Utilities) | | | 62 | |
| | | 1,855 | | Duke Energy Corp. (Electric Utilities) | | | 199 | |
| | | 938 | | Duke Realty Corp. (Equity Real Estate Investment Trusts) | | | 52 | |
| | | 1,299 | | DuPont de Nemours, Inc. (Chemicals) | | | 72 | |
| | | 426 | | Dynatrace, Inc. (Software)(b) | | | 17 | |
| | | 304 | | Eastman Chemical Co. (Chemicals) | | | 27 | |
| | | 1,566 | | eBay, Inc. (Internet & Direct Marketing Retail) | | | 65 | |
| | | 624 | | Ecolab, Inc. (Chemicals) | | | 96 | |
| | | 915 | | Edison International (Electric Utilities) | | | 58 | |
| | | 1,510 | | Edwards Lifesciences Corp. (Health Care Equipment & Supplies)(b) | | | 144 | |
| | | 1,000 | | Elanco Animal Health, Inc. (Pharmaceuticals)(b) | | | 20 | |
| | | 699 | | Electronic Arts, Inc. (Entertainment) | | | 85 | |
| | | 582 | | Elevance Health, Inc. (Health Care Providers & Services) | | | 281 | |
| | | 1,979 | | Eli Lilly & Co. (Pharmaceuticals) | | | 642 | |
| | | 1,451 | | Emerson Electric Co. (Electrical Equipment) | | | 115 | |
| | | 315 | | Enphase Energy, Inc. (Semiconductors & Semiconductor Equipment)(b) | | | 62 | |
| | | 305 | | Entegris, Inc. (Semiconductors & Semiconductor Equipment) | | | 28 | |
| | | 508 | | Entergy Corp. (Electric Utilities) | | | 57 | |
| | | 1,408 | | EOG Resources, Inc. (Oil, Gas & Consumable Fuels) | | | 155 | |
| | | 139 | | EPAM Systems, Inc. (IT Services)(b) | | | 41 | |
| | | 825 | | EQT Corp. (Oil, Gas & Consumable Fuels) | | | 28 | |
| | | 296 | | Equifax, Inc. (Professional Services) | | | 54 | |
See accompanying notes to financial statements.
89
HC CAPITAL TRUST
The ESG Growth Portfolio
Portfolio of Investments (continued) — June 30, 2022
| | Shares | | Security Description | | Value
(000) | |
| | | | | Common Stocks (continued) |
| | | | | United States (continued) |
| | | 221 | | Equinix, Inc. (Equity Real Estate Investment Trusts) | | $ | 145 | |
| | | 940 | | Equitable Holdings, Inc. (Diversified Financial Services) | | | 25 | |
| | | 399 | | Equity Lifestyle Properties, Inc. (Equity Real Estate Investment Trusts) | | | 28 | |
| | | 881 | | Equity Residential (Equity Real Estate Investment Trusts) | | | 64 | |
| | | 63 | | Erie Indemnity Co., Class - A (Insurance) | | | 12 | |
| | | 545 | | Essential Utilities, Inc. (Water Utilities) | | | 25 | |
| | | 158 | | Essex Property Trust, Inc. (Equity Real Estate Investment Trusts) | | | 41 | |
| | | 309 | | Etsy, Inc. (Internet & Direct Marketing Retail)(b) | | | 23 | |
| | | 581 | | Evergy, Inc. (Electric Utilities) | | | 38 | |
| | | 842 | | Eversource Energy (Electric Utilities) | | | 71 | |
| | | 376 | | Exact Sciences Corp. (Biotechnology)(b) | | | 15 | |
| | | 2,361 | | Exelon Corp. (Electric Utilities) | | | 107 | |
| | | 347 | | Expedia Group, Inc. (Hotels, Restaurants & Leisure)(b) | | | 33 | |
| | | 434 | | Expeditors International of Washington, Inc. (Air Freight & Logistics) | | | 42 | |
| | | 327 | | Extra Space Storage, Inc. (Equity Real Estate Investment Trusts) | | | 56 | |
| | | 10,268 | | Exxon Mobil Corp. (Oil, Gas & Consumable Fuels) | | | 879 | |
| | | 153 | | F5, Inc. (Communications Equipment)(b) | | | 23 | |
| | | 96 | | FactSet Research Systems, Inc. (Capital Markets) | | | 37 | |
| | | 75 | | Fair Isaac Corp. (Software)(b) | | | 30 | |
| | | 1,398 | | Fastenal Co. (Trading Companies & Distributors) | | | 70 | |
| | | 618 | | FedEx Corp. (Air Freight & Logistics) | | | 140 | |
| | | 676 | | Fidelity National Financial, Inc. (Insurance) | | | 25 | |
| | | 1,510 | | Fidelity National Information Services, Inc. (IT Services) | | | 138 | |
| | | 1,665 | | Fifth Third Bancorp (Banks) | | | 56 | |
| | | 5,715 | | First Republic Bank (Banks) | | | 824 | |
| | | 1,378 | | FirstEnergy Corp. (Electric Utilities) | | | 53 | |
| | | 1,441 | | Fiserv, Inc. (IT Services)(b) | | | 128 | |
| | | 193 | | FleetCor Technologies, Inc. (IT Services)(b) | | | 41 | |
| | | 331 | | FMC Corp. (Chemicals) | | | 35 | |
| | | 1,720 | | Fortinet, Inc. (Software)(b) | | | 97 | |
| | | 18,829 | | Fortive Corp. (Machinery) | | | 1,024 | |
| | | 336 | | Fortune Brands Home & Security, Inc. (Building Products) | | | 20 | |
| | | 832 | | Fox Corp., Class - A (Media) | | | 27 | |
| | | 244 | | Fox Corp., Class - B (Media) | | | 7 | |
| | | 748 | | Franklin Resources, Inc. (Capital Markets) | | | 17 | |
| | | 3,696 | | Freeport-McMoRan, Inc. (Metals & Mining) | | | 108 | |
| | | 209 | | Gartner, Inc. (IT Services)(b) | | | 51 | |
| | Shares | | Security Description | | Value
(000) | |
| | | | | United States (continued) |
| | | 153 | | Generac Holdings, Inc. (Electrical Equipment)(b) | | $ | 32 | |
| | | 589 | | General Dynamics Corp. (Aerospace & Defense) | | | 130 | |
| | | 2,676 | | General Electric Co. (Industrial Conglomerates) | | | 170 | |
| | | 1,485 | | General Mills, Inc. (Food Products) | | | 112 | |
| | | 3,224 | | General Motors Co. (Automobiles)(b) | | | 102 | |
| | | 367 | | Genuine Parts Co. (Distributors) | | | 49 | |
| | | 3,055 | | Gilead Sciences, Inc. (Biotechnology) | | | 189 | |
| | | 728 | | Global Payments, Inc. (IT Services) | | | 81 | |
| | | 436 | | GoDaddy, Inc., Class - A (IT Services)(b) | | | 30 | |
| | | 208 | | Guidewire Software, Inc. (Software)(b) | | | 15 | |
| | | 2,310 | | Halliburton Co. (Energy Equipment & Services) | | | 72 | |
| | | 328 | | Hasbro, Inc. (Leisure Products) | | | 27 | |
| | | 612 | | HCA Healthcare, Inc. (Health Care Providers & Services) | | | 103 | |
| | | 1,356 | | Healthpeak Properties, Inc. (Equity Real Estate Investment Trusts) | | | 35 | |
| | | 100 | | HEICO Corp. (Aerospace & Defense) | | | 13 | |
| | | 183 | | HEICO Corp., Class - A (Aerospace & Defense) | | | 19 | |
| | | 370 | | Henry Schein, Inc. (Health Care Providers & Services)(b) | | | 28 | |
| | | 700 | | Hess Corp. (Oil, Gas & Consumable Fuels) | | | 74 | |
| | | 3,301 | | Hewlett Packard Enterprise Co. (Technology Hardware, Storage & Peripherals) | | | 44 | |
| | | 684 | | Hilton Worldwide Holdings, Inc. (Hotels, Restaurants & Leisure) | | | 76 | |
| | | 613 | | Hologic, Inc. (Health Care Equipment & Supplies)(b) | | | 42 | |
| | | 1,655 | | Honeywell International, Inc. (Industrial Conglomerates) | | | 288 | |
| | | 749 | | Hormel Foods Corp. (Food Products) | | | 35 | |
| | | 1,807 | | Host Hotels & Resorts, Inc. (Equity Real Estate Investment Trusts) | | | 28 | |
| | | 979 | | Howmet Aerospace, Inc. (Aerospace & Defense) | | | 31 | |
| | | 2,735 | | HP, Inc. (Technology Hardware, Storage & Peripherals) | | | 90 | |
| | | 106 | | HubSpot, Inc. (Software)(b) | | | 32 | |
| | | 321 | | Humana, Inc. (Health Care Providers & Services) | | | 150 | |
| | | 3,515 | | Huntington Bancshares, Inc. (Banks) | | | 42 | |
| | | 103 | | Huntington Ingalls Industries, Inc. (Aerospace & Defense) | | | 22 | |
| | | 142 | | IDEX Corp. (Machinery) | | | 26 | |
| | | 207 | | IDEXX Laboratories, Inc. (Health Care Equipment & Supplies)(b) | | | 73 | |
| | | 768 | | Illinois Tool Works, Inc. (Machinery) | | | 140 | |
| | | 367 | | Illumina, Inc. (Life Sciences Tools & Services)(b) | | | 68 | |
| | | 10,777 | | Incyte Corp. (Biotechnology)(b) | | | 819 | |
| | | 891 | | Ingersoll Rand, Inc. (Machinery) | | | 37 | |
See accompanying notes to financial statements.
90
HC CAPITAL TRUST
The ESG Growth Portfolio
Portfolio of Investments (continued) — June 30, 2022
| | Shares | | Security Description | | Value
(000) | |
| | | | | Common Stocks (continued) |
| | | | | United States (continued) |
| | | 158 | | Insulet Corp. (Health Care Equipment & Supplies)(b) | | $ | 34 | |
| | | 9,907 | | Intel Corp. (Semiconductors & Semiconductor Equipment) | | | 371 | |
| | | 1,375 | | Intercontinental Exchange, Inc. (Capital Markets) | | | 129 | |
| | | 2,182 | | International Business Machines Corp. (IT Services) | | | 308 | |
| | | 626 | | International Flavors & Fragrances, Inc. (Chemicals) | | | 75 | |
| | | 727 | | International Paper Co. (Containers & Packaging) | | | 30 | |
| | | 661 | | Intuit, Inc. (Software) | | | 255 | |
| | | 861 | | Intuitive Surgical, Inc. (Health Care Equipment & Supplies)(b) | | | 173 | |
| | | 1,407 | | Invitation Homes, Inc. (Equity Real Estate Investment Trusts) | | | 50 | |
| | | 468 | | IQVIA Holdings, Inc. (Life Sciences Tools & Services)(b) | | | 102 | |
| | | 722 | | Iron Mountain, Inc. (Equity Real Estate Investment Trusts) | | | 35 | |
| | | 196 | | Jack Henry & Associates, Inc. (IT Services) | | | 35 | |
| | | 299 | | Jacobs Engineering Group, Inc. (Professional Services) | | | 38 | |
| | | 152 | | Jazz Pharmaceuticals PLC (Pharmaceuticals)(b) | | | 24 | |
| | | 214 | | JB Hunt Transport Services, Inc. (Road & Rail) | | | 34 | |
| | | 6,377 | | Johnson & Johnson (Pharmaceuticals) | | | 1,132 | |
| | | 1,745 | | Johnson Controls International PLC (Building Products) | | | 84 | |
| | | 7,189 | | JPMorgan Chase & Co. (Banks) | | | 810 | |
| | | 661 | | Juniper Networks, Inc. (Communications Equipment) | | | 19 | |
| | | 653 | | Kellogg Co. (Food Products) | | | 47 | |
| | | 1,823 | | Keurig Dr Pepper, Inc. (Beverages) | | | 65 | |
| | | 2,368 | | KeyCorp (Banks) | | | 41 | |
| | | 447 | | Keysight Technologies, Inc. (Electronic Equipment, Instruments & Components)(b) | | | 62 | |
| | | 827 | | Kimberly-Clark Corp. (Household Products) | | | 112 | |
| | | 1,458 | | Kimco Realty Corp. (Equity Real Estate Investment Trusts) | | | 29 | |
| | | 4,978 | | Kinder Morgan, Inc. (Oil, Gas & Consumable Fuels) | | | 83 | |
| | | 1,264 | | KKR & Co., Inc. (Capital Markets) | | | 59 | |
| | | 377 | | KLA Corp. (Semiconductors & Semiconductor Equipment) | | | 120 | |
| | | 384 | | Knight-Swift Transportation Holdings, Inc. (Road & Rail) | | | 18 | |
| | | 467 | | L3Harris Technologies, Inc. (Aerospace & Defense) | | | 113 | |
| | Shares | | Security Description | | Value
(000) | |
| | | | | United States (continued) |
| | | 227 | | Laboratory Corporation of America Holdings (Health Care Providers & Services) | | $ | 53 | |
| | | 349 | | Lam Research Corp. (Semiconductors & Semiconductor Equipment) | | | 149 | |
| | | 882 | | Las Vegas Sands Corp. (Hotels, Restaurants & Leisure)(b) | | | 30 | |
| | | 147 | | Lear Corp. (Auto Components) | | | 19 | |
| | | 343 | | Leidos Holdings, Inc. (Professional Services) | | | 35 | |
| | | 653 | | Lennar Corp., Class - A (Household Durables) | | | 46 | |
| | | 87 | | Lennox International, Inc. (Building Products) | | | 18 | |
| | | 382 | | Liberty Broadband Corp., Class - C (Media)(b) | | | 44 | |
| | | 401 | | Lincoln National Corp. (Insurance) | | | 19 | |
| | | 382 | | Live Nation Entertainment, Inc. (Entertainment)(b) | | | 32 | |
| | | 744 | | LKQ Corp. (Distributors) | | | 37 | |
| | | 591 | | Lockheed Martin Corp. (Aerospace & Defense) | | | 254 | |
| | | 381 | | Loews Corp. (Insurance) | | | 23 | |
| | | 1,630 | | Lowe’s Companies, Inc. (Specialty Retail) | | | 285 | |
| | | 198 | | LPL Financial Holdings, Inc. (Capital Markets) | | | 37 | |
| | | 1,022 | | Lucid Group, Inc. (Automobiles)(b) | | | 18 | |
| | | 2,503 | | Lumen Technologies, Inc. (Diversified Telecommunication Services) | | | 27 | |
| | | 669 | | Lyft, Inc., Class - A (Road & Rail)(b) | | | 9 | |
| | | 420 | | M&T Bank Corp. (Banks) | | | 67 | |
| | | 1,663 | | Marathon Oil Corp. (Oil, Gas & Consumable Fuels) | | | 37 | |
| | | 1,381 | | Marathon Petroleum Corp. (Oil, Gas & Consumable Fuels) | | | 114 | |
| | | 33 | | Markel Corp. (Insurance)(b) | | | 43 | |
| | | 1,274 | | MarketAxess Holdings, Inc. (Capital Markets) | | | 326 | |
| | | 667 | | Marriott International, Inc., Class - A (Hotels, Restaurants & Leisure) | | | 91 | |
| | | 1,231 | | Marsh & McLennan Companies, Inc. (Insurance) | | | 191 | |
| | | 159 | | Martin Marietta Materials, Inc. (Construction Materials) | | | 48 | |
| | | 1,969 | | Marvell Technology, Inc. (Semiconductors & Semiconductor Equipment) | | | 86 | |
| | | 619 | | Masco Corp. (Building Products) | | | 31 | |
| | | 128 | | Masimo Corp. (Health Care Equipment & Supplies)(b) | | | 17 | |
| | | 2,131 | | MasterCard, Inc., Class - A (IT Services) | | | 672 | |
| | | 630 | | McCormick & Company, Inc. (Food Products) | | | 52 | |
| | | 1,802 | | McDonald’s Corp. (Hotels, Restaurants & Leisure) | | | 445 | |
| | | 388 | | McKesson Corp. (Health Care Providers & Services) | | | 127 | |
| | | 1,392 | | Medical Properties Trust, Inc. (Equity Real Estate Investment Trusts) | | | 21 | |
See accompanying notes to financial statements.
91
HC CAPITAL TRUST
The ESG Growth Portfolio
Portfolio of Investments (continued) — June 30, 2022
| | Shares | | Security Description | | Value
(000) | |
| | | | | Common Stocks (continued) |
| | | | | United States (continued) |
| | | 111 | | MercadoLibre, Inc. (Internet & Direct Marketing Retail)(b) | | $ | 71 | |
| | | 6,178 | | Merck & Co., Inc. (Pharmaceuticals) | | | 563 | |
| | | 1,681 | | MetLife, Inc. (Insurance) | | | 106 | |
| | | 58 | | Mettler-Toledo International, Inc. (Life Sciences Tools & Services)(b) | | | 67 | |
| | | 969 | | MGM Resorts International (Hotels, Restaurants & Leisure) | | | 28 | |
| | | 1,314 | | Microchip Technology, Inc. (Semiconductors & Semiconductor Equipment) | | | 76 | |
| | | 2,755 | | Micron Technology, Inc. (Semiconductors & Semiconductor Equipment) | | | 152 | |
| | | 23,433 | | Microsoft Corp. (Software) | | | 6,017 | |
| | | 291 | | Mid-America Apartment Communities, Inc. (Equity Real Estate Investment Trusts) | | | 51 | |
| | | 853 | | Moderna, Inc. (Biotechnology)(b) | | | 122 | |
| | | 144 | | Mohawk Industries, Inc. (Household Durables)(b) | | | 18 | |
| | | 139 | | Molina Heathcare, Inc. (Health Care Providers & Services)(b) | | | 39 | |
| | | 479 | | Molson Coors Beverage Co., Class - B (Beverages) | | | 26 | |
| | | 3,411 | | Mondelez International, Inc., Class - A (Food Products) | | | 212 | |
| | | 151 | | MongoDB, Inc. (IT Services)(b) | | | 39 | |
| | | 102 | | Monolithic Power Systems, Inc. (Semiconductors & Semiconductor Equipment) | | | 39 | |
| | | 410 | | Moody’s Corp. (Capital Markets) | | | 112 | |
| | | 3,295 | | Morgan Stanley (Capital Markets) | | | 251 | |
| | | 409 | | Motorola Solutions, Inc. (Communications Equipment) | | | 86 | |
| | | 272 | | Nasdaq, Inc. (Capital Markets) | | | 41 | |
| | | 576 | | NetApp, Inc. (Technology Hardware, Storage & Peripherals) | | | 38 | |
| | | 1,081 | | Netflix, Inc. (Entertainment)(b) | | | 189 | |
| | | 236 | | Neurocrine Biosciences, Inc. (Biotechnology)(b) | | | 23 | |
| | | 966 | | Newell Brands, Inc. (Household Durables) | | | 18 | |
| | | 1,981 | | Newmont Corp. (Metals & Mining) | | | 118 | |
| | | 4,822 | | NextEra Energy, Inc. (Electric Utilities) | | | 374 | |
| | | 3,137 | | NIKE, Inc., Class - B (Textiles, Apparel & Luxury Goods) | | | 321 | |
| | | 943 | | NiSource, Inc. (Multi-Utilities) | | | 28 | |
| | | 128 | | Nordson Corp. (Machinery) | | | 26 | |
| | | 559 | | Norfolk Southern Corp. (Road & Rail) | | | 127 | |
| | | 484 | | Northern Trust Corp. (Capital Markets) | | | 47 | |
| | Shares | | Security Description | | Value
(000) | |
| | | | | United States (continued) |
| | | 356 | | Northrop Grumman Corp. (Aerospace & Defense) | | $ | 170 | |
| | | 1,470 | | Nortonlifelock, Inc. (Software) | | | 32 | |
| | | 592 | | NRG Energy, Inc. (Electric Utilities) | | | 23 | |
| | | 689 | | Nucor Corp. (Metals & Mining) | | | 72 | |
| | | 9,667 | | NVIDIA Corp. (Semiconductors & Semiconductor Equipment) | | | 1,466 | |
| | | 8 | | NVR, Inc. (Household Durables)(b) | | | 32 | |
| | | 2,279 | | Occidental Petroleum Corp. (Oil, Gas & Consumable Fuels) | | | 134 | |
| | | 377 | | Okta, Inc. (IT Services)(b) | | | 34 | |
| | | 234 | | Old Dominion Freight Line, Inc. (Road & Rail) | | | 60 | |
| | | 555 | | Omnicom Group, Inc. (Media) | | | 35 | |
| | | 1,010 | | ON Semiconductor Corp. (Semiconductors & Semiconductor Equipment)(b) | | | 51 | |
| | | 1,109 | | ONEOK, Inc. (Oil, Gas & Consumable Fuels) | | | 62 | |
| | | 3,857 | | Oracle Corp. (Software) | | | 269 | |
| | | 1,007 | | Otis Worldwide Corp. (Machinery) | | | 71 | |
| | | 250 | | Owens Corning (Building Products) | | | 19 | |
| | | 836 | | PACCAR, Inc. (Machinery) | | | 69 | |
| | | 243 | | Packaging Corporation of America (Containers & Packaging) | | | 33 | |
| | | 243 | | Palo Alto Networks, Inc. (Software)(b) | | | 120 | |
| | | 1,495 | | Paramount Global, Class - B (Media) | | | 37 | |
| | | 311 | | Parker Hannifin Corp. (Machinery) | | | 77 | |
| | | 790 | | Paychex, Inc. (IT Services) | | | 90 | |
| | | 127 | | PAYCOM Software, Inc. (Software)(b) | | | 36 | |
| | | 2,717 | | PayPal Holdings, Inc. (IT Services)(b) | | | 190 | |
| | | 11,235 | | PepsiCo, Inc. (Beverages) | | | 1,871 | |
| | | 280 | | PerkinElmer, Inc. (Life Sciences Tools & Services) | | | 40 | |
| | | 3,595 | | PG&E Corp. (Electric Utilities)(b) | | | 36 | |
| | | 1,129 | | Phillips 66 (Oil, Gas & Consumable Fuels) | | | 93 | |
| | | 565 | | Pioneer Natural Resources Co. (Oil, Gas & Consumable Fuels) | | | 126 | |
| | | 1,248 | | Plug Power, Inc. (Electrical Equipment)(b) | | | 21 | |
| | | 975 | | PNC Financial Services Group, Inc. (Banks) | | | 154 | |
| | | 98 | | Pool Corp. (Distributors) | | | 34 | |
| | | 569 | | PPG Industries, Inc. (Chemicals) | | | 65 | |
| | | 1,723 | | PPL Corp. (Electric Utilities) | | | 47 | |
| | | 579 | | Principal Financial Group, Inc. (Insurance) | | | 39 | |
| | | 1,809 | | Prologis, Inc. (Equity Real Estate Investment Trusts) | | | 213 | |
| | | 863 | | Prudential Financial, Inc. (Insurance) | | | 83 | |
| | | 276 | | PTC, Inc. (Software)(b) | | | 29 | |
| | | 1,236 | | Public Service Enterprise Group, Inc. (Multi-Utilities) | | | 78 | |
See accompanying notes to financial statements.
92
HC CAPITAL TRUST
The ESG Growth Portfolio
Portfolio of Investments (continued) — June 30, 2022
| | Shares | | Security Description | | Value
(000) | |
| | | | | Common Stocks (continued) |
| | | | | United States (continued) |
| | | 386 | | Public Storage (Equity Real Estate Investment Trusts) | | $ | 121 | |
| | | 647 | | PulteGroup, Inc. (Household Durables) | | | 26 | |
| | | 274 | | Qorvo, Inc. (Semiconductors & Semiconductor Equipment)(b) | | | 26 | |
| | | 2,746 | | QUALCOMM, Inc. (Semiconductors & Semiconductor Equipment) | | | 351 | |
| | | 350 | | Quanta Services, Inc. (Construction & Engineering) | | | 44 | |
| | | 319 | | Quest Diagnostics, Inc. (Health Care Providers & Services) | | | 42 | |
| | | 471 | | Raymond James Financial, Inc. (Capital Markets) | | | 42 | |
| | | 3,677 | | Raytheon Technologies Corp. (Aerospace & Defense) | | | 353 | |
| | | 1,476 | | Realty Income Corp. (Equity Real Estate Investment Trusts) | | | 101 | |
| | | 373 | | Regency Centers Corp. (Equity Real Estate Investment Trusts) | | | 22 | |
| | | 267 | | Regeneron Pharmaceuticals, Inc. (Biotechnology)(b) | | | 158 | |
| | | 2,436 | | Regions Financial Corp. (Banks) | | | 46 | |
| | | 540 | | Republic Services, Inc. (Commercial Services & Supplies) | | | 71 | |
| | | 354 | | ResMed, Inc. (Health Care Equipment & Supplies) | | | 74 | |
| | | 179 | | RingCentral, Inc., Class - A (Software)(b) | | | 9 | |
| | | 475 | | Rivian Automotive, Inc., Class - A (Automobiles)(b) | | | 12 | |
| | | 298 | | Robert Half International, Inc. (Professional Services) | | | 22 | |
| | | 282 | | Rockwell Automation, Inc. (Electrical Equipment) | | | 56 | |
| | | 288 | | Roku, Inc. (Entertainment)(b) | | | 24 | |
| | | 474 | | Rollins, Inc. (Commercial Services & Supplies) | | | 17 | |
| | | 254 | | Roper Technologies, Inc. (Industrial Conglomerates) | | | 100 | |
| | | 862 | | Ross Stores, Inc. (Specialty Retail) | | | 61 | |
| | | 327 | | RPM International, Inc. (Chemicals) | | | 26 | |
| | | 856 | | S&P Global, Inc. (Capital Markets) | | | 289 | |
| | | 2,385 | | Salesforce, Inc. (Software)(b) | | | 394 | |
| | | 270 | | SBA Communications Corp. (Equity Real Estate Investment Trusts) | | | 86 | |
| | | 3,354 | | Schlumberger N.V. (Energy Equipment & Services) | | | 120 | |
| | | 332 | | Seagen, Inc. (Biotechnology)(b) | | | 59 | |
| | | 371 | | Sealed Air Corp. (Containers & Packaging) | | | 21 | |
| | | 766 | | Sempra Energy (Multi-Utilities) | | | 115 | |
| | Shares | | Security Description | | Value
(000) | |
| | | | | United States (continued) |
| | | 483 | | ServiceNow, Inc. (Software)(b) | | $ | 230 | |
| | | 815 | | Simon Property Group, Inc. (Equity Real Estate Investment Trusts) | | | 77 | |
| | | 1,436 | | Sirius XM Holdings, Inc. (Media) | | | 9 | |
| | | 402 | | Skyworks Solutions, Inc. (Semiconductors & Semiconductor Equipment) | | | 37 | |
| | | 2,657 | | Snap, Inc., Class - A (Interactive Media & Services)(b) | | | 35 | |
| | | 132 | | Snap-on, Inc. (Machinery) | | | 26 | |
| | | 513 | | Snowflake, Inc., Class - A (IT Services)(b) | | | 71 | |
| | | 410 | | Southwest Airlines Co. (Airlines)(b) | | | 15 | |
| | | 394 | | Splunk, Inc. (Software)(b) | | | 35 | |
| | | 388 | | Stanley Black & Decker, Inc. (Machinery) | | | 41 | |
| | | 2,775 | | Starbucks Corp. (Hotels, Restaurants & Leisure) | | | 212 | |
| | | 856 | | State Street Corp. (Capital Markets) | | | 53 | |
| | | 433 | | Steel Dynamics, Inc. (Metals & Mining) | | | 29 | |
| | | 281 | | Sun Communities, Inc. (Equity Real Estate Investment Trusts) | | | 45 | |
| | | 1,373 | | SVB Financial Group (Banks)(b) | | | 542 | |
| | | 1,295 | | Synchrony Financial (Consumer Finance) | | | 36 | |
| | | 371 | | Synopsys, Inc. (Software)(b) | | | 113 | |
| | | 1,248 | | Sysco Corp. (Food & Staples Retailing) | | | 106 | |
| | | 548 | | T. Rowe Price Group, Inc. (Capital Markets) | | | 62 | |
| | | 387 | | Take-Two Interactive Software, Inc. (Entertainment)(b) | | | 47 | |
| | | 560 | | Targa Resources Corp. (Oil, Gas & Consumable Fuels) | | | 33 | |
| | | 1,159 | | Target Corp. (Multiline Retail) | | | 164 | |
| | | 347 | | Teladoc Health, Inc. (Health Care Technology)(b) | | | 12 | |
| | | 131 | | Teledyne Technologies, Inc. (Electronic Equipment, Instruments & Components)(b) | | | 49 | |
| | | 118 | | Teleflex, Inc. (Health Care Equipment & Supplies) | | | 29 | |
| | | 356 | | Teradyne, Inc. (Semiconductors & Semiconductor Equipment) | | | 32 | |
| | | 2,139 | | Tesla, Inc. (Automobiles)(b) | | | 1,439 | |
| | | 2,248 | | Texas Instruments, Inc. (Semiconductors & Semiconductor Equipment) | | | 345 | |
| | | 551 | | Textron, Inc. (Aerospace & Defense) | | | 34 | |
| | | 1,676 | | The AES Corp. (Independent Power and Renewable Electricity Producers) | | | 35 | |
| | | 653 | | The Allstate Corp. (Insurance) | | | 83 | |
| | | 1,892 | | The Bank of New York Mellon Corp. (Capital Markets) | | | 79 | |
| | | 1,356 | | The Boeing Co. (Aerospace & Defense)(b) | | | 185 | |
| | | 303 | | The Carlyle Group, Inc. (Capital Markets) | | | 10 | |
| | | 15,507 | | The Charles Schwab Corp. (Capital Markets) | | | 980 | |
See accompanying notes to financial statements.
93
HC CAPITAL TRUST
The ESG Growth Portfolio
Portfolio of Investments (continued) — June 30, 2022
| | Shares | | Security Description | | Value
(000) | |
| | | | | Common Stocks (continued) |
| | | | | United States (continued) |
| | | 320 | | The Clorox Co. (Household Products) | | $ | 45 | |
| | | 10,025 | | The Coca-Cola Co. (Beverages) | | | 631 | |
| | | 126 | | The Cooper Companies, Inc. (Health Care Equipment & Supplies) | | | 39 | |
| | | 3,662 | | The Estee Lauder Companies, Inc. (Personal Products) | | | 932 | |
| | | 814 | | The Goldman Sachs Group, Inc. (Capital Markets) | | | 242 | |
| | | 870 | | The Hartford Financial Services Group, Inc. (Insurance) | | | 57 | |
| | | 358 | | The Hershey Co. (Food Products) | | | 77 | |
| | | 2,534 | | The Home Depot, Inc. (Specialty Retail) | | | 695 | |
| | | 935 | | The Interpublic Group of Companies, Inc. (Media) | | | 26 | |
| | | 238 | | The J.M. Smucker Co. (Food Products) | | | 30 | |
| | | 1,776 | | The Kraft Heinz Co. (Food Products) | | | 68 | |
| | | 1,752 | | The Kroger Co. (Food & Staples Retailing) | | | 83 | |
| | | 882 | | The Mosaic Co. (Chemicals) | | | 42 | |
| | | 5,827 | | The Procter & Gamble Co. (Household Products) | | | 838 | |
| | | 1,421 | | The Progressive Corp. (Insurance) | | | 165 | |
| | | 612 | | The Sherwin-Williams Co. (Chemicals) | | | 137 | |
| | | 2,569 | | The Southern Co. (Electric Utilities) | | | 183 | |
| | | 2,921 | | The TJX Companies, Inc. (Specialty Retail) | | | 163 | |
| | | 613 | | The Travelers Companies, Inc. (Insurance) | | | 104 | |
| | | 4,432 | | The Walt Disney Co. (Entertainment)(b) | | | 418 | |
| | | 1,057 | | The Western Union Co. (IT Services) | | | 17 | |
| | | 2,892 | | The Williams Companies, Inc. (Oil, Gas & Consumable Fuels) | | | 90 | |
| | | 958 | | Thermo Fisher Scientific, Inc. (Life Sciences Tools & Services) | | | 520 | |
| | | 9,896 | | T-Mobile US, Inc. (Wireless Telecommunication Services)(b) | | | 1,332 | |
| | | 280 | | Tractor Supply Co. (Specialty Retail) | | | 54 | |
| | | 239 | | Tradeweb Markets, Inc., Class - A (Capital Markets) | | | 16 | |
| | | 579 | | Trane Technologies PLC (Building Products) | | | 75 | |
| | | 129 | | TransDigm Group, Inc. (Aerospace & Defense)(b) | | | 69 | |
| | | 480 | | TransUnion (Professional Services) | | | 38 | |
| | | 628 | | Trimble, Inc. (Electronic Equipment, Instruments & Components)(b) | | | 37 | |
| | | 3,214 | | Truist Financial Corp. (Banks) | | | 152 | |
| | | 396 | | Twilio, Inc., Class - A (IT Services)(b) | | | 33 | |
| | | 1,981 | | Twitter, Inc. (Interactive Media & Services)(b) | | | 74 | |
| | | 99 | | Tyler Technologies, Inc. (Software)(b) | | | 33 | |
| | | 753 | | Tyson Foods, Inc., Class - A (Food Products) | | | 65 | |
| | | 3,445 | | U.S. Bancorp (Banks) | | | 159 | |
| | | 3,598 | | Uber Technologies, Inc. (Road & Rail)(b) | | | 74 | |
| | Shares | | Security Description | | Value
(000) | |
| | | | | United States (continued) |
| | | 748 | | UDR, Inc. (Equity Real Estate Investment Trusts) | | $ | 34 | |
| | | 502 | | UGI Corp. (Gas Utilities) | | | 19 | |
| | | 127 | | Ulta Beauty, Inc. (Specialty Retail)(b) | | | 49 | |
| | | 1,528 | | Union Pacific Corp. (Road & Rail) | | | 326 | |
| | | 1,789 | | United Parcel Service, Inc., Class - B (Air Freight & Logistics) | | | 327 | |
| | | 172 | | United Rentals, Inc. (Trading Companies & Distributors)(b) | | | 42 | |
| | | 6,041 | | UnitedHealth Group, Inc. (Health Care Providers & Services) | | | 3,101 | |
| | | 526 | | Unity Software, Inc. (Software)(b) | | | 19 | |
| | | 797 | | V.F. Corp. (Textiles, Apparel & Luxury Goods) | | | 35 | |
| | | 98 | | Vail Resorts, Inc. (Hotels, Restaurants & Leisure) | | | 21 | |
| | | 1,014 | | Valero Energy Corp. (Oil, Gas & Consumable Fuels) | | | 108 | |
| | | 333 | | Veeva Systems, Inc., Class - A (Health Care Technology)(b) | | | 66 | |
| | | 951 | | Ventas, Inc. (Equity Real Estate Investment Trusts) | | | 49 | |
| | | 244 | | VeriSign, Inc. (IT Services)(b) | | | 41 | |
| | | 372 | | Verisk Analytics, Inc., Class - A (Professional Services) | | | 64 | |
| | | 10,103 | | Verizon Communications, Inc. (Diversified Telecommunication Services) | | | 513 | |
| | | 633 | | Vertex Pharmaceuticals, Inc. (Biotechnology)(b) | | | 178 | |
| | | 3,079 | | Viatris, Inc. (Pharmaceuticals) | | | 32 | |
| | | 2,135 | | VICI Properties, Inc. (Equity Real Estate Investment Trusts) | | | 64 | |
| | | 3,996 | | Visa, Inc., Class - A (IT Services) | | | 787 | |
| | | 1,051 | | Vistra Corp. (Independent Power and Renewable Electricity Producers) | | | 24 | |
| | | 508 | | VMware, Inc., Class - A (Software) | | | 58 | |
| | | 338 | | Vulcan Materials Co. (Construction Materials) | | | 48 | |
| | | 550 | | W.R. Berkley Corp. (Insurance) | | | 38 | |
| | | 109 | | W.W. Grainger, Inc. (Trading Companies & Distributors) | | | 50 | |
| | | 1,782 | | Walgreens Boots Alliance, Inc. (Food & Staples Retailing) | | | 68 | |
| | | 3,727 | | Walmart, Inc. (Food & Staples Retailing) | | | 453 | |
| | | 5,366 | | Warner Bros. Discovery, Inc. (Entertainment)(b) | | | 72 | |
| | | 977 | | Waste Management, Inc. (Commercial Services & Supplies) | | | 149 | |
| | | 148 | | Waters Corp. (Life Sciences Tools & Services)(b) | | | 49 | |
| | | 174 | | Wayfair, Inc., Class - A (Internet & Direct Marketing Retail)(b) | | | 8 | |
| | | 383 | | Webster Financial Corp. (Banks) | | | 16 | |
| | | 793 | | WEC Energy Group, Inc. (Multi-Utilities) | | | 80 | |
| | | 9,187 | | Wells Fargo & Co. (Banks) | | | 360 | |
See accompanying notes to financial statements.
94
HC CAPITAL TRUST
The ESG Growth Portfolio
Portfolio of Investments (continued) — June 30, 2022
| | Shares | | Security Description | | Value
(000) | |
| | | | | Common Stocks (continued) |
| | | | | United States (continued) |
| | | 1,078 | | Welltower, Inc. (Equity Real Estate Investment Trusts) | | $ | 89 | |
| | | 180 | | West Pharmaceutical Services, Inc. (Health Care Equipment & Supplies) | | | 54 | |
| | | 722 | | Western Digital Corp. (Technology Hardware, Storage & Peripherals)(b) | | | 32 | |
| | | 459 | | Westinghouse Air Brake Technologies Corp. (Machinery) | | | 38 | |
| | | 649 | | WestRock Co. (Containers & Packaging) | | | 26 | |
| | | 1,901 | | Weyerhaeuser Co. (Equity Real Estate Investment Trusts) | | | 63 | |
| | | 151 | | Whirlpool Corp. (Household Durables) | | | 23 | |
| | | 461 | | Workday, Inc., Class - A (Software)(b) | | | 64 | |
| | | 439 | | WP Carey, Inc. (Equity Real Estate Investment Trusts) | | | 36 | |
| | | 240 | | Wynn Resorts Ltd. (Hotels, Restaurants & Leisure)(b) | | | 14 | |
| | | 1,316 | | Xcel Energy, Inc. (Electric Utilities) | | | 93 | |
| | | 459 | | Xylem, Inc. (Machinery) | | | 36 | |
| | | 727 | | YUM! Brands, Inc. (Hotels, Restaurants & Leisure) | | | 83 | |
| | | 127 | | Zebra Technologies Corp. (Electronic Equipment, Instruments & Components)(b) | | | 37 | |
| | | 285 | | Zendesk, Inc. (Software)(b) | | | 21 | |
| | | 570 | | Zillow Group, Inc., Class - C (Real Estate Management & Development)(b) | | | 18 | |
| | | 508 | | Zimmer Biomet Holdings, Inc. (Health Care Equipment & Supplies) | | | 53 | |
| | | 1,157 | | Zoetis, Inc. (Pharmaceuticals) | | | 199 | |
| | | 577 | | Zoom Video Communications, Inc., Class - A (Software)(b) | | | 62 | |
| | | 728 | | ZoomInfo Technologies, Inc. (Interactive Media & Services)(b) | | | 24 | |
| | | 199 | | Zscaler, Inc. (Software)(b) | | | 30 | |
| | | | | | | | 93,827 | |
| | | | | Total Common Stocks | | | 142,169 | |
| | Shares | | Security Description | | Value
(000) | |
| | | | | Preferred Stocks — 0.04% |
| | | | | Germany — 0.04% |
| | | 121 | | Bayerische Motoren Werke Aktiengesellschaft — Preferred (Automobiles)(d) | | $ | 9 | |
| | | 452 | | Henkel AG & Co. KGAA — Preferred (Household Products)(d) | | | 27 | |
| | | 65 | | Sartorius AG — Preferred (Health Care Equipment & Supplies) | | | 23 | |
| | | | | Total Preferred Stocks | | | 59 | |
| | | | | Investment Company — 0.42% |
| | | 606,007 | | State Street Institutional Treasury Plus Money Market Fund, Trust Class, 1.40%(e) | | | 606 | |
| | | | | Total Investment Company | | | 606 | |
| | | | | Total Investments (cost $119,843) — 99.43% | | | 142,834 | |
| | | | | Other assets in excess of liabilities — 0.57% | | | 826 | |
| | | | | Net Assets — 100.00% | | $ | 143,660 | |
Amounts designated as “—” are $0 or have been rounded to $0.
(a) | Represents a security purchased under Rule 144A or Section 4(2) and is exempt from registration under the Securities Act of 1933, as amended, or is otherwise restricted to resale. Certain of these securities may be resold in transactions exempt from registration, normally to qualified institutional buyers. These securities have been deemed liquid by the Specialist Manager. |
(b) | Represents non-income producing security. |
(c) | Security was valued using significant unobservable inputs as of June 30, 2022. |
(d) | A perpetual bond is one with no maturity date that pays a fixed interest rate until the bond insurance is terminated. |
(e) | Annualized 7-day yield as of period-end. |
ADR—American Depositary Receipt
REIT—Real Estate Investment Trust
See accompanying notes to financial statements.
95
HC CAPITAL TRUST
The ESG Growth Portfolio
Portfolio of Investments (concluded) — June 30, 2022
The following table reflects the percentage of total net assets of the Portfolio attributable to each Specialist Manager as of June 30, 2022.
| The ESG Growth Portfolio | | Mellon
Investments
Corporation | | | Parametric
Portfolio
Associates,
LLC | | | RBC Global
Asset
Management
(UK) Limited | | | Total | |
| Common Stocks | | | 80.14 | % | | | — | | | | 18.83 | % | | | 98.97 | % |
| Preferred Stocks | | | 0.04 | % | | | — | | | | — | | | | 0.04 | % |
| Investment Company | | | 0.06 | % | | | 0.36 | % | | | — | | | | 0.42 | % |
| Other Assets (Liabilities) | | | 0.23 | % | | | 0.11 | % | | | 0.23 | % | | | 0.57 | % |
| Total Net Assets | | | 80.47 | % | | | 0.47 | % | | | 19.06 | % | | | 100.00 | % |
Amounts designated as “—” indicate the Specialist Manager did not manage any holdings in that category.
The following table reflects the open derivative positions held by the Portfolio as of June 30, 2022.
Futures Contracts Purchased*
Description | | Number of
Contracts | | | Expiration
Date | | | Notional
Amount
(000) | | | Value and
Unrealized
Appreciation/
(Depreciation)
(000) | |
E-Mini S&P 500 Future | | | 1 | | | | 9/16/22 | | | $ | 189 | | | $ | 2 | |
MSCI EAFE Index Future | | | 3 | | | | 9/16/22 | | | | 279 | | | | (2 | ) |
| | | | | | | | | | | $ | 468 | | | $ | — | |
| | Total Unrealized Appreciation | | $ | 2 | |
| | Total Unrealized Depreciation | | | (2 | ) |
| | Total Net Unrealized Appreciation/(Depreciation) | | $ | — | |
* | Cash has been pledged as collateral for futures contracts held by the Portfolio. |
Amounts designated as “—” are $0 or have been rounded to $0.
See accompanying notes to financial statements.
96
HC CAPITAL TRUST
The Catholic SRI Growth Portfolio
Portfolio of Investments — June 30, 2022
| | Shares | | Security Description | | Value
(000) | |
| | | | | Common Stocks — 99.54% |
| | | | | Australia — 2.21% |
| | | 116 | | Ampol Ltd. (Oil, Gas & Consumable Fuels) | | $ | 3 | |
| | | 606 | | APA Group (Gas Utilities) | | | 5 | |
| | | 309 | | Aristocrat Leisure Ltd. (Hotels, Restaurants & Leisure) | | | 7 | |
| | | 102 | | ASX Ltd. (Capital Markets) | | | 6 | |
| | | 921 | | Aurizon Holdings Ltd. (Road & Rail) | | | 2 | |
| | | 1,464 | | Australia & New Zealand Banking Group Ltd. (Banks) | | | 22 | |
| | | 2,642 | | BHP Group Ltd. (Metals & Mining) | | | 74 | |
| | | 248 | | BlueScope Steel Ltd. (Metals & Mining) | | | 3 | |
| | | 759 | | Brambles Ltd. (Commercial Services & Supplies) | | | 6 | |
| | | 34 | | Cochlear Ltd. (Health Care Equipment & Supplies) | | | 5 | |
| | | 684 | | Coles Group Ltd. (Food & Staples Retailing) | | | 8 | |
| | | 893 | | Commonwealth Bank of Australia (Banks) | | | 55 | |
| | | 306 | | Computershare Ltd. (IT Services) | | | 5 | |
| | | 551 | | Dexus (Equity Real Estate Investment Trusts) | | | 3 | |
| | | 29 | | Domino’s Pizza Enterprises Ltd. (Hotels, Restaurants & Leisure) | | | 1 | |
| | | 679 | | Endeavour Group Ltd. (Food & Staples Retailing) | | | 4 | |
| | | 901 | | Evolution Mining Ltd. (Metals & Mining) | | | 1 | |
| | | 885 | | Fortescue Metals Group Ltd. (Metals & Mining) | | | 11 | |
| | | 878 | | Goodman Group (Equity Real Estate Investment Trusts) | | | 11 | |
| | | 115 | | IDP Education Ltd. (Diversified Consumer Services) | | | 2 | |
| | | 1,294 | | Insurance Australia Group Ltd. (Insurance) | | | 4 | |
| | | 364 | | LendLease Group (Real Estate Management & Development)(a) | | | 2 | |
| | | 185 | | Macquarie Group Ltd. (Capital Markets) | | | 21 | |
| | | 1,579 | | Medibank Private Ltd. (Insurance) | | | 4 | |
| | | 83 | | Mineral Resources Ltd. (Metals & Mining) | | | 3 | |
| | | 2,016 | | Mirvac Group (Equity Real Estate Investment Trusts) | | | 3 | |
| | | 1,662 | | National Australia Bank Ltd. (Banks) | | | 31 | |
| | | 472 | | Newcrest Mining Ltd. (Metals & Mining) | | | 7 | |
| | | 564 | | Northern Star Resources Ltd. (Metals & Mining) | | | 3 | |
| | | 193 | | Orica Ltd. (Chemicals) | | | 2 | |
| | | 906 | | Origin Energy Ltd. (Electric Utilities) | | | 4 | |
| | | 503 | | Qantas Airways Ltd. (Airlines)(b) | | | 2 | |
| | | 768 | | QBE Insurance Group Ltd. (Insurance) | | | 6 | |
| | | 29 | | REA Group Ltd. (Interactive Media & Services) | | | 2 | |
| | | 114 | | Reece Ltd. (Trading Companies & Distributors) | | | 1 | |
| | | 200 | | Rio Tinto Ltd. (Metals & Mining) | | | 14 | |
| | | 1,705 | | Santos Ltd. (Oil, Gas & Consumable Fuels)(a) | | | 9 | |
| | Shares | | Security Description | | Value
(000) | |
| | | | | Australia (continued) |
| | | 2,660 | | Scentre Group (Equity Real Estate Investment Trusts) | | $ | 5 | |
| | | 181 | | SEEK Ltd. (Interactive Media & Services) | | | 3 | |
| | | 239 | | Sonic Healthcare Ltd. (Health Care Providers & Services) | | | 5 | |
| | | 2,444 | | South32 Ltd. (Metals & Mining) | | | 7 | |
| | | 1,366 | | Stockland (Equity Real Estate Investment Trusts) | | | 3 | |
| | | 658 | | Suncorp Group Ltd. (Insurance) | | | 5 | |
| | | 2,120 | | Telstra Corp. Ltd. (Diversified Telecommunication Services) | | | 6 | |
| | | 912 | | The GPT Group (Equity Real Estate Investment Trusts) | | | 3 | |
| | | 1,118 | | The Lottery Corp. Ltd. (Hotels, Restaurants & Leisure)(b) | | | 3 | |
| | | 1,597 | | Transurban Group (Transportation Infrastructure) | | | 16 | |
| | | 413 | | Treasury Wine Estates Ltd. (Beverages) | | | 3 | |
| | | 2,104 | | Vicinity Centres (Equity Real Estate Investment Trusts)(a) | | | 3 | |
| | | 103 | | Washington H Soul Pattinson & Co. Ltd. (Oil, Gas & Consumable Fuels) | | | 2 | |
| | | 598 | | Wesfarmers Ltd. (Multiline Retail) | | | 17 | |
| | | 1,807 | | Westpac Banking Corp. (Banks) | | | 24 | |
| | | 84 | | WiseTech Global Ltd. (Software) | | | 2 | |
| | | 769 | | Woodside Energy Group Ltd. (Oil, Gas & Consumable Fuels) | | | 17 | |
| | | 217 | | Woodside Energy Group Ltd. (Oil, Gas & Consumable Fuels) | | | 5 | |
| | | 632 | | Woolworths Group Ltd. (Food & Staples Retailing) | | | 16 | |
| | | | | | | | 497 | |
| | | | | Austria — 0.05% |
| | | 175 | | Erste Group Bank AG (Banks)(a) | | | 5 | |
| | | 74 | | OMV AG (Oil, Gas & Consumable Fuels) | | | 3 | |
| | | 33 | | Verbund AG (Electric Utilities) | | | 3 | |
| | | 52 | | Voestalpine AG (Metals & Mining) | | | 1 | |
| | | | | | | | 12 | |
| | | | | Belgium — 0.27% |
| | | 91 | | Ageas SA (Insurance) | | | 4 | |
| | | 455 | | Anheuser-Busch InBev N.V. (Beverages) | | | 25 | |
| | | 14 | | D’ieteren Group (Distributors) | | | 2 | |
| | | 17 | | Elia Group SA (Electric Utilities)(a) | | | 2 | |
| | | 51 | | Groupe Bruxelles Lambert SA (Diversified Financial Services) | | | 4 | |
| | | 130 | | KBC Group N.V. (Banks) | | | 8 | |
| | | 71 | | Proximus SADP (Diversified Telecommunication Services) | | | 1 | |
| | | 9 | | Sofina SA (Diversified Financial Services) | | | 2 | |
| | | 38 | | Solvay SA, Class - A (Chemicals) | | | 3 | |
| | | 65 | | UCB SA (Pharmaceuticals) | | | 5 | |
See accompanying notes to financial statements.
97
HC CAPITAL TRUST
The Catholic SRI Growth Portfolio
Portfolio of Investments (continued) — June 30, 2022
| | Shares | | Security Description | | Value
(000) | |
| | | | | Common Stocks (continued) |
| | | | | Belgium (continued) |
| | | 108 | | Umicore SA (Chemicals)(a) | | $ | 4 | |
| | | 66 | | Warehouses De Pauw CVA (Equity Real Estate Investment Trusts)(a) | | | 2 | |
| | | | | | | | 62 | |
| | | | | Bermuda — 0.11% |
| | | 199 | | Arch Capital Group Ltd. (Insurance)(b) | | | 8 | |
| | | 73 | | Bunge Ltd. (Food Products) | | | 7 | |
| | | 20 | | Everest Re Group Ltd. (Insurance) | | | 6 | |
| | | 187 | | Invesco Ltd. (Capital Markets) | | | 3 | |
| | | | | | | | 24 | |
| | | | | Canada — 4.23% |
| | | 242 | | Agnico Eagle Mines Ltd. (Metals & Mining) | | | 11 | |
| | | 100 | | Air Canada (Airlines)(a)(b) | | | 1 | |
| | | 343 | | Algonquin Power & Utilities Corp. (Multi-Utilities) | | | 5 | |
| | | 445 | | Alimentation Couche-Tard, Inc. (Food & Staples Retailing) | | | 17 | |
| | | 144 | | AltaGas Ltd. (Gas Utilities) | | | 3 | |
| | | 359 | | ARC Resources Ltd. (Oil, Gas & Consumable Fuels) | | | 5 | |
| | | 336 | | Bank of Montreal (Banks) | | | 32 | |
| | | 939 | | Barrick Gold Corp. (Metals & Mining) | | | 17 | |
| | | 38 | | BCE, Inc. (Diversified Telecommunication Services) | | | 2 | |
| | | 251 | | Blackberry Ltd. (Software)(b) | | | 1 | |
| | | 741 | | Brookfield Asset Management, Inc. (Capital Markets) | | | 33 | |
| | | 23 | | BRP, Inc. (Leisure Products) | | | 1 | |
| | | 209 | | Cameco Corp. (Oil, Gas & Consumable Fuels) | | | 4 | |
| | | 50 | | Canadian Apartment Properties REIT (Equity Real Estate Investment Trusts)(a) | | | 2 | |
| | | 468 | | Canadian Imperial Bank of Commerce (Banks) | | | 23 | |
| | | 309 | | Canadian National Railway Co. (Road & Rail) | | | 35 | |
| | | 611 | | Canadian Natural Resources Ltd. (Oil, Gas & Consumable Fuels) | | | 33 | |
| | | 488 | | Canadian Pacific Railway Ltd. (Road & Rail) | | | 34 | |
| | | 31 | | Canadian Tire Corp. Ltd., Class - A (Multiline Retail) | | | 4 | |
| | | 49 | | Canadian Utilities Ltd., Class - A (Multi-Utilities) | | | 1 | |
| | | 81 | | CCL Industries, Inc. (Containers & Packaging)(a) | | | 4 | |
| | | 729 | | Cenovus Energy, Inc. (Oil, Gas & Consumable Fuels) | | | 14 | |
| | | 120 | | CGI, Inc. (IT Services)(b) | | | 10 | |
| | | 11 | | Constellation Software, Inc. (Software) | | | 16 | |
| | | 153 | | Dollarama, Inc. (Multiline Retail) | | | 9 | |
| | | 133 | | Emera, Inc. (Electric Utilities) | | | 6 | |
| | Shares | | Security Description | | Value
(000) | |
| | | | | Canada (continued) |
| | | 85 | | Empire Co. Ltd. (Food & Staples Retailing) | | $ | 3 | |
| | | 1,055 | | Enbridge, Inc. (Oil, Gas & Consumable Fuels) | | | 45 | |
| | | 13 | | Fairfax Financial Holdings Ltd. (Insurance) | | | 7 | |
| | | 310 | | First Quantum Minerals Ltd. (Metals & Mining) | | | 6 | |
| | | 20 | | FirstService Corp. (Real Estate Management & Development) | | | 2 | |
| | | 246 | | Fortis, Inc. (Electric Utilities) | | | 12 | |
| | | 101 | | Franco-Nevada Corp. (Metals & Mining) | | | 13 | |
| | | 40 | | George Weston Ltd. (Food & Staples Retailing) | | | 5 | |
| | | 83 | | GFL Environmental, Inc. (Commercial Services & Supplies) | | | 2 | |
| | | 101 | | Gildan Activewear, Inc. (Textiles, Apparel & Luxury Goods) | | | 3 | |
| | | 150 | | Great-West Lifeco, Inc. (Insurance) | | | 4 | |
| | | 166 | | Hydro One Ltd. (Electric Utilities)(a) | | | 4 | |
| | | 53 | | iA Financial Corp., Inc. (Insurance) | | | 3 | |
| | | 50 | | IGM Financial, Inc. (Capital Markets) | | | 1 | |
| | | 120 | | Imperial Oil Ltd. (Oil, Gas & Consumable Fuels) | | | 6 | |
| | | 92 | | Intact Financial Corp. (Insurance) | | | 13 | |
| | | 320 | | Ivanhoe Mines Ltd. (Metals & Mining)(b) | | | 2 | |
| | | 121 | | Keyera Corp. (Oil, Gas & Consumable Fuels)(a) | | | 3 | |
| | | 598 | | Kinross Gold Corp. (Metals & Mining) | | | 2 | |
| | | 66 | | Lightspeed Commerce, Inc. (Software)(b) | | | 1 | |
| | | 87 | | Loblaw Companies Ltd. (Food & Staples Retailing) | | | 8 | |
| | | 62 | | Lululemon Athletica, Inc. (Textiles, Apparel & Luxury Goods)(b) | | | 17 | |
| | | 340 | | Lundin Mining Corp. (Metals & Mining)(a) | | | 2 | |
| | | 150 | | Magna International, Inc. (Auto Components) | | | 8 | |
| | | 1,016 | | Manulife Financial Corp. (Insurance) | | | 18 | |
| | | 127 | | Metro, Inc. (Food & Staples Retailing) | | | 7 | |
| | | 174 | | National Bank of Canada (Banks) | | | 11 | |
| | | 118 | | Northland Power, Inc. (Independent Power and Renewable Electricity Producers) | | | 4 | |
| | | 287 | | Nutrien Ltd. (Chemicals) | | | 23 | |
| | | 32 | | Nuvei Corp. (IT Services)(b) | | | 1 | |
| | | 42 | | Onex Corp. (Diversified Financial Services) | | | 2 | |
| | | 135 | | Open Text Corp. (Software)(a) | | | 5 | |
| | | 111 | | Pan American Silver Corp. (Metals & Mining) | | | 2 | |
| | | 80 | | Parkland Corp. (Oil, Gas & Consumable Fuels)(a) | | | 2 | |
| | | 290 | | Pembina Pipelines Corp. (Oil, Gas & Consumable Fuels) | | | 10 | |
| | | 278 | | Power Corp. of Canada (Insurance) | | | 7 | |
| | | 78 | | Quebecor, Inc., Class - B (Media) | | | 2 | |
| | | 149 | | Restaurant Brands International, Inc. (Hotels, Restaurants & Leisure) | | | 7 | |
| | | 72 | | RioCan Real Estate Investment Trust (Equity Real Estate Investment Trusts)(a) | | | 1 | |
See accompanying notes to financial statements.
98
HC CAPITAL TRUST
The Catholic SRI Growth Portfolio
Portfolio of Investments (continued) — June 30, 2022
| | Shares | | Security Description | | Value
(000) | |
| | | | | Common Stocks (continued) |
| | | | | Canada (continued) |
| | | 63 | | Ritchie Bros. Auctioneers, Inc. (Commercial Services & Supplies) | | $ | 4 | |
| | | 186 | | Rogers Communications, Inc., Class - B (Wireless Telecommunication Services) | | | 9 | |
| | | 736 | | Royal Bank of Canada (Banks) | | | 70 | |
| | | 141 | | Saputo, Inc. (Food Products)(a) | | | 3 | |
| | | 237 | | Shaw Communications, Inc., Class - B (Media) | | | 7 | |
| | | 600 | | Shopify, Inc. (IT Services)(b) | | | 19 | |
| | | 310 | | Sun Life Financial, Inc. (Insurance) | | | 14 | |
| | | 744 | | Suncor Energy, Inc. (Oil, Gas & Consumable Fuels) | | | 26 | |
| | | 513 | | TC Energy Corp. (Oil, Gas & Consumable Fuels) | | | 27 | |
| | | 249 | | Teck Resources Ltd., Class - B (Metals & Mining) | | | 8 | |
| | | 234 | | TELUS Corp. (Diversified Telecommunication Services) | | | 5 | |
| | | 44 | | TFI International, Inc. (Road & Rail) | | | 4 | |
| | | 634 | | The Bank of Nova Scotia (Banks) | | | 38 | |
| | | 945 | | The Toronto-Dominion Bank (Banks) | | | 61 | |
| | | 90 | | Thomson Reuters Corp. (Professional Services) | | | 9 | |
| | | 28 | | TMX Group Ltd. (Capital Markets) | | | 3 | |
| | | 47 | | Toromont Industries Ltd. (Trading Companies & Distributors) | | | 4 | |
| | | 164 | | Tourmaline Oil Corp. (Oil, Gas & Consumable Fuels) | | | 9 | |
| | | 137 | | Waste Connections, Inc. (Commercial Services & Supplies) | | | 17 | |
| | | 49 | | West Fraser Timber Co. Ltd. (Paper & Forest Products) | | | 4 | |
| | | 240 | | Wheaton Precious Metals Corp. (Metals & Mining) | | | 9 | |
| | | 63 | | WSP Global, Inc. (Construction & Engineering)(a) | | | 7 | |
| | | | | | | | 954 | |
| | | | | China — 0.04% |
| | | 24 | | Futu Holdings Ltd., ADR (Capital Markets)(b) | | | 1 | |
| | | 100 | | Jardine Matheson Holdings Ltd. (Industrial Conglomerates) | | | 5 | |
| | | 1,000 | | SITC International Holdings Co. Ltd. (Marine) | | | 3 | |
| | | | | | | | 9 | |
| | | | | Denmark — 0.40% |
| | | 2 | | A.P. Moller - Maersk A/S, Class - A (Marine) | | | 5 | |
| | | 3 | | A.P. Moller - Maersk A/S, Class - B (Marine) | | | 7 | |
| | | 53 | | Carlsberg A/S, Class - B (Beverages) | | | 7 | |
| | | 55 | | Christian Hansen Holding A/S (Chemicals)(a) | | | 4 | |
| | | 62 | | Coloplast A/S, Class - B (Health Care Equipment & Supplies) | | | 7 | |
| | | 331 | | Danske Bank A/S (Banks) | | | 5 | |
| | Shares | | Security Description | | Value
(000) | |
| | | | | Denmark (continued) |
| | | 51 | | Demant A/S (Health Care Equipment & Supplies)(b) | | $ | 2 | |
| | | 102 | | DSV A/S (Road & Rail) | | | 15 | |
| | | 64 | | GN Store Nord A/S (Health Care Equipment & Supplies) | | | 2 | |
| | | 108 | | Novozymes A/S, B Shares (Chemicals) | | | 6 | |
| | | 100 | | Orsted A/S (Electric Utilities)(a) | | | 10 | |
| | | 50 | | Pandora A/S (Textiles, Apparel & Luxury Goods) | | | 3 | |
| | | 5 | | ROCKWOOL A/S, Class - B (Building Products) | | | 1 | |
| | | 192 | | Tryg A/S (Insurance)(a) | | | 4 | |
| | | 533 | | Vestas Wind Systems A/S (Electrical Equipment) | | | 11 | |
| | | | | | | | 89 | |
| | | | | Finland — 0.37% |
| | | 73 | | Elisa Oyj (Diversified Telecommunication Services) | | | 4 | |
| | | 234 | | Fortum Oyj (Electric Utilities) | | | 4 | |
| | | 138 | | Kesko Oyj, Class - B (Food & Staples Retailing) | | | 3 | |
| | | 182 | | Kone Oyj, Class - B (Machinery) | | | 9 | |
| | | 222 | | Neste Oyj (Oil, Gas & Consumable Fuels) | | | 10 | |
| | | 2,804 | | Nokia Oyj (Communications Equipment) | | | 13 | |
| | | 1,639 | | Nordea Bank Abp (Banks) | | | 14 | |
| | | 257 | | Sampo Oyj, Class - A (Insurance) | | | 11 | |
| | | 299 | | Stora Enso Oyj, Registered Shares (Paper & Forest Products) | | | 5 | |
| | | 275 | | UPM-Kymmene Oyj (Paper & Forest Products) | | | 8 | |
| | | 235 | | Wartsila Oyj Abp (Machinery) | | | 2 | |
| | | | | | | | 83 | |
| | | | | France — 2.89% |
| | | 84 | | Accor SA (Hotels, Restaurants & Leisure)(a)(b) | | | 2 | |
| | | 16 | | Aeroports de Paris (Transportation Infrastructure)(b) | | | 2 | |
| | | 271 | | Air Liquide SA (Chemicals) | | | 36 | |
| | | 160 | | Alstom SA (Machinery) | | | 4 | |
| | | 30 | | Amundi SA (Capital Markets) | | | 2 | |
| | | 31 | | Arkema SA (Chemicals) | | | 3 | |
| | | 1,016 | | AXA SA (Insurance) | | | 23 | |
| | | 23 | | BioMerieux (Health Care Equipment & Supplies) | | | 2 | |
| | | 586 | | BNP Paribas SA (Banks) | | | 28 | |
| | | 481 | | Bollore SA (Entertainment) | | | 2 | |
| | | 120 | | Bouygues SA (Construction & Engineering) | | | 4 | |
| | | 163 | | Bureau Veritas SA (Professional Services)(a) | | | 4 | |
| | | 84 | | Capgemini SE (IT Services) | | | 14 | |
| | | 320 | | Carrefour SA (Food & Staples Retailing)(a) | | | 6 | |
| | | 344 | | Cie Generale des Etablissements Michelin SCA (Auto Components) | | | 9 | |
| | | 255 | | Compagnie de Saint-Gobain (Building Products) | | | 11 | |
| | | 25 | | Covivio (Equity Real Estate Investment Trusts) | | | 1 | |
See accompanying notes to financial statements.
99
HC CAPITAL TRUST
The Catholic SRI Growth Portfolio
Portfolio of Investments (continued) — June 30, 2022
| | Shares | | Security Description | | Value
(000) | |
| | | | | Common Stocks (continued) |
| | | | | France (continued) |
| | | 622 | | Credit Agricole SA (Banks) | | $ | 6 | |
| | | 341 | | Danone SA (Food Products) | | | 19 | |
| | | 350 | | Dassault Systemes SE (Software) | | | 13 | |
| | | 132 | | Edenred (IT Services) | | | 6 | |
| | | 42 | | Eiffage SA (Construction & Engineering)(a) | | | 4 | |
| | | 322 | | Electricite de France SA (Electric Utilities) | | | 3 | |
| | | 955 | | Engie SA (Multi-Utilities) | | | 11 | |
| | | 154 | | EssilorLuxottica SA (Textiles, Apparel & Luxury Goods) | | | 23 | |
| | | 23 | | Eurazeo SE (Diversified Financial Services) | | | 1 | |
| | | 36 | | Gecina SA (Equity Real Estate Investment Trusts)(a) | | | 3 | |
| | | 218 | | Getlink SE (Transportation Infrastructure) | | | 4 | |
| | | 17 | | Hermes International (Textiles, Apparel & Luxury Goods) | | | 19 | |
| | | 18 | | Ipsen SA (Pharmaceuticals) | | | 2 | |
| | | 40 | | Kering SA (Textiles, Apparel & Luxury Goods) | | | 21 | |
| | | 107 | | Klepierre SA (Equity Real Estate Investment Trusts) | | | 2 | |
| | | 59 | | LA Francaise des Jeux SAEM (Hotels, Restaurants & Leisure) | | | 2 | |
| | | 139 | | Legrand SA (Electrical Equipment) | | | 10 | |
| | | 126 | | L’Oreal SA (Personal Products) | | | 43 | |
| | | 144 | | LVMH Moet Hennessy Louis Vuitton SE (Textiles, Apparel & Luxury Goods) | | | 89 | |
| | | 1,025 | | Orange SA (Diversified Telecommunication Services)(a) | | | 12 | |
| | | 108 | | Pernod Ricard SA (Beverages) | | | 20 | |
| | | 119 | | Publicis Groupe SA (Media) | | | 6 | |
| | | 11 | | Remy Cointreau SA (Beverages) | | | 2 | |
| | | 99 | | Renault SA (Automobiles)(b) | | | 2 | |
| | | 283 | | Schneider Electric SE (Electrical Equipment)(a) | | | 33 | |
| | | 16 | | SEB SA (Household Durables) | | | 2 | |
| | | 422 | | Societe Generale SA (Banks) | | | 9 | |
| | | 47 | | Sodexo SA (Hotels, Restaurants & Leisure) | | | 3 | |
| | | 31 | | Teleperformance (Professional Services) | | | 10 | |
| | | 1,286 | | TotalEnergies SE (Oil, Gas & Consumable Fuels) | | | 68 | |
| | | 49 | | UbiSoft Entertainment SA (Entertainment)(b) | | | 2 | |
| | | 66 | | Unibail-Rodamco-Westfield (Equity Real Estate Investment Trusts)(b) | | | 3 | |
| | | 119 | | Valeo (Auto Components) | | | 2 | |
| | | 343 | | Veolia Environnement SA (Multi-Utilities)(b) | | | 8 | |
| | | 281 | | Vinci SA (Construction & Engineering) | | | 25 | |
| | | 387 | | Vivendi SE (Entertainment) | | | 4 | |
| | | 15 | | Wendel SE (Diversified Financial Services) | | | 1 | |
| | | 122 | | Worldline SA (IT Services)(b) | | | 5 | |
| | | | | | | | 651 | |
| | Shares | | Security Description | | Value
(000) | |
| | | | | Germany — 2.05% |
| | | 93 | | adidas AG (Textiles, Apparel & Luxury Goods) | | $ | 16 | |
| | | 214 | | Allianz SE (Insurance) | | | 41 | |
| | | 571 | | Aroundtown SA (Real Estate Management & Development)(a) | | | 2 | |
| | | 480 | | BASF SE (Chemicals) | | | 21 | |
| | | 167 | | Bayerische Motoren Werke AG (Automobiles) | | | 13 | |
| | | 45 | | Bechtle AG (IT Services) | | | 2 | |
| | | 79 | | Brenntag AG (Trading Companies & Distributors) | | | 5 | |
| | | 23 | | Carl Zeiss Meditec AG (Health Care Equipment & Supplies) | | | 3 | |
| | | 542 | | Commerzbank AG (Banks)(b) | | | 4 | |
| | | 57 | | Continental AG (Auto Components) | | | 4 | |
| | | 99 | | Covestro AG (Chemicals) | | | 3 | |
| | | 236 | | Daimler Truck Holding AG (Machinery)(b) | | | 6 | |
| | | 81 | | Delivery Hero SE (Internet & Direct Marketing Retail)(b) | | | 3 | |
| | | 1,084 | | Deutsche Bank AG, Registered Shares (Capital Markets) | | | 9 | |
| | | 100 | | Deutsche Boerse AG (Capital Markets) | | | 17 | |
| | | 304 | | Deutsche Lufthansa AG, Registered Shares (Airlines)^(b) | | | 2 | |
| | | 518 | | Deutsche Post AG, Registered Shares (Air Freight & Logistics) | | | 19 | |
| | | 1,689 | | Deutsche Telekom AG (Diversified Telecommunication Services)(a) | | | 34 | |
| | | 1,169 | | E.ON SE (Multi-Utilities) | | | 10 | |
| | | 105 | | Evonik Industries AG (Chemicals) | | | 2 | |
| | | 108 | | Fresenius Medical Care AG & Co. KGaA (Health Care Providers & Services) | | | 5 | |
| | | 91 | | GEA Group AG (Machinery) | | | 3 | |
| | | 31 | | Hannover Rueck SE (Insurance) | | | 4 | |
| | | 76 | | HeidelbergCement AG (Construction Materials) | | | 4 | |
| | | 88 | | HelloFresh SE (Food & Staples Retailing)(b) | | | 3 | |
| | | 75 | | Henkel AG & Co. KGaA (Household Products) | | | 5 | |
| | | 637 | | Infineon Technologies AG (Semiconductors & Semiconductor Equipment)(a) | | | 15 | |
| | | 37 | | KION Group AG (Machinery)(a) | | | 2 | |
| | | 41 | | Knorr-Bremse AG (Machinery) | | | 2 | |
| | | 41 | | LEG Immobilien AG (Real Estate Management & Development) | | | 3 | |
| | | 397 | | Mercedes-Benz Group AG (Automobiles)(a) | | | 23 | |
| | | 29 | | MTU Aero Engines AG (Aerospace & Defense) | | | 5 | |
| | | 73 | | Muenchener Rueckversicherungs-Gesellschaft AG, Registered Shares (Insurance) | | | 17 | |
| | | 35 | | Nemetschek SE (Software) | | | 2 | |
| | | 68 | | Puma SE (Textiles, Apparel & Luxury Goods)(a) | | | 4 | |
See accompanying notes to financial statements.
100
HC CAPITAL TRUST
The Catholic SRI Growth Portfolio
Portfolio of Investments (continued) — June 30, 2022
| | Shares | | Security Description | | Value
(000) | |
| | | | | Common Stocks (continued) |
| | | | | Germany (continued) |
| | | 3 | | Rational AG (Machinery) | | $ | 2 | |
| | | 336 | | RWE AG (Multi-Utilities) | | | 12 | |
| | | 553 | | SAP SE (Software) | | | 51 | |
| | | 49 | | Scout24 AG (Interactive Media & Services) | | | 3 | |
| | | 403 | | Siemens AG, Registered Shares (Industrial Conglomerates) | | | 42 | |
| | | 217 | | Siemens Energy AG (Electrical Equipment) | | | 3 | |
| | | 147 | | Siemens Healthineers AG (Health Care Equipment & Supplies) | | | 7 | |
| | | 69 | | Symrise AG (Chemicals)(a) | | | 8 | |
| | | 627 | | Telefonica Deutschland Holding AG (Diversified Telecommunication Services) | | | 2 | |
| | | 56 | | Uniper SE (Independent Power and Renewable Electricity Producers) | | | 1 | |
| | | 58 | | United Internet AG (Diversified Telecommunication Services)(a) | | | 2 | |
| | | 16 | | Volkswagen AG (Automobiles) | | | 3 | |
| | | 373 | | Vonovia SE (Real Estate Management & Development) | | | 11 | |
| | | 121 | | Zalando SE (Internet & Direct Marketing Retail)(b) | | | 3 | |
| | | | | | | | 463 | |
| | | | | Hong Kong — 1.05% |
| | | 6,292 | | AIA Group Ltd. (Insurance) | | | 68 | |
| | | 2,000 | | BOC Hong Kong Holdings Ltd. (Banks) | | | 8 | |
| | | 800 | | Budweiser Brewing Co. APAC Ltd. (Beverages) | | | 2 | |
| | | 800 | | Chow Tai Fook Jewellery Group Ltd. (Specialty Retail) | | | 2 | |
| | | 1,000 | | CK Asset Holdings Ltd. (Real Estate Management & Development) | | | 7 | |
| | | 1,500 | | CK Hutchison Holdings Ltd. (Industrial Conglomerates) | | | 10 | |
| | | 500 | | CK Infrastructure Holdings Ltd. (Electric Utilities) | | | 3 | |
| | | 1,000 | | CLP Holdings Ltd. (Electric Utilities) | | | 8 | |
| | | 1,000 | | ESR Cayman Ltd. (Real Estate Management & Development)(b) | | | 3 | |
| | | 1,000 | | Galaxy Entertainment Group Ltd. (Hotels, Restaurants & Leisure) | | | 6 | |
| | | 1,000 | | Hang Lung Properties Ltd. (Real Estate Management & Development) | | | 2 | |
| | | 400 | | Hang Seng Bank Ltd. (Banks) | | | 7 | |
| | | 1,000 | | Henderson Land Development Co. Ltd. (Real Estate Management & Development) | | | 4 | |
| | | 1,500 | | HK Electric Investments & HK Electric Investments Ltd. (Electric Utilities) | | | 1 | |
| | | 2,000 | | HKT Trust & HKT Ltd. (Diversified Telecommunication Services)(a) | | | 3 | |
| | Shares | | Security Description | | Value
(000) | |
| | | | | Hong Kong (continued) |
| | | 5,985 | | Hong Kong & China Gas Co. Ltd. (Gas Utilities) | | $ | 6 | |
| | | 623 | | Hong Kong Exchanges & Clearing Ltd. (Capital Markets) | | | 31 | |
| | | 700 | | Hongkong Land Holdings Ltd. (Real Estate Management & Development) | | | 4 | |
| | | 1,000 | | MTR Corp. Ltd. (Road & Rail) | | | 5 | |
| | | 1,250 | | New World Development Co. Ltd. (Real Estate Management & Development) | | | 4 | |
| | | 779 | | Power Assets Holdings Ltd. (Electric Utilities) | | | 5 | |
| | | 1,200 | | Sands China Ltd. (Hotels, Restaurants & Leisure)(b) | | | 3 | |
| | | 2,000 | | Sino Land Co. Ltd. (Real Estate Management & Development) | | | 3 | |
| | | 1,000 | | Sun Hung Kai Properties Ltd. (Real Estate Management & Development) | | | 12 | |
| | | 139 | | Swire Pacific Ltd., Class - A (Real Estate Management & Development) | | | 1 | |
| | | 600 | | Swire Properties Ltd. (Real Estate Management & Development) | | | 1 | |
| | | 757 | | Techtronic Industries Co. Ltd. (Machinery) | | | 8 | |
| | | 1,073 | | The Link Real Estate Investment Trust (Equity Real Estate Investment Trusts) | | | 9 | |
| | | 4,728 | | WH Group Ltd. (Food Products) | | | 4 | |
| | | 1,000 | | Wharf Real Estate Investment Co. Ltd. (Real Estate Management & Development) | | | 5 | |
| | | 1,000 | | Xinyi Glass Holdings Ltd. (Building Products) | | | 2 | |
| | | | | | | | 237 | |
| | | | | Ireland (Republic of) — 0.83% |
| | | 73 | | AerCap Holdings N.V. (Trading Companies & Distributors)(b) | | | 3 | |
| | | 39 | | Allegion PLC (Building Products) | | | 4 | |
| | | 378 | | CRH PLC (Construction Materials)(a) | | | 13 | |
| | | 209 | | Eaton Corp. PLC (Electrical Equipment) | | | 26 | |
| | | 484 | | Experian PLC (Professional Services) | | | 14 | |
| | | 88 | | Flutter Entertainment PLC (Hotels, Restaurants & Leisure)(b) | | | 9 | |
| | | 112 | | Horizon Therapeutics PLC (Pharmaceuticals)(b) | | | 9 | |
| | | 235 | | James Hardie Industries PLC (Construction Materials) | | | 5 | |
| | | 85 | | Kerry Group PLC, Class - A (Food Products)(a) | | | 8 | |
| | | 83 | | Kingspan Group PLC (Building Products) | | | 5 | |
| | | 701 | | Medtronic PLC (Health Care Equipment & Supplies) | | | 64 | |
| | | 93 | | Pentair PLC (Machinery) | | | 4 | |
| | | 104 | | Seagate Technology Holdings PLC (Technology Hardware, Storage & Peripherals) | | | 7 | |
| | | 128 | | Smurfit Kappa Group PLC (Containers & Packaging)(a) | | | 4 | |
See accompanying notes to financial statements.
101
HC CAPITAL TRUST
The Catholic SRI Growth Portfolio
Portfolio of Investments (continued) — June 30, 2022
| | Shares | | Security Description | | Value
(000) | |
| | | | | Common Stocks (continued) |
| | | | | Ireland (Republic of) (continued) |
| | | 52 | | STERIS PLC (Health Care Equipment & Supplies) | | $ | 11 | |
| | | | | | | | 186 | |
| | | | | Isle of Man — 0.02% |
| | | 308 | | Entain PLC (Hotels, Restaurants & Leisure)(b) | | | 5 | |
| | | | | Israel — 0.24% |
| | | 26 | | Azrieli Group Ltd. (Real Estate Management & Development) | | | 2 | |
| | | 689 | | Bank Hapoalim BM (Banks) | | | 6 | |
| | | 720 | | Bank Leumi Le (Banks) | | | 6 | |
| | | 56 | | Check Point Software Technologies Ltd. (Software)(b) | | | 7 | |
| | | 23 | | CyberArk Software Ltd. (Software)(b) | | | 3 | |
| | | 362 | | ICL Group Ltd. (Chemicals) | | | 3 | |
| | | — | | Isacard Ltd. (Consumer Finance) | | | — | |
| | | 596 | | Israel Discount Bank Ltd., Class - A (Banks) | | | 3 | |
| | | 30 | | Kornit Digital Ltd. (Machinery)(b) | | | 1 | |
| | | 66 | | Mizrahi Tefahot Bank Ltd. (Banks) | | | 2 | |
| | | 33 | | Nice Ltd. (Software)(b) | | | 6 | |
| | | 27 | | SolarEdge Technologies, Inc. (Semiconductors & Semiconductor Equipment)(b) | | | 8 | |
| | | 55 | | Tower Semiconductor Ltd. (Semiconductors & Semiconductor Equipment)(b) | | | 3 | |
| | | 30 | | Wix.com Ltd. (IT Services)(b) | | | 2 | |
| | | 43 | | ZIM Integrated Shipping Services Ltd. (Marine) | | | 2 | |
| | | | | | | | 54 | |
| | | | | Italy — 0.61% |
| | | 62 | | Amplifon SpA (Health Care Providers & Services) | | | 2 | |
| | | 574 | | Assicurazioni Generali SpA (Insurance) | | | 9 | |
| | | 265 | | Atlantia SpA (Transportation Infrastructure) | | | 6 | |
| | | 265 | | Davide Campari-Milano N.V., Class - M (Beverages) | | | 3 | |
| | | 13 | | DiaSorin SpA (Health Care Equipment & Supplies) | | | 2 | |
| | | 4,270 | | Enel SpA (Electric Utilities)(a) | | | 23 | |
| | | 1,410 | | Eni SpA (Oil, Gas & Consumable Fuels) | | | 17 | |
| | | 65 | | Ferrari N.V. (Automobiles) | | | 12 | |
| | | 344 | | FinecoBank Banca Fineco SpA (Banks) | | | 4 | |
| | | 208 | | Infrastrutture Wireless Italiane SpA (Diversified Telecommunication Services)(a) | | | 2 | |
| | | 8,620 | | Intesa Sanpaolo SpA (Banks)(a) | | | 16 | |
| | | 318 | | Mediobanca Banca di Credito Finanziario SpA (Banks) | | | 3 | |
| | | 114 | | Moncler SpA (Textiles, Apparel & Luxury Goods) | | | 5 | |
| | Shares | | Security Description | | Value
(000) | |
| | | | | Italy (continued) |
| | | 243 | | Nexi SpA (IT Services)(b) | | $ | 2 | |
| | | 265 | | Poste Italiane SpA (Insurance) | | | 2 | |
| | | 133 | | Prusmian SpA (Electrical Equipment) | | | 4 | |
| | | 49 | | Recordati SpA (Pharmaceuticals) | | | 2 | |
| | | 1,023 | | Snam SpA (Gas Utilities) | | | 5 | |
| | | 4,562 | | Telecom Italia SpA (Diversified Telecommunication Services)(b) | | | 1 | |
| | | 719 | | Terna - Rete Elettrica Nazionale SpA (Electric Utilities) | | | 6 | |
| | | 1,107 | | Unicredit SpA (Banks) | | | 11 | |
| | | | | | | | 137 | |
| | | | | Japan — 6.23% |
| | | 100 | | Advantest Corp. (Semiconductors & Semiconductor Equipment)(a) | | | 5 | |
| | | 300 | | Aeon Co. Ltd. (Food & Staples Retailing) | | | 5 | |
| | | 100 | | AGC, Inc. (Building Products) | | | 4 | |
| | | 100 | | Aisin Crop. (Auto Components) | | | 3 | |
| | | 100 | | ANA Holdings, Inc. (Airlines)(a)(b) | | | 2 | |
| | | 100 | | Asahi Intecc Co. Ltd. (Health Care Equipment & Supplies) | | | 2 | |
| | | 800 | | Asahi Kasei Corp. (Chemicals) | | | 6 | |
| | | 100 | | Azbil Corp. (Electronic Equipment, Instruments & Components) | | | 3 | |
| | | 100 | | Bandai Namco Holdings, Inc. (Leisure Products) | | | 7 | |
| | | 333 | | Bridgestone Corp. (Auto Components) | | | 12 | |
| | | 100 | | Brother Industries Ltd. (Technology Hardware, Storage & Peripherals) | | | 2 | |
| | | 500 | | Canon, Inc. (Technology Hardware, Storage & Peripherals) | | | 11 | |
| | | 100 | | Capcom Co. Ltd. (Entertainment) | | | 2 | |
| | | 100 | | Central Japan Railway Co. (Road & Rail) | | | 12 | |
| | | 400 | | Chubu Electric Power Co., Inc. (Electric Utilities) | | | 4 | |
| | | 900 | | Concordia Financial Group Ltd. (Banks) | | | 3 | |
| | | 300 | | CyberAgent, Inc. (Media) | | | 3 | |
| | | 100 | | Dai Nippon Printing Co. Ltd. (Commercial Services & Supplies) | | | 2 | |
| | | 30 | | Daifuku Co. Ltd. (Machinery) | | | 2 | |
| | | 486 | | Dai-ichi Life Holdings, Inc. (Insurance) | | | 9 | |
| | | 120 | | Daikin Industries Ltd. (Building Products) | | | 19 | |
| | | 300 | | Daiwa House Industry Co. Ltd. (Real Estate Management & Development) | | | 7 | |
| | | 2 | | Daiwa House REIT Investment Corp. (Equity Real Estate Investment Trusts)(a) | | | 5 | |
| | | 900 | | Daiwa Securities Group, Inc. (Capital Markets) | | | 4 | |
| | | 256 | | Denso Corp. (Auto Components) | | | 14 | |
| | | 100 | | Dentsu Group, Inc. (Media) | | | 3 | |
| | | 35 | | Disco Corp. (Semiconductors & Semiconductor Equipment) | | | 8 | |
See accompanying notes to financial statements.
102
HC CAPITAL TRUST
The Catholic SRI Growth Portfolio
Portfolio of Investments (continued) — June 30, 2022
| | Shares | | Security Description | | Value
(000) | |
| | | | | Common Stocks (continued) |
| | | | | Japan (continued) |
| | | 200 | | East Japan Railway Co. (Road & Rail) | | $ | 10 | |
| | | 1,700 | | ENEOS Holdings, Inc. (Oil, Gas & Consumable Fuels) | | | 6 | |
| | | 149 | | FANUC Corp. (Machinery) | | | 23 | |
| | | 100 | | Fuji Electric Co. Ltd. (Electrical Equipment) | | | 4 | |
| | | 200 | | FUJIFILM Holdings Corp. (Technology Hardware, Storage & Peripherals) | | | 11 | |
| | | 52 | | Fujitsu Ltd. (IT Services)(a) | | | 7 | |
| | | 3 | | GLP J-Reit (Equity Real Estate Investment Trusts) | | | 4 | |
| | | 100 | | Hakuhodo DY Holdings, Inc. (Media) | | | 1 | |
| | | 100 | | Hamamatsu Photonics K.K. (Electronic Equipment, Instruments & Components) | | | 4 | |
| | | 100 | | Hankyu Hanshin Holdings, Inc. (Road & Rail) | | | 3 | |
| | | 27 | | Hikari Tsushin, Inc. (Specialty Retail) | | | 3 | |
| | | 42 | | Hirose Electric Co. Ltd. (Electronic Equipment, Instruments & Components) | | | 6 | |
| | | 100 | | Hitachi Construction Machinery Co. Ltd. (Machinery) | | | 2 | |
| | | 100 | | Hitachi Metals Ltd. (Metals & Mining)(b) | | | 2 | |
| | | 900 | | Honda Motor Co. Ltd. (Automobiles) | | | 22 | |
| | | 200 | | HOYA Corp. (Health Care Equipment & Supplies) | | | 17 | |
| | | 200 | | Hulic Co. Ltd. (Real Estate Management & Development)(a) | | | 2 | |
| | | 100 | | Ibiden Co. Ltd. (Electronic Equipment, Instruments & Components) | | | 3 | |
| | | 152 | | Idemitsu Kosan Co. Ltd. (Oil, Gas & Consumable Fuels)(a) | | | 4 | |
| | | 100 | | Iida Group Holdings Co. Ltd. (Household Durables) | | | 2 | |
| | | 500 | | Inpex Corp. (Oil, Gas & Consumable Fuels) | | | 5 | |
| | | 300 | | Isuzu Motors Ltd. (Automobiles) | | | 3 | |
| | | 600 | | ITOCHU Corp. (Trading Companies & Distributors) | | | 16 | |
| | | 48 | | Japan Airlines Co. Ltd. (Airlines)(a)(b) | | | 1 | |
| | | 300 | | Japan Exchange Group, Inc. (Capital Markets) | | | 4 | |
| | | 200 | | Japan Post Bank Co. Ltd. (Banks) | | | 2 | |
| | | 1,400 | | Japan Post Holdings Co. Ltd. (Insurance)(a) | | | 10 | |
| | | 100 | | Japan Post Insurance Co. Ltd. (Insurance)(a) | | | 2 | |
| | | 1 | | Japan Real Estate Investment Corp. (Equity Real Estate Investment Trusts) | | | 5 | |
| | | 4 | | Japan Retail Fund Investment Corp. (Equity Real Estate Investment Trusts) | | | 3 | |
| | | 300 | | JFE Holdings, Inc. (Metals & Mining) | | | 3 | |
| | | 200 | | Kajima Corp. (Construction & Engineering) | | | 2 | |
| | | 100 | | Kakaku.com, Inc. (Interactive Media & Services) | | | 2 | |
| | | 227 | | Kao Corp. (Personal Products) | | | 9 | |
| | Shares | | Security Description | | Value
(000) | |
| | | | | Japan (continued) |
| | | 874 | | KDDI Corp. (Wireless Telecommunication Services) | | $ | 28 | |
| | | 32 | | Keio Corp. (Road & Rail) | | | 1 | |
| | | 100 | | Keisei Electric Railway Co. Ltd. (Road & Rail) | | | 3 | |
| | | 134 | | Keyence Corp. (Electronic Equipment, Instruments & Components) | | | 46 | |
| | | 100 | | Kikkoman Corp. (Food Products) | | | 5 | |
| | | 100 | | Kintetsu Group Holdings Co. Ltd. (Road & Rail) | | | 3 | |
| | | 400 | | Kirin Holdings Co. Ltd. (Beverages) | | | 6 | |
| | | 100 | | Kobe Bussan Co. Ltd. (Food & Staples Retailing) | | | 2 | |
| | | 34 | | Koito Manufacturing Co. Ltd. (Auto Components) | | | 1 | |
| | | 500 | | Komatsu Ltd. (Machinery) | | | 11 | |
| | | 43 | | Kose Corp. (Personal Products) | | | 4 | |
| | | 500 | | Kubota Corp. (Machinery) | | | 7 | |
| | | 100 | | Kurita Water Industries Ltd. (Machinery) | | | 4 | |
| | | 200 | | Kyocera Corp. (Electronic Equipment, Instruments & Components) | | | 11 | |
| | | 100 | | Kyowa Kirin Co. Ltd. (Pharmaceuticals) | | | 2 | |
| | | 200 | | Lixil Corp. (Building Products) | | | 4 | |
| | | 200 | | M3, Inc. (Health Care Technology) | | | 6 | |
| | | 100 | | Makita Corp. (Machinery) | | | 2 | |
| | | 800 | | Marubeni Corp. (Trading Companies & Distributors) | | | 7 | |
| | | 300 | | Mazda Motor Corp. (Automobiles) | | | 2 | |
| | | 200 | | MINEBEA MITSUMI, Inc. (Machinery) | | | 3 | |
| | | 100 | | MISUMI Group, Inc. (Machinery) | | | 2 | |
| | | 700 | | Mitsubishi Corp. (Trading Companies & Distributors) | | | 21 | |
| | | 1,100 | | Mitsubishi Electric Corp. (Electrical Equipment) | | | 12 | |
| | | 600 | | Mitsubishi Estate Co. Ltd. (Real Estate Management & Development) | | | 9 | |
| | | 500 | | Mitsubishi HC Capital, Inc. (Diversified Financial Services) | | | 2 | |
| | | 200 | | Mitsubishi Heavy Industries Ltd. (Machinery) | | | 7 | |
| | | 6,479 | | Mitsubishi UFJ Financial Group, Inc. (Banks) | | | 35 | |
| | | 700 | | Mitsui & Co. Ltd. (Trading Companies & Distributors) | | | 15 | |
| | | 100 | | Mitsui Chemicals, Inc. (Chemicals) | | | 2 | |
| | | 500 | | Mitsui Fudosan Co. Ltd. (Real Estate Management & Development) | | | 11 | |
| | | 200 | | Mitsui O.S.K. Lines Ltd. (Marine) | | | 5 | |
| | | 1,310 | | Mizuho Financial Group, Inc. (Banks) | | | 15 | |
| | | 100 | | MonotaRO Co. Ltd. (Trading Companies & Distributors) | | | 1 | |
| | | 230 | | MS&AD Insurance Group Holdings, Inc. (Insurance) | | | 7 | |
See accompanying notes to financial statements.
103
HC CAPITAL TRUST
The Catholic SRI Growth Portfolio
Portfolio of Investments (continued) — June 30, 2022
| | Shares | | Security Description | | Value
(000) | |
| | | | | Common Stocks (continued) |
| | | | | Japan (continued) |
| | | 337 | | Murata Manufacturing Co. Ltd. (Electronic Equipment, Instruments & Components) | | $ | 18 | |
| | | 130 | | NEC Corp. (Technology Hardware, Storage & Peripherals) | | | 5 | |
| | | 300 | | Nexon Co. Ltd. (Entertainment) | | | 6 | |
| | | 100 | | NGK Insulators Ltd. (Machinery) | | | 1 | |
| | | 200 | | Nidec Corp. (Electrical Equipment) | | | 12 | |
| | | 200 | | Nihon M&A Center Holdings, Inc. (Professional Services) | | | 2 | |
| | | 45 | | Nintendo Co. Ltd. (Entertainment) | | | 19 | |
| | | 1 | | Nippon Building Fund, Inc. (Equity Real Estate Investment Trusts) | | | 5 | |
| | | 400 | | Nippon Paint Holdings Co. Ltd. (Chemicals)(a) | | | 3 | |
| | | 1 | | Nippon Prologis REIT, Inc. (Equity Real Estate Investment Trusts)(a) | | | 2 | |
| | | 100 | | Nippon Sanso Holdings Corp. (Chemicals) | | | 2 | |
| | | 400 | | Nippon Steel Corp. (Metals & Mining)(a) | | | 6 | |
| | | 662 | | Nippon Telegraph & Telephone Corp. (Diversified Telecommunication Services) | | | 19 | |
| | | 100 | | Nippon Yusen KK (Marine) | | | 7 | |
| | | 1,300 | | Nissan Motor Co. Ltd. (Automobiles) | | | 5 | |
| | | 154 | | Nisshin Seifun Group, Inc. (Food Products) | | | 2 | |
| | | 100 | | Nitori Holdings Co. Ltd. (Specialty Retail) | | | 10 | |
| | | 100 | | Nitto Denko Corp. (Chemicals) | | | 6 | |
| | | 1,500 | | Nomura Holdings, Inc. (Capital Markets) | | | 5 | |
| | | 100 | | Nomura Real Estate Holdings, Inc. (Real Estate Management & Development) | | | 2 | |
| | | 3 | | Nomura Real Estate Master Fund, Inc. (Equity Real Estate Investment Trusts) | | | 4 | |
| | | 135 | | Nomura Research Institute Ltd. (IT Services) | | | 4 | |
| | | 300 | | NTT Data Corp. (IT Services) | | | 4 | |
| | | 600 | | Obayashi Corp. (Construction & Engineering) | | | 4 | |
| | | 100 | | Odakyu Electric Railway Co. Ltd. (Road & Rail) | | | 1 | |
| | | 500 | | Oji Paper Co. Ltd. (Paper & Forest Products) | | | 2 | |
| | | 147 | | OMRON Corp. (Electronic Equipment, Instruments & Components) | | | 7 | |
| | | 49 | | Oracle Corp. (Software) | | | 3 | |
| | | 100 | | Oriental Land Co. Ltd. (Hotels, Restaurants & Leisure) | | | 14 | |
| | | 600 | | ORIX Corp. (Diversified Financial Services) | | | 10 | |
| | | 200 | | Osaka Gas Co. Ltd. (Gas Utilities) | | | 4 | |
| | | 34 | | OTSUKA Corp. (IT Services) | | | 1 | |
| | | 168 | | Pan Pacific International Holdings Corp. (Multiline Retail) | | | 3 | |
| | | 1,200 | | Panasonic Holdings Corp. (Household Durables) | | | 10 | |
| | | 100 | | Persol Holdings Co. Ltd. (Professional Services)(a) | | | 2 | |
| | Shares | | Security Description | | Value
(000) | |
| | | | | Japan (continued) |
| | | 500 | | Rakuten Group, Inc. (Internet & Direct Marketing Retail) | | $ | 2 | |
| | | 800 | | Recruit Holdings Co. Ltd. (Professional Services) | | | 24 | |
| | | 700 | | Renesas Electronics Corp. (Semiconductors & Semiconductor Equipment)(a)(b) | | | 6 | |
| | | 1,300 | | Resona Holdings, Inc. (Banks) | | | 5 | |
| | | 300 | | Ricoh Co. Ltd. (Technology Hardware, Storage & Peripherals) | | | 2 | |
| | | 21 | | Rohm Co. Ltd. (Semiconductors & Semiconductor Equipment) | | | 1 | |
| | | 100 | | SBI Holdings, Inc. (Capital Markets) | | | 2 | |
| | | 100 | | SCSK Corp. (IT Services) | | | 2 | |
| | | 100 | | Secom Co. Ltd. (Commercial Services & Supplies) | | | 6 | |
| | | 100 | | Seiko Epson Corp. (Technology Hardware, Storage & Peripherals) | | | 1 | |
| | | 200 | | Sekisui Chemical Co. Ltd. (Household Durables) | | | 3 | |
| | | 300 | | Sekisui House Ltd. (Household Durables) | | | 5 | |
| | | 367 | | Seven & i Holdings Co. Ltd. (Food & Staples Retailing) | | | 14 | |
| | | 200 | | SG Holdings Co. Ltd. (Air Freight & Logistics) | | | 3 | |
| | | 100 | | Sharp Corp. (Household Durables)(a) | | | 1 | |
| | | 300 | | Shimizu Corp. (Construction & Engineering) | | | 2 | |
| | | 200 | | Shin-Etsu Chemical Co. Ltd. (Chemicals) | | | 23 | |
| | | 1,500 | | Softbank Corp. (Wireless Telecommunication Services) | | | 17 | |
| | | 618 | | SoftBank Group Corp. (Wireless Telecommunication Services) | | | 24 | |
| | | 200 | | Sompo Holdings, Inc. (Insurance) | | | 9 | |
| | | 700 | | Sony Corp. (Household Durables) | | | 57 | |
| | | 300 | | Subaru Corp. (Automobiles) | | | 5 | |
| | | 200 | | SUMCO Corp. (Semiconductors & Semiconductor Equipment)(a) | | | 3 | |
| | | 600 | | Sumitomo Corp. (Trading Companies & Distributors) | | | 8 | |
| | | 400 | | Sumitomo Electric Industries Ltd. (Auto Components) | | | 4 | |
| | | 100 | | Sumitomo Metal Mining Co. Ltd. (Metals & Mining) | | | 3 | |
| | | 700 | | Sumitomo Mitsui Financial Group, Inc. (Banks) | | | 21 | |
| | | 223 | | Sumitomo Mitsui Trust Holdings, Inc. (Banks) | | | 7 | |
| | | 200 | | Sumitomo Realty & Development Co. Ltd. (Real Estate Management & Development) | | | 5 | |
| | | 100 | | Suntory Beverage & Food Ltd. (Beverages) | | | 4 | |
| | | 200 | | Suzuki Motor Corp. (Automobiles) | | | 6 | |
| | | 300 | | T&D Holdings, Inc. (Insurance) | | | 4 | |
See accompanying notes to financial statements.
104
HC CAPITAL TRUST
The Catholic SRI Growth Portfolio
Portfolio of Investments (continued) — June 30, 2022
| | Shares | | Security Description | | Value
(000) | |
| | | | | Common Stocks (continued) |
| | | | | Japan (continued) |
| | | 100 | | Taisei Corp. (Construction & Engineering) | | $ | 3 | |
| | | 200 | | TDK Corp. (Electronic Equipment, Instruments & Components) | | | 6 | |
| | | 300 | | Terumo Corp. (Health Care Equipment & Supplies) | | | 9 | |
| | | 400 | | The Chiba Bank Ltd. (Banks) | | | 2 | |
| | | 500 | | The Kansai Electric Power Co., Inc. (Electric Utilities) | | | 5 | |
| | | 400 | | The Shizuoka Bank Ltd. (Banks) | | | 2 | |
| | | 100 | | TIS, Inc. (IT Services) | | | 3 | |
| | | 145 | | Tobu Railway Co. Ltd. (Road & Rail) | | | 3 | |
| | | 45 | | Toho Co. Ltd. (Entertainment) | | | 2 | |
| | | 331 | | Tokio Marine Holdings, Inc. (Insurance) | | | 19 | |
| | | 900 | | Tokyo Electric Power Co. Holdings, Inc. (Electric Utilities)(b) | | | 4 | |
| | | 100 | | Tokyo Electron Ltd. (Semiconductors & Semiconductor Equipment) | | | 33 | |
| | | 200 | | Tokyo Gas Co. Ltd. (Gas Utilities) | | | 4 | |
| | | 300 | | Tokyu Corp. (Road & Rail) | | | 4 | |
| | | 100 | | TOPPAN, Inc. (Commercial Services & Supplies) | | | 2 | |
| | | 800 | | Toray Industries, Inc. (Chemicals) | | | 4 | |
| | | 200 | | Toshiba Corp. (Industrial Conglomerates) | | | 8 | |
| | | 100 | | Tosoh Corp. (Chemicals) | | | 1 | |
| | | 100 | | TOTO Ltd. (Building Products) | | | 3 | |
| | | 100 | | Toyota Industries Corp. (Auto Components) | | | 6 | |
| | | 5,550 | | Toyota Motor Corp. (Automobiles) | | | 87 | |
| | | 100 | | Trend Micro, Inc. (Software) | | | 5 | |
| | | 200 | | Unicharm Corp. (Household Products) | | | 7 | |
| | | 100 | | USS Co. Ltd. (Specialty Retail) | | | 2 | |
| | | 100 | | Yakult Honsha Co. Ltd. (Food Products) | | | 6 | |
| | | 100 | | Yamaha Corp. (Leisure Products) | | | 4 | |
| | | 200 | | Yamaha Motor Co. Ltd. (Automobiles) | | | 4 | |
| | | 200 | | Yamato Holdings Co. Ltd. (Air Freight & Logistics) | | | 3 | |
| | | 100 | | Yaskawa Electric Corp. (Machinery) | | | 3 | |
| | | 100 | | Yokogawa Electric Corp. (Electronic Equipment, Instruments & Components) | | | 2 | |
| | | 1,500 | | Z Holdings Corp. (Interactive Media & Services) | | | 4 | |
| | | 100 | | ZOZO, Inc. (Internet & Direct Marketing Retail)(a) | | | 2 | |
| | | | | | | | 1,405 | |
| | | | | Jersey — 0.17% |
| | | 5,119 | | Glencore PLC (Metals & Mining)(a) | | | 28 | |
| | | 49 | | Novocure Ltd. (Health Care Equipment & Supplies)(b) | | | 3 | |
| | | 616 | | WPP PLC (Media) | | | 6 | |
| | | | | | | | 37 | |
| | Shares | | Security Description | | Value
(000) | |
| | | | | Liberia — 0.02% |
| | | 122 | | Royal Caribbean Cruises Ltd. (Hotels, Restaurants & Leisure)(b) | | $ | 4 | |
| | | | | Luxembourg — 0.05% |
| | | 315 | | ArcelorMittal SA (Metals & Mining) | | | 7 | |
| | | 259 | | Tenaris SA (Energy Equipment & Services) | | | 3 | |
| | | | | | | | 10 | |
| | | | | Netherlands — 1.56% |
| | | 224 | | ABN AMRO Bank N.V. (Banks) | | | 3 | |
| | | 12 | | Adyen N.V. (IT Services)(a)(b) | | | 17 | |
| | | 949 | | AEGON N.V. (Insurance) | | | 4 | |
| | | 99 | | Akzo Nobel N.V. (Chemicals) | | | 6 | |
| | | 26 | | Argenx SE (Biotechnology)(b) | | | 10 | |
| | | 24 | | ASM International N.V. (Semiconductors & Semiconductor Equipment) | | | 6 | |
| | | 210 | | ASML Holding N.V. (Semiconductors & Semiconductor Equipment)(a) | | | 101 | |
| | | 541 | | CNH Industrial N.V. (Machinery) | | | 6 | |
| | | 45 | | Euronext N.V. (Capital Markets) | | | 4 | |
| | | 62 | | EXOR N.V. (Diversified Financial Services) | | | 4 | |
| | | 48 | | Heineken Holding N.V. (Beverages) | | | 3 | |
| | | 136 | | Heineken N.V. (Beverages) | | | 12 | |
| | | 31 | | IMCD NV (Trading Companies & Distributors)(a) | | | 4 | |
| | | 2,051 | | ING Groep N.V. (Banks) | | | 20 | |
| | | 59 | | JDE Peet’s N.V. (Food Products) | | | 2 | |
| | | 103 | | Just Eat Takeaway.com N.V. (Internet & Direct Marketing Retail)(b) | | | 2 | |
| | | 546 | | Koninklijke Ahold Delhaize N.V. (Food & Staples Retailing) | | | 14 | |
| | | 93 | | Koninklijke DSM N.V. (Chemicals) | | | 13 | |
| | | 1,769 | | Koninklijke KPN N.V. (Diversified Telecommunication Services) | | | 6 | |
| | | 487 | | Koninklijke Philips N.V. (Health Care Equipment & Supplies) | | | 10 | |
| | | 139 | | LyondellBasell Industries N.V., Class - A (Chemicals) | | | 12 | |
| | | 146 | | NN Group N.V. (Insurance) | | | 7 | |
| | | 137 | | NXP Semiconductors N.V. (Semiconductors & Semiconductor Equipment) | | | 20 | |
| | | 51 | | OCI N.V. (Chemicals)(a) | | | 2 | |
| | | 444 | | Prosus N.V. (Internet & Direct Marketing Retail)(a) | | | 30 | |
| | | 62 | | Randstad N.V. (Professional Services) | | | 3 | |
| | | 316 | | STMicroelectronics N.V. (Semiconductors & Semiconductor Equipment) | | | 10 | |
| | | 383 | | Universal Music Group N.V. (Entertainment) | | | 8 | |
See accompanying notes to financial statements.
105
HC CAPITAL TRUST
The Catholic SRI Growth Portfolio
Portfolio of Investments (continued) — June 30, 2022
| | Shares | | Security Description | | Value
(000) | |
| | | | | Common Stocks (continued) |
| | | | | Netherlands (continued) |
| | | 138 | | Wolters Kluwer N.V. (Professional Services) | | $ | 13 | |
| | | | | | | | 352 | |
| | | | | New Zealand — 0.08% |
| | | 716 | | Auckland International Airport Ltd. (Transportation Infrastructure)(b) | | | 3 | |
| | | 304 | | Fisher & Paykel Healthcare Corp. Ltd. (Health Care Equipment & Supplies) | | | 4 | |
| | | 356 | | Mercury NZ Ltd. (Electric Utilities) | | | 1 | |
| | | 828 | | Meridian Energy Ltd. (Independent Power and Renewable Electricity Producers) | | | 2 | |
| | | 843 | | Spark New Zealand Ltd. (Diversified Telecommunication Services) | | | 3 | |
| | | 70 | | Xero Ltd. (Software)(b) | | | 4 | |
| | | | | | | | 17 | |
| | | | | Norway — 0.26% |
| | | 161 | | Adevinta ASA (Interactive Media & Services)(b) | | | 1 | |
| | | 160 | | Aker BP ASA (Oil, Gas & Consumable Fuels) | | | 6 | |
| | | 490 | | DNB Bank ASA (Banks) | | | 9 | |
| | | 510 | | Equinor ASA (Oil, Gas & Consumable Fuels) | | | 18 | |
| | | 121 | | Gjensidige Forsikring ASA (Insurance) | | | 2 | |
| | | 220 | | Mowi ASA (Food Products)(a) | | | 5 | |
| | | 712 | | Norsk Hydro ASA (Metals & Mining) | | | 4 | |
| | | 382 | | Orkla ASA (Food Products) | | | 3 | |
| | | 33 | | Salmar ASA (Food Products) | | | 2 | |
| | | 373 | | Telenor ASA (Diversified Telecommunication Services) | | | 5 | |
| | | 86 | | Yara International ASA (Chemicals) | | | 4 | |
| | | | | | | | 59 | |
| | | | | Panama — 0.02% |
| | | 444 | | Carnival Corp. (Hotels, Restaurants & Leisure)(b) | | | 4 | |
| | | | | Portugal — 0.06% |
| | | 1,449 | | EDP - Energias de Portugal SA (Electric Utilities) | | | 7 | |
| | | 282 | | Galp Energia SGPS SA, B Shares (Oil, Gas & Consumable Fuels)(a) | | | 3 | |
| | | 146 | | Jeronimo Martins SGPS, SA (Food & Staples Retailing)(a) | | | 3 | |
| | | | | | | | 13 | |
| | | | | Singapore — 0.43% |
| | | 1,650 | | Ascendas Real Estate Investment Trust (Equity Real Estate Investment Trusts) | | | 3 | |
| | | 2,740 | | CapitaLand Integrated Commercial Trust (Equity Real Estate Investment Trusts) | | | 4 | |
| | | 1,500 | | Capitaland Investment, Ltd. (Real Estate Management & Development) | | | 4 | |
| | Shares | | Security Description | | Value
(000) | |
| | | | | Singapore (continued) |
| | | 200 | | City Developments Ltd. (Real Estate Management & Development) | | $ | 1 | |
| | | 924 | | DBS Group Holdings Ltd. (Banks) | | | 21 | |
| | | 3,300 | | Genting Singapore Ltd. (Hotels, Restaurants & Leisure) | | | 2 | |
| | | 488 | | Grab Holdings Ltd. (Road & Rail)(b) | | | 1 | |
| | | 800 | | Keppel Corp. Ltd. (Industrial Conglomerates) | | | 4 | |
| | | 100 | | Mapletree Commercial Trust (Equity Real Estate Investment Trusts) | | | — | |
| | | 1,659 | | Mapletree Logistics Trust (Equity Real Estate Investment Trusts) | | | 2 | |
| | | 1,835 | | Oversea-Chinese Banking Corp. Ltd. (Banks) | | | 15 | |
| | | 189 | | Sea Ltd., ADR (Entertainment)(b) | | | 13 | |
| | | 600 | | Singapore Airlines Ltd. (Airlines)(b) | | | 2 | |
| | | 500 | | Singapore Exchange Ltd. (Capital Markets) | | | 3 | |
| | | 3,800 | | Singapore Telecommunications Ltd. (Diversified Telecommunication Services) | | | 7 | |
| | | 600 | | United Overseas Bank Ltd. (Banks) | | | 11 | |
| | | 100 | | Venture Corp. Ltd. (Electronic Equipment, Instruments & Components) | | | 1 | |
| | | 900 | | Wilmar International Ltd. (Food Products) | | | 3 | |
| | | | | | | | 97 | |
| | | | | Spain — 0.81% |
| | | 12 | | Acciona SA (Electric Utilities) | | | 2 | |
| | | 127 | | ACS Actividades de Construccion y Servicios SA (Construction & Engineering) | | | 3 | |
| | | 38 | | Aena SME SA (Transportation Infrastructure)(b) | | | 5 | |
| | | 238 | | Amadeus IT Group SA (IT Services)(b) | | | 13 | |
| | | 3,478 | | Banco Bilbao Vizcaya Argentaria SA (Banks) | | | 16 | |
| | | 9,187 | | Banco Santander SA (Banks)(a) | | | 26 | |
| | | 2,300 | | CaixaBank SA (Banks) | | | 8 | |
| | | 285 | | Cellnex Telecom SA (Diversified Telecommunication Services) | | | 11 | |
| | | 150 | | EDP Renovaveis SA (Independent Power and Renewable Electricity Producers) | | | 4 | |
| | | 121 | | Enagas SA (Gas Utilities)(a) | | | 3 | |
| | | 177 | | Endesa SA (Electric Utilities) | | | 3 | |
| | | 261 | | Ferrovial SA (Construction & Engineering) | | | 7 | |
| | | 154 | | Grifols SA (Biotechnology)(b) | | | 3 | |
| | | 3,053 | | Iberdrola SA (Electric Utilities) | | | 31 | |
| | | 597 | | Industria de Diseno Textil SA (Specialty Retail) | | | 14 | |
| | | 70 | | Naturgy Energy Group SA (Gas Utilities) | | | 2 | |
| | | 223 | | Red Electrica Corp. SA (Electric Utilities) | | | 4 | |
| | | 752 | | Repsol SA (Oil, Gas & Consumable Fuels) | | | 11 | |
| | | 116 | | Siemens Gamesa Renewable Energy SA, Registered Shares (Electrical Equipment)(b) | | | 2 | |
| | | 2,835 | | Telefonica SA (Diversified Telecommunication Services) | | | 14 | |
| | | | | | | | 182 | |
See accompanying notes to financial statements.
106
HC CAPITAL TRUST
The Catholic SRI Growth Portfolio
Portfolio of Investments (continued) — June 30, 2022
| | Shares | | Security Description | | Value
(000) | |
| | | | | Common Stocks (continued) |
| | | | | Sweden — 0.96% |
| | | 156 | | Alfa Laval AB (Machinery) | | $ | 4 | |
| | | 518 | | Assa Abloy AB, B Shares (Building Products) | | | 11 | |
| | | 1,412 | | Atlas Copco AB, Class - A (Machinery)(b) | | | 13 | |
| | | 848 | | Atlas Copco AB, Class - B (Machinery)(b) | | | 7 | |
| | | 163 | | Boliden AB (Metals & Mining) | | | 5 | |
| | | 98 | | Electrolux AB, Class - B (Household Durables) | | | 1 | |
| | | 367 | | Embracer Group AB (Entertainment)(b) | | | 3 | |
| | | 348 | | Epiroc AB, Class - A (Machinery) | | | 5 | |
| | | 212 | | Epiroc AB, Class - B (Machinery) | | | 3 | |
| | | 151 | | Equities AB (Capital Markets) | | | 3 | |
| | | 322 | | Essity AB, Class - B (Household Products) | | | 8 | |
| | | 103 | | Evolution AB (Hotels, Restaurants & Leisure) | | | 9 | |
| | | 306 | | Fastighets AB Balder, B Shares (Real Estate Management & Development)(b) | | | 1 | |
| | | 120 | | Getinge AB, B Shares (Health Care Equipment & Supplies) | | | 3 | |
| | | 403 | | H & M Hennes & Mauritz AB, B Shares (Specialty Retail) | | | 5 | |
| | | 971 | | Hexagon AB, Class - B (Electronic Equipment, Instruments & Components) | | | 10 | |
| | | 48 | | Holmen AB, B Shares (Paper & Forest Products) | | | 2 | |
| | | 214 | | Husqvarna AB, B Shares (Machinery) | | | 2 | |
| | | 71 | | Industrivarden AB, A Shares (Diversified Financial Services)(a) | | | 2 | |
| | | 87 | | Industrivarden AB, Class - C (Diversified Financial Services) | | | 2 | |
| | | 155 | | Indutrade AB (Trading Companies & Distributors) | | | 3 | |
| | | 81 | | Investment AB Latour, Class - B (Industrial Conglomerates) | | | 2 | |
| | | 278 | | Investor AB, Class - A (Diversified Financial Services)^ | | | 5 | |
| | | 941 | | Investor AB, Class - B (Diversified Financial Services) | | | 14 | |
| | | 120 | | Kinnevik AB, Class - B (Diversified Financial Services)(b) | | | 2 | |
| | | 37 | | L E Lundbergforetagen AB, Class - B (Diversified Financial Services) | | | 2 | |
| | | 127 | | Lifco AB, Class - B (Industrial Conglomerates) | | | 2 | |
| | | 882 | | Nibe Industrier AB, Class - B (Building Products) | | | 7 | |
| | | 95 | | Sagax AB, Class - B (Real Estate Management & Development) | | | 2 | |
| | | 583 | | Sandvik AB (Machinery) | | | 9 | |
| | | 148 | | Securitas AB, Class - B (Commercial Services & Supplies) | | | 1 | |
| | | 314 | | Sinch AB (Software)(b) | | | 1 | |
| | Shares | | Security Description | | Value
(000) | |
| | | | | Sweden (continued) |
| | | 899 | | Skandinaviska Enskilda Banken AB, Class - A (Banks) | | $ | 9 | |
| | | 174 | | Skanska AB, B Shares (Construction & Engineering) | | | 3 | |
| | | 194 | | SKF AB, B Shares (Machinery) | | | 3 | |
| | | 310 | | Svenska Cellulosa AB SCA, Class - B (Paper & Forest Products) | | | 5 | |
| | | 765 | | Svenska Handelsbanken AB, A Shares (Banks) | | | 7 | |
| | | 465 | | Swedbank AB, A Shares (Banks) | | | 6 | |
| | | 264 | | Tele2 AB, B Shares (Wireless Telecommunication Services) | | | 3 | |
| | | 1,530 | | Telefonaktiebolaget LM Ericsson, Class - B (Communications Equipment) | | | 11 | |
| | | 1,342 | | Telia Co. AB (Diversified Telecommunication Services)(a) | | | 5 | |
| | | 678 | | Volvo AB, B Shares (Machinery) | | | 11 | |
| | | 207 | | Volvo AB, Class - A (Machinery) | | | 3 | |
| | | 325 | | Volvo Car AB, Class - B (Automobiles)(b) | | | 2 | |
| | | | | | | | 217 | |
| | | | | Switzerland — 2.55% |
| | | 863 | | ABB Ltd., Registered Shares (Electrical Equipment) | | | 23 | |
| | | 82 | | Adecco Group AG (Professional Services)(a) | | | 3 | |
| | | 262 | | Alcon, Inc. (Health Care Equipment & Supplies) | | | 18 | |
| | | 24 | | Baloise Holding AG, Registered Shares (Insurance) | | | 4 | |
| | | 2 | | Barry Callebaut AG, Registered Shares (Food Products)(a) | | | 4 | |
| | | 1 | | Chocoladefabriken Lindt & Spruengli AG (Food Products) | | | 10 | |
| | | 225 | | Chubb Ltd. (Insurance) | | | 44 | |
| | | 275 | | cie Financiere Richemont SA, Registered Shares (Textiles, Apparel & Luxury Goods) | | | 29 | |
| | | 100 | | Clariant AG, Registered Shares (Chemicals)(b) | | | 2 | |
| | | 114 | | Coca-Cola HBC AG (Beverages) | | | 3 | |
| | | 1,391 | | Credit Suisse Group AG, Registered Shares (Capital Markets) | | | 8 | |
| | | 3 | | EMS-Chemie Holding AG (Chemicals) | | | 2 | |
| | | 80 | | Garmin Ltd. (Household Durables) | | | 8 | |
| | | 20 | | Geberit AG, Registered Shares (Building Products) | | | 10 | |
| | | 5 | | Givaudan SA, Registered Shares (Chemicals) | | | 18 | |
| | | 287 | | Holcim Ltd., Registered Shares (Construction Materials)(a) | | | 12 | |
| | | 119 | | Julius Baer Group Ltd. (Capital Markets) | | | 5 | |
| | | 28 | | Kuehne & Nagel International AG, Registered Shares (Marine) | | | 7 | |
See accompanying notes to financial statements.
107
HC CAPITAL TRUST
The Catholic SRI Growth Portfolio
Portfolio of Investments (continued) — June 30, 2022
| | Shares | | Security Description | | Value
(000) | |
| | | | | Common Stocks (continued) |
| | | | | Switzerland (continued) |
| | | 89 | | Logitech International SA, Registered Shares (Technology Hardware, Storage & Peripherals) | | $ | 5 | |
| | | 1,474 | | Nestle SA, Registered Shares (Food Products) | | | 172 | |
| | | 12 | | Partners Group Holding AG (Capital Markets) | | | 11 | |
| | | 18 | | Schindler Holding AG (Machinery) | | | 3 | |
| | | 19 | | Schindler Holding AG, Registered Shares (Machinery) | | | 3 | |
| | | 3 | | SGS SA, Registered Shares (Professional Services)(a) | | | 7 | |
| | | 76 | | Sika AG, Registered Shares (Chemicals)(a) | | | 18 | |
| | | 28 | | Sonova Holding AG, Registered Shares (Health Care Equipment & Supplies)(a) | | | 9 | |
| | | 55 | | Straumann Holding AG, Registered Shares (Health Care Equipment & Supplies) | | | 7 | |
| | | 16 | | Swiss Life Holding AG (Insurance) | | | 8 | |
| | | 38 | | Swiss Prime Site AG, Registered Shares (Real Estate Management & Development) | | | 3 | |
| | | 158 | | Swiss Re AG (Insurance) | | | 12 | |
| | | 13 | | Swisscom AG, Registered Shares (Diversified Telecommunication Services) | | | 7 | |
| | | 161 | | TE Connectivity Ltd. (Electronic Equipment, Instruments & Components) | | | 18 | |
| | | 35 | | Temenos AG, Registered Shares (Software) | | | 3 | |
| | | 39 | | The Swatch Group AG (Textiles, Apparel & Luxury Goods) | | | 2 | |
| | | 14 | | The Swatch Group AG, B Shares (Textiles, Apparel & Luxury Goods) | | | 3 | |
| | | 1,844 | | UBS Group AG (Capital Markets) | | | 30 | |
| | | 14 | | VAT Group AG (Machinery) | | | 3 | |
| | | 26 | | Vifor Pharma AG (Pharmaceuticals) | | | 5 | |
| | | 79 | | Zurich Financial Services AG (Insurance) | | | 34 | |
| | | | | | | | 573 | |
| | | | | United Arab Emirates — 0.00% |
| | | 118 | | NMC Health PLC (Health Care Providers & Services)(b)(c) | | | — | |
| | | | | United Kingdom — 4.31% |
| | | 506 | | 3i Group PLC (Capital Markets) | | | 7 | |
| | | 1,208 | | abrdn PLC (Diversified Financial Services) | | | 2 | |
| | | 100 | | Admiral Group PLC (Insurance)(a) | | | 3 | |
| | | 795 | | Amcor PLC (Containers & Packaging) | | | 10 | |
| | | 671 | | Anglo American PLC (Metals & Mining) | | | 24 | |
| | | 200 | | Antofagasta PLC (Metals & Mining) | | | 3 | |
| | | 110 | | Aon PLC, Class - A (Insurance) | | | 30 | |
| | | 142 | | Aptiv PLC (Auto Components)(b) | | | 13 | |
| | | 234 | | Ashtead Group PLC (Trading Companies & Distributors) | | | 10 | |
| | | 190 | | Associated British Foods PLC (Food Products) | | | 4 | |
| | Shares | | Security Description | | Value
(000) | |
| | | | | United Kingdom (continued) |
| | | 483 | | Auto Trader Group PLC (Interactive Media & Services)(a) | | $ | 3 | |
| | | 69 | | Aveva Group PLC (Software) | | | 2 | |
| | | 1,646 | | Aviva PLC (Insurance) | | | 8 | |
| | | 8,735 | | Barclays PLC (Banks)(a) | | | 16 | |
| | | 502 | | Barratt Developments PLC (Household Durables)(a) | | | 3 | |
| | | 52 | | Berkeley Group Holdings PLC (Household Durables)(b) | | | 2 | |
| | | 10,047 | | BP PLC (Oil, Gas & Consumable Fuels) | | | 47 | |
| | | 426 | | British Land Co. PLC (Equity Real Estate Investment Trusts) | | | 2 | |
| | | 3,510 | | BT Group PLC (Diversified Telecommunication Services) | | | 8 | |
| | | 177 | | Bunzl PLC (Trading Companies & Distributors) | | | 6 | |
| | | 221 | | Burberry Group PLC (Textiles, Apparel & Luxury Goods)(a) | | | 4 | |
| | | 182 | | Clarivate PLC (Professional Services)(b) | | | 3 | |
| | | 108 | | Coca-Cola Europacific Partners PLC (Beverages) | | | 6 | |
| | | 936 | | Compass Group PLC (Hotels, Restaurants & Leisure) | | | 19 | |
| | | 71 | | Croda International PLC (Chemicals)(a) | | | 6 | |
| | | 1,215 | | Diageo PLC (Beverages) | | | 52 | |
| | | 116 | | Ferguson PLC (Trading Companies & Distributors) | | | 13 | |
| | | 169 | | Halma PLC (Electronic Equipment, Instruments & Components) | | | 4 | |
| | | 176 | | Hargreaves Lansdown PLC (Capital Markets) | | | 2 | |
| | | 10,641 | | HSBC Holdings PLC (Banks) | | | 69 | |
| | | 810 | | Informa PLC (Media)(b) | | | 5 | |
| | | 96 | | Intercontinental Hotels Group PLC (Hotels, Restaurants & Leisure) | | | 5 | |
| | | 83 | | Intertek Group PLC (Professional Services) | | | 4 | |
| | | 842 | | J Sainsbury PLC (Food & Staples Retailing) | | | 2 | |
| | | 1,475 | | JD Sports Fashion PLC (Specialty Retail)(b) | | | 2 | |
| | | 100 | | Johnson Matthey PLC (Chemicals) | | | 2 | |
| | | 1,048 | | Kingfisher PLC (Specialty Retail) | | | 3 | |
| | | 371 | | Land Securities Group PLC (Equity Real Estate Investment Trusts) | | | 3 | |
| | | 3,141 | | Legal & General Group PLC (Insurance) | | | 9 | |
| | | 72 | | Liberty Global PLC, Class - A (Media)(b) | | | 2 | |
| | | 182 | | Liberty Global PLC, Class - C (Diversified Telecommunication Services)(b) | | | 4 | |
| | | 268 | | Linde PLC (Chemicals) | | | 77 | |
| | | 36,873 | | Lloyds Banking Group PLC (Banks) | | | 19 | |
| | | 173 | | London Stock Exchange Group PLC (Capital Markets)(a) | | | 16 | |
| | | 1,406 | | M&G PLC (Diversified Financial Services) | | | 3 | |
| | | 267 | | Mondi PLC (Paper & Forest Products) | | | 5 | |
See accompanying notes to financial statements.
108
HC CAPITAL TRUST
The Catholic SRI Growth Portfolio
Portfolio of Investments (continued) — June 30, 2022
| | Shares | | Security Description | | Value
(000) | |
| | | | | Common Stocks (continued) |
| | | | | United Kingdom (continued) |
| | | 1,842 | | National Grid PLC (Multi-Utilities) | | $ | 24 | |
| | | 2,892 | | Natwest Group PLC (Banks)(a) | | | 8 | |
| | | 77 | | Next PLC (Multiline Retail) | | | 5 | |
| | | 254 | | Ocado Group PLC (Food & Staples Retailing)(a)(b) | | | 2 | |
| | | 399 | | Pearson PLC (Media) | | | 4 | |
| | | 163 | | Persimmon PLC (Household Durables) | | | 4 | |
| | | 381 | | Phoenix Group Holdings PLC (Insurance) | | | 3 | |
| | | 1,456 | | Prudential PLC (Insurance) | | | 18 | |
| | | 1,011 | | RELX PLC (Professional Services) | | | 27 | |
| | | 983 | | Rentokil Initial PLC (Commercial Services & Supplies) | | | 6 | |
| | | 582 | | Rio Tinto PLC (Metals & Mining) | | | 35 | |
| | | 71 | | Schroders PLC (Capital Markets) | | | 2 | |
| | | 618 | | Segro PLC (Equity Real Estate Investment Trusts) | | | 7 | |
| | | 74 | | Sensata Technologies Holding PLC (Electrical Equipment) | | | 3 | |
| | | 121 | | Severn Trent PLC (Water Utilities)(a) | | | 4 | |
| | | 4,001 | | Shell PLC (Oil, Gas & Consumable Fuels) | | | 104 | |
| | | 463 | | Smith & Nephew PLC (Health Care Equipment & Supplies) | | | 6 | |
| | | 219 | | Smiths Group PLC (Industrial Conglomerates) | | | 4 | |
| | | 38 | | Spirax-Sarco Engineering PLC (Machinery) | | | 5 | |
| | | 552 | | SSE PLC (Electric Utilities) | | | 11 | |
| | | 272 | | St. James Place PLC (Capital Markets) | | | 4 | |
| | | 1,366 | | Standard Chartered PLC (Banks) | | | 10 | |
| | | 1,079 | | Stellantis N.V. (Automobiles) | | | 13 | |
| | | 1,778 | | Taylor Wimpey PLC (Household Durables)(a) | | | 3 | |
| | | 3,950 | | Tesco PLC (Food & Staples Retailing) | | | 12 | |
| | | 545 | | The Sage Group PLC (Software) | | | 4 | |
| | | 1,346 | | Unilever PLC (Personal Products) | | | 61 | |
| | | 340 | | United Utilities Group PLC (Water Utilities) | | | 4 | |
| | | 14,263 | | Vodafone Group PLC (Wireless Telecommunication Services) | | | 22 | |
| | | 107 | | Whitbread PLC (Hotels, Restaurants & Leisure) | | | 3 | |
| | | 59 | | Willis Towers Watson PLC (Insurance) | | | 12 | |
| | | | | | | | 972 | |
| | | | | United States — 66.66% |
| | | 302 | | 3M Co. (Industrial Conglomerates) | | | 39 | |
| | | 72 | | A.O. Smith Corp. (Building Products) | | | 4 | |
| | | 24 | | Abiomed, Inc. (Health Care Equipment & Supplies)(b) | | | 6 | |
| | | 332 | | Accenture PLC, Class - A (IT Services) | | | 92 | |
| | | 409 | | Activision Blizzard, Inc. (Entertainment) | | | 32 | |
| | | 247 | | Adobe, Inc. (Software)(b) | | | 90 | |
| | | 36 | | Advance Auto Parts, Inc. (Specialty Retail) | | | 6 | |
| | Shares | | Security Description | | Value
(000) | |
| | | | | United States (continued) |
| | | 855 | | Advanced Micro Devices, Inc. (Semiconductors & Semiconductor Equipment)(b) | | $ | 65 | |
| | | 95 | | Affirm Holdings, Inc. (IT Services)(b) | | | 2 | |
| | | 325 | | Aflac, Inc. (Insurance) | | | 18 | |
| | | 156 | | Agilent Technologies, Inc. (Life Sciences Tools & Services) | | | 19 | |
| | | 116 | | Air Products & Chemicals, Inc. (Chemicals) | | | 28 | |
| | | 178 | | Airbnb, Inc., Class - A (Hotels, Restaurants & Leisure)(b) | | | 16 | |
| | | 86 | | Akamai Technologies, Inc. (IT Services)(b) | | | 8 | |
| | | 61 | | Albemarle Corp. (Chemicals) | | | 13 | |
| | | 97 | | Alcoa Corp. (Metals & Mining) | | | 4 | |
| | | 77 | | Alexandria Real Estate Equities, Inc. (Equity Real Estate Investment Trusts) | | | 11 | |
| | | 39 | | Align Technology, Inc. (Health Care Equipment & Supplies)(b) | | | 9 | |
| | | 7 | | Alleghany Corp. (Insurance)(b) | | | 6 | |
| | | 148 | | Alliant Energy Corp. (Electric Utilities) | | | 9 | |
| | | 174 | | Ally Financial, Inc. (Consumer Finance) | | | 6 | |
| | | 63 | | Alnylam Pharmaceuticals, Inc. (Biotechnology)(b) | | | 9 | |
| | | 157 | | Alphabet, Inc., Class - A (Interactive Media & Services)(b) | | | 342 | |
| | | 149 | | Alphabet, Inc., Class - C (Interactive Media & Services)(b) | | | 326 | |
| | | 4,798 | | Amazon.com, Inc. (Internet & Direct Marketing Retail)(b) | | | 510 | |
| | | 261 | | AMC Entertainment Holdings, Inc. (Entertainment)^(b) | | | 4 | |
| | | 5 | | AMERCO (Road & Rail) | | | 2 | |
| | | 132 | | Ameren Corp. (Multi-Utilities) | | | 12 | |
| | | 275 | | American Electric Power Company, Inc. (Electric Utilities) | | | 26 | |
| | | 335 | | American Express Co. (Consumer Finance) | | | 46 | |
| | | 37 | | American Financial Group, Inc. (Insurance) | | | 5 | |
| | | 209 | | American Homes 4 Rent, Class - A (Equity Real Estate Investment Trusts) | | | 7 | |
| | | 411 | | American International Group, Inc. (Insurance) | | | 21 | |
| | | 237 | | American Tower Corp. (Equity Real Estate Investment Trusts) | | | 61 | |
| | | 95 | | American Water Works Co., Inc. (Water Utilities) | | | 14 | |
| | | 59 | | Ameriprise Financial, Inc. (Capital Markets) | | | 14 | |
| | | 80 | | AmerisourceBergen Corp. (Health Care Providers & Services) | | | 11 | |
| | | 118 | | AMETEK, Inc. (Electrical Equipment) | | | 13 | |
| | | 280 | | Amphenol Corp., Class - A (Electronic Equipment, Instruments & Components) | | | 18 | |
See accompanying notes to financial statements.
109
HC CAPITAL TRUST
The Catholic SRI Growth Portfolio
Portfolio of Investments (continued) — June 30, 2022
| | Shares | | Security Description | | Value
(000) | |
| | | | | Common Stocks (continued) |
| | | | | United States (continued) |
| | | 267 | | Analog Devices, Inc. (Semiconductors & Semiconductor Equipment) | | $ | 39 | |
| | | 799 | | Annaly Capital Management, Inc. (Mortgage Real Estate Investment Trusts) | | | 5 | |
| | | 50 | | ANSYS, Inc. (Software)(b) | | | 12 | |
| | | 179 | | APA Corp. (Oil, Gas & Consumable Fuels) | | | 6 | |
| | | 210 | | Apollo Global Management, Inc. (Diversified Financial Services) | | | 10 | |
| | | 8,557 | | Apple, Inc. (Technology Hardware, Storage & Peripherals) | | | 1,170 | |
| | | 453 | | Applied Materials, Inc. (Semiconductors & Semiconductor Equipment) | | | 41 | |
| | | 67 | | AppLovin Corp., Class A (Software)(b) | | | 2 | |
| | | 124 | | Aramark (Hotels, Restaurants & Leisure) | | | 4 | |
| | | 293 | | Archer-Daniels-Midland Co. (Food Products) | | | 23 | |
| | | 130 | | Arista Networks, Inc. (Communications Equipment)(b) | | | 12 | |
| | | 33 | | Arrow Electronics, Inc. (Electronic Equipment, Instruments & Components)(b) | | | 4 | |
| | | 108 | | Arthur J. Gallagher & Co. (Insurance) | | | 18 | |
| | | 30 | | Assurant, Inc. (Insurance) | | | 5 | |
| | | 3,720 | | AT&T, Inc. (Diversified Telecommunication Services) | | | 78 | |
| | | 69 | | Atmos Energy Corp. (Gas Utilities) | | | 8 | |
| | | 116 | | Autodesk, Inc. (Software)(b) | | | 20 | |
| | | 222 | | Automatic Data Processing, Inc. (IT Services) | | | 47 | |
| | | 11 | | AutoZone, Inc. (Specialty Retail)(b) | | | 24 | |
| | | 47 | | Avalara, Inc. (Software)(b) | | | 3 | |
| | | 72 | | AvalonBay Communities, Inc. (Equity Real Estate Investment Trusts) | | | 14 | |
| | | 323 | | Avantor, Inc. (Life Sciences Tools & Services)(b) | | | 10 | |
| | | 42 | | Avery Dennison Corp. (Containers & Packaging) | | | 7 | |
| | | 499 | | Baker Hughes, Inc. (Energy Equipment & Services) | | | 14 | |
| | | 169 | | Ball Corp. (Containers & Packaging) | | | 12 | |
| | | 3,822 | | Bank of America Corp. (Banks) | | | 119 | |
| | | 141 | | Bath & Body Works, Inc. (Specialty Retail) | | | 4 | |
| | | 262 | | Baxter International, Inc. (Health Care Equipment & Supplies) | | | 17 | |
| | | 147 | | Becton Dickinson & Co. (Health Care Equipment & Supplies) | | | 36 | |
| | | 88 | | Bentley Systems, Inc., Class - B (Software) | | | 3 | |
| | | 671 | | Berkshire Hathaway, Inc., Class - B (Diversified Financial Services)(b) | | | 183 | |
| | | 117 | | Best Buy Co., Inc. (Specialty Retail) | | | 8 | |
| | | 50 | | Bill.com Holdings, Inc. (Software)(b) | | | 5 | |
| | | 95 | | BioMarin Pharmaceutical, Inc. (Biotechnology)(b) | | | 8 | |
| | Shares | | Security Description | | Value
(000) | |
| | | | | United States (continued) |
| | | 12 | | Bio-Rad Laboratories, Inc., Class - A (Life Sciences Tools & Services)(b) | | $ | 6 | |
| | | 20 | | Bio-Techne Corp. (Life Sciences Tools & Services) | | | 7 | |
| | | 85 | | Black Knight, Inc. (IT Services)(b) | | | 6 | |
| | | 79 | | BlackRock, Inc., Class - A (Capital Markets) | | | 48 | |
| | | 365 | | Blackstone, Inc., Class - A (Capital Markets) | | | 33 | |
| | | 267 | | Block, Inc. (IT Services)(b) | | | 16 | |
| | | 22 | | Booking Holdings, Inc. (Hotels, Restaurants & Leisure)(b) | | | 38 | |
| | | 71 | | Booz Allen Hamilton Holding Corp. (Professional Services) | | | 6 | |
| | | 123 | | BorgWarner, Inc. (Auto Components) | | | 4 | |
| | | 78 | | Boston Properties, Inc. (Equity Real Estate Investment Trusts) | | | 7 | |
| | | 747 | | Boston Scientific Corp. (Health Care Equipment & Supplies)(b) | | | 28 | |
| | | 214 | | Broadcom, Inc. (Semiconductors & Semiconductor Equipment) | | | 104 | |
| | | 61 | | Broadridge Financial Solutions, Inc. (IT Services) | | | 9 | |
| | | 63 | | Brookfield Renewable Corp., Class - A (Independent Power and Renewable Electricity Producers)(a) | | | 2 | |
| | | 124 | | Brown & Brown, Inc. (Insurance) | | | 7 | |
| | | 161 | | Brown-Forman Corp., Class - B (Beverages) | | | 11 | |
| | | 36 | | Burlington Stores, Inc. (Specialty Retail)(b) | | | 5 | |
| | | 68 | | C.H. Robinson Worldwide, Inc. (Air Freight & Logistics) | | | 7 | |
| | | 3 | | Cable One, Inc. (Media) | | | 4 | |
| | | 146 | | Cadence Design Systems, Inc. (Software)(b) | | | 22 | |
| | | 113 | | Caesars Entertainment, Inc. (Hotels, Restaurants & Leisure)(b) | | | 4 | |
| | | 53 | | Camden Property Trust (Equity Real Estate Investment Trusts) | | | 7 | |
| | | 103 | | Campbell Soup Co. (Food Products) | | | 5 | |
| | | 211 | | Capital One Financial Corp. (Consumer Finance) | | | 22 | |
| | | 147 | | Cardinal Health, Inc. (Health Care Providers & Services) | | | 8 | |
| | | 85 | | CarMax, Inc. (Specialty Retail)(b) | | | 8 | |
| | | 435 | | Carrier Global Corp. (Building Products) | | | 16 | |
| | | 44 | | Carvana Co. (Specialty Retail)(b) | | | 1 | |
| | | 279 | | Caterpillar, Inc. (Machinery) | | | 50 | |
| | | 58 | | CBOE Global Markets, Inc. (Capital Markets) | | | 7 | |
| | | 175 | | CBRE Group, Inc., Class - A (Real Estate Management & Development)(b) | | | 13 | |
| | | 72 | | CDW Corp. (Electronic Equipment, Instruments & Components) | | | 11 | |
| | | 57 | | Celanese Corp., Series A (Chemicals) | | | 7 | |
See accompanying notes to financial statements.
110
HC CAPITAL TRUST
The Catholic SRI Growth Portfolio
Portfolio of Investments (continued) — June 30, 2022
| | Shares | | Security Description | | Value
(000) | |
| | | | | Common Stocks (continued) |
| | | | | United States (continued) |
| | | 328 | | CenterPoint Energy, Inc. (Multi-Utilities) | | $ | 10 | |
| | | 74 | | Ceridian HCM Holding, Inc. (Software)(b) | | | 3 | |
| | | 112 | | CF Industries Holdings, Inc. (Chemicals) | | | 10 | |
| | | 63 | | Charter Communications, Inc., Class - A (Media)(b) | | | 30 | |
| | | 121 | | Cheniere Energy, Inc. (Oil, Gas & Consumable Fuels) | | | 16 | |
| | | 1,025 | | Chevron Corp. (Oil, Gas & Consumable Fuels) | | | 148 | |
| | | 57 | | Chewy, Inc., Class - A (Internet & Direct Marketing Retail)(b) | | | 2 | |
| | | 15 | | Chipotle Mexican Grill, Inc. (Hotels, Restaurants & Leisure)(b) | | | 20 | |
| | | 167 | | Cigna Corp. (Health Care Providers & Services) | | | 44 | |
| | | 79 | | Cincinnati Financial Corp. (Insurance) | | | 9 | |
| | | 49 | | Cintas Corp. (Commercial Services & Supplies) | | | 18 | |
| | | 2,166 | | Cisco Systems, Inc. (Communications Equipment) | | | 92 | |
| | | 1,053 | | Citigroup, Inc. (Banks) | | | 48 | |
| | | 261 | | Citizens Financial Group, Inc. (Banks) | | | 9 | |
| | | 65 | | Citrix Systems, Inc. (Software) | | | 6 | |
| | | 275 | | Cleveland-Cliffs, Inc. (Metals & Mining)(b) | | | 4 | |
| | | 137 | | Cloudflare, Inc., Class - A (Software)(b) | | | 6 | |
| | | 189 | | CME Group, Inc. (Capital Markets) | | | 39 | |
| | | 149 | | CMS Energy Corp. (Multi-Utilities) | | | 10 | |
| | | 90 | | Cognex Corp. (Electronic Equipment, Instruments & Components) | | | 4 | |
| | | 272 | | Cognizant Technology Solutions Corp. (IT Services) | | | 18 | |
| | | 65 | | Coinbase Global, Inc., Class - A (Capital Markets)^(b) | | | 3 | |
| | | 419 | | Colgate-Palmolive Co. (Household Products) | | | 34 | |
| | | 2,354 | | Comcast Corp., Class - A (Media) | | | 92 | |
| | | 250 | | Conagra Brands, Inc. (Food Products) | | | 9 | |
| | | 687 | | ConocoPhillips (Oil, Gas & Consumable Fuels) | | | 62 | |
| | | 182 | | Consolidated Edison, Inc. (Multi-Utilities) | | | 17 | |
| | | 86 | | Constellation Brands, Inc., Class - A (Beverages) | | | 20 | |
| | | 172 | | Constellation Energy Corp. (Electric Utilities) | | | 10 | |
| | | 113 | | Copart, Inc. (Commercial Services & Supplies)(b) | | | 12 | |
| | | 382 | | Corteva, Inc. (Chemicals) | | | 21 | |
| | | 210 | | CoStar Group, Inc. (Professional Services)(b) | | | 13 | |
| | | 231 | | Costco Wholesale Corp. (Food & Staples Retailing) | | | 111 | |
| | | 424 | | Coterra Energy, Inc. (Oil, Gas & Consumable Fuels) | | | 11 | |
| | | 38 | | Coupa Software, Inc. (Software)(b) | | | 2 | |
| | | 103 | | Crowdstrike Holdings, Inc., Class - A (Software)(b) | | | 17 | |
| | Shares | | Security Description | | Value
(000) | |
| | | | | United States (continued) |
| | | 226 | | Crown Castle International Corp. (Equity Real Estate Investment Trusts) | | $ | 38 | |
| | | 66 | | Crown Holdings, Inc. (Containers & Packaging) | | | 6 | |
| | | 1,146 | | CSX Corp. (Road & Rail) | | | 33 | |
| | | 76 | | Cummins, Inc. (Machinery) | | | 15 | |
| | | 687 | | CVS Health Corp. (Health Care Providers & Services) | | | 64 | |
| | | 175 | | D.R. Horton, Inc. (Household Durables) | | | 12 | |
| | | 69 | | Darden Restaurants, Inc. (Hotels, Restaurants & Leisure) | | | 8 | |
| | | 115 | | Datadog, Inc., Class - A (Software)(b) | | | 11 | |
| | | 30 | | DaVita, Inc. (Health Care Providers & Services)(b) | | | 2 | |
| | | 152 | | Deere & Co. (Machinery) | | | 46 | |
| | | 151 | | DELL Technologies, Inc., Class - C (Technology Hardware, Storage & Peripherals) | | | 7 | |
| | | 79 | | Delta Air Lines, Inc. (Airlines)(b) | | | 2 | |
| | | 109 | | DENTSPLY SIRONA, Inc. (Health Care Equipment & Supplies) | | | 4 | |
| | | 329 | | Devon Energy Corp. (Oil, Gas & Consumable Fuels) | | | 18 | |
| | | 204 | | Dexcom, Inc. (Health Care Equipment & Supplies)(b) | | | 15 | |
| | | 91 | | Diamondback Energy, Inc. (Oil, Gas & Consumable Fuels) | | | 11 | |
| | | 154 | | Digital Realty Trust, Inc. (Equity Real Estate Investment Trusts) | | | 20 | |
| | | 147 | | Discover Financial Services (Consumer Finance) | | | 14 | |
| | | 140 | | Dish Network Corp. (Media)(b) | | | 3 | |
| | | 104 | | DocuSign, Inc. (Software)(b) | | | 6 | |
| | | 123 | | Dollar General Corp. (Multiline Retail) | | | 30 | |
| | | 119 | | Dollar Tree, Inc. (Multiline Retail)(b) | | | 19 | |
| | | 419 | | Dominion Energy, Inc. (Multi-Utilities) | | | 33 | |
| | | 19 | | Domino’s Pizza, Inc. (Hotels, Restaurants & Leisure) | | | 7 | |
| | | 104 | | DoorDash, Inc., Class - A (Internet & Direct Marketing Retail)(b) | | | 7 | |
| | | 77 | | Dover Corp. (Machinery) | | | 9 | |
| | | 379 | | Dow, Inc. (Chemicals) | | | 20 | |
| | | 162 | | Dropbox, Inc., Class - A (Software)(b) | | | 3 | |
| | | 100 | | DTE Energy Co. (Multi-Utilities) | | | 13 | |
| | | 421 | | Duke Energy Corp. (Electric Utilities) | | | 45 | |
| | | 198 | | Duke Realty Corp. (Equity Real Estate Investment Trusts) | | | 11 | |
| | | 271 | | DuPont de Nemours, Inc. (Chemicals) | | | 15 | |
| | | 98 | | Dynatrace, Inc. (Software)(b) | | | 4 | |
| | | 70 | | Eastman Chemical Co. (Chemicals) | | | 6 | |
| | | 316 | | eBay, Inc. (Internet & Direct Marketing Retail) | | | 13 | |
See accompanying notes to financial statements.
111
HC CAPITAL TRUST
The Catholic SRI Growth Portfolio
Portfolio of Investments (continued) — June 30, 2022
| | Shares | | Security Description | | Value
(000) | |
| | | | | Common Stocks (continued) |
| | | | | United States (continued) |
| | | 135 | | Ecolab, Inc. (Chemicals) | | $ | 21 | |
| | | 198 | | Edison International (Electric Utilities) | | | 13 | |
| | | 327 | | Edwards Lifesciences Corp. (Health Care Equipment & Supplies)(b) | | | 31 | |
| | | 225 | | Elanco Animal Health, Inc. (Pharmaceuticals)(b) | | | 4 | |
| | | 150 | | Electronic Arts, Inc. (Entertainment) | | | 18 | |
| | | 127 | | Elevance Health, Inc. (Health Care Providers & Services) | | | 61 | |
| | | 313 | | Emerson Electric Co. (Electrical Equipment) | | | 25 | |
| | | 70 | | Enphase Energy, Inc. (Semiconductors & Semiconductor Equipment)(b) | | | 14 | |
| | | 68 | | Entegris, Inc. (Semiconductors & Semiconductor Equipment) | | | 6 | |
| | | 104 | | Entergy Corp. (Electric Utilities) | | | 12 | |
| | | 307 | | EOG Resources, Inc. (Oil, Gas & Consumable Fuels) | | | 34 | |
| | | 30 | | EPAM Systems, Inc. (IT Services)(b) | | | 9 | |
| | | 176 | | EQT Corp. (Oil, Gas & Consumable Fuels) | | | 6 | |
| | | 64 | | Equifax, Inc. (Professional Services) | | | 12 | |
| | | 47 | | Equinix, Inc. (Equity Real Estate Investment Trusts) | | | 31 | |
| | | 185 | | Equitable Holdings, Inc. (Diversified Financial Services) | | | 5 | |
| | | 85 | | Equity Lifestyle Properties, Inc. (Equity Real Estate Investment Trusts) | | | 6 | |
| | | 191 | | Equity Residential (Equity Real Estate Investment Trusts) | | | 14 | |
| | | 15 | | Erie Indemnity Co., Class - A (Insurance) | | | 3 | |
| | | 122 | | Essential Utilities, Inc. (Water Utilities) | | | 6 | |
| | | 36 | | Essex Property Trust, Inc. (Equity Real Estate Investment Trusts) | | | 9 | |
| | | 67 | | Etsy, Inc. (Internet & Direct Marketing Retail)(b) | | | 5 | |
| | | 118 | | Evergy, Inc. (Electric Utilities) | | | 8 | |
| | | 179 | | Eversource Energy (Electric Utilities) | | | 15 | |
| | | 91 | | Exact Sciences Corp. (Biotechnology)(b) | | | 4 | |
| | | 496 | | Exelon Corp. (Electric Utilities) | | | 22 | |
| | | 87 | | Expedia Group, Inc. (Hotels, Restaurants & Leisure)(b) | | | 8 | |
| | | 89 | | Expeditors International of Washington, Inc. (Air Freight & Logistics) | | | 9 | |
| | | 70 | | Extra Space Storage, Inc. (Equity Real Estate Investment Trusts) | | | 12 | |
| | | 2,214 | | Exxon Mobil Corp. (Oil, Gas & Consumable Fuels) | | | 190 | |
| | | 32 | | F5, Inc. (Communications Equipment)(b) | | | 5 | |
| | | 20 | | FactSet Research Systems, Inc. (Capital Markets) | | | 8 | |
| | | 14 | | Fair Isaac Corp. (Software)(b) | | | 6 | |
| | | 302 | | Fastenal Co. (Trading Companies & Distributors) | | | 15 | |
| | Shares | | Security Description | | Value
(000) | |
| | | | | United States (continued) |
| | | 132 | | FedEx Corp. (Air Freight & Logistics) | | $ | 30 | |
| | | 142 | | Fidelity National Financial, Inc. (Insurance) | | | 5 | |
| | | 320 | | Fidelity National Information Services, Inc. (IT Services) | | | 29 | |
| | | 357 | | Fifth Third Bancorp (Banks) | | | 12 | |
| | | 6 | | First Citizens BancShares, Inc., Class - A (Banks) | | | 4 | |
| | | 92 | | First Republic Bank (Banks) | | | 13 | |
| | | 284 | | FirstEnergy Corp. (Electric Utilities) | | | 11 | |
| | | 326 | | Fiserv, Inc. (IT Services)(b) | | | 29 | |
| | | 41 | | FleetCor Technologies, Inc. (IT Services)(b) | | | 9 | |
| | | 66 | | FMC Corp. (Chemicals) | | | 7 | |
| | | 2,021 | | Ford Motor Co. (Automobiles) | | | 22 | |
| | | 365 | | Fortinet, Inc. (Software)(b) | | | 21 | |
| | | 182 | | Fortive Corp. (Machinery) | | | 10 | |
| | | 73 | | Fortune Brands Home & Security, Inc. (Building Products) | | | 4 | |
| | | 161 | | Fox Corp., Class - A (Media) | | | 5 | |
| | | 93 | | Fox Corp., Class - B (Media) | | | 3 | |
| | | 152 | | Franklin Resources, Inc. (Capital Markets) | | | 4 | |
| | | 766 | | Freeport-McMoRan, Inc. (Metals & Mining) | | | 22 | |
| | | 43 | | Gartner, Inc. (IT Services)(b) | | | 10 | |
| | | 33 | | Generac Holdings, Inc. (Electrical Equipment)(b) | | | 7 | |
| | | 316 | | General Mills, Inc. (Food Products) | | | 24 | |
| | | 700 | | General Motors Co. (Automobiles)(b) | | | 22 | |
| | | 76 | | Genuine Parts Co. (Distributors) | | | 10 | |
| | | 150 | | Global Payments, Inc. (IT Services) | | | 17 | |
| | | 49 | | Globe Life, Inc. (Insurance) | | | 5 | |
| | | 87 | | GoDaddy, Inc., Class - A (IT Services)(b) | | | 6 | |
| | | 58 | | Guidewire Software, Inc. (Software)(b) | | | 4 | |
| | | 459 | | Halliburton Co. (Energy Equipment & Services) | | | 14 | |
| | | 73 | | Hasbro, Inc. (Leisure Products) | | | 6 | |
| | | 126 | | HCA Healthcare, Inc. (Health Care Providers & Services) | | | 21 | |
| | | 270 | | Healthpeak Properties, Inc. (Equity Real Estate Investment Trusts) | | | 7 | |
| | | 23 | | HEICO Corp. (Aerospace & Defense) | | | 3 | |
| | | 39 | | HEICO Corp., Class - A (Aerospace & Defense) | | | 4 | |
| | | 74 | | Henry Schein, Inc. (Health Care Providers & Services)(b) | | | 6 | |
| | | 147 | | Hess Corp. (Oil, Gas & Consumable Fuels) | | | 16 | |
| | | 623 | | Hewlett Packard Enterprise Co. (Technology Hardware, Storage & Peripherals) | | | 8 | |
| | | 146 | | Hilton Worldwide Holdings, Inc. (Hotels, Restaurants & Leisure) | | | 16 | |
| | | 132 | | Hologic, Inc. (Health Care Equipment & Supplies)(b) | | | 9 | |
| | | 155 | | Hormel Foods Corp. (Food Products) | | | 7 | |
See accompanying notes to financial statements.
112
HC CAPITAL TRUST
The Catholic SRI Growth Portfolio
Portfolio of Investments (continued) — June 30, 2022
| | Shares | | Security Description | | Value
(000) | |
| | | | | Common Stocks (continued) |
| | | | | United States (continued) |
| | | 376 | | Host Hotels & Resorts, Inc. (Equity Real Estate Investment Trusts) | | $ | 6 | |
| | | 202 | | Howmet Aerospace, Inc. (Aerospace & Defense) | | | 6 | |
| | | 542 | | HP, Inc. (Technology Hardware, Storage & Peripherals) | | | 18 | |
| | | 24 | | HubSpot, Inc. (Software)(b) | | | 7 | |
| | | 66 | | Humana, Inc. (Health Care Providers & Services) | | | 31 | |
| | | 755 | | Huntington Bancshares, Inc. (Banks) | | | 9 | |
| | | 43 | | IAC/InterActiveCorp. (Interactive Media & Services)(b) | | | 3 | |
| | | 42 | | IDEX Corp. (Machinery) | | | 8 | |
| | | 45 | | IDEXX Laboratories, Inc. (Health Care Equipment & Supplies)(b) | | | 16 | |
| | | 163 | | Illinois Tool Works, Inc. (Machinery) | | | 30 | |
| | | 98 | | Incyte Corp. (Biotechnology)(b) | | | 7 | |
| | | 217 | | Ingersoll Rand, Inc. (Machinery) | | | 9 | |
| | | 36 | | Insulet Corp. (Health Care Equipment & Supplies)(b) | | | 8 | |
| | | 2,130 | | Intel Corp. (Semiconductors & Semiconductor Equipment) | | | 80 | |
| | | 296 | | Intercontinental Exchange, Inc. (Capital Markets) | | | 28 | |
| | | 471 | | International Business Machines Corp. (IT Services) | | | 67 | |
| | | 133 | | International Flavors & Fragrances, Inc. (Chemicals) | | | 16 | |
| | | 191 | | International Paper Co. (Containers & Packaging) | | | 8 | |
| | | 141 | | Intuit, Inc. (Software) | | | 54 | |
| | | 187 | | Intuitive Surgical, Inc. (Health Care Equipment & Supplies)(b) | | | 38 | |
| | | 349 | | Invitation Homes, Inc. (Equity Real Estate Investment Trusts) | | | 12 | |
| | | 99 | | IQVIA Holdings, Inc. (Life Sciences Tools & Services)(b) | | | 21 | |
| | | 151 | | Iron Mountain, Inc. (Equity Real Estate Investment Trusts) | | | 7 | |
| | | 39 | | Jack Henry & Associates, Inc. (IT Services) | | | 7 | |
| | | 68 | | Jacobs Engineering Group, Inc. (Professional Services) | | | 9 | |
| | | 32 | | Jazz Pharmaceuticals PLC (Pharmaceuticals)(b) | | | 5 | |
| | | 44 | | JB Hunt Transport Services, Inc. (Road & Rail) | | | 7 | |
| | | 373 | | Johnson Controls International PLC (Building Products) | | | 18 | |
| | | 1,543 | | JPMorgan Chase & Co. (Banks) | | | 174 | |
| | | 161 | | Juniper Networks, Inc. (Communications Equipment) | | | 5 | |
| | | 133 | | Kellogg Co. (Food Products) | | | 9 | |
| | | 419 | | Keurig Dr Pepper, Inc. (Beverages) | | | 15 | |
| | Shares | | Security Description | | Value
(000) | |
| | | | | United States (continued) |
| | | 488 | | KeyCorp (Banks) | | $ | 8 | |
| | | 88 | | Keysight Technologies, Inc. (Electronic Equipment, Instruments & Components)(b) | | | 12 | |
| | | 177 | | Kimberly-Clark Corp. (Household Products) | | | 24 | |
| | | 327 | | Kimco Realty Corp. (Equity Real Estate Investment Trusts) | | | 6 | |
| | | 1,064 | | Kinder Morgan, Inc. (Oil, Gas & Consumable Fuels) | | | 18 | |
| | | 288 | | KKR & Co., Inc. (Capital Markets) | | | 13 | |
| | | 78 | | KLA Corp. (Semiconductors & Semiconductor Equipment) | | | 25 | |
| | | 81 | | Knight-Swift Transportation Holdings, Inc. (Road & Rail) | | | 4 | |
| | | 49 | | Laboratory Corporation of America Holdings (Health Care Providers & Services) | | | 11 | |
| | | 73 | | Lam Research Corp. (Semiconductors & Semiconductor Equipment) | | | 31 | |
| | | 183 | | Las Vegas Sands Corp. (Hotels, Restaurants & Leisure)(b) | | | 6 | |
| | | 32 | | Lear Corp. (Auto Components) | | | 4 | |
| | | 141 | | Lennar Corp., Class - A (Household Durables) | | | 10 | |
| | | 19 | | Lennox International, Inc. (Building Products) | | | 4 | |
| | | 72 | | Liberty Broadband Corp., Class - C (Media)(b) | | | 8 | |
| | | 98 | | Liberty Media Corp. - Liberty Formula One, Class - C (Entertainment)(b) | | | 6 | |
| | | 51 | | Liberty Media Corp. - Liberty SiriusXM, Class - A (Media)(b) | | | 2 | |
| | | 87 | | Liberty Media Corp. - Liberty SiriusXM, Class - C (Media)(b) | | | 3 | |
| | | 89 | | Lincoln National Corp. (Insurance) | | | 4 | |
| | | 88 | | Live Nation Entertainment, Inc. (Entertainment)(b) | | | 7 | |
| | | 147 | | LKQ Corp. (Distributors) | | | 7 | |
| | | 105 | | Loews Corp. (Insurance) | | | 6 | |
| | | 353 | | Lowe’s Companies, Inc. (Specialty Retail) | | | 62 | |
| | | 42 | | LPL Financial Holdings, Inc. (Capital Markets) | | | 8 | |
| | | 205 | | Lucid Group, Inc. (Automobiles)^(b) | | | 4 | |
| | | 456 | | Lumen Technologies, Inc. (Diversified Telecommunication Services) | | | 5 | |
| | | 147 | | Lyft, Inc., Class - A (Road & Rail)(b) | | | 2 | |
| | | 94 | | M&T Bank Corp. (Banks) | | | 15 | |
| | | 403 | | Marathon Oil Corp. (Oil, Gas & Consumable Fuels) | | | 9 | |
| | | 295 | | Marathon Petroleum Corp. (Oil, Gas & Consumable Fuels) | | | 24 | |
| | | 7 | | Markel Corp. (Insurance)(b) | | | 9 | |
| | | 20 | | MarketAxess Holdings, Inc. (Capital Markets) | | | 5 | |
| | | 145 | | Marriott International, Inc., Class - A (Hotels, Restaurants & Leisure) | | | 20 | |
See accompanying notes to financial statements.
113
HC CAPITAL TRUST
The Catholic SRI Growth Portfolio
Portfolio of Investments (continued) — June 30, 2022
| | Shares | | Security Description | | Value
(000) | |
| | | | | Common Stocks (continued) |
| | | | | United States (continued) |
| | | 263 | | Marsh & McLennan Companies, Inc. (Insurance) | | $ | 41 | |
| | | 32 | | Martin Marietta Materials, Inc. (Construction Materials) | | | 10 | |
| | | 435 | | Marvell Technology, Inc. (Semiconductors & Semiconductor Equipment) | | | 19 | |
| | | 131 | | Masco Corp. (Building Products) | | | 7 | |
| | | 29 | | Masimo Corp. (Health Care Equipment & Supplies)(b) | | | 4 | |
| | | 457 | | MasterCard, Inc., Class - A (IT Services) | | | 144 | |
| | | 157 | | Match Group, Inc. (Interactive Media & Services)(b) | | | 11 | |
| | | 130 | | McCormick & Company, Inc. (Food Products) | | | 11 | |
| | | 389 | | McDonald’s Corp. (Hotels, Restaurants & Leisure) | | | 96 | |
| | | 78 | | McKesson Corp. (Health Care Providers & Services) | | | 25 | |
| | | 315 | | Medical Properties Trust, Inc. (Equity Real Estate Investment Trusts) | | | 5 | |
| | | 24 | | MercadoLibre, Inc. (Internet & Direct Marketing Retail)(b) | | | 15 | |
| | | 1,211 | | Meta Platforms, Inc., Class - A (Interactive Media & Services)(b) | | | 195 | |
| | | 357 | | MetLife, Inc. (Insurance) | | | 22 | |
| | | 12 | | Mettler-Toledo International, Inc. (Life Sciences Tools & Services)(b) | | | 14 | |
| | | 197 | | MGM Resorts International (Hotels, Restaurants & Leisure) | | | 6 | |
| | | 275 | | Microchip Technology, Inc. (Semiconductors & Semiconductor Equipment) | | | 16 | |
| | | 584 | | Micron Technology, Inc. (Semiconductors & Semiconductor Equipment) | | | 32 | |
| | | 3,726 | | Microsoft Corp. (Software) | | | 957 | |
| | | 60 | | Mid-America Apartment Communities, Inc. (Equity Real Estate Investment Trusts) | | | 10 | |
| | | 30 | | Mohawk Industries, Inc. (Household Durables)(b) | | | 4 | |
| | | 31 | | Molina Heathcare, Inc. (Health Care Providers & Services)(b) | | | 9 | |
| | | 99 | | Molson Coors Beverage Co., Class - B (Beverages) | | | 5 | |
| | | 731 | | Mondelez International, Inc., Class - A (Food Products) | | | 45 | |
| | | 36 | | MongoDB, Inc. (IT Services)(b) | | | 9 | |
| | Shares | | Security Description | | Value
(000) | |
| | | | | United States (continued) |
| | | 23 | | Monolithic Power Systems, Inc. (Semiconductors & Semiconductor Equipment) | | $ | 9 | |
| | | 209 | | Monster Beverage Corp. (Beverages)(b) | | | 19 | |
| | | 88 | | Moody’s Corp. (Capital Markets) | | | 24 | |
| | | 700 | | Morgan Stanley (Capital Markets) | | | 53 | |
| | | 87 | | Motorola Solutions, Inc. (Communications Equipment) | | | 18 | |
| | | 43 | | MSCI, Inc. (Capital Markets) | | | 18 | |
| | | 59 | | Nasdaq, Inc. (Capital Markets) | | | 9 | |
| | | 116 | | NetApp, Inc. (Technology Hardware, Storage & Peripherals) | | | 8 | |
| | | 233 | | Netflix, Inc. (Entertainment)(b) | | | 41 | |
| | | 49 | | Neurocrine Biosciences, Inc. (Biotechnology)(b) | | | 5 | |
| | | 437 | | Newmont Corp. (Metals & Mining) | | | 26 | |
| | | 201 | | News Corp., Class - A (Media) | | | 3 | |
| | | 1,022 | | NextEra Energy, Inc. (Electric Utilities) | | | 79 | |
| | | 669 | | NIKE, Inc., Class - B (Textiles, Apparel & Luxury Goods) | | | 68 | |
| | | 202 | | NiSource, Inc. (Multi-Utilities) | | | 6 | |
| | | 29 | | Nordson Corp. (Machinery) | | | 6 | |
| | | 125 | | Norfolk Southern Corp. (Road & Rail) | | | 28 | |
| | | 104 | | Northern Trust Corp. (Capital Markets) | | | 10 | |
| | | 307 | | Nortonlifelock, Inc. (Software) | | | 7 | |
| | | 124 | | NRG Energy, Inc. (Electric Utilities) | | | 5 | |
| | | 141 | | Nucor Corp. (Metals & Mining) | | | 15 | |
| | | 1,307 | | NVIDIA Corp. (Semiconductors & Semiconductor Equipment) | | | 198 | |
| | | 2 | | NVR, Inc. (Household Durables)(b) | | | 8 | |
| | | 483 | | Occidental Petroleum Corp. (Oil, Gas & Consumable Fuels) | | | 28 | |
| | | 78 | | Okta, Inc. (IT Services)(b) | | | 7 | |
| | | 51 | | Old Dominion Freight Line, Inc. (Road & Rail) | | | 13 | |
| | | 112 | | Omnicom Group, Inc. (Media) | | | 7 | |
| | | 222 | | ON Semiconductor Corp. (Semiconductors & Semiconductor Equipment)(b) | | | 11 | |
| | | 234 | | ONEOK, Inc. (Oil, Gas & Consumable Fuels) | | | 13 | |
| | | 839 | | Oracle Corp. (Software) | | | 59 | |
| | | 36 | | O’Reilly Automotive, Inc. (Specialty Retail)(b) | | | 23 | |
| | | 227 | | Otis Worldwide Corp. (Machinery) | | | 16 | |
| | | 54 | | Owens Corning (Building Products) | | | 4 | |
| | | 184 | | PACCAR, Inc. (Machinery) | | | 15 | |
| | | 49 | | Packaging Corporation of America (Containers & Packaging) | | | 7 | |
| | | 858 | | Palantir Technologies, Inc., Class - A (Software)(b) | | | 8 | |
| | | 52 | | Palo Alto Networks, Inc. (Software)(b) | | | 26 | |
| | | 319 | | Paramount Global, Class - B (Media) | | | 8 | |
See accompanying notes to financial statements.
114
HC CAPITAL TRUST
The Catholic SRI Growth Portfolio
Portfolio of Investments (continued) — June 30, 2022
| | Shares | | Security Description | | Value
(000) | |
| | | | | Common Stocks (continued) |
| | | | | United States (continued) |
| | | 68 | | Parker Hannifin Corp. (Machinery) | | $ | 17 | |
| | | 170 | | Paychex, Inc. (IT Services) | | | 19 | |
| | | 27 | | PAYCOM Software, Inc. (Software)(b) | | | 8 | |
| | | 580 | | PayPal Holdings, Inc. (IT Services)(b) | | | 41 | |
| | | 159 | | Peloton Interactive, Inc., Class - A (Leisure Products)(b) | | | 1 | |
| | | 724 | | PepsiCo, Inc. (Beverages) | | | 121 | |
| | | 785 | | PG&E Corp. (Electric Utilities)(b) | | | 8 | |
| | | 252 | | Phillips 66 (Oil, Gas & Consumable Fuels) | | | 21 | |
| | | 297 | | Pinterest, Inc., Class - A (Interactive Media & Services)(b) | | | 5 | |
| | | 122 | | Pioneer Natural Resources Co. (Oil, Gas & Consumable Fuels) | | | 27 | |
| | | 269 | | Plug Power, Inc. (Electrical Equipment)(b) | | | 4 | |
| | | 219 | | PNC Financial Services Group, Inc. (Banks) | | | 35 | |
| | | 21 | | Pool Corp. (Distributors) | | | 7 | |
| | | 124 | | PPG Industries, Inc. (Chemicals) | | | 14 | |
| | | 395 | | PPL Corp. (Electric Utilities) | | | 11 | |
| | | 140 | | Principal Financial Group, Inc. (Insurance) | | | 9 | |
| | | 387 | | Prologis, Inc. (Equity Real Estate Investment Trusts) | | | 46 | |
| | | 192 | | Prudential Financial, Inc. (Insurance) | | | 18 | |
| | | 59 | | PTC, Inc. (Software)(b) | | | 6 | |
| | | 267 | | Public Service Enterprise Group, Inc. (Multi-Utilities) | | | 17 | |
| | | 83 | | Public Storage (Equity Real Estate Investment Trusts) | | | 26 | |
| | | 131 | | PulteGroup, Inc. (Household Durables) | | | 5 | |
| | | 54 | | Qorvo, Inc. (Semiconductors & Semiconductor Equipment)(b) | | | 5 | |
| | | 586 | | QUALCOMM, Inc. (Semiconductors & Semiconductor Equipment) | | | 75 | |
| | | 77 | | Quanta Services, Inc. (Construction & Engineering) | | | 10 | |
| | | 62 | | Quest Diagnostics, Inc. (Health Care Providers & Services) | | | 8 | |
| | | 97 | | Raymond James Financial, Inc. (Capital Markets) | | | 9 | |
| | | 307 | | Realty Income Corp. (Equity Real Estate Investment Trusts) | | | 21 | |
| | | 76 | | Regency Centers Corp. (Equity Real Estate Investment Trusts) | | | 5 | |
| | | 497 | | Regions Financial Corp. (Banks) | | | 9 | |
| | | 116 | | Republic Services, Inc. (Commercial Services & Supplies) | | | 15 | |
| | | 76 | | ResMed, Inc. (Health Care Equipment & Supplies) | | | 16 | |
| | | 44 | | RingCentral, Inc., Class - A (Software)(b) | | | 2 | |
| | Shares | | Security Description | | Value
(000) | |
| | | | | United States (continued) |
| | | 88 | | Rivian Automotive, Inc., Class - A (Automobiles)(b) | | $ | 2 | |
| | | 59 | | Robert Half International, Inc. (Professional Services) | | | 4 | |
| | | 191 | | ROBLOX Corp., Class - A (Entertainment)(b) | | | 6 | |
| | | 61 | | Rockwell Automation, Inc. (Electrical Equipment) | | | 12 | |
| | | 62 | | Roku, Inc. (Entertainment)(b) | | | 5 | |
| | | 118 | | Rollins, Inc. (Commercial Services & Supplies) | | | 4 | |
| | | 58 | | Roper Technologies, Inc. (Industrial Conglomerates) | | | 23 | |
| | | 190 | | Ross Stores, Inc. (Specialty Retail) | | | 13 | |
| | | 178 | | Royalty Pharma PLC, Class - A (Pharmaceuticals) | | | 7 | |
| | | 67 | | RPM International, Inc. (Chemicals) | | | 5 | |
| | | 186 | | S&P Global, Inc. (Capital Markets) | | | 63 | |
| | | 514 | | Salesforce, Inc. (Software)(b) | | | 85 | |
| | | 56 | | SBA Communications Corp. (Equity Real Estate Investment Trusts) | | | 18 | |
| | | 741 | | Schlumberger N.V. (Energy Equipment & Services) | | | 26 | |
| | | 72 | | Seagen, Inc. (Biotechnology)(b) | | | 13 | |
| | | 75 | | Sealed Air Corp. (Containers & Packaging) | | | 4 | |
| | | 83 | | SEI Investments Co. (Capital Markets) | | | 4 | |
| | | 167 | | Sempra Energy (Multi-Utilities) | | | 25 | |
| | | 105 | | ServiceNow, Inc. (Software)(b) | | | 50 | |
| | | 32 | | Signature Bank (Banks) | | | 6 | |
| | | 173 | | Simon Property Group, Inc. (Equity Real Estate Investment Trusts) | | | 16 | |
| | | 400 | | Sirius XM Holdings, Inc. (Media)^ | | | 2 | |
| | | 83 | | Skyworks Solutions, Inc. (Semiconductors & Semiconductor Equipment) | | | 8 | |
| | | 571 | | Snap, Inc., Class - A (Interactive Media & Services)(b) | | | 7 | |
| | | 29 | | Snap-on, Inc. (Machinery) | | | 6 | |
| | | 111 | | Snowflake, Inc., Class - A (IT Services)(b) | | | 15 | |
| | | 74 | | Southwest Airlines Co. (Airlines)(b) | | | 3 | |
| | | 86 | | Splunk, Inc. (Software)(b) | | | 8 | |
| | | 122 | | SS&C Technologies Holdings, Inc. (Software) | | | 7 | |
| | | 87 | | Stanley Black & Decker, Inc. (Machinery) | | | 9 | |
| | | 605 | | Starbucks Corp. (Hotels, Restaurants & Leisure) | | | 46 | |
| | | 193 | | State Street Corp. (Capital Markets) | | | 12 | |
| | | 104 | | Steel Dynamics, Inc. (Metals & Mining) | | | 7 | |
| | | 176 | | Stryker Corp. (Health Care Equipment & Supplies) | | | 35 | |
| | | 61 | | Sun Communities, Inc. (Equity Real Estate Investment Trusts) | | | 10 | |
| | | 31 | | SVB Financial Group (Banks)(b) | | | 12 | |
See accompanying notes to financial statements.
115
HC CAPITAL TRUST
The Catholic SRI Growth Portfolio
Portfolio of Investments (continued) — June 30, 2022
| | Shares | | Security Description | | Value
(000) | |
| | | | | Common Stocks (continued) |
| | | | | United States (continued) |
| | | 263 | | Synchrony Financial (Consumer Finance) | | $ | 7 | |
| | | 81 | | Synopsys, Inc. (Software)(b) | | | 25 | |
| | | 269 | | Sysco Corp. (Food & Staples Retailing) | | | 23 | |
| | | 119 | | T. Rowe Price Group, Inc. (Capital Markets) | | | 14 | |
| | | 81 | | Take-Two Interactive Software, Inc. (Entertainment)(b) | | | 10 | |
| | | 116 | | Targa Resources Corp. (Oil, Gas & Consumable Fuels) | | | 7 | |
| | | 251 | | Target Corp. (Multiline Retail) | | | 35 | |
| | | 87 | | Teladoc Health, Inc. (Health Care Technology)(b) | | | 3 | |
| | | 25 | | Teledyne Technologies, Inc. (Electronic Equipment, Instruments & Components)(b) | | | 9 | |
| | | 24 | | Teleflex, Inc. (Health Care Equipment & Supplies) | | | 6 | |
| | | 84 | | Teradyne, Inc. (Semiconductors & Semiconductor Equipment) | | | 8 | |
| | | 461 | | Tesla, Inc. (Automobiles)(b) | | | 310 | |
| | | 481 | | Texas Instruments, Inc. (Semiconductors & Semiconductor Equipment) | | | 74 | |
| | | 350 | | The AES Corp. (Independent Power and Renewable Electricity Producers) | | | 7 | |
| | | 146 | | The Allstate Corp. (Insurance) | | | 19 | |
| | | 398 | | The Bank of New York Mellon Corp. (Capital Markets) | | | 17 | |
| | | 89 | | The Carlyle Group, Inc. (Capital Markets) | | | 3 | |
| | | 760 | | The Charles Schwab Corp. (Capital Markets) | | | 48 | |
| | | 65 | | The Clorox Co. (Household Products) | | | 9 | |
| | | 2,150 | | The Coca-Cola Co. (Beverages) | | | 135 | |
| | | 122 | | The Estee Lauder Companies, Inc. (Personal Products) | | | 31 | |
| | | 175 | | The Goldman Sachs Group, Inc. (Capital Markets) | | | 52 | |
| | | 173 | | The Hartford Financial Services Group, Inc. (Insurance) | | | 11 | |
| | | 75 | | The Hershey Co. (Food Products) | | | 16 | |
| | | 547 | | The Home Depot, Inc. (Specialty Retail) | | | 150 | |
| | | 207 | | The Interpublic Group of Companies, Inc. (Media) | | | 6 | |
| | | 56 | | The J.M. Smucker Co. (Food Products) | | | 7 | |
| | | 379 | | The Kraft Heinz Co. (Food Products) | | | 14 | |
| | | 359 | | The Kroger Co. (Food & Staples Retailing) | | | 17 | |
| | | 194 | | The Mosaic Co. (Chemicals) | | | 9 | |
| | | 305 | | The Progressive Corp. (Insurance) | | | 35 | |
| | | 130 | | The Sherwin-Williams Co. (Chemicals) | | | 29 | |
| | | 553 | | The Southern Co. (Electric Utilities) | | | 39 | |
| | | 634 | | The TJX Companies, Inc. (Specialty Retail) | | | 35 | |
| | | 230 | | The Trade Desk, Inc., Class - A (Software)(b) | | | 10 | |
| | Shares | | Security Description | | Value
(000) | |
| | | | | United States (continued) |
| | | 128 | | The Travelers Companies, Inc. (Insurance) | | $ | 22 | |
| | | 949 | | The Walt Disney Co. (Entertainment)(b) | | | 90 | |
| | | 209 | | The Western Union Co. (IT Services) | | | 3 | |
| | | 633 | | The Williams Companies, Inc. (Oil, Gas & Consumable Fuels) | | | 20 | |
| | | 327 | | T-Mobile US, Inc. (Wireless Telecommunication Services)(b) | | | 44 | |
| | | 62 | | Tractor Supply Co. (Specialty Retail) | | | 12 | |
| | | 56 | | Tradeweb Markets, Inc., Class - A (Capital Markets) | | | 4 | |
| | | 123 | | Trane Technologies PLC (Building Products) | | | 16 | |
| | | 28 | | TransDigm Group, Inc. (Aerospace & Defense)(b) | | | 15 | |
| | | 101 | | TransUnion (Professional Services) | | | 8 | |
| | | 121 | | Trimble, Inc. (Electronic Equipment, Instruments & Components)(b) | | | 7 | |
| | | 698 | | Truist Financial Corp. (Banks) | | | 33 | |
| | | 91 | | Twilio, Inc., Class - A (IT Services)(b) | | | 8 | |
| | | 420 | | Twitter, Inc. (Interactive Media & Services)(b) | | | 16 | |
| | | 23 | | Tyler Technologies, Inc. (Software)(b) | | | 8 | |
| | | 154 | | Tyson Foods, Inc., Class - A (Food Products) | | | 13 | |
| | | 749 | | U.S. Bancorp (Banks) | | | 34 | |
| | | 768 | | Uber Technologies, Inc. (Road & Rail)(b) | | | 16 | |
| | | 152 | | UDR, Inc. (Equity Real Estate Investment Trusts) | | | 7 | |
| | | 110 | | UGI Corp. (Gas Utilities) | | | 4 | |
| | | 31 | | Ulta Beauty, Inc. (Specialty Retail)(b) | | | 12 | |
| | | 332 | | Union Pacific Corp. (Road & Rail) | | | 71 | |
| | | 382 | | United Parcel Service, Inc., Class - B (Air Freight & Logistics) | | | 70 | |
| | | 38 | | United Rentals, Inc. (Trading Companies & Distributors)(b) | | | 9 | |
| | | 495 | | UnitedHealth Group, Inc. (Health Care Providers & Services) | | | 254 | |
| | | 106 | | Unity Software, Inc. (Software)(b) | | | 4 | |
| | | 34 | | Universal Health Services, Inc., Class - B (Health Care Providers & Services) | | | 3 | |
| | | 39 | | Upstart Holdings, Inc. (Consumer Finance)^(b) | | | 1 | |
| | | 171 | | V.F. Corp. (Textiles, Apparel & Luxury Goods) | | | 8 | |
| | | 21 | | Vail Resorts, Inc. (Hotels, Restaurants & Leisure) | | | 5 | |
| | | 214 | | Valero Energy Corp. (Oil, Gas & Consumable Fuels) | | | 23 | |
| | | 73 | | Veeva Systems, Inc., Class - A (Health Care Technology)(b) | | | 14 | |
| | | 203 | | Ventas, Inc. (Equity Real Estate Investment Trusts) | | | 10 | |
| | | 55 | | VeriSign, Inc. (IT Services)(b) | | | 9 | |
| | | 85 | | Verisk Analytics, Inc., Class - A (Professional Services) | | | 15 | |
See accompanying notes to financial statements.
116
HC CAPITAL TRUST
The Catholic SRI Growth Portfolio
Portfolio of Investments (continued) — June 30, 2022
| | Shares | | Security Description | | Value
(000) | |
| | | | | Common Stocks (continued) |
| | | | | United States (continued) |
| | | 2,203 | | Verizon Communications, Inc. (Diversified Telecommunication Services) | | $ | 112 | |
| | | 509 | | VICI Properties, Inc. (Equity Real Estate Investment Trusts) | | | 15 | |
| | | 868 | | Visa, Inc., Class - A (IT Services) | | | 171 | |
| | | 227 | | Vistra Corp. (Independent Power and Renewable Electricity Producers) | | | 5 | |
| | | 111 | | VMware, Inc., Class - A (Software) | | | 13 | |
| | | 79 | | Vornado Realty Trust (Equity Real Estate Investment Trusts) | | | 2 | |
| | | 71 | | Vulcan Materials Co. (Construction Materials) | | | 10 | |
| | | 108 | | W.R. Berkley Corp. (Insurance) | | | 7 | |
| | | 23 | | W.W. Grainger, Inc. (Trading Companies & Distributors) | | | 10 | |
| | | 385 | | Walgreens Boots Alliance, Inc. (Food & Staples Retailing) | | | 15 | |
| | | 795 | | Walmart, Inc. (Food & Staples Retailing) | | | 97 | |
| | | 1,144 | | Warner Bros. Discovery, Inc. (Entertainment)(b) | | | 15 | |
| | | 215 | | Waste Management, Inc. (Commercial Services & Supplies) | | | 33 | |
| | | 32 | | Waters Corp. (Life Sciences Tools & Services)(b) | | | 11 | |
| | | 41 | | Wayfair, Inc., Class - A (Internet & Direct Marketing Retail)(b) | | | 2 | |
| | | 93 | | Webster Financial Corp. (Banks) | | | 4 | |
| | | 175 | | WEC Energy Group, Inc. (Multi-Utilities) | | | 18 | |
| | | 2,008 | | Wells Fargo & Co. (Banks) | | | 79 | |
| | | 241 | | Welltower, Inc. (Equity Real Estate Investment Trusts) | | | 20 | |
| | | 39 | | West Pharmaceutical Services, Inc. (Health Care Equipment & Supplies) | | | 12 | |
| | | 164 | | Western Digital Corp. (Technology Hardware, Storage & Peripherals)(b) | | | 7 | |
| | | 95 | | Westinghouse Air Brake Technologies Corp. (Machinery) | | | 8 | |
| | | 19 | | Westlake Corp. (Chemicals) | | | 2 | |
| | | 137 | | WestRock Co. (Containers & Packaging) | | | 5 | |
| | | 393 | | Weyerhaeuser Co. (Equity Real Estate Investment Trusts) | | | 13 | |
| | | 31 | | Whirlpool Corp. (Household Durables) | | | 5 | |
| | | 103 | | Workday, Inc., Class - A (Software)(b) | | | 14 | |
| | | 98 | | WP Carey, Inc. (Equity Real Estate Investment Trusts) | | | 8 | |
| | | 57 | | Wynn Resorts Ltd. (Hotels, Restaurants & Leisure)(b) | | | 3 | |
| | | 281 | | Xcel Energy, Inc. (Electric Utilities) | | | 20 | |
| | | 97 | | Xylem, Inc. (Machinery) | | | 8 | |
| | | 153 | | YUM! Brands, Inc. (Hotels, Restaurants & Leisure) | | | 17 | |
| | Shares | | Security Description | | Value
(000) | |
| | | | | United States (continued) |
| | | 27 | | Zebra Technologies Corp. (Electronic Equipment, Instruments & Components)(b) | | $ | 8 | |
| | | 64 | | Zendesk, Inc. (Software)(b) | | | 5 | |
| | | 81 | | Zillow Group, Inc., Class - C (Real Estate Management & Development)(b) | | | 3 | |
| | | 111 | | Zimmer Biomet Holdings, Inc. (Health Care Equipment & Supplies) | | | 12 | |
| | | 248 | | Zoetis, Inc. (Pharmaceuticals) | | | 43 | |
| | | 115 | | Zoom Video Communications, Inc., Class - A (Software)(b) | | | 12 | |
| | | 144 | | ZoomInfo Technologies, Inc. (Interactive Media & Services)(b) | | | 5 | |
| | | 45 | | Zscaler, Inc. (Software)(b) | | | 7 | |
| | | | | | | | 15,016 | |
| | | | | Total Common Stocks | | | 22,421 | |
| | | | | Preferred Stocks — 0.11% |
| | | | | Germany — 0.11% |
| | | 33 | | Bayerische Motoren Werke Aktiengesellschaft — Preferred (Automobiles)(d) | | | 2 | |
| | | 80 | | Henkel AG & Co. KGAA — Preferred (Household Products)(d) | | | 5 | |
| | | 79 | | Porsche Automobil Holding SE — Preferred (Automobiles)(d) | | | 5 | |
| | | 98 | | Volkswagen AG — Preferred (Automobiles)(d) | | | 14 | |
| | | | | Total Preferred Stocks | | | 26 | |
| | | | | Investment Companies — 0.13% |
| | | 21,171 | | Federated Hermes Treasury Obligations Fund, Institutional Shares, 1.37%^^(e) | | | 22 | |
| | | 7,317 | | State Street Institutional Treasury Plus Money Market Fund, Trust Class, 1.40%(e) | | | 7 | |
| | | | | Total Investment Companies | | | 29 | |
| | | | | Total Investments (cost $17,167) — 99.78% | | | 22,476 | |
| | | | | Other assets in excess of liabilities — 0.22% | | | 49 | |
| | | | | Net Assets — 100.00% | | $ | 22,525 | |
Amounts designated as “—” are $0 or have been rounded to $0.
^ | All or part of this security was on loan as of June 30, 2022. |
^^ | Purchased with cash collateral held from securities lending. The value of the collateral could include collateral held for securities that were sold on or before June 30, 2022. |
(a) | Represents a security purchased under Rule 144A or Section 4(2) and is exempt from registration under the Securities Act of 1933, as amended, or is otherwise restricted to resale. Certain of these securities may be resold in transactions exempt from registration, normally to qualified institutional buyers. These securities have been deemed liquid by the Specialist Manager. |
(b) | Represents non-income producing security. |
See accompanying notes to financial statements.
117
HC CAPITAL TRUST
The Catholic SRI Growth Portfolio
Portfolio of Investments (concluded) — June 30, 2022
(c) | Security was valued using significant unobservable inputs as of June 30, 2022. |
(d) | A perpetual bond is one with no maturity date that pays a fixed interest rate until the bond insurance is terminated. |
(e) | Annualized 7-day yield as of period-end. |
| As of June 30, 2022, 100% of the Portfolio’s net assets were managed by Mellon Investments Corporation. |
| ADR—American Depositary Receipt |
| REIT—Real Estate Investment Trust |
See accompanying notes to financial statements.
118
HC CAPITAL TRUST
The International Equity Portfolio
Portfolio of Investments — June 30, 2022
| | Shares | | Security Description | | Value
(000) | |
| | | | | Common Stocks — 95.52% |
| | | | | Australia — 7.04% |
| | | 66,309 | | Ampol Ltd. (Oil, Gas & Consumable Fuels) | | $ | 1,566 | |
| | | 35,958 | | APA Group (Gas Utilities) | | | 280 | |
| | | 21,823 | | Aristocrat Leisure Ltd. (Hotels, Restaurants & Leisure) | | | 518 | |
| | | 193,458 | | Australia & New Zealand Banking Group Ltd. (Banks) | | | 2,941 | |
| | | 82,839 | | Bendigo & Adelaide Bank Ltd. (Banks) | | | 519 | |
| | | 98,175 | | BHP Group Ltd. (Metals & Mining) | | | 2,795 | |
| | | 85,014 | | BHP Group Ltd. (Metals & Mining) | | | 2,377 | |
| | | 1,978 | | Cochlear Ltd. (Health Care Equipment & Supplies) | | | 271 | |
| | | 46,273 | | Commonwealth Bank of Australia (Banks) | | | 2,886 | |
| | | 8,316 | | CSL Ltd. (Biotechnology) | | | 1,544 | |
| | | 201,121 | | Dexus (Equity Real Estate Investment Trusts) | | | 1,232 | |
| | | 2,350 | | Domino’s Pizza Enterprises Ltd. (Hotels, Restaurants & Leisure) | | | 110 | |
| | | 48,346 | | Endeavour Group Ltd. (Food & Staples Retailing) | | | 253 | |
| | | 64,304 | | Fortescue Metals Group Ltd. (Metals & Mining) | | | 778 | |
| | | 68,557 | | Goodman Group (Equity Real Estate Investment Trusts) | | | 844 | |
| | | 7,899 | | Macquarie Group Ltd. (Capital Markets) | | | 897 | |
| | | 104,574 | | Medibank Private Ltd. (Insurance) | | | 235 | |
| | | 206,900 | | National Australia Bank Ltd. (Banks) | | | 3,910 | |
| | | 24,120 | | Northern Star Resources Ltd. (Metals & Mining) | | | 114 | |
| | | 44,626 | | Qantas Airways Ltd. (Airlines)(a) | | | 138 | |
| | | 55,092 | | QBE Insurance Group Ltd. (Insurance) | | | 462 | |
| | | 16,336 | | Rio Tinto Ltd. (Metals & Mining) | | | 1,158 | |
| | | 152,239 | | Santos Ltd. (Oil, Gas & Consumable Fuels) | | | 780 | |
| | | 205,252 | | Scentre Group (Equity Real Estate Investment Trusts) | | | 367 | |
| | | 90,538 | | Stockland (Equity Real Estate Investment Trusts) | | | 226 | |
| | | 18,427 | | Suncorp Group Ltd. (Insurance) | | | 140 | |
| | | 562,458 | | Tabcorp Holdings Ltd. (Hotels, Restaurants & Leisure) | | | 413 | |
| | | 42,567 | | The GPT Group (Equity Real Estate Investment Trusts) | | | 124 | |
| | | 562,458 | | The Lottery Corp. Ltd. (Hotels, Restaurants & Leisure)(a) | | | 1,754 | |
| | | 65,302 | | Transurban Group (Transportation Infrastructure) | | | 648 | |
| | | 44,996 | | Treasury Wine Estates Ltd. (Beverages) | | | 352 | |
| | | 63,839 | | Wesfarmers Ltd. (Multiline Retail) | | | 1,846 | |
| | | 224,539 | | Westpac Banking Corp. (Banks) | | | 3,021 | |
| | | 17,740 | | Woodside Energy Group Ltd. (Oil, Gas & Consumable Fuels) | | | 390 | |
| | | 15,362 | | Woodside Energy Group Ltd. (Oil, Gas & Consumable Fuels) | | | 325 | |
| | Shares | | Security Description | | Value
(000) | |
| | | | | Australia (continued) |
| | | 48,346 | | Woolworths Group Ltd. (Food & Staples Retailing) | | $ | 1,188 | |
| | | 35,740 | | Worley Ltd. (Energy Equipment & Services) | | | 351 | |
| | | | | | | | 37,753 | |
| | | | | Austria — 0.17% |
| | | 23,927 | | Erste Group Bank AG (Banks) | | | 606 | |
| | | 4,792 | | OMV AG (Oil, Gas & Consumable Fuels) | | | 225 | |
| | | 1,051 | | Verbund AG (Electric Utilities) | | | 103 | |
| | | | | | | | 934 | |
| | | | | Belgium — 0.94% |
| | | 4,100 | | Ageas SA (Insurance) | | | 180 | |
| | | 48,894 | | Anheuser-Busch InBev N.V. (Beverages) | | | 2,631 | |
| | | 5,470 | | Elia Group SA (Electric Utilities) | | | 775 | |
| | | 9,584 | | KBC Group N.V. (Banks) | | | 538 | |
| | | 1,294 | | Solvay SA, Class - A (Chemicals) | | | 105 | |
| | �� | 1,253 | | UCB SA (Pharmaceuticals) | | | 106 | |
| | | 20,206 | | Umicore SA (Chemicals) | | | 705 | |
| | | | | | | | 5,040 | |
| | | | | Canada — 10.74% |
| | | 3,860 | | Agnico Eagle Mines Ltd. (Metals & Mining) | | | 177 | |
| | | 30,089 | | Air Canada (Airlines)(a) | | | 375 | |
| | | 50,883 | | Alimentation Couche-Tard, Inc. (Food & Staples Retailing) | | | 1,985 | |
| | | 8,987 | | AltaGas Ltd. (Gas Utilities) | | | 190 | |
| | | 45,514 | | Bank of Montreal (Banks) | | | 4,376 | |
| | | 73,544 | | Barrick Gold Corp. (Metals & Mining) | | | 1,301 | |
| | | 19,921 | | Blackberry Ltd. (Software)(a) | | | 107 | |
| | | 3,340 | | Brookfield Asset Management, Inc. (Capital Markets) | | | 149 | |
| | | 10,168 | | CAE, Inc. (Aerospace & Defense)(a) | | | 251 | |
| | | 31,854 | | Cameco Corp. (Oil, Gas & Consumable Fuels) | | | 670 | |
| | | 3,161 | | Canadian Apartment Properties REIT (Equity Real Estate Investment Trusts) | | | 110 | |
| | | 6,838 | | Canadian National Railway Co. (Road & Rail) | | | 769 | |
| | | 55,707 | | Canadian Natural Resources Ltd. (Oil, Gas & Consumable Fuels) | | | 2,994 | |
| | | 3,130 | | Canadian Pacific Railway Ltd. (Road & Rail) | | | 219 | |
| | | 11,085 | | Canadian Tire Corp. Ltd., Class - A (Multiline Retail) | | | 1,399 | |
| | | 4,454 | | Canadian Utilities Ltd., Class - A (Multi-Utilities) | | | 133 | |
| | | 3,259 | | CCL Industries, Inc. (Containers & Packaging) | | | 154 | |
| | | 125,033 | | Cenovus Energy, Inc. (Oil, Gas & Consumable Fuels) | | | 2,379 | |
| | | 9,128 | | CGI, Inc. (IT Services)(a) | | | 727 | |
| | | 30,477 | | CI Financial Corp. (Capital Markets) | | | 324 | |
| | | 835 | | Constellation Software, Inc. (Software) | | | 1,240 | |
| | | 11,192 | | Dollarama, Inc. (Multiline Retail) | | | 645 | |
See accompanying notes to financial statements.
119
HC CAPITAL TRUST
The International Equity Portfolio
Portfolio of Investments (continued) — June 30, 2022
| | Shares | | Security Description | | Value
(000) | |
| | | | | Common Stocks (continued) |
| | | | | Canada (continued) |
| | | 19,379 | | Empire Co. Ltd. (Food & Staples Retailing) | | $ | 597 | |
| | | 77,385 | | Enbridge, Inc. (Oil, Gas & Consumable Fuels) | | | 3,268 | |
| | | 1,023 | | Fairfax Financial Holdings Ltd. (Insurance) | | | 542 | |
| | | 10,649 | | First Capital Real Estate Investment Trust (Real Estate Management & Development) | | | 124 | |
| | | 17,917 | | First Quantum Minerals Ltd. (Metals & Mining) | | | 340 | |
| | | 3,127 | | Fortis, Inc. (Electric Utilities) | | | 148 | |
| | | 7,691 | | Franco-Nevada Corp. (Metals & Mining) | | | 1,012 | |
| | | 24,142 | | GFL Environmental, Inc. (Commercial Services & Supplies) | | | 623 | |
| | | 64,358 | | Great-West Lifeco, Inc. (Insurance) | | | 1,572 | |
| | | 27,914 | | H&R Real Estate Investment Trust (Equity Real Estate Investment Trusts) | | | 270 | |
| | | 12,464 | | Hydro One Ltd. (Electric Utilities) | | | 335 | |
| | | 5,430 | | Intact Financial Corp. (Insurance) | | | 766 | |
| | | 56,358 | | Keyera Corp. (Oil, Gas & Consumable Fuels) | | | 1,287 | |
| | | 41,480 | | Kinross Gold Corp. (Metals & Mining) | | | 148 | |
| | | 36,396 | | Magna International, Inc. (Auto Components) | | | 1,999 | |
| | | 8,370 | | Manulife Financial Corp. (Insurance) | | | 145 | |
| | | 15,818 | | Methanex Corp. (Chemicals) | | | 604 | |
| | | 18,402 | | National Bank of Canada (Banks) | | | 1,208 | |
| | | 3,470 | | Nutrien Ltd. (Chemicals) | | | 276 | |
| | | 2,234 | | Onex Corp. (Diversified Financial Services) | | | 111 | |
| | | 7,732 | | Pembina Pipelines Corp. (Oil, Gas & Consumable Fuels) | | | 273 | |
| | | 66,482 | | Power Corp. of Canada (Insurance) | | | 1,711 | |
| | | 6,978 | | Primaris REIT (Equity Real Estate Investment Trusts) | | | 66 | |
| | | 1,938 | | Restaurant Brands International, Inc. (Hotels, Restaurants & Leisure) | | | 97 | |
| �� | | 67,963 | | RioCan Real Estate Investment Trust (Equity Real Estate Investment Trusts) | | | 1,057 | |
| | | 4,162 | | Ritchie Bros. Auctioneers, Inc. (Commercial Services & Supplies) | | | 271 | |
| | | 2,933 | | Rogers Communications, Inc., Class - B (Wireless Telecommunication Services) | | | 141 | |
| | | 23,444 | | Royal Bank of Canada (Banks) | | | 2,270 | |
| | | 57,560 | | Shopify, Inc. (IT Services)(a) | | | 1,799 | |
| | | 7,087 | | SmartCentres Real Estate Investment Trust (Equity Real Estate Investment Trusts) | | | 151 | |
| | | 52,951 | | Sun Life Financial, Inc. (Insurance) | | | 2,427 | |
| | | 5,745 | | Suncor Energy, Inc. (Oil, Gas & Consumable Fuels) | | | 202 | |
| | | 16,639 | | TC Energy Corp. (Oil, Gas & Consumable Fuels) | | | 862 | |
| | | 18,439 | | Teck Resources Ltd., Class - B (Metals & Mining) | | | 564 | |
| | Shares | | Security Description | | Value
(000) | |
| | | | | Canada (continued) |
| | | 72,937 | | TELUS Corp. (Diversified Telecommunication Services) | | $ | 1,625 | |
| | | 46,844 | | The Bank of Nova Scotia (Banks) | | | 2,773 | |
| | | 27,327 | | The Toronto-Dominion Bank (Banks) | | | 1,792 | |
| | | 22,457 | | Thomson Reuters Corp. (Professional Services) | | | 2,341 | |
| | | 1,552 | | Topicus.com, Inc. (Software) | | | 88 | |
| | | 28,308 | | Wheaton Precious Metals Corp. (Metals & Mining) | | | 1,020 | |
| | | | | | | | 57,579 | |
| | | | | China — 0.10% |
| | | 9,100 | | Jardine Matheson Holdings Ltd. (Industrial Conglomerates) | | | 479 | |
| | | 1,657 | | JD.com, Inc., Class - A (Internet & Direct Marketing Retail) | | | 53 | |
| | | | | | | | 532 | |
| | | | | Denmark — 2.70% |
| | | 77 | | A.P. Moller - Maersk A/S, Class - B (Marine) | | | 180 | |
| | | 23,055 | | Danske Bank A/S (Banks) | | | 326 | |
| | | 4,260 | | Demant A/S (Health Care Equipment & Supplies)(a) | | | 160 | |
| | | 5,336 | | DSV A/S (Road & Rail) | | | 745 | |
| | | 10,121 | | Genmab A/S (Biotechnology)(a) | | | 3,276 | |
| | | 80,513 | | Novo Nordisk A/S, Class - B (Pharmaceuticals) | | | 8,932 | |
| | | 6,306 | | Orsted A/S (Electric Utilities) | | | 659 | |
| | | 410 | | ROCKWOOL A/S, Class - B (Building Products) | | | 92 | |
| | | 3,832 | | Tryg A/S (Insurance) | | | 86 | |
| | | | | | | | 14,456 | |
| | | | | Finland — 1.46% |
| | | 17,096 | | Fortum Oyj (Electric Utilities) | | | 256 | |
| | | 4,521 | | Kesko Oyj, Class - B (Food & Staples Retailing) | | | 107 | |
| | | 38,217 | | Neste Oyj (Oil, Gas & Consumable Fuels) | | | 1,691 | |
| | | 231,473 | | Nokia Oyj (Communications Equipment) | | | 1,077 | |
| | | 278,699 | | Nordea Bank Abp (Banks) | | | 2,453 | |
| | | 3,545 | | Orion Oyj, Class - B (Pharmaceuticals) | | | 158 | |
| | | 4,638 | | Sampo Oyj, Class - A (Insurance) | | | 202 | |
| | | 44,232 | | Stora Enso Oyj, Registered Shares (Paper & Forest Products) | | | 694 | |
| | | 38,915 | | UPM-Kymmene Oyj (Paper & Forest Products) | | | 1,183 | |
| | | | | | | | 7,821 | |
| | | | | France — 8.69% |
| | | 4,298 | | Accor SA (Hotels, Restaurants & Leisure)(a) | | | 116 | |
| | | 2,427 | | Aeroports de Paris (Transportation Infrastructure)(a) | | | 307 | |
| | | 34,826 | | Air Liquide SA (Chemicals) | | | 4,676 | |
| | | 10,577 | | Alstom SA (Machinery) | | | 239 | |
| | | 2,081 | | Amundi SA (Capital Markets) | | | 114 | |
| | | 69,410 | | AXA SA (Insurance) | | | 1,575 | |
See accompanying notes to financial statements.
120
HC CAPITAL TRUST
The International Equity Portfolio
Portfolio of Investments (continued) — June 30, 2022
| | Shares | | Security Description | | Value
(000) | |
| | | | | Common Stocks (continued) |
| | | | | France (continued) |
| | | 1,813 | | BioMerieux (Health Care Equipment & Supplies) | | $ | 177 | |
| | | 71,443 | | BNP Paribas SA (Banks) | | | 3,396 | |
| | | 7,743 | | Bouygues SA (Construction & Engineering) | | | 238 | |
| | | 1,044 | | Capgemini SE (IT Services) | | | 179 | |
| | | 8,347 | | Carrefour SA (Food & Staples Retailing) | | | 148 | |
| | | 3,697 | | Compagnie de Saint-Gobain (Building Products) | | | 159 | |
| | | 124,100 | | Credit Agricole SA (Banks) | | | 1,135 | |
| | | 1,914 | | Danone SA (Food Products) | | | 107 | |
| | | 27,000 | | Dassault Systemes SE (Software) | | | 993 | |
| | | 3,326 | | Eiffage SA (Construction & Engineering) | | | 299 | |
| | | 12,117 | | Electricite de France SA (Electric Utilities) | | | 99 | |
| | | 25,532 | | Engie SA (Multi-Utilities) | | | 293 | |
| | | 18,607 | | EssilorLuxottica SA (Textiles, Apparel & Luxury Goods) | | | 2,786 | |
| | | 2,933 | | Eurazeo SE (Diversified Financial Services) | | | 182 | |
| | | 1,743 | | Euroapi SA (Pharmaceuticals)(a) | | | 27 | |
| | | 1,347 | | Gecina SA (Equity Real Estate Investment Trusts) | | | 126 | |
| | | 2,500 | | Hermes International (Textiles, Apparel & Luxury Goods) | | | 2,795 | |
| | | 7,279 | | JCDecaux SA (Media)(a) | | | 122 | |
| | | 2,878 | | Kering SA (Textiles, Apparel & Luxury Goods) | | | 1,478 | |
| | | 10,625 | | L’Oreal SA (Personal Products) | | | 3,666 | |
| | | 5,480 | | LVMH Moet Hennessy Louis Vuitton SE (Textiles, Apparel & Luxury Goods) | | | 3,340 | |
| | | 8,063 | | Pernod Ricard SA (Beverages) | | | 1,481 | |
| | | 8,075 | | Publicis Groupe SA (Media) | | | 395 | |
| | | 7,261 | | Renault SA (Automobiles)(a) | | | 181 | |
| | | 40,107 | | Sanofi (Pharmaceuticals) | | | 4,049 | |
| | | 922 | | Sartorius Stedim Biotech (Life Sciences Tools & Services) | | | 289 | |
| | | 34,976 | | Schneider Electric SE (Electrical Equipment) | | | 4,139 | |
| | | 4,329 | | SCOR SE (Insurance) | | | 93 | |
| | | 112,087 | | Societe Generale SA (Banks) | | | 2,453 | |
| | | 1,544 | | Sodexo SA (Hotels, Restaurants & Leisure) | | | 108 | |
| | | 2,405 | | Teleperformance (Professional Services) | | | 739 | |
| | | 4,176 | | Thales SA (Aerospace & Defense) | | | 512 | |
| | | 41,460 | | TotalEnergies SE (Oil, Gas & Consumable Fuels) | | | 2,188 | |
| | | 7,086 | | Unibail-Rodamco-Westfield (Equity Real Estate Investment Trusts)(a) | | | 361 | |
| | | 5,243 | | Valeo (Auto Components) | | | 101 | |
| | | 15,933 | | Veolia Environnement SA (Multi-Utilities)(a) | | | 389 | |
| | | 3,828 | | Wendel SE (Diversified Financial Services) | | | 320 | |
| | | | | | | | 46,570 | |
| | | | | Germany — 5.92% |
| | | 10,077 | | Allianz SE (Insurance) | | | 1,923 | |
| | | 1,793 | | Bayerische Motoren Werke AG (Automobiles) | | | 138 | |
| | Shares | | Security Description | | Value
(000) | |
| | | | | Germany (continued) |
| | | 1,065 | | Beiersdorf AG (Personal Products) | | $ | 109 | |
| | | 1,341 | | Carl Zeiss Meditec AG (Health Care Equipment & Supplies) | | | 160 | |
| | | 33,975 | | Commerzbank AG (Banks)(a) | | | 238 | |
| | | 6,091 | | Continental AG (Auto Components) | | | 424 | |
| | | 1,439 | | Daimler Truck Holding AG (Machinery)(a) | | | 38 | |
| | | 113,622 | | Deutsche Bank AG, Registered Shares (Capital Markets) | | | 990 | |
| | | 22,300 | | Deutsche Boerse AG (Capital Markets) | | | 3,729 | |
| | | 44,418 | | Deutsche Lufthansa AG, Registered Shares (Airlines)(a) | | | 259 | |
| | | 88,039 | | Deutsche Post AG, Registered Shares (Air Freight & Logistics) | | | 3,297 | |
| | | 243,953 | | Deutsche Telekom AG (Diversified Telecommunication Services) | | | 4,844 | |
| | | 53,960 | | E.ON SE (Multi-Utilities) | | | 453 | |
| | | 7,498 | | Fraport AG Frankfurt Airport Services Worldwide (Transportation Infrastructure)(a) | | | 326 | |
| | | 6,838 | | Fresenius Medical Care AG & Co. KGaA (Health Care Providers & Services) | | | 341 | |
| | | 12,856 | | Fresenius SE & Co. KGaA (Health Care Providers & Services) | | | 389 | |
| | | 6,983 | | GEA Group AG (Machinery) | | | 241 | |
| | | 1,115 | | Hannover Rueck SE (Insurance) | | | 162 | |
| | | 3,464 | | Henkel AG & Co. KGaA (Household Products) | | | 212 | |
| | | 82,230 | | Infineon Technologies AG (Semiconductors & Semiconductor Equipment) | | | 1,989 | |
| | | 2,878 | | Mercedes-Benz Group AG (Automobiles) | | | 167 | |
| | | 2,128 | | Merck KGaA (Pharmaceuticals) | | | 359 | |
| | | 1,793 | | MTU Aero Engines AG (Aerospace & Defense) | | | 326 | |
| | | 2,688 | | Muenchener Rueckversicherungs-Gesellschaft AG, Registered Shares (Insurance) | | | 631 | |
| | | 3,699 | | Puma SE (Textiles, Apparel & Luxury Goods) | | | 244 | |
| | | 20,979 | | RWE AG (Multi-Utilities) | | | 771 | |
| | | 42,196 | | SAP SE (Software) | | | 3,844 | |
| | | 32,127 | | Siemens AG, Registered Shares (Industrial Conglomerates) | | | 3,268 | |
| | | 5,796 | | Siemens Healthineers AG (Health Care Equipment & Supplies) | | | 294 | |
| | | 10,266 | | Symrise AG (Chemicals) | | | 1,117 | |
| | | 48,500 | | Telefonica Deutschland Holding AG (Diversified Telecommunication Services) | | | 139 | |
| | | 1,218 | | Vitesco Technologies Group AG (Auto Components)(a) | | | 47 | |
| | | 1,532 | | Volkswagen AG (Automobiles) | | | 279 | |
| | | | | | | | 31,748 | |
See accompanying notes to financial statements.
121
HC CAPITAL TRUST
The International Equity Portfolio
Portfolio of Investments (continued) — June 30, 2022
| | Shares | | Security Description | | Value
(000) | |
| | | | | Common Stocks (continued) |
| | | | | Hong Kong — 2.57% |
| | | 483,480 | | AIA Group Ltd. (Insurance) | | $ | 5,239 | |
| | | 75,055 | | BOC Hong Kong Holdings Ltd. (Banks) | | | 297 | |
| | | 63,400 | | Budweiser Brewing Co. APAC Ltd. (Beverages) | | | 190 | |
| | | 334,000 | | China Common Rich Renewable Energy Investment Ltd. (Independent Power and Renewable Electricity Producers)(a)(b) | | | — | |
| | | 98,500 | | CK Asset Holdings Ltd. (Real Estate Management & Development) | | | 697 | |
| | | 12,093 | | CLP Holdings Ltd. (Electric Utilities) | | | 100 | |
| | | 73,000 | | Galaxy Entertainment Group Ltd. (Hotels, Restaurants & Leisure) | | | 435 | |
| | | 57,000 | | Hang Lung Properties Ltd. (Real Estate Management & Development) | | | 108 | |
| | | 15,506 | | Hang Seng Bank Ltd. (Banks) | | | 274 | |
| | | 58,800 | | Hong Kong Exchanges & Clearing Ltd. (Capital Markets) | | | 2,893 | |
| | | 335,900 | | Hongkong Land Holdings Ltd. (Real Estate Management & Development) | | | 1,686 | |
| | | 43,500 | | Kerry Properties Ltd. (Real Estate Management & Development) | | | 121 | |
| | | 59,500 | | MTR Corp. Ltd. (Road & Rail) | | | 311 | |
| | | 14,472 | | Pacific Century Premium Developments Ltd. (Real Estate Management & Development)(a) | | | 1 | |
| | | 121,391 | | PCCW Ltd. (Diversified Telecommunication Services) | | | 64 | |
| | | 18,256 | | Sun Hung Kai Properties Ltd. (Real Estate Management & Development) | | | 216 | |
| | | 24,000 | | Swire Pacific Ltd., Class - A (Real Estate Management & Development) | | | 143 | |
| | | 52,000 | | Techtronic Industries Co. Ltd. (Machinery) | | | 542 | |
| | | 59,417 | | The Link Real Estate Investment Trust (Equity Real Estate Investment Trusts) | | | 485 | |
| | | | | | | | 13,802 | |
| | | | | Ireland (Republic of) — 0.85% |
| | | 8,728 | | AerCap Holdings N.V. (Trading Companies & Distributors)(a) | | | 357 | |
| | | 332,317 | | Bank of Ireland Group PLC (Banks) | | | 2,100 | |
| | | 24,053 | | CRH PLC (Construction Materials) | | | 832 | |
| | | 30,741 | | Experian PLC (Professional Services) | | | 900 | |
| | | 16,821 | | James Hardie Industries PLC (Construction Materials) | | | 369 | |
| | | | | | | | 4,558 | |
| | | | | Isle of Man — 0.11% |
| | | 38,847 | | Entain PLC (Hotels, Restaurants & Leisure)(a) | | | 589 | |
| | | | | Israel — 0.60% |
| | | 43,244 | | Bank Hapoalim BM (Banks) | | | 361 | |
| | Shares | | Security Description | | Value
(000) | |
| | | | | Israel (continued) |
| | | 849 | | Check Point Software Technologies Ltd. (Software)(a) | | $ | 103 | |
| | | 862 | | CyberArk Software Ltd. (Software)(a) | | | 110 | |
| | | 3,036 | | Kornit Digital Ltd. (Machinery)(a) | | | 96 | |
| | | 1,765 | | Nice Ltd. (Software)(a) | | | 339 | |
| | | 11,379 | | Nice Systems Ltd., ADR (Software) | | | 2,191 | |
| | | | | | | | 3,200 | |
| | | | | Italy — 1.73% |
| | | 3,755 | | Amplifon SpA (Health Care Providers & Services) | | | 115 | |
| | | 69,888 | | Assicurazioni Generali SpA (Insurance) | | | 1,115 | |
| | | 19,370 | | Atlantia SpA (Transportation Infrastructure) | | | 454 | |
| | | 888 | | DiaSorin SpA (Health Care Equipment & Supplies) | | | 116 | |
| | | 199,184 | | Enel SpA (Electric Utilities) | | | 1,089 | |
| | | 4,949 | | Ferrari N.V. (Automobiles) | | | 909 | |
| | | 549,472 | | Intesa Sanpaolo SpA (Banks) | | | 1,025 | |
| | | 7,820 | | Iveco Group N.V. (Machinery)(a) | | | 41 | |
| | | 187,061 | | Mediobanca Banca di Credito Finanziario SpA (Banks) | | | 1,620 | |
| | | 7,356 | | Moncler SpA (Textiles, Apparel & Luxury Goods) | | | 315 | |
| | | 13,543 | | Nexi SpA (IT Services)(a) | | | 112 | |
| | | 23,414 | | Pirelli & C SpA (Auto Components) | | | 95 | |
| | | 10,481 | | Poste Italiane SpA (Insurance) | | | 98 | |
| | | 110,979 | | Snam SpA (Gas Utilities) | | | 581 | |
| | | 201,736 | | Terna - Rete Elettrica Nazionale SpA (Electric Utilities) | | | 1,583 | |
| | | | | | | | 9,268 | |
| | | | | Japan — 18.33% |
| | | 6,300 | | Advantest Corp. (Semiconductors & Semiconductor Equipment) | | | 337 | |
| | | 6,845 | | AGC, Inc. (Building Products) | | | 241 | |
| | | 27,300 | | Ajinomoto Co., Inc. (Food Products) | | | 664 | |
| | | 15,300 | | Amada Co. Ltd. (Machinery) | | | 112 | |
| | | 22,900 | | Asahi Group Holdings Ltd. (Beverages) | | | 750 | |
| | | 14,600 | | Asahi Kasei Corp. (Chemicals) | | | 111 | |
| | | 103,600 | | Astellas Pharma, Inc. (Pharmaceuticals) | | | 1,615 | |
| | | 3,900 | | Azbil Corp. (Electronic Equipment, Instruments & Components) | | | 102 | |
| | | 26,700 | | Bandai Namco Holdings, Inc. (Leisure Products) | | | 1,885 | |
| | | 15,200 | | Bridgestone Corp. (Auto Components) | | | 555 | |
| | | 38,300 | | Canon, Inc. (Technology Hardware, Storage & Peripherals) | | | 871 | |
| | | 4,300 | | Capcom Co. Ltd. (Entertainment) | | | 104 | |
| | | 363,700 | | Concordia Financial Group Ltd. (Banks) | | | 1,260 | |
| | | 41,000 | | CyberAgent, Inc. (Media) | | | 408 | |
| | | 13,388 | | Dai Nippon Printing Co. Ltd. (Commercial Services & Supplies) | | | 289 | |
See accompanying notes to financial statements.
122
HC CAPITAL TRUST
The International Equity Portfolio
Portfolio of Investments (continued) — June 30, 2022
| | Shares | | Security Description | | Value
(000) | |
| | | | | Common Stocks (continued) |
| | | | | Japan (continued) |
| | | 3,400 | | Daifuku Co. Ltd. (Machinery) | | $ | 194 | |
| | | 40,900 | | Dai-ichi Life Holdings, Inc. (Insurance) | | | 757 | |
| | | 15,400 | | Daikin Industries Ltd. (Building Products) | | | 2,469 | |
| | | 1,279 | | Daito Trust Construction Co. Ltd. (Real Estate Management & Development) | | | 110 | |
| | | 16,050 | | Daiwa House Industry Co. Ltd. (Real Estate Management & Development) | | | 374 | |
| | | 67 | | Daiwa House REIT Investment Corp. (Equity Real Estate Investment Trusts) | | | 152 | |
| | | 3,000 | | Denso Corp. (Auto Components) | | | 159 | |
| | | 4,800 | | Dentsu Group, Inc. (Media) | | | 144 | |
| | | 800 | | Disco Corp. (Semiconductors & Semiconductor Equipment) | | | 190 | |
| | | 5,800 | | FANUC Corp. (Machinery) | | | 908 | |
| | | 13,700 | | FUJIFILM Holdings Corp. (Technology Hardware, Storage & Peripherals) | | | 735 | |
| | | 10,900 | | Fujitsu Ltd. (IT Services) | | | 1,363 | |
| | | 142 | | GLP J-Reit (Equity Real Estate Investment Trusts) | | | 173 | |
| | | 1,900 | | GMO Payment Gateway, Inc. (IT Services) | | | 134 | |
| | | 11,800 | | Hakuhodo DY Holdings, Inc. (Media) | | | 108 | |
| | | 37,100 | | Hitachi Ltd. (Industrial Conglomerates) | | | 1,761 | |
| | | 12,600 | | Hitachi Metals Ltd. (Metals & Mining)(a) | | | 191 | |
| | | 43,400 | | Honda Motor Co. Ltd. (Automobiles) | | | 1,053 | |
| | | 3,600 | | Hoshizaki Corp. (Machinery) | | | 107 | |
| | | 25,800 | | HOYA Corp. (Health Care Equipment & Supplies) | | | 2,203 | |
| | | 8,800 | | Iida Group Holdings Co. Ltd. (Household Durables) | | | 136 | |
| | | 39,100 | | Inpex Corp. (Oil, Gas & Consumable Fuels) | | | 424 | |
| | | 22,100 | | Isetan Mitsukoshi Holdings Ltd. (Multiline Retail) | | | 179 | |
| | | 21,000 | | Isuzu Motors Ltd. (Automobiles) | | | 232 | |
| | | 100,617 | | ITOCHU Corp. (Trading Companies & Distributors) | | | 2,721 | |
| | | 5,100 | | Itochu Techno-Solutions Corp. (IT Services) | | | 125 | |
| | | 6,000 | | Japan Airlines Co. Ltd. (Airlines)(a) | | | 105 | |
| | | 83,200 | | Japan Exchange Group, Inc. (Capital Markets) | | | 1,201 | |
| | | 8,300 | | Japan Post Insurance Co. Ltd. (Insurance) | | | 133 | |
| | | 39 | | Japan Prime Realty Investment Corp. (Equity Real Estate Investment Trusts) | | | 115 | |
| | | 40 | | Japan Real Estate Investment Corp. (Equity Real Estate Investment Trusts) | | | 184 | |
| | | 200 | | Japan Retail Fund Investment Corp. (Equity Real Estate Investment Trusts) | | | 156 | |
| | | 40,000 | | Japan Tobacco, Inc. (Tobacco) | | | 692 | |
| | | 5,554 | | JSR Corp. (Chemicals) | | | 144 | |
| | | 9,200 | | Kawasaki Heavy Industries Ltd. (Machinery) | | | 173 | |
| | Shares | | Security Description | | Value
(000) | |
| | | | | Japan (continued) |
| | | 101,200 | | KDDI Corp. (Wireless Telecommunication Services) | | $ | 3,201 | |
| | | 33,900 | | Keio Corp. (Road & Rail) | | | 1,213 | |
| | | 6,500 | | Keyence Corp. (Electronic Equipment, Instruments & Components) | | | 2,222 | |
| | | 15,145 | | Komatsu Ltd. (Machinery) | | | 336 | |
| | | 12,300 | | Kose Corp. (Personal Products) | | | 1,119 | |
| | | 39,300 | | Kubota Corp. (Machinery) | | | 587 | |
| | | 6,000 | | Lasertec Corp. (Semiconductors & Semiconductor Equipment) | | | 714 | |
| | | 18,100 | | M3, Inc. (Health Care Technology) | | | 520 | |
| | | 7,500 | | Makita Corp. (Machinery) | | | 187 | |
| | | 63,300 | | Marubeni Corp. (Trading Companies & Distributors) | | | 571 | |
| | | 2,700 | | McDonald’s Holdings Co. Ltd. (Hotels, Restaurants & Leisure) | | | 98 | |
| | | 5,800 | | MINEBEA MITSUMI, Inc. (Machinery) | | | 99 | |
| | | 57,145 | | Mitsubishi Corp. (Trading Companies & Distributors) | | | 1,701 | |
| | | 7,200 | | Mitsubishi Estate Co. Ltd. (Real Estate Management & Development) | | | 105 | |
| | | 432,200 | | Mitsubishi UFJ Financial Group, Inc. (Banks) | | | 2,324 | |
| | | 131,788 | | Mitsui & Co. Ltd. (Trading Companies & Distributors) | | | 2,910 | |
| | | 36,100 | | Mitsui Fudosan Co. Ltd. (Real Estate Management & Development) | | | 776 | |
| | | 4,300 | | Mitsui O.S.K. Lines Ltd. (Marine) | | | 98 | |
| | | 15,700 | | MonotaRO Co. Ltd. (Trading Companies & Distributors) | | | 233 | |
| | | 47,200 | | Murata Manufacturing Co. Ltd. (Electronic Equipment, Instruments & Components) | | | 2,573 | |
| | | 14,700 | | NEC Corp. (Technology Hardware, Storage & Peripherals) | | | 571 | |
| | | 21,600 | | Nexon Co. Ltd. (Entertainment) | | | 442 | |
| | | 31,500 | | Nidec Corp. (Electrical Equipment) | | | 1,946 | |
| | | 19,200 | | Nikon Corp. (Household Durables) | | | 222 | |
| | | 4,600 | | Nintendo Co. Ltd. (Entertainment) | | | 1,990 | |
| | | 35 | | Nippon Building Fund, Inc. (Equity Real Estate Investment Trusts) | | | 174 | |
| | | 2,800 | | NIPPON EXPRESS HOLDINGS, INC. (Road & Rail) | | | 152 | |
| | | 86 | | Nippon Prologis REIT, Inc. (Equity Real Estate Investment Trusts) | | | 212 | |
| | | 6,300 | | Nippon Sanso Holdings Corp. (Chemicals) | | | 100 | |
| | | 4,900 | | Nippon Shinyaku Co. Ltd. (Pharmaceuticals) | | | 298 | |
| | | 30,800 | | Nippon Steel Corp. (Metals & Mining) | | | 431 | |
| | | 36,400 | | Nippon Telegraph & Telephone Corp. (Diversified Telecommunication Services) | | | 1,045 | |
See accompanying notes to financial statements.
123
HC CAPITAL TRUST
The International Equity Portfolio
Portfolio of Investments (continued) — June 30, 2022
| | Shares | | Security Description | | Value
(000) | |
| | | | | Common Stocks (continued) |
| | | | | Japan (continued) |
| | | 1,400 | | Nippon Yusen KK (Marine) | | $ | 96 | |
| | | 77,500 | | Nissan Motor Co. Ltd. (Automobiles) | | | 302 | |
| | | 162 | | Nomura Real Estate Master Fund, Inc. (Equity Real Estate Investment Trusts) | | | 202 | |
| | | 18,200 | | Nomura Research Institute Ltd. (IT Services) | | | 484 | |
| | | 21,100 | | NTT Data Corp. (IT Services) | | | 292 | |
| | | 2,400 | | Obic Co. Ltd. (IT Services) | | | 339 | |
| | | 89,200 | | Odakyu Electric Railway Co. Ltd. (Road & Rail) | | | 1,200 | |
| | | 44,500 | | Olympus Corp. (Health Care Equipment & Supplies) | | | 894 | |
| | | 26,100 | | OMRON Corp. (Electronic Equipment, Instruments & Components) | | | 1,326 | |
| | | 12,300 | | Ono Pharmaceutical Co. Ltd. (Pharmaceuticals) | | | 316 | |
| | | 10,800 | | ORIX Corp. (Diversified Financial Services) | | | 181 | |
| | | 8,900 | | Osaka Gas Co. Ltd. (Gas Utilities) | | | 170 | |
| | | 32,500 | | Otsuka Holdings Co. Ltd. (Pharmaceuticals) | | | 1,154 | |
| | | 12,700 | | Pan Pacific International Holdings Corp. (Multiline Retail) | | | 203 | |
| | | 201,500 | | Panasonic Holdings Corp. (Household Durables) | | | 1,629 | |
| | | 19,100 | | Ricoh Co. Ltd. (Technology Hardware, Storage & Peripherals) | | | 149 | |
| | | 5,600 | | Rohm Co. Ltd. (Semiconductors & Semiconductor Equipment) | | | 391 | |
| | | 5,800 | | SBI Holdings, Inc. (Capital Markets) | | | 114 | |
| | | 1,600 | | Secom Co. Ltd. (Commercial Services & Supplies) | | | 99 | |
| | | 35,552 | | Sekisui House Ltd. (Household Durables) | | | 623 | |
| | | 25,100 | | Seven & i Holdings Co. Ltd. (Food & Staples Retailing) | | | 975 | |
| | | 13,100 | | SG Holdings Co. Ltd. (Air Freight & Logistics) | | | 221 | |
| | | 13,900 | | Sharp Corp. (Household Durables) | | | 107 | |
| | | 11,200 | | Shin-Etsu Chemical Co. Ltd. (Chemicals) | | | 1,263 | |
| | | 25,200 | | Shionogi & Co. Ltd. (Pharmaceuticals) | | | 1,273 | |
| | | 6,600 | | Showa Denko KK (Chemicals) | | | 112 | |
| | | 62,800 | | SoftBank Group Corp. (Wireless Telecommunication Services) | | | 2,423 | |
| | | 12,800 | | Sompo Holdings, Inc. (Insurance) | | | 565 | |
| | | 30,800 | | Sony Corp. (Household Durables) | | | 2,519 | |
| | | 14,000 | | Subaru Corp. (Automobiles) | | | 249 | |
| | | 14,148 | | Sumitomo Mitsui Financial Group, Inc. (Banks) | | | 420 | |
| | | 10,300 | | Sumitomo Realty & Development Co. Ltd. (Real Estate Management & Development) | | | 272 | |
| | | 4,600 | | Suntory Beverage & Food Ltd. (Beverages) | | | 174 | |
| | | 55,300 | | Takeda Pharmaceutical Co. Ltd. (Pharmaceuticals) | | | 1,556 | |
| | | 3,300 | | TDK Corp. (Electronic Equipment, Instruments & Components) | | | 102 | |
| | Shares | | Security Description | | Value
(000) | |
| | | | | Japan (continued) |
| | | 2,900 | | The Bank of Kyoto Ltd. (Banks) | | $ | 124 | |
| | | 22,400 | | The Chiba Bank Ltd. (Banks) | | | 122 | |
| | | 9,900 | | Tokio Marine Holdings, Inc. (Insurance) | | | 577 | |
| | | 59,300 | | Tokyo Electric Power Co. Holdings, Inc. (Electric Utilities)(a) | | | 248 | |
| | | 8,800 | | Tokyo Electron Ltd. (Semiconductors & Semiconductor Equipment) | | | 2,875 | |
| | | 25,700 | | Tokyo Fudosan Holdings Corp. (Real Estate Management & Development) | | | 135 | |
| | | 52,600 | | Toray Industries, Inc. (Chemicals) | | | 295 | |
| | | 14,700 | | Toshiba Corp. (Industrial Conglomerates) | | | 598 | |
| | | 4,700 | | TOTO Ltd. (Building Products) | | | 155 | |
| | | 21,600 | | Toyota Industries Corp. (Auto Components) | | | 1,337 | |
| | | 485,000 | | Toyota Motor Corp. (Automobiles) | | | 7,509 | |
| | | 6,770 | | Toyota Tsusho Corp. (Trading Companies & Distributors) | | | 221 | |
| | | 6,727 | | Trend Micro, Inc. (Software) | | | 328 | |
| | | 46,400 | | Unicharm Corp. (Household Products) | | | 1,553 | |
| | | 7,500 | | West Japan Railway Co. (Road & Rail) | | | 276 | |
| | | 4,900 | | Yakult Honsha Co. Ltd. (Food Products) | | | 283 | |
| | | 4,600 | | Yamaha Corp. (Leisure Products) | | | 190 | |
| | | 9,500 | | Yaskawa Electric Corp. (Machinery) | | | 306 | |
| | | 9,100 | | Yokogawa Electric Corp. (Electronic Equipment, Instruments & Components) | | | 150 | |
| | | 5,700 | | ZOZO, Inc. (Internet & Direct Marketing Retail) | | | 103 | |
| | | | | | | | 98,259 | |
| | | | | Jersey — 0.56% |
| | | 387,007 | | Glencore PLC (Metals & Mining) | | | 2,096 | |
| | | 88,265 | | WPP PLC (Media) | | | 886 | |
| | | | | | | | 2,982 | |
| | | | | Luxembourg — 0.41% |
| | | 27,423 | | ArcelorMittal SA (Metals & Mining) | | | 618 | |
| | | 4,486 | | Eurofins Scientific SE (Life Sciences Tools & Services) | | | 353 | |
| | | 96,377 | | Tenaris SA (Energy Equipment & Services) | | | 1,239 | |
| | | | | | | | 2,210 | |
| | | | | Netherlands — 4.10% |
| | | 58,647 | | ABN AMRO Bank N.V. (Banks) | | | 658 | |
| | | 722 | | Adyen N.V. (IT Services)(a) | | | 1,050 | |
| | | 73,595 | | AEGON N.V. (Insurance) | | | 318 | |
| | | 23,149 | | Airbus SE (Aerospace & Defense) | | | 2,242 | |
| | | 29,390 | | Akzo Nobel N.V. (Chemicals) | | | 1,928 | |
| | | 728 | | Argenx SE (Biotechnology)(a) | | | 273 | |
| | | 12,374 | | ASML Holding N.V. (Semiconductors & Semiconductor Equipment) | | | 5,910 | |
| | | 39,102 | | CNH Industrial N.V. (Machinery) | | | 452 | |
| | | 4,144 | | EXOR N.V. (Diversified Financial Services) | | | 258 | |
| | | 6,020 | | Heineken N.V. (Beverages) | | | 549 | |
See accompanying notes to financial statements.
124
HC CAPITAL TRUST
The International Equity Portfolio
Portfolio of Investments (continued) — June 30, 2022
| | Shares | | Security Description | | Value
(000) | |
| | | | | Common Stocks (continued) |
| | | | | Netherlands (continued) |
| | | 15,662 | | ING Groep N.V. (Banks) | | $ | 155 | |
| | | 62,296 | | Koninklijke Ahold Delhaize N.V. (Food & Staples Retailing) | | | 1,623 | |
| | | 15,440 | | Koninklijke DSM N.V. (Chemicals) | | | 2,218 | |
| | | 5,828 | | NN Group N.V. (Insurance) | | | 265 | |
| | | 35,844 | | Prosus N.V. (Internet & Direct Marketing Retail) | | | 2,347 | |
| | | 31,487 | | Universal Music Group N.V. (Entertainment) | | | 631 | |
| | | 11,488 | | Wolters Kluwer N.V. (Professional Services) | | | 1,114 | |
| | | | | | | | 21,991 | |
| | | | | New Zealand — 0.12% |
| | | 60,589 | | Auckland International Airport Ltd. (Transportation Infrastructure)(a) | | | 272 | |
| | | 38,532 | | Mercury NZ Ltd. (Electric Utilities) | | | 136 | |
| | | 35,900 | | Meridian Energy Ltd. (Independent Power and Renewable Electricity Producers) | | | 105 | |
| | | 36,835 | | Spark New Zealand Ltd. (Diversified Telecommunication Services) | | | 110 | |
| | | | | | | | 623 | |
| | | | | Norway — 0.93% |
| | | 42,469 | | DNB Bank ASA (Banks) | | | 762 | |
| | | 105,375 | | Equinor ASA (Oil, Gas & Consumable Fuels) | | | 3,666 | |
| | | 24,674 | | Mowi ASA (Food Products) | | | 562 | |
| | | | | | | | 4,990 | |
| | | | | Portugal — 0.38% |
| | | 400,153 | | EDP - Energias de Portugal SA (Electric Utilities) | | | 1,867 | |
| | | 6,830 | | Jeronimo Martins SGPS, SA (Food & Staples Retailing) | | | 148 | |
| | | | | | | | 2,015 | |
| | | | | Singapore — 1.05% |
| | | 232,772 | | Ascendas Real Estate Investment Trust (Equity Real Estate Investment Trusts) | | | 478 | |
| | | 175,970 | | CapitaLand Integrated Commercial Trust (Equity Real Estate Investment Trusts) | | | 275 | |
| | | 58,000 | | Capitaland Investment, Ltd. (Real Estate Management & Development) | | | 160 | |
| | | 57,800 | | DBS Group Holdings Ltd. (Banks) | | | 1,235 | |
| | | 14,500 | | Oversea-Chinese Banking Corp. Ltd. (Banks) | | | 119 | |
| | | 58,700 | | Singapore Airlines Ltd. (Airlines)(a) | | | 216 | |
| | | 18,700 | | Singapore Exchange Ltd. (Capital Markets) | | | 127 | |
| | | 540,700 | | Singapore Technologies Engineering Ltd. (Aerospace & Defense) | | | 1,587 | |
| | | 6,600 | | United Overseas Bank Ltd. (Banks) | | | 125 | |
| | | 457,800 | | Wilmar International Ltd. (Food Products) | | | 1,331 | |
| | | | | | | | 5,653 | |
| | Shares | | Security Description | | Value
(000) | |
| | | | | South Africa — 0.01% |
| | | 4,663 | | Thungela Resources Ltd. (Oil, Gas & Consumable Fuels) | | $ | 66 | |
| | | | | South Korea — 0.15% |
| | | 18,906 | | Samsung Electronics Co. Ltd. (Technology Hardware, Storage & Peripherals) | | | 830 | |
| | | | | Spain — 1.62% |
| | | 4,549 | | ACS Actividades de Construccion y Servicios SA (Construction & Engineering) | | | 110 | |
| | | 2,724 | | Aena SME SA (Transportation Infrastructure)(a) | | | 346 | |
| | | 10,177 | | Amadeus IT Group SA (IT Services)(a) | | | 567 | |
| | | 678,386 | | Banco Bilbao Vizcaya Argentaria SA (Banks) | | | 3,079 | |
| | | 28,433 | | Bankinter SA (Banks) | | | 177 | |
| | | 62,673 | | CaixaBank SA (Banks) | | | 218 | |
| | | 5,247 | | Endesa SA (Electric Utilities) | | | 99 | |
| | | 9,943 | | Grifols SA (Biotechnology)(a) | | | 188 | |
| | | 255,515 | | Iberdrola SA (Electric Utilities) | | | 2,650 | |
| | | 14,553 | | Industria de Diseno Textil SA (Specialty Retail) | | | 329 | |
| | | 28,433 | | Linea Directa Aseguradora SA Cia de Seguros y Reaseguros (Insurance) | | | 37 | |
| | | 11,872 | | Naturgy Energy Group SA (Gas Utilities) | | | 342 | |
| | | 17,963 | | Repsol SA (Oil, Gas & Consumable Fuels) | | | 264 | |
| | | 9,036 | | Siemens Gamesa Renewable Energy SA, Registered Shares (Electrical Equipment)(a) | | | 170 | |
| | | 22,455 | | Telefonica SA (Diversified Telecommunication Services) | | | 114 | |
| | | | | | | | 8,690 | |
| | | | | Sweden — 1.97% |
| | | 9,788 | | Alfa Laval AB (Machinery) | | | 236 | |
| | | 38,059 | | Assa Abloy AB, B Shares (Building Products) | | | 809 | |
| | | 14,818 | | Atlas Copco AB (Machinery)(a) | | | 12 | |
| | | 25,498 | | Atlas Copco AB (Machinery)(a) | | | 20 | |
| | | 103,010 | | Atlas Copco AB, Class - A (Machinery)(a) | | | 963 | |
| | | 59,272 | | Atlas Copco AB, Class - B (Machinery)(a) | | | 496 | |
| | | 45,021 | | Fastighets AB Balder, B Shares (Real Estate Management & Development)(a) | | | 216 | |
| | | 17,181 | | Husqvarna AB, B Shares (Machinery) | | | 126 | |
| | | 5,133 | | Industrivarden AB, Class - C (Diversified Financial Services) | | | 114 | |
| | | 6,156 | | Investor AB, Class - B (Diversified Financial Services) | | | 101 | |
| | | 35,660 | | L E Lundbergforetagen AB, Class - B (Diversified Financial Services) | | | 1,451 | |
| | | 50,521 | | Nibe Industrier AB, Class - B (Building Products) | | | 379 | |
| | | 5,141 | | Sagax AB, Class - B (Real Estate Management & Development) | | | 95 | |
| | | 31,682 | | Sandvik AB (Machinery) | | | 514 | |
See accompanying notes to financial statements.
125
HC CAPITAL TRUST
The International Equity Portfolio
Portfolio of Investments (continued) — June 30, 2022
| | Shares | | Security Description | | Value
(000) | |
| | | | | Common Stocks (continued) |
| | | | | Sweden (continued) |
| | | 11,977 | | Securitas AB, Class - B (Commercial Services & Supplies) | | $ | 103 | |
| | | 61,801 | | Skandinaviska Enskilda Banken AB, Class - A (Banks) | | | 607 | |
| | | 33,960 | | Skanska AB, B Shares (Construction & Engineering) | | | 521 | |
| | | 36,959 | | SKF AB, B Shares (Machinery) | | | 544 | |
| | | 34,388 | | Swedbank AB, A Shares (Banks) | | | 435 | |
| | | 72,064 | | Swedish Match AB (Tobacco) | | | 734 | |
| | | 24,390 | | Tele2 AB, B Shares (Wireless Telecommunication Services) | | | 278 | |
| | | 117,701 | | Volvo AB, B Shares (Machinery) | | | 1,823 | |
| | | | | | | | 10,577 | |
| | | | | Switzerland — 9.34% |
| | | 135,931 | | ABB Ltd., Registered Shares (Electrical Equipment) | | | 3,626 | |
| | | 8,475 | | Alcon, Inc. (Health Care Equipment & Supplies) | | | 592 | |
| | | 1,503 | | Bachem Holding AG, Registered Shares (Life Sciences Tools & Services) | | | 104 | |
| | | 1,838 | | Baloise Holding AG, Registered Shares (Insurance) | | | 300 | |
| | | 116 | | Barry Callebaut AG, Registered Shares (Food Products) | | | 259 | |
| | | 44 | | Chocoladefabriken Lindt & Spruengli AG (Food Products) | | | 448 | |
| | | 19,821 | | cie Financiere Richemont SA, Registered Shares (Textiles, Apparel & Luxury Goods) | | | 2,111 | |
| | | 13,970 | | Coca-Cola HBC AG (Beverages) | | | 310 | |
| | | 761 | | EMS-Chemie Holding AG (Chemicals) | | | 566 | |
| | | 5,080 | | Kuehne & Nagel International AG, Registered Shares (Marine) | | | 1,203 | |
| | | 5,770 | | Logitech International SA, Registered Shares (Technology Hardware, Storage & Peripherals) | | | 301 | |
| | | 4,467 | | Lonza Group AG, Registered Shares (Life Sciences Tools & Services) | | | 2,382 | |
| | | 8,432 | | Medacta Group SA (Health Care Equipment & Supplies) | | | 805 | |
| | | 115,521 | | Nestle SA, Registered Shares (Food Products) | | | 13,487 | |
| | | 69,317 | | Novartis AG, Registered Shares (Pharmaceuticals) | | | 5,871 | |
| | | 441 | | Partners Group Holding AG (Capital Markets) | | | 397 | |
| | | 22,333 | | Roche Holding AG (Pharmaceuticals) | | | 7,453 | |
| | | 500 | | SGS SA, Registered Shares (Professional Services) | | | 1,145 | |
| | | 536 | | Sonova Holding AG, Registered Shares (Health Care Equipment & Supplies) | | | 171 | |
| | Shares | | Security Description | | Value
(000) | |
| | | | | Switzerland (continued) |
| | | 3,575 | | Swiss Prime Site AG, Registered Shares (Real Estate Management & Development) | | $ | 314 | |
| | | 9,698 | | Swiss Re AG (Insurance) | | | 752 | |
| | | 1,212 | | Swisscom AG, Registered Shares (Diversified Telecommunication Services) | | | 670 | |
| | | 1,430 | | Temenos AG, Registered Shares (Software) | | | 122 | |
| | | 1,098 | | The Swatch Group AG, B Shares (Textiles, Apparel & Luxury Goods) | | | 261 | |
| | | 205,765 | | UBS Group AG (Capital Markets) | | | 3,318 | |
| | | 9,683 | | Vifor Pharma AG (Pharmaceuticals) | | | 1,734 | |
| | | 3,139 | | Zurich Financial Services AG (Insurance) | | | 1,365 | |
| | | | | | | | 50,067 | |
| | | | | United Kingdom — 12.93% |
| | | 38,163 | | 3i Group PLC (Capital Markets) | | | 515 | |
| | | 68,289 | | abrdn PLC (Diversified Financial Services) | | | 133 | |
| | | 5,633 | | Admiral Group PLC (Insurance) | | | 154 | |
| | | 46,639 | | Anglo American PLC (Metals & Mining) | | | 1,667 | |
| | | 17,119 | | Ashtead Group PLC (Trading Companies & Distributors) | | | 717 | |
| | | 53,266 | | AstraZeneca PLC (Pharmaceuticals) | | | 7,002 | |
| | | 148,397 | | Auto Trader Group PLC (Interactive Media & Services) | | | 1,002 | |
| | | 6,163 | | Aveva Group PLC (Software) | | | 169 | |
| | | 289,546 | | Aviva PLC (Insurance) | | | 1,414 | |
| | | 121,738 | | BAE Systems PLC (Aerospace & Defense) | | | 1,230 | |
| | | 74,250 | | Barratt Developments PLC (Household Durables) | | | 413 | |
| | | 205,005 | | BP PLC (Oil, Gas & Consumable Fuels) | | | 969 | |
| | | 75,073 | | British American Tobacco PLC (Tobacco) | | | 3,216 | |
| | | 48,150 | | British Land Co. PLC (Equity Real Estate Investment Trusts) | | | 262 | |
| | | 67,311 | | BT Group PLC (Diversified Telecommunication Services) | | | 153 | |
| | | 12,788 | | Bunzl PLC (Trading Companies & Distributors) | | | 423 | |
| | | 44,208 | | Burberry Group PLC (Textiles, Apparel & Luxury Goods) | | | 883 | |
| | | 19,461 | | Coca-Cola Europacific Partners PLC (Beverages) | | | 1,004 | |
| | | 68,973 | | Compass Group PLC (Hotels, Restaurants & Leisure) | | | 1,410 | |
| | | 4,651 | | Croda International PLC (Chemicals) | | | 366 | |
| | | 40,786 | | Diageo PLC (Beverages) | | | 1,753 | |
| | | 8,558 | | Ferguson PLC (Trading Companies & Distributors) | | | 957 | |
| | | 176,859 | | GlaxoSmithKline PLC (Pharmaceuticals) | | | 3,801 | |
| | | 303,921 | | HSBC Holdings PLC (Banks) | | | 1,981 | |
| | | 98,505 | | Imperial Brands PLC (Tobacco) | | | 2,201 | |
| | | 278,038 | | Informa PLC (Media)(a) | | | 1,789 | |
| | | 6,566 | | Intercontinental Hotels Group PLC (Hotels, Restaurants & Leisure) | | | 348 | |
See accompanying notes to financial statements.
126
HC CAPITAL TRUST
The International Equity Portfolio
Portfolio of Investments (continued) — June 30, 2022
| | Shares | | Security Description | | Value
(000) | |
| | | | | Common Stocks (continued) |
| | | | | United Kingdom (continued) |
| | | 5,381 | | Intertek Group PLC (Professional Services) | | $ | 275 | |
| | | 480,645 | | J Sainsbury PLC (Food & Staples Retailing) | | | 1,193 | |
| | | 344,289 | | Kingfisher PLC (Specialty Retail) | | | 1,024 | |
| | | 26,793 | | Land Securities Group PLC (Equity Real Estate Investment Trusts) | | | 217 | |
| | | 230,229 | | Legal & General Group PLC (Insurance) | | | 671 | |
| | | 8,632 | | Linde PLC (Chemicals) | | | 2,478 | |
| | | 56,079 | | M&G PLC (Diversified Financial Services) | | | 133 | |
| | | 98,922 | | Meggitt PLC (Aerospace & Defense)(a) | | | 950 | |
| | | 166,027 | | Melrose Industries PLC (Industrial Conglomerates) | | | 302 | |
| | | 165,568 | | National Grid PLC (Multi-Utilities) | | | 2,120 | |
| | | 5,190 | | Next PLC (Multiline Retail) | | | 370 | |
| | | 16,942 | | Pearson PLC (Media) | | | 155 | |
| | | 14,606 | | Persimmon PLC (Household Durables) | | | 331 | |
| | | 91,555 | | Prudential PLC (Insurance) | | | 1,132 | |
| | | 56,944 | | RELX PLC (Professional Services) | | | 1,543 | |
| | | 66,751 | | Rio Tinto PLC (Metals & Mining) | | | 3,994 | |
| | | 92,457 | | Rolls-Royce Holdings PLC (Aerospace & Defense)(a) | | | 93 | |
| | | 41,641 | | Segro PLC (Equity Real Estate Investment Trusts) | | | 495 | |
| | | 8,382 | | Severn Trent PLC (Water Utilities) | | | 277 | |
| | | 322,094 | | Shell PLC (Oil, Gas & Consumable Fuels) | | | 8,367 | |
| | | 12,142 | | Smiths Group PLC (Industrial Conglomerates) | | | 207 | |
| | | 44,660 | | SSE PLC (Electric Utilities) | | | 878 | |
| | | 9,471 | | St. James Place PLC (Capital Markets) | | | 127 | |
| | | 87,671 | | Stellantis N.V. (Automobiles) | | | 1,083 | |
| | | 33,934 | | The Sage Group PLC (Software) | | | 262 | |
| | | 18,373 | | The Weir Group PLC (Machinery) | | | 305 | |
| | | 55,598 | | Unilever PLC (Personal Products) | | | 2,518 | |
| | | 22,731 | | United Utilities Group PLC (Water Utilities) | | | 282 | |
| | Shares | | Security Description | | Value
(000) | |
| | | | | United Kingdom (continued) |
| | | 897,498 | | Vodafone Group PLC (Wireless Telecommunication Services) | | $ | 1,384 | |
| | | 7,977 | | Whitbread PLC (Hotels, Restaurants & Leisure) | | | 241 | |
| | | | | | | | 69,339 | |
| | | | | Total Common Stocks | | | 512,142 | |
| | | | | Preferred Stocks — 0.46% |
| | | | | Germany — 0.46% |
| | | 2,330 | | Sartorius AG — Preferred (Health Care Equipment & Supplies) | | | 814 | |
| | | 12,574 | | Volkswagen AG — Preferred (Automobiles)(c) | | | 1,679 | |
| | | | | Total Preferred Stocks | | | 2,493 | |
| | | | | Investment Company —1.66% |
| | | 8,898,208 | | State Street Institutional Treasury Plus Money Market Fund, Trust Class, 1.40%(d) | | | 8,898 | |
| | | | | Total Investment Company | | | 8,898 | |
| | | | | Purchased Options on Futures — 0.08% |
| | | | | Total Purchased Options on Futures | | | 446 | |
| | | | | Total Investments (cost $382,063) — 97.72% | | | 523,979 | |
| | | | | Other assets in excess of liabilities — 2.28% | | | 12,229 | |
| | | | | Net Assets — 100.00% | | $ | 536,208 | |
Amounts designated as “—” are $0 or have been rounded to $0.
(a) | Represents non-income producing security. |
(b) | Security was valued using significant unobservable inputs as of June 30, 2022. |
(c) | A perpetual bond is one with no maturity date that pays a fixed interest rate until the bond insurance is terminated. |
(d) | Annualized 7-day yield as of period-end. |
| As of June 30, 2022, 100% of the Portfolio’s net assets were managed by Parametric Portfolio Associates, LLC. |
| ADR—American Depositary Receipt |
| REIT—Real Estate Investment Trust |
The following tables reflect the open derivative positions held by the Portfolio as of June 30, 2022.
Futures Contracts Purchased*
Description | | Number of
Contracts | | | Expiration
Date | | | Notional
Amount
(000) | | | Value and
Unrealized
Appreciation/
(Depreciation)
(000) | |
MSCI EAFE Index Future | | | 150 | | | | 9/16/22 | | | $ | 13,925 | | | $ | (123 | ) |
| | | | | | | | | | | $ | 13,925 | | | $ | (123 | ) |
See accompanying notes to financial statements.
127
HC CAPITAL TRUST
The International Equity Portfolio
Portfolio of Investments (continued) — June 30, 2022
Futures Contracts Sold*
Description | | Number of
Contracts | | | Expiration
Date | | | Notional
Amount
(000) | | | Value and
Unrealized
Appreciation/
(Depreciation)
(000) | |
E-Mini S&P 500 Future | | | 11 | | | | 9/16/22 | | | $ | 2,084 | | | $ | 337 | |
| | | | | | | | | | | $ | 2,084 | | | $ | 337 | |
| | Total Unrealized Appreciation | | $ | 337 | |
| | Total Unrealized Depreciation | | | (123 | ) |
| | Total Net Unrealized Appreciation/(Depreciation) | | $ | 214 | |
* | Cash has been pledged as collateral for futures contracts held by the Portfolio. |
Options on Futures Contracts
Exchange-traded options on futures contacts written as of June 30, 2022 were as follows:
Description | | Put/Call | | | Number of
Contracts | | | Notional
Amount
(000) | | | Exercise
Price | | | Expiration
Date | | | Value
(000) | |
E-Mini S&P 500 Future Option | | | Put | | | | 3 | | | $ | 588 | | | $ | 3,920.00 | | | | 7/15/22 | | | $ | (24 | ) |
E-Mini S&P 500 Future Option | | | Put | | | | 6 | | | | 1,173 | | | | 3,910.00 | | | | 7/15/22 | | | | (44 | ) |
E-Mini S&P 500 Future Option | | | Put | | | | 6 | | | | 1,167 | | | | 3,890.00 | | | | 7/15/22 | | | | (41 | ) |
E-Mini S&P 500 Future Option | | | Put | | | | 6 | | | | 1,155 | | | | 3,850.00 | | | | 7/15/22 | | | | (33 | ) |
E-Mini S&P 500 Future Option | | | Put | | | | 6 | | | | 1,155 | | | | 3,850.00 | | | | 7/29/22 | | | | (42 | ) |
E-Mini S&P 500 Future Option | | | Put | | | | 3 | | | | 579 | | | | 3,860.00 | | | | 7/29/22 | | | | (22 | ) |
E-Mini S&P 500 Future Option | | | Put | | | | 6 | | | | 1,152 | | | | 3,840.00 | | | | 7/29/22 | | | | (41 | ) |
E-Mini S&P 500 Future Option | | | Put | | | | 6 | | | | 1,158 | | | | 3,860.00 | | | | 8/19/22 | | | | (53 | ) |
E-Mini S&P 500 Future Option | | | Put | | | | 5 | | | | 888 | | | | 3,550.00 | | | | 8/19/22 | | | | (17 | ) |
E-Mini S&P 500 Future Option | | | Put | | | | 3 | | | | 578 | | | | 3,850.00 | | | | 8/19/22 | | | | (26 | ) |
E-Mini S&P 500 Future Option | | | Put | | | | 7 | | | | 1,330 | | | | 3,800.00 | | | | 8/19/22 | | | | (51 | ) |
E-Mini S&P 500 Future Option | | | Put | | | | 6 | | | | 1,050 | | | | 3,500.00 | | | | 8/19/22 | | | | (17 | ) |
E-Mini S&P 500 Future Option | | | Put | | | | 6 | | | | 1,041 | | | | 3,470.00 | | | | 8/19/22 | | | | (15 | ) |
E-Mini S&P 500 Future Option | | | Put | | | | 3 | | | | 503 | | | | 3,350.00 | | | | 8/19/22 | | | | (5 | ) |
E-Mini S&P 500 Future Option | | | Put | | | | 3 | | | | 480 | | | | 3,200.00 | | | | 8/19/22 | | | | (3 | ) |
E-Mini S&P 500 Future Option | | | Put | | | | 6 | | | | 1,044 | | | | 3,480.00 | | | | 8/31/22 | | | | (20 | ) |
E-Mini S&P 500 Future Option | | | Put | | | | 6 | | | | 1,080 | | | | 3,600.00 | | | | 8/31/22 | | | | (27 | ) |
E-Mini S&P 500 Future Option | | | Put | | | | 6 | | | | 1,050 | | | | 3,500.00 | | | | 8/31/22 | | | | (21 | ) |
E-Mini S&P 500 Future Option | | | Put | | | | 6 | | | | 1,005 | | | | 3,350.00 | | | | 8/31/22 | | | | (13 | ) |
E-Mini S&P 500 Future Option | | | Put | | | | 6 | | | | 1,020 | | | | 3,400.00 | | | | 8/31/22 | | | | (15 | ) |
E-Mini S&P 500 Future Option | | | Put | | | | 14 | | | | 2,386 | | | | 3,410.00 | | | | 8/31/22 | | | | (36 | ) |
E-Mini S&P 500 Future Option | | | Put | | | | 6 | | | | 1,047 | | | | 3,490.00 | | | | 8/31/22 | | | | (20 | ) |
| | | | | | | | | | | | | | | | | | | | | | | $ | (586 | ) |
See accompanying notes to financial statements.
128
HC CAPITAL TRUST
The International Equity Portfolio
Portfolio of Investments (concluded) — June 30, 2022
Exchanged-traded options on futures contacts purchased as of June 30, 2022 were as follows:
Description | | Put/Call | | | Number of
Contracts | | | Notional
Amount
(000) | | | Exercise
Price | | | Expiration
Date | | | Value
(000) | |
E-Mini S&P 500 Future Option | | | Call | | | | 2 | | | $ | 388 | | | $ | 3,875.00 | | | | 7/8/22 | | | $ | 2 | |
E-Mini S&P 500 Future Option | | | Call | | | | 2 | | | | 390 | | | | 3,900.00 | | | | 7/8/22 | | | | 1 | |
E-Mini S&P 500 Future Option | | | Call | | | | 2 | | | | 395 | | | | 3,950.00 | | | | 7/15/22 | | | | 2 | |
E-Mini S&P 500 Future Option | | | Put | | | | 2 | | | | 370 | | | | 3,700.00 | | | | 7/8/22 | | | | 3 | |
E-Mini S&P 500 Future Option | | | Put | | | | 2 | | | | 373 | | | | 3,725.00 | | | | 7/8/22 | | | | 3 | |
E-Mini S&P 500 Future Option | | | Put | | | | 3 | | | | 608 | | | | 4,050.00 | | | | 7/15/22 | | | | 40 | |
E-Mini S&P 500 Future Option | | | Put | | | | 3 | | | | 615 | | | | 4,100.00 | | | | 7/15/22 | | | | 47 | |
E-Mini S&P 500 Future Option | | | Put | | | | 3 | | | | 630 | | | | 4,200.00 | | | | 7/15/22 | | | | 61 | |
E-Mini S&P 500 Future Option | | | Put | | | | 5 | | | | 955 | | | | 3,820.00 | | | | 7/15/22 | | | | 24 | |
E-Mini S&P 500 Future Option | | | Put | | | | 2 | | | | 370 | | | | 3,700.00 | | | | 7/15/22 | | | | 5 | |
E-Mini S&P 500 Future Option | | | Put | | | | 6 | | | | 1,079 | | | | 3,600.00 | | | | 7/15/22 | | | | 8 | |
E-Mini S&P 500 Future Option | | | Put | | | | 10 | | | | 1,787 | | | | 3,575.00 | | | | 7/15/22 | | | | 11 | |
E-Mini S&P 500 Future Option | | | Put | | | | 3 | | | | 615 | | | | 4,100.00 | | | | 7/29/22 | | | | 48 | |
E-Mini S&P 500 Future Option | | | Put | | | | 12 | | | | 2,147 | | | | 3,580.00 | | | | 7/29/22 | | | | 28 | |
E-Mini S&P 500 Future Option | | | Put | | | | 6 | | | | 1,068 | | | | 3,560.00 | | | | 7/29/22 | | | | 13 | |
E-Mini S&P 500 Future Option | | | Put | | | | 4 | | | | 710 | | | | 3,550.00 | | | | 7/29/22 | | | | 8 | |
E-Mini S&P 500 Future Option | | | Put | | | | 3 | | | | 608 | | | | 4,050.00 | | | | 7/29/22 | | | | 42 | |
E-Mini S&P 500 Future Option | | | Put | | | | 3 | | | | 555 | | | | 3,700.00 | | | | 8/19/22 | | | | 16 | |
E-Mini S&P 500 Future Option | | | Put | | | | 3 | | | | 623 | | | | 4,150.00 | | | | 8/19/22 | | | | 56 | |
E-Mini S&P 500 Future Option | | | Put | | | | 3 | | | | 578 | | | | 3,850.00 | | | | 8/31/22 | | | | 28 | |
| | | | | | | | | | | | | | | | | | | | | | | $ | 446 | |
See accompanying notes to financial statements.
129
HC CAPITAL TRUST
The Institutional International Equity Portfolio
Portfolio of Investments — June 30, 2022
| | Shares | | Security Description | | Value
(000) | |
| | | | | Common Stocks — 75.45% |
| | | | | Australia — 5.59% |
| | | 10,383 | | Ampol Ltd. (Oil, Gas & Consumable Fuels) | | $ | 246 | |
| | | 59,126 | | APA Group (Gas Utilities) | | | 460 | |
| | | 24,468 | | Aristocrat Leisure Ltd. (Hotels, Restaurants & Leisure) | | | 581 | |
| | | 9,084 | | ASX Ltd. (Capital Markets) | | | 512 | |
| | | 99,050 | | Aurizon Holdings Ltd. (Road & Rail) | | | 260 | |
| | | 113,828 | | Australia & New Zealand Banking Group Ltd. (Banks) | | | 1,731 | |
| | | 205,530 | | BHP Group Ltd. (Metals & Mining) | | | 5,850 | |
| | | 19,903 | | BlueScope Steel Ltd. (Metals & Mining) | | | 218 | |
| | | 68,618 | | Brambles Ltd. (Commercial Services & Supplies) | | | 508 | |
| | | 2,670 | | Cochlear Ltd. (Health Care Equipment & Supplies) | | | 366 | |
| | | 62,539 | | Coles Group Ltd. (Food & Staples Retailing) | | | 769 | |
| | | 69,279 | | Commonwealth Bank of Australia (Banks) | | | 4,320 | |
| | | 22,060 | | Computershare Ltd. (IT Services) | | | 375 | |
| | | 19,660 | | CSL Ltd. (Biotechnology) | | | 3,649 | |
| | | 52,281 | | Dexus (Equity Real Estate Investment Trusts) | | | 321 | |
| | | 5,238 | | Domino’s Pizza Enterprises Ltd. (Hotels, Restaurants & Leisure) | | | 246 | |
| | | 54,535 | | Endeavour Group Ltd. (Food & Staples Retailing) | | | 285 | |
| | | 127,842 | | Evolution Mining Ltd. (Metals & Mining) | | | 210 | |
| | | 68,753 | | Fortescue Metals Group Ltd. (Metals & Mining) | | | 832 | |
| | | 68,265 | | Goodman Group (Equity Real Estate Investment Trusts) | | | 840 | |
| | | 9,173 | | IDP Education Ltd. (Diversified Consumer Services) | | | 151 | |
| | | 113,850 | | Insurance Australia Group Ltd. (Insurance) | | | 342 | |
| | | 30,266 | | LendLease Group (Real Estate Management & Development)(a) | | | 190 | |
| | | 14,797 | | Macquarie Group Ltd. (Capital Markets) | | | 1,680 | |
| | | 150,186 | | Medibank Private Ltd. (Insurance) | | | 337 | |
| | | 6,901 | | Mineral Resources Ltd. (Metals & Mining) | | | 230 | |
| | | 160,072 | | Mirvac Group (Equity Real Estate Investment Trusts) | | | 218 | |
| | | 131,291 | | National Australia Bank Ltd. (Banks) | | | 2,481 | |
| | | 43,490 | | Newcrest Mining Ltd. (Metals & Mining) | | | 627 | |
| | | 66,602 | | Northern Star Resources Ltd. (Metals & Mining) | | | 314 | |
| | | 16,599 | | Orica Ltd. (Chemicals) | | | 181 | |
| | | 71,505 | | Origin Energy Ltd. (Electric Utilities) | | | 283 | |
| | | 40,608 | | Qantas Airways Ltd. (Airlines)(b) | | | 125 | |
| | | 60,088 | | QBE Insurance Group Ltd. (Insurance) | | | 504 | |
| | | 7,918 | | Ramsay Health Care Ltd. (Health Care Providers & Services) | | | 400 | |
| | | 2,322 | | REA Group Ltd. (Interactive Media & Services) | | | 179 | |
| | | 17,712 | | Reece Ltd. (Trading Companies & Distributors) | | | 168 | |
| | Shares | | Security Description | | Value
(000) | |
| | | | | Australia (continued) |
| | | 15,765 | | Rio Tinto Ltd. (Metals & Mining) | | $ | 1,117 | |
| | | 130,633 | | Santos Ltd. (Oil, Gas & Consumable Fuels)(a) | | | 669 | |
| | | 210,729 | | Scentre Group (Equity Real Estate Investment Trusts) | | | 377 | |
| | | 13,651 | | SEEK Ltd. (Interactive Media & Services) | | | 198 | |
| | | 21,742 | | Sonic Healthcare Ltd. (Health Care Providers & Services) | | | 496 | |
| | | 188,787 | | South32 Ltd. (Metals & Mining) | | | 513 | |
| | | 96,919 | | Stockland (Equity Real Estate Investment Trusts) | | | 241 | |
| | | 51,262 | | Suncorp Group Ltd. (Insurance) | | | 388 | |
| | | 204,158 | | Telstra Corp. Ltd. (Diversified Telecommunication Services) | | | 543 | |
| | | 77,772 | | The GPT Group (Equity Real Estate Investment Trusts) | | | 226 | |
| | | 90,366 | | The Lottery Corp. Ltd. (Hotels, Restaurants & Leisure)(b) | | | 282 | |
| | | 127,599 | | Transurban Group (Transportation Infrastructure) | | | 1,266 | |
| | | 37,347 | | Treasury Wine Estates Ltd. (Beverages) | | | 293 | |
| | | 157,099 | | Vicinity Centres (Equity Real Estate Investment Trusts)(a) | | | 199 | |
| | | 12,302 | | Washington H Soul Pattinson & Co. Ltd. (Oil, Gas & Consumable Fuels) | | | 200 | |
| | | 47,288 | | Wesfarmers Ltd. (Multiline Retail) | | | 1,368 | |
| | | 142,145 | | Westpac Banking Corp. (Banks) | | | 1,913 | |
| | | 6,905 | | WiseTech Global Ltd. (Software) | | | 180 | |
| | | 58,823 | | Woodside Energy Group Ltd. (Oil, Gas & Consumable Fuels) | | | 1,293 | |
| | | 20,770 | | Woodside Energy Group Ltd. (Oil, Gas & Consumable Fuels) | | | 440 | |
| | | 53,072 | | Woolworths Group Ltd. (Food & Staples Retailing) | | | 1,304 | |
| | | | | | | | 44,495 | |
| | | | | Austria — 0.13% |
| | | 13,960 | | Erste Group Bank AG (Banks)(a) | | | 355 | |
| | | 5,979 | | OMV AG (Oil, Gas & Consumable Fuels) | | | 280 | |
| | | 2,765 | | Verbund AG (Electric Utilities) | | | 270 | |
| | | 5,100 | | Voestalpine AG (Metals & Mining) | | | 108 | |
| | | | | | | | 1,013 | |
| | | | | Belgium — 0.63% |
| | | 6,593 | | Ageas SA (Insurance) | | | 290 | |
| | | 35,265 | | Anheuser-Busch InBev N.V. (Beverages) | | | 1,897 | |
| | | 1,097 | | D’ieteren Group (Distributors) | | | 160 | |
| | | 1,638 | | Elia Group SA (Electric Utilities)(a) | | | 232 | |
| | | 4,126 | | Groupe Bruxelles Lambert SA (Diversified Financial Services) | | | 344 | |
| | | 10,155 | | KBC Group N.V. (Banks) | | | 570 | |
| | | 10,325 | | Proximus SADP (Diversified Telecommunication Services) | | | 153 | |
| | | 758 | | Sofina SA (Diversified Financial Services) | | | 155 | |
See accompanying notes to financial statements.
130
HC CAPITAL TRUST
The Institutional International Equity Portfolio
Portfolio of Investments (continued) — June 30, 2022
| | Shares | | Security Description | | Value
(000) | |
| | | | | Common Stocks (continued) |
| | | | | Belgium (continued) |
| | | 3,009 | | Solvay SA, Class - A (Chemicals) | | $ | 244 | |
| | | 5,465 | | UCB SA (Pharmaceuticals) | | | 462 | |
| | | 8,661 | | Umicore SA (Chemicals)(a) | | | 302 | |
| | | 6,039 | | Warehouses De Pauw CVA (Equity Real Estate Investment Trusts)(a) | | | 190 | |
| | | | | | | | 4,999 | |
| | | | | Canada — 0.39% |
| | | 2,501 | | Agnico Eagle Mines Ltd. (Metals & Mining) | | | 114 | |
| | | 880 | | Algonquin Power & Utilities Corp. (Multi-Utilities) | | | 12 | |
| | | 958 | | Alimentation Couche-Tard, Inc. (Food & Staples Retailing) | | | 37 | |
| | | 6,639 | | Barrick Gold Corp. (Metals & Mining) | | | 117 | |
| | | 1,027 | | BCE, Inc. (Diversified Telecommunication Services) | | | 50 | |
| | | 2,792 | | Canadian Apartment Properties REIT (Equity Real Estate Investment Trusts) | | | 97 | |
| | | 282 | | Canadian National Railway Co. (Road & Rail) | | | 32 | |
| | | 4,936 | | Canadian Pacific Railway Ltd. (Road & Rail) | | | 346 | |
| | | 1,286 | | Canadian Utilities Ltd., Class - A (Multi-Utilities) | | | 38 | |
| | | 525 | | CCL Industries, Inc. (Containers & Packaging) | | | 25 | |
| | | 820 | | CGI, Inc. (IT Services)(b) | | | 65 | |
| | | 59 | | Constellation Software, Inc. (Software) | | | 88 | |
| | | 1,635 | | Dollarama, Inc. (Multiline Retail) | | | 94 | |
| | | 1,337 | | Emera, Inc. (Electric Utilities) | | | 63 | |
| | | 3,557 | | Empire Co. Ltd. (Food & Staples Retailing) | | | 110 | |
| | | 97 | | Fairfax Financial Holdings Ltd. (Insurance) | | | 51 | |
| | | 159 | | FirstService Corp. (Real Estate Management & Development) | | | 19 | |
| | | 1,183 | | Fortis, Inc. (Electric Utilities) | | | 56 | |
| | | 960 | | Franco-Nevada Corp. (Metals & Mining) | | | 127 | |
| | | 705 | | George Weston Ltd. (Food & Staples Retailing) | | | 82 | |
| | | 3,376 | | GFL Environmental, Inc. (Commercial Services & Supplies) | | | 87 | |
| | | 3,984 | | Hydro One Ltd. (Electric Utilities) | | | 107 | |
| | | 550 | | Intact Financial Corp. (Insurance) | | | 78 | |
| | | 27,970 | | Kinross Gold Corp. (Metals & Mining) | | | 100 | |
| | | 1,166 | | Loblaw Companies Ltd. (Food & Staples Retailing) | | | 105 | |
| | | 2,226 | | Metro, Inc. (Food & Staples Retailing) | | | 119 | |
| | | 728 | | Northland Power, Inc. (Independent Power and Renewable Electricity Producers) | | | 22 | |
| | | 433 | | Open Text Corp. (Software) | | | 16 | |
| | | 3,355 | | Pan American Silver Corp. (Metals & Mining) | | | 66 | |
| | | 3,740 | | Quebecor, Inc., Class - B (Media) | | | 80 | |
| | | 1,098 | | Ritchie Bros. Auctioneers, Inc. (Commercial Services & Supplies) | | | 71 | |
| | Shares | | Security Description | | Value
(000) | |
| | | | | Canada (continued) |
| | | 934 | | Rogers Communications, Inc., Class - B (Wireless Telecommunication Services) | | $ | 45 | |
| | | 2,696 | | Saputo, Inc. (Food Products) | �� | | 59 | |
| | | 1,187 | | Shaw Communications, Inc., Class - B (Media) | | | 35 | |
| | | 2,356 | | TELUS Corp. (Diversified Telecommunication Services) | | | 52 | |
| | | 867 | | Thomson Reuters Corp. (Professional Services) | | | 90 | |
| | | 1,024 | | TMX Group Ltd. (Capital Markets) | | | 104 | |
| | | 968 | | Toromont Industries Ltd. (Trading Companies & Distributors) | | | 78 | |
| | | 3,376 | | Wheaton Precious Metals Corp. (Metals & Mining) | | | 123 | |
| | | 264 | | WSP Global, Inc. (Construction & Engineering) | | | 30 | |
| | | | | | | | 3,090 | |
| | | | | China — 0.10% |
| | | 2,237 | | Futu Holdings Ltd., ADR (Capital Markets)(b) | | | 117 | |
| | | 10,500 | | Jardine Matheson Holdings Ltd. (Industrial Conglomerates) | | | 551 | |
| | | 54,000 | | SITC International Holdings Co. Ltd. (Marine) | | | 153 | |
| | | | | | | | 821 | |
| | | | | Denmark — 2.12% |
| | | 128 | | A.P. Moller - Maersk A/S, Class - A (Marine) | | | 295 | |
| | | 217 | | A.P. Moller - Maersk A/S, Class - B (Marine) | | | 506 | |
| | | 4,249 | | Carlsberg A/S, Class - B (Beverages) | | | 541 | |
| | | 5,796 | | Christian Hansen Holding A/S (Chemicals)(a) | | | 422 | |
| | | 5,925 | | Coloplast A/S, Class - B (Health Care Equipment & Supplies) | | | 675 | |
| | | 28,004 | | Danske Bank A/S (Banks) | | | 396 | |
| | | 3,900 | | Demant A/S (Health Care Equipment & Supplies)(b) | | | 146 | |
| | | 7,795 | | DSV A/S (Road & Rail) | | | 1,089 | |
| | | 2,669 | | Genmab A/S (Biotechnology)(a)(b) | | | 864 | |
| | | 5,464 | | GN Store Nord A/S (Health Care Equipment & Supplies) | | | 191 | |
| | | 72,233 | | Novo Nordisk A/S, Class - B (Pharmaceuticals) | | | 8,013 | |
| | | 9,961 | | Novozymes A/S, B Shares (Chemicals) | | | 598 | |
| | | 11,757 | | Orsted A/S (Electric Utilities)(a) | | | 1,230 | |
| | | 3,857 | | Pandora A/S (Textiles, Apparel & Luxury Goods) | | | 243 | |
| | | 368 | | ROCKWOOL A/S, Class - B (Building Products) | | | 83 | |
| | | 16,212 | | Tryg A/S (Insurance)(a) | | | 364 | |
| | | 56,310 | | Vestas Wind Systems A/S (Electrical Equipment) | | | 1,189 | |
| | | | | | | | 16,845 | |
| | | | | Finland — 0.87% |
| | | 7,081 | | Elisa Oyj (Diversified Telecommunication Services) | | | 397 | |
| | | 18,032 | | Fortum Oyj (Electric Utilities) | | | 270 | |
| | | 12,353 | | Kesko Oyj, Class - B (Food & Staples Retailing) | | | 292 | |
| | | 14,785 | | Kone Oyj, Class - B (Machinery) | | | 703 | |
See accompanying notes to financial statements.
131
HC CAPITAL TRUST
The Institutional International Equity Portfolio
Portfolio of Investments (continued) — June 30, 2022
| | Shares | | Security Description | | Value
(000) | |
| | | | | Common Stocks (continued) |
| | | | | Finland (continued) |
| | | 17,176 | | Neste Oyj (Oil, Gas & Consumable Fuels) | | $ | 760 | |
| | | 219,704 | | Nokia Oyj (Communications Equipment) | | | 1,022 | |
| | | 134,347 | | Nordea Bank Abp (Banks) | | | 1,183 | |
| | | 6,093 | | Orion Oyj, Class - B (Pharmaceuticals) | | | 272 | |
| | | 20,249 | | Sampo Oyj, Class - A (Insurance) | | | 881 | |
| | | 22,376 | | Stora Enso Oyj, Registered Shares (Paper & Forest Products) | | | 351 | |
| | | 22,135 | | UPM-Kymmene Oyj (Paper & Forest Products) | | | 673 | |
| | | 20,800 | | Wartsila Oyj Abp (Machinery) | | | 162 | |
| | | | | | | | 6,966 | |
| | | | | France — 8.08% |
| | | 6,910 | | Accor SA (Hotels, Restaurants & Leisure)(a)(b) | | | 187 | |
| | | 1,305 | | Aeroports de Paris (Transportation Infrastructure)(b) | | | 165 | |
| | | 24,332 | | Air Liquide SA (Chemicals) | | | 3,266 | |
| | | 14,800 | | Alstom SA (Machinery)^ | | | 334 | |
| | | 2,677 | | Amundi SA (Capital Markets) | | | 146 | |
| | | 2,413 | | Arkema SA (Chemicals) | | | 215 | |
| | | 78,652 | | AXA SA (Insurance) | | | 1,785 | |
| | | 3,371 | | BioMerieux (Health Care Equipment & Supplies) | | | 329 | |
| | | 52,203 | | BNP Paribas SA (Banks) | | | 2,482 | |
| | | 38,721 | | Bollore SA (Entertainment) | | | 179 | |
| | | 9,318 | | Bouygues SA (Construction & Engineering)^ | | | 287 | |
| | | 14,200 | | Bureau Veritas SA (Professional Services)(a) | | | 364 | |
| | | 6,649 | | Capgemini SE (IT Services) | | | 1,139 | |
| | | 32,433 | | Carrefour SA (Food & Staples Retailing)^(a) | | | 574 | |
| | | 27,544 | | Cie Generale des Etablissements Michelin SCA (Auto Components) | | | 750 | |
| | | 28,286 | | Compagnie de Saint-Gobain (Building Products) | | | 1,213 | |
| | | 1,920 | | Covivio (Equity Real Estate Investment Trusts) | | | 107 | |
| | | 50,564 | | Credit Agricole SA (Banks) | | | 463 | |
| | | 28,467 | | Danone SA (Food Products) | | | 1,588 | |
| | | 1,346 | | Dassault Aviation SA (Aerospace & Defense)(a) | | | 210 | |
| | | 39,135 | | Dassault Systemes SE (Software) | | | 1,439 | |
| | | 10,635 | | Edenred (IT Services) | | | 501 | |
| | | 3,382 | | Eiffage SA (Construction & Engineering)(a) | | | 304 | |
| | | 22,758 | | Electricite de France SA (Electric Utilities)^ | | | 186 | |
| | | 75,736 | | Engie SA (Multi-Utilities) | | | 870 | |
| | | 14,224 | | EssilorLuxottica SA (Textiles, Apparel & Luxury Goods)^ | | | 2,130 | |
| | | 1,741 | | Eurazeo SE (Diversified Financial Services) | | | 108 | |
| | | 1 | | Euroapi SA (Pharmaceuticals)(b) | | | — | |
| | | 2,182 | | Gecina SA (Equity Real Estate Investment Trusts)(a) | | | 204 | |
| | | 17,864 | | Getlink SE (Transportation Infrastructure) | | | 315 | |
| | | 1,331 | | Hermes International (Textiles, Apparel & Luxury Goods) | | | 1,488 | |
| | Shares | | Security Description | | Value
(000) | |
| | | | | France (continued) |
| | | 2,550 | | Ipsen SA (Pharmaceuticals) | | $ | 240 | |
| | | 3,038 | | Kering SA (Textiles, Apparel & Luxury Goods) | | | 1,560 | |
| | | 8,931 | | Klepierre SA (Equity Real Estate Investment Trusts) | | | 172 | |
| | | 6,663 | | LA Francaise des Jeux SAEM (Hotels, Restaurants & Leisure) | | | 230 | |
| | | 11,435 | | Legrand SA (Electrical Equipment) | | | 845 | |
| | | 10,991 | | L’Oreal SA (Personal Products) | | | 3,792 | |
| | | 11,853 | | LVMH Moet Hennessy Louis Vuitton SE (Textiles, Apparel & Luxury Goods) | | | 7,225 | |
| | | 90,536 | | Orange SA (Diversified Telecommunication Services)(a) | | | 1,064 | |
| | | 10,962 | | Pernod Ricard SA (Beverages) | | | 2,013 | |
| | | 9,261 | | Publicis Groupe SA (Media) | | | 453 | |
| | | 1,680 | | Remy Cointreau SA (Beverages) | | | 293 | |
| | | 7,804 | | Renault SA (Automobiles)(b) | | | 195 | |
| | | 13,877 | | Safran SA (Aerospace & Defense) | | | 1,370 | |
| | | 50,798 | | Sanofi (Pharmaceuticals) | | | 5,128 | |
| | | 1,525 | | Sartorius Stedim Biotech (Life Sciences Tools & Services) | | | 478 | |
| | | 24,914 | | Schneider Electric SE (Electrical Equipment)(a) | | | 2,947 | |
| | | 2,383 | | SEB SA (Household Durables) | | | 229 | |
| | | 32,288 | | Societe Generale SA (Banks) | | | 707 | |
| | | 3,592 | | Sodexo SA (Hotels, Restaurants & Leisure) | | | 252 | |
| | | 2,641 | | Teleperformance (Professional Services) | | | 812 | |
| | | 4,793 | | Thales SA (Aerospace & Defense) | | | 588 | |
| | | 107,479 | | TotalEnergies SE (Oil, Gas & Consumable Fuels) | | | 5,672 | |
| | | 7,221 | | UbiSoft Entertainment SA (Entertainment)(b) | | | 317 | |
| | | 4,783 | | Unibail-Rodamco-Westfield (Equity Real Estate Investment Trusts)(b) | | | 244 | |
| | | 8,371 | | Valeo (Auto Components) | | | 162 | |
| | | 26,988 | | Veolia Environnement SA (Multi-Utilities)^(b) | | | 659 | |
| | | 25,583 | | Vinci SA (Construction & Engineering) | | | 2,278 | |
| | | 72,488 | | Vivendi SE (Entertainment) | | | 736 | |
| | | 1,180 | | Wendel SE (Diversified Financial Services) | | | 99 | |
| | | 9,679 | | Worldline SA (IT Services)(b) | | | 359 | |
| | | | | | | | 64,447 | |
| | | | | Germany — 5.77% |
| | | 8,993 | | adidas AG (Textiles, Apparel & Luxury Goods) | | | 1,590 | |
| | | 18,417 | | Allianz SE (Insurance) | | | 3,513 | |
| | | 43,899 | | Aroundtown SA (Real Estate Management & Development)(a) | | | 140 | |
| | | 37,290 | | BASF SE (Chemicals) | | | 1,622 | |
| | | 45,750 | | Bayer AG, Registered Shares (Pharmaceuticals) | | | 2,719 | |
| | | 13,443 | | Bayerische Motoren Werke AG (Automobiles) | | | 1,035 | |
| | | 4,203 | | Bechtle AG (IT Services) | | | 172 | |
| | | 5,158 | | Beiersdorf AG (Personal Products) | | | 527 | |
| | | 11,821 | | Brenntag AG (Trading Companies & Distributors) | | | 769 | |
See accompanying notes to financial statements.
132
HC CAPITAL TRUST
The Institutional International Equity Portfolio
Portfolio of Investments (continued) — June 30, 2022
| | Shares | | Security Description | | Value
(000) | |
| | | | | Common Stocks (continued) |
| | | | | Germany (continued) |
| | | 1,757 | | Carl Zeiss Meditec AG (Health Care Equipment & Supplies) | | $ | 210 | |
| | | 43,219 | | Commerzbank AG (Banks)(b) | | | 303 | |
| | | 4,466 | | Continental AG (Auto Components) | | | 311 | |
| | | 7,844 | | Covestro AG (Chemicals) | | | 271 | |
| | | 18,376 | | Daimler Truck Holding AG (Machinery)(b) | | | 480 | |
| | | 7,038 | | Delivery Hero SE (Internet & Direct Marketing Retail)(b) | | | 264 | |
| | | 123,864 | | Deutsche Bank AG, Registered Shares (Capital Markets) | | | 1,079 | |
| | | 8,013 | | Deutsche Boerse AG (Capital Markets) | | | 1,340 | |
| | | 26,265 | | Deutsche Lufthansa AG, Registered Shares (Airlines)^(b) | | | 153 | |
| | | 49,741 | | Deutsche Post AG, Registered Shares (Air Freight & Logistics) | | | 1,863 | |
| | | 151,676 | | Deutsche Telekom AG (Diversified Telecommunication Services)(a) | | | 3,010 | |
| | | 98,643 | | E.ON SE (Multi-Utilities) | | | 828 | |
| | | 8,514 | | Evonik Industries AG (Chemicals) | | | 182 | |
| | | 10,354 | | Fresenius Medical Care AG & Co. KGaA (Health Care Providers & Services) | | | 517 | |
| | | 17,006 | | Fresenius SE & Co. KGaA (Health Care Providers & Services) | | | 515 | |
| | | 6,229 | | GEA Group AG (Machinery) | | | 215 | |
| | | 2,448 | | Hannover Rueck SE (Insurance) | | | 355 | |
| | | 5,880 | | HeidelbergCement AG (Construction Materials) | | | 282 | |
| | | 9,653 | | HelloFresh SE (Food & Staples Retailing)(b) | | | 312 | |
| | | 5,180 | | Henkel AG & Co. KGaA (Household Products) | | | 317 | |
| | | 67,368 | | Infineon Technologies AG (Semiconductors & Semiconductor Equipment)(a) | | | 1,630 | |
| | | 3,171 | | KION Group AG (Machinery)(a) | | | 132 | |
| | | 4,650 | | Knorr-Bremse AG (Machinery) | | | 265 | |
| | | 4,185 | | LEG Immobilien AG (Real Estate Management & Development) | | | 347 | |
| | | 32,576 | | Mercedes-Benz Group AG (Automobiles)(a) | | | 1,885 | |
| | | 5,576 | | Merck KGaA (Pharmaceuticals) | | | 941 | |
| | | 2,169 | | MTU Aero Engines AG (Aerospace & Defense) | | | 395 | |
| | | 5,688 | | Muenchener Rueckversicherungs-Gesellschaft AG, Registered Shares (Insurance) | | | 1,336 | |
| | | 2,538 | | Nemetschek SE (Software) | | | 154 | |
| | | 4,286 | | Puma SE (Textiles, Apparel & Luxury Goods)(a) | | | 282 | |
| | | 262 | | Rational AG (Machinery) | | | 152 | |
| | | 1,768 | | Rheinmetall AG (Industrial Conglomerates) | | | 408 | |
| | | 35,549 | | RWE AG (Multi-Utilities) | | | 1,307 | |
| | | 46,134 | | SAP SE (Software) | | | 4,201 | |
| | | 5,175 | | Scout24 AG (Interactive Media & Services) | | | 266 | |
| | Shares | | Security Description | | Value
(000) | |
| | | | | Germany (continued) |
| | | 34,470 | | Siemens AG, Registered Shares (Industrial Conglomerates) | | $ | 3,506 | |
| | | 21,851 | | Siemens Energy AG (Electrical Equipment) | | | 320 | |
| | | 13,178 | | Siemens Healthineers AG (Health Care Equipment & Supplies) | | | 670 | |
| | | 6,448 | | Symrise AG (Chemicals)(a) | | | 702 | |
| | | 73,087 | | Telefonica Deutschland Holding AG (Diversified Telecommunication Services) | | | 209 | |
| | | 5,502 | | Uniper SE (Independent Power and Renewable Electricity Producers) | | | 82 | |
| | | 5,543 | | United Internet AG (Diversified Telecommunication Services)(a) | | | 159 | |
| | | 3,047 | | Volkswagen AG (Automobiles) | | | 555 | |
| | | 30,646 | | Vonovia SE (Real Estate Management & Development) | | | 944 | |
| | | 9,043 | | Zalando SE (Internet & Direct Marketing Retail)(b) | | | 237 | |
| | | | | | | | 45,979 | |
| | | | | Hong Kong — 2.36% |
| | | 525,118 | | AIA Group Ltd. (Insurance) | | | 5,693 | |
| | | 155,695 | | BOC Hong Kong Holdings Ltd. (Banks) | | | 615 | |
| | | 74,300 | | Budweiser Brewing Co. APAC Ltd. (Beverages) | | | 222 | |
| | | 588,000 | | China Common Rich Renewable Energy Investment Ltd. (Independent Power and Renewable Electricity Producers)(b)(c) | | | — | |
| | | 87,800 | | Chow Tai Fook Jewellery Group Ltd. (Specialty Retail) | | | 165 | |
| | | 81,200 | | CK Asset Holdings Ltd. (Real Estate Management & Development) | | | 574 | |
| | | 108,910 | | CK Hutchison Holdings Ltd. (Industrial Conglomerates) | | | 736 | |
| | | 31,500 | | CK Infrastructure Holdings Ltd. (Electric Utilities) | | | 193 | |
| | | 74,719 | | CLP Holdings Ltd. (Electric Utilities) | | | 620 | |
| | | 81,600 | | ESR Cayman Ltd. (Real Estate Management & Development)(b) | | | 220 | |
| | | 88,000 | | Galaxy Entertainment Group Ltd. (Hotels, Restaurants & Leisure) | | | 525 | |
| | | 88,720 | | Hang Lung Properties Ltd. (Real Estate Management & Development) | | | 168 | |
| | | 32,439 | | Hang Seng Bank Ltd. (Banks) | | | 573 | |
| | | 66,845 | | Henderson Land Development Co. Ltd. (Real Estate Management & Development) | | | 250 | |
| | | 197,877 | | HK Electric Investments & HK Electric Investments Ltd. (Electric Utilities) | | | 182 | |
| | | 197,550 | | HKT Trust & HKT Ltd. (Diversified Telecommunication Services)(a) | | | 265 | |
| | | 508,247 | | Hong Kong & China Gas Co. Ltd. (Gas Utilities) | | | 547 | |
See accompanying notes to financial statements.
133
HC CAPITAL TRUST
The Institutional International Equity Portfolio
Portfolio of Investments (continued) — June 30, 2022
| | Shares | | Security Description | | Value
(000) | |
| | | | | Common Stocks (continued) |
| | | | | Hong Kong (continued) |
| | | 48,900 | | Hong Kong Exchanges & Clearing Ltd. (Capital Markets) | | $ | 2,407 | |
| | | 57,440 | | Hongkong Land Holdings Ltd. (Real Estate Management & Development) | | | 288 | |
| | | 72,000 | | MTR Corp. Ltd. (Road & Rail) | | | 376 | |
| | | 61,310 | | New World Development Co. Ltd. (Real Estate Management & Development) | | | 220 | |
| | | 66,868 | | Power Assets Holdings Ltd. (Electric Utilities) | | | 421 | |
| | | 98,660 | | Sands China Ltd. (Hotels, Restaurants & Leisure)(b) | | | 235 | |
| | | 139,429 | | Sino Land Co. Ltd. (Real Estate Management & Development) | | | 206 | |
| | | 60,360 | | Sun Hung Kai Properties Ltd. (Real Estate Management & Development) | | | 713 | |
| | | 21,930 | | Swire Pacific Ltd., Class - A (Real Estate Management & Development) | | | 131 | |
| | | 51,400 | | Swire Properties Ltd. (Real Estate Management & Development) | | | 128 | |
| | | 56,000 | | Techtronic Industries Co. Ltd. (Machinery) | | | 584 | |
| | | 90,636 | | The Link Real Estate Investment Trust (Equity Real Estate Investment Trusts) | | | 739 | |
| | | 338,356 | | WH Group Ltd. (Food Products) | | | 261 | |
| | | 68,000 | | Wharf Real Estate Investment Co. Ltd. (Real Estate Management & Development) | | | 324 | |
| | | 73,000 | | Xinyi Glass Holdings Ltd. (Building Products) | | | 175 | |
| | | | | | | | 18,756 | |
| | | | | Ireland (Republic of) — 0.73% |
| | | 5,468 | | AerCap Holdings N.V. (Trading Companies & Distributors)(b) | | | 224 | |
| | | 41,404 | | CRH PLC (Construction Materials)(a) | | | 1,432 | |
| | | 4,702 | | DCC PLC (Industrial Conglomerates)(a) | | | 291 | |
| | | 38,283 | | Experian PLC (Professional Services) | | | 1,122 | |
| | | 10,150 | | Flutter Entertainment PLC (Hotels, Restaurants & Leisure)(b) | | | 1,027 | |
| | | 18,081 | | James Hardie Industries PLC (Construction Materials) | | | 396 | |
| | | 6,462 | | Kerry Group PLC, Class - A (Food Products)(a) | | | 618 | |
| | | 6,259 | | Kingspan Group PLC (Building Products) | | | 376 | |
| | | 9,991 | | Smurfit Kappa Group PLC (Containers & Packaging)(a) | | | 336 | |
| | | | | | | | 5,822 | |
| | | | | Isle of Man — 0.05% |
| | | 23,818 | | Entain PLC (Hotels, Restaurants & Leisure)(b) | | | 361 | |
| | | | | Israel — 0.55% |
| | | 2,157 | | Azrieli Group Ltd. (Real Estate Management & Development) | | | 151 | |
| | | 51,548 | | Bank Hapoalim BM (Banks) | | | 431 | |
| | | 63,841 | | Bank Leumi Le (Banks) | | | 569 | |
| | Shares | | Security Description | | Value
(000) | |
| | | | | Israel (continued) |
| | | 4,523 | | Check Point Software Technologies Ltd. (Software)(b) | | $ | 550 | |
| | | 1,614 | | CyberArk Software Ltd. (Software)(b) | | | 207 | |
| | | 1,233 | | Elbit Systems Ltd. (Aerospace & Defense) | | | 281 | |
| | | 30,512 | | ICL Group Ltd. (Chemicals) | | | 277 | |
| | | 1 | | Isacard Ltd. (Consumer Finance) | | | — | |
| | | 50,223 | | Israel Discount Bank Ltd., Class - A (Banks) | | | 261 | |
| | | 2,045 | | Kornit Digital Ltd. (Machinery)(b) | | | 65 | |
| | | 6,198 | | Mizrahi Tefahot Bank Ltd. (Banks) | | | 205 | |
| | | 2,563 | | Nice Ltd. (Software)(b) | | | 492 | |
| | | 44,795 | | Teva Pharmaceutical Industries Ltd., ADR (Pharmaceuticals)(b) | | | 337 | |
| | | 4,429 | | Tower Semiconductor Ltd. (Semiconductors & Semiconductor Equipment)(b) | | | 206 | |
| | | 2,503 | | Wix.com Ltd. (IT Services)(b) | | | 164 | |
| | | 3,697 | | ZIM Integrated Shipping Services Ltd. (Marine) | | | 175 | |
| | | | | | | | 4,371 | |
| | | | | Italy — 1.53% |
| | | 6,607 | | Amplifon SpA (Health Care Providers & Services) | | | 203 | |
| | | 44,934 | | Assicurazioni Generali SpA (Insurance) | | | 717 | |
| | | 20,116 | | Atlantia SpA (Transportation Infrastructure) | | | 472 | |
| | | 25,815 | | Davide Campari-Milano N.V., Class - M (Beverages) | | | 271 | |
| | | 1,727 | | DiaSorin SpA (Health Care Equipment & Supplies) | | | 226 | |
| | | 333,551 | | Enel SpA (Electric Utilities)(a) | | | 1,823 | |
| | | 102,471 | | Eni SpA (Oil, Gas & Consumable Fuels) | | | 1,216 | |
| | | 7,222 | | Ferrari N.V. (Automobiles) | | | 1,326 | |
| | | 24,762 | | FinecoBank Banca Fineco SpA (Banks) | | | 296 | |
| | | 22,120 | | Infrastrutture Wireless Italiane SpA (Diversified Telecommunication Services)(a) | | | 225 | |
| | | 851,323 | | Intesa Sanpaolo SpA (Banks)(a) | | | 1,588 | |
| | | 24,575 | | Mediobanca Banca di Credito Finanziario SpA (Banks) | | | 213 | |
| | | 8,334 | | Moncler SpA (Textiles, Apparel & Luxury Goods) | | | 357 | |
| | | 23,028 | | Nexi SpA (IT Services)(b) | | | 191 | |
| | | 21,211 | | Poste Italiane SpA (Insurance) | | | 198 | |
| | | 10,773 | | Prusmian SpA (Electrical Equipment) | | | 296 | |
| | | 5,750 | | Recordati SpA (Pharmaceuticals) | | | 250 | |
| | | 92,411 | | Snam SpA (Gas Utilities) | | | 484 | |
| | | 533,421 | | Telecom Italia SpA (Diversified Telecommunication Services)(b) | | | 140 | |
| | | 65,821 | | Terna - Rete Elettrica Nazionale SpA (Electric Utilities) | | | 516 | |
| | | 120,300 | | Unicredit SpA (Banks) | | | 1,143 | |
| | | | | | | | 12,151 | |
See accompanying notes to financial statements.
134
HC CAPITAL TRUST
The Institutional International Equity Portfolio
Portfolio of Investments (continued) — June 30, 2022
| | Shares | | Security Description | | Value
(000) | |
| | | | | Common Stocks (continued) |
| | | | | Japan — 16.07% |
| | | 7,700 | | Advantest Corp. (Semiconductors & Semiconductor Equipment)(a) | | $ | 412 | |
| | | 28,400 | | Aeon Co. Ltd. (Food & Staples Retailing) | | | 493 | |
| | | 7,865 | | AGC, Inc. (Building Products) | | | 277 | |
| | | 6,000 | | Aisin Crop. (Auto Components) | | | 186 | |
| | | 21,400 | | Ajinomoto Co., Inc. (Food Products) | | | 520 | |
| | | 7,000 | | ANA Holdings, Inc. (Airlines)(a)(b) | | | 129 | |
| | | 18,500 | | Asahi Group Holdings Ltd. (Beverages)(a) | | | 606 | |
| | | 11,900 | | Asahi Intecc Co. Ltd. (Health Care Equipment & Supplies) | | | 179 | |
| | | 50,910 | | Asahi Kasei Corp. (Chemicals) | | | 389 | |
| | | 76,890 | | Astellas Pharma, Inc. (Pharmaceuticals) | | | 1,198 | |
| | | 4,700 | | Azbil Corp. (Electronic Equipment, Instruments & Components) | | | 124 | |
| | | 8,300 | | Bandai Namco Holdings, Inc. (Leisure Products) | | | 586 | |
| | | 23,160 | | Bridgestone Corp. (Auto Components) | | | 845 | |
| | | 10,400 | | Brother Industries Ltd. (Technology Hardware, Storage & Peripherals) | | | 183 | |
| | | 41,147 | | Canon, Inc. (Technology Hardware, Storage & Peripherals) | | | 935 | |
| | | 10,300 | | Capcom Co. Ltd. (Entertainment) | | | 250 | |
| | | 6,000 | | Central Japan Railway Co. (Road & Rail) | | | 693 | |
| | | 33,200 | | Chubu Electric Power Co., Inc. (Electric Utilities) | | | 334 | |
| | | 29,300 | | Chugai Pharmaceutical Co. Ltd. (Pharmaceuticals)^ | | | 749 | |
| | | 47,800 | | Concordia Financial Group Ltd. (Banks) | | | 166 | |
| | | 21,100 | | CyberAgent, Inc. (Media) | | | 210 | |
| | | 9,039 | | Dai Nippon Printing Co. Ltd. (Commercial Services & Supplies) | | | 195 | |
| | | 4,100 | | Daifuku Co. Ltd. (Machinery) | | | 235 | |
| | | 40,800 | | Dai-ichi Life Holdings, Inc. (Insurance) | | | 755 | |
| | | 71,800 | | Daiichi Sankyo Co. Ltd. (Pharmaceuticals) | | | 1,819 | |
| | | 10,100 | | Daikin Industries Ltd. (Building Products) | | | 1,619 | |
| | | 2,947 | | Daito Trust Construction Co. Ltd. (Real Estate Management & Development) | | | 255 | |
| | | 24,330 | | Daiwa House Industry Co. Ltd. (Real Estate Management & Development) | | | 567 | |
| | | 122 | | Daiwa House REIT Investment Corp. (Equity Real Estate Investment Trusts)(a) | | | 277 | |
| | | 55,200 | | Daiwa Securities Group, Inc. (Capital Markets) | | | 247 | |
| | | 17,600 | | Denso Corp. (Auto Components) | | | 935 | |
| | | 8,770 | | Dentsu Group, Inc. (Media) | | | 263 | |
| | | 1,200 | | Disco Corp. (Semiconductors & Semiconductor Equipment) | | | 285 | |
| | | 12,800 | | East Japan Railway Co. (Road & Rail) | | | 655 | |
| | | 10,800 | | Eisai Co. Ltd. (Pharmaceuticals) | | | 455 | |
| | Shares | | Security Description | | Value
(000) | |
| | | | | Japan (continued) |
| | | 136,278 | | ENEOS Holdings, Inc. (Oil, Gas & Consumable Fuels) | | $ | 516 | |
| | | 7,800 | | FANUC Corp. (Machinery) | | | 1,221 | |
| | | 2,300 | | Fast Retailing Co. Ltd. (Specialty Retail) | | | 1,205 | |
| | | 5,200 | | Fuji Electric Co. Ltd. (Electrical Equipment) | | | 215 | |
| | | 15,310 | | FUJIFILM Holdings Corp. (Technology Hardware, Storage & Peripherals) | | | 822 | |
| | | 8,050 | | Fujitsu Ltd. (IT Services)(a) | | | 1,007 | |
| | | 235 | | GLP J-Reit (Equity Real Estate Investment Trusts) | | | 287 | |
| | | 2,200 | | GMO Payment Gateway, Inc. (IT Services) | | | 155 | |
| | | 10,300 | | Hakuhodo DY Holdings, Inc. (Media) | | | 95 | |
| | | 5,700 | | Hamamatsu Photonics K.K. (Electronic Equipment, Instruments & Components) | | | 221 | |
| | | 9,300 | | Hankyu Hanshin Holdings, Inc. (Road & Rail) | | | 254 | |
| | | 900 | | Hikari Tsushin, Inc. (Specialty Retail) | | | 92 | |
| | | 1,380 | | Hirose Electric Co. Ltd. (Electronic Equipment, Instruments & Components) | | | 183 | |
| | | 4,700 | | Hitachi Construction Machinery Co. Ltd. (Machinery) | | | 104 | |
| | | 39,280 | | Hitachi Ltd. (Industrial Conglomerates) | | | 1,864 | |
| | | 12,500 | | Hitachi Metals Ltd. (Metals & Mining)(b) | | | 189 | |
| | | 66,154 | | Honda Motor Co. Ltd. (Automobiles) | | | 1,606 | |
| | | 4,800 | | Hoshizaki Corp. (Machinery) | | | 143 | |
| | | 15,000 | | HOYA Corp. (Health Care Equipment & Supplies) | | | 1,281 | |
| | | 16,900 | | Hulic Co. Ltd. (Real Estate Management & Development)(a) | | | 131 | |
| | | 5,100 | | Ibiden Co. Ltd. (Electronic Equipment, Instruments & Components) | | | 144 | |
| | | 10,659 | | Idemitsu Kosan Co. Ltd. (Oil, Gas & Consumable Fuels)(a) | | | 257 | |
| | | 6,500 | | Iida Group Holdings Co. Ltd. (Household Durables) | | | 100 | |
| | | 42,200 | | Inpex Corp. (Oil, Gas & Consumable Fuels) | | | 457 | |
| | | 23,670 | | Isuzu Motors Ltd. (Automobiles) | | | 262 | |
| | | 3,600 | | ITO EN Ltd. (Beverages) | | | 162 | |
| | | 49,058 | | ITOCHU Corp. (Trading Companies & Distributors) | | | 1,326 | |
| | | 6,300 | | Itochu Techno-Solutions Corp. (IT Services) | | | 154 | |
| | | 6,300 | | Japan Airlines Co. Ltd. (Airlines)(a)(b) | | | 110 | |
| | | 22,800 | | Japan Exchange Group, Inc. (Capital Markets) | | | 329 | |
| | | 25,300 | | Japan Post Bank Co. Ltd. (Banks) | | | 197 | |
| | | 104,160 | | Japan Post Holdings Co. Ltd. (Insurance)(a) | | | 745 | |
| | | 9,800 | | Japan Post Insurance Co. Ltd. (Insurance)(a) | | | 157 | |
| | | 66 | | Japan Real Estate Investment Corp. (Equity Real Estate Investment Trusts) | | | 304 | |
| | | 284 | | Japan Retail Fund Investment Corp. (Equity Real Estate Investment Trusts) | | | 221 | |
See accompanying notes to financial statements.
135
HC CAPITAL TRUST
The Institutional International Equity Portfolio
Portfolio of Investments (continued) — June 30, 2022
| | Shares | | Security Description | | Value
(000) | |
| | | | | Common Stocks (continued) |
| | | | | Japan (continued) |
| | | 52,027 | | Japan Tobacco, Inc. (Tobacco)^ | | $ | 900 | |
| | | 21,600 | | JFE Holdings, Inc. (Metals & Mining) | | | 228 | |
| | | 7,333 | | JSR Corp. (Chemicals) | | | 190 | |
| | | 17,200 | | Kajima Corp. (Construction & Engineering) | | | 197 | |
| | | 5,900 | | Kakaku.com, Inc. (Interactive Media & Services) | | | 97 | |
| | | 20,700 | | Kao Corp. (Personal Products)^ | | | 834 | |
| | | 67,400 | | KDDI Corp. (Wireless Telecommunication Services) | | | 2,132 | |
| | | 5,000 | | Keio Corp. (Road & Rail) | | | 179 | |
| | | 5,700 | | Keisei Electric Railway Co. Ltd. (Road & Rail) | | | 157 | |
| | | 7,900 | | Keyence Corp. (Electronic Equipment, Instruments & Components) | | | 2,702 | |
| | | 5,900 | | Kikkoman Corp. (Food Products) | | | 313 | |
| | | 7,900 | | Kintetsu Group Holdings Co. Ltd. (Road & Rail) | | | 246 | |
| | | 36,010 | | Kirin Holdings Co. Ltd. (Beverages)^ | | | 567 | |
| | | 3,300 | | Kobayashi Pharmaceutical Co. Ltd. (Personal Products) | | | 204 | |
| | | 9,400 | | Kobe Bussan Co. Ltd. (Food & Staples Retailing) | | | 230 | |
| | | 4,210 | | Koei Tecmo Holdings Co. Ltd. (Entertainment) | | | 136 | |
| | | 4,600 | | Koito Manufacturing Co. Ltd. (Auto Components) | | | 146 | |
| | | 37,490 | | Komatsu Ltd. (Machinery) | | | 831 | |
| | | 3,800 | | Konami Group Corp. (Entertainment) | | | 210 | |
| | | 1,500 | | Kose Corp. (Personal Products) | | | 136 | |
| | | 41,400 | | Kubota Corp. (Machinery) | | | 619 | |
| | | 4,300 | | Kurita Water Industries Ltd. (Machinery) | | | 156 | |
| | | 13,020 | | Kyocera Corp. (Electronic Equipment, Instruments & Components) | | | 696 | |
| | | 12,100 | | Kyowa Kirin Co. Ltd. (Pharmaceuticals) | | | 272 | |
| | | 3,100 | | Lasertec Corp. (Semiconductors & Semiconductor Equipment) | | | 369 | |
| | | 12,045 | | Lixil Corp. (Building Products) | | | 226 | |
| | | 18,300 | | M3, Inc. (Health Care Technology) | | | 525 | |
| | | 9,100 | | Makita Corp. (Machinery) | | | 227 | |
| | | 63,571 | | Marubeni Corp. (Trading Companies & Distributors) | | | 574 | |
| | | 23,050 | | Mazda Motor Corp. (Automobiles) | | | 189 | |
| | | 5,600 | | McDonald’s Holdings Co. Ltd. (Hotels, Restaurants & Leisure) | | | 203 | |
| | | 6,000 | | MEIJI Holdings Co. Ltd. (Food Products) | | | 295 | |
| | | 14,700 | | MINEBEA MITSUMI, Inc. (Machinery) | | | 250 | |
| | | 11,500 | | MISUMI Group, Inc. (Machinery) | | | 242 | |
| | | 52,010 | | Mitsubishi Chemical Group Corp. (Chemicals) | | | 283 | |
| | | 52,240 | | Mitsubishi Corp. (Trading Companies & Distributors) | | | 1,555 | |
| | | 78,490 | | Mitsubishi Electric Corp. (Electrical Equipment) | | | 840 | |
| | Shares | | Security Description | | Value
(000) | |
| | | | | Japan (continued) |
| | | 48,000 | | Mitsubishi Estate Co. Ltd. (Real Estate Management & Development) | | $ | 697 | |
| | | 29,000 | | Mitsubishi HC Capital, Inc. (Diversified Financial Services) | | | 134 | |
| | | 12,997 | | Mitsubishi Heavy Industries Ltd. (Machinery) | | | 455 | |
| | | 485,282 | | Mitsubishi UFJ Financial Group, Inc. (Banks) | | | 2,610 | |
| | | 56,666 | | Mitsui & Co. Ltd. (Trading Companies & Distributors) | | | 1,251 | |
| | | 8,050 | | Mitsui Chemicals, Inc. (Chemicals) | | | 171 | |
| | | 37,000 | | Mitsui Fudosan Co. Ltd. (Real Estate Management & Development) | | | 796 | |
| | | 14,000 | | Mitsui O.S.K. Lines Ltd. (Marine) | | | 320 | |
| | | 99,552 | | Mizuho Financial Group, Inc. (Banks) | | | 1,132 | |
| | | 15,000 | | MonotaRO Co. Ltd. (Trading Companies & Distributors)^ | | | 222 | |
| | | 19,400 | | MS&AD Insurance Group Holdings, Inc. (Insurance) | | | 595 | |
| | | 23,300 | | Murata Manufacturing Co. Ltd. (Electronic Equipment, Instruments & Components) | | | 1,270 | |
| | | 10,330 | | NEC Corp. (Technology Hardware, Storage & Peripherals) | | | 402 | |
| | | 23,000 | | Nexon Co. Ltd. (Entertainment) | | | 471 | |
| | | 9,700 | | NGK Insulators Ltd. (Machinery) | | | 131 | |
| | | 18,200 | | Nidec Corp. (Electrical Equipment) | | | 1,124 | |
| | | 13,300 | | Nihon M&A Center Holdings, Inc. (Professional Services) | | | 141 | |
| | | 4,700 | | Nintendo Co. Ltd. (Entertainment) | | | 2,033 | |
| | | 75 | | Nippon Building Fund, Inc. (Equity Real Estate Investment Trusts) | | | 374 | |
| | | 3,400 | | NIPPON EXPRESS HOLDINGS, INC. (Road & Rail) | | | 185 | |
| | | 33,700 | | Nippon Paint Holdings Co. Ltd. (Chemicals)(a) | | | 251 | |
| | | 119 | | Nippon Prologis REIT, Inc. (Equity Real Estate Investment Trusts)(a) | | | 293 | |
| | | 7,700 | | Nippon Sanso Holdings Corp. (Chemicals) | | | 123 | |
| | | 3,100 | | Nippon Shinyaku Co. Ltd. (Pharmaceuticals) | | | 189 | |
| | | 32,800 | | Nippon Steel Corp. (Metals & Mining)(a) | | | 459 | |
| | | 50,840 | | Nippon Telegraph & Telephone Corp. (Diversified Telecommunication Services) | | | 1,460 | |
| | | 6,600 | | Nippon Yusen KK (Marine) | | | 451 | |
| | | 5,200 | | Nissan Chemical Corp. (Chemicals) | | | 240 | |
| | | 94,200 | | Nissan Motor Co. Ltd. (Automobiles) | | | 367 | |
| | | 11,700 | | Nisshin Seifun Group, Inc. (Food Products) | | | 137 | |
| | | 3,600 | | Nissin Foods Holdings Co. Ltd. (Food Products)(a) | | | 249 | |
| | | 4,000 | | Nitori Holdings Co. Ltd. (Specialty Retail) | | | 381 | |
| | | 5,760 | | Nitto Denko Corp. (Chemicals) | | | 373 | |
| | | 118,200 | | Nomura Holdings, Inc. (Capital Markets) | | | 432 | |
See accompanying notes to financial statements.
136
HC CAPITAL TRUST
The Institutional International Equity Portfolio
Portfolio of Investments (continued) — June 30, 2022
| | Shares | | Security Description | | Value
(000) | |
| | | | | Common Stocks (continued) |
| | | | | Japan (continued) |
| | | 5,200 | | Nomura Real Estate Holdings, Inc. (Real Estate Management & Development) | | $ | 127 | |
| | | 212 | | Nomura Real Estate Master Fund, Inc. (Equity Real Estate Investment Trusts) | | | 265 | |
| | | 15,120 | | Nomura Research Institute Ltd. (IT Services) | | | 402 | |
| | | 25,600 | | NTT Data Corp. (IT Services) | | | 354 | |
| | | 28,500 | | Obayashi Corp. (Construction & Engineering) | | | 207 | |
| | | 3,200 | | Obic Co. Ltd. (IT Services) | | | 453 | |
| | | 14,400 | | Odakyu Electric Railway Co. Ltd. (Road & Rail) | | | 194 | |
| | | 35,700 | | Oji Paper Co. Ltd. (Paper & Forest Products) | | | 155 | |
| | | 50,100 | | Olympus Corp. (Health Care Equipment & Supplies) | | | 1,007 | |
| | | 7,500 | | OMRON Corp. (Electronic Equipment, Instruments & Components) | | | 381 | |
| | | 16,900 | | Ono Pharmaceutical Co. Ltd. (Pharmaceuticals) | | | 434 | |
| | | 3,600 | | Open House Group Co. Ltd. (Household Durables)(a) | | | 143 | |
| | | 2,400 | | Oracle Corp. (Software) | | | 139 | |
| | | 8,400 | | Oriental Land Co. Ltd. (Hotels, Restaurants & Leisure) | | | 1,172 | |
| | | 48,500 | | ORIX Corp. (Diversified Financial Services) | | | 814 | |
| | | 18,645 | | Osaka Gas Co. Ltd. (Gas Utilities) | | | 357 | |
| | | 6,600 | | OTSUKA Corp. (IT Services) | | | 195 | |
| | | 15,900 | | Otsuka Holdings Co. Ltd. (Pharmaceuticals) | | | 565 | |
| | | 19,200 | | Pan Pacific International Holdings Corp. (Multiline Retail) | | | 306 | |
| | | 89,700 | | Panasonic Holdings Corp. (Household Durables) | | | 725 | |
| | | 7,800 | | Persol Holdings Co. Ltd. (Professional Services)(a) | | | 142 | |
| | | 40,800 | | Rakuten Group, Inc. (Internet & Direct Marketing Retail) | | | 184 | |
| | | 58,500 | | Recruit Holdings Co. Ltd. (Professional Services) | | | 1,723 | |
| | | 47,400 | | Renesas Electronics Corp. (Semiconductors & Semiconductor Equipment)(a)(b) | | | 431 | |
| | | 87,685 | | Resona Holdings, Inc. (Banks) | | | 328 | |
| | | 23,300 | | Ricoh Co. Ltd. (Technology Hardware, Storage & Peripherals) | | | 182 | |
| | | 3,570 | | Rohm Co. Ltd. (Semiconductors & Semiconductor Equipment) | | | 249 | |
| | | 10,000 | | SBI Holdings, Inc. (Capital Markets) | | | 196 | |
| | | 8,400 | | SCSK Corp. (IT Services) | | | 142 | |
| | | 9,300 | | Secom Co. Ltd. (Commercial Services & Supplies) | | | 574 | |
| | | 12,269 | | Seiko Epson Corp. (Technology Hardware, Storage & Peripherals) | | | 174 | |
| | | 15,300 | | Sekisui Chemical Co. Ltd. (Household Durables) | | | 209 | |
| | Shares | | Security Description | | Value
(000) | |
| | | | | Japan (continued) |
| | | 25,725 | | Sekisui House Ltd. (Household Durables) | | $ | 450 | |
| | | 31,830 | | Seven & i Holdings Co. Ltd. (Food & Staples Retailing) | | | 1,236 | |
| | | 15,100 | | SG Holdings Co. Ltd. (Air Freight & Logistics) | | | 254 | |
| | | 11,000 | | Sharp Corp. (Household Durables)(a) | | | 85 | |
| | | 9,600 | | Shimadzu Corp. (Electronic Equipment, Instruments & Components) | | | 304 | |
| | | 3,200 | | Shimano, Inc. (Leisure Products) | | | 541 | |
| | | 24,300 | | Shimizu Corp. (Construction & Engineering) | | | 134 | |
| | | 15,185 | | Shin-Etsu Chemical Co. Ltd. (Chemicals) | | | 1,713 | |
| | | 11,700 | | Shionogi & Co. Ltd. (Pharmaceuticals) | | | 591 | |
| | | 16,200 | | Shiseido Co. Ltd. (Personal Products) | | | 650 | |
| | | 2,300 | | SMC Corp. (Machinery) | | | 1,025 | |
| | | 123,254 | | Softbank Corp. (Wireless Telecommunication Services) | | | 1,368 | |
| | | 49,000 | | SoftBank Group Corp. (Wireless Telecommunication Services) | | | 1,891 | |
| | | 12,960 | | Sompo Holdings, Inc. (Insurance) | | | 571 | |
| | | 51,200 | | Sony Corp. (Household Durables) | | | 4,188 | |
| | | 5,200 | | Square Enix Holdings Co. Ltd. (Entertainment) | | | 230 | |
| | | 24,954 | | Subaru Corp. (Automobiles) | | | 444 | |
| | | 14,200 | | SUMCO Corp. (Semiconductors & Semiconductor Equipment)(a) | | | 184 | |
| | | 60,460 | | Sumitomo Chemical Co. Ltd. (Chemicals) | | | 237 | |
| | | 45,740 | | Sumitomo Corp. (Trading Companies & Distributors) | | | 626 | |
| | | 29,020 | | Sumitomo Electric Industries Ltd. (Auto Components) | | | 321 | |
| | | 10,000 | | Sumitomo Metal Mining Co. Ltd. (Metals & Mining) | | | 313 | |
| | | 53,003 | | Sumitomo Mitsui Financial Group, Inc. (Banks) | | | 1,575 | |
| | | 13,700 | | Sumitomo Mitsui Trust Holdings, Inc. (Banks) | | | 422 | |
| | | 12,600 | | Sumitomo Realty & Development Co. Ltd. (Real Estate Management & Development) | | | 333 | |
| | | 7,000 | | Suntory Beverage & Food Ltd. (Beverages) | | | 265 | |
| | | 15,000 | | Suzuki Motor Corp. (Automobiles) | | | 471 | |
| | | 6,800 | | Sysmex Corp. (Health Care Equipment & Supplies) | | | 409 | |
| | | 21,500 | | T&D Holdings, Inc. (Insurance) | | | 257 | |
| | | 7,750 | | Taisei Corp. (Construction & Engineering) | | | 241 | |
| | | 62,445 | | Takeda Pharmaceutical Co. Ltd. (Pharmaceuticals) | | | 1,757 | |
| | | 15,800 | | TDK Corp. (Electronic Equipment, Instruments & Components) | | | 488 | |
| | | 26,200 | | Terumo Corp. (Health Care Equipment & Supplies) | | | 790 | |
| | | 23,300 | | The Chiba Bank Ltd. (Banks) | | | 127 | |
See accompanying notes to financial statements.
137
HC CAPITAL TRUST
The Institutional International Equity Portfolio
Portfolio of Investments (continued) — June 30, 2022
| | Shares | | Security Description | | Value
(000) | |
| | | | | Common Stocks (continued) |
| | | | | Japan (continued) |
| | | 34,610 | | The Kansai Electric Power Co., Inc. (Electric Utilities) | | $ | 342 | |
| | | 25,400 | | The Shizuoka Bank Ltd. (Banks) | | | 153 | |
| | | 10,300 | | TIS, Inc. (IT Services) | | | 270 | |
| | | 9,700 | | Tobu Railway Co. Ltd. (Road & Rail) | | | 221 | |
| | | 6,000 | | Toho Co. Ltd. (Entertainment) | | | 217 | |
| | | 25,840 | | Tokio Marine Holdings, Inc. (Insurance) | | | 1,505 | |
| | | 68,100 | | Tokyo Electric Power Co. Holdings, Inc. (Electric Utilities)(b) | | | 284 | |
| | | 6,060 | | Tokyo Electron Ltd. (Semiconductors & Semiconductor Equipment) | | | 1,980 | |
| | | 19,400 | | Tokyo Gas Co. Ltd. (Gas Utilities) | | | 401 | |
| | | 21,600 | | Tokyu Corp. (Road & Rail) | | | 254 | |
| | | 10,600 | | TOPPAN, Inc. (Commercial Services & Supplies) | | | 177 | |
| | | 56,300 | | Toray Industries, Inc. (Chemicals) | | | 316 | |
| | | 16,600 | | Toshiba Corp. (Industrial Conglomerates)^ | | | 675 | |
| | | 11,400 | | Tosoh Corp. (Chemicals) | | | 142 | |
| | | 5,700 | | TOTO Ltd. (Building Products) | | | 188 | |
| | | 6,000 | | Toyota Industries Corp. (Auto Components) | | | 372 | |
| | | 430,600 | | Toyota Motor Corp. (Automobiles) | | | 6,667 | |
| | | 8,600 | | Toyota Tsusho Corp. (Trading Companies & Distributors) | | | 281 | |
| | | 6,200 | | Trend Micro, Inc. (Software) | | | 303 | |
| | | 18,300 | | Unicharm Corp. (Household Products) | | | 613 | |
| | | 11,200 | | USS Co. Ltd. (Specialty Retail) | | | 194 | |
| | | 7,900 | | Welcia Holdings Co. Ltd. (Food & Staples Retailing) | | | 158 | |
| | | 9,300 | | West Japan Railway Co. (Road & Rail)(a) | | | 342 | |
| | | 6,300 | | Yakult Honsha Co. Ltd. (Food Products) | | | 363 | |
| | | 5,700 | | Yamaha Corp. (Leisure Products) | | | 235 | |
| | | 12,100 | | Yamaha Motor Co. Ltd. (Automobiles)^ | | | 222 | |
| | | 14,200 | | Yamato Holdings Co. Ltd. (Air Freight & Logistics) | | | 227 | |
| | | 9,700 | | Yaskawa Electric Corp. (Machinery) | | | 312 | |
| | | 10,000 | | Yokogawa Electric Corp. (Electronic Equipment, Instruments & Components) | | | 165 | |
| | | 107,900 | | Z Holdings Corp. (Interactive Media & Services) | | | 315 | |
| | | 7,000 | | ZOZO, Inc. (Internet & Direct Marketing Retail)(a) | | | 126 | |
| | | | | | | | 128,057 | |
| | | | | Jersey — 0.33% |
| | | 401,481 | | Glencore PLC (Metals & Mining)(a) | | | 2,175 | |
| | | 46,374 | | WPP PLC (Media) | | | 465 | |
| | | | | | | | 2,640 | |
| | | | | Luxembourg — 0.22% |
| | | 39,995 | | ArcelorMittal SA (Metals & Mining) | | | 901 | |
| | Shares | | Security Description | | Value
(000) | |
| | | | | Luxembourg (continued) |
| | | 7,176 | | Eurofins Scientific SE (Life Sciences Tools & Services) | | $ | 565 | |
| | | 19,172 | | Tenaris SA (Energy Equipment & Services) | | | 246 | |
| | | | | | | | 1,712 | |
| | | | | Netherlands — 3.87% |
| | | 17,174 | | ABN AMRO Bank N.V. (Banks) | | | 193 | |
| | | 880 | | Adyen N.V. (IT Services)(a)(b) | | | 1,280 | |
| | | 78,669 | | AEGON N.V. (Insurance) | | | 340 | |
| | | 27,665 | | Airbus SE (Aerospace & Defense) | | | 2,680 | |
| | | 7,936 | | Akzo Nobel N.V. (Chemicals) | | | 521 | |
| | | 1,965 | | Argenx SE (Biotechnology)(b) | | | 736 | |
| | | 1,901 | | ASM International N.V. (Semiconductors & Semiconductor Equipment) | | | 475 | |
| | | 17,229 | | ASML Holding N.V. (Semiconductors & Semiconductor Equipment)(a) | | | 8,230 | |
| | | 41,546 | | CNH Industrial N.V. (Machinery) | | | 480 | |
| | | 4,792 | | Euronext N.V. (Capital Markets) | | | 391 | |
| | | 4,403 | | EXOR N.V. (Diversified Financial Services) | | | 274 | |
| | | 5,241 | | Heineken Holding N.V. (Beverages) | | | 382 | |
| | | 15,349 | | Heineken N.V. (Beverages) | | | 1,399 | |
| | | 2,481 | | IMCD NV (Trading Companies & Distributors)(a) | | | 341 | |
| | | 193,141 | | ING Groep N.V. (Banks) | | | 1,908 | |
| | | 10,390 | | JDE Peet’s N.V. (Food Products) | | | 296 | |
| | | 7,941 | | Just Eat Takeaway.com N.V. (Internet & Direct Marketing Retail)(b) | | | 125 | |
| | | 48,063 | | Koninklijke Ahold Delhaize N.V. (Food & Staples Retailing) | | | 1,252 | |
| | | 7,598 | | Koninklijke DSM N.V. (Chemicals) | | | 1,091 | |
| | | 269,903 | | Koninklijke KPN N.V. (Diversified Telecommunication Services) | | | 962 | |
| | | 38,028 | | Koninklijke Philips N.V. (Health Care Equipment & Supplies)^ | | | 819 | |
| | | 11,615 | | NN Group N.V. (Insurance) | | | 527 | |
| | | 4,644 | | OCI N.V. (Chemicals)(a) | | | 153 | |
| | | 33,676 | | Prosus N.V. (Internet & Direct Marketing Retail)(a) | | | 2,205 | |
| | | 12,034 | | QIAGEN N.V. (Life Sciences Tools & Services)(b) | | | 564 | |
| | | 4,855 | | Randstad N.V. (Professional Services) | | | 235 | |
| | | 27,748 | | STMicroelectronics N.V. (Semiconductors & Semiconductor Equipment) | | | 872 | |
| | | 29,449 | | Universal Music Group N.V. (Entertainment) | | | 590 | |
| | | 15,556 | | Wolters Kluwer N.V. (Professional Services) | | | 1,509 | |
| | | | | | | | 30,830 | |
| | | | | New Zealand — 0.16% |
| | | 50,822 | | Auckland International Airport Ltd. (Transportation Infrastructure)(b) | | | 228 | |
See accompanying notes to financial statements.
138
HC CAPITAL TRUST
The Institutional International Equity Portfolio
Portfolio of Investments (continued) — June 30, 2022
| | Shares | | Security Description | | Value
(000) | |
| | | | | Common Stocks (continued) |
| | | | | New Zealand (continued) |
| | | 23,431 | | Fisher & Paykel Healthcare Corp. Ltd. (Health Care Equipment & Supplies) | | $ | 293 | |
| | | 29,936 | | Mercury NZ Ltd. (Electric Utilities) | | | 106 | |
| | | 56,575 | | Meridian Energy Ltd. (Independent Power and Renewable Electricity Producers) | | | 165 | |
| | | 75,898 | | Spark New Zealand Ltd. (Diversified Telecommunication Services) | | | 227 | |
| | | 5,464 | | Xero Ltd. (Software)(b) | | | 290 | |
| | | | | | | | 1,309 | |
| | | | | Norway — 0.61% |
| | | 12,805 | | Adevinta ASA (Interactive Media & Services)(b) | | | 93 | |
| | | 13,135 | | Aker BP ASA (Oil, Gas & Consumable Fuels)^ | | | 456 | |
| | | 37,767 | | DNB Bank ASA (Banks) | | | 677 | |
| | | 39,679 | | Equinor ASA (Oil, Gas & Consumable Fuels) | | | 1,381 | |
| | | 9,943 | | Gjensidige Forsikring ASA (Insurance) | | | 201 | |
| | | 3,942 | | Kongsberg Gruppen ASA (Aerospace & Defense) | | | 141 | |
| | | 18,184 | | Mowi ASA (Food Products)(a) | | | 414 | |
| | | 54,601 | | Norsk Hydro ASA (Metals & Mining) | | | 306 | |
| | | 37,037 | | Orkla ASA (Food Products) | | | 296 | |
| | | 2,596 | | Salmar ASA (Food Products) | | | 183 | |
| | | 31,652 | | Telenor ASA (Diversified Telecommunication Services) | | | 421 | |
| | | 7,054 | | Yara International ASA (Chemicals) | | | 295 | |
| | | | | | | | 4,864 | |
| | | | | Portugal — 0.13% |
| | | 112,704 | | EDP - Energias de Portugal SA (Electric Utilities) | | | 525 | |
| | | 20,351 | | Galp Energia SGPS SA, B Shares (Oil, Gas & Consumable Fuels)(a) | | | 239 | |
| | | 11,497 | | Jeronimo Martins SGPS, SA (Food & Staples Retailing)(a) | | | 250 | |
| | | | | | | | 1,014 | |
| | | | | Singapore — 1.06% |
| | | 153,638 | | Ascendas Real Estate Investment Trust (Equity Real Estate Investment Trusts) | | | 315 | |
| | | 214,624 | | CapitaLand Integrated Commercial Trust (Equity Real Estate Investment Trusts) | | | 335 | |
| | | 105,600 | | Capitaland Investment, Ltd. (Real Estate Management & Development) | | | 290 | |
| | | 18,000 | | City Developments Ltd. (Real Estate Management & Development) | | | 106 | |
| | | 73,531 | | DBS Group Holdings Ltd. (Banks) | | | 1,571 | |
| | | 265,700 | | Genting Singapore Ltd. (Hotels, Restaurants & Leisure) | | | 138 | |
| | | 47,695 | | Grab Holdings Ltd. (Road & Rail)(b) | | | 121 | |
| | | 64,700 | | Keppel Corp. Ltd. (Industrial Conglomerates) | | | 302 | |
| | Shares | | Security Description | | Value
(000) | |
| | | | | Singapore (continued) |
| | | 102,200 | | Mapletree Commercial Trust (Equity Real Estate Investment Trusts) | | $ | 135 | |
| | | 137,190 | | Mapletree Logistics Trust (Equity Real Estate Investment Trusts) | | | 166 | |
| | | 139,737 | | Oversea-Chinese Banking Corp. Ltd. (Banks) | | | 1,146 | |
| | | 14,557 | | Sea Ltd., ADR (Entertainment)(b) | | | 973 | |
| | | 54,400 | | Singapore Airlines Ltd. (Airlines)(b) | | | 200 | |
| | | 44,600 | | Singapore Exchange Ltd. (Capital Markets) | | | 304 | |
| | | 81,000 | | Singapore Technologies Engineering Ltd. (Aerospace & Defense) | | | 238 | |
| | | 367,640 | | Singapore Telecommunications Ltd. (Diversified Telecommunication Services) | | | 670 | |
| | | 48,500 | | United Overseas Bank Ltd. (Banks) | | | 916 | |
| | | 28,300 | | United Overseas Land Group Ltd. (Real Estate Management & Development) | | | 150 | |
| | | 12,200 | | Venture Corp. Ltd. (Electronic Equipment, Instruments & Components) | | | 146 | |
| | | 78,000 | | Wilmar International Ltd. (Food Products) | | | 227 | |
| | | | | | | | 8,449 | |
| | | | | Spain — 1.92% |
| | | 1,002 | | Acciona SA (Electric Utilities) | | | 184 | |
| | | 8,973 | | ACS Actividades de Construccion y Servicios SA (Construction & Engineering) | | | 217 | |
| | | 3,045 | | Aena SME SA (Transportation Infrastructure)(b) | | | 387 | |
| | | 24,736 | | Amadeus IT Group SA (IT Services)(b) | | | 1,378 | |
| | | 270,716 | | Banco Bilbao Vizcaya Argentaria SA (Banks) | | | 1,228 | |
| | | 704,029 | | Banco Santander SA (Banks)(a) | | | 1,984 | |
| | | 179,994 | | CaixaBank SA (Banks) | | | 626 | |
| | | 24,161 | | Cellnex Telecom SA (Diversified Telecommunication Services) | | | 937 | |
| | | 11,700 | | EDP Renovaveis SA (Independent Power and Renewable Electricity Producers) | | | 276 | |
| | | 13,442 | | Enagas SA (Gas Utilities)(a) | | | 297 | |
| | | 14,485 | | Endesa SA (Electric Utilities) | | | 273 | |
| | | 19,582 | | Ferrovial SA (Construction & Engineering) | | | 496 | |
| | | 17,140 | | Grifols SA (Biotechnology)(b) | | | 324 | |
| | | 240,949 | | Iberdrola SA (Electric Utilities) | | | 2,499 | |
| | | 59,599 | | Industria de Diseno Textil SA (Specialty Retail) | | | 1,348 | |
| | | 7,578 | | Naturgy Energy Group SA (Gas Utilities) | | | 218 | |
| | | 22,297 | | Red Electrica Corp. SA (Electric Utilities) | | | 421 | |
| | | 58,912 | | Repsol SA (Oil, Gas & Consumable Fuels) | | | 867 | |
| | | 9,679 | | Siemens Gamesa Renewable Energy SA, Registered Shares (Electrical Equipment)(b) | | | 182 | |
| | | 221,812 | | Telefonica SA (Diversified Telecommunication Services) | | | 1,130 | |
| | | | | | | | 15,272 | |
| | | | | Sweden — 2.34% |
| | | 11,921 | | Alfa Laval AB (Machinery) | | | 288 | |
| | | 42,176 | | Assa Abloy AB, B Shares (Building Products) | | | 896 | |
See accompanying notes to financial statements.
139
HC CAPITAL TRUST
The Institutional International Equity Portfolio
Portfolio of Investments (continued) — June 30, 2022
| | Shares | | Security Description | | Value
(000) | |
| | | | | Common Stocks (continued) |
| | | | | Sweden (continued) |
| | | 109,054 | | Atlas Copco AB, Class - A (Machinery)(b) | | $ | 1,018 | |
| | | 63,371 | | Atlas Copco AB, Class - B (Machinery)(b) | | | 530 | |
| | | 11,105 | | Boliden AB (Metals & Mining) | | | 353 | |
| | | 10,991 | | Electrolux AB, Class - B (Household Durables) | | | 148 | |
| | | 32,246 | | Embracer Group AB (Entertainment)^(b) | | | 246 | |
| | | 26,756 | | Epiroc AB, Class - A (Machinery) | | | 413 | |
| | | 15,833 | | Epiroc AB, Class - B (Machinery) | | | 214 | |
| | | 12,013 | | Equities AB (Capital Markets) | | | 246 | |
| | | 27,019 | | Essity AB, Class - B (Household Products) | | | 706 | |
| | | 7,675 | | Evolution AB (Hotels, Restaurants & Leisure) | | | 698 | |
| | | 27,726 | | Fastighets AB Balder, B Shares (Real Estate Management & Development)(b) | | | 133 | |
| | | 11,572 | | Getinge AB, B Shares (Health Care Equipment & Supplies) | | | 268 | |
| | | 29,652 | | H & M Hennes & Mauritz AB, B Shares (Specialty Retail) | | | 354 | |
| | | 79,025 | | Hexagon AB, Class - B (Electronic Equipment, Instruments & Components) | | | 821 | |
| | | 4,135 | | Holmen AB, B Shares (Paper & Forest Products) | | | 168 | |
| | | 22,253 | | Husqvarna AB, B Shares (Machinery) | | | 163 | |
| | | 5,730 | | Industrivarden AB, A Shares (Diversified Financial Services)(a) | | | 129 | |
| | | 6,252 | | Industrivarden AB, Class - C (Diversified Financial Services) | | | 139 | |
| | | 11,090 | | Indutrade AB (Trading Companies & Distributors) | | | 202 | |
| | | 6,505 | | Investment AB Latour, Class - B (Industrial Conglomerates) | | | 129 | |
| | | 21,175 | | Investor AB, Class - A (Diversified Financial Services) | | | 381 | |
| | | 73,970 | | Investor AB, Class - B (Diversified Financial Services) | | | 1,216 | |
| | | 10,640 | | Kinnevik AB, Class - B (Diversified Financial Services)(b) | | | 172 | |
| | | 4,244 | | L E Lundbergforetagen AB, Class - B (Diversified Financial Services) | | | 173 | |
| | | 10,243 | | Lifco AB, Class - B (Industrial Conglomerates) | | | 165 | |
| | | 61,529 | | Nibe Industrier AB, Class - B (Building Products) | | | 462 | |
| | | 8,447 | | Sagax AB, Class - B (Real Estate Management & Development) | | | 156 | |
| | | 43,289 | | Sandvik AB (Machinery) | | | 702 | |
| | | 18,367 | | Securitas AB, Class - B (Commercial Services & Supplies) | | | 159 | |
| | | 22,989 | | Sinch AB (Software)(b) | | | 75 | |
| | | 66,077 | | Skandinaviska Enskilda Banken AB, Class - A (Banks) | | | 649 | |
| | Shares | | Security Description | | Value
(000) | |
| | | | | Sweden (continued) |
| | | 13,812 | | Skanska AB, B Shares (Construction & Engineering) | | $ | 212 | |
| | | 15,564 | | SKF AB, B Shares (Machinery)^ | | | 229 | |
| | | 27,378 | | Svenska Cellulosa AB SCA, Class - B (Paper & Forest Products) | | | 410 | |
| | | 62,282 | | Svenska Handelsbanken AB, A Shares (Banks) | | | 532 | |
| | | 38,249 | | Swedbank AB, A Shares (Banks) | | | 484 | |
| | | 70,609 | | Swedish Match AB (Tobacco) | | | 720 | |
| | | 7,446 | | Swedish Orphan Biovitrum AB (Biotechnology)(b) | | | 161 | |
| | | 28,538 | | Tele2 AB, B Shares (Wireless Telecommunication Services) | | | 326 | |
| | | 170,240 | | Telefonaktiebolaget LM Ericsson, Class - B (Communications Equipment) | | | 1,269 | |
| | | 122,039 | | Telia Co. AB (Diversified Telecommunication Services)(a) | | | 468 | |
| | | 61,267 | | Volvo AB, B Shares (Machinery) | | | 948 | |
| | | 8,799 | | Volvo AB, Class - A (Machinery) | | | 142 | |
| | | 24,194 | | Volvo Car AB, Class - B (Automobiles)^(b) | | | 161 | |
| | | | | | | | 18,634 | |
| | | | | Switzerland — 7.92% |
| | | 66,686 | | ABB Ltd., Registered Shares (Electrical Equipment) | | | 1,779 | |
| | | 6,551 | | Adecco Group AG (Professional Services)(a) | | | 223 | |
| | | 20,288 | | Alcon, Inc. (Health Care Equipment & Supplies) | | | 1,417 | |
| | | 2,699 | | Bachem Holding AG, Registered Shares (Life Sciences Tools & Services) | | | 188 | |
| | | 2,024 | | Baloise Holding AG, Registered Shares (Insurance) | | | 331 | |
| | | 234 | | Barry Callebaut AG, Registered Shares (Food Products)(a) | | | 523 | |
| | | 47 | | Chocoladefabriken Lindt & Spruengli AG (Food Products) | | | 478 | |
| | | 6 | | Chocoladefabriken Lindt & Spruengli AG (Food Products) | | | 629 | |
| | | 24,617 | | Cie Financiere Richemont SA, Registered Shares (Textiles, Apparel & Luxury Goods) | | | 2,622 | |
| | | 9,481 | | Clariant AG, Registered Shares (Chemicals)(b) | | | 181 | |
| | | 8,833 | | Coca-Cola HBC AG (Beverages) | | | 196 | |
| | | 107,620 | | Credit Suisse Group AG, Registered Shares (Capital Markets) | | | 611 | |
| | | 433 | | EMS-Chemie Holding AG (Chemicals) | | | 322 | |
| | | 1,586 | | Geberit AG, Registered Shares (Building Products) | | | 762 | |
| | | 414 | | Givaudan SA, Registered Shares (Chemicals) | | | 1,456 | |
| | | 22,506 | | Holcim Ltd., Registered Shares (Construction Materials)(a) | | | 963 | |
| | | 8,982 | | Julius Baer Group Ltd. (Capital Markets) | | | 414 | |
See accompanying notes to financial statements.
140
HC CAPITAL TRUST
The Institutional International Equity Portfolio
Portfolio of Investments (continued) — June 30, 2022
| | Shares | | Security Description | | Value
(000) | |
| | | | | Common Stocks (continued) |
| | | | | Switzerland (continued) |
| | | 2,726 | | Kuehne & Nagel International AG, Registered Shares (Marine) | | $ | 645 | |
| | | 7,338 | | Logitech International SA, Registered Shares (Technology Hardware, Storage & Peripherals) | | | 383 | |
| | | 3,714 | | Lonza Group AG, Registered Shares (Life Sciences Tools & Services)(a) | | | 1,980 | |
| | | 118,627 | | Nestle SA, Registered Shares (Food Products) | | | 13,850 | |
| | | 94,107 | | Novartis AG, Registered Shares (Pharmaceuticals) | | | 7,972 | |
| | | 921 | | Partners Group Holding AG (Capital Markets) | | | 830 | |
| | | 29,604 | | Roche Holding AG (Pharmaceuticals) | | | 9,880 | |
| | | 1,209 | | Roche Holding AG (Pharmaceuticals) | | | 467 | |
| | | 1,653 | | Schindler Holding AG (Machinery) | | | 302 | |
| | | 1,858 | | Schindler Holding AG, Registered Shares (Machinery) | | | 334 | |
| | | 447 | | SGS SA, Registered Shares (Professional Services)(a) | | | 1,024 | |
| | | 7,431 | | Sika AG, Registered Shares (Chemicals)(a) | | | 1,712 | |
| | | 2,180 | | Sonova Holding AG, Registered Shares (Health Care Equipment & Supplies)(a) | | | 694 | |
| | | 4,525 | | Straumann Holding AG, Registered Shares (Health Care Equipment & Supplies) | | | 544 | |
| | | 1,280 | | Swiss Life Holding AG (Insurance) | | | 624 | |
| | | 5,514 | | Swiss Prime Site AG, Registered Shares (Real Estate Management & Development) | | | 483 | |
| | | 12,246 | | Swiss Re AG (Insurance) | | | 949 | |
| | | 1,461 | | Swisscom AG, Registered Shares (Diversified Telecommunication Services) | | | 807 | |
| | | 2,579 | | Temenos AG, Registered Shares (Software) | | | 221 | |
| | | 2,136 | | The Swatch Group AG (Textiles, Apparel & Luxury Goods) | | | 95 | |
| | | 1,175 | | The Swatch Group AG, B Shares (Textiles, Apparel & Luxury Goods) | | | 279 | |
| | | 165,152 | | UBS Group AG (Capital Markets) | | | 2,662 | |
| | | 1,096 | | VAT Group AG (Machinery) | | | 261 | |
| | | 1,847 | | Vifor Pharma AG (Pharmaceuticals) | | | 331 | |
| | | 6,109 | | Zurich Financial Services AG (Insurance) | | | 2,657 | |
| | | | | | | | 63,081 | |
| | | | | Taiwan — 0.04% |
| | | 4,171 | | Taiwan Semiconductor Manufacturing Co. Ltd., ADR (Semiconductors & Semiconductor Equipment) | | | 341 | |
| | | | | United Kingdom — 11.86% |
| | | 39,513 | | 3i Group PLC (Capital Markets) | | | 533 | |
| | | 84,537 | | abrdn PLC (Diversified Financial Services) | | | 164 | |
| | | 12,750 | | Admiral Group PLC (Insurance)(a) | | | 348 | |
| | | 51,608 | | Anglo American PLC (Metals & Mining) | | | 1,845 | |
| | Shares | | Security Description | | Value
(000) | |
| | | | | United Kingdom (continued) |
| | | 16,010 | | Antofagasta PLC (Metals & Mining) | | $ | 225 | |
| | | 18,059 | | Ashtead Group PLC (Trading Companies & Distributors) | | | 756 | |
| | | 15,066 | | Associated British Foods PLC (Food Products) | | | 290 | |
| | | 66,568 | | AstraZeneca PLC (Pharmaceuticals)(a) | | | 8,749 | |
| | | 51,979 | | Auto Trader Group PLC (Interactive Media & Services)(a) | | | 351 | |
| | | 6,240 | | Aveva Group PLC (Software) | | | 171 | |
| | | 114,865 | | Aviva PLC (Insurance) | | | 561 | |
| | | 135,366 | | BAE Systems PLC (Aerospace & Defense) | | | 1,368 | |
| | | 867,975 | | Barclays PLC (Banks)(a) | | | 1,618 | |
| | | 41,516 | | Barratt Developments PLC (Household Durables)(a) | | | 231 | |
| | | 5,582 | | Berkeley Group Holdings PLC (Household Durables)(b) | | | 253 | |
| | | 790,591 | | BP PLC (Oil, Gas & Consumable Fuels) | | | 3,736 | |
| | | 98,062 | | British American Tobacco PLC (Tobacco) | | | 4,201 | |
| | | 35,748 | | British Land Co. PLC (Equity Real Estate Investment Trusts) | | | 195 | |
| | | 443,523 | | BT Group PLC (Diversified Telecommunication Services) | | | 1,006 | |
| | | 17,595 | | Bunzl PLC (Trading Companies & Distributors) | | | 582 | |
| | | 17,794 | | Burberry Group PLC (Textiles, Apparel & Luxury Goods)(a) | | | 355 | |
| | | 8,337 | | Coca-Cola Europacific Partners PLC (Beverages) | | | 430 | |
| | | 89,887 | | Compass Group PLC (Hotels, Restaurants & Leisure) | | | 1,838 | |
| | | 7,514 | | Croda International PLC (Chemicals)(a) | | | 592 | |
| | | 103,428 | | Diageo PLC (Beverages) | | | 4,444 | |
| | | 8,879 | | Ferguson PLC (Trading Companies & Distributors) | | | 993 | |
| | | 211,413 | | GlaxoSmithKline PLC (Pharmaceuticals) | | | 4,543 | |
| | | 18,666 | | Halma PLC (Electronic Equipment, Instruments & Components) | | | 457 | |
| | | 15,631 | | Hargreaves Lansdown PLC (Capital Markets) | | | 150 | |
| | | 15,938 | | Hikma Pharmaceuticals PLC (Pharmaceuticals)(a) | | | 314 | |
| | | 822,239 | | HSBC Holdings PLC (Banks) | | | 5,360 | |
| | | 40,523 | | Imperial Brands PLC (Tobacco) | | | 905 | |
| | | 60,704 | | Informa PLC (Media)(b) | | | 391 | |
| | | 7,471 | | Intercontinental Hotels Group PLC (Hotels, Restaurants & Leisure) | | | 396 | |
| | | 7,799 | | Intertek Group PLC (Professional Services) | | | 399 | |
| | | 135,835 | | J Sainsbury PLC (Food & Staples Retailing) | | | 337 | |
| | | 148,750 | | JD Sports Fashion PLC (Specialty Retail)(b) | | | 209 | |
| | | 7,607 | | Johnson Matthey PLC (Chemicals) | | | 178 | |
| | | 111,207 | | Kingfisher PLC (Specialty Retail) | | | 330 | |
| | | 31,115 | | Land Securities Group PLC (Equity Real Estate Investment Trusts) | | | 251 | |
See accompanying notes to financial statements.
141
HC CAPITAL TRUST
The Institutional International Equity Portfolio
Portfolio of Investments (continued) — June 30, 2022
| | Shares | | Security Description | | Value
(000) | |
| | | | | Common Stocks (continued) |
| | | | | United Kingdom (continued) |
| | | 242,400 | | Legal & General Group PLC (Insurance) | | $ | 707 | |
| | | 1,183 | | Linde PLC (Chemicals) | | | 340 | |
| | | 3,556,235 | | Lloyds Banking Group PLC (Banks) | | | 1,831 | |
| | | 14,436 | | London Stock Exchange Group PLC (Capital Markets)(a) | | | 1,341 | |
| | | 105,556 | | M&G PLC (Diversified Financial Services) | | | 250 | |
| | | 177,520 | | Melrose Industries PLC (Industrial Conglomerates) | | | 323 | |
| | | 19,713 | | Mondi PLC (Paper & Forest Products) | | | 349 | |
| | | 157,402 | | National Grid PLC (Multi-Utilities) | | | 2,016 | |
| | | 358,595 | | Natwest Group PLC (Banks)(a) | | | 953 | |
| | | 5,370 | | Next PLC (Multiline Retail) | | | 383 | |
| | | 37,656 | | Ocado Group PLC (Food & Staples Retailing)(a)(b) | | | 358 | |
| | | 34,986 | | Pearson PLC (Media) | | | 320 | |
| | | 12,960 | | Persimmon PLC (Household Durables) | | | 294 | |
| | | 30,436 | | Phoenix Group Holdings PLC (Insurance) | | | 219 | |
| | | 142,525 | | Prudential PLC (Insurance) | | | 1,763 | |
| | | 35,844 | | RecKitt Benckiser Group PLC (Household Products) | | | 2,692 | |
| | | 93,757 | | RELX PLC (Professional Services) | | | 2,540 | |
| | | 93,131 | | Rentokil Initial PLC (Commercial Services & Supplies) | | | 538 | |
| | | 51,413 | | Rio Tinto PLC (Metals & Mining) | | | 3,076 | |
| | | 339,724 | | Rolls-Royce Holdings PLC (Aerospace & Defense)(b) | | | 343 | |
| | | 5,462 | | Schroders PLC (Capital Markets) | | | 178 | |
| | | 58,322 | | Segro PLC (Equity Real Estate Investment Trusts) | | | 693 | |
| | | 14,381 | | Severn Trent PLC (Water Utilities)(a) | | | 476 | |
| | | 322,780 | | Shell PLC (Oil, Gas & Consumable Fuels) | | | 8,382 | |
| | | 35,710 | | Smith & Nephew PLC (Health Care Equipment & Supplies) | | | 499 | |
| | | 15,718 | | Smiths Group PLC (Industrial Conglomerates) | | | 268 | |
| | | 3,819 | | Spirax-Sarco Engineering PLC (Machinery) | | | 459 | |
| | | 45,003 | | SSE PLC (Electric Utilities) | | | 885 | |
| | | 21,952 | | St. James Place PLC (Capital Markets) | | | 295 | |
| | | 105,856 | | Standard Chartered PLC (Banks) | | | 797 | |
| | | 89,030 | | Stellantis N.V. (Automobiles) | | | 1,100 | |
| | | 148,141 | | Taylor Wimpey PLC (Household Durables)(a) | | | 210 | |
| | | 474,805 | | Tesco PLC (Food & Staples Retailing) | | | 1,477 | |
| | | 55,678 | | The Sage Group PLC (Software) | | | 430 | |
| | | 115,066 | | Unilever PLC (Personal Products) | | | 5,211 | |
| | | 38,736 | | United Utilities Group PLC (Water Utilities) | | | 481 | |
| | | 1,119,140 | | Vodafone Group PLC (Wireless Telecommunication Services) | | | 1,725 | |
| | | 8,201 | | Whitbread PLC (Hotels, Restaurants & Leisure) | | | 247 | |
| | | | | | | | 94,504 | |
| | Shares | | Security Description | | Value
(000) | |
| | | | | United States — 0.02% |
| | | 3,396 | | Brookfield Renewable Corp., Class - A (Independent Power and Renewable Electricity Producers) | | $ | 121 | |
| | | | | Total Common Stocks | | | 600,944 | |
| | | | | Preferred Stocks — 0.31% |
| | | | | Germany — 0.31% |
| | | 2,535 | | Bayerische Motoren Werke Aktiengesellschaft — Preferred (Automobiles) | | | 180 | |
| | | 7,233 | | Henkel AG & Co. KGAA — Preferred (Household Products) | | | 445 | |
| | | 6,217 | | Porsche Automobil Holding SE — Preferred (Automobiles) | | | 411 | |
| | | 1,218 | | Sartorius AG — Preferred (Health Care Equipment & Supplies) | | | 425 | |
| | | 7,535 | | Volkswagen AG — Preferred (Automobiles) | | | 1,007 | |
| | | | | Total Preferred Stocks | | | 2,468 | |
| | | | | Right — 0.00% |
| | | | | United Kingdom — 0.00% |
| | | 418,457 | | CC Japan Income & Growth Trust, Subscription Shares, 3/1/23 (Capital Markets)(b) | | | 9 | |
| | | | | Total Right | | | 9 | |
| | | | | Warrant — 0.00% |
| | | | | Australia — 0.00% |
| | | 502,568 | | WAM Global Ltd., 9/12/22 (Capital Markets) | | | — | |
| | | | | Total Warrant | | | — | |
| | | | | Exchange-Traded Funds — 0.63% |
| | | 50,360 | | iShares Core MSCI Japan IMI UCITS ETF | | | 2,063 | |
| | | 27,225 | | iShares MSCI EAFE ETF | | | 1,701 | |
| | | 32,350 | | Vanguard FTSE 100 UCITS ETF | | | 1,232 | |
| | | | | Total Exchange-Traded Funds | | | 4,996 | |
| | | | | Investment Companies — 21.03% |
| | | 665,983 | | Aberdeen New Dawn Investment Trust PLC | | | 2,261 | |
| | | 300,097 | | Aberforth Smaller Companies Trust PLC | | | 4,288 | |
| | | 500,251 | | Abrdn UK Smaller Companies Growth Trust PLC^ | | | 2,758 | |
| | | 137,249 | | ASA Gold and Precious Metals, Ltd. | | | 2,013 | |
| | | 1,614,892 | | AVI Japan Opportunity Trust PLC | | | 2,074 | |
| | | 1,138,931 | | Baillie Gifford European Growth Trust PLC | | | 1,101 | |
| | | 375,445 | | Baillie Gifford Japan Trust PLC | | | 3,203 | |
| | | 818,164 | | Baillie Gifford UK Growth Fund PLC | | | 1,504 | |
| | | 400,000 | | Baillie Gifford US Growth Trust PLC | | | 729 | |
| | | 243,006 | | BlackRock Health Sciences Trust II | | | 3,993 | |
| | | 387,171 | | BlackRock Innovation & Growth Trust | | | 3,074 | |
| | | 72,511 | | BlackRock Science Technology Trust II | | | 1,420 | |
| | | 598,027 | | BMO Global Smaller Companies PLC | | | 1,020 | |
| | | 1,416,785 | | CC Japan Income & Growth Trust PLC | | | 2,345 | |
See accompanying notes to financial statements.
142
HC CAPITAL TRUST
The Institutional International Equity Portfolio
Portfolio of Investments (continued) — June 30, 2022
| | Shares | | Security Description | | Value
(000) | |
| | | | | Investment Companies (continued) |
| | | 579,383 | | Edinburgh Investment Trust PLC | | $ | 4,210 | |
| | | 348,163 | | Edinburgh Worldwide Investment Trust PLC | | | 736 | |
| | | 553,229 | | European Opportunities Trust PLC | | | 4,444 | |
| | | 1,841,147 | | Federated Hermes Treasury Obligations Fund, Institutional Shares, 1.37%^^(d) | | | 1,841 | |
| | | 398,091 | | Fidelity Emerging Markets Ltd. | | | 3,070 | |
| | | 1,167,042 | | Fidelity European Trust PLC | | | 4,006 | |
| | | 1,004,768 | | Fidelity Japan Trust PLC | | | 1,822 | |
| | | 156,477 | | Finsbury Growth Income Trust PLC Fund | | | 1,459 | |
| | | 102,598 | | First Trust Dynamic Europe Equity Income Fund | | | 1,142 | |
| | | 2,280,000 | | Henderson European Focus Trust PLC | | | 3,607 | |
| | | 1,617,450 | | Henderson EuroTrust PLC | | | 2,225 | |
| | | 714,791 | | Japan Smaller Capitalization Fund, Inc. | | | 4,517 | |
| | | 1,198,275 | | JPMorgan European Discovery Trust PLC | | | 5,506 | |
| | | 6,971,422 | | JPMorgan European Growth & Income PLC | | | 6,517 | |
| | | 56,771 | | JPMorgan Indian Investment Trust PLC | | | 521 | |
| | | 472,078 | | JPMorgan Japan Small Cap Growth & Income, Ordinary Shares | | | 1,781 | |
| | | 822,471 | | JPMorgan Japanese Investment Trust PLC | | | 4,249 | |
| | | 1,351,111 | | Mercantile Investment Trust PLC | | | 2,940 | |
| | | 180,609 | | Morgan Stanley China A Share Fund, Inc. | | | 3,058 | |
| | | 204,803 | | Murray Income Trust PLC | | | 2,074 | |
| | | 522,242 | | Neuberger Berman MLP and Energy Income Fund, Inc. | | | 3,133 | |
| | | 471,842 | | Neuberger Berman Next Generation Connectivity Fund, Inc. | | | 4,681 | |
| | | 850,100 | | Oakley Capital Investments Ltd. | | | 3,983 | |
| | | 25,826 | | Pershing Square Holdings Fund Ltd. | | | 770 | |
| | | 1,669,246 | | Polar Capital Global Financials Trust PLC | | | 2,763 | |
| | | 484,557 | | Polar Capital Global Healthcare Trust PLC | | | 1,787 | |
| | | 2,642,280 | | Schroder Japan Growth Fund PLC | | | 6,095 | |
| | | 5,902,219 | | Schroder UK Public Private Trust PLC | | | 1,519 | |
| | | 164,345 | | Smithson Investment Trust PLC | | | 2,370 | |
| | | 21,828,882 | | State Street Institutional Treasury Plus Money Market Fund, Trust Class, 1.40%(d) | | | 21,829 | |
| | | 1,104,841 | | Strategic Equity Capital PLC | | | 3,765 | |
| | | 1,151,235 | | Temple Bar Investment Trust PLC | | | 3,055 | |
| | Shares | | Security Description | | Value
(000) | |
| | | | | Investment Companies (continued) |
| | | 1,912,674 | | Templeton Emerging Markets Investment Trust PLC | | $ | 3,455 | |
| | | 76,903 | | The Mexico Fund, Inc. | | | 1,110 | |
| | | 137,670 | | The New Germany Fund, Inc. | | | 1,161 | |
| | | 2,438,909 | | TR European Growth Trust PLC | | | 4,156 | |
| | | 783,022 | | TR Property Investment Trust PLC Ordinary Shares | | | 3,531 | |
| | | 2,434,088 | | VGI Partners Asian Investments Ltd.^ | | | 3,007 | |
| | | 1,287,275 | | WAM Global Ltd. | | | 1,501 | |
| | | 60,040 | | Worldwide Healthcare Trust PLC Fund | | | 2,291 | |
| | | | | Total Investment Companies | | | 167,470 | |
| | | | | Purchased Options on Futures — 0.37% |
| | | | | Total Purchased Options on Futures | | | 2,918 | |
| | | | | Total Investments (cost $741,655) — 97.79% | | | 778,805 | |
| | | | | Other assets in excess of liabilities — 2.21% | | | 17,594 | |
| | | | | Net Assets — 100.00% | | $ | 796,399 | |
Amounts designated as “—” are $0 or have been rounded to $0.
^ | All or part of this security was on loan as of June 30, 2022. |
^^ | Purchased with cash collateral held from securities lending. The value of the collateral could include collateral held for securities that were sold on or before June 30, 2022. |
(a) | Represents a security purchased under Rule 144A or Section 4(2) and is exempt from registration under the Securities Act of 1933, as amended, or is otherwise restricted to resale. Certain of these securities may be resold in transactions exempt from registration, normally to qualified institutional buyers. These securities have been deemed liquid by the Specialist Manager. |
(b) | Represents non-income producing security. |
(c) | Security was valued using significant unobservable inputs as of June 30, 2022. |
(d) | Annualized 7-day yield as of period-end. |
| ADR—American Depositary Receipt |
| REIT—Real Estate Investment Trust |
See accompanying notes to financial statements.
143
HC CAPITAL TRUST
The Institutional International Equity Portfolio
Portfolio of Investments (continued) — June 30, 2022
The following table reflects the percentage of total net assets of the Portfolio attributable to each Specialist Manager as of June 30, 2022.
| The Institutional International Equity Portfolio | | City of London
Investment
Management
Company,
Limited | | | Mellon
Investments
Corporation | | | Parametric
Portfolio
Associates,
LLC | | | HC Capital
Solutions | | | Total | |
| Common Stocks | | | — | | | | 75.45 | % | | | — | | | | — | | | | 75.45 | % |
| Preferred Stocks | | | — | | | | 0.31 | % | | | — | | | | — | | | | 0.31 | % |
| Right | | | 0.00 | % | | | — | | | | — | | | | — | | | | 0.00 | % |
| Warrant | | | 0.00 | % | | | — | | | | — | | | | — | | | | 0.00 | % |
| Exchange-Traded Funds | | | 0.41 | % | | | 0.22 | % | | | — | | | | — | | | | 0.63 | % |
| Investment Companies | | | 18.23 | % | | | 0.29 | % | | | 2.50 | % | | | 0.01 | % | | | 21.03 | % |
| Purchased Options on Futures | | | — | | | | — | | | | 0.37 | % | | | — | | | | 0.37 | % |
| Other Assets (Liabilities) | | | 0.06 | % | | | 0.45 | % | | | 1.09 | % | | | 0.61 | % | | | 2.21 | % |
| Total Net Assets | | | 18.70 | % | | | 76.72 | % | | | 3.96 | % | | | 0.62 | % | | | 100.00 | % |
Amounts designated as “—” indicate the Specialist Manager did not manage any holdings in that category.
Amounts designated as 0.00% round to less than 0.005%.
The following tables reflect the open derivative positions held by the Portfolio as of June 30, 2022.
Futures Contracts Purchased*
Description | | Number of
Contracts | | | Expiration
Date | | | Notional
Amount
(000) | | | Value and
Unrealized
Appreciation/
(Depreciation)
(000) | |
MSCI EAFE Index Future | | | 384 | | | | 9/16/22 | | | $ | 35,673 | | | $ | (646 | ) |
| | | | | | | | | | | $ | 35,673 | | | $ | (646 | ) |
Futures Contracts Sold*
Description | | Number of
Contracts | | | Expiration
Date | | | Notional
Amount
(000) | | | Value and
Unrealized
Appreciation/
(Depreciation)
(000) | |
E-Mini S&P 500 Future | | | 45 | | | | 9/16/22 | | | $ | 8,526 | | | $ | 1,651 | |
| | | | | | | | | | | $ | 8,526 | | | $ | 1,651 | |
| | Total Unrealized Appreciation | | $ | 1,651 | |
| | Total Unrealized Depreciation | | | (646 | ) |
| | Total Net Unrealized Appreciation/(Depreciation) | | $ | 1,005 | |
* | Cash has been pledged as collateral for futures contracts held by the Portfolio. |
See accompanying notes to financial statements.
144
HC CAPITAL TRUST
The Institutional International Equity Portfolio
Portfolio of Investments (continued) — June 30, 2022
Options on Futures Contracts
Exchange-traded options on futures contacts written as of June 30, 2022 were as follows:
Description | | Put/Call | | | Number of
Contracts | | | Notional
Amount
(000) | | | Exercise
Price | | | Expiration
Date | | | Value
(000) | |
E-Mini S&P 500 Future Option | | | Put | | | | 43 | | | | 8,428 | | | | 3,920.00 | | | | 7/15/22 | | | $ | (339 | ) |
E-Mini S&P 500 Future Option | | | Put | | | | 36 | | | | 7,038 | | | | 3,910.00 | | | | 7/15/22 | | | | (270 | ) |
E-Mini S&P 500 Future Option | | | Put | | | | 36 | | | | 7,002 | | | | 3,890.00 | | | | 7/15/22 | | | | (244 | ) |
E-Mini S&P 500 Future Option | | | Put | | | | 36 | | | | 6,930 | | | | 3,850.00 | | | | 7/15/22 | | | | (200 | ) |
E-Mini S&P 500 Future Option | | | Put | | | | 36 | | | | 6,912 | | | | 3,840.00 | | | | 7/29/22 | | | | (245 | ) |
E-Mini S&P 500 Future Option | | | Put | | | | 36 | | | | 6,930 | | | | 3,850.00 | | | | 7/29/22 | | | | (254 | ) |
E-Mini S&P 500 Future Option | | | Put | | | | 18 | | | | 3,474 | | | | 3,860.00 | | | | 7/29/22 | | | | (132 | ) |
E-Mini S&P 500 Future Option | | | Put | | | | 20 | | | | 3,850 | | | | 3,850.00 | | | | 8/19/22 | | | | (170 | ) |
E-Mini S&P 500 Future Option | | | Put | | | | 34 | | | | 6,460 | | | | 3,800.00 | | | | 8/19/22 | | | | (250 | ) |
E-Mini S&P 500 Future Option | | | Put | | | | 36 | | | | 6,300 | | | | 3,500.00 | | | | 8/19/22 | | | | (100 | ) |
E-Mini S&P 500 Future Option | | | Put | | | | 36 | | | | 6,246 | | | | 3,470.00 | | | | 8/19/22 | | | | (90 | ) |
E-Mini S&P 500 Future Option | | | Put | | | | 18 | | | | 3,015 | | | | 3,350.00 | | | | 8/19/22 | | | | (29 | ) |
E-Mini S&P 500 Future Option | | | Put | | | | 18 | | | | 2,880 | | | | 3,200.00 | | | | 8/19/22 | | | | (17 | ) |
E-Mini S&P 500 Future Option | | | Put | | | | 36 | | | | 6,948 | | | | 3,860.00 | | | | 8/19/22 | | | | (315 | ) |
E-Mini S&P 500 Future Option | | | Put | | | | 37 | | | | 6,568 | | | | 3,550.00 | | | | 8/19/22 | | | | (123 | ) |
E-Mini S&P 500 Future Option | | | Put | | | | 36 | | | | 6,300 | | | | 3,500.00 | | | | 8/31/22 | | | | (125 | ) |
E-Mini S&P 500 Future Option | | | Put | | | | 36 | | | | 6,282 | | | | 3,490.00 | | | | 8/31/22 | | | | (121 | ) |
E-Mini S&P 500 Future Option | | | Put | | | | 36 | | | | 6,480 | | | | 3,600.00 | | | | 8/31/22 | | | | (169 | ) |
E-Mini S&P 500 Future Option | | | Put | | | | 36 | | | | 6,030 | | | | 3,350.00 | | | | 8/31/22 | | | | (77 | ) |
E-Mini S&P 500 Future Option | | | Put | | | | 36 | | | | 6,120 | | | | 3,400.00 | | | | 8/31/22 | | | | (91 | ) |
E-Mini S&P 500 Future Option | | | Put | | | | 70 | | | | 11,935 | | | | 3,410.00 | | | | 8/31/22 | | | | (182 | ) |
E-Mini S&P 500 Future Option | | | Put | | | | 36 | | | | 6,264 | | | | 3,480.00 | | | | 8/31/22 | | | | (117 | ) |
| | | | | | | | | | | | | | | | | | | | | | | $ | (3,660 | ) |
Exchanged-traded options on futures contacts purchased as of June 30, 2022 were as follows:
Description | | Put/Call | | | Number of
Contracts | | | Notional
Amount
(000) | | | Exercise
Price | | | Expiration
Date | | | Value
(000) | |
E-Mini S&P 500 Future Option | | | Call | | | | 20 | | | $ | 3,875 | | | $ | 3,875.00 | | | | 7/8/22 | | | $ | 21 | |
E-Mini S&P 500 Future Option | | | Call | | | | 20 | | | | 3,900 | | | | 3,900.00 | | | | 7/8/22 | | | | 15 | |
E-Mini S&P 500 Future Option | | | Call | | | | 20 | | | | 3,950 | | | | 3,950.00 | | | | 7/15/22 | | | | 20 | |
E-Mini S&P 500 Future Option | | | Put | | | | 20 | | | | 3,725 | | | | 3,725.00 | | | | 7/8/22 | | | | 32 | |
E-Mini S&P 500 Future Option | | | Put | | | | 20 | | | | 3,700 | | | | 3,700.00 | | | | 7/8/22 | | | | 25 | |
E-Mini S&P 500 Future Option | | | Put | | | | 44 | | | | 8,140 | | | | 3,700.00 | | | | 7/15/22 | | | | 105 | |
E-Mini S&P 500 Future Option | | | Put | | | | 100 | | | | 17,875 | | | | 3,575.00 | | | | 7/15/22 | | | | 106 | |
E-Mini S&P 500 Future Option | | | Put | | | | 36 | | | | 6,480 | | | | 3,600.00 | | | | 7/15/22 | | | | 45 | |
E-Mini S&P 500 Future Option | | | Put | | | | 18 | | | | 3,645 | | | | 4,050.00 | | | | 7/15/22 | | | | 240 | |
E-Mini S&P 500 Future Option | | | Put | | | | 18 | | | | 3,690 | | | | 4,100.00 | | | | 7/15/22 | | | | 283 | |
E-Mini S&P 500 Future Option | | | Put | | | | 18 | | | | 3,780 | | | | 4,200.00 | | | | 7/15/22 | | | | 369 | |
E-Mini S&P 500 Future Option | | | Put | | | | 40 | | | | 7,640 | | | | 3,820.00 | | | | 7/15/22 | | | | 191 | |
E-Mini S&P 500 Future Option | | | Put | | | | 72 | | | | 12,888 | | | | 3,580.00 | | | | 7/29/22 | | | | 166 | |
E-Mini S&P 500 Future Option | | | Put | | | | 36 | | | | 6,408 | | | | 3,560.00 | | | | 7/29/22 | | | | 75 | |
E-Mini S&P 500 Future Option | | | Put | | | | 18 | | | | 3,690 | | | | 4,100.00 | | | | 7/29/22 | | | | 290 | |
E-Mini S&P 500 Future Option | | | Put | | | | 18 | | | | 3,645 | | | | 4,050.00 | | | | 7/29/22 | | | | 251 | |
E-Mini S&P 500 Future Option | | | Put | | | | 40 | | | | 7,100 | | | | 3,550.00 | | | | 7/29/22 | | | | 80 | |
See accompanying notes to financial statements.
145
HC CAPITAL TRUST
The Institutional International Equity Portfolio
Portfolio of Investments (concluded) — June 30, 2022
Description | | Put/Call | | | Number of
Contracts | | | Notional
Amount
(000) | | | Exercise
Price | | | Expiration
Date | | | Value
(000) | |
E-Mini S&P 500 Future Option | | | Put | | | | 18 | | | | 3,330 | | | | 3,700.00 | | | | 8/19/22 | | | $ | 98 | |
E-Mini S&P 500 Future Option | | | Put | | | | 18 | | | | 3,735 | | | | 4,150.00 | | | | 8/19/22 | | | | 339 | |
E-Mini S&P 500 Future Option | | | Put | | | | 18 | | | | 3,465 | | | | 3,850.00 | | | | 8/31/22 | | | | 167 | |
| | | | | | | | | | | | | | | | | | | | | | | $ | 2,918 | |
See accompanying notes to financial statements.
146
HC CAPITAL TRUST
The Emerging Markets Portfolio
Portfolio of Investments — June 30, 2022
| | Shares | | Security Description | | Value
(000) | |
| | | | | Common Stocks — 82.63% |
| | | | | Bermuda — 0.08% |
| | | 348,000 | | Alibaba Health Information Technology Ltd. (Health Care Technology)(a)(b) | | $ | 239 | |
| | | 1,039,733 | | Beijing Enterprises Water Group Ltd. (Water Utilities)(b) | | | 315 | |
| | | | | | | | 554 | |
| | | | | Brazil — 3.42% |
| | | 575,300 | | Ambev SA (Beverages) | | | 1,473 | |
| | | 47,055 | | Americanas SA (Internet & Direct Marketing Retail) | | | 121 | |
| | | 407,700 | | B3 SA - Brasil Bolsa Balcao (Capital Markets) | | | 854 | |
| | | 230,432 | | Banco Bradesco SA (Banks) | | | 633 | |
| | | 120,800 | | Banco do Brasil SA (Banks) | | | 771 | |
| | | 276,650 | | BB Seguridade Participacoes SA (Insurance) | | | 1,372 | |
| | | 71,700 | | BRF SA (Food Products)(a) | | | 186 | |
| | | 69,300 | | Centrais Electricas Brasileiras SA (Electric Utilities) | | | 612 | |
| | | 98,100 | | Companhia Siderurgica Nacional SA (CSN) (Metals & Mining) | | | 289 | |
| | | 502,500 | | Itau Unibanco Holding SA (Banks) | | | 2,177 | |
| | | 133,700 | | JBS SA (Food Products) | | | 807 | |
| | | 144,200 | | Klabin SA (Containers & Packaging) | | | 557 | |
| | | 103,765 | | Localiza Rent A Car SA (Road & Rail)(b) | | | 1,039 | |
| | | 153,824 | | Lojas Renner SA (Multiline Retail) | | | 665 | |
| | | 462,500 | | Magazine Luiza SA (Multiline Retail) | | | 207 | |
| | | 142,500 | | Natura & Co. Holding SA (Personal Products)(b) | | | 365 | |
| | | 772,900 | | Petroleo Brasileiro SA (Oil, Gas & Consumable Fuels) | | | 4,512 | |
| | | 215,000 | | Raia Drogasil SA (Food & Staples Retailing) | | | 789 | |
| | | 108,800 | | Rumo SA (Road & Rail)(b) | | | 332 | |
| | | 41,400 | | Suzano SA (Paper & Forest Products) | | | 393 | |
| | | 260,400 | | Tim SA (Wireless Telecommunication Services) | | | 635 | |
| | | 262,000 | | Vale SA (Metals & Mining) | | | 3,833 | |
| | | 366,300 | | WEG SA (Machinery) | | | 1,851 | |
| | | | | | | | 24,473 | |
| | | | | Cayman Islands — 3.06% |
| | | 14,000 | | AAC Technologies Holdings, Inc. (Electronic Equipment, Instruments & Components) | | | 32 | |
| | | 1,241,198 | | Alibaba Group Holding Ltd. (Internet & Direct Marketing Retail)(a) | | | 17,701 | |
| | | 103,000 | | ANTA Sports Products Ltd. (Textiles, Apparel & Luxury Goods)(b) | | | 1,265 | |
| | | 24,000 | | China Mengniu Dairy Co. Ltd. (Food Products)(b) | | | 120 | |
| | | 480,000 | | Geely Automobile Holdings Ltd. (Automobiles)(b) | | | 1,091 | |
| | | 62,000 | | Kingsoft Corp. Ltd. (Entertainment)(b) | | | 242 | |
| | Shares | | Security Description | | Value
(000) | |
| | | | | Cayman Islands (continued) |
| | | 7,000 | | Parade Technologies Ltd. (Semiconductors & Semiconductor Equipment) | | $ | 271 | |
| | | 99,700 | | Shenzhou International Group Holdings Ltd. (Textiles, Apparel & Luxury Goods)(b) | | | 1,208 | |
| | | | | | | | 21,930 | |
| | | | | Chile — 0.38% |
| | | 18,870 | | Banco de Credito e Inversiones SA (Banks) | | | 553 | |
| | | 293,158 | | Empresas CMPC SA (Paper & Forest Products) | | | 487 | |
| | | 9,904,113 | | Enel Americas SA (Electric Utilities) | | | 940 | |
| | | 7,027,795 | | Enel Chile SA (Electric Utilities) | | | 159 | |
| | | 47,236 | | Falabella SA (Multiline Retail) | | | 111 | |
| | | 5,610 | | Sociedad Quimica y Minera de Chile SA (Chemicals) | | | 468 | |
| | | | | | | | 2,718 | |
| | | | | China — 24.96% |
| | | 333,965 | | 360 Security Technology, Inc., Class - A (Software) | | | 425 | |
| | | 2,150,000 | | Agricultural Bank of China Ltd., H Shares (Banks)(a) | | | 811 | |
| | | 700,000 | | Air China Ltd. (Airlines)(a) | | | 608 | |
| | | 75,400 | | Air China Ltd. (Airlines)(a) | | | 131 | |
| | | 28,440 | | Alibaba Group Holding Ltd., ADR (Internet & Direct Marketing Retail)(a) | | | 3,233 | |
| | | 314,000 | | Aluminum Corp of China Ltd., H Shares (Metals & Mining) | | | 119 | |
| | | 419,700 | | Aluminum Corp. of China Ltd., Class A (Metals & Mining)(a) | | | 298 | |
| | | 5,814 | | Autohome, Inc., ADR (Interactive Media & Services) | | | 229 | |
| | | 29,197 | | Baidu, Inc., ADR (Interactive Media & Services)(a) | | | 4,343 | |
| | | 6,902,100 | | Bank of China Ltd., H Shares (Banks)(a) | | | 2,753 | |
| | | 1,399,000 | | Bank of Communications Co. Ltd., H Shares (Banks) | | | 966 | |
| | | 4,000 | | BeiGene Ltd., ADR (Biotechnology)(a) | | | 647 | |
| | | 281,350 | | Beijing Dabeinong Technology Group Co. Ltd., Class - A (Food Products)(a) | | | 328 | |
| | | 241,864 | | Beijing Shiji Information Technology Co. Ltd. (Software) | | | 573 | |
| | | 27,600 | | Beijing Tiantan Biological Products Corp. Ltd. (Biotechnology)(a) | | | 100 | |
| | | 9,449 | | Bilibili, Inc., ADR (Entertainment)(a) | | | 242 | |
| | | 122,000 | | Brilliance China Automotive Holdings Ltd. (Automobiles)(a) | | | 114 | |
| | | 93,653 | | BYD Co. Ltd. (Automobiles) | | | 4,667 | |
| | | 32,000 | | BYD Co. Ltd., H Shares (Automobiles)(b) | | | 1,281 | |
| | | 115,500 | | BYD Electronic International Co. Ltd. (Communications Equipment) | | | 364 | |
See accompanying notes to financial statements.
147
HC CAPITAL TRUST
The Emerging Markets Portfolio
Portfolio of Investments (continued) — June 30, 2022
| | Shares | | Security Description | | Value
(000) | |
| | | | | Common Stocks (continued) |
| | | | | China (continued) |
| | | 4,000 | | CanSino Biologics, Inc., Class - H (Pharmaceuticals)(a) | | $ | 41 | |
| | | 9,036 | | CanSino Biologics, Inc., Class A (Pharmaceuticals)(a) | | | 269 | |
| | | 60,100 | | Chengxin Lithium Group Co. Ltd., Class - A (Paper & Forest Products) | | | 542 | |
| | | 432,000 | | China Cinda Asset Management Co. Ltd., H Shares (Capital Markets)(b) | | | 68 | |
| | | 134,900 | | China Communications Services Corp. Ltd., H Shares (Construction & Engineering) | | | 59 | |
| | | 545,000 | | China Conch Venture Holdings Ltd. (Machinery) | | | 1,188 | |
| | | 10,570,350 | | China Construction Bank Corp., H Shares (Banks) | | | 7,100 | |
| | | 1,641,000 | | China Everbright Bank Co. Ltd., H Shares (Banks) | | | 531 | |
| | | 38,000 | | China Evergrande Group (Real Estate Management & Development)(a) | | | 8 | |
| | | 110,000 | | China Feihe Ltd. (Food Products) | | | 126 | |
| | | 227,000 | | China Galaxy Securities Co. Ltd., Class A (Capital Markets) | | | 328 | |
| | | 174,000 | | China Galaxy Securities Co. Ltd., H Shares (Capital Markets) | | | 100 | |
| | | 50,800 | | China International Capital Corp. Ltd. (Capital Markets) | | | 108 | |
| | | 53,600 | | China International Capital Corp. Ltd., Class A (Capital Markets) | | | 356 | |
| | | 20,800 | | China International Travel Service Corp. Ltd. (Hotels, Restaurants & Leisure)(a) | | | 724 | |
| | | 1,115,000 | | China Life Insurance Co. Ltd., H Shares (Insurance) | | | 1,941 | |
| | | 108,200 | | China Literature Ltd. (Media)(a)(b) | | | 523 | |
| | | 217,000 | | China Longyuan Power Group Corp. Ltd., H Shares (Independent Power and Renewable Electricity Producers) | | | 419 | |
| | | 77,800 | | China Merchants Bank Co. Ltd. (Banks) | | | 490 | |
| | | 521,000 | | China Merchants Bank Co. Ltd., H Shares (Banks) | | | 3,486 | |
| | | 285,000 | | China Molybdenum Co. Ltd. (Metals & Mining) | | | 159 | |
| | | 102,000 | | China National Building Material Co. Ltd., H Shares (Construction Materials)(b) | | | 109 | |
| | | 80,850 | | China Northern Rare Earth Group High-Tech Co. Ltd. (Metals & Mining) | | | 425 | |
| | | 584,800 | | China Petroleum & Chemical Corp., Class A (Oil, Gas & Consumable Fuels) | | | 356 | |
| | | 1,643,400 | | China Petroleum & Chemical Corp., H Shares (Oil, Gas & Consumable Fuels) | | | 739 | |
| | | 748,000 | | China Resources Cement Holdings Ltd. (Construction Materials)(b) | | | 502 | |
| | Shares | | Security Description | | Value
(000) | |
| | | | | China (continued) |
| | | 941,761 | | China Resources Land Ltd. (Real Estate Management & Development) | | $ | 4,394 | |
| | | 730,143 | | China Resources Power Holdings Co. Ltd. (Independent Power and Renewable Electricity Producers) | | | 1,507 | |
| | | 697,500 | | China Shenhua Energy Co. Ltd., H Shares (Oil, Gas & Consumable Fuels) | | | 2,000 | |
| | | 846,000 | | China Southern Airlines Co. Ltd., H Shares (Airlines)(a) | | | 489 | |
| | | 5,316,000 | | China Tower Corp. Ltd. (Diversified Telecommunication Services) | | | 684 | |
| | | 304,900 | | China Vanke Co. Ltd., H Shares (Real Estate Management & Development)(b) | | | 766 | |
| | | 12,400 | | Chongqing Brewery Co. Ltd. (Beverages) | | | 272 | |
| | | 37,100 | | Chongqing Zhifei Biological Products Co. Ltd. (Biotechnology) | | | 615 | |
| | | 199,680 | | CIFI Holdings Group Co. Ltd. (Real Estate Management & Development) | | | 100 | |
| | | 33,465 | | CITIC Securities Co. Ltd. (Capital Markets) | | | 108 | |
| | | 48,500 | | CITIC Securities Co. Ltd., H Shares (Capital Markets) | | | 108 | |
| | | 12,800 | | Contemporary Amperex Technology Co. Ltd., Class - A (Electrical Equipment) | | | 1,021 | |
| | | 482,430 | | COSCO SHIPPING Holdings Co. Ltd. (Marine) | | | 1,002 | |
| | | 124,800 | | COSCO SHIPPING Holdings Co. Ltd., H Shares (Marine) | | | 174 | |
| | | 786,000 | | Country Garden Holdings Co. (Real Estate Management & Development)(b) | | | 487 | |
| | | 130,678 | | Country Garden Services Holdings Co. Ltd., Series S (Real Estate Management & Development) | | | 582 | |
| | | 118,100 | | CSC Financial Co. Ltd. (Capital Markets) | | | 510 | |
| | | 121,600 | | DA An Gene Co., Ltd. of Sun Yat-Sen University, Class - A (Biotechnology) | | | 312 | |
| | | 4,307 | | Daqo New Energy Corp., ADR (Semiconductors & Semiconductor Equipment)(a) | | | 307 | |
| | | 73,400 | | Dongfang Electric Corp. Ltd. (Electrical Equipment) | | | 180 | |
| | | 168,825 | | East Money Information Co. Ltd. (Capital Markets) | | | 641 | |
| | | 117,200 | | ENN Energy Holdings Ltd. (Gas Utilities) | | | 1,925 | |
| | | 55,623 | | Eve Energy Co. Ltd. (Electrical Equipment)(a) | | | 810 | |
| | | 85,400 | | Fangda Carbon New Material Co. Ltd. (Electrical Equipment)(a) | | | 97 | |
| | | 450,300 | | Focus Media Information Technology Co. Ltd. (Media) | | | 453 | |
| | | 95,300 | | Foshan Haitian Flavouring & Food Co. Ltd. (Food Products) | | | 1,286 | |
See accompanying notes to financial statements.
148
HC CAPITAL TRUST
The Emerging Markets Portfolio
Portfolio of Investments (continued) — June 30, 2022
| | Shares | | Security Description | | Value
(000) | |
| | | | | Common Stocks (continued) |
| | | | | China (continued) |
| | | 6,300 | | Fu Jian Anjoy Foods Co., Ltd., Class - A (Food Products) | | $ | 158 | |
| | | 25,400 | | Fujian Sunner Development Co. Ltd. (Food Products) | | | 73 | |
| | | 10,463 | | GDS Holdings Ltd., ADR (IT Services)(a) | | | 349 | |
| | | 110,000 | | Genscript Biotech Corp. (Life Sciences Tools & Services)(a)(b) | | | 399 | |
| | | 85,000 | | GF Securities Co. Ltd., Class - H (Capital Markets) | | | 112 | |
| | | 112,200 | | GF Securities Co. Ltd., Class A (Capital Markets) | | | 313 | |
| | | 2,400 | | Ginlong Technologies Co. Ltd., Class - A (Electrical Equipment) | | | 76 | |
| | | 276,500 | | Great Wall Motor Co. Ltd., H Shares (Automobiles) | | | 569 | |
| | | 157,000 | | Guanghui Energy Co. Ltd., Class - A (Oil, Gas & Consumable Fuels) | | | 247 | |
| | | 598,000 | | Guangzhou Automobile Group Co. Ltd., H Shares (Automobiles) | | | 578 | |
| | | 7,072 | | H World Group Ltd., ADR (Hotels, Restaurants & Leisure) | | | 269 | |
| | | 46,000 | | Haidilao International Holding Ltd. (Hotels, Restaurants & Leisure)(a) | | | 107 | |
| | | 211,800 | | Haier Smart Home Co. Ltd., Class - H (Household Durables) | | | 784 | |
| | | 86,800 | | Haier Smart Home Co. Ltd., Class A (Household Durables) | | | 356 | |
| | | 45,900 | | Haitong Securities Co. Ltd. (Capital Markets) | | | 67 | |
| | | 88,400 | | Haitong Securities Co. Ltd., H Shares (Capital Markets) | | | 65 | |
| | | 45,000 | | Hengli Petrochemical Co. Ltd. (Chemicals) | | | 150 | |
| | | 276,000 | | HengTen Networks Group, Ltd. (Internet & Direct Marketing Retail)(a) | | | 101 | |
| | | 25,900 | | Hithink RoyalFlush Information Network Co. Ltd. (Capital Markets) | | | 372 | |
| | | 137,000 | | Hua Hong Semiconductor Ltd. (Semiconductors & Semiconductor Equipment)(a)(b) | | | 496 | |
| | | 25,200 | | Huadong Medicine Co. Ltd. (Health Care Providers & Services) | | | 170 | |
| | | 59,000 | | Huatai Securities Co. Ltd., Class - H (Capital Markets) | | | 88 | |
| | | 143,300 | | Huatai Securities Co. Ltd., Class A (Capital Markets) | | | 304 | |
| | | 153,200 | | Iflytek Co. Ltd. (Software) | | | 943 | |
| | | 7,221,440 | | Industrial & Commercial Bank of China Ltd., H Shares (Banks) | | | 4,290 | |
| | | 222,200 | | Inner Mongolia BaoTou Steel Union Co. Ltd. (Metals & Mining) | | | 78 | |
| | Shares | | Security Description | | Value
(000) | |
| | | | | China (continued) |
| | | 79,000 | | Innovent Biologics, Inc. (Biotechnology)(a)(b) | | $ | 351 | |
| | | 23,184 | | Inspur Electronic Information Industry Co. Ltd. (Technology Hardware, Storage & Peripherals) | | | 92 | |
| | | 13,860 | | Intco Medical Technology Co., Ltd., Class - A (Health Care Equipment & Supplies) | | | 53 | |
| | | 14,242 | | iQiyi, Inc., ADR (Entertainment)(a) | | | 60 | |
| | | 182,657 | | JD.com, Inc., Class - A (Internet & Direct Marketing Retail) | | | 5,886 | |
| | | 1,180,000 | | Jiangsu Expressway Co. Ltd., H Shares (Transportation Infrastructure) | | | 1,188 | |
| | | 131,931 | | Jiangsu Hengrui Medicine Co. Ltd. (Pharmaceuticals) | | | 731 | |
| | | 176,600 | | Jiangxi Zhengbang Technology Co. Ltd. (Food Products)(a) | | | 160 | |
| | | 98,300 | | Jinke Properties Group Co. Ltd. (Real Estate Management & Development) | | | 42 | |
| | | 2,600 | | Joinn Laboratories China Co. Ltd., Class - A (Life Sciences Tools & Services) | | | 44 | |
| | | 1,500 | | JOYY, Inc., ADR (Interactive Media & Services) | | | 45 | |
| | | 14,100 | | Juewei Food Co. Ltd. (Food Products) | | | 122 | |
| | | 28,762 | | KE Holdings, Inc., ADR (Real Estate Management & Development)(a) | | | 516 | |
| | | 122,500 | | Kingboard Holdings Ltd. (Electronic Equipment, Instruments & Components) | | | 464 | |
| | | 421,000 | | Kingdee International Software Group Co. Ltd. (Software)(a) | | | 987 | |
| | | 17,900 | | Kuaishou Technology (Media)(a) | | | 199 | |
| | | 5,900 | | Kweichow Moutai Co. Ltd. (Beverages) | | | 1,803 | |
| | | 46,500 | | Lens Technology Co. Ltd. (Electronic Equipment, Instruments & Components) | | | 77 | |
| | | 35,612 | | LI Auto, Inc., ADR (Automobiles)(a) | | | 1,364 | |
| | | 278,500 | | Li Ning Co. Ltd. (Textiles, Apparel & Luxury Goods) | | | 2,580 | |
| | | 131,819 | | Luxshare Precision Industry Co. Ltd. (Electronic Equipment, Instruments & Components) | | | 665 | |
| | | 218,160 | | Meinian Onehealth Healthcare Holdings Co. Ltd. (Health Care Providers & Services)(a) | | | 182 | |
| | | 336,700 | | Meituan Dianping (Internet & Direct Marketing Retail)(a) | | | 8,334 | |
| | | 59,000 | | Microport Scientific Corp. (Health Care Equipment & Supplies)(a) | | | 171 | |
| | | 7,280 | | Muyuan Foodstuff Co. Ltd. (Food Products) | | | 60 | |
| | | 136,600 | | National Silicon Industry Group Co. Ltd., Class - A (Semiconductors & Semiconductor Equipment)(a) | | | 469 | |
| | | 214,500 | | NetEase, Inc. (Entertainment) | | | 3,940 | |
See accompanying notes to financial statements.
149
HC CAPITAL TRUST
The Emerging Markets Portfolio
Portfolio of Investments (continued) — June 30, 2022
| | Shares | | Security Description | | Value
(000) | |
| | | | | Common Stocks (continued) |
| | | | | China (continued) |
| | | 171,200 | | New China Life Insurance Co. Ltd., H Shares (Insurance)(b) | | $ | 481 | |
| | | 65,100 | | New China Life Insurance Co., Ltd., Class A (Insurance) | | | 313 | |
| | | 106,357 | | NIO, Inc., ADR (Automobiles)(a) | | | 2,310 | |
| | | 77,290 | | O-FILM Tech Co. Ltd. (Electronic Equipment, Instruments & Components)(a) | | | 77 | |
| | | 23,520 | | Ovctek China, Inc. (Health Care Equipment & Supplies) | | | 201 | |
| | | 111,600 | | Perfect World Co. Ltd., Class - A (Entertainment) | | | 240 | |
| | | 456,300 | | PetroChina Co. Ltd., Class A (Oil, Gas & Consumable Fuels) | | | 361 | |
| | | 904,000 | | PetroChina Co. Ltd., H Shares (Oil, Gas & Consumable Fuels) | | | 431 | |
| | | 27,000 | | Pharmaron Beijing Co. Ltd., Class - H (Life Sciences Tools & Services) | | | 270 | |
| | | 38,973 | | Pinduoduo, Inc., ADR (Internet & Direct Marketing Retail)(a) | | | 2,409 | |
| | | 1,272,517 | | Ping An Insurance Group Company of China Ltd. (Insurance) | | | 8,653 | |
| | | 345,600 | | Rongsheng Petro Chemical Co. Ltd., Class - A (Chemicals) | | | 795 | |
| | | 142,000 | | Seazen Group Ltd. (Real Estate Management & Development)(a) | | | 70 | |
| | | 120,299 | | Shandong Buchang Pharmaceuticals Co. Ltd., Class - A (Pharmaceuticals) | | | 354 | |
| | | 136,100 | | Shanghai Electric Group Co. Ltd. (Electrical Equipment) | | | 84 | |
| | | 9,000 | | Shanghai Junshi Biosciences Co. Ltd., Class - A (Biotechnology)(a) | | | 101 | |
| | | 921,300 | | Shanghai Pharmaceuticals Holding Co. Ltd., H Shares (Health Care Providers & Services) | | | 1,526 | |
| | | 4,200 | | Shanghai Putailai New Energy Technology Co. Ltd., Class - A (Chemicals) | | | 53 | |
| | | 43,600 | | Shanghai Zhangjiang High-Tech Park Development Co. (Real Estate Management & Development) | | | 81 | |
| | | 82,200 | | Shanxi Meijin Energy Co. Ltd. (Metals & Mining) | | | 150 | |
| | | 10,300 | | Shanxi Xinghuacun Fen Wine Factory Co. Ltd., Class - A (Beverages) | | | 500 | |
| | | 57,920 | | Shenzhen Kangtai Biological Products Co. Ltd. (Biotechnology) | | | 391 | |
| | | 26,100 | | Sichuan Kelun Pharmaceutical Co. Ltd. (Pharmaceuticals) | | | 73 | |
| | | 18,700 | | Sichuan New Energy Power Co. Ltd. (Trading Companies & Distributors)(a) | | | 62 | |
| | Shares | | Security Description | | Value
(000) | |
| | | | | China (continued) |
| | | 8,000 | | Silergy Corp. (Semiconductors & Semiconductor Equipment) | | $ | 644 | |
| | | 54,000 | | Sinotruk Hong Kong Ltd. (Machinery) | | | 76 | |
| | | 169,000 | | Smoore International Holdings Ltd. (Tobacco)^ | | | 521 | |
| | | 233,617 | | Songcheng Performance Development Co. Ltd., Class - A (Hotels, Restaurants & Leisure) | | | 536 | |
| | | 5,000 | | StarPower Semiconductor Ltd., Class - A (Semiconductors & Semiconductor Equipment) | | | 288 | |
| | | 170,427 | | Sunny Optical Technology Group Co. Ltd. (Electronic Equipment, Instruments & Components) | | | 2,778 | |
| | | 30,900 | | Suzhou Dongshan Precision Manufacturing Co. Ltd., Class - A (Electronic Equipment, Instruments & Components) | | | 106 | |
| | | 8,480 | | Suzhou Maxwell Technologies Co. Ltd., Class - A (Electrical Equipment) | | | 622 | |
| | | 45,497 | | TAL Education Group, ADR (Diversified Consumer Services)(a) | | | 222 | |
| | | 611,286 | | Tencent Holdings Ltd. (Interactive Media & Services)(b) | | | 27,610 | |
| | | 31,445 | | Tencent Music Entertainment Group, ADR (Entertainment)(a) | | | 158 | |
| | | 184,632 | | Toly Bread Co. Ltd. (Food Products) | | | 457 | |
| | | 89,000 | | Transfar Zhilian Co. Ltd. (Chemicals) | | | 85 | |
| | | 27,444 | | Trip.com Group Ltd., ADR (Internet & Direct Marketing Retail)(a) | | | 753 | |
| | | 30,940 | | Unisplendour Corp. Ltd., Class - A (Electronic Equipment, Instruments & Components)(a) | | | 90 | |
| | | 34,096 | | Vipshop Holdings Ltd., ADR (Internet & Direct Marketing Retail)(a) | | | 337 | |
| | | 81,675 | | Walvax Biotechnology Co Ltd., Class - A (Biotechnology) | | | 590 | |
| | | 8,500 | | Weibo Corp., ADR (Interactive Media & Services)(a) | | | 197 | |
| | | 50,500 | | Weichai Power Co. Ltd. (Machinery) | | | 94 | |
| | | 54,000 | | Weichai Power Co. Ltd. (Machinery) | | | 86 | |
| | | 44,260 | | Wens Foodstuffs Group Co. Ltd. (Food Products) | | | 141 | |
| | | 103,292 | | Wuhan Guide Infrared Co. Ltd. (Electronic Equipment, Instruments & Components) | | | 199 | |
| | | 16,700 | | Wuliangye Yibin Co. Ltd., Class - A (Beverages) | | | 504 | |
| | | 30,360 | | WUS Printed Circuit Kunshan Co. Ltd. (Electronic Equipment, Instruments & Components) | | | 67 | |
See accompanying notes to financial statements.
150
HC CAPITAL TRUST
The Emerging Markets Portfolio
Portfolio of Investments (continued) — June 30, 2022
| | Shares | | Security Description | | Value
(000) | |
| | | | | Common Stocks (continued) |
| | | | | China (continued) |
| | | 30,340 | | WuXi AppTec Co. Ltd., Class - H (Life Sciences Tools & Services) | | $ | 404 | |
| | | 242,000 | | Wuxi Biologics Cayman, Inc. (Life Sciences Tools & Services)(a)(b) | | | 2,214 | |
| | | 1,159,000 | | Xiaomi Corp. (Technology Hardware, Storage & Peripherals)(a)(b) | | | 2,015 | |
| | | 51,700 | | Xinjiang Goldwind Science & Technology Co. Ltd. (Electrical Equipment) | | | 114 | |
| | | 468,481 | | Xinyi Solar Holdings Ltd. (Semiconductors & Semiconductor Equipment) | | | 724 | |
| | | 28,268 | | Xpeng, Inc., ADR (Automobiles)(a) | | | 897 | |
| | | 366,000 | | Yadea Group Holdings Ltd. (Automobiles)(b) | | | 716 | |
| | | 43,550 | | Yealink Network Technology Corp. Ltd. (Communications Equipment) | | | 495 | |
| | | 61,000 | | Yihai International Holdings (Food Products) | | | 220 | |
| | | 76,440 | | Yintai Gold Co. Ltd. (Metals & Mining) | | | 111 | |
| | | 124,076 | | Yonyou Network Technology Co. Ltd. (Software) | | | 402 | |
| | | 2,900 | | Youngy Co. Ltd., Class - A (Metals & Mining)(a) | | | 67 | |
| | | 27,030 | | Yunda Holding Co. Ltd. (Air Freight & Logistics) | | | 69 | |
| | | 10,800 | | Yunnan Energy New Material Co. Ltd., Class - A (Containers & Packaging) | | | 404 | |
| | | 4,926 | | Zai Lab Ltd., ADR (Biotechnology)(a) | | | 171 | |
| | | 23,900 | | Zhangzhou Pientzehuang Pharmaceutical Co. Ltd. (Pharmaceuticals)(a) | | | 1,274 | |
| | | 51,400 | | Zhejiang Century Huatong Group Co. Ltd., Class - A (Entertainment)(a) | | | 37 | |
| | | 13,440 | | Zhejiang Dingli Machinery Co. Ltd. (Machinery) | | | 102 | |
| | | 1,094,000 | | Zhejiang Expressway Co. Ltd., H Shares (Transportation Infrastructure)(a) | | | 1,009 | |
| | | 2,982 | | Zhejiang HangKe Technology, Inc. Co., Class - A (Electrical Equipment) | | | 31 | |
| | | 61,300 | | Zhejiang Semir Garment Co. Ltd. (Textiles, Apparel & Luxury Goods) | | | 54 | |
| | | 8,200 | | Zhejiang Supor Co. Ltd. (Household Durables) | | | 69 | |
| | | 75,900 | | Zheshang Securities Co. Ltd. (Capital Markets) | | | 129 | |
| | | 29,200 | | ZhongAn Online P&C Insurance Co. Ltd. (Insurance)^(a) | | | 95 | |
| | | 15,300 | | Zhongji Innolight Co. Ltd. (Communications Equipment) | | | 71 | |
| | | 63,500 | | Zhongsheng Group Holdings Ltd. (Specialty Retail) | | | 448 | |
| | | 770,300 | | Zijin Mining Group Co. Ltd., Class - A (Metals & Mining) | | | 1,074 | |
| | | 218,000 | | Zijin Mining Group Co. Ltd., H Shares (Metals & Mining) | | | 267 | |
| | Shares | | Security Description | | Value
(000) | |
| | | | | China (continued) |
| | | 120,400 | | Zoomlion Heavy Industry Science & Technology Co. Ltd., H Shares (Machinery) | | $ | 64 | |
| | | 325,100 | | Zoomlion Heavy Industry Science And Technology Co. Ltd, Class A (Machinery) | | | 299 | |
| | | 169,800 | | ZTE Corp. (Communications Equipment) | | | 648 | |
| | | 183,800 | | ZTE Corp., H Shares (Communications Equipment) | | | 428 | |
| | | 27,491 | | ZTO Express Cayman, Inc., ADR (Air Freight & Logistics) | | | 755 | |
| | | | | | | | 178,882 | |
| | | | | Colombia — 0.15% |
| | | 1,914,419 | | Ecopetrol SA (Oil, Gas & Consumable Fuels) | | | 1,041 | |
| | | | | Cyprus — 0.00% |
| | | 7,712 | | TCS Group Holding PLC, GDR (Banks)(a)(c) | | | — | |
| | | | | Czech Republic — 0.10% |
| | | 190,434 | | Moneta Money Bank AS (Banks)(b) | | | 692 | |
| | | | | Egypt — 0.05% |
| | | 195,461 | | Commercial International Bank Egypt SAE (Banks) | | | 388 | |
| | | | | Greece — 0.29% |
| | | 51,559 | | Alpha Services and Holdings SA (Banks)(a)(b) | | | 45 | |
| | | 116,923 | | Hellenic Telecommunication Organization SA (Diversified Telecommunication Services) | | | 2,030 | |
| | | | | | | | 2,075 | |
| | | | | Hong Kong — 0.94% |
| | | 3,310,000 | | Alibaba Pictures Group Ltd. (Entertainment)(a) | | | 325 | |
| | | 712,182 | | China Everbright Environment Group Ltd. (Commercial Services & Supplies) | | | 420 | |
| | | 1,546,000 | | China Jinmao Holdings Group Ltd. (Real Estate Management & Development) | | | 416 | |
| | | 432,500 | | China Overseas Land & Investment Ltd. (Real Estate Management & Development) | | | 1,366 | |
| | | 36,000 | | China Resources Beer Holdings Co. Ltd. (Beverages) | | | 268 | |
| | | 112,000 | | China State Construction International Holdings Ltd. (Construction & Engineering) | | | 124 | |
| | | 79,400 | | China Taiping Insurance Holdings Co. Ltd. (Insurance)(b) | | | 98 | |
| | | 288,000 | | CSPC Pharmaceutical Group Ltd. (Pharmaceuticals)(b) | | | 286 | |
| | | 1,172,000 | | Far East Horizon Ltd. (Diversified Financial Services) | | | 982 | |
| | | 67,000 | | Fosun International Ltd. (Industrial Conglomerates) | | | 62 | |
| | | 179,000 | | Hengan International Group Co. Ltd. (Personal Products) | | | 840 | |
See accompanying notes to financial statements.
151
HC CAPITAL TRUST
The Emerging Markets Portfolio
Portfolio of Investments (continued) — June 30, 2022
| | Shares | | Security Description | | Value
(000) | |
| | | | | Common Stocks (continued) |
| | | | | Hong Kong (continued) |
| | | 25,200 | | Hutchison China Meditech Ltd., ADR (Pharmaceuticals)(a) | | $ | 319 | |
| | | 332,000 | | Kingboard Laminates Holdings Ltd. (Electronic Equipment, Instruments & Components)(b) | | | 410 | |
| | | 124,000 | | Lenovo Group Ltd. (Technology Hardware, Storage & Peripherals) | | | 116 | |
| | | 735,000 | | Sino Biopharmaceutiical Ltd. (Pharmaceuticals)(b) | | | 466 | |
| | | 209,600 | | Yuexiu Property Co. Ltd. (Real Estate Management & Development) | | | 269 | |
| | | | | | | | 6,767 | |
| | | | | Hungary — 0.32% |
| | | 62,779 | | MOL Hungarian Oil & Gas PLC (Oil, Gas & Consumable Fuels) | | | 485 | |
| | | 36,300 | | OTP Bank Nyrt PLC (Banks) | | | 809 | |
| | | 54,565 | | Richter Gedeon Nyrt (Pharmaceuticals) | | | 985 | |
| | | | | | | | 2,279 | |
| | | | | India — 10.64% |
| | | 54,236 | | Adani Green Energy, Ltd. (Independent Power and Renewable Electricity Producers)(a) | | | 1,325 | |
| | | 203,324 | | Adani Ports & Special Economic Zone Ltd. (Transportation Infrastructure) | | | 1,730 | |
| | | 37,899 | | Adani Total Gas Ltd. (Gas Utilities) | | | 1,148 | |
| | | 33,041 | | Adani Transmission Ltd. (Electric Utilities)(a) | | | 1,035 | |
| | | 319,100 | | Ambuja Cements Ltd. (Construction Materials) | | | 1,467 | |
| | | 8,752 | | Apollo Hospitals Enterprise (Health Care Providers & Services)(b) | | | 408 | |
| | | 11,498 | | Asian Paints Ltd. (Chemicals) | | | 392 | |
| | | 34,614 | | Aurobindo Pharma Ltd. (Pharmaceuticals)(b) | | | 225 | |
| | | 56,857 | | Avenue Supermarts Ltd. (Food & Staples Retailing)(a)(b) | | | 2,452 | |
| | | 348,104 | | Axis Bank Ltd. (Banks)(a)(b) | | | 2,807 | |
| | | 17,379 | | Bajaj Auto Ltd. (Automobiles) | | | 816 | |
| | | 37,286 | | Bajaj Finance Ltd. (Consumer Finance)(b) | | | 2,550 | |
| | | 7,701 | | Bajaj Finserv Ltd. (Insurance) | | | 1,066 | |
| | | 216,368 | | Bharat Petroleum Corp. Ltd. (Oil, Gas & Consumable Fuels)(b) | | | 845 | |
| | | 12,160 | | Biocon Ltd. (Biotechnology) | | | 47 | |
| | | 8,842,285 | | Chennai Super Kings Cricket Ltd. (Entertainment)(a)(c) | | | — | |
| | | 722,710 | | Coal India Ltd. (Oil, Gas & Consumable Fuels) | | | 1,699 | |
| | | 73,059 | | Dr. Reddy’s Laboratories Ltd., ADR (Pharmaceuticals) | | | 4,047 | |
| | | 12,020 | | Eicher Motors Ltd. (Automobiles)(b) | | | 425 | |
| | | 318,734 | | GAIL India Ltd. (Gas Utilities) | | | 546 | |
| | | 161,026 | | HCL Technologies Ltd. (IT Services) | | | 1,985 | |
| | Shares | | Security Description | | Value
(000) | |
| | | | | India (continued) |
| | | 46,133 | | Hindustan Unilever Ltd. (Household Products)(b) | | $ | 1,303 | |
| | | 209,234 | | Housing Development Finance Corp. Ltd. (Thrifts & Mortgage Finance)(b) | | | 5,752 | |
| | | 665,177 | | ICICI Bank Ltd. (Banks)(b) | | | 5,957 | |
| | | 277,936 | | Infosys Ltd. (IT Services) | | | 5,145 | |
| | | 17,988 | | InterGlobe Aviation Ltd. (Airlines)(a)(b) | | | 366 | |
| | | 611,134 | | ITC Ltd. (Tobacco)(b) | | | 2,117 | |
| | | 19,610 | | Kotak Mahindra Bank Ltd. (Banks)(b) | | | 413 | |
| | | 543,033 | | NTPC Ltd. (Independent Power and Renewable Electricity Producers)(b) | | | 983 | |
| | | 231,740 | | Oil & Natural Gas Corp. Ltd. (Oil, Gas & Consumable Fuels)(b) | | | 445 | |
| | | 31,703 | | Pidilite Industries Ltd. (Chemicals) | | | 839 | |
| | | 271,566 | | Reliance Industries Ltd. (Oil, Gas & Consumable Fuels)(a) | | | 8,927 | |
| | | 30,301 | | SBI Life Insurance Co. Ltd. (Insurance) | | | 415 | |
| | | 5,875 | | Shree Cement Ltd. (Construction Materials)(b) | | | 1,414 | |
| | | 305,548 | | State Bank of India (Banks)(b) | | | 1,803 | |
| | | 81,597 | | Tata Consultancy Services Ltd. (IT Services)(b) | | | 3,376 | |
| | | 111,086 | | Tata Motors Ltd. (Automobiles)(a) | | | 579 | |
| | | 186,711 | | Tata Steel Ltd. (Metals & Mining) | | | 2,050 | |
| | | 32,627 | | Titan Co. Ltd. (Textiles, Apparel & Luxury Goods) | | | 802 | |
| | | 4,235 | | Trent Ltd. (Multiline Retail) | | | 58 | |
| | | 22,694 | | Ultra Tech Cement Ltd. (Construction Materials) | | | 1,611 | |
| | | 222,144 | | United Spirits Ltd. (Beverages)(a) | | | 2,137 | |
| | | 225,053 | | Vedanta Ltd. (Metals & Mining) | | | 636 | |
| | | 363,041 | | Wipro Ltd. (IT Services)(b) | | | 1,913 | |
| | | 1,074,947 | | Yes Bank, Ltd. (Banks)(a)(b) | | | 172 | |
| | | | | | | | 76,228 | |
| | | | | Indonesia — 1.85% |
| | | 360,200 | | Aneka Tambang Tbk (Metals & Mining) | | | 44 | |
| | | 2,110,400 | | PT Astra International Tbk (Automobiles) | | | 939 | |
| | | 7,534,785 | | PT Bank Central Asia Tbk (Banks) | | | 3,666 | |
| | | 5,393,700 | | PT Bank Rakyat Indonesia Persero Tbk (Banks) | | | 1,503 | |
| | | 830,300 | | PT Barito Pacific Tbk (Chemicals) | | | 42 | |
| | | 1,875,600 | | PT Charoen Pokphand Indonesia Tbk (Food Products) | | | 756 | |
| | | 345,000 | | PT Indah Kiat Pulp & Paper Tbk (Paper & Forest Products) | | | 176 | |
| | | 2,093,700 | | PT Indofood Sukses Makmur Tbk (Food Products) | | | 991 | |
| | | 20,553,735 | | PT Kalbe Farma Tbk (Pharmaceuticals) | | | 2,291 | |
| | | 237,400 | | PT Merdeka Copper Gold Tbk (Metals & Mining)(a)(b) | | | 64 | |
| | | 621,400 | | PT Semen Indonesia Persero Tbk (Construction Materials) | | | 297 | |
See accompanying notes to financial statements.
152
HC CAPITAL TRUST
The Emerging Markets Portfolio
Portfolio of Investments (continued) — June 30, 2022
| | Shares | | Security Description | | Value
(000) | |
| | | | | Common Stocks (continued) |
| | | | | Indonesia (continued) |
| | | 7,476,650 | | PT Telkom Indonesia Persero Tbk (Diversified Telecommunication Services)(b) | | $ | 2,008 | |
| | | 251,300 | | PT United Tractors Tbk (Oil, Gas & Consumable Fuels) | | | 479 | |
| | | | | | | | 13,256 | |
| | | | | Kuwait — 0.28% |
| | | 363,537 | | Boubyan Bank KSCP (Banks) | | | 917 | |
| | | 392,282 | | Kuwait Finance House KSCP (Banks) | | | 1,114 | |
| | | | | | | | 2,031 | |
| | | | | Malaysia — 1.83% |
| | | 241,900 | | AMMB Holdings Berhad (Banks) | | | 205 | |
| | | 1,488,900 | | Dialog Group Berhad (Energy Equipment & Services) | | | 720 | |
| | | 60,200 | | DiGi.Com Berhad (Wireless Telecommunication Services) | | | 48 | |
| | | 281,400 | | Hartalega Holdings Berhad (Health Care Equipment & Supplies) | | | 195 | |
| | | 1,093,800 | | IHH Healthcare Berhad (Health Care Providers & Services) | | | 1,601 | |
| | | 1,283,100 | | IOI Corp. Berhad (Food Products) | | | 1,118 | |
| | | 378,796 | | Malayan Banking Berhad (Banks) | | | 739 | |
| | | 1,764,700 | | Malaysia Airports Holdings Berhad (Transportation Infrastructure)(a) | | | 2,643 | |
| | | 581,500 | | Maxis Berhad (Wireless Telecommunication Services)(b) | | | 436 | |
| | | 15,300 | | Petronas Gas Berhad (Gas Utilities) | | | 57 | |
| | | 1,200,200 | | Press Metal Aluminum Holdings (Metals & Mining)(b) | | | 1,297 | |
| | | 1,142,400 | | Public Bank Berhad (Banks) | | | 1,133 | |
| | | 1,262,600 | | QL Resources Berhad (Food Products) | | | 1,490 | |
| | | 558,900 | | Sime Darby Berhad (Industrial Conglomerates) | | | 270 | |
| | | 1,028,100 | | Sime Darby Plantation Berhad (Food Products) | | | 1,010 | |
| | | 685,700 | | Top Glove Corp. Berhad (Health Care Equipment & Supplies) | | | 162 | |
| | | | | | | | 13,124 | |
| | | | | Mexico — 2.18% |
| | | 3,159,500 | | America Movil SAB de CV (Wireless Telecommunication Services) | | | 3,229 | |
| | | 1,050,300 | | Cemex SAB de CV (Construction Materials)(a) | | | 409 | |
| | | 138,800 | | Coca-Cola Femsa SAB de CV (Beverages) | | | 769 | |
| | | 156,300 | | Fibra Uno Amdinistracion SA (Equity Real Estate Investment Trusts)(b) | | | 156 | |
| | | 47,504 | | Fomento Economico Mexicano SAB de CV, ADR (Beverages) | | | 3,205 | |
| | | 57,155 | | Grupo Aeroportuario del Sureste SAB de CV, Class - B (Transportation Infrastructure) | | | 1,124 | |
| | Shares | | Security Description | | Value
(000) | |
| | | | | Mexico (continued) |
| | | 363,500 | | Grupo Bimbo SAB de CV, Series A (Food Products) | | $ | 1,182 | |
| | | 195,000 | | Grupo Financiero Banorte SAB de CV (Banks) | | | 1,088 | |
| | | 544,645 | | Grupo Mexico SAB de CV, Series B (Metals & Mining) | | | 2,256 | |
| | | 255,700 | | Grupo Televisa SAB de CV (Media) | | | 420 | |
| | | 576,600 | | Kimberly-Clark de Mexico SAB de CV, A Shares (Household Products) | | | 781 | |
| | | 439,825 | | Orbia Advance Corp SAB de CV (Chemicals) | | | 1,030 | |
| | | | | | | | 15,649 | |
| | | | | Peru — 0.33% |
| | | 109,508 | | Compania de Minas Buenaventura SA, ADR (Metals & Mining) | | | 723 | |
| | | 13,465 | | Credicorp Ltd. (Banks) | | | 1,614 | |
| | | | | | | | 2,337 | |
| | | | | Philippines — 0.81% |
| | | 1,181,140 | | Aboitiz Equity Ventures, Inc. (Industrial Conglomerates)(b) | | | 1,022 | |
| | | 1,797,673 | | Metropolitan Bank & Trust Co. (Banks) | | | 1,563 | |
| | | 17,765 | | PLDT, Inc. (Wireless Telecommunication Services) | | | 543 | |
| | | 187,693 | | SM Investments Corp. (Industrial Conglomerates) | | | 2,670 | |
| | | | | | | | 5,798 | |
| | | | | Poland — 0.29% |
| | | 97,123 | | Bank Pekao SA (Banks)(b) | | | 1,769 | |
| | | 3,287 | | CD Projekt SA (Entertainment) | | | 70 | |
| | | 3,670 | | KGHM Polska Miedz SA (Metals & Mining)(a) | | | 97 | |
| | | 4,503 | | Powszechny Zaklad Ubezpieczen SA (Insurance)(b) | | | 30 | |
| | | 85,078 | | Telekomunikacja Polska SA (Diversified Telecommunication Services) | | | 119 | |
| | | | | | | | 2,085 | |
| | | | | Qatar — 0.31% |
| | | 125,342 | | Mesaieed Petrochemical Holding Co. (Chemicals) | | | 86 | |
| | | 66,824 | | Qatar Islamic Bank SAQ (Banks) | | | 408 | |
| | | 153,868 | | Qatar National Bank (Banks) | | | 844 | |
| | | 459,841 | | The Commercial Bank of Qatar QSC (Banks) | | | 865 | |
| | | | | | | | 2,203 | |
| | | | | Russia — 0.00% |
| | | 877,850 | | Gazprom PJSC (Oil, Gas & Consumable Fuels)(c) | | | — | |
| | | 280,855 | | Gazprom PJSC, ADR (Oil, Gas & Consumable Fuels)(c) | | | — | |
| | | 27,710 | | LUKOIL (Oil, Gas & Consumable Fuels)(c) | | | — | |
| | | 5,276 | | LUKOIL PJSC (Oil, Gas & Consumable Fuels)(c) | | | — | |
See accompanying notes to financial statements.
153
HC CAPITAL TRUST
The Emerging Markets Portfolio
Portfolio of Investments (continued) — June 30, 2022
| | Shares | | Security Description | | Value
(000) | |
| | | | | Common Stocks (continued) |
| | | | | Russia (continued) |
| | | 23,471 | | LUKOIL PJSC, ADR (Oil, Gas & Consumable Fuels)(c) | | $ | — | |
| | | 8,073 | | Novatek OAO, Registered Shares, GDR (Oil, Gas & Consumable Fuels)(c) | | | — | |
| | | 2,132 | | Novatek PJSC, GDR (Oil, Gas & Consumable Fuels)(c) | | | — | |
| | | 38,369 | | Polymetal International PLC (Metals & Mining)(c) | | | — | |
| | | 3,734 | | Polyus PJSC (Metals & Mining)(c) | | | — | |
| | | 89,489 | | Sberbank of Russia PJSC, ADR (Banks)(a)(c) | | | — | |
| | | 113,164 | | Severstal, Registered Shares, GDR (Metals & Mining)(c) | | | — | |
| | | 125,880 | | Tatneft PJSC, Class - S (Oil, Gas & Consumable Fuels)(c) | | | — | |
| | | 766,486 | | The Moscow Exchange (Capital Markets)(a)(c) | | | — | |
| | | 814,600,000 | | VTB Bank PJSC (Banks)(c) | | | — | |
| | | 31,318 | | Yandex NV, Class A (Interactive Media & Services)(a)(c) | | | — | |
| | | | | | | | — | |
| | | | | Saudi Arabia — 3.44% |
| | | 188,707 | | Al Rajhi Bank (Banks) | | | 4,150 | |
| | | 4,497 | | Almarai Co. JSC (Food Products) | | | 63 | |
| | | 77,181 | | Banque Saudi Fransi (Banks) | | | 975 | |
| | | 16,955 | | Bupa Arabia For Cooperative Insurance Co. (Insurance) | | | 720 | |
| | | 382,830 | | Dar Al Arkan Real Estate Development Co. (Real Estate Management & Development)(a) | | | 1,098 | |
| | | 1,354 | | Dr. Sulaiman Al Habib Medical Services Group Co. (Health Care Providers & Services) | | | 70 | |
| | | 38,940 | | Elm Co. (IT Services) | | | 2,647 | |
| | | 224,771 | | Emaar Economic City (Real Estate Management & Development)(a) | | | 592 | |
| | | 17,324 | | Mobile Telecommunications Co. (Wireless Telecommunication Services)(a) | | | 52 | |
| | | 105,859 | | National Commercial Bank (Banks) | | | 1,859 | |
| | | 172,781 | | Riyad Bank (Banks) | | | 1,478 | |
| | | 59,797 | | SABIC Agri-Nutrients Co. (Chemicals) | | | 2,196 | |
| | | 46,591 | | Sahara International Petrochemical Co. (Chemicals) | | | 623 | |
| | | 196,682 | | Saudi Arabian Mining Co. (Metals & Mining)(a) | | | 2,613 | |
| | | 62,760 | | Saudi Basic Industries Corp. (Chemicals) | | | 1,700 | |
| | | 72,167 | | Saudi Industrial Investment Group (Chemicals) | | | 548 | |
| | | 127,544 | | Saudi Kayan Petrochemical Co. (Chemicals)(a) | | | 536 | |
| | | 6,543 | | Saudi Tadawul Group Holding Co. (Capital Markets) | | | 330 | |
| | | 48,506 | | Saudi Telecom Co. (Diversified Telecommunication Services)(b) | | | 1,255 | |
| | Shares | | Security Description | | Value
(000) | |
| | | | | Saudi Arabia (continued) |
| | | 71,146 | | The Saudi British Bank (Banks)(b) | | $ | 772 | |
| | | 37,378 | | The Savola Group (Food Products) | | | 335 | |
| | | | | | | | 24,612 | |
| | | | | South Africa — 2.91% |
| | | 8,100 | | Absa Group Ltd. (Banks) | | | 77 | |
| | | 7,411 | | Anglo American Platinum Ltd. (Metals & Mining) | | | 649 | |
| | | 59,086 | | AngloGold Ashanti Ltd. (Metals & Mining) | | | 890 | |
| | | 11,124 | | Aspen Pharmacare Holdings Ltd. (Pharmaceuticals) | | | 95 | |
| | | 61,875 | | Bid Corp. Ltd. (Food & Staples Retailing) | | | 1,167 | |
| | | 31,869 | | Bidvest Group Ltd. (Industrial Conglomerates) | | | 411 | |
| | | 6,145 | | Capitec Bank Holdings Ltd. (Banks) | | | 749 | |
| | | 229,901 | | Discovery Ltd. (Insurance)(a)(b) | | | 1,811 | |
| | | 583,993 | | FirstRand Ltd. (Diversified Financial Services) | | | 2,240 | |
| | | 57,103 | | Gold Fields Ltd. (Metals & Mining)(b) | | | 537 | |
| | | 399,656 | | Growthpoint Properties Ltd. (Equity Real Estate Investment Trusts)(b) | | | 304 | |
| | | 48,655 | | Impala Platinum Holdings Ltd. (Metals & Mining) | | | 542 | |
| | | 32,304 | | Mr. Price Group Ltd. (Specialty Retail) | | | 352 | |
| | | 270,984 | | MTN Group Ltd. (Wireless Telecommunication Services) | | | 2,200 | |
| | | 79,012 | | MultiChoice Group Ltd. (Media) | | | 563 | |
| | | 23,161 | | Naspers Ltd. (Media) | | | 3,373 | |
| | | 6,453 | | Nedbank Group Ltd. (Banks)(b) | | | 82 | |
| | | 144,156 | | Old Mutual Ltd. (Insurance) | | | 98 | |
| | | 15,002 | | Remgro Ltd. (Diversified Financial Services) | | | 120 | |
| | | 34,236 | | Sanlam Ltd. (Insurance)(b) | | | 111 | |
| | | 54,300 | | Sasol Ltd. (Chemicals)(a) | | | 1,241 | |
| | | 9,822 | | Shoprite Holdings Ltd. (Food & Staples Retailing) | | | 120 | |
| | | 455,387 | | Sibanye Stillwater Ltd. (Metals & Mining) | | | 1,139 | |
| | | 198,044 | | Standard Bank Group Ltd. (Banks) | | | 1,890 | |
| | | 22,743 | | Woolworths Holdings Ltd. (Multiline Retail)(b) | | | 76 | |
| | | | | | | | 20,837 | |
| | | | | South Korea — 9.04% |
| | | 4,208 | | AmorePacific Corp. (Personal Products) | | | 421 | |
| | | 7,301 | | Celltrion Healthcare Co. Ltd. (Health Care Providers & Services)(b) | | | 386 | |
| | | 12,579 | | Celltrion, Inc. (Biotechnology)(b) | | | 1,730 | |
| | | 2,884 | | CJ Cheiljedang Corp. (Food Products) | | | 842 | |
| | | 10,846 | | DB Insurance Co. Ltd. (Insurance)(b) | | | 512 | |
| | | 10,961 | | E-Mart Co. Ltd. (Food & Staples Retailing) | | | 891 | |
| | | 1,990 | | GS Holdings Corp. (Oil, Gas & Consumable Fuels) | | | 64 | |
| | | 25,499 | | Hana Financial Group, Inc. (Banks) | | | 773 | |
| | | 2,925 | | Hankook Tire & Technology Co. Ltd. (Auto Components) | | | 74 | |
See accompanying notes to financial statements.
154
HC CAPITAL TRUST
The Emerging Markets Portfolio
Portfolio of Investments (continued) — June 30, 2022
| | Shares | | Security Description | | Value
(000) | |
| | | | | Common Stocks (continued) |
| | | | | South Korea (continued) |
| | | 25,998 | | Hanon Systems (Auto Components) | | $ | 201 | |
| | | 8,426 | | HLB, Inc. (Leisure Products)(a) | | | 230 | |
| | | 16,423 | | HMM Co. Ltd. (Marine) | | | 311 | |
| | | 5,698 | | Hotel Shilla Co. Ltd. (Specialty Retail) | | | 313 | |
| | | 23,284 | | Hyundai Engineering & Construction Co. Ltd. (Construction & Engineering) | | | 742 | |
| | | 8,869 | | Hyundai Mobis Co. Ltd. (Auto Components) | | | 1,360 | |
| | | 12,780 | | Hyundai Motor Co. Ltd. (Automobiles) | | | 1,777 | |
| | | 11,325 | | Industrial Bank of Korea (Banks) | | | 84 | |
| | | 17,719 | | Kakao Corp. (Interactive Media & Services) | | | 954 | |
| | | 16,639 | | KakaoBank Corp. (Banks)(a) | | | 388 | |
| | | 61,371 | | Kangwon Land, Inc. (Hotels, Restaurants & Leisure)(a) | | | 1,201 | |
| | | 37,692 | | KB Financial Group, Inc. (Banks)(b) | | | 1,398 | |
| | | 34,438 | | Kia Motors Corp. (Automobiles) | | | 2,051 | |
| | | 77,662 | | Korea Electric Power Corp. (Electric Utilities)(a) | | | 1,349 | |
| | | 9,376 | | Korea Shipbuilding & Offshore Engineering Co. Ltd. (Machinery)(a) | | | 678 | |
| | | 5,017 | | Krafton, Inc. (Entertainment)(a) | | | 846 | |
| | | 35,580 | | KT&G Corp. (Tobacco)(b) | | | 2,253 | |
| | | 7,095 | | Kumho Petrochemical Co. Ltd. (Chemicals) | | | 760 | |
| | | 4,203 | | LG Chem Ltd. (Chemicals) | | | 1,671 | |
| | | 35,797 | | LG Display Co. Ltd. (Electronic Equipment, Instruments & Components) | | | 401 | |
| | | 500 | | LG Energy Solution (Electrical Equipment)(a) | | | 143 | |
| | | 1,179 | | LG H&H Co. Ltd. (Personal Products) | | | 618 | |
| | | 963 | | LG Household & Health Care Ltd. (Personal Products) | | | 242 | |
| | | 2,237 | | LG Innotek Co. Ltd. (Electronic Equipment, Instruments & Components) | | | 590 | |
| | | 65,000 | | Mirae Asset Daewoo Co. Ltd. (Capital Markets) | | | 331 | |
| | | 11,210 | | Naver Corp. (Interactive Media & Services) | | | 2,073 | |
| | | 138,644 | | Pan Ocean Co. Ltd. (Marine) | | | 634 | |
| | | 7,647 | | Pearl Abyss Corp. (Entertainment)(a) | | | 301 | |
| | | 9,435 | | POSCO Chemical Co. Ltd. (Construction Materials) | | | 778 | |
| | | 8,136 | | POSCO Holdings, Inc. (Metals & Mining) | | | 1,445 | |
| | | 2,836 | | Samsung Biologics Co. Ltd. (Life Sciences Tools & Services)(a) | | | 1,726 | |
| �� | | 9,149 | | Samsung Electro-Mechanics Co. Ltd. (Electronic Equipment, Instruments & Components) | | | 920 | |
| | | 396,834 | | Samsung Electronics Co. Ltd. (Technology Hardware, Storage & Peripherals) | | | 17,424 | |
| | | 54,624 | | Samsung Engineering Co. Ltd. (Construction & Engineering)(a)(b) | | | 907 | |
| | Shares | | Security Description | | Value
(000) | |
| | | | | South Korea (continued) |
| | | 7,638 | | Samsung Fire & Marine Insurance Co. Ltd. (Insurance) | | $ | 1,183 | |
| | | 4,007 | | Samsung SDI Co. Ltd. (Electronic Equipment, Instruments & Components) | | | 1,642 | |
| | | 2,942 | | Seegene, Inc. (Biotechnology) | | | 82 | |
| | | 60,008 | | Shinhan Financial Group Co. Ltd. (Banks) | | | 1,713 | |
| | | 728 | | SK Chemicals Co., Ltd. (Chemicals) | | | 52 | |
| | | 45,837 | | SK Hynix, Inc. (Semiconductors & Semiconductor Equipment) | | | 3,213 | |
| | | 433 | | SK IE Technology Co. Ltd. (Chemicals)(a)(b) | | | 33 | |
| | | 8,885 | | SK Innovation Co. Ltd. (Oil, Gas & Consumable Fuels) | | | 1,314 | |
| | | 15,950 | | SK Square Co. Ltd. (Semiconductors & Semiconductor Equipment)(a) | | | 480 | |
| | | 11,214 | | SK Telecom Co. Ltd. (Wireless Telecommunication Services) | | | 449 | |
| | | 7,649 | | SK Telecom Co. Ltd., ADR (Wireless Telecommunication Services) | | | 171 | |
| | | 22,426 | | Woongjin Coway Co. Ltd. (Household Durables) | | | 1,104 | |
| | | 57,981 | | Woori Financial Group, Inc. (Banks) | | | 540 | |
| | | | | | | | 64,769 | |
| | | | | Taiwan — 11.55% |
| | | 55,904 | | Airtac International Group (Machinery)(a) | | | 1,863 | |
| | | 495,672 | | ASE Technology Holding Co. Ltd., Class - H (Semiconductors & Semiconductor Equipment) | | | 1,274 | |
| | | 745,971 | | Asia Cement Corp. (Construction Materials) | | | 1,099 | |
| | | 116,000 | | Asustek Computer, Inc. (Technology Hardware, Storage & Peripherals) | | | 1,211 | |
| | | 110,000 | | Catcher Technology Co. Ltd. (Technology Hardware, Storage & Peripherals) | | | 612 | |
| | | 1,077,000 | | Cheng Shin Rubber Industry Co. Ltd. (Auto Components) | | | 1,282 | |
| | | 4,428,000 | | China Development Financial Holding Corp. (Banks) | | | 2,189 | |
| | | 280,000 | | Chunghwa Telecom Co. Ltd. (Diversified Telecommunication Services) | | | 1,149 | |
| | | 1,248,000 | | Compal Electronics, Inc. (Technology Hardware, Storage & Peripherals) | | | 955 | |
| | | 63,000 | | Eclat Textile Co. Ltd. (Textiles, Apparel & Luxury Goods) | | | 880 | |
| | | 12,000 | | eMemory Technology, Inc. (Semiconductors & Semiconductor Equipment) | | | 418 | |
| | | 235,000 | | Evergreen Marine Corp. Ltd. (Marine) | | | 669 | |
| | | 649,000 | | Far EasTone Telecommunications Co. Ltd. (Wireless Telecommunication Services) | | | 1,825 | |
See accompanying notes to financial statements.
155
HC CAPITAL TRUST
The Emerging Markets Portfolio
Portfolio of Investments (continued) — June 30, 2022
| | Shares | | Security Description | | Value
(000) | |
| | | | | Common Stocks (continued) |
| | | | | Taiwan (continued) |
| | | 712,707 | | Fubon Financial Holding Co. Ltd. (Diversified Financial Services) | | $ | 1,433 | |
| | | 55,000 | | Globalwafers Co. Ltd. (Semiconductors & Semiconductor Equipment) | | | 838 | |
| | | 946,000 | | Hon Hai Precision Industry Co. Ltd. (Electronic Equipment, Instruments & Components) | | | 3,468 | |
| | | 1,090,000 | | Innolux Corp. (Electronic Equipment, Instruments & Components) | | | 444 | |
| | | 1,142,000 | | Inventec Corp. (Technology Hardware, Storage & Peripherals) | | | 966 | |
| | | 15,000 | | Largan Precision Co. Ltd. (Electronic Equipment, Instruments & Components) | | | 870 | |
| | | 720,554 | | Lite-On Technology Corp. (Technology Hardware, Storage & Peripherals) | | | 1,403 | |
| | | 106,962 | | MediaTek, Inc. (Semiconductors & Semiconductor Equipment) | | | 2,342 | |
| | | 2,707,477 | | Mega Financial Holding Co. Ltd. (Banks) | | | 3,215 | |
| | | 28,000 | | Nan Ya Printed Circuit Board Corp. (Electronic Equipment, Instruments & Components) | | | 245 | |
| | | 230,000 | | Nanya Technology Corp. (Semiconductors & Semiconductor Equipment)(b) | | | 382 | |
| | | 78,000 | | Novatek Microelectronics Corp. (Semiconductors & Semiconductor Equipment) | | | 792 | |
| | | 680,000 | | Pegatron Corp. (Technology Hardware, Storage & Peripherals) | | | 1,304 | |
| | | 495,620 | | Pou Chen Corp. (Textiles, Apparel & Luxury Goods) | | | 492 | |
| | | 425,000 | | Quanta Computer, Inc. (Technology Hardware, Storage & Peripherals) | | | 1,141 | |
| | | 575,488 | | Ruentex Development Co. Ltd. (Real Estate Management & Development) | | | 1,421 | |
| | | 825,900 | | Synnex Technology International Corp. (Electronic Equipment, Instruments & Components) | | | 1,478 | |
| | | 1,144,721 | | Taiwan Cement Corp. (Construction Materials) | | | 1,521 | |
| | | 276,000 | | Taiwan Mobile Co. Ltd. (Wireless Telecommunication Services) | | | 1,003 | |
| | | 2,169,000 | | Taiwan Semiconductor Manufacturing Co. Ltd. (Semiconductors & Semiconductor Equipment) | | | 34,725 | |
| | | 438,243 | | The Shanghai Commercial & Savings Bank Ltd. (Banks) | | | 783 | |
| | | 67,000 | | Unimicron Technology Corp. (Electronic Equipment, Instruments & Components) | | | 357 | |
| | Shares | | Security Description | | Value
(000) | |
| | | | | Taiwan (continued) |
| | | 801,000 | | United Microelectronics Corp. (Semiconductors & Semiconductor Equipment) | | $ | 1,055 | |
| | | 81,000 | | Win Semiconductors Corp. (Semiconductors & Semiconductor Equipment) | | | 524 | |
| | | 661,000 | | Winbond Electronics Corp. (Semiconductors & Semiconductor Equipment) | | | 482 | |
| | | 714,400 | | WPG Holdings Ltd. (Electronic Equipment, Instruments & Components) | | | 1,324 | |
| | | 55,000 | | Yageo Corp. (Electronic Equipment, Instruments & Components) | | | 570 | |
| | | 241,000 | | Yang Ming Marine Transport Corp. (Marine) | | | 667 | |
| | | 3,179,480 | | Yuanta Financial Holding Co. Ltd. (Capital Markets) | | | 2,107 | |
| | | | | | | | 82,778 | |
| | | | | Thailand — 1.82% |
| | | 264,700 | | Advanced Info Service Public Co. Ltd., Class - F (Wireless Telecommunication Services) | | | 1,456 | |
| | | 379,300 | | Airports of Thailand PCL (Transportation Infrastructure)(a) | | | 762 | |
| | | 691,100 | | Berli Jucker PCL (Food & Staples Retailing) | | | 635 | |
| | | 728,100 | | BTS Group Holdings PCL (Road & Rail) | | | 176 | |
| | | 171,633 | | Central Retail Corp.-Local (Multiline Retail) | | | 170 | |
| | | 45,500 | | Delta Electronics Thailand PCL - NVDR (Electronic Equipment, Instruments & Components) | | | 429 | |
| | | 174,000 | | Delta Electronics, Inc. (Electronic Equipment, Instruments & Components) | | | 1,296 | |
| | | 688,700 | | Energy Absolute PCL (Independent Power and Renewable Electricity Producers) | | | 1,589 | |
| | | 1,418,800 | | Gulf Energy Development PCL (Independent Power and Renewable Electricity Producers) | | | 1,867 | |
| | | 89,800 | | Indorama Ventures PCL - NVDR (Chemicals) | | | 119 | |
| | | 1,724,700 | | Krung Thai Bank Public Co. Ltd., Registered Shares (Banks) | | | 756 | |
| | | 682,900 | | Minor International PCL (Hotels, Restaurants & Leisure)(a) | | | 657 | |
| | | 93,800 | | Muangthai Capital PCL (Consumer Finance) | | | 113 | |
| | | 429,142 | | PTT Chemical Public Co. Ltd. (Chemicals) | | | 552 | |
| | | 272,575 | | PTT Exploration & Production Public Co. Ltd. (Oil, Gas & Consumable Fuels) | | | 1,230 | |
| | | 361,600 | | SCB X PCL (Banks)(a) | | | 1,064 | |
| | | 98,100 | | Thai Oil Public Co. Ltd. (Oil, Gas & Consumable Fuels) | | | 143 | |
| | | | | | | | 13,014 | |
See accompanying notes to financial statements.
156
HC CAPITAL TRUST
The Emerging Markets Portfolio
Portfolio of Investments (continued) — June 30, 2022
| | Shares | | Security Description | | Value
(000) | |
| | | | | Common Stocks (continued) |
| | | | | Turkey — 0.24% |
| | | 435,775 | | Aselsan Elektronik Sanayi Ve Ticaret AS (Aerospace & Defense) | | $ | 598 | |
| | | 39,242 | | BIM Birlesik Magazalar A/S (Food & Staples Retailing) | | | 190 | |
| | | 266,822 | | Eregli Demir ve Celik Fabrikalari TAS (Metals & Mining) | | | 434 | |
| | | 1 | | Kardemir Karabuk Demir Celik Sanayi ve Ticaret A/S, Class - D (Metals & Mining) | | | — | |
| | | 482,245 | | Turkcell Iletisim Hizmetleri A/S (Wireless Telecommunication Services) | | | 468 | |
| | | | | | | | 1,690 | |
| | | | | United Arab Emirates — 0.68% |
| | | 421,761 | | Abu Dhabi Commercial Bank PJSC (Banks) | | | 1,017 | |
| | | 775,182 | | Dubai Islamic Bank PJSC (Banks) | | | 1,216 | |
| | | 517,479 | | First Abu Dhabi Bank PJSC (Banks) | | | 2,646 | |
| | | | | | | | 4,879 | |
| | | | | United States — 0.68% |
| | | 21,795 | | Southern Copper Corp. (Metals & Mining) | | | 1,086 | |
| | | 78,444 | | Yum China Holdings, Inc. (Hotels, Restaurants & Leisure) | | | 3,804 | |
| | | | | | | | 4,890 | |
| | | | | Total Common Stocks | | | 591,979 | |
| | | | | Preferred Stocks — 1.25% |
| | | | | Brazil — 0.62% |
| | | 675,688 | | Banco Bradesco SA — Preferred (Banks)(b) | | | 2,222 | |
| | | 444,892 | | Cia Energetica de Minas Gerais — Preferred (Electric Utilities) | | | 882 | |
| | | 24,400 | | Gerdau SA — Preferred (Metals & Mining) | | | 104 | |
| | | 227,800 | | Petroleo Brasileiro SA — Preferred (Oil, Gas & Consumable Fuels) | | | 1,216 | |
| | | | | | | | 4,424 | |
| | Shares | | Security Description | | Value
(000) | |
| | | | | Chile — 0.10% |
| | | 8,573 | | Sociedad Quimica y Minera de Chile SA — Preferred, B Shares (Chemicals) | | $ | 715 | |
| | | | | South Korea — 0.53% |
| | | 11,127 | | Hyundai Motor Co. — Preferred (Automobiles) | | | 751 | |
| | | 6,687 | | Hyundai Motor Co. — Preferred (Automobiles) | | | 448 | |
| | | 1,665 | | LG Chem Ltd. — Preferred (Chemicals) | | | 308 | |
| | | 57,211 | | Samsung Electronics Co. Ltd. — Preferred (Technology Hardware, Storage & Peripherals) | | | 2,292 | |
| | | | | | | | 3,799 | |
| | | | | Total Preferred Stocks | | | 8,938 | |
| | | | | Investment Companies — 5.57% |
| | | 98,865 | | Federated Hermes Treasury Obligations Fund, Institutional Shares, 1.37%^^(d) | | | 99 | |
| | | 39,809,110 | | State Street Institutional Treasury Plus Money Market Fund, Trust Class, 1.40%(d) | | | 39,809 | |
| | | | | Total Investment Companies | | | 39,908 | |
| | | | | Purchased Options on Futures — 0.08% |
| | | | | Total Purchased Options on Futures | | | 595 | |
| | | | | Total Investments (cost $619,213) — 89.53% | | | 641,420 | |
| | | | | Other assets in excess of liabilities — 10.47% | | | 74,979 | |
| | | | | Net Assets — 100.00% | | $ | 716,399 | |
Amounts designated as “-” are $0 or have been rounded to $0.
^ | All or part of this security was on loan as of June 30, 2022. |
^^ | Purchased with cash collateral held from securities lending. The value of the collateral could include collateral held for securities that were sold on or before June 30, 2022. |
(a) | Represents non-income producing security. |
(b) | Represents a security purchased under Rule 144A or Section 4(2) and is exempt from registration under the Securities Act of 1933, as amended, or is otherwise restricted to resale. Certain of these securities may be resold in transactions exempt from registration, normally to qualified institutional buyers. These securities have been deemed liquid by the Specialist Manager. |
(c) | Security was valued using significant unobservable inputs as of June 30, 2022. |
(d) | Annualized 7-day yield as of period-end. |
| ADR—American Depositary Receipt |
| GDR—Global Depositary Receipt |
| NVDR—Non-Voting Depository Receipt |
See accompanying notes to financial statements.
157
HC CAPITAL TRUST
The Emerging Markets Portfolio
Portfolio of Investments (continued) — June 30, 2022
The following table reflects the percentage of total net assets of the Portfolio attributable to each Specialist Manager as of June 30, 2022.
| The Emerging Markets Portfolio | | Mellon
Investments
Corporation | | | Parametric
Portfolio
Associates,
LLC | | | XY
Investments
(HK) Limited | | | Total | |
| Common Stocks | | | 82.63 | % | | | — | | | | — | | | | 82.63 | % |
| Preferred Stocks | | | 1.25 | % | | | — | | | | — | | | | 1.25 | % |
| Investment Companies | | | 1.12 | % | | | 4.45 | % | | | — | | | | 5.57 | % |
| Purchased Options on Futures | | | — | | | | 0.08 | % | | | — | | | | 0.08 | % |
| Other Assets (Liabilities) | | | 0.43 | % | | | 1.40 | % | | | 8.64 | % | | | 10.47 | % |
| Total Net Assets | | | 85.43 | % | | | 5.93 | % | | | 8.64 | % | | | 100.00 | % |
Amounts designated as “—” indicate the Specialist Manager did not manage any holdings in that category.
The following tables reflect the open derivative positions held by the Portfolio as of June 30, 2022.
Futures Contracts Purchased*
Description | | Number of
Contracts | | | Expiration
Date | | | Notional
Amount
(000) | | | Value and
Unrealized
Appreciation/
(Depreciation)
(000) | |
MSCI Emerging Markets Index Future | | | 1,080 | | | | 9/16/22 | | | $ | 54,146 | | | $ | (458 | ) |
| | | | | | | | | | | $ | 54,146 | | | $ | (458 | ) |
Futures Contracts Sold*
Description | | Number of
Contracts | | | Expiration
Date | | | Notional
Amount
(000) | | | Value and
Unrealized
Appreciation/
(Depreciation)
(000) | |
E-Mini S&P 500 Future | | | 14 | | | | 9/16/22 | | | $ | 2,653 | | | $ | 463 | |
| | | | | | | | | | | $ | 2,653 | | | $ | 463 | |
| | Total Unrealized Appreciation | | $ | 463 | |
| | Total Unrealized Depreciation | | | (458 | ) |
| | Total Net Unrealized Appreciation/(Depreciation) | | $ | 5 | |
* | Cash has been pledged as collateral for futures contracts held by the Portfolio. |
See accompanying notes to financial statements.
158
HC CAPITAL TRUST
The Emerging Markets Portfolio
Portfolio of Investments (continued) — June 30, 2022
Options on Futures Contracts
Exchange-traded options on futures contacts written as of June 30, 2022 were as follows:
Description | | Put/Call | | | Number of
Contracts | | | Notional
Amount
(000) | | | Exercise
Price | | | Expiration
Date | | | Value
(000) | |
E-Mini S&P 500 Future Option | | | Put | | | | 4 | | | $ | 784 | | | $ | 3,920.00 | | | | 7/15/22 | | | $ | (31 | ) |
E-Mini S&P 500 Future Option | | | Put | | | | 8 | | | | 1,564 | | | | 3,910.00 | | | | 7/15/22 | | | | (60 | ) |
E-Mini S&P 500 Future Option | | | Put | | | | 8 | | | | 1,556 | | | | 3,890.00 | | | | 7/15/22 | | | | (54 | ) |
E-Mini S&P 500 Future Option | | | Put | | | | 8 | | | | 1,540 | | | | 3,850.00 | | | | 7/15/22 | | | | (44 | ) |
E-Mini S&P 500 Future Option | | | Put | | | | 4 | | | | 772 | | | | 3,860.00 | | | | 7/29/22 | | | | (29 | ) |
E-Mini S&P 500 Future Option | | | Put | | | | 8 | | | | 1,540 | | | | 3,850.00 | | | | 7/29/22 | | | | (57 | ) |
E-Mini S&P 500 Future Option | | | Put | | | | 8 | | | | 1,536 | | | | 3,840.00 | | | | 7/29/22 | | | | (54 | ) |
E-Mini S&P 500 Future Option | | | Put | | | | 4 | | | | 640 | | | | 3,200.00 | | | | 8/19/22 | | | | (4 | ) |
E-Mini S&P 500 Future Option | | | Put | | | | 8 | | | | 1,420 | | | | 3,550.00 | | | | 8/19/22 | | | | (27 | ) |
E-Mini S&P 500 Future Option | | | Put | | | | 2 | | | | 385 | | | | 3,850.00 | | | | 8/19/22 | | | | (17 | ) |
E-Mini S&P 500 Future Option | | | Put | | | | 9 | | | | 1,710 | | | | 3,800.00 | | | | 8/19/22 | | | | (66 | ) |
E-Mini S&P 500 Future Option | | | Put | | | | 8 | | | | 1,400 | | | | 3,500.00 | | | | 8/19/22 | | | | (22 | ) |
E-Mini S&P 500 Future Option | | | Put | | | | 8 | | | | 1,388 | | | | 3,470.00 | | | | 8/19/22 | | | | (20 | ) |
E-Mini S&P 500 Future Option | | | Put | | | | 4 | | | | 670 | | | | 3,350.00 | | | | 8/19/22 | | | | (7 | ) |
E-Mini S&P 500 Future Option | | | Put | | | | 8 | | | | 1,544 | | | | 3,860.00 | | | | 8/19/22 | | | | (70 | ) |
E-Mini S&P 500 Future Option | | | Put | | | | 8 | | | | 1,392 | | | | 3,480.00 | | | | 8/31/22 | | | | (26 | ) |
E-Mini S&P 500 Future Option | | | Put | | | | 8 | | | | 1,440 | | | | 3,600.00 | | | | 8/31/22 | | | | (38 | ) |
E-Mini S&P 500 Future Option | | | Put | | | | 8 | | | | 1,400 | | | | 3,500.00 | | | | 8/31/22 | | | | (28 | ) |
E-Mini S&P 500 Future Option | | | Put | | | | 8 | | | | 1,340 | | | | 3,350.00 | | | | 8/31/22 | | | | (17 | ) |
E-Mini S&P 500 Future Option | | | Put | | | | 8 | | | | 1,360 | | | | 3,400.00 | | | | 8/31/22 | | | | (20 | ) |
E-Mini S&P 500 Future Option | | | Put | | | | 16 | | | | 2,728 | | | | 3,410.00 | | | | 8/31/22 | | | | (42 | ) |
E-Mini S&P 500 Future Option | | | Put | | | | 8 | | | | 1,396 | | | | 3,490.00 | | | | 8/31/22 | | | | (27 | ) |
| | | | | | | | | | | | | | | | | | | | | | | $ | (760 | ) |
Exchanged-traded options on futures contacts purchased as of June 30, 2022 were as follows:
Description | | Put/Call | | | Number of
Contracts | | | Notional
Amount
(000) | | | Exercise
Price | | | Expiration
Date | | | Value
(000) | |
E-Mini S&P 500 Future Option | | | Call | | | | 3 | | | $ | 585 | | | $ | 3,900.00 | | | | 7/8/22 | | | $ | 2 | |
E-Mini S&P 500 Future Option | | | Call | | | | 3 | | | | 581 | | | | 3,875.00 | | | | 7/8/22 | | | | 3 | |
E-Mini S&P 500 Future Option | | | Call | | | | 3 | | | | 593 | | | | 3,950.00 | | | | 7/15/22 | | | | 3 | |
E-Mini S&P 500 Future Option | | | Put | | | | 3 | | | | 559 | | | | 3,725.00 | | | | 7/8/22 | | | | 5 | |
E-Mini S&P 500 Future Option | | | Put | | | | 3 | | | | 555 | | | | 3,700.00 | | | | 7/8/22 | | | | 4 | |
E-Mini S&P 500 Future Option | | | Put | | | | 4 | | | | 740 | | | | 3,700.00 | | | | 7/15/22 | | | | 10 | |
E-Mini S&P 500 Future Option | | | Put | | | | 5 | | | | 955 | | | | 3,820.00 | | | | 7/15/22 | | | | 24 | |
E-Mini S&P 500 Future Option | | | Put | | | | 8 | | | | 1,440 | | | | 3,600.00 | | | | 7/15/22 | | | | 10 | |
E-Mini S&P 500 Future Option | | | Put | | | | 15 | | | | 2,681 | | | | 3,575.00 | | | | 7/15/22 | | | | 16 | |
E-Mini S&P 500 Future Option | | | Put | | | | 4 | | | | 840 | | | | 4,200.00 | | | | 7/15/22 | | | | 81 | |
E-Mini S&P 500 Future Option | | | Put | | | | 4 | | | | 810 | | | | 4,050.00 | | | | 7/15/22 | | | | 53 | |
E-Mini S&P 500 Future Option | | | Put | | | | 4 | | | | 820 | | | | 4,100.00 | | | | 7/15/22 | | | | 63 | |
E-Mini S&P 500 Future Option | | | Put | | | | 6 | | | | 1,065 | | | | 3,550.00 | | | | 7/29/22 | | | | 12 | |
E-Mini S&P 500 Future Option | | | Put | | | | 4 | | | | 810 | | | | 4,050.00 | | | | 7/29/22 | | | | 56 | |
E-Mini S&P 500 Future Option | | | Put | | | | 4 | | | | 820 | | | | 4,100.00 | | | | 7/29/22 | | | | 64 | |
E-Mini S&P 500 Future Option | | | Put | | | | 16 | | | | 2,864 | | | | 3,580.00 | | | | 7/29/22 | | | | 37 | |
E-Mini S&P 500 Future Option | | | Put | | | | 8 | | | | 1,424 | | | | 3,560.00 | | | | 7/29/22 | | | | 17 | |
E-Mini S&P 500 Future Option | | | Put | | | | 4 | | | | 830 | | | | 4,150.00 | | | | 8/19/22 | | | | 76 | |
E-Mini S&P 500 Future Option | | | Put | | | | 4 | | | | 740 | | | | 3,700.00 | | | | 8/19/22 | | | | 22 | |
E-Mini S&P 500 Future Option | | | Put | | | | 4 | | | | 770 | | | | 3,850.00 | | | | 8/31/22 | | | | 37 | |
| | | | | | | | | | | | | | | | | | | | | | | $ | 595 | |
See accompanying notes to financial statements.
159
HC CAPITAL TRUST
The Emerging Markets Portfolio
Portfolio of Investments (continued) — June 30, 2022
Total Return Swap Agreements |
Pay/
Receive(a) | | Financing
Rate | | Description | | Counterparty | | | Expiration
Date | | | Payment
Frequency | | | Notional
Amount
(000) | | | Value
(000) | | | Upfront
Premiums
Paid/
(Received)
(000) | | | Unrealized
Appreciation/
(Depreciation)
(000) | |
Receive | | | 0.22% | | 37 Interactive Entertainment Network Technology Group Co. Ltd. A-shares | | | Morgan Stanley | | | | 2/5/24 | | | | At Maturity | | | $ | 165 | | | $ | (5 | ) | | $ | — | | | $ | (5 | ) |
Receive | | | 0.22% | | ADAMA Ltd. A-shares | | | Morgan Stanley | | | | 2/5/24 | | | | At Maturity | | | | 86 | | | | 13 | | | | — | | | | 13 | |
Receive | | | 0.22% | | Advanced Micro-Fabrication Equipment, Inc. A-shares | | | Morgan Stanley | | | | 2/5/24 | | | | At Maturity | | | | 24 | | | | — | | | | — | | | | — | |
Receive | | | 0.22% | | AECC Aero-Engine Control Co. Ltd. A-shares | | | Morgan Stanley | | | | 2/5/24 | | | | At Maturity | | | | 85 | | | | 5 | | | | — | | | | 5 | |
Receive | | | 0.22% | | Agricultural Bank of China Ltd. A-shares | | | Morgan Stanley | | | | 2/5/24 | | | | At Maturity | | | | 101 | | | | 1 | | | | — | | | | 1 | |
Receive | | | 0.22% | | Aier Eye Hospital Group Co. Ltd. A-shares | | | Morgan Stanley | | | | 2/5/24 | | | | At Maturity | | | | 25 | | | | 8 | | | | — | | | | 8 | |
Receive | | | 0.22% | | AIMA Technology Group Co. Ltd. A-shares | | | Morgan Stanley | | | | 2/5/24 | | | | At Maturity | | | | 90 | | | | 15 | | | | — | | | | 15 | |
Receive | | | 0.22% | | Air China Ltd. A-shares | | | Morgan Stanley | | | | 2/5/24 | | | | At Maturity | | | | 22 | | | | 4 | | | | — | | | | 4 | |
Receive | | | 0.22% | | Amlogic Shanghai Co. Ltd. A-shares | | | Morgan Stanley | | | | 2/5/24 | | | | At Maturity | | | | 300 | | | | (7 | ) | | | — | | | | (7 | ) |
Receive | | | 0.22% | | An Hui Wenergy Co. Ltd. A-shares | | | Morgan Stanley | | | | 2/5/24 | | | | At Maturity | | | | 25 | | | | — | | | | — | | | | — | |
Receive | | | 0.22% | | Angel Yeast Co. Ltd. A-shares | | | Morgan Stanley | | | | 2/5/24 | | | | At Maturity | | | | 5 | | | | 1 | | | | — | | | | 1 | |
Receive | | | 0.22% | | Anhui Guangxin Agrochemical Co. Ltd. A-shares | | | Morgan Stanley | | | | 2/5/24 | | | | At Maturity | | | | 220 | | | | — | | | | — | | | | — | |
Receive | | | 0.22% | | Anhui Gujing Distillery Co. Ltd. A-shares | | | Morgan Stanley | | | | 2/5/24 | | | | At Maturity | | | | 4 | | | | — | | | | — | | | | — | |
Receive | | | 0.22% | | Anhui Huilong Agricultural Means of Production Co. Ltd. A-shares | | | Morgan Stanley | | | | 2/5/24 | | | | At Maturity | | | | 311 | | | | 26 | | | | — | | | | 26 | |
Receive | | | 0.22% | | Anhui Jinhe Industrial Co. Ltd. A-shares | | | Morgan Stanley | | | | 2/5/24 | | | | At Maturity | | | | 61 | | | | 8 | | | | — | | | | 8 | |
Receive | | | 0.22% | | Anhui Transport Consulting & Design Institute Co. Ltd. A-shares | | | Morgan Stanley | | | | 2/5/24 | | | | At Maturity | | | | 8 | | | | 1 | | | | — | | | | 1 | |
Receive | | | 0.22% | | Anhui Yingjia Distillery Co. Ltd. A-shares | | | Morgan Stanley | | | | 2/5/24 | | | | At Maturity | | | | 119 | | | | 8 | | | | — | | | | 8 | |
Receive | | | 0.22% | | Anhui Zhongding Sealing Parts Co. Ltd. A-shares | | | Morgan Stanley | | | | 2/5/24 | | | | At Maturity | | | | 3 | | | | 1 | | | | — | | | | 1 | |
Receive | | | 0.22% | | Anji Microelectronics Technology Shanghai Co. Ltd. A-shares | | | Morgan Stanley | | | | 2/5/24 | | | | At Maturity | | | | 10 | | | | — | | | | — | | | | — | |
Receive | | | 0.22% | | Anker Innovations Technology Co. Ltd. A-shares | | | Morgan Stanley | | | | 2/5/24 | | | | At Maturity | | | | 3 | | | | — | | | | — | | | | — | |
Receive | | | 0.22% | | Aoshikang Technology Co. Ltd. A-shares | | | Morgan Stanley | | | | 2/5/24 | | | | At Maturity | | | | 172 | | | | 7 | | | | — | | | | 7 | |
Receive | | | 0.22% | | Asia - Potash International Investment Guangzhou Co. Ltd. A-shares | | | Morgan Stanley | | | | 2/5/24 | | | | At Maturity | | | | 4 | | | | — | | | | — | | | | — | |
Receive | | | 0.22% | | Asymchem Laboratories Tianjin Co. Ltd. A-shares | | | Morgan Stanley | | | | 2/5/24 | | | | At Maturity | | | | 20 | | | | 1 | | | | — | | | | 1 | |
See accompanying notes to financial statements.
160
HC CAPITAL TRUST
The Emerging Markets Portfolio
Portfolio of Investments (continued) — June 30, 2022
Total Return Swap Agreements |
Pay/
Receive(a) | | Financing
Rate | | Description | | Counterparty | | | Expiration
Date | | | Payment
Frequency | | | Notional
Amount
(000) | | | Value
(000) | | | Upfront
Premiums
Paid/
(Received)
(000) | | | Unrealized
Appreciation/
(Depreciation)
(000) | |
Receive | | | 0.22% | | Avary Holding Shenzhen Co. Ltd. A-shares | | | Morgan Stanley | | | | 2/5/24 | | | | At Maturity | | | $ | 32 | | | $ | 3 | | | $ | — | | | $ | 3 | |
Receive | | | 0.22% | | AVIC Electromechanical Systems Co. Ltd. A-shares | | | Morgan Stanley | | | | 2/5/24 | | | | At Maturity | | | | 6 | | | | — | | | | — | | | | — | |
Receive | | | 0.22% | | Bafang Electric Suzhou Co. Ltd. A-shares | | | Morgan Stanley | | | | 2/5/24 | | | | At Maturity | | | | 159 | | | | — | | | | — | | | | — | |
Receive | | | 0.22% | | Bank of Changsha Co. Ltd. A-shares | | | Morgan Stanley | | | | 2/5/24 | | | | At Maturity | | | | 16 | | | | — | | | | — | | | | — | |
Receive | | | 0.22% | | Bank of Chengdu Co. Ltd. A-shares | | | Morgan Stanley | | | | 2/5/24 | | | | At Maturity | | | | 380 | | | | 13 | | | | — | | | | 13 | |
Receive | | | 0.22% | | Bank of Chongqing Co. Ltd. A-shares | | | Morgan Stanley | | | | 2/5/24 | | | | At Maturity | | | | 9 | | | | — | | | | — | | | | — | |
Receive | | | 0.22% | | Bank of Hangzhou Co. Ltd. A-shares | | | Morgan Stanley | | | | 2/5/24 | | | | At Maturity | | | | 423 | | | | 17 | | | | — | | | | 17 | |
Receive | | | 0.22% | | Bank of Jiangsu Co. Ltd. A-shares | | | Morgan Stanley | | | | 2/5/24 | | | | At Maturity | | | | 1,115 | | | | 31 | | | | — | | | | 31 | |
Receive | | | 0.22% | | Bank of Nanjing Co. Ltd. A-shares | | | Morgan Stanley | | | | 2/5/24 | | | | At Maturity | | | | 198 | | | | (9 | ) | | | — | | | | (9 | ) |
Receive | | | 0.22% | | Bank of Ningbo Co. Ltd. A-shares | | | Morgan Stanley | | | | 2/5/24 | | | | At Maturity | | | | 117 | | | | 7 | | | | — | | | | 7 | |
Receive | | | 0.22% | | Bank of Zhengzhou Co. Ltd. A-shares | | | Morgan Stanley | | | | 2/5/24 | | | | At Maturity | | | | 3 | | | | — | | | | — | | | | — | |
Receive | | | 0.22% | | Bear Electric Appliance Co. Ltd. A-shares | | | Morgan Stanley | | | | 2/5/24 | | | | At Maturity | | | | 3 | | | | 1 | | | | — | | | | 1 | |
Receive | | | 0.22% | | Beijing Bei Mo Gao Ke Friction Material Co. Ltd. A-shares | | | Morgan Stanley | | | | 2/5/24 | | | | At Maturity | | | | 118 | | | | 2 | | | | — | | | | 2 | |
Receive | | | 0.22% | | Beijing Compass Technology Development Co. Ltd. A-shares | | | Morgan Stanley | | | | 2/5/24 | | | | At Maturity | | | | 161 | | | | 60 | | | | — | | | | 60 | |
Receive | | | 0.22% | | Beijing Easpring Material Technology Co. Ltd. A-shares | | | Morgan Stanley | | | | 2/5/24 | | | | At Maturity | | | | 130 | | | | 35 | | | | — | | | | 35 | |
Receive | | | 0.22% | | Beijing Huafeng Test & Control Technology Co. Ltd. A-shares | | | Morgan Stanley | | | | 2/5/24 | | | | At Maturity | | | | 32 | | | | — | | | | — | | | | — | |
Receive | | | 0.22% | | Beijing Kingsoft Office Software, Inc. A-shares | | | Morgan Stanley | | | | 2/5/24 | | | | At Maturity | | | | 36 | | | | — | | | | — | | | | — | |
Receive | | | 0.22% | | Beijing New Building Materials PLC A-shares | | | Morgan Stanley | | | | 2/5/24 | | | | At Maturity | | | | 10 | | | | 2 | | | | — | | | | 2 | |
Receive | | | 0.22% | | Beijing Shunxin Agriculture Co. Ltd. A-shares | | | Morgan Stanley | | | | 2/5/24 | | | | At Maturity | | | | 3 | | | | — | | | | — | | | | — | |
Receive | | | 0.22% | | Beijing Tongrentang Co. Ltd. A-shares | | | Morgan Stanley | | | | 2/5/24 | | | | At Maturity | | | | 6 | | | | — | | | | — | | | | — | |
Receive | | | 0.22% | | Beijing United Information Technology Co. Ltd. A-shares | | | Morgan Stanley | | | | 2/5/24 | | | | At Maturity | | | | 253 | | | | 19 | | | | — | | | | 19 | |
Receive | | | 0.22% | | Beijing Wantai Biological Pharmacy Enterprise Co. Ltd. A-shares | | | Morgan Stanley | | | | 2/5/24 | | | | At Maturity | | | | 355 | | | | (18 | ) | | | — | | | | (18 | ) |
Receive | | | 0.22% | | Beijing Yuanliu Hongyuan Electronic Technology Co. Ltd. A-shares | | | Morgan Stanley | | | | 2/5/24 | | | | At Maturity | | | | 113 | | | | 5 | | | | — | | | | 5 | |
See accompanying notes to financial statements.
161
HC CAPITAL TRUST
The Emerging Markets Portfolio
Portfolio of Investments (continued) — June 30, 2022
Total Return Swap Agreements |
Pay/
Receive(a) | | Financing
Rate | | Description | | Counterparty | | | Expiration
Date | | | Payment
Frequency | | | Notional
Amount
(000) | | | Value
(000) | | | Upfront
Premiums
Paid/
(Received)
(000) | | | Unrealized
Appreciation/
(Depreciation)
(000) | |
Receive | | | 0.22% | | Beijing Zhong Ke San Huan High-Tech Co. Ltd. A-shares | | | Morgan Stanley | | | | 2/5/24 | | | | At Maturity | | | $ | 47 | | | $ | 23 | | | $ | — | | | $ | 23 | |
Receive | | | 0.22% | | Bethel Automotive Safety Systems Co. Ltd. A-shares | | | Morgan Stanley | | | | 2/5/24 | | | | At Maturity | | | | 16 | | | | — | | | | — | | | | — | |
Receive | | | 0.22% | | Beyondsoft Corp. A-shares | | | Morgan Stanley | | | | 2/5/24 | | | | At Maturity | | | | 291 | | | | 3 | | | | — | | | | 3 | |
Receive | | | 0.22% | | Biem.L.Fdlkk Garment Co. Ltd. A-shares | | | Morgan Stanley | | | | 2/5/24 | | | | At Maturity | | | | 86 | | | | 2 | | | | — | | | | 2 | |
Receive | | | 0.22% | | Bloomage Biotechnology Corp. Ltd. A-shares | | | Morgan Stanley | | | | 2/5/24 | | | | At Maturity | | | | 19 | | | | (1 | ) | | | — | | | | (1 | ) |
Receive | | | 0.22% | | BOC International China Co. Ltd. A-shares | | | Morgan Stanley | | | | 2/5/24 | | | | At Maturity | | | | 17 | | | | — | | | | — | | | | — | |
Receive | | | 0.22% | | BTG Hotels Group Co. Ltd. A-shares | | | Morgan Stanley | | | | 2/5/24 | | | | At Maturity | | | | 3 | | | | — | | | | — | | | | — | |
Receive | | | 0.22% | | BYD Co. Ltd. A-shares | | | Morgan Stanley | | | | 2/5/24 | | | | At Maturity | | | | 490 | | | | 112 | | | | — | | | | 112 | |
Receive | | | 0.22% | | By-health Co. Ltd. A-shares | | | Morgan Stanley | | | | 2/5/24 | | | | At Maturity | | | | 64 | | | | 2 | | | | — | | | | 2 | |
Receive | | | 0.22% | | Castech, Inc. A-shares | | | Morgan Stanley | | | | 2/5/24 | | | | At Maturity | | | | 35 | | | | — | | | | — | | | | — | |
Receive | | | 0.22% | | CECEP Solar Energy Co. Ltd. A-shares | | | Morgan Stanley | | | | 2/5/24 | | | | At Maturity | | | | 3 | | | | — | | | | — | | | | — | |
Receive | | | 0.22% | | Cheng De Lolo Co. Ltd. A-shares | | | Morgan Stanley | | | | 2/5/24 | | | | At Maturity | | | | 221 | | | | 19 | | | | — | | | | 19 | |
Receive | | | 0.22% | | Chengdu ALD Aviation Manufacturing Corp. A-shares | | | Morgan Stanley | | | | 2/5/24 | | | | At Maturity | | | | 57 | | | | 1 | | | | — | | | | 1 | |
Receive | | | 0.22% | | Chengdu CORPRO Technology Co. Ltd. A-shares | | | Morgan Stanley | | | | 2/5/24 | | | | At Maturity | | | | 45 | | | | 7 | | | | — | | | | 7 | |
Receive | | | 0.22% | | Chengdu Leejun Industrial Co. Ltd. A-shares | | | Morgan Stanley | | | | 2/5/24 | | | | At Maturity | | | | 2 | | | | — | | | | — | | | | — | |
Receive | | | 0.22% | | Chengdu Wintrue Holding Co. Ltd. A-shares | | | Morgan Stanley | | | | 2/5/24 | | | | At Maturity | | | | 112 | | | | 12 | | | | — | | | | 12 | |
Receive | | | 0.22% | | Chenguang Biotech Group Co. Ltd. A-shares | | | Morgan Stanley | | | | 2/5/24 | | | | At Maturity | | | | 393 | | | | (20 | ) | | | — | | | | (20 | ) |
Receive | | | 0.22% | | Chengxin Lithium Group Co. Ltd. A-shares | | | Morgan Stanley | | | | 2/5/24 | | | | At Maturity | | | | 237 | | | | 50 | | | | — | | | | 50 | |
Receive | | | 0.22% | | Chifeng Jilong Gold Mining Co. Ltd. A-shares | | | Morgan Stanley | | | | 2/5/24 | | | | At Maturity | | | | 7 | | | | — | | | | — | | | | — | |
Receive | | | 0.22% | | China CITIC Bank Corp. Ltd. A-shares | | | Morgan Stanley | | | | 2/5/24 | | | | At Maturity | | | | 97 | | | | 2 | | | | — | | | | 2 | |
Receive | | | 0.22% | | China Coal Energy Co. Ltd. A-shares | | | Morgan Stanley | | | | 2/5/24 | | | | At Maturity | | | | 117 | | | | 15 | | | | — | | | | 15 | |
Receive | | | 0.22% | | China Construction Bank Corp. A-shares | | | Morgan Stanley | | | | 2/5/24 | | | | At Maturity | | | | 145 | | | | 1 | | | | — | | | | 1 | |
Receive | | | 0.22% | | China Design Group Co. Ltd. A-shares | | | Morgan Stanley | | | | 2/5/24 | | | | At Maturity | | | | 20 | | | | 1 | | | | — | | | | 1 | |
See accompanying notes to financial statements.
162
HC CAPITAL TRUST
The Emerging Markets Portfolio
Portfolio of Investments (continued) — June 30, 2022
Total Return Swap Agreements |
Pay/
Receive(a) | | Financing
Rate | | Description | | Counterparty | | | Expiration
Date | | | Payment
Frequency | | | Notional
Amount
(000) | | | Value
(000) | | | Upfront
Premiums
Paid/
(Received)
(000) | | | Unrealized
Appreciation/
(Depreciation)
(000) | |
Receive | | | 0.22% | | China Energy Engineering Corp. Ltd. A-shares | | | Morgan Stanley | | | | 2/5/24 | | | | At Maturity | | | $ | 21 | | | $ | (1 | ) | | $ | — | | | $ | (1 | ) |
Receive | | | 0.22% | | China Galaxy Securities Co. Ltd. A-shares | | | Morgan Stanley | | | | 2/5/24 | | | | At Maturity | | | | 567 | | | | 12 | | | | — | | | | 12 | |
Receive | | | 0.22% | | China International Capital Corp. Ltd. A-shares | | | Morgan Stanley | | | | 2/5/24 | | | | At Maturity | | | | 32 | | | | 1 | | | | — | | | | 1 | |
Receive | | | 0.22% | | China Jushi Co. Ltd. A-shares | | | Morgan Stanley | | | | 2/5/24 | | | | At Maturity | | | | 698 | | | | 59 | | | | — | | | | 59 | |
Receive | | | 0.22% | | China Kings Resources Group Co. Ltd. A-shares | | | Morgan Stanley | | | | 2/5/24 | | | | At Maturity | | | | 16 | | | | 1 | | | | — | | | | 1 | |
Receive | | | 0.22% | | China Merchants Bank Co. Ltd. A-shares | | | Morgan Stanley | | | | 2/5/24 | | | | At Maturity | | | | 540 | | | | (11 | ) | | | — | | | | (11 | ) |
Receive | | | 0.22% | | China Merchants Property Operation & Service Co. Ltd. A-shares | | | Morgan Stanley | | | | 2/5/24 | | | | At Maturity | | | | 2 | | | | — | | | | — | | | | — | |
Receive | | | 0.22% | | China National Chemical Engineering Co. Ltd. A-shares | | | Morgan Stanley | | | | 2/5/24 | | | | At Maturity | | | | 78 | | | | (1 | ) | | | — | | | | (1 | ) |
Receive | | | 0.22% | | China National Nuclear Power Co. Ltd. A-shares | | | Morgan Stanley | | | | 2/5/24 | | | | At Maturity | | | | 19 | | | | — | | | | — | | | | — | |
Receive | | | 0.22% | | China Northern Rare Earth Group High-Tech Co. Ltd. A-shares | | | Morgan Stanley | | | | 2/5/24 | | | | At Maturity | | | | 56 | | | | (1 | ) | | | — | | | | (1 | ) |
Receive | | | 0.22% | | China Oilfield Services Ltd. A-shares | | | Morgan Stanley | | | | 2/5/24 | | | | At Maturity | | | | 29 | | | | (4 | ) | | | — | | | | (4 | ) |
Receive | | | 0.22% | | China Railway Group Ltd. A-shares | | | Morgan Stanley | | | | 2/5/24 | | | | At Maturity | | | | 10 | | | | (1 | ) | | | — | | | | (1 | ) |
Receive | | | 0.22% | | China Resources Boya Bio-pharmaceutical Group Co. Ltd. A-shares | | | Morgan Stanley | | | | 2/5/24 | | | | At Maturity | | | | 3 | | | | — | | | | — | | | | — | |
Receive | | | 0.22% | | China Resources Microelectronics Ltd. A-shares | | | Morgan Stanley | | | | 2/5/24 | | | | At Maturity | | | | 20 | | | | 1 | | | | — | | | | 1 | |
Receive | | | 0.22% | | China Resources Sanjiu Medical & Pharmaceutical Co. Ltd. A-shares | | | Morgan Stanley | | | | 2/5/24 | | | | At Maturity | | | | 7 | | | | — | | | | — | | | | — | |
Receive | | | 0.22% | | China Shenhua Energy Co. Ltd. A-shares | | | Morgan Stanley | | | | 2/5/24 | | | | At Maturity | | | | 225 | | | | 4 | | | | — | | | | 4 | |
Receive | | | 0.22% | | China Southern Airlines Co. Ltd. A-shares | | | Morgan Stanley | | | | 2/5/24 | | | | At Maturity | | | | 6 | | | | 1 | | | | — | | | | 1 | |
Receive | | | 0.22% | | China State Construction Engineering Corp. Ltd. A-shares | | | Morgan Stanley | | | | 2/5/24 | | | | At Maturity | | | | 405 | | | | (8 | ) | | | — | | | | (8 | ) |
Receive | | | 0.22% | | China Suntien Green Energy Corp. Ltd. A-shares | | | Morgan Stanley | | | | 2/5/24 | | | | At Maturity | | | | 5 | | | | — | | | | — | | | | — | |
Receive | | | 0.22% | | China Testing & Certification International Group Co. Ltd. A-shares | | | Morgan Stanley | | | | 2/5/24 | | | | At Maturity | | | | — | | | | — | | | | — | | | | — | |
Receive | | | 0.22% | | China Three Gorges Renewables Group Co. Ltd. A-shares | | | Morgan Stanley | | | | 2/5/24 | | | | At Maturity | | | | 133 | | | | (1 | ) | | | — | | | | (1 | ) |
Receive | | | 0.22% | | China Tourism Group Duty Free Corp. Ltd. A-shares | | | Morgan Stanley | | | | 2/5/24 | | | | At Maturity | | | | 147 | | | | 44 | | | | — | | | | 44 | |
Receive | | | 0.22% | | China Tungsten And Hightech Materials Co. Ltd. A-shares | | | Morgan Stanley | | | | 2/5/24 | | | | At Maturity | | | | 3 | | | | — | | | | — | | | | — | |
See accompanying notes to financial statements.
163
HC CAPITAL TRUST
The Emerging Markets Portfolio
Portfolio of Investments (continued) — June 30, 2022
Total Return Swap Agreements |
Pay/
Receive(a) | | Financing
Rate | | Description | | Counterparty | | | Expiration
Date | | | Payment
Frequency | | | Notional
Amount
(000) | | | Value
(000) | | | Upfront
Premiums
Paid/
(Received)
(000) | | | Unrealized
Appreciation/
(Depreciation)
(000) | |
Receive | | | 0.22% | | China United Network Communications Ltd. A-shares | | | Morgan Stanley | | | | 2/5/24 | | | | At Maturity | | | $ | 1 | | | $ | — | | | $ | — | | | $ | — | |
Receive | | | 0.22% | | China Vanke Co. Ltd. A-shares | | | Morgan Stanley | | | | 2/5/24 | | | | At Maturity | | | | 24 | | | | (1 | ) | | | — | | | | (1 | ) |
Receive | | | 0.22% | | China World Trade Center Co. Ltd. A-shares | | | Morgan Stanley | | | | 2/5/24 | | | | At Maturity | | | | 5 | | | | — | | | | — | | | | — | |
Receive | | | 0.22% | | China Yangtze Power Co. Ltd. A-shares | | | Morgan Stanley | | | | 2/5/24 | | | | At Maturity | | | | 18 | | | | (1 | ) | | | — | | | | (1 | ) |
Receive | | | 0.22% | | China Zhenhua Group Science & Technology Co. Ltd. A-shares | | | Morgan Stanley | | | | 2/5/24 | | | | At Maturity | | | | 452 | | | | 36 | | | | — | | | | 36 | |
Receive | | | 0.22% | | China Zheshang Bank Co. Ltd. A-shares | | | Morgan Stanley | | | | 2/5/24 | | | | At Maturity | | | | 187 | | | | 2 | | | | — | | | | 2 | |
Receive | | | 0.22% | | Chongqing Brewery Co. Ltd. A-shares | | | Morgan Stanley | | | | 2/5/24 | | | | At Maturity | | | | 6 | | | | 1 | | | | — | | | | 1 | |
Receive | | | 0.22% | | Chongqing Changan Automobile Co. Ltd. A-shares | | | Morgan Stanley | | | | 2/5/24 | | | | At Maturity | | | | 111 | | | | 50 | | | | — | | | | 50 | |
Receive | | | 0.22% | | Chongqing Department Store Co. Ltd. A-shares | | | Morgan Stanley | | | | 2/5/24 | | | | At Maturity | | | | 64 | | | | 1 | | | | — | | | | 1 | |
Receive | | | 0.22% | | Chongqing Fuling Zhacai Group Co. Ltd. A-shares | | | Morgan Stanley | | | | 2/5/24 | | | | At Maturity | | | | 23 | | | | (1 | ) | | | — | | | | (1 | ) |
Receive | | | 0.22% | | Chongqing Zaisheng Technology Corp. Ltd. A-shares | | | Morgan Stanley | | | | 2/5/24 | | | | At Maturity | | | | 21 | | | | — | | | | — | | | | — | |
Receive | | | 0.22% | | Chongqing Zongshen Power Machinery Co. Ltd. A-shares | | | Morgan Stanley | | | | 2/5/24 | | | | At Maturity | | | | 127 | | | | 3 | | | | — | | | | 3 | |
Receive | | | 0.22% | | Chow Tai Seng Jewellery Co. Ltd. A-shares | | | Morgan Stanley | | | | 2/5/24 | | | | At Maturity | | | | 3 | | | | — | | | | — | | | | — | |
Receive | | | 0.22% | | Citic Pacific Special Steel Group Co. Ltd. A-shares | | | Morgan Stanley | | | | 2/5/24 | | | | At Maturity | | | | 19 | | | | — | | | | — | | | | — | |
Receive | | | 0.22% | | CITIC Securities Co. Ltd. A-shares | | | Morgan Stanley | | | | 2/5/24 | | | | At Maturity | | | | 558 | | | | 68 | | | | — | | | | 68 | |
Receive | | | 0.22% | | CMOC Group Ltd. A-shares | | | Morgan Stanley | | | | 2/5/24 | | | | At Maturity | | | | 7 | | | | 1 | | | | — | | | | 1 | |
Receive | | | 0.22% | | CNGR Advanced Material Co. Ltd. A-shares | | | Morgan Stanley | | | | 2/5/24 | | | | At Maturity | | | | 21 | | | | — | | | | — | | | | — | |
Receive | | | 0.22% | | CNOOC Energy Technology & Services Ltd. A-shares | | | Morgan Stanley | | | | 2/5/24 | | | | At Maturity | | | | 93 | | | | (4 | ) | | | — | | | | (4 | ) |
Receive | | | 0.22% | | CNPC Capital Co. Ltd. A-shares | | | Morgan Stanley | | | | 2/5/24 | | | | At Maturity | | | | 39 | | | | — | | | | — | | | | — | |
Receive | | | 0.22% | | CNSIG Inner Mongolia Chemical Industry Co. Ltd. A-shares | | | Morgan Stanley | | | | 2/5/24 | | | | At Maturity | | | | 13 | | | | 1 | | | | — | | | | 1 | |
Receive | | | 0.22% | | CoCreation Grass Co. Ltd. A-shares | | | Morgan Stanley | | | | 2/5/24 | | | | At Maturity | | | | 30 | | | | (2 | ) | | | — | | | | (2 | ) |
Receive | | | 0.22% | | Contemporary Amperex Technology Co. Ltd. A-shares | | | Morgan Stanley | | | | 2/5/24 | | | | At Maturity | | | | 817 | | | | 107 | | | | — | | | | 107 | |
Receive | | | 0.22% | | COSCO SHIPPING Energy Transportation Co. Ltd. A-shares | | | Morgan Stanley | | | | 2/5/24 | | | | At Maturity | | | | 5 | | | | — | | | | — | | | | — | |
See accompanying notes to financial statements.
164
HC CAPITAL TRUST
The Emerging Markets Portfolio
Portfolio of Investments (continued) — June 30, 2022
Total Return Swap Agreements |
Pay/
Receive(a) | | Financing
Rate | | Description | | Counterparty | | | Expiration
Date | | | Payment
Frequency | | | Notional
Amount
(000) | | | Value
(000) | | | Upfront
Premiums
Paid/
(Received)
(000) | | | Unrealized
Appreciation/
(Depreciation)
(000) | |
Receive | | | 0.22% | | COSCO SHIPPING Holdings Co. Ltd. A-shares | | | Morgan Stanley | | | | 2/5/24 | | | | At Maturity | | | $ | 242 | | | $ | (20 | ) | | $ | — | | | $ | (20 | ) |
Receive | | | 0.22% | | CTS International Logistics Corp. Ltd. A-shares | | | Morgan Stanley | | | | 2/5/24 | | | | At Maturity | | | | 27 | | | | — | | | | — | | | | — | |
Receive | | | 0.22% | | Daan Gene Co. Ltd. A-shares | | | Morgan Stanley | | | | 2/5/24 | | | | At Maturity | | | | 84 | | | | — | | | | — | | | | — | |
Receive | | | 0.22% | | DBG Technology Co. Ltd. A-shares | | | Morgan Stanley | | | | 2/5/24 | | | | At Maturity | | | | 113 | | | | 6 | | | | — | | | | 6 | |
Receive | | | 0.22% | | DeHua TB New Decoration Materials Co. Ltd. A-shares | | | Morgan Stanley | | | | 2/5/24 | | | | At Maturity | | | | 15 | | | | 1 | | | | — | | | | 1 | |
Receive | | | 0.22% | | Digital China Group Co. Ltd. A-shares | | | Morgan Stanley | | | | 2/5/24 | | | | At Maturity | | | | 21 | | | | — | | | | — | | | | — | |
Receive | | | 0.22% | | Do-Fluoride New Materials Co. Ltd. A-shares | | | Morgan Stanley | | | | 2/5/24 | | | | At Maturity | | | | 29 | | | | 9 | | | | — | | | | 9 | |
Receive | | | 0.22% | | Dongxing Securities Co. Ltd. A-shares | | | Morgan Stanley | | | | 2/5/24 | | | | At Maturity | | | | 304 | | | | 29 | | | | — | | | | 29 | |
Receive | | | 0.22% | | East Money Information Co. Ltd. A-shares | | | Morgan Stanley | | | | 2/5/24 | | | | At Maturity | | | | 357 | | | | 26 | | | | — | | | | 26 | |
Receive | | | 0.22% | | Eastern Air Logistics Co. Ltd. A-shares | | | Morgan Stanley | | | | 2/5/24 | | | | At Maturity | | | | 426 | | | | (40 | ) | | | — | | | | (40 | ) |
Receive | | | 0.22% | | Ecovacs Robotics Co. Ltd. A-shares | | | Morgan Stanley | | | | 2/5/24 | | | | At Maturity | | | | 22 | | | | 2 | | | | — | | | | 2 | |
Receive | | | 0.22% | | ENN Natural Gas Co. Ltd. A-shares | | | Morgan Stanley | | | | 2/5/24 | | | | At Maturity | | | | 131 | | | | (1 | ) | | | — | | | | (1 | ) |
Receive | | | 0.22% | | Eoptolink Technology, Inc. Ltd. A-shares | | | Morgan Stanley | | | | 2/5/24 | | | | At Maturity | | | | 92 | | | | 2 | | | | — | | | | 2 | |
Receive | | | 0.22% | | Era Co. Ltd. A-shares | | | Morgan Stanley | | | | 2/5/24 | | | | At Maturity | | | | 9 | | | | — | | | | — | | | | — | |
Receive | | | 0.22% | | Eve Energy Co. Ltd. A-shares | | | Morgan Stanley | | | | 2/5/24 | | | | At Maturity | | | | 51 | | | | 2 | | | | — | | | | 2 | |
Receive | | | 0.22% | | Fangda Special Steel Technology Co. Ltd. A-shares | | | Morgan Stanley | | | | 2/5/24 | | | | At Maturity | | | | 213 | | | | (21 | ) | | | — | | | | (21 | ) |
Receive | | | 0.22% | | Flat Glass Group Co. Ltd. A-shares | | | Morgan Stanley | | | | 2/5/24 | | | | At Maturity | | | | 6 | | | | (1 | ) | | | — | | | | (1 | ) |
Receive | | | 0.22% | | Focus Media Information Technology Co. Ltd. A-shares | | | Morgan Stanley | | | | 2/5/24 | | | | At Maturity | | | | 7 | | | | — | | | | — | | | | — | |
Receive | | | 0.22% | | Foran Energy Group Co. Ltd. A-shares | | | Morgan Stanley | | | | 2/5/24 | | | | At Maturity | | | | 77 | | | | (1 | ) | | | — | | | | (1 | ) |
Receive | | | 0.22% | | Foshan Haitian Flavouring & Food Co. Ltd. A-shares | | | Morgan Stanley | | | | 2/5/24 | | | | At Maturity | | | | 2 | | | | — | | | | — | | | | — | |
Receive | | | 0.22% | | Fujian Boss Software Development Co. Ltd. A-shares | | | Morgan Stanley | | | | 2/5/24 | | | | At Maturity | | | | 47 | | | | — | | | | — | | | | — | |
Receive | | | 0.22% | | Fujian Star-net Communication Co. Ltd. A-shares | | | Morgan Stanley | | | | 2/5/24 | | | | At Maturity | | | | 77 | | | | 3 | | | | — | | | | 3 | |
Receive | | | 0.22% | | Fujian Sunner Development Co. Ltd. A-shares | | | Morgan Stanley | | | | 2/5/24 | | | | At Maturity | | | | 4 | | | | — | | | | — | | | | — | |
See accompanying notes to financial statements.
165
HC CAPITAL TRUST
The Emerging Markets Portfolio
Portfolio of Investments (continued) — June 30, 2022
Total Return Swap Agreements |
Pay/
Receive(a) | | Financing
Rate | | Description | | Counterparty | | | Expiration
Date | | | Payment
Frequency | | | Notional
Amount
(000) | | | Value
(000) | | | Upfront
Premiums
Paid/
(Received)
(000) | | | Unrealized
Appreciation/
(Depreciation)
(000) | |
Receive | | | 0.22% | | Fuyao Glass Industry Group Co. Ltd. A-shares | | | Morgan Stanley | | | | 2/5/24 | | | | At Maturity | | | $ | 175 | | | $ | 3 | | | $ | — | | | $ | 3 | |
Receive | | | 0.22% | | Gan & Lee Pharmaceuticals Co. Ltd. A-shares | | | Morgan Stanley | | | | 2/5/24 | | | | At Maturity | | | | 14 | | | | 1 | | | | — | | | | 1 | |
Receive | | | 0.22% | | Ganfeng Lithium Co. Ltd. A-shares | | | Morgan Stanley | | | | 2/5/24 | | | | At Maturity | | | | 309 | | | | 110 | | | | — | | | | 110 | |
Receive | | | 0.22% | | G-bits Network Technology Xiamen Co. Ltd. A-shares | | | Morgan Stanley | | | | 2/5/24 | | | | At Maturity | | | | 153 | | | | 10 | | | | — | | | | 10 | |
Receive | | | 0.22% | | GD Power Development Co. Ltd. A-shares | | | Morgan Stanley | | | | 2/5/24 | | | | At Maturity | | | | 11 | | | | 2 | | | | — | | | | 2 | |
Receive | | | 0.22% | | Gemdale Corp. A-shares | | | Morgan Stanley | | | | 2/5/24 | | | | At Maturity | | | | 6 | | | | — | | | | — | | | | — | |
Receive | | | 0.22% | | Geovis Technology Co. Ltd. A-shares | | | Morgan Stanley | | | | 2/5/24 | | | | At Maturity | | | | 2 | | | | — | | | | — | | | | — | |
Receive | | | 0.22% | | Getein Biotech, Inc. A-shares | | | Morgan Stanley | | | | 2/5/24 | | | | At Maturity | | | | 311 | | | | 10 | | | | — | | | | 10 | |
Receive | | | 0.22% | | GF Securities Co. Ltd. A-shares | | | Morgan Stanley | | | | 2/5/24 | | | | At Maturity | | | | 22 | | | | 2 | | | | — | | | | 2 | |
Receive | | | 0.22% | | Gigadevice Semiconductor Beijing, Inc. A-shares | | | Morgan Stanley | | | | 2/5/24 | | | | At Maturity | | | | 164 | | | | 8 | | | | — | | | | 8 | |
Receive | | | 0.22% | | Ginlong Technologies Co. Ltd. A-shares | | | Morgan Stanley | | | | 2/5/24 | | | | At Maturity | | | | 18 | | | | 8 | | | | — | | | | 8 | |
Receive | | | 0.22% | | Glodon Co. Ltd. A-shares | | | Morgan Stanley | | | | 2/5/24 | | | | At Maturity | | | | 30 | | | | — | | | | — | | | | — | |
Receive | | | 0.22% | | GoerTek, Inc. A-shares | | | Morgan Stanley | | | | 2/5/24 | | | | At Maturity | | | | 17 | | | | (2 | ) | | | — | | | | (2 | ) |
Receive | | | 0.22% | | GoldenHome Living Co. Ltd. A-shares | | | Morgan Stanley | | | | 2/5/24 | | | | At Maturity | | | | 30 | | | | 1 | | | | — | | | | 1 | |
Receive | | | 0.22% | | Gotion High-tech Co. Ltd. A-shares | | | Morgan Stanley | | | | 2/5/24 | | | | At Maturity | | | | 24 | | | | 5 | | | | — | | | | 5 | |
Receive | | | 0.22% | | Great Wall Motor Co. Ltd. A-shares | | | Morgan Stanley | | | | 2/5/24 | | | | At Maturity | | | | 32 | | | | 2 | | | | — | | | | 2 | |
Receive | | | 0.22% | | Greattown Holdings Ltd. A-shares | | | Morgan Stanley | | | | 2/5/24 | | | | At Maturity | | | | 11 | | | | — | | | | — | | | | — | |
Receive | | | 0.22% | | Gree Electric Appliances, Inc. A-shares | | | Morgan Stanley | | | | 2/5/24 | | | | At Maturity | | | | 11 | | | | — | | | | — | | | | — | |
Receive | | | 0.22% | | GRG Banking Equipment Co. Ltd. A-shares | | | Morgan Stanley | | | | 2/5/24 | | | | At Maturity | | | | 19 | | | | — | | | | — | | | | — | |
Receive | | | 0.22% | | Grinm Advanced Materials Co. Ltd. A-shares | | | Morgan Stanley | | | | 2/5/24 | | | | At Maturity | | | | 16 | | | | 1 | | | | — | | | | 1 | |
Receive | | | 0.22% | | Guangdong Dongpeng Holdings Co. Ltd. A-shares | | | Morgan Stanley | | | | 2/5/24 | | | | At Maturity | | | | 1 | | | | — | | | | — | | | | — | |
Receive | | | 0.22% | | Guangdong Dowstone Technology Co. Ltd. A-shares | | | Morgan Stanley | | | | 2/5/24 | | | | At Maturity | | | | 93 | | | | (1 | ) | | | — | | | | (1 | ) |
Receive | | | 0.22% | | Guangdong Goworld Co. Ltd. A-shares | | | Morgan Stanley | | | | 2/5/24 | | | | At Maturity | | | | 140 | | | | 3 | | | | — | | | | 3 | |
See accompanying notes to financial statements.
166
HC CAPITAL TRUST
The Emerging Markets Portfolio
Portfolio of Investments (continued) — June 30, 2022
Total Return Swap Agreements |
Pay/
Receive(a) | | Financing
Rate | | Description | | Counterparty | | | Expiration
Date | | | Payment
Frequency | | | Notional
Amount
(000) | | | Value
(000) | | | Upfront
Premiums
Paid/
(Received)
(000) | | | Unrealized
Appreciation/
(Depreciation)
(000) | |
Receive | | | 0.22% | | Guangdong Guanghua Sci-Tech Co. Ltd. A-shares | | | Morgan Stanley | | | | 2/5/24 | | | | At Maturity | | | $ | 53 | | | $ | 7 | | | $ | — | | | $ | 7 | |
Receive | | | 0.22% | | Guangdong Haid Group Co. Ltd. A-shares | | | Morgan Stanley | | | | 2/5/24 | | | | At Maturity | | | | 8 | | | | — | | | | — | | | | — | |
Receive | | | 0.22% | | Guangdong Hybribio Biotech Co. Ltd. A-shares | | | Morgan Stanley | | | | 2/5/24 | | | | At Maturity | | | | 402 | | | | (5 | ) | | | — | | | | (5 | ) |
Receive | | | 0.22% | | Guangdong Sirio Pharma Co. Ltd. A-shares | | | Morgan Stanley | | | | 2/5/24 | | | | At Maturity | | | | 6 | | | | — | | | | — | | | | — | |
Receive | | | 0.22% | | Guangdong South New Media Co. Ltd. A-shares | | | Morgan Stanley | | | | 2/5/24 | | | | At Maturity | | | | 4 | | | | — | | | | — | | | | — | |
Receive | | | 0.22% | | Guanghui Energy Co. Ltd. A-shares | | | Morgan Stanley | | | | 2/5/24 | | | | At Maturity | | | | 395 | | | | 57 | | | | — | | | | 57 | |
Receive | | | 0.22% | | Guanglian Aviation Industry Co. Ltd. A-shares | | | Morgan Stanley | | | | 2/5/24 | | | | At Maturity | | | | 63 | | | | 4 | | | | — | | | | 4 | |
Receive | | | 0.22% | | Guangxi Guiguan Electric Power Co. Ltd. A-shares | | | Morgan Stanley | | | | 2/5/24 | | | | At Maturity | | | | 85 | | | | — | | | | — | | | | — | |
Receive | | | 0.22% | | Guangzhou Automobile Group Co. Ltd. A-shares | | | Morgan Stanley | | | | 2/5/24 | | | | At Maturity | | | | 6 | | | | 1 | | | | — | | | | 1 | |
Receive | | | 0.22% | | Guangzhou Baiyunshan Pharmaceutical Holdings Co. Ltd. A-shares | | | Morgan Stanley | | | | 2/5/24 | | | | At Maturity | | | | 50 | | | | 2 | | | | — | | | | 2 | |
Receive | | | 0.22% | | Guangzhou GRG Metrology & Test Co. Ltd. A-shares | | | Morgan Stanley | | | | 2/5/24 | | | | At Maturity | | | | 8 | | | | 1 | | | | — | | | | 1 | |
Receive | | | 0.22% | | Guangzhou KDT Machinery Co. Ltd. A-shares | | | Morgan Stanley | | | | 2/5/24 | | | | At Maturity | | | | 2 | | | | — | | | | — | | | | — | |
Receive | | | 0.22% | | Guangzhou Kingmed Diagnostics Group Co. Ltd. A-shares | | | Morgan Stanley | | | | 2/5/24 | | | | At Maturity | | | | 249 | | | | 15 | | | | — | | | | 15 | |
Receive | | | 0.22% | | Guangzhou Shangpin Home Collection Co. Ltd. A-shares | | | Morgan Stanley | | | | 2/5/24 | | | | At Maturity | | | | 7 | | | | 1 | | | | — | | | | 1 | |
Receive | | | 0.22% | | Guangzhou Shiyuan Electronic Technology Co. Ltd. A-shares | | | Morgan Stanley | | | | 2/5/24 | | | | At Maturity | | | | 87 | | | | 7 | | | | — | | | | 7 | |
Receive | | | 0.22% | | Guangzhou Tinci Materials Technology Co. Ltd. A-shares | | | Morgan Stanley | | | | 2/5/24 | | | | At Maturity | | | | 148 | | | | 87 | | | | — | | | | 87 | |
Receive | | | 0.22% | | Guangzhou Wondfo Biotech Co. Ltd. A-shares | | | Morgan Stanley | | | | 2/5/24 | | | | At Maturity | | | | 211 | | | | (2 | ) | | | — | | | | (2 | ) |
Receive | | | 0.22% | | Guizhou Chanhen Chemical Corp. A-shares | | | Morgan Stanley | | | | 2/5/24 | | | | At Maturity | | | | 72 | | | | 33 | | | | — | | | | 33 | |
Receive | | | 0.22% | | Guotai Junan Securities Co. Ltd. A-shares | | | Morgan Stanley | | | | 2/5/24 | | | | At Maturity | | | | 125 | | | | (1 | ) | | | — | | | | (1 | ) |
Receive | | | 0.22% | | Haier Smart Home Co. Ltd. A-shares | | | Morgan Stanley | | | | 2/5/24 | | | | At Maturity | | | | 75 | | | | 6 | | | | — | | | | 6 | |
Receive | | | 0.22% | | Hainan Development Holdings Nanhai Co. Ltd. A-shares | | | Morgan Stanley | | | | 2/5/24 | | | | At Maturity | | | | 2 | | | | — | | | | — | | | | — | |
Receive | | | 0.22% | | Hainan Haide Capital Management Co. Ltd. A-shares | | | Morgan Stanley | | | | 2/5/24 | | | | At Maturity | | | | 64 | | | | 3 | | | | — | | | | 3 | |
Receive | | | 0.22% | | Hand Enterprise Solutions Co. Ltd. A-shares | | | Morgan Stanley | | | | 2/5/24 | | | | At Maturity | | | | 128 | | | | — | | | | — | | | | — | |
See accompanying notes to financial statements.
167
HC CAPITAL TRUST
The Emerging Markets Portfolio
Portfolio of Investments (continued) — June 30, 2022
Total Return Swap Agreements |
Pay/
Receive(a) | | Financing
Rate | | Description | | Counterparty | | | Expiration
Date | | | Payment
Frequency | | | Notional
Amount
(000) | | | Value
(000) | | | Upfront
Premiums
Paid/
(Received)
(000) | | | Unrealized
Appreciation/
(Depreciation)
(000) | |
Receive | | | 0.22% | | Hangzhou Binjiang Real Estate Group Co. Ltd. A-shares | | | Morgan Stanley | | | | 2/5/24 | | | | At Maturity | | | $ | 4 | | | $ | — | | | $ | — | | | $ | — | |
Receive | | | 0.22% | | Hangzhou Chang Chuan Technology Co. Ltd. A-shares | | | Morgan Stanley | | | | 2/5/24 | | | | At Maturity | | | | 15 | | | | — | | | | — | | | | — | |
Receive | | | 0.22% | | Hangzhou Dptech Technologies Co. Ltd. A-shares | | | Morgan Stanley | | | | 2/5/24 | | | | At Maturity | | | | 39 | | | | 2 | | | | — | | | | 2 | |
Receive | | | 0.22% | | Hangzhou Lion Electronics Co. Ltd. A-shares | | | Morgan Stanley | | | | 2/5/24 | | | | At Maturity | | | | 25 | | | | 4 | | | | — | | | | 4 | |
Receive | | | 0.22% | | Hangzhou Tigermed Consulting Co. Ltd. A-shares | | | Morgan Stanley | | | | 2/5/24 | | | | At Maturity | | | | 35 | | | | 6 | | | | — | | | | 6 | |
Receive | | | 0.22% | | Harbin Boshi Automation Co. Ltd. A-shares | | | Morgan Stanley | | | | 2/5/24 | | | | At Maturity | | | | 11 | | | | — | | | | — | | | | — | |
Receive | | | 0.22% | | Healthcare Co. Ltd. A-shares | | | Morgan Stanley | | | | 2/5/24 | | | | At Maturity | | | | 10 | | | | — | | | | — | | | | — | |
Receive | | | 0.22% | | Hebei Hengshui Laobaigan Liquor Co. Ltd. A-shares | | | Morgan Stanley | | | | 2/5/24 | | | | At Maturity | | | | 24 | | | | 1 | | | | — | | | | 1 | |
Receive | | | 0.22% | | Heilongjiang Agriculture Co. Ltd. A-shares | | | Morgan Stanley | | | | 2/5/24 | | | | At Maturity | | | | 21 | | | | (1 | ) | | | — | | | | (1 | ) |
Receive | | | 0.22% | | Henan Lingrui Pharmaceutical Co. A-shares | | | Morgan Stanley | | | | 2/5/24 | | | | At Maturity | | | | 433 | | | | (3 | ) | | | — | | | | (3 | ) |
Receive | | | 0.22% | | Henan Shenhuo Coal & Power Co. Ltd. A-shares | | | Morgan Stanley | | | | 2/5/24 | | | | At Maturity | | | | 228 | | | | (5 | ) | | | — | | | | (5 | ) |
Receive | | | 0.22% | | Henan Shuanghui Investment & Development Co. Ltd. A-shares | | | Morgan Stanley | | | | 2/5/24 | | | | At Maturity | | | | 26 | | | | — | | | | — | | | | — | |
Receive | | | 0.22% | | Hengtong Optic-electric Co. Ltd. A-shares | | | Morgan Stanley | | | | 2/5/24 | | | | At Maturity | | | | 4 | | | | 1 | | | | — | | | | 1 | |
Receive | | | 0.22% | | Hengyi Petrochemical Co. Ltd. A-shares | | | Morgan Stanley | | | | 2/5/24 | | | | At Maturity | | | | 4 | | | | — | | | | — | | | | — | |
Receive | | | 0.22% | | Hisense Home Appliances Group Co. Ltd. A-shares | | | Morgan Stanley | | | | 2/5/24 | | | | At Maturity | | | | 137 | | | | 14 | | | | — | | | | 14 | |
Receive | | | 0.22% | | Hongfa Technology Co. Ltd. A-shares | | | Morgan Stanley | | | | 2/5/24 | | | | At Maturity | | | | 200 | | | | 12 | | | | — | | | | 12 | |
Receive | | | 0.22% | | Hongli Zhihui Group Co. Ltd. A-shares | | | Morgan Stanley | | | | 2/5/24 | | | | At Maturity | | | | 1 | | | | — | | | | — | | | | — | |
Receive | | | 0.22% | | Hoshine Silicon Industry Co. Ltd. A-shares | | | Morgan Stanley | | | | 2/5/24 | | | | At Maturity | | | | 8 | | | | 1 | | | | — | | | | 1 | |
Receive | | | 0.22% | | Huadian Power International Corp. Ltd. A-shares | | | Morgan Stanley | | | | 2/5/24 | | | | At Maturity | | | | 9 | | | | — | | | | — | | | | — | |
Receive | | | 0.22% | | Huadong Medicine Co. Ltd. A-shares | | | Morgan Stanley | | | | 2/5/24 | | | | At Maturity | | | | 13 | | | | 1 | | | | — | | | | 1 | |
Receive | | | 0.22% | | Huagong Tech Co. Ltd. A-shares | | | Morgan Stanley | | | | 2/5/24 | | | | At Maturity | | | | 4 | | | | — | | | | — | | | | — | |
Receive | | | 0.22% | | Huaibei Mining Holdings Co. Ltd. A-shares | | | Morgan Stanley | | | | 2/5/24 | | | | At Maturity | | | | 222 | | | | 5 | | | | — | | | | 5 | |
Receive | | | 0.22% | | Huali Industrial Group Co. Ltd. A-shares | | | Morgan Stanley | | | | 2/5/24 | | | | At Maturity | | | | 13 | | | | (1 | ) | | | — | | | | (1 | ) |
See accompanying notes to financial statements.
168
HC CAPITAL TRUST
The Emerging Markets Portfolio
Portfolio of Investments (continued) — June 30, 2022
Total Return Swap Agreements |
Pay/
Receive(a) | | Financing
Rate | | Description | | Counterparty | | | Expiration
Date | | | Payment
Frequency | | | Notional
Amount
(000) | | | Value
(000) | | | Upfront
Premiums
Paid/
(Received)
(000) | | | Unrealized
Appreciation/
(Depreciation)
(000) | |
Receive | | | 0.22% | | Huaneng Power International, Inc. A-shares | | | Morgan Stanley | | | | 2/5/24 | | | | At Maturity | | | $ | 6 | | | $ | — | | | $ | — | | | $ | — | |
Receive | | | 0.22% | | Huatai Securities Co. Ltd. A-shares | | | Morgan Stanley | | | | 2/5/24 | | | | At Maturity | | | | 9 | | | | — | | | | — | | | | — | |
Receive | | | 0.22% | | Huaxia Bank Co. Ltd. A-shares | | | Morgan Stanley | | | | 2/5/24 | | | | At Maturity | | | | 14 | | | | — | | | | — | | | | — | |
Receive | | | 0.22% | | Huaxin Cement Co. Ltd. A-shares | | | Morgan Stanley | | | | 2/5/24 | | | | At Maturity | | | | 5 | | | | — | | | | — | | | | — | |
Receive | | | 0.22% | | Huayu Automotive Systems Co. Ltd. A-shares | | | Morgan Stanley | | | | 2/5/24 | | | | At Maturity | | | | 71 | | | | (4 | ) | | | — | | | | (4 | ) |
Receive | | | 0.22% | | Hubei Dinglong Co. Ltd. A-shares | | | Morgan Stanley | | | | 2/5/24 | | | | At Maturity | | | | 2 | | | | — | | | | — | | | | — | |
Receive | | | 0.22% | | Hubei Feilihua Quartz Glass Co. Ltd. A-shares | | | Morgan Stanley | | | | 2/5/24 | | | | At Maturity | | | | 5 | | | | 1 | | | | — | | | | 1 | |
Receive | | | 0.22% | | Hubei Jumpcan Pharmaceutical Co. Ltd. A-shares | | | Morgan Stanley | | | | 2/5/24 | | | | At Maturity | | | | 116 | | | | (5 | ) | | | — | | | | (5 | ) |
Receive | | | 0.22% | | Hubei Xingfa Chemicals Group Co. Ltd. A-shares | | | Morgan Stanley | | | | 2/5/24 | | | | At Maturity | | | | 318 | | | | 70 | | | | — | | | | 70 | |
Receive | | | 0.22% | | Huizhou Desay Sv Automotive Co. Ltd. A-shares | | | Morgan Stanley | | | | 2/5/24 | | | | At Maturity | | | | 180 | | | | 25 | | | | — | | | | 25 | |
Receive | | | 0.22% | | Humanwell Healthcare Group Co. Ltd. A-shares | | | Morgan Stanley | | | | 2/5/24 | | | | At Maturity | | | | 3 | | | | — | | | | — | | | | — | |
Receive | | | 0.22% | | Hunan Aihua Group Co. Ltd. A-shares | | | Morgan Stanley | | | | 2/5/24 | | | | At Maturity | | | | 4 | | | | — | | | | — | | | | — | |
Receive | | | 0.22% | | Imeik Technology Development Co. Ltd. A-shares | | | Morgan Stanley | | | | 2/5/24 | | | | At Maturity | | | | 70 | | | | 11 | | | | — | | | | 11 | |
Receive | | | 0.22% | | Industrial Bank Co. Ltd. A-shares | | | Morgan Stanley | | | | 2/5/24 | | | | At Maturity | | | | 595 | | | | (4 | ) | | | — | | | | (4 | ) |
Receive | | | 0.22% | | Inner Mongolia Dian Tou Energy Corp. Ltd. A-shares | | | Morgan Stanley | | | | 2/5/24 | | | | At Maturity | | | | 118 | | | | (9 | ) | | | — | | | | (9 | ) |
Receive | | | 0.22% | | Inner Mongolia ERDOS Resources Co. Ltd. A-shares | | | Morgan Stanley | | | | 2/5/24 | | | | At Maturity | | | | 8 | | | | — | | | | — | | | | — | |
Receive | | | 0.22% | | Inner Mongolia Yili Industrial Group Co. Ltd. A-shares | | | Morgan Stanley | | | | 2/5/24 | | | | At Maturity | | | | 438 | | | | 16 | | | | — | | | | 16 | |
Receive | | | 0.22% | | Inner Mongolia Yuan Xing Energy Co. Ltd. A-shares | | | Morgan Stanley | | | | 2/5/24 | | | | At Maturity | | | | 10 | | | | — | | | | — | | | | — | |
Receive | | | 0.22% | | Jade Bird Fire Co. Ltd. A-shares | | | Morgan Stanley | | | | 2/5/24 | | | | At Maturity | | | | 12 | | | | — | | | | — | | | | — | |
Receive | | | 0.22% | | Jafron Biomedical Co. Ltd. A-shares | | | Morgan Stanley | | | | 2/5/24 | | | | At Maturity | | | | 182 | | | | 7 | | | | — | | | | 7 | |
Receive | | | 0.22% | | Jason Furniture Hangzhou Co. Ltd. A-shares | | | Morgan Stanley | | | | 2/5/24 | | | | At Maturity | | | | 15 | | | | 1 | | | | — | | | | 1 | |
Receive | | | 0.22% | | JCET Group Co. Ltd. A-shares | | | Morgan Stanley | | | | 2/5/24 | | | | At Maturity | | | | 68 | | | | 9 | | | | — | | | | 9 | |
Receive | | | 0.22% | | Jiajiayue Group Co. Ltd. A-shares | | | Morgan Stanley | | | | 2/5/24 | | | | At Maturity | | | | 125 | | | | 4 | | | | — | | | | 4 | |
See accompanying notes to financial statements.
169
HC CAPITAL TRUST
The Emerging Markets Portfolio
Portfolio of Investments (continued) — June 30, 2022
Total Return Swap Agreements |
Pay/
Receive(a) | | Financing
Rate | | Description | | Counterparty | | | Expiration
Date | | | Payment
Frequency | | | Notional
Amount
(000) | | | Value
(000) | | | Upfront
Premiums
Paid/
(Received)
(000) | | | Unrealized
Appreciation/
(Depreciation)
(000) | |
Receive | | | 0.22% | | Jiangsu Amer New Material Co. Ltd. A-shares | | | Morgan Stanley | | | | 2/5/24 | | | | At Maturity | | | $ | 13 | | | $ | 1 | | | $ | — | | | $ | 1 | |
Receive | | | 0.22% | | Jiangsu Azure Corp. A-shares | | | Morgan Stanley | | | | 2/5/24 | | | | At Maturity | | | | 15 | | | | 3 | | | | — | | | | 3 | |
Receive | | | 0.22% | | Jiangsu Bioperfectus Technologies Co. Ltd. A-shares | | | Morgan Stanley | | | | 2/5/24 | | | | At Maturity | | | | 235 | | | | (27 | ) | | | — | | | | (27 | ) |
Receive | | | 0.22% | | Jiangsu Changshu Rural Commercial Bank Co. Ltd. A-shares | | | Morgan Stanley | | | | 2/5/24 | | | | At Maturity | | | | 3 | | | | — | | | | — | | | | — | |
Receive | | | 0.22% | | Jiangsu Eastern Shenghong Co. Ltd. A-shares | | | Morgan Stanley | | | | 2/5/24 | | | | At Maturity | | | | 6 | | | | 1 | | | | — | | | | 1 | |
Receive | | | 0.22% | | Jiangsu Gian Technology Co. Ltd. A-shares | | | Morgan Stanley | | | | 2/5/24 | | | | At Maturity | | | | 2 | | | | — | | | | — | | | | — | |
Receive | | | 0.22% | | Jiangsu GoodWe Power Supply Technology Co. Ltd. A-shares | | | Morgan Stanley | | | | 2/5/24 | | | | At Maturity | | | | 18 | | | | 8 | | | | — | | | | 8 | |
Receive | | | 0.22% | | Jiangsu Guotai International Group Co. Ltd. A-shares | | | Morgan Stanley | | | | 2/5/24 | | | | At Maturity | | | | 76 | | | | (4 | ) | | | — | | | | (4 | ) |
Receive | | | 0.22% | | Jiangsu Huahong Technology Stock Co. Ltd. A-shares | | | Morgan Stanley | | | | 2/5/24 | | | | At Maturity | | | | 150 | | | | 7 | | | | — | | | | 7 | |
Receive | | | 0.22% | | Jiangsu Jiangyin Rural Commercial Bank Co. Ltd. A-shares | | | Morgan Stanley | | | | 2/5/24 | | | | At Maturity | | | | 151 | | | | 14 | | | | — | | | | 14 | |
Receive | | | 0.22% | | Jiangsu King’s Luck Brewery JSC Ltd. A-shares | | | Morgan Stanley | | | | 2/5/24 | | | | At Maturity | | | | 337 | | | | 36 | | | | — | | | | 36 | |
Receive | | | 0.22% | | Jiangsu Lihua Animal Husbandry Stock Co. Ltd. A-shares | | | Morgan Stanley | | | | 2/5/24 | | | | At Maturity | | | | 7 | | | | 1 | | | | — | | | | 1 | |
Receive | | | 0.22% | | Jiangsu Linyang Energy Co. Ltd. A-shares | | | Morgan Stanley | | | | 2/5/24 | | | | At Maturity | | | | 41 | | | | (1 | ) | | | — | | | | (1 | ) |
Receive | | | 0.22% | | Jiangsu Nata Opto-electronic Material Co. Ltd. A-shares | | | Morgan Stanley | | | | 2/5/24 | | | | At Maturity | | | | 93 | | | | 18 | | | | — | | | | 18 | |
Receive | | | 0.22% | | Jiangsu Nhwa Pharmaceutical Co. Ltd. A-shares | | | Morgan Stanley | | | | 2/5/24 | | | | At Maturity | | | | 14 | | | | — | | | | — | | | | — | |
Receive | | | 0.22% | | Jiangsu Provincial Agricultural Reclamation and Development Corp. A-shares | | | Morgan Stanley | | | | 2/5/24 | | | | At Maturity | | | | 3 | | | | — | | | | — | | | | — | |
Receive | | | 0.22% | | Jiangsu Sopo Chemical Co. A-shares | | | Morgan Stanley | | | | 2/5/24 | | | | At Maturity | | | | 9 | | | | (1 | ) | | | — | | | | (1 | ) |
Receive | | | 0.22% | | Jiangsu Yanghe Brewery Joint-Stock Co. Ltd. A-shares | | | Morgan Stanley | | | | 2/5/24 | | | | At Maturity | | | | 467 | | | | 69 | | | | — | | | | 69 | |
Receive | | | 0.22% | | Jiangsu Yangnong Chemical Co. Ltd. A-shares | | | Morgan Stanley | | | | 2/5/24 | | | | At Maturity | | | | 312 | | | | (17 | ) | | | — | | | | (17 | ) |
Receive | | | 0.22% | | Jiangsu Yuyue Medical Equipment & Supply Co. Ltd. A-shares | | | Morgan Stanley | | | | 2/5/24 | | | | At Maturity | | | | 96 | | | | (3 | ) | | | — | | | | (3 | ) |
Receive | | | 0.22% | | Jiangsu Zhangjiagang Rural Commercial Bank Co. Ltd. A-shares | | | Morgan Stanley | | | | 2/5/24 | | | | At Maturity | | | | 109 | | | | 7 | | | | — | | | | 7 | |
Receive | | | 0.22% | | Jiangsu Zhongtian Technology Co. Ltd. A-shares | | | Morgan Stanley | | | | 2/5/24 | | | | At Maturity | | | | 42 | | | | 12 | | | | — | | | | 12 | |
Receive | | | 0.22% | | Jiangxi Special Electric Motor Co. Ltd. A-shares | | | Morgan Stanley | | | | 2/5/24 | | | | At Maturity | | | | 179 | | | | 23 | | | | — | | | | 23 | |
See accompanying notes to financial statements.
170
HC CAPITAL TRUST
The Emerging Markets Portfolio
Portfolio of Investments (continued) — June 30, 2022
Total Return Swap Agreements |
Pay/
Receive(a) | | Financing
Rate | | Description | | Counterparty | | | Expiration
Date | | | Payment
Frequency | | | Notional
Amount
(000) | | | Value
(000) | | | Upfront
Premiums
Paid/
(Received)
(000) | | | Unrealized
Appreciation/
(Depreciation)
(000) | |
Receive | | | 0.22% | | Jiangyin Hengrun Heavy Industries Co. Ltd. A-shares | | | Morgan Stanley | | | | 2/5/24 | | | | At Maturity | | | $ | 2 | | | $ | 1 | | | $ | — | | | $ | 1 | |
Receive | | | 0.22% | | Jiangzhong Pharmaceutical Co. Ltd. A-shares | | | Morgan Stanley | | | | 2/5/24 | | | | At Maturity | | | | 15 | | | | — | | | | — | | | | — | |
Receive | | | 0.22% | | Jingjin Equipment, Inc. A-shares | | | Morgan Stanley | | | | 2/5/24 | | | | At Maturity | | | | 39 | | | | 2 | | | | — | | | | 2 | |
Receive | | | 0.22% | | JiuGui Liquor Co. Ltd. A-shares | | | Morgan Stanley | | | | 2/5/24 | | | | At Maturity | | | | 273 | | | | 69 | | | | — | | | | 69 | |
Receive | | | 0.22% | | Jizhong Energy Resources Co. Ltd. A-shares | | | Morgan Stanley | | | | 2/5/24 | | | | At Maturity | | | | 4 | | | | — | | | | — | | | | — | |
Receive | | | 0.22% | | JL Mag Rare-Earth Co. Ltd. A-shares | | | Morgan Stanley | | | | 2/5/24 | | | | At Maturity | | | | 29 | | | | — | | | | — | | | | — | |
Receive | | | 0.22% | | Joincare Pharmaceutical Group Industry Co. Ltd. A-shares | | | Morgan Stanley | | | | 2/5/24 | | | | At Maturity | | | | 413 | | | | 11 | | | | — | | | | 11 | |
Receive | | | 0.22% | | Juewei Food Co. Ltd. A-shares | | | Morgan Stanley | | | | 2/5/24 | | | | At Maturity | | | | 4 | | | | 1 | | | | — | | | | 1 | |
Receive | | | 0.22% | | Juneyao Airlines Co. Ltd. A-shares | | | Morgan Stanley | | | | 2/5/24 | | | | At Maturity | | | | 3 | | | | 1 | | | | — | | | | 1 | |
Receive | | | 0.22% | | KBC Corp. Ltd. A-shares | | | Morgan Stanley | | | | 2/5/24 | | | | At Maturity | | | | 95 | | | | 11 | | | | — | | | | 11 | |
Receive | | | 0.22% | | Keda Industrial Group Co. Ltd. A-shares | | | Morgan Stanley | | | | 2/5/24 | | | | At Maturity | | | | 108 | | | | 31 | | | | — | | | | 31 | |
Receive | | | 0.22% | | Keeson Technology Corp. Ltd. A-shares | | | Morgan Stanley | | | | 2/5/24 | | | | At Maturity | | | | 109 | | | | 4 | | | | — | | | | 4 | |
Receive | | | 0.22% | | KingClean Electric Co. Ltd. A-shares | | | Morgan Stanley | | | | 2/5/24 | | | | At Maturity | | | | 122 | | | | 8 | | | | — | | | | 8 | |
Receive | | | 0.22% | | Kingnet Network Co. Ltd. A-shares | | | Morgan Stanley | | | | 2/5/24 | | | | At Maturity | | | | 273 | | | | 29 | | | | — | | | | 29 | |
Receive | | | 0.22% | | Konfoong Materials International Co. Ltd. A-shares | | | Morgan Stanley | | | | 2/5/24 | | | | At Maturity | | | | 3 | | | | — | | | | — | | | | — | |
Receive | | | 0.22% | | Kweichow Moutai Co. Ltd. A-shares | | | Morgan Stanley | | | | 2/5/24 | | | | At Maturity | | | | 3,071 | | | | 204 | | | | — | | | | 204 | |
Receive | | | 0.22% | | Lakala Payment Co. Ltd. A-shares | | | Morgan Stanley | | | | 2/5/24 | | | | At Maturity | | | | — | | | | — | | | | — | | | | — | |
Receive | | | 0.22% | | Levima Advanced Materials Corp. A-shares | | | Morgan Stanley | | | | 2/5/24 | | | | At Maturity | | | | 13 | | | | — | | | | — | | | | — | |
Receive | | | 0.22% | | Lier Chemical Co. Ltd. A-shares | | | Morgan Stanley | | | | 2/5/24 | | | | At Maturity | | | | 285 | | | | 10 | | | | — | | | | 10 | |
Receive | | | 0.22% | | Lizhong Sitong Light Alloys Group Co. Ltd. A-shares | | | Morgan Stanley | | | | 2/5/24 | | | | At Maturity | | | | 22 | | | | 2 | | | | — | | | | 2 | |
Receive | | | 0.22% | | Longhua Technology Group Luoyang Co. Ltd. A-shares | | | Morgan Stanley | | | | 2/5/24 | | | | At Maturity | | | | 1 | | | | — | | | | — | | | | — | |
Receive | | | 0.22% | | LONGi Green Energy Technology Co. Ltd. A-shares | | | Morgan Stanley | | | | 2/5/24 | | | | At Maturity | | | | 533 | | | | 130 | | | | — | | | | 130 | |
Receive | | | 0.22% | | Longshine Technology Group Co. Ltd. A-shares | | | Morgan Stanley | | | | 2/5/24 | | | | At Maturity | | | | 33 | | | | (1 | ) | | | — | | | | (1 | ) |
See accompanying notes to financial statements.
171
HC CAPITAL TRUST
The Emerging Markets Portfolio
Portfolio of Investments (continued) — June 30, 2022
Total Return Swap Agreements |
Pay/
Receive(a) | | Financing
Rate | | Description | | Counterparty | | | Expiration
Date | | | Payment
Frequency | | | Notional
Amount
(000) | | | Value
(000) | | | Upfront
Premiums
Paid/
(Received)
(000) | | | Unrealized
Appreciation/
(Depreciation)
(000) | |
Receive | | | 0.22% | | Luenmei Quantum Co. Ltd. A-shares | | | Morgan Stanley | | | | 2/5/24 | | | | At Maturity | | | $ | 275 | | | $ | 18 | | | $ | — | | | $ | 18 | |
Receive | | | 0.22% | | Luoyang Xinqianglian Slewing Bearing Co. Ltd. A-shares | | | Morgan Stanley | | | | 2/5/24 | | | | At Maturity | | | | 4 | | | | — | | | | — | | | | — | |
Receive | | | 0.22% | | Luxi Chemical Group Co. Ltd. A-shares | | | Morgan Stanley | | | | 2/5/24 | | | | At Maturity | | | | 86 | | | | (6 | ) | | | — | | | | (6 | ) |
Receive | | | 0.22% | | Luxshare Precision Industry Co. Ltd. A-shares | | | Morgan Stanley | | | | 2/5/24 | | | | At Maturity | | | | 41 | | | | 2 | | | | — | | | | 2 | |
Receive | | | 0.22% | | Luzhou Laojiao Co. Ltd. A-shares | | | Morgan Stanley | | | | 2/5/24 | | | | At Maturity | | | | 458 | | | | 98 | | | | — | | | | 98 | |
Receive | | | 0.22% | | Mango Excellent Media Co. Ltd. A-shares | | | Morgan Stanley | | | | 2/5/24 | | | | At Maturity | | | | 37 | | | | (2 | ) | | | — | | | | (2 | ) |
Receive | | | 0.22% | | Mayinglong Pharmaceutical Group Co. Ltd. A-shares | | | Morgan Stanley | | | | 2/5/24 | | | | At Maturity | | | | 162 | | | | 11 | | | | — | | | | 11 | |
Receive | | | 0.22% | | Merit Interactive Co. Ltd. A-shares | | | Morgan Stanley | | | | 2/5/24 | | | | At Maturity | | | | 57 | | | | (1 | ) | | | — | | | | (1 | ) |
Receive | | | 0.22% | | Metallurgical Corp. of China Ltd. A-shares | | | Morgan Stanley | | | | 2/5/24 | | | | At Maturity | | | | 121 | | | | (1 | ) | | | — | | | | (1 | ) |
Receive | | | 0.22% | | Mianyang Fulin Precision Co. Ltd. A-shares | | | Morgan Stanley | | | | 2/5/24 | | | | At Maturity | | | | 59 | | | | 23 | | | | — | | | | 23 | |
Receive | | | 0.22% | | Midea Group Co. Ltd. A-shares | | | Morgan Stanley | | | | 2/5/24 | | | | At Maturity | | | | 251 | | | | 19 | | | | — | | | | 19 | |
Receive | | | 0.22% | | Milkyway Chemical Supply Chain Service Co. Ltd. A-shares | | | Morgan Stanley | | | | 2/5/24 | | | | At Maturity | | | | 21 | | | | 4 | | | | — | | | | 4 | |
Receive | | | 0.22% | | Ming Yang Smart Energy Group Ltd. A-shares | | | Morgan Stanley | | | | 2/5/24 | | | | At Maturity | | | | 317 | | | | 140 | | | | — | | | | 140 | |
Receive | | | 0.22% | | MLS Co. Ltd. A-shares | | | Morgan Stanley | | | | 2/5/24 | | | | At Maturity | | | | 11 | | | | 1 | | | | — | | | | 1 | |
Receive | | | 0.22% | | Montage Technology Co. Ltd. A-shares | | | Morgan Stanley | | | | 2/5/24 | | | | At Maturity | | | | 22 | | | | 2 | | | | — | | | | 2 | |
Receive | | | 0.22% | | Muyuan Foods Co. Ltd. A-shares | | | Morgan Stanley | | | | 2/5/24 | | | | At Maturity | | | | 44 | | | | (1 | ) | | | — | | | | (1 | ) |
Receive | | | 0.22% | | Nanjing Gaoke Co. Ltd. A-shares | | | Morgan Stanley | | | | 2/5/24 | | | | At Maturity | | | | 33 | | | | — | | | | — | | | | — | |
Receive | | | 0.22% | | Nanjing Yunhai Special Metals Co. Ltd. A-shares | | | Morgan Stanley | | | | 2/5/24 | | | | At Maturity | | | | 27 | | | | 8 | | | | — | | | | 8 | |
Receive | | | 0.22% | | Nantong Jianghai Capacitor Co. Ltd. A-shares | | | Morgan Stanley | | | | 2/5/24 | | | | At Maturity | | | | 3 | | | | — | | | | — | | | | — | |
Receive | | | 0.22% | | NARI Technology Co. Ltd. A-shares | | | Morgan Stanley | | | | 2/5/24 | | | | At Maturity | | | | 75 | | | | — | | | | — | | | | — | |
Receive | | | 0.22% | | NAURA Technology Group Co. Ltd. A-shares | | | Morgan Stanley | | | | 2/5/24 | | | | At Maturity | | | | 78 | | | | 10 | | | | — | | | | 10 | |
Receive | | | 0.22% | | Ningbo Deye Technology Co. Ltd. A-shares | | | Morgan Stanley | | | | 2/5/24 | | | | At Maturity | | | | 19 | | | | 7 | | | | — | | | | 7 | |
Receive | | | 0.22% | | Ningbo Haitian Precision Machinery Co. Ltd. A-shares | | | Morgan Stanley | | | | 2/5/24 | | | | At Maturity | | | | 282 | | | | 37 | | | | — | | | | 37 | |
See accompanying notes to financial statements.
172
HC CAPITAL TRUST
The Emerging Markets Portfolio
Portfolio of Investments (continued) — June 30, 2022
Total Return Swap Agreements |
Pay/
Receive(a) | | Financing
Rate | | Description | | Counterparty | | | Expiration
Date | | | Payment
Frequency | | | Notional
Amount
(000) | | | Value
(000) | | | Upfront
Premiums
Paid/
(Received)
(000) | | | Unrealized
Appreciation/
(Depreciation)
(000) | |
Receive | | | 0.22% | | Ningbo Huaxiang Electronic Co. Ltd. A-shares | | | Morgan Stanley | | | | 2/5/24 | | | | At Maturity | | | $ | 62 | | | $ | (3 | ) | | $ | — | | | $ | (3 | ) |
Receive | | | 0.22% | | Ningbo Orient Wires & Cables Co. Ltd. A-shares | | | Morgan Stanley | | | | 2/5/24 | | | | At Maturity | | | | 24 | | | | 8 | | | | — | | | | 8 | |
Receive | | | 0.22% | | Ningbo Ronbay New Energy Technology Co. Ltd. A-shares | | | Morgan Stanley | | | | 2/5/24 | | | | At Maturity | | | | 38 | | | | 4 | | | | — | | | | 4 | |
Receive | | | 0.22% | | Ningbo Shanshan Co. Ltd. A-shares | | | Morgan Stanley | | | | 2/5/24 | | | | At Maturity | | | | 5 | | | | 1 | | | | — | | | | 1 | |
Receive | | | 0.22% | | Ningbo Tuopu Group Co. Ltd. A-shares | | | Morgan Stanley | | | | 2/5/24 | | | | At Maturity | | | | 175 | | | | 7 | | | | — | | | | 7 | |
Receive | | | 0.22% | | Ningbo Xusheng Auto Technology Co. Ltd. A-shares | | | Morgan Stanley | | | | 2/5/24 | | | | At Maturity | | | | 46 | | | | — | | | | — | | | | — | |
Receive | | | 0.22% | | North Huajin Chemical Industries Co. Ltd. A-shares | | | Morgan Stanley | | | | 2/5/24 | | | | At Maturity | | | | 4 | | | | — | | | | — | | | | — | |
Receive | | | 0.22% | | North Industries Group Red Arrow Co. Ltd. A-shares | | | Morgan Stanley | | | | 2/5/24 | | | | At Maturity | | | | 8 | | | | 1 | | | | — | | | | 1 | |
Receive | | | 0.22% | | Ocean’s King Lighting Science & Technology Co. Ltd. A-shares | | | Morgan Stanley | | | | 2/5/24 | | | | At Maturity | | | | 2 | | | | — | | | | — | | | | — | |
Receive | | | 0.22% | | Oppein Home Group, Inc. A-shares | | | Morgan Stanley | | | | 2/5/24 | | | | At Maturity | | | | 5 | | | | 2 | | | | — | | | | 2 | |
Receive | | | 0.22% | | Orient Securities Co. Ltd. A-shares | | | Morgan Stanley | | | | 2/5/24 | | | | At Maturity | | | | 6 | | | | — | | | | — | | | | — | |
Receive | | | 0.22% | | Ovctek China, Inc. A-shares | | | Morgan Stanley | | | | 2/5/24 | | | | At Maturity | | | | 4 | | | | 1 | | | | — | | | | 1 | |
Receive | | | 0.22% | | PetroChina Co. Ltd. A-shares | | | Morgan Stanley | | | | 2/5/24 | | | | At Maturity | | | | 133 | | | | 1 | | | | — | | �� | | 1 | |
Receive | | | 0.22% | | PhiChem Corp. A-shares | | | Morgan Stanley | | | | 2/5/24 | | | | At Maturity | | | | 151 | | | | 12 | | | | — | | | | 12 | |
Receive | | | 0.22% | | Ping An Bank Co. Ltd. A-shares | | | Morgan Stanley | | | | 2/5/24 | | | | At Maturity | | | | 334 | | | | 1 | | | | — | | | | 1 | |
Receive | | | 0.22% | | Ping An Insurance Group Co. of China Ltd. A-shares | | | Morgan Stanley | | | | 2/5/24 | | | | At Maturity | | | | 389 | | | | 6 | | | | — | | | | 6 | |
Receive | | | 0.22% | | Pingdingshan Tianan Coal Mining Co. Ltd. A-shares | | | Morgan Stanley | | | | 2/5/24 | | | | At Maturity | | | | 150 | | | | (4 | ) | | | — | | | | (4 | ) |
Receive | | | 0.22% | | Poly Developments and Holdings Group Co. Ltd. A-shares | | | Morgan Stanley | | | | 2/5/24 | | | | At Maturity | | | | 32 | | | | 2 | | | | — | | | | 2 | |
Receive | | | 0.22% | | Pony Testing International Group Co. Ltd. A-shares | | | Morgan Stanley | | | | 2/5/24 | | | | At Maturity | | | | 80 | | | | 9 | | | | — | | | | 9 | |
Receive | | | 0.22% | | Porton Pharma Solutions Ltd. A-shares | | | Morgan Stanley | | | | 2/5/24 | | | | At Maturity | | | | 197 | | | | 15 | | | | — | | | | 15 | |
Receive | | | 0.22% | | Postal Savings Bank of China Co. Ltd. A-shares | | | Morgan Stanley | | | | 2/5/24 | | | | At Maturity | | | | 33 | | | | (1 | ) | | | — | | | | (1 | ) |
Receive | | | 0.22% | | Power Construction Corp. of China Ltd. A-shares | | | Morgan Stanley | | | | 2/5/24 | | | | At Maturity | | | | 42 | | | | — | | | | — | | | | — | |
Receive | | | 0.22% | | Proya Cosmetics Co. Ltd. A-shares | | | Morgan Stanley | | | | 2/5/24 | | | | At Maturity | | | | 228 | | | | 13 | | | | — | | | | 13 | |
See accompanying notes to financial statements.
173
HC CAPITAL TRUST
The Emerging Markets Portfolio
Portfolio of Investments (continued) — June 30, 2022
Total Return Swap Agreements |
Pay/
Receive(a) | | Financing
Rate | | Description | | Counterparty | | | Expiration
Date | | | Payment
Frequency | | | Notional
Amount
(000) | | | Value
(000) | | | Upfront
Premiums
Paid/
(Received)
(000) | | | Unrealized
Appreciation/
(Depreciation)
(000) | |
Receive | | | 0.22% | | Qingdao East Steel Tower Stock Co. Ltd. A-shares | | | Morgan Stanley | | | | 2/5/24 | | | | At Maturity | | | $ | 118 | | | $ | (2 | ) | | $ | — | | | $ | (2 | ) |
Receive | | | 0.22% | | Qingdao Haier Biomedical Co. Ltd. A-shares | | | Morgan Stanley | | | | 2/5/24 | | | | At Maturity | | | | 14 | | | | — | | | | — | | | | — | |
Receive | | | 0.22% | | Qingdao Hiron Commercial Cold Chain Co. Ltd. A-shares | | | Morgan Stanley | | | | 2/5/24 | | | | At Maturity | | | | 7 | | | | — | | | | — | | | | — | |
Receive | | | 0.22% | | Qingdao Port International Co. Ltd. A-shares | | | Morgan Stanley | | | | 2/5/24 | | | | At Maturity | | | | 266 | | | | (8 | ) | | | — | | | | (8 | ) |
Receive | | | 0.22% | | Qingdao Sentury Tire Co. Ltd. A-shares | | | Morgan Stanley | | | | 2/5/24 | | | | At Maturity | | | | 25 | | | | (1 | ) | | | — | | | | (1 | ) |
Receive | | | 0.22% | | Qinghai Salt Lake Industry Co. Ltd. A-shares | | | Morgan Stanley | | | | 2/5/24 | | | | At Maturity | | | | 33 | | | | (2 | ) | | | — | | | | (2 | ) |
Receive | | | 0.22% | | QuakeSafe Technologies Co. Ltd. A-shares | | | Morgan Stanley | | | | 2/5/24 | | | | At Maturity | | | | 2 | | | | — | | | | — | | | | — | |
Receive | | | 0.22% | | Quectel Wireless Solutions Co. Ltd. A-shares | | | Morgan Stanley | | | | 2/5/24 | | | | At Maturity | | | | 29 | | | | — | | | | — | | | | — | |
Receive | | | 0.22% | | Red Avenue New Materials Group Co. Ltd. A-shares | | | Morgan Stanley | | | | 2/5/24 | | | | At Maturity | | | | 16 | | | | 3 | | | | — | | | | 3 | |
Receive | | | 0.22% | | Remegen Co. Ltd. A-shares | | | Morgan Stanley | | | | 2/5/24 | | | | At Maturity | | | | 6 | | | | — | | | | — | | | | — | |
Receive | | | 0.22% | | Rianlon Corp. A-shares | | | Morgan Stanley | | | | 2/5/24 | | | | At Maturity | | | | 7 | | | | — | | | | — | | | | — | |
Receive | | | 0.22% | | Richinfo Technology Co. Ltd. A-shares | | | Morgan Stanley | | | | 2/5/24 | | | | At Maturity | | | | 207 | | | | 14 | | | | — | | | | 14 | |
Receive | | | 0.22% | | Risen Energy Co. Ltd. A-shares | | | Morgan Stanley | | | | 2/5/24 | | | | At Maturity | | | | 17 | | | | — | | | | — | | | | — | |
Receive | | | 0.22% | | Rongsheng Petrochemical Co. Ltd. A-shares | | | Morgan Stanley | | | | 2/5/24 | | | | At Maturity | | | | 167 | | | | (1 | ) | | | — | | | | (1 | ) |
Receive | | | 0.22% | | Runjian Co. Ltd. A-shares | | | Morgan Stanley | | | | 2/5/24 | | | | At Maturity | | | | 2 | | | | — | | | | — | | | | — | |
Receive | | | 0.22% | | SAIC Motor Corp. Ltd. A-shares | | | Morgan Stanley | | | | 2/5/24 | | | | At Maturity | | | | 10 | | | | — | | | | — | | | | — | |
Receive | | | 0.22% | | Sailun Group Co. Ltd. A-shares | | | Morgan Stanley | | | | 2/5/24 | | | | At Maturity | | | | 8 | | | | — | | | | — | | | | — | |
Receive | | | 0.22% | | Sanquan Food Co. Ltd. A-shares | | | Morgan Stanley | | | | 2/5/24 | | | | At Maturity | | | | 39 | | | | 1 | | | | — | | | | 1 | |
Receive | | | 0.22% | | Sany Heavy Industry Co. Ltd. A-shares | | | Morgan Stanley | | | | 2/5/24 | | | | At Maturity | | | | 49 | | | | 3 | | | | — | | | | 3 | |
Receive | | | 0.22% | | Satellite Chemical Co. Ltd. A-shares | | | Morgan Stanley | | | | 2/5/24 | | | | At Maturity | | | | 36 | | | | 2 | | | | — | | | | 2 | |
Receive | | | 0.22% | | Sealand Securities Co. Ltd. A-shares | | | Morgan Stanley | | | | 2/5/24 | | | | At Maturity | | | | 482 | | | | 3 | | | | — | | | | 3 | |
Receive | | | 0.22% | | SF Holding Co. Ltd. A-shares | | | Morgan Stanley | | | | 2/5/24 | | | | At Maturity | | | | 42 | | | | 4 | | | | — | | | | 4 | |
Receive | | | 0.22% | | SG Micro Corp. A-shares | | | Morgan Stanley | | | | 2/5/24 | | | | At Maturity | | | | 625 | | | | (48 | ) | | | — | | | | (48 | ) |
See accompanying notes to financial statements.
174
HC CAPITAL TRUST
The Emerging Markets Portfolio
Portfolio of Investments (continued) — June 30, 2022
Total Return Swap Agreements |
Pay/
Receive(a) | | Financing
Rate | | Description | | Counterparty | | | Expiration
Date | | | Payment
Frequency | | | Notional
Amount
(000) | | | Value
(000) | | | Upfront
Premiums
Paid/
(Received)
(000) | | | Unrealized
Appreciation/
(Depreciation)
(000) | |
Receive | | | 0.22% | | Shaanxi Coal Industry Co. Ltd. A-shares | | | Morgan Stanley | | | | 2/5/24 | | | | At Maturity | | | $ | 348 | | | $ | 62 | | | $ | — | | | $ | 62 | |
Receive | | | 0.22% | | Shan Xi Hua Yang Group New Energy Co. Ltd. A-shares | | | Morgan Stanley | | | | 2/5/24 | | | | At Maturity | | | | 3 | | | | 1 | | | | — | | | | 1 | |
Receive | | | 0.22% | | Shandong Denghai Seeds Co. Ltd. A-shares | | | Morgan Stanley | | | | 2/5/24 | | | | At Maturity | | | | 4 | | | | — | | | | — | | | | — | |
Receive | | | 0.22% | | Shandong Head Group Co. Ltd. A-shares | | | Morgan Stanley | | | | 2/5/24 | | | | At Maturity | | | | 15 | | | | (2 | ) | | | — | | | | (2 | ) |
Receive | | | 0.22% | | Shandong Himile Mechanical Science & Technology Co. Ltd. A-shares | | | Morgan Stanley | | | | 2/5/24 | | | | At Maturity | | | | 6 | | | | — | | | | — | | | | — | |
Receive | | | 0.22% | | Shandong Hualu Hengsheng Chemical Co. Ltd. A-shares | | | Morgan Stanley | | | | 2/5/24 | | | | At Maturity | | | | 91 | | | | (2 | ) | | | — | | | | (2 | ) |
Receive | | | 0.22% | | Shandong Jincheng Pharmaceutical Group Co. Ltd. A-shares | | | Morgan Stanley | | | | 2/5/24 | | | | At Maturity | | | | 4 | | | | (1 | ) | | | — | | | | (1 | ) |
Receive | | | 0.22% | | Shandong Shida Shenghua Chemical Group Co. Ltd. A-shares | | | Morgan Stanley | | | | 2/5/24 | | | | At Maturity | | | | 52 | | | | 20 | | | | — | | | | 20 | |
Receive | | | 0.22% | | Shandong Sun Paper Industry JSC Ltd. A-shares | | | Morgan Stanley | | | | 2/5/24 | | | | At Maturity | | | | 37 | | | | 1 | | | | — | | | | 1 | |
Receive | | | 0.22% | | Shandong WIT Dyne Health Co. Ltd. A-shares | | | Morgan Stanley | | | | 2/5/24 | | | | At Maturity | | | | 226 | | | | 1 | | | | — | | | | 1 | |
Receive | | | 0.22% | | Shanghai Baolong Automotive Corp. A-shares | | | Morgan Stanley | | | | 2/5/24 | | | | At Maturity | | | | 1 | | | | 1 | | | | — | | | | 1 | |
Receive | | | 0.22% | | Shanghai Baosight Software Co. Ltd. A-shares | | | Morgan Stanley | | | | 2/5/24 | | | | At Maturity | | | | 5 | | | | — | | | | — | | | | — | |
Receive | | | 0.22% | | Shanghai Bright Power Semiconductor Co. Ltd. A-shares | | | Morgan Stanley | | | | 2/5/24 | | | | At Maturity | | | | 5 | | | | — | | | | — | | | | — | |
Receive | | | 0.22% | | Shanghai Fengyuzhu Culture and Technology Co. Ltd. A-shares | | | Morgan Stanley | | | | 2/5/24 | | | | At Maturity | | | | 2 | | | | — | | | | — | | | | — | |
Receive | | | 0.22% | | Shanghai Flyco Electrical Appliance Co. Ltd. A-shares | | | Morgan Stanley | | | | 2/5/24 | | | | At Maturity | | | | 144 | | | | 20 | | | | — | | | | 20 | |
Receive | | | 0.22% | | Shanghai Friendess Electronic Technology Corp. Ltd. A-shares | | | Morgan Stanley | | | | 2/5/24 | | | | At Maturity | | | | 10 | | | | 1 | | | | — | | | | 1 | |
Receive | | | 0.22% | | Shanghai Ganglian E-Commerce Holdings Co. Ltd. A-shares | | | Morgan Stanley | | | | 2/5/24 | | | | At Maturity | | | | 159 | | | | (1 | ) | | | — | | | | (1 | ) |
Receive | | | 0.22% | | Shanghai Hanbell Precise Machinery Co. Ltd. A-shares | | | Morgan Stanley | | | | 2/5/24 | | | | At Maturity | | | | 11 | | | | 4 | | | | — | | | | 4 | |
Receive | | | 0.22% | | Shanghai Haohai Biological Technology Co. Ltd. A-shares | | | Morgan Stanley | | | | 2/5/24 | | | | At Maturity | | | | 9 | | | | 1 | | | | — | | | | 1 | |
Receive | | | 0.22% | | Shanghai Huace Navigation Technology Ltd. A-shares | | | Morgan Stanley | | | | 2/5/24 | | | | At Maturity | | | | 5 | | | | 1 | | | | — | | | | 1 | |
Receive | | | 0.22% | | Shanghai Jinqiao Export Processing Zone Development Co. Ltd. A-shares | | | Morgan Stanley | | | | 2/5/24 | | | | At Maturity | | | | 198 | | | | 2 | | | | — | | | | 2 | |
Receive | | | 0.22% | | Shanghai Kinetic Medical Co. Ltd. A-shares | | | Morgan Stanley | | | | 2/5/24 | | | | At Maturity | | | | 7 | | | | — | | | | — | | | | — | |
Receive | | | 0.22% | | Shanghai Liangxin Electrical Co. Ltd. A-shares | | | Morgan Stanley | | | | 2/5/24 | | | | At Maturity | | | | 13 | | | | 2 | | | | — | | | | 2 | |
See accompanying notes to financial statements.
175
HC CAPITAL TRUST
The Emerging Markets Portfolio
Portfolio of Investments (continued) — June 30, 2022
Total Return Swap Agreements |
Pay/
Receive(a) | | Financing
Rate | | Description | | Counterparty | | | Expiration
Date | | | Payment
Frequency | | | Notional
Amount
(000) | | | Value
(000) | | | Upfront
Premiums
Paid/
(Received)
(000) | | | Unrealized
Appreciation/
(Depreciation)
(000) | |
Receive | | | 0.22% | | Shanghai M&G Stationery, Inc. A-shares | | | Morgan Stanley | | | | 2/5/24 | | | | At Maturity | | | $ | 5 | | | $ | 1 | | | $ | — | | | $ | 1 | |
Receive | | | 0.22% | | Shanghai MicroPort Endovascular MedTech Group Co. Ltd. A-shares | | | Morgan Stanley | | | | 2/5/24 | | | | At Maturity | | | | 116 | | | | 4 | | | | — | | | | 4 | |
Receive | | | 0.22% | | Shanghai Putailai New Energy Technology Co. Ltd. A-shares | | | Morgan Stanley | | | | 2/5/24 | | | | At Maturity | | | | 108 | | | | 16 | | | | — | | | | 16 | |
Receive | | | 0.22% | | Shanghai Tongji Science & Technology Industrial Co. Ltd. A-shares | | | Morgan Stanley | | | | 2/5/24 | | | | At Maturity | | | | 185 | | | | 6 | | | | — | | | | 6 | |
Receive | | | 0.22% | | Shanghai Tunnel Engineering Co. Ltd. A-shares | | | Morgan Stanley | | | | 2/5/24 | | | | At Maturity | | | | 18 | | | | — | | | | — | | | | — | |
Receive | | | 0.22% | | Shanghai Waigaoqiao Free Trade Zone Group Co. Ltd. A-shares | | | Morgan Stanley | | | | 2/5/24 | | | | At Maturity | | | | 297 | | | | (7 | ) | | | — | | | | (7 | ) |
Receive | | | 0.22% | | Shanghai Zhonggu Logistics Co. Ltd. A-shares | | | Morgan Stanley | | | | 2/5/24 | | | | At Maturity | | | | 130 | | | | (7 | ) | | | — | | | | (7 | ) |
Receive | | | 0.22% | | Shanxi Blue Flame Holding Co. Ltd. A-shares | | | Morgan Stanley | | | | 2/5/24 | | | | At Maturity | | | | 27 | | | | — | | | | — | | | | — | |
Receive | | | 0.22% | | Shanxi Coking Coal Energy Group Co. Ltd. A-shares | | | Morgan Stanley | | | | 2/5/24 | | | | At Maturity | | | | 197 | | | | 13 | | | | — | | | | 13 | |
Receive | | | 0.22% | | Shanxi Lu’an Environmental Energy Development Co. Ltd. A-shares | | | Morgan Stanley | | | | 2/5/24 | | | | At Maturity | | | | 176 | | | | (3 | ) | | | — | | | | (3 | ) |
Receive | | | 0.22% | | Shanxi Securities Co. Ltd. A-shares | | | Morgan Stanley | | | | 2/5/24 | | | | At Maturity | | | | 225 | | | | 1 | | | | — | | | | 1 | |
Receive | | | 0.22% | | Shanxi Xinghuacun Fen Wine Factory Co. Ltd. A-shares | | | Morgan Stanley | | | | 2/5/24 | | | | At Maturity | | | | 398 | | | | 102 | | | | — | | | | 102 | |
Receive | | | 0.22% | | Shenghe Resources Holding Co. Ltd. A-shares | | | Morgan Stanley | | | | 2/5/24 | | | | At Maturity | | | | 239 | | | | 66 | | | | — | | | | 66 | |
Receive | | | 0.22% | | Shengyi Technology Co. Ltd. A-shares | | | Morgan Stanley | | | | 2/5/24 | | | | At Maturity | | | | — | | | | — | | | | — | | | | — | |
Receive | | | 0.22% | | Shennan Circuits Co. Ltd. A-shares | | | Morgan Stanley | | | | 2/5/24 | | | | At Maturity | | | | 91 | | | | — | | | | — | | | | — | |
Receive | | | 0.22% | | Shenyang Xingqi Pharmaceutical Co. Ltd. A-shares | | | Morgan Stanley | | | | 2/5/24 | | | | At Maturity | | | | 34 | | | | (1 | ) | | | — | | | | (1 | ) |
Receive | | | 0.22% | | Shenzhen Bioeasy Biotechnology Co. Ltd. A-shares | | | Morgan Stanley | | | | 2/5/24 | | | | At Maturity | | | | 6 | | | | — | | | | — | | | | — | |
Receive | | | 0.22% | | Shenzhen Capchem Technology Co. Ltd. A-shares | | | Morgan Stanley | | | | 2/5/24 | | | | At Maturity | | | | 237 | | | | 67 | | | | — | | | | 67 | |
Receive | | | 0.22% | | Shenzhen Changhong Technology Co. Ltd. A-shares | | | Morgan Stanley | | | | 2/5/24 | | | | At Maturity | | | | 9 | | | | 2 | | | | — | | | | 2 | |
Receive | | | 0.22% | | Shenzhen Click Technology Co. Ltd. A-shares | | | Morgan Stanley | | | | 2/5/24 | | | | At Maturity | | | | 1 | | | | — | | | | — | | | | — | |
Receive | | | 0.22% | | Shenzhen Dynanonic Co. Ltd. A-shares | | | Morgan Stanley | | | | 2/5/24 | | | | At Maturity | | | | 247 | | | | 98 | | | | — | | | | 98 | |
Receive | | | 0.22% | | Shenzhen Fastprint Circuit Tech Co. Ltd. A-shares | | | Morgan Stanley | | | | 2/5/24 | | | | At Maturity | | | | 82 | | | | 10 | | | | — | | | | 10 | |
Receive | | | 0.22% | | Shenzhen Huaqiang Industry Co. Ltd. A-shares | | | Morgan Stanley | | | | 2/5/24 | | | | At Maturity | | | | 46 | | | | — | | | | — | | | | — | |
See accompanying notes to financial statements.
176
HC CAPITAL TRUST
The Emerging Markets Portfolio
Portfolio of Investments (continued) — June 30, 2022
Total Return Swap Agreements |
Pay/
Receive(a) | | Financing
Rate | | Description | | Counterparty | | | Expiration
Date | | | Payment
Frequency | | | Notional
Amount
(000) | | | Value
(000) | | | Upfront
Premiums
Paid/
(Received)
(000) | | | Unrealized
Appreciation/
(Depreciation)
(000) | |
Receive | | | 0.22% | | Shenzhen Inovance Technology Co. Ltd. A-shares | | | Morgan Stanley | | | | 2/5/24 | | | | At Maturity | | | $ | 53 | | | $ | 4 | | | $ | — | | | $ | 4 | |
Receive | | | 0.22% | | Shenzhen Kedali Industry Co. Ltd. A-shares | | | Morgan Stanley | | | | 2/5/24 | | | | At Maturity | | | | 3 | | | | — | | | | — | | | | — | |
Receive | | | 0.22% | | Shenzhen Kstar Science And Technology Co. Ltd. A-shares | | | Morgan Stanley | | | | 2/5/24 | | | | At Maturity | | | | 3 | | | | 1 | | | | — | | | | 1 | |
Receive | | | 0.22% | | Shenzhen Microgate Technology Co. Ltd. A-shares | | | Morgan Stanley | | | | 2/5/24 | | | | At Maturity | | | | 2 | | | | — | | | | — | | | | — | |
Receive | | | 0.22% | | Shenzhen Mindray Bio-Medical Electronics Co. Ltd. A-shares | | | Morgan Stanley | | | | 2/5/24 | | | | At Maturity | | | | 250 | | | | (1 | ) | | | — | | | | (1 | ) |
Receive | | | 0.22% | | Shenzhen New Industries Biomedical Engineering Co. Ltd. A-shares | | | Morgan Stanley | | | | 2/5/24 | | | | At Maturity | | | | 13 | | | | 2 | | | | — | | | | 2 | |
Receive | | | 0.22% | | Shenzhen New Nanshan Holding Group Co. Ltd. A-shares | | | Morgan Stanley | | | | 2/5/24 | | | | At Maturity | | | | 2 | | | | — | | | | — | | | | — | |
Receive | | | 0.22% | | Shenzhen SC New Energy Technology Corp. A-shares | | | Morgan Stanley | | | | 2/5/24 | | | | At Maturity | | | | 15 | | | | 4 | | | | — | | | | 4 | |
Receive | | | 0.22% | | Shenzhen Senior Technology Material Co. Ltd. A-shares | | | Morgan Stanley | | | | 2/5/24 | | | | At Maturity | | | | 173 | | | | 9 | | | | — | | | | 9 | |
Receive | | | 0.22% | | Shenzhen Suntak Circuit Technology Co. Ltd. A-shares | | | Morgan Stanley | | | | 2/5/24 | | | | At Maturity | | | | 101 | | | | 9 | | | | — | | | | 9 | |
Receive | | | 0.22% | | Shenzhen Tagen Group Co. Ltd. A-shares | | | Morgan Stanley | | | | 2/5/24 | | | | At Maturity | | | | 42 | | | | 1 | | | | — | | | | 1 | |
Receive | | | 0.22% | | Shenzhen Yinghe Technology Co. Ltd. A-shares | | | Morgan Stanley | | | | 2/5/24 | | | | At Maturity | | | | 13 | | | | 3 | | | | — | | | | 3 | |
Receive | | | 0.22% | | Shenzhen Zhongjin Lingnan Nonfemet Co. Ltd. A-shares | | | Morgan Stanley | | | | 2/5/24 | | | | At Maturity | | | | 172 | | | | (2 | ) | | | — | | | | (2 | ) |
Receive | | | 0.22% | | Sichuan Development Lomon Co. Ltd. A-shares | | | Morgan Stanley | | | | 2/5/24 | | | | At Maturity | | | | 23 | | | | 15 | | | | — | | | | 15 | |
Receive | | | 0.22% | | Sichuan Furong Technology Co. Ltd. A-shares | | | Morgan Stanley | | | | 2/5/24 | | | | At Maturity | | | | 182 | | | | 9 | | | | — | | | | 9 | |
Receive | | | 0.22% | | Sichuan Hebang Biotechnology Co. Ltd. A-shares | | | Morgan Stanley | | | | 2/5/24 | | | | At Maturity | | | | 30 | | | | 5 | | | | — | | | | 5 | |
Receive | | | 0.22% | | Sichuan Jiuyuan Yinhai Software Co. Ltd. A-shares | | | Morgan Stanley | | | | 2/5/24 | | | | At Maturity | | | | 48 | | | | 1 | | | | — | | | | 1 | |
Receive | | | 0.22% | | Sichuan Jiuzhou Electric Co. Ltd. A-shares | | | Morgan Stanley | | | | 2/5/24 | | | | At Maturity | | | | 3 | | | | — | | | | — | | | | — | |
Receive | | | 0.22% | | Sichuan Road & Bridge Co. Ltd. A-shares | | | Morgan Stanley | | | | 2/5/24 | | | | At Maturity | | | | 61 | | | | — | | | | — | | | | — | |
Receive | | | 0.22% | | Sichuan Yahua Industrial Group Co. Ltd. A-shares | | | Morgan Stanley | | | | 2/5/24 | | | | At Maturity | | | | 175 | | | | 31 | | | | — | | | | 31 | |
Receive | | | 0.22% | | Sieyuan Electric Co. Ltd. A-shares | | | Morgan Stanley | | | | 2/5/24 | | | | At Maturity | | | | 4 | | | | — | | | | — | | | | — | |
Receive | | | 0.22% | | Sino Wealth Electronic Ltd. A-shares | | | Morgan Stanley | | | | 2/5/24 | | | | At Maturity | | | | 132 | | | | (6 | ) | | | — | | | | (6 | ) |
Receive | | | 0.22% | | Sinoma International Engineering Co. A-shares | | | Morgan Stanley | | | | 2/5/24 | | | | At Maturity | | | | 17 | | | | 3 | | | | — | | | | 3 | |
See accompanying notes to financial statements.
177
HC CAPITAL TRUST
The Emerging Markets Portfolio
Portfolio of Investments (continued) — June 30, 2022
Total Return Swap Agreements |
Pay/
Receive(a) | | Financing
Rate | | Description | | Counterparty | | | Expiration
Date | | | Payment
Frequency | | | Notional
Amount
(000) | | | Value
(000) | | | Upfront
Premiums
Paid/
(Received)
(000) | | | Unrealized
Appreciation/
(Depreciation)
(000) | |
Receive | | | 0.22% | | Sinomine Resource Group Co. Ltd. A-shares | | | Morgan Stanley | | | | 2/5/24 | | | | At Maturity | | | $ | 224 | | | $ | 132 | | | $ | — | | | $ | 132 | |
Receive | | | 0.22% | | Sinoseal Holding Co. Ltd. A-shares | | | Morgan Stanley | | | | 2/5/24 | | | | At Maturity | | | | 342 | | | | (8 | ) | | | — | | | | (8 | ) |
Receive | | | 0.22% | | Skshu Paint Co. Ltd. A-shares | | | Morgan Stanley | | | | 2/5/24 | | | | At Maturity | | | | 23 | | | | 8 | | | | — | | | | 8 | |
Receive | | | 0.22% | | Sobute New Materials Co. Ltd. A-shares | | | Morgan Stanley | | | | 2/5/24 | | | | At Maturity | | | | 10 | | | | 1 | | | | — | | | | 1 | |
Receive | | | 0.22% | | SooChow Securities Co. Ltd. A-shares | | | Morgan Stanley | | | | 2/5/24 | | | | At Maturity | | | | 109 | | | | — | | | | — | | | | — | |
Receive | | | 0.22% | | StarPower Semiconductor Ltd. A-shares | | | Morgan Stanley | | | | 2/5/24 | | | | At Maturity | | | | 24 | | | | 5 | | | | — | | | | 5 | |
Receive | | | 0.22% | | STO Express Co. Ltd. A-shares | | | Morgan Stanley | | | | 2/5/24 | | | | At Maturity | | | | 16 | | | | 1 | | | | — | | | | 1 | |
Receive | | | 0.22% | | Sunresin New Materials Co. Ltd. A-shares | | | Morgan Stanley | | | | 2/5/24 | | | | At Maturity | | | | 2 | | | | 1 | | | | — | | | | 1 | |
Receive | | | 0.22% | | Suzhou Electrical Apparatus Science Academy Co. Ltd. A-shares | | | Morgan Stanley | | | | 2/5/24 | | | | At Maturity | | | | 13 | | | | — | | | | — | | | | — | |
Receive | | | 0.22% | | Suzhou Maxwell Technologies Co. Ltd. A-shares | | | Morgan Stanley | | | | 2/5/24 | | | | At Maturity | | | | 52 | | | | 17 | | | | — | | | | 17 | |
Receive | | | 0.22% | | Suzhou Secote Precision Electronic Co. Ltd. A-shares | | | Morgan Stanley | | | | 2/5/24 | | | | At Maturity | | | | 9 | | | | 1 | | | | — | | | | 1 | |
Receive | | | 0.22% | | Suzhou TA&A Ultra Clean Technology Co. Ltd. A-shares | | | Morgan Stanley | | | | 2/5/24 | | | | At Maturity | | | | 309 | | | | 133 | | | | — | | | | 133 | |
Receive | | | 0.22% | | Suzhou TFC Optical Communication Co. Ltd. A-shares | | | Morgan Stanley | | | | 2/5/24 | | | | At Maturity | | | | 81 | | | | (2 | ) | | | — | | | | (2 | ) |
Receive | | | 0.22% | | Tangshan Sanyou Chemical Industries Co. Ltd. A-shares | | | Morgan Stanley | | | | 2/5/24 | | | | At Maturity | | | | 3 | | | | — | | | | — | | | | — | |
Receive | | | 0.22% | | TBEA Co. Ltd. A-shares | | | Morgan Stanley | | | | 2/5/24 | | | | At Maturity | | | | 571 | | | | 157 | | | | — | | | | 157 | |
Receive | | | 0.22% | | TCL Zhonghuan Renewable Energy Technology Co. Ltd. A-shares | | | Morgan Stanley | | | | 2/5/24 | | | | At Maturity | | | | 261 | | | | 81 | | | | — | | | | 81 | |
Receive | | | 0.22% | | The People’s Insurance Co. Group of China Ltd. A-shares | | | Morgan Stanley | | | | 2/5/24 | | | | At Maturity | | | | 684 | | | | 56 | | | | — | | | | 56 | |
Receive | | | 0.22% | | Thunder Software Technology Co. Ltd. A-shares | | | Morgan Stanley | | | | 2/5/24 | | | | At Maturity | | | | 73 | | | | 10 | | | | — | | | | 10 | |
Receive | | | 0.22% | | Tian Di Science & Technology Co. Ltd. A-shares | | | Morgan Stanley | | | | 2/5/24 | | | | At Maturity | | | | 15 | | | | — | | | | — | | | | — | |
Receive | | | 0.22% | | Tianqi Lithium Corp. A-shares | | | Morgan Stanley | | | | 2/5/24 | | | | At Maturity | | | | 446 | | | | 32 | | | | — | | | | 32 | |
Receive | | | 0.22% | | Tibet Mineral Development Co. A-shares | | | Morgan Stanley | | | | 2/5/24 | | | | At Maturity | | | | 48 | | | | 2 | | | | — | | | | 2 | |
Receive | | | 0.22% | | Titan Wind Energy Suzhou Co. Ltd. A-shares | | | Morgan Stanley | | | | 2/5/24 | | | | At Maturity | | | | 20 | | | | 1 | | | | — | | | | 1 | |
Receive | | | 0.22% | | Tofflon Science & Technology Group Co. Ltd. A-shares | | | Morgan Stanley | | | | 2/5/24 | | | | At Maturity | | | | 21 | | | | 1 | | | | — | | | | 1 | |
See accompanying notes to financial statements.
178
HC CAPITAL TRUST
The Emerging Markets Portfolio
Portfolio of Investments (continued) — June 30, 2022
Total Return Swap Agreements |
Pay/
Receive(a) | | Financing
Rate | | Description | | Counterparty | | | Expiration
Date | | | Payment
Frequency | | | Notional
Amount
(000) | | | Value
(000) | | | Upfront
Premiums
Paid/
(Received)
(000) | | | Unrealized
Appreciation/
(Depreciation)
(000) | |
Receive | | | 0.22% | | Tongwei Co. Ltd. A-shares | | | Morgan Stanley | | | | 2/5/24 | | | | At Maturity | | | $ | 719 | | | $ | 215 | | | $ | — | | | $ | 215 | |
Receive | | | 0.22% | | Top Resource Conservation & Environment Corp. A-shares | | | Morgan Stanley | | | | 2/5/24 | | | | At Maturity | | | | 119 | | | | 5 | | | | — | | | | 5 | |
Receive | | | 0.22% | | Trina Solar Co. Ltd. A-shares | | | Morgan Stanley | | | | 2/5/24 | | | | At Maturity | | | | 41 | | | | (2 | ) | | | — | | | | (2 | ) |
Receive | | | 0.22% | | Tsingtao Brewery Co. Ltd. A-shares | | | Morgan Stanley | | | | 2/5/24 | | | | At Maturity | | | | 46 | | | | 9 | | | | — | | | | 9 | |
Receive | | | 0.22% | | Unigroup Guoxin Microelectronics Co. Ltd. A-shares | | | Morgan Stanley | | | | 2/5/24 | | | | At Maturity | | | | 135 | | | | 1 | | | | — | | | | 1 | |
Receive | | | 0.22% | | Unilumin Group Co. Ltd. A-shares | | | Morgan Stanley | | | | 2/5/24 | | | | At Maturity | | | | 47 | | | | 1 | | | | — | | | | 1 | |
Receive | | | 0.22% | | Unisplendour Corp. Ltd. A-shares | | | Morgan Stanley | | | | 2/5/24 | | | | At Maturity | | | | 6 | | | | 1 | | | | — | | | | 1 | |
Receive | | | 0.22% | | Valiant Co. Ltd. A-shares | | | Morgan Stanley | | | | 2/5/24 | | | | At Maturity | | | | 223 | | | | 19 | | | | — | | | | 19 | |
Receive | | | 0.22% | | Vats Liquor Chain Store Management JSC Ltd. A-shares | | | Morgan Stanley | | | | 2/5/24 | | | | At Maturity | | | | 37 | | | | 6 | | | | — | | | | 6 | |
Receive | | | 0.22% | | Wanhua Chemical Group Co. Ltd. A-shares | | | Morgan Stanley | | | | 2/5/24 | | | | At Maturity | | | | 11 | | | | 2 | | | | — | | | | 2 | |
Receive | | | 0.22% | | Wanxiang Qianchao Co. Ltd. A-shares | | | Morgan Stanley | | | | 2/5/24 | | | | At Maturity | | | | 164 | | | | 13 | | | | — | | | | 13 | |
Receive | | | 0.22% | | Weifu High-Technology Group Co. Ltd. A-shares | | | Morgan Stanley | | | | 2/5/24 | | | | At Maturity | | | | 357 | | | | (16 | ) | | | — | | | | (16 | ) |
Receive | | | 0.22% | | Weihai Guangwei Composites Co. Ltd. A-shares | | | Morgan Stanley | | | | 2/5/24 | | | | At Maturity | | | | 138 | | | | 5 | | | | — | | | | 5 | |
Receive | | | 0.22% | | Western Superconducting Technologies Co. Ltd. A-shares | | | Morgan Stanley | | | | 2/5/24 | | | | At Maturity | | | | 127 | | | | 4 | | | | — | | | | 4 | |
Receive | | | 0.22% | | Will Semiconductor Co. Ltd. A-shares | | | Morgan Stanley | | | | 2/5/24 | | | | At Maturity | | | | 3 | | | | — | | | | — | | | | — | |
Receive | | | 0.22% | | Wuhan DR Laser Technology Corp. Ltd. A-shares | | | Morgan Stanley | | | | 2/5/24 | | | | At Maturity | | | | 4 | | | | 1 | | | | — | | | | 1 | |
Receive | | | 0.22% | | Wuhan Easydiagnosis Biomedicine Co. Ltd. A-shares | | | Morgan Stanley | | | | 2/5/24 | | | | At Maturity | | | | 1 | | | | — | | | | — | | | | — | |
Receive | | | 0.22% | | Wuhan P&S Information Technology Co. Ltd. A-shares | | | Morgan Stanley | | | | 2/5/24 | | | | At Maturity | | | | 17 | | | | 1 | | | | — | | | | 1 | |
Receive | | | 0.22% | | Wuliangye Yibin Co. Ltd. A-shares | | | Morgan Stanley | | | | 2/5/24 | | | | At Maturity | | | | 505 | | | | 113 | | | | — | | | | 113 | |
Receive | | | 0.22% | | WUS Printed Circuit Kunshan Co. Ltd. A-shares | | | Morgan Stanley | | | | 2/5/24 | | | | At Maturity | | | | 5 | | | | — | | | | — | | | | — | |
Receive | | | 0.22% | | WuXi AppTec Co. Ltd. A-shares | | | Morgan Stanley | | | | 2/5/24 | | | | At Maturity | | | | 417 | | | | (12 | ) | | | — | | | | (12 | ) |
Receive | | | 0.22% | | Wuxi Lead Intelligent Equipment Co. Ltd. A-shares | | | Morgan Stanley | | | | 2/5/24 | | | | At Maturity | | | | 44 | | | | — | | | | — | | | | — | |
Receive | | | 0.22% | | Wuxi NCE Power Co. Ltd. A-shares | | | Morgan Stanley | | | | 2/5/24 | | | | At Maturity | | | | 3 | | | | 1 | | | | — | | | | 1 | |
See accompanying notes to financial statements.
179
HC CAPITAL TRUST
The Emerging Markets Portfolio
Portfolio of Investments (continued) — June 30, 2022
Total Return Swap Agreements |
Pay/
Receive(a) | | Financing
Rate | | Description | | Counterparty | | | Expiration
Date | | | Payment
Frequency | | | Notional
Amount
(000) | | | Value
(000) | | | Upfront
Premiums
Paid/
(Received)
(000) | | | Unrealized
Appreciation/
(Depreciation)
(000) | |
Receive | | | 0.22% | | Wuxi Shangji Automation Co. Ltd. A-shares | | | Morgan Stanley | | | | 2/5/24 | | | | At Maturity | | | $ | 29 | | | $ | 6 | | | $ | — | | | $ | 6 | |
Receive | | | 0.22% | | XGD, Inc. A-shares | | | Morgan Stanley | | | | 2/5/24 | | | | At Maturity | | | | 69 | | | | (10 | ) | | | — | | | | (10 | ) |
Receive | | | 0.22% | | Xiamen Bank Co. Ltd. A-shares | | | Morgan Stanley | | | | 2/5/24 | | | | At Maturity | | | | 9 | | | | — | | | | — | | | | — | |
Receive | | | 0.22% | | Xiamen C & D, Inc. A-shares | | | Morgan Stanley | | | | 2/5/24 | | | | At Maturity | | | | 35 | | | | 3 | | | | — | | | | 3 | |
Receive | | | 0.22% | | Xiamen Faratronic Co. Ltd. A-shares | | | Morgan Stanley | | | | 2/5/24 | | | | At Maturity | | | | 305 | | | | 57 | | | | — | | | | 57 | |
Receive | | | 0.22% | | Xiamen Tungsten Co. Ltd. A-shares | | | Morgan Stanley | | | | 2/5/24 | | | | At Maturity | | | | 79 | | | | 3 | | | | — | | | | 3 | |
Receive | | | 0.22% | | Xiamen Xiangyu Co. Ltd. A-shares | | | Morgan Stanley | | | | 2/5/24 | | | | At Maturity | | | | 165 | | | | 2 | | | | — | | | | 2 | |
Receive | | | 0.22% | | Xi’an Triangle Defense Co. Ltd. A-shares | | | Morgan Stanley | | | | 2/5/24 | | | | At Maturity | | | | 72 | | | | 10 | | | | — | | | | 10 | |
Receive | | | 0.22% | | Xinfengming Group Co. Ltd. A-shares | | | Morgan Stanley | | | | 2/5/24 | | | | At Maturity | | | | 3 | | | | — | | | | — | | | | — | |
Receive | | | 0.22% | | Xinjiang Goldwind Science & Technology Co. Ltd. A-shares | | | Morgan Stanley | | | | 2/5/24 | | | | At Maturity | | | | 168 | | | | 16 | | | | — | | | | 16 | |
Receive | | | 0.22% | | Xinxing Ductile Iron Pipes Co. Ltd. A-shares | | | Morgan Stanley | | | | 2/5/24 | | | | At Maturity | | | | 4 | | | | — | | | | — | | | | — | |
Receive | | | 0.22% | | Xinyu Iron & Steel Co. Ltd. A-shares | | | Morgan Stanley | | | | 2/5/24 | | | | At Maturity | | | | 64 | | | | (8 | ) | | | — | | | | (8 | ) |
Receive | | | 0.22% | | Yangling Metron New Material, Inc. A-shares | | | Morgan Stanley | | | | 2/5/24 | | | | At Maturity | | | | 100 | | | | 4 | | | | — | | | | 4 | |
Receive | | | 0.22% | | Yangzhou Yangjie Electronic Technology Co. Ltd. A-shares | | | Morgan Stanley | | | | 2/5/24 | | | | At Maturity | | | | 192 | | | | — | | | | — | | | | — | |
Receive | | | 0.22% | | Yankuang Energy Group Co. Ltd. A-shares | | | Morgan Stanley | | | | 2/5/24 | | | | At Maturity | | | | 174 | | | | 19 | | | | — | | | | 19 | |
Receive | | | 0.22% | | Yantai China Pet Foods Co. Ltd. A-shares | | | Morgan Stanley | | | | 2/5/24 | | | | At Maturity | | | | 15 | | | | — | | | | — | | | | — | |
Receive | | | 0.22% | | Yantai Jereh Oilfield Services Group Co. Ltd. A-shares | | | Morgan Stanley | | | | 2/5/24 | | | | At Maturity | | | | 8 | | | | — | | | | — | | | | — | |
Receive | | | 0.22% | | YanTai Shuangta Food Co. Ltd. A-shares | | | Morgan Stanley | | | | 2/5/24 | | | | At Maturity | | | | 2 | | | | — | | | | — | | | | — | |
Receive | | | 0.22% | | Yantai Zhenghai Magnetic Material Co. Ltd. A-shares | | | Morgan Stanley | | | | 2/5/24 | | | | At Maturity | | | | 14 | | | | 1 | | | | — | | | | 1 | |
Receive | | | 0.22% | | Yealink Network Technology Corp. Ltd. A-shares | | | Morgan Stanley | | | | 2/5/24 | | | | At Maturity | | | | 196 | | | | 5 | | | | — | | | | 5 | |
Receive | | | 0.22% | | YGSOFT, Inc. A-shares | | | Morgan Stanley | | | | 2/5/24 | | | | At Maturity | | | | 55 | | | | — | | | | — | | | | — | |
Receive | | | 0.22% | | Yifeng Pharmacy Chain Co. Ltd. A-shares | | | Morgan Stanley | | | | 2/5/24 | | | | At Maturity | | | | 4 | | | | 1 | | | | — | | | | 1 | |
Receive | | | 0.22% | | Yintai Gold Co. Ltd. A-shares | | | Morgan Stanley | | | | 2/5/24 | | | | At Maturity | | | | 3 | | | | — | | | | — | | | | — | |
See accompanying notes to financial statements.
180
HC CAPITAL TRUST
The Emerging Markets Portfolio
Portfolio of Investments (continued) — June 30, 2022
Total Return Swap Agreements |
Pay/
Receive(a) | | Financing
Rate | | Description | | Counterparty | | | Expiration
Date | | | Payment
Frequency | | | Notional
Amount
(000) | | | Value
(000) | | | Upfront
Premiums
Paid/
(Received)
(000) | | | Unrealized
Appreciation/
(Depreciation)
(000) | |
Receive | | | 0.22% | | YongXing Special Materials Technology Co. Ltd. A-shares | | | Morgan Stanley | | | | 2/5/24 | | | | At Maturity | | | $ | 265 | | | $ | 97 | | | $ | — | | | $ | 97 | |
Receive | | | 0.22% | | Youngor Group Co. Ltd. A-shares | | | Morgan Stanley | | | | 2/5/24 | | | | At Maturity | | | | 85 | | | | (2 | ) | | | — | | | | (2 | ) |
Receive | | | 0.22% | | Youngy Co. Ltd. A-shares | | | Morgan Stanley | | | | 2/5/24 | | | | At Maturity | | | | 129 | | | | 26 | | | | — | | | | 26 | |
Receive | | | 0.22% | | YTO Express Group Co. Ltd. A-shares | | | Morgan Stanley | | | | 2/5/24 | | | | At Maturity | | | | 96 | | | | 1 | | | | — | | | | 1 | |
Receive | | | 0.22% | | Yunda Holding Co. Ltd. A-shares | | | Morgan Stanley | | | | 2/5/24 | | | | At Maturity | | | | 11 | | | | — | | | | — | | | | — | |
Receive | | | 0.22% | | Yunnan Aluminium Co. Ltd. A-shares | | | Morgan Stanley | | | | 2/5/24 | | | | At Maturity | | | | 4 | | | | (1 | ) | | | — | | | | (1 | ) |
Receive | | | 0.22% | | Yunnan Botanee Bio-Technology Group Co. Ltd. A-shares | | | Morgan Stanley | | | | 2/5/24 | | | | At Maturity | | | | 35 | | | | 4 | | | | — | | | | 4 | |
Receive | | | 0.22% | | Yunnan Copper Co. Ltd. A-shares | | | Morgan Stanley | | | | 2/5/24 | | | | At Maturity | | | | 133 | | | | (3 | ) | | | — | | | | (3 | ) |
Receive | | | 0.22% | | Yunnan Energy New Material Co. Ltd. A-shares | | | Morgan Stanley | | | | 2/5/24 | | | | At Maturity | | | | 303 | | | | 37 | | | | — | | | | 37 | |
Receive | | | 0.22% | | Yunnan Tin Co. Ltd. A-shares | | | Morgan Stanley | | | | 2/5/24 | | | | At Maturity | | | | 122 | | | | (3 | ) | | | — | | | | (3 | ) |
Receive | | | 0.22% | | Yunnan Yuntianhua Co. Ltd. A-shares | | | Morgan Stanley | | | | 2/5/24 | | | | At Maturity | | | | 95 | | | | 7 | | | | — | | | | 7 | |
Receive | | | 0.22% | | Zhejiang China Commodities City Group Co. Ltd. A-shares | | | Morgan Stanley | | | | 2/5/24 | | | | At Maturity | | | | 8 | | | | — | | | | — | | | | — | |
Receive | | | 0.22% | | Zhejiang Dingli Machinery Co. Ltd. A-shares | | | Morgan Stanley | | | | 2/5/24 | | | | At Maturity | | | | 7 | | | | — | | | | — | | | | — | |
Receive | | | 0.22% | | Zhejiang Garden Bio-Chemical High-tech Co. Ltd. A-shares | | | Morgan Stanley | | | | 2/5/24 | | | | At Maturity | | | | 10 | | | | 2 | | | | — | | | | 2 | |
Receive | | | 0.22% | | Zhejiang HangKe Technology, Inc. Co. A-shares | | | Morgan Stanley | | | | 2/5/24 | | | | At Maturity | | | | 11 | | | | — | | | | — | | | | — | |
Receive | | | 0.22% | | Zhejiang Huayou Cobalt Co. Ltd. A-shares | | | Morgan Stanley | | | | 2/5/24 | | | | At Maturity | | | | 83 | | | | 12 | | | | — | | | | 12 | |
Receive | | | 0.22% | | Zhejiang Jiahua Energy Chemical Industry Co. Ltd. A-shares | | | Morgan Stanley | | | | 2/5/24 | | | | At Maturity | | | | 621 | | | | 5 | | | | — | | | | 5 | |
Receive | | | 0.22% | | Zhejiang Jiecang Linear Motion Technology Co. Ltd. A-shares | | | Morgan Stanley | | | | 2/5/24 | | | | At Maturity | | | | 2 | | | | — | | | | — | | | | — | |
Receive | | | 0.22% | | Zhejiang Jiemei Electronic & Technology Co. Ltd. A-shares | | | Morgan Stanley | | | | 2/5/24 | | | | At Maturity | | | | 12 | | | | 1 | | | | — | | | | 1 | |
Receive | | | 0.22% | | Zhejiang Jingsheng Mechanical & Electrical Co. Ltd. A-shares | | | Morgan Stanley | | | | 2/5/24 | | | | At Maturity | | | | 180 | | | | 35 | | | | — | | | | 35 | |
Receive | | | 0.22% | | Zhejiang JIULI Hi-tech Metals Co. Ltd. A-shares | | | Morgan Stanley | | | | 2/5/24 | | | | At Maturity | | | | 28 | | | | (1 | ) | | | — | | | | (1 | ) |
Receive | | | 0.22% | | Zhejiang Jiuzhou Pharmaceutical Co. Ltd. A-shares | | | Morgan Stanley | | | | 2/5/24 | | | | At Maturity | | | | 70 | | | | 7 | | | | — | | | | 7 | |
Receive | | | 0.22% | | Zhejiang Medicine Co. Ltd. A-shares | | | Morgan Stanley | | | | 2/5/24 | | | | At Maturity | | | | 61 | | | | — | | | | — | | | | — | |
See accompanying notes to financial statements.
181
HC CAPITAL TRUST
The Emerging Markets Portfolio
Portfolio of Investments (continued) — June 30, 2022
Total Return Swap Agreements |
Pay/
Receive(a) | | Financing
Rate | | Description | | Counterparty | | | Expiration
Date | | | Payment
Frequency | | | Notional
Amount
(000) | | | Value
(000) | | | Upfront
Premiums
Paid/
(Received)
(000) | | | Unrealized
Appreciation/
(Depreciation)
(000) | |
Receive | | | 0.22% | | Zhejiang Meida Industrial Co. Ltd. A-shares | | | Morgan Stanley | | | | 2/5/24 | | | | At Maturity | | | $ | 361 | | | $ | 18 | | | $ | — | | | $ | 18 | |
Receive | | | 0.22% | | Zhejiang Narada Power Source Co. Ltd. A-shares | | | Morgan Stanley | | | | 2/5/24 | | | | At Maturity | | | | 53 | | | | 6 | | | | — | | | | 6 | |
Receive | | | 0.22% | | Zhejiang Orient Gene Biotech Co. Ltd. A-shares | | | Morgan Stanley | | | | 2/5/24 | | | | At Maturity | | | | 212 | | | | (25 | ) | | | — | | | | (25 | ) |
Receive | | | 0.22% | | Zhejiang Shuanghuan Driveline Co. Ltd. A-shares | | | Morgan Stanley | | | | 2/5/24 | | | | At Maturity | | | | 16 | | | | 4 | | | | — | | | | 4 | |
Receive | | | 0.22% | | Zhejiang Supor Co. Ltd. A-shares | | | Morgan Stanley | | | | 2/5/24 | | | | At Maturity | | | | 145 | | | | 5 | | | | — | | | | 5 | |
Receive | | | 0.22% | | Zhejiang Wanfeng Auto Wheel Co. Ltd. A-shares | | | Morgan Stanley | | | | 2/5/24 | | | | At Maturity | | | | 38 | | | | 1 | | | | — | | | | 1 | |
Receive | | | 0.22% | | Zhejiang Wanliyang Co. Ltd. A-shares | | | Morgan Stanley | | | | 2/5/24 | | | | At Maturity | | | | 3 | | | | — | | | | — | | | | — | |
Receive | | | 0.22% | | Zhejiang Wanma Co. Ltd. A-shares | | | Morgan Stanley | | | | 2/5/24 | | | | At Maturity | | | | 10 | | | | — | | | | — | | | | — | |
Receive | | | 0.22% | | Zhejiang Weixing Industrial Development Co. Ltd. A-shares | | | Morgan Stanley | | | | 2/5/24 | | | | At Maturity | | | | 2 | | | | — | | | | — | | | | — | |
Receive | | | 0.22% | | Zhejiang Weixing New Building Materials Co. Ltd. A-shares | | | Morgan Stanley | | | | 2/5/24 | | | | At Maturity | | | | 24 | | | | 7 | | | | — | | | | 7 | |
Receive | | | 0.22% | | Zhejiang Windey Co. Ltd. A-shares | | | Morgan Stanley | | | | 2/5/24 | | | | At Maturity | | | | — | | | | — | | | | — | | | | — | |
Receive | | | 0.22% | | Zhejiang Xianju Pharmaceutical Co. Ltd. A-shares | | | Morgan Stanley | | | | 2/5/24 | | | | At Maturity | | | | 12 | | | | — | | | | — | | | | — | |
Receive | | | 0.22% | | Zhejiang Xinan Chemical Industrial Group Co. Ltd. A-shares | | | Morgan Stanley | | | | 2/5/24 | | | | At Maturity | | | | 161 | | | | 3 | | | | — | | | | 3 | |
Receive | | | 0.22% | | Zhejiang Yasha Decoration Co. Ltd. A-shares | | | Morgan Stanley | | | | 2/5/24 | | | | At Maturity | | | | 16 | | | | — | | | | — | | | | — | |
Receive | | | 0.22% | | Zhengzhou Coal Mining Machinery Group Co. Ltd. A-shares | | | Morgan Stanley | | | | 2/5/24 | | | | At Maturity | | | | 90 | | | | 9 | | | | — | | | | 9 | |
Receive | | | 0.22% | | Zhongji Innolight Co. Ltd. A-shares | | | Morgan Stanley | | | | 2/5/24 | | | | At Maturity | | | | 115 | | | | (2 | ) | | | — | | | | (2 | ) |
Receive | | | 0.22% | | Zhongshan Broad Ocean Motor Co. Ltd. A-shares | | | Morgan Stanley | | | | 2/5/24 | | | | At Maturity | | | | 19 | | | | — | | | | — | | | | — | |
Receive | | | 0.22% | | Zhuhai Bojay Electronics Co. Ltd. A-shares | | | Morgan Stanley | | | | 2/5/24 | | | | At Maturity | | | | 5 | | | | — | | | | — | | | | — | |
Receive | | | 0.22% | | Zhuhai Huafa Properties Co. Ltd. A-shares | | | Morgan Stanley | | | | 2/5/24 | | | | At Maturity | | | | 44 | | | | 4 | | | | — | | | | 4 | |
Receive | | | 0.22% | | Zhuzhou CRRC Times Electric Co. Ltd. A-shares | | | Morgan Stanley | | | | 2/5/24 | | | | At Maturity | | | | 19 | | | | 3 | | | | — | | | | 3 | |
Receive | | | 0.22% | | Zijin Mining Group Co. Ltd. A-shares | | | Morgan Stanley | | | | 2/5/24 | | | | At Maturity | | | | 498 | | | | (74 | ) | | | — | | | | (74 | ) |
See accompanying notes to financial statements.
182
HC CAPITAL TRUST
The Emerging Markets Portfolio
Portfolio of Investments (concluded) — June 30, 2022
Total Return Swap Agreements |
Pay/
Receive(a) | | Financing
Rate | | Description | | Counterparty | | | Expiration
Date | | | Payment
Frequency | | | Notional
Amount
(000) | | | Value
(000) | | | Upfront
Premiums
Paid/
(Received)
(000) | | | Unrealized
Appreciation/
(Depreciation)
(000) | |
Receive | | | 0.22% | | ZTE Corp. A-shares | | | Morgan Stanley | | | | 2/5/24 | | | | At Maturity | | | $ | 10 | | | $ | — | | | $ | — | | | $ | — | |
| | | | | | | | | | | | | | | | | | | | | | | | $ | 4,301 | | | $ | — | | | $ | 4,301 | |
| | | | | | | | | | | Total swap agreements at value (assets) | | $ | 4,862 | |
| | | | | | | | | | | Total swap agreements at value (liabilities) | | | (561 | ) |
| | | | | | | | | | | Net swap agreements at value | | $ | 4,301 | |
Amounts designated as “—” are $0 or have been rounded to $0.
(a) | Receive represents that the Portfolio receives payments for any positive return on the underlying reference. The Portfolio makes payments for any negative return on such underlying reference. Pay represents that the Portfolio receives payments for any negative return on the underlying reference. The Portfolio makes payments for any positive return on such underlying reference. |
See accompanying notes to financial statements.
183
HC CAPITAL TRUST
The Core Fixed Income Portfolio
Portfolio of Investments — June 30, 2022
| | Principal
Amount
(000) | | Security Description | | Rate % | | | Maturity
Date | | | Value
(000) | |
| | | | | Asset Backed Securities — 0.12% | | | | | | | | | | | | |
| | $ | 15 | | Capital One Multi-Asset Execution Trust, Series 2021-A2, Class - A2 | | | 1.39 | | | | 7/15/30 | | | $ | 13 | |
| | | 10 | | GM Financial Automobile Leasing Trust, Series 2021-3, Class - A3, Callable 3/20/24 @ 100.00 | | | 0.39 | | | | 10/21/24 | | | | 10 | |
| | | 20 | | Hyundai Auto Receivables Trust, Series 2022-A, Class - A3, Callable 3/15/26 @ 100.00 | | | 2.22 | | | | 10/15/26 | | | | 19 | |
| | | 15 | | Synchrony Card Funding LLC, Series 2022-A1, Class - A | | | 3.37 | | | | 4/15/28 | | | | 15 | |
| | | 10 | | World Omni Auto Receivables Trust, Series 2021-C, Class - A4, Callable 9/15/24 @ 100.00 | | | 0.64 | | | | 9/15/27 | | | | 9 | |
| | | | | Total Asset Backed Securities | | | | | | | | | | | 66 | |
| | | | | | | | | | | | | | | | | |
| | | | | Collateralized Mortgage Obligations — 1.62% | | | | | | | | | | | | |
| | | 20 | | Bank, Series 2019-BN21, Class - A5, Callable 9/15/29 @ 100.00 | | | 2.85 | | | | 10/15/52 | | | | 18 | |
| | | 40 | | Bank, Series 2017-BNK8, Class - A3, Callable 10/15/27 @ 100.00 | | | 3.23 | | | | 11/15/50 | | | | 38 | |
| | | 25 | | Bank, Series 2017-BNK9, Class - ASB, Callable 8/15/27 @ 100.00 | | | 3.47 | | | | 11/15/54 | | | | 25 | |
| | | 20 | | BBCMS Mortgage Trust, Series 2020-C7, Class - AS, Callable 3/15/30 @ 100.00 | | | 2.44 | | | | 4/15/53 | | | | 17 | |
| | | 10 | | Benchmark Mortgage Trust, Series 2020-IG1, Class - AS, Callable 1/15/30 @ 100.00 | | | 2.91(a) | | | | 9/15/43 | | | | 9 | |
| | | 10 | | Benchmark Mortgage Trust, Series 2019-B9, Class - A5, Callable 1/15/29 @ 100.00 | | | 4.02 | | | | 3/15/52 | | | | 10 | |
| | | 21 | | Citigroup Commercial Mortgage Trust, Series 2015-GC27, Class - A4, Callable 11/10/24 @ 100.00 | | | 2.88 | | | | 2/10/48 | | | | 20 | |
| | | 15 | | Citigroup Commercial Mortgage Trust, Series 2020-GC46, Class - AS, Callable 2/15/30 @ 100.00 | | | 2.92 | | | | 2/15/53 | | | | 13 | |
| | | 10 | | Citigroup Commercial Mortgage Trust, Series 2019-C7, Class - A4, Callable 12/15/29 @ 100.00 | | | 3.10 | | | | 12/15/72 | | | | 9 | |
| | | 25 | | Citigroup Commercial Mortgage Trust, Series 2014-GC23, Class - A4, Callable 7/10/24 @ 100.00 | | | 3.62 | | | | 7/10/47 | | | | 25 | |
| | | 20 | | COMM Mortgage Trust, Series 2015-DC1, Class - A5, Callable 1/10/25 @ 100.00 | | | 3.35 | | | | 2/10/48 | | | | 20 | |
| | | 25 | | Commercial Mortgage Trust, Series 2015-LC19, Class - A4, Callable 1/10/25 @ 100.00 | | | 3.18 | | | | 2/10/48 | | | | 24 | |
| | | 25 | | Commercial Mortgage Trust, Series 2013-CR11, Class - B, Callable 9/10/23 @ 100.00 | | | 5.11(a) | | | | 8/10/50 | | | | 25 | |
| | | 20 | | Fannie Mae-ACES, Series 2020-M14, Class - A2 | | | 1.78 | | | | 5/25/30 | | | | 18 | |
| | | 20 | | Fannie Mae-ACES, Series 2015-M1, Class - A2 | | | 2.53 | | | | 9/25/24 | | | | 20 | |
| | | 10 | | Fannie Mae-ACES, Series 2015-M8, Class - A2 | | | 2.90(a) | | | | 1/25/25 | | | | 10 | |
| | | 21 | | Fannie Mae-ACES, Series 2016-M1, Class - A2 | | | 2.94(a) | | | | 1/25/26 | | | | 21 | |
| | | 20 | | Fannie Mae-ACES, Series 2017-M12, Class - A2 | | | 3.07(a) | | | | 6/25/27 | | | | 20 | |
| | | 20 | | Fannie Mae-ACES, Series 2018-M1, Class - A2 | | | 3.09(a) | | | | 12/25/27 | | | | 20 | |
| | | 20 | | Fannie Mae-ACES, Series 2019-M5, Class - A2 | | | 3.27 | | | | 1/25/29 | | | | 20 | |
| | | 25 | | Fannie Mae-ACES, Series 2018-M10, Class - A2 | | | 3.48(a) | | | | 7/25/28 | | | | 25 | |
| | | 20 | | Freddie Mac Multifamily Structured Pass-Through Certificates, Series K112, Class - A2, Callable 5/25/30 @ 100.00 | | | 1.31 | | | | 5/25/30 | | | | 17 | |
| | | 20 | | Freddie Mac Multifamily Structured Pass-Through Certificates, Series K1516, Class - A2, Callable 5/25/35 @ 100.00 | | | 1.72 | | | | 5/25/35 | | | | 16 | |
| | | 25 | | Freddie Mac Multifamily Structured Pass-Through Certificates, Series K126, Class - A2, Callable 1/25/31 @ 100.00 | | | 2.07 | | | | 1/25/31 | | | | 22 | |
| | | 10 | | Freddie Mac Multifamily Structured Pass-Through Certificates, Series K-1521, Class - A2, Callable 8/25/36 @ 100.00 | | | 2.18 | | | | 8/25/36 | | | | 8 | |
| | | 27 | | Freddie Mac Multifamily Structured Pass-Through Certificates, Series K726, Class - A2, Callable 4/25/24 @ 100.00 | | | 2.91 | | | | 7/25/49 | | | | 26 | |
| | | 30 | | Freddie Mac Multifamily Structured Pass-Through Certificates, Series K033, Class - A2, Callable 7/25/23 @ 100.00 | | | 3.06(a) | | | | 7/25/23 | | | | 30 | |
| | | 25 | | Freddie Mac Multifamily Structured Pass-Through Certificates, Series K052, Class - A2, Callable 11/25/25 @ 100.00 | | | 3.15 | | | | 11/25/25 | | | | 25 | |
| | | 50 | | Freddie Mac Multifamily Structured Pass-Through Certificates, Series K091, Class - A2, Callable 3/25/29 @ 100.00 | | | 3.51 | | | | 3/25/29 | | | | 49 | |
| | | 25 | | Freddie Mac Multifamily Structured Pass-Through Certificates, Series K082, Class - A2, Callable 9/25/28 @ 100.00 | | | 3.92(a) | | | | 9/25/28 | | | | 25 | |
See accompanying notes to financial statements.
184
HC CAPITAL TRUST
The Core Fixed Income Portfolio
Portfolio of Investments (continued) — June 30, 2022
| | Principal
Amount
(000) | | Security Description | | Rate % | | | Maturity
Date | | | Value
(000) | |
| | | | | Collateralized Mortgage Obligations (continued) |
| | $ | 50 | | GS Mortgage Securities Trust, Series 2018-GS9, Class - A4, Callable 2/10/28 @ 100.00 | | | 3.99(a) | | | | 3/10/51 | | | $ | 49 | |
| | | 25 | | JPMBB Commercial Mortgage Securities Trust, Series 2014-C24, Class - A5, Callable 10/15/24 @ 100.00 | | | 3.64 | | | | 11/15/47 | | | | 25 | |
| | | 50 | | JPMDB Commercial Mortgage Securities Trust, Series 2016-C4, Class - A3, Callable 10/15/26 @ 100.00 | | | 3.14 | | | | 12/15/49 | | | | 47 | |
| | | 25 | | Morgan Stanley BAML Trust, Series 2013-C9, Class - AS, Callable 4/15/23 @ 100.00 | | | 3.46 | | | | 5/15/46 | | | | 25 | |
| | | 25 | | Morgan Stanley BAML Trust, Series 2014-C19, Class - A4, Callable 11/15/24 @ 100.00 | | | 3.53 | | | | 12/15/47 | | | | 25 | |
| | | 25 | | Morgan Stanley BAML Trust, Series 2017-C33, Class - A5, Callable 4/15/27 @ 100.00 | | | 3.60 | | | | 5/15/50 | | | | 24 | |
| | | 20 | | Santander Drive Auto Receivables Trust, Series 2021-1, Class - D, Callable 2/15/24 @ 100.00 | | | 1.13 | | | | 11/16/26 | | | | 19 | |
| | | 25 | | SG Commercial Mortgage Securities Trust, Series 2016-C5, Class - A4, Callable 6/10/26 @ 100.00 | | | 3.06 | | | | 10/10/48 | | | | 24 | |
| | | 20 | | Toyota Auto Receivables Owner Trust, Series 2021-A, Class - A3, Callable 11/15/24 @ 100.00 | | | 0.26 | | | | 5/15/25 | | | | 20 | |
| | | 25 | | UBS Commercial Mortgage Trust, Series 2018-C12, Class - A5, Callable 7/15/28 @ 100.00 | | | 4.30 | | | | 8/15/51 | | | | 25 | |
| | | 25 | | Wells Fargo Commercial Mortgage Trust, Series 2018-C47, Class - A4, Callable 9/15/28 @ 100.00 | | | 4.44 | | | | 9/15/61 | | | | 25 | |
| | | | | Total Collateralized Mortgage Obligations | | | | | | | | | | | 933 | |
| | | | | | | | | | | | | | | | | |
| | | | | U.S. Government Agency Mortgages — 21.54% | | | | | | | | | | | | |
| | | 10 | | Fannie Mae, Series 2020-M52, Class - A2 | | | 1.36(a) | | | | 10/25/30 | | | | 8 | |
| | | 22 | | Fannie Mae, Pool #MA4236 | | | 1.50 | | | | 1/1/51 | | | | 19 | |
| | | 24 | | Fannie Mae, Pool #MA4122 | | | 1.50 | | | | 9/1/35 | | | | 21 | |
| | | 18 | | Fannie Mae, Pool #BQ3141 | | | 1.50 | | | | 10/1/35 | | | | 16 | |
| | | 23 | | Fannie Mae, Pool #MA4342 | | | 1.50 | | | | 4/1/41 | | | | 19 | |
| | | 23 | | Fannie Mae, Pool #MA4280 | | | 1.50 | | | | 3/1/51 | | | | 19 | |
| | | 45 | | Fannie Mae, Pool #FM6579 | | | 1.50 | | | | 3/1/51 | | | | 38 | |
| | | 23 | | Fannie Mae, Pool #MA4417 | | | 1.50 | | | | 9/1/36 | | | | 21 | |
| | | 21 | | Fannie Mae, Pool #MA4302 | | | 1.50 | | | | 4/1/36 | | | | 19 | |
| | | 22 | | Fannie Mae, Pool #CA7695 | | | 1.50 | | | | 11/1/50 | | | | 18 | |
| | | 47 | | Fannie Mae, Pool #CB0711 | | | 1.50 | | | | 6/1/51 | | | | 39 | |
| | | 22 | | Fannie Mae, Pool #CA7696 | | | 1.50 | | | | 11/1/50 | | | | 18 | |
| | | 24 | | Fannie Mae, Pool #MA4445 | | | 1.50 | | | | 10/1/41 | | | | 20 | |
| | | 44 | | Fannie Mae, Pool #CB0310 | | | 1.50 | | | | 4/1/36 | | | | 40 | |
| | | 47 | | Fannie Mae, Pool #MA4441 | | | 1.50 | | | | 10/1/36 | | | | 42 | |
| | | 18 | | Fannie Mae, Pool #BQ5781 | | | 1.50 | | | | 11/1/35 | | | | 16 | |
| | | 22 | | Fannie Mae, Pool #MA4181 | | | 1.50 | | | | 11/1/50 | | | | 18 | |
| | | 46 | | Fannie Mae, Pool #MA4304 | | | 1.50 | | | | 4/1/51 | | | | 38 | |
| | | 46 | | Fannie Mae, Pool #MA4343 | | | 1.50 | | | | 5/1/51 | | | | 39 | |
| | | 47 | | Fannie Mae, Pool #FM7411 | | | 2.00 | | | | 5/1/51 | | | | 41 | |
| | | 22 | | Fannie Mae, Pool #BQ9685 | | | 2.00 | | | | 1/1/51 | | | | 19 | |
| | | 42 | | Fannie Mae, Pool #CA8110 | | | 2.00 | | | | 12/1/50 | | | | 37 | |
| | | 42 | | Fannie Mae, Pool #BQ5112 | | | 2.00 | | | | 11/1/50 | | | | 36 | |
| | | 45 | | Fannie Mae, Pool #MA4325 | | | 2.00 | | | | 5/1/51 | | | | 39 | |
| | | 21 | | Fannie Mae, Pool #CA8118 | | | 2.00 | | | | 12/1/50 | | | | 18 | |
| | | 25 | | Fannie Mae, Pool #FM4969 | | | 2.00 | | | | 12/1/50 | | | | 22 | |
| | | 45 | | Fannie Mae, Pool #BR4435 | | | 2.00 | | | | 4/1/51 | | | | 39 | |
| | | 42 | | Fannie Mae, Pool #MA4237 | | | 2.00 | | | | 1/1/51 | | | | 37 | |
| | | 43 | | Fannie Mae, Pool #MA4255 | | | 2.00 | | | | 2/1/51 | | | | 37 | |
See accompanying notes to financial statements.
185
HC CAPITAL TRUST
The Core Fixed Income Portfolio
Portfolio of Investments (continued) — June 30, 2022
| | Principal
Amount
(000) | | Security Description | | Rate % | | | Maturity
Date | | | Value
(000) | |
| | | | | U.S. Government Agency Mortgages (continued) |
| | $ | 25 | | Fannie Mae, Pool #FS0355 | | | 2.00 | | | | 9/1/51 | | | $ | 21 | |
| | | 21 | | Fannie Mae, Pool #FM5044 | | | 2.00 | | | | 12/1/50 | | | | 19 | |
| | | 42 | | Fannie Mae, Pool #FM4788 | | | 2.00 | | | | 11/1/50 | | | | 36 | |
| | | 22 | | Fannie Mae, Pool #BR4094 | | | 2.00 | | | | 1/1/51 | | | | 19 | |
| | | 22 | | Fannie Mae, Pool #FM5308 | | | 2.00 | | | | 12/1/50 | | | | 19 | |
| | | 24 | | Fannie Mae, Pool #FM9704 | | | 2.00 | | | | 12/1/51 | | | | 21 | |
| | | 24 | | Fannie Mae, Pool #FM9579 | | | 2.00 | | | | 7/1/51 | | | | 20 | |
| | | 22 | | Fannie Mae, Pool #CA8687 | | | 2.00 | | | | 1/1/51 | | | | 19 | |
| | | 22 | | Fannie Mae, Pool #CA7833 | | | 2.00 | | | | 11/1/50 | | | | 19 | |
| | | 23 | | Fannie Mae, Pool #BR0948 | | | 2.00 | | | | 4/1/51 | | | | 20 | |
| | | 43 | | Fannie Mae, Pool #MA4281 | | | 2.00 | | | | 3/1/51 | | | | 38 | |
| | | 49 | | Fannie Mae, Pool #MA4511 | | | 2.00 | | | | 1/1/52 | | | | 42 | |
| | | 44 | | Fannie Mae, Pool #CA8850 | | | 2.00 | | | | 2/1/51 | | | | 39 | |
| | | 23 | | Fannie Mae, Pool #FM6559 | | | 2.00 | | | | 3/1/51 | | | | 20 | |
| | | 19 | | Fannie Mae, Pool #MA4176 | | | 2.00 | | | | 10/1/40 | | | | 17 | |
| | | 21 | | Fannie Mae, Pool #MA4208 | | | 2.00 | | | | 12/1/50 | | | | 18 | |
| | | 41 | | Fannie Mae, Pool #MA4303 | | | 2.00 | | | | 4/1/36 | | | | 39 | |
| | | 30 | | Fannie Mae, Pool #FM3755 | | | 2.00 | | | | 9/1/35 | | | | 28 | |
| | | 21 | | Fannie Mae, Pool #CA7225 | | | 2.00 | | | | 10/1/50 | | | | 18 | |
| | | 23 | | Fannie Mae, Pool #BR2176 | | | 2.00 | | | | 7/1/36 | | | | 21 | |
| | | 23 | | Fannie Mae, Pool #CB0684 | | | 2.00 | | | | 6/1/51 | | | | 20 | |
| | | 23 | | Fannie Mae, Pool #CB0497 | | | 2.00 | | | | 5/1/51 | | | | 20 | |
| | | 46 | | Fannie Mae, Pool #CB0325 | | | 2.00 | | | | 4/1/51 | | | | 40 | |
| | | 41 | | Fannie Mae, Pool #CA9183 | | | 2.00 | | | | 2/1/36 | | | | 38 | |
| | | 20 | | Fannie Mae, Pool #CA7224 | | | 2.00 | | | | 10/1/50 | | | | 18 | |
| | | 24 | | Fannie Mae, Pool #BT0240 | | | 2.00 | | | | 9/1/51 | | | | 21 | |
| | | 24 | | Fannie Mae, Pool #CB1787 | | | 2.00 | | | | 10/1/51 | | | | 21 | |
| | | 48 | | Fannie Mae, Pool #CB1620 | | | 2.00 | | | | 9/1/51 | | | | 41 | |
| | | 22 | | Fannie Mae, Pool #MA4403 | | | 2.00 | | | | 8/1/36 | | | | 21 | |
| | | 45 | | Fannie Mae, Pool #FM6448 | | | 2.00 | | | | 3/1/51 | | | | 39 | |
| | | 44 | | Fannie Mae, Pool #FM6852 | | | 2.00 | | | | 5/1/51 | | | | 39 | |
| | | 43 | | Fannie Mae, Pool #BQ7777 | | | 2.00 | | | | 3/1/36 | | | | 40 | |
| | | 43 | | Fannie Mae, Pool #BQ3004 | | | 2.00 | | | | 10/1/50 | | | | 37 | |
| | | 41 | | Fannie Mae, Pool #BP9370 | | | 2.00 | | | | 7/1/50 | | | | 36 | |
| | | 20 | | Fannie Mae, Pool #MA4204 | | | 2.00 | | | | 12/1/40 | | | | 17 | |
| | | 16 | | Fannie Mae, Pool #FM4039 | | | 2.00 | | | | 10/1/35 | | | | 15 | |
| | | 22 | | Fannie Mae, Pool #MA4360 | | | 2.00 | | | | 6/1/36 | | | | 20 | |
| | | 20 | | Fannie Mae, Pool #FM5453 | | | 2.00 | | | | 1/1/41 | | | | 18 | |
| | | 44 | | Fannie Mae, Pool #FM6555 | | | 2.00 | | | | 4/1/51 | | | | 39 | |
| | | 20 | | Fannie Mae, Pool #MA4182 | | | 2.00 | | | | 11/1/50 | | | | 17 | |
| | | 24 | | Fannie Mae, Pool #BU7103 | | | 2.00 | | | | 12/1/51 | | | | 21 | |
| | | 24 | | Fannie Mae, Pool #MA4474 | | | 2.00 | | | | 11/1/41 | | | | 21 | |
| | | 46 | | Fannie Mae, Pool #MA4442 | | | 2.00 | | | | 10/1/36 | | | | 43 | |
| | | 24 | | Fannie Mae, Pool #MA4437 | | | 2.00 | | | | 10/1/51 | | | | 21 | |
| | | 25 | | Fannie Mae, Pool #FS1621 | | | 2.00 | | | | 7/1/51 | | | | 21 | |
| | | 44 | | Fannie Mae, Pool #MA4305 | | | 2.00 | | | | 4/1/51 | | | | 39 | |
| | | 12 | | Fannie Mae, Pool #AS2673 | | | 2.00 | | | | 5/1/29 | | | | 11 | |
| | | 42 | | Fannie Mae, Pool #BQ8341 | | | 2.00 | | | | 12/1/50 | | | | 36 | |
See accompanying notes to financial statements.
186
HC CAPITAL TRUST
The Core Fixed Income Portfolio
Portfolio of Investments (continued) — June 30, 2022
| | Principal
Amount
(000) | | Security Description | | Rate % | | | Maturity
Date | | | Value
(000) | |
| | | | | U.S. Government Agency Mortgages (continued) |
| | $ | 43 | | Fannie Mae, Pool #CA8252 | | | 2.00 | | | | 12/1/45 | | | $ | 38 | |
| | | 22 | | Fannie Mae, Pool #MA4119 | | | 2.00 | | | | 9/1/50 | | | | 19 | |
| | | 24 | | Fannie Mae, Pool #FS0317 | | | 2.00 | | | | 2/1/42 | | | | 22 | |
| | | 34 | | Fannie Mae, Pool #MA4128 | | | 2.00 | | | | 9/1/40 | | | | 30 | |
| | | 15 | | Fannie Mae, Pool #MA2854 | | | 2.50 | | | | 12/1/46 | | | | 14 | |
| | | 23 | | Fannie Mae, Pool #CB1556 | | | 2.50 | | | | 9/1/51 | | | | 21 | |
| | | 23 | | Fannie Mae, Pool #BO4657 | | | 2.50 | | | | 11/1/49 | | | | 21 | |
| | | 24 | | Fannie Mae, Pool #CB1784 | | | 2.50 | | | | 10/1/51 | | | | 22 | |
| | | 16 | | Fannie Mae, Pool #AU6677 | | | 2.50 | | | | 9/1/28 | | | | 16 | |
| | | 22 | | Fannie Mae, Pool #CB0415 | | | 2.50 | | | | 5/1/51 | | | | 20 | |
| | | 45 | | Fannie Mae, Pool #BR7857 | | | 2.50 | | | | 5/1/51 | | | | 41 | |
| | | 23 | | Fannie Mae, Pool #FM2881 | | | 2.50 | | | | 4/1/50 | | | | 21 | |
| | | 26 | | Fannie Mae, Pool #CA6074 | | | 2.50 | | | | 6/1/50 | | | | 23 | |
| | | 24 | | Fannie Mae, Pool #CB1828 | | | 2.50 | | | | 10/1/51 | | | | 22 | |
| | | 42 | | Fannie Mae, Pool #CA8955 | | | 2.50 | | | | 2/1/51 | | | | 38 | |
| | | 21 | | Fannie Mae, Pool #AP4742 | | | 2.50 | | | | 8/1/27 | | | | 21 | |
| | | 23 | | Fannie Mae, Pool #FM9033 | | | 2.50 | | | | 10/1/51 | | | | 21 | |
| | | 15 | | Fannie Mae, Pool #FM3878 | | | 2.50 | | | | 7/1/50 | | | | 14 | |
| | | 24 | | Fannie Mae, Pool #BU1451 | | | 2.50 | | | | 1/1/52 | | | | 22 | |
| | | 14 | | Fannie Mae, Pool #CA6075 | | | 2.50 | | | | 6/1/50 | | | | 13 | |
| | | 19 | | Fannie Mae, Pool #CA8131 | | | 2.50 | | | | 12/1/50 | | | | 17 | |
| | | 17 | | Fannie Mae, Pool #MA4159 | | | 2.50 | | | | 10/1/50 | | | | 15 | |
| | | 7 | | Fannie Mae, Pool #MA3154 | | | 2.50 | | | | 10/1/32 | | | | 7 | |
| | | 16 | | Fannie Mae, Pool #BP5878 | | | 2.50 | | | | 6/1/50 | | | | 15 | |
| | | 23 | | Fannie Mae, Pool #MA4423 | | | 2.50 | | | | 9/1/41 | | | | 21 | |
| | | 25 | | Fannie Mae, Pool #FS0235 | | | 2.50 | | | | 1/1/52 | | | | 22 | |
| | | 5 | | Fannie Mae, Pool #MA2789 | | | 2.50 | | | | 10/1/36 | | | | 5 | |
| | | 8 | | Fannie Mae, Pool #MA3990 | | | 2.50 | | | | 4/1/50 | | | | 8 | |
| | | 25 | | Fannie Mae, Pool #FS1340 | | | 2.50 | | | | 3/1/52 | | | | 22 | |
| | | 24 | | Fannie Mae, Pool #BU5917 | | | 2.50 | | | | 12/1/51 | | | | 22 | |
| | | 9 | | Fannie Mae, Pool #MA3902 | | | 2.50 | | | | 12/1/49 | | | | 8 | |
| | | 13 | | Fannie Mae, Pool #BK2588 | | | 2.50 | | | | 5/1/50 | | | | 12 | |
| | | 34 | | Fannie Mae, Pool #FM4638 | | | 2.50 | | | | 10/1/50 | | | | 30 | |
| | | 8 | | Fannie Mae, Pool #AS4946 | | | 2.50 | | | | 5/1/30 | | | | 8 | |
| | | 7 | | Fannie Mae, Pool #MA3246 | | | 2.50 | | | | 1/1/33 | | | | 7 | |
| | | 13 | | Fannie Mae, Pool #BD8046 | | | 2.50 | | | | 9/1/31 | | | | 13 | |
| | | 17 | | Fannie Mae, Pool #FM4231 | | | 2.50 | | | | 9/1/50 | | | | 16 | |
| | | 12 | | Fannie Mae, Pool #AS8893 | | | 2.50 | | | | 2/1/32 | | | | 12 | |
| | | 13 | | Fannie Mae, Pool #MA4075 | | | 2.50 | | | | 7/1/35 | | | | 13 | |
| | | 19 | | Fannie Mae, Pool #BQ5110 | | | 2.50 | | | | 11/1/50 | | | | 17 | |
| | | 22 | | Fannie Mae, Pool #CA8132 | | | 2.50 | | | | 12/1/50 | | | | 19 | |
| | | 18 | | Fannie Mae, Pool #MA4256 | | | 2.50 | | | | 2/1/51 | | | | 16 | |
| | | 24 | | Fannie Mae, Pool #MA4541 | | | 2.50 | | | | 2/1/42 | | | | 22 | |
| | | 7 | | Fannie Mae, Pool #MA3827 | | | 2.50 | | | | 11/1/34 | | | | 7 | |
| | | 23 | | Fannie Mae, Pool #MA4399 | | | 2.50 | | | | 8/1/51 | | | | 20 | |
| | | 7 | | Fannie Mae, Pool #MA3765 | | | 2.50 | | | | 9/1/49 | | | | 6 | |
| | | 8 | | Fannie Mae, Pool #MA3965 | | | 2.50 | | | | 3/1/40 | | | | 7 | |
| | | 29 | | Fannie Mae, Pool #CA6304 | | | 2.50 | | | | 7/1/50 | | | | 26 | |
See accompanying notes to financial statements.
187
HC CAPITAL TRUST
The Core Fixed Income Portfolio
Portfolio of Investments (continued) — June 30, 2022
| | Principal
Amount
(000) | | Security Description | | Rate % | | | Maturity
Date | | | Value
(000) | |
| | | | | U.S. Government Agency Mortgages (continued) |
| | $ | 23 | | Fannie Mae, Pool #CB1131 | | | 2.50 | | | | 7/1/51 | | | $ | 20 | |
| | | 24 | | Fannie Mae, Pool #FS0547 | | | 2.50 | | | | 2/1/52 | | | | 22 | |
| | | 17 | | Fannie Mae, Pool #MA4210 | | | 2.50 | | | | 12/1/50 | | | | 16 | |
| | | 23 | | Fannie Mae, Pool #MA4414 | | | 2.50 | | | | 9/1/51 | | | | 21 | |
| | | 8 | | Fannie Mae, Pool #MA3930 | | | 2.50 | | | | 2/1/35 | | | | 8 | |
| | | 11 | | Fannie Mae, Pool #MA1277 | | | 2.50 | | | | 12/1/27 | | | | 11 | |
| | | 15 | | Fannie Mae, Pool #AB7391 | | | 2.50 | | | | 12/1/42 | | | | 14 | |
| | | 18 | | Fannie Mae, Pool #FM4309 | | | 2.50 | | | | 9/1/50 | | | | 16 | |
| | | 14 | | Fannie Mae, Pool #MA4096 | | | 2.50 | | | | 8/1/50 | | | | 13 | |
| | | 13 | | Fannie Mae, Pool #MA4078 | | | 2.50 | | | | 7/1/50 | | | | 12 | |
| | | 25 | | Fannie Mae, Pool #FS0030 | | | 2.50 | | | | 4/1/51 | | | | 22 | |
| | | 24 | | Fannie Mae, Pool #FM8745 | | | 2.50 | | | | 9/1/51 | | | | 21 | |
| | | 24 | | Fannie Mae, Pool #CB2523 | | | 2.50 | | | | 1/1/52 | | | | 22 | |
| | | 23 | | Fannie Mae, Pool #FM8997 | | | 2.50 | | | | 10/1/51 | | | | 21 | |
| | | 17 | | Fannie Mae, Pool #BC9041 | | | 2.50 | | | | 11/1/31 | | | | 16 | |
| | | 17 | | Fannie Mae, Pool #MA4183 | | | 2.50 | | | | 11/1/50 | | | | 15 | |
| | | 16 | | Fannie Mae, Pool #BQ0329 | | | 2.50 | | | | 7/1/50 | | | | 15 | |
| | | 8 | | Fannie Mae, Pool #MA3833 | | | 2.50 | | | | 11/1/49 | | | | 7 | |
| | | 6 | | Fannie Mae, Pool #FM2132 | | | 3.00 | | | | 1/1/50 | | | | 5 | |
| | | 11 | | Fannie Mae, Pool #MA3802 | | | 3.00 | | | | 10/1/49 | | | | 10 | |
| | | 4 | | Fannie Mae, Pool #MA3744 | | | 3.00 | | | | 8/1/49 | | | | 4 | |
| | | 8 | | Fannie Mae, Pool #BD5545 | | | 3.00 | | | | 10/1/46 | | | | 7 | |
| | | 5 | | Fannie Mae, Pool #FM1299 | | | 3.00 | | | | 7/1/49 | | | | 5 | |
| | | 7 | | Fannie Mae, Pool #BO3192 | | | 3.00 | | | | 10/1/49 | | | | 7 | |
| | | 10 | | Fannie Mae, Pool #MA4048 | | | 3.00 | | | | 6/1/50 | | | | 9 | |
| | | 7 | | Fannie Mae, Pool #BO2201 | | | 3.00 | | | | 9/1/49 | | | | 7 | |
| | | 7 | | Fannie Mae, Pool #MA3890 | | | 3.00 | | | | 1/1/40 | | | | 6 | |
| | | 12 | | Fannie Mae, Pool #AS7908 | | | 3.00 | | | | 9/1/46 | | | | 11 | |
| | | 15 | | Fannie Mae, Pool #BC9003 | | | 3.00 | | | | 11/1/46 | | | | 14 | |
| | | 5 | | Fannie Mae, Pool #MA3774 | | | 3.00 | | | | 9/1/49 | | | | 5 | |
| | | 10 | | Fannie Mae, Pool #BO7242 | | | 3.00 | | | | 1/1/50 | | | | 10 | |
| | | 6 | | Fannie Mae, Pool #MA3871 | | | 3.00 | | | | 12/1/49 | | | | 6 | |
| | | 9 | | Fannie Mae, Pool #CA5423 | | | 3.00 | | | | 3/1/50 | | | | 8 | |
| | | 11 | | Fannie Mae, Pool #BP1932 | | | 3.00 | | | | 4/1/50 | | | | 10 | |
| | | 4 | | Fannie Mae, Pool #MA3691 | | | 3.00 | | | | 7/1/49 | | | | 4 | |
| | | 5 | | Fannie Mae, Pool #FM1585 | | | 3.00 | | | | 9/1/49 | | | | 5 | |
| | | 25 | | Fannie Mae, Pool #BU8883 | | | 3.00 | | | | 3/1/52 | | | | 23 | |
| | | 7 | | Fannie Mae, Pool #890566 | | | 3.00 | | | | 12/1/43 | | | | 6 | |
| | | 9 | | Fannie Mae, Pool #CA5519 | | | 3.00 | | | | 4/1/50 | | | | 8 | |
| | | 7 | | Fannie Mae, Pool #AS8074 | | | 3.00 | | | | 10/1/46 | | | | 6 | |
| | | 24 | | Fannie Mae, Pool #BU1241 | | | 3.00 | | | | 3/1/52 | | | | 23 | |
| | | 7 | | Fannie Mae, Pool #AS8739 | | | 3.00 | | | | 2/1/37 | | | | 7 | |
| | | 15 | | Fannie Mae, Pool #MA3991 | | | 3.00 | | | | 4/1/50 | | | | 14 | |
| | | 11 | | Fannie Mae, Pool #MA4079 | | | 3.00 | | | | 7/1/50 | | | | 10 | |
| | | 9 | | Fannie Mae, Pool #B06219 | | | 3.00 | | | | 12/1/49 | | | | 8 | |
| | | 7 | | Fannie Mae, Pool #MA2897 | | | 3.00 | | | | 2/1/37 | | | | 7 | |
| | | 14 | | Fannie Mae, Pool #MA3834 | | | 3.00 | | | | 11/1/49 | | | | 13 | |
| | | 4 | | Fannie Mae, Pool #AO7628 | | | 3.00 | | | | 6/1/27 | | | | 4 | |
See accompanying notes to financial statements.
188
HC CAPITAL TRUST
The Core Fixed Income Portfolio
Portfolio of Investments (continued) — June 30, 2022
| | Principal
Amount
(000) | | Security Description | | Rate % | | | Maturity
Date | | | Value
(000) | |
| | | | | U.S. Government Agency Mortgages (continued) |
| | $ | 8 | | Fannie Mae, Pool #AZ2936 | | | 3.00 | | | | 9/1/45 | | | $ | 8 | |
| | | 6 | | Fannie Mae, Pool #BN7703 | | | 3.00 | | | | 8/1/49 | | | | 5 | |
| | | 6 | | Fannie Mae, Pool #MA3339 | | | 3.00 | | | | 4/1/33 | | | | 6 | |
| | | 6 | | Fannie Mae, Pool #MA3237 | | | 3.00 | | | | 1/1/48 | | | | 6 | |
| | | 8 | | Fannie Mae, Pool #AS8414 | | | 3.00 | | | | 11/1/46 | | | | 8 | |
| | | 6 | | Fannie Mae, Pool #MA3127 | | | 3.00 | | | | 9/1/37 | | | | 6 | |
| | | 14 | | Fannie Mae, Pool #QB1382 | | | 3.00 | | | | 7/1/50 | | | | 14 | |
| | | 11 | | Fannie Mae, Pool #AU3353 | | | 3.00 | | | | 8/1/43 | | | | 10 | |
| | | 25 | | Fannie Mae, Pool #AT0682 | | | 3.00 | | | | 4/1/43 | | | | 24 | |
| | | 26 | | Fannie Mae, Pool #AS0302 | | | 3.00 | | | | 8/1/43 | | | | 25 | |
| | | 16 | | Fannie Mae, Pool #AL9865 | | | 3.00 | | | | 2/1/47 | | | | 15 | |
| | | 19 | | Fannie Mae, Pool #AK0006 | | | 3.00 | | | | 1/1/27 | | | | 18 | |
| | | 24 | | Fannie Mae, Pool #AB8897 | | | 3.00 | | | | 4/1/43 | | | | 23 | |
| | | 10 | | Fannie Mae, Pool #MA3738 | | | 3.00 | | | | 8/1/34 | | | | 10 | |
| | | 10 | | Fannie Mae, Pool #MA3897 | | | 3.00 | | | | 1/1/35 | | | | 10 | |
| | | 21 | | Fannie Mae, Pool #AQ7920 | | | 3.00 | | | | 12/1/42 | | | | 20 | |
| | | 11 | | Fannie Mae, Pool #FM3395 | | | 3.00 | | | | 6/1/50 | | | | 10 | |
| | | 10 | | Fannie Mae, Pool #FM4317 | | | 3.00 | | | | 9/1/50 | | | | 9 | |
| | | 6 | | Fannie Mae, Pool #MA3377 | | | 3.00 | | | | 5/1/48 | | | | 6 | |
| | | 12 | | Fannie Mae, Pool #AS5977 | | | 3.00 | | | | 10/1/30 | | | | 12 | |
| | | 3 | | Fannie Mae, Pool #BH8817 | | | 3.00 | | | | 10/1/47 | | | | 3 | |
| | | 15 | | Fannie Mae, Pool #BC4764 | | | 3.00 | | | | 10/1/46 | | | | 14 | |
| | | 7 | | Fannie Mae, Pool #MA2863 | | | 3.00 | | | | 1/1/47 | | | | 7 | |
| | | 7 | | Fannie Mae, Pool #B08947 | | | 3.00 | | | | 1/1/50 | | | | 7 | |
| | | 33 | | Fannie Mae, Pool #AO0752 | | | 3.00 | | | | 4/1/42 | | | | 32 | |
| | | 10 | | Fannie Mae, Pool #AB2047 | | | 3.00 | | | | 1/1/26 | | | | 9 | |
| | | 16 | | Fannie Mae, Pool #MA3937 | | | 3.00 | | | | 2/1/50 | | | | 15 | |
| | | 7 | | Fannie Mae, Pool #FM1370 | | | 3.00 | | | | 4/1/46 | | | | 7 | |
| | | 10 | | Fannie Mae, Pool #CA5668 | | | 3.00 | | | | 5/1/50 | | | | 9 | |
| | | 12 | | Fannie Mae, Pool #BP6466 | | | 3.00 | | | | 7/1/50 | | | | 11 | |
| | | 5 | | Fannie Mae, Pool #MA2523 | | | 3.00 | | | | 2/1/36 | | | | 5 | |
| | | 10 | | Fannie Mae, Pool #AL9996 | | | 3.00 | | | | 4/1/32 | | | | 9 | |
| | | 23 | | Fannie Mae, Pool #MA2246 | | | 3.00 | | | | 4/1/30 | | | | 23 | |
| | | 24 | | Fannie Mae, Pool #CB3172 | | | 3.00 | | | | 3/1/52 | | | | 22 | |
| | | 16 | | Fannie Mae, Pool #AY2961 | | | 3.00 | | | | 5/1/45 | | | | 15 | |
| | | 16 | | Fannie Mae, Pool #BD2446 | | | 3.00 | | | | 1/1/47 | | | | 16 | |
| | | 29 | | Fannie Mae, Pool #AS8483 | | | 3.00 | | | | 12/1/46 | | | | 27 | |
| | | 5 | | Fannie Mae, Pool #MA2416 | | | 3.00 | | | | 10/1/35 | | | | 5 | |
| | | 11 | | Fannie Mae, Pool #B09169 | | | 3.00 | | | | 12/1/49 | | | | 10 | |
| | | 6 | | Fannie Mae, Pool #MA3831 | | | 3.00 | | | | 11/1/39 | | | | 5 | |
| | | 10 | | Fannie Mae, Pool #MA1307 | | | 3.00 | | | | 1/1/33 | | | | 9 | |
| | | 7 | | Fannie Mae, Pool #MA3905 | | | 3.00 | | | | 1/1/50 | | | | 6 | |
| | | 31 | | Fannie Mae, Pool #AB7099 | | | 3.00 | | | | 11/1/42 | | | | 30 | |
| | | 11 | | Fannie Mae, Pool #AL9263 | | | 3.00 | | | | 10/1/46 | | | | 10 | |
| | | 13 | | Fannie Mae, Pool #AS8276 | | | 3.00 | | | | 11/1/46 | | | | 12 | |
| | | 6 | | Fannie Mae, Pool #MA3210 | | | 3.50 | | | | 12/1/49 | | | | 6 | |
| | | 8 | | Fannie Mae, Pool #AL1717 | | | 3.50 | | | | 5/1/27 | | | | 8 | |
| | | 4 | | Fannie Mae, Pool #AS5596 | | | 3.50 | | | | 8/1/45 | | | | 4 | |
See accompanying notes to financial statements.
189
HC CAPITAL TRUST
The Core Fixed Income Portfolio
Portfolio of Investments (continued) — June 30, 2022
| | Principal
Amount
(000) | | Security Description | | Rate % | | | Maturity
Date | | | Value
(000) | |
| | | | | U.S. Government Agency Mortgages (continued) |
| | $ | 3 | | Fannie Mae, Pool #MA3597 | | | 3.50 | | | | 2/1/49 | | | $ | 3 | |
| | | 5 | | Fannie Mae, Pool #BD5046 | | | 3.50 | | | | 2/1/47 | | | | 5 | |
| | | 6 | | Fannie Mae, Pool #FM1001 | | | 3.50 | | | | 11/1/48 | | | | 5 | |
| | | 11 | | Fannie Mae, Pool #MA3243 | | | 3.50 | | | | 1/1/38 | | | | 11 | |
| | | 11 | | Fannie Mae, Pool #BJ4916 | | | 3.50 | | | | 3/1/48 | | | | 10 | |
| | | 6 | | Fannie Mae, Pool #FM1566 | | | 3.50 | | | | 11/1/48 | | | | 6 | |
| | | 3 | | Fannie Mae, Pool #MA3692 | | | 3.50 | | | | 7/1/49 | | | | 3 | |
| | | 9 | | Fannie Mae, Pool #BP1947 | | | 3.50 | | | | 4/1/50 | | | | 8 | |
| | | 8 | | Fannie Mae, Pool #BC1158 | | | 3.50 | | | | 2/1/46 | | | | 7 | |
| | | 3 | | Fannie Mae, Pool #MA3614 | | | 3.50 | | | | 3/1/49 | | | | 3 | |
| | | 6 | | Fannie Mae, Pool #BM2000 | | | 3.50 | | | | 5/1/49 | | | | 6 | |
| | | 6 | | Fannie Mae, Pool #MA2389 | | | 3.50 | | | | 9/1/35 | | | | 6 | |
| | | 5 | | Fannie Mae, Pool #MA3906 | | | 3.50 | | | | 1/1/50 | | | | 5 | |
| | | 4 | | Fannie Mae, Pool #MA2522 | | | 3.50 | | | | 2/1/46 | | | | 4 | |
| | | 15 | | Fannie Mae, Pool #MA2125 | | | 3.50 | | | | 12/1/44 | | | | 15 | |
| | | 12 | | Fannie Mae, Pool #AJ1886 | | | 3.50 | | | | 3/1/42 | | | | 12 | |
| | | 27 | | Fannie Mae, Pool #AB6017 | | | 3.50 | | | | 8/1/42 | | | | 27 | |
| | | 3 | | Fannie Mae, Pool #MA3494 | | | 3.50 | | | | 10/1/48 | | | | 3 | |
| | | 14 | | Fannie Mae, Pool #AB5511 | | | 3.50 | | | | 7/1/42 | | | | 14 | |
| | | 7 | | Fannie Mae, Pool #AS7388 | | | 3.50 | | | | 6/1/46 | | | | 7 | |
| | | 4 | | Fannie Mae, Pool #BA1893 | | | 3.50 | | | | 8/1/45 | | | | 4 | |
| | | 53 | | Fannie Mae, Pool #AO2548 | | | 3.50 | | | | 4/1/42 | | | | 51 | |
| | | 5 | | Fannie Mae, Pool #MA3305 | | | 3.50 | | | | 3/1/48 | | | | 5 | |
| | | 5 | | Fannie Mae, Pool #MA3148 | | | 3.50 | | | | 10/1/47 | | | | 5 | |
| | | 8 | | Fannie Mae, Pool #MA3026 | | | 3.50 | | | | 6/1/47 | | | | 8 | |
| | | 21 | | Fannie Mae, Pool #AS3133 | | | 3.50 | | | | 8/1/44 | | | | 21 | |
| | | 29 | | Fannie Mae, Pool #AQ0546 | | | 3.50 | | | | 11/1/42 | | | | 28 | |
| | | 10 | | Fannie Mae, Pool #MA1980 | | | 3.50 | | | | 8/1/44 | | | | 10 | |
| | | 8 | | Fannie Mae, Pool #AS0024 | | | 3.50 | | | | 7/1/43 | | | | 8 | |
| | | 7 | | Fannie Mae, Pool #AS7491 | | | 3.50 | | | | 7/1/46 | | | | 6 | |
| | | 7 | | Fannie Mae, Pool #MA3520 | | | 3.50 | | | | 10/1/48 | | | | 7 | |
| | | 5 | | Fannie Mae, Pool #MA3059 | | | 3.50 | | | | 7/1/37 | | | | 5 | |
| | | 5 | | Fannie Mae, Pool #ZA5052 | | | 3.50 | | | | 11/1/47 | | | | 5 | |
| | | 3 | | Fannie Mae, Pool #MA3637 | | | 3.50 | | | | 4/1/49 | | | | 3 | |
| | | 4 | | Fannie Mae, Pool #MA3775 | | | 3.50 | | | | 9/1/49 | | | | 4 | |
| | | 6 | | Fannie Mae, Pool #BK9038 | | | 3.50 | | | | 10/1/33 | | | | 6 | |
| | | 5 | | Fannie Mae, Pool #MA3057 | | | 3.50 | | | | 7/1/47 | | | | 5 | |
| | | 4 | | Fannie Mae, Pool #MA3663 | | | 3.50 | | | | 5/1/49 | | | | 3 | |
| | | 3 | | Fannie Mae, Pool #BM5485 | | | 3.50 | | | | 2/1/49 | | | | 3 | |
| | | 5 | | Fannie Mae, Pool #MA3835 | | | 3.50 | | | | 11/1/49 | | | | 5 | |
| | | 10 | | Fannie Mae, Pool #AS4772 | | | 3.50 | | | | 4/1/45 | | | | 10 | |
| | | 10 | | Fannie Mae, Pool #AZ0862 | | | 3.50 | | | | 7/1/45 | | | | 9 | |
| | | 4 | | Fannie Mae, Pool #AS6394 | | | 3.50 | | | | 12/1/45 | | | | 4 | |
| | | 7 | | Fannie Mae, Pool #FM1911 | | | 3.50 | | | | 7/1/48 | | | | 7 | |
| | | 4 | | Fannie Mae, Pool #AS4236 | | | 3.50 | | | | 1/1/45 | | | | 4 | |
| | | 6 | | Fannie Mae, Pool #BJ3716 | | | 3.50 | | | | 12/1/47 | | | | 6 | |
| | | 6 | | Fannie Mae, Pool #BC0443 | | | 3.50 | | | | 12/1/45 | | | | 6 | |
| | | 9 | | Fannie Mae, Pool #MA2706 | | | 3.50 | | | | 8/1/46 | | | | 9 | |
See accompanying notes to financial statements.
190
HC CAPITAL TRUST
The Core Fixed Income Portfolio
Portfolio of Investments (continued) — June 30, 2022
| | Principal
Amount
(000) | | Security Description | | Rate % | | | Maturity
Date | | | Value
(000) | |
| | | | | U.S. Government Agency Mortgages (continued) |
| | $ | 10 | | Fannie Mae, Pool #MA3182 | | | 3.50 | | | | 11/1/47 | | | $ | 9 | |
| | | 5 | | Fannie Mae, Pool #BM4703 | | | 3.50 | | | | 2/1/48 | | | | 5 | |
| | | 11 | | Fannie Mae, Pool #BM1568 | | | 3.50 | | | | 7/1/47 | | | | 11 | |
| | | 11 | | Fannie Mae, Pool #BC2926 | | | 3.50 | | | | 3/1/46 | | | | 10 | |
| | | 3 | | Fannie Mae, Pool #CA4026 | | | 3.50 | | | | 5/1/49 | | | | 3 | |
| | | 4 | | Fannie Mae, Pool #MA3745 | | | 3.50 | | | | 8/1/49 | | | | 4 | |
| | | 6 | | Fannie Mae, Pool #BA3123 | | | 3.50 | | | | 2/1/46 | | | | 6 | |
| | | 8 | | Fannie Mae, Pool #AB2052 | | | 3.50 | | | | 1/1/26 | | | | 8 | |
| | | 7 | | Fannie Mae, Pool #AS6102 | | | 3.50 | | | | 11/1/45 | | | | 7 | |
| | | 14 | | Fannie Mae, Pool #AS4771 | | | 3.50 | | | | 4/1/45 | | | | 13 | |
| | | 4 | | Fannie Mae, Pool #FM0020 | | | 3.50 | | | | 7/1/49 | | | | 4 | |
| | | 6 | | Fannie Mae, Pool #AS9831 | | | 4.00 | | | | 6/1/47 | | | | 6 | |
| | | 6 | | Fannie Mae, Pool #AS3452 | | | 4.00 | | | | 9/1/44 | | | | 6 | |
| | | 8 | | Fannie Mae, Pool #MA3121 | | | 4.00 | | | | 9/1/47 | | | | 8 | |
| | | 7 | | Fannie Mae, Pool #AU8849 | | | 4.00 | | | | 11/1/43 | | | | 7 | |
| | | 4 | | Fannie Mae, Pool #AS8532 | | | 4.00 | | | | 12/1/46 | | | | 4 | |
| | | 5 | | Fannie Mae, Pool #BD7165 | | | 4.00 | | | | 4/1/47 | | | | 5 | |
| | | 14 | | Fannie Mae, Pool #BK7943 | | | 4.00 | | | | 11/1/48 | | | | 14 | |
| | | 9 | | Fannie Mae, Pool #AS3467 | | | 4.00 | | | | 10/1/44 | | | | 9 | |
| | | 3 | | Fannie Mae, Pool #AY9901 | | | 4.00 | | | | 7/1/45 | | | | 3 | |
| | | 8 | | Fannie Mae, Pool #BM2002 | | | 4.00 | | | | 10/1/47 | | | | 8 | |
| | | 12 | | Fannie Mae, Pool #AL8139 | | | 4.00 | | | | 2/1/32 | | | | 12 | |
| | | 11 | | Fannie Mae, Pool #BM1066 | | | 4.00 | | | | 2/1/47 | | | | 11 | |
| | | 11 | | Fannie Mae, Pool #AS3468 | | | 4.00 | | | | 10/1/44 | | | | 11 | |
| | | 18 | | Fannie Mae, Pool #AO2959 | | | 4.00 | | | | 5/1/42 | | | | 18 | |
| | | 5 | | Fannie Mae, Pool #MA3277 | | | 4.00 | | | | 2/1/48 | | | | 5 | |
| | | 5 | | Fannie Mae, Pool #AS7600 | | | 4.00 | | | | 7/1/46 | | | | 5 | |
| | | 5 | | Fannie Mae, Pool #FM1960 | | | 4.00 | | | | 5/1/49 | | | | 5 | |
| | | 21 | | Fannie Mae, Pool #AJ5303 | | | 4.00 | | | | 11/1/41 | | | | 21 | |
| | | 4 | | Fannie Mae, Pool #CA0183 | | | 4.00 | | | | 8/1/47 | | | | 4 | |
| | | 2 | | Fannie Mae, Pool #MA3592 | | | 4.00 | | | | 2/1/49 | | | | 2 | |
| | | 3 | | Fannie Mae, Pool #MA3615 | | | 4.00 | | | | 3/1/49 | | | | 3 | |
| | | 3 | | Fannie Mae, Pool #MA3638 | | | 4.00 | | | | 4/1/49 | | | | 3 | |
| | | 3 | | Fannie Mae, Pool #BM4991 | | | 4.00 | | | | 9/1/48 | | | | 3 | |
| | | 4 | | Fannie Mae, Pool #MA3746 | | | 4.00 | | | | 8/1/49 | | | | 4 | |
| | | 8 | | Fannie Mae, Pool #MA2995 | | | 4.00 | | | | 5/1/47 | | | | 8 | |
| | | 4 | | Fannie Mae, Pool #MA3183 | | | 4.00 | | | | 11/1/47 | | | | 4 | |
| | | 3 | | Fannie Mae, Pool #BK0909 | | | 4.00 | | | | 7/1/48 | | | | 3 | |
| | | 3 | | Fannie Mae, Pool #BK0920 | | | 4.00 | | | | 7/1/48 | | | | 3 | |
| | | 4 | | Fannie Mae, Pool #BD7060 | | | 4.00 | | | | 3/1/47 | | | | 4 | |
| | | 4 | | Fannie Mae, Pool #MA3563 | | | 4.00 | | | | 1/1/49 | | | | 4 | |
| | | 6 | | Fannie Mae, Pool #MA3804 | | | 4.00 | | | | 10/1/49 | | | | 6 | |
| | | 4 | | Fannie Mae, Pool #MA2415 | | | 4.00 | | | | 10/1/45 | | | | 4 | |
| | | 4 | | Fannie Mae, Pool #FM1571 | | | 4.00 | | | | 12/1/48 | | | | 4 | |
| | | 4 | | Fannie Mae, Pool #FM1415 | | | 4.00 | | | | 12/1/48 | | | | 4 | |
| | | 7 | | Fannie Mae, Pool #AS9314 | | | 4.00 | | | | 3/1/47 | | | | 7 | |
| | | 14 | | Fannie Mae, Pool #AC7328 | | | 4.00 | | | | 12/1/39 | | | | 14 | |
| | | 3 | | Fannie Mae, Pool #AV0606 | | | 4.00 | | | | 11/1/43 | | | | 3 | |
See accompanying notes to financial statements.
191
HC CAPITAL TRUST
The Core Fixed Income Portfolio
Portfolio of Investments (continued) — June 30, 2022
| | Principal
Amount
(000) | | Security Description | | Rate % | | | Maturity
Date | | | Value
(000) | |
| | | | | U.S. Government Agency Mortgages (continued) |
| | $ | 10 | | Fannie Mae, Pool #AS8823 | | | 4.00 | | | | 2/1/47 | | | $ | 10 | |
| | | 4 | | Fannie Mae, Pool #FM0021 | | | 4.00 | | | | 3/1/49 | | | | 4 | |
| | | 5 | | Fannie Mae, Pool #BE8373 | | | 4.00 | | | | 2/1/47 | | | | 5 | |
| | | 37 | | Fannie Mae, Pool #190405 | | | 4.00 | | | | 10/1/40 | | | | 37 | |
| | | 10 | | Fannie Mae, Pool #AH6242 | | | 4.00 | | | | 4/1/26 | | | | 10 | |
| | | 6 | | Fannie Mae, Pool #AS7558 | | | 4.00 | | | | 7/1/46 | | | | 6 | |
| | | 9 | | Fannie Mae, Pool #BM4306 | | | 4.00 | | | | 9/1/25 | | | | 9 | |
| | | 3 | | Fannie Mae, Pool #MA3521 | | | 4.00 | | | | 11/1/48 | | | | 3 | |
| | | 10 | | Fannie Mae, Pool #AX0841 | | | 4.00 | | | | 9/1/44 | | | | 10 | |
| | | 6 | | Fannie Mae, Pool #BN6677 | | | 4.00 | | | | 6/1/49 | | | | 6 | |
| | | 4 | | Fannie Mae, Pool #BN0334 | | | 4.00 | | | | 12/1/48 | | | | 4 | |
| | | 10 | | Fannie Mae, Pool #MA0534 | | | 4.00 | | | | 10/1/30 | | | | 10 | |
| | | 3 | | Fannie Mae, Pool #CA2316 | | | 4.00 | | | | 7/1/48 | | | | 3 | |
| | | 5 | | Fannie Mae, Pool #AZ7362 | | | 4.00 | | | | 11/1/45 | | | | 5 | |
| | | 4 | | Fannie Mae, Pool #AZ1210 | | | 4.00 | | | | 5/1/45 | | | | 4 | |
| | | 6 | | Fannie Mae, Pool #AS2751 | | | 4.50 | | | | 6/1/44 | | | | 6 | |
| | | 2 | | Fannie Mae, Pool #BE6489 | | | 4.50 | | | | 1/1/47 | | | | 2 | |
| | | 12 | | Fannie Mae, Pool #MA3184 | | | 4.50 | | | | 11/1/47 | | | | 13 | |
| | | 12 | | Fannie Mae, Pool #AS9394 | | | 4.50 | | | | 4/1/47 | | | | 13 | |
| | | 5 | | Fannie Mae, Pool #CA0623 | | | 4.50 | | | | 10/1/47 | | | | 5 | |
| | | 24 | | Fannie Mae, Pool #AE0217 | | | 4.50 | | | | 8/1/40 | | | | 25 | |
| | | 2 | | Fannie Mae, Pool #BK6328 | | | 4.50 | | | | 6/1/48 | | | | 2 | |
| | | 7 | | Fannie Mae, Pool #AL6567 | | | 4.50 | | | | 10/1/44 | | | | 8 | |
| | | 8 | | Fannie Mae, Pool #MA3747 | | | 4.50 | | | | 8/1/49 | | | | 8 | |
| | | 19 | | Fannie Mae, Pool #AE0954 | | | 4.50 | | | | 2/1/41 | | | | 20 | |
| | | 2 | | Fannie Mae, Pool #BN4309 | | | 4.50 | | | | 1/1/49 | | | | 3 | |
| | | 3 | | Fannie Mae, Pool #MA3537 | | | 4.50 | | | | 12/1/48 | | | | 3 | |
| | | 3 | | Fannie Mae, Pool #BK4850 | | | 4.50 | | | | 5/1/48 | | | | 3 | |
| | | 4 | | Fannie Mae, Pool #CA1711 | | | 4.50 | | | | 5/1/48 | | | | 4 | |
| | | 6 | | Fannie Mae, Pool #BM3286 | | | 4.50 | | | | 11/1/47 | | | | 6 | |
| | | 3 | | Fannie Mae, Pool #BH3310 | | | 4.50 | | | | 5/1/47 | | | | 3 | |
| | | 5 | | Fannie Mae, Pool #AU9017 | | | 4.50 | | | | 9/1/43 | | | | 5 | |
| | | 28 | | Fannie Mae, Pool #AL1107 | | | 4.50 | | | | 11/1/41 | | | | 28 | |
| | | 1 | | Fannie Mae, Pool #930998 | | | 4.50 | | | | 4/1/29 | | | | 1 | |
| | | 4 | | Fannie Mae, Pool #MA3639 | | | 4.50 | | | | 4/1/49 | | | | 4 | |
| | | 3 | | Fannie Mae, Pool #890603 | | | 5.00 | | | | 8/1/41 | | | | 3 | |
| | | 5 | | Fannie Mae, Pool #725027 | | | 5.00 | | | | 11/1/33 | | | | 5 | |
| | | 24 | | Fannie Mae, Pool #889117 | | | 5.00 | | | | 10/1/35 | | | | 25 | |
| | | 11 | | Fannie Mae, Pool #725238 | | | 5.00 | | | | 3/1/34 | | | | 12 | |
| | | 5 | | Fannie Mae, Pool #BM3904 | | | 5.00 | | | | 5/1/48 | | | | 5 | |
| | | 5 | | Fannie Mae, Pool #890221 | | | 5.50 | | | | 12/1/33 | | | | 5 | |
| | | 28 | | Fannie Mae, Pool #725228 | | | 6.00 | | | | 3/1/34 | | | | 30 | |
| | | 11 | | Fannie Mae, Pool #959451 | | | 6.00 | | | | 12/1/37 | | | | 12 | |
| | | 14 | | Fannie Mae, Pool #AE0442 | | | 6.50 | | | | 1/1/39 | | | | 16 | |
| | | 75 | | Fannie Mae, 15 YR TBA | | | 1.50 | | | | 7/25/37 | | | | 67 | |
| | | 75 | | Fannie Mae, 15 YR TBA | | | 2.00 | | | | 7/25/37 | | | | 69 | |
| | | 25 | | Fannie Mae, 15 YR TBA | | | 2.50 | | | | 7/25/37 | | | | 24 | |
| | | 25 | | Fannie Mae, 30 YR TBA | | | 2.00 | | | | 7/25/52 | | | | 22 | |
See accompanying notes to financial statements.
192
HC CAPITAL TRUST
The Core Fixed Income Portfolio
Portfolio of Investments (continued) — June 30, 2022
| | Principal
Amount
(000) | | Security Description | | Rate % | | | Maturity
Date | | | Value
(000) | |
| | | | | U.S. Government Agency Mortgages (continued) |
| | $ | 100 | | Fannie Mae, 30 YR TBA | | | 2.50 | | | | 7/25/52 | | | $ | 89 | |
| | | 150 | | Fannie Mae, 30 YR TBA | | | 3.00 | | | | 7/25/52 | | | | 139 | |
| | | 25 | | Fannie Mae, 30 YR TBA | | | 3.00 | | | | 8/25/51 | | | | 23 | |
| | | 50 | | Fannie Mae, 30 YR TBA | | | 3.50 | | | | 8/25/52 | | | | 47 | |
| | | 50 | | Fannie Mae, 30 YR TBA | | | 3.50 | | | | 7/25/52 | | | | 47 | |
| | | 50 | | Fannie Mae, 30 YR TBA, TBA | | | 4.00 | | | | 8/25/51 | | | | 48 | |
| | | 25 | | Fannie Mae, 30 YR TBA | | | 4.00 | | | | 7/25/52 | | | | 25 | |
| | | 19 | | Federal National Mortgage Association, Pool #MA4205 | | | 1.50 | | | | 12/1/35 | | | | 17 | |
| | | 22 | | Federal National Mortgage Association, Pool #CA8893 | | | 2.00 | | | | 2/1/51 | | | | 19 | |
| | | 47 | | Freddie Mac, Pool #SD8154 | | | 1.50 | | | | 6/1/51 | | | | 39 | |
| | | 46 | | Freddie Mac, Pool #QC0962 | | | 1.50 | | | | 4/1/51 | | | | 38 | |
| | | 20 | | Freddie Mac, Pool #SB8088 | | | 1.50 | | | | 2/1/36 | | | | 18 | |
| | | 24 | | Freddie Mac, Pool #SB8144 | | | 1.50 | | | | 3/1/37 | | | | 22 | |
| | | 23 | | Freddie Mac, Pool #RB5110 | | | 1.50 | | | | 5/1/41 | | | | 19 | |
| | | 21 | | Freddie Mac, Pool #SB8097 | | | 1.50 | | | | 4/1/36 | | | | 19 | |
| | | 24 | | Freddie Mac, Pool #QN9521 | | | 1.50 | | | | 2/1/37 | | | | 22 | |
| | | 47 | | Freddie Mac, Pool #SD8160 | | | 2.00 | | | | 8/1/51 | | | | 41 | |
| | | 24 | | Freddie Mac, Pool #QC7473 | | | 2.00 | | | | 9/1/51 | | | | 21 | |
| | | 49 | | Freddie Mac, Pool #SD8188 | | | 2.00 | | | | 1/1/52 | | | | 42 | |
| | | 44 | | Freddie Mac, Pool #RA4986 | | | 2.00 | | | | 4/1/51 | | | | 38 | |
| | | 24 | | Freddie Mac, Pool #RA5155 | | | 2.00 | | | | 5/1/51 | | | | 21 | |
| | | 36 | | Freddie Mac, Pool #SB8079 | | | 2.00 | | | | 12/1/35 | | | | 34 | |
| | | 48 | | Freddie Mac, Pool #SD8177 | | | 2.00 | | | | 10/1/51 | | | | 42 | |
| | | 20 | | Freddie Mac, Pool #RB5095 | | | 2.00 | | | | 12/1/40 | | | | 18 | |
| | | 18 | | Freddie Mac, Pool #RC1727 | | | 2.00 | | | | 12/1/35 | | | | 17 | |
| | | 45 | | Freddie Mac, Pool #QB6893 | | | 2.00 | | | | 12/1/50 | | | | 39 | |
| | | 25 | | Freddie Mac, Pool #QD5748 | | | 2.00 | | | | 2/1/52 | | | | 21 | |
| | | 23 | | Freddie Mac, Pool #SB8128 | | | 2.00 | | | | 11/1/36 | | | | 22 | |
| | | 41 | | Freddie Mac, Pool #SD8113 | | | 2.00 | | | | 12/1/50 | | | | 36 | |
| | | 21 | | Freddie Mac, Pool #SB8510 | | | 2.00 | | | | 2/1/36 | | | | 20 | |
| | | 15 | | Freddie Mac, Pool #ZS7735 | | | 2.00 | | | | 1/1/32 | | | | 14 | |
| | | 49 | | Freddie Mac, Pool #SD8193 | | | 2.00 | | | | 2/1/52 | | | | 42 | |
| | | 21 | | Freddie Mac, Pool #SD8121 | | | 2.00 | | | | 12/1/50 | | | | 18 | |
| | | 24 | | Freddie Mac, Pool #SD8172 | | | 2.00 | | | | 9/1/51 | | | | 21 | |
| | | 48 | | Freddie Mac, Pool #RA6507 | | | 2.00 | | | | 12/1/51 | | | | 42 | |
| | | 21 | | Freddie Mac, Pool #SB8107 | | | 2.00 | | | | 5/1/36 | | | | 20 | |
| | | 22 | | Freddie Mac, Pool #SD8146 | | | 2.00 | | | | 5/1/51 | | | | 20 | |
| | | 45 | | Freddie Mac, Pool #SD7537 | | | 2.00 | | | | 3/1/51 | | | | 39 | |
| | | 20 | | Freddie Mac, Pool #QB3926 | | | 2.00 | | | | 10/1/50 | | | | 18 | |
| | | 45 | | Freddie Mac, Pool #QC1075 | | | 2.00 | | | | 4/1/51 | | | | 39 | |
| | | 23 | | Freddie Mac, Pool #QC3597 | | | 2.00 | | | | 6/1/51 | | | | 20 | |
| | | 15 | | Freddie Mac, Pool #SB8061 | | | 2.00 | | | | 9/1/35 | | | | 14 | |
| | | 46 | | Freddie Mac, Pool #QC1333 | | | 2.00 | | | | 5/1/51 | | | | 39 | |
| | | 24 | | Freddie Mac, Pool #QC4423 | | | 2.00 | | | | 7/1/51 | | | | 20 | |
| | | 46 | | Freddie Mac, Pool #QC3697 | | | 2.00 | | | | 6/1/51 | | | | 40 | |
| | | 45 | | Freddie Mac, Pool #QC0423 | | | 2.00 | | | | 4/1/51 | | | | 39 | |
| | | 21 | | Freddie Mac, Pool #RA3575 | | | 2.00 | | | | 9/1/50 | | | | 18 | |
| | | 23 | | Freddie Mac, Pool #SD8079 | | | 2.00 | | | | 7/1/50 | | | | 20 | |
See accompanying notes to financial statements.
193
HC CAPITAL TRUST
The Core Fixed Income Portfolio
Portfolio of Investments (continued) — June 30, 2022
| | Principal
Amount
(000) | | Security Description | | Rate % | | | Maturity
Date | | | Value
(000) | |
| | | | | U.S. Government Agency Mortgages (continued) |
| | $ | 23 | | Freddie Mac, Pool #RA5257 | | | 2.00 | | | | 5/1/51 | | | $ | 20 | |
| | | 23 | | Freddie Mac, Pool #RA5040 | | | 2.00 | | | | 4/1/51 | | | | 20 | |
| | | 43 | | Freddie Mac, Pool #QB7708 | | | 2.00 | | | | 1/1/51 | | | | 37 | |
| | | 20 | | Freddie Mac, Pool #RA3205 | | | 2.00 | | | | 8/1/50 | | | | 17 | |
| | | 22 | | Freddie Mac, Pool #RA4214 | | | 2.00 | | | | 12/1/50 | | | | 19 | |
| | | 24 | | Freddie Mac, Pool #RA3328 | | | 2.00 | | | | 8/1/50 | | | | 21 | |
| | | 24 | | Freddie Mac, Pool #SD8098 | | | 2.00 | | | | 10/1/50 | | | | 20 | |
| | | 42 | | Freddie Mac, Pool #SD8128 | | | 2.00 | | | | 2/1/51 | | | | 37 | |
| | | 20 | | Freddie Mac, Pool #QB3716 | | | 2.00 | | | | 9/1/50 | | | | 17 | |
| | | 45 | | Freddie Mac, Pool #QB8064 | | | 2.00 | | | | 1/1/51 | | | | 39 | |
| | | 10 | | Freddie Mac, Pool #J25686 | | | 2.00 | | | | 9/1/28 | | | | 10 | |
| | | 25 | | Freddie Mac, Pool #SD8199 | | | 2.00 | | | | 3/1/52 | | | | 21 | |
| | | 23 | | Freddie Mac, Pool #RB5121 | | | 2.00 | | | | 7/1/41 | | | | 21 | |
| | | 22 | | Freddie Mac, Pool #RB5114 | | | 2.00 | | | | 6/1/41 | | | | 20 | |
| | | 44 | | Freddie Mac, Pool #QB9896 | | | 2.00 | | | | 3/1/51 | | | | 39 | |
| | | 22 | | Freddie Mac, Pool #SB8115 | | | 2.00 | | | | 8/1/36 | | | | 21 | |
| | | 24 | | Freddie Mac, Pool #RA6025 | | | 2.00 | | | | 10/1/51 | | | | 21 | |
| | | 25 | | Freddie Mac, Pool #QO0110 | | | 2.00 | | | | 4/1/37 | | | | 23 | |
| | | 24 | | Freddie Mac, Pool #QD0433 | | | 2.00 | | | | 11/1/51 | | | | 21 | |
| | | 24 | | Freddie Mac, Pool #QC6925 | | | 2.00 | | | | 9/1/51 | | | | 21 | |
| | | 24 | | Freddie Mac, Pool #RA6333 | | | 2.00 | | | | 11/1/51 | | | | 21 | |
| | | 47 | | Freddie Mac, Pool #QC6815 | | | 2.00 | | | | 9/1/51 | | | | 41 | |
| | | 48 | | Freddie Mac, Pool #QD1254 | | | 2.00 | | | | 11/1/51 | | | | 42 | |
| | | 35 | | Freddie Mac, Pool #RA2634 | | | 2.50 | | | | 5/1/50 | | | | 32 | |
| | | 16 | | Freddie Mac, Pool #RA2897 | | | 2.50 | | | | 6/1/50 | | | | 15 | |
| | | 22 | | Freddie Mac, Pool #SD0578 | | | 2.50 | | | | 3/1/51 | | | | 19 | |
| | | 18 | | Freddie Mac, Pool #SD8122 | | | 2.50 | | | | 1/1/51 | | | | 16 | |
| | | 18 | | Freddie Mac, Pool #RA2645 | | | 2.50 | | | | 6/1/50 | | | | 16 | |
| | | 8 | | Freddie Mac, Pool #RB5043 | | | 2.50 | | | | 4/1/40 | | | | 7 | |
| | | 22 | | Freddie Mac, Pool #RA3528 | | | 2.50 | | | | 9/1/50 | | | | 20 | |
| | | 17 | | Freddie Mac, Pool #QB3287 | | | 2.50 | | | | 8/1/50 | | | | 15 | |
| | | 16 | | Freddie Mac, Pool #SD8099 | | | 2.50 | | | | 10/1/50 | | | | 15 | |
| | | 24 | | Freddie Mac, Pool #QD5204 | | | 2.50 | | | | 1/1/52 | | | | 22 | |
| | | 47 | | Freddie Mac, Pool #QC9156 | | | 2.50 | | | | 10/1/51 | | | | 43 | |
| | | 49 | | Freddie Mac, Pool #SD1011 | | | 2.50 | | | | 4/1/52 | | | | 44 | |
| | | 25 | | Freddie Mac, Pool #G18611 | | | 2.50 | | | | 9/1/31 | | | | 24 | |
| | | 22 | | Freddie Mac, Pool #RA5286 | | | 2.50 | | | | 5/1/51 | | | | 19 | |
| | | 23 | | Freddie Mac, Pool #SD8167 | | | 2.50 | | | | 9/1/51 | | | | 21 | |
| | | 35 | | Freddie Mac, Pool #SD8114 | | | 2.50 | | | | 12/1/50 | | | | 31 | |
| | | 8 | | Freddie Mac, Pool #G07445 | | | 2.50 | | | | 7/1/43 | | | | 8 | |
| | | 8 | | Freddie Mac, Pool #ZS8692 | | | 2.50 | | | | 4/1/33 | | | | 8 | |
| | | 17 | | Freddie Mac, Pool #ZS4687 | | | 2.50 | | | | 11/1/46 | | | | 15 | |
| | | 8 | | Freddie Mac, Pool #ZK8425 | | | 2.50 | | | | 12/1/31 | | | | 7 | |
| | | 12 | | Freddie Mac, Pool #RB5054 | | | 2.50 | | | | 6/1/40 | | | | 11 | |
| | | 24 | | Freddie Mac, Pool #RA6340 | | | 2.50 | | | | 11/1/51 | | | | 22 | |
| | | 18 | | Freddie Mac, Pool #SD8129 | | | 2.50 | | | | 2/1/51 | | | | 16 | |
| | | 48 | | Freddie Mac, Pool #SD8183 | | | 2.50 | | | | 12/1/51 | | | | 43 | |
| | | 22 | | Freddie Mac, Pool #SD8151 | | | 2.50 | | | | 6/1/51 | | | | 20 | |
See accompanying notes to financial statements.
194
HC CAPITAL TRUST
The Core Fixed Income Portfolio
Portfolio of Investments (continued) — June 30, 2022
| | Principal
Amount
(000) | | Security Description | | Rate % | | | Maturity
Date | | | Value
(000) | |
| | | | | U.S. Government Agency Mortgages (continued) |
| | $ | 24 | | Freddie Mac, Pool #SD8189 | | | 2.50 | | | | 1/1/52 | | | $ | 22 | |
| | | 49 | | Freddie Mac, Pool #RA6493 | | | 2.50 | | | | 12/1/51 | | | | 44 | |
| | | 18 | | Freddie Mac, Pool #RA4070 | | | 2.50 | | | | 11/1/50 | | | | 16 | |
| | | 23 | | Freddie Mac, Pool #RA6019 | | | 2.50 | | | | 10/1/51 | | | | 21 | |
| | | 25 | | Freddie Mac, Pool #SD8205 | | | 2.50 | | | | 4/1/52 | | | | 22 | |
| | | 23 | | Freddie Mac, Pool #SD8021 | | | 2.50 | | | | 9/1/49 | | | | 21 | |
| | | 18 | | Freddie Mac, Pool #QB3703 | | | 2.50 | | | | 9/1/50 | | | | 17 | |
| | | 24 | | Freddie Mac, Pool #RA5802 | | | 2.50 | | | | 9/1/51 | | | | 21 | |
| | | 33 | | Freddie Mac, Pool #SB8045 | | | 2.50 | | | | 5/1/35 | | | | 32 | |
| | | 22 | | Freddie Mac, Pool #QC2251 | | | 2.50 | | | | 5/1/51 | | | | 20 | |
| | | 15 | | Freddie Mac, Pool #RA2595 | | | 2.50 | | | | 5/1/50 | | | | 13 | |
| | | 21 | | Freddie Mac, Pool #SD8147 | | | 2.50 | | | | 5/1/51 | | | | 19 | |
| | | 24 | | Freddie Mac, Pool #RA6621 | | | 2.50 | | | | 1/1/52 | | | | 22 | |
| | | 46 | | Freddie Mac, Pool #RA5832 | | | 2.50 | | | | 9/1/51 | | | | 41 | |
| | | 42 | | Freddie Mac, Pool #SD0412 | | | 2.50 | | | | 8/1/50 | | | | 38 | |
| | | 35 | | Freddie Mac, Pool #RA2643 | | | 2.50 | | | | 6/1/50 | | | | 32 | |
| | | 16 | | Freddie Mac, Pool #G18485 | | | 2.50 | | | | 10/1/28 | | | | 15 | |
| | | 41 | | Freddie Mac, Pool #SD8141 | | | 2.50 | | | | 4/1/51 | | | | 37 | |
| | | 16 | | Freddie Mac, Pool #G18470 | | | 2.50 | | | | 6/1/28 | | | | 16 | |
| | | 49 | | Freddie Mac, Pool #SD8194 | | | 2.50 | | | | 2/1/52 | | | | 44 | |
| | | 19 | | Freddie Mac, Pool #RA4527 | | | 2.50 | | | | 2/1/51 | | | | 17 | |
| | | 15 | | Freddie Mac, Pool #SD8083 | | | 2.50 | | | | 8/1/50 | | | | 13 | |
| | | 7 | | Freddie Mac, Pool #G18687 | | | 2.50 | | | | 5/1/33 | | | | 6 | |
| | | 23 | | Freddie Mac, Pool #QC7457 | | | 2.50 | | | | 9/1/51 | | | | 21 | |
| | | 20 | | Freddie Mac, Pool #ZS8483 | | | 2.50 | | | | 3/1/28 | | | | 19 | |
| | | 8 | | Freddie Mac, Pool #G18635 | | | 2.50 | | | | 3/1/32 | | | | 8 | |
| | | 25 | | Freddie Mac, Pool #QE2352 | | | 2.50 | | | | 5/1/52 | | | | 22 | |
| | | 24 | | Freddie Mac, Pool #RA6815 | | | 2.50 | | | | 2/1/52 | | | | 22 | |
| | | 8 | | Freddie Mac, Pool #SD8055 | | | 2.50 | | | | 4/1/50 | | | | 8 | |
| | | 22 | | Freddie Mac, Pool #QC2031 | | | 2.50 | | | | 5/1/51 | | | | 19 | |
| | | 9 | | Freddie Mac, Pool #QA5290 | | | 2.50 | | | | 12/1/49 | | | | 8 | |
| | | 25 | | Freddie Mac, Series K-1514, Class - A2, Callable 10/25/34 @ 100.00 | | | 2.86 | | | | 10/25/34 | | | | 23 | |
| | | 38 | | Freddie Mac, Pool #C09035 | | | 3.00 | | | | 4/1/43 | | | | 36 | |
| | | 6 | | Freddie Mac, Pool #C91927 | | | 3.00 | | | | 5/1/37 | | | | 6 | |
| | | 8 | | Freddie Mac, Pool #G61680 | | | 3.00 | | | | 4/1/47 | | | | 7 | |
| | | 44 | | Freddie Mac, Pool #SD8174 | | | 3.00 | | | | 10/1/51 | | | | 41 | |
| | | 1 | | Freddie Mac, Pool #J25193 | | | 3.00 | | | | 8/1/23 | | | | 1 | |
| | | 6 | | Freddie Mac, Pool #QA1033 | | | 3.00 | | | | 7/1/49 | | | | 5 | |
| | | 19 | | Freddie Mac, Pool #G60989 | | | 3.00 | | | | 12/1/46 | | | | 17 | |
| | | 7 | | Freddie Mac, Pool #ZM2169 | | | 3.00 | | | | 11/1/46 | | | | 7 | |
| | | 11 | | Freddie Mac, Pool #G15145 | | | 3.00 | | | | 7/1/29 | | | | 11 | |
| | | 4 | | Freddie Mac, Pool #G18518 | | | 3.00 | | | | 7/1/29 | | | | 4 | |
| | | 13 | | Freddie Mac, Pool #SD8030 | | | 3.00 | | | | 11/1/49 | | | | 13 | |
| | | 13 | | Freddie Mac, Pool #G18663 | | | 3.00 | | | | 10/1/32 | | | | 13 | |
| | | 7 | | Freddie Mac, Pool #ZM2089 | | | 3.00 | | | | 11/1/46 | | | | 7 | |
| | | 7 | | Freddie Mac, Pool #ZM2721 | | | 3.00 | | | | 2/1/47 | | | | 7 | |
| | | 8 | | Freddie Mac, Pool #J36428 | | | 3.00 | | | | 2/1/32 | | | | 8 | |
| | | 27 | | Freddie Mac, Pool #ZS4511 | | | 3.00 | | | | 3/1/43 | | | | 25 | |
See accompanying notes to financial statements.
195
HC CAPITAL TRUST
The Core Fixed Income Portfolio
Portfolio of Investments (continued) — June 30, 2022
| | Principal
Amount
(000) | | Security Description | | Rate % | | | Maturity
Date | | | Value
(000) | |
| | | | | U.S. Government Agency Mortgages (continued) |
| | $ | 39 | | Freddie Mac, Pool #ZS4522 | | | 3.00 | | | | 7/1/43 | | | $ | 37 | |
| | | 25 | | Freddie Mac, Pool #QD9881 | | | 3.00 | | | | 3/1/52 | | | | 23 | |
| | | 9 | | Freddie Mac, Pool #SB8046 | | | 3.00 | | | | 5/1/35 | | | | 9 | |
| | | 17 | | Freddie Mac, Pool #ZA2304 | | | 3.00 | | | | 6/1/33 | | | | 16 | |
| | | 17 | | Freddie Mac, Pool #ZS4606 | | | 3.00 | | | | 3/1/45 | | | | 17 | |
| | | 12 | | Freddie Mac, Pool #ZS4658 | | | 3.00 | | | | 4/1/46 | | | | 11 | |
| | | 16 | | Freddie Mac, Pool #ZS4706 | | | 3.00 | | | | 3/1/47 | | | | 15 | |
| | | 11 | | Freddie Mac, Pool #SD8074 | | | 3.00 | | | | 7/1/50 | | | | 10 | |
| | | 7 | | Freddie Mac, Pool #SD8056 | | | 3.00 | | | | 4/1/50 | | | | 7 | |
| | | 5 | | Freddie Mac, Pool #G08635 | | | 3.00 | | | | 4/1/45 | | | | 5 | |
| | | 28 | | Freddie Mac, Pool #ZS4697 | | | 3.00 | | | | 1/1/47 | | | | 27 | |
| | | 6 | | Freddie Mac, Pool #ZS4688 | | | 3.00 | | | | 11/1/46 | | | | 6 | |
| | | 10 | | Freddie Mac, Pool #QA8065 | | | 3.00 | | | | 3/1/50 | | | | 9 | |
| | | 8 | | Freddie Mac, Pool #J38057 | | | 3.00 | | | | 12/1/32 | | | | 8 | |
| | | 13 | | Freddie Mac, Pool #G08737 | | | 3.00 | | | | 12/1/46 | | | | 13 | |
| | | 6 | | Freddie Mac, Pool #G08803 | | | 3.00 | | | | 3/1/48 | | | | 5 | |
| | | 6 | | Freddie Mac, Pool #G18601 | | | 3.00 | | | | 5/1/31 | | | | 6 | |
| | | 5 | | Freddie Mac, Pool #C91809 | | | 3.00 | | | | 2/1/35 | | | | 5 | |
| | | 11 | | Freddie Mac, Pool #QA9049 | | | 3.00 | | | | 4/1/50 | | | | 11 | |
| | | 13 | | Freddie Mac, Pool #ZS4618 | | | 3.50 | | | | 6/1/45 | | | | 13 | |
| | | 8 | | Freddie Mac, Pool #G08761 | | | 3.50 | | | | 5/1/47 | | | | 8 | |
| | | 4 | | Freddie Mac, Pool #SD8001 | | | 3.50 | | | | 7/1/49 | | | | 4 | |
| | | 3 | | Freddie Mac, Pool #ZS4771 | | | 3.50 | | | | 6/1/48 | | | | 3 | |
| | | 25 | | Freddie Mac, Pool #SD8214 | | | 3.50 | | | | 5/1/52 | | | | 24 | |
| | | 5 | | Freddie Mac, Pool #ZA5128 | | | 3.50 | | | | 12/1/47 | | | | 5 | |
| | | 6 | | Freddie Mac, Pool #ZM4908 | | | 3.50 | | | | 11/1/47 | | | | 5 | |
| | | 7 | | Freddie Mac, Pool #SD8011 | | | 3.50 | | | | 9/1/49 | | | | 7 | |
| | | 8 | | Freddie Mac, Pool #ZS4651 | | | 3.50 | | | | 3/1/46 | | | | 8 | |
| | | 6 | | Freddie Mac, Pool #G08620 | | | 3.50 | | | | 12/1/44 | | | | 6 | |
| | | 9 | | Freddie Mac, Pool #RA2469 | | | 3.50 | | | | 4/1/50 | | | | 9 | |
| | | 9 | | Freddie Mac, Pool #RA1508 | | | 3.50 | | | | 10/1/49 | | | | 9 | |
| | | 5 | | Freddie Mac, Pool #ZS4599 | | | 3.50 | | | | 1/1/45 | | | | 4 | |
| | | 4 | | Freddie Mac, Pool #ZS4713 | | | 3.50 | | | | 4/1/47 | | | | 4 | |
| | | 16 | | Freddie Mac, Pool #ZS4642 | | | 3.50 | | | | 12/1/45 | | | | 16 | |
| | | 9 | | Freddie Mac, Pool #G08698 | | | 3.50 | | | | 3/1/46 | | | | 8 | |
| | | 3 | | Freddie Mac, Pool #Q57871 | | | 3.50 | | | | 8/1/48 | | | | 3 | |
| | | 4 | | Freddie Mac, Pool #J14069 | | | 3.50 | | | | 1/1/26 | | | | 4 | |
| | | 7 | | Freddie Mac, Pool #Q43933 | | | 3.50 | | | | 10/1/46 | | | | 7 | |
| | | 5 | | Freddie Mac, Pool #V83453 | | | 3.50 | | | | 10/1/47 | | | | 5 | |
| | | 18 | | Freddie Mac, Pool #G08636 | | | 3.50 | | | | 4/1/45 | | | | 17 | |
| | | 9 | | Freddie Mac, Pool #G61148 | | | 3.50 | | | | 9/1/47 | | | | 9 | |
| | | 15 | | Freddie Mac, Pool #Q09896 | | | 3.50 | | | | 8/1/42 | | | | 15 | |
| | | 9 | | Freddie Mac, Pool #G08687 | | | 3.50 | | | | 1/1/46 | | | | 8 | |
| | | 10 | | Freddie Mac, Pool #SB8007 | | | 3.50 | | | | 9/1/34 | | | | 10 | |
| | | 15 | | Freddie Mac, Pool #C91456 | | | 3.50 | | | | 6/1/32 | | | | 15 | |
| | | 7 | | Freddie Mac, Pool #Q53176 | | | 3.50 | | | | 12/1/47 | | | | 7 | |
| | | 4 | | Freddie Mac, Pool #ZS4659 | | | 3.50 | | | | 4/1/46 | | | | 4 | |
| | | 35 | | Freddie Mac, Pool #ZS4487 | | | 3.50 | | | | 6/1/42 | | | | 34 | |
See accompanying notes to financial statements.
196
HC CAPITAL TRUST
The Core Fixed Income Portfolio
Portfolio of Investments (continued) — June 30, 2022
| | Principal
Amount
(000) | | Security Description | | Rate % | | | Maturity
Date | | | Value
(000) | |
| | | | | U.S. Government Agency Mortgages (continued) |
| | $ | 4 | | Freddie Mac, Pool #G08770 | | | 3.50 | | | | 7/1/47 | | | $ | 4 | |
| | | 8 | | Freddie Mac, Pool #G08784 | | | 3.50 | | | | 10/1/47 | | | | 7 | |
| | | 7 | | Freddie Mac, Pool #J30284 | | | 3.50 | | | | 11/1/29 | | | | 7 | |
| | | 19 | | Freddie Mac, Pool #G08554 | | | 3.50 | | | | 10/1/43 | | | | 19 | |
| | | 14 | | Freddie Mac, Pool #C03759 | | | 3.50 | | | | 2/1/42 | | | | 13 | |
| | | 4 | | Freddie Mac, Pool #G08627 | | | 3.50 | | | | 2/1/45 | | | | 4 | |
| | | 17 | | Freddie Mac, Pool #ZL7781 | | | 4.00 | | | | 2/1/44 | | | | 17 | |
| | | 3 | | Freddie Mac, Pool #ZT2106 | | | 4.00 | | | | 3/1/49 | | | | 3 | |
| | | 7 | | Freddie Mac, Pool #C91395 | | | 4.00 | | | | 9/1/31 | | | | 7 | |
| | | 15 | | Freddie Mac, Pool #G08637 | | | 4.00 | | | | 4/1/45 | | | | 15 | |
| | | 5 | | Freddie Mac, Pool #G08801 | | | 4.00 | | | | 2/1/48 | | | | 5 | |
| | | 11 | | Freddie Mac, Pool #G08606 | | | 4.00 | | | | 9/1/44 | | | | 12 | |
| | | 9 | | Freddie Mac, Pool #SD8070 | | | 4.00 | | | | 6/1/50 | | | | 9 | |
| | | 10 | | Freddie Mac, Pool #G08567 | | | 4.00 | | | | 1/1/44 | | | | 10 | |
| | | 9 | | Freddie Mac, Pool #ZS4631 | | | 4.00 | | | | 9/1/45 | | | | 9 | |
| | | 3 | | Freddie Mac, Pool #ZA6946 | | | 4.00 | | | | 5/1/49 | | | | 3 | |
| | | 3 | | Freddie Mac, Pool #ZT1840 | | | 4.00 | | | | 9/1/48 | | | | 3 | |
| | | 8 | | Freddie Mac, Pool #G08563 | | | 4.00 | | | | 1/1/44 | | | | 8 | |
| | | 8 | | Freddie Mac, Pool #ZS4708 | | | 4.00 | | | | 3/1/47 | | | | 8 | |
| | | 6 | | Freddie Mac, Pool #SD0290 | | | 4.00 | | | | 4/1/50 | | | | 6 | |
| | | 11 | | Freddie Mac, Pool #A96286 | | | 4.00 | | | | 1/1/41 | | | | 11 | |
| | | 16 | | Freddie Mac, Pool #G06506 | | | 4.00 | | | | 12/1/40 | | | | 16 | |
| | | 9 | | Freddie Mac, Pool #ZA4988 | | | 4.00 | | | | 8/1/47 | | | | 8 | |
| | | 5 | | Freddie Mac, Pool #G08771 | | | 4.00 | | | | 7/1/47 | | | | 5 | |
| | | 8 | | Freddie Mac, Pool #G08775 | | | 4.00 | | | | 8/1/47 | | | | 8 | |
| | | 6 | | Freddie Mac, Pool #ZT1320 | | | 4.00 | | | | 11/1/48 | | | | 6 | |
| | | 7 | | Freddie Mac, Pool #Q58680 | | | 4.00 | | | | 9/1/48 | | | | 7 | |
| | | 5 | | Freddie Mac, Pool #G08781 | | | 4.50 | | | | 9/1/47 | | | | 5 | |
| | | 3 | | Freddie Mac, Pool #ZS4774 | | | 4.50 | | | | 5/1/48 | | | | 3 | |
| | | 5 | | Freddie Mac, Pool #C09059 | | | 4.50 | | | | 3/1/44 | | | | 5 | |
| | | 6 | | Freddie Mac, Pool #A97186 | | | 4.50 | | | | 3/1/41 | | | | 6 | |
| | | 16 | | Freddie Mac, Pool #G01890 | | | 4.50 | | | | 10/1/35 | | | | 16 | |
| | | 1 | | Freddie Mac, Pool #C90686 | | | 4.50 | | | | 6/1/23 | | | | 1 | |
| | | 5 | | Freddie Mac, Pool #Q58217 | | | 4.50 | | | | 9/1/48 | | | | 5 | |
| | | 6 | | Freddie Mac, Pool #Q52321 | | | 4.50 | | | | 11/1/47 | | | | 6 | |
| | | 20 | | Freddie Mac, Pool #A97692 | | | 4.50 | | | | 3/1/41 | | | | 20 | |
| | | 4 | | Freddie Mac, Pool #G08838 | | | 5.00 | | | | 9/1/48 | | | | 4 | |
| | | 8 | | Freddie Mac, Pool #ZT1779 | | | 5.00 | | | | 3/1/49 | | | | 8 | |
| | | 11 | | Freddie Mac, Pool #G05904 | | | 5.00 | | | | 9/1/39 | | | | 11 | |
| | | 10 | | Freddie Mac, Pool #G04817 | | | 5.00 | | | | 9/1/38 | | | | 10 | |
| | | 10 | | Freddie Mac, Pool #G01962 | | | 5.00 | | | | 12/1/35 | | | | 11 | |
| | | 17 | | Freddie Mac, Pool #G01665 | | | 5.50 | | | | 3/1/34 | | | | 18 | |
| | | 11 | | Freddie Mac, Pool #G02794 | | | 6.00 | | | | 5/1/37 | | | | 12 | |
| | | 5 | | Freddie Mac, Pool #G03616 | | | 6.00 | | | | 12/1/37 | | | | 6 | |
| | | 2 | | Freddie Mac, Pool #C90989 | | | 6.00 | | | | 9/1/26 | | | | 2 | |
| | | 24 | | Government National Mortgage Association, Pool #MA7588 | | | 2.00 | | | | 9/20/51 | | | | 21 | |
| | | 46 | | Government National Mortgage Association, Pool #MA7471 | | | 2.00 | | | | 7/20/51 | | | | 40 | |
| | | 48 | | Government National Mortgage Association, Pool #MA7704 | | | 2.00 | | | | 11/20/51 | | | | 43 | |
See accompanying notes to financial statements.
197
HC CAPITAL TRUST
The Core Fixed Income Portfolio
Portfolio of Investments (continued) — June 30, 2022
| | Principal
Amount
(000) | | Security Description | | Rate % | | | Maturity
Date | | | Value
(000) | |
| | | | | U.S. Government Agency Mortgages (continued) |
| | $ | 42 | | Government National Mortgage Association, Pool #MA7254 | | | 2.00 | | | | 3/20/51 | | | $ | 37 | |
| | | 20 | | Government National Mortgage Association, Pool #MA7051 | | | 2.00 | | | | 12/20/50 | | | | 18 | |
| | | 38 | | Government National Mortgage Association, Pool #MA6930 | | | 2.00 | | | | 10/20/50 | | | | 34 | |
| | | 37 | | Government National Mortgage Association, Pool #MA6864 | | | 2.00 | | | | 9/20/50 | | | | 33 | |
| | | 22 | | Government National Mortgage Association, Pool #MA7311 | | | 2.00 | | | | 4/20/51 | | | | 19 | |
| | | 22 | | Government National Mortgage Association, Pool #MA7366 | | | 2.00 | | | | 5/20/51 | | | | 19 | |
| | | 24 | | Government National Mortgage Association, Pool #MA7826 | | | 2.00 | | | | 1/20/52 | | | | 22 | |
| | | 20 | | Government National Mortgage Association, Pool #MA7135 | | | 2.00 | | | | 1/20/51 | | | | 18 | |
| | | 23 | | Government National Mortgage Association, Pool #MA6994 | | | 2.00 | | | | 11/20/50 | | | | 21 | |
| | | 24 | | Government National Mortgage Association, Pool #MA7766 | | | 2.00 | | | | 12/20/51 | | | | 22 | |
| | | 25 | | Government National Mortgage Association, Pool #MA7935 | | | 2.00 | | | | 3/20/52 | | | | 22 | |
| | | 20 | | Government National Mortgage Association, Pool #MA7312 | | | 2.50 | | | | 4/20/51 | | | | 19 | |
| | | 24 | | Government National Mortgage Association, Pool #MA7767 | | | 2.50 | | | | 12/20/51 | | | | 22 | |
| | | 11 | | Government National Mortgage Association, Pool #MA6655 | | | 2.50 | | | | 5/20/50 | | | | 10 | |
| | | 23 | | Government National Mortgage Association, Pool #MA7589 | | | 2.50 | | | | 9/20/51 | | | | 21 | |
| | | 21 | | Government National Mortgage Association, Pool #MA7136 | | | 2.50 | | | | 1/20/51 | | | | 20 | |
| | | 39 | | Government National Mortgage Association, Pool #MA7255 | | | 2.50 | | | | 3/20/51 | | | | 36 | |
| | | 25 | | Government National Mortgage Association, Pool #MA8042 | | | 2.50 | | | | 5/20/52 | | | | 23 | |
| | | 25 | | Government National Mortgage Association, Pool #MA7936 | | | 2.50 | | | | 3/20/52 | | | | 23 | |
| | | 16 | | Government National Mortgage Association, Pool #MA6995 | | | 2.50 | | | | 11/20/50 | | | | 15 | |
| | | 40 | | Government National Mortgage Association, Pool #MA6865 | | | 2.50 | | | | 9/20/50 | | | | 37 | |
| | | 23 | | Government National Mortgage Association, Pool #MA7534 | | | 2.50 | | | | 8/20/51 | | | | 21 | |
| | | 8 | | Government National Mortgage Association, Pool #MA6540 | | | 2.50 | | | | 3/20/50 | | | | 8 | |
| | | 3 | | Government National Mortgage Association, Pool #AA8341 | | | 2.50 | | | | 2/15/28 | | | | 3 | |
| | | 7 | | Government National Mortgage Association, Pool #MA4355 | | | 2.50 | | | | 4/20/32 | | | | 7 | |
| | | 26 | | Government National Mortgage Association, Pool #MA4260 | | | 2.50 | | | | 2/20/47 | | | | 24 | |
| | | 25 | | Government National Mortgage Association, Pool #MA7987 | | | 2.50 | | | | 4/20/52 | | | | 23 | |
| | | 16 | | Government National Mortgage Association, Pool #MA6931 | | | 2.50 | | | | 10/20/50 | | | | 14 | |
| | | 5 | | Government National Mortgage Association, Pool #MA1155 | | | 2.50 | | | | 7/20/43 | | | | 5 | |
| | | 25 | | Government National Mortgage Association, Pool #MA7881 | | | 2.50 | | | | 2/20/52 | | | | 23 | |
| | | 22 | | Government National Mortgage Association, Pool #MA7418 | | | 2.50 | | | | 6/20/51 | | | | 20 | |
| | | 45 | | Government National Mortgage Association, Pool #MA7472 | | | 2.50 | | | | 7/20/51 | | | | 42 | |
| | | 37 | | Government National Mortgage Association, Pool #MA7193 | | | 2.50 | | | | 2/20/51 | | | | 34 | |
| | | 24 | | Government National Mortgage Association, Pool #MA6709 | | | 2.50 | | | | 6/20/50 | | | | 22 | |
| | | 7 | | Government National Mortgage Association, Pool #MA4194 | | | 2.50 | | | | 1/20/47 | | | | 6 | |
| | | 29 | | Government National Mortgage Association, Pool #MA6819 | | | 2.50 | | | | 8/20/50 | | | | 26 | |
| | | 48 | | Government National Mortgage Association, Pool #MA7649 | | | 2.50 | | | | 10/20/51 | | | | 44 | |
| | | 8 | | Government National Mortgage Association, Pool #MA0205 | | | 3.00 | | | | 7/20/27 | | | | 7 | |
| | | 9 | | Government National Mortgage Association, Pool #AA5897 | | | 3.00 | | | | 12/15/42 | | | | 9 | |
| | | 7 | | Government National Mortgage Association, Pool #MA6283 | | | 3.00 | | | | 11/20/49 | | | | 6 | |
| | | 9 | | Government National Mortgage Association, Pool #MA3662 | | | 3.00 | | | | 5/20/46 | | | | 9 | |
| | | 10 | | Government National Mortgage Association, Pool #MA3936 | | | 3.00 | | | | 9/20/46 | | | | 10 | |
| | | 6 | | Government National Mortgage Association, Pool #MA3873 | | | 3.00 | | | | 8/20/46 | | | | 5 | |
| | | 9 | | Government National Mortgage Association, Pool #MA2960 | | | 3.00 | | | | 7/20/45 | | | | 8 | |
| | | 8 | | Government National Mortgage Association, Pool #MA3243 | | | 3.00 | | | | 11/20/45 | | | | 8 | |
| | | 14 | | Government National Mortgage Association, Pool #MA4003 | | | 3.00 | | | | 10/20/46 | | | | 14 | |
| | | 7 | | Government National Mortgage Association, Pool #MA6338 | | | 3.00 | | | | 12/20/49 | | | | 7 | |
| | | 7 | | Government National Mortgage Association, Pool #MA4509 | | | 3.00 | | | | 6/20/47 | | | | 6 | |
See accompanying notes to financial statements.
198
HC CAPITAL TRUST
The Core Fixed Income Portfolio
Portfolio of Investments (continued) — June 30, 2022
| | Principal
Amount
(000) | | Security Description | | Rate % | | | Maturity
Date | | | Value
(000) | |
| | | | | U.S. Government Agency Mortgages (continued) |
| | $ | 11 | | Government National Mortgage Association, Pool #MA4777 | | | 3.00 | | | | 10/20/47 | | | $ | 10 | |
| | | 14 | | Government National Mortgage Association, Pool #MA6474 | | | 3.00 | | | | 2/20/50 | | | | 13 | |
| | | 20 | | Government National Mortgage Association, Pool #MA6656 | | | 3.00 | | | | 5/20/50 | | | | 19 | |
| | | 9 | | Government National Mortgage Association, Pool #MA6599 | | | 3.00 | | | | 4/20/50 | | | | 8 | |
| | | 12 | | Government National Mortgage Association, Pool #MA4320 | | | 3.00 | | | | 3/20/47 | | | | 11 | |
| | | 10 | | Government National Mortgage Association, Pool #MA6710 | | | 3.00 | | | | 6/20/50 | | | | 10 | |
| | | 15 | | Government National Mortgage Association, Pool #MA5018 | | | 3.00 | | | | 2/20/48 | | | | 14 | |
| | | 18 | | Government National Mortgage Association, Pool #MA0461 | | | 3.00 | | | | 10/20/42 | | | | 17 | |
| | | 12 | | Government National Mortgage Association, Pool #MA2520 | | | 3.00 | | | | 1/20/45 | | | | 11 | |
| | | 17 | | Government National Mortgage Association, Pool #MA4899 | | | 3.00 | | | | 12/20/47 | | | | 16 | |
| | | 17 | | Government National Mortgage Association, Pool #MA1011 | | | 3.00 | | | | 5/20/43 | | | | 16 | |
| | | 17 | | Government National Mortgage Association, Pool #MA0851 | | | 3.00 | | | | 3/20/43 | | | | 16 | |
| | | 7 | | Government National Mortgage Association, Pool #MA6409 | | | 3.00 | | | | 1/20/50 | | | | 7 | |
| | | 22 | | Government National Mortgage Association, Pool #MA6766 | | | 3.00 | | | | 7/20/50 | | | | 21 | |
| | | 6 | | Government National Mortgage Association, Pool #MA5815 | | | 3.00 | | | | 3/20/49 | | | | 5 | |
| | | 7 | | Government National Mortgage Association, Pool #MA6089 | | | 3.00 | | | | 8/20/49 | | | | 6 | |
| | | 10 | | Government National Mortgage Association, Pool #MA3802 | | | 3.00 | | | | 7/20/46 | | | | 9 | |
| | | 13 | | Government National Mortgage Association, Pool #MA3375 | | | 3.00 | | | | 1/20/46 | | | | 12 | |
| | | 12 | | Government National Mortgage Association, Pool #MA6820 | | | 3.00 | | | | 8/20/50 | | | | 11 | |
| | | 6 | | Government National Mortgage Association, Pool #MA4068 | | | 3.00 | | | | 11/20/46 | | | | 6 | |
| | | 8 | | Government National Mortgage Association, Pool #MA4126 | | | 3.00 | | | | 12/20/46 | | | | 7 | |
| | | 6 | | Government National Mortgage Association, Pool #MA4261 | | | 3.00 | | | | 2/20/47 | | | | 6 | |
| | | 9 | | Government National Mortgage Association, Pool #MA4836 | | | 3.00 | | | | 11/20/47 | | | | 9 | |
| | | 21 | | Government National Mortgage Association, Pool #MA1447 | | | 3.00 | | | | 11/20/43 | | | | 20 | |
| | | 25 | | Government National Mortgage Association, Pool #MA6218 | | | 3.00 | | | | 10/20/49 | | | | 24 | |
| | | 24 | | Government National Mortgage Association, Pool #AA6149 | | | 3.00 | | | | 3/20/43 | | | | 23 | |
| | | 4 | | Government National Mortgage Association, Pool #MA3596 | | | 3.00 | | | | 4/20/46 | | | | 4 | |
| | | 9 | | Government National Mortgage Association, Pool #MA4195 | | | 3.00 | | | | 1/20/47 | | | | 8 | |
| | | 9 | | Government National Mortgage Association, Pool #MA3309 | | | 3.00 | | | | 12/20/45 | | | | 8 | |
| | | 12 | | Government National Mortgage Association, Pool #MA3735 | | | 3.00 | | | | 6/20/46 | | | | 11 | |
| | | 9 | | Government National Mortgage Association, Pool #MA4382 | | | 3.50 | | | | 4/20/47 | | | | 9 | |
| | | 14 | | Government National Mortgage Association, Pool #MA0934 | | | 3.50 | | | | 4/20/43 | | | | 14 | |
| | | 5 | | Government National Mortgage Association, Pool #MA6339 | | | 3.50 | | | | 12/20/49 | | | | 5 | |
| | | 9 | | Government National Mortgage Association, Pool #MA4321 | | | 3.50 | | | | 3/20/47 | | | | 9 | |
| | | 14 | | Government National Mortgage Association, Pool #MA0318 | | | 3.50 | | | | 8/20/42 | | | | 14 | |
| | | 18 | | Government National Mortgage Association, Pool #MA0220 | | | 3.50 | | | | 7/20/42 | | | | 17 | |
| | | 6 | | Government National Mortgage Association, Pool #AJ0411 | | | 3.50 | | | | 9/15/44 | | | | 6 | |
| | | 8 | | Government National Mortgage Association, Pool #MA3736 | | | 3.50 | | | | 6/20/46 | | | | 8 | |
| | | 6 | | Government National Mortgage Association, Pool #AC3938 | | | 3.50 | | | | 1/15/43 | | | | 5 | |
| | | 5 | | Government National Mortgage Association, Pool #MA4778 | | | 3.50 | | | | 10/20/47 | | | | 5 | |
| | | 9 | | Government National Mortgage Association, Pool #MA3874 | | | 3.50 | | | | 8/20/46 | | | | 9 | |
| | | 9 | | Government National Mortgage Association, Pool #MA4262 | | | 3.50 | | | | 2/20/47 | | | | 9 | |
| | | 8 | | Government National Mortgage Association, Pool #MA4586 | | | 3.50 | | | | 7/20/47 | | | | 8 | |
| | | 7 | | Government National Mortgage Association, Pool #MA5019 | | | 3.50 | | | | 2/20/48 | | | | 7 | |
| | | 8 | | Government National Mortgage Association, Pool #MA3310 | | | 3.50 | | | | 12/20/45 | | | | 8 | |
| | | 8 | | Government National Mortgage Association, Pool #MA3803 | | | 3.50 | | | | 7/20/46 | | | | 8 | |
| | | 9 | | Government National Mortgage Association, Pool #MA4510 | | | 3.50 | | | | 6/20/47 | | | | 9 | |
| | | 4 | | Government National Mortgage Association, Pool #MA5762 | | | 3.50 | | | | 2/20/49 | | | | 4 | |
See accompanying notes to financial statements.
199
HC CAPITAL TRUST
The Core Fixed Income Portfolio
Portfolio of Investments (continued) — June 30, 2022
| | Principal
Amount
(000) | | Security Description | | Rate % | | | Maturity
Date | | | Value
(000) | |
| | | | | U.S. Government Agency Mortgages (continued) |
| | $ | 8 | | Government National Mortgage Association, Pool #MA5875 | | | 3.50 | | | | 4/20/49 | | | $ | 8 | |
| | | 9 | | Government National Mortgage Association, Pool #MA4004 | | | 3.50 | | | | 10/20/46 | | | | 9 | |
| | | 6 | | Government National Mortgage Association, Pool #AM4971 | | | 3.50 | | | | 4/20/45 | | | | 6 | |
| | | 5 | | Government National Mortgage Association, Pool #MA4837 | | | 3.50 | | | | 11/20/47 | | | | 5 | |
| | | 26 | | Government National Mortgage Association, Pool #MA0462 | | | 3.50 | | | | 10/20/42 | | | | 26 | |
| | | 11 | | Government National Mortgage Association, Pool #MA4127 | | | 3.50 | | | | 12/20/46 | | | | 11 | |
| | | 5 | | Government National Mortgage Association, Pool #MA1574 | | | 3.50 | | | | 1/20/29 | | | | 5 | |
| | | 7 | | Government National Mortgage Association, Pool #MA2961 | | | 3.50 | | | | 7/20/45 | | | | 7 | |
| | | 8 | | Government National Mortgage Association, Pool #MA3376 | | | 3.50 | | | | 1/20/46 | | | | 8 | |
| | | 8 | | Government National Mortgage Association, Pool #MA3597 | | | 3.50 | | | | 4/20/46 | | | | 8 | |
| | | 10 | | Government National Mortgage Association, Pool #MA4652 | | | 3.50 | | | | 8/20/47 | | | | 10 | |
| | | 6 | | Government National Mortgage Association, Pool #MA2826 | | | 3.50 | | | | 5/20/45 | | | | 6 | |
| | | 19 | | Government National Mortgage Association, Pool #MA1157 | | | 3.50 | | | | 7/20/43 | | | | 19 | |
| | | 6 | | Government National Mortgage Association, Pool #MA3244 | | | 3.50 | | | | 11/20/45 | | | | 6 | |
| | | 6 | | Government National Mortgage Association, Pool #MA5191 | | | 3.50 | | | | 5/20/48 | | | | 6 | |
| | | 11 | | Government National Mortgage Association, Pool #MA3173 | | | 3.50 | | | | 10/20/45 | | | | 11 | |
| | | 4 | | Government National Mortgage Association, Pool #MA3454 | | | 3.50 | | | | 2/20/46 | | | | 4 | |
| | | 13 | | Government National Mortgage Association, Pool #MA2445 | | | 3.50 | | | | 12/20/44 | | | | 12 | |
| | | 3 | | Government National Mortgage Association, Pool #MA1600 | | | 3.50 | | | | 1/20/44 | | | | 3 | |
| | | 16 | | Government National Mortgage Association, Pool #MA0699 | | | 3.50 | | | | 1/20/43 | | | | 16 | |
| | | 9 | | Government National Mortgage Association, Pool #MA2371 | | | 3.50 | | | | 11/20/44 | | | | 9 | |
| | | 5 | | Government National Mortgage Association, Pool #MA6219 | | | 3.50 | | | | 10/20/49 | | | | 5 | |
| | | 8 | | Government National Mortgage Association, Pool #MA3105 | | | 3.50 | | | | 9/20/45 | | | | 8 | |
| | | 9 | | Government National Mortgage Association, Pool #MA2223 | | | 3.50 | | | | 9/20/44 | | | | 9 | |
| | | 5 | | Government National Mortgage Association, Pool #AB9211 | | | 3.50 | | | | 11/15/42 | | | | 4 | |
| | | 10 | | Government National Mortgage Association, Pool #MA6091 | | | 4.00 | | | | 8/20/49 | | | | 10 | |
| | | 11 | | Government National Mortgage Association, Pool #MA3737 | | | 4.00 | | | | 6/20/46 | | | | 11 | |
| | | 4 | | Government National Mortgage Association, Pool #MA5651 | | | 4.00 | | | | 12/20/48 | | | | 4 | |
| | | 4 | | Government National Mortgage Association, Pool #MA4653 | | | 4.00 | | | | 8/20/47 | | | | 4 | |
| | | 8 | | Government National Mortgage Association, Pool #MA6040 | | | 4.00 | | | | 7/20/49 | | | | 8 | |
| | | 3 | | Government National Mortgage Association, Pool #MA3245 | | | 4.00 | | | | 11/20/45 | | | | 3 | |
| | | 7 | | Government National Mortgage Association, Pool #MA1996 | | | 4.00 | | | | 6/20/44 | | | | 7 | |
| | | 7 | | Government National Mortgage Association, Pool #MA2224 | | | 4.00 | | | | 9/20/44 | | | | 8 | |
| | | 4 | | Government National Mortgage Association, Pool #MA4263 | | | 4.00 | | | | 2/20/47 | | | | 4 | |
| | | 5 | | Government National Mortgage Association, Pool #MA6155 | | | 4.00 | | | | 9/20/49 | | | | 5 | |
| | | 4 | | Government National Mortgage Association, Pool #MA5595 | | | 4.00 | | | | 11/20/48 | | | | 4 | |
| | | 8 | | Government National Mortgage Association, Pool #MA4511 | | | 4.00 | | | | 6/20/47 | | | | 8 | |
| | | 31 | | Government National Mortgage Association, Pool #MA1091 | | | 4.00 | | | | 6/20/43 | | | | 31 | |
| | | 8 | | Government National Mortgage Association, Pool #MA1286 | | | 4.00 | | | | 9/20/43 | | | | 9 | |
| | | 7 | | Government National Mortgage Association, Pool #MA2304 | | | 4.00 | | | | 10/20/44 | | | | 7 | |
| | | 4 | | Government National Mortgage Association, Pool #MA5466 | | | 4.00 | | | | 9/20/48 | | | | 4 | |
| | | 5 | | Government National Mortgage Association, Pool #MA3522 | | | 4.00 | | | | 3/20/46 | | | | 5 | |
| | | 4 | | Government National Mortgage Association, Pool #MA0023 | | | 4.00 | | | | 4/20/42 | | | | 4 | |
| | | 3 | | Government National Mortgage Association, Pool #MA5986 | | | 4.00 | | | | 6/20/49 | | | | 3 | |
| | | 3 | | Government National Mortgage Association, Pool #MA5876 | | | 4.00 | | | | 4/20/49 | | | | 3 | |
| | | 3 | | Government National Mortgage Association, Pool #MA5710 | | | 4.00 | | | | 1/20/49 | | | | 3 | |
| | | 6 | | Government National Mortgage Association, Pool #BD9886 | | | 4.00 | | | | 1/15/48 | | | | 6 | |
| | | 4 | | Government National Mortgage Association, Pool #MA3377 | | | 4.00 | | | | 1/20/46 | | | | 4 | |
See accompanying notes to financial statements.
200
HC CAPITAL TRUST
The Core Fixed Income Portfolio
Portfolio of Investments (continued) — June 30, 2022
| | Principal
Amount
(000) | | Security Description | | Rate % | | | Maturity
Date | | | Value
(000) | |
| | | | | U.S. Government Agency Mortgages (continued) |
| | $ | 7 | | Government National Mortgage Association, Pool #MA1761 | | | 4.00 | | | | 3/20/44 | | | $ | 7 | |
| | | 4 | | Government National Mortgage Association, Pool #MA4322 | | | 4.00 | | | | 3/20/47 | | | | 4 | |
| | | 5 | | Government National Mortgage Association, Pool #MA5931 | | | 4.00 | | | | 5/20/49 | | | | 5 | |
| | | 3 | | Government National Mortgage Association, Pool #MA4721 | | | 4.50 | | | | 9/20/47 | | | | 4 | |
| | | 8 | | Government National Mortgage Association, Pool #MA2756 | | | 4.50 | | | | 4/20/45 | | | | 8 | |
| | | 10 | | Government National Mortgage Association, Pool #MA5987 | | | 4.50 | | | | 6/20/49 | | | | 10 | |
| | | 3 | | Government National Mortgage Association, Pool #MA1762 | | | 4.50 | | | | 3/20/44 | | | | 3 | |
| | | 6 | | Government National Mortgage Association, Pool #MA5764 | | | 4.50 | | | | 2/20/49 | | | | 6 | |
| | | 4 | | Government National Mortgage Association, Pool #738906 | | | 4.50 | | | | 10/15/41 | | | | 5 | |
| | | 3 | | Government National Mortgage Association, Pool #MA5193 | | | 4.50 | | | | 5/20/48 | | | | 3 | |
| | | 6 | | Government National Mortgage Association, Pool #MA2373 | | | 4.50 | | | | 11/20/44 | | | | 6 | |
| | | 27 | | Government National Mortgage Association, Pool #4801 | | | 4.50 | | | | 9/20/40 | | | | 28 | |
| | | 4 | | Government National Mortgage Association, Pool #BA2485 | | | 4.50 | | | | 4/15/47 | | | | 4 | |
| | | 16 | | Government National Mortgage Association, Pool #721760 | | | 4.50 | | | | 8/15/40 | | | | 17 | |
| | | 3 | | Government National Mortgage Association, Pool #MA5596 | | | 4.50 | | | | 11/20/48 | | | | 3 | |
| | | 3 | | Government National Mortgage Association, Pool #MA5818 | | | 4.50 | | | | 3/20/49 | | | | 3 | |
| | | 6 | | Government National Mortgage Association, Pool #MA5399 | | | 4.50 | | | | 8/20/48 | | | | 7 | |
| | | 17 | | Government National Mortgage Association, Pool #4559 | | | 5.00 | | | | 10/20/39 | | | | 18 | |
| | | 4 | | Government National Mortgage Association, Pool #MA5933 | | | 5.00 | | | | 5/20/49 | | | | 4 | |
| | | 3 | | Government National Mortgage Association, Pool #MA5530 | | | 5.00 | | | | 10/20/48 | | | | 3 | |
| | | 12 | | Government National Mortgage Association, Pool #697946 | | | 5.00 | | | | 3/15/39 | | | | 12 | |
| | | 3 | | Government National Mortgage Association, Pool #MA5653 | | | 5.00 | | | | 12/20/48 | | | | 3 | |
| | | 4 | | Government National Mortgage Association, Pool #MA5988 | | | 5.00 | | | | 6/20/49 | | | | 4 | |
| | | 6 | | Government National Mortgage Association, Pool #510835 | | | 5.50 | | | | 2/15/35 | | | | 7 | |
| | | 9 | | Government National Mortgage Association, Pool #MA0466 | | | 5.50 | | | | 10/20/42 | | | | 10 | |
| | | 8 | | Government National Mortgage Association, Pool #4222 | | | 6.00 | | | | 8/20/38 | | | | 9 | |
| | | 300 | | Government National Mortgage Association, 30 YR TBA | | | 2.00 | | | | 7/20/52 | | | | 265 | |
| | | 150 | | Government National Mortgage Association, 30 YR TBA | | | 2.50 | | | | 7/20/52 | | | | 136 | |
| | | 25 | | Government National Mortgage Association, 30 YR TBA | | | 2.50 | | | | 8/20/52 | | | | 23 | |
| | | 75 | | Government National Mortgage Association, 30 YR TBA | | | 3.00 | | | | 7/20/52 | | | | 70 | |
| | | 25 | | Government National Mortgage Association, 30 YR TBA | | | 3.50 | | | | 8/1/52 | | | | 24 | |
| | | | | Total U.S. Government Agency Mortgages | | | | | | | | | | | 12,384 | |
| | | | | | | | | | | | | | | | | |
| | | | | U.S. Government Agency Securities — 0.80% | | | | | | | | | | | | |
| | | 25 | | Fannie Mae | | | 0.50 | | | | 6/17/25 | | | | 23 | |
| | | 25 | | Fannie Mae, Callable 9/18/22 @ 100.00 | | | 0.88 | | | | 12/18/26 | | | | 23 | |
| | | 25 | | Fannie Mae | | | 1.63 | | | | 1/7/25 | | | | 24 | |
| | | 10 | | Fannie Mae | | | 5.63 | | | | 7/15/37 | | | | 12 | |
| | | 20 | | Fannie Mae | | | 6.63 | | | | 11/15/30 | | | | 25 | |
| | | 25 | | Federal Farm Credit Bank | | | 0.25 | | | | 2/26/24 | | | | 24 | |
| | | 75 | | Federal Farm Credit Bank | | | 0.88 | | | | 11/18/24 | | | | 70 | |
| | | 25 | | Federal Home Loan Bank | | | 0.63 | | | | 12/22/23 | | | | 24 | |
| | | 25 | | Federal Home Loan Bank | | | 2.75 | | | | 6/28/24 | | | | 25 | |
| | | 40 | | Federal Home Loan Bank | | | 2.88 | | | | 9/13/24 | | | | 40 | |
| | | 50 | | Freddie Mac | | | 0.25 | | | | 12/4/23 | | | | 48 | |
| | | 50 | | Freddie Mac | | | 0.38 | | | | 7/21/25 | | | | 46 | |
| | | 15 | | Freddie Mac | | | 6.25 | | | | 7/15/32 | | | | 19 | |
| | | 10 | | Freddie Mac | | | 6.75 | | | | 3/15/31 | | | | 13 | |
See accompanying notes to financial statements.
201
HC CAPITAL TRUST
The Core Fixed Income Portfolio
Portfolio of Investments (continued) — June 30, 2022
| | Principal
Amount
(000) | | Security Description | | Rate % | | | Maturity
Date | | | Value
(000) | |
| | | | | U.S. Government Agency Securities (continued) |
| | $ | 5 | | Tennessee Valley Authority | | | 3.50 | | | | 12/15/42 | | | $ | 5 | |
| | | 30 | | Tennessee Valley Authority | | | 5.88 | | | | 4/1/36 | | | | 36 | |
| | | | | Total U.S. Government Agency Securities | | | | | | | | | | | 457 | |
| | | | | | | | | | | | | | | | | |
| | | | | Corporate Bonds — 36.27% | | | | | | | | | | | | |
| | | 85 | | AbbVie, Inc. (Biotechnology), Callable 8/14/28 @ 100.00 | | | 4.25 | | | | 11/14/28 | | | | 84 | |
| | | 215 | | AbbVie, Inc. (Biotechnology) | | | 4.40 | | | | 11/6/42 | | | | 196 | |
| | | 25 | | Alabama Power Co. (Electric Utilities), Callable 2/15/44 @ 100.00 | | | 4.15 | | | | 8/15/44 | | | | 22 | |
| | | 250 | | Ally Financial, Inc. (Consumer Finance), Callable 10/21/25 @ 100.00 | | | 5.75 | | | | 11/20/25 | | | | 244 | |
| | | 225 | | Amgen, Inc. (Biotechnology), Callable 8/21/39 @ 100.00 | | | 3.15 | | | | 2/21/40 | | | | 178 | |
| | | 180 | | Anheuser-Busch Companies LLC/Anheuser-Busch InBev Worldwide, Inc. (Beverages), Callable 8/1/45 @ 100.00 | | | 4.90 | | | | 2/1/46 | | | | 169 | |
| | | 220 | | Anheuser-Busch InBev Worldwide, Inc. (Beverages), Callable 12/1/39 @ 100.00 | | | 4.35 | | | | 6/1/40 | | | | 197 | |
| | | 40 | | Anthem, Inc. (Health Care Providers & Services), Callable 2/15/30 @ 100.00 | | | 2.25 | | | | 5/15/30 | | | | 34 | |
| | | 185 | | Anthem, Inc. (Health Care Providers & Services), Callable 12/1/27 @ 100.00 | | | 4.10 | | | | 3/1/28 | | | | 184 | |
| | | 70 | | Anthem, Inc. (Health Care Providers & Services) | | | 4.63 | | | | 5/15/42 | | | | 67 | |
| | | 270 | | Apple, Inc. (Technology Hardware, Storage & Peripherals), Callable 8/23/45 @ 100.00 | | | 4.65 | | | | 2/23/46 | | | | 277 | |
| | | 293 | | AT&T, Inc. (Diversified Telecommunication Services), Callable 3/15/53 @ 100.00 | | | 3.50 | | | | 9/15/53 | | | | 221 | |
| | | 300 | | AT&T, Inc. (Diversified Telecommunication Services), Callable 12/1/28 @ 100.00 | | | 4.35 | | | | 3/1/29 | | | | 295 | |
| | | 55 | | AT&T, Inc. (Diversified Telecommunication Services), Callable 9/9/48 @ 100.00 | | | 4.55 | | | | 3/9/49 | | | | 50 | |
| | | 65 | | Atmos Energy Corp. (Gas Utilities), Callable 4/15/44 @ 100.00 | | | 4.13 | | | | 10/15/44 | | | | 57 | |
| | | 95 | | Atmos Energy Corp. (Gas Utilities), Callable 7/15/42 @ 100.00 | | | 4.15 | | | | 1/15/43 | | | | 84 | |
| | | 430 | | Bank of America Corp. (Banks), Callable 12/20/27 @ 100.00 | | | 3.42 (US0003M + 104 bps)(b) | | | | 12/20/28 | | | | 400 | |
| | | 680 | | Bank of America Corp., MTN (Banks), Callable 2/7/29 @ 100.00 | | | 3.97 (US0003M + 121 bps)(b) | | | | 2/7/30 | | | | 646 | |
| | | 165 | | Berkshire Hathaway, Inc. (Multi-Utilities), Callable 8/1/44 @ 100.00 | | | 4.50 | | | | 2/1/45 | | | | 153 | |
| | | 25 | | BP Capital Markets America, Inc. (Diversified Financial Services), Callable 8/24/49 @ 100.00 | | | 3.00 | | | | 2/24/50 | | | | 18 | |
| | | 135 | | Bristol-Myers Squibb Co. (Pharmaceuticals), Callable 4/26/49 @ 100.00 | | | 4.25 | | | | 10/26/49 | | | | 127 | |
| | | 317 | | Brown & Brown, Inc. (Insurance), Callable 12/15/28 @ 100.00 | | | 4.50 | | | | 3/15/29 | | | | 311 | |
| | | 195 | | Bunge Limited Finance Corp. (Food Products), Callable 2/14/31 @ 100.00 | | | 2.75 | | | | 5/14/31 | | | | 161 | |
| | | 170 | | Bunge Limited Finance Corp. (Food Products), Callable 5/15/26 @ 100.00 | | | 3.25 | | | | 8/15/26 | | | | 162 | |
| | | 80 | | Capital One Financial Corp. (Consumer Finance), Callable 1/5/25 @ 100.00 | | | 3.20 | | | | 2/5/25 | | | | 78 | |
| | | 130 | | Capital One Financial Corp. (Consumer Finance), Callable 9/30/24 @ 100.00 | | | 3.30 | | | | 10/30/24 | | | | 127 | |
| | | 255 | | Capital One Financial Corp. (Consumer Finance), Callable 3/31/25 @ 100.00 | | | 4.25 | | | | 4/30/25 | | | | 255 | |
| | | 410 | | Charter Communications Operating LLC/Charter Communications Operating Capital (Media), Callable 12/30/28 @ 100.00 | | | 5.05 | | | | 3/30/29 | | | | 395 | |
| | | 30 | | Cisco Systems, Inc. (Communications Equipment) | | | 5.50 | | | | 1/15/40 | | | | 33 | |
| | | 595 | | Citigroup, Inc. (Banks), Callable 7/21/26 @ 100.00 | | | 3.20 | | | | 10/21/26 | | | | 567 | |
| | | 65 | | Citigroup, Inc. (Banks), Callable 4/23/28 @ 100.00 | | | 4.08 (US0003M + 119 bps)(b) | | | | 4/23/29 | | | | 62 | |
| | | 210 | | Citigroup, Inc. (Banks), Callable 3/31/30 @ 100.00 | | | 4.41 (SOFR + 391 bps)(b) | | | | 3/31/31 | | | | 200 | |
| | | 55 | | Comcast Corp. (Media), Callable 8/1/49 @ 100.00 | | | 3.45 | | | | 2/1/50 | | | | 44 | |
| | | 25 | | Comcast Corp. (Media), Callable 5/1/49 @ 100.00 | | | 4.00 | | | | 11/1/49 | | | | 22 | |
| | | 25 | | Comcast Corp. (Media) | | | 4.65 | | | | 7/15/42 | | | | 24 | |
See accompanying notes to financial statements.
202
HC CAPITAL TRUST
The Core Fixed Income Portfolio
Portfolio of Investments (continued) — June 30, 2022
| | Principal
Amount
(000) | | Security Description | | Rate % | | | Maturity
Date | | | Value
(000) | |
| | | | | Corporate Bonds (continued) |
| | $ | 245 | | Comcast Corp. (Media) | | | 4.75 | | | | 3/1/44 | | | $ | 236 | |
| | | 20 | | Consolidated Edison Company of New York, Inc., Series 2008-B (Multi-Utilities) | | | 6.75 | | | | 4/1/38 | | | | 23 | |
| | | 255 | | Constellation Brands, Inc. (Beverages), Callable 5/1/29 @ 100.00 | | | 3.15 | | | | 8/1/29 | | | | 229 | |
| | | 230 | | CSX Corp. (Road & Rail) | | | 6.22 | | | | 4/30/40 | | | | 259 | |
| | | 94 | | CVS Health Corp. (Health Care Providers & Services), Callable 12/25/27 @ 100.00 | | | 4.30 | | | | 3/25/28 | | | | 93 | |
| | | 260 | | CVS Health Corp. (Health Care Providers & Services), Callable 9/25/37 @ 100.00 | | | 4.78 | | | | 3/25/38 | | | | 247 | |
| | | 45 | | CVS Health Corp. (Health Care Providers & Services), Callable 9/25/47 @ 100.00 | | | 5.05 | | | | 3/25/48 | | | | 43 | |
| | | 145 | | Dell International LLC/EMC Corp. (Tech Hardware & Semiconductors), Callable 8/1/26 @ 100.00 | | | 4.90 | | | | 10/1/26 | | | | 145 | |
| | | 188 | | Devon Energy Corp. (Oil, Gas & Consumable Fuels), Callable 1/15/41 @ 100.00 | | | 5.60 | | | | 7/15/41 | | | | 187 | |
| | | 185 | | Digital Realty Trust LP (Equity Real Estate Investment Trusts), Callable 4/15/28 @ 100.00 | | | 4.45 | | | | 7/15/28 | | | | 179 | |
| | | 115 | | Dominion Energy Gas Holding LLC, Series B (Multi-Utilities), Callable 8/15/29 @ 100.00 | | | 3.00 | | | | 11/15/29 | | | | 101 | |
| | | 225 | | Dominion Gas Holdings LLC (Multi-Utilities), Callable 9/15/24 @ 100.00 | | | 3.60 | | | | 12/15/24 | | | | 222 | |
| | | 35 | | Duke Energy Carolinas LLC (Electric Utilities), Callable 6/15/41 @ 100.00 | | | 4.25 | | | | 12/15/41 | | | | 32 | |
| | | 25 | | Duke Energy Progress LLC (Electric Utilities), Callable 2/15/45 @ 100.00 | | | 4.20 | | | | 8/15/45 | | | | 22 | |
| | | 55 | | E.I. du Pont de Nemours and Co. (Chemicals), Callable 4/15/30 @ 100.00 | | | 2.30 | | | | 7/15/30 | | | | 48 | |
| | | 5 | | Energy Transfer Partners LP (Oil, Gas & Consumable Fuels), Callable 3/15/28 @ 100.00 | | | 4.95 | | | | 6/15/28 | | | | 5 | |
| | | 274 | | Enterprise Products Operating LLC (Oil, Gas & Consumable Fuels), Callable 9/15/43 @ 100.00 | | | 4.85 | | | | 3/15/44 | | | | 248 | |
| | | 179 | | FedEx Corp., Series 2020-1, AA (Air Freight & Logistics) | | | 1.88 | | | | 8/20/35 | | | | 155 | |
| | | 140 | | Fiserv, Inc. (IT Services), Callable 4/1/29 @ 100.00 | | | 3.50 | | | | 7/1/29 | | | | 128 | |
| | | 10 | | Fiserv, Inc. (IT Services), Callable 1/1/49 @ 100.00 | | | 4.40 | | | | 7/1/49 | | | | 9 | |
| | | 50 | | General Motors Co. (Automobiles), Callable 7/1/27 @ 100.00 | | | 4.20 | | | | 10/1/27 | | | | 48 | |
| | | 355 | | General Motors Co. (Automobiles), Callable 9/1/25 @ 100.00 | | | 6.13 | | | | 10/1/25 | | | | 366 | |
| | | 111 | | Gilead Sciences, Inc. (Biotechnology), Callable 8/1/44 @ 100.00 | | | 4.50 | | | | 2/1/45 | | | | 102 | |
| | | 220 | | HCA, Inc. (Health Care Providers & Services) | | | 5.38 | | | | 2/1/25 | | | | 219 | |
| | | 175 | | Intel Corp. (Semiconductors & Semiconductor Equipment), Callable 6/8/47 @ 100.00 | | | 3.73 | | | | 12/8/47 | | | | 148 | |
| | | 75 | | International Business Machines Corp. (IT Services) | | | 4.00 | | | | 6/20/42 | | | | 65 | |
| | | 105 | | International Paper Co. (Containers & Packaging), Callable 5/15/41 @ 100.00 | | | 6.00 | | | | 11/15/41 | | | | 109 | |
| | | 30 | | JPMorgan Chase & Co. (Banks), Callable 5/1/27 @ 100.00 | | | 3.54 (US0003M + 138 bps)(b) | | | | 5/1/28 | | | | 28 | |
| | | 400 | | JPMorgan Chase & Co. (Banks), Callable 5/6/29 @ 100.00 | | | 3.70 (US0003M + 116 bps)(b) | | | | 5/6/30 | | | | 375 | |
| | | 640 | | JPMorgan Chase & Co. (Banks), Callable 4/23/28 @ 100.00 | | | 4.00 (US0003M + 112 bps)(b) | | | | 4/23/29 | | | | 614 | |
| | | 195 | | Kinder Morgan, Inc. (Oil, Gas & Consumable Fuels), Callable 12/1/44 @ 100.00 | | | 5.55 | | | | 6/1/45 | | | | 184 | |
| | | 145 | | Lincoln National Corp. (Insurance), Callable 12/1/27 @ 100.00 | | | 3.80 | | | | 3/1/28 | | | | 140 | |
| | | 175 | | Lincoln National Corp. (Insurance) | | | 7.00 | | | | 6/15/40 | | | | 200 | |
| | | 30 | | Lockheed Martin Corp. (Aerospace & Defense), Callable 9/1/44 @ 100.00 | | | 3.80 | | | | 3/1/45 | | | | 26 | |
| | | 70 | | Lockheed Martin Corp. (Aerospace & Defense) | | | 4.07 | | | | 12/15/42 | | | | 65 | |
| | | 70 | | Martin Marietta Materials, Inc. (Construction Materials), Callable 3/1/27 @ 100.00 | | | 3.45 | | | | 6/1/27 | | | | 67 | |
| | | 75 | | Martin Marietta Materials, Inc. (Construction Materials), Callable 9/15/27 @ 100.00 | | | 3.50 | | | | 12/15/27 | | | | 71 | |
| | | 135 | | Martin Marietta Materials, Inc. (Construction Materials), Callable 4/2/24 @ 100.00 | | | 4.25 | | | | 7/2/24 | | | | 135 | |
| | | 150 | | Marvell Technology, Inc. (Semiconductors & Semiconductor Equipment), Callable 2/15/28 @ 100.00 | | | 2.45 | | | | 4/15/28 | | | | 131 | |
| | | 80 | | Marvell Technology, Inc. (Semiconductors & Semiconductor Equipment), Callable 1/15/31 @ 100.00 | | | 2.95 | | | | 4/15/31 | | | | 67 | |
| | | 40 | | Microchip Technology, Inc. (Semiconductors & Semiconductor Equipment), Callable 9/1/22 @ 102.13 | | | 4.25 | | | | 9/1/25 | | | | 39 | |
See accompanying notes to financial statements.
203
HC CAPITAL TRUST
The Core Fixed Income Portfolio
Portfolio of Investments (continued) — June 30, 2022
| | Principal
Amount
(000) | | Security Description | | Rate % | | | Maturity
Date | | | Value
(000) | |
| | | | | Corporate Bonds (continued) |
| | $ | 215 | | Microsoft Corp. (Software), Callable 9/17/61 @ 100.00 | | | 3.04 | | | | 3/17/62 | | | $ | 166 | |
| | | 105 | | Mohawk Industries, Inc. (Household Durables), Callable 2/15/30 @ 100.00 | | | 3.63 | | | | 5/15/30 | | | | 94 | |
| | | 200 | | Morgan Stanley, MTN (Capital Markets), Callable 7/20/26 @ 100.00 | | | 1.51 (SOFR + 86 bps)(b) | | | | 7/20/27 | | | | 176 | |
| | | 505 | | Morgan Stanley, MTN (Capital Markets), Callable 1/23/29 @ 100.00 | | | 4.43 (US0003M + 163 bps)(b) | | | | 1/23/30 | | | | 492 | |
| | | 185 | | National Retail Properties, Inc. (Equity Real Estate Investment Trusts), Callable 1/15/30 @ 100.00 | | | 2.50 | | | | 4/15/30 | | | | 158 | |
| | | 100 | | National Rural Utilities Cooperative Finance Corp. (Diversified Financial Services), Callable 12/15/29 @ 100.00 | | | 2.40 | | | | 3/15/30 | | | | 87 | |
| | | 125 | | National Rural Utilities Cooperative Finance Corp. (Diversified Financial Services), Callable 8/1/28 @ 100.00 | | | 3.90 | | | | 11/1/28 | | | | 122 | |
| | | 50 | | Netflix, Inc. (Entertainment) | | | 5.88 | | | | 2/15/25 | | | | 51 | |
| | | 130 | | NextEra Energy Capital Holdings, Inc. (Electric Utilities), Callable 3/1/30 @ 100.00 | | | 2.25 | | | | 6/1/30 | | | | 109 | |
| | | 130 | | Northrop Grumman Corp. (Aerospace & Defense), Callable 4/15/47 @ 100.00 | | | 4.03 | | | | 10/15/47 | | | | 116 | |
| | | 125 | | Nucor Corp. (Metals & Mining), Callable 2/1/43 @ 100.00 | | | 5.20 | | | | 8/1/43 | | | | 124 | |
| | | 145 | | NVIDIA Corp. (Semiconductors & Semiconductor Equipment), Callable 1/1/30 @ 100.00 | | | 2.85 | | | | 4/1/30 | | | | 133 | |
| | | 220 | | Oklahoma Gas and Electric Co. (Electric Utilities), Callable 2/15/28 @ 100.00 | | | 3.80 | | | | 8/15/28 | | | | 212 | |
| | | 170 | | Oracle Corp. (Software), Callable 11/15/44 @ 100.00 | | | 4.13 | | | | 5/15/45 | | | | 129 | |
| | | 120 | | Pfizer, Inc. (Pharmaceuticals), Callable 3/15/38 @ 100.00 | | | 4.10 | | | | 9/15/38 | | | | 117 | |
| | | 50 | | Pfizer, Inc. (Pharmaceuticals) | | | 4.30 | | | | 6/15/43 | | | | 49 | |
| | | 173 | | Philip Morris International, Inc. (Tobacco), Callable 5/11/25 @ 100.00 | | | 3.38 | | | | 8/11/25 | | | | 170 | |
| | | 160 | | Philip Morris International, Inc. (Tobacco) | | | 4.50 | | | | 3/20/42 | | | | 136 | |
| | | 155 | | Principal Financial Group, Inc. (Insurance), Callable 2/15/29 @ 100.00 | | | 3.70 | | | | 5/15/29 | | | | 146 | |
| | | 255 | | Progress Energy, Inc. (Electric Utilities) | | | 6.00 | | | | 12/1/39 | | | | 267 | |
| | | 110 | | Prudential Financial, Inc. (Insurance) | | | 4.60 | | | | 5/15/44 | | | | 104 | |
| | | 15 | | Prudential Financial, Inc. (Insurance) | | | 6.63 | | | | 6/21/40 | | | | 17 | |
| | | 30 | | Public Service Electric & Gas Co. (Electric Utilities), Callable 3/1/42 @ 100.00 | | | 3.65 | | | | 9/1/42 | | | | 25 | |
| | | 95 | | Reliance Steel & Aluminum Co. (Metals & Mining), Callable 7/15/25 @ 100.00 | | | 1.30 | | | | 8/15/25 | | | | 87 | |
| | | 70 | | Reliance Steel & Aluminum Co. (Metals & Mining), Callable 5/15/30 @ 100.00 | | | 2.15 | | | | 8/15/30 | | | | 57 | |
| | | 280 | | RELX Capital, Inc. (Professional Services), Callable 2/22/30 @ 100.00 | | | 3.00 | | | | 5/22/30 | | | | 253 | |
| | | 155 | | Rockwell Collins, Inc. (Aerospace & Defense), Callable 12/15/26 @ 100.00 | | | 3.50 | | | | 3/15/27 | | | | 150 | |
| | | 90 | | Roper Technologies, Inc. (Industrial Conglomerates), Callable 6/15/28 @ 100.00 | | | 4.20 | | | | 9/15/28 | | | | 88 | |
| | | 70 | | Sabra Health Care, LP (Equity Real Estate Investment Trusts), Callable 9/1/31 @ 100.00 | | | 3.20 | | | | 12/1/31 | | | | 56 | |
| | | 180 | | Sabra Health Care, LP (Equity Real Estate Investment Trusts), Callable 5/15/26 @ 100.00 | | | 5.13 | | | | 8/15/26 | | | | 175 | |
| | | 30 | | Southern Company Gas Capital Corp. (Electric Utilities), Callable 3/15/26 @ 100.00 | | | 3.25 | | | | 6/15/26 | | | | 29 | |
| | | 80 | | Southern Company Gas Capital Corp. (Electric Utilities), Callable 11/30/46 @ 100.00 | | | 4.40 | | | | 5/30/47 | | | | 70 | |
| | | 125 | | Southwest Airlines Co. (Airlines), Callable 4/15/27 @ 100.00 | | | 5.13 | | | | 6/15/27 | | | | 126 | |
| | | 25 | | Southwest Airlines Co., Series 2017-1 (Airlines) | | | 6.15 | | | | 2/1/24 | | | | 25 | |
| | | 255 | | Sunoco Logistics Partners Operations LP (Oil, Gas & Consumable Fuels), Callable 10/15/22 @ 100.00 | | | 3.45 | | | | 1/15/23 | | | | 254 | |
| | | 185 | | Sunoco Logistics Partners Operations LP (Oil, Gas & Consumable Fuels), Callable 7/15/42 @ 100.00 | | | 4.95 | | | | 1/15/43 | | | | 153 | |
| | | 150 | | TCI Communications, Inc. (Media) | | | 7.88 | | | | 2/15/26 | | | | 168 | |
| | | 720 | | The Goldman Sachs Group, Inc. (Capital Markets), Callable 6/5/27 @ 100.00 | | | 3.69 (US0003M + 151 bps)(b) | | | | 6/5/28 | | | | 682 | |
| | | 60 | | The Goldman Sachs Group, Inc. (Capital Markets), Callable 10/31/37 @ 100.00 | | | 4.02 (US0003M + 137 bps)(b) | | | | 10/31/38 | | | | 52 | |
See accompanying notes to financial statements.
204
HC CAPITAL TRUST
The Core Fixed Income Portfolio
Portfolio of Investments (continued) — June 30, 2022
| | Principal
Amount
(000) | | Security Description | | Rate % | | | Maturity
Date | | | Value
(000) | |
| | | | | Corporate Bonds (continued) |
| | $ | 55 | | The Home Depot, Inc. (Specialty Retail), Callable 6/6/48 @ 100.00 | | | 4.50 | | | | 12/6/48 | | | $ | 53 | |
| | | 145 | | The Home Depot, Inc. (Specialty Retail), Callable 3/15/40 @ 100.00 | | | 5.40 | | | | 9/15/40 | | | | 156 | |
| | | 125 | | The Interpublic Group of Companies, Inc. (Media) | | | 4.20 | | | | 4/15/24 | | | | 125 | |
| | | 70 | | The Interpublic Group of Companies, Inc. (Media), Callable 4/1/48 @ 100.00 | | | 5.40 | | | | 10/1/48 | | | | 69 | |
| | | 70 | | The Travelers Companies, Inc. (Insurance) | | | 5.35 | | | | 11/1/40 | | | | 74 | |
| | | 120 | | The Travelers Companies, Inc. (Insurance) | | | 6.25 | | | | 6/15/37 | | | | 141 | |
| | | 175 | | The Walt Disney Co. (Entertainment), Callable 3/15/44 @ 100.00 | | | 4.75 | | | | 9/15/44 | | | | 170 | |
| | | 120 | | Toyota Motor Credit Corp., MTN (Consumer Finance) | | | 3.38 | | | | 4/1/30 | | | | 113 | |
| | | 15 | | United Parcel Service, Inc. (Air Freight & Logistics), Callable 9/15/48 @ 100.00 | | | 4.25 | | | | 3/15/49 | | | | 14 | |
| | | 50 | | United Technologies Corp. (Aerospace & Defense) | | | 4.50 | | | | 6/1/42 | | | | 48 | |
| | | 45 | | UnitedHealth Group, Inc. (Health Care Providers & Services), Callable 5/15/41 @ 100.00 | | | 4.63 | | | | 11/15/41 | | | | 45 | |
| | | 130 | | UnitedHealth Group, Inc. (Health Care Providers & Services) | | | 4.75 | | | | 7/15/45 | | | | 130 | |
| | | 135 | | Valero Energy Corp. (Oil, Gas & Consumable Fuels) | | | 6.63 | | | | 6/15/37 | | | | 144 | |
| | | 487 | | Verizon Communications, Inc. (Diversified Telecommunication Services), Callable 9/22/40 @ 100.00 | | | 3.40 | | | | 3/22/41 | | | | 395 | |
| | | 220 | | Verizon Communications, Inc. (Diversified Telecommunication Services) | | | 4.33 | | | | 9/21/28 | | | | 219 | |
| | | 130 | | Virginia Electric and Power Co., Series B (Electric Utilities), Callable 3/15/47 @ 100.00 | | | 3.80 | | | | 9/15/47 | | | | 111 | |
| | | 80 | | Virginia Electric and Power Co., Series D (Electric Utilities), Callable 2/15/43 @ 100.00 | | | 4.65 | | | | 8/15/43 | | | | 76 | |
| | | 530 | | Wells Fargo & Co., MTN (Banks), Callable 10/30/29 @ 100.00 | | | 2.88 (US0003M + 117 bps)(b) | | | | 10/30/30 | | | | 465 | |
| | | 120 | | Wells Fargo & Co., MTN (Banks), Callable 5/22/27 @ 100.00 | | | 3.58 (US0003M + 131 bps)(b) | | | | 5/22/28 | | | | 114 | |
| | | 90 | | Wells Fargo & Co., MTN (Banks), Callable 10/24/28 @ 100.00 | | | 4.15 | | | | 1/24/29 | | | | 87 | |
| | | 55 | | WestRock MWV LLC (Containers & Packaging) | | | 8.20 | | | | 1/15/30 | | | | 65 | |
| | | 265 | | WRKCo, Inc. (Containers & Packaging), Callable 1/15/26 @ 100.00 | | | 4.65 | | | | 3/15/26 | | | | 268 | |
| | | 165 | | XTO Energy, Inc. (Oil, Gas & Consumable Fuels) | | | 6.75 | | | | 8/1/37 | | | | 190 | |
| | | | | Total Corporate Bonds | | | | | | | | | | | 20,851 | |
| | | | | | | | | | | | | | | | | |
| | | | | U.S. Treasury Obligations — 25.29% | | | | | | | | | | | | |
| | | 15 | | U.S. Treasury Bond | | | 1.13 | | | | 5/15/40 | | | | 10 | |
| | | 8 | | U.S. Treasury Bond | | | 1.13 | | | | 8/15/40 | | | | 6 | |
| | | 105 | | U.S. Treasury Bond | | | 1.25 | | | | 5/15/50 | | | | 67 | |
| | | 28 | | U.S. Treasury Bond | | | 1.38 | | | | 11/15/40 | | | | 20 | |
| | | 10 | | U.S. Treasury Bond | | | 1.38 | | | | 8/15/50 | | | | 7 | |
| | | 140 | | U.S. Treasury Bond | | | 1.63 | | | | 11/15/50 | | | | 98 | |
| | | 86 | | U.S. Treasury Bond | | | 1.88 | | | | 2/15/51 | | | | 65 | |
| | | 44 | | U.S. Treasury Bond | | | 1.88 | | | | 11/15/51 | | | | 33 | |
| | | 106 | | U.S. Treasury Bond | | | 2.00 | | | | 2/15/50 | | | | 82 | |
| | | 49 | | U.S. Treasury Bond | | | 2.00 | | | | 8/15/51 | | | | 38 | |
| | | 101 | | U.S. Treasury Bond | | | 2.25 | | | | 8/15/49 | | | | 83 | |
| | | 23 | | U.S. Treasury Bond | | | 2.25 | | | | 2/15/52 | | | | 19 | |
| | | 117 | | U.S. Treasury Bond | | | 2.25 | | | | 8/15/46 | | | | 94 | |
| | | 60 | | U.S. Treasury Bond | | | 2.38 | | | | 5/15/51 | | | | 51 | |
| | | 96 | | U.S. Treasury Bond | | | 2.38 | | | | 11/15/49 | | | | 81 | |
| | | 75 | | U.S. Treasury Bond | | | 2.50 | | | | 5/15/46 | | | | 64 | |
| | | 60 | | U.S. Treasury Bond | | | 2.50 | | | | 2/15/45 | | | | 51 | |
| | | 80 | | U.S. Treasury Bond | | | 2.50 | | | | 2/15/46 | | | | 68 | |
| | | 55 | | U.S. Treasury Bond | | | 2.75 | | | | 8/15/47 | | | | 49 | |
See accompanying notes to financial statements.
205
HC CAPITAL TRUST
The Core Fixed Income Portfolio
Portfolio of Investments (continued) — June 30, 2022
| | Principal
Amount
(000) | | Security Description | | Rate % | | | Maturity
Date | | | Value
(000) | |
| | | | | U.S. Treasury Obligations (continued) |
| | $ | 80 | | U.S. Treasury Bond | | | 2.75 | | | | 11/15/47 | | | $ | 72 | |
| | | 22 | | U.S. Treasury Bond | | | 2.88 | | | | 5/15/52 | | | | 21 | |
| | | 60 | | U.S. Treasury Bond | | | 2.88 | | | | 5/15/43 | | | | 55 | |
| | | 65 | | U.S. Treasury Bond | | | 2.88 | | | | 11/15/46 | | | | 59 | |
| | | 94 | | U.S. Treasury Bond | | | 2.88 | | | | 5/15/49 | | | | 88 | |
| | | 60 | | U.S. Treasury Bond | | | 2.88 | | | | 8/15/45 | | | | 54 | |
| | | 90 | | U.S. Treasury Bond | | | 3.00 | | | | 2/15/49 | | | | 86 | |
| | | 55 | | U.S. Treasury Bond | | | 3.00 | | | | 5/15/47 | | | | 51 | |
| | | 50 | | U.S. Treasury Bond | | | 3.00 | | | | 2/15/48 | | | | 47 | |
| | | 100 | | U.S. Treasury Bond | | | 3.00 | | | | 11/15/44 | | | | 93 | |
| | | 50 | | U.S. Treasury Bond | | | 3.00 | | | | 11/15/45 | | | | 46 | |
| | | 95 | | U.S. Treasury Bond | | | 3.00 | | | | 8/15/48 | | | | 90 | |
| | | 50 | | U.S. Treasury Bond | | | 3.00 | | | | 5/15/45 | | | | 46 | |
| | | 75 | | U.S. Treasury Bond | | | 3.00 | | | | 2/15/47 | | | | 70 | |
| | | 22 | | U.S. Treasury Bond | | | 3.13 | | | | 8/15/44 | | | | 21 | |
| | | 90 | | U.S. Treasury Bond | | | 3.13 | | | | 2/15/43 | | | | 85 | |
| | | 25 | | U.S. Treasury Bond | | | 3.13 | | | | 11/15/41 | | | | 24 | |
| | | 80 | | U.S. Treasury Bond | | | 3.13 | | | | 5/15/48 | | | | 77 | |
| | | 30 | | U.S. Treasury Bond | | | 3.38 | | | | 11/15/48 | | | | 30 | |
| | | 75 | | U.S. Treasury Bond | | | 3.38 | | | | 5/15/44 | | | | 74 | |
| | | 8 | | U.S. Treasury Bond | | | 3.50 | | | | 2/15/39 | | | | 8 | |
| | | 75 | | U.S. Treasury Bond | | | 3.63 | | | | 8/15/43 | | | | 77 | |
| | | 100 | | U.S. Treasury Bond | | | 3.63 | | | | 2/15/44 | | | | 103 | |
| | | 75 | | U.S. Treasury Bond | | | 3.75 | | | | 11/15/43 | | | | 78 | |
| | | 33 | | U.S. Treasury Bond | | | 3.75 | | | | 8/15/41 | | | | 35 | |
| | | 10 | | U.S. Treasury Bond | | | 3.88 | | | | 8/15/40 | | | | 11 | |
| | | 25 | | U.S. Treasury Bond | | | 4.38 | | | | 2/15/38 | | | | 29 | |
| | | 35 | | U.S. Treasury Bond | | | 4.38 | | | | 5/15/41 | | | | 40 | |
| | | 25 | | U.S. Treasury Bond | | | 4.38 | | | | 11/15/39 | | | | 29 | |
| | | 15 | | U.S. Treasury Bond | | | 4.38 | | | | 5/15/40 | | | | 17 | |
| | | 20 | | U.S. Treasury Bond | | | 4.50 | | | | 2/15/36 | | | | 24 | |
| | | 35 | | U.S. Treasury Bond | | | 4.63 | | | | 2/15/40 | | | | 42 | |
| | | 70 | | U.S. Treasury Bond | | | 4.75 | | | | 2/15/41 | | | | 84 | |
| | | 40 | | U.S. Treasury Bond | | | 5.00 | | | | 5/15/37 | | | | 49 | |
| | | 20 | | U.S. Treasury Bond | | | 5.25 | | | | 2/15/29 | | | | 23 | |
| | | 40 | | U.S. Treasury Bond | | | 5.38 | | | | 2/15/31 | | | | 47 | |
| | | 25 | | U.S. Treasury Bond | | | 6.00 | | | | 2/15/26 | | | | 27 | |
| | | 60 | | U.S. Treasury Bond | | | 6.13 | | | | 11/15/27 | | | | 69 | |
| | | 25 | | U.S. Treasury Bond | | | 6.13 | | | | 8/15/29 | | | | 30 | |
| | | 35 | | U.S. Treasury Bond | | | 6.25 | | | | 5/15/30 | | | | 43 | |
| | | 15 | | U.S. Treasury Bond | | | 6.50 | | | | 11/15/26 | | | | 17 | |
| | | 17 | | U.S. Treasury Bond | | | 7.50 | | | | 11/15/24 | | | | 19 | |
| | | 15 | | U.S. Treasury Bond | | | 7.63 | | | | 2/15/25 | | | | 17 | |
| | | 120 | | U.S. Treasury Note | | | 0.13 | | | | 12/15/23 | | | | 115 | |
| | | 45 | | U.S. Treasury Note | | | 0.13 | | | | 10/15/23 | | | | 43 | |
| | | 50 | | U.S. Treasury Note | | | 0.13 | | | | 8/31/23 | | | | 48 | |
| | | 115 | | U.S. Treasury Note | | | 0.25 | | | | 8/31/25 | | | | 105 | |
| | | 25 | | U.S. Treasury Note | | | 0.25 | | | | 9/30/25 | | | | 23 | |
See accompanying notes to financial statements.
206
HC CAPITAL TRUST
The Core Fixed Income Portfolio
Portfolio of Investments (continued) — June 30, 2022
| | Principal
Amount
(000) | | Security Description | | Rate % | | | Maturity
Date | | | Value
(000) | |
| | | | | U.S. Treasury Obligations (continued) |
| | $ | 85 | | U.S. Treasury Note | | | 0.25 | | | | 5/31/25 | | | $ | 78 | |
| | | 55 | | U.S. Treasury Note | | | 0.25 | | | | 11/15/23 | | | | 53 | |
| | | 125 | | U.S. Treasury Note | | | 0.25 | | | | 10/31/25 | | | | 114 | |
| | | 60 | | U.S. Treasury Note | | | 0.25 | | | | 7/31/25 | | | | 55 | |
| | | 70 | | U.S. Treasury Note | | | 0.25 | | | | 9/30/23 | | | | 68 | |
| | | 60 | | U.S. Treasury Note | | | 0.25 | | | | 6/30/25 | | | | 55 | |
| | | 25 | | U.S. Treasury Note | | | 0.38 | | | | 4/30/25 | | | | 23 | |
| | | 82 | | U.S. Treasury Note | | | 0.38 | | | | 1/31/26 | | | | 75 | |
| | | 25 | | U.S. Treasury Note | | | 0.38 | | | | 12/31/25 | | | | 23 | |
| | | 75 | | U.S. Treasury Note | | | 0.38 | | | | 10/31/23 | | | | 72 | |
| | | 60 | | U.S. Treasury Note | | | 0.38 | | | | 11/30/25 | | | | 55 | |
| | | 5 | | U.S. Treasury Note | | | 0.50 | | | | 4/30/27 | | | | 4 | |
| | | 130 | | U.S. Treasury Note | | | 0.50 | | | | 2/28/26 | | | | 118 | |
| | | 30 | | U.S. Treasury Note | | | 0.63 | | | | 12/31/27 | | | | 26 | |
| | | 5 | | U.S. Treasury Note | | | 0.63 | | | | 3/31/27 | | | | 4 | |
| | | 25 | | U.S. Treasury Note | | | 0.63 | | | | 11/30/27 | | | | 22 | |
| | | 120 | | U.S. Treasury Note | | | 0.63 | | | | 5/15/30 | | | | 100 | |
| | | 175 | | U.S. Treasury Note | | | 0.63 | | | | 8/15/30 | | | | 145 | |
| | | 15 | | U.S. Treasury Note | | | 0.63 | | | | 7/31/26 | | | | 14 | |
| | | 115 | | U.S. Treasury Note | | | 0.75 | | | | 12/31/23 | | | | 111 | |
| | | 42 | | U.S. Treasury Note | | | 0.75 | | | | 8/31/26 | | | | 38 | |
| | | 30 | | U.S. Treasury Note | | | 0.75 | | | | 5/31/26 | | | | 27 | |
| | | 125 | | U.S. Treasury Note | | | 0.75 | | | | 4/30/26 | | | | 115 | |
| | | 35 | | U.S. Treasury Note | | | 0.75 | | | | 1/31/28 | | | | 31 | |
| | | 185 | | U.S. Treasury Note | | | 0.88 | | | | 11/15/30 | | | | 156 | |
| | | 15 | | U.S. Treasury Note | | | 0.88 | | | | 9/30/26 | | | | 14 | |
| | | 60 | | U.S. Treasury Note | | | 0.88 | | | | 6/30/26 | | | | 55 | |
| | | 90 | | U.S. Treasury Note | | | 0.88 | | | | 1/31/24 | | | | 87 | |
| | | 125 | | U.S. Treasury Note | | | 1.00 | | | | 7/31/28 | | | | 111 | |
| | | 61 | | U.S. Treasury Note | | | 1.13 | | | | 2/15/31 | | | | 52 | |
| | | 10 | | U.S. Treasury Note | | | 1.13 | | | | 2/28/27 | | | | 9 | |
| | | 30 | | U.S. Treasury Note | | | 1.13 | | | | 10/31/26 | | | | 28 | |
| | | 125 | | U.S. Treasury Note | | | 1.13 | | | | 8/31/28 | | | | 111 | |
| | | 30 | | U.S. Treasury Note | | | 1.13 | | | | 2/29/28 | | | | 27 | |
| | | 35 | | U.S. Treasury Note | | | 1.25 | | | | 11/30/26 | | | | 32 | |
| | | 95 | | U.S. Treasury Note | | | 1.25 | | | | 8/15/31 | | | | 82 | |
| | | 120 | | U.S. Treasury Note | | | 1.25 | | | | 9/30/28 | | | | 107 | |
| | | 130 | | U.S. Treasury Note | | | 1.25 | | | | 4/30/28 | | | | 117 | |
| | | 125 | | U.S. Treasury Note | | | 1.25 | | | | 6/30/28 | | | | 112 | |
| | | 130 | | U.S. Treasury Note | | | 1.25 | | | | 3/31/28 | | | | 117 | |
| | | 130 | | U.S. Treasury Note | | | 1.25 | | | | 5/31/28 | | | | 117 | |
| | | 75 | | U.S. Treasury Note | | | 1.38 | | | | 9/30/23 | | | | 74 | |
| | | 97 | | U.S. Treasury Note | | | 1.38 | | | | 11/15/31 | | | | 84 | |
| | | 120 | | U.S. Treasury Note | | | 1.38 | | | | 10/31/28 | | | | 108 | |
| | | 25 | | U.S. Treasury Note | | | 1.38 | | | | 8/31/23 | | | | 25 | |
| | | 115 | | U.S. Treasury Note | | | 1.38 | | | | 12/31/28 | | | | 104 | |
| | | 115 | | U.S. Treasury Note | | | 1.50 | | | | 11/30/28 | | | | 104 | |
| | | 90 | | U.S. Treasury Note | | | 1.50 | | | | 2/29/24 | | | | 88 | |
See accompanying notes to financial statements.
207
HC CAPITAL TRUST
The Core Fixed Income Portfolio
Portfolio of Investments (continued) — June 30, 2022
| | Principal
Amount
(000) | | Security Description | | Rate % | | | Maturity
Date | | | Value
(000) | |
| | | | | U.S. Treasury Obligations (continued) |
| | $ | 90 | | U.S. Treasury Note | | | 1.50 | | | | 11/30/24 | | | $ | 87 | |
| | | 85 | | U.S. Treasury Note | | | 1.50 | | | | 2/15/25 | | | | 82 | |
| | | 25 | | U.S. Treasury Note | | | 1.50 | | | | 8/15/26 | | | | 23 | |
| | | 63 | | U.S. Treasury Note | | | 1.50 | | | | 2/15/30 | | | | 57 | |
| | | 35 | | U.S. Treasury Note | | | 1.50 | | | | 1/31/27 | | | | 33 | |
| | | 30 | | U.S. Treasury Note | | | 1.50 | | | | 9/30/24 | | | | 29 | |
| | | 100 | | U.S. Treasury Note | | | 1.63 | | | | 10/31/23 | | | | 98 | |
| | | 70 | | U.S. Treasury Note | | | 1.63 | | | | 9/30/26 | | | | 66 | |
| | | 120 | | U.S. Treasury Note | | | 1.63 | | | | 2/15/26 | | | | 114 | |
| | | 130 | | U.S. Treasury Note | | | 1.63 | | | | 8/15/29 | | | | 118 | |
| | | 195 | | U.S. Treasury Note | | | 1.63 | | | | 5/15/31 | | | | 174 | |
| | | 20 | | U.S. Treasury Note | | | 1.75 | | | | 12/31/26 | | | | 19 | |
| | | 120 | | U.S. Treasury Note | | | 1.75 | | | | 11/15/29 | | | | 110 | |
| | | 88 | | U.S. Treasury Note | | | 1.75 | | | | 12/31/24 | | | | 85 | |
| | | 75 | | U.S. Treasury Note | | | 1.75 | | | | 6/30/24 | | | | 73 | |
| | | 75 | | U.S. Treasury Note | | | 1.75 | | | | 3/15/25 | | | | 72 | |
| | | 90 | | U.S. Treasury Note | | | 1.75 | | | | 1/31/29 | | | | 83 | |
| | | 25 | | U.S. Treasury Note | | | 1.88 | | | | 6/30/26 | | | | 24 | |
| | | 75 | | U.S. Treasury Note | | | 1.88 | | | | 7/31/26 | | | | 72 | |
| | | 117 | | U.S. Treasury Note | | | 1.88 | | | | 2/15/32 | | | | 106 | |
| | | 40 | | U.S. Treasury Note | | | 1.88 | | | | 2/28/27 | | | | 38 | |
| | | 20 | | U.S. Treasury Note | | | 1.88 | | | | 8/31/24 | | | | 20 | |
| | | 85 | | U.S. Treasury Note | | | 1.88 | | | | 2/28/29 | | | | 79 | |
| | | 70 | | U.S. Treasury Note | | | 2.00 | | | | 4/30/24 | | | | 69 | |
| | | 95 | | U.S. Treasury Note | | | 2.00 | | | | 6/30/24 | | | | 93 | |
| | | 170 | | U.S. Treasury Note | | | 2.00 | | | | 2/15/25 | | | | 166 | |
| | | 125 | | U.S. Treasury Note | | | 2.00 | | | | 5/31/24 | | | | 123 | |
| | | 160 | | U.S. Treasury Note | | | 2.00 | | | | 11/15/26 | | | | 153 | |
| | | 65 | | U.S. Treasury Note | | | 2.13 | | | | 9/30/24 | | | | 64 | |
| | | 95 | | U.S. Treasury Note | | | 2.13 | | | | 3/31/24 | | | | 94 | |
| | | 5 | | U.S. Treasury Note | | | 2.13 | | | | 2/29/24 | | | | 5 | |
| | | 90 | | U.S. Treasury Note | | | 2.13 | | | | 11/30/23 | | | | 89 | |
| | | 85 | | U.S. Treasury Note | | | 2.13 | | | | 5/15/25 | | | | 83 | |
| | | 55 | | U.S. Treasury Note | | | 2.13 | | | | 7/31/24 | | | | 54 | |
| | | 100 | | U.S. Treasury Note | | | 2.13 | | | | 5/31/26 | | | | 97 | |
| | | 150 | | U.S. Treasury Note | | | 2.25 | | | | 11/15/27 | | | | 144 | |
| | | 55 | | U.S. Treasury Note | | | 2.25 | | | | 12/31/24 | | | | 54 | |
| | | 80 | | U.S. Treasury Note | | | 2.25 | | | | 3/31/26 | | | | 78 | |
| | | 160 | | U.S. Treasury Note | | | 2.25 | | | | 8/15/27 | | | | 154 | |
| | | 80 | | U.S. Treasury Note | | | 2.25 | | | | 12/31/23 | | | | 79 | |
| | | 60 | | U.S. Treasury Note | | | 2.25 | | | | 3/31/24 | | | | 59 | |
| | | 95 | | U.S. Treasury Note | | | 2.25 | | | | 11/15/25 | | | | 93 | |
| | | 165 | | U.S. Treasury Note | | | 2.25 | | | | 2/15/27 | | | | 159 | |
| | | 50 | | U.S. Treasury Note | | | 2.25 | | | | 4/30/24 | | | | 49 | |
| | | 55 | | U.S. Treasury Note | | | 2.25 | | | | 10/31/24 | | | | 54 | |
| | | 150 | | U.S. Treasury Note | | | 2.25 | | | | 11/15/24 | | | | 147 | |
| | | 30 | | U.S. Treasury Note | | | 2.25 | | | | 1/31/24 | | | | 30 | |
| | | 100 | | U.S. Treasury Note | | | 2.38 | | | | 8/15/24 | | | | 99 | |
| | | 70 | | U.S. Treasury Note | | | 2.38 | | | | 3/31/29 | | | | 67 | |
See accompanying notes to financial statements.
208
HC CAPITAL TRUST
The Core Fixed Income Portfolio
Portfolio of Investments (continued) — June 30, 2022
| | Principal
Amount
(000) | | Security Description | | Rate % | | | Maturity
Date | | | Value
(000) | |
| | | | | U.S. Treasury Obligations (continued) |
| | $ | 120 | | U.S. Treasury Note | | | 2.38 | | | | 5/15/29 | | | $ | 115 | |
| | | 100 | | U.S. Treasury Note | | | 2.38 | | | | 2/29/24 | | | | 99 | |
| | | 80 | | U.S. Treasury Note | | | 2.38 | | | | 4/30/26 | | | | 78 | |
| | | 50 | | U.S. Treasury Note | | | 2.50 | | | | 1/31/24 | | | | 50 | |
| | | 60 | | U.S. Treasury Note | | | 2.50 | | | | 2/28/26 | | | | 59 | |
| | | 80 | | U.S. Treasury Note | | | 2.50 | | | | 5/31/24 | | | | 79 | |
| | | 80 | | U.S. Treasury Note | | | 2.50 | | | | 3/31/27 | | | | 78 | |
| | | 105 | | U.S. Treasury Note | | | 2.50 | | | | 5/15/24 | | | | 104 | |
| | | 75 | | U.S. Treasury Note | | | 2.50 | | | | 4/30/24 | | | | 74 | |
| | | 67 | | U.S. Treasury Note | | | 2.50 | | | | 8/15/23 | | | | 67 | |
| | | 85 | | U.S. Treasury Note | | | 2.63 | | | | 1/31/26 | | | | 84 | |
| | | 90 | | U.S. Treasury Note | | | 2.63 | | | | 12/31/25 | | | | 89 | |
| | | 100 | | U.S. Treasury Note | | | 2.63 | | | | 12/31/23 | | | | 99 | |
| | | 45 | | U.S. Treasury Note | | | 2.63 | | | | 5/31/27 | | | | 44 | |
| | | 70 | | U.S. Treasury Note | | | 2.63 | | | | 4/15/25 | | | | 69 | |
| | | 75 | | U.S. Treasury Note | | | 2.63 | | | | 3/31/25 | | | | 74 | |
| | | 165 | | U.S. Treasury Note | | | 2.63 | | | | 2/15/29 | | | | 161 | |
| | | 65 | | U.S. Treasury Note | | | 2.75 | | | | 5/15/25 | | | | 65 | |
| | | 75 | | U.S. Treasury Note | | | 2.75 | | | | 4/30/27 | | | | 74 | |
| | | 100 | | U.S. Treasury Note | | | 2.75 | | | | 2/15/24 | | | | 100 | |
| | | 60 | | U.S. Treasury Note | | | 2.75 | | | | 5/31/29 | | | | 59 | |
| | | 105 | | U.S. Treasury Note | | | 2.75 | | | | 2/15/28 | | | | 103 | |
| | | 85 | | U.S. Treasury Note | | | 2.75 | | | | 8/31/25 | | | | 84 | |
| | | 105 | | U.S. Treasury Note | | | 2.75 | | | | 8/31/23 | | | | 105 | |
| | | 170 | | U.S. Treasury Note | | | 2.75 | | | | 11/15/23 | | | | 169 | |
| | | 75 | | U.S. Treasury Note | | | 2.75 | | | | 7/31/23 | | | | 75 | |
| | | 90 | | U.S. Treasury Note | | | 2.75 | | | | 6/30/25 | | | | 89 | |
| | | 90 | | U.S. Treasury Note | | | 2.75 | | | | 2/28/25 | | | | 89 | |
| | | 65 | | U.S. Treasury Note | | | 2.88 | | | | 4/30/29 | | | | 64 | |
| | | 65 | | U.S. Treasury Note | | | 2.88 | | | | 5/15/32 | | | | 64 | |
| | | 65 | | U.S. Treasury Note | | | 2.88 | | | | 6/15/25 | | | | 65 | |
| | | 90 | | U.S. Treasury Note | | | 2.88 | | | | 4/30/25 | | | | 90 | |
| | | 75 | | U.S. Treasury Note | | | 2.88 | | | | 7/31/25 | | | | 75 | |
| | | 90 | | U.S. Treasury Note | | | 2.88 | | | | 11/30/25 | | | | 89 | |
| | | 50 | | U.S. Treasury Note | | | 2.88 | | | | 5/15/28 | | | | 49 | |
| | | 50 | | U.S. Treasury Note | | | 2.88 | | | | 10/31/23 | | | | 50 | |
| | | 125 | | U.S. Treasury Note | | | 2.88 | | | | 8/15/28 | | | | 123 | |
| | | 105 | | U.S. Treasury Note | | | 2.88 | | | | 9/30/23 | | | | 105 | |
| | | 35 | | U.S. Treasury Note | | | 2.88 | | | | 11/30/23 | | | | 35 | |
| | | 85 | | U.S. Treasury Note | | | 3.00 | | | | 9/30/25 | | | | 85 | |
| | | 85 | | U.S. Treasury Note | | | 3.00 | | | | 10/31/25 | | | | 85 | |
| | | 65 | | U.S. Treasury Note | | | 3.00 | | | | 6/30/24 | | | | 65 | |
| | | 140 | | U.S. Treasury Note | | | 3.13 | | | | 11/15/28 | | | | 140 | |
| | | 70 | | U.S. Treasury Note | | | 3.25 | | | | 6/30/27 | | | | 71 | |
| | | 60 | | U.S. Treasury Note | | | 3.25 | | | | 6/30/29 | | | | 61 | |
| | | | | Total U.S. Treasury Obligations | | | | | | | | | | | 14,543 | |
| | | | | | | | | | | | | | | | | |
See accompanying notes to financial statements.
209
HC CAPITAL TRUST
The Core Fixed Income Portfolio
Portfolio of Investments (continued) — June 30, 2022
| | Principal
Amount
(000) | | Security Description | | Rate % | | | Maturity
Date | | | Value
(000) | |
| | | | | Yankee Dollars — 4.14% | | | | | | | | | | | | |
| | $ | 85 | | America Movil SAB de CV (Wireless Telecommunication Services) | | | 6.13 | | | | 11/15/37 | | | $ | 93 | |
| | | 75 | | BHP Billiton Finance USA Ltd. (Metals & Mining) | | | 5.00 | | | | 9/30/43 | | | | 77 | |
| | | 114 | | British Telecommunications PLC (Diversified Telecommunication Services) | | | 9.63 | | | | 12/15/30 | | | | 142 | |
| | | 170 | | Canadian Natural Resources Ltd. (Oil, Gas & Consumable Fuels), Callable 6/15/25 @ 100.00 | | | 2.05 | | | | 7/15/25 | | | | 159 | |
| | | 200 | | Canadian Natural Resources Ltd. (Oil, Gas & Consumable Fuels), Callable 3/1/27 @ 100.00 | | | 3.85 | | | | 6/1/27 | | | | 191 | |
| | | 80 | | Canadian Pacific Railway Co. (Road & Rail), Callable 12/5/29 @ 100.00 | | | 2.05 | | | | 3/5/30 | | | | 68 | |
| | | 105 | | Deutsche Telekom International Finance BV (Diversified Telecommunication Services) | | | 8.75(c) | | | | 6/15/30 | | | | 129 | |
| | | 90 | | Diageo Capital PLC (Diversified Financial Services) | | | 5.88 | | | | 9/30/36 | | | | 101 | |
| | | 160 | | Enbridge, Inc. (Oil, Gas & Consumable Fuels), Callable 2/1/51 @ 100.00 | | | 3.40 | | | | 8/1/51 | | | | 121 | |
| | | 55 | | Equinor ASA (Oil, Gas & Consumable Fuels) | | | 3.95 | | | | 5/15/43 | | | | 49 | |
| | | 105 | | Equinor ASA (Oil, Gas & Consumable Fuels) | | | 5.10 | | | | 8/17/40 | | | | 109 | |
| | | 140 | | Iberdrola International BV (Electric Utilities) | | | 5.81 | | | | 3/15/25 | | | | 148 | |
| | | 145 | | Iberdrola International BV (Electric Utilities) | | | 6.75 | | | | 7/15/36 | | | | 167 | |
| | | 14 | | LyondellBasell Industries N.V. (Chemicals) | | | 4.00 | | | | 7/15/23 | | | | 14 | |
| | | 20 | | LyondellBasell Industries N.V. (Chemicals), Callable 8/26/54 @ 100.00 | | | 4.63 | | | | 2/26/55 | | | | 17 | |
| | | 120 | | Nutrien Ltd. (Chemicals), Callable 2/13/30 @ 100.00 | | | 2.95 | | | | 5/13/30 | | | | 107 | |
| | | 120 | | Orange SA (Diversified Telecommunication Services) | | | 9.00 | | | | 3/1/31 | | | | 154 | |
| | | 90 | | Shell International Finance BV (Oil, Gas & Consumable Fuels) | | | 4.13 | | | | 5/11/35 | | | | 86 | |
| | | 50 | | Shell International Finance BV (Diversified Financial Services) | | | 4.55 | | | | 8/12/43 | | | | 47 | |
| | | 55 | | Shell International Finance BV (Oil, Gas & Consumable Fuels) | | | 6.38 | | | | 12/15/38 | | | | 64 | |
| | | 75 | | Telefonica Emisiones SAU (Diversified Telecommunication Services) | | | 7.05 | | | | 6/20/36 | | | | 83 | |
| | | 140 | | The Toronto-Dominion Bank (Banks) | | | 3.20 | | | | 3/10/32 | | | | 125 | |
| | | 40 | | TransCanada PipeLines Ltd. (Oil, Gas & Consumable Fuels), Callable 4/16/43 @ 100.00 | | | 5.00 | | | | 10/16/43 | | | | 38 | |
| | | 35 | | Vodafone Group PLC (Wireless Telecommunication Services) | | | 5.00 | | | | 5/30/38 | | | | 33 | |
| | | 55 | | Vodafone Group PLC (Wireless Telecommunication Services) | | | 6.15 | | | | 2/27/37 | | | | 59 | |
| | | | | Total Yankee Dollars | | | | | | | | | | | 2,381 | |
| | | | | | | | | | | | | | | | | |
| | Shares | | | | | | | | | | | | | | |
| | | | | Investment Companies — 11.65% | | | | | | | | | | | | |
| | | 947,708 | | State Street Institutional Treasury Money Market Fund, Premier Class | | | 1.04(d) | | | | | | | | 948 | |
| | | 5,751,198 | | State Street Institutional Treasury Plus Money Market Fund, Trust Class | | | 1.40(d) | | | | | | | | 5,751 | |
| | | | | Total Investment Companies | | | | | | | | | | | 6,699 | |
| | | | | Total Investments Before TBA Sale Commitments (cost $63,569) — 101.43% | | | | | | | | | | | 58,314 | |
| | Principal
Amount
(000) | | | | | | | | | | | | | | |
| | | | | TBA Sale Commitments (e) — (0.08)% | | | | | | | | | | | | |
| | $ | (25 | ) | Fannie Mae, 30 YR TBA | | | 1.50 | | | | 7/25/52 | | | | (21 | ) |
| | | (25 | ) | Government National Mortgage Association, 30 YR TBA | | | 4.50 | | | | 7/20/52 | | | | (25 | ) |
| | | | | Total TBA Sale Commitments | | | | | | | | | | | (46 | ) |
| | | | | Liabilities in excess of other assets — (1.35)% | | | | | | | | | | | (774 | ) |
| | | | | Net Assets — 100.00% | | | | | | | | | | $ | 57,494 | |
(a) | The rate for certain asset-backed and mortgage-backed securities may vary based on factors relating to the pool of assets underlying the security. The rate disclosed is the rate in effect on June 30, 2022. |
(b) | Variable Rate Security. The rate disclosed is the rate in effect on June 30, 2022. |
See accompanying notes to financial statements.
210
HC CAPITAL TRUST
The Core Fixed Income Portfolio
Portfolio of Investments (concluded) — June 30, 2022
(c) | Step Bond: Coupon rate is set for an initial period and then increased to a higher coupon rate at a specified date. The rate disclosed is the rate in effect on June 30, 2022. |
(d) | Annualized 7-day yield as of period-end. |
(e) | Represents a “to be announced” transaction. The Portfolio has committed to sell securities for which all specific information is not available at this time. (See Note 2 in the Notes to Financial Statements.) |
| SOFR—Secured Overnight Financing Rate |
| TBA—To Be Announced purchase or sale commitment. Security is subject to delayed delivery |
| US0003M—3 Month US Dollar LIBOR |
The following table reflects the percentage of total net assets of the Portfolio attributable to each Specialist Manager as of June 30, 2022.
| The Core Fixed Income Portfolio | | Agincourt
Capital
Management,
LLC | | | Mellon
Investments
Corporation | | | HC Capital
Solutions | | | Total | |
| Asset Backed Securities | | | — | | | | 0.12 | % | | | — | | | | 0.12 | % |
| Collateralized Mortgage Obligations | | | — | | | | 1.62 | % | | | — | | | | 1.62 | % |
| U.S. Government Agency Mortgages | | | — | | | | 21.54 | % | | | — | | | | 21.54 | % |
| U.S. Government Agency Securities | | | — | | | | 0.80 | % | | | — | | | | 0.80 | % |
| Corporate Bonds | | | 36.27 | % | | | — | | | | — | | | | 36.27 | % |
| U.S. Treasury Obligations | | | — | | | | 25.29 | % | | | — | | | | 25.29 | % |
| Yankee Dollars | | | 4.14 | % | | | — | | | | — | | | | 4.14 | % |
| Investment Companies | | | 1.65 | % | | | 2.05 | % | | | 7.95 | % | | | 11.65 | % |
| TBA Sale Commitments | | | — | | | | -0.08 | % | | | — | | | | -0.08 | % |
| Other Assets (Liabilities) | | | 0.46 | % | | | -1.80 | % | | | -0.01 | % | | | -1.35 | % |
| Total Net Assets | | | 42.52 | % | | | 49.54 | % | | | 7.94 | % | | | 100.00 | % |
Amounts designated as “—” indicate the Specialist Manager did not manage any holdings in that category.
See accompanying notes to financial statements.
211
HC CAPITAL TRUST
The Corporate Opportunities Portfolio
Portfolio of Investments — June 30, 2022
| | Shares | | Security Description | | Rate % | | | Maturity
Date | | | Value
(000) | |
| | | | | Common Stock — 0.00% | | | | | | | | | | | | |
| | | 1,740,900 | | ACC Claims Holding LLC (Communications Equipment) (a)(b)^ | | | | | | | | | | $ | — | |
| | | | | Total Common Stock | | | | | | | | | | | — | |
| | | | | | | | | | | | | | | | | |
| | Principal
Amount
(000) | | | | | | | | | | | | | | |
| | | | | Loan Participations and Assignments — 5.43% | | | | | | | | | | | | |
| | $ | 14,160 | | Centric Commercial Funding, LP(b)(c) | | | 6.50 (US00001M with 1.00% floor + 550 bps) | | | | 10/9/22 | | | | 14,059 | |
| | | | | Total Loan Participations and Assignments | | | | | | | | | | | 14,059 | |
| | | | | | | | | | | | | | | | | |
| | Shares | | | | | | | | | | | | | | |
| | | | | Investment Companies — 91.98% | | | | | | | | | | | | |
| | | 1,177,000 | | Federated Hermes Treasury Obligations Fund, Institutional Shares^^ | | | 1.37(d) | | | | | | | | 1,177 | |
| | | 237,136,341 | | State Street Institutional Treasury Plus Money Market Fund, Trust Class | | | 1.40(d) | | | | | | | | 237,136 | |
| | | | | Total Investment Companies | | | | | | | | | | | 238,313 | |
| | | | | | | | | | | | | | | | | |
| | | | | Total Investments (cost $252,474) — 97.41% | | | | | | | | | | | 252,372 | |
| | | | | Other assets in excess of liabilities — 2.59% | | | | | | | | | | | 6,715 | |
| | | | | Net Assets — 100.00% | | | | | | | | | | $ | 259,087 | |
Amounts designated as “—” are $0 or have been rounded to $0.
^ | All or part of this security was on loan as of June 30, 2022. |
^^ | Purchased with cash collateral held from securities lending. |
(a) | Escrow security due to bankruptcy. |
(b) | Security was valued using significant unobservable inputs as of June 30, 2022. |
(c) | The original loan commitment represents $24,000. The unfunded commitment represents $10,800 as of June 30, 2022 (amounts in thousands). |
(d) | Annualized 7-day yield as of period-end. |
The following table reflects the percentage of total net assets of the Portfolio attributable to each Specialist Manager as of June 30, 2022.
| The Corporate Opportunities Portfolio | | Parametric
Portfolio
Associates,
LLC | | | HC
Capital
Solutions | | | Total | |
| Common Stock | | | 0.00 | % | | | — | | | | 0.00 | % |
| Loan Participations and Assignments | | | — | | | | 5.43 | % | | | 5.43 | % |
| Investment Companies | | | 91.52 | % | | | 0.46 | % | | | 91.98 | % |
| Other Assets (Liabilities) | | | 3.03 | % | | | -0.44 | % | | | 2.59 | % |
| Total Net Assets | | | 94.55 | % | | | 5.45 | % | | | 100.00 | % |
Amounts designated as “—” indicate the Specialist Manager did not manage any holdings in that category.
Amounts designated as 0.00% round to less than 0.005%.
See accompanying notes to financial statements.
212
HC CAPITAL TRUST
The Corporate Opportunities Portfolio
Portfolio of Investments (concluded) — June 30, 2022
The following table reflects the open derivative positions held by the Portfolio as of June 30, 2022.
Futures Contracts Purchased*
Description | | Number of
Contracts | | | Expiration
Date | | | Notional
Amount
(000) | | | Value and
Unrealized
Appreciation/
(Depreciation)
(000) | |
5 Year US Treasury Note Future | | | 1,331 | | | | 9/30/22 | | | $ | 149,405 | | | $ | (1,520 | ) |
E-Mini S&P 500 Future | | | 504 | | | | 9/16/22 | | | | 95,495 | | | | 885 | |
| | | | | | | | | | | $ | 244,900 | | | $ | (635 | ) |
| | Total Unrealized Appreciation | | $ | 885 | |
| | Total Unrealized Depreciation | | | (1,520 | ) |
| | Total Net Unrealized Appreciation/(Depreciation) | | $ | (635 | ) |
* | Cash has been pledged as collateral for futures contracts held by the Portfolio. |
See accompanying notes to financial statements.
213
HC CAPITAL TRUST
The U.S. Government Fixed Income Securities Portfolio
Portfolio of Investments — June 30, 2022
| | Principal
Amount
(000) | | Security Description | | Rate % | | | Maturity
Date | | | Value
(000) | |
| | | | | U.S. Government Agency Securities — 2.31% | | | | | | | | | | | | |
| | $ | 200 | | Fannie Mae | | | 0.25 | | | | 7/10/23 | | | $ | 195 | |
| | | 500 | | Fannie Mae | | | 0.25 | | | | 11/27/23 | | | | 481 | |
| | | 200 | | Fannie Mae | | | 0.38 | | | | 8/25/25 | | | | 184 | |
| | | 400 | | Fannie Mae | | | 0.50 | | | | 11/7/25 | | | | 367 | |
| | | 650 | | Fannie Mae | | | 0.50 | | | | 6/17/25 | | | | 602 | |
| | | 150 | | Fannie Mae | | | 0.63 | | | | 4/22/25 | | | | 140 | |
| | | 550 | | Fannie Mae | | | 0.75 | | | | 10/8/27 | | | | 487 | |
| | | 100 | | Fannie Mae, Callable 9/18/22 @ 100.00 | | | 0.88 | | | | 12/18/26 | | | | 90 | |
| | | 200 | | Fannie Mae | | | 0.88 | | | | 8/5/30 | | | | 165 | |
| | | 125 | | Fannie Mae | | | 1.75 | | | | 7/2/24 | | | | 122 | |
| | | 100 | | Fannie Mae | | | 1.88 | | | | 9/24/26 | | | | 95 | |
| | | 150 | | Fannie Mae | | | 2.13 | | | | 4/24/26 | | | | 145 | |
| | | 200 | | Fannie Mae | | | 2.50 | | | | 2/5/24 | | | | 198 | |
| | | 250 | | Fannie Mae | | | 2.63 | | | | 9/6/24 | | | | 248 | |
| | | 95 | | Fannie Mae | | | 6.25 | | | | 5/15/29 | | | | 113 | |
| | | 160 | | Fannie Mae | | | 6.63 | | | | 11/15/30 | | | | 198 | |
| | | 180 | | Fannie Mae | | | 7.25 | | | | 5/15/30 | | | | 228 | |
| | | 250 | | Federal Farm Credit Bank | | | 0.13 | | | | 11/23/22 | | | | 248 | |
| | | 300 | | Federal Farm Credit Bank | | | 0.25 | | | | 2/26/24 | | | | 287 | |
| | | 500 | | Federal Farm Credit Bank | | | 0.50 | | | | 12/1/23 | | | | 483 | |
| | | 500 | | Federal Farm Credit Bank | | | 0.88 | | | | 11/18/24 | | | | 475 | |
| | | 250 | | Federal Farm Credit Bank | | | 1.13 | | | | 1/6/25 | | | | 238 | |
| | | 75 | | Federal Farm Credit Bank, Callable 7/13/22 @ 100.00 | | | 1.24 | | | | 12/23/30 | | | | 62 | |
| | | 750 | | Federal Farm Credit Bank | | | 2.63 | | | | 5/16/24 | | | | 744 | |
| | | 100 | | Federal Home Loan Bank | | | 0.13 | | | | 8/28/23 | | | | 97 | |
| | | 750 | | Federal Home Loan Bank | | | 0.50 | | | | 11/9/23 | | | | 725 | |
| | | 700 | | Federal Home Loan Bank | | | 0.50 | | | | 4/14/25 | | | | 652 | |
| | | 100 | | Federal Home Loan Bank | | | 1.25 | | | | 12/21/26 | | | | 92 | |
| | | 500 | | Federal Home Loan Bank | | | 1.38 | | | | 2/17/23 | | | | 496 | |
| | | 50 | | Federal Home Loan Bank | | | 2.13 | | | | 3/10/23 | | | | 50 | |
| | | 450 | | Federal Home Loan Bank | | | 2.75 | | | | 6/28/24 | | | | 447 | |
| | | 150 | | Federal Home Loan Bank | | | 2.88 | | | | 9/13/24 | | | | 149 | |
| | | 600 | | Federal Home Loan Bank | | | 3.25 | | | | 11/16/28 | | | | 603 | |
| | | 300 | | Federal Home Loan Bank | | | 3.38 | | | | 9/8/23 | | | | 301 | |
| | | 65 | | Federal Home Loan Bank | | | 5.50 | | | | 7/15/36 | | | | 78 | |
| | | 50 | | Freddie Mac | | | 0.13 | | | | 10/16/23 | | | | 48 | |
| | | 750 | | Freddie Mac | | | 0.25 | | | | 11/6/23 | | | | 723 | |
| | | 400 | | Freddie Mac | | | 0.25 | | | | 12/4/23 | | | | 385 | |
| | | 300 | | Freddie Mac | | | 0.25 | | | | 8/24/23 | | | | 291 | |
| | | 500 | | Freddie Mac | | | 0.38 | | | | 9/23/25 | | | | 459 | |
| | | 200 | | Freddie Mac | | | 0.38 | | | | 5/5/23 | | | | 196 | |
| | | 400 | | Freddie Mac | | | 0.38 | | | | 7/21/25 | | | | 369 | |
| | | 100 | | Freddie Mac, Callable 7/27/22 @ 100.00 | | | 0.80 | | | | 10/27/26 | | | | 91 | |
| | | 350 | | Freddie Mac | | | 1.50 | | | | 2/12/25 | | | | 336 | |
| | | 250 | | Freddie Mac | | | 6.25 | | | | 7/15/32 | | | | 311 | |
| | | 180 | | Freddie Mac | | | 6.75 | | | | 3/15/31 | | | | 226 | |
| | | 110 | | Tennessee Valley Authority | | | 4.70 | | | | 7/15/33 | | | | 121 | |
| | | 85 | | Tennessee Valley Authority | | | 5.25 | | | | 9/15/39 | | | | 97 | |
See accompanying notes to financial statements.
214
HC CAPITAL TRUST
The U.S. Government Fixed Income Securities Portfolio
Portfolio of Investments (continued) — June 30, 2022
| | Principal
Amount
(000) | | Security Description | | Rate % | | | Maturity
Date | | | Value
(000) | |
| | | | | U.S. Government Agency Securities (continued) |
| | $ | 200 | | Tennessee Valley Authority | | | 5.38 | | | | 4/1/56 | | | $ | 243 | |
| | | 100 | | Tennessee Valley Authority | | | 5.88 | | | | 4/1/36 | | | | 121 | |
| | | 190 | | Tennessee Valley Authority | | | 6.15 | | | | 1/15/38 | | | | 236 | |
| | | | | Total U.S. Government Agency Securities | | | | | | | | | | | 14,538 | |
| | | | | | | | | | | | | | | | | |
| | | | | U.S. Treasury Obligations — 72.78% | | | | | | | | | | | | |
| | | 1,500 | | U.S. Treasury Bond | | | 1.13 | | | | 5/15/40 | | | | 1,044 | |
| | | 2,625 | | U.S. Treasury Bond | | | 1.13 | | | | 8/15/40 | | | | 1,812 | |
| | | 3,410 | | U.S. Treasury Bond | | | 1.25 | | | | 5/15/50 | | | | 2,169 | |
| | | 1,965 | | U.S. Treasury Bond | | | 1.38 | | | | 11/15/40 | | | | 1,415 | |
| | | 4,330 | | U.S. Treasury Bond | | | 1.38 | | | | 8/15/50 | | | | 2,850 | |
| | | 2,320 | | U.S. Treasury Bond | | | 1.63 | | | | 11/15/50 | | | | 1,631 | |
| | | 4,425 | | U.S. Treasury Bond | | | 1.75 | | | | 8/15/41 | | | | 3,365 | |
| | | 4,070 | | U.S. Treasury Bond | | | 1.88 | | | | 11/15/51 | | | | 3,054 | |
| | | 2,695 | | U.S. Treasury Bond | | | 1.88 | | | | 2/15/51 | | | | 2,022 | |
| | | 2,140 | | U.S. Treasury Bond | | | 1.88 | | | | 2/15/41 | | | | 1,678 | |
| | | 2,835 | | U.S. Treasury Bond | | | 2.00 | | | | 8/15/51 | | | | 2,191 | |
| | | 1,345 | | U.S. Treasury Bond | | | 2.00 | | | | 2/15/50 | | | | 1,042 | |
| | | 3,300 | | U.S. Treasury Bond | | | 2.00 | | | | 11/15/41 | | | | 2,620 | |
| | | 1,260 | | U.S. Treasury Bond | | | 2.25 | | | | 8/15/46 | | | | 1,015 | |
| | | 1,250 | | U.S. Treasury Bond | | | 2.25 | | | | 8/15/49 | | | | 1,025 | |
| | | 4,115 | | U.S. Treasury Bond | | | 2.25 | | | | 2/15/52 | | | | 3,386 | |
| | | 1,750 | | U.S. Treasury Bond | | | 2.25 | | | | 5/15/41 | | | | 1,459 | |
| | | 4,135 | | U.S. Treasury Bond | | | 2.38 | | | | 5/15/51 | | | | 3,490 | |
| | | 3,680 | | U.S. Treasury Bond | | | 2.38 | | | | 2/15/42 | | | | 3,120 | |
| | | 3,000 | | U.S. Treasury Bond | | | 2.38 | | | | 11/15/49 | | | | 2,533 | |
| | | 1,135 | | U.S. Treasury Bond | | | 2.50 | | | | 2/15/46 | | | | 962 | |
| | | 800 | | U.S. Treasury Bond | | | 2.50 | | | | 5/15/46 | | | | 678 | |
| | | 2,015 | | U.S. Treasury Bond | | | 2.50 | | | | 2/15/45 | | | | 1,708 | |
| | | 1,110 | | U.S. Treasury Bond | | | 2.75 | | | | 8/15/47 | | | | 992 | |
| | | 2,350 | | U.S. Treasury Bond | | | 2.75 | | | | 11/15/42 | | | | 2,103 | |
| | | 2,320 | | U.S. Treasury Bond | | | 2.75 | | | | 11/15/47 | | | | 2,077 | |
| | | 775 | | U.S. Treasury Bond | | | 2.75 | | | | 8/15/42 | | | | 694 | |
| | | 1,116 | | U.S. Treasury Bond | | | 2.88 | | | | 5/15/43 | | | | 1,017 | |
| | | 745 | | U.S. Treasury Bond | | | 2.88 | | | | 5/15/52 | | | | 703 | |
| | | 780 | | U.S. Treasury Bond | | | 2.88 | | | | 8/15/45 | | | | 708 | |
| | | 955 | | U.S. Treasury Bond | | | 2.88 | | | | 11/15/46 | | | | 870 | |
| | | 2,000 | | U.S. Treasury Bond | | | 2.88 | | | | 5/15/49 | | | | 1,864 | |
| | | 1,125 | | U.S. Treasury Bond | | | 3.00 | | | | 5/15/42 | | | | 1,053 | |
| | | 670 | | U.S. Treasury Bond | | | 3.00 | | | | 11/15/45 | | | | 622 | |
| | | 1,460 | | U.S. Treasury Bond | | | 3.00 | | | | 8/15/48 | | | | 1,379 | |
| | | 1,645 | | U.S. Treasury Bond | | | 3.00 | | | | 2/15/49 | | | | 1,567 | |
| | | 1,370 | | U.S. Treasury Bond | | | 3.00 | | | | 2/15/48 | | | | 1,291 | |
| | | 1,075 | | U.S. Treasury Bond | | | 3.00 | | | | 5/15/47 | | | | 1,005 | |
| | | 440 | | U.S. Treasury Bond | | | 3.00 | | | | 2/15/47 | | | | 411 | |
| | | 1,015 | | U.S. Treasury Bond | | | 3.00 | | | | 11/15/44 | | | | 940 | |
| | | 1,010 | | U.S. Treasury Bond | | | 3.00 | | | | 5/15/45 | | | | 937 | |
| | | 1,230 | | U.S. Treasury Bond | | | 3.13 | | | | 8/15/44 | | | | 1,165 | |
See accompanying notes to financial statements.
215
HC CAPITAL TRUST
The U.S. Government Fixed Income Securities Portfolio
Portfolio of Investments (continued) — June 30, 2022
| | Principal
Amount
(000) | | Security Description | | Rate % | | | Maturity
Date | | | Value
(000) | |
| | | | | U.S. Treasury Obligations (continued) |
| | $ | 1,000 | | U.S. Treasury Bond | | | 3.13 | | | | 11/15/41 | | | $ | 959 | |
| | | 827 | | U.S. Treasury Bond | | | 3.13 | | | | 2/15/43 | | | | 785 | |
| | | 1,000 | | U.S. Treasury Bond | | | 3.13 | | | | 2/15/42 | | | | 957 | |
| | | 1,030 | | U.S. Treasury Bond | | | 3.13 | | | | 5/15/48 | | | | 996 | |
| | | 2,900 | | U.S. Treasury Bond | | | 3.38 | | | | 11/15/48 | | | | 2,946 | |
| | | 1,130 | | U.S. Treasury Bond | | | 3.38 | | | | 5/15/44 | | | | 1,115 | |
| | | 40 | | U.S. Treasury Bond | | | 3.50 | | | | 2/15/39 | | | | 42 | |
| | | 1,030 | | U.S. Treasury Bond | | | 3.63 | | | | 2/15/44 | | | | 1,056 | |
| | | 970 | | U.S. Treasury Bond | | | 3.63 | | | | 8/15/43 | | | | 995 | |
| | | 645 | | U.S. Treasury Bond | | | 3.75 | | | | 11/15/43 | | | | 674 | |
| | | 225 | | U.S. Treasury Bond | | | 3.88 | | | | 8/15/40 | | | | 242 | |
| | | 550 | | U.S. Treasury Bond | | | 4.25 | | | | 11/15/40 | | | | 621 | |
| | | 30 | | U.S. Treasury Bond | | | 4.25 | | | | 5/15/39 | | | | 34 | |
| | | 530 | | U.S. Treasury Bond | | | 4.38 | | | | 2/15/38 | | | | 617 | |
| | | 551 | | U.S. Treasury Bond | | | 4.38 | | | | 5/15/41 | | | | 631 | |
| | | 855 | | U.S. Treasury Bond | | | 4.38 | | | | 11/15/39 | | | | 987 | |
| | | 163 | | U.S. Treasury Bond | | | 4.38 | | | | 5/15/40 | | | | 188 | |
| | | 400 | | U.S. Treasury Bond | | | 4.50 | | | | 2/15/36 | | | | 470 | |
| | | 255 | | U.S. Treasury Bond | | | 4.50 | | | | 5/15/38 | | | | 301 | |
| | | 1,150 | | U.S. Treasury Bond | | | 4.50 | | | | 8/15/39 | | | | 1,352 | |
| | | 673 | | U.S. Treasury Bond | | | 4.63 | | | | 2/15/40 | | | | 800 | |
| | | 70 | | U.S. Treasury Bond | | | 4.75 | | | | 2/15/37 | | | | 84 | |
| | | 1,500 | | U.S. Treasury Bond | | | 4.75 | | | | 2/15/41 | | | | 1,805 | |
| | | 235 | | U.S. Treasury Bond | | | 5.00 | | | | 5/15/37 | | | | 290 | |
| | | 282 | | U.S. Treasury Bond | | | 5.25 | | | | 11/15/28 | | | | 317 | |
| | | 425 | | U.S. Treasury Bond | | | 5.25 | | | | 2/15/29 | | | | 480 | |
| | | 849 | | U.S. Treasury Bond | | | 5.38 | | | | 2/15/31 | | | | 998 | |
| | | 85 | | U.S. Treasury Bond | | | 6.00 | | | | 2/15/26 | | | | 93 | |
| | | 280 | | U.S. Treasury Bond | | | 6.13 | | | | 8/15/29 | | | | 335 | |
| | | 1,265 | | U.S. Treasury Bond | | | 6.13 | | | | 11/15/27 | | | | 1,452 | |
| | | 320 | | U.S. Treasury Bond | | | 6.25 | | | | 5/15/30 | | | | 392 | |
| | | 1,075 | | U.S. Treasury Bond | | | 6.25 | | | | 8/15/23 | | | | 1,115 | |
| | | 100 | | U.S. Treasury Bond | | | 6.38 | | | | 8/15/27 | | | | 115 | |
| | | 218 | | U.S. Treasury Bond | | | 6.50 | | | | 11/15/26 | | | | 248 | |
| | | 1,000 | | U.S. Treasury Bond | | | 6.63 | | | | 2/15/27 | | | | 1,151 | |
| | | 200 | | U.S. Treasury Bond | | | 6.75 | | | | 8/15/26 | | | | 228 | |
| | | 300 | | U.S. Treasury Bond | | | 6.88 | | | | 8/15/25 | | | | 334 | |
| | | 295 | | U.S. Treasury Bond | | | 7.63 | | | | 2/15/25 | | | | 329 | |
| | | 125 | | U.S. Treasury Note | | | 0.13 | | | | 6/30/23 | | | | 122 | |
| | | 3,600 | | U.S. Treasury Note | | | 0.13 | | | | 8/31/23 | | | | 3,484 | |
| | | 3,165 | | U.S. Treasury Note | | | 0.13 | | | | 7/31/23 | | | | 3,070 | |
| | | 685 | | U.S. Treasury Note | | | 0.13 | | | | 10/15/23 | | | | 660 | |
| | | 1,485 | | U.S. Treasury Note | | | 0.13 | | | | 12/15/23 | | | | 1,425 | |
| | | 1,275 | | U.S. Treasury Note | | | 0.13 | | | | 1/15/24 | | | | 1,220 | |
| | | 1,745 | | U.S. Treasury Note | | | 0.13 | | | | 8/15/23 | | | | 1,690 | |
| | | 1,950 | | U.S. Treasury Note | | | 0.13 | | | | 7/15/23 | | | | 1,894 | |
| | | 2,250 | | U.S. Treasury Note | | | 0.13 | | | | 2/15/24 | | | | 2,149 | |
| | | 1,505 | | U.S. Treasury Note | | | 0.13 | | | | 9/15/23 | | | | 1,454 | |
See accompanying notes to financial statements.
216
HC CAPITAL TRUST
The U.S. Government Fixed Income Securities Portfolio
Portfolio of Investments (continued) — June 30, 2022
| | Principal
Amount
(000) | | Security Description | | Rate % | | | Maturity
Date | | | Value
(000) | |
| | | | | U.S. Treasury Obligations (continued) |
| | $ | 200 | | U.S. Treasury Note | | | 0.25 | | | | 11/15/23 | | | $ | 193 | |
| | | 3,935 | | U.S. Treasury Note | | | 0.25 | | | | 3/15/24 | | | | 3,757 | |
| | | 1,990 | | U.S. Treasury Note | | | 0.25 | | | | 9/30/25 | | | | 1,817 | |
| | | 3,535 | | U.S. Treasury Note | | | 0.25 | | | | 5/15/24 | | | | 3,359 | |
| | | 1,790 | | U.S. Treasury Note | | | 0.25 | | | | 7/31/25 | | | | 1,643 | |
| | | 2,955 | | U.S. Treasury Note | | | 0.25 | | | | 6/15/24 | | | | 2,802 | |
| | | 1,770 | | U.S. Treasury Note | | | 0.25 | | | | 8/31/25 | | | | 1,620 | |
| | | 2,540 | | U.S. Treasury Note | | | 0.25 | | | | 5/31/25 | | | | 2,344 | |
| | | 1,620 | | U.S. Treasury Note | | | 0.25 | | | | 6/30/25 | | | | 1,491 | |
| | | 1,680 | | U.S. Treasury Note | | | 0.25 | | | | 10/31/25 | | | | 1,531 | |
| | | 200 | | U.S. Treasury Note | | | 0.25 | | | | 9/30/23 | | | | 193 | |
| | | 2,500 | | U.S. Treasury Note | | | 0.38 | | | | 4/15/24 | | | | 2,386 | |
| | | 3,605 | | U.S. Treasury Note | | | 0.38 | | | | 8/15/24 | | | | 3,410 | |
| | | 3,095 | | U.S. Treasury Note | | | 0.38 | | | | 7/15/24 | | | | 2,935 | |
| | | 3,500 | | U.S. Treasury Note | | | 0.38 | | | | 11/30/25 | | | | 3,196 | |
| | | 2,360 | | U.S. Treasury Note | | | 0.38 | | | | 4/30/25 | | | | 2,190 | |
| | | 3,945 | | U.S. Treasury Note | | | 0.38 | | | | 9/15/24 | | | | 3,723 | |
| | | 2,145 | | U.S. Treasury Note | | | 0.38 | | | | 7/31/27 | | | | 1,875 | |
| | | 1,400 | | U.S. Treasury Note | | | 0.38 | | | | 1/31/26 | | | | 1,273 | |
| | | 3,220 | | U.S. Treasury Note | | | 0.38 | | | | 9/30/27 | | | | 2,800 | |
| | | 1,545 | | U.S. Treasury Note | | | 0.38 | | | | 12/31/25 | | | | 1,408 | |
| | | 2,570 | | U.S. Treasury Note | | | 0.50 | | | | 8/31/27 | | | | 2,254 | |
| | | 2,600 | | U.S. Treasury Note | | | 0.50 | | | | 5/31/27 | | | | 2,295 | |
| | | 2,275 | | U.S. Treasury Note | | | 0.50 | | | | 10/31/27 | | | | 1,987 | |
| | | 2,295 | | U.S. Treasury Note | | | 0.50 | | | | 3/31/25 | | | | 2,142 | |
| | | 2,690 | | U.S. Treasury Note | | | 0.50 | | | | 6/30/27 | | | | 2,370 | |
| | | 2,175 | | U.S. Treasury Note | | | 0.50 | | | | 2/28/26 | | | | 1,982 | |
| | | 1,885 | | U.S. Treasury Note | | | 0.50 | | | | 4/30/27 | | | | 1,668 | |
| | | 1,635 | | U.S. Treasury Note | | | 0.63 | | | | 7/31/26 | | | | 1,482 | |
| | | 2,240 | | U.S. Treasury Note | | | 0.63 | | | | 11/30/27 | | | | 1,967 | |
| | | 2,255 | | U.S. Treasury Note | | | 0.63 | | | | 12/31/27 | | | | 1,976 | |
| | | 1,575 | | U.S. Treasury Note | | | 0.63 | | | | 3/31/27 | | | | 1,406 | |
| | | 2,720 | | U.S. Treasury Note | | | 0.63 | | | | 5/15/30 | | | | 2,268 | |
| | | 3,945 | | U.S. Treasury Note | | | 0.63 | | | | 10/15/24 | | | | 3,738 | |
| | | 5,895 | | U.S. Treasury Note | | | 0.63 | | | | 8/15/30 | | | | 4,888 | |
| | | 4,150 | | U.S. Treasury Note | | | 0.75 | | | | 1/31/28 | | | | 3,655 | |
| | | 3,820 | | U.S. Treasury Note | | | 0.75 | | | | 3/31/26 | | | | 3,508 | |
| | | 1,845 | | U.S. Treasury Note | | | 0.75 | | | | 8/31/26 | | | | 1,679 | |
| | | 3,690 | | U.S. Treasury Note | | | 0.75 | | | | 4/30/26 | | | | 3,382 | |
| | | 3,750 | | U.S. Treasury Note | | | 0.75 | | | | 12/31/23 | | | | 3,627 | |
| | | 4,115 | | U.S. Treasury Note | | | 0.75 | | | | 5/31/26 | | | | 3,766 | |
| | | 3,460 | | U.S. Treasury Note | | | 0.75 | | | | 11/15/24 | | | | 3,280 | |
| | | 2,000 | | U.S. Treasury Note | | | 0.88 | | | | 1/31/24 | | | | 1,935 | |
| | | 4,830 | | U.S. Treasury Note | | | 0.88 | | | | 11/15/30 | | | | 4,079 | |
| | | 2,295 | | U.S. Treasury Note | | | 0.88 | | | | 6/30/26 | | | | 2,106 | |
| | | 1,910 | | U.S. Treasury Note | | | 0.88 | | | | 9/30/26 | | | | 1,744 | |
| | | 3,465 | | U.S. Treasury Note | | | 1.00 | | | | 7/31/28 | | | | 3,064 | |
| | | 2,225 | | U.S. Treasury Note | | | 1.00 | | | | 12/15/24 | | | | 2,119 | |
See accompanying notes to financial statements.
217
HC CAPITAL TRUST
The U.S. Government Fixed Income Securities Portfolio
Portfolio of Investments (continued) — June 30, 2022
| | Principal
Amount
(000) | | Security Description | | Rate % | | | Maturity
Date | | | Value
(000) | |
| | | | | U.S. Treasury Obligations (continued) |
| | $ | 2,030 | | U.S. Treasury Note | | | 1.13 | | | | 1/15/25 | | | $ | 1,935 | |
| | | 650 | | U.S. Treasury Note | | | 1.13 | | | | 2/28/27 | | | | 595 | |
| | | 3,775 | | U.S. Treasury Note | | | 1.13 | | | | 10/31/26 | | | | 3,479 | |
| | | 2,550 | | U.S. Treasury Note | | | 1.13 | | | | 8/31/28 | | | | 2,270 | |
| | | 2,535 | | U.S. Treasury Note | | | 1.13 | | | | 2/29/28 | | | | 2,279 | |
| | | 3,715 | | U.S. Treasury Note | | | 1.13 | | | | 2/15/31 | | | | 3,191 | |
| | | 965 | | U.S. Treasury Note | | | 1.13 | | | | 2/28/25 | | | | 918 | |
| | | 1,625 | | U.S. Treasury Note | | | 1.25 | | | | 6/30/28 | | | | 1,462 | |
| | | 4,100 | | U.S. Treasury Note | | | 1.25 | | | | 11/30/26 | | | | 3,797 | |
| | | 2,270 | | U.S. Treasury Note | | | 1.25 | | | | 4/30/28 | | | | 2,048 | |
| | | 1,660 | | U.S. Treasury Note | | | 1.25 | | | | 5/31/28 | | | | 1,495 | |
| | | 2,740 | | U.S. Treasury Note | | | 1.25 | | | | 3/31/28 | | | | 2,475 | |
| | | 2,000 | | U.S. Treasury Note | | | 1.25 | | | | 12/31/26 | | | | 1,848 | |
| | | 2,520 | | U.S. Treasury Note | | | 1.25 | | | | 9/30/28 | | | | 2,257 | |
| | | 4,885 | | U.S. Treasury Note | | | 1.25 | | | | 8/15/31 | | | | 4,206 | |
| | | 1,350 | | U.S. Treasury Note | | | 1.25 | | | | 7/31/23 | | | | 1,326 | |
| | | 1,515 | | U.S. Treasury Note | | | 1.25 | | | | 8/31/24 | | | | 1,459 | |
| | | 1,205 | | U.S. Treasury Note | | | 1.38 | | | | 1/31/25 | | | | 1,155 | |
| | | 6,300 | | U.S. Treasury Note | | | 1.38 | | | | 11/15/31 | | | | 5,465 | |
| | | 3,775 | | U.S. Treasury Note | | | 1.38 | | | | 10/31/28 | | | | 3,403 | |
| | | 450 | | U.S. Treasury Note | | | 1.38 | | | | 8/31/26 | | | | 420 | |
| | | 2,000 | | U.S. Treasury Note | | | 1.38 | | | | 12/31/28 | | | | 1,803 | |
| | | 1,000 | | U.S. Treasury Note | | | 1.38 | | | | 9/30/23 | | | | 980 | |
| | | 2,000 | | U.S. Treasury Note | | | 1.38 | | | | 8/31/23 | | | | 1,963 | |
| | | 3,750 | | U.S. Treasury Note | | | 1.50 | | | | 11/30/28 | | | | 3,405 | |
| | | 1,000 | | U.S. Treasury Note | | | 1.50 | | | | 8/15/26 | | | | 939 | |
| | | 4,105 | | U.S. Treasury Note | | | 1.50 | | | | 1/31/27 | | | | 3,833 | |
| | | 2,590 | | U.S. Treasury Note | | | 1.50 | | | | 11/30/24 | | | | 2,498 | |
| | | 1,915 | | U.S. Treasury Note | | | 1.50 | | | | 2/15/30 | | | | 1,720 | |
| | | 1,220 | | U.S. Treasury Note | | | 1.50 | | | | 2/15/25 | | | | 1,172 | |
| | | 1,485 | | U.S. Treasury Note | | | 1.50 | | | | 9/30/24 | | | | 1,436 | |
| | | 1,270 | | U.S. Treasury Note | | | 1.50 | | | | 10/31/24 | | | | 1,227 | |
| | | 3,500 | | U.S. Treasury Note | | | 1.50 | | | | 2/29/24 | | | | 3,417 | |
| | | 945 | | U.S. Treasury Note | | | 1.63 | | | | 11/30/26 | | | | 889 | |
| | | 1,920 | | U.S. Treasury Note | | | 1.63 | | | | 8/15/29 | | | | 1,748 | |
| | | 200 | | U.S. Treasury Note | | | 1.63 | | | | 10/31/23 | | | | 196 | |
| | | 1,400 | | U.S. Treasury Note | | | 1.63 | | | | 2/15/26 | | | | 1,331 | |
| | | 4,155 | | U.S. Treasury Note | | | 1.63 | | | | 5/15/31 | | | | 3,712 | |
| | | 600 | | U.S. Treasury Note | | | 1.63 | | | | 9/30/26 | | | | 566 | |
| | | 1,000 | | U.S. Treasury Note | | | 1.63 | | | | 10/31/26 | | | | 942 | |
| | | 3,500 | | U.S. Treasury Note | | | 1.63 | | | | 5/15/26 | | | | 3,316 | |
| | | 1,160 | | U.S. Treasury Note | | | 1.75 | | | | 12/31/24 | | | | 1,124 | |
| | | 1,100 | | U.S. Treasury Note | | | 1.75 | | | | 12/31/26 | | | | 1,040 | |
| | | 745 | | U.S. Treasury Note | | | 1.75 | | | | 7/31/24 | | | | 726 | |
| | | 1,675 | | U.S. Treasury Note | | | 1.75 | | | | 6/30/24 | | | | 1,635 | |
| | | 790 | | U.S. Treasury Note | | | 1.75 | | | | 11/15/29 | | | | 725 | |
| | | 2,095 | | U.S. Treasury Note | | | 1.75 | | | | 3/15/25 | | | | 2,025 | |
| | | 1,075 | | U.S. Treasury Note | | | 1.75 | | | | 1/31/29 | | | | 991 | |
See accompanying notes to financial statements.
218
HC CAPITAL TRUST
The U.S. Government Fixed Income Securities Portfolio
Portfolio of Investments (continued) — June 30, 2022
| | Principal
Amount
(000) | | Security Description | | Rate % | | | Maturity
Date | | | Value
(000) | |
| | | | | U.S. Treasury Obligations (continued) |
| | $ | 2,390 | | U.S. Treasury Note | | | 1.88 | | | | 7/31/26 | | | $ | 2,282 | |
| | | 475 | | U.S. Treasury Note | | | 1.88 | | | | 6/30/26 | | | | 454 | |
| | | 1,650 | | U.S. Treasury Note | | | 1.88 | | | | 2/28/27 | | | | 1,566 | |
| | | 990 | | U.S. Treasury Note | | | 1.88 | | | | 8/31/24 | | | | 966 | |
| | | 6,150 | | U.S. Treasury Note | | | 1.88 | | | | 2/15/32 | | | | 5,572 | |
| | | 2,000 | | U.S. Treasury Note | | | 1.88 | | | | 2/28/29 | | | | 1,859 | |
| | | 1,421 | | U.S. Treasury Note | | | 2.00 | | | | 2/15/25 | | | | 1,384 | |
| | | 1,825 | | U.S. Treasury Note | | | 2.00 | | | | 8/15/25 | | | | 1,768 | |
| | | 1,885 | | U.S. Treasury Note | | | 2.00 | | | | 11/15/26 | | | | 1,802 | |
| | | 2,360 | | U.S. Treasury Note | | | 2.00 | | | | 4/30/24 | | | | 2,318 | |
| | | 1,450 | | U.S. Treasury Note | | | 2.00 | | | | 6/30/24 | | | | 1,422 | |
| | | 2,710 | | U.S. Treasury Note | | | 2.00 | | | | 5/31/24 | | | | 2,660 | |
| | | 1,750 | | U.S. Treasury Note | | | 2.13 | | | | 5/31/26 | | | | 1,690 | |
| | | 1,340 | | U.S. Treasury Note | | | 2.13 | | | | 7/31/24 | | | | 1,316 | |
| | | 1,145 | | U.S. Treasury Note | | | 2.13 | | | | 2/29/24 | | | | 1,129 | |
| | | 2,385 | | U.S. Treasury Note | | | 2.13 | | | | 5/15/25 | | | | 2,326 | |
| | | 2,950 | | U.S. Treasury Note | | | 2.13 | | | | 3/31/24 | | | | 2,906 | |
| | | 67 | | U.S. Treasury Note | | | 2.13 | | | | 11/30/23 | | | | 66 | |
| | | 445 | | U.S. Treasury Note | | | 2.13 | | | | 11/30/24 | | | | 436 | |
| | | 1,065 | | U.S. Treasury Note | | | 2.13 | | | | 9/30/24 | | | | 1,045 | |
| | | 1,675 | | U.S. Treasury Note | | | 2.25 | | | | 11/15/25 | | | | 1,631 | |
| | | 2,220 | | U.S. Treasury Note | | | 2.25 | | | | 8/15/27 | | | | 2,132 | |
| | | 1,775 | | U.S. Treasury Note | | | 2.25 | | | | 11/15/27 | | | | 1,702 | |
| | | 790 | | U.S. Treasury Note | | | 2.25 | | | | 10/31/24 | | | | 776 | |
| | | 1,785 | | U.S. Treasury Note | | | 2.25 | | | | 2/15/27 | | | | 1,721 | |
| | | 810 | | U.S. Treasury Note | | | 2.25 | | | | 1/31/24 | | | | 801 | |
| | | 1,955 | | U.S. Treasury Note | | | 2.25 | | | | 11/15/24 | | | | 1,922 | |
| | | 795 | | U.S. Treasury Note | | | 2.25 | | | | 12/31/24 | | | | 780 | |
| | | 950 | | U.S. Treasury Note | | | 2.25 | | | | 12/31/23 | | | | 940 | |
| | | 3,000 | | U.S. Treasury Note | | | 2.25 | | | | 3/31/24 | | | | 2,962 | |
| | | 2,700 | | U.S. Treasury Note | | | 2.25 | | | | 4/30/24 | | | | 2,665 | |
| | | 2,500 | | U.S. Treasury Note | | | 2.25 | | | | 3/31/26 | | | | 2,429 | |
| | | 2,510 | | U.S. Treasury Note | | | 2.38 | | | | 5/15/27 | | | | 2,429 | |
| | | 1,125 | | U.S. Treasury Note | | | 2.38 | | | | 2/29/24 | | | | 1,114 | |
| | | 1,675 | | U.S. Treasury Note | | | 2.38 | | | | 8/15/24 | | | | 1,653 | |
| | | 2,440 | | U.S. Treasury Note | | | 2.38 | | | | 5/15/29 | | | | 2,337 | |
| | | 340 | | U.S. Treasury Note | | | 2.38 | | | | 4/30/26 | | | | 332 | |
| | | 2,000 | | U.S. Treasury Note | | | 2.38 | | | | 3/31/29 | | | | 1,914 | |
| | | 1,020 | | U.S. Treasury Note | | | 2.50 | | | | 1/31/25 | | | | 1,006 | |
| | | 3,500 | | U.S. Treasury Note | | | 2.50 | | | | 4/30/24 | | | | 3,469 | |
| | | 1,300 | | U.S. Treasury Note | | | 2.50 | | | | 1/31/24 | | | | 1,290 | |
| | | 850 | | U.S. Treasury Note | | | 2.50 | | | | 2/28/26 | | | | 834 | |
| | | 2,000 | | U.S. Treasury Note | | | 2.50 | | | | 3/31/27 | | | | 1,951 | |
| | | 3,500 | | U.S. Treasury Note | | | 2.50 | | | | 5/31/24 | | | | 3,469 | |
| | | 3,065 | | U.S. Treasury Note | | | 2.50 | | | | 5/15/24 | | | | 3,037 | |
| | | 2,870 | | U.S. Treasury Note | | | 2.50 | | | | 8/15/23 | | | | 2,856 | |
| | | 3,250 | | U.S. Treasury Note | | | 2.63 | | | | 5/31/27 | | | | 3,189 | |
| | | 1,785 | | U.S. Treasury Note | | | 2.63 | | | | 2/15/29 | | | | 1,738 | |
See accompanying notes to financial statements.
219
HC CAPITAL TRUST
The U.S. Government Fixed Income Securities Portfolio
Portfolio of Investments (continued) — June 30, 2022
| | Principal
Amount
(000) | | Security Description | | Rate % | | | Maturity
Date | | | Value
(000) | |
| | | | | U.S. Treasury Obligations (continued) |
| | $ | 1,250 | | U.S. Treasury Note | | | 2.63 | | | | 12/31/23 | | | $ | 1,243 | |
| | | 1,120 | | U.S. Treasury Note | | | 2.63 | | | | 4/15/25 | | | | 1,108 | |
| | | 1,205 | | U.S. Treasury Note | | | 2.63 | | | | 12/31/25 | | | | 1,188 | |
| | | 1,055 | | U.S. Treasury Note | | | 2.63 | | | | 1/31/26 | | | | 1,040 | |
| | | 955 | | U.S. Treasury Note | | | 2.63 | | | | 3/31/25 | | | | 945 | |
| | | 3,620 | | U.S. Treasury Note | | | 2.75 | | | | 2/15/24 | | | | 3,607 | |
| | | 1,525 | | U.S. Treasury Note | | | 2.75 | | | | 5/15/25 | | | | 1,513 | |
| | | 1,177 | | U.S. Treasury Note | | | 2.75 | | | | 11/15/23 | | | | 1,173 | |
| | | 1,675 | | U.S. Treasury Note | | | 2.75 | | | | 2/15/28 | | | | 1,645 | |
| | | 780 | | U.S. Treasury Note | | | 2.75 | | | | 8/31/25 | | | | 773 | |
| | | 3,000 | | U.S. Treasury Note | | | 2.75 | | | | 5/31/29 | | | | 2,941 | |
| | | 1,120 | | U.S. Treasury Note | | | 2.75 | | | | 8/31/23 | | | | 1,117 | |
| | | 2,750 | | U.S. Treasury Note | | | 2.75 | | | | 4/30/27 | | | | 2,713 | |
| | | 2,500 | | U.S. Treasury Note | | | 2.75 | | | | 2/28/25 | | | | 2,481 | |
| | | 1,050 | | U.S. Treasury Note | | | 2.75 | | | | 7/31/23 | | | | 1,048 | |
| | | 500 | | U.S. Treasury Note | | | 2.88 | | | | 9/30/23 | | | | 499 | |
| | | 800 | | U.S. Treasury Note | | | 2.88 | | | | 11/30/25 | | | | 795 | |
| | | 3,000 | | U.S. Treasury Note | | | 2.88 | | | | 4/30/29 | | | | 2,965 | |
| | | 1,995 | | U.S. Treasury Note | | | 2.88 | | | | 5/15/28 | | | | 1,971 | |
| | | 1,105 | | U.S. Treasury Note | | | 2.88 | | | | 10/31/23 | | | | 1,103 | |
| | | 505 | | U.S. Treasury Note | | | 2.88 | | | | 5/31/25 | | | | 503 | |
| | | 4,230 | | U.S. Treasury Note | | | 2.88 | | | | 8/15/28 | | | | 4,179 | |
| | | 2,005 | | U.S. Treasury Note | | | 2.88 | | | | 6/15/25 | | | | 1,997 | |
| | | 540 | | U.S. Treasury Note | | | 2.88 | | | | 7/31/25 | | | | 537 | |
| | | 3,275 | | U.S. Treasury Note | | | 2.88 | | | | 5/15/32 | | | | 3,238 | |
| | | 750 | | U.S. Treasury Note | | | 2.88 | | | | 11/30/23 | | | | 749 | |
| | | 995 | | U.S. Treasury Note | | | 3.00 | | | | 9/30/25 | | | | 993 | |
| | | 880 | | U.S. Treasury Note | | | 3.00 | | | | 10/31/25 | | | | 878 | |
| | | 3,380 | | U.S. Treasury Note | | | 3.13 | | | | 11/15/28 | | | | 3,386 | |
| | | 400 | | U.S. Treasury Note | | | 5.50 | | | | 8/15/28 | | | | 453 | |
| | | | | Total U.S. Treasury Obligations | | | | | | | | | | | 457,351 | |
| | | | | | | | | | | | | | | | | |
| | | | | Yankee Dollar — 0.02% | | | | | | | | | | | | |
| | | 115 | | AID-Israel (Sovereign) | | | 5.50 | | | | 9/18/23 | | | | 118 | |
| | | | | Total Yankee Dollar | | | | | | | | | | | 118 | |
| | | | | | | | | | | | | | | | | |
| | Shares | | | | | | | | | | | | | | |
| | | | | Exchange-Traded Fund — 24.64% | | | | | | | | | | | | |
| | | 2,775,700 | | Schwab U.S. TIPS ETF | | | | | | | | | | | 154,884 | |
| | | | | Total Exchange-Traded Fund | | | | | | | | | | | 154,884 | |
| | | | | | | | | | | | | | | | | |
| | | | | Total Investments (cost $650,946) — 99.75% | | | | | | | | | | | 626,891 | |
| | | | | Other assets in excess of liabilities — 0.25% | | | | | | | | | | | 1,577 | |
| | | | | Net Assets — 100.00% | | | | | | | | | | $ | 628,468 | |
See accompanying notes to financial statements.
220
HC CAPITAL TRUST
The U.S. Government Fixed Income Securities Portfolio
Portfolio of Investments (concluded) — June 30, 2022
The following table reflects the percentage of total net assets of the Portfolio attributable to each Specialist Manager as of June 30, 2022.
| The U.S. Government Fixed Income Securities Portfolio | | Mellon
Investments
Corporation | | | Parametric
Portfolio
Associates,
LLC | | | Total | |
| U.S. Government Agency Securities | | | 2.31 | % | | | — | | | | 2.31 | % |
| U.S. Treasury Obligations | | | 72.78 | % | | | — | | | | 72.78 | % |
| Yankee Dollar | | | 0.02 | % | | | — | | | | 0.02 | % |
| Exchange-Traded Fund | | | — | | | | 24.64 | % | | | 24.64 | % |
| Other Assets (Liabilities) | | | 0.23 | % | | | 0.02 | % | | | 0.25 | % |
| Total Net Assets | | | 75.34 | % | | | 24.66 | % | | | 100.00 | % |
Amounts designated as “—” indicate the Specialist Manager did not manage any holdings in that category.
See accompanying notes to financial statements.
221
HC CAPITAL TRUST
The U.S. Corporate Fixed Income Securities Portfolio
Portfolio of Investments — June 30, 2022
| | Principal
Amount
(000) | | Security Description | | Rate % | | | Maturity
Date | | | Value
(000) | |
| | | | | Corporate Bonds — 74.64% | | | | | | | | | | | | |
| | $ | 750 | | AbbVie, Inc. (Biotechnology), Callable 8/14/28 @ 100.00 | | | 4.25 | | | | 11/14/28 | | | $ | 740 | |
| | | 1,954 | | AbbVie, Inc. (Biotechnology) | | | 4.40 | | | | 11/6/42 | | | | 1,779 | |
| | | 530 | | Alabama Power Co., Series B (Electric Utilities), Callable 6/1/47 @ 100.00 | | | 3.70 | | | | 12/1/47 | | | | 442 | |
| | | 155 | | Alabama Power Co. (Electric Utilities), Callable 2/15/44 @ 100.00 | | | 4.15 | | | | 8/15/44 | | | | 137 | |
| | | 2,155 | | Ally Financial, Inc. (Consumer Finance), Callable 10/21/25 @ 100.00 | | | 5.75 | | | | 11/20/25 | | | | 2,102 | |
| | | 1,935 | | Amgen, Inc. (Biotechnology), Callable 8/21/39 @ 100.00 | | | 3.15 | | | | 2/21/40 | | | | 1,531 | |
| | | 135 | | Amgen, Inc. (Biotechnology), Callable 12/15/50 @ 100.00 | | | 4.66 | | | | 6/15/51 | | | | 126 | |
| | | 1,790 | | Anheuser-Busch Companies LLC/Anheuser-Busch InBev Worldwide, Inc. (Beverages), Callable 8/1/45 @ 100.00 | | | 4.90 | | | | 2/1/46 | | | | 1,684 | |
| | | 1,880 | | Anheuser-Busch InBev Worldwide, Inc. (Beverages), Callable 12/1/39 @ 100.00 | | | 4.35 | | | | 6/1/40 | | | | 1,683 | |
| | | 1,980 | | Anthem, Inc. (Health Care Providers & Services), Callable 12/1/27 @ 100.00 | | | 4.10 | | | | 3/1/28 | | | | 1,966 | |
| | | 790 | | Anthem, Inc. (Health Care Providers & Services) | | | 4.63 | | | | 5/15/42 | | | | 758 | |
| | | 2,465 | | Apple, Inc. (Technology Hardware, Storage & Peripherals), Callable 8/23/45 @ 100.00 | | | 4.65 | | | | 2/23/46 | | | | 2,532 | |
| | | 2,519 | | AT&T, Inc. (Diversified Telecommunication Services), Callable 3/15/53 @ 100.00 | | | 3.50 | | | | 9/15/53 | | | | 1,904 | |
| | | 2,250 | | AT&T, Inc. (Diversified Telecommunication Services), Callable 12/1/28 @ 100.00 | | | 4.35 | | | | 3/1/29 | | | | 2,213 | |
| | | 875 | | AT&T, Inc. (Diversified Telecommunication Services), Callable 9/9/48 @ 100.00 | | | 4.55 | | | | 3/9/49 | | | | 788 | |
| | | 255 | | Atmos Energy Corp. (Gas Utilities), Callable 4/15/44 @ 100.00 | | | 4.13 | | | | 10/15/44 | | | | 225 | |
| | | 1,145 | | Atmos Energy Corp. (Gas Utilities), Callable 7/15/42 @ 100.00 | | | 4.15 | | | | 1/15/43 | | | | 1,013 | |
| | | 5,291 | | Bank of America Corp. (Banks), Callable 12/20/27 @ 100.00 | | | 3.42 (US0003M + 104 bps)(a) | | | | 12/20/28 | | | | 4,927 | |
| | | 5,225 | | Bank of America Corp., MTN (Banks), Callable 2/7/29 @ 100.00 | | | 3.97 (US0003M + 121 bps)(a) | | | | 2/7/30 | | | | 4,966 | |
| | | 1,665 | | Berkshire Hathaway, Inc. (Multi-Utilities), Callable 8/1/44 @ 100.00 | | | 4.50 | | | | 2/1/45 | | | | 1,543 | |
| | | 265 | | BP Capital Markets America, Inc. (Diversified Financial Services), Callable 8/24/49 @ 100.00 | | | 3.00 | | | | 2/24/50 | | | | 193 | |
| | | 1,245 | | Bristol-Myers Squibb Co. (Pharmaceuticals), Callable 4/26/49 @ 100.00 | | | 4.25 | | | | 10/26/49 | | | | 1,167 | |
| | | 2,705 | | Brown & Brown, Inc. (Insurance), Callable 12/15/28 @ 100.00 | | | 4.50 | | | | 3/15/29 | | | | 2,655 | |
| | | 1,315 | | Bunge Limited Finance Corp. (Food Products), Callable 2/14/31 @ 100.00 | | | 2.75 | | | | 5/14/31 | | | | 1,086 | |
| | | 2,445 | | Bunge Limited Finance Corp. (Food Products), Callable 5/15/26 @ 100.00 | | | 3.25 | | | | 8/15/26 | | | | 2,325 | |
| | | 500 | | Capital One Bank USA NA (Banks), Callable 1/28/25 @ 100.00 | | | 2.28 (SOFR + 91 bps)(a) | | | | 1/28/26 | | | | 476 | |
| | | 700 | | Capital One Financial Corp. (Consumer Finance), Callable 1/5/25 @ 100.00 | | | 3.20 | | | | 2/5/25 | | | | 681 | |
| | | 1,000 | | Capital One Financial Corp. (Consumer Finance), Callable 9/30/24 @ 100.00 | | | 3.30 | | | | 10/30/24 | | | | 978 | |
| | | 2,022 | | Capital One Financial Corp. (Consumer Finance), Callable 3/31/25 @ 100.00 | | | 4.25 | | | | 4/30/25 | | | | 2,020 | |
| | | 3,930 | | Charter Communications Operating LLC/Charter Communications Operating Capital (Media), Callable 12/30/28 @ 100.00 | | | 5.05 | | | | 3/30/29 | | | | 3,787 | |
| | | 310 | | Cisco Systems, Inc. (Communications Equipment) | | | 5.50 | | | | 1/15/40 | | | | 339 | |
| | | 6,520 | | Citigroup, Inc. (Banks), Callable 7/21/26 @ 100.00 | | | 3.20 | | | | 10/21/26 | | | | 6,208 | |
| | | 650 | | Citigroup, Inc. (Banks), Callable 4/23/28 @ 100.00 | | | 4.08 (US0003M + 119 bps)(a) | | | | 4/23/29 | | | | 617 | |
| | | 1,310 | | Citigroup, Inc. (Banks), Callable 3/31/30 @ 100.00 | | | 4.41 (SOFR + 391 bps)(a) | | | | 3/31/31 | | | | 1,250 | |
| | | 400 | | Comcast Corp. (Media), Callable 8/1/49 @ 100.00 | | | 3.45 | | | | 2/1/50 | | | | 318 | |
| | | 280 | | Comcast Corp. (Media), Callable 5/1/49 @ 100.00 | | | 4.00 | | | | 11/1/49 | | | | 244 | |
| | | 295 | | Comcast Corp. (Media) | | | 4.65 | | | | 7/15/42 | | | | 285 | |
| | | 2,185 | | Comcast Corp. (Media) | | | 4.75 | | | | 3/1/44 | | | | 2,107 | |
| | | 175 | | Consolidated Edison Company of New York, Inc., Series 2008-B (Multi-Utilities) | | | 6.75 | | | | 4/1/38 | | | | 204 | |
| | | 2,195 | | Constellation Brands, Inc. (Beverages), Callable 5/1/29 @ 100.00 | | | 3.15 | | | | 8/1/29 | | | | 1,974 | |
| | | 2,050 | | CSX Corp. (Road & Rail) | | | 6.22 | | | | 4/30/40 | | | | 2,312 | |
See accompanying notes to financial statements.
222
HC CAPITAL TRUST
The U.S. Corporate Fixed Income Securities Portfolio
Portfolio of Investments (continued) — June 30, 2022
| | Principal
Amount
(000) | | Security Description | | Rate % | | | Maturity
Date | | | Value
(000) | |
| | | | | Corporate Bonds (continued) |
| | $ | 822 | | CVS Health Corp. (Health Care Providers & Services), Callable 12/25/27 @ 100.00 | | | 4.30 | | | | 3/25/28 | | | $ | 816 | |
| | | 2,415 | | CVS Health Corp. (Health Care Providers & Services), Callable 9/25/37 @ 100.00 | | | 4.78 | | | | 3/25/38 | | | | 2,290 | |
| | | 430 | | CVS Health Corp. (Health Care Providers & Services), Callable 9/25/47 @ 100.00 | | | 5.05 | | | | 3/25/48 | | | | 411 | |
| | | 1,230 | | Dell International LLC/EMC Corp. (Tech Hardware & Semiconductors), Callable 8/1/26 @ 100.00 | | | 4.90 | | | | 10/1/26 | | | | 1,227 | |
| | | 1,565 | | Devon Energy Corp. (Oil, Gas & Consumable Fuels), Callable 1/15/41 @ 100.00 | | | 5.60 | | | | 7/15/41 | | | | 1,559 | |
| | | 315 | | Devon Energy Corp. (Oil, Gas & Consumable Fuels), Callable 9/15/25 @ 100.00 | | | 5.85 | | | | 12/15/25 | | | | 328 | |
| | | 1,958 | | Digital Realty Trust LP (Equity Real Estate Investment Trusts), Callable 4/15/28 @ 100.00 | | | 4.45 | | | | 7/15/28 | | | | 1,895 | |
| | | 1,005 | | Dominion Energy Gas Holding LLC, Series B (Multi-Utilities), Callable 8/15/29 @ 100.00 | | | 3.00 | | | | 11/15/29 | | | | 883 | |
| | | 1,830 | | Dominion Gas Holdings LLC (Multi-Utilities), Callable 9/15/24 @ 100.00 | | | 3.60 | | | | 12/15/24 | | | | 1,806 | |
| | | 685 | | E.I. du Pont de Nemours and Co. (Chemicals), Callable 4/15/30 @ 100.00 | | | 2.30 | | | | 7/15/30 | | | | 593 | |
| | | 800 | | Energy Transfer Partners LP (Oil, Gas & Consumable Fuels), Callable 3/15/28 @ 100.00 | | | 4.95 | | | | 6/15/28 | | | | 789 | |
| | | 2,497 | | Enterprise Products Operating LLC (Oil, Gas & Consumable Fuels), Callable 9/15/43 @ 100.00 | | | 4.85 | | | | 3/15/44 | | | | 2,260 | |
| | | 1,991 | | FedEx Corp., Series 2020-1, AA (Air Freight & Logistics) | | | 1.88 | | | | 8/20/35 | | | | 1,720 | |
| | | 1,275 | | Fiserv, Inc. (IT Services), Callable 4/1/29 @ 100.00 | | | 3.50 | | | | 7/1/29 | | | | 1,164 | |
| | | 225 | | Fiserv, Inc. (IT Services), Callable 1/1/49 @ 100.00 | | | 4.40 | | | | 7/1/49 | | | | 193 | |
| | | 428 | | General Motors Co. (Automobiles), Callable 7/1/27 @ 100.00 ^ | | | 4.20 | | | | 10/1/27 | | | | 407 | |
| | | 3,495 | | General Motors Co. (Automobiles), Callable 9/1/25 @ 100.00 | | | 6.13 | | | | 10/1/25 | | | | 3,607 | |
| | | 1,155 | | Gilead Sciences, Inc. (Biotechnology), Callable 8/1/44 @ 100.00 | | | 4.50 | | | | 2/1/45 | | | | 1,063 | |
| | | 1,890 | | HCA, Inc. (Health Care Providers & Services) | | | 5.38 | | | | 2/1/25 | | | | 1,881 | |
| | | 1,512 | | Intel Corp. (Semiconductors & Semiconductor Equipment), Callable 6/8/47 @ 100.00 | | | 3.73 | | | | 12/8/47 | | | | 1,279 | |
| | | 560 | | International Business Machines Corp. (IT Services) | | | 4.00 | | | | 6/20/42 | | | | 488 | |
| | | 795 | | International Paper Co. (Containers & Packaging), Callable 5/15/41 @ 100.00 | | | 6.00 | | | | 11/15/41 | | | | 828 | |
| | | 1,045 | | JPMorgan Chase & Co. (Banks), Callable 5/1/27 @ 100.00 | | | 3.54 (US0003M + 138 bps)(a) | | | | 5/1/28 | | | | 991 | |
| | | 3,018 | | JPMorgan Chase & Co. (Banks), Callable 5/6/29 @ 100.00 | | | 3.70 (US0003M + 116 bps)(a) | | | | 5/6/30 | | | | 2,832 | |
| | | 5,900 | | JPMorgan Chase & Co. (Banks), Callable 4/23/28 @ 100.00 | | | 4.00 (US0003M + 112 bps)(a) | | | | 4/23/29 | | | | 5,657 | |
| | | 1,665 | | Kinder Morgan, Inc. (Oil, Gas & Consumable Fuels), Callable 12/1/44 @ 100.00 | | | 5.55 | | | | 6/1/45 | | | | 1,568 | |
| | | 2,000 | | Lincoln National Corp. (Insurance), Callable 12/1/27 @ 100.00 | | | 3.80 | | | | 3/1/28 | | | | 1,924 | |
| | | 1,365 | | Lincoln National Corp. (Insurance) | | | 7.00 | | | | 6/15/40 | | | | 1,559 | |
| | | 40 | | Lockheed Martin Corp. (Aerospace & Defense), Callable 9/1/44 @ 100.00 | | | 3.80 | | | | 3/1/45 | | | | 35 | |
| | | 655 | | Lockheed Martin Corp. (Aerospace & Defense) | | | 4.07 | | | | 12/15/42 | | | | 606 | |
| | | 789 | | Martin Marietta Materials, Inc. (Construction Materials), Callable 3/1/27 @ 100.00 | | | 3.45 | | | | 6/1/27 | | | | 751 | |
| | | 1,355 | | Martin Marietta Materials, Inc. (Construction Materials), Callable 9/15/27 @ 100.00 | | | 3.50 | | | | 12/15/27 | | | | 1,283 | |
| | | 1,275 | | Marvell Technology, Inc. (Semiconductors & Semiconductor Equipment), Callable 2/15/28 @ 100.00 | | | 2.45 | | | | 4/15/28 | | | | 1,112 | |
| | | 810 | | Marvell Technology, Inc. (Semiconductors & Semiconductor Equipment), Callable 1/15/31 @ 100.00 | | | 2.95 | | | | 4/15/31 | | | | 675 | |
| | | 340 | | Microchip Technology, Inc. (Semiconductors & Semiconductor Equipment), Callable 9/1/22 @ 102.13 | | | 4.25 | | | | 9/1/25 | | | | 329 | |
| | | 2,055 | | Microsoft Corp. (Software), Callable 9/17/61 @ 100.00 | | | 3.04 | | | | 3/17/62 | | | | 1,587 | |
| | | 960 | | Mohawk Industries, Inc. (Household Durables), Callable 2/15/30 @ 100.00 | | | 3.63 | | | | 5/15/30 | | | | 857 | |
| | | 1,800 | | Morgan Stanley, MTN (Capital Markets), Callable 7/20/26 @ 100.00 | | | 1.51 (SOFR + 86 bps)(a) | | | | 7/20/27 | | | | 1,582 | |
| | | 4,555 | | Morgan Stanley, MTN (Capital Markets), Callable 1/23/29 @ 100.00 | | | 4.43 (US0003M + 163 bps)(a) | | | | 1/23/30 | | | | 4,435 | |
See accompanying notes to financial statements.
223
HC CAPITAL TRUST
The U.S. Corporate Fixed Income Securities Portfolio
Portfolio of Investments (continued) — June 30, 2022
| | Principal
Amount
(000) | | Security Description | | Rate % | | | Maturity
Date | | | Value
(000) | |
| | | | | Corporate Bonds (continued) |
| | $ | 1,580 | | National Retail Properties, Inc. (Equity Real Estate Investment Trusts), Callable 1/15/30 @ 100.00 | | | 2.50 | | | | 4/15/30 | | | $ | 1,346 | |
| | | 1,615 | | National Rural Utilities Cooperative Finance Corp. (Diversified Financial Services), Callable 12/15/29 @ 100.00 | | | 2.40 | | | | 3/15/30 | | | | 1,411 | |
| | | 450 | | Netflix, Inc. (Entertainment) | | | 5.88 | | | | 2/15/25 | | | | 456 | |
| | | 1,000 | | NextEra Energy Capital Holdings, Inc. (Electric Utilities), Callable 3/1/30 @ 100.00 | | | 2.25 | | | | 6/1/30 | | | | 840 | |
| | | 1,210 | | Northrop Grumman Corp. (Aerospace & Defense), Callable 4/15/47 @ 100.00 | | | 4.03 | | | | 10/15/47 | | | | 1,075 | |
| | | 1,056 | | Nucor Corp. (Metals & Mining), Callable 2/1/43 @ 100.00 | | | 5.20 | | | | 8/1/43 | | | | 1,047 | |
| | | 955 | | NVIDIA Corp. (Semiconductors & Semiconductor Equipment), Callable 1/1/30 @ 100.00 | | | 2.85 | | | | 4/1/30 | | | | 875 | |
| | | 2,420 | | Oklahoma Gas and Electric Co. (Electric Utilities), Callable 2/15/28 @ 100.00 | | | 3.80 | | | | 8/15/28 | | | | 2,335 | |
| | | 1,460 | | Oracle Corp. (Software), Callable 11/15/44 @ 100.00 | | | 4.13 | | | | 5/15/45 | | | | 1,110 | |
| | | 1,080 | | Pfizer, Inc. (Pharmaceuticals), Callable 3/15/38 @ 100.00 | | | 4.10 | | | | 9/15/38 | | | | 1,049 | |
| | | 400 | | Pfizer, Inc. (Pharmaceuticals) | | | 4.30 | | | | 6/15/43 | | | | 390 | |
| | | 2,640 | | Philip Morris International, Inc. (Tobacco), Callable 5/11/25 @ 100.00 | | | 3.38 | | | | 8/11/25 | | | | 2,597 | |
| | | 1,435 | | Philip Morris International, Inc. (Tobacco) | | | 4.50 | | | | 3/20/42 | | | | 1,217 | |
| | | 1,420 | | Principal Financial Group, Inc. (Insurance), Callable 2/15/29 @ 100.00 | | | 3.70 | | | | 5/15/29 | | | | 1,342 | |
| | | 2,534 | | Progress Energy, Inc. (Electric Utilities) | | | 6.00 | | | | 12/1/39 | | | | 2,649 | |
| | | 1,095 | | Prudential Financial, Inc. (Insurance) | | | 4.60 | | | | 5/15/44 | | | | 1,040 | |
| | | 152 | | Prudential Financial, Inc. (Insurance) | | | 6.63 | | | | 6/21/40 | | | | 177 | |
| | | 265 | | Public Service Electric & Gas Co. (Electric Utilities), Callable 3/1/42 @ 100.00 | | | 3.65 | | | | 9/1/42 | | | | 223 | |
| | | 809 | | Reliance Steel & Aluminum Co. (Metals & Mining), Callable 7/15/25 @ 100.00 | | | 1.30 | | | | 8/15/25 | | | | 739 | |
| | | 610 | | Reliance Steel & Aluminum Co. (Metals & Mining), Callable 5/15/30 @ 100.00 | | | 2.15 | | | | 8/15/30 | | | | 494 | |
| | | 2,501 | | RELX Capital, Inc. (Professional Services), Callable 2/22/30 @ 100.00 | | | 3.00 | | | | 5/22/30 | | | | 2,262 | |
| | | 1,244 | | Rockwell Collins, Inc. (Aerospace & Defense), Callable 12/15/26 @ 100.00 ^ | | | 3.50 | | | | 3/15/27 | | | | 1,202 | |
| | | 864 | | Roper Technologies, Inc. (Industrial Conglomerates), Callable 6/15/28 @ 100.00 | | | 4.20 | | | | 9/15/28 | | | | 848 | |
| | | 930 | | Sabra Health Care, LP (Equity Real Estate Investment Trusts), Callable 9/1/31 @ 100.00 | | | 3.20 | | | | 12/1/31 | | | | 739 | |
| | | 959 | | Sabra Health Care, LP (Equity Real Estate Investment Trusts), Callable 5/15/26 @ 100.00 | | | 5.13 | | | | 8/15/26 | | | | 930 | |
| | | 330 | | Southern Company Gas Capital Corp. (Electric Utilities), Callable 3/15/26 @ 100.00 | | | 3.25 | | | | 6/15/26 | | | | 316 | |
| | | 920 | | Southern Company Gas Capital Corp. (Electric Utilities), Callable 11/30/46 @ 100.00 | | | 4.40 | | | | 5/30/47 | | | | 800 | |
| | | 1,095 | | Southwest Airlines Co. (Airlines), Callable 4/15/27 @ 100.00 | | | 5.13 | | | | 6/15/27 | | | | 1,104 | |
| | | 156 | | Southwest Airlines Co., Series 2017-1 (Airlines) | | | 6.15 | | | | 2/1/24 | | | | 156 | |
| | | 3,371 | | Sunoco Logistics Partners Operations LP (Oil, Gas & Consumable Fuels), Callable 10/15/22 @ 100.00 | | | 3.45 | | | | 1/15/23 | | | | 3,358 | |
| | | 1,625 | | Sunoco Logistics Partners Operations LP (Oil, Gas & Consumable Fuels), Callable 7/15/42 @ 100.00 | | | 4.95 | | | | 1/15/43 | | | | 1,345 | |
| | | 1,850 | | TCI Communications, Inc. (Media) | | | 7.88 | | | | 2/15/26 | | | | 2,077 | |
| | | 6,705 | | The Goldman Sachs Group, Inc. (Capital Markets), Callable 6/5/27 @ 100.00 | | | 3.69 (US0003M + 151 bps)(a) | | | | 6/5/28 | | | | 6,360 | |
| | | 530 | | The Goldman Sachs Group, Inc. (Capital Markets), Callable 10/31/37 @ 100.00 | | | 4.02 (US0003M + 137 bps)(a) | | | | 10/31/38 | | | | 462 | |
| | | 345 | | The Home Depot, Inc. (Specialty Retail), Callable 6/6/48 @ 100.00 | | | 4.50 | | | | 12/6/48 | | | | 335 | |
| | | 1,210 | | The Home Depot, Inc. (Specialty Retail), Callable 3/15/40 @ 100.00 | | | 5.40 | | | | 9/15/40 | | | | 1,299 | |
| | | 1,065 | | The Interpublic Group of Companies, Inc. (Media) | | | 4.20 | | | | 4/15/24 | | | | 1,069 | |
| | | 2 | | The Interpublic Group of Companies, Inc. (Media), Callable 12/30/29 @ 100.00 | | | 4.75 | | | | 3/30/30 | | | | 2 | |
| | | 575 | | The Interpublic Group of Companies, Inc. (Media), Callable 4/1/48 @ 100.00 | | | 5.40 | | | | 10/1/48 | | | | 567 | |
| | | 430 | | The Travelers Companies, Inc. (Insurance) | | | 5.35 | | | | 11/1/40 | | | | 454 | |
| | | 901 | | The Travelers Companies, Inc. (Insurance) | | | 6.25 | | | | 6/15/37 | | | | 1,061 | |
| | | 1,485 | | The Walt Disney Co. (Entertainment), Callable 3/15/44 @ 100.00 | | | 4.75 | | | | 9/15/44 | | | | 1,442 | |
See accompanying notes to financial statements.
224
HC CAPITAL TRUST
The U.S. Corporate Fixed Income Securities Portfolio
Portfolio of Investments (continued) — June 30, 2022
| | Principal
Amount
(000) | | Security Description | | Rate % | | | Maturity
Date | | | Value
(000) | |
| | | | | Corporate Bonds (continued) |
| | $ | 560 | | Toyota Motor Credit Corp., MTN (Consumer Finance) | | | 3.38 | | | | 4/1/30 | | | $ | 527 | |
| | | 140 | | United Parcel Service, Inc. (Air Freight & Logistics), Callable 9/15/48 @ 100.00 | | | 4.25 | | | | 3/15/49 | | | | 134 | |
| | | 674 | | United Technologies Corp. (Aerospace & Defense) | | | 4.50 | | | | 6/1/42 | | | | 643 | |
| | | 810 | | UnitedHealth Group, Inc. (Health Care Providers & Services), Callable 5/15/41 @ 100.00 | | | 4.63 | | | | 11/15/41 | | | | 805 | |
| | | 905 | | UnitedHealth Group, Inc. (Health Care Providers & Services) | | | 4.75 | | | | 7/15/45 | | | | 908 | |
| | | 1,190 | | Valero Energy Corp. (Oil, Gas & Consumable Fuels) | | | 6.63 | | | | 6/15/37 | | | | 1,271 | |
| | | 4,580 | | Verizon Communications, Inc. (Diversified Telecommunication Services), Callable 9/22/40 @ 100.00 | | | 3.40 | | | | 3/22/41 | | | | 3,716 | |
| | | 1,870 | | Verizon Communications, Inc. (Diversified Telecommunication Services) | | | 4.33 | | | | 9/21/28 | | | | 1,857 | |
| | | 625 | | Virginia Electric and Power Co., Series B (Electric Utilities), Callable 3/15/47 @ 100.00 | | | 3.80 | | | | 9/15/47 | | | | 535 | |
| | | 820 | | Virginia Electric and Power Co., Series D (Electric Utilities), Callable 2/15/43 @ 100.00 | | | 4.65 | | | | 8/15/43 | | | | 781 | |
| | | 4,825 | | Wells Fargo & Co., MTN (Banks), Callable 10/30/29 @ 100.00 | | | 2.88 (US0003M + 117 bps)(a) | | | | 10/30/30 | | | | 4,235 | |
| | | 1,295 | | Wells Fargo & Co., MTN (Banks), Callable 5/22/27 @ 100.00 | | | 3.58 (US0003M + 131 bps)(a) | | | | 5/22/28 | | | | 1,229 | |
| | | 770 | | Wells Fargo & Co., MTN (Banks), Callable 10/24/28 @ 100.00 | | | 4.15 | | | | 1/24/29 | | | | 747 | |
| | | 340 | | WestRock MWV LLC (Containers & Packaging) | | | 8.20 | | | | 1/15/30 | | | | 404 | |
| | | 3,045 | | WRKCo, Inc. (Containers & Packaging), Callable 1/15/26 @ 100.00 | | | 4.65 | | | | 3/15/26 | | | | 3,078 | |
| | | 1,146 | | XTO Energy, Inc. (Oil, Gas & Consumable Fuels) | | | 6.75 | | | | 8/1/37 | | | | 1,322 | |
| | | | | Total Corporate Bonds | | | | | | | | | | | 192,347 | |
| | | | | | | | | | | | | | | | | |
| | | | | Yankee Dollars — 8.75% | | | | | | | | | | | | |
| | | 850 | | America Movil SAB de CV (Wireless Telecommunication Services) | | | 6.13 | | | | 11/15/37 | | | | 929 | |
| | | 645 | | BHP Billiton Finance USA Ltd. (Metals & Mining) | | | 5.00 | | | | 9/30/43 | | | | 661 | |
| | | 1,246 | | British Telecommunications PLC (Diversified Telecommunication Services) | | | 9.63 | | | | 12/15/30 | | | | 1,554 | |
| | | 880 | | Canadian Natural Resources Ltd. (Oil, Gas & Consumable Fuels), Callable 6/15/25 @ 100.00 | | | 2.05 | | | | 7/15/25 | | | | 824 | |
| | | 2,504 | | Canadian Natural Resources Ltd. (Oil, Gas & Consumable Fuels), Callable 3/1/27 @ 100.00 | | | 3.85 | | | | 6/1/27 | | | | 2,392 | |
| | | 665 | | Canadian Pacific Railway Co. (Road & Rail), Callable 12/5/29 @ 100.00 | | | 2.05 | | | | 3/5/30 | | | | 562 | |
| | | 1,106 | | Deutsche Telekom International Finance BV (Diversified Telecommunication Services) | | | 8.75(b) | | | | 6/15/30 | | | | 1,363 | |
| | | 1,010 | | Diageo Capital PLC (Diversified Financial Services) | | | 5.88 | | | | 9/30/36 | | | | 1,129 | |
| | | 1,365 | | Enbridge, Inc. (Oil, Gas & Consumable Fuels), Callable 2/1/51 @ 100.00 | | | 3.40 | | �� | | 8/1/51 | | | | 1,029 | |
| | | 1 | | Enbridge, Inc. (Oil, Gas & Consumable Fuels), Callable 4/15/27 @ 100.00 | | | 3.70 | | | | 7/15/27 | | | | 1 | |
| | | 560 | | Equinor ASA (Oil, Gas & Consumable Fuels) | | | 3.95 | | | | 5/15/43 | | | | 499 | |
| | | 825 | | Equinor ASA (Oil, Gas & Consumable Fuels) | | | 5.10 | | | | 8/17/40 | | | | 855 | |
| | | 1,430 | | Iberdrola International BV (Electric Utilities) | | | 5.81 | | | | 3/15/25 | | | | 1,507 | |
| | | 1,655 | | Iberdrola International BV (Electric Utilities) | | | 6.75 | | | | 7/15/36 | | | | 1,902 | |
| | | 180 | | LyondellBasell Industries N.V. (Chemicals), Callable 8/26/54 @ 100.00 | | | 4.63 | | | | 2/26/55 | | | | 154 | |
| | | 1,012 | | Nutrien Ltd. (Chemicals), Callable 2/13/30 @ 100.00 | | | 2.95 | | | | 5/13/30 | | | | 900 | |
| | | 1,143 | | Orange SA (Diversified Telecommunication Services) | | | 9.00 | | | | 3/1/31 | | | | 1,471 | |
| | | 893 | | Shell International Finance BV (Oil, Gas & Consumable Fuels) | | | 4.13 | | | | 5/11/35 | | | | 851 | |
| | | 910 | | Shell International Finance BV (Diversified Financial Services) | | | 4.55 | | | | 8/12/43 | | | | 863 | |
| | | 850 | | Telefonica Emisiones SA (Diversified Telecommunication Services) | | | 4.67 | | | | 3/6/38 | | | | 753 | |
| | | 1,270 | | The Toronto-Dominion Bank (Banks) | | | 3.20 | | | | 3/10/32 | | | | 1,132 | |
| | | 340 | | TransCanada PipeLines Ltd. (Oil, Gas & Consumable Fuels), Callable 4/16/43 @ 100.00 | | | 5.00 | | | | 10/16/43 | | | | 324 | |
| | | 826 | | Vodafone Group PLC (Wireless Telecommunication Services) | | | 6.15 | | | | 2/27/37 | | | | 890 | |
| | | | | Total Yankee Dollars | | | | | | | | | | | 22,545 | |
| | | | | | | | | | | | | | | | | |
See accompanying notes to financial statements.
225
HC CAPITAL TRUST
The U.S. Corporate Fixed Income Securities Portfolio
Portfolio of Investments (concluded) — June 30, 2022
| | Principal
Amount
(000) | | Security Description | | Rate % | | | Maturity
Date | | | Value
(000) | |
| | | | | Loan Participations and Assignments — 3.64% | | | | | | | | | | | | |
| | $ | 9,440 | | Centric Commercial Funding, LP(c)(d) | | | 6.50 (US00001M with 1.00% floor + 550 bps) | | | | 10/9/22 | | | $ | 9,373 | |
| | | | | Total Loan Participations and Assignments | | | | | | | | | | | 9,373 | |
| | | | | | | | | | | | | | | | | |
| | Shares | | | | | | | | | | | | | | |
| | | | | Investment Companies — 12.25% | | | | | | | | | | | | |
| | | 396,013 | | Federated Hermes Treasury Obligations Fund, Institutional Shares^^ | | | 1.37(e) | | | | | | | | 396 | |
| | | 5,686,927 | | State Street Institutional Treasury Money Market Fund, Premier Class | | | 1.04(e) | | | | | | | | 5,687 | |
| | | 25,489,042 | | State Street Institutional Treasury Plus Money Market Fund, Trust Class | | | 1.40(e) | | | | | | | | 25,489 | |
| | | | | Total Investment Companies | | | | | | | | | | | 31,572 | |
| | | | | | | | | | | | | | | | | |
| | | | | Total Investments (cost $284,419) — 99.28% | | | | | | | | | | | 255,837 | |
| | | | | Other assets in excess of liabilities — 0.72% | | | | | | | | | | | 1,862 | |
| | | | | Net Assets — 100.00% | | | | | | | | | | $ | 257,699 | |
^ | All or part of this security was on loan as of June 30, 2022. |
^^ | Purchased with cash collateral held from securities lending. The value of the collateral could include collateral held for securities that were sold on or before June 30, 2022. |
(a) | Variable Rate Security. The rate disclosed is the rate in effect on June 30, 2022. |
(b) | Step Bond: Coupon rate is set for an initial period and then increased to a higher coupon rate at a specified date. The rate disclosed is the rate in effect on June 30, 2022. |
(c) | The original loan commitment represents $16,000. The unfunded commitment represents $7,200 as of June 30, 2022 (amounts in thousands). |
(d) | Security was valued using significant unobservable inputs as of June 30, 2022. |
(e) | Annualized 7-day yield as of period-end. |
| SOFR—Secured Overnight Financing Rate |
| US0003M—3 Month US Dollar LIBOR |
The following table reflects the percentage of total net assets of the Portfolio attributable to each Specialist Manager as of June 30, 2022.
| The U.S. Corporate Fixed Income Securities Portfolio | | Agincourt
Capital
Management,
LLC | | | HC
Capital
Solutions | | | Total | |
| Corporate Bonds | | | 74.64 | % | | | — | | | | 74.64 | % |
| Yankee Dollars | | | 8.75 | % | | | — | | | | 8.75 | % |
| Loan Participations and Assignments | | | — | | | | 3.64 | % | | | 3.64 | % |
| Investment Companies | | | 2.36 | % | | | 9.89 | % | | | 12.25 | % |
| Other Assets (Liabilities) | | | 0.80 | % | | | -0.08 | % | | | 0.72 | % |
| Total Net Assets | | | 86.55 | % | | | 13.45 | % | | | 100.00 | % |
Amounts designated as “—” indicate the Specialist Manager did not manage any holdings in that category.
See accompanying notes to financial statements.
226
HC CAPITAL TRUST
The U.S. Mortgage/Asset Backed Fixed Income Securities Portfolio
Portfolio of Investments — June 30, 2022
| | Principal
Amount
(000) | | Security Description | | Rate % | | | Maturity
Date | | | Value
(000) | |
| | | | | Asset Backed Securities — 0.71% | | | | | | | | | | | | |
| | $ | 150 | | American Express Credit Account Master Trust, Series 2021-1, Class - A | | | 0.90 | | | | 11/15/26 | | | $ | 143 | |
| | | 140 | | Capital One Multi-Asset Execution Trust, Series 2021-A2, Class - A2 | | | 1.39 | | | | 7/15/30 | | | | 122 | |
| | | 200 | | GM Financial Automobile Leasing Trust, Series 2021-3, Class - A3, Callable 3/20/24 @ 100.00 | | | 0.39 | | | | 10/21/24 | | | | 194 | |
| | | 100 | | Honda Auto Receivables Owner Trust, Series 2021-1, Class - A4, Callable 5/21/24 @ 100.00 | | | 0.42 | | | | 1/21/28 | | | | 94 | |
| | | 100 | | Hyundai Auto Receivables Trust, Series 2022-A, Class - A3, Callable 3/15/26 @ 100.00 | | | 2.22 | | | | 10/15/26 | | | | 97 | |
| | | 300 | | Mercedes-Benz Auto Lease Trust, Series 2021-B, Class - A3, Callable 3/15/24 @ 100.00 | | | 0.40 | | | | 11/15/24 | | | | 290 | |
| | | 100 | | Synchrony Card Funding LLC, Series 2022-A1, Class - A | | | 3.37 | | | | 4/15/28 | | | | 99 | |
| | | 100 | | Toyota Auto Receivables Owner Trust, Series 2021-A, Class - A4, Callable 11/15/24 @ 100.00 | | | 0.39 | | | | 6/15/26 | | | | 93 | |
| | | 200 | | World Omni Auto Receivables Trust, Series 2021-C, Class - A4, Callable 9/15/24 @ 100.00 | | | 0.64 | | | | 9/15/27 | | | | 183 | |
| | | 200 | | World Omni Auto Receivables Trust, Series 2020-B, Class - A4, Callable 3/15/24 @ 100.00 | | | 0.82 | | | | 1/15/26 | | | | 192 | |
| | | | | Total Asset Backed Securities | | | | | | | | | | | 1,507 | |
| | | | | | | | | | | | | | | | | |
| | | | | Collateralized Mortgage Obligations — 6.14% | | | | | | | | | | | | |
| | | 150 | | Bank, Series 2020-BNK26, Class - A4, Callable 2/15/30 @ 100.00 | | | 2.40 | | | | 3/15/63 | | | | 132 | |
| | | 300 | | Bank, Series 2021-BN37, Class - A5, Callable 10/15/31 @ 100.00 | | | 2.62(a) | | | | 11/15/64 | | | | 262 | |
| | | 100 | | Bank, Series 2019-BN21, Class - A5, Callable 9/15/29 @ 100.00 | | | 2.85 | | | | 10/15/52 | | | | 91 | |
| | | 100 | | Bank, Series 2019-BNK19, Class - A3, Callable 7/15/29 @ 100.00 | | | 3.18 | | | | 8/15/61 | | | | 93 | |
| | | 250 | | Bank, Series 2017-BNK9, Class - ASB, Callable 8/15/27 @ 100.00 | | | 3.47 | | | | 11/15/54 | | | | 246 | |
| | | 300 | | Bank, Series 2018-BN10, Class - A5, Callable 1/15/28 @ 100.00 | | | 3.69 | | | | 2/15/61 | | | | 292 | |
| | | 100 | | Bank, Series 2019-BN17, Class - A4, Callable 3/15/29 @ 100.00 | | | 3.71 | | | | 4/15/52 | | | | 97 | |
| | | 93 | | Bank of America Commercial Mortgage Trust, Series 2017-BNK3, Class - ASB, Callable 6/15/26 @ 100.00 | | | 3.37 | | | | 2/15/50 | | | | 92 | |
| | | 60 | | BBCMS Mortgage Trust, Series 2020-C7, Class - AS, Callable 3/15/30 @ 100.00 | | | 2.44 | | | | 4/15/53 | | | | 51 | |
| | | 100 | | Benchmark Mortgage Trust, Series 2020-IG1, Class - AS, Callable 1/15/30 @ 100.00 | | | 2.91(a) | | | | 9/15/43 | | | | 88 | |
| | | 200 | | Benchmark Mortgage Trust, Series 2022-B33, Class - A5, Callable 2/15/32 @ 100.00 | | | 3.46 | | | | 3/15/55 | | | | 187 | |
| | | 250 | | Benchmark Mortgage Trust, Series 2019-B9, Class - A5, Callable 1/15/29 @ 100.00 | | | 4.02 | | | | 3/15/52 | | | | 246 | |
| | | 200 | | Benchmark Mortgage Trust, Series 2018-B6, Class - A4, Callable 8/10/28 @ 100.00 | | | 4.26 | | | | 10/10/51 | | | | 199 | |
| | | 190 | | Citigroup Commercial Mortgage Trust, Series 2015-GC27, Class - A4, Callable 11/10/24 @ 100.00 | | | 2.88 | | | | 2/10/48 | | | | 185 | |
| | | 100 | | Citigroup Commercial Mortgage Trust, Series 2020-GC46, Class - AS, Callable 2/15/30 @ 100.00 | | | 2.92 | | | | 2/15/53 | | | | 88 | |
| | | 150 | | Citigroup Commercial Mortgage Trust, Series 2019-C7, Class - A4, Callable 12/15/29 @ 100.00 | | | 3.10 | | | | 12/15/72 | | | | 138 | |
| | | 100 | | Citigroup Commercial Mortgage Trust, Series 2016-GC37, Class - A4, Callable 1/10/26 @ 100.00 | | | 3.31 | | | | 4/10/49 | | | | 97 | |
| | | 100 | | Citigroup Commercial Mortgage Trust, Series 2016-GC36, Class - A5, Callable 1/10/26 @ 100.00 | | | 3.62 | | | | 2/10/49 | | | | 98 | |
| | | 228 | | Citigroup Commercial Mortgage Trust, Series 2014-GC23, Class - A4, Callable 7/10/24 @ 100.00 | | | 3.62 | | | | 7/10/47 | | | | 226 | |
| | | 80 | | COMM Mortgage Trust, Series 2015-DC1, Class - A5, Callable 1/10/25 @ 100.00 | | | 3.35 | | | | 2/10/48 | | | | 78 | |
| | | 183 | | Commercial Mortgage Trust, Series 2015-LC19, Class - A4, Callable 1/10/25 @ 100.00 | | | 3.18 | | | | 2/10/48 | | | | 178 | |
| | | 256 | | Commercial Mortgage Trust, Series 2013-CR8, Class - A5, Callable 5/10/23 @ 100.00 | | | 3.61(a) | | | | 6/10/46 | | | | 256 | |
| | | 100 | | Commercial Mortgage Trust, Series 2014-UBS4, Class - AM, Callable 7/10/24 @ 100.00 | | | 3.97 | | | | 8/10/47 | | | | 98 | |
| | | 100 | | Commercial Mortgage Trust, Series 2013-CR11, Class - B, Callable 9/10/23 @ 100.00 | | | 5.11(a) | | | | 8/10/50 | | | | 100 | |
| | | 148 | | CSAIL Commercial Mortgage Trust, Series 2016-C7, Class - ASB, Callable 7/15/25 @ 100.00 | | | 3.31 | | | | 11/15/49 | | | | 147 | |
| | | 200 | | Fannie Mae-ACES, Series 2020-M8, Class - A2 | | | 1.82 | | | | 2/25/30 | | | | 177 | |
| | | 237 | | Fannie Mae-ACES, Series 2015-M3, Class - A2 | | | 2.72 | | | | 10/25/24 | | | | 233 | |
| | | 193 | | Fannie Mae-ACES, Series 2017-M7, Class - A2 | | | 2.96(a) | | | | 2/25/27 | | | | 187 | |
| | | 100 | | Fannie Mae-ACES, Series 2017-M11, Class - A2 | | | 2.98 | | | | 8/25/29 | | | | 96 | |
| | | 238 | | Fannie Mae-ACES, Series 2017-M12, Class - A2 | | | 3.07(a) | | | | 6/25/27 | | | | 234 | |
| | | 189 | | Fannie Mae-ACES, Series 2017 M15, Class - ATS2 | | | 3.15(a) | | | | 11/25/27 | | | | 184 | |
See accompanying notes to financial statements.
227
HC CAPITAL TRUST
The U.S. Mortgage/Asset Backed Fixed Income Securities Portfolio
Portfolio of Investments (continued) — June 30, 2022
| | Principal
Amount
(000) | | Security Description | | Rate % | | | Maturity
Date | | | Value
(000) | |
| | | | | Collateralized Mortgage Obligations (continued) |
| | $ | 246 | | Fannie Mae-ACES, Series 2018-M14, Class - A2 | | | 3.58(a) | | | | 8/25/28 | | | $ | 247 | |
| | | 186 | | Fannie Mae-ACES, Series 2019-M2, Class - A2 | | | 3.63(a) | | | | 11/25/28 | | | | 187 | |
| | | 300 | | Freddie Mac Multifamily Structured Pass-Through Certificates, Series K117, Class - A2, Callable 8/25/30 @ 100.00 | | | 1.41 | | | | 8/25/30 | | | | 255 | |
| | | 300 | | Freddie Mac Multifamily Structured Pass-Through Certificates, Series K1516, Class - A2, Callable 5/25/35 @ 100.00 | | | 1.72 | | | | 5/25/35 | | | | 235 | |
| | | 98 | | Freddie Mac Multifamily Structured Pass-Through Certificates, Series K106, Class - A1, Callable 10/25/29 @ 100.00 | | | 1.78 | | | | 10/25/29 | | | | 90 | |
| | | 390 | | Freddie Mac Multifamily Structured Pass-Through Certificates, Series K126, Class - A2, Callable 1/25/31 @ 100.00 | | | 2.07 | | | | 1/25/31 | | | | 347 | |
| | | 200 | | Freddie Mac Multifamily Structured Pass-Through Certificates, Series K133, Class - A2, Callable 9/25/31 @ 100.00 | | | 2.10 | | | | 9/25/31 | | | | 176 | |
| | | 300 | | Freddie Mac Multifamily Structured Pass-Through Certificates, Series K-1521, Class - A2, Callable 8/25/36 @ 100.00 | | | 2.18 | | | | 8/25/36 | | | | 245 | |
| | | 47 | | Freddie Mac Multifamily Structured Pass-Through Certificates, Series K099, Class - A1, Callable 6/25/29 @ 100.00 | | | 2.26 | | | | 6/25/29 | | | | 45 | |
| | | 69 | | Freddie Mac Multifamily Structured Pass-Through Certificates, Series K058, Class - A1, Callable 6/25/26 @ 100.00 | | | 2.34 | | | | 7/25/26 | | | | 68 | |
| | | 350 | | Freddie Mac Multifamily Structured Pass-Through Certificates, Series K055, Class - A2, Callable 3/25/26 @ 100.00 | | | 2.67 | | | | 3/25/26 | | | | 341 | |
| | | 137 | | Freddie Mac Multifamily Structured Pass-Through Certificates, Series K726, Class - A2, Callable 4/25/24 @ 100.00 | | | 2.91 | | | | 7/25/49 | | | | 136 | |
| | | 365 | | Freddie Mac Multifamily Structured Pass-Through Certificates, Series K043, Class - A2, Callable 12/25/24 @ 100.00 | | | 3.06 | | | | 12/25/24 | | | | 362 | |
| | | 100 | | Freddie Mac Multifamily Structured Pass-Through Certificates, Series K092, Class - A2, Callable 4/25/29 @ 100.00 | | | 3.30 | | | | 4/25/29 | | | | 99 | |
| | | 183 | | Freddie Mac Multifamily Structured Pass-Through Certificates, Series K032, Class - A2, Callable 5/25/23 @ 100.00 | | | 3.31(a) | | | | 5/25/23 | | | | 182 | |
| | | 100 | | Freddie Mac Multifamily Structured Pass-Through Certificates, Series K047, Class - A2, Callable 5/25/25 @ 100.00 | | | 3.33(a) | | | | 5/25/25 | | | | 100 | |
| | | 250 | | Freddie Mac Multifamily Structured Pass-Through Certificates, Series K091, Class - A2, Callable 3/25/29 @ 100.00 | | | 3.51 | | | | 3/25/29 | | | | 250 | |
| | | 250 | | Freddie Mac Multifamily Structured Pass-Through Certificates, Series K087, Class - A2, Callable 12/25/28 @ 100.00 | | | 3.77 | | | | 12/25/28 | | | | 253 | |
| | | 500 | | Freddie Mac Multifamily Structured Pass-Through Certificates, Series K077, Class - A2, Callable 5/25/28 @ 100.00 | | | 3.85 | | | | 5/25/28 | | | | 507 | |
| | | 400 | | Freddie Mac Multifamily Structured Pass-Through Certificates, Series K081, Class - A2, Callable 8/25/28 @ 100.00 | | | 3.90(a) | | | | 8/25/28 | | | | 408 | |
| | | 230 | | GS Mortgage Securities Trust, Series 2016-GS2, Class - A3, Callable 2/10/26 @ 100.00 | | | 2.79 | | | | 5/10/49 | | | | 219 | |
| | | 200 | | GS Mortgage Securities Trust, Series 2019-GC42, Class - A4, Callable 9/10/29 @ 100.00 | | | 3.00 | | | | 9/1/52 | | | | 185 | |
| | | 100 | | GS Mortgage Securities Trust, Series 2020-GC45, Class - AS, Callable 12/13/29 @ 100.00 | | | 3.17(a) | | | | 2/13/53 | | | | 90 | |
| | | 250 | | GS Mortgage Securities Trust, Series 2017-GS5, Class - A4, Callable 2/10/27 @ 100.00 | | | 3.67 | | | | 3/10/50 | | | | 244 | |
| | | 100 | | GS Mortgage Securities Trust, Series 2018-GS10, Class - A5 | | | 4.16(a) | | | | 7/10/51 | | | | 100 | |
| | | 137 | | JPMBB Commercial Mortgage Securities Trust, Series 2014-C24, Class - A5, Callable 10/15/24 @ 100.00 | | | 3.64 | | | | 11/15/47 | | | | 135 | |
| | | 183 | | JPMBB Commercial Mortgage Securities Trust, Series 2014-C22, Class - A4, Callable 8/15/24 @ 100.00 | | | 3.80 | | | | 9/15/47 | | | | 181 | |
See accompanying notes to financial statements.
228
HC CAPITAL TRUST
The U.S. Mortgage/Asset Backed Fixed Income Securities Portfolio
Portfolio of Investments (continued) — June 30, 2022
| | Principal
Amount
(000) | | Security Description | | Rate % | | | Maturity
Date | | | Value
(000) | |
| | | | | Collateralized Mortgage Obligations (continued) |
| | $ | 183 | | JPMBB Commercial Mortgage Securities Trust, Series 2013-C15, Class - A5, Callable 9/15/23 @ 100.00 | | | 4.13 | | | | 11/15/45 | | | $ | 182 | |
| | | 47 | | Morgan Stanley BAML Trust, Series 2015-C21, Class - ASB, Callable 11/15/24 @ 100.00 | | | 3.15 | | | | 3/15/48 | | | | 46 | |
| | | 183 | | Morgan Stanley BAML Trust, Series 2015-C20, Class - A4, Callable 12/15/24 @ 100.00 | | | 3.25 | | | | 2/15/48 | | | | 178 | |
| | | 200 | | Morgan Stanley BAML Trust, Series 2014-C19, Class - A4, Callable 11/15/24 @ 100.00 | | | 3.53 | | | | 12/15/47 | | | | 197 | |
| | | 200 | | Morgan Stanley BAML Trust, Series 2017-C33, Class - A5, Callable 4/15/27 @ 100.00 | | | 3.60 | | | | 5/15/50 | | | | 194 | |
| | | 100 | | Morgan Stanley BAML Trust, Series 2014-C17, Class - A5, Callable 7/15/24 @ 100.00 | | | 3.74 | | | | 8/15/47 | | | | 99 | |
| | | 200 | | Morgan Stanley Capital I Trust, Series 2017-H1, Class - A4, Callable 3/15/27 @ 100.00 | | | 3.26 | | | | 6/15/50 | | | | 191 | |
| | | 100 | | SG Commercial Mortgage Securities Trust, Series 2016-C5, Class - A4, Callable 6/10/26 @ 100.00 | | | 3.06 | | | | 10/10/48 | | | | 95 | |
| | | 50 | | Toyota Auto Receivables Owner Trust, Series 2021-A, Class - A3, Callable 11/15/24 @ 100.00 | | | 0.26 | | | | 5/15/25 | | | | 49 | |
| | | 122 | | Wells Fargo Commercial Mortgage Trust, Series 2019-C53, Class - A4, Callable 10/15/29 @ 100.00 | | | 3.04 | | | | 10/15/52 | | | | 112 | |
| | | 500 | | Wells Fargo Commercial Mortgage Trust, Series 2016-C34, Class - A4, Callable 4/15/26 @ 100.00 | | | 3.10 | | | | 6/15/49 | | | | 481 | |
| | | 183 | | Wells Fargo Commercial Mortgage Trust, Series 2015-C30, Class - A4, Callable 7/15/25 @ 100.00 | | | 3.66 | | | | 9/15/58 | | | | 180 | |
| | | 124 | | Wells Fargo Commercial Mortgage Trust, Series 2015-P2, Class - A4, Callable 11/15/25 @ 100.00 | | | 3.81 | | | | 12/15/48 | | | | 122 | |
| | | 169 | | Wells Fargo Commercial Mortgage Trust, Series 2014-LC16, Class - A5, Callable 5/15/24 @ 100.00 | | | 3.82 | | | | 8/15/50 | | | | 167 | |
| | | 142 | | Wells Fargo Commercial Mortgage Trust, Series 2015-C26, Class - C, Callable 2/15/25 @ 100.00 | | | 4.07 | | | | 2/15/48 | | | | 132 | |
| | | 100 | | Wells Fargo Commercial Mortgage Trust, Series 2018-C47, Class - A4, Callable 9/15/28 @ 100.00 | | | 4.44 | | | | 9/15/61 | | | | 100 | |
| | | | | Total Collateralized Mortgage Obligations | | | | | | | | | | | 13,088 | |
| | | | | | | | | | | | | | | | | |
| | | | | U.S. Government Agency Mortgages — 85.04% | | | | | | | | | | | | |
| | | 156 | | Fannie Mae, Pool #MA4310 | | | 1.50 | | | | 4/1/41 | | | | 132 | |
| | | 22 | | Fannie Mae, Pool #MA4181 | | | 1.50 | | | | 11/1/50 | | | | 18 | |
| | | 419 | | Fannie Mae, Pool #MA4441 | | | 1.50 | | | | 10/1/36 | | | | 381 | |
| | | 95 | | Fannie Mae, Pool #MA4445 | | | 1.50 | | | | 10/1/41 | | | | 81 | |
| | | 413 | | Fannie Mae, Pool #MA4417 | | | 1.50 | | | | 9/1/36 | | | | 375 | |
| | | 408 | | Fannie Mae, Pool #FM6579 | | | 1.50 | | | | 3/1/51 | | | | 339 | |
| | | 417 | | Fannie Mae, Pool #MA4343 | | | 1.50 | | | | 5/1/51 | | | | 347 | |
| | | 193 | | Fannie Mae, Pool #MA4266 | | | 1.50 | | | | 1/1/41 | | | | 163 | |
| | | 87 | | Fannie Mae, Pool #MA4286 | | | 1.50 | | | | 2/1/41 | | | | 74 | |
| | | 423 | | Fannie Mae, Pool #MA4236 | | | 1.50 | | | | 1/1/51 | | | | 352 | |
| | | 228 | | Fannie Mae, Pool #MA4302 | | | 1.50 | | | | 4/1/36 | | | | 208 | |
| | | 420 | | Fannie Mae, Pool #CA7695 | | | 1.50 | | | | 11/1/50 | | | | 349 | |
| | | 144 | | Fannie Mae, Pool #FM9249 | | | 1.50 | | | | 10/1/41 | | | | 122 | |
| | | 414 | | Fannie Mae, Pool #CA7696 | | | 1.50 | | | | 11/1/50 | | | | 344 | |
| | | 392 | | Fannie Mae, Pool #CB0310 | | | 1.50 | | | | 4/1/36 | | | | 356 | |
| | | 466 | | Fannie Mae, Pool #MA4354 | | | 1.50 | | | | 6/1/51 | | | | 387 | |
| | | 444 | | Fannie Mae, Pool #CB0711 | | | 1.50 | | | | 6/1/51 | | | | 369 | |
| | | 184 | | Fannie Mae, Pool #MA4386 | | | 1.50 | | | | 7/1/41 | | | | 157 | |
| | | 412 | | Fannie Mae, Pool #MA4304 | | | 1.50 | | | | 4/1/51 | | | | 342 | |
See accompanying notes to financial statements.
229
HC CAPITAL TRUST
The U.S. Mortgage/Asset Backed Fixed Income Securities Portfolio
Portfolio of Investments (continued) — June 30, 2022
| | Principal
Amount
(000) | | Security Description | | Rate % | | | Maturity
Date | | | Value
(000) | |
| | | | | U.S. Government Agency Mortgages (continued) |
| | $ | 476 | | Fannie Mae, Pool #MA4397 | | | 1.50 | | | | 8/1/51 | | | $ | 395 | |
| | | 121 | | Fannie Mae, Pool #MA4122 | | | 1.50 | | | | 9/1/35 | | | | 110 | |
| | | 351 | | Fannie Mae, Pool #BQ3141 | | | 1.50 | | | | 10/1/35 | | | | 320 | |
| | | 429 | | Fannie Mae, Pool #MA4280 | | | 1.50 | | | | 3/1/51 | | | | 357 | |
| | | 287 | | Fannie Mae, Pool #BQ5781 | | | 1.50 | | | | 11/1/35 | | | | 261 | |
| | | 45 | | Fannie Mae, Pool #MA4342 | | | 1.50 | | | | 4/1/41 | | | | 38 | |
| | | 383 | | Fannie Mae, Pool #MA4255 | | | 2.00 | | | | 2/1/51 | | | | 333 | |
| | | 378 | | Fannie Mae, Pool #MA4237 | | | 2.00 | | | | 1/1/51 | | | | 329 | |
| | | 443 | | Fannie Mae, Pool #MA4182 | | | 2.00 | | | | 11/1/50 | | | | 385 | |
| | | 400 | | Fannie Mae, Pool #FM6555 | | | 2.00 | | | | 4/1/51 | | | | 347 | |
| | | 249 | | Fannie Mae, Pool #MA4325 | | | 2.00 | | | | 5/1/51 | | | | 216 | |
| | | 139 | | Fannie Mae, Pool #FM5453 | | | 2.00 | | | | 1/1/41 | | | | 123 | |
| | | 133 | | Fannie Mae, Pool #MA4155 | | | 2.00 | | | | 10/1/35 | | | | 124 | |
| | | 257 | | Fannie Mae, Pool #FM5044 | | | 2.00 | | | | 12/1/50 | | | | 224 | |
| | | 202 | | Fannie Mae, Pool #BQ5160 | | | 2.00 | | | | 12/1/50 | | | | 175 | |
| | | 413 | | Fannie Mae, Pool #FM5308 | | | 2.00 | | | | 12/1/50 | | | | 359 | |
| | | 150 | | Fannie Mae, Pool #MA4287 | | | 2.00 | | | | 3/1/41 | | | | 133 | |
| | | 45 | | Fannie Mae, Pool #MA2906 | | | 2.00 | | | | 2/1/32 | | | | 42 | |
| | | 492 | | Fannie Mae, Pool #MA4158 | | | 2.00 | | | | 10/1/50 | | | | 427 | |
| | | 409 | | Fannie Mae, Pool #MA4360 | | | 2.00 | | | | 6/1/36 | | | | 382 | |
| | | 400 | | Fannie Mae, Pool #FM6852 | | | 2.00 | | | | 5/1/51 | | | | 347 | |
| | | 496 | | Fannie Mae, Pool #BR0948 | | | 2.00 | | | | 4/1/51 | | | | 431 | |
| | | 378 | | Fannie Mae, Pool #MA4403 | | | 2.00 | | | | 8/1/36 | | | | 353 | |
| | | 543 | | Fannie Mae, Pool #BQ5112 | | | 2.00 | | | | 11/1/50 | | | | 471 | |
| | | 95 | | Fannie Mae, Pool #MA4474 | | | 2.00 | | | | 11/1/41 | | | | 85 | |
| | | 490 | | Fannie Mae, Pool #FS1334 | | | 2.00 | | | | 11/1/51 | | | | 425 | |
| | | 262 | | Fannie Mae, Pool #MA4119 | | | 2.00 | | | | 9/1/50 | | | | 227 | |
| | | 160 | | Fannie Mae, Pool #BP6626 | | | 2.00 | | | | 8/1/50 | | | | 139 | |
| | | 372 | | Fannie Mae, Pool #MA4303 | | | 2.00 | | | | 4/1/36 | | | | 348 | |
| | | 440 | | Fannie Mae, Pool #MA4442 | | | 2.00 | | | | 10/1/36 | | | | 411 | |
| | | 428 | | Fannie Mae, Pool #CA7833 | | | 2.00 | | | | 11/1/50 | | | | 375 | |
| | | 337 | | Fannie Mae, Pool #FM3755 | | | 2.00 | | | | 9/1/35 | | | | 315 | |
| | | 546 | | Fannie Mae, Pool #BR4094 | | | 2.00 | | | | 1/1/51 | | | | 474 | |
| | | 230 | | Fannie Mae, Pool #CA8118 | | | 2.00 | | | | 12/1/50 | | | | 200 | |
| | | 400 | | Fannie Mae, Pool #MA4305 | | | 2.00 | | | | 4/1/51 | | | | 347 | |
| | | 463 | | Fannie Mae, Pool #MA4378 | | | 2.00 | | | | 7/1/51 | | | | 402 | |
| | | 243 | | Fannie Mae, Pool #MA4437 | | | 2.00 | | | | 10/1/51 | | | | 211 | |
| | | 287 | | Fannie Mae, Pool #MA4208 | | | 2.00 | | | | 12/1/50 | | | | 250 | |
| | | 98 | | Fannie Mae, Pool #FS0317 | | | 2.00 | | | | 2/1/42 | | | | 87 | |
| | | 391 | | Fannie Mae, Pool #MA4281 | | | 2.00 | | | | 3/1/51 | | | | 339 | |
| | | 187 | | Fannie Mae, Pool #MA4333 | | | 2.00 | | | | 5/1/41 | | | | 166 | |
| | | 458 | | Fannie Mae, Pool #FM9704 | | | 2.00 | | | | 12/1/51 | | | | 398 | |
| | | 21 | | Fannie Mae, Pool #AS0001 | | | 2.00 | | | | 7/1/28 | | | | 19 | |
| | | 347 | | Fannie Mae, Pool #CA7224 | | | 2.00 | | | | 10/1/50 | | | | 301 | |
| | | 370 | | Fannie Mae, Pool #CA9183 | | | 2.00 | | | | 2/1/36 | | | | 346 | |
| | | 418 | | Fannie Mae, Pool #CB0325 | | | 2.00 | | | | 4/1/51 | | | | 363 | |
| | | 434 | | Fannie Mae, Pool #CB0497 | | | 2.00 | | | | 5/1/51 | | | | 377 | |
| | | 437 | | Fannie Mae, Pool #CB0684 | | | 2.00 | | | | 6/1/51 | | | | 380 | |
See accompanying notes to financial statements.
230
HC CAPITAL TRUST
The U.S. Mortgage/Asset Backed Fixed Income Securities Portfolio
Portfolio of Investments (continued) — June 30, 2022
| | Principal
Amount
(000) | | Security Description | | Rate % | | | Maturity
Date | | | Value
(000) | |
| | | | | U.S. Government Agency Mortgages (continued) |
| | $ | 409 | | Fannie Mae, Pool #FM6448 | | | 2.00 | | | | 3/1/51 | | | $ | 355 | |
| | | 448 | | Fannie Mae, Pool #FM9579 | | | 2.00 | | | | 7/1/51 | | | | 389 | |
| | | 483 | | Fannie Mae, Pool #FM7411 | | | 2.00 | | | | 5/1/51 | | | | 419 | |
| | | 440 | | Fannie Mae, Pool #CA8687 | | | 2.00 | | | | 1/1/51 | | | | 382 | |
| | | 497 | | Fannie Mae, Pool #BK8461 | | | 2.00 | | | | 1/1/51 | | | | 433 | |
| | | 498 | | Fannie Mae, Pool #CA8933 | | | 2.00 | | | | 2/1/51 | | | | 435 | |
| | | 489 | | Fannie Mae, Pool #FM4969 | | | 2.00 | | | | 12/1/50 | | | | 424 | |
| | | 487 | | Fannie Mae, Pool #MA4511 | | | 2.00 | | | | 1/1/52 | | | | 423 | |
| | | 400 | | Fannie Mae, Pool #CA8850 | | | 2.00 | | | | 2/1/51 | | | | 347 | |
| | | 191 | | Fannie Mae, Pool #MA4176 | | | 2.00 | | | | 10/1/40 | | | | 171 | |
| | | 297 | | Fannie Mae, Pool #FS1621 | | | 2.00 | | | | 7/1/51 | | | | 258 | |
| | | 15 | | Fannie Mae, Pool #BJ4362 | | | 2.00 | | | | 11/1/32 | | | | 14 | |
| | | 453 | | Fannie Mae, Pool #CB1787 | | | 2.00 | | | | 10/1/51 | | | | 394 | |
| | | 164 | | Fannie Mae, Pool #MA4204 | | | 2.00 | | | | 12/1/40 | | | | 146 | |
| | | 249 | | Fannie Mae, Pool #BR4435 | | | 2.00 | | | | 4/1/51 | | | | 217 | |
| | | 454 | | Fannie Mae, Pool #BT0240 | | | 2.00 | | | | 9/1/51 | | | | 394 | |
| | | 387 | | Fannie Mae, Pool #BQ7777 | | | 2.00 | | | | 3/1/36 | | | | 362 | |
| | | 378 | | Fannie Mae, Pool #BQ8341 | | | 2.00 | | | | 12/1/50 | | | | 328 | |
| | | 476 | | Fannie Mae, Pool #CA8252 | | | 2.00 | | | | 12/1/45 | | | | 414 | |
| | | 400 | | Fannie Mae, Pool #BQ9685 | | | 2.00 | | | | 1/1/51 | | | | 348 | |
| | | 387 | | Fannie Mae, Pool #BQ3004 | | | 2.00 | | | | 10/1/50 | | | | 336 | |
| | | 371 | | Fannie Mae, Pool #CA7225 | | | 2.00 | | | | 10/1/50 | | | | 322 | |
| | | 409 | | Fannie Mae, Pool #BR2176 | | | 2.00 | | | | 7/1/36 | | | | 382 | |
| | | 272 | | Fannie Mae, Pool #BU7103 | | | 2.00 | | | | 12/1/51 | | | | 236 | |
| | | 114 | | Fannie Mae, Pool #AS1058 | | | 2.00 | | | | 11/1/28 | | | | 106 | |
| | | 360 | | Fannie Mae, Pool #BP9370 | | | 2.00 | | | | 7/1/50 | | | | 313 | |
| | | 46 | | Fannie Mae, Pool #MA4071 | | | 2.00 | | | | 7/1/40 | | | | 40 | |
| | | 501 | | Fannie Mae, Pool #CA9273 | | | 2.00 | | | | 2/1/51 | | | | 435 | |
| | | 466 | | Fannie Mae, Pool #FM9441 | | | 2.00 | | | | 4/1/51 | | | | 405 | |
| | | 11 | | Fannie Mae, Pool #CA0052 | | | 2.00 | | | | 7/1/32 | | | | 10 | |
| | | 542 | | Fannie Mae, Pool #FM4788 | | | 2.00 | | | | 11/1/50 | | | | 470 | |
| | | 410 | | Fannie Mae, Pool #MA4128 | | | 2.00 | | | | 9/1/40 | | | | 364 | |
| | | 18 | | Fannie Mae, Pool #AY4232 | | | 2.00 | | | | 5/1/30 | | | | 17 | |
| | | 270 | | Fannie Mae, Pool #MA4355 | | | 2.00 | | | | 6/1/51 | | | | 235 | |
| | | 428 | | Fannie Mae, Pool #CB1620 | | | 2.00 | | | | 9/1/51 | | | | 373 | |
| | | 33 | | Fannie Mae, Pool #MA4093 | | | 2.00 | | | | 8/1/40 | | | | 29 | |
| | | 257 | | Fannie Mae, Pool #FM4039 | | | 2.00 | | | | 10/1/35 | | | | 240 | |
| | | 425 | | Fannie Mae, Pool #CA8110 | | | 2.00 | | | | 12/1/50 | | | | 369 | |
| | | 270 | | Fannie Mae, Pool #FS0355 | | | 2.00 | | | | 9/1/51 | | | | 234 | |
| | | 494 | | Fannie Mae, Pool #CB2523 | | | 2.50 | | | | 1/1/52 | | | | 444 | |
| | | 10 | | Fannie Mae, Pool #MA3788 | | | 2.50 | | | | 9/1/39 | | | | 9 | |
| | | 123 | | Fannie Mae, Pool #FS1340 | | | 2.50 | | | | 3/1/52 | | | | 111 | |
| | | 28 | | Fannie Mae, Pool #AS4660 | | | 2.50 | | | | 3/1/30 | | | | 27 | |
| | | 254 | | Fannie Mae, Pool #CA6074 | | | 2.50 | | | | 6/1/50 | | | | 229 | |
| | | 56 | | Fannie Mae, Pool #MA3896 | | | 2.50 | | | | 1/1/35 | | | | 54 | |
| | | 326 | | Fannie Mae, Pool #CA7237 | | | 2.50 | | | | 10/1/50 | | | | 295 | |
| | | 174 | | Fannie Mae, Pool #MA2730 | | | 2.50 | | | | 8/1/46 | | | | 159 | |
| | | 458 | | Fannie Mae, Pool #BU5917 | | | 2.50 | | | | 12/1/51 | | | | 413 | |
See accompanying notes to financial statements.
231
HC CAPITAL TRUST
The U.S. Mortgage/Asset Backed Fixed Income Securities Portfolio
Portfolio of Investments (continued) — June 30, 2022
| | Principal
Amount
(000) | | Security Description | | Rate % | | | Maturity
Date | | | Value
(000) | |
| | | | | U.S. Government Agency Mortgages (continued) |
| | $ | 25 | | Fannie Mae, Pool #MA3737 | | | 2.50 | | | | 8/1/34 | | | $ | 24 | |
| | | 455 | | Fannie Mae, Pool #CB1784 | | | 2.50 | | | | 10/1/51 | | | | 409 | |
| | | 459 | | Fannie Mae, Pool #CB1828 | | | 2.50 | | | | 10/1/51 | | | | 413 | |
| | | 112 | | Fannie Mae, Pool #MA3827 | | | 2.50 | | | | 11/1/34 | | | | 108 | |
| | | 37 | | Fannie Mae, Pool #MA3217 | | | 2.50 | | | | 12/1/32 | | | | 36 | |
| | | 262 | | Fannie Mae, Pool #BP5878 | | | 2.50 | | | | 6/1/50 | | | | 237 | |
| | | 61 | | Fannie Mae, Pool #AS8892 | | | 2.50 | | | | 2/1/32 | | | | 59 | |
| | | 269 | | Fannie Mae, Pool #MA4078 | | | 2.50 | | | | 7/1/50 | | | | 243 | |
| | | 250 | | Fannie Mae, Pool #BK2588 | | | 2.50 | | | | 5/1/50 | | | | 226 | |
| | | 234 | | Fannie Mae, Pool #CA8132 | | | 2.50 | | | | 12/1/50 | | | | 210 | |
| | | 445 | | Fannie Mae, Pool #CB1556 | | | 2.50 | | | | 9/1/51 | | | | 401 | |
| | | 494 | | Fannie Mae, Pool #CA9289 | | | 2.50 | | | | 2/1/51 | | | | 445 | |
| | | 468 | | Fannie Mae, Pool #MA4517 | | | 2.50 | | | | 1/1/37 | | | | 448 | |
| | | 7 | | Fannie Mae, Pool #AS8172 | | | 2.50 | | | | 10/1/36 | | | | 6 | |
| | | 343 | | Fannie Mae, Pool #FM4309 | | | 2.50 | | | | 9/1/50 | | | | 311 | |
| | | 193 | | Fannie Mae, Pool #MA4414 | | | 2.50 | | | | 9/1/51 | | | | 174 | |
| | | 428 | | Fannie Mae, Pool #MA4399 | | | 2.50 | | | | 8/1/51 | | | | 386 | |
| | | 49 | | Fannie Mae, Pool #FS0547 | | | 2.50 | | | | 2/1/52 | | | | 44 | |
| | | 492 | | Fannie Mae, Pool #FS0235 | | | 2.50 | | | | 1/1/52 | | | | 443 | |
| | | 30 | | Fannie Mae, Pool #MA3282 | | | 2.50 | | | | 2/1/33 | | | | 29 | |
| | | 141 | | Fannie Mae, Pool #MA4099 | | | 2.50 | | | | 8/1/35 | | | | 135 | |
| | | 286 | | Fannie Mae, Pool #MA4256 | | | 2.50 | | | | 2/1/51 | | | | 258 | |
| | | 265 | | Fannie Mae, Pool #MA4159 | | | 2.50 | | | | 10/1/50 | | | | 240 | |
| | | 492 | | Fannie Mae, Pool #FM8745 | | | 2.50 | | | | 9/1/51 | | | | 443 | |
| | | 335 | | Fannie Mae, Pool #FM4638 | | | 2.50 | | | | 10/1/50 | | | | 302 | |
| | | 270 | | Fannie Mae, Pool #MA4096 | | | 2.50 | | | | 8/1/50 | | | | 244 | |
| | | 58 | | Fannie Mae, Pool #MA3764 | | | 2.50 | | | | 9/1/34 | | | | 55 | |
| | | 336 | | Fannie Mae, Pool #CA8955 | | | 2.50 | | | | 2/1/51 | | | | 303 | |
| | | 214 | | Fannie Mae, Pool #MA4075 | | | 2.50 | | | | 7/1/35 | | | | 205 | |
| | | 30 | | Fannie Mae, Pool #MA3801 | | | 2.50 | | | | 10/1/49 | | | | 27 | |
| | | 13 | | Fannie Mae, Pool #MA3830 | | | 2.50 | | | | 11/1/39 | | | | 11 | |
| | | 447 | | Fannie Mae, Pool #FS0030 | | | 2.50 | | | | 4/1/51 | | | | 402 | |
| | | 279 | | Fannie Mae, Pool #CA6304 | | | 2.50 | | | | 7/1/50 | | | | 251 | |
| | | 75 | | Fannie Mae, Pool #BE3032 | | | 2.50 | | | | 1/1/32 | | | | 73 | |
| | | 56 | | Fannie Mae, Pool #MA3955 | | | 2.50 | | | | 3/1/35 | | | | 54 | |
| | | 236 | | Fannie Mae, Pool #CB1131 | | | 2.50 | | | | 7/1/51 | | | | 212 | |
| | | 154 | | Fannie Mae, Pool #MA3990 | | | 2.50 | | | | 4/1/50 | | | | 139 | |
| | | 111 | | Fannie Mae, Pool #MA1277 | | | 2.50 | | | | 12/1/27 | | | | 107 | |
| | | 156 | | Fannie Mae, Pool #MA3902 | | | 2.50 | | | | 12/1/49 | | | | 142 | |
| | | 248 | | Fannie Mae, Pool #MA4210 | | | 2.50 | | | | 12/1/50 | | | | 225 | |
| | | 262 | | Fannie Mae, Pool #FM2881 | | | 2.50 | | | | 4/1/50 | | | | 236 | |
| | | 198 | | Fannie Mae, Pool #MA3246 | | | 2.50 | | | | 1/1/33 | | | | 191 | |
| | | 460 | | Fannie Mae, Pool #BU1451 | | | 2.50 | | | | 1/1/52 | | | | 414 | |
| | | 77 | | Fannie Mae, Pool #MA4053 | | | 2.50 | | | | 6/1/35 | | | | 73 | |
| | | 29 | | Fannie Mae, Pool #MA4016 | | | 2.50 | | | | 5/1/40 | | | | 26 | |
| | | 15 | | Fannie Mae, Pool #AS8437 | | | 2.50 | | | | 12/1/36 | | | | 14 | |
| | | 43 | | Fannie Mae, Pool #AS8246 | | | 2.50 | | | | 11/1/31 | | | | 42 | |
| | | 80 | | Fannie Mae, Pool #FM3296 | | | 2.50 | | | | 5/1/35 | | | | 77 | |
See accompanying notes to financial statements.
232
HC CAPITAL TRUST
The U.S. Mortgage/Asset Backed Fixed Income Securities Portfolio
Portfolio of Investments (continued) — June 30, 2022
| | Principal
Amount
(000) | | Security Description | | Rate % | | | Maturity
Date | | | Value
(000) | |
| | | | | U.S. Government Agency Mortgages (continued) |
| | $ | 118 | | Fannie Mae, Pool #MA1210 | | | 2.50 | | | | 10/1/27 | | | $ | 113 | |
| | | 362 | | Fannie Mae, Pool #BQ5110 | | | 2.50 | | | | 11/1/50 | | | | 328 | |
| | | 234 | | Fannie Mae, Pool #FM3027 | | | 2.50 | | | | 12/1/46 | | | | 214 | |
| | | 75 | | Fannie Mae, Pool #AS4946 | | | 2.50 | | | | 5/1/30 | | | | 73 | |
| | | 23 | | Fannie Mae, Pool #MA2868 | | | 2.50 | | | | 1/1/32 | | | | 23 | |
| | | 5 | | Fannie Mae, Pool #MA2789 | | | 2.50 | | | | 10/1/36 | | | | 5 | |
| | | 111 | | Fannie Mae, Pool #MA3154 | | | 2.50 | | | | 10/1/32 | | | | 107 | |
| | | 63 | | Fannie Mae, Pool #AU6387 | | | 2.50 | | | | 11/1/28 | | | | 62 | |
| | | 53 | | Fannie Mae, Pool #AU5334 | | | 2.50 | | | | 11/1/28 | | | | 52 | |
| | | 315 | | Fannie Mae, Pool #FM3878 | | | 2.50 | | | | 7/1/50 | | | | 287 | |
| | | 10 | | Fannie Mae, Pool #MA1511 | | | 2.50 | | | | 7/1/33 | | | | 10 | |
| | | 23 | | Fannie Mae, Pool #BJ3742 | | | 2.50 | | | | 12/1/32 | | | | 22 | |
| | | 112 | | Fannie Mae, Pool #MA3765 | | | 2.50 | | | | 9/1/49 | | | | 102 | |
| | | 98 | | Fannie Mae, Pool #AP4742 | | | 2.50 | | | | 8/1/27 | | | | 94 | |
| | | 20 | | Fannie Mae, Pool #AS0513 | | | 2.50 | | | | 8/1/43 | | | | 18 | |
| | | 200 | | Fannie Mae, Pool #MA4183 | | | 2.50 | | | | 11/1/50 | | | | 181 | |
| | | 407 | | Fannie Mae, Pool #BR7857 | | | 2.50 | | | | 5/1/51 | | | | 367 | |
| | | 298 | | Fannie Mae, Pool #FM3494 | | | 2.50 | | | | 4/1/48 | | | | 272 | |
| | | 31 | | Fannie Mae, Pool #BJ3944 | | | 2.50 | | | | 1/1/33 | | | | 30 | |
| | | 20 | | Fannie Mae, Pool #MA1270 | | | 2.50 | | | | 11/1/32 | | | | 18 | |
| | | 75 | | Fannie Mae, Pool #BC9041 | | | 2.50 | | | | 11/1/31 | | | | 73 | |
| | | 82 | | Fannie Mae, Pool #AB7391 | | | 2.50 | | | | 12/1/42 | | | | 76 | |
| | | 162 | | Fannie Mae, Pool #BQ0329 | | | 2.50 | | | | 7/1/50 | | | | 146 | |
| | | 258 | | Fannie Mae, Pool #BO4657 | | | 2.50 | | | | 11/1/49 | | | | 234 | |
| | | 71 | | Fannie Mae, Pool #MA3965 | | | 2.50 | | | | 3/1/40 | | | | 65 | |
| | | 459 | | Fannie Mae, Pool #FM9033 | | | 2.50 | | | | 10/1/51 | | | | 413 | |
| | | 364 | | Fannie Mae, Pool #MA4541 | | | 2.50 | | | | 2/1/42 | | | | 333 | |
| | | 364 | | Fannie Mae, Pool #CA8131 | | | 2.50 | | | | 12/1/50 | | | | 328 | |
| | | 282 | | Fannie Mae, Pool #CA6075 | | | 2.50 | | | | 6/1/50 | | | | 254 | |
| | | 10 | | Fannie Mae, Pool #MA2854 | | | 2.50 | | | | 12/1/46 | | | | 9 | |
| | | 33 | | Fannie Mae, Pool #AT2717 | | | 2.50 | | | | 5/1/43 | | | | 30 | |
| | | 445 | | Fannie Mae, Pool #FM8997 | | | 2.50 | | | | 10/1/51 | | | | 401 | |
| | | 74 | | Fannie Mae, Pool #AU2619 | | | 2.50 | | | | 8/1/28 | | | | 72 | |
| | | 8 | | Fannie Mae, Pool #MA2888 | | | 2.50 | | | | 1/1/47 | | | | 7 | |
| | | 432 | | Fannie Mae, Pool #CB0415 | | | 2.50 | | | | 5/1/51 | | | | 389 | |
| | | 27 | | Fannie Mae, Pool #AZ6458 | | | 2.50 | | | | 7/1/30 | | | | 26 | |
| | | 276 | | Fannie Mae, Pool #FM4231 | | | 2.50 | | | | 9/1/50 | | | | 250 | |
| | | 90 | | Fannie Mae, Pool #AO3019 | | | 2.50 | | | | 5/1/27 | | | | 87 | |
| | | 133 | | Fannie Mae, Pool #AB8897 | | | 3.00 | | | | 4/1/43 | | | | 127 | |
| | | 128 | | Fannie Mae, Pool #MA4079 | | | 3.00 | | | | 7/1/50 | | | | 120 | |
| | | 35 | | Fannie Mae, Pool #BD5076 | | | 3.00 | | | | 2/1/32 | | | | 35 | |
| | | 19 | | Fannie Mae, Pool #BC4276 | | | 3.00 | | | | 4/1/46 | | | | 18 | |
| | | 21 | | Fannie Mae, Pool #MA3897 | | | 3.00 | | | | 1/1/35 | | | | 21 | |
| | | 451 | | Fannie Mae, Pool #BU8883 | | | 3.00 | | | | 3/1/52 | | | | 421 | |
| | | 170 | | Fannie Mae, Pool #AP2465 | | | 3.00 | | | | 8/1/42 | | | | 163 | |
| | | 49 | | Fannie Mae, Pool #MA3147 | | | 3.00 | | | | 10/1/47 | | | | 46 | |
| | | 58 | | Fannie Mae, Pool #AB4483 | | | 3.00 | | | | 2/1/27 | | | | 57 | |
| | | 62 | | Fannie Mae, Pool #AS8521 | | | 3.00 | | | | 12/1/46 | | | | 58 | |
See accompanying notes to financial statements.
233
HC CAPITAL TRUST
The U.S. Mortgage/Asset Backed Fixed Income Securities Portfolio
Portfolio of Investments (continued) — June 30, 2022
| | Principal
Amount
(000) | | Security Description | | Rate % | | | Maturity
Date | | | Value
(000) | |
| | | | | U.S. Government Agency Mortgages (continued) |
| | $ | 148 | | Fannie Mae, Pool #BD2446 | | | 3.00 | | | | 1/1/47 | | | $ | 140 | |
| | | 141 | | Fannie Mae, Pool #AT0682 | | | 3.00 | | | | 4/1/43 | | | | 134 | |
| | | 16 | | Fannie Mae, Pool #AZ4358 | | | 3.00 | | | | 7/1/30 | | | | 16 | |
| | | 8 | | Fannie Mae, Pool #BA0826 | | | 3.00 | | | | 10/1/30 | | | | 7 | |
| | | 42 | | Fannie Mae, Pool #MA2425 | | | 3.00 | | | | 10/1/30 | | | | 42 | |
| | | 82 | | Fannie Mae, Pool #BD4225 | | | 3.00 | | | | 11/1/46 | | | | 77 | |
| | | 30 | | Fannie Mae, Pool #AU7890 | | | 3.00 | | | | 9/1/28 | | | | 30 | |
| | | 15 | | Fannie Mae, Pool #MA2087 | | | 3.00 | | | | 11/1/34 | | | | 14 | |
| | | 105 | | Fannie Mae, Pool #BC4764 | | | 3.00 | | | | 10/1/46 | | | | 99 | |
| | | 10 | | Fannie Mae, Pool #AX8309 | | | 3.00 | | | | 11/1/29 | | | | 10 | |
| | | 14 | | Fannie Mae, Pool #MA1058 | | | 3.00 | | | | 5/1/32 | | | | 13 | |
| | | 38 | | Fannie Mae, Pool #MA3991 | | | 3.00 | | | | 4/1/50 | | | | 36 | |
| | | 16 | | Fannie Mae, Pool #AS4334 | | | 3.00 | | | | 1/1/45 | | | | 16 | |
| | | 31 | | Fannie Mae, Pool #AQ3223 | | | 3.00 | | | | 11/1/27 | | | | 31 | |
| | | 19 | | Fannie Mae, Pool #MA2579 | | | 3.00 | | | | 4/1/36 | | | | 18 | |
| | | 83 | | Fannie Mae, Pool #MA3106 | | | 3.00 | | | | 8/1/47 | | | | 79 | |
| | | 369 | | Fannie Mae, Pool #AQ7920 | | | 3.00 | | | | 12/1/42 | | | | 353 | |
| | | 450 | | Fannie Mae, Pool #CB3172 | | | 3.00 | | | | 3/1/52 | | | | 420 | |
| | | 196 | | Fannie Mae, Pool #AP6493 | | | 3.00 | | | | 9/1/42 | | | | 187 | |
| | | 58 | | Fannie Mae, Pool #MA1527 | | | 3.00 | | | | 8/1/33 | | | | 55 | |
| | | 14 | | Fannie Mae, Pool #AR7426 | | | 3.00 | | | | 7/1/43 | | | | 14 | |
| | | 36 | | Fannie Mae, Pool #MA2149 | | | 3.00 | | | | 1/1/30 | | | | 35 | |
| | | 106 | | Fannie Mae, Pool #MA2246 | | | 3.00 | | | | 4/1/30 | | | | 104 | |
| | | 126 | | Fannie Mae, Pool #AL9865 | | | 3.00 | | | | 2/1/47 | | | | 120 | |
| | | 33 | | Fannie Mae, Pool #MA2230 | | | 3.00 | | | | 4/1/35 | | | | 32 | |
| | | 274 | | Fannie Mae, Pool #BU1241 | | | 3.00 | | | | 3/1/52 | | | | 256 | |
| | | 137 | | Fannie Mae, Pool #FM1370 | | | 3.00 | | | | 4/1/46 | | | | 130 | |
| | | 192 | | Fannie Mae, Pool #MA4048 | | | 3.00 | | | | 6/1/50 | | | | 180 | |
| | | 23 | | Fannie Mae, Pool #MA3958 | | | 3.00 | | | | 3/1/40 | | | | 21 | |
| | | 26 | | Fannie Mae, Pool #AS3117 | | | 3.00 | | | | 8/1/29 | | | | 25 | |
| | | 5 | | Fannie Mae, Pool #FM1585 | | | 3.00 | | | | 9/1/49 | | | | 5 | |
| | | 190 | | Fannie Mae, Pool #BP1932 | | | 3.00 | | | | 4/1/50 | | | | 177 | |
| | | 171 | | Fannie Mae, Pool #MA4020 | | | 3.00 | | | | 5/1/50 | | | | 160 | |
| | | 44 | | Fannie Mae, Pool #MA3127 | | | 3.00 | | | | 9/1/37 | | | | 42 | |
| | | 25 | | Fannie Mae, Pool #MA3304 | | | 3.00 | | | | 3/1/48 | | | | 24 | |
| | | 29 | | Fannie Mae, Pool #MA3934 | | | 3.00 | | | | 2/1/40 | | | | 27 | |
| | | 243 | | Fannie Mae, Pool #AO0752 | | | 3.00 | | | | 4/1/42 | | | | 232 | |
| | | 63 | | Fannie Mae, Pool #FM2132 | | | 3.00 | | | | 1/1/50 | | | | 59 | |
| | | 361 | | Fannie Mae, Pool #AB7099 | | | 3.00 | | | | 11/1/42 | | | | 344 | |
| | | 231 | | Fannie Mae, Pool #QB1382 | | | 3.00 | | | | 7/1/50 | | | | 216 | |
| | | 64 | | Fannie Mae, Pool #FM1552 | | | 3.00 | | | | 12/1/47 | | | | 60 | |
| | | 34 | | Fannie Mae, Pool #MA3060 | | | 3.00 | | | | 7/1/32 | | | | 33 | |
| | | 30 | | Fannie Mae, Pool #MA3090 | | | 3.00 | | | | 8/1/32 | | | | 29 | |
| | | 37 | | Fannie Mae, Pool #AL8861 | | | 3.00 | | | | 7/1/31 | | | | 37 | |
| | | 77 | | Fannie Mae, Pool #FM1134 | | | 3.00 | | | | 4/1/48 | | | | 73 | |
| | | 487 | | Fannie Mae, Pool #CB2755 | | | 3.00 | | | | 2/1/52 | | | | 454 | |
| | | 486 | | Fannie Mae, Pool #CB2756 | | | 3.00 | | | | 2/1/52 | | | | 453 | |
| | | 437 | | Fannie Mae, Pool #AP6375 | | | 3.00 | | | | 9/1/42 | | | | 418 | |
See accompanying notes to financial statements.
234
HC CAPITAL TRUST
The U.S. Mortgage/Asset Backed Fixed Income Securities Portfolio
Portfolio of Investments (continued) — June 30, 2022
| | Principal
Amount
(000) | | Security Description | | Rate % | | | Maturity
Date | | | Value
(000) | |
| | | | | U.S. Government Agency Mortgages (continued) |
| | $ | 29 | | Fannie Mae, Pool #MA1338 | | | 3.00 | | | | 2/1/33 | | | $ | 28 | |
| | | 73 | | Fannie Mae, Pool #AS4333 | | | 3.00 | | | | 1/1/45 | | | | 69 | |
| | | 493 | | Fannie Mae, Pool #CA5229 | | | 3.00 | | | | 2/1/50 | | | | 461 | |
| | | 77 | | Fannie Mae, Pool #MA3960 | | | 3.00 | | | | 3/1/50 | | | | 72 | |
| | | 57 | | Fannie Mae, Pool #MA1401 | | | 3.00 | | | | 4/1/33 | | | | 55 | |
| | | 156 | | Fannie Mae, Pool #CA5668 | | | 3.00 | | | | 5/1/50 | | | | 146 | |
| | | 92 | | Fannie Mae, Pool #AU3735 | | | 3.00 | | | | 8/1/43 | | | | 87 | |
| | | 19 | | Fannie Mae, Pool #BM1370 | | | 3.00 | | | | 4/1/37 | | | | 18 | |
| | | 44 | | Fannie Mae, Pool #AS8186 | | | 3.00 | | | | 10/1/46 | | | | 42 | |
| | | 26 | | Fannie Mae, Pool #AS8424 | | | 3.00 | | | | 12/1/36 | | | | 25 | |
| | | 10 | | Fannie Mae, Pool #MA2065 | | | 3.00 | | | | 10/1/34 | | | | 9 | |
| | | 11 | | Fannie Mae, Pool #MA2287 | | | 3.00 | | | | 6/1/35 | | | | 11 | |
| | | 138 | | Fannie Mae, Pool #AT7620 | | | 3.00 | | | | 6/1/43 | | | | 131 | |
| | | 51 | | Fannie Mae, Pool #AW7383 | | | 3.00 | | | | 8/1/29 | | | | 50 | |
| | | 94 | | Fannie Mae, Pool #MA2895 | | | 3.00 | | | | 2/1/47 | | | | 89 | |
| | | 20 | | Fannie Mae, Pool #MA2832 | | | 3.00 | | | | 12/1/36 | | | | 19 | |
| | | 64 | | Fannie Mae, Pool #BD5787 | | | 3.00 | | | | 9/1/46 | | | | 61 | |
| | | 84 | | Fannie Mae, Pool #MA2833 | | | 3.00 | | | | 12/1/46 | | | | 79 | |
| | | 92 | | Fannie Mae, Pool #AK3302 | | | 3.00 | | | | 3/1/27 | | | | 90 | |
| | | 116 | | Fannie Mae, Pool #AT2014 | | | 3.00 | | | | 4/1/43 | | | | 110 | |
| | | 55 | | Fannie Mae, Pool #AS7238 | | | 3.00 | | | | 5/1/46 | | | | 52 | |
| | | 76 | | Fannie Mae, Pool #AS4884 | | | 3.00 | | | | 5/1/45 | | | | 72 | |
| | | 7 | | Fannie Mae, Pool #MA3738 | | | 3.00 | | | | 8/1/34 | | | | 7 | |
| | | 30 | | Fannie Mae, Pool #MA3631 | | | 3.00 | | | | 4/1/34 | | | | 29 | |
| | | 15 | | Fannie Mae, Pool #MA2897 | | | 3.00 | | | | 2/1/37 | | | | 14 | |
| | | 17 | | Fannie Mae, Pool #AT1575 | | | 3.00 | | | | 5/1/43 | | | | 16 | |
| | | 88 | | Fannie Mae, Pool #AS8276 | | | 3.00 | | | | 11/1/46 | | | | 83 | |
| | | 29 | | Fannie Mae, Pool #AS8483 | | | 3.00 | | | | 12/1/46 | | | | 27 | |
| | | 61 | | Fannie Mae, Pool #CA5519 | | | 3.00 | | | | 4/1/50 | | | | 57 | |
| | | 74 | | Fannie Mae, Pool #AY4829 | | | 3.00 | | | | 5/1/45 | | | | 70 | |
| | | 57 | | Fannie Mae, Pool #AY4200 | | | 3.00 | | | | 5/1/45 | | | | 54 | |
| | | 127 | | Fannie Mae, Pool #MA2737 | | | 3.00 | | | | 9/1/46 | | | | 120 | |
| | | 105 | | Fannie Mae, Pool #MA2806 | | | 3.00 | | | | 11/1/46 | | | | 99 | |
| | | 138 | | Fannie Mae, Pool #MA2956 | | | 3.00 | | | | 4/1/47 | | | | 131 | |
| | | 132 | | Fannie Mae, Pool #MA1307 | | | 3.00 | | | | 1/1/33 | | | | 128 | |
| | | 29 | | Fannie Mae, Pool #AS8438 | | | 3.00 | | | | 12/1/36 | | | | 27 | |
| | | 45 | | Fannie Mae, Pool #BE4400 | | | 3.00 | | | | 1/1/47 | | | | 43 | |
| | | 11 | | Fannie Mae, Pool #MA3078 | | | 3.00 | | | | 7/1/37 | | | | 11 | |
| | | 47 | | Fannie Mae, Pool #AS7908 | | | 3.00 | | | | 9/1/46 | | | | 45 | |
| | | 109 | | Fannie Mae, Pool #AS0196 | | | 3.00 | | | | 8/1/28 | | | | 107 | |
| | | 101 | | Fannie Mae, Pool #MA3082 | | | 3.00 | | | | 7/1/47 | | | | 96 | |
| | | 7 | | Fannie Mae, Pool #AL9848 | | | 3.00 | | | | 3/1/47 | | | | 7 | |
| | | 23 | | Fannie Mae, Pool #BE3861 | | | 3.00 | | | | 1/1/47 | | | | 21 | |
| | | 103 | | Fannie Mae, Pool #BC9003 | | | 3.00 | | | | 11/1/46 | | | | 97 | |
| | | 19 | | Fannie Mae, Pool #BE9547 | | | 3.00 | | | | 4/1/47 | | | | 18 | |
| | | 13 | | Fannie Mae, Pool #MA3218 | | | 3.00 | | | | 12/1/32 | | | | 13 | |
| | | 155 | | Fannie Mae, Pool #B06219 | | | 3.00 | | | | 12/1/49 | | | | 146 | |
| | | 85 | | Fannie Mae, Pool #BO7242 | | | 3.00 | | | | 1/1/50 | | | | 80 | |
See accompanying notes to financial statements.
235
HC CAPITAL TRUST
The U.S. Mortgage/Asset Backed Fixed Income Securities Portfolio
Portfolio of Investments (continued) — June 30, 2022
| | Principal
Amount
(000) | | Security Description | | Rate % | | | Maturity
Date | | | Value
(000) | |
| | | | | U.S. Government Agency Mortgages (continued) |
| | $ | 118 | | Fannie Mae, Pool #MA3871 | | | 3.00 | | | | 12/1/49 | | | $ | 111 | |
| | | 123 | | Fannie Mae, Pool #B08947 | | | 3.00 | | | | 1/1/50 | | | | 115 | |
| | | 209 | | Fannie Mae, Pool #FM3395 | | | 3.00 | | | | 6/1/50 | | | | 195 | |
| | | 71 | | Fannie Mae, Pool #BD5545 | | | 3.00 | | | | 10/1/46 | | | | 67 | |
| | | 67 | | Fannie Mae, Pool #AS1527 | | | 3.00 | | | | 1/1/29 | | | | 66 | |
| | | 38 | | Fannie Mae, Pool #FM4317 | | | 3.00 | | | | 9/1/50 | | | | 36 | |
| | | 115 | | Fannie Mae, Pool #BO3192 | | | 3.00 | | | | 10/1/49 | | | | 108 | |
| | | 59 | | Fannie Mae, Pool #MA3179 | | | 3.00 | | | | 11/1/47 | | | | 56 | |
| | | 10 | | Fannie Mae, Pool #MA3657 | | | 3.00 | | | | 5/1/34 | | | | 10 | |
| | | 236 | | Fannie Mae, Pool #MA3834 | | | 3.00 | | | | 11/1/49 | | | | 222 | |
| | | 16 | | Fannie Mae, Pool #MA3185 | | | 3.00 | | | | 11/1/37 | | | | 15 | |
| | | 13 | | Fannie Mae, Pool #AS8056 | | | 3.00 | | | | 10/1/46 | | | | 12 | |
| | | 26 | | Fannie Mae, Pool #MA3247 | | | 3.00 | | | | 1/1/33 | | | | 26 | |
| | | 23 | | Fannie Mae, Pool #AW8295 | | | 3.00 | | | | 8/1/29 | | | | 22 | |
| | | 10 | | Fannie Mae, Pool #AK0006 | | | 3.00 | | | | 1/1/27 | | | | 10 | |
| | | 25 | | Fannie Mae, Pool #CA4860 | | | 3.00 | | | | 12/1/49 | | | | 23 | |
| | | 22 | | Fannie Mae, Pool #MA3237 | | | 3.00 | | | | 1/1/48 | | | | 21 | |
| | | 5 | | Fannie Mae, Pool #MA3100 | | | 3.00 | | | | 8/1/37 | | | | 5 | |
| | | 14 | | Fannie Mae, Pool #BA4786 | | | 3.00 | | | | 2/1/31 | | | | 14 | |
| | | 41 | | Fannie Mae, Pool #CA3788 | | | 3.00 | | | | 7/1/49 | | | | 39 | |
| | | 88 | | Fannie Mae, Pool #MA2863 | | | 3.00 | | | | 1/1/47 | | | | 83 | |
| | | 109 | | Fannie Mae, Pool #CA5729 | | | 3.00 | | | | 5/1/50 | | | | 102 | |
| | | 36 | | Fannie Mae, Pool #AL9996 | | | 3.00 | | | | 4/1/32 | | | | 36 | |
| | | 7 | | Fannie Mae, Pool #J24886 | | | 3.00 | | | | 7/1/23 | | | | 7 | |
| | | 37 | | Fannie Mae, Pool #MA2523 | | | 3.00 | | | | 2/1/36 | | | | 35 | |
| | | 50 | | Fannie Mae, Pool #CA3754 | | | 3.00 | | | | 6/1/34 | | | | 49 | |
| | | 33 | | Fannie Mae, Pool #AS2312 | | | 3.00 | | | | 5/1/29 | | | | 33 | |
| | | 29 | | Fannie Mae, Pool #MA3331 | | | 3.00 | | | | 4/1/48 | | | | 27 | |
| | | 85 | | Fannie Mae, Pool #AS8784 | | | 3.00 | | | | 2/1/47 | | | | 80 | |
| | | 48 | | Fannie Mae, Pool #AZ0538 | | | 3.00 | | | | 9/1/30 | | | | 47 | |
| | | 72 | | Fannie Mae, Pool #BE1901 | | | 3.00 | | | | 12/1/46 | | | | 69 | |
| | | 93 | | Fannie Mae, Pool #MA3774 | | | 3.00 | | | | 9/1/49 | | | | 88 | |
| | | 147 | | Fannie Mae, Pool #BP6466 | | | 3.00 | | | | 7/1/50 | | | | 138 | |
| | | 26 | | Fannie Mae, Pool #BJ2996 | | | 3.00 | | | | 1/1/33 | | | | 25 | |
| | | 35 | | Fannie Mae, Pool #MA3744 | | | 3.00 | | | | 8/1/49 | | | | 33 | |
| | | 25 | | Fannie Mae, Pool #CA5423 | | | 3.00 | | | | 3/1/50 | | | | 23 | |
| | | 19 | | Fannie Mae, Pool #MA2961 | | | 3.00 | | | | 4/1/37 | | | | 18 | |
| | | 128 | | Fannie Mae, Pool #AS7904 | | | 3.00 | | | | 9/1/46 | | | | 121 | |
| | | 43 | | Fannie Mae, Pool #B09169 | | | 3.00 | | | | 12/1/49 | | | | 40 | |
| | | 29 | | Fannie Mae, Pool #MA3339 | | | 3.00 | | | | 4/1/33 | | | | 28 | |
| | | 7 | | Fannie Mae, Pool #MA3802 | | | 3.00 | | | | 10/1/49 | | | | 6 | |
| | | 127 | | Fannie Mae, Pool #MA3905 | | | 3.00 | | | | 1/1/50 | | | | 119 | |
| | | 106 | | Fannie Mae, Pool #BN7703 | | | 3.00 | | | | 8/1/49 | | | | 100 | |
| | | 135 | | Fannie Mae, Pool #BO2201 | | | 3.00 | | | | 9/1/49 | | | | 127 | |
| | | 17 | | Fannie Mae, Pool #BK1015 | | | 3.00 | | | | 2/1/33 | | | | 17 | |
| | | 37 | | Fannie Mae, Pool #MA2773 | | | 3.00 | | | | 10/1/36 | | | | 36 | |
| | | 124 | | Fannie Mae, Pool #AS8414 | | | 3.00 | | | | 11/1/46 | | | | 117 | |
| | | 34 | | Fannie Mae, Pool #MA3831 | | | 3.00 | | | | 11/1/39 | | | | 32 | |
See accompanying notes to financial statements.
236
HC CAPITAL TRUST
The U.S. Mortgage/Asset Backed Fixed Income Securities Portfolio
Portfolio of Investments (continued) — June 30, 2022
| | Principal
Amount
(000) | | Security Description | | Rate % | | | Maturity
Date | | | Value
(000) | |
| | | | | U.S. Government Agency Mortgages (continued) |
| | $ | 121 | | Fannie Mae, Pool #MA3937 | | | 3.00 | | | | 2/1/50 | | | $ | 114 | |
| | | 78 | | Fannie Mae, Pool #BD5046 | | | 3.50 | | | | 2/1/47 | | | | 76 | |
| | | 184 | | Fannie Mae, Pool #BM1568 | | | 3.50 | | | | 7/1/47 | | | | 179 | |
| | | 77 | | Fannie Mae, Pool #AJ8476 | | | 3.50 | | | | 12/1/41 | | | | 75 | |
| | | 69 | | Fannie Mae, Pool #MA3745 | | | 3.50 | | | | 8/1/49 | | | | 67 | |
| | | 58 | | Fannie Mae, Pool #AK7497 | | | 3.50 | | | | 4/1/42 | | | | 57 | |
| | | 6 | | Fannie Mae, Pool #AX0159 | | | 3.50 | | | | 9/1/29 | | | | 6 | |
| | | 43 | | Fannie Mae, Pool #AS5068 | | | 3.50 | | | | 6/1/45 | | | | 42 | |
| | | 11 | | Fannie Mae, Pool #BM1231 | | | 3.50 | | | | 11/1/31 | | | | 11 | |
| | | 33 | | Fannie Mae, Pool #AJ4093 | | | 3.50 | | | | 10/1/26 | | | | 33 | |
| | | 63 | | Fannie Mae, Pool #MA3026 | | | 3.50 | | | | 6/1/47 | | | | 62 | |
| | | 58 | | Fannie Mae, Pool #AY5303 | | | 3.50 | | | | 3/1/45 | | | | 56 | |
| | | 12 | | Fannie Mae, Pool #AK0706 | | | 3.50 | | | | 2/1/27 | | | | 12 | |
| | | 28 | | Fannie Mae, Pool #AZ2614 | | | 3.50 | | | | 8/1/45 | | | | 27 | |
| | | 42 | | Fannie Mae, Pool #AY3913 | | | 3.50 | | | | 2/1/45 | | | | 41 | |
| | | 24 | | Fannie Mae, Pool #AE5487 | | | 3.50 | | | | 10/1/25 | | | | 23 | |
| | | 75 | | Fannie Mae, Pool #BK9038 | | | 3.50 | | | | 10/1/33 | | | | 75 | |
| | | 6 | | Fannie Mae, Pool #MA2996 | | | 3.50 | | | | 5/1/37 | | | | 5 | |
| | | 44 | | Fannie Mae, Pool #AY3802 | | | 3.50 | | | | 2/1/45 | | | | 43 | |
| | | 62 | | Fannie Mae, Pool #MA3414 | | | 3.50 | | | | 7/1/48 | | | | 60 | |
| | | 18 | | Fannie Mae, Pool #MA3637 | | | 3.50 | | | | 4/1/49 | | | | 18 | |
| | | 51 | | Fannie Mae, Pool #AX2486 | | | 3.50 | | | | 10/1/44 | | | | 50 | |
| | | 83 | | Fannie Mae, Pool #MA3520 | | | 3.50 | | | | 10/1/48 | | | | 81 | |
| | | 111 | | Fannie Mae, Pool #AL1717 | | | 3.50 | | | | 5/1/27 | | | | 111 | |
| | | 26 | | Fannie Mae, Pool #AX7655 | | | 3.50 | | | | 1/1/45 | | | | 26 | |
| | | 47 | | Fannie Mae, Pool #AS7239 | | | 3.50 | | | | 5/1/46 | | | | 46 | |
| | | 29 | | Fannie Mae, Pool #MA3775 | | | 3.50 | | | | 9/1/49 | | | | 28 | |
| | | 53 | | Fannie Mae, Pool #AZ9576 | | | 3.50 | | | | 12/1/45 | | | | 52 | |
| | | 70 | | Fannie Mae, Pool #MA3663 | | | 3.50 | | | | 5/1/49 | | | | 68 | |
| | | 46 | | Fannie Mae, Pool #AS6649 | | | 3.50 | | | | 2/1/46 | | | | 45 | |
| | | 86 | | Fannie Mae, Pool #AZ0862 | | | 3.50 | | | | 7/1/45 | | | | 85 | |
| | | 97 | | Fannie Mae, Pool #AS3133 | | | 3.50 | | | | 8/1/44 | | | | 94 | |
| | | 26 | | Fannie Mae, Pool #MA3494 | | | 3.50 | | | | 10/1/48 | | | | 26 | |
| | | 36 | | Fannie Mae, Pool #AS5696 | | | 3.50 | | | | 8/1/45 | | | | 35 | |
| | | 5 | | Fannie Mae, Pool #AJ6181 | | | 3.50 | | | | 12/1/26 | | | | 5 | |
| | | 16 | | Fannie Mae, Pool #310139 | | | 3.50 | | | | 11/1/25 | | | | 15 | |
| | | 7 | | Fannie Mae, Pool #MA2909 | | | 3.50 | | | | 2/1/37 | | | | 6 | |
| | | 30 | | Fannie Mae, Pool #MA2923 | | | 3.50 | | | | 3/1/37 | | | | 30 | |
| | | 29 | | Fannie Mae, Pool #AY8856 | | | 3.50 | | | | 9/1/45 | | | | 28 | |
| | | 31 | | Fannie Mae, Pool #AZ6383 | | | 3.50 | | | | 9/1/45 | | | | 30 | |
| | | 53 | | Fannie Mae, Pool #BM5485 | | | 3.50 | | | | 2/1/49 | | | | 52 | |
| | | 19 | | Fannie Mae, Pool #AE0981 | | | 3.50 | | | | 3/1/41 | | | | 19 | |
| | | 129 | | Fannie Mae, Pool #AO3760 | | | 3.50 | | | | 5/1/42 | | | | 126 | |
| | | 320 | | Fannie Mae, Pool #AO8137 | | | 3.50 | | | | 8/1/42 | | | | 315 | |
| | | 33 | | Fannie Mae, Pool #BM2001 | | | 3.50 | | | | 12/1/46 | | | | 32 | |
| | | 32 | | Fannie Mae, Pool #MA3462 | | | 3.50 | | | | 9/1/33 | | | | 32 | |
| | | 9 | | Fannie Mae, Pool #MA3634 | | | 3.50 | | | | 4/1/39 | | | | 9 | |
| | | 75 | | Fannie Mae, Pool #BM2000 | | | 3.50 | | | | 5/1/49 | | | | 73 | |
See accompanying notes to financial statements.
237
HC CAPITAL TRUST
The U.S. Mortgage/Asset Backed Fixed Income Securities Portfolio
Portfolio of Investments (continued) — June 30, 2022
| | Principal
Amount
(000) | | Security Description | | Rate % | | | Maturity
Date | | | Value
(000) | |
| | | | | U.S. Government Agency Mortgages (continued) |
| | $ | 372 | | Fannie Mae, Pool #AO2548 | | | 3.50 | | | | 4/1/42 | | | $ | 367 | |
| | | 34 | | Fannie Mae, Pool #AS5319 | | | 3.50 | | | | 7/1/45 | | | | 33 | |
| | | 13 | | Fannie Mae, Pool #MA2495 | | | 3.50 | | | | 1/1/46 | | | | 13 | |
| | | 50 | | Fannie Mae, Pool #BE3767 | | | 3.50 | | | | 7/1/47 | | | | 49 | |
| | | 50 | | Fannie Mae, Pool #AO9140 | | | 3.50 | | | | 7/1/42 | | | | 48 | |
| | | 57 | | Fannie Mae, Pool #AO4647 | | | 3.50 | | | | 6/1/42 | | | | 55 | |
| | | 159 | | Fannie Mae, Pool #BP1947 | | | 3.50 | | | | 4/1/50 | | | | 153 | |
| | | 59 | | Fannie Mae, Pool #MA3332 | | | 3.50 | | | | 4/1/48 | | | | 57 | |
| | | 137 | | Fannie Mae, Pool #MA3305 | | | 3.50 | | | | 2/1/48 | | | | 133 | |
| | | 82 | | Fannie Mae, Pool #MA3238 | | | 3.50 | | | | 1/1/48 | | | | 80 | |
| | | 11 | | Fannie Mae, Pool #MA2692 | | | 3.50 | | | | 7/1/36 | | | | 11 | |
| | | 107 | | Fannie Mae, Pool #AU1635 | | | 3.50 | | | | 7/1/43 | | | | 105 | |
| | | 63 | | Fannie Mae, Pool #AU3742 | | | 3.50 | | | | 8/1/43 | | | | 62 | |
| | | 33 | | Fannie Mae, Pool #BE5258 | | | 3.50 | | | | 1/1/47 | | | | 33 | |
| | | 68 | | Fannie Mae, Pool #MA1059 | | | 3.50 | | | | 5/1/32 | | | | 67 | |
| | | 96 | | Fannie Mae, Pool #BH5155 | | | 3.50 | | | | 9/1/47 | | | | 94 | |
| | | 116 | | Fannie Mae, Pool #BH9277 | | | 3.50 | | | | 2/1/48 | | | | 113 | |
| | | 87 | | Fannie Mae, Pool #MA2292 | | | 3.50 | | | | 6/1/45 | | | | 85 | |
| | | 32 | | Fannie Mae, Pool #BJ0647 | | | 3.50 | | | | 3/1/48 | | | | 31 | |
| | | 51 | | Fannie Mae, Pool #AY4300 | | | 3.50 | | | | 1/1/45 | | | | 50 | |
| | | 82 | | Fannie Mae, Pool #AY1306 | | | 3.50 | | | | 3/1/45 | | | | 80 | |
| | | 64 | | Fannie Mae, Pool #AX9530 | | | 3.50 | | | | 2/1/45 | | | | 63 | |
| | | 93 | | Fannie Mae, Pool #MA1107 | | | 3.50 | | | | 7/1/32 | | | | 91 | |
| | | 7 | | Fannie Mae, Pool #AV6407 | | | 3.50 | | | | 2/1/29 | | | | 7 | |
| | | 54 | | Fannie Mae, Pool #MA1980 | | | 3.50 | | | | 8/1/44 | | | | 53 | |
| | | 28 | | Fannie Mae, Pool #BC0163 | | | 3.50 | | | | 1/1/46 | | | | 27 | |
| | | 13 | | Fannie Mae, Pool #MA3835 | | | 3.50 | | | | 11/1/49 | | | | 13 | |
| | | 4 | | Fannie Mae, Pool #AL8776 | | | 3.50 | | | | 7/1/46 | | | | 4 | |
| | | 90 | | Fannie Mae, Pool #BH9215 | | | 3.50 | | | | 1/1/48 | | | | 88 | |
| | | 69 | | Fannie Mae, Pool #CA0487 | | | 3.50 | | | | 10/1/47 | | | | 67 | |
| | | 10 | | Fannie Mae, Pool #MA3152 | | | 3.50 | | | | 10/1/37 | | | | 10 | |
| | | 93 | | Fannie Mae, Pool #BM4703 | | | 3.50 | | | | 2/1/48 | | | | 91 | |
| | | 21 | | Fannie Mae, Pool #MA3692 | | | 3.50 | | | | 7/1/49 | | | | 20 | |
| | | 24 | | Fannie Mae, Pool #MA3597 | | | 3.50 | | | | 2/1/49 | | | | 24 | |
| | | 46 | | Fannie Mae, Pool #MA3243 | | | 3.50 | | | | 1/1/38 | | | | 45 | |
| | | 78 | | Fannie Mae, Pool #MA3305 | | | 3.50 | | | | 3/1/48 | | | | 76 | |
| | | 6 | | Fannie Mae, Pool #BM5446 | | | 3.50 | | | | 2/1/49 | | | | 6 | |
| | | 23 | | Fannie Mae, Pool #MA3614 | | | 3.50 | | | | 3/1/49 | | | | 22 | |
| | | 21 | | Fannie Mae, Pool #CA1191 | | | 3.50 | | | | 11/1/47 | | | | 21 | |
| | | 10 | | Fannie Mae, Pool #MA3059 | | | 3.50 | | | | 7/1/37 | | | | 10 | |
| | | 87 | | Fannie Mae, Pool #BC1158 | | | 3.50 | | | | 2/1/46 | | | | 85 | |
| | | 23 | | Fannie Mae, Pool #BC7633 | | | 3.50 | | | | 6/1/46 | | | | 23 | |
| | | 88 | | Fannie Mae, Pool #MA3182 | | | 3.50 | | | | 11/1/47 | | | | 86 | |
| | | 93 | | Fannie Mae, Pool #BJ2692 | | | 3.50 | | | | 4/1/48 | | | | 90 | |
| | | 42 | | Fannie Mae, Pool #BC3126 | | | 3.50 | | | | 1/1/46 | | | | 41 | |
| | | 71 | | Fannie Mae, Pool #FM3387 | | | 3.50 | | | | 3/1/35 | | | | 71 | |
| | | 50 | | Fannie Mae, Pool #AS4773 | | | 3.50 | | | | 4/1/45 | | | | 49 | |
| | | 28 | | Fannie Mae, Pool #AS4772 | | | 3.50 | | | | 4/1/45 | | | | 27 | |
See accompanying notes to financial statements.
238
HC CAPITAL TRUST
The U.S. Mortgage/Asset Backed Fixed Income Securities Portfolio
Portfolio of Investments (continued) — June 30, 2022
| | Principal
Amount
(000) | | Security Description | | Rate % | | | Maturity
Date | | | Value
(000) | |
| | | | | U.S. Government Agency Mortgages (continued) |
| | $ | 110 | | Fannie Mae, Pool #BD2436 | | | 3.50 | | | | 1/1/47 | | | $ | 108 | |
| | | 146 | | Fannie Mae, Pool #AQ0546 | | | 3.50 | | | | 11/1/42 | | | | 142 | |
| | | 301 | | Fannie Mae, Pool #AB6017 | | | 3.50 | | | | 8/1/42 | | | | 297 | |
| | | 65 | | Fannie Mae, Pool #AS0024 | | | 3.50 | | | | 7/1/43 | | | | 64 | |
| | | 38 | | Fannie Mae, Pool #AX5201 | | | 3.50 | | | | 10/1/29 | | | | 38 | |
| | | 51 | | Fannie Mae, Pool #FM1028 | | | 3.50 | | | | 6/1/49 | | | | 50 | |
| | | 29 | | Fannie Mae, Pool #MA2389 | | | 3.50 | | | | 9/1/35 | | | | 28 | |
| | | 21 | | Fannie Mae, Pool #AS5892 | | | 3.50 | | | | 10/1/45 | | | | 20 | |
| | | 44 | | Fannie Mae, Pool #FM0020 | | | 3.50 | | | | 7/1/49 | | | | 42 | |
| | | 55 | | Fannie Mae, Pool #AS7388 | | | 3.50 | | | | 6/1/46 | | | | 54 | |
| | | 83 | | Fannie Mae, Pool #FM1911 | | | 3.50 | | | | 7/1/48 | | | | 81 | |
| | | 66 | | Fannie Mae, Pool #AO4385 | | | 3.50 | | | | 6/1/42 | | | | 65 | |
| | | 70 | | Fannie Mae, Pool #FM1001 | | | 3.50 | | | | 11/1/48 | | | | 68 | |
| | | 7 | | Fannie Mae, Pool #MA1021 | | | 3.50 | | | | 3/1/27 | | | | 7 | |
| | | 60 | | Fannie Mae, Pool #AS7491 | | | 3.50 | | | | 7/1/46 | | | | 58 | |
| | | 63 | | Fannie Mae, Pool #AS4771 | | | 3.50 | | | | 4/1/45 | | | | 61 | |
| | | 11 | | Fannie Mae, Pool #AS2081 | | | 3.50 | | | | 4/1/29 | | | | 11 | |
| | | 10 | | Fannie Mae, Pool #CA0234 | | | 3.50 | | | | 8/1/47 | | | | 9 | |
| | | 72 | | Fannie Mae, Pool #MA1982 | | | 3.50 | | | | 8/1/34 | | | | 70 | |
| | | 85 | | Fannie Mae, Pool #FM1543 | | | 3.50 | | | | 11/1/48 | | | | 83 | |
| | | 58 | | Fannie Mae, Pool #MA3057 | | | 3.50 | | | | 7/1/47 | | | | 56 | |
| | | 69 | | Fannie Mae, Pool #MA2125 | | | 3.50 | | | | 12/1/44 | | | | 66 | |
| | | 4 | | Fannie Mae, Pool #BA5031 | | | 3.50 | | | | 1/1/46 | | | | 4 | |
| | | 23 | | Fannie Mae, Pool #AP9390 | | | 3.50 | | | | 10/1/42 | | | | 22 | |
| | | 9 | | Fannie Mae, Pool #MA3906 | | | 3.50 | | | | 1/1/50 | | | | 9 | |
| | | 65 | | Fannie Mae, Pool #FM1566 | | | 3.50 | | | | 11/1/48 | | | | 64 | |
| | | 22 | | Fannie Mae, Pool #BA1893 | | | 3.50 | | | | 8/1/45 | | | | 22 | |
| | | 55 | | Fannie Mae, Pool #BK7608 | | | 4.00 | | | | 9/1/48 | | | | 55 | |
| | | 40 | | Fannie Mae, Pool #MA3563 | | | 4.00 | | | | 1/1/49 | | | | 40 | |
| | | 14 | | Fannie Mae, Pool #MA2455 | | | 4.00 | | | | 11/1/35 | | | | 14 | |
| | | 9 | | Fannie Mae, Pool #AS2117 | | | 4.00 | | | | 4/1/44 | | | | 9 | |
| | | 30 | | Fannie Mae, Pool #BN0594 | | | 4.00 | | | | 12/1/48 | | | | 29 | |
| | | 23 | | Fannie Mae, Pool #MA3521 | | | 4.00 | | | | 11/1/48 | | | | 23 | |
| | | 26 | | Fannie Mae, Pool #BM4991 | | | 4.00 | | | | 9/1/48 | | | | 26 | |
| | | 470 | | Fannie Mae, Pool #FS0016 | | | 4.00 | | | | 6/1/49 | | | | 470 | |
| | | 71 | | Fannie Mae, Pool #MA3804 | | | 4.00 | | | | 10/1/49 | | | | 70 | |
| | | 17 | | Fannie Mae, Pool #BM4306 | | | 4.00 | | | | 9/1/25 | | | | 17 | |
| | | 114 | | Fannie Mae, Pool #AS7558 | | | 4.00 | | | | 7/1/46 | | | | 112 | |
| | | 88 | | Fannie Mae, Pool #BK7943 | | | 4.00 | | | | 11/1/48 | | | | 88 | |
| | | 46 | | Fannie Mae, Pool #BN0334 | | | 4.00 | | | | 12/1/48 | | | | 46 | |
| | | 114 | | Fannie Mae, Pool #BN6677 | | | 4.00 | | | | 6/1/49 | | | | 114 | |
| | | 34 | | Fannie Mae, Pool #AS7600 | | | 4.00 | | | | 7/1/46 | | | | 34 | |
| | | 93 | | Fannie Mae, Pool #AZ8067 | | | 4.00 | | | | 9/1/45 | | | | 92 | |
| | | 75 | | Fannie Mae, Pool #MA3746 | | | 4.00 | | | | 8/1/49 | | | | 75 | |
| | | 61 | | Fannie Mae, Pool #BM2002 | | | 4.00 | | | | 10/1/47 | | | | 61 | |
| | | 25 | | Fannie Mae, Pool #BA6910 | | | 4.00 | | | | 2/1/46 | | | | 25 | |
| | | 42 | | Fannie Mae, Pool #AS7601 | | | 4.00 | | | | 7/1/46 | | | | 41 | |
| | | 50 | | Fannie Mae, Pool #AX0841 | | | 4.00 | | | | 9/1/44 | | | | 50 | |
See accompanying notes to financial statements.
239
HC CAPITAL TRUST
The U.S. Mortgage/Asset Backed Fixed Income Securities Portfolio
Portfolio of Investments (continued) — June 30, 2022
| | Principal
Amount
(000) | | Security Description | | Rate % | | | Maturity
Date | | | Value
(000) | |
| | | | | U.S. Government Agency Mortgages (continued) |
| | $ | 8 | | Fannie Mae, Pool #AS3448 | | | 4.00 | | | | 9/1/44 | | | $ | 8 | |
| | | 33 | | Fannie Mae, Pool #AS3903 | | | 4.00 | | | | 11/1/44 | | | | 33 | |
| | | 2 | | Fannie Mae, Pool #BA0847 | | | 4.00 | | | | 3/1/46 | | | | 2 | |
| | | 15 | | Fannie Mae, Pool #CA2469 | | | 4.00 | | | | 10/1/48 | | | | 15 | |
| | | 6 | | Fannie Mae, Pool #MA3037 | | | 4.00 | | | | 6/1/37 | | | | 6 | |
| | | 154 | | Fannie Mae, Pool #AS0531 | | | 4.00 | | | | 9/1/43 | | | | 153 | |
| | | 54 | | Fannie Mae, Pool #AS3216 | | | 4.00 | | | | 9/1/44 | | | | 54 | |
| | | 39 | | Fannie Mae, Pool #AW5063 | | | 4.00 | | | | 7/1/44 | | | | 39 | |
| | | 31 | | Fannie Mae, Pool #AL4778 | | | 4.00 | | | | 10/1/32 | | | | 31 | |
| | | 13 | | Fannie Mae, Pool #AH3394 | | | 4.00 | | | | 1/1/41 | | | | 13 | |
| | | 6 | | Fannie Mae, Pool #AW9041 | | | 4.00 | | | | 8/1/44 | | | | 6 | |
| | | 108 | | Fannie Mae, Pool #AH5859 | | | 4.00 | | | | 2/1/41 | | | | 110 | |
| | | 64 | | Fannie Mae, Pool #MA3027 | | | 4.00 | | | | 6/1/47 | | | | 64 | |
| | | 59 | | Fannie Mae, Pool #MA3121 | | | 4.00 | | | | 9/1/47 | | | | 59 | |
| | | 6 | | Fannie Mae, Pool #MA2655 | | | 4.00 | | | | 6/1/36 | | | | 6 | |
| | | 174 | | Fannie Mae, Pool #AJ5303 | | | 4.00 | | | | 11/1/41 | | | | 176 | |
| | | 21 | | Fannie Mae, Pool #AY0025 | | | 4.00 | | | | 2/1/45 | | | | 21 | |
| | | 48 | | Fannie Mae, Pool #AY1595 | | | 4.00 | | | | 1/1/45 | | | | 48 | |
| | | 85 | | Fannie Mae, Pool #AU3753 | | | 4.00 | | | | 8/1/43 | | | | 86 | |
| | | 122 | | Fannie Mae, Pool #AY1377 | | | 4.00 | | | | 4/1/45 | | | | 121 | |
| | | 47 | | Fannie Mae, Pool #AV2340 | | | 4.00 | | | | 12/1/43 | | | | 48 | |
| | | 101 | | Fannie Mae, Pool #FM5134 | | | 4.00 | | | | 1/1/49 | | | | 101 | |
| | | 62 | | Fannie Mae, Pool #AH6242 | | | 4.00 | | | | 4/1/26 | | | | 63 | |
| | | 82 | | Fannie Mae, Pool #MA2995 | | | 4.00 | | | | 5/1/47 | | | | 82 | |
| | | 6 | | Fannie Mae, Pool #MA2536 | | | 4.00 | | | | 2/1/36 | | | | 6 | |
| | | 47 | | Fannie Mae, Pool #AS8532 | | | 4.00 | | | | 12/1/46 | | | | 46 | |
| | | 132 | | Fannie Mae, Pool #AJ7857 | | | 4.00 | | | | 12/1/41 | | | | 133 | |
| | | 57 | | Fannie Mae, Pool #AL8387 | | | 4.00 | | | | 3/1/46 | | | | 57 | |
| | | 49 | | Fannie Mae, Pool #AS9486 | | | 4.00 | | | | 4/1/47 | | | | 49 | |
| | | 39 | | Fannie Mae, Pool #AS3467 | | | 4.00 | | | | 10/1/44 | | | | 39 | |
| | | 71 | | Fannie Mae, Pool #MA3183 | | | 4.00 | | | | 11/1/47 | | | | 71 | |
| | | 15 | | Fannie Mae, Pool #BH2623 | | | 4.00 | | | | 8/1/47 | | | | 15 | |
| | | 14 | | Fannie Mae, Pool #BJ0639 | | | 4.00 | | | | 3/1/48 | | | | 14 | |
| | | 24 | | Fannie Mae, Pool #CA2474 | | | 4.00 | | | | 7/1/48 | | | | 24 | |
| | | 26 | | Fannie Mae, Pool #BN5258 | | | 4.00 | | | | 2/1/49 | | | | 26 | |
| | | 44 | | Fannie Mae, Pool #BM5685 | | | 4.00 | | | | 6/1/48 | | | | 44 | |
| | | 32 | | Fannie Mae, Pool #BK9697 | | | 4.00 | | | | 12/1/48 | | | | 32 | |
| | | 16 | | Fannie Mae, Pool #MA3536 | | | 4.00 | | | | 12/1/48 | | | | 16 | |
| | | 19 | | Fannie Mae, Pool #AC2995 | | | 4.00 | | | | 9/1/24 | | | | 19 | |
| | | 45 | | Fannie Mae, Pool #MA3615 | | | 4.00 | | | | 3/1/49 | | | | 45 | |
| | | 17 | | Fannie Mae, Pool #AS8823 | | | 4.00 | | | | 2/1/47 | | | | 17 | |
| | | 23 | | Fannie Mae, Pool #AY2291 | | | 4.00 | | | | 3/1/45 | | | | 23 | |
| | | 10 | | Fannie Mae, Pool #AL9742 | | | 4.00 | | | | 7/1/29 | | | | 10 | |
| | | 47 | | Fannie Mae, Pool #MA3277 | | | 4.00 | | | | 2/1/48 | | | | 47 | |
| | | 9 | | Fannie Mae, Pool #MA3413 | | | 4.00 | | | | 7/1/38 | | | | 9 | |
| | | 24 | | Fannie Mae, Pool #MA3244 | | | 4.00 | | | | 1/1/38 | | | | 24 | |
| | | 39 | | Fannie Mae, Pool #AY8981 | | | 4.00 | | | | 8/1/45 | | | | 40 | |
| | | 37 | | Fannie Mae, Pool #AS2498 | | | 4.00 | | | | 5/1/44 | | | | 37 | |
See accompanying notes to financial statements.
240
HC CAPITAL TRUST
The U.S. Mortgage/Asset Backed Fixed Income Securities Portfolio
Portfolio of Investments (continued) — June 30, 2022
| | Principal
Amount
(000) | | Security Description | | Rate % | | | Maturity
Date | | | Value
(000) | |
| | | | | U.S. Government Agency Mortgages (continued) |
| | $ | 61 | | Fannie Mae, Pool #AZ7362 | | | 4.00 | | | | 11/1/45 | | | $ | 61 | |
| | | 2 | | Fannie Mae, Pool #AZ8874 | | | 4.00 | | | | 9/1/45 | | | | 2 | |
| | | 42 | | Fannie Mae, Pool #BK0909 | | | 4.00 | | | | 7/1/48 | | | | 42 | |
| | | 7 | | Fannie Mae, Pool #AS7028 | | | 4.00 | | | | 4/1/46 | | | | 7 | |
| | | 11 | | Fannie Mae, Pool #AW5109 | | | 4.00 | | | | 8/1/44 | | | | 11 | |
| | | 14 | | Fannie Mae, Pool #MA0695 | | | 4.00 | | | | 4/1/31 | | | | 14 | |
| | | 44 | | Fannie Mae, Pool #CA1894 | | | 4.00 | | | | 6/1/48 | | | | 44 | |
| | | 51 | | Fannie Mae, Pool #AS9831 | | | 4.00 | | | | 6/1/47 | | | | 51 | |
| | | 18 | | Fannie Mae, Pool #MA3592 | | | 4.00 | | | | 2/1/49 | | | | 18 | |
| | | 31 | | Fannie Mae, Pool #AS3468 | | | 4.00 | | | | 10/1/44 | | | | 31 | |
| | | 14 | | Fannie Mae, Pool #MA3216 | | | 4.00 | | | | 12/1/37 | | | | 14 | |
| | | 183 | | Fannie Mae, Pool #AJ7689 | | | 4.00 | | | | 12/1/41 | | | | 185 | |
| | | 43 | | Fannie Mae, Pool #FM1571 | | | 4.00 | | | | 12/1/48 | | | | 43 | |
| | | 33 | | Fannie Mae, Pool #CA0237 | | | 4.00 | | | | 8/1/47 | | | | 33 | |
| | | 30 | | Fannie Mae, Pool #BK0915 | | | 4.00 | | | | 7/1/48 | | | | 30 | |
| | | 38 | | Fannie Mae, Pool #AC7328 | | | 4.00 | | | | 12/1/39 | | | | 37 | |
| | | 20 | | Fannie Mae, Pool #FM1101 | | | 4.00 | | | | 7/1/34 | | | | 20 | |
| | | 66 | | Fannie Mae, Pool #MA3211 | | | 4.00 | | | | 12/1/47 | | | | 66 | |
| | | 23 | | Fannie Mae, Pool #MA0493 | | | 4.00 | | | | 8/1/30 | | | | 24 | |
| | | 62 | | Fannie Mae, Pool #BJ9169 | | | 4.00 | | | | 5/1/48 | | | | 62 | |
| | | 63 | | Fannie Mae, Pool #CA1015 | | | 4.00 | | | | 1/1/48 | | | | 62 | |
| | | 12 | | Fannie Mae, Pool #AE0375 | | | 4.00 | | | | 7/1/25 | | | | 12 | |
| | | 36 | | Fannie Mae, Pool #AL7347 | | | 4.00 | | | | 9/1/45 | | | | 37 | |
| | | 32 | | Fannie Mae, Pool #BC5559 | | | 4.00 | | | | 3/1/46 | | | | 32 | |
| | | 28 | | Fannie Mae, Pool #BE8050 | | | 4.00 | | | | 4/1/47 | | | | 28 | |
| | | 16 | | Fannie Mae, Pool #MA3427 | | | 4.00 | | | | 7/1/33 | | | | 16 | |
| | | 3 | | Fannie Mae, Pool #CA3084 | | | 4.00 | | | | 2/1/49 | | | | 3 | |
| | | 74 | | Fannie Mae, Pool #BD7081 | | | 4.00 | | | | 3/1/47 | | | | 74 | |
| | | 81 | | Fannie Mae, Pool #AO2959 | | | 4.00 | | | | 5/1/42 | | | | 81 | |
| | | 14 | | Fannie Mae, Pool #BM5525 | | | 4.00 | | | | 3/1/31 | | | | 14 | |
| | | 49 | | Fannie Mae, Pool #AS3293 | | | 4.00 | | | | 9/1/44 | | | | 49 | |
| | | 76 | | Fannie Mae, Pool #MA0641 | | | 4.00 | | | | 2/1/31 | | | | 76 | |
| | | 20 | | Fannie Mae, Pool #AT3872 | | | 4.00 | | | | 6/1/43 | | | | 19 | |
| | | 68 | | Fannie Mae, Pool #CA0183 | | | 4.00 | | | | 8/1/47 | | | | 67 | |
| | | 26 | | Fannie Mae, Pool #MA3638 | | | 4.00 | | | | 4/1/49 | | | | 26 | |
| | | 349 | | Fannie Mae, Pool #190405 | | | 4.00 | | | | 10/1/40 | | | | 351 | |
| | | 51 | | Fannie Mae, Pool #FM1960 | | | 4.00 | | | | 5/1/49 | | | | 51 | |
| | | 15 | | Fannie Mae, Pool #AL2689 | | | 4.00 | | | | 2/1/27 | | | | 15 | |
| | | 59 | | Fannie Mae, Pool #FM0021 | | | 4.00 | | | | 3/1/49 | | | | 59 | |
| | | 46 | | Fannie Mae, Pool #FM1415 | | | 4.00 | | | | 12/1/48 | | | | 46 | |
| | | 63 | | Fannie Mae, Pool #AD8529 | | | 4.50 | | | | 8/1/40 | | | | 65 | |
| | | 2 | | Fannie Mae, Pool #982892 | | | 4.50 | | | | 5/1/23 | | | | 2 | |
| | | 157 | | Fannie Mae, Pool #AH9055 | | | 4.50 | | | | 4/1/41 | | | | 161 | |
| | | 16 | | Fannie Mae, Pool #AA0860 | | | 4.50 | | | | 1/1/39 | | | | 16 | |
| | | 16 | | Fannie Mae, Pool #FM3619 | | | 4.50 | | | | 1/1/50 | | | | 16 | |
| | | 30 | | Fannie Mae, Pool #AB1389 | | | 4.50 | | | | 8/1/40 | | | | 31 | |
| | | 33 | | Fannie Mae, Pool #AS2276 | | | 4.50 | | | | 4/1/44 | | | | 33 | |
| | | 8 | | Fannie Mae, Pool #AS0861 | | | 4.50 | | | | 10/1/43 | | | | 9 | |
See accompanying notes to financial statements.
241
HC CAPITAL TRUST
The U.S. Mortgage/Asset Backed Fixed Income Securities Portfolio
Portfolio of Investments (continued) — June 30, 2022
| | Principal
Amount
(000) | | Security Description | | Rate % | | | Maturity
Date | | | Value
(000) | |
| | | | | U.S. Government Agency Mortgages (continued) |
| | $ | 3 | | Fannie Mae, Pool #AW7048 | | | 4.50 | | | | 6/1/44 | | | $ | 3 | |
| | | 53 | | Fannie Mae, Pool #AL4450 | | | 4.50 | | | | 12/1/43 | | | | 55 | |
| | | 13 | | Fannie Mae, Pool #AH6790 | | | 4.50 | | | | 3/1/41 | | | | 13 | |
| | | 41 | | Fannie Mae, Pool #MA0481 | | | 4.50 | | | | 8/1/30 | | | | 42 | |
| | | 19 | | Fannie Mae, Pool #BM1285 | | | 4.50 | | | | 5/1/47 | | | | 20 | |
| | | 13 | | Fannie Mae, Pool #AU5302 | | | 4.50 | | | | 10/1/43 | | | | 13 | |
| | | 125 | | Fannie Mae, Pool #AS9394 | | | 4.50 | | | | 4/1/47 | | | | 130 | |
| | | 13 | | Fannie Mae, Pool #CA1218 | | | 4.50 | | | | 2/1/48 | | | | 14 | |
| | | 70 | | Fannie Mae, Pool #AE0217 | | | 4.50 | | | | 8/1/40 | | | | 72 | |
| | | 58 | | Fannie Mae, Pool #AB3192 | | | 4.50 | | | | 6/1/41 | | | | 60 | |
| | | 28 | | Fannie Mae, Pool #AS1638 | | | 4.50 | | | | 2/1/44 | | | | 29 | |
| | | 52 | | Fannie Mae, Pool #CA0148 | | | 4.50 | | | | 8/1/47 | | | | 52 | |
| | | 8 | | Fannie Mae, Pool #AA9781 | | | 4.50 | | | | 7/1/24 | | | | 8 | |
| | | 24 | | Fannie Mae, Pool #BK5283 | | | 4.50 | | | | 6/1/48 | | | | 24 | |
| | | 252 | | Fannie Mae, Pool #MA3184 | | | 4.50 | | | | 11/1/47 | | | | 254 | |
| | | 5 | | Fannie Mae, Pool #BN0877 | | | 4.50 | | | | 11/1/48 | | | | 5 | |
| | | 19 | | Fannie Mae, Pool #MA3593 | | | 4.50 | | | | 2/1/49 | | | | 20 | |
| | | 63 | | Fannie Mae, Pool #MA3639 | | | 4.50 | | | | 4/1/49 | | | | 63 | |
| | | 5 | | Fannie Mae, Pool #BK8830 | | | 4.50 | | | | 8/1/48 | | | | 5 | |
| | | 72 | | Fannie Mae, Pool #BK1416 | | | 4.50 | | | | 5/1/48 | | | | 72 | |
| | | 64 | | Fannie Mae, Pool #AI4815 | | | 4.50 | | | | 6/1/41 | | | | 66 | |
| | | 13 | | Fannie Mae, Pool #AB1470 | | | 4.50 | | | | 9/1/40 | | | | 13 | |
| | | 23 | | Fannie Mae, Pool #MA3537 | | | 4.50 | | | | 12/1/48 | | | | 23 | |
| | | 29 | | Fannie Mae, Pool #CA0623 | | | 4.50 | | | | 10/1/47 | | | | 29 | |
| | | 64 | | Fannie Mae, Pool #CA1711 | | | 4.50 | | | | 5/1/48 | | | | 64 | |
| | | 232 | | Fannie Mae, Pool #AL1107 | | | 4.50 | | | | 11/1/41 | | | | 238 | |
| | | 27 | | Fannie Mae, Pool #MA3522 | | | 4.50 | | | | 11/1/48 | | | | 27 | |
| | | 42 | | Fannie Mae, Pool #BE5992 | | | 4.50 | | | | 2/1/47 | | | | 43 | |
| | | 14 | | Fannie Mae, Pool #AS8576 | | | 4.50 | | | | 12/1/46 | | | | 14 | |
| | | 10 | | Fannie Mae, Pool #AL8816 | | | 4.50 | | | | 9/1/45 | | | | 11 | |
| | | 18 | | Fannie Mae, Pool #BE6489 | | | 4.50 | | | | 1/1/47 | | | | 18 | |
| | | 30 | | Fannie Mae, Pool #AL5082 | | | 4.50 | | | | 3/1/44 | | | | 30 | |
| | | 53 | | Fannie Mae, Pool #AS8157 | | | 4.50 | | | | 10/1/46 | | | | 54 | |
| | | 27 | | Fannie Mae, Pool #254954 | | | 4.50 | | | | 10/1/23 | | | | 26 | |
| | | 144 | | Fannie Mae, Pool #AH7521 | | | 4.50 | | | | 3/1/41 | | | | 147 | |
| | | 11 | | Fannie Mae, Pool #MA3708 | | | 5.00 | | | | 6/1/49 | | | | 11 | |
| | | 27 | | Fannie Mae, Pool #MA3594 | | | 5.00 | | | | 2/1/49 | | | | 28 | |
| | | 19 | | Fannie Mae, Pool #MA3669 | | | 5.00 | | | | 5/1/49 | | | | 19 | |
| | | 15 | | Fannie Mae, Pool #CA0349 | | | 5.00 | | | | 9/1/47 | | | | 16 | |
| | | 16 | | Fannie Mae, Pool #MA3472 | | | 5.00 | | | | 9/1/48 | | | | 17 | |
| | | 61 | | Fannie Mae, Pool #AH5988 | | | 5.00 | | | | 3/1/41 | | | | 65 | |
| | | 328 | | Fannie Mae, Pool #889117 | | | 5.00 | | | | 10/1/35 | | | | 342 | |
| | | 12 | | Fannie Mae, Pool #MA3527 | | | 5.00 | | | | 11/1/48 | | | | 12 | |
| | | 13 | | Fannie Mae, Pool #890621 | | | 5.00 | | | | 5/1/42 | | | | 13 | |
| | | 13 | | Fannie Mae, Pool #MA3617 | | | 5.00 | | | | 3/1/49 | | | | 13 | |
| | | 24 | | Fannie Mae, Pool #BM3904 | | | 5.00 | | | | 5/1/48 | | | | 24 | |
| | | 29 | | Fannie Mae, Pool #AL5788 | | | 5.00 | | | | 5/1/42 | | | | 31 | |
| | | 24 | | Fannie Mae, Pool #AS0837 | | | 5.00 | | | | 10/1/43 | | | | 25 | |
See accompanying notes to financial statements.
242
HC CAPITAL TRUST
The U.S. Mortgage/Asset Backed Fixed Income Securities Portfolio
Portfolio of Investments (continued) — June 30, 2022
| | Principal
Amount
(000) | | Security Description | | Rate % | | | Maturity
Date | | | Value
(000) | |
| | | | | U.S. Government Agency Mortgages (continued) |
| | $ | 13 | | Fannie Mae, Pool #890603 | | | 5.00 | | | | 8/1/41 | | | $ | 14 | |
| | | 34 | | Fannie Mae, Pool #836750 | | | 5.00 | | | | 10/1/35 | | | | 35 | |
| | | 11 | | Fannie Mae, Pool #BM3781 | | | 5.00 | | | | 11/1/30 | | | | 11 | |
| | | 18 | | Fannie Mae, Pool #725238 | | | 5.00 | | | | 3/1/34 | | | | 19 | |
| | | 16 | | Fannie Mae, Pool #CA1795 | | | 5.00 | | | | 5/1/48 | | | | 16 | |
| | | 25 | | Fannie Mae, Pool #AS0575 | | | 5.00 | | | | 9/1/43 | | | | 26 | |
| | | — | | Fannie Mae, Pool #AL0725 | | | 5.50 | | | | 6/1/24 | | | | — | |
| | | — | | Fannie Mae, Pool #976945 | | | 5.50 | | | | 2/1/23 | | | | — | |
| | | 525 | | Fannie Mae, Pool #890221 | | | 5.50 | | | | 12/1/33 | | | | 565 | |
| | | 1 | | Fannie Mae, Pool #A79636 | | | 5.50 | | | | 7/1/38 | | | | 1 | |
| | | 7 | | Fannie Mae, Pool #929451 | | | 5.50 | | | | 5/1/38 | | | | 7 | |
| | | 2 | | Fannie Mae, Pool #A69671 | | | 5.50 | | | | 12/1/37 | | | | 2 | |
| | | 324 | | Fannie Mae, Pool #725228 | | | 6.00 | | | | 3/1/34 | | | | 345 | |
| | | 73 | | Fannie Mae, Pool #889984 | | | 6.50 | | | | 10/1/38 | | | | 81 | |
| | | 650 | | Fannie Mae, 15 YR TBA | | | 1.50 | | | | 7/25/37 | | | | 591 | |
| | | 1,350 | | Fannie Mae, 15 YR TBA | | | 2.00 | | | | 7/25/37 | | | | 1,259 | |
| | | 150 | | Fannie Mae, 15 YR TBA | | | 2.50 | | | | 7/25/37 | | | | 143 | |
| | | 50 | | Fannie Mae, 15 YR TBA | | | 3.00 | | | | 8/25/37 | | | | 49 | |
| | | 225 | | Fannie Mae, 15 YR TBA | | | 3.00 | | | | 7/25/37 | | | | 220 | |
| | | 25 | | Fannie Mae, 30 YR TBA | | | 1.50 | | | | 7/25/52 | | | | 21 | |
| | | 300 | | Fannie Mae, 30 YR TBA | | | 2.00 | | | | 7/25/52 | | | | 260 | |
| | | 75 | | Fannie Mae, 30 YR TBA | | | 2.50 | | | | 7/25/52 | | | | 67 | |
| | | 1,775 | | Fannie Mae, 30 YR TBA | | | 3.00 | | | | 7/25/52 | | | | 1,651 | |
| | | 350 | | Fannie Mae, 30 YR TBA | | | 3.00 | | | | 8/25/51 | | | | 326 | |
| | | 700 | | Fannie Mae, 30 YR TBA | | | 3.50 | | | | 8/25/52 | | | | 672 | |
| | | 1,475 | | Fannie Mae, 30 YR TBA | | | 3.50 | | | | 7/25/52 | | | | 1,417 | |
| | | 450 | | Fannie Mae, 30 YR TBA | | | 4.00 | | | | 7/25/52 | | | | 444 | |
| | | 800 | | Fannie Mae, 30 YR TBA, TBA | | | 4.00 | | | | 8/25/51 | | | | 787 | |
| | | 447 | | Freddie Mac, Pool #SB8144 | | | 1.50 | | | | 3/1/37 | | | | 407 | |
| | | 197 | | Freddie Mac, Pool #SD8139 | | | 1.50 | | | | 4/1/51 | | | | 163 | |
| | | 409 | | Freddie Mac, Pool #SB8097 | | | 1.50 | | | | 4/1/36 | | | | 373 | |
| | | 466 | | Freddie Mac, Pool #SB8088 | | | 1.50 | | | | 2/1/36 | | | | 424 | |
| | | 436 | | Freddie Mac, Pool #SB8106 | | | 1.50 | | | | 6/1/36 | | | | 397 | |
| | | 359 | | Freddie Mac, Pool #QN9521 | | | 1.50 | | | | 2/1/37 | | | | 327 | |
| | | 68 | | Freddie Mac, Pool #RB5110 | | | 1.50 | | | | 5/1/41 | | | | 58 | |
| | | 421 | | Freddie Mac, Pool #SD8154 | | | 1.50 | | | | 6/1/51 | | | | 349 | |
| | | 76 | | Freddie Mac, Pool #SD8082 | | | 1.50 | | | | 10/1/50 | | | | 63 | |
| | | 414 | | Freddie Mac, Pool #QC0962 | | | 1.50 | | | | 4/1/51 | | | | 344 | |
| | | 484 | | Freddie Mac, Pool #SB8083 | | | 1.50 | | | | 1/1/36 | | | | 441 | |
| | | 245 | | Freddie Mac, Pool #SD7537 | | | 2.00 | | | | 3/1/51 | | | | 213 | |
| | | 296 | | Freddie Mac, Pool #RB5153 | | | 2.00 | | | | 4/1/42 | | | | 265 | |
| | | 447 | | Freddie Mac, Pool #QO0110 | | | 2.00 | | | | 4/1/37 | | | | 418 | |
| | | 349 | | Freddie Mac, Pool #RC1727 | | | 2.00 | | | | 12/1/35 | | | | 326 | |
| | | 472 | | Freddie Mac, Pool #SD0731 | | | 2.00 | | | | 5/1/51 | | | | 410 | |
| | | 145 | | Freddie Mac, Pool #RB5141 | | | 2.00 | | | | 1/1/42 | | | | 129 | |
| | | 421 | | Freddie Mac, Pool #SD8160 | | | 2.00 | | | | 8/1/51 | | | | 366 | |
| | | 247 | | Freddie Mac, Pool #SD8146 | | | 2.00 | | | | 5/1/51 | | | | 215 | |
| | | 382 | | Freddie Mac, Pool #SD8128 | | | 2.00 | | | | 2/1/51 | | | | 332 | |
See accompanying notes to financial statements.
243
HC CAPITAL TRUST
The U.S. Mortgage/Asset Backed Fixed Income Securities Portfolio
Portfolio of Investments (continued) — June 30, 2022
| | Principal
Amount
(000) | | Security Description | | Rate % | | | Maturity
Date | | | Value
(000) | |
| | | | | U.S. Government Agency Mortgages (continued) |
| | $ | 440 | | Freddie Mac, Pool #RA6507 | | | 2.00 | | | | 12/1/51 | | | $ | 383 | |
| | | 402 | | Freddie Mac, Pool #QB8064 | | | 2.00 | | | | 1/1/51 | | | | 349 | |
| | | 241 | | Freddie Mac, Pool #RA5256 | | | 2.00 | | | | 5/1/51 | | | | 209 | |
| | | 444 | | Freddie Mac, Pool #SD8098 | | | 2.00 | | | | 10/1/50 | | | | 385 | |
| | | 454 | | Freddie Mac, Pool #RA3328 | | | 2.00 | | | | 8/1/50 | | | | 394 | |
| | | 247 | | Freddie Mac, Pool #QC0423 | | | 2.00 | | | | 4/1/51 | | | | 215 | |
| | | 406 | | Freddie Mac, Pool #QC1075 | | | 2.00 | | | | 4/1/51 | | | | 352 | |
| | | 456 | | Freddie Mac, Pool #SD8079 | | | 2.00 | | | | 7/1/50 | | | | 396 | |
| | | 387 | | Freddie Mac, Pool #QB3716 | | | 2.00 | | | | 9/1/50 | | | | 336 | |
| | | 483 | | Freddie Mac, Pool #SD8182 | | | 2.00 | | | | 12/1/51 | | | | 420 | |
| | | 427 | | Freddie Mac, Pool #RA5928 | | | 2.00 | | | | 9/1/51 | | | | 371 | |
| | | 397 | | Freddie Mac, Pool #SB8115 | | | 2.00 | | | | 8/1/36 | | | | 371 | |
| | | 440 | | Freddie Mac, Pool #RA5040 | | | 2.00 | | | | 4/1/51 | | | | 382 | |
| | | 271 | | Freddie Mac, Pool #RA5257 | | | 2.00 | | | | 5/1/51 | | | | 235 | |
| | | 452 | | Freddie Mac, Pool #QC7473 | | | 2.00 | | | | 9/1/51 | | | | 392 | |
| | | 412 | | Freddie Mac, Pool #RA3205 | | | 2.00 | | | | 8/1/50 | | | | 361 | |
| | | 497 | | Freddie Mac, Pool #QB7708 | | | 2.00 | | | | 1/1/51 | | | | 431 | |
| | | 119 | | Freddie Mac, Pool #ZS7735 | | | 2.00 | | | | 1/1/32 | | | | 111 | |
| | | 392 | | Freddie Mac, Pool #RA3575 | | | 2.00 | | | | 9/1/50 | | | | 340 | |
| | | 431 | | Freddie Mac, Pool #SB8079 | | | 2.00 | | | | 12/1/35 | | | | 403 | |
| | | 21 | | Freddie Mac, Pool #G18547 | | | 2.00 | | | | 3/1/30 | | | | 20 | |
| | | 517 | | Freddie Mac, Pool #SD8113 | | | 2.00 | | | | 12/1/50 | | | | 449 | |
| | | 392 | | Freddie Mac, Pool #RA4986 | | | 2.00 | | | | 4/1/51 | | | | 340 | |
| | | 444 | | Freddie Mac, Pool #QC3597 | | | 2.00 | | | | 6/1/51 | | | | 386 | |
| | | 178 | | Freddie Mac, Pool #RB5111 | | | 2.00 | | | | 5/1/41 | | | | 158 | |
| | | 551 | | Freddie Mac, Pool #RA3606 | | | 2.00 | | | | 10/1/50 | | | | 479 | |
| | | 422 | | Freddie Mac, Pool #RA4214 | | | 2.00 | | | | 12/1/50 | | | | 367 | |
| | | 385 | | Freddie Mac, Pool #QB3926 | | | 2.00 | | | | 10/1/50 | | | | 335 | |
| | | 142 | | Freddie Mac, Pool #RB5095 | | | 2.00 | | | | 12/1/40 | | | | 126 | |
| | | 480 | | Freddie Mac, Pool #RA6333 | | | 2.00 | | | | 11/1/51 | | | | 418 | |
| | | 405 | | Freddie Mac, Pool #QB6893 | | | 2.00 | | | | 12/1/50 | | | | 352 | |
| | | 260 | | Freddie Mac, Pool #SB8061 | | | 2.00 | | | | 9/1/35 | | | | 243 | |
| | | 450 | | Freddie Mac, Pool #RA5155 | | | 2.00 | | | | 5/1/51 | | | | 391 | |
| | | 457 | | Freddie Mac, Pool #SD8177 | | | 2.00 | | | | 10/1/51 | | | | 396 | |
| | | 268 | | Freddie Mac, Pool #RB5114 | | | 2.00 | | | | 6/1/41 | | | | 238 | |
| | | 44 | | Freddie Mac, Pool #J25777 | | | 2.00 | | | | 9/1/28 | | | | 41 | |
| | | 294 | | Freddie Mac, Pool #SD8150 | | | 2.00 | | | | 6/1/51 | | | | 255 | |
| | | 487 | | Freddie Mac, Pool #SD8188 | | | 2.00 | | | | 1/1/52 | | | | 423 | |
| | | 445 | | Freddie Mac, Pool #QB9896 | | | 2.00 | | | | 3/1/51 | | | | 386 | |
| | | 457 | | Freddie Mac, Pool #QC6925 | | | 2.00 | | | | 9/1/51 | | | | 397 | |
| | | 18 | | Freddie Mac, Pool #J25759 | | | 2.00 | | | | 8/1/28 | | | | 17 | |
| | | 461 | | Freddie Mac, Pool #QD0433 | | | 2.00 | | | | 11/1/51 | | | | 400 | |
| | | 453 | | Freddie Mac, Pool #SD8172 | | | 2.00 | | | | 9/1/51 | | | | 393 | |
| | | 435 | | Freddie Mac, Pool #QD1254 | | | 2.00 | | | | 11/1/51 | | | | 377 | |
| | | 405 | | Freddie Mac, Pool #SB8107 | | | 2.00 | | | | 5/1/36 | | | | 378 | |
| | | 434 | | Freddie Mac, Pool #SD8134 | | | 2.00 | | | | 3/1/51 | | | | 377 | |
| | | 399 | | Freddie Mac, Pool #SD8121 | | | 2.00 | | | | 12/1/50 | | | | 347 | |
| | | 424 | | Freddie Mac, Pool #QC6815 | | | 2.00 | | | | 9/1/51 | | | | 368 | |
See accompanying notes to financial statements.
244
HC CAPITAL TRUST
The U.S. Mortgage/Asset Backed Fixed Income Securities Portfolio
Portfolio of Investments (continued) — June 30, 2022
| | Principal
Amount
(000) | | Security Description | | Rate % | | | Maturity
Date | | | Value
(000) | |
| | | | | U.S. Government Agency Mortgages (continued) |
| | $ | 479 | | Freddie Mac, Pool #RA6026 | | | 2.00 | | | | 10/1/51 | | | $ | 417 | |
| | | 39 | | Freddie Mac, Pool #G18634 | | | 2.00 | | | | 3/1/32 | | | | 37 | |
| | | 144 | | Freddie Mac, Pool #RB5138 | | | 2.00 | | | | 11/1/41 | | | | 128 | |
| | | 263 | | Freddie Mac, Pool #RA6025 | | | 2.00 | | | | 10/1/51 | | | | 228 | |
| | | 443 | | Freddie Mac, Pool #SD8199 | | | 2.00 | | | | 3/1/52 | | | | 384 | |
| | | 254 | | Freddie Mac, Pool #RB5121 | | | 2.00 | | | | 7/1/41 | | | | 226 | |
| | | 439 | | Freddie Mac, Pool #SB8510 | | | 2.00 | | | | 2/1/36 | | | | 411 | |
| | | 441 | | Freddie Mac, Pool #SB8128 | | | 2.00 | | | | 11/1/36 | | | | 412 | |
| | | 489 | | Freddie Mac, Pool #SD8193 | | | 2.00 | | | | 2/1/52 | | | | 425 | |
| | | 410 | | Freddie Mac, Pool #QC1333 | | | 2.00 | | | | 5/1/51 | | | | 355 | |
| | | 447 | | Freddie Mac, Pool #QC4423 | | | 2.00 | | | | 7/1/51 | | | | 388 | |
| | | 435 | | Freddie Mac, Pool #QC3697 | | | 2.00 | | | | 6/1/51 | | | | 378 | |
| | | 467 | | Freddie Mac, Pool #QD5748 | | | 2.00 | | | | 2/1/52 | | | | 405 | |
| | | 372 | | Freddie Mac, Pool #RA4527 | | | 2.50 | | | | 2/1/51 | | | | 335 | |
| | | 94 | | Freddie Mac, Pool #J26408 | | | 2.50 | | | | 11/1/28 | | | | 91 | |
| | | 74 | | Freddie Mac, Pool #G18470 | | | 2.50 | | | | 6/1/28 | | | | 71 | |
| | | 446 | | Freddie Mac, Pool #QC9156 | | | 2.50 | | | | 10/1/51 | | | | 402 | |
| | | 349 | | Freddie Mac, Pool #RA2643 | | | 2.50 | | | | 6/1/50 | | | | 315 | |
| | | 97 | | Freddie Mac, Pool #G18680 | | | 2.50 | | | | 3/1/33 | | | | 93 | |
| | | 497 | | Freddie Mac, Pool #SD8212 | | | 2.50 | | | | 5/1/52 | | | | 447 | |
| | | 248 | | Freddie Mac, Pool #QE2352 | | | 2.50 | | | | 5/1/52 | | | | 224 | |
| | | 461 | | Freddie Mac, Pool #QD5204 | | | 2.50 | | | | 1/1/52 | | | | 416 | |
| | | 153 | | Freddie Mac, Pool #G18611 | | | 2.50 | | | | 9/1/31 | | | | 149 | |
| | | 411 | | Freddie Mac, Pool #RA5286 | | | 2.50 | | | | 5/1/51 | | | | 370 | |
| | | 483 | | Freddie Mac, Pool #SD0780 | | | 2.50 | | | | 12/1/51 | | | | 434 | |
| | | 15 | | Freddie Mac, Pool #C91904 | | | 2.50 | | | | 11/1/36 | | | | 13 | |
| | | 61 | | Freddie Mac, Pool #ZS8483 | | | 2.50 | | | | 3/1/28 | | | | 59 | |
| | | 10 | | Freddie Mac, Pool #G08755 | | | 2.50 | | | | 2/1/47 | | | | 9 | |
| | | 88 | | Freddie Mac, Pool #SB8045 | | | 2.50 | | | | 5/1/35 | | | | 84 | |
| | | 174 | | Freddie Mac, Pool #SD8083 | | | 2.50 | | | | 8/1/50 | | | | 158 | |
| | | 332 | | Freddie Mac, Pool #QB3703 | | | 2.50 | | | | 9/1/50 | | | | 300 | |
| | | 68 | | Freddie Mac, Pool #G18635 | | | 2.50 | | | | 3/1/32 | | | | 66 | |
| | | 459 | | Freddie Mac, Pool #SD8189 | | | 2.50 | | | | 1/1/52 | | | | 414 | |
| | | 12 | | Freddie Mac, Pool #ZT2094 | | | 2.50 | | | | 6/1/34 | | | | 11 | |
| | | 25 | | Freddie Mac, Pool #Q42878 | | | 2.50 | | | | 9/1/46 | | | | 23 | |
| | | 30 | | Freddie Mac, Pool #G18704 | | | 2.50 | | | | 6/1/33 | | | | 29 | |
| | | 323 | | Freddie Mac, Pool #SD8167 | | | 2.50 | | | | 9/1/51 | | | | 292 | |
| | | 437 | | Freddie Mac, Pool #RA5832 | | | 2.50 | | | | 9/1/51 | | | | 394 | |
| | | 446 | | Freddie Mac, Pool #RA6019 | | | 2.50 | | | | 10/1/51 | | | | 402 | |
| | | 489 | | Freddie Mac, Pool #RA6765 | | | 2.50 | | | | 2/1/52 | | | | 440 | |
| | | 154 | | Freddie Mac, Pool #SD8055 | | | 2.50 | | | | 4/1/50 | | | | 140 | |
| | | 439 | | Freddie Mac, Pool #QC7457 | | | 2.50 | | | | 9/1/51 | | | | 396 | |
| | | 492 | | Freddie Mac, Pool #RA6621 | | | 2.50 | | | | 1/1/52 | | | | 443 | |
| | | 449 | | Freddie Mac, Pool #RA6493 | | | 2.50 | | | | 12/1/51 | | | | 404 | |
| | | 163 | | Freddie Mac, Pool #SB8108 | | | 2.50 | | | | 6/1/36 | | | | 156 | |
| | | 247 | | Freddie Mac, Pool #SD8205 | | | 2.50 | | | | 4/1/52 | | | | 222 | |
| | | 324 | | Freddie Mac, Pool #QB3287 | | | 2.50 | | | | 8/1/50 | | | | 293 | |
| | | 25 | | Freddie Mac, Pool #SB8053 | | | 2.50 | | | | 7/1/35 | | | | 24 | |
See accompanying notes to financial statements.
245
HC CAPITAL TRUST
The U.S. Mortgage/Asset Backed Fixed Income Securities Portfolio
Portfolio of Investments (continued) — June 30, 2022
| | Principal
Amount
(000) | | Security Description | | Rate % | | | Maturity
Date | | | Value
(000) | |
| | | | | U.S. Government Agency Mortgages (continued) |
| | $ | 346 | | Freddie Mac, Pool #SD8114 | | | 2.50 | | | | 12/1/50 | | | $ | 313 | |
| | | 15 | | Freddie Mac, Pool #G18665 | | | 2.50 | | | | 11/1/32 | | | | 15 | |
| | | 306 | | Freddie Mac, Pool #SD8099 | | | 2.50 | | | | 10/1/50 | | | | 277 | |
| | | 131 | | Freddie Mac, Pool #RB5043 | | | 2.50 | | | | 4/1/40 | | | | 120 | |
| | | 24 | | Freddie Mac, Pool #RA6815 | | | 2.50 | | | | 2/1/52 | | | | 22 | |
| | | 268 | | Freddie Mac, Pool #RA3528 | | | 2.50 | | | | 9/1/50 | | | | 242 | |
| | | 9 | | Freddie Mac, Pool #G08638 | | | 2.50 | | | | 4/1/45 | | | | 9 | |
| | | 12 | | Freddie Mac, Pool #G18472 | | | 2.50 | | | | 7/1/28 | | | | 11 | |
| | | 130 | | Freddie Mac, Pool #RB5086 | | | 2.50 | | | | 11/1/40 | | | | 119 | |
| | | 168 | | Freddie Mac, Pool #QA5290 | | | 2.50 | | | | 12/1/49 | | | | 152 | |
| | | 344 | | Freddie Mac, Pool #SD8129 | | | 2.50 | | | | 2/1/51 | | | | 310 | |
| | | 65 | | Freddie Mac, Pool #ZS4687 | | | 2.50 | | | | 11/1/46 | | | | 60 | |
| | | 49 | | Freddie Mac, Pool #ZS8692 | | | 2.50 | | | | 4/1/33 | | | | 47 | |
| | | 432 | | Freddie Mac, Pool #SD8183 | | | 2.50 | | | | 12/1/51 | | | | 389 | |
| | | 420 | | Freddie Mac, Pool #QC2251 | | | 2.50 | | | | 5/1/51 | | | | 379 | |
| | | 32 | | Freddie Mac, Pool #G18485 | | | 2.50 | | | | 10/1/28 | | | | 31 | |
| | | 490 | | Freddie Mac, Pool #SD1011 | | | 2.50 | | | | 4/1/52 | | | | 441 | |
| | | 388 | | Freddie Mac, Pool #SD8021 | | | 2.50 | | | | 9/1/49 | | | | 352 | |
| | | 273 | | Freddie Mac, Pool #RB5157 | | | 2.50 | | | | 5/1/42 | | | | 250 | |
| | | 457 | | Freddie Mac, Pool #RA6340 | | | 2.50 | | | | 11/1/51 | | | | 411 | |
| | | 5 | | Freddie Mac, Pool #J30875 | | | 2.50 | | | | 3/1/30 | | | | 5 | |
| | | 367 | | Freddie Mac, Pool #SD0578 | | | 2.50 | | | | 3/1/51 | | | | 331 | |
| | | 324 | | Freddie Mac, Pool #RA2634 | | | 2.50 | | | | 5/1/50 | | | | 293 | |
| | | 46 | | Freddie Mac, Pool #J35643 | | | 2.50 | | | | 11/1/31 | | | | 44 | |
| | | 59 | | Freddie Mac, Pool #RB5072 | | | 2.50 | | | | 9/1/40 | | | | 54 | |
| | | 379 | | Freddie Mac, Pool #SD0412 | | | 2.50 | | | | 8/1/50 | | | | 345 | |
| | | 63 | | Freddie Mac, Pool #J23440 | | | 2.50 | | | | 4/1/28 | | | | 61 | |
| | | 64 | | Freddie Mac, Pool #J18954 | | | 2.50 | | | | 4/1/27 | | | | 61 | |
| | | 497 | | Freddie Mac, Pool #SD8147 | | | 2.50 | | | | 5/1/51 | | | | 448 | |
| | | 61 | | Freddie Mac, Pool #ZK8425 | | | 2.50 | | | | 12/1/31 | | | | 59 | |
| | | 124 | | Freddie Mac, Pool #J38477 | | | 2.50 | | | | 2/1/33 | | | | 119 | |
| | | 230 | | Freddie Mac, Pool #SD8067 | | | 2.50 | | | | 6/1/50 | | | | 209 | |
| | | 263 | | Freddie Mac, Pool #QA9142 | | | 2.50 | | | | 5/1/50 | | | | 238 | |
| | | 61 | | Freddie Mac, Pool #RB5054 | | | 2.50 | | | | 6/1/40 | | | | 56 | |
| | | 325 | | Freddie Mac, Pool #SD8151 | | | 2.50 | | | | 6/1/51 | | | | 293 | |
| | | 60 | | Freddie Mac, Pool #G18533 | | | 2.50 | | | | 12/1/29 | | | | 58 | |
| | | 338 | | Freddie Mac, Pool #SD8122 | | | 2.50 | | | | 1/1/51 | | | | 306 | |
| | | 410 | | Freddie Mac, Pool #QC2031 | | | 2.50 | | | | 5/1/51 | | | | 370 | |
| | | 76 | | Freddie Mac, Pool #J37902 | | | 2.50 | | | | 11/1/32 | | | | 73 | |
| | | 40 | | Freddie Mac, Pool #SB8062 | | | 2.50 | | | | 9/1/35 | | | | 39 | |
| | | 487 | | Freddie Mac, Pool #SD8194 | | | 2.50 | | | | 2/1/52 | | | | 438 | |
| | | 359 | | Freddie Mac, Pool #RA2897 | | | 2.50 | | | | 6/1/50 | | | | 325 | |
| | | 372 | | Freddie Mac, Pool #SD8141 | | | 2.50 | | | | 4/1/51 | | | | 336 | |
| | | 35 | | Freddie Mac, Pool #C09026 | | | 2.50 | | | | 2/1/43 | | | | 32 | |
| | | 193 | | Freddie Mac, Pool #RA2645 | | | 2.50 | | | | 6/1/50 | | | | 174 | |
| | | 30 | | Freddie Mac, Pool #J25585 | | | 2.50 | | | | 9/1/28 | | | | 28 | |
| | | 423 | | Freddie Mac, Pool #RA5802 | | | 2.50 | | | | 9/1/51 | | | | 381 | |
| | | 77 | | Freddie Mac, Pool #G18568 | | | 2.50 | | | | 9/1/30 | | | | 74 | |
See accompanying notes to financial statements.
246
HC CAPITAL TRUST
The U.S. Mortgage/Asset Backed Fixed Income Securities Portfolio
Portfolio of Investments (continued) — June 30, 2022
| | Principal
Amount
(000) | | Security Description | | Rate % | | | Maturity
Date | | | Value
(000) | |
| | | | | U.S. Government Agency Mortgages (continued) |
| | $ | 270 | | Freddie Mac, Pool #RA2595 | | | 2.50 | | | | 5/1/50 | | | $ | 244 | |
| | | 75 | | Freddie Mac, Series K-1514, Class - A2, Callable 10/25/34 @ 100.00 | | | 2.86 | | | | 10/25/34 | | | | 68 | |
| | | 11 | | Freddie Mac, Pool #C91943 | | | 3.00 | | | | 7/1/37 | | | | 10 | |
| | | 99 | | Freddie Mac, Pool #ZA1283 | | | 3.00 | | | | 1/1/43 | | | | 95 | |
| | | 63 | | Freddie Mac, Pool #ZS4706 | | | 3.00 | | | | 3/1/47 | | | | 59 | |
| | | 45 | | Freddie Mac, Pool #G08783 | | | 3.00 | | | | 10/1/47 | | | | 42 | |
| | | 127 | | Freddie Mac, Pool #ZM2285 | | | 3.00 | | | | 12/1/46 | | | | 120 | |
| | | 63 | | Freddie Mac, Pool #ZS4779 | | | 3.00 | | | | 6/1/48 | | | | 59 | |
| | | 63 | | Freddie Mac, Pool #ZM2721 | | | 3.00 | | | | 2/1/47 | | | | 60 | |
| | | 138 | | Freddie Mac, Pool #SB8046 | | | 3.00 | | | | 5/1/35 | | | | 136 | |
| | | 67 | | Freddie Mac, Pool #G15145 | | | 3.00 | | | | 7/1/29 | | | | 66 | |
| | | 86 | | Freddie Mac, Pool #ZM2089 | | | 3.00 | | | | 11/1/46 | | | | 81 | |
| | | 7 | | Freddie Mac, Pool #G30999 | | | 3.00 | | | | 2/1/37 | | | | 7 | |
| | | 5 | | Freddie Mac, Pool #C91809 | | | 3.00 | | | | 2/1/35 | | | | 5 | |
| | | 112 | | Freddie Mac, Pool #Q43734 | | | 3.00 | | | | 10/1/46 | | | | 105 | |
| | | 29 | | Freddie Mac, Pool #G18582 | | | 3.00 | | | | 1/1/31 | | | | 29 | |
| | | 18 | | Freddie Mac, Pool #J38807 | | | 3.00 | | | | 4/1/33 | | | | 17 | |
| | | 140 | | Freddie Mac, Pool #G60989 | | | 3.00 | | | | 12/1/46 | | | | 131 | |
| | | 5 | | Freddie Mac, Pool #Q39527 | | | 3.00 | | | | 3/1/46 | | | | 5 | |
| | | 46 | | Freddie Mac, Pool #SD8056 | | | 3.00 | | | | 4/1/50 | | | | 44 | |
| | | 53 | | Freddie Mac, Pool #G18569 | | | 3.00 | | | | 9/1/30 | | | | 53 | |
| | | 63 | | Freddie Mac, Pool #ZM2169 | | | 3.00 | | | | 11/1/46 | | | | 59 | |
| | | 16 | | Freddie Mac, Pool #C91924 | | | 3.00 | | | | 4/1/37 | | | | 15 | |
| | | 49 | | Freddie Mac, Pool #ZT0195 | | | 3.00 | | | | 9/1/46 | | | | 46 | |
| | | 21 | | Freddie Mac, Pool #G18715 | | | 3.00 | | | | 11/1/33 | | | | 20 | |
| | | 48 | | Freddie Mac, Pool #Q41795 | | | 3.00 | | | | 7/1/46 | | | | 45 | |
| | | 25 | | Freddie Mac, Pool #G08540 | | | 3.00 | | | | 8/1/43 | | | | 24 | |
| | | 26 | | Freddie Mac, Pool #C91798 | | | 3.00 | | | | 12/1/34 | | | | 24 | |
| | | 6 | | Freddie Mac, Pool #C91949 | | | 3.00 | | | | 9/1/37 | | | | 5 | |
| | | 398 | | Freddie Mac, Pool #QD9881 | | | 3.00 | | | | 3/1/52 | | | | 371 | |
| | | 16 | | Freddie Mac, Pool #G18534 | | | 3.00 | | | | 12/1/29 | | | | 16 | |
| | | 83 | | Freddie Mac, Pool #G18514 | | | 3.00 | | | | 6/1/29 | | | | 81 | |
| | | 30 | | Freddie Mac, Pool #J38675 | | | 3.00 | | | | 3/1/33 | | | | 29 | |
| | | 49 | | Freddie Mac, Pool #ZS4688 | | | 3.00 | | | | 11/1/46 | | | | 47 | |
| | | 19 | | Freddie Mac, Pool #ZT2019 | | | 3.00 | | | | 5/1/34 | | | | 18 | |
| | | 25 | | Freddie Mac, Pool #Q19754 | | | 3.00 | | | | 7/1/43 | | | | 23 | |
| | | 67 | | Freddie Mac, Pool #G15217 | | | 3.00 | | | | 11/1/29 | | | | 66 | |
| | | 65 | | Freddie Mac, Pool #G18518 | | | 3.00 | | | | 7/1/29 | | | | 64 | |
| | | 31 | | Freddie Mac, Pool #J36428 | | | 3.00 | | | | 2/1/32 | | | | 31 | |
| | | 15 | | Freddie Mac, Pool #Q18599 | | | 3.00 | | | | 6/1/43 | | | | 14 | |
| | | 115 | | Freddie Mac, Pool #C04619 | | | 3.00 | | | | 3/1/43 | | | | 110 | |
| | | 59 | | Freddie Mac, Pool #Q20067 | | | 3.00 | | | | 7/1/43 | | | | 56 | |
| | | 396 | | Freddie Mac, Pool #SD8174 | | | 3.00 | | | | 10/1/51 | | | | 370 | |
| | | 6 | | Freddie Mac, Pool #Q18882 | | | 3.00 | | | | 5/1/43 | | | | 6 | |
| | | 130 | | Freddie Mac, Pool #Q16222 | | | 3.00 | | | | 3/1/43 | | | | 124 | |
| | | 257 | | Freddie Mac, Pool #Q21065 | | | 3.00 | | | | 8/1/43 | | | | 245 | |
| | | 15 | | Freddie Mac, Pool #C91905 | | | 3.00 | | | | 11/1/36 | | | | 14 | |
| | | 6 | | Freddie Mac, Pool #Q13086 | | | 3.00 | | | | 11/1/42 | | | | 6 | |
See accompanying notes to financial statements.
247
HC CAPITAL TRUST
The U.S. Mortgage/Asset Backed Fixed Income Securities Portfolio
Portfolio of Investments (continued) — June 30, 2022
| | Principal
Amount
(000) | | Security Description | | Rate % | | | Maturity
Date | | | Value
(000) | |
| | | | | U.S. Government Agency Mortgages (continued) |
| | $ | 7 | | Freddie Mac, Pool #J14241 | | | 3.00 | | | | 1/1/26 | | | $ | 7 | |
| | | 91 | | Freddie Mac, Pool #G60187 | | | 3.00 | | | | 8/1/45 | | | | 87 | |
| | | 90 | | Freddie Mac, Pool #J17774 | | | 3.00 | | | | 1/1/27 | | | | 90 | |
| | | 76 | | Freddie Mac, Pool #QA8065 | | | 3.00 | | | | 3/1/50 | | | | 71 | |
| | | 130 | | Freddie Mac, Pool #QA9049 | | | 3.00 | | | | 4/1/50 | | | | 122 | |
| | | 66 | | Freddie Mac, Pool #RA2594 | | | 3.00 | | | | 5/1/50 | | | | 62 | |
| | | 87 | | Freddie Mac, Pool #C91581 | | | 3.00 | | | | 11/1/32 | | | | 82 | |
| | | 97 | | Freddie Mac, Pool #ZS4609 | | | 3.00 | | | | 4/1/45 | | | | 92 | |
| | | 191 | | Freddie Mac, Pool #ZS4519 | | | 3.00 | | | | 6/1/43 | | | | 182 | |
| | | 103 | | Freddie Mac, Pool #G18673 | | | 3.00 | | | | 1/1/33 | | | | 102 | |
| | | 4 | | Freddie Mac, Pool #J17111 | | | 3.00 | | | | 10/1/26 | | | | 4 | |
| | | 74 | | Freddie Mac, Pool #SD8074 | | | 3.00 | | | | 7/1/50 | | | | 69 | |
| | | 57 | | Freddie Mac, Pool #ZT1323 | | | 3.00 | | | | 10/1/48 | | | | 54 | |
| | | 108 | | Freddie Mac, Pool #ZS4621 | | | 3.00 | | | | 7/1/45 | | | | 103 | |
| | | 120 | | Freddie Mac, Pool #SD8024 | | | 3.00 | | | | 11/1/49 | | | | 113 | |
| | | 37 | | Freddie Mac, Pool #ZS4641 | | | 3.00 | | | | 12/1/45 | | | | 35 | |
| | | 542 | | Freddie Mac, Pool #ZS4522 | | | 3.00 | | | | 7/1/43 | | | | 516 | |
| | | 155 | | Freddie Mac, Pool #ZS4697 | | | 3.00 | | | | 1/1/47 | | | | 147 | |
| | | 21 | | Freddie Mac, Pool #SD8030 | | | 3.00 | | | | 11/1/49 | | | | 20 | |
| | | 16 | | Freddie Mac, Pool #J38057 | | | 3.00 | | | | 12/1/32 | | | | 16 | |
| | | 94 | | Freddie Mac, Pool #QA1033 | | | 3.00 | | | | 7/1/49 | | | | 88 | |
| | | 39 | | Freddie Mac, Pool #ZS8686 | | | 3.00 | | | | 2/1/33 | | | | 38 | |
| | | 79 | | Freddie Mac, Pool #C04422 | | | 3.00 | | | | 12/1/42 | | | | 74 | |
| | | 56 | | Freddie Mac, Pool #G18531 | | | 3.00 | | | | 11/1/29 | | | | 55 | |
| | | 26 | | Freddie Mac, Pool #G30945 | | | 3.00 | | | | 9/1/36 | | | | 24 | |
| | | 31 | | Freddie Mac, Pool #C91927 | | | 3.00 | | | | 5/1/37 | | | | 30 | |
| | | 33 | | Freddie Mac, Pool #C91819 | | | 3.00 | | | | 4/1/35 | | | | 31 | |
| | | 48 | | Freddie Mac, Pool #C91707 | | | 3.00 | | | | 6/1/33 | | | | 46 | |
| | | 5 | | Freddie Mac, Pool #C91939 | | | 3.00 | | | | 6/1/37 | | | | 5 | |
| | | 20 | | Freddie Mac, Pool #G18575 | | | 3.00 | | | | 11/1/30 | | | | 20 | |
| | | 17 | | Freddie Mac, Pool #J33135 | | | 3.00 | | | | 11/1/30 | | | | 17 | |
| | | 114 | | Freddie Mac, Pool #ZS4658 | | | 3.00 | | | | 4/1/46 | | | | 108 | |
| | | 10 | | Freddie Mac, Pool #C91826 | | | 3.00 | | | | 5/1/35 | | | | 10 | |
| | | 47 | | Freddie Mac, Pool #ZT0715 | | | 3.00 | | | | 9/1/48 | | | | 45 | |
| | | 35 | | Freddie Mac, Pool #G08648 | | | 3.00 | | | | 6/1/45 | | | | 33 | |
| | | 12 | | Freddie Mac, Pool #C91969 | | | 3.00 | | | | 1/1/38 | | | | 12 | |
| | | 41 | | Freddie Mac, Pool #G08640 | | | 3.00 | | | | 5/1/45 | | | | 39 | |
| | | 67 | | Freddie Mac, Pool #ZA2313 | | | 3.00 | | | | 9/1/33 | | | | 64 | |
| | | 141 | | Freddie Mac, Pool #Q45735 | | | 3.00 | | | | 1/1/47 | | | | 133 | |
| | | 31 | | Freddie Mac, Pool #ZS4703 | | | 3.00 | | | | 2/1/47 | | | | 30 | |
| | | 16 | | Freddie Mac, Pool #J29932 | | | 3.00 | | | | 11/1/29 | | | | 16 | |
| | | 100 | | Freddie Mac, Pool #ZS4512 | | | 3.00 | | | | 5/1/43 | | | | 95 | |
| | | 80 | | Freddie Mac, Pool #ZS4693 | | | 3.00 | | | | 12/1/46 | | | | 75 | |
| | | 18 | | Freddie Mac, Pool #A96409 | | | 3.50 | | | | 1/1/41 | | | | 18 | |
| | | 29 | | Freddie Mac, Pool #ZS4759 | | | 3.50 | | | | 3/1/48 | | | | 28 | |
| | | 34 | | Freddie Mac, Pool #ZT1951 | | | 3.50 | | | | 5/1/49 | | | | 33 | |
| | | 9 | | Freddie Mac, Pool #G08620 | | | 3.50 | | | | 12/1/44 | | | | 9 | |
| | | 10 | | Freddie Mac, Pool #ZS4747 | | | 3.50 | | | | 12/1/47 | | | | 10 | |
See accompanying notes to financial statements.
248
HC CAPITAL TRUST
The U.S. Mortgage/Asset Backed Fixed Income Securities Portfolio
Portfolio of Investments (continued) — June 30, 2022
| | Principal
Amount
(000) | | Security Description | | Rate % | | | Maturity
Date | | | Value
(000) | |
| | | | | U.S. Government Agency Mortgages (continued) |
| | $ | 11 | | Freddie Mac, Pool #J26144 | | | 3.50 | | | | 10/1/23 | | | $ | 11 | |
| | | 91 | | Freddie Mac, Pool #G08766 | | | 3.50 | | | | 6/1/47 | | | | 88 | |
| | | 11 | | Freddie Mac, Pool #C92003 | | | 3.50 | | | | 7/1/38 | | | | 11 | |
| | | 101 | | Freddie Mac, Pool #G08562 | | | 3.50 | | | | 1/1/44 | | | | 100 | |
| | | 69 | | Freddie Mac, Pool #ZS4713 | | | 3.50 | | | | 4/1/47 | | | | 67 | |
| | | 104 | | Freddie Mac, Pool #G08627 | | | 3.50 | | | | 2/1/45 | | | | 102 | |
| | | 38 | | Freddie Mac, Pool #G08687 | | | 3.50 | | | | 1/1/46 | | | | 38 | |
| | | 63 | | Freddie Mac, Pool #C91456 | | | 3.50 | | | | 6/1/32 | | | | 62 | |
| | | 55 | | Freddie Mac, Pool #Q08998 | | | 3.50 | | | | 6/1/42 | | | | 55 | |
| | | 3 | | Freddie Mac, Pool #E02735 | | | 3.50 | | | | 10/1/25 | | | | 3 | |
| | | 19 | | Freddie Mac, Pool #RA1508 | | | 3.50 | | | | 10/1/49 | | | | 18 | |
| | | 15 | | Freddie Mac, Pool #Q31134 | | | 3.50 | | | | 2/1/45 | | | | 15 | |
| | | 33 | | Freddie Mac, Pool #G08698 | | | 3.50 | | | | 3/1/46 | | | | 32 | |
| | | 20 | | Freddie Mac, Pool #SB8007 | | | 3.50 | | | | 9/1/34 | | | | 20 | |
| | | 60 | | Freddie Mac, Pool #G08761 | | | 3.50 | | | | 5/1/47 | | | | 59 | |
| | | 51 | | Freddie Mac, Pool #ZS4704 | | | 3.50 | | | | 2/1/47 | | | | 50 | |
| | | 41 | | Freddie Mac, Pool #Q06749 | | | 3.50 | | | | 3/1/42 | | | | 40 | |
| | | 141 | | Freddie Mac, Pool #ZS4536 | | | 3.50 | | | | 10/1/43 | | | | 139 | |
| | | 54 | | Freddie Mac, Pool #Q53176 | | | 3.50 | | | | 12/1/47 | | | | 53 | |
| | | 40 | | Freddie Mac, Pool #Q36040 | | | 3.50 | | | | 9/1/45 | | | | 39 | |
| | | 34 | | Freddie Mac, Pool #ZS4663 | | | 3.50 | | | | 5/1/46 | | | | 33 | |
| | | 10 | | Freddie Mac, Pool #C91940 | | | 3.50 | | | | 6/1/37 | | | | 10 | |
| | | 38 | | Freddie Mac, Pool #G08733 | | | 3.50 | | | | 11/1/46 | | | | 38 | |
| | | 115 | | Freddie Mac, Pool #ZS4599 | | | 3.50 | | | | 1/1/45 | | | | 113 | |
| | | 48 | | Freddie Mac, Pool #SD8011 | | | 3.50 | | | | 9/1/49 | | | | 46 | |
| | | 81 | | Freddie Mac, Pool #ZS4642 | | | 3.50 | | | | 12/1/45 | | | | 79 | |
| | | 56 | | Freddie Mac, Pool #Q51461 | | | 3.50 | | | | 10/1/47 | | | | 54 | |
| | | 19 | | Freddie Mac, Pool #C91950 | | | 3.50 | | | | 9/1/37 | | | | 18 | |
| | | 16 | | Freddie Mac, Pool #C91742 | | | 3.50 | | | | 1/1/34 | | | | 16 | |
| | | 30 | | Freddie Mac, Pool #Q37449 | | | 3.50 | | | | 11/1/45 | | | | 29 | |
| | | 70 | | Freddie Mac, Pool #G61148 | | | 3.50 | | | | 9/1/47 | | | | 69 | |
| | | 21 | | Freddie Mac, Pool #J13582 | | | 3.50 | | | | 11/1/25 | | | | 21 | |
| | | 66 | | Freddie Mac, Pool #SD8001 | | | 3.50 | | | | 7/1/49 | | | | 64 | |
| | | 70 | | Freddie Mac, Pool #ZS4622 | | | 3.50 | | | | 7/1/45 | | | | 69 | |
| | | 88 | | Freddie Mac, Pool #G08804 | | | 3.50 | | | | 3/1/48 | | | | 86 | |
| | | 26 | | Freddie Mac, Pool #G08813 | | | 3.50 | | | | 5/1/48 | | | | 26 | |
| | | 307 | | Freddie Mac, Pool #ZS4487 | | | 3.50 | | | | 6/1/42 | | | | 302 | |
| | | 76 | | Freddie Mac, Pool #Q49490 | | | 3.50 | | | | 7/1/47 | | | | 75 | |
| | | 5 | | Freddie Mac, Pool #C91760 | | | 3.50 | | | | 5/1/34 | | | | 5 | |
| | | 27 | | Freddie Mac, Pool #C03920 | | | 3.50 | | | | 5/1/42 | | | | 26 | |
| | | 63 | | Freddie Mac, Pool #ZS4630 | | | 3.50 | | | | 9/1/45 | | | | 62 | |
| | | 79 | | Freddie Mac, Pool #G08641 | | | 3.50 | | | | 5/1/45 | | | | 77 | |
| | | 116 | | Freddie Mac, Pool #G08636 | | | 3.50 | | | | 4/1/45 | | | | 114 | |
| | | 26 | | Freddie Mac, Pool #J27494 | | | 3.50 | | | | 2/1/29 | | | | 26 | |
| | | 40 | | Freddie Mac, Pool #Q04087 | | | 3.50 | | | | 10/1/41 | | | | 39 | |
| | | 69 | | Freddie Mac, Pool #Q08903 | | | 3.50 | | | | 6/1/42 | | | | 68 | |
| | | 43 | | Freddie Mac, Pool #Q12052 | | | 3.50 | | | | 10/1/42 | | | | 42 | |
| | | 79 | | Freddie Mac, Pool #ZS4651 | | | 3.50 | | | | 3/1/46 | | | | 77 | |
See accompanying notes to financial statements.
249
HC CAPITAL TRUST
The U.S. Mortgage/Asset Backed Fixed Income Securities Portfolio
Portfolio of Investments (continued) — June 30, 2022
| | Principal
Amount
(000) | | Security Description | | Rate % | | | Maturity
Date | | | Value
(000) | |
| | | | | U.S. Government Agency Mortgages (continued) |
| | $ | 59 | | Freddie Mac, Pool #C91403 | | | 3.50 | | | | 3/1/32 | | | $ | 57 | |
| | | 38 | | Freddie Mac, Pool #G18707 | | | 3.50 | | | | 9/1/33 | | | | 38 | |
| | | 30 | | Freddie Mac, Pool #G30776 | | | 3.50 | | | | 7/1/35 | | | | 29 | |
| | | 172 | | Freddie Mac, Pool #RA2469 | | | 3.50 | | | | 4/1/50 | | | | 166 | |
| | | 71 | | Freddie Mac, Pool #G08632 | | | 3.50 | | | | 3/1/45 | | | | 70 | |
| | | 17 | | Freddie Mac, Pool #ZT0711 | | | 3.50 | | | | 10/1/48 | | | | 16 | |
| | | 38 | | Freddie Mac, Pool #Q57871 | | | 3.50 | | | | 8/1/48 | | | | 37 | |
| | | 57 | | Freddie Mac, Pool #SB0031 | | | 3.50 | | | | 10/1/27 | | | | 57 | |
| | | 11 | | Freddie Mac, Pool #Q55002 | | | 3.50 | | | | 3/1/48 | | | | 11 | |
| | | 38 | | Freddie Mac, Pool #Q58422 | | | 3.50 | | | | 9/1/48 | | | | 37 | |
| | | 6 | | Freddie Mac, Pool #C91925 | | | 3.50 | | | | 4/1/37 | | | | 6 | |
| | | 40 | | Freddie Mac, Pool #ZS4771 | | | 3.50 | | | | 6/1/48 | | | | 39 | |
| | | 30 | | Freddie Mac, Pool #ZS4659 | | | 3.50 | | | | 4/1/46 | | | | 29 | |
| | | 87 | | Freddie Mac, Pool #QA8794 | | | 3.50 | | | | 4/1/50 | | | | 84 | |
| | | 159 | | Freddie Mac, Pool #ZM4908 | | | 3.50 | | | | 11/1/47 | | | | 155 | |
| | | 493 | | Freddie Mac, Pool #SD0968 | | | 3.50 | | | | 4/1/52 | | | | 475 | |
| | | 72 | | Freddie Mac, Pool #Q09896 | | | 3.50 | | | | 8/1/42 | | | | 71 | |
| | | 23 | | Freddie Mac, Pool #G08605 | | | 3.50 | | | | 9/1/44 | | | | 22 | |
| | | 103 | | Freddie Mac, Pool #ZS4618 | | | 3.50 | | | | 6/1/45 | | | | 101 | |
| | | 42 | | Freddie Mac, Pool #ZA5128 | | | 3.50 | | | | 12/1/47 | | | | 40 | |
| | | 23 | | Freddie Mac, Pool #G08599 | | | 3.50 | | | | 8/1/44 | | | | 23 | |
| | | 69 | | Freddie Mac, Pool #J15105 | | | 3.50 | | | | 4/1/26 | | | | 68 | |
| | | 97 | | Freddie Mac, Pool #Q20860 | | | 3.50 | | | | 8/1/43 | | | | 95 | |
| | | 25 | | Freddie Mac, Pool #G08846 | | | 3.50 | | | | 11/1/48 | | | | 24 | |
| | | 396 | | Freddie Mac, Pool #SD8214 | | | 3.50 | | | | 5/1/52 | | | | 381 | |
| | | 36 | | Freddie Mac, Pool #Q58680 | | | 4.00 | | | | 9/1/48 | | | | 36 | |
| | | 9 | | Freddie Mac, Pool #C92019 | | | 4.00 | | | | 10/1/38 | | | | 9 | |
| | | 17 | | Freddie Mac, Pool #G14453 | | | 4.00 | | | | 6/1/26 | | | | 17 | |
| | | 3 | | Freddie Mac, Pool #Q27456 | | | 4.00 | | | | 7/1/44 | | | | 3 | |
| | | 47 | | Freddie Mac, Pool #SD8039 | | | 4.00 | | | | 1/1/50 | | | | 46 | |
| | | 50 | | Freddie Mac, Pool #G08618 | | | 4.00 | | | | 12/1/44 | | | | 50 | |
| | | 68 | | Freddie Mac, Pool #ZA4988 | | | 4.00 | | | | 8/1/47 | | | | 67 | |
| | | 47 | | Freddie Mac, Pool #Q27594 | | | 4.00 | | | | 8/1/44 | | | | 46 | |
| | | 7 | | Freddie Mac, Pool #C91923 | | | 4.00 | | | | 3/1/37 | | | | 7 | |
| | | 93 | | Freddie Mac, Pool #G06506 | | | 4.00 | | | | 12/1/40 | | | | 94 | |
| | | 116 | | Freddie Mac, Pool #SD0290 | | | 4.00 | | | | 4/1/50 | | | | 115 | |
| | | 68 | | Freddie Mac, Pool #ZS4731 | | | 4.00 | | | | 8/1/47 | | | | 68 | |
| | | 29 | | Freddie Mac, Pool #ZA6946 | | | 4.00 | | | | 5/1/49 | | | | 29 | |
| | | 25 | | Freddie Mac, Pool #G08483 | | | 4.00 | | | | 3/1/42 | | | | 25 | |
| | | 54 | | Freddie Mac, Pool #G08459 | | | 4.00 | | | | 9/1/41 | | | | 54 | |
| | | 88 | | Freddie Mac, Pool #ZS4627 | | | 4.00 | | | | 8/1/45 | | | | 88 | |
| | | 36 | | Freddie Mac, Pool #G08767 | | | 4.00 | | | | 6/1/47 | | | | 36 | |
| | | 24 | | Freddie Mac, Pool #ZT1840 | | | 4.00 | | | | 9/1/48 | | | | 24 | |
| | | 16 | | Freddie Mac, Pool #ZS4652 | | | 4.00 | | | | 2/1/46 | | | | 16 | |
| | | 79 | | Freddie Mac, Pool #ZL7781 | | | 4.00 | | | | 2/1/44 | | | | 79 | |
| | | 12 | | Freddie Mac, Pool #ZT1800 | | | 4.00 | | | | 3/1/34 | | | | 12 | |
| | | 23 | | Freddie Mac, Pool #G08836 | | | 4.00 | | | | 9/1/48 | | | | 22 | |
| | | 5 | | Freddie Mac, Pool #J12435 | | | 4.00 | | | | 6/1/25 | | | | 5 | |
See accompanying notes to financial statements.
250
HC CAPITAL TRUST
The U.S. Mortgage/Asset Backed Fixed Income Securities Portfolio
Portfolio of Investments (continued) — June 30, 2022
| | Principal
Amount
(000) | | Security Description | | Rate % | | | Maturity
Date | | | Value
(000) | |
| | | | | U.S. Government Agency Mortgages (continued) |
| | $ | 11 | | Freddie Mac, Pool #C91994 | | | 4.00 | | | | 5/1/38 | | | $ | 11 | |
| | | 31 | | Freddie Mac, Pool #G08637 | | | 4.00 | | | | 4/1/45 | | | | 31 | |
| | | 55 | | Freddie Mac, Pool #G08588 | | | 4.00 | | | | 5/1/44 | | | | 56 | |
| | | 13 | | Freddie Mac, Pool #G08672 | | | 4.00 | | | | 10/1/45 | | | | 13 | |
| | | 4 | | Freddie Mac, Pool #G08642 | | | 4.00 | | | | 5/1/45 | | | | 4 | |
| | | 70 | | Freddie Mac, Pool #ZS4631 | | | 4.00 | | | | 9/1/45 | | | | 70 | |
| | | 31 | | Freddie Mac, Pool #ZT1320 | | | 4.00 | | | | 11/1/48 | | | | 30 | |
| | | 52 | | Freddie Mac, Pool #ZS4573 | | | 4.00 | | | | 7/1/44 | | | | 52 | |
| | | 84 | | Freddie Mac, Pool #ZS4708 | | | 4.00 | | | | 3/1/47 | | | | 84 | |
| | | 26 | | Freddie Mac, Pool #G08601 | | | 4.00 | | | | 8/1/44 | | | | 26 | |
| | | 7 | | Freddie Mac, Pool #G08633 | | | 4.00 | | | | 3/1/45 | | | | 7 | |
| | | 29 | | Freddie Mac, Pool #ZN5030 | | | 4.00 | | | | 4/1/49 | | | | 29 | |
| | | 38 | | Freddie Mac, Pool #ZT2106 | | | 4.00 | | | | 3/1/49 | | | | 37 | |
| | | 26 | | Freddie Mac, Pool #Q34081 | | | 4.00 | | | | 6/1/45 | | | | 26 | |
| | | 32 | | Freddie Mac, Pool #C91765 | | | 4.00 | | | | 6/1/34 | | | | 32 | |
| | | 47 | | Freddie Mac, Pool #G08567 | | | 4.00 | | | | 1/1/44 | | | | 48 | |
| | | 42 | | Freddie Mac, Pool #ZT1952 | | | 4.00 | | | | 5/1/49 | | | | 42 | |
| | | 55 | | Freddie Mac, Pool #G08785 | | | 4.00 | | | | 10/1/47 | | | | 56 | |
| | | 33 | | Freddie Mac, Pool #C91738 | | | 4.00 | | | | 11/1/33 | | | | 33 | |
| | | 43 | | Freddie Mac, Pool #C09070 | | | 4.00 | | | | 12/1/44 | | | | 43 | |
| | | 142 | | Freddie Mac, Pool #SD8070 | | | 4.00 | | | | 6/1/50 | | | | 141 | |
| | | 52 | | Freddie Mac, Pool #G08616 | | | 4.00 | | | | 11/1/44 | | | | 53 | |
| | | 268 | | Freddie Mac, Pool #A96286 | | | 4.00 | | | | 1/1/41 | | | | 272 | |
| | | 22 | | Freddie Mac, Pool #G08831 | | | 4.00 | | | | 8/1/48 | | | | 22 | |
| | | 17 | | Freddie Mac, Pool #Q22671 | | | 4.50 | | | | 11/1/43 | | | | 19 | |
| | | 30 | | Freddie Mac, Pool #Q59805 | | | 4.50 | | | | 11/1/48 | | | | 30 | |
| | | 4 | | Freddie Mac, Pool #E02862 | | | 4.50 | | | | 3/1/26 | | | | 4 | |
| | | 115 | | Freddie Mac, Pool #SD8002 | | | 4.50 | | | | 7/1/49 | | | | 115 | |
| | | 5 | | Freddie Mac, Pool #A90437 | | | 4.50 | | | | 1/1/40 | | | | 5 | |
| | | 17 | | Freddie Mac, Pool #G08596 | | | 4.50 | | | | 7/1/44 | | | | 17 | |
| | | 27 | | Freddie Mac, Pool #ZS4781 | | | 4.50 | | | | 7/1/48 | | | | 27 | |
| | | 2 | | Freddie Mac, Pool #J07849 | | | 4.50 | | | | 5/1/23 | | | | 2 | |
| | | 29 | | Freddie Mac, Pool #Q57957 | | | 4.50 | | | | 8/1/48 | | | | 30 | |
| | | 14 | | Freddie Mac, Pool #G08781 | | | 4.50 | | | | 9/1/47 | | | | 14 | |
| | | 8 | | Freddie Mac, Pool #C09059 | | | 4.50 | | | | 3/1/44 | | | | 8 | |
| | | 24 | | Freddie Mac, Pool #G60512 | | | 4.50 | | | | 12/1/45 | | | | 24 | |
| | | 548 | | Freddie Mac, Pool #A97692 | | | 4.50 | | | | 3/1/41 | | | | 566 | |
| | | 56 | | Freddie Mac, Pool #ZT1711 | | | 4.50 | | | | 2/1/49 | | | | 56 | |
| | | 27 | | Freddie Mac, Pool #ZT1321 | | | 4.50 | | | | 11/1/48 | | | | 28 | |
| | | 42 | | Freddie Mac, Pool #G08759 | | | 4.50 | | | | 4/1/47 | | | | 42 | |
| | | 27 | | Freddie Mac, Pool #G08754 | | | 4.50 | | | | 3/1/47 | | | | 28 | |
| | | 28 | | Freddie Mac, Pool #ZS4774 | | | 4.50 | | | | 5/1/48 | | | | 28 | |
| | | 45 | | Freddie Mac, Pool #A97495 | | | 4.50 | | | | 3/1/41 | | | | 46 | |
| | | 18 | | Freddie Mac, Pool #Q25432 | | | 4.50 | | | | 3/1/44 | | | | 18 | |
| | | 8 | | Freddie Mac, Pool #G08838 | | | 5.00 | | | | 9/1/48 | | | | 9 | |
| | | 64 | | Freddie Mac, Pool #ZT1779 | | | 5.00 | | | | 3/1/49 | | | | 66 | |
| | | 7 | | Freddie Mac, Pool #G07068 | | | 5.00 | | | | 7/1/41 | | | | 7 | |
| | | 106 | | Freddie Mac, Pool #G04913 | | | 5.00 | | | | 3/1/38 | | | | 111 | |
See accompanying notes to financial statements.
251
HC CAPITAL TRUST
The U.S. Mortgage/Asset Backed Fixed Income Securities Portfolio
Portfolio of Investments (continued) — June 30, 2022
| | Principal
Amount
(000) | | Security Description | | Rate % | | | Maturity
Date | | | Value
(000) | |
| | | | | U.S. Government Agency Mortgages (continued) |
| | $ | 89 | | Freddie Mac, Pool #Q00763 | | | 5.00 | | | | 5/1/41 | | | $ | 91 | |
| | | 6 | | Freddie Mac, Pool #SD0093 | | | 5.00 | | | | 10/1/49 | | | | 6 | |
| | | 247 | | Freddie Mac, Pool #C01598 | | | 5.00 | | | | 8/1/33 | | | | 258 | |
| | | 16 | | Freddie Mac, Pool #G05205 | | | 5.00 | | | | 1/1/39 | | | | 17 | |
| | | 3 | | Freddie Mac, Pool #G13255 | | | 5.00 | | | | 7/1/23 | | | | 3 | |
| | | 153 | | Freddie Mac, Pool #G01665 | | | 5.50 | | | | 3/1/34 | | | | 164 | |
| | | 1 | | Freddie Mac, Pool #G06091 | | | 5.50 | | | | 5/1/40 | | | | 1 | |
| | | 35 | | Freddie Mac, Pool #G06031 | | | 5.50 | | | | 3/1/40 | | | | 38 | |
| | | 135 | | Freddie Mac, Pool #G02794 | | | 6.00 | | | | 5/1/37 | | | | 153 | |
| | | 16 | | Freddie Mac, Pool #G05709 | | | 6.00 | | | | 6/1/38 | | | | 18 | |
| | | 2 | | Freddie Mac, Pool #A62706 | | | 6.00 | | | | 6/1/37 | | | | 2 | |
| | | 30 | | Freddie Mac, Pool #G03551 | | | 6.00 | | | | 11/1/37 | | | | 34 | |
| | | 399 | | Government National Mortgage Association, Pool #MA7417 | | | 2.00 | | | | 6/20/51 | | | | 355 | |
| | | 365 | | Government National Mortgage Association, Pool #MA7135 | | | 2.00 | | | | 1/20/51 | | | | 326 | |
| | | 205 | | Government National Mortgage Association, Pool #MA6864 | | | 2.00 | | | | 9/20/50 | | | | 182 | |
| | | 407 | | Government National Mortgage Association, Pool #MA7051 | | | 2.00 | | | | 12/20/50 | | | | 362 | |
| | | 379 | | Government National Mortgage Association, Pool #MA7254 | | | 2.00 | | | | 3/20/51 | | | | 336 | |
| | | 445 | | Government National Mortgage Association, Pool #MA7935 | | | 2.00 | | | | 3/20/52 | | | | 395 | |
| | | 262 | | Government National Mortgage Association, Pool #MA7311 | | | 2.00 | | | | 4/20/51 | | | | 233 | |
| | | 372 | | Government National Mortgage Association, Pool #MA7366 | | | 2.00 | | | | 5/20/51 | | | | 330 | |
| | | 411 | | Government National Mortgage Association, Pool #MA7471 | | | 2.00 | | | | 7/20/51 | | | | 364 | |
| | | 357 | | Government National Mortgage Association, Pool #MA6818 | | | 2.00 | | | | 8/20/50 | | | | 317 | |
| | | 258 | | Government National Mortgage Association, Pool #MA6994 | | | 2.00 | | | | 11/20/50 | | | | 230 | |
| | | 345 | | Government National Mortgage Association, Pool #MA6930 | | | 2.00 | | | | 10/20/50 | | | | 308 | |
| | | 441 | | Government National Mortgage Association, Pool #MA7826 | | | 2.00 | | | | 1/20/52 | | | | 392 | |
| | | 484 | | Government National Mortgage Association, Pool #MA7704 | | | 2.00 | | | | 11/20/51 | | | | 430 | |
| | | 447 | | Government National Mortgage Association, Pool #MA7588 | | | 2.00 | | | | 9/20/51 | | | | 397 | |
| | | 487 | | Government National Mortgage Association, Pool #MA7766 | | | 2.00 | | | | 12/20/51 | | | | 432 | |
| | | 7 | | Government National Mortgage Association, Pool #MA2890 | | | 2.50 | | | | 6/20/45 | | | | 6 | |
| | | 14 | | Government National Mortgage Association, Pool #MA1133 | | | 2.50 | | | | 7/20/28 | | | | 14 | |
| | | 485 | | Government National Mortgage Association, Pool #MA7052 | | | 2.50 | | | | 12/20/50 | | | | 444 | |
| | | 488 | | Government National Mortgage Association, Pool #MA7827 | | | 2.50 | | | | 1/20/52 | | | | 447 | |
| | | 211 | | Government National Mortgage Association, Pool #MA4260 | | | 2.50 | | | | 2/20/47 | | | | 193 | |
| | | 366 | | Government National Mortgage Association, Pool #MA7255 | | | 2.50 | | | | 3/20/51 | | | | 335 | |
| | | 160 | | Government National Mortgage Association, Pool #MA6540 | | | 2.50 | | | | 3/20/50 | | | | 147 | |
| | | 11 | | Government National Mortgage Association, Pool #711729 | | | 2.50 | | | | 3/15/43 | | | | 10 | |
| | | 447 | | Government National Mortgage Association, Pool #MA7881 | | | 2.50 | | | | 2/20/52 | | | | 410 | |
| | | 407 | | Government National Mortgage Association, Pool #MA7472 | | | 2.50 | | | | 7/20/51 | | | | 374 | |
| | | 257 | | Government National Mortgage Association, Pool #MA7589 | | | 2.50 | | | | 9/20/51 | | | | 236 | |
| | | 20 | | Government National Mortgage Association, Pool #MA4717 | | | 2.50 | | | | 9/20/47 | | | | 18 | |
| | | 398 | | Government National Mortgage Association, Pool #MA7418 | | | 2.50 | | | | 6/20/51 | | | | 366 | |
| | | 14 | | Government National Mortgage Association, Pool #MA0908 | | | 2.50 | | | | 4/20/28 | | | | 13 | |
| | | 274 | | Government National Mortgage Association, Pool #MA8042 | | | 2.50 | | | | 5/20/52 | | | | 251 | |
| | | 21 | | Government National Mortgage Association, Pool #MA4067 | | | 2.50 | | | | 11/20/46 | | | | 20 | |
| | | 14 | | Government National Mortgage Association, Pool #MA4424 | | | 2.50 | | | | 5/20/32 | | | | 13 | |
| | | 13 | | Government National Mortgage Association, Pool #MA4194 | | | 2.50 | | | | 1/20/47 | | | | 12 | |
| | | 227 | | Government National Mortgage Association, Pool #MA6819 | | | 2.50 | | | | 8/20/50 | | | | 208 | |
| | | 444 | | Government National Mortgage Association, Pool #MA7936 | | | 2.50 | | | | 3/20/52 | | | | 407 | |
See accompanying notes to financial statements.
252
HC CAPITAL TRUST
The U.S. Mortgage/Asset Backed Fixed Income Securities Portfolio
Portfolio of Investments (continued) — June 30, 2022
| | Principal
Amount
(000) | | Security Description | | Rate % | | | Maturity
Date | | | Value
(000) | |
| | | | | U.S. Government Agency Mortgages (continued) |
| | $ | 445 | | Government National Mortgage Association, Pool #MA7767 | | | 2.50 | | | | 12/20/51 | | | $ | 407 | |
| | | 23 | | Government National Mortgage Association, Pool #MA0601 | | | 2.50 | | | | 12/20/27 | | | | 22 | |
| | | 7 | | Government National Mortgage Association, Pool #MA4355 | | | 2.50 | | | | 4/20/32 | | | | 7 | |
| | | 275 | | Government National Mortgage Association, Pool #MA6709 | | | 2.50 | | | | 6/20/50 | | | | 253 | |
| | | 376 | | Government National Mortgage Association, Pool #MA7312 | | | 2.50 | | | | 4/20/51 | | | | 344 | |
| | | 391 | | Government National Mortgage Association, Pool #MA7534 | | | 2.50 | | | | 8/20/51 | | | | 359 | |
| | | 40 | | Government National Mortgage Association, Pool #MA1283 | | | 2.50 | | | | 9/20/43 | | | | 35 | |
| | | 479 | | Government National Mortgage Association, Pool #MA7136 | | | 2.50 | | | | 1/20/51 | | | | 439 | |
| | | 446 | | Government National Mortgage Association, Pool #MA7987 | | | 2.50 | | | | 4/20/52 | | | | 409 | |
| | | 306 | | Government National Mortgage Association, Pool #MA6995 | | | 2.50 | | | | 11/20/50 | | | | 280 | |
| | | 440 | | Government National Mortgage Association, Pool #MA6865 | | | 2.50 | | | | 9/20/50 | | | | 403 | |
| | | 428 | | Government National Mortgage Association, Pool #MA7649 | | | 2.50 | | | | 10/20/51 | | | | 392 | |
| | | 285 | | Government National Mortgage Association, Pool #MA6931 | | | 2.50 | | | | 10/20/50 | | | | 261 | |
| | | 22 | | Government National Mortgage Association, Pool #AA8341 | | | 2.50 | | | | 2/15/28 | | | | 21 | |
| | | 203 | | Government National Mortgage Association, Pool #MA6655 | | | 2.50 | | | | 5/20/50 | | | | 186 | |
| | | 355 | | Government National Mortgage Association, Pool #MA7193 | | | 2.50 | | | | 2/20/51 | | | | 325 | |
| | | 420 | | Government National Mortgage Association, Pool #MA7367 | | | 2.50 | | | | 5/20/51 | | | | 385 | |
| | | 14 | | Government National Mortgage Association, Pool #776954 | | | 2.50 | | | | 11/15/42 | | | | 13 | |
| | | 217 | | Government National Mortgage Association, Pool #MA4125 | | | 2.50 | | | | 12/20/46 | | | | 199 | |
| | | 58 | | Government National Mortgage Association, Pool #MA3873 | | | 3.00 | | | | 8/20/46 | | | | 55 | |
| | | 114 | | Government National Mortgage Association, Pool #MA4651 | | | 3.00 | | | | 8/20/47 | | | | 108 | |
| | | 160 | | Government National Mortgage Association, Pool #MA5018 | | | 3.00 | | | | 2/20/48 | | | | 151 | |
| | | 65 | | Government National Mortgage Association, Pool #MA3309 | | | 3.00 | | | | 12/20/45 | | | | 61 | |
| | | 34 | | Government National Mortgage Association, Pool #MA0851 | | | 3.00 | | | | 3/20/43 | | | | 33 | |
| | | 148 | | Government National Mortgage Association, Pool #MA0391 | | | 3.00 | | | | 9/20/42 | | | | 141 | |
| | | 105 | | Government National Mortgage Association, Pool #MA4509 | | | 3.00 | | | | 6/20/47 | | | | 100 | |
| | | 6 | | Government National Mortgage Association, Pool #MA4935 | | | 3.00 | | | | 1/20/33 | | | | 5 | |
| | | 59 | | Government National Mortgage Association, Pool #MA2444 | | | 3.00 | | | | 12/20/44 | | | | 56 | |
| | | 84 | | Government National Mortgage Association, Pool #MA6283 | | | 3.00 | | | | 11/20/49 | | | | 79 | |
| | | 18 | | Government National Mortgage Association, Pool #MA6766 | | | 3.00 | | | | 7/20/50 | | | | 17 | |
| | | 24 | | Government National Mortgage Association, Pool #MA0205 | | | 3.00 | | | | 7/20/27 | | | | 23 | |
| | | 8 | | Government National Mortgage Association, Pool #AN5756 | | | 3.00 | | | | 7/15/45 | | | | 8 | |
| | | 184 | | Government National Mortgage Association, Pool #MA5076 | | | 3.00 | | | | 3/20/48 | | | | 174 | |
| | | 96 | | Government National Mortgage Association, Pool #MA1374 | | | 3.00 | | | | 10/20/43 | | | | 91 | |
| | | 4 | | Government National Mortgage Association, Pool #5276 | | | 3.00 | | | | 1/20/27 | | | | 4 | |
| | | 91 | | Government National Mortgage Association, Pool #MA4450 | | | 3.00 | | | | 5/20/47 | | | | 86 | |
| | | 72 | | Government National Mortgage Association, Pool #MA3662 | | | 3.00 | | | | 5/20/46 | | | | 68 | |
| | | 52 | | Government National Mortgage Association, Pool #MA3172 | | | 3.00 | | | | 10/20/45 | | | | 49 | |
| | | 10 | | Government National Mortgage Association, Pool #AA2934 | | | 3.00 | | | | 7/15/42 | | | | 9 | |
| | | 5 | | Government National Mortgage Association, Pool #AL5058 | | | 3.00 | | | | 3/15/45 | | | | 4 | |
| | | 173 | | Government National Mortgage Association, Pool #MA4195 | | | 3.00 | | | | 1/20/47 | | | | 163 | |
| | | 55 | | Government National Mortgage Association, Pool #MA2825 | | | 3.00 | | | | 5/20/45 | | | | 52 | |
| | | 17 | | Government National Mortgage Association, Pool #AG0440 | | | 3.00 | | | | 8/15/43 | | | | 16 | |
| | | 132 | | Government National Mortgage Association, Pool #MA3936 | | | 3.00 | | | | 9/20/46 | | | | 124 | |
| | | 9 | | Government National Mortgage Association, Pool #MA1890 | | | 3.00 | | | | 5/20/29 | | | | 9 | |
| | | 163 | | Government National Mortgage Association, Pool #MA4261 | | | 3.00 | | | | 2/20/47 | | | | 154 | |
| | | 34 | | Government National Mortgage Association, Pool #MA4068 | | | 3.00 | | | | 11/20/46 | | | | 32 | |
| | | 69 | | Government National Mortgage Association, Pool #MA4320 | | | 3.00 | | | | 3/20/47 | | | | 65 | |
See accompanying notes to financial statements.
253
HC CAPITAL TRUST
The U.S. Mortgage/Asset Backed Fixed Income Securities Portfolio
Portfolio of Investments (continued) — June 30, 2022
| | Principal
Amount
(000) | | Security Description | | Rate % | | | Maturity
Date | | | Value
(000) | |
| | | | | U.S. Government Agency Mortgages (continued) |
| | $ | 60 | | Government National Mortgage Association, Pool #MA3104 | | | 3.00 | | | | 9/20/45 | | | $ | 57 | |
| | | 82 | | Government National Mortgage Association, Pool #MA6089 | | | 3.00 | | | | 8/20/49 | | | | 77 | |
| | | 400 | | Government National Mortgage Association, Pool #MA6218 | | | 3.00 | | | | 10/20/49 | | | | 378 | |
| | | 65 | | Government National Mortgage Association, Pool #MA3596 | | | 3.00 | | | | 4/20/46 | | | | 61 | |
| | | 80 | | Government National Mortgage Association, Pool #MA6710 | | | 3.00 | | | | 6/20/50 | | | | 75 | |
| | | 13 | | Government National Mortgage Association, Pool #MA2797 | | | 3.00 | | | | 5/20/30 | | | | 13 | |
| | | 21 | | Government National Mortgage Association, Pool #MA2600 | | | 3.00 | | | | 2/20/45 | | | | 20 | |
| | | 195 | | Government National Mortgage Association, Pool #MA4126 | | | 3.00 | | | | 12/20/46 | | | | 186 | |
| | | 120 | | Government National Mortgage Association, Pool #MA2147 | | | 3.00 | | | | 8/20/44 | | | | 115 | |
| | | 153 | | Government National Mortgage Association, Pool #MA6474 | | | 3.00 | | | | 2/20/50 | | | | 145 | |
| | | 23 | | Government National Mortgage Association, Pool #MA4559 | | | 3.00 | | | | 7/20/32 | | | | 22 | |
| | | 277 | | Government National Mortgage Association, Pool #MA6599 | | | 3.00 | | | | 4/20/50 | | | | 262 | |
| | | 124 | | Government National Mortgage Association, Pool #MA6338 | | | 3.00 | | | | 12/20/49 | | | | 117 | |
| | | 21 | | Government National Mortgage Association, Pool #MA6820 | | | 3.00 | | | | 8/20/50 | | | | 20 | |
| | | 194 | | Government National Mortgage Association, Pool #MA4003 | | | 3.00 | | | | 10/20/46 | | | | 183 | |
| | | 145 | | Government National Mortgage Association, Pool #MA3735 | | | 3.00 | | | | 6/20/46 | | | | 137 | |
| | | 144 | | Government National Mortgage Association, Pool #MA6409 | | | 3.00 | | | | 1/20/50 | | | | 136 | |
| | | 46 | | Government National Mortgage Association, Pool #779084 | | | 3.00 | | | | 4/15/42 | | | | 44 | |
| | | 27 | | Government National Mortgage Association, Pool #MA1265 | | | 3.00 | | | | 9/20/28 | | | | 27 | |
| | | 110 | | Government National Mortgage Association, Pool #AA6149 | | | 3.00 | | | | 3/20/43 | | | | 104 | |
| | | 56 | | Government National Mortgage Association, Pool #MA2960 | | | 3.00 | | | | 7/20/45 | | | | 53 | |
| | | 137 | | Government National Mortgage Association, Pool #AD8433 | | | 3.00 | | | | 7/15/43 | | | | 131 | |
| | | 52 | | Government National Mortgage Association, Pool #AA2654 | | | 3.00 | | | | 6/15/43 | | | | 50 | |
| | | 72 | | Government National Mortgage Association, Pool #MA4381 | | | 3.00 | | | | 4/20/47 | | | | 68 | |
| | | 95 | | Government National Mortgage Association, Pool #MA2520 | | | 3.00 | | | | 1/20/45 | | | | 91 | |
| | | 43 | | Government National Mortgage Association, Pool #MA2753 | | | 3.00 | | | | 4/20/45 | | | | 41 | |
| | | 80 | | Government National Mortgage Association, Pool #MA3033 | | | 3.00 | | | | 8/20/45 | | | | 76 | |
| | | 86 | | Government National Mortgage Association, Pool #MA4777 | | | 3.00 | | | | 10/20/47 | | | | 81 | |
| | | 17 | | Government National Mortgage Association, Pool #AK7285 | | | 3.00 | | | | 3/15/45 | | | | 16 | |
| | | 81 | | Government National Mortgage Association, Pool #MA3802 | | | 3.00 | | | | 7/20/46 | | | | 77 | |
| | | 174 | | Government National Mortgage Association, Pool #MA4899 | | | 3.00 | | | | 12/20/47 | | | | 165 | |
| | | 244 | | Government National Mortgage Association, Pool #MA6656 | | | 3.00 | | | | 5/20/50 | | | | 232 | |
| | | 93 | | Government National Mortgage Association, Pool #MA0153 | | | 3.00 | | | | 6/20/42 | | | | 88 | |
| | | 24 | | Government National Mortgage Association, Pool #MA3520 | | | 3.00 | | | | 3/20/46 | | | | 23 | |
| | | 83 | | Government National Mortgage Association, Pool #MA0461 | | | 3.00 | | | | 10/20/42 | | | | 79 | |
| | | 86 | | Government National Mortgage Association, Pool #MA4961 | | | 3.00 | | | | 1/20/48 | | | | 82 | |
| | | 26 | | Government National Mortgage Association, Pool #MA3243 | | | 3.00 | | | | 11/20/45 | | | | 24 | |
| | | 520 | | Government National Mortgage Association, Pool #MA0624 | | | 3.00 | | | | 12/20/42 | | | | 498 | |
| | | 118 | | Government National Mortgage Association, Pool #MA4836 | | | 3.00 | | | | 11/20/47 | | | | 112 | |
| | | 71 | | Government National Mortgage Association, Pool #783976 | | | 3.50 | | | | 4/20/43 | | | | 70 | |
| | | 46 | | Government National Mortgage Association, Pool #AC3938 | | | 3.50 | | | | 1/15/43 | | | | 46 | |
| | | 18 | | Government National Mortgage Association, Pool #MA6339 | | | 3.50 | | | | 12/20/49 | | | | 17 | |
| | | 45 | | Government National Mortgage Association, Pool #740798 | | | 3.50 | | | | 1/15/42 | | | | 44 | |
| | | 13 | | Government National Mortgage Association, Pool #MA6475 | | | 3.50 | | | | 2/20/50 | | | | 12 | |
| | | 15 | | Government National Mortgage Association, Pool #MA6711 | | | 3.50 | | | | 6/20/50 | | | | 15 | |
| | | 15 | | Government National Mortgage Association, Pool #796271 | | | 3.50 | | | | 7/15/42 | | | | 16 | |
| | | 113 | | Government National Mortgage Association, Pool #MA3521 | | | 3.50 | | | | 3/20/46 | | | | 111 | |
| | | 19 | | Government National Mortgage Association, Pool #AD2416 | | | 3.50 | | | | 5/15/43 | | | | 20 | |
| | | 134 | | Government National Mortgage Association, Pool #MA5019 | | | 3.50 | | | | 2/20/48 | | | | 131 | |
See accompanying notes to financial statements.
254
HC CAPITAL TRUST
The U.S. Mortgage/Asset Backed Fixed Income Securities Portfolio
Portfolio of Investments (continued) — June 30, 2022
| | Principal
Amount
(000) | | Security Description | | Rate % | | | Maturity
Date | | | Value
(000) | |
| | | | | U.S. Government Agency Mortgages (continued) |
| | $ | 78 | | Government National Mortgage Association, Pool #MA4652 | | | 3.50 | | | | 8/20/47 | | | $ | 77 | |
| | | 125 | | Government National Mortgage Association, Pool #MA0934 | | | 3.50 | | | | 4/20/43 | | | | 126 | |
| | | 144 | | Government National Mortgage Association, Pool #MA0462 | | | 3.50 | | | | 10/20/42 | | | | 142 | |
| | | 10 | | Government National Mortgage Association, Pool #MA6410 | | | 3.50 | | | | 1/20/50 | | | | 10 | |
| | | 71 | | Government National Mortgage Association, Pool #MA4719 | | | 3.50 | | | | 9/20/47 | | | | 70 | |
| | | 106 | | Government National Mortgage Association, Pool #MA3034 | | | 3.50 | | | | 8/20/45 | | | | 104 | |
| | | 14 | | Government National Mortgage Association, Pool #MA5762 | | | 3.50 | | | | 2/20/49 | | | | 14 | |
| | | 14 | | Government National Mortgage Association, Pool #MA6219 | | | 3.50 | | | | 10/20/49 | | | | 13 | |
| | | 51 | | Government National Mortgage Association, Pool #MA2445 | | | 3.50 | | | | 12/20/44 | | | | 50 | |
| | | 48 | | Government National Mortgage Association, Pool #MA1838 | | | 3.50 | | | | 4/20/44 | | | | 47 | |
| | | 148 | | Government National Mortgage Association, Pool #MA2073 | | | 3.50 | | | | 7/20/44 | | | | 149 | |
| | | 125 | | Government National Mortgage Association, Pool #MA0852 | | | 3.50 | | | | 3/20/43 | | | | 125 | |
| | | 62 | | Government National Mortgage Association, Pool #MA2961 | | | 3.50 | | | | 7/20/45 | | | | 61 | |
| | | 120 | | Government National Mortgage Association, Pool #MA3173 | | | 3.50 | | | | 10/20/45 | | | | 118 | |
| | | 256 | | Government National Mortgage Association, Pool #MA0220 | | | 3.50 | | | | 7/20/42 | | | | 253 | |
| | | 81 | | Government National Mortgage Association, Pool #MA3597 | | | 3.50 | | | | 4/20/46 | | | | 80 | |
| | | 76 | | Government National Mortgage Association, Pool #MA4262 | | | 3.50 | | | | 2/20/47 | | | | 74 | |
| | | 91 | | Government National Mortgage Association, Pool #MA2303 | | | 3.50 | | | | 10/20/44 | | | | 89 | |
| | | 100 | | Government National Mortgage Association, Pool #MA0088 | | | 3.50 | | | | 5/20/42 | | | | 99 | |
| | | 119 | | Government National Mortgage Association, Pool #MA4196 | | | 3.50 | | | | 1/20/47 | | | | 117 | |
| | | 103 | | Government National Mortgage Association, Pool #MA4837 | | | 3.50 | | | | 11/20/47 | | | | 101 | |
| | | 209 | | Government National Mortgage Association, Pool #MA2148 | | | 3.50 | | | | 8/20/44 | | | | 206 | |
| | | 71 | | Government National Mortgage Association, Pool #MA5136 | | | 3.50 | | | | 4/20/48 | | | | 70 | |
| | | 20 | | Government National Mortgage Association, Pool #738602 | | | 3.50 | | | | 8/15/26 | | | | 20 | |
| | | 11 | | Government National Mortgage Association, Pool #MA5875 | | | 3.50 | | | | 4/20/49 | | | | 11 | |
| | | 52 | | Government National Mortgage Association, Pool #MA2754 | | | 3.50 | | | | 4/20/45 | | | | 51 | |
| | | 92 | | Government National Mortgage Association, Pool #AM4971 | | | 3.50 | | | | 4/20/45 | | | | 90 | |
| | | 77 | | Government National Mortgage Association, Pool #MA4069 | | | 3.50 | | | | 11/20/46 | | | | 76 | |
| | | 94 | | Government National Mortgage Association, Pool #MA3244 | | | 3.50 | | | | 11/20/45 | | | | 92 | |
| | | 85 | | Government National Mortgage Association, Pool #MA4004 | | | 3.50 | | | | 10/20/46 | | | | 84 | |
| | | 44 | | Government National Mortgage Association, Pool #MA2371 | | | 3.50 | | | | 11/20/44 | | | | 44 | |
| | | 144 | | Government National Mortgage Association, Pool #MA1157 | | | 3.50 | | | | 7/20/43 | | | | 142 | |
| | | 6 | | Government National Mortgage Association, Pool #MA1266 | | | 3.50 | | | | 9/20/28 | | | | 6 | |
| | | 46 | | Government National Mortgage Association, Pool #MA3454 | | | 3.50 | | | | 2/20/46 | | | | 45 | |
| | | 78 | | Government National Mortgage Association, Pool #MA4900 | | | 3.50 | | | | 12/20/47 | | | | 77 | |
| | | 56 | | Government National Mortgage Association, Pool #MA4510 | | | 3.50 | | | | 6/20/47 | | | | 55 | |
| | | 36 | | Government National Mortgage Association, Pool #MA4451 | | | 3.50 | | | | 5/20/47 | | | | 35 | |
| | | 76 | | Government National Mortgage Association, Pool #MA0699 | | | 3.50 | | | | 1/20/43 | | | | 75 | |
| | | 3 | | Government National Mortgage Association, Pool #AL8566 | | | 3.50 | | | | 3/15/45 | | | | 2 | |
| | | 142 | | Government National Mortgage Association, Pool #MA1090 | | | 3.50 | | | | 6/20/43 | | | | 140 | |
| | | 59 | | Government National Mortgage Association, Pool #MA3736 | | | 3.50 | | | | 6/20/46 | | | | 58 | |
| | | 58 | | Government National Mortgage Association, Pool #778157 | | | 3.50 | | | | 3/15/42 | | | | 59 | |
| | | 54 | | Government National Mortgage Association, Pool #MA4778 | | | 3.50 | | | | 10/20/47 | | | | 53 | |
| | | 63 | | Government National Mortgage Association, Pool #MA3874 | | | 3.50 | | | | 8/20/46 | | | | 62 | |
| | | 68 | | Government National Mortgage Association, Pool #MA3803 | | | 3.50 | | | | 7/20/46 | | | | 67 | |
| | | 65 | | Government National Mortgage Association, Pool #MA5077 | | | 3.50 | | | | 3/20/48 | | | | 63 | |
| | | 66 | | Government National Mortgage Association, Pool #MA3663 | | | 3.50 | | | | 5/20/46 | | | | 65 | |
| | | 19 | | Government National Mortgage Association, Pool #MA3937 | | | 3.50 | | | | 9/20/46 | | | | 18 | |
| | | 53 | | Government National Mortgage Association, Pool #MA5263 | | | 3.50 | | | | 6/20/48 | | | | 52 | |
See accompanying notes to financial statements.
255
HC CAPITAL TRUST
The U.S. Mortgage/Asset Backed Fixed Income Securities Portfolio
Portfolio of Investments (continued) — June 30, 2022
| | Principal
Amount
(000) | | Security Description | | Rate % | | | Maturity
Date | | | Value
(000) | |
| | | | | U.S. Government Agency Mortgages (continued) |
| | $ | 41 | | Government National Mortgage Association, Pool #MA1919 | | | 3.50 | | | | 5/20/44 | | | $ | 41 | |
| | | 86 | | Government National Mortgage Association, Pool #MA4382 | | | 3.50 | | | | 4/20/47 | | | | 84 | |
| | | 64 | | Government National Mortgage Association, Pool #MA3310 | | | 3.50 | | | | 12/20/45 | | | | 63 | |
| | | 29 | | Government National Mortgage Association, Pool #BD5909 | | | 3.50 | | | | 10/15/47 | | | | 29 | |
| | | 57 | | Government National Mortgage Association, Pool #MA4586 | | | 3.50 | | | | 7/20/47 | | | | 56 | |
| | | 102 | | Government National Mortgage Association, Pool #MA4127 | | | 3.50 | | | | 12/20/46 | | | | 100 | |
| | | 85 | | Government National Mortgage Association, Pool #MA2892 | | | 3.50 | | | | 6/20/45 | | | | 84 | |
| | | 81 | | Government National Mortgage Association, Pool #MA4321 | | | 3.50 | | | | 3/20/47 | | | | 79 | |
| | | 78 | | Government National Mortgage Association, Pool #MA2678 | | | 3.50 | | | | 3/20/45 | | | | 77 | |
| | | 10 | | Government National Mortgage Association, Pool #MA1574 | | | 3.50 | | | | 1/20/29 | | | | 10 | |
| | | 78 | | Government National Mortgage Association, Pool #MA0022 | | | 3.50 | | | | 4/20/42 | | | | 77 | |
| | | 82 | | Government National Mortgage Association, Pool #MA3376 | | | 3.50 | | | | 1/20/46 | | | | 81 | |
| | | 50 | | Government National Mortgage Association, Pool #MA3377 | | | 4.00 | | | | 1/20/46 | | | | 50 | |
| | | 59 | | Government National Mortgage Association, Pool #MA1449 | | | 4.00 | | | | 11/20/43 | | | | 60 | |
| | | 32 | | Government National Mortgage Association, Pool #MA3737 | | | 4.00 | | | | 6/20/46 | | | | 33 | |
| | | 16 | | Government National Mortgage Association, Pool #MA6155 | | | 4.00 | | | | 9/20/49 | | | | 16 | |
| | | 50 | | Government National Mortgage Association, Pool #713876 | | | 4.00 | | | | 8/15/39 | | | | 51 | |
| | | 54 | | Government National Mortgage Association, Pool #MA3598 | | | 4.00 | | | | 4/20/46 | | | | 55 | |
| | | 18 | | Government National Mortgage Association, Pool #MA4322 | | | 4.00 | | | | 3/20/47 | | | | 18 | |
| | | 17 | | Government National Mortgage Association, Pool #MA6091 | | | 4.00 | | | | 8/20/49 | | | | 17 | |
| | | 91 | | Government National Mortgage Association, Pool #MA5466 | | | 4.00 | | | | 9/20/48 | | | | 91 | |
| | | 108 | | Government National Mortgage Association, Pool #MA4587 | | | 4.00 | | | | 7/20/47 | | | | 109 | |
| | | 27 | | Government National Mortgage Association, Pool #MA3245 | | | 4.00 | | | | 11/20/45 | | | | 27 | |
| | | 20 | | Government National Mortgage Association, Pool #AD5627 | | | 4.00 | | | | 4/15/43 | | | | 21 | |
| | | 65 | | Government National Mortgage Association, Pool #MA5595 | | | 4.00 | | | | 11/20/48 | | | | 65 | |
| | | 54 | | Government National Mortgage Association, Pool #MA0319 | | | 4.00 | | | | 8/20/42 | | | | 55 | |
| | | 95 | | Government National Mortgage Association, Pool #MA4452 | | | 4.00 | | | | 5/20/47 | | | | 95 | |
| | | 15 | | Government National Mortgage Association, Pool #MA3106 | | | 4.00 | | | | 9/20/45 | | | | 15 | |
| | | 16 | | Government National Mortgage Association, Pool #AV6086 | | | 4.00 | | | | 7/15/47 | | | | 16 | |
| | | 32 | | Government National Mortgage Association, Pool #MA1996 | | | 4.00 | | | | 6/20/44 | | | | 33 | |
| | | 24 | | Government National Mortgage Association, Pool #740068 | | | 4.00 | | | | 9/15/40 | | | | 24 | |
| | | 10 | | Government National Mortgage Association, Pool #MA6040 | | | 4.00 | | | | 7/20/49 | | | | 10 | |
| | | 15 | | Government National Mortgage Association, Pool #MA5330 | | | 4.00 | | | | 7/20/48 | | | | 15 | |
| | | 9 | | Government National Mortgage Association, Pool #MA3174 | | | 4.00 | | | | 10/20/45 | | | | 9 | |
| | | 72 | | Government National Mortgage Association, Pool #MA1761 | | | 4.00 | | | | 3/20/44 | | | | 73 | |
| | | 31 | | Government National Mortgage Association, Pool #MA1286 | | | 4.00 | | | | 9/20/43 | | | | 32 | |
| | | 21 | | Government National Mortgage Association, Pool #738710 | | | 4.00 | | | | 9/15/41 | | | | 22 | |
| | | 45 | | Government National Mortgage Association, Pool #MA1678 | | | 4.00 | | | | 2/20/44 | | | | 46 | |
| | | 51 | | Government National Mortgage Association, Pool #MA4197 | | | 4.00 | | | | 1/20/47 | | | | 51 | |
| | | 42 | | Government National Mortgage Association, Pool #MA4263 | | | 4.00 | | | | 2/20/47 | | | | 42 | |
| | | 51 | | Government National Mortgage Association, Pool #MA5876 | | | 4.00 | | | | 4/20/49 | | | | 51 | |
| | | 183 | | Government National Mortgage Association, Pool #5139 | | | 4.00 | | | | 8/20/41 | | | | 186 | |
| | | 36 | | Government National Mortgage Association, Pool #AM8203 | | | 4.00 | | | | 5/15/45 | | | | 36 | |
| | | 53 | | Government National Mortgage Association, Pool #MA2522 | | | 4.00 | | | | 1/20/45 | | | | 54 | |
| | | 57 | | Government National Mortgage Association, Pool #MA1376 | | | 4.00 | | | | 10/20/43 | | | | 59 | |
| | | 18 | | Government National Mortgage Association, Pool #MA3455 | | | 4.00 | | | | 2/20/46 | | | | 18 | |
| | | 11 | | Government National Mortgage Association, Pool #779401 | | | 4.00 | | | | 6/15/42 | | | | 11 | |
| | | 21 | | Government National Mortgage Association, Pool #753254 | | | 4.00 | | | | 9/15/43 | | | | 21 | |
| | | 66 | | Government National Mortgage Association, Pool #MA4653 | | | 4.00 | | | | 8/20/47 | | | | 66 | |
See accompanying notes to financial statements.
256
HC CAPITAL TRUST
The U.S. Mortgage/Asset Backed Fixed Income Securities Portfolio
Portfolio of Investments (continued) — June 30, 2022
| | Principal
Amount
(000) | | Security Description | | Rate % | | | Maturity
Date | | | Value
(000) | |
| | | | | U.S. Government Agency Mortgages (continued) |
| | $ | 13 | | Government National Mortgage Association, Pool #4922 | | | 4.00 | | | | 1/20/41 | | | $ | 13 | |
| | | 60 | | Government National Mortgage Association, Pool #MA4511 | | | 4.00 | | | | 6/20/47 | | | | 61 | |
| | | 50 | | Government National Mortgage Association, Pool #MA5710 | | | 4.00 | | | | 1/20/49 | | | | 50 | |
| | | 51 | | Government National Mortgage Association, Pool #MA5078 | | | 4.00 | | | | 3/20/48 | | | | 51 | |
| | | 59 | | Government National Mortgage Association, Pool #AB1483 | | | 4.00 | | | | 8/15/42 | | | | 61 | |
| | | 29 | | Government National Mortgage Association, Pool #MA2149 | | | 4.00 | | | | 8/20/44 | | | | 29 | |
| | | 65 | | Government National Mortgage Association, Pool #MA2304 | | | 4.00 | | | | 10/20/44 | | | | 66 | |
| | | 57 | | Government National Mortgage Association, Pool #MA4383 | | | 4.00 | | | | 4/20/47 | | | | 58 | |
| | | 35 | | Government National Mortgage Association, Pool #MA2602 | | | 4.00 | | | | 2/20/45 | | | | 36 | |
| | | 87 | | Government National Mortgage Association, Pool #MA2074 | | | 4.00 | | | | 7/20/44 | | | | 88 | |
| | | 76 | | Government National Mortgage Association, Pool #MA2224 | | | 4.00 | | | | 9/20/44 | | | | 77 | |
| | | 88 | | Government National Mortgage Association, Pool #MA1839 | | | 4.00 | | | | 4/20/44 | | | | 90 | |
| | | 13 | | Government National Mortgage Association, Pool #766495 | | | 4.00 | | | | 10/15/41 | | | | 13 | |
| | | 17 | | Government National Mortgage Association, Pool #MA5986 | | | 4.00 | | | | 6/20/49 | | | | 17 | |
| | | 23 | | Government National Mortgage Association, Pool #MA0155 | | | 4.00 | | | | 6/20/42 | | | | 24 | |
| | | 20 | | Government National Mortgage Association, Pool #MA5931 | | | 4.00 | | | | 5/20/49 | | | | 20 | |
| | | 7 | | Government National Mortgage Association, Pool #MA5529 | | | 4.50 | | | | 10/20/48 | | | | 7 | |
| | | 22 | | Government National Mortgage Association, Pool #MA1092 | | | 4.50 | | | | 6/20/43 | | | | 23 | |
| | | 107 | | Government National Mortgage Association, Pool #717148 | | | 4.50 | | | | 5/15/39 | | | | 110 | |
| | | 17 | | Government National Mortgage Association, Pool #MA4780 | | | 4.50 | | | | 10/20/47 | | | | 18 | |
| | | 14 | | Government National Mortgage Association, Pool #MA5711 | | | 4.50 | | | | 1/20/49 | | | | 15 | |
| | | 20 | | Government National Mortgage Association, Pool #MA3805 | | | 4.50 | | | | 7/20/46 | | | | 21 | |
| | | 7 | | Government National Mortgage Association, Pool #BB7097 | | | 4.50 | | | | 8/15/47 | | | | 7 | |
| | | 12 | | Government National Mortgage Association, Pool #MA5596 | | | 4.50 | | | | 11/20/48 | | | | 13 | |
| | | 254 | | Government National Mortgage Association, Pool #4801 | | | 4.50 | | | | 9/20/40 | | | | 265 | |
| | | 8 | | Government National Mortgage Association, Pool #MA5987 | | | 4.50 | | | | 6/20/49 | | | | 8 | |
| | | 46 | | Government National Mortgage Association, Pool #MA5652 | | | 4.50 | | | | 12/20/48 | | | | 47 | |
| | | 14 | | Government National Mortgage Association, Pool #738793 | | | 4.50 | | | | 9/15/41 | | | | 15 | |
| | | 13 | | Government National Mortgage Association, Pool #729511 | | | 4.50 | | | | 4/15/40 | | | | 14 | |
| | | 60 | | Government National Mortgage Association, Pool #MA2756 | | | 4.50 | | | | 4/20/45 | | | | 62 | |
| | | 4 | | Government National Mortgage Association, Pool #MA5877 | | | 4.50 | | | | 4/20/49 | | | | 4 | |
| | | 40 | | Government National Mortgage Association, Pool #MA5818 | | | 4.50 | | | | 3/20/49 | | | | 41 | |
| | | 67 | | Government National Mortgage Association, Pool #5260 | | | 4.50 | | | | 12/20/41 | | | | 72 | |
| | | 67 | | Government National Mortgage Association, Pool #MA1762 | | | 4.50 | | | | 3/20/44 | | | | 70 | |
| | | 4 | | Government National Mortgage Association, Pool #MA5764 | | | 4.50 | | | | 2/20/49 | | | | 4 | |
| | | 15 | | Government National Mortgage Association, Pool #MA4721 | | | 4.50 | | | | 9/20/47 | | | | 15 | |
| | | 27 | | Government National Mortgage Association, Pool #MA5467 | | | 4.50 | | | | 9/20/48 | | | | 28 | |
| | | 10 | | Government National Mortgage Association, Pool #MA4129 | | | 4.50 | | | | 12/20/46 | | | | 11 | |
| | | 48 | | Government National Mortgage Association, Pool #MA4384 | | | 4.50 | | | | 4/20/47 | | | | 50 | |
| | | 35 | | Government National Mortgage Association, Pool #MA4512 | | | 4.50 | | | | 6/20/47 | | | | 36 | |
| | | 185 | | Government National Mortgage Association, Pool #721760 | | | 4.50 | | | | 8/15/40 | | | | 190 | |
| | | 12 | | Government National Mortgage Association, Pool #MA5399 | | | 4.50 | | | | 8/20/48 | | | | 12 | |
| | | 38 | | Government National Mortgage Association, Pool #MA0701 | | | 4.50 | | | | 1/20/43 | | | | 41 | |
| | | 30 | | Government National Mortgage Association, Pool #712690 | | | 5.00 | | | | 4/15/39 | | | | 32 | |
| | | 11 | | Government National Mortgage Association, Pool #782468 | | | 5.00 | | | | 11/15/38 | | | | 11 | |
| | | 23 | | Government National Mortgage Association, Pool #MA4007 | | | 5.00 | | | | 10/20/46 | | | | 25 | |
| | | 11 | | Government National Mortgage Association, Pool #MA5080 | | | 5.00 | | | | 3/20/48 | | | | 11 | |
| | | 13 | | Government National Mortgage Association, Pool #MA5933 | | | 5.00 | | | | 5/20/49 | | | | 13 | |
| | | 6 | | Government National Mortgage Association, Pool #MA0465 | | | 5.00 | | | | 10/20/42 | | | | 7 | |
See accompanying notes to financial statements.
257
HC CAPITAL TRUST
The U.S. Mortgage/Asset Backed Fixed Income Securities Portfolio
Portfolio of Investments (continued) — June 30, 2022
| | Principal
Amount
(000) | | Security Description | | Rate % | | | Maturity
Date | | | Value
(000) | |
| | | | | U.S. Government Agency Mortgages (continued) |
| | $ | 5 | | Government National Mortgage Association, Pool #MA5988 | | | 5.00 | | | | 6/20/49 | | | $ | 5 | |
| | | 12 | | Government National Mortgage Association, Pool #MA5400 | | | 5.00 | | | | 8/20/48 | | | | 13 | |
| | | 20 | | Government National Mortgage Association, Pool #MA5597 | | | 5.00 | | | | 11/20/48 | | | | 21 | |
| | | 11 | | Government National Mortgage Association, Pool #MA5819 | | | 5.00 | | | | 3/20/49 | | | | 11 | |
| | | 4 | | Government National Mortgage Association, Pool #MA5653 | | | 5.00 | | | | 12/20/48 | | | | 5 | |
| | | 42 | | Government National Mortgage Association, Pool #604285 | | | 5.00 | | | | 5/15/33 | | | | 45 | |
| | | 188 | | Government National Mortgage Association, Pool #4559 | | | 5.00 | | | | 10/20/39 | | | | 201 | |
| | | 41 | | Government National Mortgage Association, Pool #MA2076 | | | 5.00 | | | | 7/20/44 | | | | 44 | |
| | | 55 | | Government National Mortgage Association, Pool #694531 | | | 5.00 | | | | 11/15/38 | | | | 59 | |
| | | 92 | | Government National Mortgage Association, Pool #782523 | | | 5.00 | | | | 11/15/35 | | | | 98 | |
| | | 5 | | Government National Mortgage Association, Pool #MA5712 | | | 5.00 | | | | 1/20/49 | | | | 5 | |
| | | 11 | | Government National Mortgage Association, Pool #MA5765 | | | 5.00 | | | | 2/20/49 | | | | 11 | |
| | | 16 | | Government National Mortgage Association, Pool #675179 | | | 5.00 | | | | 3/15/38 | | | | 17 | |
| | | 11 | | Government National Mortgage Association, Pool #MA5530 | | | 5.00 | | | | 10/20/48 | | | | 12 | |
| | | 35 | | Government National Mortgage Association, Pool #510835 | | | 5.50 | | | | 2/15/35 | | | | 38 | |
| | | 56 | | Government National Mortgage Association, Pool #783284 | | | 5.50 | | | | 6/20/40 | | | | 59 | |
| | | 6 | | Government National Mortgage Association, Pool #658181 | | | 5.50 | | | | 11/15/36 | | | | 6 | |
| | | 9 | | Government National Mortgage Association, Pool #MA0466 | | | 5.50 | | | | 10/20/42 | | | | 9 | |
| | | 32 | | Government National Mortgage Association, Pool #781959 | | | 6.00 | | | | 7/15/35 | | | | 34 | |
| | | 31 | | Government National Mortgage Association, Pool #4222 | | | 6.00 | | | | 8/20/38 | | | | 32 | |
| | | 34 | | Government National Mortgage Association, Pool #4245 | | | 6.00 | | | | 9/20/38 | | | | 36 | |
| | | 8 | | Government National Mortgage Association, Pool #699237 | | | 6.50 | | | | 9/15/38 | | | | 9 | |
| | | 4,600 | | Government National Mortgage Association, 30 YR TBA | | | 2.00 | | | | 7/20/52 | | | | 4,075 | |
| | | 1,700 | | Government National Mortgage Association, 30 YR TBA | | | 2.50 | | | | 7/20/52 | | | | 1,553 | |
| | | 1,600 | | Government National Mortgage Association, 30 YR TBA | | | 3.00 | | | | 7/20/52 | | | | 1,507 | |
| | | 300 | | Government National Mortgage Association, 30 YR TBA | | | 3.00 | | | | 8/20/52 | | | | 282 | |
| | | 400 | | Government National Mortgage Association, 30 YR TBA | | | 3.50 | | | | 8/1/52 | | | | 388 | |
| | | 575 | | Government National Mortgage Association, 30 YR TBA | | | 3.50 | | | | 7/20/52 | | | | 558 | |
| | | 75 | | Government National Mortgage Association, 30 YR TBA | | | 4.00 | | | | 7/20/52 | | | | 75 | |
| | | 300 | | Government National Mortgage Association, 30 YR TBA | | | 4.00 | | | | 8/20/52 | | | | 298 | |
| | | | | Total U.S. Government Agency Mortgages | | | | | | | | | | | 181,373 | |
| | | | | | | | | | | | | | | | | |
| | Shares | | | | | | | | | | | | | | |
| | | | | Investment Company — 16.43% | | | | | | | | | | | | |
| | | 35,028,467 | | State Street Institutional Treasury Plus Money Market Fund, Trust Class | | | 1.40(b) | | | | | | | | 35,028 | |
| | | | | Total Investment Company | | | | | | | | | | | 35,028 | |
| | | | | | | | | | | | | | | | | |
| | | | | Total Investments Before TBA Sale Commitments (cost $246,643) — 108.32% | | | | | | | | | | | 230,996 | |
| | | | | | | | | | | | | | | | | |
See accompanying notes to financial statements.
258
HC CAPITAL TRUST
The U.S. Mortgage/Asset Backed Fixed Income Securities Portfolio
Portfolio of Investments (concluded) — June 30, 2022
| | Principal
Amount
(000) | | Security Description | | Rate % | | | Maturity
Date | | | Value
(000) | |
| | | | | TBA Sale Commitments (c) — (0.05)% | | | | | | | | | | | | |
| | $ | (100 | ) | Government National Mortgage Association, 30 YR TBA | | | 5.00 | | | | 7/20/52 | | | $ | (102 | ) |
| | | | | Total TBA Sale Commitments | | | | | | | | | | | (102 | ) |
| | | | | Liabilities in excess of other assets — (8.27)% | | | | | | | | | | | (17,641 | ) |
| | | | | Net Assets — 100.00% | | | | | | | | | | $ | 213,253 | |
Amounts designated as “—” are $0 or have been rounded to $0.
(a) | The rate for certain asset-backed and mortgage-backed securities may vary based on factors relating to the pool of assets underlying the security. The rate disclosed is the rate in effect on June 30, 2022. |
(b) | Annualized 7-day yield as of period-end. |
(c) | Represents a “to be announced” transaction. The Portfolio has committed to sell securities for which all specific information is not available at this time. (See Note 2 in the Notes to Financial Statements.) |
| TBA—To Be Announced purchase or sale commitment. Security is subject to delayed delivery |
The following table reflects the percentage of total net assets of the Portfolio attributable to each Specialist Manager as of June 30, 2022.
| The U.S. Mortgage/Asset Backed Fixed Income Securities Portfolio | | Mellon
Investments
Corporation | | | HC
Capital
Solutions | | | Total | |
| Asset Backed Securities | | | 0.71 | % | | | — | | | | 0.71 | % |
| Collateralized Mortgage Obligations | | | 6.14 | % | | | — | | | | 6.14 | % |
| U.S. Government Agency Mortgages | | | 85.04 | % | | | — | | | | 85.04 | % |
| Investment Company | | | 8.40 | % | | | 8.03 | % | | | 16.43 | % |
| TBA Sale Commitments | | | -0.05 | % | | | — | | | | -0.05 | % |
| Other Assets (Liabilities) | | | -8.20 | % | | | -0.07 | % | | | -8.27 | % |
| Total Net Assets | | | 92.04 | % | | | 7.96 | % | | | 100.00 | % |
Amounts designated as “—” indicate the Specialist Manager did not manage any holdings in that category.
See accompanying notes to financial statements.
259
HC CAPITAL TRUST
The Short-Term Municipal Bond Portfolio
Portfolio of Investments — June 30, 2022
| | Principal
Amount
(000) | | Security Description | | Rate % | | | Maturity
Date | | | Value
(000) | |
| | | | | Municipal Bonds — 97.92% | | | | | | | | | | | | |
| | | | | Alabama — 2.05% | | | | | | | | | | | | |
| | $ | 2,025 | | County of Baldwin Alabama, GO, Callable 11/1/24 @ 100.00 | | | 5.00 | | | | 5/1/25 | | | $ | 2,153 | |
| | | 710 | | University of Alabama Revenue, Series A, Callable 8/8/22 @ 100.00 | | | 5.00 | | | | 7/1/23 | | | | 712 | |
| | | | | | | | | | | | | | | | 2,865 | |
| | | | | Arizona — 4.81% | | | | | | | | | | | | |
| | | 805 | | County of Pima Arizona Sewer System Revenue | | | 5.00 | | | | 7/1/23 | | | | 830 | |
| | | 1,645 | | Maricopa County High School District No. 214 Tolleson Union High School, GO | | | 5.00 | | | | 7/1/24 | | | | 1,735 | |
| | | 2,475 | | Maricopa County Industrial Development Authority Revenue, Series D | | | 5.00(a) | | | | 1/1/46 | | | | 2,707 | |
| | | 1,350 | | Maricopa County Unified School District No. 41 Gilbert, GO, Series C | | | 5.00 | | | | 7/1/25 | | | | 1,459 | |
| | | | | | | | | | | | | | | | 6,731 | |
| | | | | Arkansas — 1.69% | | | | | | | | | | | | |
| | | 2,295 | | Rogers School District No. 30, GO, Callable 8/1/24 @ 100.00 (State Aid Withholding) | | | 4.00 | | | | 2/1/26 | | | | 2,362 | |
| | | | | | | | | | | | | | | | | |
| | | | | Delaware — 1.01% | | | | | | | | | | | | |
| | | 1,500 | | County of New Castle, GO | | | 0.56 | | | | 7/15/24 | | | | 1,416 | |
| | | | | | | | | | | | | | | | | |
| | | | | District of Columbia — 1.51% | | | | | | | | | | | | |
| | | 2,000 | | District of Columbia, GO, Series D | | | 5.00 | | | | 6/1/24 | | | | 2,110 | |
| | | | | | | | | | | | | | | | | |
| | | | | Florida — 3.48% | | | | | | | | | | | | |
| | | 425 | | JEA Florida Electric System Revenue, Series D | | | 5.00 | | | | 10/1/22 | | | | 428 | |
| | | 1,645 | | State of Florida Department of Management Services Refunding Certificates of Participation, Series A | | | 5.00 | | | | 11/1/23 | | | | 1,712 | |
| | | 2,420 | | State of Florida, GO, Series B, Callable 6/1/27 @ 100.00 | | | 5.00 | | | | 6/1/28 | | | | 2,727 | |
| | | | | | | | | | | | | | | | 4,867 | |
| | | | | Hawaii — 1.47% | | | | | | | | | | | | |
| | | 1,970 | | City & County Honolulu Hawaii Wastewater System Revenue | | | 4.00 | | | | 7/1/25 | | | | 2,064 | |
| | | | | | | | | | | | | | | | | |
| | | | | Indiana — 3.44% | | | | | | | | | | | | |
| | | 2,660 | | Indiana Finance Authority Revenue (Pre-Refunded/Escrowed to Maturity) | | | 5.00 | | | | 3/1/39 | | | | 2,857 | |
| | | 1,930 | | Indiana Municipal Power Agency Revenue, Series A | | | 5.00 | | | | 1/1/23 | | | | 1,957 | |
| | | | | | | | | | | | | | | | 4,814 | |
| | | | | Iowa — 5.97% | | | | | | | | | | | | |
| | | 1,440 | | Ankeny Community School District, GO | | | 5.00 | | | | 6/1/23 | | | | 1,478 | |
| | | 1,000 | | City of Ankeny, GO | | | 5.00 | | | | 6/1/25 | | | | 1,077 | |
| | | 2,105 | | City of Dubuque, GO | | | 2.00 | | | | 6/1/24 | | | | 2,094 | |
| | | 3,000 | | Iowa Finance Authority Revenue (Pre-Refunded/Escrowed to Maturity) | | | 5.50 | | | | 7/1/33 | | | | 3,108 | |
| | | 550 | | Linn-Mar Community School District, GO, Callable 5/1/26 @ 100.00 (BAM) | | | 5.00 | | | | 5/1/27 | | | | 600 | |
| | | | | | | | | | | | | | | | 8,357 | |
| | | | | Kansas — 3.44% | | | | | | | | | | | | |
| | | 1,790 | | Kansas Development Finance Authority Revenue | | | 5.00 | | | | 5/1/23 | | | | 1,830 | |
| | | 2,790 | | Kansas Development Finance Authority Revenue, Series D | | | 5.00 | | | | 4/1/25 | | | | 2,985 | |
| | | | | | | | | | | | | | | | 4,815 | |
| | | | | Kentucky — 0.51% | | | | | | | | | | | | |
| | | 685 | | University of Kentucky Revenue, Series A, Callable 4/1/24 @ 100.00 (State Intercept) | | | 5.00 | | | | 4/1/25 | | | | 717 | |
| | | | | | | | | | | | | | | | | |
See accompanying notes to financial statements.
260
HC CAPITAL TRUST
The Short-Term Municipal Bond Portfolio
Portfolio of Investments (continued) — June 30, 2022
| | Principal
Amount
(000) | | Security Description | | Rate % | | | Maturity
Date | | | Value
(000) | |
| | | | | Municipal Bonds (continued) |
| | | | | Maryland — 4.29% | | | | | | | | | | | | |
| | $ | 3,240 | | County of Prince George’s, GO, Series A | | | 5.00 | | | | 7/1/24 | | | $ | 3,430 | |
| | | 2,250 | | State of Maryland, GO | | | 5.00 | | | | 8/1/28 | | | | 2,575 | |
| | | | | | | | | | | | | | | | 6,005 | |
| | | | | Michigan — 3.15% | | | | | | | | | | | | |
| | | 2,170 | | Michigan State Housing Development Authority Revenue, Series A1, Callable 8/8/22 @ 100.00 | | | 0.65 | | | | 10/1/24 | | | | 2,081 | |
| | | 2,105 | | Wayne State University Revenue | | | 5.00 | | | | 11/15/26 | | | | 2,324 | |
| | | | | | | | | | | | | | | | 4,405 | |
| | | | | Minnesota — 3.50% | | | | | | | | | | | | |
| | | 2,000 | | Minneapolis Special School, GO (SD CRED PROG) | | | 5.00 | | | | 2/1/24 | | | | 2,095 | |
| | | 2,765 | | White Bear Lake Independent School, GO, Series A (SD CRED PROG) | | | 4.00 | | | | 2/1/23 | | | | 2,800 | |
| | | | | | | | | | | | | | | | 4,895 | |
| | | | | Missouri — 1.99% | | | | | | | | | | | | |
| | | 2,600 | | Lindbergh School District, GO | | | 4.00 | | | | 3/1/27 | | | | 2,783 | |
| | | | | | | | | | | | | | | | | |
| | | | | New Jersey — 2.04% | | | | | | | | | | | | |
| | | 2,815 | | New Jersey Infrastructure Bank Revenue, Series A | | | 3.00 | | | | 9/1/24 | | | | 2,861 | |
| | | | | | | | | | | | | | | | | |
| | | | | | | | | | | | | | | | | |
| | | | | New York — 11.04% | | | | | | | | | | | | |
| | | 2,165 | | City of New York, GO, Series A1 | | | 5.00 | | | | 8/1/23 | | | | 2,237 | |
| | | 1,525 | | City of New York, GO, Series B-1 | | | 5.00 | | | | 8/1/28 | | | | 1,728 | |
| | | 1,110 | | New York City Transitional Finance Authority Future Tax Secured Revenue, Series C-1 | | | 5.00 | | | | 2/1/28 | | | | 1,247 | |
| | | 2,000 | | New York City Transitional Finance Authority Future Tax Secured Revenue | | | 5.00 | | | | 11/1/23 | | | | 2,081 | |
| | | 3,970 | | New York State Dormitory Authority Revenue | | | 1.06 | | | | 3/15/25 | | | | 3,717 | |
| | | 440 | | New York State Dormitory Authority Revenue (Pre-Refunded/Escrowed to Maturity) | | | 5.00 | | | | 2/15/23 | | | | 448 | |
| | | 960 | | New York State Dormitory Authority Revenue (Pre-Refunded/Escrowed to Maturity) | | | 5.00 | | | | 2/15/23 | | | | 976 | |
| | | 405 | | New York State Dormitory Authority Revenue, Series A | | | 5.00 | | | | 2/15/24 | | | | 425 | |
| | | 2,500 | | Utility Debt Securitization Authority Revenue, Series TE, Callable 12/15/23 @ 100.00 | | | 5.00 | | | | 12/15/26 | | | | 2,607 | |
| | | | | | | | | | | | | | | | 15,466 | |
| | | | | North Carolina — 3.70% | | | | | | | | | | | | |
| | | 2,600 | | County of Durham North Carolina, GO | | | 3.00 | | | | 6/1/23 | | | | 2,629 | |
| | | 375 | | State of North Carolina Revenue | | | 5.00 | | | | 3/1/23 | | | | 382 | |
| | | 1,900 | | State of North Carolina, GO, Series B | | | 5.00 | | | | 6/1/28 | | | | 2,166 | |
| | | | | | | | | | | | | | | | 5,177 | |
| | | | | North Dakota — 1.01% | | | | | | | | | | | | |
| | | 1,365 | | City of Bismarck, GO | | | 4.00 | | | | 5/1/24 | | | | 1,415 | |
| | | | | | | | | | | | | | | | | |
| | | | | Ohio — 5.00% | | | | | | | | | | | | |
| | | 2,020 | | Ohio University Revenue (Pre-Refunded/Escrowed to Maturity) | | | 5.00 | | | | 12/1/32 | | | | 2,046 | |
| | | 2,955 | | State of Ohio, GO, Series B | | | 5.00 | | | | 8/1/23 | | | | 3,058 | |
| | | 2,000 | | University of Cincinnati Revenue | | | 2.26 | | | | 6/1/26 | | | | 1,903 | |
| | | | | | | | | | | | | | | | 7,007 | |
| | | | | Oregon — 0.99% | | | | | | | | | | | | |
| | | 1,320 | | City of Salem Oregon, GO | | | 5.00 | | | | 6/1/24 | | | | 1,393 | |
| | | | | | | | | | | | | | | | | |
See accompanying notes to financial statements.
261
HC CAPITAL TRUST
The Short-Term Municipal Bond Portfolio
Portfolio of Investments (continued) — June 30, 2022
| | Principal
Amount
(000) | | Security Description | | Rate % | | | Maturity
Date | | | Value
(000) | |
| | | | | Municipal Bonds (continued) |
| | | | | Pennsylvania — 3.73% | | | | | | | | | | | | |
| | $ | 2,910 | | Central Bucks School District, GO (State Aid Withholding) | | | 5.00 | | | | 5/15/23 | | | $ | 2,979 | |
| | | 2,010 | | Millcreek Township School District, GO (BAM) | | | 5.00 | | | | 9/15/27 | | | | 2,246 | |
| | | | | | | | | | | | | | | | 5,225 | |
| | | | | Texas — 14.45% | | | | | | | | | | | | |
| | | 1,730 | | Alief Independent School District, GO (PSF-GTD) | | | 5.00 | | | | 2/15/23 | | | | 1,762 | |
| | | 1,255 | | City of Arlington Texas, GO, Series A | | | 5.00 | | | | 8/15/22 | | | | 1,260 | |
| | | 1,565 | | City of Bryan Texas, GO | | | 5.00 | | | | 8/15/22 | | | | 1,571 | |
| | | 1,550 | | City of Garland Texas Electric Utility System Revenue | | | 5.00 | | | | 3/1/24 | | | | 1,622 | |
| | | 2,065 | | City of Irving Texas, GO | | | 5.00 | | | | 9/15/24 | | | | 2,198 | |
| | | 2,550 | | City of Waco Texas, GO, Series A | | | 5.00 | | | | 2/1/30 | | | | 2,952 | |
| | | 1,015 | | Conroe Independent School District, GO (PSF-GTD) | | | 5.00 | | | | 2/15/25 | | | | 1,088 | |
| | | 660 | | Dallas Area Rapid Transit Revenue, Series A | | | 5.00 | | | | 12/1/24 | | | | 706 | |
| | | 430 | | Harris County Toll Road Authority Revenue, Series B | | | 5.00 | | | | 8/15/22 | | | | 432 | |
| | | 625 | | North East Independent School District Texas, GO (PSF-GTD) | | | 5.00 | | | | 8/1/22 | | | | 627 | |
| | | 3,685 | | Pearland Independent School District, GO (PSF-GTD) | | | 5.00 | | | | 2/15/23 | | | | 3,754 | |
| | | 1,000 | | Plano Independent School, GO (PSF-GTD) | | | 5.00 | | | | 2/15/23 | | | | 1,018 | |
| | | 1,150 | | Round Rock Independent School District, GO (PSF-GTD) | | | 5.00 | | | | 8/1/25 | | | | 1,248 | |
| | | | | | | | | | | | | | | | 20,238 | |
| | | | | Utah — 2.44% | | | | | | | | | | | | |
| | | 3,140 | | Alpine School District, GO (SCH BD GTY) | | | 4.00 | | | | 3/15/29 | | | | 3,422 | |
| | | | | | | | | | | | | | | | | |
| | | | | Washington — 6.16% | | | | | | | | | | | | |
| | | 1,735 | | City of Seattle Washington Municipal Light & Power Revenue, Series A | | | 5.00 | | | | 1/1/24 | | | | 1,813 | |
| | | 1,260 | | County of King Washington, GO, Series B | | | 5.00 | | | | 7/1/25 | | | | 1,366 | |
| | | 1,085 | | King County Washington School District No. 405, GO, Series B (SCH BD GTY) | | | 5.00 | | | | 12/1/24 | | | | 1,161 | |
| | | 820 | | State of Washington Revenue, Series F | | | 5.00 | | | | 9/1/22 | | | | 825 | |
| | | 3,250 | | State of Washington, GO | | | 4.00 | | | | 7/1/26 | | | | 3,459 | |
| | | | | | | | | | | | | | | | 8,624 | |
| | | | | West Virginia — 1.51% | | | | | | | | | | | | |
| | | 2,130 | | Jefferson County Board of Education, GO | | | 2.00 | | | | 6/1/24 | | | | 2,119 | |
| | | | | | | | | | | | | | | | | |
| | | | | Wisconsin — 3.54% | | | | | | | | | | | | |
| | | 3,205 | | State of Wisconsin Environmental Improvement Fund Revenue, Series A | | | 5.00 | | | | 6/1/24 | | | | 3,384 | |
| | | 1,000 | | Stevens Point Area Public School District Wisconsin, GO | | | 5.00 | | | | 4/1/24 | | | | 1,050 | |
| | | 525 | | Wisconsin Energy Power Supply Revenue, Series A | | | 5.00 | | | | 7/1/22 | | | | 525 | |
| | | | | | | | | | | | | | | | 4,959 | |
| | | | | Total Municipal Bonds | | | | | | | | | | | 137,112 | |
| | | | | | | | | | | | | | | | | |
See accompanying notes to financial statements.
262
HC CAPITAL TRUST
The Short-Term Municipal Bond Portfolio
Portfolio of Investments (concluded) — June 30, 2022
| Shares | | | Security Description | | Rate % | | | Value
(000) | |
| | | | | Investment Company — 0.97% | | | | | | | | |
| | 1,361,358 | | | State Street Institutional Treasury Plus Money Market Fund, Trust Class | | | 1.40 | (b) | | $ | 1,361 | |
| | | | | Total Investment Company | | | | | | | 1,361 | |
| | | | | | | | | | | | | |
| | | | | Total Investments (cost $141,613) — 98.89% | | | | | | | 138,473 | |
| | | | | Other assets in excess of liabilities — 1.11% | | | | | | | 1,547 | |
| | | | | Net Assets — 100.00% | | | | | | $ | 140,020 | |
(a) | Interest rate is determined by the Remarketing Agent. The rate disclosed is the rate in effect on June 30, 2022. |
(b) | Annualized 7-day yield as of period-end. |
| As of June 30, 2022, 100% of the Portfolio’s net assets were managed by Breckinridge Capital Advisors, Inc. |
| PSF-GTD—Public School Fund Guaranteed |
| SCH BD GTY—School Board Guaranty |
| SD CRED PROG—School District Credit Program |
See accompanying notes to financial statements.
263
HC CAPITAL TRUST
The Intermediate Term Municipal Bond Portfolio
Portfolio of Investments — June 30, 2022
| | Principal
Amount
(000) | | Security Description | | Rate % | | | Maturity
Date | | | Value
(000) | |
| | | | | Municipal Bonds — 96.06% | | | | | | | | | | | | |
| | | | | Alabama — 2.25% | | | | | | | | | | | | |
| | $ | 1,675 | | Auburn University Revenue, Series A | | | 5.00 | | | | 6/1/26 | | | $ | 1,834 | |
| | | 1,400 | | Birmingham Alabama Water Works Board Water Revenue, Series B | | | 5.00 | | | | 1/1/24 | | | | 1,465 | |
| | | 2,895 | | Black Belt Energy Gas District Revenue, Callable 9/1/31 @ 100.53 | | | 4.00(a) | | | | 6/1/51 | | | | 2,924 | |
| | | 1,000 | | Lower Alabama Gas District Revenue, Callable 9/1/25 @ 100.58 (Goldman Sachs) | | | 4.00(a) | | | | 12/1/50 | | | | 1,013 | |
| | | 1,000 | | Troy University Revenue, Series A (BAM) | | | 5.00 | | | | 11/1/26 | | | | 1,100 | |
| | | | | | | | | | | | | | | | 8,336 | |
| | | | | Arizona — 1.75% | | | | | | | | | | | | |
| | | 1,685 | | City of Phoenix Civic Improvement Corp. Revenue, Callable 7/1/30 @ 100.00 | | | 5.00 | | | | 7/1/32 | | | | 1,927 | |
| | | 1,000 | | Maricopa County High School District No. 210-Phoenix, GO | | | 5.00 | | | | 7/1/25 | | | | 1,079 | |
| | | 1,215 | | Northern Arizona University Revenue, Series B (BAM) | | | 5.00 | | | | 6/1/26 | | | | 1,327 | |
| | | 1,000 | | Salt Verde Arizona Financial Corp. Senior Gas Revenue (Citigroup, Inc.) | | | 5.25 | | | | 12/1/24 | | | | 1,056 | |
| | | 1,015 | | State of Arizona Certificate of Participation, Series A | | | 5.00 | | | | 10/1/25 | | | | 1,104 | |
| | | | | | | | | | | | | | | | 6,493 | |
| | | | | Arkansas — 0.33% | | | | | | | | | | | | |
| | | 1,200 | | Arkansas State Development Finance Authority Hospital Revenue, Series B | | | 5.00 | | | | 2/1/23 | | | | 1,218 | |
| | | | | | | | | | | | | | | | | |
| | | | | California — 3.21% | | | | | | | | | | | | |
| | | 290 | | California State Department of Water Resources Revenue, Central Valley Project | | | 5.25 | | | | 7/1/22 | | | | 290 | |
| | | 3,000 | | California State, GO, Callable 11/1/30 @ 100.00 | | | 5.00 | | | | 11/1/31 | | | | 3,488 | |
| | | 1,250 | | California State, GO | | | 5.00 | | | | 8/1/24 | | | | 1,322 | |
| | | 2,460 | | Golden State Tobacco Securitization Corp. California Tobacco Settlement Revenue, Series A-1 | | | 5.00 | | | | 6/1/26 | | | | 2,698 | |
| | | 1,000 | | Los Angeles California Department of Airports Revenue | | | 5.00 | | | | 5/15/23 | | | | 1,022 | |
| | | 1,750 | | State of California, GO, Callable 4/1/29 @ 100.00 | | | 5.00 | | | | 4/1/30 | | | | 1,976 | |
| | | 1,000 | | State of California, GO, Callable 10/1/28 @ 100.00 | | | 5.00 | | | | 4/1/35 | | | | 1,112 | |
| | | | | | | | | | | | | | | | 11,908 | |
| | | | | Colorado — 4.07% | | | | | | | | | | | | |
| | | 1,225 | | Board of Governors of Colorado State University System Revenue, Series E-2 (State Intercept) | | | 5.00 | | | | 3/1/25 | | | | 1,308 | |
| | | 3,550 | | Colorado Health Facilities Authority Revenue, Series A | | | 5.00 | | | | 1/1/25 | | | | 3,770 | |
| | | 1,750 | | Denver City & County Colorado Airport System Revenue, Series A | | | 5.00 | | | | 11/15/23 | | | | 1,823 | |
| | | 3,600 | | Denver City & County Colorado Airport System Revenue, Series A | | | 5.00 | | | | 12/1/25 | | | | 3,882 | |
| | | 2,970 | | Denver City & County School District No. 1, GO, Series A (State Aid Withholding) | | | 5.50 | | | | 12/1/25 | | | | 3,285 | |
| | | 1,000 | | State of Colorado Certificate of Participation | | | 5.00 | | | | 3/15/23 | | | | 1,018 | |
| | | | | | | | | | | | | | | | 15,086 | |
| | | | | Connecticut — 1.62% | | | | | | | | | | | | |
| | | 1,085 | | Connecticut State Health & Educational Facilities Authority Revenue, Series B | | | 5.00 | | | | 12/1/26 | | | | 1,181 | |
| | | 1,500 | | State of Connecticut Special Tax Revenue, Series D, Callable 11/1/31 @ 100.00 | | | 5.00 | | | | 11/1/34 | | | | 1,711 | |
| | | 3,000 | | State of Connecticut, GO, Series A, Callable 10/15/23 @ 100.00 | | | 5.00 | | | | 10/15/25 | | | | 3,108 | |
| | | | | | | | | | | | | | | | 6,000 | |
| | | | | District of Columbia — 1.73% | | | | | | | | | | | | |
| | | 3,260 | | District of Columbia University Revenue, Callable 9/1/29 @ 100.00 | | | 5.00 | | | | 3/1/31 | | | | 3,718 | |
| | | 1,500 | | District of Columbia University Revenue | | | 5.00 | | | | 4/1/25 | | | | 1,598 | |
| | | 1,000 | | District of Columbia, GO, Callable 12/1/26 @ 100.00 | | | 5.00 | | | | 6/1/33 | | | | 1,103 | |
| | | | | | | | | | | | | | | | 6,419 | |
See accompanying notes to financial statements.
264
HC CAPITAL TRUST
The Intermediate Term Municipal Bond Portfolio
Portfolio of Investments (continued) — June 30, 2022
| | Principal
Amount
(000) | | Security Description | | Rate % | | | Maturity
Date | | | Value
(000) | |
| | | | | Municipal Bonds (continued) |
| | | | | Florida — 3.44% | | | | | | | | | | | | |
| | $ | 2,000 | | Alachua County Health Facilities Authority Revenue | | | 5.00(a) | | | | 12/1/37 | | | $ | 2,169 | |
| | | 1,500 | | Central Florida Expressway Authority Revenue (AGM) | | | 5.00 | | | | 7/1/30 | | | | 1,716 | |
| | | 955 | | County of Polk Florida Utility System Revenue | | | 5.00 | | | | 10/1/27 | | | | 1,067 | |
| | | 1,000 | | Florida Municipal Power Agency Revenue | | | 5.00 | | | | 10/1/25 | | | | 1,080 | |
| | | 1,500 | | Lee County Florida Solid Waste System Revenue (AMT) | | | 5.00 | | | | 10/1/25 | | | | 1,600 | |
| | | 1,615 | | Lee County Florida Solid Waste System Revenue | | | 5.00 | | | | 10/1/22 | | | | 1,626 | |
| | | 3,250 | | Orange County Florida Tourist Development Tax Revenue, Series B | | | 5.00 | | | | 10/1/25 | | | | 3,508 | |
| | | | | | | | | | | | | | | | 12,766 | |
| | | | | Georgia — 2.72% | | | | | | | | | | | | |
| | | 1,000 | | Atlanta Georgia Development Authority Revenue, Series A-1 | | | 5.00 | | | | 7/1/23 | | | | 1,029 | |
| | | 1,000 | | Fayette County Hospital Authority Revenue, Callable 1/1/24 @ 100.00 | | | 5.00(a) | | | | 7/1/54 | | | | 1,043 | |
| | | 250 | | Fulton County Georgia Development Authority Revenue, Series A | | | 5.00 | | | | 7/1/23 | | | | 257 | |
| | | 1,600 | | Fulton County Georgia Development Authority Revenue, Series A | | | 5.00 | | | | 7/1/24 | | | | 1,688 | |
| | | 5,000 | | Main Street Natural Gas, Inc. Revenue, Callable 6/1/26 @ 100.50 | | | 4.00(a) | | | | 3/1/50 | | | | 5,109 | |
| | | 1,000 | | Savannah Economic Development Authority Revenue | | | 1.90 | | | | 8/1/24 | | | | 977 | |
| | | | | | | | | | | | | | | | 10,103 | |
| | | | | Illinois — 7.19% | | | | | | | | | | | | |
| | | 73 | | Chicago Illinois Certificates of Participation, Tax Increment Allocation Revenue, Diversey/Narragansett Project, Series NT Continuously Callable @ 100.00 | | | 7.46 | | | | 2/15/26 | | | | 69 | |
| | | 1,000 | | Chicago Park District, GO, Series B, Callable 1/1/24 @ 100.00 | | | 5.00 | | | | 1/1/26 | | | | 1,038 | |
| | | 1,000 | | City of Chicago Illinois Waterworks Revenue | | | 5.00 | | | | 11/1/24 | | | | 1,062 | |
| | | 1,000 | | City of Chicago Illinois Waterworks Revenue, Callable 11/1/22 @ 100.00 | | | 5.00 | | | | 11/1/24 | | | | 1,010 | |
| | | 1,000 | | City of Chicago Illinois Waterworks Revenue, Callable 11/1/24 @ 100.00 | | | 5.00 | | | | 11/1/25 | | | | 1,059 | |
| | | 1,375 | | Illinois State Finance Authority Revenue, Series B-2, Callable 5/15/26 @ 100.00 | | | 5.00(a) | | | | 5/15/50 | | | | 1,481 | |
| | | 4,600 | | Illinois State Sales Tax Revenue, Series A (BAM) | | | 5.00 | | | | 6/15/25 | | | | 4,924 | |
| | | 1,635 | | Illinois State Toll Highway Authority Revenue | | | 5.00 | | | | 1/1/25 | | | | 1,732 | |
| | | 1,725 | | Metropolitan Water Reclamation District of Greater Chicago, GO, Series B | | | 5.00 | | | | 12/1/24 | | | | 1,841 | |
| | | 3,035 | | Metropolitan Water Reclamation District of Greater Chicago, GO, Series A, Callable 12/1/26 @ 100.00 | | | 5.00 | | | | 12/1/27 | | | | 3,364 | |
| | | 1,420 | | Metropolitan Water Reclamation District of Greater Chicago, GO, Series D | | | 5.00 | | | | 12/1/30 | | | | 1,619 | |
| | | 2,000 | | Regional Transportation Authority Revenue (AGC) | | | 6.00 | | | | 6/1/25 | | | | 2,143 | |
| | | 2,000 | | Sales Tax Securitization Corp. Revenue, Series A | | | 5.00 | | | | 1/1/29 | | | | 2,085 | |
| | | 2,995 | | University of Illinois Certificate of Participation, Series B, Callable 10/1/26 @ 100.00 | | | 5.00 | | | | 10/1/27 | | | | 3,240 | |
| | | | | | | | | | | | | | | | 26,667 | |
| | | | | Indiana — 3.04% | | | | | | | | | | | | |
| | | 2,500 | | City of Whiting Indiana Revenue (BP Plc) | | | 5.00(a) | | | | 12/1/44 | | | | 2,688 | |
| | | 1,150 | | Indiana Finance Authority Revenue, Series A | | | 5.00 | | | | 11/1/23 | | | | 1,197 | |
| | | 1,000 | | Indiana Finance Authority Revenue, Series A | | | 5.00 | | | | 11/1/24 | | | | 1,062 | |
| | | 1,350 | | Indiana Finance Authority Revenue, Series A, Callable 10/1/32 @ 100.00 | | | 5.00 | | | | 10/1/34 | | | | 1,561 | |
| | | 2,250 | | Indiana Finance Authority Revenue, Series B, Callable 1/1/25 @ 100.00 | | | 2.25(a) | | | | 12/1/58 | | | | 2,222 | |
| | | 1,500 | | Indiana Finance Authority Revenue, Series A | | | 3.13 | | | | 12/1/24 | | | | 1,519 | |
| | | 1,000 | | Indiana State Finance Authority Revenue, Stadium Project, Series A | | | 5.00 | | | | 2/1/23 | | | | 1,016 | |
| | | | | | | | | | | | | | | | 11,265 | |
See accompanying notes to financial statements.
265
HC CAPITAL TRUST
The Intermediate Term Municipal Bond Portfolio
Portfolio of Investments (continued) — June 30, 2022
| | Principal
Amount
(000) | | Security Description | | Rate % | | | Maturity
Date | | | Value
(000) | |
| | | | | Municipal Bonds (continued) |
| | | | | Iowa — 0.13% | | | | | | | | | | | | |
| | $ | 450 | | Iowa Tobacco Settlement Authority Revenue, Series A2, Callable 6/1/31 @ 100.00 | | | 5.00 | | | | 6/1/32 | | | $ | 488 | |
| | | | | | | | | | | | | | | | | |
| | | | | Kentucky — 2.45% | | | | | | | | | | | | |
| | | 1,300 | | City of Owensboro Kentucky Electric Light & Power System Revenue | | | 4.00 | | | | 1/1/23 | | | | 1,314 | |
| | | 3,160 | | Kentucky Public Energy Authority Revenue, Series A | | | 4.00 | | | | 4/1/23 | | | | 3,203 | |
| | | 1,000 | | Kentucky Public Energy Authority Revenue, Series A, Callable 1/2/24 @ 100.40 | | | 4.00 | | | | 4/1/24 | | | | 1,032 | |
| | | 3,500 | | Kentucky Public Energy Authority Revenue, Series B | | | 4.00(a) | | | | 1/1/49 | | | | 3,544 | |
| | | | | | | | | | | | | | | | 9,093 | |
| | | | | Louisiana — 1.34% | | | | | | | | | | | | |
| | | 1,415 | | Jefferson Sales Tax District Revenue, Series A (AGM) | | | 5.00 | | | | 12/1/25 | | | | 1,534 | |
| | | 2,500 | | Louisiana Offshore Terminal Authority Revenue | | | 1.65(a) | | | | 9/1/33 | | | | 2,472 | |
| | | 1,000 | | Parish of St. John the Baptist Louisiana Revenue | | | 2.10(a) | | | | 6/1/37 | | | | 977 | |
| | | | | | | | | | | | | | | | 4,983 | |
| | | | | Maine — 0.30% | | | | | | | | | | | | |
| | | 1,025 | | Finance Authority of Maine Revenue (AGC) | | | 5.00 | | | | 12/1/26 | | | | 1,097 | |
| | | | | | | | | | | | | | | | | |
| | | | | Maryland — 3.67% | | | | | | | | | | | | |
| | | 2,905 | | County of Montgomery Maryland, GO, Series A, Callable 8/1/30 @ 100.00 | | | 4.00 | | | | 8/1/31 | | | | 3,151 | |
| | | 4,040 | | Maryland State Stadium Authority Revenue | | | 5.00 | | | | 5/1/24 | | | | 4,246 | |
| | | 2,090 | | Maryland State Transportation Authority Revenue (AMT) | | | 5.00 | | | | 6/1/28 | | | | 2,300 | |
| | | 2,500 | | State of Maryland Department of Transportation Revenue, Callable 10/1/30 @ 100.00 | | | 5.00 | | | | 10/1/32 | | | | 2,891 | |
| | | 1,000 | | State of Maryland Department of Transportation Revenue, Callable 10/1/27 @ 100.00 | | | 4.00 | | | | 10/1/32 | | | | 1,048 | |
| | | | | | | | | | | | | | | | 13,636 | |
| | | | | Massachusetts — 2.11% | | | | | | | | | | | | |
| | | 3,000 | | Commonwealth of Massachusetts, GO, Series A (AMBAC) | | | 5.50 | | | | 8/1/30 | | | | 3,620 | |
| | | 1,400 | | Massachusetts Educational Financing Authority Revenue, Series B | | | 5.00 | | | | 7/1/29 | | | | 1,522 | |
| | | 1,615 | | Massachusetts State Educational Financing Authority Revenue, Series A (AMT) | | | 5.00 | | | | 7/1/23 | | | | 1,653 | |
| | | 1,000 | | Massachusetts State Educational Financing Authority Revenue (AMT) | | | 5.00 | | | | 1/1/25 | | | | 1,052 | |
| | | | | | | | | | | | | | | | 7,847 | |
| | | | | Michigan — 3.98% | | | | | | | | | | | | |
| | | 1,810 | | Great Lakes Michigan Water Authority Sewage Disposal System Revenue, Series B | | | 5.00 | | | | 7/1/24 | | | | 1,906 | |
| | | 1,000 | | Michigan Finance Authority Revenue, Callable 6/1/25 @ 100.00 | | | 5.50 | | | | 12/1/29 | | | | 1,074 | |
| | | 1,100 | | Michigan Finance Authority Revenue | | | 5.00 | | | | 10/1/29 | | | | 1,270 | |
| | | 1,280 | | Michigan Finance Authority Revenue, Series B | | | 5.00 | | | | 10/1/30 | | | | 1,491 | |
| | | 2,190 | | Michigan Finance Authority Revenue, Series B, Callable 10/1/30 @ 100.00 | | | 5.00 | | | | 10/1/31 | | | | 2,536 | |
| | | 1,450 | | Michigan State Building Authority Revenue | | | 5.00 | | | | 4/15/25 | | | | 1,550 | |
| | | 1,605 | | Michigan Strategic Fund Revenue | | | 5.00 | | | | 6/30/25 | | | | 1,693 | |
| | | 2,960 | | Utica Community Schools, GO (Q-SBLF) | | | 5.00 | | | | 5/1/26 | | | | 3,243 | |
| | | | | | | | | | | | | | | | 14,763 | |
| | | | | Minnesota — 0.29% | | | | | | | | | | | | |
| | | 1,000 | | Minneapolis-St. Paul Metropolitan Airports Commission Revenue, Series C | | | 5.00 | | | | 1/1/26 | | | | 1,081 | |
| | | | | | | | | | | | | | | | | |
| | | | | Missouri — 1.76% | | | | | | | | | | | | |
| | | 2,400 | | Health & Educational Facilities Authority of the State of Missouri Revenue | | | 5.00 | | | | 6/1/25 | | | | 2,577 | |
| | | 1,000 | | Missouri State Health & Educational Facilities Authority Revenue | | | 5.00 | | | | 11/15/23 | | | | 1,042 | |
See accompanying notes to financial statements.
266
HC CAPITAL TRUST
The Intermediate Term Municipal Bond Portfolio
Portfolio of Investments (continued) — June 30, 2022
| | Principal
Amount
(000) | | Security Description | | Rate % | | | Maturity
Date | | | Value
(000) | |
| | | | | Municipal Bonds (continued) |
| | | | | Missouri (continued) |
| | $ | 2,505 | | The Curators of The University of Missouri Revenue | | | 5.00 | | | | 11/1/30 | | | $ | 2,926 | |
| | | | | | | | | | | | | | | | 6,545 | |
| | | | | Nebraska — 0.57% | | | | | | | | | | | | |
| | | 1,000 | | City of Omaha Nebraska Sewer Revenue, Series A, Callable 4/1/30 @ 100.00 | | | 4.00 | | | | 4/1/31 | | | | 1,079 | |
| | | 1,000 | | City of Omaha Nebraska Sewer Revenue, Series A, Callable 4/1/30 @ 100.00 | | | 4.00 | | | | 4/1/32 | | | | 1,046 | |
| | | | | | | | | | | | | | | | 2,125 | |
| | | | | Nevada — 1.96% | | | | | | | | | | | | |
| | | 1,000 | | Clark County Nevada School District, GO, Series A | | | 5.00 | | | | 6/15/26 | | | | 1,096 | |
| | | 1,000 | | Clark County Nevada School District, GO, Series A | | | 5.00 | | | | 6/15/23 | | | | 1,030 | |
| | | 3,500 | | Las Vegas Valley Water District, GO | | | 5.00 | | | | 6/1/31 | | | | 4,067 | |
| | | 1,000 | | State of Nevada Highway Improvement Revenue | | | 5.00 | | | | 12/1/24 | | | | 1,067 | |
| | | | | | | | | | | | | | | | 7,260 | |
| | | | | New Jersey — 1.85% | | | | | | | | | | | | |
| | | 430 | | New Jersey Economic Development Authority Revenue, Callable 11/1/29 @ 100.00 | | | 5.00 | | | | 11/1/30 | | | | 466 | |
| | | 1,725 | | New Jersey Higher Education Student Assistance Authority Revenue | | | 5.00 | | | | 12/1/29 | | | | 1,894 | |
| | | 1,210 | | New Jersey State Economic Development Authority Revenue, School Facilities Construction | | | 5.00 | | | | 6/15/28 | | | | 1,317 | |
| | | 2,000 | | New Jersey State Higher Education Student Assistance Authority Revenue, Series B (AMT) | | | 5.00 | | | | 12/1/22 | | | | 2,023 | |
| | | 1,100 | | State of New Jersey, GO, Series A | | | 4.00 | | | | 6/1/31 | | | | 1,165 | |
| | | 10 | | Tobacco Settlement Financing Corp. New Jersey Revenue, Series B | | | 3.20 | | | | 6/1/27 | | | | 10 | |
| | | | | | | | | | | | | | | | 6,875 | |
| | | | | New Mexico — 0.75% | | | | | | | | | | | | |
| | | 2,590 | | New Mexico Educational Assistance Foundation Revenue, Series 1A | | | 5.00 | | | | 9/1/25 | | | | 2,788 | |
| | | | | | | | | | | | | | | | | |
| | | | | New York — 7.13% | | | | | | | | | | | | |
| | | 4,000 | | City of New York, GO, Series A-1 | | | 5.00 | | | | 8/1/27 | | | | 4,485 | |
| | | 2,890 | | City of New York, GO, Series A-1, Callable 10/1/30 @ 100.00 | | | 5.00 | | | | 4/1/32 | | | | 3,289 | |
| | | 3,000 | | New York City Housing Development Corp. Revenue, Series B-2 (Pre-Refunded/Escrowed to Maturity) | | | 5.00 | | | | 7/1/26 | | | | 3,102 | |
| | | 1,000 | | New York City Transitional Finance Authority Future Tax Secured Revenue, Series B-1, Callable 8/1/24 @ 100.00 | | | 5.00 | | | | 8/1/29 | | | | 1,053 | |
| | | 2,000 | | New York City Water & Sewer System Revenue, Callable 12/15/30 @ 100.00 | | | 5.00 | | | | 6/15/31 | | | | 2,329 | |
| | | 2,410 | | New York City Water & Sewer System Revenue, Callable 12/15/25 @ 100.00 | | | 5.00 | | | | 6/15/27 | | | | 2,611 | |
| | | 1,500 | | New York State Dormitory Authority Revenue, Series D | | | 5.00 | | | | 2/15/25 | | | | 1,610 | |
| | | 1,250 | | New York State Thruway Authority Revenue, Series A, Callable 3/15/31 @ 100.00 | | | 5.00 | | | | 3/15/33 | | | | 1,436 | |
| | | 1,795 | | New York Transportation Development Corp. Revenue | | | 5.00 | | | | 12/1/27 | | | | 1,898 | |
| | | 4,500 | | Port Authority of New York & New Jersey New York Revenue, Consolidated 185th (AMT) | | | 5.00 | | | | 9/1/23 | | | | 4,648 | |
| | | | | | | | | | | | | | | | 26,461 | |
| | | | | North Carolina — 2.03% | | | | | | | | | | | | |
| | | 1,000 | | City of Charlotte North Carolina Airport Revenue, Series C | | | 5.00 | | | | 7/1/24 | | | | 1,052 | |
| | | 1,000 | | County of Wake North Carolina Revenue | | | 5.00 | | | | 9/1/28 | | | | 1,146 | |
| | | 3,000 | | County of Wake North Carolina, GO | | | 5.00 | | | | 9/1/24 | | | | 3,183 | |
| | | 1,000 | | North Carolina State Turnpike Authority Revenue (AGC) | | | 5.00 | | | | 1/1/24 | | | | 1,041 | |
| | | 1,000 | | The Charlotte-Mecklenburg Hospital Authority Revenue | | | 5.00(a) | | | | 1/15/50 | | | | 1,125 | |
| | | | | | | | | | | | | | | | 7,547 | |
| | | | | | | | | | | | | | | | | |
See accompanying notes to financial statements.
267
HC CAPITAL TRUST
The Intermediate Term Municipal Bond Portfolio
Portfolio of Investments (continued) — June 30, 2022
| | Principal
Amount
(000) | | Security Description | | Rate % | | | Maturity
Date | | | Value
(000) | |
| | | | | Municipal Bonds (continued) |
| | | | | Ohio — 3.15% | | | | | | | | | | | | |
| | $ | 1,750 | | American Municipal Power, Inc. Revenue, Series A | | | 5.00 | | | | 2/15/24 | | | $ | 1,832 | |
| | | 1,500 | | American Municipal Power, Inc. Revenue, Series A, Callable 2/15/24 @ 100.00 | | | 5.00 | | | | 2/15/27 | | | | 1,559 | |
| | | 3,000 | | Buckeye Tobacco Settlement Financing Authority Revenue, Series A-2, Callable 6/1/30 @ 100.00 | | | 5.00 | | | | 6/1/32 | | | | 3,235 | |
| | | 800 | | County of Montgomery Revenue, Callable 8/1/31 @ 100.00 | | | 5.00 | | | | 8/1/33 | | | | 906 | |
| | | 465 | | Mahoning County Ohio Hospital Facilities Revenue, Western Reserve Care System Continuously Callable @ 100.00 (MBIA) | | | 5.50 | | | | 10/15/25 | | | | 503 | |
| | | 775 | | University of Cincinnati Revenue | | | 5.00 | | | | 6/1/26 | | | | 849 | |
| | | 700 | | University of Cincinnati Revenue | | | 5.00 | | | | 6/1/25 | | | | 752 | |
| | | 1,850 | | University of Cincinnati Revenue | | | 5.00 | | | | 6/1/27 | | | | 2,062 | |
| | | | | | | | | | | | | | | | 11,698 | |
| | | | | Oklahoma — 1.03% | | | | | | | | | | | | |
| | | 1,000 | | Oklahoma Development Finance Authority Revenue, Callable 7/27/22 @ 100.00 | | | 1.63 | | | | 7/6/23 | | | | 983 | |
| | | 530 | | Oklahoma Municipal Power Authority Revenue, Series A, Callable 1/1/31 @ 100.00 (AGM) | | | 4.00 | | | | 1/1/32 | | | | 551 | |
| | | 2,000 | | Oklahoma Turnpike Authority Revenue | | | 5.00 | | | | 1/1/30 | | | | 2,301 | |
| | | | | | | | | | | | | | | | 3,835 | |
| | | | | Oregon — 1.16% | | | | | | | | | | | | |
| | | 1,305 | | Benton & Linn Counties Consolidated School District No. 509J & 509A Corvallis, GO, Series A (SCH BD GTY) | | | 5.00(a) | | | | 6/15/25 | | | | 1,408 | |
| | | 2,500 | | Multnomah County School District No. 1 Portland, GO (SCH BD GTY) | | | 5.00 | | | | 6/15/29 | | | | 2,886 | |
| | | | | | | | | | | | | | | | 4,294 | |
| | | | | Pennsylvania — 6.82% | | | | | | | | | | | | |
| | | 3,500 | | City of Philadelphia PA Water & Wastewater Revenue, Callable 10/1/30 @ 100.00 | | | 5.00 | | | | 10/1/32 | | | | 3,970 | |
| | | 3,535 | | City of Philadelphia PA, GO, Series A | | | 5.00 | | | | 5/1/30 | | | | 4,004 | |
| | | 1,000 | | City of Philadelphia Pennsylvania Water & Wastewater Revenue, Series B | | | 5.00 | | | | 11/1/27 | | | | 1,119 | |
| | | 1,250 | | Commonwealth Financing Authority Revenue, Tobacco Master Settlement | | | 5.00 | | | | 6/1/23 | | | | 1,282 | |
| | | 850 | | Easton Area School District, GO, Series A (State Aid Withholding) | | | 4.00 | | | | 4/1/25 | | | | 890 | |
| | | 1,860 | | Luzerne County Industrial Development Authority Revenue, Callable 12/3/29 @ 100.00 | | | 2.45(a) | | | | 12/1/39 | | | | 1,780 | |
| | | 2,500 | | Pennsylvania Economic Development Financing Authority Revenue (AMT) | | | 2.15(a) | | | | 7/1/41 | | | | 2,493 | |
| | | 1,000 | | Pennsylvania Higher Education Assistance Agency Revenue | | | 5.00 | | | | 6/1/29 | | | | 1,092 | |
| | | 2,500 | | Pennsylvania State Turnpike Commission Revenue | | | 5.00 | | | | 6/1/24 | | | | 2,622 | |
| | | 625 | | Pennsylvania Turnpike Commission Revenue | | | 5.00 | | | | 12/1/28 | | | | 692 | |
| | | 3,225 | | School District of Philadelphia, GO | | | 5.00 | | | | 9/1/28 | | | | 3,628 | |
| | | 1,700 | | Southeastern Pennsylvania Transportation Authority Revenue | | | 5.00 | | | | 3/1/23 | | | | 1,730 | |
| | | | | | | | | | | | | | | | 25,302 | |
| | | | | Rhode Island — 1.56% | | | | | | | | | | | | |
| | | 2,000 | | Rhode Island Health & Educational Building Corp. Revenue | | | 5.00 | | | | 5/15/23 | | | | 2,039 | |
| | | 1,000 | | Rhode Island State Student Loan Authority Revenue, Series A (AMT) | | | 5.00 | | | | 12/1/22 | | | | 1,011 | |
| | | 625 | | Rhode Island State Student Loan Authority Revenue | | | 5.00 | | | | 12/1/29 | | | | 697 | |
| | | 1,875 | | Rhode Island Student Loan Authority Revenue, Series A | | | 5.00 | | | | 12/1/29 | | | | 2,059 | |
| | | | | | | | | | | | | | | | 5,806 | |
| | | | | South Carolina — 1.92% | | | | | | | | | | | | |
| | | 3,680 | | County of Charleston South Carolina, GO, Series A (State Aid Withholding) | | | 5.00 | | | | 11/1/26 | | | | 4,100 | |
| | | 1,000 | | Piedmont Municipal Power Agency Revenue, Series B | | | 5.00 | | | | 1/1/29 | | | | 1,121 | |
| | | 1,000 | | South Carolina Public Service Authority Revenue, Series A | | | 5.00 | | | | 12/1/31 | | | | 1,131 | |
| | | 680 | | South Carolina Public Service Authority Revenue | | | 5.00 | | | | 12/1/27 | | | | 768 | |
| | | | | | | | | | | | | | | | 7,120 | |
See accompanying notes to financial statements.
268
HC CAPITAL TRUST
The Intermediate Term Municipal Bond Portfolio
Portfolio of Investments (continued) — June 30, 2022
| | Principal
Amount
(000) | | Security Description | | Rate % | | | Maturity
Date | | | Value
(000) | |
| | | | | Municipal Bonds (continued) |
| | | | | Tennessee — 0.76% | | | | | | | | | | | | |
| | $ | 1,500 | | Tennessee Energy Acquisition Corp. Revenue, Callable 8/1/25 @ 100.22 | | | 4.00(a) | | | | 11/1/49 | | | $ | 1,538 | |
| | | 1,250 | | Tennessee State Energy Acquisition Corp. Gas Revenue, Series E, Callable 2/1/23 @ 100.43 | | | 4.00(a) | | | | 5/1/48 | | | | 1,265 | |
| | | | | | | | | | | | | | | | 2,803 | |
| | | | | Texas — 12.32% | | | | | | | | | | | | |
| | | 2,000 | | Aldine Texas Independent School District, GO (PSF-GTD) | | | 5.00 | | | | 2/15/25 | | | | 2,145 | |
| | | 1,230 | | Arlington Higher Education Finance Corp. Revenue (PSF-GTD) | | | 5.00 | | | | 8/15/28 | | | | 1,393 | |
| | | 1,025 | | Arlington Higher Education Finance Corp. Revenue (PSF-GTD) | | | 5.00 | | | | 8/15/27 | | | | 1,149 | |
| | | 1,000 | | Austin Texas Community College District, GO | | | 5.00 | | | | 8/1/23 | | | | 1,035 | |
| | | 2,450 | | City of Dallas Texas, GO, Callable 2/15/25 @ 100.00 | | | 5.00 | | | | 2/15/27 | | | | 2,610 | |
| | | 2,500 | | City of Houston Texas Airport System Revenue, Series C (AMT) | | | 5.00 | | | | 7/1/25 | | | | 2,659 | |
| | | 1,300 | | City of San Antonio Texas Electric & Gas Systems Revenue | | | 4.00 | | | | 2/1/33 | | | | 1,392 | |
| | | 950 | | Clifton Higher Education Finance Corp. Revenue, Series T, Callable 8/15/32 @ 100.00 (PSF-GTD) | | | 4.00 | | | | 8/15/34 | | | | 992 | |
| | | 1,205 | | Clifton Higher Education Finance Corp. Revenue (PSF-GTD) | | | 5.00 | | | | 8/15/24 | | | | 1,278 | |
| | | 2,200 | | Clifton Higher Education Finance Corp. Revenue (PSF-GTD) | | | 5.00 | | | | 8/15/25 | | | | 2,384 | |
| | | 2,500 | | Dallas Independent School District, GO, Series A, Callable 2/15/25 @ 100.00 (PSF-GTD) | | | 5.00 | | | | 2/15/27 | | | | 2,660 | |
| | | 2,300 | | Dallas Love Field Revenue (AMT) | | | 5.00 | | | | 11/1/25 | | | | 2,464 | |
| | | 2,100 | | Harris County Cultural Education Facilities Finance Corp. Baylor College of Medicine Revenue | | | 5.00 | | | | 11/15/27 | | | | 2,295 | |
| | | 1,650 | | Harris County Cultural Education Facilities Finance Corp. Revenue | | | 5.00 | | | | 11/15/25 | | | | 1,785 | |
| | | 2,095 | | Harris County Cultural Education Facilities Finance Corp. Revenue | | | 5.00 | | | | 11/15/23 | | | | 2,179 | |
| | | 1,220 | | Love Field Texas Airport Modernization Corp. General Airport Revenue, Callable 11/1/22 @ 100.00 | | | 5.00 | | | | 11/1/28 | | | | 1,231 | |
| | | 1,000 | | Love Field Texas Airport Modernization Corp. General Airport Revenue (AMT) | | | 5.00 | | | | 11/1/22 | | | | 1,009 | |
| | | 1,000 | | Lower Colorado River Texas Authority Revenue | | | 5.00 | | | | 5/15/26 | | | | 1,091 | |
| | | 825 | | Lower Colorado River Texas Authority Transmission Contract Revenue | | | 5.00 | | | | 5/15/23 | | | | 845 | |
| | | 1,000 | | North Texas Tollway Authority Revenue, Series A | | | 5.00 | | | | 1/1/24 | | | | 1,045 | |
| | | 1,000 | | San Antonio Texas Airport System Revenue | | | 5.00 | | | | 7/1/26 | | | | 1,081 | |
| | | 1,750 | | San Antonio Texas Airport System Revenue | | | 5.00 | | | | 7/1/25 | | | | 1,863 | |
| | | 3,585 | | Texas Water Development Board Revenue, Callable 8/1/31 @ 100.00 | | | 5.00 | | | | 8/1/33 | | | | 4,166 | |
| | | 2,230 | | University of Houston Revenue, Series C, Callable 2/15/26 @ 100.00 | | | 5.00 | | | | 2/15/28 | | | | 2,414 | |
| | | 1,300 | | West Harris County Regional Water Authority Revenue | | | 5.00 | | | | 12/15/27 | | | | 1,465 | |
| | | 1,000 | | West Travis County Public Utility Agency Revenue (BAM) | | | 5.00 | | | | 8/15/26 | | | | 1,086 | |
| | | | | | | | | | | | | | | | 45,716 | |
| | | | | Utah — 0.32% | | | | | | | | | | | | |
| | | 1,090 | | Utah Transit Authority Revenue | | | 5.00 | | | | 12/15/26 | | | | 1,205 | |
| | | | | | | | | | | | | | | | | |
| | | | | Virginia — 2.10% | | | | | | | | | | | | |
| | | 1,500 | | City of Richmond VA Public Utility Revenue, Callable 1/15/26 @ 100.00 | | | 5.00 | | | | 1/15/29 | | | | 1,636 | |
| | | 1,000 | | Fairfax County Virginia Industrial Development Authority Revenue, Series A | | | 5.00 | | | | 5/15/24 | | | | 1,054 | |
| | | 850 | | Hampton Roads Transportation Accountability Commission Revenue, Callable 7/1/30 @ 100.00 | | | 5.00 | | | | 7/1/31 | | | | 977 | |
| | | 2,000 | | King George County Economic Development Authority Revenue | | | 2.50(a) | | | | 6/1/23 | | | | 2,006 | |
| | | 1,000 | | Roanoke Economic Development Authority Revenue | | | 5.00 | | | | 7/1/25 | | | | 1,071 | |
| | | 1,000 | | Virginia Public Building Authority Revenue, Series B (AMT) | | | 5.00 | | | | 8/1/24 | | | | 1,056 | |
| | | | | | | | | | | | | | | | 7,800 | |
| | | | | Washington — 2.30% | | | | | | | | | | | | |
| | | 1,500 | | Port of Seattle Washington Revenue (AMT) | | | 5.00 | | | | 4/1/26 | | | | 1,623 | |
| | | 1,300 | | State of Washington, GO, Series C, Callable 2/1/31 @ 100.00 | | | 5.00 | | | | 2/1/33 | | | | 1,498 | |
See accompanying notes to financial statements.
269
HC CAPITAL TRUST
The Intermediate Term Municipal Bond Portfolio
Portfolio of Investments (concluded) — June 30, 2022
| | Principal
Amount
(000) | | Security Description | | Rate % | | | Maturity
Date | | | Value
(000) | |
| | | | | Municipal Bonds (continued) |
| | | | | Washington (continued) |
| | $ | 1,250 | | Washington Health Care Facilities Authority Revenue | | | 5.00 | | | | 10/1/25 | | | $ | 1,349 | |
| | | 1,600 | | Washington Health Care Facilities Authority Revenue, Series B1, Callable 2/1/24 @ 100.00 | | | 5.00(a) | | | | 8/1/49 | | | | 1,670 | |
| | | 2,310 | | Washington Health Care Facilities Authority Revenue | | | 5.00 | | | | 8/15/23 | | | | 2,391 | |
| | | | | | | | | | | | | | | | 8,531 | |
| | | | | Wisconsin — 0.95% | | | | | | | | | | | | |
| | | 1,000 | | Public Finance Authority Wisconsin Lease Development Revenue | | | 5.00 | | | | 3/1/23 | | | | 1,018 | |
| | | 1,225 | | University of Wisconsin Hospitals & Clinics Revenue | | | 5.00 | | | | 4/1/26 | | | | 1,338 | |
| | | 1,100 | | Wisconsin Health & Educational Facilities Authority Revenue | | | 4.00 | | | | 11/15/26 | | | | 1,179 | |
| | | | | | | | | | | | | | | | 3,535 | |
| | | | | Total Municipal Bonds | | | | | | | | | | | 356,495 | |
| | | | | | | | | | | | | | | | | |
| | Shares | | | | | | | | | | | | | | |
| | | | | Investment Company — 2.88% | | | | | | | | | | | | |
| | | 10,671,157 | | State Street Institutional Treasury Plus Money Market Fund, Trust Class | | | 1.40(b) | | | | | | | | 10,671 | |
| | | | | Total Investment Company | | | | | | | | | | | 10,671 | |
| | | | | | | | | | | | | | | | | |
| | | | | Total Investments (cost $382,121) — 98.94% | | | | | | | | | | | 367,166 | |
| | | | | Other assets in excess of liabilities — 1.06% | | | | | | | | | | | 3,932 | |
| | | | | Net Assets — 100.00% | | | | | | | | | | $ | 371,098 | |
(a) | Interest rate is determined by the Remarketing Agent. The rate disclosed is the rate in effect on June 30, 2022. |
(b) | Annualized 7-day yield as of period-end. |
| AGC—Assured Guaranty Corp. |
| AGM—Assured Guaranty Municipal Corporation |
| AMBAC—American Municipal Bond Assurance Corporation |
| AMT—Alternative Minimum Tax |
| MBIA—Municipal Bond Insurance Association |
| PSF-GTD—Public School Fund Guaranteed |
| Q-SBLF—Qualified School Bond Loan Fund |
| SCH BD GTY—School Board Guaranty |
The following table reflects the percentage of total net assets of the Portfolio attributable to each Specialist Manager as of June 30, 2022.
| The Intermediate Term Municipal Bond Portfolio | | Insight
North
America LLC | | | HC
Capital
Solutions | | | Total | |
| Municipal Bonds | | | 96.06 | % | | | — | | | | 96.06 | % |
| Investment Company | | | — | | | | 2.88 | % | | | 2.88 | % |
| Other Assets (Liabilities) | | | 1.08 | % | | | -0.02 | % | | | 1.06 | % |
| Total Net Assets | | | 97.14 | % | | | 2.86 | % | | | 100.00 | % |
Amounts designated as “—” indicate the Specialist Manager did not manage any holdings in that category.
See accompanying notes to financial statements.
270
HC CAPITAL TRUST
The Intermediate Term Municipal Bond II Portfolio
Portfolio of Investments — June 30, 2022
| | Principal
Amount
(000) | | Security Description | | Rate % | | | Maturity
Date | | | Value
(000) | |
| | | | | Municipal Bonds — 72.61% | | | | | | | | | | | | |
| | | | | Alabama — 2.95% | | | | | | | | | | | | |
| | $ | 1,415 | | Birmingham Alabama Special Care Facilities Financing Authority Health Care Facility Revenue, Callable 6/1/25 @ 100.00 | | | 5.00 | | | | 6/1/29 | | | $ | 1,501 | |
| | | 740 | | Pell City Alabama, GO, Series A, Callable 2/1/25 @ 100.00 | | | 5.00 | | | | 2/1/26 | | | | 789 | |
| | | 260 | | Pell City Alabama, GO, Series A (Pre-Refunded/Escrowed to Maturity) | | | 5.00 | | | | 2/1/26 | | | | 279 | |
| | | | | | | | | | | | | | | | 2,569 | |
| | | | | California — 1.48% | | | | | | | | | | | | |
| | | 1,440 | | San Ramon Valley Unified School District, GO | | | 1.44 | | | | 8/1/27 | | | | 1,289 | |
| | | | | | | | | | | | | | | | | |
| | | | | Connecticut — 1.01% | | | | | | | | | | | | |
| | | 870 | | State of Connecticut Special Tax Revenue, Callable 5/1/30 @ 100.00 | | | 4.00 | | | | 5/1/36 | | | | 876 | |
| | | | | | | | | | | | | | | | | |
| | | | | Florida — 6.57% | | | | | | | | | | | | |
| | | 1,250 | | Florida State Board of Education Lottery Revenue, Series A | | | 5.00 | | | | 7/1/26 | | | | 1,378 | |
| | | 1,400 | | Lee County Florida School Board Certificates of Participation, Series A, Callable 8/1/24 @ 100.00 | | | 5.00 | | | | 8/1/27 | | | | 1,477 | |
| | | 750 | | Miami-Dade County Florida, GO, Series A, Callable 11/1/24 @ 100.00 | | | 5.00 | | | | 11/1/27 | | | | 798 | |
| | | 585 | | Orange County Florida School Board, Certificates of Participation, Series A | | | 5.00 | | | | 8/1/23 | | | | 604 | |
| | | 1,300 | | State of Florida Department of Transportation Revenue, Callable 7/1/28 @ 100.00 | | | 5.00 | | | | 7/1/31 | | | | 1,460 | |
| | | | | | | | | | | | | | | | 5,717 | |
| | | | | Georgia — 1.40% | | | | | | | | | | | | |
| | | 1,150 | | Walton Industrial Building Authority Revenue | | | 4.00 | | | | 2/1/31 | | | | 1,221 | |
| | | | | | | | | | | | | | | | | |
| | | | | Illinois — 6.36% | | | | | | | | | | | | |
| | | 1,085 | | City of Highland Park, GO | | | 4.00 | | | | 12/30/25 | | | | 1,147 | |
| | | 1,095 | | Highland Park Park District Revenue | | | 5.00 | | | | 12/15/30 | | | | 1,257 | |
| | | 1,400 | | Illinois Finance Authority Revenue | | | 5.00 | | | | 1/1/27 | | | | 1,559 | |
| | | 1,730 | | Metropolitan Water Reclamation District of Greater Chicago, GO, Series E | | | 1.82 | | | | 12/1/27 | | | | 1,571 | |
| | | | | | | | | | | | | | | | 5,534 | |
| | | | | Iowa — 1.74% | | | | | | | | | | | | |
| | | 1,410 | | City of Bettendorf Iowa, GO, Series D | | | 5.00 | | | | 6/1/25 | | | | 1,512 | |
| | | | | | | | | | | | | | | | | |
| | | | | Kentucky — 1.61% | | | | | | | | | | | | |
| | | 1,220 | | Louisville and Jefferson County Metropolitan Sewer District Revenue, Series A | | | 5.00 | | | | 5/15/29 | | | | 1,398 | |
| | | | | | | | | | | | | | | | | |
| | | | | Minnesota — 4.77% | | | | | | | | | | | | |
| | | 1,005 | | City of Moorhead, GO | | | 5.00 | | | | 2/1/27 | | | | 1,113 | |
| | | 1,420 | | Lakeville Independent School District No. 194, GO (SD CRED PROG) | | | 5.00 | | | | 2/1/27 | | | | 1,581 | |
| | | 1,345 | | North St Paul-Maplewood-Oakdale Independent School District No. 622, GO, Series A (SD CRED PROG) | | | 4.00 | | | | 2/1/28 | | | | 1,455 | |
| | | | | | | | | | | | | | | | 4,149 | |
| | | | | Nevada — 3.62% | | | | | | | | | | | | |
| | | 1,105 | | Las Vegas Valley Nevada Water District, GO, Series B | | | 5.00 | | | | 12/1/24 | | | | 1,182 | |
| | | 800 | | Nevada State System of Higher Education Certificates of Participation Revenue, Series A, Callable 7/1/24 @ 100.00 | | | 5.00 | | | | 7/1/26 | | | | 839 | |
| | | 980 | | State of Nevada, GO, Series A | | | 5.00 | | | | 5/1/29 | | | | 1,126 | |
| | | | | | | | | | | | | | | | 3,147 | |
See accompanying notes to financial statements.
271
HC CAPITAL TRUST
The Intermediate Term Municipal Bond II Portfolio
Portfolio of Investments (continued) — June 30, 2022
| | Principal
Amount
(000) | | Security Description | | Rate % | | | Maturity
Date | | | Value
(000) | |
| | | | | Municipal Bonds (continued) |
| | | | | New Mexico — 1.31% | | | | | | | | | | | | |
| | $ | 1,025 | | Albuquerque Municipal School District No. 12, GO, Callable 8/1/28 @ 100.00 (State Aid Withholding) | | | 5.00 | | | | 8/1/29 | | | $ | 1,143 | |
| | | | | | | | | | | | | | | | | |
| | | | | New York — 5.06% | | | | | | | | | | | | |
| | | 570 | | City of New York, GO | | | 5.00 | | | | 4/1/31 | | | | 657 | |
| | | 600 | | Metropolitan Transportation Authority Revenue, Series A-1 | | | 5.00 | | | | 2/1/23 | | | | 610 | |
| | | 1,430 | | New York City Transitional Finance Authority Building Aid Revenue (State Aid Withholding) | | | 1.35 | | | | 7/15/27 | | | | 1,254 | |
| | | 625 | | New York State Dormitory Authority State Personal Income Tax Revenue, Series A, Callable 2/15/24 @ 100.00 | | | 5.00 | | | | 2/15/26 | | | | 650 | |
| | | 1,080 | | New York State Urban Development Corp. Revenue, Callable 9/15/31 @ 100.00 | | | 5.00 | | | | 3/15/32 | | | | 1,235 | |
| | | | | | | | | | | | | | | | 4,406 | |
| | | | | North Carolina — 2.30% | | | | | | | | | | | | |
| | | 1,500 | | North Carolina State Revenue, Series B | | | 5.00 | | | | 5/1/27 | | | | 1,684 | |
| | | 300 | | University of North Carolina at Greensboro Revenue | | | 5.00 | | | | 4/1/25 | | | | 321 | |
| | | | | | | | | | | | | | | | 2,005 | |
| | | | | | | | | | | | | | | | | |
| | | | | Ohio — 2.79% | | | | | | | | | | | | |
| | | 700 | | American Municipal Power, Inc. Revenue, Series A, Callable 2/15/24 @ 100.00 | | | 5.00 | | | | 2/15/27 | | | | 727 | |
| | | 1,000 | | Butler County Ohio Hospital Facilities Revenue, Series X | | | 5.00 | | | | 5/15/29 | | | | 1,144 | |
| | | 500 | | Ohio State Hospital Facility Revenue, Callable 1/1/28 @ 100.00 | | | 5.00 | | | | 1/1/30 | | | | 556 | |
| | | | | | | | | | | | | | | | 2,427 | |
| | | | | Pennsylvania — 1.71% | | | | | | | | | | | | |
| | | 1,395 | | Pennsylvania Housing Finance Agency Revenue | | | 5.00 | | | | 4/1/25 | | | | 1,490 | |
| | | | | | | | | | | | | | | | | |
| | | | | South Dakota — 2.13% | | | | | | | | | | | | |
| | | 1,675 | | South Dakota Board of Regents Revenue, Callable 10/1/27 @ 100.00 | | | 5.00 | | | | 4/1/29 | | | | 1,852 | |
| | | | | | | | | | | | | | | | | |
| | | | | Tennessee — 1.59% | | | | | | | | | | | | |
| | | 1,215 | | County of Hamblen, GO | | | 5.00 | | | | 5/1/29 | | | | 1,386 | |
| | | | | | | | | | | | | | | | | |
| | | | | Texas — 11.85% | | | | | | | | | | | | |
| | | 1,550 | | City of Missouri City Texas, GO, Callable 6/15/26 @ 100.00 | | | 5.00 | | | | 6/15/30 | | | | 1,706 | |
| | | 300 | | City of Pearland Texas, GO, Callable 3/1/27 @ 100.00 | | | 5.00 | | | | 3/1/29 | | | | 330 | |
| | | 1,500 | | Harris County Texas Cultural Education Facilities Finance Corp. Medicine Facilities Revenue, Callable 10/1/25 @ 100.00 | | | 5.00 | | | | 10/1/27 | | | | 1,619 | |
| | | 1,545 | | Harris County Texas Revenue, Series A, Callable 8/15/26 @ 100.00 | | | 5.00 | | | | 8/15/30 | | | | 1,692 | |
| | | 1,460 | | Humble Independent School District, GO, Series C | | | 5.00 | | | | 2/15/24 | | | | 1,531 | |
| | | 1,715 | | North East Independent School District Texas, GO, Series B (PSF-GTD) | | | 5.00 | | | | 2/1/24 | | | | 1,799 | |
| | | 1,500 | | Texas State Water Development Board Revenue, Series A, Callable 10/15/25 @ 100.00 | | | 5.00 | | | | 4/15/26 | | | | 1,624 | |
| | | | | | | | | | | | | | | | 10,301 | |
| | | | | Washington — 11.07% | | | | | | | | | | | | |
| | | 1,415 | | Chelan County Public Utility District No. 1 Revenue, Callable 7/1/30 @ 100.00 | | | 5.00 | | | | 7/1/31 | | | | 1,639 | |
| | | 1,255 | | County of Snohomish, GO | | | 5.00 | | | | 12/1/27 | | | | 1,412 | |
| | | 1,050 | | King County School District No. 405 Bellevue, GO, Callable 12/1/27 @ 100.00 (SCH BD GTY) | | | 5.00 | | | | 12/1/29 | | | | 1,182 | |
| | | 1,250 | | King County School District No. 410 Snoqualmie Valley, GO, Callable 6/1/27 @ 100.00 (SCH BD GTY) | | | 5.00 | | | | 12/1/27 | | | | 1,406 | |
See accompanying notes to financial statements.
272
HC CAPITAL TRUST
The Intermediate Term Municipal Bond II Portfolio
Portfolio of Investments (continued) — June 30, 2022
| | Principal
Amount
(000) | | Security Description | | Rate % | | | Maturity
Date | | | Value
(000) | |
| | | | | Municipal Bonds (continued) |
| | | | | Washington (continued) |
| | $ | 1,575 | | King County Washington, GO, Callable 1/1/29 @ 100.00 | | | 5.00 | | | | 1/1/30 | | | $ | 1,790 | |
| | | 850 | | Pierce County School District No. 403 Bethel, GO (SCH BD GTY) | | | 4.00 | | | | 12/1/28 | | | | 921 | |
| | | 1,090 | | State of Washington, GO, Series A | | | 5.00 | | | | 8/1/30 | | | | 1,277 | |
| | | | | | | | | | | | | | | | 9,627 | |
| | | | | West Virginia — 1.29% | | | | | | | | | | | | |
| | | 1,000 | | State of West Virginia, GO, Series A, Callable 6/1/29 @ 100.00 | | | 5.00 | | | | 6/1/33 | | | | 1,120 | |
| | | | | | | | | | | | | | | | | |
| | | | | Total Municipal Bonds | | | | | | | | | | | 63,169 | |
| | | | | | | | | | | | | | | | | |
| | Shares | | | | | | | | | | | | | | |
| | | | | Investment Companies — 26.19% | | | | | | | | | | | | |
| | | 86,205 | | BlackRock California Municipal Income Trust | | | | | | | | | | | 977 | |
| | | 95,222 | | BlackRock Muni Intermediate Duration Fund, Inc. | | | | | | | | | | | 1,134 | |
| | | 43,780 | | BlackRock Municipal Income Quality Trust | | | | | | | | | | | 542 | |
| | | 42,274 | | BlackRock MuniYield Fund, Inc. | | | | | | | | | | | 471 | |
| | | 125,736 | | BlackRock MuniYield Quality Fund III, Inc. | | | | | | | | | | | 1,466 | |
| | | 71,012 | | DTF Tax-Free Income 2028 Term Fund, Inc. | | | | | | | | | | | 841 | |
| | | 109,929 | | DWS Municipal Income Trust | | | | | | | | | | | 1,033 | |
| | | 37,500 | | Eaton Vance California Municipal Bond Fund | | | | | | | | | | | 348 | |
| | | 90,000 | | Eaton Vance Municipal Bond Fund | | | | | | | | | | | 963 | |
| | | 40,000 | | Eaton Vance Municipal Income Trust | | | | | | | | | | | 438 | |
| | | 45,000 | | Invesco Quality Municipal Income Trust | | | | | | | | | | | 459 | |
| | | 134,249 | | Nuveen AMT-Free Quality Municipal Income Fund | | | | | | | | | | | 1,577 | |
| | | 65,000 | | Nuveen California Quality Municipal Income Fund | | | | | | | | | | | 801 | |
| | | 19,593 | | Nuveen Intermediate Duration Municipal Term Fund | | | | | | | | | | | 255 | |
| | | 125,500 | | Nuveen Municipal Credit Income Fund | | | | | | | | | | | 1,576 | |
| | | 60,377 | | Nuveen New York AMT-Free Quality Municipal Income Fund | | | | | | | | | | | 667 | |
| | | 132,044 | | Nuveen Quality Municipal Income Fund | | | | | | | | | | | 1,648 | |
| | | 70,688 | | Pioneer Municipal High Income Opportunities Fund, Inc. | | | | | | | | | | | 856 | |
| | | 47,478 | | Pioneer Municipal High Income Opportunities Fund, Inc. | | | | | | | | | | | 414 | |
| | | 5,999,822 | | State Street Institutional Treasury Plus Money Market Fund, Trust Class | | | 1.40(a) | | | | | | | | 6,000 | |
| | | 30,601 | | Western Asset Managed Municipals Fund, Inc. | | | | | | | | | | | 323 | |
| | | | | Total Investment Companies | | | | | | | | | | | 22,789 | |
| | | | | | | | | | | | | | | | | |
| | | | | Total Investments (cost $92,632) — 98.80% | | | | | | | | | | | 85,958 | |
| | | | | Other assets in excess of liabilities — 1.20% | | | | | | | | | | | 1,043 | |
| | | | | Net Assets — 100.00% | | | | | | | | | | $ | 87,001 | |
(a) | Annualized 7-day yield as of period-end. |
| AMT—Alternative Minimum Tax |
| PSF-GTD—Public School Fund Guaranteed |
| SCH BD GTY—School Board Guaranty |
| SD CRED PROG—School District Credit Program |
See accompanying notes to financial statements.
273
HC CAPITAL TRUST
The Intermediate Term Municipal Bond II Portfolio
Portfolio of Investments (concluded) — June 30, 2022
The following table reflects the percentage of total net assets of the Portfolio attributable to each Specialist Manager as of June 30, 2022.
| The Intermediate Term Municipal Bond II Portfolio | | Breckinridge
Capital
Advisors, Inc. | | | City of London
Investment
Management
Company,
Limited | | | HC
Capital
Solutions | | | Total | |
| Municipal Bonds | | | 72.61 | % | | | — | | | | — | | | | 72.61 | % |
| Investment Companies | | | 1.02 | % | | | 19.30 | % | | | 5.87 | % | | | 26.19 | % |
| Other Assets (Liabilities) | | | 0.88 | % | | | 0.33 | % | | | -0.01 | % | | | 1.20 | % |
| Total Net Assets | | | 74.51 | % | | | 19.63 | % | | | 5.86 | % | | | 100.00 | % |
Amounts designated as “—” indicate the Specialist Manager did not manage any holdings in that category.
See accompanying notes to financial statements.
274
HC CAPITAL TRUST
Statements of Assets and Liabilities
As of June 30, 2022
(Amounts in thousands, except per share amounts)
| | | The Value
Equity
Portfolio | | | The Growth
Equity
Portfolio | | | The
Institutional
U.S. Equity
Portfolio | | | The Small
Capitalization–
Mid Capitalization
Equity Portfolio | |
ASSETS: | | | | | | | | | | | | | | | | |
Investments in securities, at value(a) | | $ | 584,281 | | | $ | 701,639 | | | $ | 2,213,615 | | | $ | 69,156 | |
Cash | | | 61 | | | | — | | | | 14,091 | | | | 81 | |
Foreign currency, at value (Cost $0, $0, $2 and $0, respectively) | | | — | | | | — | | | | 3 | | | | — | |
Receivable for portfolio shares issued | | | — | | | | — | | | | 538 | | | | — | |
Receivable from investments sold | | | — | | | | 6,244 | | | | 13,434 | | | | 11,511 | |
Cash held as collateral at broker for derivatives | | | 281 | | | | 886 | | | | 29,243 | | | | 243 | |
Dividends and interest receivable | | | 451 | | | | 581 | | | | 1,785 | | | | 65 | |
Foreign tax reclaims receivable | | | 2 | | | | 135 | | | | 126 | | | | 4 | |
Prepaid expenses | | | 14 | | | | 20 | | | | 28 | | | | 7 | |
Total assets | | | 585,090 | | | | 709,505 | | | | 2,272,863 | | | | 81,067 | |
LIABILITIES: | | | | | | | | | | | | | | | | |
Payable to Custodian | | | — | | | | 1,718 | | | | — | | | | — | |
Payable for investments purchased | | | — | | | | — | | | | 14,239 | | | | 11,578 | |
Payable for portfolio shares redeemed | | | — | | | | 20 | | | | — | | | | — | |
Payable for collateral received on loaned securities | | | 284 | | | | 368 | | | | 1,232 | | | | 180 | |
Variation margin payable on derivatives | | | 41 | | | | 172 | | | | 4,233 | | | | 27 | |
Advisory fees payable | | | 30 | | | | 149 | | | | 308 | | | | 14 | |
Management fees payable | | | 25 | | | | 30 | | | | 95 | | | | 3 | |
Administrative services fees payable | | | 25 | | | | 29 | | | | 84 | | | | 8 | |
Professional fees payable | | | 74 | | | | 89 | | | | 291 | | | | 9 | |
Custodian fees payable | | | 31 | | | | 35 | | | | 89 | | | | 10 | |
Other accrued expenses | | | 15 | | | | 19 | | | | 52 | | | | 3 | |
Total liabilities | | | 525 | | | | 2,629 | | | | 20,623 | | | | 11,832 | |
NET ASSETS | | $ | 584,565 | | | $ | 706,876 | | | $ | 2,252,240 | | | $ | 69,235 | |
NET ASSETS CONSISTS OF: | | | | | | | | | | | | | | | | |
Shares of beneficial interest, at par value | | $ | 23 | | | $ | 27 | | | $ | 151 | | | $ | 3 | |
Additional paid-in capital | | | 317,063 | | | | 249,644 | | | | 1,927,325 | | | | 47,742 | |
Total distributable earnings/(loss) | | | 267,479 | | | | 457,205 | | | | 324,764 | | | | 21,490 | |
Net Assets | | $ | 584,565 | | | $ | 706,876 | | | $ | 2,252,240 | | | $ | 69,235 | |
NET ASSETS: | | | | | | | | | | | | | | | | |
HC Strategic Shares | | $ | 584,565 | | | $ | 706,876 | | | $ | 2,252,240 | | | $ | 69,235 | |
Total | | $ | 584,565 | | | $ | 706,876 | | | $ | 2,252,240 | | | $ | 69,235 | |
SHARES OF BENEFICIAL INTEREST OUTSTANDING (Unlimited number of shares authorized; par value $0.001): | | | | | | | | | | | | | | | | |
HC Strategic Shares | | | 23,034 | | | | 27,149 | | | | 150,841 | | | | 2,616 | |
Total | | | 23,034 | | | | 27,149 | | | | 150,841 | | | | 2,616 | |
Net Asset Value, offering and redemption price per share:(b) | | | | | | | | | | | | | | | | |
HC Strategic Shares | | $ | 25.38 | | | $ | 26.04 | | | $ | 14.93 | | | $ | 26.47 | |
| | | | | | | | | | | | | | | | | |
Investments in securities, at cost | | $ | 302,813 | | | $ | 261,255 | | | $ | 1,736,862 | | | $ | 44,036 | |
Amounts designated as “—” are $0 or have been rounded to $0.
(a) | Includes securities on loan of $271, $354, $1,192 and $171, respectively. |
(b) | Per share amounts may not recalculate due to rounding of net assets and/or shares outstanding. |
See accompanying notes to financial statements.
275
HC CAPITAL TRUST
Statements of Assets and Liabilities (continued)
As of June 30, 2022
(Amounts in thousands, except per share amounts)
| | | The ESG
Growth
Portfolio | | | The Catholic
SRI Growth
Portfolio | | | The
International
Equity
Portfolio | | | The Institutional
International
Equity
Portfolio | |
ASSETS: | | | | | | | | | | | | | | | | |
Investments in securities, at value(a) | | $ | 142,834 | | | $ | 22,476 | | | $ | 523,979 | | | $ | 778,805 | |
Cash | | | 301 | | | | 3 | | | | 5,066 | | | | 4,501 | |
Foreign currency, at value (Cost $183, $27, $1,423 and $5,850, respectively) | | | 180 | | | | 26 | | | | 1,746 | | | | 5,876 | |
Receivable for portfolio shares issued | | | — | | | | — | | | | 58 | | | | 379 | |
Receivable from investments sold | | | — | | | | — | | | | — | | | | 50,624 | |
Variation margin receivable on derivatives | | | — | | | | — | | | | 22 | | | | 137 | |
Cash held as collateral at broker for derivatives | | | 61 | | | | — | | | | 1,246 | | | | 4,911 | |
Dividends and interest receivable | | | 116 | | | | 24 | | | | 857 | | | | 1,580 | |
Foreign tax reclaims receivable | | | 263 | | | | 40 | | | | 4,200 | | | | 6,025 | |
Receivable from Adviser | | | — | | | | 12 | | | | — | | | | — | |
Prepaid expenses | | | 3 | | | | 1 | | | | 16 | | | | 18 | |
Total assets | | | 143,758 | | | | 22,582 | | | | 537,190 | | | | 852,856 | |
LIABILITIES: | | | | | | | | | | | | | | | | |
Written options, at fair value (Premiums received $0, $0, $482 and $2,994, respectively) | | | — | | | | — | | | | 586 | | | | 3,660 | |
Payable for investments purchased | | | — | | | | — | | | | — | | | | 50,226 | |
Payable for portfolio shares redeemed | | | — | | | | — | | | | 31 | | | | — | |
Payable for collateral received on loaned securities | | | — | | | | 21 | | | | — | | | | 1,841 | |
Variation margin payable on derivatives | | | 3 | | | | — | | | | 92 | | | | 289 | |
Advisory fees payable | | | 23 | | | | — | | | | 38 | | | | 100 | |
Management fees payable | | | 6 | | | | 2 | | | | 23 | | | | 34 | |
Administrative services fees payable | | | 16 | | | | 10 | | | | 34 | | | | 43 | |
Professional fees payable | | | 33 | | | | 17 | | | | 84 | | | | 126 | |
Custodian fees payable | | | 15 | | | | 6 | | | | 78 | | | | 115 | |
Other accrued expenses | | | 2 | | | | 1 | | | | 16 | | | | 23 | |
Total liabilities | | | 98 | | | | 57 | | | | 982 | | | | 56,457 | |
NET ASSETS | | $ | 143,660 | | | $ | 22,525 | | | $ | 536,208 | | | $ | 796,399 | |
NET ASSETS CONSISTS OF: | | | | | | | | | | | | | | | | |
Shares of beneficial interest, at par value | | $ | 12 | | | $ | 2 | | | $ | 53 | | | $ | 93 | |
Additional paid-in capital | | | 121,796 | | | | 17,551 | | | | 492,971 | | | | 831,850 | |
Total distributable earnings/(loss) | | | 21,852 | | | | 4,972 | | | | 43,184 | | | | (35,544 | ) |
Net Assets | | $ | 143,660 | | | $ | 22,525 | | | $ | 536,208 | | | $ | 796,399 | |
NET ASSETS: | | | | | | | | | | | | | | | | |
HC Strategic Shares | | $ | 143,660 | | | $ | 22,525 | | | $ | 536,208 | | | $ | 796,399 | |
Total | | $ | 143,660 | | | $ | 22,525 | | | $ | 536,208 | | | $ | 796,399 | |
SHARES OF BENEFICIAL INTEREST OUTSTANDING (Unlimited number of shares authorized; par value $0.001): | | | | | | | | | | | | | | | | |
HC Strategic Shares | | | 12,139 | | | | 2,474 | | | | 52,615 | | | | 93,462 | |
Total | | | 12,139 | | | | 2,474 | | | | 52,615 | | | | 93,462 | |
Net Asset Value, offering and redemption price per share:(b) | | | | | | | | | | | | | | | | |
HC Strategic Shares | | $ | 11.83 | | | $ | 9.10 | | | $ | 10.19 | | | $ | 8.52 | |
| | | | | | | | | | | | | | | | | |
Investments in securities, at cost | | $ | 119,843 | | | $ | 17,167 | | | $ | 382,063 | | | $ | 741,655 | |
Amounts designated as “—” are $0 or have been rounded to $0.
(a) | Includes securities on loan of $0, $20, $0 and $6,303, respectively. |
(b) | Per share amounts may not recalculate due to rounding of net assets and/or shares outstanding. |
See accompanying notes to financial statements.
276
HC CAPITAL TRUST
Statements of Assets and Liabilities (continued)
As of June 30, 2022
(Amounts in thousands, except per share amounts)
| | | The
Emerging
Markets
Portfolio | | | The Core
Fixed Income
Portfolio | | | The Corporate
Opportunities
Portfolio | |
ASSETS: | | | | | | | | | | | | |
Investments in securities, at value(a) | | $ | 641,420 | | | $ | 58,314 | | | $ | 252,372 | |
Cash | | | 66,083 | | | | 41 | | | | 607 | |
Foreign currency, at value (Cost $948, $0 and $0, respectively) | | | 956 | | | | — | | | | — | |
Swap agreements, at value | | | 4,862 | | | | — | | | | — | |
Receivable for portfolio shares issued | | | 29 | | | | — | | | | — | |
Receivable from investments sold | | | 103 | | | | 519 | | | | — | |
Receivable for closed swap positions | | | 441 | | | | — | | | | — | |
Variation margin receivable on derivatives | | | 32 | | | | — | | | | 941 | |
Cash held as collateral at broker for derivatives | | | 3,590 | | | | — | | | | 7,530 | |
Dividends and interest receivable | | | 3,647 | | | | 368 | | | | 230 | |
Foreign tax reclaims receivable | | | 51 | | | | — | | | | — | |
TBA sale commitments receivable | | | — | | | | 206 | | | | — | |
Prepaid expenses | | | 17 | | | | 5 | | | | 8 | |
Total assets | | | 721,231 | | | | 59,453 | | | | 261,688 | |
LIABILITIES: | | | | | | | | | | | | |
Written options, at fair value (Premiums received $626, $0 and $0, respectively) | | | 760 | | | | — | | | | — | |
Swap agreements, at value | | | 561 | | | | — | | | | — | |
Payable for investments purchased | | | — | | | | 641 | | | | — | |
Payable for portfolio shares redeemed | | | 58 | | | | 6 | | | | 537 | |
Payable for collateral received on loaned securities | | | 99 | | | | — | | | | 1,177 | |
Variation margin payable on derivatives | | | 346 | | | | — | | | | 800 | |
Accrued foreign capital gains tax | | | 2,259 | | | | — | | | | — | |
TBA sale commitments, at fair value | | | — | | | | 46 | | | | — | |
TBA sale commitments payable | | | — | | | | 1,237 | | | | — | |
Advisory fees payable | | | 125 | | | | 3 | | | | 12 | |
Management fees payable | | | 30 | | | | 2 | | | | 10 | |
Administrative services fees payable | | | 38 | | | | 10 | | | | 13 | |
Professional fees payable | | | 114 | | | | 7 | | | | 32 | |
Custodian fees payable | | | 423 | | | | 6 | | | | 14 | |
Other accrued expenses | | | 19 | | | | 1 | | | | 6 | |
Total liabilities | | | 4,832 | | | | 1,959 | | | | 2,601 | |
NET ASSETS | | $ | 716,399 | | | $ | 57,494 | | | $ | 259,087 | |
NET ASSETS CONSISTS OF: | | | | | | | | | | | | |
Shares of beneficial interest, at par value | | $ | 42 | | | $ | 7 | | | $ | 39 | |
Additional paid-in capital | | | 771,990 | | | | 63,241 | | | | 288,943 | |
Total distributable earnings/(loss) | | | (55,633 | ) | | | (5,754 | ) | | | (29,895 | ) |
Net Assets | | $ | 716,399 | | | $ | 57,494 | | | $ | 259,087 | |
NET ASSETS: | | | | | | | | | | | | |
HC Strategic Shares | | $ | 716,399 | | | $ | 57,494 | | | $ | 259,087 | |
Total | | $ | 716,399 | | | $ | 57,494 | | | $ | 259,087 | |
SHARES OF BENEFICIAL INTEREST OUTSTANDING (Unlimited number of shares authorized; par value $0.001): | | | | | | | | | | | | |
HC Strategic Shares | | | 41,595 | | | | 6,518 | | | | 38,827 | |
Total | | | 41,595 | | | | 6,518 | | | | 38,827 | |
Net Asset Value, offering and redemption price per share:(b) | | | | | | | | | | | | |
HC Strategic Shares | | $ | 17.22 | | | $ | 8.82 | | | $ | 6.67 | |
| | | | | | | | | | | | | |
Investments in securities, at cost | | $ | 619,213 | | | $ | 63,569 | | | $ | 252,474 | |
Amounts designated as “—” are $0 or have been rounded to $0.
(a) | Includes securities on loan of $610, $0 and $0, respectively. |
(b) | Per share amounts may not recalculate due to rounding of net assets and/or shares outstanding. |
See accompanying notes to financial statements.
277
HC CAPITAL TRUST
Statements of Assets and Liabilities (continued)
As of June 30, 2022
(Amounts in thousands, except per share amounts)
| | | The U.S.
Government
Fixed Income
Securities
Portfolio | | | The U.S.
Corporate Fixed
Income
Securities
Portfolio | | | The U.S.
Mortgage/Asset
Backed Fixed
Income
Securities
Portfolio | |
ASSETS: | | | | | | | | | | | | |
Investments in securities, at value(a) | | $ | 626,891 | | | $ | 255,837 | | | $ | 230,996 | |
Cash | | | 1,181 | | | | — | | | | — | |
Receivable for portfolio shares issued | | | — | | | | 10 | | | | — | |
Receivable from investments sold | | | 6,319 | | | | 1,756 | | | | — | |
Dividends and interest receivable | | | 2,030 | | | | 2,410 | | | | 458 | |
TBA sale commitments receivable | | | — | | | | — | | | | 2,531 | |
Receivable from Specialist Manager | | | 17 | | | | — | | | | — | |
Prepaid expenses | | | 9 | | | | 11 | | | | 10 | |
Total assets | | | 636,447 | | | | 260,024 | | | | 233,995 | |
LIABILITIES: | | | | | | | | | | | | |
Payable to Custodian | | | — | | | | 9 | | | | — | |
Distributions payable | | | 539 | | | | 194 | | | | 123 | |
Payable for investments purchased | | | 7,143 | | | | 1,583 | | | | 1,502 | |
Payable for portfolio shares redeemed | | | 118 | | | | 55 | | | | 39 | |
Payable for collateral received on loaned securities | | | — | | | | 396 | | | | — | |
TBA sale commitments, at fair value | | | — | | | | — | | | | 102 | |
TBA sale commitments payable | | | — | | | | — | | | | 18,899 | |
Advisory fees payable | | | 24 | | | | 15 | | | | 10 | |
Management fees payable | | | 25 | | | | 10 | | | | 9 | |
Administrative services fees payable | | | 26 | | | | 14 | | | | 17 | |
Professional fees payable | | | 83 | | | | 32 | | | | 25 | |
Custodian fees payable | | | 10 | | | | 11 | | | | 11 | |
Other accrued expenses | | | 11 | | | | 6 | | | | 5 | |
Total liabilities | | | 7,979 | | | | 2,325 | | | | 20,742 | |
NET ASSETS | | $ | 628,468 | | | $ | 257,699 | | | $ | 213,253 | |
NET ASSETS CONSISTS OF: | | | | | | | | | | | | |
Shares of beneficial interest, at par value | | $ | 71 | | | $ | 29 | | | $ | 25 | |
Additional paid-in capital | | | 654,259 | | | | 286,658 | | | | 245,192 | |
Total distributable earnings/(loss) | | | (25,862 | ) | | | (28,988 | ) | | | (31,964 | ) |
Net Assets | | $ | 628,468 | | | $ | 257,699 | | | $ | 213,253 | |
NET ASSETS: | | | | | | | | | | | | |
HC Strategic Shares | | $ | 628,468 | | | $ | 257,699 | | | $ | 213,253 | |
Total | | $ | 628,468 | | | $ | 257,699 | | | $ | 213,253 | |
SHARES OF BENEFICIAL INTEREST OUTSTANDING (Unlimited number of shares authorized; par value $0.001): | | | | | | | | | | | | |
HC Strategic Shares | | | 70,930 | | | | 29,309 | | | | 24,857 | |
Total | | | 70,930 | | | | 29,309 | | | | 24,857 | |
Net Asset Value, offering and redemption price per share:(b) | | | | | | | | | | | | |
HC Strategic Shares | | $ | 8.86 | | | $ | 8.79 | | | $ | 8.58 | |
| | | | | | | | | | | | | |
Investments in securities, at cost | | $ | 650,946 | | | $ | 284,419 | | | $ | 246,643 | |
Amounts designated as “—” are $0 or have been rounded to $0.
(a) | Includes securities on loan of $0, $386 and $0, respectively. |
(b) | Per share amounts may not recalculate due to rounding of net assets and/or shares outstanding. |
See accompanying notes to financial statements.
278
HC CAPITAL TRUST
Statements of Assets and Liabilities (concluded)
As of June 30, 2022
(Amounts in thousands, except per share amounts)
| | | The
Short-Term
Municipal Bond
Portfolio | | | The
Intermediate
Term Municipal
Bond
Portfolio | | | The
Intermediate
Term Municipal
Bond II
Portfolio | |
ASSETS: | | | | | | | | | | | | |
Investments in securities, at value | | $ | 138,473 | | | $ | 367,166 | | | $ | 85,958 | |
Cash | | | — | | | | 2,126 | | | | 248 | |
Receivable for portfolio shares issued | | | 2 | | | | 88 | | | | 24 | |
Dividends and interest receivable | | | 1,625 | | | | 3,944 | | | | 841 | |
Prepaid expenses | | | 10 | | | | 10 | | | | 6 | |
Total assets | | | 140,110 | | | | 373,334 | | | | 87,077 | |
LIABILITIES: | | | | | | | | | | | | |
Distributions payable | | | 12 | | | | 43 | | | | 13 | |
Payable for investments purchased | | | — | | | | 1,539 | | | | — | |
Payable for portfolio shares redeemed | | | 24 | | | | 100 | | | | 25 | |
Advisory fees payable | | | 14 | | | | 454 | | | | 10 | |
Management fees payable | | | 6 | | | | 15 | | | | 4 | |
Administrative services fees payable | | | 9 | | | | 17 | | | | 8 | |
Professional fees payable | | | 16 | | | | 45 | | | | 10 | |
Custodian fees payable | | | 5 | | | | 14 | | | | 5 | |
Other accrued expenses | | | 4 | | | | 9 | | | | 1 | |
Total liabilities | | | 90 | | | | 2,236 | | | | 76 | |
NET ASSETS | | $ | 140,020 | | | $ | 371,098 | | | $ | 87,001 | |
NET ASSETS CONSISTS OF: | | | | | | | | | | | | |
Shares of beneficial interest, at par value | | $ | 15 | | | $ | 39 | | | $ | 9 | |
Additional paid-in capital | | | 144,040 | | | | 386,649 | | | | 93,832 | |
Total distributable earnings/(loss) | | | (4,035 | ) | | | (15,590 | ) | | | (6,840 | ) |
Net Assets | | $ | 140,020 | | | $ | 371,098 | | | $ | 87,001 | |
NET ASSETS: | | | | | | | | | | | | |
HC Strategic Shares | | $ | 140,020 | | | $ | 371,098 | | | $ | 87,001 | |
Total | | $ | 140,020 | | | $ | 371,098 | | | $ | 87,001 | |
SHARES OF BENEFICIAL INTEREST OUTSTANDING (Unlimited number of shares authorized; par value $0.001): | | | | | | | | | | | | |
HC Strategic Shares | | | 14,583 | | | | 38,554 | | | | 9,306 | |
Total | | | 14,583 | | | | 38,554 | | | | 9,306 | |
Net Asset Value, offering and redemption price per share:(a) | | | | | | | | | | | | |
HC Strategic Shares | | $ | 9.60 | | | $ | 9.63 | | | $ | 9.35 | |
| | | | | | | | | | | | | |
Investments in securities, at cost | | $ | 141,613 | | | $ | 382,121 | | | $ | 92,632 | |
Amounts designated as “—” are $0 or have been rounded to $0.
(a) | Per share amounts may not recalculate due to rounding of net assets and/or shares outstanding. |
See accompanying notes to financial statements.
279
HC CAPITAL TRUST
Statements of Operations
For the Year Ended June 30, 2022
(Amounts in thousands)
| | | The Value
Equity
Portfolio | | | The Growth
Equity
Portfolio | | | The
Institutional
U.S. Equity
Portfolio | | | The Small
Capitalization–
Mid Capitalization
Equity Portfolio | |
INVESTMENT INCOME: | | | | | | | | | | | | | | | | |
Dividends (net of foreign withholding tax of $0, $12, $186 and $2, respectively) | | $ | 9,740 | | | $ | 10,076 | | | $ | 25,640 | | | $ | 746 | |
Income from securities lending, net | | | 5 | | | | 18 | | | | 35 | | | | 10 | |
Total Investment Income | | | 9,745 | | | | 10,094 | | | | 25,675 | | | | 756 | |
EXPENSES: | | | | | | | | | | | | | | | | |
Advisory fees | | | 604 | | | | 1,206 | | | | 3,722 | | | | 218 | |
Management fees | | | 349 | | | | 451 | | | | 1,215 | | | | 44 | |
Administrative services fees | | | 283 | | | | 354 | | | | 933 | | | | 63 | |
Professional fees | | | 105 | | | | 130 | | | | 367 | | | | 68 | |
Transfer agent fees | | | 19 | | | | 24 | | | | 60 | | | | 2 | |
Compliance service fees | | | 16 | | | | 21 | | | | 52 | | | | 2 | |
Custodian fees | | | 67 | | | | 102 | | | | 186 | | | | 21 | |
Registration and filing fees | | | 21 | | | | 21 | | | | 22 | | | | 19 | |
Trustee fees | | | 48 | | | | 62 | | | | 157 | | | | 6 | |
Other | | | 55 | | | | 71 | | | | 186 | | | | 9 | |
Total expenses before expenses paid indirectly | | | 1,567 | | | | 2,442 | | | | 6,900 | | | | 452 | |
Less: Expenses paid indirectly | | | — | | | | (2 | ) | | | (8 | ) | | | (2 | ) |
Net Expenses | | | 1,567 | | | | 2,440 | | | | 6,892 | | | | 450 | |
Net Investment Income | | | 8,178 | | | | 7,654 | | | | 18,783 | | | | 306 | |
NET REALIZED/UNREALIZED GAIN/(LOSS) ON INVESTMENTS: | | | | | | | | | | | | | | | | |
Net realized gains/(losses) from investment in securities and foreign currency translations | | | (604 | ) | | | 42,250 | | | | 79,477 | | | | 107 | |
Net realized gains/(losses) from futures transactions | | | (322 | ) | | | (466 | ) | | | (57,098 | ) | | | (1,176 | ) |
Net realized gains/(losses) from written options transactions | | | 2,176 | | | | 2,937 | | | | 24,313 | | | | — | |
Net realized gains/(losses) from investments | | | 1,250 | | | | 44,721 | | | | 46,692 | | | | (1,069 | ) |
Change in unrealized appreciation/(depreciation) on investment transactions and foreign currency translations | | | (97,124 | ) | | | (185,609 | ) | | | (448,907 | ) | | | (19,849 | ) |
Change in unrealized appreciation/(depreciation) on futures | | | 17 | | | | (336 | ) | | | (348 | ) | | | (122 | ) |
Change in unrealized appreciation/(depreciation) on written options | | | (317 | ) | | | (407 | ) | | | (3,177 | ) | | | — | |
Change in unrealized appreciation/(depreciation) on investments | | | (97,424 | ) | | | (186,352 | ) | | | (452,432 | ) | | | (19,971 | ) |
Net realized/unrealized gains/(losses) from investments | | | (96,174 | ) | | | (141,631 | ) | | | (405,740 | ) | | | (21,040 | ) |
Change in net assets resulting from operations | | $ | (87,996 | ) | | $ | (133,977 | ) | | $ | (386,957 | ) | | $ | (20,734 | ) |
Amounts designated as “—” are $0 or have been rounded to $0.
See accompanying notes to financial statements.
280
HC CAPITAL TRUST
Statements of Operations (continued)
For the Year Ended June 30, 2022
(Amounts in thousands)
| | | The ESG
Growth
Portfolio | | | The Catholic
SRI Growth
Portfolio | | | The
International
Equity
Portfolio | | | The Institutional
International
Equity
Portfolio | |
INVESTMENT INCOME: | | | | | | | | | | | | | | | | |
Dividends (net of foreign withholding tax of $195, $45, $1,725 and $3,175, respectively) | | $ | 2,990 | | | $ | 523 | | | $ | 22,180 | | | $ | 29,541 | |
Non-cash dividends | | | — | | | | 29 | | | | 1,594 | | | | 1,759 | |
Income from securities lending, net | | | — | | | | 2 | | | | 1 | | | | 223 | |
Total Investment Income | | | 2,990 | | | | 554 | | | | 23,775 | | | | 31,523 | |
EXPENSES: | | | | | | | | | | | | | | | | |
Advisory fees | | | 331 | | | | 30 | | | | 603 | | | | 1,309 | |
Management fees | | | 85 | | | | 15 | | | | 344 | | | | 559 | |
Administrative services fees | | | 120 | | | | 64 | | | | 309 | | | | 466 | |
Professional fees | | | 54 | | | | 30 | | | | 188 | | | | 241 | |
Transfer agent fees | | | 5 | | | | 1 | | | | 18 | | | | 28 | |
Compliance service fees | | | 4 | | | | 1 | | | | 15 | | | | 24 | |
Custodian fees | | | 37 | | | | 16 | | | | 160 | | | | 233 | |
Registration and filing fees | | | 3 | | | | 3 | | | | 21 | | | | 16 | |
Trustee fees | | | 13 | | | | 2 | | | | 45 | | | | 70 | |
Other | | | 19 | | | | 4 | | | | 54 | | | | 88 | |
Total expenses before waivers and/or reimbursements | | | 671 | | | | 166 | | | | 1,757 | | | | 3,034 | |
Less: Expenses waived and/or reimbursed by Adviser | | | — | | | | (74 | ) | | | — | | | | — | |
Net Expenses | | | 671 | | | | 92 | | | | 1,757 | | | | 3,034 | |
Net Investment Income | | | 2,319 | | | | 462 | | | | 22,018 | | | | 28,489 | |
NET REALIZED/UNREALIZED GAIN/(LOSS) ON INVESTMENTS: | | | | | | | | | | | | | | | | |
Net realized gains/(losses) from investment in securities and foreign currency translations | | | 1,231 | | | | 93 | | | | (6,932 | ) | | | (3,463 | ) |
Net realized gains/(losses) from futures transactions | | | (333 | ) | | | — | | | | (3,324 | ) | | | (16,498 | ) |
Net realized gains/(losses) from written options transactions | | | — | | | | — | | | | 1,910 | | | | 10,126 | |
Net realized gains/(losses) from investments | | | 898 | | | | 93 | | | | (8,346 | ) | | | (9,835 | ) |
Change in unrealized appreciation/(depreciation) on investment transactions and foreign currency translations | | | (28,372 | ) | | | (5,203 | ) | | | (120,717 | ) | | | (216,529 | ) |
Change in unrealized appreciation/(depreciation) on futures | | | 3 | | | | — | | | | 342 | | | | 5,436 | |
Change in unrealized appreciation/(depreciation) on written options | | | — | | | | — | | | | (403 | ) | | | (2,092 | ) |
Change in unrealized appreciation/(depreciation) on investments | | | (28,369 | ) | | | (5,203 | ) | | | (120,778 | ) | | | (213,185 | ) |
Net realized/unrealized gains/(losses) from investments | | | (27,471 | ) | | | (5,110 | ) | | | (129,124 | ) | | | (223,020 | ) |
Change in net assets resulting from operations | | $ | (25,152 | ) | | $ | (4,648 | ) | | $ | (107,106 | ) | | $ | (194,531 | ) |
Amounts designated as “—” are $0 or have been rounded to $0.
See accompanying notes to financial statements.
281
HC CAPITAL TRUST
Statements of Operations (continued)
For the Year Ended June 30, 2022
(Amounts in thousands)
| | | The
Emerging
Markets
Portfolio | | | The Core
Fixed Income
Portfolio | | | The Corporate
Opportunities
Portfolio | |
INVESTMENT INCOME: | | | | | | | | | | | | |
Interest | | $ | — | | | $ | 1,380 | | | $ | 988 | |
Dividends (net of foreign withholding tax of $3,411, $0 and $0, respectively) | | | 18,470 | | | | 8 | | | | 410 | |
Non-cash dividends | | | 1,931 | | | | — | | | | — | |
Income from securities lending, net | | | 69 | | | | — | | | | 9 | |
Total Investment Income | | | 20,470 | | | | 1,388 | | | | 1,407 | |
EXPENSES: | | | | | | | | | | | | |
Advisory fees | | | 2,231 | | | | 42 | | | | 186 | |
Management fees | | | 425 | | | | 31 | | | | 147 | |
Administrative services fees | | | 369 | | | | 95 | | | | 126 | |
Professional fees | | | 195 | | | | 11 | | | | 44 | |
Transfer agent fees | | | 24 | | | | 2 | | | | 7 | |
Compliance service fees | | | 21 | | | | 2 | | | | 6 | |
Custodian fees | | | 965 | | | | 16 | | | | 32 | |
Registration and filing fees | | | 13 | | | | 15 | | | | 16 | |
Trustee fees | | | 61 | | | | 4 | | | | 19 | |
Other | | | 70 | | | | 7 | | | | 24 | |
Total expenses before waivers | | | 4,374 | | | | 225 | | | | 607 | |
Less: Expenses waived by Specialist Manager | | | (492 | ) | | | — | | | | — | |
Net Expenses | | | 3,882 | | | | 225 | | | | 607 | |
Net Investment Income | | | 16,588 | | | | 1,163 | | | | 800 | |
NET REALIZED/UNREALIZED GAIN/(LOSS) ON INVESTMENTS: | | | | | | | | | | | | |
Net realized gains/(losses) from investment in securities and foreign currency translations | | | 19,840 | | | | (222 | ) | | | (10 | ) |
Net realized gains/(losses) from futures transactions | | | (15,658 | ) | | | — | | | | (21,301 | ) |
Net realized gains/(losses) from written options transactions | | | 2,476 | | | | — | | | | — | |
Net realized gains/(losses) from swap transactions | | | (12,703 | ) | | | — | | | | — | |
Net realized gains/(losses) from investments | | | (6,045 | ) | | | (222 | ) | | | (21,311 | ) |
Change in unrealized appreciation/(depreciation) on investment transactions and foreign currency translations (net of deferred foreign tax) | | | (240,393 | ) | | | (8,166 | ) | | | (41 | ) |
Change in unrealized appreciation/(depreciation) on futures | | | 239 | | | | — | | | | (2,007 | ) |
Change in unrealized appreciation/(depreciation) on written options | | | (519 | ) | | | — | | | | — | |
Change in unrealized appreciation/(depreciation) on swaps | | | 2,722 | | | | — | | | | — | |
Change in unrealized appreciation/(depreciation) on investments | | | (237,951 | ) | | | (8,166 | ) | | | (2,048 | ) |
Net realized/unrealized gains/(losses) from investments | | | (243,996 | ) | | | (8,388 | ) | | | (23,359 | ) |
Change in net assets resulting from operations | | $ | (227,408 | ) | | $ | (7,225 | ) | | $ | (22,559 | ) |
Amounts designated as “—” are $0 or have been rounded to $0.
See accompanying notes to financial statements.
282
HC CAPITAL TRUST
Statements of Operations (continued)
For the Year Ended June 30, 2022
(Amounts in thousands)
| | | The U.S.
Government
Fixed Income
Securities
Portfolio | | | The U.S.
Corporate Fixed
Income
Securities
Portfolio | | | The U.S.
Mortgage/Asset
Backed Fixed
Income
Securities
Portfolio | |
INVESTMENT INCOME: | | | | | | | | | | | | |
Interest | | $ | 5,011 | | | $ | 7,826 | | | $ | 3,215 | |
Dividends | | | 1,279 | | | | 53 | | | | 75 | |
Total Investment Income | | | 6,290 | | | | 7,879 | | | | 3,290 | |
EXPENSES: | | | | | | | | | | | | |
Advisory fees | | | 171 | | | | 191 | | | | 119 | |
Management fees | | | 146 | | | | 139 | | | | 111 | |
Administrative services fees | | | 135 | | | | 126 | | | | 163 | |
Professional fees | | | 90 | | | | 41 | | | | 37 | |
Transfer agent fees | | | 7 | | | | 6 | | | | 6 | |
Compliance service fees | | | 6 | | | | 6 | | | | 5 | |
Custodian fees | | | 22 | | | | 22 | | | | 26 | |
Registration and filing fees | | | 14 | | | | 12 | | | | 11 | |
Trustee fees | | | 19 | | | | 17 | | | | 16 | |
Other | | | 27 | | | | 21 | | | | 20 | |
Net Expenses | | | 637 | | | | 581 | | | | 514 | |
Net Investment Income | | | 5,653 | | | | 7,298 | | | | 2,776 | |
NET REALIZED/UNREALIZED GAIN/(LOSS) ON INVESTMENTS: | | | | | | | | | | | | |
Net realized gains/(losses) from investment in securities | | | (945 | ) | | | 831 | | | | (2,775 | ) |
Change in unrealized appreciation/(depreciation) on investments | | | (35,660 | ) | | | (43,676 | ) | | | (19,523 | ) |
Net realized/unrealized gains/(losses) from investments | | | (36,605 | ) | | | (42,845 | ) | | | (22,298 | ) |
Change in net assets resulting from operations | | $ | (30,952 | ) | | $ | (35,547 | ) | | $ | (19,522 | ) |
See accompanying notes to financial statements.
283
HC CAPITAL TRUST
Statements of Operations (concluded)
For the Year Ended June 30, 2022
(Amounts in thousands)
| | | The
Short-Term
Municipal Bond
Portfolio | | | The
Intermediate
Term Municipal
Bond
Portfolio | | | The
Intermediate
Term Municipal
Bond II
Portfolio | |
INVESTMENT INCOME: | | | | | | | | | | | | |
Interest | | $ | 1,591 | | | $ | 7,060 | | | $ | 1,224 | |
Dividends | | | 5 | | | | 15 | | | | 878 | |
Total Investment Income | | | 1,596 | | | | 7,075 | | | | 2,102 | |
EXPENSES: | | | | | | | | | | | | |
Advisory fees | | | 182 | | | | 618 | | | | 169 | |
Management fees | | | 73 | | | | 190 | | | | 45 | |
Administrative services fees | | | 77 | | | | 168 | | | | 56 | |
Professional fees | | | 25 | | | | 65 | | | | 16 | |
Transfer agent fees | | | 4 | | | | 10 | | | | 2 | |
Compliance service fees | | | 3 | | | | 9 | | | | 2 | |
Custodian fees | | | 13 | | | | 33 | | | | 12 | |
Registration and filing fees | | | 12 | | | | 17 | | | | 17 | |
Trustee fees | | | 10 | | | | 27 | | | | 6 | |
Other | | | 13 | | | | 34 | | | | 10 | |
Net Expenses | | | 412 | | | | 1,171 | | | | 335 | |
Net Investment Income | | | 1,184 | | | | 5,904 | | | | 1,767 | |
NET REALIZED/UNREALIZED GAIN/(LOSS) ON INVESTMENTS: | | | | | | | | | | | | |
Net realized gains/(losses) from investment in securities | | | (908 | ) | | | (360 | ) | | | 18 | |
Change in unrealized appreciation/(depreciation) on investments | | | (4,969 | ) | | | (28,652 | ) | | | (10,629 | ) |
Net realized/unrealized gains/(losses) from investments | | | (5,877 | ) | | | (29,012 | ) | | | (10,611 | ) |
Change in net assets resulting from operations | | $ | (4,693 | ) | | $ | (23,108 | ) | | $ | (8,844 | ) |
See accompanying notes to financial statements.
284
HC CAPITAL TRUST
Statements of Changes in Net Assets
(Amounts in thousands)
| | | The Value
Equity Portfolio | | | The Growth
Equity Portfolio | | | The Institutional U.S.
Equity Portfolio | |
| | | For the
Year Ended
June 30,
2022 | | | For the
Year Ended
June 30,
2021 | | | For the
Year Ended
June 30,
2022 | | | For the
Year Ended
June 30,
2021 | | | For the
Year Ended
June 30,
2022 | | | For the
Year Ended
June 30,
2021 | |
Operations: | | | | | | | | | | | | | | | | | | | | | | | | |
Net investment income | | $ | 8,178 | | | $ | 7,443 | | | $ | 7,654 | | | $ | 7,103 | | | $ | 18,783 | | | $ | 22,894 | |
Net realized gains/(losses) from investments | | | 1,250 | | | | 10,126 | | | | 44,721 | | | | 67,703 | | | | 46,692 | | | | 540,124 | |
Change in unrealized appreciation/(depreciation) from investments | | | (97,424 | ) | | | 196,223 | | | | (186,352 | ) | | | 202,627 | | | | (452,432 | ) | | | 374,176 | |
Change in net assets resulting from operations | | | (87,996 | ) | | | 213,792 | | | | (133,977 | ) | | | 277,433 | | | | (386,957 | ) | | | 937,194 | |
Distributions to Shareholders: | | | | | | | | | | | | | | | | | | | | | | | | |
HC Strategic Shares | | | (11,621 | ) | | | (7,690 | ) | | | (80,181 | ) | | | (50,849 | ) | | | (571,108 | ) | | | (162,524 | ) |
Change in net assets resulting from distributions | | | (11,621 | ) | | | (7,690 | ) | | | (80,181 | ) | | | (50,849 | ) | | | (571,108 | ) | | | (162,524 | ) |
HC Strategic Shares | | | | | | | | | | | | | | | | | | | | | | | | |
Proceeds from shares issued | | | 2,231 | | | | 9,282 | | | | 64 | | | | 1,184 | | | | 584,570 | | | | 131,407 | |
Proceeds from reinvestment of dividends | | | 9,278 | | | | 5,906 | | | | 55,608 | | | | 41,703 | | | | 559,905 | | | | 153,985 | |
Cost of shares redeemed | | | (24,444 | ) | | | (62,499 | ) | | | (68,036 | ) | | | (72,913 | ) | | | (368,288 | ) | | | (1,350,335 | ) |
Change in net assets from HC Strategic Shares of beneficial interest | | | (12,935 | ) | | | (47,311 | ) | | | (12,364 | ) | | | (30,026 | ) | | | 776,187 | | | | (1,064,943 | ) |
Change in net assets from shares of beneficial interest | | | (12,935 | ) | | | (47,311 | ) | | | (12,364 | ) | | | (30,026 | ) | | | 776,187 | | | | (1,064,943 | ) |
Change in net assets | | | (112,552 | ) | | | 158,791 | | | | (226,522 | ) | | | 196,558 | | | | (181,878 | ) | | | (290,273 | ) |
Net Assets: | | | | | | | | | | | | | | | | | | | | | | | | |
Beginning of period | | | 697,117 | | | | 538,326 | | | | 933,398 | | | | 736,840 | | | | 2,434,118 | | | | 2,724,391 | |
End of period | | $ | 584,565 | | | $ | 697,117 | | | $ | 706,876 | | | $ | 933,398 | | | $ | 2,252,240 | | | $ | 2,434,118 | |
Share Transactions: | | | | | | | | | | | | | | | | | | | | | | | | |
HC Strategic Shares | | | | | | | | | | | | | | | | | | | | | | | | |
Issued | | | 74 | | | | 364 | | | | 2 | | | | 40 | | | | 32,615 | | | | 6,446 | |
Reinvested | | | 311 | | | | 228 | | | | 1,664 | | | | 1,425 | | | | 29,824 | | | | 7,853 | |
Redeemed | | | (821 | ) | | | (2,480 | ) | | | (2,073 | ) | | | (2,423 | ) | | | (18,025 | ) | | | (67,025 | ) |
Change in HC Strategic Shares | | | (436 | ) | | | (1,888 | ) | | | (407 | ) | | | (958 | ) | | | 44,414 | | | | (52,726 | ) |
Total change in shares | | | (436 | ) | | | (1,888 | ) | | | (407 | ) | | | (958 | ) | | | 44,414 | | | | (52,726 | ) |
See accompanying notes to financial statements.
285
HC CAPITAL TRUST
Statements of Changes in Net Assets (continued)
(Amounts in thousands)
| | | The Small Capitalization-
Mid Capitalization
Equity Portfolio | | | The ESG
Growth Portfolio | | | The Catholic SRI
Growth Portfolio | |
| | | For the
Year Ended
June 30,
2022 | | | For the
Year Ended
June 30,
2021 | | | For the
Year Ended
June 30,
2022 | | | For the
Year Ended
June 30,
2021 | | | For the
Year Ended
June 30,
2022 | | | For the
Year Ended
June 30,
2021 | |
Operations: | | | | | | | | | | | | | | | | | | | | | | | | |
Net investment income | | $ | 306 | | | $ | 216 | | | $ | 2,319 | | | $ | 1,982 | | | $ | 462 | | | $ | 749 | |
Net realized gains/(losses) from investments | | | (1,069 | ) | | | 10,290 | | | | 898 | | | | 5,137 | | | | 93 | | | | 10,533 | |
Change in unrealized appreciation/(depreciation) from investments | | | (19,971 | ) | | | 27,043 | | | | (28,369 | ) | | | 43,355 | | | | (5,203 | ) | | | 7,136 | |
Change in net assets resulting from operations | | | (20,734 | ) | | | 37,549 | | | | (25,152 | ) | | | 50,474 | | | | (4,648 | ) | | | 18,418 | |
Distributions to Shareholders: | | | | | | | | | | | | | | | | | | | | | | | | |
HC Strategic Shares | | | (6,549 | ) | | | (298 | ) | | | (8,113 | ) | | | (3,686 | ) | | | (10,591 | ) | | | (786 | ) |
Change in net assets resulting from distributions | | | (6,549 | ) | | | (298 | ) | | | (8,113 | ) | | | (3,686 | ) | | | (10,591 | ) | | | (786 | ) |
HC Strategic Shares | | | | | | | | | | | | | | | | | | | | | | | | |
Proceeds from shares issued | | | 268 | | | | 408 | | | | 1,326 | | | | 1,079 | | | | 4,672 | | | | 16,924 | |
Proceeds from reinvestment of dividends | | | 4,510 | | | | 229 | | | | 5,772 | | | | 1,841 | | | | 10,591 | | | | 701 | |
Cost of shares redeemed | | | (6,077 | ) | | | (8,598 | ) | | | (665 | ) | | | (11,668 | ) | | | (6,411 | ) | | | (59,428 | ) |
Change in net assets from HC Strategic Shares of beneficial interest | | | (1,299 | ) | | | (7,961 | ) | | | 6,433 | | | | (8,748 | ) | | | 8,852 | | | | (41,803 | ) |
Change in net assets from shares of beneficial interest | | | (1,299 | ) | | | (7,961 | ) | | | 6,433 | | | | (8,748 | ) | | | 8,852 | | | | (41,803 | ) |
Change in net assets | | | (28,582 | ) | | | 29,290 | | | | (26,832 | ) | | | 38,040 | | | | (6,387 | ) | | | (24,171 | ) |
Net Assets: | | | | | | | | | | | | | | | | | | | | | | | | |
Beginning of period | | | 97,817 | | | | 68,527 | | | | 170,492 | | | | 132,452 | | | | 28,912 | | | | 53,083 | |
End of period | | $ | 69,235 | | | $ | 97,817 | | | $ | 143,660 | | | $ | 170,492 | | | $ | 22,525 | | | $ | 28,912 | |
Share Transactions: | | | | | | | | | | | | | | | | | | | | | | | | |
HC Strategic Shares | | | | | | | | | | | | | | | | | | | | | | | | |
Issued | | | 7 | | | | 13 | | | | 89 | | | | 79 | | | | 346 | | | | 1,191 | |
Reinvested | | | 135 | | | | 7 | | | | 395 | | | | 145 | | | | 921 | | | | 50 | |
Redeemed | | | (180 | ) | | | (307 | ) | | | (55 | ) | | | (873 | ) | | | (585 | ) | | | (4,012 | ) |
Change in HC Strategic Shares | | | (38 | ) | | | (287 | ) | | | 429 | | | | (649 | ) | | | 682 | | | | (2,771 | ) |
Total change in shares | | | (38 | ) | | | (287 | ) | | | 429 | | | | (649 | ) | | | 682 | | | | (2,771 | ) |
See accompanying notes to financial statements.
286
HC CAPITAL TRUST
Statements of Changes in Net Assets (continued)
(Amounts in thousands)
| | | The International
Equity Portfolio | | | The Institutional
International Equity
Portfolio | | | The Emerging
Markets Portfolio | |
| | | For the
Year Ended
June 30,
2022 | | | For the
Year Ended
June 30,
2021 | | | For the
Year Ended
June 30,
2022 | | | For the
Year Ended
June 30,
2021 | | | For the
Year Ended
June 30,
2022 | | | For the
Year Ended
June 30,
2021 | |
Operations: | | | | | | | | | | | | | | | | | | | | | | | | |
Net investment income | | $ | 22,018 | | | $ | 16,732 | | | $ | 28,489 | | | $ | 21,924 | | | $ | 16,588 | | | $ | 11,570 | |
Net realized gains/(losses) from investments | | | (8,346 | ) | | | 2,131 | | | | (9,835 | ) | | | 129,620 | | | | (6,045 | ) | | | 98,589 | |
Change in unrealized appreciation/(depreciation) from investments | | | (120,778 | ) | | | 164,837 | | | | (213,185 | ) | | | 222,150 | | | | (237,951 | ) | | | 200,638 | |
Change in net assets resulting from operations | | | (107,106 | ) | | | 183,700 | | | | (194,531 | ) | | | 373,694 | | | | (227,408 | ) | | | 310,797 | |
Distributions to Shareholders: | | | | | | | | | | | | | | | | | | | | | | | | |
HC Strategic Shares | | | (24,441 | ) | | | (16,434 | ) | | | (117,066 | ) | | | (24,462 | ) | | | (17,632 | ) | | | (10,399 | ) |
Change in net assets resulting from distributions | | | (24,441 | ) | | | (16,434 | ) | | | (117,066 | ) | | | (24,462 | ) | | | (17,632 | ) | | | (10,399 | ) |
HC Strategic Shares | | | | | | | | | | | | | | | | | | | | | | | | |
Proceeds from shares issued | | | 19,127 | | | | 19,548 | | | | 166,148 | | | | 222,127 | | | | 86,489 | | | | 54,866 | |
Proceeds from reinvestment of dividends | | | 16,914 | | | | 11,506 | | | | 105,685 | | | | 20,222 | | | | 14,462 | | | | 8,499 | |
Cost of shares redeemed | | | (88,267 | ) | | | (83,436 | ) | | | (392,253 | ) | | | (703,421 | ) | | | (103,185 | ) | | | (341,261 | ) |
Change in net assets from HC Strategic Shares of beneficial interest | | | (52,226 | ) | | | (52,382 | ) | | | (120,420 | ) | | | (461,072 | ) | | | (2,234 | ) | | | (277,896 | ) |
Change in net assets from shares of beneficial interest | | | (52,226 | ) | | | (52,382 | ) | | | (120,420 | ) | | | (461,072 | ) | | | (2,234 | ) | | | (277,896 | ) |
Change in net assets | | | (183,773 | ) | | | 114,884 | | | | (432,017 | ) | | | (111,840 | ) | | | (247,274 | ) | | | 22,502 | |
Net Assets: | | | | | | | | | | | | | | | | | | | | | | | | |
Beginning of period | | | 719,981 | | | | 605,097 | | | | 1,228,416 | | | | 1,340,256 | | | | 963,673 | | | | 941,171 | |
End of period | | $ | 536,208 | | | $ | 719,981 | | | $ | 796,399 | | | $ | 1,228,416 | | | $ | 716,399 | | | $ | 963,673 | |
Share Transactions: | | | | | | | | | | | | | | | | | | | | | | | | |
HC Strategic Shares | | | | | | | | | | | | | | | | | | | | | | | | |
Issued | | | 1,547 | | | | 1,648 | | | | 15,803 | | | | 20,995 | | | | 4,314 | | | | 2,536 | |
Reinvested | | | 1,510 | | | | 900 | | | | 10,100 | | | | 1,833 | | | | 703 | | | | 398 | |
Redeemed | | | (7,578 | ) | | | (7,495 | ) | | | (38,245 | ) | | | (68,424 | ) | | | (5,148 | ) | | | (16,704 | ) |
Change in HC Strategic Shares | | | (4,521 | ) | | | (4,947 | ) | | | (12,342 | ) | | | (45,596 | ) | | | (131 | ) | | | (13,770 | ) |
Total change in shares | | | (4,521 | ) | | | (4,947 | ) | | | (12,342 | ) | | | (45,596 | ) | | | (131 | ) | | | (13,770 | ) |
See accompanying notes to financial statements.
287
HC CAPITAL TRUST
Statements of Changes in Net Assets (continued)
(Amounts in thousands)
| | | The Core Fixed
Income Portfolio | | | The Corporate
Opportunities Portfolio | | | The U.S. Government Fixed
Income Securities Portfolio | |
| | | For the
Year Ended
June 30,
2022 | | | For the
Year Ended
June 30,
2021 | | | For the
Year Ended
June 30,
2022 | | | For the
Year Ended
June 30,
2021 | | | For the
Year Ended
June 30,
2022 | | | For the
Year Ended
June 30,
2021 | |
Operations: | | | | | | | | | | | | | | | | | | | | | | | | |
Net investment income | | $ | 1,163 | | | $ | 1,166 | | | $ | 800 | | | $ | 417 | | | $ | 5,653 | | | $ | 4,183 | |
Net realized gains/(losses) from investments, futures | | | (222 | ) | | | 1,033 | | | | (21,311 | ) | | | 49,300 | | | | (945 | ) | | | 2,042 | |
Change in unrealized appreciation/(depreciation) from investments, futures | | | (8,166 | ) | | | (2,199 | ) | | | (2,048 | ) | | | (4,186 | ) | | | (35,660 | ) | | | (15,905 | ) |
Change in net assets resulting from operations | | | (7,225 | ) | | | — | | | | (22,559 | ) | | | 45,531 | | | | (30,952 | ) | | | (9,680 | ) |
Distributions to Shareholders: | | | | | | | | | | | | | | | | | | | | | | | | |
HC Strategic Shares | | | (1,826 | ) | | | (2,157 | ) | | | (30,837 | ) | | | (394 | ) | | | (6,950 | ) | | | (14,456 | ) |
Change in net assets resulting from distributions | | | (1,826 | ) | | | (2,157 | ) | | | (30,837 | ) | | | (394 | ) | | | (6,950 | ) | | | (14,456 | ) |
HC Strategic Shares | | | | | | | | | | | | | | | | | | | | | | | | |
Proceeds from shares issued | | | 9,101 | | | | 11,596 | | | | 14,541 | | | | 19,366 | | | | 469,627 | | | | 97,804 | |
Proceeds from reinvestment of dividends | | | 1,823 | | | | 2,150 | | | | 30,098 | | | | 384 | | | | 5,369 | | | | 12,543 | |
Cost of shares redeemed | | | (10,609 | ) | | | (11,637 | ) | | | (39,499 | ) | | | (194,401 | ) | | | (65,092 | ) | | | (135,434 | ) |
Change in net assets from HC Strategic Shares of beneficial interest | | | 315 | | | | 2,109 | | | | 5,140 | | | | (174,651 | ) | | | 409,904 | | | | (25,087 | ) |
Change in net assets from shares of beneficial interest | | | 315 | | | | 2,109 | | | | 5,140 | | | | (174,651 | ) | | | 409,904 | | | | (25,087 | ) |
Change in net assets | | | (8,736 | ) | | | (48 | ) | | | (48,256 | ) | | | (129,514 | ) | | | 372,002 | | | | (49,223 | ) |
Net Assets: | | | | | | | | | | | | | | | | | | | | | | | | |
Beginning of period | | | 66,230 | | | | 66,278 | | | | 307,343 | | | | 436,857 | | | | 256,466 | | | | 305,689 | |
End of period | | $ | 57,494 | | | $ | 66,230 | | | $ | 259,087 | | | $ | 307,343 | | | $ | 628,468 | | | $ | 256,466 | |
Share Transactions: | | | | | | | | | | | | | | | | | | | | | | | | |
HC Strategic Shares | | | | | | | | | | | | | | | | | | | | | | | | |
Issued | | | 967 | | | | 1,112 | | | | 1,898 | | | | 2,543 | | | | 51,491 | | | | 9,307 | |
Reinvested | | | 186 | | | | 205 | | | | 4,048 | | | | 49 | | | | 566 | | | | 1,211 | |
Redeemed | | | (1,087 | ) | | | (1,125 | ) | | | (5,194 | ) | | | (25,675 | ) | | | (6,802 | ) | | | (13,081 | ) |
Change in HC Strategic Shares | | | 66 | | | | 192 | | | | 752 | | | | (23,083 | ) | | | 45,255 | | | | (2,563 | ) |
Total change in shares | | | 66 | | | | 192 | | | | 752 | | | | (23,083 | ) | | | 45,255 | | | | (2,563 | ) |
See accompanying notes to financial statements.
288
HC CAPITAL TRUST
Statements of Changes in Net Assets (continued)
(Amounts in thousands)
| | | The U.S. Corporate Fixed
Income Securities Portfolio | | | The U.S. Mortgage/Asset
Backed Fixed Income
Securities Portfolio | | | The Short-Term
Municipal Bond Portfolio | |
| | | For the
Year Ended
June 30,
2022 | | | For the
Year Ended
June 30,
2021 | | | For the
Year Ended
June 30,
2022 | | | For the
Year Ended
June 30,
2021 | | | For the
Year Ended
June 30,
2022 | | | For the
Year Ended
June 30,
2021 | |
Operations: | | | | | | | | | | | | | | | | | | | | | | | | |
Net investment income | | $ | 7,298 | | | $ | 8,470 | | | $ | 2,776 | | | $ | 2,189 | | | $ | 1,184 | | | $ | 1,351 | |
Net realized gains/(losses) from investments | | | 831 | | | | 14,928 | | | | (2,775 | ) | | | 169 | | | | (908 | ) | | | 34 | |
Change in unrealized appreciation/(depreciation) from investments | | | (43,676 | ) | | | (13,313 | ) | | | (19,523 | ) | | | (3,606 | ) | | | (4,969 | ) | | | (757 | ) |
Change in net assets resulting from operations | | | (35,547 | ) | | | 10,085 | | | | (19,522 | ) | | | (1,248 | ) | | | (4,693 | ) | | | 628 | |
Distributions to Shareholders: | | | | | | | | | | | | | | | | | | | | | | | | |
HC Strategic Shares | | | (18,127 | ) | | | (17,792 | ) | | | (4,043 | ) | | | (4,683 | ) | | | (1,233 | ) | | | (1,347 | ) |
Change in net assets resulting from distributions | | | (18,127 | ) | | | (17,792 | ) | | | (4,043 | ) | | | (4,683 | ) | | | (1,233 | ) | | | (1,347 | ) |
HC Strategic Shares | | | | | | | | | | | | | | | | | | | | | | | | |
Proceeds from shares issued | | | 70,919 | | | | 73,540 | | | | 52,915 | | | | 68,718 | | | | 33,267 | | | | 33,793 | |
Proceeds from reinvestment of dividends | | | 15,848 | | | | 14,345 | | | | 2,835 | | | | 3,353 | | | | 1,138 | | | | 1,287 | |
Cost of shares redeemed | | | (45,829 | ) | | | (157,396 | ) | | | (33,966 | ) | | | (100,615 | ) | | | (38,943 | ) | | | (18,942 | ) |
Change in net assets from HC Strategic Shares of beneficial interest | | | 40,938 | | | | (69,511 | ) | | | 21,784 | | | | (28,544 | ) | | | (4,538 | ) | | | 16,138 | |
Change in net assets from shares of beneficial interest | | | 40,938 | | | | (69,511 | ) | | | 21,784 | | | | (28,544 | ) | | | (4,538 | ) | | | 16,138 | |
Change in net assets | | | (12,736 | ) | | | (77,218 | ) | | | (1,781 | ) | | | (34,475 | ) | | | (10,464 | ) | | | 15,419 | |
Net Assets: | | | | | | | | | | | | | | | | | | | | | | | | |
Beginning of period | | | 270,435 | | | | 347,653 | | | | 215,034 | | | | 249,509 | | | | 150,484 | | | | 135,065 | |
End of period | | $ | 257,699 | | | $ | 270,435 | | | $ | 213,253 | | | $ | 215,034 | | | $ | 140,020 | | | $ | 150,484 | |
Share Transactions: | | | | | | | | | | | | | | | | | | | | | | | | |
HC Strategic Shares | | | | | | | | | | | | | | | | | | | | | | | | |
Issued | | | 7,142 | | | | 6,748 | | | | 5,788 | | | | 7,068 | | | | 3,391 | | | | 3,362 | |
Reinvested | | | 1,575 | | | | 1,321 | | | | 309 | | | | 346 | | | | 116 | | | | 128 | |
Redeemed | | | (4,787 | ) | | | (14,519 | ) | | | (3,767 | ) | | | (10,341 | ) | | | (3,962 | ) | | | (1,888 | ) |
Change in HC Strategic Shares | | | 3,930 | | | | (6,450 | ) | | | 2,330 | | | | (2,927 | ) | | | (455 | ) | | | 1,602 | |
Total change in shares | | | 3,930 | | | | (6,450 | ) | | | 2,330 | | | | (2,927 | ) | | | (455 | ) | | | 1,602 | |
See accompanying notes to financial statements.
289
HC CAPITAL TRUST
Statements of Changes in Net Assets (concluded)
(Amounts in thousands)
| | | The Intermediate Term
Municipal Bond Portfolio | | | The Intermediate Term
Municipal Bond II Portfolio | |
| | | For the
Year Ended
June 30,
2022 | | | For the
Year Ended
June 30,
2021 | | | For the
Year Ended
June 30,
2022 | | | For the
Year Ended
June 30,
2021 | |
Operations: | | | | | | | | | | | | | | | | |
Net investment income | | $ | 5,904 | | | $ | 6,447 | | | $ | 1,767 | | | $ | 1,519 | |
Net realized gains/(losses) from investments | | | (360 | ) | | | 1,318 | | | | 18 | | | | 876 | |
Change in unrealized appreciation/(depreciation) from investments | | | (28,652 | ) | | | 2,874 | | | | (10,629 | ) | | | 48 | |
Change in net assets resulting from operations | | | (23,108 | ) | | | 10,639 | | | | (8,844 | ) | | | 2,443 | |
Distributions to Shareholders: | | | | | | | | | | | | | | | | |
HC Strategic Shares | | | (6,487 | ) | | | (6,817 | ) | | | (2,832 | ) | | | (1,640 | ) |
Change in net assets resulting from distributions | | | (6,487 | ) | | | (6,817 | ) | | | (2,832 | ) | | | (1,640 | ) |
HC Strategic Shares | | | | | | | | | | | | | | | | |
Proceeds from shares issued | | | 28,024 | | | | 28,827 | | | | 13,703 | | | | 14,381 | |
Proceeds from reinvestment of dividends | | | 6,058 | | | | 6,485 | | | | 2,658 | | | | 1,552 | |
Cost of shares redeemed | | | (21,462 | ) | | | (42,369 | ) | | | (7,422 | ) | | | (6,984 | ) |
Change in net assets from HC Strategic Shares of beneficial interest | | | 12,620 | | | | (7,057 | ) | | | 8,939 | | | | 8,949 | |
Change in net assets from shares of beneficial interest | | | 12,620 | | | | (7,057 | ) | | | 8,939 | | | | 8,949 | |
Change in net assets | | | (16,975 | ) | | | (3,235 | ) | | | (2,737 | ) | | | 9,752 | |
Net Assets: | | | | | | | | | | | | | | | | |
Beginning of period | | | 388,073 | | | | 391,308 | | | | 89,738 | | | | 79,986 | |
End of period | | $ | 371,098 | | | $ | 388,073 | | | $ | 87,001 | | | $ | 89,738 | |
Share Transactions: | | | | | | | | | | | | | | | | |
HC Strategic Shares | | | | | | | | | | | | | | | | |
Issued | | | 2,830 | | | | 2,765 | | | | 1,358 | | | | 1,358 | |
Reinvested | | | 600 | | | | 623 | | | | 260 | | | | 147 | |
Redeemed | | | (2,128 | ) | | | (4,065 | ) | | | (742 | ) | | | (661 | ) |
Change in HC Strategic Shares | | | 1,302 | | | | (677 | ) | | | 876 | | | | 844 | |
Total change in shares | | | 1,302 | | | | (677 | ) | | | 876 | | | | 844 | |
See accompanying notes to financial statements.
290
HC CAPITAL TRUST
Financial Highlights
Selected data for a share outstanding throughout the periods indicated.
| | | | | | | Change in Net Assets
Resulting From Operations: | | | Distributions to Shareholders: | | | | | | | | | | | | | | | Ratios/Supplementary Data: | |
| | | Net Asset
Value,
Beginning
of Period | | | Net
Investment
Income/
(Loss) | | | Net Realized/
Unrealized
Gains/
(Losses) on
Investments | | | Total from
Operations | | | Net
Investment
Income | | | Net
Realized
Gains from
Investments | | | Total
Distributions
to
Shareholders | | | Net Asset
Value, End
of Period | | | Total
Return(a) | | | Net Assets,
at End of
Period
(in thousands) | | | Ratio of
Expenses to
Average Net
Assets, Prior to
Expenses Paid
Indirectly and
Waivers(b) | | | Ratio of
Expenses to
Average Net
Assets, Net of
Expenses Paid
Indirectly and
Waivers(b) | | | Ratio of Net
Investment
Income/
(Loss) to
Average Net
Assets(b) | | | Portfolio
Turnover
Rate(a)(c) | |
The Value Equity Portfolio | | | | | | | | | | | | | | | | | | | | | | | | | | | | | | | | | | | | | | | | | | | | | | | | | | | | | | | | |
HC Strategic Shares | | | | | | | | | | | | | | | | | | | | | | | | | | | | | | | | | | | | | | | | | | | | | | | | | | | | | | | | |
Year Ended June 30, 2022 | | $ | 29.70 | | | $ | 0.35 | (d) | | $ | (4.17 | ) | | $ | (3.82 | ) | | $ | (0.34 | ) | | $ | (0.16 | ) | | $ | (0.50 | ) | | $ | 25.38 | | | | (13.10 | )% | | $ | 584,565 | | | | 0.22 | % | | | 0.22 | % | | | 1.17 | % | | | 8 | % |
Year Ended June 30, 2021 | | | 21.23 | | | | 0.31 | (d) | | | 8.48 | | | | 8.79 | | | | (0.32 | ) | | | — | | | | (0.32 | ) | | | 29.70 | | | | 41.63 | % | | | 697,117 | | | | 0.22 | % | | | 0.22 | % | | | 1.20 | % | | | 6 | % |
Year Ended June 30, 2020 | | | 20.21 | | | | 0.35 | (d) | | | 1.03 | | | | 1.38 | | | | (0.35 | ) | | | (0.01 | ) | | | (0.36 | ) | | | 21.23 | | | | 6.89 | % | | | 538,326 | | | | 0.22 | % | | | 0.22 | % | | | 1.68 | % | | | 19 | % |
Year Ended June 30, 2019 | | | 19.95 | | | | 0.40 | (d) | | | 1.34 | | | | 1.74 | | | | (0.41 | ) | | | (1.07 | ) | | | (1.48 | ) | | | 20.21 | | | | 9.78 | % | | | 583,757 | | | | 0.21 | % | | | 0.21 | % | | | 2.05 | % | | | 74 | % |
Year Ended June 30, 2018 | | | 19.53 | | | | 0.42 | | | | 1.36 | | | | 1.78 | | | | (0.44 | ) | | | (0.92 | ) | | | (1.36 | ) | | | 19.95 | | | | 9.11 | % | | | 599,457 | | | | 0.27 | % | | | 0.26 | % | | | 2.10 | % | | | 59 | % |
HC Advisors Shares | | | | | | | | | | | | | | | | | | | | | | | | | | | | | | | | | | | | | | | | | | | | | | | | | | | | | | | | |
Period Ended June 30, 2019(e) | | $ | 19.95 | | | $ | 0.46 | (d) | | $ | 1.26 | | | $ | 1.72 | | | $ | (0.33 | ) | | $ | (1.07 | ) | | $ | (1.40 | ) | | $ | 20.27 | | | | 9.69 | % | | $ | — | | | | 0.46 | % | | | 0.21 | % | | | 2.29 | % | | | 74 | % |
Year Ended June 30, 2018 | | | 19.52 | | | | 0.43 | | | | 1.36 | | | | 1.79 | | | | (0.44 | ) | | | (0.92 | ) | | | (1.36 | ) | | | 19.95 | | | | 9.17 | % | | | 675 | | | | 0.52 | % | | | 0.26 | % | | | 2.08 | % | | | 59 | % |
The Growth Equity Portfolio | | | | | | | | | | | | | | | | | | | | | | | | | | | | | | | | | | | | | | | | | | | | | | | | | | | | | | | | |
HC Strategic Shares | | | | | | | | | | | | | | | | | | | | | | | | | | | | | | | | | | | | | | | | | | | | | | | | | | | | | | | | |
Year Ended June 30, 2022 | | $ | 33.87 | | | $ | 0.28 | (d) | | $ | (5.17 | ) | | $ | (4.89 | ) | | $ | (0.28 | ) | | $ | (2.66 | ) | | $ | (2.94 | ) | | $ | 26.04 | | | | (16.30 | )% | | $ | 706,876 | | | | 0.27 | % | | | 0.27 | % | | | 0.85 | % | | | 12 | % |
Year Ended June 30, 2021 | | | 25.84 | | | | 0.25 | (d) | | | 9.63 | | | | 9.88 | | | | (0.26 | ) | | | (1.59 | ) | | | (1.85 | ) | | | 33.87 | | | | 39.43 | % | | | 933,398 | | | | 0.27 | % | | | 0.27 | % | | | 0.84 | % | | | 15 | % |
Year Ended June 30, 2020 | | | 24.52 | | | | 0.31 | (d) | | | 2.37 | | | | 2.68 | | | | (0.33 | ) | | | (1.03 | ) | | | (1.36 | ) | | | 25.84 | | | | 11.17 | % | | | 736,840 | | | | 0.26 | % | | | 0.26 | % | | | 1.26 | % | | | 37 | % |
Year Ended June 30, 2019 | | | 23.54 | | | | 0.30 | (d) | | | 2.30 | | | | 2.60 | | | | (0.30 | ) | | | (1.32 | ) | | | (1.62 | ) | | | 24.52 | | | | 12.22 | % | | | 802,838 | | | | 0.25 | % | | | 0.25 | % | | | 1.28 | % | | | 41 | % |
Year Ended June 30, 2018 | | | 20.90 | | | | 0.22 | | | | 3.70 | | | | 3.92 | | | | (0.22 | ) | | | (1.06 | ) | | | (1.28 | ) | | | 23.54 | | | | 19.12 | % | | | 808,868 | | | | 0.30 | % | | | 0.29 | % | | | 0.96 | % | | | 40 | % |
HC Advisors Shares | | | | | | | | | | | | | | | | | | | | | | | | | | | | | | | | | | | | | | | | | | | | | | | | | | | | | | | | |
Period Ended June 30, 2019(e) | | $ | 23.50 | | | $ | 0.28 | (d) | | $ | 2.00 | | | $ | 2.28 | | | $ | (0.23 | ) | | $ | (1.32 | ) | | $ | (1.55 | ) | | $ | 24.23 | | | | 10.77 | % | | $ | — | | | | 0.51 | % | | | 0.26 | % | | | 1.19 | % | | | 41 | % |
Year Ended June 30, 2018 | | | 20.86 | | | | 0.22 | | | | 3.70 | | | | 3.92 | | | | (0.22 | ) | | | (1.06 | ) | | | (1.28 | ) | | | 23.50 | | | | 19.16 | % | | | 922 | | | | 0.55 | % | | | 0.29 | % | | | 0.94 | % | | | 40 | % |
(a) | Not annualized for periods less than one year. |
(b) | Annualized for periods less than one year. |
(c) | Portfolio turnover is calculated on the basis of the Portfolio, as a whole, without distinguishing between the classes of shares issued. |
(d) | Per share amounts are based on average shares outstanding. |
(e) | HC Advisors Shares are still offered, but were fully redeemed on May 1, 2019. |
See accompanying notes to financial statements.
291
HC CAPITAL TRUST
Financial Highlights (continued)
Selected data for a share outstanding throughout the periods indicated.
| | | | | | | Change in Net Assets
Resulting From Operations: | | | Distributions to Shareholders: | | | | | | | | | | | | | | | Ratios/Supplementary Data: | |
| | | Net Asset
Value,
Beginning
of Period | | | Net
Investment
Income/
(Loss) | | | Net Realized/
Unrealized
Gains/
(Losses) on
Investments | | | Total from
Operations | | | Net
Investment
Income | | | Net
Realized
Gains from
Investments | | | Total
Distributions
to
Shareholders | | | Net Asset
Value, End
of Period | | | Total
Return(a) | | | Net Assets,
at End of
Period
(in thousands) | | | Ratio of
Expenses to
Average Net
Assets, Prior to
Expenses Paid
Indirectly and
Waivers(b) | | | Ratio of
Expenses to
Average Net
Assets, Net of
Expenses Paid
Indirectly and
Waivers(b) | | | Ratio of Net
Investment
Income/
(Loss) to
Average Net
Assets(b) | | | Portfolio
Turnover
Rate(a)(c) | |
The Institutional U.S. Equity Portfolio | | | | | | | | | | | | | | | | | | | | | | | | | | | | | | | | | | | | | | | | | | | | | | | | | | | | | | | | |
HC Strategic Shares | | | | | | | | | | | | | | | | | | | | | | | | | | | | | | | | | | | | | | | | | | | | | | | | | | | | | | | | |
Year Ended June 30, 2022 | | $ | 22.87 | | | $ | 0.15 | (d) | | $ | (2.54 | ) | | $ | (2.39 | ) | | $ | (0.16 | ) | | $ | (5.39 | ) | | $ | (5.55 | ) | | $ | 14.93 | | | | (15.30 | )% | | $ | 2,252,240 | | | | 0.28 | % | | | 0.28 | % | | | 0.77 | % | | | 43 | % |
Year Ended June 30, 2021 | | | 17.12 | | | | 0.17 | (d) | | | 6.79 | | | | 6.96 | | | | (0.18 | ) | | | (1.03 | ) | | | (1.21 | ) | | | 22.87 | | | | 41.89 | % | | | 2,434,118 | | | | 0.28 | % | | | 0.28 | % | | | 0.87 | % | | | 29 | % |
Year Ended June 30, 2020 | | | 18.53 | | | | 0.23 | (d) | | | 1.98 | | | | 2.21 | | | | (0.21 | ) | | | (3.41 | ) | | | (3.62 | ) | | | 17.12 | | | | 12.71 | % | | | 2,724,391 | | | | 0.24 | % | | | 0.24 | % | | | 1.36 | % | | | 74 | % |
Year Ended June 30, 2019 | | | 18.25 | | | | 0.24 | (d) | | | 1.59 | | | | 1.83 | | | | (0.24 | ) | | | (1.31 | ) | | | (1.55 | ) | | | 18.53 | | | | 11.46 | % | | | 1,535,959 | | | | 0.23 | % | | | 0.23 | % | | | 1.31 | % | | | 70 | % |
Year Ended June 30, 2018 | | | 16.10 | | | | 0.18 | | | | 2.82 | | | | 3.00 | | | | (0.18 | ) | | | (0.67 | ) | | | (0.85 | ) | | | 18.25 | | | | 18.97 | % | | | 1,187,715 | | | | 0.28 | % | | | 0.28 | % | | | 1.04 | % | | | 43 | % |
HC Advisors Shares | | | | | | | | | | | | | | | | | | | | | | | | | | | | | | | | | | | | | | | | | | | | | | | | | | | | | | | | |
Period Ended June 30, 2019(e) | | $ | 18.25 | | | $ | 0.25 | (d) | | $ | 0.72 | | | $ | 0.97 | | | $ | (0.19 | ) | | $ | (1.31 | ) | | $ | (1.50 | ) | | $ | 17.72 | | | | 6.27 | % | | $ | — | | | | 0.48 | % | | | 0.23 | % | | | 1.36 | % | | | 70 | % |
Year Ended June 30, 2018 | | | 16.10 | | | | 0.20 | | | | 2.80 | | | | 3.00 | | | | (0.18 | ) | | | (0.67 | ) | | | (0.85 | ) | | | 18.25 | | | | 18.97 | % | | | 1,026 | | | | 0.53 | % | | | 0.28 | % | | | 1.00 | % | | | 43 | % |
The Small Capitalization-Mid Capitalization Equity Portfolio | | | | | | | | | | | | | | | | | | | | | | | | | | | | | | | | | | | | | | | | | | | | | | | | |
HC Strategic Shares | | | | | | | | | | | | | | | | | | | | | | | | | | | | | | | | | | | | | | | | | | | | | | | | | | | | | | | | |
Year Ended June 30, 2022 | | $ | 36.85 | (f) | | $ | 0.12 | (d) | | $ | (8.01 | ) | | $ | (7.89 | ) | | $ | (0.12 | ) | | $ | (2.37 | ) | | $ | (2.49 | ) | | $ | 26.47 | | | | (22.74 | )% | | $ | 69,235 | | | | 0.51 | % | | | 0.51 | % | | | 0.35 | % | | | 64 | % |
Year Ended June 30, 2021 | | | 23.30 | | | | 0.08 | (d) | | | 13.58 | | | | 13.66 | | | | (0.11 | ) | | | — | | | | (0.11 | ) | | | 36.85 | (f) | | | 58.67 | % | | | 97,817 | | | | 0.49 | % | | | 0.49 | % | | | 0.25 | % | | | 32 | % |
Year Ended June 30, 2020 | | | 26.25 | | | | 0.15 | (d) | | | (1.82 | ) | | | (1.67 | ) | | | (0.18 | ) | | | (1.10 | ) | | | (1.28 | ) | | | 23.30 | | | | (6.83 | )% | | | 68,527 | | | | 0.53 | % | | | 0.52 | % | | | 0.64 | % | | | 87 | % |
Year Ended June 30, 2019 | | | 29.52 | | | | 0.10 | (d) | | | (0.77 | ) | | | (0.67 | ) | | | (0.13 | ) | | | (2.47 | ) | | | (2.60 | ) | | | 26.25 | | | | (0.81 | )% | | | 95,614 | | | | 0.68 | % | | | 0.67 | % | | | 0.36 | % | | | 79 | % |
Year Ended June 30, 2018 | | | 25.23 | | | | 0.10 | | | | 4.29 | | | | 4.39 | | | | (0.10 | ) | | | — | | | | (0.10 | ) | | | 29.52 | | | | 17.42 | % | | | 110,489 | | | | 0.77 | % | | | 0.76 | % | | | 0.37 | % | | | 62 | % |
HC Advisors Shares | | | | | | | | | | | | | | | | | | | | | | | | | | | | | | | | | | | | | | | | | | | | | | | | | | | | | | | | |
Period Ended June 30, 2019(g) | | $ | 29.49 | | | $ | 0.08 | (d) | | $ | (0.97 | ) | | $ | (0.89 | ) | | $ | (0.10 | ) | | $ | (2.47 | ) | | $ | (2.57 | ) | | $ | 26.03 | | | | (1.62 | )% | | $ | — | | | | 0.93 | % | | | 0.66 | % | | | 0.27 | % | | | 79 | % |
Year Ended June 30, 2018 | | | 25.21 | | | | 0.10 | | | | 4.28 | | | | 4.38 | | | | (0.10 | ) | | | — | | | | (0.10 | ) | | | 29.49 | | | | 17.40 | % | | | 121 | | | | 1.02 | % | | | 0.76 | % | | | 0.36 | % | | | 62 | % |
(a) | Not annualized for periods less than one year. |
(b) | Annualized for periods less than one year. |
(c) | Portfolio turnover is calculated on the basis of the Portfolio, as a whole, without distinguishing between the classes of shares issued. |
(d) | Per share amounts are based on average shares outstanding. |
(e) | HC Advisors Shares are still offered, but were fully redeemed on May 13, 2019. |
(f) | The net asset value per share (“NAV”) for financial reporting purposes differs from the NAV reported due to adjustments made in accordance with accounting principles generally accepted in United States of America. |
(g) | HC Advisors Shares are still offered, but were fully redeemed on May 1, 2019. |
See accompanying notes to financial statements.
292
HC CAPITAL TRUST
Financial Highlights (continued)
Selected data for a share outstanding throughout the periods indicated.
| | | | | | | Change in Net Assets
Resulting From Operations: | | | Distributions to Shareholders: | | | | | | | | | | | | | | | Ratios/Supplementary Data: | |
| | | Net Asset
Value,
Beginning
of Period | | | Net
Investment
Income/
(Loss) | | | Net Realized/
Unrealized
Gains/
(Losses) on
Investments | | | Total from
Operations | | | Net
Investment
Income | | | Net
Realized
Gains from
Investments | | | Total
Distributions
to
Shareholders | | | Net Asset
Value, End
of Period | | | Total
Return(a) | | | Net Assets,
at End of
Period
(in thousands) | | | Ratio of
Expenses to
Average Net
Assets, Prior to
Expenses Paid
Indirectly and
Waivers(b) | | | Ratio of
Expenses to
Average Net
Assets, Net of
Expenses Paid
Indirectly and
Waivers(b) | | | Ratio of Net
Investment
Income/
(Loss) to
Average Net
Assets(b) | | | Portfolio
Turnover
Rate(a)(c) | |
The ESG Growth Portfolio | | | | | | | | | | | | | | | | | | | | | | | | | | | | | | | | | | | | | | | | | | | | | | | | | | | | | | | | |
HC Strategic Shares | | | | | | | | | | | | | | | | | | | | | | | | | | | | | | | | | | | | | | | | | | | | | | | | | | | | | | | | |
Year Ended June 30, 2022 | | $ | 14.56 | | | $ | 0.19 | (d) | | $ | (2.23 | ) | | $ | (2.04 | ) | | $ | (0.21 | ) | | $ | (0.48 | ) | | $ | (0.69 | ) | | $ | 11.83 | | | | (14.80 | )% | | $ | 143,660 | | | | 0.39 | % | | | 0.39 | % | | | 1.36 | % | | | 10 | % |
Year Ended June 30, 2021 | | | 10.72 | | | | 0.16 | (d) | | | 3.98 | | | | 4.14 | | | | (0.17 | ) | | | (0.13 | ) | | | (0.30 | ) | | | 14.56 | | | | 39.02 | % | | | 170,492 | | | | 0.36 | % | | | 0.36 | % | | | 1.28 | % | | | 8 | % |
Year Ended June 30, 2020 | | | 10.92 | | | | 0.18 | (d) | | | 0.32 | | | | 0.50 | | | | (0.19 | ) | | | (0.51 | ) | | | (0.70 | ) | | | 10.72 | | | | 4.49 | % | | | 132,452 | | | | 0.36 | % | | | 0.34 | % | | | 1.66 | % | | | 31 | % |
Year Ended June 30, 2019 | | | 11.42 | | | | 0.28 | (d) | | | (0.10 | ) | | | 0.18 | | | | (0.30 | ) | | | (0.38 | ) | | | (0.68 | ) | | | 10.92 | | | | 2.06 | % | | | 148,978 | | | | 0.34 | % | | | 0.34 | % | | | 2.52 | % | | | 172 | % |
Year Ended June 30, 2018 | | | 10.65 | | | | 0.30 | | | | 0.78 | | | | 1.08 | | | | (0.31 | ) | | | — | | | | (0.31 | ) | | | 11.42 | | | | 10.16 | % | | | 166,523 | | | | 0.29 | % | | | 0.29 | % | | | 2.69 | % | | | 16 | % |
HC Advisors Shares | | | | | | | | | | | | | | | | | | | | | | | | | | | | | | | | | | | | | | | | | | | | | | | | | | | | | | | | |
Period Ended June 30, 2019(e) | | $ | 11.41 | | | $ | 0.28 | (d) | | $ | (0.29 | ) | | $ | (0.01 | ) | | $ | (0.21 | ) | | $ | (0.38 | ) | | $ | (0.59 | ) | | $ | 10.81 | | | | 0.32 | % | | $ | — | | | | 0.60 | % | | | 0.35 | % | | | 2.56 | % | | | 172 | % |
Year Ended June 30, 2018 | | | 10.64 | | | | 0.30 | | | | 0.78 | | | | 1.08 | | | | (0.31 | ) | | | — | | | | (0.31 | ) | | | 11.41 | | | | 10.17 | % | | | 1 | | | | 0.54 | % | | | 0.29 | % | | | 2.67 | % | | | 16 | % |
The Catholic SRI Growth Portfolio | | | | | | | | | | | | | | | | | | | | | | | | | | | | | | | | | | | | | | | | | | | | | | | | | | | | | | | | |
HC Strategic Shares | | | | | | | | | | | | | | | | | | | | | | | | | | | | | | | | | | | | | | | | | | | | | | | | | | | | | | | | |
Year Ended June 30, 2022 | | $ | 16.13 | | | $ | 0.20 | (d) | | $ | (1.74 | ) | | $ | (1.54 | ) | | $ | (0.24 | ) | | $ | (5.25 | ) | | $ | (5.49 | ) | | $ | 9.10 | | | | (16.17 | )% | | $ | 22,525 | | | | 0.56 | % | | | 0.31 | % | | | 1.56 | % | | | 25 | % |
Year Ended June 30, 2021 | | | 11.63 | | | | 0.19 | (d) | | | 4.55 | | | | 4.74 | | | | (0.24 | ) | | | — | | | | (0.24 | ) | | | 16.13 | | | | 41.00 | % | | | 28,912 | | | | 0.38 | % | | | 0.31 | % | | | 1.38 | % | | | 42 | % |
Year Ended June 30, 2020 | | | 11.84 | | | | 0.21 | (d) | | | 0.13 | | | | 0.34 | | | | (0.20 | ) | | | (0.35 | ) | | | (0.55 | ) | | | 11.63 | | | | 2.72 | % | | | 53,083 | | | | 0.42 | % | | | 0.31 | % | | | 1.80 | % | | | 14 | % |
Year Ended June 30, 2019 | | | 12.71 | | | | 0.31 | (d) | | | (0.14 | ) | | | 0.17 | | | | (0.31 | ) | | | (0.73 | ) | | | (1.04 | ) | | | 11.84 | | | | 2.16 | % | | | 51,401 | | | | 0.41 | % | | | 0.31 | % | | | 2.60 | % | | | 180 | % |
Year Ended June 30, 2018 | | | 12.02 | | | | 0.34 | | | | 1.00 | | | | 1.34 | | | | (0.34 | ) | | | (0.31 | ) | | | (0.65 | ) | | | 12.71 | | | | 11.23 | % | | | 29,413 | | | | 0.37 | % | | | 0.31 | % | | | 2.65 | % | | | 17 | % |
HC Advisors Shares | | | | | | | | | | | | | | | | | | | | | | | | | | | | | | | | | | | | | | | | | | | | | | | | | | | | | | | | |
Period Ended June 30, 2019(e) | | $ | 12.72 | | | $ | 0.31 | (d) | | $ | (0.39 | ) | | $ | (0.08 | ) | | $ | (0.20 | ) | | $ | (0.73 | ) | | $ | (0.93 | ) | | $ | 11.71 | | | | 0.07 | % | | $ | — | | | | 0.66 | % | | | 0.31 | % | | | 2.60 | % | | | 180 | % |
Year Ended June 30, 2018 | | | 12.03 | | | | 0.35 | | | | 0.99 | | | | 1.34 | | | | (0.34 | ) | | | (0.31 | ) | | | (0.65 | ) | | | 12.72 | | | | 11.22 | % | | | 1 | | | | 0.62 | % | | | 0.31 | % | | | 2.72 | % | | | 17 | % |
(a) | Not annualized for periods less than one year. |
(b) | Annualized for periods less than one year. |
(c) | Portfolio turnover is calculated on the basis of the Portfolio, as a whole, without distinguishing between the classes of shares issued. |
(d) | Per share amounts are based on average shares outstanding. |
(e) | HC Advisors Shares are still offered, but were fully redeemed on June 14, 2019. |
See accompanying notes to financial statements.
293
HC CAPITAL TRUST
Financial Highlights (continued)
Selected data for a share outstanding throughout the periods indicated.
| | | | | | | Change in Net Assets
Resulting From Operations: | | | Distributions to Shareholders: | | | | | | | | | | | | | | | Ratios/Supplementary Data: | |
| | | Net Asset
Value,
Beginning
of Period | | | Net
Investment
Income/
(Loss) | | | Net Realized/
Unrealized
Gains/
(Losses) on
Investments | | | Total from
Operations | | | Net
Investment
Income | | | Net
Realized
Gains from
Investments | | | Total
Distributions
to
Shareholders | | | Net Asset
Value, End
of Period | | | Total
Return(a) | | | Net Assets,
at End of
Period
(in thousands) | | | Ratio of
Expenses to
Average Net
Assets, Prior to
Expenses Paid
Indirectly and
Waivers(b)* | | | Ratio of
Expenses to
Average Net
Assets, Net of
Expenses Paid
Indirectly and
Waivers(b)* | | | Ratio of Net
Investment
Income/
(Loss) to
Average Net
Assets(b) | | | Portfolio
Turnover
Rate(a)(c) | |
The International Equity Portfolio | | | | | | | | | | | | | | | | | | | | | | | | | | | | | | | | | | | | | | | | | | | | | | | | | | | | | | | | |
HC Strategic Shares | | | | | | | | | | | | | | | | | | | | | | | | | | | | | | | | | | | | | | | | | | | | | | | | | | | | | | | | |
Year Ended June 30, 2022 | | $ | 12.60 | | | $ | 0.39 | (d) | | $ | (2.35 | ) | | $ | (1.96 | ) | | $ | (0.45 | ) | | $ | — | | | $ | (0.45 | ) | | $ | 10.19 | | | | (15.85 | )% | | $ | 536,208 | | | | 0.26 | % | | | 0.26 | % | | | 3.20 | % | | | 19 | % |
Year Ended June 30, 2021 | | | 9.75 | | | | 0.29 | (d) | | | 2.85 | | | | 3.14 | | | | (0.29 | ) | | | — | | | | (0.29 | ) | | | 12.60 | | | | 32.16 | % | | | 719,981 | | | | 0.25 | % | | | 0.25 | % | | | 2.51 | % | | | 23 | % |
Year Ended June 30, 2020 | | | 10.37 | | | | 0.19 | (d) | | | (0.58 | ) | | | (0.39 | ) | | | (0.23 | ) | | | — | | | | (0.23 | ) | | | 9.75 | | | | (3.82 | )% | | | 605,097 | | | | 0.41 | % | | | 0.41 | % | | | 1.88 | % | | | 95 | % |
Year Ended June 30, 2019 | | | 10.74 | | | | 0.34 | (d) | | | (0.32 | ) | | | 0.02 | | | | (0.39 | ) | | | — | | | | (0.39 | ) | | | 10.37 | | | | 0.24 | % | | | 911,059 | | | | 0.47 | % | | | 0.47 | % | | | 3.28 | % | | | 55 | % |
Year Ended June 30, 2018 | | | 10.48 | | | | 0.33 | | | | 0.26 | | | | 0.59 | | | | (0.33 | ) | | | — | | | | (0.33 | ) | | | 10.74 | | | | 5.60 | % | | | 1,213,191 | | | | 0.44 | % | | | 0.44 | % | | | 2.88 | % | | | 30 | % |
HC Advisors Shares | | | | | | | | | | | | | | | | | | | | | | | | | | | | | | | | | | | | | | | | | | | | | | | | | | | | | | | | |
Period Ended June 30, 2019(e) | | $ | 10.75 | | | $ | 0.20 | (d) | | $ | (0.17 | ) | | $ | 0.03 | | | $ | (0.03 | ) | | $ | — | | | $ | (0.03 | ) | | $ | 10.75 | | | | 0.31 | % | | $ | — | | | | 0.72 | % | | | 0.46 | % | | | 1.95 | % | | | 55 | % |
Year Ended June 30, 2018 | | | 10.49 | | | | 0.38 | | | | 0.21 | | | | 0.59 | | | | (0.33 | ) | | | — | | | | (0.33 | ) | | | 10.75 | | | | 5.60 | % | | | 1,661 | | | | 0.69 | % | | | 0.44 | % | | | 2.77 | % | | | 30 | % |
The Institutional International Equity Portfolio | | | | | | | | | | | | | | | | | | | | | | | | | | | | | | | | | | | | | | | | | | | | | | | | | | | | |
HC Strategic Shares | | | | | | | | | | | | | | | | | | | | | | | | | | | | | | | | | | | | | | | | | | | | | | | | | | | | | | | | |
Year Ended June 30, 2022 | | $ | 11.61 | | | $ | 0.27 | (d) | | $ | (2.20 | ) | | $ | (1.93 | ) | | $ | (0.67 | ) | | $ | (0.49 | ) | | $ | (1.16 | ) | | $ | 8.52 | | | | (18.16 | )% | | $ | 796,399 | | | | 0.27 | % | | | 0.27 | % | | | 2.55 | % | | | 23 | % |
Year Ended June 30, 2021 | | | 8.85 | | | | 0.18 | (d) | | | 2.78 | | | | 2.96 | | | | (0.20 | ) | | | — | | | | (0.20 | ) | | | 11.61 | | | | 33.57 | % | | | 1,228,416 | | | | 0.25 | % | | | 0.25 | % | | | 1.73 | % | | | 7 | % |
Year Ended June 30, 2020 | | | 9.70 | | | | 0.18 | (d) | | | (0.83 | ) | | | (0.65 | ) | | | (0.20 | ) | | | — | | | | (0.20 | ) | | | 8.85 | | | | (6.83 | )% | | | 1,340,256 | | | | 0.44 | % | | | 0.44 | % | | | 1.96 | % | | | 64 | % |
Year Ended June 30, 2019 | | | 10.57 | | | | 0.34 | (d) | | | (0.40 | ) | | | (0.06 | ) | | | (0.42 | ) | | | (0.39 | ) | | | (0.81 | ) | | | 9.70 | | | | 0.09 | % | | | 1,886,176 | | | | 0.42 | % | | | 0.42 | % | | | 3.46 | % | | | 38 | % |
Year Ended June 30, 2018 | | | 10.38 | | | | 0.35 | | | | 0.26 | | | | 0.61 | | | | (0.40 | ) | | | (0.02 | ) | | | (0.42 | ) | | | 10.57 | | | | 5.77 | % | | | 2,332,353 | | | | 0.40 | % | | | 0.40 | % | | | 3.11 | % | | | 40 | % |
HC Advisors Shares | | | | | | | | | | | | | | | | | | | | | | | | | | | | | | | | | | | | | | | | | | | | | | | | | | | | | | | | |
Period Ended June 30, 2019(f) | | $ | 10.56 | | | $ | 0.22 | (d) | | $ | (0.69 | ) | | $ | (0.47 | ) | | $ | (0.15 | ) | | $ | (0.39 | ) | | $ | (0.54 | ) | | $ | 9.55 | | | | (4.06 | )% | | $ | — | | | | 0.67 | % | | | 0.42 | % | | | 2.14 | % | | | 38 | % |
Year Ended June 30, 2018 | | | 10.37 | | | | 0.30 | | | | 0.31 | | | | 0.61 | | | | (0.40 | ) | | | (0.02 | ) | | | (0.42 | ) | | | 10.56 | | | | 5.78 | % | | | 1,868 | | | | 0.65 | % | | | 0.40 | % | | | 2.78 | % | | | 40 | % |
The Emerging Markets Portfolio | | | | | | | | | | | | | | | | | | | | | | | | | | | | | | | | | | | | | | | | | | | | | | | | | | | | | | | | |
HC Strategic Shares | | | | | | | | | | | | | | | | | | | | | | | | | | | | | | | | | | | | | | | | | | | | | | | | | | | | | | | | |
Year Ended June 30, 2022 | | $ | 23.10 | | | $ | 0.40 | (d) | | $ | (5.85 | ) | | $ | (5.45 | ) | | $ | (0.43 | ) | | $ | — | | | $ | (0.43 | ) | | $ | 17.22 | (g) | | | (23.87 | )% | | $ | 716,399 | | | | 0.52 | % | | | 0.46 | % | | | 1.96 | % | | | 20 | % |
Year Ended June 30, 2021 | | | 16.96 | | | | 0.25 | (d) | | | 6.11 | | | | 6.36 | | | | (0.22 | ) | | | — | | | | (0.22 | ) | | | 23.10 | | | | 37.62 | % | | | 963,673 | | | | 0.51 | % | | | 0.51 | % | | | 1.20 | % | | | 8 | % |
Year Ended June 30, 2020 | | | 18.14 | | | | 0.48 | (d) | | | (1.05 | ) | | | (0.57 | ) | | | (0.61 | ) | | | — | | | | (0.61 | ) | | | 16.96 | | | | (3.44 | )% | | | 941,171 | | | | 0.51 | % | | | 0.51 | % | | | 2.77 | % | | | 11 | % |
Year Ended June 30, 2019 | | | 17.78 | | | | 0.39 | (d) | | | 0.30 | | | | 0.69 | | | | (0.33 | ) | | | — | | | | (0.33 | ) | | | 18.14 | | | | 4.11 | % | | | 1,466,128 | | | | 0.58 | % | | | 0.58 | % | | | 2.24 | % | | | 50 | % |
Year Ended June 30, 2018 | | | 17.92 | | | | 0.40 | (d) | | | (0.13 | ) | | | 0.27 | | | | (0.41 | ) | | | — | | | | (0.41 | ) | | | 17.78 | | | | 1.34 | % | | | 1,631,863 | | | | 0.67 | % | | | 0.67 | % | | | 2.09 | % | | | 55 | % |
HC Advisors Shares | | | | | | | | | | | | | | | | | | | | | | | | | | | | | | | | | | | | | | | | | | | | | | | | | | | | | | | | |
Period Ended June 30, 2019(f) | | $ | 17.78 | | | $ | 0.38 | (d) | | $ | (0.58 | ) | | $ | (0.20 | ) | | $ | (0.33 | ) | | $ | — | | | $ | (0.33 | ) | | $ | 17.25 | | | | (0.99 | )% | | $ | — | | | | 0.84 | % | | | 0.59 | % | | | 2.19 | % | | | 50 | % |
Year Ended June 30, 2018 | | | 17.92 | | | | 0.38 | (d) | | | (0.11 | ) | | | 0.27 | | | | (0.41 | ) | | | — | | | | (0.41 | ) | | | 17.78 | | | | 1.34 | % | | | 1,451 | | | | 0.92 | % | | | 0.67 | % | | | 1.97 | % | | | 55 | % |
* | The expense ratios reflected do not include acquired fund fees and expenses of investment companies, in which a Portfolio invests. |
(a) | Not annualized for periods less than one year. |
(b) | Annualized for periods less than one year. |
(c) | Portfolio turnover is calculated on the basis of the Portfolio, as a whole, without distinguishing between the classes of shares issued. |
(d) | Per share amounts are based on average shares outstanding. |
(e) | HC Advisors Shares are still offered, but were fully redeemed on May 1, 2019. |
(f) | HC Advisors Shares are still offered, but were fully redeemed on May 13, 2019. |
(g) | The net asset value per share (“NAV”) for financial reporting purposes differs from the NAV reported due to adjustments made in accordance with accounting principles generally accepted in United States of America. |
See accompanying notes to financial statements.
294
HC CAPITAL TRUST
Financial Highlights (continued)
Selected data for a share outstanding throughout the periods indicated.
| | | | | | | Change in Net Assets
Resulting From Operations: | | | Distributions to Shareholders: | | | | | | | | | | | | | | | Ratios/Supplementary Data: | |
| | | Net Asset
Value,
Beginning
of Period | | | Net
Investment
Income/
(Loss) | | | Net Realized/
Unrealized
Gains/
(Losses) on
Investments | | | Total from
Operations | | | Net
Investment
Income | | | Net
Realized
Gains from
Investments | | | Total
Distributions
to
Shareholders | | | Net Asset
Value, End
of Period | | | Total
Return(a) | | | Net Assets,
at End of
Period
(in thousands) | | | Ratio of
Expenses to
Average Net
Assets, Prior to
Expenses Paid
Indirectly and
Waivers(b)* | | | Ratio of
Expenses to
Average Net
Assets, Net of
Expenses Paid
Indirectly and
Waivers(b)* | | | Ratio of Net
Investment
Income/
(Loss) to
Average Net
Assets(b) | | | Portfolio
Turnover
Rate(a)(c) | |
The Core Fixed Income Portfolio | | | | | | | | | | | | | | | | | | | | | | | | | | | | | | | | | | | | | | | | | | | | | | | | | | | | | | | | |
HC Strategic Shares | | | | | | | | | | | | | | | | | | | | | | | | | | | | | | | | | | | | | | | | | | | | | | | | | | | | | | | | |
Year Ended June 30, 2022 | | $ | 10.27 | | | $ | 0.18 | (d) | | $ | (1.35 | ) | | $ | (1.17 | ) | | $ | (0.19 | ) | | $ | (0.09 | ) | | $ | (0.28 | ) | | $ | 8.82 | | | | (11.58 | )% | | $ | 57,494 | | | | 0.36 | % | | | 0.36 | % | | | 1.87 | % | | | 33 | %(e) |
Year Ended June 30, 2021 | | | 10.59 | | | | 0.18 | (d) | | | (0.17 | ) | | | 0.01 | | | | (0.21 | ) | | | (0.12 | ) | | | (0.33 | ) | | | 10.27 | | | | 0.09 | % | | | 66,230 | | | | 0.33 | % | | | 0.33 | % | | | 1.71 | % | | | 38 | %(e) |
Year Ended June 30, 2020 | | | 9.98 | | | | 0.25 | (d) | | | 0.62 | | | | 0.87 | | | | (0.26 | ) | | | — | | | | (0.26 | ) | | | 10.59 | | | | 8.85 | % | | | 66,278 | | | | 0.32 | % | | | 0.32 | % | | | 2.42 | % | | | 36 | %(e) |
Year Ended June 30, 2019 | | | 9.49 | | | | 0.25 | (d) | | | 0.51 | | | | 0.76 | | | | (0.27 | ) | | | — | | | | (0.27 | ) | | | 9.98 | | | | 8.12 | % | | | 68,267 | | | | 0.35 | % | | | 0.35 | % | | | 2.63 | % | | | 34 | %(e) |
Year Ended June 30, 2018 | | | 9.80 | | | | 0.22 | | | | (0.30 | ) | | | (0.08 | ) | | | (0.23 | ) | | | — | | | | (0.23 | ) | | | 9.49 | | | | (0.85 | )% | | | 65,387 | | | | 0.33 | % | | | 0.33 | % | | | 2.26 | % | | | 44 | %(e) |
HC Advisors Shares | | | | | | | | | | | | | | | | | | | | | | | | | | | | | | | | | | | | | | | | | | | | | | | | | | | | | | | | |
Period Ended June 30, 2019(f) | | $ | 9.49 | | | $ | 0.25 | (d) | | $ | 0.23 | | | $ | 0.48 | | | $ | (0.22 | ) | | $ | — | | | $ | (0.22 | ) | | $ | 9.75 | | | | 5.14 | % | | $ | — | | | | 0.60 | % | | | 0.35 | % | | | 2.63 | % | | | 34 | %(e) |
Year Ended June 30, 2018 | | | 9.79 | | | | 0.23 | | | | (0.30 | ) | | | (0.07 | ) | | | (0.23 | ) | | | — | | | | (0.23 | ) | | | 9.49 | | | | (0.75 | )% | | | 1,362 | | | | 0.58 | % | | | 0.33 | % | | | 2.25 | % | | | 44 | %(e) |
The Corporate Opportunities Portfolio | | | | | | | | | | | | | | | | | | | | | | | | | | | | | | | | | | | | | | | | | | | | | | | | | | | | | | | | |
HC Strategic Shares | | | | | | | | | | | | | | | | | | | | | | | | | | | | | | | | | | | | | | | | | | | | | | | | | | | | | | | | |
Year Ended June 30, 2022 | | $ | 8.07 | | | $ | 0.02 | (d) | | $ | (0.58 | ) | | $ | (0.56 | ) | | $ | (0.02 | ) | | $ | (0.82 | ) | | $ | (0.84 | ) | | $ | 6.67 | | | | (8.03 | )% | | $ | 259,087 | | | | 0.21 | % | | | 0.21 | % | | | 0.27 | % | | | 44 | % |
Year Ended June 30, 2021 | | | 7.14 | | | | 0.01 | (d) | | | 0.93 | | | | 0.94 | | | | (0.01 | ) | | | — | | | | (0.01 | ) | | | 8.07 | | | | 13.17 | % | | | 307,343 | | | | 0.21 | % | | | 0.21 | % | | | 0.12 | % | | | 123 | % |
Year Ended June 30, 2020 | | | 7.01 | (g) | | | 0.20 | (d) | | | 0.16 | | | | 0.36 | | | | (0.23 | ) | | | — | | | | (0.23 | ) | | | 7.14 | | | | 5.23 | % | | | 436,857 | | | | 0.32 | % | | | 0.32 | % | | | 2.81 | % | | | 40 | % |
Year Ended June 30, 2019 | | | 6.85 | | | | 0.40 | (d) | | | 0.17 | | | | 0.57 | | | | (0.41 | ) | | | — | | | | (0.41 | ) | | | 7.01 | (g) | | | 8.62 | % | | | 597,848 | | | | 0.47 | % | | | 0.47 | % | | | 5.81 | % | | | 52 | % |
Year Ended June 30, 2018 | | | 6.95 | | | | 0.38 | | | | (0.10 | ) | | | 0.28 | | | | (0.38 | ) | | | — | | | | (0.38 | ) | | | 6.85 | | | | 4.06 | % | | | 673,271 | | | | 0.44 | % | | | 0.44 | % | | | 5.46 | % | | | 38 | % |
HC Advisors Shares | | | | | | | | | | | | | | | | | | | | | | | | | | | | | | | | | | | | | | | | | | | | | | | | | | | | | | | | |
Period Ended June 30, 2019(f) | | $ | 6.85 | | | $ | 0.39 | (d) | | $ | 0.05 | | | $ | 0.44 | | | $ | (0.30 | ) | | $ | — | | | $ | (0.30 | ) | | $ | 6.99 | | | | 6.61 | % | | $ | — | | | | 0.72 | % | | | 0.47 | % | | | 5.74 | % | | | 52 | % |
Year Ended June 30, 2018 | | | 6.95 | | | | 0.42 | | | | (0.14 | ) | | | 0.28 | | | | (0.38 | ) | | | — | | | | (0.38 | ) | | | 6.85 | | | | 4.06 | % | | | 362 | | | | 0.69 | % | | | 0.44 | % | | | 5.43 | % | | | 38 | % |
The U.S. Government Fixed Income Securities Portfolio | | | | | | | | | | | | | | | | | | | | | | | | | | | | | | | | | | | | | | | | | | | | | | | | |
HC Strategic Shares | | | | | | | | | | | | | | | | | | | | | | | | | | | | | | | | | | | | | | | | | | | | | | | | | | | | | | | | |
Year Ended June 30, 2022 | | $ | 9.99 | | | $ | 0.18 | (d) | | $ | (1.10 | ) | | $ | (0.92 | ) | | $ | (0.15 | ) | | $ | (0.06 | ) | | $ | (0.21 | ) | | $ | 8.86 | | | | (9.40 | )% | | $ | 628,468 | | | | 0.22 | % | | | 0.22 | % | | | 1.93 | % | | | 41 | % |
Year Ended June 30, 2021 | | | 10.83 | | | | 0.15 | (d) | | | (0.50 | ) | | | (0.35 | ) | | | (0.15 | ) | | | (0.34 | ) | | | (0.49 | ) | | | 9.99 | | | | (3.30 | )% | | | 256,466 | | | | 0.20 | % | | | 0.20 | % | | | 1.47 | % | | | 67 | % |
Year Ended June 30, 2020 | | | 10.03 | | | | 0.21 | (d) | | | 0.80 | | | | 1.01 | | | | (0.21 | ) | | | — | | | | (0.21 | ) | | | 10.83 | | | | 10.21 | % | | | 305,689 | | | | 0.19 | % | | | 0.19 | % | | | 1.99 | % | | | 58 | % |
Year Ended June 30, 2019 | | | 9.59 | | | | 0.21 | (d) | | | 0.44 | | | | 0.65 | | | | (0.21 | ) | | | — | | | | (0.21 | ) | | | 10.03 | | | | 6.87 | % | | | 305,531 | | | | 0.20 | % | | | 0.20 | % | | | 2.22 | % | | | 31 | % |
Year Ended June 30, 2018 | | | 9.84 | | | | 0.17 | | | | (0.25 | ) | | | (0.08 | ) | | | (0.17 | ) | | | — | | | | (0.17 | ) | | | 9.59 | | | | (0.79 | )% | | | 233,377 | | | | 0.19 | % | | | 0.19 | % | | | 1.81 | % | | | 33 | % |
* | The expense ratios reflected do not include acquired fund fees and expenses of investment companies, in which a Portfolio invests. |
(a) | Not annualized for periods less than one year. |
(b) | Annualized for periods less than one year. |
(c) | Portfolio turnover is calculated on the basis of the Portfolio, as a whole, without distinguishing between the classes of shares issued. |
(d) | Per share amounts are based on average shares outstanding. |
(e) | Portfolio turnover does not include TBA security transactions. |
(f) | HC Advisors Shares are still offered, but were fully redeemed on May 13, 2019. |
(g) | The net asset value per share (“NAV”) for financial reporting purposes differs from the NAV reported due to adjustments made in accordance with accounting principles generally accepted in the United States of America. |
See accompanying notes to financial statements.
295
HC CAPITAL TRUST
Financial Highlights (continued)
Selected data for a share outstanding throughout the periods indicated.
| | | | | | | Change in Net Assets
Resulting From Operations: | | | Distributions to Shareholders: | | | | | | | | | | | | | | | Ratios/Supplementary Data: | |
| | | Net Asset
Value,
Beginning
of Period | | | Net
Investment
Income/
(Loss) | | | Net Realized/
Unrealized
Gains/
(Losses) on
Investments | | | Total from
Operations | | | Net
Investment
Income | | | Net
Realized
Gains from
Investments | | | Total
Distributions
to
Shareholders | | | Net Asset
Value, End
of Period | | | Total
Return | | | Net Assets,
at End of
Period
(in thousands) | | | Ratio of
Expenses to
Average Net
Assets, Prior
to Expenses
Paid Indirectly
and Waivers | | | Ratio of
Expenses to
Average Net
Assets, Net of
Expenses Paid
Indirectly
and Waivers | | | Ratio of Net
Investment
Income/
(Loss) to
Average Net
Assets | | | Portfolio
Turnover
Rate(a) | |
The U.S. Corporate Fixed Income Securities Portfolio | | | | | | | | | | | | | | | | | | | | | | | | | | | | | | | | | | | | | | | | | | | | | | | | | | | | |
HC Strategic Shares | | | | | | | | | | | | | | | | | | | | | | | | | | | | | | | | | | | | | | | | | | | | | | | | | | | | | | | | |
Year Ended June 30, 2022 | | $ | 10.66 | | | $ | 0.26 | (b) | | $ | (1.48 | ) | | $ | (1.22 | ) | | $ | (0.26 | ) | | $ | (0.39 | ) | | $ | (0.65 | ) | | $ | 8.79 | | | | (12.12 | )% | | $ | 257,699 | | | | 0.21 | % | | | 0.21 | % | | | 2.63 | % | | | 31 | % |
Year Ended June 30, 2021 | | | 10.92 | | | | 0.30 | (b) | | | 0.05 | | | | 0.35 | | | | (0.31 | ) | | | (0.30 | ) | | | (0.61 | ) | | | 10.66 | | | | 3.21 | % | | | 270,435 | | | | 0.23 | % | | | 0.23 | % | | | 2.77 | % | | | 46 | % |
Year Ended June 30, 2020 | | | 10.29 | | | | 0.32 | (b) | | | 0.70 | | | | 1.02 | | | | (0.32 | ) | | | (0.07 | ) | | | (0.39 | ) | | | 10.92 | | | | 10.10 | % | | | 347,653 | | | | 0.21 | % | | | 0.21 | % | | | 3.04 | % | | | 43 | % |
Year Ended June 30, 2019 | | | 9.59 | | | | 0.34 | (b) | | | 0.70 | | | | 1.04 | | | | (0.34 | ) | | | — | | | | (0.34 | ) | | | 10.29 | | | | 11.07 | % | | | 312,255 | | | | 0.21 | % | | | 0.21 | % | | | 3.47 | % | | | 25 | % |
Year Ended June 30, 2018 | | | 10.03 | | | | 0.29 | | | | (0.41 | ) | | | (0.12 | ) | | | (0.29 | ) | | | (0.03 | ) | | | (0.32 | ) | | | 9.59 | | | | (1.21 | )% | | | 286,956 | | | | 0.20 | % | | | 0.20 | % | | | 3.00 | % | | | 45 | % |
The U.S. Mortgage/Asset Backed Fixed Income Securities Portfolio | | | | | | | | | | | | | | | | | | | | | | | | | | | | | | | | | | | | | | | | | | | | | | | | |
HC Strategic Shares | | | | | | | | | | | | | | | | | | | | | | | | | | | | | | | | | | | | | | | | | | | | | | | | | | | | | | | | |
Year Ended June 30, 2022 | | $ | 9.55 | | | $ | 0.12 | (b) | | $ | (0.92 | ) | | $ | (0.80 | ) | | $ | (0.17 | ) | | $ | — | | | $ | (0.17 | ) | | $ | 8.58 | | | | (8.51 | )% | | $ | 213,253 | | | | 0.23 | % | | | 0.23 | % | | | 1.25 | % | | | 27 | %(c) |
Year Ended June 30, 2021 | | | 9.80 | | | | 0.09 | (b) | | | (0.14 | ) | | | (0.05 | ) | | | (0.20 | ) | | | — | | | | (0.20 | ) | | | 9.55 | | | | (0.51 | )% | | | 215,034 | | | | 0.23 | % | | | 0.23 | % | | | 0.96 | % | | | 46 | %(c) |
Year Ended June 30, 2020 | | | 9.57 | | | | 0.20 | (b) | | | 0.28 | | | | 0.48 | | | | (0.25 | ) | | | — | | | | (0.25 | ) | | | 9.80 | | | | 5.12 | % | | | 249,509 | | | | 0.22 | % | | | 0.22 | % | | | 2.04 | % | | | 32 | %(c) |
Year Ended June 30, 2019 | | | 9.32 | | | | 0.24 | (b) | | | 0.28 | | | | 0.52 | | | | (0.27 | ) | | | — | | | | (0.27 | ) | | | 9.57 | | | | 5.70 | % | | | 216,403 | | | | 0.24 | % | | | 0.24 | % | | | 2.60 | % | | | 15 | %(c) |
Year Ended June 30, 2018 | | | 9.59 | | | | 0.21 | | | | (0.23 | ) | | | (0.02 | ) | | | (0.25 | ) | | | — | | | | (0.25 | ) | | | 9.32 | | | | (0.20 | )% | | | 205,138 | | | | 0.23 | % | | | 0.23 | % | | | 2.24 | % | | | 17 | %(c) |
The Short-Term Municipal Bond Portfolio | | | | | | | | | | | | | | | | | | | | | | | | | | | | | | | | | | | | | | | | | | | | | | | | | | | | | | | | |
HC Strategic Shares | | | | | | | | | | | | | | | | | | | | | | | | | | | | | | | | | | | | | | | | | | | | | | | | | | | | | | | | |
Year Ended June 30, 2022 | | $ | 10.01 | | | $ | 0.08 | (b) | | $ | (0.41 | ) | | $ | (0.33 | ) | | $ | (0.08 | ) | | $ | — | | | $ | (0.08 | ) | | $ | 9.60 | | | | (3.27 | )% | | $ | 140,020 | | | | 0.28 | % | | | 0.28 | % | | | 0.82 | % | | | 32 | % |
Year Ended June 30, 2021 | | | 10.05 | | | | 0.09 | (b) | | | (0.04 | ) | | | 0.05 | | | | (0.09 | ) | | | — | (d) | | | (0.09 | ) | | | 10.01 | | | | 0.51 | % | | | 150,484 | | | | 0.28 | % | | | 0.28 | % | | | 0.91 | % | | | 18 | % |
Year Ended June 30, 2020 | | | 9.93 | | | | 0.14 | (b) | | | 0.12 | | | | 0.26 | | | | (0.14 | ) | | | — | | | | (0.14 | ) | | | 10.05 | | | | 2.68 | % | | | 135,065 | | | | 0.28 | % | | | 0.28 | % | | | 1.44 | % | | | 21 | % |
Year Ended June 30, 2019 | | | 9.80 | | | | 0.15 | (b) | | | 0.13 | | | | 0.28 | | | | (0.15 | ) | | | — | | | | (0.15 | ) | | | 9.93 | | | | 2.88 | % | | | 106,274 | | | | 0.28 | % | | | 0.28 | % | | | 1.56 | % | | | 15 | % |
Year Ended June 30, 2018 | | | 9.87 | | | | 0.11 | | | | (0.08 | ) | | | 0.03 | | | | (0.10 | ) | | | — | | | | (0.10 | ) | | | 9.80 | | | | 0.34 | % | | | 79,612 | | | | 0.33 | % | | | 0.33 | % | | | 1.23 | % | | | 19 | % |
(a) | Portfolio turnover is calculated on the basis of the Portfolio, as a whole, without distinguishing between the classes of shares issued. |
(b) | Per share amounts are based on average shares outstanding. |
(c) | Portfolio turnover does not include TBA security transactions. |
(d) | Amounts round to less than $0.005 per share. |
See accompanying notes to financial statements.
296
HC CAPITAL TRUST
Financial Highlights (concluded)
Selected data for a share outstanding throughout the periods indicated.
| | | | | | | Change in Net Assets
Resulting From Operations: | | | Distributions to Shareholders: | | | | | | | | | | | | | | | Ratios/Supplementary Data: | |
| | | Net Asset
Value,
Beginning
of Period | | | Net
Investment
Income/
(Loss) | | | Net Realized/
Unrealized
Gains/
(Losses) on
Investments | | | Total from
Operations | | | Net
Investment
Income | | | Net
Realized
Gains from
Investments | | | Total
Distributions
to
Shareholders | | | Net Asset
Value, End
of Period | | | Total
Return(a) | | | Net Assets,
at End of
Period
(in thousands) | | | Ratio of
Expenses to
Average Net
Assets, Prior to
Expenses Paid
Indirectly and
Waivers(b)* | | | Ratio of
Expenses to
Average Net
Assets, Net of
Expenses Paid
Indirectly and
Waivers(b)* | | | Ratio of Net
Investment
Income/
(Loss) to
Average Net
Assets(b) | | | Portfolio
Turnover
Rate(a)(c) | |
The Intermediate Term Municipal Bond Portfolio | | | | | | | | | | | | | | | | | | | | | | | | | | | | | | | | | | | | | | | | | | | | | | | | | | | | |
HC Strategic Shares | | | | | | | | | | | | | | | | | | | | | | | | | | | | | | | | | | | | | | | | | | | | | | | | | | | | | | | | |
Year Ended June 30, 2022 | | $ | 10.42 | | | $ | 0.16 | (d) | | $ | (0.77 | ) | | $ | (0.61 | ) | | $ | (0.16 | ) | | $ | (0.02 | ) | | $ | (0.18 | ) | | $ | 9.63 | | | | (5.98 | )% | | $ | 371,098 | | | | 0.31 | % | | | 0.31 | % | | | 1.56 | % | | | 7 | % |
Year Ended June 30, 2021 | | | 10.32 | | | | 0.17 | (d) | | | 0.11 | | | | 0.28 | | | | (0.18 | ) | | | — | | | | (0.18 | ) | | | 10.42 | | | | 2.70 | % | | | 388,073 | | | | 0.30 | % | | | 0.30 | % | | | 1.61 | % | | | 17 | % |
Year Ended June 30, 2020 | | | 10.21 | | | | 0.20 | (d) | | | 0.12 | | | | 0.32 | | | | (0.20 | ) | | | (0.01 | ) | | | (0.21 | ) | | | 10.32 | | | | 3.21 | % | | | 391,308 | | | | 0.31 | % | | | 0.31 | % | | | 1.92 | % | | | 36 | % |
Year Ended June 30, 2019 | | | 9.90 | | | | 0.22 | (d) | | | 0.31 | | | | 0.53 | | | | (0.22 | ) | | | — | | | | (0.22 | ) | | | 10.21 | | | | 5.45 | % | | | 393,097 | | | | 0.32 | % | | | 0.32 | % | | | 2.21 | % | | | 27 | % |
Year Ended June 30, 2018 | | | 10.08 | | | | 0.19 | | | | (0.18 | ) | | | 0.01 | | | | (0.19 | ) | | | — | | | | (0.19 | ) | | | 9.90 | | | | 0.13 | % | | | 383,200 | | | | 0.29 | % | | | 0.29 | % | | | 1.94 | % | | | 26 | % |
HC Advisors Shares | | | | | | | | | | | | | | | | | | | | | | | | | | | | | | | | | | | | | | | | | | | | | | | | | | | | | | | | |
Period Ended June 30, 2019(e) | | $ | 9.90 | | | $ | 0.22 | (d) | | $ | 0.32 | | | $ | 0.54 | | | $ | (0.19 | ) | | $ | — | | | $ | (0.19 | ) | | $ | 10.25 | | | | 5.48 | % | | $ | — | | | | 0.57 | % | | | 0.31 | % | | | 2.20 | % | | | 27 | % |
Year Ended June 30, 2018 | | | 10.08 | | | | 0.20 | | | | (0.19 | ) | | | 0.01 | | | | (0.19 | ) | | | — | | | | (0.19 | ) | | | 9.90 | | | | 0.14 | % | | | 1,008 | | | | 0.54 | % | | | 0.29 | % | | | 1.94 | % | | | 26 | % |
The Intermediate Term Municipal Bond II Portfolio | | | | | | | | | | | | | | | | | | | | | | | | | | | | | | | | | | | | | | | | | | | | | | | | | | | | |
HC Strategic Shares | | | | | | | | | | | | | | | | | | | | | | | | | | | | | | | | | | | | | | | | | | | | | | | | | | | | | | | | |
Year Ended June 30, 2022 | | $ | 10.64 | | | $ | 0.20 | (d) | | $ | (1.17 | ) | | $ | (0.97 | ) | | $ | (0.20 | ) | | $ | (0.12 | ) | | $ | (0.32 | ) | | $ | 9.35 | | | | (9.35 | )% | | $ | 87,001 | | | | 0.37 | % | | | 0.37 | % | | | 1.96 | % | | | 22 | % |
Year Ended June 30, 2021 | | | 10.54 | | | | 0.19 | (d) | | | 0.11 | | | | 0.30 | | | | (0.19 | ) | | | (0.01 | ) | | | (0.20 | ) | | | 10.64 | | | | 2.92 | % | | | 89,738 | | | | 0.32 | % | | | 0.32 | % | | | 1.80 | % | | | 39 | % |
Year Ended June 30, 2020 | | | 10.38 | | | | 0.20 | (d) | | | 0.18 | | | | 0.38 | | | | (0.21 | ) | | | (0.01 | ) | | | (0.22 | ) | | | 10.54 | | | | 3.69 | % | | | 79,986 | | | | 0.30 | % | | | 0.30 | % | | | 1.95 | % | | | 8 | % |
Year Ended June 30, 2019 | | | 10.09 | | | | 0.22 | (d) | | | 0.30 | | | | 0.52 | | | | (0.22 | ) | | | (0.01 | ) | | | (0.23 | ) | | | 10.38 | | | | 5.26 | % | | | 78,705 | | | | 0.31 | % | | | 0.31 | % | | | 2.16 | % | | | 17 | % |
Year Ended June 30, 2018 | | | 10.30 | | | | 0.22 | | | | (0.21 | ) | | | 0.01 | | | | (0.22 | ) | | | — | (f) | | | (0.22 | ) | | | 10.09 | | | | 0.07 | % | | | 77,455 | | | | 0.27 | % | | | 0.27 | % | | | 2.14 | % | | | 22 | % |
HC Advisors Shares | | | | | | | | | | | | | | | | | | | | | | | | | | | | | | | | | | | | | | | | | | | | | | | | | | | | | | | | |
Period Ended June 30, 2019(e) | | $ | 10.09 | | | $ | 0.22 | (d) | | $ | 0.05 | | | $ | 0.27 | | | $ | (0.18 | ) | | $ | (0.01 | ) | | $ | (0.19 | ) | | $ | 10.17 | | | | 2.78 | % | | $ | — | | | | 0.56 | % | | | 0.30 | % | | | 2.18 | % | | | 17 | % |
Year Ended June 30, 2018 | | | 10.30 | | | | 0.22 | | | | (0.21 | ) | | | 0.01 | | | | (0.22 | ) | | | — | (f) | | | (0.22 | ) | | | 10.09 | | | | 0.07 | % | | | 260 | | | | 0.52 | % | | | 0.27 | % | | | 2.13 | % | | | 22 | % |
* | The expense ratios reflected do not include acquired fund fees and expenses of investment companies, in which a Portfolio invests. |
(a) | Not annualized for periods less than one year. |
(b) | Annualized for periods less than one year. |
(c) | Portfolio turnover is calculated on the basis of the Portfolio, as a whole, without distinguishing between the classes of shares issued. |
(d) | Per share amounts are based on average shares outstanding. |
(e) | HC Advisors Shares are still offered, but were fully redeemed on May 1, 2019. |
(f) | Amount rounds to less than $0.005 per share. |
See accompanying notes to financial statements.
297
HC CAPITAL TRUST
Notes to Financial Statements — June 30, 2022
1. DESCRIPTION. HC Capital Trust (the “Trust”) is registered under the Investment Company Act of 1940, as amended (the “1940 Act”), as an open-end management series investment company. The Trust is a Delaware statutory trust which was organized on December 15, 1994. As of June 30, 2022, the Trust offered seventeen separate investment portfolios: The Value Equity Portfolio (“Value Portfolio”), The Growth Equity Portfolio (“Growth Portfolio”), The Institutional U.S. Equity Portfolio (“Institutional U.S. Portfolio”), The Small Capitalization-Mid Capitalization Equity Portfolio (“Small Cap-Mid Cap Portfolio”), The ESG Growth Portfolio (“ESG Growth Portfolio”), The Catholic SRI Growth Portfolio (“Catholic SRI Growth Portfolio”), The International Equity Portfolio (“International Portfolio”), The Institutional International Equity Portfolio (“Institutional International Portfolio”), The Emerging Markets Portfolio (“Emerging Markets Portfolio”), The Core Fixed Income Portfolio (“Core Fixed Income Portfolio”), The Corporate Opportunities Portfolio (“Corporate Opportunities Portfolio”), The U.S. Government Fixed Income Securities Portfolio (“U.S. Government Fixed Income Portfolio”), The U.S. Corporate Fixed Income Securities Portfolio (“U.S. Corporate Fixed Income Portfolio”), The U.S. Mortgage/Asset Backed Fixed Income Securities Portfolio (“U.S. Mortgage/Asset Backed Fixed Income Portfolio”), The Short-Term Municipal Bond Portfolio (“Short-Term Municipal Portfolio”), The Intermediate Term Municipal Bond Portfolio (“Intermediate Municipal Portfolio”), and The Intermediate Term Municipal Bond II Portfolio (“Intermediate Municipal II Portfolio) (each a “Portfolio” and collectively the “Portfolios”).
Each Portfolio is authorized to issue an unlimited number of shares of beneficial interest with a par value of $0.001 each in two classes of shares: HC Advisors Shares and HC Strategic Shares. As of June 30, 2022, the HC Advisors Shares were not active for any of the Portfolios. Each class of shares for each of the Portfolios has identical rights and privileges except with respect to voting rights on matters affecting a single class of shares. The Trust’s investment adviser is HC Capital Solutions (the “Adviser”), an operating division of Hirtle Callaghan & Co., LLC.
As of June 30, 2022, all Portfolios in the Trust are diversified Portfolios under the 1940 Act.
As is customary, the Trust’s organizational documents permit the Trust to indemnify its officers and trustees against certain liabilities under certain circumstances. In addition, in the normal course of business, the Trust enters into contracts with its vendors and others that also permit the indemnification of parties to the contract under certain circumstances. The Trust’s maximum exposure under these arrangements is unknown, as this would involve future claims that may be made against the Trust.
2. SIGNIFICANT ACCOUNTING POLICIES. The following is a summary of the significant accounting policies followed by the Portfolios in the preparation of their financial statements. The Portfolios are investment companies and follow accounting and reporting guidance under Financial Accounting Standards Board (“FASB”) Accounting Standards Codification (“ASC”) Topic 946, “Financial Services — Investment Companies.” The policies are in conformity with accounting principles generally accepted in the United States of America (“GAAP”). The presentation of the Portfolios’ financial statements in conformity with GAAP requires management to make estimates and assumptions that affect the reported amounts of assets and liabilities at the date of the financial statements and the reported amounts of income and expenses for the period. Actual results could differ from those estimates.
A. Portfolio Valuation. The net asset value (“NAV”) per share of each Portfolio is determined at the close of regular trading on the New York Stock Exchange (“NYSE”), normally at 4:00 p.m. Eastern time, on days the NYSE is open. Each class’s NAV per share is calculated by adding the market value or fair value, as applicable, of all securities and other assets of the Portfolio, subtracting its liabilities and dividing the result by the number of its outstanding shares.
B. Securities Valuation. Security values are ordinarily obtained through the use of independent pricing services in accordance with procedures adopted by the Trust’s Board of Trustees (the “Board”). Pursuant to such procedures, the Portfolios may use a pricing service, bank, or broker-dealer experienced in such matters to value the Portfolio’s securities. When reliable market quotations are not readily available for any security, the fair value of that security will be determined by a committee established by the Board in accordance with procedures adopted by the Board. The fair valuation process is designed to value the security at the price the Portfolio would reasonably expect to receive upon its current sale. Additional consideration is given to securities that have experienced a decrease in the volume or level of activity or to circumstances that indicate that a transaction is not orderly.
298
HC CAPITAL TRUST
Notes to Financial Statements (continued) — June 30, 2022
For disclosure purposes, the Trust has a three-tier fair value hierarchy that is dependent upon the observability of various “inputs” used to determine the value of the Portfolios’ investments. These inputs are summarized in the three broad levels listed below:
● Level 1 — quoted prices in active markets for identical assets that each Portfolio has the ability to access
| | ● | Level 2 — other significant observable inputs (including quoted prices for similar securities, interest rates, prepayment speeds, credit risk, etc.) |
| | ● | Level 3 — significant unobservable inputs (including a Portfolio’s own assumptions in determining the fair value of investments) |
Changes in valuation techniques may result in transfer in and out of an assigned level within the fair value hierarchy. The inputs or methodology used for valuing securities are not necessarily an indication of the risks associated with investing in those securities.
Equity Securities (Common and Preferred Stock, Exchange-Traded Funds and Closed-End Funds): Readily marketable portfolio securities listed on a securities exchange, including Nasdaq, are valued at the closing price on the exchange or at the Nasdaq Official Closing Price. If there have been no sales on such exchange, the securities are valued at the closing bid price. In each of these situations, valuations are typically categorized as Level 1 in the fair value hierarchy. Readily marketable securities traded only in the over-the-counter market are valued at the closing price and are typically categorized as Level 1 in the fair value hierarchy, or, if there have been no sales, are valued at the mean of the last reported bid and asked prices and are typically categorized as Level 2 in the fair value hierarchy.
Securities listed on a foreign exchange are valued at the closing price on that exchange, provided that where the prices of such securities are denominated in foreign currencies, such prices are converted into U.S. dollars at the bid price of such currencies against U.S. dollars at the time of the NAV calculation. If there have been no sales on such exchange, the security is valued at the closing bid price. In each of these situations, valuations are typically categorized as Level 1 in the fair value hierarchy. Fair value pricing may be used if events materially affecting the value of foreign securities occur between the time when the exchange on which they are traded closes and the time when the NAV is calculated. Such securities may be valued at fair value in accordance with procedures adopted by the Board. Management identifies possible fluctuations in international securities by monitoring the increase or decrease in the value of a designated benchmark index. In the event of an increase or decrease greater than predetermined levels, a Portfolio may use a systematic valuation model provided by an independent third party to fair value its international securities. Such systematic valuations are typically categorized as Level 2 in the fair value hierarchy.
Mutual Funds: Mutual funds are valued at their respective daily net asset value and are typically categorized as Level 1 in the fair value hierarchy.
Fixed Income Securities (Corporate, Municipal and Foreign Bonds, U.S. Government and Agency Securities): Fixed income securities are valued using various inputs including benchmark yields, reported trades, broker/dealer quotes, issuer spreads, two-sided markets, benchmark securities, bids, offers, reference data, and industry and market events, and are typically categorized as Level 2 in the fair value hierarchy.
Asset-Backed and Mortgage-Backed Securities: In addition to the inputs discussed above for fixed-income securities, asset-backed and mortgage-backed securities are valued using new issue data, monthly payment information and collateral performance, and are typically categorized as Level 2 in the fair value hierarchy.
Short-Term Obligations: Short-term obligations with maturities of 60 days or less may also be valued at amortized cost, which constitutes fair value as determined by the Board. Such securities are typically categorized as Level 2 in the fair value hierarchy.
Loan Participations and Assignments: Loan participations and assignments for which a secondary trading market exists are valued using prices or quotations provided by banks, dealers or pricing services and are typically categorized as Level 2 in the fair value hierarchy. To the extent a secondary trading market does not exist, loan participations and assignments are valued in accordance with procedures adopted by the Board, utilizing unobservable input evaluations from the investment manager of the lender and taking into consideration, among other factors: (i) the creditworthiness of the borrower and the lender; (ii) the
299
HC CAPITAL TRUST
Notes to Financial Statements (continued) — June 30, 2022
current interest rate; period until next rate reset and maturity of the loan; (iii) currently available prices in the market for similar loans; and (iv) currently available prices in the market for instruments of similar quality, rate, period until next interest rate reset and maturity and are typically categorized as Level 3 in the fair value hierarchy.
Derivative Instruments (Futures, Options, Swaps and Forward Currency Contracts): Swaps are valued using interdealer broker rates, benchmark yields, and swap details and are typically categorized as Level 2 in the fair value hierarchy. Exchange traded futures, swaps and options are valued using quoted prices from the exchange and are typically categorized as Level 1 in the fair value hierarchy. Forward currency contracts are valued using market quotes posted by major currency dealers and are typically categorized as Level 2 in the fair value hierarchy.
The following is a summary of the inputs used to value the following Portfolios’ securities as of June 30, 2022 (amounts in thousands). The breakdown of investment categorization is disclosed in the Schedule of Portfolio Investments for each Portfolio.
Portfolio | | LEVEL 1 –
Quoted
Prices | | | LEVEL 2 –
Other
Significant
Observable
Inputs | | | LEVEL 3 –
Significant
Unobservable
Inputs | | | Total | |
Value Portfolio | | | | | | | | | | | | | | | | |
Common Stocks | | $ | 578,662 | | | $ | — | | | $ | — | | | $ | 578,662 | |
Investment Companies | | | 5,619 | | | | — | | | | — | | | | 5,619 | |
Total Investment Securities | | $ | 584,281 | | | $ | — | | | $ | — | | | $ | 584,281 | |
Other Financial Instruments1 | | | | | | | | | | | | | | | | |
Futures | | $ | 28 | | | $ | — | | | $ | — | | | $ | 28 | |
Total Investments | | $ | 584,309 | | | $ | — | | | $ | — | | | $ | 584,309 | |
| | | | | | | | | | | | | | | | | |
Growth Portfolio | | | | | | | | | | | | | | | | |
Common Stocks | | $ | 688,330 | | | $ | — | | | $ | — | | | $ | 688,330 | |
Investment Companies | | | 13,309 | | | | — | | | | — | | | | 13,309 | |
Total Investment Securities | | $ | 701,639 | | | $ | — | | | $ | — | | | $ | 701,639 | |
Other Financial Instruments1 | | | | | | | | | | | | | | | | |
Futures | | $ | 40 | | | $ | — | | | $ | — | | | $ | 40 | |
Total Investments | | $ | 701,679 | | | $ | — | | | $ | — | | | $ | 701,679 | |
| | | | | | | | | | | | | | | | | |
Institutional U.S. Portfolio | | | | | | | | | | | | | | | | |
Common Stocks | | $ | 1,664,318 | | | $ | — | | | $ | — | | | $ | 1,664,318 | |
Contingent Right | | | — | | | | — | | | | — | 2 | | | — | |
Exchange-Traded Funds | | | 110,553 | | | | — | | | | — | | | | 110,553 | |
Investment Companies | | | 438,744 | | | | — | | | | — | | | | 438,744 | |
Total Investment Securities | | $ | 2,213,615 | | | $ | — | | | $ | — | | | $ | 2,213,615 | |
Other Financial Instruments1 | | | | | | | | | | | | | | | | |
Futures | | $ | 3,428 | | | $ | — | | | $ | — | | | $ | 3,428 | |
Total Investments | | $ | 2,217,043 | | | $ | — | | | $ | — | | | $ | 2,217,043 | |
| | | | | | | | | | | | | | | | | |
Small Cap-Mid Cap Portfolio | | | | | | | | | | | | | | | | |
Common Stocks | | $ | 64,720 | | | $ | 5 | | | $ | — | | | $ | 64,725 | |
Contingent Rights | | | 77 | | | | 1 | | | | — | 2 | | | 78 | |
Investment Companies | | | 4,353 | | | | — | | | | — | | | | 4,353 | |
Total Investment Securities | | $ | 69,150 | | | $ | 6 | | | $ | — | | | $ | 69,156 | |
300
HC CAPITAL TRUST
Notes to Financial Statements (continued) — June 30, 2022
Portfolio | | LEVEL 1 –
Quoted
Prices | | | LEVEL 2 –
Other
Significant
Observable
Inputs | | | LEVEL 3 –
Significant
Unobservable
Inputs | | | Total | |
Small Cap-Mid Cap Portfolio (continued) | | | | | | | | | | | | | | | | |
Other Financial Instruments1 | | | | | | | | | | | | | | | | |
Futures | | $ | (186 | ) | | $ | — | | | $ | — | | | $ | (186 | ) |
Total Investments | | $ | 68,964 | | | $ | 6 | | | $ | — | | | $ | 68,970 | |
| | | | | | | | | | | | | | | | | |
ESG Growth Portfolio | | | | | | | | | | | | | | | | |
Common Stocks | | $ | 142,169 | | | $ | — | | | $ | — | 2 | | $ | 142,169 | |
Preferred Stocks | | | 59 | | | | — | | | | — | | | | 59 | |
Investment Company | | | 606 | | | | — | | | | — | | | | 606 | |
Total Investment Securities | | $ | 142,834 | | | $ | — | | | $ | — | | | $ | 142,834 | |
Other Financial Instruments1 | | | | | | | | | | | | | | | | |
Futures | | $ | — | | | $ | — | | | $ | — | | | $ | — | |
Total Investments | | $ | 142,834 | | | $ | — | | | $ | — | | | $ | 142,834 | |
| | | | | | | | | | | | | | | | | |
Catholic SRI Growth Portfolio | | | | | | | | | | | | | | | | |
Common Stocks | | $ | 22,421 | | | $ | — | | | $ | — | 2 | | $ | 22,421 | |
Preferred Stocks | | | 26 | | | | — | | | | — | | | | 26 | |
Investment Companies | | | 29 | | | | — | | | | — | | | | 29 | |
Total Investment Securities | | $ | 22,476 | | | $ | — | | | $ | — | | | $ | 22,476 | |
| | | | | | | | | | | | | | | | | |
International Portfolio | | | | | | | | | | | | | | | | |
Common Stocks | | $ | 512,110 | | | $ | 32 | | | $ | — | 2 | | $ | 512,142 | |
Preferred Stocks | | | 2,493 | | | | — | | | | — | | | | 2,493 | |
Investment Company | | | 8,898 | | | | — | | | | — | | | | 8,898 | |
Purchased Options | | | 446 | | | | — | | | | — | | | | 446 | |
Total Investment Securities | | $ | 523,947 | | | $ | 32 | | | $ | — | | | $ | 523,979 | |
Other Financial Instruments1 | | | | | | | | | | | | | | | | |
Futures | | $ | 214 | | | $ | — | | | $ | — | | | $ | 214 | |
Written Options | | | (586 | ) | | | — | | | | — | | | | (586 | ) |
Total Investments | | $ | 523,575 | | | $ | 32 | | | $ | — | | | $ | 523,607 | |
| | | | | | | | | | | | | | | | | |
Institutional International Portfolio | | | | | | | | | | | | | | | | |
Common Stocks | | $ | 600,944 | | | $ | — | | | $ | — | 2 | | $ | 600,944 | |
Preferred Stocks | | | 2,468 | | | | — | | | | — | | | | 2,468 | |
Right | | | 9 | | | | — | | | | — | | | | 9 | |
Exchange-Traded Funds | | | 4,996 | | | | — | | | | — | | | | 4,996 | |
Investment Companies | | | 167,470 | | | | — | | | | — | | | | 167,470 | |
Purchased Options | | | 2,918 | | | | — | | | | — | | | | 2,918 | |
Total Investment Securities | | $ | 778,805 | | | $ | — | | | $ | — | | | $ | 778,805 | |
Other Financial Instruments1 | | | | | | | | | | | | | | | | |
Futures | | $ | 1,005 | | | $ | — | | | $ | — | | | $ | 1,005 | |
Written Options | | | (3,660 | ) | | | — | | | | — | | | | (3,660 | ) |
Total Investments | | $ | 776,150 | | | $ | — | | | $ | — | | | $ | 776,150 | |
301
HC CAPITAL TRUST
Notes to Financial Statements (continued) — June 30, 2022
Portfolio | | LEVEL 1 –
Quoted
Prices | | | LEVEL 2 –
Other
Significant
Observable
Inputs | | | LEVEL 3 –
Significant
Unobservable
Inputs | | | Total | |
Emerging Markets Portfolio | | | | | | | | | | | | | | | | |
Common Stocks | | $ | 587,863 | | | $ | 4,116 | | | $ | — | 2, 3 | | $ | 591,979 | |
Preferred Stocks | | | 8,938 | | | | — | | | | — | | | | 8,938 | |
Investment Companies | | | 39,908 | | | | — | | | | — | | | | 39,908 | |
Purchased Options | | | 595 | | | | — | | | | — | | | | 595 | |
Total Investment Securities | | $ | 637,304 | | | $ | 4,116 | | | $ | — | | | $ | 641,420 | |
Other Financial Instruments1 | | | | | | | | | | | | | | | | |
Futures | | $ | 5 | | | $ | — | | | $ | — | | | $ | 5 | |
Written Options | | | (760 | ) | | | — | | | | — | | | | (760 | ) |
Total Return Swaps | | | — | | | | 4,301 | | | | — | | | | 4,301 | |
Total Investments | | $ | 636,549 | | | $ | 8,417 | | | $ | — | | | $ | 644,966 | |
| | | | | | | | | | | | | | | | | |
Core Fixed Income Portfolio | | | | | | | | | | | | | | | | |
Asset Backed Securities | | $ | — | | | $ | 66 | | | $ | — | | | $ | 66 | |
Collateralized Mortgage Obligations | | | — | | | | 933 | | | | — | | | | 933 | |
U.S. Government Agency Mortgages | | | — | | | | 12,384 | | | | — | | | | 12,384 | |
U.S. Government Agency Securities | | | — | | | | 457 | | | | — | | | | 457 | |
Corporate Bonds | | | — | | | | 20,851 | | | | — | | | | 20,851 | |
U.S. Treasury Obligations | | | — | | | | 14,543 | | | | — | | | | 14,543 | |
Yankee Dollars | | | — | | | | 2,381 | | | | — | | | | 2,381 | |
Investment Companies | | | 6,699 | | | | — | | | | — | | | | 6,699 | |
Total Investment Securities | | $ | 6,699 | | | $ | 51,615 | | | $ | — | | | $ | 58,314 | |
Other Financial Instruments1 | | | | | | | | | | | | | | | | |
TBA Sale Commitments | | $ | — | | | $ | (46 | ) | | $ | — | | | $ | (46 | ) |
Total Investments | | $ | 6,699 | | | $ | 51,569 | | | $ | — | | | $ | 58,268 | |
| | | | | | | | | | | | | | | | | |
Corporate Opportunities Portfolio | | | | | | | | | | | | | | | | |
Common Stock | | $ | — | | | $ | — | | | $ | — | 2 | | $ | — | |
Loan Participations and Assignments | | | — | | | | — | | | | 14,059 | | | | 14,059 | |
Investment Companies | | | 238,313 | | | | — | | | | — | | | | 238,313 | |
Total Investment Securities | | $ | 238,313 | | | $ | — | | | $ | 14,059 | | | $ | 252,372 | |
Other Financial Instruments1 | | | | | | | | | | | | | | | | |
Futures | | $ | (635 | ) | | $ | — | | | $ | — | | | $ | (635 | ) |
Total Investments | | $ | 237,678 | | | $ | — | | | $ | 14,059 | | | $ | 251,737 | |
| | | | | | | | | | | | | | | | | |
U.S. Government Fixed Income Portfolio | | | | | | | | | | | | | | | | |
U.S. Government Agency Securities | | $ | — | | | $ | 14,538 | | | $ | — | | | $ | 14,538 | |
U.S. Treasury Obligations | | | — | | | | 457,351 | | | | — | | | | 457,351 | |
Yankee Dollar | | | — | | | | 118 | | | | — | | | | 118 | |
Exchange-Traded Fund | | | 154,884 | | | | — | | | | — | | | | 154,884 | |
Total Investment Securities | | $ | 154,884 | | | $ | 472,007 | | | $ | — | | | $ | 626,891 | |
| | | | | | | | | | | | | | | | | |
302
HC CAPITAL TRUST
Notes to Financial Statements (continued) — June 30, 2022
Portfolio | | LEVEL 1 –
Quoted
Prices | | | LEVEL 2 –
Other
Significant
Observable
Inputs | | | LEVEL 3 –
Significant
Unobservable
Inputs | | | Total | |
U.S. Corporate Fixed Income Portfolio | | | | | | | | | | | | | | | | |
Corporate Bonds | | $ | — | | | $ | 192,347 | | | $ | — | | | $ | 192,347 | |
Yankee Dollars | | | — | | | | 22,545 | | | | — | | | | 22,545 | |
Loan Participations and Assignments | | | — | | | | — | | | | 9,373 | | | | 9,373 | |
Investment Companies | | | 31,572 | | | | — | | | | — | | | | 31,572 | |
Total Investment Securities | | $ | 31,572 | | | $ | 214,892 | | | $ | 9,373 | | | $ | 255,837 | |
| | | | | | | | | | | | | | | | | |
U.S. Mortgage/Asset Backed Fixed Income Portfolio | | | | | | | | | | | | | | | | |
Asset Backed Securities | | $ | — | | | $ | 1,507 | | | $ | — | | | $ | 1,507 | |
Collateralized Mortgage Obligations | | | — | | | | 13,088 | | | | — | | | | 13,088 | |
U.S. Government Agency Mortgages | | | — | | | | 181,373 | | | | — | | | | 181,373 | |
Investment Company | | | 35,028 | | | | — | | | | — | | | | 35,028 | |
Total Investment Securities | | $ | 35,028 | | | $ | 195,968 | | | $ | — | | | $ | 230,996 | |
Other Financial Instruments1 | | | | | | | | | | | | | | | | |
TBA Sale Commitments | | $ | — | | | $ | (102 | ) | | $ | — | | | $ | (102 | ) |
Total Investments | | $ | 35,028 | | | $ | 195,866 | | | $ | — | | | $ | 230,894 | |
| | | | | | | | | | | | | | | | | |
Short-Term Municipal Portfolio | | | | | | | | | | | | | | | | |
Municipal Bonds | | $ | — | | | $ | 137,112 | | | $ | — | | | $ | 137,112 | |
Investment Company | | | 1,361 | | | | — | | | | — | | | | 1,361 | |
Total Investment Securities | | $ | 1,361 | | | $ | 137,112 | | | $ | — | | | $ | 138,473 | |
| | | | | | | | | | | | | | | | | |
Intermediate Municipal Portfolio | | | | | | | | | | | | | | | | |
Municipal Bonds | | $ | — | | | $ | 356,495 | | | $ | — | | | $ | 356,495 | |
Investment Company | | | 10,671 | | | | — | | | | — | | | | 10,671 | |
Total Investment Securities | | $ | 10,671 | | | $ | 356,495 | | | $ | — | | | $ | 367,166 | |
| | | | | | | | | | | | | | | | | |
Intermediate Municipal II Portfolio | | | | | | | | | | | | | | | | |
Municipal Bonds | | $ | — | | | $ | 63,169 | | | $ | — | | | $ | 63,169 | |
Investment Companies | | | 22,789 | | | | — | | | | — | | | | 22,789 | |
Total Investment Securities | | $ | 22,789 | | | $ | 63,169 | | | $ | — | | | $ | 85,958 | |
Amounts designated as “—” are $0 or have been rounded to $0.
1 | Other Financial Instruments are TBA sale commitments or derivative instruments not reflected in the total investment securities, such as futures, which are valued at the unrealized appreciation/(depreciation) on the instrument and written options and swap agreements, which are valued at fair value. |
2 | A reconciliation of assets in which Level 3 inputs are used in determining fair value, along with the additional quantitative disclosures, are presented when there are significant Level 3 investments at the end of the period. As of June 30, 2022, Level 3 investments were 0.00% of net assets and are not considered significant. |
3 | For the year ended June 30, 2022, the Emerging Markets Portfolio held securities listed as Level 3 investments for which significant unobservable inputs were used to determine fair value. The Russian held investments were fair valued by management, due to the impact of the Ukraine invasion and sanctions on market conditions in Russia. It was determined to value these investments at zero, due to such market conditions. Change in unrealized appreciation/(depreciation) on these investments (amounts in thousands) was $(5,922) for the Portfolio. |
303
HC CAPITAL TRUST
Notes to Financial Statements (continued) — June 30, 2022
A reconciliation of Level 3 financial instruments is presented when a Portfolio had a significant amount of Level 3 investments at the beginning and/or end of the period in relation to net assets. The following table is a reconciliation of Level 3 investments for which significant unobservable inputs were used in determining fair value (amounts in thousands):
Portfolio | | Asset
Group | | | Balance
as of
June 30,
2021 | | | Realized
Gain/
(Loss) | | | Change in
Unrealized
Appreciation /
(Depreciation) | | | Purchases | | | Sales
Proceeds | | | Transfer
into
Level 3 | | | Transfer
out of
Level 3 | | | Balance
as of
June 30,
2022 | |
Corporate Opportunities Portfolio | | | Loan Participations and Assignments | | | $ | 14,958 | | | $ | (3 | ) | | $ | (68 | ) | | $ | 16,076 | | | $ | (16,904 | ) | | $ | — | | | $ | — | | | $ | 14,059 | |
U.S. Corporate Fixed Income Portfolio | | | Loan Participations and Assignments | | | | 9,972 | | | | (2 | ) | | | (46 | ) | | | 9,911 | | | | (10,462 | ) | | | — | | | | — | | | | 9,373 | |
Amounts designated as “—” are $0 or have been rounded to $0.
The Portfolios’ financial instruments that are categorized as Level 3 were valued utilizing third party pricing information without adjustment. Such valuations are based on unobservable inputs. A significant change in third party information could result in a significantly lower or higher value of such Level 3 financial instruments.
C. Securities Transactions and Investment Income. For financial reporting purposes, portfolio securities transactions are reported on trade date. However, for daily NAV determination, portfolio securities transactions are reflected no later than in the first calculation on the first business day following trade date. Dividend income is recognized on the ex-dividend date and foreign dividends are recognized as soon as reliable information is available from the Portfolio’s sources. Interest income, including amortization of premium and accretion of discount on investments, is accrued daily. Pay-in-kind interest income and non-cash dividend income received in the form of securities in-lieu of cash, if any, are recorded at the fair value of the securities received. Realized gains and losses from securities transactions are determined by comparing the identified cost of the security lot sold to the net sales proceeds. Realized gains and losses from principal payment transactions on mortgage-backed and asset- backed securities are classified as investment income or loss for financial reporting purposes.
For certain securities, including real estate investment trusts, the Portfolio records distributions received in excess of income as a reduction of the cost of investments and/or realized gain. Such amounts are based on estimates if actual amounts are not available. Actual amounts of income, realized gain and return of capital may differ from the estimated amounts. The Portfolio records adjustments to the estimated amounts of the components of distributions to investment income, unrealized appreciation/depreciation and realized gain/loss on investments as necessary, once the issuers provide information about the actual composition of the distributions.
D. Restricted Securities. A restricted security is a security that cannot be offered for public sale without prior registration under the Securities Act of 1933 (the “1933 Act”) (absent an exemption). Whether a restricted security is illiquid is determined pursuant to guidelines established by the Board. Not all restricted securities are considered illiquid.
E. Allocations. Expenses directly attributable to a Portfolio are charged to that Portfolio. Class-specific expenses, if any, are borne by that class. Other expenses are allocated proportionately among the Portfolios in relation to the net assets of each Portfolio or by another appropriate method. Income, non-class-specific expenses and realized and unrealized gains and losses are allocated to the respective classes based on relative net assets.
F. Dividends and Capital Gain Distributions to Shareholders. The Core Fixed Income Portfolio, U.S. Government Fixed Income Portfolio, U.S. Corporate Fixed Income Portfolio, U.S. Mortgage/Asset Backed Fixed Income Portfolio, Short-Term Municipal Portfolio, Intermediate Municipal Portfolio and Intermediate Municipal II Portfolio declare and distribute dividends from net investment income, if any, on a monthly basis. The Value Portfolio, Growth Portfolio, Institutional U.S. Portfolio, Small Cap-Mid Cap Portfolio, ESG Growth Portfolio, Catholic SRI Growth Portfolio and Corporate Opportunities Portfolio declare and distribute dividends from net investment income, if any, on a quarterly basis. The International Portfolio and Institutional International Portfolio declare and distribute dividends from net investment income, if any, on a semiannual basis. The Emerging Markets Portfolio declares and distributes dividends from net investment income, if any, on an annual basis. Net realized capital gains, if any, are declared and distributed at least annually by each Portfolio.
304
HC CAPITAL TRUST
Notes to Financial Statements (continued) — June 30, 2022
G. Repurchase Agreements. Among the instruments that each of the Portfolios may use for temporary investment purposes are repurchase agreements. Under the terms of a typical repurchase agreement, a Portfolio would acquire an underlying debt security for a relatively short period (usually not more than one week), subject to an obligation of the seller to repurchase that security from the Portfolio at an agreed-upon price and date. Repurchase agreements may involve certain risks in the event of default or insolvency of the counterparty, including possible delays or restrictions upon the Portfolio’s ability to dispose of the underlying securities. The creditworthiness of those banks and non-bank dealers with which the Portfolios may enter into repurchase agreements are monitored in accordance with guidelines adopted by the Board, as is the market value of the securities underlying any repurchase agreement to ensure that the seller’s obligation to repurchase is collateralized by an amount at least equal to the repurchase price including accrued interest. All repurchase agreements are fully collateralized by cash and/or government securities (as defined in the 1940 Act). If approved by the Adviser, repurchase agreements may also be fully collateralized by other securities that, at the time the repurchase agreement is entered into, are determined by the Board, or its authorized delegate, to be (i) issued by an issuer that has an exceptionally strong capacity to meet its obligations on the collateral, and (ii) sufficiently liquid that they can be sold by the Portfolio at approximately their carrying value in the ordinary course of business within seven calendar days. Master Repurchase Agreements (“MRA”) permit the Portfolios, under certain circumstances, including an event of default (such as bankruptcy or insolvency), to offset receivables under the MRA with collateral posted by the counterparty and create one net payment due to or from the Portfolios. However, bankruptcy or insolvency laws of a particular jurisdiction may impose restrictions on or prohibitions against such a right of offset in the event of the counterparty’s bankruptcy or insolvency. Pursuant to the terms of the MRA, the Portfolios receive securities as collateral with a market value in excess of the repurchase price to be received by the Portfolios upon the maturity of the transaction. Upon a bankruptcy or insolvency of the counterparty, the Portfolios would recognize a liability with respect to such excess collateral to reflect the Portfolio’s obligation under bankruptcy law to return the excess to the counterparty.
H. TBA Purchase and Sale Commitments. Certain of the Portfolios may enter into “TBA” (to be announced) commitments to purchase or sell securities for a fixed price at a future date, typically not to exceed 45 days. TBA commitments may be considered securities in themselves, and involve a risk of loss if the value of the security to be purchased or sold declines or increases, respectively, prior to settlement date. Unsettled TBA commitments are valued at the current market value of the underlying securities, according to the procedures described under “Securities Valuation” above.
I. Commission Recapture. Certain of the Portfolios participate in a commission recapture program. These Portfolios will utilize the recaptured commissions to pay for, in whole or in part, certain expenses of the Portfolios, excluding investment advisory and distribution fees. The expenses eligible to be paid will include, but are not limited to, administrative service fees, audit fees, custodian fees, legal fees and printing expenses, as directed by the Trust. These amounts are disclosed as “Expenses paid indirectly” on the Statements of Operations.
For the year ended June 30, 2022, the following commissions were recaptured:
Portfolio | | Commissions
Recaptured
(000) | |
Growth Portfolio | | $ | 2 | |
Institutional U.S. Portfolio | | | 8 | |
Small Cap-Mid Cap Portfolio | | | 2 | |
J. Foreign Exchange Transactions. The books and records of the Portfolios are maintained in U.S. dollars. Non-U.S. dollar denominated amounts are translated into U.S. dollars as follows, with the resultant exchange gains and losses recorded in the Statements of Operations:
i) value of investment securities and other assets and liabilities at the exchange rate on the valuation date; and
ii) purchases and sales of investment securities and income and expenses at the exchange rate prevailing on the respective date of such transactions.
The Portfolios do not isolate realized and unrealized gains and losses attributable to changes in the exchange rates from gains and losses that arise from changes in the value of investments. Such fluctuations are included with net realized and unrealized gain or loss on investments.
305
HC CAPITAL TRUST
Notes to Financial Statements (continued) — June 30, 2022
Dividends and interest from non-U.S. sources received by a Portfolio are generally subject to non-U.S. withholding taxes at rates ranging up to 30%. Such withholding taxes may be reduced or eliminated under the terms of applicable U.S. income tax treaties, and each Portfolio intends to, if reasonable, undertake any procedural steps required to claim the benefits of such treaties. If the value of more than 50% of a Portfolio’s total assets at the close of any taxable year consists of stock or securities of non-U.S. corporations, the Portfolio may elect to treat any non-U.S. taxes paid by it as paid by its shareholders.
The Portfolios may be subject to foreign taxes on gains in investments or currency repatriation. The Portfolios accrue such taxes, as applicable, based on their current interpretation of tax rules in the foreign markets in which they invest.
K. Derivative Instruments. Certain of the Portfolios may invest in various financial instruments including positions in forward currency contracts, financial futures contracts, options contracts and swap agreements.
The following is a summary of the fair value of derivative instruments held by the Portfolios as of June 30, 2022 (amounts in thousands).
| | | Assets | |
Portfolio | | Unrealized
appreciation
on futures
contracts* | | | Investments,
at value for
purchased
options | | | Swap
agreements,
at value* | |
Equity Risk Exposure: | | | | | | | | | | | | |
Value Portfolio | | $ | 47 | | | $ | — | | | $ | — | |
Growth Portfolio | | | 44 | | | | — | | | | — | |
Institutional U.S. Portfolio | | | 4,415 | | | | — | | | | — | |
ESG Growth Portfolio | | | 2 | | | | — | | | | — | |
International Portfolio | | | 337 | | | | 446 | | | | — | |
Institutional International Portfolio | | | 1,651 | | | | 2,918 | | | | — | |
Emerging Markets Portfolio | | | 463 | | | | 595 | | | | 4,862 | |
Corporate Opportunities Portfolio | | | 885 | | | | — | | | | — | |
| | | Liabilities | |
Portfolio | | Unrealized
depreciation
on futures
contracts* | | | Written
options, at
fair value | | | Swap
agreements,
at value* | |
Equity Risk Exposure: | | | | | | | | | | | | |
Value Portfolio | | $ | 19 | | | $ | — | | | $ | — | |
Growth Portfolio | | | 4 | | | | — | | | | — | |
Institutional U.S. Portfolio | | | 987 | | | | — | | | | — | |
Small Cap-Mid Cap Portfolio | | | 186 | | | | — | | | | — | |
ESG Growth Portfolio | | | 2 | | | | — | | | | — | |
International Portfolio | | | 123 | | | | 586 | | | | — | |
Institutional International Portfolio | | | 646 | | | | 3,660 | | | | — | |
Emerging Markets Portfolio | | | 458 | | | | 760 | | | | 561 | |
| | | | | | | | | | | | | |
Interest Rate Risk Exposure: | | | | | | | | | | | | |
Corporate Opportunities Portfolio | | | 1,520 | | | | — | | | | — | |
Amounts designated as “—” are $0 or have been rounded to $0.
* | Total fair value is presented by Primary Risk Exposure. For futures contracts, the amounts represent their cumulative appreciation/depreciation, which includes movements of variation margin. |
306
HC CAPITAL TRUST
Notes to Financial Statements (continued) — June 30, 2022
The following is a summary of the effect of derivative instruments on the Statements of Operations for the year ended June 30, 2022 (amounts in thousands):
Portfolio | | Net realized
gains/(losses)
from futures
transactions | | | Net realized
gains/(losses)
from written
options
transactions | | | Net realized
gains/(losses)
from
purchased
options
transactions | | | Net realized
gains/(losses)
from swap
transactions | |
Equity Risk Exposure: | | | | | | | | | | | | | | | | |
Value Portfolio | | $ | (322 | ) | | $ | 2,176 | | | $ | (1,485 | ) | | $ | — | |
Growth Portfolio | | | (466 | ) | | | 2,937 | | | | (1,965 | ) | | | — | |
Institutional U.S Portfolio | | | (57,098 | ) | | | 24,313 | | | | (16,569 | ) | | | — | |
Small Cap-Mid Cap Portfolio | | | (1,176 | ) | | | — | | | | — | | | | — | |
ESG Growth Portfolio | | | (333 | ) | | | — | | | | — | | | | — | |
International Portfolio | | | (3,324 | ) | | | 1,910 | | | | (1,520 | ) | | | — | |
Institutional International Portfolio | | | (16,498 | ) | | | 10,126 | | | | (9,106 | ) | | | — | |
Emerging Markets Portfolio | | | (15,658 | ) | | | 2,476 | | | | (1,973 | ) | | | (12,703 | ) |
Corporate Opportunities Portfolio | | | (9,707 | ) | | | — | | | | — | | | | — | |
| | | | | | | | | | | | | | | | | |
Interest Rate Risk Exposure: | | | | | | | | | | | | | | | | |
Corporate Opportunities Portfolio | | | (11,594 | ) | | | — | | | | — | | | | — | |
| | | Net Change in Unrealized Appreciation (Depreciation)
on Derivatives Recognized as a Result from Operations | |
Portfolio | | Change in
unrealized
appreciation/
(depreciation)
on futures | | | Change in
unrealized
appreciation/
(depreciation)
on written
options | | | Change in
unrealized
appreciation/
(depreciation)
on purchased
options | | | Change in
unrealized
appreciation/
(depreciation)
on swaps | |
Equity Risk Exposure: | | | | | | | | | | | | | | | | |
Value Portfolio | | $ | 17 | | | $ | (317 | ) | | $ | 156 | | | $ | — | |
Growth Portfolio | | | (336 | ) | | | (407 | ) | | | 201 | | | | — | |
Institutional U.S. Portfolio | | | (348 | ) | | | (3,177 | ) | | | 1,595 | | | | — | |
Small Cap-Mid Cap Portfolio | | | (122 | ) | | | — | | | | — | | | | — | |
ESG Growth Portfolio | | | 3 | | | | — | | | | — | | | | — | |
International Portfolio | | | 342 | | | | (403 | ) | | | 206 | | | | — | |
Institutional International Portfolio | | | 5,436 | | | | (2,092 | ) | | | 967 | | | | — | |
Emerging Markets Portfolio | | | 239 | | | | (519 | ) | | | 271 | | | | 2,722 | |
Corporate Opportunities Portfolio | | | (743 | ) | | | — | | | | — | | | | — | |
| | | | | | | | | | | | | | | | | |
Interest Rate Risk Exposure: | | | | | | | | | | | | | | | | |
Corporate Opportunities Portfolio | | | (1,264 | ) | | | — | | | | — | | | | — | |
Amounts designated as “—” are $0 or have been rounded to $0.
The Trust may be subject to master netting agreements (“MNA”) that allow for amounts owed between a Portfolio and the counterparty to be netted. The party that has the larger payable pays the excess of the larger amount over the smaller amount to the counterparty. The MNA do not apply to amounts owed to/from different counterparties. The amounts shown in
307
HC CAPITAL TRUST
Notes to Financial Statements (continued) — June 30, 2022
the Statements of Assets and Liabilities do not take into consideration the effects of legally enforceable MNA. The table below presents the gross and net amounts of these assets and liabilities with any offsets to reflect the Portfolio’s ability to transact net amounts with counterparties at June 30, 2022.
As of June 30, 2022, each Portfolio’s derivative assets and liabilities by type are as follows (amounts in thousands):
| | | Value Portfolio | | | Growth Portfolio | | | Institutional
U.S. Portfolio | |
| | | Assets | | | Liabilities | | | Assets | | | Liabilities | | | Assets | | | Liabilities | |
Derivative Financial Instruments: | | | | | | | | | | | | | | | | | | | | | | | | |
Futures contracts | | $ | 47 | | | $ | 19 | | | $ | 44 | | | $ | 4 | | | $ | 4,415 | | | $ | 987 | |
Total derivative assets and liabilities on the Statements of Assets and Liabilities | | | 47 | | | | 19 | | | | 44 | | | | 4 | | | | 4,415 | | | | 987 | |
Derivatives not subject to a MNA or similar agreement | | | (47 | ) | | | (19 | ) | | | (44 | ) | | | (4 | ) | | | (4,415 | ) | | | (987 | ) |
Total assets and liabilities subject to a MNA | | $ | — | | | $ | — | | | $ | — | | | $ | — | | | $ | — | | | $ | — | |
| | | Small Cap-Mid
Cap Portfolio | | | ESG Growth
Portfolio | | | International
Portfolio | |
| | | Assets | | | Liabilities | | | Assets | | | Liabilities | | | Assets | | | Liabilities | |
Derivative Financial Instruments: | | | | | | | | | | | | | | | | | | | | | | | | |
Futures contracts | | $ | — | | | $ | 186 | | | $ | 2 | | | $ | 2 | | | $ | 337 | | | $ | 123 | |
Options on futures contracts* | | | — | | | | — | | | | — | | | | — | | | | 446 | | | | 586 | |
Total derivative assets and liabilities on the Statements of Assets and Liabilities | | | — | | | | 186 | | | | 2 | | | | 2 | | | | 783 | | | | 709 | |
Derivatives not subject to a MNA or similar agreement | | | — | | | | (186 | ) | | | (2 | ) | | | (2 | ) | | | (783 | ) | | | (709 | ) |
Total assets and liabilities subject to a MNA | | $ | — | | | $ | — | | | $ | — | | | $ | — | | | $ | — | | | $ | — | |
| | | Institutional
International
Portfolio | | | Emerging Markets
Portfolio | | | Corporate
Opportunities
Portfolio | |
| | | Assets | | | Liabilities | | | Assets | | | Liabilities | | | Assets | | | Liabilities | |
Derivative Financial Instruments: | | | | | | | | | | | | | | | | | | | | | | | | |
Futures contracts | | $ | 1,651 | | | $ | 646 | | | $ | 463 | | | $ | 458 | | | $ | 885 | | | $ | 1,520 | |
Options on futures contracts* | | | 2,918 | | | | 3,660 | | | | 595 | | | | 760 | | | | — | | | | — | |
Swap agreements | | | — | | | | — | | | | 4,862 | | | | 561 | | | | — | | | | — | |
Total derivative assets and liabilities on the Statements of Assets and Liabilities | | | 4,569 | | | | 4,306 | | | | 5,920 | | | | 1,779 | | | | 885 | | | | 1,520 | |
Derivatives not subject to a MNA or similar agreement | | | (4,569 | ) | | | (4,306 | ) | | | (1,058 | ) | | | (1,218 | ) | | | (885 | ) | | | (1,520 | ) |
Total assets and liabilities subject to a MNA | | $ | — | | | $ | — | | | $ | 4,862 | | | $ | 561 | | | $ | — | | | $ | — | |
Amounts designated as “—” are $0 or have been rounded to $0.
* | Includes options contracts purchased at value as reported on the Statements of Assets and Liabilities. |
308
HC CAPITAL TRUST
Notes to Financial Statements (continued) — June 30, 2022
The following table represents the Emerging Markets Portfolio’s derivative assets by counterparty, net of amounts available for offset under an MNA and net of the related collateral received by the Portfolio as of June 30, 2022 (amounts in thousands).
Counterparty | | Derivative
Assets Subject
to a MNA by
Counterparty | | | Derivatives
Available
for Offset | | | Non-cash
Collateral
Received(a) | | | Cash
Collateral
Received(a) | | | Net Amount
of Derivative
Assets | |
Emerging Markets Portfolio | | | | | | | | | | | | | | | | | | | | |
Morgan Stanley | | $ | 4,862 | | | $ | (561 | ) | | $ | — | | | $ | — | | | $ | 4,301 | |
Total | | $ | 4,862 | | | $ | (561 | ) | | $ | — | | | $ | — | | | $ | 4,301 | |
The following table represents the Emerging Markets Portfolio’s derivative liabilities by counterparty, net of amounts available for offset under an MNA and net of the related collateral pledged by the Portfolio as of June 30, 2022 (amounts in thousands).
Counterparty | | Derivative
Liabilities
Subject to
a MNA by
Counterparty | | | Derivatives
Available
for Offset | | | Non-cash
Collateral
Pledged(a) | | | Cash
Collateral
Pledged(a) | | | Net Amount
of Derivative
Liabilities | |
Emerging Markets Portfolio | | | | | | | | | | | | | | | | | | | | |
Morgan Stanley | | $ | (561 | ) | | $ | 561 | | | $ | — | | | $ | — | | | $ | — | |
Total | | $ | (561 | ) | | $ | 561 | | | $ | — | | | $ | — | | | $ | — | |
Amounts designated as “—” are $0 or have been rounded to $0.
(a) | The actual collateral received or pledged may be in excess of the amounts shown in the tables. The tables only reflect collateral amounts up to the amount of the financial instruments disclosed on the Statements of Assets and Liabilities. |
Forward Currency Contracts: Certain of the Portfolios may be subject to currency exchange rate risk in the normal course of pursuing their investment objectives. A Portfolio enters into forward currency contracts (“forward contracts”) for the purpose of hedging exposure to changes in foreign currency exchange rates on its holdings. A forward contract is an agreement between two parties to buy and sell a currency at a set price on a future date. The value of the forward contract fluctuates with changes in currency exchange rates. The forward contract is marked-to-market daily and the change in value is recorded by the Portfolio as unrealized appreciation or depreciation. When the forward contract is closed, the Portfolio records a realized gain or loss equal to the fluctuation in value during the period the forward contract was open. The Portfolio is subject to credit risk, which is the risk that the counterparty is unable to meet the terms of a forward contract, and market risk, which is the risk that the value of the currency changes unfavorably.
Forward contracts may involve credit or market risk in excess of the amounts reflected on a Portfolio’s Statement of Assets and Liabilities. The gain or loss from the difference between the cost of original contracts and the amount realized upon the closing of such forward contracts is included in net realized gains or losses on foreign currency transactions. Fluctuations in the value of forward contracts held are recorded for financial reporting purposes as net unrealized gains or losses. In addition, at June 30, 2022, the Portfolios entered into currency contracts to settle trades in foreign currencies. These transactions are included in “Receivable from investments sold” and “Payable for investments purchased” on the Statements of Assets and Liabilities. The Portfolios did not invest in forward currency contracts during the year ended June 30, 2022.
Financial Futures Contracts: Certain of the Portfolios may be subject to equity price risk, interest rate risk, and foreign currency exchange rate risk in the normal course of pursuing their investment objectives. Certain of the Portfolios may invest in financial futures contracts (“futures contracts”) in order to reduce such risks, as part of their investment strategies or to gain exposure to or hedge against changes in the value of equities, interest rates or foreign currencies. A futures contract represents a commitment for the future purchase or sale of an asset at a specified price on a specified date. Upon entering into a futures contract, a Portfolio is required to pledge to the broker an amount of cash and/or other assets equal to a certain percentage of
309
HC CAPITAL TRUST
Notes to Financial Statements (continued) — June 30, 2022
the contract amount (initial margin deposit). Subsequent payments, known as “variation margin,” may be made or received by a Portfolio each day, depending on the daily fluctuations in the value of the underlying financial instrument. A Portfolio recognizes a gain or loss equal to the daily variation margin, which is recorded as a receivable or payable on the Statement of Assets and Liabilities (if applicable). When a futures contract is closed, a realized gain or loss is recorded as “Net realized gains/(losses) from futures transactions” on the Statement of Operations. Should market conditions move unexpectedly, the Portfolio may not achieve the anticipated benefits of the futures contracts and may realize a loss. The use of futures transactions involves the risk of an imperfect correlation in movements in the price of futures contracts, interest rates, and the underlying hedged assets. With futures contracts, there is minimal counterparty credit risk to the Portfolios since futures contracts are exchange traded and the exchange’s clearinghouse, as counterparty to all exchange-traded futures contracts, guarantees the futures contracts against default. Securities designated as collateral for market value on futures contracts are noted in each Portfolio’s Portfolio of Investments (if applicable). Such collateral is held with the broker. The notional value of the futures contracts outstanding at June 30, 2022 and the month-end average notional amount for the year ended June 30, 2022 are detailed in the table below:
| | | Outstanding
Notional Amount
(000) | | | Monthly Average
Notional Amount
(000) | |
Futures Contracts: | | Long | | | Short | | | Long | | | Short | |
Value Portfolio | | $ | 4,734 | | | $ | — | | | $ | 5,114 | | | $ | 129 | |
Growth Portfolio | | | 12,852 | | | | — | | | | 10,049 | | | | 238 | |
Institutional U.S. Portfolio | | | 506,345 | | | | — | | | | 372,645 | | | | 1,432 | |
Small Cap-Mid Cap Portfolio | | | 3,416 | | | | — | | | | 5,217 | | | | — | |
ESG Growth Portfolio | | | 468 | | | | — | | | | 2,323 | | | | — | |
International Portfolio | | | 13,925 | | | | 2,084 | | | | 18,649 | | | | 415 | |
Institutional International Portfolio | | | 35,673 | | | | 8,526 | | | | 104,436 | | | | 2,759 | |
Emerging Markets Portfolio | | | 54,146 | | | | 2,653 | | | | 59,230 | | | | 379 | |
Corporate Opportunities Portfolio | | | 244,900 | | | | — | | | | 273,714 | | | | — | |
Amounts designated as “—” are $0 or have been rounded to $0.
Purchased Options Contracts: Certain of the Portfolios may be subject to equity price risk and interest rate risk in the normal course of pursuing their investment objectives. In order to reduce such risks, as part of their investment strategies and/ or in anticipation of future purchases, including to achieve market exposure pending direct investment in securities, certain of the Portfolios may purchase put or call options. Options contracts provide the purchaser with the right, but not the obligation, to buy or sell (call or put option, respectively) a financial instrument at the exercise price. The Portfolio pays a premium which is included in “Investments, at value” on the Statement of Assets and Liabilities and marked-to-market to reflect the current value of the option. Premiums paid for purchasing options which expire are treated as realized losses. When an option is exercised or closed, premiums paid for purchasing options are offset against proceeds to determine the realized gain or loss on the transaction.
Written Options Contracts: Certain of the Portfolios may be subject to equity price risk and interest rate risk in the normal course of pursuing their investment objectives. In order to reduce such risks, as part of their investment strategies and/or in anticipation of future purchases, including to achieve market exposure pending direct investment in securities, certain of the Portfolios may write put or call options. Premiums received from written options contracts are recorded as liabilities on the Statement of Assets and Liabilities and are marked-to-market to reflect the current value of the options written. Premiums received from writing options which expire are treated as realized gains. Premiums received from writing options, which are either exercised or closed, are offset against the proceeds received or the amount paid on the transaction to determine realized gains or losses. Realized gains and losses are reported as “Net realized gains/(losses) from written options transactions” on the Statement of Operations (if applicable). When writing an option, the Portfolio bears the market risk of unfavorable changes in the price of the underlying instrument.
310
HC CAPITAL TRUST
Notes to Financial Statements (continued) — June 30, 2022
With exchange-traded options, there is minimal counterparty credit risk to the Portfolios since the exchange’s clearinghouse, as counterparty to all exchange-traded options, guarantees the options against default. With over-the-counter options, the Portfolios bear the risk that counterparties will be unable to perform under the terms of the contracts.
The notional value of purchased and written options outstanding at June 30, 2022 and the month-end average notional amount for the year ended June 30, 2022 are detailed in the tables below:
Purchased Option Contracts: | | Outstanding
Notional
Amount
(000) | | | Monthly
Average
Notional
Amount
(000) | |
Value Portfolio | | $ | — | | | $ | 14,365 | (a) |
Growth Portfolio | | | — | | | | 19,316 | (a) |
Institutional U.S. Portfolio | | | — | | | | 164,986 | (a) |
International Portfolio | | | 14,864 | | | | 11,217 | |
Institutional International Portfolio | | | 114,661 | | | | 68,086 | |
Emerging Markets Portfolio | | | 20,482 | | | | 14,375 | |
Written Option Contracts: | | Outstanding
Notional
Amount
(000) | | | Monthly
Average
Notional
Amount
(000) | |
Value Portfolio | | $ | — | | | $ | 42,813 | (a) |
Growth Portfolio | | | — | | | | 57,255 | (a) |
Institutional U.S. Portfolio | | | — | | | | 481,938 | (a) |
International Portfolio | | | 22,629 | | | | 35,054 | |
Institutional International Portfolio | | | 138,392 | | | | 199,759 | |
Emerging Markets Portfolio | | | 29,505 | | | | 44,951 | |
Amounts designated as “—” are $0 or have been rounded to $0.
(a) | For the period July 1, 2021 through March 31, 2022. |
Swap Agreements: Certain of the Portfolios may enter into swap agreements (“swaps”) for purposes of attempting to gain exposure to the securities making up an index without actually purchasing those instruments, to hedge a position or to gain exposure to a particular instrument or currency. A swap is a two-party contract entered into for periods ranging from one day to more than one year. In a standard swap transaction, two parties agree to exchange the returns (or differentials in rates of return) earned or realized on particular predetermined investments or instruments. The gross returns to be exchanged or “swapped” between the parties are calculated with respect to a “notional amount,” i.e., the return on or increase in value of a particular dollar amount invested in a “basket” of securities representing a particular index. Swap agreements are privately negotiated in the over-the-counter (“OTC”) market and may be entered into as a bilateral contract (“OTC swaps”) or cleared through a third party, known as a clearing organization (“centrally cleared swap”). Swaps are marked to market daily based upon valuations as determined from the underlying contract or in accordance with the requirements of the clearing organization. Changes in market value, if any, are reflected as a component of net change in unrealized appreciation or depreciation on swap agreements on the Statement of Operations. Daily changes in valuation of centrally cleared swaps, if any, are recorded as variation margin on swap agreements on the Statement of Assets and Liabilities.
Total Return Swaps: Certain of the Portfolios may enter into total return swaps to gain or mitigate exposure to the underlying securities or indices. In “long” total return swaps, the counterparty will generally agree to pay the Portfolio the amount, if any, by which the notional amount of the swaps would have increased in value had it been invested in the particular instruments, plus an amount equal to any dividends or interest that would have been received on those instruments. The
311
HC CAPITAL TRUST
Notes to Financial Statements (continued) — June 30, 2022
Portfolio will agree to pay to the counterparty an amount equal to a fixed or floating rate of interest on the notional amount of the swaps plus the amount, if any, by which the notional amount would have decreased in value had it been invested in such instruments plus, in certain instances, commissions or trading spreads on the notional amount. Total return swaps do not involve the delivery of securities or other underlying instruments. The net amount of the excess, if any, of a Portfolio’s obligations over its entitlements with respect to each swap is accrued on a daily basis and an amount of cash or liquid assets, having an aggregate value at least equal to such accrued excess, is maintained at the broker-dealer or the Portfolio’s custodian. Until a total return swap is settled in cash, the gain or loss on the notional amount plus dividends or interest on the instruments less the interest paid by the Portfolio on the notional amount is recorded as “change in unrealized appreciation/(depreciation) on swaps” and, when cash is exchanged, the gain or loss realized is recorded as “net realized gains/(losses) from swap transactions.” A Portfolio may enter into total return swaps that provide the opposite return of its benchmark index or security (“short” the index or security). Its operations are similar to those swaps disclosed above except that the counterparty pays interest to the Portfolio on the notional amount outstanding and that dividends or interest on the underlying instruments reduce the value of the swaps plus, in certain instances, the Portfolio will agree to pay to the counterparty commissions or trading spreads on the notional amount. These amounts are netted against any unrealized appreciation or depreciation to determine the value of the swaps.
The primary risks associated with the use of swaps are an imperfect correlation between the prices of financial instruments and movements in the prices of the underlying investments and the inability of counterparties to perform under the agreement. The counterparty to any swap agreement will typically be a bank, investment banking firm or broker-dealer. The Portfolio will bear the counterparty risk, i.e., the risk of loss of the net amount, if any, expected to be received under a swap in the event of the default or bankruptcy of the swap counterparty. The counterparty risk for centrally cleared swap agreements is generally lower than for OTC swap agreements because generally a clearing organization becomes substituted for each counterparty to a centrally cleared swap agreement and, in effect, guarantees the parties’ performance under the contract as each party to a trade looks only to a clearing house for performance of financial obligations. However, there can be no assurance that the clearing house, or its members will satisfy obligations to the Portfolio. The unrealized gain or loss at June 30, 2022 is disclosed in the swap tables included in the Portfolios of Investments. The notional value of the swap agreements outstanding at June 30, 2022 and the month-end average notional amount for the year ended June 30, 2022 are detailed in the table below:
Total Return Swap Agreements: | | Outstanding
Notional
Amount
(000) | | | Monthly
Average
Notional
Amount
(000) | |
Emerging Markets Portfolio | | $ | 56,722 | | | $ | 64,959 | |
L. Loan Participations and Assignments. Certain of the Portfolios may purchase participations in commercial loans. Loan participations typically will result in a Portfolio having a contractual relationship only with the lender, not with the borrower. A Portfolio will have the right to receive payments of principal, interest, and any fees to which it is entitled only from the lender selling the participation and only upon receipt by the lender of the payments from the borrower. In connection with purchasing loan participations, a Portfolio generally will have no right to enforce compliance by the borrower with the terms of the loan agreement relating to the loan, nor any rights of set-off against the borrower, and the Portfolio may not benefit directly from any collateral supporting the loan in which it has purchased the participation. As a result, a Portfolio will assume the credit risk of both the borrower and the lender that is selling the participation. In the event of the insolvency of the lender selling a loan participation, a Portfolio may be treated as a general creditor of the lender and may not benefit from any set-off between the lender and the borrower. A Portfolio will acquire loan participations only if the lender interpositioned between the Portfolio and the borrower is determined by the applicable Specialist Manager or the Adviser to be creditworthy. When a Portfolio purchases assignments from lenders, the Portfolio will acquire direct rights against the borrower on the loan, except that under certain circumstances such rights may be more limited than those held by the assigning lender.
Investments in loans may include unfunded loan commitments, which are contractual obligations for future funding. Unfunded loan commitments represent a future obligation in full, even though a percentage of the committed amount may not be utilized by the borrower. A Portfolio may receive a commitment fee based on the undrawn portion of the underlying line of credit portion of a loan. Any such fees earned are recorded as a component of interest income on the Statements of Operations.
312
HC CAPITAL TRUST
Notes to Financial Statements (continued) — June 30, 2022
M. Securities Lending. Certain of the Portfolios may lend their portfolio securities to broker-dealers pursuant to a Master Securities Lending Agreement (“MSLA”) that requires the borrower to post collateral equal to at least the market value of the securities loaned, which is marked-to-market on a daily basis. Any collateral shortfalls associated with increases in the valuation of the securities loaned are adjusted the next business day. The Portfolios will continue to benefit from interest or dividends on the securities loaned and may also earn a return from the collateral. The Portfolios pay various fees in connection with the investment of the collateral. Any voting rights, or rights to consent, relating to securities loaned, pass to the borrower. Currently cash collateral received by a Portfolio in securities lending transactions may only be invested in repurchase agreements or money market funds that invest in U.S. treasury obligations. A Portfolio bears the risk of such investments. Securities on loan at June 30, 2022 are presented in the Portfolios of Investments. The Portfolios pay the Securities Lending Agent fees based on the investment income received from securities lending activities as reflected on the Statements of Operations.
Cash collateral received from the borrower is recorded on the Statements of Assets and Liabilities as “Payable for collateral received on loaned securities.” Investments acquired with such cash collateral are reported in a manner consistent with other portfolio investments held by the Portfolios as an investment, at value on the Statements of Assets and Liabilities. The Portfolios may receive non-cash collateral in the form of securities such as U.S. treasuries, which the Portfolios may not sell or re-pledge and accordingly are not reflected on the Statements of Assets and Liabilities.
Securities lending transactions are entered into by a Portfolio under a MSLA which permits the Portfolio, under certain circumstances, including an event of default (such as bankruptcy or insolvency), to offset amounts payable by the Portfolio to the same counterparty against amounts to be received and create a net payment due to or from the Portfolio.
The following table is a summary of the Portfolios’ securities lending transactions accounted for as secured borrowings, which are subject to offset under an MSLA, at June 30, 2022 (amounts in thousands):
Portfolio | | Value of
Securities on
Loan | | | Value of
Collateral
Received* | | | Net Amount | |
Value Portfolio | | $ | 271 | | | $ | 271 | | | $ | — | |
Growth Portfolio | | | 354 | | | | 354 | | | | — | |
Institutional U.S. Portfolio | | | 1,192 | | | | 1,192 | | | | — | |
Small Cap-Mid Cap Portfolio | | | 171 | | | | 171 | | | | — | |
Catholic SRI Growth Portfolio | | | 20 | | | | 20 | | | | — | |
Institutional International Portfolio | | | 6,303 | | | | 1,841 | | | | 4,462 | |
Emerging Markets Portfolio | | | 610 | | | | 99 | | | | 511 | |
U.S. Corporate Fixed Income Portfolio | | | 386 | | | | 386 | | | | — | |
Amounts designated as “—” are $0 or have been round to $0.
* | The actual collateral received may be in excess of the amounts shown in the table. The table only reflects collateral amounts up to the amount of the value of securities on loan as disclosed in the Portfolios of Investments and excludes any non-cash collateral received. Any collateral shortfalls associated with increases in the valuation of the securities loaned are adjusted the next business day. |
313
HC CAPITAL TRUST
Notes to Financial Statements (continued) — June 30, 2022
Securities lending transactions as of June 30, 2022 (amounts in thousands):
| | | Remaining Contractual Maturity
of the Collateral Held | |
Portfolio | | Overnight and Continuous
- Investment Companies | | | Total* | |
Value Portfolio | | $ | 284 | | | $ | 284 | |
Growth Portfolio | | | 368 | | | | 368 | |
Institutional U.S. Portfolio | | | 1,232 | | | | 1,232 | |
Small Cap-Mid Cap Portfolio | | | 180 | | | | 180 | |
Catholic SRI Growth Portfolio | | | 21 | | | | 21 | |
Institutional International Portfolio | | | 1,841 | | | | 1,841 | |
Emerging Markets Portfolio | | | 99 | | | | 99 | |
Corporate Opportunities Portfolio | | | 1,177 | ** | | | 1,177 | |
U.S. Corporate Fixed Income Portfolio | | | 396 | | | | 396 | |
* | Excludes non-cash collateral received with a value of (amounts in thousands) $4, $5,299 and $687 for the Catholic SRI Growth Portfolio, Institutional International Portfolio and Emerging Markets Portfolio, respectively. |
** | Represents collateral received from prior securities lending activity. |
N. Recent Accounting Pronouncements. In march 2020, the FASB issued Accounting Standards Update No. 2020-04 (“ASU 2020 – 04”), “Reference Rate Reform (Topic 840): Facilitation of the Effects of Reference Rate Reform on Financial Reporting”, ASU 2020 – 04 provides the Portfolios with optional guidance to ease the potential accounting burden associated with transitioning away from reference rates (e.g. LIBOR) that are expected to be discontinued. ASU 2020-04 allows, among other things, certain contract modifications, such as those within the scope of Topic 310 on receivables, to be accounted as a continuation of the existing contract. This ASU was effective upon the issuance and its optional relief can be applied through December 31, 2022. The Portfolios will consider this optional guidance prospectively, if applicable.
3. INVESTMENT ADVISORY AND ADMINISTRATIVE CONTRACTS. The Trust has entered into investment advisory contracts (“Portfolio Management Contracts”) on behalf of each of the Portfolios with one or more investment management organizations (each, a “Specialist Manager”). For the Portfolio(s) it serves, each Specialist Manager is responsible for providing a continuous program of investment management for that portion of the Portfolio allocated to it and for placing all orders for the purchase and sale of securities and other instruments for such portion of the Portfolio. Except as noted, each Specialist Manager earns a fee, accrued daily and paid either monthly or quarterly, based on average daily net assets of that portion of the Portfolio managed.
For the year ended June 30, 2022, the Portfolios incurred the following investment advisory fees, before any applicable fee waivers, with respect to the services of the indicated Specialist Manager(s) as reflected on the Statements of Operations as “Advisory fees.” The following annual fee rates are applied to the portions of the Portfolios that are managed by the Specialist Managers in determining amounts earned, except as footnoted.
314
HC CAPITAL TRUST
Notes to Financial Statements (continued) — June 30, 2022
Value Portfolio:
Specialist Manager | | Amount
Earned
(000) | | | Fee | |
Echo Street Capital Management, LLC | | $ | — | | | | 0.64 | %(a)(b) |
Frontier Capital Management Company, LLC | | | — | | | | 0.45 | %(b)(c) |
Mellon Investments Corporation (Index Strategy) | | | — | | | | 0.04 | %(b)(d) |
Mellon Investments Corporation (Factor Strategy) | | | — | | | | 0.065 | %(b)(d) |
Parametric Portfolio Associates, LLC (Liquidity Strategy) | | | 12 | | | | 0.40 | %(e) |
Parametric Portfolio Associates, LLC (Targeted Strategy) | | | — | | | | 0.05 | %(b)(f) |
Parametric Portfolio Associates, LLC (Tax-Managed Custom Strategy) | | | 537 | | | | 0.08 | %(g) |
Parametric Portfolio Associates, LLC (Options Overlay Strategy) | | | 55 | | | | 2.42 | %(h) |
Total | | $ | 604 | | | | 0.09 | % |
Growth Portfolio:
Specialist Manager | | Amount
Earned
(000) | | | Fee | |
Echo Street Capital Management LLC | | $ | — | | | | 0.64 | %(a)(b) |
Jennison Associates, LLC | | | 603 | | | | 0.30 | %(i) |
Mellon Investments Corporation (Index Strategy) | | | — | | | | 0.04 | %(b)(d) |
Mellon Investments Corporation (Factor Strategy) | | | — | | | | 0.065 | %(b)(d) |
Parametric Portfolio Associates, LLC (Liquidity Strategy) | | | 13 | | | | 0.29 | %(e) |
Parametric Portfolio Associates, LLC (Targeted Strategy) | | | — | | | | 0.05 | %(b)(f) |
Parametric Portfolio Associates, LLC (Tax-Managed Custom Strategy) | | | 535 | | | | 0.08 | %(g) |
Parametric Portfolio Associates, LLC (Options Overlay Strategy) | | | 55 | | | | 1.09 | %(h) |
Total | | $ | 1,206 | | | | 0.13 | % |
Institutional U.S. Portfolio:
Specialist Manager | | Amount
Earned
(000) | | | Fee | |
Echo Street Capital Management LLC | | $ | 1,850 | | | | 0.64 | %(a) |
Frontier Capital Management Company, LLC | | | — | | | | 0.45 | %(b)(c) |
Jennison Associates, LLC | | | 308 | | | | 0.30 | %(i) |
Mellon Investments Corporation (Index Strategy) | | | 505 | | | | 0.04 | %(d) |
Mellon Investments Corporation (Factor Strategy) | | | 230 | | | | 0.065 | %(d) |
Pacific Investment Management Company, LLC (Enhanced Index Strategy) | | | — | | | | 0.25 | %(b)(y) |
Parametric Portfolio Associates, LLC (Liquidity Strategy) | | | 174 | | | | 0.07 | %(e) |
Parametric Portfolio Associates, LLC (Targeted Strategy) | | | 34 | | | | 0.06 | %(f) |
Parametric Portfolio Associates, LLC (Options Overlay Strategy) | | | 55 | | | | 0.24 | %(h) |
Wellington Management Company, LLP | | | 566 | | | | 0.75 | %(j) |
Total | | $ | 3,722 | | | | 0.15 | % |
315
HC CAPITAL TRUST
Notes to Financial Statements (continued) — June 30, 2022
Small Cap-Mid Cap Portfolio:
Specialist Manager | | Amount
Earned
(000) | | | Fee | |
Frontier Capital Management Company, LLC | | $ | 169 | | | | 0.45 | %(c) |
Mellon Investments Corporation (Index Strategy) | | | — | | | | 0.04 | %(b)(d) |
Mellon Investments Corporation (Factor Strategy) | | | — | | | | 0.065 | %(b)(d) |
Parametric Portfolio Associates, LLC (Liquidity Strategy) | | | 13 | | | | 0.25 | %(e) |
Parametric Portfolio Associates, LLC (Targeted Strategy) | | | — | | | | 0.05 | %(b)(f) |
Parametric Portfolio Associates, LLC (Tax-Managed Custom Strategy) | | | 36 | | | | 0.08 | %(g) |
Total | | $ | 218 | | | | 0.25 | % |
ESG Growth Portfolio:
Specialist Manager | | Amount
Earned
(000) | | | Fee | |
Agincourt Capital Management, LLC | | $ | — | | | | 0.12 | %(b) |
Mellon Investments Corporation | | | 135 | | | | 0.10 | % |
Parametric Portfolio Associates, LLC (Liquidity Strategy) | | | 12 | | | | 0.45 | %(e) |
Parametric Portfolio Associates, LLC (Targeted Strategy) | | | — | | | | 0.05 | %(b)(f) |
RBC Global Asset Management (U.K.) Limited | | | 184 | | | | 0.55 | %(k) |
Total | | $ | 331 | | | | 0.19 | % |
Catholic SRI Growth Portfolio:
Specialist Manager | | Amount
Earned
(000) | | | Fee | |
Agincourt Capital Management, LLC | | $ | — | | | | 0.12 | %(b) |
Mellon Investments Corporation | | | 30 | | | | 0.10 | % |
Parametric Portfolio Associates, LLC (Liquidity Strategy) | | | — | | | | 0.05 | %(b)(e) |
Parametric Portfolio Associates, LLC (Targeted Strategy) | | | — | | | | 0.05 | %(b)(f) |
Total | | $ | 30 | | | | 0.10 | % |
316
HC CAPITAL TRUST
Notes to Financial Statements (continued) — June 30, 2022
International Portfolio:
Specialist Manager | | Amount
Earned
(000) | | | Fee | |
City of London Investment Management Company, Limited | | $ | — | | | | 0.55 | %(b)(l) |
Mellon Investments Corporation (Developed Markets Strategy) | | | — | | | | 0.05 | %(b)(m) |
Mellon Investments Corporation (Developed Factor Strategy) | | | — | | | | 0.075 | %(b)(m) |
Mellon Investments Corporation (Emerging Markets Strategy) | | | — | | | | 0.13 | %(b)(m) |
Parametric Portfolio Associates, LLC (Liquidity Strategy) | | | 18 | | | | 0.14 | %(e) |
Parametric Portfolio Associates, LLC (Targeted Strategy) | | | — | | | | 0.05 | %(b)(f) |
Parametric Portfolio Associates, LLC (Tax-Managed Custom Strategy) | | | 519 | | | | 0.08 | %(g) |
Parametric Portfolio Associates, LLC (Options Overlay Strategy) | | | 66 | | | | 1.38 | %(h) |
WCM Investment Management, LLC | | | — | | | | 0.85 | %(b)(n) |
Total | | $ | 603 | | | | 0.09 | % |
Institutional International Portfolio:
Specialist Manager | | Amount
Earned
(000) | | | Fee | |
City of London Investment Management Company, Limited | | $ | 736 | | | | 0.55 | %(l) |
Mellon Investments Corporation (Developed Markets Strategy) | | | 436 | | | | 0.05 | %(m) |
Mellon Investments Corporation (Developed Factor Strategy) | | | — | | | | 0.075 | %(b)(m) |
Mellon Investments Corporation (Emerging Markets Strategy) | | | — | | | | 0.13 | %(b)(m) |
Mellon Investments Corporation (Factor Strategy) | | | — | | | | 0.05 | %(b)(m) |
Pacific Investment Management Company, LLC | | | — | | | | 0.39 | %(b)(o) |
Parametric Portfolio Associates, LLC (Liquidity Strategy) | | | 71 | | | | 0.08 | %(e) |
Parametric Portfolio Associates, LLC (Targeted Strategy) | | | — | | | | 0.05 | %(b)(f) |
Parametric Portfolio Associates, LLC (Options Overlay Strategy) | | | 66 | | | | 0.60 | %(h) |
WCM Investment Management, LLC | | | — | | | | 0.85 | %(b)(n) |
Total | | $ | 1,309 | | | | 0.12 | % |
Emerging Markets Portfolio:
Specialist Manager | | Amount
Earned
(000) | | | Fee | �� |
City of London Investment Management Company, Limited | | $ | — | | | | 1.00 | %(b)(p) |
Mellon Investments Corporation | | | 837 | | | | 0.13 | %(m) |
Parametric Portfolio Associates, LLC (Liquidity Strategy) | | | 40 | | | | 0.09 | %(e) |
Parametric Portfolio Associates, LLC (Targeted Strategy) | | | — | | | | 0.05 | %(b)(f) |
Parametric Portfolio Associates, LLC (Tax-Managed Custom Strategy) | | | — | | | | 0.08 | %(b)(g) |
Parametric Portfolio Associates, LLC (Options Overlay Strategy) | | | 66 | | | | 0.82 | %(h) |
RBC Global Asset Management (U.K.) Limited | | | 631 | | | | 0.75 | %(q) |
XY Investments (HK) Limited | | | 657 | | | | 1.00 | %(r) |
Total | | $ | 2,231 | | | | 0.26 | % |
317
HC CAPITAL TRUST
Notes to Financial Statements (continued) — June 30, 2022
Core Fixed Income Portfolio:
Specialist Manager | | Amount
Earned
(000) | | | Fee | |
Agincourt Capital Management, LLC | | $ | 22 | | | | 0.08 | % |
Mellon Investments Corporation (U.S. Government, Mortgage and Asset Backed Strategy) | | | 20 | | | | 0.06 | % |
Mellon Investments Corporation (Corporate Strategy) | | | — | | | | 0.15 | %(b) |
Pacific Investment Management Company, LLC | | | — | | | | 0.25 | %(b)(s) |
Parametric Portfolio Associates, LLC (Options Overlay Strategy) | | | — | | | | N/A | (b)(t) |
Total | | $ | 42 | | | | 0.07 | % |
Corporate Opportunities Portfolio:
Specialist Manager | | Amount
Earned
(000) | | | Fee | |
City of London Investment Management Company, Limited | | $ | — | | | | 0.45 | %(b) |
Fort Washington Investment Advisors, Inc. | | | — | | | | 0.20 | %(b)(u) |
Mellon Investments Corporation | | | — | | | | 0.25 | %(b) |
Pacific Investment Management Company, LLC | | | — | | | | 0.45 | %(b)(v) |
Parametric Portfolio Associates, LLC (Liquidity Strategy) | | | 186 | | | | 0.07 | %(e) |
Parametric Portfolio Associates, LLC (Targeted Strategy) | | | — | | | | 0.05 | %(b)(f) |
Parametric Portfolio Associates, LLC (Options Overlay Strategy) | | | — | | | | N/A | (b)(h) |
Western Asset Management Company, Ltd. | | | — | | | | 0.75 | %(b) |
Total | | $ | 186 | | | | 0.06 | % |
U.S. Government Fixed Income Portfolio:
Specialist Manager | | Amount
Earned
(000) | | | Fee | |
Mellon Investments Corporation | | $ | 166 | | | | 0.06 | % |
Parametric Portfolio Associates, LLC (Options Overlay Strategy) | | | 5 | | | | 0.04 | %(t) |
| | | $ | 171 | | | | 0.06 | % |
U.S. Corporate Fixed Income Portfolio:
Specialist Manager | | Amount
Earned
(000) | | | Fee | |
Agincourt Capital Management, LLC | | $ | 191 | | | | 0.08 | % |
Mellon Investments Corporation | | | — | | | | 0.15 | %(b) |
Pacific Investment Management Company, LLC | | | — | | | | 0.60 | %(b)(w) |
Parametric Portfolio Associates, LLC (Options Overlay Strategy) | | | — | | | | N/A | (b)(t) |
Total | | $ | 191 | | | | 0.07 | % |
318
HC CAPITAL TRUST
Notes to Financial Statements (continued) — June 30, 2022
U.S. Mortgage/Asset Backed Fixed Income Portfolio:
Specialist Manager | | Amount
Earned
(000) | | | Fee | |
Mellon Investments Corporation | | $ | 119 | | | | 0.06 | % |
Pacific Investment Management Company, LLC | | | — | | | | 0.60 | %(b)(w) |
Parametric Portfolio Associates, LLC (Options Overlay Strategy) | | | — | | | | N/A | (b)(t) |
| | | $ | 119 | | | | 0.06 | % |
Short-Term Municipal Portfolio:
Specialist Manager | | Amount
Earned
(000) | | | Fee | |
Breckinridge Capital Advisors, Inc. | | $ | 182 | | | | 0.125 | % |
Intermediate Municipal Portfolio:
Specialist Manager | | Amount
Earned
(000) | | | Fee | |
Breckinridge Capital Advisors, Inc. | | $ | — | | | | 0.125 | %(b) |
City of London Investment Management Company, Limited | | | — | | | | 0.45 | %(b) |
Insight North America LLC | | | 618 | | | | 0.16 | %(x) |
Parametric Portfolio Associates, LLC (Options Overlay Strategy) | | | — | | | | N/A | (b)(t) |
Total | | $ | 618 | | | | 0.16 | % |
Intermediate Municipal II Portfolio:
Specialist Manager | | Amount
Earned
(000) | | | Fee | |
Breckinridge Capital Advisors, Inc. | | $ | 80 | | | | 0.125 | % |
City of London Investment Management Company, Limited | | | 89 | | | | 0.45 | % |
Parametric Portfolio Associates, LLC (Options Overlay Strategy) | | | — | | | | N/A | (b)(t) |
Total | | $ | 169 | | | | 0.19 | % |
Amounts designated as “—” are $0 or have been rounded to $0.
(a) | Echo Street Capital Management LLC (“Echo Street”) receives a fee based on the average daily net assets, payable quarterly, of that portion of assets managed by Echo Street, at the annual rate of 0.85% of the first $50 million of Combined Assets (as defined below); 0.70% of the next $50 million of Combined Assets; 0.60% of the next $100 million of Combined Assets; and 0.55% of Combined Assets in excess of $200 million. |
| “Combined Assets” shall mean the sum of: the net assets of each portion of the Value Portfolio, Growth Portfolio, and Institutional U.S. Portfolio allocated to Echo Street. |
(b) | Specialist Manager approved by the Board but a strategy to which no assets were allocated during the period ended June 30, 2022. |
319
HC CAPITAL TRUST
Notes to Financial Statements (continued) — June 30, 2022
(c) | Frontier Capital Management Company, LLC (“Frontier”) receives a fee based on the average daily net assets of that portion of assets managed by Frontier, at an annual rate of 0.45% on the first $90 million of the Combined Assets (as defined below) and 0.75% of Combined Assets exceeding $90 million. |
| “Combined Assets” shall mean the sum of: the net assets of that portion managed by Frontier in the Value Portfolio, Institutional U.S. Portfolio, Small Cap-Mid Cap Portfolio, and the net assets invested in the same strategy as the Portfolios that are managed by Frontier for certain other clients of the Trust’s primary adviser. |
(d) | For assets allocated to an Index Strategy, for so long as the Combined Assets (as defined below) are greater than $2 billion, Mellon Investments Corporation (“Mellon”) receives a fee at the annual rate of 0.04% of the average daily net assets of the Account. If the Combined Assets are reduced to $2 billion or less due to withdrawals or redemptions, beginning with the start of the first calendar year following the date on which such withdrawals or redemptions reduced such Combined Assets to $2 billion or less, the fee shall be calculated based on average daily net assets of the Account at annual rate of 0.065%. Index Strategy shall mean a portfolio wherein the Portfolio Manager seeks to approximate, over the long term, the performance of a specific market index. |
| For assets allocated to a Factor Strategy, for so long as the Combined Assets are greater than $2 billion, the fee shall be at the annual rate of 0.065% of the average daily net assets of the Account. If the Combined Assets are reduced to $2 billion or less due to withdrawals or redemptions, beginning with the start of the first calendar year following the date on which such withdrawal or redemption reduced such Combined Assets to $2 billion or less, the fee shall be calculated based on average daily net assets of the Account at annual rate of 0.075%. Factor Strategy shall mean a portfolio wherein the Portfolio Manager seeks to implement a strategy developed by Hirtle Callaghan & Co. or an affiliate with the objective of obtaining exposure to one or more factors such as value or quality within the U.S. equity markets. |
| “Combined Assets” shall mean the sum of: the net assets managed by Mellon in the Value Portfolio, Growth Portfolio, Institutional U.S. Portfolio, Small Cap-Mid Cap Portfolio, International Portfolio, Institutional International Portfolio, Emerging Markets Portfolio, and the net assets managed by Mellon using these strategies in other investment advisory accounts for which HC Capital Solutions serves as investment adviser. |
(e) | With respect to its Liquidity Strategy, Parametric Portfolio Associates, LLC (“Parametric”), a part of the asset management division of Morgan Stanley Investment Management, receives a fee, which shall be calculated daily and payable monthly in arrears, at an annual rate of 0.15% of the first $50 million of the Combined Liquidity Assets (as defined below); 0.10% of the next $100 million of Combined Liquidity Assets; and 0.05% of Combined Liquidity Assets over $150 million. Parametric is also entitled to receive a flat fee of $10,000 per year for each Portfolio. One Twelfth of the flat fee with respect to any given Portfolio will be waived with respect to each calendar month during which no Portfolio assets were allocated to the Liquidity Strategy in that Portfolio. |
| “Combined Liquidity Assets” shall mean the sum of: the net assets of that portion of each Portfolio managed by Parametric for investment in its Liquidity Strategy. |
(f) | With respect to its Targeted Strategy, Parametric receives a fee, which shall be calculated daily and payable in arrears at the rate of 0.05%. Parametric is also entitled to receive a flat fee of $5,000 per year for each Portfolio, provided that such fee will be waived with respect to each calendar year during which no Portfolio assets were allocated to the Targeted Strategy in that Portfolio. |
(g) | With respect to its Tax-Managed Custom Strategy, Parametric receives a fee, which shall be calculated daily and payable in arrears at the annual rate of 0.10% of the first $250 million of the Combined Tax-Managed Custom Strategy Assets (as defined below); 0.09% of the next $250 million of the Combined Tax-Managed Custom Strategy Assets; 0.08% of the next $500 million of the Combined Tax-Managed Custom Strategy Assets; and 0.07% of the Combined Tax-Managed Custom Strategy Assets over $1 billion. |
| “Combined Tax-Managed Custom Strategy Assets” shall mean the sum of: the net assets of that portion of each of the other Portfolios of the Trust allocated to Parametric from time to time for investment in their Tax-Management Custom Core Strategy. |
(h) | With respect to its Options Overlay Strategy, Parametric receives a fee, which shall be calculated daily and payable in arrears, of $5,500 per calendar month for each equity Portfolio, provided that such fee will be waived with respect to each calendar month during which no Portfolio assets were allocated to the Options Overlay Strategy in that Portfolio. |
(i) | Jennison Associates LLC (“Jennison”) is entitled to receive an annual fee of no more than 0.30% of average daily net assets of that portion of the Growth Portfolio and Institutional U.S. Portfolio allocated to Jennison (the “Jennison Accounts”). While the rate at which Jennison’s fee for managing the Portfolios will not exceed 0.30%, the fee may decrease based on the aggregate market value of the Jennison Accounts and certain other assets managed by Jennison (which may pay fees exceeding 0.30%) for the benefit of certain investors who are clients of the Trust’s primary adviser at the following annual rates: |
320
HC CAPITAL TRUST
Notes to Financial Statements (continued) — June 30, 2022
| — 0.75% on the first $10 million; |
| — 0.50% on the next $30 million; |
| — 0.35% on the next $25 million; |
| — 0.25% on the next $335 million; |
| — 0.22% on the next $600 million; |
| — 0.20% on the next $4 billion; and |
(j) | Wellington Management Company, LLP (“Wellington”) receives a fee, which shall be payable monthly in arrears of 0.75% of the average daily net assets of the first $50 million of the Combined Assets (as defined below). On Combined Assets over $50 million, the fee shall be at the annual rate of 0.65% of the Combined Assets. |
| “Combined Assets” shall mean the sum of: the net assets of the Institutional U.S. Portfolio and assets in the same investment strategy as the Portfolio that are managed by Wellington for certain other clients of the Trust’s primary adviser. |
(k) | RBC Global Asset Management (U.K.) Limited (“RBC”) receives a fee based on the average daily net assets, payable monthly, of that portion of assets managed by RBC, at the annual rate of 0.55% of the first $50 million; 0.50% of the next $50 million; and 0.45% exceeding $100 million. |
(l) | City of London Investment Management Company, Limited (“CLIM”) receives a fee, which shall be calculated daily and payable monthly in arrears at the annual rate of 0.80% of the first $50 million of the Combined Assets (as defined below) and 0.40% of the Combined assets exceeding $50 million. |
| “Combined Assets” shall mean the sum of: the average daily net assets managed by CLIM in the International Portfolio and the Institutional International Portfolio; and the net assets invested in the same strategy as the Portfolios that are managed by CLIM for certain other clients of the Trust’s primary adviser. |
(m) | For its services to the International Portfolio, Institutional International Portfolio and Emerging Markets Portfolio, Mellon receives differing fees from each Portfolio with respect to each of Mellon’s Developed Index Strategy, Developed Factor Strategy, and Emerging Markets Strategy calculated based on the average daily net assets of that portion of the assets of the Portfolio managed by it. |
| For assets allocated to a Developed Index Strategy (the “Index Account”), for so long as the Combined Assets (as defined below) are greater than $2 billion, the fee shall be at the annual rate of 0.05% of the average daily net assets of the Index Account. If the Combined Assets are reduced to $2 billion or less due to withdrawals or redemptions, beginning with the start of the first calendar year following the date on which such withdrawal or redemption reduced such Combined Assets to $2 billion or less, the fee shall be calculated based on average daily net assets of the Index Account at an annual rate of 0.06%. |
| For assets allocated to a Developed Factor Strategy (the “Factor Account”), for so long as the Combined Assets (as defined below) are greater than $2 billion, the fee shall be at the annual rate of 0.075% of the average daily net assets of the Factor Account. If the Combined Assets are reduced to $2 billion or less due to withdrawals or redemptions, beginning with the start of the first calendar year following the date on which such withdrawal or redemptions reduced such Combined Assets to $2 billion or less, the fee shall be calculated based on average daily net assets of the Account at an annual rate of 0.085%. |
| For assets allocated to an Emerging Markets Strategy (the “EM Account”), for so long as the aggregate assets allocated to Mellon for all of its passive equity mandates (including accounts for other clients of the Advisor and certain of its affiliates besides the Trust) exceed $2 billion, the fee shall be at the annual rate of 0.13% of the average daily net assets of the EM Account. Should these aggregate assets fall below $2 billion; the fee will be calculated at an annual rate of 0.15% for those assets allocated to emerging markets strategies. |
| The term “Combined Assets” means the sum of: (i) the net assets of the Value Portfolio, Growth Portfolio, Institutional U.S. Portfolio, Small Cap-Mid- Cap Portfolio, International Portfolio, Institutional International Portfolio and the Emerging Markets Portfolio of the Trust (“collectively the “Trust Portfolios”) managed by the Mellon; and (ii) the net assets of each other investment advisory account for which HC Capital Solutions or one of its affiliates serves as investment adviser and for which Mellon provides portfolio management services using the strategies employed in Trust Portfolios. |
(n) | WCM Investment Management, LLC (“WCM”) received a fee, which was calculated daily and payable monthly in arrears at the annual rate of 0.85% of the first $100 million of the Combined Assets (as defined below) and 0.75% of Combined Assets exceeding $100 million. |
| “Combined Assets” shall mean the sum of: the net assets of that portion managed by WCM in the International Portfolio and the Institutional International Portfolio. |
321
HC CAPITAL TRUST
Notes to Financial Statements (continued) — June 30, 2022
| WCM’s Portfolio Management Agreement was terminated on August 19, 2021. |
(o) | Pacific Investment Management Company, LLC (“PIMCO”) receives a fee, which shall be payable monthly in arrears, at an annual rate of 0.39% on the month-end net assets subject to proration of contributions or withdrawals on daily net flows in excess of 1% of the month-end net assets. |
| PIMCO’s Portfolio Management Agreement expired on June 30, 2022. |
(p) | CLIM receives a fee, which shall be calculated daily and payable quarterly in arrears at the annual rate of 1.00% of the first $100 million of the Combined Assets (as defined below); 0.80% of the next $100 million of Combined Assets; and 0.50% of Combined Assets exceeding $200 million. |
| “Combined Assets” shall mean the sum of: the average daily net assets managed by CLIM in the Portfolio and the net assets invested in the same strategy as the Portfolio that are managed by CLIM for certain other clients of the Trust’s primary adviser. |
(q) | RBC received a fee, which was payable quarterly in arrears at the annual rate of 0.80% of the first $100 million of the Combined Assets (as defined below); 0.65% of the next $150 million of Combined Assets; and 0.60% of Combined Assets in excess of $250 million. |
| RBC’s Portfolio Management Agreement was terminated on May 10, 2022. |
| “Combined Assets” shall mean the sum of: (i) the net assets of the Account; and (ii) the net assets of each other investment advisory account for which Hirtle Callaghan & Co. serves as investment adviser and for which Portfolio Manager provides portfolio management services (“Other Hirtle Accounts”) using the same strategies as employed for the Account. |
(r) | XY Investments (HK) Limited receives a fee, which shall be payable monthly in arrears at the annual rate of 1.00% of the average daily net assets of the Account. The annual rate shall be reduced to 0.90% once the assets under management with respect to the Portfolio Manager’s and its affiliates Offshore Strategy (as defined below) exceeds $2 billion. |
| “Offshore Strategy” shall mean any vehicle, fund, account or other product utilizing a quantitative enhanced index investment strategy of investing in a China A-share market, but excluding any vehicle, fund, account or product dedicated solely to the Portfolio Manager’s Shanghai business. |
(s) | PIMCO receives a fee, which shall be payable monthly in arrears, at an annual rate of 0.25% on the month-end net assets subject to proration for contributions and withdrawals on daily net flows in excess of 1% of the month-end net assets. |
| PIMCO’s Portfolio Management Agreement expired on June 30, 2022. |
(t) | With respect to its Options Overlay Strategy, Parametric receives a fee, which shall be calculated daily and payable in arrears, of $4,500 per calendar month for each fixed income Portfolio, provided that such fee will be waived with respect to the calendar month during which no Portfolio assets were allocated to the Options Overlay Strategy in that Portfolio. |
(u) | Fort Washington Investment Advisors, Inc. (“Fort Washington”) receives a fee, which shall be payable quarterly in arrears. For so long as the Combined Assets (as defined below) are greater than $200 million, the fee shall be at the annual rate of 0.20% of the Combined Assets. If the Combined Assets are reduced to $200 million or less due to withdrawals or redemptions, beginning with the first calendar quarter following the date of such withdrawals or redemptions, the fee shall be based on 0.40% of the first $25 million of the Combined Assets, 0.375% of the next $25 million of the Combined Assets, 0.3375% of the next $50 million of the Combined Assets, 0.25% of the next $100 million of the Combined Assets, and 0.20% exceeding $200 million. |
| “Combined Assets” shall mean the sum of: the net assets managed by Fort Washington in the Portfolio and the net assets invested in the same strategy as the Portfolio that are managed by Fort Washington for the benefit of certain investors who are clients of the Trust’s primary adviser. |
(v) | PIMCO receives a fee, which shall be payable monthly in arrears, at an annual rate of 0.45% on the month-end net assets subject to proration for contributions or withdrawals on daily net flows in excess of 1% of the month-end net assets. |
| PIMCO’s Portfolio Management Agreement expired on June 30, 2022. |
(w) | PIMCO receives a fee, which shall be payable monthly in arrears, at an annual rate of 0.60% on the month-end net assets subject to proration for contributions or withdrawals on daily net flows in excess of 1% of the month-end nets assets. |
| PIMCO’s Portfolio Management Agreement expired on June 30, 2022. |
322
HC CAPITAL TRUST
Notes to Financial Statements (continued) — June 30, 2022
(x) | Insight North America LLC (“Insight”) receives a fee, which shall be calculated daily and payable quarterly, at an annual rate of 0.25% for the first $100 million of the Combined Assets (as defined below); and 0.15% of the Combined Assets exceeding $100 million. Insight is entitled to receive a fee at an annual rate not to exceed 0.20% of the Combined Assets. |
(y) | PIMCO’s Portfolio Management Agreement expired on June 30, 2022. |
| “Combined Assets” shall mean the sum of: the net assets managed by Insight in the Portfolio and the net assets invested in the same strategy as the Portfolio that are managed by Insight for the benefit of certain investors who are clients of the Trust’s primary adviser. |
Pursuant to discretionary investment advisory agreements between the Trust and the Adviser, the Adviser is paid a fee which is accrued daily and paid monthly at an annual rate of 0.05% of average daily net assets per Portfolio. The fees that the Adviser receives are listed as “Management fees” on the Statements of Operations. The Adviser continuously monitors the performance of various investment management organizations, including the Specialist Managers retained by the Trust, and generally oversees the services provided to the Trust by its administrator, custodian and other service providers. The Adviser is also authorized to allocate and reallocate assets among Specialist Managers in multi-manager portfolios of the Trust from time to time without additional authorization of the Board. In addition, the Adviser makes its officers available to serve as officers and/or Trustees of the Trust, and maintains office space sufficient for the Trust’s principal office. The Securities and Exchange Commission has issued an order that permits the Trust to enter into portfolio management agreements with Specialist Managers upon the approval of the Board but without submitting such contracts for the approval of the shareholders of the relevant Portfolio under certain circumstances.
Citi Fund Services Ohio, Inc. (“Citi”) provides the Portfolios with administrative and fund accounting services. The fees for these services are disclosed as “Administrative service fees” on the Statements of Operations. The fees are accrued daily and payable on a monthly basis at an annual rate of 0.0506% of the Trust’s Portfolios’ average daily net assets up to $6 billion; 0.0047% of the Trust’s Portfolios’ average daily net assets between $6 billion and $12 billion; and 0.0276% of average daily net assets in excess of $12 billion. Citi receives additional fees paid by the Trust for compliance services, regulatory reporting services and reimbursement of certain expenses.
FIS Investor Services LLC, a wholly-owned subsidiary of Fidelity National Information Services, provides dividend and capital gains disbursing agent and transfer agency services. The fees for these services are disclosed as “Transfer agent fees” on the Statements of Operations. The fees are accrued daily and payable on a monthly basis at an annual rate of 0.0034% of the Trust’s Portfolios’ average daily net assets up to $6 billion; 0.0003% of the Trust’s Portfolios’ average daily net assets between $6 billion and $12 billion; and 0.0019% of average daily net assets in excess of $12 billion.
The Trust has adopted a Distribution Plan for the HC Advisors Shares under which the Adviser may receive compensation for distribution services. Under the Distribution Plan, which was adopted pursuant to Rule 12b-1 under the 1940 Act, the Adviser is entitled to receive a fee of up to 0.25% annually of the average daily net assets attributable to the HC Advisors Shares. The Adviser has voluntarily waived all fees associated with the Distribution Plan through June 30, 2022 and there is no current intention to collect such a fee in the future.
Ultimus Fund Distributors, LLC (“Ultimus”) provides certain distribution services to the Trust. Ultimus receives an annual fee of $50,000 for performing the services listed under its agreement with the Trust. None of Ultimus’ duties under its agreement are primarily intended to result in the sale of Trust shares.
Foreside Fund Officer Services LLC provides CCO services to the Trust pursuant to a Compliance Services Agreement assigned to Foreside effective December 7, 2021 by Alaric Compliance Services LLC (“Alaric”) following Foreside Financial Group, LLC’s acquisition of Alaric. Through June 30, 2022 the Trust paid an annual fee of $164,000 for such services.
323
HC CAPITAL TRUST
Notes to Financial Statements (continued) — June 30, 2022
4. PURCHASE AND SALE TRANSACTIONS. The aggregate cost of purchases and proceeds from sales of investment securities, other than long-term U.S. government securities, TBA securities and short-term securities, for the year ended June 30, 2022 were as follows (amounts in thousands):
Portfolio | | Purchases | | | Sales | |
Value Portfolio | | $ | 51,788 | | | $ | 67,327 | |
Growth Portfolio | | | 105,479 | | | | 193,404 | |
Institutional U.S Portfolio | | | 913,083 | | | | 900,911 | |
Small Cap-Mid Cap Portfolio | | | 52,437 | | | | 57,284 | |
ESG Growth Portfolio | | | 20,499 | | | | 17,366 | |
Catholic SRI Growth Portfolio | | | 7,206 | | | | 8,459 | |
International Portfolio | | | 122,372 | | | | 177,892 | |
Institutional International Portfolio | | | 230,814 | | | | 308,448 | |
Emerging Markets Portfolio | | | 155,850 | | | | 150,780 | |
Core Fixed Income Portfolio | | | 9,570 | | | | 8,040 | |
Corporate Opportunities Portfolio | | | 5,647 | | | | 16,827 | |
U.S. Government Fixed Income Portfolio | | | 161,155 | | | | — | |
U.S. Corporate Fixed Income Portfolio | | | 97,028 | | | | 73,484 | |
U.S. Mortgage/Asset Backed Fixed Income Portfolio | | | 1,854 | | | | 2,407 | |
Short-Term Municipal Portfolio | | | 44,943 | | | | 45,457 | |
Intermediate Municipal Portfolio | | | 45,429 | | | | 24,796 | |
Intermediate Municipal II Portfolio | | | 32,455 | | | | 18,238 | |
The aggregate cost of purchases and proceeds from sales of long-term U.S. government securities for the year ended June 30, 2022 were as follows (amounts in thousands):
Portfolio | | Purchases | | | Sales | |
Core Fixed Income Portfolio | | $ | 9,502 | | | $ | 11,999 | |
U.S. Government Fixed Income Portfolio | | | 389,109 | | | | 124,499 | |
U.S. Mortgage/Asset Backed Fixed Income Portfolio | | | 74,454 | | | | 44,500 | |
5. FEDERAL INCOME TAXES. It is the policy of each Portfolio to continue to qualify as a regulated investment company by complying with the provisions available to certain investment companies, as defined in applicable sections of the Internal Revenue Code (the “Code”), and to make distributions of net investment income and net realized capital gains sufficient to relieve it (but not the shareholders) from all, or substantially all, federal income taxes. The Portfolios may, under certain circumstances, utilize equalization accounting for tax purposes by designating earnings and profits, including net realized gains distributed to shareholders on redemption of shares, as a part of the dividends paid deduction for income tax purposes.
The Trust has evaluated tax positions taken or expected to be taken in the course of preparing each Portfolio’s tax returns to determine whether it is more likely than not (i.e., greater than 50-percent chance) that each tax position will be sustained upon examination by a tax authority based on the technical merits of the position. A tax position that meets the more-likely-than-not recognition threshold is measured to determine the amount of benefit to recognize in the financial statements. Differences between tax positions taken in a tax return and amounts recognized in the financial statements will generally result in an increase in a liability for taxes payable (or a reduction of a tax refund receivable), including the recognition of any related interest and penalties as an operating expense. Tax positions taken in tax years remain subject to examination by tax authorities (generally the last three tax year ends 2019 to 2021, and the interim tax period since then). The determination has been made that there are no uncertain tax positions that would require the Portfolios to record a tax liability and, therefore, there is no impact to the Portfolios’ financial statements. Furthermore, management of the Portfolios is not aware of any tax position for which it is reasonably possible that the total amounts of unrecognized tax benefits will significantly change in the next 12 months.
324
HC CAPITAL TRUST
Notes to Financial Statements (continued) — June 30, 2022
A. As of June 30, 2022, the cost basis of investments for federal income tax purposes, gross unrealized appreciation, gross unrealized depreciation and net unrealized appreciation/depreciation were as follows (amounts in thousands):
Portfolio | | Tax
Cost of
Investments | | | Tax
Unrealized
Appreciation | | | Tax
Unrealized
(Depreciation) | | | Unrealized
Appreciation/
(Depreciation) | |
Value Portfolio | | $ | 303,898 | | | $ | 281,690 | | | $ | (1,307 | ) | | $ | 280,383 | |
Growth Portfolio | | | 262,693 | | | | 445,802 | | | | (6,856 | ) | | | 438,946 | |
Institutional U.S. Portfolio | | | 1,761,332 | | | | 575,129 | | | | (122,846 | ) | | | 452,283 | |
Small Cap-Mid Cap Portfolio | | | 44,695 | | | | 25,510 | | | | (1,049 | ) | | | 24,461 | |
ESG Growth Portfolio | | | 120,733 | | | | 33,862 | | | | (11,761 | ) | | | 22,101 | |
Catholic SRI Growth Portfolio | | | 17,562 | | | | 6,460 | | | | (1,546 | ) | | | 4,914 | |
International Portfolio | | | 389,848 | | | | 146,280 | | | | (13,077 | ) | | | 133,203 | |
Institutional International Portfolio | | | 769,921 | | | | 112,174 | | | | (109,202 | ) | | | 2,972 | |
Emerging Markets Portfolio | | | 623,907 | | | | 121,910 | | | | (105,618 | ) | | | 16,292 | |
Core Fixed Income Portfolio | | | 63,575 | | | | 43 | | | | (5,350 | ) | | | (5,307 | ) |
Corporate Opportunities Portfolio | | | 252,477 | | | | — | | | | (105 | ) | | | (105 | ) |
U.S. Government Fixed Income Portfolio | | | 652,669 | | | | 303 | | | | (26,081 | ) | | | (25,778 | ) |
U.S. Corporate Fixed Income Portfolio | | | 284,428 | | | | 9 | | | | (28,601 | ) | | | (28,592 | ) |
U.S. Mortgage/Asset Backed Fixed Income Portfolio | | | 246,575 | | | | 291 | | | | (15,971 | ) | | | (15,680 | ) |
Short-Term Municipal Portfolio | | | 141,613 | | | | 149 | | | | (3,289 | ) | | | (3,140 | ) |
Intermediate Municipal Portfolio | | | 382,121 | | | | 647 | | | | (15,602 | ) | | | (14,955 | ) |
Intermediate Municipal II Portfolio | | | 92,631 | | | | 201 | | | | (6,874 | ) | | | (6,673 | ) |
Amounts designated as “—” are $0 or have been rounded to $0.
The tax cost of investments includes the cost of securities, proceeds received from TBA sales commitments and any upfront premiums paid or received on derivatives, as applicable. The tax unrealized appreciation/depreciation amounts include securities, TBA sales commitments and derivatives that are not considered realized for tax purposes, as applicable.
The differences between book-basis and tax-basis unrealized appreciation/depreciation are attributable primarily to: tax deferral of losses on wash sales, the realization for tax purposes of unrealized gains/losses on investments in passive foreign investment companies, the difference between book and tax accretion methods for market discount, derivatives, and in-kind purchases by investors that, for tax purposes, created a controlling interest in a Portfolio.
B. Tax Characteristics of Distributions Paid
The tax characteristics of distributions paid during the fiscal years ended June 30, 2022 and June 30, 2021, respectively, were as follows (amounts in thousands):
| | | Distributions Paid From: | |
Year Ended June 30, 2022 | | Ordinary
Income | | | Net Long
Term Gains | | | Total Taxable
Distributions | | | Tax-Exempt
Distributions | | | Total
Distributions
Paid* | |
Value Portfolio | | $ | 7,920 | | | $ | 3,702 | | | $ | 11,622 | | | $ | — | | | $ | 11,622 | |
Growth Portfolio | | | 11,760 | | | | 68,421 | | | | 80,181 | | | | — | | | | 80,181 | |
Institutional U.S. Portfolio | | | 151,089 | | | | 420,019 | | | | 571,108 | | | | — | | | | 571,108 | |
Small Cap-Mid Cap Portfolio | | | 306 | | | | 6,243 | | | | 6,549 | | | | — | | | | 6,549 | |
ESG Growth Portfolio | | | 3,983 | | | | 4,129 | | | | 8,112 | | | | — | | | | 8,112 | |
Catholic SRI Growth Portfolio | | | 525 | | | | 10,067 | | | | 10,592 | | | | — | | | | 10,592 | |
International Portfolio | | | 24,441 | | | | — | | | | 24,441 | | | | — | | | | 24,441 | |
Institutional International Portfolio | | | 73,315 | | | | 43,751 | | | | 117,066 | | | | — | | | | 117,066 | |
Emerging Markets Portfolio | | | 17,632 | | | | — | | | | 17,632 | | | | — | | | | 17,632 | |
Core Fixed Income Portfolio | | | 1,238 | | | | 588 | | | | 1,826 | | | | — | | | | 1,826 | |
Corporate Opportunities Portfolio | | | 21,358 | | | | 9,479 | | | | 30,837 | | | | — | | | | 30,837 | |
325
HC CAPITAL TRUST
Notes to Financial Statements (continued) — June 30, 2022
| | | Distributions Paid From: | |
Year Ended June 30, 2022 | | Ordinary
Income | | | Net Long
Term Gains | | | Total Taxable
Distributions | | | Tax-Exempt
Distributions | | | Total
Distributions
Paid* | |
U.S. Government Fixed Income Portfolio | | $ | 4,982 | | | $ | 1,533 | | | $ | 6,515 | | | $ | — | | | $ | 6,515 | |
U.S. Corporate Fixed Income Portfolio | | | 8,108 | | | | 10,005 | | | | 18,113 | | | | — | | | | 18,113 | |
U.S. Mortgage/Asset Backed Fixed Income Portfolio | | | 4,032 | | | | — | | | | 4,032 | | | | — | | | | 4,032 | |
Short-Term Municipal Portfolio | | | 82 | | | | 38 | | | | 120 | | | | 1,108 | | | | 1,228 | |
Intermediate Municipal Portfolio | | | 13 | | | | 653 | | | | 666 | | | | 5,810 | | | | 6,476 | |
Intermediate Municipal II Portfolio | | | 243 | | | | 851 | | | | 1,094 | | | | 1,734 | | | | 2,828 | |
| | | Distributions Paid From: | | | | | | | | | | | | | |
Year Ended June 30, 2021 | | Ordinary
Income | | | Net Long
Term Gains | | | Total Taxable
Distributions | | | Tax-Exempt
Distributions | | | Total
Distributions
Paid* | |
Value Portfolio | | $ | 7,690 | | | $ | — | | | $ | 7,690 | | | $ | — | | | $ | 7,690 | |
Growth Portfolio | | | 7,897 | | | | 42,952 | | | | 50,849 | | | | — | | | | 50,849 | |
Institutional U.S. Portfolio | | | 68,946 | | | | 93,578 | | | | 162,524 | | | | — | | | | 162,524 | |
Small Cap-Mid Cap Portfolio | | | 216 | | | | 82 | | | | 298 | | | | — | | | | 298 | |
ESG Growth Portfolio | | | 2,021 | | | | 1,665 | | | | 3,686 | | | | — | | | | 3,686 | |
Catholic SRI Growth Portfolio | | | 786 | | | | — | | | | 786 | | | | — | | | | 786 | |
International Portfolio | | | 16,434 | | | | — | | | | 16,434 | | | | — | | | | 16,434 | |
Institutional International Portfolio | | | 24,462 | | | | — | | | | 24,462 | | | | — | | | | 24,462 | |
Emerging Markets Portfolio | | | 10,399 | | | | — | | | | 10,399 | | | | — | | | | 10,399 | |
Core Fixed Income Portfolio | | | 1,365 | | | | 792 | | | | 2,157 | | | | — | | | | 2,157 | |
Corporate Opportunities Portfolio | | | 394 | | | | — | | | | 394 | | | | — | | | | 394 | |
U.S. Government Fixed Income Portfolio | | | 7,087 | | | | 7,412 | | | | 14,499 | | | | — | | | | 14,499 | |
U.S. Corporate Fixed Income Portfolio | | | 9,924 | | | | 7,963 | | | | 17,887 | | | | — | | | | 17,887 | |
U.S. Mortgage/Asset Backed Fixed Income Portfolio | | | 4,715 | | | | — | | | | 4,715 | | | | — | | | | 4,715 | |
Short-Term Municipal Portfolio | | | — | | | | 11 | | | | 11 | | | | 1,334 | | | | 1,345 | |
Intermediate Municipal Portfolio | | | 1 | | | | 289 | | | | 290 | | | | 6,522 | | | | 6,812 | |
Intermediate Municipal II Portfolio | | | 2 | | | | 114 | | | | 116 | | | | 1,521 | | | | 1,637 | |
Amounts designated as “—” are $0 or have been rounded to $0.
* | Total distributions paid may differ from what appears in the Statements of Changes in Net Assets because dividends for tax purposes are recognized when actually paid. |
326
HC CAPITAL TRUST
Notes to Financial Statements (continued) — June 30, 2022
C. Components of Accumulated Earnings
As of June 30, 2022, the components of accumulated earnings/(deficit) on a tax basis were as follows (amounts in thousands):
Portfolio | | Undistributed
Ordinary
Income/Tax
Exempt
Income | | | Undistributed
Long-Term
Capital
Gains | | | Accumulated
Earnings | | | Distributions
Payable | | | Accumulated
Capital and
Other Losses | | | Unrealized
Appreciation/
(Depreciation) | | | Total
Accumulated
Earnings/
(Deficit)* | |
Value Portfolio | | $ | 259 | | | $ | 2,531 | | | $ | 2,790 | | | $ | — | | | $ | (15,692 | )(a) | | $ | 280,383 | | | $ | 267,481 | |
Growth Portfolio | | | 42 | | | | 45,036 | | | | 45,078 | | | | — | | | | (26,819 | )(a) | | | 438,946 | | | | 457,205 | |
Institutional U.S. Portfolio | | | — | | | | 116,175 | | | | 116,175 | | | | — | | | | (243,693 | )(a) | | | 452,282 | | | | 324,764 | |
Small Cap-Mid Cap Portfolio | | | — | | | | 19 | | | | 19 | | | | — | | | | (2,985 | ) | | | 24,461 | | | | 21,495 | |
ESG Growth Portfolio | | | — | | | | 54 | | | | 54 | | | | — | | | | (286 | ) | | | 22,084 | | | | 21,852 | |
Catholic SRI Growth Portfolio | | | — | | | | 74 | | | | 74 | | | | — | | | | (16 | ) | | | 4,912 | | | | 4,970 | |
International Portfolio | | | — | | | | — | | | | — | | | | — | | | | (90,059 | )(a) | | | 133,241 | | | | 43,182 | |
Institutional International Portfolio | | | 360 | | | | 226 | | | | 586 | | | | — | | | | (38,779 | ) | | | 2,651 | | | | (35,542 | ) |
Emerging Markets Portfolio | | | 6,949 | | | | — | | | | 6,949 | | | | — | | | | (76,645 | ) | | | 14,008 | | | | (55,688 | ) |
Core Fixed Income Portfolio | | | 23 | | | | — | | | | 23 | | | | — | | | | (473 | ) | | | (5,307 | ) | | | (5,757 | ) |
Corporate Opportunities Portfolio | | | 204 | | | | — | | | | 204 | | | | — | | | | (29,995 | ) | | | (105 | ) | | | (29,896 | ) |
U.S. Government Fixed Income Portfolio | | | 709 | | | | 11 | | | | 720 | | | | (539 | ) | | | (264 | ) | | | (25,778 | ) | | | (25,861 | ) |
U.S. Corporate Fixed Income Portfolio | | | 354 | | | | — | | | | 354 | | | | (194 | ) | | | (558 | ) | | | (28,592 | ) | | | (28,990 | ) |
U.S. Mortgage/Asset Backed Fixed Income Portfolio | | | 223 | | | | — | | | | 223 | | | | (123 | ) | | | (16,383 | ) | | | (15,680 | ) | | | (31,963 | ) |
Short-Term Municipal Portfolio | | | 44 | | | | — | | | | 44 | | | | (12 | ) | | | (925 | ) | | | (3,140 | ) | | | (4,033 | ) |
Intermediate Municipal Portfolio | | | 130 | | | | — | | | | 130 | | | | (43 | ) | | | (724 | ) | | | (14,955 | ) | | | (15,592 | ) |
Intermediate Municipal II Portfolio | | | 12 | | | | — | | | | 12 | | | | (13 | ) | | | (159 | ) | | | (6,673 | ) | | | (6,833 | ) |
Amounts designated as “—” are $0 or have been rounded to $0.
* | Total accumulated earnings/(deficit) may differ from the total distributable earnings amounts reported in the Statements of Assets and Liabilities due to certain temporary differences between book-basis and tax-basis. |
(a) | Includes $15,692, $26,819, $230,025, $26,997 of straddle losses which were deferred for the Value Portfolio, Growth Portfolio, Institutional U.S. Portfolio and International Portfolio, respectively (amounts in thousands). |
D. Capital Loss Carryforwards
As of their tax year ended June 30, 2022, the following Portfolios had capital loss carryforwards which do not expire, as summarized below (amounts in thousands):
Portfolio | | Short-Term
Amount | | | Long-Term
Amount | | | Total | |
Institutional U.S. Portfolio | | $ | 4,246 | | | $ | 9,423 | | | $ | 13,669 | |
International Portfolio | | | 62,212 | | | | — | | | | 62,212 | |
Emerging Markets Portfolio | | | 49,576 | | | | 27,069 | | | | 76,645 | |
U.S. Mortgage/Asset Backed Fixed Income Portfolio | | | 6,130 | | | | 10,253 | | | | 16,383 | |
Amounts designated as “—” are $0 or have been rounded to $0.
327
HC CAPITAL TRUST
Notes to Financial Statements (continued) — June 30, 2022
E. Deferred Losses
Under current tax law, capital losses and specified ordinary losses realized after October 31 or non-specified ordinary losses realized after December 31 (ordinary losses collectively known as “late year ordinary loss”) may be deferred and treated as occurring on the first business day of the following fiscal year. The following Portfolios had net deferred losses, which will be treated as arising on the first day of the fiscal year ended June 30, 2023 (amounts in thousands):
Portfolio | Post-October
Capital
Losses | Last Year
Ordinary
Losses |
Small Cap-Mid Cap Portfolio | $ 2,985 | $ — |
ESG Growth Portfolio | 169 | 117 |
Catholic SRI Growth Portfolio | — | 16 |
International Portfolio | — | 850 |
Institutional International Portfolio | 18,550 | 20,229 |
Core Fixed Income Portfolio | 473 | — |
Corporate Opportunities Portfolio | 29,995 | — |
U.S. Government Fixed Income Portfolio | 264 | — |
U.S. Corporate Fixed Income Portfolio | 558 | — |
Short-Term Municipal Portfolio | 925 | — |
Intermediate Municipal Portfolio | 724 | — |
Intermediate Municipal II Portfolio | 159 | — |
F. Book-To-Tax Differences
Distributions are based on amounts calculated in accordance with applicable federal tax regulations, which may differ from GAAP. To the extent these differences are permanent in nature (e.g., net operating losses, reclassification of bond discount and premium, equalization accounting, treatment of gains and losses relating to foreign currency transactions, distribution re-characterization, in-kind redemptions and differing treatment of income relating to swap agreements), such amounts are reclassified within the capital accounts based on their federal tax-basis treatment; temporary differences do not require reclassifications.
On the Statements of Assets and Liabilities, as a result of permanent book-to-tax differences, reclassification adjustments were made as follows (amounts in thousands):
Portfolio | Paid-In
Capital | Distributable
Earnings/
(Loss) |
Value Portfolio | $ 27 | $ (27) |
Growth Portfolio | 4,557 | (4,557) |
Institutional U.S. Portfolio | 60,927 | (60,927) |
Small Cap-Mid Cap Portfolio | 13 | (13) |
U.S. Corporate Fixed Income Portfolio | (3) | 3 |
Intermediate Municipal Portfolio | (289) | 289 |
6. RISK CONSIDERATIONS.
Market Risk — Market risk is the risk that the market value of a security may move up and down, sometimes rapidly and unpredictably. These fluctuations may cause a security to be worth less than the price originally paid for it, or less than it was worth at an earlier time. Market risk may affect a single issuer, industrial sector of the economy or the market as a whole. In addition, unexpected events and their aftermaths, such as the spread of deadly diseases; natural environmental, or man-made disasters; financial, political, or social disruptions; terrorism and war; and other tragedies or catastrophes, can cause investor
328
HC CAPITAL TRUST
Notes to Financial Statements (continued) — June 30, 2022
fear and panic, which can adversely affect the economies of many companies, sectors, nations, regions, and the market in general, in ways that cannot necessarily be foreseen. Finally, key information about a security or market may be inaccurate or unavailable. This is particularly relevant to investments in foreign securities.
Credit Risk — Credit risk is the risk that an issuer (or in the case of certain securities, the guarantor or counterparty) will be unable to make principal and interest payments when due. The creditworthiness of an issuer may be affected by a number of factors, including the financial condition of the issuer (or guarantor) and, in the case of foreign issuers, the financial condition of the region.
Foreign Investment Risk — Investments in securities issued by non-U.S. companies and non-U.S. governments and their agencies may be adversely affected by the lack of timely or reliable financial information, political, social and/or economic developments abroad and foreign regulatory requirements and market practices. Securities denominated in foreign currencies are subject to the risk that the value of the foreign currency will decline in relation to the U.S. dollar. In addition, risks associated with foreign investments may be intensified in the case of investments in emerging-market countries, whose political, legal and economic systems are less developed and less stable than those of more developed nations.
Options Risk — Purchasing and writing put and call options are highly specialized activities and entail greater-than-ordinary investment risks. If the Portfolio writes a put option, it incurs the risk that the market value of the underlying security or futures contract could decrease below the option’s exercise price. If this occurs, the option could be exercised and the portfolio would be forced to buy the underlying security or futures contract at a higher price than its current market value. When a Portfolio purchases an option, it will lose the premium paid for the option if the price of the underlying security or futures contract decreases or remains the same (in the case of a call option) or increases or remains the same (in the case of a put option). If an option purchased by the Portfolio were permitted to expire without being sold or exercised, its premium would represent a loss to the Portfolio.
Options Writing Strategy Risk — If the Index appreciates or depreciates sufficiently over the period to offset the new premium from the written option on that index, a net loss will result. In addition, the value of the index substitute is subject to change as the values of the component securities fluctuate. The performance of the index substitute may not exactly match the performance of the index. An index substitute reflects the underlying risks of the index and index substitute options are subject to the same risks as index options.
Floating Rate Investments Risk — Coupon rates on these investments are floating, not fixed, and are tied to a benchmark lending rate, such as the London Interbank Offered Rate or “LIBOR”. The risks associated with floating rate loans are similar to the risks of below investment grade securities. Adverse changes in economic conditions are likely to cause issuers of these securities to be unable to meet their obligations. In addition, the value of the collateral securing the loan may decline, causing a loan to be substantially unsecured. The sale and purchase of a bank loan are subject to the requirements of the underlying credit agreement governing such bank loan. These requirements may limit the eligible pool of potential bank loan holders by placing conditions or restrictions on sales and purchases of bank loans. Further, bank loans are not traded on an exchange and purchasers and sellers of bank loans rely on market makers, usually the administrative agent for a particular bank loan, to trade bank loans. These factors, in addition to overall market volatility, may negatively impact the liquidity of loans. Difficulty in selling a floating rate loan may result in a loss. Borrowers may pay back principal before the scheduled due date when interest rates decline, which may require the Portfolio to replace a particular loan with a lower-yielding security. There may be less extensive public information available with respect to loans than for rated, registered or exchange listed securities. The Portfolio may assume the credit risk of the primary lender in addition to the borrower, and investments in loan assignments may involve the risks of being a lender. On July 27, 2017, the head of the United Kingdom’s Financial Conduct Authority announced a desire to phase out the use of LIBOR by the end of 2021. However, subsequent announcements by the FCA, the LIBOR administrator and other regulators announced the extension of the publication of the more commonly used U.S. dollar LIBOR settings to the end of June 2023. There remains uncertainty regarding the future utilization of LIBOR and the nature of any replacement rate. As such, the potential effect of a transition away from LIBOR on the Portfolio or the financial instruments in which the Portfolio invests cannot yet be determined. The transition process might lead to increased volatility and illiquidity in markets that currently rely on LIBOR to determine interest rates. It could also lead to a reduction in the value of some LIBOR-based investments and reduce the effectiveness of new hedges placed against existing LIBOR-based instruments. Since the
329
HC CAPITAL TRUST
Notes to Financial Statements (concluded) — June 30, 2022
usefulness of LIBOR as a benchmark could deteriorate during the transition period, these effects could occur prior to the phase out effective date. Management is still evaluating the impact to the Portfolios of the June 30, 2023 planned discontinuation of the more commonly used U.S. dollar LIBOR settings.
Loan Participation Risk — Loan participations typically will result in a Portfolio having a contractual relationship only with the lender, not with the borrower. In connection with purchasing loan participations, a Portfolio generally will have no right to enforce compliance by the borrower with the terms of the loan agreement relating to the loan, nor any rights of set-off against the borrower, and a Portfolio may not benefit directly from any collateral supporting the loan in which it has purchased the participation. As a result, a Portfolio will assume the credit risk of both the borrower and the lender that is selling the participation. A Portfolio may have difficultly disposing of loan participations as the market for such instruments is not highly liquid.
7. SIGNIFICANT SHAREHOLDERS.
Shareholders, including other funds, individuals, accounts, as well as the Portfolio’s investment manager(s) and/or investment personnel, may from time to time own (beneficially or of record) a significant percentage of the Portfolio’s Shares and can be considered to “control” the Portfolio when that ownership exceeds 25% of the Portfolio’s assets (which may differ from control as determined in accordance with accounting principles generally accepted in the United States of America).
The following table includes the Portfolios which had individual shareholder accounts with ownership of voting securities greater than 10% of the total outstanding voting securities but less than 25% and/or accounts with ownership of voting securities greater than 25% of the total outstanding voting securities.
Portfolio | Number of shareholders with
ownership of voting securities
of the Portfolio greater than
10% and less than 25% of the
total Portfolio’s outstanding
voting securities | Number of shareholders with
ownership of voting securities
of the Portfolio greater than
25% of the total Portfolio’s
outstanding voting securities |
Institutional U.S. Portfolio | 1 | — |
Small Cap-Mid Cap Portfolio | 1 | 1 |
ESG Growth Portfolio | — | 1 |
Catholic SRI Growth Portfolio | — | 2 |
Institutional International Portfolio | 1 | — |
Emerging Markets Portfolio | 1 | — |
U.S. Government Fixed Income Portfolio | 1 | — |
U.S. Corporate Fixed Income Portfolio | 1 | — |
U.S. Mortgage/Asset Backed Fixed Income Portfolio | — | 1 |
8. CONCENTRATION OF INVESTMENTS.
As of June 30, 2022, the Corporate Opportunities Portfolio’s investment in the State Street Institutional Treasury Plus Money Market Fund represented greater than 25% of the Portfolio’s net assets. The financial statements of the State Street Institutional Treasury Plus Money Market Fund can be found by accessing the fund’s website at http://www.ssga.com.
9. SUBSEQUENT EVENTS.
Management has evaluated subsequent events through the date these financial statements were issued.
Effective August 18, 2022, the Board approved Portfolio Management Agreements between the Trust and RhumbLine Advisers, LP for the Institutional U.S. Portfolio and the Institutional International Portfolio and between the Trust and MacKay Shields LLC for the Corporate Opportunities Portfolio.
Effective August 23, 2022, the Board terminated the Portfolio Management Agreement between the Trust and Frontier Capital Management Company, LLC for the Value Portfolio, the Institutional U.S. Portfolio and the Small Cap-Mid Cap Portfolio.
Based on the evaluation, no additional disclosures or adjustments were required to the financial statements as of June 30, 2022.
330

331

332
HC CAPITAL TRUST
Additional Information — June 30, 2022 (Unaudited)
1. SECURITY PROXY VOTING. A description of the policies and procedures that the Trust uses to determine how to vote proxies relating to portfolio securities is contained in the Statement of Additional Information. Information regarding how the Portfolios voted proxies relating to portfolio securities during the most recent twelve months ended June 30 is available without charge, upon request, by calling 800-242-9596 and on the Securities and Exchange Commission’s (“SEC”) website at http://www.sec.gov.
2. SHAREHOLDER VOTES.
During the period ending June 30, 2022, no actions were taken by the shareholders of the Portfolios.
3. EXPENSE EXAMPLE. As a shareholder of the Trust, you incur ongoing costs, including management fees and other Portfolio expenses. This example (as set forth in the table below) is intended to help you understand your ongoing costs (in dollars) of investing in the Trust and to compare these costs with the ongoing costs of investing in other mutual funds. The example is based on an investment of $1,000 invested at the beginning of the period and held for the entire period from January 1, 2022 through June 30, 2022.
Actual Expenses: The table below provides information about actual account values and actual expenses. You may use the information below, together with the amount you invested, to estimate the expenses that you paid over the period. Simply divide your account value by $1,000 (for example, an $8,600 account value divided by $1,000 = 8.6), then multiply the result by the number in the table under the heading entitled “Expenses Paid During Period” to estimate the expenses you paid on your account during this period.
Hypothetical Example for Comparison Purposes: The table below provides information about hypothetical account values and hypothetical expenses based on each of the Portfolio’s actual expense ratio and an assumed rate of return of 5% per year before expenses, which is not the Portfolio’s actual return. The hypothetical account values and expenses may not be used to estimate the actual ending account balance or expenses you paid for the period. You may use this information to compare this 5% hypothetical example with the 5% hypothetical examples that appear in the shareholder reports of other funds.
Please note that the expenses shown in the table are meant to highlight your ongoing costs only and do not reflect any transactional costs, such as redemption fees or exchange fees. Therefore, the table is useful in comparing ongoing costs only, and will not help you determine the relative total costs of owning different funds. In addition, if these transactional costs were included, your costs would have been higher.
Portfolio | Beginning
Account
Value
January 1,
2022 | Ending
Account
Value
June 30,
2022 | Expenses
Paid
During
Period1 | Annualized
Expense
Ratio |
Value Portfolio | HC Strategic Shares | Actual | $ 1,000.00 | $ 794.70 | $ 0.98 | 0.22% |
| | | Hypothetical2 | $ 1,000.00 | $ 1,023.70 | $ 1.10 | 0.22% |
| | | | | | | |
Growth Portfolio | HC Strategic Shares | Actual | $ 1,000.00 | $ 755.70 | $ 1.18 | 0.27% |
| | | Hypothetical2 | $ 1,000.00 | $ 1,023.46 | $ 1.35 | 0.27% |
| | | | | | | |
Institutional U.S. Portfolio | HC Strategic Shares | Actual | $ 1,000.00 | $ 773.50 | $ 1.23 | 0.28% |
| | | Hypothetical2 | $ 1,000.00 | $ 1,023.41 | $ 1.40 | 0.28% |
| | | | | | | |
Small Cap-Mid Cap Portfolio | HC Strategic Shares | Actual | $ 1,000.00 | $ 768.10 | $ 2.32 | 0.53% |
| | | Hypothetical2 | $ 1,000.00 | $ 1,022.17 | $ 2.66 | 0.53% |
| | | | | | | |
ESG Growth Portfolio | HC Strategic Shares | Actual | $ 1,000.00 | $ 789.50 | $ 1.77 | 0.40% |
| | | Hypothetical2 | $ 1,000.00 | $ 1,022.81 | $ 2.01 | 0.40% |
333
HC CAPITAL TRUST
Additional Information (continued) — June 30, 2022 (Unaudited)
Portfolio | Beginning
Account
Value
January 1,
2022 | Ending
Account
Value
June 30,
2022 | Expenses
Paid
During
Period1 | Annualized
Expense
Ratio |
Catholic SRI Growth Portfolio | HC Strategic Shares | Actual | $ 1,000.00 | $ 777.20 | $ 1.37 | 0.31% |
| | | Hypothetical2 | $ 1,000.00 | $ 1,023.26 | $ 1.56 | 0.31% |
| | | | | | | |
International Portfolio | HC Strategic Shares | Actual | $ 1,000.00 | $ 818.20 | $ 1.17 | 0.26% |
| | | Hypothetical2 | $ 1,000.00 | $ 1,023.51 | $ 1.30 | 0.26% |
| | | | | | | |
Institutional International Portfolio | HC Strategic Shares | Actual | $ 1,000.00 | $ 799.00 | $ 1.20 | 0.27% |
| | | Hypothetical2 | $ 1,000.00 | $ 1,023.46 | $ 1.35 | 0.27% |
| | | | | | | |
Emerging Markets Portfolio | HC Strategic Shares | Actual | $ 1,000.00 | $ 828.80 | $ 2.04 | 0.45% |
| | | Hypothetical2 | $ 1,000.00 | $ 1,022.56 | $ 2.26 | 0.45% |
| | | | | | | |
Core Fixed Income Portfolio | HC Strategic Shares | Actual | $ 1,000.00 | $ 886.90 | $ 1.82 | 0.39% |
| | | Hypothetical2 | $ 1,000.00 | $ 1,022.86 | $ 1.96 | 0.39% |
| | | | | | | |
Corporate Opportunities Portfolio | HC Strategic Shares | Actual | $ 1,000.00 | $ 888.30 | $ 0.94 | 0.20% |
| | | Hypothetical2 | $ 1,000.00 | $ 1,023.80 | $ 1.00 | 0.20% |
| | | | | | | |
U.S. Government Fixed Income Portfolio | HC Strategic Shares | Actual | $ 1,000.00 | $ 906.50 | $ 1.09 | 0.23% |
| | | Hypothetical2 | $ 1,000.00 | $ 1,023.65 | $ 1.15 | 0.23% |
| | | | | | | |
U.S. Corporate Fixed Income Portfolio | HC Strategic Shares | Actual | $ 1,000.00 | $ 878.40 | $ 0.93 | 0.20% |
| | | Hypothetical2 | $ 1,000.00 | $ 1,023.80 | $ 1.00 | 0.20% |
| | | | | | | |
U.S. Mortgage/Asset Backed Fixed Income Portfolio | HC Strategic Shares | Actual | $ 1,000.00 | $ 919.90 | $ 1.09 | 0.23% |
| | | Hypothetical2 | $ 1,000.00 | $ 1,023.65 | $ 1.15 | 0.23% |
| | | | | | | |
Short-Term Municipal Portfolio | HC Strategic Shares | Actual | $ 1,000.00 | $ 968.80 | $ 1.42 | 0.29% |
| | | Hypothetical2 | $ 1,000.00 | $ 1,023.36 | $ 1.45 | 0.29% |
| | | | | | | |
Intermediate Municipal Portfolio | HC Strategic Shares | Actual | $ 1,000.00 | $ 939.60 | $ 1.49 | 0.31% |
| | | Hypothetical2 | $ 1,000.00 | $ 1,023.26 | $ 1.56 | 0.31% |
334
HC CAPITAL TRUST
Additional Information (continued) — June 30, 2022 (Unaudited)
Portfolio | Beginning
Account
Value
January 1,
2022 | Ending
Account
Value
June 30,
2022 | Expenses
Paid
During
Period1 | Annualized
Expense
Ratio |
Intermediate Municipal II Portfolio | HC Strategic Shares | Actual | $ 1,000.00 | $ 903.60 | $ 1.79 | 0.38% |
| | | Hypothetical2 | $ 1,000.00 | $ 1,022.91 | $ 1.91 | 0.38% |
1 | Expenses are equal to the average account value over the period, multiplied by the Portfolio’s annualized expense ratio, multiplied by 181/365 (to reflect the one half year period). |
2 | Represents the hypothetical 5% annual return before expenses. |
4. ADDITIONAL FEDERAL INCOME TAX INFORMATION
A. Dividends Received Deduction. For corporate shareholders, the following percentage of the total ordinary income distributions paid during the fiscal year ending June 30, 2022, qualify for the corporate dividend received deduction for the following Portfolios:
Portfolio | | Dividends
Received
Deduction | |
Value Portfolio | | | 100.00 | % |
Growth Portfolio | | | 88.79 | % |
Institutional U.S. Portfolio | | | 21.63 | % |
Small Cap-Mid Cap Portfolio | | | 100.00 | % |
ESG Growth Portfolio | | | 46.90 | % |
Catholic SRI Growth Portfolio | | | 52.78 | % |
Institutional International Portfolio | | | 0.07 | % |
Emerging Markets Portfolio | | | 0.45 | % |
B. Qualified Dividends. For the fiscal year ending June 30, 2022, under current tax law, the following dividends paid may be subject to a maximum tax rate of 15%:
Portfolio | | Dividends
Paid | |
Value Portfolio | | | 100.00 | % |
Growth Portfolio | | | 88.11 | % |
Institutional U.S. Portfolio | | | 24.14 | % |
Small Cap-Mid Cap Portfolio | | | 100.00 | % |
ESG Growth Portfolio | | | 89.34 | % |
Catholic SRI Growth Portfolio | | | 100.00 | % |
International Portfolio | | | 97.72 | % |
Institutional International Portfolio | | | 57.32 | % |
Emerging Markets Portfolio | | | 71.38 | % |
335
HC CAPITAL TRUST
Additional Information (continued) — June 30, 2022 (Unaudited)
C. Foreign Tax Pass through Credit. Certain HC Capital Trust Portfolios intend to elect to pass through to shareholders the income tax credit for taxes paid to foreign countries. The pass through of the credit will only affect those persons who are shareholders of the Portfolio on a dividend record date in calendar year 2022. These shareholders will receive more detailed information along with their 2022 Form 1099-DIV. Foreign source income and foreign tax expense per outstanding share on June 30, 2022, are as follows:
Portfolio | | Foreign
Source Income | | | Foreign
Tax Expense | |
International Portfolio | | $ | 0.48 | | | $ | 0.03 | |
Institutional International Portfolio | | $ | 0.36 | | | $ | 0.03 | |
Emerging Markets Portfolio | | $ | 0.57 | | | $ | 0.08 | |
The Portfolios intend to designate the maximum amount allowable as taxed at a maximum rate of 15%. Complete information will be reported in conjunction with your 2022 Form 1099-DIV.
D. Qualified Interest Income. For the fiscal year ending June 30, 2022, the following dividends paid by the Portfolios were designated as Qualified Interest Income that may be exempt from U.S. withholding tax on accounts of foreign investors.
Portfolio | | Qualified
Interest
Income | �� |
Core Fixed Income Portfolio | | | 99.46 | % |
Corporate Opportunities Portfolio | | | 67.55 | % |
U.S. Government Fixed Income Portfolio | | | 2.02 | % |
U.S. Corporate Fixed Income Portfolio | | | 99.24 | % |
U.S. Mortgage/Asset Backed Fixed Income Portfolio | | | 98.43 | % |
Intermediate Municipal II Portfolio | | | 3.01 | % |
E. Long Term Capital Gains. The Portfolios declared long term distributions of realized gains qualifying for a maximum 15% capital gains tax rate for individuals as follows:
Portfolio | | Amount
(000) | |
Value Portfolio | | $ | 3,729 | |
Growth Portfolio | | | 72,978 | |
Institutional U.S. Portfolio | | | 425,392 | |
Small Cap-Mid Cap Portfolio | | | 6,243 | |
ESG Growth Portfolio | | | 4,129 | |
Catholic SRI Growth Portfolio | | | 10,067 | |
Institutional International Portfolio | | | 43,751 | |
Core Fixed Income Portfolio | | | 588 | |
Corporate Opportunities Portfolio | | | 9,479 | |
U.S. Government Fixed Income Portfolio | | | 1,533 | |
U.S. Corporate Fixed Income Portfolio | | | 10,005 | |
Short-Term Municipal Portfolio | | | 38 | |
Intermediate Municipal Portfolio | | | 653 | |
Intermediate Municipal II Portfolio | | | 851 | |
336
HC CAPITAL TRUST
Additional Information (continued) — June 30, 2022 (Unaudited)
F. Short Term Capital Gains. The Portfolios declared short term distributions of realized gains as follows:
Portfolio | | Amount
(000) | |
Growth Portfolio | | $ | 4,148 | |
Institutional U.S. Portfolio | | | 131,637 | |
ESG Growth Portfolio | | | 1,469 | |
Institutional International Portfolio | | | 7,331 | |
Corporate Opportunities Portfolio | | | 20,739 | |
U.S. Government Fixed Income Portfolio | | | 34 | |
U.S. Corporate Fixed Income Portfolio | | | 855 | |
Intermediate Municipal II Portfolio | | | 202 | |
G. Tax Exempt Distributions. The Portfolios declared and paid tax exempt distributions for the fiscal year ending June 30, 2022, as follows:
Portfolio | | Amount
(000) | |
Short-Term Municipal Portfolio | | $ | 1,108 | |
Intermediate Municipal Portfolio | | | 5,810 | |
Intermediate Municipal II Portfolio | | | 1,734 | |
5. ACCESS TO QUARTERLY HOLDINGS
A complete schedule of each Portfolio’s portfolio holdings for the first and third fiscal quarter of each fiscal year is filed with the SEC on Form N-PORT and is available on the SEC’s website at http://www.sec.gov.
6. ADDITIONAL PORTFOLIO HOLDINGS INFORMATION
The following tables reflect the percentage of the net assets of each Portfolio attributable to the indicated industry sector, type of investments, as appropriate for the indicated Portfolio.
Value Portfolio
Investment Allocation | | Percentage
of Net Assets | |
Information Technology | | | 25.5 | % |
Health Care | | | 14.8 | % |
Financials | | | 10.8 | % |
Consumer Discretionary | | | 10.7 | % |
Industrials | | | 8.8 | % |
Communication Services | | | 8.4 | % |
Consumer Staples | | | 6.6 | % |
Energy | | | 4.5 | % |
Real Estate | | | 3.2 | % |
Utilities | | | 3.1 | % |
Materials | | | 2.6 | % |
Investment Companies | | | 1.0 | % |
Total Investment Securities | | | 100.0 | % |
Other Financial Instruments | | | | |
Futures | | | 0.0 | % |
Total Investments | | | 100.0 | % |
Growth Portfolio
Investment Allocation | | Percentage
of Net Assets | |
Information Technology | | | 30.1 | % |
Consumer Discretionary | | | 14.2 | % |
Health Care | | | 14.0 | % |
Financials | | | 9.0 | % |
Communication Services | | | 7.2 | % |
Consumer Staples | | | 6.3 | % |
Industrials | | | 6.0 | % |
Energy | | | 3.1 | % |
Real Estate | | | 2.7 | % |
Utilities | | | 2.5 | % |
Materials | | | 2.3 | % |
Investment Companies | | | 1.9 | % |
Total Investment Securities | | | 99.3 | % |
Other Financial Instruments | | | | |
Futures | | | 0.0 | % |
Total Investments | | | 99.3 | % |
337
HC CAPITAL TRUST
Additional Information (continued) — June 30, 2022 (Unaudited)
Institutional U.S. Portfolio
Investment Allocation | | Percentage
of Net Assets | |
Information Technology | | | 19.9 | % |
Investment Companies | | | 19.5 | % |
Health Care | | | 11.3 | % |
Consumer Discretionary | | | 7.2 | % |
Financials | | | 6.6 | % |
Industrials | | | 6.2 | % |
Communication Services | | | 5.8 | % |
Real Estate | | | 5.5 | % |
Exchange-Traded Funds | | | 4.9 | % |
Consumer Staples | | | 4.8 | % |
Utilities | | | 2.5 | % |
Energy | | | 2.1 | % |
Materials | | | 2.0 | % |
Contingent Right | | | 0.0 | % |
Total Investment Securities | | | 98.3 | % |
Other Financial Instruments | | | | |
Futures | | | 0.2 | % |
Total Investments | | | 98.5 | % |
Small Cap–Mid Cap Portfolio
Investment Allocation | | Percentage
of Net Assets | |
Financials | | | 16.2 | % |
Health Care | | | 15.5 | % |
Information Technology | | | 14.0 | % |
Industrials | | | 13.8 | % |
Consumer Discretionary | | | 8.8 | % |
Real Estate | | | 6.8 | % |
Investment Companies | | | 6.3 | % |
Materials | | | 5.1 | % |
Energy | | | 4.9 | % |
Consumer Staples | | | 3.2 | % |
Utilities | | | 3.0 | % |
Communication Services | | | 2.2 | % |
Contingent Rights | | | 0.1 | % |
Total Investment Securities | | | 99.9 | % |
Other Financial Instruments | | | | |
Futures | | | -0.3 | % |
Total Investments | | | 99.6 | % |
ESG Growth Portfolio
Investment Allocation | | Percentage
of Net Assets | |
Information Technology | | | 20.2 | % |
Financials | | | 15.7 | % |
Health Care | | | 15.4 | % |
Consumer Discretionary | | | 9.9 | % |
Industrials | | | 9.1 | % |
Consumer Staples | | | 8.3 | % |
Communication Services | | | 7.7 | % |
Energy | | | 5.8 | % |
Materials | | | 3.5 | % |
Utilities | | | 2.2 | % |
Real Estate | | | 1.2 | % |
Investment Company | | | 0.4 | % |
Total Investment Securities | | | 99.4 | % |
Other Financial Instruments | | | | |
Futures | | | 0.0 | % |
Total Investments | | | 99.4 | % |
Catholic SRI Growth Portfolio
Investment Allocation | | Percentage
of Net Assets | |
Information Technology | | | 24.6 | % |
Financials | | | 16.7 | % |
Consumer Discretionary | | | 12.1 | % |
Industrials | | | 8.6 | % |
Communication Services | | | 8.6 | % |
Consumer Staples | | | 7.1 | % |
Energy | | | 6.4 | % |
Health Care | | | 5.5 | % |
Materials | | | 4.3 | % |
Utilities | | | 3.3 | % |
Real Estate | | | 2.5 | % |
Investment Companies | | | 0.1 | % |
Total Investment Securities | | | 99.8 | % |
Total Investments | | | 99.8 | % |
338
HC CAPITAL TRUST
Additional Information (continued) — June 30, 2022 (Unaudited)
International Portfolio
Investment Allocation | | Percentage
of Net Assets | |
Financials | | | 19.1 | % |
Industrials | | | 13.5 | % |
Health Care | | | 11.9 | % |
Consumer Discretionary | | | 10.2 | % |
Consumer Staples | | | 9.3 | % |
Information Technology | | | 7.7 | % |
Materials | | | 7.5 | % |
Energy | | | 6.6 | % |
Communication Services | | | 4.8 | % |
Utilities | | | 3.2 | % |
Real Estate | | | 2.1 | % |
Investment Company | | | 1.7 | % |
Purchased Options | | | 0.1 | % |
Total Investment Securities | | | 97.7 | % |
Other Financial Instruments | | | | |
Futures | | | 0.0 | % |
Written Options | | | 0.0 | % |
Total Investments | | | 97.7 | % |
Institutional International Portfolio
Investment Allocation | | Percentage
of Net Assets | |
Investment Companies | | | 21.0 | % |
Financials | | | 15.4 | % |
Industrials | | | 11.1 | % |
Health Care | | | 11.0 | % |
Consumer Staples | | | 8.3 | % |
Consumer Discretionary | | | 8.3 | % |
Information Technology | | | 5.7 | % |
Materials | | | 4.9 | % |
Communication Services | | | 4.0 | % |
Energy | | | 4.0 | % |
Utilities | | | 2.1 | % |
Real Estate | | | 1.0 | % |
Exchange-Traded Funds | | | 0.6 | % |
Purchased Options | | | 0.4 | % |
Right | | | 0.0 | % |
Warrant | | | 0.0 | % |
Total Investment Securities | | | 97.8 | % |
Other Financial Instruments | | | | |
Futures | | | 0.1 | % |
Written Options | | | -0.1 | % |
Total Investments | | | 97.8 | % |
Emerging Markets Portfolio
Investment Allocation | | Percentage
of Net Assets | |
Financials | | | 17.7 | % |
Information Technology | | | 16.9 | % |
Consumer Discretionary | | | 11.8 | % |
Communication Services | | | 9.5 | % |
Materials | | | 7.0 | % |
Investment Companies | | | 5.6 | % |
Consumer Staples | | | 5.2 | % |
Industrials | | | 4.2 | % |
Energy | | | 3.8 | % |
Health Care | | | 3.4 | % |
Utilities | | | 2.4 | % |
Real Estate | | | 2.0 | % |
Purchased Options | | | 0.1 | % |
Total Investment Securities | | | 89.6 | % |
Other Financial Instruments | | | | |
Total Return Swaps | | | 0.6 | % |
Futures | | | 0.0 | % |
Written Options | | | 0.0 | % |
Total Investments | | | 90.2 | % |
Core Fixed Income Portfolio
Investment Allocation | | Percentage
of Net Assets | |
U.S. Treasury Obligations | | | 25.3 | % |
U.S. Government Agency Mortgages | | | 21.5 | % |
Financials | | | 13.1 | % |
Investment Companies | | | 11.7 | % |
Communication Services | | | 5.5 | % |
Energy | | | 3.7 | % |
Utilities | | | 3.3 | % |
Health Care | | | 3.3 | % |
Industrials | | | 2.4 | % |
Information Technology | | | 2.3 | % |
Materials | | | 2.1 | % |
Consumer Staples | | | 2.1 | % |
Collateralized Mortgage Obligations | | | 1.6 | % |
Consumer Discretionary | | | 1.3 | % |
Real Estate | | | 1.0 | % |
U.S. Government Agency Securities | | | 0.8 | % |
Technology | | | 0.3 | % |
Asset Backed Securities | | | 0.1 | % |
Total Investment Securities | | | 101.4 | % |
Other Financial Instruments | | | | |
TBA Sale Commitments | | | -0.1 | % |
Total Investments | | | 101.3 | % |
339
HC CAPITAL TRUST
Additional Information (continued) — June 30, 2022 (Unaudited)
Corporate Opportunities Portfolio
Investment Allocation | | Percentage
of Net Assets | |
Investment Companies | | | 92.0 | % |
Loan Participations and Assignments | | | 5.4 | % |
Common Stock | | | 0.0 | % |
Total Investment Securities | | | 97.4 | % |
Other Financial Instruments | | | | |
Futures | | | -0.2 | % |
Total Investments | | | 97.2 | % |
U.S. Government Fixed Income Portfolio
Investment Allocation | | Percentage
of Net Assets | |
U.S. Treasury Obligations | | | 72.8 | % |
Exchange-Traded Fund | | | 24.7 | % |
U.S. Government Agency Securities | | | 2.3 | % |
Yankee Dollar | | | 0.0 | % |
Total Investment Securities | | | 99.8 | % |
Total Investments | | | 99.8 | % |
U.S. Corporate Fixed Income Portfolio
Investment Allocation | | Percentage
of Net Assets | |
Financials | | | 26.3 | % |
Investment Companies | | | 12.3 | % |
Communication Services | | | 11.5 | % |
Energy | | | 7.9 | % |
Utilities | | | 7.1 | % |
Health Care | | | 7.0 | % |
Consumer Staples | | | 5.0 | % |
Industrials | | | 4.9 | % |
Information Technology | | | 4.5 | % |
Materials | | | 4.3 | % |
Loan Participations and Assignments | | | 3.6 | % |
Consumer Discretionary | | | 2.5 | % |
Real Estate | | | 1.9 | % |
Technology | | | 0.5 | % |
Total Investment Securities | | | 99.3 | % |
Total Investments | | | 99.3 | % |
U.S. Mortgage/Asset Backed Fixed Income Portfolio
Investment Allocation | | Percentage
of Net Assets | |
U.S. Government Agency Mortgages | | | 85.1 | % |
Investment Company | | | 16.4 | % |
Collateralized Mortgage Obligations | | | 6.1 | % |
Asset Backed Securities | | | 0.7 | % |
Total Investment Securities | | | 108.3 | % |
Other Financial Instruments | | | | |
TBA Sale Commitments | | | 0.0 | % |
Total Investments | | | 108.3 | % |
Short-Term Municipal Portfolio
Investment Allocation | | Percentage
of Net Assets | |
General Obligation | | | 56.0 | % |
Revenue Bonds | | | 32.4 | % |
Financials | | | 9.5 | % |
Investment Company | | | 1.0 | % |
Total Investment Securities | | | 98.9 | % |
Total Investments | | | 98.9 | % |
Intermediate Municipal Portfolio
Investment Allocation | | Percentage
of Net Assets | |
Revenue Bonds | | | 58.9 | % |
General Obligation | | | 16.7 | % |
General | | | 6.2 | % |
Investment Company | | | 2.9 | % |
Water | | | 1.7 | % |
Financials | | | 1.7 | % |
Medical | | | 1.6 | % |
Education | | | 1.3 | % |
Facilities | | | 1.3 | % |
Student Loan | | | 1.2 | % |
Airport | | | 1.1 | % |
Transportation | | | 1.0 | % |
School District | | | 0.9 | % |
Higher Education | | | 0.8 | % |
Tobacco Settlement | | | 0.7 | % |
Power | | | 0.5 | % |
Utilities | | | 0.4 | % |
Total Investment Securities | | | 98.9 | % |
Total Investments | | | 98.9 | % |
340
HC CAPITAL TRUST
Additional Information (continued) — June 30, 2022 (Unaudited)
Intermediate Municipal II Portfolio
Investment Allocation | | Percentage
of Net Assets | |
General Obligation | | | 38.0 | % |
Investment Companies | | | 26.2 | % |
Revenue Bonds | | | 20.4 | % |
School District | | | 4.4 | % |
Medical | | | 3.0 | % |
General | | | 2.3 | % |
Water | | | 1.9 | % |
Higher Education | | | 1.0 | % |
Utilities | | | 0.8 | % |
Financials | | | 0.8 | % |
Total Investment Securities | | | 98.8 | % |
Total Investments | | | 98.8 | % |
7. BOARD APPROVAL OF INVESTMENT ADVISORY CONTRACTS
The Trust’s investment adviser is HC Capital Solutions (the “Adviser”), an operating division of Hirtle Callaghan & Co. LLC (“Hirtle Callaghan”). The Adviser provides overall investment management services with respect to HC Capital Trust (the “Trust”) and each of its separate portfolios (“Portfolios”) pursuant to the terms of two separate agreements with the Trust (the “HC Contracts”). The Adviser is authorized under the HC Contracts to purchase and sell portfolio securities for the Portfolios. Day-to-day portfolio management services, however, are generally provided to the respective Portfolios by one or more investment advisory organizations (each a “Specialist Manager”) pursuant to the terms of separate investment advisory agreements (each a “Portfolio Management Agreement”). The Trust offers seventeen Portfolios, fifteen of which were managed by two or more Specialist Managers. One Portfolio, The Inflation Protected Securities Portfolio, was liquidated during the period. Each Specialist Manager is responsible for providing day-to-day portfolio management services for that portion of a Portfolio’s assets allocated to it by, and under the supervision of, the Adviser.
During the six month period ended June 30, 2022, the Trust’s Board of Trustees (the “Board”):
● Approved Amended and Restated HC Contracts
● Approved the continuation of certain Portfolio Management Agreements, as set forth below
In considering the information and materials described herein, the Trustees of the Trust who are not “interested persons” of the Trust or the Adviser within the meaning of the Investment Company Act (the “Independent Trustees”) were represented by, and met separately with, their independent legal counsel and were provided with a written description of their statutory responsibilities and the legal standards that are applicable to approvals of advisory agreements. In view of the broad scope and variety of factors and information, the Board did not find it practicable to, and did not, assign relative weights to the specific factors considered in reaching its conclusions to approve the HC Contracts and the various Portfolio Management Agreements and amendments. Rather, the conclusions were made on the basis of each Trustee’s business judgment after consideration of all of the factors taken in their entirety.
Approval of the HC Contracts. The Trust’s Board approved the continuation of both of the HC Contracts. In approving the HC Contracts, the Board gave substantial weight to the fact that the Trust and the Portfolios are designed to serve as asset allocation vehicles for, and are available exclusively to, clients of Hirtle Callaghan. Other factors considered by the Board in connection with its determination to approve the HC Contracts are summarized below.
With respect to the nature, extent and quality of the services provided by the Adviser to the Trust, the Board concluded that it was satisfied with the services. The Board determined that the Adviser’s services, including its role in the selection and oversight of the Specialist Managers, the allocation of assets among the Specialist Managers in multi-manager Portfolios, the process for identifying instances where there may be a need to add, eliminate or replace a Specialist Manager and the process with regard to the efficient and economical implementation of such changes were consistent with the expectations of the Trust’s shareholders. In reaching this determination, the Board considered the services of the Trust’s executive officers, each of whom
341
HC CAPITAL TRUST
Additional Information (continued) — June 30, 2022 (Unaudited)
is an employee of Hirtle Callaghan, their oversight of the activities of the Trust’s administrator and other service providers, and the oversight of the Specialist Managers provided by the Adviser. The Board also considered the Adviser’s efforts to control the costs of the Trust, including obtaining advisory fee concessions from various Specialist Managers. The Board further considered the Adviser’s response to the market volatility and uncertainty during the ongoing pandemic and the implementation of the Adviser’s business continuity plan.
With respect to the performance achieved by the Trust’s Portfolios, the Board viewed the overall performance of the respective Portfolios in the context of their use as vehicles through which the Adviser seeks to access specific asset classes on behalf of Hirtle Callaghan clients. The Board was informed with respect to publicly available information about the performance of peer funds but based its conclusions primarily on the specific facts and circumstances of the Trust. The Board concluded that the performance results achieved by each Portfolio reflect appropriate manager selection by the Adviser and that the continuation of the relationship with the Adviser and approval of the HC Contracts were in the best interests of the Trust’s shareholders and consistent with shareholder expectations.
With respect to the fees paid to the Adviser under the HC Contracts, the Board considered the fact that Hirtle Callaghan’s standard client agreement provides for a fee reduction to the extent that a client’s assets are invested in a Portfolio that is equal to the 0.05% fee payable to the Adviser by each Portfolio under the HC Contract, effectively reducing the Adviser’s income from the Trust to 0.00%. Although informed with respect to advisory fees charged by peer funds, the Board did not consider such information to be a material factor in reaching its conclusion regarding the reasonableness of the fees paid to the Adviser by the Portfolios under the HC Contracts although the Board did consider comparisons of overall expenses to those of peer funds. In light of the unique fee reduction feature embedded in Hirtle Callaghan’s standard client agreements, the Board did not consider the financial position of the Adviser or specific information with respect to the costs and expenses incurred by the Adviser in providing services to the Trust other than to confirm the Adviser’s continued financial viability. Given the structure of the Advisor’s fee schedule, the Board determined that there was no realistic opportunity for a Portfolio to achieve economies of scale with respect to the level of the Adviser’s fee. Based on the foregoing and other information relating to the structure and level of the Adviser’s fee provided to the Board, the Board concluded that the rate at which the Adviser is paid by the Trust for the services it provides to each Portfolio is reasonable.
Continuation of Certain Portfolio Management Agreements. The Portfolio Management Agreements approved for continuance during the period (collectively, the “Continuing Agreements”) are identified below, together with the Specialist Managers subject to review during the period.
Specialist Manager | Portfolios |
Agincourt Capital Management, LLC (“Agincourt”) | The ESG Growth Portfolio The Catholic SRI Growth Portfolio The Core Fixed Income Portfolio The U.S. Corporate Fixed Income Securities Portfolio |
Breckinridge Capital Advisors, Inc. (“Breckinridge”) | The Short-Term Municipal Bond Portfolio The Intermediate Term Municipal Bond Portfolio The Intermediate Term Municipal Bond II Portfolio |
City of London Investment Management Company, Limited (“CLIM”) | The International Equity Portfolio The Institutional International Equity Portfolio The Emerging Markets Portfolio The Corporate Opportunities Portfolio The Intermediate Term Municipal Bond Portfolio The Intermediate Term Municipal Bond II Portfolio |
Fort Washington Investment Advisors, Inc. (“Fort Washington”) | The Corporate Opportunities Portfolio |
342
HC CAPITAL TRUST
Additional Information (continued) — June 30, 2022 (Unaudited)
Specialist Manager | Portfolios |
Insight North America, LLC (“Insight”) | The Intermediate Term Municipal Bond Portfolio |
Mellon Investments Corporation (“Mellon”) | The Value Equity Portfolio The Growth Equity Portfolio The Institutional U.S. Equity Portfolio The Small Capitalization-Mid Capitalization Equity Portfolio The ESG Growth Portfolio The Catholic SRI Growth Portfolio The International Equity Portfolio The Institutional International Equity Portfolio The Emerging Markets Portfolio The Core Fixed Income Portfolio The Corporate Opportunities Portfolio The U.S. Government Fixed Income Securities Portfolio The U.S. Mortgage/Asset Backed Fixed Income Securities Portfolio The U.S. Corporate Fixed Income Securities Portfolio |
Jennison Associates LLC (“Jennison”) | The Growth Equity Portfolio The Institutional U.S. Equity Portfolio |
Parametric Portfolio Associates (“Parametric”) | The Value Equity Portfolio (four agreements related to four different strategies) The Growth Equity Portfolio (four agreements related to four different strategies) The Institutional U.S. Equity Portfolio (three agreements related to three different strategies) The Small Capitalization-Mid Capitalization Equity Portfolio (three agreements related to three different strategies) The ESG Growth Portfolio (two agreements related to two different strategies) The Catholic SRI Growth Portfolio (two agreements related to two different strategies) The International Equity Portfolio (four agreements related to four different strategies) The Institutional International Equity Portfolio (three agreements related to three different strategies) The Emerging Markets Portfolio (four agreements related to four different strategies) The Core Fixed Income Portfolio The Corporate Opportunities Portfolio (three agreements related to three different strategies) The U.S. Government Fixed Income Securities Portfolio The U.S. Corporate Fixed Income Securities Portfolio The U.S. Mortgage/Asset Backed Fixed Income Securities Portfolio The Intermediate Term Municipal Bond Portfolio The Intermediate Term Municipal Bond II Portfolio |
343
HC CAPITAL TRUST
Additional Information (continued) — June 30, 2022 (Unaudited)
In its deliberations with respect to each of the Continuing Agreements, the Board recognized that, under each such agreement, a Specialist Manager is responsible only for day-to-day investment decisions with respect that portion of a Portfolio’s assets allocated to it. The Board further recognized that the Specialist Managers do not participate in the administration of any of the Portfolios or in the distribution of shares of any of the Portfolios and thus receive limited, if any, benefit from their association with the Trust other than the fee paid to them by the respective Portfolios for investment management services.
In approving the Continuing Agreements, the Board concluded that continuation of each of the Continuing Agreements was in the best interests of each respective Portfolio and consistent with the expectations of shareholders of the Portfolios. While the Board did not identify any particular factor as controlling, the Board gave substantial weight to the fact that the Trust is designed primarily to serve as a vehicle through which the Adviser implements asset allocation strategies on behalf of Hirtle Callaghan’s clients; and that shares of the respective Portfolios are generally available only to such clients. With respect to the nature, extent and quality of the services provided by each of the Specialist Managers, the Board was informed with respect to the specific investment process employed by each of the Specialist Managers in managing the assets of the respective Portfolios allocated to them and the qualifications of each Specialist Manager’s investment management personnel. The Board was also informed with respect to each Specialist Manager’s infrastructure and whether it appears to adequately support the strategies being implemented for the various Portfolios. The Board was further informed about the impact of the ongoing pandemic on the Specialist Managers and the implementation of their business continuity plans. The Board concluded that the nature, extent and quality of the portfolio management services provided by each of the Specialist Managers were satisfactory in light of the specific strategies employed on behalf of the respective Portfolios and, thus, supported a decision to approve the continuation of each of the Continuing Agreements.
The Board also considered representations made by the Adviser that the performance achieved by the relevant Specialist Managers was consistent with the Adviser’s expectations in the context of the overall objectives, and multi-manager strategy, of each of the respective Portfolios. During the course of its deliberations, the Board was informed with respect to publicly available information assembled by a third-party service provider about the performance of peer funds managed by other investment advisory organizations. The Board did not specifically rely on such information but based its conclusions on the facts and circumstances related to each Portfolio.
With respect to Agincourt, the Board was informed that Agincourt’s investment process uses a yield-driven active management approach which focuses on value, while minimizing interest rate forecasting and market timing, and which is implemented by using three specific strategies: sector management, security selection and yield curve/duration management. For the ESG Growth and Catholic SRI Growth Portfolios, additional screens would be applied before final investment decisions are made, but that at the current time, there were no assets allocated to Agincourt with respect to The ESG Growth Portfolio and The Catholic SRI Growth Portfolio. The Board was informed that Agincourt’s returns outperformed the returns of its peer group and benchmarks, during the past year as well as during the three and five year periods.
With respect to Breckinridge, the Board was informed that the firm uses a flexible bottom-up approach that seeks to take advantage of opportunities created by inefficiencies in the market for municipal securities without exposure to excessive risk. The firm’s reported performance for The Short-Term Municipal Bond Portfolio showed that it underperformed its benchmark index and most of its peer funds for the one, three and five year periods, while for The Intermediate Term Municipal Bond II Portfolio, it outperformed its benchmark index for the one and three-year periods, while underperforming for the five year period and showed mixed results when compared to peer funds for the same periods. The Board was further informed with respect to the Adviser’s evaluation that the firm’s focus on high grade municipal securities causes their performance to lag the market when low quality securities do well, but that the Adviser has specifically contracted Breckinridge to focus on the high grade sector of the market.
With respect to CLIM, the Board was informed that CLIM’s investment strategy involves an actively managed bottom-up selection process to identify closed-end funds that City of London believes will provide the desired asset-class exposure with a lower volatility than their peers in order to take advantage of closed-end fund discount volatility. The Board was informed that, at the time of the meeting, Trust assets were only allocated to The Institutional International Equity Portfolio and that, with respect to that Portfolio, the firm had outperformed its benchmark index and peer group over the past one, three and five-year periods. The Board was also presented with composite performance information for firm strategies that correspond to the strategies that would be employed in the other Portfolios for which it is under contract and such information showed that, for
344
HC CAPITAL TRUST
Additional Information (continued) — June 30, 2022 (Unaudited)
fixed income strategies, the firm had outperformed its respective benchmark indices and peer groups for the previous one, three and five-year periods and for emerging markets strategies, it also outperformed its benchmark index and peer group for the one through five year periods.
With respect to Fort Washington, the Board was informed that Fort Washington’s investment strategy involves investing in relatively high quality, high yield securities by combining a top down, risk control approach with a bottom up credit analysis approach, pursuant to which it then narrows the universe to a smaller subset that it believes has the most appropriate upside-downside trade-off. The Board was informed that the Adviser had allocated all assets away from Fort Washington and that, as of 2019, when the firm last managed assets for the Trust, Fort Washington had underperformed its benchmark index over the previous five years, while outperforming that index for the previous one and three year periods. The Adviser further informed the Board that, while it had re-allocated assets away from Fort Washington in 2019 in response to a sell-off in the high yield bond market, the Adviser was satisfied with the Fort Washington investment team and the firm’s performance for the period during which the firm was allocated assets and that it made sense to keep Fort Washington available for use as an active manager for high yield securities.
With respect to Insight, the Board was informed that the firm actively manages assets for The Intermediate Term Municipal Bond Portfolio by focusing on sector analysis and security selection. The Board was informed that the firm (including performance of the management team under predecessor firms) has outperformed its benchmark index for the one-year period, while underperforming that index for the three and five year periods. The firm also underperformed the average performance of its peer group for the one, three, five and ten-year periods.
With respect to Mellon, the Board was informed that the firm managed assets for equity Portfolios of the Trust using several different strategies – both indexing strategies and factor-based strategies, and that the Adviser allocates Portfolio assets among these strategies. With respect to fixed income Portfolios, the firm generally uses passive investment strategies intended to mirror the returns of the applicable benchmark index. The Board was informed that Mellon had assets allocated to it in nine of the Portfolios for which it is under contract and that it had outperformed the applicable benchmark indices for each of the strategies employed for equity Portfolios since the respective inceptions of such accounts, generally within 0.10% of the applicable benchmark indices, with the exceptions of the ESG Growth and Catholic SRI Growth Portfolios, which had each outperformed their respective indices by larger margins. The Board was also informed that Mellon had underperformed the applicable benchmark indices for each of the strategies employed for fixed income Portfolios since the respective inceptions of such accounts, generally within 0.10% of the applicable benchmark indices, with the exception of U.S. mortgage strategies in The Core Fixed Income and U.S. Mortgage/Asset Backed Fixed Income Securities Portfolios, which had underperformed their index by a larger margin.
With respect to Jennison, the Board was informed that Jennison’s investment process seeks to provide exposure to companies with above-average growth in units, revenues, earnings, and cash flows that will drive the value of these securities over time while seeking to capture acceleration or duration of growth that is not fully reflected in a stock’s price. The Board was informed that Jennison’s returns underperformed the returns of its peer group for the one-year period and its benchmark for the one- and three-year periods ended March 31, 2022, while outperforming its peer group for the three-, five- and ten-year periods and outperforming its benchmark for the five- and ten-year periods.
With respect to Parametric, the Board was informed that the firm provides investment services using several different strategies. The Liquidity strategy uses derivatives to “equitize” a Portfolio’s cash position. The Targeted strategy is designed to provide exposure to market segments that a Portfolio’s primary investment adviser determines is unintentionally underrepresented in the investment portfolios of the other Specialist Managers. The Tax-Managed Custom Core strategy is designed to track a specified index while taking advantage of opportunities for active tax management. The Options Overlay Strategy uses written put and call options to attempt to capitalize on market volatility. The Board was informed that, given the highly customized nature of the Liquidity, Targeted and Tax-Managed Custom Core strategies, there were no meaningful peer group comparisons available, but that of the accounts being managed across the various Portfolios in these strategies, ten had underperformed their benchmark index since inception and eight had outperformed their benchmark index since inception. The Board was advised that the firm had executed the strategies it had been assigned and that such underperformances and/or outperformances reflected the nature of such assignments. With respect to the Options Overlay Strategies, the Board was informed as to the amounts earned by such strategies since their inceptions.
345
HC CAPITAL TRUST
Additional Information (continued) — June 30, 2022 (Unaudited)
In concluding that continuation of the Continuing Agreements was appropriate, the Board did not rely upon any single factor but gave considerable weight to the Adviser’s recommendations and its assessment of each Specialist Manager’s overall compliance profile and the success and future ability of each Specialist Manager in capturing the respective Portfolios’ desired asset classes. Based on the foregoing, the Board concluded that the performance of the Specialist Managers was satisfactory, and that continuation of such contracts was in the best interest of shareholders of the respective Portfolios.
The Board also concluded that the fee rates at which each of the Specialist Managers is compensated under the Continuing Agreements is reasonable. In reaching this conclusion, the Board had before it information about the impact of break-points, financial information about the Specialist Managers relating to factors such as profitability, comparable fees charged to other institutional clients and/or to peer funds for similar services and costs incurred by the Specialist Managers in providing services to the respective Portfolios. The Board was also informed with respect to advisory fees paid by other, unaffiliated, funds with similar objectives and strategies. In considering this information, the Board gave substantial weight to information demonstrating that the rate at which these Specialist Managers are compensated was determined as a result of arms-length negotiations conducted by the officers of the Trust and the Adviser, including in several cases, negotiated fee waivers/reductions and scheduled breakpoints designed to recognize economies of scale where appropriate. Accordingly, the Board concluded that the profitability to each Specialist Manager was not a material factor in its deliberations with respect to the consideration of the approval of the Continuing Agreements.
With respect to Agincourt, the Board was informed that the firm received an annual fee of 0.08% for the Core Fixed Income and U.S. Corporate Fixed Income Portfolios and 0.12% for the ESG Growth and Catholic SRI Growth Portfolios, noting that the higher fees for the ESG Growth and Catholic SRI Growth Portfolios were intended to compensate the firm for the additional work of applying the necessary ESG-related screens to the investment portfolios, and that these fees were substantially lower than the comparable industry average fees.
With respect to Breckinridge, the Board was informed that the firm received an annual fee of 0.125% for each of the Portfolios it serves, and that this fee was substantially lower than the comparable industry average fees.
With respect to CLIM, the Board was informed that the firm receives an annual fee of 0.45% for each of the Corporate Opportunities, Intermediate Term Municipal Bond and Intermediate Term Municipal Bond II Portfolio, an annual fee ranging from 0.80% to 0.40%, depending on asset levels, for each of the International Equity and Institutional International Equity Portfolios, which resulted in an effective fee of 0.56% for The Institutional International Equity Portfolio, and an annual fee ranging from 1.00% to 0.50%, depending on asset levels for The Emerging Markets Portfolio. The Board was informed that some of these fees were higher than the closest comparable industry average fees and others were lower, but that the comparative fees were not necessarily directly comparable as they did not reflect advisors managing the type of closed-end fund strategies employed by CLIM, for which no comparable fee data was available.
With respect to Fort Washington, the Board was informed that the firm was entitled to an annual fee ranging from 0.40% to 0.25% depending on asset levels, which drops to a flat fee of 0.20% if the account has at least $200 million in assets. The Board was informed that these fee arrangements are lower than the comparable industry average fees at all levels.
With respect to Insight, the Board was informed that the Firm is entitled to an annual fee ranging from 0.25% to 0.15%, depending on asset levels, which resulted in an effective fee of 0.17% for 2021, and that this fee was substantially lower than the comparable industry average fees.
With respect to Mellon, the Board was informed with respect to the fact that the firm is entitled to multiple different fee arrangements, depending on asset class, asset levels and strategy and that these fee levels range from 0.15% to 0.04% for equity Portfolios and from 0.25% to 0.04% for fixed income Portfolios. Effective fees paid during 2021 were 0.045% for The Institutional U.S. Equity Portfolio, 0.10% for the ESG Growth and Catholic SRI Growth Portfolios, 0.13% for the Institutional International Equity and Emerging Markets Portfolios and 0.06% for the Core Fixed Income, U.S. Government Fixed Income Securities and U.S. Mortgage/Asset Backed Fixed Income Securities portfolios. The Board was informed that each of these fee structures was equal to or lower than the comparable industry average fees.
With respect to Jennison, the Board was informed that the firm received an annual fee of no more than 0.30%, with breakpoint schedules tied to the total aggregate level of assets managed by Jennison for all clients of Hirtle Callaghan, including the Trust Portfolios, and that this fee schedule was substantially lower than the comparable industry average fees.
346
HC CAPITAL TRUST
Additional Information (continued) — June 30, 2022 (Unaudited)
With respect to Parametric, the Board was informed that the firm’s fees varies according to strategy. The Board noted that fees for the Liquidity Strategy use a breakpoint schedule starting at high rate of 0.15%, but also include an additional flat fee of $10,000 per Portfolio per year (which is waived for periods when no assets are being managed in a given Portfolio), and that for each Portfolio in which assets were being managed using this strategy, the effective fee paid was lower than comparable industry averages. The Board was also informed that fees for the Targeted Strategy are 0.05% with an additional flat fee of $5,000 per Portfolio per year (which is waived for years when no assets are being managed in a given Portfolio), and that for each Portfolio in which assets were being managed using this strategy, the effective fee paid was lower than comparable industry averages. The Board also noted that fees for the Tax-Managed Custom Core Strategy use a breakpoint schedule starting at high rate of 0.10%, and that for each Portfolio in which assets were being managed using this strategy, the effective fee paid was lower than comparable industry averages. With respect to the Options Overlay Strategy, the Board was informed that Portfolios using this strategy pay a flat fee per month in which such strategy is employed and that in some cases, depending on the level of assets committed to the strategy, Portfolios paid a higher fee than industry averages for their asset class when these fees were expressed as percentages of assets.
8. OPERATION AND IMPLEMENTATION OF THE LIQUIDITY MANAGEMENT PROGRAM
Pursuant to Rule 22e-4 under the 1940 Act (the “Liquidity Rule”), the Trust has adopted a liquidity risk management program (“Program”). Liquidity risk is defined as the risk that a Portfolio could not meet redemption requests without significant dilution of remaining investors’ interests in the Portfolio.
The Program is overseen by the Trust’s Liquidity Risk Officer (the “Program Administrator”), appointed by the Trust’s Board of Trustees, and the Program’s principal objectives include assessing, managing and periodically reviewing each Portfolio’s liquidity risk, based on factors specific to the circumstances of each respective Portfolio.
In assessing and managing each Portfolio’s liquidity risk, the Program Administrator considers, as relevant, a variety of factors, including: (1) the Portfolio’s investment strategy and liquidity of portfolio investments during both normal and reasonably foreseeable stressed conditions; (2) short-term and long-term cash flow projections for the Portfolio during both normal and reasonably foreseeable stressed conditions; and (3) the Portfolio’s holdings of cash and cash equivalents and any borrowing arrangements. Classification of each Portfolio’s portfolio holdings in one of four liquidity categories is based on the number of days it is reasonably expected to take to convert the investment to cash (for Highly Liquid and Moderately Liquid holdings) or to sell or dispose of the investment (for Less Liquid and Illiquid investments), in current market conditions without significantly changing the investment’s market value. Each Portfolio primarily holds assets that are classified as Highly Liquid, and therefore none of the Trust’s Portfolios is required to establish a Highly Liquid Investment Minimum (“HLIM”).
At a meeting of the Board of Trustees held on March 8, 2022, the Program Administrator provided a written report to the Board addressing the Program’s operation and assessing the adequacy and effectiveness of its implementation for the calendar year of 2021 (the “Review Period”). The Program Administrator concluded that the Program as adopted and implemented, operated effectively to achieve the goal of assessing and managing each Portfolio’s liquidity risk. The Program Administrator also concluded that the Program remained reasonably designed to continue to manage liquidity risk going forward. The Program Administrator also stated that no Portfolio was required to set a HLIM, no material changes were made to the Program during the Review Period, and each Portfolio was able to meet requests for redemption without diluting the remaining investors’ interests in the Portfolio.
347
HC CAPITAL TRUST
Additional Information (continued) — June 30, 2022 (Unaudited)
OFFICERS. The table below sets forth certain information about the Trust’s executive officers.
NAME, ADDRESS,
AND AGE | POSITION(S)
HELD WITH
TRUST | TERM OF
OFFICE;
TERM
SERVED IN
OFFICE | PRINCIPAL
OCCUPATION(S) DURING
PAST FIVE YEARS | NUMBER OF
PORTFOLIOS
IN FUND
COMPLEX
OVERSEEN |
Geoffrey A. Trzepacz Five Tower Bridge, 300 Barr Harbor Drive, West Conshohocken, PA 19428 Born: 1975 | President | Indefinite; President since 12/11/18 | Mr. Trzepacz is currently the Chief Operating Officer (COO) of the Adviser since January 2018. Prior to January 2018, Mr. Trzepacz served as COO for the Americas for Aberdeen Asset Management. | 17 |
Colette Bergman Five Tower Bridge, 300 Barr Harbor Drive, West Conshohocken, PA 19428 Born: 1970 | Vice President & Treasurer | Indefinite; Since 6/12/12 | Ms. Bergman is currently a Director of the Adviser. She has been with the Adviser for more than five years. | 17 |
Guy Talarico Foreside Fund Officer Services, LLC Three Canal Plaza, Suite 100 Portland, ME 04101 Born: 1955 | Chief Compliance Officer | Indefinite; Since 4/25/13 | Mr. Talarico is a Managing Director with Foreside Fund Officer Services, LLC since December 2021. Prior to December 2021, Mr. Talarico was President and CEO of Alaric Compliance Services, LLC since the company’s inception in 2004. | 17 |
Umar Ehtisham Five Tower Bridge, 300 Barr Harbor Drive, West Conshohocken, PA 19428 Born: 1981 | Liquidity Risk Officer | Indefinite; Since 12/01/18 | Mr. Ehtisham is currently the Chief Compliance & Risk Officer (CCO) of the Adviser since May 2018. Prior to January 2018, Mr. Ehtisham served as Director & CCO at Cipperman Compliance Services (09/2014 – 05/2018) and Audit Manager at E*Trade Financial (01/2013 – 09/2014). | 17 |
Dimitrios Spiliakos Citi Fund Services 4400 Easton Commons, Suite 200 Columbus, OH 43219 Born: 1977 | Secretary | Indefinite; Since 6/14/22 | Mr. Spiliakos is a Vice President with Citi Fund Services Ohio, Inc. since May 2022. Prior to May 2022, Mr. Spiliakos served as a Vice President, Regulatory Administration Department, The Bank of New York Mellon. | 17 |
348
HC CAPITAL TRUST
Additional Information (continued) — June 30, 2022 (Unaudited)
INDEPENDENT TRUSTEES. The following table sets forth certain information about the Independent Trustees.
NAME, ADDRESS,
AND AGE | POSITION(S)
HELD WITH
TRUST | TERM OF
OFFICE;
TERM
SERVED
IN
OFFICE | PRINCIPAL
OCCUPATION(S)
DURING PAST
FIVE YEARS | NUMBER OF
PORTFOLIOS
IN FUND
COMPLEX
OVERSEEN | OTHER
DIRECTORSHIPS
HELD BY
TRUSTEE* |
John M. Dyer Five Tower Bridge, 300 Barr Harbor Drive, West Conshohocken, PA 19428 Born: 1954 | Trustee | Indefinite; Since 6/18/19 | Mr. Dyer is currently a Board member of Cox Enterprises, Inc. (technology, communications and automotive services) (“Cox”) since 2010 and World Wide Technology (technology services) since 2019. Formerly, President and CEO of Cox (2014 – 2017). | 17 | EBSCO Industries (diversified business) (11/20 to current) |
Jarrett Burt Kling Five Tower Bridge, 300 Barr Harbor Drive, West Conshohocken, PA 19428 Born: 1943 | Trustee | Indefinite; Since 7/20/95 | For more than the past five years Mr. Kling has been a managing director of CBRE Investment Management, LLC, a registered investment adviser. | 17 | None |
R. Richard Williams Five Tower Bridge, 300 Barr Harbor Drive, West Conshohocken, PA 19428 Born: 1945 | Trustee and Chairman | Indefinite; Trustee Since 7/15/99; Chairman since 3/21/17 | Since 2000, Mr. Williams has been the owner of Seaboard Advisers (consulting services). | 17 | None |
Richard W. Wortham, III Five Tower Bridge, 300 Barr Harbor Drive, West Conshohocken, PA 19428 Born: 1938 | Trustee | Indefinite; Since 7/20/95 | Mr. Wortham is currently the President and Chief Executive Officer of The Wortham Foundation and has been a Trustee for more than the past five years. Prior to April 2021 and for more than the past five years, Mr. Wortham served as a director of Oncor Electric Delivery Company LLC. | 17 | None |
349
HC CAPITAL TRUST
Additional Information (concluded) — June 30, 2022 (Unaudited)
INTERESTED TRUSTEE. The following table sets forth certain information about the Interested Trustee.
NAME, ADDRESS,
AND AGE | POSITION(S)
HELD WITH
TRUST | TERM OF
OFFICE;
TERM
SERVED
IN
OFFICE | PRINCIPAL
OCCUPATION(S)
DURING PAST
FIVE YEARS | NUMBER OF
PORTFOLIOS
IN FUND
COMPLEX
OVERSEEN | OTHER
DIRECTORSHIPS
HELD BY
TRUSTEE* |
Geoffrey A. Trzepacz** Five Tower Bridge, 300 Barr Harbor Drive, West Conshohocken, PA 19428 Born: 1975 | Trustee and President | Indefinite; Since 1/01/19 | Mr. Trzepacz is currently the Chief Operating Officer (COO) of the Adviser since January 2018. Prior to January 2018, Mr. Trzepacz served as COO for the Americas for Aberdeen Asset Management. | 17 | None |
* | The information in this column relates only to directorships in companies required to file certain reports with the SEC under the various federal securities laws. |
** | Mr. Trzepacz is considered to be “interested” as a result of his present positions with the Adviser or its affiliates. |
Additional information about the Portfolios’ Trustees and officers may be found in the Portfolios’ Statement of Additional Information, which is available without charge, upon request, by calling toll-free 1-800-242-9596.
350
THIS PAGE INTENTIONALLY LEFT BLANK
THIS PAGE INTENTIONALLY LEFT BLANK
THIS PAGE INTENTIONALLY LEFT BLANK
HC CAPITAL TRUST
Trustees
GEOFFREY A. TRZEPACZ*
JOHN M. DYER
JARRETT B. KLING
R. RICHARD WILLIAMS
RICHARD W. WORTHAM III
* ‘Interested Person’ as that term is defined in the Investment Company Act of 1940.
Investment Adviser
HC Capital Solutions
Five Tower Bridge
300 Barr Harbor Drive, 5th Floor
West Conshohocken, PA 19428 | Counsel
Stradley Ronon Stevens & Young, LLP
2005 Market Street, Suite 2600
Philadelphia, PA 19103-7018 |
Administrator
Citi Fund Services Ohio, Inc.
4400 Easton Commons, Suite 200
Columbus, OH 43219 | Independent Registered Public Accounting Firm
Grant Thornton LLP
Two Commerce Square
2001 Market Street, Suite 700
Philadelphia, PA 19103 |
Distributor
Ultimus Fund Distributors, LLC
225 Pictoria Drive, Suite 450
Cincinnati, OH 45246 | Custodian
State Street Bank and Trust Company
State Street Financial Center
1 Lincoln Street
Boston, MA 02111-2900 |
This report is for the information of the shareholders of HC Capital Trust. Its use in connection with any offering of the Trust’s shares is authorized only in case of a concurrent or prior delivery of the Trust’s current prospectus. The prospectus contains more complete information, including investment objectives, risks, fees and expenses and should be read carefully before investing or sending any money.
8/22
Item 2. Code of Ethics.
(a) The Registrant has adopted a code of ethics that applies to the Registrant's principal executive officer, principal financial officer, principal accounting officer or controller, or persons performing similar functions, regardless of whether these individuals are employed by the Registrant or a third party (the "Code of Ethics"). The Code of Ethics is included as an Exhibit. During the period covered by the report, with respect to the Registrant's Code of Ethics, there have been no amendments to, nor any waivers granted from, a provision that relates to any element of the code of ethics definition enumerated in paragraph (b) of this Item 2 of Form N-CSR.
Item 3. Audit Committee Financial Expert.
3(a)(1) The Registrant's Board of Trustees has determined that the Registrant has at least one audit committee financial expert serving on its audit committee.
3(a)(2) The audit committee financial expert is John M. Dyer, who is "independent" for purposes of this Item 3 of Form N-CSR. Mr. Dyer was appointed to the Board of Trustees effective June 17, 2019 and was determined to be an audit committee financial expert on June 16, 2020.
Item 4. Principal Accountant Fees and Services.
(a) Audit Fees
2021 $399,000
2022 $420,000
For the fiscal years ended June 30, 2021 and June 30, 2022, the aggregate fees billed by Grant Thornton LLP for professional services rendered for the audits of the financial statements or services that are normally provided in connection with statutory and regulatory filings or engagements for those fiscal years for the Registrant are shown in the table above.
(b) Audit-Related Fees
2021 $0
2022 $0
Audit-related fees include the aggregate fees billed in each of the last two fiscal years for assurance and related services provided by PricewaterhouseCoopers LLP that are reasonably related to the performance of the audit of the Registrant's financial statements and are not reported under Audit Fees under Item 4(a).
(c) Tax Fees
2021 $119,000
2022 $89,400
Tax fees include the aggregate fees billed in each of the last two fiscal years for professional services related to tax compliance, tax advice, and tax planning. Such tax services included the review of income and excise tax returns for the Registrant as shown in the table above for the fiscal years ended June 30, 2021 and June 30, 2022.
(d) All Other Fees
2021 $172,030
2022 $281,709
Other fees include the aggregate fees billed in each of the last two fiscal years related to international tax services provided by PricewaterhouseCoopers LLP for the Registrant as shown in the table above for the fiscal years ended June 30, 2021 and June 30, 2022.
(e)(1) - Except as permitted by Rule 2-01 (c)(7)(i)(c) of Regulation S-X, the HC Capital Trust Audit Committee must pre-approve all audit and non-audit services provided by the independent accountants relating to the operations or financial reporting of the Portfolios. Prior to the commencement of any audit or non-audit services to a Fund, the Audit Committee reviews the services to determine whether they are appropriate and permissible under applicable law.
(e)(2) – The following percentages of the services summarized in (b)-(d) above were approved by the Audit Committee pursuant to Rule 2-01 (c)(7)(i)(c) of Regulation S-X.
2021 0%
2022 0%
(f) - Not applicable.
(g) - For the fiscal years ended June 30, 2021 and June 30, 2022, the aggregate non-audit fees billed by Grant Thornton LLP for services rendered to the Registrant and to the Registrant's investment advisers (the "Advisers") and any entity controlling, controlled by, or under common control with the Advisers that provided ongoing services to the Registrant were $0 and $0, respectively.
(h) - Not applicable.
Item 5. Audit Committee of Listed Registrants.
Not applicable.
Item 6. Schedule of Investments.
(a) Not applicable.
(b) Not applicable.
Item 7. Disclosure of Proxy Voting Policies and Procedures for Closed-End Management Investment Companies.
Not applicable.
Item 8. Portfolio Managers of Closed-End Management Investment Companies.
Not applicable.
Item 9. Purchases of Equity Securities by Closed-End Management Investment Company and Affiliated Purchasers.
Not applicable.
Item 10. Submission of Matters to a Vote of Security Holders.
Not applicable.
Item 11. Controls and Procedures.
(a) The Registrant's principal executive officer and principal financial officer have concluded, based on their evaluation of the Registrant's disclosure controls and procedures as conducted within 90 days of the filing date of this report, that these disclosure controls and procedures are adequately designed and are operating effectively to ensure that information required to be disclosed by the Registrant on Form N-CSR is recorded, processed, summarized and reported within the time periods specified in the Securities and Exchange Commission's rules and forms.
(b) There were no changes in the Registrant's internal control over financial reporting (as defined in Rule 30a-3(d) under the Investment Company Act of 1940 ("the Act") (17 CFR 270.30a-3(d)) that occurred during the period covered by this report that have materially affected or are reasonably likely to materially affect, the Registrant's internal control over financial reporting.
Item 12. Disclosures of Securities Lending Activities for Closed-End Management Investment Companies.
Not applicable.
Item 13. Exhibits.
(a)(1) The Code of Ethics that is the subject of the disclosure required by Item 2 is attached hereto.
(a)(2) Certifications pursuant to Rule 30a-2(a) under the Act are attached hereto.
(a)(3) Not applicable.
(b) Certifications pursuant to Rule 30a-2(b) under the Act are attached hereto.
SIGNATURES
Pursuant to the requirements of the Securities Exchange Act of 1934 and the Investment Company Act of 1940, the Registrant has duly caused this report to be signed on its behalf by the undersigned, thereunto duly authorized.
| (Registrant) | HC Capital Trust | |
| | | |
| By (Signature and Title) | /s/ Geoffrey Trzepacz | |
| | Geoffrey Trzepacz, Principal Executive Officer | |
| | | |
| Date: | September 2, 2022 | |
Pursuant to the requirements of the Securities Exchange Act of 1934 and the Investment Company Act of 1940, this report has been signed below by the following persons on behalf of the Registrant and in the capacities and on the dates indicated.
| By (Signature and Title) | /s/ Colette Bergman | |
| Colette Bergman, Principal Financial Officer | |
| | | |
| Date: | September 2, 2022 | |
| | | |
| By (Signature and Title) | /s/ Geoffrey Trzepacz | |
| | Geoffrey Trzepacz, Principal Executive Officer | |
| | | |
| Date: | September 2, 2022 | |